Embed Size (px)
Citation preview
Outer Ring Road, Bellandur, Bengaluru – 560103
DEPARTMENT OF ELECTRICAL AND ELECTRONICS
ENGINEERING
EEE75 Project - Phase 2
Report on
IOT BASED TRANSFORMER MONITORING
AND CONTROL
Submitted in the partial fulfilment of the Final Year Project - Phase II
Submitted by
Vijay C 1NH16EE712
Javeria Firdous K R 1NH16EE722
Nethra T 1NH16EE730
Pavithra V 1NH16EE733
2019-2020
VISVESVARAYA TECHNOLOGICAL UNIVERSITY
“Jnana Sangama”, Belgaum: 590018
Outer Ring Road, Bellandur, Bengaluru - 560103
DEPARTMENT OF ELECTRICAL AND ELECTRONICS ENGINEERING
CERTIFICATE
Certified that the Project work entitled “IOT BASED TRANSFORMER
MONITORING AND CONTROL” carried out by Vijay C (1NH16EE712), Javeria
Firdous K R (1NH16EE722), Nethra T (1NH16EE730), Pavithra V (1NH16EE733)
bonafide Student(s) of New Horizon College of Engineering submitted report in the partial
fulfillment for the award of Bachelor of Engineering in Department of Electrical and
Electronics Engineering, New Horizon College of Engineering of Visveswaraiah
Technological University, Belgaum during the Year 2019-20.
It is certified that all the corrections / suggestions indicated for Internal Assessment
have been incorporated in the report deposited in the department library.
The project report has been approved as it satisfies the academic requirements in
respect of project work prescribed for said Degree.
SEMESTER END EXAMINATION
Internal Examiner External Examiner
Name & Signature of the
Project Guide
Name & Signature of
Head of the Department
Signature of
Principal
Prof. SATISH KUMAR D Dr.S.RAMKUMAR Dr.MANJUNATHA
DECLARATION
We Vijay C (1NH16EE712), Javeria Firdous K R (1NH16EE722),
Nethra T (1NH16EE730), Pavithra V (1NH16EE733) students of New
Horizon College of Engineering hereby declare that, this project work entitled
“IOT BASED TRANSFORMER MONITORING AND CONTROL” is an
original and bonafide work carried out by me at New Horizon College of
Engineering in partial fulfillment of Bachelor of Engineering in Electrical and
Electronics Engineering of Visvesvaraya Technological University, Belgaum.
We also declare that, to the best of my knowledge and belief, the work
reported here in does not form part of any other thesis or dissertation on the
basis of which a degree or award was conferred on an earlier occasion by any
student.
VIJAY C USN: 1NH16EE712
JAVERIA FIRDOUS K R USN: 1NH16EE722
NETHR T USN: 1NH16EE730
PAVITHRA V USN: 1NH16EE733

ACKNOWLEDGEMENT
We take this opportunity to convey my gratitude to all those who have
been kind enough to offer their advice and provide assistance when needed
which has let to the successful completion of the project.
We would like to express my immense gratitude to our Principal
Dr.Manjunatha and Dr. S Ramkumar Head of the department for their constant
support and motivation that has encouraged me to come up with this project and
also for providing the right ambience for carrying out the work and the facilities
provided to me.
We express my warm thanks to my project guide Prof.Satish Kumar D,
Dept.of Electrical and Electronics Engineering, New Horizon College of
Engineering for his skilful guidance, constant supervision, timely suggestion
and constructive criticism in successful completion of my project in time.
We wish to thank all the staff of Electrical and Electronics Department
for providing me all support whenever needed.
We would like to thank my parents for supporting and helping in the
completion of the project.
Last but not the least We would like to thank all my friends without
whose support and co-operation the completion of project would not have been
possible.
VIJAY C USN: 1NH16EE712
JAVERIA FIRDOUS K R USN: 1NH16EE722
NETHR T USN: 1NH16EE730
PAVITHRA V USN: 1NH16EE733
ABSTRACT
Transformers are the main building block in a power system. Any
damages in transformers adversely affects the balance of a power system. The
damages are mainly occurring due to overloading and inefficient cooling. The
main objective of the real time monitoring of the health conditions of the
distribution transformer using IOT technology.
The parameters such as temperature, voltage, current and oil level of a
transformer are monitored, processed and recorded in servers. For this purpose,
we use sensors interfaced with atmega328 microcontroller. The recorded data
can be send using Wi-Fi module and accessed from anywhere around the world
using IOT technology. This helps in identifying without human dependency.
This helps in identifying and solving a problem before a failure without human
monitoring.
CONTENTS
Chapter
No Content Page No
1 Introduction 1 - 4
2 Literature Survey 5 - 7
3 Methodology 8 - 9
4 Hardware Description 10 - 26
5 Software Implementation 27 - 29
6 Working & Program 30 - 32
7 Advantages and Applications 33
8 Conclusion 34
9 Future Scope 35
10 References 36
LIST OF FIGURES
SNO Name of Figure Page No
1 Block Diagram 9
2 Power Supply 10
3 Arduino – Circuit Diagram 12
4 Current Sensor 13
5 Voltage Sensor 15
6 Voltage Divider Circuit 15
7 Ultrasonic Sensor 16
8 Ultrasonic Distance Sensor 17
9 HC-SR04 18
10 HC-SR04 Frequency 19
11 Liquid Crystal Display 20
12 Liquid Crystal Display Of 16×2 22
13 Liquid Crystal Display Circuit 22
14 Arduino Board 24
15 Arduino Board Circuit 27
16 Arduino Board 29
17 Hardware Kit 30
18 Flow Chart 31
LIST OF TABLES
SNO Name of the Table Page No
1 Pin Description 21
CHAPTER 1
INTRODUCTION
Electricity plays an important role in our life. Every moment of our life depends upon
electricity. Electricity has several components and equipment helping human to transfer and
regulate the distribution according to usage. The most crucial equipment of transmission and
distribution of electric power is transformer. In Power system, an electrical component
transformer directly distributes power to the low-voltage users and its operation condition is a
criteria of the entire network operation. The majority of the devices have been in service for
many years in different (electrical, mechanical, environmental) conditions. They are the main
components and constitute the large portion of capital investment. Operation of distribution
transformer under rated condition (as per specification in their name plate) guarantees their
long service life. However their life is significantly reduced if they are subjected to
overloading, heating low or high voltage current resulting in unexpected failure and loss of
supply to a large number of customers thus is effecting system reliability. Overloading, oil
temperature load current and ineffective cooling of transformer are the major cause of failure
in distribution transformer.
As a large number of transformers are distributed over a wide area in present electric
systems, it’s difficult to measure the condition manually of every single transformer. So we
need a distribution transformer system to monitor all essential parameters operation, and send
to the monitoring system in time. It provides the necessary information about the health of the
transformer. This will help and guide the utilities to optimally use the transformer and keep
this equipment in operation for a longer period. This Proposed project presents design and
implementation of IOT embedded system to measure load currents, over voltage, transformer
oil level and temperature. This is implemented by using on-line measuring system using
Internet of Things (IOT), with single chip Arduino microcontroller and sensors. It is installed
at the distribution transformer site.
The output values of sensors are processed and recorded in the system memory.
System programmed with some predefined instructions to check abnormal conditions. If there
is any abnormality on the system, details are automatically updated in the internet through
serial communication. This Internet of Things (IOT) will help the utilities to optimally utilize
transformers and identify problems before any catastrophic failure occurs. Thus online
measuring system is used to collect and analyze temperature data over time. So Transformer
Health Measuring will help to identify or recognize unexpected situations before any serious
failure which leads to a greater reliability and significant cost savings. Transformer is one of
the important electrical equipment that is used in power system.
Monitoring transformer for the problem before they occur can prevent faults that are
costly to repair and result in a loss of electricity. Currently, failure of the transformer can be
detected by color changing of silica gel and decreasing the quality and viscosity of oil. The
main aim of the project is to acquire real-time data of transformer remotely over the internet
falling under the category of Internet of Things (IOT).
OBJECTIVE AND SCOPE:
The main objective of this proposal is to acquire live data of transformer health
remotely over the internet using Internet of Things technology. We are going to monitor the
transformer parameter such as temperature, current, level. These data will be sent over
internet using TCP / IP protocol. From there we will able to read from anywhere of world
location.
For this real-time aspect, we take one temperature sensor, one potential transformer
and one current transformer for monitoring Temperature(T), Voltage(V), Current (I)
data of the transformer and then send them to a remote location.
These three analog values are taken in multiplexing mode and connected to a
programmable microcontroller.
They are then sent directly to a Wi-Fi module under TCP IP protocol to a dedicated IP
that displays the data in real-time chart form in any web connected PC / Laptop for
display in different charts. The real-time data is also seen at the sending end LCD
display interfaced with the microcontroller.
PROBLEM STATEMENT:
• Transformer is a static device which convert the voltage from one level to other level
without change in frequency and power. Load is connected at secondary winding of
the transformer it increases to the rated value. Due to short circuit or suddenly
increase in load can cause overloading, over-voltages and overheating that can
harmful to the transformer windings insulation and severe damage can be occur on the
secondary side of transformer.
• Transformer can cause failure due to the different faults occur. Various faults like
over currents, over voltage faults, under voltage and also rise in temperature of
transformer.
• Localized heating caused by eddy currents in parts of the winding, induced by
magnetic flux
• Impact forces caused by fault currents.
• Thermal heating caused by overloading.
FAULTS IN TRANSFORMERS:
The major faults occurring in a transformer are overload, over / under voltage,
temperature rise, oil level fault etc. Overload / Overcurrent: Overload / Overcurrent is the
flow of fault current occurring in the power system through the transformer. These condition
last for a short duration of about or less than 2 seconds as protection relays isolate the power
system.
Temperature Rise: Transformers are generally designed to work for 24 hours with an
average ambient temperature of 300 C. Over voltage and over current causes an increase of
oil temperature which induce failure of insulation of transformer winding.
Oil level fault: Oil present in transformers provides cooling and insulation. Temperature
could reduce the oil level and its reduction beyond a required level affects cooling and
insulation.
Disadvantage of Existing System:
Firing of transformer can easily occurs.
Not accurate.
Frequency interference in system.
Noise problem in network
PROPOSED SYSTEM:
The proposed project is about acquiring real time status of transformer health
parameters. Temperature, voltage and current of transformers are monitored and send over
internet The live tracking of these parameters can be done using IOT technology from
anywhere around the world .This is cost effective in nature. Thus the responsible authority
can access information on any power failure or maintenance. The transformers play a vital
role in distribution part of power system. Therefore the monitoring and protection of
transformer is very crucial.
This system introduces a new and improved method of transformer health parameter
monitoring using IOT. The sensors incorporated in the system collect the data of transformer
health parameters such as voltage, temperature and current. These data are send to an IOT
platform, ThingSpeak using. These data can be sent and accessed using IOT technology.
Thus the real time data collection, storage and monitoring of the transformer health
parameters are possible with the system.
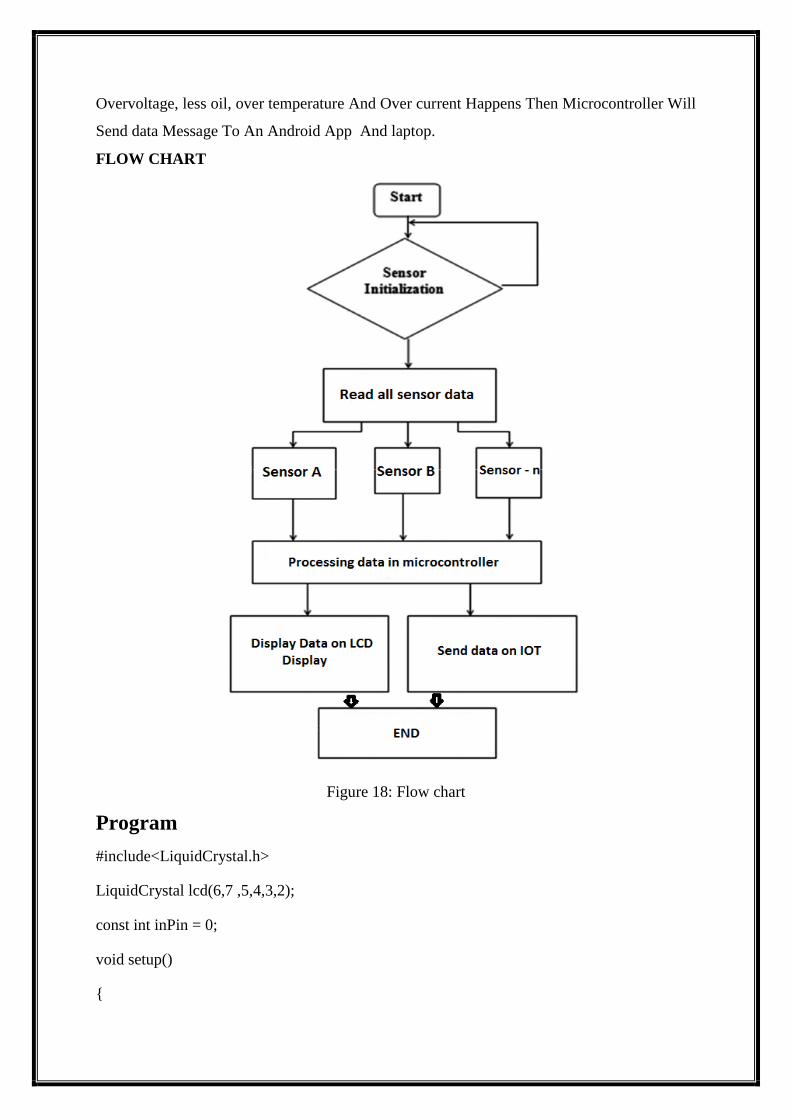
ALGORITHM OF PROPOSED SYSTEM:
Start
Initialize proposed system with GPIO pin.
All sensors such as current sensor, temperature sensor, oil level sensor, take the
reading.
All analog values convert them into digital.
All parameter values are passed to microcontroller.
Microcontroller display these values on LCD.
Microcontroller sends these values on IOT Cloud server.
CHAPTER 2
LITERATURE SURVEY
In most power companies, for online monitoring of power transformers, use supervisory
control and data acquisition (SCADA) system, but for online monitoring of power
transformer, the extending the SCADA system is an expensive proposition. Power
transformers are currently monitored manually, where a person visits a transformer site, for
maintenance and taking records purpose. But main drawbacks of these systems are, it cannot
provide information about overloads (Voltage & Current) and overheating of transformer oil
& windings. Due to these, the transformer life is reduced.
Real Time Transformer Health Monitoring System using IOT
Assistant Professor, UG scholar, Department of Electronics Engineering Priyadarshini
College of Engineering, Nagpur, India.
Monika Agarwal,
This paper represents that they are designing a system where there exits communication
between system and operator. For this we are using Transformer, microcontroller, logic level
converter and GSM i.e. global system for mobile communication modem. This GSM modem
helps to monitor transformer health by sending message to the system.
Hongyan Mao,
This paper represents a large number of power distribution transformer stations and they
are far away from city, wireless GPRS transmission provides a good communication solution
to supervise power distribution transformer stations. The scheme of remote wireless
monitoring system for power distribution transformer station based on GPRS wireless
network was designed in this paper. A control terminal system implement was mainly given,
which adopted LPC2132 as main processor, GR47 as the date communication module. The
monitor terminal software and flow chart were also designed. At last, the way of configuring
the GPRS module to connect network is analyzed.
Pathak A.K,
This paper represents a design and implementation of a mobile embedded system to
monitor and record key parameters of a distribution transformer like load currents, oil level
and ambient Modem, with a standalone single chip microcontroller and different sensors. It is
installed at the distribution transformer site and the above parameters are recorded using the
analog to digital converter (ADC) of the embedded system. The obtained parameters are
processed and recorded in the system memory. If any abnormality or an emergency situation
occurs the system sends SMS (short message service) messages to the mobile phones
containing information about the abnormality according to some predefined instructions
programmed in the microcontroller. This mobile system will help the transformers to operate
smoothly and identify problems before any catastrophic failure.
Transformer Monitoring and Control Using IOT
Deepraj Duttachowdhury, Vivek Patil, Arya Parab, Raj Patel.
(Electrical, Atharva College Of Engineering, India)
Distribution Transformers Are Monitored Physically Where A Man Visits the
Transformer Site And Analyses the Parameters. Incidental Overload And Overheating Of
Transformer Oil And Windings If Not Monitored Properly These Parameters Can Decrease
The Transformer Life Which Is Unachievable By The Current Operation System. A Single
Transformer Parameter Is Generally Detected by a Normal Transformer,
E.g.; Control Current Voltage While Some Ways Could Recognize Multipara meter, It Takes
Too Long for the Parameter Operation and Testing Pace Is Dull.
A Monitoring System Is Not Able To Monitor All Useful Data Of Distribution
Transformer To Reduce Costs, But Can Only Monitor The Operating State. Auspicious
Detection Data Will Not Be Sent To Observing Centers in Time Which Cannot Judge
Distribution Transformer Three Phase Equilibrium Detection System Is Not Reliable. The
Main Principle Execution Is the Devoice Itself Instability, Poor Anti Jamming Capability,
Low Measurement Accuracy of Data.
In Done Research Using GSM Technology Which Is Not Reliable, Cheap And
Compact As Compared To The Proposed Methodology. In States An Innovative Design To
Develop A System Which Is Based On AVR Microcontroller That Is Used For Logging The
Voltage, Current And Temperature Of A Power Transformer In A Substation And To Protect
The System From Any Uncertainty Conditions. In Et Al M. V. Ramesh This Design
Incorporates Effective Solutions For Problems Faced By Indians’ Electricity Distribution
System Such As Power Theft And Transmission Line Fault and Various Other Faults. In
Stated Above Right Away Monitoring Of Distribution Transformer By The Use Of Internet.
In Helps to Understand Various Transformer Faults and the Parameters Affecting It.
The Growth Of The Incipient Faults And Other Faults Can Be Kept In Check
Instantaneously. So Which Will Help The Utilities To Optimally Use Their Transformers
And Keep Them In Operation In Longer Period. This Will Also Identify Problems Before
Any Catastrophic Failure, Which Can Result In A Significant Cost Savings And Greater
Reliability.
Monitoring and Control of Operational Parameters of Distribution Transformer using
IOT Technology
Vishwanath. M. Soppimath, Pavitra Sheeri, Rajakumar Kalakaraddi Chawan Sagar Kumar
Department of Electrical and Electronics Engineering, KLE Institute of Technology,
Hubballi, Karnataka
Design and implementation of a mobile embedded system to monitor and record
operational parameters of distribution transformer such as loading condition, transformer oil
level and winding temperature etc. Abnormal values of operational parameters message will
be sent to mobile device using a GSM network Monitoring of loading condition of power
lines and communicating to control room using SMS based GSM technology. This
methodology is design and implementation using embedded system to monitor and record
load fluctuations with respect to current and voltage in power lines and it isolates the power
lines during abnormal loads. Online monitoring system integrates the GSM modem with a
single chip microcontroller and sensors. It is implemented at the distribution transformer side.
Also this system to protect distribution transformers from overheating and overloading
Comparison of many combinations ways of internet of things and power, the oil based
transformer monitoring system is analyzed, but it has high cost, loss data and feedback
control of function. This system uses a single basmati point temperature measurement
method and GSM network remote control and data processing combined, so that speed of the
temperature and its analysis becomes improved also accuracy of system is also improved,
reducing the cost of temperature monitoring system and using the remote control module to
avoid the failure of transformers. Design and implementation of a system to monitor and
record operations of a distribution transformer like overvoltage, over current, temperature,
rise or fall of oil level.
CHAPTER 3
METHODOLOGY
The internet of things is about connecting the unconnected things. It allows things to
accessible from the internet that historically have not been. The internet of things is able to
improve quality of life for everyone by taking advantage of these connected thing and data
produced. The billions of m2m connection make possible everything in IOT. The process
element leverages the connection between data thing and people to deliver the right
information. To right thing or person, at the right time, it is these billions of connection that
add value. Distribution Transformers have a long life if they are operated under appraised
conditions.
However, their life is essentially decreased if they are overloaded, resulting in
unexpected failures and loss of supply to an expansive number of customers hence affecting
system unwavering quality. Overloading and ineffective cooling of transformers are the
major significant reasons for failure in distribution transformers. Most power companies use
Supervisory Control and Data Acquisition system for web-based monitoring of power
transformers yet amplifying the system for online monitoring of distribution transformers is
an a costly suggestion.
Distribution transformers are as of now observed physically where a man
intermittently visits a transformer site for support and records parameter of
significance. This type of monitoring can't give data about incidental over-load and
overheating of transformer oil and windings. Every one of these variables can
essentially decrease transformer life.
Normal transformer measurement system generally detects a single transformer
parameter, for example, control, current, voltage, and stage. While some ways could
recognize multi-parameter, the time of acquisition and operation parameters is too
long, and testing pace is not sufficiently quick.
A monitoring system can only monitor the operation state or guard against steal the
power, and is not able to monitor all useful data of distribution transformers to reduce
costs
Auspicious detection data will not be sent to observing centers in time, which cannot
judge distribution transformers three phase equilibrium.
Detection system itself is not reliable. The main principle execution is the device itself
instability, poor anti jamming capability, low measurement accuracy of the data.
According to the above requirements, we need a distribution transformer real-time
monitoring system to detect all operating parameters operation, and send to the monitoring
center in time. It leads to Online monitoring of key operational parameters of distribution
transformers can provide useful information about the health of transformers which will help
the utilities to optimally use their transformers and keep the asset in operation for a longer
period. This will also help identify problems before any catastrophic failure which can result
in a significant cost savings and greater reliability.
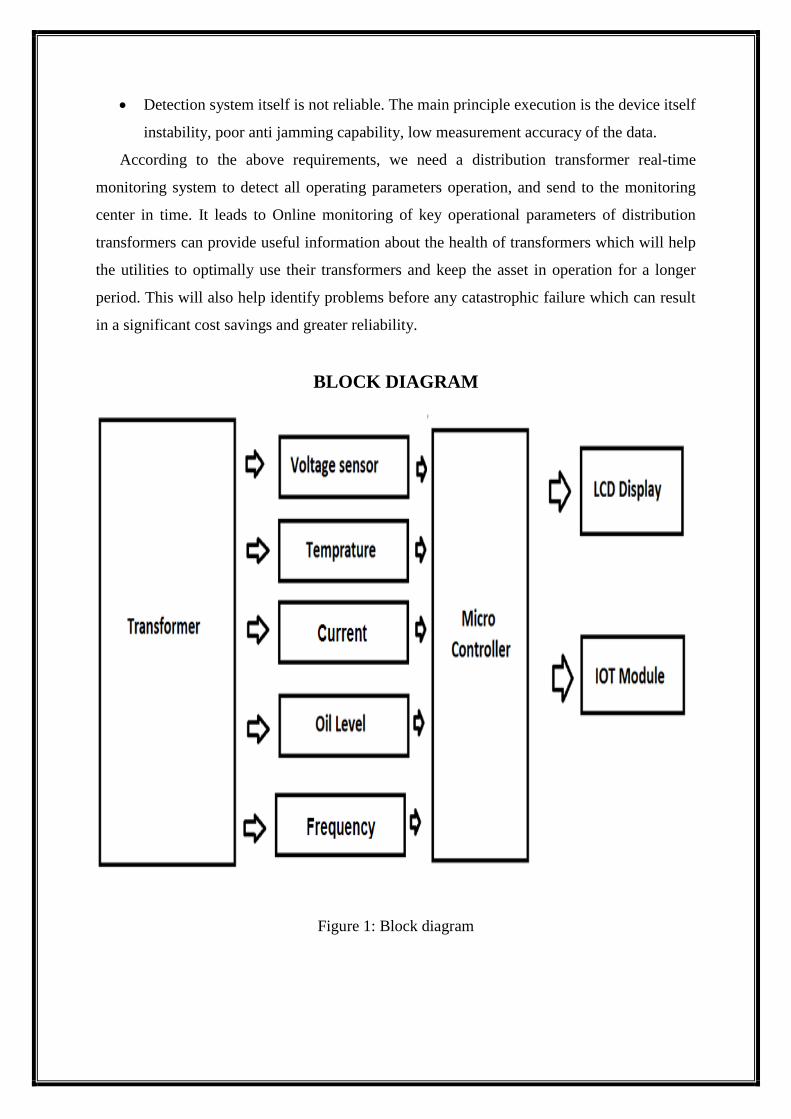
BLOCK DIAGRAM
Figure 1: Block diagram
CHAPTER 4
HARDWARE DESCRIPTION
COMPONENT REQUIREMENT:
Microcontroller
Transformer
Wi-Fi Module
Current sensor
Voltage sensor
LCD display
Power supply
Oil level sensor
Connecting wire
Temperature Sensor
Opto Coupler
Rectifier
SOFTWARE:
Arduino IDE
12 VOLT DC ADAPTER INTERNAL HARDWARE DESCRIPTION
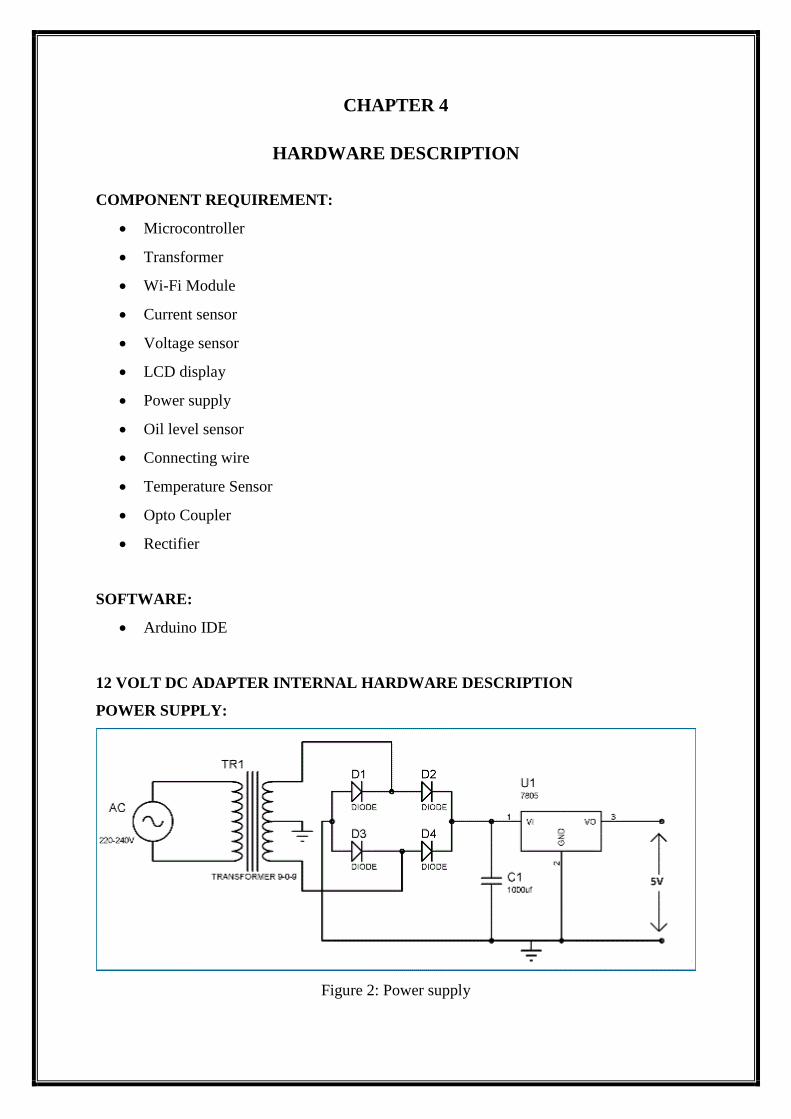
POWER SUPPLY:
Figure 2: Power supply
220V AC power is converted into 12V AC (12V RMS value wherein the peak value is
around 17V), but the required power is 5V DC; for this purpose, 17V AC power must be
primarily converted into DC power then it can be stepped down to the 5V DC. AC power can be
converted into DC using one of the power electronic converters called as Rectifier. There are
different types of rectifiers, such as half-wave rectifier, full-wave rectifier and bridge rectifier.
Due to the advantages of the bridge rectifier over the half and full wave rectifier, the bridge
rectifier is frequently used for converting AC to DC.
Bridge rectifier consists of four diodes which are connected in the form a bridge. We
know that the diode is an uncontrolled rectifier which will conduct only forward bias and will not
conduct during the reverse bias. If the diode anode voltage is greater than the cathode voltage then
the diode is said to be in forward bias. During positive half cycle, diodes D2 and D4 will conduct
and during negative half cycle diodes D1 and D3 will conduct. Thus, AC is converted into DC;
here the obtained is not a pure DC as it consists of pulses. Hence, it is called as pulsating DC
power. But voltage drop across the diodes is (2*0.7V) 1.4V; therefore, the peak voltage at the
output of this retifier circuit is 15V (17-1.4) approx.
15V DC can be regulated into 5V DC using a step-down converter, but before this, it is
required to obtain pure DC power. The output of the diode bridge is a DC consisting of ripples
also called as pulsating DC. This pulsating DC can be filtered using an inductor filter or a
capacitor filter or a resistor-capacitor-coupled filter for removing the ripples. Consider a capacitor
filter which is frequently used in most cases for smoothing.
TEMPERATURE SENSOR:
LM35 is an analog, linear temperature sensor whose output voltage varies linearly
with change in temperature. LM35 is three terminal linear temperature sensor from National
semiconductors. It can measure temperature from-55 degree Celsius to +150 degree
Celsius. The voltage output of the LM35 increases 10mV per degree Celsius rise in
temperature. LM35 can be operated from a 5V supply and the stand by current is less than
60uA. The pin out of LM35 is shown in the figure below.
So that’s all info you need about LM35 for this particular temperature display project
using Arduino Uno. So let’s get to LM35 temperature sensor interfacing with Arduino!
We are using Arduino Uno as our board and LM35 can be connected to Arduino as shown in
circuit diagram.
LM35 is an analog temperature sensor. This means the output of LM35 is an analog
signal. Microcontrollers don’t accept analog signals as their input directly. We need to
convert this analog output signal to digital before we can feed it to a microcontroller’s input.
For this purpose, we can use an ADC (Analog to Digital Converter).If we are using a basic
microcontroller like 8051, we need to use an external ADC to convert analog output from
LM35 to digital. We then feed the outpuw3t of ADC (converted digital value) to input of
8051. But modern day boards like Arduino and most modern day micro controllers come
with inbuilt ADC. Our Arduino Uno has an in built 10 bit ADC (6 channel). We can make
use of this in built ADC of Arduino to convert the analog output of LM35 to digital output.
Since Arduino Uno has a 6 channel inbuilt ADC, there are 6 analog input pins numbered
from A0 to A5. Connect analog out of LM35 to any of these analog input pins of Arduino.
LM35 AND ARDUINO – CIRCUIT DIAGRAM
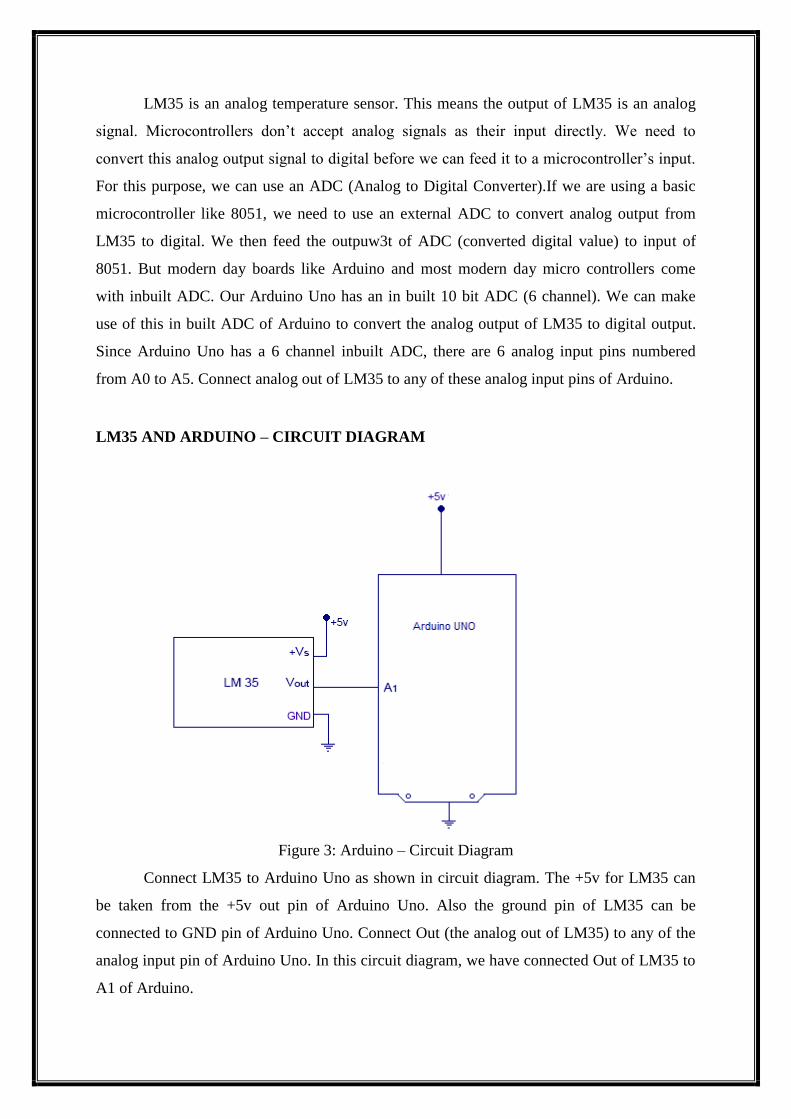
Figure 3: Arduino – Circuit Diagram
Connect LM35 to Arduino Uno as shown in circuit diagram. The +5v for LM35 can
be taken from the +5v out pin of Arduino Uno. Also the ground pin of LM35 can be
connected to GND pin of Arduino Uno. Connect Out (the analog out of LM35) to any of the
analog input pin of Arduino Uno. In this circuit diagram, we have connected Out of LM35 to
A1 of Arduino.
Note:- LM35 is available in the market in 3 series variations – LM35A, LM35C and
LM35D series. The main difference between these 3 versions of LM35 IC are in their
range of temperature measurements. The LM35D series is designed to measure from
0 degree Celsius to 100 degree Celsius, whereas the LM35A series is designed to
measure a wider range of -55 degree Celsius to 155 degree Celsius. The LM35C
series is designed to measure from -40 degree Celsius to 110 degree Celsius.
In our LM35 Arduino example, we are using the LM35 sensor- which falls under LM35D
series. So our min-max range of temperature measurement is 0 degree Celsius to 100 degree
Celsius.
ZMCT103C CURRENT SENSOR MODULE
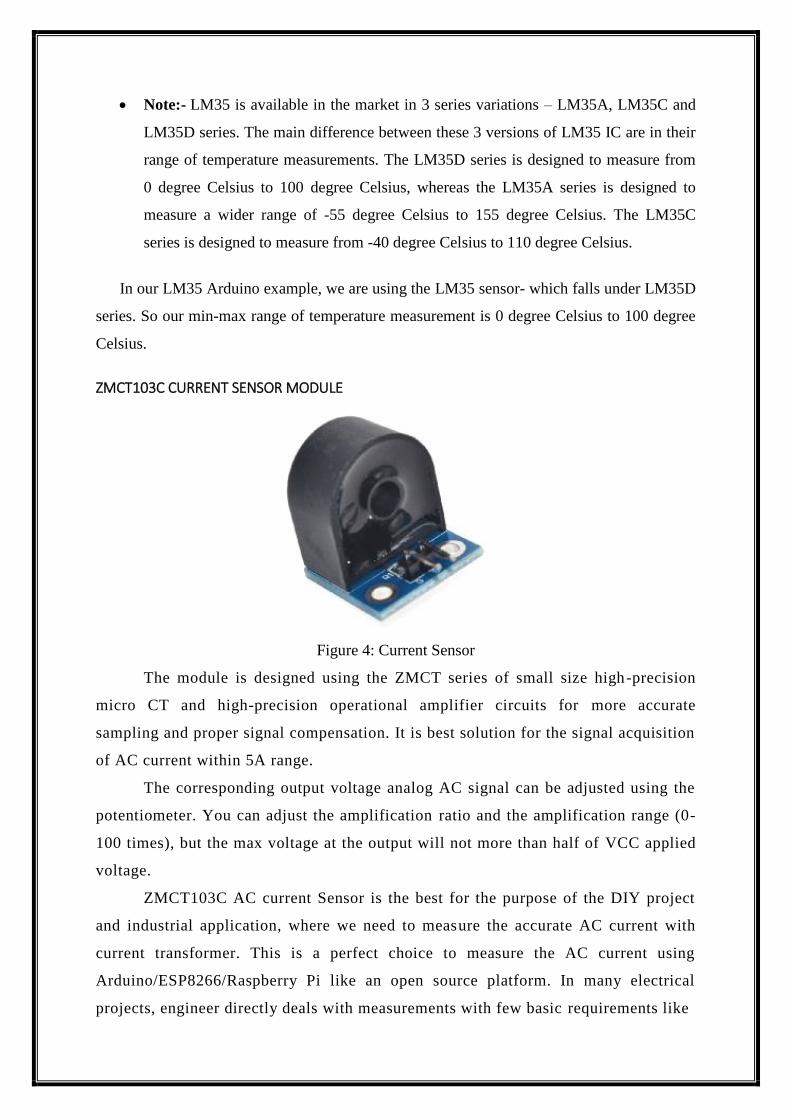
Figure 4: Current Sensor
The module is designed using the ZMCT series of small size high-precision
micro CT and high-precision operational amplifier circuits for more accurate
sampling and proper signal compensation. It is best solution for the signal acquisition
of AC current within 5A range.
The corresponding output voltage analog AC signal can be adjusted using the
potentiometer. You can adjust the amplification ratio and the amplification range (0-
100 times), but the max voltage at the output will not more than half of VCC applied
voltage.
ZMCT103C AC current Sensor is the best for the purpose of the DIY project
and industrial application, where we need to measure the accurate AC current with
current transformer. This is a perfect choice to measure the AC current using
Arduino/ESP8266/Raspberry Pi like an open source platform. In many electrical
projects, engineer directly deals with measurements with few basic requirements like
High galvanic isolation
High accuracy
Good Consistency
This is a high precision micro current Transformer. This module makes it easy to
monitor AC mains current up to 5 Amps. ZMCT103 is a PCB mount current
transformer with 1000:1 turn’s ratio and Dimensions: 28 x 12 x 15 mm (LxWxH).
SPECIFICATION AND FEATURES:
Dimensions: 28 x 12 x 15 mm (LxWxH).
Weight: 4 gm.
Onboard
Rated input current: 5A
Rated output current: 5mA
Change: 1000: 1
The linear range: 0 ~ 10A (100 ohms)
Linearity: 0.2%
Precision Rating: 0.2
Uses isolation voltage: 3000V Measurement
Sealing material: epoxy resin
Operating temperature: – 40 Celsius to + 70 Celsius
Onboard sampling resistor and micro-precision current transformer
Modules 5A can be measured within an alternating current, the analog output
corresponding to 5A/5mA
APPLICATIONS OF ZMCT103C CURRENT TRANSFORMER:
Metering (electrical energy meters)
AC Voltage measurements
Sensing Overload Current
Ground fault detection
Household electrical equipment
Industrial apparatuses
Electrical testing equipment and relay protection
Analog to digital circuits
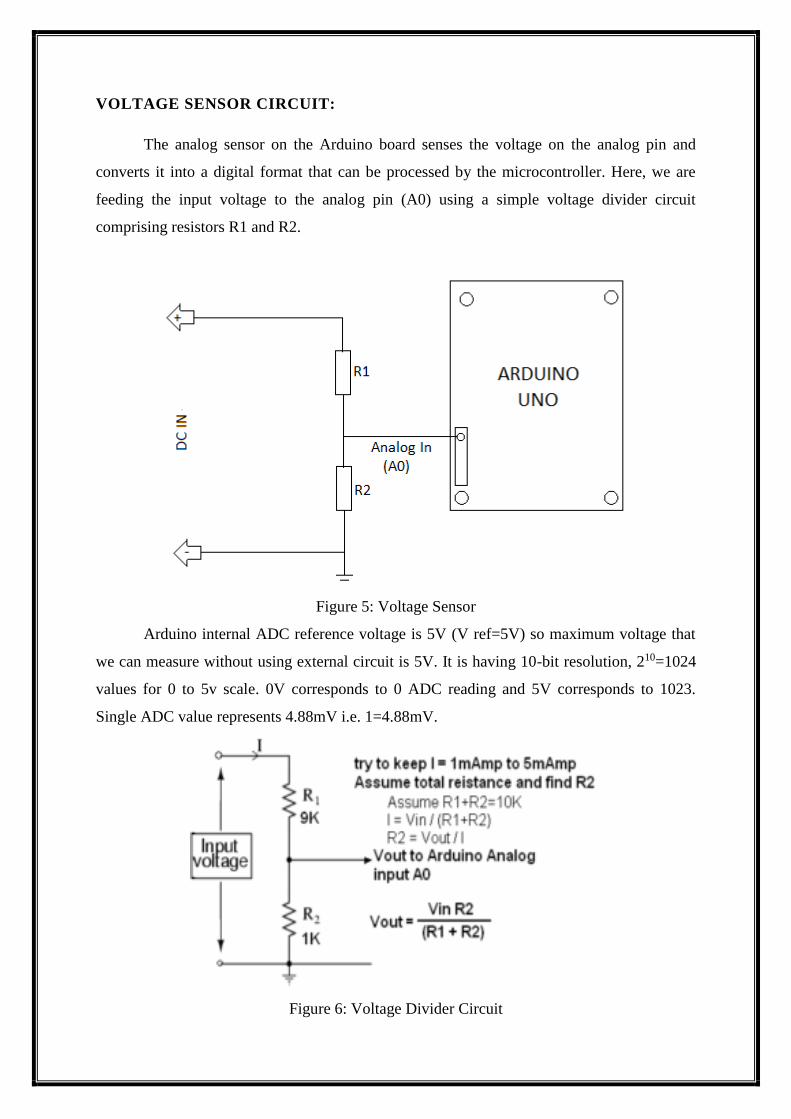
VOLTAGE SENSOR CIRCUIT:
The analog sensor on the Arduino board senses the voltage on the analog pin and
converts it into a digital format that can be processed by the microcontroller. Here, we are
feeding the input voltage to the analog pin (A0) using a simple voltage divider circuit
comprising resistors R1 and R2.
Figure 5: Voltage Sensor
Arduino internal ADC reference voltage is 5V (V ref=5V) so maximum voltage that
we can measure without using external circuit is 5V. It is having 10-bit resolution, 210=1024
values for 0 to 5v scale. 0V corresponds to 0 ADC reading and 5V corresponds to 1023.
Single ADC value represents 4.88mV i.e. 1=4.88mV.
Figure 6: Voltage Divider Circuit
To measure higher voltages than 5V we need external voltage divider to match the
ADC requirements, It converters required measurement voltage in to 0 to 5V scale. It can be
created using two resistors.
Voltage = ADC_value x (Vref/1024) x Division Factor
Where:
Vref=5V
ADC_Value is AnalogRead integer
Division Factor is voltage divider ratio = Vin/Vout
VOLTAGE DIVIDER CIRCUIT:
A voltage divider circuit consisting of two resistors in series will divide the input
voltage to bring it within the range of the Arduino analog inputs.
The voltage divider equation assumes that you know three values of the above circuit:
the input voltage (Vin), and both resistor values (R1 and R2). Given those values, we can use
this equation to find the output voltage (Vout):
This equation states that the output voltage is directly proportional to the input voltage and
the ratio of R1 and R2.
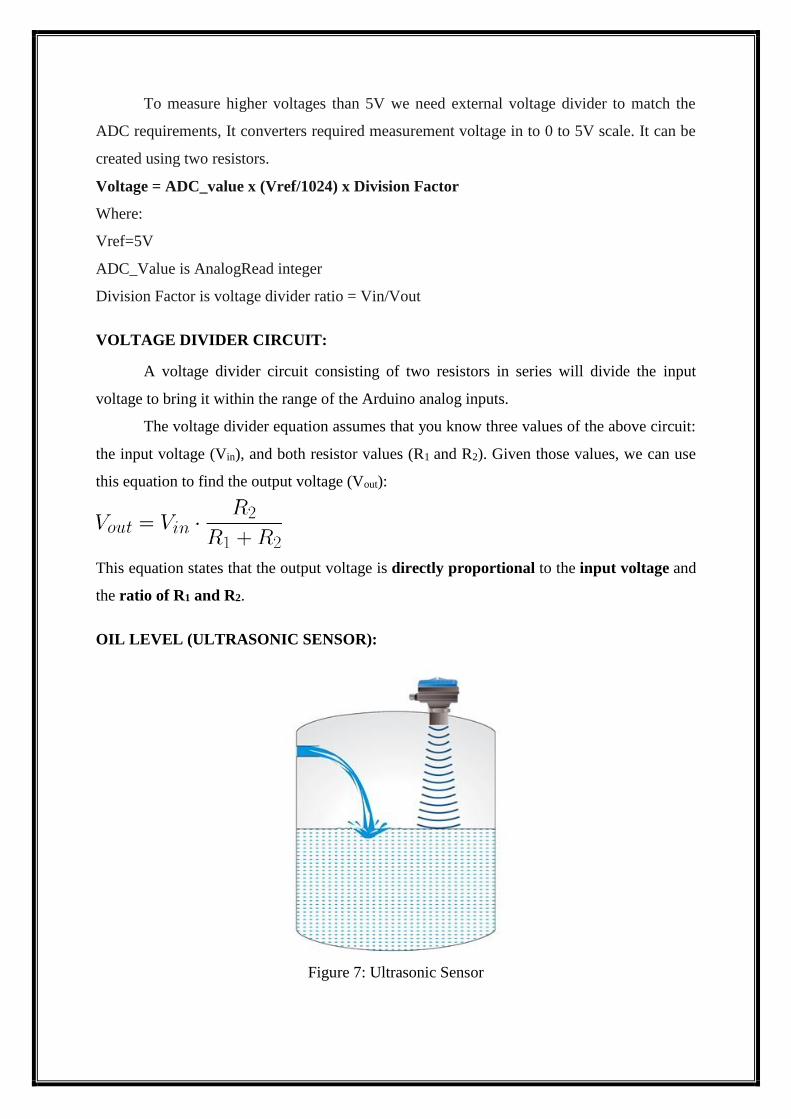
OIL LEVEL (ULTRASONIC SENSOR):
Figure 7: Ultrasonic Sensor
An ultrasonic level transmitter is mounted on the top of the tank and transmits an
ultrasonic pulse down into the tank. This pulse, travelling at the speed of sound, is reflected
back to the transmitter from the liquid surface. The transmitter measures the time delay
between the transmitted and received echo signal and the on-board microprocessor calculates
the distance to the liquid surface using the formula.
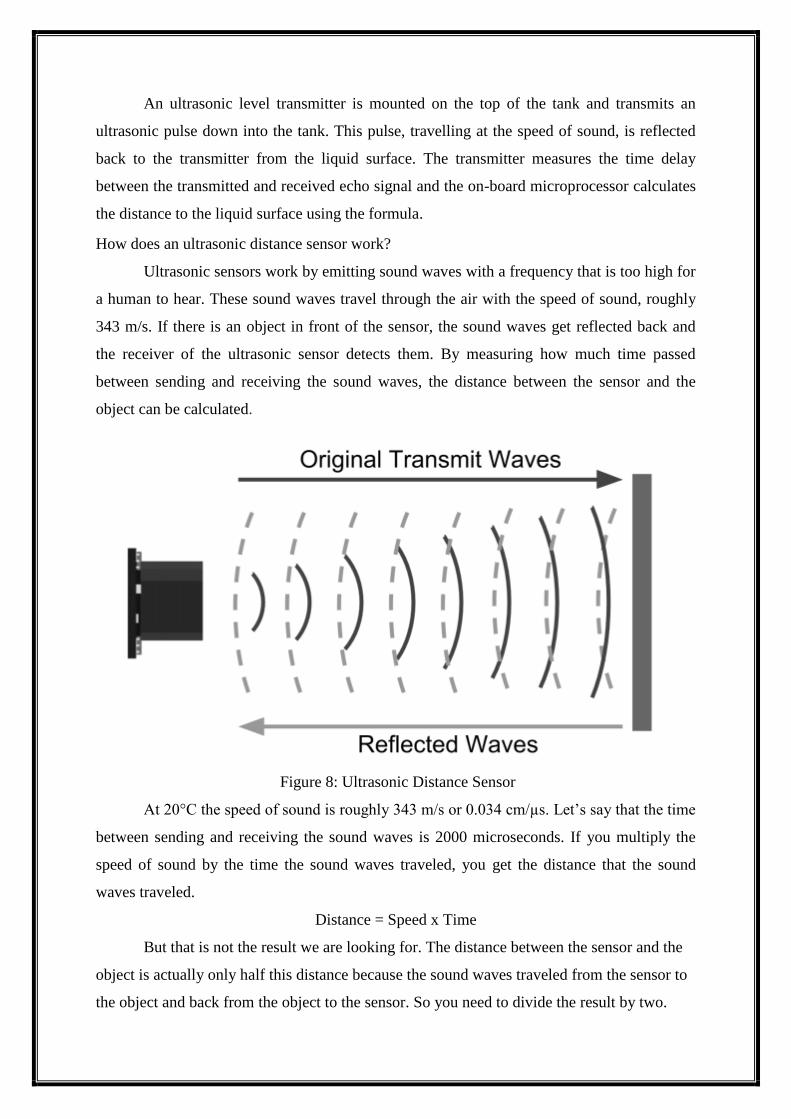
How does an ultrasonic distance sensor work?
Ultrasonic sensors work by emitting sound waves with a frequency that is too high for
a human to hear. These sound waves travel through the air with the speed of sound, roughly
343 m/s. If there is an object in front of the sensor, the sound waves get reflected back and
the receiver of the ultrasonic sensor detects them. By measuring how much time passed
between sending and receiving the sound waves, the distance between the sensor and the
object can be calculated.
Figure 8: Ultrasonic Distance Sensor
At 20°C the speed of sound is roughly 343 m/s or 0.034 cm/µs. Let’s say that the time
between sending and receiving the sound waves is 2000 microseconds. If you multiply the
speed of sound by the time the sound waves traveled, you get the distance that the sound
waves traveled.
Distance = Speed x Time
But that is not the result we are looking for. The distance between the sensor and the
object is actually only half this distance because the sound waves traveled from the sensor to
the object and back from the object to the sensor. So you need to divide the result by two.
Distance (cm) = Speed of sound (cm/µs) × Time (µs) / 2
And so for the example this becomes:
Distance (cm) = 0.0343 (cm/µs) × 2000 (µs) / 2 = 34.3 cm
TEMPERATURE DEPENDENCE OF THE SPEED OF THE SPEED OF SOUND:
The speed of sound actually depends strongly on temperature and to a far lesser degree on the
humidity of the air. Wikipedia states that the speed of sound increases with roughly 0.6 m/s
per degree Celsius. For most cases at 20°C you can just use 343 m/s but if you want to get
more accurate readings, you can calculate the speed of sound with the following formula:
V (m/s) = 331.3 + (0.606 × T)
V = Speed of sound (m/s)
T = Air Temperature (°C)
This formula doesn’t include the humidity since its effect on the speed of sound is only very
small.
Below you can find a tutorial on how to use a DHT11 temperature and humidity sensor to
calibrate the speed of sound and get a more accurate distance reading with the HC-SR04.
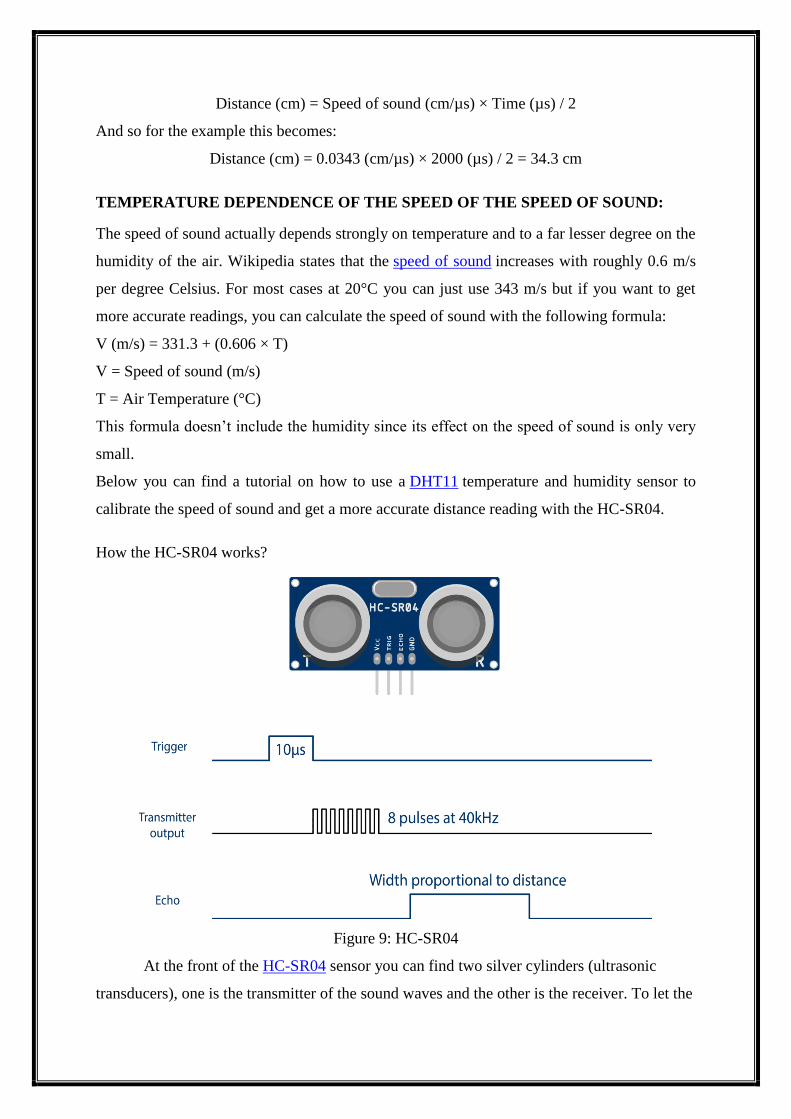
How the HC-SR04 works?
Figure 9: HC-SR04
At the front of the HC-SR04 sensor you can find two silver cylinders (ultrasonic
transducers), one is the transmitter of the sound waves and the other is the receiver. To let the
sensor generate a sonic burst, you need to set the Trig pin high for at least 10 µs. The sensor
then creates an 8 cycle burst of ultrasound at 40 kHz.
This sonic burst travels at the speed of sound, bounces back and gets received by the
receiver of the sensor. The Echo pin then outputs the time that the sound waves traveled in
micro seconds.
You can use the pulse In() function in the Arduino code to read the length of the pulse from
the Echo pin. After that, you can use the formula mentioned above to calculate the distance
between the sensor and the object.
Distance = (Speed of sound in air x time delay) / 2
Once the transmitter is programmed with the bottom reference of the application – usually the
bottom of the tank – the liquid level is calculated by the microcontroller. The basic equation
for calculating the tank level is
Level = Tank Height – Distance
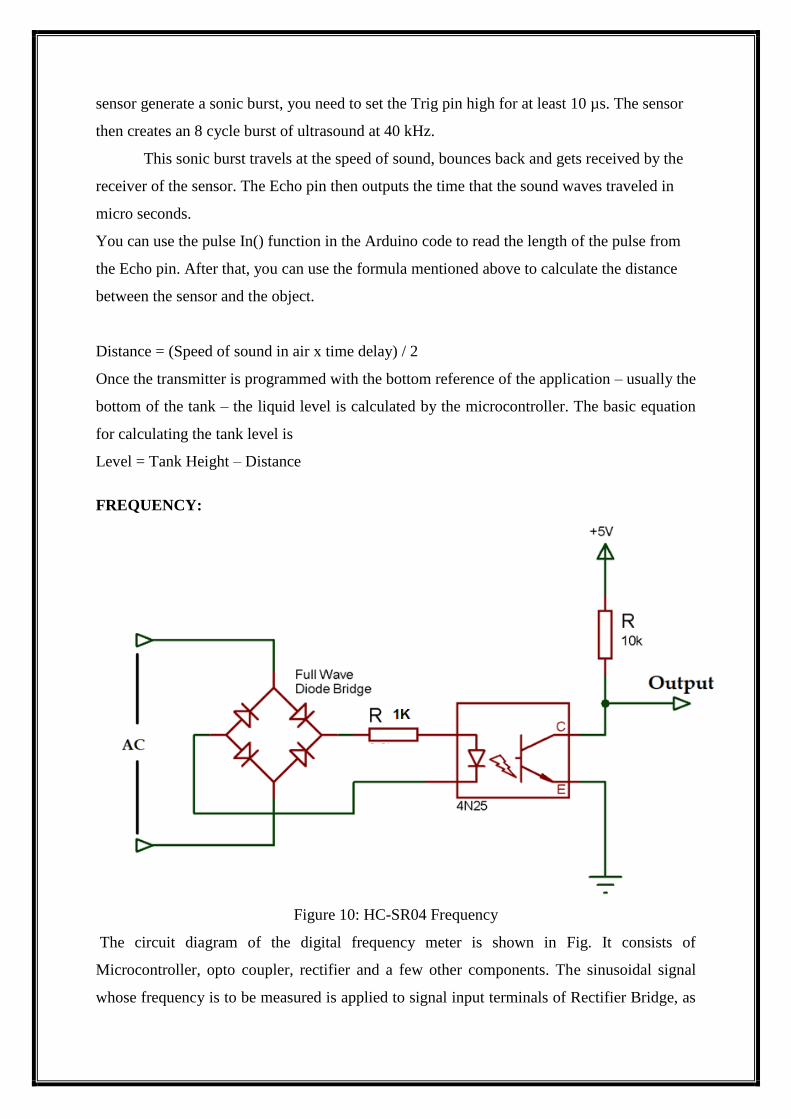
FREQUENCY:
Figure 10: HC-SR04 Frequency
The circuit diagram of the digital frequency meter is shown in Fig. It consists of
Microcontroller, opto coupler, rectifier and a few other components. The sinusoidal signal
whose frequency is to be measured is applied to signal input terminals of Rectifier Bridge, as
shown in Fig. In this frequency meter, the test signal must be an alternating one and its
amplitude must not exceed the maximum forward diode current rating of the opto coupler for
a particular value of series resistance. (Here, we used 1k series resistance.)
The next stage is a bridge rectifier, which converts the alternating signal to fully-
rectified pulsating DC signal. This fully-rectified pulsating DC signal is applied to the diode
side of the opto coupler. With the help of the opto coupler, spikes are produced. Frequency of
the spikes is twice that of test signal input. These spikes are applied to digital I/O pin of
microcontroller, and the program running in the microcontroller (MCU) calculates the
frequency of the signal and displays it on the 16×2 LCD and on same send to IOT .
LCD INTERFACING:
The display units are very important in communication between the human world and the
machine world. The display unit work on the same principle, it does not depend on the size of
the display it may be big or the small. We are working with the simple displays like 16×1 and
16×2 units. The 16×1 display unit has the 16 characters which present in one line and 16×2
display units have 32 characters which are present in the 2 line. We should know that to
display the each character there are 5×10 pixels. Thus to display one character all the 50
pixels should be together. In the display, there is a controller which is HD44780 it is used to
control the pixels of characters to display.
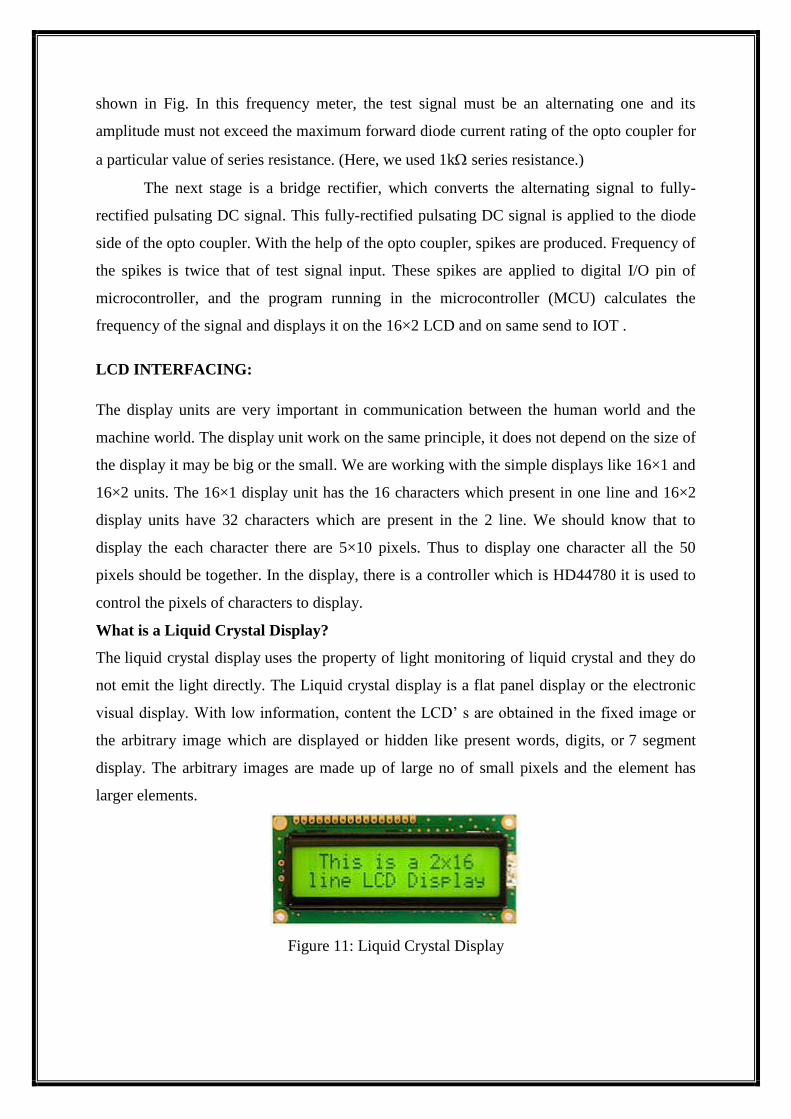
What is a Liquid Crystal Display?
The liquid crystal display uses the property of light monitoring of liquid crystal and they do
not emit the light directly. The Liquid crystal display is a flat panel display or the electronic
visual display. With low information, content the LCD’ s are obtained in the fixed image or
the arbitrary image which are displayed or hidden like present words, digits, or 7 segment
display. The arbitrary images are made up of large no of small pixels and the element has
larger elements.
Figure 11: Liquid Crystal Display
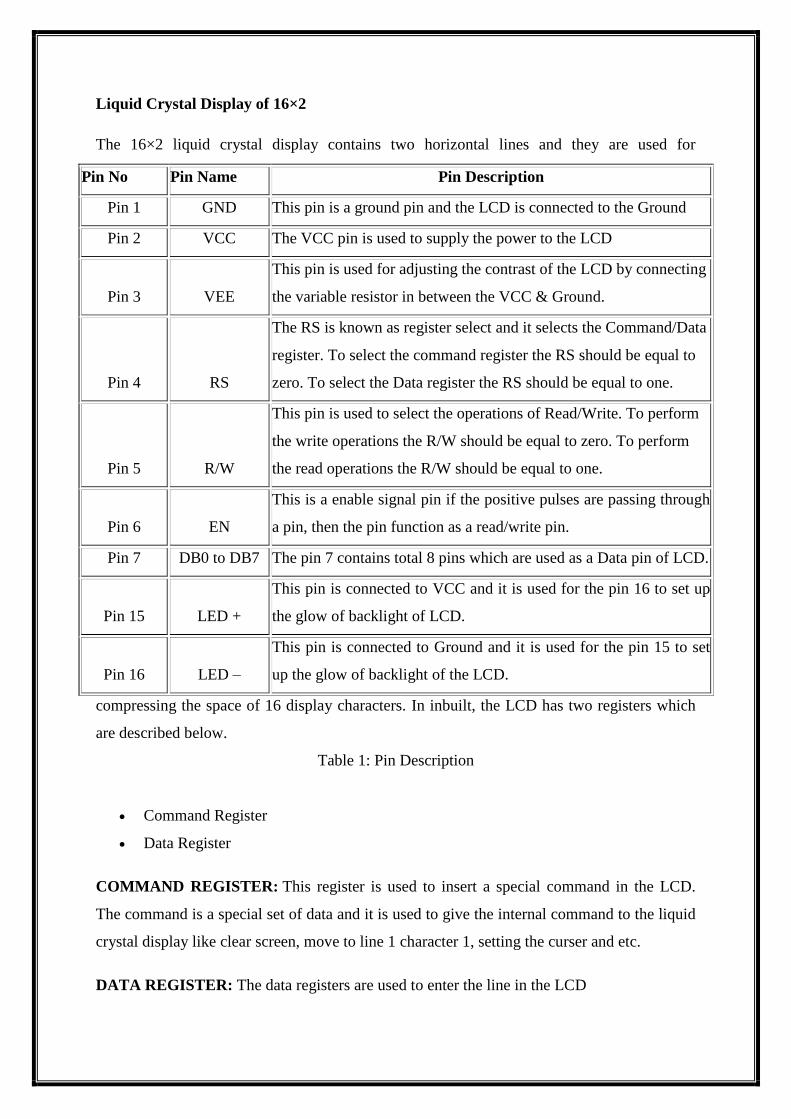
Liquid Crystal Display of 16×2
The 16×2 liquid crystal display contains two horizontal lines and they are used for
compressing the space of 16 display characters. In inbuilt, the LCD has two registers which
are described below.
Table 1: Pin Description
Command Register
Data Register
COMMAND REGISTER: This register is used to insert a special command in the LCD.
The command is a special set of data and it is used to give the internal command to the liquid
crystal display like clear screen, move to line 1 character 1, setting the curser and etc.
DATA REGISTER: The data registers are used to enter the line in the LCD
Pin No Pin Name Pin Description
Pin 1 GND This pin is a ground pin and the LCD is connected to the Ground
Pin 2 VCC The VCC pin is used to supply the power to the LCD
Pin 3 VEE
This pin is used for adjusting the contrast of the LCD by connecting
the variable resistor in between the VCC & Ground.
Pin 4 RS
The RS is known as register select and it selects the Command/Data
register. To select the command register the RS should be equal to
zero. To select the Data register the RS should be equal to one.
Pin 5 R/W
This pin is used to select the operations of Read/Write. To perform
the write operations the R/W should be equal to zero. To perform
the read operations the R/W should be equal to one.
Pin 6 EN
This is a enable signal pin if the positive pulses are passing through
a pin, then the pin function as a read/write pin.
Pin 7 DB0 to DB7 The pin 7 contains total 8 pins which are used as a Data pin of LCD.
Pin 15 LED +
This pin is connected to VCC and it is used for the pin 16 to set up
the glow of backlight of LCD.
Pin 16 LED –
This pin is connected to Ground and it is used for the pin 15 to set
up the glow of backlight of the LCD.
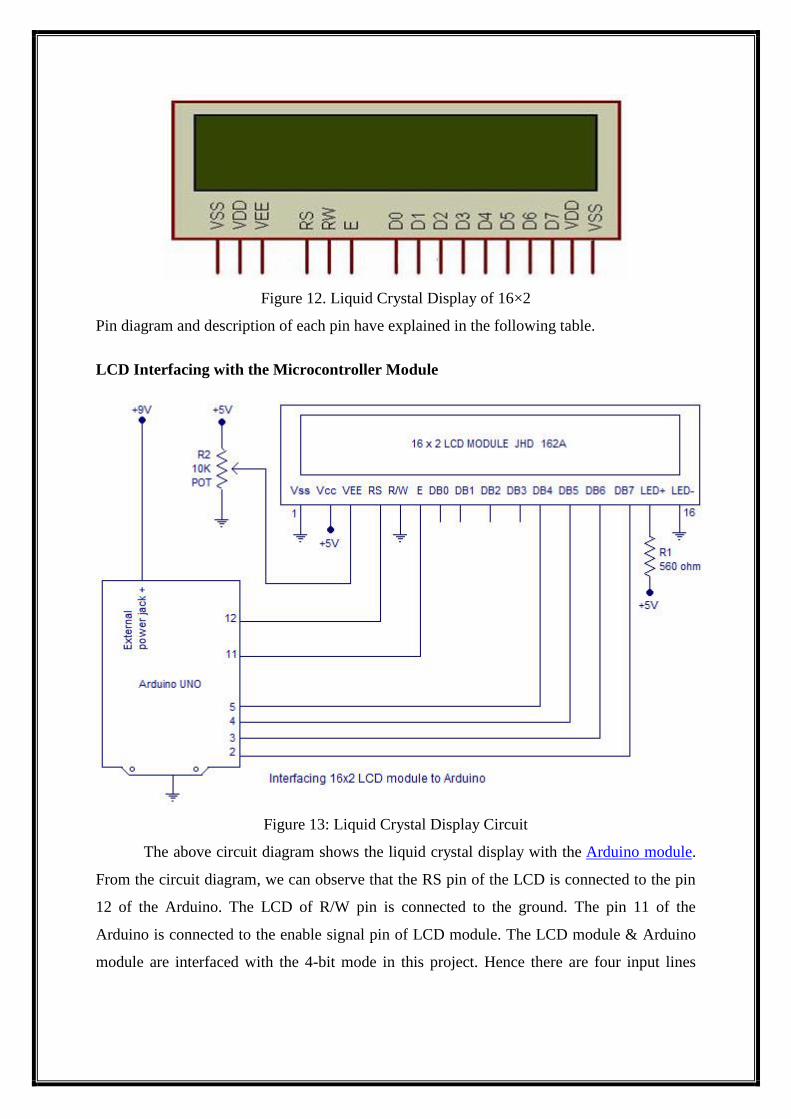
Figure 12. Liquid Crystal Display of 16×2
Pin diagram and description of each pin have explained in the following table.
LCD Interfacing with the Microcontroller Module
Figure 13: Liquid Crystal Display Circuit
The above circuit diagram shows the liquid crystal display with the Arduino module.
From the circuit diagram, we can observe that the RS pin of the LCD is connected to the pin
12 of the Arduino. The LCD of R/W pin is connected to the ground. The pin 11 of the
Arduino is connected to the enable signal pin of LCD module. The LCD module & Arduino
module are interfaced with the 4-bit mode in this project. Hence there are four input lines
which are DB4 to DB7 of the LCD. This process very simple, it requires fewer connection
cables and also we can utilize the most potential of the LCD module.
LCD INTERFACING WITH THE ARDUINO MODULE:
The digital input lines (DB4-DB7) are interfaced with the Arduino pins from 5-2. To
adjust the contrast of the display here we are using a 10K potentiometer. The current through
the back LED light is from the 560-ohm resistor. The external power jack is provided by the
board to the Arduino. Using the PC through the USB port the Arduino can power. Some parts
of the circuit can require the +5V power supply it is taken from the 5V source on the Arduino
board.
What is Arduino?
Arduino is an open-source electronics platform based on easy-to-use hardware and
software. Arduino boards are able to read inputs - light on a sensor, a finger on a button, or
a Twitter message - and turn it into an output - activating a motor, turning on an LED,
publishing something online. You can tell your board what to do by sending a set of
instructions to the microcontroller on the board. To do so you use the Arduino
programming language and the Arduino Software (IDE), based on processing.
Over the years Arduino has been the brain of thousands of projects, from everyday
objects to complex scientific instruments. A worldwide community of makers - students,
hobbyists, artists, programmers, and professionals - has gathered around this open-source
platform, their contributions have added up to an incredible amount of accessible
knowledge that can be of great help to novices and experts alike.
Arduino was born at the Ivrea Interaction Design Institute as an easy tool for fast
prototyping, aimed at students without a background in electronics and programming. As
soon as it reached a wider community, the Arduino board started changing to adapt to new
needs and challenges, differentiating its offer from simple 8-bit boards to products
for IOT applications, wearable, 3D printing, and embedded environments. All Arduino
boards are completely open-source, empowering users to build them independently and
eventually adapt them to their particular needs. The software, too, is open-source, and it is
growing through the contributions of users worldwide.
What's on the board?
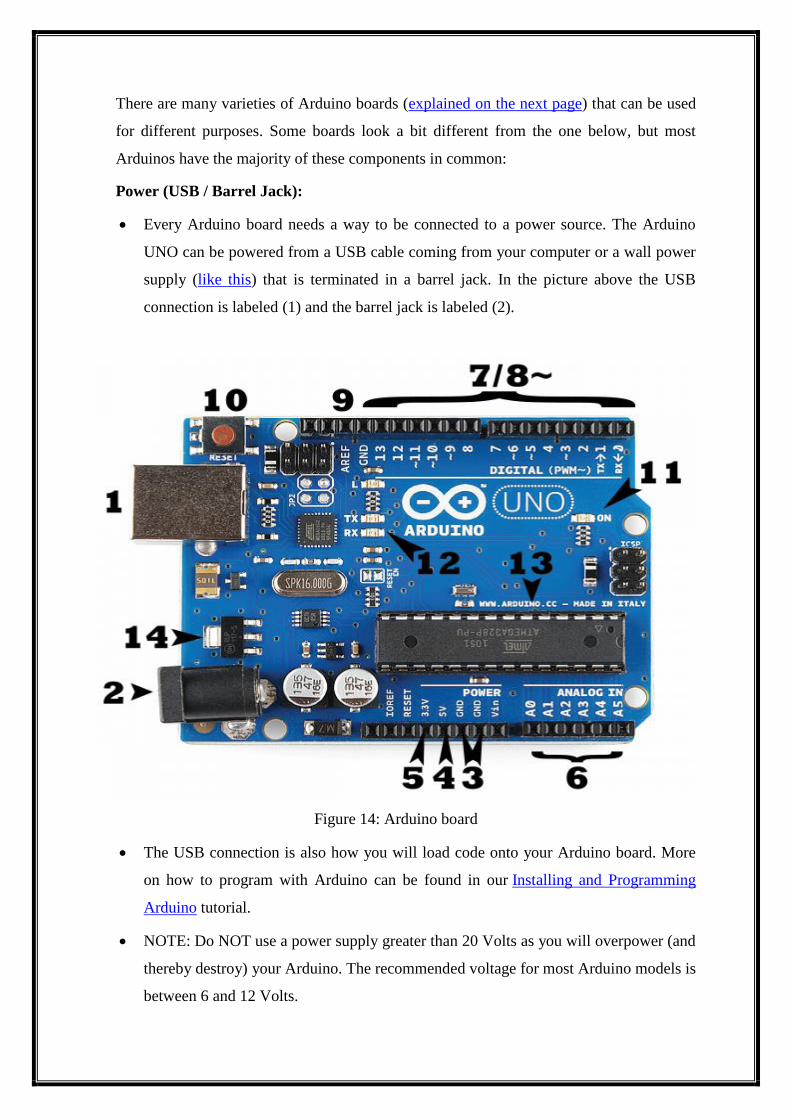
There are many varieties of Arduino boards (explained on the next page) that can be used
for different purposes. Some boards look a bit different from the one below, but most
Arduinos have the majority of these components in common:
Power (USB / Barrel Jack):
Every Arduino board needs a way to be connected to a power source. The Arduino
UNO can be powered from a USB cable coming from your computer or a wall power
supply (like this) that is terminated in a barrel jack. In the picture above the USB
connection is labeled (1) and the barrel jack is labeled (2).
Figure 14: Arduino board
The USB connection is also how you will load code onto your Arduino board. More
on how to program with Arduino can be found in our Installing and Programming
Arduino tutorial.
NOTE: Do NOT use a power supply greater than 20 Volts as you will overpower (and
thereby destroy) your Arduino. The recommended voltage for most Arduino models is
between 6 and 12 Volts.
Pins (5V, 3.3V, GND, Analog, Digital, PWM, AREF)
The pins on your Arduino are the places where you connect wires to construct a
circuit (probably in conjuction with a breadboard and some wire. They usually have
black plastic ‘headers’ that allow you to just plug a wire right into the board. The
Arduino has several different kinds of pins, each of which is labeled on the board and
used for different functions.
GND (3): Short for ‘Ground’. There are several GND pins on the Arduino, any of
which can be used to ground your circuit.
5V (4) & 3.3V (5): As you might guess, the 5V pin supplies 5 volts of power, and the
3.3V pin supplies 3.3 volts of power. Most of the simple components used with the
Arduino run happily off of 5 or 3.3 volts.
Analog (6): The area of pins under the ‘Analog In’ label (A0 through A5 on the UNO)
are Analog In pins. These pins can read the signal from an analog sensor (like
a temperature sensor) and convert it into a digital value that we can read.
Digital (7): Across from the analog pins are the digital pins (0 through 13 on the
UNO). These pins can be used for both digital input (like telling if a button is pushed)
and digital output (like powering an LED).
PWM (8): You may have noticed the tilde (~) next to some of the digital pins (3, 5, 6,
9, 10, and 11 on the UNO). These pins act as normal digital pins, but can also be used
for something called Pulse-Width Modulation (PWM). We have a tutorial on PWM,
but for now, think of these pins as being able to simulate analog output (like fading an
LED in and out).
AREF (9): Stands for Analog Reference. Most of the time you can leave this pin
alone. It is sometimes used to set an external reference voltage (between 0 and 5
Volts) as the upper limit for the analog input pins.
RESET BUTTON:
Just like the original Nintendo, the Arduino has a reset button (10). Pushing it will
temporarily connect the reset pin to ground and restart any code that is loaded on the
Arduino. This can be very useful if your code doesn’t repeat, but you want to test it
multiple times. Unlike the original Nintendo however, blowing on the Arduino doesn't
usually fix any problems.
POWER LED INDICATOR:
Just beneath and to the right of the word “UNO” on your circuit board, there’s a tiny
LED next to the word ‘ON’ (11). This LED should light up whenever you plug your
Arduino into a power source. If this light doesn’t turn on, there’s a good chance
something is wrong. Time to re-check your circuit!
TX RX LEDs:
TX is short for transmit, RX is short for receive. These markings appear quite a bit in
electronics to indicate the pins responsible for serial communication. In our case,
there are two places on the Arduino UNO where TX and RX appear -- once by digital
pins 0 and 1, and a second time next to the TX and RX indicator LEDs (12). These
LEDs will give us some nice visual indications whenever our Arduino is receiving or
transmitting data (like when we’re loading a new program onto the board).
Main IC:
The black thing with all the metal legs is an IC, or Integrated Circuit (13). Think of it
as the brains of our Arduino. The main IC on the Arduino is slightly different from
board type to board type, but is usually from the ATmega line of IC’s from the
ATMEL company. This can be important, as you may need to know the IC type
(along with your board type) before loading up a new program from the Arduino
software. This information can usually be found in writing on the top side of the IC. If
you want to know more about the difference between various IC's, reading the
datasheets is often a good idea.
VOLTAGE REGULATOR:
The voltage regulator (14) is not actually something you can (or should) interact with
on the Arduino. But it is potentially useful to know that it is there and what it’s for.
The voltage regulator does exactly what it says -- it controls the amount of voltage
that is let into the Arduino board. Think of it as a kind of gatekeeper; it will turn away
an extra voltage that might harm the circuit. Of course, it has its limits, so don’t hook
up your Arduino to anything greater than 20 volts.
CHAPTER 5
SOFTWARE REQUIREMENTs
THE ARDUINO FAMILY:
Arduino makes several different boards, each with different capabilities. In addition,
part of being open source hardware means that others can modify and produce
derivatives of Arduino boards that provide even more form factors and functionality.
If you’re not sure which one is right for your project, check this guide for some
helpful hints. Here are a few options that are well-suited to someone new to the world
of Arduino:
ARDUINO UNO (R3):
The Uno is a great choice for your first Arduino. It's got everything you need to get
started, and nothing you don't. It has 14 digital input/output pins (of which 6 can be
used as PWM outputs), 6 analog inputs, a USB connection, a power jack, a reset
button and more. It contains everything needed to support the microcontroller; simply
connect it to a computer with a USB cable or power it with a AC-to-DC adapter or
battery to get started.
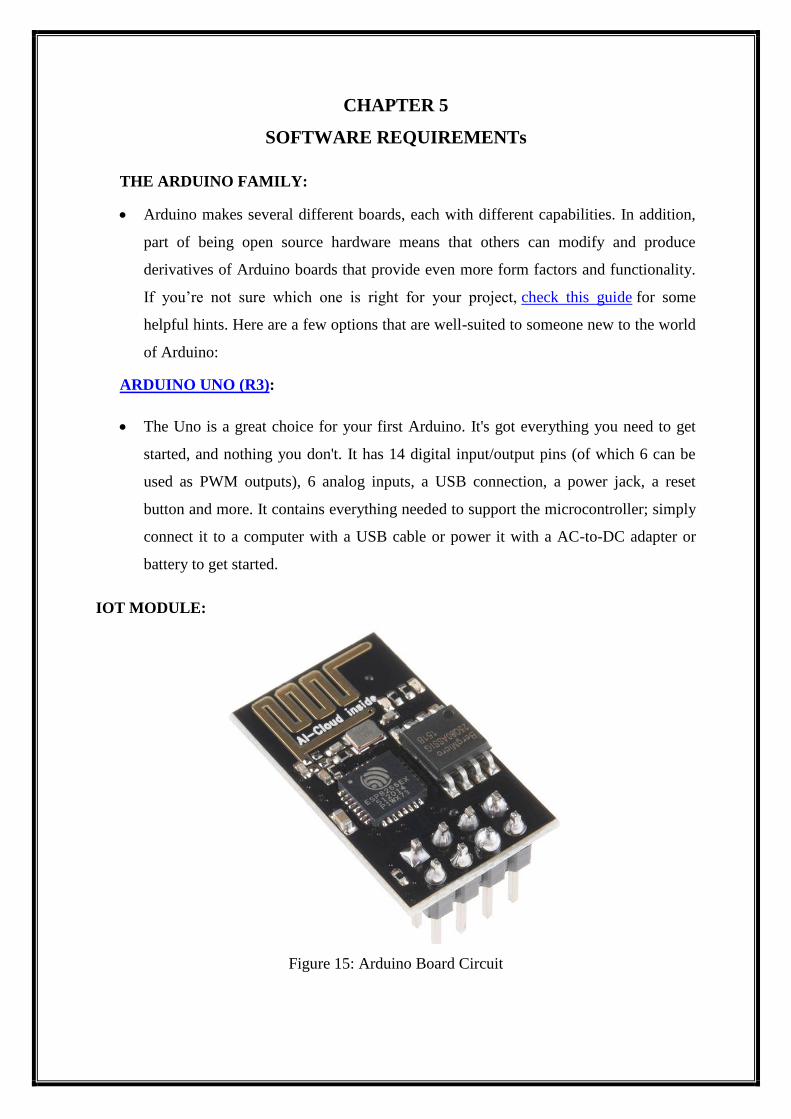
IOT MODULE:
Figure 15: Arduino Board Circuit
The ESP8266 is a small WiFi module built around the ESP8266 chip that can connect
your microcontroller to the internet wirelessly for a very small cost. It can be a great
option for Internet of Things (IoT) projects, but can be difficult to work with for
beginner hobbyists who do not have prior experience with the module. In this
tutorial, we hope to show you how to interface the ESP8266 with an Arduino and
perform some basic functions like connecting it to a WiFi network.
802.11 b/g/n
Wi-Fi Direct (P2P), soft-AP
Integrated TCP/IP protocol stack
Integrated TR switch, balun, LNA, power amplifier and matching network
Integrated PLLs, regulators, DCXO and power management units
+19.5dBm output power in 802.11b mode
Power down leakage current of <10uA
1MB Flash Memory
Integrated low power 32-bit CPU could be used as application processor
SDIO 1.1 / 2.0, SPI, UART
STBC, 1×1 MIMO, 2×1 MIMO
A-MPDU & A-MSDU aggregation & 0.4ms guard interval
Wake up and transmit packets in < 2ms
Standby power consumption of < 1.0mW (DTIM3)
The steps you need to take are simple. This is written for the ESP8266-01 but you can find
the pinout for other models easily and use the same pins. First we will connect the Arduino
UNO to a breadboard:
1. Connect the Arduino’s 3v3 (3.3V) output to the red line on a breadboard. The
ESP8266 works with 3.3V and not 5V, so this is necessary. If you want to connect
other components that use 5V, you can connect the 5V output to the other red line of
the breadboard, just make sure you don’t connect the two.
2. Connect GND (ground) to the blue line.
3. Connect the RES or RESET pin to the blue line. When you ground the reset pin, the
Arduino works as a dumb USB to serial connector, which is what we want to talk to
the ESP8266.
4. Connect the RXD pin of the Arduino to the RX pin of the ESP8266 (yellow color in
the picture).
5. Connect the TXD pin of the Arduino to the TX pin of the ESP (green color in the
picture). Usually, when we want two things to talk to each other over serial, we
connect the TX pin of one to the RX of the other (send goes to receive and the
opposite). Here we do not have the Arduino talk to the ESP8266 though, our
computer is talking to it via the Arduino.
6. Connect the GND pin of the ESP to the blue line and the VCC pin to the red line.
7. Finally CH_PD goes to the red line, supposedly it will not work if you do not connect
this. According to a discussion I found:
ESP-01 and ESP-03 were initially meant to be used as an Arduino WiFi module. In that
aspect it made sense to break out CH_PD so that the user could disable the device when not
in use (to save power).
In the Arduino IDE, you don’t need to choose a board, as we’re not uploading
anything to the ESP8266. Just choose the right port in the Tools menu and go
to Tools → Serial Monitor. Then simply set your baud rate to 115200 (the default ESP8266
firmware uses it) and your line endings to Both NL & CR. If you type AT in the message
field and press enter, it should respond with OK.
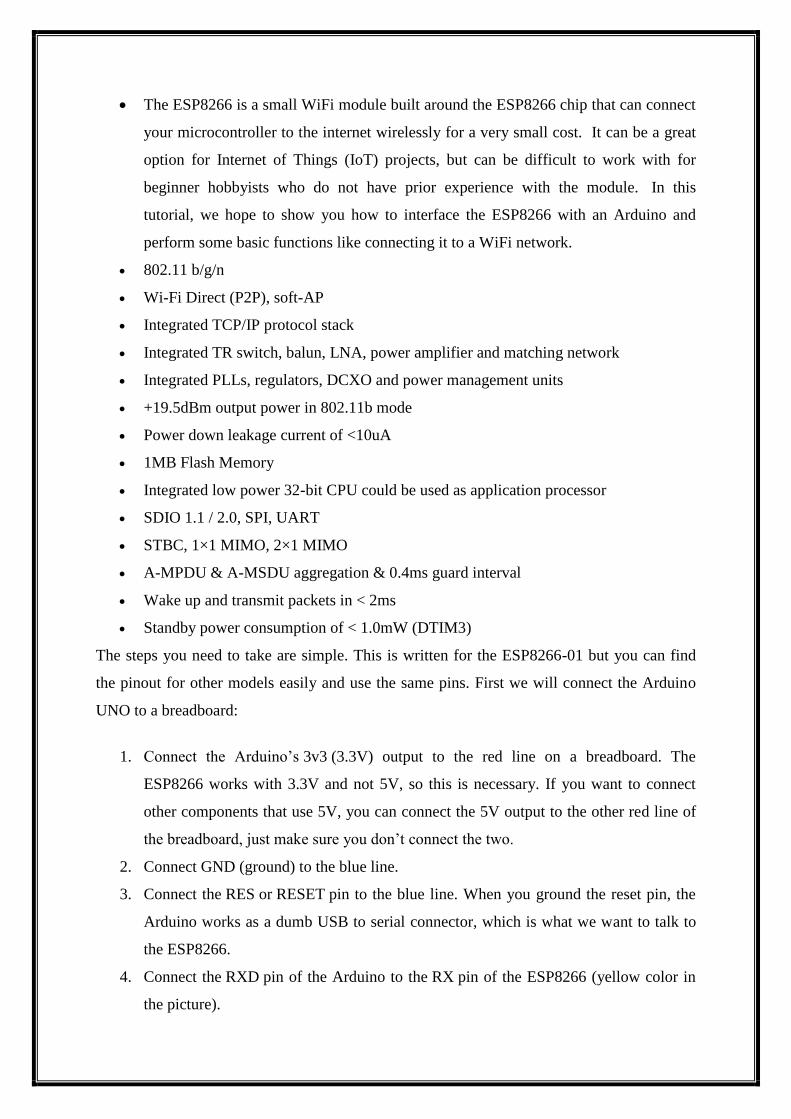
Figure 16: Arduino board
And since we talked about the CH_PD pin, remember that if you want to flash the ESP8266
you should connect the GPIO0 pin to GND (blue line), which puts the ESP into flash mode.
CHAPTER 6
WORKING & PROGRAM
For This Proposed Real-Time Framework We Take a Voltage sensor, oil level, A
Current sensor And a LM35 Temperature Sensor for Monitoring Voltage, Current,
Temperature, Respectively Data Of The Transformer And Then Send Them To A Desired
Location Anywhere In The World. These Three Analog Values Are Taken In Multiplexing
Mode Connected To A Programmable Microcontroller Arduino. Then The Values Are Then
Sent Directly Through An Wi-Fi Module Under TCP IP Protocol To A Dedicated IP That
Displays The Data In Real Time Chart Form In Any Web Connected PC / Laptop/Mobile For
Display .The Real Time Data Is Also Seen At The Sending End Upon A Android App
Interfaced To The Microcontroller.
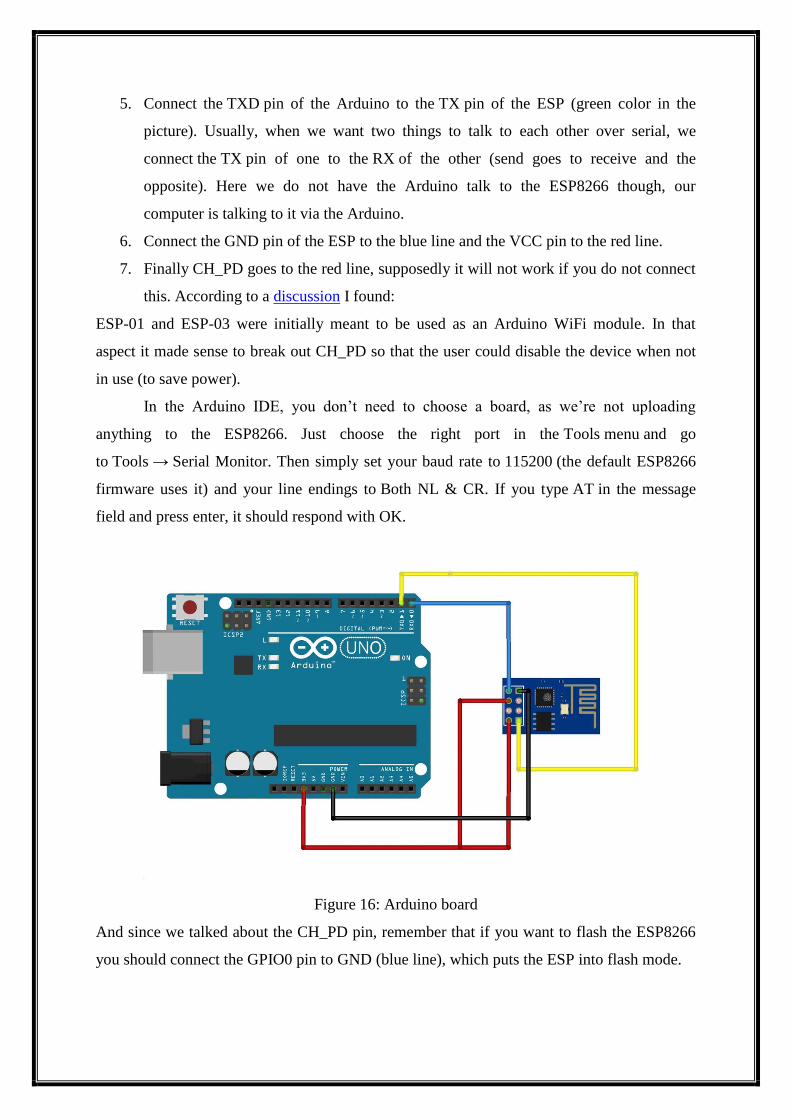
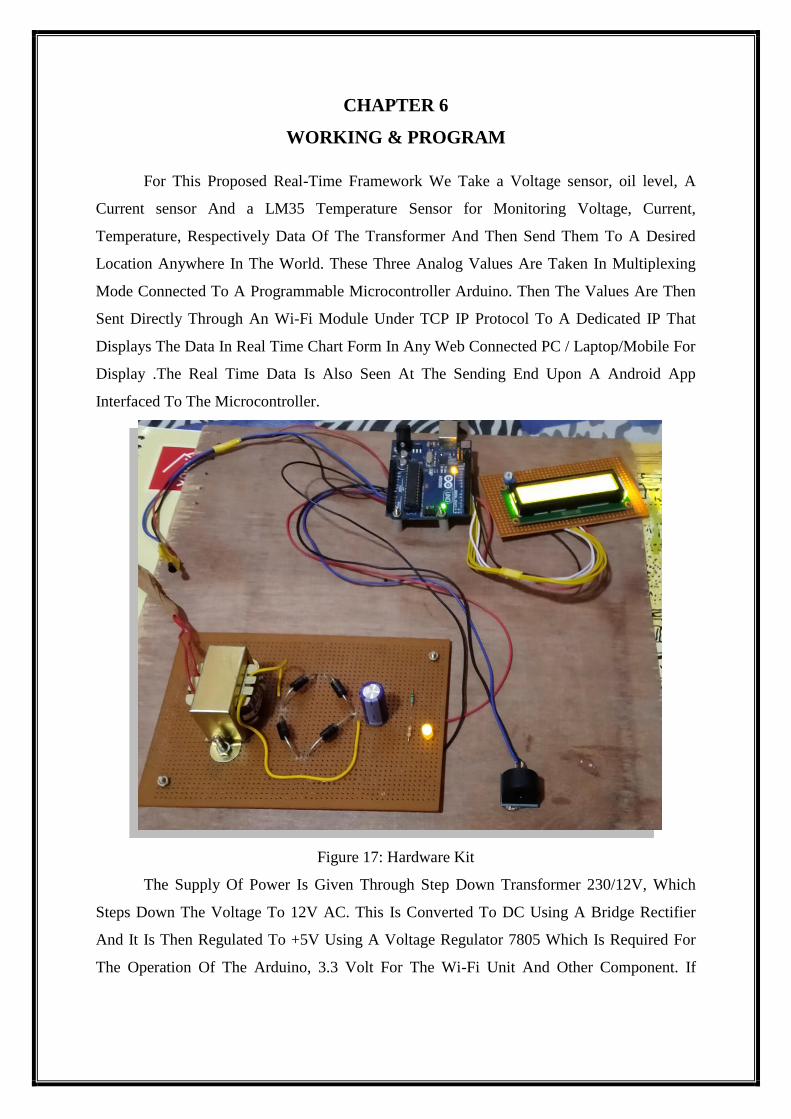
Figure 17: Hardware Kit
The Supply Of Power Is Given Through Step Down Transformer 230/12V, Which
Steps Down The Voltage To 12V AC. This Is Converted To DC Using A Bridge Rectifier
And It Is Then Regulated To +5V Using A Voltage Regulator 7805 Which Is Required For
The Operation Of The Arduino, 3.3 Volt For The Wi-Fi Unit And Other Component. If
Overvoltage, less oil, over temperature And Over current Happens Then Microcontroller Will
Send data Message To An Android App And laptop.
FLOW CHART
Figure 18: Flow chart
Program
#include<LiquidCrystal.h>
LiquidCrystal lcd(6,7 ,5,4,3,2);
const int inPin = 0;
void setup()
{
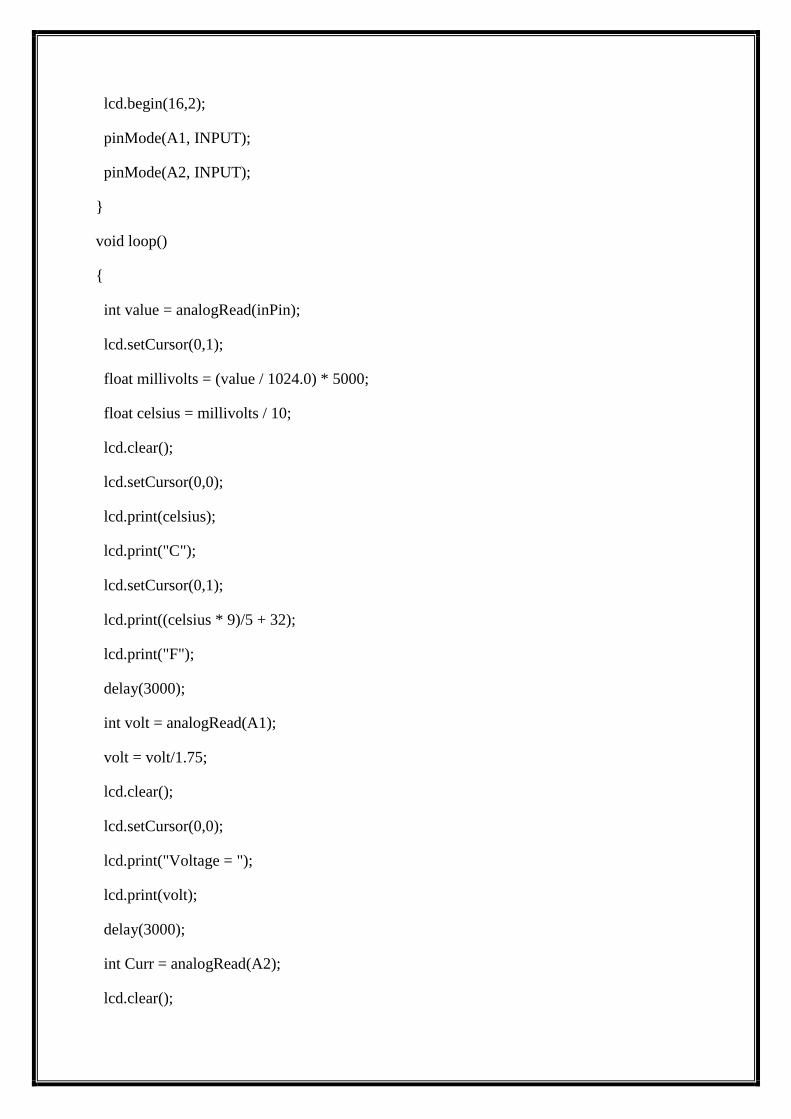
lcd.begin(16,2);
pinMode(A1, INPUT);
pinMode(A2, INPUT);
}
void loop()
{
int value = analogRead(inPin);
lcd.setCursor(0,1);
float millivolts = (value / 1024.0) * 5000;
float celsius = millivolts / 10;
lcd.clear();
lcd.setCursor(0,0);
lcd.print(celsius);
lcd.print("C");
lcd.setCursor(0,1);
lcd.print((celsius * 9)/5 + 32);
lcd.print("F");
delay(3000);
int volt = analogRead(A1);
volt = volt/1.75;
lcd.clear();
lcd.setCursor(0,0);
lcd.print("Voltage = ");
lcd.print(volt);
delay(3000);
int Curr = analogRead(A2);
lcd.clear();
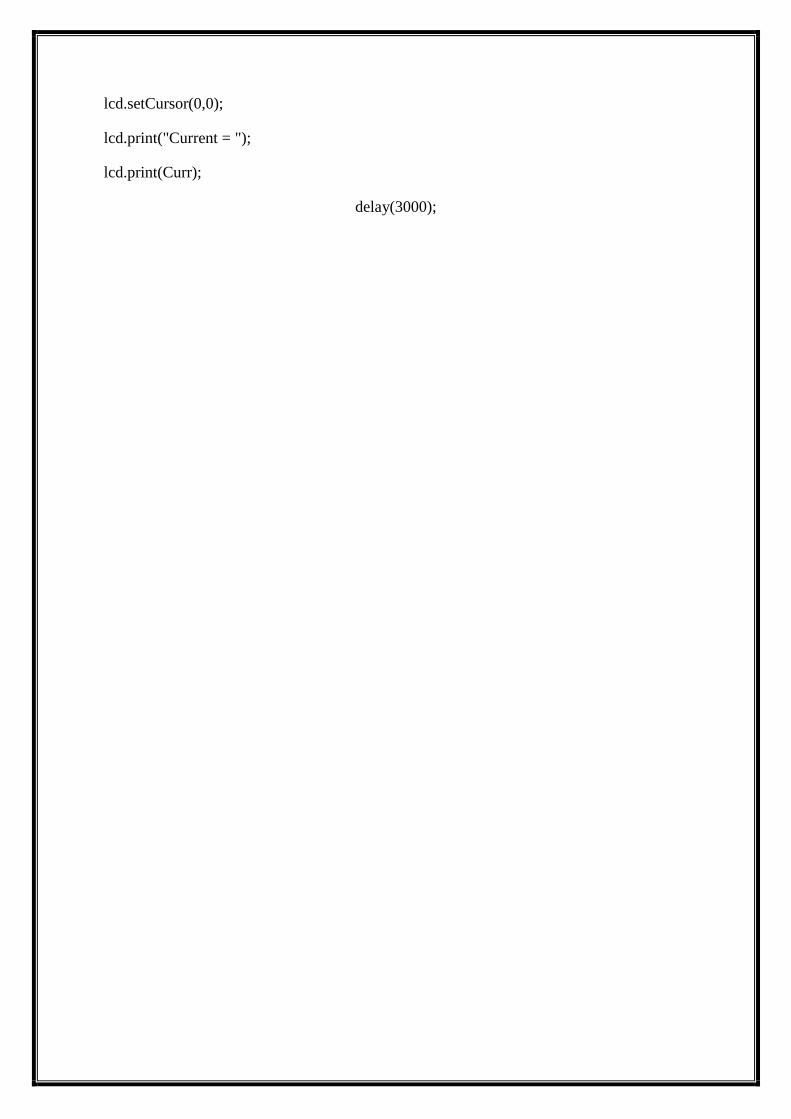
lcd.setCursor(0,0);
lcd.print("Current = ");
lcd.print(Curr);
delay(3000);

CHAPTER 7
ADVANTAGES AND APPLICATIONS
ADVANTAGES:
Low cost.
Real-time monitoring.
High efficiency.
High Accuracy.
Remote monitoring
Improve system reliability.
APPLICATIONS:
Distribution Transformer.
Industrial Applications.
On High Grade Motors.
GRID Monitoring

CHAPTER 8
CONCLUSION
An IOT based transformer monitoring system for power transformer was designed,
implemented and tested. It is quite useful as compared to manual monitoring and also it is
reliable as it is not possible to monitor always the oil level, oil temperature rise, ambient
temperature rise, load current manually. A server module can be added to this system to
periodically receive and store transformer parameters information about all the power
transformers in a database application. After receiving message on any abnormality, we can
take immediate action to prevent any catastrophic failures of power transformers. We need
not have to check all power transformers and corresponding phase currents and voltages and
thus we can recover the system in less time and faults before any uncertain failures thus
resulting in significant cost saving as well as improving system reliability.
The proposed technique with results has shown that the protection scheme works
properly with accuracy, sensitivity of this scheme very high for the abnormal and faulty
conditions. Transformer Health Monitoring will help to identify or recognize unexpected
situations before any serious failure, which leads to greater reliability and significant cost
savings. If transformer is in abnormal condition, we can know from anywhere. No human
power need to monitor the transformer. Details about the transformer are automatically
updated in webpage.
CHAPTER 9
FUTURE SCOPE
In future work we can develop database of all parameters of distribution transformer,
which are placed at different places. We can get all information by placing the proposed
system modules at every transformer. We can send the data through Wi-Fi module and
through Ethernet router. With server, we can store data on webpage or website. A Wi-Fi
module connects to nearby network and sends information to monitoring node.
CHAPTER 10
REFERENCES
[1]. https://www.allaboutcircuits.com/textbook/semiconductors/chpt-3/rectifier-circuits/
[2]. Mrs. A. P. Khandait1, Swapnil Kadaskar2, Girish Thakare3, “Real Time Monitoring of
Transformer. using IOT” , International Journal of Engineering Research & Technology
(IJERT),Vol. 6 Issue 03, March2017.
[3]. Ansuman Sharma, Rajesh Behura; “GSM based Distribution Transformer Monitoring
System”, May 2013.
[4]. Par S.Tenbohlen,T Stirl, M. Rösner, “Benefit of sensors for on-line monitoring system
for power transformers”.
[5]. http://dfe.petrsu.ru/koi/posob/avrlab/ATMega16.pdf.
[6]. GSM based Transformer Condition Monitoring System Ms.Swati R.Wandhare,
Ms.Bhagyashree Shikkewal Special Issue-2 ISSN : 24541311 International Conference on
Science and Engineering for Sustainable Development (ICSESD
2017)(www.jit.org.in)International Journal of Advanced Engineering, Management and
Science (IJAEMS).


