Embed Size (px)
Citation preview
Copyright © 2015 Blue Hill Research Page 1
ANALYST INSIGHT
IoT Analytics in Practice
Published: September 2015
Analysts: James Haight, Research Analyst;
Hyoun Park, Chief Research Officer
What You Need To Know
The Internet of Things (IoT) presents an opportunity to collect real-time
information about every physical operation of a business. From the
temperature of equipment to the performance of a fleet of wind turbines,
IoT sensors can deliver this information in real time. There is tremendous
opportunity for those businesses that can convert raw IoT data into
business insights, and the key to doing so lies within effective data
analytics.
To research the current state of IoT analytics, Blue Hill Research conducted
deep qualitative interviews with three organizations that invested
significant time and resources into their own IoT analytics initiatives. By
distilling key themes and lessons learned from peer organizations, Blue
Hill Research offers our analysis so that business decision makers can
ultimately make informed investment decisions about the future of their
IoT analytics projects.
Study Overview
During the course of the study, Blue Hill Research interviewed three
organizations to get a deep understanding of their IoT analytics initiatives
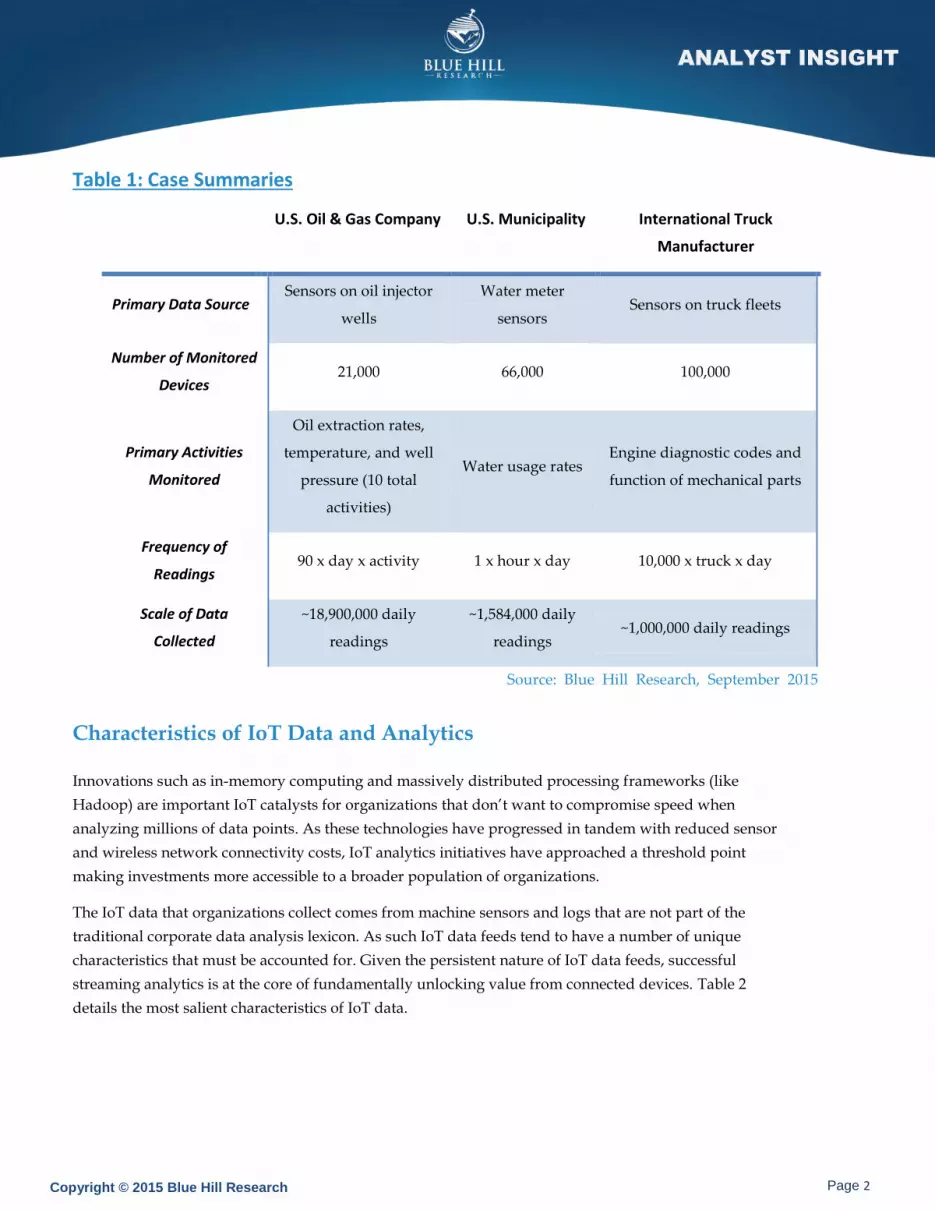
including: a U.S. based oil & gas company building a sensor network to track
oil field performance, a U.S. municipality transitioning to automated water meter readings, and an
international truck manufacturer optimizing fleet performance and manufacturing. The following table
summarizes the key details and goals for each IoT initiative that Blue Hill studied.
AT A GLANCE
Studied Organizations
U.S. Municipality
U.S. Oil & Gas Company
International Truck Manufacturer
IoT Analytics Initiatives
Smart utility meter monitoring
Oil field performance monitoring
Predictive maintenance on truck fleet
Key Business Outcomes
$10 million capital savings
Optimized oil field production
Net-new revenue stream & enhanced truck manufacturing
Report Number: A0173
Share This Report
Copyright © 2015 Blue Hill Research Page 2
ANALYST INSIGHT
Table 1: Case Summaries
U.S. Oil & Gas Company U.S. Municipality International Truck
Manufacturer
Primary Data Source Sensors on oil injector
wells
Water meter
sensors Sensors on truck fleets
Number of Monitored
Devices 21,000 66,000 100,000
Primary Activities
Monitored
Oil extraction rates,
temperature, and well
pressure (10 total
activities)
Water usage rates Engine diagnostic codes and
function of mechanical parts
Frequency of
Readings 90 x day x activity 1 x hour x day 10,000 x truck x day
Scale of Data
Collected
~18,900,000 daily
readings
~1,584,000 daily
readings ~1,000,000 daily readings
Source: Blue Hill Research, September 2015
Characteristics of IoT Data and Analytics
Innovations such as in-memory computing and massively distributed processing frameworks (like
Hadoop) are important IoT catalysts for organizations that don’t want to compromise speed when
analyzing millions of data points. As these technologies have progressed in tandem with reduced sensor
and wireless network connectivity costs, IoT analytics initiatives have approached a threshold point
making investments more accessible to a broader population of organizations.
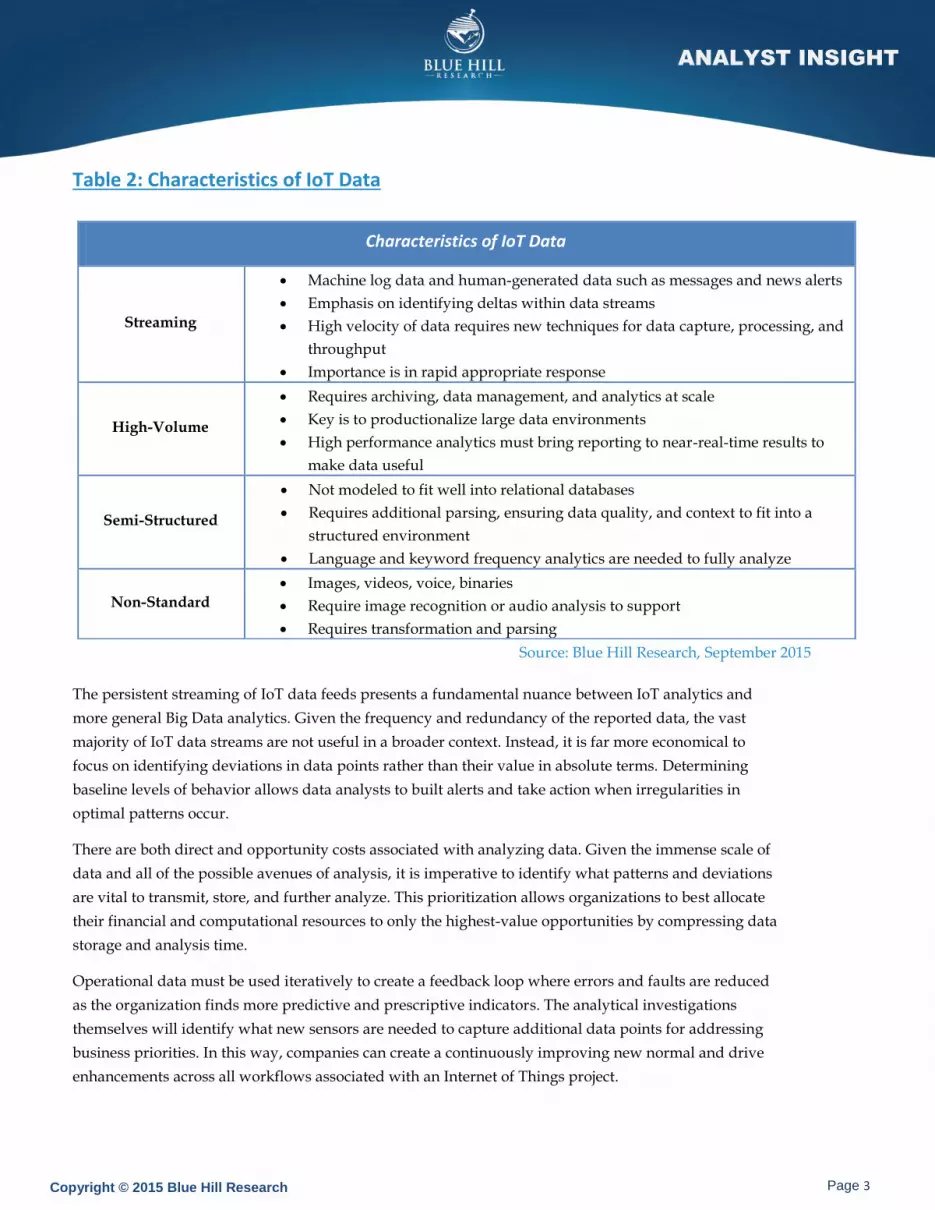
The IoT data that organizations collect comes from machine sensors and logs that are not part of the
traditional corporate data analysis lexicon. As such IoT data feeds tend to have a number of unique
characteristics that must be accounted for. Given the persistent nature of IoT data feeds, successful
streaming analytics is at the core of fundamentally unlocking value from connected devices. Table 2
details the most salient characteristics of IoT data.
Copyright © 2015 Blue Hill Research Page 3
ANALYST INSIGHT
Table 2: Characteristics of IoT Data
Source: Blue Hill Research, September 2015
The persistent streaming of IoT data feeds presents a fundamental nuance between IoT analytics and
more general Big Data analytics. Given the frequency and redundancy of the reported data, the vast
majority of IoT data streams are not useful in a broader context. Instead, it is far more economical to
focus on identifying deviations in data points rather than their value in absolute terms. Determining
baseline levels of behavior allows data analysts to built alerts and take action when irregularities in
optimal patterns occur.
There are both direct and opportunity costs associated with analyzing data. Given the immense scale of
data and all of the possible avenues of analysis, it is imperative to identify what patterns and deviations
are vital to transmit, store, and further analyze. This prioritization allows organizations to best allocate
their financial and computational resources to only the highest-value opportunities by compressing data
storage and analysis time.
Operational data must be used iteratively to create a feedback loop where errors and faults are reduced
as the organization finds more predictive and prescriptive indicators. The analytical investigations
themselves will identify what new sensors are needed to capture additional data points for addressing
business priorities. In this way, companies can create a continuously improving new normal and drive
enhancements across all workflows associated with an Internet of Things project.
Characteristics of IoT Data
Streaming
Machine log data and human-generated data such as messages and news alerts
Emphasis on identifying deltas within data streams
High velocity of data requires new techniques for data capture, processing, and
throughput
Importance is in rapid appropriate response
High-Volume
Requires archiving, data management, and analytics at scale
Key is to productionalize large data environments
High performance analytics must bring reporting to near-real-time results to
make data useful
Semi-Structured
Not modeled to fit well into relational databases
Requires additional parsing, ensuring data quality, and context to fit into a
structured environment
Language and keyword frequency analytics are needed to fully analyze
Non-Standard
Images, videos, voice, binaries
Require image recognition or audio analysis to support
Requires transformation and parsing
Copyright © 2015 Blue Hill Research Page 4
ANALYST INSIGHT
Choosing the Right Analytics Solution
In each observed instance, value to the organization – whether from cost savings or new revenue
opportunities – was unlocked from the analysis of the collected data. That is to say, the process through
which individual signals from sensors becomes actionable is through analytics.
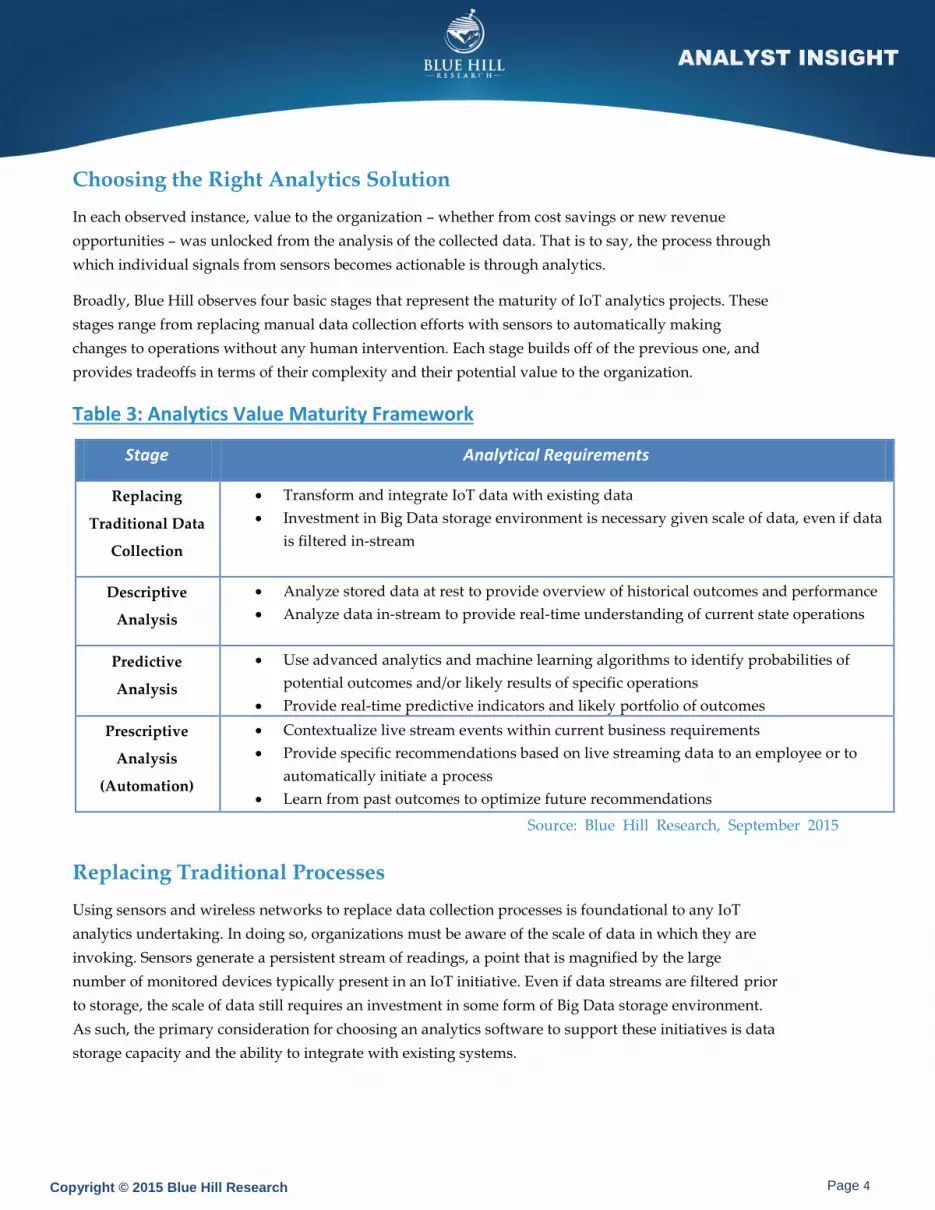
Broadly, Blue Hill observes four basic stages that represent the maturity of IoT analytics projects. These
stages range from replacing manual data collection efforts with sensors to automatically making
changes to operations without any human intervention. Each stage builds off of the previous one, and
provides tradeoffs in terms of their complexity and their potential value to the organization.
Table 3: Analytics Value Maturity Framework
Stage Analytical Requirements
Replacing
Traditional Data
Collection
Transform and integrate IoT data with existing data
Investment in Big Data storage environment is necessary given scale of data, even if data
is filtered in-stream
Descriptive
Analysis
Analyze stored data at rest to provide overview of historical outcomes and performance
Analyze data in-stream to provide real-time understanding of current state operations
Predictive
Analysis
Use advanced analytics and machine learning algorithms to identify probabilities of
potential outcomes and/or likely results of specific operations
Provide real-time predictive indicators and likely portfolio of outcomes
Prescriptive
Analysis
(Automation)
Contextualize live stream events within current business requirements
Provide specific recommendations based on live streaming data to an employee or to
automatically initiate a process
Learn from past outcomes to optimize future recommendations
Source: Blue Hill Research, September 2015
Replacing Traditional Processes
Using sensors and wireless networks to replace data collection processes is foundational to any IoT
analytics undertaking. In doing so, organizations must be aware of the scale of data in which they are
invoking. Sensors generate a persistent stream of readings, a point that is magnified by the large
number of monitored devices typically present in an IoT initiative. Even if data streams are filtered prior
to storage, the scale of data still requires an investment in some form of Big Data storage environment.
As such, the primary consideration for choosing an analytics software to support these initiatives is data
storage capacity and the ability to integrate with existing systems.

Copyright © 2015 Blue Hill Research Page 5
ANALYST INSIGHT
While relatively straightforward from a conceptual standpoint, this stage’s potential value-add should
not be overlooked. For organizations that already invest significant time and effort into collecting and
aggregating sensor data, the long-run cost savings can be substantial.
For instance, the U.S. municipality that switched to smart meters for its water usage monitoring saw
immediate and sustained savings. Their data collection process evolved from a manually intensive
process (in which field technicians traveled to every meter) to one where meter readings were
automatically recorded and transmitted to a central database. This has enormous cost savings both in
man-hours and in field equipment such as trucks. The town is projecting a total savings of $28 million.
This equates to a net savings of approximately $10 million over the lifetime of the initiative.
Descriptive Analysis
Descriptive analysis offers an opportunity for organizations to understand the state of affairs of their
operations. Whether through data discovery efforts or building dashboards, descriptive analysis allows
business decision makers to drill into specific areas of the business to identify performance levels,
anomalies, and root causes of top-line outcomes.
IoT initiatives present a distinction as this analysis can be handled both on ‘at-rest’ data and live
‘in-stream’ data. With IoT sensors, organizations have the opportunity to monitor key metrics and
performance numbers in real-time by bringing the live data feeds directly into their analysis. This allows
organizations to have the most up-to-date understanding of operations, and ensures that decisions are
being made on the most relevant data points.
However, not all IoT analytics initiatives rely on real-time decision-making. Even if the analytics
systems bring in live streams of data from the field, organizations may prefer to review the data in
aggregate at the end of specified time periods. As an example, the California based oil & gas company is
able to monitor the performance of oil wells at the end of every day or week. This allows them to
identify opportunities for improvement (such as increasing production levels) and areas of potential
concern. Ultimately, they are able to take this information and disseminate it to their field crew to make
adjustments or repairs. The result is reduced downtime and increased production levels. The company
estimates that they lose $500 for every hour that a single oil well is not in operation. After analyzing the
initial impacts of sensor deployment they estimate that quicker oil well repairs saves approximately
$145,000 in cost avoidance per month per field.
To take full advantage of descriptive analytics, companies must be able to analyze all relevant data. This
can be a challenge, given the large number of disparate data sources and informational silos that
organizations develop. New data sources must be integrated with existing repositories in a consistent
and unified way to ensure that insights can be understood within the context of the organization as
whole.
Copyright © 2015 Blue Hill Research Page 6
ANALYST INSIGHT
Predictive Analysis
Using available data to create forecasts and predict future outcomes presents a next step for extending
the value proposition of analytics efforts. In this regard, Blue Hill observes important implications
across a spectrum of outcomes, from increasing asset uptime to strategic decision-making.
For example, a manufacturer monitoring their production line can gain significant advantages by
forecasting likely equipment failures before they happen. They may have sensors that monitor
characteristics such as temperature, uptime, and output levels of a key piece of equipment. Predictive
models built from these monitored sensor readings, combined with historical performance data, can
identify leading indicators to future breakdowns. Making adjustments or repairs during scheduled
downtime is far more cost-effective than disrupting planned production cycles. The result from
predictive analysis in this sense is a reduced number of breakdowns and a higher level of production.
This, in turn, may mean additional revenue as well as lower costs.
Predictive modeling and machine learning algorithms are built and trained upon past observations, and
must be continually refined based on realized outcomes. Again, IoT initiatives presents a distinction in
that predictive analysis can be performed based on already-stored data at rest and with live in-stream
data. Analytics environments that can stream data live enable dynamic forecasts to be delivered to
critical decision makers in real time. This affords the potential for substantial competitive advantages
and efficiency gains by reducing response times and generating more accurate predictions.
Predictive analytics requires both an understanding of what statistical insights are possible and the tools
to create accurate projections. As a starting point, this means avoiding basic statistical fallacies
associated with error, interpolation, extrapolation, and accurate regression modeling to build a portfolio
of outcomes. This can also mean using predictive analytic tools not only for operational data, but also
for relevant text inputs, work schedules, and other external data that can provide context to the
prediction at hand. Predictive analytics also require the same clean data needed to conduct historical
analysis as a starting point to accurately benchmark and project success.
Prescriptive Analytics (Automation)
The highest level of IoT analytics value is realized when incoming data is translated into action without
human intervention. Doing so maximizes revenue and lowers costs through the support of
instantaneous adjustments to business impacting events.
The international truck manufacturer provides a mature use case of operationalizing sensor data.
Sensors in the trucks combined with predictive models detect when a mechanical failure is likely to
occur. When such an event is identified, the system schedules a maintenance appointment for the truck
based on the truck’s route and optimized for scheduled delivery times. Further, appropriate parts are
ordered and shipped to the identified service center and the technicians are notified exactly what needs
Copyright © 2015 Blue Hill Research Page 7
ANALYST INSIGHT
to be fixed. The result is an interconnected web of sensors and operational systems that communicate to
save time and money across the operation.
Analytics software solutions supporting IoT endeavors must contextualize outputs for the larger
business operation. To contextualize a decision, companies have to use an industry-specific analytics
solution that translates mathematical outcomes into action. Rather than provide a recommendation that
states “r=0.73,” devoid of useful context, the recommendation needs to provide a specific course of
action such as shutting down a particular engine or scheduling a repair.
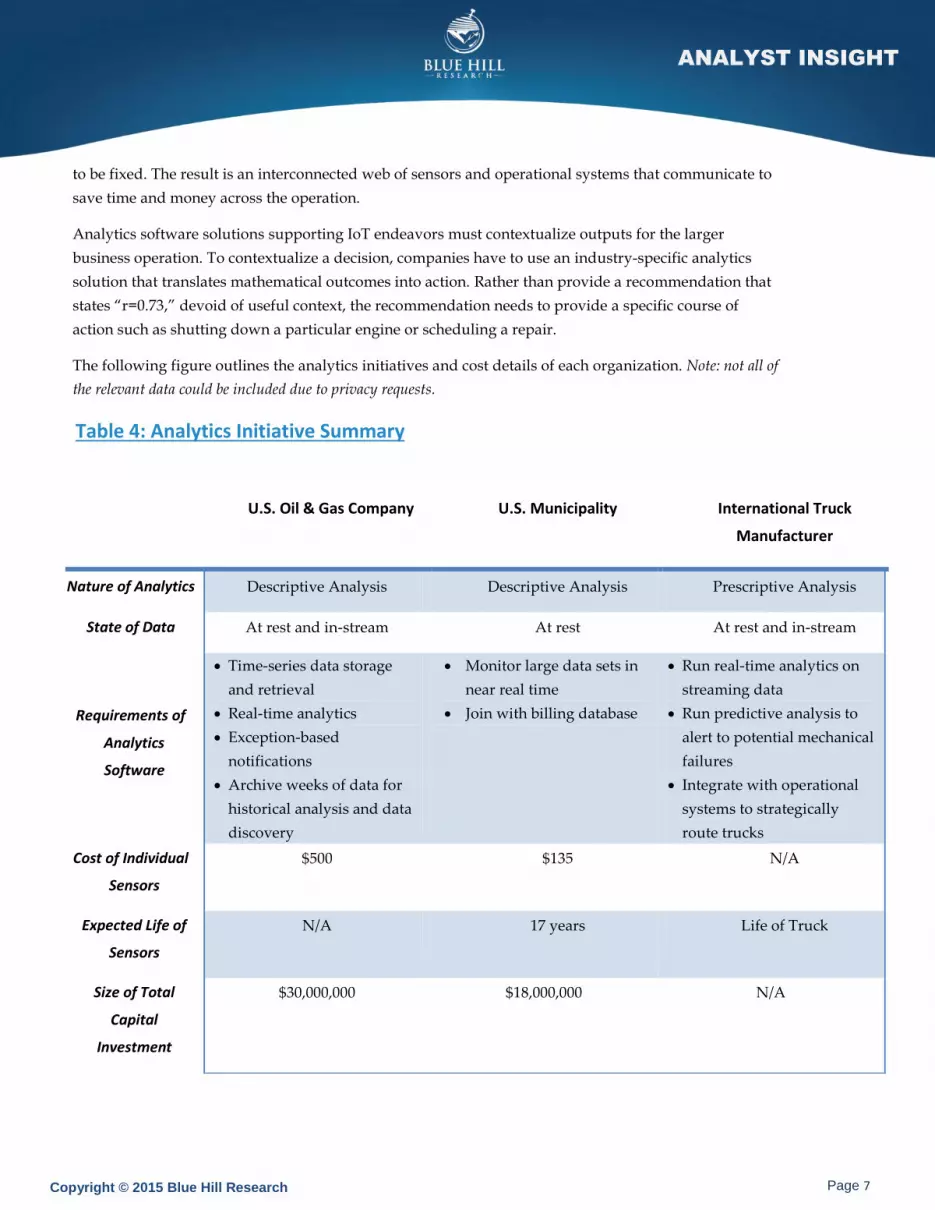
The following figure outlines the analytics initiatives and cost details of each organization. Note: not all of
the relevant data could be included due to privacy requests.
Table 4: Analytics Initiative Summary
U.S. Oil & Gas Company U.S. Municipality International Truck
Manufacturer
Nature of Analytics Descriptive Analysis Descriptive Analysis Prescriptive Analysis
State of Data At rest and in-stream At rest At rest and in-stream
Requirements of
Analytics
Software
Time-series data storage
and retrieval
Real-time analytics
Exception-based
notifications
Archive weeks of data for
historical analysis and data
discovery
Monitor large data sets in
near real time
Join with billing database
Run real-time analytics on
streaming data
Run predictive analysis to
alert to potential mechanical
failures
Integrate with operational
systems to strategically
route trucks
Cost of Individual
Sensors
$500 $135 N/A
Expected Life of
Sensors
N/A 17 years Life of Truck
Size of Total
Capital
Investment
$30,000,000 $18,000,000 N/A
Copyright © 2015 Blue Hill Research Page 8
ANALYST INSIGHT
Source: Blue Hill Research, September 2015
Obtaining Value
Blue Hill observed consistently that organizations implementing IoT analytics were able to achieve
transformative results in operating their business and making decisions.
Consider the U.S. municipality that gained the ability to automatically collect water meter readings 24
hours a day. This was a drastic change from the prior manual collection process, both because of the
immense logistical cost savings and because the municipality made a fundamental shift to a proactive
service-oriented organization. Now the town can identify issues within hours of them happening, rather
than weeks or months. With better and more accurate data, the town proactively reaches out to
households to mitigate overuse or unexpected fees. The billing and management teams have shifted
from an internal reporting organization to a customer-facing hub that provides residents a markedly
better experience.
Blue Hill Research finds a number of ways in which IoT analytics initiatives can impact top-line growth,
reduce costs, and improve the customer experience.
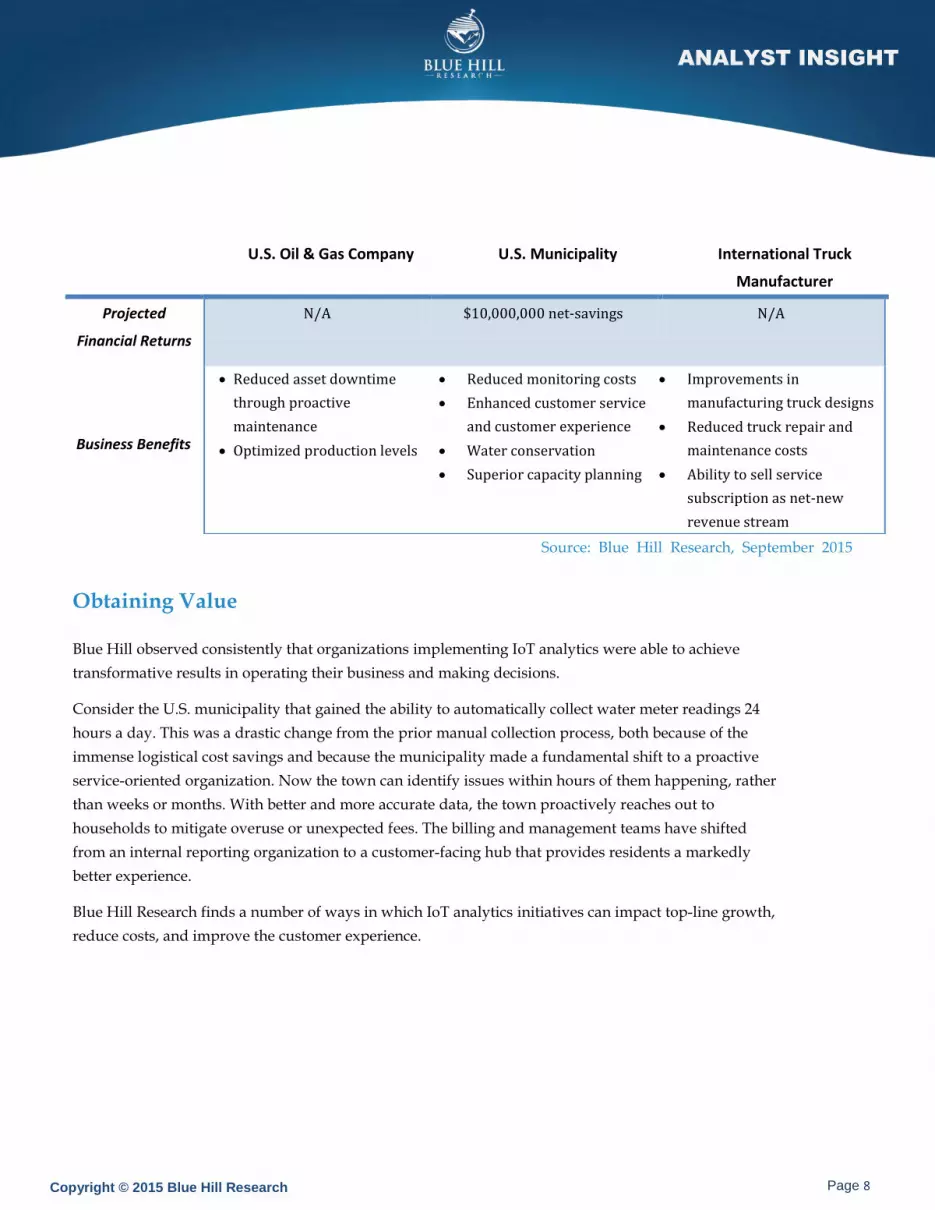
U.S. Oil & Gas Company U.S. Municipality International Truck
Manufacturer
Projected
Financial Returns
N/A $10,000,000 net-savings N/A
Business Benefits
Reduced asset downtime
through proactive
maintenance
Optimized production levels
Reduced monitoring costs
Enhanced customer service
and customer experience
Water conservation
Superior capacity planning
Improvements in
manufacturing truck designs
Reduced truck repair and
maintenance costs
Ability to sell service
subscription as net-new
revenue stream

Copyright © 2015 Blue Hill Research Page 9
ANALYST INSIGHT
Cost Savings:
Blue Hill observes three primary ways in which IoT analytics initiatives drive cost savings:
Elimination of manual data collection processes
Greater production capacity planning and prescriptive maintenance
More efficient service and warranty processes
Displacing manual data collection efforts presents an opportunity to simplify managerial oversight and
field equipment costs required to collect data. Similarly, sensors provide improved insight into how
production equipment is performing, so managers can know when machines operate most efficiently.
As managers replace instinct with fact, they can optimize production capacity. A proactive identification
of potential breakdowns can reduce a large cost center for any capital equipment intensive operation.
Planning and scheduling repairs during optimal times is much less costly for the business than
disrupting production cycles. In addition, both parts and technicians can be routed intelligently to
minimize the downtime of the actual repair. This also presents opportunities to better manage warranty
processes as early indicators of potential failure can be used to proactively respond to customer claims
or to resolve them before they occur. On a longer-term basis, this information can be used to flag usage
patterns of products across different customer segments, as well as to identify the specific issues that
occur most frequently. Organizations are then able to change warranty policies or enhance specific
product features to minimize warranty claims.
Revenue Generation:
Blue Hill observes three primary avenues in which organizations increase revenue as a direct impact of
their IoT analytics undertakings:
Greater uptime for value-producing assets
Net-new products and services from collected data
The implication of reduced needs for repair and shorter downtime of machinery is greater production
capacity. Whether it is an oil well, manufacturing line, or generator, maximized productivity leads to
potential for greater sales. Maximizing uptime has a significant impact on top-line performance.
Process improvements such as those mentioned above have been demonstrated to add value. However,
business leaders would do well to ensure that their thinking is not constrained to just incremental
changes. IoT is a sweeping technological movement that presents vast opportunities for organizations to
explore. Businesses should audit the streams of data that they are or could obtain about their operations,
and ask themselves if they can be repackaged for additional uses.
For instance, the international truck manufacturer first began using sensors on its trucks to monitor
repairs and common points of failure. The analysis of this sensor data eventually evolved into
Copyright © 2015 Blue Hill Research Page 10
ANALYST INSIGHT
notification and routing adjustments. Now the manufacturer provides this as an add-on service for
customers as long as the truck is under warranty. After the warranty is up, customers can purchase the
capabilities as a subscription service. In doing so, the truck manufacturer provides a value-added
service and creates a new and recurring revenue stream.
Providing predictive maintenance ‘as-a-service’ could be broadly applied to any manufacturer of capital
equipment. Alternatively, organizations collecting weather or geographic data may find willing buyers
who would subscribe to their data feeds to improve their own business. As the IoT continues to emerge,
expect to see continued business model innovation. Every company collects data in some way, and
savvy business leaders will put themselves in a position to take advantage of this shift.
Enhanced High-Value Customer Ownership and Service
Although less direct than the immediate top- and bottom-line impacts discussed, the effect that IoT
analytic initiatives can have on improving customer experiences should not be overlooked. By
identifying potential occurrences before they become problems, organizations can stop issues from ever
reaching the customer; the identification itself could provide a value-added service. For instance, the
U.S. municipality, upon detecting an anomaly (such as heavy water usage at unusual hours of the day),
reaches out to households and alerts them to a potential leak. This eliminates surprise spikes in
customer utility bills, and results in an improved experience. In the case of the truck manufacturer,
routing repairs and the continual improvement of their engineering process based on sensor feedback
removes significant would-be headaches for their customers. Similar themes can be extended across any
service model where monitored equipment performance has downstream customer implications.
Enhanced customer satisfaction and a higher value ownership experience manifests itself in better
customer retention rates and increased customer lifetime value, which translates into revenue growth.
Conclusion
The advent of the IoT will continue to provide businesses with a myriad of opportunities to optimize
their current operations as well as to create net-new business opportunities. But to do so, businesses
must invest in a combination of people, processes, and technology that can transform individual sensor
signals into action. The key to extracting sustained business value from IoT initiatives is, ultimately,
sound business analytics practices.
IoT analytics initiatives must account for the unique streaming, high-volume, semi-structured, and
non-standard data types that characterize IoT data. Businesses must also understand the level of
maturity that their analytics operations require to gain value both from replacing manual data collection
and building fully autonomous prescriptive analysis capabilities.
Decision makers can learn from the experiences of the studied organizations. These separate approaches
each yielded significant and persistent business enhancements by bringing the Internet of Things and
industrial-grade analytics together.

James Haight is a research analyst at Blue Hill Researchfocusing on analytics and emerging enterprise technologies.
His primary research includes exploring the business casedevelopment and solution assessment for data warehousing,
data integration, advanced analytics and businessintelligence applications. He also hosts Blue Hill's Emerging
Tech Roundup Podcast, which features interviews withindustry leaders and CEOs on the forefront of a variety of
emerging technologies. Prior to Blue Hill Research, Jamesworked in Radford Consulting's Executive and Board ofDirector Compensation practice, specializing in the hightech and life sciences industries. Currently he serves onthe strategic advisory board of the Bentley MicrofinanceGroup, a 501(c)(3) non-profit organization dedicated to
community development through funding and consultingentrepreneurs in the Greater Boston area.
Blue Hill Research is the only industry analyst firm with a success-based methodology. Based on the Path to Success, Blue HillResearch provides unique and differentiated guidance to translate corporate technology investments into success for the three keystakeholders: the technologist, the financial buyer, and the line of business executive.
Unless otherwise noted, the contents of this publication are copyrighted by Blue Hill Research and may not be hosted, archived,transmitted or reproduced, in any form or by any means without prior permission from Blue Hill Research.
For further information or questions, please contact us:
ABOUT THE AUTHOR
James Haight
Analyst
Phone: +1 (617)624-3600
Fax : +1 (617)367-4210
Twitter: @BlueHillBoston
LinkedIn: www.linkedin.com/company/blue-hill-research
Contact Research: [email protected]
Copyright © 2015 Blue Hill Research www.bluehillresearch.com
CONNECT ON SOCIAL MEDIA
@James_Haight
www.linkedin.com/in/jamesthaight
bluehillresearch.com/author/james-haight/
CONNECT ON SOCIAL MEDIA

Blue Hill Research is the only industry analyst firm with a success-based methodology. Based on the Path to Success, Blue HillResearch provides unique and differentiated guidance to translate corporate technology investments into success for the three keystakeholders: the technologist, the financial buyer, and the line of business executive.
Unless otherwise noted, the contents of this publication are copyrighted by Blue Hill Research and may not be hosted, archived,transmitted or reproduced, in any form or by any means without prior permission from Blue Hill Research.
For further information or questions, please contact us:
ABOUT THE AUTHOR
Hyoun ParkChief Research Officer
Phone: +1 (617)624-3600Fax : +1 (617)367-4210
Twitter: @BlueHillBostonLinkedIn: www.linkedin.com/company/blue-hill-research
Contact Research: [email protected]
Copyright © 2015 Blue Hill Research www.bluehillresearch.com
CONNECT ON SOCIAL MEDIA
@hyounpark
www.linkedin.com/in/hyounpark
bluehillresearch.com/author/hyoun-park/
Hyoun Park is the Chief Research Officer of Blue HillResearch where he oversees day-to-day research
operations, delivery and methodology focused on vendorand technology selection. In addition, Park covers
analytics and enterprise mobility technologies as a notedadvisor, social influencer, and practitioner. Park has been
named as a top 10 Big Data, analytics, and mobilityinfluencer including quotes in USA Today, the Los AngelesTimes, and a wide variety of industry media sources. Over
the past 20 years, Park has been on the cutting edge of web,social, cloud, and mobile technologies in both startup and
enterprise roles. Park holds a Masters of BusinessAdministration from Boston University and graduated with
a Bachelor of Arts in Women's and Gender Studies fromAmherst College.
SAS and all other SAS Institute Inc. product or service names are registered trademarks or trademarks of SAS Institute Inc. in the USA and other countries. ® indicates USA registration. Other brand and product names are trademarks of their respective companies. 107941_S145329.0915


