Embed Size (px)
Citation preview
2016 State of the Market Report for PJM 91
Section 3 Energy Market
© 2017 Monitoring Analytics, LLC
Energy MarketThe PJM Energy Market comprises all types of energy transactions, including the sale or purchase of energy in PJM’s Day-Ahead and Real-Time Energy Markets, bilateral and forward markets and self-supply. Energy transactions analyzed in this report include those in the PJM Day-Ahead and Real-Time Energy Markets. These markets provide key benchmarks against which market participants may measure results of transactions in other markets.
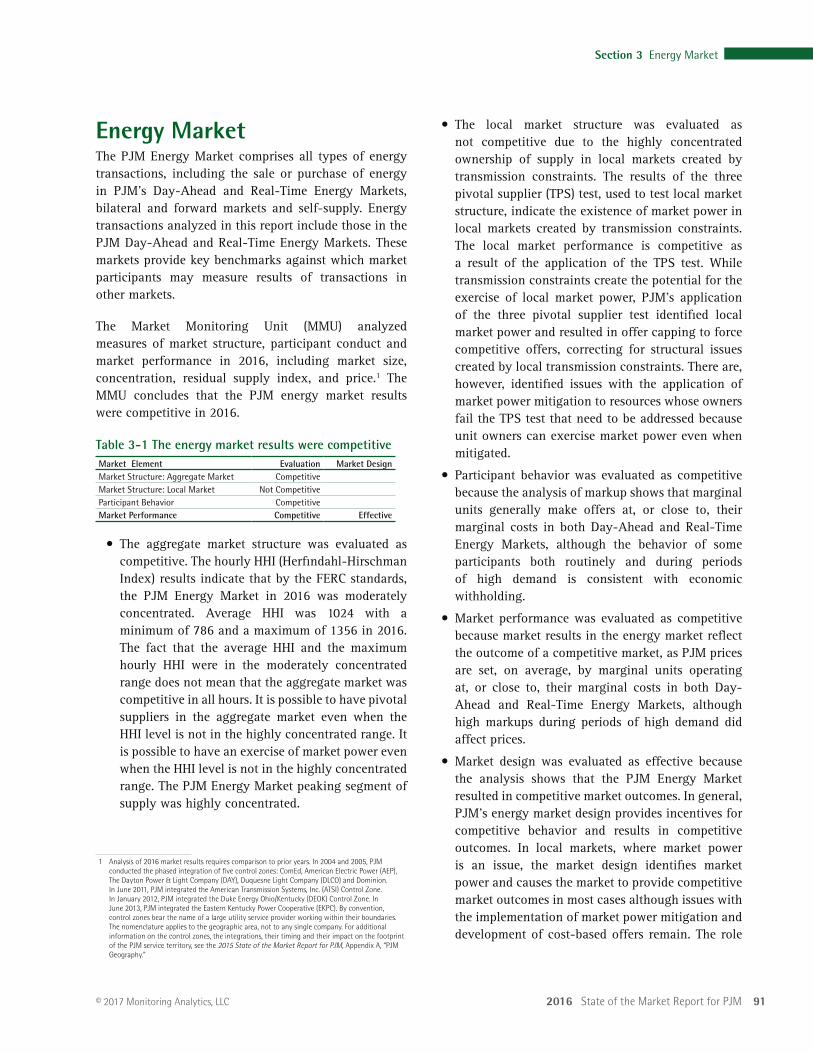
The Market Monitoring Unit (MMU) analyzed measures of market structure, participant conduct and market performance in 2016, including market size, concentration, residual supply index, and price.1 The MMU concludes that the PJM energy market results were competitive in 2016.
Table 3-1 The energy market results were competitiveMarket Element Evaluation Market DesignMarket Structure: Aggregate Market CompetitiveMarket Structure: Local Market Not CompetitiveParticipant Behavior CompetitiveMarket Performance Competitive Effective
• The aggregate market structure was evaluated as competitive. The hourly HHI (Herfindahl-Hirschman Index) results indicate that by the FERC standards, the PJM Energy Market in 2016 was moderately concentrated. Average HHI was 1024 with a minimum of 786 and a maximum of 1356 in 2016. The fact that the average HHI and the maximum hourly HHI were in the moderately concentrated range does not mean that the aggregate market was competitive in all hours. It is possible to have pivotal suppliers in the aggregate market even when the HHI level is not in the highly concentrated range. It is possible to have an exercise of market power even when the HHI level is not in the highly concentrated range. The PJM Energy Market peaking segment of supply was highly concentrated.
1 Analysis of 2016 market results requires comparison to prior years. In 2004 and 2005, PJM conducted the phased integration of five control zones: ComEd, American Electric Power (AEP), The Dayton Power & Light Company (DAY), Duquesne Light Company (DLCO) and Dominion. In June 2011, PJM integrated the American Transmission Systems, Inc. (ATSI) Control Zone. In January 2012, PJM integrated the Duke Energy Ohio/Kentucky (DEOK) Control Zone. In June 2013, PJM integrated the Eastern Kentucky Power Cooperative (EKPC). By convention, control zones bear the name of a large utility service provider working within their boundaries. The nomenclature applies to the geographic area, not to any single company. For additional information on the control zones, the integrations, their timing and their impact on the footprint of the PJM service territory, see the 2015 State of the Market Report for PJM, Appendix A, “PJM Geography.”
• The local market structure was evaluated as not competitive due to the highly concentrated ownership of supply in local markets created by transmission constraints. The results of the three pivotal supplier (TPS) test, used to test local market structure, indicate the existence of market power in local markets created by transmission constraints. The local market performance is competitive as a result of the application of the TPS test. While transmission constraints create the potential for the exercise of local market power, PJM’s application of the three pivotal supplier test identified local market power and resulted in offer capping to force competitive offers, correcting for structural issues created by local transmission constraints. There are, however, identified issues with the application of market power mitigation to resources whose owners fail the TPS test that need to be addressed because unit owners can exercise market power even when mitigated.
• Participant behavior was evaluated as competitive because the analysis of markup shows that marginal units generally make offers at, or close to, their marginal costs in both Day-Ahead and Real-Time Energy Markets, although the behavior of some participants both routinely and during periods of high demand is consistent with economic withholding.
• Market performance was evaluated as competitive because market results in the energy market reflect the outcome of a competitive market, as PJM prices are set, on average, by marginal units operating at, or close to, their marginal costs in both Day-Ahead and Real-Time Energy Markets, although high markups during periods of high demand did affect prices.
• Market design was evaluated as effective because the analysis shows that the PJM Energy Market resulted in competitive market outcomes. In general, PJM’s energy market design provides incentives for competitive behavior and results in competitive outcomes. In local markets, where market power is an issue, the market design identifies market power and causes the market to provide competitive market outcomes in most cases although issues with the implementation of market power mitigation and development of cost-based offers remain. The role
92 Section 3 Energy Market
2016 State of the Market Report for PJM
© 2017 Monitoring Analytics, LLC
OverviewMarket Structure• Supply. Supply includes physical generation and
imports and virtual transactions. The maximum of average offered real-time generation increased by 3,957 MW, or 2.4 percent, from 167,343 MW in the summer of 2015 to 171,300 MW in the summer of 2016. In 2016, 5,421.4 MW of new capacity resources were added. In 2016, 395.5 MW were retired.
PJM average real-time cleared generation in 2016 increased by 2,676 MW, or 3.0 percent, from 2015, from 88,628 MW to 91,304 MW.
PJM average day-ahead cleared supply in 2016, including INCs and up to congestion transactions, increased by 14.6 percent from 2015, from 114,889 MW to 131,634 MW, primarily as a result of an increase in UTC volumes.
• Market Concentration. The PJM Energy Market was moderately concentrated overall with moderate concentration in the baseload and intermediate segments, but high concentration in the peaking segment.
• Generation Fuel Mix. In 2016, coal units provided 33.9 percent, nuclear units 34.4 percent and natural gas units 26.5 percent of total generation. Compared to 2015, generation from coal units decreased 3.3 percent, generation from natural gas units increased 18.3 percent and generation from nuclear units increased 0.2 percent.
• Fuel Diversity. In 2016, the fuel diversity of energy generation, measured by the fuel diversity index for energy (FDIe), increased 0.9 percent over the 2015 FDIe.
• Marginal Resources. In the PJM Real-Time Energy Market, in 2016, coal units were 44.9 percent of marginal resources and natural gas units were 43.8 percent of marginal resources. In 2015, coal units were 51.7 percent and natural gas units were 35.5 percent of the marginal resources.
In the PJM Day-Ahead Energy Market, in 2016, up to congestion transactions were 82.4 percent of marginal resources, INCs were 4.2 percent of marginal resources, DECs were 8.6 percent of marginal resources, and generation resources were 4.7 percent of marginal resources. In 2015,
of UTCs in the Day-Ahead Energy Market continues to cause concerns.
PJM markets are designed to promote competitive outcomes derived from the interaction of supply and demand in each of the PJM markets. Market design itself is the primary means of achieving and promoting competitive outcomes in PJM markets. One of the MMU’s primary goals is to identify actual or potential market design flaws.2 The approach to market power mitigation in PJM has focused on market designs that promote competition (a structural basis for competitive outcomes) and on limiting market power mitigation to instances where the market structure is not competitive and thus where market design alone cannot mitigate market power. In the PJM Energy Market, this occurs primarily in the case of local market power. When a transmission constraint creates the potential for local market power, PJM applies a structural test to determine if the local market is competitive, applies a behavioral test to determine if generator offers exceed competitive levels and applies a market performance test to determine if such generator offers would affect the market price.3 There are, however, identified issues with the application of market power mitigation to resources whose owners fail the TPS test that can result in the exercise of local market power even when market power mitigation rules are applied. These issues need to be addressed. There are issues related to the definition of gas costs includable in energy offers that need to be addressed. There are issues related to the level of variable operating and maintenance expense includable in energy offers that need to be addressed. There are currently no market power mitigation rules in place that limit the ability to exercise market power when aggregate market conditions are tight and there are pivotal suppliers in the aggregate market. Aggregate market power needs to be addressed. Now that generators will be allowed to modify offers hourly, market design must reflect appropriate incentives for competitive behavior, the application of local market power mitigation needs to be fixed, the definition of a competitive offer needs to be fixed, and aggregate market power mitigation rules need to be developed. The importance of these issues is amplified by the new rules permitting cost-based offers in excess of $1,000 per MWh.
2 PJM. OATT Attachment M (PJM Market Monitoring Plan).3 The market performance test means that offer capping is not applied if the offer does not exceed
the competitive level and therefore market power would not affect market performance.
2016 State of the Market Report for PJM 93
Section 3 Energy Market
© 2017 Monitoring Analytics, LLC
In 2016, 11 control zones experienced congestion resulting from one or more constraints binding for 100 or more hours. The analysis of the application of the TPS test to local markets demonstrates that it is working successfully to identify pivotal owners when the market structure is noncompetitive and to ensure that owners are not subject to offer capping when the market structure is competitive. There are, however, identified issues with the application of market power mitigation to resources whose owners fail the TPS test that can result in the exercise of local market power. These issues need to be addressed.
• Offer Capping for Reliability. PJM also offer caps units that are committed for reliability reasons, specifically for black start service and reactive service. In the Day-Ahead Energy Market, for units committed for reliability reasons, offer-capped unit hours decreased from 0.4 percent in 2015 to 0.04 percent in 2016. In the Real-Time Energy Market, for units committed for reliability reasons, offer-capped unit hours decreased from 0.4 percent in 2015 to 0.1 percent in 2016.
• Markup Index. The markup index is a summary measure of participant offer behavior for individual marginal units. In 2016, in the PJM Real-Time Energy Market, 90.1 percent of marginal units had offer prices less than $50 per MWh. The average dollar markups of units with offer prices less than $25 per MWh was negative when using unadjusted cost offers. The average dollar markups of units with offer prices less than $50 per MWh was negative when using unadjusted cost offers. Negative markup means the unit is offering to run at a price less than its cost-based offer, implying a revealed short run marginal cost that is less than the allowable cost-based offer under the PJM Market Rules. Some marginal units did have substantial markups. Using the unadjusted cost offers, the highest markup for any marginal unit in 2016 was $258.16 per MWh while the highest markup in 2015 was $792.21 per MWh.
In the PJM Day-Ahead Energy Market, when using unadjusted cost offers, in 2016, 89.9 percent of marginal generating units had offer prices less than $50 per MWh and the average dollar markup was negative, and 0.4 percent of marginal generating units had offers in the $75 to $125 per MWh range
up to congestion transactions were 76.1 percent of marginal resources, INCs were 5.1 percent of marginal resources, DECs were 8.9 percent of marginal resources, and generation resources were 9.6 percent of marginal resources.
• Demand. Demand includes physical load and exports and virtual transactions. The PJM metered system peak load during 2016 was 152,177 MW in the HE 1500 on August 11, 2016, which was 8,480 MW, 5.9 percent, higher than the PJM peak load for 2015, which was 143,697 MW in the HE 1600 on July 28, 2015.
PJM average real-time load in 2016 increased from 2015, from 88,594 MW to 88,601 MW. PJM average day-ahead demand in 2016, including DECs and up to congestion transactions, increased by 14.1 percent in 2015, from 111,644 MW to 127,390 MW.
• Supply and Demand: Load and Spot Market. Companies that serve load in PJM can do so using a combination of self-supply, bilateral market purchases and spot market purchases. For 2016, 12.9 percent of real-time load was supplied by bilateral contracts, 23.9 percent by spot market purchases and 63.2 percent by self-supply. Compared with 2015, reliance on bilateral contracts increased by 2.3 percentage points, reliance on spot market purchases decreased by 5.4 percentage points and reliance on self-supply increased by 3.1 percentage points.
• Supply and Demand: Scarcity. There were no shortage pricing events in 2016.
Market Behavior• Offer Capping for Local Market Power. PJM offer
caps units when the local market structure is noncompetitive. Offer capping is an effective means of addressing local market power when the rules are designed and implemented properly. Offer capping levels have historically been low in PJM. In the Day-Ahead Energy Market, for units committed to provide energy for local constraint relief, offer-capped unit hours decreased from 0.2 percent in 2015 to 0.1 percent in 2016. In the Real-Time Energy Market, for units committed to provide energy for local constraint relief, offer-capped unit hours remained at 0.4 percent in 2015 and 2016.
94 Section 3 Energy Market
2016 State of the Market Report for PJM
© 2017 Monitoring Analytics, LLC
and are available for economic dispatch up to their economic maximum are categorized as self scheduled and dispatchable. Of all generator offers in 2016, 53.7 percent were offered as available for economic dispatch, 4.4 percent were offered as emergency dispatch, 22.3 percent were offered as self scheduled, and 19.6 percent were offered as self scheduled and dispatchable.
Market Performance• Prices. PJM LMPs are a direct measure of market
performance. Price level is a good, general indicator of market performance, although the number of factors influencing the overall level of prices means it must be analyzed carefully. Among other things, overall average prices reflect changes in supply and demand, generation fuel mix, the cost of fuel, emissions related expenses, markup and local price differences caused by congestion. PJM also may administratively set prices with the creation of closed loop interfaces related to demand side resources or reactive power, the application of transmission penalty factors, or the application of price setting logic.
PJM real-time energy market prices decreased in 2016 compared to 2015. The load-weighted average real-time LMP was 19.2 percent lower in 2016 than in 2015, $29.23 per MWh versus $36.16 per MWh. PJM real-time load-weighted energy market prices were lower in 2016 that at any time in PJM history since the beginning of the competitive wholesale market on April 1, 1999.
PJM day-ahead energy market prices decreased in 2016 compared to 2015. The load-weighted average day-ahead LMP was 19.2 percent lower in 2016 than in 2015, $29.68 per MWh versus $36.73 per MWh. PJM day-ahead load-weighted energy market prices were lower in 2016 that at any time in PJM history since the introduction of the PJM Day-Ahead Energy Market in June 2000.
• Components of LMP. In the PJM Real-Time Energy Market, in 2016, 45.4 percent of the load-weighted LMP was the result of coal costs, 27.2 percent was the result of gas costs and 1.89 percent was the result of the cost of emission allowances.
In the PJM Day-Ahead Energy Market in 2016, 36.4 percent of the load-weighted LMP was the result of
and the average dollar markup and the average markup index were both negative.
• Markup. The markup frequency distributions show that a significant proportion of units make price-based offers less than the cost-based offers permitted under the PJM Market Rules. This behavior means that competitive price-based offers reveal actual unit marginal costs and imply that PJM market rules permit the inclusion of costs in cost-based offers that are not short run marginal costs.
The markup behavior shown in the markup frequency distributions also shows that a substantial number of units were offered with high markups, consistent with the exercise of market power.
• Frequently Mitigated Units (FMU) and Associated Units (AU). A new FMU rule became effective November 1, 2014, limiting the availability of FMU adders to units with net revenues less than unit going forward costs. The number of units that were eligible for an FMU or AU adder declined from an average of 70 units during the first 11 months of 2014, to zero since December 2014.
• Virtual Offers and Bids. Any market participant in the PJM Day-Ahead Energy Market can use increment offers, decrement bids, up to congestion transactions, import transactions and export transactions as financial instruments that do not require physical generation or load. In 2016, the average hourly increment offers submitted MW increased by 26.0 percent from 7,175 MW in 2015 to 9,043 MW in 2016, and cleared MW increased by 11.4 percent from 4,675 MW in 2015 to 5,207 MW in 2016. In 2016, the average hourly decrement bids submitted MW increased by 25.3 percent from 6,879 MW in 2015 to 8,618 MW in 2016, and cleared MW increased by 18.6 percent from 4,051 MW in 2015 to 4,805 MW in 2016. In 2016, the average hourly up to congestion submitted MW increased by 70.3 percent from 83,422 MW in 2015 to 142,075 MW in 2016, and cleared MW increased by 78.6 percent from 19,255 MW in 2015 to 34,385 MW in 2016.
• Generator Offers. Generator offers are categorized as dispatchable and self scheduled. Units which are available for economic dispatch are dispatchable. Units which are self scheduled to generate fixed output are categorized as self scheduled. Units which are self scheduled at their economic minimum
2016 State of the Market Report for PJM 95
Section 3 Energy Market
© 2017 Monitoring Analytics, LLC
Scarcity• There were no shortage pricing events in 2016.
Recommendations• The MMU recommends that the market rules should
explicitly require that offers into the Day-Ahead Energy Market be competitive, where competitive is defined to be the short run marginal cost of the units. The short run marginal cost should reflect opportunity cost when and where appropriate. (Priority: Medium. First reported 2009. Status: Not adopted.)
• The MMU recommends that PJM require every market participant to make available at least one cost schedule with the same fuel-type and parameters as that of their offered price schedule. (Priority: Medium. First reported 2015. Status: Not adopted.)
• The MMU recommends that PJM require that the level of incremental costs includable in cost offers not exceed the unit’s short run marginal cost. (Priority: Medium. New recommendation. Status: Not adopted.)
• The MMU recommends that PJM require that all fuel cost policies be algorithmic, verifiable, and systematic. (Priority: Medium. New recommendation. Status: Not adopted.)
• The MMU recommends that Manual 15 be replaced with a straightforward description of the components of cost offers based on short run marginal costs and the correct calculation of cost offers. (Priority: Medium. New recommendation. Status: Not adopted.)
• The MMU recommends removal of all use of the FERC System of Accounts in the Cost Development Guidelines. (Priority: Medium. New recommendation. Status: Not adopted.)
• The MMU recommends the removal of all use of cyclic starting and peaking factors from the Cost Development Guidelines. (Priority: Medium. New recommendation. Status: Not adopted.)
• The MMU recommends the removal of all labor costs from the Cost Development Guidelines. (Priority: Medium. New recommendation. Status: Not adopted.)
the cost of coal, 26.7 percent was the result of DECs, 11.0 percent was the result of the cost of gas, 1.9 percent was the result of INCs, and 2.2 percent was the result of up to congestion transactions.
• Markup. The markup conduct of individual owners and units has an identifiable impact on market prices. Markup is a key indicator of the competitiveness of the energy market.
In the PJM Real-Time Energy Market in 2016, the adjusted markup component of LMP was $1.77 per MWh or 6.1 percent of the PJM real-time, load-weighted average LMP. August had the highest adjusted peak markup component, $4.47 per MWh, or 10.24 percent of the real-time peak hour load-weighted average LMP. Using the unadjusted cost offers, the highest markup of a marginal unit in 2016 was $258.16 per MWh. There were 33 hours in 2016 where the positive markup contribution to the PJM system wide, load-weighted, average LMP exceeded $54.51 per MWh.
In the PJM Day-Ahead Energy Market, INCs, DECs and UTCs have zero markups. In 2016, the adjusted markup component of LMP resulting from generation resources was $0.21 per MWh or 0.7 percent of the PJM day-ahead load-weighted average LMP. August had the highest adjusted peak markup component, $5.65 per MWh or 16.5 percent of the day-ahead load-weighted average LMP.
Participant behavior was evaluated as competitive because the analysis of markup shows that marginal units generally make offers at, or close to, their marginal costs in both the Day-Ahead and Real-Time Energy Markets, although the behavior of some participants is consistent with economic withholding.
• Price Convergence. Hourly and daily price differences between the Day-Ahead and Real-Time Energy Markets fluctuate continuously and substantially from positive to negative. The difference between the average day-ahead and real-time prices was -$0.73 per MWh in 2015 and -$0.53 per MWh in 2016. The difference between average day-ahead and real-time prices, by itself, is not a measure of the competitiveness or effectiveness of the Day-Ahead Energy Market.
96 Section 3 Energy Market
2016 State of the Market Report for PJM
© 2017 Monitoring Analytics, LLC
price-based non-PLS offer. (Priority: High. First reported 2015. Status: Not adopted.)
• The MMU recommends that capacity performance resources and base capacity resources (during the June through September period) be held to the OEM operating parameters of the capacity market CONE reference resource for performance assessment and energy uplift payments and that this standard be applied to all technologies on a uniform basis. (Priority: Medium. First reported 2015. Status: Not adopted.)
• The MMU recommends that under the capacity performance construct, PJM recognize the difference between operational parameters that indicate to PJM dispatchers what a unit is capable of during the operating day and the parameters that are used for capacity performance assessment as well as uplift payments. The parameters which determine nonperformance charges and the amount of uplift payments to those generators should reflect the flexibility goals of the capacity performance construct. (Priority: Medium. First reported 2015. Status: Not adopted.)
• The MMU recommends that PJM retain the $1,000 per MWh offer cap in the PJM Energy Market except when cost-based offers exceed $1,000 per MWh, and retain other existing rules that limit incentives to exercise market power. (Priority: High. First reported 1999. Status: Partially adopted, 1999.)
• The MMU recommends that PJM not allow nuclear generators which do not respond to prices or which only respond to manual instructions from the dispatcher to set the LMPs in the real-time market. (Priority: Low. New recommendation. Status: Not adopted.)
• The MMU recommends that PJM document how LMPs are calculated when demand response is marginal. The LMPs in excess of $1,800 per MWh on January 7, 2014, were potentially a result of the way in which PJM modeled zonal (not nodal) demand response as a marginal resource. (Priority: Low. First reported 2014. Status: Not Adopted.)
• The MMU recommends that PJM explicitly state its policy on the use of transmission penalty factors including: the level of the penalty factors; the triggers for the use of the penalty factors; the appropriate line ratings to trigger the use of penalty
• The MMU recommends changing the definition of the start heat input for combined cycles to include only the amount of fuel used from firing each combustion turbine in the combined cycle to the breaker close of each combustion turbine. (Priority: Medium. New recommendation. Status: Not adopted.)
• The MMU recommends the removal of nuclear fuel and nonfuel operations and maintenance costs that are not short run marginal costs from the Cost Development Guidelines. (Priority: Medium. New recommendation. Status: Not adopted.)
• The MMU recommends revising the pumped hydro fuel cost calculation to include day-ahead and real-time power purchases. (Priority: Medium. New recommendation. Status: Not adopted.)
• The MMU recommends revisions to the calculation of energy market opportunity costs to incorporate all time based offer parameters and all limitations that impact the opportunity cost of generating unit output. (Priority: Medium. New recommendation. Status: Not adopted.)
• The MMU recommends removing the catastrophic designation for force majeure fuel supply limitations in Schedule 2. (Priority: Medium. New recommendation. Status: Not adopted.)
• The MMU recommends that the rules governing the application of the TPS test be clarified and documented. (Priority: High. First reported 2010. Status: Not adopted.)
• The MMU recommends, in order to ensure effective market power mitigation when the TPS test is failed, that markup be constant across the full MWh range of price and cost offers, that there be at least one cost-based offer using the same fuel as the available price-based offer. (Priority: High. First reported 2015. Status: Not adopted.)
• The MMU recommends that in order to ensure effective market power mitigation when the TPS test is failed, the operating parameters in the cost-based offer and the price-based parameter limited schedule (PLS) offer be at least as flexible as the operating parameters in the available non-PLS price-based offer, and that the price-MW pairs in the price-based PLS offer be exactly equal to the
2016 State of the Market Report for PJM 97
Section 3 Energy Market
© 2017 Monitoring Analytics, LLC
not negative load, for purposes of calculating generation and load-weighted LMP. (Priority: Low. First reported 2013. Status: Not adopted.)
• The MMU recommends that PJM remove nonspecific fuel types such as other or co-fire other from the list of fuel types available for market participants to identify the fuel type associated with their price and cost schedules. (Priority: Medium. First reported 2015. Status: Partially adopted.)
• The MMU recommends that PJM routinely review all transmission facility ratings and any changes to those ratings to ensure that the normal, emergency and load dump ratings used in modeling the transmission system are accurate and reflect standard ratings practice. (Priority: Low. First reported 2013. Status: Partially adopted.)
• The MMU recommends that PJM identify and collect data on available behind the meter generation resources, including nodal location information and relevant operating parameters. (Priority: Low. First reported 2013. Status: Partially adopted.)
• The MMU recommends that PJM continue to enhance its posting of market data to promote market efficiency. (Priority: Medium. First reported 2005. Status: Partially adopted.)
• The MMU recommends the elimination of FMU and AU adders. FMU and AU adders no longer serve the purpose for which they were created and interfere with the efficient operation of PJM markets. (Priority: Medium. First reported 2012. Status: Partially adopted, 2014.)
• The MMU recommends that PJM require all generating units to identify the fuel type associated with each of their offered schedules. (Priority: Low. First reported 2014. Status: Adopted in full, 2014.)
ConclusionThe MMU analyzed key elements of PJM energy market structure, participant conduct and market performance in 2016, including aggregate supply and demand, concentration ratios, three pivotal supplier test results, offer capping, participation in demand response programs, loads and prices.
Average PJM real-time cleared generation increased by 2,676 MW, 3.0 percent, and peak load increased by 8,480 MW, 5.9 percent, in 2016 compared to
factors; the allowed duration of the violation; the use of constraint relaxation logic; and when the transmission penalty factors will be used to set the shadow price. (Priority: Medium. First reported 2015. Status: Not adopted.)
• The MMU recommends that the definition of maximum emergency status in the tariff apply at all times rather than just during maximum emergency events.4 (Priority: Medium. First reported 2012. Status: Not adopted.)
• The MMU recommends that PJM update the outage impact studies, the reliability analyses used in RPM for capacity deliverability and the reliability analyses used in RTEP for transmission upgrades to be consistent with the more conservative emergency operations (post contingency load dump limit exceedance analysis) in the energy market that were implemented in June 2013. (Priority: Low. First reported 2013. Status: Not adopted.)
• The MMU recommends that the roles of PJM and the transmission owners in the decision making process to control for local contingencies be clarified, that PJM’s role be strengthened and that the process be made transparent. (Priority: Low. First reported 2013. Status: Not adopted.)
• The MMU recommends that PJM include in the appropriate manual an explanation of the initial creation of hubs, the process for modifying hub definitions and a description of how hub definitions have changed.5 There is currently no PJM documentation in the tariff or manuals explaining how hubs are created and how their definitions are changed.6 (Priority: Low. First reported 2013. Status: Not adopted.)
• The MMU recommends that during hours when a generation bus shows a net withdrawal, the energy withdrawal be treated as load, not negative generation, for purposes of calculating load and load-weighted LMP. The MMU recommends that during hours when a load bus shows a net injection, the energy injection be treated as generation,
4 PJM. OATT Section: 6A.1.3 Maximum Emergency, (February 25, 2014), p. 1740, 1795.5 According to minutes from the first meeting of the Energy Market Committee (EMC) on January
28, 1998, the EMC unanimously agreed to be responsible for approving additions, deletions and changes to the hub definitions to be published and modeled by PJM. Since the EMC has become the Market Implementation Committee (MIC), the MIC now appears to be responsible for such changes.
6 The general definition of a hub can be found in the PJM.com Glossary <http://www.pjm.com/Glossary.aspx>.
98 Section 3 Energy Market
2016 State of the Market Report for PJM
© 2017 Monitoring Analytics, LLC
transmission constraints.7 This is a flexible, targeted real-time measure of market structure which replaced the offer capping of all units required to relieve a constraint. A generation owner or group of generation owners is pivotal for a local market if the output of the owners’ generation facilities is required in order to relieve a transmission constraint. When a generation owner or group of owners is pivotal, it has the ability to increase the market price above the competitive level. The three pivotal supplier test explicitly incorporates the impact of excess supply and implicitly accounts for the impact of the price elasticity of demand in the market power tests. The result of the introduction of the three pivotal supplier test was to limit offer capping to times when the local market structure was noncompetitive and specific owners had structural market power. The analysis of the application of the three pivotal supplier test demonstrates that it is working for most hours to exempt owners when the local market structure is competitive and to require offer capping of owners when the local market structure is noncompetitive.
However, there are some issues with the application of market power mitigation in the Day-Ahead Energy Market and the Real-Time Energy Market when market sellers fail the TPS test. There is no tariff or manual language that defines in detail the application of the TPS test and offer capping in the Day-Ahead Energy Market and the Real-Time Energy Market. In both the Day-Ahead and Real-Time Energy Markets, generators have the ability to avoid mitigation by using varying markups in their price-based offers, offering different operating parameters in their price-based and cost-based offers, and using different fuels in their price-based and cost-based offers. These issues can be resolved by simple rule changes requiring that markup be constant across price and cost offers, that there be at least one cost-based offer using the same fuel as the available price-based offer, that the price-MW pairs in the price-based PLS offer be exactly equal to the price-based non-PLS offer, and requiring cost-based and price-based PLS offers to be at least as flexible as price-based non-PLS offers.
Another issue with the application of market power mitigation in the Day-Ahead Energy Market and the Real-Time Energy Market when market sellers fail the TPS test is related to the definition of a competitive
7 The MMU reviews PJM’s application of the TPS test and brings issues to the attention of PJM.
2015. Market concentration levels remained moderate although there is high concentration in the peaking segment of the supply curve which adds to concerns about market power when market conditions are tight. The relationship between supply and demand, regardless of the specific market, balanced by market concentration and the extent of pivotal suppliers, is referred to as the supply-demand fundamentals or economic fundamentals. While the market structure does not guarantee competitive outcomes, overall the market structure of the PJM aggregate energy market remains reasonably competitive for most hours although aggregate market power does exist during high demand hours. Low average aggregate concentration does not mean that market power cannot be exercised. It is possible that market power can be exercised at times when individual suppliers or small groups of suppliers are pivotal even when the HHI level does not indicate that the market is highly concentrated. High markups for some units demonstrate the potential to exercise market power during high demand conditions.
Prices are a key outcome of markets. Prices vary across hours, days and years for multiple reasons. Price is an indicator of the level of competition in a market although individual prices are not always easy to interpret. In a competitive market, prices are directly related to the marginal cost of the most expensive unit required to serve load in each hour. The pattern of prices within days and across months and years illustrates how prices are directly related to supply and demand conditions and thus also illustrates the potential significance of the impact of the price elasticity of demand on prices. Energy market results in 2016 generally reflected supply-demand fundamentals, although the behavior of some participants during high demand periods is consistent with economic withholding. Economic withholding is the ability to increase markups substantially in tight market conditions. There are additional issues in the energy market including the uncertainties about the pricing and availability of natural gas, the way that generation owners incorporate natural gas costs in offers, and the lack of adequate incentives for unit owners to take all necessary actions to acquire fuel and operate rather than take an outage.
The three pivotal supplier test is applied by PJM on an ongoing basis for local energy markets in order to determine whether offer capping is required for
2016 State of the Market Report for PJM 99
Section 3 Energy Market
© 2017 Monitoring Analytics, LLC
in 2012. There are significant issues with the scarcity pricing net revenue true up mechanism in the PJM scarcity pricing design, which will create issues when scarcity pricing occurs. There are also significant issues with PJM’s scarcity pricing rules, including the absence of a clear trigger based on measured reserve levels (the current triggers are based on estimated reserves) and the lack of adequate locational scarcity pricing options.
The overall energy market results support the conclusion that energy prices in PJM are set, generally, by marginal units operating at, or close to, their marginal costs, although this was not always the case in 2014, 2015 or 2016. This is evidence of generally competitive behavior and competitive market outcomes, although the behavior of some participants during the high demand periods is consistent with economic withholding. Given the structure of the energy market which can permit the exercise of aggregate market power at times of high demand, the tighter market conditions and the change in some participants’ behavior are sources of concern in the energy market and provide a reason to use cost as the sole basis for hourly changes in offers or offers greater than $1,000 per MWh. The MMU concludes that the PJM energy market results were competitive in 2016.
Market StructureMarket ConcentrationAnalysis of supply curve segments of the PJM Energy Market in 2016 indicates moderate concentration in the base load and intermediate segments, but high concentration in the peaking segment.8 High concentration levels, particularly in the peaking segment, increase the probability that a generation owner will be pivotal in the aggregate market during high demand periods. The fact that the average HHI and the maximum hourly HHI were in the moderately concentrated range does not mean that the aggregate market was competitive in all hours. It is possible to have pivotal suppliers in the aggregate market even when the HHI level does not indicate highly concentrated. It is possible to have an exercise of market power even when the HHI level does not indicate highly concentrated.
8 A unit is classified as base load if it runs for more than 50 percent of hours, as intermediate if it runs for less than 50 percent but greater than 10 percent of hours, and as peak if it runs for less than 10 percent of hours.
offer. A competitive offer is equal to short run marginal costs. The enforcement of market power mitigation rules is undermined if the definition of a competitive offer is not correct. The significance of competition metrics like markup is also undermined if the definition of a competitive offer is not correct. The definition of a competitive offer, as interpreted by PJM, is not currently correct. Some unit owners include costs that are not short run marginal costs in offers, including maintenance costs. This issue can be resolved by simple changes to the PJM Market Rules to incorporate a clear and accurate definition of short run marginal costs.
PJM also offer caps units that are committed for reliability reasons in addition to units committed to provide constraint relief. Specifically, units that are committed to provide reactive support and black start service are offer capped in the energy market. These units are committed manually in both the Day-Ahead and Real-Time Energy Markets.
With or without a capacity market, energy market design must permit scarcity pricing when such pricing is consistent with market conditions and constrained by reasonable rules to ensure that market power is not exercised. Scarcity pricing can serve two functions in wholesale power markets: revenue adequacy and price signals. Scarcity pricing for revenue adequacy is not required in PJM. Scarcity pricing for price signals that reflect market conditions during periods of scarcity is required in PJM. Scarcity pricing is also part of an appropriate incentive structure facing both load and generation owners in a working wholesale electric power market design. Scarcity pricing must be designed to ensure that market prices reflect actual market conditions, that scarcity pricing occurs with transparent triggers based on measured reserve levels and transparent prices and that there are strong incentives for competitive behavior and strong disincentives to exercise market power. Such administrative scarcity pricing is a key link between energy and capacity markets. The PJM Capacity Market is explicitly designed to provide revenue adequacy and the resultant reliability. Nonetheless, with a market design that includes a direct and explicit scarcity pricing net revenue true up mechanism, scarcity pricing can be a mechanism to appropriately increase reliance on the energy market as a source of revenues and incentives in a competitive market without reliance on the exercise of market power. PJM implemented scarcity pricing rules
100 Section 3 Energy Market
2016 State of the Market Report for PJM
© 2017 Monitoring Analytics, LLC
When transmission constraints exist, local markets are created with ownership that is typically significantly more concentrated than the overall energy market. PJM offer capping rules that limit the exercise of local market power were generally effective in preventing the exercise of market power in 2016, although there are issues with the application of market power mitigation for resources whose owners fail the TPS test that permit local market power to be exercised even when mitigation rules are applied. These issues include the lack of a method for consistently determining the cheaper of the cost and price schedules, and the lack of rules requiring that cost based offers equal to short run marginal costs.
The concentration ratio used here is the Herfindahl-Hirschman Index (HHI), calculated by summing the squares of the market shares of all firms in a market. Hourly PJM energy market HHIs were calculated based on the real-time energy output of generators, adjusted for hourly net imports by owner (Table 3-2).
The HHI may not accurately capture market power issues in situations where, for example, there is moderate concentration in all on line resources but there is a high level of concentration in resources needed to meet increases in load. The HHIs for supply curve segments is an indication of such issues with the ownership of incremental resources. An aggregate pivotal supplier test is required to accurately measure the ability of incremental resources to exercise market power when load is high, for example.
Hourly HHIs were also calculated for baseload, intermediate and peaking segments of generation supply. Hourly energy market HHIs by supply curve segment were calculated based on hourly energy market shares, unadjusted for imports.
The “Merger Policy Statement” of the FERC states that a market can be broadly characterized as:
• Unconcentrated. Market HHI below 1000, equivalent to 10 firms with equal market shares;
• Moderately Concentrated. Market HHI between 1000 and 1800; and
• Highly Concentrated. Market HHI greater than 1800, equivalent to between five and six firms with equal market shares.9
PJM HHI ResultsCalculations for hourly HHI indicate that by the FERC standards, the PJM Energy Market during 2016 was moderately concentrated (Table 3-2).
Table 3-2 PJM hourly energy market HHI: 2015 and 201610
Hourly Market HHI (2015)
Hourly Market HHI (2016)
Average 1096 1024 Minimum 879 786 Maximum 1468 1356 Highest market share (One hour) 31% 28%Average of the highest hourly market share 21% 20%
# Hours 8,760 8,784# Hours HHI > 1800 0 0% Hours HHI > 1800 0% 0%
Table 3-3 includes HHI values by supply curve segment, including base, intermediate and peaking plants for 2015 and 2016. The PJM Energy Market was moderately concentrated overall with moderate concentration in the baseload and intermediate segments, but high concentration in the peaking segment.
Table 3-3 PJM hourly energy market HHI (By supply segment): 2015 and 2016
2015 2016Minimum Average Maximum Minimum Average Maximum
Base 988 1132 1487 945 1106 1428 Intermediate 603 1863 6375 578 1371 5029 Peak 716 5728 10000 684 5620 10000
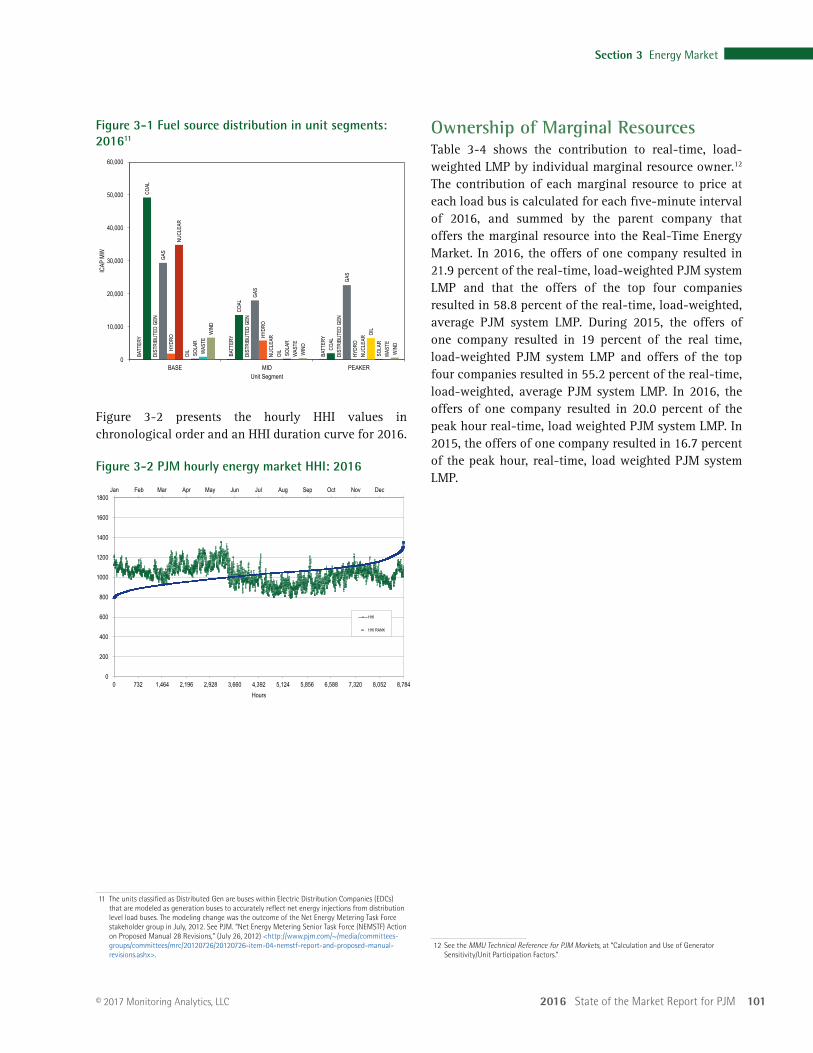
Figure 3-1 shows the total installed capacity (ICAP) MW of units in the baseload, intermediate and peaking segments by fuel source in 2016.
9 77 FERC ¶ 61,263, pp. 64-70 (1996), “Inquiry Concerning the Commission’s Merger Policy under the Federal Power Act: Policy Statement.”
10 This analysis includes all hours in 2015 and 2016, regardless of congestion.
2016 State of the Market Report for PJM 101
Section 3 Energy Market
© 2017 Monitoring Analytics, LLC
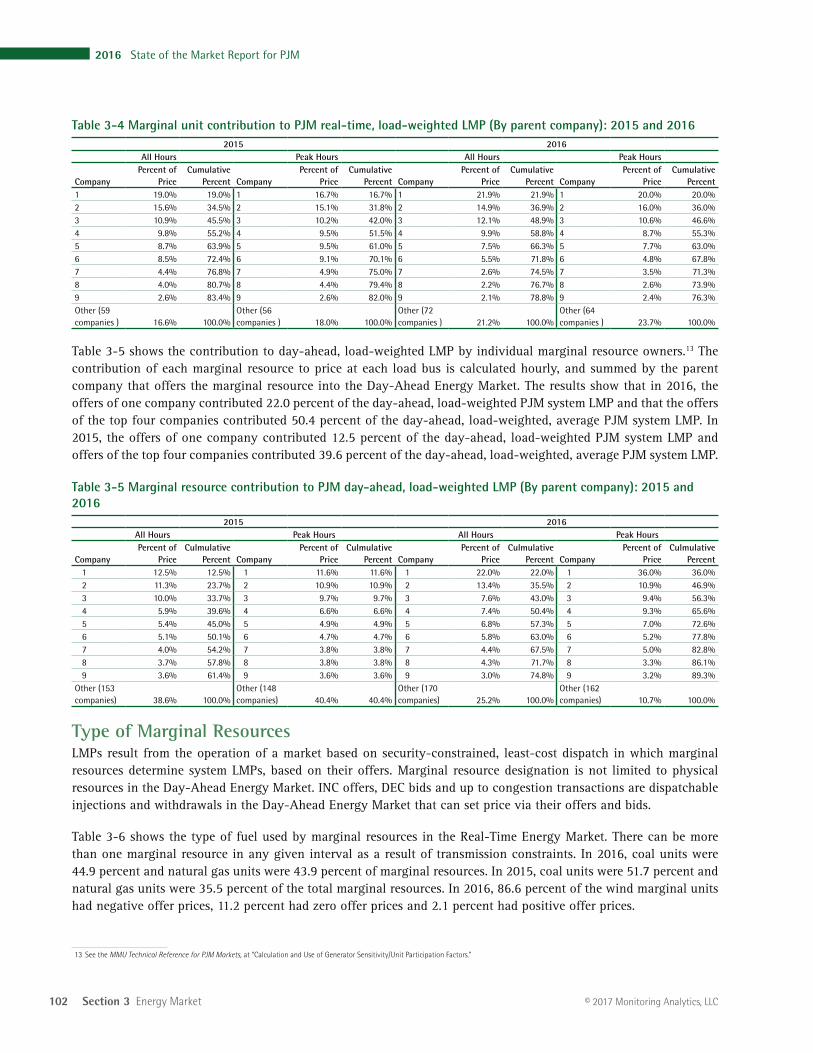
Ownership of Marginal ResourcesTable 3-4 shows the contribution to real-time, load-weighted LMP by individual marginal resource owner.12 The contribution of each marginal resource to price at each load bus is calculated for each five-minute interval of 2016, and summed by the parent company that offers the marginal resource into the Real-Time Energy Market. In 2016, the offers of one company resulted in 21.9 percent of the real-time, load-weighted PJM system LMP and that the offers of the top four companies resulted in 58.8 percent of the real-time, load-weighted, average PJM system LMP. During 2015, the offers of one company resulted in 19 percent of the real time, load-weighted PJM system LMP and offers of the top four companies resulted in 55.2 percent of the real-time, load-weighted, average PJM system LMP. In 2016, the offers of one company resulted in 20.0 percent of the peak hour real-time, load weighted PJM system LMP. In 2015, the offers of one company resulted in 16.7 percent of the peak hour, real-time, load weighted PJM system LMP.
12 See the MMU Technical Reference for PJM Markets, at “Calculation and Use of Generator Sensitivity/Unit Participation Factors.”
Figure 3-1 Fuel source distribution in unit segments: 201611
BATT
ERY
BATT
ERY
BATT
ERY
COAL
COAL
COAL
DIST
RIBU
TED
GEN
DIST
RIBU
TED
GEN
DIST
RIBU
TED
GEN
GAS
GAS
GAS
HYDR
O HYDR
O
HYDR
O
NUCL
EAR
NUCL
EAR
NUCL
EAR
OIL
OIL
OIL
SOLA
R
SOLA
R
SOLA
R
WAS
TE
WAS
TE
WAS
TE
WIN
D
WIN
D
WIN
D
0
10,000
20,000
30,000
40,000
50,000
60,000
BASE MID PEAKER
ICAP
MW
Unit Segment
Figure 3-2 presents the hourly HHI values in chronological order and an HHI duration curve for 2016.
Figure 3-2 PJM hourly energy market HHI: 2016
0 732 1,464 2,196 2,928 3,660 4,392 5,124 5,856 6,588 7,320 8,052 8,7840
200
400
600
800
1000
1200
1400
1600
1800Jan Feb Mar Apr May Jun Jul Aug Sep Oct Nov Dec
Hours
HHI
HHI RANK
11 The units classified as Distributed Gen are buses within Electric Distribution Companies (EDCs) that are modeled as generation buses to accurately reflect net energy injections from distribution level load buses. The modeling change was the outcome of the Net Energy Metering Task Force stakeholder group in July, 2012. See PJM. “Net Energy Metering Senior Task Force (NEMSTF) Action on Proposed Manual 28 Revisions,” (July 26, 2012) <http://www.pjm.com/~/media/committees-groups/committees/mrc/20120726/20120726-item-04-nemstf-report-and-proposed-manual-revisions.ashx>.
102 Section 3 Energy Market
2016 State of the Market Report for PJM
© 2017 Monitoring Analytics, LLC
Table 3-4 Marginal unit contribution to PJM real-time, load-weighted LMP (By parent company): 2015 and 20162015 2016
All Hours Peak Hours All Hours Peak Hours
CompanyPercent of
PriceCumulative
Percent CompanyPercent of
PriceCumulative
Percent CompanyPercent of
PriceCumulative
Percent CompanyPercent of
PriceCumulative
Percent1 19.0% 19.0% 1 16.7% 16.7% 1 21.9% 21.9% 1 20.0% 20.0%2 15.6% 34.5% 2 15.1% 31.8% 2 14.9% 36.9% 2 16.0% 36.0%3 10.9% 45.5% 3 10.2% 42.0% 3 12.1% 48.9% 3 10.6% 46.6%4 9.8% 55.2% 4 9.5% 51.5% 4 9.9% 58.8% 4 8.7% 55.3%5 8.7% 63.9% 5 9.5% 61.0% 5 7.5% 66.3% 5 7.7% 63.0%6 8.5% 72.4% 6 9.1% 70.1% 6 5.5% 71.8% 6 4.8% 67.8%7 4.4% 76.8% 7 4.9% 75.0% 7 2.6% 74.5% 7 3.5% 71.3%8 4.0% 80.7% 8 4.4% 79.4% 8 2.2% 76.7% 8 2.6% 73.9%9 2.6% 83.4% 9 2.6% 82.0% 9 2.1% 78.8% 9 2.4% 76.3%Other (59 companies ) 16.6% 100.0%
Other (56 companies ) 18.0% 100.0%
Other (72 companies ) 21.2% 100.0%
Other (64 companies ) 23.7% 100.0%
Table 3-5 shows the contribution to day-ahead, load-weighted LMP by individual marginal resource owners.13 The contribution of each marginal resource to price at each load bus is calculated hourly, and summed by the parent company that offers the marginal resource into the Day-Ahead Energy Market. The results show that in 2016, the offers of one company contributed 22.0 percent of the day-ahead, load-weighted PJM system LMP and that the offers of the top four companies contributed 50.4 percent of the day-ahead, load-weighted, average PJM system LMP. In 2015, the offers of one company contributed 12.5 percent of the day-ahead, load-weighted PJM system LMP and offers of the top four companies contributed 39.6 percent of the day-ahead, load-weighted, average PJM system LMP.
Table 3-5 Marginal resource contribution to PJM day-ahead, load-weighted LMP (By parent company): 2015 and 2016
2015 2016All Hours Peak Hours All Hours Peak Hours
CompanyPercent of
PriceCulmulative
Percent CompanyPercent of
PriceCulmulative
Percent CompanyPercent of
PriceCulmulative
Percent CompanyPercent of
PriceCulmulative
Percent 1 12.5% 12.5% 1 11.6% 11.6% 1 22.0% 22.0% 1 36.0% 36.0% 2 11.3% 23.7% 2 10.9% 10.9% 2 13.4% 35.5% 2 10.9% 46.9% 3 10.0% 33.7% 3 9.7% 9.7% 3 7.6% 43.0% 3 9.4% 56.3% 4 5.9% 39.6% 4 6.6% 6.6% 4 7.4% 50.4% 4 9.3% 65.6% 5 5.4% 45.0% 5 4.9% 4.9% 5 6.8% 57.3% 5 7.0% 72.6% 6 5.1% 50.1% 6 4.7% 4.7% 6 5.8% 63.0% 6 5.2% 77.8% 7 4.0% 54.2% 7 3.8% 3.8% 7 4.4% 67.5% 7 5.0% 82.8% 8 3.7% 57.8% 8 3.8% 3.8% 8 4.3% 71.7% 8 3.3% 86.1% 9 3.6% 61.4% 9 3.6% 3.6% 9 3.0% 74.8% 9 3.2% 89.3%Other (153 companies) 38.6% 100.0%
Other (148 companies) 40.4% 40.4%
Other (170 companies) 25.2% 100.0%
Other (162 companies) 10.7% 100.0%
Type of Marginal ResourcesLMPs result from the operation of a market based on security-constrained, least-cost dispatch in which marginal resources determine system LMPs, based on their offers. Marginal resource designation is not limited to physical resources in the Day-Ahead Energy Market. INC offers, DEC bids and up to congestion transactions are dispatchable injections and withdrawals in the Day-Ahead Energy Market that can set price via their offers and bids.
Table 3-6 shows the type of fuel used by marginal resources in the Real-Time Energy Market. There can be more than one marginal resource in any given interval as a result of transmission constraints. In 2016, coal units were 44.9 percent and natural gas units were 43.9 percent of marginal resources. In 2015, coal units were 51.7 percent and natural gas units were 35.5 percent of the total marginal resources. In 2016, 86.6 percent of the wind marginal units had negative offer prices, 11.2 percent had zero offer prices and 2.1 percent had positive offer prices.
13 See the MMU Technical Reference for PJM Markets, at “Calculation and Use of Generator Sensitivity/Unit Participation Factors.”
2016 State of the Market Report for PJM 103
Section 3 Energy Market
© 2017 Monitoring Analytics, LLC
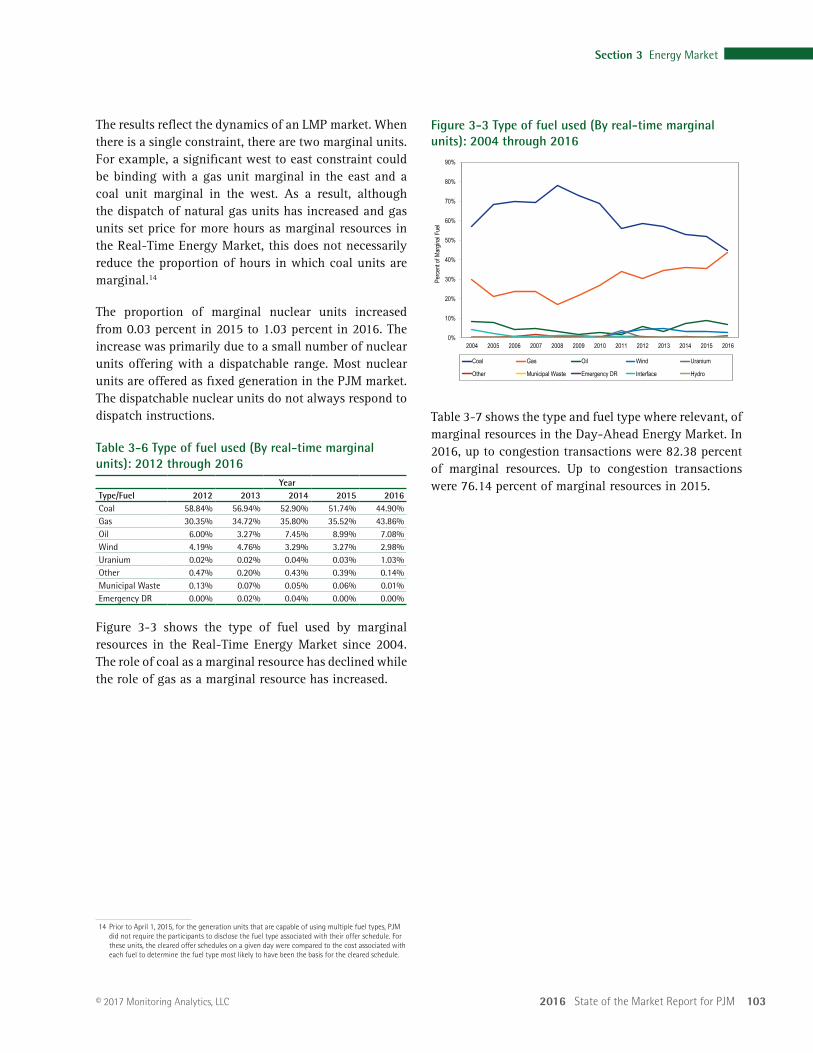
Figure 3-3 Type of fuel used (By real-time marginal units): 2004 through 2016
0%
10%
20%
30%
40%
50%
60%
70%
80%
90%
2004 2005 2006 2007 2008 2009 2010 2011 2012 2013 2014 2015 2016
Perce
nt of
Marg
inal F
uel
Coal Gas Oil Wind Uranium
Other Municipal Waste Emergency DR Interface Hydro
Table 3-7 shows the type and fuel type where relevant, of marginal resources in the Day-Ahead Energy Market. In 2016, up to congestion transactions were 82.38 percent of marginal resources. Up to congestion transactions were 76.14 percent of marginal resources in 2015.
The results reflect the dynamics of an LMP market. When there is a single constraint, there are two marginal units. For example, a significant west to east constraint could be binding with a gas unit marginal in the east and a coal unit marginal in the west. As a result, although the dispatch of natural gas units has increased and gas units set price for more hours as marginal resources in the Real-Time Energy Market, this does not necessarily reduce the proportion of hours in which coal units are marginal.14
The proportion of marginal nuclear units increased from 0.03 percent in 2015 to 1.03 percent in 2016. The increase was primarily due to a small number of nuclear units offering with a dispatchable range. Most nuclear units are offered as fixed generation in the PJM market. The dispatchable nuclear units do not always respond to dispatch instructions.
Table 3-6 Type of fuel used (By real-time marginal units): 2012 through 2016
YearType/Fuel 2012 2013 2014 2015 2016Coal 58.84% 56.94% 52.90% 51.74% 44.90%Gas 30.35% 34.72% 35.80% 35.52% 43.86%Oil 6.00% 3.27% 7.45% 8.99% 7.08%Wind 4.19% 4.76% 3.29% 3.27% 2.98%Uranium 0.02% 0.02% 0.04% 0.03% 1.03%Other 0.47% 0.20% 0.43% 0.39% 0.14%Municipal Waste 0.13% 0.07% 0.05% 0.06% 0.01%Emergency DR 0.00% 0.02% 0.04% 0.00% 0.00%
Figure 3-3 shows the type of fuel used by marginal resources in the Real-Time Energy Market since 2004. The role of coal as a marginal resource has declined while the role of gas as a marginal resource has increased.
14 Prior to April 1, 2015, for the generation units that are capable of using multiple fuel types, PJM did not require the participants to disclose the fuel type associated with their offer schedule. For these units, the cleared offer schedules on a given day were compared to the cost associated with each fuel to determine the fuel type most likely to have been the basis for the cleared schedule.
104 Section 3 Energy Market
2016 State of the Market Report for PJM
© 2017 Monitoring Analytics, LLC
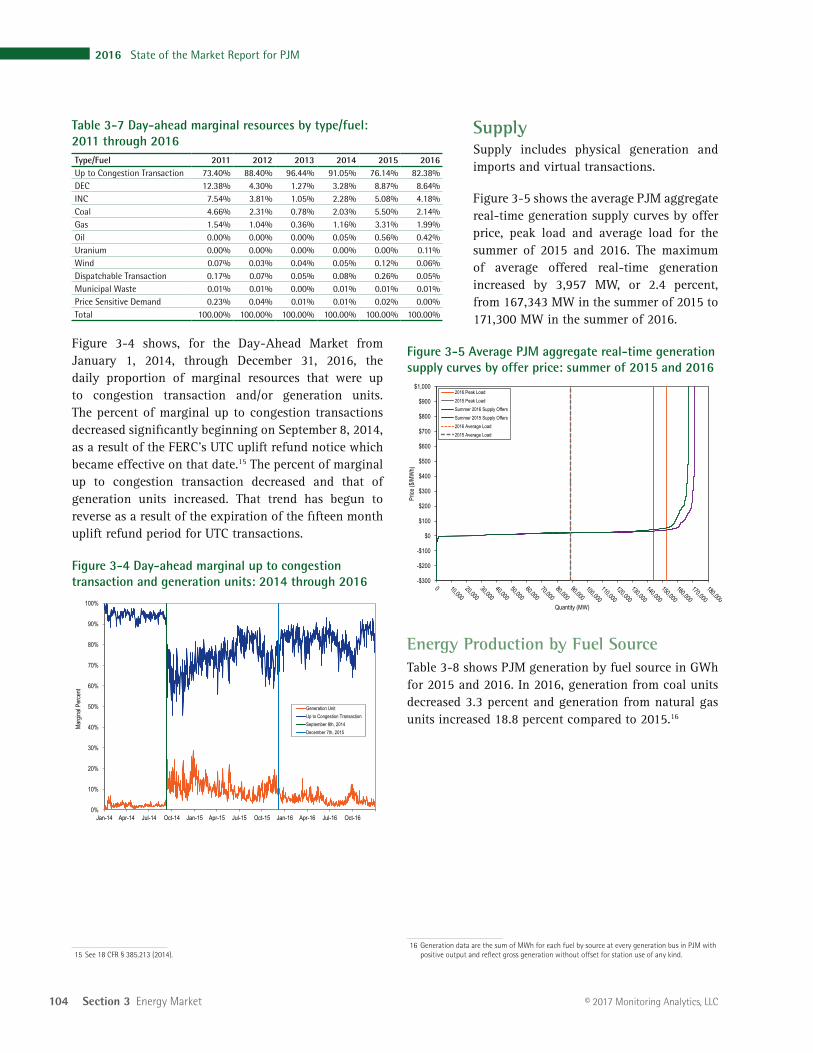
SupplySupply includes physical generation and imports and virtual transactions.
Figure 3-5 shows the average PJM aggregate real-time generation supply curves by offer price, peak load and average load for the summer of 2015 and 2016. The maximum of average offered real-time generation increased by 3,957 MW, or 2.4 percent, from 167,343 MW in the summer of 2015 to 171,300 MW in the summer of 2016.
Figure 3-5 Average PJM aggregate real-time generation supply curves by offer price: summer of 2015 and 2016
-$300
-$200
-$100
$0
$100
$200
$300
$400
$500
$600
$700
$800
$900
$1,000
Price
($/M
Wh)
Quantity (MW)
2016 Peak Load2015 Peak LoadSummer 2016 Supply OffersSummer 2015 Supply Offers2016 Average Load2015 Average Load
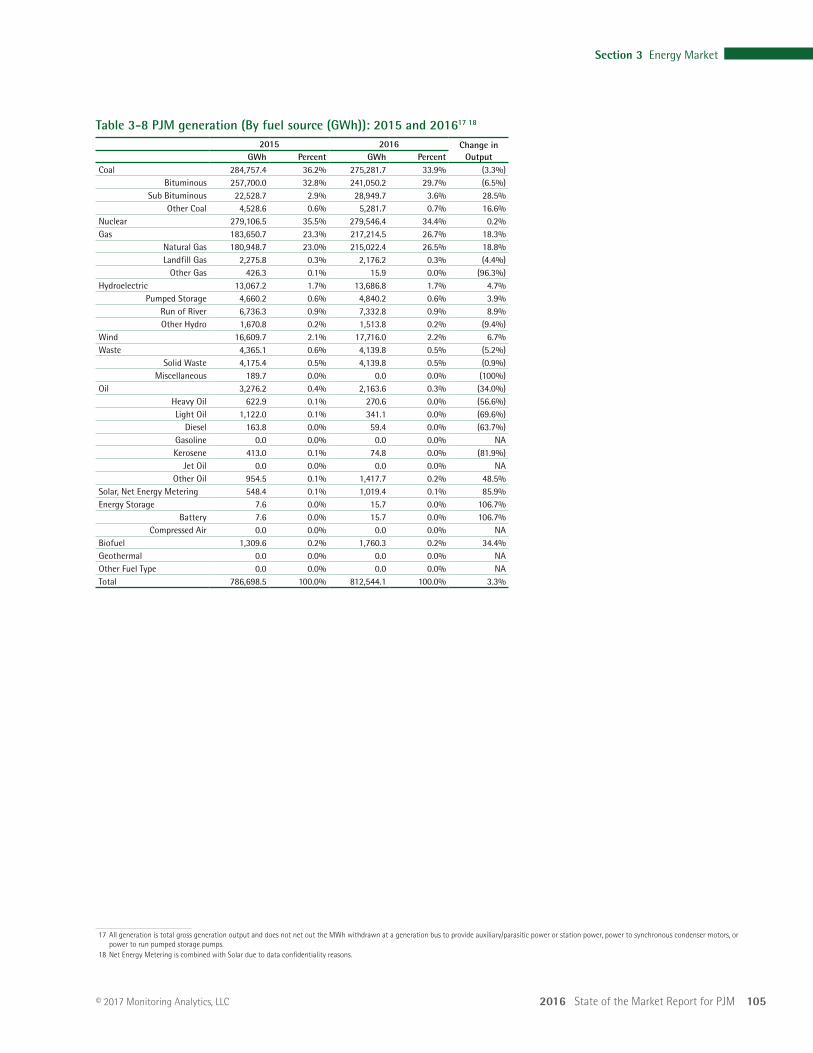
Energy Production by Fuel SourceTable 3-8 shows PJM generation by fuel source in GWh for 2015 and 2016. In 2016, generation from coal units decreased 3.3 percent and generation from natural gas units increased 18.8 percent compared to 2015.16
16 Generation data are the sum of MWh for each fuel by source at every generation bus in PJM with positive output and reflect gross generation without offset for station use of any kind.
Table 3-7 Day-ahead marginal resources by type/fuel: 2011 through 2016Type/Fuel 2011 2012 2013 2014 2015 2016Up to Congestion Transaction 73.40% 88.40% 96.44% 91.05% 76.14% 82.38%DEC 12.38% 4.30% 1.27% 3.28% 8.87% 8.64%INC 7.54% 3.81% 1.05% 2.28% 5.08% 4.18%Coal 4.66% 2.31% 0.78% 2.03% 5.50% 2.14%Gas 1.54% 1.04% 0.36% 1.16% 3.31% 1.99%Oil 0.00% 0.00% 0.00% 0.05% 0.56% 0.42%Uranium 0.00% 0.00% 0.00% 0.00% 0.00% 0.11%Wind 0.07% 0.03% 0.04% 0.05% 0.12% 0.06%Dispatchable Transaction 0.17% 0.07% 0.05% 0.08% 0.26% 0.05%Municipal Waste 0.01% 0.01% 0.00% 0.01% 0.01% 0.01%Price Sensitive Demand 0.23% 0.04% 0.01% 0.01% 0.02% 0.00%Total 100.00% 100.00% 100.00% 100.00% 100.00% 100.00%
Figure 3-4 shows, for the Day-Ahead Market from January 1, 2014, through December 31, 2016, the daily proportion of marginal resources that were up to congestion transaction and/or generation units. The percent of marginal up to congestion transactions decreased significantly beginning on September 8, 2014, as a result of the FERC’s UTC uplift refund notice which became effective on that date.15 The percent of marginal up to congestion transaction decreased and that of generation units increased. That trend has begun to reverse as a result of the expiration of the fifteen month uplift refund period for UTC transactions.
Figure 3-4 Day-ahead marginal up to congestion transaction and generation units: 2014 through 2016
0%
10%
20%
30%
40%
50%
60%
70%
80%
90%
100%
Jan-14 Apr-14 Jul-14 Oct-14 Jan-15 Apr-15 Jul-15 Oct-15 Jan-16 Apr-16 Jul-16 Oct-16
Marg
inal P
erce
nt
Generation UnitUp to Congestion TransactionSeptember 8th, 2014December 7th, 2015
15 See 18 CFR § 385.213 (2014).
2016 State of the Market Report for PJM 105
Section 3 Energy Market
© 2017 Monitoring Analytics, LLC
Table 3-8 PJM generation (By fuel source (GWh)): 2015 and 201617 18
2015 2016 Change in OutputGWh Percent GWh Percent
Coal 284,757.4 36.2% 275,281.7 33.9% (3.3%)Bituminous 257,700.0 32.8% 241,050.2 29.7% (6.5%)
Sub Bituminous 22,528.7 2.9% 28,949.7 3.6% 28.5%Other Coal 4,528.6 0.6% 5,281.7 0.7% 16.6%
Nuclear 279,106.5 35.5% 279,546.4 34.4% 0.2%Gas 183,650.7 23.3% 217,214.5 26.7% 18.3%
Natural Gas 180,948.7 23.0% 215,022.4 26.5% 18.8%Landfill Gas 2,275.8 0.3% 2,176.2 0.3% (4.4%)
Other Gas 426.3 0.1% 15.9 0.0% (96.3%)Hydroelectric 13,067.2 1.7% 13,686.8 1.7% 4.7%
Pumped Storage 4,660.2 0.6% 4,840.2 0.6% 3.9%Run of River 6,736.3 0.9% 7,332.8 0.9% 8.9%Other Hydro 1,670.8 0.2% 1,513.8 0.2% (9.4%)
Wind 16,609.7 2.1% 17,716.0 2.2% 6.7%Waste 4,365.1 0.6% 4,139.8 0.5% (5.2%)
Solid Waste 4,175.4 0.5% 4,139.8 0.5% (0.9%)Miscellaneous 189.7 0.0% 0.0 0.0% (100%)
Oil 3,276.2 0.4% 2,163.6 0.3% (34.0%)Heavy Oil 622.9 0.1% 270.6 0.0% (56.6%)Light Oil 1,122.0 0.1% 341.1 0.0% (69.6%)
Diesel 163.8 0.0% 59.4 0.0% (63.7%)Gasoline 0.0 0.0% 0.0 0.0% NAKerosene 413.0 0.1% 74.8 0.0% (81.9%)
Jet Oil 0.0 0.0% 0.0 0.0% NAOther Oil 954.5 0.1% 1,417.7 0.2% 48.5%
Solar, Net Energy Metering 548.4 0.1% 1,019.4 0.1% 85.9%Energy Storage 7.6 0.0% 15.7 0.0% 106.7%
Battery 7.6 0.0% 15.7 0.0% 106.7%Compressed Air 0.0 0.0% 0.0 0.0% NA
Biofuel 1,309.6 0.2% 1,760.3 0.2% 34.4%Geothermal 0.0 0.0% 0.0 0.0% NAOther Fuel Type 0.0 0.0% 0.0 0.0% NATotal 786,698.5 100.0% 812,544.1 100.0% 3.3%
17 All generation is total gross generation output and does not net out the MWh withdrawn at a generation bus to provide auxiliary/parasitic power or station power, power to synchronous condenser motors, or power to run pumped storage pumps.
18 Net Energy Metering is combined with Solar due to data confidentiality reasons.
106 Section 3 Energy Market
2016 State of the Market Report for PJM
© 2017 Monitoring Analytics, LLC
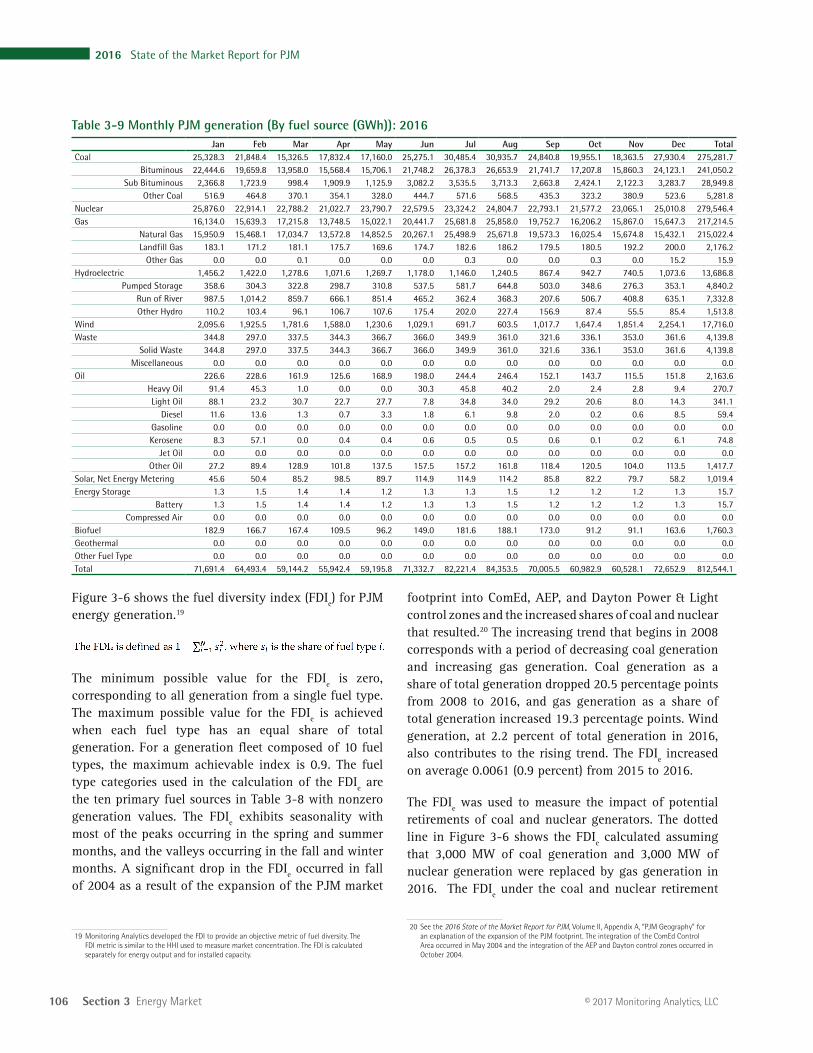
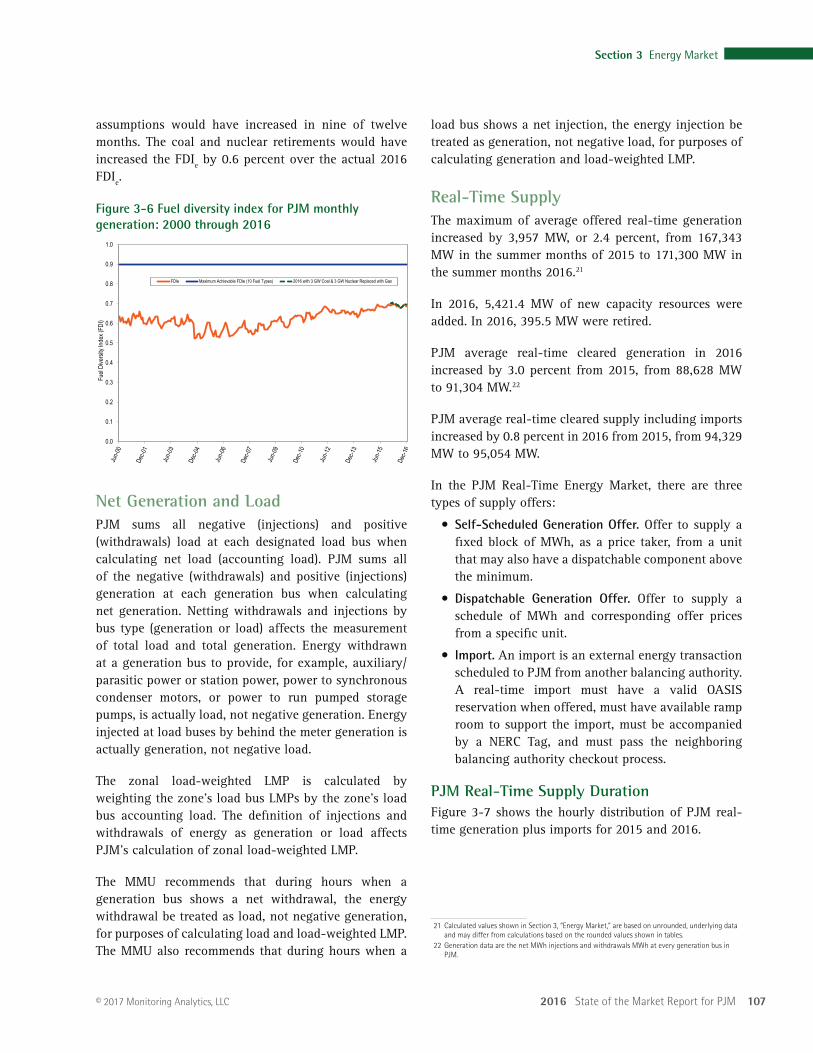
footprint into ComEd, AEP, and Dayton Power & Light control zones and the increased shares of coal and nuclear that resulted.20 The increasing trend that begins in 2008 corresponds with a period of decreasing coal generation and increasing gas generation. Coal generation as a share of total generation dropped 20.5 percentage points from 2008 to 2016, and gas generation as a share of total generation increased 19.3 percentage points. Wind generation, at 2.2 percent of total generation in 2016, also contributes to the rising trend. The FDIe increased on average 0.0061 (0.9 percent) from 2015 to 2016.
The FDIe was used to measure the impact of potential retirements of coal and nuclear generators. The dotted line in Figure 3-6 shows the FDIe calculated assuming that 3,000 MW of coal generation and 3,000 MW of nuclear generation were replaced by gas generation in 2016. The FDIe under the coal and nuclear retirement
20 See the 2016 State of the Market Report for PJM, Volume II, Appendix A, “PJM Geography” for an explanation of the expansion of the PJM footprint. The integration of the ComEd Control Area occurred in May 2004 and the integration of the AEP and Dayton control zones occurred in October 2004.
Jan Feb Mar Apr May Jun Jul Aug Sep Oct Nov Dec TotalCoal 25,328.3 21,848.4 15,326.5 17,832.4 17,160.0 25,275.1 30,485.4 30,935.7 24,840.8 19,955.1 18,363.5 27,930.4 275,281.7
Bituminous 22,444.6 19,659.8 13,958.0 15,568.4 15,706.1 21,748.2 26,378.3 26,653.9 21,741.7 17,207.8 15,860.3 24,123.1 241,050.2 Sub Bituminous 2,366.8 1,723.9 998.4 1,909.9 1,125.9 3,082.2 3,535.5 3,713.3 2,663.8 2,424.1 2,122.3 3,283.7 28,949.8
Other Coal 516.9 464.8 370.1 354.1 328.0 444.7 571.6 568.5 435.3 323.2 380.9 523.6 5,281.8 Nuclear 25,876.0 22,914.1 22,788.2 21,022.7 23,790.7 22,579.5 23,324.2 24,804.7 22,793.1 21,577.2 23,065.1 25,010.8 279,546.4 Gas 16,134.0 15,639.3 17,215.8 13,748.5 15,022.1 20,441.7 25,681.8 25,858.0 19,752.7 16,206.2 15,867.0 15,647.3 217,214.5
Natural Gas 15,950.9 15,468.1 17,034.7 13,572.8 14,852.5 20,267.1 25,498.9 25,671.8 19,573.3 16,025.4 15,674.8 15,432.1 215,022.4 Landfill Gas 183.1 171.2 181.1 175.7 169.6 174.7 182.6 186.2 179.5 180.5 192.2 200.0 2,176.2
Other Gas 0.0 0.0 0.1 0.0 0.0 0.0 0.3 0.0 0.0 0.3 0.0 15.2 15.9 Hydroelectric 1,456.2 1,422.0 1,278.6 1,071.6 1,269.7 1,178.0 1,146.0 1,240.5 867.4 942.7 740.5 1,073.6 13,686.8
Pumped Storage 358.6 304.3 322.8 298.7 310.8 537.5 581.7 644.8 503.0 348.6 276.3 353.1 4,840.2 Run of River 987.5 1,014.2 859.7 666.1 851.4 465.2 362.4 368.3 207.6 506.7 408.8 635.1 7,332.8 Other Hydro 110.2 103.4 96.1 106.7 107.6 175.4 202.0 227.4 156.9 87.4 55.5 85.4 1,513.8
Wind 2,095.6 1,925.5 1,781.6 1,588.0 1,230.6 1,029.1 691.7 603.5 1,017.7 1,647.4 1,851.4 2,254.1 17,716.0 Waste 344.8 297.0 337.5 344.3 366.7 366.0 349.9 361.0 321.6 336.1 353.0 361.6 4,139.8
Solid Waste 344.8 297.0 337.5 344.3 366.7 366.0 349.9 361.0 321.6 336.1 353.0 361.6 4,139.8 Miscellaneous 0.0 0.0 0.0 0.0 0.0 0.0 0.0 0.0 0.0 0.0 0.0 0.0 0.0
Oil 226.6 228.6 161.9 125.6 168.9 198.0 244.4 246.4 152.1 143.7 115.5 151.8 2,163.6 Heavy Oil 91.4 45.3 1.0 0.0 0.0 30.3 45.8 40.2 2.0 2.4 2.8 9.4 270.7 Light Oil 88.1 23.2 30.7 22.7 27.7 7.8 34.8 34.0 29.2 20.6 8.0 14.3 341.1
Diesel 11.6 13.6 1.3 0.7 3.3 1.8 6.1 9.8 2.0 0.2 0.6 8.5 59.4 Gasoline 0.0 0.0 0.0 0.0 0.0 0.0 0.0 0.0 0.0 0.0 0.0 0.0 0.0 Kerosene 8.3 57.1 0.0 0.4 0.4 0.6 0.5 0.5 0.6 0.1 0.2 6.1 74.8
Jet Oil 0.0 0.0 0.0 0.0 0.0 0.0 0.0 0.0 0.0 0.0 0.0 0.0 0.0 Other Oil 27.2 89.4 128.9 101.8 137.5 157.5 157.2 161.8 118.4 120.5 104.0 113.5 1,417.7
Solar, Net Energy Metering 45.6 50.4 85.2 98.5 89.7 114.9 114.9 114.2 85.8 82.2 79.7 58.2 1,019.4 Energy Storage 1.3 1.5 1.4 1.4 1.2 1.3 1.3 1.5 1.2 1.2 1.2 1.3 15.7
Battery 1.3 1.5 1.4 1.4 1.2 1.3 1.3 1.5 1.2 1.2 1.2 1.3 15.7 Compressed Air 0.0 0.0 0.0 0.0 0.0 0.0 0.0 0.0 0.0 0.0 0.0 0.0 0.0
Biofuel 182.9 166.7 167.4 109.5 96.2 149.0 181.6 188.1 173.0 91.2 91.1 163.6 1,760.3 Geothermal 0.0 0.0 0.0 0.0 0.0 0.0 0.0 0.0 0.0 0.0 0.0 0.0 0.0 Other Fuel Type 0.0 0.0 0.0 0.0 0.0 0.0 0.0 0.0 0.0 0.0 0.0 0.0 0.0 Total 71,691.4 64,493.4 59,144.2 55,942.4 59,195.8 71,332.7 82,221.4 84,353.5 70,005.5 60,982.9 60,528.1 72,652.9 812,544.1
Figure 3-6 shows the fuel diversity index (FDIe) for PJM energy generation.19
The minimum possible value for the FDIe is zero, corresponding to all generation from a single fuel type. The maximum possible value for the FDIe is achieved when each fuel type has an equal share of total generation. For a generation fleet composed of 10 fuel types, the maximum achievable index is 0.9. The fuel type categories used in the calculation of the FDIe are the ten primary fuel sources in Table 3-8 with nonzero generation values. The FDIe exhibits seasonality with most of the peaks occurring in the spring and summer months, and the valleys occurring in the fall and winter months. A significant drop in the FDIe occurred in fall of 2004 as a result of the expansion of the PJM market
19 Monitoring Analytics developed the FDI to provide an objective metric of fuel diversity. The FDI metric is similar to the HHI used to measure market concentration. The FDI is calculated separately for energy output and for installed capacity.
Table 3-9 Monthly PJM generation (By fuel source (GWh)): 2016
2016 State of the Market Report for PJM 107
Section 3 Energy Market
© 2017 Monitoring Analytics, LLC
load bus shows a net injection, the energy injection be treated as generation, not negative load, for purposes of calculating generation and load-weighted LMP.
Real-Time SupplyThe maximum of average offered real-time generation increased by 3,957 MW, or 2.4 percent, from 167,343 MW in the summer months of 2015 to 171,300 MW in the summer months 2016.21
In 2016, 5,421.4 MW of new capacity resources were added. In 2016, 395.5 MW were retired.
PJM average real-time cleared generation in 2016 increased by 3.0 percent from 2015, from 88,628 MW to 91,304 MW.22
PJM average real-time cleared supply including imports increased by 0.8 percent in 2016 from 2015, from 94,329 MW to 95,054 MW.
In the PJM Real-Time Energy Market, there are three types of supply offers:
• Self-Scheduled Generation Offer. Offer to supply a fixed block of MWh, as a price taker, from a unit that may also have a dispatchable component above the minimum.
• Dispatchable Generation Offer. Offer to supply a schedule of MWh and corresponding offer prices from a specific unit.
• Import. An import is an external energy transaction scheduled to PJM from another balancing authority. A real-time import must have a valid OASIS reservation when offered, must have available ramp room to support the import, must be accompanied by a NERC Tag, and must pass the neighboring balancing authority checkout process.
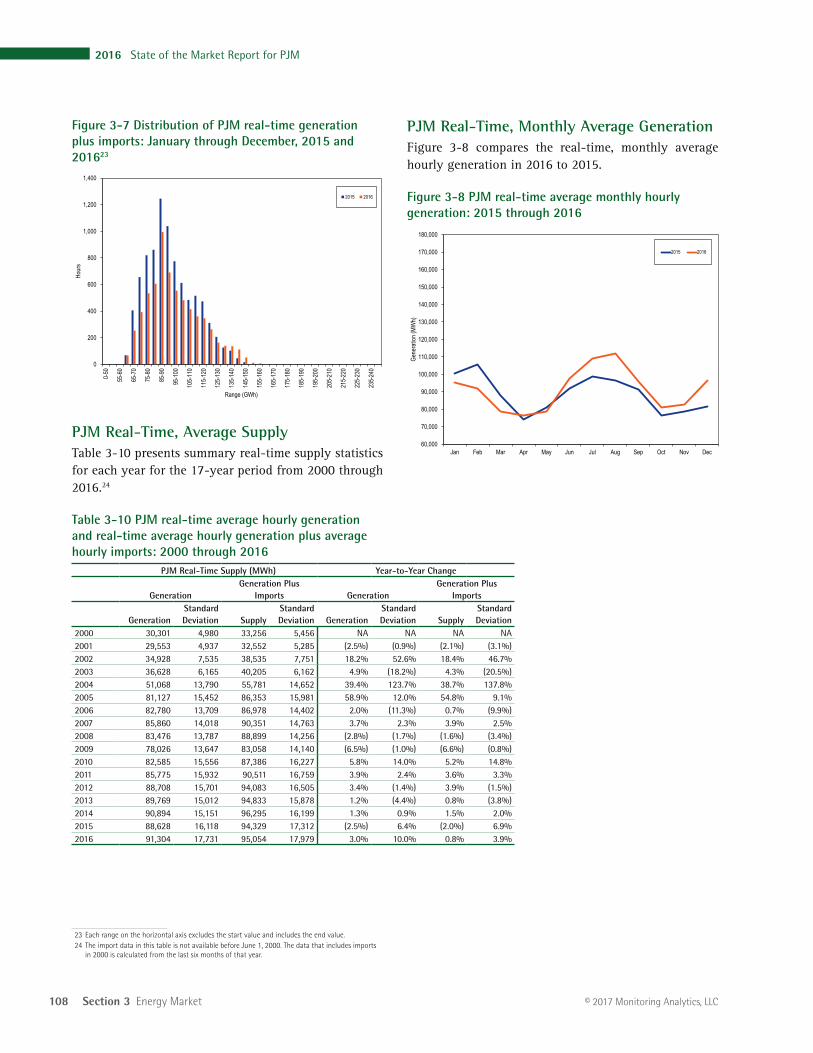
PJM Real-Time Supply DurationFigure 3-7 shows the hourly distribution of PJM real-time generation plus imports for 2015 and 2016.
21 Calculated values shown in Section 3, “Energy Market,” are based on unrounded, underlying data and may differ from calculations based on the rounded values shown in tables.
22 Generation data are the net MWh injections and withdrawals MWh at every generation bus in PJM.
assumptions would have increased in nine of twelve months. The coal and nuclear retirements would have increased the FDIe by 0.6 percent over the actual 2016 FDIe.
Figure 3-6 Fuel diversity index for PJM monthly generation: 2000 through 2016
0.0
0.1
0.2
0.3
0.4
0.5
0.6
0.7
0.8
0.9
1.0
Fuel
Dive
rsity
Index
(FDI
)
FDIe Maximum Achievable FDIe (10 Fuel Types) 2016 with 3 GW Coal & 3 GW Nuclear Replaced with Gas
Net Generation and LoadPJM sums all negative (injections) and positive (withdrawals) load at each designated load bus when calculating net load (accounting load). PJM sums all of the negative (withdrawals) and positive (injections) generation at each generation bus when calculating net generation. Netting withdrawals and injections by bus type (generation or load) affects the measurement of total load and total generation. Energy withdrawn at a generation bus to provide, for example, auxiliary/parasitic power or station power, power to synchronous condenser motors, or power to run pumped storage pumps, is actually load, not negative generation. Energy injected at load buses by behind the meter generation is actually generation, not negative load.
The zonal load-weighted LMP is calculated by weighting the zone’s load bus LMPs by the zone’s load bus accounting load. The definition of injections and withdrawals of energy as generation or load affects PJM’s calculation of zonal load-weighted LMP.
The MMU recommends that during hours when a generation bus shows a net withdrawal, the energy withdrawal be treated as load, not negative generation, for purposes of calculating load and load-weighted LMP. The MMU also recommends that during hours when a
108 Section 3 Energy Market
2016 State of the Market Report for PJM
© 2017 Monitoring Analytics, LLC
PJM Real-Time, Monthly Average GenerationFigure 3-8 compares the real-time, monthly average hourly generation in 2016 to 2015.
Figure 3-8 PJM real-time average monthly hourly generation: 2015 through 2016
60,000
70,000
80,000
90,000
100,000
110,000
120,000
130,000
140,000
150,000
160,000
170,000
180,000
Jan Feb Mar Apr May Jun Jul Aug Sep Oct Nov Dec
Gene
ratio
n (MW
h)
2015 2016
Figure 3-7 Distribution of PJM real-time generation plus imports: January through December, 2015 and 201623
0
200
400
600
800
1,000
1,200
1,400
0-50
55-6
0
65-7
0
75-8
0
85-9
0
95-1
00
105-
110
115-
120
125-
130
135-
140
145-
150
155-
160
165-
170
175-
180
185-
190
195-
200
205-
210
215-
220
225-
230
235-
240
Hour
s
Range (GWh)
2015 2016
PJM Real-Time, Average SupplyTable 3-10 presents summary real-time supply statistics for each year for the 17-year period from 2000 through 2016.24
Table 3-10 PJM real-time average hourly generation and real-time average hourly generation plus average hourly imports: 2000 through 2016
PJM Real-Time Supply (MWh) Year-to-Year Change
GenerationGeneration Plus
Imports GenerationGeneration Plus
Imports
GenerationStandard Deviation Supply
Standard Deviation Generation
Standard Deviation Supply
Standard Deviation
2000 30,301 4,980 33,256 5,456 NA NA NA NA2001 29,553 4,937 32,552 5,285 (2.5%) (0.9%) (2.1%) (3.1%)2002 34,928 7,535 38,535 7,751 18.2% 52.6% 18.4% 46.7%2003 36,628 6,165 40,205 6,162 4.9% (18.2%) 4.3% (20.5%)2004 51,068 13,790 55,781 14,652 39.4% 123.7% 38.7% 137.8%2005 81,127 15,452 86,353 15,981 58.9% 12.0% 54.8% 9.1%2006 82,780 13,709 86,978 14,402 2.0% (11.3%) 0.7% (9.9%)2007 85,860 14,018 90,351 14,763 3.7% 2.3% 3.9% 2.5%2008 83,476 13,787 88,899 14,256 (2.8%) (1.7%) (1.6%) (3.4%)2009 78,026 13,647 83,058 14,140 (6.5%) (1.0%) (6.6%) (0.8%)2010 82,585 15,556 87,386 16,227 5.8% 14.0% 5.2% 14.8%2011 85,775 15,932 90,511 16,759 3.9% 2.4% 3.6% 3.3%2012 88,708 15,701 94,083 16,505 3.4% (1.4%) 3.9% (1.5%)2013 89,769 15,012 94,833 15,878 1.2% (4.4%) 0.8% (3.8%)2014 90,894 15,151 96,295 16,199 1.3% 0.9% 1.5% 2.0%2015 88,628 16,118 94,329 17,312 (2.5%) 6.4% (2.0%) 6.9%2016 91,304 17,731 95,054 17,979 3.0% 10.0% 0.8% 3.9%
23 Each range on the horizontal axis excludes the start value and includes the end value.24 The import data in this table is not available before June 1, 2000. The data that includes imports
in 2000 is calculated from the last six months of that year.
2016 State of the Market Report for PJM 109
Section 3 Energy Market
© 2017 Monitoring Analytics, LLC
it is also submitted through the real-time energy market scheduling process.
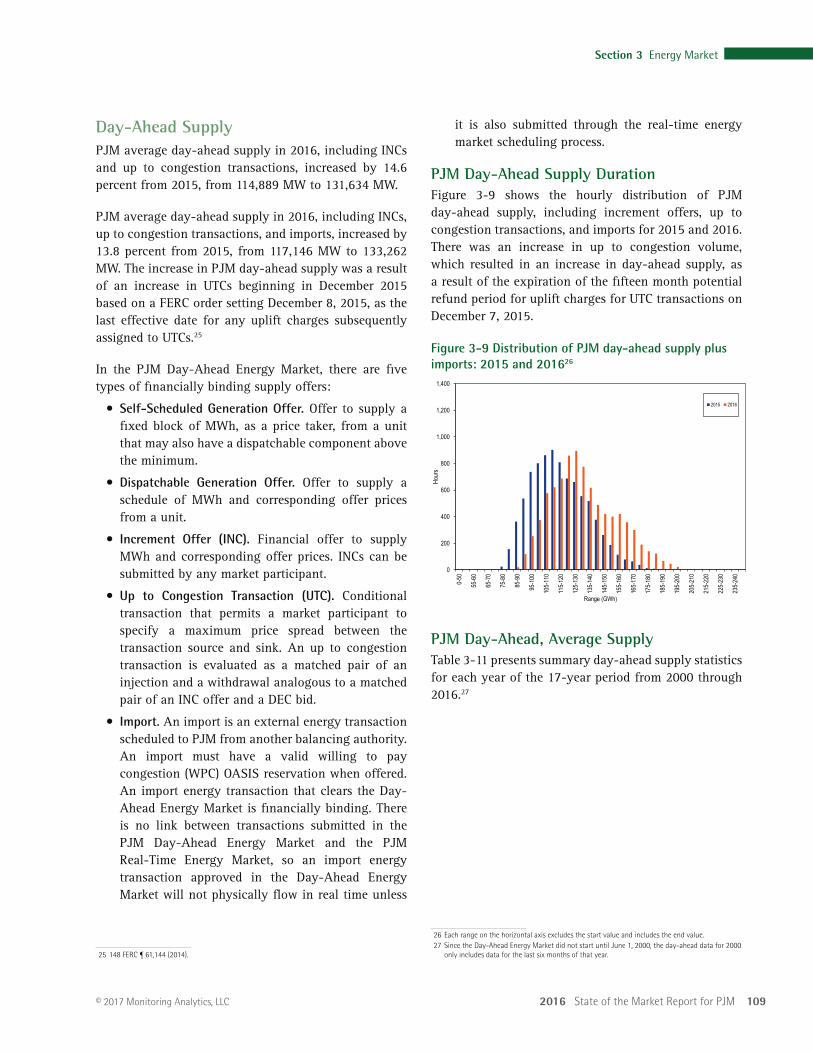
PJM Day-Ahead Supply DurationFigure 3-9 shows the hourly distribution of PJM day-ahead supply, including increment offers, up to congestion transactions, and imports for 2015 and 2016. There was an increase in up to congestion volume, which resulted in an increase in day-ahead supply, as a result of the expiration of the fifteen month potential refund period for uplift charges for UTC transactions on December 7, 2015.
Figure 3-9 Distribution of PJM day-ahead supply plus imports: 2015 and 201626
0
200
400
600
800
1,000
1,200
1,400
0-50
55-6
0
65-7
0
75-8
0
85-9
0
95-1
00
105-
110
115-
120
125-
130
135-
140
145-
150
155-
160
165-
170
175-
180
185-
190
195-
200
205-
210
215-
220
225-
230
235-
240
Hour
s
Range (GWh)
2015 2016
PJM Day-Ahead, Average SupplyTable 3-11 presents summary day-ahead supply statistics for each year of the 17-year period from 2000 through 2016.27
26 Each range on the horizontal axis excludes the start value and includes the end value.27 Since the Day-Ahead Energy Market did not start until June 1, 2000, the day-ahead data for 2000
only includes data for the last six months of that year.
Day-Ahead SupplyPJM average day-ahead supply in 2016, including INCs and up to congestion transactions, increased by 14.6 percent from 2015, from 114,889 MW to 131,634 MW.
PJM average day-ahead supply in 2016, including INCs, up to congestion transactions, and imports, increased by 13.8 percent from 2015, from 117,146 MW to 133,262 MW. The increase in PJM day-ahead supply was a result of an increase in UTCs beginning in December 2015 based on a FERC order setting December 8, 2015, as the last effective date for any uplift charges subsequently assigned to UTCs.25
In the PJM Day-Ahead Energy Market, there are five types of financially binding supply offers:
• Self-Scheduled Generation Offer. Offer to supply a fixed block of MWh, as a price taker, from a unit that may also have a dispatchable component above the minimum.
• Dispatchable Generation Offer. Offer to supply a schedule of MWh and corresponding offer prices from a unit.
• Increment Offer (INC). Financial offer to supply MWh and corresponding offer prices. INCs can be submitted by any market participant.
• Up to Congestion Transaction (UTC). Conditional transaction that permits a market participant to specify a maximum price spread between the transaction source and sink. An up to congestion transaction is evaluated as a matched pair of an injection and a withdrawal analogous to a matched pair of an INC offer and a DEC bid.
• Import. An import is an external energy transaction scheduled to PJM from another balancing authority. An import must have a valid willing to pay congestion (WPC) OASIS reservation when offered. An import energy transaction that clears the Day-Ahead Energy Market is financially binding. There is no link between transactions submitted in the PJM Day-Ahead Energy Market and the PJM Real-Time Energy Market, so an import energy transaction approved in the Day-Ahead Energy Market will not physically flow in real time unless
25 148 FERC ¶ 61,144 (2014).
110 Section 3 Energy Market
2016 State of the Market Report for PJM
© 2017 Monitoring Analytics, LLC
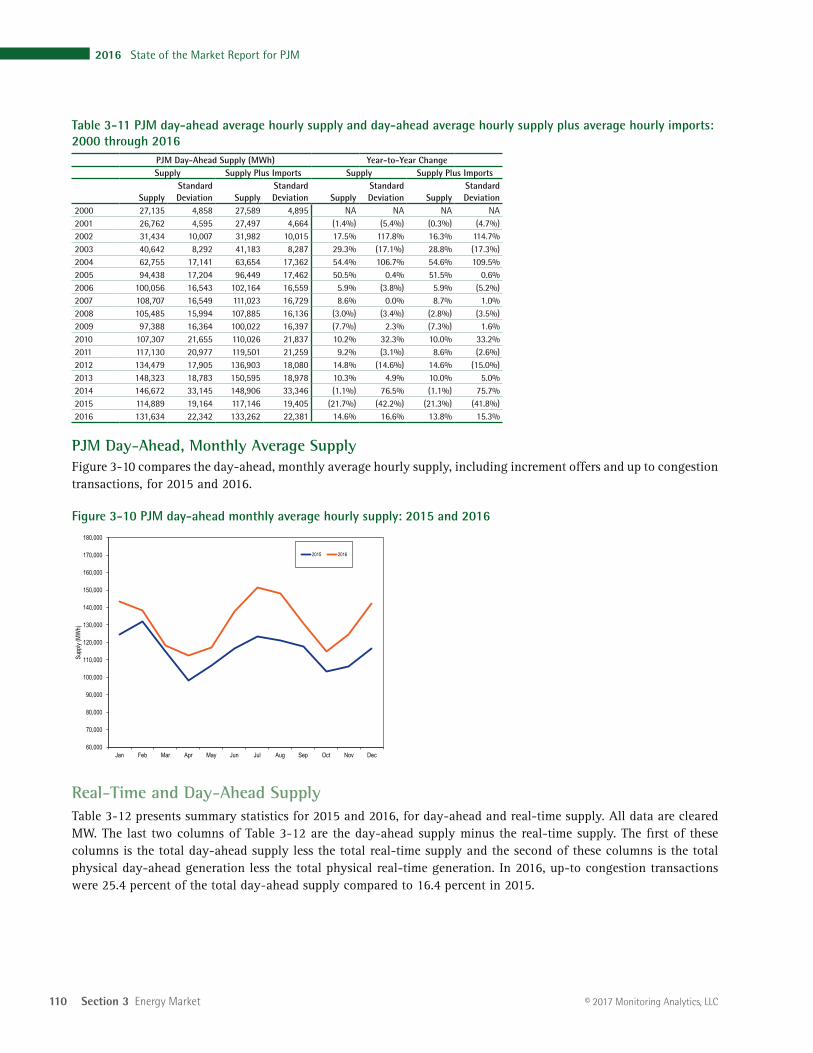
Table 3-11 PJM day-ahead average hourly supply and day-ahead average hourly supply plus average hourly imports: 2000 through 2016
PJM Day-Ahead Supply (MWh) Year-to-Year ChangeSupply Supply Plus Imports Supply Supply Plus Imports
SupplyStandard Deviation Supply
Standard Deviation Supply
Standard Deviation Supply
Standard Deviation
2000 27,135 4,858 27,589 4,895 NA NA NA NA2001 26,762 4,595 27,497 4,664 (1.4%) (5.4%) (0.3%) (4.7%)2002 31,434 10,007 31,982 10,015 17.5% 117.8% 16.3% 114.7%2003 40,642 8,292 41,183 8,287 29.3% (17.1%) 28.8% (17.3%)2004 62,755 17,141 63,654 17,362 54.4% 106.7% 54.6% 109.5%2005 94,438 17,204 96,449 17,462 50.5% 0.4% 51.5% 0.6%2006 100,056 16,543 102,164 16,559 5.9% (3.8%) 5.9% (5.2%)2007 108,707 16,549 111,023 16,729 8.6% 0.0% 8.7% 1.0%2008 105,485 15,994 107,885 16,136 (3.0%) (3.4%) (2.8%) (3.5%)2009 97,388 16,364 100,022 16,397 (7.7%) 2.3% (7.3%) 1.6%2010 107,307 21,655 110,026 21,837 10.2% 32.3% 10.0% 33.2%2011 117,130 20,977 119,501 21,259 9.2% (3.1%) 8.6% (2.6%)2012 134,479 17,905 136,903 18,080 14.8% (14.6%) 14.6% (15.0%)2013 148,323 18,783 150,595 18,978 10.3% 4.9% 10.0% 5.0%2014 146,672 33,145 148,906 33,346 (1.1%) 76.5% (1.1%) 75.7%2015 114,889 19,164 117,146 19,405 (21.7%) (42.2%) (21.3%) (41.8%)2016 131,634 22,342 133,262 22,381 14.6% 16.6% 13.8% 15.3%
PJM Day-Ahead, Monthly Average SupplyFigure 3-10 compares the day-ahead, monthly average hourly supply, including increment offers and up to congestion transactions, for 2015 and 2016.
Figure 3-10 PJM day-ahead monthly average hourly supply: 2015 and 2016
60,000
70,000
80,000
90,000
100,000
110,000
120,000
130,000
140,000
150,000
160,000
170,000
180,000
Jan Feb Mar Apr May Jun Jul Aug Sep Oct Nov Dec
Supp
ly (M
Wh)
2015 2016
Real-Time and Day-Ahead SupplyTable 3-12 presents summary statistics for 2015 and 2016, for day-ahead and real-time supply. All data are cleared MW. The last two columns of Table 3-12 are the day-ahead supply minus the real-time supply. The first of these columns is the total day-ahead supply less the total real-time supply and the second of these columns is the total physical day-ahead generation less the total physical real-time generation. In 2016, up-to congestion transactions were 25.4 percent of the total day-ahead supply compared to 16.4 percent in 2015.
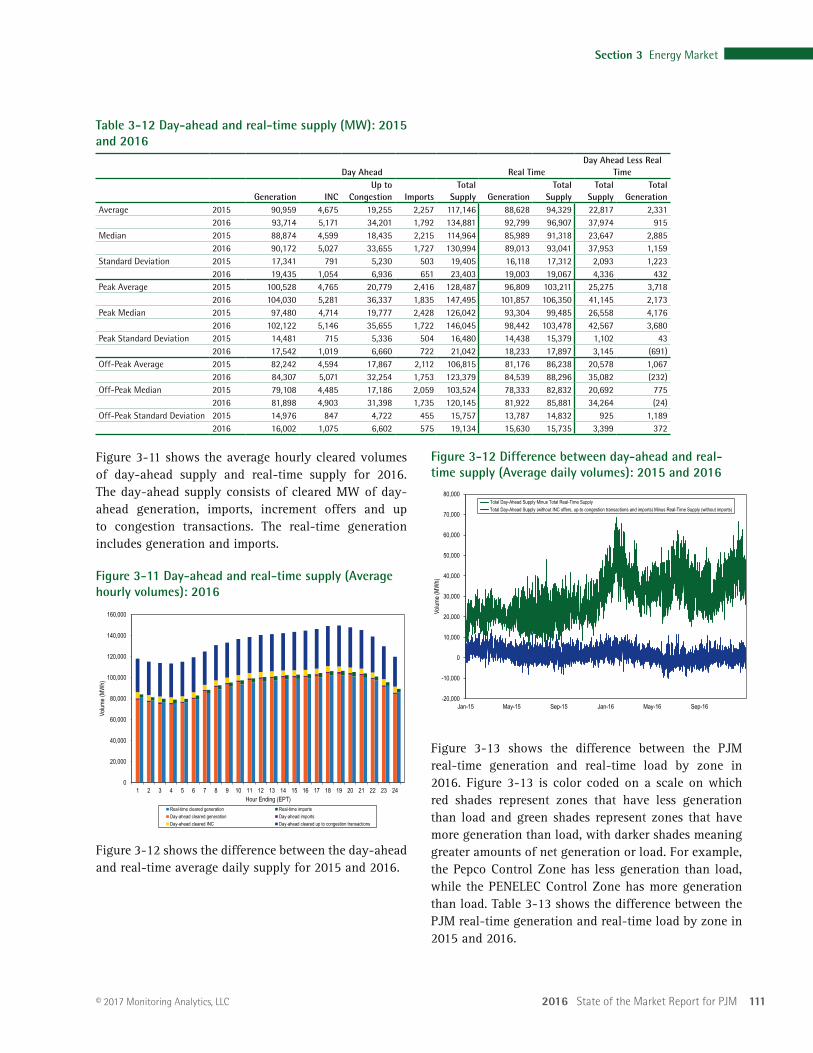
2016 State of the Market Report for PJM 111
Section 3 Energy Market
© 2017 Monitoring Analytics, LLC
Figure 3-12 Difference between day-ahead and real-time supply (Average daily volumes): 2015 and 2016
-20,000
-10,000
0
10,000
20,000
30,000
40,000
50,000
60,000
70,000
80,000
Jan-15 May-15 Sep-15 Jan-16 May-16 Sep-16
Volum
e (MW
h)
Total Day-Ahead Supply Minus Total Real-Time SupplyTotal Day-Ahead Supply (without INC offers, up-to congestion transactions and imports) Minus Real-Time Supply (without imports)
Figure 3-13 shows the difference between the PJM real-time generation and real-time load by zone in 2016. Figure 3-13 is color coded on a scale on which red shades represent zones that have less generation than load and green shades represent zones that have more generation than load, with darker shades meaning greater amounts of net generation or load. For example, the Pepco Control Zone has less generation than load, while the PENELEC Control Zone has more generation than load. Table 3-13 shows the difference between the PJM real-time generation and real-time load by zone in 2015 and 2016.
Table 3-12 Day-ahead and real-time supply (MW): 2015 and 2016
Day Ahead Real TimeDay Ahead Less Real
Time
Generation INCUp to
Congestion ImportsTotal
Supply GenerationTotal
SupplyTotal
SupplyTotal
GenerationAverage 2015 90,959 4,675 19,255 2,257 117,146 88,628 94,329 22,817 2,331
2016 93,714 5,171 34,201 1,792 134,881 92,799 96,907 37,974 915 Median 2015 88,874 4,599 18,435 2,215 114,964 85,989 91,318 23,647 2,885
2016 90,172 5,027 33,655 1,727 130,994 89,013 93,041 37,953 1,159 Standard Deviation 2015 17,341 791 5,230 503 19,405 16,118 17,312 2,093 1,223
2016 19,435 1,054 6,936 651 23,403 19,003 19,067 4,336 432 Peak Average 2015 100,528 4,765 20,779 2,416 128,487 96,809 103,211 25,275 3,718
2016 104,030 5,281 36,337 1,835 147,495 101,857 106,350 41,145 2,173 Peak Median 2015 97,480 4,714 19,777 2,428 126,042 93,304 99,485 26,558 4,176
2016 102,122 5,146 35,655 1,722 146,045 98,442 103,478 42,567 3,680 Peak Standard Deviation 2015 14,481 715 5,336 504 16,480 14,438 15,379 1,102 43
2016 17,542 1,019 6,660 722 21,042 18,233 17,897 3,145 (691)Off-Peak Average 2015 82,242 4,594 17,867 2,112 106,815 81,176 86,238 20,578 1,067
2016 84,307 5,071 32,254 1,753 123,379 84,539 88,296 35,082 (232)Off-Peak Median 2015 79,108 4,485 17,186 2,059 103,524 78,333 82,832 20,692 775
2016 81,898 4,903 31,398 1,735 120,145 81,922 85,881 34,264 (24)Off-Peak Standard Deviation 2015 14,976 847 4,722 455 15,757 13,787 14,832 925 1,189
2016 16,002 1,075 6,602 575 19,134 15,630 15,735 3,399 372
Figure 3-11 shows the average hourly cleared volumes of day-ahead supply and real-time supply for 2016. The day-ahead supply consists of cleared MW of day-ahead generation, imports, increment offers and up to congestion transactions. The real-time generation includes generation and imports.
Figure 3-11 Day-ahead and real-time supply (Average hourly volumes): 2016
0
20,000
40,000
60,000
80,000
100,000
120,000
140,000
160,000
1 2 3 4 5 6 7 8 9 10 11 12 13 14 15 16 17 18 19 20 21 22 23 24
Volum
e (MW
h)
Hour Ending (EPT) Real-time cleared generation Real-time importsDay-ahead cleared generation Day-ahead importsDay-ahead cleared INC Day-ahead cleared up to congestion transactions
Figure 3-12 shows the difference between the day-ahead and real-time average daily supply for 2015 and 2016.
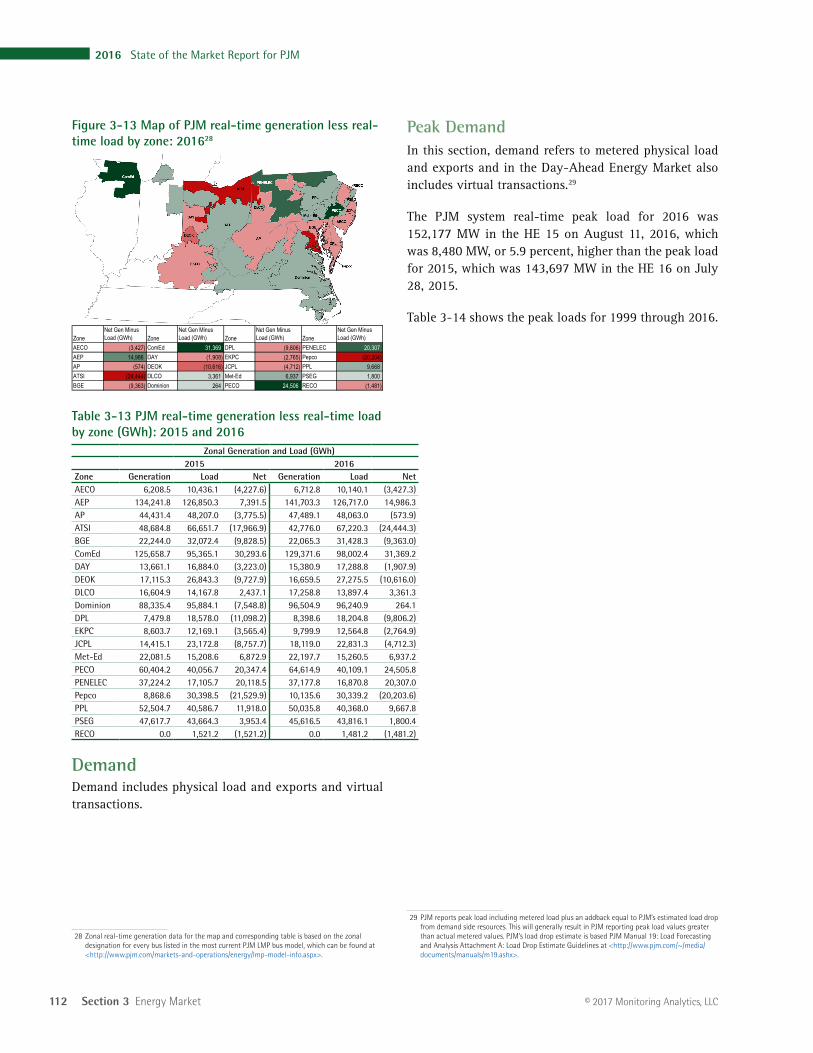
112 Section 3 Energy Market
2016 State of the Market Report for PJM
© 2017 Monitoring Analytics, LLC
Figure 3-13 Map of PJM real-time generation less real-time load by zone: 201628
ZoneNet Gen Minus Load (GWh) Zone
Net Gen Minus Load (GWh) Zone
Net Gen Minus Load (GWh) Zone
Net Gen Minus Load (GWh)
AECO (3,427) ComEd 31,369 DPL (9,806) PENELEC 20,307AEP 14,986 DAY (1,908) EKPC (2,765) Pepco (20,204)AP (574) DEOK (10,616) JCPL (4,712) PPL 9,668ATSI (24,444) DLCO 3,361 Met-Ed 6,937 PSEG 1,800BGE (9,363) Dominion 264 PECO 24,506 RECO (1,481)
Table 3-13 PJM real-time generation less real-time load by zone (GWh): 2015 and 2016
Zonal Generation and Load (GWh)2015 2016
Zone Generation Load Net Generation Load NetAECO 6,208.5 10,436.1 (4,227.6) 6,712.8 10,140.1 (3,427.3)AEP 134,241.8 126,850.3 7,391.5 141,703.3 126,717.0 14,986.3 AP 44,431.4 48,207.0 (3,775.5) 47,489.1 48,063.0 (573.9)ATSI 48,684.8 66,651.7 (17,966.9) 42,776.0 67,220.3 (24,444.3)BGE 22,244.0 32,072.4 (9,828.5) 22,065.3 31,428.3 (9,363.0)ComEd 125,658.7 95,365.1 30,293.6 129,371.6 98,002.4 31,369.2 DAY 13,661.1 16,884.0 (3,223.0) 15,380.9 17,288.8 (1,907.9)DEOK 17,115.3 26,843.3 (9,727.9) 16,659.5 27,275.5 (10,616.0)DLCO 16,604.9 14,167.8 2,437.1 17,258.8 13,897.4 3,361.3 Dominion 88,335.4 95,884.1 (7,548.8) 96,504.9 96,240.9 264.1 DPL 7,479.8 18,578.0 (11,098.2) 8,398.6 18,204.8 (9,806.2)EKPC 8,603.7 12,169.1 (3,565.4) 9,799.9 12,564.8 (2,764.9)JCPL 14,415.1 23,172.8 (8,757.7) 18,119.0 22,831.3 (4,712.3)Met-Ed 22,081.5 15,208.6 6,872.9 22,197.7 15,260.5 6,937.2 PECO 60,404.2 40,056.7 20,347.4 64,614.9 40,109.1 24,505.8 PENELEC 37,224.2 17,105.7 20,118.5 37,177.8 16,870.8 20,307.0 Pepco 8,868.6 30,398.5 (21,529.9) 10,135.6 30,339.2 (20,203.6)PPL 52,504.7 40,586.7 11,918.0 50,035.8 40,368.0 9,667.8 PSEG 47,617.7 43,664.3 3,953.4 45,616.5 43,816.1 1,800.4 RECO 0.0 1,521.2 (1,521.2) 0.0 1,481.2 (1,481.2)
DemandDemand includes physical load and exports and virtual transactions.
28 Zonal real-time generation data for the map and corresponding table is based on the zonal designation for every bus listed in the most current PJM LMP bus model, which can be found at <http://www.pjm.com/markets-and-operations/energy/lmp-model-info.aspx>.
Peak DemandIn this section, demand refers to metered physical load and exports and in the Day-Ahead Energy Market also includes virtual transactions.29
The PJM system real-time peak load for 2016 was 152,177 MW in the HE 15 on August 11, 2016, which was 8,480 MW, or 5.9 percent, higher than the peak load for 2015, which was 143,697 MW in the HE 16 on July 28, 2015.
Table 3-14 shows the peak loads for 1999 through 2016.
29 PJM reports peak load including metered load plus an addback equal to PJM’s estimated load drop from demand side resources. This will generally result in PJM reporting peak load values greater than actual metered values. PJM’s load drop estimate is based PJM Manual 19: Load Forecasting and Analysis Attachment A: Load Drop Estimate Guidelines at <http://www.pjm.com/~/media/documents/manuals/m19.ashx>.
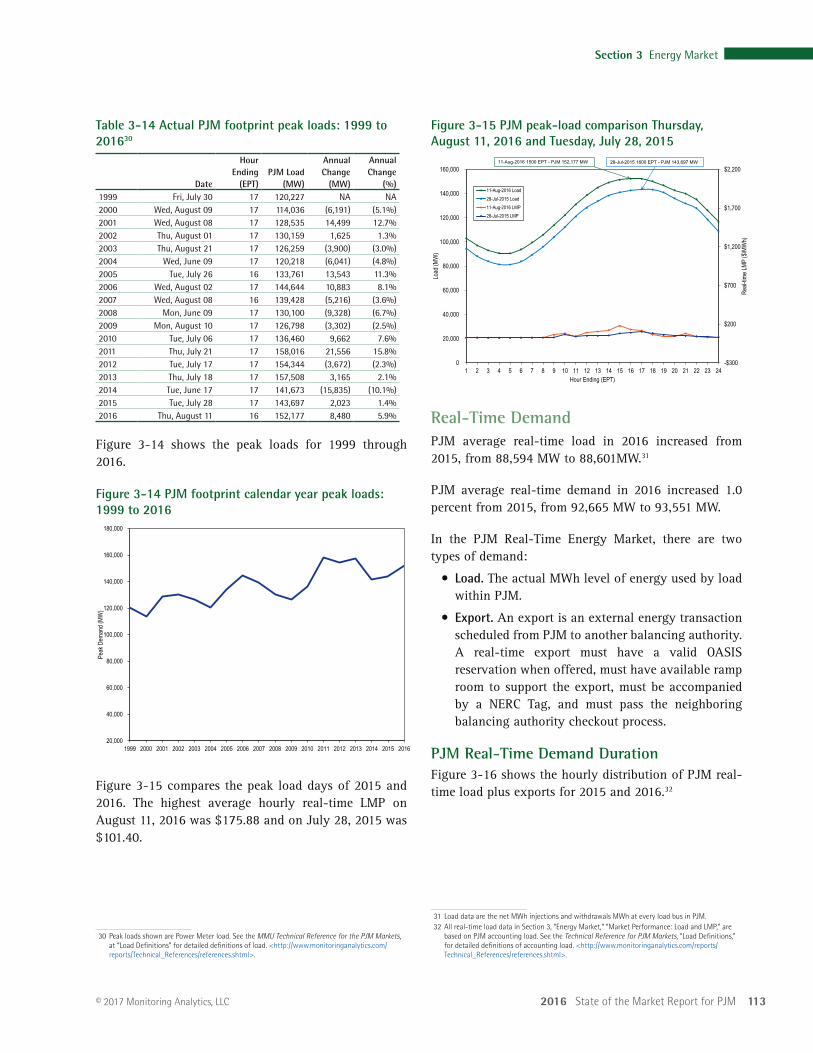
2016 State of the Market Report for PJM 113
Section 3 Energy Market
© 2017 Monitoring Analytics, LLC
Figure 3-15 PJM peak-load comparison Thursday, August 11, 2016 and Tuesday, July 28, 2015
-$300
$200
$700
$1,200
$1,700
$2,200
0
20,000
40,000
60,000
80,000
100,000
120,000
140,000
160,000
1 2 3 4 5 6 7 8 9 10 11 12 13 14 15 16 17 18 19 20 21 22 23 24
Real-
time L
MP ($
\MW
h)
Load
(MW
)
Hour Ending (EPT)
11-Aug-2016 Load28-Jul-2015 Load11-Aug-2016 LMP28-Jul-2015 LMP
11-Aug-2016 1500 EPT - PJM 152,177 MW 28-Jul-2015 1600 EPT - PJM 143,697 MW
Real-Time DemandPJM average real-time load in 2016 increased from 2015, from 88,594 MW to 88,601MW.31
PJM average real-time demand in 2016 increased 1.0 percent from 2015, from 92,665 MW to 93,551 MW.
In the PJM Real-Time Energy Market, there are two types of demand:
• Load. The actual MWh level of energy used by load within PJM.
• Export. An export is an external energy transaction scheduled from PJM to another balancing authority. A real-time export must have a valid OASIS reservation when offered, must have available ramp room to support the export, must be accompanied by a NERC Tag, and must pass the neighboring balancing authority checkout process.
PJM Real-Time Demand DurationFigure 3-16 shows the hourly distribution of PJM real-time load plus exports for 2015 and 2016.32
31 Load data are the net MWh injections and withdrawals MWh at every load bus in PJM.32 All real-time load data in Section 3, “Energy Market,” “Market Performance: Load and LMP,” are
based on PJM accounting load. See the Technical Reference for PJM Markets, “Load Definitions,” for detailed definitions of accounting load. <http://www.monitoringanalytics.com/reports/Technical_References/references.shtml>.
Table 3-14 Actual PJM footprint peak loads: 1999 to 201630
Date
Hour Ending
(EPT)PJM Load
(MW)
Annual Change
(MW)
Annual Change
(%)1999 Fri, July 30 17 120,227 NA NA2000 Wed, August 09 17 114,036 (6,191) (5.1%)2001 Wed, August 08 17 128,535 14,499 12.7%2002 Thu, August 01 17 130,159 1,625 1.3%2003 Thu, August 21 17 126,259 (3,900) (3.0%)2004 Wed, June 09 17 120,218 (6,041) (4.8%)2005 Tue, July 26 16 133,761 13,543 11.3%2006 Wed, August 02 17 144,644 10,883 8.1%2007 Wed, August 08 16 139,428 (5,216) (3.6%)2008 Mon, June 09 17 130,100 (9,328) (6.7%)2009 Mon, August 10 17 126,798 (3,302) (2.5%)2010 Tue, July 06 17 136,460 9,662 7.6%2011 Thu, July 21 17 158,016 21,556 15.8%2012 Tue, July 17 17 154,344 (3,672) (2.3%)2013 Thu, July 18 17 157,508 3,165 2.1%2014 Tue, June 17 17 141,673 (15,835) (10.1%)2015 Tue, July 28 17 143,697 2,023 1.4%2016 Thu, August 11 16 152,177 8,480 5.9%
Figure 3-14 shows the peak loads for 1999 through 2016.
Figure 3-14 PJM footprint calendar year peak loads: 1999 to 2016
20,000
40,000
60,000
80,000
100,000
120,000
140,000
160,000
180,000
1999 2000 2001 2002 2003 2004 2005 2006 2007 2008 2009 2010 2011 2012 2013 2014 2015 2016
Peak
Dem
and (
MW)
Figure 3-15 compares the peak load days of 2015 and 2016. The highest average hourly real-time LMP on August 11, 2016 was $175.88 and on July 28, 2015 was $101.40.
30 Peak loads shown are Power Meter load. See the MMU Technical Reference for the PJM Markets, at “Load Definitions” for detailed definitions of load. <http://www.monitoringanalytics.com/reports/Technical_References/references.shtml>.
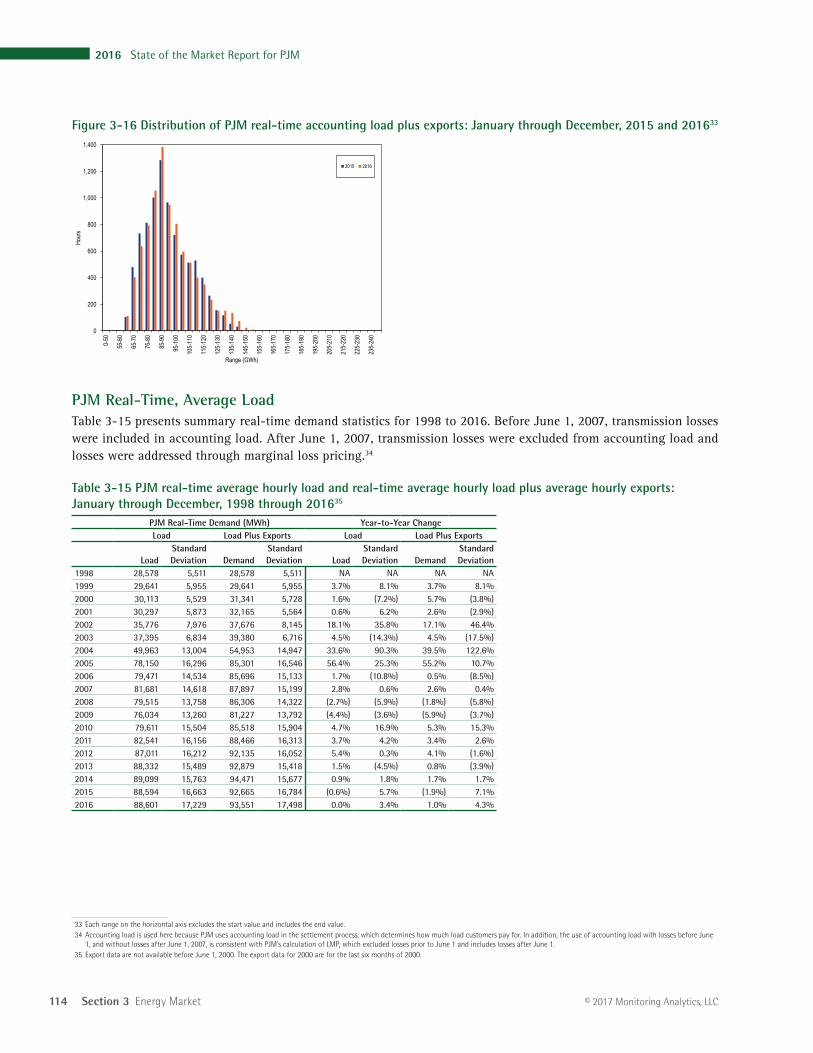
114 Section 3 Energy Market
2016 State of the Market Report for PJM
© 2017 Monitoring Analytics, LLC
Figure 3-16 Distribution of PJM real-time accounting load plus exports: January through December, 2015 and 201633
0
200
400
600
800
1,000
1,200
1,400
0-50
55-6
0
65-7
0
75-8
0
85-9
0
95-1
00
105-
110
115-
120
125-
130
135-
140
145-
150
155-
160
165-
170
175-
180
185-
190
195-
200
205-
210
215-
220
225-
230
235-
240
Hour
s
Range (GWh)
2015 2016
PJM Real-Time, Average LoadTable 3-15 presents summary real-time demand statistics for 1998 to 2016. Before June 1, 2007, transmission losses were included in accounting load. After June 1, 2007, transmission losses were excluded from accounting load and losses were addressed through marginal loss pricing.34
Table 3-15 PJM real-time average hourly load and real-time average hourly load plus average hourly exports: January through December, 1998 through 201635
PJM Real-Time Demand (MWh) Year-to-Year ChangeLoad Load Plus Exports Load Load Plus Exports
LoadStandard Deviation Demand
Standard Deviation Load
Standard Deviation Demand
Standard Deviation
1998 28,578 5,511 28,578 5,511 NA NA NA NA1999 29,641 5,955 29,641 5,955 3.7% 8.1% 3.7% 8.1%2000 30,113 5,529 31,341 5,728 1.6% (7.2%) 5.7% (3.8%)2001 30,297 5,873 32,165 5,564 0.6% 6.2% 2.6% (2.9%)2002 35,776 7,976 37,676 8,145 18.1% 35.8% 17.1% 46.4%2003 37,395 6,834 39,380 6,716 4.5% (14.3%) 4.5% (17.5%)2004 49,963 13,004 54,953 14,947 33.6% 90.3% 39.5% 122.6%2005 78,150 16,296 85,301 16,546 56.4% 25.3% 55.2% 10.7%2006 79,471 14,534 85,696 15,133 1.7% (10.8%) 0.5% (8.5%)2007 81,681 14,618 87,897 15,199 2.8% 0.6% 2.6% 0.4%2008 79,515 13,758 86,306 14,322 (2.7%) (5.9%) (1.8%) (5.8%)2009 76,034 13,260 81,227 13,792 (4.4%) (3.6%) (5.9%) (3.7%)2010 79,611 15,504 85,518 15,904 4.7% 16.9% 5.3% 15.3%2011 82,541 16,156 88,466 16,313 3.7% 4.2% 3.4% 2.6%2012 87,011 16,212 92,135 16,052 5.4% 0.3% 4.1% (1.6%)2013 88,332 15,489 92,879 15,418 1.5% (4.5%) 0.8% (3.9%)2014 89,099 15,763 94,471 15,677 0.9% 1.8% 1.7% 1.7%2015 88,594 16,663 92,665 16,784 (0.6%) 5.7% (1.9%) 7.1%2016 88,601 17,229 93,551 17,498 0.0% 3.4% 1.0% 4.3%
33 Each range on the horizontal axis excludes the start value and includes the end value.34 Accounting load is used here because PJM uses accounting load in the settlement process, which determines how much load customers pay for. In addition, the use of accounting load with losses before June
1, and without losses after June 1, 2007, is consistent with PJM’s calculation of LMP, which excluded losses prior to June 1 and includes losses after June 1.35 Export data are not available before June 1, 2000. The export data for 2000 are for the last six months of 2000.
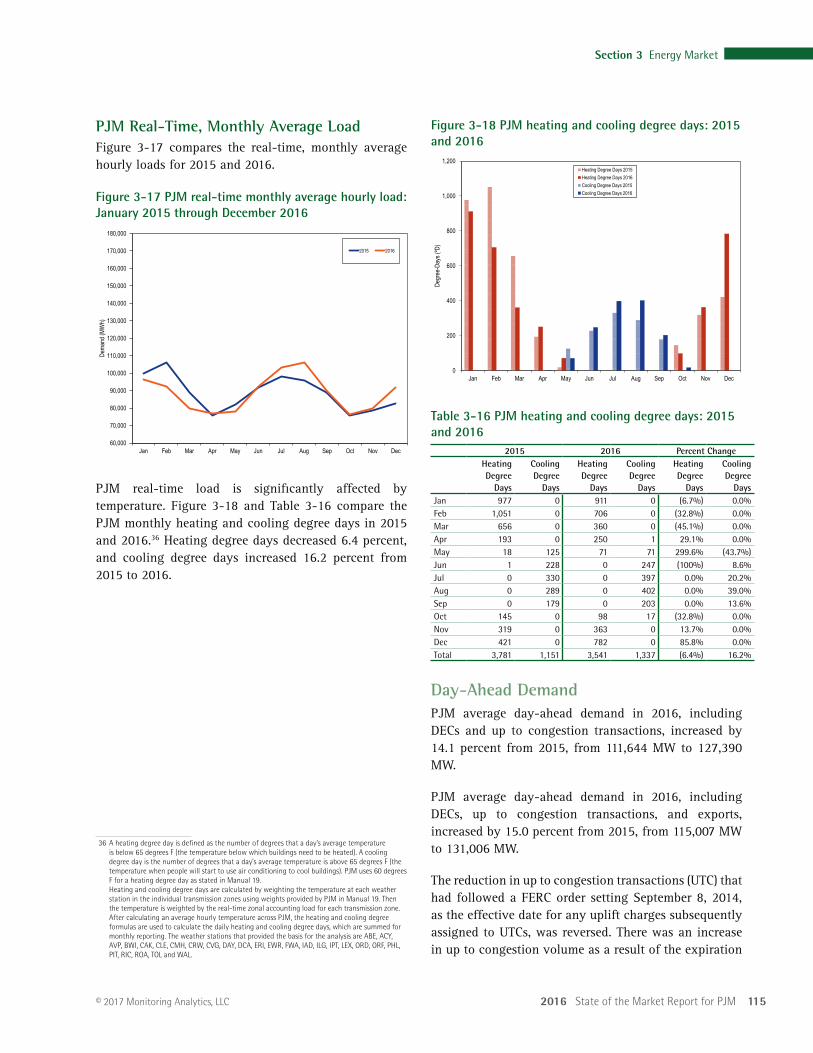
2016 State of the Market Report for PJM 115
Section 3 Energy Market
© 2017 Monitoring Analytics, LLC
Figure 3-18 PJM heating and cooling degree days: 2015 and 2016
0
200
400
600
800
1,000
1,200
Jan Feb Mar Apr May Jun Jul Aug Sep Oct Nov Dec
Degr
ee-D
ays (
ºD)
Heating Degree Days 2015Heating Degree Days 2016Cooling Degree Days 2015Cooling Degree Days 2016
Table 3-16 PJM heating and cooling degree days: 2015 and 2016
2015 2016 Percent ChangeHeating Degree
Days
Cooling Degree
Days
Heating Degree
Days
Cooling Degree
Days
Heating Degree
Days
Cooling Degree
DaysJan 977 0 911 0 (6.7%) 0.0%Feb 1,051 0 706 0 (32.8%) 0.0%Mar 656 0 360 0 (45.1%) 0.0%Apr 193 0 250 1 29.1% 0.0%May 18 125 71 71 299.6% (43.7%)Jun 1 228 0 247 (100%) 8.6%Jul 0 330 0 397 0.0% 20.2%Aug 0 289 0 402 0.0% 39.0%Sep 0 179 0 203 0.0% 13.6%Oct 145 0 98 17 (32.8%) 0.0%Nov 319 0 363 0 13.7% 0.0%Dec 421 0 782 0 85.8% 0.0%Total 3,781 1,151 3,541 1,337 (6.4%) 16.2%
Day-Ahead DemandPJM average day-ahead demand in 2016, including DECs and up to congestion transactions, increased by 14.1 percent from 2015, from 111,644 MW to 127,390 MW.
PJM average day-ahead demand in 2016, including DECs, up to congestion transactions, and exports, increased by 15.0 percent from 2015, from 115,007 MW to 131,006 MW.
The reduction in up to congestion transactions (UTC) that had followed a FERC order setting September 8, 2014, as the effective date for any uplift charges subsequently assigned to UTCs, was reversed. There was an increase in up to congestion volume as a result of the expiration
PJM Real-Time, Monthly Average LoadFigure 3-17 compares the real-time, monthly average hourly loads for 2015 and 2016.
Figure 3-17 PJM real-time monthly average hourly load: January 2015 through December 2016
60,000
70,000
80,000
90,000
100,000
110,000
120,000
130,000
140,000
150,000
160,000
170,000
180,000
Jan Feb Mar Apr May Jun Jul Aug Sep Oct Nov Dec
Dema
nd (M
Wh)
2015 2016
PJM real-time load is significantly affected by temperature. Figure 3-18 and Table 3-16 compare the PJM monthly heating and cooling degree days in 2015 and 2016.36 Heating degree days decreased 6.4 percent, and cooling degree days increased 16.2 percent from 2015 to 2016.
36 A heating degree day is defined as the number of degrees that a day’s average temperature is below 65 degrees F (the temperature below which buildings need to be heated). A cooling degree day is the number of degrees that a day’s average temperature is above 65 degrees F (the temperature when people will start to use air conditioning to cool buildings). PJM uses 60 degrees F for a heating degree day as stated in Manual 19. Heating and cooling degree days are calculated by weighting the temperature at each weather station in the individual transmission zones using weights provided by PJM in Manual 19. Then the temperature is weighted by the real-time zonal accounting load for each transmission zone. After calculating an average hourly temperature across PJM, the heating and cooling degree formulas are used to calculate the daily heating and cooling degree days, which are summed for monthly reporting. The weather stations that provided the basis for the analysis are ABE, ACY, AVP, BWI, CAK, CLE, CMH, CRW, CVG, DAY, DCA, ERI, EWR, FWA, IAD, ILG, IPT, LEX, ORD, ORF, PHL, PIT, RIC, ROA, TOL and WAL.
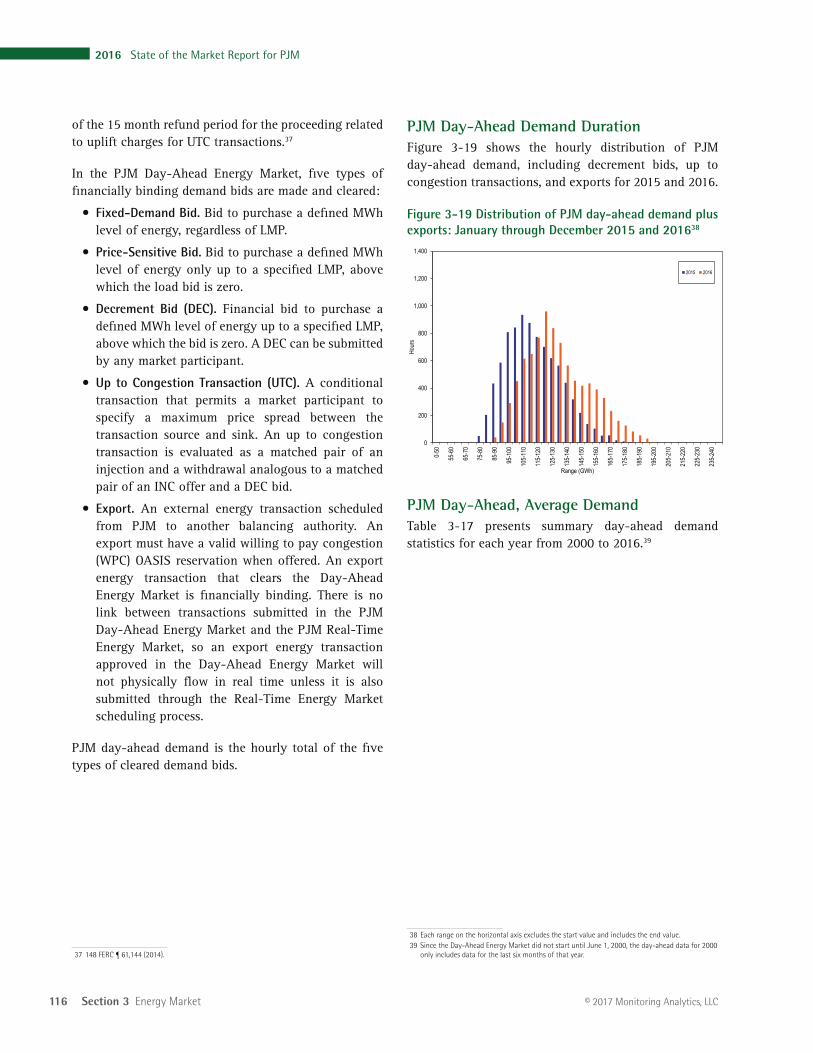
116 Section 3 Energy Market
2016 State of the Market Report for PJM
© 2017 Monitoring Analytics, LLC
PJM Day-Ahead Demand DurationFigure 3-19 shows the hourly distribution of PJM day-ahead demand, including decrement bids, up to congestion transactions, and exports for 2015 and 2016.
Figure 3-19 Distribution of PJM day-ahead demand plus exports: January through December 2015 and 201638
0
200
400
600
800
1,000
1,200
1,400
0-50
55-6
0
65-7
0
75-8
0
85-9
0
95-1
00
105-
110
115-
120
125-
130
135-
140
145-
150
155-
160
165-
170
175-
180
185-
190
195-
200
205-
210
215-
220
225-
230
235-
240
Hour
s
Range (GWh)
2015 2016
PJM Day-Ahead, Average DemandTable 3-17 presents summary day-ahead demand statistics for each year from 2000 to 2016.39
38 Each range on the horizontal axis excludes the start value and includes the end value.39 Since the Day-Ahead Energy Market did not start until June 1, 2000, the day-ahead data for 2000
only includes data for the last six months of that year.
of the 15 month refund period for the proceeding related to uplift charges for UTC transactions.37
In the PJM Day-Ahead Energy Market, five types of financially binding demand bids are made and cleared:
• Fixed-Demand Bid. Bid to purchase a defined MWh level of energy, regardless of LMP.
• Price-Sensitive Bid. Bid to purchase a defined MWh level of energy only up to a specified LMP, above which the load bid is zero.
• Decrement Bid (DEC). Financial bid to purchase a defined MWh level of energy up to a specified LMP, above which the bid is zero. A DEC can be submitted by any market participant.
• Up to Congestion Transaction (UTC). A conditional transaction that permits a market participant to specify a maximum price spread between the transaction source and sink. An up to congestion transaction is evaluated as a matched pair of an injection and a withdrawal analogous to a matched pair of an INC offer and a DEC bid.
• Export. An external energy transaction scheduled from PJM to another balancing authority. An export must have a valid willing to pay congestion (WPC) OASIS reservation when offered. An export energy transaction that clears the Day-Ahead Energy Market is financially binding. There is no link between transactions submitted in the PJM Day-Ahead Energy Market and the PJM Real-Time Energy Market, so an export energy transaction approved in the Day-Ahead Energy Market will not physically flow in real time unless it is also submitted through the Real-Time Energy Market scheduling process.
PJM day-ahead demand is the hourly total of the five types of cleared demand bids.
37 148 FERC ¶ 61,144 (2014).
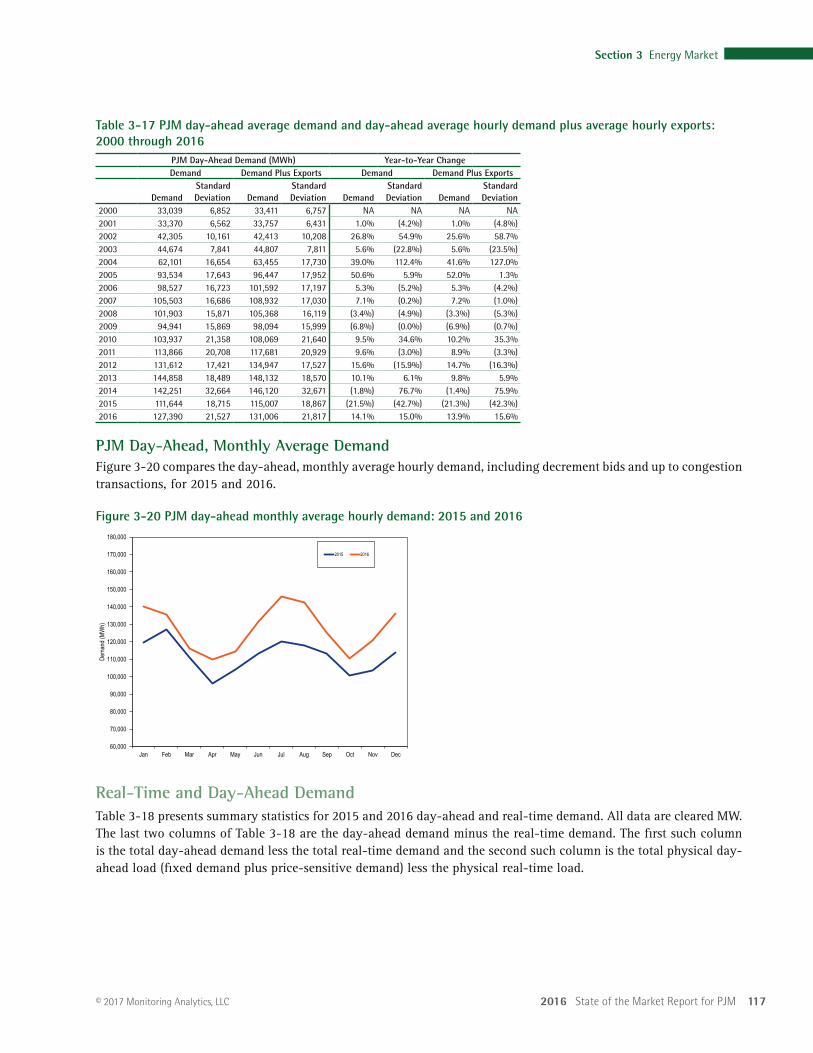
2016 State of the Market Report for PJM 117
Section 3 Energy Market
© 2017 Monitoring Analytics, LLC
Table 3-17 PJM day-ahead average demand and day-ahead average hourly demand plus average hourly exports: 2000 through 2016
PJM Day-Ahead Demand (MWh) Year-to-Year ChangeDemand Demand Plus Exports Demand Demand Plus Exports
DemandStandard Deviation Demand
Standard Deviation Demand
Standard Deviation Demand
Standard Deviation
2000 33,039 6,852 33,411 6,757 NA NA NA NA2001 33,370 6,562 33,757 6,431 1.0% (4.2%) 1.0% (4.8%)2002 42,305 10,161 42,413 10,208 26.8% 54.9% 25.6% 58.7%2003 44,674 7,841 44,807 7,811 5.6% (22.8%) 5.6% (23.5%)2004 62,101 16,654 63,455 17,730 39.0% 112.4% 41.6% 127.0%2005 93,534 17,643 96,447 17,952 50.6% 5.9% 52.0% 1.3%2006 98,527 16,723 101,592 17,197 5.3% (5.2%) 5.3% (4.2%)2007 105,503 16,686 108,932 17,030 7.1% (0.2%) 7.2% (1.0%)2008 101,903 15,871 105,368 16,119 (3.4%) (4.9%) (3.3%) (5.3%)2009 94,941 15,869 98,094 15,999 (6.8%) (0.0%) (6.9%) (0.7%)2010 103,937 21,358 108,069 21,640 9.5% 34.6% 10.2% 35.3%2011 113,866 20,708 117,681 20,929 9.6% (3.0%) 8.9% (3.3%)2012 131,612 17,421 134,947 17,527 15.6% (15.9%) 14.7% (16.3%)2013 144,858 18,489 148,132 18,570 10.1% 6.1% 9.8% 5.9%2014 142,251 32,664 146,120 32,671 (1.8%) 76.7% (1.4%) 75.9%2015 111,644 18,715 115,007 18,867 (21.5%) (42.7%) (21.3%) (42.3%)2016 127,390 21,527 131,006 21,817 14.1% 15.0% 13.9% 15.6%
PJM Day-Ahead, Monthly Average DemandFigure 3-20 compares the day-ahead, monthly average hourly demand, including decrement bids and up to congestion transactions, for 2015 and 2016.
Figure 3-20 PJM day-ahead monthly average hourly demand: 2015 and 2016
60,000
70,000
80,000
90,000
100,000
110,000
120,000
130,000
140,000
150,000
160,000
170,000
180,000
Jan Feb Mar Apr May Jun Jul Aug Sep Oct Nov Dec
Dema
nd (M
Wh)
2015 2016
Real-Time and Day-Ahead DemandTable 3-18 presents summary statistics for 2015 and 2016 day-ahead and real-time demand. All data are cleared MW. The last two columns of Table 3-18 are the day-ahead demand minus the real-time demand. The first such column is the total day-ahead demand less the total real-time demand and the second such column is the total physical day-ahead load (fixed demand plus price-sensitive demand) less the physical real-time load.
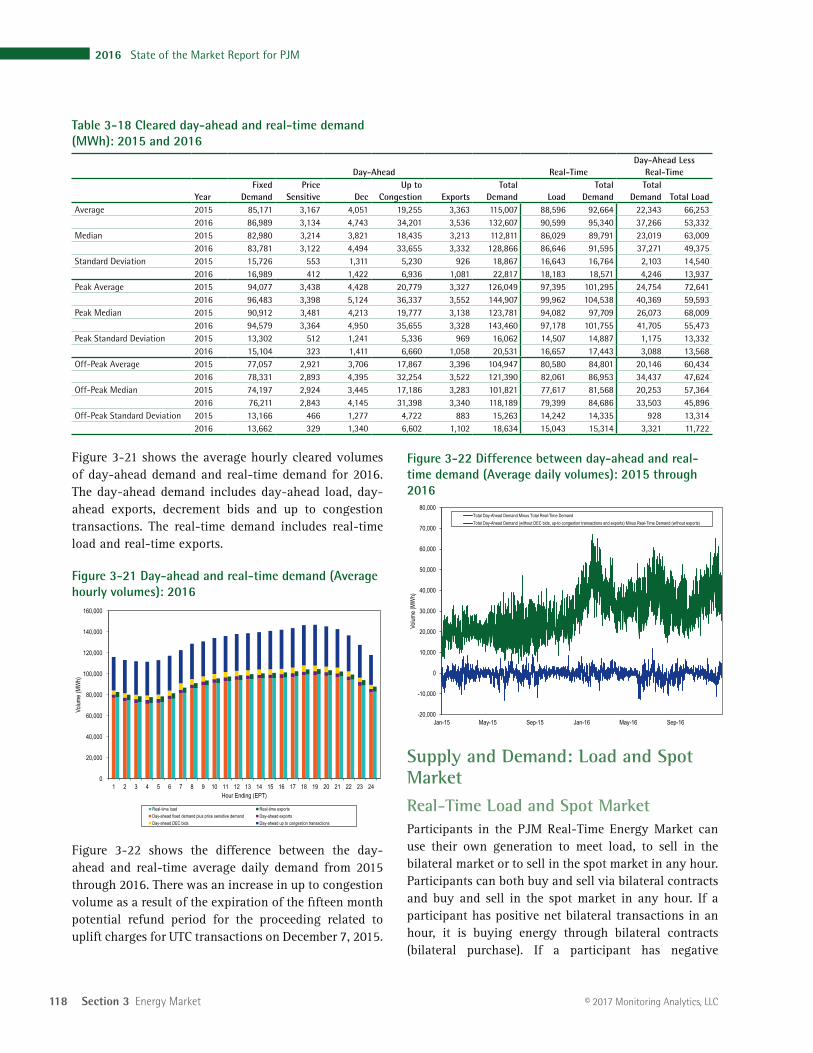
118 Section 3 Energy Market
2016 State of the Market Report for PJM
© 2017 Monitoring Analytics, LLC
Figure 3-22 Difference between day-ahead and real-time demand (Average daily volumes): 2015 through 2016
-20,000
-10,000
0
10,000
20,000
30,000
40,000
50,000
60,000
70,000
80,000
Jan-15 May-15 Sep-15 Jan-16 May-16 Sep-16
Volum
e (MW
h)
Total Day-Ahead Demand Minus Total Real-Time DemandTotal Day-Ahead Demand (without DEC bids, up-to congestion transactions and exports) Minus Real-Time Demand (without exports)
Supply and Demand: Load and Spot Market
Real-Time Load and Spot MarketParticipants in the PJM Real-Time Energy Market can use their own generation to meet load, to sell in the bilateral market or to sell in the spot market in any hour. Participants can both buy and sell via bilateral contracts and buy and sell in the spot market in any hour. If a participant has positive net bilateral transactions in an hour, it is buying energy through bilateral contracts (bilateral purchase). If a participant has negative
Table 3-18 Cleared day-ahead and real-time demand (MWh): 2015 and 2016
Day-Ahead Real-TimeDay-Ahead Less
Real-Time
YearFixed
DemandPrice
Sensitive DecUp to
Congestion ExportsTotal
Demand LoadTotal
DemandTotal
Demand Total LoadAverage 2015 85,171 3,167 4,051 19,255 3,363 115,007 88,596 92,664 22,343 66,253
2016 86,989 3,134 4,743 34,201 3,536 132,607 90,599 95,340 37,266 53,332 Median 2015 82,980 3,214 3,821 18,435 3,213 112,811 86,029 89,791 23,019 63,009
2016 83,781 3,122 4,494 33,655 3,332 128,866 86,646 91,595 37,271 49,375 Standard Deviation 2015 15,726 553 1,311 5,230 926 18,867 16,643 16,764 2,103 14,540
2016 16,989 412 1,422 6,936 1,081 22,817 18,183 18,571 4,246 13,937 Peak Average 2015 94,077 3,438 4,428 20,779 3,327 126,049 97,395 101,295 24,754 72,641
2016 96,483 3,398 5,124 36,337 3,552 144,907 99,962 104,538 40,369 59,593 Peak Median 2015 90,912 3,481 4,213 19,777 3,138 123,781 94,082 97,709 26,073 68,009
2016 94,579 3,364 4,950 35,655 3,328 143,460 97,178 101,755 41,705 55,473 Peak Standard Deviation 2015 13,302 512 1,241 5,336 969 16,062 14,507 14,887 1,175 13,332
2016 15,104 323 1,411 6,660 1,058 20,531 16,657 17,443 3,088 13,568 Off-Peak Average 2015 77,057 2,921 3,706 17,867 3,396 104,947 80,580 84,801 20,146 60,434
2016 78,331 2,893 4,395 32,254 3,522 121,390 82,061 86,953 34,437 47,624 Off-Peak Median 2015 74,197 2,924 3,445 17,186 3,283 101,821 77,617 81,568 20,253 57,364
2016 76,211 2,843 4,145 31,398 3,340 118,189 79,399 84,686 33,503 45,896 Off-Peak Standard Deviation 2015 13,166 466 1,277 4,722 883 15,263 14,242 14,335 928 13,314
2016 13,662 329 1,340 6,602 1,102 18,634 15,043 15,314 3,321 11,722
Figure 3-21 shows the average hourly cleared volumes of day-ahead demand and real-time demand for 2016. The day-ahead demand includes day-ahead load, day-ahead exports, decrement bids and up to congestion transactions. The real-time demand includes real-time load and real-time exports.
Figure 3-21 Day-ahead and real-time demand (Average hourly volumes): 2016
0
20,000
40,000
60,000
80,000
100,000
120,000
140,000
160,000
1 2 3 4 5 6 7 8 9 10 11 12 13 14 15 16 17 18 19 20 21 22 23 24
Volum
e (MW
h)
Hour Ending (EPT)
Real-time load Real-time exportsDay-ahead fixed demand plus price sensitive demand Day-ahead exportsDay-ahead DEC bids Day-ahead up to congestion transactions
Figure 3-22 shows the difference between the day-ahead and real-time average daily demand from 2015 through 2016. There was an increase in up to congestion volume as a result of the expiration of the fifteen month potential refund period for the proceeding related to uplift charges for UTC transactions on December 7, 2015.
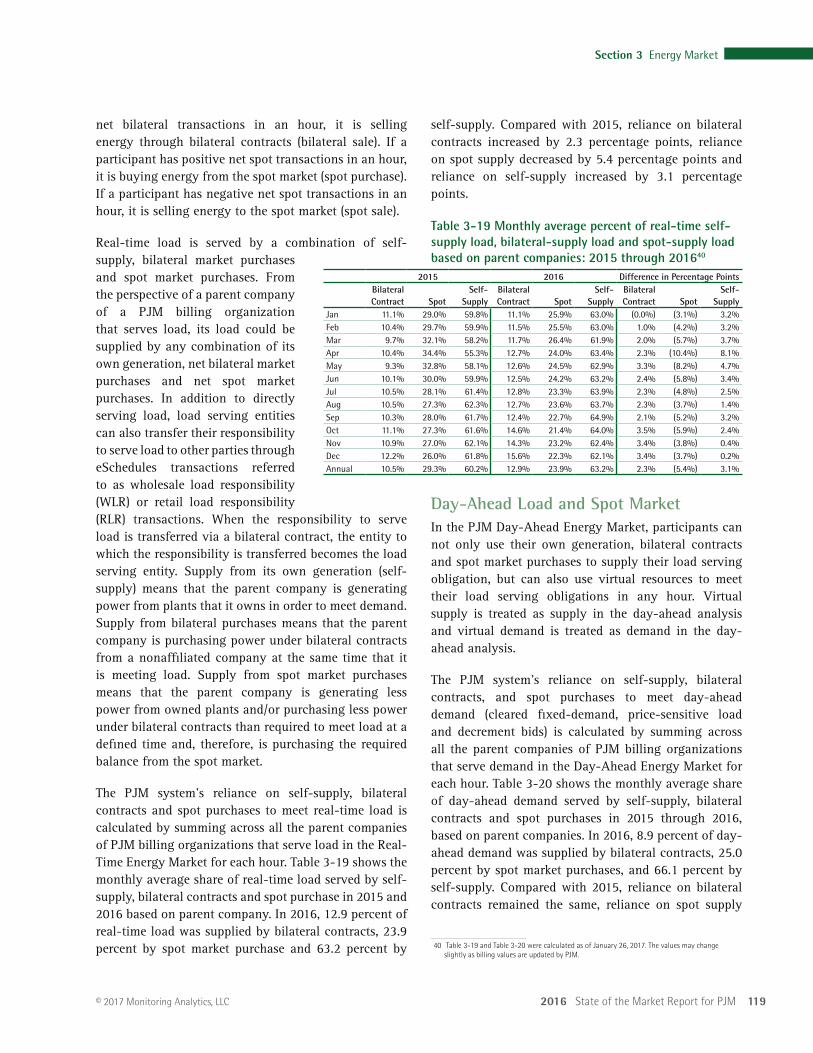
2016 State of the Market Report for PJM 119
Section 3 Energy Market
© 2017 Monitoring Analytics, LLC
self-supply. Compared with 2015, reliance on bilateral contracts increased by 2.3 percentage points, reliance on spot supply decreased by 5.4 percentage points and reliance on self-supply increased by 3.1 percentage points.
Table 3-19 Monthly average percent of real-time self-supply load, bilateral-supply load and spot-supply load based on parent companies: 2015 through 201640
2015 2016 Difference in Percentage PointsBilateral Contract Spot
Self-Supply
Bilateral Contract Spot
Self-Supply
Bilateral Contract Spot
Self-Supply
Jan 11.1% 29.0% 59.8% 11.1% 25.9% 63.0% (0.0%) (3.1%) 3.2%Feb 10.4% 29.7% 59.9% 11.5% 25.5% 63.0% 1.0% (4.2%) 3.2%Mar 9.7% 32.1% 58.2% 11.7% 26.4% 61.9% 2.0% (5.7%) 3.7%Apr 10.4% 34.4% 55.3% 12.7% 24.0% 63.4% 2.3% (10.4%) 8.1%May 9.3% 32.8% 58.1% 12.6% 24.5% 62.9% 3.3% (8.2%) 4.7%Jun 10.1% 30.0% 59.9% 12.5% 24.2% 63.2% 2.4% (5.8%) 3.4%Jul 10.5% 28.1% 61.4% 12.8% 23.3% 63.9% 2.3% (4.8%) 2.5%Aug 10.5% 27.3% 62.3% 12.7% 23.6% 63.7% 2.3% (3.7%) 1.4%Sep 10.3% 28.0% 61.7% 12.4% 22.7% 64.9% 2.1% (5.2%) 3.2%Oct 11.1% 27.3% 61.6% 14.6% 21.4% 64.0% 3.5% (5.9%) 2.4%Nov 10.9% 27.0% 62.1% 14.3% 23.2% 62.4% 3.4% (3.8%) 0.4%Dec 12.2% 26.0% 61.8% 15.6% 22.3% 62.1% 3.4% (3.7%) 0.2%Annual 10.5% 29.3% 60.2% 12.9% 23.9% 63.2% 2.3% (5.4%) 3.1%
Day-Ahead Load and Spot MarketIn the PJM Day-Ahead Energy Market, participants can not only use their own generation, bilateral contracts and spot market purchases to supply their load serving obligation, but can also use virtual resources to meet their load serving obligations in any hour. Virtual supply is treated as supply in the day-ahead analysis and virtual demand is treated as demand in the day-ahead analysis.
The PJM system’s reliance on self-supply, bilateral contracts, and spot purchases to meet day-ahead demand (cleared fixed-demand, price-sensitive load and decrement bids) is calculated by summing across all the parent companies of PJM billing organizations that serve demand in the Day-Ahead Energy Market for each hour. Table 3-20 shows the monthly average share of day-ahead demand served by self-supply, bilateral contracts and spot purchases in 2015 through 2016, based on parent companies. In 2016, 8.9 percent of day-ahead demand was supplied by bilateral contracts, 25.0 percent by spot market purchases, and 66.1 percent by self-supply. Compared with 2015, reliance on bilateral contracts remained the same, reliance on spot supply
40 Table 3-19 and Table 3-20 were calculated as of January 26, 2017. The values may change slightly as billing values are updated by PJM.
net bilateral transactions in an hour, it is selling energy through bilateral contracts (bilateral sale). If a participant has positive net spot transactions in an hour, it is buying energy from the spot market (spot purchase). If a participant has negative net spot transactions in an hour, it is selling energy to the spot market (spot sale).
Real-time load is served by a combination of self-supply, bilateral market purchases and spot market purchases. From the perspective of a parent company of a PJM billing organization that serves load, its load could be supplied by any combination of its own generation, net bilateral market purchases and net spot market purchases. In addition to directly serving load, load serving entities can also transfer their responsibility to serve load to other parties through eSchedules transactions referred to as wholesale load responsibility (WLR) or retail load responsibility (RLR) transactions. When the responsibility to serve load is transferred via a bilateral contract, the entity to which the responsibility is transferred becomes the load serving entity. Supply from its own generation (self-supply) means that the parent company is generating power from plants that it owns in order to meet demand. Supply from bilateral purchases means that the parent company is purchasing power under bilateral contracts from a nonaffiliated company at the same time that it is meeting load. Supply from spot market purchases means that the parent company is generating less power from owned plants and/or purchasing less power under bilateral contracts than required to meet load at a defined time and, therefore, is purchasing the required balance from the spot market.
The PJM system’s reliance on self-supply, bilateral contracts and spot purchases to meet real-time load is calculated by summing across all the parent companies of PJM billing organizations that serve load in the Real-Time Energy Market for each hour. Table 3-19 shows the monthly average share of real-time load served by self-supply, bilateral contracts and spot purchase in 2015 and 2016 based on parent company. In 2016, 12.9 percent of real-time load was supplied by bilateral contracts, 23.9 percent by spot market purchase and 63.2 percent by
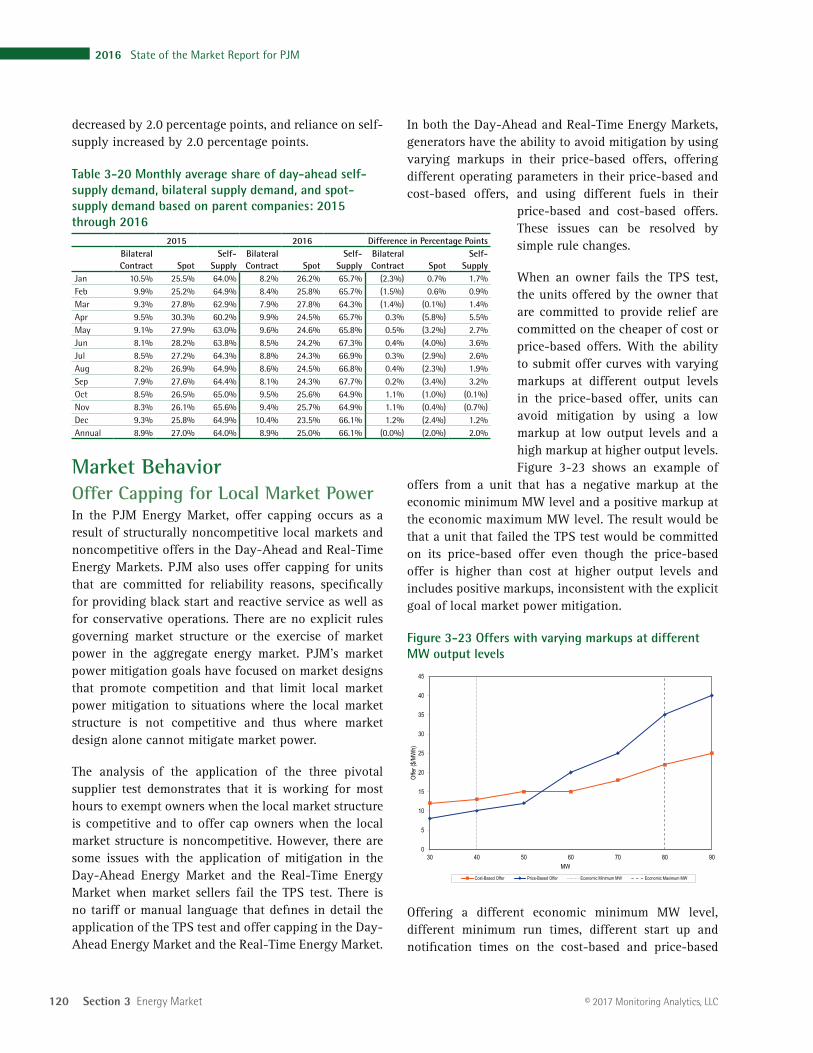
120 Section 3 Energy Market
2016 State of the Market Report for PJM
© 2017 Monitoring Analytics, LLC
In both the Day-Ahead and Real-Time Energy Markets, generators have the ability to avoid mitigation by using varying markups in their price-based offers, offering different operating parameters in their price-based and cost-based offers, and using different fuels in their
price-based and cost-based offers. These issues can be resolved by simple rule changes.
When an owner fails the TPS test, the units offered by the owner that are committed to provide relief are committed on the cheaper of cost or price-based offers. With the ability to submit offer curves with varying markups at different output levels in the price-based offer, units can avoid mitigation by using a low markup at low output levels and a high markup at higher output levels. Figure 3-23 shows an example of
offers from a unit that has a negative markup at the economic minimum MW level and a positive markup at the economic maximum MW level. The result would be that a unit that failed the TPS test would be committed on its price-based offer even though the price-based offer is higher than cost at higher output levels and includes positive markups, inconsistent with the explicit goal of local market power mitigation.
Figure 3-23 Offers with varying markups at different MW output levels
0
5
10
15
20
25
30
35
40
45
30 40 50 60 70 80 90
Offer
($/M
Wh)
MW Cost-Based Offer Price-Based Offer Economic Minimum MW Economic Maximum MW
Offering a different economic minimum MW level, different minimum run times, different start up and notification times on the cost-based and price-based
decreased by 2.0 percentage points, and reliance on self-supply increased by 2.0 percentage points.
Table 3-20 Monthly average share of day-ahead self-supply demand, bilateral supply demand, and spot-supply demand based on parent companies: 2015 through 2016
2015 2016 Difference in Percentage PointsBilateral Contract Spot
Self-Supply
Bilateral Contract Spot
Self-Supply
Bilateral Contract Spot
Self-Supply
Jan 10.5% 25.5% 64.0% 8.2% 26.2% 65.7% (2.3%) 0.7% 1.7%Feb 9.9% 25.2% 64.9% 8.4% 25.8% 65.7% (1.5%) 0.6% 0.9%Mar 9.3% 27.8% 62.9% 7.9% 27.8% 64.3% (1.4%) (0.1%) 1.4%Apr 9.5% 30.3% 60.2% 9.9% 24.5% 65.7% 0.3% (5.8%) 5.5%May 9.1% 27.9% 63.0% 9.6% 24.6% 65.8% 0.5% (3.2%) 2.7%Jun 8.1% 28.2% 63.8% 8.5% 24.2% 67.3% 0.4% (4.0%) 3.6%Jul 8.5% 27.2% 64.3% 8.8% 24.3% 66.9% 0.3% (2.9%) 2.6%Aug 8.2% 26.9% 64.9% 8.6% 24.5% 66.8% 0.4% (2.3%) 1.9%Sep 7.9% 27.6% 64.4% 8.1% 24.3% 67.7% 0.2% (3.4%) 3.2%Oct 8.5% 26.5% 65.0% 9.5% 25.6% 64.9% 1.1% (1.0%) (0.1%)Nov 8.3% 26.1% 65.6% 9.4% 25.7% 64.9% 1.1% (0.4%) (0.7%)Dec 9.3% 25.8% 64.9% 10.4% 23.5% 66.1% 1.2% (2.4%) 1.2%Annual 8.9% 27.0% 64.0% 8.9% 25.0% 66.1% (0.0%) (2.0%) 2.0%
Market BehaviorOffer Capping for Local Market PowerIn the PJM Energy Market, offer capping occurs as a result of structurally noncompetitive local markets and noncompetitive offers in the Day-Ahead and Real-Time Energy Markets. PJM also uses offer capping for units that are committed for reliability reasons, specifically for providing black start and reactive service as well as for conservative operations. There are no explicit rules governing market structure or the exercise of market power in the aggregate energy market. PJM’s market power mitigation goals have focused on market designs that promote competition and that limit local market power mitigation to situations where the local market structure is not competitive and thus where market design alone cannot mitigate market power.
The analysis of the application of the three pivotal supplier test demonstrates that it is working for most hours to exempt owners when the local market structure is competitive and to offer cap owners when the local market structure is noncompetitive. However, there are some issues with the application of mitigation in the Day-Ahead Energy Market and the Real-Time Energy Market when market sellers fail the TPS test. There is no tariff or manual language that defines in detail the application of the TPS test and offer capping in the Day-Ahead Energy Market and the Real-Time Energy Market.
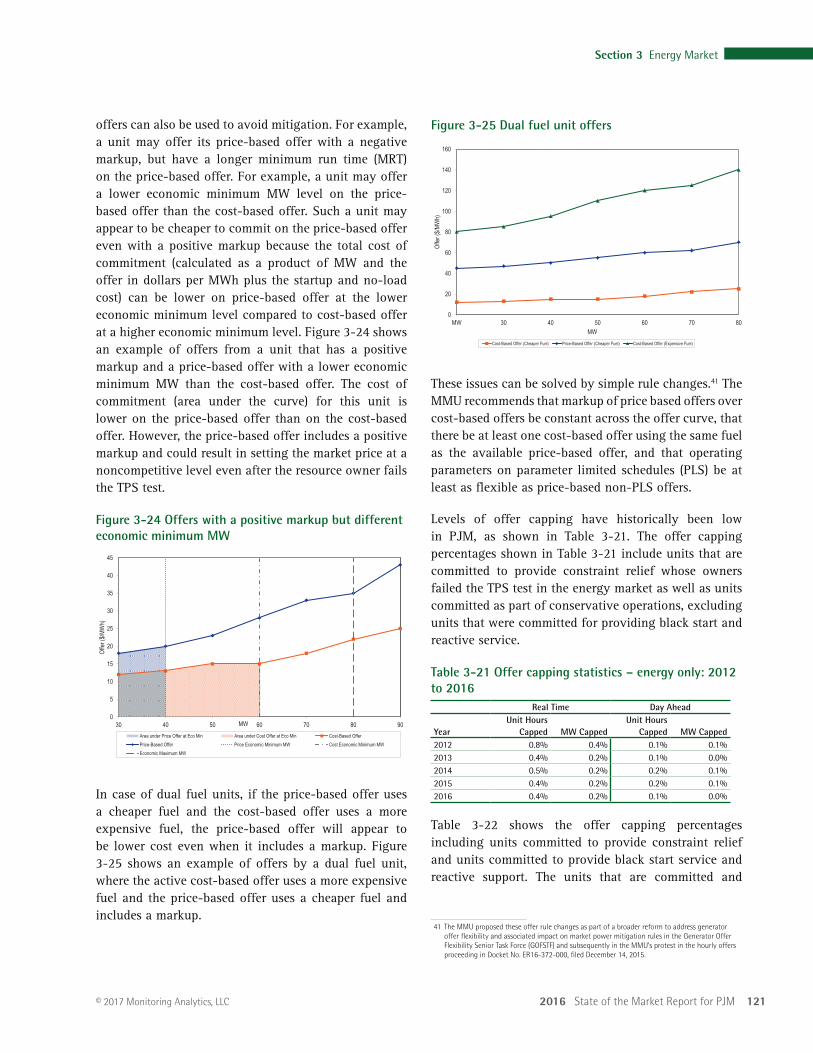
2016 State of the Market Report for PJM 121
Section 3 Energy Market
© 2017 Monitoring Analytics, LLC
Figure 3-25 Dual fuel unit offers
0
20
40
60
80
100
120
140
160
MW 30 40 50 60 70 80
Offer
($/M
Wh)
MW Cost-Based Offer (Cheaper Fuel) Price-Based Offer (Cheaper Fuel) Cost-Based Offer (Expensive Fuel)
These issues can be solved by simple rule changes.41 The MMU recommends that markup of price based offers over cost-based offers be constant across the offer curve, that there be at least one cost-based offer using the same fuel as the available price-based offer, and that operating parameters on parameter limited schedules (PLS) be at least as flexible as price-based non-PLS offers.
Levels of offer capping have historically been low in PJM, as shown in Table 3-21. The offer capping percentages shown in Table 3-21 include units that are committed to provide constraint relief whose owners failed the TPS test in the energy market as well as units committed as part of conservative operations, excluding units that were committed for providing black start and reactive service.
Table 3-21 Offer capping statistics – energy only: 2012 to 2016
Real Time Day Ahead
YearUnit Hours
Capped MW CappedUnit Hours
Capped MW Capped2012 0.8% 0.4% 0.1% 0.1%2013 0.4% 0.2% 0.1% 0.0%2014 0.5% 0.2% 0.2% 0.1%2015 0.4% 0.2% 0.2% 0.1%2016 0.4% 0.2% 0.1% 0.0%
Table 3-22 shows the offer capping percentages including units committed to provide constraint relief and units committed to provide black start service and reactive support. The units that are committed and
41 The MMU proposed these offer rule changes as part of a broader reform to address generator offer flexibility and associated impact on market power mitigation rules in the Generator Offer Flexibility Senior Task Force (GOFSTF) and subsequently in the MMU’s protest in the hourly offers proceeding in Docket No. ER16-372-000, filed December 14, 2015.
offers can also be used to avoid mitigation. For example, a unit may offer its price-based offer with a negative markup, but have a longer minimum run time (MRT) on the price-based offer. For example, a unit may offer a lower economic minimum MW level on the price-based offer than the cost-based offer. Such a unit may appear to be cheaper to commit on the price-based offer even with a positive markup because the total cost of commitment (calculated as a product of MW and the offer in dollars per MWh plus the startup and no-load cost) can be lower on price-based offer at the lower economic minimum level compared to cost-based offer at a higher economic minimum level. Figure 3-24 shows an example of offers from a unit that has a positive markup and a price-based offer with a lower economic minimum MW than the cost-based offer. The cost of commitment (area under the curve) for this unit is lower on the price-based offer than on the cost-based offer. However, the price-based offer includes a positive markup and could result in setting the market price at a noncompetitive level even after the resource owner fails the TPS test.
Figure 3-24 Offers with a positive markup but different economic minimum MW
0
5
10
15
20
25
30
35
40
45
30 40 50 60 70 80 90
Offer
($/M
Wh)
MW
Area under Price Offer at Eco Min Area under Cost Offer at Eco Min Cost-Based OfferPrice-Based Offer Price Economic Minimum MW Cost Economic Minimum MWEconomic Maximum MW
In case of dual fuel units, if the price-based offer uses a cheaper fuel and the cost-based offer uses a more expensive fuel, the price-based offer will appear to be lower cost even when it includes a markup. Figure 3-25 shows an example of offers by a dual fuel unit, where the active cost-based offer uses a more expensive fuel and the price-based offer uses a cheaper fuel and includes a markup.
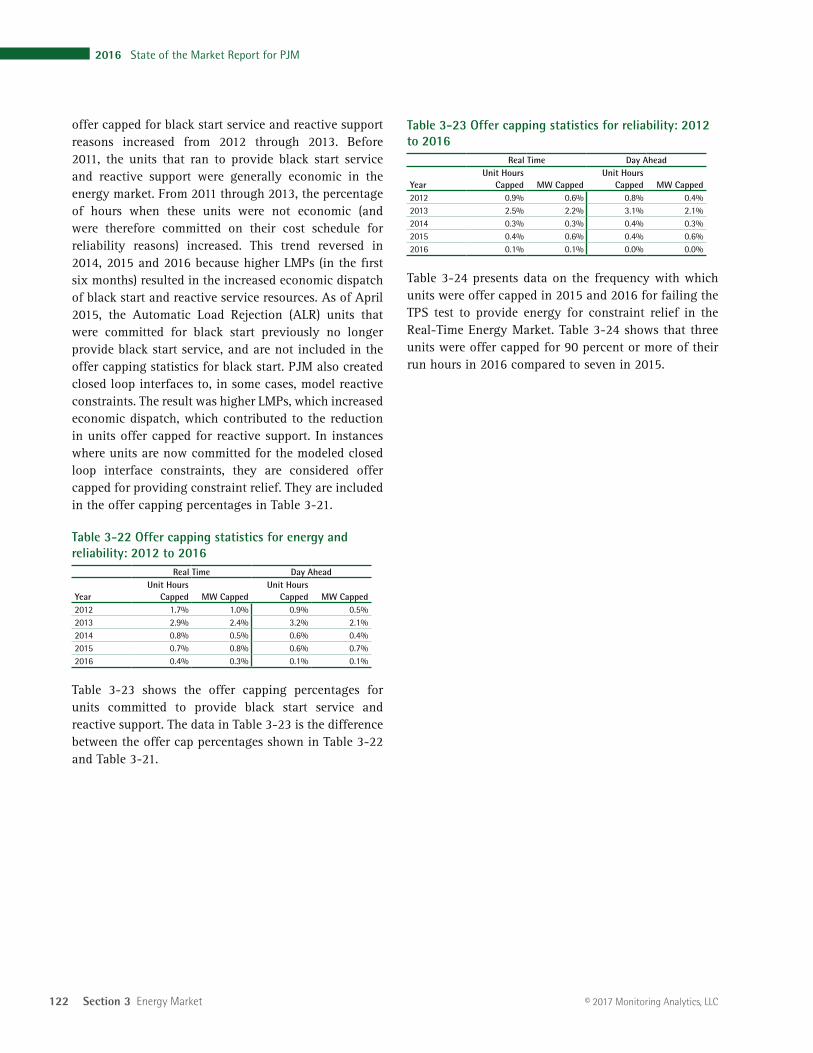
122 Section 3 Energy Market
2016 State of the Market Report for PJM
© 2017 Monitoring Analytics, LLC
Table 3-23 Offer capping statistics for reliability: 2012 to 2016
Real Time Day Ahead
YearUnit Hours
Capped MW CappedUnit Hours
Capped MW Capped2012 0.9% 0.6% 0.8% 0.4%2013 2.5% 2.2% 3.1% 2.1%2014 0.3% 0.3% 0.4% 0.3%2015 0.4% 0.6% 0.4% 0.6%2016 0.1% 0.1% 0.0% 0.0%
Table 3-24 presents data on the frequency with which units were offer capped in 2015 and 2016 for failing the TPS test to provide energy for constraint relief in the Real-Time Energy Market. Table 3-24 shows that three units were offer capped for 90 percent or more of their run hours in 2016 compared to seven in 2015.
offer capped for black start service and reactive support reasons increased from 2012 through 2013. Before 2011, the units that ran to provide black start service and reactive support were generally economic in the energy market. From 2011 through 2013, the percentage of hours when these units were not economic (and were therefore committed on their cost schedule for reliability reasons) increased. This trend reversed in 2014, 2015 and 2016 because higher LMPs (in the first six months) resulted in the increased economic dispatch of black start and reactive service resources. As of April 2015, the Automatic Load Rejection (ALR) units that were committed for black start previously no longer provide black start service, and are not included in the offer capping statistics for black start. PJM also created closed loop interfaces to, in some cases, model reactive constraints. The result was higher LMPs, which increased economic dispatch, which contributed to the reduction in units offer capped for reactive support. In instances where units are now committed for the modeled closed loop interface constraints, they are considered offer capped for providing constraint relief. They are included in the offer capping percentages in Table 3-21.
Table 3-22 Offer capping statistics for energy and reliability: 2012 to 2016
Real Time Day Ahead
YearUnit Hours
Capped MW CappedUnit Hours
Capped MW Capped2012 1.7% 1.0% 0.9% 0.5%2013 2.9% 2.4% 3.2% 2.1%2014 0.8% 0.5% 0.6% 0.4%2015 0.7% 0.8% 0.6% 0.7%2016 0.4% 0.3% 0.1% 0.1%
Table 3-23 shows the offer capping percentages for units committed to provide black start service and reactive support. The data in Table 3-23 is the difference between the offer cap percentages shown in Table 3-22 and Table 3-21.
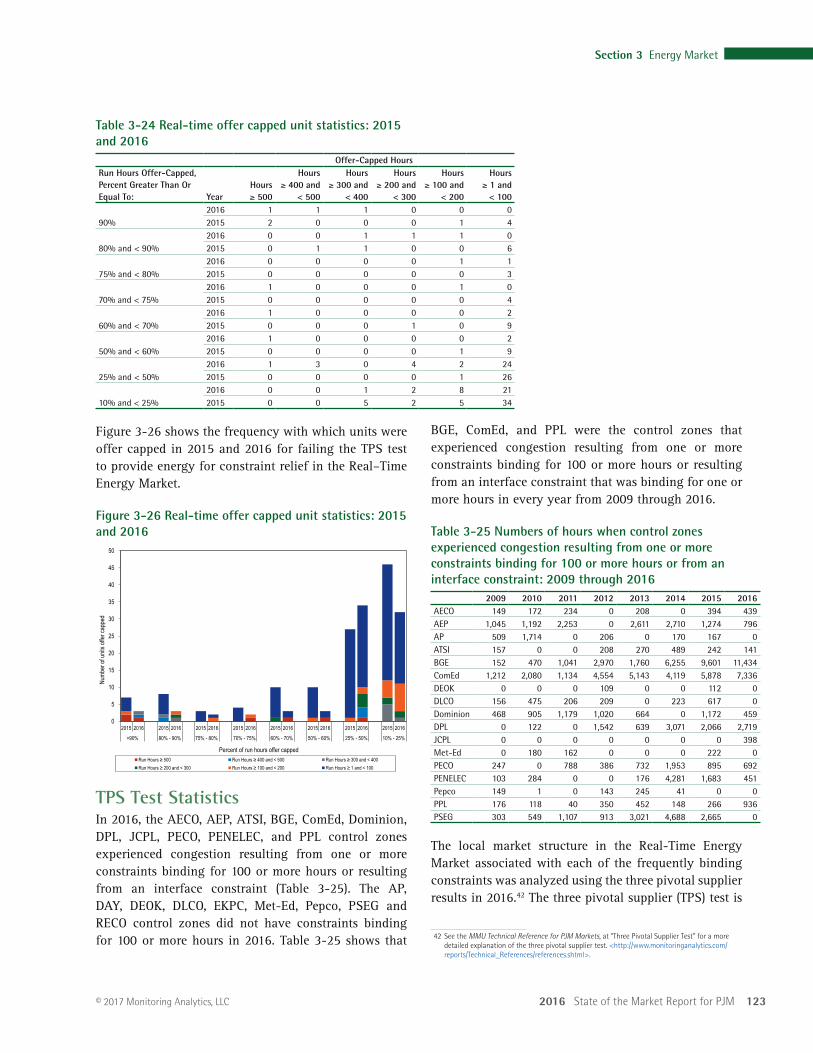
2016 State of the Market Report for PJM 123
Section 3 Energy Market
© 2017 Monitoring Analytics, LLC
BGE, ComEd, and PPL were the control zones that experienced congestion resulting from one or more constraints binding for 100 or more hours or resulting from an interface constraint that was binding for one or more hours in every year from 2009 through 2016.
Table 3-25 Numbers of hours when control zones experienced congestion resulting from one or more constraints binding for 100 or more hours or from an interface constraint: 2009 through 2016
2009 2010 2011 2012 2013 2014 2015 2016AECO 149 172 234 0 208 0 394 439 AEP 1,045 1,192 2,253 0 2,611 2,710 1,274 796 AP 509 1,714 0 206 0 170 167 0 ATSI 157 0 0 208 270 489 242 141 BGE 152 470 1,041 2,970 1,760 6,255 9,601 11,434 ComEd 1,212 2,080 1,134 4,554 5,143 4,119 5,878 7,336 DEOK 0 0 0 109 0 0 112 0 DLCO 156 475 206 209 0 223 617 0 Dominion 468 905 1,179 1,020 664 0 1,172 459 DPL 0 122 0 1,542 639 3,071 2,066 2,719 JCPL 0 0 0 0 0 0 0 398 Met-Ed 0 180 162 0 0 0 222 0 PECO 247 0 788 386 732 1,953 895 692 PENELEC 103 284 0 0 176 4,281 1,683 451 Pepco 149 1 0 143 245 41 0 0 PPL 176 118 40 350 452 148 266 936 PSEG 303 549 1,107 913 3,021 4,688 2,665 0
The local market structure in the Real-Time Energy Market associated with each of the frequently binding constraints was analyzed using the three pivotal supplier results in 2016.42 The three pivotal supplier (TPS) test is
42 See the MMU Technical Reference for PJM Markets, at “Three Pivotal Supplier Test” for a more detailed explanation of the three pivotal supplier test. <http://www.monitoringanalytics.com/reports/Technical_References/references.shtml>.
Table 3-24 Real-time offer capped unit statistics: 2015 and 2016
Offer-Capped HoursRun Hours Offer-Capped, Percent Greater Than Or Equal To: Year
Hours ≥ 500
Hours ≥ 400 and
< 500
Hours ≥ 300 and
< 400
Hours ≥ 200 and
< 300
Hours ≥ 100 and
< 200
Hours ≥ 1 and
< 100
90%2016 1 1 1 0 0 0 2015 2 0 0 0 1 4
80% and < 90%2016 0 0 1 1 1 0 2015 0 1 1 0 0 6
75% and < 80% 2016 0 0 0 0 1 1 2015 0 0 0 0 0 3
70% and < 75%2016 1 0 0 0 1 0 2015 0 0 0 0 0 4
60% and < 70%2016 1 0 0 0 0 2 2015 0 0 0 1 0 9
50% and < 60%2016 1 0 0 0 0 2 2015 0 0 0 0 1 9
25% and < 50%2016 1 3 0 4 2 24 2015 0 0 0 0 1 26
10% and < 25%2016 0 0 1 2 8 21 2015 0 0 5 2 5 34
Figure 3-26 shows the frequency with which units were offer capped in 2015 and 2016 for failing the TPS test to provide energy for constraint relief in the Real–Time Energy Market.
Figure 3-26 Real-time offer capped unit statistics: 2015 and 2016
0
5
10
15
20
25
30
35
40
45
50
2015 2016 2015 2016 2015 2016 2015 2016 2015 2016 2015 2016 2015 2016 2015 2016
>90% 80% - 90% 75% - 80% 70% - 75% 60% - 70% 50% - 60% 25% - 50% 10% - 25%
Numb
er of
units
offer
capp
ed
Percent of run hours offer capped Run Hours ≥ 500 Run Hours ≥ 400 and < 500 Run Hours ≥ 300 and < 400 Run Hours ≥ 200 and < 300 Run Hours ≥ 100 and < 200 Run Hours ≥ 1 and < 100
TPS Test StatisticsIn 2016, the AECO, AEP, ATSI, BGE, ComEd, Dominion, DPL, JCPL, PECO, PENELEC, and PPL control zones experienced congestion resulting from one or more constraints binding for 100 or more hours or resulting from an interface constraint (Table 3-25). The AP, DAY, DEOK, DLCO, EKPC, Met-Ed, Pepco, PSEG and RECO control zones did not have constraints binding for 100 or more hours in 2016. Table 3-25 shows that
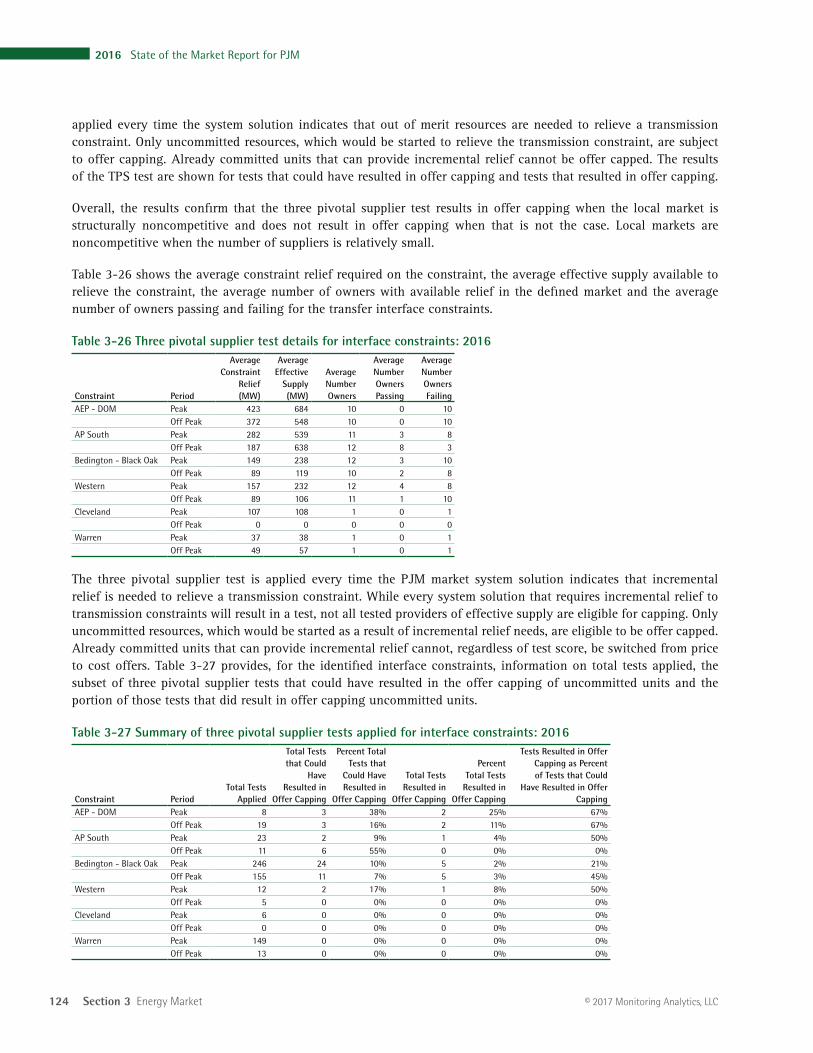
124 Section 3 Energy Market
2016 State of the Market Report for PJM
© 2017 Monitoring Analytics, LLC
applied every time the system solution indicates that out of merit resources are needed to relieve a transmission constraint. Only uncommitted resources, which would be started to relieve the transmission constraint, are subject to offer capping. Already committed units that can provide incremental relief cannot be offer capped. The results of the TPS test are shown for tests that could have resulted in offer capping and tests that resulted in offer capping.
Overall, the results confirm that the three pivotal supplier test results in offer capping when the local market is structurally noncompetitive and does not result in offer capping when that is not the case. Local markets are noncompetitive when the number of suppliers is relatively small.
Table 3-26 shows the average constraint relief required on the constraint, the average effective supply available to relieve the constraint, the average number of owners with available relief in the defined market and the average number of owners passing and failing for the transfer interface constraints.
Table 3-26 Three pivotal supplier test details for interface constraints: 2016
Constraint Period
Average Constraint
Relief (MW)
Average Effective
Supply (MW)
Average Number Owners
Average Number Owners Passing
Average Number Owners Failing
AEP - DOM Peak 423 684 10 0 10 Off Peak 372 548 10 0 10
AP South Peak 282 539 11 3 8 Off Peak 187 638 12 8 3
Bedington - Black Oak Peak 149 238 12 3 10 Off Peak 89 119 10 2 8
Western Peak 157 232 12 4 8 Off Peak 89 106 11 1 10
Cleveland Peak 107 108 1 0 1 Off Peak 0 0 0 0 0
Warren Peak 37 38 1 0 1 Off Peak 49 57 1 0 1
The three pivotal supplier test is applied every time the PJM market system solution indicates that incremental relief is needed to relieve a transmission constraint. While every system solution that requires incremental relief to transmission constraints will result in a test, not all tested providers of effective supply are eligible for capping. Only uncommitted resources, which would be started as a result of incremental relief needs, are eligible to be offer capped. Already committed units that can provide incremental relief cannot, regardless of test score, be switched from price to cost offers. Table 3-27 provides, for the identified interface constraints, information on total tests applied, the subset of three pivotal supplier tests that could have resulted in the offer capping of uncommitted units and the portion of those tests that did result in offer capping uncommitted units.
Table 3-27 Summary of three pivotal supplier tests applied for interface constraints: 2016
Constraint PeriodTotal Tests
Applied
Total Tests that Could
Have Resulted in
Offer Capping
Percent Total Tests that
Could Have Resulted in
Offer Capping
Total Tests Resulted in
Offer Capping
Percent Total Tests
Resulted in Offer Capping
Tests Resulted in Offer Capping as Percent of Tests that Could
Have Resulted in Offer Capping
AEP - DOM Peak 8 3 38% 2 25% 67%Off Peak 19 3 16% 2 11% 67%
AP South Peak 23 2 9% 1 4% 50%Off Peak 11 6 55% 0 0% 0%
Bedington - Black Oak Peak 246 24 10% 5 2% 21%Off Peak 155 11 7% 5 3% 45%
Western Peak 12 2 17% 1 8% 50%Off Peak 5 0 0% 0 0% 0%
Cleveland Peak 6 0 0% 0 0% 0%Off Peak 0 0 0% 0 0% 0%
Warren Peak 149 0 0% 0 0% 0%Off Peak 13 0 0% 0 0% 0%
2016 State of the Market Report for PJM 125
Section 3 Energy Market
© 2017 Monitoring Analytics, LLC
Parameter LimitsDuring the extreme cold weather conditions in the first three months of 2016, as well as 2015 and 2014, a number of gas fired generators requested temporary exceptions to parameter limits for their parameter limited schedules due to restrictions imposed by natural gas pipelines. The parameters that were affected because of gas pipeline restrictions include minimum run time (MRT) and turn down ratio (TDR, the ratio of economic maximum MW to economic minimum MW). When pipelines issue critical notices and enforce ratable take requirements, generators may, depending on the nature of the transportation service purchased, be forced to nominate an equal amount of gas for each hour in a 24 hour period, with penalties for deviating from the nominated quantity. This led to requests for 24 hour minimum run times and turn down ratios close to 1.0, to avoid deviations from the hourly nominated quantity.
Key parameters like startup and notification time were not included in the PLS matrix in 2016 and prior periods for annual resources that do not have capacity performance obligations. Some resource owners notified PJM that they needed extended notification times based on the claimed necessity for generation owners to nominate gas prior to gas nomination cycle deadlines. Startup and notification times are limited for capacity performance resources beginning June 1, 2016, in accordance with predetermined unit specific parameter limits. The unit specific parameter limits for capacity performance resources were based on default minimum operating parameter limits posted by PJM by technology type. These default parameters were based on analysis by the MMU. Market participants could request an adjustment to the default values by submitting supporting documentation, which was reviewed by PJM and the MMU. The default minimum operating parameter limits or approved adjusted values are used by capacity performance resources for their parameter limited schedules.
PJM has the authority to approve adjusted parameters with input from the MMU. PJM has inappropriately applied different review standards to coal units than to CTs and CCs despite the objections of the MMU. PJM has approved parameter limits for steam units based on historical performance and existing equipment while
Parameter Limited Schedules
Cost-Based OffersAll capacity resources in PJM are required to submit at least one cost-based offer. During the 2016/2017 and 2017/2018 delivery years, all cost-based offers, submitted by resources that are not capacity performance resources, are parameter limited in accordance with the Parameter Limited Schedule (PLS) matrix or with the level of an approved exception.43 During the 2016/2017 and 2017/2018 delivery years, all cost-based offers, submitted by capacity performance resources, are parameter limited in accordance with predetermined unit specific parameter limits. During the 2016/2017 and 2017/2018 delivery years, there was no base capacity procured.
For the 2018/2019 and 2019/2020 delivery years, PJM procured two types of capacity resources, capacity performance resources and base capacity resources. Beginning June 1, 2018, there will no longer be any resources committed as the current annual capacity product. All cost-based offers, submitted by capacity performance resources and base capacity resources, are parameter limited in accordance with predetermined unit specific parameter limits.
Price-Based OffersAll capacity resources that choose to offer price-based offers are required to make available at least one price-based parameter limited offer (referred to as price-based PLS). For resources that are not capacity performance resources or not base capacity resources, the price-based parameter limited schedule is to be used by PJM for committing generation resources when a maximum emergency generation alert is declared. For capacity performance resources, the price-based parameter limited schedule is to be used by PJM for committing generation resources when hot weather alerts and cold weather alerts are declared. For base capacity resources (during the 2018/2019 and 2019/2020 delivery years only), the price-based parameter limited schedule is to be used by PJM for committing generation resources when hot weather alerts are declared.
43 See PJM, OATT, § 6.6 Minimum Generator Operating Parameters - Parameter-Limited Schedules, (September 10, 2014), pp. 1937- 1940.
126 Section 3 Energy Market
2016 State of the Market Report for PJM
© 2017 Monitoring Analytics, LLC
parameters based on nonphysical constraints should receive uplift payments.45 The Commission directed PJM to submit tariff language to establish a process through which capacity performance resources that operate outside the defined unit-specific parameter limits can justify such operation and therefore remain eligible for make whole payments.46
A primary goal of the capacity performance market design is to assign performance risk to generation owners and to ensure that capacity prices reflect underlying supply and demand conditions, including the cost of taking on performance risk. The June 9th Order’s determination on parameters is not consistent with that goal. By permitting generation owners to establish unit parameters based on nonphysical limits, the June 9th Order has weakened the incentives for units to be flexible and has weakened the assignment of performance risk to generation owners. Contractual limits, unlike generating unit operational limits, are a function of the interests and incentives of the parties to the contracts. If a generation owner expects to be compensated through uplift payments for running for 24 hours regardless of whether the energy is economic or needed, that generation owner has no incentive to pay more to purchase the flexible gas service that would permit the unit to be flexible in response to dispatch.
The fact that a contract may be just and reasonable because it was an arm’s length contract entered into by two willing parties does not mean that is the only possible arrangement between the two parties or that it is consistent with an efficient market outcome or that such a contract can reasonably impose costs on customers who were not party to the contract. The actual contractual terms are a function of the incentives and interests of the parties. The fact that a just and reasonable contract exists between a generation owner and a gas supplier does not mean that it is appropriate or efficient to impose the resultant costs on electric customers or that it incorporates an efficient allocation of performance risk between the generation owner and other market participants.
The approach to parameters defined in the June 9th Order will increase energy market uplift payments
45 Id at P 439.46 Id at P 440.
holding CTs and CCs to higher standards based on OEM documentation and up to date equipment configuration.
Currently, there are no rules in the PJM tariff or manuals that limit the nonparameter attributes of price-based PLS offers. The intent of the price-based PLS offer is to prevent the exercise of market power during high demand conditions by preventing units from offering inflexible operating parameters in order to extract higher market revenues or higher uplift payments. However, a generator can include a higher markup in the price-based PLS offer than in the price-based non-PLS schedule. The result is that the offer is higher and market prices are higher as a result of the exercise of market power using the PLS offer. This defeats the purpose of requiring price-based PLS offers.
The MMU recommends that in order to ensure rigorous market power mitigation when the TPS test is failed, the operating parameters in the cost-based offer and the price-based parameter limited schedule (PLS) offer be at least as flexible as the operating parameters in the available non-PLS price-based offer, and that the price-MW pairs in the price-based PLS offer be exactly equal to the price-based non-PLS offer.
Parameter Limited Schedules under Capacity PerformanceBeginning in the 2016/2017 delivery year, resources that have capacity performance (CP) commitments are required to submit, in their parameter limited schedules (cost-based offers and price-based PLS offers), unit specific parameters that reflect the physical capability of the technology type of the resource. For the 2018/2019 and 2019/2020 delivery years, resources that have base capacity commitments are also required to submit, in their parameter limited schedules, unit specific parameters that reflect the physical capability of the technology type of the resource. In its order on capacity performance, the Commission determined that capacity performance resources should be able to reflect actual constraints based on not just the resource physical constraints, but also other constraints, such as contractual limits that are not based on the physical characteristics of the generator.44 The Commission directed that capacity performance resources with
44 PJM Interconnection, L.L.C. et al., 151 FERC ¶ 61,208 at P 437 (June 9th Order).
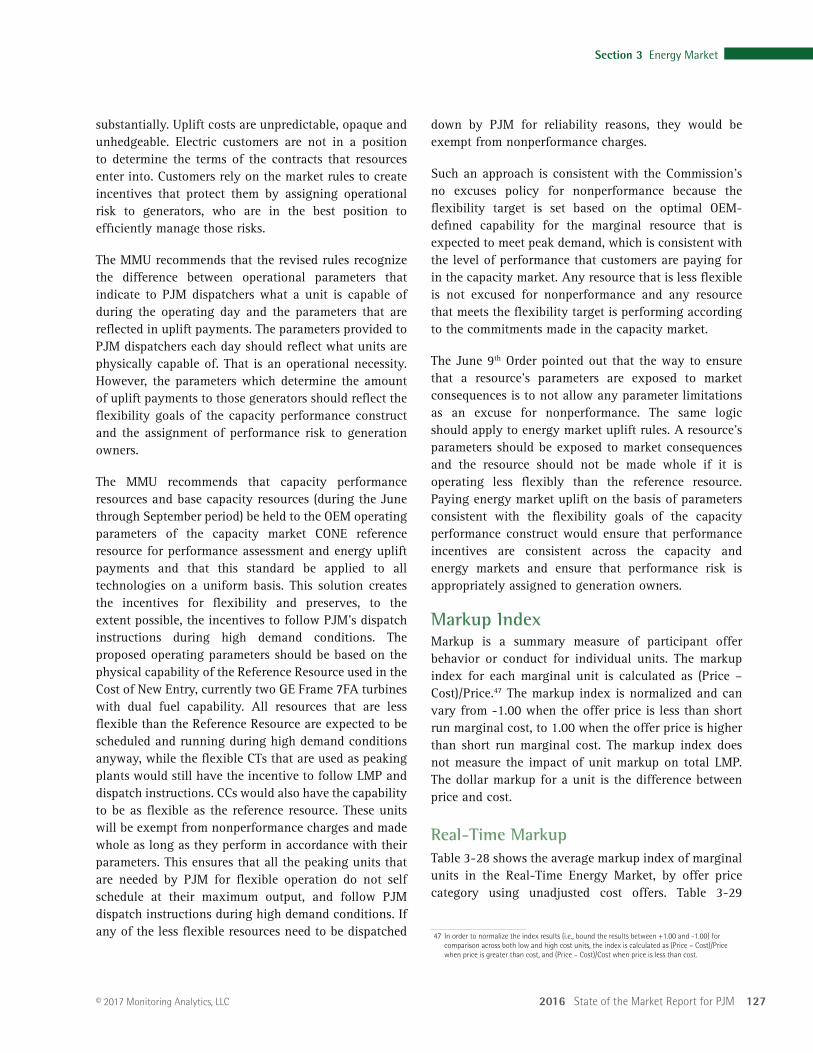
2016 State of the Market Report for PJM 127
Section 3 Energy Market
© 2017 Monitoring Analytics, LLC
down by PJM for reliability reasons, they would be exempt from nonperformance charges.
Such an approach is consistent with the Commission’s no excuses policy for nonperformance because the flexibility target is set based on the optimal OEM-defined capability for the marginal resource that is expected to meet peak demand, which is consistent with the level of performance that customers are paying for in the capacity market. Any resource that is less flexible is not excused for nonperformance and any resource that meets the flexibility target is performing according to the commitments made in the capacity market.
The June 9th Order pointed out that the way to ensure that a resource’s parameters are exposed to market consequences is to not allow any parameter limitations as an excuse for nonperformance. The same logic should apply to energy market uplift rules. A resource’s parameters should be exposed to market consequences and the resource should not be made whole if it is operating less flexibly than the reference resource. Paying energy market uplift on the basis of parameters consistent with the flexibility goals of the capacity performance construct would ensure that performance incentives are consistent across the capacity and energy markets and ensure that performance risk is appropriately assigned to generation owners.
Markup IndexMarkup is a summary measure of participant offer behavior or conduct for individual units. The markup index for each marginal unit is calculated as (Price – Cost)/Price.47 The markup index is normalized and can vary from -1.00 when the offer price is less than short run marginal cost, to 1.00 when the offer price is higher than short run marginal cost. The markup index does not measure the impact of unit markup on total LMP. The dollar markup for a unit is the difference between price and cost.
Real-Time MarkupTable 3-28 shows the average markup index of marginal units in the Real-Time Energy Market, by offer price category using unadjusted cost offers. Table 3-29
47 In order to normalize the index results (i.e., bound the results between +1.00 and -1.00) for comparison across both low and high cost units, the index is calculated as (Price – Cost)/Price when price is greater than cost, and (Price – Cost)/Cost when price is less than cost.
substantially. Uplift costs are unpredictable, opaque and unhedgeable. Electric customers are not in a position to determine the terms of the contracts that resources enter into. Customers rely on the market rules to create incentives that protect them by assigning operational risk to generators, who are in the best position to efficiently manage those risks.
The MMU recommends that the revised rules recognize the difference between operational parameters that indicate to PJM dispatchers what a unit is capable of during the operating day and the parameters that are reflected in uplift payments. The parameters provided to PJM dispatchers each day should reflect what units are physically capable of. That is an operational necessity. However, the parameters which determine the amount of uplift payments to those generators should reflect the flexibility goals of the capacity performance construct and the assignment of performance risk to generation owners.
The MMU recommends that capacity performance resources and base capacity resources (during the June through September period) be held to the OEM operating parameters of the capacity market CONE reference resource for performance assessment and energy uplift payments and that this standard be applied to all technologies on a uniform basis. This solution creates the incentives for flexibility and preserves, to the extent possible, the incentives to follow PJM’s dispatch instructions during high demand conditions. The proposed operating parameters should be based on the physical capability of the Reference Resource used in the Cost of New Entry, currently two GE Frame 7FA turbines with dual fuel capability. All resources that are less flexible than the Reference Resource are expected to be scheduled and running during high demand conditions anyway, while the flexible CTs that are used as peaking plants would still have the incentive to follow LMP and dispatch instructions. CCs would also have the capability to be as flexible as the reference resource. These units will be exempt from nonperformance charges and made whole as long as they perform in accordance with their parameters. This ensures that all the peaking units that are needed by PJM for flexible operation do not self schedule at their maximum output, and follow PJM dispatch instructions during high demand conditions. If any of the less flexible resources need to be dispatched
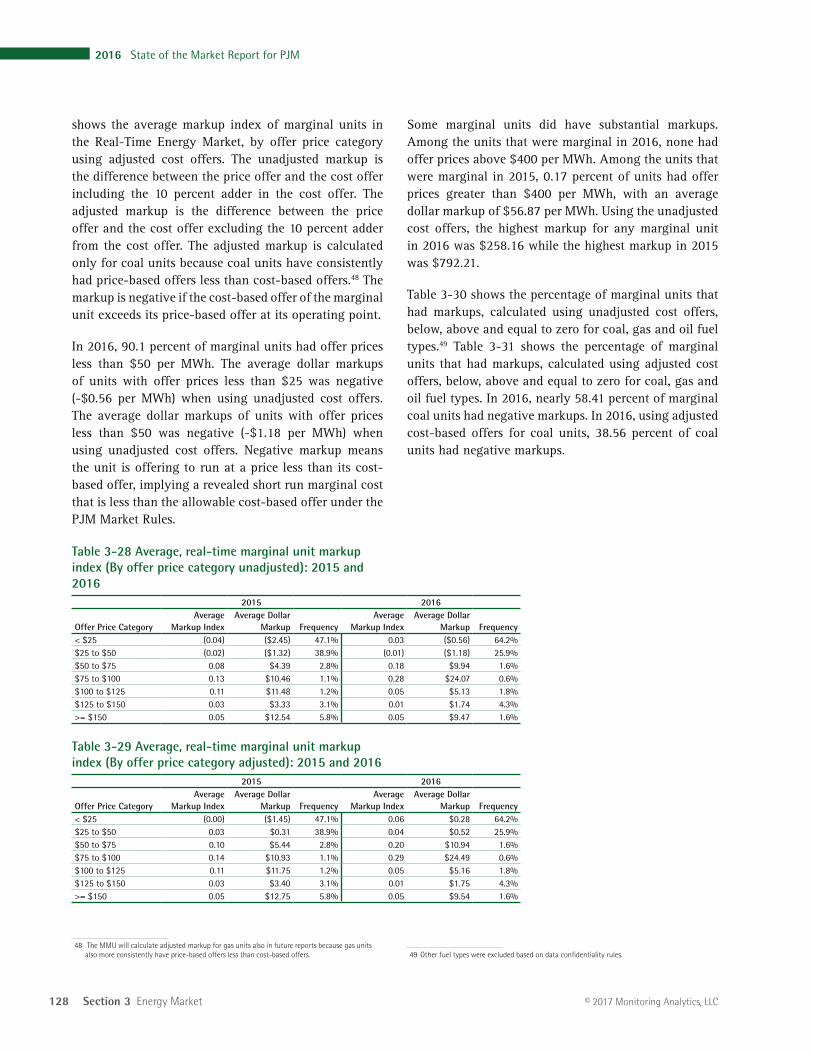
128 Section 3 Energy Market
2016 State of the Market Report for PJM
© 2017 Monitoring Analytics, LLC
shows the average markup index of marginal units in the Real-Time Energy Market, by offer price category using adjusted cost offers. The unadjusted markup is the difference between the price offer and the cost offer including the 10 percent adder in the cost offer. The adjusted markup is the difference between the price offer and the cost offer excluding the 10 percent adder from the cost offer. The adjusted markup is calculated only for coal units because coal units have consistently had price-based offers less than cost-based offers.48 The markup is negative if the cost-based offer of the marginal unit exceeds its price-based offer at its operating point.
In 2016, 90.1 percent of marginal units had offer prices less than $50 per MWh. The average dollar markups of units with offer prices less than $25 was negative (-$0.56 per MWh) when using unadjusted cost offers. The average dollar markups of units with offer prices less than $50 was negative (-$1.18 per MWh) when using unadjusted cost offers. Negative markup means the unit is offering to run at a price less than its cost-based offer, implying a revealed short run marginal cost that is less than the allowable cost-based offer under the PJM Market Rules.
Table 3-28 Average, real-time marginal unit markup index (By offer price category unadjusted): 2015 and 2016
2015 2016
Offer Price CategoryAverage
Markup IndexAverage Dollar
Markup FrequencyAverage
Markup IndexAverage Dollar
Markup Frequency< $25 (0.04) ($2.45) 47.1% 0.03 ($0.56) 64.2%$25 to $50 (0.02) ($1.32) 38.9% (0.01) ($1.18) 25.9%$50 to $75 0.08 $4.39 2.8% 0.18 $9.94 1.6%$75 to $100 0.13 $10.46 1.1% 0.28 $24.07 0.6%$100 to $125 0.11 $11.48 1.2% 0.05 $5.13 1.8%$125 to $150 0.03 $3.33 3.1% 0.01 $1.74 4.3%>= $150 0.05 $12.54 5.8% 0.05 $9.47 1.6%
Table 3-29 Average, real-time marginal unit markup index (By offer price category adjusted): 2015 and 2016
2015 2016
Offer Price CategoryAverage
Markup IndexAverage Dollar
Markup FrequencyAverage
Markup IndexAverage Dollar
Markup Frequency< $25 (0.00) ($1.45) 47.1% 0.06 $0.28 64.2%$25 to $50 0.03 $0.31 38.9% 0.04 $0.52 25.9%$50 to $75 0.10 $5.44 2.8% 0.20 $10.94 1.6%$75 to $100 0.14 $10.93 1.1% 0.29 $24.49 0.6%$100 to $125 0.11 $11.75 1.2% 0.05 $5.16 1.8%$125 to $150 0.03 $3.40 3.1% 0.01 $1.75 4.3%>= $150 0.05 $12.75 5.8% 0.05 $9.54 1.6%
48 The MMU will calculate adjusted markup for gas units also in future reports because gas units also more consistently have price-based offers less than cost-based offers.
Some marginal units did have substantial markups. Among the units that were marginal in 2016, none had offer prices above $400 per MWh. Among the units that were marginal in 2015, 0.17 percent of units had offer prices greater than $400 per MWh, with an average dollar markup of $56.87 per MWh. Using the unadjusted cost offers, the highest markup for any marginal unit in 2016 was $258.16 while the highest markup in 2015 was $792.21.
Table 3-30 shows the percentage of marginal units that had markups, calculated using unadjusted cost offers, below, above and equal to zero for coal, gas and oil fuel types.49 Table 3-31 shows the percentage of marginal units that had markups, calculated using adjusted cost offers, below, above and equal to zero for coal, gas and oil fuel types. In 2016, nearly 58.41 percent of marginal coal units had negative markups. In 2016, using adjusted cost-based offers for coal units, 38.56 percent of coal units had negative markups.
49 Other fuel types were excluded based on data confidentiality rules.
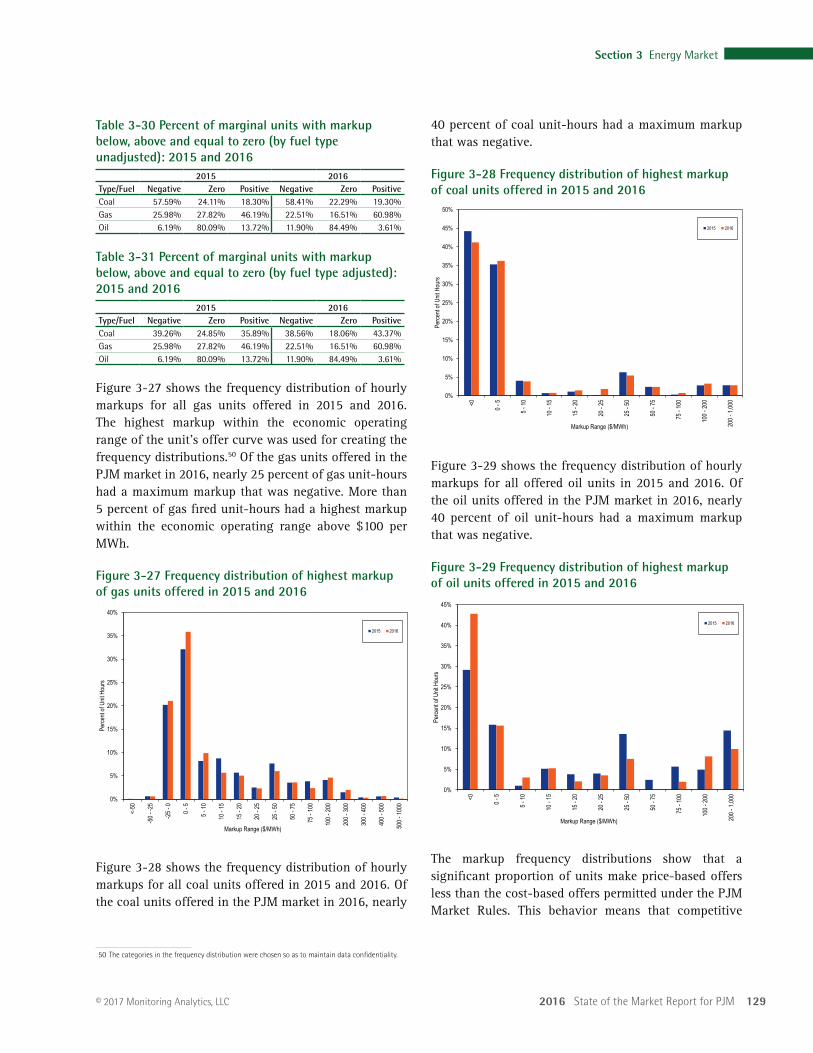
2016 State of the Market Report for PJM 129
Section 3 Energy Market
© 2017 Monitoring Analytics, LLC
40 percent of coal unit-hours had a maximum markup that was negative.
Figure 3-28 Frequency distribution of highest markup of coal units offered in 2015 and 2016
0%
5%
10%
15%
20%
25%
30%
35%
40%
45%
50%
<0
0 - 5
5 - 10
10 -
15
15 -
20
20 -
25
25 -
50
50 -
75
75 -
100
100 -
200
200 -
1,00
0
Perce
nt of
Unit H
ours
Markup Range ($/MWh)
2015 2016
Figure 3-29 shows the frequency distribution of hourly markups for all offered oil units in 2015 and 2016. Of the oil units offered in the PJM market in 2016, nearly 40 percent of oil unit-hours had a maximum markup that was negative.
Figure 3-29 Frequency distribution of highest markup of oil units offered in 2015 and 2016
0%
5%
10%
15%
20%
25%
30%
35%
40%
45%
<0
0 - 5
5 - 10
10 -
15
15 -
20
20 -
25
25 -
50
50 -
75
75 -
100
100 -
200
200 -
1,00
0
Perce
nt of
Unit H
ours
Markup Range ($/MWh)
2015 2016
The markup frequency distributions show that a significant proportion of units make price-based offers less than the cost-based offers permitted under the PJM Market Rules. This behavior means that competitive
Table 3-30 Percent of marginal units with markup below, above and equal to zero (by fuel type unadjusted): 2015 and 2016
2015 2016Type/Fuel Negative Zero Positive Negative Zero PositiveCoal 57.59% 24.11% 18.30% 58.41% 22.29% 19.30%Gas 25.98% 27.82% 46.19% 22.51% 16.51% 60.98%Oil 6.19% 80.09% 13.72% 11.90% 84.49% 3.61%
Table 3-31 Percent of marginal units with markup below, above and equal to zero (by fuel type adjusted): 2015 and 2016
2015 2016Type/Fuel Negative Zero Positive Negative Zero PositiveCoal 39.26% 24.85% 35.89% 38.56% 18.06% 43.37%Gas 25.98% 27.82% 46.19% 22.51% 16.51% 60.98%Oil 6.19% 80.09% 13.72% 11.90% 84.49% 3.61%
Figure 3-27 shows the frequency distribution of hourly markups for all gas units offered in 2015 and 2016. The highest markup within the economic operating range of the unit’s offer curve was used for creating the frequency distributions.50 Of the gas units offered in the PJM market in 2016, nearly 25 percent of gas unit-hours had a maximum markup that was negative. More than 5 percent of gas fired unit-hours had a highest markup within the economic operating range above $100 per MWh.
Figure 3-27 Frequency distribution of highest markup of gas units offered in 2015 and 2016
0%
5%
10%
15%
20%
25%
30%
35%
40%
<-50
-50 -
-25
-25 -
0
0 - 5
5 - 10
10 -
15
15 -
20
20 -
25
25 -
50
50 -
75
75 -
100
100 -
200
200 -
300
300 -
400
400 -
500
500 -
1000
Perce
nt of
Unit H
ours
Markup Range ($/MWh)
2015 2016
Figure 3-28 shows the frequency distribution of hourly markups for all coal units offered in 2015 and 2016. Of the coal units offered in the PJM market in 2016, nearly
50 The categories in the frequency distribution were chosen so as to maintain data confidentiality.
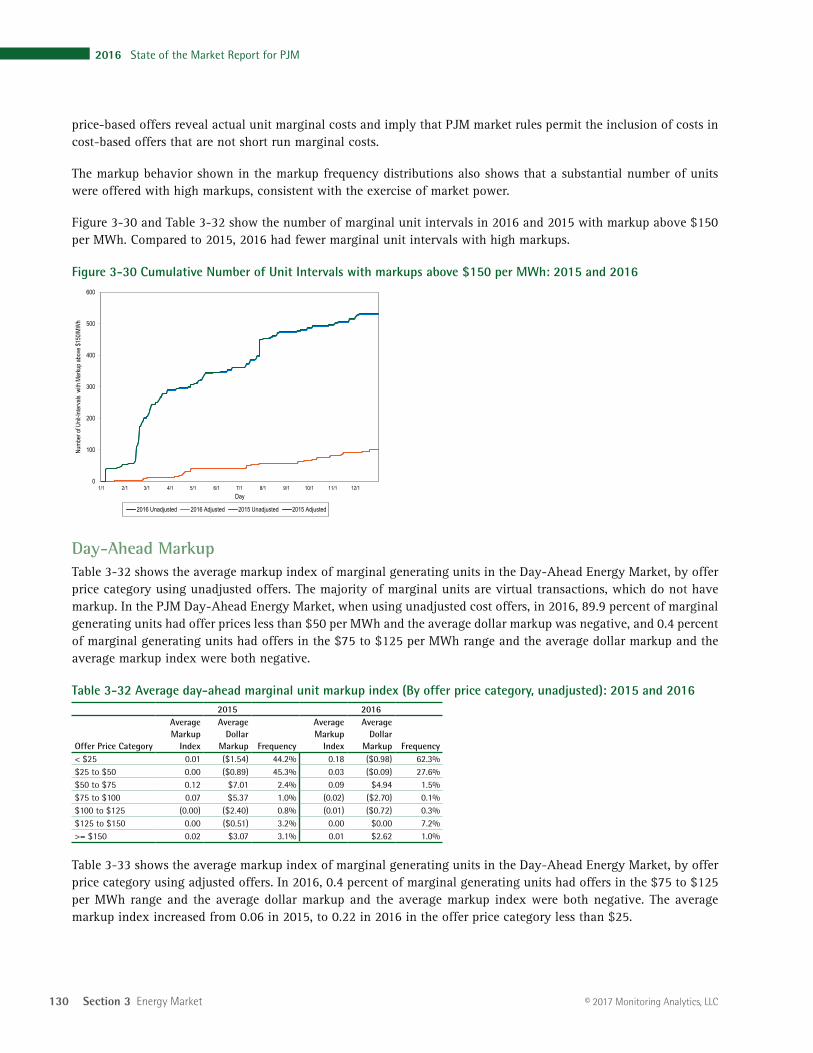
130 Section 3 Energy Market
2016 State of the Market Report for PJM
© 2017 Monitoring Analytics, LLC
price-based offers reveal actual unit marginal costs and imply that PJM market rules permit the inclusion of costs in cost-based offers that are not short run marginal costs.
The markup behavior shown in the markup frequency distributions also shows that a substantial number of units were offered with high markups, consistent with the exercise of market power.
Figure 3-30 and Table 3-32 show the number of marginal unit intervals in 2016 and 2015 with markup above $150 per MWh. Compared to 2015, 2016 had fewer marginal unit intervals with high markups.
Figure 3-30 Cumulative Number of Unit Intervals with markups above $150 per MWh: 2015 and 2016
0
100
200
300
400
500
600
1/1 2/1 3/1 4/1 5/1 6/1 7/1 8/1 9/1 10/1 11/1 12/1
Numb
er of
Unit
-Inter
vals
with
Mar
kup a
bove
$150
/MW
h
Day
2016 Unadjusted 2016 Adjusted 2015 Unadjusted 2015 Adjusted
Day-Ahead MarkupTable 3-32 shows the average markup index of marginal generating units in the Day-Ahead Energy Market, by offer price category using unadjusted offers. The majority of marginal units are virtual transactions, which do not have markup. In the PJM Day-Ahead Energy Market, when using unadjusted cost offers, in 2016, 89.9 percent of marginal generating units had offer prices less than $50 per MWh and the average dollar markup was negative, and 0.4 percent of marginal generating units had offers in the $75 to $125 per MWh range and the average dollar markup and the average markup index were both negative.
Table 3-32 Average day-ahead marginal unit markup index (By offer price category, unadjusted): 2015 and 20162015 2016
Offer Price Category
Average Markup
Index
Average Dollar
Markup Frequency
Average Markup
Index
Average Dollar
Markup Frequency< $25 0.01 ($1.54) 44.2% 0.18 ($0.98) 62.3%$25 to $50 0.00 ($0.89) 45.3% 0.03 ($0.09) 27.6%$50 to $75 0.12 $7.01 2.4% 0.09 $4.94 1.5%$75 to $100 0.07 $5.37 1.0% (0.02) ($2.70) 0.1%$100 to $125 (0.00) ($2.40) 0.8% (0.01) ($0.72) 0.3%$125 to $150 0.00 ($0.51) 3.2% 0.00 $0.00 7.2%>= $150 0.02 $3.07 3.1% 0.01 $2.62 1.0%
Table 3-33 shows the average markup index of marginal generating units in the Day-Ahead Energy Market, by offer price category using adjusted offers. In 2016, 0.4 percent of marginal generating units had offers in the $75 to $125 per MWh range and the average dollar markup and the average markup index were both negative. The average markup index increased from 0.06 in 2015, to 0.22 in 2016 in the offer price category less than $25.
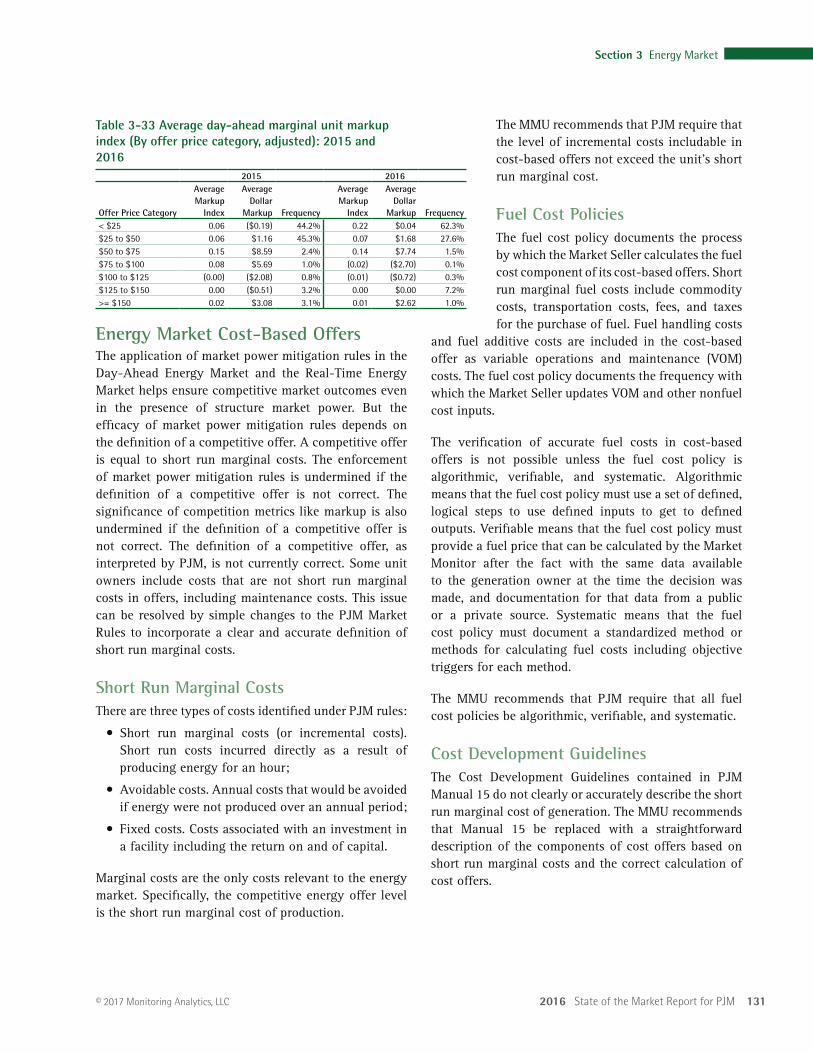
2016 State of the Market Report for PJM 131
Section 3 Energy Market
© 2017 Monitoring Analytics, LLC
The MMU recommends that PJM require that the level of incremental costs includable in cost-based offers not exceed the unit’s short run marginal cost.
Fuel Cost PoliciesThe fuel cost policy documents the process by which the Market Seller calculates the fuel cost component of its cost-based offers. Short run marginal fuel costs include commodity costs, transportation costs, fees, and taxes for the purchase of fuel. Fuel handling costs
and fuel additive costs are included in the cost-based offer as variable operations and maintenance (VOM) costs. The fuel cost policy documents the frequency with which the Market Seller updates VOM and other nonfuel cost inputs.
The verification of accurate fuel costs in cost-based offers is not possible unless the fuel cost policy is algorithmic, verifiable, and systematic. Algorithmic means that the fuel cost policy must use a set of defined, logical steps to use defined inputs to get to defined outputs. Verifiable means that the fuel cost policy must provide a fuel price that can be calculated by the Market Monitor after the fact with the same data available to the generation owner at the time the decision was made, and documentation for that data from a public or a private source. Systematic means that the fuel cost policy must document a standardized method or methods for calculating fuel costs including objective triggers for each method.
The MMU recommends that PJM require that all fuel cost policies be algorithmic, verifiable, and systematic.
Cost Development GuidelinesThe Cost Development Guidelines contained in PJM Manual 15 do not clearly or accurately describe the short run marginal cost of generation. The MMU recommends that Manual 15 be replaced with a straightforward description of the components of cost offers based on short run marginal costs and the correct calculation of cost offers.
Table 3-33 Average day-ahead marginal unit markup index (By offer price category, adjusted): 2015 and 2016
2015 2016
Offer Price Category
Average Markup
Index
Average Dollar
Markup Frequency
Average Markup
Index
Average Dollar
Markup Frequency< $25 0.06 ($0.19) 44.2% 0.22 $0.04 62.3%$25 to $50 0.06 $1.16 45.3% 0.07 $1.68 27.6%$50 to $75 0.15 $8.59 2.4% 0.14 $7.74 1.5%$75 to $100 0.08 $5.69 1.0% (0.02) ($2.70) 0.1%$100 to $125 (0.00) ($2.08) 0.8% (0.01) ($0.72) 0.3%$125 to $150 0.00 ($0.51) 3.2% 0.00 $0.00 7.2%>= $150 0.02 $3.08 3.1% 0.01 $2.62 1.0%
Energy Market Cost-Based OffersThe application of market power mitigation rules in the Day-Ahead Energy Market and the Real-Time Energy Market helps ensure competitive market outcomes even in the presence of structure market power. But the efficacy of market power mitigation rules depends on the definition of a competitive offer. A competitive offer is equal to short run marginal costs. The enforcement of market power mitigation rules is undermined if the definition of a competitive offer is not correct. The significance of competition metrics like markup is also undermined if the definition of a competitive offer is not correct. The definition of a competitive offer, as interpreted by PJM, is not currently correct. Some unit owners include costs that are not short run marginal costs in offers, including maintenance costs. This issue can be resolved by simple changes to the PJM Market Rules to incorporate a clear and accurate definition of short run marginal costs.
Short Run Marginal CostsThere are three types of costs identified under PJM rules:
• Short run marginal costs (or incremental costs). Short run costs incurred directly as a result of producing energy for an hour;
• Avoidable costs. Annual costs that would be avoided if energy were not produced over an annual period;
• Fixed costs. Costs associated with an investment in a facility including the return on and of capital.
Marginal costs are the only costs relevant to the energy market. Specifically, the competitive energy offer level is the short run marginal cost of production.
132 Section 3 Energy Market
2016 State of the Market Report for PJM
© 2017 Monitoring Analytics, LLC
treatment of combined cycles consistent with steam turbines.
Nuclear CostsThe fuel costs for nuclear plants are fixed in the short run and amortized over the period between refueling outages. The short run marginal cost of fuel for nuclear plants is zero. Operations and maintenance costs for nuclear power plants consist primarily of labor and maintenance costs incurred during outages, which are also fixed in the short run.
The MMU recommends the removal of nuclear fuel and nonfuel operations and maintenance costs that are not short run marginal costs from the Cost Development Guidelines.
Pumped Hydro CostsThe calculation of pumped hydro costs for energy storage in Section 7.3 of PJM Manual 15 is inaccurate. The mathematical formulation contains an error in the calculation of the weighted average pumping cost, and it does not take into account the purchase of power for pumping in the day-ahead market.
The MMU recommends revising the pumped hydro fuel cost calculation to include day-ahead and real-time power purchases.
Energy Market Opportunity CostsThe calculation of energy market opportunity costs for energy limited units in Section 12 of PJM Manual 15 fails to account for a number of physical unit characteristics and environmental restrictions that influence opportunity costs. These include start up time, notification time, minimum down time, multiple fuel capability, multiple emissions limitations, and fuel usage limitations.
The MMU recommends revisions to the calculation of energy market opportunity costs to incorporate all time based offer parameters and all limitations that impact the opportunity cost of generating unit output.
The use of Catastrophic Force Majeure as the criterion for the use of opportunity costs for fuel supply limitations in Schedule 2 of the Operating Agreement is overly restrictive. This criterion would not allow the use of opportunity costs to allocate limited fuel in the case
FERC System of AccountsPJM Manual 15 relies heavily on the FERC System of Accounts, which predates markets and does not define costs consistently with market economics.
The MMU recommends removal of all use of the FERC System of Accounts in the Cost Development Guidelines.
Cyclic Starting and Peaking FactorsThe use of cyclic starting and peaking factors for calculating VOM costs for combined cycles and combustion turbines is designed to allocate a greater proportion of long term maintenance costs to starts and the tail block of the cost curve. The use of such factors is not appropriate given that long term maintenance costs are not short run marginal costs and should not be included in cost offers.
The MMU recommends the removal of all cyclic starting and peaking factors from the Cost Development Guidelines.
Labor CostsPJM Manual 15 allows for the inclusion of plant staffing costs in energy market cost offers. This is inappropriate given that labor costs are avoidable costs, not short run marginal costs, and are correctly includable in the RPM Avoidable Cost Rate.
The MMU recommends the removal of all labor costs from the Cost Development Guidelines.
Combined Cycle Start Heat Input DefinitionPJM Manual 15 defines the start heat input of combined cycles as the amount of fuel used from the firing of the first combustion turbine to the close of the steam turbine breaker plus any fuel used by other combustion turbines in the combined cycle from firing to the point at which the HRSG steam pressure matches the steam turbine steam pressure. This definition is inappropriate given that after each combustion turbine is synchronized, some of the fuel is used to produce energy for which the resource is compensated in the energy market.
The MMU recommends changing the definition of the start heat input for combined cycles to include only the amount of fuel used from firing each combustion turbine in the combined cycle to the breaker close of each combustion turbine. This change will make the
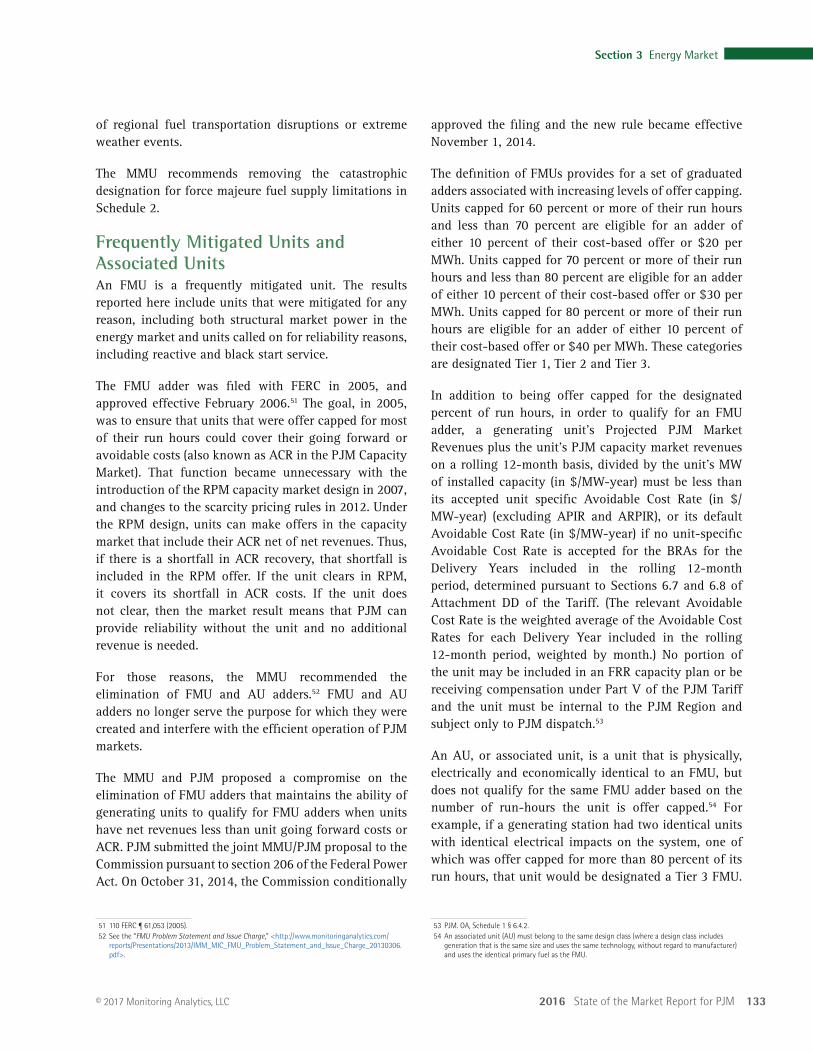
2016 State of the Market Report for PJM 133
Section 3 Energy Market
© 2017 Monitoring Analytics, LLC
approved the filing and the new rule became effective November 1, 2014.
The definition of FMUs provides for a set of graduated adders associated with increasing levels of offer capping. Units capped for 60 percent or more of their run hours and less than 70 percent are eligible for an adder of either 10 percent of their cost-based offer or $20 per MWh. Units capped for 70 percent or more of their run hours and less than 80 percent are eligible for an adder of either 10 percent of their cost-based offer or $30 per MWh. Units capped for 80 percent or more of their run hours are eligible for an adder of either 10 percent of their cost-based offer or $40 per MWh. These categories are designated Tier 1, Tier 2 and Tier 3.
In addition to being offer capped for the designated percent of run hours, in order to qualify for an FMU adder, a generating unit’s Projected PJM Market Revenues plus the unit’s PJM capacity market revenues on a rolling 12-month basis, divided by the unit’s MW of installed capacity (in $/MW-year) must be less than its accepted unit specific Avoidable Cost Rate (in $/MW-year) (excluding APIR and ARPIR), or its default Avoidable Cost Rate (in $/MW-year) if no unit-specific Avoidable Cost Rate is accepted for the BRAs for the Delivery Years included in the rolling 12-month period, determined pursuant to Sections 6.7 and 6.8 of Attachment DD of the Tariff. (The relevant Avoidable Cost Rate is the weighted average of the Avoidable Cost Rates for each Delivery Year included in the rolling 12-month period, weighted by month.) No portion of the unit may be included in an FRR capacity plan or be receiving compensation under Part V of the PJM Tariff and the unit must be internal to the PJM Region and subject only to PJM dispatch.53
An AU, or associated unit, is a unit that is physically, electrically and economically identical to an FMU, but does not qualify for the same FMU adder based on the number of run-hours the unit is offer capped.54 For example, if a generating station had two identical units with identical electrical impacts on the system, one of which was offer capped for more than 80 percent of its run hours, that unit would be designated a Tier 3 FMU.
53 PJM. OA, Schedule 1 § 6.4.2.54 An associated unit (AU) must belong to the same design class (where a design class includes
generation that is the same size and uses the same technology, without regard to manufacturer) and uses the identical primary fuel as the FMU.
of regional fuel transportation disruptions or extreme weather events.
The MMU recommends removing the catastrophic designation for force majeure fuel supply limitations in Schedule 2.
Frequently Mitigated Units and Associated UnitsAn FMU is a frequently mitigated unit. The results reported here include units that were mitigated for any reason, including both structural market power in the energy market and units called on for reliability reasons, including reactive and black start service.
The FMU adder was filed with FERC in 2005, and approved effective February 2006.51 The goal, in 2005, was to ensure that units that were offer capped for most of their run hours could cover their going forward or avoidable costs (also known as ACR in the PJM Capacity Market). That function became unnecessary with the introduction of the RPM capacity market design in 2007, and changes to the scarcity pricing rules in 2012. Under the RPM design, units can make offers in the capacity market that include their ACR net of net revenues. Thus, if there is a shortfall in ACR recovery, that shortfall is included in the RPM offer. If the unit clears in RPM, it covers its shortfall in ACR costs. If the unit does not clear, then the market result means that PJM can provide reliability without the unit and no additional revenue is needed.
For those reasons, the MMU recommended the elimination of FMU and AU adders.52 FMU and AU adders no longer serve the purpose for which they were created and interfere with the efficient operation of PJM markets.
The MMU and PJM proposed a compromise on the elimination of FMU adders that maintains the ability of generating units to qualify for FMU adders when units have net revenues less than unit going forward costs or ACR. PJM submitted the joint MMU/PJM proposal to the Commission pursuant to section 206 of the Federal Power Act. On October 31, 2014, the Commission conditionally
51 110 FERC ¶ 61,053 (2005).52 See the “FMU Problem Statement and Issue Charge,” <http://www.monitoringanalytics.com/
reports/Presentations/2013/IMM_MIC_FMU_Problem_Statement_and_Issue_Charge_20130306.pdf>.
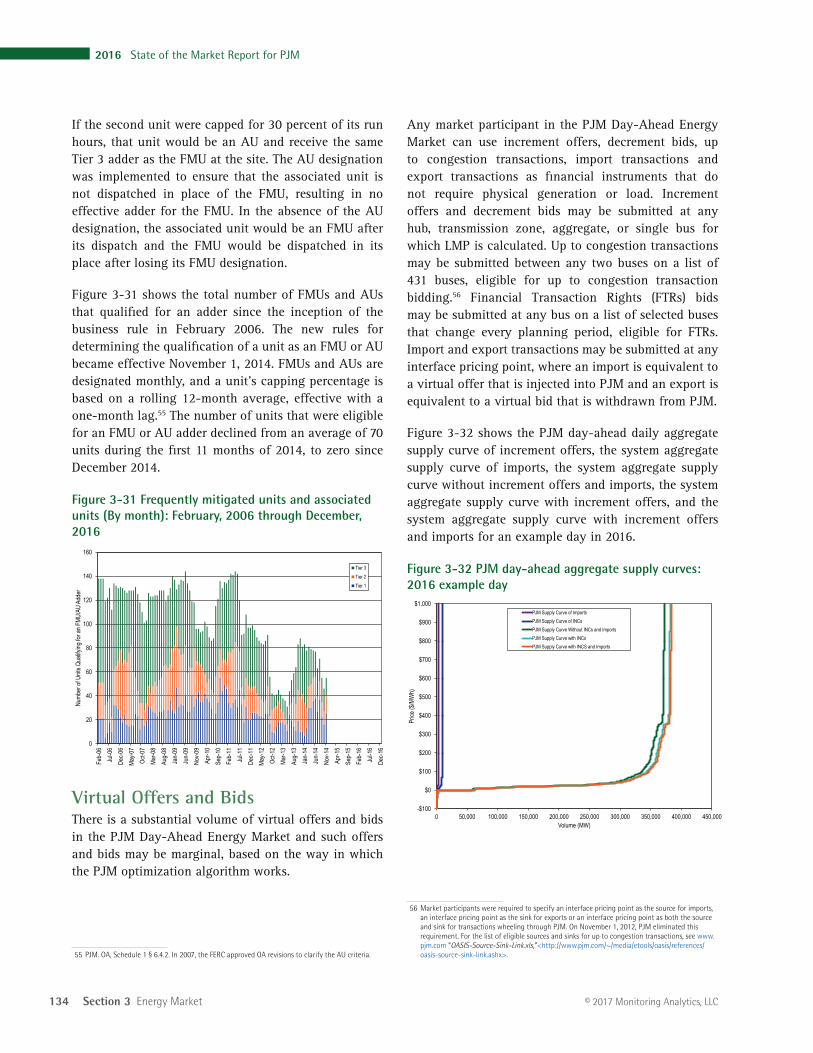
134 Section 3 Energy Market
2016 State of the Market Report for PJM
© 2017 Monitoring Analytics, LLC
Any market participant in the PJM Day-Ahead Energy Market can use increment offers, decrement bids, up to congestion transactions, import transactions and export transactions as financial instruments that do not require physical generation or load. Increment offers and decrement bids may be submitted at any hub, transmission zone, aggregate, or single bus for which LMP is calculated. Up to congestion transactions may be submitted between any two buses on a list of 431 buses, eligible for up to congestion transaction bidding.56 Financial Transaction Rights (FTRs) bids may be submitted at any bus on a list of selected buses that change every planning period, eligible for FTRs. Import and export transactions may be submitted at any interface pricing point, where an import is equivalent to a virtual offer that is injected into PJM and an export is equivalent to a virtual bid that is withdrawn from PJM.
Figure 3-32 shows the PJM day-ahead daily aggregate supply curve of increment offers, the system aggregate supply curve of imports, the system aggregate supply curve without increment offers and imports, the system aggregate supply curve with increment offers, and the system aggregate supply curve with increment offers and imports for an example day in 2016.
Figure 3-32 PJM day-ahead aggregate supply curves: 2016 example day
-$100
$0
$100
$200
$300
$400
$500
$600
$700
$800
$900
$1,000
0 50,000 100,000 150,000 200,000 250,000 300,000 350,000 400,000 450,000
Price
($/M
Wh)
Volume (MW)
PJM Supply Curve of ImportsPJM Supply Curve of INCsPJM Supply Curve Without INCs and ImportsPJM Supply Curve with INCsPJM Supply Curve with INCS and Imports
56 Market participants were required to specify an interface pricing point as the source for imports, an interface pricing point as the sink for exports or an interface pricing point as both the source and sink for transactions wheeling through PJM. On November 1, 2012, PJM eliminated this requirement. For the list of eligible sources and sinks for up to congestion transactions, see www.pjm.com “OASIS-Source-Sink-Link.xls,”<http://www.pjm.com/~/media/etools/oasis/references/oasis-source-sink-link.ashx>.
If the second unit were capped for 30 percent of its run hours, that unit would be an AU and receive the same Tier 3 adder as the FMU at the site. The AU designation was implemented to ensure that the associated unit is not dispatched in place of the FMU, resulting in no effective adder for the FMU. In the absence of the AU designation, the associated unit would be an FMU after its dispatch and the FMU would be dispatched in its place after losing its FMU designation.
Figure 3-31 shows the total number of FMUs and AUs that qualified for an adder since the inception of the business rule in February 2006. The new rules for determining the qualification of a unit as an FMU or AU became effective November 1, 2014. FMUs and AUs are designated monthly, and a unit’s capping percentage is based on a rolling 12-month average, effective with a one-month lag.55 The number of units that were eligible for an FMU or AU adder declined from an average of 70 units during the first 11 months of 2014, to zero since December 2014.
Figure 3-31 Frequently mitigated units and associated units (By month): February, 2006 through December, 2016
0
20
40
60
80
100
120
140
160
Feb-
06Ju
l-06
Dec-0
6Ma
y-07
Oct-0
7Ma
r-08
Aug-
08Ja
n-09
Jun-
09No
v-09
Apr-1
0Se
p-10
Feb-
11Ju
l-11
Dec-1
1Ma
y-12
Oct-1
2Ma
r-13
Aug-
13Ja
n-14
Jun-
14No
v-14
Apr-1
5Se
p-15
Feb-
16Ju
l-16
Dec-1
6
Numb
er of
Unit
s Qua
lifying
for a
n FMU
/AU
Adde
r
Tier 3
Tier 2Tier 1
Virtual Offers and BidsThere is a substantial volume of virtual offers and bids in the PJM Day-Ahead Energy Market and such offers and bids may be marginal, based on the way in which the PJM optimization algorithm works.
55 PJM. OA, Schedule 1 § 6.4.2. In 2007, the FERC approved OA revisions to clarify the AU criteria.
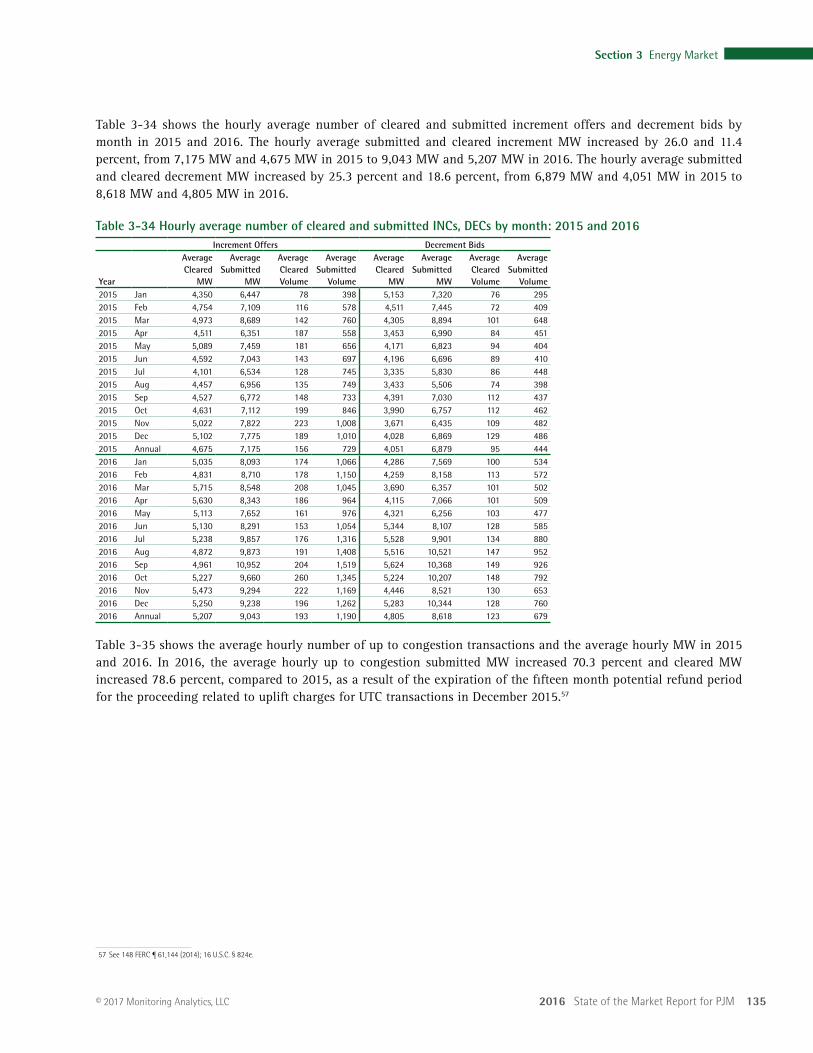
2016 State of the Market Report for PJM 135
Section 3 Energy Market
© 2017 Monitoring Analytics, LLC
Table 3-34 shows the hourly average number of cleared and submitted increment offers and decrement bids by month in 2015 and 2016. The hourly average submitted and cleared increment MW increased by 26.0 and 11.4 percent, from 7,175 MW and 4,675 MW in 2015 to 9,043 MW and 5,207 MW in 2016. The hourly average submitted and cleared decrement MW increased by 25.3 percent and 18.6 percent, from 6,879 MW and 4,051 MW in 2015 to 8,618 MW and 4,805 MW in 2016.
Table 3-34 Hourly average number of cleared and submitted INCs, DECs by month: 2015 and 2016Increment Offers Decrement Bids
Year
Average Cleared
MW
Average Submitted
MW
Average Cleared Volume
Average Submitted
Volume
Average Cleared
MW
Average Submitted
MW
Average Cleared Volume
Average Submitted
Volume2015 Jan 4,350 6,447 78 398 5,153 7,320 76 2952015 Feb 4,754 7,109 116 578 4,511 7,445 72 4092015 Mar 4,973 8,689 142 760 4,305 8,894 101 6482015 Apr 4,511 6,351 187 558 3,453 6,990 84 4512015 May 5,089 7,459 181 656 4,171 6,823 94 4042015 Jun 4,592 7,043 143 697 4,196 6,696 89 4102015 Jul 4,101 6,534 128 745 3,335 5,830 86 4482015 Aug 4,457 6,956 135 749 3,433 5,506 74 3982015 Sep 4,527 6,772 148 733 4,391 7,030 112 4372015 Oct 4,631 7,112 199 846 3,990 6,757 112 4622015 Nov 5,022 7,822 223 1,008 3,671 6,435 109 4822015 Dec 5,102 7,775 189 1,010 4,028 6,869 129 4862015 Annual 4,675 7,175 156 729 4,051 6,879 95 4442016 Jan 5,035 8,093 174 1,066 4,286 7,569 100 5342016 Feb 4,831 8,710 178 1,150 4,259 8,158 113 5722016 Mar 5,715 8,548 208 1,045 3,690 6,357 101 5022016 Apr 5,630 8,343 186 964 4,115 7,066 101 5092016 May 5,113 7,652 161 976 4,321 6,256 103 4772016 Jun 5,130 8,291 153 1,054 5,344 8,107 128 5852016 Jul 5,238 9,857 176 1,316 5,528 9,901 134 8802016 Aug 4,872 9,873 191 1,408 5,516 10,521 147 9522016 Sep 4,961 10,952 204 1,519 5,624 10,368 149 9262016 Oct 5,227 9,660 260 1,345 5,224 10,207 148 7922016 Nov 5,473 9,294 222 1,169 4,446 8,521 130 6532016 Dec 5,250 9,238 196 1,262 5,283 10,344 128 7602016 Annual 5,207 9,043 193 1,190 4,805 8,618 123 679
Table 3-35 shows the average hourly number of up to congestion transactions and the average hourly MW in 2015 and 2016. In 2016, the average hourly up to congestion submitted MW increased 70.3 percent and cleared MW increased 78.6 percent, compared to 2015, as a result of the expiration of the fifteen month potential refund period for the proceeding related to uplift charges for UTC transactions in December 2015.57
57 See 148 FERC ¶ 61,144 (2014); 16 U.S.C. § 824e.
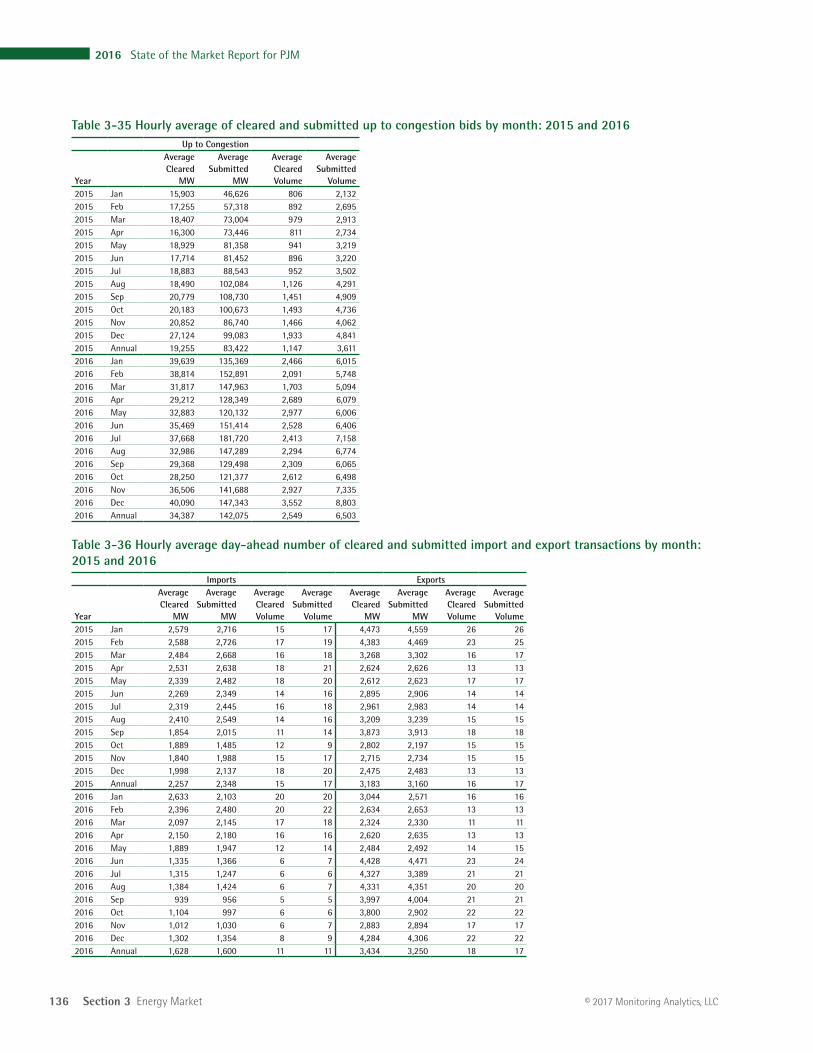
136 Section 3 Energy Market
2016 State of the Market Report for PJM
© 2017 Monitoring Analytics, LLC
Table 3-35 Hourly average of cleared and submitted up to congestion bids by month: 2015 and 2016Up to Congestion
Year
Average Cleared
MW
Average Submitted
MW
Average Cleared Volume
Average Submitted
Volume2015 Jan 15,903 46,626 806 2,1322015 Feb 17,255 57,318 892 2,6952015 Mar 18,407 73,004 979 2,9132015 Apr 16,300 73,446 811 2,7342015 May 18,929 81,358 941 3,2192015 Jun 17,714 81,452 896 3,2202015 Jul 18,883 88,543 952 3,5022015 Aug 18,490 102,084 1,126 4,2912015 Sep 20,779 108,730 1,451 4,9092015 Oct 20,183 100,673 1,493 4,7362015 Nov 20,852 86,740 1,466 4,0622015 Dec 27,124 99,083 1,933 4,8412015 Annual 19,255 83,422 1,147 3,6112016 Jan 39,639 135,369 2,466 6,0152016 Feb 38,814 152,891 2,091 5,7482016 Mar 31,817 147,963 1,703 5,0942016 Apr 29,212 128,349 2,689 6,0792016 May 32,883 120,132 2,977 6,0062016 Jun 35,469 151,414 2,528 6,4062016 Jul 37,668 181,720 2,413 7,1582016 Aug 32,986 147,289 2,294 6,7742016 Sep 29,368 129,498 2,309 6,0652016 Oct 28,250 121,377 2,612 6,4982016 Nov 36,506 141,688 2,927 7,3352016 Dec 40,090 147,343 3,552 8,8032016 Annual 34,387 142,075 2,549 6,503
Table 3-36 Hourly average day-ahead number of cleared and submitted import and export transactions by month: 2015 and 2016
Imports Exports
Year
Average Cleared
MW
Average Submitted
MW
Average Cleared Volume
Average Submitted
Volume
Average Cleared
MW
Average Submitted
MW
Average Cleared Volume
Average Submitted
Volume2015 Jan 2,579 2,716 15 17 4,473 4,559 26 262015 Feb 2,588 2,726 17 19 4,383 4,469 23 252015 Mar 2,484 2,668 16 18 3,268 3,302 16 172015 Apr 2,531 2,638 18 21 2,624 2,626 13 132015 May 2,339 2,482 18 20 2,612 2,623 17 172015 Jun 2,269 2,349 14 16 2,895 2,906 14 142015 Jul 2,319 2,445 16 18 2,961 2,983 14 142015 Aug 2,410 2,549 14 16 3,209 3,239 15 152015 Sep 1,854 2,015 11 14 3,873 3,913 18 182015 Oct 1,889 1,485 12 9 2,802 2,197 15 152015 Nov 1,840 1,988 15 17 2,715 2,734 15 152015 Dec 1,998 2,137 18 20 2,475 2,483 13 132015 Annual 2,257 2,348 15 17 3,183 3,160 16 172016 Jan 2,633 2,103 20 20 3,044 2,571 16 162016 Feb 2,396 2,480 20 22 2,634 2,653 13 132016 Mar 2,097 2,145 17 18 2,324 2,330 11 112016 Apr 2,150 2,180 16 16 2,620 2,635 13 132016 May 1,889 1,947 12 14 2,484 2,492 14 152016 Jun 1,335 1,366 6 7 4,428 4,471 23 242016 Jul 1,315 1,247 6 6 4,327 3,389 21 212016 Aug 1,384 1,424 6 7 4,331 4,351 20 202016 Sep 939 956 5 5 3,997 4,004 21 212016 Oct 1,104 997 6 6 3,800 2,902 22 222016 Nov 1,012 1,030 6 7 2,883 2,894 17 172016 Dec 1,302 1,354 8 9 4,284 4,306 22 222016 Annual 1,628 1,600 11 11 3,434 3,250 18 17
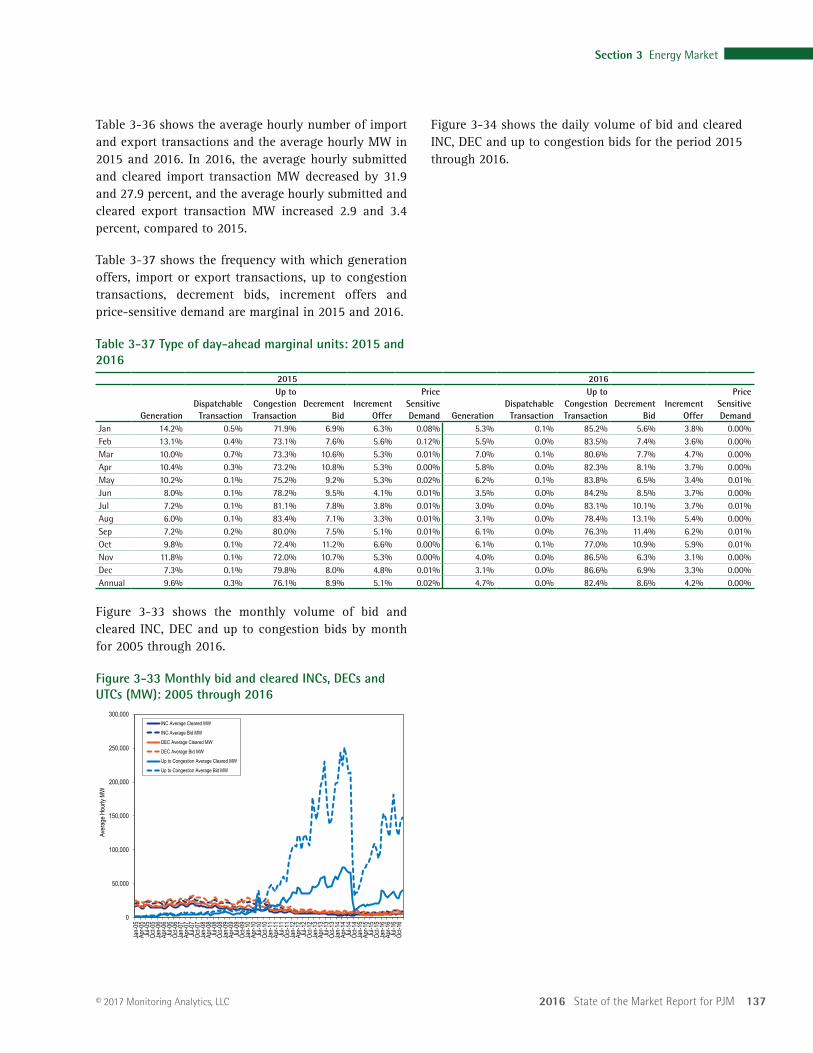
2016 State of the Market Report for PJM 137
Section 3 Energy Market
© 2017 Monitoring Analytics, LLC
Figure 3-34 shows the daily volume of bid and cleared INC, DEC and up to congestion bids for the period 2015 through 2016.
Table 3-36 shows the average hourly number of import and export transactions and the average hourly MW in 2015 and 2016. In 2016, the average hourly submitted and cleared import transaction MW decreased by 31.9 and 27.9 percent, and the average hourly submitted and cleared export transaction MW increased 2.9 and 3.4 percent, compared to 2015.
Table 3-37 shows the frequency with which generation offers, import or export transactions, up to congestion transactions, decrement bids, increment offers and price-sensitive demand are marginal in 2015 and 2016.
Table 3-37 Type of day-ahead marginal units: 2015 and 2016
2015 2016
GenerationDispatchable Transaction
Up to Congestion Transaction
Decrement
BidIncrement
Offer
Price Sensitive Demand Generation
Dispatchable Transaction
Up to Congestion Transaction
Decrement
BidIncrement
Offer
Price Sensitive Demand
Jan 14.2% 0.5% 71.9% 6.9% 6.3% 0.08% 5.3% 0.1% 85.2% 5.6% 3.8% 0.00%Feb 13.1% 0.4% 73.1% 7.6% 5.6% 0.12% 5.5% 0.0% 83.5% 7.4% 3.6% 0.00%Mar 10.0% 0.7% 73.3% 10.6% 5.3% 0.01% 7.0% 0.1% 80.6% 7.7% 4.7% 0.00%Apr 10.4% 0.3% 73.2% 10.8% 5.3% 0.00% 5.8% 0.0% 82.3% 8.1% 3.7% 0.00%May 10.2% 0.1% 75.2% 9.2% 5.3% 0.02% 6.2% 0.1% 83.8% 6.5% 3.4% 0.01%Jun 8.0% 0.1% 78.2% 9.5% 4.1% 0.01% 3.5% 0.0% 84.2% 8.5% 3.7% 0.00%Jul 7.2% 0.1% 81.1% 7.8% 3.8% 0.01% 3.0% 0.0% 83.1% 10.1% 3.7% 0.01%Aug 6.0% 0.1% 83.4% 7.1% 3.3% 0.01% 3.1% 0.0% 78.4% 13.1% 5.4% 0.00%Sep 7.2% 0.2% 80.0% 7.5% 5.1% 0.01% 6.1% 0.0% 76.3% 11.4% 6.2% 0.01%Oct 9.8% 0.1% 72.4% 11.2% 6.6% 0.00% 6.1% 0.1% 77.0% 10.9% 5.9% 0.01%Nov 11.8% 0.1% 72.0% 10.7% 5.3% 0.00% 4.0% 0.0% 86.5% 6.3% 3.1% 0.00%Dec 7.3% 0.1% 79.8% 8.0% 4.8% 0.01% 3.1% 0.0% 86.6% 6.9% 3.3% 0.00%Annual 9.6% 0.3% 76.1% 8.9% 5.1% 0.02% 4.7% 0.0% 82.4% 8.6% 4.2% 0.00%
Figure 3-33 shows the monthly volume of bid and cleared INC, DEC and up to congestion bids by month for 2005 through 2016.
Figure 3-33 Monthly bid and cleared INCs, DECs and UTCs (MW): 2005 through 2016
0
50,000
100,000
150,000
200,000
250,000
300,000
Jan-
05Ap
r-05
Jul-0
5Oc
t-05
Jan-
06Ap
r-06
Jul-0
6Oc
t-06
Jan-
07Ap
r-07
Jul-0
7Oc
t-07
Jan-
08Ap
r-08
Jul-0
8Oc
t-08
Jan-
09Ap
r-09
Jul-0
9Oc
t-09
Jan-
10Ap
r-10
Jul-1
0Oc
t-10
Jan-
11Ap
r-11
Jul-1
1Oc
t-11
Jan-
12Ap
r-12
Jul-1
2Oc
t-12
Jan-
13Ap
r-13
Jul-1
3Oc
t-13
Jan-
14Ap
r-14
Jul-1
4Oc
t-14
Jan-
15Ap
r-15
Jul-1
5Oc
t-15
Jan-
16Ap
r-16
Jul-1
6Oc
t-16
Aver
age H
ourly
MW
INC Average Cleared MW
INC Average Bid MW
DEC Average Cleared MW
DEC Average Bid MW
Up to Congestion Average Cleared MW
Up to Congestion Average Bid MW
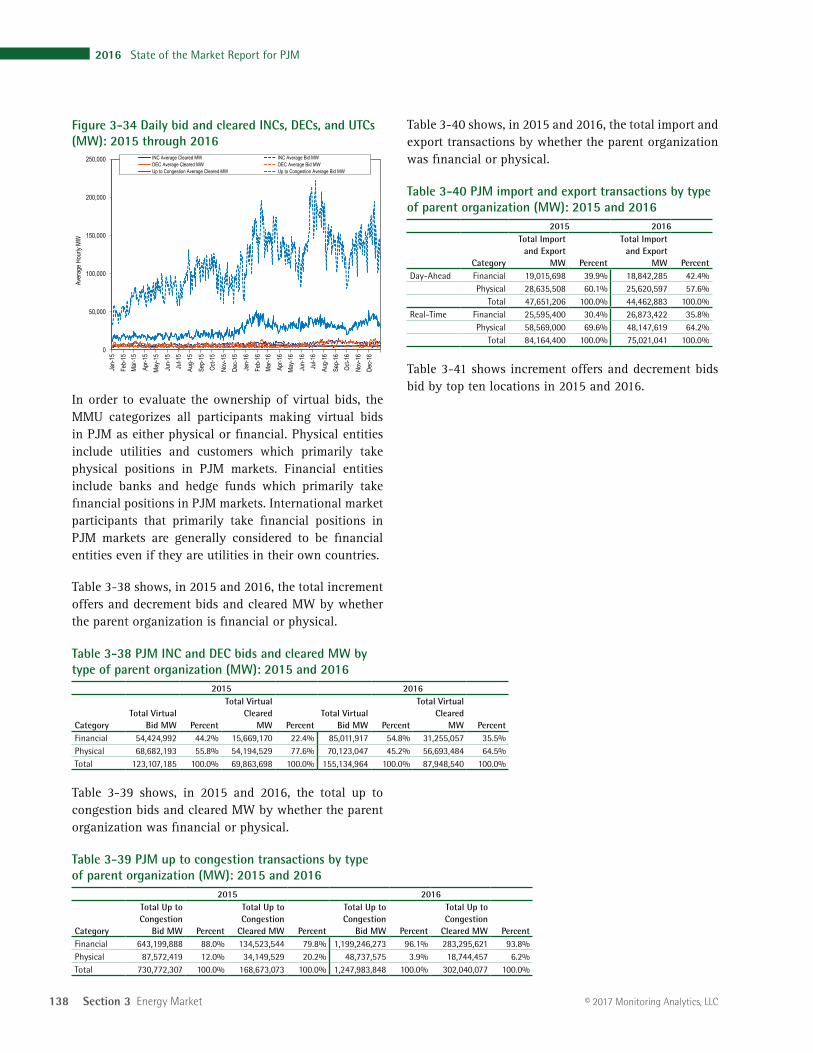
138 Section 3 Energy Market
2016 State of the Market Report for PJM
© 2017 Monitoring Analytics, LLC
Table 3-40 shows, in 2015 and 2016, the total import and export transactions by whether the parent organization was financial or physical.
Table 3-40 PJM import and export transactions by type of parent organization (MW): 2015 and 2016
2015 2016
Category
Total Import and Export
MW Percent
Total Import and Export
MW PercentDay-Ahead Financial 19,015,698 39.9% 18,842,285 42.4%
Physical 28,635,508 60.1% 25,620,597 57.6%Total 47,651,206 100.0% 44,462,883 100.0%
Real-Time Financial 25,595,400 30.4% 26,873,422 35.8%Physical 58,569,000 69.6% 48,147,619 64.2%
Total 84,164,400 100.0% 75,021,041 100.0%
Table 3-41 shows increment offers and decrement bids bid by top ten locations in 2015 and 2016.
Figure 3-34 Daily bid and cleared INCs, DECs, and UTCs (MW): 2015 through 2016
0
50,000
100,000
150,000
200,000
250,000
Jan-
15Fe
b-15
Mar-1
5Ap
r-15
May-1
5Ju
n-15
Jul-1
5Au
g-15
Sep-
15Oc
t-15
Nov-1
5De
c-15
Jan-
16Fe
b-16
Mar-1
6Ap
r-16
May-1
6Ju
n-16
Jul-1
6Au
g-16
Sep-
16Oc
t-16
Nov-1
6De
c-16
Aver
age H
ourly
MW
INC Average Cleared MW INC Average Bid MWDEC Average Cleared MW DEC Average Bid MWUp to Congestion Average Cleared MW Up to Congestion Average Bid MW
In order to evaluate the ownership of virtual bids, the MMU categorizes all participants making virtual bids in PJM as either physical or financial. Physical entities include utilities and customers which primarily take physical positions in PJM markets. Financial entities include banks and hedge funds which primarily take financial positions in PJM markets. International market participants that primarily take financial positions in PJM markets are generally considered to be financial entities even if they are utilities in their own countries.
Table 3-38 shows, in 2015 and 2016, the total increment offers and decrement bids and cleared MW by whether the parent organization is financial or physical.
Table 3-38 PJM INC and DEC bids and cleared MW by type of parent organization (MW): 2015 and 2016
2015 2016
CategoryTotal Virtual
Bid MW Percent
Total Virtual Cleared
MW PercentTotal Virtual
Bid MW Percent
Total Virtual Cleared
MW PercentFinancial 54,424,992 44.2% 15,669,170 22.4% 85,011,917 54.8% 31,255,057 35.5%Physical 68,682,193 55.8% 54,194,529 77.6% 70,123,047 45.2% 56,693,484 64.5%Total 123,107,185 100.0% 69,863,698 100.0% 155,134,964 100.0% 87,948,540 100.0%
Table 3-39 shows, in 2015 and 2016, the total up to congestion bids and cleared MW by whether the parent organization was financial or physical.
Table 3-39 PJM up to congestion transactions by type of parent organization (MW): 2015 and 2016
2015 2016
Category
Total Up to Congestion
Bid MW Percent
Total Up to Congestion
Cleared MW Percent
Total Up to Congestion
Bid MW Percent
Total Up to Congestion
Cleared MW PercentFinancial 643,199,888 88.0% 134,523,544 79.8% 1,199,246,273 96.1% 283,295,621 93.8%Physical 87,572,419 12.0% 34,149,529 20.2% 48,737,575 3.9% 18,744,457 6.2%Total 730,772,307 100.0% 168,673,073 100.0% 1,247,983,848 100.0% 302,040,077 100.0%
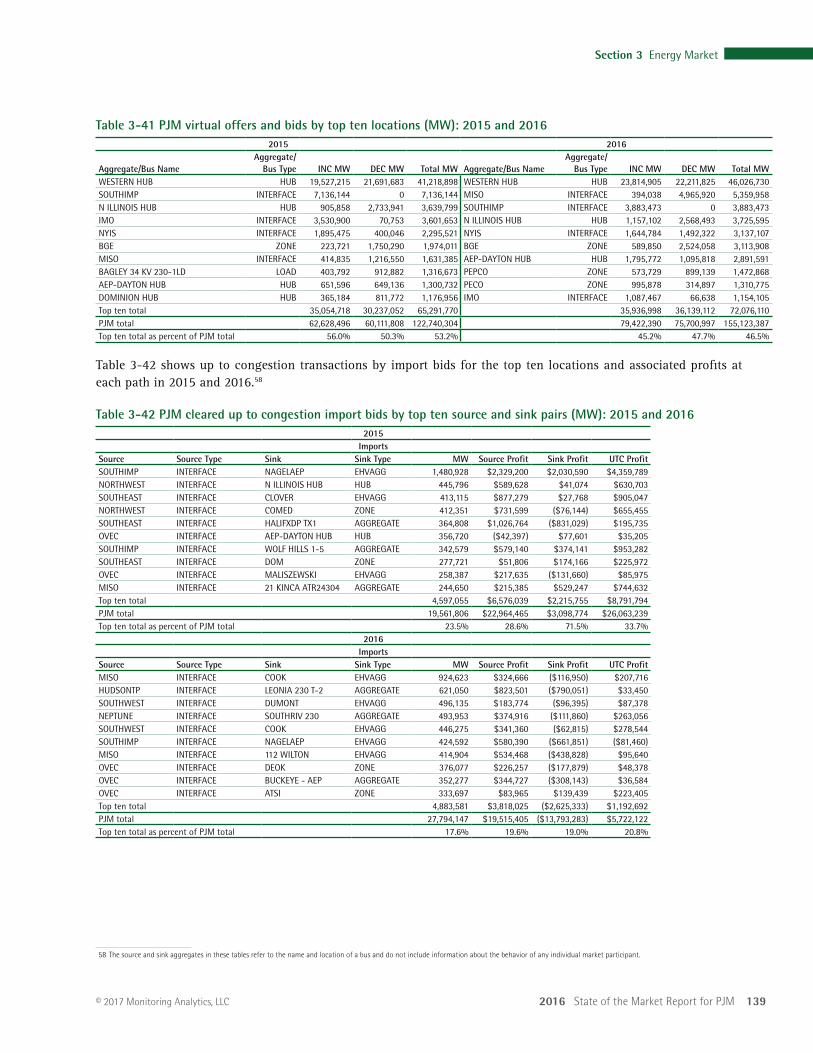
2016 State of the Market Report for PJM 139
Section 3 Energy Market
© 2017 Monitoring Analytics, LLC
Table 3-41 PJM virtual offers and bids by top ten locations (MW): 2015 and 20162015 2016
Aggregate/Bus NameAggregate/
Bus Type INC MW DEC MW Total MW Aggregate/Bus NameAggregate/
Bus Type INC MW DEC MW Total MWWESTERN HUB HUB 19,527,215 21,691,683 41,218,898 WESTERN HUB HUB 23,814,905 22,211,825 46,026,730SOUTHIMP INTERFACE 7,136,144 0 7,136,144 MISO INTERFACE 394,038 4,965,920 5,359,958N ILLINOIS HUB HUB 905,858 2,733,941 3,639,799 SOUTHIMP INTERFACE 3,883,473 0 3,883,473IMO INTERFACE 3,530,900 70,753 3,601,653 N ILLINOIS HUB HUB 1,157,102 2,568,493 3,725,595NYIS INTERFACE 1,895,475 400,046 2,295,521 NYIS INTERFACE 1,644,784 1,492,322 3,137,107BGE ZONE 223,721 1,750,290 1,974,011 BGE ZONE 589,850 2,524,058 3,113,908MISO INTERFACE 414,835 1,216,550 1,631,385 AEP-DAYTON HUB HUB 1,795,772 1,095,818 2,891,591BAGLEY 34 KV 230-1LD LOAD 403,792 912,882 1,316,673 PEPCO ZONE 573,729 899,139 1,472,868AEP-DAYTON HUB HUB 651,596 649,136 1,300,732 PECO ZONE 995,878 314,897 1,310,775DOMINION HUB HUB 365,184 811,772 1,176,956 IMO INTERFACE 1,087,467 66,638 1,154,105Top ten total 35,054,718 30,237,052 65,291,770 35,936,998 36,139,112 72,076,110PJM total 62,628,496 60,111,808 122,740,304 79,422,390 75,700,997 155,123,387Top ten total as percent of PJM total 56.0% 50.3% 53.2% 45.2% 47.7% 46.5%
Table 3-42 shows up to congestion transactions by import bids for the top ten locations and associated profits at each path in 2015 and 2016.58
Table 3-42 PJM cleared up to congestion import bids by top ten source and sink pairs (MW): 2015 and 20162015
ImportsSource Source Type Sink Sink Type MW Source Profit Sink Profit UTC ProfitSOUTHIMP INTERFACE NAGELAEP EHVAGG 1,480,928 $2,329,200 $2,030,590 $4,359,789 NORTHWEST INTERFACE N ILLINOIS HUB HUB 445,796 $589,628 $41,074 $630,703 SOUTHEAST INTERFACE CLOVER EHVAGG 413,115 $877,279 $27,768 $905,047 NORTHWEST INTERFACE COMED ZONE 412,351 $731,599 ($76,144) $655,455 SOUTHEAST INTERFACE HALIFXDP TX1 AGGREGATE 364,808 $1,026,764 ($831,029) $195,735 OVEC INTERFACE AEP-DAYTON HUB HUB 356,720 ($42,397) $77,601 $35,205 SOUTHIMP INTERFACE WOLF HILLS 1-5 AGGREGATE 342,579 $579,140 $374,141 $953,282 SOUTHEAST INTERFACE DOM ZONE 277,721 $51,806 $174,166 $225,972 OVEC INTERFACE MALISZEWSKI EHVAGG 258,387 $217,635 ($131,660) $85,975 MISO INTERFACE 21 KINCA ATR24304 AGGREGATE 244,650 $215,385 $529,247 $744,632 Top ten total 4,597,055 $6,576,039 $2,215,755 $8,791,794 PJM total 19,561,806 $22,964,465 $3,098,774 $26,063,239 Top ten total as percent of PJM total 23.5% 28.6% 71.5% 33.7%
2016Imports
Source Source Type Sink Sink Type MW Source Profit Sink Profit UTC ProfitMISO INTERFACE COOK EHVAGG 924,623 $324,666 ($116,950) $207,716 HUDSONTP INTERFACE LEONIA 230 T-2 AGGREGATE 621,050 $823,501 ($790,051) $33,450 SOUTHWEST INTERFACE DUMONT EHVAGG 496,135 $183,774 ($96,395) $87,378 NEPTUNE INTERFACE SOUTHRIV 230 AGGREGATE 493,953 $374,916 ($111,860) $263,056 SOUTHWEST INTERFACE COOK EHVAGG 446,275 $341,360 ($62,815) $278,544 SOUTHIMP INTERFACE NAGELAEP EHVAGG 424,592 $580,390 ($661,851) ($81,460)MISO INTERFACE 112 WILTON EHVAGG 414,904 $534,468 ($438,828) $95,640 OVEC INTERFACE DEOK ZONE 376,077 $226,257 ($177,879) $48,378 OVEC INTERFACE BUCKEYE - AEP AGGREGATE 352,277 $344,727 ($308,143) $36,584 OVEC INTERFACE ATSI ZONE 333,697 $83,965 $139,439 $223,405 Top ten total 4,883,581 $3,818,025 ($2,625,333) $1,192,692 PJM total 27,794,147 $19,515,405 ($13,793,283) $5,722,122 Top ten total as percent of PJM total 17.6% 19.6% 19.0% 20.8%
58 The source and sink aggregates in these tables refer to the name and location of a bus and do not include information about the behavior of any individual market participant.
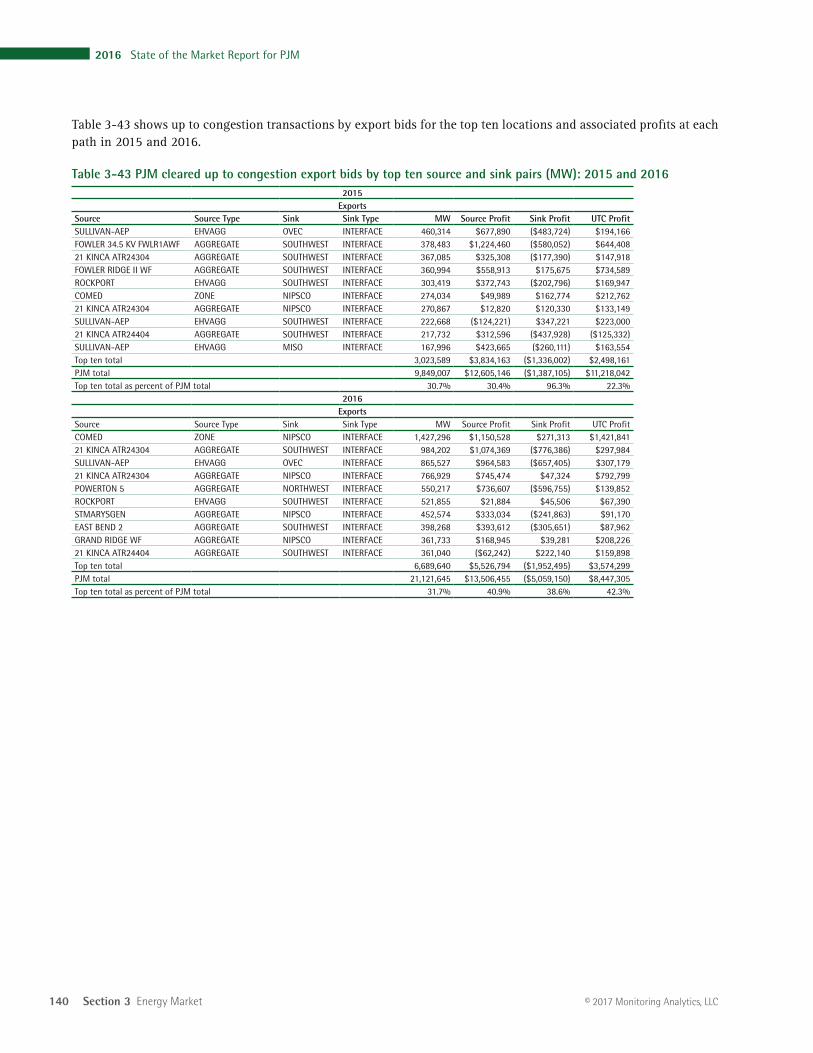
140 Section 3 Energy Market
2016 State of the Market Report for PJM
© 2017 Monitoring Analytics, LLC
Table 3-43 shows up to congestion transactions by export bids for the top ten locations and associated profits at each path in 2015 and 2016.
Table 3-43 PJM cleared up to congestion export bids by top ten source and sink pairs (MW): 2015 and 20162015
ExportsSource Source Type Sink Sink Type MW Source Profit Sink Profit UTC ProfitSULLIVAN-AEP EHVAGG OVEC INTERFACE 460,314 $677,890 ($483,724) $194,166 FOWLER 34.5 KV FWLR1AWF AGGREGATE SOUTHWEST INTERFACE 378,483 $1,224,460 ($580,052) $644,408 21 KINCA ATR24304 AGGREGATE SOUTHWEST INTERFACE 367,085 $325,308 ($177,390) $147,918 FOWLER RIDGE II WF AGGREGATE SOUTHWEST INTERFACE 360,994 $558,913 $175,675 $734,589 ROCKPORT EHVAGG SOUTHWEST INTERFACE 303,419 $372,743 ($202,796) $169,947 COMED ZONE NIPSCO INTERFACE 274,034 $49,989 $162,774 $212,762 21 KINCA ATR24304 AGGREGATE NIPSCO INTERFACE 270,867 $12,820 $120,330 $133,149 SULLIVAN-AEP EHVAGG SOUTHWEST INTERFACE 222,668 ($124,221) $347,221 $223,000 21 KINCA ATR24404 AGGREGATE SOUTHWEST INTERFACE 217,732 $312,596 ($437,928) ($125,332)SULLIVAN-AEP EHVAGG MISO INTERFACE 167,996 $423,665 ($260,111) $163,554 Top ten total 3,023,589 $3,834,163 ($1,336,002) $2,498,161 PJM total 9,849,007 $12,605,146 ($1,387,105) $11,218,042 Top ten total as percent of PJM total 30.7% 30.4% 96.3% 22.3%
2016Exports
Source Source Type Sink Sink Type MW Source Profit Sink Profit UTC ProfitCOMED ZONE NIPSCO INTERFACE 1,427,296 $1,150,528 $271,313 $1,421,841 21 KINCA ATR24304 AGGREGATE SOUTHWEST INTERFACE 984,202 $1,074,369 ($776,386) $297,984 SULLIVAN-AEP EHVAGG OVEC INTERFACE 865,527 $964,583 ($657,405) $307,179 21 KINCA ATR24304 AGGREGATE NIPSCO INTERFACE 766,929 $745,474 $47,324 $792,799 POWERTON 5 AGGREGATE NORTHWEST INTERFACE 550,217 $736,607 ($596,755) $139,852 ROCKPORT EHVAGG SOUTHWEST INTERFACE 521,855 $21,884 $45,506 $67,390 STMARYSGEN AGGREGATE NIPSCO INTERFACE 452,574 $333,034 ($241,863) $91,170 EAST BEND 2 AGGREGATE SOUTHWEST INTERFACE 398,268 $393,612 ($305,651) $87,962 GRAND RIDGE WF AGGREGATE NIPSCO INTERFACE 361,733 $168,945 $39,281 $208,226 21 KINCA ATR24404 AGGREGATE SOUTHWEST INTERFACE 361,040 ($62,242) $222,140 $159,898 Top ten total 6,689,640 $5,526,794 ($1,952,495) $3,574,299 PJM total 21,121,645 $13,506,455 ($5,059,150) $8,447,305 Top ten total as percent of PJM total 31.7% 40.9% 38.6% 42.3%
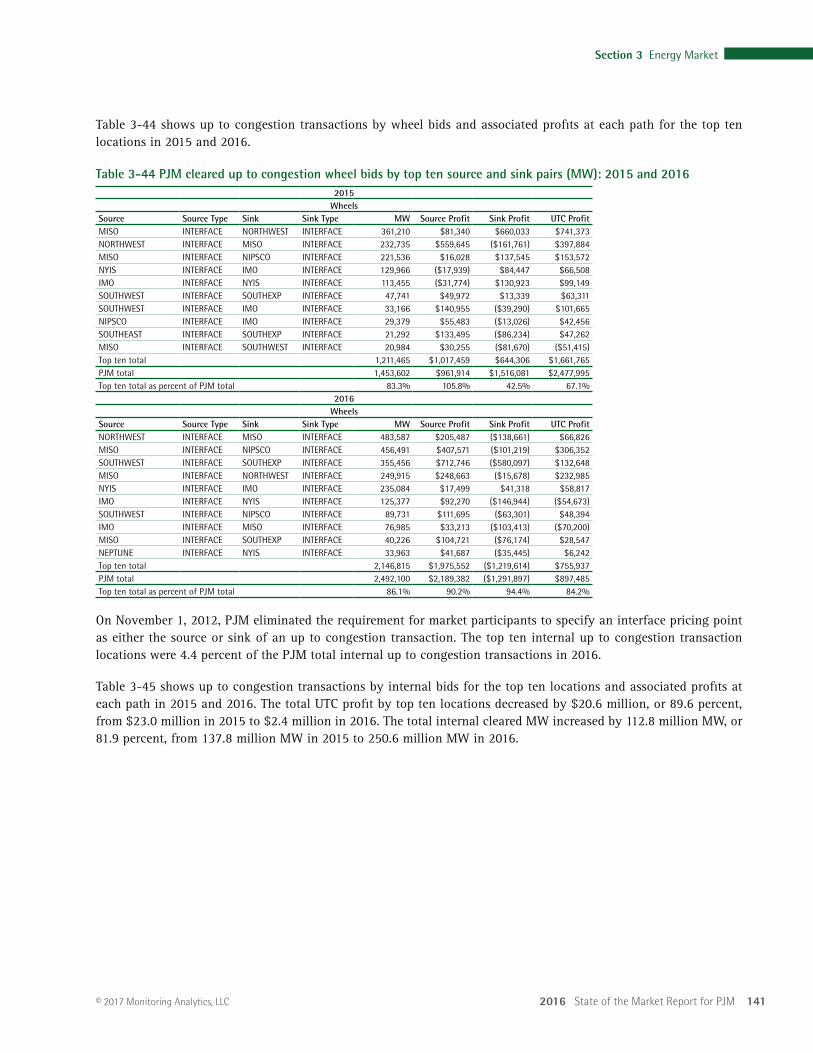
2016 State of the Market Report for PJM 141
Section 3 Energy Market
© 2017 Monitoring Analytics, LLC
Table 3-44 shows up to congestion transactions by wheel bids and associated profits at each path for the top ten locations in 2015 and 2016.
Table 3-44 PJM cleared up to congestion wheel bids by top ten source and sink pairs (MW): 2015 and 20162015
WheelsSource Source Type Sink Sink Type MW Source Profit Sink Profit UTC ProfitMISO INTERFACE NORTHWEST INTERFACE 361,210 $81,340 $660,033 $741,373 NORTHWEST INTERFACE MISO INTERFACE 232,735 $559,645 ($161,761) $397,884 MISO INTERFACE NIPSCO INTERFACE 221,536 $16,028 $137,545 $153,572 NYIS INTERFACE IMO INTERFACE 129,966 ($17,939) $84,447 $66,508 IMO INTERFACE NYIS INTERFACE 113,455 ($31,774) $130,923 $99,149 SOUTHWEST INTERFACE SOUTHEXP INTERFACE 47,741 $49,972 $13,339 $63,311 SOUTHWEST INTERFACE IMO INTERFACE 33,166 $140,955 ($39,290) $101,665 NIPSCO INTERFACE IMO INTERFACE 29,379 $55,483 ($13,026) $42,456 SOUTHEAST INTERFACE SOUTHEXP INTERFACE 21,292 $133,495 ($86,234) $47,262 MISO INTERFACE SOUTHWEST INTERFACE 20,984 $30,255 ($81,670) ($51,415)Top ten total 1,211,465 $1,017,459 $644,306 $1,661,765 PJM total 1,453,602 $961,914 $1,516,081 $2,477,995 Top ten total as percent of PJM total 83.3% 105.8% 42.5% 67.1%
2016Wheels
Source Source Type Sink Sink Type MW Source Profit Sink Profit UTC ProfitNORTHWEST INTERFACE MISO INTERFACE 483,587 $205,487 ($138,661) $66,826 MISO INTERFACE NIPSCO INTERFACE 456,491 $407,571 ($101,219) $306,352 SOUTHWEST INTERFACE SOUTHEXP INTERFACE 355,456 $712,746 ($580,097) $132,648 MISO INTERFACE NORTHWEST INTERFACE 249,915 $248,663 ($15,678) $232,985 NYIS INTERFACE IMO INTERFACE 235,084 $17,499 $41,318 $58,817 IMO INTERFACE NYIS INTERFACE 125,377 $92,270 ($146,944) ($54,673)SOUTHWEST INTERFACE NIPSCO INTERFACE 89,731 $111,695 ($63,301) $48,394 IMO INTERFACE MISO INTERFACE 76,985 $33,213 ($103,413) ($70,200)MISO INTERFACE SOUTHEXP INTERFACE 40,226 $104,721 ($76,174) $28,547 NEPTUNE INTERFACE NYIS INTERFACE 33,963 $41,687 ($35,445) $6,242 Top ten total 2,146,815 $1,975,552 ($1,219,614) $755,937 PJM total 2,492,100 $2,189,382 ($1,291,897) $897,485 Top ten total as percent of PJM total 86.1% 90.2% 94.4% 84.2%
On November 1, 2012, PJM eliminated the requirement for market participants to specify an interface pricing point as either the source or sink of an up to congestion transaction. The top ten internal up to congestion transaction locations were 4.4 percent of the PJM total internal up to congestion transactions in 2016.
Table 3-45 shows up to congestion transactions by internal bids for the top ten locations and associated profits at each path in 2015 and 2016. The total UTC profit by top ten locations decreased by $20.6 million, or 89.6 percent, from $23.0 million in 2015 to $2.4 million in 2016. The total internal cleared MW increased by 112.8 million MW, or 81.9 percent, from 137.8 million MW in 2015 to 250.6 million MW in 2016.
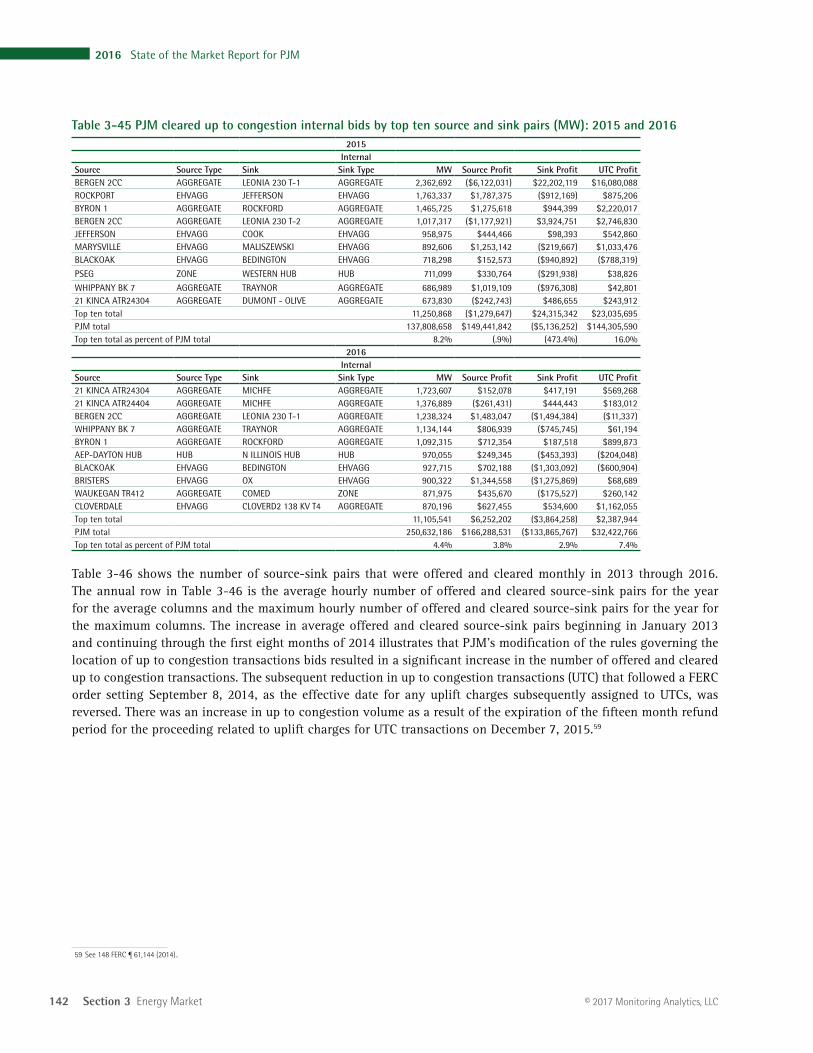
142 Section 3 Energy Market
2016 State of the Market Report for PJM
© 2017 Monitoring Analytics, LLC
Table 3-45 PJM cleared up to congestion internal bids by top ten source and sink pairs (MW): 2015 and 20162015
InternalSource Source Type Sink Sink Type MW Source Profit Sink Profit UTC ProfitBERGEN 2CC AGGREGATE LEONIA 230 T-1 AGGREGATE 2,362,692 ($6,122,031) $22,202,119 $16,080,088 ROCKPORT EHVAGG JEFFERSON EHVAGG 1,763,337 $1,787,375 ($912,169) $875,206 BYRON 1 AGGREGATE ROCKFORD AGGREGATE 1,465,725 $1,275,618 $944,399 $2,220,017 BERGEN 2CC AGGREGATE LEONIA 230 T-2 AGGREGATE 1,017,317 ($1,177,921) $3,924,751 $2,746,830 JEFFERSON EHVAGG COOK EHVAGG 958,975 $444,466 $98,393 $542,860 MARYSVILLE EHVAGG MALISZEWSKI EHVAGG 892,606 $1,253,142 ($219,667) $1,033,476 BLACKOAK EHVAGG BEDINGTON EHVAGG 718,298 $152,573 ($940,892) ($788,319)
PSEG ZONE WESTERN HUB HUB 711,099 $330,764 ($291,938) $38,826
WHIPPANY BK 7 AGGREGATE TRAYNOR AGGREGATE 686,989 $1,019,109 ($976,308) $42,801 21 KINCA ATR24304 AGGREGATE DUMONT - OLIVE AGGREGATE 673,830 ($242,743) $486,655 $243,912 Top ten total 11,250,868 ($1,279,647) $24,315,342 $23,035,695 PJM total 137,808,658 $149,441,842 ($5,136,252) $144,305,590 Top ten total as percent of PJM total 8.2% (.9%) (473.4%) 16.0%
2016Internal
Source Source Type Sink Sink Type MW Source Profit Sink Profit UTC Profit21 KINCA ATR24304 AGGREGATE MICHFE AGGREGATE 1,723,607 $152,078 $417,191 $569,268 21 KINCA ATR24404 AGGREGATE MICHFE AGGREGATE 1,376,889 ($261,431) $444,443 $183,012 BERGEN 2CC AGGREGATE LEONIA 230 T-1 AGGREGATE 1,238,324 $1,483,047 ($1,494,384) ($11,337)WHIPPANY BK 7 AGGREGATE TRAYNOR AGGREGATE 1,134,144 $806,939 ($745,745) $61,194 BYRON 1 AGGREGATE ROCKFORD AGGREGATE 1,092,315 $712,354 $187,518 $899,873 AEP-DAYTON HUB HUB N ILLINOIS HUB HUB 970,055 $249,345 ($453,393) ($204,048)BLACKOAK EHVAGG BEDINGTON EHVAGG 927,715 $702,188 ($1,303,092) ($600,904)BRISTERS EHVAGG OX EHVAGG 900,322 $1,344,558 ($1,275,869) $68,689 WAUKEGAN TR412 AGGREGATE COMED ZONE 871,975 $435,670 ($175,527) $260,142 CLOVERDALE EHVAGG CLOVERD2 138 KV T4 AGGREGATE 870,196 $627,455 $534,600 $1,162,055 Top ten total 11,105,541 $6,252,202 ($3,864,258) $2,387,944 PJM total 250,632,186 $166,288,531 ($133,865,767) $32,422,766 Top ten total as percent of PJM total 4.4% 3.8% 2.9% 7.4%
Table 3-46 shows the number of source-sink pairs that were offered and cleared monthly in 2013 through 2016. The annual row in Table 3-46 is the average hourly number of offered and cleared source-sink pairs for the year for the average columns and the maximum hourly number of offered and cleared source-sink pairs for the year for the maximum columns. The increase in average offered and cleared source-sink pairs beginning in January 2013 and continuing through the first eight months of 2014 illustrates that PJM’s modification of the rules governing the location of up to congestion transactions bids resulted in a significant increase in the number of offered and cleared up to congestion transactions. The subsequent reduction in up to congestion transactions (UTC) that followed a FERC order setting September 8, 2014, as the effective date for any uplift charges subsequently assigned to UTCs, was reversed. There was an increase in up to congestion volume as a result of the expiration of the fifteen month refund period for the proceeding related to uplift charges for UTC transactions on December 7, 2015.59
59 See 148 FERC ¶ 61,144 (2014)..
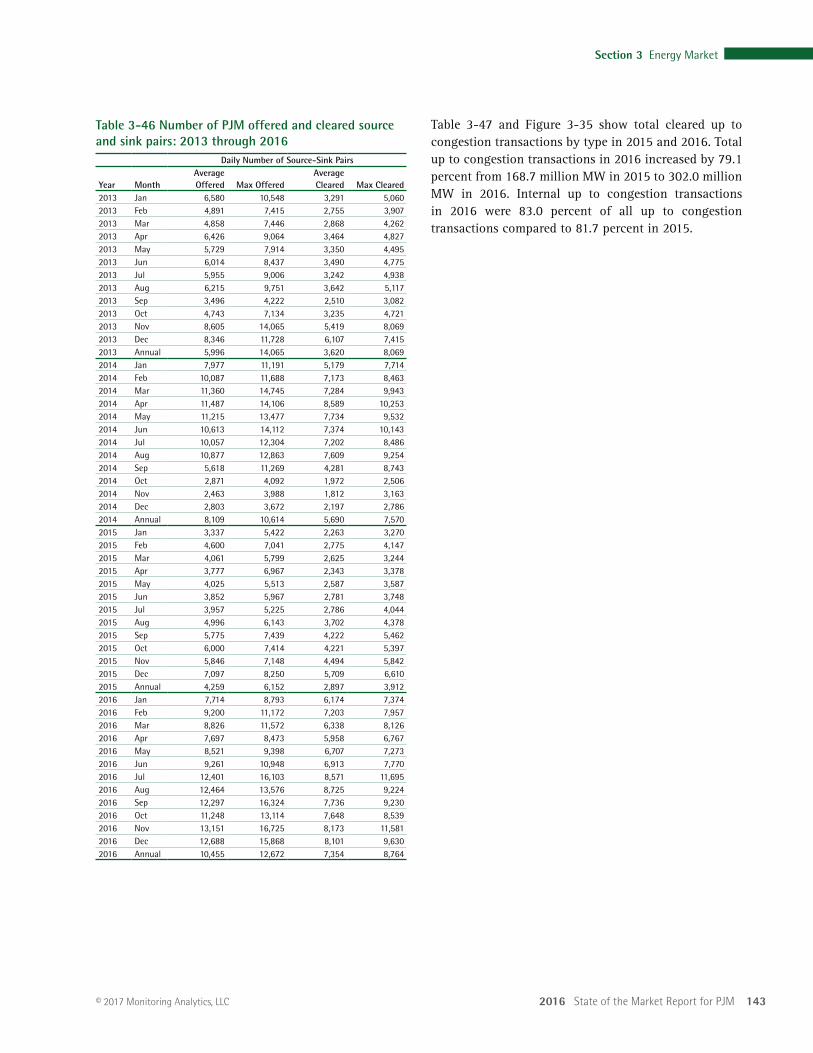
2016 State of the Market Report for PJM 143
Section 3 Energy Market
© 2017 Monitoring Analytics, LLC
Table 3-47 and Figure 3-35 show total cleared up to congestion transactions by type in 2015 and 2016. Total up to congestion transactions in 2016 increased by 79.1 percent from 168.7 million MW in 2015 to 302.0 million MW in 2016. Internal up to congestion transactions in 2016 were 83.0 percent of all up to congestion transactions compared to 81.7 percent in 2015.
Table 3-46 Number of PJM offered and cleared source and sink pairs: 2013 through 2016
Daily Number of Source-Sink Pairs
Year MonthAverage Offered Max Offered
Average Cleared Max Cleared
2013 Jan 6,580 10,548 3,291 5,0602013 Feb 4,891 7,415 2,755 3,9072013 Mar 4,858 7,446 2,868 4,2622013 Apr 6,426 9,064 3,464 4,8272013 May 5,729 7,914 3,350 4,4952013 Jun 6,014 8,437 3,490 4,7752013 Jul 5,955 9,006 3,242 4,9382013 Aug 6,215 9,751 3,642 5,1172013 Sep 3,496 4,222 2,510 3,0822013 Oct 4,743 7,134 3,235 4,7212013 Nov 8,605 14,065 5,419 8,0692013 Dec 8,346 11,728 6,107 7,4152013 Annual 5,996 14,065 3,620 8,0692014 Jan 7,977 11,191 5,179 7,7142014 Feb 10,087 11,688 7,173 8,4632014 Mar 11,360 14,745 7,284 9,9432014 Apr 11,487 14,106 8,589 10,2532014 May 11,215 13,477 7,734 9,5322014 Jun 10,613 14,112 7,374 10,1432014 Jul 10,057 12,304 7,202 8,4862014 Aug 10,877 12,863 7,609 9,2542014 Sep 5,618 11,269 4,281 8,7432014 Oct 2,871 4,092 1,972 2,5062014 Nov 2,463 3,988 1,812 3,1632014 Dec 2,803 3,672 2,197 2,7862014 Annual 8,109 10,614 5,690 7,5702015 Jan 3,337 5,422 2,263 3,2702015 Feb 4,600 7,041 2,775 4,1472015 Mar 4,061 5,799 2,625 3,2442015 Apr 3,777 6,967 2,343 3,3782015 May 4,025 5,513 2,587 3,5872015 Jun 3,852 5,967 2,781 3,7482015 Jul 3,957 5,225 2,786 4,0442015 Aug 4,996 6,143 3,702 4,3782015 Sep 5,775 7,439 4,222 5,4622015 Oct 6,000 7,414 4,221 5,3972015 Nov 5,846 7,148 4,494 5,8422015 Dec 7,097 8,250 5,709 6,6102015 Annual 4,259 6,152 2,897 3,9122016 Jan 7,714 8,793 6,174 7,3742016 Feb 9,200 11,172 7,203 7,9572016 Mar 8,826 11,572 6,338 8,1262016 Apr 7,697 8,473 5,958 6,7672016 May 8,521 9,398 6,707 7,2732016 Jun 9,261 10,948 6,913 7,7702016 Jul 12,401 16,103 8,571 11,6952016 Aug 12,464 13,576 8,725 9,2242016 Sep 12,297 16,324 7,736 9,2302016 Oct 11,248 13,114 7,648 8,5392016 Nov 13,151 16,725 8,173 11,5812016 Dec 12,688 15,868 8,101 9,6302016 Annual 10,455 12,672 7,354 8,764
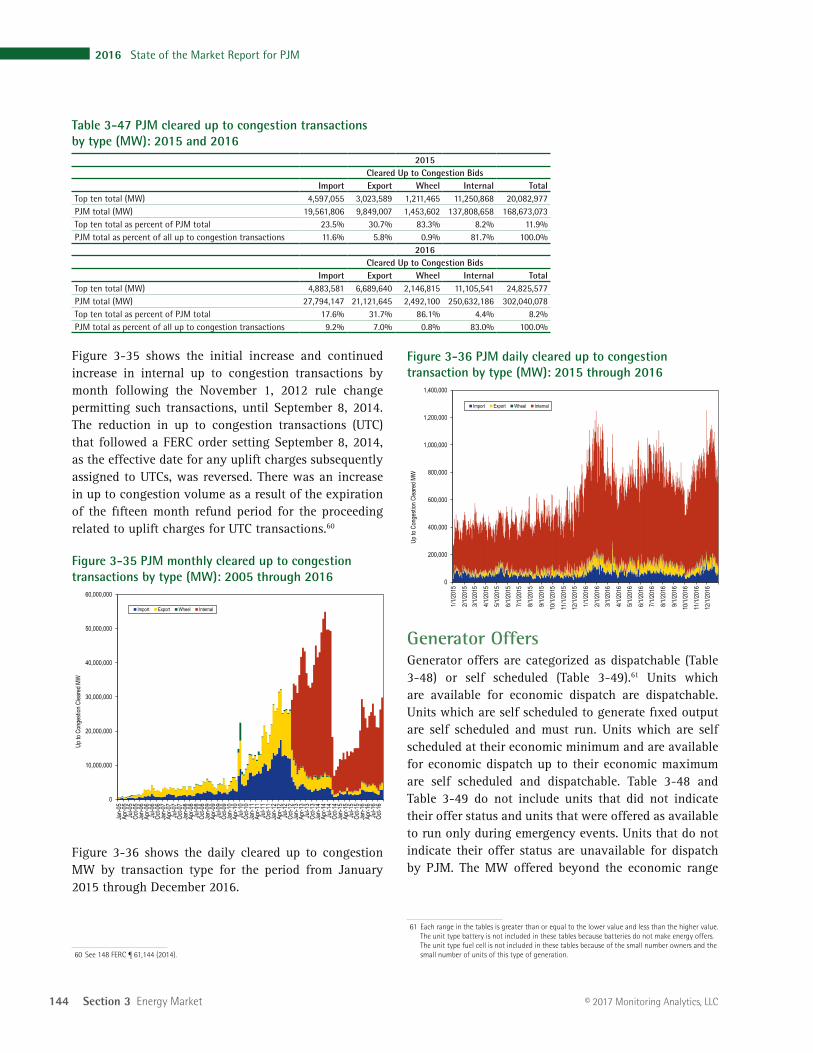
144 Section 3 Energy Market
2016 State of the Market Report for PJM
© 2017 Monitoring Analytics, LLC
Figure 3-36 PJM daily cleared up to congestion transaction by type (MW): 2015 through 2016
0
200,000
400,000
600,000
800,000
1,000,000
1,200,000
1,400,000
1/1/20
152/1
/2015
3/1/20
154/1
/2015
5/1/20
156/1
/2015
7/1/20
158/1
/2015
9/1/20
1510
/1/20
1511
/1/20
1512
/1/20
151/1
/2016
2/1/20
163/1
/2016
4/1/20
165/1
/2016
6/1/20
167/1
/2016
8/1/20
169/1
/2016
10/1/
2016
11/1/
2016
12/1/
2016
Up to
Con
gesti
on C
leare
d MW
Import Export Wheel Internal
Generator OffersGenerator offers are categorized as dispatchable (Table 3-48) or self scheduled (Table 3-49).61 Units which are available for economic dispatch are dispatchable. Units which are self scheduled to generate fixed output are self scheduled and must run. Units which are self scheduled at their economic minimum and are available for economic dispatch up to their economic maximum are self scheduled and dispatchable. Table 3-48 and Table 3-49 do not include units that did not indicate their offer status and units that were offered as available to run only during emergency events. Units that do not indicate their offer status are unavailable for dispatch by PJM. The MW offered beyond the economic range
61 Each range in the tables is greater than or equal to the lower value and less than the higher value. The unit type battery is not included in these tables because batteries do not make energy offers. The unit type fuel cell is not included in these tables because of the small number owners and the small number of units of this type of generation.
Table 3-47 PJM cleared up to congestion transactions by type (MW): 2015 and 2016
2015Cleared Up to Congestion Bids
Import Export Wheel Internal TotalTop ten total (MW) 4,597,055 3,023,589 1,211,465 11,250,868 20,082,977PJM total (MW) 19,561,806 9,849,007 1,453,602 137,808,658 168,673,073Top ten total as percent of PJM total 23.5% 30.7% 83.3% 8.2% 11.9%PJM total as percent of all up to congestion transactions 11.6% 5.8% 0.9% 81.7% 100.0%
2016Cleared Up to Congestion Bids
Import Export Wheel Internal TotalTop ten total (MW) 4,883,581 6,689,640 2,146,815 11,105,541 24,825,577PJM total (MW) 27,794,147 21,121,645 2,492,100 250,632,186 302,040,078Top ten total as percent of PJM total 17.6% 31.7% 86.1% 4.4% 8.2%PJM total as percent of all up to congestion transactions 9.2% 7.0% 0.8% 83.0% 100.0%
Figure 3-35 shows the initial increase and continued increase in internal up to congestion transactions by month following the November 1, 2012 rule change permitting such transactions, until September 8, 2014. The reduction in up to congestion transactions (UTC) that followed a FERC order setting September 8, 2014, as the effective date for any uplift charges subsequently assigned to UTCs, was reversed. There was an increase in up to congestion volume as a result of the expiration of the fifteen month refund period for the proceeding related to uplift charges for UTC transactions.60
Figure 3-35 PJM monthly cleared up to congestion transactions by type (MW): 2005 through 2016
0
10,000,000
20,000,000
30,000,000
40,000,000
50,000,000
60,000,000
Jan-
05Ap
r-05
Jul-0
5Oc
t-05
Jan-
06Ap
r-06
Jul-0
6Oc
t-06
Jan-
07Ap
r-07
Jul-0
7Oc
t-07
Jan-
08Ap
r-08
Jul-0
8Oc
t-08
Jan-
09Ap
r-09
Jul-0
9Oc
t-09
Jan-
10Ap
r-10
Jul-1
0Oc
t-10
Jan-
11Ap
r-11
Jul-1
1Oc
t-11
Jan-
12Ap
r-12
Jul-1
2Oc
t-12
Jan-
13Ap
r-13
Jul-1
3Oc
t-13
Jan-
14Ap
r-14
Jul-1
4Oc
t-14
Jan-
15Ap
r-15
Jul-1
5Oc
t-15
Jan-
16Ap
r-16
Jul-1
6Oc
t-16
Up to
Con
gesti
on C
leare
d MW
Import Export Wheel Internal
Figure 3-36 shows the daily cleared up to congestion MW by transaction type for the period from January 2015 through December 2016.
60 See 148 FERC ¶ 61,144 (2014).
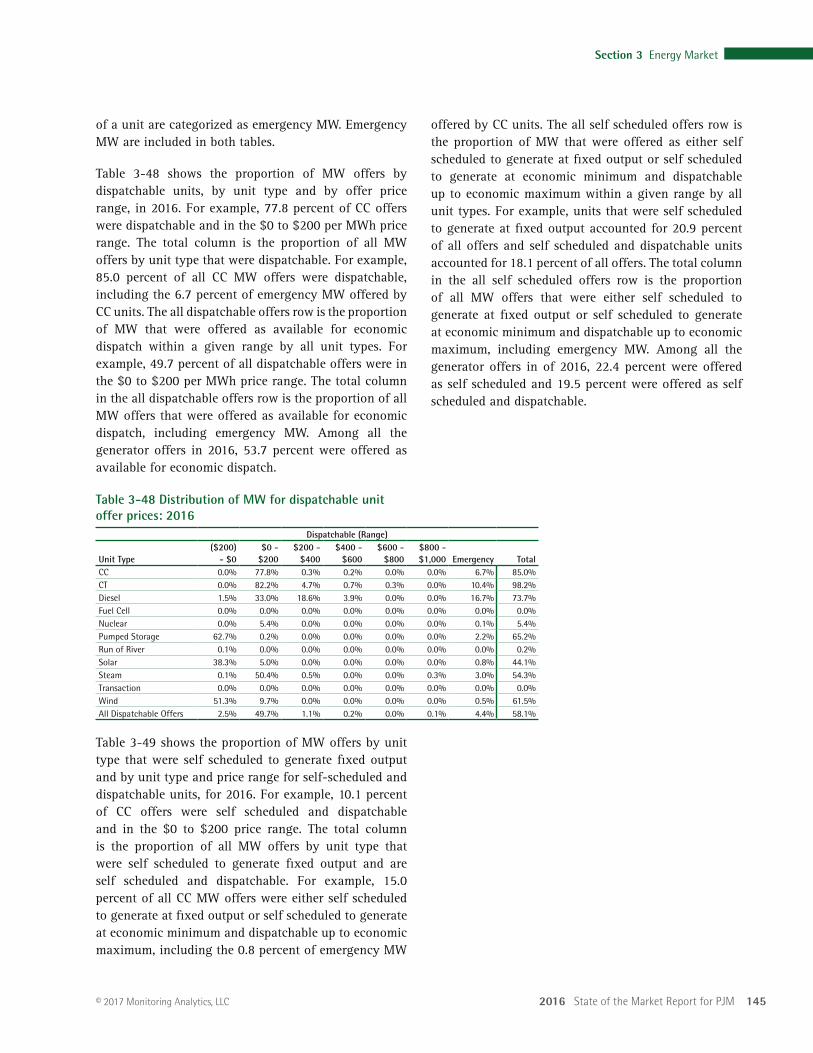
2016 State of the Market Report for PJM 145
Section 3 Energy Market
© 2017 Monitoring Analytics, LLC
offered by CC units. The all self scheduled offers row is the proportion of MW that were offered as either self scheduled to generate at fixed output or self scheduled to generate at economic minimum and dispatchable up to economic maximum within a given range by all unit types. For example, units that were self scheduled to generate at fixed output accounted for 20.9 percent of all offers and self scheduled and dispatchable units accounted for 18.1 percent of all offers. The total column in the all self scheduled offers row is the proportion of all MW offers that were either self scheduled to generate at fixed output or self scheduled to generate at economic minimum and dispatchable up to economic maximum, including emergency MW. Among all the generator offers in of 2016, 22.4 percent were offered as self scheduled and 19.5 percent were offered as self scheduled and dispatchable.
of a unit are categorized as emergency MW. Emergency MW are included in both tables.
Table 3-48 shows the proportion of MW offers by dispatchable units, by unit type and by offer price range, in 2016. For example, 77.8 percent of CC offers were dispatchable and in the $0 to $200 per MWh price range. The total column is the proportion of all MW offers by unit type that were dispatchable. For example, 85.0 percent of all CC MW offers were dispatchable, including the 6.7 percent of emergency MW offered by CC units. The all dispatchable offers row is the proportion of MW that were offered as available for economic dispatch within a given range by all unit types. For example, 49.7 percent of all dispatchable offers were in the $0 to $200 per MWh price range. The total column in the all dispatchable offers row is the proportion of all MW offers that were offered as available for economic dispatch, including emergency MW. Among all the generator offers in 2016, 53.7 percent were offered as available for economic dispatch.
Table 3-48 Distribution of MW for dispatchable unit offer prices: 2016
Dispatchable (Range)
Unit Type ($200)
- $0 $0 - $200
$200 - $400
$400 - $600
$600 - $800
$800 - $1,000 Emergency Total
CC 0.0% 77.8% 0.3% 0.2% 0.0% 0.0% 6.7% 85.0%CT 0.0% 82.2% 4.7% 0.7% 0.3% 0.0% 10.4% 98.2%Diesel 1.5% 33.0% 18.6% 3.9% 0.0% 0.0% 16.7% 73.7%Fuel Cell 0.0% 0.0% 0.0% 0.0% 0.0% 0.0% 0.0% 0.0%Nuclear 0.0% 5.4% 0.0% 0.0% 0.0% 0.0% 0.1% 5.4%Pumped Storage 62.7% 0.2% 0.0% 0.0% 0.0% 0.0% 2.2% 65.2%Run of River 0.1% 0.0% 0.0% 0.0% 0.0% 0.0% 0.0% 0.2%Solar 38.3% 5.0% 0.0% 0.0% 0.0% 0.0% 0.8% 44.1%Steam 0.1% 50.4% 0.5% 0.0% 0.0% 0.3% 3.0% 54.3%Transaction 0.0% 0.0% 0.0% 0.0% 0.0% 0.0% 0.0% 0.0%Wind 51.3% 9.7% 0.0% 0.0% 0.0% 0.0% 0.5% 61.5%All Dispatchable Offers 2.5% 49.7% 1.1% 0.2% 0.0% 0.1% 4.4% 58.1%
Table 3-49 shows the proportion of MW offers by unit type that were self scheduled to generate fixed output and by unit type and price range for self-scheduled and dispatchable units, for 2016. For example, 10.1 percent of CC offers were self scheduled and dispatchable and in the $0 to $200 price range. The total column is the proportion of all MW offers by unit type that were self scheduled to generate fixed output and are self scheduled and dispatchable. For example, 15.0 percent of all CC MW offers were either self scheduled to generate at fixed output or self scheduled to generate at economic minimum and dispatchable up to economic maximum, including the 0.8 percent of emergency MW
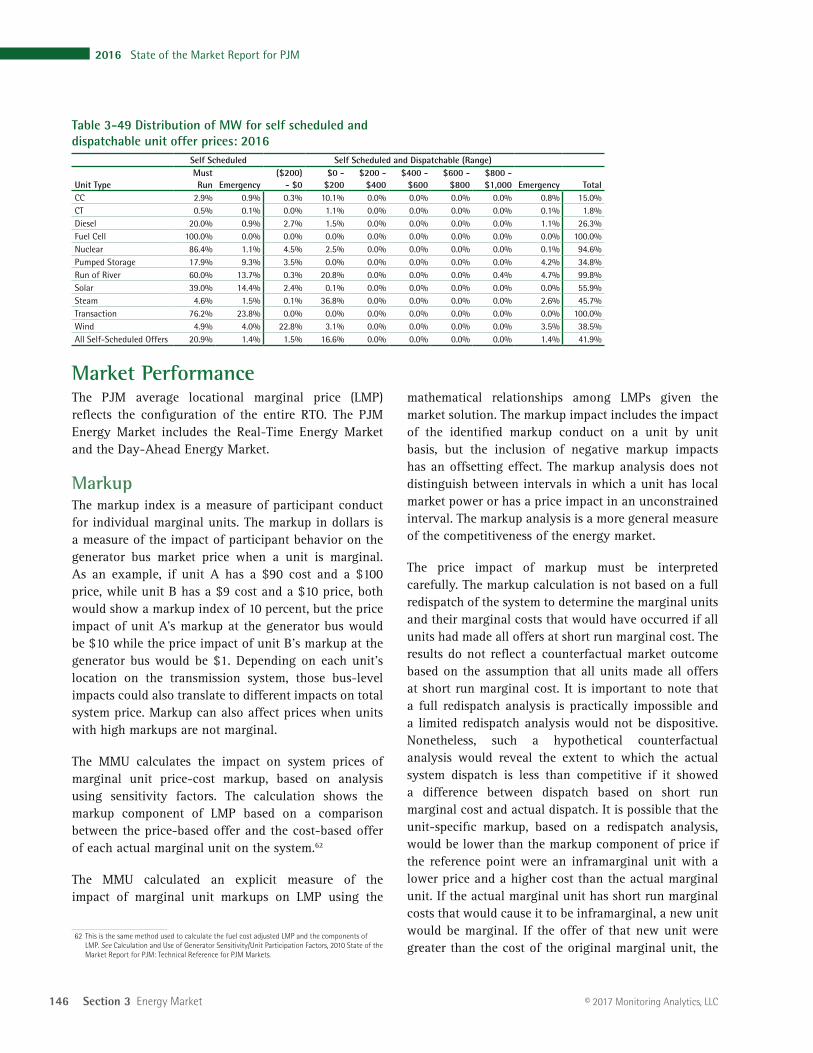
146 Section 3 Energy Market
2016 State of the Market Report for PJM
© 2017 Monitoring Analytics, LLC
mathematical relationships among LMPs given the market solution. The markup impact includes the impact of the identified markup conduct on a unit by unit basis, but the inclusion of negative markup impacts has an offsetting effect. The markup analysis does not distinguish between intervals in which a unit has local market power or has a price impact in an unconstrained interval. The markup analysis is a more general measure of the competitiveness of the energy market.
The price impact of markup must be interpreted carefully. The markup calculation is not based on a full redispatch of the system to determine the marginal units and their marginal costs that would have occurred if all units had made all offers at short run marginal cost. The results do not reflect a counterfactual market outcome based on the assumption that all units made all offers at short run marginal cost. It is important to note that a full redispatch analysis is practically impossible and a limited redispatch analysis would not be dispositive. Nonetheless, such a hypothetical counterfactual analysis would reveal the extent to which the actual system dispatch is less than competitive if it showed a difference between dispatch based on short run marginal cost and actual dispatch. It is possible that the unit-specific markup, based on a redispatch analysis, would be lower than the markup component of price if the reference point were an inframarginal unit with a lower price and a higher cost than the actual marginal unit. If the actual marginal unit has short run marginal costs that would cause it to be inframarginal, a new unit would be marginal. If the offer of that new unit were greater than the cost of the original marginal unit, the
Table 3-49 Distribution of MW for self scheduled and dispatchable unit offer prices: 2016
Self Scheduled Self Scheduled and Dispatchable (Range)
Unit TypeMust Run Emergency
($200) - $0
$0 - $200
$200 - $400
$400 - $600
$600 - $800
$800 - $1,000 Emergency Total
CC 2.9% 0.9% 0.3% 10.1% 0.0% 0.0% 0.0% 0.0% 0.8% 15.0%CT 0.5% 0.1% 0.0% 1.1% 0.0% 0.0% 0.0% 0.0% 0.1% 1.8%Diesel 20.0% 0.9% 2.7% 1.5% 0.0% 0.0% 0.0% 0.0% 1.1% 26.3%Fuel Cell 100.0% 0.0% 0.0% 0.0% 0.0% 0.0% 0.0% 0.0% 0.0% 100.0%Nuclear 86.4% 1.1% 4.5% 2.5% 0.0% 0.0% 0.0% 0.0% 0.1% 94.6%Pumped Storage 17.9% 9.3% 3.5% 0.0% 0.0% 0.0% 0.0% 0.0% 4.2% 34.8%Run of River 60.0% 13.7% 0.3% 20.8% 0.0% 0.0% 0.0% 0.4% 4.7% 99.8%Solar 39.0% 14.4% 2.4% 0.1% 0.0% 0.0% 0.0% 0.0% 0.0% 55.9%Steam 4.6% 1.5% 0.1% 36.8% 0.0% 0.0% 0.0% 0.0% 2.6% 45.7%Transaction 76.2% 23.8% 0.0% 0.0% 0.0% 0.0% 0.0% 0.0% 0.0% 100.0%Wind 4.9% 4.0% 22.8% 3.1% 0.0% 0.0% 0.0% 0.0% 3.5% 38.5%All Self-Scheduled Offers 20.9% 1.4% 1.5% 16.6% 0.0% 0.0% 0.0% 0.0% 1.4% 41.9%
Market PerformanceThe PJM average locational marginal price (LMP) reflects the configuration of the entire RTO. The PJM Energy Market includes the Real-Time Energy Market and the Day-Ahead Energy Market.
MarkupThe markup index is a measure of participant conduct for individual marginal units. The markup in dollars is a measure of the impact of participant behavior on the generator bus market price when a unit is marginal. As an example, if unit A has a $90 cost and a $100 price, while unit B has a $9 cost and a $10 price, both would show a markup index of 10 percent, but the price impact of unit A’s markup at the generator bus would be $10 while the price impact of unit B’s markup at the generator bus would be $1. Depending on each unit’s location on the transmission system, those bus-level impacts could also translate to different impacts on total system price. Markup can also affect prices when units with high markups are not marginal.
The MMU calculates the impact on system prices of marginal unit price-cost markup, based on analysis using sensitivity factors. The calculation shows the markup component of LMP based on a comparison between the price-based offer and the cost-based offer of each actual marginal unit on the system.62
The MMU calculated an explicit measure of the impact of marginal unit markups on LMP using the
62 This is the same method used to calculate the fuel cost adjusted LMP and the components of LMP. See Calculation and Use of Generator Sensitivity/Unit Participation Factors, 2010 State of the Market Report for PJM: Technical Reference for PJM Markets.
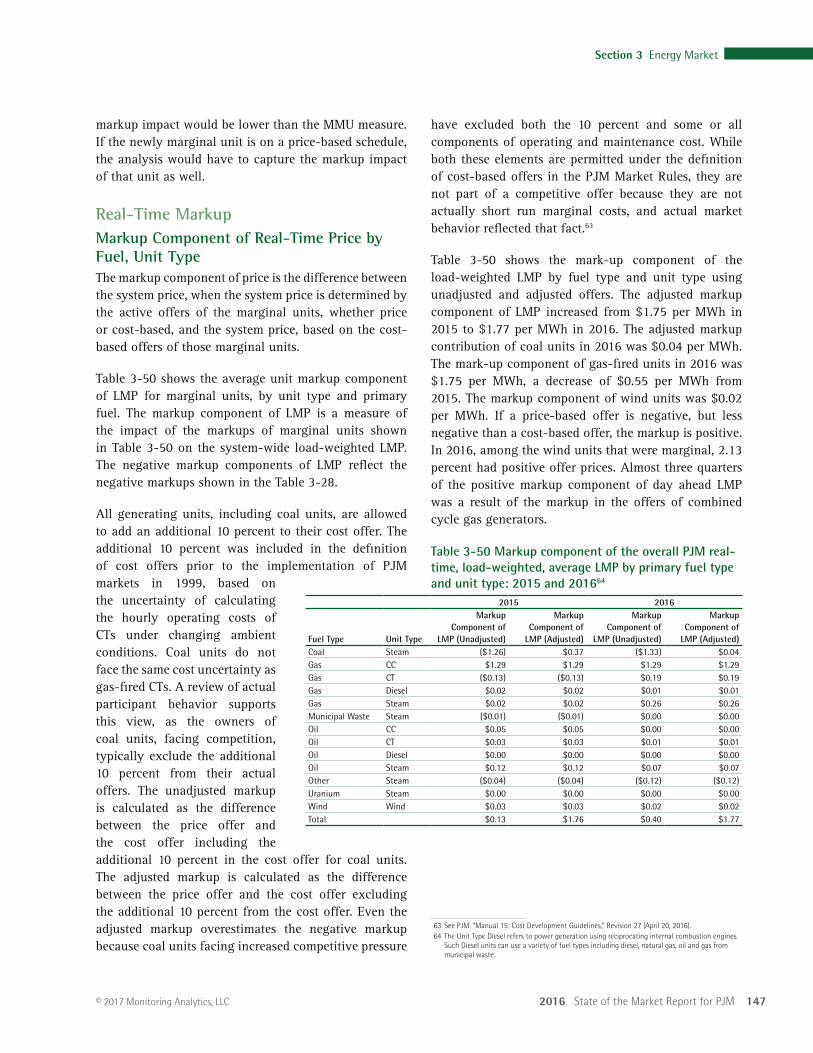
2016 State of the Market Report for PJM 147
Section 3 Energy Market
© 2017 Monitoring Analytics, LLC
markup impact would be lower than the MMU measure. If the newly marginal unit is on a price-based schedule, the analysis would have to capture the markup impact of that unit as well.
Real-Time MarkupMarkup Component of Real-Time Price by Fuel, Unit TypeThe markup component of price is the difference between the system price, when the system price is determined by the active offers of the marginal units, whether price or cost-based, and the system price, based on the cost-based offers of those marginal units.
Table 3-50 shows the average unit markup component of LMP for marginal units, by unit type and primary fuel. The markup component of LMP is a measure of the impact of the markups of marginal units shown in Table 3-50 on the system-wide load-weighted LMP. The negative markup components of LMP reflect the negative markups shown in the Table 3-28.
All generating units, including coal units, are allowed to add an additional 10 percent to their cost offer. The additional 10 percent was included in the definition of cost offers prior to the implementation of PJM markets in 1999, based on the uncertainty of calculating the hourly operating costs of CTs under changing ambient conditions. Coal units do not face the same cost uncertainty as gas-fired CTs. A review of actual participant behavior supports this view, as the owners of coal units, facing competition, typically exclude the additional 10 percent from their actual offers. The unadjusted markup is calculated as the difference between the price offer and the cost offer including the additional 10 percent in the cost offer for coal units. The adjusted markup is calculated as the difference between the price offer and the cost offer excluding the additional 10 percent from the cost offer. Even the adjusted markup overestimates the negative markup because coal units facing increased competitive pressure
have excluded both the 10 percent and some or all components of operating and maintenance cost. While both these elements are permitted under the definition of cost-based offers in the PJM Market Rules, they are not part of a competitive offer because they are not actually short run marginal costs, and actual market behavior reflected that fact.63
Table 3-50 shows the mark-up component of the load-weighted LMP by fuel type and unit type using unadjusted and adjusted offers. The adjusted markup component of LMP increased from $1.75 per MWh in 2015 to $1.77 per MWh in 2016. The adjusted markup contribution of coal units in 2016 was $0.04 per MWh. The mark-up component of gas-fired units in 2016 was $1.75 per MWh, a decrease of $0.55 per MWh from 2015. The markup component of wind units was $0.02 per MWh. If a price-based offer is negative, but less negative than a cost-based offer, the markup is positive. In 2016, among the wind units that were marginal, 2.13 percent had positive offer prices. Almost three quarters of the positive markup component of day ahead LMP was a result of the markup in the offers of combined cycle gas generators.
Table 3-50 Markup component of the overall PJM real-time, load-weighted, average LMP by primary fuel type and unit type: 2015 and 201664
2015 2016
Fuel Type Unit Type
Markup Component of
LMP (Unadjusted)
Markup Component of
LMP (Adjusted)
Markup Component of
LMP (Unadjusted)
Markup Component of
LMP (Adjusted)Coal Steam ($1.26) $0.37 ($1.33) $0.04 Gas CC $1.29 $1.29 $1.29 $1.29 Gas CT ($0.13) ($0.13) $0.19 $0.19 Gas Diesel $0.02 $0.02 $0.01 $0.01 Gas Steam $0.02 $0.02 $0.26 $0.26 Municipal Waste Steam ($0.01) ($0.01) $0.00 $0.00 Oil CC $0.05 $0.05 $0.00 $0.00 Oil CT $0.03 $0.03 $0.01 $0.01 Oil Diesel $0.00 $0.00 $0.00 $0.00 Oil Steam $0.12 $0.12 $0.07 $0.07 Other Steam ($0.04) ($0.04) ($0.12) ($0.12)Uranium Steam $0.00 $0.00 $0.00 $0.00 Wind Wind $0.03 $0.03 $0.02 $0.02 Total $0.13 $1.76 $0.40 $1.77
63 See PJM. “Manual 15: Cost Development Guidelines,” Revision 27 (April 20, 2016).64 The Unit Type Diesel refers to power generation using reciprocating internal combustion engines.
Such Diesel units can use a variety of fuel types including diesel, natural gas, oil and gas from municipal waste.
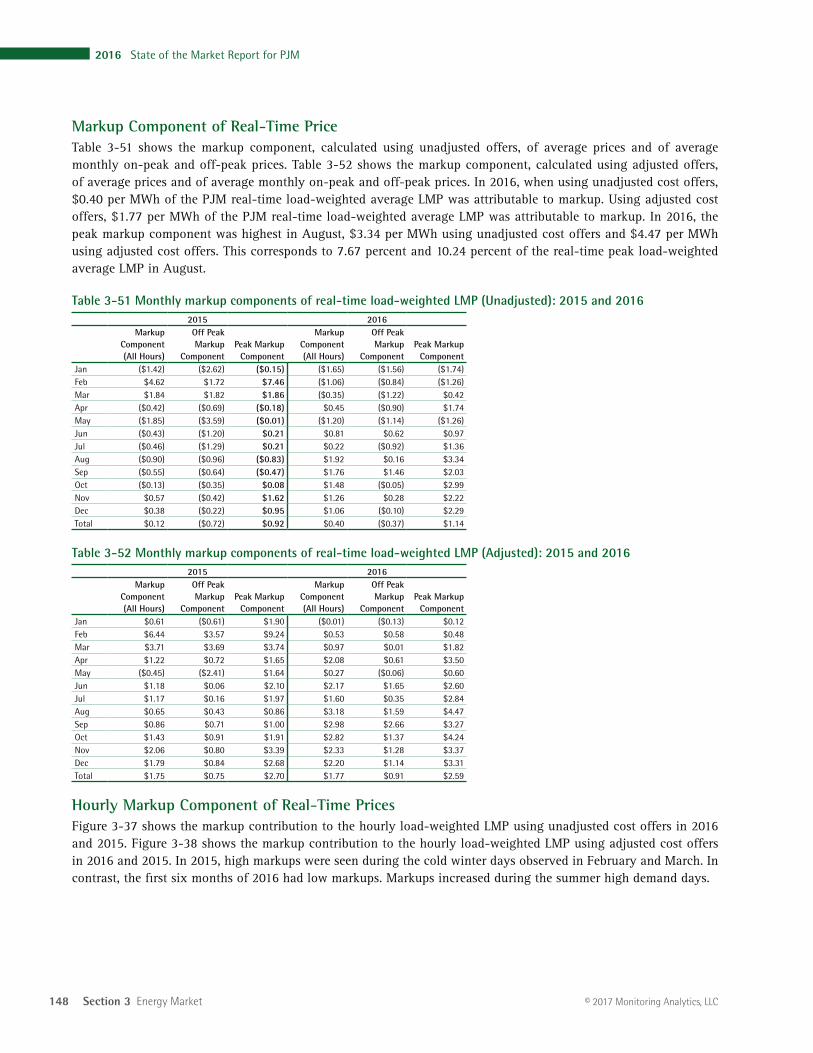
148 Section 3 Energy Market
2016 State of the Market Report for PJM
© 2017 Monitoring Analytics, LLC
Markup Component of Real-Time PriceTable 3-51 shows the markup component, calculated using unadjusted offers, of average prices and of average monthly on-peak and off-peak prices. Table 3-52 shows the markup component, calculated using adjusted offers, of average prices and of average monthly on-peak and off-peak prices. In 2016, when using unadjusted cost offers, $0.40 per MWh of the PJM real-time load-weighted average LMP was attributable to markup. Using adjusted cost offers, $1.77 per MWh of the PJM real-time load-weighted average LMP was attributable to markup. In 2016, the peak markup component was highest in August, $3.34 per MWh using unadjusted cost offers and $4.47 per MWh using adjusted cost offers. This corresponds to 7.67 percent and 10.24 percent of the real-time peak load-weighted average LMP in August.
Table 3-51 Monthly markup components of real-time load-weighted LMP (Unadjusted): 2015 and 20162015 2016
Markup Component (All Hours)
Off Peak Markup
ComponentPeak Markup
Component
Markup Component (All Hours)
Off Peak Markup
ComponentPeak Markup
ComponentJan ($1.42) ($2.62) ($0.15) ($1.65) ($1.56) ($1.74)Feb $4.62 $1.72 $7.46 ($1.06) ($0.84) ($1.26)Mar $1.84 $1.82 $1.86 ($0.35) ($1.22) $0.42 Apr ($0.42) ($0.69) ($0.18) $0.45 ($0.90) $1.74 May ($1.85) ($3.59) ($0.01) ($1.20) ($1.14) ($1.26)Jun ($0.43) ($1.20) $0.21 $0.81 $0.62 $0.97 Jul ($0.46) ($1.29) $0.21 $0.22 ($0.92) $1.36 Aug ($0.90) ($0.96) ($0.83) $1.92 $0.16 $3.34 Sep ($0.55) ($0.64) ($0.47) $1.76 $1.46 $2.03 Oct ($0.13) ($0.35) $0.08 $1.48 ($0.05) $2.99 Nov $0.57 ($0.42) $1.62 $1.26 $0.28 $2.22 Dec $0.38 ($0.22) $0.95 $1.06 ($0.10) $2.29 Total $0.12 ($0.72) $0.92 $0.40 ($0.37) $1.14
Table 3-52 Monthly markup components of real-time load-weighted LMP (Adjusted): 2015 and 20162015 2016
Markup Component (All Hours)
Off Peak Markup
ComponentPeak Markup
Component
Markup Component (All Hours)
Off Peak Markup
ComponentPeak Markup
ComponentJan $0.61 ($0.61) $1.90 ($0.01) ($0.13) $0.12 Feb $6.44 $3.57 $9.24 $0.53 $0.58 $0.48 Mar $3.71 $3.69 $3.74 $0.97 $0.01 $1.82 Apr $1.22 $0.72 $1.65 $2.08 $0.61 $3.50 May ($0.45) ($2.41) $1.64 $0.27 ($0.06) $0.60 Jun $1.18 $0.06 $2.10 $2.17 $1.65 $2.60 Jul $1.17 $0.16 $1.97 $1.60 $0.35 $2.84 Aug $0.65 $0.43 $0.86 $3.18 $1.59 $4.47 Sep $0.86 $0.71 $1.00 $2.98 $2.66 $3.27 Oct $1.43 $0.91 $1.91 $2.82 $1.37 $4.24 Nov $2.06 $0.80 $3.39 $2.33 $1.28 $3.37 Dec $1.79 $0.84 $2.68 $2.20 $1.14 $3.31 Total $1.75 $0.75 $2.70 $1.77 $0.91 $2.59
Hourly Markup Component of Real-Time PricesFigure 3-37 shows the markup contribution to the hourly load-weighted LMP using unadjusted cost offers in 2016 and 2015. Figure 3-38 shows the markup contribution to the hourly load-weighted LMP using adjusted cost offers in 2016 and 2015. In 2015, high markups were seen during the cold winter days observed in February and March. In contrast, the first six months of 2016 had low markups. Markups increased during the summer high demand days.
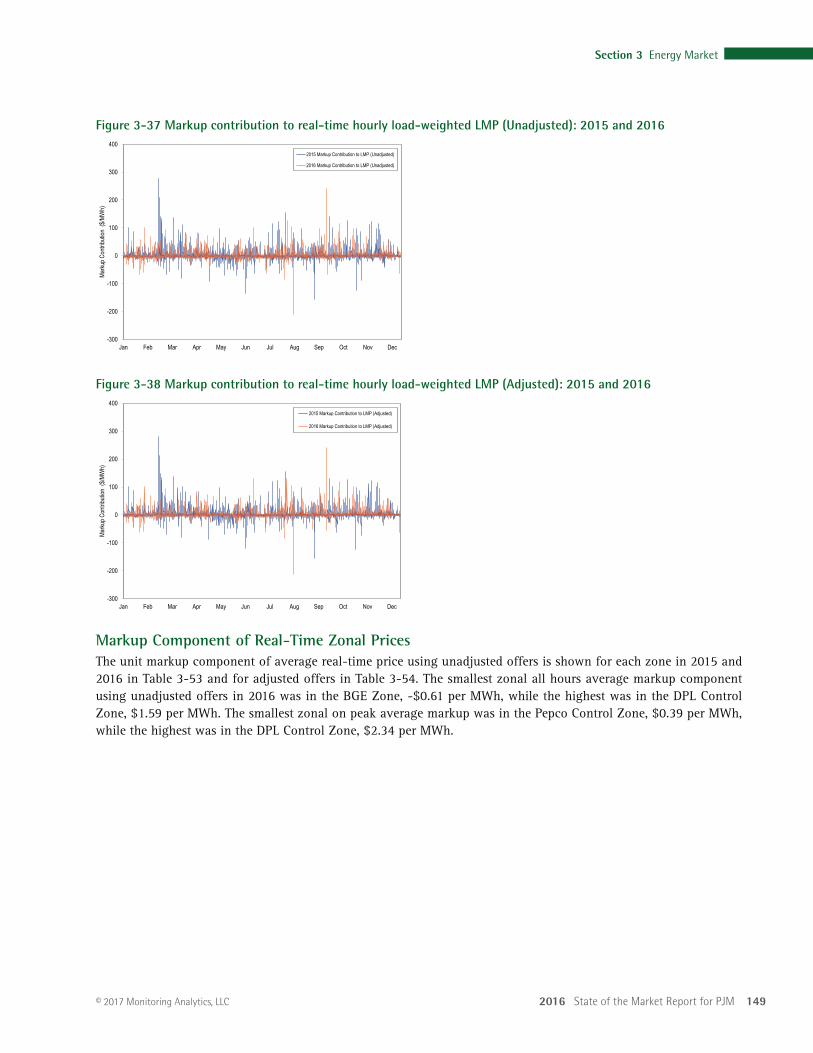
2016 State of the Market Report for PJM 149
Section 3 Energy Market
© 2017 Monitoring Analytics, LLC
Figure 3-37 Markup contribution to real-time hourly load-weighted LMP (Unadjusted): 2015 and 2016
-300
-200
-100
0
100
200
300
400
Jan Feb Mar Apr May Jun Jul Aug Sep Oct Nov Dec
Marku
p Con
tributi
on (
$/MW
h)
2015 Markup Contribution to LMP (Unadjusted)
2016 Markup Contribution to LMP (Unadjusted)
Figure 3-38 Markup contribution to real-time hourly load-weighted LMP (Adjusted): 2015 and 2016
-300
-200
-100
0
100
200
300
400
Jan Feb Mar Apr May Jun Jul Aug Sep Oct Nov Dec
Marku
p Con
tributi
on (
$/MW
h)
2015 Markup Contribution to LMP (Adjusted)
2016 Markup Contribution to LMP (Adjusted)
Markup Component of Real-Time Zonal PricesThe unit markup component of average real-time price using unadjusted offers is shown for each zone in 2015 and 2016 in Table 3-53 and for adjusted offers in Table 3-54. The smallest zonal all hours average markup component using unadjusted offers in 2016 was in the BGE Zone, -$0.61 per MWh, while the highest was in the DPL Control Zone, $1.59 per MWh. The smallest zonal on peak average markup was in the Pepco Control Zone, $0.39 per MWh, while the highest was in the DPL Control Zone, $2.34 per MWh.
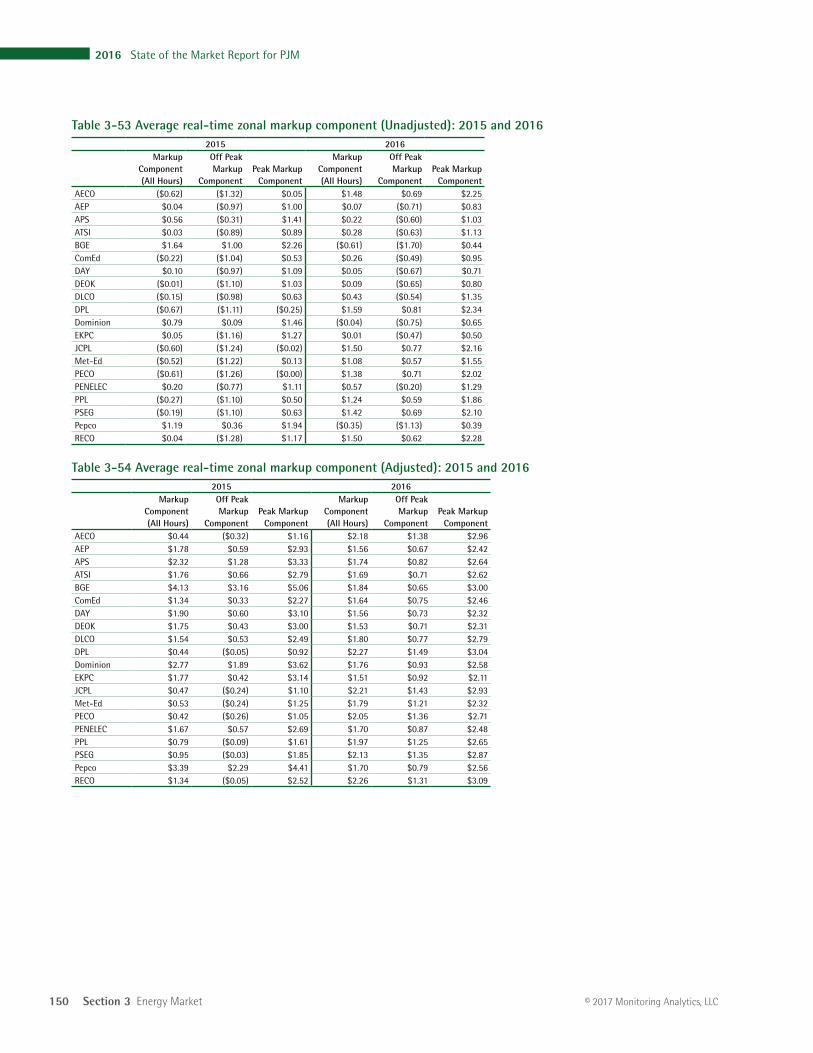
150 Section 3 Energy Market
2016 State of the Market Report for PJM
© 2017 Monitoring Analytics, LLC
Table 3-53 Average real-time zonal markup component (Unadjusted): 2015 and 20162015 2016
Markup Component (All Hours)
Off Peak Markup
ComponentPeak Markup
Component
Markup Component (All Hours)
Off Peak Markup
ComponentPeak Markup
ComponentAECO ($0.62) ($1.32) $0.05 $1.48 $0.69 $2.25 AEP $0.04 ($0.97) $1.00 $0.07 ($0.71) $0.83 APS $0.56 ($0.31) $1.41 $0.22 ($0.60) $1.03 ATSI $0.03 ($0.89) $0.89 $0.28 ($0.63) $1.13 BGE $1.64 $1.00 $2.26 ($0.61) ($1.70) $0.44 ComEd ($0.22) ($1.04) $0.53 $0.26 ($0.49) $0.95 DAY $0.10 ($0.97) $1.09 $0.05 ($0.67) $0.71 DEOK ($0.01) ($1.10) $1.03 $0.09 ($0.65) $0.80 DLCO ($0.15) ($0.98) $0.63 $0.43 ($0.54) $1.35 DPL ($0.67) ($1.11) ($0.25) $1.59 $0.81 $2.34 Dominion $0.79 $0.09 $1.46 ($0.04) ($0.75) $0.65 EKPC $0.05 ($1.16) $1.27 $0.01 ($0.47) $0.50 JCPL ($0.60) ($1.24) ($0.02) $1.50 $0.77 $2.16 Met-Ed ($0.52) ($1.22) $0.13 $1.08 $0.57 $1.55 PECO ($0.61) ($1.26) ($0.00) $1.38 $0.71 $2.02 PENELEC $0.20 ($0.77) $1.11 $0.57 ($0.20) $1.29 PPL ($0.27) ($1.10) $0.50 $1.24 $0.59 $1.86 PSEG ($0.19) ($1.10) $0.63 $1.42 $0.69 $2.10 Pepco $1.19 $0.36 $1.94 ($0.35) ($1.13) $0.39 RECO $0.04 ($1.28) $1.17 $1.50 $0.62 $2.28
Table 3-54 Average real-time zonal markup component (Adjusted): 2015 and 20162015 2016
Markup Component (All Hours)
Off Peak Markup
ComponentPeak Markup
Component
Markup Component (All Hours)
Off Peak Markup
ComponentPeak Markup
ComponentAECO $0.44 ($0.32) $1.16 $2.18 $1.38 $2.96 AEP $1.78 $0.59 $2.93 $1.56 $0.67 $2.42 APS $2.32 $1.28 $3.33 $1.74 $0.82 $2.64 ATSI $1.76 $0.66 $2.79 $1.69 $0.71 $2.62 BGE $4.13 $3.16 $5.06 $1.84 $0.65 $3.00 ComEd $1.34 $0.33 $2.27 $1.64 $0.75 $2.46 DAY $1.90 $0.60 $3.10 $1.56 $0.73 $2.32 DEOK $1.75 $0.43 $3.00 $1.53 $0.71 $2.31 DLCO $1.54 $0.53 $2.49 $1.80 $0.77 $2.79 DPL $0.44 ($0.05) $0.92 $2.27 $1.49 $3.04 Dominion $2.77 $1.89 $3.62 $1.76 $0.93 $2.58 EKPC $1.77 $0.42 $3.14 $1.51 $0.92 $2.11 JCPL $0.47 ($0.24) $1.10 $2.21 $1.43 $2.93 Met-Ed $0.53 ($0.24) $1.25 $1.79 $1.21 $2.32 PECO $0.42 ($0.26) $1.05 $2.05 $1.36 $2.71 PENELEC $1.67 $0.57 $2.69 $1.70 $0.87 $2.48 PPL $0.79 ($0.09) $1.61 $1.97 $1.25 $2.65 PSEG $0.95 ($0.03) $1.85 $2.13 $1.35 $2.87 Pepco $3.39 $2.29 $4.41 $1.70 $0.79 $2.56 RECO $1.34 ($0.05) $2.52 $2.26 $1.31 $3.09
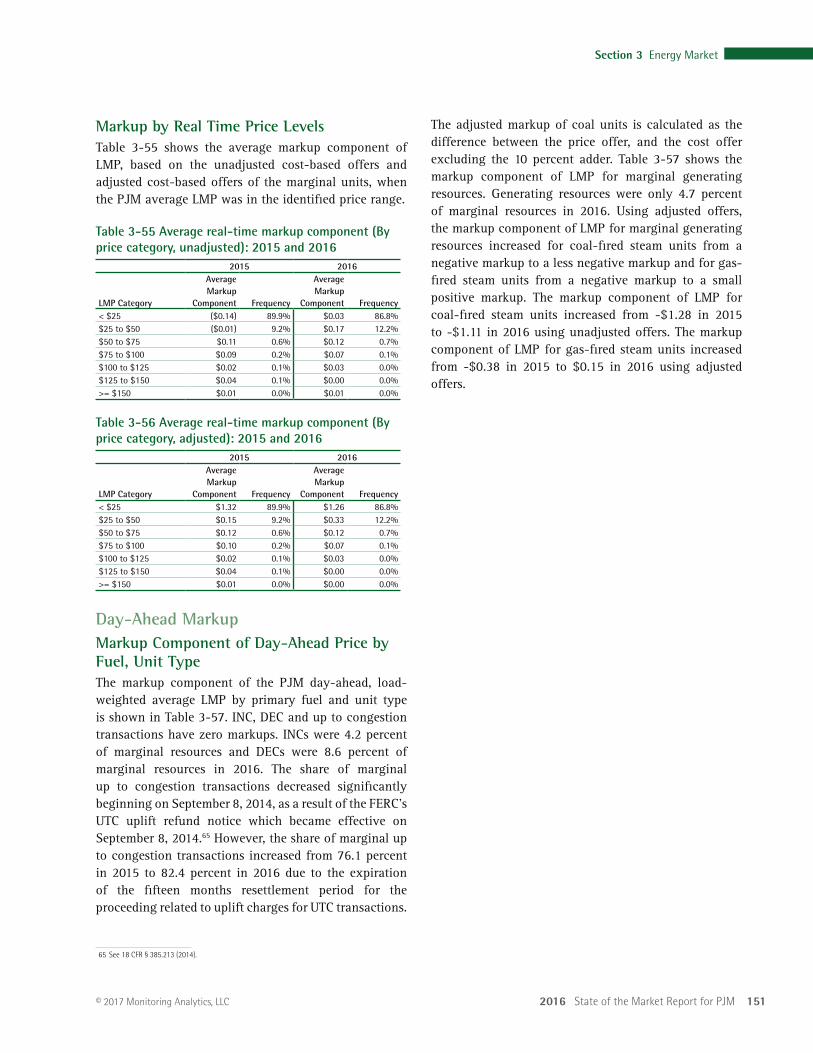
2016 State of the Market Report for PJM 151
Section 3 Energy Market
© 2017 Monitoring Analytics, LLC
The adjusted markup of coal units is calculated as the difference between the price offer, and the cost offer excluding the 10 percent adder. Table 3-57 shows the markup component of LMP for marginal generating resources. Generating resources were only 4.7 percent of marginal resources in 2016. Using adjusted offers, the markup component of LMP for marginal generating resources increased for coal-fired steam units from a negative markup to a less negative markup and for gas-fired steam units from a negative markup to a small positive markup. The markup component of LMP for coal-fired steam units increased from -$1.28 in 2015 to -$1.11 in 2016 using unadjusted offers. The markup component of LMP for gas-fired steam units increased from -$0.38 in 2015 to $0.15 in 2016 using adjusted offers.
Markup by Real Time Price LevelsTable 3-55 shows the average markup component of LMP, based on the unadjusted cost-based offers and adjusted cost-based offers of the marginal units, when the PJM average LMP was in the identified price range.
Table 3-55 Average real-time markup component (By price category, unadjusted): 2015 and 2016
2015 2016
LMP Category
Average Markup
Component Frequency
Average Markup
Component Frequency< $25 ($0.14) 89.9% $0.03 86.8%$25 to $50 ($0.01) 9.2% $0.17 12.2%$50 to $75 $0.11 0.6% $0.12 0.7%$75 to $100 $0.09 0.2% $0.07 0.1%$100 to $125 $0.02 0.1% $0.03 0.0%$125 to $150 $0.04 0.1% $0.00 0.0%>= $150 $0.01 0.0% $0.01 0.0%
Table 3-56 Average real-time markup component (By price category, adjusted): 2015 and 2016
2015 2016
LMP Category
Average Markup
Component Frequency
Average Markup
Component Frequency< $25 $1.32 89.9% $1.26 86.8%$25 to $50 $0.15 9.2% $0.33 12.2%$50 to $75 $0.12 0.6% $0.12 0.7%$75 to $100 $0.10 0.2% $0.07 0.1%$100 to $125 $0.02 0.1% $0.03 0.0%$125 to $150 $0.04 0.1% $0.00 0.0%>= $150 $0.01 0.0% $0.00 0.0%
Day-Ahead MarkupMarkup Component of Day-Ahead Price by Fuel, Unit TypeThe markup component of the PJM day-ahead, load-weighted average LMP by primary fuel and unit type is shown in Table 3-57. INC, DEC and up to congestion transactions have zero markups. INCs were 4.2 percent of marginal resources and DECs were 8.6 percent of marginal resources in 2016. The share of marginal up to congestion transactions decreased significantly beginning on September 8, 2014, as a result of the FERC’s UTC uplift refund notice which became effective on September 8, 2014.65 However, the share of marginal up to congestion transactions increased from 76.1 percent in 2015 to 82.4 percent in 2016 due to the expiration of the fifteen months resettlement period for the proceeding related to uplift charges for UTC transactions.
65 See 18 CFR § 385.213 (2014).
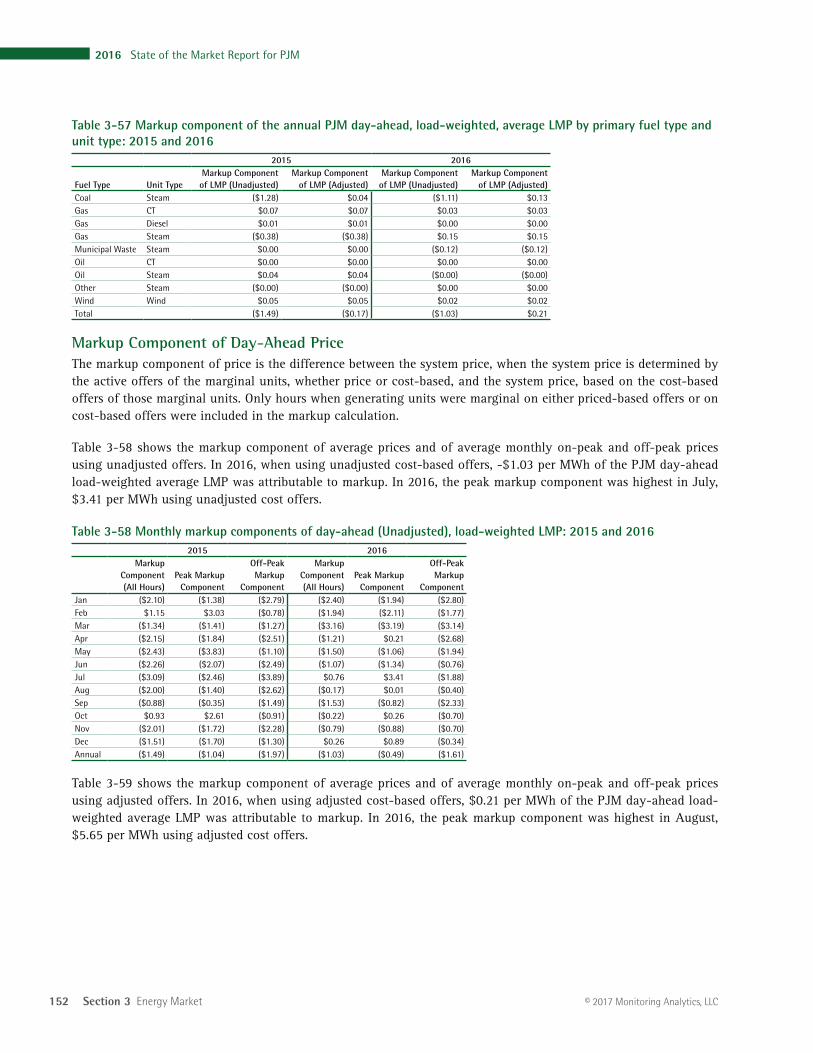
152 Section 3 Energy Market
2016 State of the Market Report for PJM
© 2017 Monitoring Analytics, LLC
Table 3-57 Markup component of the annual PJM day-ahead, load-weighted, average LMP by primary fuel type and unit type: 2015 and 2016
2015 2016
Fuel Type Unit TypeMarkup Component of LMP (Unadjusted)
Markup Component of LMP (Adjusted)
Markup Component of LMP (Unadjusted)
Markup Component of LMP (Adjusted)
Coal Steam ($1.28) $0.04 ($1.11) $0.13 Gas CT $0.07 $0.07 $0.03 $0.03 Gas Diesel $0.01 $0.01 $0.00 $0.00 Gas Steam ($0.38) ($0.38) $0.15 $0.15 Municipal Waste Steam $0.00 $0.00 ($0.12) ($0.12)Oil CT $0.00 $0.00 $0.00 $0.00 Oil Steam $0.04 $0.04 ($0.00) ($0.00)Other Steam ($0.00) ($0.00) $0.00 $0.00 Wind Wind $0.05 $0.05 $0.02 $0.02 Total ($1.49) ($0.17) ($1.03) $0.21
Markup Component of Day-Ahead PriceThe markup component of price is the difference between the system price, when the system price is determined by the active offers of the marginal units, whether price or cost-based, and the system price, based on the cost-based offers of those marginal units. Only hours when generating units were marginal on either priced-based offers or on cost-based offers were included in the markup calculation.
Table 3-58 shows the markup component of average prices and of average monthly on-peak and off-peak prices using unadjusted offers. In 2016, when using unadjusted cost-based offers, -$1.03 per MWh of the PJM day-ahead load-weighted average LMP was attributable to markup. In 2016, the peak markup component was highest in July, $3.41 per MWh using unadjusted cost offers.
Table 3-58 Monthly markup components of day-ahead (Unadjusted), load-weighted LMP: 2015 and 20162015 2016
Markup Component (All Hours)
Peak Markup Component
Off-Peak Markup
Component
Markup Component (All Hours)
Peak Markup Component
Off-Peak Markup
ComponentJan ($2.10) ($1.38) ($2.79) ($2.40) ($1.94) ($2.80)Feb $1.15 $3.03 ($0.78) ($1.94) ($2.11) ($1.77)Mar ($1.34) ($1.41) ($1.27) ($3.16) ($3.19) ($3.14)Apr ($2.15) ($1.84) ($2.51) ($1.21) $0.21 ($2.68)May ($2.43) ($3.83) ($1.10) ($1.50) ($1.06) ($1.94)Jun ($2.26) ($2.07) ($2.49) ($1.07) ($1.34) ($0.76)Jul ($3.09) ($2.46) ($3.89) $0.76 $3.41 ($1.88)Aug ($2.00) ($1.40) ($2.62) ($0.17) $0.01 ($0.40)Sep ($0.88) ($0.35) ($1.49) ($1.53) ($0.82) ($2.33)Oct $0.93 $2.61 ($0.91) ($0.22) $0.26 ($0.70)Nov ($2.01) ($1.72) ($2.28) ($0.79) ($0.88) ($0.70)Dec ($1.51) ($1.70) ($1.30) $0.26 $0.89 ($0.34)Annual ($1.49) ($1.04) ($1.97) ($1.03) ($0.49) ($1.61)
Table 3-59 shows the markup component of average prices and of average monthly on-peak and off-peak prices using adjusted offers. In 2016, when using adjusted cost-based offers, $0.21 per MWh of the PJM day-ahead load-weighted average LMP was attributable to markup. In 2016, the peak markup component was highest in August, $5.65 per MWh using adjusted cost offers.
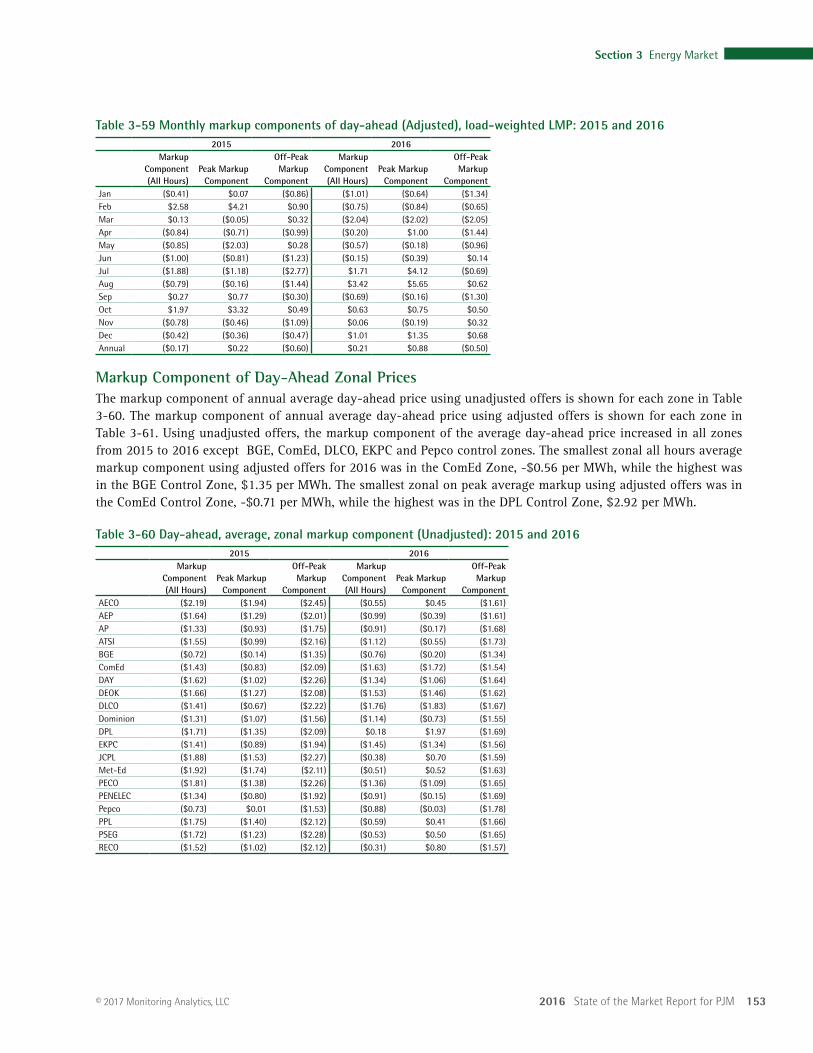
2016 State of the Market Report for PJM 153
Section 3 Energy Market
© 2017 Monitoring Analytics, LLC
Table 3-59 Monthly markup components of day-ahead (Adjusted), load-weighted LMP: 2015 and 20162015 2016
Markup Component (All Hours)
Peak Markup Component
Off-Peak Markup
Component
Markup Component (All Hours)
Peak Markup Component
Off-Peak Markup
ComponentJan ($0.41) $0.07 ($0.86) ($1.01) ($0.64) ($1.34)Feb $2.58 $4.21 $0.90 ($0.75) ($0.84) ($0.65)Mar $0.13 ($0.05) $0.32 ($2.04) ($2.02) ($2.05)Apr ($0.84) ($0.71) ($0.99) ($0.20) $1.00 ($1.44)May ($0.85) ($2.03) $0.28 ($0.57) ($0.18) ($0.96)Jun ($1.00) ($0.81) ($1.23) ($0.15) ($0.39) $0.14 Jul ($1.88) ($1.18) ($2.77) $1.71 $4.12 ($0.69)Aug ($0.79) ($0.16) ($1.44) $3.42 $5.65 $0.62 Sep $0.27 $0.77 ($0.30) ($0.69) ($0.16) ($1.30)Oct $1.97 $3.32 $0.49 $0.63 $0.75 $0.50 Nov ($0.78) ($0.46) ($1.09) $0.06 ($0.19) $0.32 Dec ($0.42) ($0.36) ($0.47) $1.01 $1.35 $0.68 Annual ($0.17) $0.22 ($0.60) $0.21 $0.88 ($0.50)
Markup Component of Day-Ahead Zonal PricesThe markup component of annual average day-ahead price using unadjusted offers is shown for each zone in Table 3-60. The markup component of annual average day-ahead price using adjusted offers is shown for each zone in Table 3-61. Using unadjusted offers, the markup component of the average day-ahead price increased in all zones from 2015 to 2016 except BGE, ComEd, DLCO, EKPC and Pepco control zones. The smallest zonal all hours average markup component using adjusted offers for 2016 was in the ComEd Zone, -$0.56 per MWh, while the highest was in the BGE Control Zone, $1.35 per MWh. The smallest zonal on peak average markup using adjusted offers was in the ComEd Control Zone, -$0.71 per MWh, while the highest was in the DPL Control Zone, $2.92 per MWh.
Table 3-60 Day-ahead, average, zonal markup component (Unadjusted): 2015 and 20162015 2016
Markup Component (All Hours)
Peak Markup Component
Off-Peak Markup
Component
Markup Component (All Hours)
Peak Markup Component
Off-Peak Markup
ComponentAECO ($2.19) ($1.94) ($2.45) ($0.55) $0.45 ($1.61)AEP ($1.64) ($1.29) ($2.01) ($0.99) ($0.39) ($1.61)AP ($1.33) ($0.93) ($1.75) ($0.91) ($0.17) ($1.68)ATSI ($1.55) ($0.99) ($2.16) ($1.12) ($0.55) ($1.73)BGE ($0.72) ($0.14) ($1.35) ($0.76) ($0.20) ($1.34)ComEd ($1.43) ($0.83) ($2.09) ($1.63) ($1.72) ($1.54)DAY ($1.62) ($1.02) ($2.26) ($1.34) ($1.06) ($1.64)DEOK ($1.66) ($1.27) ($2.08) ($1.53) ($1.46) ($1.62)DLCO ($1.41) ($0.67) ($2.22) ($1.76) ($1.83) ($1.67)Dominion ($1.31) ($1.07) ($1.56) ($1.14) ($0.73) ($1.55)DPL ($1.71) ($1.35) ($2.09) $0.18 $1.97 ($1.69)EKPC ($1.41) ($0.89) ($1.94) ($1.45) ($1.34) ($1.56)JCPL ($1.88) ($1.53) ($2.27) ($0.38) $0.70 ($1.59)Met-Ed ($1.92) ($1.74) ($2.11) ($0.51) $0.52 ($1.63)PECO ($1.81) ($1.38) ($2.26) ($1.36) ($1.09) ($1.65)PENELEC ($1.34) ($0.80) ($1.92) ($0.91) ($0.15) ($1.69)Pepco ($0.73) $0.01 ($1.53) ($0.88) ($0.03) ($1.78)PPL ($1.75) ($1.40) ($2.12) ($0.59) $0.41 ($1.66)PSEG ($1.72) ($1.23) ($2.28) ($0.53) $0.50 ($1.65)RECO ($1.52) ($1.02) ($2.12) ($0.31) $0.80 ($1.57)
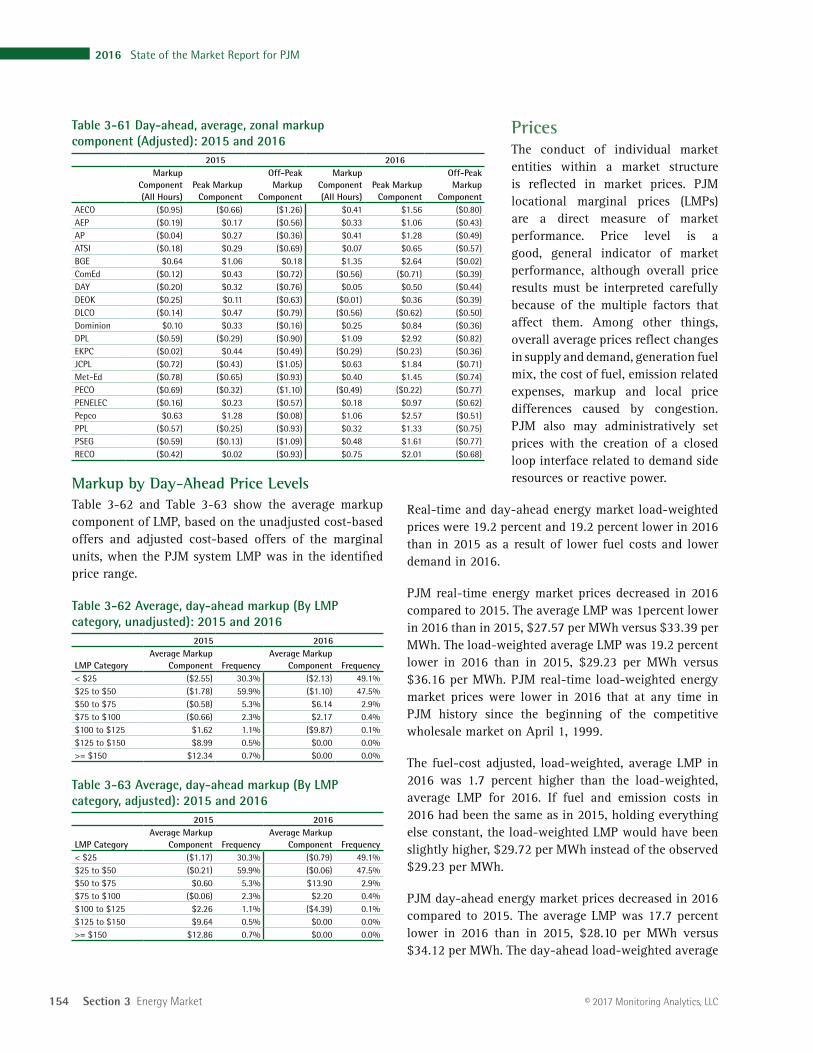
154 Section 3 Energy Market
2016 State of the Market Report for PJM
© 2017 Monitoring Analytics, LLC
PricesThe conduct of individual market entities within a market structure is reflected in market prices. PJM locational marginal prices (LMPs) are a direct measure of market performance. Price level is a good, general indicator of market performance, although overall price results must be interpreted carefully because of the multiple factors that affect them. Among other things, overall average prices reflect changes in supply and demand, generation fuel mix, the cost of fuel, emission related expenses, markup and local price differences caused by congestion. PJM also may administratively set prices with the creation of a closed loop interface related to demand side resources or reactive power.
Real-time and day-ahead energy market load-weighted prices were 19.2 percent and 19.2 percent lower in 2016 than in 2015 as a result of lower fuel costs and lower demand in 2016.
PJM real-time energy market prices decreased in 2016 compared to 2015. The average LMP was 1percent lower in 2016 than in 2015, $27.57 per MWh versus $33.39 per MWh. The load-weighted average LMP was 19.2 percent lower in 2016 than in 2015, $29.23 per MWh versus $36.16 per MWh. PJM real-time load-weighted energy market prices were lower in 2016 that at any time in PJM history since the beginning of the competitive wholesale market on April 1, 1999.
The fuel-cost adjusted, load-weighted, average LMP in 2016 was 1.7 percent higher than the load-weighted, average LMP for 2016. If fuel and emission costs in 2016 had been the same as in 2015, holding everything else constant, the load-weighted LMP would have been slightly higher, $29.72 per MWh instead of the observed $29.23 per MWh.
PJM day-ahead energy market prices decreased in 2016 compared to 2015. The average LMP was 17.7 percent lower in 2016 than in 2015, $28.10 per MWh versus $34.12 per MWh. The day-ahead load-weighted average
Table 3-61 Day-ahead, average, zonal markup component (Adjusted): 2015 and 2016
2015 2016Markup
Component (All Hours)
Peak Markup Component
Off-Peak Markup
Component
Markup Component (All Hours)
Peak Markup Component
Off-Peak Markup
ComponentAECO ($0.95) ($0.66) ($1.26) $0.41 $1.56 ($0.80)AEP ($0.19) $0.17 ($0.56) $0.33 $1.06 ($0.43)AP ($0.04) $0.27 ($0.36) $0.41 $1.28 ($0.49)ATSI ($0.18) $0.29 ($0.69) $0.07 $0.65 ($0.57)BGE $0.64 $1.06 $0.18 $1.35 $2.64 ($0.02)ComEd ($0.12) $0.43 ($0.72) ($0.56) ($0.71) ($0.39)DAY ($0.20) $0.32 ($0.76) $0.05 $0.50 ($0.44)DEOK ($0.25) $0.11 ($0.63) ($0.01) $0.36 ($0.39)DLCO ($0.14) $0.47 ($0.79) ($0.56) ($0.62) ($0.50)Dominion $0.10 $0.33 ($0.16) $0.25 $0.84 ($0.36)DPL ($0.59) ($0.29) ($0.90) $1.09 $2.92 ($0.82)EKPC ($0.02) $0.44 ($0.49) ($0.29) ($0.23) ($0.36)JCPL ($0.72) ($0.43) ($1.05) $0.63 $1.84 ($0.71)Met-Ed ($0.78) ($0.65) ($0.93) $0.40 $1.45 ($0.74)PECO ($0.69) ($0.32) ($1.10) ($0.49) ($0.22) ($0.77)PENELEC ($0.16) $0.23 ($0.57) $0.18 $0.97 ($0.62)Pepco $0.63 $1.28 ($0.08) $1.06 $2.57 ($0.51)PPL ($0.57) ($0.25) ($0.93) $0.32 $1.33 ($0.75)PSEG ($0.59) ($0.13) ($1.09) $0.48 $1.61 ($0.77)RECO ($0.42) $0.02 ($0.93) $0.75 $2.01 ($0.68)
Markup by Day-Ahead Price LevelsTable 3-62 and Table 3-63 show the average markup component of LMP, based on the unadjusted cost-based offers and adjusted cost-based offers of the marginal units, when the PJM system LMP was in the identified price range.
Table 3-62 Average, day-ahead markup (By LMP category, unadjusted): 2015 and 2016
2015 2016
LMP CategoryAverage Markup
Component FrequencyAverage Markup
Component Frequency< $25 ($2.55) 30.3% ($2.13) 49.1%$25 to $50 ($1.78) 59.9% ($1.10) 47.5%$50 to $75 ($0.58) 5.3% $6.14 2.9%$75 to $100 ($0.66) 2.3% $2.17 0.4%$100 to $125 $1.62 1.1% ($9.87) 0.1%$125 to $150 $8.99 0.5% $0.00 0.0%>= $150 $12.34 0.7% $0.00 0.0%
Table 3-63 Average, day-ahead markup (By LMP category, adjusted): 2015 and 2016
2015 2016
LMP CategoryAverage Markup
Component FrequencyAverage Markup
Component Frequency< $25 ($1.17) 30.3% ($0.79) 49.1%$25 to $50 ($0.21) 59.9% ($0.06) 47.5%$50 to $75 $0.60 5.3% $13.90 2.9%$75 to $100 ($0.06) 2.3% $2.20 0.4%$100 to $125 $2.26 1.1% ($4.39) 0.1%$125 to $150 $9.64 0.5% $0.00 0.0%>= $150 $12.86 0.7% $0.00 0.0%
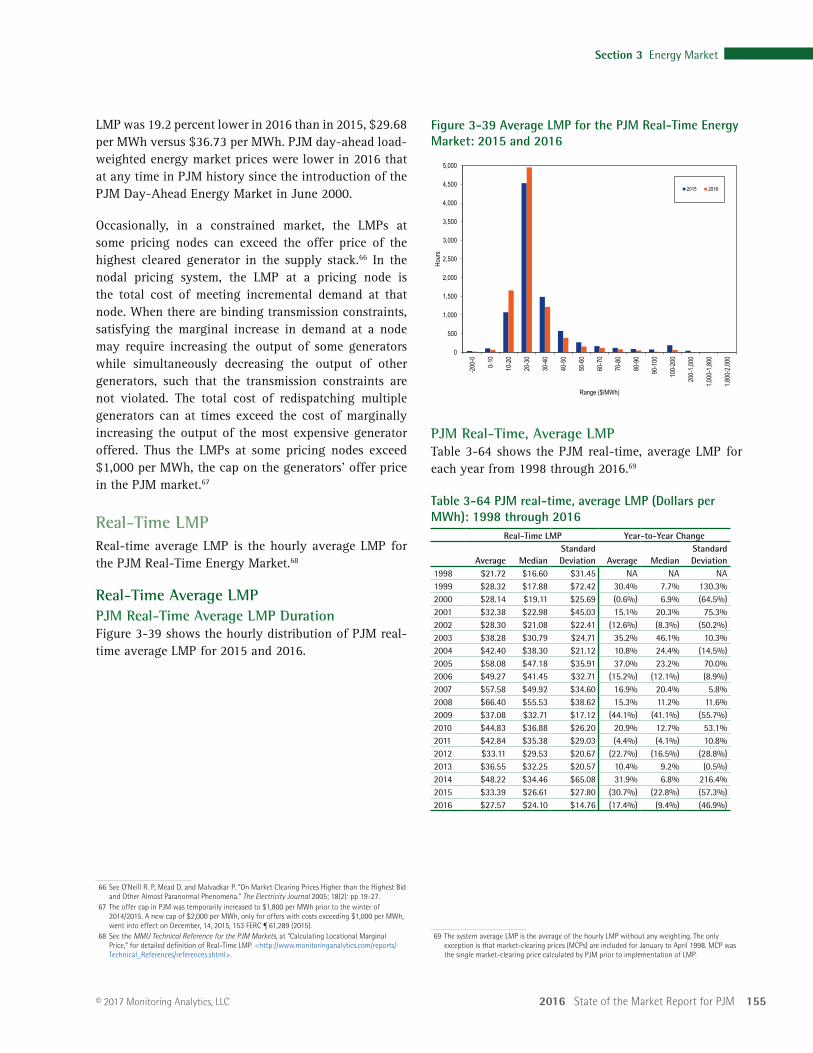
2016 State of the Market Report for PJM 155
Section 3 Energy Market
© 2017 Monitoring Analytics, LLC
Figure 3-39 Average LMP for the PJM Real-Time Energy Market: 2015 and 2016
0
500
1,000
1,500
2,000
2,500
3,000
3,500
4,000
4,500
5,000
-200
-0
0-10
10-2
0
20-3
0
30-4
0
40-5
0
50-6
0
60-7
0
70-8
0
80-9
0
90-1
00
100-
200
200-
1,000
1,000
-1,80
0
1,800
-2,00
0
Hour
s
Range ($/MWh)
2015 2016
PJM Real-Time, Average LMPTable 3-64 shows the PJM real-time, average LMP for each year from 1998 through 2016.69
Table 3-64 PJM real-time, average LMP (Dollars per MWh): 1998 through 2016
Real-Time LMP Year-to-Year Change
Average MedianStandard Deviation Average Median
Standard Deviation
1998 $21.72 $16.60 $31.45 NA NA NA1999 $28.32 $17.88 $72.42 30.4% 7.7% 130.3%2000 $28.14 $19.11 $25.69 (0.6%) 6.9% (64.5%)2001 $32.38 $22.98 $45.03 15.1% 20.3% 75.3%2002 $28.30 $21.08 $22.41 (12.6%) (8.3%) (50.2%)2003 $38.28 $30.79 $24.71 35.2% 46.1% 10.3%2004 $42.40 $38.30 $21.12 10.8% 24.4% (14.5%)2005 $58.08 $47.18 $35.91 37.0% 23.2% 70.0%2006 $49.27 $41.45 $32.71 (15.2%) (12.1%) (8.9%)2007 $57.58 $49.92 $34.60 16.9% 20.4% 5.8%2008 $66.40 $55.53 $38.62 15.3% 11.2% 11.6%2009 $37.08 $32.71 $17.12 (44.1%) (41.1%) (55.7%)2010 $44.83 $36.88 $26.20 20.9% 12.7% 53.1%2011 $42.84 $35.38 $29.03 (4.4%) (4.1%) 10.8%2012 $33.11 $29.53 $20.67 (22.7%) (16.5%) (28.8%)2013 $36.55 $32.25 $20.57 10.4% 9.2% (0.5%)2014 $48.22 $34.46 $65.08 31.9% 6.8% 216.4%2015 $33.39 $26.61 $27.80 (30.7%) (22.8%) (57.3%)2016 $27.57 $24.10 $14.76 (17.4%) (9.4%) (46.9%)
69 The system average LMP is the average of the hourly LMP without any weighting. The only exception is that market-clearing prices (MCPs) are included for January to April 1998. MCP was the single market-clearing price calculated by PJM prior to implementation of LMP.
LMP was 19.2 percent lower in 2016 than in 2015, $29.68 per MWh versus $36.73 per MWh. PJM day-ahead load-weighted energy market prices were lower in 2016 that at any time in PJM history since the introduction of the PJM Day-Ahead Energy Market in June 2000.
Occasionally, in a constrained market, the LMPs at some pricing nodes can exceed the offer price of the highest cleared generator in the supply stack.66 In the nodal pricing system, the LMP at a pricing node is the total cost of meeting incremental demand at that node. When there are binding transmission constraints, satisfying the marginal increase in demand at a node may require increasing the output of some generators while simultaneously decreasing the output of other generators, such that the transmission constraints are not violated. The total cost of redispatching multiple generators can at times exceed the cost of marginally increasing the output of the most expensive generator offered. Thus the LMPs at some pricing nodes exceed $1,000 per MWh, the cap on the generators’ offer price in the PJM market.67
Real-Time LMPReal-time average LMP is the hourly average LMP for the PJM Real-Time Energy Market.68
Real-Time Average LMPPJM Real-Time Average LMP DurationFigure 3-39 shows the hourly distribution of PJM real-time average LMP for 2015 and 2016.
66 See O’Neill R. P, Mead D. and Malvadkar P. “On Market Clearing Prices Higher than the Highest Bid and Other Almost Paranormal Phenomena.” The Electricity Journal 2005; 18(2): pp 19-27.
67 The offer cap in PJM was temporarily increased to $1,800 per MWh prior to the winter of 2014/2015. A new cap of $2,000 per MWh, only for offers with costs exceeding $1,000 per MWh, went into effect on December, 14, 2015, 153 FERC ¶ 61,289 (2015).
68 See the MMU Technical Reference for the PJM Markets, at “Calculating Locational Marginal Price,” for detailed definition of Real-Time LMP. <http://www.monitoringanalytics.com/reports/Technical_References/references.shtml>.
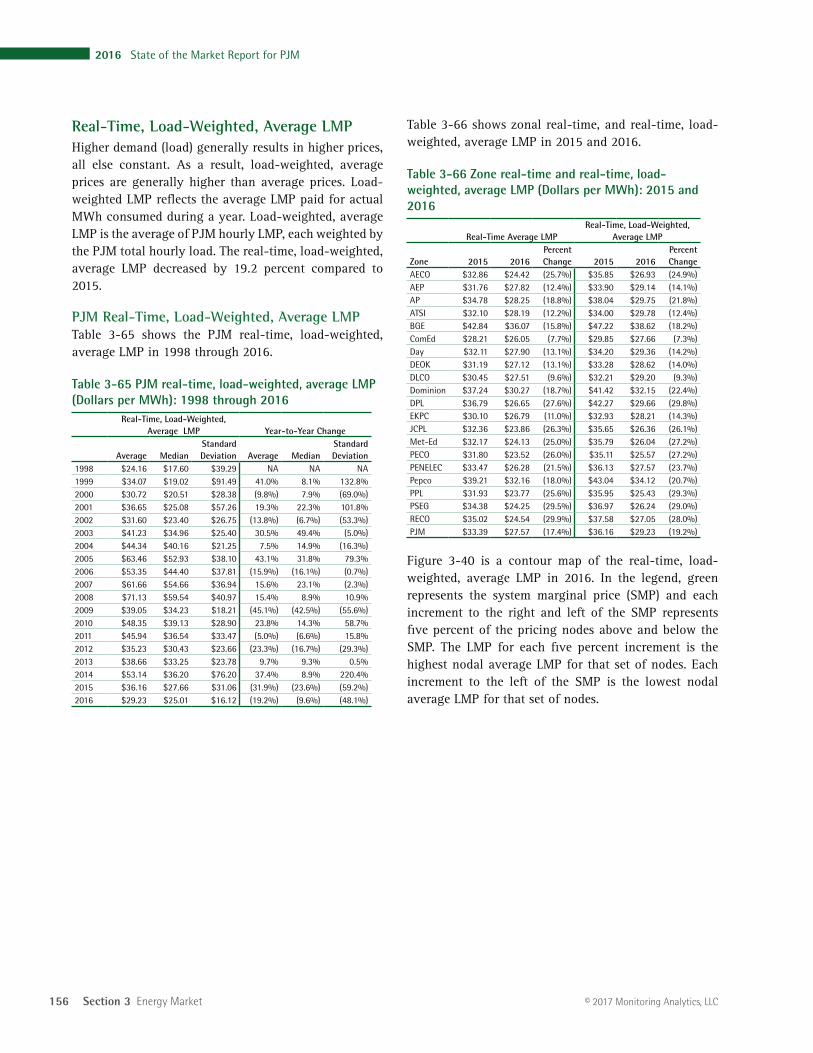
156 Section 3 Energy Market
2016 State of the Market Report for PJM
© 2017 Monitoring Analytics, LLC
Table 3-66 shows zonal real-time, and real-time, load-weighted, average LMP in 2015 and 2016.
Table 3-66 Zone real-time and real-time, load-weighted, average LMP (Dollars per MWh): 2015 and 2016
Real-Time Average LMPReal-Time, Load-Weighted,
Average LMP
Zone 2015 2016Percent Change 2015 2016
Percent Change
AECO $32.86 $24.42 (25.7%) $35.85 $26.93 (24.9%)AEP $31.76 $27.82 (12.4%) $33.90 $29.14 (14.1%)AP $34.78 $28.25 (18.8%) $38.04 $29.75 (21.8%)ATSI $32.10 $28.19 (12.2%) $34.00 $29.78 (12.4%)BGE $42.84 $36.07 (15.8%) $47.22 $38.62 (18.2%)ComEd $28.21 $26.05 (7.7%) $29.85 $27.66 (7.3%)Day $32.11 $27.90 (13.1%) $34.20 $29.36 (14.2%)DEOK $31.19 $27.12 (13.1%) $33.28 $28.62 (14.0%)DLCO $30.45 $27.51 (9.6%) $32.21 $29.20 (9.3%)Dominion $37.24 $30.27 (18.7%) $41.42 $32.15 (22.4%)DPL $36.79 $26.65 (27.6%) $42.27 $29.66 (29.8%)EKPC $30.10 $26.79 (11.0%) $32.93 $28.21 (14.3%)JCPL $32.36 $23.86 (26.3%) $35.65 $26.36 (26.1%)Met-Ed $32.17 $24.13 (25.0%) $35.79 $26.04 (27.2%)PECO $31.80 $23.52 (26.0%) $35.11 $25.57 (27.2%)PENELEC $33.47 $26.28 (21.5%) $36.13 $27.57 (23.7%)Pepco $39.21 $32.16 (18.0%) $43.04 $34.12 (20.7%)PPL $31.93 $23.77 (25.6%) $35.95 $25.43 (29.3%)PSEG $34.38 $24.25 (29.5%) $36.97 $26.24 (29.0%)RECO $35.02 $24.54 (29.9%) $37.58 $27.05 (28.0%)PJM $33.39 $27.57 (17.4%) $36.16 $29.23 (19.2%)
Figure 3-40 is a contour map of the real-time, load-weighted, average LMP in 2016. In the legend, green represents the system marginal price (SMP) and each increment to the right and left of the SMP represents five percent of the pricing nodes above and below the SMP. The LMP for each five percent increment is the highest nodal average LMP for that set of nodes. Each increment to the left of the SMP is the lowest nodal average LMP for that set of nodes.
Real-Time, Load-Weighted, Average LMPHigher demand (load) generally results in higher prices, all else constant. As a result, load-weighted, average prices are generally higher than average prices. Load-weighted LMP reflects the average LMP paid for actual MWh consumed during a year. Load-weighted, average LMP is the average of PJM hourly LMP, each weighted by the PJM total hourly load. The real-time, load-weighted, average LMP decreased by 19.2 percent compared to 2015.
PJM Real-Time, Load-Weighted, Average LMPTable 3-65 shows the PJM real-time, load-weighted, average LMP in 1998 through 2016.
Table 3-65 PJM real-time, load-weighted, average LMP (Dollars per MWh): 1998 through 2016
Real-Time, Load-Weighted, Average LMP Year-to-Year Change
Average MedianStandard Deviation Average Median
Standard Deviation
1998 $24.16 $17.60 $39.29 NA NA NA1999 $34.07 $19.02 $91.49 41.0% 8.1% 132.8%2000 $30.72 $20.51 $28.38 (9.8%) 7.9% (69.0%)2001 $36.65 $25.08 $57.26 19.3% 22.3% 101.8%2002 $31.60 $23.40 $26.75 (13.8%) (6.7%) (53.3%)2003 $41.23 $34.96 $25.40 30.5% 49.4% (5.0%)2004 $44.34 $40.16 $21.25 7.5% 14.9% (16.3%)2005 $63.46 $52.93 $38.10 43.1% 31.8% 79.3%2006 $53.35 $44.40 $37.81 (15.9%) (16.1%) (0.7%)2007 $61.66 $54.66 $36.94 15.6% 23.1% (2.3%)2008 $71.13 $59.54 $40.97 15.4% 8.9% 10.9%2009 $39.05 $34.23 $18.21 (45.1%) (42.5%) (55.6%)2010 $48.35 $39.13 $28.90 23.8% 14.3% 58.7%2011 $45.94 $36.54 $33.47 (5.0%) (6.6%) 15.8%2012 $35.23 $30.43 $23.66 (23.3%) (16.7%) (29.3%)2013 $38.66 $33.25 $23.78 9.7% 9.3% 0.5%2014 $53.14 $36.20 $76.20 37.4% 8.9% 220.4%2015 $36.16 $27.66 $31.06 (31.9%) (23.6%) (59.2%)2016 $29.23 $25.01 $16.12 (19.2%) (9.6%) (48.1%)
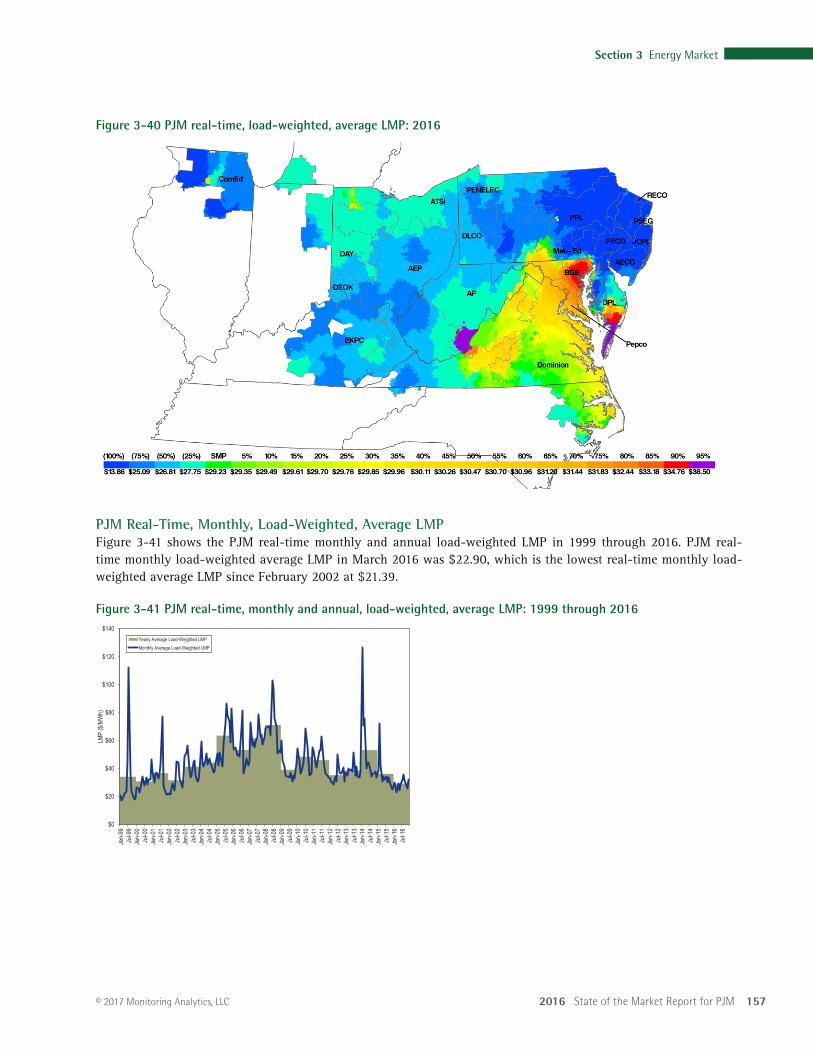
2016 State of the Market Report for PJM 157
Section 3 Energy Market
© 2017 Monitoring Analytics, LLC
Figure 3-40 PJM real-time, load-weighted, average LMP: 2016
PJM Real-Time, Monthly, Load-Weighted, Average LMPFigure 3-41 shows the PJM real-time monthly and annual load-weighted LMP in 1999 through 2016. PJM real-time monthly load-weighted average LMP in March 2016 was $22.90, which is the lowest real-time monthly load-weighted average LMP since February 2002 at $21.39.
Figure 3-41 PJM real-time, monthly and annual, load-weighted, average LMP: 1999 through 2016
$0
$20
$40
$60
$80
$100
$120
$140
Jan-
99Ju
l-99
Jan-
00Ju
l-00
Jan-
01Ju
l-01
Jan-
02Ju
l-02
Jan-
03Ju
l-03
Jan-
04Ju
l-04
Jan-
05Ju
l-05
Jan-
06Ju
l-06
Jan-
07Ju
l-07
Jan-
08Ju
l-08
Jan-
09Ju
l-09
Jan-
10Ju
l-10
Jan-
11Ju
l-11
Jan-
12Ju
l-12
Jan-
13Ju
l-13
Jan-
14Ju
l-14
Jan-
15Ju
l-15
Jan-
16Ju
l-16
LMP
($/M
Wh)
Yearly Average Load-Weighted LMPMonthly Average Load-Weighted LMP
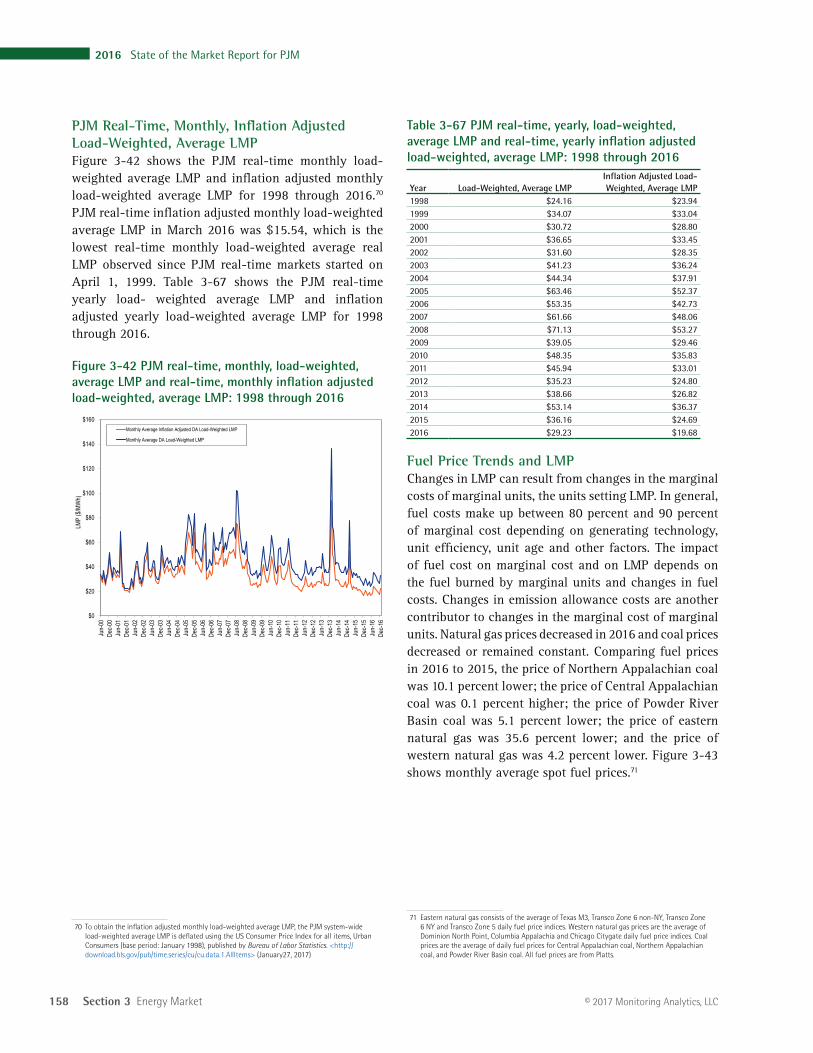
158 Section 3 Energy Market
2016 State of the Market Report for PJM
© 2017 Monitoring Analytics, LLC
Table 3-67 PJM real-time, yearly, load-weighted, average LMP and real-time, yearly inflation adjusted load-weighted, average LMP: 1998 through 2016
Year Load-Weighted, Average LMPInflation Adjusted Load-Weighted, Average LMP
1998 $24.16 $23.94 1999 $34.07 $33.04 2000 $30.72 $28.80 2001 $36.65 $33.45 2002 $31.60 $28.35 2003 $41.23 $36.24 2004 $44.34 $37.91 2005 $63.46 $52.37 2006 $53.35 $42.73 2007 $61.66 $48.06 2008 $71.13 $53.27 2009 $39.05 $29.46 2010 $48.35 $35.83 2011 $45.94 $33.01 2012 $35.23 $24.80 2013 $38.66 $26.82 2014 $53.14 $36.37 2015 $36.16 $24.69 2016 $29.23 $19.68
Fuel Price Trends and LMPChanges in LMP can result from changes in the marginal costs of marginal units, the units setting LMP. In general, fuel costs make up between 80 percent and 90 percent of marginal cost depending on generating technology, unit efficiency, unit age and other factors. The impact of fuel cost on marginal cost and on LMP depends on the fuel burned by marginal units and changes in fuel costs. Changes in emission allowance costs are another contributor to changes in the marginal cost of marginal units. Natural gas prices decreased in 2016 and coal prices decreased or remained constant. Comparing fuel prices in 2016 to 2015, the price of Northern Appalachian coal was 10.1 percent lower; the price of Central Appalachian coal was 0.1 percent higher; the price of Powder River Basin coal was 5.1 percent lower; the price of eastern natural gas was 35.6 percent lower; and the price of western natural gas was 4.2 percent lower. Figure 3-43 shows monthly average spot fuel prices.71
71 Eastern natural gas consists of the average of Texas M3, Transco Zone 6 non-NY, Transco Zone 6 NY and Transco Zone 5 daily fuel price indices. Western natural gas prices are the average of Dominion North Point, Columbia Appalachia and Chicago Citygate daily fuel price indices. Coal prices are the average of daily fuel prices for Central Appalachian coal, Northern Appalachian coal, and Powder River Basin coal. All fuel prices are from Platts.
PJM Real-Time, Monthly, Inflation Adjusted Load-Weighted, Average LMPFigure 3-42 shows the PJM real-time monthly load-weighted average LMP and inflation adjusted monthly load-weighted average LMP for 1998 through 2016.70 PJM real-time inflation adjusted monthly load-weighted average LMP in March 2016 was $15.54, which is the lowest real-time monthly load-weighted average real LMP observed since PJM real-time markets started on April 1, 1999. Table 3-67 shows the PJM real-time yearly load- weighted average LMP and inflation adjusted yearly load-weighted average LMP for 1998 through 2016.
Figure 3-42 PJM real-time, monthly, load-weighted, average LMP and real-time, monthly inflation adjusted load-weighted, average LMP: 1998 through 2016
$0
$20
$40
$60
$80
$100
$120
$140
$160
Jun-
00De
c-00
Jun-
01De
c-01
Jun-
02De
c-02
Jun-
03De
c-03
Jun-
04De
c-04
Jun-
05De
c-05
Jun-
06De
c-06
Jun-
07De
c-07
Jun-
08De
c-08
Jun-
09De
c-09
Jun-
10De
c-10
Jun-
11De
c-11
Jun-
12De
c-12
Jun-
13De
c-13
Jun-
14De
c-14
Jun-
15De
c-15
Jun-
16De
c-16
LMP
($/M
Wh)
Monthly Average Inflation Adjusted DA Load-Weighted LMP
Monthly Average DA Load-Weighted LMP
70 To obtain the inflation adjusted monthly load-weighted average LMP, the PJM system-wide load-weighted average LMP is deflated using the US Consumer Price Index for all items, Urban Consumers (base period: January 1998), published by Bureau of Labor Statistics. <http://download.bls.gov/pub/time.series/cu/cu.data.1.AllItems> (January27, 2017)
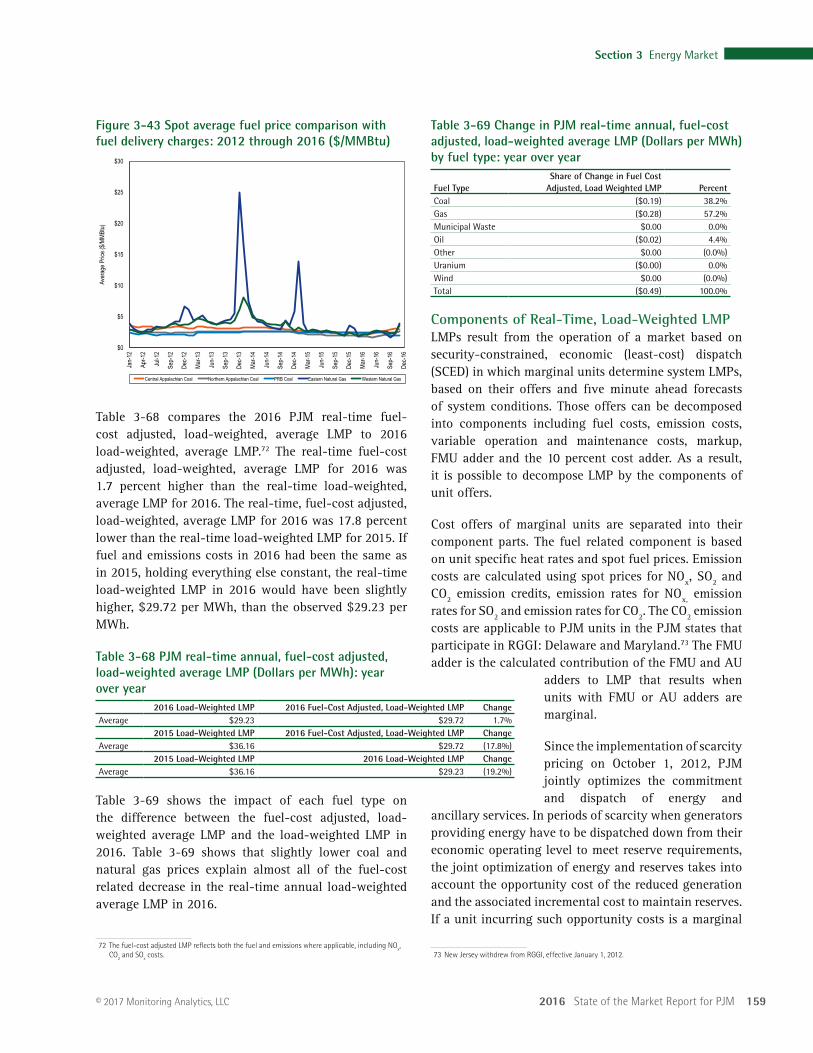
2016 State of the Market Report for PJM 159
Section 3 Energy Market
© 2017 Monitoring Analytics, LLC
Table 3-69 Change in PJM real-time annual, fuel-cost adjusted, load-weighted average LMP (Dollars per MWh) by fuel type: year over year
Fuel TypeShare of Change in Fuel Cost
Adjusted, Load Weighted LMP PercentCoal ($0.19) 38.2%Gas ($0.28) 57.2%Municipal Waste $0.00 0.0%Oil ($0.02) 4.4%Other $0.00 (0.0%)Uranium ($0.00) 0.0%Wind $0.00 (0.0%)Total ($0.49) 100.0%
Components of Real-Time, Load-Weighted LMPLMPs result from the operation of a market based on security-constrained, economic (least-cost) dispatch (SCED) in which marginal units determine system LMPs, based on their offers and five minute ahead forecasts of system conditions. Those offers can be decomposed into components including fuel costs, emission costs, variable operation and maintenance costs, markup, FMU adder and the 10 percent cost adder. As a result, it is possible to decompose LMP by the components of unit offers.
Cost offers of marginal units are separated into their component parts. The fuel related component is based on unit specific heat rates and spot fuel prices. Emission costs are calculated using spot prices for NOx, SO2 and CO2 emission credits, emission rates for NOx, emission rates for SO2 and emission rates for CO2. The CO2 emission costs are applicable to PJM units in the PJM states that participate in RGGI: Delaware and Maryland.73 The FMU adder is the calculated contribution of the FMU and AU
adders to LMP that results when units with FMU or AU adders are marginal.
Since the implementation of scarcity pricing on October 1, 2012, PJM jointly optimizes the commitment and dispatch of energy and
ancillary services. In periods of scarcity when generators providing energy have to be dispatched down from their economic operating level to meet reserve requirements, the joint optimization of energy and reserves takes into account the opportunity cost of the reduced generation and the associated incremental cost to maintain reserves. If a unit incurring such opportunity costs is a marginal
73 New Jersey withdrew from RGGI, effective January 1, 2012.
Figure 3-43 Spot average fuel price comparison with fuel delivery charges: 2012 through 2016 ($/MMBtu)
$0
$5
$10
$15
$20
$25
$30
Jan-
12
Apr-1
2
Jul-1
2
Sep-
12
Dec-1
2
Mar-1
3
Jun-
13
Sep-
13
Dec-1
3
Mar-1
4
Jun-
14
Sep-
14
Dec-1
4
Mar-1
5
Jun-
15
Sep-
15
Dec-1
5
Mar-1
6
Jun-
16
Sep-
16
Dec-1
6
Aver
age P
rice (
$/MMB
tu)
Central Appalachian Coal Northern Appalachian Coal PRB Coal Eastern Natural Gas Western Natural Gas
Table 3-68 compares the 2016 PJM real-time fuel-cost adjusted, load-weighted, average LMP to 2016 load-weighted, average LMP.72 The real-time fuel-cost adjusted, load-weighted, average LMP for 2016 was 1.7 percent higher than the real-time load-weighted, average LMP for 2016. The real-time, fuel-cost adjusted, load-weighted, average LMP for 2016 was 17.8 percent lower than the real-time load-weighted LMP for 2015. If fuel and emissions costs in 2016 had been the same as in 2015, holding everything else constant, the real-time load-weighted LMP in 2016 would have been slightly higher, $29.72 per MWh, than the observed $29.23 per MWh.
Table 3-68 PJM real-time annual, fuel-cost adjusted, load-weighted average LMP (Dollars per MWh): year over year
2016 Load-Weighted LMP 2016 Fuel-Cost Adjusted, Load-Weighted LMP ChangeAverage $29.23 $29.72 1.7%
2015 Load-Weighted LMP 2016 Fuel-Cost Adjusted, Load-Weighted LMP ChangeAverage $36.16 $29.72 (17.8%)
2015 Load-Weighted LMP 2016 Load-Weighted LMP ChangeAverage $36.16 $29.23 (19.2%)
Table 3-69 shows the impact of each fuel type on the difference between the fuel-cost adjusted, load-weighted average LMP and the load-weighted LMP in 2016. Table 3-69 shows that slightly lower coal and natural gas prices explain almost all of the fuel-cost related decrease in the real-time annual load-weighted average LMP in 2016.
72 The fuel-cost adjusted LMP reflects both the fuel and emissions where applicable, including NOx, CO2 and SOx costs.
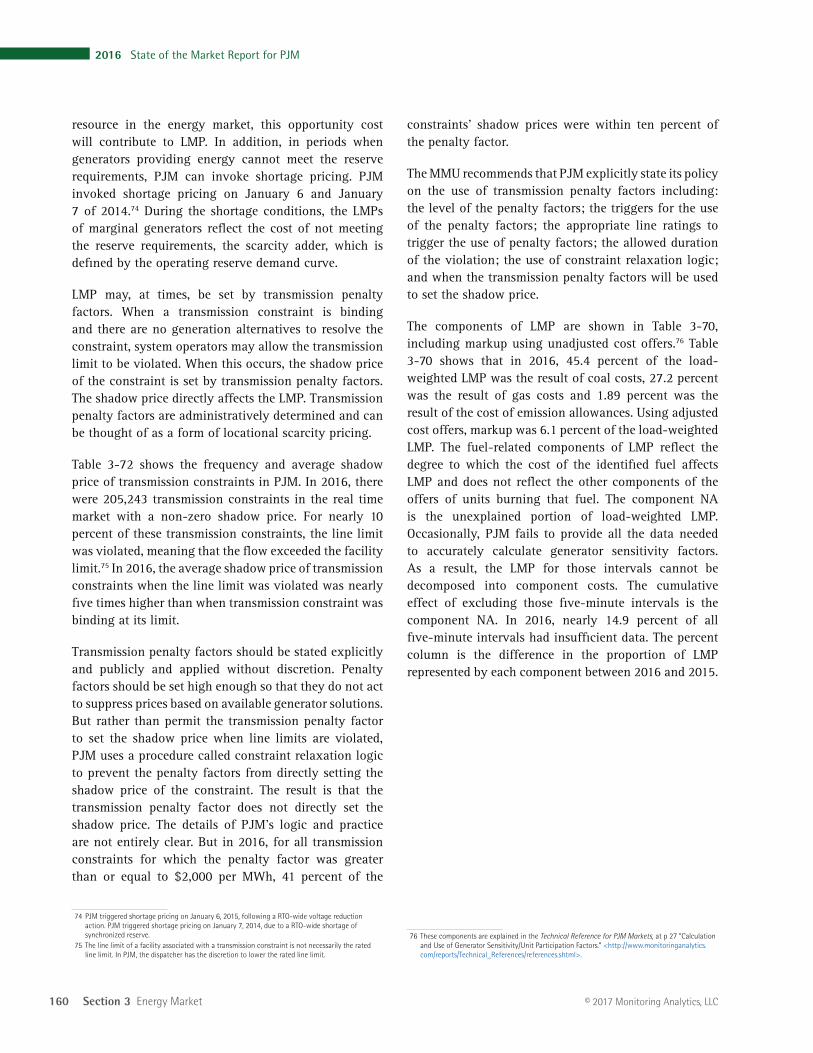
160 Section 3 Energy Market
2016 State of the Market Report for PJM
© 2017 Monitoring Analytics, LLC
constraints’ shadow prices were within ten percent of the penalty factor.
The MMU recommends that PJM explicitly state its policy on the use of transmission penalty factors including: the level of the penalty factors; the triggers for the use of the penalty factors; the appropriate line ratings to trigger the use of penalty factors; the allowed duration of the violation; the use of constraint relaxation logic; and when the transmission penalty factors will be used to set the shadow price.
The components of LMP are shown in Table 3-70, including markup using unadjusted cost offers.76 Table 3-70 shows that in 2016, 45.4 percent of the load-weighted LMP was the result of coal costs, 27.2 percent was the result of gas costs and 1.89 percent was the result of the cost of emission allowances. Using adjusted cost offers, markup was 6.1 percent of the load-weighted LMP. The fuel-related components of LMP reflect the degree to which the cost of the identified fuel affects LMP and does not reflect the other components of the offers of units burning that fuel. The component NA is the unexplained portion of load-weighted LMP. Occasionally, PJM fails to provide all the data needed to accurately calculate generator sensitivity factors. As a result, the LMP for those intervals cannot be decomposed into component costs. The cumulative effect of excluding those five-minute intervals is the component NA. In 2016, nearly 14.9 percent of all five-minute intervals had insufficient data. The percent column is the difference in the proportion of LMP represented by each component between 2016 and 2015.
76 These components are explained in the Technical Reference for PJM Markets, at p 27 “Calculation and Use of Generator Sensitivity/Unit Participation Factors.” <http://www.monitoringanalytics.com/reports/Technical_References/references.shtml>.
resource in the energy market, this opportunity cost will contribute to LMP. In addition, in periods when generators providing energy cannot meet the reserve requirements, PJM can invoke shortage pricing. PJM invoked shortage pricing on January 6 and January 7 of 2014.74 During the shortage conditions, the LMPs of marginal generators reflect the cost of not meeting the reserve requirements, the scarcity adder, which is defined by the operating reserve demand curve.
LMP may, at times, be set by transmission penalty factors. When a transmission constraint is binding and there are no generation alternatives to resolve the constraint, system operators may allow the transmission limit to be violated. When this occurs, the shadow price of the constraint is set by transmission penalty factors. The shadow price directly affects the LMP. Transmission penalty factors are administratively determined and can be thought of as a form of locational scarcity pricing.
Table 3-72 shows the frequency and average shadow price of transmission constraints in PJM. In 2016, there were 205,243 transmission constraints in the real time market with a non-zero shadow price. For nearly 10 percent of these transmission constraints, the line limit was violated, meaning that the flow exceeded the facility limit.75 In 2016, the average shadow price of transmission constraints when the line limit was violated was nearly five times higher than when transmission constraint was binding at its limit.
Transmission penalty factors should be stated explicitly and publicly and applied without discretion. Penalty factors should be set high enough so that they do not act to suppress prices based on available generator solutions. But rather than permit the transmission penalty factor to set the shadow price when line limits are violated, PJM uses a procedure called constraint relaxation logic to prevent the penalty factors from directly setting the shadow price of the constraint. The result is that the transmission penalty factor does not directly set the shadow price. The details of PJM’s logic and practice are not entirely clear. But in 2016, for all transmission constraints for which the penalty factor was greater than or equal to $2,000 per MWh, 41 percent of the
74 PJM triggered shortage pricing on January 6, 2015, following a RTO-wide voltage reduction action. PJM triggered shortage pricing on January 7, 2014, due to a RTO-wide shortage of synchronized reserve.
75 The line limit of a facility associated with a transmission constraint is not necessarily the rated line limit. In PJM, the dispatcher has the discretion to lower the rated line limit.
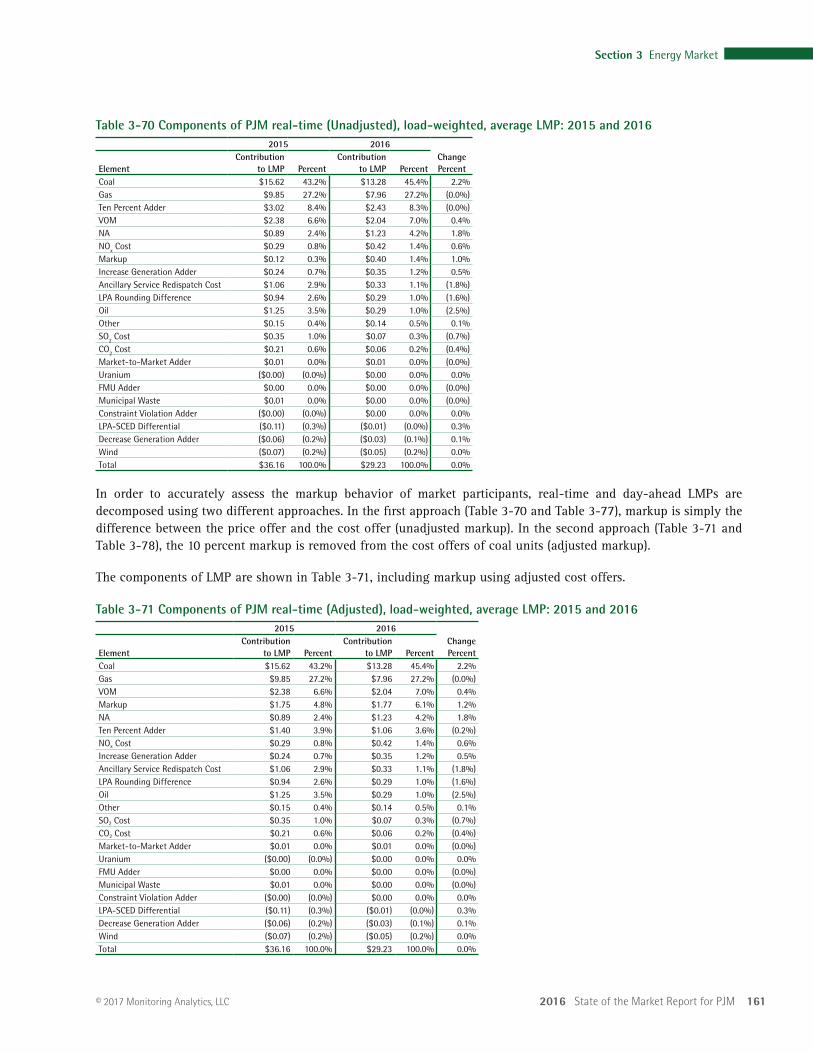
2016 State of the Market Report for PJM 161
Section 3 Energy Market
© 2017 Monitoring Analytics, LLC
Table 3-70 Components of PJM real-time (Unadjusted), load-weighted, average LMP: 2015 and 20162015 2016
Change PercentElement
Contribution to LMP Percent
Contribution to LMP Percent
Coal $15.62 43.2% $13.28 45.4% 2.2%Gas $9.85 27.2% $7.96 27.2% (0.0%)Ten Percent Adder $3.02 8.4% $2.43 8.3% (0.0%)VOM $2.38 6.6% $2.04 7.0% 0.4%NA $0.89 2.4% $1.23 4.2% 1.8%NOx Cost $0.29 0.8% $0.42 1.4% 0.6%Markup $0.12 0.3% $0.40 1.4% 1.0%Increase Generation Adder $0.24 0.7% $0.35 1.2% 0.5%Ancillary Service Redispatch Cost $1.06 2.9% $0.33 1.1% (1.8%)LPA Rounding Difference $0.94 2.6% $0.29 1.0% (1.6%)Oil $1.25 3.5% $0.29 1.0% (2.5%)Other $0.15 0.4% $0.14 0.5% 0.1%SO2 Cost $0.35 1.0% $0.07 0.3% (0.7%)CO2 Cost $0.21 0.6% $0.06 0.2% (0.4%)Market-to-Market Adder $0.01 0.0% $0.01 0.0% (0.0%)Uranium ($0.00) (0.0%) $0.00 0.0% 0.0%FMU Adder $0.00 0.0% $0.00 0.0% (0.0%)Municipal Waste $0.01 0.0% $0.00 0.0% (0.0%)Constraint Violation Adder ($0.00) (0.0%) $0.00 0.0% 0.0%LPA-SCED Differential ($0.11) (0.3%) ($0.01) (0.0%) 0.3%Decrease Generation Adder ($0.06) (0.2%) ($0.03) (0.1%) 0.1%Wind ($0.07) (0.2%) ($0.05) (0.2%) 0.0%Total $36.16 100.0% $29.23 100.0% 0.0%
In order to accurately assess the markup behavior of market participants, real-time and day-ahead LMPs are decomposed using two different approaches. In the first approach (Table 3-70 and Table 3-77), markup is simply the difference between the price offer and the cost offer (unadjusted markup). In the second approach (Table 3-71 and Table 3-78), the 10 percent markup is removed from the cost offers of coal units (adjusted markup).
The components of LMP are shown in Table 3-71, including markup using adjusted cost offers.
Table 3-71 Components of PJM real-time (Adjusted), load-weighted, average LMP: 2015 and 20162015 2016
Change PercentElement
Contribution to LMP Percent
Contribution to LMP Percent
Coal $15.62 43.2% $13.28 45.4% 2.2%Gas $9.85 27.2% $7.96 27.2% (0.0%)VOM $2.38 6.6% $2.04 7.0% 0.4%Markup $1.75 4.8% $1.77 6.1% 1.2%NA $0.89 2.4% $1.23 4.2% 1.8%Ten Percent Adder $1.40 3.9% $1.06 3.6% (0.2%)NOx Cost $0.29 0.8% $0.42 1.4% 0.6%Increase Generation Adder $0.24 0.7% $0.35 1.2% 0.5%Ancillary Service Redispatch Cost $1.06 2.9% $0.33 1.1% (1.8%)LPA Rounding Difference $0.94 2.6% $0.29 1.0% (1.6%)Oil $1.25 3.5% $0.29 1.0% (2.5%)Other $0.15 0.4% $0.14 0.5% 0.1%SO2 Cost $0.35 1.0% $0.07 0.3% (0.7%)CO2 Cost $0.21 0.6% $0.06 0.2% (0.4%)Market-to-Market Adder $0.01 0.0% $0.01 0.0% (0.0%)Uranium ($0.00) (0.0%) $0.00 0.0% 0.0%FMU Adder $0.00 0.0% $0.00 0.0% (0.0%)Municipal Waste $0.01 0.0% $0.00 0.0% (0.0%)Constraint Violation Adder ($0.00) (0.0%) $0.00 0.0% 0.0%LPA-SCED Differential ($0.11) (0.3%) ($0.01) (0.0%) 0.3%Decrease Generation Adder ($0.06) (0.2%) ($0.03) (0.1%) 0.1%Wind ($0.07) (0.2%) ($0.05) (0.2%) 0.0%Total $36.16 100.0% $29.23 100.0% 0.0%
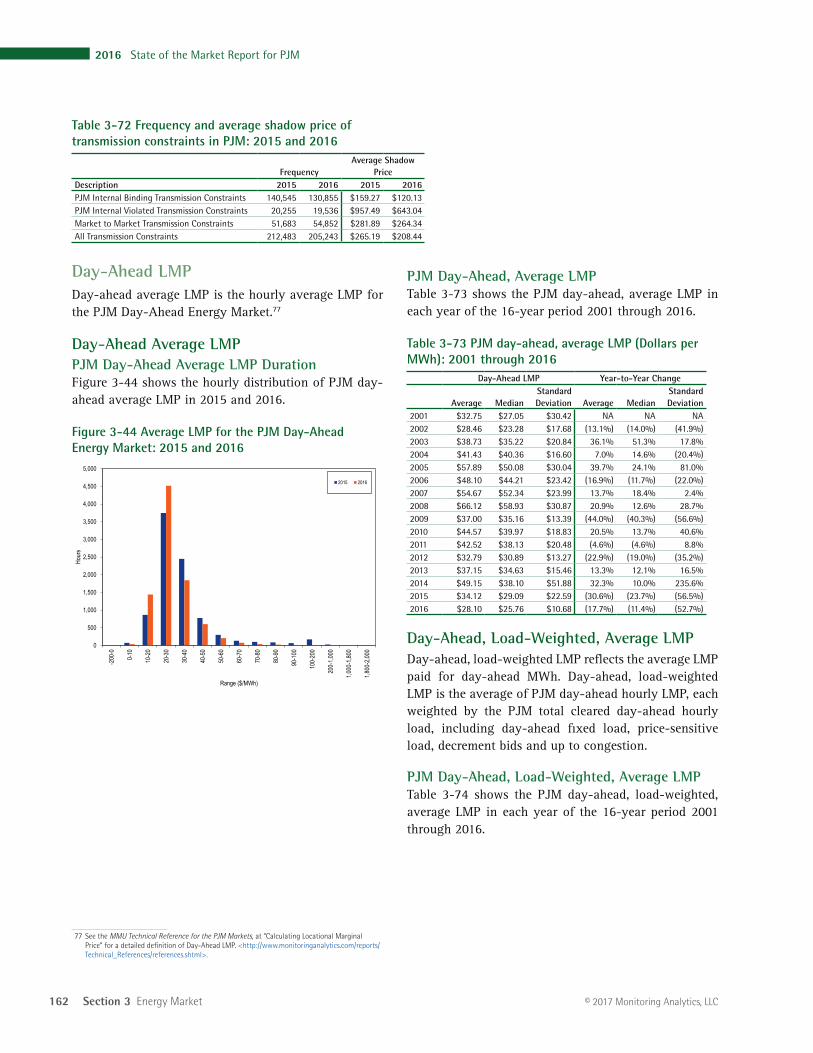
162 Section 3 Energy Market
2016 State of the Market Report for PJM
© 2017 Monitoring Analytics, LLC
PJM Day-Ahead, Average LMPTable 3-73 shows the PJM day-ahead, average LMP in each year of the 16-year period 2001 through 2016.
Table 3-73 PJM day-ahead, average LMP (Dollars per MWh): 2001 through 2016
Day-Ahead LMP Year-to-Year Change
Average MedianStandard Deviation Average Median
Standard Deviation
2001 $32.75 $27.05 $30.42 NA NA NA2002 $28.46 $23.28 $17.68 (13.1%) (14.0%) (41.9%)2003 $38.73 $35.22 $20.84 36.1% 51.3% 17.8%2004 $41.43 $40.36 $16.60 7.0% 14.6% (20.4%)2005 $57.89 $50.08 $30.04 39.7% 24.1% 81.0%2006 $48.10 $44.21 $23.42 (16.9%) (11.7%) (22.0%)2007 $54.67 $52.34 $23.99 13.7% 18.4% 2.4%2008 $66.12 $58.93 $30.87 20.9% 12.6% 28.7%2009 $37.00 $35.16 $13.39 (44.0%) (40.3%) (56.6%)2010 $44.57 $39.97 $18.83 20.5% 13.7% 40.6%2011 $42.52 $38.13 $20.48 (4.6%) (4.6%) 8.8%2012 $32.79 $30.89 $13.27 (22.9%) (19.0%) (35.2%)2013 $37.15 $34.63 $15.46 13.3% 12.1% 16.5%2014 $49.15 $38.10 $51.88 32.3% 10.0% 235.6%2015 $34.12 $29.09 $22.59 (30.6%) (23.7%) (56.5%)2016 $28.10 $25.76 $10.68 (17.7%) (11.4%) (52.7%)
Day-Ahead, Load-Weighted, Average LMPDay-ahead, load-weighted LMP reflects the average LMP paid for day-ahead MWh. Day-ahead, load-weighted LMP is the average of PJM day-ahead hourly LMP, each weighted by the PJM total cleared day-ahead hourly load, including day-ahead fixed load, price-sensitive load, decrement bids and up to congestion.
PJM Day-Ahead, Load-Weighted, Average LMPTable 3-74 shows the PJM day-ahead, load-weighted, average LMP in each year of the 16-year period 2001 through 2016.
Table 3-72 Frequency and average shadow price of transmission constraints in PJM: 2015 and 2016
FrequencyAverage Shadow
PriceDescription 2015 2016 2015 2016PJM Internal Binding Transmission Constraints 140,545 130,855 $159.27 $120.13 PJM Internal Violated Transmission Constraints 20,255 19,536 $957.49 $643.04 Market to Market Transmission Constraints 51,683 54,852 $281.89 $264.34 All Transmission Constraints 212,483 205,243 $265.19 $208.44
Day-Ahead LMPDay-ahead average LMP is the hourly average LMP for the PJM Day-Ahead Energy Market.77
Day-Ahead Average LMPPJM Day-Ahead Average LMP DurationFigure 3-44 shows the hourly distribution of PJM day-ahead average LMP in 2015 and 2016.
Figure 3-44 Average LMP for the PJM Day-Ahead Energy Market: 2015 and 2016
0
500
1,000
1,500
2,000
2,500
3,000
3,500
4,000
4,500
5,000
-200
-0
0-10
10-2
0
20-3
0
30-4
0
40-5
0
50-6
0
60-7
0
70-8
0
80-9
0
90-1
00
100-
200
200-
1,000
1,000
-1,80
0
1,800
-2,00
0
Hour
s
Range ($/MWh)
2015 2016
77 See the MMU Technical Reference for the PJM Markets, at “Calculating Locational Marginal Price” for a detailed definition of Day-Ahead LMP. <http://www.monitoringanalytics.com/reports/Technical_References/references.shtml>.
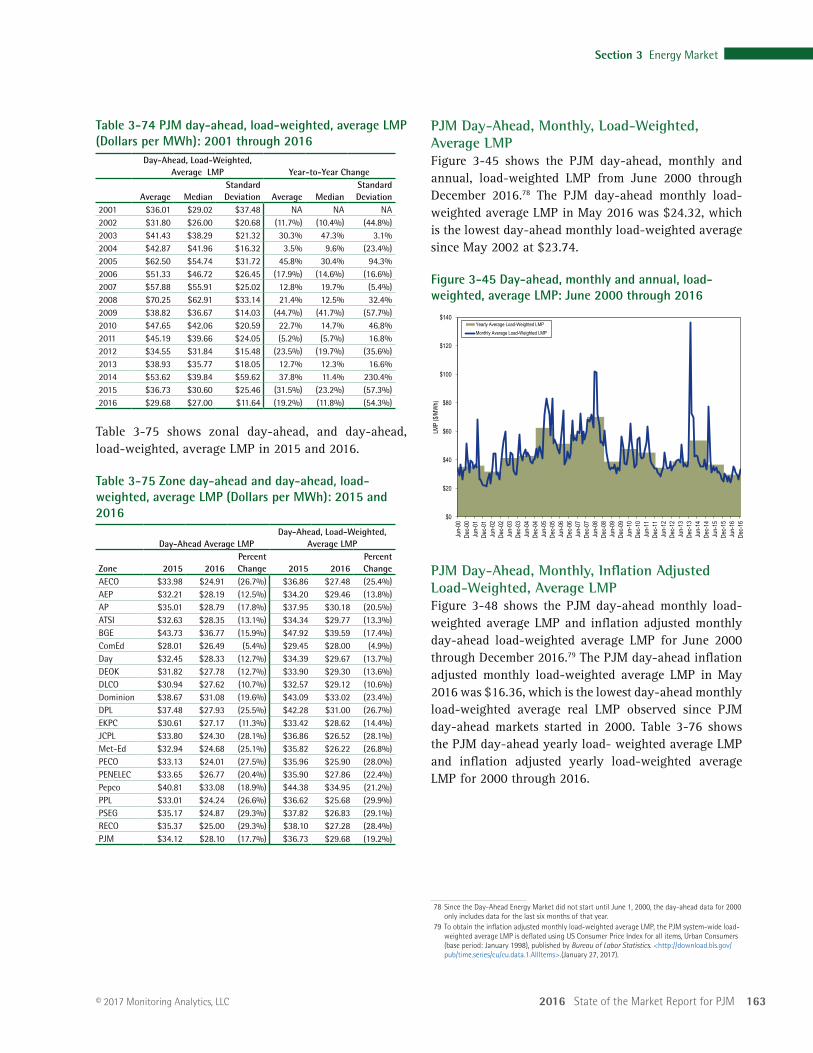
2016 State of the Market Report for PJM 163
Section 3 Energy Market
© 2017 Monitoring Analytics, LLC
PJM Day-Ahead, Monthly, Load-Weighted, Average LMPFigure 3-45 shows the PJM day-ahead, monthly and annual, load-weighted LMP from June 2000 through December 2016.78 The PJM day-ahead monthly load-weighted average LMP in May 2016 was $24.32, which is the lowest day-ahead monthly load-weighted average since May 2002 at $23.74.
Figure 3-45 Day-ahead, monthly and annual, load-weighted, average LMP: June 2000 through 2016
$0
$20
$40
$60
$80
$100
$120
$140
Jun-
00De
c-00
Jun-
01De
c-01
Jun-
02De
c-02
Jun-
03De
c-03
Jun-
04De
c-04
Jun-
05De
c-05
Jun-
06De
c-06
Jun-
07De
c-07
Jun-
08De
c-08
Jun-
09De
c-09
Jun-
10De
c-10
Jun-
11De
c-11
Jun-
12De
c-12
Jun-
13De
c-13
Jun-
14De
c-14
Jun-
15De
c-15
Jun-
16De
c-16
LMP
($/M
Wh)
Yearly Average Load-Weighted LMPMonthly Average Load-Weighted LMP
PJM Day-Ahead, Monthly, Inflation Adjusted Load-Weighted, Average LMPFigure 3-48 shows the PJM day-ahead monthly load-weighted average LMP and inflation adjusted monthly day-ahead load-weighted average LMP for June 2000 through December 2016.79 The PJM day-ahead inflation adjusted monthly load-weighted average LMP in May 2016 was $16.36, which is the lowest day-ahead monthly load-weighted average real LMP observed since PJM day-ahead markets started in 2000. Table 3-76 shows the PJM day-ahead yearly load- weighted average LMP and inflation adjusted yearly load-weighted average LMP for 2000 through 2016.
78 Since the Day-Ahead Energy Market did not start until June 1, 2000, the day-ahead data for 2000 only includes data for the last six months of that year.
79 To obtain the inflation adjusted monthly load-weighted average LMP, the PJM system-wide load-weighted average LMP is deflated using US Consumer Price Index for all items, Urban Consumers (base period: January 1998), published by Bureau of Labor Statistics. <http://download.bls.gov/pub/time.series/cu/cu.data.1.AllItems>.(January 27, 2017).
Table 3-74 PJM day-ahead, load-weighted, average LMP (Dollars per MWh): 2001 through 2016
Day-Ahead, Load-Weighted, Average LMP Year-to-Year Change
Average MedianStandard Deviation Average Median
Standard Deviation
2001 $36.01 $29.02 $37.48 NA NA NA2002 $31.80 $26.00 $20.68 (11.7%) (10.4%) (44.8%)2003 $41.43 $38.29 $21.32 30.3% 47.3% 3.1%2004 $42.87 $41.96 $16.32 3.5% 9.6% (23.4%)2005 $62.50 $54.74 $31.72 45.8% 30.4% 94.3%2006 $51.33 $46.72 $26.45 (17.9%) (14.6%) (16.6%)2007 $57.88 $55.91 $25.02 12.8% 19.7% (5.4%)2008 $70.25 $62.91 $33.14 21.4% 12.5% 32.4%2009 $38.82 $36.67 $14.03 (44.7%) (41.7%) (57.7%)2010 $47.65 $42.06 $20.59 22.7% 14.7% 46.8%2011 $45.19 $39.66 $24.05 (5.2%) (5.7%) 16.8%2012 $34.55 $31.84 $15.48 (23.5%) (19.7%) (35.6%)2013 $38.93 $35.77 $18.05 12.7% 12.3% 16.6%2014 $53.62 $39.84 $59.62 37.8% 11.4% 230.4%2015 $36.73 $30.60 $25.46 (31.5%) (23.2%) (57.3%)2016 $29.68 $27.00 $11.64 (19.2%) (11.8%) (54.3%)
Table 3-75 shows zonal day-ahead, and day-ahead, load-weighted, average LMP in 2015 and 2016.
Table 3-75 Zone day-ahead and day-ahead, load-weighted, average LMP (Dollars per MWh): 2015 and 2016
Day-Ahead Average LMPDay-Ahead, Load-Weighted,
Average LMP
Zone 2015 2016Percent Change 2015 2016
Percent Change
AECO $33.98 $24.91 (26.7%) $36.86 $27.48 (25.4%)AEP $32.21 $28.19 (12.5%) $34.20 $29.46 (13.8%)AP $35.01 $28.79 (17.8%) $37.95 $30.18 (20.5%)ATSI $32.63 $28.35 (13.1%) $34.34 $29.77 (13.3%)BGE $43.73 $36.77 (15.9%) $47.92 $39.59 (17.4%)ComEd $28.01 $26.49 (5.4%) $29.45 $28.00 (4.9%)Day $32.45 $28.33 (12.7%) $34.39 $29.67 (13.7%)DEOK $31.82 $27.78 (12.7%) $33.90 $29.30 (13.6%)DLCO $30.94 $27.62 (10.7%) $32.57 $29.12 (10.6%)Dominion $38.67 $31.08 (19.6%) $43.09 $33.02 (23.4%)DPL $37.48 $27.93 (25.5%) $42.28 $31.00 (26.7%)EKPC $30.61 $27.17 (11.3%) $33.42 $28.62 (14.4%)JCPL $33.80 $24.30 (28.1%) $36.86 $26.52 (28.1%)Met-Ed $32.94 $24.68 (25.1%) $35.82 $26.22 (26.8%)PECO $33.13 $24.01 (27.5%) $35.96 $25.90 (28.0%)PENELEC $33.65 $26.77 (20.4%) $35.90 $27.86 (22.4%)Pepco $40.81 $33.08 (18.9%) $44.38 $34.95 (21.2%)PPL $33.01 $24.24 (26.6%) $36.62 $25.68 (29.9%)PSEG $35.17 $24.87 (29.3%) $37.82 $26.83 (29.1%)RECO $35.37 $25.00 (29.3%) $38.10 $27.28 (28.4%)PJM $34.12 $28.10 (17.7%) $36.73 $29.68 (19.2%)
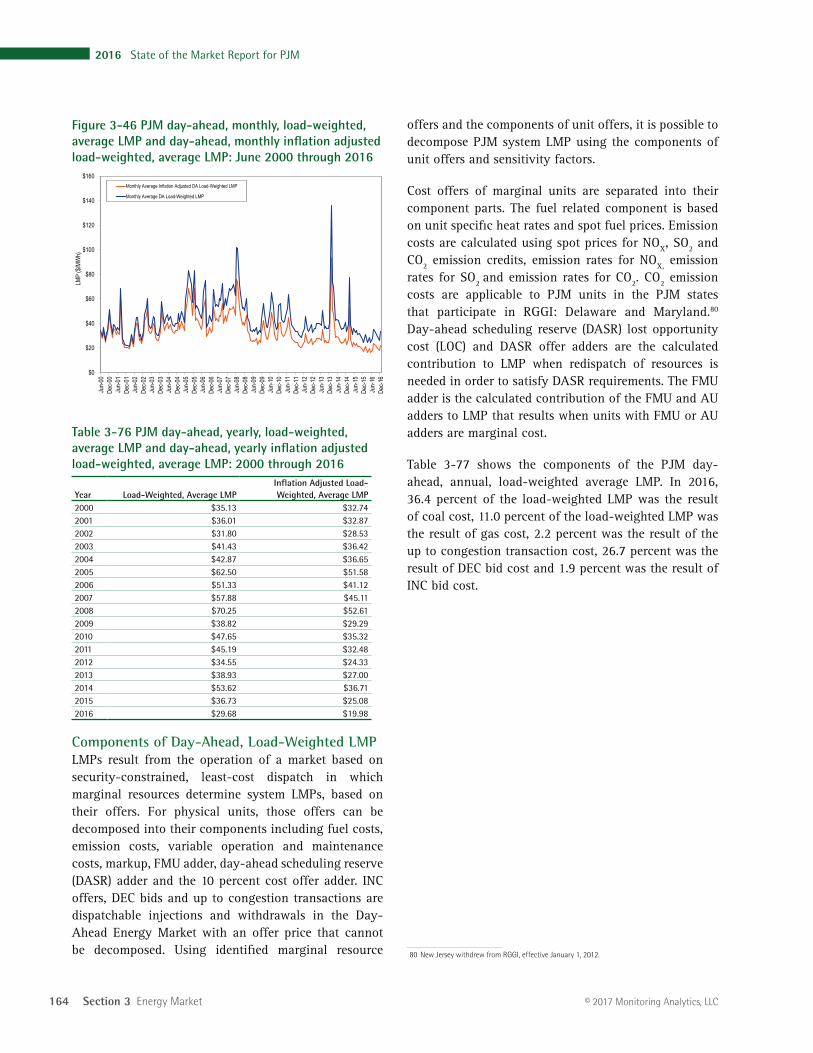
164 Section 3 Energy Market
2016 State of the Market Report for PJM
© 2017 Monitoring Analytics, LLC
offers and the components of unit offers, it is possible to decompose PJM system LMP using the components of unit offers and sensitivity factors.
Cost offers of marginal units are separated into their component parts. The fuel related component is based on unit specific heat rates and spot fuel prices. Emission costs are calculated using spot prices for NOX, SO2 and CO2 emission credits, emission rates for NOX, emission rates for SO2 and emission rates for CO2. CO2 emission costs are applicable to PJM units in the PJM states that participate in RGGI: Delaware and Maryland.80 Day-ahead scheduling reserve (DASR) lost opportunity cost (LOC) and DASR offer adders are the calculated contribution to LMP when redispatch of resources is needed in order to satisfy DASR requirements. The FMU adder is the calculated contribution of the FMU and AU adders to LMP that results when units with FMU or AU adders are marginal cost.
Table 3-77 shows the components of the PJM day-ahead, annual, load-weighted average LMP. In 2016, 36.4 percent of the load-weighted LMP was the result of coal cost, 11.0 percent of the load-weighted LMP was the result of gas cost, 2.2 percent was the result of the up to congestion transaction cost, 26.7 percent was the result of DEC bid cost and 1.9 percent was the result of INC bid cost.
80 New Jersey withdrew from RGGI, effective January 1, 2012.
Figure 3-46 PJM day-ahead, monthly, load-weighted, average LMP and day-ahead, monthly inflation adjusted load-weighted, average LMP: June 2000 through 2016
$0
$20
$40
$60
$80
$100
$120
$140
$160
Jun-
00De
c-00
Jun-
01De
c-01
Jun-
02De
c-02
Jun-
03De
c-03
Jun-
04De
c-04
Jun-
05De
c-05
Jun-
06De
c-06
Jun-
07De
c-07
Jun-
08De
c-08
Jun-
09De
c-09
Jun-
10De
c-10
Jun-
11De
c-11
Jun-
12De
c-12
Jun-
13De
c-13
Jun-
14De
c-14
Jun-
15De
c-15
Jun-
16De
c-16
LMP
($/M
Wh)
Monthly Average Inflation Adjusted DA Load-Weighted LMP
Monthly Average DA Load-Weighted LMP
Table 3-76 PJM day-ahead, yearly, load-weighted, average LMP and day-ahead, yearly inflation adjusted load-weighted, average LMP: 2000 through 2016
Year Load-Weighted, Average LMPInflation Adjusted Load-Weighted, Average LMP
2000 $35.13 $32.74 2001 $36.01 $32.87 2002 $31.80 $28.53 2003 $41.43 $36.42 2004 $42.87 $36.65 2005 $62.50 $51.58 2006 $51.33 $41.12 2007 $57.88 $45.11 2008 $70.25 $52.61 2009 $38.82 $29.29 2010 $47.65 $35.32 2011 $45.19 $32.48 2012 $34.55 $24.33 2013 $38.93 $27.00 2014 $53.62 $36.71 2015 $36.73 $25.08 2016 $29.68 $19.98
Components of Day-Ahead, Load-Weighted LMPLMPs result from the operation of a market based on security-constrained, least-cost dispatch in which marginal resources determine system LMPs, based on their offers. For physical units, those offers can be decomposed into their components including fuel costs, emission costs, variable operation and maintenance costs, markup, FMU adder, day-ahead scheduling reserve (DASR) adder and the 10 percent cost offer adder. INC offers, DEC bids and up to congestion transactions are dispatchable injections and withdrawals in the Day-Ahead Energy Market with an offer price that cannot be decomposed. Using identified marginal resource
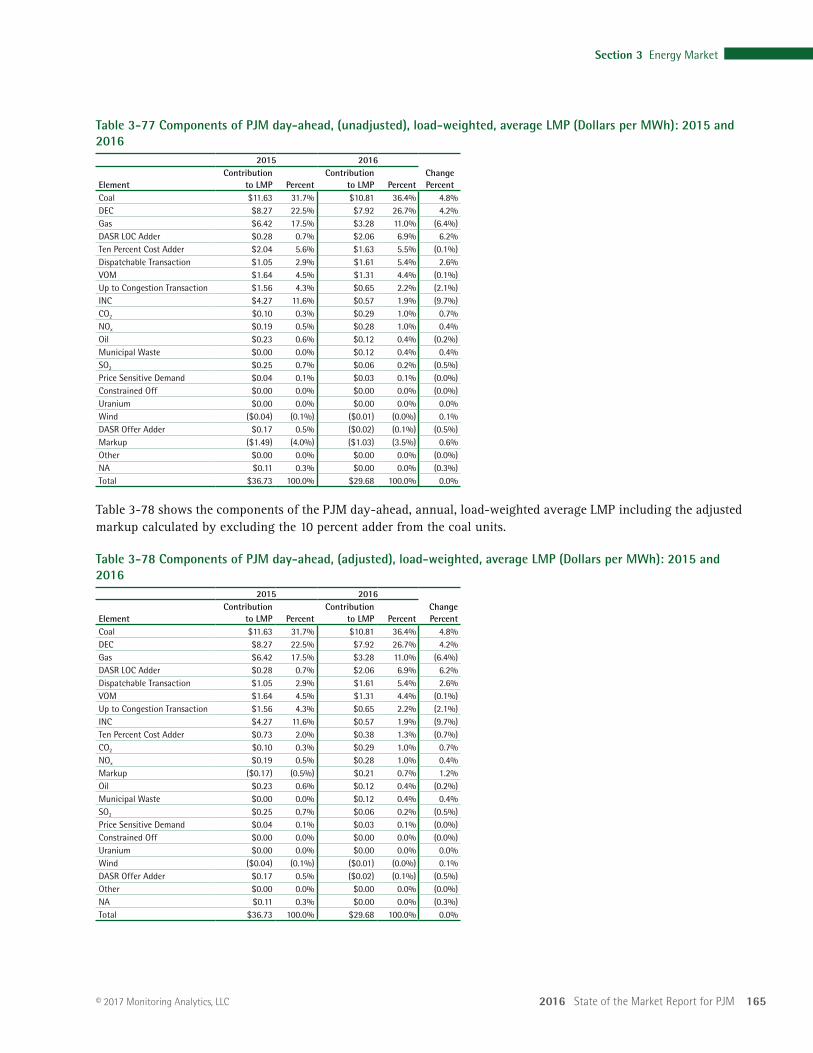
2016 State of the Market Report for PJM 165
Section 3 Energy Market
© 2017 Monitoring Analytics, LLC
Table 3-77 Components of PJM day-ahead, (unadjusted), load-weighted, average LMP (Dollars per MWh): 2015 and 2016
2015 2016Change PercentElement
Contribution to LMP Percent
Contribution to LMP Percent
Coal $11.63 31.7% $10.81 36.4% 4.8%DEC $8.27 22.5% $7.92 26.7% 4.2%Gas $6.42 17.5% $3.28 11.0% (6.4%)DASR LOC Adder $0.28 0.7% $2.06 6.9% 6.2%Ten Percent Cost Adder $2.04 5.6% $1.63 5.5% (0.1%)Dispatchable Transaction $1.05 2.9% $1.61 5.4% 2.6%VOM $1.64 4.5% $1.31 4.4% (0.1%)Up to Congestion Transaction $1.56 4.3% $0.65 2.2% (2.1%)INC $4.27 11.6% $0.57 1.9% (9.7%)CO2 $0.10 0.3% $0.29 1.0% 0.7%NOx $0.19 0.5% $0.28 1.0% 0.4%Oil $0.23 0.6% $0.12 0.4% (0.2%)Municipal Waste $0.00 0.0% $0.12 0.4% 0.4%SO2 $0.25 0.7% $0.06 0.2% (0.5%)Price Sensitive Demand $0.04 0.1% $0.03 0.1% (0.0%)Constrained Off $0.00 0.0% $0.00 0.0% (0.0%)Uranium $0.00 0.0% $0.00 0.0% 0.0%Wind ($0.04) (0.1%) ($0.01) (0.0%) 0.1%DASR Offer Adder $0.17 0.5% ($0.02) (0.1%) (0.5%)Markup ($1.49) (4.0%) ($1.03) (3.5%) 0.6%Other $0.00 0.0% $0.00 0.0% (0.0%)NA $0.11 0.3% $0.00 0.0% (0.3%)Total $36.73 100.0% $29.68 100.0% 0.0%
Table 3-78 shows the components of the PJM day-ahead, annual, load-weighted average LMP including the adjusted markup calculated by excluding the 10 percent adder from the coal units.
Table 3-78 Components of PJM day-ahead, (adjusted), load-weighted, average LMP (Dollars per MWh): 2015 and 2016
2015 2016Change PercentElement
Contribution to LMP Percent
Contribution to LMP Percent
Coal $11.63 31.7% $10.81 36.4% 4.8%DEC $8.27 22.5% $7.92 26.7% 4.2%Gas $6.42 17.5% $3.28 11.0% (6.4%)DASR LOC Adder $0.28 0.7% $2.06 6.9% 6.2%Dispatchable Transaction $1.05 2.9% $1.61 5.4% 2.6%VOM $1.64 4.5% $1.31 4.4% (0.1%)Up to Congestion Transaction $1.56 4.3% $0.65 2.2% (2.1%)INC $4.27 11.6% $0.57 1.9% (9.7%)Ten Percent Cost Adder $0.73 2.0% $0.38 1.3% (0.7%)CO2 $0.10 0.3% $0.29 1.0% 0.7%NOx $0.19 0.5% $0.28 1.0% 0.4%Markup ($0.17) (0.5%) $0.21 0.7% 1.2%Oil $0.23 0.6% $0.12 0.4% (0.2%)Municipal Waste $0.00 0.0% $0.12 0.4% 0.4%SO2 $0.25 0.7% $0.06 0.2% (0.5%)Price Sensitive Demand $0.04 0.1% $0.03 0.1% (0.0%)Constrained Off $0.00 0.0% $0.00 0.0% (0.0%)Uranium $0.00 0.0% $0.00 0.0% 0.0%Wind ($0.04) (0.1%) ($0.01) (0.0%) 0.1%DASR Offer Adder $0.17 0.5% ($0.02) (0.1%) (0.5%)Other $0.00 0.0% $0.00 0.0% (0.0%)NA $0.11 0.3% $0.00 0.0% (0.3%)Total $36.73 100.0% $29.68 100.0% 0.0%
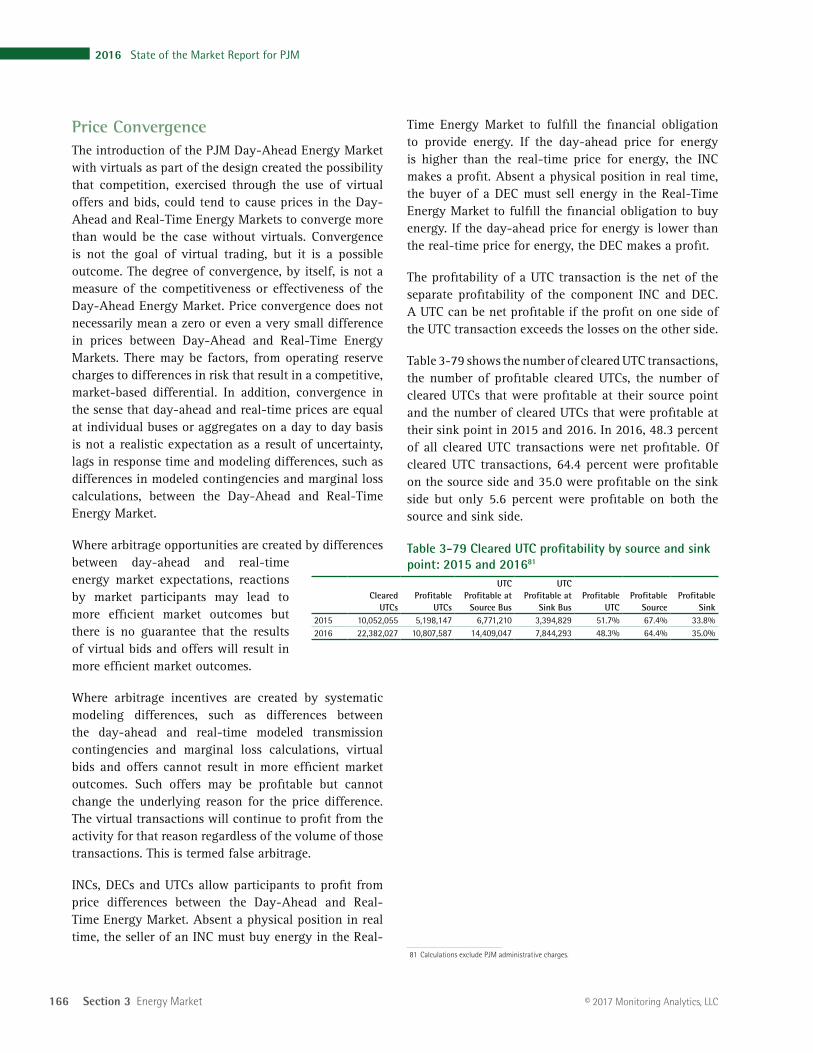
166 Section 3 Energy Market
2016 State of the Market Report for PJM
© 2017 Monitoring Analytics, LLC
Time Energy Market to fulfill the financial obligation to provide energy. If the day-ahead price for energy is higher than the real-time price for energy, the INC makes a profit. Absent a physical position in real time, the buyer of a DEC must sell energy in the Real-Time Energy Market to fulfill the financial obligation to buy energy. If the day-ahead price for energy is lower than the real-time price for energy, the DEC makes a profit.
The profitability of a UTC transaction is the net of the separate profitability of the component INC and DEC. A UTC can be net profitable if the profit on one side of the UTC transaction exceeds the losses on the other side.
Table 3-79 shows the number of cleared UTC transactions, the number of profitable cleared UTCs, the number of cleared UTCs that were profitable at their source point and the number of cleared UTCs that were profitable at their sink point in 2015 and 2016. In 2016, 48.3 percent of all cleared UTC transactions were net profitable. Of cleared UTC transactions, 64.4 percent were profitable on the source side and 35.0 were profitable on the sink side but only 5.6 percent were profitable on both the source and sink side.
Table 3-79 Cleared UTC profitability by source and sink point: 2015 and 201681
Cleared UTCs
Profitable UTCs
UTC Profitable at
Source Bus
UTC Profitable at
Sink BusProfitable
UTCProfitable
SourceProfitable
Sink2015 10,052,055 5,198,147 6,771,210 3,394,829 51.7% 67.4% 33.8%2016 22,382,027 10,807,587 14,409,047 7,844,293 48.3% 64.4% 35.0%
81 Calculations exclude PJM administrative charges.
Price ConvergenceThe introduction of the PJM Day-Ahead Energy Market with virtuals as part of the design created the possibility that competition, exercised through the use of virtual offers and bids, could tend to cause prices in the Day-Ahead and Real-Time Energy Markets to converge more than would be the case without virtuals. Convergence is not the goal of virtual trading, but it is a possible outcome. The degree of convergence, by itself, is not a measure of the competitiveness or effectiveness of the Day-Ahead Energy Market. Price convergence does not necessarily mean a zero or even a very small difference in prices between Day-Ahead and Real-Time Energy Markets. There may be factors, from operating reserve charges to differences in risk that result in a competitive, market-based differential. In addition, convergence in the sense that day-ahead and real-time prices are equal at individual buses or aggregates on a day to day basis is not a realistic expectation as a result of uncertainty, lags in response time and modeling differences, such as differences in modeled contingencies and marginal loss calculations, between the Day-Ahead and Real-Time Energy Market.
Where arbitrage opportunities are created by differences between day-ahead and real-time energy market expectations, reactions by market participants may lead to more efficient market outcomes but there is no guarantee that the results of virtual bids and offers will result in more efficient market outcomes.
Where arbitrage incentives are created by systematic modeling differences, such as differences between the day-ahead and real-time modeled transmission contingencies and marginal loss calculations, virtual bids and offers cannot result in more efficient market outcomes. Such offers may be profitable but cannot change the underlying reason for the price difference. The virtual transactions will continue to profit from the activity for that reason regardless of the volume of those transactions. This is termed false arbitrage.
INCs, DECs and UTCs allow participants to profit from price differences between the Day-Ahead and Real-Time Energy Market. Absent a physical position in real time, the seller of an INC must buy energy in the Real-
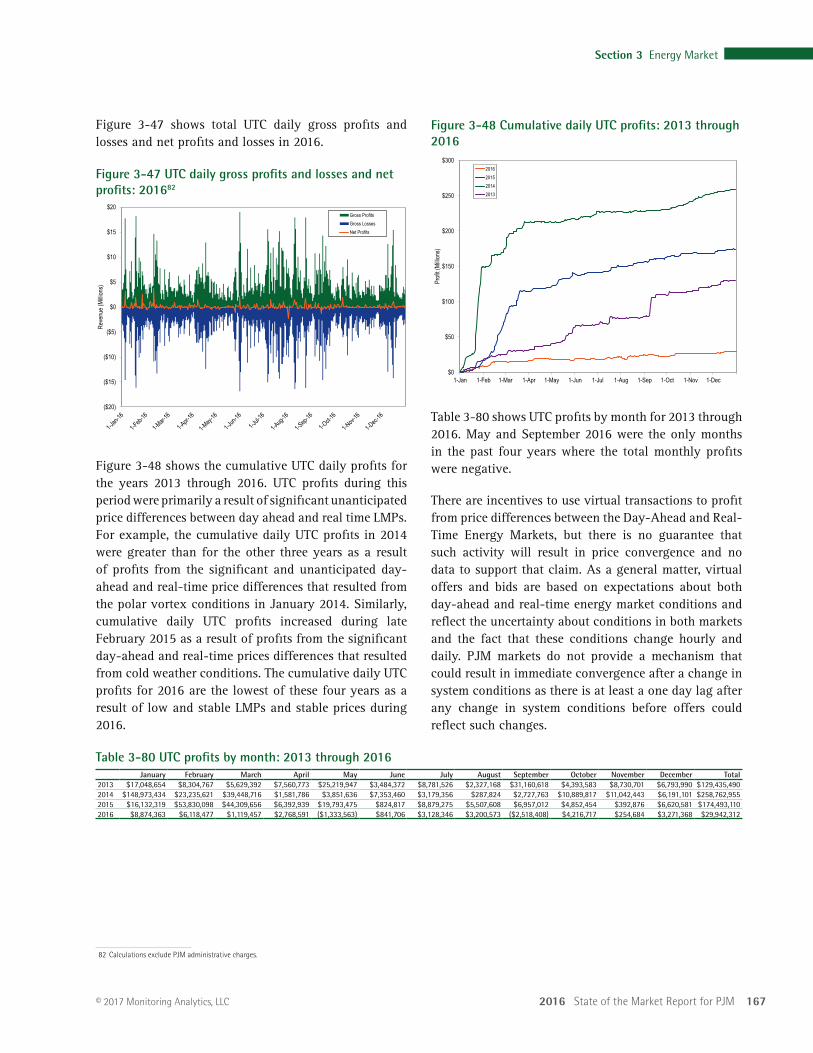
2016 State of the Market Report for PJM 167
Section 3 Energy Market
© 2017 Monitoring Analytics, LLC
Figure 3-48 Cumulative daily UTC profits: 2013 through 2016
$0
$50
$100
$150
$200
$250
$300
1-Jan 1-Feb 1-Mar 1-Apr 1-May 1-Jun 1-Jul 1-Aug 1-Sep 1-Oct 1-Nov 1-Dec
Profi
t (Mi
llions
)
2016201520142013
Table 3-80 shows UTC profits by month for 2013 through 2016. May and September 2016 were the only months in the past four years where the total monthly profits were negative.
There are incentives to use virtual transactions to profit from price differences between the Day-Ahead and Real-Time Energy Markets, but there is no guarantee that such activity will result in price convergence and no data to support that claim. As a general matter, virtual offers and bids are based on expectations about both day-ahead and real-time energy market conditions and reflect the uncertainty about conditions in both markets and the fact that these conditions change hourly and daily. PJM markets do not provide a mechanism that could result in immediate convergence after a change in system conditions as there is at least a one day lag after any change in system conditions before offers could reflect such changes.
Figure 3-47 shows total UTC daily gross profits and losses and net profits and losses in 2016.
Figure 3-47 UTC daily gross profits and losses and net profits: 201682
($20)
($15)
($10)
($5)
$0
$5
$10
$15
$20
Reve
nue (
Millio
ns)
Gross ProfitsGross LossesNet Profits
Figure 3-48 shows the cumulative UTC daily profits for the years 2013 through 2016. UTC profits during this period were primarily a result of significant unanticipated price differences between day ahead and real time LMPs. For example, the cumulative daily UTC profits in 2014 were greater than for the other three years as a result of profits from the significant and unanticipated day-ahead and real-time price differences that resulted from the polar vortex conditions in January 2014. Similarly, cumulative daily UTC profits increased during late February 2015 as a result of profits from the significant day-ahead and real-time prices differences that resulted from cold weather conditions. The cumulative daily UTC profits for 2016 are the lowest of these four years as a result of low and stable LMPs and stable prices during 2016.
Table 3-80 UTC profits by month: 2013 through 2016January February March April May June July August September October November December Total
2013 $17,048,654 $8,304,767 $5,629,392 $7,560,773 $25,219,947 $3,484,372 $8,781,526 $2,327,168 $31,160,618 $4,393,583 $8,730,701 $6,793,990 $129,435,490 2014 $148,973,434 $23,235,621 $39,448,716 $1,581,786 $3,851,636 $7,353,460 $3,179,356 $287,824 $2,727,763 $10,889,817 $11,042,443 $6,191,101 $258,762,955 2015 $16,132,319 $53,830,098 $44,309,656 $6,392,939 $19,793,475 $824,817 $8,879,275 $5,507,608 $6,957,012 $4,852,454 $392,876 $6,620,581 $174,493,110 2016 $8,874,363 $6,118,477 $1,119,457 $2,768,591 ($1,333,563) $841,706 $3,128,346 $3,200,573 ($2,518,408) $4,216,717 $254,684 $3,271,368 $29,942,312
82 Calculations exclude PJM administrative charges.
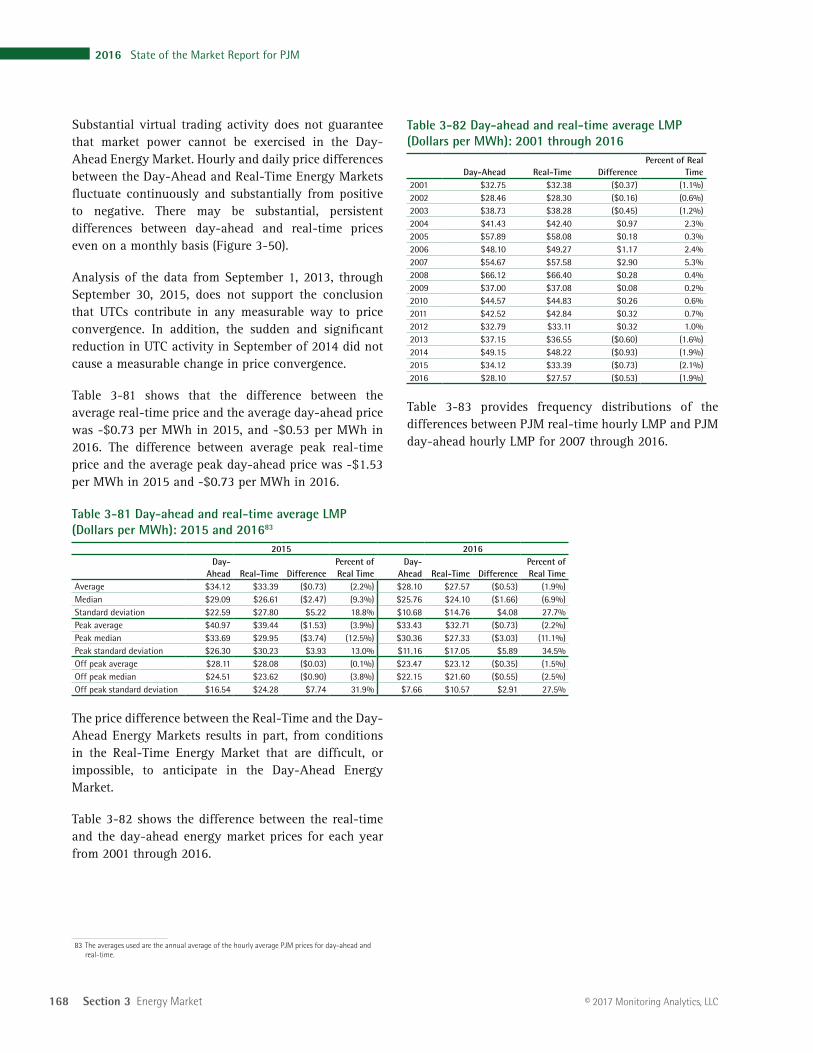
168 Section 3 Energy Market
2016 State of the Market Report for PJM
© 2017 Monitoring Analytics, LLC
Table 3-82 Day-ahead and real-time average LMP (Dollars per MWh): 2001 through 2016
Day-Ahead Real-Time DifferencePercent of Real
Time2001 $32.75 $32.38 ($0.37) (1.1%)2002 $28.46 $28.30 ($0.16) (0.6%)2003 $38.73 $38.28 ($0.45) (1.2%)2004 $41.43 $42.40 $0.97 2.3%2005 $57.89 $58.08 $0.18 0.3%2006 $48.10 $49.27 $1.17 2.4%2007 $54.67 $57.58 $2.90 5.3%2008 $66.12 $66.40 $0.28 0.4%2009 $37.00 $37.08 $0.08 0.2%2010 $44.57 $44.83 $0.26 0.6%2011 $42.52 $42.84 $0.32 0.7%2012 $32.79 $33.11 $0.32 1.0%2013 $37.15 $36.55 ($0.60) (1.6%)2014 $49.15 $48.22 ($0.93) (1.9%)2015 $34.12 $33.39 ($0.73) (2.1%)2016 $28.10 $27.57 ($0.53) (1.9%)
Table 3-83 provides frequency distributions of the differences between PJM real-time hourly LMP and PJM day-ahead hourly LMP for 2007 through 2016.
Substantial virtual trading activity does not guarantee that market power cannot be exercised in the Day-Ahead Energy Market. Hourly and daily price differences between the Day-Ahead and Real-Time Energy Markets fluctuate continuously and substantially from positive to negative. There may be substantial, persistent differences between day-ahead and real-time prices even on a monthly basis (Figure 3-50).
Analysis of the data from September 1, 2013, through September 30, 2015, does not support the conclusion that UTCs contribute in any measurable way to price convergence. In addition, the sudden and significant reduction in UTC activity in September of 2014 did not cause a measurable change in price convergence.
Table 3-81 shows that the difference between the average real-time price and the average day-ahead price was -$0.73 per MWh in 2015, and -$0.53 per MWh in 2016. The difference between average peak real-time price and the average peak day-ahead price was -$1.53 per MWh in 2015 and -$0.73 per MWh in 2016.
Table 3-81 Day-ahead and real-time average LMP (Dollars per MWh): 2015 and 201683
2015 2016Day-
Ahead Real-Time DifferencePercent of Real Time
Day-Ahead Real-Time Difference
Percent of Real Time
Average $34.12 $33.39 ($0.73) (2.2%) $28.10 $27.57 ($0.53) (1.9%)Median $29.09 $26.61 ($2.47) (9.3%) $25.76 $24.10 ($1.66) (6.9%)Standard deviation $22.59 $27.80 $5.22 18.8% $10.68 $14.76 $4.08 27.7%Peak average $40.97 $39.44 ($1.53) (3.9%) $33.43 $32.71 ($0.73) (2.2%)Peak median $33.69 $29.95 ($3.74) (12.5%) $30.36 $27.33 ($3.03) (11.1%)Peak standard deviation $26.30 $30.23 $3.93 13.0% $11.16 $17.05 $5.89 34.5%Off peak average $28.11 $28.08 ($0.03) (0.1%) $23.47 $23.12 ($0.35) (1.5%)Off peak median $24.51 $23.62 ($0.90) (3.8%) $22.15 $21.60 ($0.55) (2.5%)Off peak standard deviation $16.54 $24.28 $7.74 31.9% $7.66 $10.57 $2.91 27.5%
The price difference between the Real-Time and the Day-Ahead Energy Markets results in part, from conditions in the Real-Time Energy Market that are difficult, or impossible, to anticipate in the Day-Ahead Energy Market.
Table 3-82 shows the difference between the real-time and the day-ahead energy market prices for each year from 2001 through 2016.
83 The averages used are the annual average of the hourly average PJM prices for day-ahead and real-time.
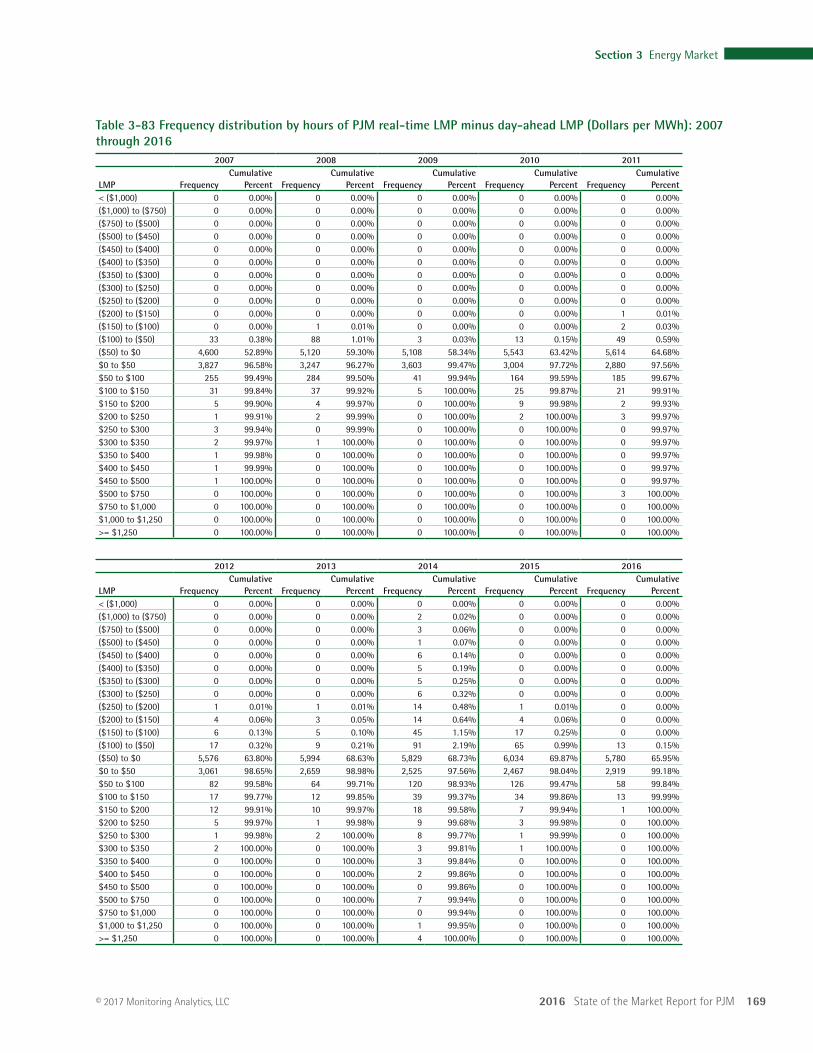
2016 State of the Market Report for PJM 169
Section 3 Energy Market
© 2017 Monitoring Analytics, LLC
Table 3-83 Frequency distribution by hours of PJM real-time LMP minus day-ahead LMP (Dollars per MWh): 2007 through 2016
2007 2008 2009 2010 2011
LMP FrequencyCumulative
Percent FrequencyCumulative
Percent FrequencyCumulative
Percent FrequencyCumulative
Percent FrequencyCumulative
Percent< ($1,000) 0 0.00% 0 0.00% 0 0.00% 0 0.00% 0 0.00%($1,000) to ($750) 0 0.00% 0 0.00% 0 0.00% 0 0.00% 0 0.00%($750) to ($500) 0 0.00% 0 0.00% 0 0.00% 0 0.00% 0 0.00%($500) to ($450) 0 0.00% 0 0.00% 0 0.00% 0 0.00% 0 0.00%($450) to ($400) 0 0.00% 0 0.00% 0 0.00% 0 0.00% 0 0.00%($400) to ($350) 0 0.00% 0 0.00% 0 0.00% 0 0.00% 0 0.00%($350) to ($300) 0 0.00% 0 0.00% 0 0.00% 0 0.00% 0 0.00%($300) to ($250) 0 0.00% 0 0.00% 0 0.00% 0 0.00% 0 0.00%($250) to ($200) 0 0.00% 0 0.00% 0 0.00% 0 0.00% 0 0.00%($200) to ($150) 0 0.00% 0 0.00% 0 0.00% 0 0.00% 1 0.01%($150) to ($100) 0 0.00% 1 0.01% 0 0.00% 0 0.00% 2 0.03%($100) to ($50) 33 0.38% 88 1.01% 3 0.03% 13 0.15% 49 0.59%($50) to $0 4,600 52.89% 5,120 59.30% 5,108 58.34% 5,543 63.42% 5,614 64.68%$0 to $50 3,827 96.58% 3,247 96.27% 3,603 99.47% 3,004 97.72% 2,880 97.56%$50 to $100 255 99.49% 284 99.50% 41 99.94% 164 99.59% 185 99.67%$100 to $150 31 99.84% 37 99.92% 5 100.00% 25 99.87% 21 99.91%$150 to $200 5 99.90% 4 99.97% 0 100.00% 9 99.98% 2 99.93%$200 to $250 1 99.91% 2 99.99% 0 100.00% 2 100.00% 3 99.97%$250 to $300 3 99.94% 0 99.99% 0 100.00% 0 100.00% 0 99.97%$300 to $350 2 99.97% 1 100.00% 0 100.00% 0 100.00% 0 99.97%$350 to $400 1 99.98% 0 100.00% 0 100.00% 0 100.00% 0 99.97%$400 to $450 1 99.99% 0 100.00% 0 100.00% 0 100.00% 0 99.97%$450 to $500 1 100.00% 0 100.00% 0 100.00% 0 100.00% 0 99.97%$500 to $750 0 100.00% 0 100.00% 0 100.00% 0 100.00% 3 100.00%$750 to $1,000 0 100.00% 0 100.00% 0 100.00% 0 100.00% 0 100.00%$1,000 to $1,250 0 100.00% 0 100.00% 0 100.00% 0 100.00% 0 100.00%>= $1,250 0 100.00% 0 100.00% 0 100.00% 0 100.00% 0 100.00%
2012 2013 2014 2015 2016
LMP FrequencyCumulative
Percent FrequencyCumulative
Percent FrequencyCumulative
Percent FrequencyCumulative
Percent FrequencyCumulative
Percent< ($1,000) 0 0.00% 0 0.00% 0 0.00% 0 0.00% 0 0.00%($1,000) to ($750) 0 0.00% 0 0.00% 2 0.02% 0 0.00% 0 0.00%($750) to ($500) 0 0.00% 0 0.00% 3 0.06% 0 0.00% 0 0.00%($500) to ($450) 0 0.00% 0 0.00% 1 0.07% 0 0.00% 0 0.00%($450) to ($400) 0 0.00% 0 0.00% 6 0.14% 0 0.00% 0 0.00%($400) to ($350) 0 0.00% 0 0.00% 5 0.19% 0 0.00% 0 0.00%($350) to ($300) 0 0.00% 0 0.00% 5 0.25% 0 0.00% 0 0.00%($300) to ($250) 0 0.00% 0 0.00% 6 0.32% 0 0.00% 0 0.00%($250) to ($200) 1 0.01% 1 0.01% 14 0.48% 1 0.01% 0 0.00%($200) to ($150) 4 0.06% 3 0.05% 14 0.64% 4 0.06% 0 0.00%($150) to ($100) 6 0.13% 5 0.10% 45 1.15% 17 0.25% 0 0.00%($100) to ($50) 17 0.32% 9 0.21% 91 2.19% 65 0.99% 13 0.15%($50) to $0 5,576 63.80% 5,994 68.63% 5,829 68.73% 6,034 69.87% 5,780 65.95%$0 to $50 3,061 98.65% 2,659 98.98% 2,525 97.56% 2,467 98.04% 2,919 99.18%$50 to $100 82 99.58% 64 99.71% 120 98.93% 126 99.47% 58 99.84%$100 to $150 17 99.77% 12 99.85% 39 99.37% 34 99.86% 13 99.99%$150 to $200 12 99.91% 10 99.97% 18 99.58% 7 99.94% 1 100.00%$200 to $250 5 99.97% 1 99.98% 9 99.68% 3 99.98% 0 100.00%$250 to $300 1 99.98% 2 100.00% 8 99.77% 1 99.99% 0 100.00%$300 to $350 2 100.00% 0 100.00% 3 99.81% 1 100.00% 0 100.00%$350 to $400 0 100.00% 0 100.00% 3 99.84% 0 100.00% 0 100.00%$400 to $450 0 100.00% 0 100.00% 2 99.86% 0 100.00% 0 100.00%$450 to $500 0 100.00% 0 100.00% 0 99.86% 0 100.00% 0 100.00%$500 to $750 0 100.00% 0 100.00% 7 99.94% 0 100.00% 0 100.00%$750 to $1,000 0 100.00% 0 100.00% 0 99.94% 0 100.00% 0 100.00%$1,000 to $1,250 0 100.00% 0 100.00% 1 99.95% 0 100.00% 0 100.00%>= $1,250 0 100.00% 0 100.00% 4 100.00% 0 100.00% 0 100.00%
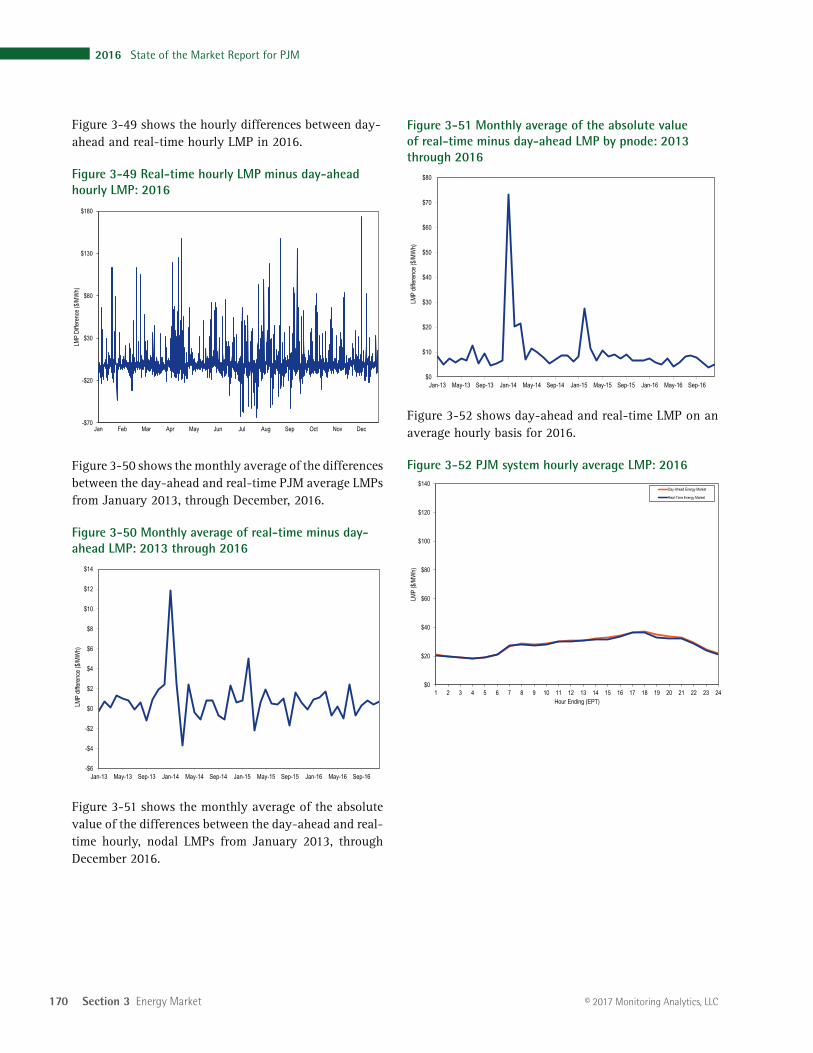
170 Section 3 Energy Market
2016 State of the Market Report for PJM
© 2017 Monitoring Analytics, LLC
Figure 3-51 Monthly average of the absolute value of real-time minus day-ahead LMP by pnode: 2013 through 2016
$0
$10
$20
$30
$40
$50
$60
$70
$80
Jan-13 May-13 Sep-13 Jan-14 May-14 Sep-14 Jan-15 May-15 Sep-15 Jan-16 May-16 Sep-16
LMP
differ
ence
($/M
Wh)
Figure 3-52 shows day-ahead and real-time LMP on an average hourly basis for 2016.
Figure 3-52 PJM system hourly average LMP: 2016
$0
$20
$40
$60
$80
$100
$120
$140
1 2 3 4 5 6 7 8 9 10 11 12 13 14 15 16 17 18 19 20 21 22 23 24
LMP
($/M
Wh)
Hour Ending (EPT)
Day-Ahead Energy Market
Real-Time Energy Market
Figure 3-49 shows the hourly differences between day-ahead and real-time hourly LMP in 2016.
Figure 3-49 Real-time hourly LMP minus day-ahead hourly LMP: 2016
-$70
-$20
$30
$80
$130
$180
Jan Feb Mar Apr May Jun Jul Aug Sep Oct Nov Dec
LMP
Diffe
renc
e ($/M
Wh)
Figure 3-50 shows the monthly average of the differences between the day-ahead and real-time PJM average LMPs from January 2013, through December, 2016.
Figure 3-50 Monthly average of real-time minus day-ahead LMP: 2013 through 2016
-$6
-$4
-$2
$0
$2
$4
$6
$8
$10
$12
$14
Jan-13 May-13 Sep-13 Jan-14 May-14 Sep-14 Jan-15 May-15 Sep-15 Jan-16 May-16 Sep-16
LMP
differ
ence
($/M
Wh)
Figure 3-51 shows the monthly average of the absolute value of the differences between the day-ahead and real-time hourly, nodal LMPs from January 2013, through December 2016.
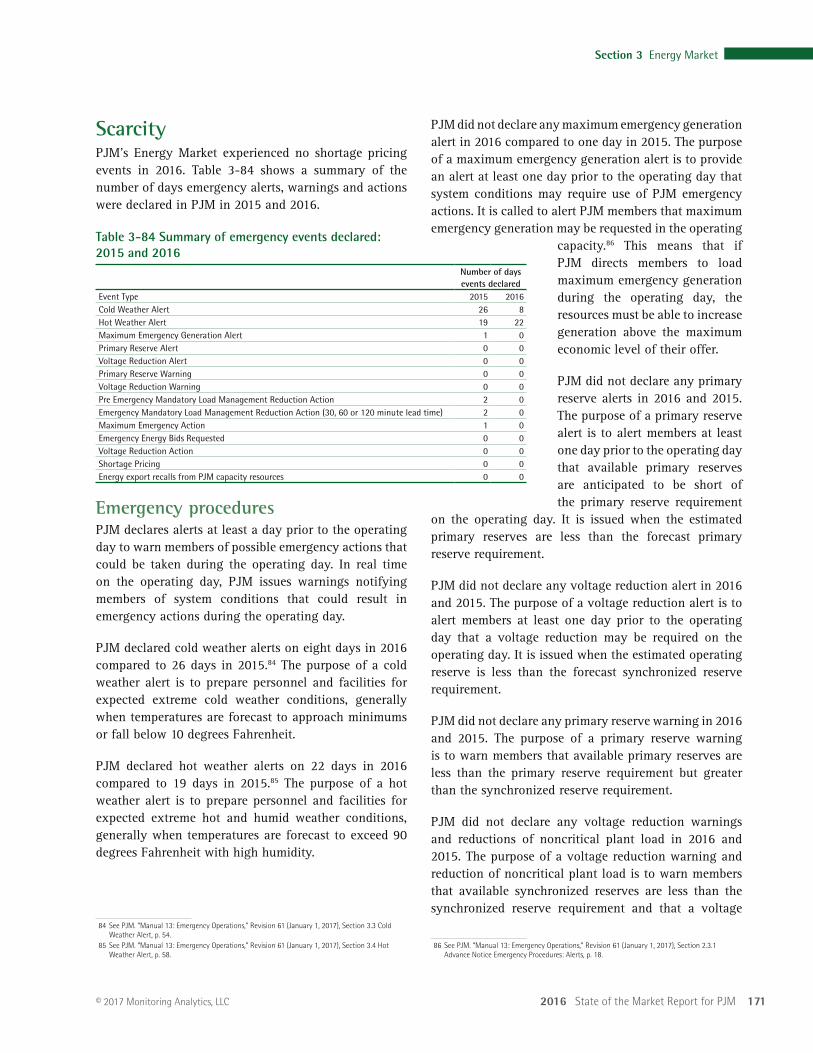
2016 State of the Market Report for PJM 171
Section 3 Energy Market
© 2017 Monitoring Analytics, LLC
PJM did not declare any maximum emergency generation alert in 2016 compared to one day in 2015. The purpose of a maximum emergency generation alert is to provide an alert at least one day prior to the operating day that system conditions may require use of PJM emergency actions. It is called to alert PJM members that maximum emergency generation may be requested in the operating
capacity.86 This means that if PJM directs members to load maximum emergency generation during the operating day, the resources must be able to increase generation above the maximum economic level of their offer.
PJM did not declare any primary reserve alerts in 2016 and 2015. The purpose of a primary reserve alert is to alert members at least one day prior to the operating day that available primary reserves are anticipated to be short of the primary reserve requirement
on the operating day. It is issued when the estimated primary reserves are less than the forecast primary reserve requirement.
PJM did not declare any voltage reduction alert in 2016 and 2015. The purpose of a voltage reduction alert is to alert members at least one day prior to the operating day that a voltage reduction may be required on the operating day. It is issued when the estimated operating reserve is less than the forecast synchronized reserve requirement.
PJM did not declare any primary reserve warning in 2016 and 2015. The purpose of a primary reserve warning is to warn members that available primary reserves are less than the primary reserve requirement but greater than the synchronized reserve requirement.
PJM did not declare any voltage reduction warnings and reductions of noncritical plant load in 2016 and 2015. The purpose of a voltage reduction warning and reduction of noncritical plant load is to warn members that available synchronized reserves are less than the synchronized reserve requirement and that a voltage
86 See PJM. “Manual 13: Emergency Operations,” Revision 61 (January 1, 2017), Section 2.3.1 Advance Notice Emergency Procedures: Alerts, p. 18.
ScarcityPJM’s Energy Market experienced no shortage pricing events in 2016. Table 3-84 shows a summary of the number of days emergency alerts, warnings and actions were declared in PJM in 2015 and 2016.
Table 3-84 Summary of emergency events declared: 2015 and 2016
Number of days events declared
Event Type 2015 2016Cold Weather Alert 26 8Hot Weather Alert 19 22Maximum Emergency Generation Alert 1 0Primary Reserve Alert 0 0Voltage Reduction Alert 0 0Primary Reserve Warning 0 0Voltage Reduction Warning 0 0Pre Emergency Mandatory Load Management Reduction Action 2 0Emergency Mandatory Load Management Reduction Action (30, 60 or 120 minute lead time) 2 0Maximum Emergency Action 1 0Emergency Energy Bids Requested 0 0Voltage Reduction Action 0 0Shortage Pricing 0 0Energy export recalls from PJM capacity resources 0 0
Emergency proceduresPJM declares alerts at least a day prior to the operating day to warn members of possible emergency actions that could be taken during the operating day. In real time on the operating day, PJM issues warnings notifying members of system conditions that could result in emergency actions during the operating day.
PJM declared cold weather alerts on eight days in 2016 compared to 26 days in 2015.84 The purpose of a cold weather alert is to prepare personnel and facilities for expected extreme cold weather conditions, generally when temperatures are forecast to approach minimums or fall below 10 degrees Fahrenheit.
PJM declared hot weather alerts on 22 days in 2016 compared to 19 days in 2015.85 The purpose of a hot weather alert is to prepare personnel and facilities for expected extreme hot and humid weather conditions, generally when temperatures are forecast to exceed 90 degrees Fahrenheit with high humidity.
84 See PJM. “Manual 13: Emergency Operations,” Revision 61 (January 1, 2017), Section 3.3 Cold Weather Alert, p. 54.
85 See PJM. “Manual 13: Emergency Operations,” Revision 61 (January 1, 2017), Section 3.4 Hot Weather Alert, p. 58.
172 Section 3 Energy Market
2016 State of the Market Report for PJM
© 2017 Monitoring Analytics, LLC
reduction may be required. It can be issued for the RTO or for specific control zones.
PJM did not declare any emergency mandatory load management reductions in 2016, compared to two days in 2015 in all or parts of the PJM service territory. The purpose of emergency mandatory load management is to request curtailment service providers (CSP) to implement load reductions from demand resources registered in PJM demand response programs that have a lead time of between one and two hours (long lead time) and a lead time of up to one hour (short lead time). Starting in June 2014, PJM combined the long lead and short lead emergency load management action procedures into Emergency Mandatory Load Management Reduction Action (30, 60 or 120 minute lead time). PJM dispatch declares NERC Energy Emergency Alert level 2 (EEA2) concurrent with Emergency Mandatory load Management Reductions. PJM also added a Pre-Emergency Mandatory Load Management Reduction Action (30, 60 or 120 minute lead time) step to request load reductions before declaring emergency load management reductions.
PJM did not declare any maximum emergency generation actions in 2016 compared to one day in 2015. The purpose of a maximum emergency generation action is to request generators to increase output to the maximum emergency level which unit owners may define at a level above the maximum economic level. A maximum emergency generation action can be issued for the RTO, for specific control zones or for parts of control zones.
PJM did not request any offers for emergency energy purchases in 2016 and 2015.
PJM did not declare any voltage reduction actions in 2016 and 2015. The purpose of a voltage reduction is to reduce load to provide sufficient reserves, to maintain tie flow schedules, and to preserve limited energy sources. When a voltage reduction action is issued for a reserve zone or subzone, the primary reserve penalty factor and synchronized reserve penalty factor are incorporated into the synchronized and nonsynchronized reserve market clearing prices and locational marginal prices until the voltage reduction action has been terminated.
PJM declared 16 synchronized reserve events in 2016 compared to 21 synchronized reserve events in 2015.87 Synchronized reserve events may occur at any time of the year due to sudden loss of generation or transmission facilities and do not necessarily coincide with capacity emergency conditions such as maximum generation emergency events or emergency load management events.
Table 3-85 provides a description of PJM declared emergency procedures.
87 See 2016 State of the Market Report for PJM, Section 10: Ancillary Service Markets for details on the spinning events.
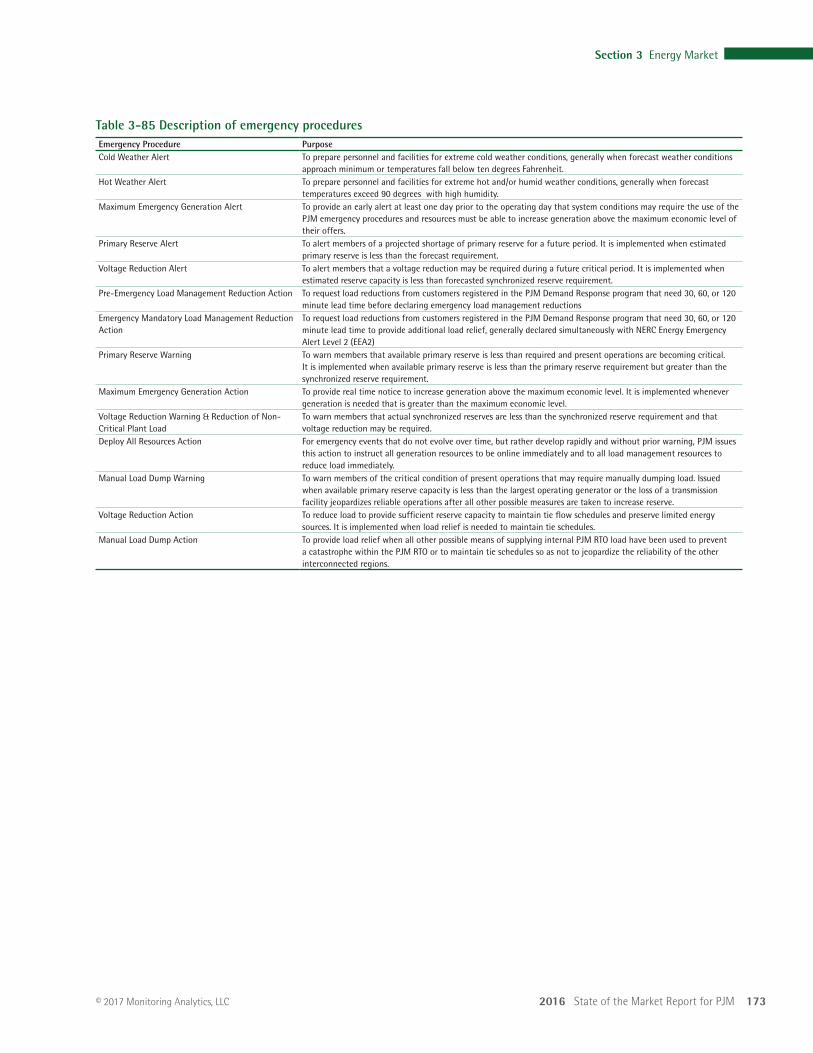
2016 State of the Market Report for PJM 173
Section 3 Energy Market
© 2017 Monitoring Analytics, LLC
Table 3-85 Description of emergency proceduresEmergency Procedure PurposeCold Weather Alert To prepare personnel and facilities for extreme cold weather conditions, generally when forecast weather conditions
approach minimum or temperatures fall below ten degrees Fahrenheit.Hot Weather Alert To prepare personnel and facilities for extreme hot and/or humid weather conditions, generally when forecast
temperatures exceed 90 degrees with high humidity.Maximum Emergency Generation Alert To provide an early alert at least one day prior to the operating day that system conditions may require the use of the
PJM emergency procedures and resources must be able to increase generation above the maximum economic level of their offers.
Primary Reserve Alert To alert members of a projected shortage of primary reserve for a future period. It is implemented when estimated primary reserve is less than the forecast requirement.
Voltage Reduction Alert To alert members that a voltage reduction may be required during a future critical period. It is implemented when estimated reserve capacity is less than forecasted synchronized reserve requirement.
Pre-Emergency Load Management Reduction Action To request load reductions from customers registered in the PJM Demand Response program that need 30, 60, or 120 minute lead time before declaring emergency load management reductions
Emergency Mandatory Load Management Reduction Action
To request load reductions from customers registered in the PJM Demand Response program that need 30, 60, or 120 minute lead time to provide additional load relief, generally declared simultaneously with NERC Energy Emergency Alert Level 2 (EEA2)
Primary Reserve Warning To warn members that available primary reserve is less than required and present operations are becoming critical. It is implemented when available primary reserve is less than the primary reserve requirement but greater than the synchronized reserve requirement.
Maximum Emergency Generation Action To provide real time notice to increase generation above the maximum economic level. It is implemented whenever generation is needed that is greater than the maximum economic level.
Voltage Reduction Warning & Reduction of Non-Critical Plant Load
To warn members that actual synchronized reserves are less than the synchronized reserve requirement and that voltage reduction may be required.
Deploy All Resources Action For emergency events that do not evolve over time, but rather develop rapidly and without prior warning, PJM issues this action to instruct all generation resources to be online immediately and to all load management resources to reduce load immediately.
Manual Load Dump Warning To warn members of the critical condition of present operations that may require manually dumping load. Issued when available primary reserve capacity is less than the largest operating generator or the loss of a transmission facility jeopardizes reliable operations after all other possible measures are taken to increase reserve.
Voltage Reduction Action To reduce load to provide sufficient reserve capacity to maintain tie flow schedules and preserve limited energy sources. It is implemented when load relief is needed to maintain tie schedules.
Manual Load Dump Action To provide load relief when all other possible means of supplying internal PJM RTO load have been used to prevent a catastrophe within the PJM RTO or to maintain tie schedules so as not to jeopardize the reliability of the other interconnected regions.
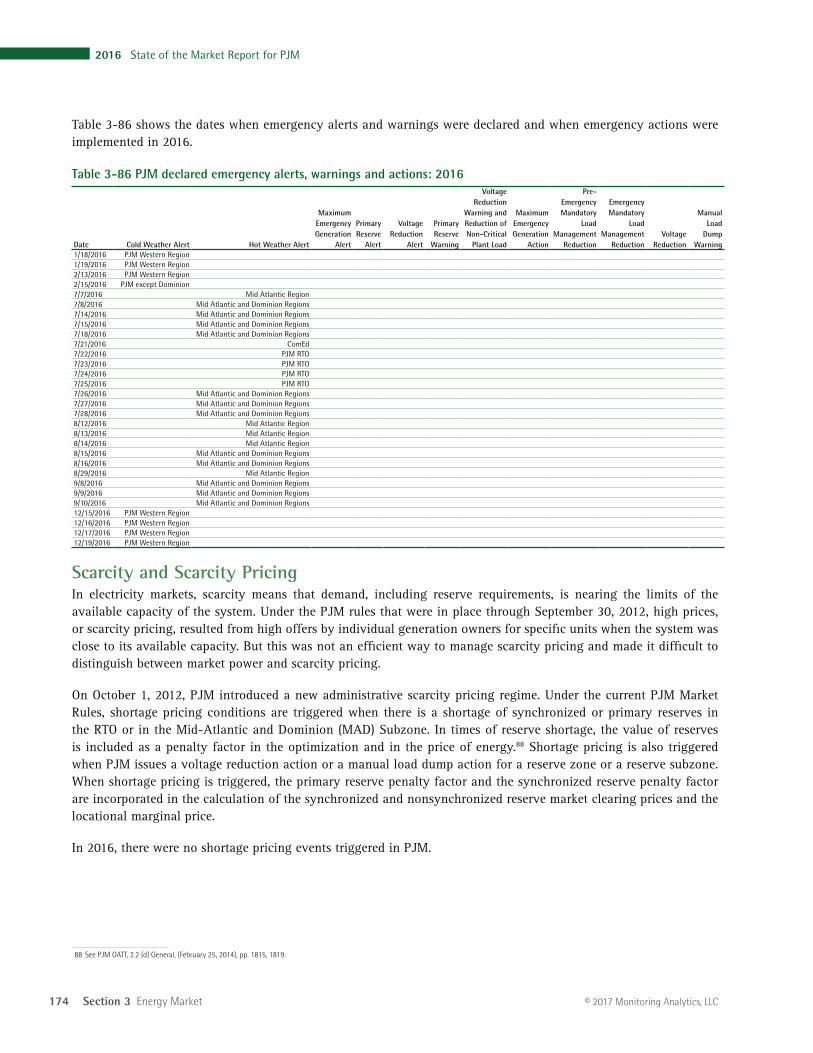
174 Section 3 Energy Market
2016 State of the Market Report for PJM
© 2017 Monitoring Analytics, LLC
Table 3-86 shows the dates when emergency alerts and warnings were declared and when emergency actions were implemented in 2016.
Table 3-86 PJM declared emergency alerts, warnings and actions: 2016
Date Cold Weather Alert Hot Weather Alert
Maximum Emergency Generation
Alert
Primary Reserve
Alert
Voltage Reduction
Alert
Primary Reserve
Warning
Voltage Reduction
Warning and Reduction of Non-Critical
Plant Load
Maximum Emergency Generation
Action
Pre-Emergency Mandatory
Load Management
Reduction
Emergency Mandatory
Load Management
Reduction Voltage
Reduction
Manual Load
Dump Warning
1/18/2016 PJM Western Region1/19/2016 PJM Western Region2/13/2016 PJM Western Region2/15/2016 PJM except Dominion7/7/2016 Mid Atlantic Region7/8/2016 Mid Atlantic and Dominion Regions7/14/2016 Mid Atlantic and Dominion Regions7/15/2016 Mid Atlantic and Dominion Regions7/18/2016 Mid Atlantic and Dominion Regions7/21/2016 ComEd7/22/2016 PJM RTO7/23/2016 PJM RTO7/24/2016 PJM RTO7/25/2016 PJM RTO7/26/2016 Mid Atlantic and Dominion Regions7/27/2016 Mid Atlantic and Dominion Regions7/28/2016 Mid Atlantic and Dominion Regions8/12/2016 Mid Atlantic Region8/13/2016 Mid Atlantic Region8/14/2016 Mid Atlantic Region8/15/2016 Mid Atlantic and Dominion Regions8/16/2016 Mid Atlantic and Dominion Regions8/29/2016 Mid Atlantic Region9/8/2016 Mid Atlantic and Dominion Regions9/9/2016 Mid Atlantic and Dominion Regions9/10/2016 Mid Atlantic and Dominion Regions12/15/2016 PJM Western Region12/16/2016 PJM Western Region12/17/2016 PJM Western Region12/19/2016 PJM Western Region
Scarcity and Scarcity PricingIn electricity markets, scarcity means that demand, including reserve requirements, is nearing the limits of the available capacity of the system. Under the PJM rules that were in place through September 30, 2012, high prices, or scarcity pricing, resulted from high offers by individual generation owners for specific units when the system was close to its available capacity. But this was not an efficient way to manage scarcity pricing and made it difficult to distinguish between market power and scarcity pricing.
On October 1, 2012, PJM introduced a new administrative scarcity pricing regime. Under the current PJM Market Rules, shortage pricing conditions are triggered when there is a shortage of synchronized or primary reserves in the RTO or in the Mid-Atlantic and Dominion (MAD) Subzone. In times of reserve shortage, the value of reserves is included as a penalty factor in the optimization and in the price of energy.88 Shortage pricing is also triggered when PJM issues a voltage reduction action or a manual load dump action for a reserve zone or a reserve subzone. When shortage pricing is triggered, the primary reserve penalty factor and the synchronized reserve penalty factor are incorporated in the calculation of the synchronized and nonsynchronized reserve market clearing prices and the locational marginal price.
In 2016, there were no shortage pricing events triggered in PJM.
88 See PJM OATT, 2.2 (d) General, (February 25, 2014), pp. 1815, 1819.
2016 State of the Market Report for PJM 175
Section 3 Energy Market
© 2017 Monitoring Analytics, LLC
synchronized) for a time period shorter than a defined threshold (30 minutes) due to ramp limitations or unit startup delays, it is considered a transient shortage, a shortage event is not declared, and shortage pricing is not implemented. Currently, both Real-Time SCED and Intermediate-Term SCED have to consistently identify that a shortage of a particular reserve product exists for a period of at least 30 minutes to trigger the shortage pricing penalty factor for that reserve product. For example, if Real-Time SCED indicates a shortage of RTO wide primary reserve for an interval but the Intermediate-Term SCED forecasts that the reserve shortage does not extend beyond its first look ahead interval (15 minutes ahead of the Real-Time SCED interval), it is considered a transient shortage, and shortage pricing is not implemented. If Real-Time SCED indicates a shortage of RTO wide primary reserve for an interval and the Intermediate-Term SCED forecasts that the reserve shortage extends for at least two look ahead intervals (30 minutes ahead of the Real-Time SCED interval), shortage pricing is implemented. The rationale for including voltage reduction actions and manual load dump actions as triggers for shortage pricing is to reflect the fact that when dispatchers need to take these emergency actions to maintain reliability, the system is short reserves and prices should reflect that condition, even if the data does not show a shortage of reserves.94
Accuracy of Reserve MeasurementIf PJM were to move to a shortage pricing mechanism that is triggered by five minute shortages, there needs to be accurate measurement of real-time reserves that can support such a definition. That does not appear to be the case at present in PJM, but there does not appear to be any reason that PJM cannot implement that capability. Without very accurate measurement of reserves at minute by minute granularity, system operators cannot know with certainty that there is a shortage condition and therefore an appropriate trigger for five minute shortage pricing does not exist. The advantages of five minute shortage pricing are all implicitly based on the premise that the RTO knows accurately whether it is in a shortage condition. If PJM cannot demonstrate that it can accurately measure reserves at minute by minute granularity, it should not implement or continue five
94 See, e.g., Scarcity and Shortage Pricing, Offer Mitigation and Offer Caps Workshop, Docket No. AD14-14-000, Transcript 29:21- 30:14 (Oct. 28, 2014)
Final Rule on Shortage Pricing and Settlement IntervalsOn September 17, 2015, the Commission issued a Notice of Proposed Rulemaking (NOPR) in which the Commission proposed to address price formation issues in RTOs/ISOs (“price formation NOPR”).89 In particular, the price formation NOPR proposed (i) to require the alignment of settlement and dispatch intervals for energy and operating reserves; and (ii) to require that each RTO/ISO trigger shortage pricing for any dispatch interval during which a shortage of energy or operating reserves occurs. These proposed reforms are intended to ensure that resources have price signals that provide incentives to conform their output to dispatch instructions, and that prices reflect operating needs at each dispatch interval.90
On June 16, 2016, the Commission issued a Final Rule in which it required each RTO/ISO to settle energy, operating reserves and intertie transactions using the same time intervals that it uses for to dispatch units or schedule these transactions.91 In PJM, the energy market dispatch and pricing interval is five minutes, and the order requires PJM to settle energy transactions on a five minute basis. In PJM, the synchronized reserve and regulation market dispatch and pricing interval is five minutes, and the order requires PJM to settle these reserves on a five minute basis. In PJM, intertie transactions are scheduled on fifteen minute intervals, and the order requires PJM to settle intertie transactions on a fifteen minute basis. However, the Commission allowed PJM to propose a shorter time interval for settling intertie transactions.92
The Commission also required each RTO/ISO to trigger shortage pricing for any dispatch and pricing interval in which a shortage of energy or operating reserves is indicated by the RTO/ISO’s software.93 In PJM, the rule would require PJM to trigger shortage pricing for any five minute interval when the Real-Time SCED (Security Constrained Economic Dispatch) indicates a shortage of synchronized reserves or primary reserves. Currently in PJM, if the dispatch tools (Intermediate-Term and Real-Time SCED) reflect a shortage of reserves (primary or
89 152 FERC ¶ 61,218 (September 17, 2015).90 Id at P 5.91 155 FERC ¶ 61,276 (June 16, 2016).92 Id at P 90.93 Id at P 162.
176 Section 3 Energy Market
2016 State of the Market Report for PJM
© 2017 Monitoring Analytics, LLC
Beginning in 2016, PJM started reporting the response to spinning events only from the units that were part of its tier 1 estimate MW. Table 3-87 shows that, in 2016, the tier 1 MW response percent was never greater than 85 percent, with an average tier 1 response of 75 percent.
If PJM is going to trigger shortage pricing based on shortage of synchronized reserves that is calculated based on current estimates, system operators will be relying on estimates of synchronized reserve MW that have historically been inaccurate.
minute shortage pricing until it can demonstrate that capability.95
The Commission directed in the Final Rule that, to the extent an RTO/ISO needs to enhance its measurement capabilities to implement the shortage pricing requirement, it should propose to do so in its compliance filing.96
The accuracy of reserve measurement in PJM can be evaluated using historical data on performance during spinning events. The level of tier 1 biasing also reflects PJM dispatchers’ estimate of the error in the measurement of tier 1 synchronized reserve. Both of these data sources provide insight into the accuracy of reserve measurement based on actual historical data.
Historical Performance During Spinning EventsHistorical data on response from synchronized reserves during spinning events shows the accuracy of PJM reserve estimates. Synchronized reserves consist of tier 1 and tier 2 synchronized reserves that are procured to meet the RTO and Mid-Atlantic reserve requirements. Tier 1 synchronized reserve is comprised of all online resources following economic dispatch and able to ramp up from their current output in response to a synchronized reserve event.97
All resources that respond to spinning events are paid for their response. Table 3-87 shows the performance of tier 1 and tier 2 synchronized reserves during spinning events, declared in 2015 and 2016, that lasted at least 10 minutes. In 2015, tier 1 response MW shown in Table 3-87 were measured as the increase in MW from all resources as a response to the spinning event declaration, regardless of whether the units were part of the tier 1 MW estimate. Since the tier 1 response MW to spinning events included resources that were not part of the tier 1 MW estimate, the 2015 estimates for tier 1 response were greater than 100 percent. In 2016, PJM reports tier 1 response only from the units that were part of the estimated tier 1 MW.
95 See Comments of the Independent Market Monitor for PJM, Docket No. RM15-24-000 (December 1, 2015) at 9.
96 155 FERC ¶ 61,276 at P 177 (June 16, 2016).97 See 2016 State of the Market Report for PJM, Section 10: Ancillary Service Markets at “Tier 1
Synchronized Reserve” for details on Tier 1 synchronized reserves.
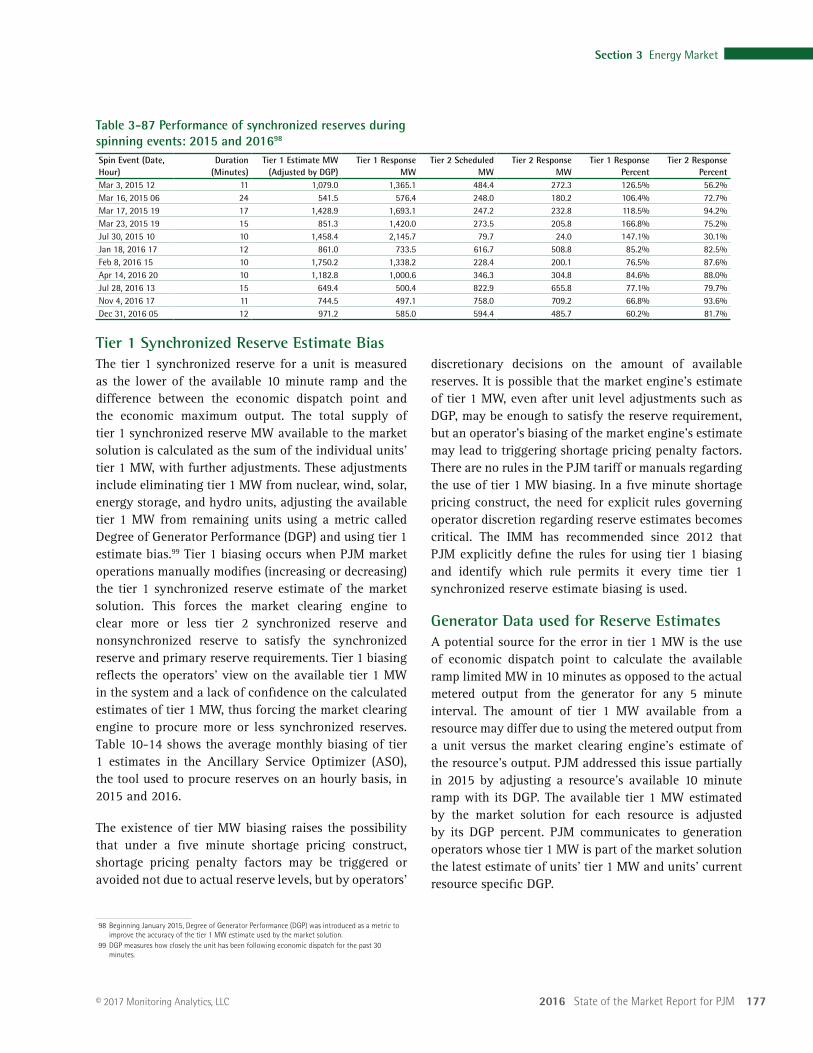
2016 State of the Market Report for PJM 177
Section 3 Energy Market
© 2017 Monitoring Analytics, LLC
discretionary decisions on the amount of available reserves. It is possible that the market engine’s estimate of tier 1 MW, even after unit level adjustments such as DGP, may be enough to satisfy the reserve requirement, but an operator’s biasing of the market engine’s estimate may lead to triggering shortage pricing penalty factors. There are no rules in the PJM tariff or manuals regarding the use of tier 1 MW biasing. In a five minute shortage pricing construct, the need for explicit rules governing operator discretion regarding reserve estimates becomes critical. The IMM has recommended since 2012 that PJM explicitly define the rules for using tier 1 biasing and identify which rule permits it every time tier 1 synchronized reserve estimate biasing is used.
Generator Data used for Reserve EstimatesA potential source for the error in tier 1 MW is the use of economic dispatch point to calculate the available ramp limited MW in 10 minutes as opposed to the actual metered output from the generator for any 5 minute interval. The amount of tier 1 MW available from a resource may differ due to using the metered output from a unit versus the market clearing engine’s estimate of the resource’s output. PJM addressed this issue partially in 2015 by adjusting a resource’s available 10 minute ramp with its DGP. The available tier 1 MW estimated by the market solution for each resource is adjusted by its DGP percent. PJM communicates to generation operators whose tier 1 MW is part of the market solution the latest estimate of units’ tier 1 MW and units’ current resource specific DGP.
Table 3-87 Performance of synchronized reserves during spinning events: 2015 and 201698
Spin Event (Date, Hour)
Duration (Minutes)
Tier 1 Estimate MW (Adjusted by DGP)
Tier 1 Response MW
Tier 2 Scheduled MW
Tier 2 Response MW
Tier 1 Response Percent
Tier 2 Response Percent
Mar 3, 2015 12 11 1,079.0 1,365.1 484.4 272.3 126.5% 56.2%Mar 16, 2015 06 24 541.5 576.4 248.0 180.2 106.4% 72.7%Mar 17, 2015 19 17 1,428.9 1,693.1 247.2 232.8 118.5% 94.2%Mar 23, 2015 19 15 851.3 1,420.0 273.5 205.8 166.8% 75.2%Jul 30, 2015 10 10 1,458.4 2,145.7 79.7 24.0 147.1% 30.1%Jan 18, 2016 17 12 861.0 733.5 616.7 508.8 85.2% 82.5%Feb 8, 2016 15 10 1,750.2 1,338.2 228.4 200.1 76.5% 87.6%Apr 14, 2016 20 10 1,182.8 1,000.6 346.3 304.8 84.6% 88.0%Jul 28, 2016 13 15 649.4 500.4 822.9 655.8 77.1% 79.7%Nov 4, 2016 17 11 744.5 497.1 758.0 709.2 66.8% 93.6%Dec 31, 2016 05 12 971.2 585.0 594.4 485.7 60.2% 81.7%
Tier 1 Synchronized Reserve Estimate BiasThe tier 1 synchronized reserve for a unit is measured as the lower of the available 10 minute ramp and the difference between the economic dispatch point and the economic maximum output. The total supply of tier 1 synchronized reserve MW available to the market solution is calculated as the sum of the individual units’ tier 1 MW, with further adjustments. These adjustments include eliminating tier 1 MW from nuclear, wind, solar, energy storage, and hydro units, adjusting the available tier 1 MW from remaining units using a metric called Degree of Generator Performance (DGP) and using tier 1 estimate bias.99 Tier 1 biasing occurs when PJM market operations manually modifies (increasing or decreasing) the tier 1 synchronized reserve estimate of the market solution. This forces the market clearing engine to clear more or less tier 2 synchronized reserve and nonsynchronized reserve to satisfy the synchronized reserve and primary reserve requirements. Tier 1 biasing reflects the operators’ view on the available tier 1 MW in the system and a lack of confidence on the calculated estimates of tier 1 MW, thus forcing the market clearing engine to procure more or less synchronized reserves. Table 10-14 shows the average monthly biasing of tier 1 estimates in the Ancillary Service Optimizer (ASO), the tool used to procure reserves on an hourly basis, in 2015 and 2016.
The existence of tier MW biasing raises the possibility that under a five minute shortage pricing construct, shortage pricing penalty factors may be triggered or avoided not due to actual reserve levels, but by operators’
98 Beginning January 2015, Degree of Generator Performance (DGP) was introduced as a metric to improve the accuracy of the tier 1 MW estimate used by the market solution.
99 DGP measures how closely the unit has been following economic dispatch for the past 30 minutes.
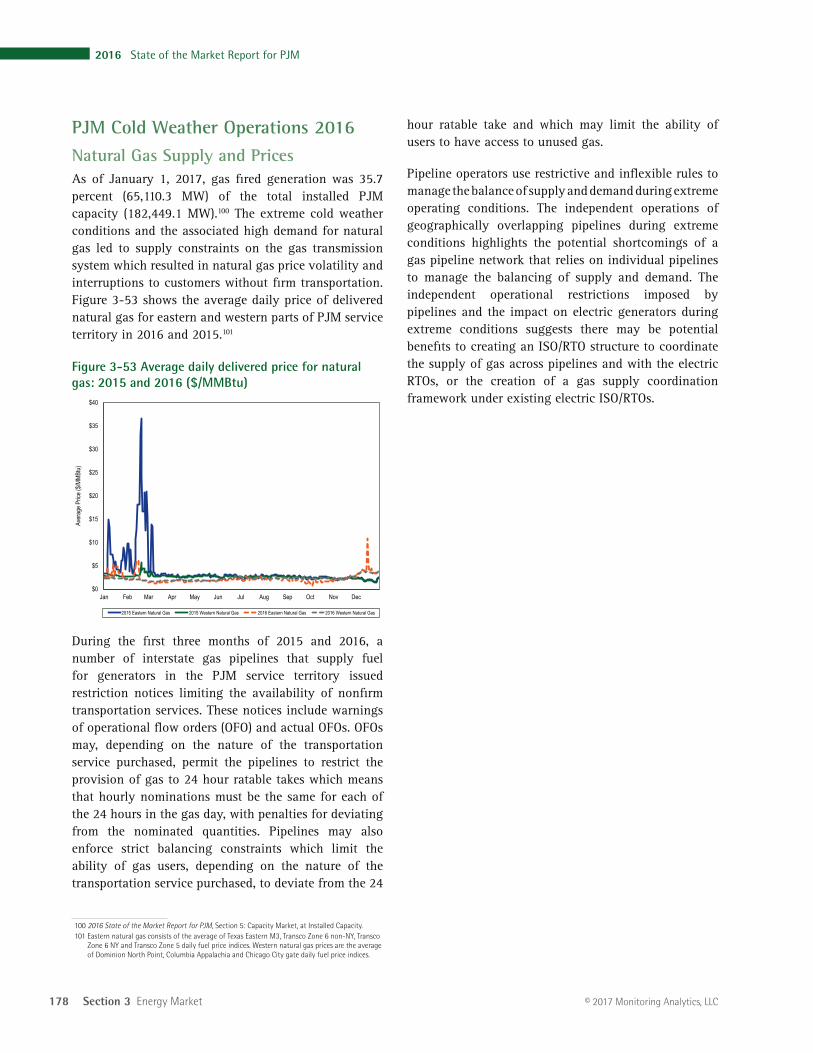
178 Section 3 Energy Market
2016 State of the Market Report for PJM
© 2017 Monitoring Analytics, LLC
hour ratable take and which may limit the ability of users to have access to unused gas.
Pipeline operators use restrictive and inflexible rules to manage the balance of supply and demand during extreme operating conditions. The independent operations of geographically overlapping pipelines during extreme conditions highlights the potential shortcomings of a gas pipeline network that relies on individual pipelines to manage the balancing of supply and demand. The independent operational restrictions imposed by pipelines and the impact on electric generators during extreme conditions suggests there may be potential benefits to creating an ISO/RTO structure to coordinate the supply of gas across pipelines and with the electric RTOs, or the creation of a gas supply coordination framework under existing electric ISO/RTOs.
PJM Cold Weather Operations 2016
Natural Gas Supply and PricesAs of January 1, 2017, gas fired generation was 35.7 percent (65,110.3 MW) of the total installed PJM capacity (182,449.1 MW).100 The extreme cold weather conditions and the associated high demand for natural gas led to supply constraints on the gas transmission system which resulted in natural gas price volatility and interruptions to customers without firm transportation. Figure 3-53 shows the average daily price of delivered natural gas for eastern and western parts of PJM service territory in 2016 and 2015.101
Figure 3-53 Average daily delivered price for natural gas: 2015 and 2016 ($/MMBtu)
$0
$5
$10
$15
$20
$25
$30
$35
$40
Jan Feb Mar Apr May Jun Jul Aug Sep Oct Nov Dec
Aver
age P
rice (
$/MMB
tu)
2015 Eastern Natural Gas 2015 Western Natural Gas 2016 Eastern Natural Gas 2016 Western Natural Gas
During the first three months of 2015 and 2016, a number of interstate gas pipelines that supply fuel for generators in the PJM service territory issued restriction notices limiting the availability of nonfirm transportation services. These notices include warnings of operational flow orders (OFO) and actual OFOs. OFOs may, depending on the nature of the transportation service purchased, permit the pipelines to restrict the provision of gas to 24 hour ratable takes which means that hourly nominations must be the same for each of the 24 hours in the gas day, with penalties for deviating from the nominated quantities. Pipelines may also enforce strict balancing constraints which limit the ability of gas users, depending on the nature of the transportation service purchased, to deviate from the 24
100 2016 State of the Market Report for PJM, Section 5: Capacity Market, at Installed Capacity.101 Eastern natural gas consists of the average of Texas Eastern M3, Transco Zone 6 non-NY, Transco
Zone 6 NY and Transco Zone 5 daily fuel price indices. Western natural gas prices are the average of Dominion North Point, Columbia Appalachia and Chicago City gate daily fuel price indices.