Embed Size (px)
Citation preview
6/1/2021
1This is custom documentation. For more information, please visit the SAP Help Portal
SAP Analytics Cloud HelpGenerated on: 2021-06-01 09:35:28 GMT+0000
SAP Analytics Cloud | Q2 2021 (2021.7)
PUBLIC
Original content: https://help.sap.com/viewer/00f68c2e08b941f081002fd3691d86a7/release/en-US
Warning
This document has been generated from the SAP Help Portal and is an incomplete version of the official SAP product documentation. The information included in customdocumentation may not re�ect the arrangement of topics in the SAP Help Portal, and may be missing important aspects and/or correlations to other topics. For this reason, itis not for productive use.
For more information, please visit the https://help.sap.com/viewer/disclaimer.
Help Library
Have a question? Get help with SAP Analytics Cloud here.
Find a Help TopicWhat's New – 2021 Releases
Getting Started
Catalog
Mobile App
Video Tutorials
Digital Boardroom
Stories
Analytic Applications
Charts
6/1/2021
2This is custom documentation. For more information, please visit the SAP Help Portal
Analyzing Geographical Data
Tables
Augmented Analytics
Smart Predict – Using Predictive Scenarios
Formulas and Calculations
About Datasets and Dataset Types
Models
Allocations
Value Driver Trees
Data Actions
Calendar
Multilingual Content Support
Files
Security
Importing and Exporting Content
Schedule a Publication
Connections
System
Requirements
Troubleshooting Errors
Glossary
Copyright and Important Disclaimers and Legal Information
Find Help for DevelopersSAP Analytics Cloud URL API
SAP Analytics Cloud REST API
Analytics Designer API Reference
SAP Analytics Cloud Custom Widget Developer Guide
SAP Analytics Cloud User and Team Provisioning API
SAP Analytics Cloud iOS SDK Developer Guide
More Help Resources
Also check out our SAP Analytics Cloud page on http://help.sap.com for additional documentation and learning resources.
What's New – 2021 Releases
Find out what's new in the latest version of SAP Analytics Cloud.
What's New Video for Q2 2021Disclaimer: The below video is not part of the SAP product documentation. Please read the legal disclaimer for video links before viewing this video.
Version 2021.7
SAP Analytics Cloud: What's New QRC Q2 2021SAP Analytics Cloud: What's New QRC Q2 2021
6/1/2021
3This is custom documentation. For more information, please visit the SAP Help Portal
SAP is pleased to announce a new version of SAP Analytics Cloud.
New Model
Meet the New Model
Introducing: a new modeling paradigm.
SAP Analytics Cloud has completely redesigned the modeling experience for the better. The Modeler now offers the possibility to create a New Model which lets youadd multiple measures and an optional account dimension to the model, bene�ting both planning and reporting functions.
This New Model blends concepts from account-based modeling and measure – or key �gure – based modeling approaches to allow for greater �exibility and power insolution design, providing you with:
More �exible modeling: You can set formatting and aggregation on accounts, measures, or both, and choose which settings to prioritize. This �exibility opens upnew options like integrating your balance sheet and your pro�t and loss statement. You can also choose to use a generic dimension for your accounts to avoidany limitations related to the account dimension.
DECIMAL and INTEGER support: When you create a measure, you can select a measure data type. Supported data types include DECIMAL(31,n) where n is in 0,…,7 and INTEGER. When you enter and distribute data in tables, all cells of an integer-type measure will get integer values.
Powerful calculation options: Calculated measures and currency conversion measures can be added in the modeler and reused across multiple stories andanalytic applications. You can create calculated measures in the modeler that take another measure and a typed dimension attribute as an input and �ip thesign of the input measure according to the sign of the typed attribute. You can also create a custom priority for calculations to ensure that measure and accountcalculations are applied in the required order.
Enhanced currency conversion: Besides reusable conversion measures, you can base calculated measures and accounts on your currency conversions. In tables,you can plan on any base measure or conversion measure and instantly see the results across currencies – and you can apply currency conversion while copyingdata with a data action. Finally, all options (rate versions, booking date, and more) that are known for Classic Account Models are supported, and existing ratetables created for Classic Account Models can be re-used.
Better integration: Measure models match the structure of many trusted data sources like SAP S/4HANA more closely, making data integration faster andsimpler. As a result, you can re-edit existing jobs and bene�t from a more intuitive work�ow and mapping experience, enhanced wrangling expression language,an improved experience during execution – including visual cues of job progression – and more.
Clearer experience for story builders and viewers: Non-�nancial data can be stored in measures instead of members of the account dimension, making data incharts and tables easier to understand.
Migration tool: To get access to the new features quickly, you can migrate a classic account model with no dependent objects into a new model with measures.The resulting New Model has same account-type dimensions as the classic account model and the option to add additional measures.
Please note that Classic Account Models continue to work as before. Furthermore, you can choose to opt-in to the New Model at your own pace, so there's no rush!
Note also that Classic Account Models can be converted into New Models and additional measures can be created after conversion.
Analytics Data Modeling
Filter Data Audit Reports with Enhanced Filter Functionalities
This just in! On the Security Data Changes screen, you can now �lter auditing data by Audit Time, Audit User, Audit Action, and all dimensions from the planningmodel.
Prior to this feature, in audit reports, you could only �lter audit data by Audit Time. Now, you can �lter by Audit Time, Audit User, Audit Action, dimensions, and more toeasily narrow down search results for large reports.
Dashboard & Story Design
Data Visualization
Support Restricted Measures Based on Calculations and BW Formulas for SAP BW Live Data Sources
For SAP BW Live data sources, you can now create restricted measures that are based on SAP Analytics Cloud story calculations or on SAP BW formulas.
Please note that SAP BW Live requires versions 1.0.75 and above. See SAP Note 2984958 for reference.
Replace Datasets in Your Story with New Public Datasets
Great news! You can now replace any public or private dataset in your story with a new public dataset that can contain additional measures and dimensions,alongside the measures and dimensions of the original dataset.
Thanks to this feature enhancement, you can preserves the con�guration of all widgets in your story, and story editors can easily update datasets directly fromtheir stories.
Add Expression to Your Comments with Rich Text Formatting
Add some personality and expression to your story and data point comments by formatting with different font styles and colors. You can also add bullet ornumbered lists, and insert hyperlinks. This will be key to linking to useful examples and resources while collaborating on a story with your team.
Enterprise Reporting
6/1/2021
4This is custom documentation. For more information, please visit the SAP Help Portal
Create Pixel-Perfect Reports
Since its initial release in Q1 2021, Enterprise Reporting in SAP Analytics Cloud has come a long way. In fact, planners and business analysts can now create near pixel-perfect reports and distribute them across their organization easily and effectively. This is all thanks to some key highlights in the Enterprise Reporting realm, includingthe ability to…
Repeat Dimension Headers in Tables: We know when managing tables that span across several pages that it's not always clear what a dimension contains. As aresult, for Beta tables that span across multiple pages, SAP Analytics Cloud now repeats the table header on each page for easy consumption. Furthermore, youcan now freeze a table's header for vertical scrolling to make for a more intuitive, Excel-like experience.
Add sections to your canvas story tabs: Sections allow you to split report information into smaller, more comprehensible and manageable parts. This is a greatway to create comparisons quickly by laying out multiple section instances in a paginated canvas. You can also use sections to improve the layout of your storiesand break down your analysis per dimension member. Once you have chosen a dimension as a section �lter, the members are displayed in the section, and thewidgets in the section that are based on the same model are �ltered on that member.
Essentially, at design time, you can insert a section in a canvas to group widgets and break them down by dimension values into a container widget. By default, sectionsare set to Show all instances on pages in the Styling panel.
Repeat Dimension Headers in Tables
We know when managing tables that span across several pages that it's not always clear what a dimension contains. As a result, for Beta tables that span acrossmultiple pages, SAP Analytics Cloud will now repeat the table header on each page for easy consumption.
Furthermore, you can now freeze a table's header for vertical scrolling to make for a more intuitive, Excel-like experience.
Include Sections in Canvas Tabs to Improve Reporting and Dashboarding
Sections allow you to split report information into smaller, more comprehensible and manageable parts. This is also a great way to create comparisons quickly by layingout multiple section instances in a paginated canvas.
You can use sections to improve the layout of your stories and break down your analysis per dimension member. Once you have chosen a dimension as a section �lter,the members are displayed in the section, and the widgets in the section that are based on the same model are �ltered on that member.
Customization and Styling
Essentially, at design time, you can insert a section in a canvas to group widgets and break them down by dimension values into a container widget.
By default, sections are set to Show all instances on pages in the Styling panel. Like with other widgets, however, section and section heading styling can becustomized. That is to say, if you wanted to quickly browse through the members of a section in View mode, make sure to enable the Browse and search instancesoption in the Styling panel. When enabled, the application displays in View mode:
Left and right arrows in the section header so you can switch between members of a section.
A search to quickly reach a dimension member and browse through your data.
From here, you can choose the view time behavior. Your options include:
Or display a carousel that also allows searching dimension values.
Limitations
Please note the following limitations to this feature
Sections take the whole width of the canvas.
You can’t currently create sections within sections.
Some widgets can’t be place in a section (Value Driver Tree, Data Action Trigger & BPC Planning Sequence).
You can’t use time hierarchy dimensions as section �lter.
You can’t use Planning features in a section.
You can’t add comments to a section.
Try the New 16:9 (HD) Canvas Size at Design Time
Previously, at design time, the default "Present" template was sized at 1024 x 768px. Now, users can set the size of a �xed canvas to exactly match the MicrosoftPowerPoint default size of 16:9 (HD), or 1280 x 720px. Note that this will be the default export �le type to PowerPoint (pptx) when all canvas tabs are 16:9 (HD), andthat this canvas size is only available in landscape orientation.
Collaborative Enterprise Planning
Publish the Delta Version by Default
Heads up SAP Analytics Cloud users – when you publish a private version to an unrelated public version, the default publishing option has changed.
Previously, the default action was to overwrite all existing data. Now, by default, you'll publish only the changed data, not the entire version. This is the more defensivealternative as it reduces the likelihood of accidental data overwrites.
Paired with the upcoming “Private Version Size Limits” feature which promotes creating smaller private versions, delta publish is the best default option for you.
Compute Data Locks for Advanced Filters in Story Tables
Previously, data locking was disabled in story tables when Advanced Filters (also known as complex �lters) were present. Now, data locks are supported with certaintypes of Advanced Filters: the �lter de�nition must be Cartesian and it must be inclusive.
6/1/2021
5This is custom documentation. For more information, please visit the SAP Help Portal
This applies to Advanced Filters that are generated when clicking "Filter" in the context menu of the story table for Cartesian selections, for instance. However, otherways to de�ne Advanced Filters can be used as well.
The data locks will display correctly while performing planning operations in appropriately �ltered tables. Note also that Linked Analysis is a special work�ow that willespecially bene�t from this feature.
Preview Validation Rules in Table View
You can now preview validation rules in a table view that displays all relevant dimensions.
This is an effective method for Administrators to quickly understand the impact of validation rules, simplifying admin work and saving con�guration time.
Automatically Run Data Actions in the Background
When you add a data action trigger in asynchronous mode, you can now set it to automatically run the data action in the background with the new "Always run inbackground" option.
When you log on to your SAP Analytics Cloud tenant, you will notice that when you click data action task in a story, this option is visible.
Highlight Modi�ed Cells in Tables
When you modify data in the cell of a table, all changed cells – including any new cells (i.e., records) – will now be highlighted. This will make for simpler and easier tounderstand rules for cell highlighting.
Use Dependent Variables When Executing BPC Planning Sequences
In the BW system, Compounded Characteristics enable variables and dimensions to be dependent on one another. This is less formally known as Parent and ChildCharacteristics. When we have dependent Parent and Child variables, a Child value has no logical meaning in the system without a �tting Parent value.
If you had two variables, a Parent variable and a Child variable, you could enter values for each. The previous problem here was that, if you used the value help for theChild variable, you saw all the values that existed in the system, independent of the Parent variable.
Now, if you select a Child variable, the inputs for the Parent variable are considered. In other words, only the children of the parent, so to speak, are shown in the valuehelp, making selecting relevant variables fast and easy.
Navigate to Desired Functions with even Greater Ease with our Improved View Time Toolbar
To make it easier to access functions directly where you need them in your work�ow, we have now moved some functions – such as Value Lock Management, CellReferences and Show or Hide for Formulas – from the view-time toolbar for Stories and Analytic Applications to the Table context menu.
Get Noti�ed of Exceeding Version Size Limits to Ensure Optimized Performance
Since planning on large model versions can affect performance, models now have a recommended limit on the initial version size for planning. As such, modelers cancon�gure the size limit, and if users exceed this limit while creating a private version or starting to edit a public version, a warning dialog like the one pictured belowappears.
Schedule Automatic Data Locking Tasks in the Calendar
As the data locking owner of a speci�c region (or data slice) of a model, you can now schedule automatic data locking tasks in the calendar, and the system will set thelocks at the speci�ed time. As a result, in the �rst scope, the data locks are executed on the rights of the owner or creator of the task as there are no assignees onautomatic tasks.
Through the automation of data locking, you do not need to log in just for a simple click on submit. With the recurrence feature it is then possible to have all regularlocking executed automatically at the point in time they are needed with no need for users to take any further steps except creation.
Publish and Submit in One Step
If you are working on a task with an associated story, you now can publish your data changes within the submit dialog. That is to say, when assignees and reviewers ofcalendar tasks change data in a story or analytic application, they don't need to publish their changes in a separate step anymore. The data changes will automaticallybe published when assignees submit the task, and when reviewers approve or reject the work of the others.
Run Data Actions in Story Contexts
For data action triggers in stories, you can now link parameter values to input controls and story �lters. This lets users run the data action on the current story contextby retrieving parameter values automatically from the linked input controls and �lters, without opening the trigger con�guration or the prompt dialog.
Optimize Advanced Formula Scripts with the Calculation Scope Dialog Box
When working in advanced formulas, you can now bene�t from a pop-up dialog box that shows the calculation scope of the formula in question. With this new feature,you can estimate the scope of a calculation in design time and optimize the formula script for better execution performance.
The Sky is the Limit with Removed Limitations for IF Conditions with AND/OR Keywords
Several limitations have been removed for IF conditions with AND and OR keywords. For example, you can now combine conditions on members, RESULTLOOKUPvalues, properties, variables, external parameters, dates, and numbers. You can also use parentheses to group conditions. Furthermore, more complex and detailedcondition expressions are possible with shortened scripts, meaning better execution performance time and better overall readability.
Leverage Aggregated Dimensions in Advanced Formulas
In the advanced formulas script editor, you can now specify dimension members to aggregate for the entire step, whether from the default model or a linked model.This way, you can avoid running calculations on separate records for each dimension member. You can also load pre-aggregated values as the calculation scope forcurrent or remote models, minimizing the dataset size of calculation scopes for non-calculation related dimensions, such as SAP Analytics Cloud story �lters orBusiness Warehouse aggregation levels.
Stop and Exit FOREACH Loops Immediately Using BREAK

6/1/2021
6This is custom documentation. For more information, please visit the SAP Help Portal
In an advanced formulas step, you can now specify a condition to skip the remaining loops of a FOREACH function, using the BREAK keyword. For example, you can stopthe depreciation loop with a date dimension if the residual book value reaches a value of zero.
This gives you better control over FOREACH calculations, and lets you improve the performance of your data action by skipping unnecessary calculations in a FOREACHfunction.
Augmented Analytics
Smart Predict
Make Predictions with Greater Accuracy When Using Classi�cation and Regression Predictive Scenarios
Classi�cation and regression predictive scenarios now leverage a gradient-boosting technique to deliver more accurate and trusted predictions.
Accuracy improvements are approximately in the range of 2-20%, depending on the underlying data.
Create Better Quality Time Series Forecasts with the Exponential Smoothing Technique
You can now experience better quality time series forecasts with our data smoothing technique, especially in the event of a disrupted time series.
Please note that no additional setting is required, and that the data smoothing technique automatically competes with the other forecasting techniques.Furthermore, we have enriched reports for time series predictive scenarios to describe the forecasting technique used.
As for other forecasting techniques, the data smoothing technique clearly highlights the trend & cyclic components detected in the time series.
Predictive Planning
Build Your Own Time-Series Performance Indicators
Predictive planning now lets you save predictive forecasts for past periods to the private version of your planning model. This means you can assess theperformance of your predictive forecast by using all the visual and modeling powers right there in your story, to compare the difference between your predictiveforecast and the actuals, plans or budget.
Analytics Design
Leverage Live SAP HANA and SAP Analytics Cloud Model Support in Data Analyzer
Data Analyzer continues to be one of the most sought-after features to manage and analyze your data in SAP Analytics Cloud. This quarter, we are excited to introducethe ability to connect to SAP HANA Live calculation views and the ability to create an ad-hoc analysis based on an SAP Analytics Cloud Model. That is to say that as auser of Data Analyzer, you can now select SAP HANA view as a data source for your data analysis through the data source dialog or by URL – with no additional modelcreation required.
As a result, for ad-hoc analysis, you can use the Data Analyzer to connect to SAP HANA Live views to get the job done quickly and efficiently.
Customize Parameters with the Data Action API
Our next update is for the planning and Analytics Designer users. Introducing: the Data Action API – a feature that enables execution selectively based on triggeredevents captured by analytic applications. This allows users to customize the parameters sent to each Data Action execution and makes for a much more robust anddynamic planning experience.
Moreover, the Data Action API allows you to automatically enable Analytics Designer to update based on certain events and chain multiple data actions together aspart of the call, thereby dramatically improving usability and performance.
Directly Manage Calendar Tasks Within Analytic Applications
With this latest calendar task integration, directly within analytic applications, users can:
Submit() and Decline() APIs to submit/decline a calendar event for the assignee user role, or
Approve() and Reject() APIs to approve/reject a calendar event for the reviewer user role.
Additionally, as an application designer, you can now use the new technical component Calendar Integration together with the following new APIs for the calendarevent:
getCurrentTask()
getStatus()
getType()
hasUserRole()
All of this can be done via Analytics Designer script APIs or through the Calendar Task Toolbar.
Use Script APIs to Create Stories from Charts and Tables in Analytic Applications
Application consumers can also more conveniently create a story from tables and charts within analytic applications. This provides more �exibility for integrationsscenarios in relation to stories and applications.
Trigger Data Actions Within Analytic Applications for the SAP Analytics Cloud Mobile iOS App
This just in! You can now add and trigger data action widgets within the SAP Analytics Cloud Mobile iOS App. In addition, we've introduced a CSS class to allow users tochange the opacity of a widget, so that you can further modify the appearance of the data action widget.
Select SAP HANA Views in Data Analyzer
6/1/2021
7This is custom documentation. For more information, please visit the SAP Help Portal
As a user of the data analyzer, you can now select SAP HANA view as a data source for your data analysis through the data source dialog or by URL – with no additionalmodel creation required.
As a result, for ad-hoc analysis, you can use the Data Analyzer to connect to SAP HANA Live views to get the job done quickly and efficiently.
Leverage Data Change Insights Enhancements and APIs
As a user of analytic application, you can now set the chart-level change range when setting high importance/subscribe/unsubscribe in Data Change Insights, such thatyou can decide whether the data point value is included or excluded during the Data Change Insights calculation.
Moreover, you can de�ne the version of the Data Change Insights component for snapshot validation and customize subscription settings or open the subscriptiondialog using script APIs.
The provided script APIs include:
Open subscription dialog via Script API
Get/set subscription level/range
De�ne a subscription range
With this enhancement, application consumers can receive more focused and personalized data change insights results based on the data range settings. Moreover,application consumer can more conveniently trigger the subscription dialog and view the data change insight result based on different snapshot comparison.
Trigger Export to Excel/CSV Dialogue via Script API
Besides starting the export to Excel and CSV from the table's context menu at runtime, as an application designer, you can now use the Script API exportReport() tolaunch the table export to Excel and CSV on an event such as Button.onClick. This provides corresponding APIs for different Export settings, enabling applicationconsumers to more conveniently trigger the export to Excel or export to CSV with pre-de�ned settings.
Plan Unbooked Cells for BPC Live Models with Script API
This new feature enhancement is short, but sweet. As an application designer, you can now use the setUserInput() API on BPC live models to plan an unbooked cell.
Access Models Directly in Data Analyzer
As a user of data analyzer, you can now directly access SAP Analytics Cloud models in the Select Data Source dialog for your ad-hoc data analysis.
Use Data Actions for Analytical Applications
As an application designer, you can now use the technical object Data Actions and the relating script APIs to run short-running data actions via scripts as well as setand read parameter values, allowing for better, more �exible integration of Data Actions into your work�ow.
Mobile Analytics
Provision Default Con�gurations for the Mobile Android App
System administrators can now provision default con�gurations for the SAP Analytics Cloud mobile Android app, using VMware AirWatch, MobileIron Cloud, and MSIntunes. This allows MDM solutions to push a default tenant URL such that users do not have to enter said URL manually. Furthermore, MDM solutions can push adefault story – removing the need to set a story as a default manually.
Allow Table Actions in SAP Analytics Cloud Mobile
Great news! You can now enrich the table consumption and interactions capabilities in mobile by enabling table actions when working with the SAP Analytics CloudAndroid app and when working with the iOS app in Optimized iOS mode and iOS Safari embed story. As such, the following table cell actions are now supported:
Swap Axis
Drill
Display Options
Hyperlinks
Leverage Live Connection to SAP BW/HANA Using a Tunnel Connection with SAML SSO for iOS
The SAP Analytics Cloud Mobile iOS app now supports "Tunnel" direct remote connections with SAML SSO when working in the optimized story loading mode. Usersleveraging this type of connection can remove dependency over VPN and can seamlessly connect to their backends both for SAP Analytics Cloud desktop and mobileversions.
Analytics Platform Services
Preview the Availability of Publication Slots
In SAP Analytics Cloud, there is a limit to the amount of publications that can run in a given timeframe.
We are happy to announce that when scheduling your publication, you can now check the availability of time slots in each timeframe – enabling you to select theappropriate slots and plan ahead with con�dence.
De�ne Commenting Privileges in Stories, Analytic Applications, Models, and Folders
At SAP, we understand that comments made on deliverables such as stories and analytic applications can contain con�dential information.
As a result, while sharing a story, you now have the option to de�ne commenting privileges for end users – such as the ability to view, add, or delete comments.
6/1/2021
8This is custom documentation. For more information, please visit the SAP Help Portal
Embed Safely and Securely with the Removal of "Allow All Origin" in Trusted Origin
On SAP Analytics Cloud's System Administration App Integration tab, the "Allow all origins" option has been removed from the "Trusted Origins" section. This optionwas removed to enhance security when embedding SAP Analytics Cloud in your client application.
Please note that you can still add any speci�c trusted origins that will host your client application, but intruders can no longer in�ltrate via an allow all option.
Add-in for Microsoft Office
Leverage Unbooked Support
SAC add-in for Microsoft now supports unbooked setting per dimension. With this, you can show not only values that can be found in the transactional data, but alsomaster data for which you do not �nd equivalent values in the model. If you have new master data (e.g., new employees, new products, etc.) that you would like to planon, the setting will show you new lines for this master data.
The feature also allows you to delete existing data.
Report and Sort According to IDs and Texts with Enhanced Display Options
You can report and sort according to IDs and texts. This is a basic reporting requirement that enables you to use display options to either show ID or description. Notethat, if you need to show both ID and description, we recommend to use properties.
System Administration
Microsoft Internet Explorer 11 Deprecation
As of the next quarterly version (Q3 2021 (2021.14)), SAP Analytics Cloud will no longer support Microsoft Internet Explorer 11, in accordance with Microsoft’sannouncement that Office 365 will no longer support IE11 .
Version 2021.6
SAP is pleased to announce a new version of SAP Analytics Cloud.
Modeling
The Modeler now offers the possibility to create a new model type which lets you add multiple measures and an optional account dimension to the model. Models withmeasures are bene�cial for both planning and reporting, and they provide you with:
More �exible modeling: You can set formatting and aggregation on accounts, measures, or both, and choose which settings to prioritize. This �exibility opens upnew options like generating your balance sheet and your pro�t and loss statement out of a single model. You can also choose to use a generic dimension for youraccounts to avoid any limitations related to the account dimension.
New powerful calculation area in the modeler: Calculated measures and currency conversion measures can be added in the modeler and reused across multiplestories and analytic applications. Numeric dimension properties are also available for calculations. You now can see the results of your calculations and currencyconversions instantly in the preview. As in the story table, you can add dimensions to the drill, �lter on values, and so on.
Enhanced currency conversion: You can now model and plan on transaction currencies, local currencies, and group currency. Besides reusable conversionmeasures, you can also base calculated measures on your currency conversions. In tables, you can plan on any base measure or conversion measure andinstantly see the results across currencies. And you can apply currency conversion while copying data with a data action.
Better integration: Measure models match the structure of many trusted data sources like SAP S/4HANA more closely, making data integration faster andsimpler.
Clearer experience for story builders and viewers: Non-�nancial data can be stored in measures instead of members of the account dimension, making data incharts and tables easier to understand.
Migration tool: To get access to the new features quickly, you can migrate a classic account model with no dependent objects into a new model with measures.The new model has same account hierarchy and the option to add additional measures.
You can now switch off currency conversion in a model that doesn't have dependent objects, LINK formulas, private versions, or pre-converted currencies.
General
For reporting, the canvas now supports a 16:9 (HD) page size, which is 1280x720.
You can format story and data point comments with different font styles and colors, add bullet or numbered lists, and insert hyperlinks.
Stories
Blending data is supported for the new model type (model with measures). The new model type with an account dimension (model with measures and an accountdimension) is not supported for blending.
When using a new model type, the Explorer now shows facets for Accounts, Measures, and Dimensions. For the classic account model, the Explorer now shows facetsfor Measures, Cross Calculations, and Dimensions.
Planning
6/1/2021
9This is custom documentation. For more information, please visit the SAP Help Portal
As the data locking owner of a speci�c region (or data slice) of a model, you can now schedule automatic data locking tasks in the calendar, and the system will set thelocks at the speci�ed time.
When assignees and reviewers of calendar tasks change data in a story or analytic application, they don't need to publish their changes in a separate step anymore.The data changes will automatically be published when assignees submit the task, and when reviewers approve or reject the work of the others.
When adding a data action trigger to a story, you can now link parameter values to input controls and story �lters. This lets users run the data action on the currentstory context by retrieving parameter values automatically from the linked input controls and �lters.
Several limitations have been removed for IF conditions with AND and OR keywords. For example, you can now combine conditions on members, RESULTLOOKUPvalues, properties, variables, external parameters, dates, and numbers. You can also use parentheses to group conditions. For more information, see All ScriptFormulas and Calculations in Advanced Formulas.
In the advanced formulas script editor, you can now specify dimension members to aggregate for the entire step, whether from the default model or a linked model.This way, you can avoid running calculations on separate records for each dimension member.
The advanced formulas script editor now lets you check the scope of your functions by hovering over them, letting you see how many members from each dimensionare included and whether all members are included for any dimensions. It helps you understand how each calculation will work, and how long it might take to run.
In an advanced formulas step, you can now specify a condition to skip the remaining loops of a FOREACH function, using the BREAK keyword. This gives you bettercontrol over FOREACH calculations, and lets you improve the performance of your data action by skipping unnecessary calculations in a FOREACH function.
Mobile
The iOS app now supports "Tunnel" direct remote connections when working in the optimized story loading mode.
Smart Predict
Predictive planning now lets you save predictive forecasts for past periods to the private version of your planning model. This means you can assess the performance ofyour predictive forecast by using all the visual and modeling powers right there in your story, to compare the difference between your predictive forecast and theactuals, plans or budget.
Analytics Designer
As there is a new model type in SAP Analytics Cloud, some enhancements and changes relating to this new model type have also been made in analytic applications.These enhancements and changes include:
Display of account structure, measure structure or both in the navigation panel depending on the (new) model con�guration.
Script API adaptions to make the script APIs work consistently with all different types of models.
R Visualization widget and analytic application bookmark adaptions to make these widgets run consistently with all different types of models.
As a user of data analyzer, you can now directly access SAP Analytics Cloud models in the Select Data Source dialog for your ad-hoc data analysis.
As an application designer, you can now use the technical object Data Actions and the relating script APIs to run short-running data actions via scripts as well as setand read parameter values.
Analytics Content Network
You can now choose a location to import your Analytics Content Network (ACN) packages.
You can now add datapoint comments to the new model type.
SAP Analytics Cloud, add-in for Microsoft Office
The SAP Analytics Cloud, add-in for Microsoft Office has been updated. For a list of new features, see the What's New.
System Administration Notes
With the 2021.6 release of SAP Analytics Cloud, SAP Analytics Cloud agent's minimum version remains at 1.0.75, with the following exceptions:
If you require data acquisition from SAP ERP / SQL Database, the minimum version is 1.0.99.
If you require data acquisition from SAP Universe (UNX), the minimum version is 1.0.91.
If you require data acquisition from SAP Business Warehouse (BW), the minimum version is 1.0.233.
If you require data acquisition from an SAP HANA view, the minimum version is 1.0.235.
If you require data acquisition from File Server, you need to upgrade to version 1.0.248.
For more information, see System Requirements and Technical Prerequisites.
NoteAlthough it is not required, you can upgrade to the agent version 1.0.313, no matter what data acquisition type you use. Do this to take advantage of updatesmade to SAP Analytics Cloud agent.
6/1/2021
10This is custom documentation. For more information, please visit the SAP Help Portal
Regarding supported features and required updates for the integration of SAP BW with SAP Analytics Cloud, refer to SAP Note 2541557 for further details.
Regarding supported features and required updates for live universe access through SAP BusinessObjects Live Data Connect with SAP Analytics Cloud, refer to SAPNote 2771921 for further details.
Version 2021.5
SAP is pleased to announce a new version of SAP Analytics Cloud.
General
On the System Administration App Integration tab, the "Allow all origins" option has been removed from the "Trusted Origins" section. This option was removed toenhance security when embedding SAP Analytics Cloud in your client application. You can still add any speci�c trusted origins that will host your client application.
Stories
You can now include sections in your canvas story tabs.
Planning
Since planning on large versions can affect performance, models now have a recommended limit on the initial version size for planning. Modelers can con�gure the sizelimit, and a warning appears if users exceed it while creating a private version or starting to edit a public version.
Mobile
The following table cell actions are now supported:
Swap Axis
Drill
Display Options
Hyperlinks
This limited support is available when working with the iOS app in Optimized iOS mode, the Android app, and IOS Safari.
Analytics Designer
As a user of the data analyzer, you can now select SAP HANA view as a data source for your data analysis.
Besides starting the export to Excel and CSV from the table's context menu at runtime, as an application designer, you can now use the Script API exportReport()to launch the table export to Excel and CSV on an event such as, for example, Button.onClick.
As a user of analytic application, you can now set the chart-level change range when setting high importance/subscribe/unsubscribe in Data Change Insights, so thatyou can decide whether the data point value is included or excluded during the Data Change Insights calculation. Moreover, you can de�ne the version of the DataChange Insights component for snapshot validation and customize subscription settings or open the subscription dialog using script APIs.
As an application designer, you can now use the setUserInput() API on BPC live models to plan an unbooked cell.
SAP Analytics Cloud, add-in for Microsoft Office
The SAP Analytics Cloud, add-in for Microsoft Office has been updated. For a list of new features, see the What's New.
System Administration Notes
With the 2021.5 release of SAP Analytics Cloud, SAP Analytics Cloud agent's minimum version remains at 1.0.75, with the following exceptions:
If you require data acquisition from SAP ERP / SQL Database, the minimum version is 1.0.99.
If you require data acquisition from SAP Universe (UNX), the minimum version is 1.0.91.
If you require data acquisition from SAP Business Warehouse (BW), the minimum version is 1.0.233.
If you require data acquisition from an SAP HANA view, the minimum version is 1.0.235.
If you require data acquisition from File Server, you need to upgrade to version 1.0.248.
For more information, see System Requirements and Technical Prerequisites.
Regarding supported features and required updates for the integration of SAP BW with SAP Analytics Cloud, refer to SAP Note 2541557 for further details.
NoteAlthough it is not required, you can upgrade to the agent version 1.0.311, no matter what data acquisition type you use. Do this to take advantage of updatesmade to SAP Analytics Cloud agent.
6/1/2021
11This is custom documentation. For more information, please visit the SAP Help Portal
Regarding supported features and required updates for live universe access through SAP BusinessObjects Live Data Connect with SAP Analytics Cloud, refer to SAPNote 2771921 for further details.
Version 2021.4
SAP is pleased to announce a new version of SAP Analytics Cloud.
Stories
To make it easier to access functions directly where you need them in your work�ow, we have moved some functions (Value Lock Management, Cell References andShow/Hide for Formulas) from the view-time toolbar for Stories and Analytic Applications to the Table context menu.
Smart Predict
We have introduced a data smoothing technique that helps to increase on average the quality of your predictive models, and to better handle disruptive time series.We've also enhanced the reports for time series predictive scenarios to explain the forecasting technique used.
Security and Infrastructure
On the Security Data Changes screen, you can now �lter the auditing data by Audit Time, Audit User, Audit Action, and all dimensions from the planning model.
System Administration Notes
With the 2021.4 release of SAP Analytics Cloud, SAP Analytics Cloud agent's minimum version remains at 1.0.75, with the following exceptions:
If you require data acquisition from SAP ERP / SQL Database, the minimum version is 1.0.99.
If you require data acquisition from SAP Universe (UNX), the minimum version is 1.0.91.
If you require data acquisition from SAP Business Warehouse (BW), the minimum version is 1.0.233.
If you require data acquisition from an SAP HANA view, the minimum version is 1.0.235.
If you require data acquisition from File Server, you need to upgrade to version 1.0.248.
For more information, see System Requirements and Technical Prerequisites.
Regarding supported features and required updates for the integration of SAP BW with SAP Analytics Cloud, refer to SAP Note 2541557 for further details.
Regarding supported features and required updates for live universe access through SAP BusinessObjects Live Data Connect with SAP Analytics Cloud, refer to SAPNote 2771921 for further details.
Version 2021.3
SAP is pleased to announce a new version of SAP Analytics Cloud.
General
While scheduling your publication, you can now check the availability of time slots.
You can customize the permissions to add, view, and delete comments on a story, analytic application, model, and folder.
As a story creator, you can now choose to remove a story's URL when you export a story or when you schedule a story for publication: the setting is in the systemcon�guration area.
Stories
For SAP BW Live data sources, you can now create restricted measures that are based on SAP Analytics Cloud story calculations or on SAP BW formulas.
For Beta tables that span multiple pages, the table header will be repeated on each page. You can also freeze the Table header for vertical scrolling tables.
You can now replace any public or private dataset in your story with a new public dataset that can contain additional measures and dimensions, alongside the measuresand dimensions of the original dataset. Replacing the dataset preserves the con�guration of all widgets in your story.
Planning
When you publish a private version to an unrelated public version, the default publishing option has changed. You'll publish only the changed data by default, not theentire version.
You can now preview validation rules in a table view that displays all relevant dimensions.
NoteAlthough it is not required, you can upgrade to the agent version 1.0.309, no matter what data acquisition type you use. Do this to take advantage of updatesmade to SAP Analytics Cloud agent.
6/1/2021
12This is custom documentation. For more information, please visit the SAP Help Portal
When choosing variables for a BPC planning sequence in a live connection model, after you set the values for the parent variable, the available choices for the childvariable now show only the values of the child characteristic that matches the selected parent.
When you modify data in a table cell, all changed cells – including any new cells (records) – will be highlighted.
When you add a data action trigger, you can now set it to automatically run the data action in the background.
In a table, data locking is now supported with certain types of advanced �lters. The appropriate data will be locked while you're carrying out planning operations in the�ltered table.
Smart Predict
You can now get even more accurate and trusted predictive results when creating Smart Predict classi�cation and regression models.
Mobile
System administrators can now provision default con�gurations for the Android mobile app, using VMware AirWatch and MobileIron Cloud.
Analytics Designer
With this version, hierarchies for dimensions on a free axis in a table are no longer ignored. Consequently, if you have used setDimensionFilter() in your applicationswith these types of dimensions, you may experience different results and need to adapt your scripts manually for each analytic application that usessetDimensionFilter API functions in the mentioned context. Please read the SAP Analytics Cloud Analytics Designer API Reference for suggestions on adjusting theaffected scripts in the analytic application.
As an application designer, you can now use the new technical component Calendar Integration together with the following new APIs for the calendar event:
Submit() and Decline() APIs to submit/decline a calendar event for the assignee user role.
Approve() and Reject() APIs to approve/reject a calendar event for the reviewer user role.
Additionally, the following APIs are introduced and can be used for the Calendar Integration technical component:
getCurrentTask()
getStatus()
getType()
hasUserRole()
As an application designer, you can write a createStoryFromWidget() API to allow application users to create a new story from a chart or table widget during theapplication's runtime.
You can now add and trigger a data action widget in an SAP Analytics Cloud iOS mobile App. In addition, we've introduced a CSS class to allow users to change theopacity of a widget, so that you can further modify the appearance of the data action widget.
System Administration Notes
With the 2021.3 release of SAP Analytics Cloud, SAP Analytics Cloud agent's minimum version remains at 1.0.75, with the following exceptions:
If you require data acquisition from SAP ERP / SQL Database, the minimum version is 1.0.99.
If you require data acquisition from SAP Universe (UNX), the minimum version is 1.0.91.
If you require data acquisition from SAP Business Warehouse (BW), the minimum version is 1.0.233.
If you require data acquisition from an SAP HANA view, the minimum version is 1.0.235.
If you require data acquisition from File Server, you need to upgrade to version 1.0.248.
For more information, see System Requirements and Technical Prerequisites.
Regarding supported features and required updates for the integration of SAP BW with SAP Analytics Cloud, refer to SAP Note 2541557 for further details.
Regarding supported features and required updates for live universe access through SAP BusinessObjects Live Data Connect with SAP Analytics Cloud, refer to SAPNote 2771921 for further details.
Version 2021.2
SAP is pleased to announce a new version of SAP Analytics Cloud.
Administration & Infrastructure
NoteAlthough it is not required, you can upgrade to the agent version 1.0.307, no matter what data acquisition type you use. Do this to take advantage of updatesmade to SAP Analytics Cloud agent.
6/1/2021
13This is custom documentation. For more information, please visit the SAP Help Portal
Change in SAP Analytics Cloud’s Catalog Filter Behavior
In the past, the logic on �ltering across categories was based on the OR operation. This meant that users could effectively utilize one �lter category at a time. Now, thelogic has been changed to AND, enabling users to drill down to more speci�c result sets.
For example, let's say you have the following company departments:
Sales Canada
Sales Germany
Operations Canada
Operations India
Development India
Development France
If you select Sales and Operations in the Department �lter category, and you select India in the Region category, the �lter will return:
Operations India
In previous releases, the �lter would return:
Sales Canada
Sales Germany
Operations Canada
Operations India
Development India
With this enhancement, catalog �ltering behavior is more aligned with common patterns for �ltering, enabling users to �nd the right content faster.
SAP Analytics Cloud Performance Analysis Tool
Through the SAP Analytics Cloud Analysis Tool, performance statistics of stories and Analytic Applications are collected and stored in the tenant database, independentof live or import connectivity. This tool can be exposed through SAP Analytics Cloud live models and consumed in a precon�gured Analytic Application.
As a result, you can not only analyze the performance of speci�c story and Analytic Application executions, but also compare historic runtimes of single users againstyour whole user community.
Analytics Designer
Changes to the General Availability of Data Change Insights
You can subscribe to data change insights from the toolbar menu if Data Change Insights is switched on in the details of an analytic application. Some subscriptiondetails can be set in the dialog, including name, subscription recurrence, global variables, and bookmarks. Now, users can also identify the importance of the Chart andthe number of data change insights that can be con�gured!
Furthermore, an email and a noti�cation can be sent to multiple end users, and a “do not send noti�cation” option can be set when no insights are found. You can alsochange the subscription “customize script variable” option to be turned off by default.
Supported data connections include both live and import connections. These changes also support the ability to save snapshots in remote repository schemas whileproviding script APIs to con�gure the display of data change insights.
Comment Widget Integration
Hey Analytics Designer users! Meet the comment widget. Use the comment widget in analytic applications to save, edit, read, and delete table-cell comments to pavethe way for ever clearer communication!
Please note that comments entered through existing script APIs are synchronized with the new comment widget.
Mobile Support for Custom Widgets
Get excited! Custom widgets can now also be interacted with and consumed in the Safari browser on the iPad as well as in the SAP Analytics Cloud Mobile iOS App.
Before using this feature, make sure the following prerequisites have been completed:
Set “supportsMobile” to true in the contribution json �le.
Add MobileMode to the custom widget property to enable developers to add mobile-speci�c behaviors such as different CSS classes or different event listers.
Script API Enhancement – Apply Explore Results Back to Table and Chart
Did you hear? You can now enable tighter integration between Analytics Designer and the Explorer by applying Explorer results back to analytic applications. Thismeans that, by leveraging script API, once you have �nished analyzing in Explorer, you can take the analysis results back to charts or tables in analytic applications.
Bonus: you can also bookmark the application to save the Explorer results!
Script API Enhancement – Retrieve Member Information of a Data Source
You can also use script APIs to retrieve member information from a data source:
DataSource.getMember as the new API
6/1/2021
14This is custom documentation. For more information, please visit the SAP Help Portal
DataSource.getMembers Improvements
Extend MemberInfo:
ID
DimensionID
Description
Furthermore, you can add new JSON object MemberOptions such as:
limit
accessMode: Master data or Booked data
hierachyId
Sample Content – Generic Analysis Application
Generic Analysis Application is delivered as sample content to cover �exible ad-hoc analysis scenarios for your SAP Analytics Cloud data models. With the GenericAnalysis Application, you perform analysis on all your SAP Analytics Cloud models. Sample content can be used directly or as inspiration to further con�gure, change, orenhance your existing models.
Functionalities of the Generic Analysis Application include:
All SAP Analytics Cloud models are supported as data sources
Use the data browser to select SAP Analytics Cloud models as the main data source
Dynamically set SAP Analytics Cloud model IDs via the URL parameter
Leverage tables for data visualization purposes
Add or remove dimensions or key �gures via Navigation Panel
Con�gure a quick menu or a context menu for tables
Variable prompt dialog
Export tables as Excel or CSV �les
Export the application as a PDF
Create global and personal bookmarks
Find �lter information and variable information in the information panel
Explore the table setting panel (scaling, unit etc.)
With this ready-to-run application, you can directly perform ad-hoc analysis based on all SAP Analytics Cloud models. Furthermore, you can leverage Analytics Designercapabilities to customize and modify this pre-de�ned application to create your own generic ad-hoc analysis.
Data Discovery
Save an Insight in Data Analyzer
The much-anticipated Data Analyzer capability from 2019 just got better! Now, Admin, BI Admin, and BI Content Creators can save an insight within the Data Analyzer.These saved insights can contain data source information such as:
Selected variable prompts,
Filters,
Text presentations (ID / Description), and
Drill-down levels in hierarchies
SAP Analytics Cloud displays the insights you save in folders. After you have saved an insight, you can launch and manage it through Files, where you can performoperations such as:
View
List
Rename
Overwrite
Delete
Share
Data Integration
New Custom Transformations in the Wrangling Expression Language (WEL)
6/1/2021
15This is custom documentation. For more information, please visit the SAP Help Portal
By accessing the WEL through the Custom Expression Editor, you can transform your data with new custom expressions and model your dataset based on your exactneeds. The delivery of this new set of custom transformations is geared towards grouping values together and includes the following expressions:
Filter your values for further analysis using the "startsWith" and "endsWith" expression, which search for values starting or ending with a speci�c string value.
Count the number of words within the cells in a given column using "countWords".
Group the records based on numeric values into bins.
Use binByBinWidth to group records of a column into bins of equal width.
Use binByBinCount to specify the number of equal-width bins you need and distribute the data in those bins.
Use binByTileCount to distribute the data points equally by bins.
Use binByStandardDeviation to get bins based on standard deviation from the mean.
This means that users who are familiar with the WEL can now segment speci�c columns regardless of whether variables are numeric or string (containing non-numericvalues such as letters and other characters).
Setting Scale for Measures in SAP Analytics Cloud
For improved readability, new scale factors have been incorporated for measures in embedded and public datasets. Today, the scaling options available in MeasureProperties are:
None
Percentage
Thousand
Million
Billion
Data Visualization
Story Exploration and View Time Toolbar
Great news! With Q1 2021’s enhancement to the Explorer, you can more easily explore your entire story while navigating between pages and widgets. You can also opena story in Explorer by default.
What’s more? Now, you can bookmark, save, and enter full-screen within the Explorer and enable the Explorer for all charts and tables in your story.
Furthermore, we are always working to ensure that our SAP Analytics Cloud features are easy to use and navigate to make for a seamless user experience. As a result,for one of our �rst updates of the 2021 year, we redesigned the view time toolbar for Stories and Analytical Applications:
So that you can quickly get to the most commonly used functions, we've grouped the functions into sections with quick access buttons – sparing you searchtime and helping you get the job done faster.
You can also move more easily through stories with a lot of pages, using the enhanced page navigation, making for a more streamlined consumption experienceand equating to an enterprise-ready toolbar that scales to users' needs.
For Planning users, the new full-screen mode completely hides the toolbar so that you can focus more on your content. But, if you want to see a condensedversion of the toolbar again, just hover over the top of the screen.
BI Calculations – Standard Deviation
With SAP Analytics Cloud Story calculations, you can create new measures based on your existing business data to gain more advanced insights.
Thanks to this week’s feature enhancement, story designers are now able to create standard deviation calculations in the Exception aggregation list. For reference,standard deviation is a calculation used in statistics across �nance, supply chain, operations, and marketing in many different forms.
More speci�cally, a standard deviation formula can be used to understand customer distribution based on average spending! The standard deviation lets you know howclose the data is or how much difference there is between pieces of data by showing how close to the average each data point is.
What can you conclude from a high or low standard deviation result? A low standard deviation means that the data is closely related to the average and is therebyconsidered reliable. A high standard deviation, on the other hand, means that there is a large variance between the data and the statistical average, deeming itunreliable.
Note that the Standard Deviation formula is supported for models based on acquired or live HANA connections only. Live HANA requires versions 2.00.024.0500(EPMMDS 1.00.201815.00) or above.
Canvas Pagination for Vertically Resizing Legacy and Beta Tables
Tables are a great way to view and analyze data more clearly within a story. When changing existing features or adding new ones in tables, however, you run the risk ofcreating problems with your data. With beta tables, however, you can test new functionalities instead of replacing known behavior, mitigating risk.
With the latest beta table enhancement, users can now bene�t from the vertical resizing table property. That is, Story Designers can now con�gure report tables tovertically expand when more data needs to be displayed.
This allows users in view time to see all the data of a table in a report, paginated based on the canvas size at design-time.
Note that these "pages" can also be exported.
Replace an Analytic Account Model in a Story with a Planning Model
6/1/2021
16This is custom documentation. For more information, please visit the SAP Help Portal
This just in! You can now replace analytic account models with Planning models. That is, story editors can re-point an analytic account model to a “compatible” Planningmodel (and vice versa), as long as the target model contains all the measures and dimensions of the source model.
As a result, the story editor can re-use Business Intelligence (BI) stories for planning purposes and Planning stories for BI purposes! Note that replacing the modelpreserves the con�guration of all widgets in your story.
Pagination Export to PDF/PPT
With product update 2021.01, users can export all Pagination Pages from story view mode to PDF and PowerPoint (PPT) formats. Furthermore, users can export in EditMode to maintain old behavior.
That’s not all, folks! Users can also perform regular exports, batch exports, sync exports, and async exports, based on what their situation requires. Note that there isalso the option for users to disable pagination exports all together, if they wish to do so.
Independent Rank and Sort
Previously, our rank and sort features were dependent on one another and were performed simultaneously. That is, upon ranking data, our rank feature performed botha rank and a sort action when producing chart results. With update 2021.02, when ranking is applied, sorting is disabled and vice versa.
As a result, ranking and sorting features are speci�ed independently and are de-coupled such that you have full control of how your ranking is ordered. Furthermore,users are offered a greater degree of �exibility when ranking or sorting their data.
Mobile
Voice Support in Search to Insight for iOS
You may have heard about Search to Insight, a powerful feature that allows users to ask questions about their data using natural language queries. With this 2021enhancement to the SAP Analytics Cloud mobile iOS app, you can leverage the power of Search to Insight from your mobile iOS device by commanding queries such as“show top �ve British Columbia sales by priority” out loud, and SAP Analytics Cloud will return your desired results.
Note that some queries may require the use of a combination of voice commands and typing in order to prepare your query. Furthermore, suggested tokens requiremanual selection.
Default File and Landing Tab for the Android App
We are happy to announce that SAP Analytics Cloud can also run on Android 11. Furthermore, you can now specify which landing tab and story you would like to open bydefault when you initially launch and log in to the Android app.
As a result, from now on, users can avoid the same steps required to navigate upon logging in – simply open the Android app, and you will instantly be brought to yourdesired page.
Android App Now Supports Default Server URL Con�guration Pushed through Microsoft InTune
Great news! Our Android app now supports the default server URL con�guration to be pushed through Microsoft InTune. This means that Administrators canprecon�gure the tenant URL such that users no longer need to manually add it in, allowing for a more simpli�ed user experience.
Please note that the app currently only supports Microsoft InTune mobile device management (MDM) and that only single URLs can be precon�gured.
Live Data Connection to SAP BW/HANA Using a Tunnel Connection and SSO – Android App
SAP Analytics Cloud now supports the Tunnel Connection type with SAML SSO. Users that leverage this type of connection no longer need to be dependent on VPN andcan connect to the backend seamlessly! Now that’s an enhancement we can get behind.
Please note that currently the support is only for Stories in the Android App.
Live Data Connection to SAP BW/HANA Using SAP Cloud Connector – Android App
There’s more! The Android App now also supports the Cloud Connector based SSO as an Advanced feature on the current direct SAML connection. Users currentlyleveraging the Cloud Connector based SSO with the iOS app can use the same connection type with the Android, once again removing the need for VPN to access thebackend connectivity.
Saving Default Bookmarks with Optimized View – iOS and Android App
Have no fear, Apple users, here’s an update for both the iOS and the Android App! Discover the added capability to save the current state of your story as a DefaultPersonal bookmark in the SAP Analytics Cloud mobile app based on your choice of defaults.
If you are an iOS user, please note that you must toggle iOS Optimized View in order to make use of this update.
App Link Support – Android App
With App Link support in SAP Analytics Cloud Android App, you can now directly jump to the app using copied links shared with you via email or through SAP AnalyticsCloud’s Share functionality. Supported domains include .sapbusinessobjects.cloud and .sapanalytics.cloud.
Please note that universal links are not yet supported in the iOS App, and additional domains are forecasted to be added in the near future.
The ability to open stories directly in the Android App allows you to jump seamlessly from your email – or any other method of sharing links – to the app with ease.
XCode 12 Support for SAP Analytics Cloud Mobile App SDK – iOS App
SAP Analytics Cloud Mobile App SDK is now compatible with XCode 12! Please note that the new App SDK will now require XCode 12 to build and deploy Apps to internalApp stores, and XCode 11 will no longer be supported.
The introduction of XCode 12 support makes the app future-ready for upcoming iOS releases, ful�lling App store review guidelines and creating a base for leveragingnew iOS features.
6/1/2021
17This is custom documentation. For more information, please visit the SAP Help Portal
Modeling
Overwrite Formulas Used in Public Account Dimensions
With this next new update, you can now overwrite formulas located in models and used in public account dimensions without affecting other models that are based onthose same public account dimensions.
This means users can customize account members in one model without having to worry about making undetected changes to other models. In addition, the ModelerUI now indicates the differentiation between the non-model-speci�c formulas and the model-speci�c formulas so that users can detect the difference every time.
Planning
Flexible Modeling of Calendar Tasks and Processes
You can now use new task types in the SAP Analytics Cloud calendar: composite tasks, general tasks and review tasks. Your existing events are automatically migrated.
Additional features let you set up your work�ows in a �exible way:
Owners of a composite task can adjust the default time distribution between the assignees' and the reviewers' work.
When multiple assignees work on a task, not all of them need to submit it. The task is accomplished once one of them submits.
When multiple reviewers work in one review round, not all of them need to accept the task. The review round is accomplished once one of them accepts.
To �ne-tune their work�ow, owners can convert a composite task to a process that consists of a general task for the assignees and one review task for eachreview round.
To delegate their task to others, assignees can convert the composite task assigned to them to a process that consists of a child process and one review taskfor each review round.
Support the Conversion of Text Script to Visual Formula
Through Visual Formulas, we aim to make advanced enterprise planning universal. With this new enhancement to our Visual Formulas feature, Planning users canconvert text scripts into their visual counterparts within advanced formulas for Data Actions. As a result, users are able to quickly switch editing modes to �ne tunecalculations and leverage all the bene�ts from text scripts and visual formulas alike.
Please note that some text script syntaxes are not supported by the visual tool and will thereby be displayed as ʻread-only.’ New text script syntaxes have also beenintroduced for Block comment (/* */) and Visual Formulas Annotation (/*! */).
Support ELSE Statement in Advanced Formulas
You may recall that, in the past, there was no way to automatically calculate the remaining scope of all previous conditions. As a result, you had to de�ne the remainingscope directly with IF/ELSEIF statement. Well, now you can use the ELSE statement, instead!
What does this mean, exactly? Now, users can de�ne ELSE in an IF statement to take in the remaining scope of all previous conditions in advanced formulas step ofdata action.
Note that you can calculate a larger scope due to ELSE statement, therefore a warning message might show up in certain conditions.
Support Member Suggestion in Advanced Formulas
In advanced formulas, if you only know part of a member ID or description, you can now simply type a double quotation (") to get a �ltered list of valid members. As aresult, you no longer need to know or type in full details.
Smart Assist
De�ne the Context of Your Business Question in Smart Discovery
Smart Discovery now helps you explore your data more effectively by letting you clearly de�ne the context of the business question you want to ask. As well aschoosing a measure or dimension as a target, you can now also select an entity, which consists of one or more dimensions.
The entity de�nes the level at which Smart Discovery will aggregate your data so that it can be analyzed in relation to the target. For example, if you want to explorerevenue by customer, you can select ʻRevenue’ as the target and ʻcustomer’ as the entity. In contrast, if you wanted to understand revenue by product, you could selectʻProduct’ as the entity instead.
To access a brief summary of the data selected prior to running Smart Discovery, users can open a Preview dialog. Here, you can �nd enhancements to the content andpresentation of the analysis results generated by Smart Discovery through new heuristics that display charts that are more meaningful and easier to consume.
Now, users are empowered to explore their data in relation to a speci�c context and entity without the need for any additional data preparation. This way, users cananalyze the same target in relation to different entities and get different results that re�ect the speci�c question being asked in a way that is easier to digest.
Customize Smart Insights Top Contributor Results
Gone are the days of sifting through Smart Insights results to �nd relevant dimensions. Now, through the Smart Insights panel, story designers can customize SmartInsights top contributor results by excluding unwanted dimensions. This way, if a user excludes a dimension, no dimension member for said dimension will be shown as atop contributor, ensuring that results are as relevant as possible to the business context.
Excluded dimensions are then hidden from users’ top contributor results for the lifetime of their story or until they wish to undo the action and include them again.
Use Latest Data to Fit Time Series Model
Previously, several hypotheses (combination of trend, cycles, and �uctuations) were �tted on three quarters of the available data, and the best one was selected on thelast quarter. In Smart Predict, for Time Series analysis and forecasting, the �nal model retained is now re�tted on the whole available data.
6/1/2021
18This is custom documentation. For more information, please visit the SAP Help Portal
As a result, the Time Series model should be closer to the last part of the signal, providing response to recent changes in the data, with expectation of better forecasts!
Improved Default Visualizations in Search to Insight and Explorer
With this new enhancement, Search to Insight and Explorer present improved default chart types, which help users gain valuable insights quickly. The charts are alsomore readable and follow visualization best practices.
Improvements include:
Auto Scaling
Auto Sorting (if applicable)
Formatted Data Labels
Recommended Alternative Charts (Search to Insight)
In certain scenarios, more than one chart type may be useful in presenting the data. Improvements in Search to Insight include recommending suitable alternativevisualizations within Search to Insight, so users can choose the best way to gather valuable insights.
Add-in for Microsoft Office
Get Help through the SAP Analytics Cloud Ribbon
Within the SAP Analytics Cloud Ribbon in Microsoft Excel, users can bene�t from a Help button, providing direct access to our SAP Help Portal. Here, users can �ndinformation related to what’s new in SAP Analytics Cloud, how to get started, FAQs related to troubleshooting, and more.
Support for Automatic Mass Data Entry Mode
Furthermore, Mass Data Entry Mode is now the default for SAP Analytics Cloud’s Microsoft Office add-in. This mode is Excel-optimized, making for a simpler, moreintuitive user experience.
Mass Data Entry Mode – Enhancement
With SAP Analytics Cloud’s latest Add-in for Microsoft Office enhancement, you can now copy and paste several values into data entry cells – making for a moreintuitive, Excel-like experience. Furthermore, with the latest enhanced error handling feature, incorrect cells are highlighted to improve the overall data entry process.
Member Sorting
But wait, that’s not all! You can now also sort member values such as �at lists and hierarchies by default, ascending, or descending order.
APIs and Extensions for Developers
SCIM API – Remove Sensitive Data from URLs
A new POST endpoint for searching users has been added to the SCIM API. This API allows consumers to pass in search data such as usernames and email addresses inthe POST request body. This addresses privacy concerns where personal identi�able information was being passed in the URLs as query parameters.
For more information on this topic, visit the SCIM section of our Help Portal.
General
Renaming “External Content” to “Content Link”
The object type “External Content” is used to provide URLs to content located outside of SAP Analytics Cloud. The term has now been renamed “Content Link” toremove the confusion surrounding the word “External,” especially while viewing �lters in the Catalog.
Improved Consumption Experience – Story & Analytics Designer
We are always working to make sure that our SAP Analytics Cloud features are easy to use and navigate to make for a seamless user experience. As a result, for our�rst update of the 2021 year, we have redesigned the view time toolbar for Stories and Analytical Applications:
So that you can quickly get to the most commonly used functions, we've grouped the functions into sections with quick access buttons – sparing you searchtime and helping you get the job done faster.
You can also move more easily through stories with a lot of pages, using the enhanced page navigation, making for a more streamlined consumption experienceand equating to an enterprise-ready toolbar that scales to users' needs.
For Planning users, the new full screen mode completely hides the toolbar, so you can focus more on your content. But, if you want to see a condensed versionof the toolbar again, just hover over the top of the screen.
Version 2021.1
SAP is pleased to announce a new version of SAP Analytics Cloud.
General
As part of SAP's commitment to social justice and equality, SAP is replacing insensitive terms in our software and documentation with inclusive language – de�ned as"language free from expressions or words that re�ect prejudice". Our �rst and foremost objective was to replace the terms "master/slave" and "whitelist/blacklist" in
6/1/2021
19This is custom documentation. For more information, please visit the SAP Help Portal
SAP documentation with "neutral" terms that are more technically accurate, and to apply these new terms across all major products and solutions over time. You will�nd the modi�cations to these terms in the latest version of the SAP Analytics Cloud Help.
To make it easier to navigate to the functions that are most important to you in your current work�ow, we've enhanced the view time toolbar for Stories and AnalyticalApplications:
So that you can quickly get to the most commonly used functions, we've grouped the functions into sections with quick access buttons.
You can also move more easily through stories with a lot of pages, using the enhanced page navigation.
The new full screen mode completely hides the toolbar, so you can focus more on your content. But, if you want to see a condensed version of the toolbar again,just hover over the top of the screen.
When exporting or batch exporting to PDF and PPT from Story View mode, paginated reports are now supported to include all pagination pages.
The Catalog �lter behavior has been changed. For example, let's say you have the following company departments:
Sales Canada
Sales Germany
Operations Canada
Operations India
Development India
Development France
If you select Sales and Operations in the Department �lter category, and you select India in the Region category, the �lter will return:
Operations India
In previous releases, the �lter would return:
Sales Canada
Sales Germany
Operations Canada
Operations India
Development India
Stories
In a story that lets you explore charts and tables, you can now modify the Explorer view or even create and save new Explorer views.
Story Designers can now con�gure report tables to vertically expand when more data needs to be displayed.
In �xed-size story tabs in View mode, dynamic-size (growing) tables can now be displayed on multiple pages when they expand.
When running Search to Insight queries, recommended follow ups are provided to help users improve their visualization experience.
You can now replace an analytic account model in your story with a planning model, and vice versa, as long as the new model has at least the same measures anddimensions as the original model. Replacing the model preserves the con�guration of all widgets in your story.
You can now create calculations that aggregate values based on standard deviation. Minimal support is for acquired and Live HANA 2.0 only.
Calendar
You can now use new task types in the calendar: composite tasks, general tasks and review tasks. Your existing events are automatically migrated.
Additional features let you set up your work�ows in a �exible way:
Owners of a composite task can adjust the default time distribution between the assignees' and the reviewers' work.
When multiple assignees work on a task, not all of them need to submit. The task is accomplished once one of them submits.
When multiple reviewers work in one review round, not all of them need to accept the task. The review round is accomplished once one of them accepts.
To �ne-tune their work�ow, owners can convert a composite task to a process that consists of a general task for the assignees and one review task for eachreview round.
To delegate their task to others, assignees can convert the composite task assigned to them to a process that consists of a child process and one review task foreach review round.
Modeling
To make large numbers easier to read in stories, you can now assign a scaling factor to your measures under Measure properties.
Planning
6/1/2021
20This is custom documentation. For more information, please visit the SAP Help Portal
When using advanced formulas in a data action, you can now de�ne ELSE in an IF condition to take in the remaining scope of all previous conditions.
When you're viewing a story or analytic application, the streamlined toolbar makes it easier to work with planning model data. Common functions like VersionManagement and Allocate are more prominent, and the new Publish Data button lets you quickly publish or revert your edits to public versions.
When using a script to design an advanced formula in a data action, you can now type " (double quotation mark) for a list of valid members and �lter members (by ID) inreal-time.
Smart Predict
The automated time series forecasting function of Smart Predict (Predictive Planning) has been enhanced to help �nancial planners and BI analysts produce moreaccurate and reliable forecasts in this climate of increasing disruption.
Mobile
Search to Insight on the iOS mobile app now supports voice recognition for entering text in the search �eld.
The Android app now supports a seamless SSO experience, based on the SAPCP Cloud Connector, to SAP BW and SAP HANA live data sources.
The Android mobile app now supports "Tunnel" direct remote connections.
SAP Analytics Cloud iOS SDK now supports XCode 12.
You can now save bookmarks when using optimized story-loading mode on iOS mobile and Android app.
Analytics Designer
A new section has been added to the Custom Widget Developer Guide that explains hosting custom widgets in more detail.
The new API DataSource.getMember() has been added to retrieve member information by passing a member ID. As well, the API DataSource.getMembers()has been extended, so that you can better specify what members you want to retrieve.
The noti�cation settings for subscribing to data-change insights have been updated. Users can now:
De�ne how many auto-insights are needed.
Choose whether to send noti�cations via email or the mobile app or both.
Add multiple SAP Analytics Cloud users to receive the subscription noti�cations.
Change the subscription "Customize Script Variable" option to be off by default.
Update insights ranking calculations when a chart has TopN enabled.
Custom widgets can now be enabled for rendering on mobile devices by using a new property in the contribution JSON. The lifecycle callbacksonBeforeCustomWidgetUpdate and onAfterCustomWidgetUpdate are passed in the information if the application is running on a mobile device.
As an application designer, you can now add a Comment widget to a canvas to work with table data-cell comments.
New DataExplorer APIs that allow application users to apply explorer results to a chart or table widget are introduced in this release. With the updated results,application users can change chart or table dimensions/measures/�lters and/or chart type when running an analytic application; they can also bookmark the resultsafterwards.
You can now save an insight in data analyzer. An insight represents the displayed data source with �lters, the navigation and the presentation state of the table.
SAP Analytics Cloud, add-in for Microsoft Office
The SAP Analytics Cloud, add-in for Microsoft Office has been updated. For a list of new features, see the What's New.
System Administration Notes
With the 2021.1 release of SAP Analytics Cloud, SAP Analytics Cloud agent's minimum version remains at 1.0.75, with the following exceptions:
If you require data acquisition from SAP ERP / SQL Database, the minimum version is 1.0.99.
If you require data acquisition from SAP Universe (UNX), the minimum version is 1.0.91.
If you require data acquisition from SAP Business Warehouse (BW), the minimum version is 1.0.233.
If you require data acquisition from an SAP HANA view, the minimum version is 1.0.235.
If you require data acquisition from File Server, you need to upgrade to version 1.0.248.
For more information, see System Requirements and Technical Prerequisites.
Regarding supported features and required updates for the integration of SAP BW with SAP Analytics Cloud, refer to SAP Note 2541557 for further details.
NoteAlthough it is not required, you can upgrade to the agent version 1.0.303, no matter what data acquisition type you use. Do this to take advantage of updatesmade to SAP Analytics Cloud agent.
6/1/2021
21This is custom documentation. For more information, please visit the SAP Help Portal
Regarding supported features and required updates for live universe access through SAP BusinessObjects Live Data Connect with SAP Analytics Cloud, refer to SAPNote 2771921 for further details.
For information on new features introduced in versions of SAP Analytics Cloud from 2020, see 2020 Releases.
2020 Releases
An archive of SAP Analytics Cloud What's New topics from 2020.
Version 2020.23
SAP is pleased to announce a new version of SAP Analytics Cloud.
General
"External Content" (for example, links to resources outside of SAP Analytics Cloud) is now renamed to "Content Links".
Modeling
Model your dataset at your need by transforming your data with the new custom expressions:
Filter your values for further analysis using the "startsWith" and "endsWith" expression, which search for values starting or ending with a speci�c string value.
Count the number of words of a cell in a given column using "countWords".
Group the records based on numeric values into bins:
Use binByBinWidth to group records of a column into bins of equal width.
Use binByBinCount to specify the number of equal-width bins you need and distribute the data in those bins.
Use binByTileCount to distribute the data points equally by bins.
Use binByStandardDeviation to get bins based on standard deviation from the mean.
Planning
In advanced formulas for Data Actions, you can now convert a text script to its visual counterpart.
Mobile
The Android app now supports default server URL con�guration pushed through Microsoft InTunes.
Smart Assist
As a story designer, you can now customize your Smart Insights top contributor results, to make sure they are as relevant as possible to your business context. Ifcertain dimensions or dimension members aren't interesting to you, you can exclude them. The selected dimensions or dimension members are excluded from your topcontributor results for the lifetime of your story, or until you select to included them again.
Smart Discovery now helps you explore your data more effectively by letting you clearly de�ne the context of the business question you want to ask:
As well as choosing a measure or dimension as a target, you can now also choose an entity, which consists of one or more dimensions. The entity de�nes thelevel to which Smart Discovery will aggregate your data, so it can be analyzed in relation to the target.
Smart Discovery uses both the target and the entity to form your business question.
You can get a preview of your data selection, to make sure you're happy with it, before running Smart Discovery.
The content and presentation of the analysis results are also enhanced.
System Administration Notes
With the 2020.23 release of SAP Analytics Cloud, SAP Analytics Cloud agent's minimum version remains at 1.0.75, with the following exceptions:
If you require data acquisition from SAP ERP / SQL Database, the minimum version is 1.0.99.
If you require data acquisition from SAP Universe (UNX), the minimum version is 1.0.91.
If you require data acquisition from SAP Business Warehouse (BW), the minimum version is 1.0.233.
If you require data acquisition from an SAP HANA view, the minimum version is 1.0.235.
If you require data acquisition from File Server, you need to upgrade to version 1.0.248.
NoteAlthough it is not required, you can upgrade to the agent version 1.0.301, no matter what data acquisition type you use. Do this to take advantage of updatesmade to SAP Analytics Cloud agent.
6/1/2021
22This is custom documentation. For more information, please visit the SAP Help Portal
For more information, see System Requirements and Technical Prerequisites.
Regarding supported features and required updates for the integration of SAP BW with SAP Analytics Cloud, refer to SAP Note 2541557 for further details.
Regarding supported features and required updates for live universe access through SAP BusinessObjects Live Data Connect with SAP Analytics Cloud, refer to SAPNote 2771921 for further details.
Version 2020.22
SAP is pleased to announce a new version of SAP Analytics Cloud.
General
A new POST endpoint for searching users has been added to the SAP Analytics Cloud User and Team Provisioning API (api/v1/scim/Users/.search). For details,see this topic.
Modeling
Formulas used in public account dimensions can be overwritten in models without affecting other models based on that public account dimension. The Modeler UI nowshows the difference between the non-model-speci�c formulas and model-speci�c formulas.
Planning
Use of the terms Validation Rule and Dimension Combination Rule has been merged to refer to rules that let you de�ne the allowed member combinations acrossdimensions to prevent improper data entry and planning operations in stories. Validation Rule is now the preferred term; the term Dimension Combination Rule will nolonger be used.
Mobile
The Android app now runs on Android 11.
You can now specify what landing tab and story to open by default when you launch the Android app.
Analytics Designer
As an application user of the �lter line, you can now scroll through a list of all available dimensions for �ltering if the list gets very long. To close the list, click anywhere inthe application (instead of clicking the �lter line symbol, as you did in the past).
SAP Analytics Cloud, add-in for Microsoft Office
The SAP Analytics Cloud, add-in for Microsoft Office has been updated. For a list of new features, see the What's New.
System Administration Notes
With the 2020.22 release of SAP Analytics Cloud, SAP Analytics Cloud agent's minimum version remains at 1.0.75, with the following exceptions:
If you require data acquisition from SAP ERP / SQL Database, the minimum version is 1.0.99.
If you require data acquisition from SAP Universe (UNX), the minimum version is 1.0.91.
If you require data acquisition from SAP Business Warehouse (BW), the minimum version is 1.0.233.
If you require data acquisition from an SAP HANA view, the minimum version is 1.0.235.
If you require data acquisition from File Server, you need to upgrade to version 1.0.248.
For more information, see System Requirements and Technical Prerequisites.
Regarding supported features and required updates for the integration of SAP BW with SAP Analytics Cloud, refer to SAP Note 2541557 for further details.
Regarding supported features and required updates for live universe access through SAP BusinessObjects Live Data Connect with SAP Analytics Cloud, refer to SAPNote 2771921 for further details.
Version 2020.21
SAP is pleased to announce a new version of SAP Analytics Cloud.
NoteAlthough it is not required, you can upgrade to the agent version 1.0.299, no matter what data acquisition type you use. Do this to take advantage of updatesmade to SAP Analytics Cloud agent.
6/1/2021
23This is custom documentation. For more information, please visit the SAP Help Portal
Add-in for Microsoft Office
Highlight Changed Cells in Planning
With SAP Analytics Cloud add-in for Microsoft Office, you can now see which of your cell values are being affected by your data input within your planning models andstories. If your new entered value is successfully processed, the visible values which are affected and changed by this data entry will be highlighted in yellow.
New Features in Add-In for Microsoft Office
Great news! We have a handful of new features for the SAP Analytics Cloud, Add-in for Microsoft Office. These enhancements include:
The ability to log off from your SAP Analytics Cloud Tenant.
Removing tables within your workbook.
With one click, swapping axis allows you to move all dimensions (including Account / Measure structure) in the Rows axis to the Columns axis and vice versa.
Availability on Windows Desktop App
The SAP Analytics Cloud, Add-in for Microsoft Office will now support your application version of Microsoft Excel on your Windows desktop. Now, you can leverage thebest of the Microsoft Excel interface with the planning and analytic bene�ts of SAP Analytics Cloud right on your Windows desktop application.
Administration & Infrastructure
Extended Translate Support for Content Catalog
For content published to the Analytics Content Catalog, you can now translate third-party link names, content �lter names, and member names in your stories andanalytics applications. This means you can search for, view and consume content in your preferred language.
Filter Content Packages Based on the Lines of Business or Industries in the Content Network
SAP Analytics Cloud’s Content Network provides various pre-made analytic dashboards, stories, and data models for a variety of analytic scenarios related to variousindustries and lines of businesses. With this new update, you can now easily and quickly �nd content by applying �lters to your search. Content publishers can add �ltersto the content packages from a set of available options.
Analytics Designer
Mobile iOS Integration
End-users are now able to use the SAP Analytics Cloud mobile iOS app to list, view, and interact with the analytic applications that were created by their analyticsdesigners.
Pattern-based Functions to Create String-based Functions
As an application designer, you can now use pattern-based functions to create string-based functions by providing only input and output examples instead of writingscript code. By leveraging machine learning to automatically generate string-based functions, this new enhancement makes it more convenient to generate string-based functions without coding.
Exporting Data to PDF
Have you ever wanted to convert your table data to a PDF �le? Data Analyzers can now export data from tables in the form of a PDF �le. You will also be able tocon�gure the following for the exported PDF document:
Scope Selection
Page Orientation
Appendix and Page Size
Value Driver Tree Widget
As an analytic application user, you can now use the Value Driver Tree widget for a variety of budgeting and forecasting scenarios. The Value Driver Tree widget is a toolthat you can use to connect areas of your business and run “what if” scenarios so you can make informed data-driven decisions.
Viewing Custom Messages of Scheduled Tasks
As an analytic application user, you can now view user-de�ned warning and error messages of your scheduled publication tasks in the Calendar, using the availablescript API: Scheduling.logMessage(messageType, messageText).
Switch Widget
Application designers can now design a switch widget to allow application users to tap the switch and change the state to “on” or “off,” providing a more user-friendlyexperience. The application developer can con�gure the following properties:
Background color
Button handle color
Border color
Size, position
Sending Noti�cation to the SAP Analytics Cloud Mobile iOS App
6/1/2021
24This is custom documentation. For more information, please visit the SAP Help Portal
For all you Application Designers, we’ve enhanced the Noti�cation API. Now, SAP Analytics Cloud iOS App users can now receive noti�cations in their analyticapplications.
Filter Line Working with Multiple Widgets
As an application designer, you can now de�ne a �lter line for a group of widgets. Application users can then �lter members for multiple widgets at once. The �ltersde�ned in the �lter line will be merged with the �lters applied to the same dimensions in these widgets.
Option to Always Initialize Widgets on Startup
As an application designer, when your application has background loading, you can now use the widget action “Always initialize on startup” to optimize the startupperformance of your analytic application. This allows you, for example, to access widgets that are used in the onInitialization script without the need to wait for thesewidgets to be initialized in the background.
Flow Panel for Responsive Layout
As an application designer, you can now add a �ow panel to your applications. The �ow panel allows you to display content in a �ow layout, which automatically adjustssize to different devices—enabling you to easily create responsive scenarios without any coding efforts.
CSS-like Theme
As an application designer, you can now de�ne multiple CSS class styles either as a global default or per widget. The styles conform to CSS standard and are no longerlimited to the existing styling properties provided by Analytics Designer.
PauseRefresh Script API
Application designers can now use the PauseRefresh API to allow application users to pause the refresh of tables or charts until the user has completed correspondingactions or necessary initial loading activities. This can improve the efficiency of retrieving and updating a table or chart when running an application.
Data Change Insights to support Remote Repository Schema (Beta)
You can now con�gure where to store your Data Change Insights snapshots. The storage place is the local tenant by default. If you are a live data connection user andwant to save data changes to your own HANA system, you can also choose any other remote data repository that you con�gured in Data Repositories.
Select Data Source Dialog
At application runtime, users can now open the Data Source Dialog to change the underlying data model for table widgets—allowing you to easily and quickly switch toa different data model when running your applications.
Data Integration
Make an Embedded Dataset Public
With this new update, you will now be able to convert an embedded dataset into a public dataset in SAP Analytics Cloud. This new feature allows other users to utilizethe embedded data throughout different stories.
Support Live Connection from SAP Analytics Cloud to SAP HANA Cloud
You can now work with live SAP HANA Cloud data in SAP Analytics Cloud. By connecting to SAP HANA Cloud, you can quickly connect to your data in real-time, so yourorganization can develop powerful applications, leverage advance analytics, and therefore make strategic business decisions.
Deduplication Transform
We understand that data wrangling can be a tedious process. With SAP Analytics Cloud, one of our main objectives is to alleviate some of the common challenges thataccompany the data wrangling process. That is why we are excited to introduce the new Remove duplicate rows transform. This feature allows you to remove allduplicate rows across all columns in a dataset. Once you’ve deleted the duplicate rows from the sample, you’ll be able to see the total number of rows that wereremoved. Preparing your data is now easier than ever.
Live Connectivity from SAP Analytics Cloud to SAP HANA Cloud
We have simpli�ed the connection setup to SAP HANA Cloud. SAP Analytics Cloud users with Cloud Foundry tenants can now connect to live data from SAP HANA Cloudusing SSO or basic authentication, without needing to set up the SAP HANA Analytics Adapter. This new enhancement allows you to quickly connect to the product in amatter of minutes—saving you time and effort!
Ability to Set Aggregation Type for a Measure in the Dataset
From the dataset overview panel in Smart Wrangling, you will now be able to de�ne default aggregation behavior—including SUM, COUNT, NONE—for your measures,so that you don’t have to create a calculation for standard aggregation behavior in your story. Here are the following options. This feature overall saves you from havingto create calculated measures for aggregation in every story.
RowNumber() Function Added in the Custom Editor
In SAP Analytics Cloud, you can create a new Custom Expression to add a unique row number to each row of your dataset, which can then be used to see individualmeasures instead of aggregated ones in your story. This update provides a quicker way to uniquely identify rows of a dataset, making this particularly helpful forcreating aggregations.
Live Data Connect 3.1 for SAP Business Objects
Available with SAP BusinessObjects BI 4.2 SP7+ and BI 4.3, SAP Analytics Cloud users can now perform live data connections to SAP BusinessObjects Web Intelligencedocument data models. Leveraging on-premise SAP BusinessObjects Web Intelligence document data from SAP Analytics Cloud enables you to reuse extensive
NoteIt’s not guaranteed that a given row will have the same number for the sample, the full data, or between data refreshes.
6/1/2021
25This is custom documentation. For more information, please visit the SAP Help Portal
calculations, solve complex queries, and merge data providers to inform a more agile business intelligence process.
Data Visualization
Refresh Indicator Enhancement
When you refresh a story or use story/page �lters, you now have a more visible indication for the table refresh similar to charts that are being refreshed, removingconfusion and providing greater clarity regarding the refresh status of your data.
Suppress Zeros and Nulls
With this new update, you can now suppress zeros and nulls on SAP BW tables and charts within your story. In SAP Analytics Cloud, the Zero Suppression featuremakes it easier to extract meaning from data as it allows you to remove redundant or valueless data.
Statistical Aggregations in BI Calculations: Median and Quartile Formulas
You can now create statistical aggregations that will calculate the median values and the �rst or third quartile values in your stories. These formulas allow you tounderstand the distribution of your measure values and create valuable business insights. For example, you can use this enhancement to understand the distribution ofyour employee salaries, identify larger outlier order values or create customer spending groups based on quartiles. Note that this new capability is only supported formodels based on acquired or live HANA Connections.
Simulation for Agile BI
SAP Analytics Cloud users can now quickly simulate different scenarios by creating private simulations on data uploaded from Excel. Basic simulation features such asentering values, copying and pasting, and undoing or redoing changes are available. This allows you to simulate the impact of different strategic changes on businessoutcomes so you can gain valuable insights on the �y.
Reorder Dimension Facets in Explorer
Good news for users who use SAC Explorer. You can now set your own custom order of the dimension facets for exploration. Your custom facet order will be stored withthe Exploration view when saving your story or bookmarking. Custom order of facets makes exploration and ad-hoc analysis easier and more convenient by allowing youto curate the default facet order in your views compared to choosing certain dimension facets every time from a long list of dimension facets.
Duplicate BI Story Calculated Measures/Dimensions
As a Story creator, you will now be able to duplicate calculated measures, calculated dimensions, and cross calculations, in the stories which will help in reducing yourtime spent on creating calculations and increase productivity. For example, you can now use an existing or newly created restricted calculation for Sales Revenue in theyear 2019, duplicate it, and then change the time restriction to 2018 to create Sales Revenue for the year 2018 and quickly compare the company’s performance overtwo years.
Replace Model Behind Story for Acquired Models
You can now replace any acquired model in your story with another acquired model that has additional measures and dimensions, alongside the original measures anddimensions—providing you with more �exibility when it comes to repointing models. Replacing the model preserves the con�guration of all widgets in your story.
Suppress Zeros and Nulls on Charts for live HANA Models
With this new update, you can now suppress zeros and nulls on charts based on acquired HANA models and live HANA Models. In SAP Analytics Cloud, the ZeroSuppression feature makes it easier to extract meaning from data as it allows you to remove redundant or invaluable data.
Automatic Format for Decimal Places in BI Charts and Geo Widgets
In SAP Analytics Cloud, you will now see the option automatic under Decimal Places in the Styling panel. With this new option, the scale will automatically update with aminimum of three decimal places for Charts and Geo maps.
Choropleth Layer Support with Live HANA Cloud Connection
SAP HANA Cloud users can now view and utilize choropleth layers in geo maps. Please note that, in order to correctly set up the spatial �les within the SAP HANACloud instance with synonyms within the administrative page, sysAdmin is required. Synonyms are required for Live HANA Cloud. While Live HANA customers will beable to set up geo choropleth synonyms with this new enhancement, synonyms are only supported for Live HANA 2.00.024.09 + customers.
Mobile
New Optimized Story View for SAP Analytics Cloud Mobile on iOS
It isn’t a well-kept secret that we all want fast loading times when using any mobile application. This next feature will help with just that in our SAP Analytics Cloud iOSapp. You can now leverage the new Optimized View in your mobile-enabled stories, to enable faster loading times.
Disable Mobile Cache for Enhanced Security
Security is always top of mind when developing SAP Analytics Cloud. For the SAP Analytics Cloud iOS app, administrators can now disable the cache for app users toprevent offline access, adding an extra layer of security.
China Cyber Security (CCSL) Compliance for SAP Analytics Cloud Mobile
The iOS and Android mobile apps are now compliant with the China Cyber Security Law (CCSL). This applies only in the following usage scenarios:
The device language is set to Chinese.
The device is set to China Standard Time (CST).
For more information, see Downloading and Setting Up the Mobile App.
6/1/2021
26This is custom documentation. For more information, please visit the SAP Help Portal
Modeling
Add or Remove Dimensions from a Model with Existing Artifacts
This next enhancement will help you simplify model maintenance. For models with private versions, you can now add or remove dimensions. Upon deleting dimensions,a warning message will let you know what dependencies will be impacted.
User and Teams Validation
This next enhancement helps speed up the loading times of your models in SAP Analytics Cloud. When opening or saving a model, a user validation is triggered. Thisfeature allows you to easily detect and unassign missing or invalid users with data access and rights on dimensions linked to your model.
Planning
Financial Analytics Dashboard
SAP Analytics Cloud’s latest Financial Analytics Dashboard is a �exible, cross-application analytics solution that enables a company’s CFO to monitor and act on themost critical business metrics, while improving their company’s overall performance. Through access to key performance indicators such as P&L, balance sheets, cash�ow, and people analytics, a CFO is granted the ability to make strong decisions with con�dence.
This is all achieved by bringing together data from applications such as SAP S/4HANA, SAP Data Warehouse Cloud, and SAP SuccessFactors to help key players get thefull picture when it comes to their company’s health.
What-If Analysis
SAP Analytics Cloud users can now quickly simulate different scenarios by creating private simulations on data uploaded from Excel. Basic simulation features such asentering values, copying and pasting, and undoing or redoing changes are available. This allows you to simulate the impact of different strategic changes on businessoutcomes so you can gain valuable insights on the �y.
Data Action Nesting and Monitoring
In SAP Analytics Cloud for planning, embedded data action steps are now available. With one simple click, you will be able to add an entire data action as a step withinanother Data Action. This simpli�es the overall design and administration of Data Actions, while also streamlining the end user experience by allowing them to run aseries of Data Actions with a single click. Creating your plans has never been quicker.
After running data actions in a story, analytic application, or scheduling data actions using the Calendar, you’ll now be able to monitor and manage your data actions onthe new Data Action Monitor page—providing greater visibility to task owners. The Data Action Monitor will provide updates on:
Current status of executed/scheduled data action.
Timing of when a data action was triggered.
Use who triggered the data action.
Which object the data action was triggered from (for example, speci�c story).
Copy and Paste Values in a Table with an Advanced Filter
In SAP Analytics Cloud for planning, you can now copy and paste values in a table where Advanced Filters are enabled. This includes copying underlying values wherethe target cells are already booked or pasting a value without weighting where the target cells do not have pre-existing values.
Embedded Data Action Steps
In SAP Analytics Cloud for planning, embedded data action steps are now available. With one simple click, you will be able to add an entire data action as a step withinanother Data Action. This simpli�es the overall design and administration of Data Actions, while also streamlining the end user experience by allowing them to run aseries of Data Actions with a single click. Creating your plans has never been quicker.
Validation Warnings
Accuracy is key during the planning process. With this new enhancement, you’ll be able to mitigate any potential errors when entering plan values. In tables, unbookeddata cells will now be proactively disabled for data entry if they are invalid according to the validation rules of the underlying model. A grey dash character (-) indicatesthat you can’t enter data, providing you with guidance to plan on valid member combinations.
New Enhancements to the Calendar with the List View
Collaboration is a huge part of the planning and analysis process. That’s why we are introducing the List View. Now, you can monitor and manage your calendar eventswith greater efficiency with List View. You can now easily toggle between List, calendar, and Gantt chart to provide an overview of your planning processes.
Create Rules and Dimensions Relationships with Greater Flexibility
You can now create rules and dimension relationships directly in the rule builder without the need for attributes. With this new enhancement, you now have the bene�tof referencing parents directly as part of the rule and the ability to apply to all decedents.
Support New Time Function “LAST”
When writing advanced formulas scripts in a Data Action, you can now use the new function LAST() to retrieve the last time period of the year taken from the givendate argument. The other two-time scope selection functions FIRST() and PREYEARLAST() have been enhanced as well to support returning a time period of the yeartaken from a given date argument. The date argument can be a date type dimension, a dimension attribute, a �xed date, a single selection of an external parameter, orTODAY().
ATTRIBUTE Function Without RESULTLOOKUP
When writing advanced formulas scripts in a data action, now you can use the ATTRIBUTE function together with IF condition; for example, “IFATTRIBUTE([d/Employee].[p/HRGrade]) > 25 THEN”. Also, you can use the ATTRIBUTE function standalone for the number variable assignment, without needing to
6/1/2021
27This is custom documentation. For more information, please visit the SAP Help Portal
include RESULTLOOKUP as part of the calculation. All similar functions that return numeric values (that is, DATEDIFF, DATERATIO, DAYSINMONTH, DAYSINYEAR, DAY,MONTH, YEAR) now have the same behavior.
Platform Services
Scheduling a Story in PowerPoint File Format
For PowerPoint users, you’ll be excited by this next feature. In SAP Analytics Cloud, the PowerPoint presentation, .pptx format, will now be supported as a �le type whilescheduling a story. This way, you can send your data visualizations in a PowerPoint format, so your end-user can easily integrate the slide in future presentations.
Manage Schedules
In SAP Analytics Cloud, you can now appoint speci�c users as Schedule Administrators. Schedule Administrators are able to manage all the schedules available on atenant in the following ways:
Delete unwanted schedule created by other users.
Discontinue certain schedules that are not required anymore.
Change time of the schedules.
Schedule Administrator can Delete any Schedule Within Tenant
To effectively manage and delete unwanted schedules from your tenant to free up scheduling slots, the administrator can now delete the occurrence or recurrence of aschedule. Here, the schedule owner will be noti�ed when a schedule is deleted.
Discontinue and Move Schedule Occurrence or Reoccurrence to Cancelled State
You can now discontinue an occurrence or a series of a schedule. Once you discontinue a scheduled publication, the overall status of the schedule will show “canceled.”This enhancement helps you make room for essential scheduled publications in SAP Analytics Cloud.
Customer SMTP Server Con�guration
As an administrator, you can now con�gure an SMTP server of your choice for email delivery in SAP Analytics Cloud.
Commenting Privileges for Story, Analytic Application, Model, and Folder
In SAP Analytics Cloud, you will now be able to control who can view, add, or delete comments on your stories, analytic applications, and folders while sharing it withyour users and teams. This is particularly useful when you are dealing with con�dential information.
Smart Assist
Smart Insights Enhancements
Efficiently �nd the answers to your business questions with this new Smart Insights enhancement. Smart Insights will now �nd more meaningful insights on yourhierarchical data by basing the analysis on the most interesting level of your dimension hierarchy, opposed to solely using the leaf node level. Details of your dimensionhierarchy will also be displayed when you hover over a selected dimension member in the Smart Insights panel, or in the Dynamic Insight text.
Furthermore, to use Smart Insights against a Live HANA data source, users can implement advanced features in a one-time only step. From then onward, users caneffortlessly discover new insights on the �y. For all HANA permissions, each �lter added by a user is considered when generating insights, so information is tailored totheir respective work�ows. When we use a Live HANA source, we can therefore be con�dent that we are getting the latest insight every time.
Improved Search to Insight Autocomplete Suggestions
In SAP Analytics Cloud, we’ve streamlined the search suggestion experience. Now, Search to Insight will automatically group matching measures and dimensions (thatare found in multiple models) into the same search suggestion. Additionally, the measures and dimensions that are suggested are now ranked based on the frequencythat they are used in Stories.
Chart Interactions in Search to Insight
In SAP Analytics Cloud, you can now directly interact with your search results from Search to Insight. This provides the following bene�ts:
Quickly answer follow up questions. For example, by drilling on a dimension member.
Efficiently �lter or exclude dimension members that aren’t your focus.
Easily export your search results to Excel.
Re-pointing an Acquired “Identical” Model in a Story
Within Data View, you can now replace any acquired model in your story with another acquired model that has the same structure, saving you time and effort.Replacing the model also preserves the con�guration of all widgets in your story.
Search to Insight via Home Page Hides Embedded Models
When using Search to Insight, embedded models are now only included in the search scope if the query is initiated from within a story. This will increase your datarelevancy by providing more meaningful Search to Insight suggestions.
Display Descriptions in Smart Predict Debrief for Planning Forecasts
In SAP Analytics Cloud, Smart Predict was designed to help you predict future outcomes, so you can make meaningful, data-driven decisions. With this newenhancement, we are making it easier to understand your predictive results from Smart Predict. Now, the information displayed in the Smart Predict debrief will bebased on dimension descriptions instead of IDs.
Predictive Planning—Enhancements to Smart Predict
6/1/2021
28This is custom documentation. For more information, please visit the SAP Help Portal
Using Smart Predict, �nancial planners can now generate forecasts using the default currency or local currency. This update empowers you to predict and plan theevolution of your �nancial KPIs expressed in your local currencies.
Version 2020.20
SAP is pleased to announce a new version of SAP Analytics Cloud.
General
As an administrator, you can now con�gure an SMTP server of your choice for email delivery.
You can use SAP BW Dynamic Filters as prompts and de�ne their values for a publication while creating or editing a schedule.
Data Acquisition, Live Data Connections, and Integration
From the dataset overview panel in Smart Wrangling, de�ne default aggregation behavior for your measures so that you don't have to create a calculation for standardaggregation behavior in your story. Create a new Custom Expression to add a unique row number to each row of your dataset, which can be used to see individualmeasures instead of aggregated ones in your story.
You can now connect to live data from SAP HANA Cloud using SSO or basic authentication, without needing to set up the SAP HANA Analytics Adapter.
Stories
For Charts and Geo maps, you can now set data points to automatically set the decimal places to a minimum of 3 digits.
You can now suppress zeros and nulls on charts in your story, for all SAP HANA models.
You can now replace any acquired model in your story with another acquired model that has additional measures and dimensions, alongside the original measures anddimensions. Replacing the model preserves the con�guration of all widgets in your story.
Planning
You can monitor and manage your data actions on the Data Action Monitor page after running data actions in a story or analytic application or scheduling data actionsusing the Calendar.
Smart Predict
Using Predictive Planning, �nancial planners can predict and plan the evolution of their �nancial KPIs expressed in local currencies.
Analytics Designer
As an application designer, you can now de�ne multiple CSS class styles either as a global default or per widget. The styles conform to CSS standard and are no longerlimited to the existing styling properties provided by Analytics Designer.
As an application developer, you can add a �ow panel that displays content in a �ow layout which automatically adjusts size to different devices.
You can con�gure where to store your data change insights snapshots. The storage place is the local tenant by default. If you are a live data connection user and wantto save data changes to your own HANA system, you can also choose any other remote data repository that you con�gured in Data Repositories.
As an application designer, you can use the PauseRefresh API to allow application users to pause the refresh of a table or chart until the user has completedcorresponding actions or necessary initial loading activities. This can improve the efficiency of retrieving and updating a table or chart when running an application.
System Administration Notes
With the 2020.20 release of SAP Analytics Cloud, SAP Analytics Cloud agent's minimum version remains at 1.0.75, with the following exceptions:
If you require data acquisition from SAP ERP / SQL Database, the minimum version is 1.0.99.
If you require data acquisition from SAP Universe (UNX), the minimum version is 1.0.91.
If you require data acquisition from SAP Business Warehouse (BW), the minimum version is 1.0.233.
If you require data acquisition from an SAP HANA view, the minimum version is 1.0.235.
If you require data acquisition from File Server, you need to upgrade to version 1.0.248.
For more information, see System Requirements and Technical Prerequisites.
Regarding supported features and required updates for the integration of SAP BW with SAP Analytics Cloud, refer to SAP Note 2541557 for further details.
NoteAlthough it is not required, you can upgrade to the agent version 1.0.295, no matter what data acquisition type you use. Do this to take advantage of updatesmade to SAP Analytics Cloud agent.
6/1/2021
29This is custom documentation. For more information, please visit the SAP Help Portal
Regarding supported features and required updates for live universe access through SAP BusinessObjects Live Data Connect with SAP Analytics Cloud, refer to SAPNote 2771921 for further details.
Version 2020.19
SAP is pleased to announce a new version of SAP Analytics Cloud.
General
You can now �lter prede�ned content packages based on the lines of business or industries in the Content Network, and search within the �ltered list.
You can now discontinue an occurrence or a series of a schedule.
A schedule manager can now delete the occurrence or recurrence of a schedule. To access a schedule available in a tenant, the schedule manager should have Managepermission on the private and public �les.
Stories
You can now more quickly create similar calculated measures, dimensions, or cross calculations by duplicating the existing calculation and then modifying it. Forexample, create a restricted measure with a time �lter, copy it, and then change the time �lter.
When using Search to Insight, embedded models are now only included in the search scope if the query is initiated from within a story.
Planning
In addition to creating dimension combination rules via existing attributes, you can now create a dimension combination rule by directly specifying the dimensionmembers that allow data entry. Other dimension combinations are invalid and won't allow data entry.
When writing advanced formulas scripts in a data action, you can now use a new function LAST() to retrieve the last time period of the year taken from the given dateargument. The other two time scope selection functions FIRST() and PREYEARLAST() have been enhanced as well to support returning a time period of the year takenfrom a given date argument. The date argument can be a date type dimension, a dimension attribute, a �xed date, a single selection of an external parameter, orTODAY().
When writing advanced formulas scripts in a data action, now you can use the ATTRIBUTE function together with IF condition; for example, "IFATTRIBUTE([d/Employee].[p/HRGrade]) > 25 THEN". Also, you can use the ATTRIBUTE function standalone for number variable assignment, without RESULTLOOKUPin the calculation. All similar functions that return numeric values (DATEDIFF, DATERATIO, DAYSINMONTH, DAYSINYEAR, DAY, MONTH, YEAR) now have the samebehavior.
Modeling
When opening a model, a user validation is triggered: you can then easily detect and unassign missing or invalid users with data access and rights on dimensions linkedto your model.
Mobile
The iOS and Android mobile apps are now compliant with the China Cyber Security Law (CCSL). This applies only in the following usage scenarios:
The device language is set to Chinese.
The device is set to China Standard Time (CST).
For more information, see Downloading and Setting Up the Mobile App.
Analytics Designer
As an application designer, you can now de�ne a �lter line for a group of widgets. Then when running the analytic application, application users can �lter members formultiple widgets at one time and the �lters de�ned in a �lter line will be merged with the �lters applied to the same dimensions in these widgets.
As an application designer, you can now use the widget action "Always initialize on startup" to in�uence the performance of your analytic application if the application isrun using background loading. This allows you, for example, to access widgets that are used in the onInitialization script without the need to wait for these widgets tobe initialized in the background.
System Administration Notes
With the 2020.19 release of SAP Analytics Cloud, SAP Analytics Cloud agent's minimum version remains at 1.0.75, with the following exceptions:
If you require data acquisition from SAP ERP / SQL Database, the minimum version is 1.0.99.
If you require data acquisition from SAP Universe (UNX), the minimum version is 1.0.91.
If you require data acquisition from SAP Business Warehouse (BW), the minimum version is 1.0.233.
If you require data acquisition from an SAP HANA view, the minimum version is 1.0.235.
If you require data acquisition from File Server, you need to upgrade to version 1.0.248.
6/1/2021
30This is custom documentation. For more information, please visit the SAP Help Portal
For more information, see System Requirements and Technical Prerequisites.
Regarding supported features and required updates for the integration of SAP BW with SAP Analytics Cloud, refer to SAP Note 2541557 for further details.
Regarding supported features and required updates for live universe access through SAP BusinessObjects Live Data Connect with SAP Analytics Cloud, refer to SAPNote 2771921 for further details.
Version 2020.18
SAP is pleased to announce a new version of SAP Analytics Cloud.
General
For content published to the catalog, you can now translate third-party link names, and content �lter names and member names.
You can now allow users to manage all the schedules available on a tenant.
Stories
When using an SAP BW data source, in your input control and �lter settings you can choose to allow the selection of both parents and their children, rather than one orthe other.
In Explorer, you can now set your own custom order for the dimension facets. Your custom facet order will be stored with Exploration view, when bookmarking or savingthe story.
Mobile
You can now set your mobile-enabled story to load faster on an iOS mobile application by leveraging the Optimized iOS story setting, with some limitations.
Administrators can now disable the cache for iOS mobile app users.
Analytics Designer
The Noti�cation API has been enhanced, letting application designers send noti�cations to SAP Analytics Cloud iOS App users.
SAP Analytics Cloud, add-in for Microsoft Office
The SAP Analytics Cloud, add-in for Microsoft Office has been updated. For a list of new features, see the What's New.
System Administration Notes
With the 2020.18 release of SAP Analytics Cloud, SAP Analytics Cloud agent's minimum version remains at 1.0.75, with the following exceptions:
If you require data acquisition from SAP ERP / SQL Database, the minimum version is 1.0.99.
If you require data acquisition from SAP Universe (UNX), the minimum version is 1.0.91.
If you require data acquisition from SAP Business Warehouse (BW), the minimum version is 1.0.233.
If you require data acquisition from an SAP HANA view, the minimum version is 1.0.235.
If you require data acquisition from File Server, you need to upgrade to version 1.0.248.
For more information, see System Requirements and Technical Prerequisites.
Regarding supported features and required updates for the integration of SAP BW with SAP Analytics Cloud, refer to SAP Note 2541557 for further details.
Regarding supported features and required updates for live universe access through SAP BusinessObjects Live Data Connect with SAP Analytics Cloud, refer to SAPNote 2771921 for further details.
Version 2020.17
SAP is pleased to announce a new version of SAP Analytics Cloud.
General
NoteAlthough it is not required, you can upgrade to the agent version 1.0.293, no matter what data acquisition type you use. Do this to take advantage of updatesmade to SAP Analytics Cloud agent.
NoteAlthough it is not required, you can upgrade to the agent version 1.0.291, no matter what data acquisition type you use. Do this to take advantage of updatesmade to SAP Analytics Cloud agent.
6/1/2021
31This is custom documentation. For more information, please visit the SAP Help Portal
PowerPoint presentation (.pptx format) is now supported as a �le type while scheduling a story.
Data Acquisition, Live Data Connections, and Integration
During a wrangling session, you'll now be able to use a new transform directly from the toolbar. The new Remove duplicate rows transform allows you to remove allduplicate rows across all columns in a dataset.
Stories
You can now quickly simulate different scenarios by adding data to your story and making temporary changes to it in a table. Basic simulation features like enteringvalues, copying and pasting, and undoing or redoing changes are available.
You can now interact with charts based on Search to Insight results.
Search to Insight now offers a new experience for search suggestions.
Planning
You can now monitor and manage your calendar events in a list view. This view provides an overview of your calendar events in a customizable table.
You can now �lter the calendar for events where you aren't involved in any role. This lets you, for example, display events that were assigned to you but a substitutetook over. The new None role �lter also lets administrators �lter all scheduled publications.
Modeling
You can now add or remove dimensions for models with private versions.
Smart Assist
You can now replace any acquired model in your story with another acquired model that has the same structure. Replacing the model also preserves the con�gurationof all widgets in your story.
Analytics Designer
Application users can view user-de�ned warning and error messages of their scheduled publication tasks in Calendar.
Application designers can now design a switch widget to allow application users to tap the switch and change a state to on or off.
System Administration Notes
With the 2020.17 release of SAP Analytics Cloud, SAP Analytics Cloud agent's minimum version remains at 1.0.75, with the following exceptions:
If you require data acquisition from SAP ERP / SQL Database, the minimum version is 1.0.99.
If you require data acquisition from SAP Universe (UNX), the minimum version is 1.0.91.
If you require data acquisition from SAP Business Warehouse (BW), the minimum version is 1.0.233.
If you require data acquisition from an SAP HANA view, the minimum version is 1.0.235.
If you require data acquisition from File Server, you need to upgrade to version 1.0.248.
For more information, see System Requirements and Technical Prerequisites.
Regarding supported features and required updates for the integration of SAP BW with SAP Analytics Cloud, refer to SAP Note 2541557 for further details.
Regarding supported features and required updates for live universe access through SAP BusinessObjects Live Data Connect with SAP Analytics Cloud, refer to SAPNote 2771921 for further details.
Version 2020.16
SAP is pleased to announce a new version of SAP Analytics Cloud.
General
You will now receive all SAP Analytics Cloud email noti�cations from noreply-sac+noti�[email protected] and not [email protected].
Stories
NoteAlthough it is not required, you can upgrade to the agent version 1.0.289, no matter what data acquisition type you use. Do this to take advantage of updatesmade to SAP Analytics Cloud agent.
6/1/2021
32This is custom documentation. For more information, please visit the SAP Help Portal
You can now create statistical aggregations that will calculate the median values or the 1st or 3rd quartile values in stories.
You can now work with live SAP HANA Cloud data in SAP Analytics Cloud. For more information, including limitations, see Live Data Connection to SAP HANA CloudUsing a Direct Connection and SSO.
Planning
Embedded data action steps are now available, letting you add an entire data action as a step within another data action.
In tables, unbooked data cells are disabled for data entry if they are not valid according to the validation rules of the underlying model. A grey dash character (-)indicates that you can't enter data.
Analytics Designer
As a user of analytic applications, you can now use the Value Driver Tree widget to do budgeting and forecasting based on different scenarios, and thus make businessdecisions.
As a user of analytic applications, you can now export the full table as PDF or together with other widgets during the application PDF exporting and scheduling.
SAP Analytics Cloud, add-in for Microsoft Office
The SAP Analytics Cloud, add-in for Microsoft Office has been updated. For a list of new features, see the What's New.
System Administration Notes
With the 2020.16 release of SAP Analytics Cloud, SAP Analytics Cloud agent's minimum version remains at 1.0.75, with the following exceptions:
If you require data acquisition from SAP ERP / SQL Database, the minimum version is 1.0.99.
If you require data acquisition from SAP Universe (UNX), the minimum version is 1.0.91.
If you require data acquisition from SAP Business Warehouse (BW), the minimum version is 1.0.233.
If you require data acquisition from an SAP HANA view, the minimum version is 1.0.235.
If you require data acquisition from File Server, you need to upgrade to version 1.0.248.
For more information, see System Requirements and Technical Prerequisites.
Regarding supported features and required updates for the integration of SAP BW with SAP Analytics Cloud, refer to SAP Note 2541557 for further details.
Regarding supported features and required updates for live universe access through SAP BusinessObjects Live Data Connect with SAP Analytics Cloud, refer to SAPNote 2771921 for further details.
Version 2020.15
SAP is pleased to announce a new version of SAP Analytics Cloud.
Data Acquisition, Live Data Connections, and Integration
You can now convert an embedded dataset to a public dataset so that it can be used in other stories and by other users.
Stories
When you refresh story, you now have a more visible indication for the charts that are being refreshed.
You can now suppress zeros and nulls on SAP BW tables and charts in your story.
Planning
You can now copy and paste values in a table with an advanced �lter, including copying underlying values to booked cells.
In tables, the context menu items for version management are now combined in a separate submenu.
Modeling
It is now possible to link dimensions with multiple parent-child hierarchies on matching hierarchies (by ID) in the Dimension Linking dialog. This change enhancesblending/�ltering across models functionality and performance.
NoteAlthough it is not required, you can upgrade to the agent version 1.0.287, no matter what data acquisition type you use. Do this to take advantage of updatesmade to SAP Analytics Cloud agent.
6/1/2021
33This is custom documentation. For more information, please visit the SAP Help Portal
Smart Assist
Smart Insights now �nds better insights on your hierarchical data, by basing the analysis on the most interesting level of your dimension hierarchy, rather than on justthe leaf node level. Details of your dimension hierarchy are now also displayed when you hover over a selected dimension member in the Smart Insights panel, or in thedynamic insight text.
Analytics Designer
As an application designer, you can now use pattern-based functions to create string-based functions by providing only input and output examples instead of writingscript code.
As a user of the data analyzer, you can now export data from your table as a PDF �le.
System Administration Notes
With the 2020.15 release of SAP Analytics Cloud, SAP Analytics Cloud agent's minimum version remains at 1.0.75, with the following exceptions:
If you require data acquisition from SAP ERP / SQL Database, the minimum version is 1.0.99.
If you require data acquisition from SAP Universe (UNX), the minimum version is 1.0.91.
If you require data acquisition from SAP Business Warehouse (BW), the minimum version is 1.0.233.
If you require data acquisition from an SAP HANA view, the minimum version is 1.0.235.
If you require data acquisition from File Server, you need to upgrade to version 1.0.248.
For more information, see System Requirements and Technical Prerequisites.
Regarding supported features and required updates for the integration of SAP BW with SAP Analytics Cloud, refer to SAP Note 2541557 for further details.
Regarding supported features and required updates for live universe access through SAP BusinessObjects Live Data Connect with SAP Analytics Cloud, refer to SAPNote 2771921 for further details.
Version 2020.14
SAP is pleased to announce a new version of SAP Analytics Cloud.
Add-in for Microsoft Office
Microsoft Excel Integration
We are excited to announce that you can now integrate Microsoft Excel with SAP Analytics Cloud. With this new integration, we are combining the best of the MicrosoftExcel interface with the planning and analytic bene�ts of SAP Analytics Cloud. This makes it even easier to analyze your plans, simulate future outcomes, and takeeffective business actions. Here are some of the exciting features you can utilize with this new integration:
Report on SAP Analytics Cloud models and write back data into different versions: You can publish different versions of your data and revert them in case youwould like to discard your changes.
Pivoting and �lter features: You can use pivoting and �lter features within the highly interactive table to easily create your ad hoc reports.
Add any calculations and use formulas to easily create added value.
Create Hierarchies and return Subtotals in your database.
If you want to use this integration, please ensure you meet the following prerequisites:
Have an SAP Analytics Cloud tenant.
SAP Analytics Cloud deployment on Cloud Foundry.
Have a Data-acquired in SAP Analytics Cloud models.
Administration & Infrastructure
Working with Live SAP HANA Cloud Data
You can now work with live SAP HANA Cloud data in SAP Analytics Cloud. To learn about this great new feature, click this link: Live Data Connection to SAP HANA CloudUsing a Direct Connection and SSO.
Performance Statistics in SAP Analytics Cloud
Have you ever wanted to identify which of your SAP Analytics Cloud models have the highest impact on your connected backend systems? The new PerformanceStatistics feature will do just that!
NoteAlthough it is not required, you can upgrade to the agent version 1.0.286, no matter what data acquisition type you use. Do this to take advantage of updatesmade to SAP Analytics Cloud agent.
6/1/2021
34This is custom documentation. For more information, please visit the SAP Help Portal
With this new update, you can get statistics of your highest performing models, which will be aggregated in a dashboard/story directly within SAP Analytics Cloud. Youcan easily identify Models and Stories that bring the highest load and processing to the backend system, so you can make improvements as needed. The dashboard willcontain a variety information regarding Backend (HANA, BW) Runtime Statistics (and distributions), Query Types, most frequent Users, Models, Connections, andmore.
Invite Speci�c Teams to a Discussion
You asked and we’ve listened! For this new release, you will now be able to invite speci�c teams to a discussion. Collaboration is essential when working on your analyticand planning scenarios and this new feature will make collaboration in SAP Analytics Cloud even more user-friendly.
Support Microsoft Edge Browsers Based on the Chromium Engine
For those who use Microsoft Edge, SAP Analytics Cloud now supports Microsoft Edge Browsers based on the Chromium Engine. This will provide you with a smootherand more enhanced user experience when working with SAP Analytics Cloud in your Microsoft Edge browser.
Content Network
From the Content Network, you can now import and export teams, team folders, and content in the “System” folder. This means, for administrators who are managingthe lifecycle of content between tenants, you can now import and export team related content. This update provides you with greater control while managing thelifecycle of team content.
De�ne Default Tab
With SAP Analytics Cloud, one of our goals is to ensure you can easily access the content you need. This new feature will help you do just that. On the SAP AnalyticsCloud home page, administrators can now de�ne a default tab by going to System > Administration or by clicking the Edit Home Screen button. Your individual userscan also navigate to the Edit Home Screen dialog and de�ne their own default tab. Please note that if all tabs are disabled, then this option will be hidden in the EditHome Screen dialog and disabled in the Default Appearance tab.
Analytics Designer
Select Multiple Widgets
Exciting news! We’ve made some design time enhancements to improve your work efficiency when designing analytical applications. Now, you can select multiplewidgets in which you can move the widgets around the canvas in unison. You can also set common properties for the selected widgets, providing you with more�exibility when designing your analytical applications.
Create New Dimension Members Using Planning Model APIs
Did someone say more �exibility when designing planning interfaces? You heard right. We are now providing script APIs that will help you create, update, and deletedimension members on the �y.
Here are the new APIs that are offered:
PlanningModel.getMember();
PlanningModel.getMembers();
PlanningModel.createMembers();
PlanningModel.updateMembers();
PlanningModel.deleteMembers();
Access an Analytic Application from a Calendar Task
You can now integrate your analytic application into the calendar task work�ow. This impacts each task role as such:
As a task owner, you can de�ne your analytic application as a work �le.
As a task assignee, you can access the application from the calendar task and choose whether to submit, reject, review or set the progress of the task in theapplication.
As a task reviewer, you can access the application from a calendar task in which you can accept or reject all actions in the application.
Export to PDF Scripting
End users can now de�ne the speci�c widgets that they want to include or exclude in their exported PDF. This provides your end users with the ability to incorporate themost relevant widgets in their exported PDFs. This can be achieved through the Build panel or the following scripts:
ExportToPDF.includeComponent()
ExportToPDF.excludeComponent()
Application.showMessage() API
In SAP Analytics Cloud, �exibility and customization is at the top of our agendas when we are developing new enhancements. This next update provides analyticdevelopers with the �exibility to customize your application messages in a way that is more digestible and relevant for your end users. You will be able to access thisnew capability by using the following APIs:
Application.ShowMessage() API enables you to create custom messages.
Application.setMessageTypesToShow() API allows analytic developers to �lter certain types of messages to manage what the end users can see. The differenttypes of messages you can �lter include Success, Info, Warning, and Error messages.
DataSource APIs
6/1/2021
35This is custom documentation. For more information, please visit the SAP Help Portal
For all application developers out there, we have a handful of useful updates that will provide you more �exibility when using SAP Analytics Cloud.
As an application designer, you can now use the DataSource APIs(setHierarchyLevel(), getHierarchyLevel() ,expandNode() and collapseNode()) to set the hierarchylevel of a dimension and to expand or collapse individual hierarchy nodes.
Create an Analytic Application Using Datasets of SAP Data Warehouse Cloud
Within SAP Analytics Cloud, application designers can now create analytic applications by using datasets from SAP Data Warehouse Cloud. By using the “Select Model”dialog, the application designer can choose a con�gured connection, space, and dataset for the model-based widgets. This new enhancement will increase the scope ofthe data you can utilize when designing your analytic applications.
Create an Analytic Application Starting in SAP Data Warehouse Cloud
Application designers will now also be able to create an analytic application directly in SAP Data Warehouse Cloud. There are two methods application designers canfollow to create an analytic application in Data Warehouse Cloud:
Select Data Warehouse space and then select Analytic Application.
Select Analytics Cloud space and then select Analytic application.
Using either of these options, the application designer will then navigate to SAP Analytics Cloud, where you can choose a con�gured connection, space, and dataset forthe model-based widgets. This new enhancement will increase the scope of the data you can utilize when creating your analytic applications.
Subscribe to an Application’s Top N Data Change Insights (Beta)
For analytic application users, you can now subscribe to an application’s top N data change insights either through noti�cations or your email. You can set thesubscription to notify you by day or week depending on your SAP Analytics Cloud scheduling infrastructure. This new capability allows you to easily and quickly retrievethe most important and relevant insights on your data changes in your analytic application. The data change insights will be delivered as a technical component withthe corresponding script APIs.
SetStyle API
Now, as an application designer, you can use the setStyle API to dynamically customize the style of your widgets including font color, background color, shapes, andmuch more, all at run time. The widgets that are supported in the setStyle API are text, input �eld, text area, and shape widgets. This customization is particularlyuseful for when you are working with conditional formatting scenarios.
Optimize the Startup Performance of Analytic Applications
It’s time to speed things up a bit! You will now be able to automatically load all invisible widgets in the background either through the Analytic Application Setting Dialogor the Application URL parameter: loadInvisibleWidgets=inBackground. This new feature will not only improve the performance of your application but also speed upthe initialization time.
Application.getInfo() API
You asked and we listened! Application designers will now be able to use the Application.getInfo() API to access information regarding your application including the ID,name, description, and URL. Now, you can �nd all your application information in one, central place.
Set Variable Value for Hierarchy Node Variable
Calling on all application developers. We have a handful of useful updates that will provide you more �exibility when using SAP Analytics Cloud.
First, you can now set a variable value for a BW and HANA hierarchy node variable. To achieve this, here are the following APIs:
Single node: Table_1.getDataSource().setVariableValue(“0BC_CUST_NODE”, “0HIER_NODE!FRANKREICH”);
Multiple nodes: Table_1.getDataSource().setVariableValue(“0BC_CUST_NODE”, { values: [“0HIER_NODE!CANADA”,“0HIER_NODE!DEUTSCHLAND”] });
Not Assigned nodes: Table_1.getDataSource().setVariableValue(“0BC_CUST_NODE”, “1HIER_REST!REST_H”);
It’s important to note that excluding hierarchy nodes and range speci�cations (less, greaterOrEqual, from, to) are not supported.
APIs to Retrieve Additional Dimension Visible Properties
Get ready to build more interactive dashboards! As an application developer, you can now retrieve additional dimension visible properties. You can then display theseproperties in a dropdown box or as a text widget. This can be achieved by using the following APIs:
First, use DataSource APIs getResultset() to retrieve all properties. Example code: Table_1.getDataSource().getResultSet();
Then, use getResultMember(0 to get dimension visible properties for a particular dimension member. Example code:Table_1.getDataSource().getResultMember(“0D_NW_PROD”,Table_1.getSelections()[0]);
Support for NULL Members and Totals Members
SAP Analytics Cloud will now support “NULL” members and “Totals” members to application design scripting APIs. This change enhances the Alias enumeration withtwo new literals: Alias.NullMember and Alias.TotalsMember. These literals should be used in scripts whenever a “NULL” or “Totals” member needs to be referenced.
The following DataSource APIs have been enhanced to handle or return NULL or Totals members correctly: getMembers(), setDimensionFilter(),setVariableValue(), getData(), getResultSet(), getDataSelections(), getResultMember()
The following Table / Chart API has been enhanced: getSelections()
The following Planning APIs have been enhanced: setUserInput(), DataLocking.getState
Chart and Table Number Format
You can say goodbye to manually having to set the scaling factor for each chart individually. Now, application designers can set the number format of charts and tableswith the following APIs:
6/1/2021
36This is custom documentation. For more information, please visit the SAP Help Portal
setScaleUnit()
setScaleFormat()
setDecimalPlaces()
setSignDisplay()
Page Book Widget
In your mobile device, you can now use the Page Book widget to group the application contents by different pages. You can use the swipe gesture to navigate from onepage to another. The Page Book widget was designed to make it much easier to navigate through your analytic applications on your mobile device.
Variable Parameters to open an application URL
Let’s speed things up a bit! Let’s take a look at an enhancement that will accelerate your analytic application’s start up performance. Users can now set the variablevalue through the application URL parameters. For analytic applications, setting variables via the application URL parameter can avoid the double round trip ofcomparing setting variables in onInit event.
New API openNavigationPanel()
The Navigation Panel for tables is now available in the Analytics Designer. This enhancement provides users with a convenient way to analyze their underlying datamodels. With the Navigation Panel, users can perform the following actions at application runtime:
Add/remove dimensions and measures
Swap axis /Arrange Totals
Display dimensions in key/text representation
Select Hierarchies/Properties
Compact Display/Suppress Zeros (for BW)
To open or close this panel, you can use the following new APIs:
openNavigationPanel()
closeNavigationPanel()
Available items panel can be opened via the optional parameter.
Shake and Long Press Gesture
We have an exciting enhancement that will provide a more mobile user-friendly way to consume analytic applications on your iPad device. We are introducing thefollowing mobile speci�c gestures for analytic applications running on a native safari browser on the iPad:
Shake event
LongPress event for Button, Shape, and Image widgets
onOrientationChange event
Save & Leave
When exiting an analytic application that has not been saved, there will now be a new “Save & Leave” dialog. This dialog will ask you whether you want to save yourprogress before exiting. This ensures you don’t accidentally exit and lose all your unsaved changes that you have made to your application.
New API getVariableValues()
You can now use the new API getVariableValues() to return an array of the current values of a speci�ed variable. With this new API, you can transfer those returnedvariable values to other widgets, applications and stories, providing you with more �exibility to add interactivity between widgets or within your applications andstories.
New API getDimensionFilters()
You can now use the new API getDimensionFilters() to return an array of the current �lter values of a speci�c dimension, also providing you with more �exibility whenadding interactivity between widgets or within applications and stories. This new API supports single �lter values, multi �lter values, and range values.
Planning Model Extension
The Planning Model API has been extended, meaning you can now read and change a dimension memberʻs data locking owner and responsible person.
System Runtime Messages
Have you ever gotten a system runtime error message but didn’t understand why? To provide more clari�cation, Analytic Application users will now be able to receivemore details about system runtime messages for failures and error messages. This information will be displayed in the calendar for a scheduling tasks regarding thefollowing scenarios:
Export to PDF technical component is missing.
Variable input dialog is open for user input and blocks the work�ow.
The script execution failed due to an error.
Error occurs during the export of a PDF.
The selected bookmark doesn’t exist anymore.
6/1/2021
37This is custom documentation. For more information, please visit the SAP Help Portal
Error occurs during processing Data Change Insights.
When an applications developer forgets to use the Scheduling.publish() script when scheduling in manual mode.
Collaboration
Commenting Widget
It isn’t a well-kept secret that collaboration is key to any business’ success. This new collaboration feature was designed to help you and your teammates seamlesslycollaborate when analyzing stories. The new Commenting widget allows you to contextually add comments based on a speci�c data model directly in your story page. Ahighlight of this new widget is that you can add comments on different �lter combinations in your story, providing other users with the most relevant commentsregarding speci�c contexts.
Data Integration
New Data Preparation Experience
We understand that the data preparation process can be quite time-consuming and complex. This is why we are excited to introduce a new, smarter data preparationexperience that was designed to add ease and �exibility when working with your data in SAP Analytics Cloud.
Wrangling Public Datasets
You can now quickly analyze and visualize public datasets in stories. Features include:
Cleanse public datasets
Directly consume public datasets in stories: Analyzing data has never been easier! Simply upload the data in your Dataset and directly analyze it in astory. Datasets are entities that are ready to be analyzed from the get-go: The dataset creation step includes an automatic inference of which columnsare dimensions and which are measures. Users can always adjust those by editing the Dataset.
Reminder: the upload thresholds for Datasets are 1B cells, 1000 columns, 5000 characters in a cell.
For the security measures on datasets:
Object security of Datasets will be maintained in stories.
If a user has view rights on the dataset, they can see the data, but not change it.
Users with edit rights will be able to open a Dataset and use all of the wrangling capabilities.
If a public dataset is used in a story, any user with at least view rights on the dataset will be able to see it in view mode directly in the story. This newfeature provides users with the con�dence when working with their data.
Embedded Datasets in Stories
We are introducing a complete self-service analytical experience that will bring you closer to data manipulation and the augmented analytic capabilities of yourstories. When loading data in a story, users will now create an embedded dataset. The biggest bene�t is the near-instant transition between the story layoutand the wrangling area, making any adjustment to the data a simple click away. For those fans who are a fan of Excel, you will also be able to drag and drop theirdata into the homepage to get start analyzing it right away. In case you are still looking for an environment you are still familiar with, there is an option to startwrangling with the basic data preparation experience.
Model and Column Overview
Next, we have simpli�ed the modeling experience by introducing a new right-hand side panel that will provide a summarize representation of your modelincluding your dimensions, measures, and descriptions. Here are the actions that will be directly available from panel:
Change from dimension to measure and vice-versa via the drag and drop or menu
Rename and delete objects
Shortcuts to geo-enrich dimensions
Create hierarchies
Check errors
There is also the ability to view all columns of the dataset, even those not part of the model, by switching to the column view. Note that if columns are not part ofthe model, they will simply not appear when selecting dimensions or measures to create charts, or any story widget.
Data Types and Statistical Types
In SAP Analytics Cloud, there will be new data types in each column. If a value doesn’t match the data type, the value will be �agged and will not be visible in thestory. However, these errors will not block the move to story view nor will delete rows. Here is a list of the different column types:
Date
Integer
Number
String
Date and Time
Boolean
6/1/2021
38This is custom documentation. For more information, please visit the SAP Help Portal
In addition, columns will also contain a statistical type, which can be edited.
Working with a Sample
With this new experience, you are still working on a 2000 row sample when wrangling. You also have the option to validate all the data outside the sample.Warnings will be raised to the user:
If the data in a column does not �t corresponding datatype
If an ID has multiple descriptions
All errors are only warnings, meaning that users can always proceed to work with that dataset. In this case, cells with issues will be cleared but rows will not bedeleted.
Transformations, Unpivot
All existing transformations are available also on Datasets. These transformations include concatenate, split, extract, replace, change, and unpivot. In additionto these transformations, Filter is a new function that will be available as a transformation. It will allow users to specify which values to �lter out, even if they arenot part of the sample.
Note, that unpivot can only be run on a single column header, and if you want to be able to unpivot a dataset with multiple headers, you will have to move to thebasic data preparation experience to have access to this functionality.
Custom Transformations
Next, SAP Analytics Cloud will contain a variety of data manipulation functions enabling data analysts to write custom transformations. A particular focus wasset on providing the best development experience when writing a new expression. Imagine being able to write the custom transformation without leaving thekeyboard. That was the challenge and in order to address it, here are some of the features that were brought into the editor:
Typeahead of column, function, keyword names
Function stub automatically displayed
Easy navigation across function arguments
Copy/Paste of expressions
Clear troubleshooting experience
Custom transformations are based on a new, powerful language, developed in-house:
Functions are divided in the following categories: Numeric, String, Date and Time, Spatial, Others
A total of 50 functions are available, further superseding existing capabilities. Notable additions: timeDiff(), Distance(), element() etc.
Outputs are now named: [NewTown]=“Roma” creates a new column with “Roma” as constant value
If needed, transformations can be edited from the transform log for further adjustments, thus matching the realities of everyday developments.
Semantic Enrichments
For the drilling experience in charts across dimensions, users can create level-based hierarchies. This means:
Levels are de�ned by dimensions
Hierarchies are declared objects in models
Dimensions can only be used in one hierarchy
Columns can be ordered together in the grid
To map data points, users can geo-enrich existing dimensions through a variety of entry points, such as the toolbar and dimension menu. A big improvement isthat an associated hierarchy can be created in the model, which users can use to build charts. Locations that have errors will not be displayed but will also notprevent the enrichment nor delete rows in the dataset.
Reimport Data for Dataset
This new feature introduces the ability for users to update data inside a dataset. For any local dataset, whether a public dataset or embedded dataset in a story,users can now re-acquire the data from the original source to fully replace the contents of the dataset. The columns of the dataset will automatically bematched to the newly acquired ones. In cases where there are structural differences with the newly acquired data, the process will be canceled. Lastly, regarding�les, users will need to specify the location of the new �le in order for all other sources queries to be automatically re-executed.
Invoking Basic Data Preparation Option
Lastly, users can now re-initialize the wrangling session in the classic work�ow without having to re-acquire data. When doing this, a warning sign will inform theuser that all work will be lost. Basic data preparation can only be opened when the column count of the Dataset is less than 100 columns and has less than 100mcells total for non-�le sources.
Bene�ts of using the Basic Data Preparation includes be able to:
Append data to an existing embedded dataset
Map a new upload into an existing dataset
Acquire data coming from Dow Jones
Use multi-headers when doing unpivot
6/1/2021
39This is custom documentation. For more information, please visit the SAP Help Portal
Use Smart Insight on variance chart
Build a parent-child hierarchy
Support of cross-calculations on tables and charts (just like remote models, universal models)
Default Data Mapping Inherited from SQL Source
When acquiring SQL data, default data mappings are now inherited from the source. The data type de�nition is directly passed through from the SQL source, and notinferred. This feature saves you from having to recreate the metadata in the wrangling view, saving you time and reducing any possible errors.
Tunnel Connection Type
Would you like to be able to share your business �ndings and insights with your external stakeholders, without giving them VPN rights? SAP Analytics Cloudadministrators will now be able to create connections using the Tunnel connection type. This connection type will allow users outside your corporate network to connectlive to your data, without giving them VPN rights. The Tunnel connection can be created to an on-premise remote source through the SAP Cloud Connector. Thesesources include HANA, BW, and S4HANA.
Acquire Data from SAP HANA Using an SSL Connection
With SAP Analytics Cloud, security is at the top of our agendas. We are introducing a new option to con�gure an SSL connection when connecting to SAP HANA fromSAP Analytics Cloud. This adds a higher level of security when you’re connecting to SAP HANA on-premise.
Data Visualization
Growing Tables
For business reporting needs, it is essential to have a full picture of your dataset. That is why we integrated the new growing tables feature available in the Canvas.With this feature, you can now automatically resize the table vertically to view you canvas in full height. This simpli�es your viewing experience as it allows you to get afull picture of your whole dataset without having to scroll too much.
Dimension Member Display Con�guration for Dimension Input Controls
When you are dynamically analyzing your data, switching the selection within a dimension input control can be cumbersome when you have to constantly switchbetween description and ID. For example, you may want to view store names as a description, but it is added as an ID. Now, when you are con�guring a dimension inputcontrol, you will have the ability to specify on a per dimension basis whether you want your dimension member to be displayed as an ID or description.
String Functions in Calculated Dimensions
Great news! We have introduced the following new functions in calculated dimensions to provide you with more �exibility to manipulate strings at the story levelinstead of planning to do the changes at the data source level. The functions specially help when you want to do ad-hoc analysis and analyze your data. Please note thatthese functions are only supported for models based on acquired or live HANA connections.
CONCAT: You can now use the CONCAT function to combine two strings into one string dimension. An example would be if you wanted to combine thedimensions, �rst name and last name, into a single dimension.
REPLACE: You can now use REPLACE function to replace characters speci�ed by location in a given text string with another text string. For example, if you wantto replace a certain country with a prescribed value, you can use the REPLACE function to achieve this.
LOWERCASE and UPPERCASE: You can now use LOWERCASE and UPPERCASE functions to convert a text string to all LOWER and UPPER cases.
SPLIT: You can now use the SPLIT function to return a substring from a string, using a delimiter character to divide the string into a sequence of tokens. Anexample would be if you want to split your customers’ �rst names and last names with a comma.
FINDINDEX: The FINDINDEX function searches for substring and returns its start index with 0 as a default. The function will return -1 if the target is not found.
ENDSWITH: The ENDSWITH function returns “True” if the given string ends with the user’s mentioned substring. This function does not ignore trailing whitespaces.
RIGHT and LEFT: The RIGHT function returns the speci�ed number of characters from the end of the given string. The LEFT function returns the speci�ednumber of characters from the start of the given string.
BW: Paste Filter Values in Story and Page Input Controls
Both story viewers and designers can now make changes to story and page �lter selections faster, especially when working with a large list of values. You can nowsimply copy and paste �lter values into the input control to either overwrite or append the existing selection when working with BW models.
Data Labels with Background Color and Opacity
Have you ever created a chart and the data label was difficult to read? We have a new customization feature that will enhance the readability of your data labels. Now,you can choose the background color and opacity for your data labels. Please note that this feature does not support Cluster Bubbles, Bullet & Numeric Point Charts,and in conjunction with Web Fonts.
Display Values for Mixed Periods in Previous Period Time Calculations
We have made an enhancement to the Previous Period Time Calculation. Now, story designers have the �exibility to show all values in widgets containing differenthierarchy levels such as year, quarter, and months in Previous Period Time Calculations. This new capability can provide you with more holistic view when analyzing yourdata.
Paste Filter Values in Story and Page Input Controls
Both story viewers and designers can now make changes to story and page �lter selections faster, especially when working with a large list of values. Simply copy andpaste �lter values into the input control to either overwrite or append the existing selection when working with Acquired and HANA live Models.
Remove Member Count Limitation for Input Controls Based on Flat Dimensions in BW
6/1/2021
40This is custom documentation. For more information, please visit the SAP Help Portal
Story Designers can now create story, page, and Digital Boardroom topic �lters with more than 4,000 members with BW live Models and other data sources on �atdimensions. This means that you can now access all of your input control members without any limitations, allowing you to easily access all the information you need.
The TRIM Function in Story Formulas
Story creators can now use the TRIM function in story formulas. This means you will now have the �exibility to trim string spaces in the story calculations rather thanrelying on backend data source calculation layers, overall reducing the turnaround times when creating and editing stories. This function is speci�cally useful whendoing calculations on data from �at �le uploads. TRIM is supported only for models based on Acquired or Live HANA connections.
BW Input Controls: Starts/Ends with Search Improvements
In SAP Analytics Cloud, you can now search for members with a certain pattern in input controls. This means, when searching in story and page �lters, you can nowspecify “starts with” (a*) or “ends with” (*a) search terms. Please note that this is not a wildcard �lter, meaning this only encompasses searches for existing membersof the dimension. New members will not be automatically reselected. Also, it is important to note that this feature is only supported for Story and Page �lters and notsupported for Hierarchies.
Facet Loading Con�guration in Explorer
When enabling Explorer views for visualizations in Stories, Story Designers can con�gure measures and dimensions to be included in the view. To improve performancewhen opening the Exploration View, by default, only dimensions used in the chart will be loaded as facets in Explorer. To see other con�gured dimensions, the viewer willneed to select desired dimensions. Story designers can disable the default for all con�gured dimensions to be loaded upon opening of Explorer View.
Mobile
Search to Insight on iOS for iPhone and iPad
Are you ready to �nd the answers you need no matter where or when you are working? You will now be able to extract insights with just a few taps using the newSearch to Insight capability on the SAP Analytics Cloud Mobile iOS app available on iPhone and iPad. This new feature is supported for acquired and live models basedon Prompts available for acquired/live SAP HANA, SAP S/4HANA, SAP BW.
Please Note: Currently, Search to Insight on Mobile does not support changing variable values and uses the default set model parameter values to run the query. If novariables are set with default values, then all results are returned. Setting chart level variables is also not supported.
Synonyms in Search to Insight on iOS
Quickly �nd the answers to your business questions right at your �ngertips. iOS Mobile users can now view and de�ne synonyms for measure and dimension names,which they can then easily search for in Search to Insight. The synonyms created will appear in the Search to Insight autosuggestions along with other measures anddimensions. This new enhancement will provide more customization that is tailored to your business when searching for your answers on your mobile device.
Modeling
New Viewing Options
For every organization, it’s essential to get the full picture of your data to make the most effective and meaningful business decisions. This is why we are introducingtwo new viewing options in SAP Analytics Cloud:
“Structure View”: Will allow you to easily look at your models in a star schema style view, providing you a graphical, diagram-based modeling experience. Thisview works for account-based models.
“Data Foundation View”: Will allow you to see the underlying fact data of your model from the “Model” tab. This view is synchronized with “List” and “Structure”views.
Planning
Build Value Driver Trees Within a Story
You can now build Value Driver Trees in a story. Here are some exciting key highlights of this new feature:
Choose any display time granularity: Now when building a Value Driver Tree, you can choose any display granularity you would like.
Supports Story Calculations: You can use story calculations for your accounts or cross calculations, providing you with more control over your accounts.
Supports Analytical Models: You can build a Value Driver Tree based on an analytical model. Note: You do not need a planning license.
Independent Node Con�guration: Each of your nodes can be con�gured independently, displaying its own versions, cross calculations, or �lters.
Default Node Con�guration: You can now design Value Driver Trees even faster by providing a default mode con�guration.
Select Multiple Cross Calculations for One Node: Nodes can display any number of cross calculations.
Collapse and Expand Nodes: You can collapse your subtrees to make your Value Driver Trees more compact.
Drag & Drop Linking: Connect nodes through drag and drop.
The Planning Panel
The data entry process can be quite time-consuming and tedious, especially when you are working with complex planning scenarios that involve spreading, distributing,and assigning operations. It’s time to part ways with spending countless hours during the data entry stage because we have created a tool that will allow you toexecute your planning scenarios with ease. We are excited to introduce the Planning Panel in SAP Analytics Cloud!
The Planning Panel is an all-encompassing tool that enables you to quickly and effectively execute your ad hoc planning scenarios all in one united, consolidatedplatform. From providing recommendations for typical planning scenarios to distributing values along multiple dimensions at the same time, the Planning Panel has got
6/1/2021
41This is custom documentation. For more information, please visit the SAP Help Portal
you covered for all your planning needs.
Data Actions with Automatic Publishing of Target Version
You can now set a follow-up action for the execution of a data action so that the target version is automatically published upon successful execution.
This is available for:
Data Action Triggers: Saving additional user interactions for publishing after a manually triggered execution has �nished.
Data Action Tasks in the Calendar: Supporting the automated planning process by publishing results.
Successful publishing and errors will be indicated to the user via noti�cations. Please note that this feature can only be applied for public target versions. For privatetarget versions or versions of BPC Writeback models, the user needs to manually publish.
Create Data Action Tasks in Calendar
We are introducing a new task type, which will allow you to schedule the execution of your Data Actions. You can also set this execution to occur on a regular interval.
Transforming a Legacy Value Driver Tree
A few waves back, we announced the new Value Driver Tree widget that can be added directly into your stories. This widget contains many amazing capabilities such asthe ability to leverage story calculations, to collapse and expand branches of the Value Driver Tree, to utilize more granular time scales, and several other capabilities.With this release, we are now allowing you to easily transform your legacy Value Driver Trees into a Value Driver Tree widget. This feature will save you time and effortsince you don’t need to completely remodel the Value Driver Trees to gain the bene�ts that the new story-based Vale Driver Trees provide.
The Datediff Function
The Datediff function is now available for advanced formula steps in Data Actions. With this function, you can easily calculate the difference between two dates at aspeci�ed granularity.
De�ne In-Cell Charts and Thresholds
For BW queries, you can now de�ne in-cell charts and thresholds for the second structure. In other words, you can now de�ne both of your dimensions as a numberde�nition dimension. This helps ease the setup of in-cell charts and thresholds for tables on BW queries in SAP Analytics Cloud.
Apply Viewer Role to all Subtasks of a Calendar Process
By selecting the new “Shared with” icon in the Process panel, you can now simultaneously add a viewer to all child tasks of a Calendar process. As a viewer, you will beable to see all the descendants of a process that has been shared with you.
Use Three Dimensions to De�ne Dimension Combination Rule
In planning models, you can now create a maximum of three validation rules in one model and three dimensions per rule to de�ne allowed member combinations acrossdimensions. This will add ease during the data entry process and will be useful when you are planning on more complex member combinations.
Validation Warnings
As a planner, you’ll now see validation warnings in your table, enabling you to quickly identify which values are invalid for data entry due to dimension combination rules.You can delete the value in these cells, but data changes will be reverted when you publish your version. These visual cues will help reduce errors and streamline theplan entry for users by highlighting valid dimensional combinations in-line during the data entry process.
Work File Handling Made Easy for Calendar Tasks and Processes
For calendar tasks and processes, we have redesigned the header section in the Builder panel to provide a streamlined experience for accessing all relevantinformation. This update includes:
Work �les: A huge part of this redesign is that you can now �nd all the work �les of a task or process in the header section, which are displayed as separatetokens.
Add URL links as work �les to your tasks: In addition to stories and analytic applications, you can add URL links as work �les to your tasks or processes.
Links that will instantly take you to a desired section in the Builder panel: Here, you can view relevant information in greater detail.
Platform Services
Schedule Story or Analytic Application based on SAP HANA 2.0 Live Data Connection
For those who are using a HANA 2.0 live data connection, we have a fantastic update for you. You can now schedule a Story or Analytic Application based on SAP HANA2.0 live data connections, increasing the scope for sharing your stories and analytic applications with your teams and stakeholders. When creating or editing a SchedulePublication for your stories based on SAP HANA 2.0 Live Models, you will also be able to de�ne and edit prompt values.
Check Maximum Number of Publications per hour
In SAP Analytics Cloud, you can now check the maximum number of scheduled publications per hour based on your license under System Monitor Overview Maximumnumber of Publications every one hour .
Copy an Instance of a Schedule
It’s time to simplify your workload with this new enhancement. You can now copy an instance of an existing schedule from the calendar and reuse it with new date andtime. By default, the existing values of the scheduling parameters are available and can be modi�ed after copying the schedule. This feature will help simplify yourwork�ow, particularly when you want to copy and rerun a failed schedule with the same parameter or copy a schedule and modify some of the parameters.
Smart Assist
6/1/2021
42This is custom documentation. For more information, please visit the SAP Help Portal
Synonyms for Measure and Dimensions in Search to Insight Questions
Power users can now de�ne synonyms for measure and dimension names, which they can then easily search for in Search to Insight. The synonyms created will appearin the Search to Insight autosuggestions along with other measures and dimensions. Under System, you can access the synonyms dictionary, which lists all thede�nitions of synonyms used for dimension and measure names independent of a model. This new enhancement will allow provide you with more customization whensearching for your answers, allowing you to ask questions in a more business-like language.
Dimension Speci�c Indexing Con�guration for Live Models in Search to Insight
The 5000-member indexing limit will be removed, allowing Search to Insight users to search for all dimension members even for high cardinality dimensions. At indextime, it’s possible to exclude certain dimensions, such as sensitive or unwanted dimensions, in order to hide dimension members from Search to Insight. This updateempowers users to choose their desired level of hierarchies to index from, providing you with greater control over results in Search to Insights while increasing overallperformance.
Predictive Forecast on a Planning Model at Y/H/Q/M Time Hierarchies
Currently, SAP Analytics Cloud allows you to run a predictive forecast on a monthly, quarterly, half-year, and yearly basis. With SAP Analytics Cloud Planning, you willnow be able to run a predictive forecast on a planning model at Y/H/Q/M time hierarchies, even when the lowest level granularity of your model is “Day.” This providesyou with more �exibility when you are working with predictive forecasts for planning models with different time granularities.
Enriched Smart Insights for Formulas
We’ve enhanced Smart Insights for formulas! First, you can now hover over a measure to quickly see its corresponding values. The second exciting enhancement is thatyou can now trigger Smart Insights from Measures in the Smart Insights Panel. These insights are automatically generated, which helps you and your business increaseefficiency when working with formulas.
Smart Insights on a Data Point Calculated Using the MIN and MAX Aggregation Types
You will now be able to get Smart Insights on a data point that was calculated using the MIN and MAX aggregation types. With this enhancement, you can access usefulinsights for more calculation types.
Smart Insights on Data Points that Represent Account Dimensions
Currently, SAP Analytics Cloud supports Smart Insights on data points representing account dimensions which have Income (INC) and Expense (EXP) as �nancialaccount types. We are extending this support as you will now be able to receive Smart Insights on data points that represent account dimensions which have Liabilities& Equities (LEQ) and Assets (AST) as �nancial account types. With this enhancement, Planners can access valuable insights for more �nancial account types.
Enhanced Dynamic Text on the Footer
We’ve added a visibility enhancement for dynamic text on a chart footer. When you add Smart Insights as a footer on your chart, the enhanced dynamic text will nowcall out the highest contributor to your chart and make reference to all Smart Insights that are available in the Smart Insights panel.
Improved Visibility of Leak Variables and Chart Details on Smart Discovery
In Smart Discovery, we’ve improved visibility of leak variables and chart details information.
Smart Predict
Planning Models can now be used as Data Sources for Predictive Scenarios
The next feature revolves around integrating planning model data sources with Smart Predict to unify the Predictive, BI, and Planning experience in SAP AnalyticsCloud. This means you will be able to create your predictive model from your planning models. You can then inject the predictive results directly into your planningmodels. These predictive results can be broken down and segmented across multiple dimensions and members, facilitating automated and intelligent bottom-upforecasting at scale.
Further, planning users will be able to access the predictive reports, enabling them to see the quality of the debriefs and KPIs. Receiving these insights will empowerusers to make the most accurate and con�dent decisions for their business.
Predictive Scenarios in Files Area
In SAP Analytics Cloud, predictive scenarios will now be created and stored in the “Files” area. Here, you can also store your predictive scenarios alongside yourfavorite models, stories and other �les. This update provides you with a layer of security when working with your predictive scenarios as you can decide which scenariosare visible to your teammates or to speci�c users.
Redesigned Settings Panel in Predictive Models
Did someone say more improvements? Yes, you heard right because we have made improvements to the Settings Panel, providing you with a smoother userexperience when creating and editing predictive models. The new enhancements for the Settings Panel include:
On-demand contextual “Help” for entry �elds with the associated information (i) icon.
Click the (i) to display the “Help” dialog, which provides an explanation of the entry requirement for the speci�c �eld.
We’ve made key terminology changes to make complex predictive concepts more understandable.
Predictive modeling parameters and options have been regrouped to facilitate predictive model creation. This will make it easier to de�ne your predictivegoal.
New messages inform and guide users when a selected parameter or option isn’t available in the data source, along with default placeholder values in�elds.
Moving Predictive Scenarios to Files Area
In SAP Analytics Cloud, predictive scenarios can now be moved from the Browse Predictive Scenarios area to the “Files” area into a selected public folder. ThePredictive Scenario Migration feature supports single �lter values, multi �lter values, and range values. This update provides you with a layer of security when working
6/1/2021
43This is custom documentation. For more information, please visit the SAP Help Portal
with your predictive scenarios as you can decide which scenarios are visible to your teammates or to speci�c users.
Version 2020.13
SAP is pleased to announce a new version of SAP Analytics Cloud.
General
Administrators can now de�ne the default tab on the Home page for all users, and individual users can also de�ne their own default tab.
The Catalog, Favorites, and Shared With Me tabs are now on by default for new tenants, but an administrator can switch them off.
Data Acquisition, Live Data Connections, and Integration
Users can now employ a TLS connection when acquiring data from SAP HANA data sources.
Leveraging your existing live connections to SAP Universes, you can now use existing Web Intelligence documents as data sources and create models based on theirsemantics.
Stories
You can now use synonyms in your queries for Search to Insight.
You can now use the data point Commenting widget in your story to create and review data point comments.
You can now schedule a Story or Analytic Application based on SAP HANA 2.0 live data connection and, if it includes prompts, you can then edit the prompt values whilecreating, editing, or scheduling the Story or Analytic Application.
You can now set a background color for data labels in charts as well as change the opacity of those labels.
You can now use the following string functions in calculation formulas in your stories: Split, FindIndex, Right, Left, and Endswith.
For SAP BW data, you can now copy and paste values into your story and page �lters. (This applies only to �at dimensions.)
Planning
You can now �nd all work �les of a task or a process in the header section. In addition to stories and analytic applications, you can add URL links as work �les to yourtasks or processes. For example, you might want to add a link to a custom web application or an SAP Analysis for Microsoft Office document (workbook orpresentation).
In a story, you can now transform a legacy value driver tree into a value driver tree widget to use new features.
Analytics Designer
As an application designer, you can now use the Listbox widget to display a list of value entries in the analytic application and to trigger speci�c actions at runtime whenthe application user selects one or more of the value entries.
You can now schedule a Story or Analytic Application based on SAP HANA 2.0 live data connection and, if it includes prompts, you can then edit the prompt values whilecreating, editing, or scheduling the Story or Analytic Application.
As an application designer, you can now bind a simple widget's data source to a primitive type Script Variable, Tile Filter or Variable, Model Variable, and so on, so thatthe values of the widget can be updated dynamically. The supported simple widgets include the following: Checkbox Group, Radio Button Group, Dropdown, Listbox,Input Field, Text Area, Slider, Range Slider, and Image. Meanwhile, the selected/updated value at runtime can be written back to a speci�c script variable as well(excluding the image widget as it doesn’t support writing runtime values back).
As a user of analytic applications on mobile devices, you can now use the shake gesture. On the Button, Shape and Image widgets, you can also use the long-pressgesture. The onOrientationChange event is also now supported.
A new entry "Save & Leave" is added in the dialog that is displayed when an analytic application is not saved, and the user tries to navigate away from it.
You can now use the new API getVariableValues() that returns an array of the current values of the speci�ed variable.
You can now use the new API getDimensionFilters() that returns an array of the current �lter values of the speci�ed dimension.
You can now use the new API openNavigationPanel() to open the data analyzer navigation panel in analytics designer at runtime. By using the optional parameterexpanded, you can control the expand status of the "Available Items Panel" (left part of the navigation panel). To close the navigation panel, you can use thecloseNavigationPanel() API.
The Planning Model API has been extended, so you can now read and change a dimension member's data locking owner and responsible person.
System Administration Notes
With the 2020.13 release of SAP Analytics Cloud, SAP Analytics Cloud agent's minimum version remains at 1.0.75, with the following exceptions:
If you require data acquisition from SAP ERP / SQL Database, the minimum version is 1.0.99.
If you require data acquisition from SAP Universe (UNX), the minimum version is 1.0.91.
6/1/2021
44This is custom documentation. For more information, please visit the SAP Help Portal
If you require data acquisition from SAP Business Warehouse (BW), the minimum version is 1.0.233.
If you require data acquisition from an SAP HANA view, the minimum version is 1.0.235.
If you require data acquisition from File Server, you need to upgrade to version 1.0.248.
For more information, see System Requirements and Technical Prerequisites.
Regarding supported features and required updates for the integration of SAP BW with SAP Analytics Cloud, refer to SAP Note 2541557 for further details.
Regarding supported features and required updates for live universe access through SAP BusinessObjects Live Data Connect with SAP Analytics Cloud, refer to SAPNote 2771921 for further details.
Version 2020.12
SAP is pleased to announce a new version of SAP Analytics Cloud.
Data Acquisition, Live Data Connections, and Integration
You can now use a new data preparation experience to quickly analyze and visualize imported local datasets in stories. Features of this new tool include:
Quick and seamless transitions between stories and data.
Faster transforms and navigation options.
Your model overview presented in a dedicated side panel, listing all available dimensions and measures.
Creating your own custom transforms.
Geo-enriching your dimensions through a variety of entry points.
Reimporting data into your dataset.
Reusing dimensions in custom hierarchies.
More permissive error handling of data in your dataset.
Wrangling of your public datasets.
Direct consumption of a dataset in a story.
You can now use the Tunnel connection type if your organization wants to expose some of your data to users outside of your corporate network, without giving themVPN rights.
SAP universes now support the optimized acquisition work�ows of SAP Analytics Cloud. When acquiring data from SAP universes, you can now create datasets basedon that data without loss of information.
Stories
You can now use the following string functions in your story: Concat, Replace, Lowercase, and Uppercase. These functions are supported for both acquired and liveHANA connections.
Analytics Designer
As a user of SAP Analytics Cloud and SAP Data Warehouse Cloud, you can now create an analytic application using datasets of SAP Data Warehouse Cloud in AnalyticsDesigner. Therefore, the dialog to select a model for the widget(s) created on the canvas has been extended by the additional entry for "Data Warehouse CloudAnalytical Dataset". Choosing this option, you can select one of the con�gured connections to SAP Data Warehouse Cloud systems for the current SAP Analytics Cloudtenant, the space, and �nally the dataset to initialize the model-based widget.
As a user of SAP Analytics Cloud and SAP Data Warehouse Cloud, you can now create an analytic application starting in SAP Data Warehouse Cloud. You can eitherchoose an SAP Data Warehouse Cloud space and navigate to SAP Analytics Cloud to create the application, or you can choose an SAP Analytic Cloud space andnavigate to SAP Analytics Cloud where you can choose a con�gured connection, space, and dataset for the model-based widget(s) (table and chart) created on thecanvas.
As an application designer, you can now use the page book widget to group the application contents by different pages.
You can now add variable parameters to open an application URL. Variable parameters can be supplied for an application using a model with variable constraints.
System Administration Notes
With the 2020.12 release of SAP Analytics Cloud, SAP Analytics Cloud agent's minimum version remains at 1.0.75, with the following exceptions:
If you require data acquisition from SAP ERP / SQL Database, the minimum version is 1.0.99.
If you require data acquisition from SAP Universe (UNX), the minimum version is 1.0.91.
NoteAlthough it is not required, you can upgrade to the agent version 1.0.281, no matter what data acquisition type you use. Do this to take advantage of updatesmade to SAP Analytics Cloud agent.
6/1/2021
45This is custom documentation. For more information, please visit the SAP Help Portal
If you require data acquisition from SAP Business Warehouse (BW), the minimum version is 1.0.233.
If you require data acquisition from an SAP HANA view, the minimum version is 1.0.235.
If you require data acquisition from File Server, you need to upgrade to version 1.0.248.
For more information, see System Requirements and Technical Prerequisites.
Regarding supported features and required updates for the integration of SAP BW with SAP Analytics Cloud, refer to SAP Note 2541557 for further details.
Regarding supported features and required updates for live universe access through SAP BusinessObjects Live Data Connect with SAP Analytics Cloud, refer to SAPNote 2771921 for further details.
Version 2020.11
SAP is pleased to announce a new version of SAP Analytics Cloud.
General
We have improved performance for variables that are not input-enabled. Metadata for this kind of variable is not loaded anymore, bringing a noticeable performanceoptimization for variables with a lot of metadata.
Stories
When working with live models, Search to Insight users can customize dimensions and hierarchy levels to be indexed.
For SAP BW, when searching in story and page �lters you can now specify "starts with" (a*) or "ends with" (*a) search terms.
You can now use the TRIM function in your story formulas. TRIM returns the speci�ed string without any leading or trailing spaces. TRIM is supported only for modelsbased on acquired or live HANA connections.
Planning
As a planner, you'll now see validation warnings in your table to quickly identify which cells are invalid for data entry due to dimension combination rules. You can deletethe existing values in these cells, but data changes will be reverted when you publish your version.
Modeling
SAP Analytics Cloud now gives you an easy way to view a model with a visual tool (the new Structure view), and also a way to see the underlying fact data of the modelwith the new Data Foundation view. For details, see this blog and this help topic.
Smart Predict
Planning models can now be used as data sources for predictive scenarios. This means you get to add predictive forecasts directly to your planning models. You caneasily combine dimensions to split your data into entities, getting forecasts for each entity to improve predictive accuracy and con�dence. This is great news for largescale forecasting.
Planning users get access to predictive reports so they can see the quality of the debriefs and KPIs. Experiencing the business orientated insights �rsthand will buildcon�dence for them to use the predictive forecasts.
The integration of planning model data sources with Smart Predict now uni�es the Predictive, BI, and Planning experience in SAP Analytics Cloud.
Predictive Scenarios are now created and stored in the Files area of SAP Analytics Cloud. This has the advantage of securing your predictive scenarios, so they arevisible to your teammates but not visible to every user. You also get to store your predictive scenarios alongside your favorite models, stories, and other �les in thesame folder.
The user experience to create and edit predictive models has been improved with a redesigned Settings panel that includes:
On-demand contextual Help for entry �elds with the associated information (i) icon. Click the (i) to show Help text that explains the entry requirement for the�eld.
Some key terminology changes have been made to make it easier for SAP Analytic Cloud users to understand and feel comfortable with predictive concepts.
Predictive modeling parameters and options have been regrouped to facilitate predictive model creation. It is now easier to de�ne your predictive goal withoutworrying too much about more advanced options, but these are there if you need them.
New messages inform and guide users when a selected parameter or option isn't available in the data source, along with default placeholder values in �elds soyou know what sort of input is required.
Analytics Designer
NoteAlthough it is not required, you can upgrade to the agent version 1.0.277, no matter what data acquisition type you use. Do this to take advantage of updatesmade to SAP Analytics Cloud agent.
6/1/2021
46This is custom documentation. For more information, please visit the SAP Help Portal
As an application designer, you can now use the DataSource APIs, setHierarchyLevel(), getHierarchyLevel(), expandNode(), collapseNode(), to setthe hierarchy level of a dimension, and to expand or collapse individual hierarchy nodes.
This change adds support for NULL members and Totals members to application design scripting APIs. This change enhances the Alias enumeration with two newliterals: Alias.NullMember and Alias.TotalsMember. These literals should be used in scripts whenever a NULL or Totals member needs to be referenced.
The following DataSource APIs have been enhanced to handle or return NULL or Totals members correctly: getMembers(), setDimensionFilter(),setVariableValue(), getData(), getResultSet(), getDataSelections(), getResultMember()
The following Table / Chart API has been enhanced: getSelections()
The following Planning APIs have been enhanced: setUserInput(), DataLocking.getState()
The info dialog is now displayed in two tabs: General and Variables. All the information given in these tabs was shown before, but it previously appeared together in oneplace.
The following improvements have been made:
If you switch on "Compact Display" for the Universal Display Hierarchy, you are required to have subtotals ON, or you won't see any aggregated �gures shown.
Aggregated values in "Compact Display" action come from the sub totals. Therefore, only if the subtotals are switched on, these �gures will be shown.
A warning/info message will indicate this to you if the query used does not have subtotals ON and asks you to enable subtotals to see any aggregated �gures.
You can now open the data analyzer using �lter parameters in the URL.
The �lter bar is now collapsible and, by default, in collapsed state.
As an application designer, you can now set the Chart's and Table's number format with the following APIs: setScaleUnit(), setScaleFormat(),setDecimalPlaces(), setSignDisplay().
Content Network
From the Content Network, you can now import and export teams, team folders, and content in the System folder.
System Administration Notes
With the 2020.11 release of SAP Analytics Cloud, SAP Analytics Cloud agent's minimum version remains at 1.0.75, with the following exceptions:
If you require data acquisition from SAP ERP / SQL Database, the minimum version is 1.0.99.
If you require data acquisition from SAP Universe (UNX), the minimum version is 1.0.91.
If you require data acquisition from SAP Business Warehouse (BW), the minimum version is 1.0.233.
If you require data acquisition from an SAP HANA view, the minimum version is 1.0.235.
If you require data acquisition from File Server, you need to upgrade to version 1.0.248.
For more information, see System Requirements and Technical Prerequisites.
Regarding supported features and required updates for the integration of SAP BW with SAP Analytics Cloud, refer to SAP Note 2541557 for further details.
Regarding supported features and required updates for live universe access through SAP BusinessObjects Live Data Connect with SAP Analytics Cloud, refer to SAPNote 2771921 for further details.
Version 2020.10
SAP is pleased to announce a new version of SAP Analytics Cloud.
General
You can now invite speci�c teams to a discussion.
We now support Microsoft Edge browsers based on the Chromium engine.
Stories
You can now override the builder panel display settings for a dimension input control: instead of all the dimensions displaying the same option (ID, Description, or ID andDescription), you can edit the input control so that each dimension can display a different option. (For example, Dimension A can display ID and Dimension B can displayID and Description.)
Planning
NoteAlthough it is not required, you can upgrade to the agent version 1.0.275, no matter what data acquisition type you use. Do this to take advantage of updatesmade to SAP Analytics Cloud agent.
6/1/2021
47This is custom documentation. For more information, please visit the SAP Help Portal
You can now set up data actions that publish the target version when they �nish running. This option is available for data action triggers and automatic data actions inthe Calendar.
You can now create automatic data action tasks in the calendar. This task type lets you run data actions automatically.
You can now use three dimensions to de�ne a dimension combination rule.
You can now add a viewer ("Shared with") to all child tasks of a Calendar process simultaneously. As a viewer, you have an overview of all child tasks that are sharedwith you.
Smart Assist
When you add Smart Insights as a footer on your chart, the enhanced dynamic text now calls out the highest contributor to your chart, plus a reference to all SmartInsights that are available in the Smart Insights panel.
The Key In�uencers page in Smart Discovery has been enhanced to more clearly display chart information, and to clearly explain which columns were excluded from thepredictive model, due to their high correlation with the target.
Analytics Designer
Previously, hierarchy node variables were not supported and explicitly disabled in the scripting API setVariableValue, as well as in the value help in script editors. Nowthis limitation has been removed.
Activating the value help for the variable (the �rst parameter of setVariableValue) now lists hierarchy node variables of SAP BW and SAP HANA models as well.Activating the value help for the variable value (the second parameter) now offers the option to open the member selector, which will properly display the hierarchynodes in a tree (a radio button tree in case of single-value selection, and a checkbox tree for multi-value selection). Note that excluding hierarchy nodes is notsupported, as well as range speci�cations such as less, greaterOrEqual, from, to, etc.
As an application designer, you can now specify which widgets will be included in the PDF exporting via the build panel of the "Export to PDF" scripting part, or by usingExportToPDF.includeComponent() and ExportToPDF.excludeComponent().
As an application designer, you can now use the Application.showMessage() API to create custom messages to inform end users. And you can also now use theApplication.setMessageTypesToShow() API to only show certain types of messages. The message types include: Success, Info, Warning, and Error.
As an application designer, you can now use the DataSource APIs getResultset() and getResultMember() to retrieve additional dimension visible properties.
System Administration Notes
With the 2020.10 release of SAP Analytics Cloud, SAP Analytics Cloud agent's minimum version remains at 1.0.75, with the following exceptions:
If you require data acquisition from SAP ERP / SQL Database, the minimum version is 1.0.99.
If you require data acquisition from SAP Universe (UNX), the minimum version is 1.0.91.
If you require data acquisition from SAP Business Warehouse (BW), the minimum version is 1.0.233.
If you require data acquisition from an SAP HANA view, the minimum version is 1.0.235.
If you require data acquisition from File Server, you need to upgrade to version 1.0.248.
For more information, see System Requirements and Technical Prerequisites.
Regarding supported features and required updates for the integration of SAP BW with SAP Analytics Cloud, refer to SAP Note 2541557 for further details.
Regarding supported features and required updates for live universe access through SAP BusinessObjects Live Data Connect with SAP Analytics Cloud, refer to SAPNote 2771921 for further details.
Version 2020.9
SAP is pleased to announce a new version of SAP Analytics Cloud.
General
When all concurrent session licenses are in use, and another concurrent-license user tries to log on, a message now explains that the user should try again later orcontact the system administrator.
Stories
There is no longer a member count limitation when you create input controls that are based on �at dimensions in BW.
When dealing with large datasets, you can use the Automatically resize table vertically option to resize the table so it can take advantage of the full page height todisplay all possible rows. Resizing may happen after actions such as a data refresh or adding new �lters.
NoteAlthough it is not required, you can upgrade to the agent version 1.0.275, no matter what data acquisition type you use. Do this to take advantage of updatesmade to SAP Analytics Cloud agent.
6/1/2021
48This is custom documentation. For more information, please visit the SAP Help Portal
For acquired data and SAP HANA Live data, you can now paste values into your story and page �lters to update which �lter values are selected. Values that don't existin the �lter won't be added dynamically by using this feature. (This applies only to �at dimensions.)
Planning
You can now build value driver trees within a story. The new value driver tree widget lets you add story calculations, expand and collapse nodes, choose your timegranularity, and more.
The new Planning Panel lets you quickly move values around in a table. The panel offers �exibility to carry out different types of ad hoc allocations such as spreading,distributing, and assigning values, without leaving the table.
The Datediff function is now available for advanced formulas steps in data actions. With this function, you can calculate the difference between two dates at a speci�edgranularity.
For BW queries, a 2nd structure is now recognized. This enhancement lets you de�ne in-cell charts and thresholds for members of the 2nd structure, among otherthings.
Smart Assist
You can now run a Predictive Forecast on a planning model at Y/H/Q/M time hierarchies, even when the lowest level granularity on your model is Day.
We've enriched Smart Insights for formulas, to let you do further analysis on each of the measures that contribute to the formula on which your data point is based.
You can now get Smart Insights on a data point that was calculated using the MIN and MAX aggregation types.
You can now get Smart Insights on data points that represent account dimensions which have Liabilities & Equities (LEQ) and Assets (AST) as �nancial account types.
Analytics Designer
You can now select multiple widgets to move them together and set their common properties.
As an application designer, you can now use the setStyle API to dynamically change the style of widgets. Please note that the setStyle API supports only the text, input�eld, text area, and shape widgets.
You can now use planning model APIs to create new dimension members in planning applications. The following APIs are offered for this:
PlanningModel.getMember();
PlanningModel.getMembers();
PlanningModel.createMembers();
PlanningModel.updateMembers();
PlanningModel.deleteMembers();
As in stories, you can now access an analytic application from a calendar task. As an assignee, you access an application from a task, and then you can submit, reject,view, or set the progress to your task. As a reviewer, you access an application from a task, and then you can perform the "accept all" or "reject all" actions from withinyour application.
With the loading of widgets in the background, you can optimize the startup performance of your analytic applications that contain invisible widgets. To use thisfunction, choose the mode "Load invisible widgets in background" in the new "Analytic Application Settings" dialog. Additionally, for testing purposes and if the defaultdoesn't meet the application user's expectations, the application user can (at any time) overwrite the default behavior with the new URL parameter"loadInvisibleWidgets" and the corresponding possible values for it: "inBackground" and "onInitialization".
As an application designer, you can now use the Application.getInfo() API to get information about the application, including ID, name, and description.
You can now �nd an updated version of the SAP Analytics Cloud Custom Widget Developer Guide. The following topics have been added or enhanced:
A new data type, the simple object type
How to dispatch a property change correctly
How to call methods of passed objects of Script API types
How to implement property setter and getters consistently
When are arguments returned by value and when by reference?
Lifecycle methods of the custom widget and its Styling and Builder Panel
System Administration Notes
With the 2020.9 release of SAP Analytics Cloud, SAP Analytics Cloud agent's minimum version remains at 1.0.75, with the following exceptions:
With the 2020.9 release of SAP Analytics Cloud, SAP Analytics Cloud agent's minimum version remains at 1.0.75, with the following exceptions:If you requiredata acquisition from SAP ERP / SQL Database, the minimum version is 1.0.99.With the 2020.9 release of SAP Analytics Cloud, SAP Analytics Cloud agent'sminimum version remains at 1.0.75, with the following exceptions:
If you require data acquisition from SAP Universe (UNX), the minimum version is 1.0.91.
If you require data acquisition from SAP Business Warehouse (BW), the minimum version is 1.0.233.
6/1/2021
49This is custom documentation. For more information, please visit the SAP Help Portal
If you require data acquisition from an SAP HANA view, the minimum version is 1.0.235.
If you require data acquisition from File Server, you need to upgrade to version 1.0.248.
For more information, see System Requirements and Technical Prerequisites.
Regarding supported features and required updates for the integration of SAP BW with SAP Analytics Cloud, refer to SAP Note 2541557 for further details.
Regarding supported features and required updates for live universe access through SAP BusinessObjects Live Data Connect with SAP Analytics Cloud, refer to SAPNote 2771921 for further details.
Version 2020.8
SAP is pleased to announce a new version of SAP Analytics Cloud.
Administration & Infrastructure
SAP Analytics Cloud, add-in for Microsoft Office
With the new add-in, you can continue to analyze your SAP Analytics Cloud data in Excel for the web. Based on SAP Analytics Cloud models, you can deepen youranalysis using �lters, totals, and Excel formulas. You can also enter data for planning and write it back to the cloud. During your analysis, you can update your table withthe actual data from SAP Analytics Cloud at any time.
You can download the add-in for free from the Microsoft Office store . All you need is your SAP Analytics Cloud license to get started.
For more information, please see SAP Analytics Cloud, add-in for Microsoft Office.
Support for Safari
SAP Analytics Cloud now supports the Safari browser for the following use cases:
Consuming applications created by Analytics Designer on iPad in embed mode.
Viewing Canvas/Responsive stories on Mac for all embedded scenarios with different solutions like SAP S/4 and Success Factors.
Analytics Catalog
Members of you organization can now view published content in one central location within SAP Analytics Cloud – the new Catalog tab in the Home Page. Analyticresources such as stories, boardroom presentations, and more can be published and viewed in the Catalog. Users can easily search for published content using meta-data and �lters to make their daily tasks more productive.
Manage Team-speci�c Folders
You can now manage team-speci�c folders the same way you can manage other folders. This addition gives admins more control over the Team folders, including beingable to rename and delete them, improving �le repository organization.
Quicker Access to Content from the Home Page
The Home page now includes the following features to let users and teams quickly discover and access important content:
A Favorites tab dedicated to all the content you have designated as "Favorites".
A Shared with Me tab listing all the content that has been shared with you by other users.
Note that this feature is disabled by default, and tenant admins can turn it on via the administration settings.
Permissions to discuss and comment
Companies may have very speci�c rules around which applications should be used to allow the direct user to user collaboration. You can now manage permissions tostart a discussion or view and contribute to it through a new application privilege managed in the role de�nitions. The same application privilege is also available formanaging commenting. Thus, effective team communication can be achieved while data security is ensured!
Self-service IdP maintenance
You can now use the Identity Provider Administration tool to manage the custom identity provider con�gured with SAP Analytics Cloud. This can be used to recoveryour IdP con�guration in case of unexpected interruption. For example, you can upload new metadata for the current custom identity provider or revert to using thedefault identity provider.
View Recent Files
You can now open recently accessed �les on the Recent Files widget located on the Home Page. This update saves you time navigating to your recent work and openingthe �les you use most often. You need to turn this feature on in the administration panel as it is turned off by default.
Publish Content for All Users
The ability to publish to "All Users" has been added to the Publish To Catalog dialogue box. This allows you to publish content to all current and future users of an SAPAnalytics Cloud system.
Create URLs to Share Content
NoteAlthough it is not required, you can upgrade to the agent version 1.0.273, no matter what data acquisition type you use. Do this to take advantage of updatesmade to SAP Analytics Cloud agent.
6/1/2021
50This is custom documentation. For more information, please visit the SAP Help Portal
When sharing content, the default link can be quite lengthy and nonspeci�c. You will now be able to customize your URL when sharing content. This way, you can makeyour links more understandable and sharable for your teammates and other users.
Analytics Designer
Support for SAP Data Warehouse Cloud
An application creator can now create an analytic application based on an SAP Data Warehouse Cloud space in SAP Analytics Cloud. This increases the scope of thedata you can choose from when designing analytical applications.
Copy widget to Analytic Application
Users can now copy widgets from a story to analytic applications at design time within the same browser page. Copying can be achieved via ctrl +c and ctrl + v, or viathe copy feature on the quick menu. All the property capabilities on the widget itself will be copied over.
Supported features: State of the widgets (calculated measures, features created by the building and styling panel), copying widgets to container or a popup, copyinggrouping widgets (without group information), chart in smart insight panel, etc.
Not supported features: Value Driver Tree, Input Control, linked analysis, story �lter, geo polygon �lter, etc. In a word, the properties that are saved within the entirestory.
OData Services on more SAP systems
In addition to SAP S/4HANA live connections, you can now de�ne OData Services in analytics designer based on SAP BW systems, SAP HANA systems, and SAPBusiness Planning and Consolidation (BPC) systems. Additional back-end support is added, so you can trigger Odata actions on data from more SAP systems.
Referenced custom widgets in exported archives
Custom widgets enable you to create your own visualizations. With this new enhancement, you can export analytic applications that contain all referenced customwidgets by default. This will guarantee you access to all custom widgets, saving you time and trouble.
New APIs
There are two new scripting APIs for BW and HANA Live connections:
removeVariableValue()
copyVariableValueFrom()
You can set, remove or copy the variables values when editing your script for analytical applications. In the story or application, the variables are merged by default,which means any changes you made on the variables will affect all tables and charts the variables are used. You can choose to set Table Variables to let the variables beunmerged on the widget, meaning that only a particular chart will be affected if you make any changes. Have fun with the extra scripting capabilities from this update!
Improved Adding Widget Menu
The adding widget menu gets longer with each new widget added, so we have enhanced it by regrouping some widgets. Widgets that are not used frequently areregrouped in "More Widgets". Custom widget is also separated on the widget menu. New groupings give developers easier navigation to work on their widgets.
Restore the latest deleted widget
Accidentally deleted a widget when working on Analytic Designer? Don’t worry. With this update, you can restore the deleted widget or technical component within theten seconds after you deleted it. The restored item will keep the previous state so you can easily pick up where you left off.
Error count on Analytic Application
We now show the error count on the information panel toolbar's icon of your analytic application. This will help inform the application developer instantly when theapplication has an error.
Edit Button
When you're running Analytic Applications, you can now use the Edit button in the toolbar of an executed application to enter edit mode. The Edit button is not availablein Microsoft Internet Explorer and is only displayed for application users with corresponding permissions. Quickly switching from run time to design time increases yourefficiency when designing an Analytic Application.
onBeforeExecute event
As an application designer, you can now use the onBeforeExecute event for the Data Action Trigger and the BPC Planning Sequence.
You can use this event to add any scripts that should be executed before the data action trigger/Planning is executed. So now you have more �exibility and room forcreativity when designing applications.
Copy Widgets Across Browser Tabs
You can now copy widgets from story to analytic applications and application to application at design time across different browser tabs.
Enhanced Tabs in Builder Panel
Application developers can now rename and reorder tabs in the Builder Panel. The name and order of the tabs within a Tabstrip in Builder Panel is synchronized withthe outline. In the outline, application developers can reorder the tabs within the same Tabstrip via drag and drop. New scripting APIs for the tabs are also provided.Your capability to organize the Tabstrips of your applications is enhanced, making it easier for your viewers to consume the information.
Data Locks
When working on a planning application, the developer can now use the menu entry Data Locks at design time to display locked cells in the table. Now the Data Lockingdisplay is available at both design and run time.
6/1/2021
51This is custom documentation. For more information, please visit the SAP Help Portal
New API to send a noti�cation
Application developers can now use the Application.sendNoti�cation() API to send a noti�cation when an analytic application is running on the backend, i.e. scheduling.You can use scripting capabilities to con�gure the noti�cation. Users can receive the noti�cation via email or the noti�cation panel. A maximum of three noti�cationscan be sent per scheduling job.
New APIs to move widgets
Application developers can now decide to move widgets or containers dynamically to other containers at application runtime to cover dynamic layout scenarios.
Supported container widgets are canvas, panel, or tab strip.
Provided scripting APIs:
Application.moveWidget();
Tabstrip.moveWidget();
Panel.moveWidget()
New API to apply bookmarks at run time
Application developers can now use the BookmarkSet.apply() API to load/apply bookmarks at run time. This scripting API needs to be related to the technicalcomponent of a bookmark, Bookmark Set. This new feature lets designers load bookmarks more conveniently.
The included widgets within the bookmark de�nition will be reloaded. The status of non-included widgets within the bookmark de�nition will be kept.
API DataSource.setDimensionFilter() supports range �lters and exclude �lters
Application developers can now use the scripting API DataSource.setDimensionFilter() to support:
Range �lters
Excluding members with single and multiple �lter values
New APIs for SAP BW models
Application developers can use the following scripting APIs for SAP BW models in the table widget:
Table.setCompactDisplayEnabled()
Table.isCompactDisplayEnabled()
Table.setZeroSuppression()
Table.isZeroSuppressionEnabled() table axis.
DataSource.getDimensionProperties()
Table.setActiveDimensionProperties()
Table.getActiveDimensionProperties()
This allows application designers to customize the table design. For example, when a user wants to open a chart in a popup / fullscreen container, the applicationdeveloper can move the table to that popup / fullscreen container directly – with all the interaction states kept.
New API to improve the existing read access to OData services
You can now use the API getEntitiesCountFromEntitySet to improve the existing read access to OData services by enabling the OData system query options for "�lter","orderby", "select", "count", "top", and "skip".
The new API works like the getEntitiesFromEntitySet API but returns the count instead of an entity list.
Data Integration
Live Data Connection to Data Warehouse Cloud
You can now combine the data management and modeling capabilities of SAP Data Warehouse Cloud with SAP Analytics Cloud. Create a live data connection to yourSAP Datahouse Cloud system, and get started visualizing your analytical datasets and designing compelling Stories today!
Remove Duplicate Rows
Duplicate rows in the dataset can be removed while creating a public model. You can �nd the option "Remove duplicate rows" in the Actions tab. Initially, the duplicatesare removed from the sample. Once the "Create Model" button is clicked, the duplicate rows are removed from the entire dataset. This helps you keep your datasetlean and clean.
Expanded Limits for Acquiring Data
Great news! We have increased the data acquisition limits for handling large amounts of customer data for models and datasets. This will be available for sources suchas Business Warehouse, Business Objects Enterprises, HANA, SQL, and BigQuery.
Data acquisition will now have a cell limit of 100 million cells and 100 columns per load.
Datasets will now have a cell limit of 1 billion cells and 1000 columns per load. Hierarchies.
Export blank values as the speci�ed value
6/1/2021
52This is custom documentation. For more information, please visit the SAP Help Portal
When exporting data using an SAP Analytics Cloud property for the target member ID, users can now export members with blank property values. Member valuesacquired from BW system are sometimes empty, and users using SAP Analytics Cloud for planning purposes may want to export them as empty or replace them with adefault value. This new functionality helps ensure the completion of data throughout the analyzing process.
Import from SAP HANA views based on XS Advanced
This feature enhances existing on-premise data acquisition from HANA to support XSA based HANA Views.
Support for more Open Connectors data sources
We now support more data sources via SAP Open Connectors: Autotask CRM, Close, ConnectWise CRM, Infusionsoft CRM, Insightly, and Box. Users can acquire datafrom one of these sources and create a model based on imported data. Note that the users must be on a Cloud Foundry tenant and have the Open Connectors account.
Data Visualization
Custom Hierarchies/Groups for BW Live
Story designers want to organize members of different dimension groups. When working on a story, you can de�ne custom hierarchies on BW dimensions. Thesehierarchies can be used in charts, tables and even input controls and �lters. The de�nition of a new hierarchy always starts from the �at dimension. Changing theVariables will reset all custom hierarchies. Please note that this new feature requires BW 7.5 SP16 and SAP Note 2865887 and SAP Note 2865929 .
Export Story Content to PowerPoint
We've released the ability to export a story to Microsoft PowerPoint, allowing users to easily include stories in their presentations and streamline their work�ow. Eachexported story page will be one image on a PowerPoint slide. This feature has the same capabilities and limitations as exporting stories to PDF or Google Slides.
User-de�ned hierarchies with custom shape �les in the geo choropleth layer on SAP BW
For SAP BW, you can now consume user-de�ned hierarchies with custom shape �les in the geo choropleth layer. It allows you to drill down to a speci�c level. Forexample, you can access level two with one click.
Custom sort for dimension members in SAP BW
You can now set up a custom sort for dimension members in tables, visualizations and Explorer. Flat list and Hierarchy are sorted only within the same hierarchy leveland Characteristic Structures. This can be shared between the same model within the same story.
Input Controls Search Improvements
You can now search for members with certain patterns in input controls.
Note that this feature works only for searches of existing members of the dimension. New members are not automatically reselected. It is available for Acquired andHANA Live models only, and not supported for Hierarchies.
Restricted Measures with Constant Selection on a Subset of Dimensions
We have made improvements to Restricted Measures as you can now create restricted measures that allow you to select dimension(s) that you want to hold constantor �xed. What this means is you now have the �exibility to bypass con�icting �lters and breakdowns for a selected subset. An example of where this would be useful isfor creating complex comparison calculations between members of the same dimension, allowing you to effectively compare your data in analysis.
Widget Filters on Dynamic Time Using a Custom Current Date
Now you have the ability to create widget �lters with dynamic time ranges based on a "custom current date". Viewers can control the current date used for thedynamic time range, so they can have more options when it comes to working with data in different timelines. Note there is only one custom current date input control,which is located in the �lter bar. This feature is currently not supported on Geo Maps.
Favorite Story and Boardroom in View Time
You can mark your story or boardroom as "favorite" during view time, making it easier and faster to open and pick up where you left at a later time. In all newboardrooms, you can �nd "favorite" in the action bar; as for the existing ones, you can add them through settings.
Choose between ID and Description Display of Member Input Controls
Users can select whether to display ID, description, or both in an input control, to better select members in a �lter. Searching for members is based on the displaysettings. The selection can be changed during view time and is persisted in bookmarks.
Disable Data Label Rounding in Charts
Some chart types round the data labels in favor of a cleaner visualization. Although Data Label Rounding remains the default, you can disable it by unchecking "RoundData Label Values". Chart types supported include: Bar/Column, Combined Column and Line, Stacked Bar, Waterfall, Heat Map, Tree Map, Marimekko, Bubble.
Responsive Layout as Preferred Page Type
The use of responsive pages is being encouraged through small UI changes, so your stories can automatically resize to �t on different devices or screen sizes. Whencreating a new page, Responsive Layout is suggested �rst, and stories created by Data Exploration use responsive pages by default.
Show/Hide Data Markers On Line Charts And Combined Line Charts
Show/hide data markers on line charts and combined line charts are now available. When you choose to hide data markers, thresholds will also be hidden. This updatesimpli�es your visualization and increases the readability of your charts.
Display Measure Values in the Bubble Layer of a Geo Map
Now you have the ability to show measure values in the bubble layer of a Geo Map. You can choose to display the color, size, or measure values.
Enhanced Number Format Capabilities for Geo Maps
6/1/2021
53This is custom documentation. For more information, please visit the SAP Help Portal
We have enhanced our number formatting styling capabilities, so you can adjust the scale, scale format, and decimals when working on geo maps. All values also updatein tooltips, even when they're hidden.
Search and viewing enhancements for widget �lters and input controls
When viewing a story page, you can now choose whether to display (and search) the ID, Description, or ID and Description for widget �lters and input controls. Thisaction can be done through the "more actions" menu or the right-click menu.
Mobile
Available on Android
To all Android users, the SAP Analytics Cloud Mobile App is now available for you! You can discover mobile-enabled Stories by using the global search or navigatingthrough the content folders. From now on, you can view and work on stories via your phone anywhere, anytime.
Easier navigation
Mobile users can now easily navigate to their desired content through the following:
A new Home tab containing favorite and featured content, as well as recently viewed items.
A new Files tab to view all the folders and �les containing stories and presentations enabled for mobile.
Settings are now available under the Pro�le icon.
Global search on both the Home and Files tabs for accelerated content discovery.
Support for story metadata
The SAP Analytics Cloud Mobile App now supports translated, user-de�ned story metadata based on acquired data connections. Multilingual communication will offer acompetitive advantage to companies in the wave of globalization.
Access speci�ed content
Now when a user creates a link to share a story with others on the Mobile Application, it will include speci�ed �lters, page indexes, and prompts, so the receiver of thelink can access the speci�ed content with ease. This feature greatly improves the shareability of stories on the Analytics Mobile Application.
Query time in Search to Insight
Search to Insight on Mobile now supports time-related keywords such as "… by Year", "… by Quarter", etc. to offer more contextual information based on different timeinquiries. This update provides you with more concise search results at your �ngertips.
Query Live Data Models in Search to Insight
You can query models based on live data (SAP HANA, SAP BW, SAP S/4 HANA) when working with Search to Insight on iPhones. Now you can enjoy the bene�ts of ourconversational arti�cial intelligence to visualize and analyze live data on your iPhone.
Single-sign-on experience
You can now use a simpli�ed single-sign-on experience when using the mobile App to connect to your live SAP BW, SAP HANA, or SAP S/4HANA data using SAP CloudConnector. This gives end-users seamless access to their data without worrying about entering credentials, saving you time and trouble.
This feature can be enabled on existing connections by supplying the right con�gurations details.
Support for Xcode-11
The SAP Analytics Mobile App and SDK now support Xcode 11. This means that the new App is now built with Xcode 11 and deprecating older iOS versions.
The Mobile SDK requires Xcode 11.3 to be able to build an IPA �le and deploy it in internal App Stores.
Home Tab on Android
For all of you Android users, the "Home" page will now be available in SAP Analytics Cloud Mobile. Now when you log into the application, you will be directed to the"Home”"page where you can quickly access your favorites, featured �les, and most recent �les. Accessing and discovering your most important content has never beenquicker and easier.
Language Enhancements on Android
The SAP Analytics Cloud Mobile for Android will now support most languages across the application. The menus, buttons, messages, and other elements will now betranslated based on your language settings. That's not all! The Android Mobile App will also support translated, user-de�ned story metadata based on acquired dataconnections. With these language enhancements, Analytics can be consumed by a wider audience within your organization, which is especially useful for internationalorganizations.
Modeling
Shareable Full Control access
If you share a model with Full Control access, other users are now able to export jobs. This update improves team collaboration and makes it easier for the appropriateusers to make exports as necessary.
Planning
Create validation rules to de�ne valid ranges of data
6/1/2021
54This is custom documentation. For more information, please visit the SAP Help Portal
In planning models, you can now create validation rules to establish relationships of members across different dimensions to restrict planned data entry. For example,you may want to restrict planning to only a few products in a given geography. With this capability, you can set relationships based on attributes to enforce this type ofrestriction.
Calendar Integration for Reviewer in Story
When you're reviewing a story that's part of a calendar task, you can access it through the new status bar, which is located on the top of the task-connected story. Italso shows calendar information when hovered over, together with Submit, Reject, and Details buttons. This update saves you unnecessary clicks to switch back andforth between the Calendar and the story.
Export data from SAP Analytics Cloud to S/4HANA Activity Type Plan Cost Rates
We have expanded our capabilities to push plan information from SAP Analytics Cloud to speci�c components within S/4HANA. With this release, you can now exportdata from SAP Analytics Cloud to S/4HANA Activity Type Plan Cost Rates (ACCOSTRATE). Con�guration for this export is consistent with the current export toS/4HANA capabilities (i.e. ACDOCP).
Return the current Coordinated Universal Time in Advanced Formulas
A new function TODAY is now available within Advanced Formulas which returns the current system date in Coordinated Universal Time (UTC) in the formatYYYYMMDD. This function can be modi�ed to return local time based on the con�guration setting CONFIG.TIME_ZONE_OFFSET.
Set Completion Options to Ignore
When copying data across different models, there is a new completion option, "Ignore", to help you include only data that is relevant for the speci�c copy action.
By setting the "Ignore" option, any source members that were not automatically mapped to a target member are excluded from the copy. This can improve overallcross model copy performance and simpli�es and streamlines the overall cross model copy mapping experience.
Enhanced Table experience
We've improved the table experience with the following updates:
Smooth scrolling bar appears when your cursor hovers over the table and saves you from clicking.
Improved performance of in-cell charts and thresholds.
Ability to specify exact row height or use the prede�ned Fiori heights (Default, Condensed, Cozy).
Ability to specify exact column width for non-responsive tables.
Deselect linked analysis members with "Esc" on keyboard.
This should make your experience feel more familiar and intuitive.
Reference another time dimension for time functions NEXT/PREVIOUS
For planning models with multiple time dimensions, you can now reference a secondary time dimension within the Advanced Formula functions Next and Previous.
One of the more typical use-cases for this are scenarios that require amortization of revenue recognition. For example, in the insurance industry, premiums are paidupfront for the duration of the contract. However, these payments cannot be recognized as revenue immediately, but rather need to be spread over the contractduration.
By introducing the ability to reference a secondary time dimension in the Next/Previous functions, it becomes easier to de�ne relative time offsets to the initialpayment period to amortize the speci�c revenues or expenses.
Show Units and Scale in cell
Using the styling panel, story designers can decide where units and scale should be shown in the table. You can format it at the cell level to increase visibility. You canchoose to display units and scale in:
Default
Row
Column
Cell
Open the data locking editor from a Data Locking Task
You can now easily open the Data Locking editor in read-only mode from a Data Locking Task. The context of the task is applied to the editor as driving dimensions soyou can see the current lock state for your task.
Platform Services
Schedule Publications
Scheduling publications on stories and analytical applications will allow you to create a schedule with recurring patterns and allow you to distribute the content as aPDF over email. With the same story, you can customize the publications using bookmarks to send more relevant information to your colleagues and even to externalaudiences.
This new feature greatly improves the distribution of your stories and analytical applications. With this new feature, you'll be able to maintain historical data from yourcontent at any pre-de�ned frequency.
SAP BW and HANA Prompt Variables are supported. On the Calendar, you are able to see the status of your scheduling job. Please note that scheduling is only availableon Cloud Foundry.
6/1/2021
55This is custom documentation. For more information, please visit the SAP Help Portal
De�ning Prompt Value while scheduling a story
When creating or editing a "Schedule Publication" for stories based on SAP BW and HANA data models, you can now de�ne prompt values. In this way, you can sharedifferent views with different prompt values for your story with the same or a new set of recipients, increasing the shareability.
Smart Assist
Live Universe Connection in Search to Insight
Search to Insight can be used on Live Universe Connections. The model needs to be indexed in the Model Settings and requires Live Universe 2.3. This will help yourend-users quickly ask questions of their data from the live universe connection.
Story Filter in Search to Insight
When you open Search to Insight from a story, all story �lters are automatically applied in the question you ask. Only �lters affecting the speci�c chart get displayed.This update makes it easier for you to dig deeper into the �ltered data, simpli�es your work�ow and makes the experience with Search to Insight more seamless.
Enhanced Simulation View
For your business, it's really important to answer the question "What would happen if…?" To better help you answer that question for all your new stories, our impactsimulator replaces the original waterfall chart. This will better explain your simulation results, help you forecast possible scenarios and make smart business decisions.
Histograms in Search to Insight
Users can use histogram as chart type in Search to Insight by specifying "as histogram". For example, type "Show me Employee by Salary for 2019 as histogram" inSearch to Insight, instantly the results will be visualized with a histogram.
Smart Insights in Explorer and Digital Boardroom
You can now use Smart Insights in Explorer and Digital Boardroom, allowing users to get contextual insights in more scenarios.
Enriched Smart Insights for calculations
Smart Insights for calculations can now show you their top contributors and how they change over time. It lets you see more information about calculations on aparticular data point or variance in your visualization or table, and understand which factors are making the biggest impact on them.
Search using number abbreviations In Search to Insight
You can now search data using number abbreviations allowing you to search in a more natural & intuitive way. For example:
Numeric decimal values, such as "2.4 B".
Expressions in English, such as "a million" or "a half million".
Words for fractions, such as "half a million".
Version 2020.7
SAP is pleased to announce a new version of SAP Analytics Cloud.
General
The Home page now includes the following features to let you quickly access content:
A Favorites tab dedicated to all the content you have designated as "Favorites".
A Shared with Me tab listing all the content that has been shared with you by other users.
You can now manage team-speci�c folders the same way you manage other folders.
You can now specify that published content will be available to all current and future users of an SAP Analytics Cloud system.
You can de�ne a prompt value while scheduling a new publication or editing an existing schedule of a publication.
Data Acquisition, Live Data Connections, and Integration
We now support more Open Connectors data sources: Autotask CRM, Close, ConnectWise CRM, Infusionsoft CRM, Insightly, and Box.
Stories
You can now add and style labels for measure values on geo maps for the bubble and bubble on choropleth layers.
You can now apply number formatting to measure values on geo maps for both labels and tooltips.
You can now set up a custom sort for dimension members in SAP BW.
For SAP BW, you can now consume user-de�ned hierarchies with custom shape �les in the geo choropleth layer.
Modeling
When working with an acquired dataset in a new or existing model, you can now use a dedicated transform to remove duplicated rows.
6/1/2021
56This is custom documentation. For more information, please visit the SAP Help Portal
Planning
In planning models, you can now create validation rules to de�ne valid ranges of data that allow data entry and planning operations. A speci�c type of validation rule isthe dimension combination rules that let you de�ne allowed member combinations across dimensions to prevent improper data entry.
In tables, you can now set the style to show the unit (percentage, dollar sign) in every cell, even when all cells have the same unit.
You can now view the data slice of your model in the data locking dialog directly from the Calendar data locking task.
When you're reviewing a story that's part of a calendar task, you no longer need to switch back and forth between the Calendar and the story. The new status bar thathas been added to the top of the task-connected story, which also shows calendar information when hovered over, is also visible for reviewers now, together withSubmit, Reject, and Details buttons.
Analytics Designer
You can now use the API getEntitiesCountFromEntitySet to improve the existing read access to OData services by enabling the OData system query options for"�lter", "orderby", "select", "count", "top", and "skip". The new API works like the getEntitiesFromEntitySet API but returns the count instead of an entity list.
You can use the following APIs to move widgets to a canvas, panel, or tab strip:
Application.moveWidget();
Tabstrip.moveWidget();
Panel.moveWidget();
You can now use the Application.sendNotification() API to send a noti�cation when an analytic application is run from the backend (that is, scheduling). Thenoti�cation can be received via email or seen in the noti�cations panel of SAP Analytics Cloud.
You can now use the BookmarkSet.apply() API to apply bookmarks at run time dynamically and keep the previous states of uncovered widgets.
The script API DataSource.setDimensionFilter() now supports range �lters and exclude �lters.
To enable the compact display and zero suppression, you can now use the following APIs, which can be used only for SAP BW models:
Table.setCompactDisplayEnabled() – enables/disables compact display for the given table axis.
Table.isCompactDisplayEnabled() – returns whether compact display is enabled on the given table axis.
Table.setZeroSuppression() – enables/disables zero suppression on the given table axis.
Table.isZeroSuppressionEnabled() – returns whether zero suppression is enabled on the given table axis.
You can now use the following APIs for dimension properties:
DataSource.getDimensionProperties() – returns all available dimension properties of the given dimension.
Table.setActiveDimensionProperties() – sets which dimension properties of the speci�ed dimension should be active (visible).
Table.getActiveDimensionProperties() – returns the IDs of all currently active dimension properties of the speci�ed dimension.
Mobile
The SAP Analytics Cloud mobile iOS app now supports Search to Insight on an iPad.
System Administration Notes
With the 2020.7 release of SAP Analytics Cloud, SAP Analytics Cloud agent's minimum version remains at 1.0.75, with the following exceptions:
If you require data acquisition from SAP ERP / SQL Database, the minimum version is 1.0.99.
If you require data acquisition from SAP Universe (UNX), the minimum version is 1.0.91.
If you require data acquisition from SAP Business Warehouse (BW), the minimum version is 1.0.233.
If you require data acquisition from an SAP HANA view, the minimum version is 1.0.235.
If you require data acquisition from File Server, you need to upgrade to version 1.0.248.
For more information, see System Requirements and Technical Prerequisites.
Regarding supported features and required updates for the integration of SAP BW with SAP Analytics Cloud, refer to SAP Note 2541557 for further details.
Regarding supported features and required updates for live universe access through SAP BusinessObjects Live Data Connect with SAP Analytics Cloud, refer to SAPNote 2771921 for further details.
Version 2020.6
NoteAlthough it is not required, you can upgrade to the agent version 1.0.269, no matter what data acquisition type you use. Do this to take advantage of updatesmade to SAP Analytics Cloud agent.
6/1/2021
57This is custom documentation. For more information, please visit the SAP Help Portal
SAP is pleased to announce a new version of SAP Analytics Cloud.
General
When users create or modify a schedule, con�icts in time slots are now shown in the scheduler with information about which occurrence has the con�ict.
Data Acquisition, Live Data Connections, and Integration
You can now import data from SAP HANA views based on XS Advanced.
Live Data Connections to SAP Data Warehouse Cloud system and create stories using your analyticalSAP Data Warehouse datasets. Cloud
Stories
When viewing a story page, you can now choose whether to display (and search) the ID, Description, or ID and Description for widget �lters and input controls includingChart �lters, table �lters, Calculation Input Controls, Measure Input Controls, and so on.
In tables, we have �xed the behavior of threshold colors on frontend calculations for the account type "INC" or "LEQ". These calculations no longer invert the thresholdcolors.
Planning
The NEXT and PREVIOUS functions for advanced formulas in data actions now let you specify a granularity and a date. You can use these functions to look up valuesfrom one date dimension in reference to a different date dimension, for example.
Analytics Designer
You can now copy SAC document content across browser pages, not only from story to analytic application, but also from story to story and analytic application toanalytic application.
As an application designer, you can now change the name of a tab within a tab strip widget. As well, you can now use the API Tab.setVisible to set the visibility of the tab.
When working on a planning application, you can now use the menu entry Data Locks at design time to display locked cells in the table. Up to now this menu entry wasonly available at runtime.
You can now create an analytic application based on an SAP Data Warehouse Cloud space in SAP Analytics Cloud.
Smart Assist
You can now use various formats to enter numbers in your Search to Insight queries:
Decimal values, for example 2.4 billion.
Words (English only) for fractions, for example half a million.
Expressions such as "a million" or "a half million".
Mobile
The SAP Analytics Mobile App and SDK now support xCode-11.
You can now use a simpli�ed single-sign-on experience when using the mobile app to connect to your live SAP BW, SAP HANA, or SAP S/4HANA data using SAP CloudConnector.
System Administration Notes
With the 2020.6 release of SAP Analytics Cloud, SAP Analytics Cloud agent's minimum version remains at 1.0.75, with the following exceptions:
If you require data acquisition from SAP ERP / SQL Database, the minimum version is 1.0.99.
If you require data acquisition from SAP Universe (UNX), the minimum version is 1.0.91.
If you require data acquisition from SAP Business Warehouse (BW), the minimum version is 1.0.233.
If you require data acquisition from an SAP HANA view, the minimum version is 1.0.235.
If you require data acquisition from File Server, you need to upgrade to version 1.0.248.
For more information, see System Requirements and Technical Prerequisites.
Regarding supported features and required updates for the integration of SAP BW with SAP Analytics Cloud, refer to SAP Note 2541557 for further details.
NoteAlthough it is not required, you can upgrade to the agent version 1.0.267, no matter what data acquisition type you use. Do this to take advantage of updatesmade to SAP Analytics Cloud agent.
6/1/2021
58This is custom documentation. For more information, please visit the SAP Help Portal
Regarding supported features and required updates for live universe access through SAP BusinessObjects Live Data Connect with SAP Analytics Cloud, refer to SAPNote 2771921 for further details.
Version 2020.5
SAP is pleased to announce a new version of SAP Analytics Cloud.
General
You can now view published content in the new Catalog tab in your Home page. Published content includes stories, analytic applications, Digital Boardroompresentations, uploaded �les, and external content.
You can now add URL links to external content and save them in the Files list or publish them to the Catalog.
Stories
You can now use story-level �lters when working with Search to Insight within Stories.
Planning
The new Table experience includes these features:
Smooth scrolling, which also applies when your cursor hovers over the table (no click needed).
Improved performance of in-cell charts and thresholds.
Ability to specify exact row height or use the prede�ned Fiori heights (Default, Condensed, Cozy).
Ability to specify exact column width for non-responsive tables.
Deselect linked analysis members with ESC.
When designing a new table or applying the improvements to an existing table, select the "Beta table" option to try it out.
When mapping dimension members in a cross model copy action, you can now set the Completion Options to Ignore. This setting �lters out any source members thatweren't automatically mapped to a target member.
Analytics Designer
As an application designer, you can now use the onBeforeExecute event for the Data Action Trigger and the BPC Planning Sequence.
Smart Assist
The simulation view is now enhanced to better help you understand how changing the values of your key in�uencers could have an impact on the value of your targetmeasure.
Mobile
You can now query models based on live data (SAP HANA, SAP BW, SAP S/4 HANA) when working with Search to Insight on iOS mobile.
System Administration Notes
With the 2020.5 release of SAP Analytics Cloud, SAP Analytics Cloud agent's minimum version remains at 1.0.75, with the following exceptions:
If you require data acquisition from SAP ERP / SQL Database, the minimum version is 1.0.99.
If you require data acquisition from SAP Universe (UNX), the minimum version is 1.0.91.
If you require data acquisition from SAP Business Warehouse (BW), the minimum version is 1.0.233.
If you require data acquisition from an SAP HANA view, the minimum version is 1.0.235.
If you require data acquisition from File Server, you need to upgrade to version 1.0.248.
For more information, see System Requirements and Technical Prerequisites.
Regarding supported features and required updates for the integration of SAP BW with SAP Analytics Cloud, refer to SAP Note 2541557 for further details.
Regarding supported features and required updates for live universe access through SAP BusinessObjects Live Data Connect with SAP Analytics Cloud, refer to SAPNote 2771921 for further details.
NoteAlthough it is not required, you can upgrade to the agent version 1.0.265, no matter what data acquisition type you use. Do this to take advantage of updatesmade to SAP Analytics Cloud agent.
6/1/2021
59This is custom documentation. For more information, please visit the SAP Help Portal
Version 2020.4
SAP is pleased to announce a new version of SAP Analytics Cloud.
General
You can now export stories to Microsoft PowerPoint.
You can now view your recently accessed �les on the home page.
Data Acquisition, Live Data Connections, and Integration
You can now use Search to Insight directly with SAP Universes live data. Get more from your universes with natural language and get instant quality data using thepower of Search to Insight.
Planning
You can now export data from SAP Analytics Cloud to S/4HANA tables other than ACCDOCP, such as Activity Type Plan Cost Rates.
A new function TODAY is now supported to return the current system date in Coordinated Universal Time (UTC) in the format YYYYMMDD. To adjust to the user's timezone, use the CONFIG.TIME_ZONE_OFFSET function.
Search to Insight
Search to Insight now supports the Live Universe Connection (LUC).
Analytics Designer
You can now copy a supported story widget to an analytic application in the same browser page.
As an application designer, you can now restore the latest deleted widget or technical component when designing an analytic application.
We now enhance user experience by directly showing the error count on the info panel toolbar's icon of your analytic application. This will help inform the applicationdeveloper instantly when the application has an error.
You can now use the Edit button in the toolbar of an executed application to return to the edit mode. The Edit button is not available in Microsoft Internet Explorer andis only displayed for application users with update permissions.
Smart Assist
We've enriched Smart Insights for calculations to show you, where applicable, what their top contributors are, and how they've changed over time.
You can now get Smart Insights on variances when you're working in Explorer and Digital Boardroom.
Mobile
Using deep links, mobile app users can now access content with speci�ed �lters, page index, and prompts.
You can now query search to insight in the mobile app using time-related phrases such as "by quarter", "by year", and so on.
System Administration Notes
With the 2020.4 release of SAP Analytics Cloud, SAP Analytics Cloud agent's minimum version remains at 1.0.75, with the following exceptions:
If you require data acquisition from SAP ERP / SQL Database, the minimum version is 1.0.99.
If you require data acquisition from SAP Universe (UNX), the minimum version is 1.0.91.
If you require data acquisition from SAP Business Warehouse (BW), the minimum version is 1.0.233.
If you require data acquisition from an SAP HANA view, the minimum version is 1.0.235.
If you require data acquisition from File Server, you need to upgrade to version 1.0.248.
For more information, see System Requirements and Technical Prerequisites.
Regarding supported features and required updates for the integration of SAP BW with SAP Analytics Cloud, refer to SAP Note 2541557 for further details.
Regarding supported features and required updates for live universe access through SAP BusinessObjects Live Data Connect with SAP Analytics Cloud, refer to SAPNote 2771921 for further details.
NoteAlthough it is not required, you can upgrade to the agent version 1.0.263, no matter what data acquisition type you use. Do this to take advantage of updatesmade to SAP Analytics Cloud agent.
6/1/2021
60This is custom documentation. For more information, please visit the SAP Help Portal
Version 2020.3
SAP is pleased to announce a new version of SAP Analytics Cloud.
General
You can now use the Identity Provider Administration tool to manage the custom identity provider con�gured with SAP Analytics Cloud. You can upload new metadatafor the current custom identity provider or revert to using the default identity provider.
In this release, an administrator can carry out the following tasks:
Manage permissions to start a discussion or view and contribute to it through the new privilege Discussion at the tenant level.
Manage permissions to create, view, or delete a comment through the new privilege Comment at the tenant level.
SAP Analytics Cloud now supports viewing stories in embed mode with the Safari browser on Mac.
Data Acquisition, Live Data Connections, and Integration
You can now create live data connections to on-premise data sources, that advanced feature work�ows connect to, through the SAP Cloud Platform cloud connector.Connecting to data sources through the cloud connector can be bene�cial in various use cases; for example, if you want to schedule the publication of stories based onlive data connections.
When exporting data using an SAP Analytics Cloud property for the target member ID, you can now export members with blank property values by specifying a value tobe used instead.
Stories
You can now choose whether to round the data label values for charts or to show the speci�ed number of decimal values.
For the �lters and input control in the following list, you can now choose whether to display (and Search) the Description, ID and Description, or ID:
Topic �lter
Story �lter
Page �lter
Calculation input control
When viewing a story or a Digital Boardroom presentation, you can now mark it as a favorite.
You can now set custom current dates for dynamic time �lters in charts and tables.
Modeling
If you share a model with Full Control access, other users are now able to edit and run export jobs.
Analytics Designer
In addition to SAP S/4HANA live connections, you can now also de�ne OData Services in analytics designer based on SAP BW systems, SAP HANA systems, and SAPBusiness Planning and Consolidation (BPC) systems.
The adding widget menu gets longer with each new widget we add, so we have enhanced it by regrouping some widgets.
Exported archives of analytic applications now, by default, contain all referenced custom widgets.
As an application designer, you can now use the APIs removeVariableValue() and copyVariableValueFrom().
After embedding an analytic application in your own application (for example, in your company's portal via iFrame), you can now directly view the embedded analyticapplication in the Safari browser on an iPad with an optimized user experience. In this release, directly opening the analytic application from the File Repository is notsupported. You can only view your analytic application embedded in your own application.
Mobile
Mobile users can now easily navigate to their desired content through the following:
A new Home tab containing favorite and featured content, as well as recently viewed items.
A new Files tab to view all the folders and �les containing stories and presentations enabled for mobile.
Settings are now available under the Pro�le icon.
Global search on both the Home and Files tabs for accelerated content discovery.
The SAP Analytics Cloud Mobile App is now available on Android. You can discover mobile-enabled stories by using the global search or navigating through the contentfolders.
The mobile app now supports translated, user-de�ned story metadata based on acquired data connections.
6/1/2021
61This is custom documentation. For more information, please visit the SAP Help Portal
System Administration Notes
With the 2020.3 release of SAP Analytics Cloud, SAP Analytics Cloud agent's minimum version remains at 1.0.75, with the following exceptions:
If you require data acquisition from SAP ERP / SQL Database, the minimum version is 1.0.99.
If you require data acquisition from SAP Universe (UNX), the minimum version is 1.0.91.
If you require data acquisition from SAP Business Warehouse (BW), the minimum version is 1.0.233.
If you require data acquisition from an SAP HANA view, the minimum version is 1.0.235.
If you require data acquisition from File Server, you need to upgrade to version 1.0.248.
For more information, see System Requirements and Technical Prerequisites.
Regarding supported features and required updates for the integration of SAP BW with SAP Analytics Cloud, refer to SAP Note 2541557 for further details.
Regarding supported features and required updates for live universe access through SAP BusinessObjects Live Data Connect with SAP Analytics Cloud, refer to SAPNote 2771921 for further details.
Version 2020.2
SAP is pleased to announce a new version of SAP Analytics Cloud.
Administration & Infrastructure
Translate Analytics Hub Content
You can now translate SAP Analytics Hub asset content and structure using the SAP Analytics Cloud translation service. Users can update their language preferenceand view translated content in their preferred language. Support for over 30 languages allows for Analytics to be consumed by a wider audience within yourorganization, which is perfect for international organizations!
Buy and Import Content
When browsing paid content from Content Libraries on the Content Network, you can now follow a link to the SAP App Center to buy the content, and then import itdirectly into SAP Analytics Cloud. This seamless integration makes it much easier and faster to bring in your favorite external content.
Browse menu improvements
With this update, the Content Network, Translation, and Analytic Application Bookmarks can now be accessed from the Browse menu instead of the Files area, savingyou a few clicks.
SSO IdP improvements
You can now con�gure IdP-initiated SSO for SAP Data Centers, allowing for tighter integration to portals and other applications that share an IdP, as well as linkingfrom a portal page to SAP Analytics Cloud without prompting the user for credentials. In addition to that, administrators will have the option to con�gure the behaviorof SAP Analytics Cloud to keep users logged into the corporate IdP when they logout of SAP Analytics Cloud. SSO.
Update and manage IDP metadata
System owners can now fully update and manage SAML SSO metadata before the current metadata expires, avoiding support tickets and downtime.
Danish Support
You can now choose Danish as your user interface language. Velkommen to all our Danish users!
Analytics Designer
New text-area widget
You can now add a new text-area widget to your Analytic Application. It is similar to the input �eld widget, but different in that it can wrap text automatically based onthe size of the widget and the line break entered by the application users. This is especially useful when you get long text from comments and descriptions.
Scripting for Search to Insight
As an application designer, you can now use scripting API to build your own Search to Insight UI by integrating Search to Insight with another application, such as aChatbot or your own company portal. This new scripting API allows users to pass a question through the application and apply the resulting chart or table in an AnalyticApplication, making it faster and easier for the end user to get custom analytics.
Concurrent Session Noti�cations
This usability improvement will help ensure that users don't overwrite each others work when working on the same Application. When a second user opens the sameApplication, system noti�cations will indicate to them that someone else is already editing, and the original editor will receive a noti�cation that someone else openedthe �le. Once an edit is made by one of the users, the other user will receive a noti�cation to either save a copy of their Application or jump to the most recent revisionto continue working.
NoteAlthough it is not required, you can upgrade to the agent version 1.0.261, no matter what data acquisition type you use. Do this to take advantage of updatesmade to SAP Analytics Cloud agent.
6/1/2021
62This is custom documentation. For more information, please visit the SAP Help Portal
Data Source API Enhancements
With this update you'll now be able to use the data source prompt API, <DataSource.setVariableValue()>, to facilitate more customization in Analytics Designer. Pleasenote that this API will not be supported for hierarchy node variables for live data connections to SAP BW.
Data locking APIs
You'll also be able to use data-locking APIs to check whether a model is data-locking enabled as well as to set or get data locks, even if the table is not planning enabled.This is great for quickly changing data in tables, where a designer can create a button to lock certain data as �xed.
Change themes when running applications
Application designers will now have access to the setTheme() API, which would allow users to easily change the theme when running the application.
API Improvements
Multiple improvements have been made with a synopsis listed below for each improvement:
The wave version of the API reference is displayed in the browser tab and in the �rst link of the "Contents" section.
The link "API Reference Latest Published Version" in the "Contents" section navigates to the latest publicly available version of the API reference.
Class, �eld, method, and event API additions are listed in their documentation with the wave version of their addition under the heading "Since" and their updateunder "Last Update".
Direct subclasses of a class are listed in the class documentation under the heading "Direct Subclasses".
Each class in the "Contents" section has decorator icons indicating special capabilities of the class:
Icon with the letter "D" indicates whether the class contains �elds or methods that can be directly accessed in the script editor without creating aninstance of the class.
Icon with the letter "T" indicates whether the class can be used as a type in method arguments, return values, or global script variables.
The API reference shows the type library information of each class and all classes are grouped into type libraries.
Performance Enhancements
This update will allow you to improve performance by merging queries from SAP BW or SAP HANA for multiple charts in the Analytics Designer. To enable this feature,visit the Query Settings pop-up panel and turn on the "Enable Query Merge" toggle.
Loading Indicator
Application Designers can now de�ne a loading indicator to prevent Application users from performing new actions while an operation is still in progress. This willimprove the user experience as they will receive a visual cue that a process is occurring.
There are two types of loading indicators:
Automatically triggered when loading is longer than a prede�ned delay time. This is con�gured in the Styling panel of the canvas.
De�ned for the application as a pop up, a tab strip, or a panel, by leveraging corresponding APIs.
Data Analyzer Enhancements
As a user of the data analyzer, you will �nd several improvements for this ready-to-run service to improve your work�ow efficiency:
The "Available Items" area is now displayed by default.
You can use the Refresh button in the query information dialog to refresh your data source.
In the query information dialog, prompts that have been set for the data source are now displayed.
You can now quickly and easily collapse the �lter line.
Trigger Refreshing for Widgets
By leveraging the refresh data APIs, Application Designers can allow Application users to trigger a data refresh for a speci�c widget (such as a table or chart) or allwidgets related to an Application data source. This ensures that relevant and up-to-date information is always available for your end user to make decisions.
Type Library Optimization
More isn't always better, especially when it comes to searching through help sections. In an effort to save Analytic Designers from having to sift through multipleirrelevant topics, new Analytic Applications will only suggest types that are available in the standard library, within the script editor value help. Whenever a widget ortechnical object is loaded into the application, the associated type library will be added as well. For Analytic Applications that were created prior to this update, therewill be an "Optimize type Libraries" button under the "Settings" menu which will remove any unused libraries from the script editor value help.
Data Integration
Qualtrics Import Connection
Could you think of a time when knowing how a customer or partner felt would have helped your business? Most of us would agree that understanding how people feelabout an experience would be incredibly bene�cial and offer insights that simply cannot be gained through �nancial metrics. With this new release of SAP AnalyticsCloud, we're bringing in the experiential data (X data) powers of Qualtrics by allowing you to import survey questions and answers, adding new insights to augmentyour operational data (O data). Users will be able to de�ne what data to import via the familiar query building experience, making the X+O connection experienceseamless and intuitive, so you can focus on understanding how to offer your customers the most bene�t.
Option to allow import data to public dimension for non-leaf node in hierarchy
6/1/2021
63This is custom documentation. For more information, please visit the SAP Help Portal
When importing data into Global dimensions, users can now omit validation, allowing non-leaf members to contain fact data for speci�c hierarchies.
Live Connections to CF HANA 2.0 without setting up HDI
Connection setup to Cloud Foundry HANA 2.0 has been simpli�ed by removing the need to force the connection through an HDI container. The overall architecture ofthe live connection has not changed, the only difference is to replace the HDI container reference to a user provided service.
Query Panel Resizing Improvements for Live SAP Universe
When creating a model on a Universe with SAP Live Data Connect, you can now use the full-screen icon in the Query Panel header to maximize the view. This will makeit easier to deal with large quantities of selected data, especially when working on smaller computer screens.
View Mapping and Import Job Transformations
Users can now view data mapping and transform history after they import data into a model or dimension. This history can be used to help map or transform data forother import jobs, saving you time and potential confusion!
Data Visualization
Background gradients or image for Responsive Pages and Lanes
Story designers can now select gradient colors and images to use as a background for responsive pages and lanes. Background images and color gradient are alsoavailable in story preferences for ease of story design.
Threshold legend in charts
Story designers can now choose to display a threshold legend when a threshold is applied on a chart. Just like other chart legends, the threshold legend can also behidden via the "More Actions" menu.
Custom Web Fonts
Administrators now have the ability to bring in Custom Web Fonts to their tenant from within the Administration Panel. Story Designers can then use these CustomWeb Fonts anywhere fonts are con�gurable in the Story, in the exact same way you would use a pre-installed font. This will allow for better brand consistency forcompanies with custom typefaces and offers more �exibility in formatting.
Right-Click Context Menu
This update brings a big increase in usability and discoverability of possible widget actions by providing a right click context menu. Widget menu items will now beaccessible by right clicking anywhere on the widget, or through the �oating "More Actions" icon at top right of the widget. The wrap title action will be moved inside thecontext menu to reduce clutter on the main widget screen and core datapoint actions such as �lter, exclude, and drill will remain available via left click. These updatesshould make interacting with widgets much more intuitive and consistent.
Live BW Support for Exception Aggregations
Story designers now have the ability to create aggregations in the story calculation editor using Live BW models. There is one exception: the First & Last aggregationcan only contain one aggregation dimension while the other aggregations will have a limit of �ve.
Restrict Measures on Dynamic Time Using a Custom Current Date
This feature provides the ability to create restricted measures and cross calculations with dynamic time range �lters based on a "custom current date". This allowsviewers to control the "current period" used for the dynamic time range based on their current date con�guration. Essentially, you will no longer need to update thedate �lter range whenever you want to change the time-period, just update the custom current date and the rest will change accordingly!
Story-Level Font Resize in Device Preview
Story Designers can now change the font scaling of the entire story for each individual device size using a single scale. Widgets can still be individually scaled but thiswill save you a lot of time from having to con�gure each widget one-by-one.
Digital Boardroom
Set prompts for All Pages
Boardroom presenters can now change prompts for all pages rather than page by page. This dramatically reduces the number of clicks needed to change prompts andallows for a more consistent view of the data. Prompts can still be set for individual pages if desired, allowing you to choose between efficiency or customization!
Combine Action Bar with Header or Footer
Digital Boardroom designers can now easily integrate the Action Bar into the header or footer of the Boardroom for quick access. This greatly improves discoverabilityand leaves more space for viewing the boardroom story itself. These options can be con�gured in the boardroom preferences.
General Updates
SAP Analytics Cloud for Office
SAP Analytics Cloud's add-in for Microsoft Office extends our analytic and planning capabilities with the well-known Excel frontend and functions to allow planners towork on their preferred device while still getting all the bene�ts SAP Analytics Cloud provides. This add-in works both on premise, with a product installation, as well ason desktop and in the cloud where no installation is required since the add-on can be found in the Microsoft store. And, of course, please keep in mind that somefunctionality may be missing as this feature is still in Beta.
Intelligent Enterprise
6/1/2021
64This is custom documentation. For more information, please visit the SAP Help Portal
Live BW Support for Time Variances
Time-based variances on Live BW models can now be created within the story, and they will also support Recommended Comparisons, giving you expertly curated waysto view your data.
Mobile
Search to Insight on Mobile
Search to Insight is here! You can now query your acquired models using Search to Insight in the mobile app to get quick answers to questions and share these �ndingswith other users. As you type your query, auto-complete suggestions will display, bringing augmented analytics right to your �ngertips no matter where you are in theworld!
BW Bex variable prompt support for �scal year and currency
The SAP Analytics Cloud mobile app now supports BW Bex variable prompts for Fiscal Year and Currency Variables.
iOS 13 Support
The SAP Analytics Cloud mobile app now runs on iOS 13 for iPhones.
Application Logs
The SAP Analytics Cloud App will now generate local application logs to help analyze issues when contacting the SAP Support team. This will help accelerate resolutionof any issues you may face.
Support for HANA Variables
HANA Input parameters and variables will now be supported within the SAP Analytics Cloud Mobile app.
Modeling
Delete private versions
As an administrator, you can now delete all private versions for a speci�c model for all users of that model.
Planning
Cut and paste shortcuts
With this update you'll be able to cut and paste cell values with keyboard shortcuts such as Ctrl+C and Ctrl+V, or Cmd+X and Cmd+V. This brings the functionality thatwas available for custom cells, to data cells, creating a consistent user experience.
Option to Switch to Input Mode in BPC Embedded
When planning against BPC embedded, planners now have the option to toggle between input mode to edit data in a table, or view mode to only view data in the table.In view mode, there is no BW backend lock, and other planners can change data. This improves collaboration and makes it easier for appropriate users to make edits asnecessary.
Show Hyperlink in Tables
Table hyperlinks are now visible through a quick "Go to Link" Hyperlink button available in the context menu of each cell. The hyperlinks will be displayed with the URLand additional context for quick comprehension and access to the destination.
Allocation Steps in Data Actions
Rather than manually executing allocations from within you story, you can now add structured allocations as part of a data action to provide a more automatedexperience for your end user. You can also combine an allocation step with other step types in one data action, and then easily execute them with one click using thedata action trigger. Quick and easy!
Copy Data Actions
In this release, you'll gain the ability to copy a data action with all its steps and parameters, saving you time in those cases when you want to duplicate an existing dataaction. Just be aware that you can only copy one data action at a time, in order to not lose any previous copies.
Export quantities to S4/HANA
When you export data to S/4HANA using OData Services and your target key �gure is a quantity, you will now be able to map it to a unit dimension and export thequantities of the different units. This will ensure accurate mapping and improve the quality of data exports to S/4HANA.
Rename Account and Measures in the Builder Panel
The table now provides options to rename Account and Measure dimensions directly from the Builder panel. The changes will not be saved to the model itself but areuseful for customizing individual stories based on individual preferences.
Activate Processes Automatically on Start Date
As you can already do with tasks, you can now enable Processes activate automatically on the start date you've chosen. This reduces the manual inputs required forProcesses, leaving you more time to spend on the actual tasks!
Auto Complete Process on the Due Date
6/1/2021
65This is custom documentation. For more information, please visit the SAP Help Portal
Planners can now choose to have a process complete automatically on the due date and de�ne the completion settings. In addition, Planners are able to apply thesame completion settings to subtasks and Processes, or they can complete them with custom settings. Another case of SAP Analytics Cloud saving you time throughautomation!
Smart Assist
Additional Time Phrases in Search to Insight
Search to Insight will offer more contextual information based on different time inquiries. The following time phrases are now supported:
Q1, Q2, Q3, Q4
H1, H2
Previous, Current, This, Next
First, Second, …, Last
Half of the Year
This will provide the end user with a more pleasant experience and better search results!
Better Support for Time-Based Questions in Search to Insight
Natural language is more useful than ever! Users can now ask for a measure over time in a much simpler way as well as specify the granularity through familiar terms,for example:
Show me Gross Margin…
over time
by year
by �scal quarter
broken into months
broken down by week
by date
Show me monthly Gross Margin
Search to Insight will also automatically select a time dimension if the user does not specify one explicitly. This will help your end user get quick information in a veryintuitive manner without needing any speci�c knowledge about the data!
Smart Insights Enhancements
To help you make better business decisions, Smart Insights now brings top contributors for all generic dimensions, even those with large number of dimensionmembers. To further improve the value of insights, "unassigned" values will no longer be shown as a top contributor, and for variances, Smart Insights now supports upto 50 dimension members.
Search to Insight Support for Acquired Models with Data Access
Acquired Models with Data Access Control (DAC) will now be used in Search to Insight when indexing is enabled from the Model Preferences. By default, models withDAC are not indexed, and because indexing does not respect the DAC settings, users without access to a member will still be able to see it in autocomplete.
Exclude Acquired Models from Search to Insight
Acquired Models can be excluded from Search to Insight by disabling indexing, giving users more control over which models get exposed.
Smart Insights on Data Over Time
Smart Insights now show you how your data points have changed over time, including when they have time dimension �lters applied to them. This comes with aconvenient tab view of the different time granularities which you can quickly toggle between. These features not only provide more context for better insights, but theyalso make for a more intuitive interface!
Smart Insights on Account Dimensions
You can now get Smart Insights on data points representing account dimensions which have Income (INC) and Expense (EXP) as �nancial account types. This feature isespecially useful for Planners, offering more valuable insights when looking at �nancial data.
Smart Predict
Time-Series Forecasting Predictive Model Improvements
The time-series forecasting predictive model has received several major improvements with this release. In an effort to improve navigation and interactivity, thepredictive reports are now available as tabs to quickly switch between. Furthermore, the structure of the debriefs has been enhanced by removing one of the reportsand grouping the information in a more concise and relevant way. The default report has also changed, showing the forecasts as the initial report. Lastly, theexplainable AI has been improved by exposing the in�uencers and their contributions in the debrief, as well as providing a description for each component of the signalto help with interpretation.
Smart Predict Cloud native and converged architecture
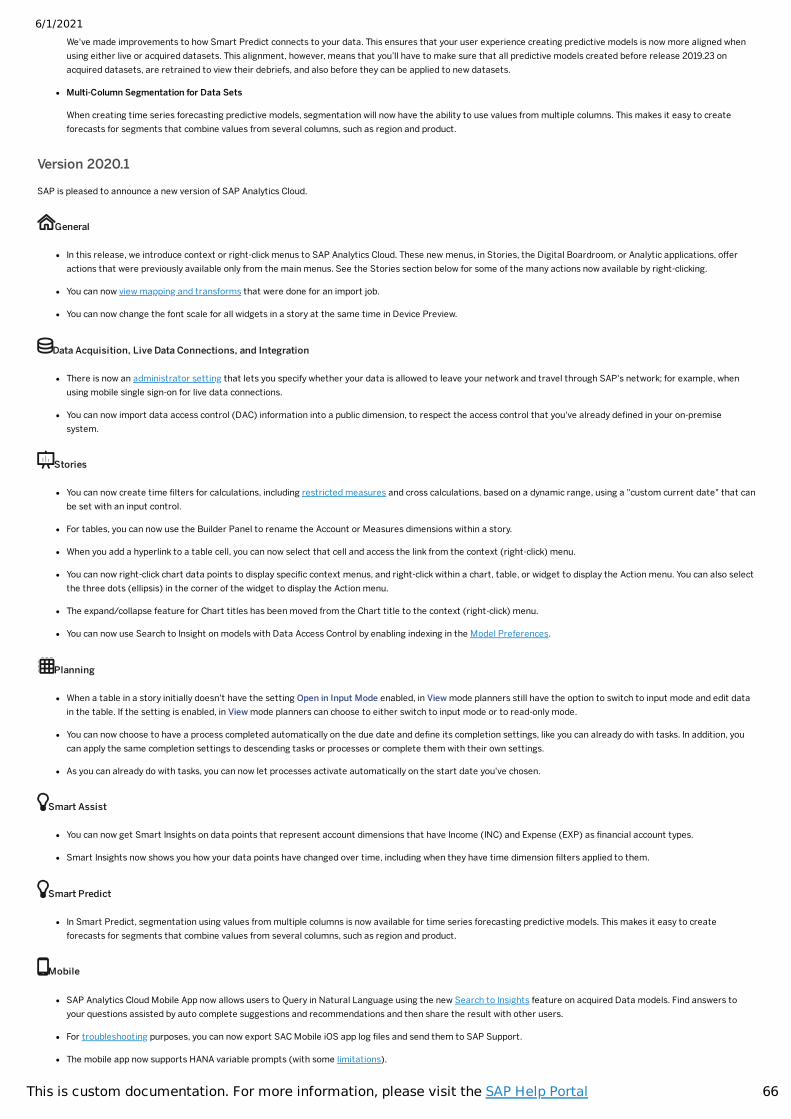
6/1/2021
66This is custom documentation. For more information, please visit the SAP Help Portal
We've made improvements to how Smart Predict connects to your data. This ensures that your user experience creating predictive models is now more aligned whenusing either live or acquired datasets. This alignment, however, means that you’ll have to make sure that all predictive models created before release 2019.23 onacquired datasets, are retrained to view their debriefs, and also before they can be applied to new datasets.
Multi-Column Segmentation for Data Sets
When creating time series forecasting predictive models, segmentation will now have the ability to use values from multiple columns. This makes it easy to createforecasts for segments that combine values from several columns, such as region and product.
Version 2020.1
SAP is pleased to announce a new version of SAP Analytics Cloud.
General
In this release, we introduce context or right-click menus to SAP Analytics Cloud. These new menus, in Stories, the Digital Boardroom, or Analytic applications, offeractions that were previously available only from the main menus. See the Stories section below for some of the many actions now available by right-clicking.
You can now view mapping and transforms that were done for an import job.
You can now change the font scale for all widgets in a story at the same time in Device Preview.
Data Acquisition, Live Data Connections, and Integration
There is now an administrator setting that lets you specify whether your data is allowed to leave your network and travel through SAP's network; for example, whenusing mobile single sign-on for live data connections.
You can now import data access control (DAC) information into a public dimension, to respect the access control that you've already de�ned in your on-premisesystem.
Stories
You can now create time �lters for calculations, including restricted measures and cross calculations, based on a dynamic range, using a "custom current date" that canbe set with an input control.
For tables, you can now use the Builder Panel to rename the Account or Measures dimensions within a story.
When you add a hyperlink to a table cell, you can now select that cell and access the link from the context (right-click) menu.
You can now right-click chart data points to display speci�c context menus, and right-click within a chart, table, or widget to display the Action menu. You can also selectthe three dots (ellipsis) in the corner of the widget to display the Action menu.
The expand/collapse feature for Chart titles has been moved from the Chart title to the context (right-click) menu.
You can now use Search to Insight on models with Data Access Control by enabling indexing in the Model Preferences.
Planning
When a table in a story initially doesn't have the setting Open in Input Mode enabled, in View mode planners still have the option to switch to input mode and edit datain the table. If the setting is enabled, in View mode planners can choose to either switch to input mode or to read-only mode.
You can now choose to have a process completed automatically on the due date and de�ne its completion settings, like you can already do with tasks. In addition, youcan apply the same completion settings to descending tasks or processes or complete them with their own settings.
As you can already do with tasks, you can now let processes activate automatically on the start date you've chosen.
Smart Assist
You can now get Smart Insights on data points that represent account dimensions that have Income (INC) and Expense (EXP) as �nancial account types.
Smart Insights now shows you how your data points have changed over time, including when they have time dimension �lters applied to them.
Smart Predict
In Smart Predict, segmentation using values from multiple columns is now available for time series forecasting predictive models. This makes it easy to createforecasts for segments that combine values from several columns, such as region and product.
Mobile
SAP Analytics Cloud Mobile App now allows users to Query in Natural Language using the new Search to Insights feature on acquired Data models. Find answers toyour questions assisted by auto complete suggestions and recommendations and then share the result with other users.
For troubleshooting purposes, you can now export SAC Mobile iOS app log �les and send them to SAP Support.
The mobile app now supports HANA variable prompts (with some limitations).
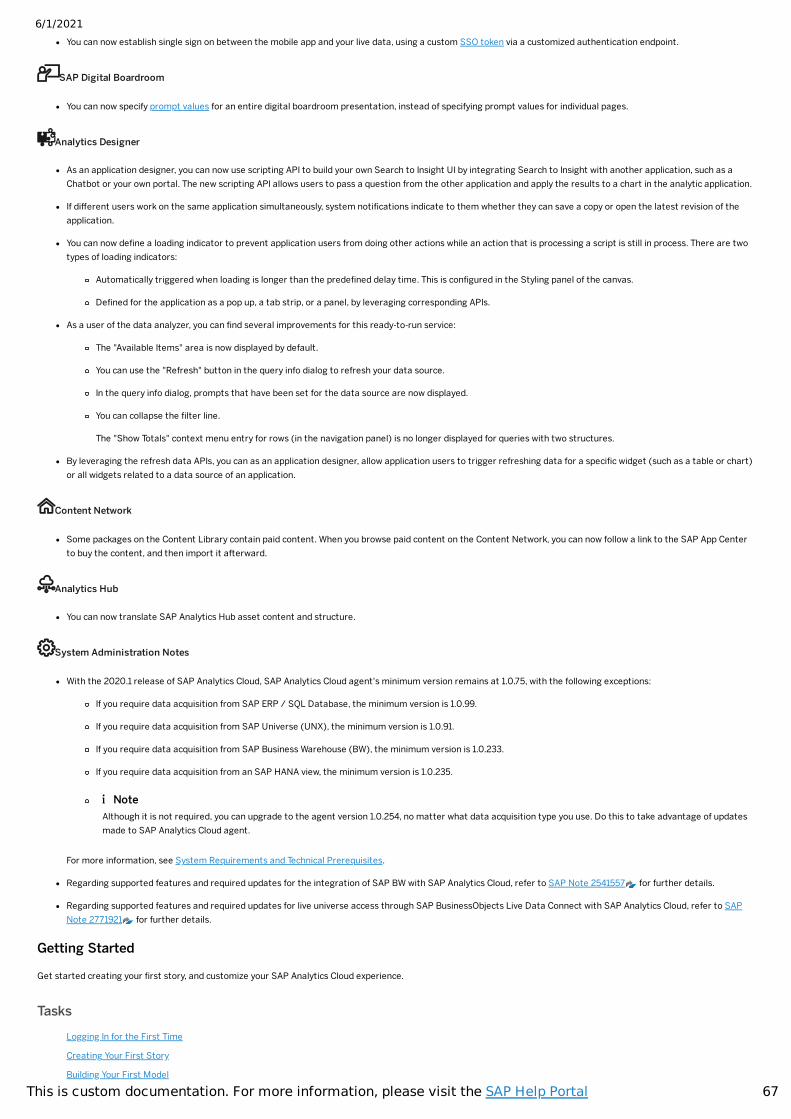
6/1/2021
67This is custom documentation. For more information, please visit the SAP Help Portal
You can now establish single sign on between the mobile app and your live data, using a custom SSO token via a customized authentication endpoint.
SAP Digital Boardroom
You can now specify prompt values for an entire digital boardroom presentation, instead of specifying prompt values for individual pages.
Analytics Designer
As an application designer, you can now use scripting API to build your own Search to Insight UI by integrating Search to Insight with another application, such as aChatbot or your own portal. The new scripting API allows users to pass a question from the other application and apply the results to a chart in the analytic application.
If different users work on the same application simultaneously, system noti�cations indicate to them whether they can save a copy or open the latest revision of theapplication.
You can now de�ne a loading indicator to prevent application users from doing other actions while an action that is processing a script is still in process. There are twotypes of loading indicators:
Automatically triggered when loading is longer than the prede�ned delay time. This is con�gured in the Styling panel of the canvas.
De�ned for the application as a pop up, a tab strip, or a panel, by leveraging corresponding APIs.
As a user of the data analyzer, you can �nd several improvements for this ready-to-run service:
The "Available Items" area is now displayed by default.
You can use the "Refresh" button in the query info dialog to refresh your data source.
In the query info dialog, prompts that have been set for the data source are now displayed.
You can collapse the �lter line.
The "Show Totals" context menu entry for rows (in the navigation panel) is no longer displayed for queries with two structures.
By leveraging the refresh data APIs, you can as an application designer, allow application users to trigger refreshing data for a speci�c widget (such as a table or chart)or all widgets related to a data source of an application.
Content Network
Some packages on the Content Library contain paid content. When you browse paid content on the Content Network, you can now follow a link to the SAP App Centerto buy the content, and then import it afterward.
Analytics Hub
You can now translate SAP Analytics Hub asset content and structure.
System Administration Notes
With the 2020.1 release of SAP Analytics Cloud, SAP Analytics Cloud agent's minimum version remains at 1.0.75, with the following exceptions:
If you require data acquisition from SAP ERP / SQL Database, the minimum version is 1.0.99.
If you require data acquisition from SAP Universe (UNX), the minimum version is 1.0.91.
If you require data acquisition from SAP Business Warehouse (BW), the minimum version is 1.0.233.
If you require data acquisition from an SAP HANA view, the minimum version is 1.0.235.
For more information, see System Requirements and Technical Prerequisites.
Regarding supported features and required updates for the integration of SAP BW with SAP Analytics Cloud, refer to SAP Note 2541557 for further details.
Regarding supported features and required updates for live universe access through SAP BusinessObjects Live Data Connect with SAP Analytics Cloud, refer to SAPNote 2771921 for further details.
Getting Started
Get started creating your �rst story, and customize your SAP Analytics Cloud experience.
TasksLogging In for the First Time
Creating Your First Story
Building Your First Model
NoteAlthough it is not required, you can upgrade to the agent version 1.0.254, no matter what data acquisition type you use. Do this to take advantage of updatesmade to SAP Analytics Cloud agent.
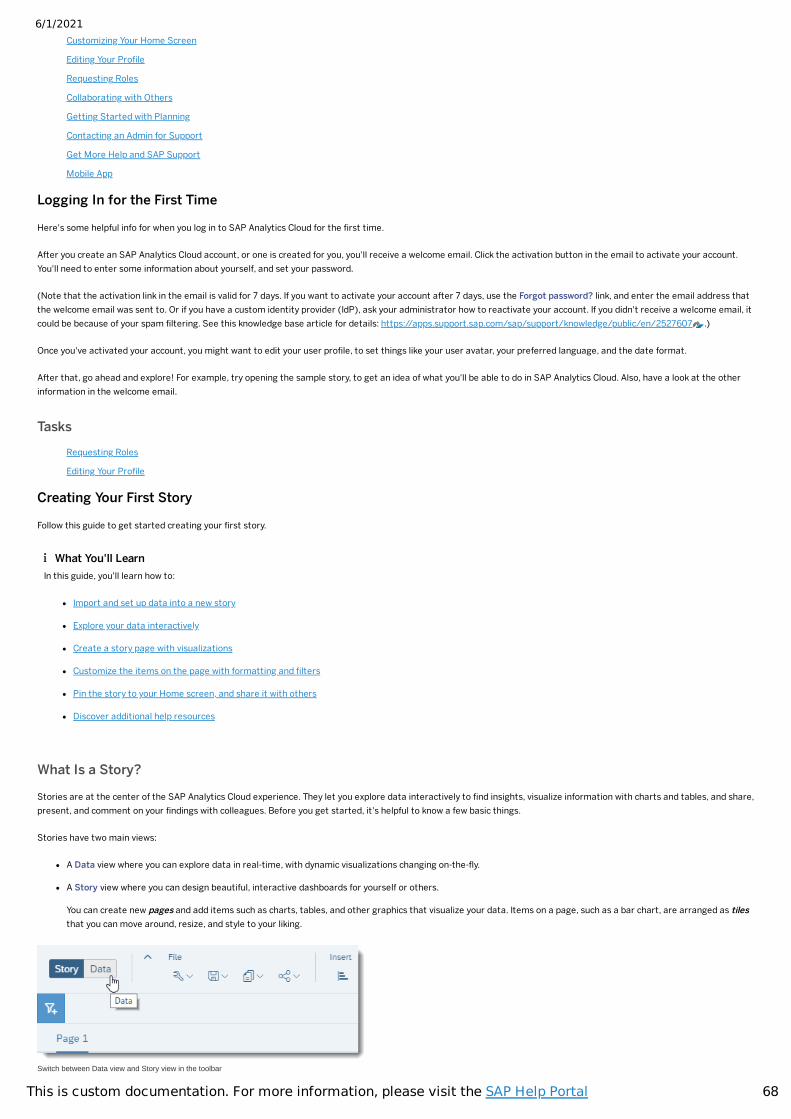
6/1/2021
68This is custom documentation. For more information, please visit the SAP Help Portal
Customizing Your Home Screen
Editing Your Pro�le
Requesting Roles
Collaborating with Others
Getting Started with Planning
Contacting an Admin for Support
Get More Help and SAP Support
Mobile App
Logging In for the First Time
Here's some helpful info for when you log in to SAP Analytics Cloud for the �rst time.
After you create an SAP Analytics Cloud account, or one is created for you, you'll receive a welcome email. Click the activation button in the email to activate your account.You'll need to enter some information about yourself, and set your password.
(Note that the activation link in the email is valid for 7 days. If you want to activate your account after 7 days, use the Forgot password? link, and enter the email address thatthe welcome email was sent to. Or if you have a custom identity provider (IdP), ask your administrator how to reactivate your account. If you didn't receive a welcome email, itcould be because of your spam �ltering. See this knowledge base article for details: https://apps.support.sap.com/sap/support/knowledge/public/en/2527607 .)
Once you've activated your account, you might want to edit your user pro�le, to set things like your user avatar, your preferred language, and the date format.
After that, go ahead and explore! For example, try opening the sample story, to get an idea of what you'll be able to do in SAP Analytics Cloud. Also, have a look at the otherinformation in the welcome email.
TasksRequesting Roles
Editing Your Pro�le
Creating Your First Story
Follow this guide to get started creating your �rst story.
What Is a Story?
Stories are at the center of the SAP Analytics Cloud experience. They let you explore data interactively to �nd insights, visualize information with charts and tables, and share,present, and comment on your �ndings with colleagues. Before you get started, it's helpful to know a few basic things.
Stories have two main views:
A Data view where you can explore data in real-time, with dynamic visualizations changing on-the-�y.
A Story view where you can design beautiful, interactive dashboards for yourself or others.
You can create new pages and add items such as charts, tables, and other graphics that visualize your data. Items on a page, such as a bar chart, are arranged as tilesthat you can move around, resize, and style to your liking.
Switch between Data view and Story view in the toolbar
What You'll LearnIn this guide, you'll learn how to:
Import and set up data into a new story
Explore your data interactively
Create a story page with visualizations
Customize the items on the page with formatting and �lters
Pin the story to your Home screen, and share it with others
Discover additional help resources
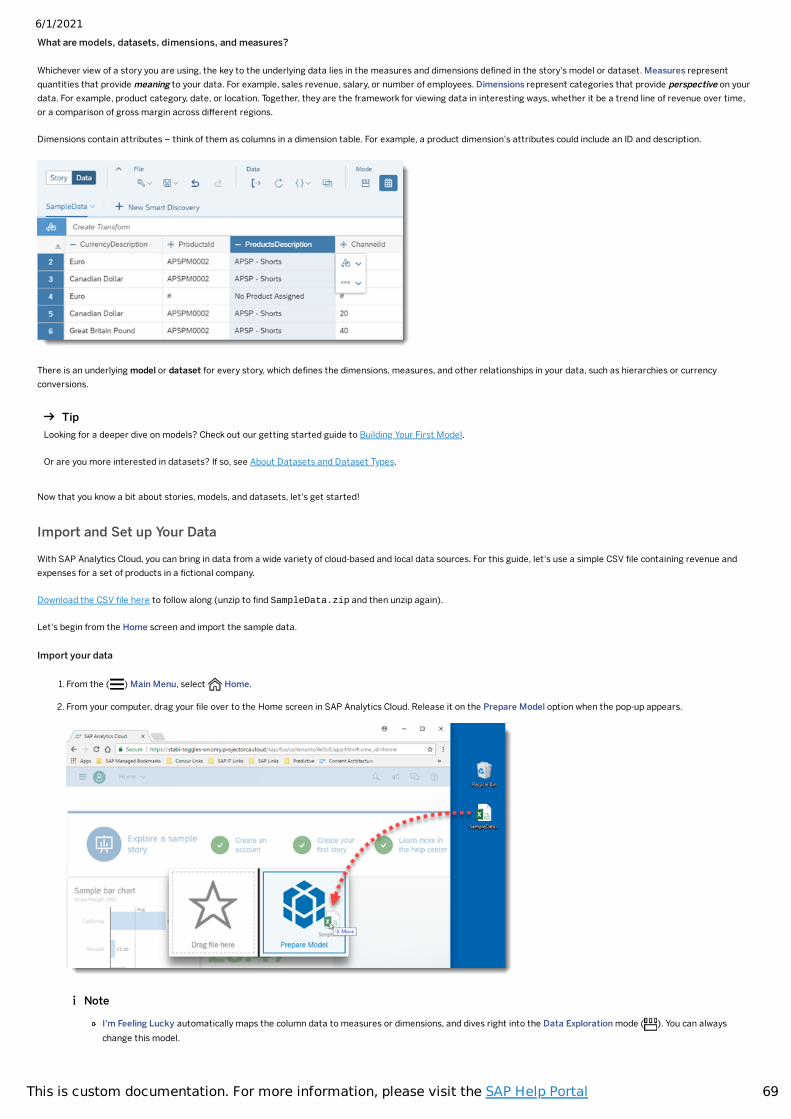
6/1/2021
69This is custom documentation. For more information, please visit the SAP Help Portal
What are models, datasets, dimensions, and measures?
Whichever view of a story you are using, the key to the underlying data lies in the measures and dimensions de�ned in the story's model or dataset. Measures representquantities that provide meaning to your data. For example, sales revenue, salary, or number of employees. Dimensions represent categories that provide perspective on yourdata. For example, product category, date, or location. Together, they are the framework for viewing data in interesting ways, whether it be a trend line of revenue over time,or a comparison of gross margin across different regions.
Dimensions contain attributes – think of them as columns in a dimension table. For example, a product dimension's attributes could include an ID and description.
There is an underlying model or dataset for every story, which de�nes the dimensions, measures, and other relationships in your data, such as hierarchies or currencyconversions.
Now that you know a bit about stories, models, and datasets, let's get started!
Import and Set up Your Data
With SAP Analytics Cloud, you can bring in data from a wide variety of cloud-based and local data sources. For this guide, let's use a simple CSV �le containing revenue andexpenses for a set of products in a �ctional company.
Download the CSV �le here to follow along (unzip to �nd SampleData.zip and then unzip again).
Let's begin from the Home screen and import the sample data.
Import your data
1. From the ( ) Main Menu, select Home.
2. From your computer, drag your �le over to the Home screen in SAP Analytics Cloud. Release it on the Prepare Model option when the pop-up appears.
TipLooking for a deeper dive on models? Check out our getting started guide to Building Your First Model.
Or are you more interested in datasets? If so, see About Datasets and Dataset Types.
Note
I'm Feeling Lucky automatically maps the column data to measures or dimensions, and dives right into the Data Exploration mode ( ). You can alwayschange this model.
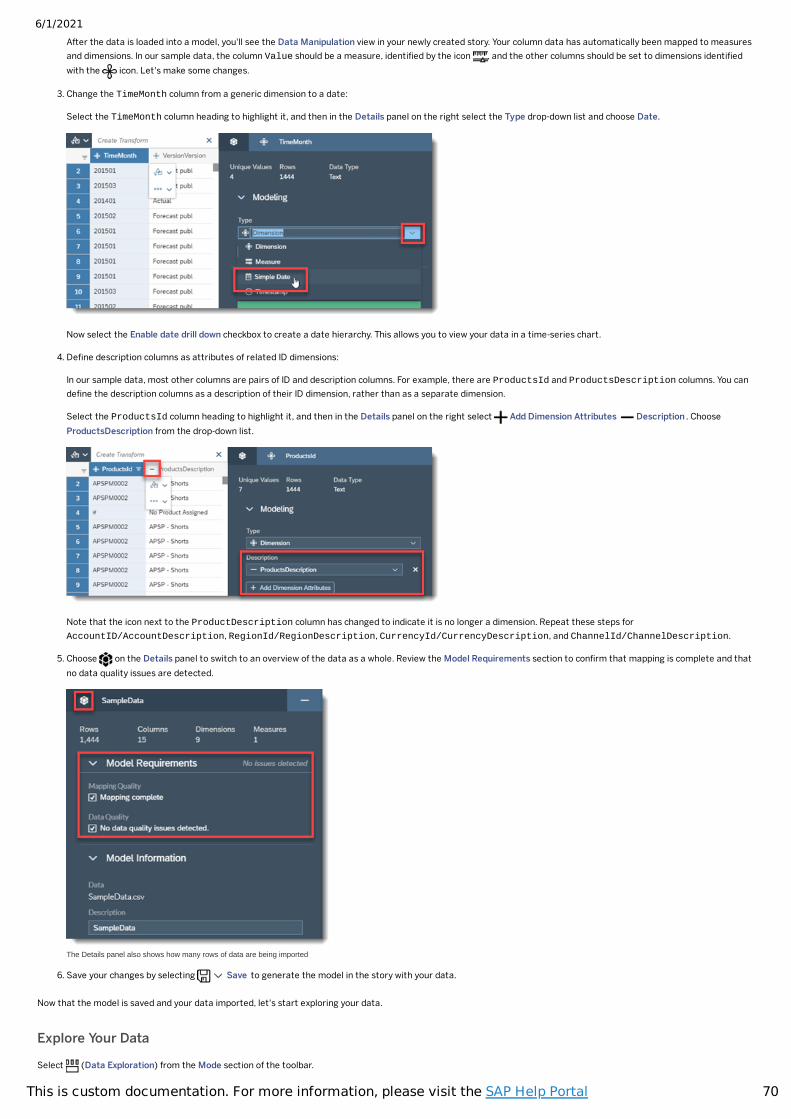
6/1/2021
70This is custom documentation. For more information, please visit the SAP Help Portal
After the data is loaded into a model, you'll see the Data Manipulation view in your newly created story. Your column data has automatically been mapped to measuresand dimensions. In our sample data, the column Value should be a measure, identi�ed by the icon , and the other columns should be set to dimensions identi�edwith the icon. Let's make some changes.
3. Change the TimeMonth column from a generic dimension to a date:
Select the TimeMonth column heading to highlight it, and then in the Details panel on the right select the Type drop-down list and choose Date.
Now select the Enable date drill down checkbox to create a date hierarchy. This allows you to view your data in a time-series chart.
4. De�ne description columns as attributes of related ID dimensions:
In our sample data, most other columns are pairs of ID and description columns. For example, there are ProductsId and ProductsDescription columns. You cande�ne the description columns as a description of their ID dimension, rather than as a separate dimension.
Select the ProductsId column heading to highlight it, and then in the Details panel on the right select Add Dimension Attributes Description . ChooseProductsDescription from the drop-down list.
Note that the icon next to the ProductDescription column has changed to indicate it is no longer a dimension. Repeat these steps forAccountID/AccountDescription, RegionId/RegionDescription, CurrencyId/CurrencyDescription, and ChannelId/ChannelDescription.
5. Choose on the Details panel to switch to an overview of the data as a whole. Review the Model Requirements section to con�rm that mapping is complete and thatno data quality issues are detected.
The Details panel also shows how many rows of data are being imported
6. Save your changes by selecting Save to generate the model in the story with your data.
Now that the model is saved and your data imported, let's start exploring your data.
Explore Your Data
Select (Data Exploration) from the Mode section of the toolbar.
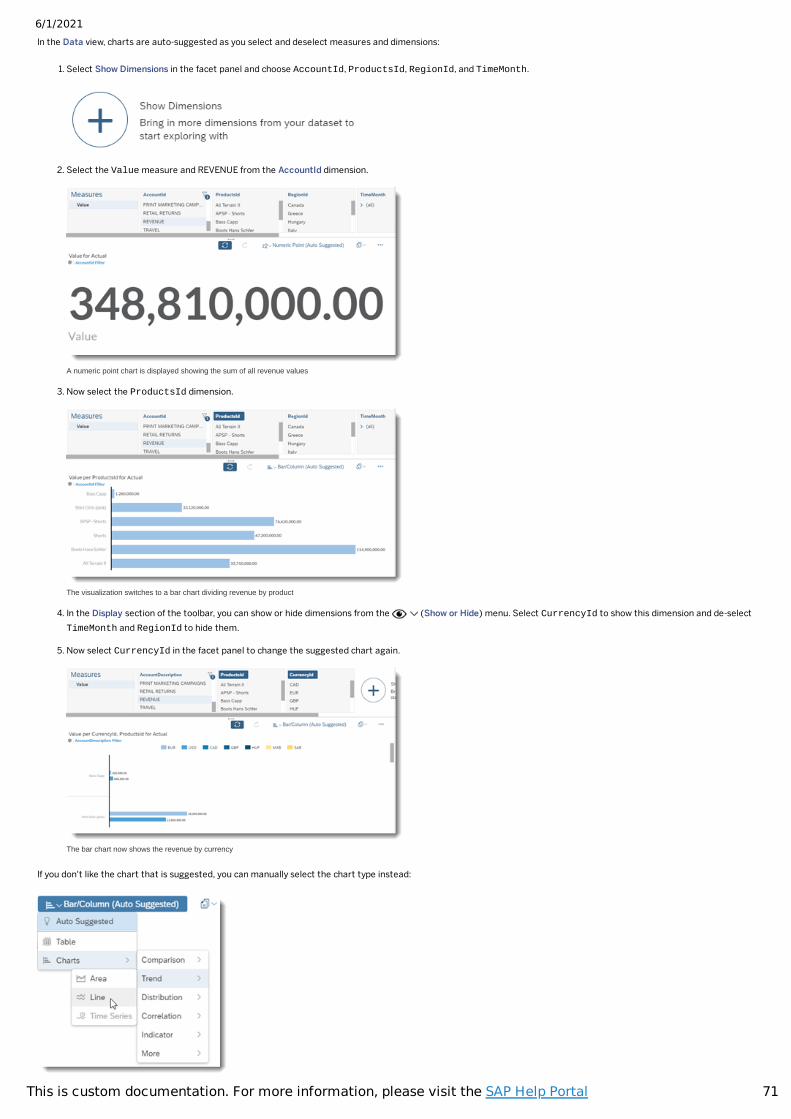
6/1/2021
71This is custom documentation. For more information, please visit the SAP Help Portal
In the Data view, charts are auto-suggested as you select and deselect measures and dimensions:
1. Select Show Dimensions in the facet panel and choose AccountId, ProductsId, RegionId, and TimeMonth.
2. Select the Value measure and REVENUE from the AccountId dimension.
A numeric point chart is displayed showing the sum of all revenue values
3. Now select the ProductsId dimension.
The visualization switches to a bar chart dividing revenue by product
4. In the Display section of the toolbar, you can show or hide dimensions from the (Show or Hide) menu. Select CurrencyId to show this dimension and de-selectTimeMonth and RegionId to hide them.
5. Now select CurrencyId in the facet panel to change the suggested chart again.
The bar chart now shows the revenue by currency
If you don't like the chart that is suggested, you can manually select the chart type instead:
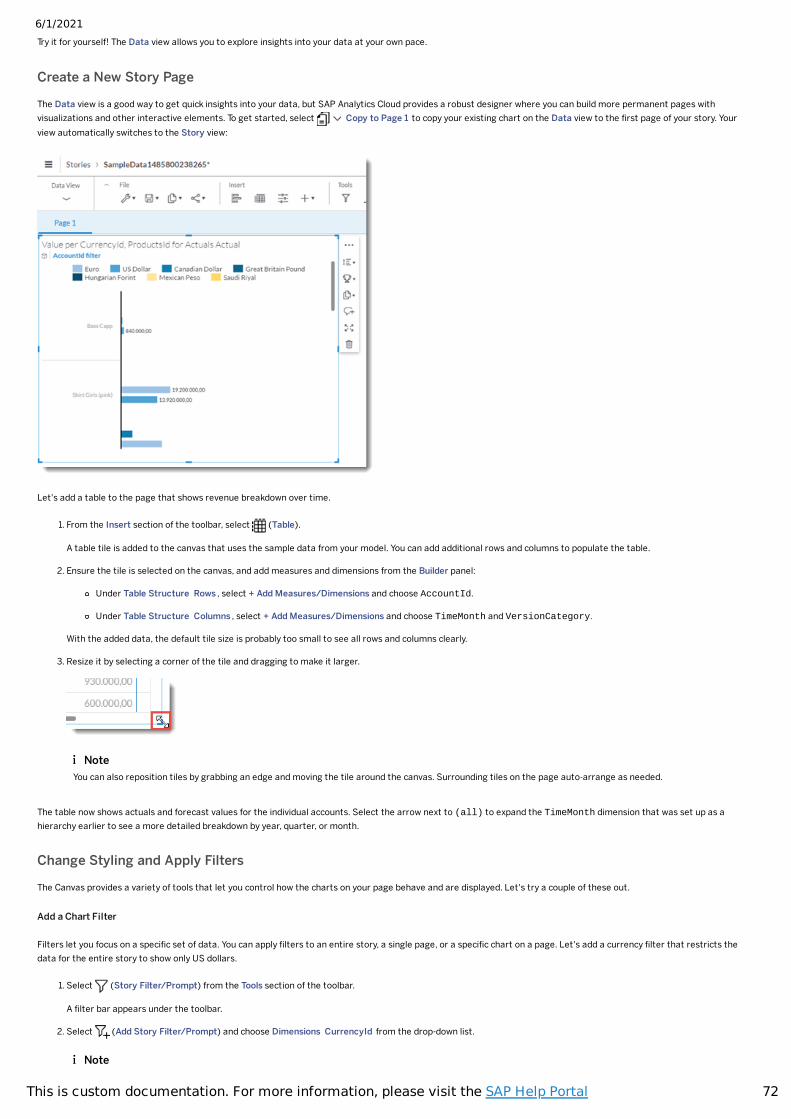
6/1/2021
72This is custom documentation. For more information, please visit the SAP Help Portal
Try it for yourself! The Data view allows you to explore insights into your data at your own pace.
Create a New Story Page
The Data view is a good way to get quick insights into your data, but SAP Analytics Cloud provides a robust designer where you can build more permanent pages withvisualizations and other interactive elements. To get started, select Copy to Page 1 to copy your existing chart on the Data view to the �rst page of your story. Yourview automatically switches to the Story view:
Let's add a table to the page that shows revenue breakdown over time.
1. From the Insert section of the toolbar, select (Table).
A table tile is added to the canvas that uses the sample data from your model. You can add additional rows and columns to populate the table.
2. Ensure the tile is selected on the canvas, and add measures and dimensions from the Builder panel:
Under Table Structure Rows , select + Add Measures/Dimensions and choose AccountId.
Under Table Structure Columns , select + Add Measures/Dimensions and choose TimeMonth and VersionCategory.
With the added data, the default tile size is probably too small to see all rows and columns clearly.
3. Resize it by selecting a corner of the tile and dragging to make it larger.
The table now shows actuals and forecast values for the individual accounts. Select the arrow next to (all) to expand the TimeMonth dimension that was set up as ahierarchy earlier to see a more detailed breakdown by year, quarter, or month.
Change Styling and Apply Filters
The Canvas provides a variety of tools that let you control how the charts on your page behave and are displayed. Let's try a couple of these out.
Add a Chart Filter
Filters let you focus on a speci�c set of data. You can apply �lters to an entire story, a single page, or a speci�c chart on a page. Let's add a currency �lter that restricts thedata for the entire story to show only US dollars.
1. Select (Story Filter/Prompt) from the Tools section of the toolbar.
A �lter bar appears under the toolbar.
2. Select (Add Story Filter/Prompt) and choose Dimensions CurrencyId from the drop-down list.
NoteYou can also reposition tiles by grabbing an edge and moving the tile around the canvas. Surrounding tiles on the page auto-arrange as needed.
Note
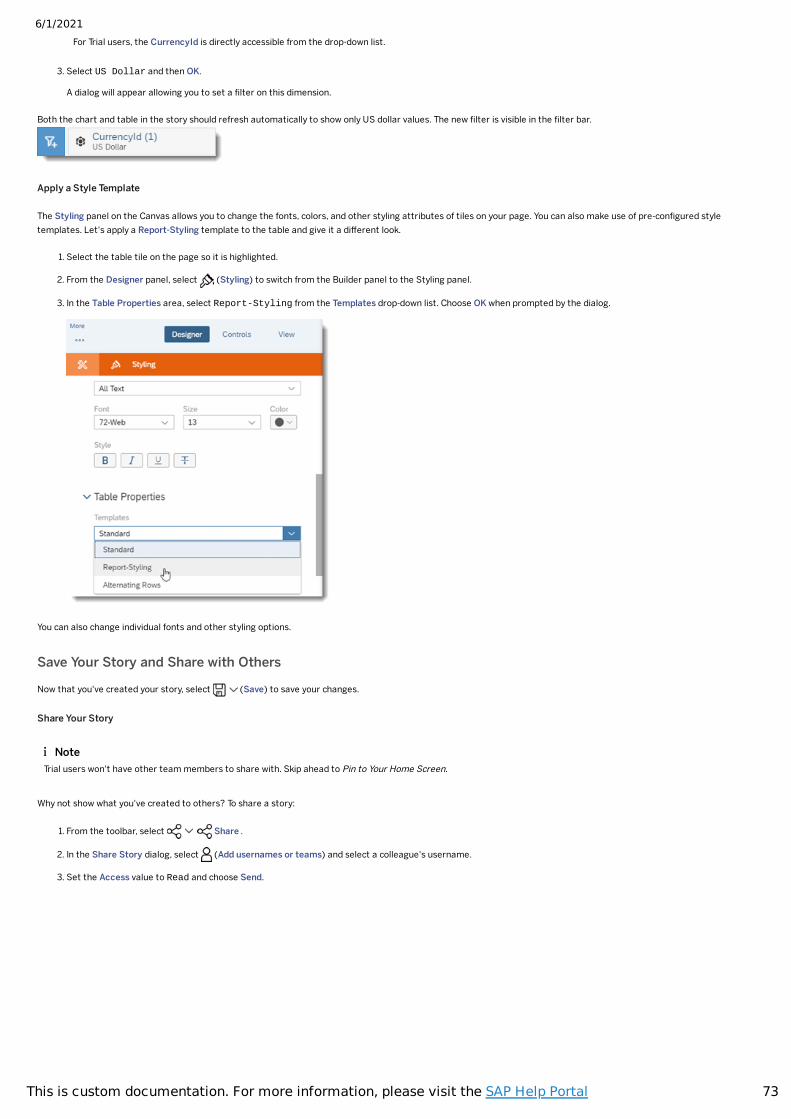
6/1/2021
73This is custom documentation. For more information, please visit the SAP Help Portal
3. Select US Dollar and then OK.
A dialog will appear allowing you to set a �lter on this dimension.
Both the chart and table in the story should refresh automatically to show only US dollar values. The new �lter is visible in the �lter bar.
Apply a Style Template
The Styling panel on the Canvas allows you to change the fonts, colors, and other styling attributes of tiles on your page. You can also make use of pre-con�gured styletemplates. Let's apply a Report-Styling template to the table and give it a different look.
1. Select the table tile on the page so it is highlighted.
2. From the Designer panel, select (Styling) to switch from the Builder panel to the Styling panel.
3. In the Table Properties area, select Report-Styling from the Templates drop-down list. Choose OK when prompted by the dialog.
You can also change individual fonts and other styling options.
Save Your Story and Share with Others
Now that you've created your story, select (Save) to save your changes.
Share Your Story
Why not show what you've created to others? To share a story:
1. From the toolbar, select Share .
2. In the Share Story dialog, select (Add usernames or teams) and select a colleague's username.
3. Set the Access value to Read and choose Send.
For Trial users, the CurrencyId is directly accessible from the drop-down list.
NoteTrial users won't have other team members to share with. Skip ahead to Pin to Your Home Screen.
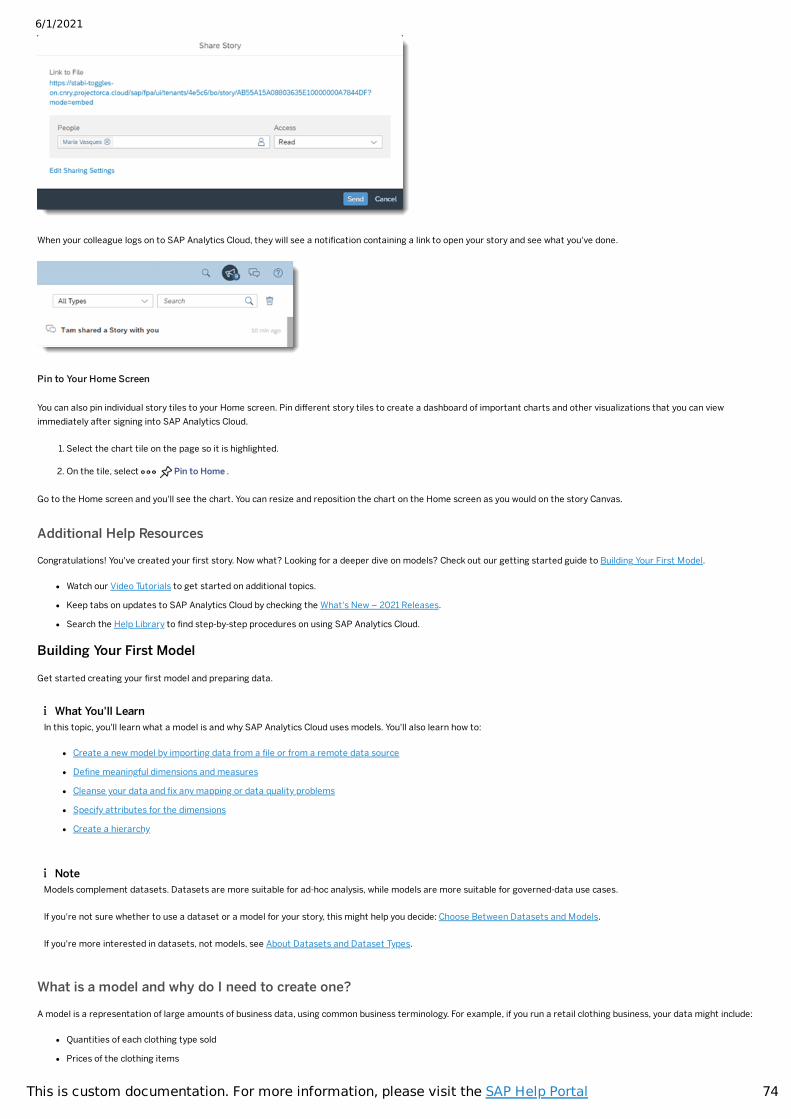
6/1/2021
74This is custom documentation. For more information, please visit the SAP Help Portal
When your colleague logs on to SAP Analytics Cloud, they will see a noti�cation containing a link to open your story and see what you've done.
Pin to Your Home Screen
You can also pin individual story tiles to your Home screen. Pin different story tiles to create a dashboard of important charts and other visualizations that you can viewimmediately after signing into SAP Analytics Cloud.
1. Select the chart tile on the page so it is highlighted.
2. On the tile, select Pin to Home .
Go to the Home screen and you'll see the chart. You can resize and reposition the chart on the Home screen as you would on the story Canvas.
Additional Help Resources
Congratulations! You've created your �rst story. Now what? Looking for a deeper dive on models? Check out our getting started guide to Building Your First Model.
Watch our Video Tutorials to get started on additional topics.
Keep tabs on updates to SAP Analytics Cloud by checking the What's New – 2021 Releases.
Search the Help Library to �nd step-by-step procedures on using SAP Analytics Cloud.
Building Your First Model
Get started creating your �rst model and preparing data.
What is a model and why do I need to create one?
A model is a representation of large amounts of business data, using common business terminology. For example, if you run a retail clothing business, your data might include:
Quantities of each clothing type sold
Prices of the clothing items
What You'll LearnIn this topic, you'll learn what a model is and why SAP Analytics Cloud uses models. You'll also learn how to:
Create a new model by importing data from a �le or from a remote data source
De�ne meaningful dimensions and measures
Cleanse your data and �x any mapping or data quality problems
Specify attributes for the dimensions
Create a hierarchy
NoteModels complement datasets. Datasets are more suitable for ad-hoc analysis, while models are more suitable for governed-data use cases.
If you're not sure whether to use a dataset or a model for your story, this might help you decide: Choose Between Datasets and Models.
If you're more interested in datasets, not models, see About Datasets and Dataset Types.
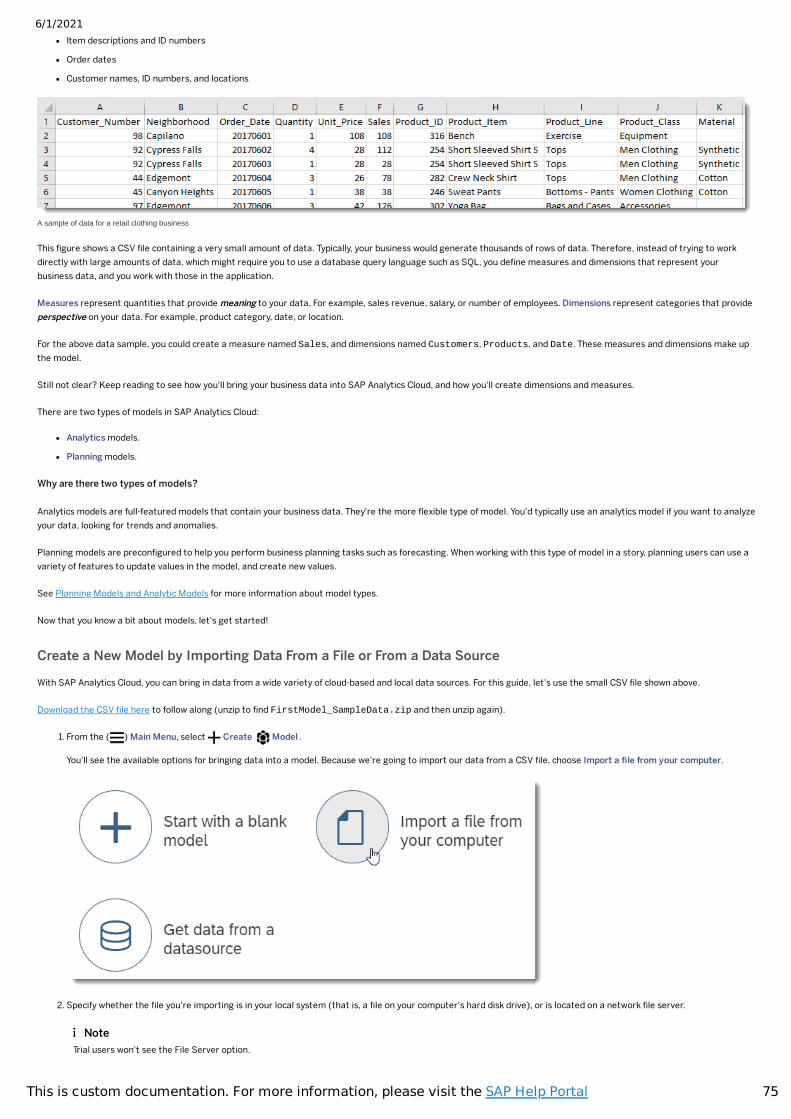
6/1/2021
75This is custom documentation. For more information, please visit the SAP Help Portal
Item descriptions and ID numbers
Order dates
Customer names, ID numbers, and locations
A sample of data for a retail clothing business
This �gure shows a CSV �le containing a very small amount of data. Typically, your business would generate thousands of rows of data. Therefore, instead of trying to workdirectly with large amounts of data, which might require you to use a database query language such as SQL, you de�ne measures and dimensions that represent yourbusiness data, and you work with those in the application.
Measures represent quantities that provide meaning to your data. For example, sales revenue, salary, or number of employees. Dimensions represent categories that provideperspective on your data. For example, product category, date, or location.
For the above data sample, you could create a measure named Sales, and dimensions named Customers, Products, and Date. These measures and dimensions make upthe model.
Still not clear? Keep reading to see how you'll bring your business data into SAP Analytics Cloud, and how you'll create dimensions and measures.
There are two types of models in SAP Analytics Cloud:
Analytics models.
Planning models.
Why are there two types of models?
Analytics models are full-featured models that contain your business data. They're the more �exible type of model. You'd typically use an analytics model if you want to analyzeyour data, looking for trends and anomalies.
Planning models are precon�gured to help you perform business planning tasks such as forecasting. When working with this type of model in a story, planning users can use avariety of features to update values in the model, and create new values.
See Planning Models and Analytic Models for more information about model types.
Now that you know a bit about models, let's get started!
Create a New Model by Importing Data From a File or From a Data Source
With SAP Analytics Cloud, you can bring in data from a wide variety of cloud-based and local data sources. For this guide, let's use the small CSV �le shown above.
Download the CSV �le here to follow along (unzip to �nd FirstModel_SampleData.zip and then unzip again).
1. From the ( ) Main Menu, select Create Model .
You'll see the available options for bringing data into a model. Because we're going to import our data from a CSV �le, choose Import a �le from your computer.
2. Specify whether the �le you're importing is in your local system (that is, a �le on your computer's hard disk drive), or is located on a network �le server.
NoteTrial users won't see the File Server option.
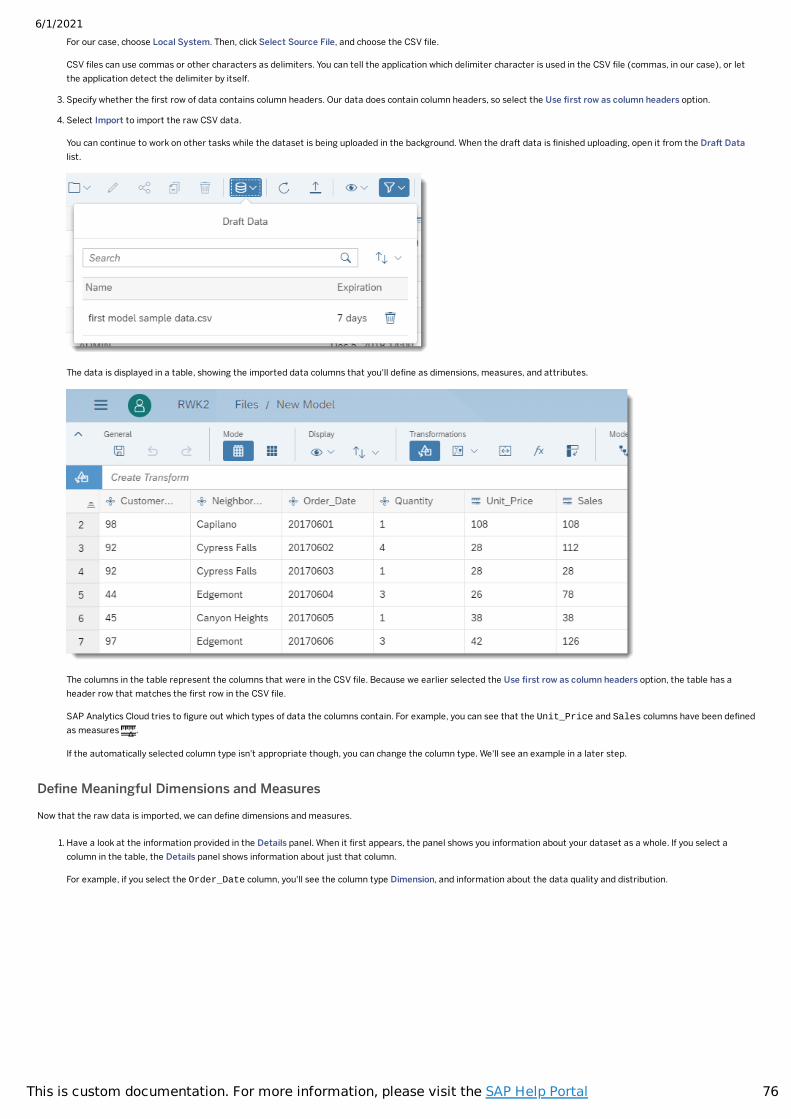
6/1/2021
76This is custom documentation. For more information, please visit the SAP Help Portal
For our case, choose Local System. Then, click Select Source File, and choose the CSV �le.
CSV �les can use commas or other characters as delimiters. You can tell the application which delimiter character is used in the CSV �le (commas, in our case), or letthe application detect the delimiter by itself.
3. Specify whether the �rst row of data contains column headers. Our data does contain column headers, so select the Use �rst row as column headers option.
4. Select Import to import the raw CSV data.
You can continue to work on other tasks while the dataset is being uploaded in the background. When the draft data is �nished uploading, open it from the Draft Datalist.
The data is displayed in a table, showing the imported data columns that you'll de�ne as dimensions, measures, and attributes.
The columns in the table represent the columns that were in the CSV �le. Because we earlier selected the Use �rst row as column headers option, the table has aheader row that matches the �rst row in the CSV �le.
SAP Analytics Cloud tries to �gure out which types of data the columns contain. For example, you can see that the Unit_Price and Sales columns have been de�nedas measures .
If the automatically selected column type isn't appropriate though, you can change the column type. We'll see an example in a later step.
De�ne Meaningful Dimensions and Measures
Now that the raw data is imported, we can de�ne dimensions and measures.
1. Have a look at the information provided in the Details panel. When it �rst appears, the panel shows you information about your dataset as a whole. If you select acolumn in the table, the Details panel shows information about just that column.
For example, if you select the Order_Date column, you'll see the column type Dimension, and information about the data quality and distribution.
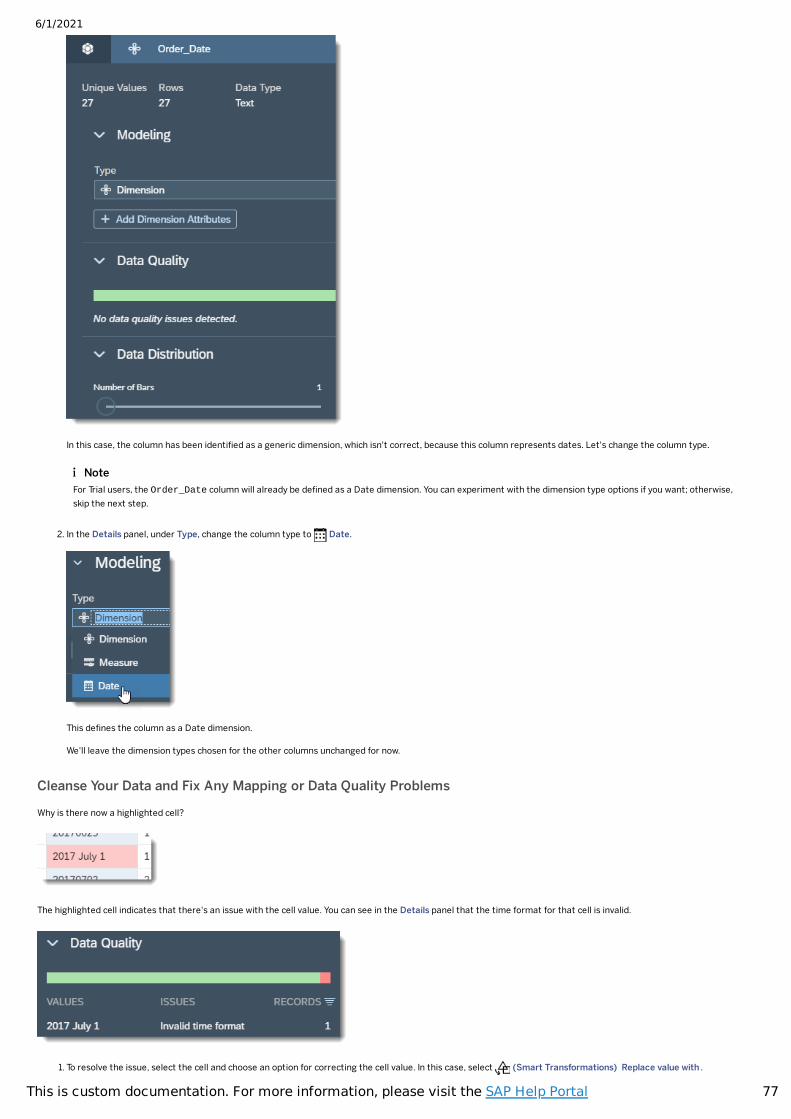
6/1/2021
77This is custom documentation. For more information, please visit the SAP Help Portal
In this case, the column has been identi�ed as a generic dimension, which isn't correct, because this column represents dates. Let's change the column type.
2. In the Details panel, under Type, change the column type to Date.
This de�nes the column as a Date dimension.
We'll leave the dimension types chosen for the other columns unchanged for now.
Cleanse Your Data and Fix Any Mapping or Data Quality Problems
Why is there now a highlighted cell?
The highlighted cell indicates that there's an issue with the cell value. You can see in the Details panel that the time format for that cell is invalid.
1. To resolve the issue, select the cell and choose an option for correcting the cell value. In this case, select (Smart Transformations) Replace value with .
NoteFor Trial users, the Order_Date column will already be de�ned as a Date dimension. You can experiment with the dimension type options if you want; otherwise,skip the next step.
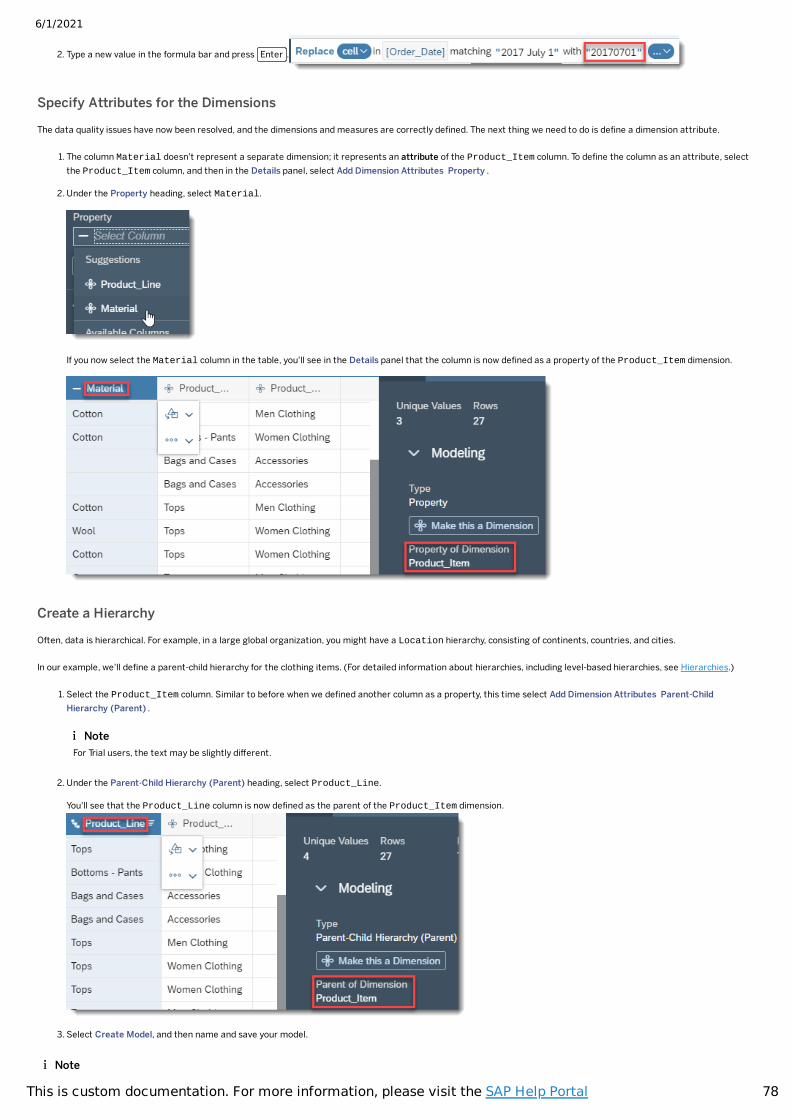
6/1/2021
78This is custom documentation. For more information, please visit the SAP Help Portal
2. Type a new value in the formula bar and press Enter .
Specify Attributes for the Dimensions
The data quality issues have now been resolved, and the dimensions and measures are correctly de�ned. The next thing we need to do is de�ne a dimension attribute.
1. The column Material doesn't represent a separate dimension; it represents an attribute of the Product_Item column. To de�ne the column as an attribute, selectthe Product_Item column, and then in the Details panel, select Add Dimension Attributes Property .
2. Under the Property heading, select Material.
If you now select the Material column in the table, you'll see in the Details panel that the column is now de�ned as a property of the Product_Item dimension.
Create a Hierarchy
Often, data is hierarchical. For example, in a large global organization, you might have a Location hierarchy, consisting of continents, countries, and cities.
In our example, we'll de�ne a parent-child hierarchy for the clothing items. (For detailed information about hierarchies, including level-based hierarchies, see Hierarchies.)
1. Select the Product_Item column. Similar to before when we de�ned another column as a property, this time select Add Dimension Attributes Parent-ChildHierarchy (Parent) .
2. Under the Parent-Child Hierarchy (Parent) heading, select Product_Line.
You'll see that the Product_Line column is now de�ned as the parent of the Product_Item dimension.
3. Select Create Model, and then name and save your model.
NoteFor Trial users, the text may be slightly different.
Note
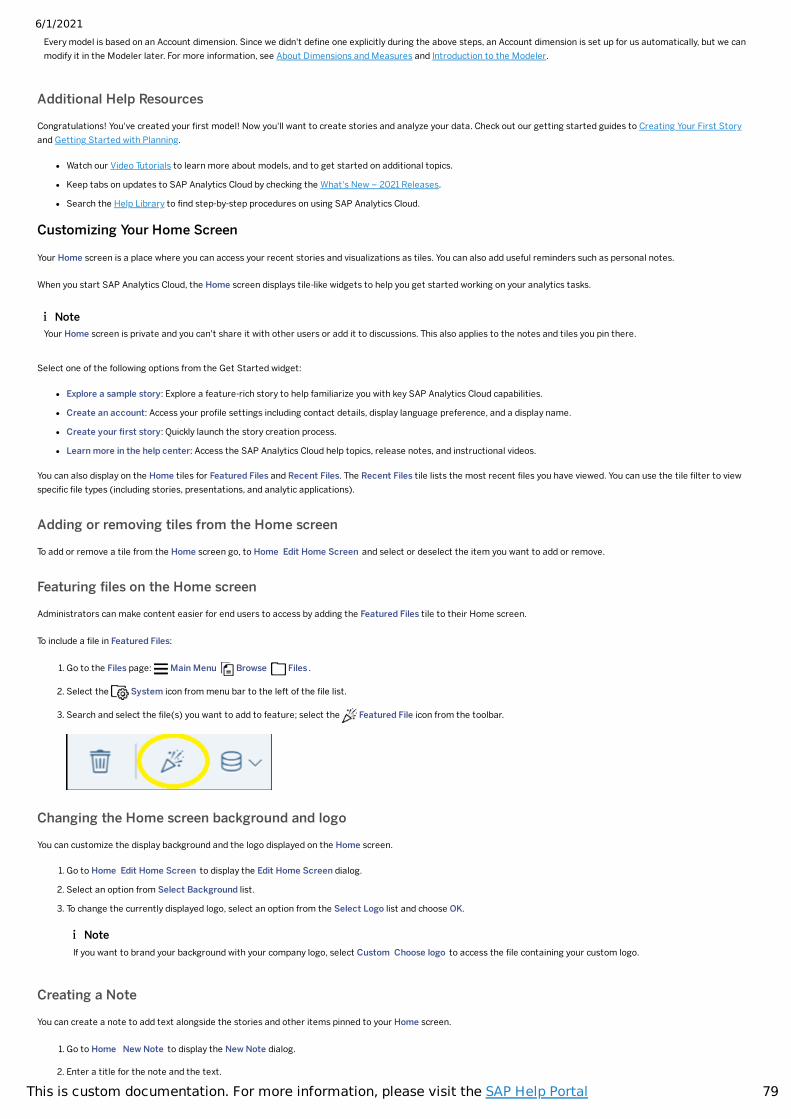
6/1/2021
79This is custom documentation. For more information, please visit the SAP Help Portal
Additional Help Resources
Congratulations! You've created your �rst model! Now you'll want to create stories and analyze your data. Check out our getting started guides to Creating Your First Storyand Getting Started with Planning.
Watch our Video Tutorials to learn more about models, and to get started on additional topics.
Keep tabs on updates to SAP Analytics Cloud by checking the What's New – 2021 Releases.
Search the Help Library to �nd step-by-step procedures on using SAP Analytics Cloud.
Customizing Your Home Screen
Your Home screen is a place where you can access your recent stories and visualizations as tiles. You can also add useful reminders such as personal notes.
When you start SAP Analytics Cloud, the Home screen displays tile-like widgets to help you get started working on your analytics tasks.
Select one of the following options from the Get Started widget:
Explore a sample story: Explore a feature-rich story to help familiarize you with key SAP Analytics Cloud capabilities.
Create an account: Access your pro�le settings including contact details, display language preference, and a display name.
Create your �rst story: Quickly launch the story creation process.
Learn more in the help center: Access the SAP Analytics Cloud help topics, release notes, and instructional videos.
You can also display on the Home tiles for Featured Files and Recent Files. The Recent Files tile lists the most recent �les you have viewed. You can use the tile �lter to viewspeci�c �le types (including stories, presentations, and analytic applications).
Adding or removing tiles from the Home screen
To add or remove a tile from the Home screen go, to Home Edit Home Screen and select or deselect the item you want to add or remove.
Featuring �les on the Home screen
Administrators can make content easier for end users to access by adding the Featured Files tile to their Home screen.
To include a �le in Featured Files:
1. Go to the Files page: Main Menu Browse Files .
2. Select the System icon from menu bar to the left of the �le list.
3. Search and select the �le(s) you want to add to feature; select the Featured File icon from the toolbar.
Changing the Home screen background and logo
You can customize the display background and the logo displayed on the Home screen.
1. Go to Home Edit Home Screen to display the Edit Home Screen dialog.
2. Select an option from Select Background list.
3. To change the currently displayed logo, select an option from the Select Logo list and choose OK.
Creating a Note
You can create a note to add text alongside the stories and other items pinned to your Home screen.
1. Go to Home New Note to display the New Note dialog.
2. Enter a title for the note and the text.
Every model is based on an Account dimension. Since we didn't de�ne one explicitly during the above steps, an Account dimension is set up for us automatically, but we canmodify it in the Modeler later. For more information, see About Dimensions and Measures and Introduction to the Modeler.
NoteYour Home screen is private and you can't share it with other users or add it to discussions. This also applies to the notes and tiles you pin there.
NoteIf you want to brand your background with your company logo, select Custom Choose logo to access the �le containing your custom logo.
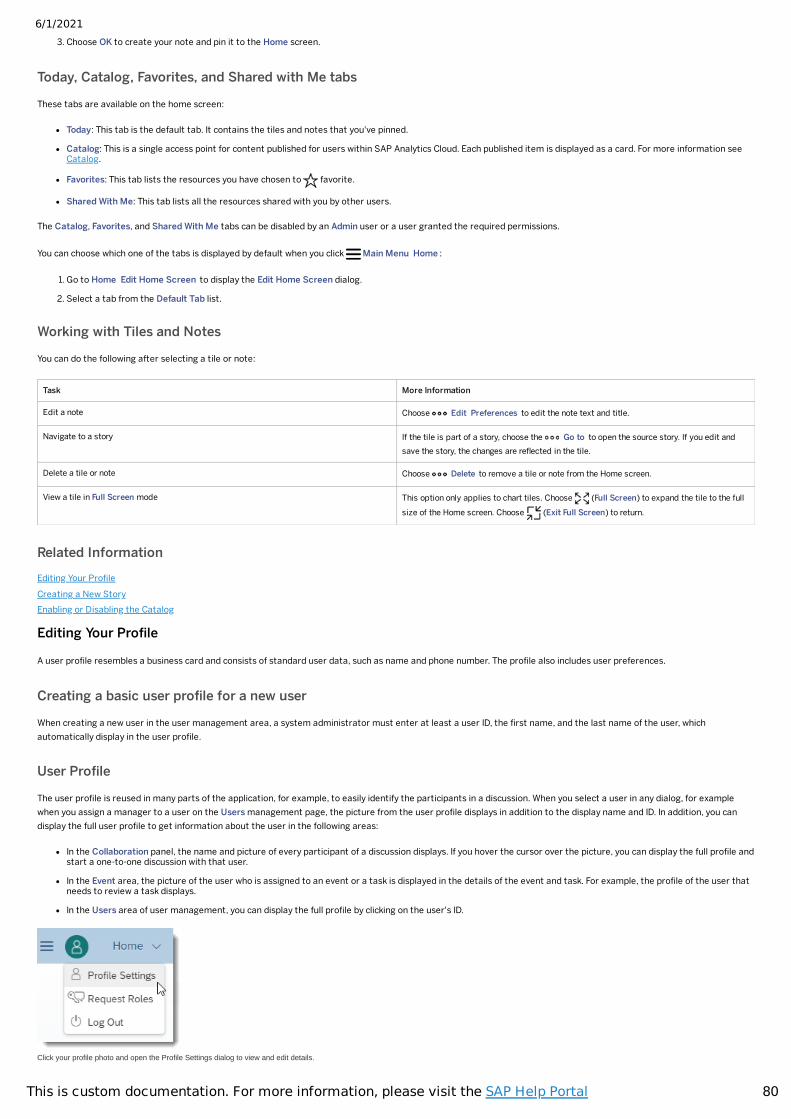
6/1/2021
80This is custom documentation. For more information, please visit the SAP Help Portal
3. Choose OK to create your note and pin it to the Home screen.
Today, Catalog, Favorites, and Shared with Me tabs
These tabs are available on the home screen:
Today: This tab is the default tab. It contains the tiles and notes that you've pinned.
Catalog: This is a single access point for content published for users within SAP Analytics Cloud. Each published item is displayed as a card. For more information seeCatalog.
Favorites: This tab lists the resources you have chosen to favorite.
Shared With Me: This tab lists all the resources shared with you by other users.
The Catalog, Favorites, and Shared With Me tabs can be disabled by an Admin user or a user granted the required permissions.
You can choose which one of the tabs is displayed by default when you click Main Menu Home :
1. Go to Home Edit Home Screen to display the Edit Home Screen dialog.
2. Select a tab from the Default Tab list.
Working with Tiles and Notes
You can do the following after selecting a tile or note:
Task More Information
Edit a note Choose Edit Preferences to edit the note text and title.
Navigate to a story If the tile is part of a story, choose the Go to to open the source story. If you edit andsave the story, the changes are re�ected in the tile.
Delete a tile or note Choose Delete to remove a tile or note from the Home screen.
View a tile in Full Screen mode This option only applies to chart tiles. Choose (Full Screen) to expand the tile to the fullsize of the Home screen. Choose (Exit Full Screen) to return.
Related InformationEditing Your Pro�leCreating a New StoryEnabling or Disabling the Catalog
Editing Your Pro�le
A user pro�le resembles a business card and consists of standard user data, such as name and phone number. The pro�le also includes user preferences.
Creating a basic user pro�le for a new user
When creating a new user in the user management area, a system administrator must enter at least a user ID, the �rst name, and the last name of the user, whichautomatically display in the user pro�le.
User Pro�le
The user pro�le is reused in many parts of the application, for example, to easily identify the participants in a discussion. When you select a user in any dialog, for examplewhen you assign a manager to a user on the Users management page, the picture from the user pro�le displays in addition to the display name and ID. In addition, you candisplay the full user pro�le to get information about the user in the following areas:
In the Collaboration panel, the name and picture of every participant of a discussion displays. If you hover the cursor over the picture, you can display the full pro�le andstart a one-to-one discussion with that user.
In the Event area, the picture of the user who is assigned to an event or a task is displayed in the details of the event and task. For example, the pro�le of the user thatneeds to review a task displays.
In the Users area of user management, you can display the full pro�le by clicking on the user's ID.
Click your profile photo and open the Profile Settings dialog to view and edit details.
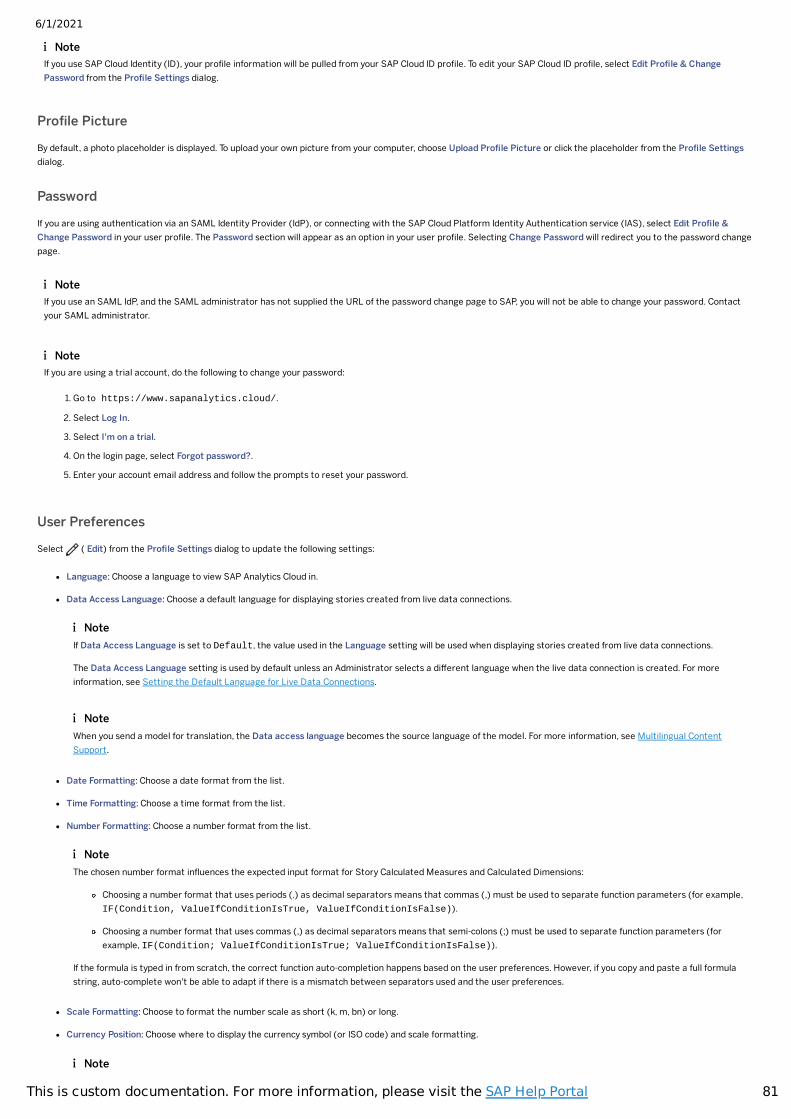
6/1/2021
81This is custom documentation. For more information, please visit the SAP Help Portal
Pro�le Picture
By default, a photo placeholder is displayed. To upload your own picture from your computer, choose Upload Pro�le Picture or click the placeholder from the Pro�le Settingsdialog.
Password
If you are using authentication via an SAML Identity Provider (IdP), or connecting with the SAP Cloud Platform Identity Authentication service (IAS), select Edit Pro�le &Change Password in your user pro�le. The Password section will appear as an option in your user pro�le. Selecting Change Password will redirect you to the password changepage.
User Preferences
Select ( Edit) from the Pro�le Settings dialog to update the following settings:
Language: Choose a language to view SAP Analytics Cloud in.
Data Access Language: Choose a default language for displaying stories created from live data connections.
Date Formatting: Choose a date format from the list.
Time Formatting: Choose a time format from the list.
Number Formatting: Choose a number format from the list.
Scale Formatting: Choose to format the number scale as short (k, m, bn) or long.
Currency Position: Choose where to display the currency symbol (or ISO code) and scale formatting.
NoteIf you use SAP Cloud Identity (ID), your pro�le information will be pulled from your SAP Cloud ID pro�le. To edit your SAP Cloud ID pro�le, select Edit Pro�le & ChangePassword from the Pro�le Settings dialog.
NoteIf you use an SAML IdP, and the SAML administrator has not supplied the URL of the password change page to SAP, you will not be able to change your password. Contactyour SAML administrator.
NoteIf you are using a trial account, do the following to change your password:
1. Go to https://www.sapanalytics.cloud/.
2. Select Log In.
3. Select I'm on a trial.
4. On the login page, select Forgot password?.
5. Enter your account email address and follow the prompts to reset your password.
NoteIf Data Access Language is set to Default, the value used in the Language setting will be used when displaying stories created from live data connections.
The Data Access Language setting is used by default unless an Administrator selects a different language when the live data connection is created. For moreinformation, see Setting the Default Language for Live Data Connections.
NoteWhen you send a model for translation, the Data access language becomes the source language of the model. For more information, see Multilingual ContentSupport.
NoteThe chosen number format in�uences the expected input format for Story Calculated Measures and Calculated Dimensions:
Choosing a number format that uses periods (.) as decimal separators means that commas (,) must be used to separate function parameters (for example,IF(Condition, ValueIfConditionIsTrue, ValueIfConditionIsFalse)).
Choosing a number format that uses commas (,) as decimal separators means that semi-colons (;) must be used to separate function parameters (forexample, IF(Condition; ValueIfConditionIsTrue; ValueIfConditionIsFalse)).
If the formula is typed in from scratch, the correct function auto-completion happens based on the user preferences. However, if you copy and paste a full formulastring, auto-complete won't be able to adapt if there is a mismatch between separators used and the user preferences.
Note
6/1/2021
82This is custom documentation. For more information, please visit the SAP Help Portal
Clean up noti�cations: Choose a date after which you want the system to delete noti�cations. Otherwise, the system keeps the most recent 500 noti�cations.
Default Application: Sets the landing page displayed when you access the SAP Analytics Cloud URL.
Email Noti�cation: To receive information via email about system activities, for example when a new password is set, enable this feature.
Requesting Roles
As a user of SAP Analytics Cloud, you can request additional roles in the system.
Context
To request roles as a business user, do the following:
Procedure1. With the user name and initial password you received from your system administrator, log into SAP Analytics Cloud.
2. Select your user pro�le photo in the top bar (which may be the default image if you haven't uploaded a photo yet), and choose Request Roles.
3. In the dialog, choose one of the following options:
To request standard roles that the administrator has de�ned, choose Default Roles and select the role you need.
To request individual roles, choose Self Service Roles and select the role you need.
4. You can optionally add a comment, for example, to explain why you need the selected role.
5. Send your request.
Collaborating with Others
Use social collaboration options to support and optimize group decision-making processes.
All collaboration activity is grouped under discussion threads. Choose (Collaboration) from the main toolbar to see a list of discussions that you have been invited to. Youcan start a new discussion at any time by choosing (New Discussion) and inviting speci�c participants or teams. Only people who have been invited can see the discussion.
Select a discussion to open it. All contributions which have been posted are listed in chronological order. Here you can read all previous posts and make new contributions tothe discussion. Discussions are fully integrated with the application: you can simply click on any linked item in the thread to open the content. Once a discussion is created, youdo any of the following by choosing ( New) at the bottom of the discussion panel:
Attach a �le to the discussion; �les that are already stored in the �le repository or �les saved locally on your computer.
Link a discussion to the currently displayed story. You can only link discussions to saved stories. To remove the link to the story select the (More Actions) icon to theright of the current title and choose Related Content X on the story's image.
Create a task for any of the discussion participants.
A discussion can only be deleted by the user who created it. With the exception of the discussion creator, all other participants have the option to leave a discussion. However,if you're part of a team that has been invited to a discussion, you cannot leave the discussion. You can still access and read archived discussions once you leave a discussion(available from the list of closed discussions) but no new additions can be made.
Noti�cations and Email
Noti�cations are used throughout SAP Analytics Cloud to send system messages to users. A noti�cation may be sent, for example, when users are invited to join a discussion,or when users are newly added to a team and invited to a discussion, when a comment is added to a shared story, or when reminders become due. You may not be noti�ed ifyou are added to a team that is already in a discussion or if you are removed from a team which is part of a discussion.
For SAP BW, this features requires the following patch:“ 2700031 - InA: Complex Units / Unit Index”
NoteThis setting will appear only when the user has an Analytics Hub license.
NoteRoles cannot be requested if you are using a trial account.
NoteBy default discussions have automatically generated titles based on the display names of the other participants. To change the discussion title, select the (MoreActions) icon to the right of the current title and choose Preferences. Select , enter a new name in the Select a Group Name �eld and save with .
NoteYou can con�gure a custom SMTP server for email delivery. For more information, see Con�guring Custom SMTP Server.
6/1/2021
83This is custom documentation. For more information, please visit the SAP Help Portal
To read your noti�cations choose (Noti�cations) on the main toolbar. Noti�cations can also be read by users with the SAP Analytics Cloud mobile app and sent to users byemail.
After you read a noti�cation, you can delete it by selecting the X icon that appears when you hover over it. To delete all noti�cations, select ( Delete All Noti�cations) icon.
Stories and Events
Stories and Events in particular are closely integrated with the Collaboration panel:
Under Collaboration, the Comments panel lists all the comment threads posted for speci�c pages or widgets within a story. Under speci�c circumstances you canalso see comments posted on data points in a table. For more information, see Adding Comments to a Data Cell.
Whenever you create a new event a discussion thread is automatically created so that you can collaborate with the group of colleagues assigned to the event. For anyactions arising from a discussion thread you can quickly create new tasks and assign these to colleagues.
If you create a new discussion while working on a story, you need to explicitly link the discussion to the story.
Related InformationCollaboration for StoriesAdding Comments to a Data Cell
Getting Started with Planning
Business planning can include a wide range of complex processes. Read this guide to get a basic understanding of some of these processes, and to learn how SAP AnalyticsCloud can help you carry them out.
What is planning?
Planning is all about setting strategic goals for a business and then determining how to meet those goals by creating annual budgets, tracking progress in forecasts, andsimulating scenarios to �nd new opportunities. These plans are formed by projecting historical data (known as actuals) into the future, by gathering input from differentdepartments, and by considering trends, risks, and opportunities in the market.
For example, the executive leadership of a bicycle manufacturer notices the growing demand for electric bikes, and decides to increase the sale of e-bikes by 20 percent overthe next three years. In the upcoming year's budget, the Finance department determines the overall cost and income resulting from this plan.
However, planning activities aren't restricted to executives and �nancial analysts. Departments across the organization collaborate on the plan:
Sales managers set new quotas for their account executives, determine which geographic areas will make up the increased sales, and incentivize e-bike sales withhigher commissions.
The Marketing department plans promotions and advertising campaigns to drive higher e-bike sales.
The Operations department makes sure that the supply chain and manufacturing capacity are available to increase e-bike inventory.
HR plans to hire technicians who have experience with electric motors and to create new training resources for existing staff.
These departmental plans each relate back to the central �nancial plan, and to the overall goal set out by leadership. Successful plans often include input from manyemployees, not just from �nance experts.
NoteNoti�cation settings can be set in the User Preferences section of your Pro�le: you can choose whether to send emails in addition to noti�cations (the email address foreach user is de�ned in the user pro�le) and a housekeeping option is available to automatically delete old noti�cations.
Topic SectionsThis guide contains the following sections:
What is planning?
How can SAP Analytics Cloud help?
Planning in the new model type
Find out about planning features
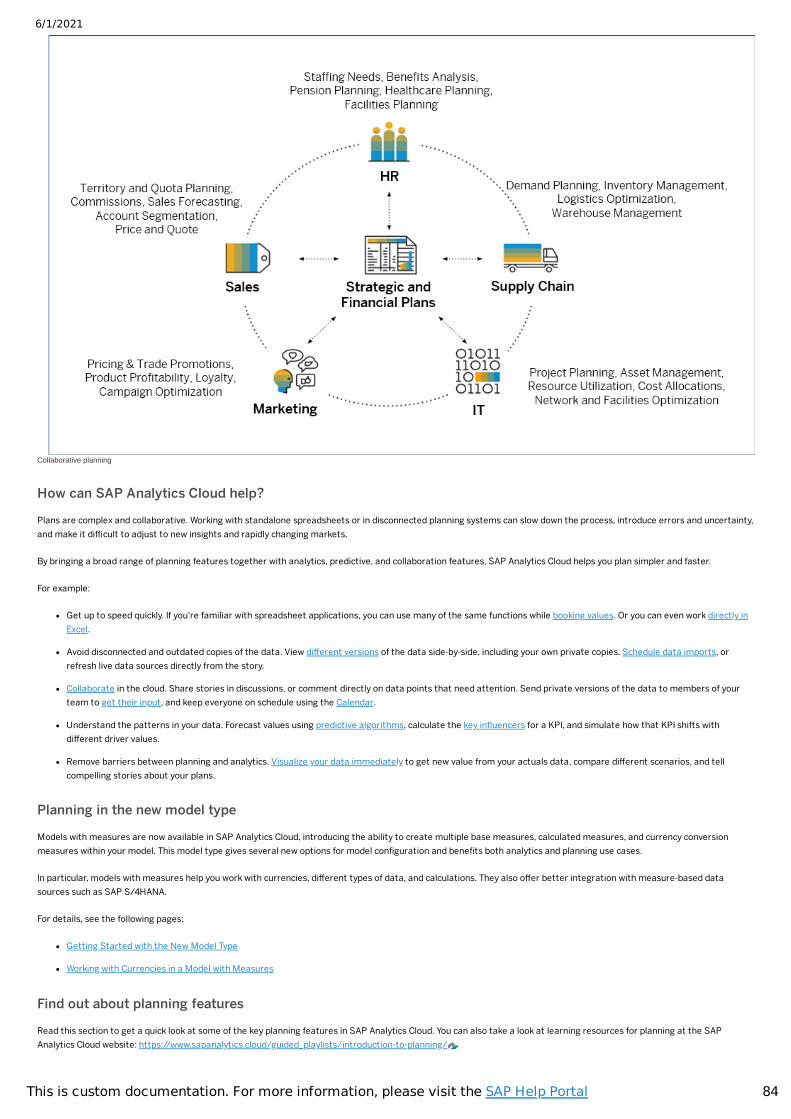
6/1/2021
84This is custom documentation. For more information, please visit the SAP Help Portal
Collaborative planning
How can SAP Analytics Cloud help?
Plans are complex and collaborative. Working with standalone spreadsheets or in disconnected planning systems can slow down the process, introduce errors and uncertainty,and make it difficult to adjust to new insights and rapidly changing markets.
By bringing a broad range of planning features together with analytics, predictive, and collaboration features, SAP Analytics Cloud helps you plan simpler and faster.
For example:
Get up to speed quickly. If you're familiar with spreadsheet applications, you can use many of the same functions while booking values. Or you can even work directly inExcel.
Avoid disconnected and outdated copies of the data. View different versions of the data side-by-side, including your own private copies. Schedule data imports, orrefresh live data sources directly from the story.
Collaborate in the cloud. Share stories in discussions, or comment directly on data points that need attention. Send private versions of the data to members of yourteam to get their input, and keep everyone on schedule using the Calendar.
Understand the patterns in your data. Forecast values using predictive algorithms, calculate the key in�uencers for a KPI, and simulate how that KPI shifts withdifferent driver values.
Remove barriers between planning and analytics. Visualize your data immediately to get new value from your actuals data, compare different scenarios, and tellcompelling stories about your plans.
Planning in the new model type
Models with measures are now available in SAP Analytics Cloud, introducing the ability to create multiple base measures, calculated measures, and currency conversionmeasures within your model. This model type gives several new options for model con�guration and bene�ts both analytics and planning use cases.
In particular, models with measures help you work with currencies, different types of data, and calculations. They also offer better integration with measure-based datasources such as SAP S/4HANA.
For details, see the following pages:
Getting Started with the New Model Type
Working with Currencies in a Model with Measures
Find out about planning features
Read this section to get a quick look at some of the key planning features in SAP Analytics Cloud. You can also take a look at learning resources for planning at the SAPAnalytics Cloud website: https://www.sapanalytics.cloud/guided_playlists/introduction-to-planning/
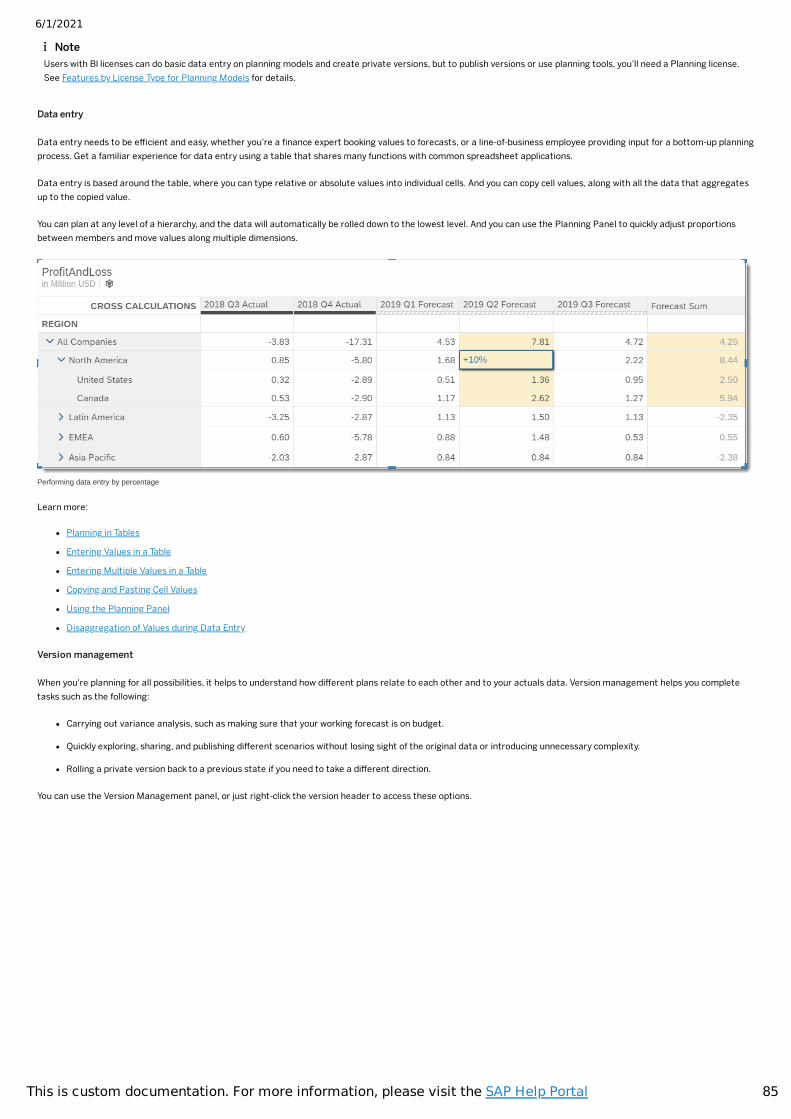
6/1/2021
85This is custom documentation. For more information, please visit the SAP Help Portal
Data entry
Data entry needs to be efficient and easy, whether you’re a �nance expert booking values to forecasts, or a line-of-business employee providing input for a bottom-up planningprocess. Get a familiar experience for data entry using a table that shares many functions with common spreadsheet applications.
Data entry is based around the table, where you can type relative or absolute values into individual cells. And you can copy cell values, along with all the data that aggregatesup to the copied value.
You can plan at any level of a hierarchy, and the data will automatically be rolled down to the lowest level. And you can use the Planning Panel to quickly adjust proportionsbetween members and move values along multiple dimensions.
Performing data entry by percentage
Learn more:
Planning in Tables
Entering Values in a Table
Entering Multiple Values in a Table
Copying and Pasting Cell Values
Using the Planning Panel
Disaggregation of Values during Data Entry
Version management
When you're planning for all possibilities, it helps to understand how different plans relate to each other and to your actuals data. Version management helps you completetasks such as the following:
Carrying out variance analysis, such as making sure that your working forecast is on budget.
Quickly exploring, sharing, and publishing different scenarios without losing sight of the original data or introducing unnecessary complexity.
Rolling a private version back to a previous state if you need to take a different direction.
You can use the Version Management panel, or just right-click the version header to access these options.
NoteUsers with BI licenses can do basic data entry on planning models and create private versions, but to publish versions or use planning tools, you’ll need a Planning license.See Features by License Type for Planning Models for details.
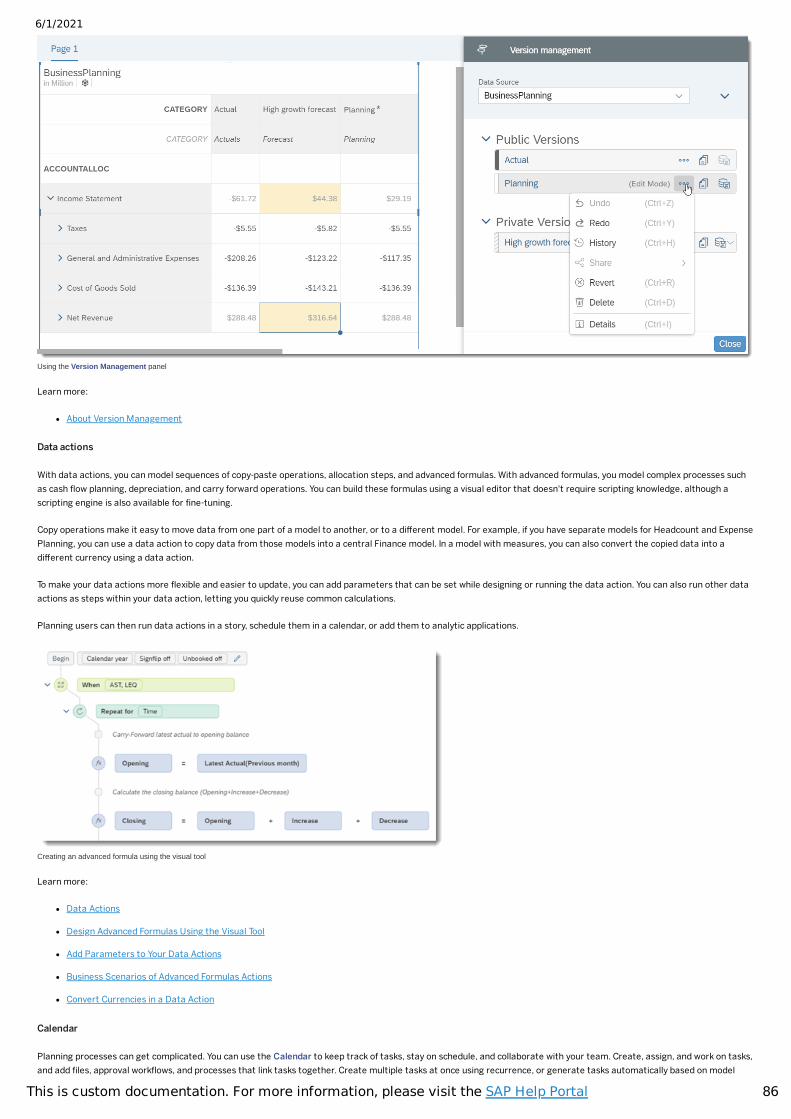
6/1/2021
86This is custom documentation. For more information, please visit the SAP Help Portal
Using the Version Management panel
Learn more:
About Version Management
Data actions
With data actions, you can model sequences of copy-paste operations, allocation steps, and advanced formulas. With advanced formulas, you model complex processes suchas cash �ow planning, depreciation, and carry forward operations. You can build these formulas using a visual editor that doesn't require scripting knowledge, although ascripting engine is also available for �ne-tuning.
Copy operations make it easy to move data from one part of a model to another, or to a different model. For example, if you have separate models for Headcount and ExpensePlanning, you can use a data action to copy data from those models into a central Finance model. In a model with measures, you can also convert the copied data into adifferent currency using a data action.
To make your data actions more �exible and easier to update, you can add parameters that can be set while designing or running the data action. You can also run other dataactions as steps within your data action, letting you quickly reuse common calculations.
Planning users can then run data actions in a story, schedule them in a calendar, or add them to analytic applications.
Creating an advanced formula using the visual tool
Learn more:
Data Actions
Design Advanced Formulas Using the Visual Tool
Add Parameters to Your Data Actions
Business Scenarios of Advanced Formulas Actions
Convert Currencies in a Data Action
Calendar
Planning processes can get complicated. You can use the Calendar to keep track of tasks, stay on schedule, and collaborate with your team. Create, assign, and work on tasks,and add �les, approval work�ows, and processes that link tasks together. Create multiple tasks at once using recurrence, or generate tasks automatically based on model
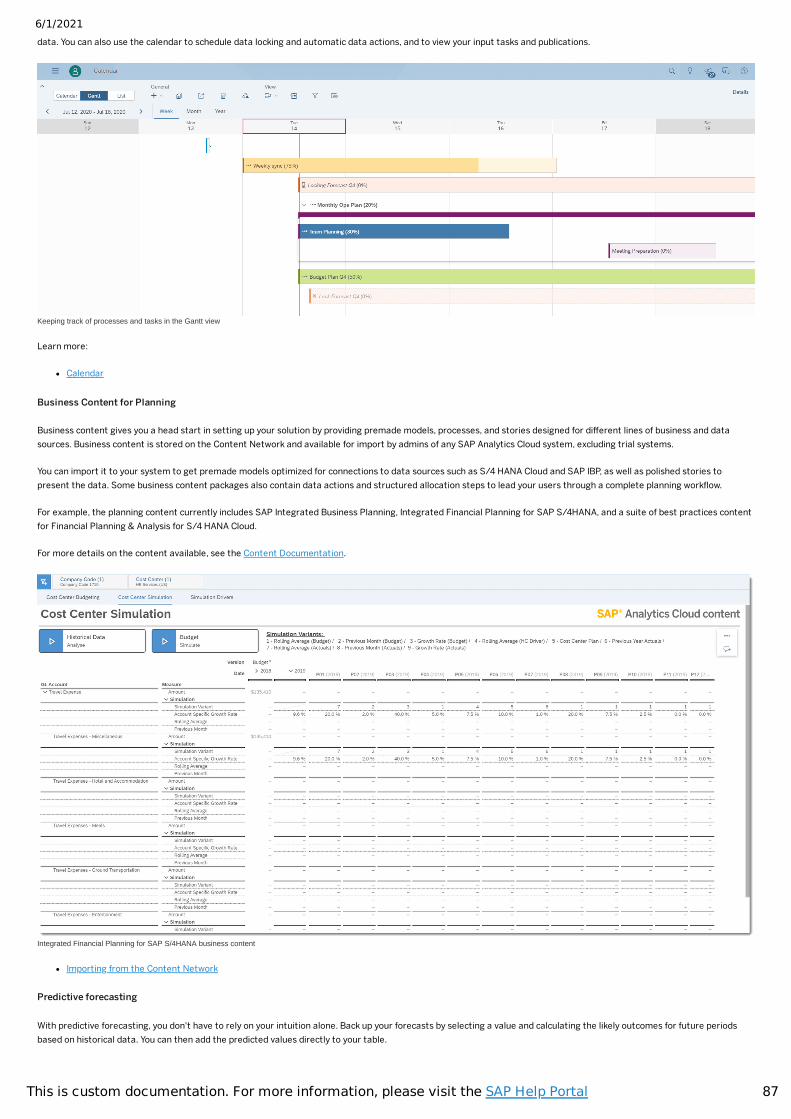
6/1/2021
87This is custom documentation. For more information, please visit the SAP Help Portal
data. You can also use the calendar to schedule data locking and automatic data actions, and to view your input tasks and publications.
Keeping track of processes and tasks in the Gantt view
Learn more:
Calendar
Business Content for Planning
Business content gives you a head start in setting up your solution by providing premade models, processes, and stories designed for different lines of business and datasources. Business content is stored on the Content Network and available for import by admins of any SAP Analytics Cloud system, excluding trial systems.
You can import it to your system to get premade models optimized for connections to data sources such as S/4 HANA Cloud and SAP IBP, as well as polished stories topresent the data. Some business content packages also contain data actions and structured allocation steps to lead your users through a complete planning work�ow.
For example, the planning content currently includes SAP Integrated Business Planning, Integrated Financial Planning for SAP S/4HANA, and a suite of best practices contentfor Financial Planning & Analysis for S/4 HANA Cloud.
For more details on the content available, see the Content Documentation.
Integrated Financial Planning for SAP S/4HANA business content
Importing from the Content Network
Predictive forecasting
With predictive forecasting, you don't have to rely on your intuition alone. Back up your forecasts by selecting a value and calculating the likely outcomes for future periodsbased on historical data. You can then add the predicted values directly to your table.
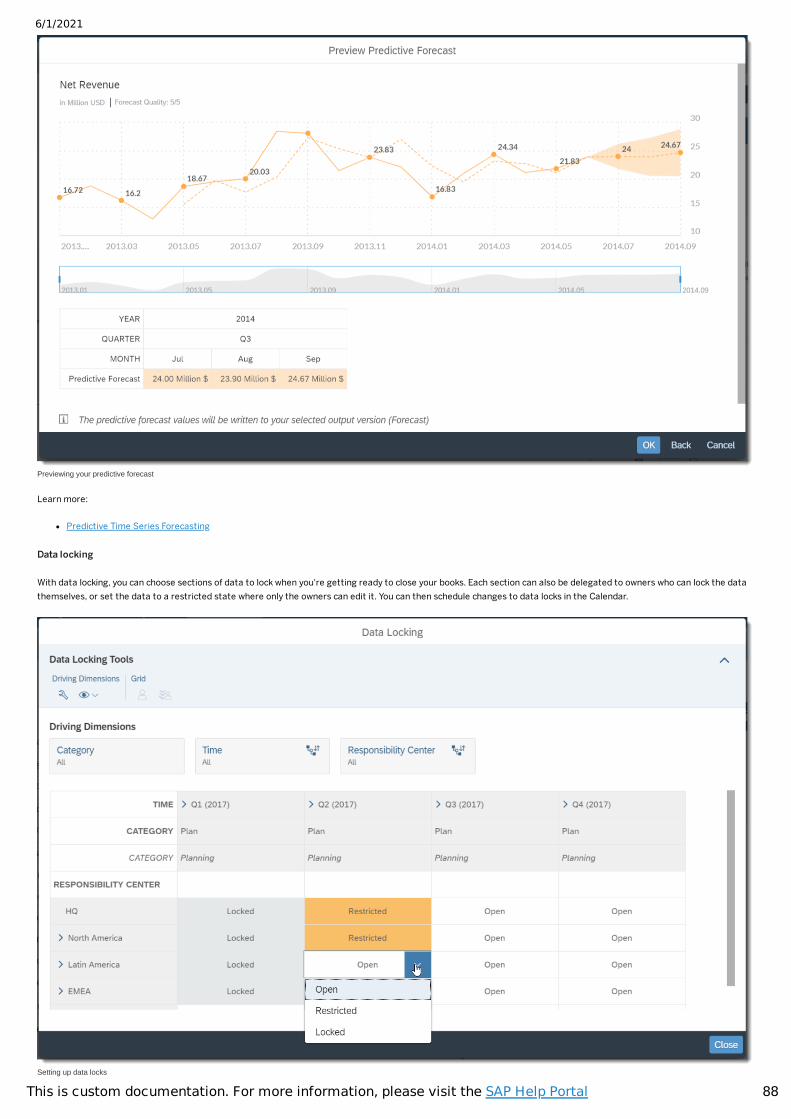
6/1/2021
88This is custom documentation. For more information, please visit the SAP Help Portal
Previewing your predictive forecast
Learn more:
Predictive Time Series Forecasting
Data locking
With data locking, you can choose sections of data to lock when you're getting ready to close your books. Each section can also be delegated to owners who can lock the datathemselves, or set the data to a restricted state where only the owners can edit it. You can then schedule changes to data locks in the Calendar.
Setting up data locks
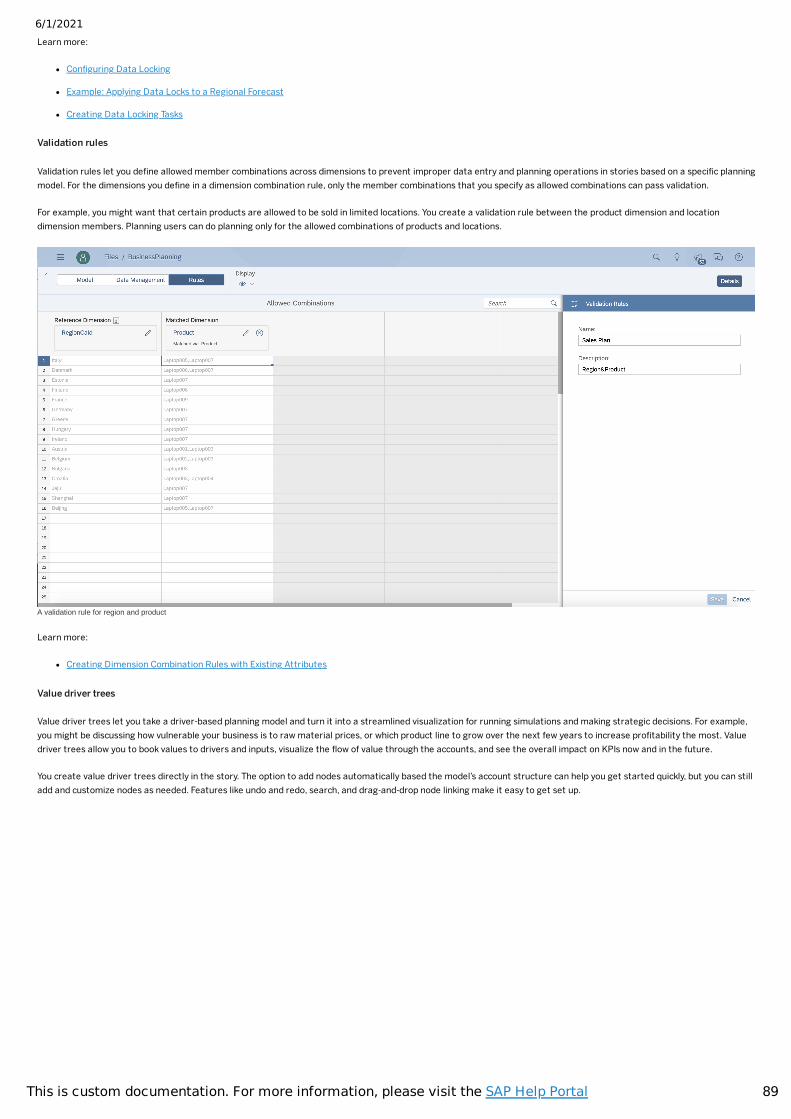
6/1/2021
89This is custom documentation. For more information, please visit the SAP Help Portal
Learn more:
Con�guring Data Locking
Example: Applying Data Locks to a Regional Forecast
Creating Data Locking Tasks
Validation rules
Validation rules let you de�ne allowed member combinations across dimensions to prevent improper data entry and planning operations in stories based on a speci�c planningmodel. For the dimensions you de�ne in a dimension combination rule, only the member combinations that you specify as allowed combinations can pass validation.
For example, you might want that certain products are allowed to be sold in limited locations. You create a validation rule between the product dimension and locationdimension members. Planning users can do planning only for the allowed combinations of products and locations.
A validation rule for region and product
Learn more:
Creating Dimension Combination Rules with Existing Attributes
Value driver trees
Value driver trees let you take a driver-based planning model and turn it into a streamlined visualization for running simulations and making strategic decisions. For example,you might be discussing how vulnerable your business is to raw material prices, or which product line to grow over the next few years to increase pro�tability the most. Valuedriver trees allow you to book values to drivers and inputs, visualize the �ow of value through the accounts, and see the overall impact on KPIs now and in the future.
You create value driver trees directly in the story. The option to add nodes automatically based the model’s account structure can help you get started quickly, but you can stilladd and customize nodes as needed. Features like undo and redo, search, and drag-and-drop node linking make it easy to get set up.
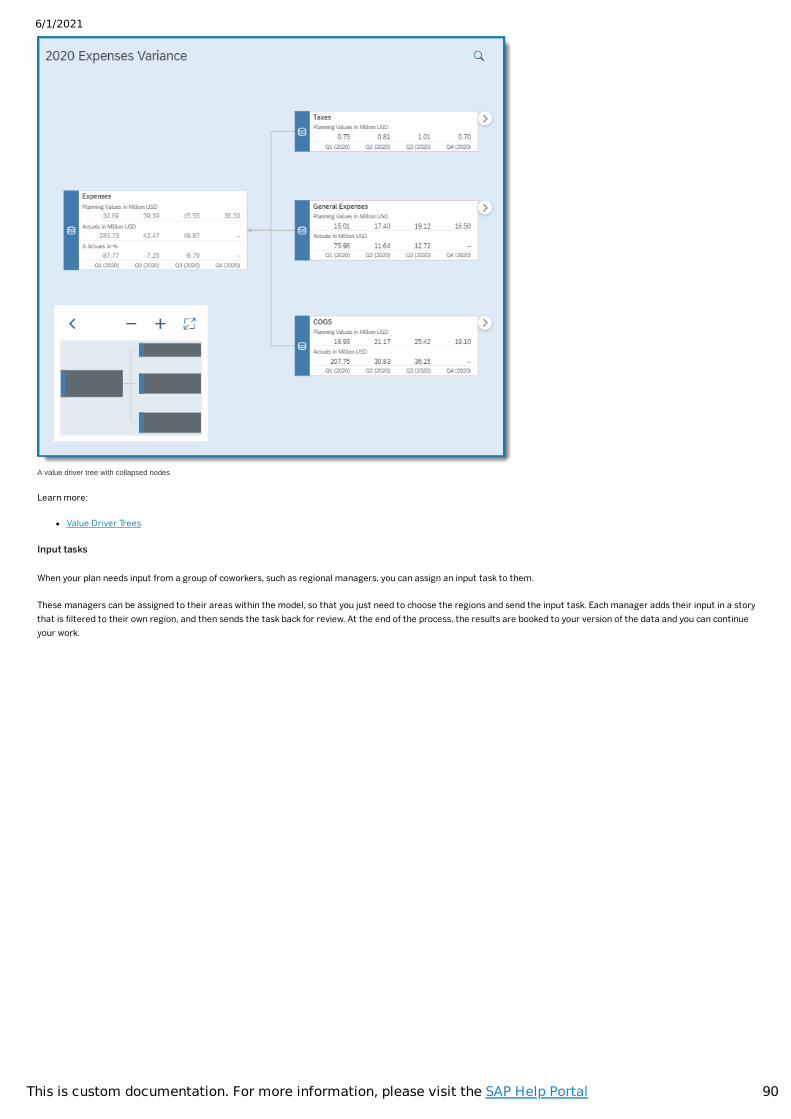
6/1/2021
90This is custom documentation. For more information, please visit the SAP Help Portal
A value driver tree with collapsed nodes
Learn more:
Value Driver Trees
Input tasks
When your plan needs input from a group of coworkers, such as regional managers, you can assign an input task to them.
These managers can be assigned to their areas within the model, so that you just need to choose the regions and send the input task. Each manager adds their input in a storythat is �ltered to their own region, and then sends the task back for review. At the end of the process, the results are booked to your version of the data and you can continueyour work.
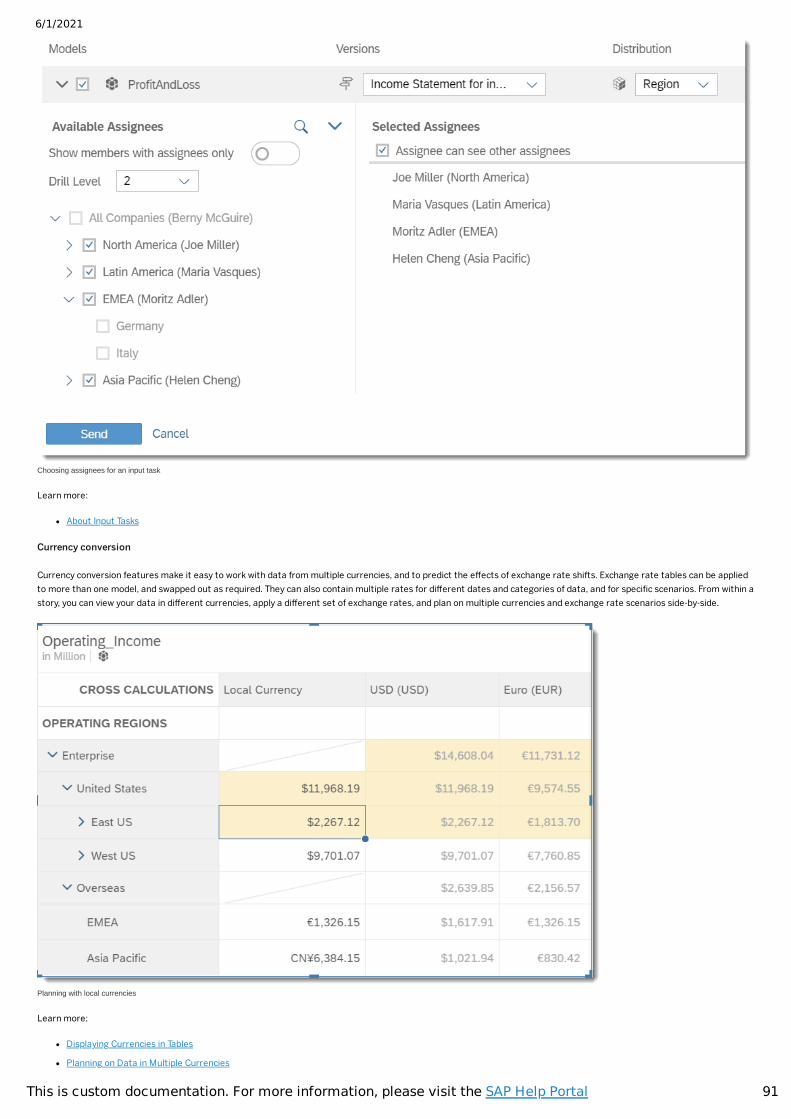
6/1/2021
91This is custom documentation. For more information, please visit the SAP Help Portal
Choosing assignees for an input task
Learn more:
About Input Tasks
Currency conversion
Currency conversion features make it easy to work with data from multiple currencies, and to predict the effects of exchange rate shifts. Exchange rate tables can be appliedto more than one model, and swapped out as required. They can also contain multiple rates for different dates and categories of data, and for speci�c scenarios. From within astory, you can view your data in different currencies, apply a different set of exchange rates, and plan on multiple currencies and exchange rate scenarios side-by-side.
Planning with local currencies
Learn more:
Displaying Currencies in Tables
Planning on Data in Multiple Currencies
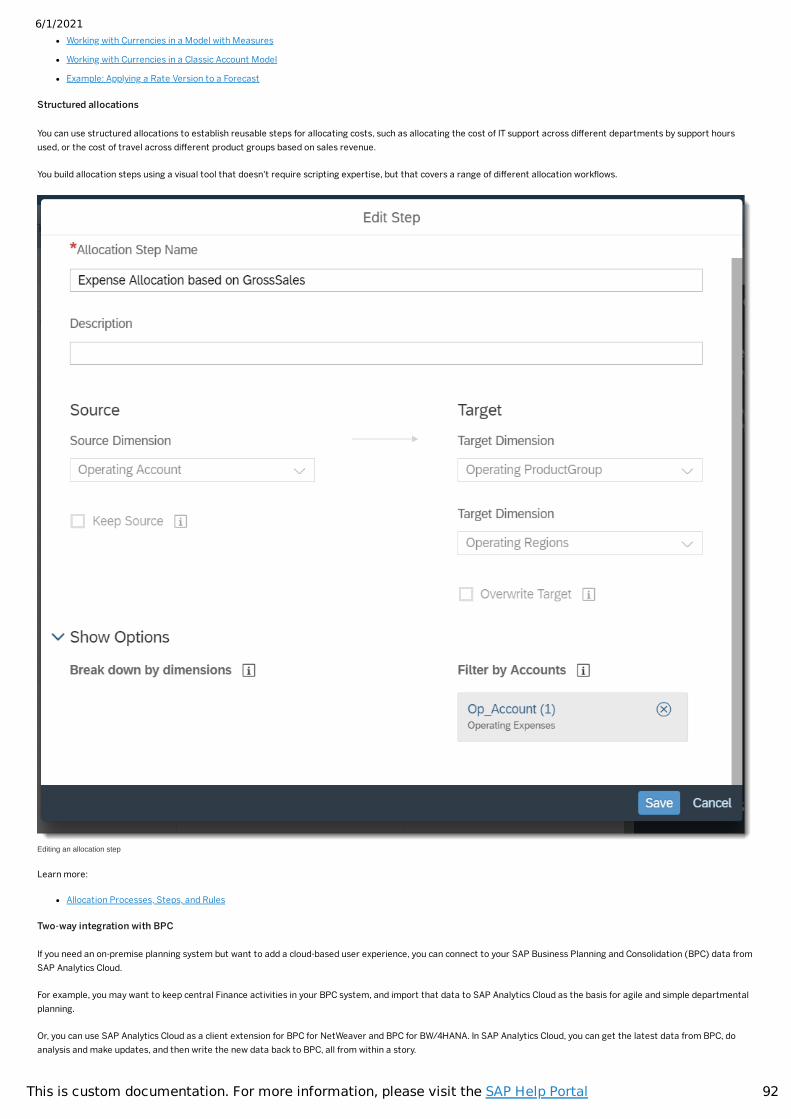
6/1/2021
92This is custom documentation. For more information, please visit the SAP Help Portal
Working with Currencies in a Model with Measures
Working with Currencies in a Classic Account Model
Example: Applying a Rate Version to a Forecast
Structured allocations
You can use structured allocations to establish reusable steps for allocating costs, such as allocating the cost of IT support across different departments by support hoursused, or the cost of travel across different product groups based on sales revenue.
You build allocation steps using a visual tool that doesn't require scripting expertise, but that covers a range of different allocation work�ows.
Editing an allocation step
Learn more:
Allocation Processes, Steps, and Rules
Two-way integration with BPC
If you need an on-premise planning system but want to add a cloud-based user experience, you can connect to your SAP Business Planning and Consolidation (BPC) data fromSAP Analytics Cloud.
For example, you may want to keep central Finance activities in your BPC system, and import that data to SAP Analytics Cloud as the basis for agile and simple departmentalplanning.
Or, you can use SAP Analytics Cloud as a client extension for BPC for NetWeaver and BPC for BW/4HANA. In SAP Analytics Cloud, you can get the latest data from BPC, doanalysis and make updates, and then write the new data back to BPC, all from within a story.
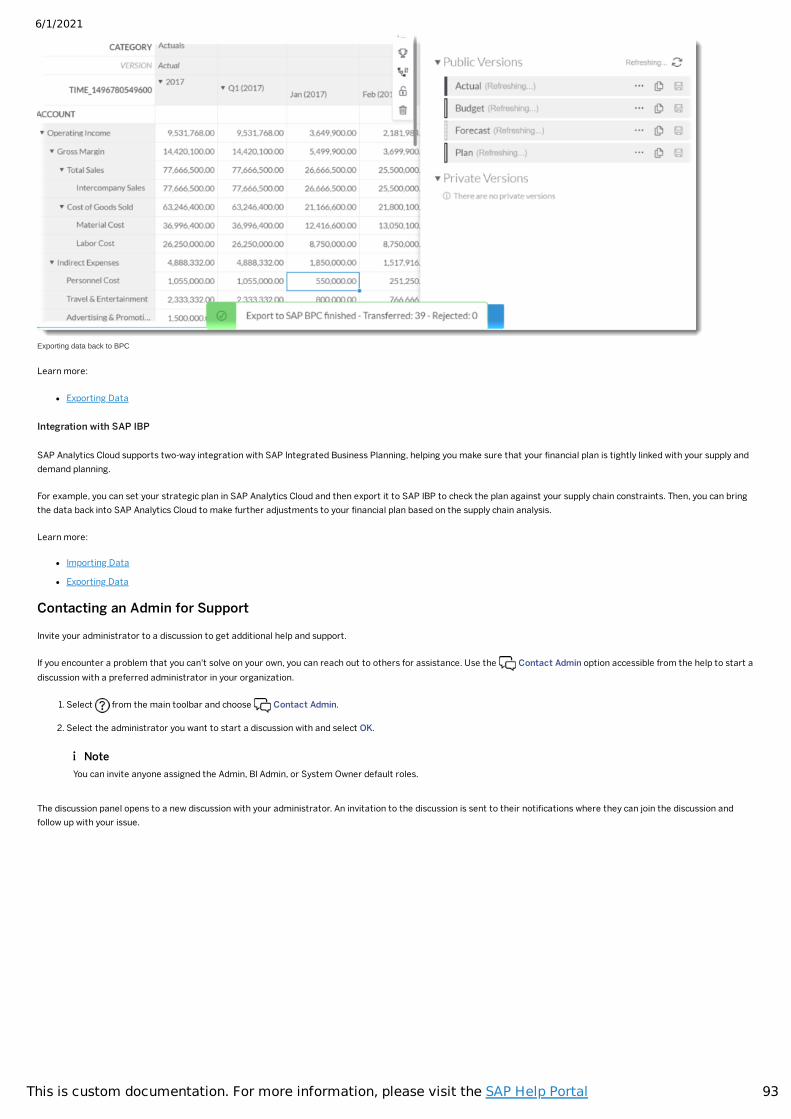
6/1/2021
93This is custom documentation. For more information, please visit the SAP Help Portal
Exporting data back to BPC
Learn more:
Exporting Data
Integration with SAP IBP
SAP Analytics Cloud supports two-way integration with SAP Integrated Business Planning, helping you make sure that your �nancial plan is tightly linked with your supply anddemand planning.
For example, you can set your strategic plan in SAP Analytics Cloud and then export it to SAP IBP to check the plan against your supply chain constraints. Then, you can bringthe data back into SAP Analytics Cloud to make further adjustments to your �nancial plan based on the supply chain analysis.
Learn more:
Importing Data
Exporting Data
Contacting an Admin for Support
Invite your administrator to a discussion to get additional help and support.
If you encounter a problem that you can't solve on your own, you can reach out to others for assistance. Use the Contact Admin option accessible from the help to start adiscussion with a preferred administrator in your organization.
1. Select from the main toolbar and choose Contact Admin.
2. Select the administrator you want to start a discussion with and select OK.
The discussion panel opens to a new discussion with your administrator. An invitation to the discussion is sent to their noti�cations where they can join the discussion andfollow up with your issue.
NoteYou can invite anyone assigned the Admin, BI Admin, or System Owner default roles.
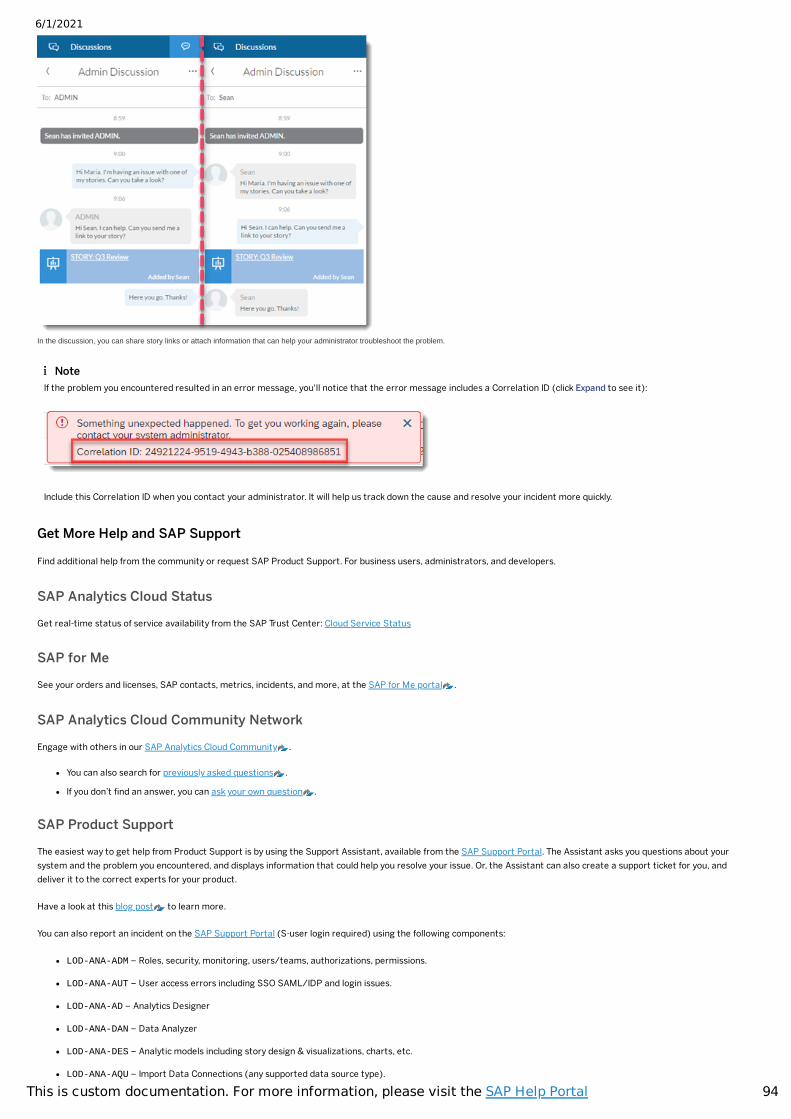
6/1/2021
94This is custom documentation. For more information, please visit the SAP Help Portal
In the discussion, you can share story links or attach information that can help your administrator troubleshoot the problem.
Get More Help and SAP Support
Find additional help from the community or request SAP Product Support. For business users, administrators, and developers.
SAP Analytics Cloud Status
Get real-time status of service availability from the SAP Trust Center: Cloud Service Status
SAP for Me
See your orders and licenses, SAP contacts, metrics, incidents, and more, at the SAP for Me portal .
SAP Analytics Cloud Community Network
Engage with others in our SAP Analytics Cloud Community .
You can also search for previously asked questions .
If you don’t �nd an answer, you can ask your own question .
SAP Product Support
The easiest way to get help from Product Support is by using the Support Assistant, available from the SAP Support Portal. The Assistant asks you questions about yoursystem and the problem you encountered, and displays information that could help you resolve your issue. Or, the Assistant can also create a support ticket for you, anddeliver it to the correct experts for your product.
Have a look at this blog post to learn more.
You can also report an incident on the SAP Support Portal (S-user login required) using the following components:
LOD-ANA-ADM – Roles, security, monitoring, users/teams, authorizations, permissions.
LOD-ANA-AUT – User access errors including SSO SAML/IDP and login issues.
LOD-ANA-AD – Analytics Designer
LOD-ANA-DAN – Data Analyzer
LOD-ANA-DES – Analytic models including story design & visualizations, charts, etc.
LOD-ANA-AQU – Import Data Connections (any supported data source type).
NoteIf the problem you encountered resulted in an error message, you'll notice that the error message includes a Correlation ID (click Expand to see it):
Include this Correlation ID when you contact your administrator. It will help us track down the cause and resolve your incident more quickly.
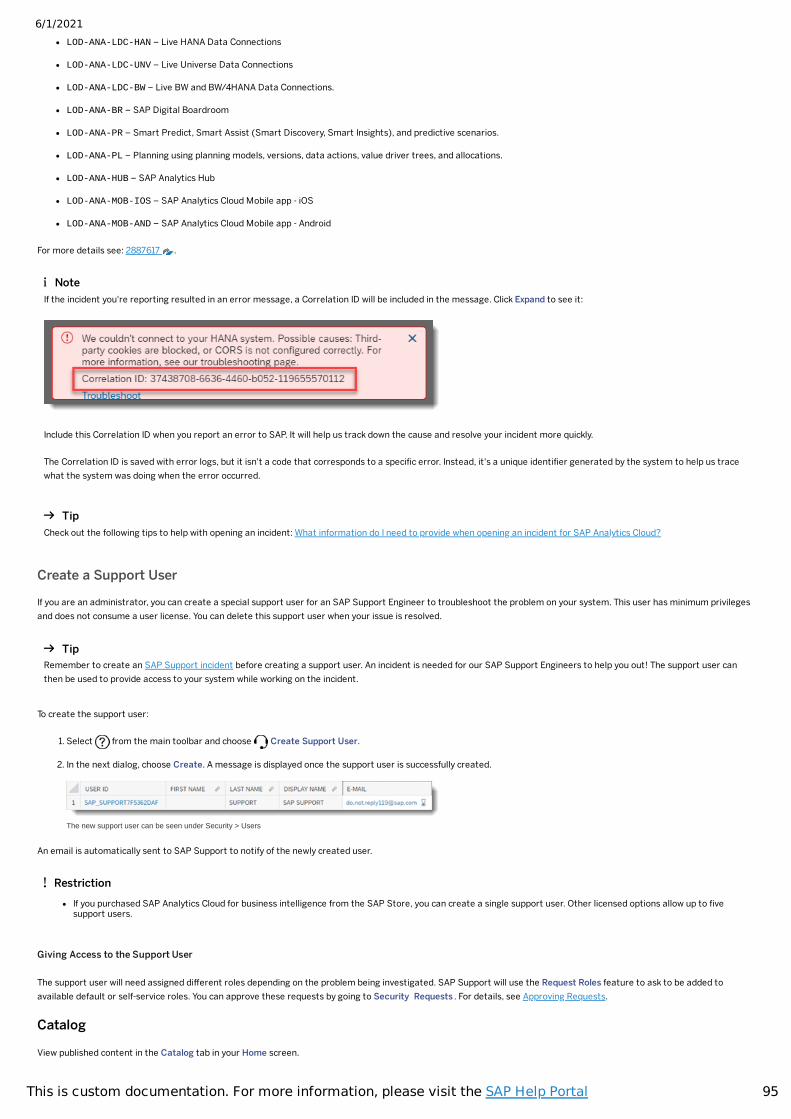
6/1/2021
95This is custom documentation. For more information, please visit the SAP Help Portal
LOD-ANA-LDC-HAN – Live HANA Data Connections
LOD-ANA-LDC-UNV – Live Universe Data Connections
LOD-ANA-LDC-BW – Live BW and BW/4HANA Data Connections.
LOD-ANA-BR – SAP Digital Boardroom
LOD-ANA-PR – Smart Predict, Smart Assist (Smart Discovery, Smart Insights), and predictive scenarios.
LOD-ANA-PL – Planning using planning models, versions, data actions, value driver trees, and allocations.
LOD-ANA-HUB – SAP Analytics Hub
LOD-ANA-MOB-IOS – SAP Analytics Cloud Mobile app - iOS
LOD-ANA-MOB-AND – SAP Analytics Cloud Mobile app - Android
For more details see: 2887617 .
Create a Support User
If you are an administrator, you can create a special support user for an SAP Support Engineer to troubleshoot the problem on your system. This user has minimum privilegesand does not consume a user license. You can delete this support user when your issue is resolved.
To create the support user:
1. Select from the main toolbar and choose Create Support User.
2. In the next dialog, choose Create. A message is displayed once the support user is successfully created.
The new support user can be seen under Security > Users
An email is automatically sent to SAP Support to notify of the newly created user.
Giving Access to the Support User
The support user will need assigned different roles depending on the problem being investigated. SAP Support will use the Request Roles feature to ask to be added toavailable default or self-service roles. You can approve these requests by going to Security Requests . For details, see Approving Requests.
Catalog
View published content in the Catalog tab in your Home screen.
NoteIf the incident you're reporting resulted in an error message, a Correlation ID will be included in the message. Click Expand to see it:
Include this Correlation ID when you report an error to SAP. It will help us track down the cause and resolve your incident more quickly.
The Correlation ID is saved with error logs, but it isn't a code that corresponds to a speci�c error. Instead, it's a unique identi�er generated by the system to help us tracewhat the system was doing when the error occurred.
TipCheck out the following tips to help with opening an incident: What information do I need to provide when opening an incident for SAP Analytics Cloud?
TipRemember to create an SAP Support incident before creating a support user. An incident is needed for our SAP Support Engineers to help you out! The support user canthen be used to provide access to your system while working on the incident.
RestrictionIf you purchased SAP Analytics Cloud for business intelligence from the SAP Store, you can create a single support user. Other licensed options allow up to �vesupport users.
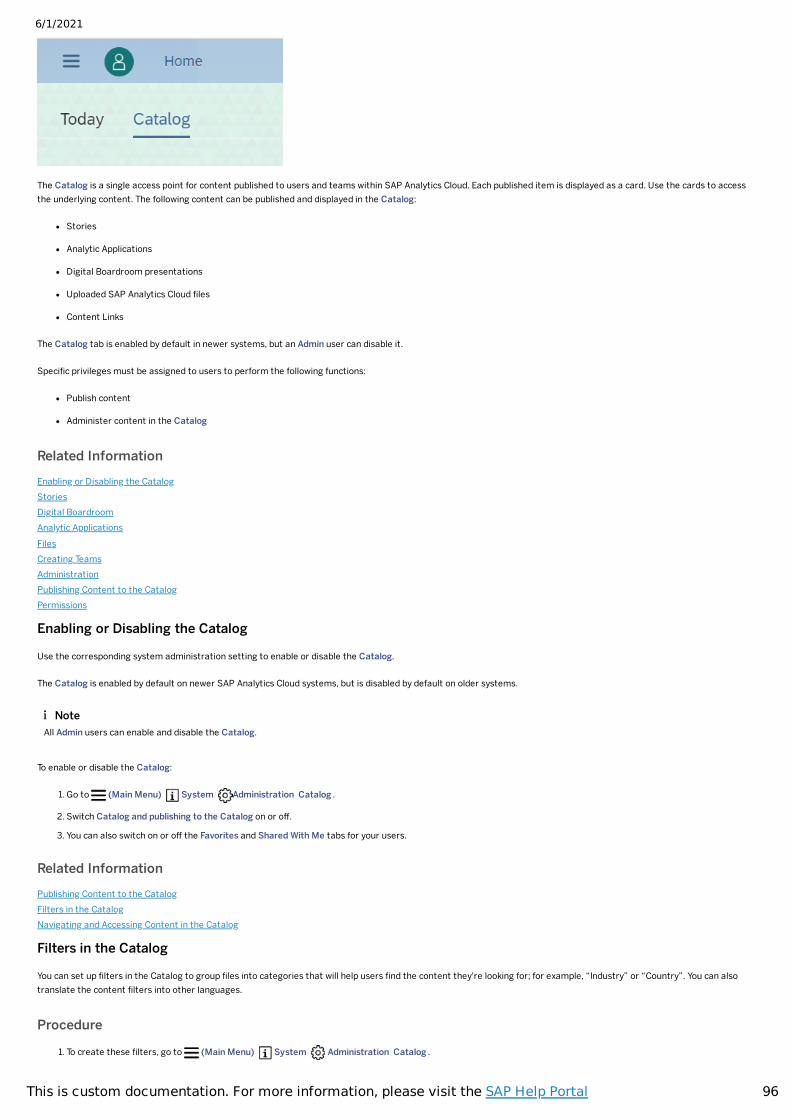
6/1/2021
96This is custom documentation. For more information, please visit the SAP Help Portal
The Catalog is a single access point for content published to users and teams within SAP Analytics Cloud. Each published item is displayed as a card. Use the cards to accessthe underlying content. The following content can be published and displayed in the Catalog:
Stories
Analytic Applications
Digital Boardroom presentations
Uploaded SAP Analytics Cloud �les
Content Links
The Catalog tab is enabled by default in newer systems, but an Admin user can disable it.
Speci�c privileges must be assigned to users to perform the following functions:
Publish content
Administer content in the Catalog
Related InformationEnabling or Disabling the CatalogStoriesDigital BoardroomAnalytic ApplicationsFilesCreating TeamsAdministrationPublishing Content to the CatalogPermissions
Enabling or Disabling the Catalog
Use the corresponding system administration setting to enable or disable the Catalog.
The Catalog is enabled by default on newer SAP Analytics Cloud systems, but is disabled by default on older systems.
To enable or disable the Catalog:
1. Go to (Main Menu) System Administration Catalog .
2. Switch Catalog and publishing to the Catalog on or off.
3. You can also switch on or off the Favorites and Shared With Me tabs for your users.
Related InformationPublishing Content to the CatalogFilters in the CatalogNavigating and Accessing Content in the Catalog
Filters in the Catalog
You can set up �lters in the Catalog to group �les into categories that will help users �nd the content they're looking for; for example, “Industry” or “Country”. You can alsotranslate the content �lters into other languages.
Procedure
1. To create these �lters, go to (Main Menu) System Administration Catalog .
NoteAll Admin users can enable and disable the Catalog.
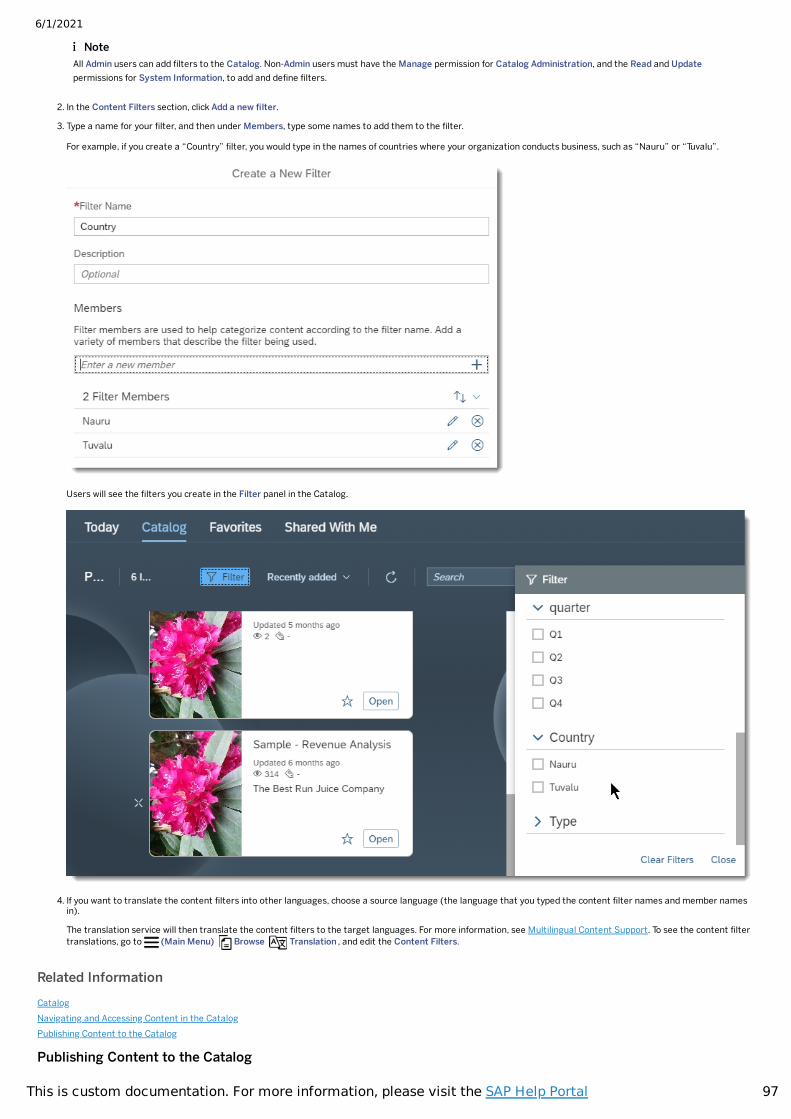
6/1/2021
97This is custom documentation. For more information, please visit the SAP Help Portal
2. In the Content Filters section, click Add a new �lter.
3. Type a name for your �lter, and then under Members, type some names to add them to the �lter.
For example, if you create a “Country” �lter, you would type in the names of countries where your organization conducts business, such as “Nauru” or “Tuvalu”.
Users will see the �lters you create in the Filter panel in the Catalog.
4. If you want to translate the content �lters into other languages, choose a source language (the language that you typed the content �lter names and member namesin).
The translation service will then translate the content �lters to the target languages. For more information, see Multilingual Content Support. To see the content �ltertranslations, go to (Main Menu) Browse Translation , and edit the Content Filters.
Related InformationCatalogNavigating and Accessing Content in the CatalogPublishing Content to the Catalog
Publishing Content to the Catalog
NoteAll Admin users can add �lters to the Catalog. Non-Admin users must have the Manage permission for Catalog Administration, and the Read and Updatepermissions for System Information, to add and de�ne �lters.
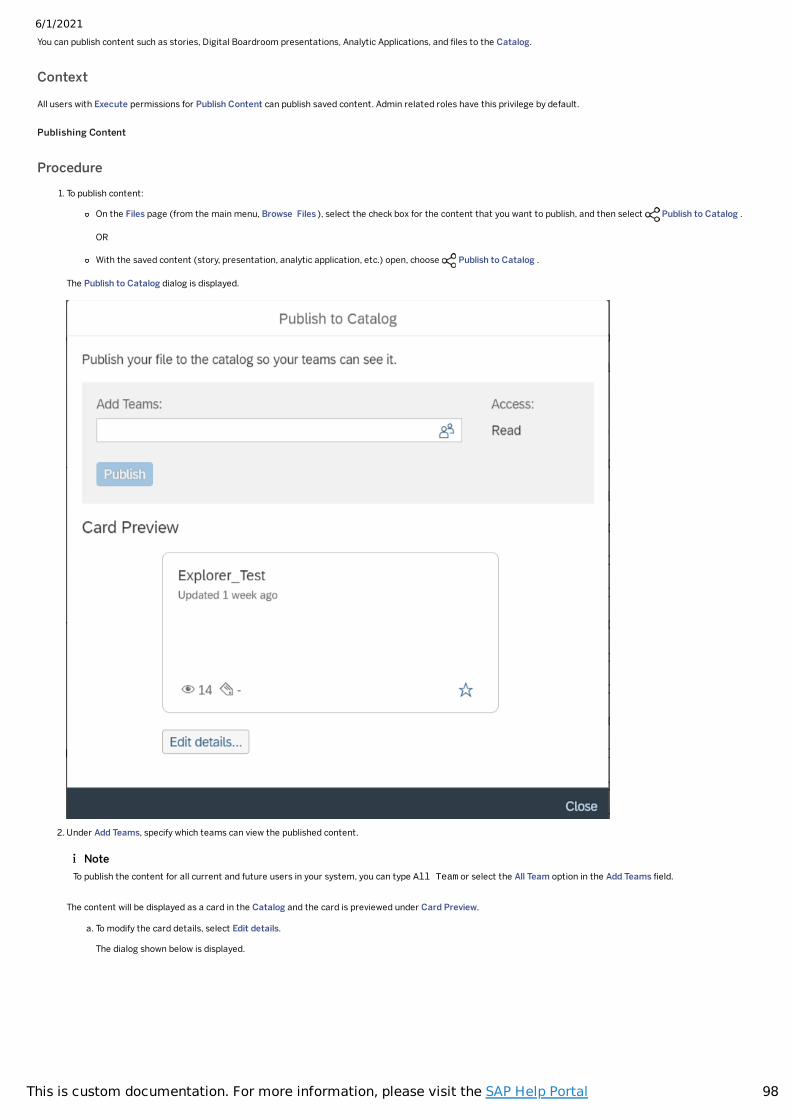
6/1/2021
98This is custom documentation. For more information, please visit the SAP Help Portal
You can publish content such as stories, Digital Boardroom presentations, Analytic Applications, and �les to the Catalog.
Context
All users with Execute permissions for Publish Content can publish saved content. Admin related roles have this privilege by default.
Publishing Content
Procedure1. To publish content:
On the Files page (from the main menu, Browse Files ), select the check box for the content that you want to publish, and then select Publish to Catalog .
OR
With the saved content (story, presentation, analytic application, etc.) open, choose Publish to Catalog .
The Publish to Catalog dialog is displayed.
2. Under Add Teams, specify which teams can view the published content.
The content will be displayed as a card in the Catalog and the card is previewed under Card Preview.
a. To modify the card details, select Edit details.
The dialog shown below is displayed.
NoteTo publish the content for all current and future users in your system, you can type All Team or select the All Team option in the Add Teams �eld.
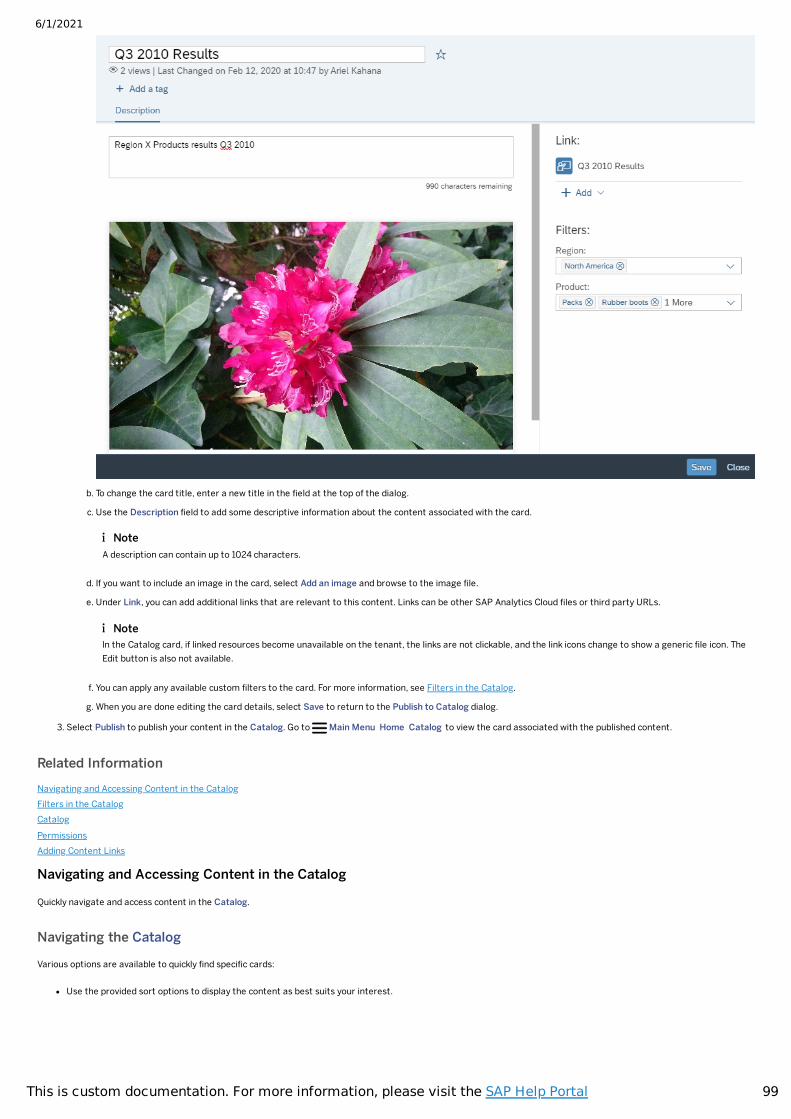
6/1/2021
99This is custom documentation. For more information, please visit the SAP Help Portal
b. To change the card title, enter a new title in the �eld at the top of the dialog.
c. Use the Description �eld to add some descriptive information about the content associated with the card.
d. If you want to include an image in the card, select Add an image and browse to the image �le.
e. Under Link, you can add additional links that are relevant to this content. Links can be other SAP Analytics Cloud �les or third party URLs.
f. You can apply any available custom �lters to the card. For more information, see Filters in the Catalog.
g. When you are done editing the card details, select Save to return to the Publish to Catalog dialog.
3. Select Publish to publish your content in the Catalog. Go to Main Menu Home Catalog to view the card associated with the published content.
Related InformationNavigating and Accessing Content in the CatalogFilters in the CatalogCatalogPermissionsAdding Content Links
Navigating and Accessing Content in the Catalog
Quickly navigate and access content in the Catalog.
Navigating the Catalog
Various options are available to quickly �nd speci�c cards:
Use the provided sort options to display the content as best suits your interest.
NoteA description can contain up to 1024 characters.
NoteIn the Catalog card, if linked resources become unavailable on the tenant, the links are not clickable, and the link icons change to show a generic �le icon. TheEdit button is also not available.
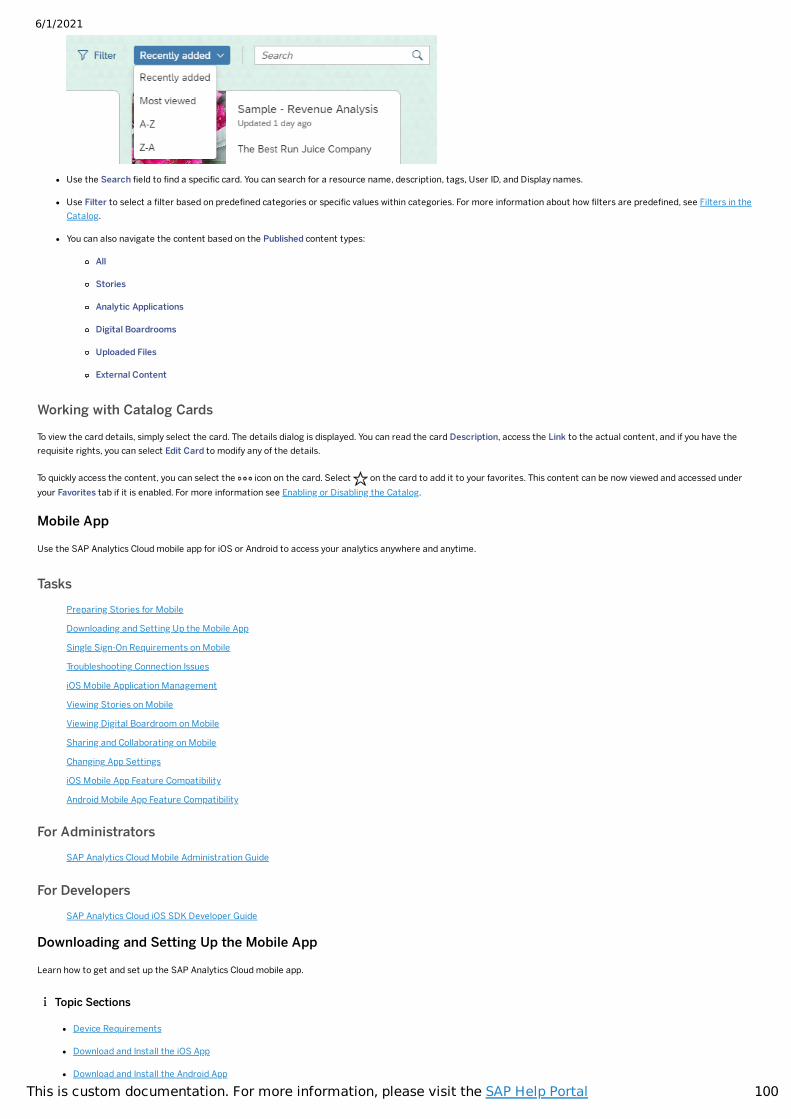
6/1/2021
100This is custom documentation. For more information, please visit the SAP Help Portal
Use the Search �eld to �nd a speci�c card. You can search for a resource name, description, tags, User ID, and Display names.
Use Filter to select a �lter based on prede�ned categories or speci�c values within categories. For more information about how �lters are prede�ned, see Filters in theCatalog.
You can also navigate the content based on the Published content types:
All
Stories
Analytic Applications
Digital Boardrooms
Uploaded Files
External Content
Working with Catalog Cards
To view the card details, simply select the card. The details dialog is displayed. You can read the card Description, access the Link to the actual content, and if you have therequisite rights, you can select Edit Card to modify any of the details.
To quickly access the content, you can select the icon on the card. Select on the card to add it to your favorites. This content can be now viewed and accessed underyour Favorites tab if it is enabled. For more information see Enabling or Disabling the Catalog.
Mobile App
Use the SAP Analytics Cloud mobile app for iOS or Android to access your analytics anywhere and anytime.
TasksPreparing Stories for Mobile
Downloading and Setting Up the Mobile App
Single Sign-On Requirements on Mobile
Troubleshooting Connection Issues
iOS Mobile Application Management
Viewing Stories on Mobile
Viewing Digital Boardroom on Mobile
Sharing and Collaborating on Mobile
Changing App Settings
iOS Mobile App Feature Compatibility
Android Mobile App Feature Compatibility
For AdministratorsSAP Analytics Cloud Mobile Administration Guide
For DevelopersSAP Analytics Cloud iOS SDK Developer Guide
Downloading and Setting Up the Mobile App
Learn how to get and set up the SAP Analytics Cloud mobile app.
Topic Sections
Device Requirements
Download and Install the iOS App
Download and Install the Android App
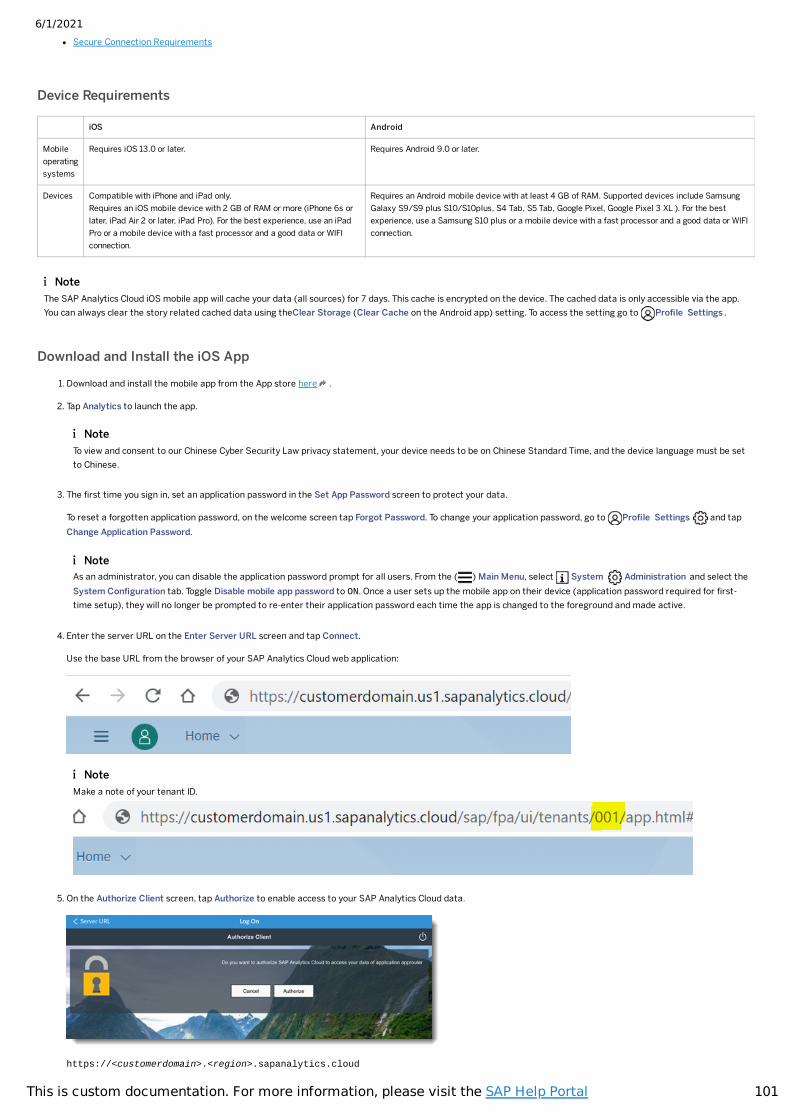
6/1/2021
101This is custom documentation. For more information, please visit the SAP Help Portal
Device Requirements
iOS Android
Mobileoperatingsystems
Requires iOS 13.0 or later. Requires Android 9.0 or later.
Devices Compatible with iPhone and iPad only.Requires an iOS mobile device with 2 GB of RAM or more (iPhone 6s orlater, iPad Air 2 or later, iPad Pro). For the best experience, use an iPadPro or a mobile device with a fast processor and a good data or WIFIconnection.
Requires an Android mobile device with at least 4 GB of RAM. Supported devices include SamsungGalaxy S9/S9 plus S10/S10plus, S4 Tab, S5 Tab, Google Pixel, Google Pixel 3 XL ). For the bestexperience, use a Samsung S10 plus or a mobile device with a fast processor and a good data or WIFIconnection.
Download and Install the iOS App
1. Download and install the mobile app from the App store here .
2. Tap Analytics to launch the app.
3. The �rst time you sign in, set an application password in the Set App Password screen to protect your data.
To reset a forgotten application password, on the welcome screen tap Forgot Password. To change your application password, go to Pro�le Settings and tapChange Application Password.
4. Enter the server URL on the Enter Server URL screen and tap Connect.
Use the base URL from the browser of your SAP Analytics Cloud web application:
5. On the Authorize Client screen, tap Authorize to enable access to your SAP Analytics Cloud data.
https://<customerdomain>.<region>.sapanalytics.cloud
Secure Connection Requirements
NoteThe SAP Analytics Cloud iOS mobile app will cache your data (all sources) for 7 days. This cache is encrypted on the device. The cached data is only accessible via the app.You can always clear the story related cached data using theClear Storage (Clear Cache on the Android app) setting. To access the setting go to Pro�le Settings .
NoteTo view and consent to our Chinese Cyber Security Law privacy statement, your device needs to be on Chinese Standard Time, and the device language must be setto Chinese.
NoteAs an administrator, you can disable the application password prompt for all users. From the ( ) Main Menu, select System Administration and select theSystem Con�guration tab. Toggle Disable mobile app password to ON. Once a user sets up the mobile app on their device (application password required for �rst-time setup), they will no longer be prompted to re-enter their application password each time the app is changed to the foreground and made active.
NoteMake a note of your tenant ID.
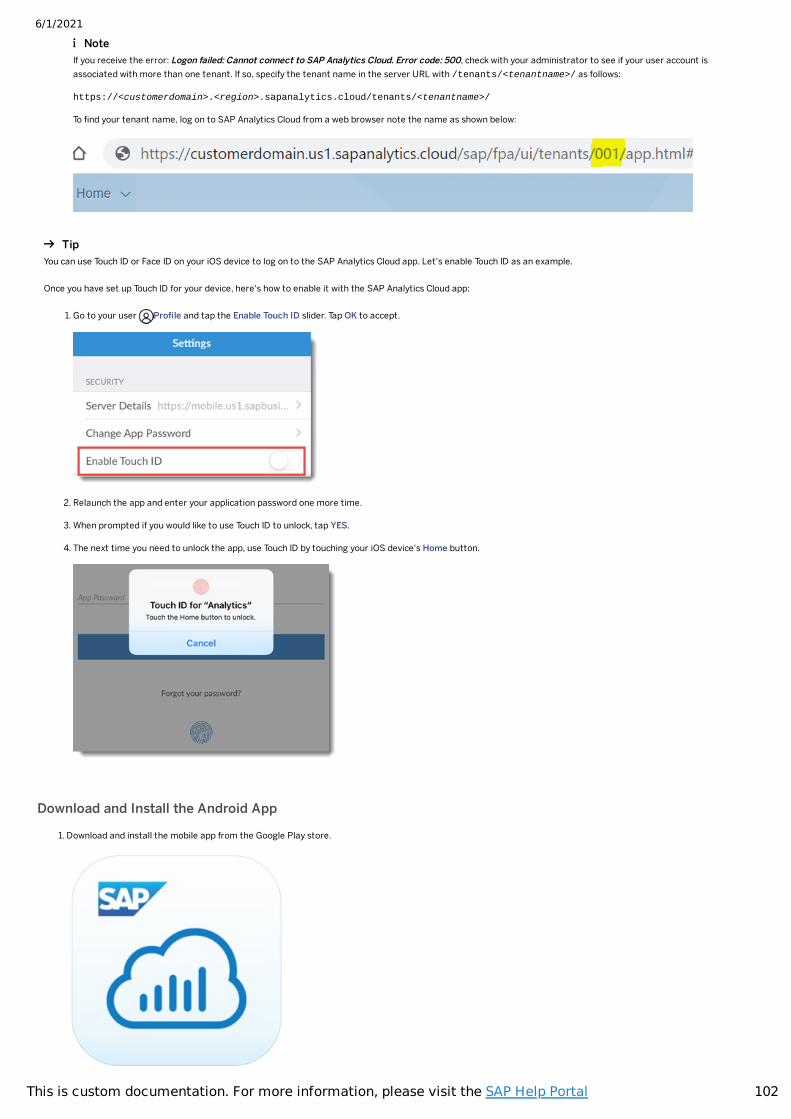
6/1/2021
102This is custom documentation. For more information, please visit the SAP Help Portal
Download and Install the Android App
1. Download and install the mobile app from the Google Play store.
NoteIf you receive the error: Logon failed: Cannot connect to SAP Analytics Cloud. Error code: 500, check with your administrator to see if your user account isassociated with more than one tenant. If so, specify the tenant name in the server URL with /tenants/<tenantname>/ as follows:
https://<customerdomain>.<region>.sapanalytics.cloud/tenants/<tenantname>/
To �nd your tenant name, log on to SAP Analytics Cloud from a web browser note the name as shown below:
TipYou can use Touch ID or Face ID on your iOS device to log on to the SAP Analytics Cloud app. Let's enable Touch ID as an example.
Once you have set up Touch ID for your device, here's how to enable it with the SAP Analytics Cloud app:
1. Go to your user Pro�le and tap the Enable Touch ID slider. Tap OK to accept.
2. Relaunch the app and enter your application password one more time.
3. When prompted if you would like to use Touch ID to unlock, tap YES.
4. The next time you need to unlock the app, use Touch ID by touching your iOS device's Home button.
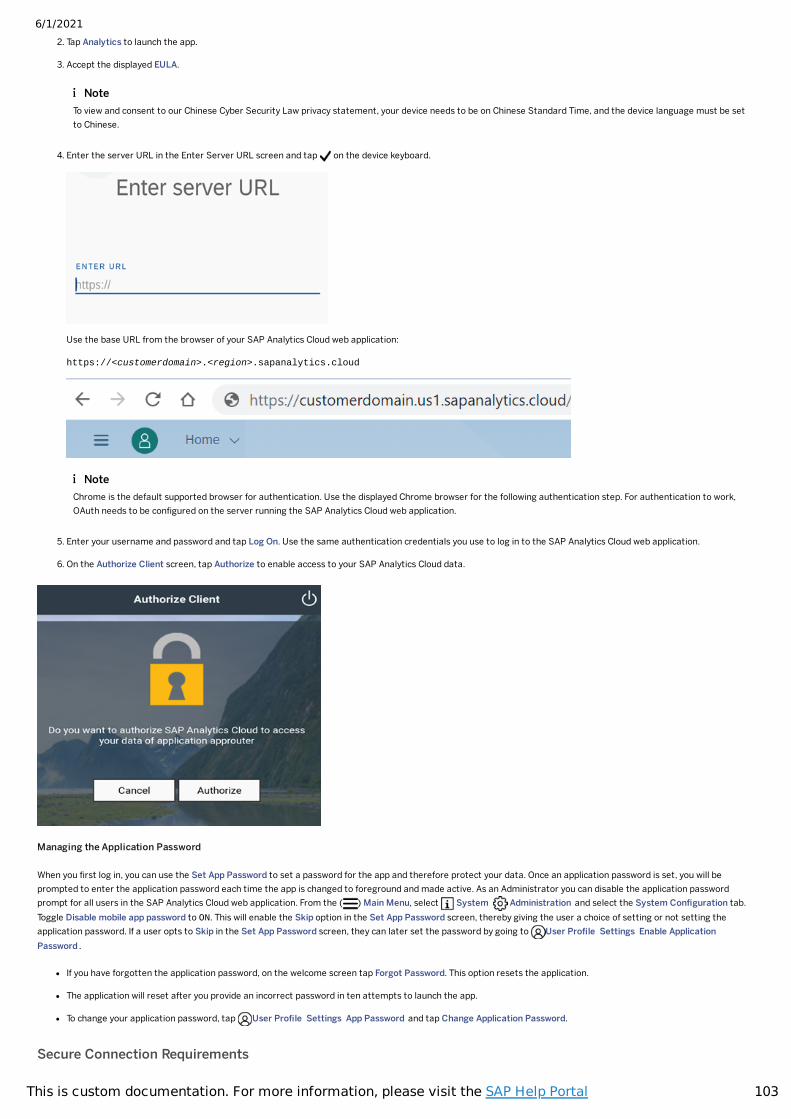
6/1/2021
103This is custom documentation. For more information, please visit the SAP Help Portal
2. Tap Analytics to launch the app.
3. Accept the displayed EULA.
4. Enter the server URL in the Enter Server URL screen and tap on the device keyboard.
Use the base URL from the browser of your SAP Analytics Cloud web application:
https://<customerdomain>.<region>.sapanalytics.cloud
5. Enter your username and password and tap Log On. Use the same authentication credentials you use to log in to the SAP Analytics Cloud web application.
6. On the Authorize Client screen, tap Authorize to enable access to your SAP Analytics Cloud data.
Managing the Application Password
When you �rst log in, you can use the Set App Password to set a password for the app and therefore protect your data. Once an application password is set, you will beprompted to enter the application password each time the app is changed to foreground and made active. As an Administrator you can disable the application passwordprompt for all users in the SAP Analytics Cloud web application. From the ( ) Main Menu, select System Administration and select the System Con�guration tab.Toggle Disable mobile app password to ON. This will enable the Skip option in the Set App Password screen, thereby giving the user a choice of setting or not setting theapplication password. If a user opts to Skip in the Set App Password screen, they can later set the password by going to User Pro�le Settings Enable ApplicationPassword .
If you have forgotten the application password, on the welcome screen tap Forgot Password. This option resets the application.
The application will reset after you provide an incorrect password in ten attempts to launch the app.
To change your application password, tap User Pro�le Settings App Password and tap Change Application Password.
Secure Connection Requirements
NoteTo view and consent to our Chinese Cyber Security Law privacy statement, your device needs to be on Chinese Standard Time, and the device language must be setto Chinese.
NoteChrome is the default supported browser for authentication. Use the displayed Chrome browser for the following authentication step. For authentication to work,OAuth needs to be con�gured on the server running the SAP Analytics Cloud web application.
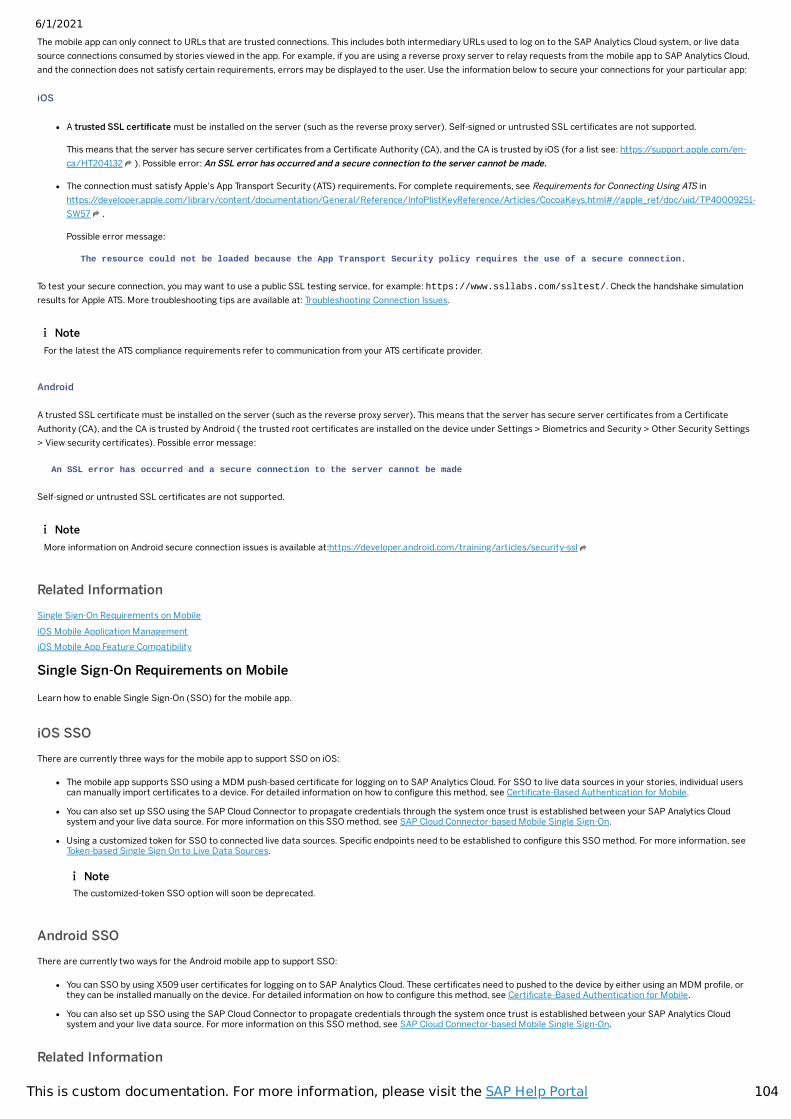
6/1/2021
104This is custom documentation. For more information, please visit the SAP Help Portal
The mobile app can only connect to URLs that are trusted connections. This includes both intermediary URLs used to log on to the SAP Analytics Cloud system, or live datasource connections consumed by stories viewed in the app. For example, if you are using a reverse proxy server to relay requests from the mobile app to SAP Analytics Cloud,and the connection does not satisfy certain requirements, errors may be displayed to the user. Use the information below to secure your connections for your particular app:
iOS
A trusted SSL certi�cate must be installed on the server (such as the reverse proxy server). Self-signed or untrusted SSL certi�cates are not supported.
This means that the server has secure server certi�cates from a Certi�cate Authority (CA), and the CA is trusted by iOS (for a list see: https://support.apple.com/en-ca/HT204132 ). Possible error: An SSL error has occurred and a secure connection to the server cannot be made.
The connection must satisfy Apple's App Transport Security (ATS) requirements. For complete requirements, see Requirements for Connecting Using ATS inhttps://developer.apple.com/library/content/documentation/General/Reference/InfoPlistKeyReference/Articles/CocoaKeys.html#//apple_ref/doc/uid/TP40009251-SW57 .
Possible error message:
To test your secure connection, you may want to use a public SSL testing service, for example: https://www.ssllabs.com/ssltest/. Check the handshake simulationresults for Apple ATS. More troubleshooting tips are available at: Troubleshooting Connection Issues.
Android
A trusted SSL certi�cate must be installed on the server (such as the reverse proxy server). This means that the server has secure server certi�cates from a Certi�cateAuthority (CA), and the CA is trusted by Android ( the trusted root certi�cates are installed on the device under Settings > Biometrics and Security > Other Security Settings> View security certi�cates). Possible error message:
Self-signed or untrusted SSL certi�cates are not supported.
Related InformationSingle Sign-On Requirements on MobileiOS Mobile Application ManagementiOS Mobile App Feature Compatibility
Single Sign-On Requirements on Mobile
Learn how to enable Single Sign-On (SSO) for the mobile app.
iOS SSOThere are currently three ways for the mobile app to support SSO on iOS:
The mobile app supports SSO using a MDM push-based certi�cate for logging on to SAP Analytics Cloud. For SSO to live data sources in your stories, individual userscan manually import certi�cates to a device. For detailed information on how to con�gure this method, see Certi�cate-Based Authentication for Mobile.
You can also set up SSO using the SAP Cloud Connector to propagate credentials through the system once trust is established between your SAP Analytics Cloudsystem and your live data source. For more information on this SSO method, see SAP Cloud Connector-based Mobile Single Sign-On.
Using a customized token for SSO to connected live data sources. Speci�c endpoints need to be established to con�gure this SSO method. For more information, seeToken-based Single Sign On to Live Data Sources.
Android SSOThere are currently two ways for the Android mobile app to support SSO:
You can SSO by using X509 user certi�cates for logging on to SAP Analytics Cloud. These certi�cates need to pushed to the device by either using an MDM pro�le, orthey can be installed manually on the device. For detailed information on how to con�gure this method, see Certi�cate-Based Authentication for Mobile.
You can also set up SSO using the SAP Cloud Connector to propagate credentials through the system once trust is established between your SAP Analytics Cloudsystem and your live data source. For more information on this SSO method, see SAP Cloud Connector-based Mobile Single Sign-On.
Related Information
The resource could not be loaded because the App Transport Security policy requires the use of a secure connection.
NoteFor the latest the ATS compliance requirements refer to communication from your ATS certi�cate provider.
An SSL error has occurred and a secure connection to the server cannot be made
NoteMore information on Android secure connection issues is available at:https://developer.android.com/training/articles/security-ssl
NoteThe customized-token SSO option will soon be deprecated.
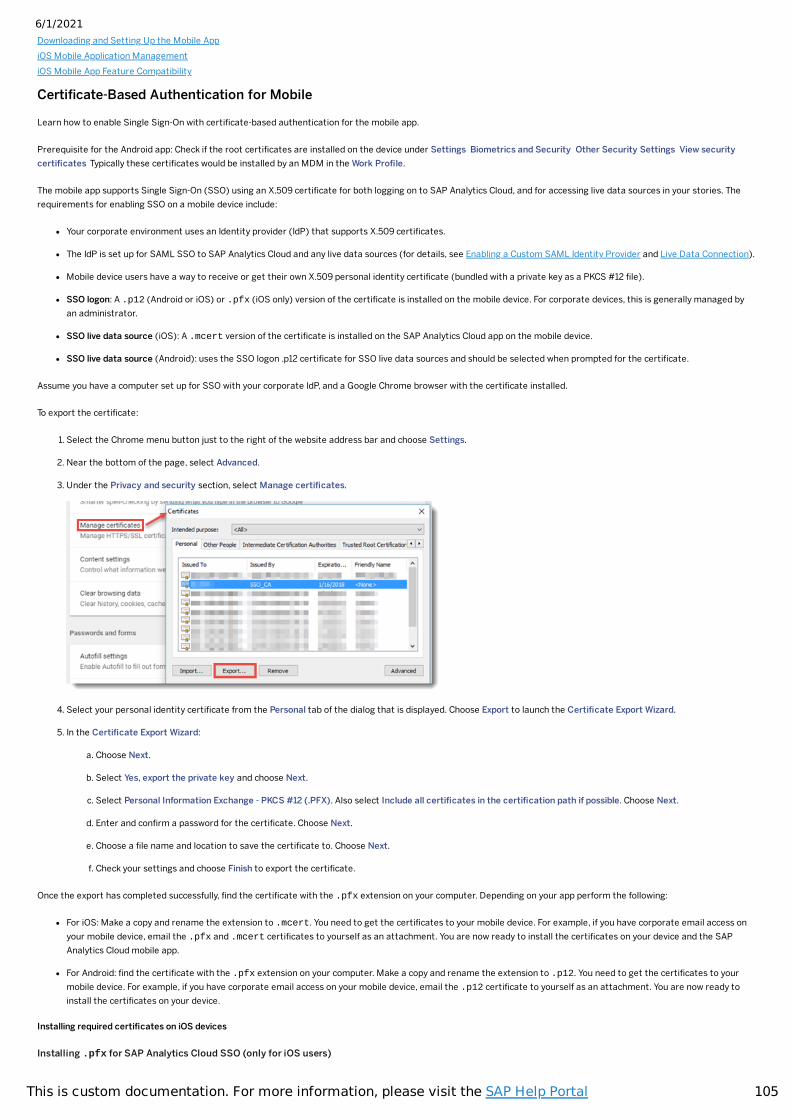
6/1/2021
105This is custom documentation. For more information, please visit the SAP Help Portal
Downloading and Setting Up the Mobile AppiOS Mobile Application ManagementiOS Mobile App Feature Compatibility
Certi�cate-Based Authentication for Mobile
Learn how to enable Single Sign-On with certi�cate-based authentication for the mobile app.
Prerequisite for the Android app: Check if the root certi�cates are installed on the device under Settings Biometrics and Security Other Security Settings View securitycerti�cates Typically these certi�cates would be installed by an MDM in the Work Pro�le.
The mobile app supports Single Sign-On (SSO) using an X.509 certi�cate for both logging on to SAP Analytics Cloud, and for accessing live data sources in your stories. Therequirements for enabling SSO on a mobile device include:
Your corporate environment uses an Identity provider (IdP) that supports X.509 certi�cates.
The IdP is set up for SAML SSO to SAP Analytics Cloud and any live data sources (for details, see Enabling a Custom SAML Identity Provider and Live Data Connection).
Mobile device users have a way to receive or get their own X.509 personal identity certi�cate (bundled with a private key as a PKCS #12 �le).
SSO logon: A .p12 (Android or iOS) or .pfx (iOS only) version of the certi�cate is installed on the mobile device. For corporate devices, this is generally managed byan administrator.
SSO live data source (iOS): A .mcert version of the certi�cate is installed on the SAP Analytics Cloud app on the mobile device.
SSO live data source (Android): uses the SSO logon .p12 certi�cate for SSO live data sources and should be selected when prompted for the certi�cate.
Assume you have a computer set up for SSO with your corporate IdP, and a Google Chrome browser with the certi�cate installed.
To export the certi�cate:
1. Select the Chrome menu button just to the right of the website address bar and choose Settings.
2. Near the bottom of the page, select Advanced.
3. Under the Privacy and security section, select Manage certi�cates.
4. Select your personal identity certi�cate from the Personal tab of the dialog that is displayed. Choose Export to launch the Certi�cate Export Wizard.
5. In the Certi�cate Export Wizard:
a. Choose Next.
b. Select Yes, export the private key and choose Next.
c. Select Personal Information Exchange - PKCS #12 (.PFX). Also select Include all certi�cates in the certi�cation path if possible. Choose Next.
d. Enter and con�rm a password for the certi�cate. Choose Next.
e. Choose a �le name and location to save the certi�cate to. Choose Next.
f. Check your settings and choose Finish to export the certi�cate.
Once the export has completed successfully, �nd the certi�cate with the .pfx extension on your computer. Depending on your app perform the following:
For iOS: Make a copy and rename the extension to .mcert. You need to get the certi�cates to your mobile device. For example, if you have corporate email access onyour mobile device, email the .pfx and .mcert certi�cates to yourself as an attachment. You are now ready to install the certi�cates on your device and the SAPAnalytics Cloud mobile app.
For Android: �nd the certi�cate with the .pfx extension on your computer. Make a copy and rename the extension to .p12. You need to get the certi�cates to yourmobile device. For example, if you have corporate email access on your mobile device, email the .p12 certi�cate to yourself as an attachment. You are now ready toinstall the certi�cates on your device.
Installing required certi�cates on iOS devices
Installing .pfx for SAP Analytics Cloud SSO (only for iOS users)
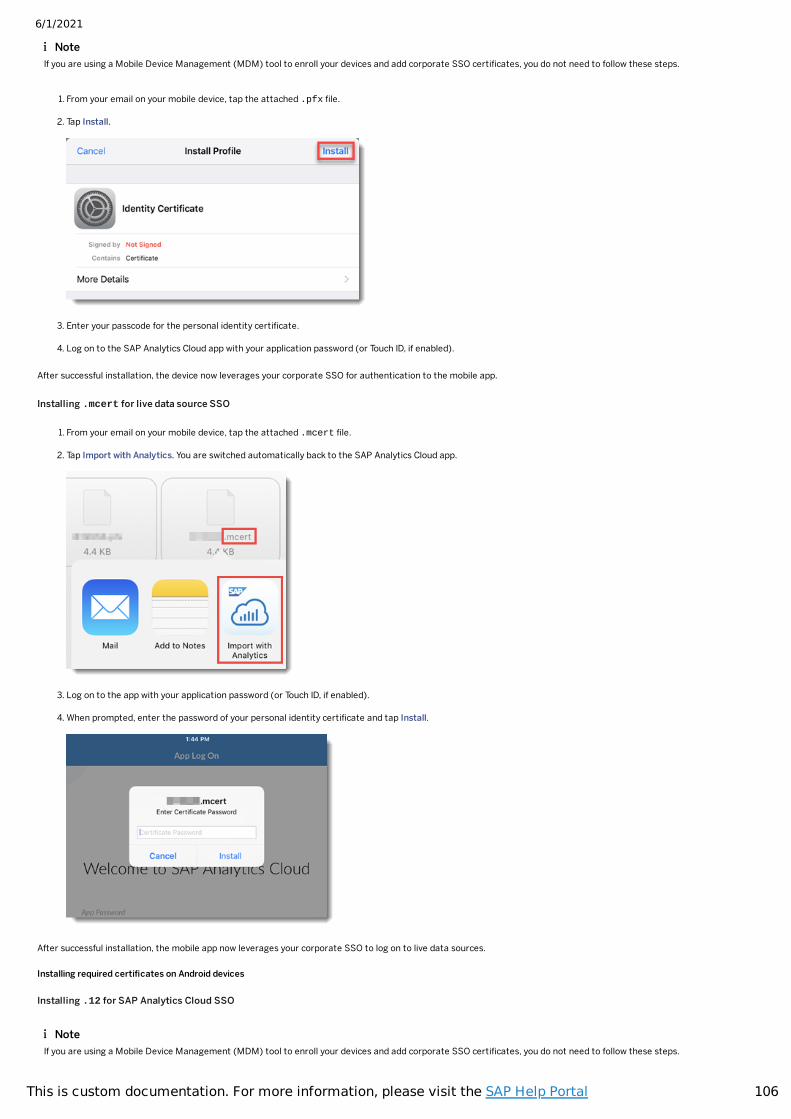
6/1/2021
106This is custom documentation. For more information, please visit the SAP Help Portal
1. From your email on your mobile device, tap the attached .pfx �le.
2. Tap Install.
3. Enter your passcode for the personal identity certi�cate.
4. Log on to the SAP Analytics Cloud app with your application password (or Touch ID, if enabled).
After successful installation, the device now leverages your corporate SSO for authentication to the mobile app.
Installing .mcert for live data source SSO
1. From your email on your mobile device, tap the attached .mcert �le.
2. Tap Import with Analytics. You are switched automatically back to the SAP Analytics Cloud app.
3. Log on to the app with your application password (or Touch ID, if enabled).
4. When prompted, enter the password of your personal identity certi�cate and tap Install.
After successful installation, the mobile app now leverages your corporate SSO to log on to live data sources.
Installing required certi�cates on Android devices
Installing .12 for SAP Analytics Cloud SSO
NoteIf you are using a Mobile Device Management (MDM) tool to enroll your devices and add corporate SSO certi�cates, you do not need to follow these steps.
NoteIf you are using a Mobile Device Management (MDM) tool to enroll your devices and add corporate SSO certi�cates, you do not need to follow these steps.
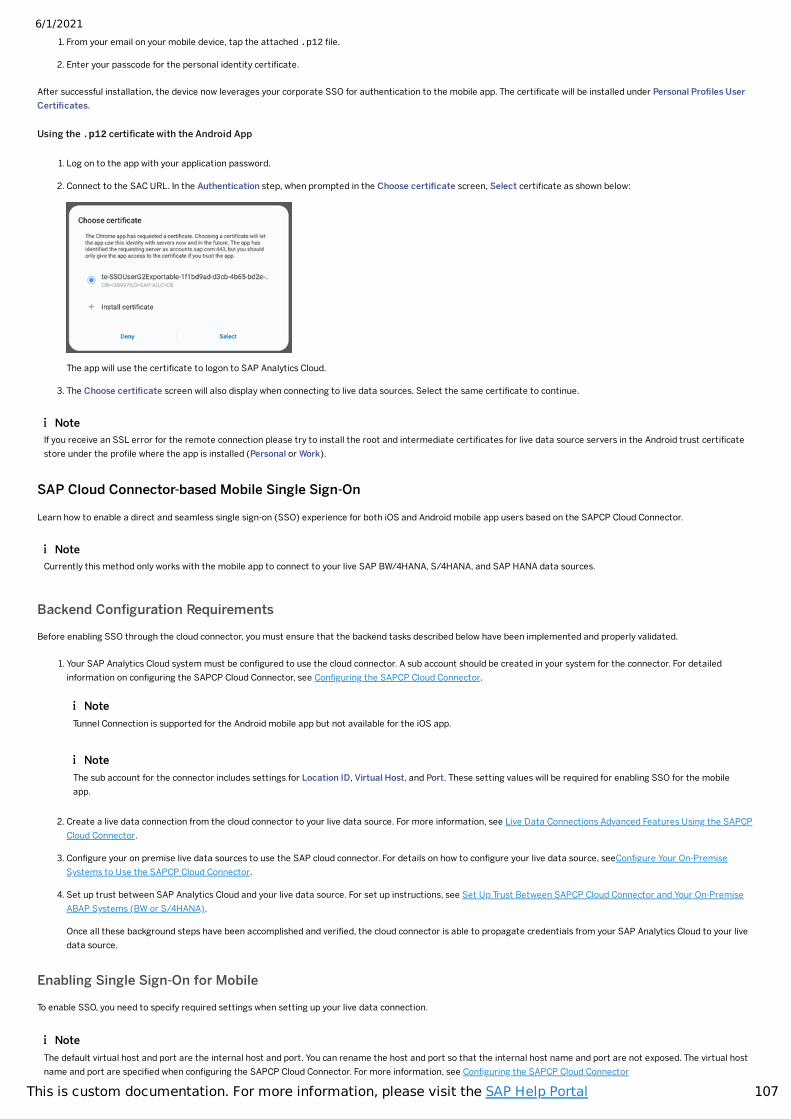
6/1/2021
107This is custom documentation. For more information, please visit the SAP Help Portal
1. From your email on your mobile device, tap the attached .p12 �le.
2. Enter your passcode for the personal identity certi�cate.
After successful installation, the device now leverages your corporate SSO for authentication to the mobile app. The certi�cate will be installed under Personal Pro�les UserCerti�cates.
Using the .p12 certi�cate with the Android App
1. Log on to the app with your application password.
2. Connect to the SAC URL. In the Authentication step, when prompted in the Choose certi�cate screen, Select certi�cate as shown below:
The app will use the certi�cate to logon to SAP Analytics Cloud.
3. The Choose certi�cate screen will also display when connecting to live data sources. Select the same certi�cate to continue.
SAP Cloud Connector-based Mobile Single Sign-On
Learn how to enable a direct and seamless single sign-on (SSO) experience for both iOS and Android mobile app users based on the SAPCP Cloud Connector.
Backend Con�guration Requirements
Before enabling SSO through the cloud connector, you must ensure that the backend tasks described below have been implemented and properly validated.
1. Your SAP Analytics Cloud system must be con�gured to use the cloud connector. A sub account should be created in your system for the connector. For detailedinformation on con�guring the SAPCP Cloud Connector, see Con�guring the SAPCP Cloud Connector.
2. Create a live data connection from the cloud connector to your live data source. For more information, see Live Data Connections Advanced Features Using the SAPCPCloud Connector.
3. Con�gure your on premise live data sources to use the SAP cloud connector. For details on how to con�gure your live data source, seeCon�gure Your On-PremiseSystems to Use the SAPCP Cloud Connector.
4. Set up trust between SAP Analytics Cloud and your live data source. For set up instructions, see Set Up Trust Between SAPCP Cloud Connector and Your On-PremiseABAP Systems (BW or S/4HANA).
Once all these background steps have been accomplished and veri�ed, the cloud connector is able to propagate credentials from your SAP Analytics Cloud to your livedata source.
Enabling Single Sign-On for Mobile
To enable SSO, you need to specify required settings when setting up your live data connection.
NoteIf you receive an SSL error for the remote connection please try to install the root and intermediate certi�cates for live data source servers in the Android trust certi�catestore under the pro�le where the app is installed (Personal or Work).
NoteCurrently this method only works with the mobile app to connect to your live SAP BW/4HANA, S/4HANA, and SAP HANA data sources.
NoteTunnel Connection is supported for the Android mobile app but not available for the iOS app.
NoteThe sub account for the connector includes settings for Location ID, Virtual Host, and Port. These setting values will be required for enabling SSO for the mobileapp.
NoteThe default virtual host and port are the internal host and port. You can rename the host and port so that the internal host name and port are not exposed. The virtual hostname and port are speci�ed when con�guring the SAPCP Cloud Connector. For more information, see Con�guring the SAPCP Cloud Connector
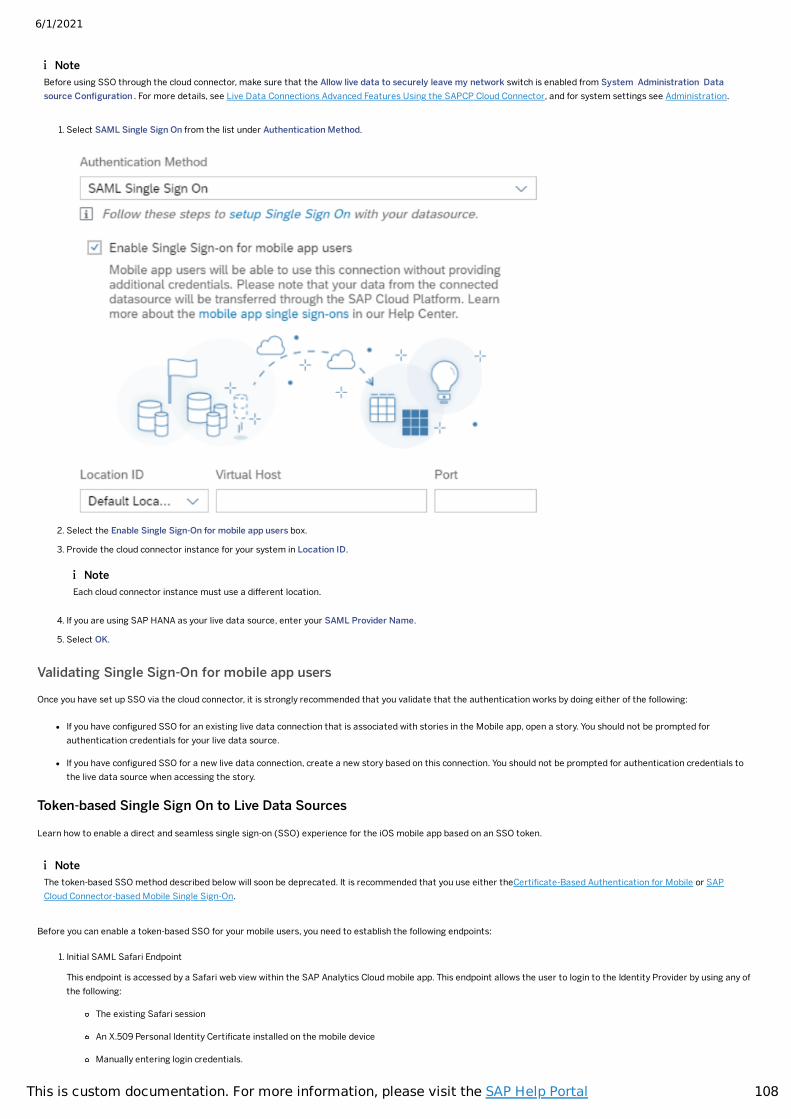
6/1/2021
108This is custom documentation. For more information, please visit the SAP Help Portal
1. Select SAML Single Sign On from the list under Authentication Method.
2. Select the Enable Single Sign-On for mobile app users box.
3. Provide the cloud connector instance for your system in Location ID.
4. If you are using SAP HANA as your live data source, enter your SAML Provider Name.
5. Select OK.
Validating Single Sign-On for mobile app users
Once you have set up SSO via the cloud connector, it is strongly recommended that you validate that the authentication works by doing either of the following:
If you have con�gured SSO for an existing live data connection that is associated with stories in the Mobile app, open a story. You should not be prompted forauthentication credentials for your live data source.
If you have con�gured SSO for a new live data connection, create a new story based on this connection. You should not be prompted for authentication credentials tothe live data source when accessing the story.
Token-based Single Sign On to Live Data Sources
Learn how to enable a direct and seamless single sign-on (SSO) experience for the iOS mobile app based on an SSO token.
Before you can enable a token-based SSO for your mobile users, you need to establish the following endpoints:
1. Initial SAML Safari Endpoint
This endpoint is accessed by a Safari web view within the SAP Analytics Cloud mobile app. This endpoint allows the user to login to the Identity Provider by using any ofthe following:
The existing Safari session
An X.509 Personal Identity Certi�cate installed on the mobile device
Manually entering login credentials.
NoteBefore using SSO through the cloud connector, make sure that the Allow live data to securely leave my network switch is enabled from System Administration Datasource Con�guration . For more details, see Live Data Connections Advanced Features Using the SAPCP Cloud Connector, and for system settings see Administration.
NoteEach cloud connector instance must use a different location.
NoteThe token-based SSO method described below will soon be deprecated. It is recommended that you use either theCerti�cate-Based Authentication for Mobile or SAPCloud Connector-based Mobile Single Sign-On.
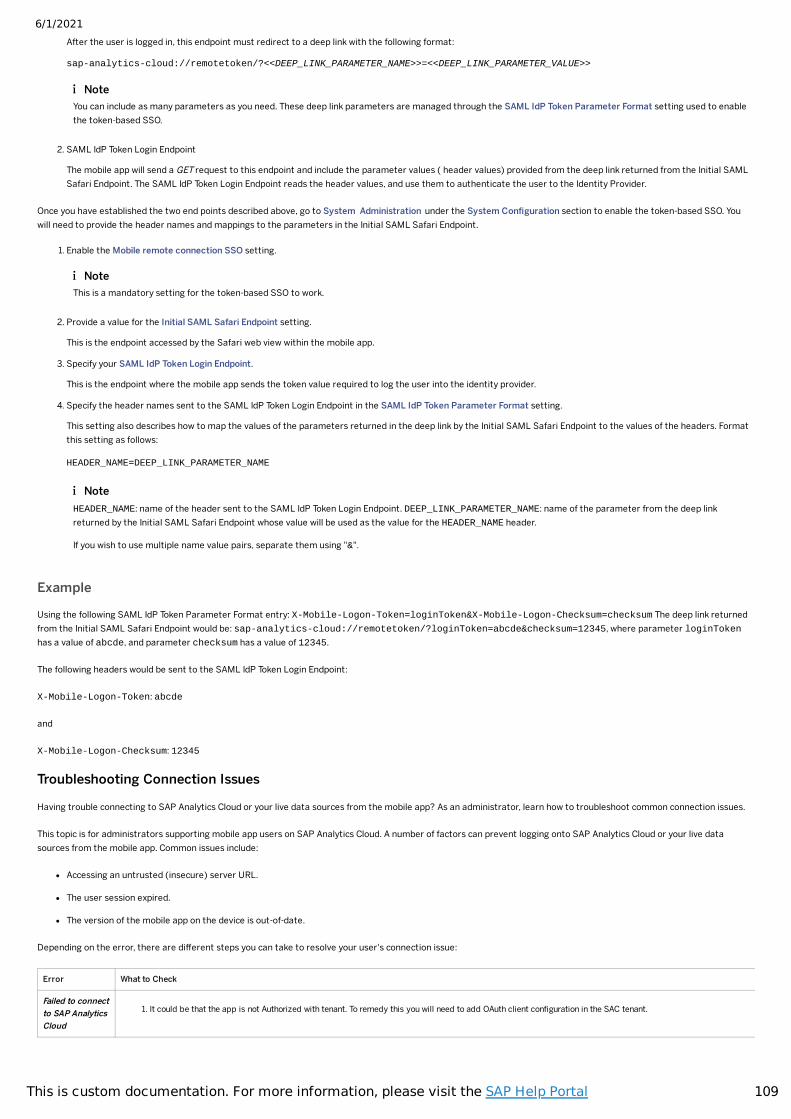
6/1/2021
109This is custom documentation. For more information, please visit the SAP Help Portal
After the user is logged in, this endpoint must redirect to a deep link with the following format:
sap-analytics-cloud://remotetoken/?<<DEEP_LINK_PARAMETER_NAME>>=<<DEEP_LINK_PARAMETER_VALUE>>
2. SAML IdP Token Login Endpoint
The mobile app will send a GET request to this endpoint and include the parameter values ( header values) provided from the deep link returned from the Initial SAMLSafari Endpoint. The SAML IdP Token Login Endpoint reads the header values, and use them to authenticate the user to the Identity Provider.
Once you have established the two end points described above, go to System Administration under the System Con�guration section to enable the token-based SSO. Youwill need to provide the header names and mappings to the parameters in the Initial SAML Safari Endpoint.
1. Enable the Mobile remote connection SSO setting.
2. Provide a value for the Initial SAML Safari Endpoint setting.
This is the endpoint accessed by the Safari web view within the mobile app.
3. Specify your SAML IdP Token Login Endpoint.
This is the endpoint where the mobile app sends the token value required to log the user into the identity provider.
4. Specify the header names sent to the SAML IdP Token Login Endpoint in the SAML IdP Token Parameter Format setting.
This setting also describes how to map the values of the parameters returned in the deep link by the Initial SAML Safari Endpoint to the values of the headers. Formatthis setting as follows:
HEADER_NAME=DEEP_LINK_PARAMETER_NAME
Example
Using the following SAML IdP Token Parameter Format entry: X-Mobile-Logon-Token=loginToken&X-Mobile-Logon-Checksum=checksum The deep link returnedfrom the Initial SAML Safari Endpoint would be: sap-analytics-cloud://remotetoken/?loginToken=abcde&checksum=12345, where parameter loginTokenhas a value of abcde, and parameter checksum has a value of 12345.
The following headers would be sent to the SAML IdP Token Login Endpoint:
X-Mobile-Logon-Token: abcde
and
X-Mobile-Logon-Checksum: 12345
Troubleshooting Connection Issues
Having trouble connecting to SAP Analytics Cloud or your live data sources from the mobile app? As an administrator, learn how to troubleshoot common connection issues.
This topic is for administrators supporting mobile app users on SAP Analytics Cloud. A number of factors can prevent logging onto SAP Analytics Cloud or your live datasources from the mobile app. Common issues include:
Accessing an untrusted (insecure) server URL.
The user session expired.
The version of the mobile app on the device is out-of-date.
Depending on the error, there are different steps you can take to resolve your user's connection issue:
Error What to Check
Failed to connectto SAP AnalyticsCloud
1. It could be that the app is not Authorized with tenant. To remedy this you will need to add OAuth client con�guration in the SAC tenant.
NoteYou can include as many parameters as you need. These deep link parameters are managed through the SAML IdP Token Parameter Format setting used to enablethe token-based SSO.
NoteThis is a mandatory setting for the token-based SSO to work.
NoteHEADER_NAME: name of the header sent to the SAML IdP Token Login Endpoint. DEEP_LINK_PARAMETER_NAME: name of the parameter from the deep linkreturned by the Initial SAML Safari Endpoint whose value will be used as the value for the HEADER_NAME header.
If you wish to use multiple name value pairs, separate them using "&".
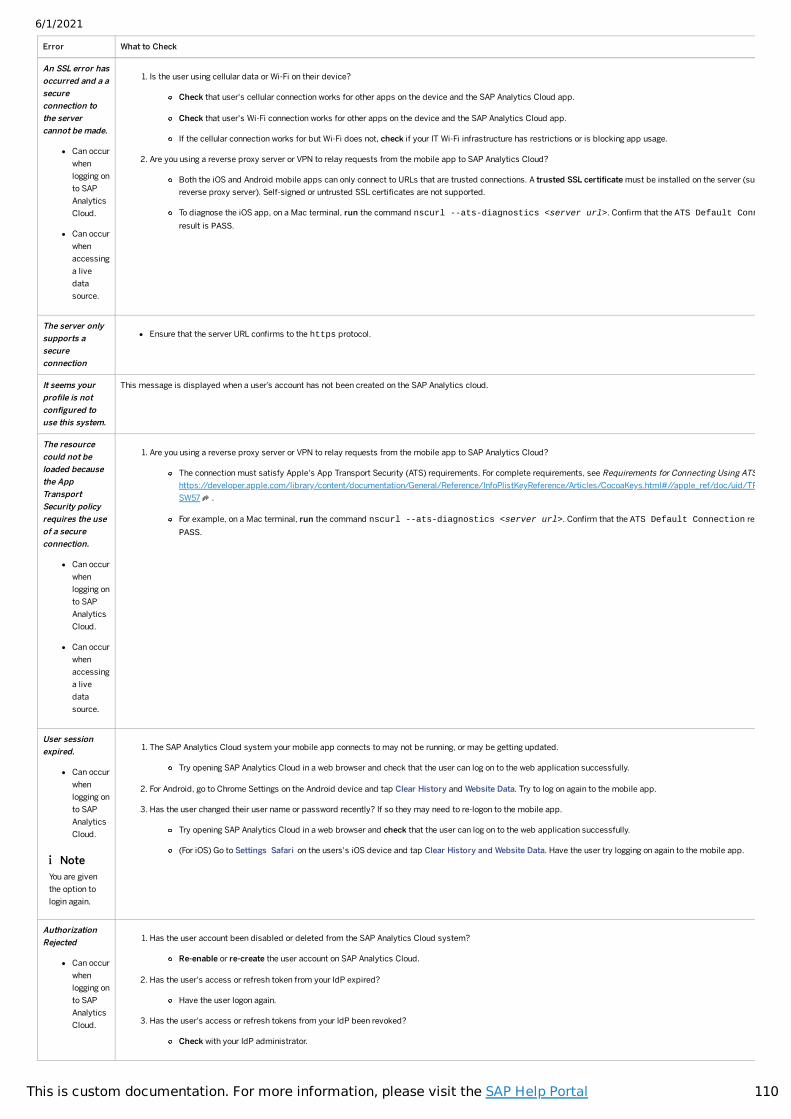
6/1/2021
110This is custom documentation. For more information, please visit the SAP Help Portal
Error What to Check
An SSL error hasoccurred and a asecureconnection tothe servercannot be made.
Can occurwhenlogging onto SAPAnalyticsCloud.
Can occurwhenaccessinga livedatasource.
1. Is the user using cellular data or Wi-Fi on their device?
Check that user's cellular connection works for other apps on the device and the SAP Analytics Cloud app.
Check that user's Wi-Fi connection works for other apps on the device and the SAP Analytics Cloud app.
If the cellular connection works for but Wi-Fi does not, check if your IT Wi-Fi infrastructure has restrictions or is blocking app usage.
2. Are you using a reverse proxy server or VPN to relay requests from the mobile app to SAP Analytics Cloud?
Both the iOS and Android mobile apps can only connect to URLs that are trusted connections. A trusted SSL certi�cate must be installed on the server (sucreverse proxy server). Self-signed or untrusted SSL certi�cates are not supported.
To diagnose the iOS app, on a Mac terminal, run the command nscurl --ats-diagnostics <server url>. Con�rm that the ATS Default Connresult is PASS.
The server onlysupports asecureconnection
Ensure that the server URL con�rms to the https protocol.
It seems yourpro�le is notcon�gured touse this system.
This message is displayed when a user’s account has not been created on the SAP Analytics cloud.
The resourcecould not beloaded becausethe AppTransportSecurity policyrequires the useof a secureconnection.
Can occurwhenlogging onto SAPAnalyticsCloud.
Can occurwhenaccessinga livedatasource.
1. Are you using a reverse proxy server or VPN to relay requests from the mobile app to SAP Analytics Cloud?
The connection must satisfy Apple's App Transport Security (ATS) requirements. For complete requirements, see Requirements for Connecting Using ATShttps://developer.apple.com/library/content/documentation/General/Reference/InfoPlistKeyReference/Articles/CocoaKeys.html#//apple_ref/doc/uid/TPSW57 .
For example, on a Mac terminal, run the command nscurl --ats-diagnostics <server url>. Con�rm that the ATS Default Connection resPASS.
User sessionexpired.
Can occurwhenlogging onto SAPAnalyticsCloud.
1. The SAP Analytics Cloud system your mobile app connects to may not be running, or may be getting updated.
Try opening SAP Analytics Cloud in a web browser and check that the user can log on to the web application successfully.
2. For Android, go to Chrome Settings on the Android device and tap Clear History and Website Data. Try to log on again to the mobile app.
3. Has the user changed their user name or password recently? If so they may need to re-logon to the mobile app.
Try opening SAP Analytics Cloud in a web browser and check that the user can log on to the web application successfully.
(For iOS) Go to Settings Safari on the users's iOS device and tap Clear History and Website Data. Have the user try logging on again to the mobile app.
AuthorizationRejected
Can occurwhenlogging onto SAPAnalyticsCloud.
1. Has the user account been disabled or deleted from the SAP Analytics Cloud system?
Re-enable or re-create the user account on SAP Analytics Cloud.
2. Has the user's access or refresh token from your IdP expired?
Have the user logon again.
3. Has the user's access or refresh tokens from your IdP been revoked?
Check with your IdP administrator.
NoteYou are giventhe option tologin again.
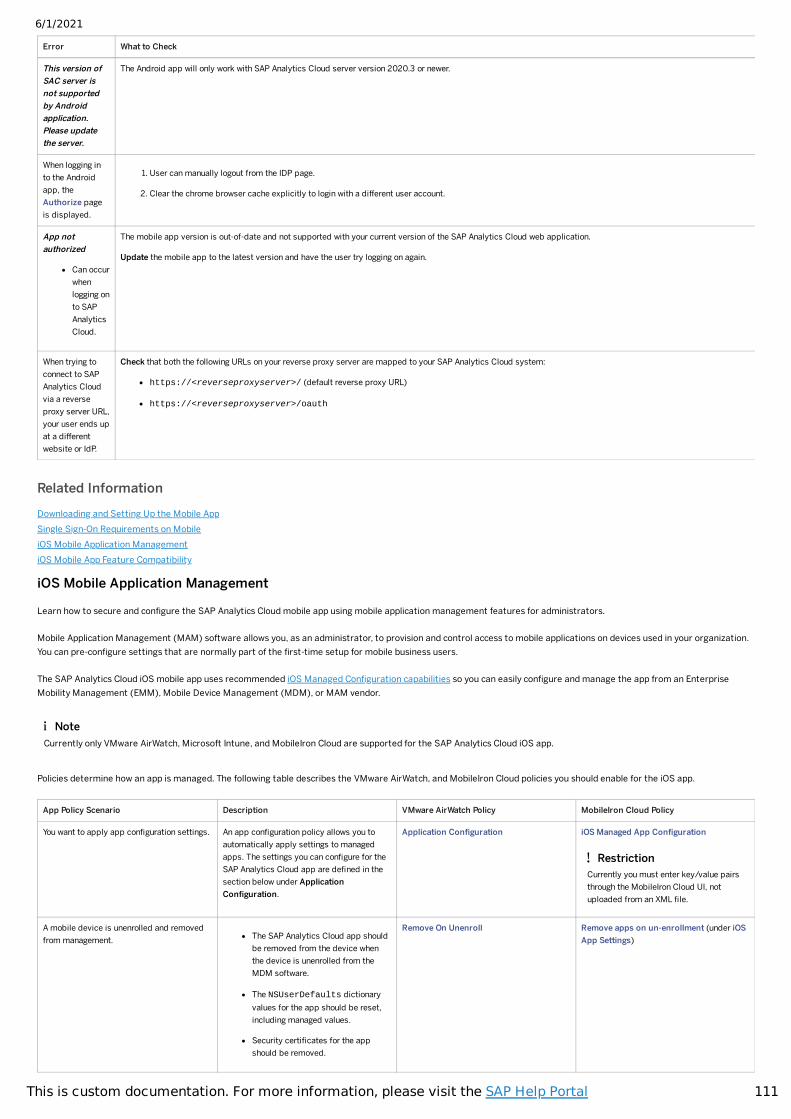
6/1/2021
111This is custom documentation. For more information, please visit the SAP Help Portal
Related InformationDownloading and Setting Up the Mobile AppSingle Sign-On Requirements on MobileiOS Mobile Application ManagementiOS Mobile App Feature Compatibility
iOS Mobile Application Management
Learn how to secure and con�gure the SAP Analytics Cloud mobile app using mobile application management features for administrators.
Mobile Application Management (MAM) software allows you, as an administrator, to provision and control access to mobile applications on devices used in your organization.You can pre-con�gure settings that are normally part of the �rst-time setup for mobile business users.
The SAP Analytics Cloud iOS mobile app uses recommended iOS Managed Con�guration capabilities so you can easily con�gure and manage the app from an EnterpriseMobility Management (EMM), Mobile Device Management (MDM), or MAM vendor.
Policies determine how an app is managed. The following table describes the VMware AirWatch, and MobileIron Cloud policies you should enable for the iOS app.
App Policy Scenario Description VMware AirWatch Policy MobileIron Cloud Policy
You want to apply app con�guration settings. An app con�guration policy allows you toautomatically apply settings to managedapps. The settings you can con�gure for theSAP Analytics Cloud app are de�ned in thesection below under ApplicationCon�guration.
Application Con�guration iOS Managed App Con�guration
A mobile device is unenrolled and removedfrom management. The SAP Analytics Cloud app should
be removed from the device whenthe device is unenrolled from theMDM software.
The NSUserDefaults dictionaryvalues for the app should be reset,including managed values.
Security certi�cates for the appshould be removed.
Remove On Unenroll Remove apps on un-enrollment (under iOSApp Settings)
Error What to Check
This version ofSAC server isnot supportedby Androidapplication.Please updatethe server.
The Android app will only work with SAP Analytics Cloud server version 2020.3 or newer.
When logging into the Androidapp, theAuthorize pageis displayed.
1. User can manually logout from the IDP page.
2. Clear the chrome browser cache explicitly to login with a different user account.
App notauthorized
Can occurwhenlogging onto SAPAnalyticsCloud.
The mobile app version is out-of-date and not supported with your current version of the SAP Analytics Cloud web application.
Update the mobile app to the latest version and have the user try logging on again.
When trying toconnect to SAPAnalytics Cloudvia a reverseproxy server URL,your user ends upat a differentwebsite or IdP.
Check that both the following URLs on your reverse proxy server are mapped to your SAP Analytics Cloud system:
https://<reverseproxyserver>/ (default reverse proxy URL)
https://<reverseproxyserver>/oauth
NoteCurrently only VMware AirWatch, Microsoft Intune, and MobileIron Cloud are supported for the SAP Analytics Cloud iOS app.
RestrictionCurrently you must enter key/value pairsthrough the MobileIron Cloud UI, notuploaded from an XML �le.
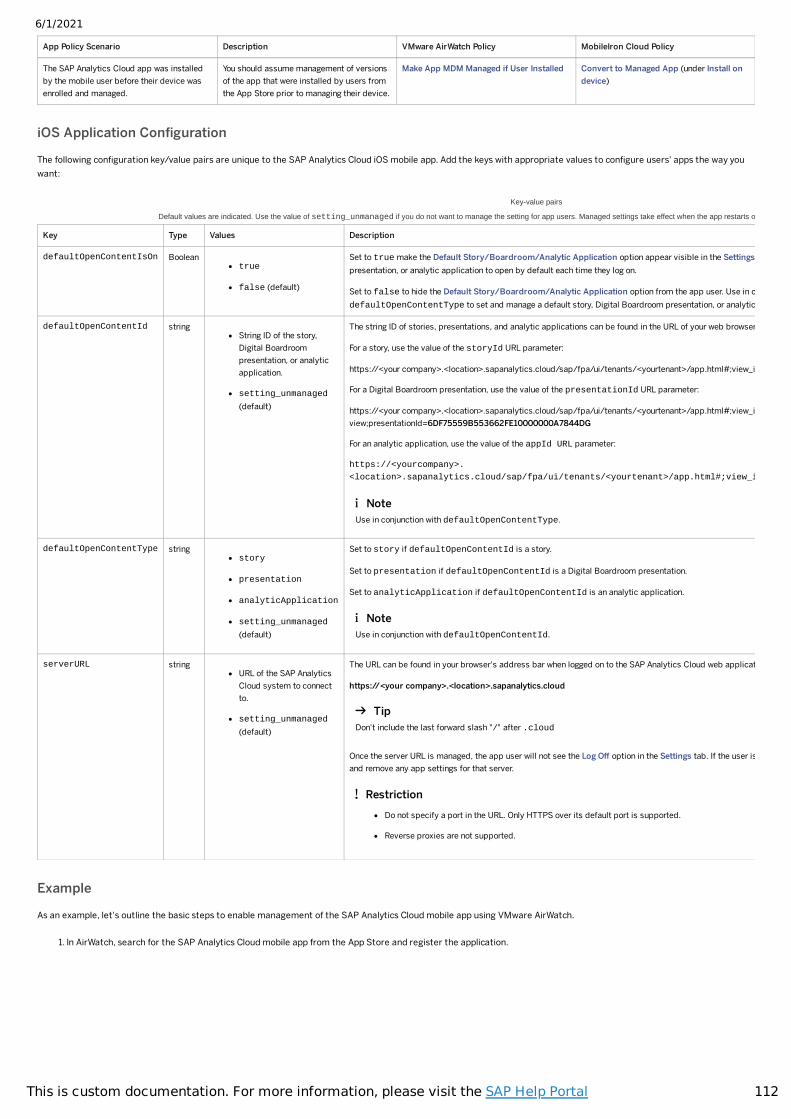
6/1/2021
112This is custom documentation. For more information, please visit the SAP Help Portal
App Policy Scenario Description VMware AirWatch Policy MobileIron Cloud Policy
The SAP Analytics Cloud app was installedby the mobile user before their device wasenrolled and managed.
You should assume management of versionsof the app that were installed by users fromthe App Store prior to managing their device.
Make App MDM Managed if User Installed Convert to Managed App (under Install ondevice)
iOS Application Con�guration
The following con�guration key/value pairs are unique to the SAP Analytics Cloud iOS mobile app. Add the keys with appropriate values to con�gure users' apps the way youwant:
Example
As an example, let's outline the basic steps to enable management of the SAP Analytics Cloud mobile app using VMware AirWatch.
1. In AirWatch, search for the SAP Analytics Cloud mobile app from the App Store and register the application.
Key-value pairs
Default values are indicated. Use the value of setting_unmanaged if you do not want to manage the setting for app users. Managed settings take effect when the app restarts o
Key Type Values Description
defaultOpenContentIsOn Booleantrue
false (default)
Set to true make the Default Story/Boardroom/Analytic Application option appear visible in the Settings presentation, or analytic application to open by default each time they log on.
Set to false to hide the Default Story/Boardroom/Analytic Application option from the app user. Use in cdefaultOpenContentType to set and manage a default story, Digital Boardroom presentation, or analytic
defaultOpenContentId stringString ID of the story,Digital Boardroompresentation, or analyticapplication.
setting_unmanaged
(default)
The string ID of stories, presentations, and analytic applications can be found in the URL of your web browser
For a story, use the value of the storyId URL parameter:
https://<your company>.<location>.sapanalytics.cloud/sap/fpa/ui/tenants/<yourtenant>/app.html#;view_i
For a Digital Boardroom presentation, use the value of the presentationId URL parameter:
https://<your company>.<location>.sapanalytics.cloud/sap/fpa/ui/tenants/<yourtenant>/app.html#;view_iview;presentationId=6DF75559B553662FE10000000A7844DG
For an analytic application, use the value of the appId URL parameter:
https://<yourcompany>.
<location>.sapanalytics.cloud/sap/fpa/ui/tenants/<yourtenant>/app.html#;view_i
defaultOpenContentType stringstory
presentation
analyticApplication
setting_unmanaged
(default)
Set to story if defaultOpenContentId is a story.
Set to presentation if defaultOpenContentId is a Digital Boardroom presentation.
Set to analyticApplication if defaultOpenContentId is an analytic application.
serverURL stringURL of the SAP AnalyticsCloud system to connectto.
setting_unmanaged
(default)
The URL can be found in your browser's address bar when logged on to the SAP Analytics Cloud web applicat
https://<your company>.<location>.sapanalytics.cloud
Once the server URL is managed, the app user will not see the Log Off option in the Settings tab. If the user isand remove any app settings for that server.
NoteUse in conjunction with defaultOpenContentType.
NoteUse in conjunction with defaultOpenContentId.
TipDon't include the last forward slash "/" after .cloud
RestrictionDo not specify a port in the URL. Only HTTPS over its default port is supported.
Reverse proxies are not supported.
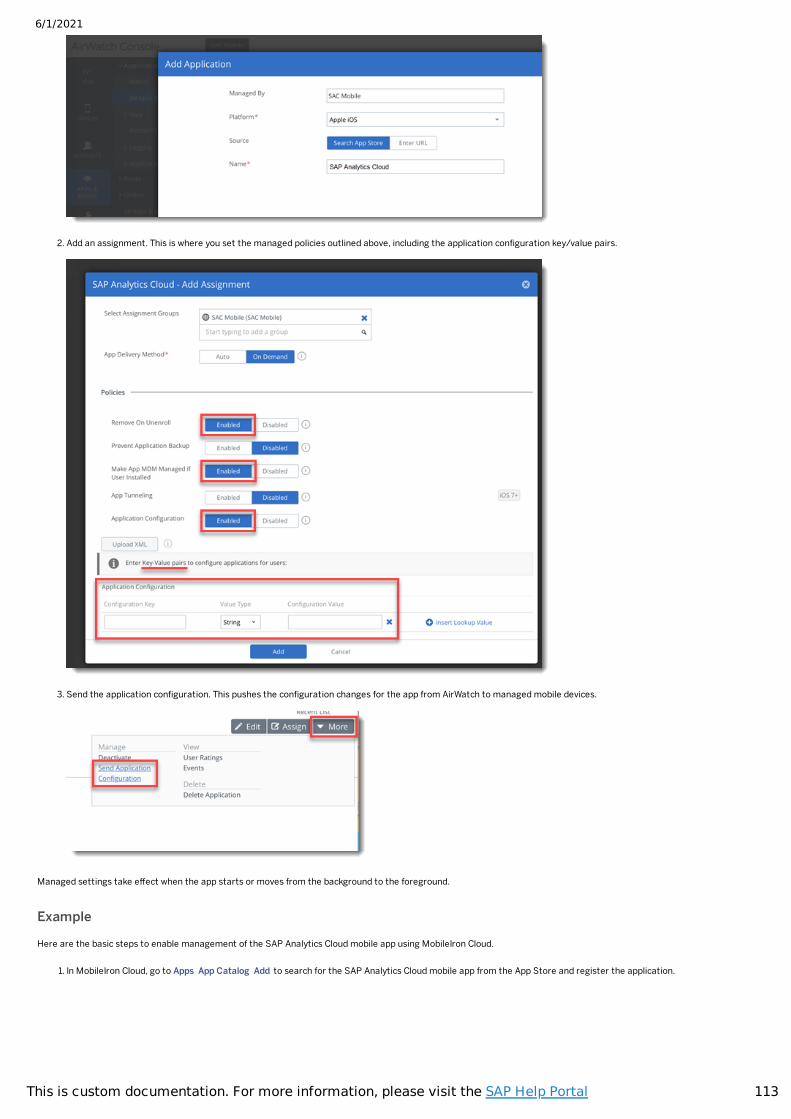
6/1/2021
113This is custom documentation. For more information, please visit the SAP Help Portal
2. Add an assignment. This is where you set the managed policies outlined above, including the application con�guration key/value pairs.
3. Send the application con�guration. This pushes the con�guration changes for the app from AirWatch to managed mobile devices.
Managed settings take effect when the app starts or moves from the background to the foreground.
Example
Here are the basic steps to enable management of the SAP Analytics Cloud mobile app using MobileIron Cloud.
1. In MobileIron Cloud, go to Apps App Catalog Add to search for the SAP Analytics Cloud mobile app from the App Store and register the application.
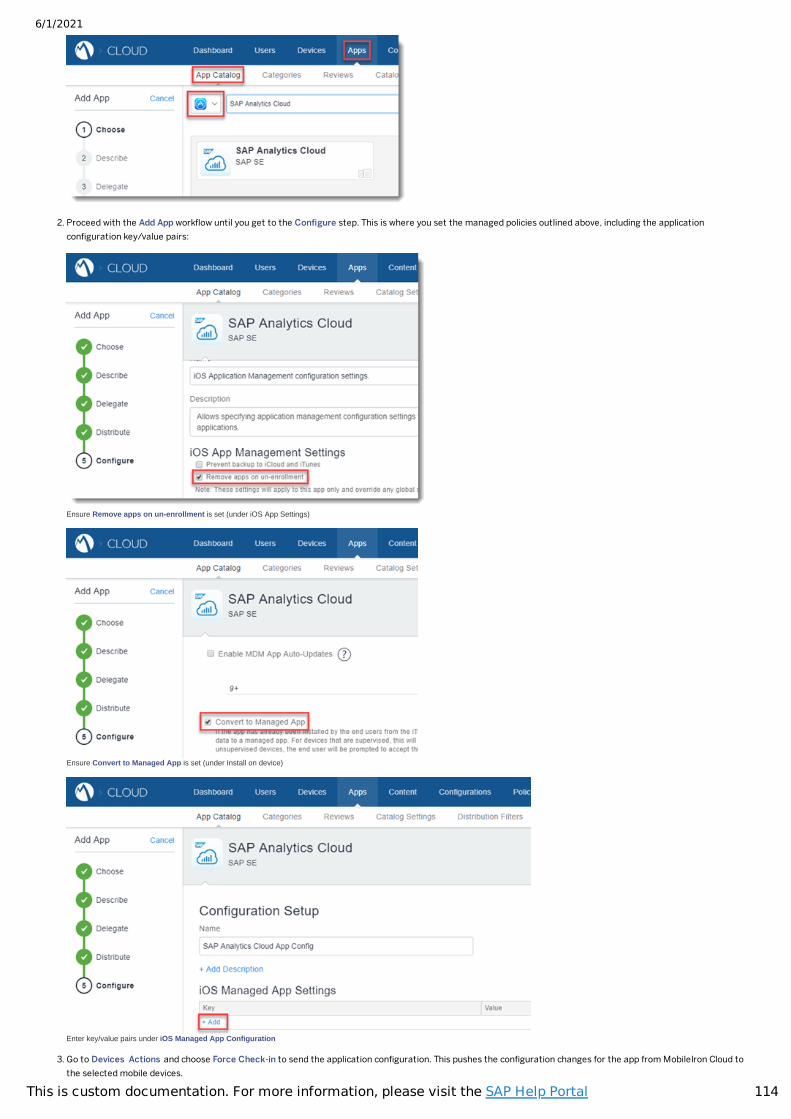
6/1/2021
114This is custom documentation. For more information, please visit the SAP Help Portal
2. Proceed with the Add App work�ow until you get to the Con�gure step. This is where you set the managed policies outlined above, including the applicationcon�guration key/value pairs:
Ensure Remove apps on un-enrollment is set (under iOS App Settings)
Ensure Convert to Managed App is set (under Install on device)
Enter key/value pairs under iOS Managed App Configuration
3. Go to Devices Actions and choose Force Check-in to send the application con�guration. This pushes the con�guration changes for the app from MobileIron Cloud tothe selected mobile devices.
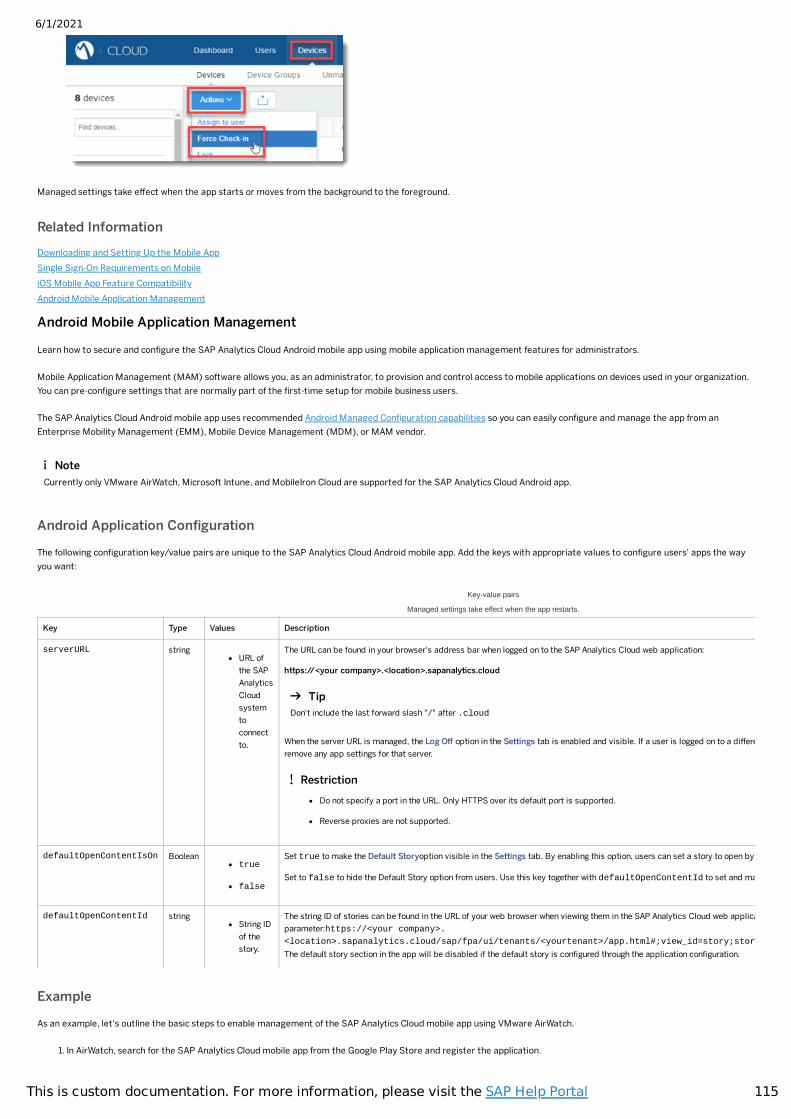
6/1/2021
115This is custom documentation. For more information, please visit the SAP Help Portal
Managed settings take effect when the app starts or moves from the background to the foreground.
Related InformationDownloading and Setting Up the Mobile AppSingle Sign-On Requirements on MobileiOS Mobile App Feature CompatibilityAndroid Mobile Application Management
Android Mobile Application Management
Learn how to secure and con�gure the SAP Analytics Cloud Android mobile app using mobile application management features for administrators.
Mobile Application Management (MAM) software allows you, as an administrator, to provision and control access to mobile applications on devices used in your organization.You can pre-con�gure settings that are normally part of the �rst-time setup for mobile business users.
The SAP Analytics Cloud Android mobile app uses recommended Android Managed Con�guration capabilities so you can easily con�gure and manage the app from anEnterprise Mobility Management (EMM), Mobile Device Management (MDM), or MAM vendor.
Android Application Con�guration
The following con�guration key/value pairs are unique to the SAP Analytics Cloud Android mobile app. Add the keys with appropriate values to con�gure users' apps the wayyou want:
Example
As an example, let's outline the basic steps to enable management of the SAP Analytics Cloud mobile app using VMware AirWatch.
1. In AirWatch, search for the SAP Analytics Cloud mobile app from the Google Play Store and register the application.
Key-value pairs
Managed settings take effect when the app restarts.
Key Type Values Description
serverURL stringURL ofthe SAPAnalyticsCloudsystemtoconnectto.
The URL can be found in your browser's address bar when logged on to the SAP Analytics Cloud web application:
https://<your company>.<location>.sapanalytics.cloud
When the server URL is managed, the Log Off option in the Settings tab is enabled and visible. If a user is logged on to a differeremove any app settings for that server.
defaultOpenContentIsOn Booleantrue
false
Set true to make the Default Storyoption visible in the Settings tab. By enabling this option, users can set a story to open by
Set to false to hide the Default Story option from users. Use this key together with defaultOpenContentId to set and ma
defaultOpenContentId stringString IDof thestory.
The string ID of stories can be found in the URL of your web browser when viewing them in the SAP Analytics Cloud web applicaparameter:https://<your company>.<location>.sapanalytics.cloud/sap/fpa/ui/tenants/<yourtenant>/app.html#;view_id=story;story
The default story section in the app will be disabled if the default story is con�gured through the application con�guration.
NoteCurrently only VMware AirWatch, Microsoft Intune, and MobileIron Cloud are supported for the SAP Analytics Cloud Android app.
TipDon't include the last forward slash "/" after .cloud
RestrictionDo not specify a port in the URL. Only HTTPS over its default port is supported.
Reverse proxies are not supported.
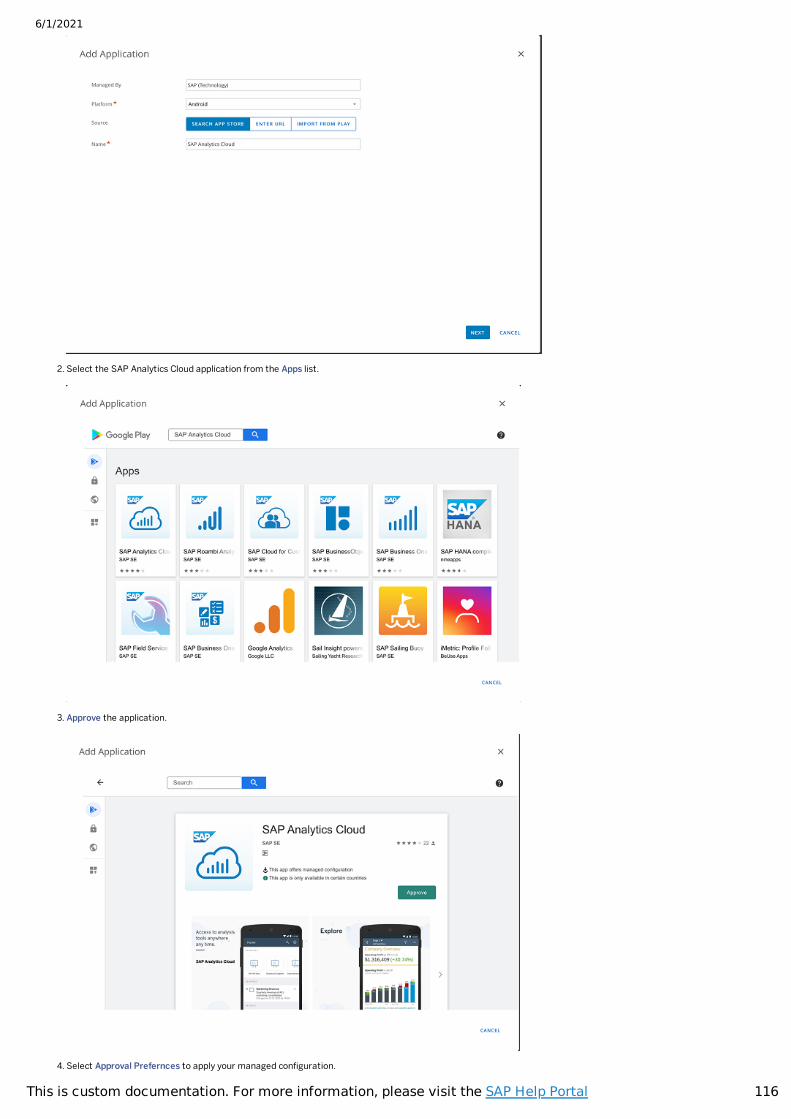
6/1/2021
116This is custom documentation. For more information, please visit the SAP Help Portal
2. Select the SAP Analytics Cloud application from the Apps list.
3. Approve the application.
4. Select Approval Prefernces to apply your managed con�guration.
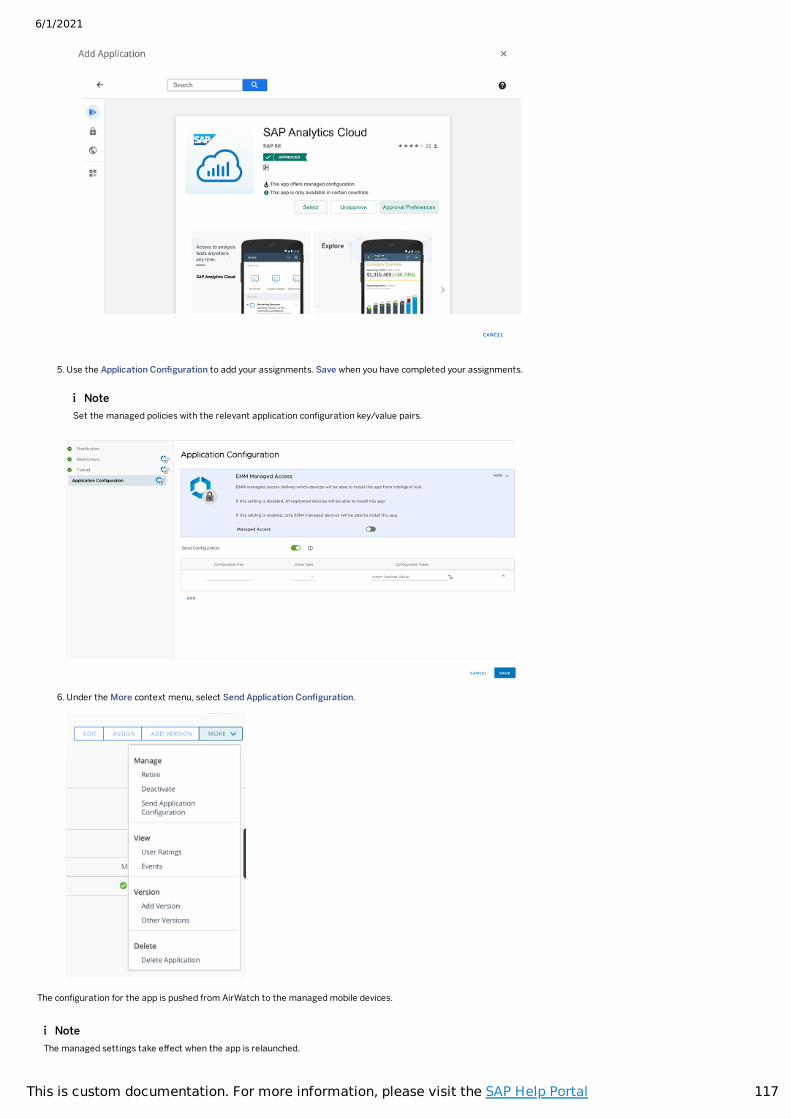
6/1/2021
117This is custom documentation. For more information, please visit the SAP Help Portal
5. Use the Application Con�guration to add your assignments. Save when you have completed your assignments.
6. Under the More context menu, select Send Application Con�guration.
The con�guration for the app is pushed from AirWatch to the managed mobile devices.
NoteSet the managed policies with the relevant application con�guration key/value pairs.
NoteThe managed settings take effect when the app is relaunched.
6/1/2021
118This is custom documentation. For more information, please visit the SAP Help Portal
Related InformationiOS Mobile Application ManagementAndroid Mobile App Feature CompatibilityDownloading and Setting Up the Mobile App
Preparing Stories for Mobile
Learn how to enable your stories for either the iOS or Android mobile apps.
To view stories in the mobile app, they must be created using Responsive pages (not Canvas or Grid). When creating your story, you can preview how it will look on a device bychoosing (Device Preview) from the story toolbar. Select either Android or iOS for your Device type and specify a Size from the list provided.
You can set different font sizes for the resolutions of different device types. This allows story designers to target how text is displayed for a single story when viewed acrossmultiple mobile devices. First select a device and size, such as an iOS Small Phone. Then with a tile in the story selected, open the Designer panel and select Styling.Fonts can be changed for individual tiles in the story.
You can also hide an individual Responsive story page so it doesn't appear on mobile devices. Select the page tab in the story designer and choose Hide in mobile.
Optimized story loading on iOS mobile
You can set your mobile-enabled story to load faster on iOS mobile devices by leveraging the embedded browser.
1. Access your story:
From the Home Screen, under Recent Stories, select the story. OR
From the ( ) Main Menu, select Browse, then Files, and then click the story.
2. Next to Controls, select Edit.
From the (Edit Story) dropdown list, select Story Details.
3. Under Optimized iOS, turn on the Enable for iOS App setting.
What is supported with this feature? What is not supported with this feature?
NoteThe size previews for Phone and Tablet correspond to the following Android device speci�cations:
Generic Phone: Viewport equal or under 768 px width
Generic Tablet: Viewport between 769 to 1024 px width
Large Tablet: Viewport equal or greater than 1025 px width
NoteThe size previews for Phone and Tablet correspond to the following iOS devices:
Small Phone: iPhone 11 Pro, iPhone XS, iPhone X, iPhone 8, iPhone 7, iPhone 6S
Large Phone: iPhone 11, iPhone 11 Pro Max, iPhone XS Max, iPhone XR, iPhone 8 Plus, iPhone 7 Plus, iPhone 6S Plus
Small Tablet: iPad Pro (9.7-inch), iPad Air 2, iPad (9.7-inch), iPad Mini
Large Tablet: iPad Pro (10.5-inch, 11 inch, 12.9 inch), iPad Air (2019)
The mobile apps can only be viewed in portrait mode for phones and landscape mode for tablets. The apps do not rotate orientation.
6/1/2021
119This is custom documentation. For more information, please visit the SAP Help Portal
What is supported with this feature? What is not supported with this feature?
Only available in the iOS Mobile App starting from version 2.77.0Hyperlinks in tables
Planning:
Value Driver Tree
Data Action
Commenting
Dynamic Images
R-Visualizations
Clock
Geo Maps
Chart �lter reset
Chart footers
Smart Insights
Web page
Top N options
Canvas pages: canvas and grid layouts
iOS devices with at least 3GB of RAM Offline mode
Supported story features:
Charts
Tables with limited support for cell actions:
Swap Axis
Drill
Display Options
Hyperlinks
Images/Shapes
Text/Headers with Dynamic text support
RSS
Story Filters and Input Controls
Sharing and Annotation
Hyperlinks
Apply Bookmarks
Saving Bookmarks
Widget full screen landscape mode
Deeplinks
Prompts
Device Preview
Chart Scaling
Offline – limited to analytics models
Mobile application management through MDMs
Mobile SDK
SAP Digital Boardroom
Local and live models (SAP HANA and SAP BW)
Working with Live Data sources in Optimized iOSmode
The table below summarizes live connectivity supported features and work�ows as well as limitations for mobile-enabled stories running in Optimized iOS mode.
NoteForecasting in timeseries and timestamp charts is not supported.
NoteA bookmark is saved as a personal default bookmark. You cannot rename or delete the bookmark in the mobile app.
6/1/2021
120This is custom documentation. For more information, please visit the SAP Help Portal
What is supported? What is not supported?What is supported? What is not supported?
Live data connectivity
Direct type connections for BW & HANA data sources (authentication type):
SAML
Cloud Connector-based Mobile Single Sign-On
Basic
Tunnel type connection for BW & HANA data sources (authentication type):
SAML
Live data connectivity
Direct type connections for BW &HANA data sources (authenticationtype):
Token-based Single Sign On tolive data sources
SAML login using user importedcerti�cate
IDP session timeout – inconsistent reconnection todata source.
Viewing Stories on Mobile
Learn how to view and interact with your stories in the SAP Analytics Cloud iOS and Android mobile apps.
Story, Page, and Other �lters
Chart Filters and the Quick Actions Menu
Additional Chart Interactions
Navigate to the story you want to view using either the Home or Files tabs.
The Home tab contains your favorite and featured content, as well as recently viewed items.
The Files tab displays all the folders and �les containing stories and presentations enabled for mobile.
Tap Stories to choose a story you want to view. You can view stories you own, stories shared with you by others, and public stories all from your mobile device.
For stories with multiple pages, swipe left to go the next page and swipe right to go the previous page by tapping the page title at the top of the screen. This brings up adialog where you can jump directly to any page.
Story, Page, and Other �lters
Story �lters, page �lters, model and dimension �lters, and calculations that exist in the story can be interacted with in the Input Controls panel of the mobile app.
To change a story, page or calculation �lter value:
1. While viewing a story, tap (found in the upper right part of your screen).
2. In the Input Controls panel, you'll see a list of �lters (calculations appear under Others). Select a �lter.
3. In the panel for the selected �lter, you can see a list of all possible �lter values. Select one or multiple values by tapping the check box next to each value.
4. (Optional) If the dimension contains a hierarchy, you can select the dimension to see the next level of dimension values and select one or more of the child values.
5. Tap Apply and the story will refresh with your changes.
NoteFor direct SAML Connection, the IDP login is displayed for up to 60 sec to enter credentials. It closes automatically. In case of atimed-out or failed connection, tap Story refresh to reconnect your live data source.
NoteIt is recommended that you manually refresh thestory to reconnect.
NoteYou can also use the search tool provided on the Home and Files tabs to �nd your story.
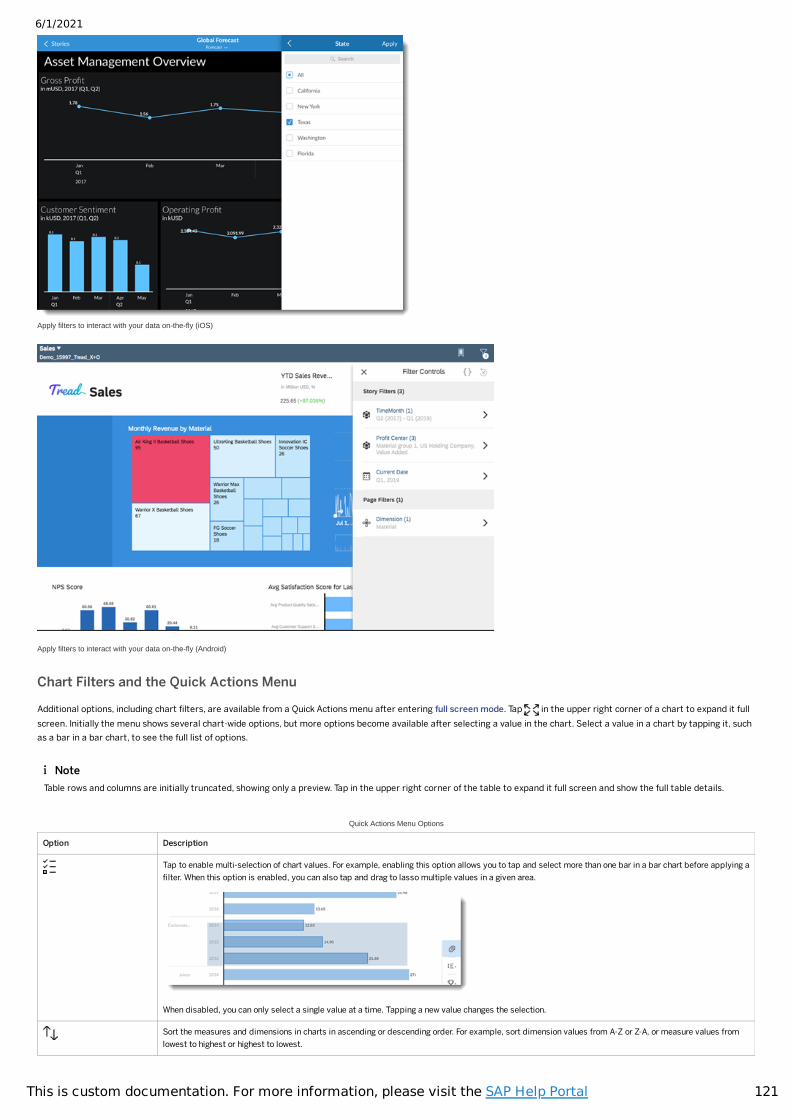
6/1/2021
121This is custom documentation. For more information, please visit the SAP Help Portal
Apply filters to interact with your data on-the-fly (iOS)
Apply filters to interact with your data on-the-fly (Android)
Chart Filters and the Quick Actions Menu
Additional options, including chart �lters, are available from a Quick Actions menu after entering full screen mode. Tap in the upper right corner of a chart to expand it fullscreen. Initially the menu shows several chart-wide options, but more options become available after selecting a value in the chart. Select a value in a chart by tapping it, suchas a bar in a bar chart, to see the full list of options.
Quick Actions Menu Options
Option Description
Tap to enable multi-selection of chart values. For example, enabling this option allows you to tap and select more than one bar in a bar chart before applying a�lter. When this option is enabled, you can also tap and drag to lasso multiple values in a given area.
When disabled, you can only select a single value at a time. Tapping a new value changes the selection.
Sort the measures and dimensions in charts in ascending or descending order. For example, sort dimension values from A-Z or Z-A, or measure values fromlowest to highest or highest to lowest.
NoteTable rows and columns are initially truncated, showing only a preview. Tap in the upper right corner of the table to expand it full screen and show the full table details.
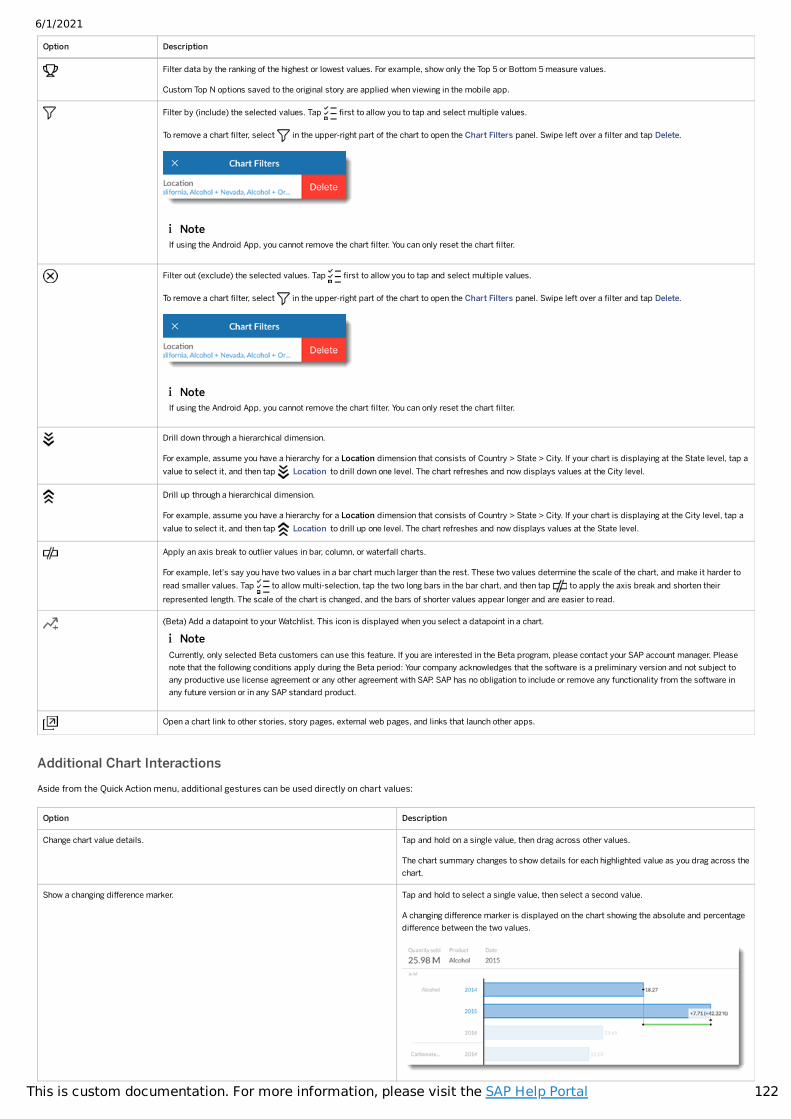
6/1/2021
122This is custom documentation. For more information, please visit the SAP Help Portal
Option Description
Filter data by the ranking of the highest or lowest values. For example, show only the Top 5 or Bottom 5 measure values.
Custom Top N options saved to the original story are applied when viewing in the mobile app.
Filter by (include) the selected values. Tap �rst to allow you to tap and select multiple values.
To remove a chart �lter, select in the upper-right part of the chart to open the Chart Filters panel. Swipe left over a �lter and tap Delete.
Filter out (exclude) the selected values. Tap �rst to allow you to tap and select multiple values.
To remove a chart �lter, select in the upper-right part of the chart to open the Chart Filters panel. Swipe left over a �lter and tap Delete.
Drill down through a hierarchical dimension.
For example, assume you have a hierarchy for a Location dimension that consists of Country > State > City. If your chart is displaying at the State level, tap avalue to select it, and then tap Location to drill down one level. The chart refreshes and now displays values at the City level.
Drill up through a hierarchical dimension.
For example, assume you have a hierarchy for a Location dimension that consists of Country > State > City. If your chart is displaying at the City level, tap avalue to select it, and then tap Location to drill up one level. The chart refreshes and now displays values at the State level.
Apply an axis break to outlier values in bar, column, or waterfall charts.
For example, let's say you have two values in a bar chart much larger than the rest. These two values determine the scale of the chart, and make it harder toread smaller values. Tap to allow multi-selection, tap the two long bars in the bar chart, and then tap to apply the axis break and shorten theirrepresented length. The scale of the chart is changed, and the bars of shorter values appear longer and are easier to read.
(Beta) Add a datapoint to your Watchlist. This icon is displayed when you select a datapoint in a chart.
Open a chart link to other stories, story pages, external web pages, and links that launch other apps.
Additional Chart InteractionsAside from the Quick Action menu, additional gestures can be used directly on chart values:
Option Description
Change chart value details. Tap and hold on a single value, then drag across other values.
The chart summary changes to show details for each highlighted value as you drag across thechart.
Show a changing difference marker. Tap and hold to select a single value, then select a second value.
A changing difference marker is displayed on the chart showing the absolute and percentagedifference between the two values.
NoteIf using the Android App, you cannot remove the chart �lter. You can only reset the chart �lter.
NoteIf using the Android App, you cannot remove the chart �lter. You can only reset the chart �lter.
NoteCurrently, only selected Beta customers can use this feature. If you are interested in the Beta program, please contact your SAP account manager. Pleasenote that the following conditions apply during the Beta period: Your company acknowledges that the software is a preliminary version and not subject toany productive use license agreement or any other agreement with SAP. SAP has no obligation to include or remove any functionality from the software inany future version or in any SAP standard product.
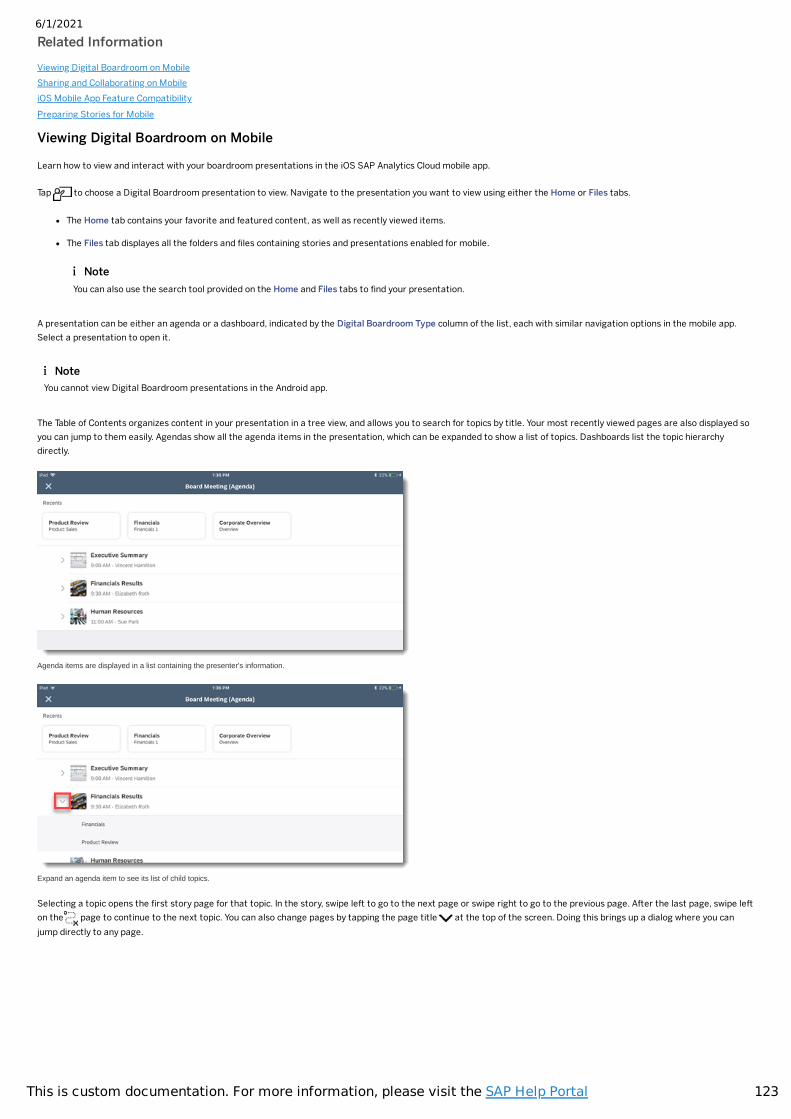
6/1/2021
123This is custom documentation. For more information, please visit the SAP Help Portal
Related InformationViewing Digital Boardroom on MobileSharing and Collaborating on MobileiOS Mobile App Feature CompatibilityPreparing Stories for Mobile
Viewing Digital Boardroom on Mobile
Learn how to view and interact with your boardroom presentations in the iOS SAP Analytics Cloud mobile app.
Tap to choose a Digital Boardroom presentation to view. Navigate to the presentation you want to view using either the Home or Files tabs.
The Home tab contains your favorite and featured content, as well as recently viewed items.
The Files tab displayes all the folders and �les containing stories and presentations enabled for mobile.
A presentation can be either an agenda or a dashboard, indicated by the Digital Boardroom Type column of the list, each with similar navigation options in the mobile app.Select a presentation to open it.
The Table of Contents organizes content in your presentation in a tree view, and allows you to search for topics by title. Your most recently viewed pages are also displayed soyou can jump to them easily. Agendas show all the agenda items in the presentation, which can be expanded to show a list of topics. Dashboards list the topic hierarchydirectly.
Agenda items are displayed in a list containing the presenter's information.
Expand an agenda item to see its list of child topics.
Selecting a topic opens the �rst story page for that topic. In the story, swipe left to go to the next page or swipe right to go to the previous page. After the last page, swipe lefton the page to continue to the next topic. You can also change pages by tapping the page title at the top of the screen. Doing this brings up a dialog where you canjump directly to any page.
NoteYou can also use the search tool provided on the Home and Files tabs to �nd your presentation.
NoteYou cannot view Digital Boardroom presentations in the Android app.
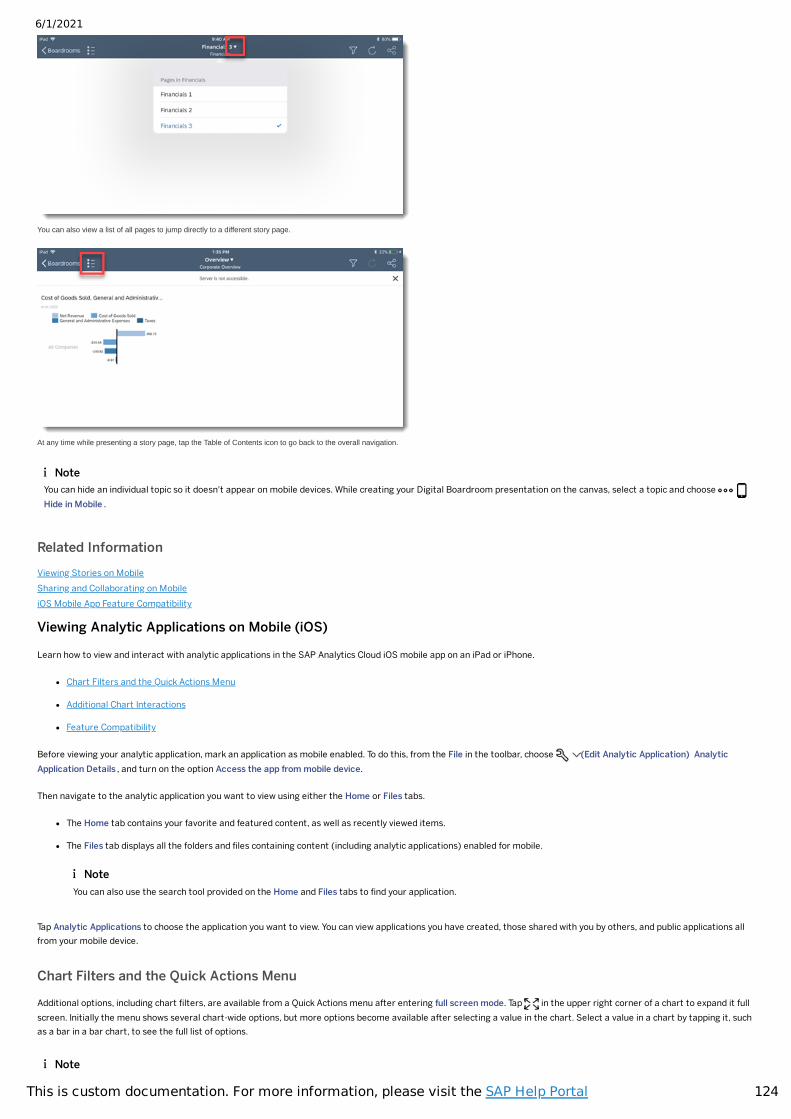
6/1/2021
124This is custom documentation. For more information, please visit the SAP Help Portal
You can also view a list of all pages to jump directly to a different story page.
At any time while presenting a story page, tap the Table of Contents icon to go back to the overall navigation.
Related InformationViewing Stories on MobileSharing and Collaborating on MobileiOS Mobile App Feature Compatibility
Viewing Analytic Applications on Mobile (iOS)
Learn how to view and interact with analytic applications in the SAP Analytics Cloud iOS mobile app on an iPad or iPhone.
Chart Filters and the Quick Actions Menu
Additional Chart Interactions
Feature Compatibility
Before viewing your analytic application, mark an application as mobile enabled. To do this, from the File in the toolbar, choose (Edit Analytic Application) AnalyticApplication Details , and turn on the option Access the app from mobile device.
Then navigate to the analytic application you want to view using either the Home or Files tabs.
The Home tab contains your favorite and featured content, as well as recently viewed items.
The Files tab displays all the folders and �les containing content (including analytic applications) enabled for mobile.
Tap Analytic Applications to choose the application you want to view. You can view applications you have created, those shared with you by others, and public applications allfrom your mobile device.
Chart Filters and the Quick Actions Menu
Additional options, including chart �lters, are available from a Quick Actions menu after entering full screen mode. Tap in the upper right corner of a chart to expand it fullscreen. Initially the menu shows several chart-wide options, but more options become available after selecting a value in the chart. Select a value in a chart by tapping it, suchas a bar in a bar chart, to see the full list of options.
NoteYou can hide an individual topic so it doesn't appear on mobile devices. While creating your Digital Boardroom presentation on the canvas, select a topic and choose Hide in Mobile .
NoteYou can also use the search tool provided on the Home and Files tabs to �nd your application.
Note
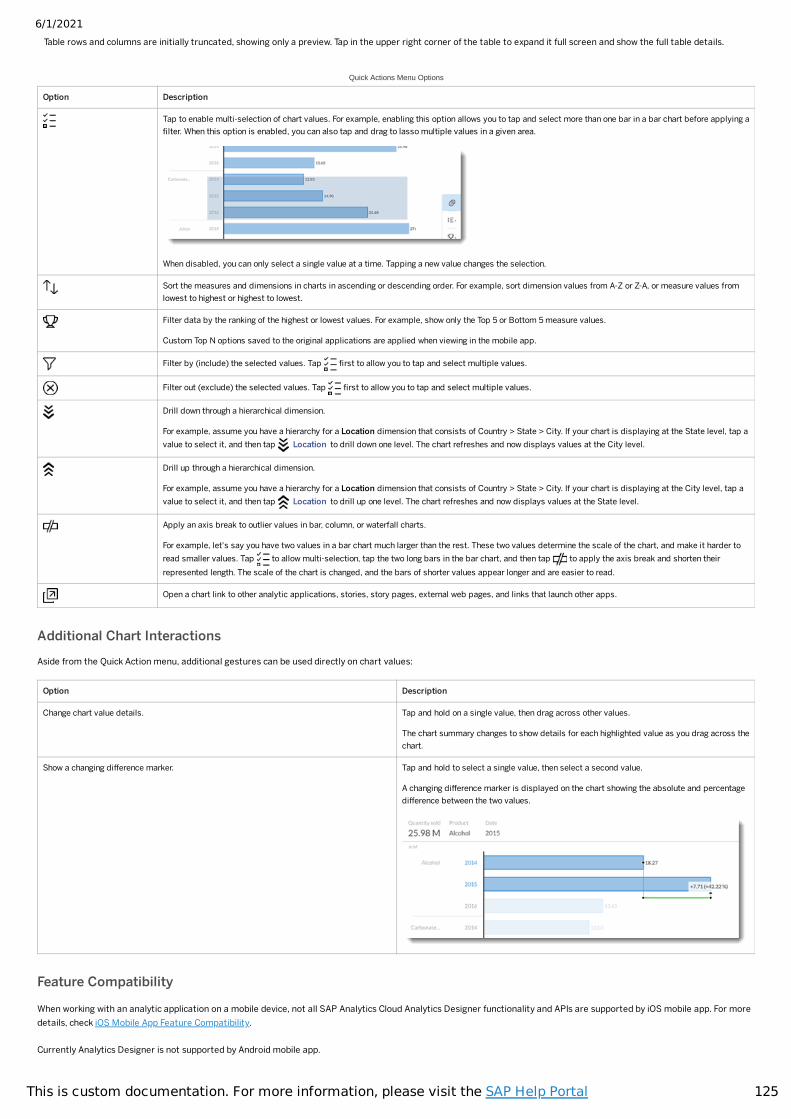
6/1/2021
125This is custom documentation. For more information, please visit the SAP Help Portal
Quick Actions Menu Options
Option Description
Tap to enable multi-selection of chart values. For example, enabling this option allows you to tap and select more than one bar in a bar chart before applying a�lter. When this option is enabled, you can also tap and drag to lasso multiple values in a given area.
When disabled, you can only select a single value at a time. Tapping a new value changes the selection.
Sort the measures and dimensions in charts in ascending or descending order. For example, sort dimension values from A-Z or Z-A, or measure values fromlowest to highest or highest to lowest.
Filter data by the ranking of the highest or lowest values. For example, show only the Top 5 or Bottom 5 measure values.
Custom Top N options saved to the original applications are applied when viewing in the mobile app.
Filter by (include) the selected values. Tap �rst to allow you to tap and select multiple values.
Filter out (exclude) the selected values. Tap �rst to allow you to tap and select multiple values.
Drill down through a hierarchical dimension.
For example, assume you have a hierarchy for a Location dimension that consists of Country > State > City. If your chart is displaying at the State level, tap avalue to select it, and then tap Location to drill down one level. The chart refreshes and now displays values at the City level.
Drill up through a hierarchical dimension.
For example, assume you have a hierarchy for a Location dimension that consists of Country > State > City. If your chart is displaying at the City level, tap avalue to select it, and then tap Location to drill up one level. The chart refreshes and now displays values at the State level.
Apply an axis break to outlier values in bar, column, or waterfall charts.
For example, let's say you have two values in a bar chart much larger than the rest. These two values determine the scale of the chart, and make it harder toread smaller values. Tap to allow multi-selection, tap the two long bars in the bar chart, and then tap to apply the axis break and shorten theirrepresented length. The scale of the chart is changed, and the bars of shorter values appear longer and are easier to read.
Open a chart link to other analytic applications, stories, story pages, external web pages, and links that launch other apps.
Additional Chart InteractionsAside from the Quick Action menu, additional gestures can be used directly on chart values:
Option Description
Change chart value details. Tap and hold on a single value, then drag across other values.
The chart summary changes to show details for each highlighted value as you drag across thechart.
Show a changing difference marker. Tap and hold to select a single value, then select a second value.
A changing difference marker is displayed on the chart showing the absolute and percentagedifference between the two values.
Feature Compatibility
When working with an analytic application on a mobile device, not all SAP Analytics Cloud Analytics Designer functionality and APIs are supported by iOS mobile app. For moredetails, check iOS Mobile App Feature Compatibility.
Currently Analytics Designer is not supported by Android mobile app.
Table rows and columns are initially truncated, showing only a preview. Tap in the upper right corner of the table to expand it full screen and show the full table details.
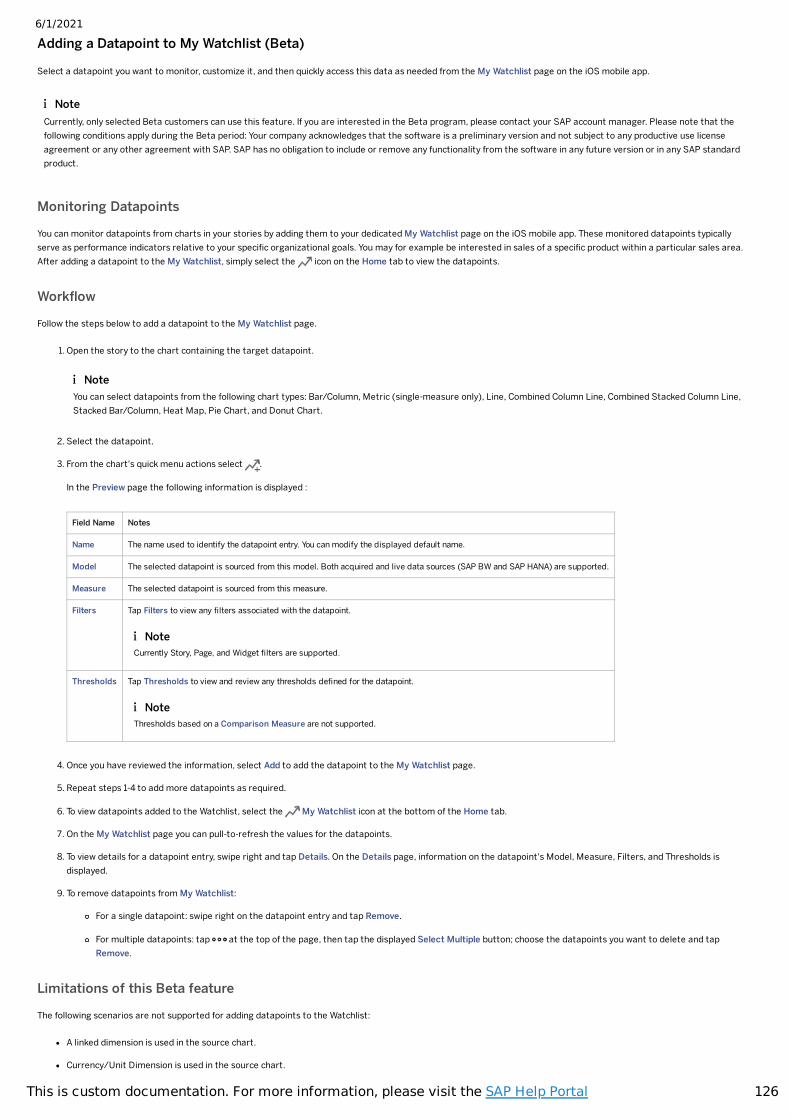
6/1/2021
126This is custom documentation. For more information, please visit the SAP Help Portal
Adding a Datapoint to My Watchlist (Beta)
Select a datapoint you want to monitor, customize it, and then quickly access this data as needed from the My Watchlist page on the iOS mobile app.
Monitoring Datapoints
You can monitor datapoints from charts in your stories by adding them to your dedicated My Watchlist page on the iOS mobile app. These monitored datapoints typicallyserve as performance indicators relative to your speci�c organizational goals. You may for example be interested in sales of a speci�c product within a particular sales area.After adding a datapoint to the My Watchlist, simply select the icon on the Home tab to view the datapoints.
Work�ow
Follow the steps below to add a datapoint to the My Watchlist page.
1. Open the story to the chart containing the target datapoint.
2. Select the datapoint.
3. From the chart's quick menu actions select .
In the Preview page the following information is displayed :
Field Name Notes
Name The name used to identify the datapoint entry. You can modify the displayed default name.
Model The selected datapoint is sourced from this model. Both acquired and live data sources (SAP BW and SAP HANA) are supported.
Measure The selected datapoint is sourced from this measure.
Filters Tap Filters to view any �lters associated with the datapoint.
Thresholds Tap Thresholds to view and review any thresholds de�ned for the datapoint.
4. Once you have reviewed the information, select Add to add the datapoint to the My Watchlist page.
5. Repeat steps 1-4 to add more datapoints as required.
6. To view datapoints added to the Watchlist, select the My Watchlist icon at the bottom of the Home tab.
7. On the My Watchlist page you can pull-to-refresh the values for the datapoints.
8. To view details for a datapoint entry, swipe right and tap Details. On the Details page, information on the datapoint's Model, Measure, Filters, and Thresholds isdisplayed.
9. To remove datapoints from My Watchlist:
For a single datapoint: swipe right on the datapoint entry and tap Remove.
For multiple datapoints: tap at the top of the page, then tap the displayed Select Multiple button; choose the datapoints you want to delete and tapRemove.
Limitations of this Beta feature
The following scenarios are not supported for adding datapoints to the Watchlist:
A linked dimension is used in the source chart.
Currency/Unit Dimension is used in the source chart.
NoteCurrently, only selected Beta customers can use this feature. If you are interested in the Beta program, please contact your SAP account manager. Please note that thefollowing conditions apply during the Beta period: Your company acknowledges that the software is a preliminary version and not subject to any productive use licenseagreement or any other agreement with SAP. SAP has no obligation to include or remove any functionality from the software in any future version or in any SAP standardproduct.
NoteYou can select datapoints from the following chart types: Bar/Column, Metric (single-measure only), Line, Combined Column Line, Combined Stacked Column Line,Stacked Bar/Column, Heat Map, Pie Chart, and Donut Chart.
NoteCurrently Story, Page, and Widget �lters are supported.
NoteThresholds based on a Comparison Measure are not supported.
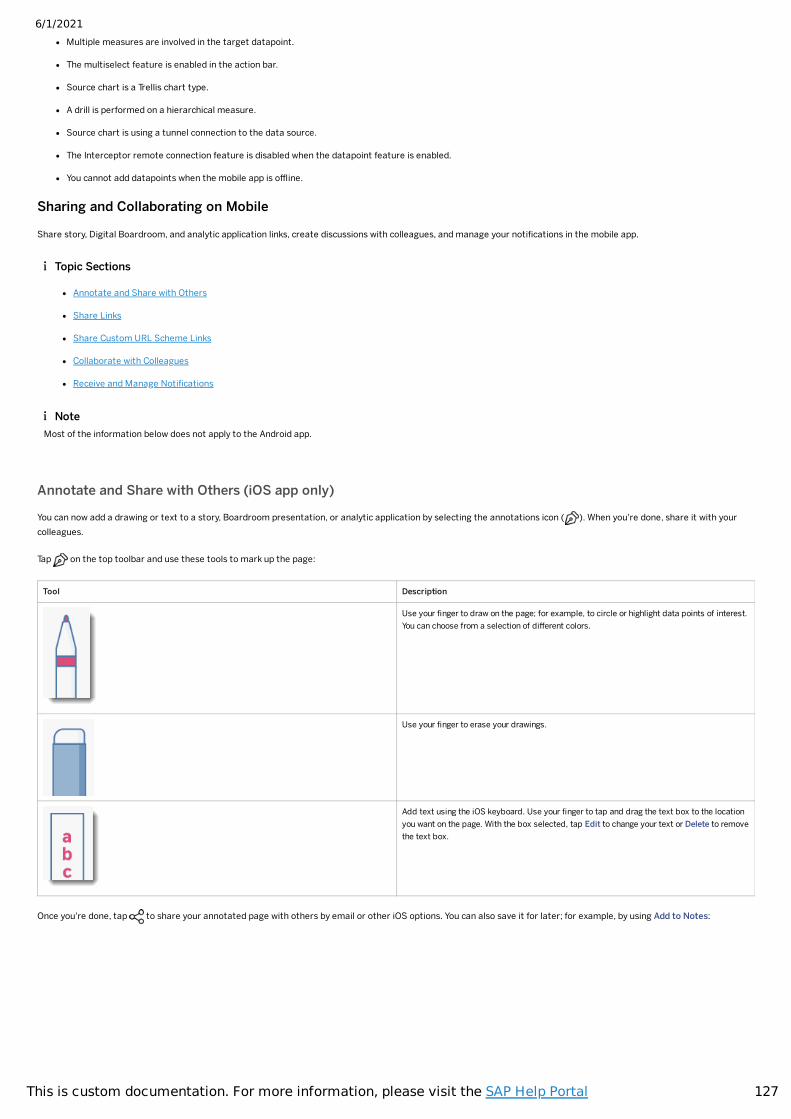
6/1/2021
127This is custom documentation. For more information, please visit the SAP Help Portal
Multiple measures are involved in the target datapoint.
The multiselect feature is enabled in the action bar.
Source chart is a Trellis chart type.
A drill is performed on a hierarchical measure.
Source chart is using a tunnel connection to the data source.
The Interceptor remote connection feature is disabled when the datapoint feature is enabled.
You cannot add datapoints when the mobile app is offline.
Sharing and Collaborating on Mobile
Share story, Digital Boardroom, and analytic application links, create discussions with colleagues, and manage your noti�cations in the mobile app.
Annotate and Share with Others (iOS app only)
You can now add a drawing or text to a story, Boardroom presentation, or analytic application by selecting the annotations icon ( ). When you're done, share it with yourcolleagues.
Tap on the top toolbar and use these tools to mark up the page:
Tool Description
Use your �nger to draw on the page; for example, to circle or highlight data points of interest.You can choose from a selection of different colors.
Use your �nger to erase your drawings.
Add text using the iOS keyboard. Use your �nger to tap and drag the text box to the locationyou want on the page. With the box selected, tap Edit to change your text or Delete to removethe text box.
Once you're done, tap to share your annotated page with others by email or other iOS options. You can also save it for later; for example, by using Add to Notes:
Topic Sections
Annotate and Share with Others
Share Links
Share Custom URL Scheme Links
Collaborate with Colleagues
Receive and Manage Noti�cations
NoteMost of the information below does not apply to the Android app.
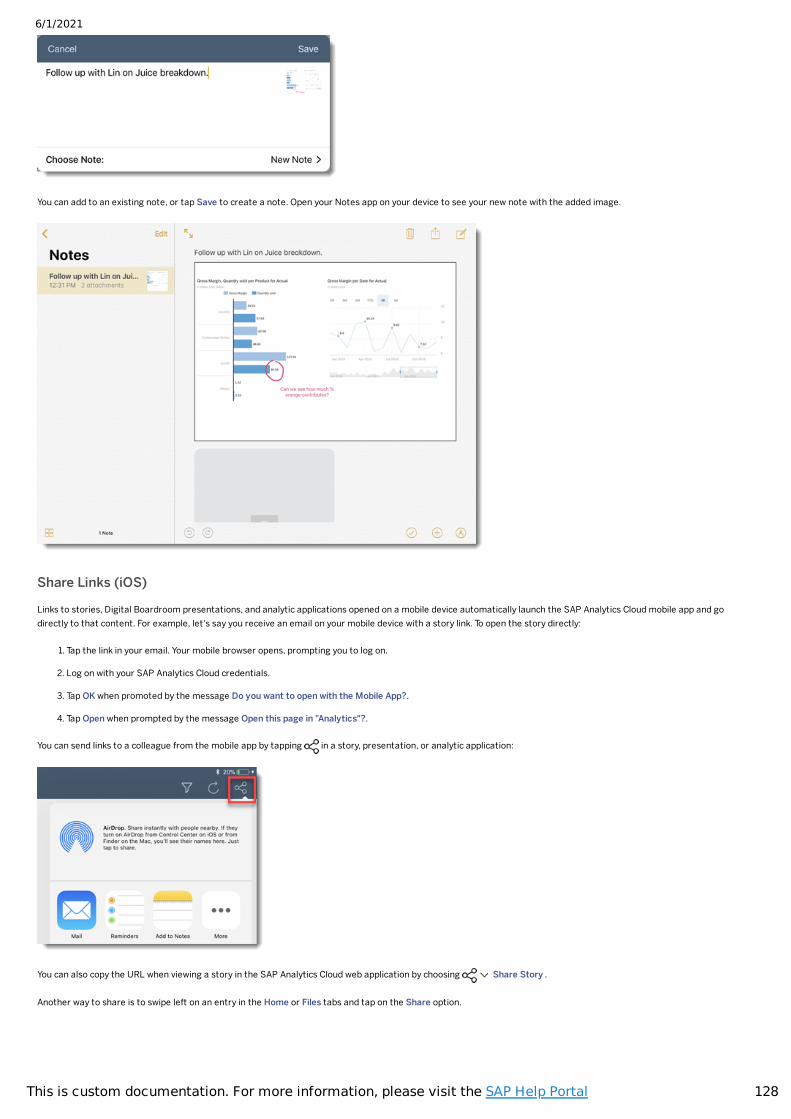
6/1/2021
128This is custom documentation. For more information, please visit the SAP Help Portal
You can add to an existing note, or tap Save to create a note. Open your Notes app on your device to see your new note with the added image.
Share Links (iOS)
Links to stories, Digital Boardroom presentations, and analytic applications opened on a mobile device automatically launch the SAP Analytics Cloud mobile app and godirectly to that content. For example, let's say you receive an email on your mobile device with a story link. To open the story directly:
1. Tap the link in your email. Your mobile browser opens, prompting you to log on.
2. Log on with your SAP Analytics Cloud credentials.
3. Tap OK when promoted by the message Do you want to open with the Mobile App?.
4. Tap Open when prompted by the message Open this page in "Analytics"?.
You can send links to a colleague from the mobile app by tapping in a story, presentation, or analytic application:
You can also copy the URL when viewing a story in the SAP Analytics Cloud web application by choosing Share Story .
Another way to share is to swipe left on an entry in the Home or Files tabs and tap on the Share option.
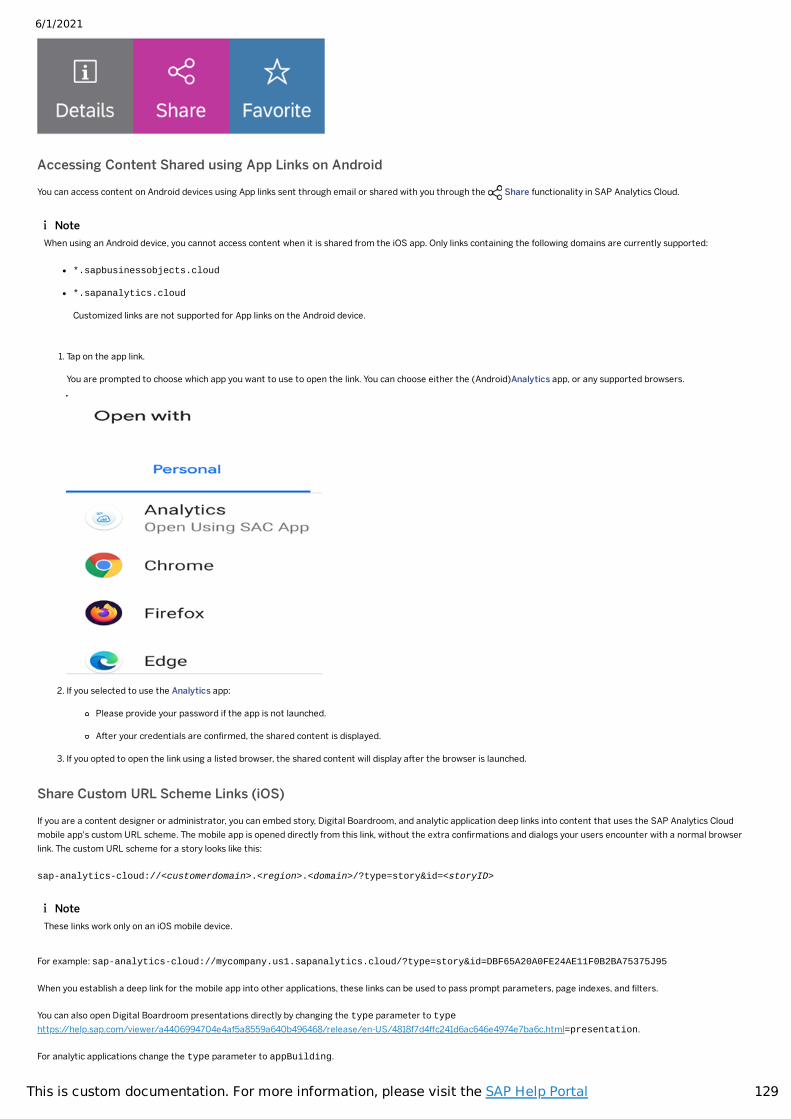
6/1/2021
129This is custom documentation. For more information, please visit the SAP Help Portal
Accessing Content Shared using App Links on Android
You can access content on Android devices using App links sent through email or shared with you through the Share functionality in SAP Analytics Cloud.
1. Tap on the app link.
You are prompted to choose which app you want to use to open the link. You can choose either the (Android)Analytics app, or any supported browsers.
2. If you selected to use the Analytics app:
Please provide your password if the app is not launched.
After your credentials are con�rmed, the shared content is displayed.
3. If you opted to open the link using a listed browser, the shared content will display after the browser is launched.
Share Custom URL Scheme Links (iOS)
If you are a content designer or administrator, you can embed story, Digital Boardroom, and analytic application deep links into content that uses the SAP Analytics Cloudmobile app's custom URL scheme. The mobile app is opened directly from this link, without the extra con�rmations and dialogs your users encounter with a normal browserlink. The custom URL scheme for a story looks like this:
sap-analytics-cloud://<customerdomain>.<region>.<domain>/?type=story&id=<storyID>
For example: sap-analytics-cloud://mycompany.us1.sapanalytics.cloud/?type=story&id=DBF65A20A0FE24AE11F0B2BA75375J95
When you establish a deep link for the mobile app into other applications, these links can be used to pass prompt parameters, page indexes, and �lters.
You can also open Digital Boardroom presentations directly by changing the type parameter to typehttps://help.sap.com/viewer/a4406994704e4af5a8559a640b496468/release/en-US/4818f7d4ffc241d6ac646e4974e7ba6c.html=presentation.
For analytic applications change the type parameter to appBuilding.
NoteWhen using an Android device, you cannot access content when it is shared from the iOS app. Only links containing the following domains are currently supported:
*.sapbusinessobjects.cloud
*.sapanalytics.cloud
Customized links are not supported for App links on the Android device.
NoteThese links work only on an iOS mobile device.
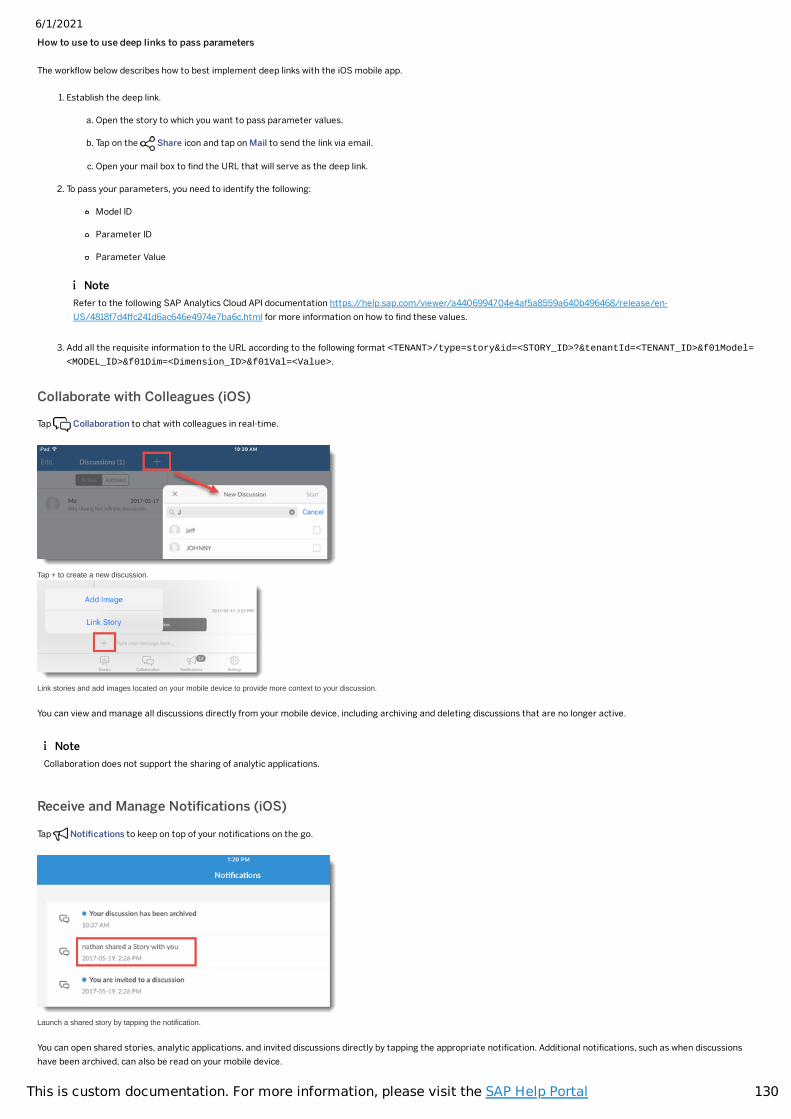
6/1/2021
130This is custom documentation. For more information, please visit the SAP Help Portal
How to use to use deep links to pass parameters
The work�ow below describes how to best implement deep links with the iOS mobile app.
1. Establish the deep link.
a. Open the story to which you want to pass parameter values.
b. Tap on the Share icon and tap on Mail to send the link via email.
c. Open your mail box to �nd the URL that will serve as the deep link.
2. To pass your parameters, you need to identify the following:
Model ID
Parameter ID
Parameter Value
3. Add all the requisite information to the URL according to the following format <TENANT>/type=story&id=<STORY_ID>?&tenantId=<TENANT_ID>&f01Model=<MODEL_ID>&f01Dim=<Dimension_ID>&f01Val=<Value>.
Collaborate with Colleagues (iOS)
Tap Collaboration to chat with colleagues in real-time.
Tap + to create a new discussion.
Link stories and add images located on your mobile device to provide more context to your discussion.
You can view and manage all discussions directly from your mobile device, including archiving and deleting discussions that are no longer active.
Receive and Manage Noti�cations (iOS)
Tap Noti�cations to keep on top of your noti�cations on the go.
Launch a shared story by tapping the notification.
You can open shared stories, analytic applications, and invited discussions directly by tapping the appropriate noti�cation. Additional noti�cations, such as when discussionshave been archived, can also be read on your mobile device.
NoteRefer to the following SAP Analytics Cloud API documentation https://help.sap.com/viewer/a4406994704e4af5a8559a640b496468/release/en-US/4818f7d4ffc241d6ac646e4974e7ba6c.html for more information on how to �nd these values.
NoteCollaboration does not support the sharing of analytic applications.
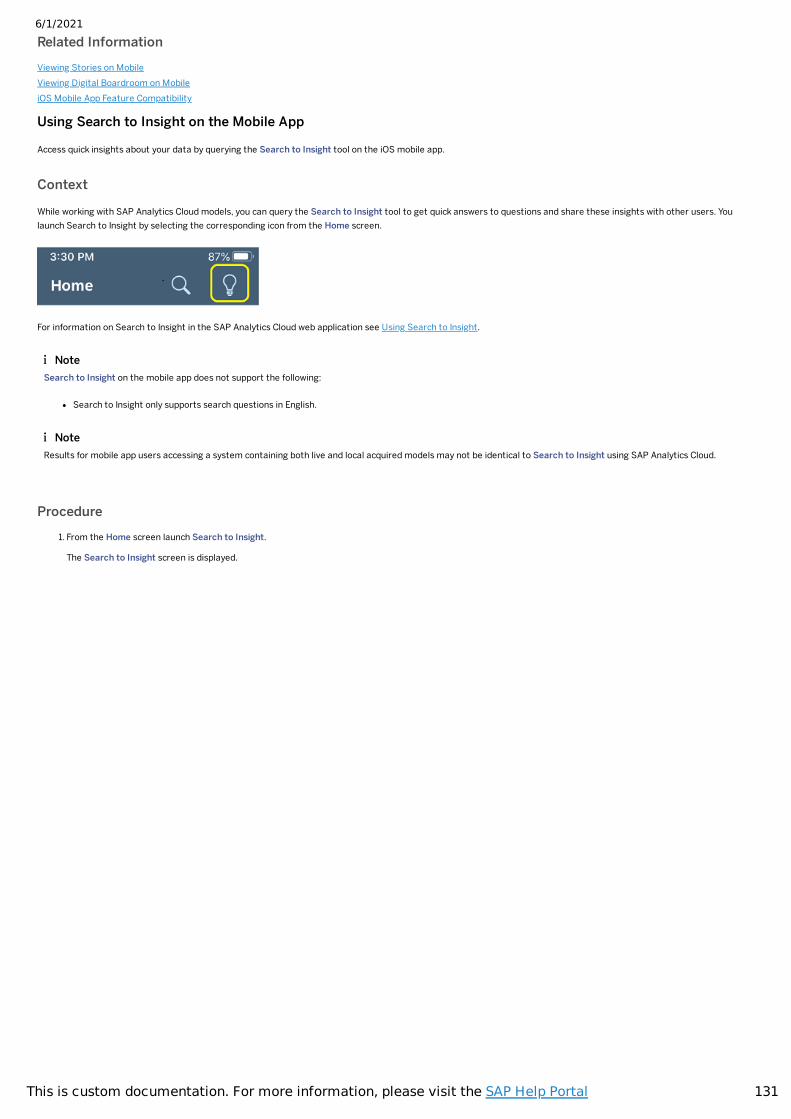
6/1/2021
131This is custom documentation. For more information, please visit the SAP Help Portal
Related InformationViewing Stories on MobileViewing Digital Boardroom on MobileiOS Mobile App Feature Compatibility
Using Search to Insight on the Mobile App
Access quick insights about your data by querying the Search to Insight tool on the iOS mobile app.
Context
While working with SAP Analytics Cloud models, you can query the Search to Insight tool to get quick answers to questions and share these insights with other users. Youlaunch Search to Insight by selecting the corresponding icon from the Home screen.
For information on Search to Insight in the SAP Analytics Cloud web application see Using Search to Insight.
Procedure1. From the Home screen launch Search to Insight.
The Search to Insight screen is displayed.
NoteSearch to Insight on the mobile app does not support the following:
Search to Insight only supports search questions in English.
NoteResults for mobile app users accessing a system containing both live and local acquired models may not be identical to Search to Insight using SAP Analytics Cloud.
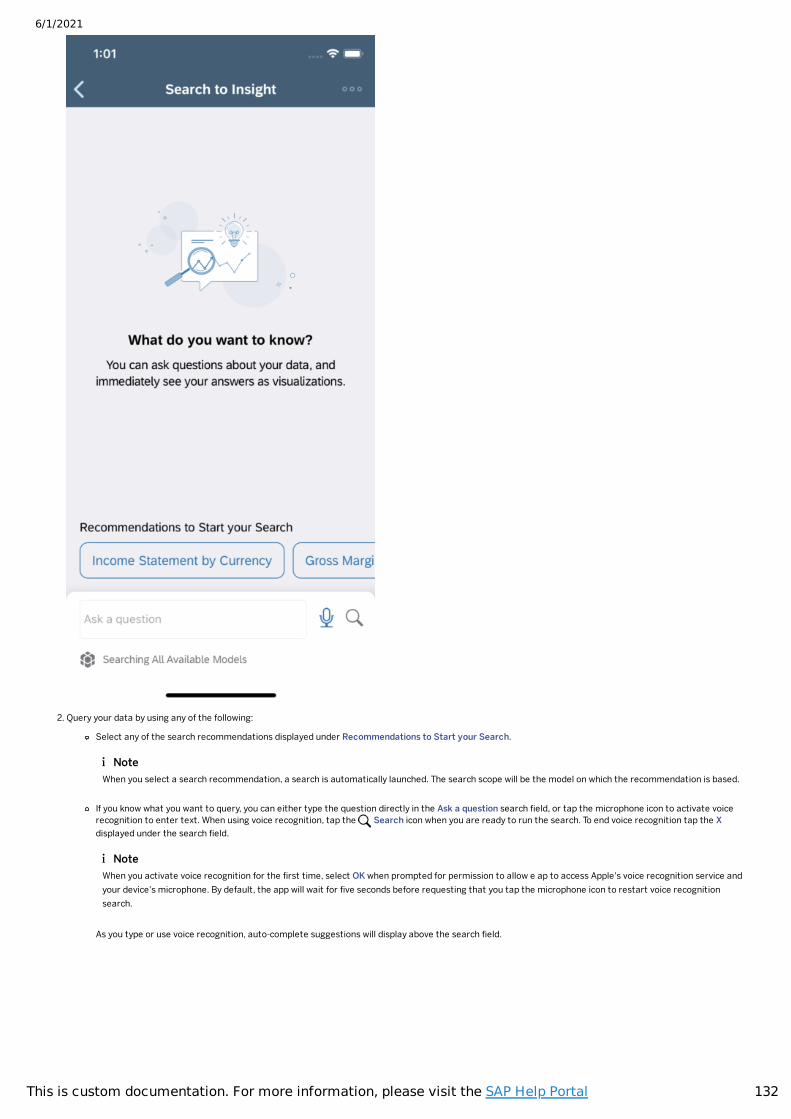
6/1/2021
132This is custom documentation. For more information, please visit the SAP Help Portal
2. Query your data by using any of the following:
Select any of the search recommendations displayed under Recommendations to Start your Search.
If you know what you want to query, you can either type the question directly in the Ask a question search �eld, or tap the microphone icon to activate voicerecognition to enter text. When using voice recognition, tap the Search icon when you are ready to run the search. To end voice recognition tap the Xdisplayed under the search �eld.
As you type or use voice recognition, auto-complete suggestions will display above the search �eld.
NoteWhen you select a search recommendation, a search is automatically launched. The search scope will be the model on which the recommendation is based.
NoteWhen you activate voice recognition for the �rst time, select OK when prompted for permission to allow e ap to access Apple's voice recognition service andyour device's microphone. By default, the app will wait for �ve seconds before requesting that you tap the microphone icon to restart voice recognitionsearch.
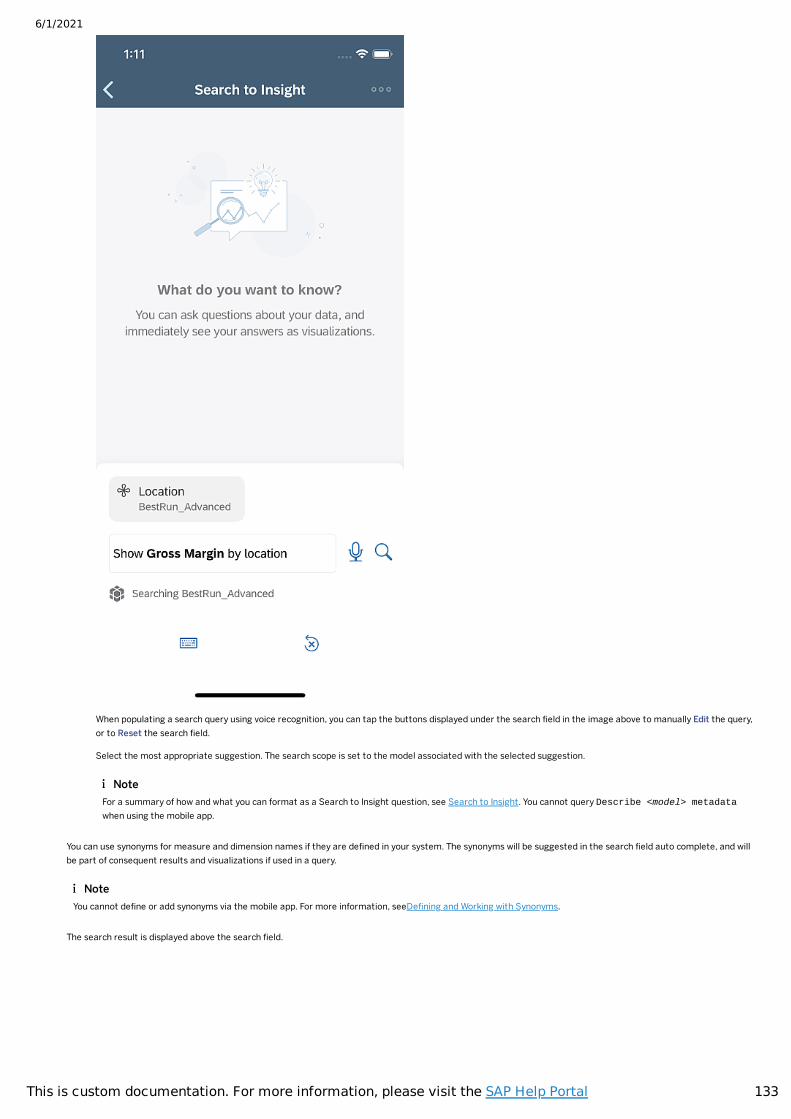
6/1/2021
133This is custom documentation. For more information, please visit the SAP Help Portal
When populating a search query using voice recognition, you can tap the buttons displayed under the search �eld in the image above to manually Edit the query,or to Reset the search �eld.
Select the most appropriate suggestion. The search scope is set to the model associated with the selected suggestion.
You can use synonyms for measure and dimension names if they are de�ned in your system. The synonyms will be suggested in the search �eld auto complete, and willbe part of consequent results and visualizations if used in a query.
The search result is displayed above the search �eld.
NoteFor a summary of how and what you can format as a Search to Insight question, see Search to Insight. You cannot query Describe <model> metadatawhen using the mobile app.
NoteYou cannot de�ne or add synonyms via the mobile app. For more information, seeDe�ning and Working with Synonyms.
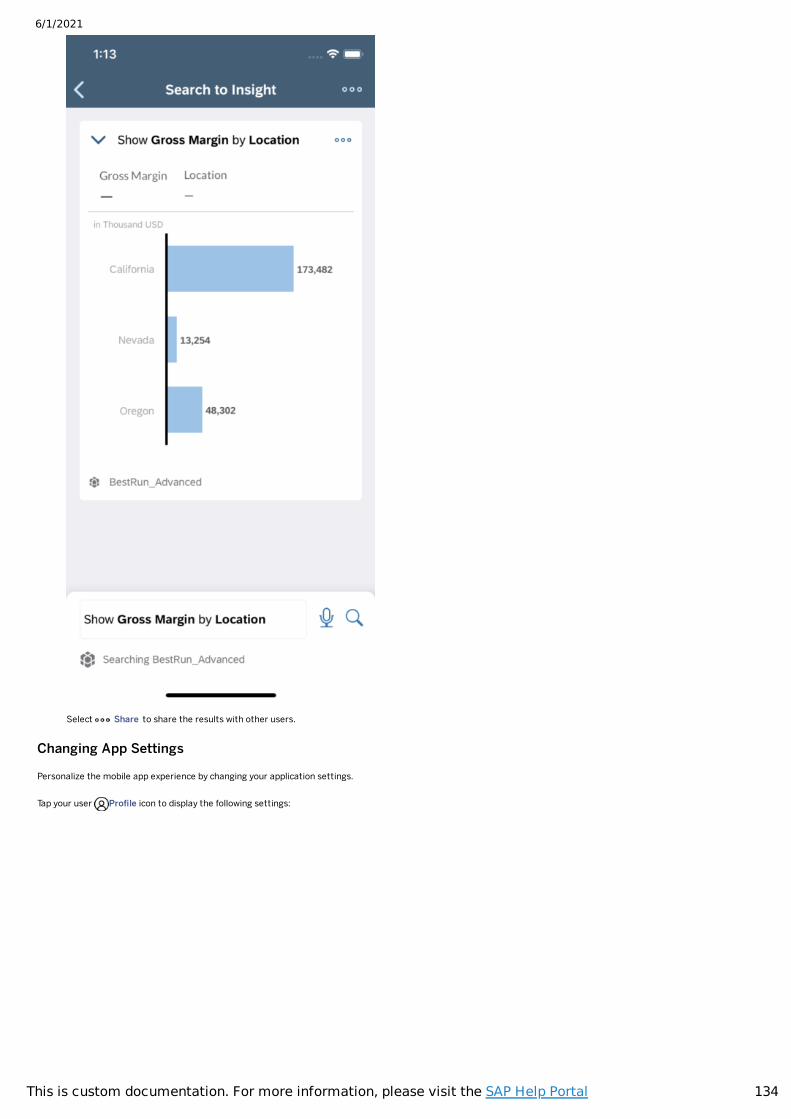
6/1/2021
134This is custom documentation. For more information, please visit the SAP Help Portal
Select Share to share the results with other users.
Changing App Settings
Personalize the mobile app experience by changing your application settings.
Tap your user Pro�le icon to display the following settings:
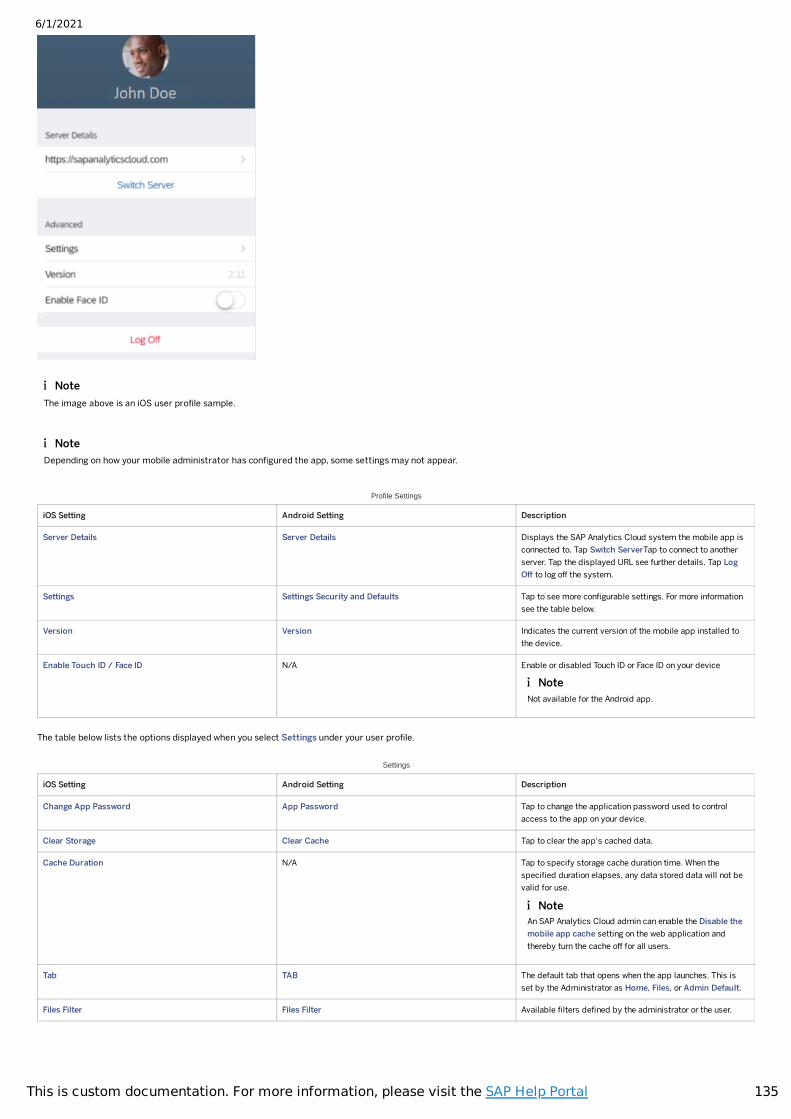
6/1/2021
135This is custom documentation. For more information, please visit the SAP Help Portal
Profile Settings
iOS Setting Android Setting Description
Server Details Server Details Displays the SAP Analytics Cloud system the mobile app isconnected to. Tap Switch ServerTap to connect to anotherserver. Tap the displayed URL see further details. Tap LogOff to log off the system.
Settings Settings Security and Defaults Tap to see more con�gurable settings. For more informationsee the table below.
Version Version Indicates the current version of the mobile app installed tothe device.
Enable Touch ID / Face ID N/A Enable or disabled Touch ID or Face ID on your device
The table below lists the options displayed when you select Settings under your user pro�le.
Settings
iOS Setting Android Setting Description
Change App Password App Password Tap to change the application password used to controlaccess to the app on your device.
Clear Storage Clear Cache Tap to clear the app's cached data.
Cache Duration N/A Tap to specify storage cache duration time. When thespeci�ed duration elapses, any data stored data will not bevalid for use.
Tab TAB The default tab that opens when the app launches. This isset by the Administrator as Home, Files, or Admin Default.
Files Filter Files Filter Available �lters de�ned by the administrator or the user.
NoteThe image above is an iOS user pro�le sample.
NoteDepending on how your mobile administrator has con�gured the app, some settings may not appear.
NoteNot available for the Android app.
NoteAn SAP Analytics Cloud admin can enable the Disable themobile app cache setting on the web application andthereby turn the cache off for all users.
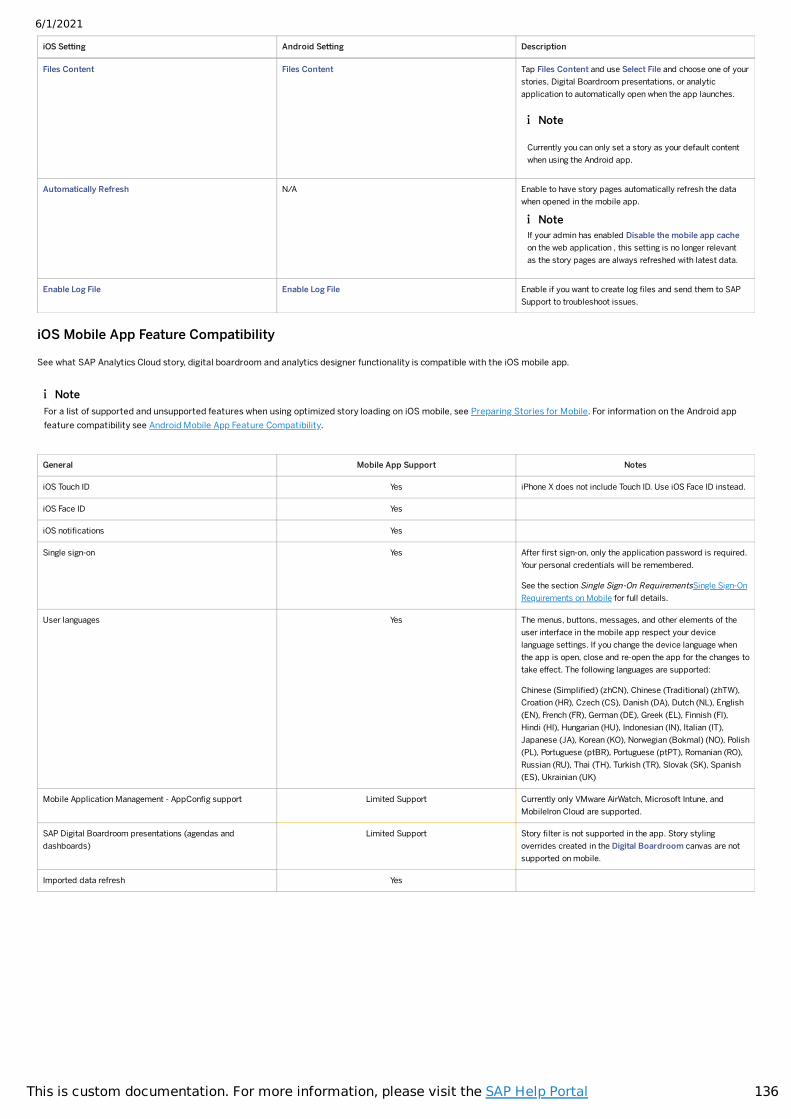
6/1/2021
136This is custom documentation. For more information, please visit the SAP Help Portal
iOS Setting Android Setting Description
Files Content Files Content Tap Files Content and use Select File and choose one of yourstories, Digital Boardroom presentations, or analyticapplication to automatically open when the app launches.
Automatically Refresh N/A Enable to have story pages automatically refresh the datawhen opened in the mobile app.
Enable Log File Enable Log File Enable if you want to create log �les and send them to SAPSupport to troubleshoot issues.
iOS Mobile App Feature Compatibility
See what SAP Analytics Cloud story, digital boardroom and analytics designer functionality is compatible with the iOS mobile app.
General Mobile App Support Notes
iOS Touch ID Yes iPhone X does not include Touch ID. Use iOS Face ID instead.
iOS Face ID Yes
iOS noti�cations Yes
Single sign-on Yes After �rst sign-on, only the application password is required.Your personal credentials will be remembered.
See the section Single Sign-On RequirementsSingle Sign-OnRequirements on Mobile for full details.
User languages Yes The menus, buttons, messages, and other elements of theuser interface in the mobile app respect your devicelanguage settings. If you change the device language whenthe app is open, close and re-open the app for the changes totake effect. The following languages are supported:
Chinese (Simpli�ed) (zhCN), Chinese (Traditional) (zhTW),Croation (HR), Czech (CS), Danish (DA), Dutch (NL), English(EN), French (FR), German (DE), Greek (EL), Finnish (FI),Hindi (HI), Hungarian (HU), Indonesian (IN), Italian (IT),Japanese (JA), Korean (KO), Norwegian (Bokmal) (NO), Polish(PL), Portuguese (ptBR), Portuguese (ptPT), Romanian (RO),Russian (RU), Thai (TH), Turkish (TR), Slovak (SK), Spanish(ES), Ukrainian (UK)
Mobile Application Management - AppCon�g support Limited Support Currently only VMware AirWatch, Microsoft Intune, andMobileIron Cloud are supported.
SAP Digital Boardroom presentations (agendas anddashboards)
Limited Support Story �lter is not supported in the app. Story stylingoverrides created in the Digital Boardroom canvas are notsupported on mobile.
Imported data refresh Yes
Note
Currently you can only set a story as your default contentwhen using the Android app.
NoteIf your admin has enabled Disable the mobile app cacheon the web application , this setting is no longer relevantas the story pages are always refreshed with latest data.
NoteFor a list of supported and unsupported features when using optimized story loading on iOS mobile, see Preparing Stories for Mobile. For information on the Android appfeature compatibility see Android Mobile App Feature Compatibility.
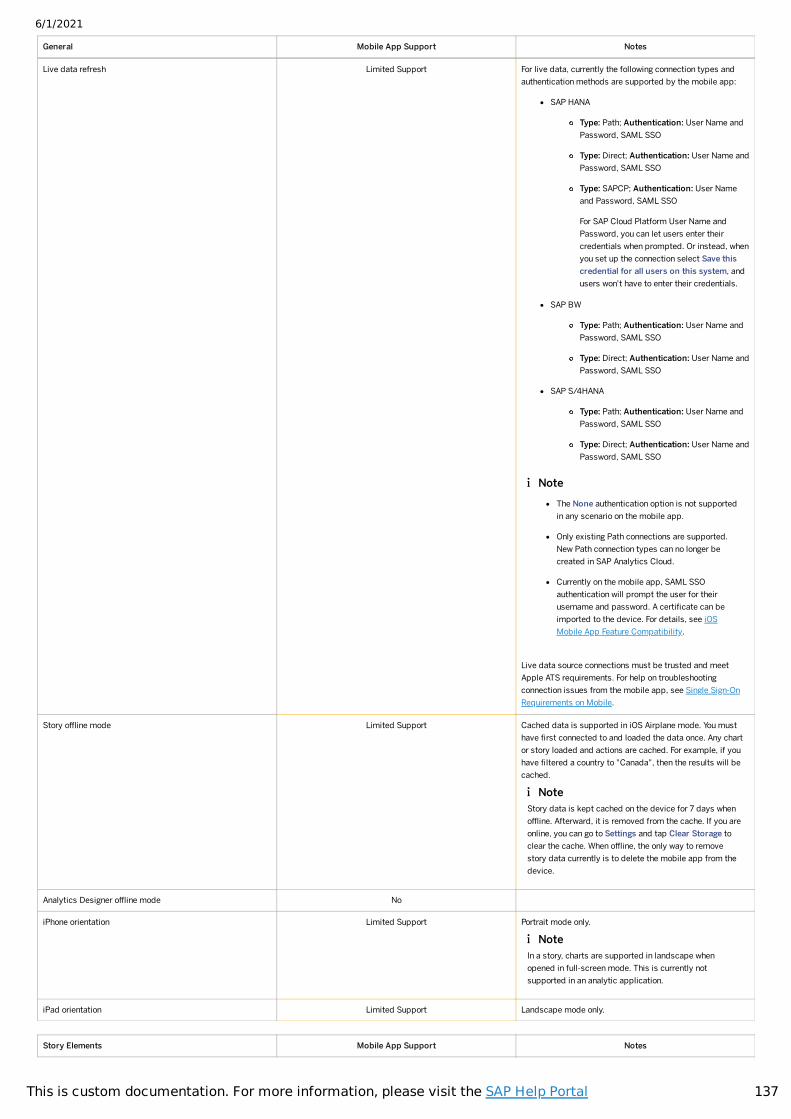
6/1/2021
137This is custom documentation. For more information, please visit the SAP Help Portal
General Mobile App Support Notes
Live data refresh Limited Support For live data, currently the following connection types andauthentication methods are supported by the mobile app:
SAP HANA
Type: Path; Authentication: User Name andPassword, SAML SSO
Type: Direct; Authentication: User Name andPassword, SAML SSO
Type: SAPCP; Authentication: User Nameand Password, SAML SSO
For SAP Cloud Platform User Name andPassword, you can let users enter theircredentials when prompted. Or instead, whenyou set up the connection select Save thiscredential for all users on this system, andusers won't have to enter their credentials.
SAP BW
Type: Path; Authentication: User Name andPassword, SAML SSO
Type: Direct; Authentication: User Name andPassword, SAML SSO
SAP S/4HANA
Type: Path; Authentication: User Name andPassword, SAML SSO
Type: Direct; Authentication: User Name andPassword, SAML SSO
Live data source connections must be trusted and meetApple ATS requirements. For help on troubleshootingconnection issues from the mobile app, see Single Sign-OnRequirements on Mobile.
Story offline mode Limited Support Cached data is supported in iOS Airplane mode. You musthave �rst connected to and loaded the data once. Any chartor story loaded and actions are cached. For example, if youhave �ltered a country to "Canada", then the results will becached.
Analytics Designer offline mode No
iPhone orientation Limited Support Portrait mode only.
iPad orientation Limited Support Landscape mode only.
Story Elements Mobile App Support Notes
NoteThe None authentication option is not supportedin any scenario on the mobile app.
Only existing Path connections are supported.New Path connection types can no longer becreated in SAP Analytics Cloud.
Currently on the mobile app, SAML SSOauthentication will prompt the user for theirusername and password. A certi�cate can beimported to the device. For details, see iOSMobile App Feature Compatibility.
NoteStory data is kept cached on the device for 7 days whenoffline. Afterward, it is removed from the cache. If you areonline, you can go to Settings and tap Clear Storage toclear the cache. When offline, the only way to removestory data currently is to delete the mobile app from thedevice.
NoteIn a story, charts are supported in landscape whenopened in full-screen mode. This is currently notsupported in an analytic application.
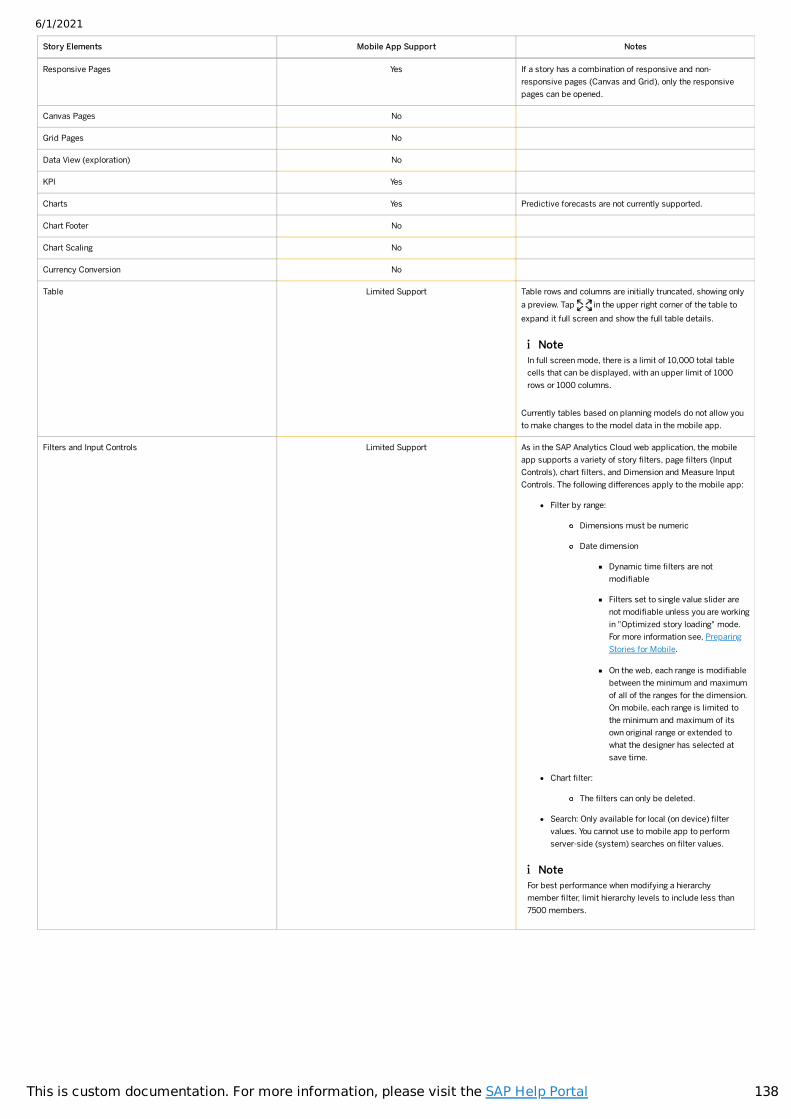
6/1/2021
138This is custom documentation. For more information, please visit the SAP Help Portal
Story Elements Mobile App Support Notes
Responsive Pages Yes If a story has a combination of responsive and non-responsive pages (Canvas and Grid), only the responsivepages can be opened.
Canvas Pages No
Grid Pages No
Data View (exploration) No
KPI Yes
Charts Yes Predictive forecasts are not currently supported.
Chart Footer No
Chart Scaling No
Currency Conversion No
Table Limited Support Table rows and columns are initially truncated, showing onlya preview. Tap in the upper right corner of the table toexpand it full screen and show the full table details.
Currently tables based on planning models do not allow youto make changes to the model data in the mobile app.
Filters and Input Controls Limited Support As in the SAP Analytics Cloud web application, the mobileapp supports a variety of story �lters, page �lters (InputControls), chart �lters, and Dimension and Measure InputControls. The following differences apply to the mobile app:
Filter by range:
Dimensions must be numeric
Date dimension
Dynamic time �lters are notmodi�able
Filters set to single value slider arenot modi�able unless you are workingin "Optimized story loading" mode.For more information see, PreparingStories for Mobile.
On the web, each range is modi�ablebetween the minimum and maximumof all of the ranges for the dimension.On mobile, each range is limited tothe minimum and maximum of itsown original range or extended towhat the designer has selected atsave time.
Chart �lter:
The �lters can only be deleted.
Search: Only available for local (on device) �ltervalues. You cannot use to mobile app to performserver-side (system) searches on �lter values.
NoteIn full screen mode, there is a limit of 10,000 total tablecells that can be displayed, with an upper limit of 1000rows or 1000 columns.
NoteFor best performance when modifying a hierarchymember �lter, limit hierarchy levels to include less than7500 members.
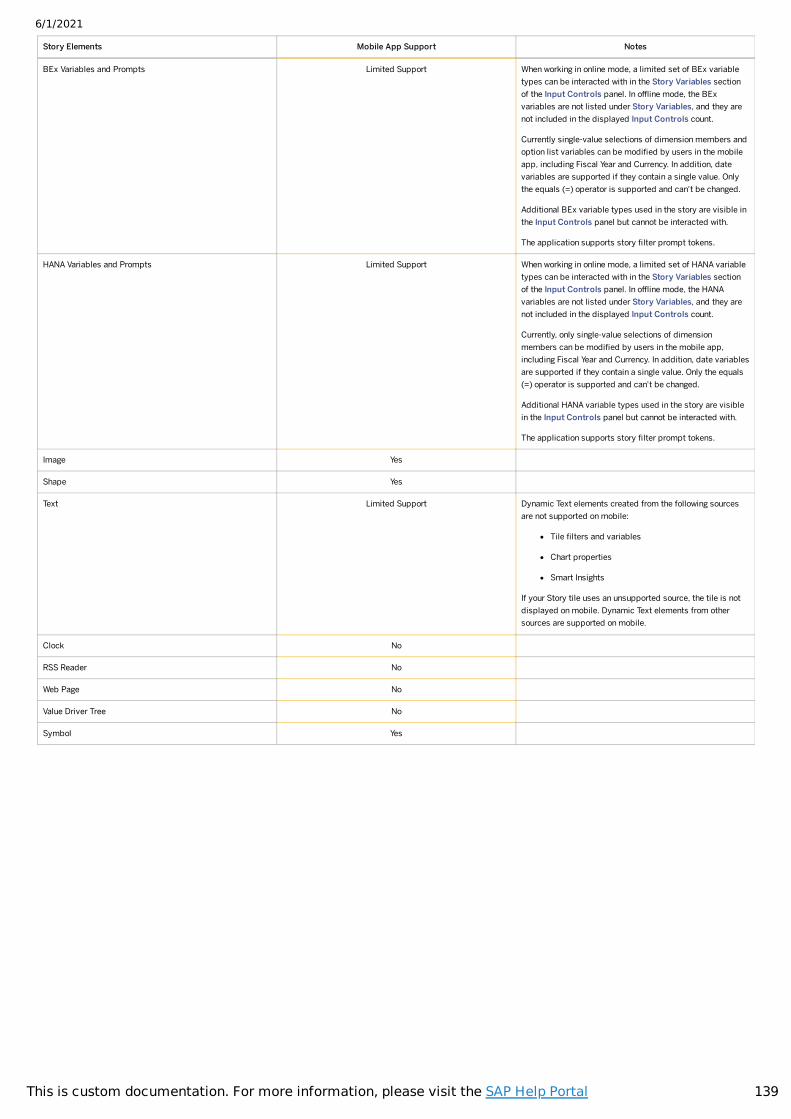
6/1/2021
139This is custom documentation. For more information, please visit the SAP Help Portal
Story Elements Mobile App Support Notes
BEx Variables and Prompts Limited Support When working in online mode, a limited set of BEx variabletypes can be interacted with in the Story Variables sectionof the Input Controls panel. In offline mode, the BExvariables are not listed under Story Variables, and they arenot included in the displayed Input Controls count.
Currently single-value selections of dimension members andoption list variables can be modi�ed by users in the mobileapp, including Fiscal Year and Currency. In addition, datevariables are supported if they contain a single value. Onlythe equals (=) operator is supported and can't be changed.
Additional BEx variable types used in the story are visible inthe Input Controls panel but cannot be interacted with.
The application supports story �lter prompt tokens.
HANA Variables and Prompts Limited Support When working in online mode, a limited set of HANA variabletypes can be interacted with in the Story Variables sectionof the Input Controls panel. In offline mode, the HANAvariables are not listed under Story Variables, and they arenot included in the displayed Input Controls count.
Currently, only single-value selections of dimensionmembers can be modi�ed by users in the mobile app,including Fiscal Year and Currency. In addition, date variablesare supported if they contain a single value. Only the equals(=) operator is supported and can't be changed.
Additional HANA variable types used in the story are visiblein the Input Controls panel but cannot be interacted with.
The application supports story �lter prompt tokens.
Image Yes
Shape Yes
Text Limited Support Dynamic Text elements created from the following sourcesare not supported on mobile:
Tile �lters and variables
Chart properties
Smart Insights
If your Story tile uses an unsupported source, the tile is notdisplayed on mobile. Dynamic Text elements from othersources are supported on mobile.
Clock No
RSS Reader No
Web Page No
Value Driver Tree No
Symbol Yes
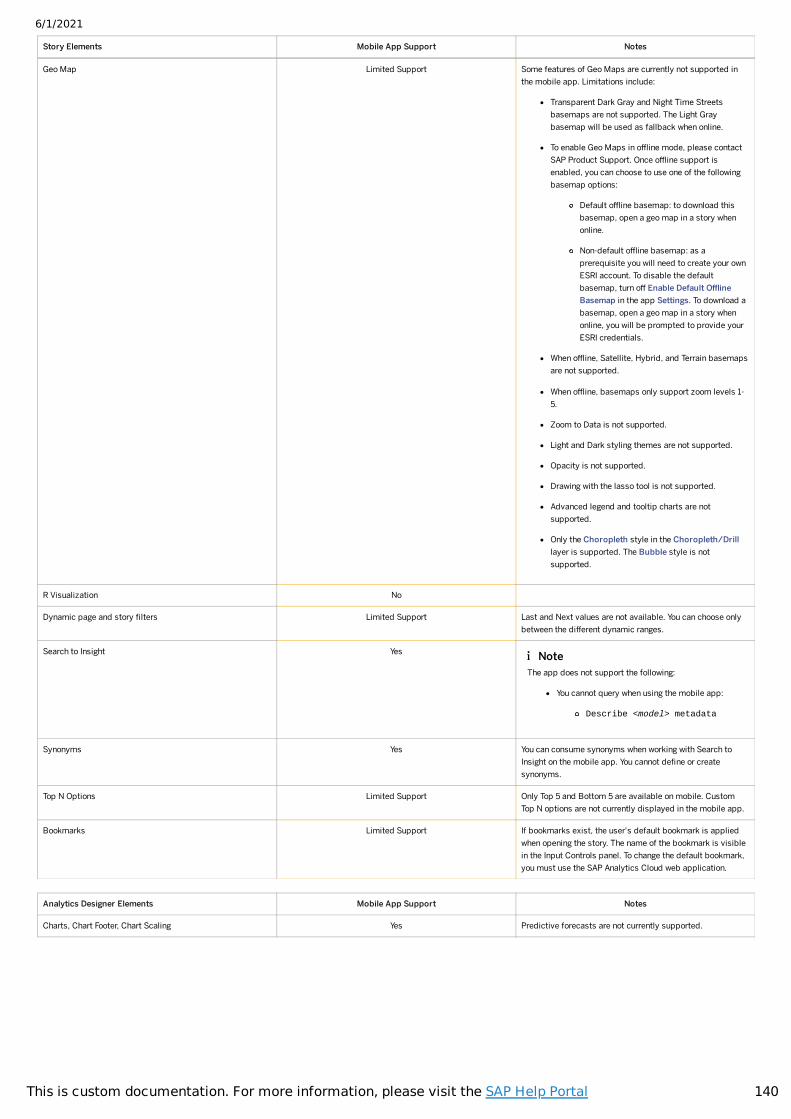
6/1/2021
140This is custom documentation. For more information, please visit the SAP Help Portal
Story Elements Mobile App Support Notes
Geo Map Limited Support Some features of Geo Maps are currently not supported inthe mobile app. Limitations include:
Transparent Dark Gray and Night Time Streetsbasemaps are not supported. The Light Graybasemap will be used as fallback when online.
To enable Geo Maps in offline mode, please contactSAP Product Support. Once offline support isenabled, you can choose to use one of the followingbasemap options:
Default offline basemap: to download thisbasemap, open a geo map in a story whenonline.
Non-default offline basemap: as aprerequisite you will need to create your ownESRI account. To disable the defaultbasemap, turn off Enable Default OfflineBasemap in the app Settings. To download abasemap, open a geo map in a story whenonline, you will be prompted to provide yourESRI credentials.
When offline, Satellite, Hybrid, and Terrain basemapsare not supported.
When offline, basemaps only support zoom levels 1-5.
Zoom to Data is not supported.
Light and Dark styling themes are not supported.
Opacity is not supported.
Drawing with the lasso tool is not supported.
Advanced legend and tooltip charts are notsupported.
Only the Choropleth style in the Choropleth/Drilllayer is supported. The Bubble style is notsupported.
R Visualization No
Dynamic page and story �lters Limited Support Last and Next values are not available. You can choose onlybetween the different dynamic ranges.
Search to Insight Yes
Synonyms Yes You can consume synonyms when working with Search toInsight on the mobile app. You cannot de�ne or createsynonyms.
Top N Options Limited Support Only Top 5 and Bottom 5 are available on mobile. CustomTop N options are not currently displayed in the mobile app.
Bookmarks Limited Support If bookmarks exist, the user's default bookmark is appliedwhen opening the story. The name of the bookmark is visiblein the Input Controls panel. To change the default bookmark,you must use the SAP Analytics Cloud web application.
Analytics Designer Elements Mobile App Support Notes
Charts, Chart Footer, Chart Scaling Yes Predictive forecasts are not currently supported.
NoteThe app does not support the following:
You cannot query when using the mobile app:
Describe <model> metadata
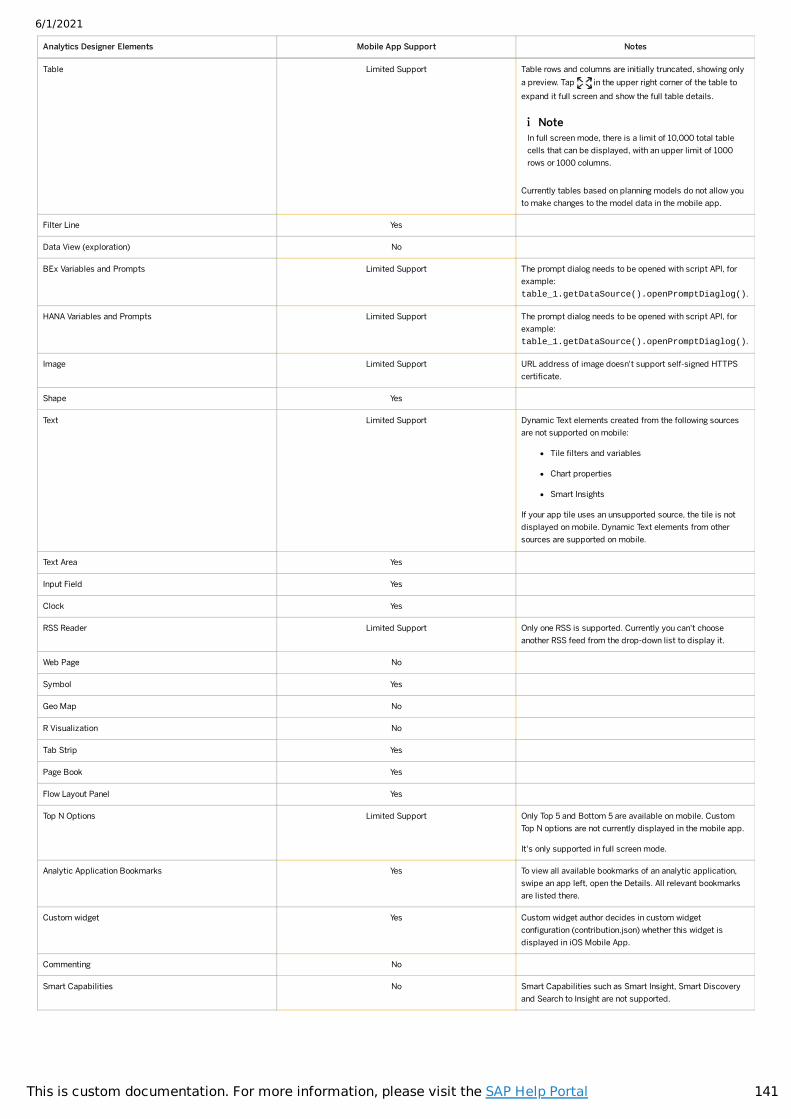
6/1/2021
141This is custom documentation. For more information, please visit the SAP Help Portal
Analytics Designer Elements Mobile App Support Notes
Table Limited Support Table rows and columns are initially truncated, showing onlya preview. Tap in the upper right corner of the table toexpand it full screen and show the full table details.
Currently tables based on planning models do not allow youto make changes to the model data in the mobile app.
Filter Line Yes
Data View (exploration) No
BEx Variables and Prompts Limited Support The prompt dialog needs to be opened with script API, forexample:table_1.getDataSource().openPromptDiaglog().
HANA Variables and Prompts Limited Support The prompt dialog needs to be opened with script API, forexample:table_1.getDataSource().openPromptDiaglog().
Image Limited Support URL address of image doesn't support self-signed HTTPScerti�cate.
Shape Yes
Text Limited Support Dynamic Text elements created from the following sourcesare not supported on mobile:
Tile �lters and variables
Chart properties
Smart Insights
If your app tile uses an unsupported source, the tile is notdisplayed on mobile. Dynamic Text elements from othersources are supported on mobile.
Text Area Yes
Input Field Yes
Clock Yes
RSS Reader Limited Support Only one RSS is supported. Currently you can't chooseanother RSS feed from the drop-down list to display it.
Web Page No
Symbol Yes
Geo Map No
R Visualization No
Tab Strip Yes
Page Book Yes
Flow Layout Panel Yes
Top N Options Limited Support Only Top 5 and Bottom 5 are available on mobile. CustomTop N options are not currently displayed in the mobile app.
It's only supported in full screen mode.
Analytic Application Bookmarks Yes To view all available bookmarks of an analytic application,swipe an app left, open the Details. All relevant bookmarksare listed there.
Custom widget Yes Custom widget author decides in custom widgetcon�guration (contribution.json) whether this widget isdisplayed in iOS Mobile App.
Commenting No
Smart Capabilities No Smart Capabilities such as Smart Insight, Smart Discoveryand Search to Insight are not supported.
NoteIn full screen mode, there is a limit of 10,000 total tablecells that can be displayed, with an upper limit of 1000rows or 1000 columns.
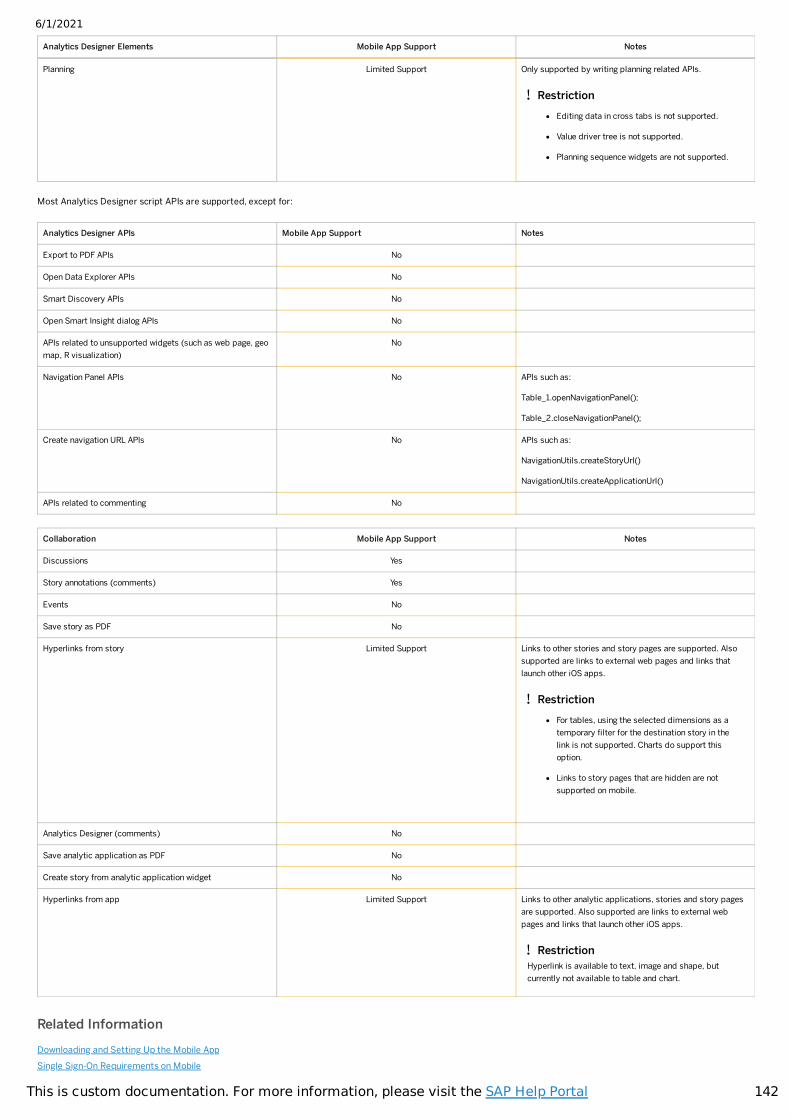
6/1/2021
142This is custom documentation. For more information, please visit the SAP Help Portal
Analytics Designer Elements Mobile App Support Notes
Planning Limited Support Only supported by writing planning related APIs.
Most Analytics Designer script APIs are supported, except for:
Analytics Designer APIs Mobile App Support Notes
Export to PDF APIs No
Open Data Explorer APIs No
Smart Discovery APIs No
Open Smart Insight dialog APIs No
APIs related to unsupported widgets (such as web page, geomap, R visualization)
No
Navigation Panel APIs No APIs such as:
Table_1.openNavigationPanel();
Table_2.closeNavigationPanel();
Create navigation URL APIs No APIs such as:
NavigationUtils.createStoryUrl()
NavigationUtils.createApplicationUrl()
APIs related to commenting No
Collaboration Mobile App Support Notes
Discussions Yes
Story annotations (comments) Yes
Events No
Save story as PDF No
Hyperlinks from story Limited Support Links to other stories and story pages are supported. Alsosupported are links to external web pages and links thatlaunch other iOS apps.
Analytics Designer (comments) No
Save analytic application as PDF No
Create story from analytic application widget No
Hyperlinks from app Limited Support Links to other analytic applications, stories and story pagesare supported. Also supported are links to external webpages and links that launch other iOS apps.
Related InformationDownloading and Setting Up the Mobile AppSingle Sign-On Requirements on Mobile
RestrictionEditing data in cross tabs is not supported.
Value driver tree is not supported.
Planning sequence widgets are not supported.
RestrictionFor tables, using the selected dimensions as atemporary �lter for the destination story in thelink is not supported. Charts do support thisoption.
Links to story pages that are hidden are notsupported on mobile.
RestrictionHyperlink is available to text, image and shape, butcurrently not available to table and chart.
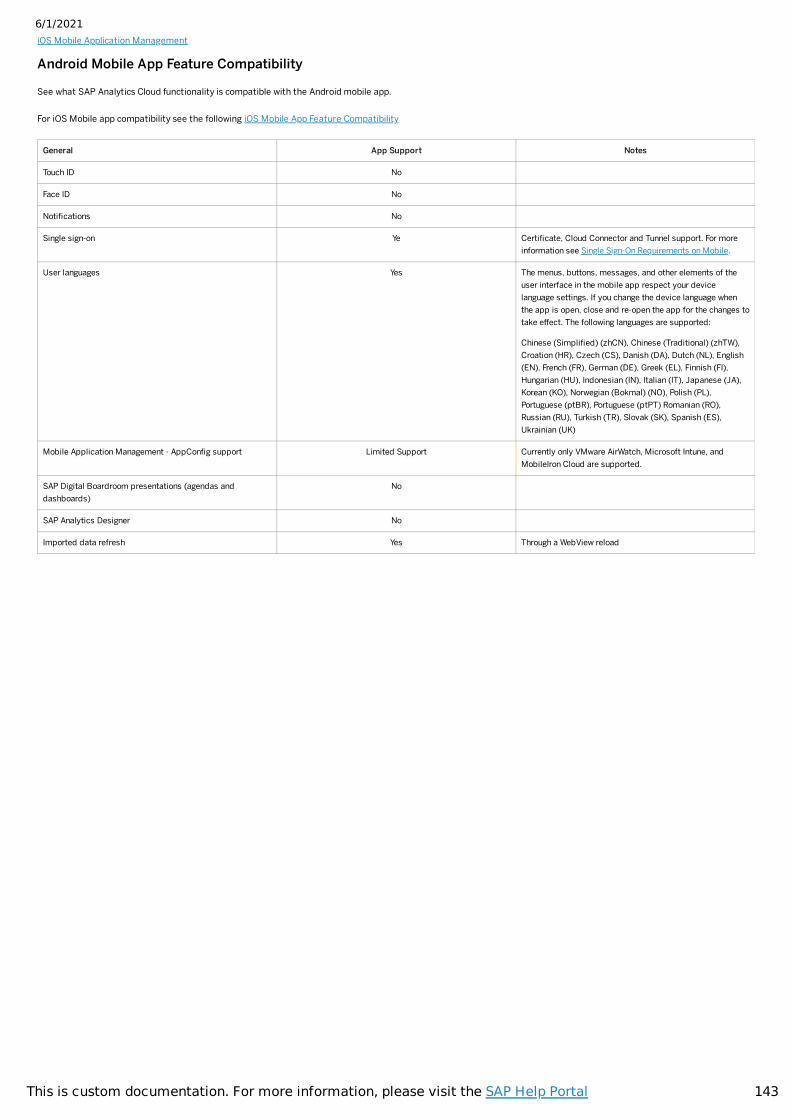
6/1/2021
143This is custom documentation. For more information, please visit the SAP Help Portal
iOS Mobile Application Management
Android Mobile App Feature Compatibility
See what SAP Analytics Cloud functionality is compatible with the Android mobile app.
For iOS Mobile app compatibility see the following iOS Mobile App Feature Compatibility
General App Support Notes
Touch ID No
Face ID No
Noti�cations No
Single sign-on Ye Certi�cate, Cloud Connector and Tunnel support. For moreinformation see Single Sign-On Requirements on Mobile.
User languages Yes The menus, buttons, messages, and other elements of theuser interface in the mobile app respect your devicelanguage settings. If you change the device language whenthe app is open, close and re-open the app for the changes totake effect. The following languages are supported:
Chinese (Simpli�ed) (zhCN), Chinese (Traditional) (zhTW),Croation (HR), Czech (CS), Danish (DA), Dutch (NL), English(EN), French (FR), German (DE), Greek (EL), Finnish (FI),Hungarian (HU), Indonesian (IN), Italian (IT), Japanese (JA),Korean (KO), Norwegian (Bokmal) (NO), Polish (PL),Portuguese (ptBR), Portuguese (ptPT) Romanian (RO),Russian (RU), Turkish (TR), Slovak (SK), Spanish (ES),Ukrainian (UK)
Mobile Application Management - AppCon�g support Limited Support Currently only VMware AirWatch, Microsoft Intune, andMobileIron Cloud are supported.
SAP Digital Boardroom presentations (agendas anddashboards)
No
SAP Analytics Designer No
Imported data refresh Yes Through a WebView reload
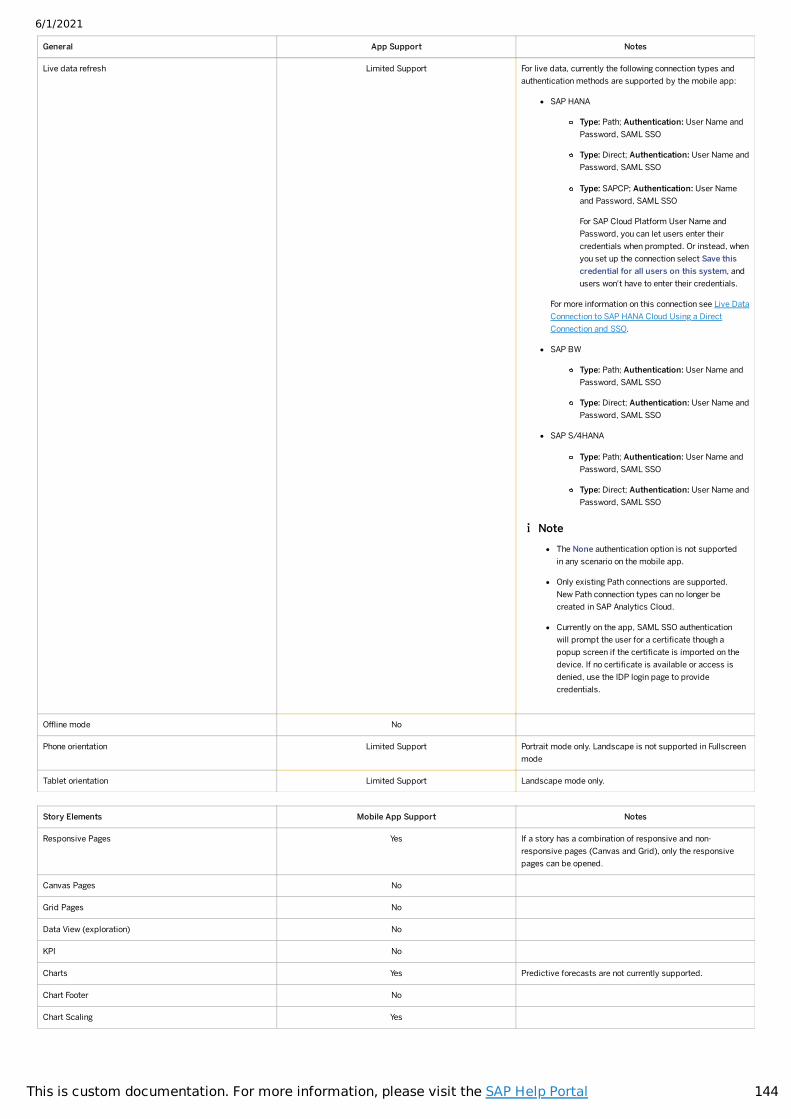
6/1/2021
144This is custom documentation. For more information, please visit the SAP Help Portal
General App Support Notes
Live data refresh Limited Support For live data, currently the following connection types andauthentication methods are supported by the mobile app:
SAP HANA
Type: Path; Authentication: User Name andPassword, SAML SSO
Type: Direct; Authentication: User Name andPassword, SAML SSO
Type: SAPCP; Authentication: User Nameand Password, SAML SSO
For SAP Cloud Platform User Name andPassword, you can let users enter theircredentials when prompted. Or instead, whenyou set up the connection select Save thiscredential for all users on this system, andusers won't have to enter their credentials.
For more information on this connection see Live DataConnection to SAP HANA Cloud Using a DirectConnection and SSO.
SAP BW
Type: Path; Authentication: User Name andPassword, SAML SSO
Type: Direct; Authentication: User Name andPassword, SAML SSO
SAP S/4HANA
Type: Path; Authentication: User Name andPassword, SAML SSO
Type: Direct; Authentication: User Name andPassword, SAML SSO
Offline mode No
Phone orientation Limited Support Portrait mode only. Landscape is not supported in Fullscreenmode
Tablet orientation Limited Support Landscape mode only.
Story Elements Mobile App Support Notes
Responsive Pages Yes If a story has a combination of responsive and non-responsive pages (Canvas and Grid), only the responsivepages can be opened.
Canvas Pages No
Grid Pages No
Data View (exploration) No
KPI No
Charts Yes Predictive forecasts are not currently supported.
Chart Footer No
Chart Scaling Yes
NoteThe None authentication option is not supportedin any scenario on the mobile app.
Only existing Path connections are supported.New Path connection types can no longer becreated in SAP Analytics Cloud.
Currently on the app, SAML SSO authenticationwill prompt the user for a certi�cate though apopup screen if the certi�cate is imported on thedevice. If no certi�cate is available or access isdenied, use the IDP login page to providecredentials.
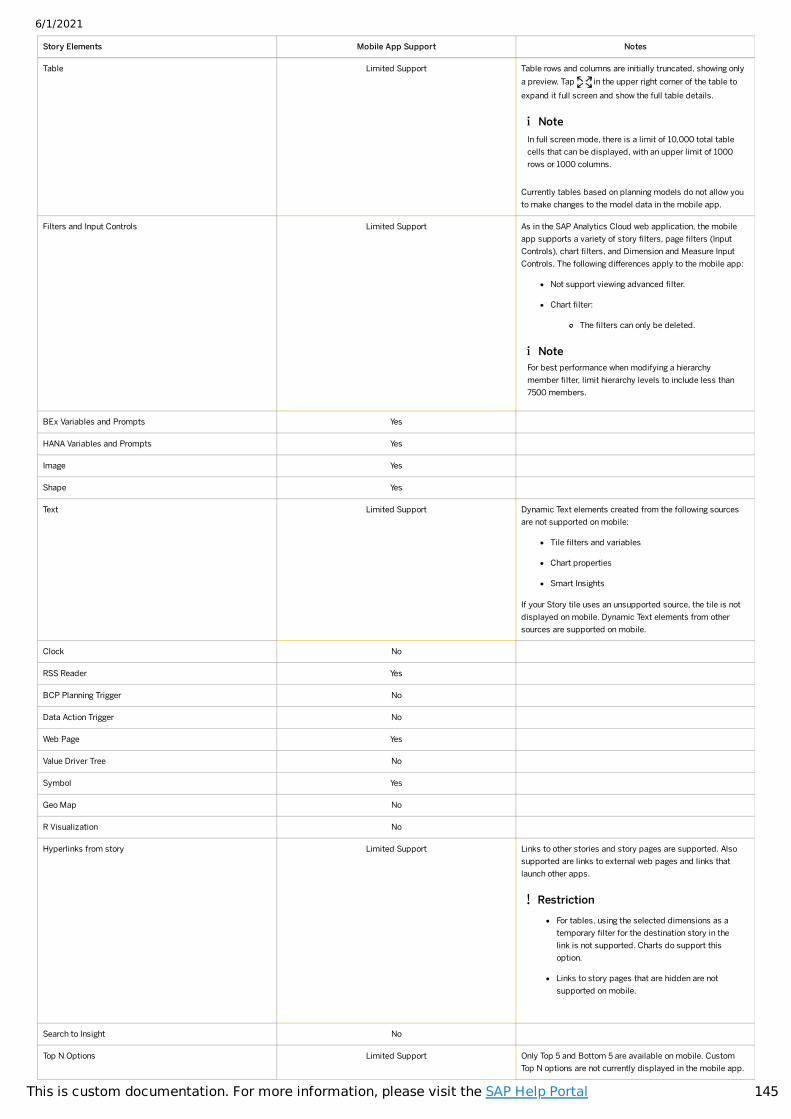
6/1/2021
145This is custom documentation. For more information, please visit the SAP Help Portal
Story Elements Mobile App Support Notes
Table Limited Support Table rows and columns are initially truncated, showing onlya preview. Tap in the upper right corner of the table toexpand it full screen and show the full table details.
Currently tables based on planning models do not allow youto make changes to the model data in the mobile app.
Filters and Input Controls Limited Support As in the SAP Analytics Cloud web application, the mobileapp supports a variety of story �lters, page �lters (InputControls), chart �lters, and Dimension and Measure InputControls. The following differences apply to the mobile app:
Not support viewing advanced �lter.
Chart �lter:
The �lters can only be deleted.
BEx Variables and Prompts Yes
HANA Variables and Prompts Yes
Image Yes
Shape Yes
Text Limited Support Dynamic Text elements created from the following sourcesare not supported on mobile:
Tile �lters and variables
Chart properties
Smart Insights
If your Story tile uses an unsupported source, the tile is notdisplayed on mobile. Dynamic Text elements from othersources are supported on mobile.
Clock No
RSS Reader Yes
BCP Planning Trigger No
Data Action Trigger No
Web Page Yes
Value Driver Tree No
Symbol Yes
Geo Map No
R Visualization No
Hyperlinks from story Limited Support Links to other stories and story pages are supported. Alsosupported are links to external web pages and links thatlaunch other apps.
Search to Insight No
Top N Options Limited Support Only Top 5 and Bottom 5 are available on mobile. CustomTop N options are not currently displayed in the mobile app.
NoteIn full screen mode, there is a limit of 10,000 total tablecells that can be displayed, with an upper limit of 1000rows or 1000 columns.
NoteFor best performance when modifying a hierarchymember �lter, limit hierarchy levels to include less than7500 members.
RestrictionFor tables, using the selected dimensions as atemporary �lter for the destination story in thelink is not supported. Charts do support thisoption.
Links to story pages that are hidden are notsupported on mobile.
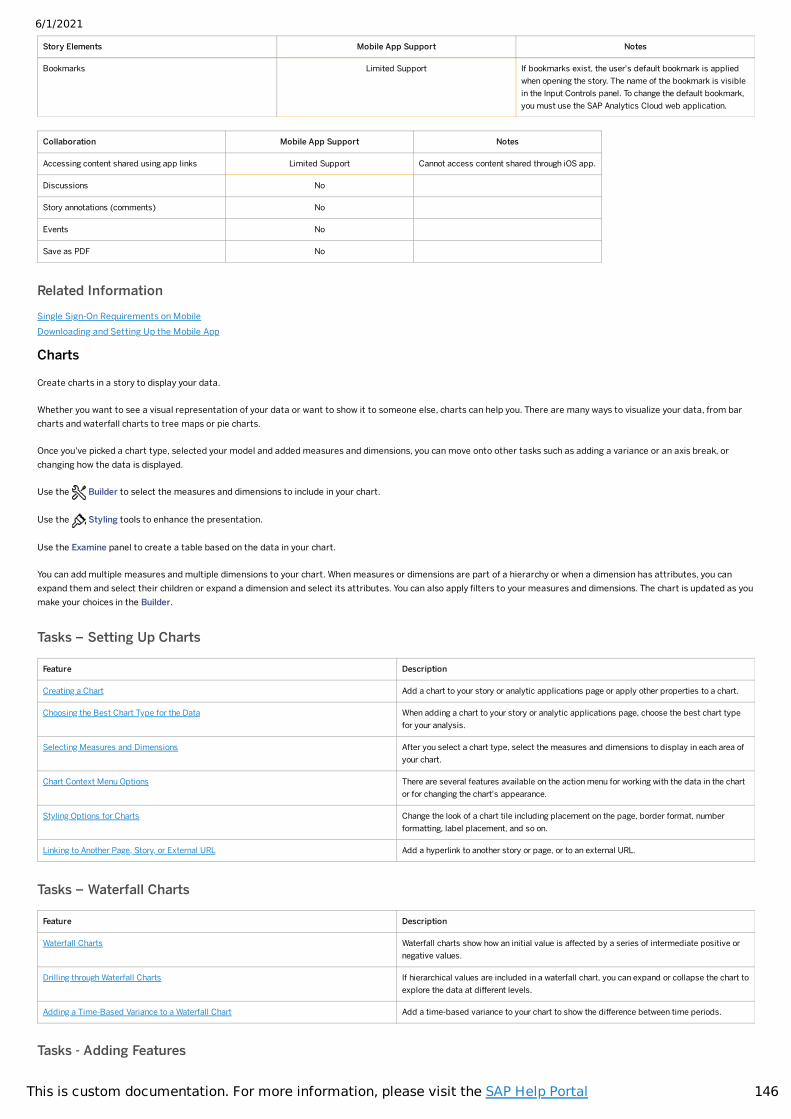
6/1/2021
146This is custom documentation. For more information, please visit the SAP Help Portal
Story Elements Mobile App Support Notes
Bookmarks Limited Support If bookmarks exist, the user's default bookmark is appliedwhen opening the story. The name of the bookmark is visiblein the Input Controls panel. To change the default bookmark,you must use the SAP Analytics Cloud web application.
Collaboration Mobile App Support Notes
Accessing content shared using app links Limited Support Cannot access content shared through iOS app.
Discussions No
Story annotations (comments) No
Events No
Save as PDF No
Related InformationSingle Sign-On Requirements on MobileDownloading and Setting Up the Mobile App
Charts
Create charts in a story to display your data.
Whether you want to see a visual representation of your data or want to show it to someone else, charts can help you. There are many ways to visualize your data, from barcharts and waterfall charts to tree maps or pie charts.
Once you've picked a chart type, selected your model and added measures and dimensions, you can move onto other tasks such as adding a variance or an axis break, orchanging how the data is displayed.
Use the Builder to select the measures and dimensions to include in your chart.
Use the Styling tools to enhance the presentation.
Use the Examine panel to create a table based on the data in your chart.
You can add multiple measures and multiple dimensions to your chart. When measures or dimensions are part of a hierarchy or when a dimension has attributes, you canexpand them and select their children or expand a dimension and select its attributes. You can also apply �lters to your measures and dimensions. The chart is updated as youmake your choices in the Builder.
Tasks – Setting Up Charts
Feature Description
Creating a Chart Add a chart to your story or analytic applications page or apply other properties to a chart.
Choosing the Best Chart Type for the Data When adding a chart to your story or analytic applications page, choose the best chart typefor your analysis.
Selecting Measures and Dimensions After you select a chart type, select the measures and dimensions to display in each area ofyour chart.
Chart Context Menu Options There are several features available on the action menu for working with the data in the chartor for changing the chart's appearance.
Styling Options for Charts Change the look of a chart tile including placement on the page, border format, numberformatting, label placement, and so on.
Linking to Another Page, Story, or External URL Add a hyperlink to another story or page, or to an external URL.
Tasks – Waterfall Charts
Feature Description
Waterfall Charts Waterfall charts show how an initial value is affected by a series of intermediate positive ornegative values.
Drilling through Waterfall Charts If hierarchical values are included in a waterfall chart, you can expand or collapse the chart toexplore the data at different levels.
Adding a Time-Based Variance to a Waterfall Chart Add a time-based variance to your chart to show the difference between time periods.
Tasks - Adding Features
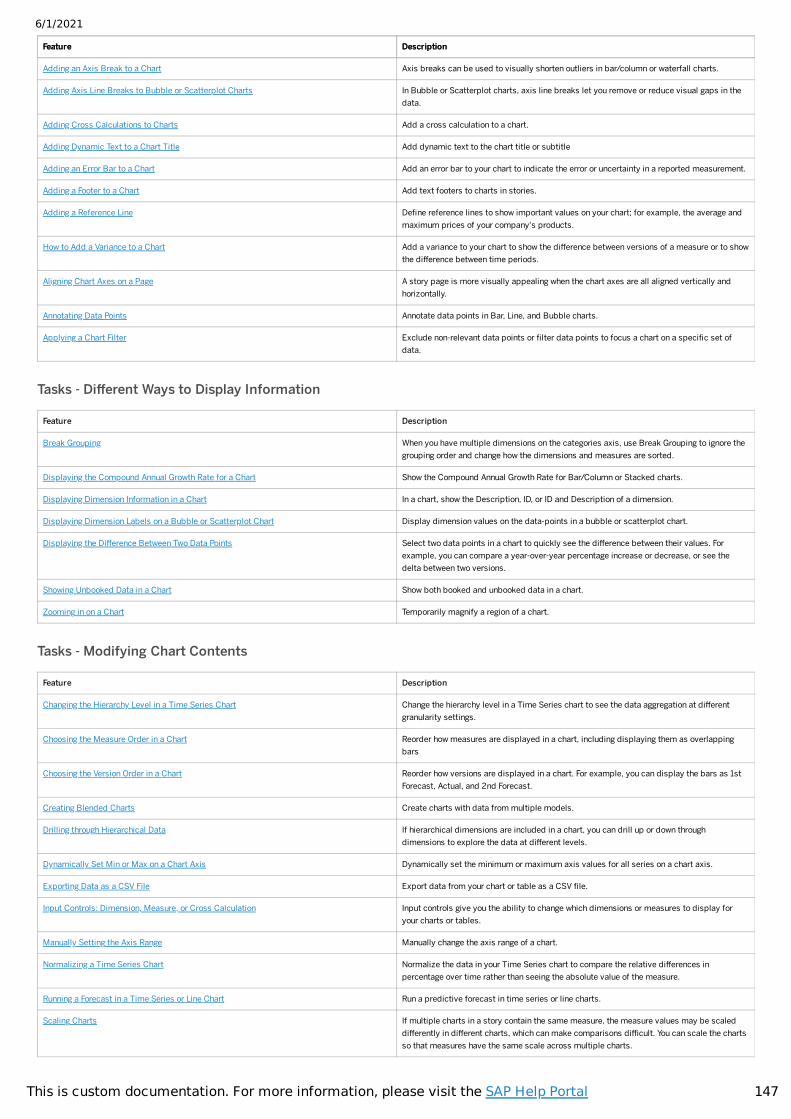
6/1/2021
147This is custom documentation. For more information, please visit the SAP Help Portal
Feature DescriptionFeature Description
Adding an Axis Break to a Chart Axis breaks can be used to visually shorten outliers in bar/column or waterfall charts.
Adding Axis Line Breaks to Bubble or Scatterplot Charts In Bubble or Scatterplot charts, axis line breaks let you remove or reduce visual gaps in thedata.
Adding Cross Calculations to Charts Add a cross calculation to a chart.
Adding Dynamic Text to a Chart Title Add dynamic text to the chart title or subtitle
Adding an Error Bar to a Chart Add an error bar to your chart to indicate the error or uncertainty in a reported measurement.
Adding a Footer to a Chart Add text footers to charts in stories.
Adding a Reference Line De�ne reference lines to show important values on your chart; for example, the average andmaximum prices of your company's products.
How to Add a Variance to a Chart Add a variance to your chart to show the difference between versions of a measure or to showthe difference between time periods.
Aligning Chart Axes on a Page A story page is more visually appealing when the chart axes are all aligned vertically andhorizontally.
Annotating Data Points Annotate data points in Bar, Line, and Bubble charts.
Applying a Chart Filter Exclude non-relevant data points or �lter data points to focus a chart on a speci�c set ofdata.
Tasks - Different Ways to Display Information
Feature Description
Break Grouping When you have multiple dimensions on the categories axis, use Break Grouping to ignore thegrouping order and change how the dimensions and measures are sorted.
Displaying the Compound Annual Growth Rate for a Chart Show the Compound Annual Growth Rate for Bar/Column or Stacked charts.
Displaying Dimension Information in a Chart In a chart, show the Description, ID, or ID and Description of a dimension.
Displaying Dimension Labels on a Bubble or Scatterplot Chart Display dimension values on the data-points in a bubble or scatterplot chart.
Displaying the Difference Between Two Data Points Select two data points in a chart to quickly see the difference between their values. Forexample, you can compare a year-over-year percentage increase or decrease, or see thedelta between two versions.
Showing Unbooked Data in a Chart Show both booked and unbooked data in a chart.
Zooming in on a Chart Temporarily magnify a region of a chart.
Tasks - Modifying Chart Contents
Feature Description
Changing the Hierarchy Level in a Time Series Chart Change the hierarchy level in a Time Series chart to see the data aggregation at differentgranularity settings.
Choosing the Measure Order in a Chart Reorder how measures are displayed in a chart, including displaying them as overlappingbars
Choosing the Version Order in a Chart Reorder how versions are displayed in a chart. For example, you can display the bars as 1stForecast, Actual, and 2nd Forecast.
Creating Blended Charts Create charts with data from multiple models.
Drilling through Hierarchical Data If hierarchical dimensions are included in a chart, you can drill up or down throughdimensions to explore the data at different levels.
Dynamically Set Min or Max on a Chart Axis Dynamically set the minimum or maximum axis values for all series on a chart axis.
Exporting Data as a CSV File Export data from your chart or table as a CSV �le.
Input Controls: Dimension, Measure, or Cross Calculation Input controls give you the ability to change which dimensions or measures to display foryour charts or tables.
Manually Setting the Axis Range Manually change the axis range of a chart.
Normalizing a Time Series Chart Normalize the data in your Time Series chart to compare the relative differences inpercentage over time rather than seeing the absolute value of the measure.
Running a Forecast in a Time Series or Line Chart Run a predictive forecast in time series or line charts.
Scaling Charts If multiple charts in a story contain the same measure, the measure values may be scaleddifferently in different charts, which can make comparisons difficult. You can scale the chartsso that measures have the same scale across multiple charts.
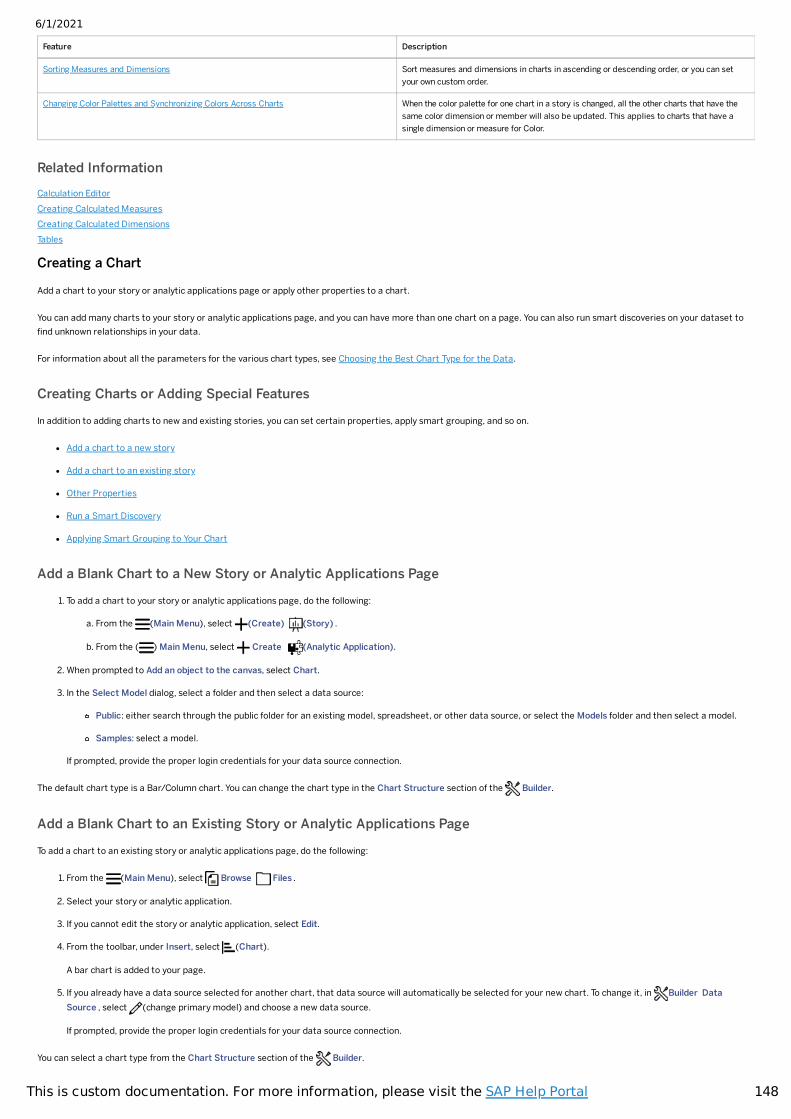
6/1/2021
148This is custom documentation. For more information, please visit the SAP Help Portal
Feature Description
Sorting Measures and Dimensions Sort measures and dimensions in charts in ascending or descending order, or you can setyour own custom order.
Changing Color Palettes and Synchronizing Colors Across Charts When the color palette for one chart in a story is changed, all the other charts that have thesame color dimension or member will also be updated. This applies to charts that have asingle dimension or measure for Color.
Related InformationCalculation EditorCreating Calculated MeasuresCreating Calculated DimensionsTables
Creating a Chart
Add a chart to your story or analytic applications page or apply other properties to a chart.
You can add many charts to your story or analytic applications page, and you can have more than one chart on a page. You can also run smart discoveries on your dataset to�nd unknown relationships in your data.
For information about all the parameters for the various chart types, see Choosing the Best Chart Type for the Data.
Creating Charts or Adding Special Features
In addition to adding charts to new and existing stories, you can set certain properties, apply smart grouping, and so on.
Add a chart to a new story
Add a chart to an existing story
Other Properties
Run a Smart Discovery
Applying Smart Grouping to Your Chart
Add a Blank Chart to a New Story or Analytic Applications Page
1. To add a chart to your story or analytic applications page, do the following:
a. From the (Main Menu), select (Create) (Story) .
b. From the ( ) Main Menu, select Create (Analytic Application).
2. When prompted to Add an object to the canvas, select Chart.
3. In the Select Model dialog, select a folder and then select a data source:
Public: either search through the public folder for an existing model, spreadsheet, or other data source, or select the Models folder and then select a model.
Samples: select a model.
If prompted, provide the proper login credentials for your data source connection.
The default chart type is a Bar/Column chart. You can change the chart type in the Chart Structure section of the Builder.
Add a Blank Chart to an Existing Story or Analytic Applications Page
To add a chart to an existing story or analytic applications page, do the following:
1. From the (Main Menu), select Browse Files .
2. Select your story or analytic application.
3. If you cannot edit the story or analytic application, select Edit.
4. From the toolbar, under Insert, select (Chart).
A bar chart is added to your page.
5. If you already have a data source selected for another chart, that data source will automatically be selected for your new chart. To change it, in Builder DataSource , select (change primary model) and choose a new data source.
If prompted, provide the proper login credentials for your data source connection.
You can select a chart type from the Chart Structure section of the Builder.
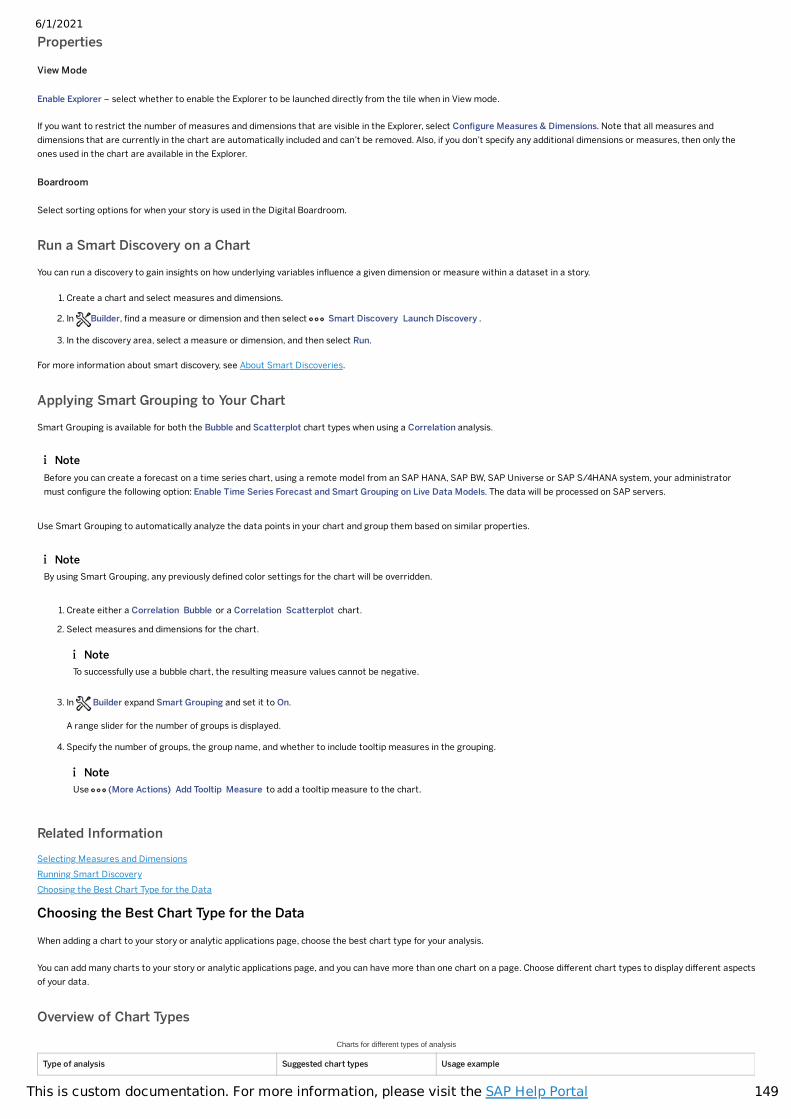
6/1/2021
149This is custom documentation. For more information, please visit the SAP Help Portal
Properties
View Mode
Enable Explorer – select whether to enable the Explorer to be launched directly from the tile when in View mode.
If you want to restrict the number of measures and dimensions that are visible in the Explorer, select Con�gure Measures & Dimensions. Note that all measures anddimensions that are currently in the chart are automatically included and can’t be removed. Also, if you don’t specify any additional dimensions or measures, then only theones used in the chart are available in the Explorer.
Boardroom
Select sorting options for when your story is used in the Digital Boardroom.
Run a Smart Discovery on a Chart
You can run a discovery to gain insights on how underlying variables in�uence a given dimension or measure within a dataset in a story.
1. Create a chart and select measures and dimensions.
2. In Builder, �nd a measure or dimension and then select Smart Discovery Launch Discovery .
3. In the discovery area, select a measure or dimension, and then select Run.
For more information about smart discovery, see About Smart Discoveries.
Applying Smart Grouping to Your Chart
Smart Grouping is available for both the Bubble and Scatterplot chart types when using a Correlation analysis.
Use Smart Grouping to automatically analyze the data points in your chart and group them based on similar properties.
1. Create either a Correlation Bubble or a Correlation Scatterplot chart.
2. Select measures and dimensions for the chart.
3. In Builder expand Smart Grouping and set it to On.
A range slider for the number of groups is displayed.
4. Specify the number of groups, the group name, and whether to include tooltip measures in the grouping.
Related InformationSelecting Measures and DimensionsRunning Smart DiscoveryChoosing the Best Chart Type for the Data
Choosing the Best Chart Type for the Data
When adding a chart to your story or analytic applications page, choose the best chart type for your analysis.
You can add many charts to your story or analytic applications page, and you can have more than one chart on a page. Choose different chart types to display different aspectsof your data.
Overview of Chart Types
Charts for different types of analysis
Type of analysis Suggested chart types Usage example
NoteBefore you can create a forecast on a time series chart, using a remote model from an SAP HANA, SAP BW, SAP Universe or SAP S/4HANA system, your administratormust con�gure the following option: Enable Time Series Forecast and Smart Grouping on Live Data Models. The data will be processed on SAP servers.
NoteBy using Smart Grouping, any previously de�ned color settings for the chart will be overridden.
NoteTo successfully use a bubble chart, the resulting measure values cannot be negative.
NoteUse (More Actions) Add Tooltip Measure to add a tooltip measure to the chart.
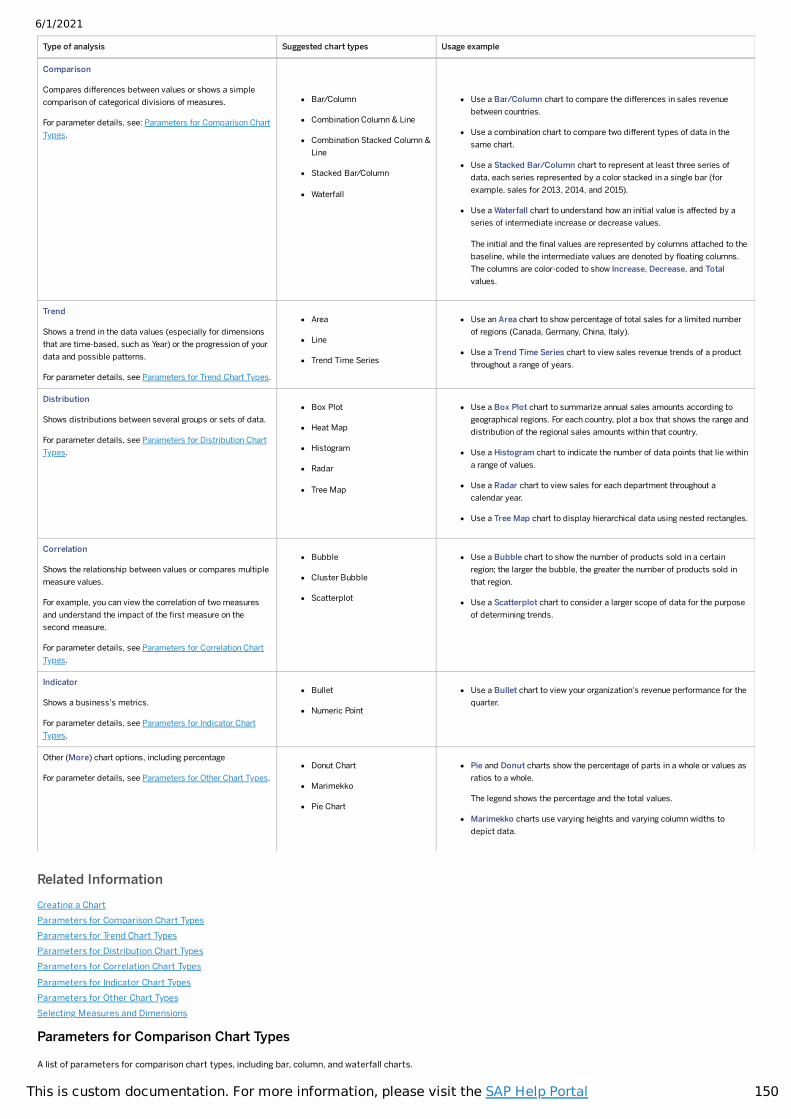
6/1/2021
150This is custom documentation. For more information, please visit the SAP Help Portal
Type of analysis Suggested chart types Usage example
Comparison
Compares differences between values or shows a simplecomparison of categorical divisions of measures.
For parameter details, see: Parameters for Comparison ChartTypes.
Bar/Column
Combination Column & Line
Combination Stacked Column &Line
Stacked Bar/Column
Waterfall
Use a Bar/Column chart to compare the differences in sales revenuebetween countries.
Use a combination chart to compare two different types of data in thesame chart.
Use a Stacked Bar/Column chart to represent at least three series ofdata, each series represented by a color stacked in a single bar (forexample, sales for 2013, 2014, and 2015).
Use a Waterfall chart to understand how an initial value is affected by aseries of intermediate increase or decrease values.
The initial and the �nal values are represented by columns attached to thebaseline, while the intermediate values are denoted by �oating columns.The columns are color-coded to show Increase, Decrease, and Totalvalues.
Trend
Shows a trend in the data values (especially for dimensionsthat are time-based, such as Year) or the progression of yourdata and possible patterns.
For parameter details, see Parameters for Trend Chart Types.
Area
Line
Trend Time Series
Use an Area chart to show percentage of total sales for a limited numberof regions (Canada, Germany, China, Italy).
Use a Trend Time Series chart to view sales revenue trends of a productthroughout a range of years.
Distribution
Shows distributions between several groups or sets of data.
For parameter details, see Parameters for Distribution ChartTypes.
Box Plot
Heat Map
Histogram
Radar
Tree Map
Use a Box Plot chart to summarize annual sales amounts according togeographical regions. For each country, plot a box that shows the range anddistribution of the regional sales amounts within that country.
Use a Histogram chart to indicate the number of data points that lie withina range of values.
Use a Radar chart to view sales for each department throughout acalendar year.
Use a Tree Map chart to display hierarchical data using nested rectangles.
Correlation
Shows the relationship between values or compares multiplemeasure values.
For example, you can view the correlation of two measuresand understand the impact of the �rst measure on thesecond measure.
For parameter details, see Parameters for Correlation ChartTypes.
Bubble
Cluster Bubble
Scatterplot
Use a Bubble chart to show the number of products sold in a certainregion; the larger the bubble, the greater the number of products sold inthat region.
Use a Scatterplot chart to consider a larger scope of data for the purposeof determining trends.
Indicator
Shows a business's metrics.
For parameter details, see Parameters for Indicator ChartTypes.
Bullet
Numeric Point
Use a Bullet chart to view your organization's revenue performance for thequarter.
Other (More) chart options, including percentage
For parameter details, see Parameters for Other Chart Types.Donut Chart
Marimekko
Pie Chart
Pie and Donut charts show the percentage of parts in a whole or values asratios to a whole.
The legend shows the percentage and the total values.
Marimekko charts use varying heights and varying column widths todepict data.
Related InformationCreating a ChartParameters for Comparison Chart TypesParameters for Trend Chart TypesParameters for Distribution Chart TypesParameters for Correlation Chart TypesParameters for Indicator Chart TypesParameters for Other Chart TypesSelecting Measures and Dimensions
Parameters for Comparison Chart Types
A list of parameters for comparison chart types, including bar, column, and waterfall charts.
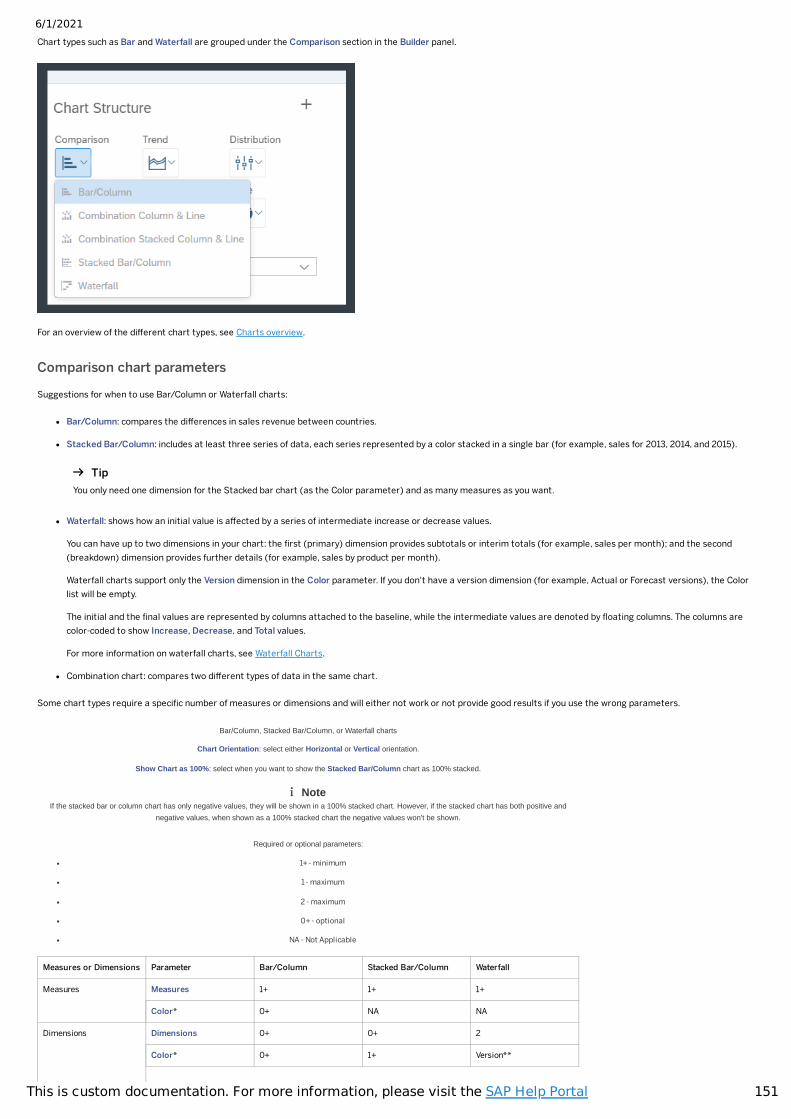
6/1/2021
151This is custom documentation. For more information, please visit the SAP Help Portal
Chart types such as Bar and Waterfall are grouped under the Comparison section in the Builder panel.
For an overview of the different chart types, see Charts overview.
Comparison chart parameters
Suggestions for when to use Bar/Column or Waterfall charts:
Bar/Column: compares the differences in sales revenue between countries.
Stacked Bar/Column: includes at least three series of data, each series represented by a color stacked in a single bar (for example, sales for 2013, 2014, and 2015).
Waterfall: shows how an initial value is affected by a series of intermediate increase or decrease values.
You can have up to two dimensions in your chart: the �rst (primary) dimension provides subtotals or interim totals (for example, sales per month); and the second(breakdown) dimension provides further details (for example, sales by product per month).
Waterfall charts support only the Version dimension in the Color parameter. If you don't have a version dimension (for example, Actual or Forecast versions), the Colorlist will be empty.
The initial and the �nal values are represented by columns attached to the baseline, while the intermediate values are denoted by �oating columns. The columns arecolor-coded to show Increase, Decrease, and Total values.
For more information on waterfall charts, see Waterfall Charts.
Combination chart: compares two different types of data in the same chart.
Some chart types require a speci�c number of measures or dimensions and will either not work or not provide good results if you use the wrong parameters.
Bar/Column, Stacked Bar/Column, or Waterfall charts
Chart Orientation: select either Horizontal or Vertical orientation.
Show Chart as 100%: select when you want to show the Stacked Bar/Column chart as 100% stacked.
Required or optional parameters:
1+ - minimum
1 - maximum
2 - maximum
0+ - optional
NA - Not Applicable
Measures or Dimensions Parameter Bar/Column Stacked Bar/Column Waterfall
Measures Measures 1+ 1+ 1+
Color* 0+ NA NA
Dimensions Dimensions 0+ 0+ 2
Color* 0+ 1+ Version**
TipYou only need one dimension for the Stacked bar chart (as the Color parameter) and as many measures as you want.
NoteIf the stacked bar or column chart has only negative values, they will be shown in a 100% stacked chart. However, if the stacked chart has both positive and
negative values, when shown as a 100% stacked chart the negative values won't be shown.
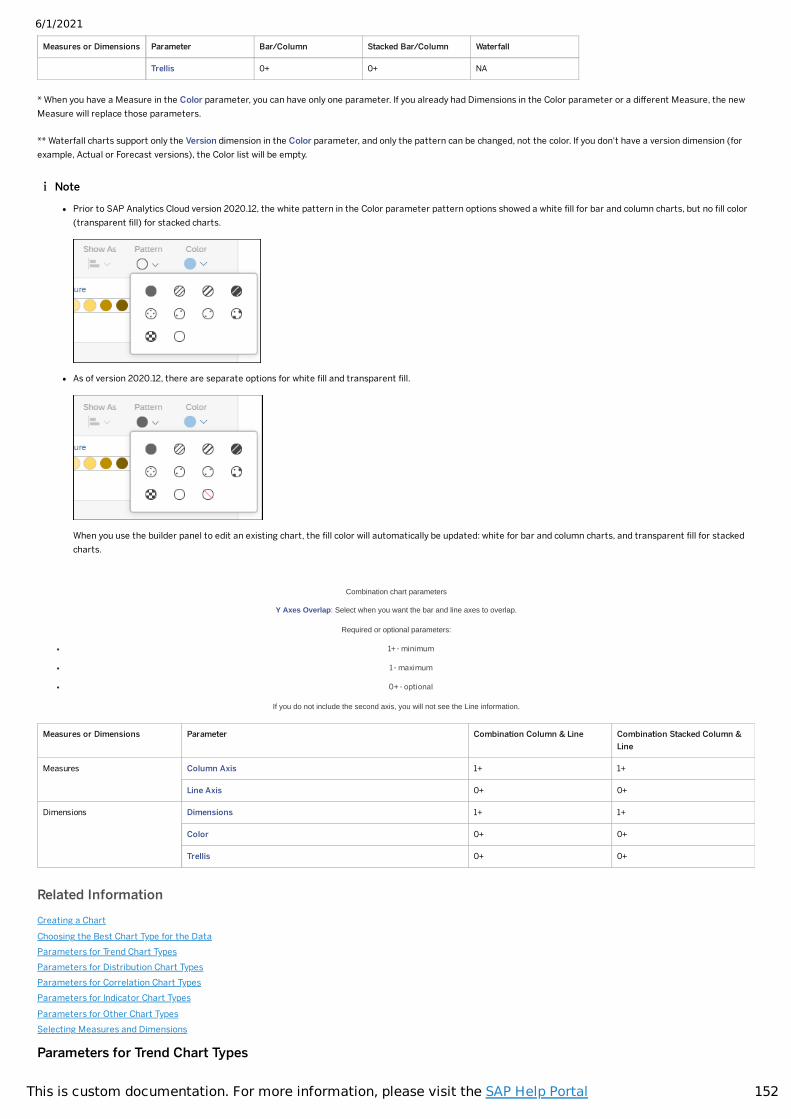
6/1/2021
152This is custom documentation. For more information, please visit the SAP Help Portal
Measures or Dimensions Parameter Bar/Column Stacked Bar/Column Waterfall
Trellis 0+ 0+ NA
* When you have a Measure in the Color parameter, you can have only one parameter. If you already had Dimensions in the Color parameter or a different Measure, the newMeasure will replace those parameters.
** Waterfall charts support only the Version dimension in the Color parameter, and only the pattern can be changed, not the color. If you don't have a version dimension (forexample, Actual or Forecast versions), the Color list will be empty.
Combination chart parameters
Y Axes Overlap: Select when you want the bar and line axes to overlap.
Required or optional parameters:
1+ - minimum
1 - maximum
0+ - optional
If you do not include the second axis, you will not see the Line information.
Measures or Dimensions Parameter Combination Column & Line Combination Stacked Column &Line
Measures Column Axis 1+ 1+
Line Axis 0+ 0+
Dimensions Dimensions 1+ 1+
Color 0+ 0+
Trellis 0+ 0+
Related InformationCreating a ChartChoosing the Best Chart Type for the DataParameters for Trend Chart TypesParameters for Distribution Chart TypesParameters for Correlation Chart TypesParameters for Indicator Chart TypesParameters for Other Chart TypesSelecting Measures and Dimensions
Parameters for Trend Chart Types
Note
Prior to SAP Analytics Cloud version 2020.12, the white pattern in the Color parameter pattern options showed a white �ll for bar and column charts, but no �ll color(transparent �ll) for stacked charts.
As of version 2020.12, there are separate options for white �ll and transparent �ll.
When you use the builder panel to edit an existing chart, the �ll color will automatically be updated: white for bar and column charts, and transparent �ll for stackedcharts.
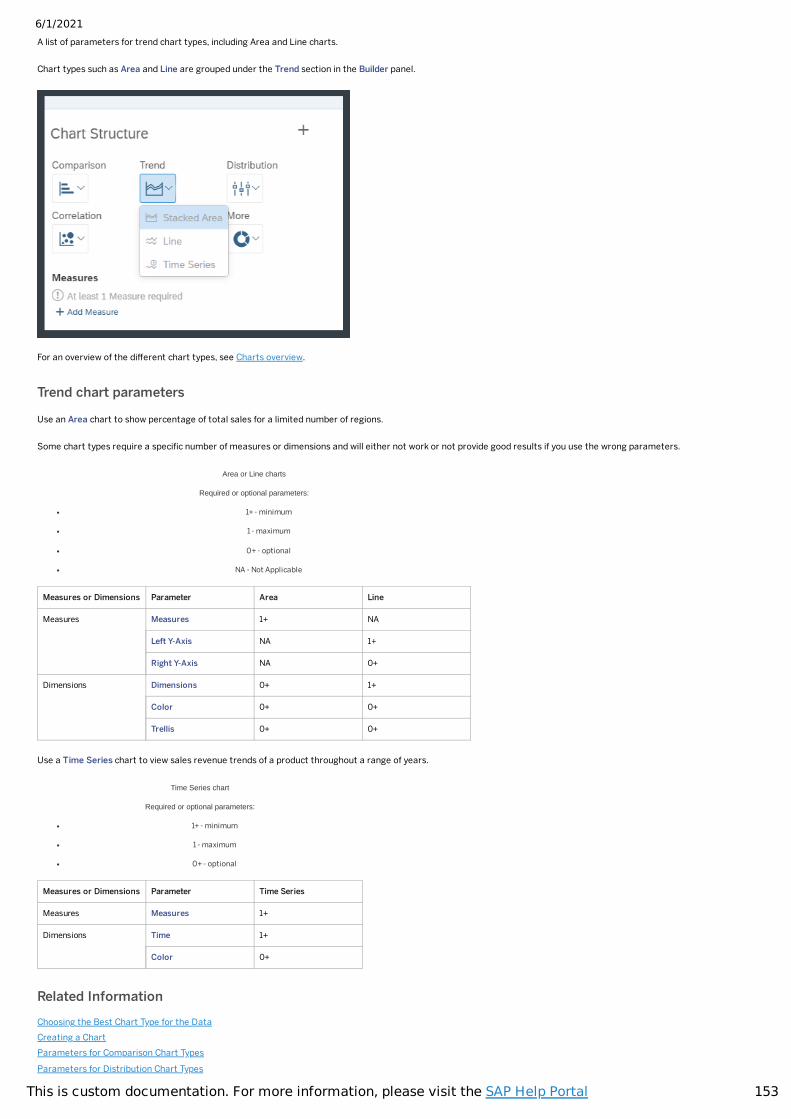
6/1/2021
153This is custom documentation. For more information, please visit the SAP Help Portal
A list of parameters for trend chart types, including Area and Line charts.
Chart types such as Area and Line are grouped under the Trend section in the Builder panel.
For an overview of the different chart types, see Charts overview.
Trend chart parameters
Use an Area chart to show percentage of total sales for a limited number of regions.
Some chart types require a speci�c number of measures or dimensions and will either not work or not provide good results if you use the wrong parameters.
Area or Line charts
Required or optional parameters:
1+ - minimum
1 - maximum
0+ - optional
NA - Not Applicable
Measures or Dimensions Parameter Area Line
Measures Measures 1+ NA
Left Y-Axis NA 1+
Right Y-Axis NA 0+
Dimensions Dimensions 0+ 1+
Color 0+ 0+
Trellis 0+ 0+
Use a Time Series chart to view sales revenue trends of a product throughout a range of years.
Time Series chart
Required or optional parameters:
1+ - minimum
1 - maximum
0+ - optional
Measures or Dimensions Parameter Time Series
Measures Measures 1+
Dimensions Time 1+
Color 0+
Related InformationChoosing the Best Chart Type for the DataCreating a ChartParameters for Comparison Chart TypesParameters for Distribution Chart Types
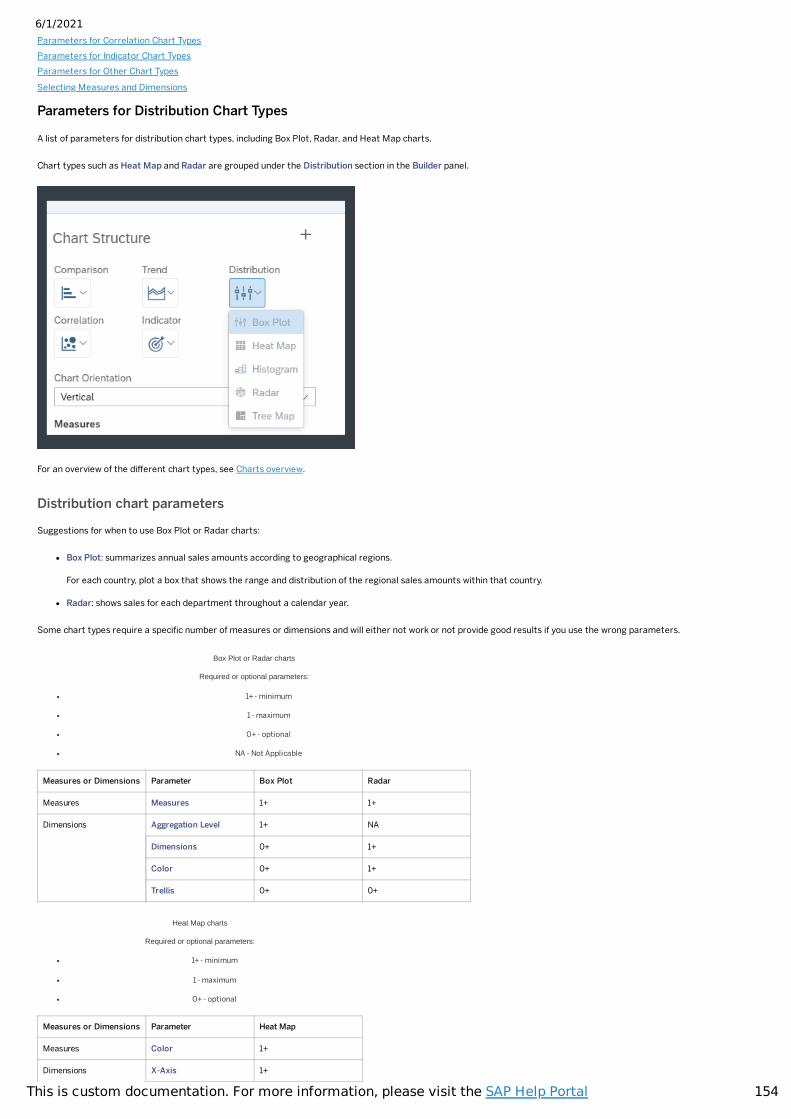
6/1/2021
154This is custom documentation. For more information, please visit the SAP Help Portal
Parameters for Correlation Chart TypesParameters for Indicator Chart TypesParameters for Other Chart TypesSelecting Measures and Dimensions
Parameters for Distribution Chart Types
A list of parameters for distribution chart types, including Box Plot, Radar, and Heat Map charts.
Chart types such as Heat Map and Radar are grouped under the Distribution section in the Builder panel.
For an overview of the different chart types, see Charts overview.
Distribution chart parameters
Suggestions for when to use Box Plot or Radar charts:
Box Plot: summarizes annual sales amounts according to geographical regions.
For each country, plot a box that shows the range and distribution of the regional sales amounts within that country.
Radar: shows sales for each department throughout a calendar year.
Some chart types require a speci�c number of measures or dimensions and will either not work or not provide good results if you use the wrong parameters.
Box Plot or Radar charts
Required or optional parameters:
1+ - minimum
1 - maximum
0+ - optional
NA - Not Applicable
Measures or Dimensions Parameter Box Plot Radar
Measures Measures 1+ 1+
Dimensions Aggregation Level 1+ NA
Dimensions 0+ 1+
Color 0+ 1+
Trellis 0+ 0+
Heat Map charts
Required or optional parameters:
1+ - minimum
1 - maximum
0+ - optional
Measures or Dimensions Parameter Heat Map
Measures Color 1+
Dimensions X-Axis 1+
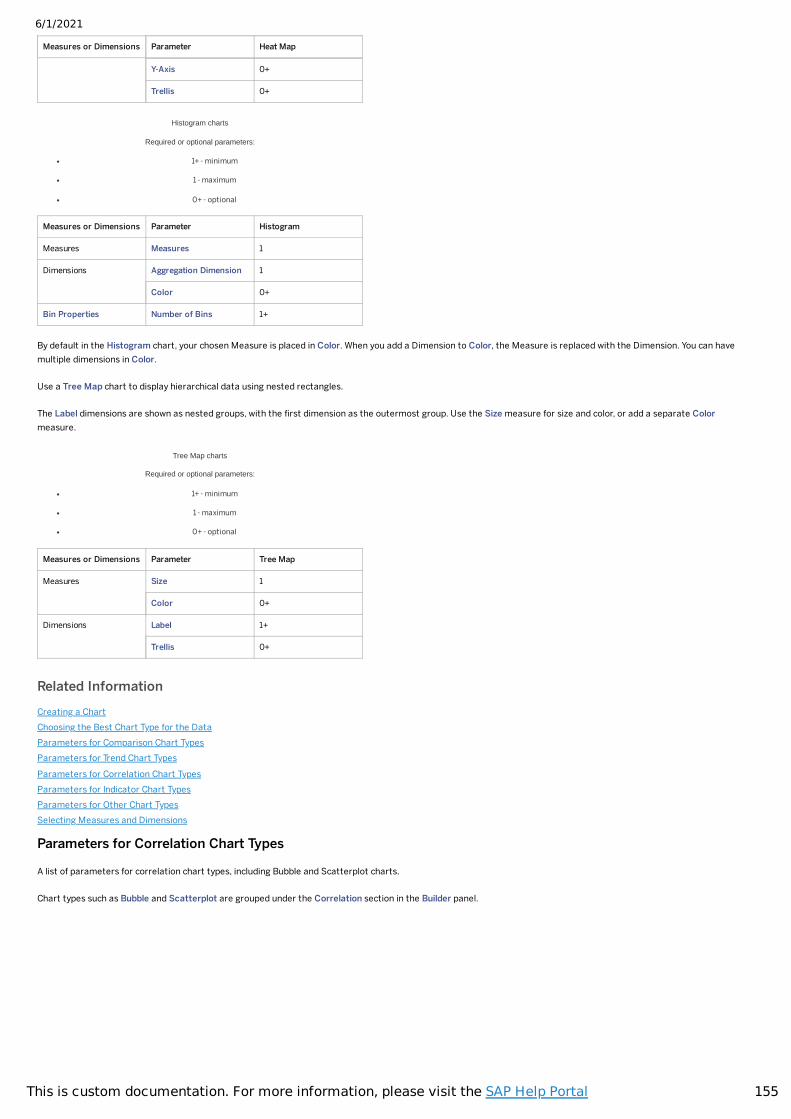
6/1/2021
155This is custom documentation. For more information, please visit the SAP Help Portal
Measures or Dimensions Parameter Heat Map
Y-Axis 0+
Trellis 0+
Histogram charts
Required or optional parameters:
1+ - minimum
1 - maximum
0+ - optional
Measures or Dimensions Parameter Histogram
Measures Measures 1
Dimensions Aggregation Dimension 1
Color 0+
Bin Properties Number of Bins 1+
By default in the Histogram chart, your chosen Measure is placed in Color. When you add a Dimension to Color, the Measure is replaced with the Dimension. You can havemultiple dimensions in Color.
Use a Tree Map chart to display hierarchical data using nested rectangles.
The Label dimensions are shown as nested groups, with the �rst dimension as the outermost group. Use the Size measure for size and color, or add a separate Colormeasure.
Tree Map charts
Required or optional parameters:
1+ - minimum
1 - maximum
0+ - optional
Measures or Dimensions Parameter Tree Map
Measures Size 1
Color 0+
Dimensions Label 1+
Trellis 0+
Related InformationCreating a ChartChoosing the Best Chart Type for the DataParameters for Comparison Chart TypesParameters for Trend Chart TypesParameters for Correlation Chart TypesParameters for Indicator Chart TypesParameters for Other Chart TypesSelecting Measures and Dimensions
Parameters for Correlation Chart Types
A list of parameters for correlation chart types, including Bubble and Scatterplot charts.
Chart types such as Bubble and Scatterplot are grouped under the Correlation section in the Builder panel.
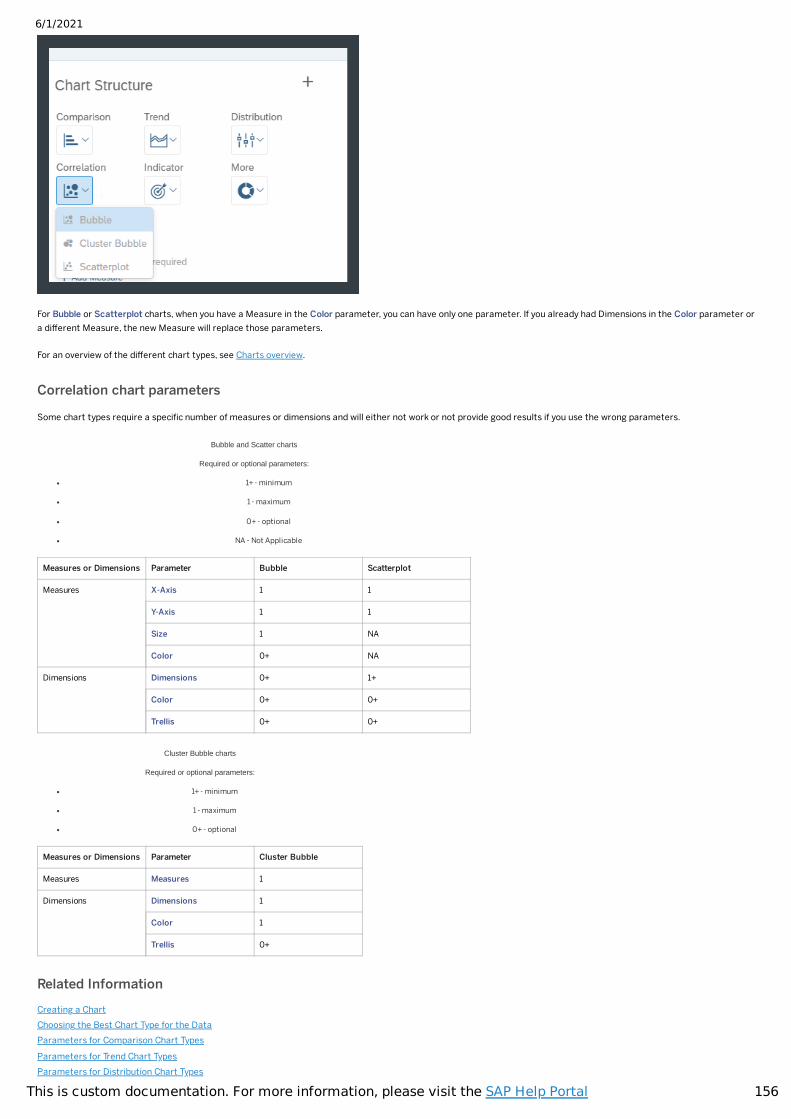
6/1/2021
156This is custom documentation. For more information, please visit the SAP Help Portal
For Bubble or Scatterplot charts, when you have a Measure in the Color parameter, you can have only one parameter. If you already had Dimensions in the Color parameter ora different Measure, the new Measure will replace those parameters.
For an overview of the different chart types, see Charts overview.
Correlation chart parameters
Some chart types require a speci�c number of measures or dimensions and will either not work or not provide good results if you use the wrong parameters.
Bubble and Scatter charts
Required or optional parameters:
1+ - minimum
1 - maximum
0+ - optional
NA - Not Applicable
Measures or Dimensions Parameter Bubble Scatterplot
Measures X-Axis 1 1
Y-Axis 1 1
Size 1 NA
Color 0+ NA
Dimensions Dimensions 0+ 1+
Color 0+ 0+
Trellis 0+ 0+
Cluster Bubble charts
Required or optional parameters:
1+ - minimum
1 - maximum
0+ - optional
Measures or Dimensions Parameter Cluster Bubble
Measures Measures 1
Dimensions Dimensions 1
Color 1
Trellis 0+
Related InformationCreating a ChartChoosing the Best Chart Type for the DataParameters for Comparison Chart TypesParameters for Trend Chart TypesParameters for Distribution Chart Types
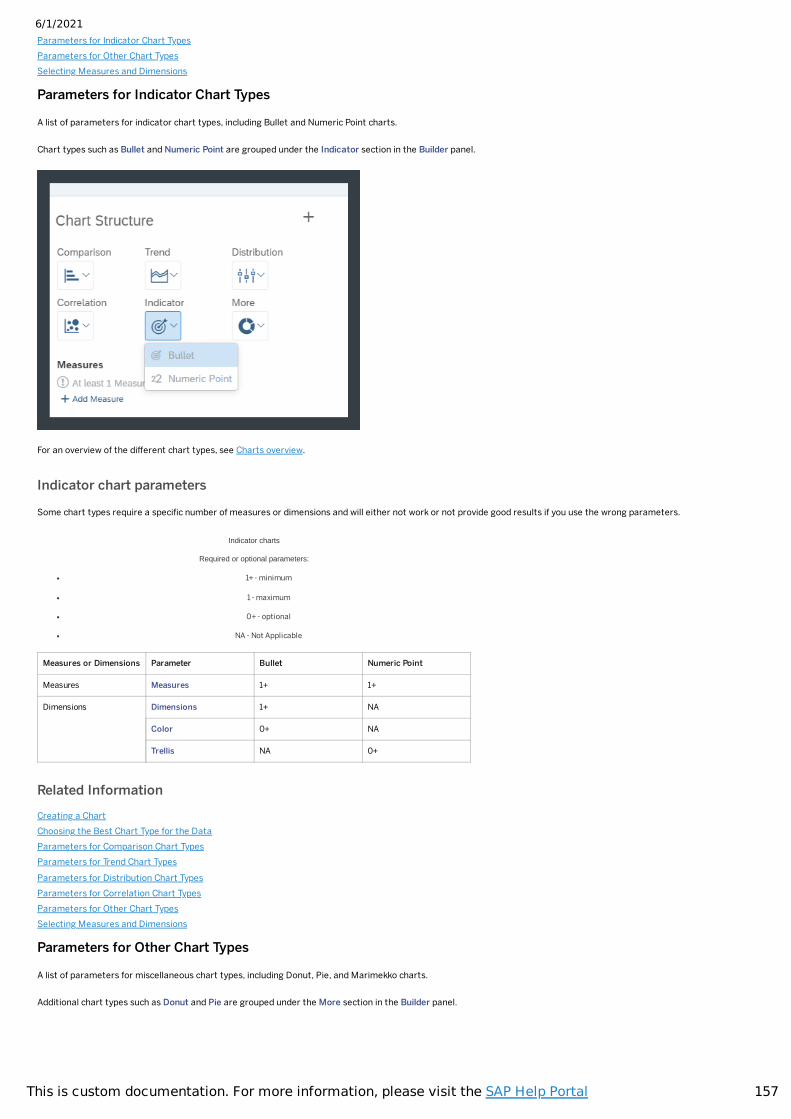
6/1/2021
157This is custom documentation. For more information, please visit the SAP Help Portal
Parameters for Indicator Chart TypesParameters for Other Chart TypesSelecting Measures and Dimensions
Parameters for Indicator Chart Types
A list of parameters for indicator chart types, including Bullet and Numeric Point charts.
Chart types such as Bullet and Numeric Point are grouped under the Indicator section in the Builder panel.
For an overview of the different chart types, see Charts overview.
Indicator chart parameters
Some chart types require a speci�c number of measures or dimensions and will either not work or not provide good results if you use the wrong parameters.
Indicator charts
Required or optional parameters:
1+ - minimum
1 - maximum
0+ - optional
NA - Not Applicable
Measures or Dimensions Parameter Bullet Numeric Point
Measures Measures 1+ 1+
Dimensions Dimensions 1+ NA
Color 0+ NA
Trellis NA 0+
Related InformationCreating a ChartChoosing the Best Chart Type for the DataParameters for Comparison Chart TypesParameters for Trend Chart TypesParameters for Distribution Chart TypesParameters for Correlation Chart TypesParameters for Other Chart TypesSelecting Measures and Dimensions
Parameters for Other Chart Types
A list of parameters for miscellaneous chart types, including Donut, Pie, and Marimekko charts.
Additional chart types such as Donut and Pie are grouped under the More section in the Builder panel.
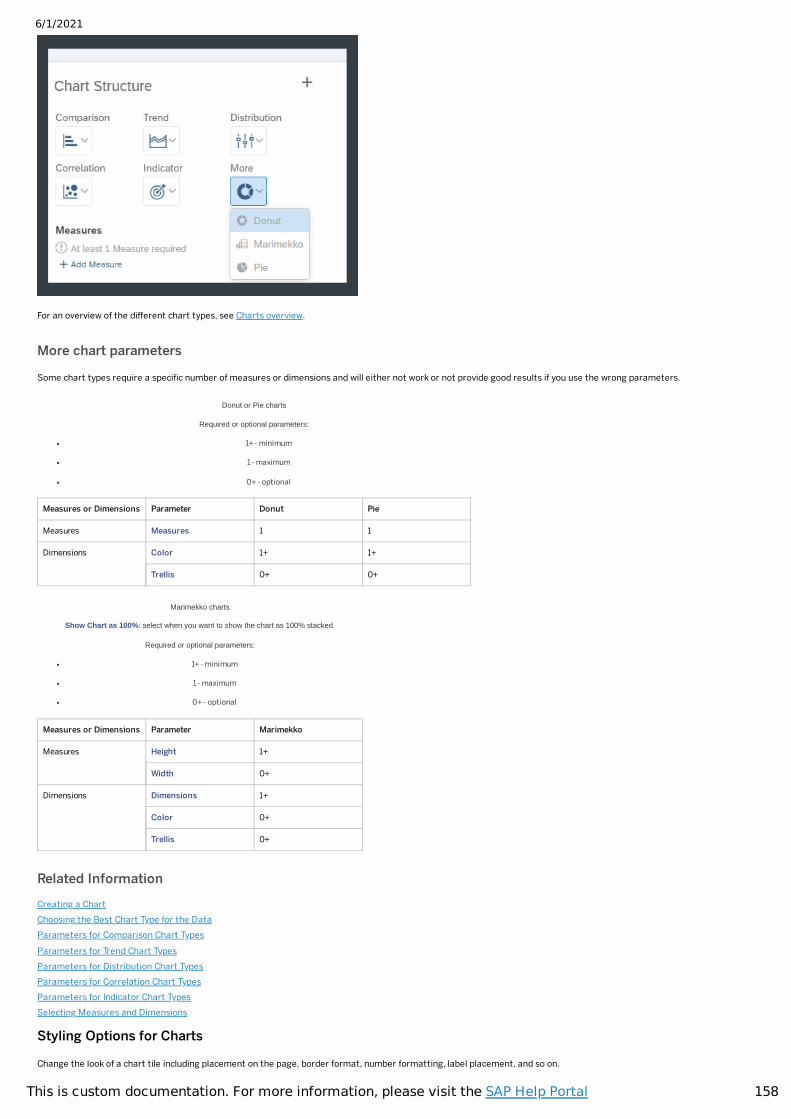
6/1/2021
158This is custom documentation. For more information, please visit the SAP Help Portal
For an overview of the different chart types, see Charts overview.
More chart parameters
Some chart types require a speci�c number of measures or dimensions and will either not work or not provide good results if you use the wrong parameters.
Donut or Pie charts
Required or optional parameters:
1+ - minimum
1 - maximum
0+ - optional
Measures or Dimensions Parameter Donut Pie
Measures Measures 1 1
Dimensions Color 1+ 1+
Trellis 0+ 0+
Marimekko charts
Show Chart as 100%: select when you want to show the chart as 100% stacked.
Required or optional parameters:
1+ - minimum
1 - maximum
0+ - optional
Measures or Dimensions Parameter Marimekko
Measures Height 1+
Width 0+
Dimensions Dimensions 1+
Color 0+
Trellis 0+
Related InformationCreating a ChartChoosing the Best Chart Type for the DataParameters for Comparison Chart TypesParameters for Trend Chart TypesParameters for Distribution Chart TypesParameters for Correlation Chart TypesParameters for Indicator Chart TypesSelecting Measures and Dimensions
Styling Options for Charts
Change the look of a chart tile including placement on the page, border format, number formatting, label placement, and so on.
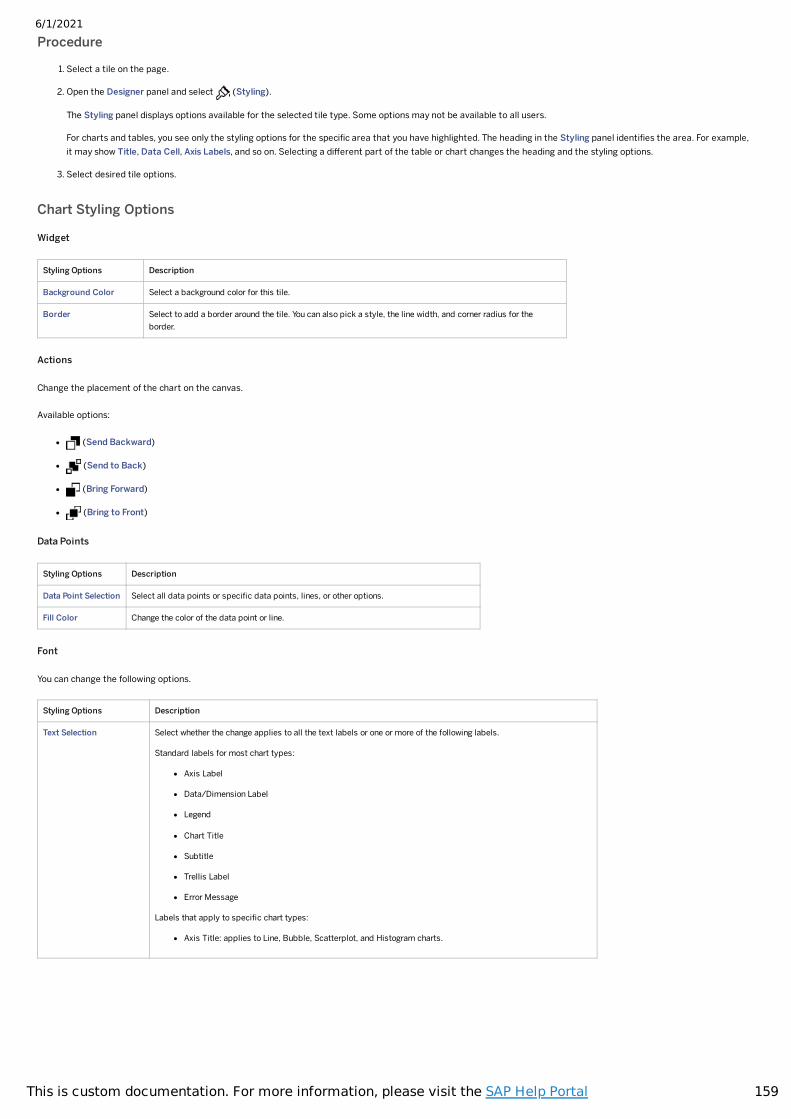
6/1/2021
159This is custom documentation. For more information, please visit the SAP Help Portal
Procedure
1. Select a tile on the page.
2. Open the Designer panel and select (Styling).
The Styling panel displays options available for the selected tile type. Some options may not be available to all users.
For charts and tables, you see only the styling options for the speci�c area that you have highlighted. The heading in the Styling panel identi�es the area. For example,it may show Title, Data Cell, Axis Labels, and so on. Selecting a different part of the table or chart changes the heading and the styling options.
3. Select desired tile options.
Chart Styling Options
Widget
Styling Options Description
Background Color Select a background color for this tile.
Border Select to add a border around the tile. You can also pick a style, the line width, and corner radius for theborder.
Actions
Change the placement of the chart on the canvas.
Available options:
(Send Backward)
(Send to Back)
(Bring Forward)
(Bring to Front)
Data Points
Styling Options Description
Data Point Selection Select all data points or speci�c data points, lines, or other options.
Fill Color Change the color of the data point or line.
Font
You can change the following options.
Styling Options Description
Text Selection Select whether the change applies to all the text labels or one or more of the following labels.
Standard labels for most chart types:
Axis Label
Data/Dimension Label
Legend
Chart Title
Subtitle
Trellis Label
Error Message
Labels that apply to speci�c chart types:
Axis Title: applies to Line, Bubble, Scatterplot, and Histogram charts.
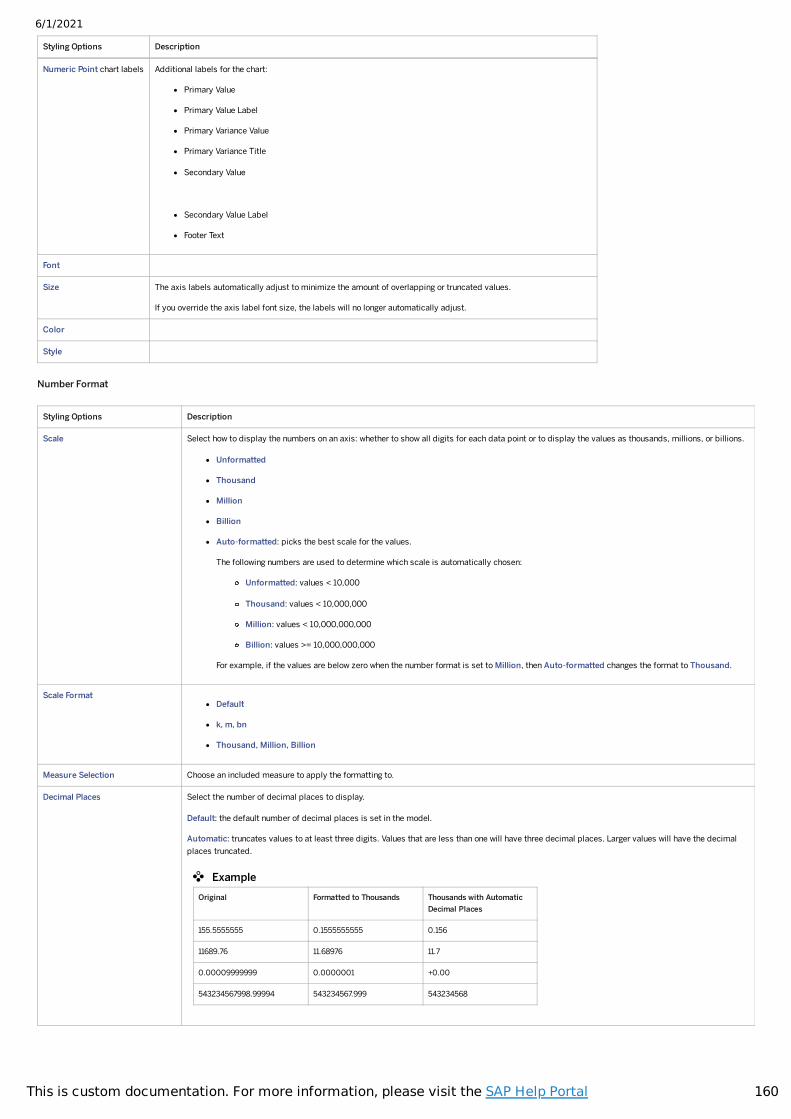
6/1/2021
160This is custom documentation. For more information, please visit the SAP Help Portal
Styling Options Description
Numeric Point chart labels Additional labels for the chart:
Primary Value
Primary Value Label
Primary Variance Value
Primary Variance Title
Secondary Value
Secondary Value Label
Footer Text
Font
Size The axis labels automatically adjust to minimize the amount of overlapping or truncated values.
If you override the axis label font size, the labels will no longer automatically adjust.
Color
Style
Number Format
Styling Options Description
Scale Select how to display the numbers on an axis: whether to show all digits for each data point or to display the values as thousands, millions, or billions.
Unformatted
Thousand
Million
Billion
Auto-formatted: picks the best scale for the values.
The following numbers are used to determine which scale is automatically chosen:
Unformatted: values < 10,000
Thousand: values < 10,000,000
Million: values < 10,000,000,000
Billion: values >= 10,000,000,000
For example, if the values are below zero when the number format is set to Million, then Auto-formatted changes the format to Thousand.
Scale FormatDefault
k, m, bn
Thousand, Million, Billion
Measure Selection Choose an included measure to apply the formatting to.
Decimal Places Select the number of decimal places to display.
Default: the default number of decimal places is set in the model.
Automatic: truncates values to at least three digits. Values that are less than one will have three decimal places. Larger values will have the decimalplaces truncated.
ExampleOriginal Formatted to Thousands Thousands with Automatic
Decimal Places
155.5555555 0.1555555555 0.156
11689.76 11.68976 11.7
0.00009999999 0.0000001 +0.00
543234567998.99994 543234567.999 543234568
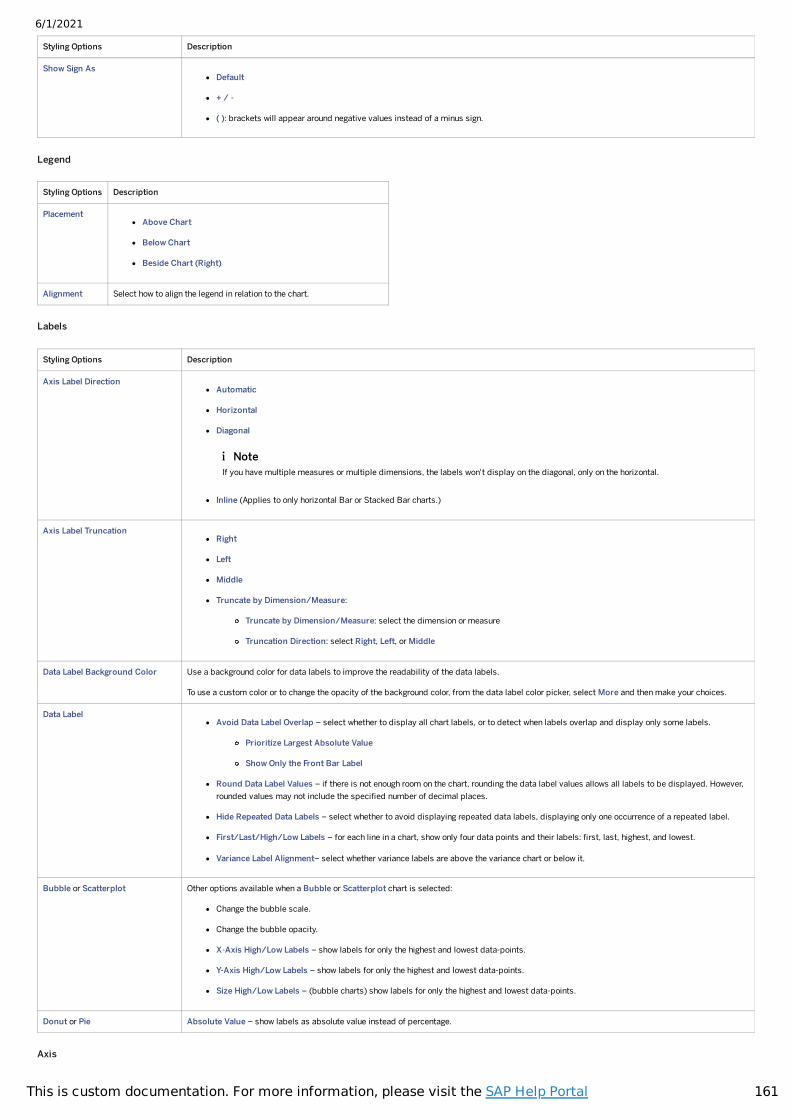
6/1/2021
161This is custom documentation. For more information, please visit the SAP Help Portal
Styling Options Description
Show Sign AsDefault
+ / -
( ): brackets will appear around negative values instead of a minus sign.
Legend
Styling Options Description
PlacementAbove Chart
Below Chart
Beside Chart (Right)
Alignment Select how to align the legend in relation to the chart.
Labels
Styling Options Description
Axis Label DirectionAutomatic
Horizontal
Diagonal
Inline (Applies to only horizontal Bar or Stacked Bar charts.)
Axis Label TruncationRight
Left
Middle
Truncate by Dimension/Measure:
Truncate by Dimension/Measure: select the dimension or measure
Truncation Direction: select Right, Left, or Middle
Data Label Background Color Use a background color for data labels to improve the readability of the data labels.
To use a custom color or to change the opacity of the background color, from the data label color picker, select More and then make your choices.
Data LabelAvoid Data Label Overlap – select whether to display all chart labels, or to detect when labels overlap and display only some labels.
Prioritize Largest Absolute Value
Show Only the Front Bar Label
Round Data Label Values – if there is not enough room on the chart, rounding the data label values allows all labels to be displayed. However,rounded values may not include the speci�ed number of decimal places.
Hide Repeated Data Labels – select whether to avoid displaying repeated data labels, displaying only one occurrence of a repeated label.
First/Last/High/Low Labels – for each line in a chart, show only four data points and their labels: �rst, last, highest, and lowest.
Variance Label Alignment– select whether variance labels are above the variance chart or below it.
Bubble or Scatterplot Other options available when a Bubble or Scatterplot chart is selected:
Change the bubble scale.
Change the bubble opacity.
X-Axis High/Low Labels – show labels for only the highest and lowest data-points.
Y-Axis High/Low Labels – show labels for only the highest and lowest data-points.
Size High/Low Labels – (bubble charts) show labels for only the highest and lowest data-points.
Donut or Pie Absolute Value – show labels as absolute value instead of percentage.
Axis
NoteIf you have multiple measures or multiple dimensions, the labels won't display on the diagonal, only on the horizontal.
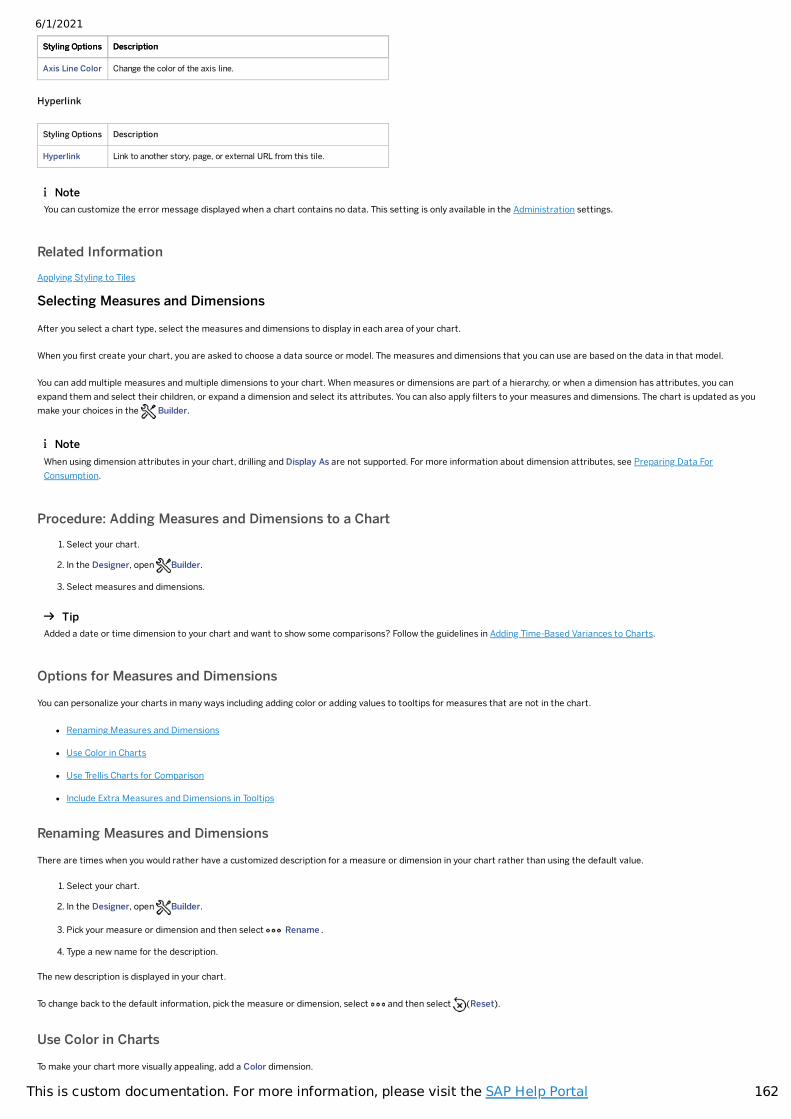
6/1/2021
162This is custom documentation. For more information, please visit the SAP Help Portal
Styling Options DescriptionStyling Options Description
Axis Line Color Change the color of the axis line.
Hyperlink
Styling Options Description
Hyperlink Link to another story, page, or external URL from this tile.
Related InformationApplying Styling to Tiles
Selecting Measures and Dimensions
After you select a chart type, select the measures and dimensions to display in each area of your chart.
When you �rst create your chart, you are asked to choose a data source or model. The measures and dimensions that you can use are based on the data in that model.
You can add multiple measures and multiple dimensions to your chart. When measures or dimensions are part of a hierarchy, or when a dimension has attributes, you canexpand them and select their children, or expand a dimension and select its attributes. You can also apply �lters to your measures and dimensions. The chart is updated as youmake your choices in the Builder.
Procedure: Adding Measures and Dimensions to a Chart1. Select your chart.
2. In the Designer, open Builder.
3. Select measures and dimensions.
Options for Measures and Dimensions
You can personalize your charts in many ways including adding color or adding values to tooltips for measures that are not in the chart.
Renaming Measures and Dimensions
Use Color in Charts
Use Trellis Charts for Comparison
Include Extra Measures and Dimensions in Tooltips
Renaming Measures and Dimensions
There are times when you would rather have a customized description for a measure or dimension in your chart rather than using the default value.
1. Select your chart.
2. In the Designer, open Builder.
3. Pick your measure or dimension and then select Rename .
4. Type a new name for the description.
The new description is displayed in your chart.
To change back to the default information, pick the measure or dimension, select and then select (Reset).
Use Color in Charts
To make your chart more visually appealing, add a Color dimension.
NoteYou can customize the error message displayed when a chart contains no data. This setting is only available in the Administration settings.
NoteWhen using dimension attributes in your chart, drilling and Display As are not supported. For more information about dimension attributes, see Preparing Data ForConsumption.
TipAdded a date or time dimension to your chart and want to show some comparisons? Follow the guidelines in Adding Time-Based Variances to Charts.
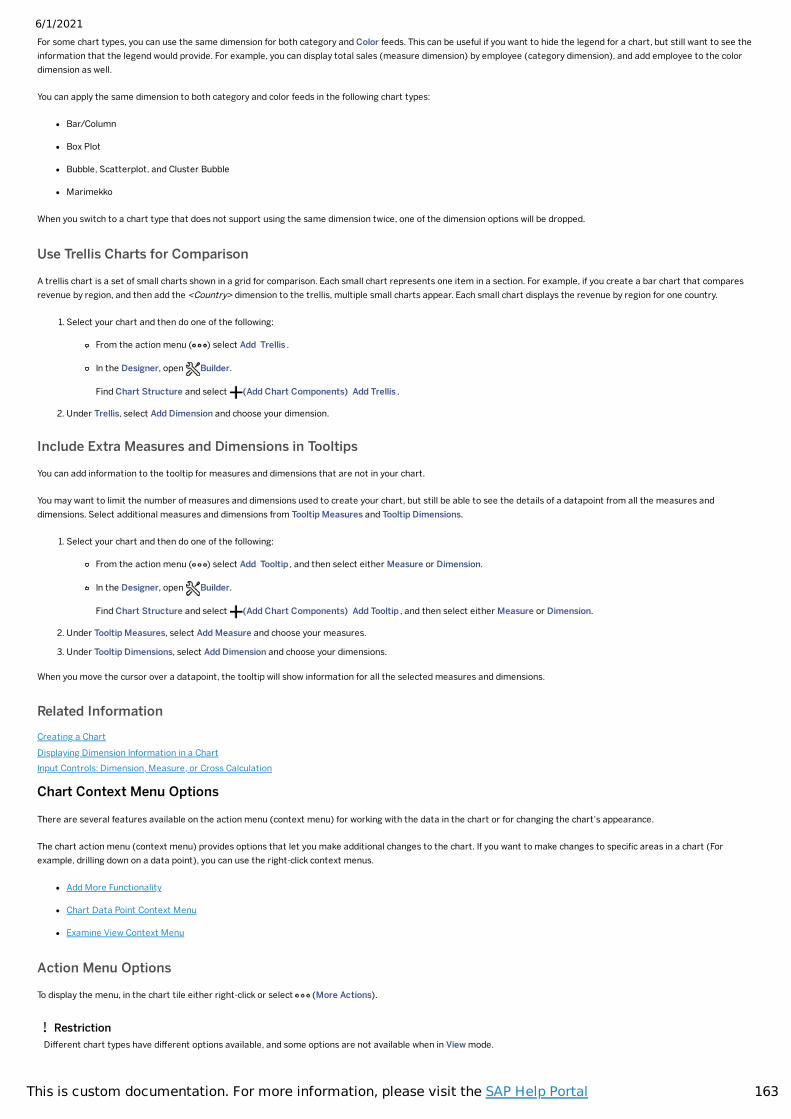
6/1/2021
163This is custom documentation. For more information, please visit the SAP Help Portal
For some chart types, you can use the same dimension for both category and Color feeds. This can be useful if you want to hide the legend for a chart, but still want to see theinformation that the legend would provide. For example, you can display total sales (measure dimension) by employee (category dimension), and add employee to the colordimension as well.
You can apply the same dimension to both category and color feeds in the following chart types:
Bar/Column
Box Plot
Bubble, Scatterplot, and Cluster Bubble
Marimekko
When you switch to a chart type that does not support using the same dimension twice, one of the dimension options will be dropped.
Use Trellis Charts for Comparison
A trellis chart is a set of small charts shown in a grid for comparison. Each small chart represents one item in a section. For example, if you create a bar chart that comparesrevenue by region, and then add the <Country> dimension to the trellis, multiple small charts appear. Each small chart displays the revenue by region for one country.
1. Select your chart and then do one of the following:
From the action menu ( ) select Add Trellis .
In the Designer, open Builder.
Find Chart Structure and select (Add Chart Components) Add Trellis .
2. Under Trellis, select Add Dimension and choose your dimension.
Include Extra Measures and Dimensions in Tooltips
You can add information to the tooltip for measures and dimensions that are not in your chart.
You may want to limit the number of measures and dimensions used to create your chart, but still be able to see the details of a datapoint from all the measures anddimensions. Select additional measures and dimensions from Tooltip Measures and Tooltip Dimensions.
1. Select your chart and then do one of the following:
From the action menu ( ) select Add Tooltip , and then select either Measure or Dimension.
In the Designer, open Builder.
Find Chart Structure and select (Add Chart Components) Add Tooltip , and then select either Measure or Dimension.
2. Under Tooltip Measures, select Add Measure and choose your measures.
3. Under Tooltip Dimensions, select Add Dimension and choose your dimensions.
When you move the cursor over a datapoint, the tooltip will show information for all the selected measures and dimensions.
Related InformationCreating a ChartDisplaying Dimension Information in a ChartInput Controls: Dimension, Measure, or Cross Calculation
Chart Context Menu Options
There are several features available on the action menu (context menu) for working with the data in the chart or for changing the chart's appearance.
The chart action menu (context menu) provides options that let you make additional changes to the chart. If you want to make changes to speci�c areas in a chart (Forexample, drilling down on a data point), you can use the right-click context menus.
Add More Functionality
Chart Data Point Context Menu
Examine View Context Menu
Action Menu Options
To display the menu, in the chart tile either right-click or select (More Actions).
RestrictionDifferent chart types have different options available, and some options are not available when in View mode.
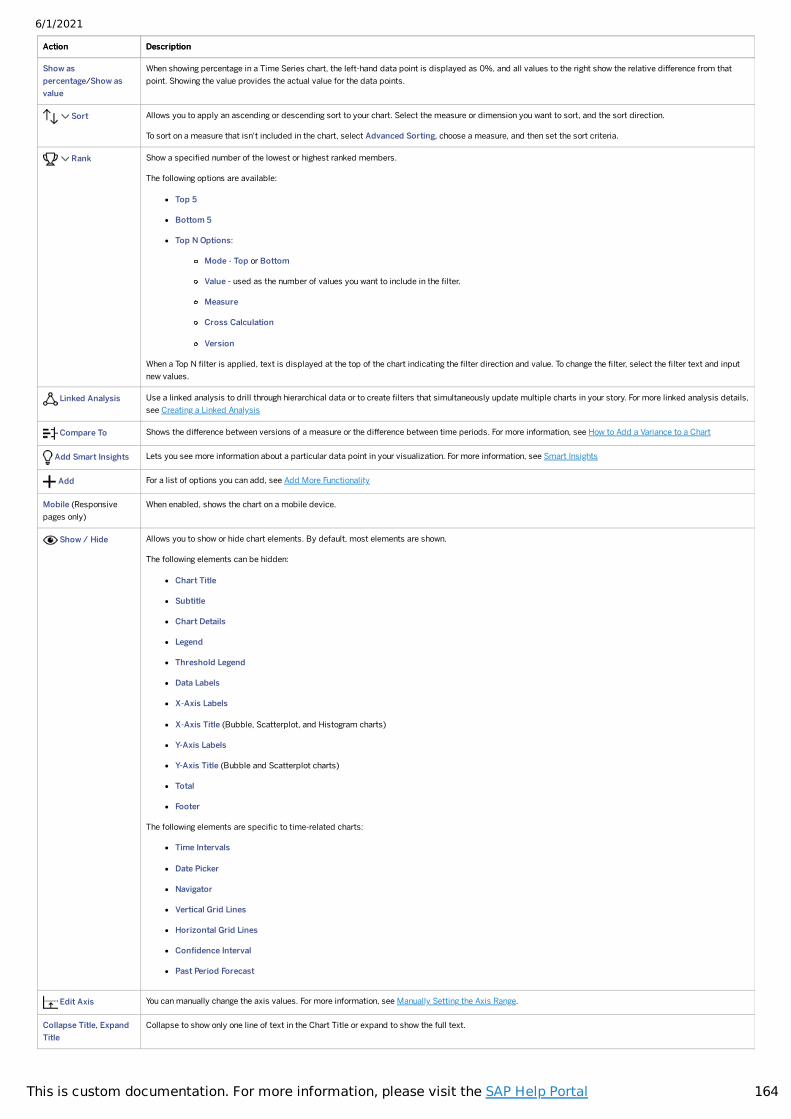
6/1/2021
164This is custom documentation. For more information, please visit the SAP Help Portal
Action DescriptionAction Description
Show aspercentage/Show asvalue
When showing percentage in a Time Series chart, the left-hand data point is displayed as 0%, and all values to the right show the relative difference from thatpoint. Showing the value provides the actual value for the data points.
Sort Allows you to apply an ascending or descending sort to your chart. Select the measure or dimension you want to sort, and the sort direction.
To sort on a measure that isn't included in the chart, select Advanced Sorting, choose a measure, and then set the sort criteria.
Rank Show a speci�ed number of the lowest or highest ranked members.
The following options are available:
Top 5
Bottom 5
Top N Options:
Mode - Top or Bottom
Value - used as the number of values you want to include in the �lter.
Measure
Cross Calculation
Version
When a Top N �lter is applied, text is displayed at the top of the chart indicating the �lter direction and value. To change the �lter, select the �lter text and inputnew values.
Linked Analysis Use a linked analysis to drill through hierarchical data or to create �lters that simultaneously update multiple charts in your story. For more linked analysis details,see Creating a Linked Analysis
Compare To Shows the difference between versions of a measure or the difference between time periods. For more information, see How to Add a Variance to a Chart
Add Smart Insights Lets you see more information about a particular data point in your visualization. For more information, see Smart Insights
Add For a list of options you can add, see Add More Functionality
Mobile (Responsivepages only)
When enabled, shows the chart on a mobile device.
Show / Hide Allows you to show or hide chart elements. By default, most elements are shown.
The following elements can be hidden:
Chart Title
Subtitle
Chart Details
Legend
Threshold Legend
Data Labels
X-Axis Labels
X-Axis Title (Bubble, Scatterplot, and Histogram charts)
Y-Axis Labels
Y-Axis Title (Bubble and Scatterplot charts)
Total
Footer
The following elements are speci�c to time-related charts:
Time Intervals
Date Picker
Navigator
Vertical Grid Lines
Horizontal Grid Lines
Con�dence Interval
Past Period Forecast
Edit Axis You can manually change the axis values. For more information, see Manually Setting the Axis Range.
Collapse Title, ExpandTitle
Collapse to show only one line of text in the Chart Title or expand to show the full text.
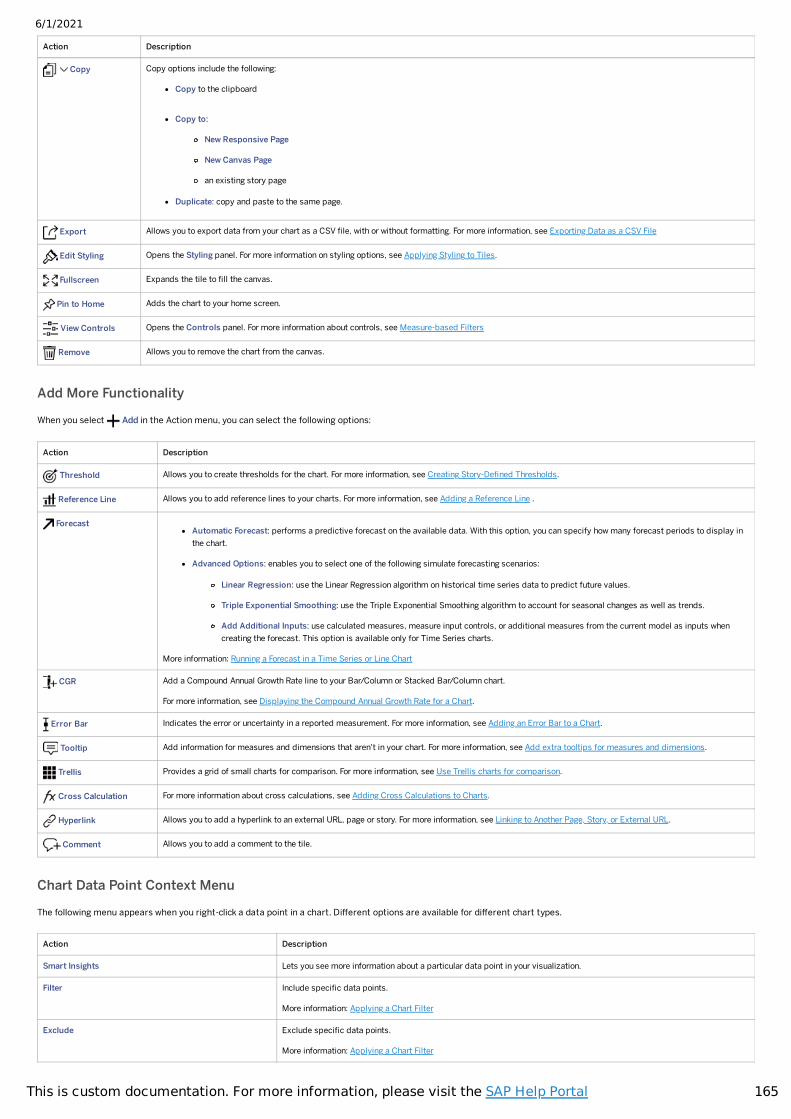
6/1/2021
165This is custom documentation. For more information, please visit the SAP Help Portal
Action Description
Copy Copy options include the following:
Copy to the clipboard
Copy to:
New Responsive Page
New Canvas Page
an existing story page
Duplicate: copy and paste to the same page.
Export Allows you to export data from your chart as a CSV �le, with or without formatting. For more information, see Exporting Data as a CSV File
Edit Styling Opens the Styling panel. For more information on styling options, see Applying Styling to Tiles.
Fullscreen Expands the tile to �ll the canvas.
Pin to Home Adds the chart to your home screen.
View Controls Opens the Controls panel. For more information about controls, see Measure-based Filters
Remove Allows you to remove the chart from the canvas.
Add More Functionality
When you select Add in the Action menu, you can select the following options:
Action Description
Threshold Allows you to create thresholds for the chart. For more information, see Creating Story-De�ned Thresholds.
Reference Line Allows you to add reference lines to your charts. For more information, see Adding a Reference Line .
ForecastAutomatic Forecast: performs a predictive forecast on the available data. With this option, you can specify how many forecast periods to display inthe chart.
Advanced Options: enables you to select one of the following simulate forecasting scenarios:
Linear Regression: use the Linear Regression algorithm on historical time series data to predict future values.
Triple Exponential Smoothing: use the Triple Exponential Smoothing algorithm to account for seasonal changes as well as trends.
Add Additional Inputs: use calculated measures, measure input controls, or additional measures from the current model as inputs whencreating the forecast. This option is available only for Time Series charts.
More information: Running a Forecast in a Time Series or Line Chart
CGR Add a Compound Annual Growth Rate line to your Bar/Column or Stacked Bar/Column chart.
For more information, see Displaying the Compound Annual Growth Rate for a Chart.
Error Bar Indicates the error or uncertainty in a reported measurement. For more information, see Adding an Error Bar to a Chart.
Tooltip Add information for measures and dimensions that aren't in your chart. For more information, see Add extra tooltips for measures and dimensions.
Trellis Provides a grid of small charts for comparison. For more information, see Use Trellis charts for comparison.
Cross Calculation For more information about cross calculations, see Adding Cross Calculations to Charts.
Hyperlink Allows you to add a hyperlink to an external URL, page or story. For more information, see Linking to Another Page, Story, or External URL.
Comment Allows you to add a comment to the tile.
Chart Data Point Context Menu
The following menu appears when you right-click a data point in a chart. Different options are available for different chart types.
Action Description
Smart Insights Lets you see more information about a particular data point in your visualization.
Filter Include speci�c data points.
More information: Applying a Chart Filter
Exclude Exclude speci�c data points.
More information: Applying a Chart Filter
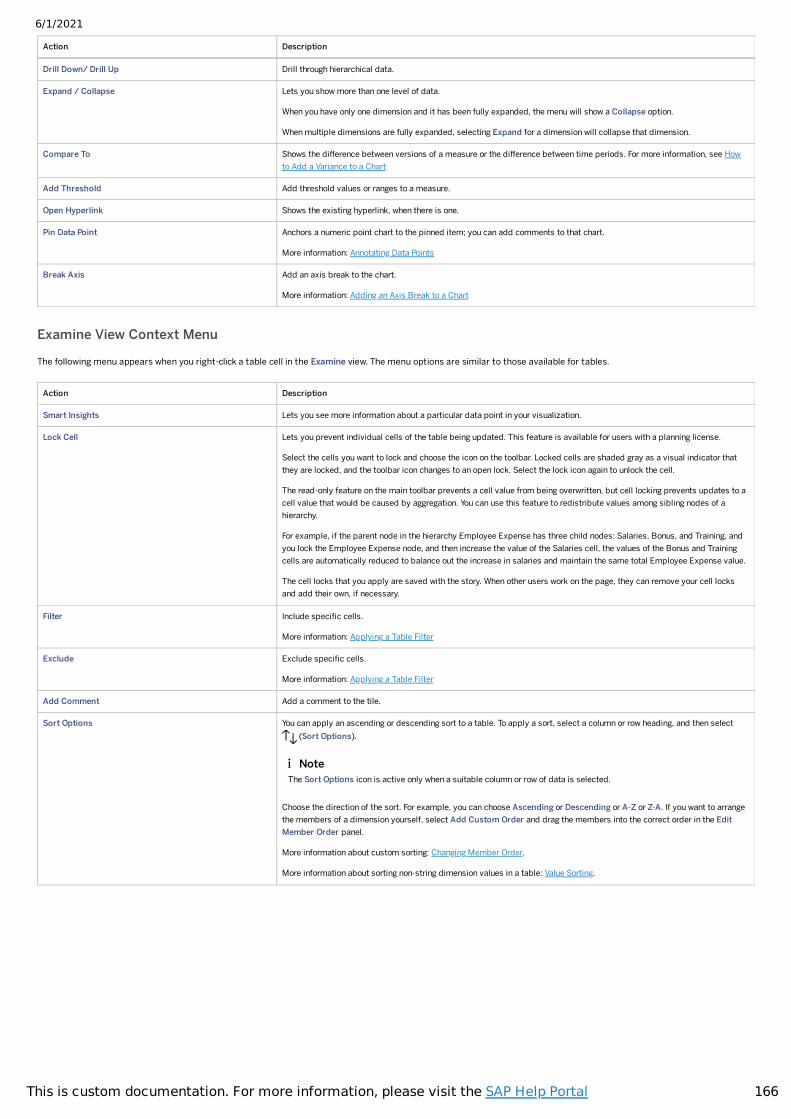
6/1/2021
166This is custom documentation. For more information, please visit the SAP Help Portal
Action Description
Drill Down/ Drill Up Drill through hierarchical data.
Expand / Collapse Lets you show more than one level of data.
When you have only one dimension and it has been fully expanded, the menu will show a Collapse option.
When multiple dimensions are fully expanded, selecting Expand for a dimension will collapse that dimension.
Compare To Shows the difference between versions of a measure or the difference between time periods. For more information, see Howto Add a Variance to a Chart
Add Threshold Add threshold values or ranges to a measure.
Open Hyperlink Shows the existing hyperlink, when there is one.
Pin Data Point Anchors a numeric point chart to the pinned item; you can add comments to that chart.
More information: Annotating Data Points
Break Axis Add an axis break to the chart.
More information: Adding an Axis Break to a Chart
Examine View Context Menu
The following menu appears when you right-click a table cell in the Examine view. The menu options are similar to those available for tables.
Action Description
Smart Insights Lets you see more information about a particular data point in your visualization.
Lock Cell Lets you prevent individual cells of the table being updated. This feature is available for users with a planning license.
Select the cells you want to lock and choose the icon on the toolbar. Locked cells are shaded gray as a visual indicator thatthey are locked, and the toolbar icon changes to an open lock. Select the lock icon again to unlock the cell.
The read-only feature on the main toolbar prevents a cell value from being overwritten, but cell locking prevents updates to acell value that would be caused by aggregation. You can use this feature to redistribute values among sibling nodes of ahierarchy.
For example, if the parent node in the hierarchy Employee Expense has three child nodes: Salaries, Bonus, and Training, andyou lock the Employee Expense node, and then increase the value of the Salaries cell, the values of the Bonus and Trainingcells are automatically reduced to balance out the increase in salaries and maintain the same total Employee Expense value.
The cell locks that you apply are saved with the story. When other users work on the page, they can remove your cell locksand add their own, if necessary.
Filter Include speci�c cells.
More information: Applying a Table Filter
Exclude Exclude speci�c cells.
More information: Applying a Table Filter
Add Comment Add a comment to the tile.
Sort Options You can apply an ascending or descending sort to a table. To apply a sort, select a column or row heading, and then select (Sort Options).
Choose the direction of the sort. For example, you can choose Ascending or Descending or A-Z or Z-A. If you want to arrangethe members of a dimension yourself, select Add Custom Order and drag the members into the correct order in the EditMember Order panel.
More information about custom sorting: Changing Member Order.
More information about sorting non-string dimension values in a table: Value Sorting.
NoteThe Sort Options icon is active only when a suitable column or row of data is selected.
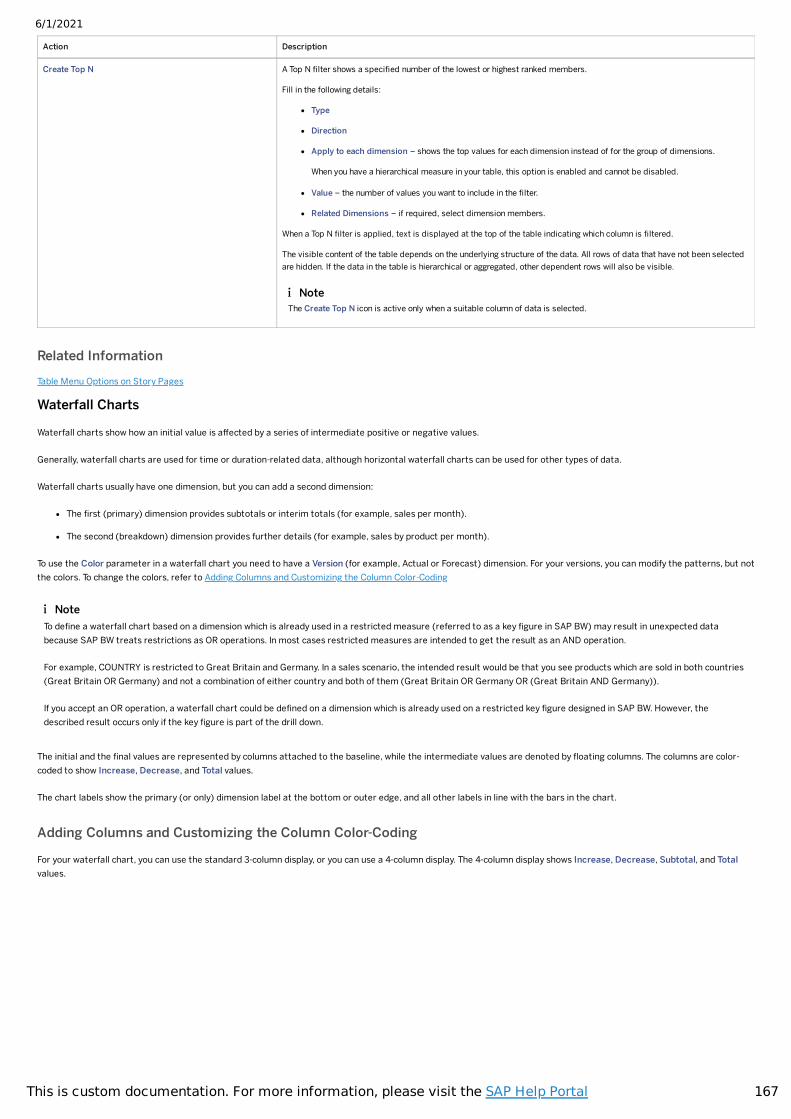
6/1/2021
167This is custom documentation. For more information, please visit the SAP Help Portal
Action Description
Create Top N A Top N �lter shows a speci�ed number of the lowest or highest ranked members.
Fill in the following details:
Type
Direction
Apply to each dimension – shows the top values for each dimension instead of for the group of dimensions.
When you have a hierarchical measure in your table, this option is enabled and cannot be disabled.
Value – the number of values you want to include in the �lter.
Related Dimensions – if required, select dimension members.
When a Top N �lter is applied, text is displayed at the top of the table indicating which column is �ltered.
The visible content of the table depends on the underlying structure of the data. All rows of data that have not been selectedare hidden. If the data in the table is hierarchical or aggregated, other dependent rows will also be visible.
Related InformationTable Menu Options on Story Pages
Waterfall Charts
Waterfall charts show how an initial value is affected by a series of intermediate positive or negative values.
Generally, waterfall charts are used for time or duration-related data, although horizontal waterfall charts can be used for other types of data.
Waterfall charts usually have one dimension, but you can add a second dimension:
The �rst (primary) dimension provides subtotals or interim totals (for example, sales per month).
The second (breakdown) dimension provides further details (for example, sales by product per month).
To use the Color parameter in a waterfall chart you need to have a Version (for example, Actual or Forecast) dimension. For your versions, you can modify the patterns, but notthe colors. To change the colors, refer to Adding Columns and Customizing the Column Color-Coding
The initial and the �nal values are represented by columns attached to the baseline, while the intermediate values are denoted by �oating columns. The columns are color-coded to show Increase, Decrease, and Total values.
The chart labels show the primary (or only) dimension label at the bottom or outer edge, and all other labels in line with the bars in the chart.
Adding Columns and Customizing the Column Color-Coding
For your waterfall chart, you can use the standard 3-column display, or you can use a 4-column display. The 4-column display shows Increase, Decrease, Subtotal, and Totalvalues.
NoteThe Create Top N icon is active only when a suitable column of data is selected.
NoteTo de�ne a waterfall chart based on a dimension which is already used in a restricted measure (referred to as a key �gure in SAP BW) may result in unexpected databecause SAP BW treats restrictions as OR operations. In most cases restricted measures are intended to get the result as an AND operation.
For example, COUNTRY is restricted to Great Britain and Germany. In a sales scenario, the intended result would be that you see products which are sold in both countries(Great Britain OR Germany) and not a combination of either country and both of them (Great Britain OR Germany OR (Great Britain AND Germany)).
If you accept an OR operation, a waterfall chart could be de�ned on a dimension which is already used on a restricted key �gure designed in SAP BW. However, thedescribed result occurs only if the key �gure is part of the drill down.
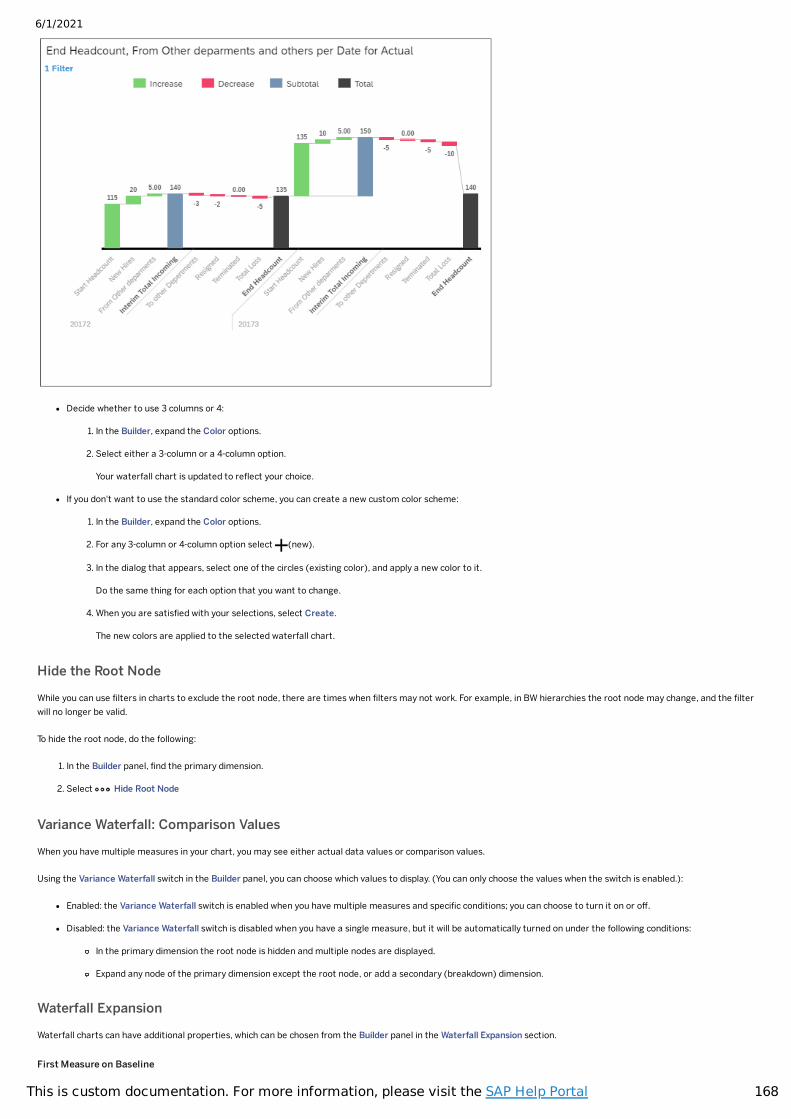
6/1/2021
168This is custom documentation. For more information, please visit the SAP Help Portal
Decide whether to use 3 columns or 4:
1. In the Builder, expand the Color options.
2. Select either a 3-column or a 4-column option.
Your waterfall chart is updated to re�ect your choice.
If you don't want to use the standard color scheme, you can create a new custom color scheme:
1. In the Builder, expand the Color options.
2. For any 3-column or 4-column option select (new).
3. In the dialog that appears, select one of the circles (existing color), and apply a new color to it.
Do the same thing for each option that you want to change.
4. When you are satis�ed with your selections, select Create.
The new colors are applied to the selected waterfall chart.
Hide the Root Node
While you can use �lters in charts to exclude the root node, there are times when �lters may not work. For example, in BW hierarchies the root node may change, and the �lterwill no longer be valid.
To hide the root node, do the following:
1. In the Builder panel, �nd the primary dimension.
2. Select Hide Root Node
Variance Waterfall: Comparison Values
When you have multiple measures in your chart, you may see either actual data values or comparison values.
Using the Variance Waterfall switch in the Builder panel, you can choose which values to display. (You can only choose the values when the switch is enabled.):
Enabled: the Variance Waterfall switch is enabled when you have multiple measures and speci�c conditions; you can choose to turn it on or off.
Disabled: the Variance Waterfall switch is disabled when you have a single measure, but it will be automatically turned on under the following conditions:
In the primary dimension the root node is hidden and multiple nodes are displayed.
Expand any node of the primary dimension except the root node, or add a secondary (breakdown) dimension.
Waterfall Expansion
Waterfall charts can have additional properties, which can be chosen from the Builder panel in the Waterfall Expansion section.
First Measure on Baseline
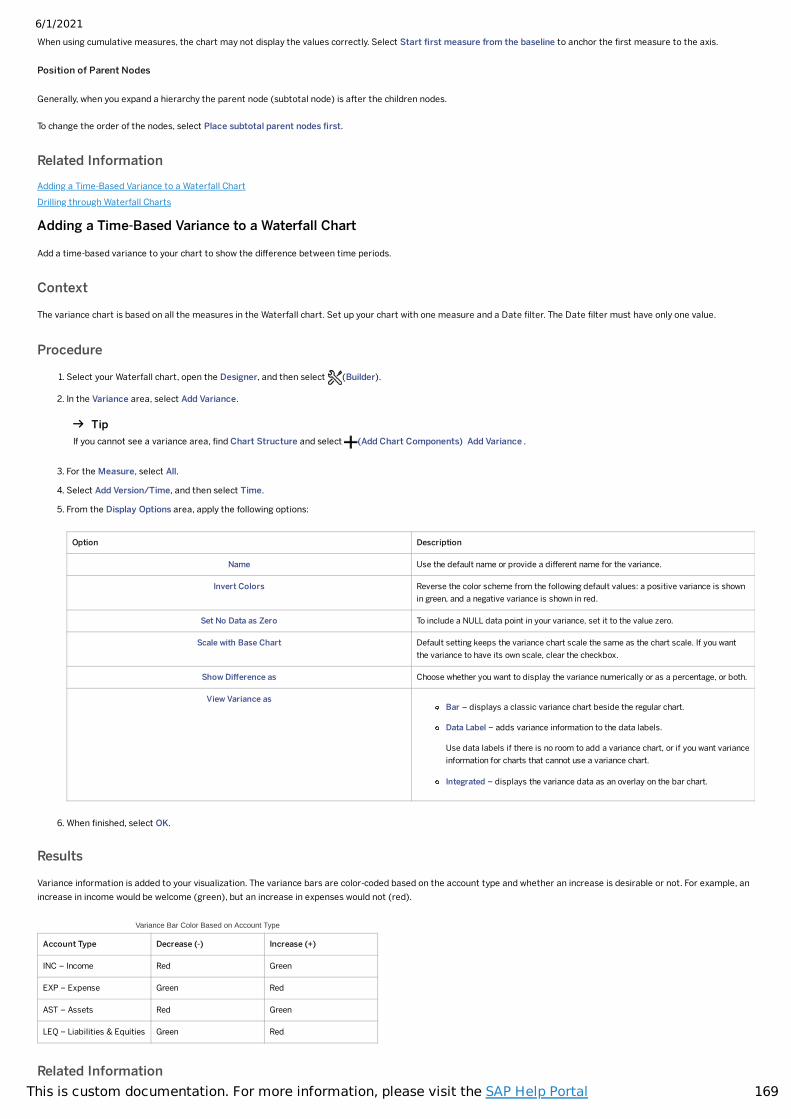
6/1/2021
169This is custom documentation. For more information, please visit the SAP Help Portal
When using cumulative measures, the chart may not display the values correctly. Select Start �rst measure from the baseline to anchor the �rst measure to the axis.
Position of Parent Nodes
Generally, when you expand a hierarchy the parent node (subtotal node) is after the children nodes.
To change the order of the nodes, select Place subtotal parent nodes �rst.
Related InformationAdding a Time-Based Variance to a Waterfall ChartDrilling through Waterfall Charts
Adding a Time-Based Variance to a Waterfall Chart
Add a time-based variance to your chart to show the difference between time periods.
Context
The variance chart is based on all the measures in the Waterfall chart. Set up your chart with one measure and a Date �lter. The Date �lter must have only one value.
Procedure
1. Select your Waterfall chart, open the Designer, and then select (Builder).
2. In the Variance area, select Add Variance.
3. For the Measure, select All.
4. Select Add Version/Time, and then select Time.
5. From the Display Options area, apply the following options:
Option Description
Name Use the default name or provide a different name for the variance.
Invert Colors Reverse the color scheme from the following default values: a positive variance is shownin green, and a negative variance is shown in red.
Set No Data as Zero To include a NULL data point in your variance, set it to the value zero.
Scale with Base Chart Default setting keeps the variance chart scale the same as the chart scale. If you wantthe variance to have its own scale, clear the checkbox.
Show Difference as Choose whether you want to display the variance numerically or as a percentage, or both.
View Variance asBar – displays a classic variance chart beside the regular chart.
Data Label – adds variance information to the data labels.
Use data labels if there is no room to add a variance chart, or if you want varianceinformation for charts that cannot use a variance chart.
Integrated – displays the variance data as an overlay on the bar chart.
6. When �nished, select OK.
Results
Variance information is added to your visualization. The variance bars are color-coded based on the account type and whether an increase is desirable or not. For example, anincrease in income would be welcome (green), but an increase in expenses would not (red).
Variance Bar Color Based on Account Type
Account Type Decrease (-) Increase (+)
INC – Income Red Green
EXP – Expense Green Red
AST – Assets Red Green
LEQ – Liabilities & Equities Green Red
Related Information
TipIf you cannot see a variance area, �nd Chart Structure and select (Add Chart Components) Add Variance .
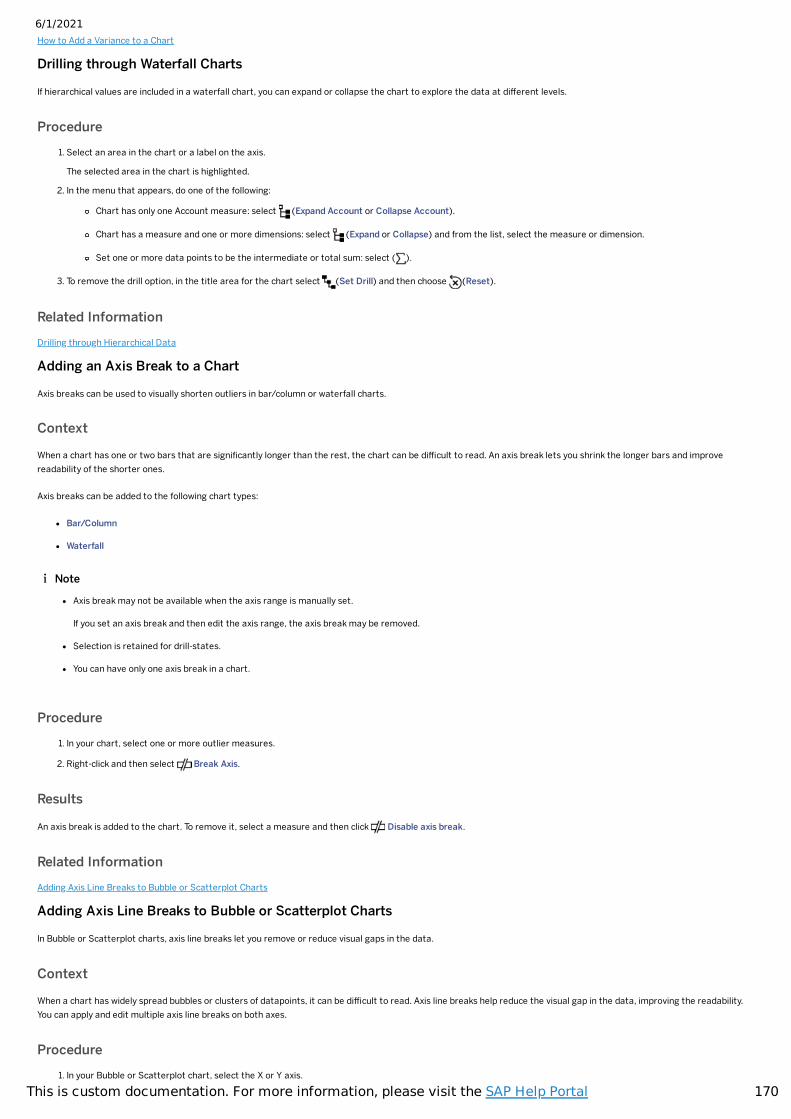
6/1/2021
170This is custom documentation. For more information, please visit the SAP Help Portal
How to Add a Variance to a Chart
Drilling through Waterfall Charts
If hierarchical values are included in a waterfall chart, you can expand or collapse the chart to explore the data at different levels.
Procedure1. Select an area in the chart or a label on the axis.
The selected area in the chart is highlighted.
2. In the menu that appears, do one of the following:
Chart has only one Account measure: select (Expand Account or Collapse Account).
Chart has a measure and one or more dimensions: select (Expand or Collapse) and from the list, select the measure or dimension.
Set one or more data points to be the intermediate or total sum: select ( ).
3. To remove the drill option, in the title area for the chart select (Set Drill) and then choose (Reset).
Related InformationDrilling through Hierarchical Data
Adding an Axis Break to a Chart
Axis breaks can be used to visually shorten outliers in bar/column or waterfall charts.
Context
When a chart has one or two bars that are signi�cantly longer than the rest, the chart can be difficult to read. An axis break lets you shrink the longer bars and improvereadability of the shorter ones.
Axis breaks can be added to the following chart types:
Bar/Column
Waterfall
Procedure1. In your chart, select one or more outlier measures.
2. Right-click and then select Break Axis.
Results
An axis break is added to the chart. To remove it, select a measure and then click Disable axis break.
Related InformationAdding Axis Line Breaks to Bubble or Scatterplot Charts
Adding Axis Line Breaks to Bubble or Scatterplot Charts
In Bubble or Scatterplot charts, axis line breaks let you remove or reduce visual gaps in the data.
Context
When a chart has widely spread bubbles or clusters of datapoints, it can be difficult to read. Axis line breaks help reduce the visual gap in the data, improving the readability.You can apply and edit multiple axis line breaks on both axes.
Procedure1. In your Bubble or Scatterplot chart, select the X or Y axis.
Note
Axis break may not be available when the axis range is manually set.
If you set an axis break and then edit the axis range, the axis break may be removed.
Selection is retained for drill-states.
You can have only one axis break in a chart.
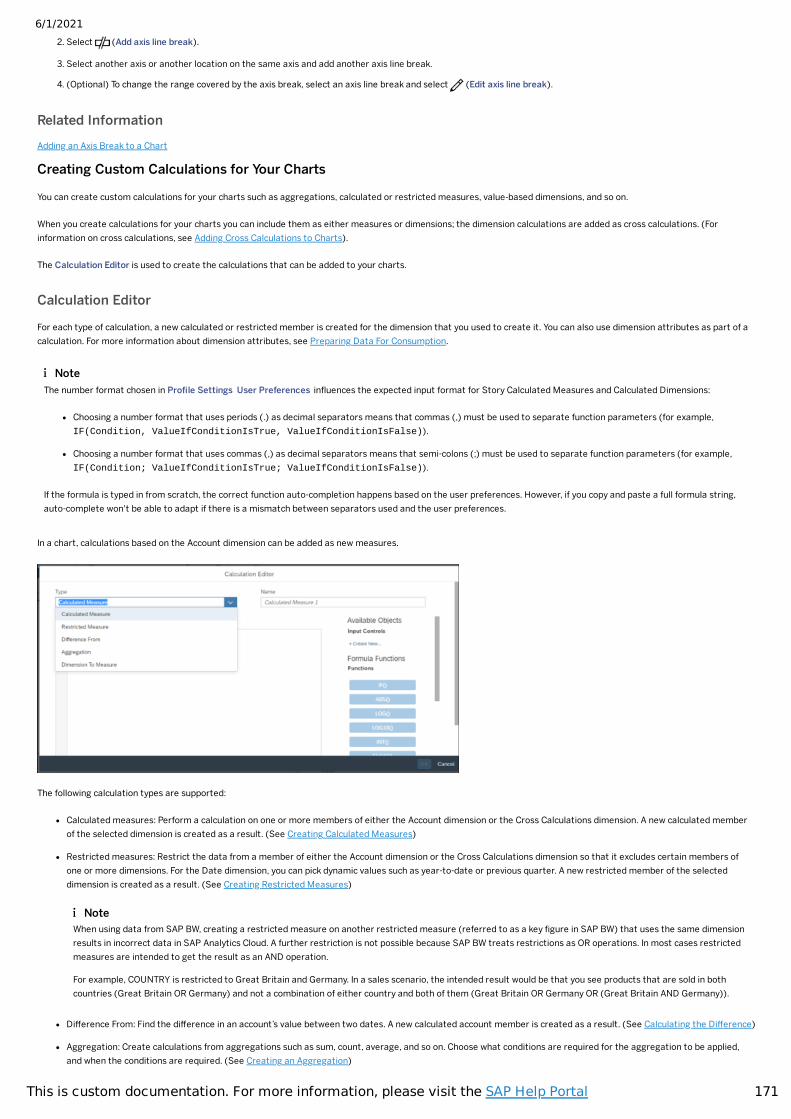
6/1/2021
171This is custom documentation. For more information, please visit the SAP Help Portal
2. Select (Add axis line break).
3. Select another axis or another location on the same axis and add another axis line break.
4. (Optional) To change the range covered by the axis break, select an axis line break and select (Edit axis line break).
Related InformationAdding an Axis Break to a Chart
Creating Custom Calculations for Your Charts
You can create custom calculations for your charts such as aggregations, calculated or restricted measures, value-based dimensions, and so on.
When you create calculations for your charts you can include them as either measures or dimensions; the dimension calculations are added as cross calculations. (Forinformation on cross calculations, see Adding Cross Calculations to Charts).
The Calculation Editor is used to create the calculations that can be added to your charts.
Calculation Editor
For each type of calculation, a new calculated or restricted member is created for the dimension that you used to create it. You can also use dimension attributes as part of acalculation. For more information about dimension attributes, see Preparing Data For Consumption.
In a chart, calculations based on the Account dimension can be added as new measures.
The following calculation types are supported:
Calculated measures: Perform a calculation on one or more members of either the Account dimension or the Cross Calculations dimension. A new calculated memberof the selected dimension is created as a result. (See Creating Calculated Measures)
Restricted measures: Restrict the data from a member of either the Account dimension or the Cross Calculations dimension so that it excludes certain members ofone or more dimensions. For the Date dimension, you can pick dynamic values such as year-to-date or previous quarter. A new restricted member of the selecteddimension is created as a result. (See Creating Restricted Measures)
Difference From: Find the difference in an account’s value between two dates. A new calculated account member is created as a result. (See Calculating the Difference)
Aggregation: Create calculations from aggregations such as sum, count, average, and so on. Choose what conditions are required for the aggregation to be applied,and when the conditions are required. (See Creating an Aggregation)
NoteThe number format chosen in Pro�le Settings User Preferences in�uences the expected input format for Story Calculated Measures and Calculated Dimensions:
Choosing a number format that uses periods (.) as decimal separators means that commas (,) must be used to separate function parameters (for example,IF(Condition, ValueIfConditionIsTrue, ValueIfConditionIsFalse)).
Choosing a number format that uses commas (,) as decimal separators means that semi-colons (;) must be used to separate function parameters (for example,IF(Condition; ValueIfConditionIsTrue; ValueIfConditionIsFalse)).
If the formula is typed in from scratch, the correct function auto-completion happens based on the user preferences. However, if you copy and paste a full formula string,auto-complete won't be able to adapt if there is a mismatch between separators used and the user preferences.
NoteWhen using data from SAP BW, creating a restricted measure on another restricted measure (referred to as a key �gure in SAP BW) that uses the same dimensionresults in incorrect data in SAP Analytics Cloud. A further restriction is not possible because SAP BW treats restrictions as OR operations. In most cases restrictedmeasures are intended to get the result as an AND operation.
For example, COUNTRY is restricted to Great Britain and Germany. In a sales scenario, the intended result would be that you see products that are sold in bothcountries (Great Britain OR Germany) and not a combination of either country and both of them (Great Britain OR Germany OR (Great Britain AND Germany)).
6/1/2021
172This is custom documentation. For more information, please visit the SAP Help Portal
Date Difference: Calculate the time interval between two dates. (See Calculating the Time Interval Between Two Dates)
Dimension to Measure: The string and number conversion functions (see Convert Strings to Numbers and Numbers to Strings) can be combined with Measure-Baseddimensions (in a calculated dimension) to create dimension to measure conversions. (See Creating Calculated Dimensions, Creating Measure-Based Dimensions, andDimension to Measure.)
Calculations Based on Input Controls
Calculations can use input controls. Input controls provide variable input for a calculation, allowing viewers to in�uence the result of a calculation without modifying theunderlying data or formula. For example, viewers can choose to see the impact of a 1%, 2%, or 3% tax-rate increase. You choose the list of values for an input control, andspecify how the user can select values. Input controls can be formatted after they are added to the canvas.
Convert Strings to Numbers and Numbers to Strings
Convert a string value to a numeric value or a numeric value to a string value and use the new values in calculated dimensions or measures.
There are two functions that you can use to convert values from one type to another in calculated measures or calculated dimensions: ToNumber and ToText.
ToNumber Function
ToNumber converts string values to numbers.
1. In Builder, under Dimensions, select Add Dimension Calculated Dimensions .
2. In the Calculation Editor under Type, select Calculated Dimension.
3. Create your formula.
ToText Function
ToText converts numeric values to strings, and it uses an existing calculated dimension in its calculations.
1. In Builder, under Dimensions, select Add Dimension Calculated Dimensions .
2. In the Calculation Editor under Type, select Calculated Dimension.
3. Create your formula.
Dimension to Measure
The string and number conversion functions can be combined with Measure-Based dimensions (in a calculated dimension) to create dimension to measure conversions. Formore information about Measure-Based dimensions, see Creating Measure-Based Dimensions.
There is also a calculation type that lets you convert a dimension to a measure.
1. Add a chart to the canvas.
2. In Builder, choose Add Measure Create Calculation Dimension To Measure .
3. From Dimension Attribute to Convert, select a dimension.
4. Select context dimensions.
5. Set the aggregation operation type.
6. Select OK and review the results in the chart.
Related InformationAll Formulas and CalculationsEntering FormulasCreating Custom Calculations for Your Table
TipThe Calculation Editor dialog will change size to �t the calculation type information �elds and re-center itself on the page.
NoteYou can add dynamic time calculations directly to a chart. For more information, see Dynamically Add a Time Calculation.
ExampleToNumber ([d/ACT_EMPLOYEE_NUMERIC:Age_String].[p/ID])
ExampleToText (<ToNumber calculated dimension> ) + " years"
6/1/2021
173This is custom documentation. For more information, please visit the SAP Help Portal
Creating Calculations from Table Rows or ColumnsAdding Calculated Rows and Columns in a Table
Calculating the Time Interval Between Two Dates
Create a calculation that shows the time interval between two dates.
Prerequisites
Your model must have Date columns or date (time) hierarchies with Day level granularity.
Procedure1. Select your chart.
2. In Builder, choose Add Measure Calculations Create Calculation .
The Calculation Editor dialog appears.
3. Select Date Difference from the list.
4. Enter a name for the calculation.
5. In the Properties section, select values for Result Granularity, Time (A), and Time (B)
The Result Granularity values are determined by the data source: if the data source does not contain quarters, you won't see them in the list of values.
6. Select OK.
The date calculation is added to the chart.
7. Add dimensions to your chart.
Adding Cross Calculations to Charts
Add a cross calculation or a cross calculation dimension to your chart.
Context
In the cross calculations dimension you can create calculations such as calculated measures, restricted measures, or currency conversions.
Procedure
1. In Builder, beside Chart Structure, select (Add Chart Components) Add Cross Calculations .
A Cross Calculations section is added with the default dimension Measure Values.
2. To use more than one cross calculation in a chart, in the Dimensions section select Add Dimension Cross Calculations .
3. In the Cross Calculations section, select Add Cross Calculation and add a dimension.
Results
A cross calculation has been added to your chart.
Related InformationCalculation EditorCreating Calculated MeasuresCreating Restricted MeasuresCreating an Aggregation
Adding Dynamic Text to a Chart Title
You can add dynamic text to the chart title or subtitle.
Context
You can change the title of a chart to include dynamic text from elements that are in use in the chart, such as �lters, dimensions, scales, and so on.
NoteAfter you add a cross calculation to a chart, you won't be able to apply thresholds to that chart.
NoteOnce you add the Cross Calculations section to your chart, you can't remove it. You must have Measure Values or some other dimension selected.
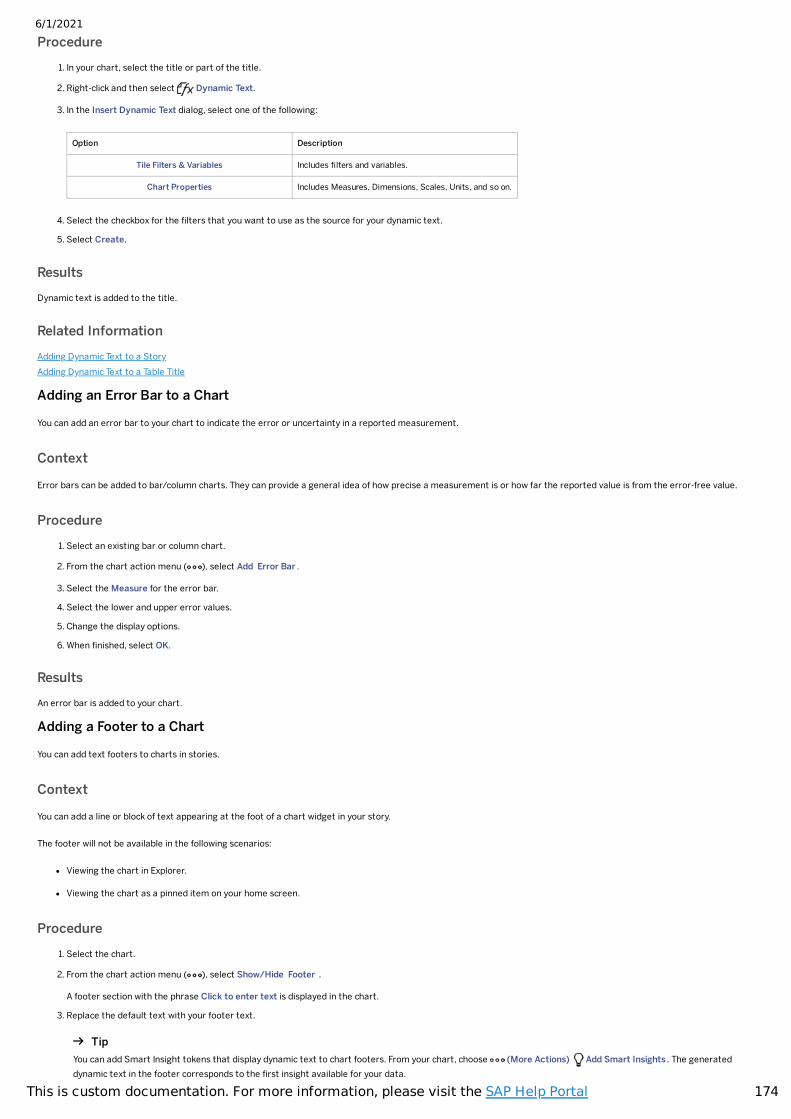
6/1/2021
174This is custom documentation. For more information, please visit the SAP Help Portal
Procedure1. In your chart, select the title or part of the title.
2. Right-click and then select Dynamic Text.
3. In the Insert Dynamic Text dialog, select one of the following:
Option Description
Tile Filters & Variables Includes �lters and variables.
Chart Properties Includes Measures, Dimensions, Scales, Units, and so on.
4. Select the checkbox for the �lters that you want to use as the source for your dynamic text.
5. Select Create.
ResultsDynamic text is added to the title.
Related InformationAdding Dynamic Text to a StoryAdding Dynamic Text to a Table Title
Adding an Error Bar to a Chart
You can add an error bar to your chart to indicate the error or uncertainty in a reported measurement.
Context
Error bars can be added to bar/column charts. They can provide a general idea of how precise a measurement is or how far the reported value is from the error-free value.
Procedure1. Select an existing bar or column chart.
2. From the chart action menu ( ), select Add Error Bar .
3. Select the Measure for the error bar.
4. Select the lower and upper error values.
5. Change the display options.
6. When �nished, select OK.
ResultsAn error bar is added to your chart.
Adding a Footer to a Chart
You can add text footers to charts in stories.
Context
You can add a line or block of text appearing at the foot of a chart widget in your story.
The footer will not be available in the following scenarios:
Viewing the chart in Explorer.
Viewing the chart as a pinned item on your home screen.
Procedure1. Select the chart.
2. From the chart action menu ( ), select Show/Hide Footer .
A footer section with the phrase Click to enter text is displayed in the chart.
3. Replace the default text with your footer text.
TipYou can add Smart Insight tokens that display dynamic text to chart footers. From your chart, choose (More Actions) Add Smart Insights . The generateddynamic text in the footer corresponds to the �rst insight available for your data.
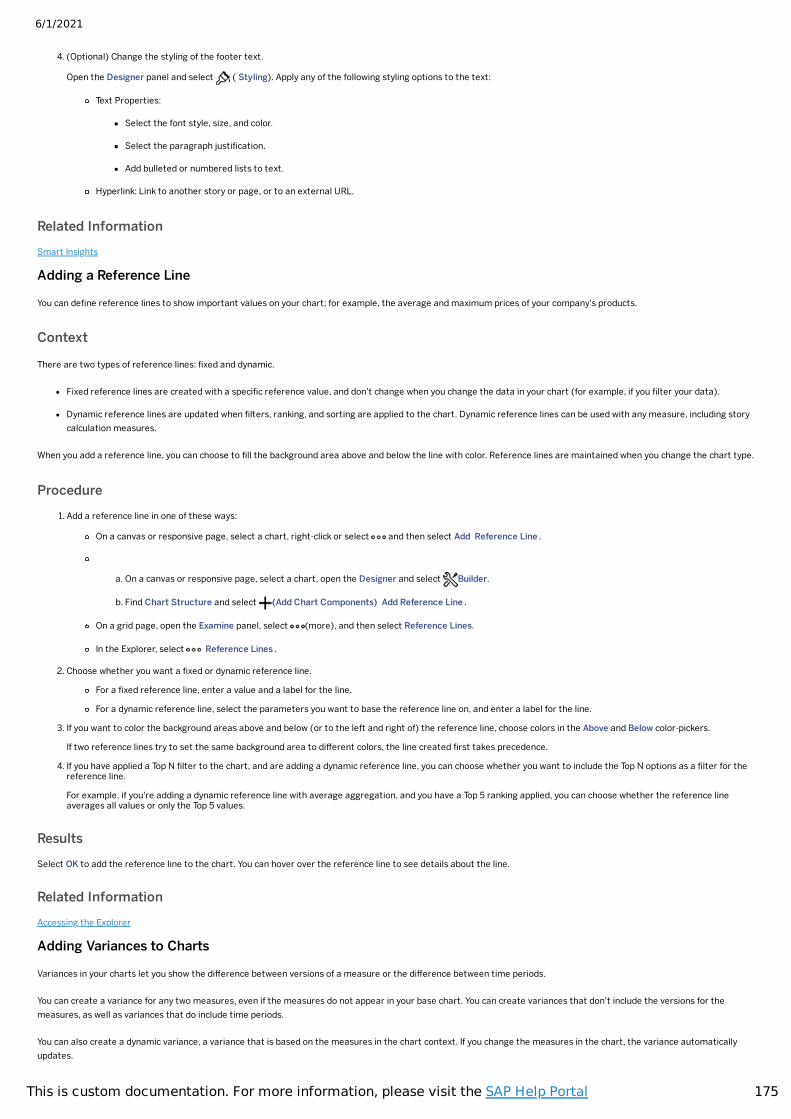
6/1/2021
175This is custom documentation. For more information, please visit the SAP Help Portal
4. (Optional) Change the styling of the footer text.
Open the Designer panel and select ( Styling). Apply any of the following styling options to the text:
Text Properties:
Select the font style, size, and color.
Select the paragraph justi�cation.
Add bulleted or numbered lists to text.
Hyperlink: Link to another story or page, or to an external URL.
Related InformationSmart Insights
Adding a Reference Line
You can de�ne reference lines to show important values on your chart; for example, the average and maximum prices of your company's products.
Context
There are two types of reference lines: �xed and dynamic.
Fixed reference lines are created with a speci�c reference value, and don't change when you change the data in your chart (for example, if you �lter your data).
Dynamic reference lines are updated when �lters, ranking, and sorting are applied to the chart. Dynamic reference lines can be used with any measure, including storycalculation measures.
When you add a reference line, you can choose to �ll the background area above and below the line with color. Reference lines are maintained when you change the chart type.
Procedure1. Add a reference line in one of these ways:
On a canvas or responsive page, select a chart, right-click or select and then select Add Reference Line .
a. On a canvas or responsive page, select a chart, open the Designer and select Builder.
b. Find Chart Structure and select (Add Chart Components) Add Reference Line .
On a grid page, open the Examine panel, select (more), and then select Reference Lines.
In the Explorer, select Reference Lines .
2. Choose whether you want a �xed or dynamic reference line.
For a �xed reference line, enter a value and a label for the line.
For a dynamic reference line, select the parameters you want to base the reference line on, and enter a label for the line.
3. If you want to color the background areas above and below (or to the left and right of) the reference line, choose colors in the Above and Below color-pickers.
If two reference lines try to set the same background area to different colors, the line created �rst takes precedence.
4. If you have applied a Top N �lter to the chart, and are adding a dynamic reference line, you can choose whether you want to include the Top N options as a �lter for thereference line.
For example, if you're adding a dynamic reference line with average aggregation, and you have a Top 5 ranking applied, you can choose whether the reference lineaverages all values or only the Top 5 values.
ResultsSelect OK to add the reference line to the chart. You can hover over the reference line to see details about the line.
Related InformationAccessing the Explorer
Adding Variances to Charts
Variances in your charts let you show the difference between versions of a measure or the difference between time periods.
You can create a variance for any two measures, even if the measures do not appear in your base chart. You can create variances that don't include the versions for themeasures, as well as variances that do include time periods.
You can also create a dynamic variance, a variance that is based on the measures in the chart context. If you change the measures in the chart, the variance automaticallyupdates.
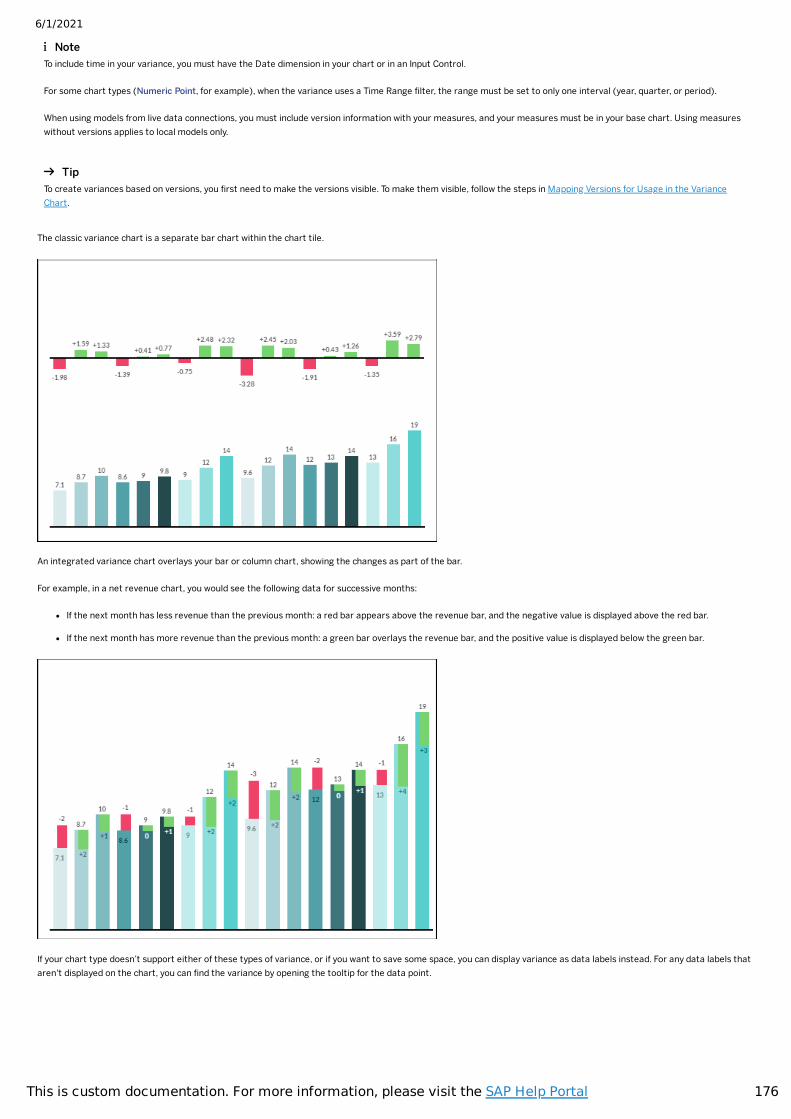
6/1/2021
176This is custom documentation. For more information, please visit the SAP Help Portal
The classic variance chart is a separate bar chart within the chart tile.
An integrated variance chart overlays your bar or column chart, showing the changes as part of the bar.
For example, in a net revenue chart, you would see the following data for successive months:
If the next month has less revenue than the previous month: a red bar appears above the revenue bar, and the negative value is displayed above the red bar.
If the next month has more revenue than the previous month: a green bar overlays the revenue bar, and the positive value is displayed below the green bar.
If your chart type doesn’t support either of these types of variance, or if you want to save some space, you can display variance as data labels instead. For any data labels thataren't displayed on the chart, you can �nd the variance by opening the tooltip for the data point.
NoteTo include time in your variance, you must have the Date dimension in your chart or in an Input Control.
For some chart types (Numeric Point, for example), when the variance uses a Time Range �lter, the range must be set to only one interval (year, quarter, or period).
When using models from live data connections, you must include version information with your measures, and your measures must be in your base chart. Using measureswithout versions applies to local models only.
TipTo create variances based on versions, you �rst need to make the versions visible. To make them visible, follow the steps in Mapping Versions for Usage in the VarianceChart.
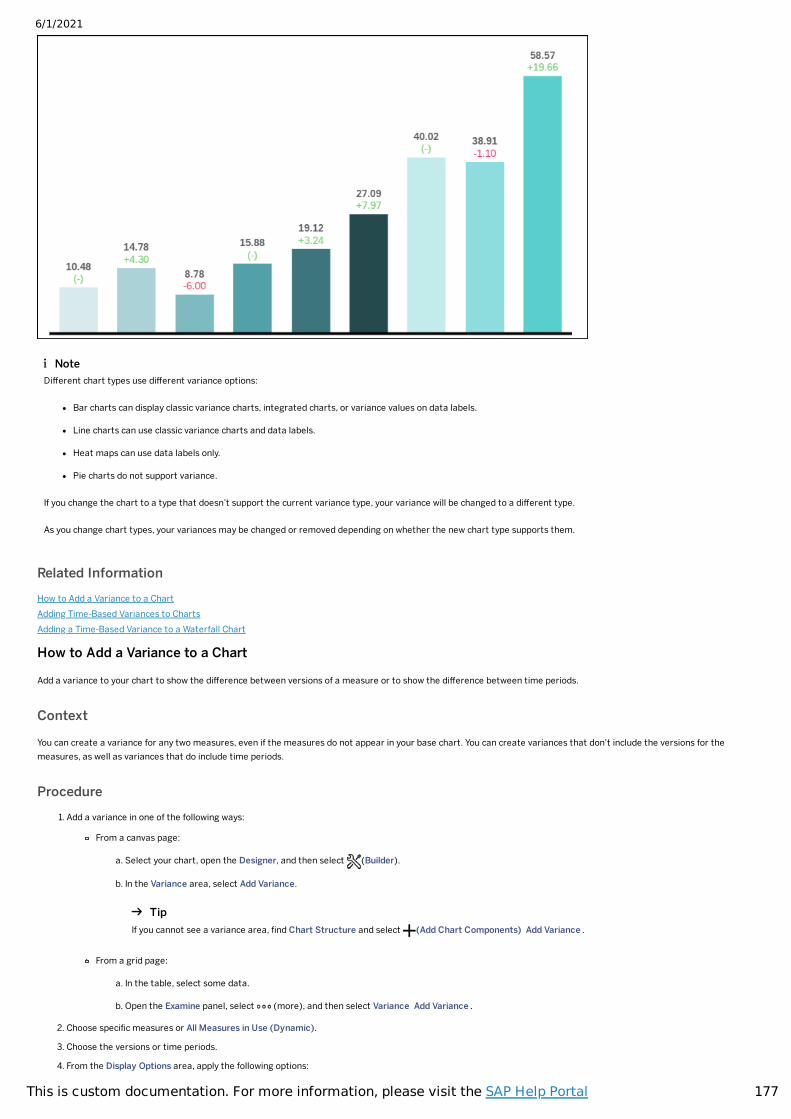
6/1/2021
177This is custom documentation. For more information, please visit the SAP Help Portal
Related InformationHow to Add a Variance to a ChartAdding Time-Based Variances to ChartsAdding a Time-Based Variance to a Waterfall Chart
How to Add a Variance to a Chart
Add a variance to your chart to show the difference between versions of a measure or to show the difference between time periods.
Context
You can create a variance for any two measures, even if the measures do not appear in your base chart. You can create variances that don't include the versions for themeasures, as well as variances that do include time periods.
Procedure1. Add a variance in one of the following ways:
From a canvas page:
a. Select your chart, open the Designer, and then select (Builder).
b. In the Variance area, select Add Variance.
From a grid page:
a. In the table, select some data.
b. Open the Examine panel, select (more), and then select Variance Add Variance .
2. Choose speci�c measures or All Measures in Use (Dynamic).
3. Choose the versions or time periods.
4. From the Display Options area, apply the following options:
NoteDifferent chart types use different variance options:
Bar charts can display classic variance charts, integrated charts, or variance values on data labels.
Line charts can use classic variance charts and data labels.
Heat maps can use data labels only.
Pie charts do not support variance.
If you change the chart to a type that doesn’t support the current variance type, your variance will be changed to a different type.
As you change chart types, your variances may be changed or removed depending on whether the new chart type supports them.
TipIf you cannot see a variance area, �nd Chart Structure and select (Add Chart Components) Add Variance .
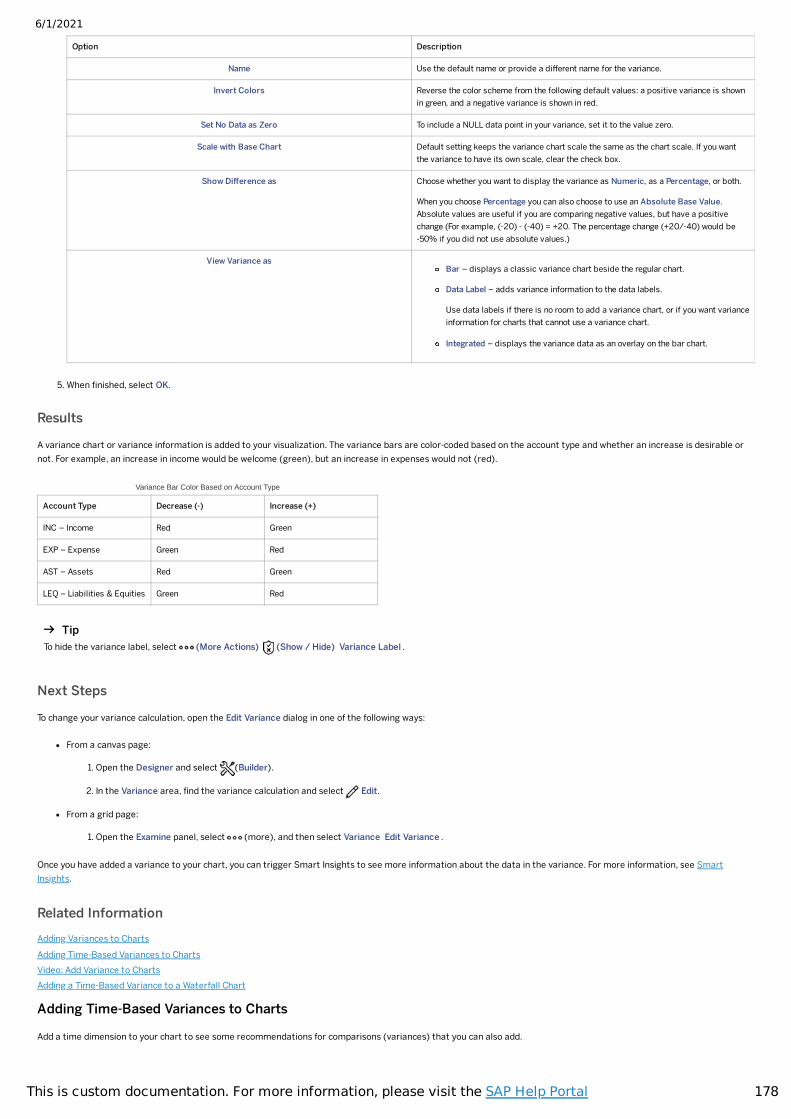
6/1/2021
178This is custom documentation. For more information, please visit the SAP Help Portal
Option Description
Name Use the default name or provide a different name for the variance.
Invert Colors Reverse the color scheme from the following default values: a positive variance is shownin green, and a negative variance is shown in red.
Set No Data as Zero To include a NULL data point in your variance, set it to the value zero.
Scale with Base Chart Default setting keeps the variance chart scale the same as the chart scale. If you wantthe variance to have its own scale, clear the check box.
Show Difference as Choose whether you want to display the variance as Numeric, as a Percentage, or both.
When you choose Percentage you can also choose to use an Absolute Base Value.Absolute values are useful if you are comparing negative values, but have a positivechange (For example, (-20) - (-40) = +20. The percentage change (+20/-40) would be-50% if you did not use absolute values.)
View Variance asBar – displays a classic variance chart beside the regular chart.
Data Label – adds variance information to the data labels.
Use data labels if there is no room to add a variance chart, or if you want varianceinformation for charts that cannot use a variance chart.
Integrated – displays the variance data as an overlay on the bar chart.
5. When �nished, select OK.
Results
A variance chart or variance information is added to your visualization. The variance bars are color-coded based on the account type and whether an increase is desirable ornot. For example, an increase in income would be welcome (green), but an increase in expenses would not (red).
Variance Bar Color Based on Account Type
Account Type Decrease (-) Increase (+)
INC – Income Red Green
EXP – Expense Green Red
AST – Assets Red Green
LEQ – Liabilities & Equities Green Red
Next Steps
To change your variance calculation, open the Edit Variance dialog in one of the following ways:
From a canvas page:
1. Open the Designer and select (Builder).
2. In the Variance area, �nd the variance calculation and select Edit.
From a grid page:
1. Open the Examine panel, select (more), and then select Variance Edit Variance .
Once you have added a variance to your chart, you can trigger Smart Insights to see more information about the data in the variance. For more information, see SmartInsights.
Related InformationAdding Variances to ChartsAdding Time-Based Variances to ChartsVideo: Add Variance to ChartsAdding a Time-Based Variance to a Waterfall Chart
Adding Time-Based Variances to Charts
Add a time dimension to your chart to see some recommendations for comparisons (variances) that you can also add.
TipTo hide the variance label, select (More Actions) (Show / Hide) Variance Label .
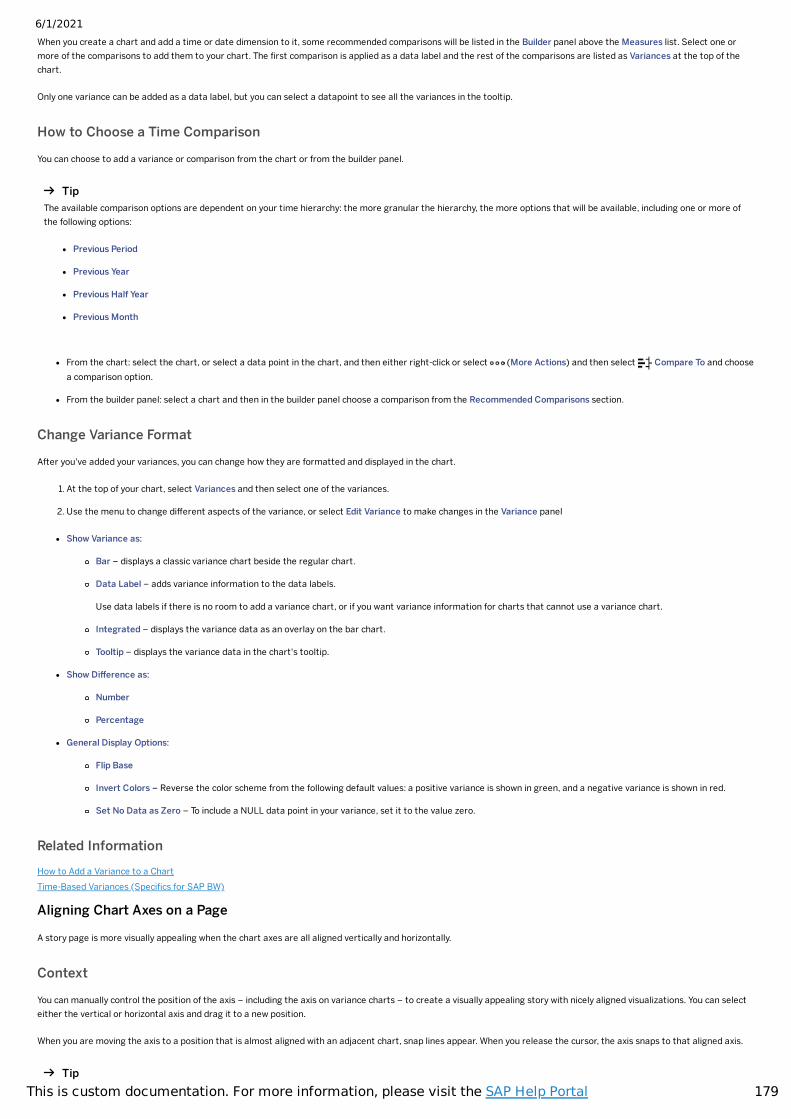
6/1/2021
179This is custom documentation. For more information, please visit the SAP Help Portal
When you create a chart and add a time or date dimension to it, some recommended comparisons will be listed in the Builder panel above the Measures list. Select one ormore of the comparisons to add them to your chart. The �rst comparison is applied as a data label and the rest of the comparisons are listed as Variances at the top of thechart.
Only one variance can be added as a data label, but you can select a datapoint to see all the variances in the tooltip.
How to Choose a Time Comparison
You can choose to add a variance or comparison from the chart or from the builder panel.
From the chart: select the chart, or select a data point in the chart, and then either right-click or select (More Actions) and then select Compare To and choosea comparison option.
From the builder panel: select a chart and then in the builder panel choose a comparison from the Recommended Comparisons section.
Change Variance Format
After you've added your variances, you can change how they are formatted and displayed in the chart.
1. At the top of your chart, select Variances and then select one of the variances.
2. Use the menu to change different aspects of the variance, or select Edit Variance to make changes in the Variance panel
Show Variance as:
Bar – displays a classic variance chart beside the regular chart.
Data Label – adds variance information to the data labels.
Use data labels if there is no room to add a variance chart, or if you want variance information for charts that cannot use a variance chart.
Integrated – displays the variance data as an overlay on the bar chart.
Tooltip – displays the variance data in the chart's tooltip.
Show Difference as:
Number
Percentage
General Display Options:
Flip Base
Invert Colors – Reverse the color scheme from the following default values: a positive variance is shown in green, and a negative variance is shown in red.
Set No Data as Zero – To include a NULL data point in your variance, set it to the value zero.
Related InformationHow to Add a Variance to a ChartTime-Based Variances (Speci�cs for SAP BW)
Aligning Chart Axes on a Page
A story page is more visually appealing when the chart axes are all aligned vertically and horizontally.
Context
You can manually control the position of the axis – including the axis on variance charts – to create a visually appealing story with nicely aligned visualizations. You can selecteither the vertical or horizontal axis and drag it to a new position.
When you are moving the axis to a position that is almost aligned with an adjacent chart, snap lines appear. When you release the cursor, the axis snaps to that aligned axis.
TipThe available comparison options are dependent on your time hierarchy: the more granular the hierarchy, the more options that will be available, including one or more ofthe following options:
Previous Period
Previous Year
Previous Half Year
Previous Month
Tip
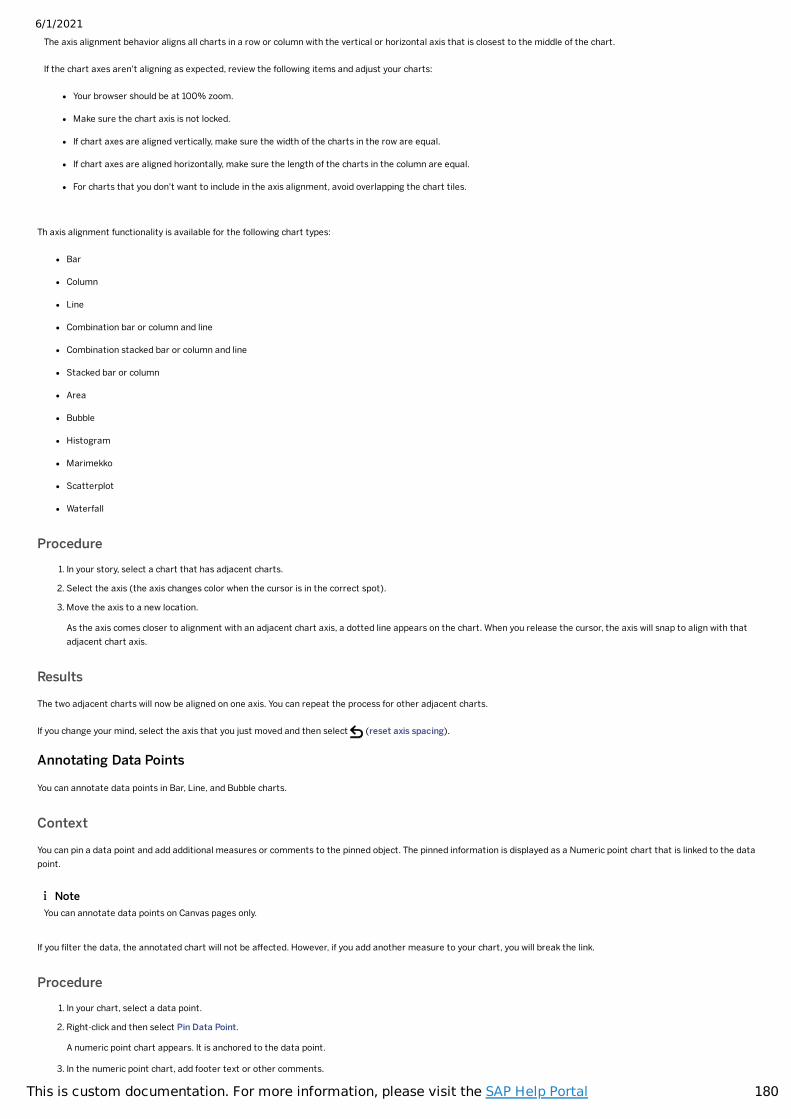
6/1/2021
180This is custom documentation. For more information, please visit the SAP Help Portal
Th axis alignment functionality is available for the following chart types:
Bar
Column
Line
Combination bar or column and line
Combination stacked bar or column and line
Stacked bar or column
Area
Bubble
Histogram
Marimekko
Scatterplot
Waterfall
Procedure1. In your story, select a chart that has adjacent charts.
2. Select the axis (the axis changes color when the cursor is in the correct spot).
3. Move the axis to a new location.
As the axis comes closer to alignment with an adjacent chart axis, a dotted line appears on the chart. When you release the cursor, the axis will snap to align with thatadjacent chart axis.
Results
The two adjacent charts will now be aligned on one axis. You can repeat the process for other adjacent charts.
If you change your mind, select the axis that you just moved and then select (reset axis spacing).
Annotating Data Points
You can annotate data points in Bar, Line, and Bubble charts.
Context
You can pin a data point and add additional measures or comments to the pinned object. The pinned information is displayed as a Numeric point chart that is linked to the datapoint.
If you �lter the data, the annotated chart will not be affected. However, if you add another measure to your chart, you will break the link.
Procedure1. In your chart, select a data point.
2. Right-click and then select Pin Data Point.
A numeric point chart appears. It is anchored to the data point.
3. In the numeric point chart, add footer text or other comments.
The axis alignment behavior aligns all charts in a row or column with the vertical or horizontal axis that is closest to the middle of the chart.
If the chart axes aren't aligning as expected, review the following items and adjust your charts:
Your browser should be at 100% zoom.
Make sure the chart axis is not locked.
If chart axes are aligned vertically, make sure the width of the charts in the row are equal.
If chart axes are aligned horizontally, make sure the length of the charts in the column are equal.
For charts that you don't want to include in the axis alignment, avoid overlapping the chart tiles.
NoteYou can annotate data points on Canvas pages only.
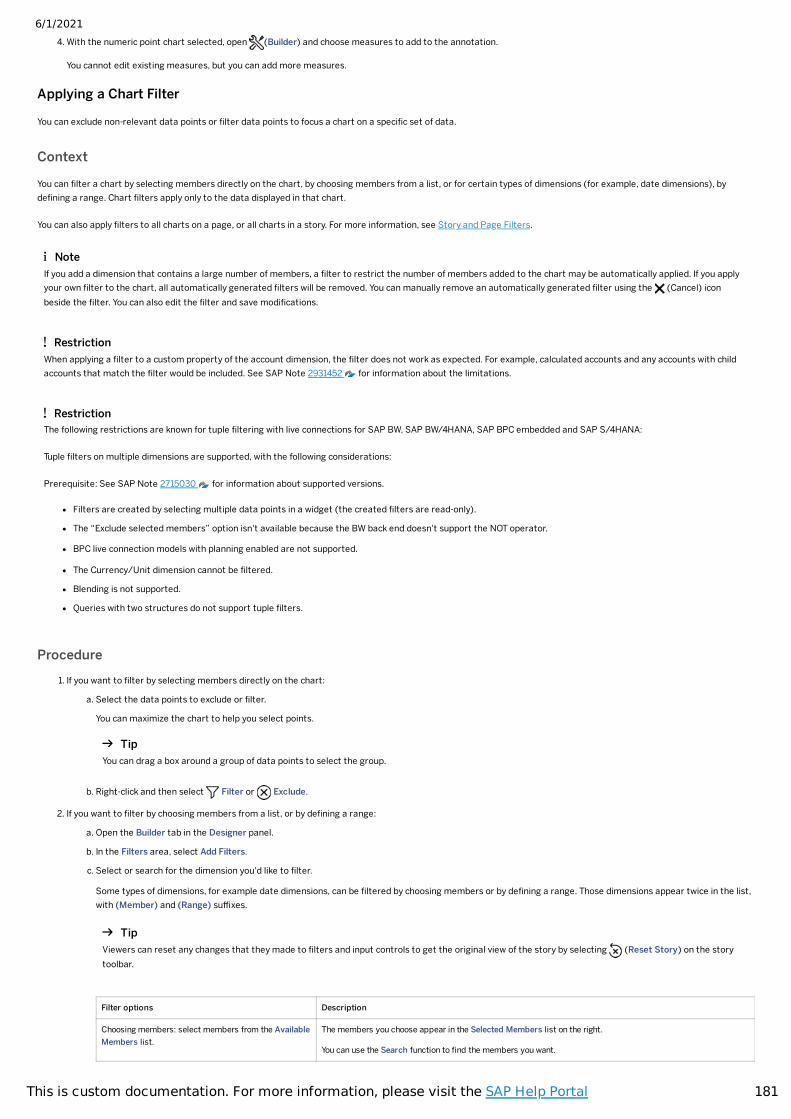
6/1/2021
181This is custom documentation. For more information, please visit the SAP Help Portal
4. With the numeric point chart selected, open (Builder) and choose measures to add to the annotation.
You cannot edit existing measures, but you can add more measures.
Applying a Chart Filter
You can exclude non-relevant data points or �lter data points to focus a chart on a speci�c set of data.
Context
You can �lter a chart by selecting members directly on the chart, by choosing members from a list, or for certain types of dimensions (for example, date dimensions), byde�ning a range. Chart �lters apply only to the data displayed in that chart.
You can also apply �lters to all charts on a page, or all charts in a story. For more information, see Story and Page Filters.
Procedure1. If you want to �lter by selecting members directly on the chart:
a. Select the data points to exclude or �lter.
You can maximize the chart to help you select points.
b. Right-click and then select Filter or Exclude.
2. If you want to �lter by choosing members from a list, or by de�ning a range:
a. Open the Builder tab in the Designer panel.
b. In the Filters area, select Add Filters.
c. Select or search for the dimension you'd like to �lter.
Some types of dimensions, for example date dimensions, can be �ltered by choosing members or by de�ning a range. Those dimensions appear twice in the list,with (Member) and (Range) suffixes.
Filter options Description
Choosing members: select members from the AvailableMembers list.
The members you choose appear in the Selected Members list on the right.
You can use the Search function to �nd the members you want.
NoteIf you add a dimension that contains a large number of members, a �lter to restrict the number of members added to the chart may be automatically applied. If you applyyour own �lter to the chart, all automatically generated �lters will be removed. You can manually remove an automatically generated �lter using the (Cancel) iconbeside the �lter. You can also edit the �lter and save modi�cations.
RestrictionWhen applying a �lter to a custom property of the account dimension, the �lter does not work as expected. For example, calculated accounts and any accounts with childaccounts that match the �lter would be included. See SAP Note 2931452 for information about the limitations.
RestrictionThe following restrictions are known for tuple �ltering with live connections for SAP BW, SAP BW/4HANA, SAP BPC embedded and SAP S/4HANA:
Tuple �lters on multiple dimensions are supported, with the following considerations:
Prerequisite: See SAP Note 2715030 for information about supported versions.
Filters are created by selecting multiple data points in a widget (the created �lters are read-only).
The “Exclude selected members” option isn't available because the BW back end doesn't support the NOT operator.
BPC live connection models with planning enabled are not supported.
The Currency/Unit dimension cannot be �ltered.
Blending is not supported.
Queries with two structures do not support tuple �lters.
TipYou can drag a box around a group of data points to select the group.
TipViewers can reset any changes that they made to �lters and input controls to get the original view of the story by selecting (Reset Story) on the storytoolbar.
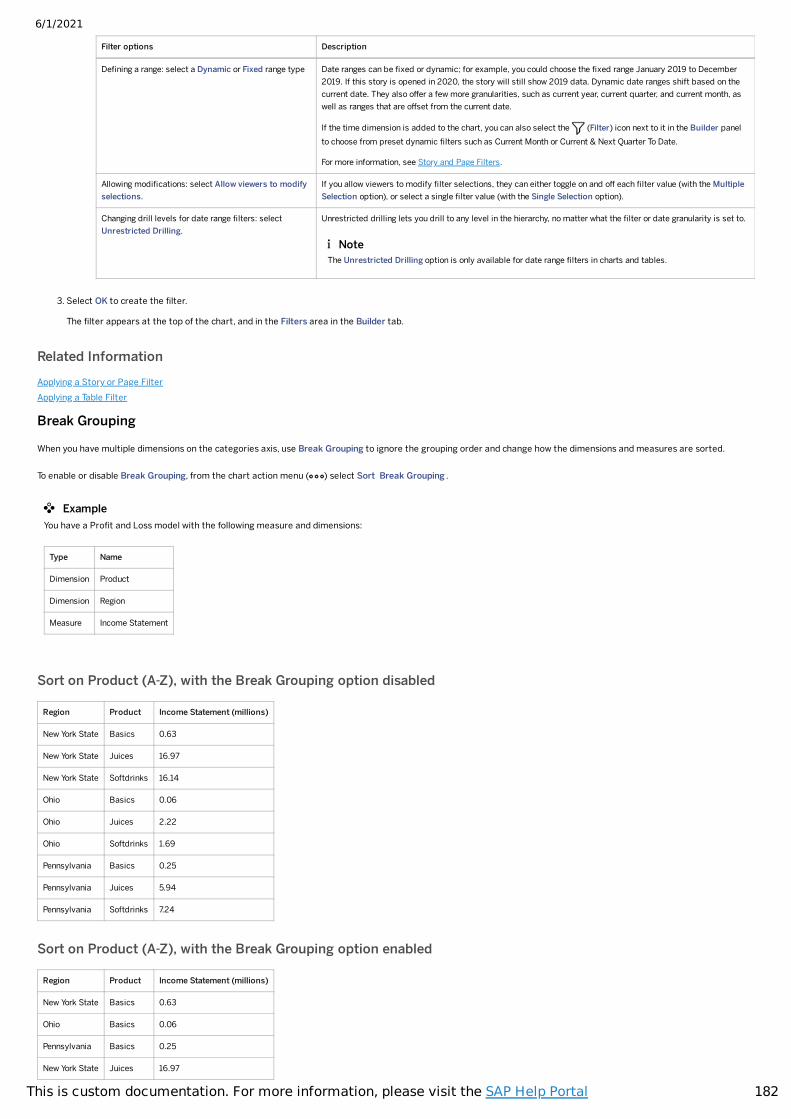
6/1/2021
182This is custom documentation. For more information, please visit the SAP Help Portal
Filter options Description
De�ning a range: select a Dynamic or Fixed range type Date ranges can be �xed or dynamic; for example, you could choose the �xed range January 2019 to December2019. If this story is opened in 2020, the story will still show 2019 data. Dynamic date ranges shift based on thecurrent date. They also offer a few more granularities, such as current year, current quarter, and current month, aswell as ranges that are offset from the current date.
If the time dimension is added to the chart, you can also select the (Filter) icon next to it in the Builder panelto choose from preset dynamic �lters such as Current Month or Current & Next Quarter To Date.
For more information, see Story and Page Filters.
Allowing modi�cations: select Allow viewers to modifyselections.
If you allow viewers to modify �lter selections, they can either toggle on and off each �lter value (with the MultipleSelection option), or select a single �lter value (with the Single Selection option).
Changing drill levels for date range �lters: selectUnrestricted Drilling.
Unrestricted drilling lets you drill to any level in the hierarchy, no matter what the �lter or date granularity is set to.
3. Select OK to create the �lter.
The �lter appears at the top of the chart, and in the Filters area in the Builder tab.
Related InformationApplying a Story or Page FilterApplying a Table Filter
Break Grouping
When you have multiple dimensions on the categories axis, use Break Grouping to ignore the grouping order and change how the dimensions and measures are sorted.
To enable or disable Break Grouping, from the chart action menu ( ) select Sort Break Grouping .
Sort on Product (A-Z), with the Break Grouping option disabled
Region Product Income Statement (millions)
New York State Basics 0.63
New York State Juices 16.97
New York State Softdrinks 16.14
Ohio Basics 0.06
Ohio Juices 2.22
Ohio Softdrinks 1.69
Pennsylvania Basics 0.25
Pennsylvania Juices 5.94
Pennsylvania Softdrinks 7.24
Sort on Product (A-Z), with the Break Grouping option enabled
Region Product Income Statement (millions)
New York State Basics 0.63
Ohio Basics 0.06
Pennsylvania Basics 0.25
New York State Juices 16.97
NoteThe Unrestricted Drilling option is only available for date range �lters in charts and tables.
ExampleYou have a Pro�t and Loss model with the following measure and dimensions:
Type Name
Dimension Product
Dimension Region
Measure Income Statement
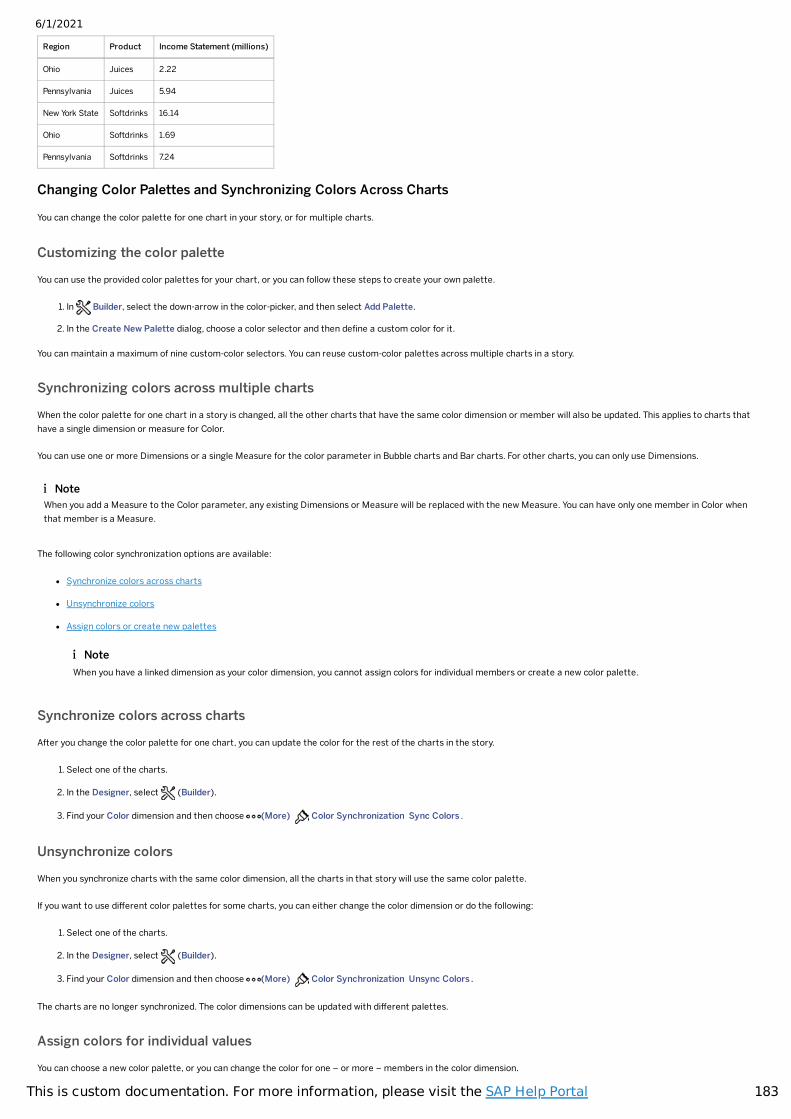
6/1/2021
183This is custom documentation. For more information, please visit the SAP Help Portal
Region Product Income Statement (millions)
Ohio Juices 2.22
Pennsylvania Juices 5.94
New York State Softdrinks 16.14
Ohio Softdrinks 1.69
Pennsylvania Softdrinks 7.24
Changing Color Palettes and Synchronizing Colors Across Charts
You can change the color palette for one chart in your story, or for multiple charts.
Customizing the color palette
You can use the provided color palettes for your chart, or you can follow these steps to create your own palette.
1. In Builder, select the down-arrow in the color-picker, and then select Add Palette.
2. In the Create New Palette dialog, choose a color selector and then de�ne a custom color for it.
You can maintain a maximum of nine custom-color selectors. You can reuse custom-color palettes across multiple charts in a story.
Synchronizing colors across multiple charts
When the color palette for one chart in a story is changed, all the other charts that have the same color dimension or member will also be updated. This applies to charts thathave a single dimension or measure for Color.
You can use one or more Dimensions or a single Measure for the color parameter in Bubble charts and Bar charts. For other charts, you can only use Dimensions.
The following color synchronization options are available:
Synchronize colors across charts
Unsynchronize colors
Assign colors or create new palettes
Synchronize colors across charts
After you change the color palette for one chart, you can update the color for the rest of the charts in the story.
1. Select one of the charts.
2. In the Designer, select (Builder).
3. Find your Color dimension and then choose (More) Color Synchronization Sync Colors .
Unsynchronize colors
When you synchronize charts with the same color dimension, all the charts in that story will use the same color palette.
If you want to use different color palettes for some charts, you can either change the color dimension or do the following:
1. Select one of the charts.
2. In the Designer, select (Builder).
3. Find your Color dimension and then choose (More) Color Synchronization Unsync Colors .
The charts are no longer synchronized. The color dimensions can be updated with different palettes.
Assign colors for individual values
You can choose a new color palette, or you can change the color for one – or more – members in the color dimension.
NoteWhen you add a Measure to the Color parameter, any existing Dimensions or Measure will be replaced with the new Measure. You can have only one member in Color whenthat member is a Measure.
NoteWhen you have a linked dimension as your color dimension, you cannot assign colors for individual members or create a new color palette.
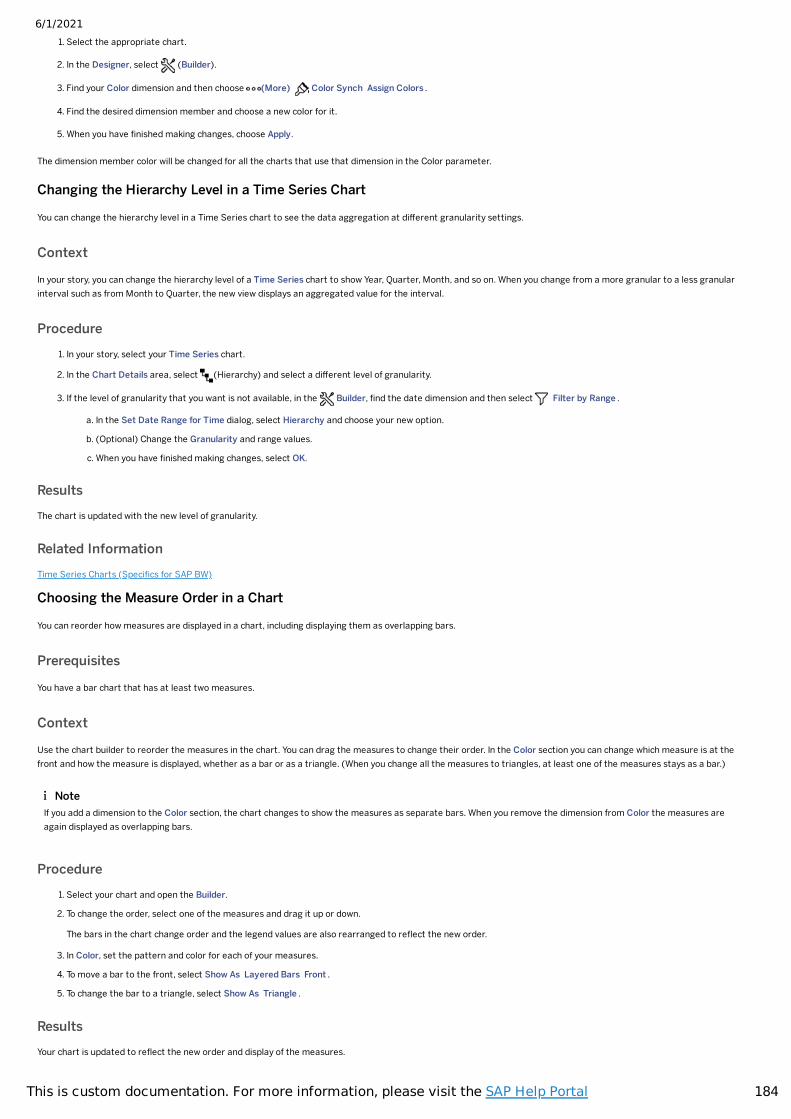
6/1/2021
184This is custom documentation. For more information, please visit the SAP Help Portal
1. Select the appropriate chart.
2. In the Designer, select (Builder).
3. Find your Color dimension and then choose (More) Color Synch Assign Colors .
4. Find the desired dimension member and choose a new color for it.
5. When you have �nished making changes, choose Apply.
The dimension member color will be changed for all the charts that use that dimension in the Color parameter.
Changing the Hierarchy Level in a Time Series Chart
You can change the hierarchy level in a Time Series chart to see the data aggregation at different granularity settings.
Context
In your story, you can change the hierarchy level of a Time Series chart to show Year, Quarter, Month, and so on. When you change from a more granular to a less granularinterval such as from Month to Quarter, the new view displays an aggregated value for the interval.
Procedure1. In your story, select your Time Series chart.
2. In the Chart Details area, select (Hierarchy) and select a different level of granularity.
3. If the level of granularity that you want is not available, in the Builder, �nd the date dimension and then select Filter by Range .
a. In the Set Date Range for Time dialog, select Hierarchy and choose your new option.
b. (Optional) Change the Granularity and range values.
c. When you have �nished making changes, select OK.
ResultsThe chart is updated with the new level of granularity.
Related InformationTime Series Charts (Speci�cs for SAP BW)
Choosing the Measure Order in a Chart
You can reorder how measures are displayed in a chart, including displaying them as overlapping bars.
Prerequisites
You have a bar chart that has at least two measures.
Context
Use the chart builder to reorder the measures in the chart. You can drag the measures to change their order. In the Color section you can change which measure is at thefront and how the measure is displayed, whether as a bar or as a triangle. (When you change all the measures to triangles, at least one of the measures stays as a bar.)
Procedure1. Select your chart and open the Builder.
2. To change the order, select one of the measures and drag it up or down.
The bars in the chart change order and the legend values are also rearranged to re�ect the new order.
3. In Color, set the pattern and color for each of your measures.
4. To move a bar to the front, select Show As Layered Bars Front .
5. To change the bar to a triangle, select Show As Triangle .
ResultsYour chart is updated to re�ect the new order and display of the measures.
NoteIf you add a dimension to the Color section, the chart changes to show the measures as separate bars. When you remove the dimension from Color the measures areagain displayed as overlapping bars.
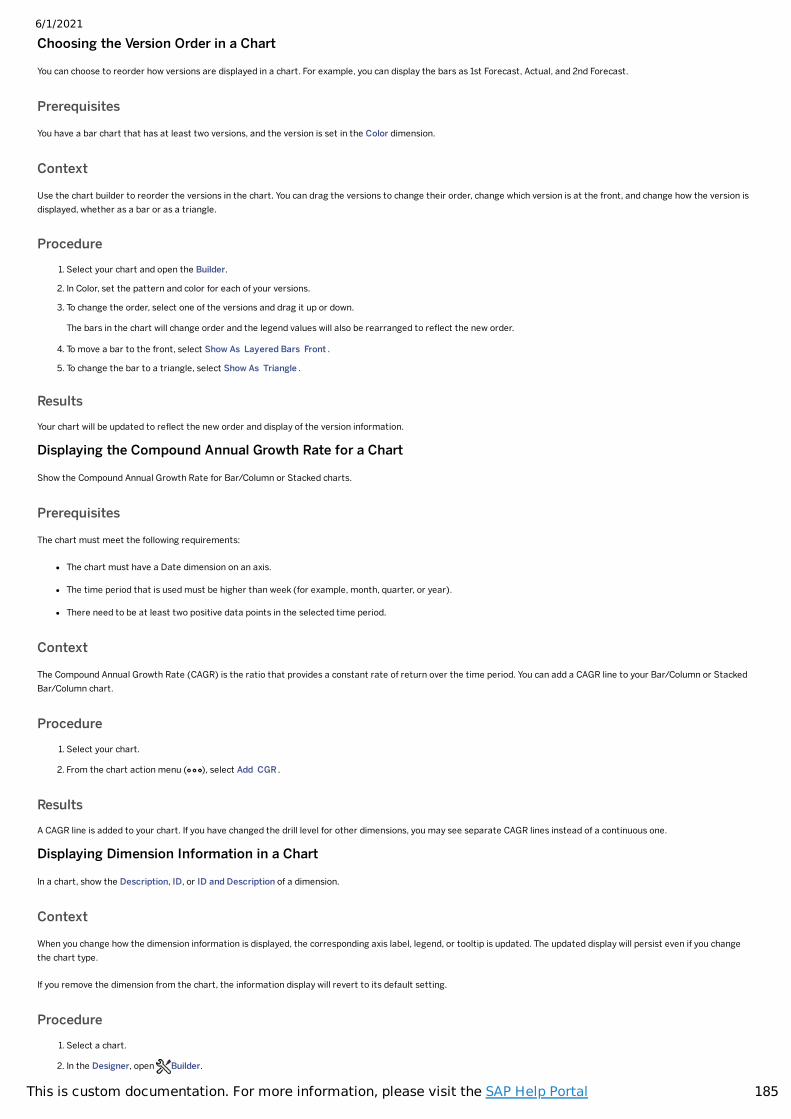
6/1/2021
185This is custom documentation. For more information, please visit the SAP Help Portal
Choosing the Version Order in a Chart
You can choose to reorder how versions are displayed in a chart. For example, you can display the bars as 1st Forecast, Actual, and 2nd Forecast.
Prerequisites
You have a bar chart that has at least two versions, and the version is set in the Color dimension.
Context
Use the chart builder to reorder the versions in the chart. You can drag the versions to change their order, change which version is at the front, and change how the version isdisplayed, whether as a bar or as a triangle.
Procedure1. Select your chart and open the Builder.
2. In Color, set the pattern and color for each of your versions.
3. To change the order, select one of the versions and drag it up or down.
The bars in the chart will change order and the legend values will also be rearranged to re�ect the new order.
4. To move a bar to the front, select Show As Layered Bars Front .
5. To change the bar to a triangle, select Show As Triangle .
ResultsYour chart will be updated to re�ect the new order and display of the version information.
Displaying the Compound Annual Growth Rate for a Chart
Show the Compound Annual Growth Rate for Bar/Column or Stacked charts.
Prerequisites
The chart must meet the following requirements:
The chart must have a Date dimension on an axis.
The time period that is used must be higher than week (for example, month, quarter, or year).
There need to be at least two positive data points in the selected time period.
Context
The Compound Annual Growth Rate (CAGR) is the ratio that provides a constant rate of return over the time period. You can add a CAGR line to your Bar/Column or StackedBar/Column chart.
Procedure1. Select your chart.
2. From the chart action menu ( ), select Add CGR .
ResultsA CAGR line is added to your chart. If you have changed the drill level for other dimensions, you may see separate CAGR lines instead of a continuous one.
Displaying Dimension Information in a Chart
In a chart, show the Description, ID, or ID and Description of a dimension.
Context
When you change how the dimension information is displayed, the corresponding axis label, legend, or tooltip is updated. The updated display will persist even if you changethe chart type.
If you remove the dimension from the chart, the information display will revert to its default setting.
Procedure1. Select a chart.
2. In the Designer, open Builder.
6/1/2021
186This is custom documentation. For more information, please visit the SAP Help Portal
3. Move your cursor to the desired dimension label and then click Display As .
4. Select one of the options:
Description
ID
ID and Description
ResultsThe labels in the chart and the tooltip information are updated.
Related InformationSelecting Measures and Dimensions
Displaying Dimension Labels on a Bubble or Scatterplot Chart
You can display dimension values on the data-points in a bubble or scatterplot chart.
Context
To make it easier to read a bubble or scatterplot chart, you can show the dimension values on the bubbles in the chart.
If you show both the dimension labels and the data labels, the displayed information will show <dimension value>(<size, measure value>).
Procedure1. Select the bubble or scatterplot chart.
2. From the chart action menu ( ), select Show/Hide Dimension Labels .
Results
Labels are displayed on the bubbles in the chart. If the labels overlap, some of the labels will be hidden.
If you adjust the scale of the chart, that will impact the space that is available for the labels.
Displaying the Difference Between Two Data Points
You can select two data points in a chart to quickly see the difference between their values. For example, you can compare a year-over-year percentage increase or decrease,or see the delta between two versions.
Context
This feature applies to Bar/Column or Combination Column & Line charts.
An arrow shows which column is the second column chosen, and the value is displayed both numerically and as a percentage. For vertical charts, the delta graphic and thevalue are displayed to the right of the selected columns. For horizontal charts, the delta graphic is displayed below the selected bars, and the value is displayed on the secondselected bar.
Delta between two data points
Height of second column or bar Positive or negative delta
Taller Positive
Shorter Negative
Procedure1. In your chart, select one bar or column.
2. Move the cursor to another bar or column and select it.
Results
A line is drawn between the two columns and the difference is displayed.
Drilling through Hierarchical Data
TipIf the action menu is hiding the result, move the cursor to a blank spot on the axis and click. The action menu will be hidden.
6/1/2021
187This is custom documentation. For more information, please visit the SAP Help Portal
If hierarchical dimensions are included in a chart, you can drill up or down through dimensions to explore the data at different levels.
Context
If the chart contains more than one hierarchical dimension, you can select which dimension to drill into.
Procedure1. Select an area in the chart or a label on the axis.
For example, you can select one or more bars in a bar chart.
The selected area in the chart is highlighted.
2. Right-click and select Drill Down or Drill Up, and then select the dimension to drill on.
You can also show all levels of the hierarchy by choosing Expand/Collapse.
3. To remove or reset the drill option, in the title area for the chart select Reset Drill and then choose which dimension to remove.
Related InformationExpanding Hierarchies in a ChartDrilling through Waterfall Charts
Dynamically Add a Time Calculation
You can add one or more time calculations to your chart without using the calculation editor.
Prerequisites
Your chart must contain a date dimension with the appropriate level of granularity. For example, if you want to see quarter over quarter results, the date dimension mustinclude quarterly or even monthly results.
Context
You can add a time calculation to a chart to show year over year changes in quantity sold.
Disclaimer: The below video is not part of the SAP product documentation. Please read the legal disclaimer for video links before viewing this video.
Procedure1. Add a measure and a date dimension to your chart.
2. In the Builder, �nd the measure that you added.
3. Select More Add Time Calculation , and then select a time period.
Results
A new measure is created. The chart now includes a bar for the time calculation.
Dynamically Set Min or Max on a Chart Axis
You can dynamically set the minimum or maximum axis values for all series on a chart axis.
Context
Add a dynamic time calculation to a chart: SAP Analytics Add a dynamic time calculation to a chart: SAP Analytics ……
6/1/2021
188This is custom documentation. For more information, please visit the SAP Help Portal
By default, charts include the zero axis even if there are no values close to zero. You can manually set ranges for your values, but you can also let the system dynamically setthe minimum and maximum values.
You can change the axis min/max setting for the following chart types:
Combination Column & Line
Combination Stacked Column & Line
Line
Bubble
Scatterplot
Procedure1. Choose your chart.
2. Choose (More Actions) Edit Axis .
3. Find the toggle for Dynamically Set Min/Max and set it to On.
If your chart has more than one min/max toggle available, set the toggle for each axis.
4. Choose Apply.
Related InformationManually Setting the Axis Range
Expanding Hierarchies in a Chart
You can expand a hierarchy in a chart and display multiple levels for all members at the same time.
Prerequisites
Your chart must have at least one hierarchical dimension.
Context
You can expand dimension hierarchies in a chart to view �ner granularity of the data. You can also display more than one level of the hierarchy at the same time, similar to howexpanded levels are displayed in a table.
The Drill dialog gives you control over which level of data is displayed as well as whether to include the parent levels.
The Expand/Collapse option within the chart expands or collapses data by one level each time you select it.
Procedure1. Select your chart.
2. To display the hierarchy expansion dialog, do one of the following:
From the Builder, �nd your dimension and select (Drill).
In the chart subtitle area, select (Set Drill).
If more than one dimension is listed, select the appropriate dimension.
3. From the Drill dialog, select a level.
If you also select Include Parent Levels, the selected level and its parent levels are displayed in the chart.
Selecting Default removes the drill level.
Selecting Reset resets the drill level to level 1.
Selecting Set Hierarchy from the drill menu in the Builder lets you use a different hierarchy for the dimension, or show a �at presentation instead. To hideparent members in the chart, select Show only leaves in widget.
ResultsThe chart displays all selected levels for the speci�ed hierarchical dimension.
TipWhen you have a linked analysis set in your story and you expand or drill into a chart, all the charts with the same hierarchy level will be refreshed to show the new level.
NoteWhen you add a �lter to the chart, the hierarchy level is reset to level 1. The drill level is now at level 1 relative to the �lter.
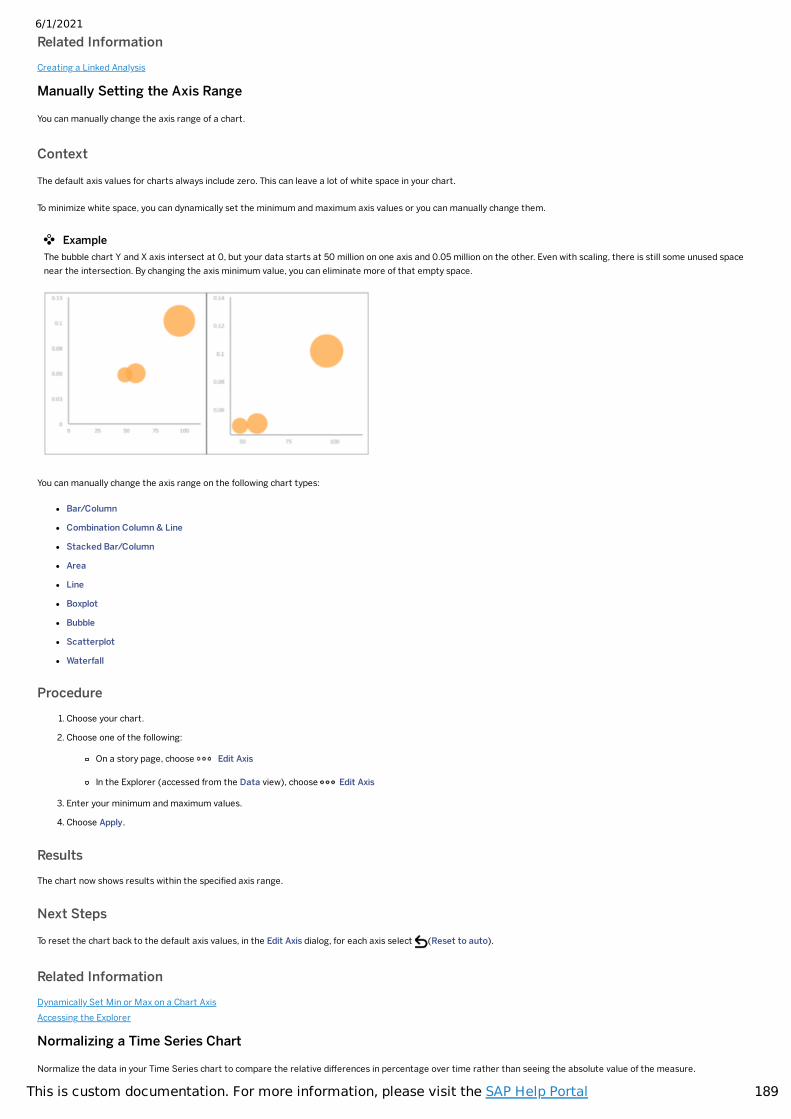
6/1/2021
189This is custom documentation. For more information, please visit the SAP Help Portal
Related InformationCreating a Linked Analysis
Manually Setting the Axis Range
You can manually change the axis range of a chart.
Context
The default axis values for charts always include zero. This can leave a lot of white space in your chart.
To minimize white space, you can dynamically set the minimum and maximum axis values or you can manually change them.
You can manually change the axis range on the following chart types:
Bar/Column
Combination Column & Line
Stacked Bar/Column
Area
Line
Boxplot
Bubble
Scatterplot
Waterfall
Procedure1. Choose your chart.
2. Choose one of the following:
On a story page, choose Edit Axis
In the Explorer (accessed from the Data view), choose Edit Axis
3. Enter your minimum and maximum values.
4. Choose Apply.
ResultsThe chart now shows results within the speci�ed axis range.
Next Steps
To reset the chart back to the default axis values, in the Edit Axis dialog, for each axis select (Reset to auto).
Related InformationDynamically Set Min or Max on a Chart AxisAccessing the Explorer
Normalizing a Time Series Chart
Normalize the data in your Time Series chart to compare the relative differences in percentage over time rather than seeing the absolute value of the measure.
ExampleThe bubble chart Y and X axis intersect at 0, but your data starts at 50 million on one axis and 0.05 million on the other. Even with scaling, there is still some unused spacenear the intersection. By changing the axis minimum value, you can eliminate more of that empty space.
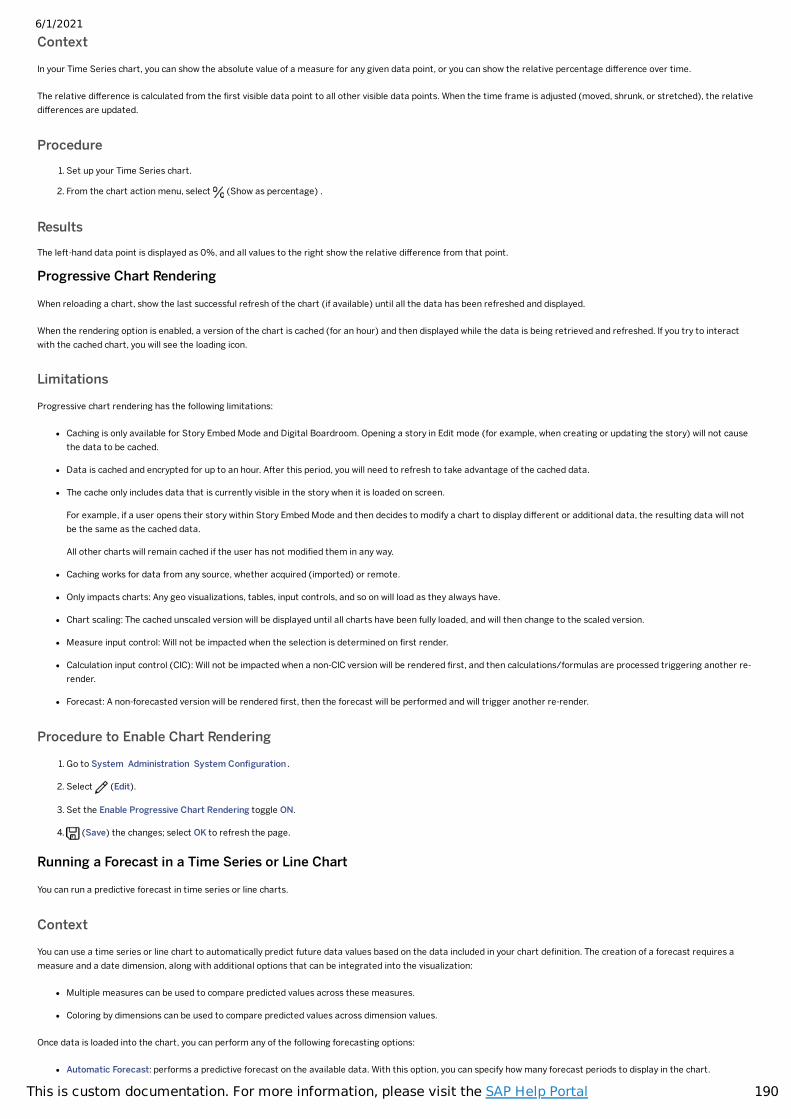
6/1/2021
190This is custom documentation. For more information, please visit the SAP Help Portal
Context
In your Time Series chart, you can show the absolute value of a measure for any given data point, or you can show the relative percentage difference over time.
The relative difference is calculated from the �rst visible data point to all other visible data points. When the time frame is adjusted (moved, shrunk, or stretched), the relativedifferences are updated.
Procedure1. Set up your Time Series chart.
2. From the chart action menu, select (Show as percentage) .
ResultsThe left-hand data point is displayed as 0%, and all values to the right show the relative difference from that point.
Progressive Chart Rendering
When reloading a chart, show the last successful refresh of the chart (if available) until all the data has been refreshed and displayed.
When the rendering option is enabled, a version of the chart is cached (for an hour) and then displayed while the data is being retrieved and refreshed. If you try to interactwith the cached chart, you will see the loading icon.
Limitations
Progressive chart rendering has the following limitations:
Caching is only available for Story Embed Mode and Digital Boardroom. Opening a story in Edit mode (for example, when creating or updating the story) will not causethe data to be cached.
Data is cached and encrypted for up to an hour. After this period, you will need to refresh to take advantage of the cached data.
The cache only includes data that is currently visible in the story when it is loaded on screen.
For example, if a user opens their story within Story Embed Mode and then decides to modify a chart to display different or additional data, the resulting data will notbe the same as the cached data.
All other charts will remain cached if the user has not modi�ed them in any way.
Caching works for data from any source, whether acquired (imported) or remote.
Only impacts charts: Any geo visualizations, tables, input controls, and so on will load as they always have.
Chart scaling: The cached unscaled version will be displayed until all charts have been fully loaded, and will then change to the scaled version.
Measure input control: Will not be impacted when the selection is determined on �rst render.
Calculation input control (CIC): Will not be impacted when a non-CIC version will be rendered �rst, and then calculations/formulas are processed triggering another re-render.
Forecast: A non-forecasted version will be rendered �rst, then the forecast will be performed and will trigger another re-render.
Procedure to Enable Chart Rendering
1. Go to System Administration System Con�guration .
2. Select (Edit).
3. Set the Enable Progressive Chart Rendering toggle ON.
4. (Save) the changes; select OK to refresh the page.
Running a Forecast in a Time Series or Line Chart
You can run a predictive forecast in time series or line charts.
Context
You can use a time series or line chart to automatically predict future data values based on the data included in your chart de�nition. The creation of a forecast requires ameasure and a date dimension, along with additional options that can be integrated into the visualization:
Multiple measures can be used to compare predicted values across these measures.
Coloring by dimensions can be used to compare predicted values across dimension values.
Once data is loaded into the chart, you can perform any of the following forecasting options:
Automatic Forecast: performs a predictive forecast on the available data. With this option, you can specify how many forecast periods to display in the chart.
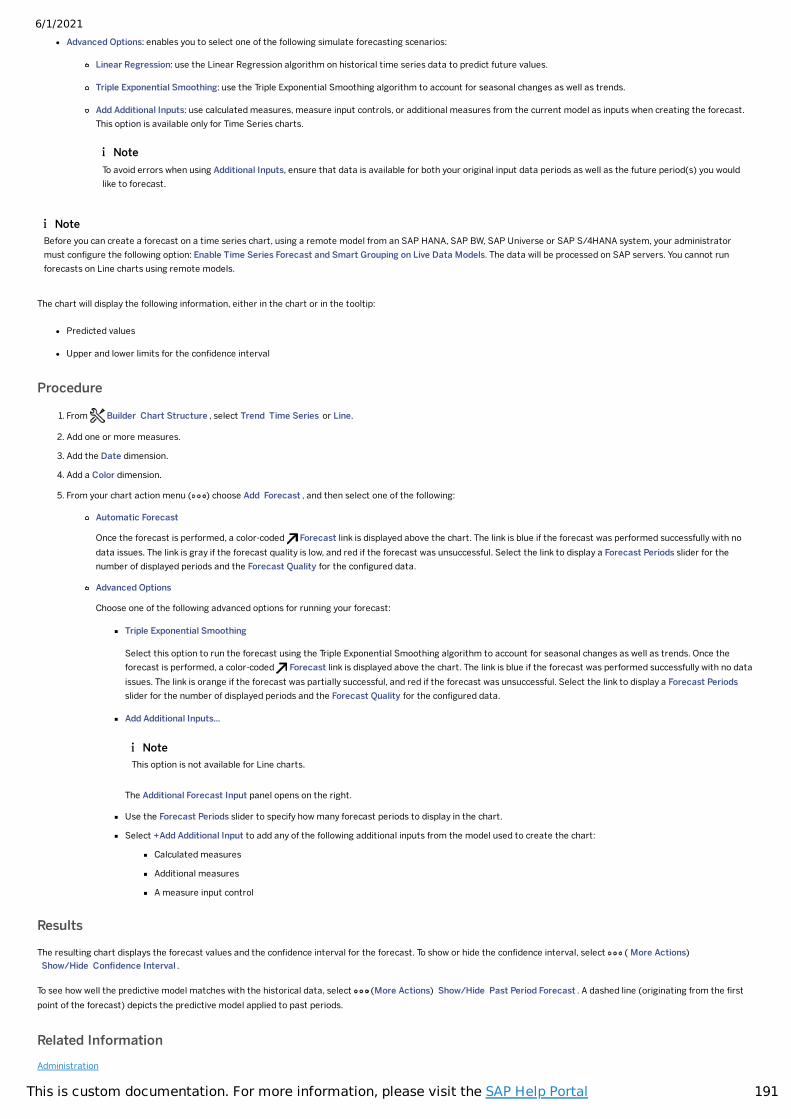
6/1/2021
191This is custom documentation. For more information, please visit the SAP Help Portal
Advanced Options: enables you to select one of the following simulate forecasting scenarios:
Linear Regression: use the Linear Regression algorithm on historical time series data to predict future values.
Triple Exponential Smoothing: use the Triple Exponential Smoothing algorithm to account for seasonal changes as well as trends.
Add Additional Inputs: use calculated measures, measure input controls, or additional measures from the current model as inputs when creating the forecast.This option is available only for Time Series charts.
The chart will display the following information, either in the chart or in the tooltip:
Predicted values
Upper and lower limits for the con�dence interval
Procedure
1. From Builder Chart Structure , select Trend Time Series or Line.
2. Add one or more measures.
3. Add the Date dimension.
4. Add a Color dimension.
5. From your chart action menu ( ) choose Add Forecast , and then select one of the following:
Automatic Forecast
Once the forecast is performed, a color-coded Forecast link is displayed above the chart. The link is blue if the forecast was performed successfully with nodata issues. The link is gray if the forecast quality is low, and red if the forecast was unsuccessful. Select the link to display a Forecast Periods slider for thenumber of displayed periods and the Forecast Quality for the con�gured data.
Advanced Options
Choose one of the following advanced options for running your forecast:
Triple Exponential Smoothing
Select this option to run the forecast using the Triple Exponential Smoothing algorithm to account for seasonal changes as well as trends. Once theforecast is performed, a color-coded Forecast link is displayed above the chart. The link is blue if the forecast was performed successfully with no dataissues. The link is orange if the forecast was partially successful, and red if the forecast was unsuccessful. Select the link to display a Forecast Periodsslider for the number of displayed periods and the Forecast Quality for the con�gured data.
Add Additional Inputs...
The Additional Forecast Input panel opens on the right.
Use the Forecast Periods slider to specify how many forecast periods to display in the chart.
Select +Add Additional Input to add any of the following additional inputs from the model used to create the chart:
Calculated measures
Additional measures
A measure input control
Results
The resulting chart displays the forecast values and the con�dence interval for the forecast. To show or hide the con�dence interval, select ( More Actions) Show/Hide Con�dence Interval .
To see how well the predictive model matches with the historical data, select (More Actions) Show/Hide Past Period Forecast . A dashed line (originating from the �rstpoint of the forecast) depicts the predictive model applied to past periods.
Related InformationAdministration
NoteTo avoid errors when using Additional Inputs, ensure that data is available for both your original input data periods as well as the future period(s) you wouldlike to forecast.
NoteBefore you can create a forecast on a time series chart, using a remote model from an SAP HANA, SAP BW, SAP Universe or SAP S/4HANA system, your administratormust con�gure the following option: Enable Time Series Forecast and Smart Grouping on Live Data Models. The data will be processed on SAP servers. You cannot runforecasts on Line charts using remote models.
NoteThis option is not available for Line charts.
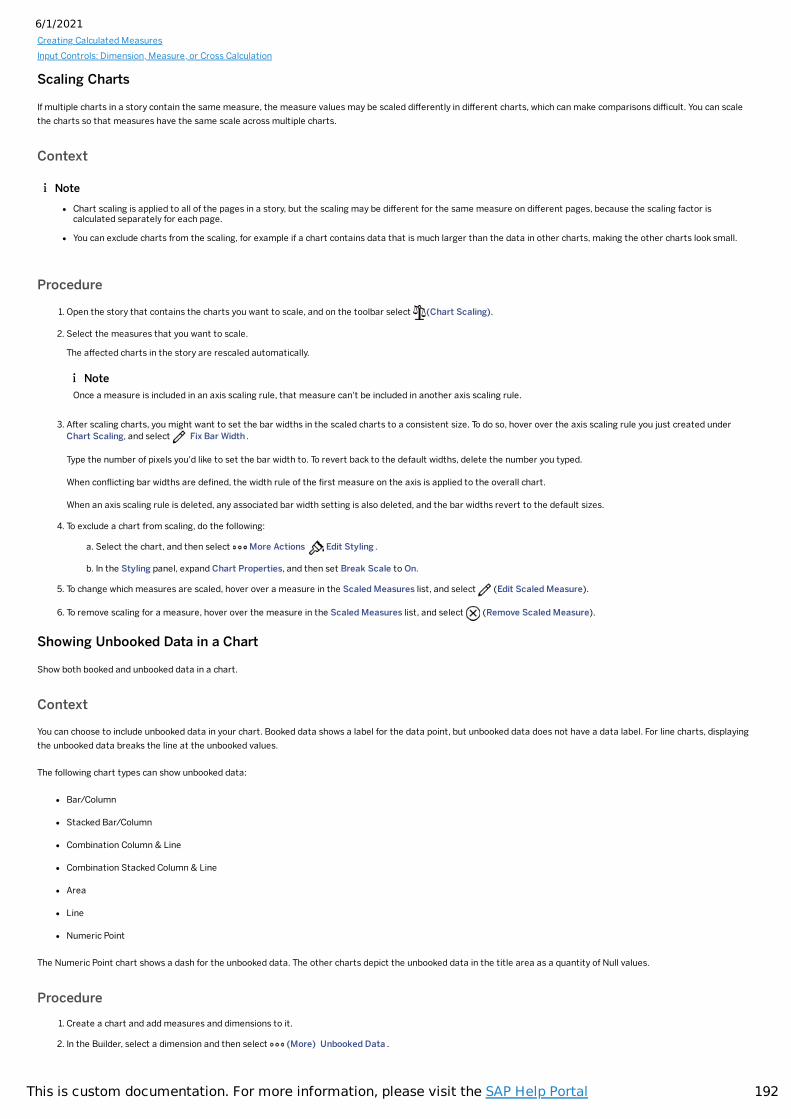
6/1/2021
192This is custom documentation. For more information, please visit the SAP Help Portal
Creating Calculated MeasuresInput Controls: Dimension, Measure, or Cross Calculation
Scaling Charts
If multiple charts in a story contain the same measure, the measure values may be scaled differently in different charts, which can make comparisons difficult. You can scalethe charts so that measures have the same scale across multiple charts.
Context
Procedure
1. Open the story that contains the charts you want to scale, and on the toolbar select (Chart Scaling).
2. Select the measures that you want to scale.
The affected charts in the story are rescaled automatically.
3. After scaling charts, you might want to set the bar widths in the scaled charts to a consistent size. To do so, hover over the axis scaling rule you just created underChart Scaling, and select Fix Bar Width .
Type the number of pixels you'd like to set the bar width to. To revert back to the default widths, delete the number you typed.
When con�icting bar widths are de�ned, the width rule of the �rst measure on the axis is applied to the overall chart.
When an axis scaling rule is deleted, any associated bar width setting is also deleted, and the bar widths revert to the default sizes.
4. To exclude a chart from scaling, do the following:
a. Select the chart, and then select More Actions Edit Styling .
b. In the Styling panel, expand Chart Properties, and then set Break Scale to On.
5. To change which measures are scaled, hover over a measure in the Scaled Measures list, and select (Edit Scaled Measure).
6. To remove scaling for a measure, hover over the measure in the Scaled Measures list, and select (Remove Scaled Measure).
Showing Unbooked Data in a Chart
Show both booked and unbooked data in a chart.
Context
You can choose to include unbooked data in your chart. Booked data shows a label for the data point, but unbooked data does not have a data label. For line charts, displayingthe unbooked data breaks the line at the unbooked values.
The following chart types can show unbooked data:
Bar/Column
Stacked Bar/Column
Combination Column & Line
Combination Stacked Column & Line
Area
Line
Numeric Point
The Numeric Point chart shows a dash for the unbooked data. The other charts depict the unbooked data in the title area as a quantity of Null values.
Procedure1. Create a chart and add measures and dimensions to it.
2. In the Builder, select a dimension and then select (More) Unbooked Data .
NoteChart scaling is applied to all of the pages in a story, but the scaling may be different for the same measure on different pages, because the scaling factor iscalculated separately for each page.
You can exclude charts from the scaling, for example if a chart contains data that is much larger than the data in other charts, making the other charts look small.
NoteOnce a measure is included in an axis scaling rule, that measure can't be included in another axis scaling rule.
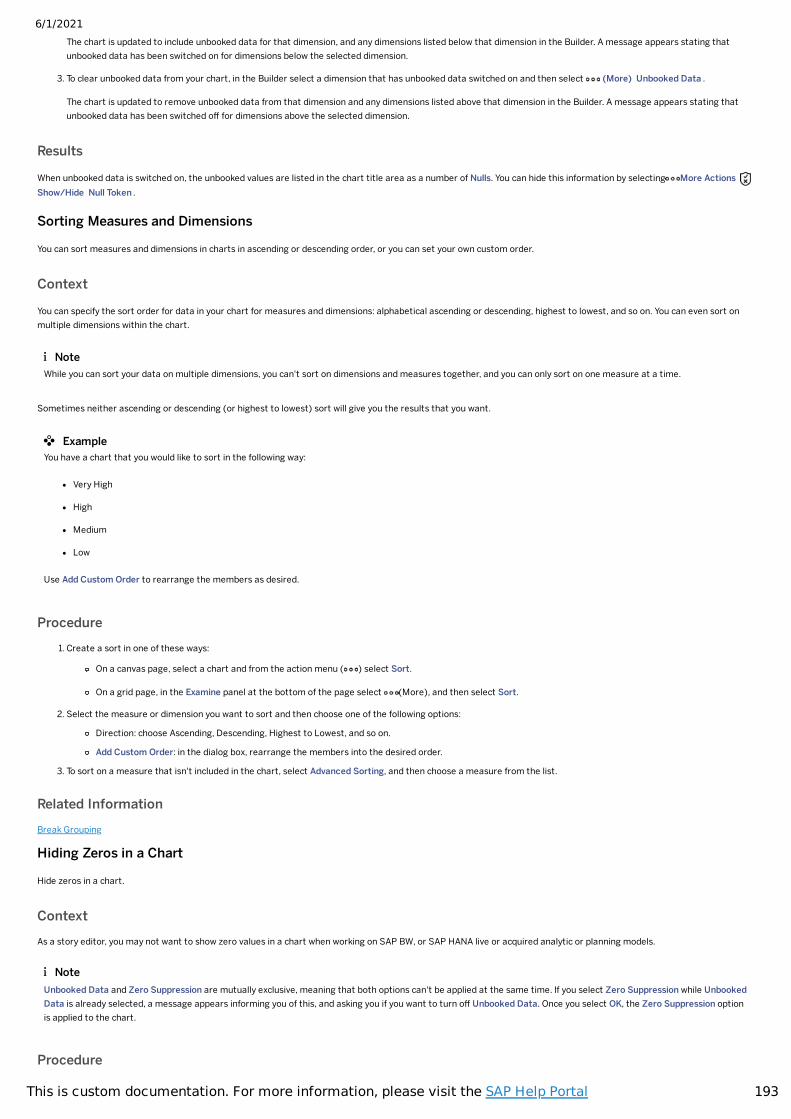
6/1/2021
193This is custom documentation. For more information, please visit the SAP Help Portal
The chart is updated to include unbooked data for that dimension, and any dimensions listed below that dimension in the Builder. A message appears stating thatunbooked data has been switched on for dimensions below the selected dimension.
3. To clear unbooked data from your chart, in the Builder select a dimension that has unbooked data switched on and then select (More) Unbooked Data .
The chart is updated to remove unbooked data from that dimension and any dimensions listed above that dimension in the Builder. A message appears stating thatunbooked data has been switched off for dimensions above the selected dimension.
Results
When unbooked data is switched on, the unbooked values are listed in the chart title area as a number of Nulls. You can hide this information by selecting More Actions Show/Hide Null Token .
Sorting Measures and Dimensions
You can sort measures and dimensions in charts in ascending or descending order, or you can set your own custom order.
Context
You can specify the sort order for data in your chart for measures and dimensions: alphabetical ascending or descending, highest to lowest, and so on. You can even sort onmultiple dimensions within the chart.
Sometimes neither ascending or descending (or highest to lowest) sort will give you the results that you want.
Procedure1. Create a sort in one of these ways:
On a canvas page, select a chart and from the action menu ( ) select Sort.
On a grid page, in the Examine panel at the bottom of the page select (More), and then select Sort.
2. Select the measure or dimension you want to sort and then choose one of the following options:
Direction: choose Ascending, Descending, Highest to Lowest, and so on.
Add Custom Order: in the dialog box, rearrange the members into the desired order.
3. To sort on a measure that isn't included in the chart, select Advanced Sorting, and then choose a measure from the list.
Related InformationBreak Grouping
Hiding Zeros in a Chart
Hide zeros in a chart.
ContextAs a story editor, you may not want to show zero values in a chart when working on SAP BW, or SAP HANA live or acquired analytic or planning models.
Procedure
NoteWhile you can sort your data on multiple dimensions, you can't sort on dimensions and measures together, and you can only sort on one measure at a time.
ExampleYou have a chart that you would like to sort in the following way:
Very High
High
Medium
Low
Use Add Custom Order to rearrange the members as desired.
NoteUnbooked Data and Zero Suppression are mutually exclusive, meaning that both options can't be applied at the same time. If you select Zero Suppression while UnbookedData is already selected, a message appears informing you of this, and asking you if you want to turn off Unbooked Data. Once you select OK, the Zero Suppression optionis applied to the chart.
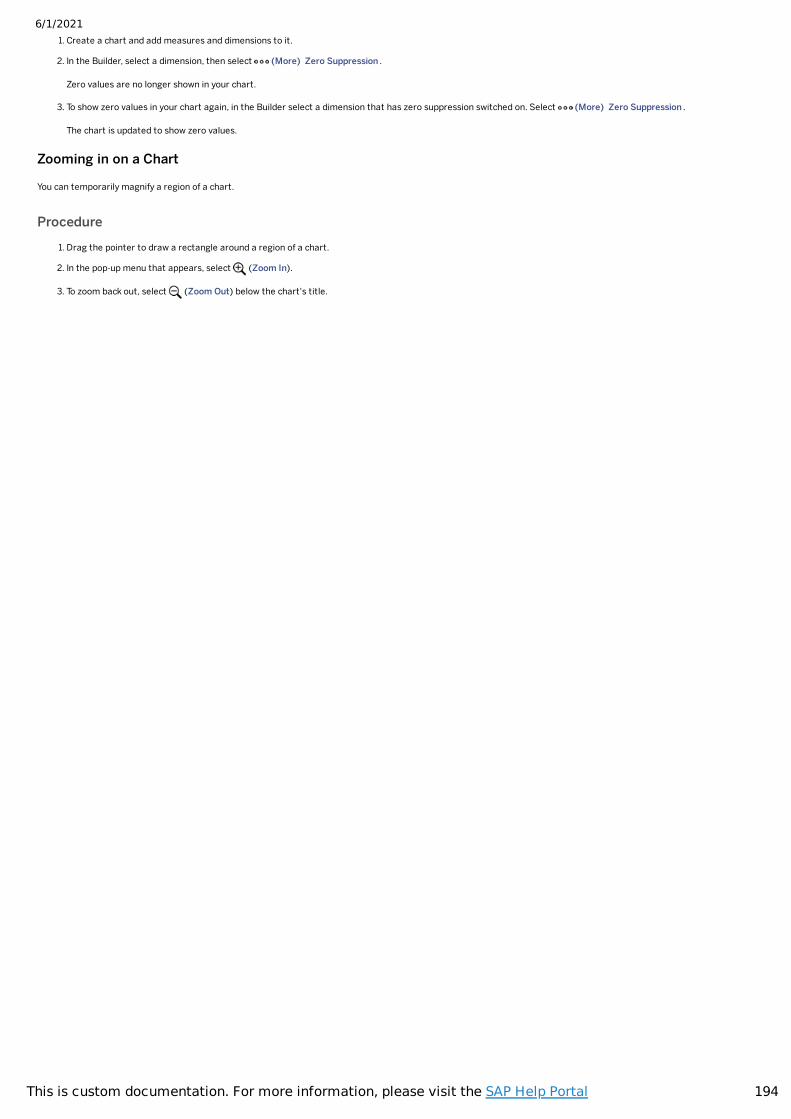
6/1/2021
194This is custom documentation. For more information, please visit the SAP Help Portal
1. Create a chart and add measures and dimensions to it.
2. In the Builder, select a dimension, then select (More) Zero Suppression .
Zero values are no longer shown in your chart.
3. To show zero values in your chart again, in the Builder select a dimension that has zero suppression switched on. Select (More) Zero Suppression .
The chart is updated to show zero values.
Zooming in on a Chart
You can temporarily magnify a region of a chart.
Procedure1. Drag the pointer to draw a rectangle around a region of a chart.
2. In the pop-up menu that appears, select (Zoom In).
3. To zoom back out, select (Zoom Out) below the chart's title.


