Embed Size (px)
Citation preview

PUBLICSAP BusinessObjects Business Intelligence SuiteDocument Version: 4.3 Support Package 1 – 2020-06-12
SAP BusinessObjects Web Intelligence User's Guide
© 2
020
SAP
SE o
r an
SAP affi
liate
com
pany
. All r
ight
s re
serv
ed.
THE BEST RUN
Content
1 What's new, how and where to get help. . . . . . . . . . . . . . . . . . . . . . . . . . . . . . . . . . . . . . . . . . . 91.1 What's New in Web Intelligence 4.3 SP1. . . . . . . . . . . . . . . . . . . . . . . . . . . . . . . . . . . . . . . . . . . . . 91.2 To get access to the user guide. . . . . . . . . . . . . . . . . . . . . . . . . . . . . . . . . . . . . . . . . . . . . . . . . . . 10
2 What is Web Intelligence?. . . . . . . . . . . . . . . . . . . . . . . . . . . . . . . . . . . . . . . . . . . . . . . . . . . . . 112.1 Getting to know Web Intelligence and the BI Launch Pad. . . . . . . . . . . . . . . . . . . . . . . . . . . . . . . . . 12
About the Web Intelligence clients. . . . . . . . . . . . . . . . . . . . . . . . . . . . . . . . . . . . . . . . . . . . . . 12About the Web Intelligence user interface. . . . . . . . . . . . . . . . . . . . . . . . . . . . . . . . . . . . . . . . . 14Getting started with the BI Launch Pad. . . . . . . . . . . . . . . . . . . . . . . . . . . . . . . . . . . . . . . . . . .15
2.2 Setting up preferences, the interface and the document locale. . . . . . . . . . . . . . . . . . . . . . . . . . . . 18Setting preferences in the BI Launch Pad. . . . . . . . . . . . . . . . . . . . . . . . . . . . . . . . . . . . . . . . . 18Setting application modes. . . . . . . . . . . . . . . . . . . . . . . . . . . . . . . . . . . . . . . . . . . . . . . . . . . 18Document locales. . . . . . . . . . . . . . . . . . . . . . . . . . . . . . . . . . . . . . . . . . . . . . . . . . . . . . . . . 19Configuring the user interface. . . . . . . . . . . . . . . . . . . . . . . . . . . . . . . . . . . . . . . . . . . . . . . . . 21Selecting the measurement unit. . . . . . . . . . . . . . . . . . . . . . . . . . . . . . . . . . . . . . . . . . . . . . . 22
3 What is Web Intelligence Rich Client?. . . . . . . . . . . . . . . . . . . . . . . . . . . . . . . . . . . . . . . . . . . .233.1 What's new in Web Intelligence Rich Client 4.3 SP1. . . . . . . . . . . . . . . . . . . . . . . . . . . . . . . . . . . . .233.2 To download Web Intelligence Rich Client from the BI Launch Pad. . . . . . . . . . . . . . . . . . . . . . . . . . 243.3 To log in to Web Intelligence Rich Client. . . . . . . . . . . . . . . . . . . . . . . . . . . . . . . . . . . . . . . . . . . . .243.4 To change your password. . . . . . . . . . . . . . . . . . . . . . . . . . . . . . . . . . . . . . . . . . . . . . . . . . . . . . 243.5 Connection modes. . . . . . . . . . . . . . . . . . . . . . . . . . . . . . . . . . . . . . . . . . . . . . . . . . . . . . . . . . . 25
About connection security rights and working locally. . . . . . . . . . . . . . . . . . . . . . . . . . . . . . . . 25Online mode. . . . . . . . . . . . . . . . . . . . . . . . . . . . . . . . . . . . . . . . . . . . . . . . . . . . . . . . . . . . . 26Offline mode. . . . . . . . . . . . . . . . . . . . . . . . . . . . . . . . . . . . . . . . . . . . . . . . . . . . . . . . . . . . . 26
3.6 To import a document from the BI Platform repository. . . . . . . . . . . . . . . . . . . . . . . . . . . . . . . . . . 263.7 To create a document. . . . . . . . . . . . . . . . . . . . . . . . . . . . . . . . . . . . . . . . . . . . . . . . . . . . . . . . . 273.8 To open a document. . . . . . . . . . . . . . . . . . . . . . . . . . . . . . . . . . . . . . . . . . . . . . . . . . . . . . . . . . 273.9 To save a document. . . . . . . . . . . . . . . . . . . . . . . . . . . . . . . . . . . . . . . . . . . . . . . . . . . . . . . . . . 283.10 To save a copy of a document. . . . . . . . . . . . . . . . . . . . . . . . . . . . . . . . . . . . . . . . . . . . . . . . . . . 283.11 To publish a document. . . . . . . . . . . . . . . . . . . . . . . . . . . . . . . . . . . . . . . . . . . . . . . . . . . . . . . . 283.12 Searching for text in Web Intelligence Rich Client. . . . . . . . . . . . . . . . . . . . . . . . . . . . . . . . . . . . . . 293.13 Configuring Secure Network Communication (SNC) Encryption on SAP BW. . . . . . . . . . . . . . . . . . 29
Preparing the SNC configuration. . . . . . . . . . . . . . . . . . . . . . . . . . . . . . . . . . . . . . . . . . . . . . .30Configuring SNC for the Rich Client. . . . . . . . . . . . . . . . . . . . . . . . . . . . . . . . . . . . . . . . . . . . .30Configuring SNC between BOE and SAP BW systems. . . . . . . . . . . . . . . . . . . . . . . . . . . . . . . . 30Configuring SNC in the CMC. . . . . . . . . . . . . . . . . . . . . . . . . . . . . . . . . . . . . . . . . . . . . . . . . . 31
2 PUBLICSAP BusinessObjects Web Intelligence User's Guide
Content
3.14 To select default folders for local documents and universes. . . . . . . . . . . . . . . . . . . . . . . . . . . . . . . 313.15 To select a measurement unit. . . . . . . . . . . . . . . . . . . . . . . . . . . . . . . . . . . . . . . . . . . . . . . . . . . .313.16 Limitations and restrictions. . . . . . . . . . . . . . . . . . . . . . . . . . . . . . . . . . . . . . . . . . . . . . . . . . . . . 32
4 Building and running queries. . . . . . . . . . . . . . . . . . . . . . . . . . . . . . . . . . . . . . . . . . . . . . . . . . 344.1 Introducing queries. . . . . . . . . . . . . . . . . . . . . . . . . . . . . . . . . . . . . . . . . . . . . . . . . . . . . . . . . . .34
Introduction to query building. . . . . . . . . . . . . . . . . . . . . . . . . . . . . . . . . . . . . . . . . . . . . . . . . 34Building and running queries. . . . . . . . . . . . . . . . . . . . . . . . . . . . . . . . . . . . . . . . . . . . . . . . . 34Introducing the query panel. . . . . . . . . . . . . . . . . . . . . . . . . . . . . . . . . . . . . . . . . . . . . . . . . . 35Customizing the query panel. . . . . . . . . . . . . . . . . . . . . . . . . . . . . . . . . . . . . . . . . . . . . . . . . 36Query properties. . . . . . . . . . . . . . . . . . . . . . . . . . . . . . . . . . . . . . . . . . . . . . . . . . . . . . . . . . 36Query objects. . . . . . . . . . . . . . . . . . . . . . . . . . . . . . . . . . . . . . . . . . . . . . . . . . . . . . . . . . . . 39Query and document user rights . . . . . . . . . . . . . . . . . . . . . . . . . . . . . . . . . . . . . . . . . . . . . . 45Non-hierarchical queries. . . . . . . . . . . . . . . . . . . . . . . . . . . . . . . . . . . . . . . . . . . . . . . . . . . . 45Hierarchical queries. . . . . . . . . . . . . . . . . . . . . . . . . . . . . . . . . . . . . . . . . . . . . . . . . . . . . . . . 46
4.2 Building queries. . . . . . . . . . . . . . . . . . . . . . . . . . . . . . . . . . . . . . . . . . . . . . . . . . . . . . . . . . . . . 48Building queries on universes. . . . . . . . . . . . . . . . . . . . . . . . . . . . . . . . . . . . . . . . . . . . . . . . . 48Building queries on Web intelligence documents. . . . . . . . . . . . . . . . . . . . . . . . . . . . . . . . . . . .70Building queries on Excel and text files. . . . . . . . . . . . . . . . . . . . . . . . . . . . . . . . . . . . . . . . . . . 71Building queries on SAP BW InfoProviders and BEx queries (incl. BW/4HANA and S/4HANA). . . . . . . . . . . . . . . . . . . . . . . . . . . . . . . . . . . . . . . . . . . . . . . . . . . . . . . . . . . . . . . . . . . . . . 74Building queries on SAP HANA views with Direct Access. . . . . . . . . . . . . . . . . . . . . . . . . . . . . 100Building queries on S/4HANA CDS views. . . . . . . . . . . . . . . . . . . . . . . . . . . . . . . . . . . . . . . . 107Building queries on relational connections using Free-Hand SQL statements. . . . . . . . . . . . . . . 107To create a query on a different data source in an existing document. . . . . . . . . . . . . . . . . . . . . 112
4.3 Managing queries. . . . . . . . . . . . . . . . . . . . . . . . . . . . . . . . . . . . . . . . . . . . . . . . . . . . . . . . . . . 114To preview query results. . . . . . . . . . . . . . . . . . . . . . . . . . . . . . . . . . . . . . . . . . . . . . . . . . . . 114To set the keydates of queries. . . . . . . . . . . . . . . . . . . . . . . . . . . . . . . . . . . . . . . . . . . . . . . . 114To add a query . . . . . . . . . . . . . . . . . . . . . . . . . . . . . . . . . . . . . . . . . . . . . . . . . . . . . . . . . . . 115To remove a query. . . . . . . . . . . . . . . . . . . . . . . . . . . . . . . . . . . . . . . . . . . . . . . . . . . . . . . . .115To duplicate a query. . . . . . . . . . . . . . . . . . . . . . . . . . . . . . . . . . . . . . . . . . . . . . . . . . . . . . . 116Flagging queries for refresh. . . . . . . . . . . . . . . . . . . . . . . . . . . . . . . . . . . . . . . . . . . . . . . . . . 116Interrupting and canceling queries. . . . . . . . . . . . . . . . . . . . . . . . . . . . . . . . . . . . . . . . . . . . . 117Changing the data source of a query. . . . . . . . . . . . . . . . . . . . . . . . . . . . . . . . . . . . . . . . . . . .118Working with multiple queries and data providers. . . . . . . . . . . . . . . . . . . . . . . . . . . . . . . . . . 124Refreshing queries in parallel. . . . . . . . . . . . . . . . . . . . . . . . . . . . . . . . . . . . . . . . . . . . . . . . . 125
4.4 Filtering queries. . . . . . . . . . . . . . . . . . . . . . . . . . . . . . . . . . . . . . . . . . . . . . . . . . . . . . . . . . . . 127Filtering data using query filters. . . . . . . . . . . . . . . . . . . . . . . . . . . . . . . . . . . . . . . . . . . . . . .128Filtering data with query prompts. . . . . . . . . . . . . . . . . . . . . . . . . . . . . . . . . . . . . . . . . . . . . 146Filtering data using subqueries. . . . . . . . . . . . . . . . . . . . . . . . . . . . . . . . . . . . . . . . . . . . . . . 157
5 Reporting data. . . . . . . . . . . . . . . . . . . . . . . . . . . . . . . . . . . . . . . . . . . . . . . . . . . . . . . . . . . . 161
SAP BusinessObjects Web Intelligence User's GuideContent PUBLIC 3
5.1 Introduction to reporting. . . . . . . . . . . . . . . . . . . . . . . . . . . . . . . . . . . . . . . . . . . . . . . . . . . . . . 1615.2 Creating reports. . . . . . . . . . . . . . . . . . . . . . . . . . . . . . . . . . . . . . . . . . . . . . . . . . . . . . . . . . . . 161
Working with reports. . . . . . . . . . . . . . . . . . . . . . . . . . . . . . . . . . . . . . . . . . . . . . . . . . . . . . 162Working with charts in reports. . . . . . . . . . . . . . . . . . . . . . . . . . . . . . . . . . . . . . . . . . . . . . . . 275Formatting reports and report elements. . . . . . . . . . . . . . . . . . . . . . . . . . . . . . . . . . . . . . . . 290
5.3 Linking. . . . . . . . . . . . . . . . . . . . . . . . . . . . . . . . . . . . . . . . . . . . . . . . . . . . . . . . . . . . . . . . . . .345Linking to other documents. . . . . . . . . . . . . . . . . . . . . . . . . . . . . . . . . . . . . . . . . . . . . . . . . 345Linking to other reports within the same document. . . . . . . . . . . . . . . . . . . . . . . . . . . . . . . . . 351
5.4 Saving. . . . . . . . . . . . . . . . . . . . . . . . . . . . . . . . . . . . . . . . . . . . . . . . . . . . . . . . . . . . . . . . . . . 352Saving and exporting documents, reports and data. . . . . . . . . . . . . . . . . . . . . . . . . . . . . . . . . 353
6 Analyzing data. . . . . . . . . . . . . . . . . . . . . . . . . . . . . . . . . . . . . . . . . . . . . . . . . . . . . . . . . . . . 3586.1 Introduction to data analysis. . . . . . . . . . . . . . . . . . . . . . . . . . . . . . . . . . . . . . . . . . . . . . . . . . . 3586.2 Drilling. . . . . . . . . . . . . . . . . . . . . . . . . . . . . . . . . . . . . . . . . . . . . . . . . . . . . . . . . . . . . . . . . . .358
Drilling on report data. . . . . . . . . . . . . . . . . . . . . . . . . . . . . . . . . . . . . . . . . . . . . . . . . . . . . 3596.3 Filtering. . . . . . . . . . . . . . . . . . . . . . . . . . . . . . . . . . . . . . . . . . . . . . . . . . . . . . . . . . . . . . . . . . 370
Filtering report data. . . . . . . . . . . . . . . . . . . . . . . . . . . . . . . . . . . . . . . . . . . . . . . . . . . . . . . 371Filtering data using input controls. . . . . . . . . . . . . . . . . . . . . . . . . . . . . . . . . . . . . . . . . . . . . 380Filtering data dynamically with groups of input controls. . . . . . . . . . . . . . . . . . . . . . . . . . . . . .388
6.4 Functions. . . . . . . . . . . . . . . . . . . . . . . . . . . . . . . . . . . . . . . . . . . . . . . . . . . . . . . . . . . . . . . . .394Using functions, formulas and calculations for data analysis. . . . . . . . . . . . . . . . . . . . . . . . . . 394
7 Collaborating and sharing data. . . . . . . . . . . . . . . . . . . . . . . . . . . . . . . . . . . . . . . . . . . . . . . .6797.1 Collaborating and sharing data. . . . . . . . . . . . . . . . . . . . . . . . . . . . . . . . . . . . . . . . . . . . . . . . . .6797.2 Comments. . . . . . . . . . . . . . . . . . . . . . . . . . . . . . . . . . . . . . . . . . . . . . . . . . . . . . . . . . . . . . . . 679
Commenting on report data. . . . . . . . . . . . . . . . . . . . . . . . . . . . . . . . . . . . . . . . . . . . . . . . . 679
8 Scheduling and publishing documents. . . . . . . . . . . . . . . . . . . . . . . . . . . . . . . . . . . . . . . . . . 6888.1 Introduction to scheduling and publishing. . . . . . . . . . . . . . . . . . . . . . . . . . . . . . . . . . . . . . . . . . 6888.2 Concepts. . . . . . . . . . . . . . . . . . . . . . . . . . . . . . . . . . . . . . . . . . . . . . . . . . . . . . . . . . . . . . . . . 688
Instances. . . . . . . . . . . . . . . . . . . . . . . . . . . . . . . . . . . . . . . . . . . . . . . . . . . . . . . . . . . . . . 689Recurrence. . . . . . . . . . . . . . . . . . . . . . . . . . . . . . . . . . . . . . . . . . . . . . . . . . . . . . . . . . . . . 689Prompts. . . . . . . . . . . . . . . . . . . . . . . . . . . . . . . . . . . . . . . . . . . . . . . . . . . . . . . . . . . . . . . 690Formats. . . . . . . . . . . . . . . . . . . . . . . . . . . . . . . . . . . . . . . . . . . . . . . . . . . . . . . . . . . . . . . 691Events. . . . . . . . . . . . . . . . . . . . . . . . . . . . . . . . . . . . . . . . . . . . . . . . . . . . . . . . . . . . . . . . 693Scheduling server group. . . . . . . . . . . . . . . . . . . . . . . . . . . . . . . . . . . . . . . . . . . . . . . . . . . .693Destinations. . . . . . . . . . . . . . . . . . . . . . . . . . . . . . . . . . . . . . . . . . . . . . . . . . . . . . . . . . . . 693Report Bursting. . . . . . . . . . . . . . . . . . . . . . . . . . . . . . . . . . . . . . . . . . . . . . . . . . . . . . . . . . 698Personalization. . . . . . . . . . . . . . . . . . . . . . . . . . . . . . . . . . . . . . . . . . . . . . . . . . . . . . . . . . 699Delivery rules for scheduling. . . . . . . . . . . . . . . . . . . . . . . . . . . . . . . . . . . . . . . . . . . . . . . . . 702Delivery rules for publishing. . . . . . . . . . . . . . . . . . . . . . . . . . . . . . . . . . . . . . . . . . . . . . . . . 703Publication extensions. . . . . . . . . . . . . . . . . . . . . . . . . . . . . . . . . . . . . . . . . . . . . . . . . . . . . 703
4 PUBLICSAP BusinessObjects Web Intelligence User's Guide
Content
Publications for Live Office. . . . . . . . . . . . . . . . . . . . . . . . . . . . . . . . . . . . . . . . . . . . . . . . . . 704Subscriptions. . . . . . . . . . . . . . . . . . . . . . . . . . . . . . . . . . . . . . . . . . . . . . . . . . . . . . . . . . . 704Viewing publications results. . . . . . . . . . . . . . . . . . . . . . . . . . . . . . . . . . . . . . . . . . . . . . . . . 705
8.3 Scheduling documents. . . . . . . . . . . . . . . . . . . . . . . . . . . . . . . . . . . . . . . . . . . . . . . . . . . . . . . 706To schedule a document. . . . . . . . . . . . . . . . . . . . . . . . . . . . . . . . . . . . . . . . . . . . . . . . . . . . 707To view instances of a document. . . . . . . . . . . . . . . . . . . . . . . . . . . . . . . . . . . . . . . . . . . . . . 708To pause or resume an instance. . . . . . . . . . . . . . . . . . . . . . . . . . . . . . . . . . . . . . . . . . . . . . 708To delete instances from your BI Inbox. . . . . . . . . . . . . . . . . . . . . . . . . . . . . . . . . . . . . . . . . . 708
8.4 Publishing documents. . . . . . . . . . . . . . . . . . . . . . . . . . . . . . . . . . . . . . . . . . . . . . . . . . . . . . . .709About publications. . . . . . . . . . . . . . . . . . . . . . . . . . . . . . . . . . . . . . . . . . . . . . . . . . . . . . . .709To create a publication. . . . . . . . . . . . . . . . . . . . . . . . . . . . . . . . . . . . . . . . . . . . . . . . . . . . . 713To open a publication. . . . . . . . . . . . . . . . . . . . . . . . . . . . . . . . . . . . . . . . . . . . . . . . . . . . . . 714To select an event to trigger a publication. . . . . . . . . . . . . . . . . . . . . . . . . . . . . . . . . . . . . . . . 714To select personalized placeholders for source documents. . . . . . . . . . . . . . . . . . . . . . . . . . . . 715To select personalized placeholders for email fields. . . . . . . . . . . . . . . . . . . . . . . . . . . . . . . . . 715To embed content from a dynamic source document in an email. . . . . . . . . . . . . . . . . . . . . . . .716To personalize a document with a global profile target. . . . . . . . . . . . . . . . . . . . . . . . . . . . . . . 716To personalize a document by filtering fields. . . . . . . . . . . . . . . . . . . . . . . . . . . . . . . . . . . . . . 717
8.5 Managing publications and instances. . . . . . . . . . . . . . . . . . . . . . . . . . . . . . . . . . . . . . . . . . . . . 717To test a publication. . . . . . . . . . . . . . . . . . . . . . . . . . . . . . . . . . . . . . . . . . . . . . . . . . . . . . . 718To view the progress or history of a publication. . . . . . . . . . . . . . . . . . . . . . . . . . . . . . . . . . . . 718To subscribe to or unsubscribe from a publication. . . . . . . . . . . . . . . . . . . . . . . . . . . . . . . . . . 718To subscribe to or unsubscribe from a publication instance. . . . . . . . . . . . . . . . . . . . . . . . . . . 719To view publications sent to the Default Enterprise Location. . . . . . . . . . . . . . . . . . . . . . . . . . . 719To view publications sent to a BI Inbox. . . . . . . . . . . . . . . . . . . . . . . . . . . . . . . . . . . . . . . . . . 719To redistribute a publication instance. . . . . . . . . . . . . . . . . . . . . . . . . . . . . . . . . . . . . . . . . . .720To retry a failed publication. . . . . . . . . . . . . . . . . . . . . . . . . . . . . . . . . . . . . . . . . . . . . . . . . . 720
8.6 Best practices for publications. . . . . . . . . . . . . . . . . . . . . . . . . . . . . . . . . . . . . . . . . . . . . . . . . . 721Best practices for adding source documents. . . . . . . . . . . . . . . . . . . . . . . . . . . . . . . . . . . . . 723Best practices for using dynamic recipient sources. . . . . . . . . . . . . . . . . . . . . . . . . . . . . . . . . 724Best practices for sending and receiving email publication instances. . . . . . . . . . . . . . . . . . . . .724
9 Working with documents in Reading mode. . . . . . . . . . . . . . . . . . . . . . . . . . . . . . . . . . . . . . . 7269.1 Interacting with documents in Reading mode. . . . . . . . . . . . . . . . . . . . . . . . . . . . . . . . . . . . . . . .726
Features available in Reading mode. . . . . . . . . . . . . . . . . . . . . . . . . . . . . . . . . . . . . . . . . . . . 727Saving and exporting documents in Reading mode. . . . . . . . . . . . . . . . . . . . . . . . . . . . . . . . . 728Printing reports. . . . . . . . . . . . . . . . . . . . . . . . . . . . . . . . . . . . . . . . . . . . . . . . . . . . . . . . . . 728To send a document to a BI Inbox. . . . . . . . . . . . . . . . . . . . . . . . . . . . . . . . . . . . . . . . . . . . . 728Viewing modes. . . . . . . . . . . . . . . . . . . . . . . . . . . . . . . . . . . . . . . . . . . . . . . . . . . . . . . . . . 729Tracking changes in data. . . . . . . . . . . . . . . . . . . . . . . . . . . . . . . . . . . . . . . . . . . . . . . . . . . 730Drilling on report data in Reading mode. . . . . . . . . . . . . . . . . . . . . . . . . . . . . . . . . . . . . . . . . 731Editing values of input controls in Reading mode. . . . . . . . . . . . . . . . . . . . . . . . . . . . . . . . . . . 734
SAP BusinessObjects Web Intelligence User's GuideContent PUBLIC 5
Folding and unfolding report data. . . . . . . . . . . . . . . . . . . . . . . . . . . . . . . . . . . . . . . . . . . . . 734Warning icons in charts. . . . . . . . . . . . . . . . . . . . . . . . . . . . . . . . . . . . . . . . . . . . . . . . . . . . .735
10 Security. . . . . . . . . . . . . . . . . . . . . . . . . . . . . . . . . . . . . . . . . . . . . . . . . . . . . . . . . . . . . . . . . 73710.1 Data protection and privacy. . . . . . . . . . . . . . . . . . . . . . . . . . . . . . . . . . . . . . . . . . . . . . . . . . . . 73710.2 General principles. . . . . . . . . . . . . . . . . . . . . . . . . . . . . . . . . . . . . . . . . . . . . . . . . . . . . . . . . . . 73710.3 Building Web Intelligence reports. . . . . . . . . . . . . . . . . . . . . . . . . . . . . . . . . . . . . . . . . . . . . . . . 73710.4 Retention policy. . . . . . . . . . . . . . . . . . . . . . . . . . . . . . . . . . . . . . . . . . . . . . . . . . . . . . . . . . . . 73810.5 Read access logging. . . . . . . . . . . . . . . . . . . . . . . . . . . . . . . . . . . . . . . . . . . . . . . . . . . . . . . . . 73810.6 Logs. . . . . . . . . . . . . . . . . . . . . . . . . . . . . . . . . . . . . . . . . . . . . . . . . . . . . . . . . . . . . . . . . . . . 73810.7 Reporting. . . . . . . . . . . . . . . . . . . . . . . . . . . . . . . . . . . . . . . . . . . . . . . . . . . . . . . . . . . . . . . . . 73910.8 Saving documents locally. . . . . . . . . . . . . . . . . . . . . . . . . . . . . . . . . . . . . . . . . . . . . . . . . . . . . 739
11 Rights appendix. . . . . . . . . . . . . . . . . . . . . . . . . . . . . . . . . . . . . . . . . . . . . . . . . . . . . . . . . . . 74011.1 New Web Intelligence security rights. . . . . . . . . . . . . . . . . . . . . . . . . . . . . . . . . . . . . . . . . . . . . . 74011.2 Web Intelligence application rights. . . . . . . . . . . . . . . . . . . . . . . . . . . . . . . . . . . . . . . . . . . . . . . 74011.3 Web Intelligence document rights. . . . . . . . . . . . . . . . . . . . . . . . . . . . . . . . . . . . . . . . . . . . . . . . 74211.4 Relational connection rights. . . . . . . . . . . . . . . . . . . . . . . . . . . . . . . . . . . . . . . . . . . . . . . . . . . . 74311.5 Universe rights. . . . . . . . . . . . . . . . . . . . . . . . . . . . . . . . . . . . . . . . . . . . . . . . . . . . . . . . . . . . . 744
12 Web Intelligence error messages. . . . . . . . . . . . . . . . . . . . . . . . . . . . . . . . . . . . . . . . . . . . . . 74612.1 Web Intelligence Desktop HTML Interface (WIH) Error Messages. . . . . . . . . . . . . . . . . . . . . . . . . . 746
Invalid session. Please close your browser and log on again. (WIH 00013). . . . . . . . . . . . . . . . . . . . . . . . . . . . . . . . . . . . . . . . . . . . . . . . . . . . . . . . . . . . . . . . 746
The document could not be saved. (WIH 00014). . . . . . . . . . . . . . . . . . . . . . . . . . . 746
The session timed out. The document {document_name}.wid has been autosaved in the Favorites\~WebIntelligence folder. Click Restore to retrieve it. (WIH 00015) . . . . . . . . . . . . . . . . . . . . . . . . . . . . . . . . . . . . . . . . . . . . . . 747
The session timed out, but the document could not be autosaved because the following security rights are not assigned (WIH 00016): {list_of_rights} . . . . . . . . . . . . . . . . . . . . . . . . . . . . . . . . . . . . . . . . . . . . . . . . . . . . . . 747
An unexpected error occurred. For information about this error, please refer to SAP Knowledge Base Article 2054722 on the SAP Support Portal. (WIH 44444). . . . . . . . . . . . . . . . . . . . . . . . . . . . . . . . . . . . . . . . . . . . . . . . . . . . . . . . . . . 748
12.2 Web Intelligence Desktop (WIO) Error Messages. . . . . . . . . . . . . . . . . . . . . . . . . . . . . . . . . . . . . 748Web Intelligence Desktop cannot log in. (WIO 00001) . . . . . . . . . . . . . . . . . . . . 748
Cannot open the hyperlink (WIO 00002).. . . . . . . . . . . . . . . . . . . . . . . . . . . . . . . . . 749
There is no more memory available. (WIS 30280) (WIO 30280). . . . . . . . . . . . . . 749
Cannot continue because memory is low. Please close documents to free memory. (WIO 30284). . . . . . . . . . . . . . . . . . . . . . . . . . . . . . . . . . . . . . . . . . . . . . . . . . . 749
12.3 Web Intelligence Server (WIS) Error Messages. . . . . . . . . . . . . . . . . . . . . . . . . . . . . . . . . . . . . . .750The query in this document is empty. (WIS 30000) . . . . . . . . . . . . . . . . . . . . . . .750
At least one query in the document is empty. (WIS 30001) . . . . . . . . . . . . . . . 750
6 PUBLICSAP BusinessObjects Web Intelligence User's Guide
Content
Your security profile does not include permission to edit queries. (WIS 30251) . . . . . . . . . . . . . . . . . . . . . . . . . . . . . . . . . . . . . . . . . . . . . . . . . . . . . . . . . . . . . . . 751
Your security profile does not include permission to edit documents. (WIS 30252) . . . . . . . . . . . . . . . . . . . . . . . . . . . . . . . . . . . . . . . . . . . . . . . . . . . . . . . . . . 751
Your security profile does not include permission to refresh documents. (WIS 30253) . . . . . . . . . . . . . . . . . . . . . . . . . . . . . . . . . . . . . . . . . . . . . . . . . . . . . . . . . . 751
Your security profile does not include permission to refresh lists of values. (WIS 30254) . . . . . . . . . . . . . . . . . . . . . . . . . . . . . . . . . . . . . . . . . . . . . . . . . . 752
Your security profile does not include permission to use lists of values. (WIS 30255) . . . . . . . . . . . . . . . . . . . . . . . . . . . . . . . . . . . . . . . . . . . . . . . . . . 752
Your security profile does not include permission to view the script generated by the query. (WIS 30256) . . . . . . . . . . . . . . . . . . . . . . . . . . . . . . . . . . . 752
Your security profile does not include permission to use the formula language. (WIS 30257) . . . . . . . . . . . . . . . . . . . . . . . . . . . . . . . . . . . . . . . . . . . . . . . . 753
Your security profile does not include permission to perform drill analysis. (WIS 30258) . . . . . . . . . . . . . . . . . . . . . . . . . . . . . . . . . . . . . . . . . . . . . . . . 753
Your security profile does not include permission to extend the scope of analysis. (WIS 30259) . . . . . . . . . . . . . . . . . . . . . . . . . . . . . . . . . . . . . . . . . . . . . .753
An internal error occurred while calling the {api_name} API. (WIS 30270) . . . . . . . . . . . . . . . . . . . . . . . . . . . . . . . . . . . . . . . . . . . . . . . . . . . . . . . . . . . . . . . 754
The document is too large to be processed by the server. (WIS 30271) . . . . . . . . . . . . . . . . . . . . . . . . . . . . . . . . . . . . . . . . . . . . . . . . . . . . . . . . . . . . . . . . . . . . . 754The document is too large to be processed by the server. (WIS 30272) . . . . . . . . . . . . . . . . . . . . . . . . . . . . . . . . . . . . . . . . . . . . . . . . . . . . . . . . . . . . . . . . . . . . . 754The query or report could not be generated.(WIS 30351) . . . . . . . . . . . . . . . . . 755
A query with this name already exists. (WIS 30371) . . . . . . . . . . . . . . . . . . . . . 755
The Web Intelligence server memory is full. Log off and try to connect later. If the problem persists, contact your administrator. (Error: ERR_WIS_30280) (WIS 30280). . . . . . . . . . . . . . . . . . . . . . . . . . . . . . . . . . . . . . . . . . . . .755
The Web Intelligence server is busy. Save any pending change and try again later. If the problem persists, contact your administrator. (Error: ERR_WIS_30284) (WIS 30284). . . . . . . . . . . . . . . . . . . . . . . . . . . . . . . . . . . . . 756
The Web Intelligence server is running out of memory, your document has been closed. If the problem persists, contact your administrator. (Error: ERR_WIS_30285) (WIS 30285). . . . . . . . . . . . . . . . . . . . . . . . . . . . . . . . . . . . . 756
This document has been migrated. We recommend saving the document to improve its performance next time you open it. (WIS 30374). . . . . . . . . . . . . . . . . . . . . . . . . . . . . . . . . . . 757This document contains geo-qualified data from a previous version of Web Intelligence. We strongly recommend you to check the geo-qualification of this data to fix potential mismatches, and avoid any loss of information in Geomap charts (WIS 30375). . . . . . . . . . . . . 757You cannot edit this document because the query property option "Allow other users to edit the query" was not enabled when the document was created. (WIS 30381) . . . . . . . . . . . . . . . . . . . . . . . . . . . . . . . . . . . . . . . . . . . . . . . . . 758
An internal error has been generated by the WIQT. (WIS 30551) . . . . . . . . . . 758
SAP BusinessObjects Web Intelligence User's GuideContent PUBLIC 7
Your WIQT session has reached timeout. Log out and log in again to the BI launch pad. (WIS 30553) . . . . . . . . . . . . . . . . . . . . . . . . . . . . . . . . . . . . . . . . . . . .758
No more WIQT servers are available. The maximum number of concurrent users is already logged in. (WIS 30554) . . . . . . . . . . . . . . . . . . . . . . . . . . . . . . . 759
Your security profile does not include permission to save documents as corporate documents or to send documents using the BI launch pad. (WIS 30555) . . . . . . . . . . . . . . . . . . . . . . . . . . . . . . . . . . . . . . . . . . . . . . . . . . . . . . . . . . . . . . . 759
A corporate document with this name already exists. Your security profile does not include permission to delete corporate documents created by other users. (WIS 30556) . . . . . . . . . . . . . . . . . . . . . . . . . . . . . . . . . . . 760
There is no document with this name in the repository. Specify a different document name. (WIS 30557) . . . . . . . . . . . . . . . . . . . . . . . . . . . . . . . . . . 760
Cannot perform the intended action on this document. (WIS 30650) . . . . . . . 760
The server failed to load the XML document. (WIS 30751) . . . . . . . . . . . . . . . . 761
The XML file for this document cannot be opened. Contact your administrator. (WIS 30752) . . . . . . . . . . . . . . . . . . . . . . . . . . . . . . . . . . . . . . . . . . . . 761
An error occurred while parsing the XML document. Contact your administrator. (WIS 30753) . . . . . . . . . . . . . . . . . . . . . . . . . . . . . . . . . . . . . . . . . . . .762
Your user profile does not provide you with access to a document domain to save corporate documents. Save this document as a personal document or contact your administrator. (WIS 40000) . . . . . . . . . . . . . . . . . . . . . . . . . . . . 762
12.4 Information Engine Services (IES) Error Messages. . . . . . . . . . . . . . . . . . . . . . . . . . . . . . . . . . . . 762IES 00001 -IES 01031 Query execution errors. . . . . . . . . . . . . . . . . . . . . . . . . . . . . . . . . . . . . 763IES 01501 - IES 01513 Graph execution errors. . . . . . . . . . . . . . . . . . . . . . . . . . . . . . . . . . . . . 783IES 10001 - IES 10903 Query execution errors (Web Intelligence only). . . . . . . . . . . . . . . . . . . . 785
12.5 ReportEngine Web Intelligence (RWI) Error Messages . . . . . . . . . . . . . . . . . . . . . . . . . . . . . . . . . 820RWI 00000 - RWI 00314. . . . . . . . . . . . . . . . . . . . . . . . . . . . . . . . . . . . . . . . . . . . . . . . . . . .820RWI 00315 - RWI 00605. . . . . . . . . . . . . . . . . . . . . . . . . . . . . . . . . . . . . . . . . . . . . . . . . . . . 827RWI 00606 - RWI 00850. . . . . . . . . . . . . . . . . . . . . . . . . . . . . . . . . . . . . . . . . . . . . . . . . . . 834
12.6 Custom Data Source (CDS) Framework Error Messages. . . . . . . . . . . . . . . . . . . . . . . . . . . . . . . . 842Custom Data Source User Interface Framework error messages. . . . . . . . . . . . . . . . . . . . . . . .842Web Services Custom Data Source Plugin error messages. . . . . . . . . . . . . . . . . . . . . . . . . . . .846Custom Data Source Framework error messages. . . . . . . . . . . . . . . . . . . . . . . . . . . . . . . . . . 850
8 PUBLICSAP BusinessObjects Web Intelligence User's Guide
Content
1 What's new, how and where to get help
1.1 What's New in Web Intelligence 4.3 SP1
New side panel design
The side panel design has been enhanced and to facilitate the interactions on the canvas and take less space on the screen. The main panel () now groups the Objects, Structure, Map, Comments and Properties panes and the secondary panel () groups the Data and Format panes. Both panels now have their dedicated icons and can be open and closed independently.
For more information, see About the Web Intelligence user interface [page 14].
Web Intelligence Rich Client
The Rich Client has been enhanced with the following features:
● You can now install the Rich Client directly from the BI Launch Pad, under Settings Application Preferences Web Intelligence .
● Use CTRL + F or Cmd + F to search for text within the active window and open UI elements such as dropdown lists, dialogs and more.
Input controls
We've simplified the creation of groups of input control. Until now, you had to add each control of a group to the filter path manually. You can now add all controls of group directly to the filter path when creating the group.
Also, input controls based on constant variables drive the variable value for the whole document, and are now displayed as document input control in the filter bar.
Formula language
New functions added: Pos [page 480] and RPos [page 486].
SAP BusinessObjects Web Intelligence User's GuideWhat's new, how and where to get help PUBLIC 9
User interface configuration
The user interface can now be configured according to the way you work. The application now saves different user interface elements you prefer to have open or closed like the side panel, the formula bar, the filter bar,…, and keeps them as default so that you don't have to reset the interface each time you open a document.
Customization
We've reintroduced the user interface configuration via the Central Management Console. Customization allows you to hide multiple interface elements to simplify the way end-users interact with the application, depending on user groups and folders containing Web Intelligence documents. You can hide data sources types, edit mode toggle, turn-off the auto refresh feature, and many more.
For more information, refer to the Customizing Web Intelligence interface elements by user group and folders section of the Business Intelligence Platform Administrator Guide on the Business Intelligence Platform help portal page.
Miscellaneous enhancements
● Add charts to the canvas directly from the Insert menu toolbar without using the Turn Into method. For more information, see To add a chart [page 285].
● In the Comments pane, it’s now possible to copy all comment from a thread using the Copy All... button. For more information, see To copy a comments thread [page 685].
● It's now possible to add a Prompt Summary cell to the canvas using the new Prompt submenu under the Insert Cell menu in the toolbar.
● We've introduced LOV sorting for prompts and query filters LOVs. They can be sorted in ascending or descending order, or keep the server order. For more information, see To select values from a list of values [page 138].
● We've addded keydates management support for SAP OLAP .UNV universes. For more information, see To set the keydates of queries [page 114].
1.2 To get access to the user guide
You can access this guide and the user assistance contents directly from the application.
1. Open Web Intelligence.
2. In the File section of the toolbar, click .3. Click Help to open the user guide on the SAP Help Portal.
10 PUBLICSAP BusinessObjects Web Intelligence User's Guide
What's new, how and where to get help
2 What is Web Intelligence?
Web Intelligence is an advanced on-premise reporting and dashboarding tool for business users, available on the Web, desktop, or mobile device. Web Intelligence allows you to:
● Get the insights you need, when you need them, no matter where you are.● Deliver personalized business intelligence to your colleagues, customers, and partners.● Improve productivity by giving users an intuitive tool and clearing IT backlogs.
In Web Intelligence, the content you create is based on data providers. Data providers are the basis of your content creation. You can use one or multiple data providers coming from different data source types. The application processes data either sequentially or in parallel, depending on the data provider types. Data providers can be merged, and you can also leverage them to create variables using Web Intelligence’s powerful formula language. Finally, data can be enriched with time or geo dimensions.
Data is the foundation of the report elements you add to reports. From simple or more complex tables to advanced charts, you’ll be able to use the multiple visualizations at your disposal to design reports. You can even go further and design your own charts using custom elements to reuse them in reports.
Once your report or dashboard is ready, you can share it with other users using either publishing or scheduling.
Caution● Web Intelligence has open or freely configurable entry fields in which you can enter data that are stored
in a system. These fields are not intended for storing personal data. To ensure data protection and privacy, we do not recommend entering personal data without the authorization of your organization and additional security measures.
● Web Intelligence is optimized for a 1920x1080 resolution. We recommend setting the scale to 100%.
Data sources
Data in Web Intelligence documents can come from:
● Universes, which organize data from relational or OLAP databases into objects or hierarchies● Existing Web Intelligence documents● Personal data providers (.XLSX files)● BEx queries based on SAP Info Cubes● Analysis View workspaces● Relational database queries via Free-Hand SQL statements● You can connect to the SAP HANA (High-Performance Analytical Appliance) data source to use in-memory
computing. SAP HANA universes based on SAP HANA views with variables are supported in Web Intelligence. The HTTP protocol is also supported, and you can create HTTP connections to your on-premise SAP HANA system, or SAP HANA Cloud Platform, through HANA InfoAccess (InA) services.
You build data providers to retrieve data from data sources and create reports from the data in data providers.
SAP BusinessObjects Web Intelligence User's GuideWhat is Web Intelligence? PUBLIC 11
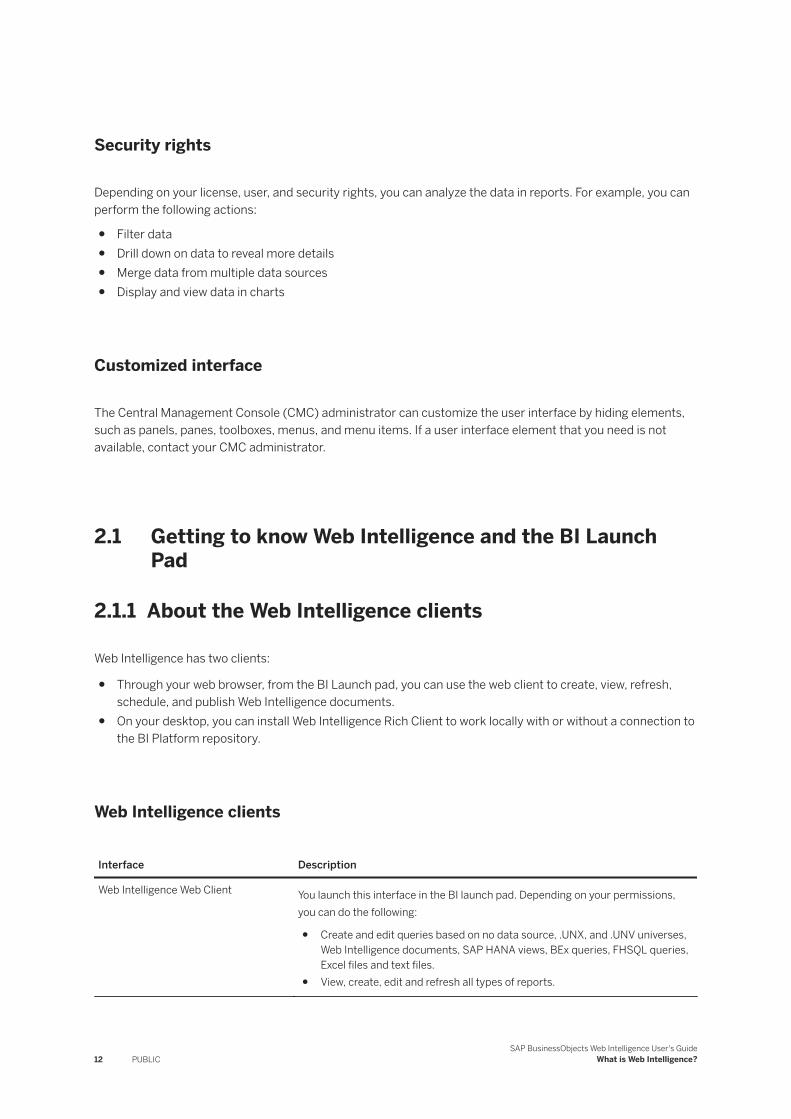
Security rights
Depending on your license, user, and security rights, you can analyze the data in reports. For example, you can perform the following actions:
● Filter data● Drill down on data to reveal more details● Merge data from multiple data sources● Display and view data in charts
Customized interface
The Central Management Console (CMC) administrator can customize the user interface by hiding elements, such as panels, panes, toolboxes, menus, and menu items. If a user interface element that you need is not available, contact your CMC administrator.
2.1 Getting to know Web Intelligence and the BI Launch Pad
2.1.1 About the Web Intelligence clients
Web Intelligence has two clients:
● Through your web browser, from the BI Launch pad, you can use the web client to create, view, refresh, schedule, and publish Web Intelligence documents.
● On your desktop, you can install Web Intelligence Rich Client to work locally with or without a connection to the BI Platform repository.
Web Intelligence clients
Interface Description
Web Intelligence Web Client You launch this interface in the BI launch pad. Depending on your permissions, you can do the following:
● Create and edit queries based on no data source, .UNX, and .UNV universes, Web Intelligence documents, SAP HANA views, BEx queries, FHSQL queries, Excel files and text files.
● View, create, edit and refresh all types of reports.
12 PUBLICSAP BusinessObjects Web Intelligence User's Guide
What is Web Intelligence?
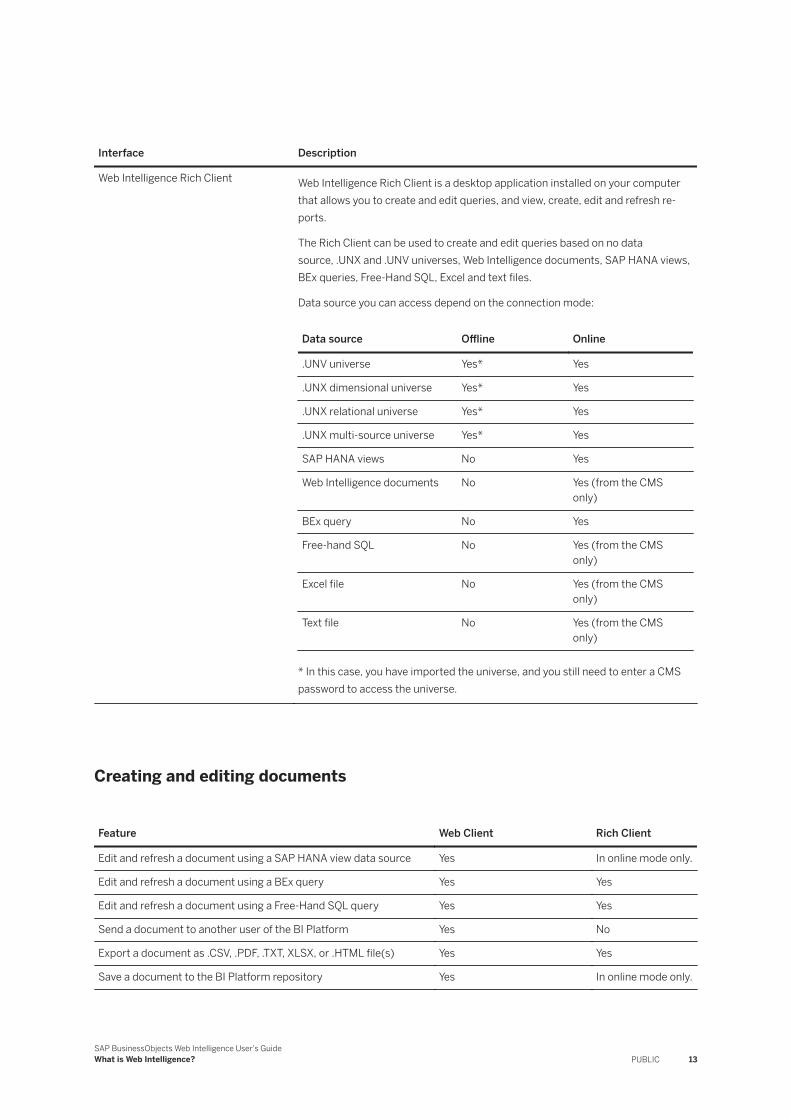
Interface Description
Web Intelligence Rich Client Web Intelligence Rich Client is a desktop application installed on your computer that allows you to create and edit queries, and view, create, edit and refresh reports.
The Rich Client can be used to create and edit queries based on no data source, .UNX and .UNV universes, Web Intelligence documents, SAP HANA views, BEx queries, Free-Hand SQL, Excel and text files.
Data source you can access depend on the connection mode:
Data source Offline Online
.UNV universe Yes* Yes
.UNX dimensional universe Yes* Yes
.UNX relational universe Yes* Yes
.UNX multi-source universe Yes* Yes
SAP HANA views No Yes
Web Intelligence documents No Yes (from the CMS only)
BEx query No Yes
Free-hand SQL No Yes (from the CMS only)
Excel file No Yes (from the CMS only)
Text file No Yes (from the CMS only)
* In this case, you have imported the universe, and you still need to enter a CMS password to access the universe.
Creating and editing documents
Feature Web Client Rich Client
Edit and refresh a document using a SAP HANA view data source Yes In online mode only.
Edit and refresh a document using a BEx query Yes Yes
Edit and refresh a document using a Free-Hand SQL query Yes Yes
Send a document to another user of the BI Platform Yes No
Export a document as .CSV, .PDF, .TXT, XLSX, or .HTML file(s) Yes Yes
Save a document to the BI Platform repository Yes In online mode only.
SAP BusinessObjects Web Intelligence User's GuideWhat is Web Intelligence? PUBLIC 13
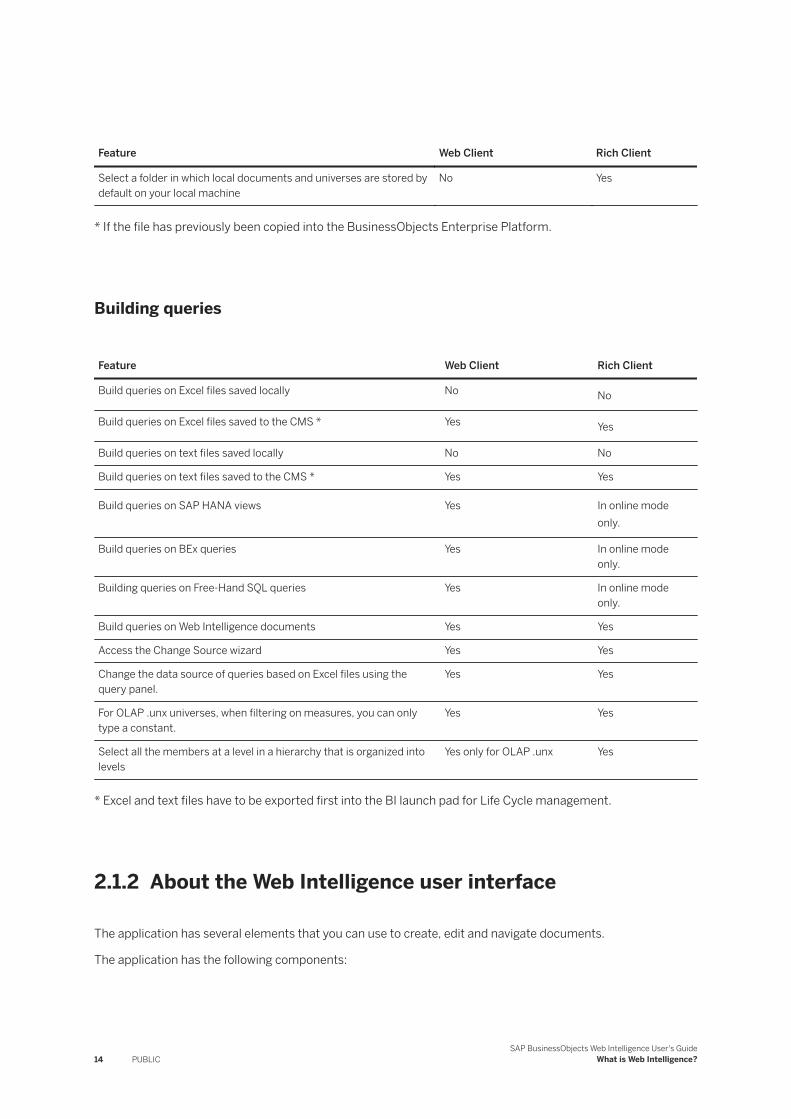
Feature Web Client Rich Client
Select a folder in which local documents and universes are stored by default on your local machine
No Yes
* If the file has previously been copied into the BusinessObjects Enterprise Platform.
Building queries
Feature Web Client Rich Client
Build queries on Excel files saved locally No No
Build queries on Excel files saved to the CMS * Yes Yes
Build queries on text files saved locally No No
Build queries on text files saved to the CMS * Yes Yes
Build queries on SAP HANA views Yes In online mode only.
Build queries on BEx queries Yes In online mode only.
Building queries on Free-Hand SQL queries Yes In online mode only.
Build queries on Web Intelligence documents Yes Yes
Access the Change Source wizard Yes Yes
Change the data source of queries based on Excel files using the query panel.
Yes Yes
For OLAP .unx universes, when filtering on measures, you can only type a constant.
Yes Yes
Select all the members at a level in a hierarchy that is organized into levels
Yes only for OLAP .unx Yes
* Excel and text files have to be exported first into the BI launch pad for Life Cycle management.
2.1.2 About the Web Intelligence user interface
The application has several elements that you can use to create, edit and navigate documents.
The application has the following components:
14 PUBLICSAP BusinessObjects Web Intelligence User's Guide
What is Web Intelligence?
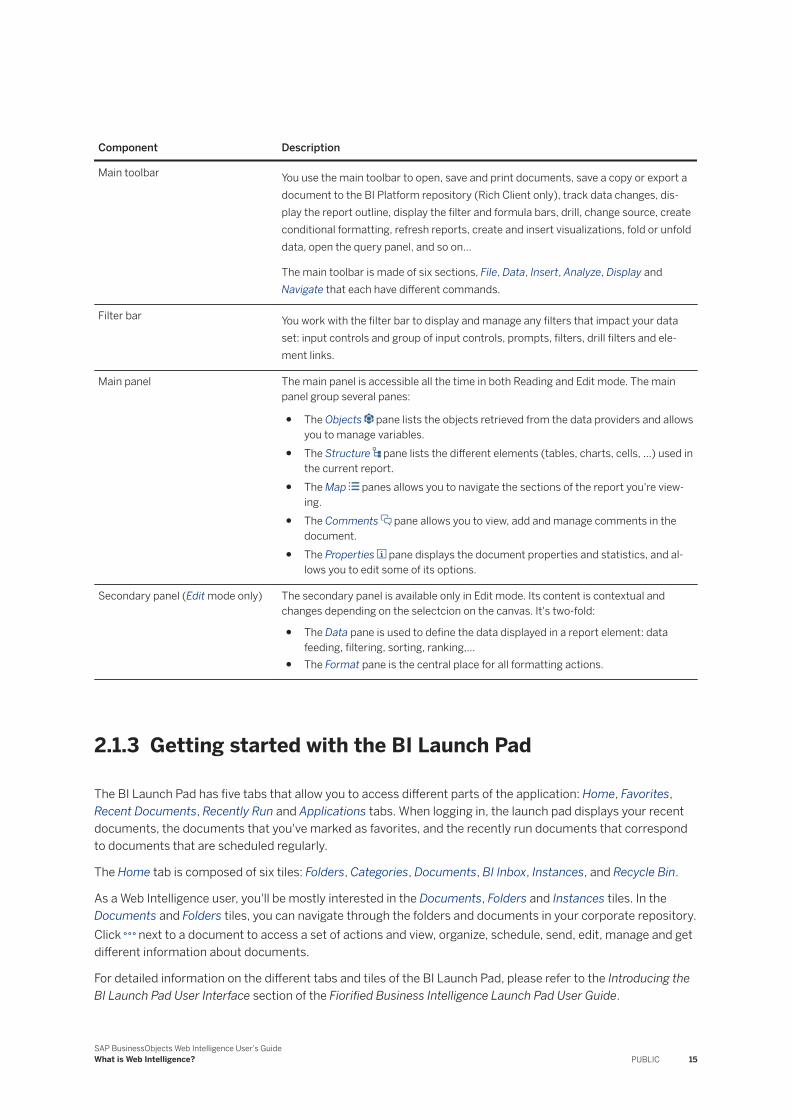
Component Description
Main toolbar You use the main toolbar to open, save and print documents, save a copy or export a document to the BI Platform repository (Rich Client only), track data changes, display the report outline, display the filter and formula bars, drill, change source, create conditional formatting, refresh reports, create and insert visualizations, fold or unfold data, open the query panel, and so on...
The main toolbar is made of six sections, File, Data, Insert, Analyze, Display and Navigate that each have different commands.
Filter bar You work with the filter bar to display and manage any filters that impact your data set: input controls and group of input controls, prompts, filters, drill filters and element links.
Main panel The main panel is accessible all the time in both Reading and Edit mode. The main panel group several panes:
● The Objects pane lists the objects retrieved from the data providers and allows you to manage variables.
● The Structure pane lists the different elements (tables, charts, cells, ...) used in the current report.
● The Map panes allows you to navigate the sections of the report you're viewing.
● The Comments pane allows you to view, add and manage comments in the document.
● The Properties pane displays the document properties and statistics, and allows you to edit some of its options.
Secondary panel (Edit mode only) The secondary panel is available only in Edit mode. Its content is contextual and changes depending on the selectcion on the canvas. It's two-fold:
● The Data pane is used to define the data displayed in a report element: data feeding, filtering, sorting, ranking,…
● The Format pane is the central place for all formatting actions.
2.1.3 Getting started with the BI Launch Pad
The BI Launch Pad has five tabs that allow you to access different parts of the application: Home, Favorites, Recent Documents, Recently Run and Applications tabs. When logging in, the launch pad displays your recent documents, the documents that you've marked as favorites, and the recently run documents that correspond to documents that are scheduled regularly.
The Home tab is composed of six tiles: Folders, Categories, Documents, BI Inbox, Instances, and Recycle Bin.
As a Web Intelligence user, you'll be mostly interested in the Documents, Folders and Instances tiles. In the Documents and Folders tiles, you can navigate through the folders and documents in your corporate repository. Click next to a document to access a set of actions and view, organize, schedule, send, edit, manage and get different information about documents.
For detailed information on the different tabs and tiles of the BI Launch Pad, please refer to the Introducing the BI Launch Pad User Interface section of the Fiorified Business Intelligence Launch Pad User Guide.
SAP BusinessObjects Web Intelligence User's GuideWhat is Web Intelligence? PUBLIC 15
Related Information
Setting preferences in the BI Launch Pad [page 18]
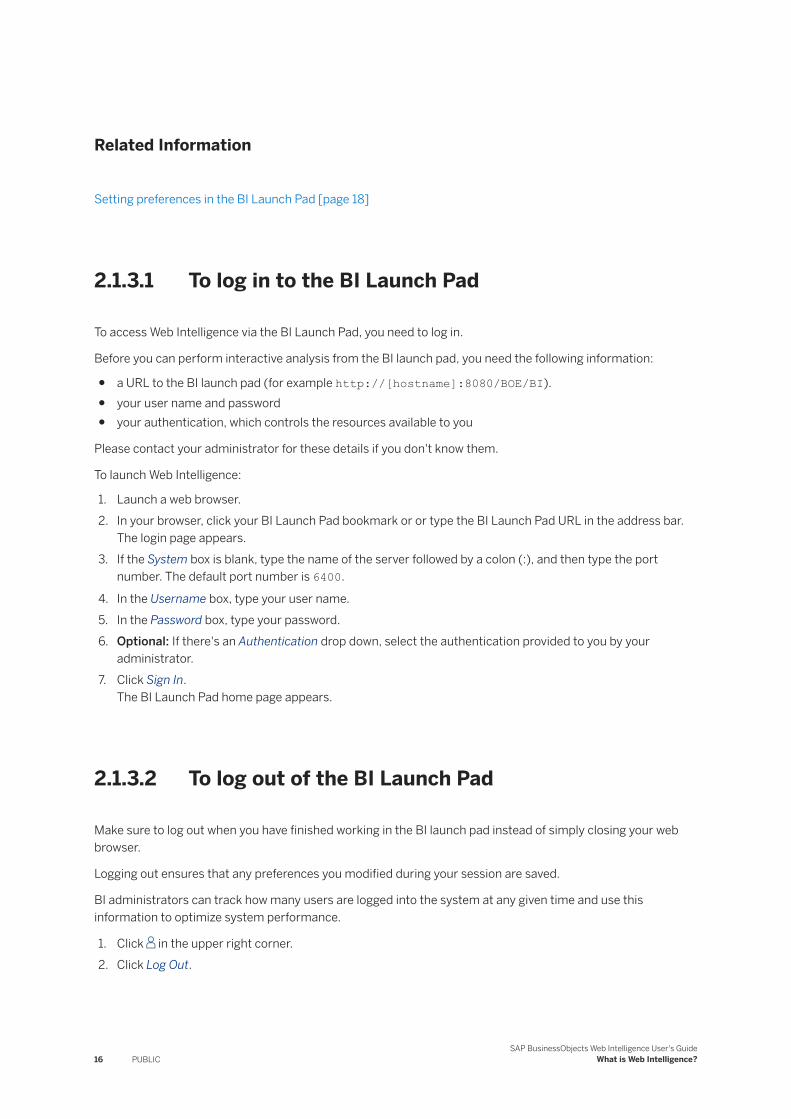
2.1.3.1 To log in to the BI Launch Pad
To access Web Intelligence via the BI Launch Pad, you need to log in.
Before you can perform interactive analysis from the BI launch pad, you need the following information:
● a URL to the BI launch pad (for example http://[hostname]:8080/BOE/BI).● your user name and password● your authentication, which controls the resources available to you
Please contact your administrator for these details if you don't know them.
To launch Web Intelligence:
1. Launch a web browser.2. In your browser, click your BI Launch Pad bookmark or or type the BI Launch Pad URL in the address bar.
The login page appears.3. If the System box is blank, type the name of the server followed by a colon (:), and then type the port
number. The default port number is 6400.
4. In the Username box, type your user name.5. In the Password box, type your password.6. Optional: If there's an Authentication drop down, select the authentication provided to you by your
administrator.7. Click Sign In.
The BI Launch Pad home page appears.
2.1.3.2 To log out of the BI Launch Pad
Make sure to log out when you have finished working in the BI launch pad instead of simply closing your web browser.
Logging out ensures that any preferences you modified during your session are saved.
BI administrators can track how many users are logged into the system at any given time and use this information to optimize system performance.
1. Click in the upper right corner.2. Click Log Out.
16 PUBLICSAP BusinessObjects Web Intelligence User's Guide
What is Web Intelligence?
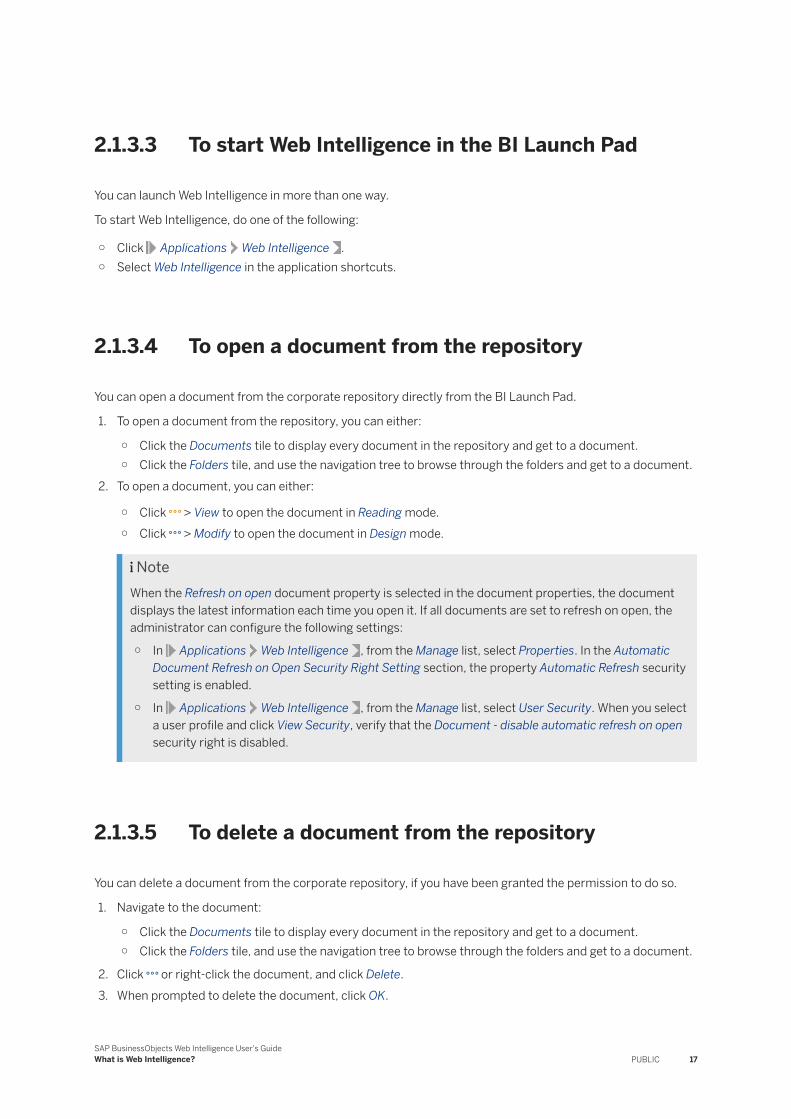
2.1.3.3 To start Web Intelligence in the BI Launch Pad
You can launch Web Intelligence in more than one way.
To start Web Intelligence, do one of the following:
○ Click Applications Web Intelligence .○ Select Web Intelligence in the application shortcuts.
2.1.3.4 To open a document from the repository
You can open a document from the corporate repository directly from the BI Launch Pad.
1. To open a document from the repository, you can either:
○ Click the Documents tile to display every document in the repository and get to a document.○ Click the Folders tile, and use the navigation tree to browse through the folders and get to a document.
2. To open a document, you can either:
○ Click > View to open the document in Reading mode.○ Click > Modify to open the document in Design mode.
NoteWhen the Refresh on open document property is selected in the document properties, the document displays the latest information each time you open it. If all documents are set to refresh on open, the administrator can configure the following settings:
○ In Applications Web Intelligence , from the Manage list, select Properties. In the Automatic Document Refresh on Open Security Right Setting section, the property Automatic Refresh security setting is enabled.
○ In Applications Web Intelligence , from the Manage list, select User Security. When you select a user profile and click View Security, verify that the Document - disable automatic refresh on open security right is disabled.
2.1.3.5 To delete a document from the repository
You can delete a document from the corporate repository, if you have been granted the permission to do so.
1. Navigate to the document:
○ Click the Documents tile to display every document in the repository and get to a document.○ Click the Folders tile, and use the navigation tree to browse through the folders and get to a document.
2. Click or right-click the document, and click Delete.3. When prompted to delete the document, click OK.
SAP BusinessObjects Web Intelligence User's GuideWhat is Web Intelligence? PUBLIC 17
2.2 Setting up preferences, the interface and the document locale
2.2.1 Setting preferences in the BI Launch Pad
You can set multiple Web Intelligence options in the BI Launch Pad.
Option Description
General Set the user default settings. These are Administrator defined.
Change Password Change your password. Enter your old password, then enter the new password twice.
Locales and Time Zone Set the product locale, preferred viewing locale, and current time zone under
Account Preferences Locale and Time Zone .
Web Intelligence Set the locale used to format data, measurement unit, drill options, and Excel
preferences under Application Preferences Web Intelligence .
Related Information
Getting started with the BI Launch Pad [page 15]
2.2.2 Setting application modes
The application is split between two modes: Reading and Design.
You can switch between both modes using the toggle in the toolbar. When the toggle is off, the application is in Reading mode.
NoteThe Design mode is also called Edit mode.
18 PUBLICSAP BusinessObjects Web Intelligence User's Guide
What is Web Intelligence?
Application modes described
Mode Description
Reading In Reading mode, you can:
● View reports● Track changes● Change filter values using the filter bar● Drill● Fold/unfold data● Access auto-refresh settings
Design In Design mode, you can:
● Perform a wide range of analysis tasks.● Add and delete report elements such as tables or charts.● Apply conditional formatting rules.● Enhance reports with formulas and variables.● Work with the report structure or with the report populated with data. Working with the
report structure only allows you to make modifications without accessing the server. When you work with reports populated with data, each change you make is applied on the server.
TipIf you are making numerous modifications, we recommend that you work with the report structure, and to populate the report with data when you have finished your modifications.
Structure Structure mode is the equivalent of Design mode, with metadata only. This mode allows you to view the skeleton of your report, and work only with the metadata. It's available in Design
mode: click in the Display section of the toolbar, and then check Structure.
2.2.3 Document locales
Locales determine the appearance of the application interface (for example, menu items and button text) and data (for example, date and number formatting) in relation to local preferences.
You can define several locales:
Locale Description
Product locale The language and interface alignment control of the application interface. You'll find this
setting in the BI Launch Pad, under Settings Account Preferences Locale and
Time Zone .
Preferred viewing locale The preferred locale for displaying document data. You'll find this setting in the BI
Launch Pad, under Settings Account Preferences Locale and Time Zone .
SAP BusinessObjects Web Intelligence User's GuideWhat is Web Intelligence? PUBLIC 19
Locale Description
Document locale The date and number locale in the document. You'll find this setting in the document properties > in Design mode, under Document Options.
Right to left alignment
The alignment of the application interface is from right to left (RTL) when you select Arabic or Hebrew. To specify the orientation used by default in a document, use the Right To Left Content Alignment toggle in the document properties.
The user interface, the printouts, the output generation (PDF and Excel files) and scheduled documents inherit the orientation set by default. If you create a document with a right to left orientation, the generated PDF will have the same orientation.
Product locale and Right to Left interface alignment
When you choose Arabic or Hebrew as the product locale, the user interface elements are always right to left (RTL), in effect mirroring the left to right (LTR) alignment. For example, the side panel for an RTL locale is on the right, whereas in an LTR locale, the side panel is on the left.
Preferred viewing locale and Right to Left Alignment
When you choose Arabic, Hebrew, Farsi, Urdu or Divehi for as the preferred viewing locale, depending on the system settings selected by the BI administrator, the elements and data in documents created in this locale may be right to left (RTL). For example, in a cross table, in an LTR locale the side header column is on the left. In an RTL locale, the side header column is on the right.
NoteCharts are LTR, per the SAP Globalization product standards.
2.2.3.1 Selecting the product locale
The product locale controls the user interface, the language of the menu items and button texts.
You can change the product locale in the BI Launch Pad settings, under Settings Account PreferencesLocale and Time Zone .
20 PUBLICSAP BusinessObjects Web Intelligence User's Guide
What is Web Intelligence?
2.2.3.2 Selecting the document locale
The document locale formats dates and numbers in documents.
The browser locale is the default document locale. If necessary, you can permanently associate the locale with a document via the Permanent regional formatting toggle, in the document properties > . When on, this option applies to all users, and formats the document data according to the locale you've set.
If you want to format the document data according to the document locale, you can do so via the Use the document locale to format the data setting under Settings Application Preferences Web Intelligence .
2.2.3.3 Selecting the preferred viewing locale
The preferred viewing locale affects the display of document data.
Your preferred viewing locale is always assigned as the initial document locale. You can set it in the BI Launch Pad, under Settings Account Preferences Locale and Time Zone .
If you want to format the data according to the prefered viewing locale, you can do so via the Use my preferred viewing locale to format the data setting under Settings Application Preferences Web Intelligence .
2.2.3.4 Selecting the document orientation
The document orientation parameter enables you to define a default orientation for the document.
In Design mode, you can switch the orientation of the document using the Right to Left Content Alignment toggle in the document properties > .
Use this paramater whenever you need to change a document's orientation. For instance, if you're viewing a document that's been created using the Arabic or Hebrew locale, you can set the orientation from left to right without altering the original document.
2.2.4 Configuring the user interface
You can set up the user interface to make sure that any document you work with on a regular basis is configured according to the way you work and feel the most comfortable with.
The user interface configuration is saved each time you tweak the zoom level, side panels, filter bar, and many more. You can also take advantage of the configuration possibilities to set up multiple documents with different configurations if need be. Configurations are independent of each other, so you can decide for example to have document A open with Instant Apply feature enabled, while document B opens with Instant Apply disabled.
Each action you perform on one of these user interface elements is saved immediately with a value. These values are used when you create a new document. For example, if the formula bar is closed in document A, it is also closed when you open document B. If you open the formula bar later on in document A, it remains closed in document B, but is open when you create document C.
SAP BusinessObjects Web Intelligence User's GuideWhat is Web Intelligence? PUBLIC 21
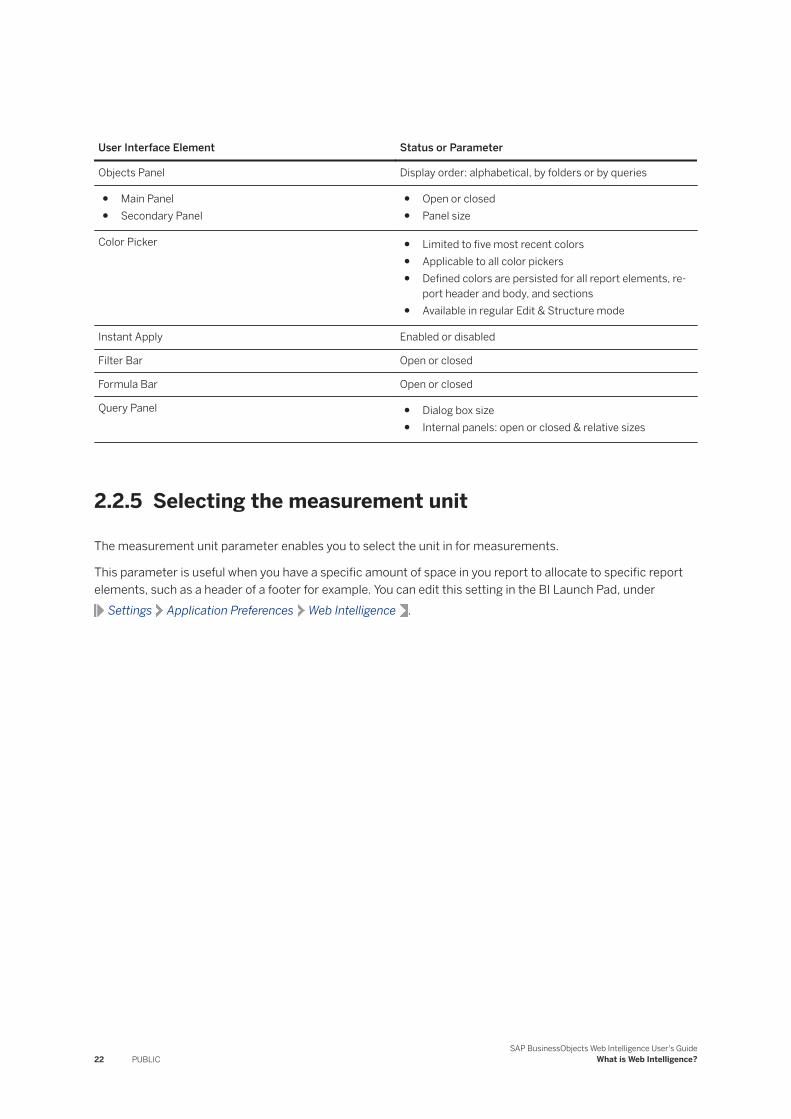
User Interface Element Status or Parameter
Objects Panel Display order: alphabetical, by folders or by queries
● Main Panel● Secondary Panel
● Open or closed● Panel size
Color Picker ● Limited to five most recent colors● Applicable to all color pickers● Defined colors are persisted for all report elements, re
port header and body, and sections● Available in regular Edit & Structure mode
Instant Apply Enabled or disabled
Filter Bar Open or closed
Formula Bar Open or closed
Query Panel ● Dialog box size● Internal panels: open or closed & relative sizes
2.2.5 Selecting the measurement unit
The measurement unit parameter enables you to select the unit in for measurements.
This parameter is useful when you have a specific amount of space in you report to allocate to specific report elements, such as a header of a footer for example. You can edit this setting in the BI Launch Pad, under
Settings Application Preferences Web Intelligence .
22 PUBLICSAP BusinessObjects Web Intelligence User's Guide
What is Web Intelligence?
3 What is Web Intelligence Rich Client?
Web Intelligence Rich Client is the desktop version of Web Intelligence, with the same features and capabilities as the web client.
Web Intelligence Rich Client allows you to work locally on your machine, without having to be connected to your Enterprise system. You can create, edit, format, print, and save documents. It’s a great alternative to the web client if you find yourself in one of these cases:
● You don’t want to install a CMS or an application server.● You can’t connect to a CMS while traveling or working in a location without network access.● You want to work with documents continually if there are server-side interruptions or performance issues.● You want to improve calculation performance.
You can still be connected to your Enterprise system, as the Rich Client offers two connections mode: online, or offline. The main difference between these modes is the security level. Note that you can’t switch between modes in the middle of a session.
There are two ways you can start working in the Rich Client: you can either edit an existing document or create a new document from scratch. If you want to edit an existing document, you’ll need to import it from the CMS first to your local machine. Here’s the complete workflow: you first import a document to save it automatically on your local machine or create a one from scratch and save it explicitely, then edit it, before publishing it back to the Central Management System.
Caution● Installing the Rich Client and BI Platform server on the same machine is not supported. For more
information, please refer to Installing BI Platform Client Tools.● Compared to the web client, the Rich Client has limitations and restrictions. For more information,
please refer to Limitations and restrictions [page 32].
3.1 What's new in Web Intelligence Rich Client 4.3 SP1
The Rich Client has been enhanced with the following features:
● You can now install the Rich Client directly from the BI Launch Pad, under Settings Application Preferences Web Intelligence .
● Add charts to the canvas directly from the Insert menu toolbar without using the Turn Into method.● Use CTRL + F to search for text within a document.● The Prompt Summary dialog is now available when clicking a prompt in the filter bar.● The UI configuration is also available in the Rich Client.
SAP BusinessObjects Web Intelligence User's GuideWhat is Web Intelligence Rich Client? PUBLIC 23
3.2 To download Web Intelligence Rich Client from the BI Launch Pad
Download the desktop app for Web Intelligence Rich Client.
1. Open the BI Launchpad and sign in.
2. Click in the menu.3. Click Settings.
4. Select Application Preferences Web Intelligence .5. Under Web Intelligence Rich Client Setup, click Download.
3.3 To log in to Web Intelligence Rich Client
1. Launch Web Intelligence Rich Client.2. Fill in the System and Authentication fields using your system credentials.3. Add you username and password.
Click in the password entry field to show the password and check that it's correct.4. Optional: Switch the Work Offline toggle to Yes if you want to work in offline mode.
The toggle applies only after you've logged in at least once in online mode.5. Click Start.
Related Information
Online mode [page 26]Offline mode [page 26]
3.4 To change your password
The application can ask you to change your password after you log in.
Note● After you change your password, the application logs you out. Make sure to log in again.● You can only change your password when the application asks you to change it.
24 PUBLICSAP BusinessObjects Web Intelligence User's Guide
What is Web Intelligence Rich Client?
1. Go to the user preferences.
2. Click User Account Account Information Change Password .3. Fill in the fields with you old and new password.4. Click Change Password to confirm.
3.5 Connection modes
Web Intelligence Rich Client has two different connection modes.
You can work with Web Intelligence Rich Client in two connection modes: Online or Offline.
3.5.1 About connection security rights and working locally
BI administrators can use the Download connection locally security right in the CMS to control connection security rights in Web Intelligence Rich Client.
When the Download connection locally security right is granted to connection objects a local refresh is performed if the middleware is correctly installed and configured. When the security right is denied, no local refresh is executed. The refresh is delegated to the server side. Query creation and modification is possible only for queries not using secured connection.
When working with a document from BusinessObjects XI 4.0 or earlier, save the document and reopen it. The security right will be correctly applied.
NoteThe BI administrator must define the security associated with the data source connection, for example the sensitive data source connection information that can be downloaded locally and by which users.
When the security option has been activated:
● No connection information transit is allowed to the client side (extra secure mode).● In a limited offline mode, it is not possible to refresh locally.● In a fully offline mode, reports can be opened, viewed and modified, but not refreshed, and the query
cannot be modified.
NoteWhen working with multiple queries in a document, the refresh action works only for non-secured data source connections. A warning is displayed when at least one query is using a secured data source connection.
SAP BusinessObjects Web Intelligence User's GuideWhat is Web Intelligence Rich Client? PUBLIC 25
3.5.2 Online mode
In online mode, you work while connected to a SAP BI BusinessObjects CMS (Central Management System).
In online mode, you’re connected to the CMS and identified. This means that you get access to every resource on the CMS, but also to local resources, secured or unsecured. You also benefit from your user account security rights in the CMS.
You can import documents and universes from the CMS, open, create, edit or refresh local documents, save documents locally, or publish documents to the CMS.
When connecting via the desktop application, either via the Windows Start menu or by double-clicking a .WID document, the connection to the CMS is in client-server mode and uses the CORBA framework of the Enterprise SDK. CORBA requires having the appropriate database middleware on your local machine.
3.5.3 Offline mode
In offline mode, you’re not connected to the CMS, but the security still applies.
When working in offline mode, you’re not logged in the CMS, but identified. Your security is stored locally on your computer in a local security information (LSI) file, that sums up your access rights to documents, folders, universes, connections and so on. The LSI file is updated each time you connect to a CMS in online mode. You can work with local documents and universes that are secured by the CMS you select at login, or with unsecured local documents and universes.
CautionBefore you can start working in offline mode, you must first connect at least once to a CMS in online mode to get the security rights and LSI file on your machine.
The CMS security rights are applied by matching the access rights for the document or universe against the locally stored security file. For example, if a document was downloaded from a CMS to your local machine, and you don't have the right to open the document in the CMS from which it was downloaded, you can't open the document on your local machine. If the security settings on objects don't allow working in offline mode, those objects can't be included when the document is used later.
NoteIn offline mode, you can't import documents or publish documents to a CMS.
3.6 To import a document from the BI Platform repository
The documents you import from the BI Platform repository are saved in the userDocs folder by default.
You can import documents only in Online mode.
1. On the home screen, click Import.
26 PUBLICSAP BusinessObjects Web Intelligence User's Guide
What is Web Intelligence Rich Client?
2. Select the document you want to import.3. Click Import & Open to start working on the document straight away.
You can find the document in the default folder, or in the Recent Local Documents list on the home screen. You can change the default location in the settings, under General.
3.7 To create a document
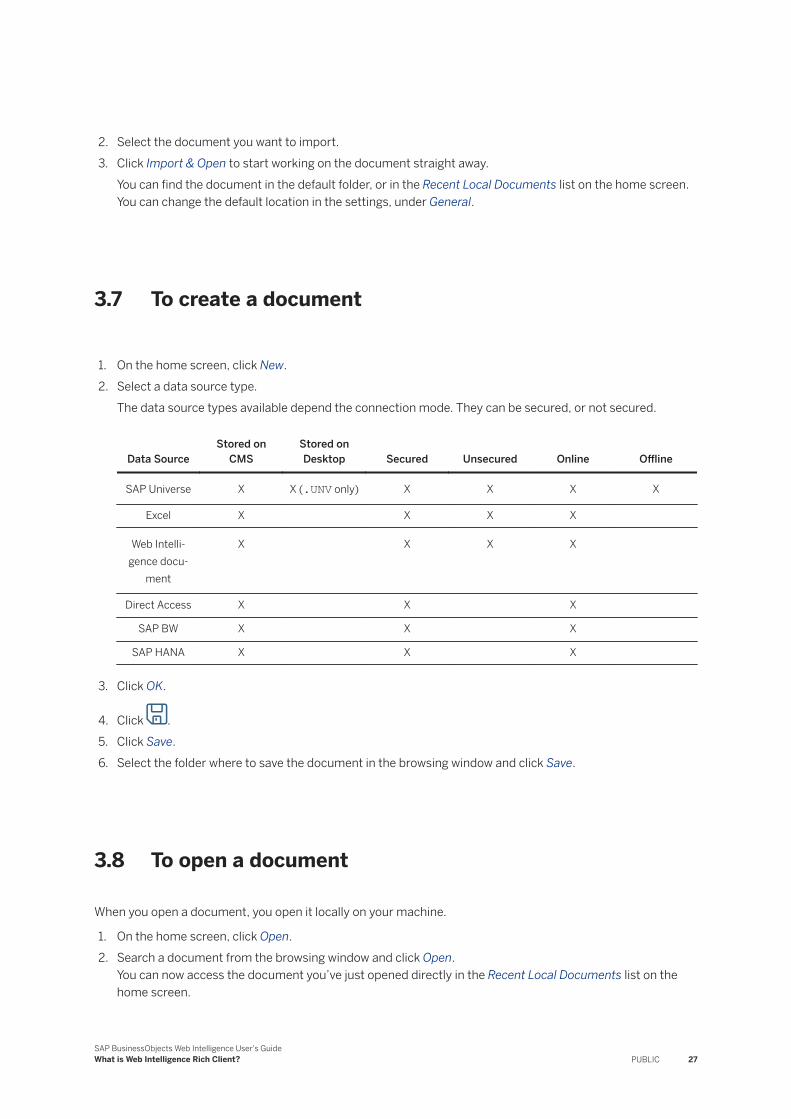
1. On the home screen, click New.2. Select a data source type.
The data source types available depend the connection mode. They can be secured, or not secured.
Data SourceStored on
CMSStored on Desktop Secured Unsecured Online Offline
SAP Universe X X (.UNV only) X X X X
Excel X X X X
Web Intelligence docu
ment
X X X X
Direct Access X X X
SAP BW X X X
SAP HANA X X X
3. Click OK.
4. Click .5. Click Save.6. Select the folder where to save the document in the browsing window and click Save.
3.8 To open a document
When you open a document, you open it locally on your machine.
1. On the home screen, click Open.2. Search a document from the browsing window and click Open.
You can now access the document you’ve just opened directly in the Recent Local Documents list on the home screen.
SAP BusinessObjects Web Intelligence User's GuideWhat is Web Intelligence Rich Client? PUBLIC 27
3.9 To save a document
When you save a document, you always save it locally on your machine. You can’t save a document directly on the CMS.
If you’ve made changes to a document you’ve imported, they’re not reflected in the CMS. If you want the document you’ve worked on to be available to colleagues for instance, you have to explicitly publish it to the CMS. Refer to the dedicated section for more information.
1. Click .2. Click Save.
3.10 To save a copy of a document
1. Click .2. Click Make Copy.3. Select a folder where to save the document in the browsing window and click Save.
3.11 To publish a document
After you’ve worked on a document and saved it, you still need to publish to the CMS if you want to make it public and available to your colleagues. If you want to, you can also publish the document privately so that only you can see it.
Make sure you're in online mode before trying to publish a document.
1. Click .2. Click Publish to Enterprise.3. Select the CMS folder where you want to publish the document and click Publish to publish the document
to the CMS.
NoteIf you want to keep the original document, give a new name to the document you’re publishing, or make sure that you’re publishing it in a different location than the original document.
28 PUBLICSAP BusinessObjects Web Intelligence User's Guide
What is Web Intelligence Rich Client?
3.12 Searching for text in Web Intelligence Rich Client
If you’re looking for some text in the active window, dropdown lists or dialog boxes, you can use the Ctrl+F function to open the search bar.
All occurrences are highlighted and the number is indicated on the right. Use the up and down arrows to move to the previous or next occurrence. To delete the text, click the blue cross. To close the search bar, click the black cross on the right.
3.13 Configuring Secure Network Communication (SNC) Encryption on SAP BW
You can configure SNC encryption on both the BOE server and client's ends for SAP BW OLAP connections using the SAP Cryptographic library.
The library is deployed automatically on the machine running the Rich Client so you can secure the data communication paths on both the server and the client machines.
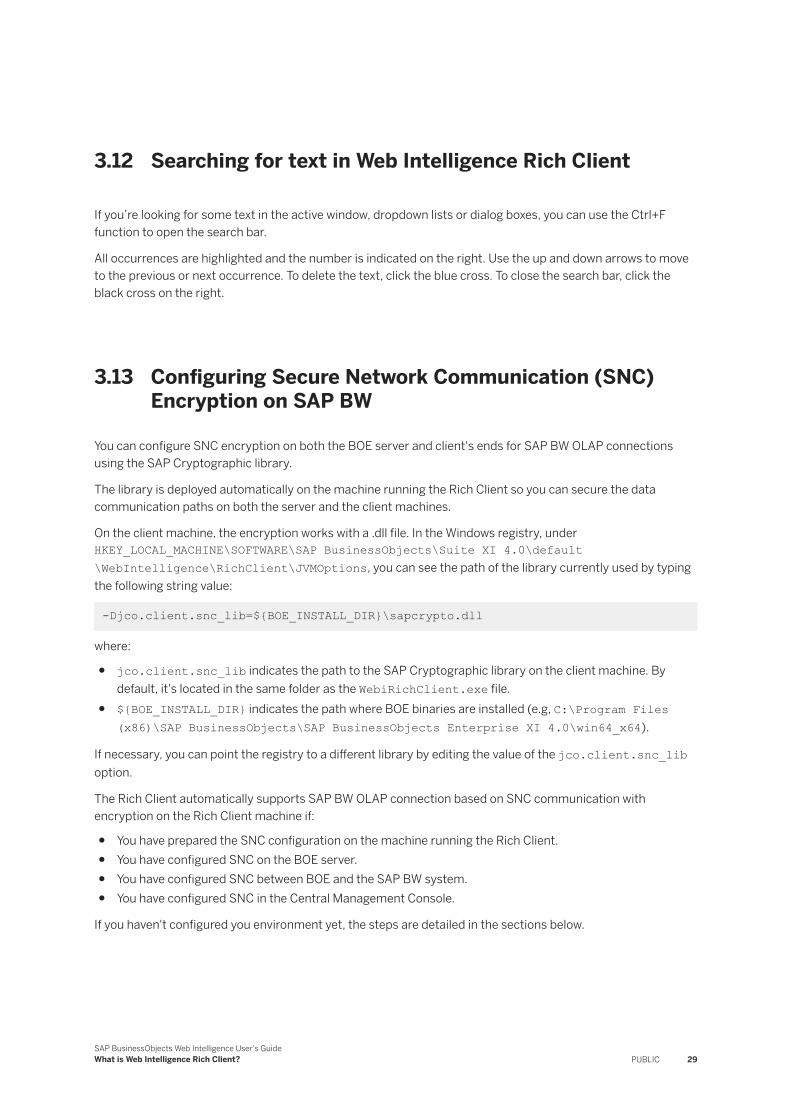
On the client machine, the encryption works with a .dll file. In the Windows registry, under HKEY_LOCAL_MACHINE\SOFTWARE\SAP BusinessObjects\Suite XI 4.0\default\WebIntelligence\RichClient\JVMOptions, you can see the path of the library currently used by typing the following string value:
-Djco.client.snc_lib=${BOE_INSTALL_DIR}\sapcrypto.dll
where:
● jco.client.snc_lib indicates the path to the SAP Cryptographic library on the client machine. By default, it's located in the same folder as the WebiRichClient.exe file.
● ${BOE_INSTALL_DIR} indicates the path where BOE binaries are installed (e.g, C:\Program Files (x86)\SAP BusinessObjects\SAP BusinessObjects Enterprise XI 4.0\win64_x64).
If necessary, you can point the registry to a different library by editing the value of the jco.client.snc_lib option.
The Rich Client automatically supports SAP BW OLAP connection based on SNC communication with encryption on the Rich Client machine if:
● You have prepared the SNC configuration on the machine running the Rich Client.● You have configured SNC on the BOE server.● You have configured SNC between BOE and the SAP BW system.● You have configured SNC in the Central Management Console.
If you haven't configured you environment yet, the steps are detailed in the sections below.
SAP BusinessObjects Web Intelligence User's GuideWhat is Web Intelligence Rich Client? PUBLIC 29
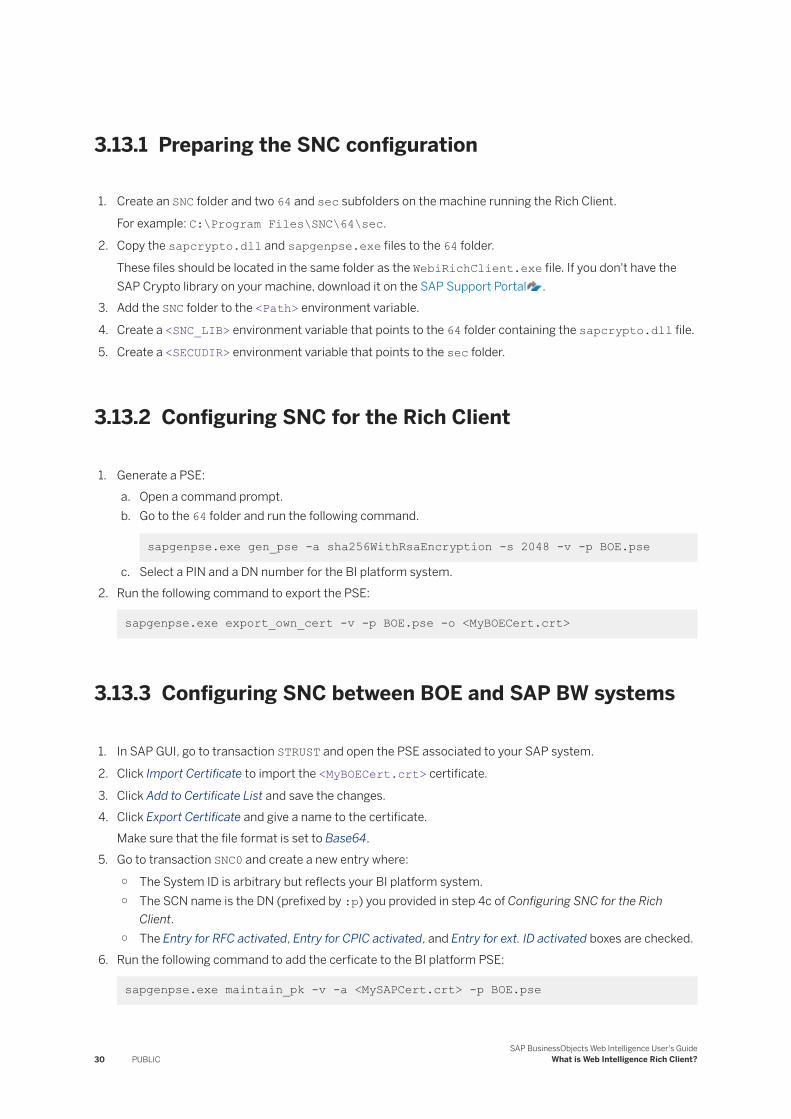
3.13.1 Preparing the SNC configuration
1. Create an SNC folder and two 64 and sec subfolders on the machine running the Rich Client.
For example: C:\Program Files\SNC\64\sec.
2. Copy the sapcrypto.dll and sapgenpse.exe files to the 64 folder.
These files should be located in the same folder as the WebiRichClient.exe file. If you don't have the SAP Crypto library on your machine, download it on the SAP Support Portal .
3. Add the SNC folder to the <Path> environment variable.
4. Create a <SNC_LIB> environment variable that points to the 64 folder containing the sapcrypto.dll file.
5. Create a <SECUDIR> environment variable that points to the sec folder.
3.13.2 Configuring SNC for the Rich Client
1. Generate a PSE:a. Open a command prompt.b. Go to the 64 folder and run the following command.
sapgenpse.exe gen_pse -a sha256WithRsaEncryption -s 2048 -v -p BOE.pse
c. Select a PIN and a DN number for the BI platform system.2. Run the following command to export the PSE:
sapgenpse.exe export_own_cert -v -p BOE.pse -o <MyBOECert.crt>
3.13.3 Configuring SNC between BOE and SAP BW systems
1. In SAP GUI, go to transaction STRUST and open the PSE associated to your SAP system.
2. Click Import Certificate to import the <MyBOECert.crt> certificate.
3. Click Add to Certificate List and save the changes.4. Click Export Certificate and give a name to the certificate.
Make sure that the file format is set to Base64.5. Go to transaction SNC0 and create a new entry where:
○ The System ID is arbitrary but reflects your BI platform system.○ The SCN name is the DN (prefixed by :p) you provided in step 4c of Configuring SNC for the Rich
Client.○ The Entry for RFC activated, Entry for CPIC activated, and Entry for ext. ID activated boxes are checked.
6. Run the following command to add the cerficate to the BI platform PSE:
sapgenpse.exe maintain_pk -v -a <MySAPCert.crt> -p BOE.pse
30 PUBLICSAP BusinessObjects Web Intelligence User's Guide
What is Web Intelligence Rich Client?
3.13.4 Configuring SNC in the CMC
1. In the CMC, click Authentication SAP .2. In the Entitlement Systems tab, select your entitlement system from the Logical system name list.3. In the SNC Settings tab, check Enable Secure Network Communication (SNC).
If you are configuring SAP authentication for the consumption of .UNX Universes or OLAP BICS connections and plan to use STS, check Prevent insecure incoming RFC connections.
4. Check Use Default to accept the default path for the library, or Define Custom Path to select a different location. If you select a custom path, specify the path to the sapcrypto.dll file.
5. Select a quality of protection.6. Under Mutual authentication settings, enter the SNC name of the SAP system.
The SNC name format depends on the SNC library. Using the SAP Crypto library, we recommend following the LDAP naming convention and prefixing the name with p:.
7. Under SNC name of Enterprise system, check that the SNC name of the credentials under which BI platform servers run appears.If several SNC names are configured, leave this field blank.
8. Click Update.9. Click the Entitlement Systems.
The SNC name field should be displayed under the Language field.10. In the SNC name box, enter the SNC name that you configured on the SAP BW server.
3.14 To select default folders for local documents and universes
You can select a folder where local documents and universes are stored by default on your local machine.
1. Go to the application preferences.2. Click General.3. Use the Browse button next to the dedicated fields to select default storage folders for universes and
documents you import from the CMS.4. Click Save.
3.15 To select a measurement unit
You can select a measurement unit in the application preferences.
1. Go to the application preferences.2. Click General.
SAP BusinessObjects Web Intelligence User's GuideWhat is Web Intelligence Rich Client? PUBLIC 31
3. Select a measurement unit.4. Click Save.
3.16 Limitations and restrictions
This section lists the limitations and restrictions of Web Intelligence Rich Client in 4.3.
Restrictions
● Samples can only be refreshed in online mode● Creating document offline based on UNX universes is not supported● You can view comments on report elements created in the web clients, but cannot create or edit comments
in the Rich Client.● Importing universes is not supported.● Relative OpenDocument links with no complete URL path specified are not supported.● Multi-system retainment (Authentication) in login screen is not available● Today, Last Week and Older sections are not available in the Recent Local Documents section
Limitations
● Zero Administration Business Objects (ZABO) mode is not supported:○ There is no ZABO setup available○ It is not possible to open a document in Web Intelligence Rich Client from the BI Launch Pad
● The Standalone mode is not available● Creating and editing queries based on the following local data sources is not supported:
○ Text, CSV○ Excel
● Creating and editing queries based on the Text or CSV data sources stored in the BI Platform repository is not supported.
● In offline mode, it is not possible to:○ Edit and refresh a doc using BEx query, Free-Hand SQL query, SAP HANA query or text source○ Create a doc using .UNX universes, BEx queries or SAP HANA queries
● Recent data sources are not available on the home page● It is not possible to open instances of scheduled documents. There's no option in the Import dialog box.● Relative OpenDocument links with no complete URL path specified are not supported.● There is no in-build help available in the Rich Client.● It is not possible to launch Web Intelligence Rich Client from the BI Launch Pad● There is no Change Password menu
32 PUBLICSAP BusinessObjects Web Intelligence User's Guide
What is Web Intelligence Rich Client?

● Full screen mode is not supported● Send by Email feature is not supported● The Find (Ctrl + F) function allowing to search for text in reports is not available● If you deny the document security right “Import document locally” for a user and try to import it in Web
Intelligence Rich Client, the displayed error message (The resource of type "Document" with identifier "undefined" does not exist.) does not properly clearly describe that the document access has been denied.
SAP BusinessObjects Web Intelligence User's GuideWhat is Web Intelligence Rich Client? PUBLIC 33
4 Building and running queries
4.1 Introducing queries
A query is a business question you ask to the application.
After you've created a document, you create the query. The query is the business question that drives the final report and its analysis. To help you phrase your business question correctly, the query uses elements called objects that contain pre-defined data.
4.1.1 Introduction to query building
In Web Intelligence, every reporting or analysis operation is done on what is called a query.
A query is a business question you ask to the application, and the application uses it in return to retrieve data. To help you phrase your business question correctly, the query uses elements called objects that contain pre-defined data.
In your company, the data are stored in databases to which you go to find specific and meaningful information about customers, revenues, products and so on. In Web Intelligence, these storage units are called data sources. You run queries on top of them to retrieve data. When you run a query, it searches the data source to answer your business question. For example, you can use a query to ask for the sales margins per product over a time period.
The following sections provide information on the different objects available to create queries, the various data sources supported in Web Intelligence and how you can create queries on top on them.
4.1.2 Building and running queries
You build queries in the query panel.
You run the query to return data in a report which you can then analyze further by, for example, filtering or ranking its data.
Measures return data, often numeric, that is calculated based on the other objects in the query (dimensions or hierarchies). For more information on measures, see Measures [page 44].
Queries based on universes can be hierarchical or non-hierarchical. Non-hierarchical queries organize data in dimensions which have no hierarchical relationship. For example, a query containing a customer dimension and a revenue measure calculates revenue per customer. For more information on universe queries, see Building queries on universes [page 48].
Hierarchies organize data into hierarchical relationships. For example, a geographical hierarchy can contain data about countries, states and cities (different levels of the hierarchy). A query containing a geographical
34 PUBLICSAP BusinessObjects Web Intelligence User's Guide
Building and running queries
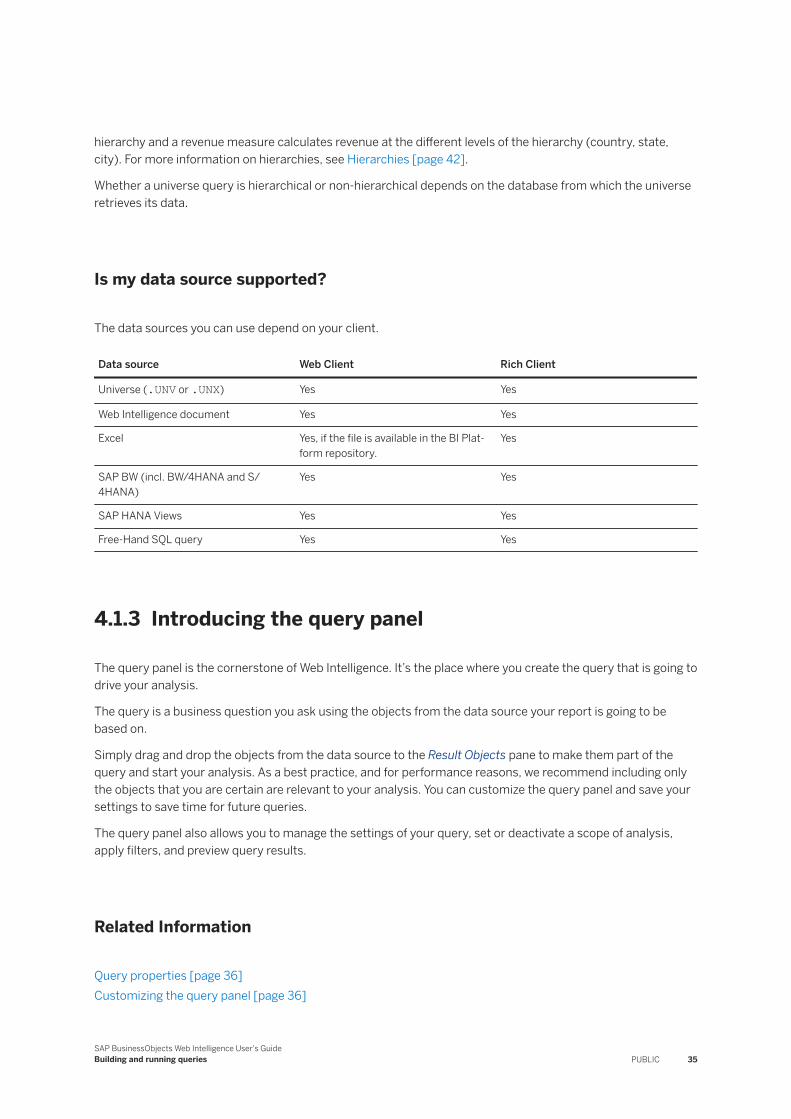
hierarchy and a revenue measure calculates revenue at the different levels of the hierarchy (country, state, city). For more information on hierarchies, see Hierarchies [page 42].
Whether a universe query is hierarchical or non-hierarchical depends on the database from which the universe retrieves its data.
Is my data source supported?
The data sources you can use depend on your client.
Data source Web Client Rich Client
Universe (.UNV or .UNX) Yes Yes
Web Intelligence document Yes Yes
Excel Yes, if the file is available in the BI Platform repository.
Yes
SAP BW (incl. BW/4HANA and S/4HANA)
Yes Yes
SAP HANA Views Yes Yes
Free-Hand SQL query Yes Yes
4.1.3 Introducing the query panel
The query panel is the cornerstone of Web Intelligence. It’s the place where you create the query that is going to drive your analysis.
The query is a business question you ask using the objects from the data source your report is going to be based on.
Simply drag and drop the objects from the data source to the Result Objects pane to make them part of the query and start your analysis. As a best practice, and for performance reasons, we recommend including only the objects that you are certain are relevant to your analysis. You can customize the query panel and save your settings to save time for future queries.
The query panel also allows you to manage the settings of your query, set or deactivate a scope of analysis, apply filters, and preview query results.
Related Information
Query properties [page 36]Customizing the query panel [page 36]
SAP BusinessObjects Web Intelligence User's GuideBuilding and running queries PUBLIC 35
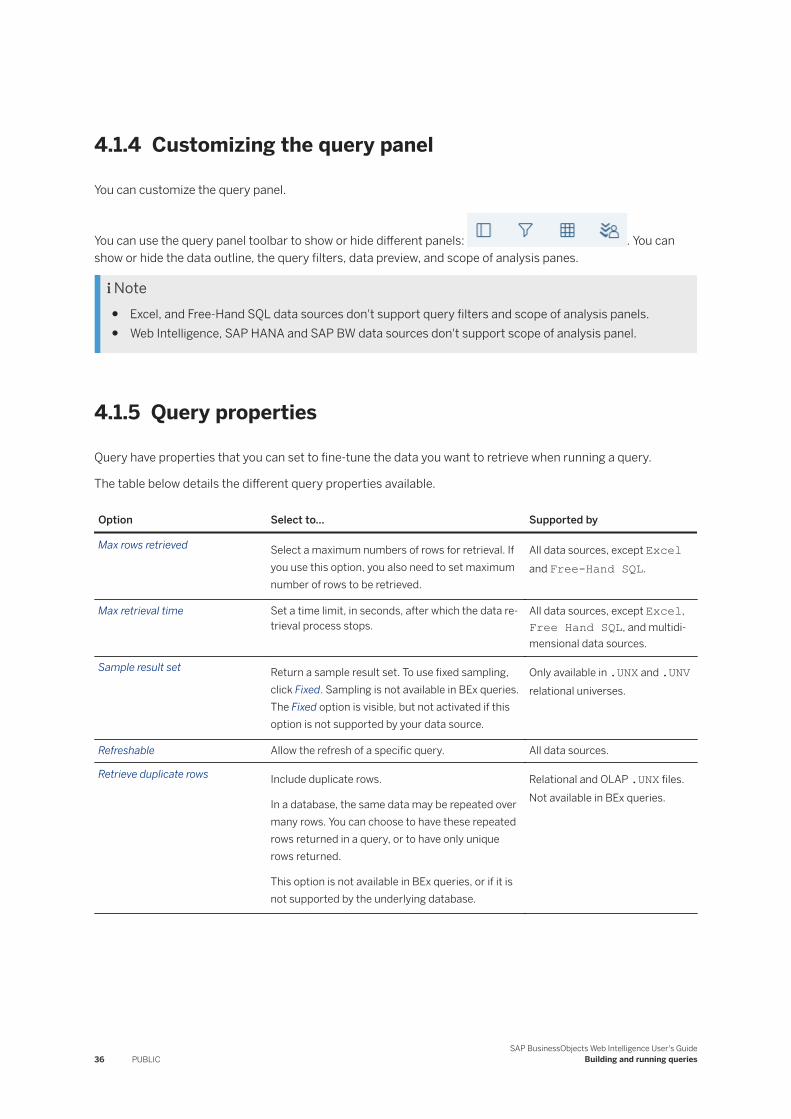
4.1.4 Customizing the query panel
You can customize the query panel.
You can use the query panel toolbar to show or hide different panels: . You can show or hide the data outline, the query filters, data preview, and scope of analysis panes.
Note● Excel, and Free-Hand SQL data sources don't support query filters and scope of analysis panels.● Web Intelligence, SAP HANA and SAP BW data sources don't support scope of analysis panel.
4.1.5 Query properties
Query have properties that you can set to fine-tune the data you want to retrieve when running a query.
The table below details the different query properties available.
Option Select to... Supported by
Max rows retrieved Select a maximum numbers of rows for retrieval. If you use this option, you also need to set maximum number of rows to be retrieved.
All data sources, except Excel and Free-Hand SQL.
Max retrieval time Set a time limit, in seconds, after which the data retrieval process stops.
All data sources, except Excel, Free Hand SQL, and multidimensional data sources.
Sample result set Return a sample result set. To use fixed sampling, click Fixed. Sampling is not available in BEx queries. The Fixed option is visible, but not activated if this option is not supported by your data source.
Only available in .UNX and .UNV relational universes.
Refreshable Allow the refresh of a specific query. All data sources.
Retrieve duplicate rows Include duplicate rows.
In a database, the same data may be repeated over many rows. You can choose to have these repeated rows returned in a query, or to have only unique rows returned.
This option is not available in BEx queries, or if it is not supported by the underlying database.
Relational and OLAP .UNX files. Not available in BEx queries.
36 PUBLICSAP BusinessObjects Web Intelligence User's Guide
Building and running queries
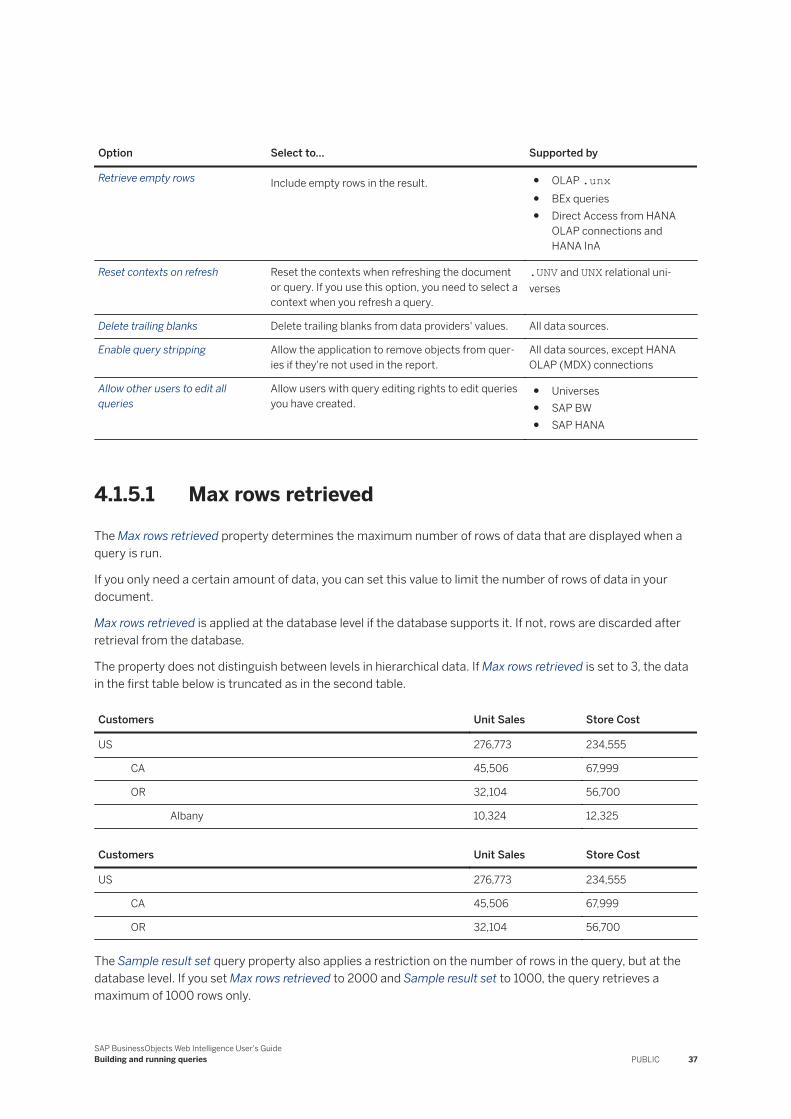
Option Select to... Supported by
Retrieve empty rows Include empty rows in the result. ● OLAP .unx● BEx queries● Direct Access from HANA
OLAP connections and HANA InA
Reset contexts on refresh Reset the contexts when refreshing the document or query. If you use this option, you need to select a context when you refresh a query.
.UNV and UNX relational universes
Delete trailing blanks Delete trailing blanks from data providers' values. All data sources.
Enable query stripping Allow the application to remove objects from queries if they're not used in the report.
All data sources, except HANA OLAP (MDX) connections
Allow other users to edit all queries
Allow users with query editing rights to edit queries you have created.
● Universes● SAP BW● SAP HANA
4.1.5.1 Max rows retrieved
The Max rows retrieved property determines the maximum number of rows of data that are displayed when a query is run.
If you only need a certain amount of data, you can set this value to limit the number of rows of data in your document.
Max rows retrieved is applied at the database level if the database supports it. If not, rows are discarded after retrieval from the database.
The property does not distinguish between levels in hierarchical data. If Max rows retrieved is set to 3, the data in the first table below is truncated as in the second table.
Customers Unit Sales Store Cost
US 276,773 234,555
CA 45,506 67,999
OR 32,104 56,700
Albany 10,324 12,325
Customers Unit Sales Store Cost
US 276,773 234,555
CA 45,506 67,999
OR 32,104 56,700
The Sample result set query property also applies a restriction on the number of rows in the query, but at the database level. If you set Max rows retrieved to 2000 and Sample result set to 1000, the query retrieves a maximum of 1000 rows only.
SAP BusinessObjects Web Intelligence User's GuideBuilding and running queries PUBLIC 37
This setting can be overridden by the limits set by the BI administrator in your security profile. For example, if you set the Max rows retrieved property to 400 rows, but your security profile limits you to 200 rows, only 200 rows of data will be retrieved when you run the query.
Related Information
Sample result set [page 38]Restricting the amount of data returned by a query [page 63]
4.1.5.2 Sample result set
The Sample result set property determines the maximum number of rows that a query returns.
This restriction is applied at the database level, in the generated script that is used to return the data.
NoteThe Sample result set property is only available for relational .unx and .unv universes, and not for OLAP .unx universes or BEx queries.
The Fixed option uses fixed sampling. At each data refresh, the query returns the same rows. If you do not set the Fixed option, the sampling is random. At each data refresh, the query returns a different set of sampled rows.
Sample result set is more efficient than the Max rows retrieved property, which discards rows beyond the maximum limit only after retrieving all the rows in the query.
Not all databases support sampling. If it is not supported, the option is deactivated . Similarly, the Fixed option may not be supported by certain databases, in which case the Fixed option is deactivated. Sampling is not available in BEx queries or OLAP .unx universes.
Related Information
Max rows retrieved [page 37]Building queries on SAP BW InfoProviders and BEx queries (incl. BW/4HANA and S/4HANA) [page 74]Restricting the amount of data returned by a query [page 63]
38 PUBLICSAP BusinessObjects Web Intelligence User's Guide
Building and running queries
4.1.5.3 Max retrieval time
You can set a time limit after which the data retrieval process stops.
NoteThis option isn't available for BEx queries.
1. In Design mode, click in the toolbar to open the query panel.
2. Click the to display the query properties.3. Check Max retrieval time and specify the limit in seconds.4. Click OK to close the dialog box and go back to the query panel.
4.1.5.4 To allow other users to edit queries
By default, queries can by edited only by the user who created them. You can give the ability to edit queries to users who have edit query rights assigned by the BI administrator.
1. In Design mode, click in the toolbar to open the query panel.
2. Click the to display the query properties.3. Check Allows other users to edit all queries.4. Click OK to go back to the query panel.
4.1.6 Query objects
Objects are an integral part of queries.
Objects contain pre-defined data coming from a database. Their role is to present a business focused front end to the SQL structures in the database. That's why you need to make sure that the objects you select when building queries are relevant to your business needs and answer the question you're trying to phrase. The objects you select are then used to return a collection of data that you can manipulate to create charts, tables etc. For example, you can build a query asking for the sales margins per product over a time period.
The following objects can be used in queries:
● Classes and subclasses [page 40]● Dimensions [page 40]● Attributes [page 41]● Hierarchies [page 42]● Levels [page 43]● Members [page 44]● Named sets [page 44]
SAP BusinessObjects Web Intelligence User's GuideBuilding and running queries PUBLIC 39
● Calculated members [page 44]● Measures [page 44]
Objects are displayed in the Objects pane, and can be arranged by alphabetical order, query, data source or navigation paths.
4.1.6.1 Classes and subclasses
A class is a folder containing objects. A sub-class is a sub-folder.
Classes organize objects into logical groups. When you create queries on the universe, classes help you to find the objects that represent the information that you want to use in a query.
Related Information
Building and running queries [page 34]
4.1.6.2 Analysis dimensions
An analysis dimension contains a collection of related hierarchies.
Analysis dimensions do not appear as result objects in queries. If you select an analysis dimension, its default hierarchy appears in the query.
Analysis dimensions use the following icon:
Related Information
Hierarchies [page 42]
4.1.6.3 Dimensions
A dimension can represent non-hierarchical data in a report.
For example, in a query containing a non-hierarchical [Customer] dimension and the [Revenue] measure, the results show the revenue generated by each customer in non-hierarchical columns.
In hierarchical data sources, hierarchies appear beneath the dimensions on which they're based in the list of available objects. When included in a query, dimensions return hierarchical data.
Dimensions are represented by this icon:
40 PUBLICSAP BusinessObjects Web Intelligence User's Guide
Building and running queries
RestrictionWeb Intelligence only supports hierarchies based on STRING data types in reports on top of OLAP connections. If your OLAP hierarchies are based on other data types such as DATE or INTEGER, their data will be converted as STRING.
Related Information
Hierarchies [page 42]
4.1.6.4 Attributes
An attribute is an object attached to a parent object that provides additional descriptive information about the parent. Age for instance can be an attribute of the Customer dimension.
An attribute can be associated with dimensions, hierarchies, measures and levels. There's no notion of hierarchy between an attribute and its parent object, both objects remain independent.
Each value of a parent object can have only one associated value of any attribute. Using the example in the above topic, each Customer value can have only one associated value in the Age attribute.
If, due to incorrect universe design, an attribute tries to return multiple values for one parent object value, its cell displays a #MULTIVALUE error message.
Attributes are represented by this icon:
NoteFor .unv universes, created with the universe design tool, attributes are referred to as details, and apply to relational data sources.
Measure Attributes
In an OLAP business layer, measure attributes provide additional information about the formatted value. Measure attributes were originally created to support BEx queries formatted values. Formatted values usually consist of strings made of number with formatted characters such as currency symbols, for instance. Because of this specificity, the way measure attributes are processed varies depending on how you use them.
In an explicit aggregation, measure attributes are processed like dimensions. If you use the SUM function in a table footer for instance, the application aggregates the unique values of the measure attribute and then proceeds to count them. However, if you use a measure attribute in a default aggregation, the aggregation is delegated to its data source. This happens when you drop a measure attribute in the body of a table for instance.
SAP BusinessObjects Web Intelligence User's GuideBuilding and running queries PUBLIC 41
Related Information
Dimensions [page 40]Measures [page 44]Default aggregation [page 187]Explicit aggregation [page 188]Examples of default and explicit aggregation [page 188]
4.1.6.5 Hierarchies
A hierarchy is a set of data members arranged in levels or parent-child relationships.
For example, a [Geography] hierarchy might contain the [Country], [State] and [City] levels. Hierarchical objects are used in BEx and OLAP data sources.
Hierarchies produce hierarchical columns in the result set produced by the query. You can expand the items in the hierarchy to explore its data. For example, you can expand the [California] level in a [Geography] hierarchy to explore data related to California.
You can select which members appear in the result set by using the Member Selector accessed via the query panel.
In hierarchical data sources, hierarchies are associated with a dimension and appear beneath the dimension with which they are associated in the list of available objects. The following information is also displayed with the hierarchy objects:
Object Description
This is the default hierarchy, it's the placeholder for the retrieved hierarchy.
[n] where 'n' is an integer This applies to BEx queries. This is the version number of the SAP BW hierarchy that was used at design time. For these hierarchies, the application displays the version of the hierarchy after the hierarchy name. For example: Country hierarchy [2]. The BEx query designer can prepend a string before the version number for clarity, for example: [version 2]. This version is also displayed in the report table header.
RestrictionThe application only supports dimensions and hierarchies based on STRING data types in reports on the top of OLAP connections. If your OLAP dimensions and hierarchies are based on other data types such as DATE or INTEGER, their data will be converted as STRING.
Related Information
Dimensions [page 40]Hierarchical queries [page 46]Using time dimensions [page 229]
42 PUBLICSAP BusinessObjects Web Intelligence User's Guide
Building and running queries
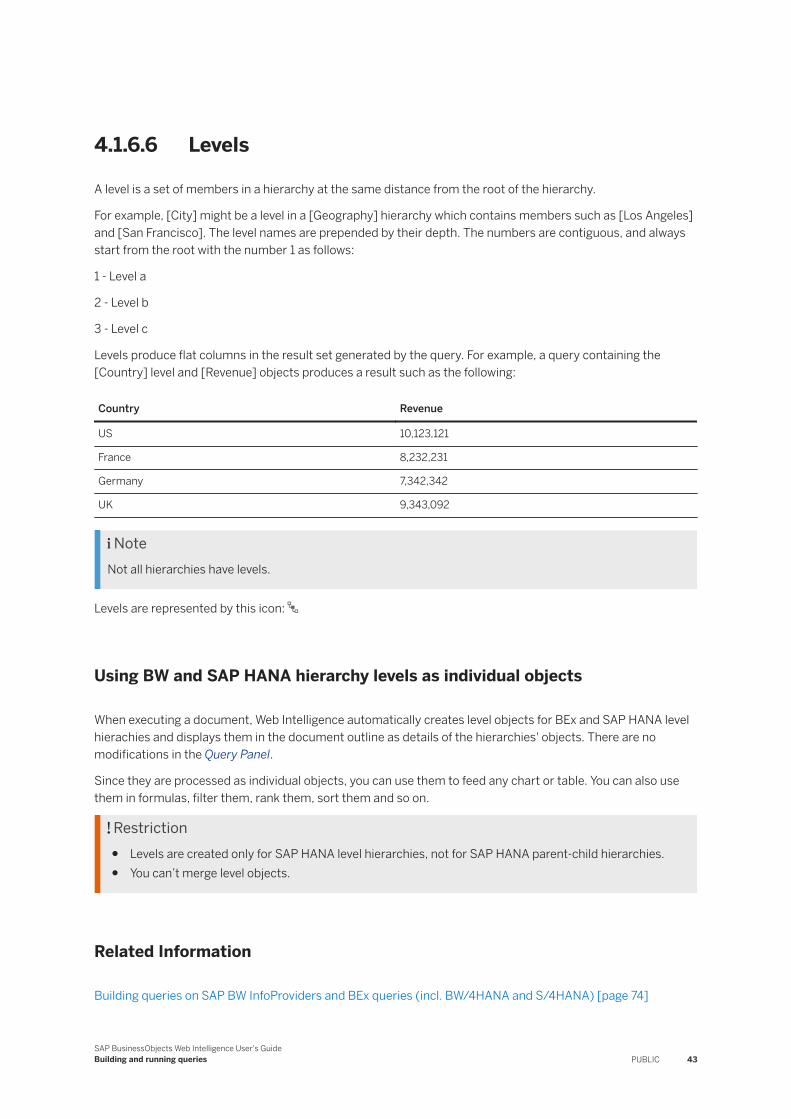
4.1.6.6 Levels
A level is a set of members in a hierarchy at the same distance from the root of the hierarchy.
For example, [City] might be a level in a [Geography] hierarchy which contains members such as [Los Angeles] and [San Francisco]. The level names are prepended by their depth. The numbers are contiguous, and always start from the root with the number 1 as follows:
1 - Level a
2 - Level b
3 - Level c
Levels produce flat columns in the result set generated by the query. For example, a query containing the [Country] level and [Revenue] objects produces a result such as the following:
Country Revenue
US 10,123,121
France 8,232,231
Germany 7,342,342
UK 9,343,092
NoteNot all hierarchies have levels.
Levels are represented by this icon:
Using BW and SAP HANA hierarchy levels as individual objects
When executing a document, Web Intelligence automatically creates level objects for BEx and SAP HANA level hierachies and displays them in the document outline as details of the hierarchies' objects. There are no modifications in the Query Panel.
Since they are processed as individual objects, you can use them to feed any chart or table. You can also use them in formulas, filter them, rank them, sort them and so on.
Restriction● Levels are created only for SAP HANA level hierarchies, not for SAP HANA parent-child hierarchies.● You can’t merge level objects.
Related Information
Building queries on SAP BW InfoProviders and BEx queries (incl. BW/4HANA and S/4HANA) [page 74]
SAP BusinessObjects Web Intelligence User's GuideBuilding and running queries PUBLIC 43
Hierarchies [page 42]
4.1.6.7 Members
A member is an individual data item in a hierarchy.
For example, the [Geography] hierarchy can contain members such as [France] at the [Country] level, or [Las Vegas] at the [City] level.
You select individual members from a hierarchy for inclusion in the query result if you do not want to include all members in the hierarchy. You can also define a named set containing a set of members.
Related Information
Hierarchies [page 42]Named sets [page 44]
4.1.6.8 Named sets
A named set is a named expression that returns a set of members.
Named sets can be defined in OLAP databases, or in universes based on relational or OLAP databases.
4.1.6.9 Calculated members
Calculated members are members returned by a Multidimensional Expression (MDX) statement.
MDX is the language used to access hierarchical data in OLAP databases.
The administrator of an OLAP database can create calculated members that are available to MDX queries that access the database.
4.1.6.10 Measures
Measures are objects composed of numeric data that represent calculations and aggregate functions that map to statistical and analytic data in the database. In a business layer, measures represent the factual information (data).
Measures return results based on the objects with which they are associated in a query. For example, a query containing the [Customer] dimension and [Revenue] measure returns revenue by customer. A query
44 PUBLICSAP BusinessObjects Web Intelligence User's Guide
Building and running queries
containing the [Geography] hierarchy and [Revenue] measure returns revenue calculated for all the different aggregations possible in the hierarchy.
Aggregating the information must make sense for the object to be a measure. For example, [Revenue] is the calculation of the number of items sold multiplied by item price. Measures are often located in a Measures class.
By default, measures are calculated by aggregating detailed values returned from the database.
Smart measures are a special kind of measures calculated by the database itself, and returned by the query already aggregated. In certain situations, smart measures impact the way in which calculations are displayed. For more information on smart measures, see the Using functions, formulas and calculations in Web Intelligence guide.
Measures are represented by this icon:
Related Information
Hierarchies [page 42]
4.1.7 Query and document user rights
Rights are defined by BI administrators.
BI administrators can view and edit queries even when the access rights have been limited to a restricted sub-set of users. Whether you can view, create, modify, or delete queries and their related objects, documents or reports, depends on your assigned user rights.
Related Information
Web Intelligence document rights [page 742]
4.1.8 Non-hierarchical queries
You build a non-hierarchical query using dimensions, attributes and measures.
Dimensions represent business objects such as customers or cities. Measures derive results, usually numerical, from the dimensions you include in the query. For example, a query containing the [Customer] dimension and the [Revenue] measure returns revenue by customer.
Non-hierarchical queries produce result sets in which dimensions are not related. Each object in the query produces one flat column in the result set.
Non-hierarchical queries do not include the following objects: hierarchies, levels, members or named sets.
SAP BusinessObjects Web Intelligence User's GuideBuilding and running queries PUBLIC 45
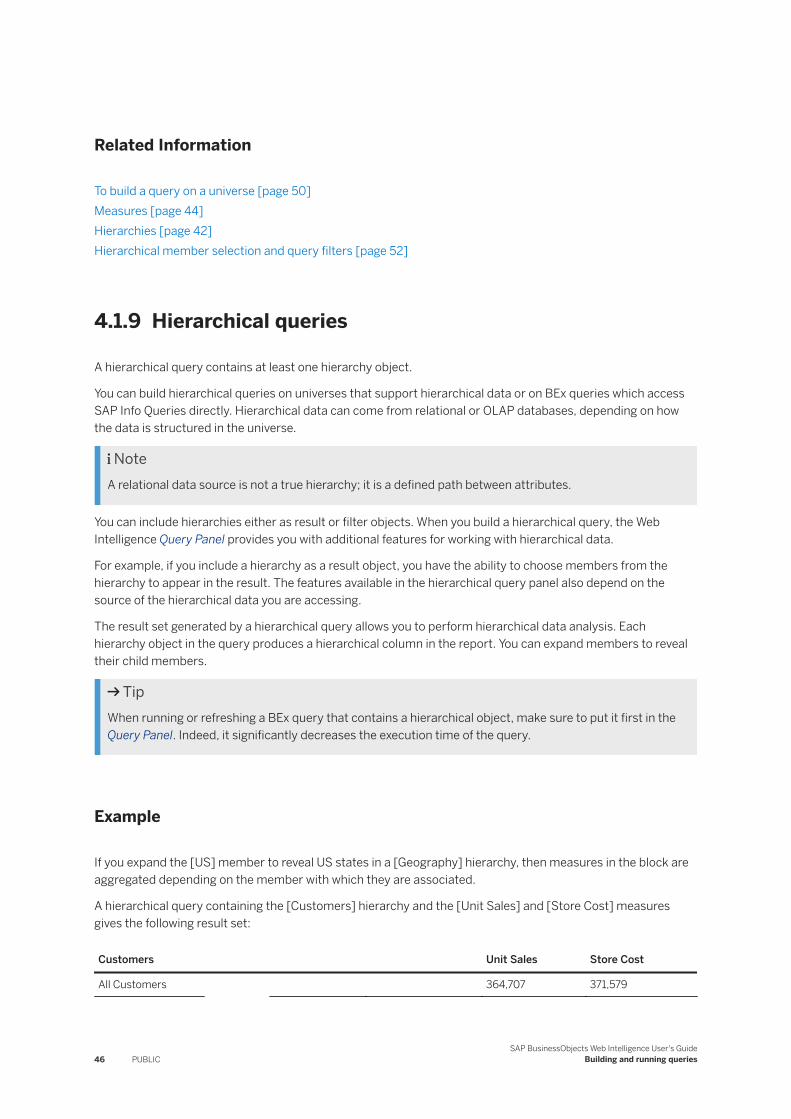
Related Information
To build a query on a universe [page 50]Measures [page 44]Hierarchies [page 42]Hierarchical member selection and query filters [page 52]
4.1.9 Hierarchical queries
A hierarchical query contains at least one hierarchy object.
You can build hierarchical queries on universes that support hierarchical data or on BEx queries which access SAP Info Queries directly. Hierarchical data can come from relational or OLAP databases, depending on how the data is structured in the universe.
NoteA relational data source is not a true hierarchy; it is a defined path between attributes.
You can include hierarchies either as result or filter objects. When you build a hierarchical query, the Web Intelligence Query Panel provides you with additional features for working with hierarchical data.
For example, if you include a hierarchy as a result object, you have the ability to choose members from the hierarchy to appear in the result. The features available in the hierarchical query panel also depend on the source of the hierarchical data you are accessing.
The result set generated by a hierarchical query allows you to perform hierarchical data analysis. Each hierarchy object in the query produces a hierarchical column in the report. You can expand members to reveal their child members.
TipWhen running or refreshing a BEx query that contains a hierarchical object, make sure to put it first in the Query Panel. Indeed, it significantly decreases the execution time of the query.
Example
If you expand the [US] member to reveal US states in a [Geography] hierarchy, then measures in the block are aggregated depending on the member with which they are associated.
A hierarchical query containing the [Customers] hierarchy and the [Unit Sales] and [Store Cost] measures gives the following result set:
Customers Unit Sales Store Cost
All Customers 364,707 371,579
46 PUBLICSAP BusinessObjects Web Intelligence User's Guide
Building and running queries
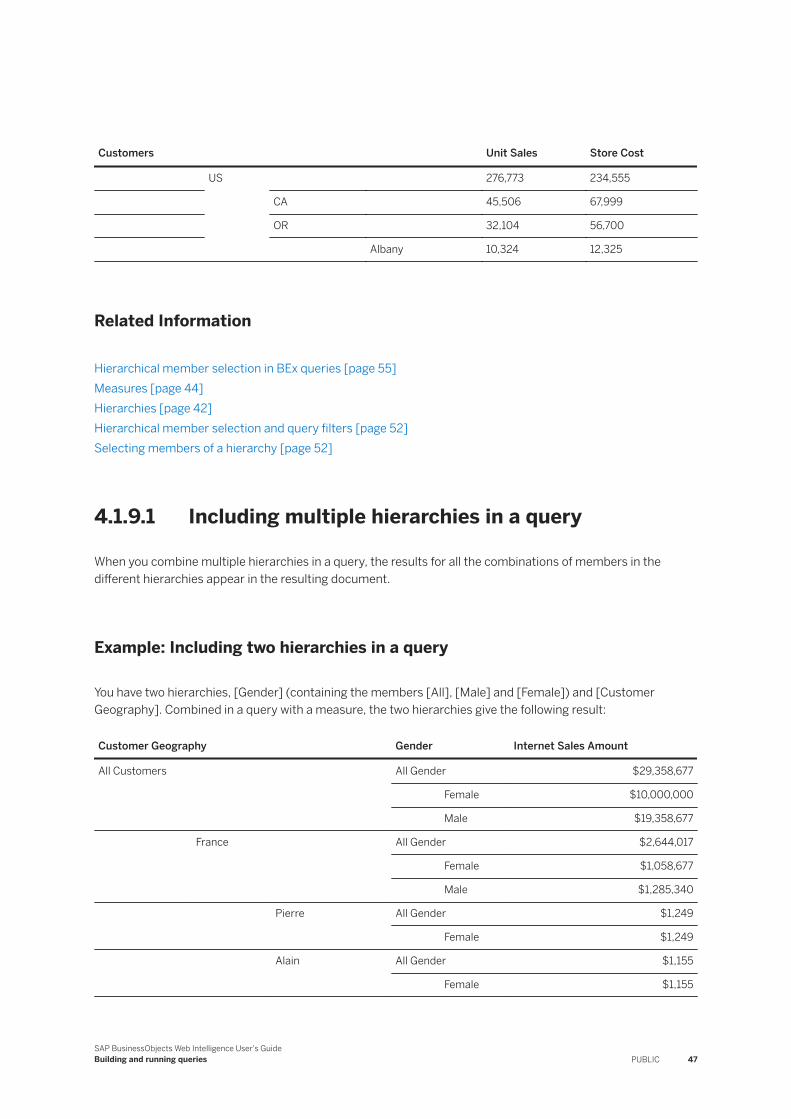
Customers Unit Sales Store Cost
US 276,773 234,555
CA 45,506 67,999
OR 32,104 56,700
Albany 10,324 12,325
Related Information
Hierarchical member selection in BEx queries [page 55]Measures [page 44]Hierarchies [page 42]Hierarchical member selection and query filters [page 52]Selecting members of a hierarchy [page 52]
4.1.9.1 Including multiple hierarchies in a query
When you combine multiple hierarchies in a query, the results for all the combinations of members in the different hierarchies appear in the resulting document.
Example: Including two hierarchies in a query
You have two hierarchies, [Gender] (containing the members [All], [Male] and [Female]) and [Customer Geography]. Combined in a query with a measure, the two hierarchies give the following result:
Customer Geography Gender Internet Sales Amount
All Customers All Gender $29,358,677
Female $10,000,000
Male $19,358,677
France All Gender $2,644,017
Female $1,058,677
Male $1,285,340
Pierre All Gender $1,249
Female $1,249
Alain All Gender $1,155
Female $1,155
SAP BusinessObjects Web Intelligence User's GuideBuilding and running queries PUBLIC 47
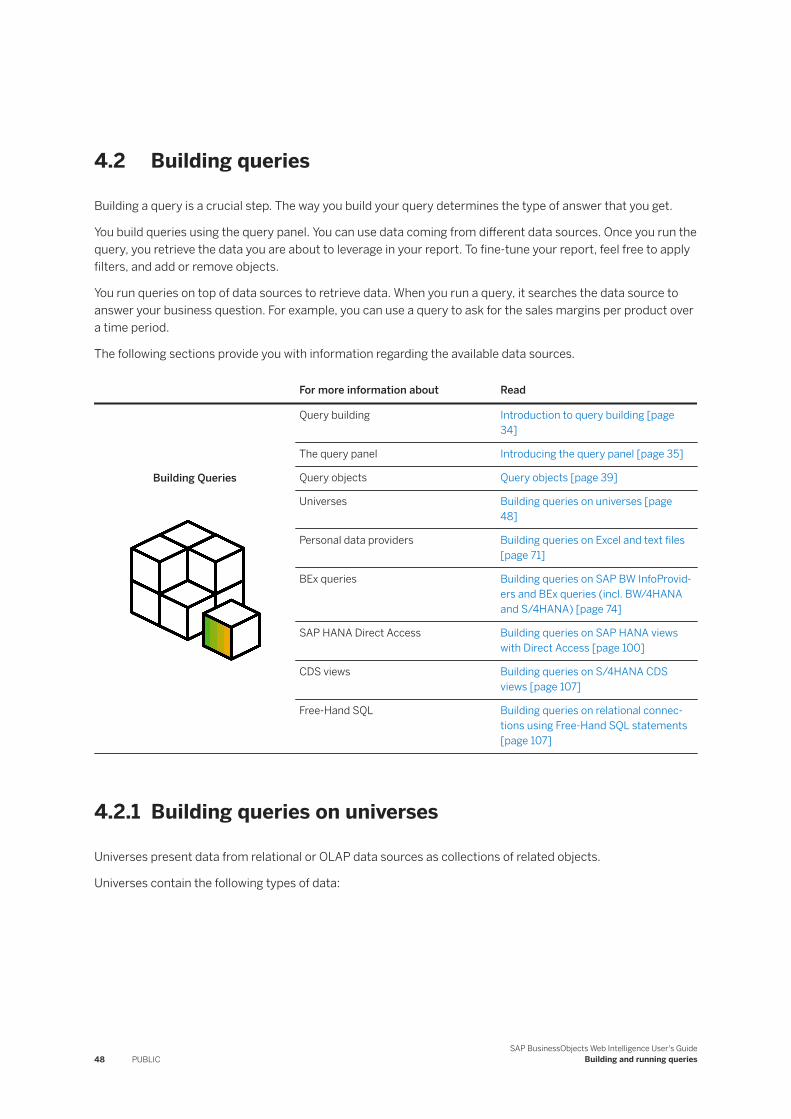
4.2 Building queries
Building a query is a crucial step. The way you build your query determines the type of answer that you get.
You build queries using the query panel. You can use data coming from different data sources. Once you run the query, you retrieve the data you are about to leverage in your report. To fine-tune your report, feel free to apply filters, and add or remove objects.
You run queries on top of data sources to retrieve data. When you run a query, it searches the data source to answer your business question. For example, you can use a query to ask for the sales margins per product over a time period.
The following sections provide you with information regarding the available data sources.
For more information about Read
Building Queries
Query building Introduction to query building [page 34]
The query panel Introducing the query panel [page 35]
Query objects Query objects [page 39]
Universes Building queries on universes [page 48]
Personal data providers Building queries on Excel and text files [page 71]
BEx queries Building queries on SAP BW InfoProviders and BEx queries (incl. BW/4HANA and S/4HANA) [page 74]
SAP HANA Direct Access Building queries on SAP HANA views with Direct Access [page 100]
CDS views Building queries on S/4HANA CDS views [page 107]
Free-Hand SQL Building queries on relational connections using Free-Hand SQL statements [page 107]
4.2.1 Building queries on universes
Universes present data from relational or OLAP data sources as collections of related objects.
Universes contain the following types of data:
48 PUBLICSAP BusinessObjects Web Intelligence User's Guide
Building and running queries
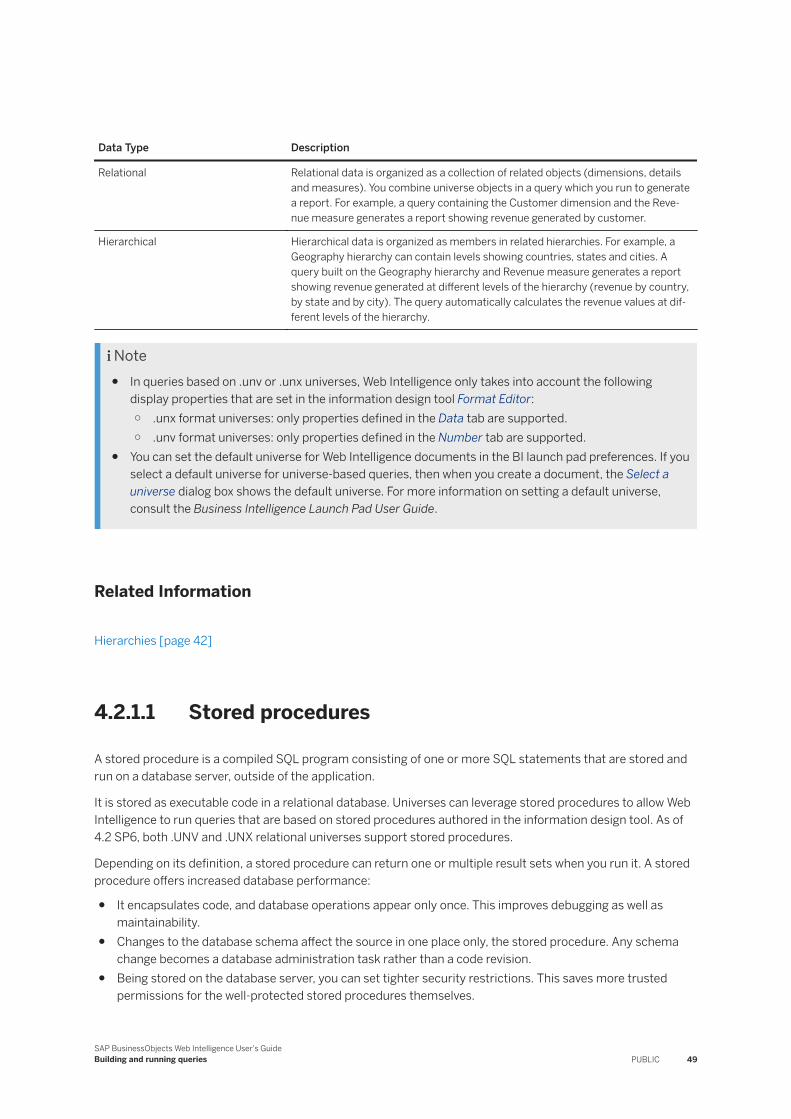
Data Type Description
Relational Relational data is organized as a collection of related objects (dimensions, details and measures). You combine universe objects in a query which you run to generate a report. For example, a query containing the Customer dimension and the Revenue measure generates a report showing revenue generated by customer.
Hierarchical Hierarchical data is organized as members in related hierarchies. For example, a Geography hierarchy can contain levels showing countries, states and cities. A query built on the Geography hierarchy and Revenue measure generates a report showing revenue generated at different levels of the hierarchy (revenue by country, by state and by city). The query automatically calculates the revenue values at different levels of the hierarchy.
Note● In queries based on .unv or .unx universes, Web Intelligence only takes into account the following
display properties that are set in the information design tool Format Editor:○ .unx format universes: only properties defined in the Data tab are supported.○ .unv format universes: only properties defined in the Number tab are supported.
● You can set the default universe for Web Intelligence documents in the BI launch pad preferences. If you select a default universe for universe-based queries, then when you create a document, the Select a universe dialog box shows the default universe. For more information on setting a default universe, consult the Business Intelligence Launch Pad User Guide.
Related Information
Hierarchies [page 42]
4.2.1.1 Stored procedures
A stored procedure is a compiled SQL program consisting of one or more SQL statements that are stored and run on a database server, outside of the application.
It is stored as executable code in a relational database. Universes can leverage stored procedures to allow Web Intelligence to run queries that are based on stored procedures authored in the information design tool. As of 4.2 SP6, both .UNV and .UNX relational universes support stored procedures.
Depending on its definition, a stored procedure can return one or multiple result sets when you run it. A stored procedure offers increased database performance:
● It encapsulates code, and database operations appear only once. This improves debugging as well as maintainability.
● Changes to the database schema affect the source in one place only, the stored procedure. Any schema change becomes a database administration task rather than a code revision.
● Being stored on the database server, you can set tighter security restrictions. This saves more trusted permissions for the well-protected stored procedures themselves.
SAP BusinessObjects Web Intelligence User's GuideBuilding and running queries PUBLIC 49
● It is compiled and stored outside of the application, and can therefore use more sensitive variables within the SQL syntax, such as passwords or personal data.
Restriction● You cannot create query filters or use sorts on objects based on stored procedure universes.● You cannot view or edit query scripts on objects based on stored procedure universes.● Input parameters that modifiy table structures at runtime aren't supported.
4.2.1.2 Hidden objects
The universe designer has the possibility to hide objects in a universe.
If the universe designer hides an object in the universe, you can no longer create a new report based on this object. However, the existing reports that use this universe object are still valid, meaning that report blocks using that object still display the data related to it. In the Available Objects pane of the Side Panel, the hidden objects is still visible.
However, the hidden object is no longer be visible and usable in the universe outline of the Query Panel. For existing reports using the object that is now hidden, it still appears in the Results Objects pane according to the query definition; but in the universe outline of the Query Panel, the hidden object is not visible. Note that if you remove the object from the query, then the object is definitively lost as it doesn’t appear in the universe outline.
If you do a universe change source towards a target universe that contains hidden objects, the match happens normally if and only if the target universe contains a hidden object with the same name and the same ID.
4.2.1.3 To build a query on a universe
You can build a query using a universe as a data source.
1. On the BI Launch Pad home screen, scroll down to the Applications section.2. Click Web Intelligence.3. Select Universe and click OK.4. Select a universe.
NoteYou can set the default universe for Web Intelligence documents in the BI launch pad preferences. If you select a default universe for universe-based queries, then when you create a document, the Select a universe dialog box shows the default universe. For more information on setting a default universe, consult the Business Intelligence Launch Pad User Guide.
The query panel opens.5. Drag the dimensions and measures you want to include in the query into the Result Objects pane.
NoteFor some OLAP .unv and .unx universes, you are required to select a measure for your query.
50 PUBLICSAP BusinessObjects Web Intelligence User's Guide
Building and running queries
Tip○ To add all the objects in the class to the Result Objects pane, double-click the class folder.○ To view the details of an object, move your mouse over the object in the Result Objects. A tooltip
shows the object details. To copy the content for reuse in another application, right-click the object and select Object Description. The Object Description dialog box displays all of the details. You can also select the text in the text box and paste it in another application.
6. Repeat the previous step until the query contains all the objects you want to include.
Tip○ To remove an object from the Result Objects or Query Filters panes, click the Remove icon in the
top corner of the pane.○ To remove all objects from the Result Objects or Query Filters panes, click the Remove All icon in
the top corner of the pane.
7. Optional: Select the objects on which you want to define query filters and drag them to the Query Filters pane. To create a quick filter on an object, select the object in the Result Objects pane then click the Add a quick filter icon in the Result Objects toolbar.
NoteIf the query is based on a HANA universe, and if the views contain HANA variables or input parameters or both, there will be query prompts. If you add prompts in the Quick Filters pane, there could be a duplication of prompts. We recommend that you run the query prior to defining any query prompts to know what prompts may already exist.
8. Set the scope of analysis and other query properties. For information on scopes of analysis, see Setting the scope of analysis [page 60].
9. Click Run Query. When you have more than one query and you want to run just one query, click Run Queries and select the query that you want to run.
Note○ If a document is created with two data providers (queries) based on same data source (universe)
and you change the source of one of the queries, the source of the other data provider is not changed.
○ If you are querying a HANA data source that uses input parameters, then when you run the query, you can encounter prompts that require you to enter values for variables and parameters. The values available in the prompts come directly from the HANA data source.
Related Information
To preview query results [page 114]Non-hierarchical queries [page 45]HANA query prompts in Web Intelligence [page 148]
SAP BusinessObjects Web Intelligence User's GuideBuilding and running queries PUBLIC 51
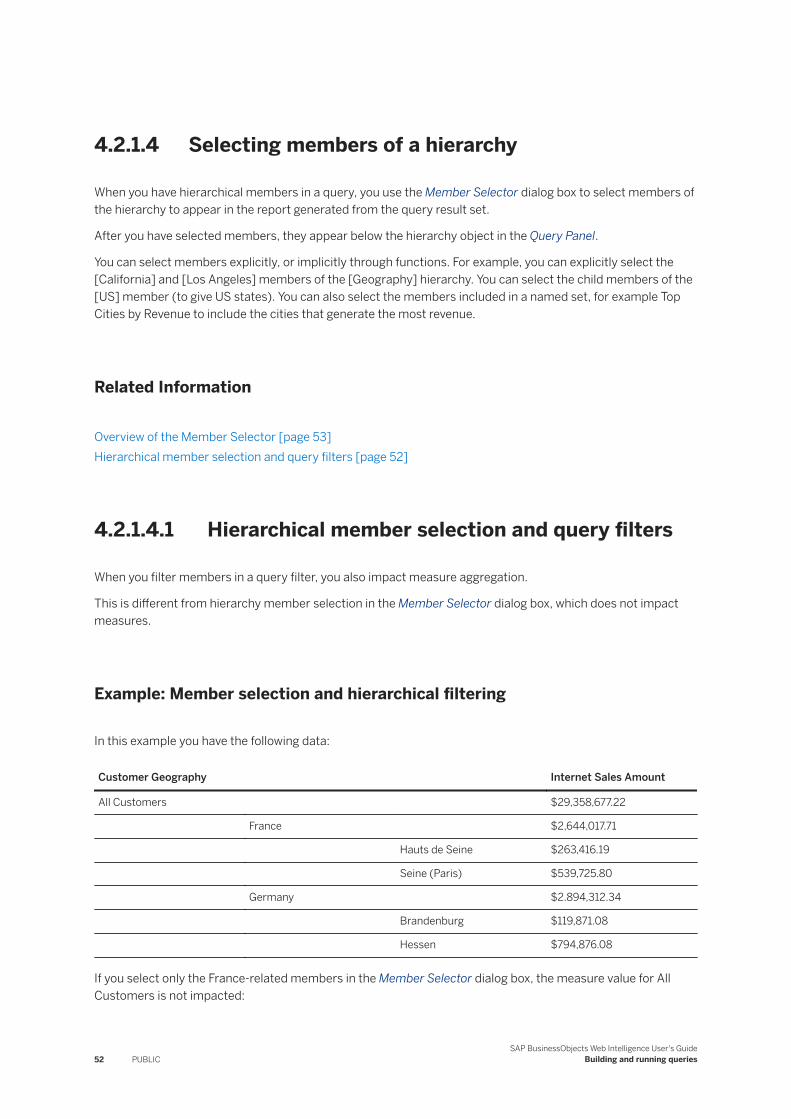
4.2.1.4 Selecting members of a hierarchy
When you have hierarchical members in a query, you use the Member Selector dialog box to select members of the hierarchy to appear in the report generated from the query result set.
After you have selected members, they appear below the hierarchy object in the Query Panel.
You can select members explicitly, or implicitly through functions. For example, you can explicitly select the [California] and [Los Angeles] members of the [Geography] hierarchy. You can select the child members of the [US] member (to give US states). You can also select the members included in a named set, for example Top Cities by Revenue to include the cities that generate the most revenue.
Related Information
Overview of the Member Selector [page 53]Hierarchical member selection and query filters [page 52]
4.2.1.4.1 Hierarchical member selection and query filters
When you filter members in a query filter, you also impact measure aggregation.
This is different from hierarchy member selection in the Member Selector dialog box, which does not impact measures.
Example: Member selection and hierarchical filtering
In this example you have the following data:
Customer Geography Internet Sales Amount
All Customers $29,358,677.22
France $2,644,017.71
Hauts de Seine $263,416.19
Seine (Paris) $539,725.80
Germany $2.894,312.34
Brandenburg $119,871.08
Hessen $794,876.08
If you select only the France-related members in the Member Selector dialog box, the measure value for All Customers is not impacted:
52 PUBLICSAP BusinessObjects Web Intelligence User's Guide
Building and running queries
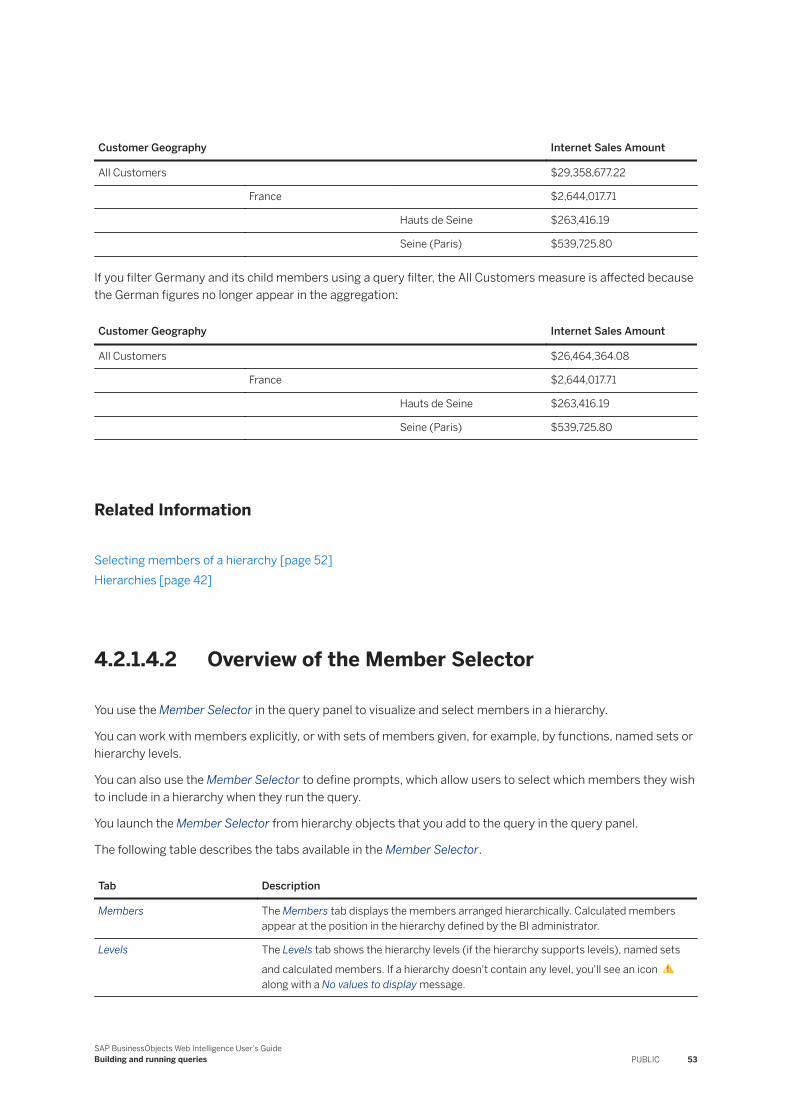
Customer Geography Internet Sales Amount
All Customers $29,358,677.22
France $2,644,017.71
Hauts de Seine $263,416.19
Seine (Paris) $539,725.80
If you filter Germany and its child members using a query filter, the All Customers measure is affected because the German figures no longer appear in the aggregation:
Customer Geography Internet Sales Amount
All Customers $26,464,364.08
France $2,644,017.71
Hauts de Seine $263,416.19
Seine (Paris) $539,725.80
Related Information
Selecting members of a hierarchy [page 52]Hierarchies [page 42]
4.2.1.4.2 Overview of the Member Selector
You use the Member Selector in the query panel to visualize and select members in a hierarchy.
You can work with members explicitly, or with sets of members given, for example, by functions, named sets or hierarchy levels.
You can also use the Member Selector to define prompts, which allow users to select which members they wish to include in a hierarchy when they run the query.
You launch the Member Selector from hierarchy objects that you add to the query in the query panel.
The following table describes the tabs available in the Member Selector.
Tab Description
Members The Members tab displays the members arranged hierarchically. Calculated members appear at the position in the hierarchy defined by the BI administrator.
Levels The Levels tab shows the hierarchy levels (if the hierarchy supports levels), named sets
and calculated members. If a hierarchy doesn't contain any level, you'll see an icon along with a No values to display message.
SAP BusinessObjects Web Intelligence User's GuideBuilding and running queries PUBLIC 53
Tab Description
Prompt The Prompts allows you to defer member selection until you run the query. When running the query, a prompt allows you to select members.
NoteIn the Member Selector, you can select the display of the technical and business names of objects or hierarchy objects. The Technical Name (also known as the unique name) is the name that identifies the object in addition to its Business Name (also known as the caption name). Technical Names are not localized whereas Business Names are. For example, a Business Name would be 'Customer', and the Technical Name could be Z_CUSTOMER.
Related Information
Selecting members of a hierarchy [page 52]
4.2.1.4.3 To select hierarchy members
You select hierarchy members for your query via the query panel.
CautionIf you select a node that has linked nodes in the Member Selector, they are selected as well after you run the query. If you open the Member Selector after you have run the query, you can see that linked nodes are also selected.
1. In Design mode, click in the toolbar to open the query panel.2. Add a hierarchy object to the Result Objects pane.
3. Click next to the hierarchy to open the Member Selector.4. Add members or levels to the query, by either:
○ Selecting the members you want to add to the query manually in the Members tab.○ Selecting all members by clicking > Select All Members in the Members tab. By doing so, you include
all members, even if the hierarchy structure changes in the future.○ Selecting all members until a specific level by clicking > Select All Members Until in the Members tab.○ Searching and selecting members by clicking in the Members tab. You can use wild cards: * replace
any string of characters, ? replaces any individual character.○ Selecting the levels you want to add to the query in the Levels tabs. You can also select calculated
members and named sets from the Levels tab.
NoteYou can't apply functions, for example Children or Parent, to a calculated member.
54 PUBLICSAP BusinessObjects Web Intelligence User's Guide
Building and running queries
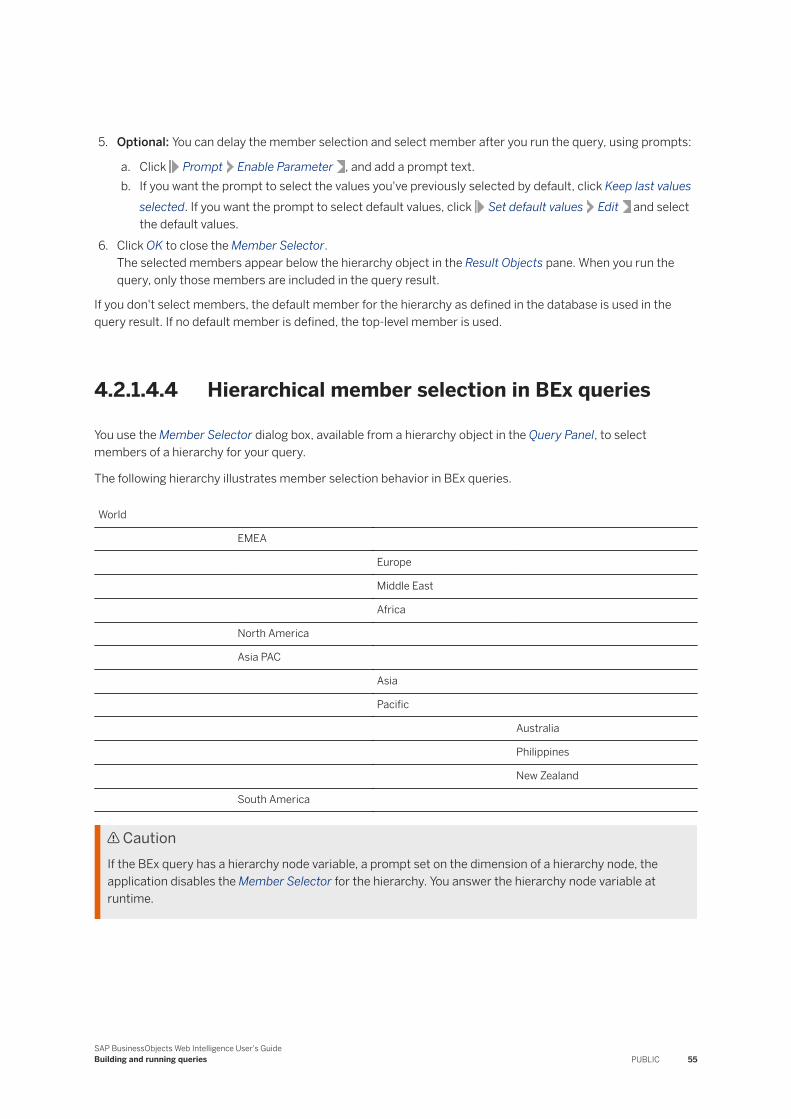
5. Optional: You can delay the member selection and select member after you run the query, using prompts:
a. Click Prompt Enable Parameter , and add a prompt text.b. If you want the prompt to select the values you've previously selected by default, click Keep last values
selected. If you want the prompt to select default values, click Set default values Edit and select the default values.
6. Click OK to close the Member Selector.The selected members appear below the hierarchy object in the Result Objects pane. When you run the query, only those members are included in the query result.
If you don't select members, the default member for the hierarchy as defined in the database is used in the query result. If no default member is defined, the top-level member is used.
4.2.1.4.4 Hierarchical member selection in BEx queries
You use the Member Selector dialog box, available from a hierarchy object in the Query Panel, to select members of a hierarchy for your query.
The following hierarchy illustrates member selection behavior in BEx queries.
World
EMEA
Europe
Middle East
Africa
North America
Asia PAC
Asia
Pacific
Australia
Philippines
New Zealand
South America
CautionIf the BEx query has a hierarchy node variable, a prompt set on the dimension of a hierarchy node, the application disables the Member Selector for the hierarchy. You answer the hierarchy node variable at runtime.
SAP BusinessObjects Web Intelligence User's GuideBuilding and running queries PUBLIC 55
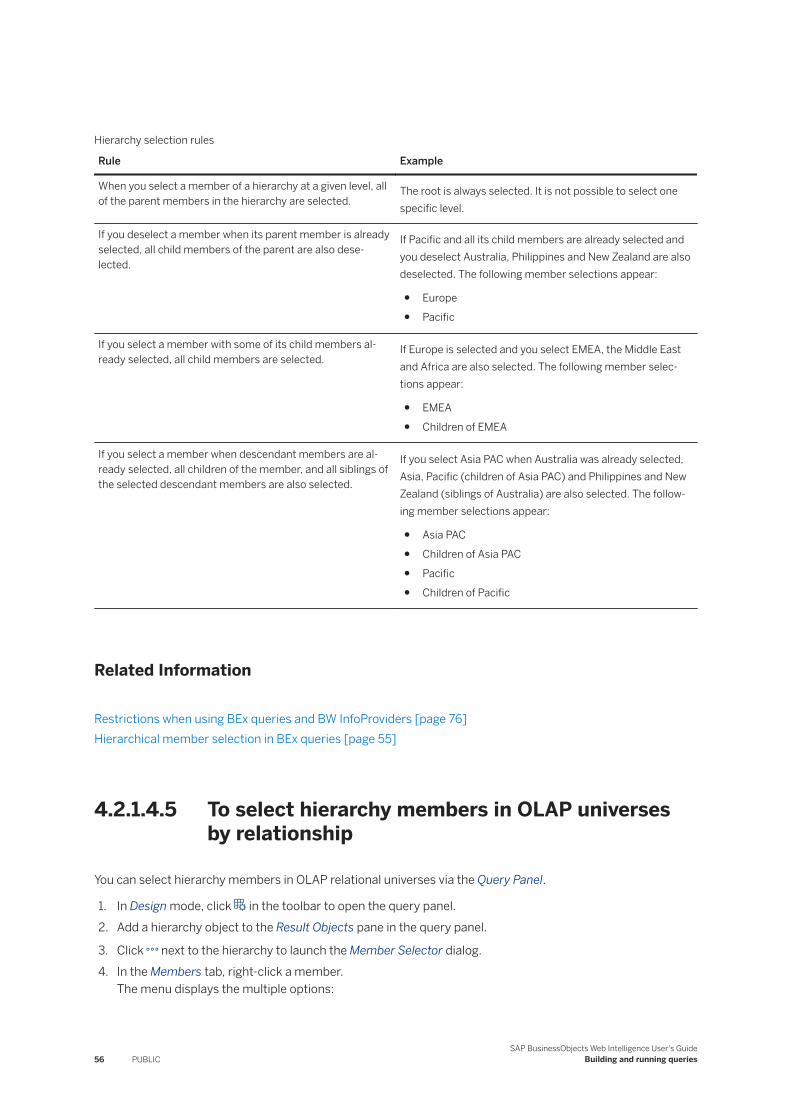
Hierarchy selection rules
Rule Example
When you select a member of a hierarchy at a given level, all of the parent members in the hierarchy are selected.
The root is always selected. It is not possible to select one specific level.
If you deselect a member when its parent member is already selected, all child members of the parent are also deselected.
If Pacific and all its child members are already selected and you deselect Australia, Philippines and New Zealand are also deselected. The following member selections appear:
● Europe● Pacific
If you select a member with some of its child members already selected, all child members are selected.
If Europe is selected and you select EMEA, the Middle East and Africa are also selected. The following member selections appear:
● EMEA● Children of EMEA
If you select a member when descendant members are already selected, all children of the member, and all siblings of the selected descendant members are also selected.
If you select Asia PAC when Australia was already selected, Asia, Pacific (children of Asia PAC) and Philippines and New Zealand (siblings of Australia) are also selected. The following member selections appear:
● Asia PAC● Children of Asia PAC● Pacific● Children of Pacific
Related Information
Restrictions when using BEx queries and BW InfoProviders [page 76]Hierarchical member selection in BEx queries [page 55]
4.2.1.4.5 To select hierarchy members in OLAP universes by relationship
You can select hierarchy members in OLAP relational universes via the Query Panel.
1. In Design mode, click in the toolbar to open the query panel.2. Add a hierarchy object to the Result Objects pane in the query panel.
3. Click next to the hierarchy to launch the Member Selector dialog.4. In the Members tab, right-click a member.
The menu displays the multiple options:
56 PUBLICSAP BusinessObjects Web Intelligence User's Guide
Building and running queries
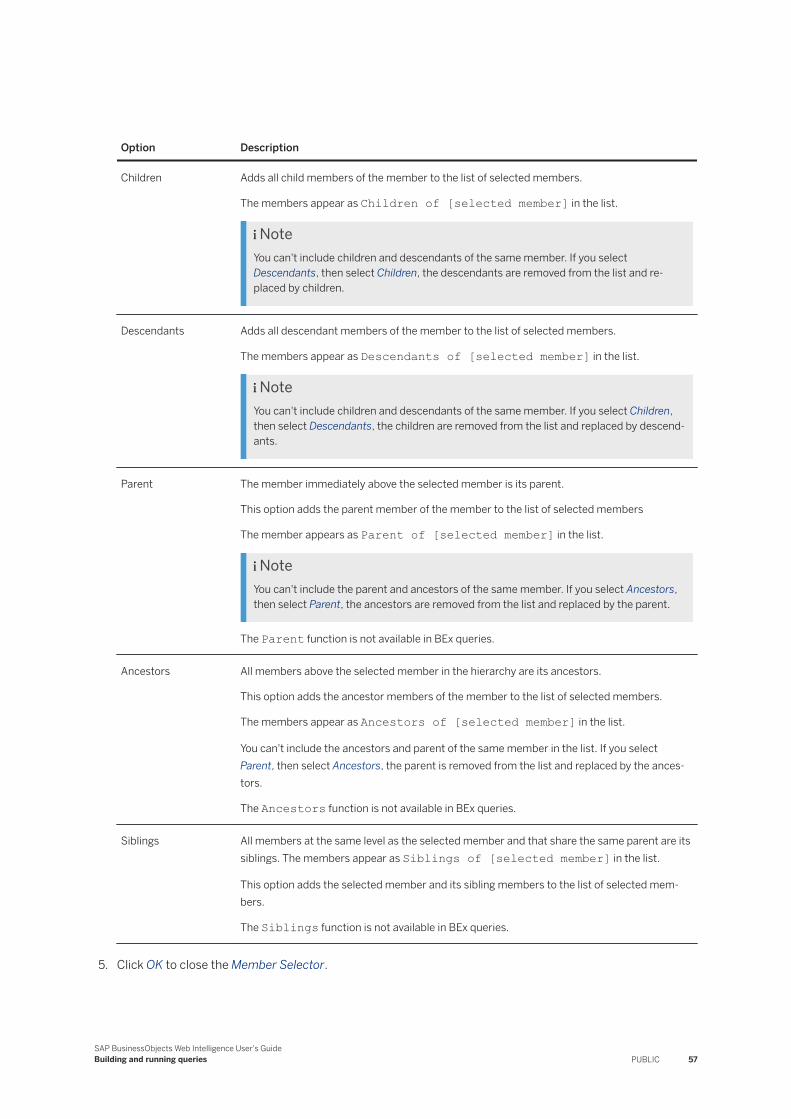
Option Description
Children Adds all child members of the member to the list of selected members.
The members appear as Children of [selected member] in the list.
NoteYou can't include children and descendants of the same member. If you select Descendants, then select Children, the descendants are removed from the list and replaced by children.
Descendants Adds all descendant members of the member to the list of selected members.
The members appear as Descendants of [selected member] in the list.
NoteYou can't include children and descendants of the same member. If you select Children, then select Descendants, the children are removed from the list and replaced by descendants.
Parent The member immediately above the selected member is its parent.
This option adds the parent member of the member to the list of selected members
The member appears as Parent of [selected member] in the list.
NoteYou can't include the parent and ancestors of the same member. If you select Ancestors, then select Parent, the ancestors are removed from the list and replaced by the parent.
The Parent function is not available in BEx queries.
Ancestors All members above the selected member in the hierarchy are its ancestors.
This option adds the ancestor members of the member to the list of selected members.
The members appear as Ancestors of [selected member] in the list.
You can't include the ancestors and parent of the same member in the list. If you select Parent, then select Ancestors, the parent is removed from the list and replaced by the ancestors.
The Ancestors function is not available in BEx queries.
Siblings All members at the same level as the selected member and that share the same parent are its siblings. The members appear as Siblings of [selected member] in the list.
This option adds the selected member and its sibling members to the list of selected members.
The Siblings function is not available in BEx queries.
5. Click OK to close the Member Selector.
SAP BusinessObjects Web Intelligence User's GuideBuilding and running queries PUBLIC 57
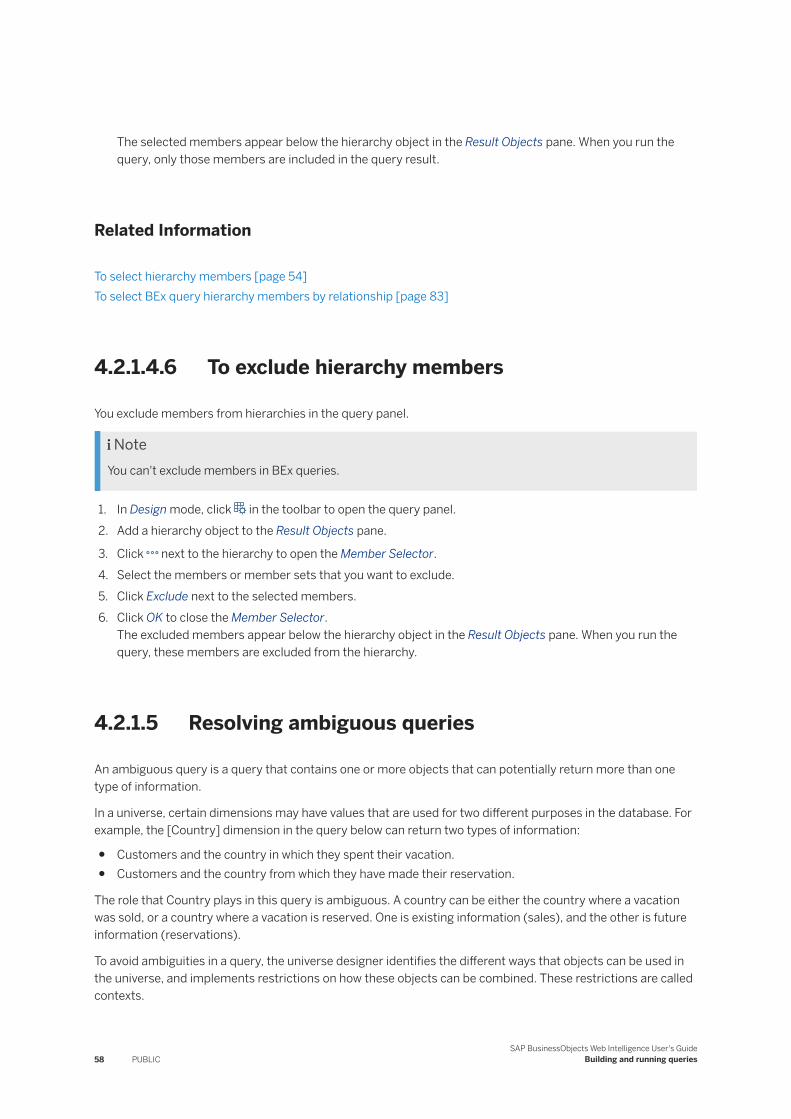
The selected members appear below the hierarchy object in the Result Objects pane. When you run the query, only those members are included in the query result.
Related Information
To select hierarchy members [page 54]To select BEx query hierarchy members by relationship [page 83]
4.2.1.4.6 To exclude hierarchy members
You exclude members from hierarchies in the query panel.
NoteYou can't exclude members in BEx queries.
1. In Design mode, click in the toolbar to open the query panel.2. Add a hierarchy object to the Result Objects pane.
3. Click next to the hierarchy to open the Member Selector.4. Select the members or member sets that you want to exclude.5. Click Exclude next to the selected members.6. Click OK to close the Member Selector.
The excluded members appear below the hierarchy object in the Result Objects pane. When you run the query, these members are excluded from the hierarchy.
4.2.1.5 Resolving ambiguous queries
An ambiguous query is a query that contains one or more objects that can potentially return more than one type of information.
In a universe, certain dimensions may have values that are used for two different purposes in the database. For example, the [Country] dimension in the query below can return two types of information:
● Customers and the country in which they spent their vacation.● Customers and the country from which they have made their reservation.
The role that Country plays in this query is ambiguous. A country can be either the country where a vacation was sold, or a country where a vacation is reserved. One is existing information (sales), and the other is future information (reservations).
To avoid ambiguities in a query, the universe designer identifies the different ways that objects can be used in the universe, and implements restrictions on how these objects can be combined. These restrictions are called contexts.
58 PUBLICSAP BusinessObjects Web Intelligence User's Guide
Building and running queries
4.2.1.5.1 Contexts in a query
A context is a defined group of objects that share a common business purpose.
This business purpose is usually the type of information that these related objects represent. For example, a sales context is a grouping of all the objects that can be used to create sales queries. A reservations context is a grouping of all the objects that can be used in reservation queries. Contexts are defined in the universe by the universe designer.
You can combine any objects within the same context to create a query. You can also combine objects in different contexts. If you use an object that is common to multiple contexts in a query and it is not possible to determine the best context that fits all the other objects in the query, you are prompted to choose the context to apply.
4.2.1.5.2 To choose a context when you run a query
When you create a query or refresh a document, you may be asked to choose a context before the query can run. Contexts are set up in a universe to avoid ambiguous queries.
You need to choose a context each time you run the query if the Reset contexts on refresh query property is selected in the query properties. You will also need to choose contexts if you select the Clear contexts option in the query properties
Note● After selecting the Clear contexts option, the next prompt on contexts will still show the last selected
context and if you want to select another context, you must first remove the existing selection.● Clearing the Reset contexts on refresh setting does not apply to LOV refresh in Prompts. The user will
be prompted for the context if the prompt requires it.● LOV's that prompt for context are not supported in the Web Intelligence HTML interface.● Before you schedule a document that contains multiple contexts, you must first select a context. To do
this, follow the steps below.
1. In a document containing multiple contexts, run the query or refresh the document.The Select a Context dialog box appears.
2. Select a context.
If prompts have been set for the document, then the Prompts dialog box appears. Otherwise the document content reflects the context you have selected.
Related Information
To reset contexts when refreshing a query [page 60]
SAP BusinessObjects Web Intelligence User's GuideBuilding and running queries PUBLIC 59
4.2.1.5.3 To reset contexts when refreshing a query
You can refresh contexts every time you refresh a query in the query panel.
1. In Design mode, click in the toolbar to open the query panel.
2. In the query panel, click to open the query properties.3. Check Reset contexts on refresh.
Related Information
To choose a context when you run a query [page 59]
4.2.1.5.4 To clear contexts from a query
You can clear the contents of a query in the query properties.
1. In Design mode, click in the toolbar to open the query panel.
2. In the query panel, click to open the query properties.3. Click Clear contexts.4. Click OK to close the query properties.
4.2.1.6 Setting the scope of analysis
The scope of analysis for a query is extra data that you can retrieve from the database that is available to offer more details on the results returned.
This extra data does not appear in the initial result report, but it remains available in the data cube, and you can pull this data into the report to allow you to access more details at any time. This process of refining the data to lower levels of detail is called drilling down on an object.
NoteThe Scope of Analysis Panel option in the Query Panel is only available for relational .unx universes and not for OLAP universes or BEx queries.
In the universe, the scope of analysis corresponds to the hierarchical levels below the object selected for a query. For example, a scope of analysis of one level down for the object Year, would include the object Quarter, which appears immediately under Year.
You can set this level when you build a query. It allows objects lower down the hierarchy to be included in the query, without them appearing in the Result Objects pane. The hierarchies in a universe allow you to choose your scope of analysis, and correspondingly the level of drill available. You can also create a custom scope of analysis by selecting specific dimensions to be included in the scope.
60 PUBLICSAP BusinessObjects Web Intelligence User's Guide
Building and running queries
Related Information
Defining the scope of analysis [page 360]
4.2.1.6.1 Levels of scope of analysis
You can set different levels for a scope of analysis in a document.
Level Description
none Only the objects that appear in the Result Objects pane are included in the query.
● one level● two levels● three levels
For each object in the Result Objects pane, one, two, or three objects lower down the hierarchy tree are included in the query. The data from these objects is stored in the cube until you add them to the document.
custom All objects added manually to the Scope of analysis pane are included in the query.
TipIncluding a scope of analysis in a document increases the document size significantly because the data necessary for the scope you specify is saved with the document. It is not visible in the reports unless you start the Drill Mode and drill down to the data to display the corresponding values.
In order to minimize the size of documents and optimize performance, include a scope of analysis only in documents where you are certain that users will need to drill.
4.2.1.6.2 To set the scope of analysis
You can set a scope of analysis for a query in the Scope of Analysis pane at the bottom of the query panel.
1. In Design mode, click in the toolbar to open the query panel.
2. Click to display the scope of analysis.The Scope of Analysis Panel appears at the bottom of the query panel. The default scope of analysis is None. Each dimension in the Result Objects pane appears in the Scope of analysis pane.
3. Click the down arrow in the Scope level dropdown list box and select a level for the scope of analysis.The level appears in the list box and the dimensions that are hierarchically below each dimension in the Result Objects pane appear in the Scope of analysis pane.
4. If you want to add selected dimensions to the scope of analysis or create a custom scope of analysis, select dimensions in the data outline and drag them across to the Scope of analysis pane.
SAP BusinessObjects Web Intelligence User's GuideBuilding and running queries PUBLIC 61
4.2.1.7 Viewing the script generated by a query
When you build a query on a universe, it generates SQL or Multidimensional Expression (MDX) script behind the scenes to run against the database to return the query result.
SQL is the query language understood by all relational databases. MDX is the query language understood by OLAP databases.
You can view and edit the SQL generated by the query. You can view MDX queries but you cannot edit them.
NoteYou cannot view the script of queries that call database stored procedures.
4.2.1.7.1 To view and edit the generated script
You can view and edit generated query script in the Query Script Viewer.
1. In Design mode, click in the toolbar to open the query panel.
2. Click in the query panel's toolbar to display the Query Script Viewer.
NoteYou can't edit the query script if the query has optional prompts. Remove the optional prompts from the query before trying to edit the SQL.
If you can't edit the script, the values you provided when answering prompts appear directly in the query.
For example, if "UK" was supplied in response to a prompt on [Country], a line similar to the following appears in the query:
Resort_country.country In ('UK')
If the prompt has no value, the syntax for prompts (described below) appears in the query.3. Click Use custom query script to edit the generated script.
When editing the script, the syntax for prompts appears in the query.
For example, a line similar to the following appears in the query:
Resort_Country.country = @prompt('Enter Country:','A','Resort\Country', Mono,Free,Persistent,,User:0)
4. Click Validate after editing the script to check that your edits are valid.5. If you are using the Rich Client, you can click Copy to copy the script to the clipboard.6. If you are using the Rich Client, you can click Print to print the script.
62 PUBLICSAP BusinessObjects Web Intelligence User's Guide
Building and running queries
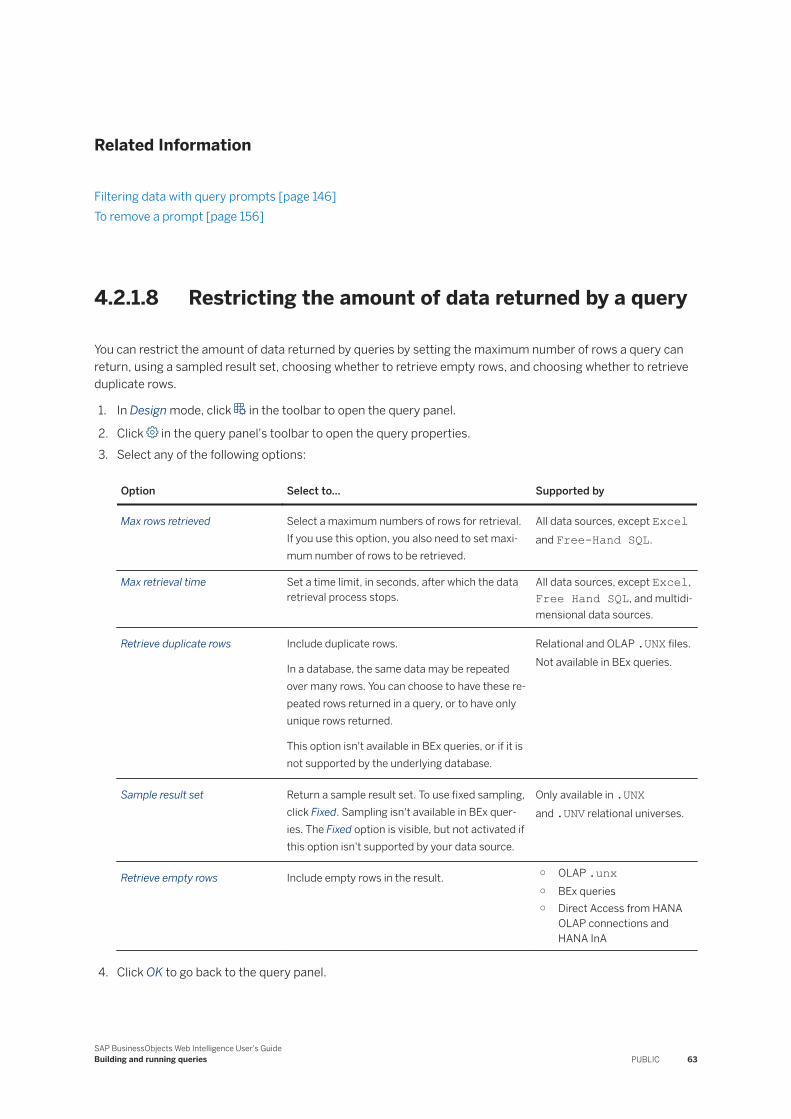
Related Information
Filtering data with query prompts [page 146]To remove a prompt [page 156]
4.2.1.8 Restricting the amount of data returned by a query
You can restrict the amount of data returned by queries by setting the maximum number of rows a query can return, using a sampled result set, choosing whether to retrieve empty rows, and choosing whether to retrieve duplicate rows.
1. In Design mode, click in the toolbar to open the query panel.
2. Click in the query panel's toolbar to open the query properties.3. Select any of the following options:
Option Select to... Supported by
Max rows retrieved Select a maximum numbers of rows for retrieval. If you use this option, you also need to set maximum number of rows to be retrieved.
All data sources, except Excel and Free-Hand SQL.
Max retrieval time Set a time limit, in seconds, after which the data retrieval process stops.
All data sources, except Excel, Free Hand SQL, and multidimensional data sources.
Retrieve duplicate rows Include duplicate rows.
In a database, the same data may be repeated over many rows. You can choose to have these repeated rows returned in a query, or to have only unique rows returned.
This option isn't available in BEx queries, or if it is not supported by the underlying database.
Relational and OLAP .UNX files. Not available in BEx queries.
Sample result set Return a sample result set. To use fixed sampling, click Fixed. Sampling isn't available in BEx queries. The Fixed option is visible, but not activated if this option isn't supported by your data source.
Only available in .UNX and .UNV relational universes.
Retrieve empty rows Include empty rows in the result. ○ OLAP .unx○ BEx queries○ Direct Access from HANA
OLAP connections and HANA InA
4. Click OK to go back to the query panel.
SAP BusinessObjects Web Intelligence User's GuideBuilding and running queries PUBLIC 63
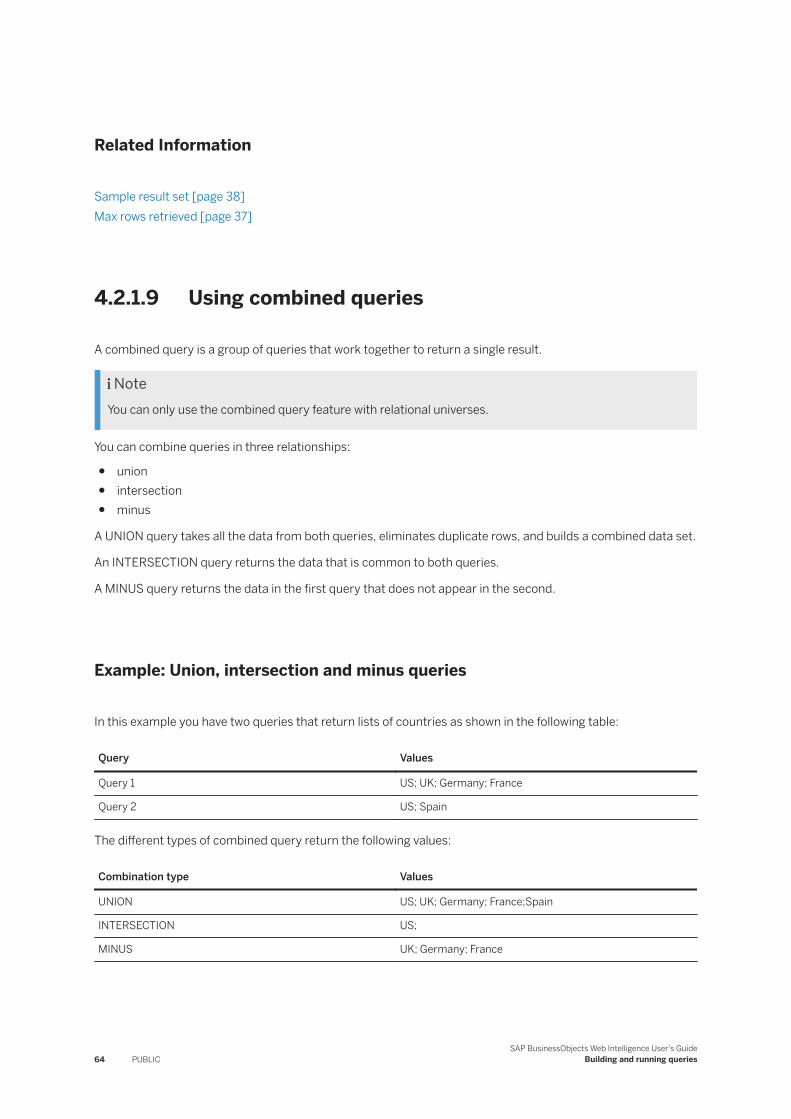
Related Information
Sample result set [page 38]Max rows retrieved [page 37]
4.2.1.9 Using combined queries
A combined query is a group of queries that work together to return a single result.
NoteYou can only use the combined query feature with relational universes.
You can combine queries in three relationships:
● union● intersection● minus
A UNION query takes all the data from both queries, eliminates duplicate rows, and builds a combined data set.
An INTERSECTION query returns the data that is common to both queries.
A MINUS query returns the data in the first query that does not appear in the second.
Example: Union, intersection and minus queries
In this example you have two queries that return lists of countries as shown in the following table:
Query Values
Query 1 US; UK; Germany; France
Query 2 US; Spain
The different types of combined query return the following values:
Combination type Values
UNION US; UK; Germany; France;Spain
INTERSECTION US;
MINUS UK; Germany; France
64 PUBLICSAP BusinessObjects Web Intelligence User's Guide
Building and running queries
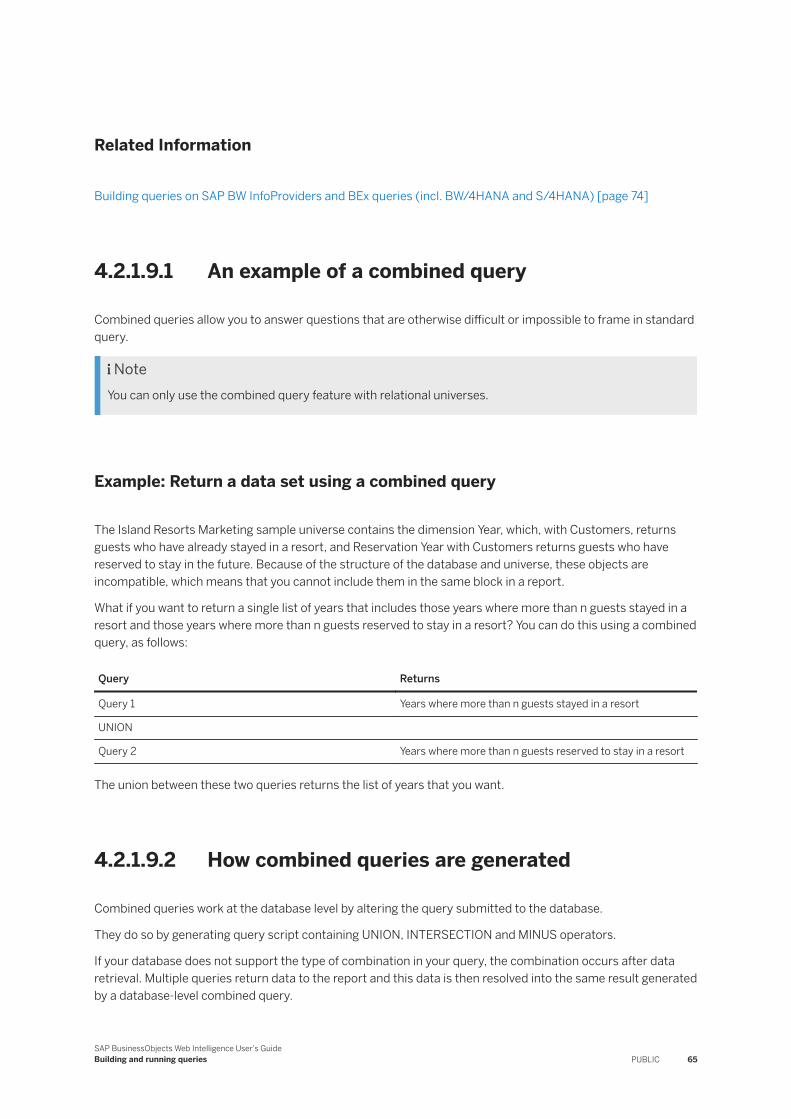
Related Information
Building queries on SAP BW InfoProviders and BEx queries (incl. BW/4HANA and S/4HANA) [page 74]
4.2.1.9.1 An example of a combined query
Combined queries allow you to answer questions that are otherwise difficult or impossible to frame in standard query.
NoteYou can only use the combined query feature with relational universes.
Example: Return a data set using a combined query
The Island Resorts Marketing sample universe contains the dimension Year, which, with Customers, returns guests who have already stayed in a resort, and Reservation Year with Customers returns guests who have reserved to stay in the future. Because of the structure of the database and universe, these objects are incompatible, which means that you cannot include them in the same block in a report.
What if you want to return a single list of years that includes those years where more than n guests stayed in a resort and those years where more than n guests reserved to stay in a resort? You can do this using a combined query, as follows:
Query Returns
Query 1 Years where more than n guests stayed in a resort
UNION
Query 2 Years where more than n guests reserved to stay in a resort
The union between these two queries returns the list of years that you want.
4.2.1.9.2 How combined queries are generated
Combined queries work at the database level by altering the query submitted to the database.
They do so by generating query script containing UNION, INTERSECTION and MINUS operators.
If your database does not support the type of combination in your query, the combination occurs after data retrieval. Multiple queries return data to the report and this data is then resolved into the same result generated by a database-level combined query.
SAP BusinessObjects Web Intelligence User's GuideBuilding and running queries PUBLIC 65
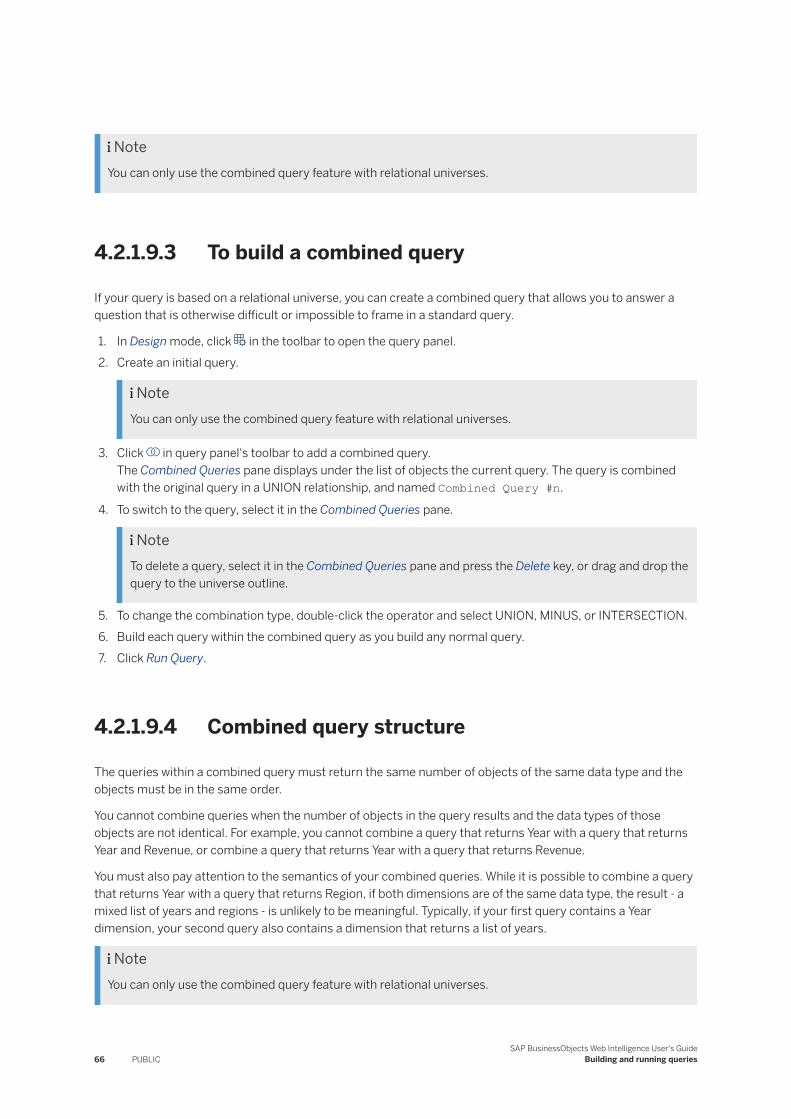
NoteYou can only use the combined query feature with relational universes.
4.2.1.9.3 To build a combined query
If your query is based on a relational universe, you can create a combined query that allows you to answer a question that is otherwise difficult or impossible to frame in a standard query.
1. In Design mode, click in the toolbar to open the query panel.2. Create an initial query.
NoteYou can only use the combined query feature with relational universes.
3. Click in query panel's toolbar to add a combined query.The Combined Queries pane displays under the list of objects the current query. The query is combined with the original query in a UNION relationship, and named Combined Query #n.
4. To switch to the query, select it in the Combined Queries pane.
NoteTo delete a query, select it in the Combined Queries pane and press the Delete key, or drag and drop the query to the universe outline.
5. To change the combination type, double-click the operator and select UNION, MINUS, or INTERSECTION.6. Build each query within the combined query as you build any normal query.7. Click Run Query.
4.2.1.9.4 Combined query structure
The queries within a combined query must return the same number of objects of the same data type and the objects must be in the same order.
You cannot combine queries when the number of objects in the query results and the data types of those objects are not identical. For example, you cannot combine a query that returns Year with a query that returns Year and Revenue, or combine a query that returns Year with a query that returns Revenue.
You must also pay attention to the semantics of your combined queries. While it is possible to combine a query that returns Year with a query that returns Region, if both dimensions are of the same data type, the result - a mixed list of years and regions - is unlikely to be meaningful. Typically, if your first query contains a Year dimension, your second query also contains a dimension that returns a list of years.
NoteYou can only use the combined query feature with relational universes.
66 PUBLICSAP BusinessObjects Web Intelligence User's Guide
Building and running queries
4.2.1.9.4.1 Example: A query of guest occupancy and reservation rates per year
You want to build a query that returns a list of years consisting of years where more than n guests stayed in a resort and years where more than n guests placed reservations to stay in a resort.
NoteThis task requires access to the Island Resorts Marketing sample universe in Web Intelligence.
NoteThe object you are filtering on must also be in the Result Objects pane.
1. In Web Intelligence, create a document and select the Island Resorts Marketing universe in the list of universes.
2. In the Query Panel, drag the Year, Number of Guests, and Future Guests objects to the Result Objects pane.
3. Drag the Number of Guests object to the Query Filters pane and create a report filter that restricts Number of Guests to greater than n.
4. Click the Add a combined query icon.Below the list of objects in the Query Panel, the Combined Query pane appears, displaying the two queries joined by a union.
5. Click the second query and remove the Year and Number of Guests objects.
6. Drag the Reservation Year object to the Result Objects pane.
7. Drag the Future Guests object to the Query Filters pane and create a report filter that restricts the future guests to greater than n.
8. Click Run Query.
The query returns the combined list of years and reservation years.
Related Information
To build a query on a universe [page 50]
4.2.1.9.5 Combined query precedence
The order of execution in a combined query is crucial in determining the final result.
In the simplest form of combined query you combine two or more queries in a relationship as follows:
Query 1
SAP BusinessObjects Web Intelligence User's GuideBuilding and running queries PUBLIC 67
INTERSECTION Query 2
Query 3
In such a case, the first result to be calculated is the intersection between Combined Query n and Combined Query n + 1. The next result is the intersection between the first result and the result of Combined Query n + 2. Query execution continues in this way through all the queries in the relationship. This gives the following result for the above example:
Query Data
Query 1 US; UK; France; Germany
Query 2 US; France; Finland
INTERSECTION of 1 and 2 US; France
Query 3 US; Spain
Final INTERSECTION US
4.2.1.9.5.1 Nested combined queries
By default, each time you add a combined query, it is combined at the initial combination level with existing queries.
Each added query extends the list of combined queries. If you add Query 3 to Query 1 and Query 2, which are already combined in a UNION relationship, you get the following result:
UNION Query 1
Query 2
Query 3
You can also nest combined queries in complex, multi-level relationships to control the order of execution, as in the following example, which combines the result of Query 1 MINUS Query 2 in an INTERSECT relationship with Query 3.
Combined Query 1
MINUS
INTERSECT Combined Query 2
Query 3
In an LTR locale, query groups are processed from right to left and from top to bottom within each group. In an RTL locale, query groups are processed from left to right and from top to bottom within each group. The way query groups are processed depends on the Preferred Viewing Locale you have selected in the BI launch pad preferences. Some locales, like the English locale, use the left-to-right (LTR) interface positioning, whereas others, like the Arabic locale, use the right-to-left (RTL) interface positioning.
68 PUBLICSAP BusinessObjects Web Intelligence User's Guide
Building and running queries
Query Result
Query 1 US; UK; Spain; Germany
Query 2 Germany
Query 1 MINUS Query 2 US; UK; Spain
Query 3 US; Spain; Finland
(Query 1 MINUS Query 2)
INTERSECT
Query 3
US; Spain
NoteIf your database directly supports the type of combined query you wish to execute, the script generated from the query contains the combination operators directly. In this case the order of precedence depends on the order of precedence defined in the database. See your database administrator for more details.
4.2.1.9.5.2 To set the order of precedence of combined queries
You set an order of precedence in combined queries by placing queries into nested groups
1. In Design mode, click in the toolbar to open the query panel.
2. Click in query panel's toolbar to add a combined query and build it.
3. Click to add a combined query node and nest the queries.4. Drag and drop a query on to the query with which you want to associate the nested pair.
The new combined query node is by default a UNION relationship.5. Continue adding queries to the nested group by dragging and dropping them on to the space between any
two queries already in the group.6. To create further nested groups within an existing higher-precedence group, repeat the previous two steps.7. Click the combination operators of all the groups in the query to change them as required.8. Run the query.
Related Information
To build a combined query [page 66]
SAP BusinessObjects Web Intelligence User's GuideBuilding and running queries PUBLIC 69
4.2.2 Building queries on Web intelligence documents
Documents have valuable content and metadata that you can reuse when creating documents.
In some cases, the semantics have been augmented with enriched metadata. The target document automatically benefits from these augmented semantics as is, which reduces the data preparation effort. Time dimensions, geo-qualified objects, or variables for instance can be reused as such, so you don’t have to go through the enrichment process twice.
4.2.2.1 Exposing Web Intelligence content
When you create a document based on another document, the document used as a data source exposes the following metadata to the target document:
● Dimensions, measures, attributes● Hierarchies● Time and geo dimensions● Variables
In the query panel, you can select the objects from the source document that you want to add to the query. When running this query, the data is retrieved from the document source's cube.
To refresh the data in the source document, you must either explicitly refresh the source document or schedule the document refresh.
If you are reusing a scheduled document with multiple instances, the application relies on the Smart View parameter defined in the CMC to decide whether it should reuse the latest instance, or the document itself. For more information about the Smart View parameter, refer to the To modify display settings for Web Intelligence section in the Business Intelligence Platform Administrator Guide.
If the source document is based on a relational .UNX universe and you've set up security filtering in the target document, the application filters the dataset according to the Business Security Profile assigned to the current user. For more information, please refer to Applying security filtering when opening a document [page 170].
4.2.2.2 To create a document based on a Web Intelligence document
1. On the BI Launch Pad home screen, scroll down to the Applications section.2. Click Web Intelligence.3. In the New Document dialog, click Web Intelligence Document.4. Select a document and click Open.
The query panel opens.5. Select the objects to add to the query and click Run Query.
The application retrieves data from the source document.
70 PUBLICSAP BusinessObjects Web Intelligence User's Guide
Building and running queries
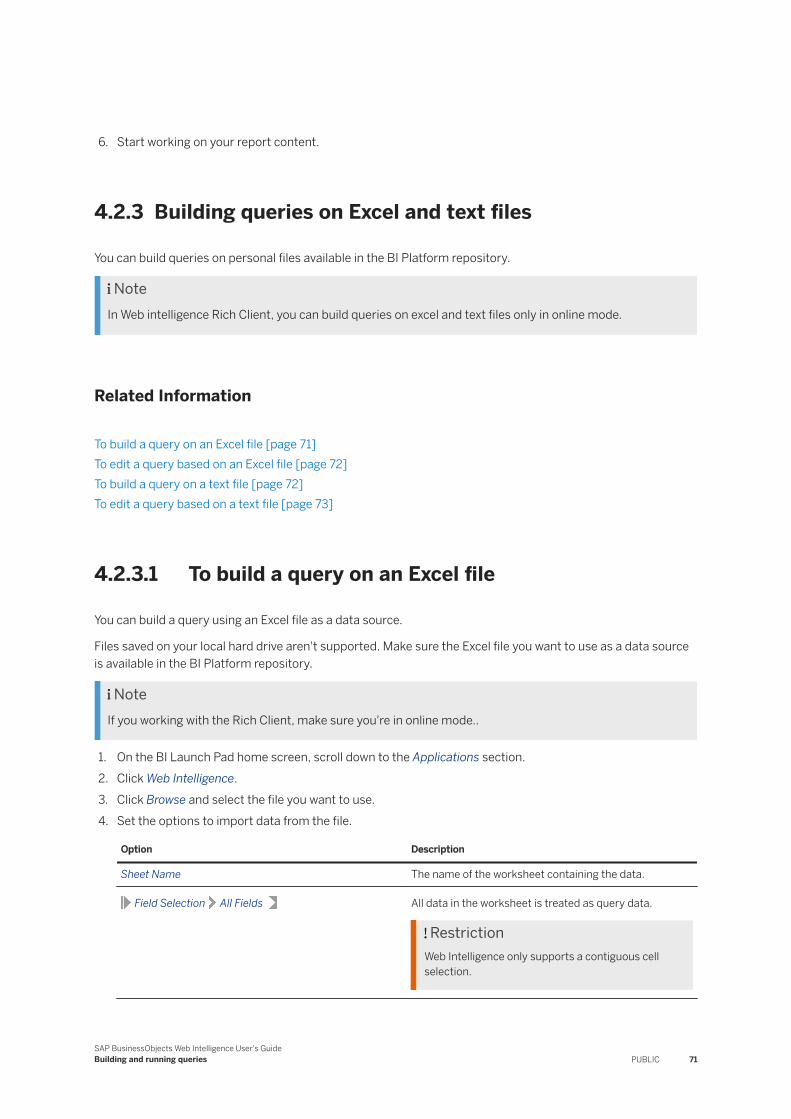
6. Start working on your report content.
4.2.3 Building queries on Excel and text files
You can build queries on personal files available in the BI Platform repository.
NoteIn Web intelligence Rich Client, you can build queries on excel and text files only in online mode.
Related Information
To build a query on an Excel file [page 71]To edit a query based on an Excel file [page 72]To build a query on a text file [page 72]To edit a query based on a text file [page 73]
4.2.3.1 To build a query on an Excel file
You can build a query using an Excel file as a data source.
Files saved on your local hard drive aren't supported. Make sure the Excel file you want to use as a data source is available in the BI Platform repository.
NoteIf you working with the Rich Client, make sure you're in online mode..
1. On the BI Launch Pad home screen, scroll down to the Applications section.2. Click Web Intelligence.3. Click Browse and select the file you want to use.4. Set the options to import data from the file.
Option Description
Sheet Name The name of the worksheet containing the data.
Field Selection All Fields All data in the worksheet is treated as query data.
RestrictionWeb Intelligence only supports a contiguous cell selection.
SAP BusinessObjects Web Intelligence User's GuideBuilding and running queries PUBLIC 71
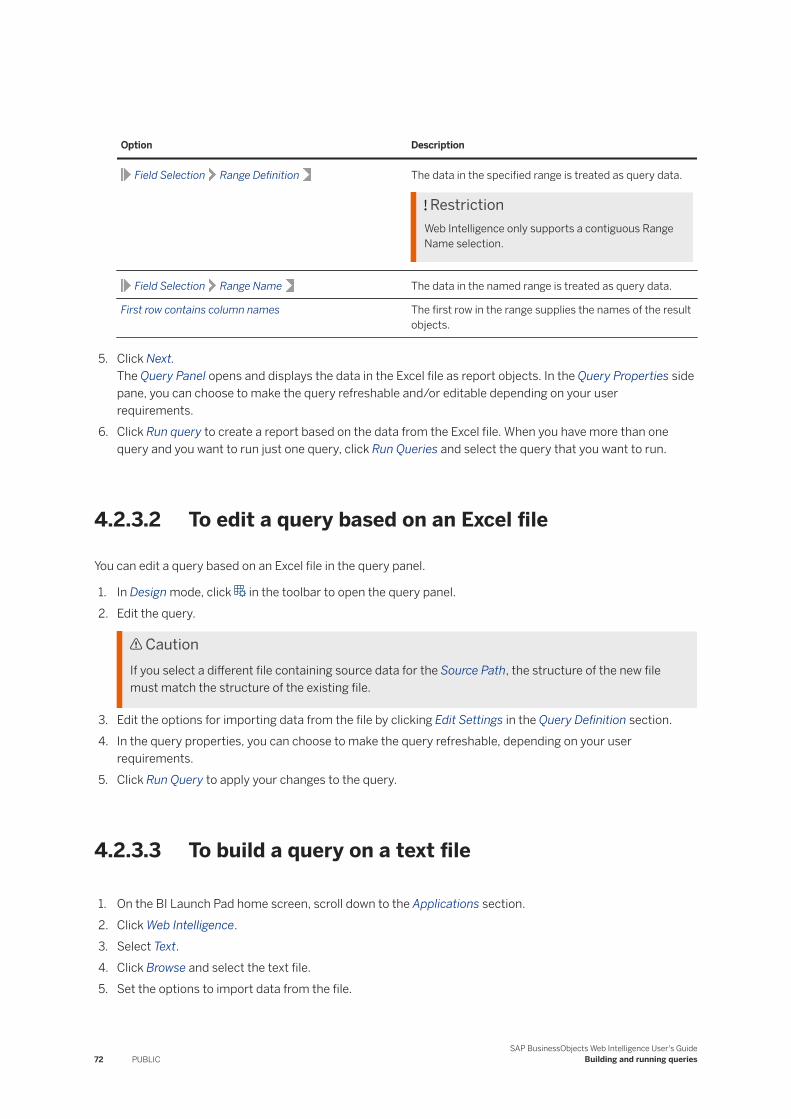
Option Description
Field Selection Range Definition The data in the specified range is treated as query data.
RestrictionWeb Intelligence only supports a contiguous Range Name selection.
Field Selection Range Name The data in the named range is treated as query data.
First row contains column names The first row in the range supplies the names of the result objects.
5. Click Next.The Query Panel opens and displays the data in the Excel file as report objects. In the Query Properties side pane, you can choose to make the query refreshable and/or editable depending on your user requirements.
6. Click Run query to create a report based on the data from the Excel file. When you have more than one query and you want to run just one query, click Run Queries and select the query that you want to run.
4.2.3.2 To edit a query based on an Excel file
You can edit a query based on an Excel file in the query panel.
1. In Design mode, click in the toolbar to open the query panel.2. Edit the query.
CautionIf you select a different file containing source data for the Source Path, the structure of the new file must match the structure of the existing file.
3. Edit the options for importing data from the file by clicking Edit Settings in the Query Definition section.4. In the query properties, you can choose to make the query refreshable, depending on your user
requirements.5. Click Run Query to apply your changes to the query.
4.2.3.3 To build a query on a text file
1. On the BI Launch Pad home screen, scroll down to the Applications section.2. Click Web Intelligence.3. Select Text.4. Click Browse and select the text file.5. Set the options to import data from the file.
72 PUBLICSAP BusinessObjects Web Intelligence User's Guide
Building and running queries
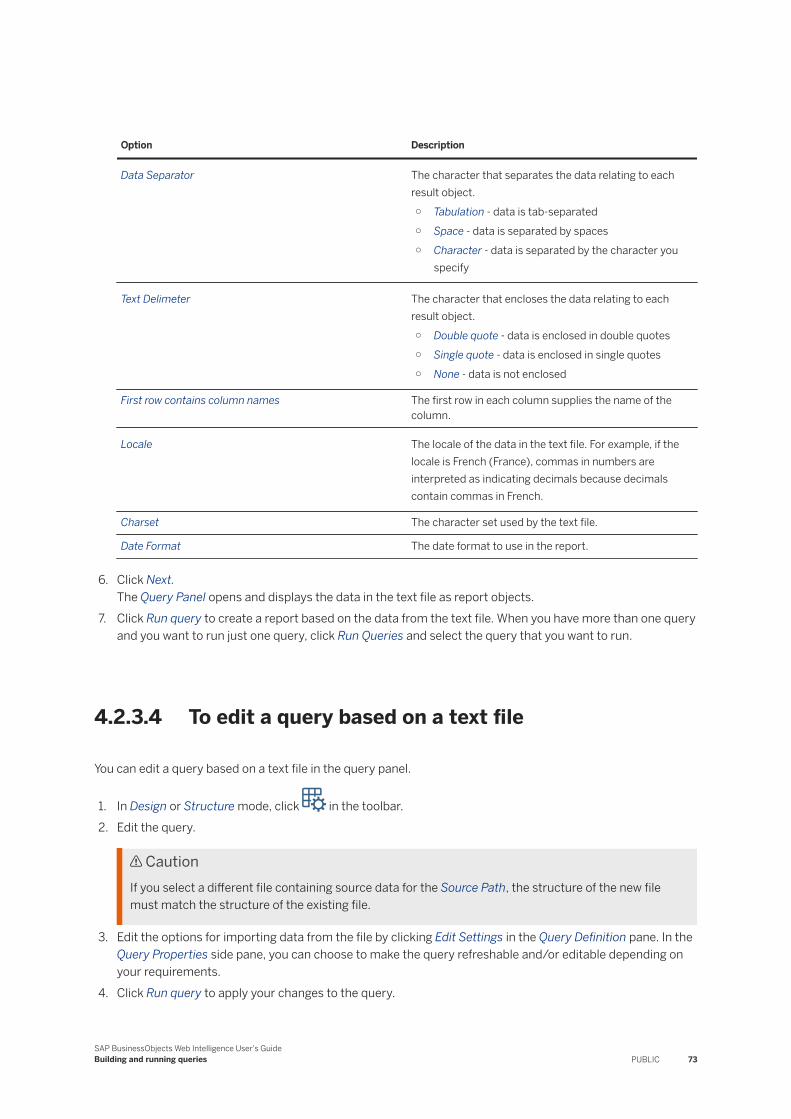
Option Description
Data Separator The character that separates the data relating to each result object.○ Tabulation - data is tab-separated○ Space - data is separated by spaces○ Character - data is separated by the character you
specify
Text Delimeter The character that encloses the data relating to each result object.○ Double quote - data is enclosed in double quotes○ Single quote - data is enclosed in single quotes○ None - data is not enclosed
First row contains column names The first row in each column supplies the name of the column.
Locale The locale of the data in the text file. For example, if the locale is French (France), commas in numbers are interpreted as indicating decimals because decimals contain commas in French.
Charset The character set used by the text file.
Date Format The date format to use in the report.
6. Click Next.The Query Panel opens and displays the data in the text file as report objects.
7. Click Run query to create a report based on the data from the text file. When you have more than one query and you want to run just one query, click Run Queries and select the query that you want to run.
4.2.3.4 To edit a query based on a text file
You can edit a query based on a text file in the query panel.
1. In Design or Structure mode, click in the toolbar.2. Edit the query.
CautionIf you select a different file containing source data for the Source Path, the structure of the new file must match the structure of the existing file.
3. Edit the options for importing data from the file by clicking Edit Settings in the Query Definition pane. In the Query Properties side pane, you can choose to make the query refreshable and/or editable depending on your requirements.
4. Click Run query to apply your changes to the query.
SAP BusinessObjects Web Intelligence User's GuideBuilding and running queries PUBLIC 73
4.2.4 Building queries on SAP BW InfoProviders and BEx queries (incl. BW/4HANA and S/4HANA)
You can leverage your SAP BW (incl. BW/4HANA and S/4HANA) environment and query a range of BW InfoProviders or BEx queries via OLAP connections based on the BICS connector.
BW InfoProviders are SAP objects containing physical data that BI applications like Web Intelligence can retrieve for reporting purposes. In SAP BW, you use BEx queries created in SAP BEx Query Designer to run analyses on the different types of InfoProviders, such as Data Store Objects, cubes, InfoObjects, InfoSets, and others. You decide whether you want to reuse existing BEx queries, or query InfoProviders directly.
No universe is needed when you query BW InfoProviders and BEx queries, as the application uses direct access to the BW data source to retrieve metadata. When accessing BW InfoProviders and BEx queries, Web Intelligence automatically maps the BW metadata to hierarchies, attributes, measures, and dimensions, like BW OLAP universes queries, so you can reuse them in your report. There are restrictions, and the objects you include in the query don't use the full capabilities of the features available for BW OLAP universes. You can get the full list of restrictions here [page 76].
Web Intelligence connects to BEx queries and BW InfoProviders using an OLAP connection to a BW system, using the SAP BICS Client middleware driver. Your BI administrator can create the connection either in Central Management Console in the OLAP Connections section, or in the Information Design Tool. For more information on how to set up the parameters of the connection, refer to the Login parameters for SAP BW and ERP connections section of the Information Design Tool User Guide.
NoteBy default, Web Intelligence has access to every BEx queries if you have the necessary security rights. If you want the application to only have access to BEx queries that have the Allow External Access to the Query option enabled in SAP BEx Query Designer, ask your administrator to edit the DSLBICSConfiguration_custom.xml configuration file, and set the BExExternalAccessDetectionMode parameter to rfcPerInfoQuery.
4.2.4.1 Supported BW metadata
Web Intelligence maps metadata from BW InfoProviders and BEx queries.
The following SAP BW metadata features are supported:
● Characteristics (including Time and Unit)● Display Attributes● Navigational Attributes● Hierarchies● Basic Key Figures● Calculated Key Figures/Formulas● Restricted Key Figures● Variables● Custom Structures
These metadata are mapped to universe objects that you can use to build queries and run reports.
74 PUBLICSAP BusinessObjects Web Intelligence User's Guide
Building and running queries
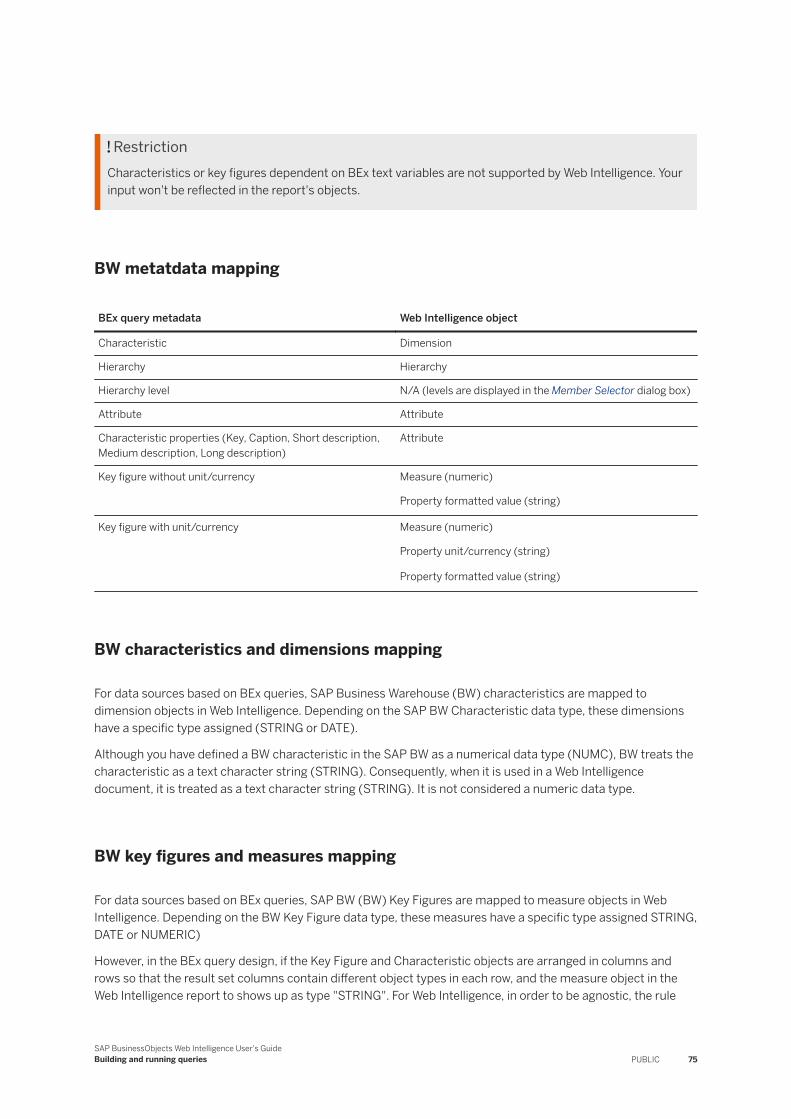
RestrictionCharacteristics or key figures dependent on BEx text variables are not supported by Web Intelligence. Your input won't be reflected in the report's objects.
BW metatdata mapping
BEx query metadata Web Intelligence object
Characteristic Dimension
Hierarchy Hierarchy
Hierarchy level N/A (levels are displayed in the Member Selector dialog box)
Attribute Attribute
Characteristic properties (Key, Caption, Short description, Medium description, Long description)
Attribute
Key figure without unit/currency Measure (numeric)
Property formatted value (string)
Key figure with unit/currency Measure (numeric)
Property unit/currency (string)
Property formatted value (string)
BW characteristics and dimensions mapping
For data sources based on BEx queries, SAP Business Warehouse (BW) characteristics are mapped to dimension objects in Web Intelligence. Depending on the SAP BW Characteristic data type, these dimensions have a specific type assigned (STRING or DATE).
Although you have defined a BW characteristic in the SAP BW as a numerical data type (NUMC), BW treats the characteristic as a text character string (STRING). Consequently, when it is used in a Web Intelligence document, it is treated as a text character string (STRING). It is not considered a numeric data type.
BW key figures and measures mapping
For data sources based on BEx queries, SAP BW (BW) Key Figures are mapped to measure objects in Web Intelligence. Depending on the BW Key Figure data type, these measures have a specific type assigned STRING, DATE or NUMERIC)
However, in the BEx query design, if the Key Figure and Characteristic objects are arranged in columns and rows so that the result set columns contain different object types in each row, and the measure object in the Web Intelligence report to shows up as type "STRING". For Web Intelligence, in order to be agnostic, the rule
SAP BusinessObjects Web Intelligence User's GuideBuilding and running queries PUBLIC 75
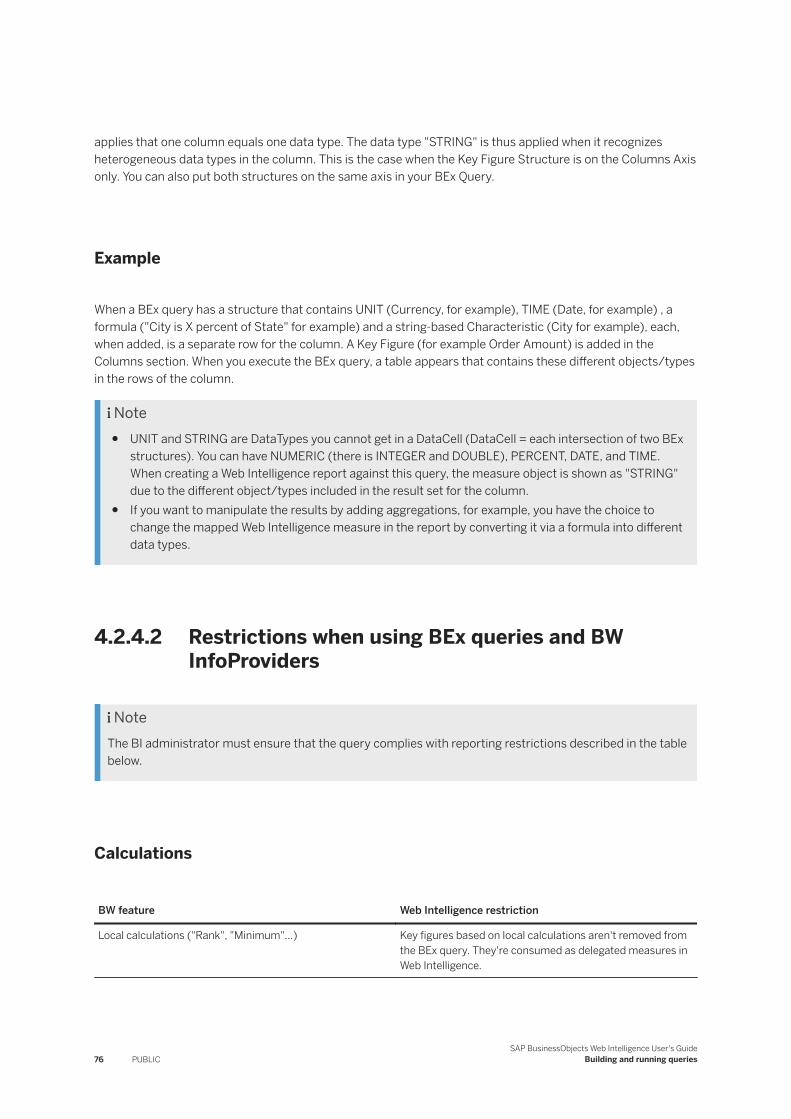
applies that one column equals one data type. The data type "STRING" is thus applied when it recognizes heterogeneous data types in the column. This is the case when the Key Figure Structure is on the Columns Axis only. You can also put both structures on the same axis in your BEx Query.
Example
When a BEx query has a structure that contains UNIT (Currency, for example), TIME (Date, for example) , a formula ("City is X percent of State" for example) and a string-based Characteristic (City for example), each, when added, is a separate row for the column. A Key Figure (for example Order Amount) is added in the Columns section. When you execute the BEx query, a table appears that contains these different objects/types in the rows of the column.
Note● UNIT and STRING are DataTypes you cannot get in a DataCell (DataCell = each intersection of two BEx
structures). You can have NUMERIC (there is INTEGER and DOUBLE), PERCENT, DATE, and TIME. When creating a Web Intelligence report against this query, the measure object is shown as "STRING" due to the different object/types included in the result set for the column.
● If you want to manipulate the results by adding aggregations, for example, you have the choice to change the mapped Web Intelligence measure in the report by converting it via a formula into different data types.
4.2.4.2 Restrictions when using BEx queries and BW InfoProviders
NoteThe BI administrator must ensure that the query complies with reporting restrictions described in the table below.
Calculations
BW feature Web Intelligence restriction
Local calculations ("Rank", "Minimum"...) Key figures based on local calculations aren't removed from the BEx query. They're consumed as delegated measures in Web Intelligence.
76 PUBLICSAP BusinessObjects Web Intelligence User's Guide
Building and running queries
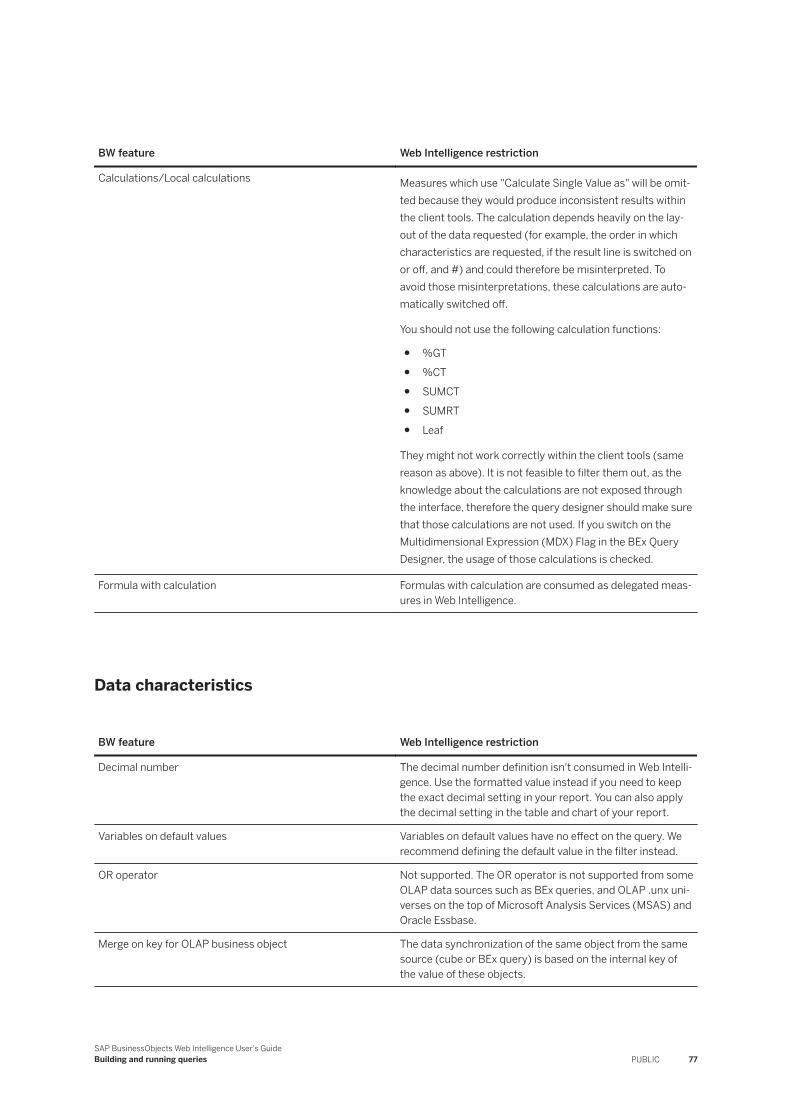
BW feature Web Intelligence restriction
Calculations/Local calculations Measures which use "Calculate Single Value as" will be omitted because they would produce inconsistent results within the client tools. The calculation depends heavily on the layout of the data requested (for example, the order in which characteristics are requested, if the result line is switched on or off, and #) and could therefore be misinterpreted. To avoid those misinterpretations, these calculations are automatically switched off.
You should not use the following calculation functions:
● %GT● %CT● SUMCT● SUMRT● Leaf
They might not work correctly within the client tools (same reason as above). It is not feasible to filter them out, as the knowledge about the calculations are not exposed through the interface, therefore the query designer should make sure that those calculations are not used. If you switch on the Multidimensional Expression (MDX) Flag in the BEx Query Designer, the usage of those calculations is checked.
Formula with calculation Formulas with calculation are consumed as delegated measures in Web Intelligence.
Data characteristics
BW feature Web Intelligence restriction
Decimal number The decimal number definition isn't consumed in Web Intelligence. Use the formatted value instead if you need to keep the exact decimal setting in your report. You can also apply the decimal setting in the table and chart of your report.
Variables on default values Variables on default values have no effect on the query. We recommend defining the default value in the filter instead.
OR operator Not supported. The OR operator is not supported from some OLAP data sources such as BEx queries, and OLAP .unx universes on the top of Microsoft Analysis Services (MSAS) and Oracle Essbase.
Merge on key for OLAP business object The data synchronization of the same object from the same source (cube or BEx query) is based on the internal key of the value of these objects.
SAP BusinessObjects Web Intelligence User's GuideBuilding and running queries PUBLIC 77
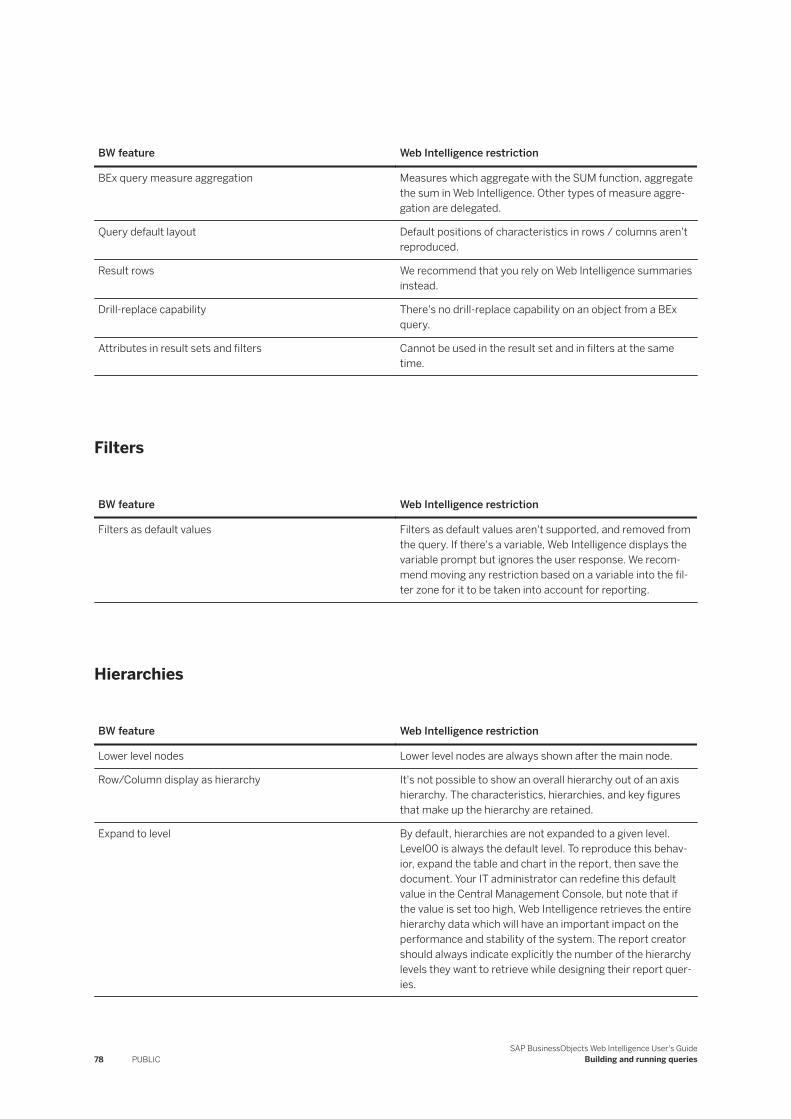
BW feature Web Intelligence restriction
BEx query measure aggregation Measures which aggregate with the SUM function, aggregate the sum in Web Intelligence. Other types of measure aggregation are delegated.
Query default layout Default positions of characteristics in rows / columns aren't reproduced.
Result rows We recommend that you rely on Web Intelligence summaries instead.
Drill-replace capability There's no drill-replace capability on an object from a BEx query.
Attributes in result sets and filters Cannot be used in the result set and in filters at the same time.
Filters
BW feature Web Intelligence restriction
Filters as default values Filters as default values aren't supported, and removed from the query. If there's a variable, Web Intelligence displays the variable prompt but ignores the user response. We recommend moving any restriction based on a variable into the fil-ter zone for it to be taken into account for reporting.
Hierarchies
BW feature Web Intelligence restriction
Lower level nodes Lower level nodes are always shown after the main node.
Row/Column display as hierarchy It's not possible to show an overall hierarchy out of an axis hierarchy. The characteristics, hierarchies, and key figures that make up the hierarchy are retained.
Expand to level By default, hierarchies are not expanded to a given level. Level00 is always the default level. To reproduce this behavior, expand the table and chart in the report, then save the document. Your IT administrator can redefine this default value in the Central Management Console, but note that if the value is set too high, Web Intelligence retrieves the entire hierarchy data which will have an important impact on the performance and stability of the system. The report creator should always indicate explicitly the number of the hierarchy levels they want to retrieve while designing their report queries.
78 PUBLICSAP BusinessObjects Web Intelligence User's Guide
Building and running queries
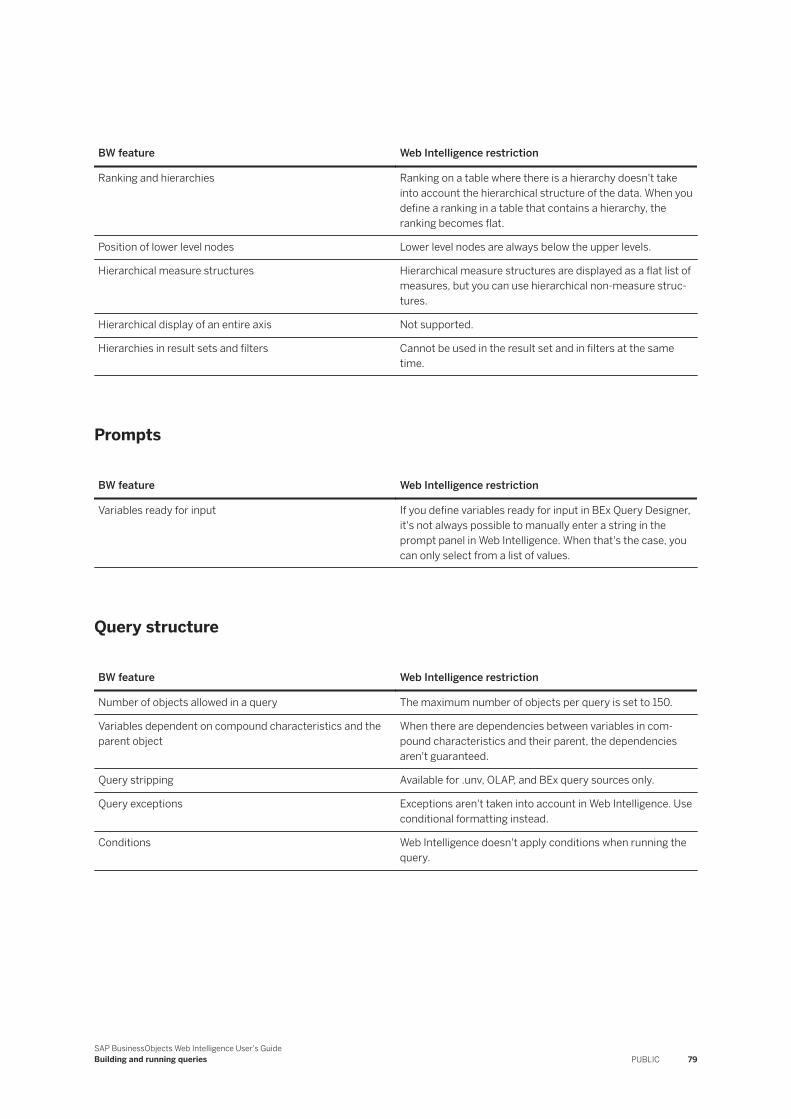
BW feature Web Intelligence restriction
Ranking and hierarchies Ranking on a table where there is a hierarchy doesn't take into account the hierarchical structure of the data. When you define a ranking in a table that contains a hierarchy, the ranking becomes flat.
Position of lower level nodes Lower level nodes are always below the upper levels.
Hierarchical measure structures Hierarchical measure structures are displayed as a flat list of measures, but you can use hierarchical non-measure structures.
Hierarchical display of an entire axis Not supported.
Hierarchies in result sets and filters Cannot be used in the result set and in filters at the same time.
Prompts
BW feature Web Intelligence restriction
Variables ready for input If you define variables ready for input in BEx Query Designer, it's not always possible to manually enter a string in the prompt panel in Web Intelligence. When that's the case, you can only select from a list of values.
Query structure
BW feature Web Intelligence restriction
Number of objects allowed in a query The maximum number of objects per query is set to 150.
Variables dependent on compound characteristics and the parent object
When there are dependencies between variables in compound characteristics and their parent, the dependencies aren't guaranteed.
Query stripping Available for .unv, OLAP, and BEx query sources only.
Query exceptions Exceptions aren't taken into account in Web Intelligence. Use conditional formatting instead.
Conditions Web Intelligence doesn't apply conditions when running the query.
SAP BusinessObjects Web Intelligence User's GuideBuilding and running queries PUBLIC 79
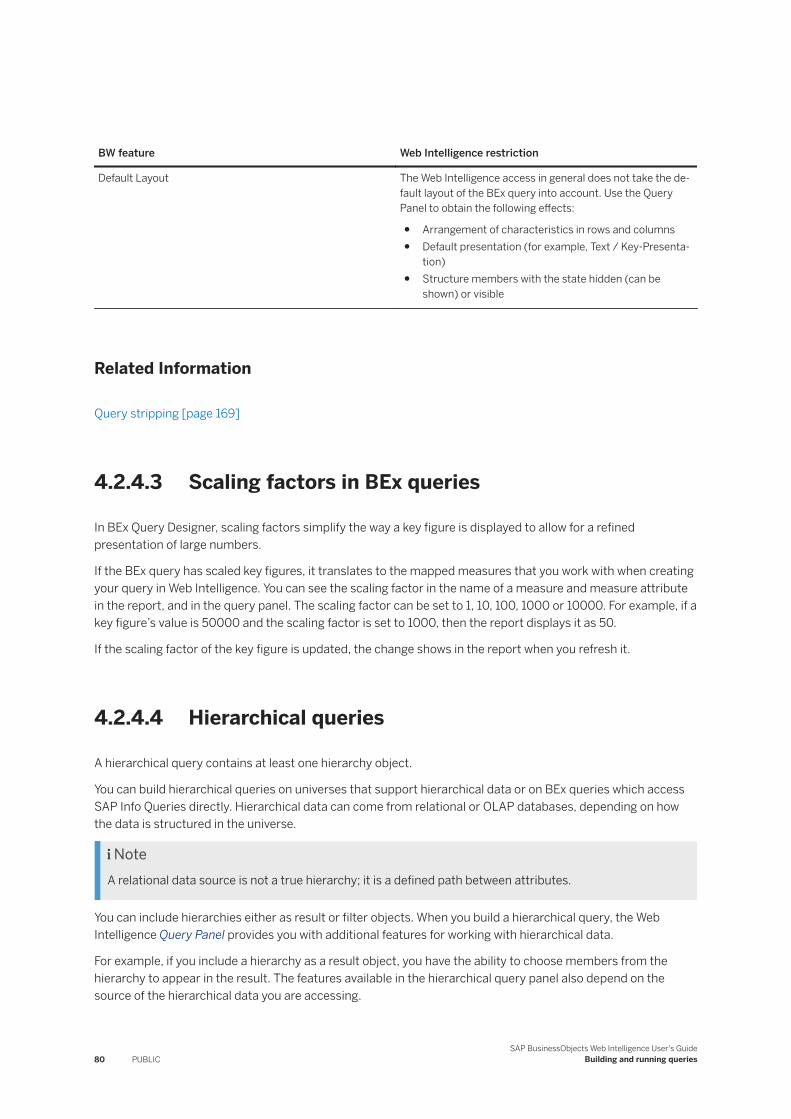
BW feature Web Intelligence restriction
Default Layout The Web Intelligence access in general does not take the default layout of the BEx query into account. Use the Query Panel to obtain the following effects:
● Arrangement of characteristics in rows and columns● Default presentation (for example, Text / Key-Presenta
tion)● Structure members with the state hidden (can be
shown) or visible
Related Information
Query stripping [page 169]
4.2.4.3 Scaling factors in BEx queries
In BEx Query Designer, scaling factors simplify the way a key figure is displayed to allow for a refined presentation of large numbers.
If the BEx query has scaled key figures, it translates to the mapped measures that you work with when creating your query in Web Intelligence. You can see the scaling factor in the name of a measure and measure attribute in the report, and in the query panel. The scaling factor can be set to 1, 10, 100, 1000 or 10000. For example, if a key figure’s value is 50000 and the scaling factor is set to 1000, then the report displays it as 50.
If the scaling factor of the key figure is updated, the change shows in the report when you refresh it.
4.2.4.4 Hierarchical queries
A hierarchical query contains at least one hierarchy object.
You can build hierarchical queries on universes that support hierarchical data or on BEx queries which access SAP Info Queries directly. Hierarchical data can come from relational or OLAP databases, depending on how the data is structured in the universe.
NoteA relational data source is not a true hierarchy; it is a defined path between attributes.
You can include hierarchies either as result or filter objects. When you build a hierarchical query, the Web Intelligence Query Panel provides you with additional features for working with hierarchical data.
For example, if you include a hierarchy as a result object, you have the ability to choose members from the hierarchy to appear in the result. The features available in the hierarchical query panel also depend on the source of the hierarchical data you are accessing.
80 PUBLICSAP BusinessObjects Web Intelligence User's Guide
Building and running queries
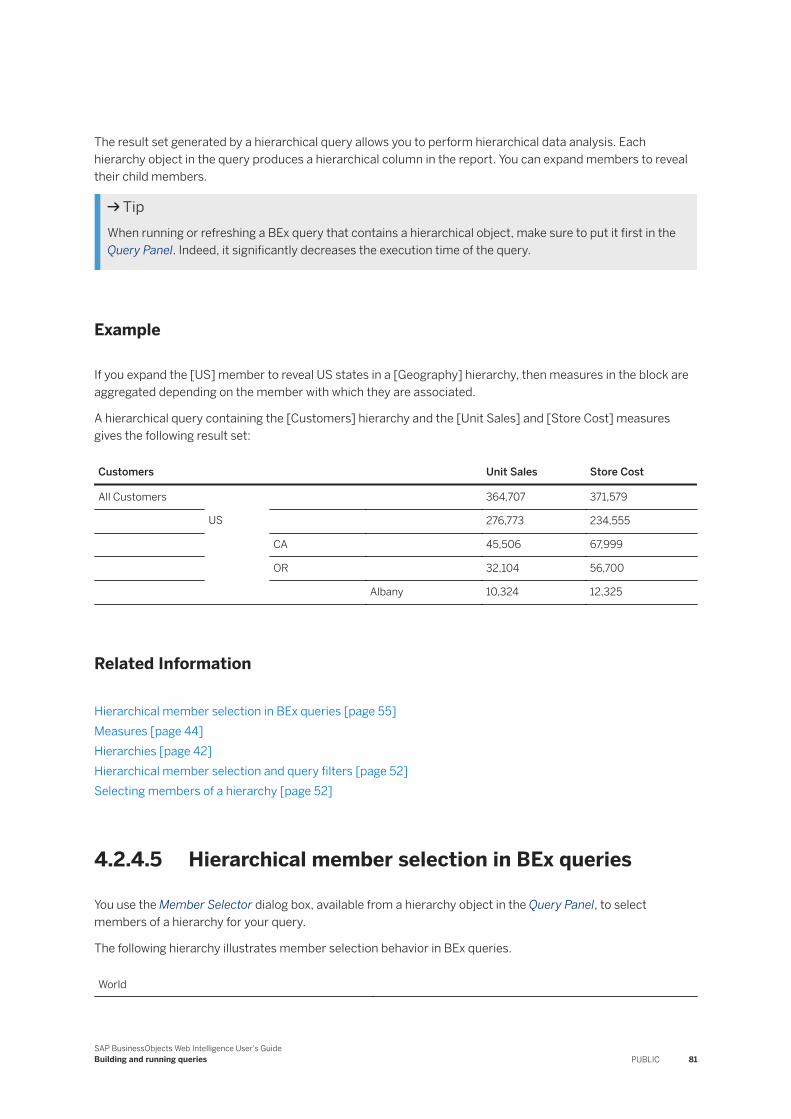
The result set generated by a hierarchical query allows you to perform hierarchical data analysis. Each hierarchy object in the query produces a hierarchical column in the report. You can expand members to reveal their child members.
TipWhen running or refreshing a BEx query that contains a hierarchical object, make sure to put it first in the Query Panel. Indeed, it significantly decreases the execution time of the query.
Example
If you expand the [US] member to reveal US states in a [Geography] hierarchy, then measures in the block are aggregated depending on the member with which they are associated.
A hierarchical query containing the [Customers] hierarchy and the [Unit Sales] and [Store Cost] measures gives the following result set:
Customers Unit Sales Store Cost
All Customers 364,707 371,579
US 276,773 234,555
CA 45,506 67,999
OR 32,104 56,700
Albany 10,324 12,325
Related Information
Hierarchical member selection in BEx queries [page 55]Measures [page 44]Hierarchies [page 42]Hierarchical member selection and query filters [page 52]Selecting members of a hierarchy [page 52]
4.2.4.5 Hierarchical member selection in BEx queries
You use the Member Selector dialog box, available from a hierarchy object in the Query Panel, to select members of a hierarchy for your query.
The following hierarchy illustrates member selection behavior in BEx queries.
World
SAP BusinessObjects Web Intelligence User's GuideBuilding and running queries PUBLIC 81
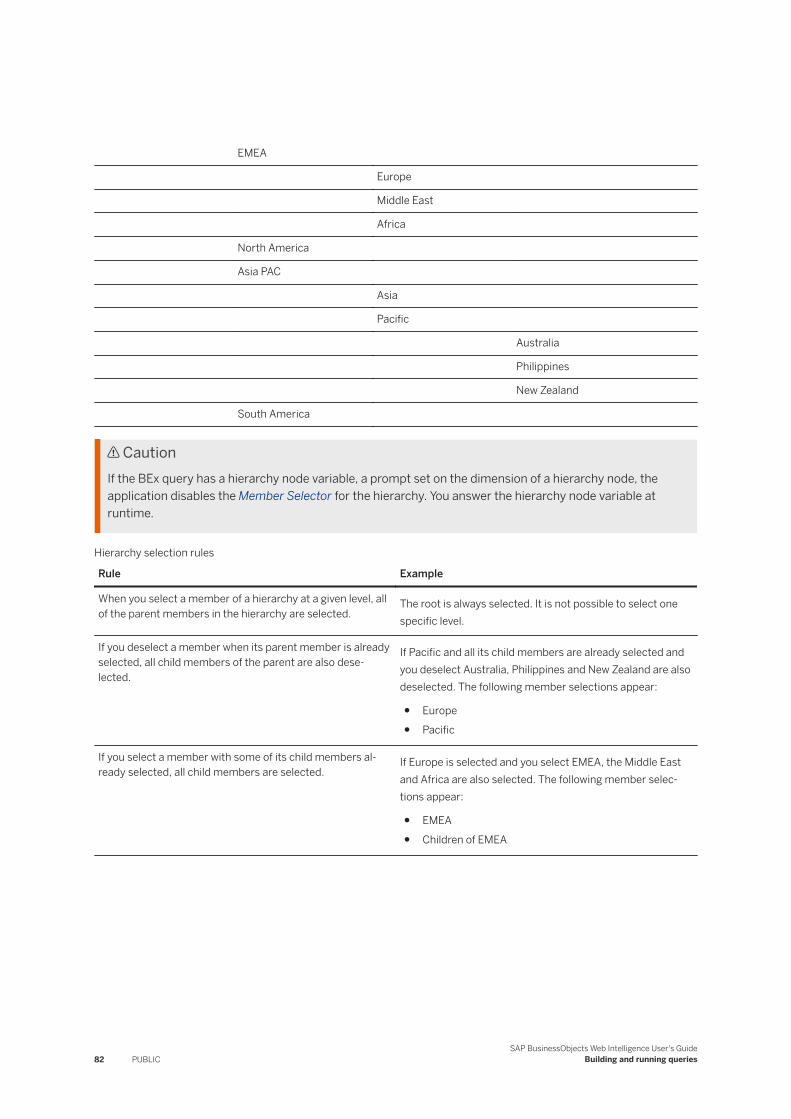
EMEA
Europe
Middle East
Africa
North America
Asia PAC
Asia
Pacific
Australia
Philippines
New Zealand
South America
CautionIf the BEx query has a hierarchy node variable, a prompt set on the dimension of a hierarchy node, the application disables the Member Selector for the hierarchy. You answer the hierarchy node variable at runtime.
Hierarchy selection rules
Rule Example
When you select a member of a hierarchy at a given level, all of the parent members in the hierarchy are selected.
The root is always selected. It is not possible to select one specific level.
If you deselect a member when its parent member is already selected, all child members of the parent are also deselected.
If Pacific and all its child members are already selected and you deselect Australia, Philippines and New Zealand are also deselected. The following member selections appear:
● Europe● Pacific
If you select a member with some of its child members already selected, all child members are selected.
If Europe is selected and you select EMEA, the Middle East and Africa are also selected. The following member selections appear:
● EMEA● Children of EMEA
82 PUBLICSAP BusinessObjects Web Intelligence User's Guide
Building and running queries
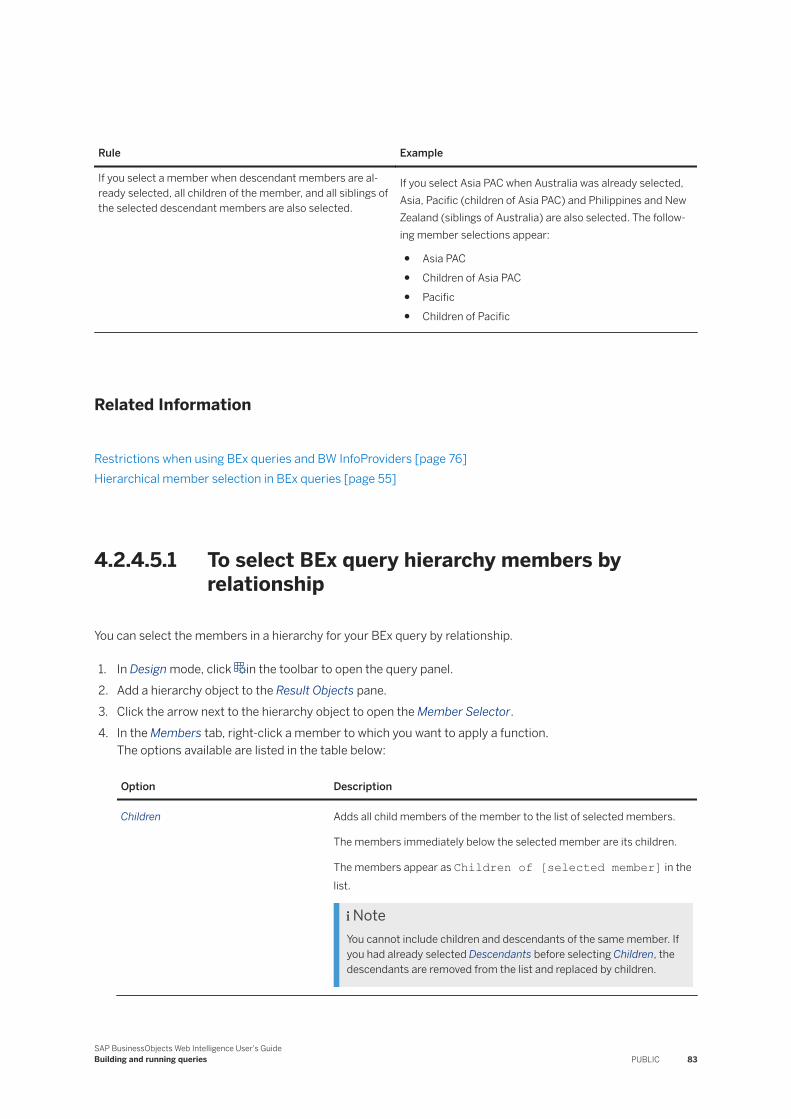
Rule Example
If you select a member when descendant members are already selected, all children of the member, and all siblings of the selected descendant members are also selected.
If you select Asia PAC when Australia was already selected, Asia, Pacific (children of Asia PAC) and Philippines and New Zealand (siblings of Australia) are also selected. The following member selections appear:
● Asia PAC● Children of Asia PAC● Pacific● Children of Pacific
Related Information
Restrictions when using BEx queries and BW InfoProviders [page 76]Hierarchical member selection in BEx queries [page 55]
4.2.4.5.1 To select BEx query hierarchy members by relationship
You can select the members in a hierarchy for your BEx query by relationship.
1. In Design mode, click in the toolbar to open the query panel.2. Add a hierarchy object to the Result Objects pane.3. Click the arrow next to the hierarchy object to open the Member Selector.4. In the Members tab, right-click a member to which you want to apply a function.
The options available are listed in the table below:
Option Description
Children Adds all child members of the member to the list of selected members.
The members immediately below the selected member are its children.
The members appear as Children of [selected member] in the list.
NoteYou cannot include children and descendants of the same member. If you had already selected Descendants before selecting Children, the descendants are removed from the list and replaced by children.
SAP BusinessObjects Web Intelligence User's GuideBuilding and running queries PUBLIC 83
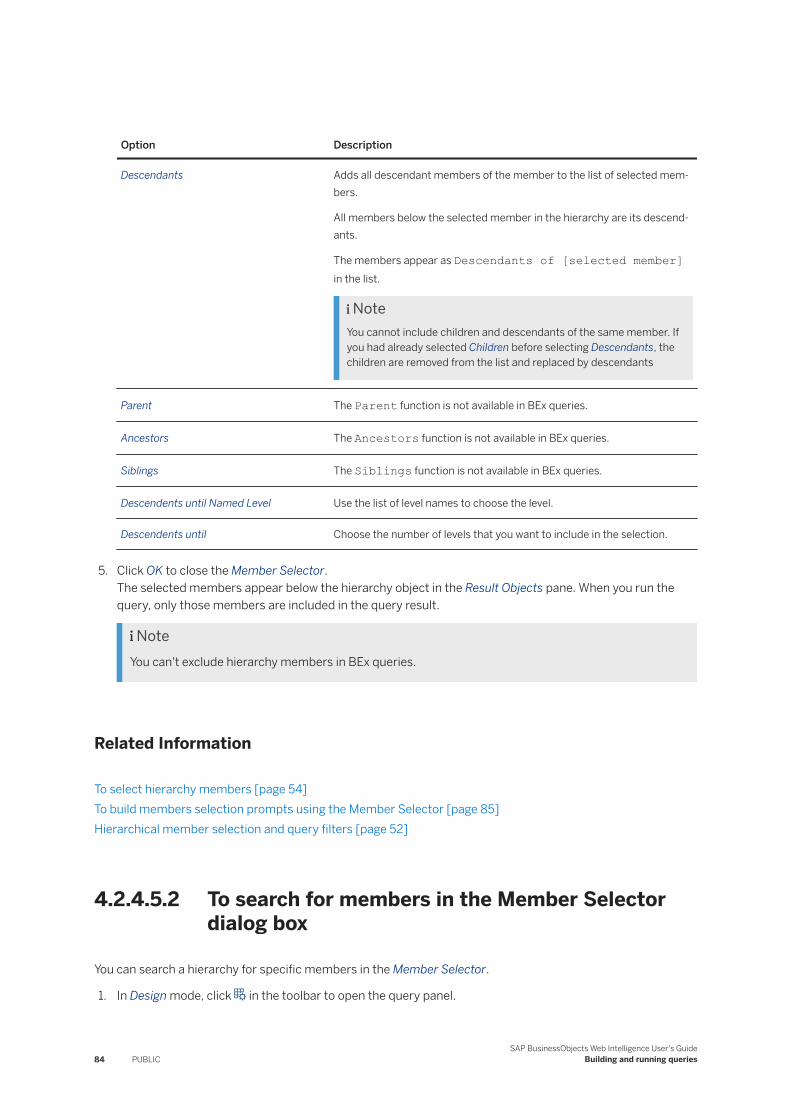
Option Description
Descendants Adds all descendant members of the member to the list of selected members.
All members below the selected member in the hierarchy are its descendants.
The members appear as Descendants of [selected member] in the list.
NoteYou cannot include children and descendants of the same member. If you had already selected Children before selecting Descendants, the children are removed from the list and replaced by descendants
Parent The Parent function is not available in BEx queries.
Ancestors The Ancestors function is not available in BEx queries.
Siblings The Siblings function is not available in BEx queries.
Descendents until Named Level Use the list of level names to choose the level.
Descendents until Choose the number of levels that you want to include in the selection.
5. Click OK to close the Member Selector.The selected members appear below the hierarchy object in the Result Objects pane. When you run the query, only those members are included in the query result.
NoteYou can't exclude hierarchy members in BEx queries.
Related Information
To select hierarchy members [page 54]To build members selection prompts using the Member Selector [page 85]Hierarchical member selection and query filters [page 52]
4.2.4.5.2 To search for members in the Member Selector dialog box
You can search a hierarchy for specific members in the Member Selector.
1. In Design mode, click in the toolbar to open the query panel.
84 PUBLICSAP BusinessObjects Web Intelligence User's Guide
Building and running queries
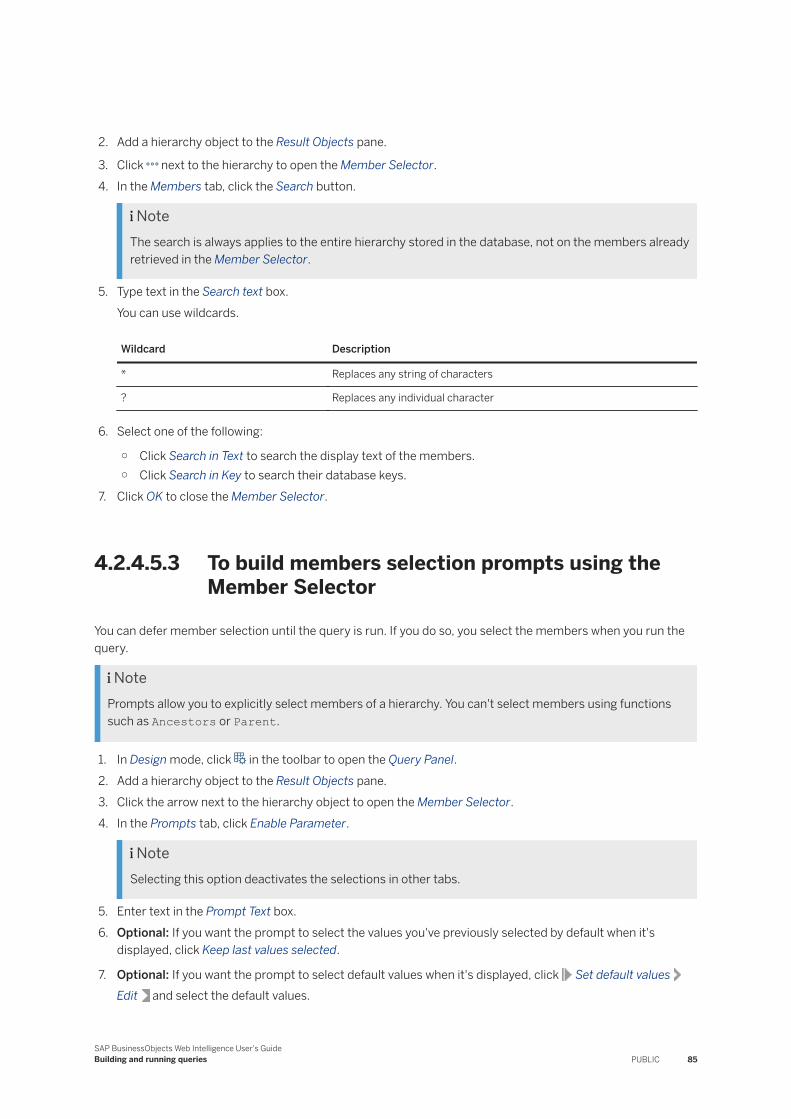
2. Add a hierarchy object to the Result Objects pane.
3. Click next to the hierarchy to open the Member Selector.4. In the Members tab, click the Search button.
NoteThe search is always applies to the entire hierarchy stored in the database, not on the members already retrieved in the Member Selector.
5. Type text in the Search text box.You can use wildcards.
Wildcard Description
* Replaces any string of characters
? Replaces any individual character
6. Select one of the following:
○ Click Search in Text to search the display text of the members.○ Click Search in Key to search their database keys.
7. Click OK to close the Member Selector.
4.2.4.5.3 To build members selection prompts using the Member Selector
You can defer member selection until the query is run. If you do so, you select the members when you run the query.
NotePrompts allow you to explicitly select members of a hierarchy. You can't select members using functions such as Ancestors or Parent.
1. In Design mode, click in the toolbar to open the Query Panel.2. Add a hierarchy object to the Result Objects pane.3. Click the arrow next to the hierarchy object to open the Member Selector.4. In the Prompts tab, click Enable Parameter.
NoteSelecting this option deactivates the selections in other tabs.
5. Enter text in the Prompt Text box.6. Optional: If you want the prompt to select the values you've previously selected by default when it's
displayed, click Keep last values selected.
7. Optional: If you want the prompt to select default values when it's displayed, click Set default valuesEdit and select the default values.
SAP BusinessObjects Web Intelligence User's GuideBuilding and running queries PUBLIC 85
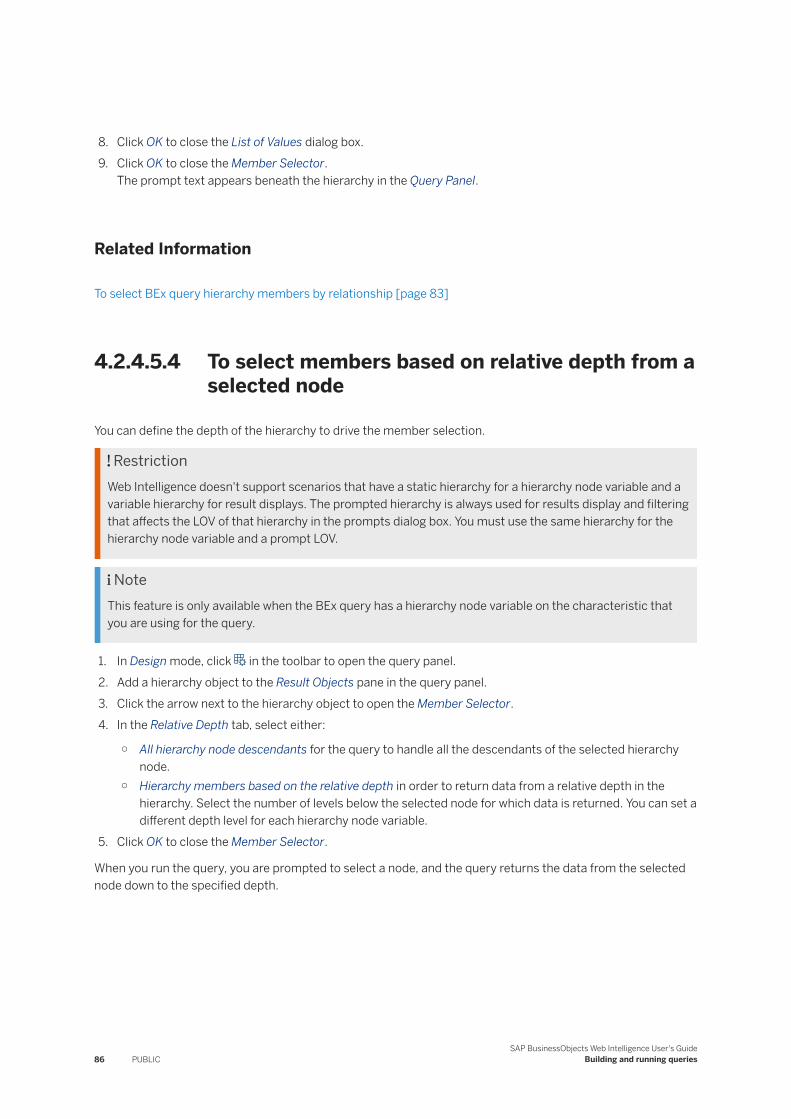
8. Click OK to close the List of Values dialog box.9. Click OK to close the Member Selector.
The prompt text appears beneath the hierarchy in the Query Panel.
Related Information
To select BEx query hierarchy members by relationship [page 83]
4.2.4.5.4 To select members based on relative depth from a selected node
You can define the depth of the hierarchy to drive the member selection.
RestrictionWeb Intelligence doesn't support scenarios that have a static hierarchy for a hierarchy node variable and a variable hierarchy for result displays. The prompted hierarchy is always used for results display and filtering that affects the LOV of that hierarchy in the prompts dialog box. You must use the same hierarchy for the hierarchy node variable and a prompt LOV.
NoteThis feature is only available when the BEx query has a hierarchy node variable on the characteristic that you are using for the query.
1. In Design mode, click in the toolbar to open the query panel.2. Add a hierarchy object to the Result Objects pane in the query panel.3. Click the arrow next to the hierarchy object to open the Member Selector.4. In the Relative Depth tab, select either:
○ All hierarchy node descendants for the query to handle all the descendants of the selected hierarchy node.
○ Hierarchy members based on the relative depth in order to return data from a relative depth in the hierarchy. Select the number of levels below the selected node for which data is returned. You can set a different depth level for each hierarchy node variable.
5. Click OK to close the Member Selector.
When you run the query, you are prompted to select a node, and the query returns the data from the selected node down to the specified depth.
86 PUBLICSAP BusinessObjects Web Intelligence User's Guide
Building and running queries
4.2.4.5.5 To select members based on levels from a selected node
You can define the number of levels of a hierarchy from which to retrieve more detailed data.
1. In Design mode, click in the toolbar to open the query panel.2. Add a hierarchy object to the Result Objects pane.3. Click the arrow next to the hierarchy object to open the Member Selector.4. In the Levels tab, select Enable levels and select the levels down to which you want to return data.5. Click OK to close the Member Selector.
When you run the query, data is retrieved down to the selected level. If you select a different hierarchy at refresh time, the level selection still applies on the new hierarchy and returns nodes and values of the new hierarchy, down to the selected level.
4.2.4.6 Managing variables
The Set Variables dialog is prompted before the query panel so you can manage variables of a BEx query. Before being able to run a BEx query, you first need to provides values for potential variables.
When you first create or open a document based on a BEx query that has variables, the Set Variables dialog automatically shows up and lists all the variables and their default values, if any. The application lists the prompts and their corresponding values according to how they were defined in the backend, with the keydates on top. In the Set Variables dialog, BEx/HANA prompts are displayed on top of prompts created in the query panel. If needed, you can check the dependencies between variables.
You can answer prompts in any order. When you save the variable values, the query panel appears so you can move on to the object selection.
NoteCurrently, the Set Prompt checkbox for each variable isn't displayed automatically when you first select the BEx query for your document. When the transient universe has been created and the query panel displays the objects, you can open the Set Variables dialog nd access the Set Prompt dialog .
CautionIf the BI administrator allows manual entry of values for a prompt, so that a start and end key selection is changed to a values list, and your document was created when manual entry was not allowed, you need to do the following for your document:
● Purge the document.● Change the default values for query prompts to be compatible with multivalue selection.
SAP BusinessObjects Web Intelligence User's GuideBuilding and running queries PUBLIC 87
Related Information
4.2.4.7 Managing mandatory variables with no default values
You can use the Set Variables dialog box to define how the variable with no default value is managed for the users.
When the report is published to multiple users, you can ensure that the user is presented with a prompt default value that makes sense.
To use the BEx default values, in the Set Variables, select the option Use BEx query defined default values at runtime. How the BEx default values are used depends on the settings in the Set Variables dialog box and how the user responds to the Purge Last Selected Prompt Values prompt when the query is purged.
CautionYou cannot hide prompts and retrieve default values from BEx at the same time. Conversely, you have to display prompts to be able to see dynamic values. If a document is purged with the Purge Last Selected Prompt Values option but you have defined a default value and the Use BEx query defined default values at runtime option is unchecked, it will still be retrieved after the purge as this value comes from the Query Panel.
Workflow when the query designer chooses to use the BEx query default values at runtime
1. When the query contains a BEx mandatory variable, the designer chooses to use the BEx variable default value and selects Use BEx query defined default values at runtime.
2. When a user runs the report, the query displays the prompt for the BEx variable. The default value proposed is 'A'. The user chooses a different value ('C', for example).
3. The report contains the results for the user's selected value 'C'.4. The user purges the report. The purge process displays a warning message asking the if the user wants to
purge the last selected prompt value ('C').
If the user:
● Selects Purge Last Selected Prompt Values, the query will retrieve 'A' as the default prompt value, since Use BEx query defined default values at runtime was selected at query design time.
● Does not select Purge Last Selected Prompt Values, the query will retrieve 'C' as the default prompt value, since this value was the last selected prompt value.
88 PUBLICSAP BusinessObjects Web Intelligence User's Guide
Building and running queries
Workflow when the query designer chooses not to use the BEx query default values at runtime
1. When the query contains a BEx mandatory variable, the designer chooses not to use the BEx variable default value ('A', for example), but chooses a different value 'B', for example). The designer has not selected Use BEx query defined default values at runtime.
2. When a user runs the report, the query displays the prompt for the BEx variable. The default value proposed is 'B', the value selected by the query designer. However, the user chooses a different value ('C', for example).
3. The report contains the results for the user's selected value 'C'.4. The user purges the report. The purge process displays a warning message asking the if the user wants to
purge the last selected prompt value ('C').
If the user:
● Selects Purge Last Selected Prompt Values, the query will retrieve 'B' as the default prompt value, since Use BEx query defined default values at runtime was not selected at query design time.
● Does not select Purge Last Selected Prompt Values, the query will retrieve 'C' as the default prompt value, since this value was the last selected prompt value.
4.2.4.8 The Selection Option in prompts on BEx variables
If there is a characteristics value variable that is of type Selection Option, Web Intelligence interprets it as a complex prompt.
The BI administrator can change this behavior to be an INLIST or BETWEEN operator, which allows multivalue selection of variables on a Selection Option prompt. When this happens the start and end value selection is changed to a multivalues list.
CautionIf a query was created when the Selection Option selection was interpreted as BETWEEN, then any values selected for this prompt do not work. You need to do the following for any document created before the change in selection behavior:
● Purge the document.● Change the default values for query prompts to be compatible with multivalue selection.
4.2.4.9 To create a query based on a BW InfoProvider or BEx query
You can create a query using BW data.
1. On the BI Launch Pad home screen, scroll down to the Applications section.2. Click Web Intelligence.
SAP BusinessObjects Web Intelligence User's GuideBuilding and running queries PUBLIC 89
3. Select SAP BW.4. Select a connection.5. Select a BW InfoProvider or BEx query.
If the query has variables, depending on the variable type, the Set Variables dialog box appears so you can set the variables properties.
Setting variables for BEx queries
If the query has… Do this...
Mandatory variable(s) where at least one variable has no default value.
Use the Set Variables dialog box to fill in any mandatory variables. The OK button is enabled when all mandatory variables have a value. The query panel appears and the outline shows the content of the BEx query as generated in the transient universe. At this point, you can open the Set Variables dialog box again and change the Set Prompts properties.
Mandatory variable(s) with default values (optional variables have no effect on the behavior).
The Set Variables automatically appears when the transient universe is created, the query panel displays the metadata.
Only optional variable(s), at least one of the variables has no default.
The transient universe is created and the query panel displays the metadata without opening the Set Variables dialog box.
Optional variables that all have default values. There are no mandatory variables.
The transient universe is created and the query panel displays the metadata without opening the Set Variables dialog box.
6. Drag and drop objects and filters in the Result Objects pane to build the query.
Note○ When you create a query based on a BEx query that contains one or multiple mandatory variables
with no default values, when you select a list of values or try to use the Member Selector dialog box, an error message appears. Use the Set Variables dialog box to set values for the mandatory variables.
○ You cannot filter on attributes in BEx queries.○ If the BEx query you connected includes SAP server-side variables, you can change the value of the
variable in the query panel. Click the Set Variables icon in the query panel toolbar, and select a new variable.
7. Click Run Query. If you have multiple queries and want to run just one, click Run Queries and select the query you want to run.
4.2.4.10 To add a second BEx query data provider to a document
Your current document is already based on a BW InfoProvider or BEx query and you want to add a second one as an additional data provider.
1. In the Query Panel, click Add Query.2. Click SAP BW.3. Browse to your BW InfoProvider or BEx query.
90 PUBLICSAP BusinessObjects Web Intelligence User's Guide
Building and running queries
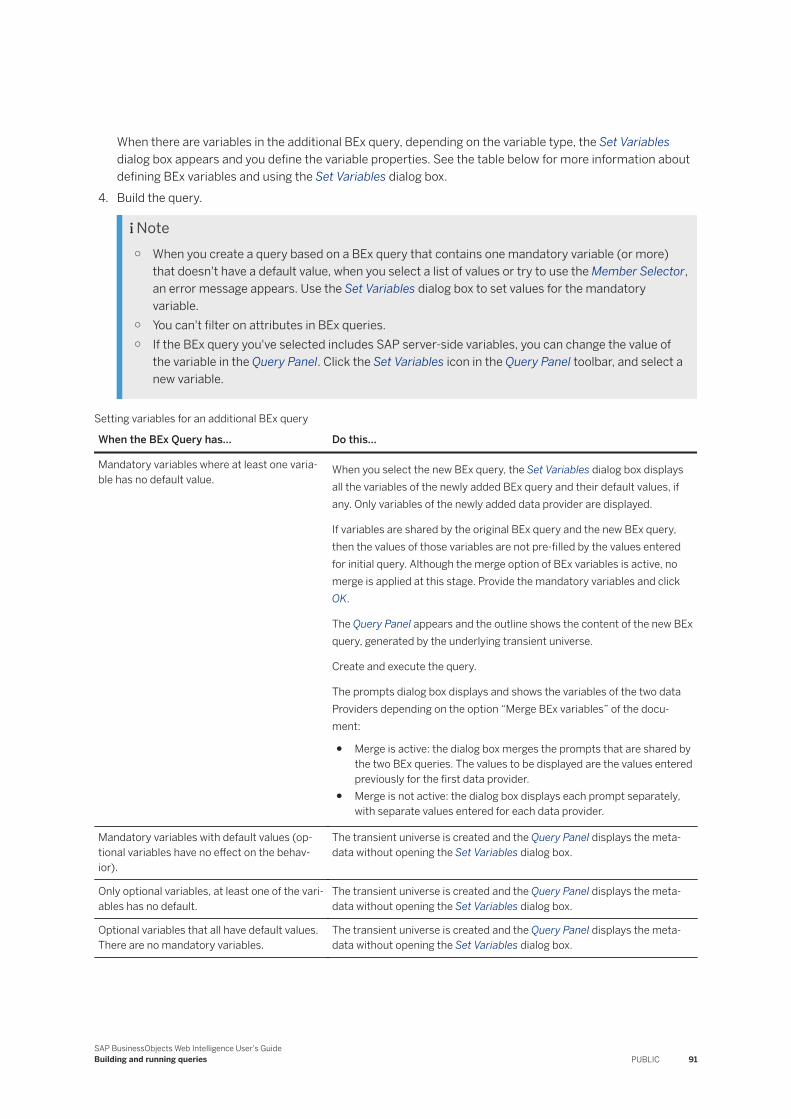
When there are variables in the additional BEx query, depending on the variable type, the Set Variables dialog box appears and you define the variable properties. See the table below for more information about defining BEx variables and using the Set Variables dialog box.
4. Build the query.
Note○ When you create a query based on a BEx query that contains one mandatory variable (or more)
that doesn't have a default value, when you select a list of values or try to use the Member Selector, an error message appears. Use the Set Variables dialog box to set values for the mandatory variable.
○ You can't filter on attributes in BEx queries.○ If the BEx query you've selected includes SAP server-side variables, you can change the value of
the variable in the Query Panel. Click the Set Variables icon in the Query Panel toolbar, and select a new variable.
Setting variables for an additional BEx query
When the BEx Query has… Do this...
Mandatory variables where at least one variable has no default value.
When you select the new BEx query, the Set Variables dialog box displays all the variables of the newly added BEx query and their default values, if any. Only variables of the newly added data provider are displayed.
If variables are shared by the original BEx query and the new BEx query, then the values of those variables are not pre-filled by the values entered for initial query. Although the merge option of BEx variables is active, no merge is applied at this stage. Provide the mandatory variables and click OK.
The Query Panel appears and the outline shows the content of the new BEx query, generated by the underlying transient universe.
Create and execute the query.
The prompts dialog box displays and shows the variables of the two data Providers depending on the option “Merge BEx variables” of the document:
● Merge is active: the dialog box merges the prompts that are shared by the two BEx queries. The values to be displayed are the values entered previously for the first data provider.
● Merge is not active: the dialog box displays each prompt separately, with separate values entered for each data provider.
Mandatory variables with default values (optional variables have no effect on the behavior).
The transient universe is created and the Query Panel displays the metadata without opening the Set Variables dialog box.
Only optional variables, at least one of the variables has no default.
The transient universe is created and the Query Panel displays the metadata without opening the Set Variables dialog box.
Optional variables that all have default values. There are no mandatory variables.
The transient universe is created and the Query Panel displays the metadata without opening the Set Variables dialog box.
SAP BusinessObjects Web Intelligence User's GuideBuilding and running queries PUBLIC 91
4.2.4.11 To edit a document based on a BEx query
You edit data providers in a BEx query in the Set Variables dialog box.
The document has multiple data providers; some of them (not all) are based on BEx queries.
When editing data providers, the Set Variables dialog box appears if a mandatory variable has no value. This can happen only if a mandatory variable was added to one of the underlying BEx queries after the document was created and saved.
1. In Design mode, click in the toolbar to open the Query Panel.The Set Variables dialog box is displayed with variables of the BEx Query related to the first Data Provider based on BEx in the document, having mandatory variables with no values. All variables of the BEx Query are displayed, not only the mandatory variables that are missing values.
2. Fill in the values for the missing mandatory valiables and click OK.The Set Variables dialog box appears with variables of the BEx Query related to the second Data Provider based on BEx in the document, having mandatory variables with no values. All variables of the BEx Query are displayed, not only the mandatory variables that are missing values.
3. Fill in the values for the missing mandatory valiables for the second BEx query and click OK.4. Repeat the previous step until there are no more BEx data providers with mandatory variables and no
default values.The Query Panel appears and displays the available objects.
5. The prompts dialog box displays and shows the variables of all data Providers depending on the option “Merge BEx variables” of the document:a. When Merge BEx variables is enabled: the dialog box merges the prompts that are shared by the BEx
Queries. The values to be displayed are the values entered previously for the first data provider.b. Merge BEx variables is disabled: the dialog box displays each prompt separately, with separate values
entered for each data provider.
When you have entered the prompt values, you can run the query for the document.
4.2.4.12 Runtime Configuration
This section describes the configuration options that can be set at runtime to change the behavior of the BW Direct Access in the Semantic Layer and in the BI tools.
All these options are Java runtime options and need to be provided for the Java Virtual Machine (JVM) in the Central Management Console (CMC).
You can provide them through the Adaptive Processing Server command line, in property files, or even through environment variables.
An example of the Adaptive Processing Server command line is as follows:
-DoptionName=optionValue
92 PUBLICSAP BusinessObjects Web Intelligence User's Guide
Building and running queries
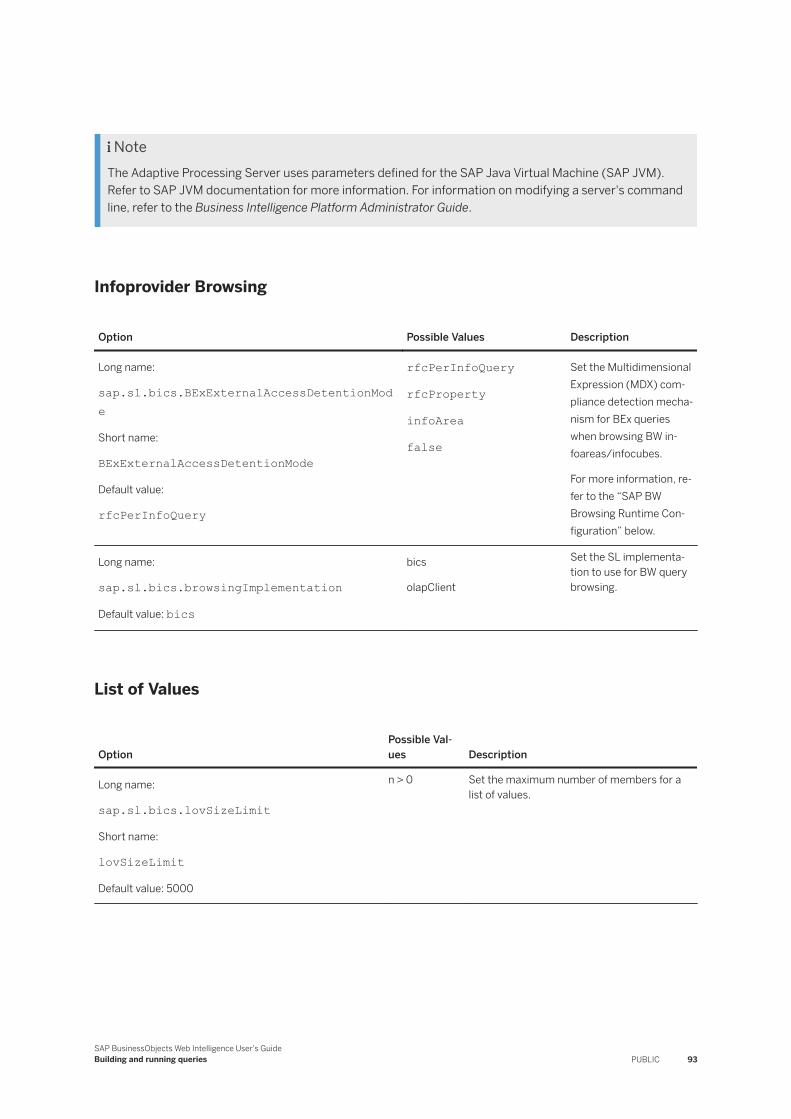
NoteThe Adaptive Processing Server uses parameters defined for the SAP Java Virtual Machine (SAP JVM). Refer to SAP JVM documentation for more information. For information on modifying a server's command line, refer to the Business Intelligence Platform Administrator Guide.
Infoprovider Browsing
Option Possible Values Description
Long name:
sap.sl.bics.BExExternalAccessDetentionMode
Short name:
BExExternalAccessDetentionMode
Default value:
rfcPerInfoQuery
rfcPerInfoQuery
rfcProperty
infoArea
false
Set the Multidimensional Expression (MDX) compliance detection mechanism for BEx queries when browsing BW infoareas/infocubes.
For more information, refer to the “SAP BW Browsing Runtime Configuration” below.
Long name:
sap.sl.bics.browsingImplementation
Default value: bics
bics
olapClient
Set the SL implementation to use for BW query browsing.
List of Values
OptionPossible Values Description
Long name:
sap.sl.bics.lovSizeLimit
Short name:
lovSizeLimit
Default value: 5000
n > 0 Set the maximum number of members for a list of values.
SAP BusinessObjects Web Intelligence User's GuideBuilding and running queries PUBLIC 93
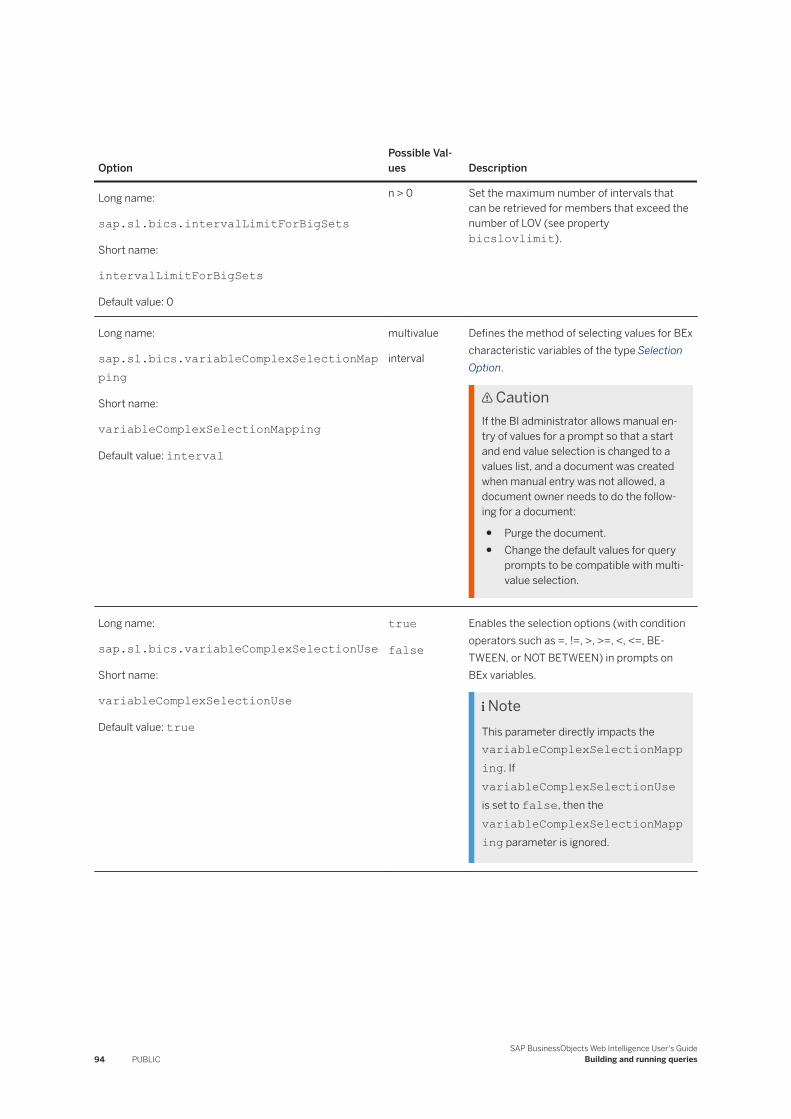
OptionPossible Values Description
Long name:
sap.sl.bics.intervalLimitForBigSets
Short name:
intervalLimitForBigSets
Default value: 0
n > 0 Set the maximum number of intervals that can be retrieved for members that exceed the number of LOV (see property bicslovlimit).
Long name:
sap.sl.bics.variableComplexSelectionMapping
Short name:
variableComplexSelectionMapping
Default value: interval
multivalue
interval
Defines the method of selecting values for BEx characteristic variables of the type Selection Option.
CautionIf the BI administrator allows manual entry of values for a prompt so that a start and end value selection is changed to a values list, and a document was created when manual entry was not allowed, a document owner needs to do the following for a document:
● Purge the document.● Change the default values for query
prompts to be compatible with multivalue selection.
Long name:
sap.sl.bics.variableComplexSelectionUse
Short name:
variableComplexSelectionUse
Default value: true
true
false
Enables the selection options (with condition operators such as =, !=, >, >=, <, <=, BETWEEN, or NOT BETWEEN) in prompts on BEx variables.
NoteThis parameter directly impacts the variableComplexSelectionMapping. If variableComplexSelectionUse is set to false, then the variableComplexSelectionMapping parameter is ignored.
94 PUBLICSAP BusinessObjects Web Intelligence User's Guide
Building and running queries
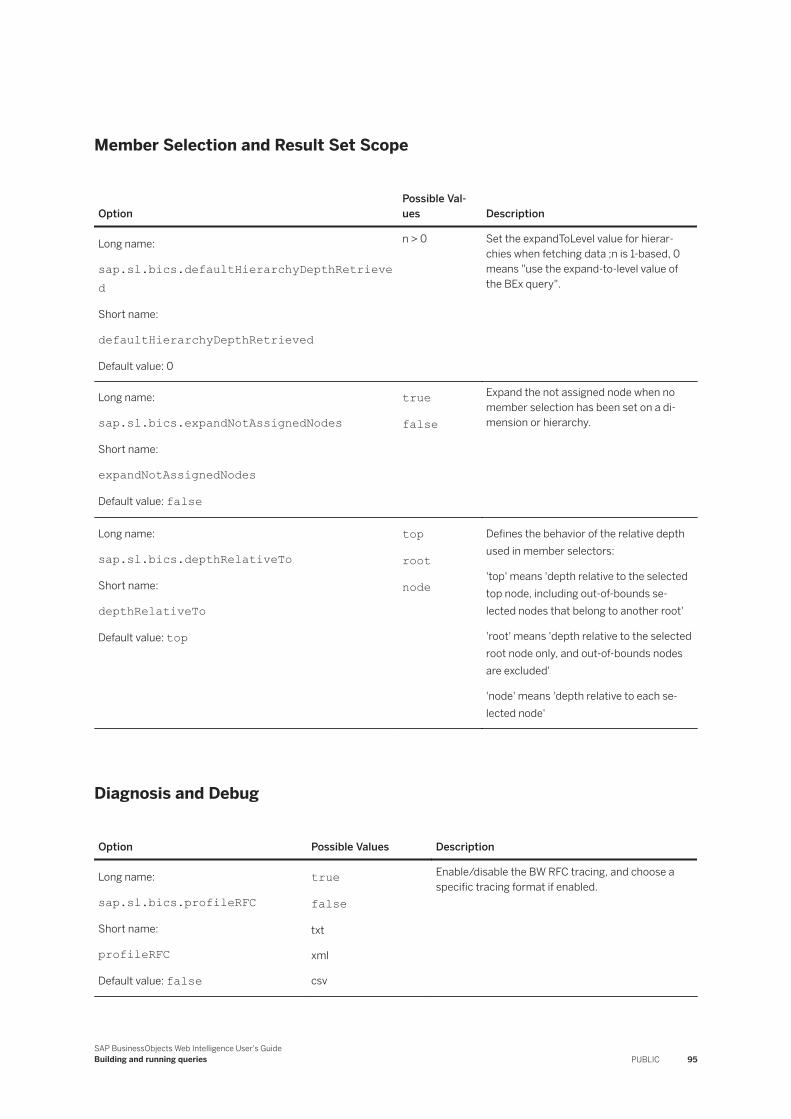
Member Selection and Result Set Scope
OptionPossible Values Description
Long name:
sap.sl.bics.defaultHierarchyDepthRetrieved
Short name:
defaultHierarchyDepthRetrieved
Default value: 0
n > 0 Set the expandToLevel value for hierarchies when fetching data ;n is 1-based, 0 means "use the expand-to-level value of the BEx query".
Long name:
sap.sl.bics.expandNotAssignedNodes
Short name:
expandNotAssignedNodes
Default value: false
true
false
Expand the not assigned node when no member selection has been set on a dimension or hierarchy.
Long name:
sap.sl.bics.depthRelativeTo
Short name:
depthRelativeTo
Default value: top
top
root
node
Defines the behavior of the relative depth used in member selectors:
'top' means 'depth relative to the selected top node, including out-of-bounds selected nodes that belong to another root'
'root' means 'depth relative to the selected root node only, and out-of-bounds nodes are excluded'
'node' means 'depth relative to each selected node'
Diagnosis and Debug
Option Possible Values Description
Long name:
sap.sl.bics.profileRFC
Short name:
profileRFC
Default value: false
true
false
txt
xml
csv
Enable/disable the BW RFC tracing, and choose a specific tracing format if enabled.
SAP BusinessObjects Web Intelligence User's GuideBuilding and running queries PUBLIC 95
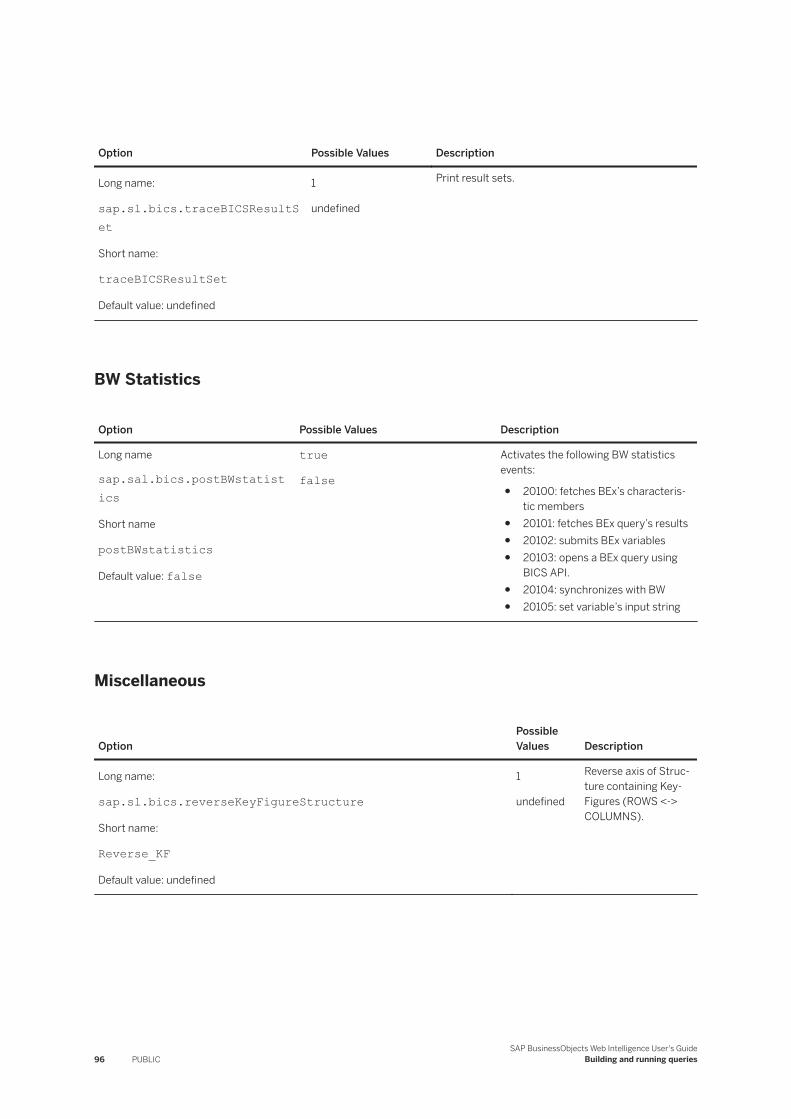
Option Possible Values Description
Long name:
sap.sl.bics.traceBICSResultSet
Short name:
traceBICSResultSet
Default value: undefined
1
undefined
Print result sets.
BW Statistics
Option Possible Values Description
Long name
sap.sal.bics.postBWstatistics
Short name
postBWstatistics
Default value: false
true
false
Activates the following BW statistics events:
● 20100: fetches BEx’s characteristic members
● 20101: fetches BEx query’s results● 20102: submits BEx variables● 20103: opens a BEx query using
BICS API.● 20104: synchronizes with BW● 20105: set variable’s input string
Miscellaneous
OptionPossible Values Description
Long name:
sap.sl.bics.reverseKeyFigureStructure
Short name:
Reverse_KF
Default value: undefined
1
undefined
Reverse axis of Structure containing KeyFigures (ROWS <-> COLUMNS).
96 PUBLICSAP BusinessObjects Web Intelligence User's Guide
Building and running queries
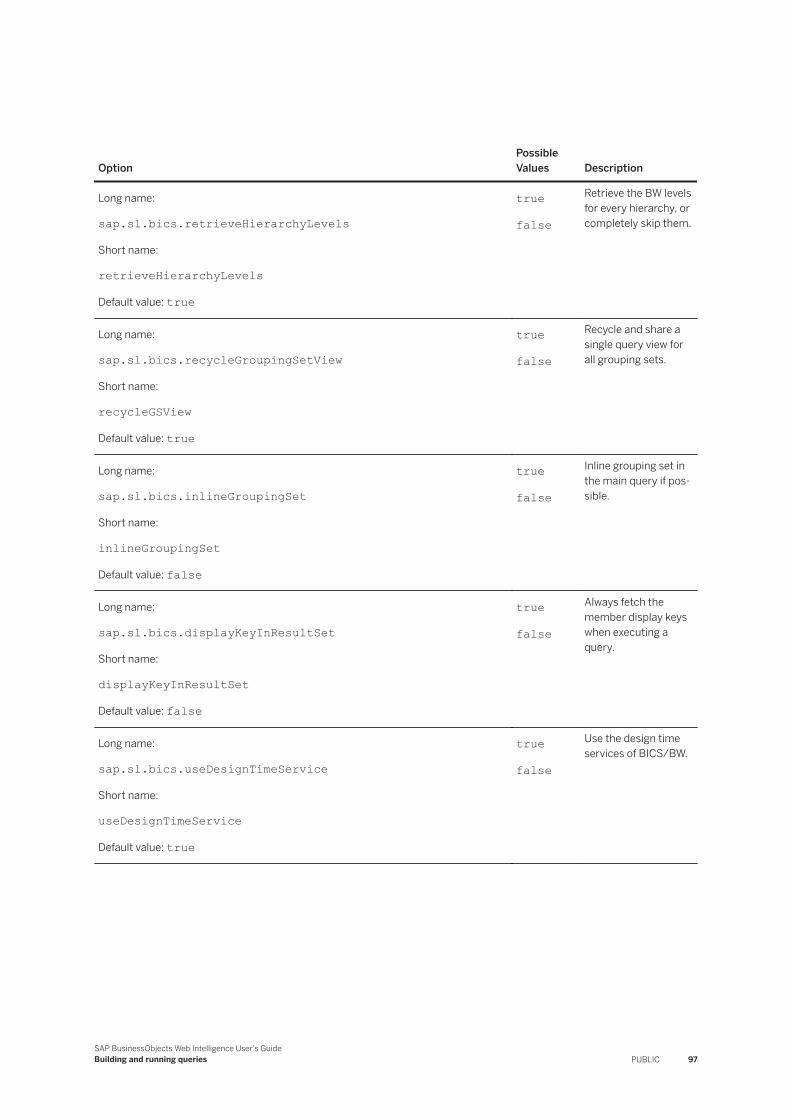
OptionPossible Values Description
Long name:
sap.sl.bics.retrieveHierarchyLevels
Short name:
retrieveHierarchyLevels
Default value: true
true
false
Retrieve the BW levels for every hierarchy, or completely skip them.
Long name:
sap.sl.bics.recycleGroupingSetView
Short name:
recycleGSView
Default value: true
true
false
Recycle and share a single query view for all grouping sets.
Long name:
sap.sl.bics.inlineGroupingSet
Short name:
inlineGroupingSet
Default value: false
true
false
Inline grouping set in the main query if possible.
Long name:
sap.sl.bics.displayKeyInResultSet
Short name:
displayKeyInResultSet
Default value: false
true
false
Always fetch the member display keys when executing a query.
Long name:
sap.sl.bics.useDesignTimeService
Short name:
useDesignTimeService
Default value: true
true
false
Use the design time services of BICS/BW.
SAP BusinessObjects Web Intelligence User's GuideBuilding and running queries PUBLIC 97
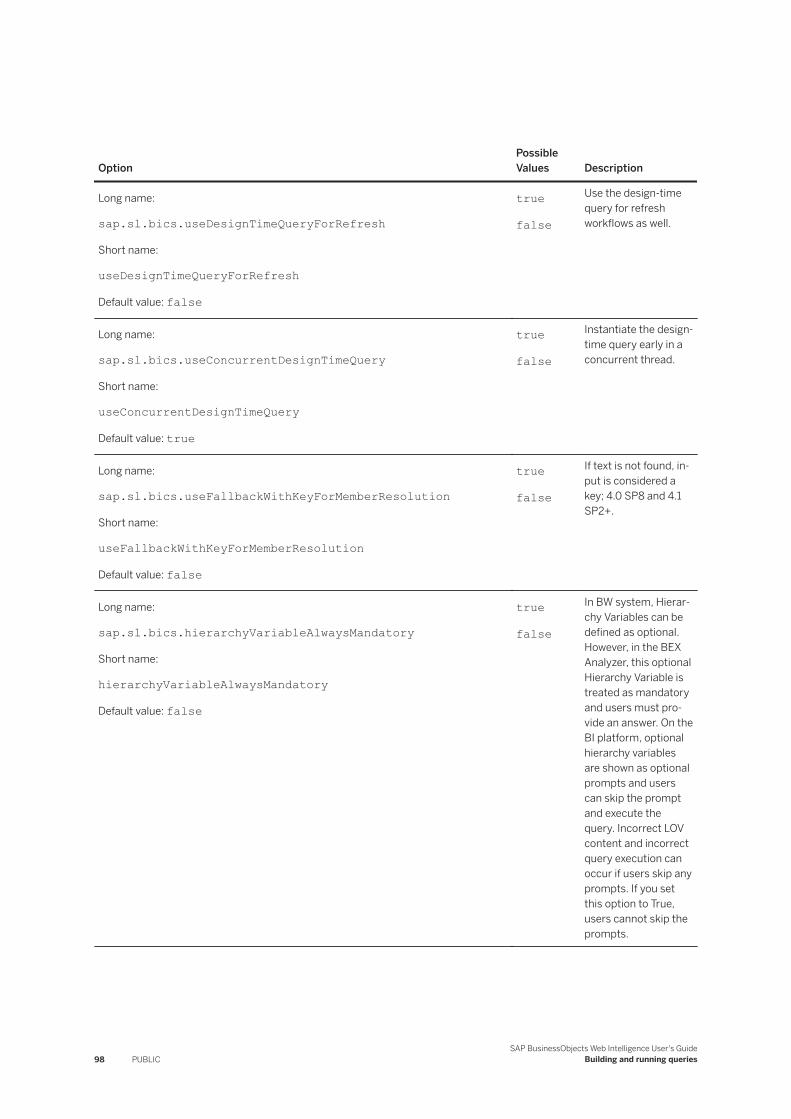
OptionPossible Values Description
Long name:
sap.sl.bics.useDesignTimeQueryForRefresh
Short name:
useDesignTimeQueryForRefresh
Default value: false
true
false
Use the design-time query for refresh workflows as well.
Long name:
sap.sl.bics.useConcurrentDesignTimeQuery
Short name:
useConcurrentDesignTimeQuery
Default value: true
true
false
Instantiate the design-time query early in a concurrent thread.
Long name:
sap.sl.bics.useFallbackWithKeyForMemberResolution
Short name:
useFallbackWithKeyForMemberResolution
Default value: false
true
false
If text is not found, input is considered a key; 4.0 SP8 and 4.1 SP2+.
Long name:
sap.sl.bics.hierarchyVariableAlwaysMandatory
Short name:
hierarchyVariableAlwaysMandatory
Default value: false
true
false
In BW system, Hierarchy Variables can be defined as optional. However, in the BEX Analyzer, this optional Hierarchy Variable is treated as mandatory and users must provide an answer. On the BI platform, optional hierarchy variables are shown as optional prompts and users can skip the prompt and execute the query. Incorrect LOV content and incorrect query execution can occur if users skip any prompts. If you set this option to True, users cannot skip the prompts.
98 PUBLICSAP BusinessObjects Web Intelligence User's Guide
Building and running queries
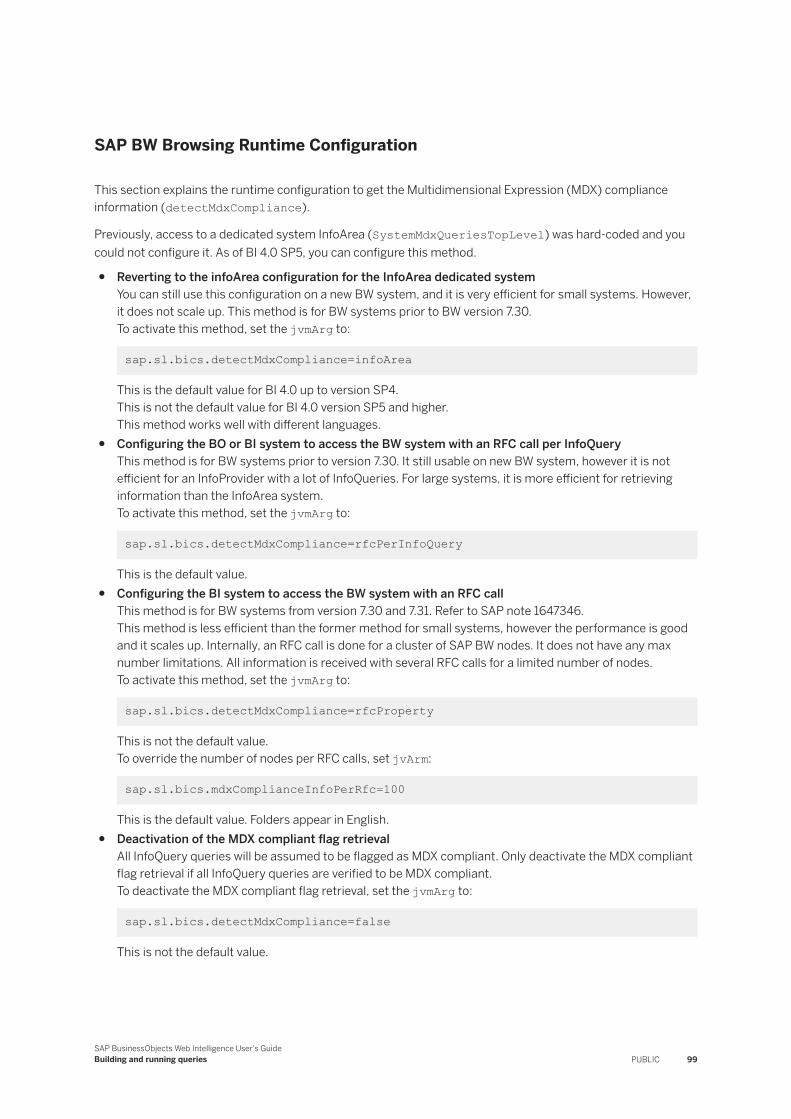
SAP BW Browsing Runtime Configuration
This section explains the runtime configuration to get the Multidimensional Expression (MDX) compliance information (detectMdxCompliance).
Previously, access to a dedicated system InfoArea (SystemMdxQueriesTopLevel) was hard-coded and you could not configure it. As of BI 4.0 SP5, you can configure this method.
● Reverting to the infoArea configuration for the InfoArea dedicated systemYou can still use this configuration on a new BW system, and it is very efficient for small systems. However, it does not scale up. This method is for BW systems prior to BW version 7.30.To activate this method, set the jvmArg to:
sap.sl.bics.detectMdxCompliance=infoArea
This is the default value for BI 4.0 up to version SP4.This is not the default value for BI 4.0 version SP5 and higher.This method works well with different languages.
● Configuring the BO or BI system to access the BW system with an RFC call per InfoQueryThis method is for BW systems prior to version 7.30. It still usable on new BW system, however it is not efficient for an InfoProvider with a lot of InfoQueries. For large systems, it is more efficient for retrieving information than the InfoArea system.To activate this method, set the jvmArg to:
sap.sl.bics.detectMdxCompliance=rfcPerInfoQuery
This is the default value.● Configuring the BI system to access the BW system with an RFC call
This method is for BW systems from version 7.30 and 7.31. Refer to SAP note 1647346.This method is less efficient than the former method for small systems, however the performance is good and it scales up. Internally, an RFC call is done for a cluster of SAP BW nodes. It does not have any max number limitations. All information is received with several RFC calls for a limited number of nodes.To activate this method, set the jvmArg to:
sap.sl.bics.detectMdxCompliance=rfcProperty
This is not the default value.To override the number of nodes per RFC calls, set jvArm:
sap.sl.bics.mdxComplianceInfoPerRfc=100
This is the default value. Folders appear in English.● Deactivation of the MDX compliant flag retrieval
All InfoQuery queries will be assumed to be flagged as MDX compliant. Only deactivate the MDX compliant flag retrieval if all InfoQuery queries are verified to be MDX compliant.To deactivate the MDX compliant flag retrieval, set the jvmArg to:
sap.sl.bics.detectMdxCompliance=false
This is not the default value.
SAP BusinessObjects Web Intelligence User's GuideBuilding and running queries PUBLIC 99
4.2.5 Building queries on SAP HANA views with Direct Access
With Direct Access, create queries on SAP HANA views directly and bypass universes.
Direct Access provides direct access to SAP HANA information models, also called HANA views, allowing the application to connect directly to the cube representing the information model. Direct Access generates a transient universe on the fly so that you don't have to go through the universe authoring process. It saves you time, as you can get straight to the query specification in the query panel.
Direct Access lets you browse SAP HANA secured relational, OLAP, and HTTP (Info Access, or InA) connections created and published either from the Central Management Console, the universe design tool, or the information design tool.
RestrictionHANA InA connections don't support:
● Filters on measures and attributes.● Member selection using the Ancestors, Exclude or Parents functions.
You can execute query scripts using SQL for relational connections, or MDX and InA for OLAP connections.
Web Intelligence supports native HANA views modeled in SAP HANA Studio, and HANA HDI calculation views modeled in SAP Web IDE for HANA with XS Advanced. Both relational and OLAP connections from HANA SP08 onwards are supported, as well as connection based on SAP HANA 2.0 (SAP HANA 2.0 SP2 onwards for HDI views).
Prerequisites for HTTP connections
Before creating SAP HANA HTTP connections, make sure that:
● Your HANA system is 1.0 SPS12 (or a higher) or SAP HANA 2.0 (or higher).● You've set up and activated the SAP HANA InfoAccess service (version 4.10.0 or above) on your SAP HANA
system.● Each user using HTTP connections has the sap.bc.ina.service.v2.userRole::INA_USER role
assigned.● If your SAP HANA system is in version 1.00.112.04 or above, you've also granted SELECT privileges to users
that are going to connect through HTTP on all view items in the _SYS_BIC schema that they should have access to.
● If the SAP HANA XS server is configured with HTTPS (SSL) with a signed certificate, you know which port the server uses for HTTPS requests.
● You've increased the session timeout configuration parameters in your SAP HANA XS server.
100 PUBLICSAP BusinessObjects Web Intelligence User's Guide
Building and running queries
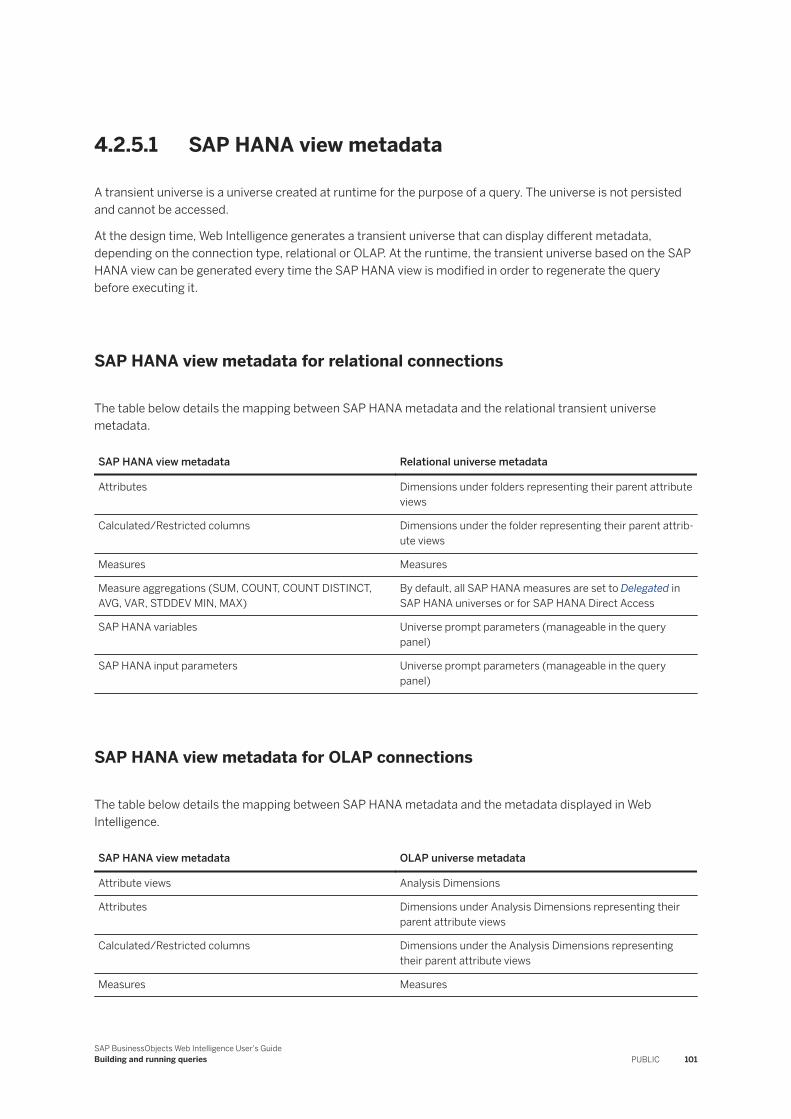
4.2.5.1 SAP HANA view metadata
A transient universe is a universe created at runtime for the purpose of a query. The universe is not persisted and cannot be accessed.
At the design time, Web Intelligence generates a transient universe that can display different metadata, depending on the connection type, relational or OLAP. At the runtime, the transient universe based on the SAP HANA view can be generated every time the SAP HANA view is modified in order to regenerate the query before executing it.
SAP HANA view metadata for relational connections
The table below details the mapping between SAP HANA metadata and the relational transient universe metadata.
SAP HANA view metadata Relational universe metadata
Attributes Dimensions under folders representing their parent attribute views
Calculated/Restricted columns Dimensions under the folder representing their parent attribute views
Measures Measures
Measure aggregations (SUM, COUNT, COUNT DISTINCT, AVG, VAR, STDDEV MIN, MAX)
By default, all SAP HANA measures are set to Delegated in SAP HANA universes or for SAP HANA Direct Access
SAP HANA variables Universe prompt parameters (manageable in the query panel)
SAP HANA input parameters Universe prompt parameters (manageable in the query panel)
SAP HANA view metadata for OLAP connections
The table below details the mapping between SAP HANA metadata and the metadata displayed in Web Intelligence.
SAP HANA view metadata OLAP universe metadata
Attribute views Analysis Dimensions
Attributes Dimensions under Analysis Dimensions representing their parent attribute views
Calculated/Restricted columns Dimensions under the Analysis Dimensions representing their parent attribute views
Measures Measures
SAP BusinessObjects Web Intelligence User's GuideBuilding and running queries PUBLIC 101
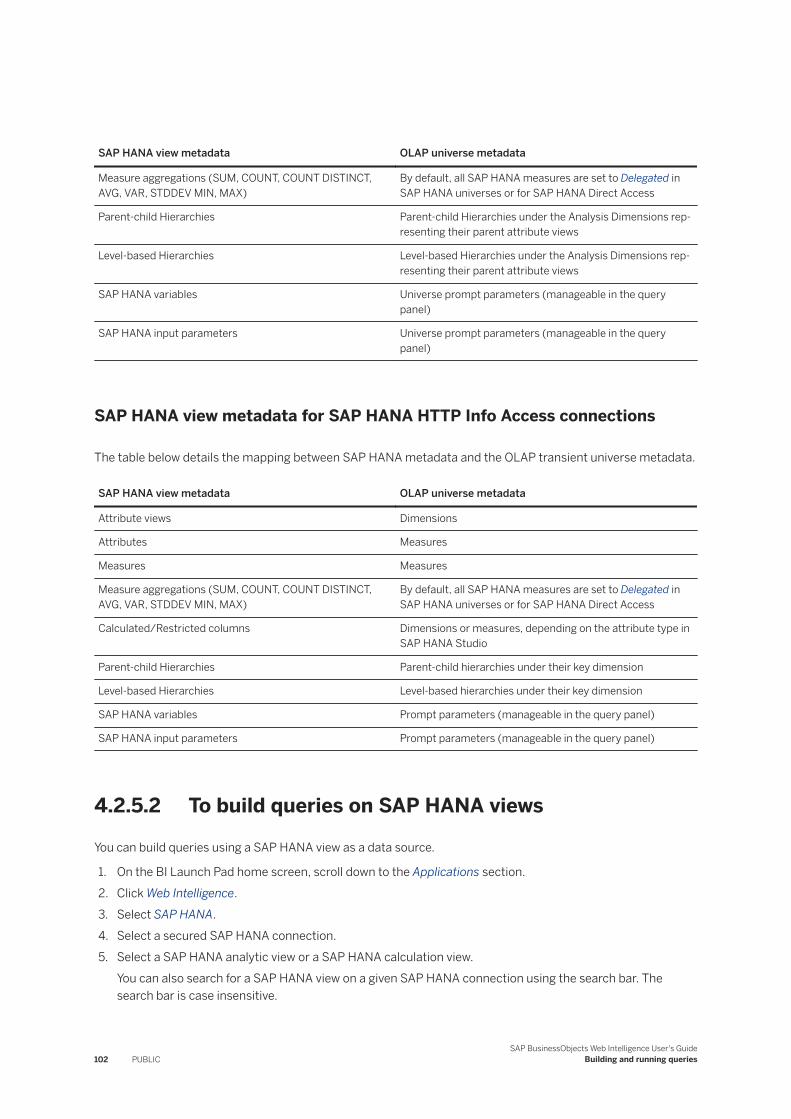
SAP HANA view metadata OLAP universe metadata
Measure aggregations (SUM, COUNT, COUNT DISTINCT, AVG, VAR, STDDEV MIN, MAX)
By default, all SAP HANA measures are set to Delegated in SAP HANA universes or for SAP HANA Direct Access
Parent-child Hierarchies Parent-child Hierarchies under the Analysis Dimensions representing their parent attribute views
Level-based Hierarchies Level-based Hierarchies under the Analysis Dimensions representing their parent attribute views
SAP HANA variables Universe prompt parameters (manageable in the query panel)
SAP HANA input parameters Universe prompt parameters (manageable in the query panel)
SAP HANA view metadata for SAP HANA HTTP Info Access connections
The table below details the mapping between SAP HANA metadata and the OLAP transient universe metadata.
SAP HANA view metadata OLAP universe metadata
Attribute views Dimensions
Attributes Measures
Measures Measures
Measure aggregations (SUM, COUNT, COUNT DISTINCT, AVG, VAR, STDDEV MIN, MAX)
By default, all SAP HANA measures are set to Delegated in SAP HANA universes or for SAP HANA Direct Access
Calculated/Restricted columns Dimensions or measures, depending on the attribute type in SAP HANA Studio
Parent-child Hierarchies Parent-child hierarchies under their key dimension
Level-based Hierarchies Level-based hierarchies under their key dimension
SAP HANA variables Prompt parameters (manageable in the query panel)
SAP HANA input parameters Prompt parameters (manageable in the query panel)
4.2.5.2 To build queries on SAP HANA views
You can build queries using a SAP HANA view as a data source.
1. On the BI Launch Pad home screen, scroll down to the Applications section.2. Click Web Intelligence.3. Select SAP HANA.4. Select a secured SAP HANA connection.5. Select a SAP HANA analytic view or a SAP HANA calculation view.
You can also search for a SAP HANA view on a given SAP HANA connection using the search bar. The search bar is case insensitive.
102 PUBLICSAP BusinessObjects Web Intelligence User's Guide
Building and running queries
6. Click OK.7. Optional: If the SAP HANA view you have selected has mandatory variables or input parameters with no
default values, provide answers to the prompts in the Variable Manager wizard and click OK.8. In the query panel, drag dimensions and measures you want to include in the query in the Result Objects
pane.
NoteOn an OLAP connection, the dimensional query panel opens so you can use the Member Selector on SAP HANA hierarchies. For SAP HANA HTTP connections, the features available in the query panel are equal to that of BEx queries.
9. Select the objects to which you want to add query filters and drag them to the query filters pane. To create a quick filter on an object, select the object in the Result Objects pane then click the Add a quick filter icon in the Result Objects toolbar.
10. Set the scope of analysis and other query properties.11. Click Run Query.
Related Information
HANA query prompts in Web Intelligence [page 148]
4.2.5.3 Smart refresh on HANA HTTP connections
Smart refresh is a query optimization process that enhances performance depending on the complexity and the type of query you're running.
Smart refresh allows SQL access to HANA HTTP connections when using Direct Access. With both SQL and HTTP access possible, the application can decide to use either one or the other to access the HANA database and retrieve data, depending on which access is the mosted suited to the query specification. This feature is transparent in the application and runs in the background.
If the query is simple and only has dimensions and measures, SQL access is preferred. HTTP access prevails whenever the query has one or more hierarchies and hierarchy levels, or when the Retrieve empty rows option is on, even if there's no hierarchies in the query. If the query has variables and input parameters, its Lists of Values are retrieved via HTTP, while the main query is handled either via SQL or HTTP depending on the query specification.
SQL access has to be configured at the connection level. If you want to benefit from SQL access, make sure that your administrator has checked the Allow SQL access to the remote database option in the information design tool, and configured the connection accordingly.
SAP BusinessObjects Web Intelligence User's GuideBuilding and running queries PUBLIC 103
4.2.5.4 Defining query limits
SAP HANA Direct Access data providers use transient universes, which means that they bypass universes and therefore do not offer the same range of settings compared to other data providers.
Your database administrator can set query limits directly at the connection level in Information Design Tool and Universe Design Tool for relational connections, or in the CMC for OLAP connections.
NoteThese options aren't available for SAP HANA HTTP connections.
These limit the amount of data returned by a query:
● Query Execution Timeout: limits the time for the query execution. The limit is expressed in seconds.● Max Cells: limits the number of cells returned by a query. This restricts the number of cells returned, but
doesn't prevent the database from processing all cells in the query. It only limits the number once the database has started to send rows.
NoteThis setting is only available for SAP HANA OLAP connections.
● Max Rows: limits the number of rows returned by a query. This restricts the number of rows returned, but doesn't prevent the database from processing all rows in the query. It only limits the number once the database has started to send rows.
NoteThis setting is only available for SAP HANA relational connections.
Query limits are also supported in SAP HANA Online mode.
Related Information
4.2.5.5 To define query limits for SAP HANA OLAP connections
You can limit the amount of time a query can run or the number of cells you want the database to retrieve.
1. On the CMC home screen, click OLAP connections.2. Right-click an SAP HANA connection.
3. Click Organize Edit .4. In the Maximum Number of Cells and Query Timeout entry fields, set the limits you want to apply to the
connection.
104 PUBLICSAP BusinessObjects Web Intelligence User's Guide
Building and running queries
4.2.5.6 Managing mandatory variables with the Variable Manager
The Variable Manager is a wizard that lets you manage the variables of a data source. Use it to answer prompts for SAP HANA variables and input parameters in documents that use SAP HANA views as data sources.
The Variable Manager is displayed before the query panel so that you can:
● View available data source variables coming from the database● Set or edit values for every data source variable● Fix or prompt values of data source variables upon refresh with the Set as prompt option for each SAP
HANA variable
The Variable Manager is available when you edit or add new data providers to a document based on an SAP HANA view. It is displayed automatically if the SAP HANA view has at least one mandatory input parameter or SAP HANA variable without a default value. If there are mandatory or optional input parameters or SAP HANA
variables with default values, you can still access the Variable Manager. Click the Variable Manager icon ( ) in the Query Panel to change the values or the prompts.
You can also check the Use BEx/HANA defined default values at runtime option to to use the default values defined in SAP HANA Studio.
The following HANA features on HANA variables and input parameters are supported:
● Mandatory and optional HANA variables and input parameters.● HANA Default values based on constant values and dynamic expressions.● Single, interval and range HANA variables.● Multiple entries for HANA variables and input parameters.● HANA variables and input parameters based on hierarchies.● HANA variables and input parameters based on value helps with description values.
4.2.5.7 To merge or unmerge SAP HANA variables
You can merge or unmerge SAP HANA variables in a Web Intelligence.
This is useful when a Web Intelligence document has multiple data providers based on the same SAP HANA view.
1. Go to the document properties.2. Check or uncheck Merge prompts (BEx or HANA Variables) to merge or unmerge SAP HANA variables.
SAP BusinessObjects Web Intelligence User's GuideBuilding and running queries PUBLIC 105
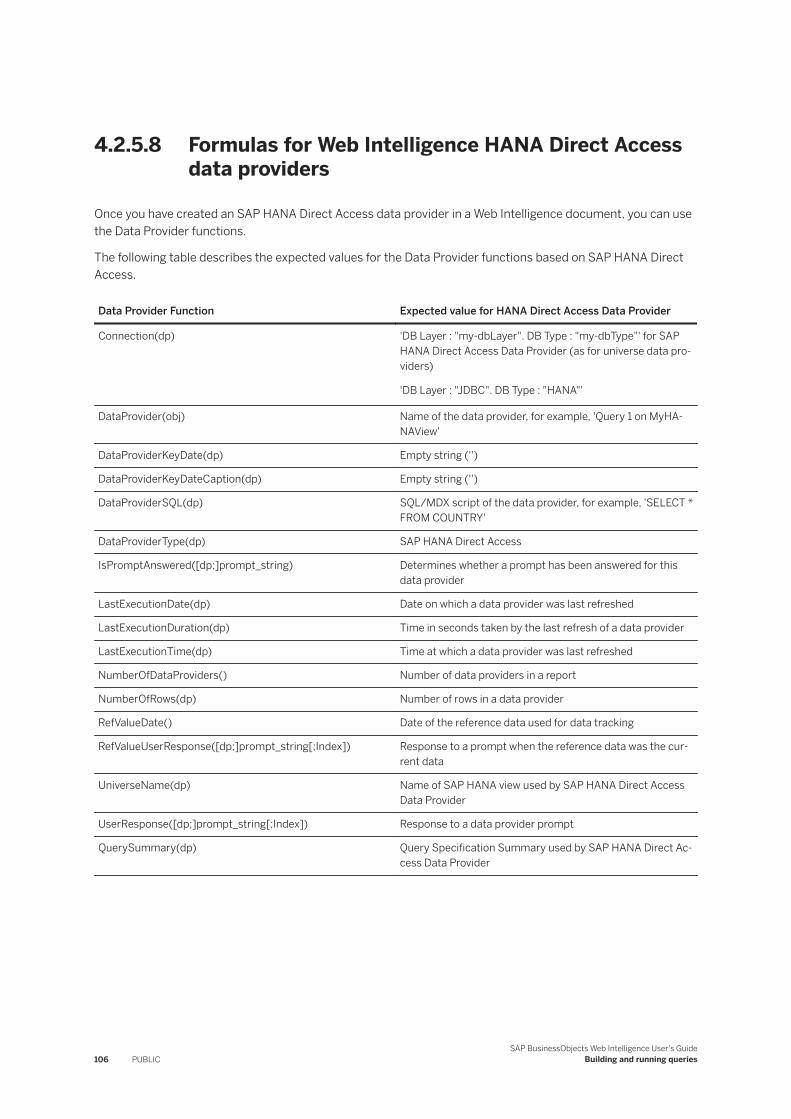
4.2.5.8 Formulas for Web Intelligence HANA Direct Access data providers
Once you have created an SAP HANA Direct Access data provider in a Web Intelligence document, you can use the Data Provider functions.
The following table describes the expected values for the Data Provider functions based on SAP HANA Direct Access.
Data Provider Function Expected value for HANA Direct Access Data Provider
Connection(dp) 'DB Layer : "my-dbLayer". DB Type : "my-dbType"' for SAP HANA Direct Access Data Provider (as for universe data providers)
'DB Layer : "JDBC". DB Type : "HANA"'
DataProvider(obj) Name of the data provider, for example, 'Query 1 on MyHANAView'
DataProviderKeyDate(dp) Empty string ('')
DataProviderKeyDateCaption(dp) Empty string ('')
DataProviderSQL(dp) SQL/MDX script of the data provider, for example, 'SELECT * FROM COUNTRY'
DataProviderType(dp) SAP HANA Direct Access
IsPromptAnswered([dp;]prompt_string) Determines whether a prompt has been answered for this data provider
LastExecutionDate(dp) Date on which a data provider was last refreshed
LastExecutionDuration(dp) Time in seconds taken by the last refresh of a data provider
LastExecutionTime(dp) Time at which a data provider was last refreshed
NumberOfDataProviders() Number of data providers in a report
NumberOfRows(dp) Number of rows in a data provider
RefValueDate() Date of the reference data used for data tracking
RefValueUserResponse([dp;]prompt_string[;Index]) Response to a prompt when the reference data was the current data
UniverseName(dp) Name of SAP HANA view used by SAP HANA Direct Access Data Provider
UserResponse([dp;]prompt_string[;Index]) Response to a data provider prompt
QuerySummary(dp) Query Specification Summary used by SAP HANA Direct Access Data Provider
106 PUBLICSAP BusinessObjects Web Intelligence User's Guide
Building and running queries
4.2.6 Building queries on S/4HANA CDS views
You can build queries on S/4HANA Core Data Service (CDS) views.
Web Intelligence can consume S/4HANA CDS views if their data category is set to CUBE or QUERY in SAP ABAP Developer Tools. Make sure to ask your administrator to add the following lines to the CDS view's Data Definition Language (DDL) file:
@Analytics: {query: true} // for QUERY S/4HANA CDS views
or
@Analytics: {cube: true} // for CUBE S/4HANA CDS views
Query CDS views are consumed as virtual BEx queries, and Cube CDS views are consumed as BW InfoProviders. Once you have converted and released the S/4HANA CDS view from SAP ABAP Development Tool, create an OLAP connection using BICS connectivity either in the Information Design Tool or the Central Management Console, and publish it to the repository.
4.2.7 Building queries on relational connections using Free-Hand SQL statements
In Web Intelligence, you can use a Free-hand SQL (FHSQL) statement to query a relational database.
FHSQL data providers are useful when you have complex SQL statements that use advanced database functions not supported by the standard semantic layer. You can copy, paste or write new statements using the Query Script Editor, define prompts with static lists of values, use existing secured relational connections to the database, and parse statements for SQL errors.
FHSQL data providers use secured relational connections which accept SQL statements. The BI administrator publishes these connections in the CMS using the SAP BusinessObjects Universe Design Tool or SAP BusinessObjects Information Design Tool.
If a connection has SAP HDI calculation views, you can also run queries on them using SQL.
A connection security right gives BI administrators the possibility to decide whether creating and running custom SQL scripts is allowed on a given relational connection. If the right is denied, the connection doesn't appear when creating a document based on an FHSQL data source or adding a new FHSQL data provider to an existing document. The Use connection for Free-Hand SQL scripts right can be managed in the Central Management Console. It's denied by default for every relational connection, and your BI administrator has to explicitly grant it. This right works together with the Query script – enable viewing (SQL, MDX…) right. Make sure that you have both rights granted.
Restriction● Web Intelligence supports Hadoop data sources, but custom SQL isn't supported.● If you use SQL statements that return multiple result sets, only the first result set will be displayed; the
others will be ignored.● You can't use the Change Source Wizard with FHSQL queries.
SAP BusinessObjects Web Intelligence User's GuideBuilding and running queries PUBLIC 107
4.2.7.1 To build a query using a Free-hand SQL statement
You can query a relational database using a Free-hand SQL (FHSQL) statement.
1. On the BI Launch Pad home screen, scroll down to the Applications section.2. Click Web Intelligence.3. Select Freehand SQL.4. Select a relational connection.5. Enter or paste a SQL statement.6. Click Validate to check the statement for SQL errors.
Web Intelligence runs the SQL against the database and displays any error message that the database returns. Refer to the following topic for keys you shouldn't use: Unsupported keywords in FHSQL SQL statements [page 112]
When you submit a modified SQL statement, it's first checked by the database. If the SQL isn't correct, then the SQL changes aren't applied. If the SQL is valid, the FHSQL data provider saves it and applies it automatically to the data source, making the following updates:
1. Any new SQL columns are added in the data source as new objects.2. The SQL columns with the same name and data type as existing data source objects are retained.3. Old data source objects are deleted if they didn't map with the newly retrieved SQL columns.
7. Once you have resolved any SQL errors, click OK.8. In the query panel, you can do the following:
○ View the objects in the query.○ Edit the properties of the data source objects.○ Change the FHSQL connection.○ Access the SQL for editing using the Edit SQL button.
9. Click Run Query.
4.2.7.2 Configuration options
The FHSQL data provider connects to the database in order to parse the SQL.
If the SQL is valid, a set of result objects appears in the Query Panel. The following table lists the default values for the Object Properties in the Query Panel.
Data source object property Default values Actions you can perform
Name Column name Change the column or object name.
Qualification ● Dimension for STRING and DATE/DATETIME data type
● Measure for NUMBER data type
Change the object qualification.
Possible values include Dimension, Measure, and Attribute.
108 PUBLICSAP BusinessObjects Web Intelligence User's Guide
Building and running queries
Data source object property Default values Actions you can perform
Type ● STRING for SQL characters such as VARCHAR, LONGVARCHAR, and so on
● NUMBER for SQL numeric objects such as INT, FLOAT, DOUBLE, and so on
● DATE for SQL Date, SQL DateTime or SQL Timestamp
RestrictionFHSQL does not support SQL BLOB/BINARY data types.
Use values such as STRING, NUMBER, and DATE/DATETIME.
Restriction● You cannot change the object
data type.● A given data type must match
the SQL data-type mapping.
Aggregate Function SUM for Measure.
For other objects, there is no default value.
Change the object aggregation function for measures.
Possible values include:
● None● Sum (by default)● Max● Min● Count● Average
Associated Dimension No default value Change the object-associated dimension for the attribute (ex-detail).
FHSQL Query Properties
In the Query Properties, you can edit the query name, change the connection, and manage refresh options:
Refresh option Description
Max Rows Retrieved By default, this option is disabled and there is no limit to the number of rows retrieved. You can set the range value to [0,¥]. If you do this, the FHSQL data provider limits the number of rows retrieved to the maximum rows given and returns a partial result set.
For more information on this option, see Max rows retrieved [page 37].
SAP BusinessObjects Web Intelligence User's GuideBuilding and running queries PUBLIC 109
Refresh option Description
Max Retrieval Time By default, this option is disabled and there is no limit to the query execution time.
You can set the Max Retrieval Time in seconds to the range value of [0,¥]. If you do this, the FHSQL data provider controls the query time; stopping it if it exceeds the given timeout. It returns a partial result set of whatever data is already fetched when the timeout occurred.
Refreshable Allow the refresh of the FHSQL query.
4.2.7.3 Using the @Variable and @Prompt functions in FHSQL SQL statements
You can use the @Variable and @Prompt functions in FHSQL statements in.
For general information on working with these functions, refer to the Information Design Tool User Guide or the Universe Design Tool User Guide.
@Variable functions and FHSQL
You can use the @Variable syntax in SQL statements to insert BusinessObjects variables into the SQL. The FHSQL data provider substitutes these variables before executing the SQL.
RestrictionFHSQL doesn't support User Attributes as configurable in the CMC User Attribute Management area in the @Variable syntax.
@Prompt functions and FHSQL
When a user selects a value in a prompt, FHSQL data provider substitutes this value for the @Prompt syntax and then executes the SQL against the database to retrieve data.
When the FHSQL parses the @Prompt syntax in order to validate the SQL or get the data structure, the FHSQL data provider substitutes the @Prompt syntax with:
● Default values (if set)● The first values of the associated static LOV (if set)● Placeholders if no default values or static LOV are defined:
110 PUBLICSAP BusinessObjects Web Intelligence User's Guide
Building and running queries
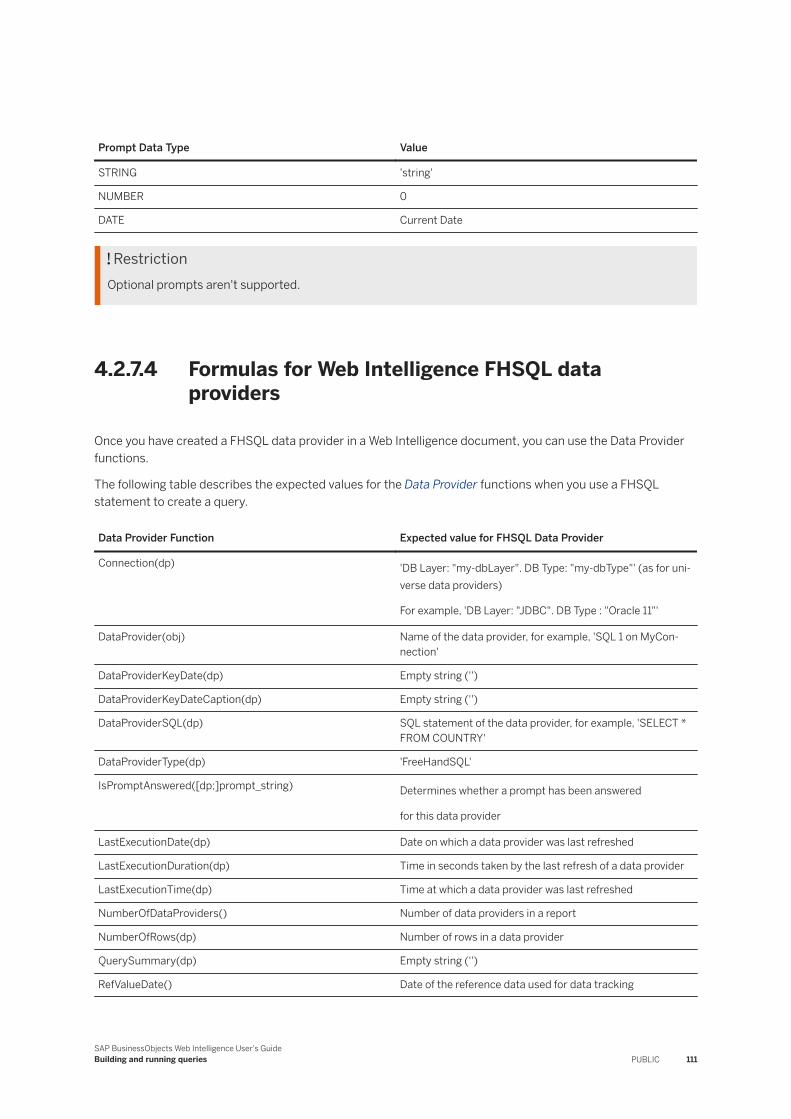
Prompt Data Type Value
STRING 'string'
NUMBER 0
DATE Current Date
RestrictionOptional prompts aren't supported.
4.2.7.4 Formulas for Web Intelligence FHSQL data providers
Once you have created a FHSQL data provider in a Web Intelligence document, you can use the Data Provider functions.
The following table describes the expected values for the Data Provider functions when you use a FHSQL statement to create a query.
Data Provider Function Expected value for FHSQL Data Provider
Connection(dp) 'DB Layer: "my-dbLayer". DB Type: "my-dbType"' (as for universe data providers)
For example, 'DB Layer: "JDBC". DB Type : "Oracle 11"'
DataProvider(obj) Name of the data provider, for example, 'SQL 1 on MyConnection'
DataProviderKeyDate(dp) Empty string ('')
DataProviderKeyDateCaption(dp) Empty string ('')
DataProviderSQL(dp) SQL statement of the data provider, for example, 'SELECT * FROM COUNTRY'
DataProviderType(dp) 'FreeHandSQL'
IsPromptAnswered([dp;]prompt_string) Determines whether a prompt has been answered
for this data provider
LastExecutionDate(dp) Date on which a data provider was last refreshed
LastExecutionDuration(dp) Time in seconds taken by the last refresh of a data provider
LastExecutionTime(dp) Time at which a data provider was last refreshed
NumberOfDataProviders() Number of data providers in a report
NumberOfRows(dp) Number of rows in a data provider
QuerySummary(dp) Empty string ('')
RefValueDate() Date of the reference data used for data tracking
SAP BusinessObjects Web Intelligence User's GuideBuilding and running queries PUBLIC 111
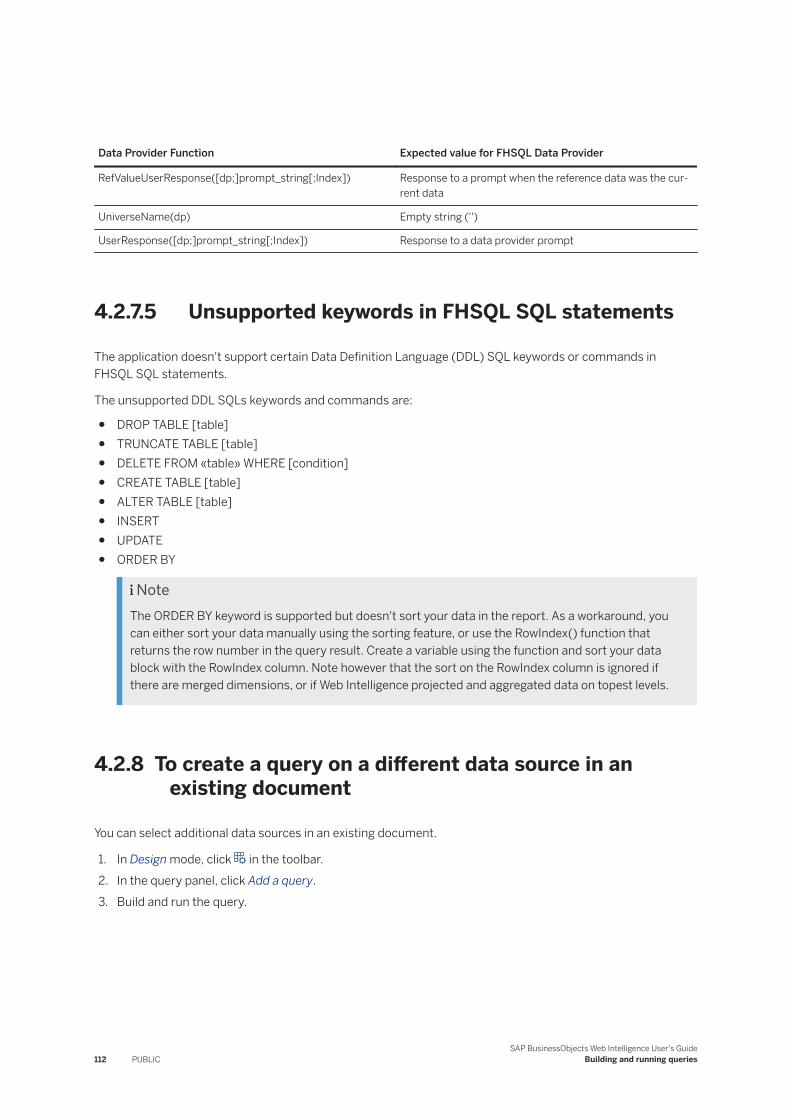
Data Provider Function Expected value for FHSQL Data Provider
RefValueUserResponse([dp;]prompt_string[;Index]) Response to a prompt when the reference data was the current data
UniverseName(dp) Empty string ('')
UserResponse([dp;]prompt_string[;Index]) Response to a data provider prompt
4.2.7.5 Unsupported keywords in FHSQL SQL statements
The application doesn't support certain Data Definition Language (DDL) SQL keywords or commands in FHSQL SQL statements.
The unsupported DDL SQLs keywords and commands are:
● DROP TABLE [table]● TRUNCATE TABLE [table]● DELETE FROM «table» WHERE [condition]● CREATE TABLE [table]● ALTER TABLE [table]● INSERT● UPDATE● ORDER BY
NoteThe ORDER BY keyword is supported but doesn't sort your data in the report. As a workaround, you can either sort your data manually using the sorting feature, or use the RowIndex() function that returns the row number in the query result. Create a variable using the function and sort your data block with the RowIndex column. Note however that the sort on the RowIndex column is ignored if there are merged dimensions, or if Web Intelligence projected and aggregated data on topest levels.
4.2.8 To create a query on a different data source in an existing document
You can select additional data sources in an existing document.
1. In Design mode, click in the toolbar.2. In the query panel, click Add a query.3. Build and run the query.
112 PUBLICSAP BusinessObjects Web Intelligence User's Guide
Building and running queries
Related Information
Changing the data source of a query [page 118]
4.2.8.1 To create a document without a data source
You can create a document without selecting a data source.
One reason you might want to create a document with no data source is if you want to create a "template" document that contains the standard title page as the first report, standard copyright text as the second report, and so on. You can set the header and footer layouts, and even include empty tables and charts that are formatted. Later on, you can connect the document to a data source using a query.
NoteThe rights set for you by the BI administrator determine your access to data sources and ability to create documents in Web Intelligence.
1. Open Web Intelligence.2. Do one of the following:
○ In Reading mode, click the New icon in the toolbar.○ In Design mode, in the File tab, click the New icon.
NoteIf you have just launched Web Intelligence Rich Client, click No Data Source in the New Document dialog.
3. Select No data source, and click OK.
A blank document opens. The Objects pane has no objects.
Related Information
Building queries on universes [page 48]Building queries on SAP BW InfoProviders and BEx queries (incl. BW/4HANA and S/4HANA) [page 74]Building queries on SAP HANA views with Direct Access [page 100]Building queries on Excel and text files [page 71]
SAP BusinessObjects Web Intelligence User's GuideBuilding and running queries PUBLIC 113
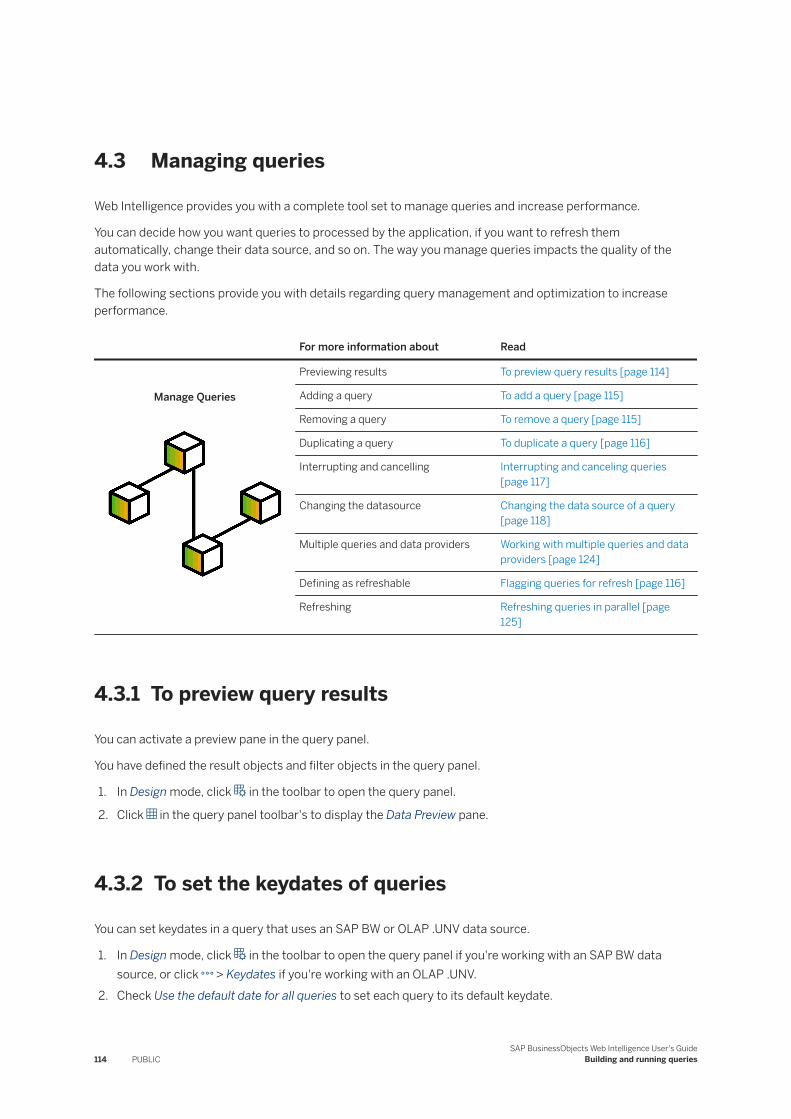
4.3 Managing queries
Web Intelligence provides you with a complete tool set to manage queries and increase performance.
You can decide how you want queries to processed by the application, if you want to refresh them automatically, change their data source, and so on. The way you manage queries impacts the quality of the data you work with.
The following sections provide you with details regarding query management and optimization to increase performance.
For more information about Read
Manage Queries
Previewing results To preview query results [page 114]
Adding a query To add a query [page 115]
Removing a query To remove a query [page 115]
Duplicating a query To duplicate a query [page 116]
Interrupting and cancelling Interrupting and canceling queries [page 117]
Changing the datasource Changing the data source of a query [page 118]
Multiple queries and data providers Working with multiple queries and data providers [page 124]
Defining as refreshable Flagging queries for refresh [page 116]
Refreshing Refreshing queries in parallel [page 125]
4.3.1 To preview query results
You can activate a preview pane in the query panel.
You have defined the result objects and filter objects in the query panel.
1. In Design mode, click in the toolbar to open the query panel.
2. Click in the query panel toolbar's to display the Data Preview pane.
4.3.2 To set the keydates of queries
You can set keydates in a query that uses an SAP BW or OLAP .UNV data source.
1. In Design mode, click in the toolbar to open the query panel if you're working with an SAP BW data source, or click > Keydates if you're working with an OLAP .UNV.
2. Check Use the default date for all queries to set each query to its default keydate.
114 PUBLICSAP BusinessObjects Web Intelligence User's Guide
Building and running queries
3. Check Set date for all queries and choose the date to specify a keydate for all queries.4. Check Prompt users when refreshing data to display a prompt for the keydate whenever a query containing
a key date is refreshed.
To change keydate value variables, open the query for edit in the Query Panel and click the Set Variables icon.
4.3.3 To add a query
You can add queries to an existing document.
1. In Design mode, click in the toolbar to open the query panel.2. Click the Add Query drop down in the top left-hand corner.3. Select a data source.4. Add objects to the query.5. Click Run Query.6. In the Add Query dialog, specify how where to add the data:
Option Description
Insert a table in a new report Display the data in a new report in the document
Insert a table in the current report Display the data in the currently selected report in a new table
Include the result objects in the document without generating a table
Include the data in the document without displaying the data on a report.
NoteYou can add the objects returned by the query to the report later.
7. Click OK.
Related Information
To create a query based on a BW InfoProvider or BEx query [page 89]To build a query on a universe [page 50]Building queries on Excel and text files [page 71]
4.3.4 To remove a query
You can remove a query in the query panel.
1. In Design mode, click in the toolbar to open the query panel.
SAP BusinessObjects Web Intelligence User's GuideBuilding and running queries PUBLIC 115
2. Click the drop down next to the query you want to delete.3. Click Delete.4. Click Yes.
4.3.5 To duplicate a query
You can duplicate a query in the query panel.
Make sure to run the query first before you duplicate it.
TipIf you want to build a different query on a universe already included in the document, instead of starting from scratch, duplicate the existing query on that universe and then modify it.
1. In Design mode, click in the toolbar to open the query panel.2. Click the drop down next to the query you want to duplicate.3. Click Duplicate.
4.3.6 Flagging queries for refresh
You can select the queries to refresh when refreshing a document.
After you've refreshed a document that contains several data providers once, you can decide not to refresh specific queries for future refreshes. In this case, the data provider keeps the dataset retrieved from the previous refresh and stored in the document cube. This improves refresh performance when you don't need to refresh queries whose data you know don't evolve in time, as there's no need to fetch the database to retrieve results.
The following data providers can be declared as refreshable:
● Excel● FHSQL● Relational universes (.UNV or .UNX)● Multidimensional universes (.UNX)● SAP BW● SAP HANA Direct Access
You declare queries as refreshable in the Query Properties with the Refreshable option. You can also check the status of a query using the QuerySummary() function.
If you haven't defined at least one query as refreshable, the refresh icon is disabled. Otherwise, in the dropdown menu next to the Refresh icon, only the refreshable queries are enabled and can be individually refreshed.
116 PUBLICSAP BusinessObjects Web Intelligence User's Guide
Building and running queries
4.3.6.1 To refresh individual queries
When working with a document with multiple queries, you can hand-pick the queries that you want to refresh.
1. In the Data section of the toolbar, click the drop down arrow next to the refresh icon in the toolbar.2. Click Advanced Refresh.3. Select the queries you want to refresh.
If one or multiple queries are greyed out, it means that the Refreshable option is off in the Query Properties.4. Click Refresh.
4.3.7 Interrupting and canceling queries
You can interrupt or cancel a query before all the data is returned to the document and choose the data you want to display.
When you click Cancel during the query execution, in most cases the application directs the database to stop processing the query and gives you back control of the document.
Query cancellation relies heavily on the type of database the application is running on. Not all databases can interrupt queries. The cancellation is either handled by the database itself or by the application.
Databases that support query cancellation are:
● Relational● OLAP● SAP HANA Direct Access● Personal Data Providers
When a database supports query cancellation, it interrupts the query which allows the application to give you back control of the document. The returned results are partially updated and the values displayed in the document don't accurately reflect the definition of the query.
When a database doesn't support query cancellation, the query can't be interrupted. The application still gives you back control of the document, but the abandoned query continues to run in the background. To avoid slowing down both the database and Web Intelligence performance, the limit of abandoned queries has been set to 10 by default.
If you try to cancel a query after this limit has been reached, the application only gives you back control of the document when one of the other abandoned pending queries is complete, or when the current query refresh action is complete.
BW databases
BW databases are a specific case. They don't support query cancellation after you have ordered a refresh command. When you cancel a query, Web Intelligence sends a cancel order to the database so that you can get back control of the document. However, the refresh action will still be carried out and completed in the background by the database.
SAP BusinessObjects Web Intelligence User's GuideBuilding and running queries PUBLIC 117
4.3.7.1 To interrupt or cancel a query
You can interrupt or cancel a query.
1. When refreshing a query, click Cancel.2. Select one of these options:
Option Description
Restore previous results
Restores the values to the document that were retrieved the last time the query was run or when the query was abandoned. The values displayed will not be the most up-to-date information available on the database. You can run the query later to retrieve the up-to-date values from the database.
Purge data Displays the document empty of values. The structure and formatting of the document is retained. You can run the query later to return the up to date values from the database.
Return partial results
Displays the new values retrieved so far in the appropriate parts of the document. The rest of the document will display the values retrieved the last time the query was run or abandoned.
3. Click OK.
4.3.8 Changing the data source of a query
You can change the data source of a query using the Change Source Wizard.
The Change Source Wizard is useful, for example, when you want to develop a document on a universe in a test environment, and then change to the universe when it has been moved or copied to the production environment.
You can also use the Change Source Wizard to change the source of a universe created with the universe design tool (UNV) to the same universe when migrated to the information design tool (UNX).
When you change the data source, you must map the objects coming from the current data source and used in the document to objects in the target data source.
CautionSource and target data sources can have different query capacities and limitations.
● If the target query doesn’t support filters on measures or attributes for instance, the application automatically removes the measure or attribute from the mapping in the target query.
● If there are filters on dimensions or hierarchies, the application takes the values from the source query and reuses them as is in the target query. Make sure to always check that filter values are correct in the target query after a change source.
● If the source query has a member selection, the application selects every member of the hierarchy from the source query and adds them to the target query, regardless of the member selection in the source query. Make sure to check the members selected in the target query after the change source.
RestrictionThe Change Source Wizard isn't available for Free-hand SQL queries, Excel, CSV, text files, Analysis Views, and Web Service data sources.
118 PUBLICSAP BusinessObjects Web Intelligence User's Guide
Building and running queries
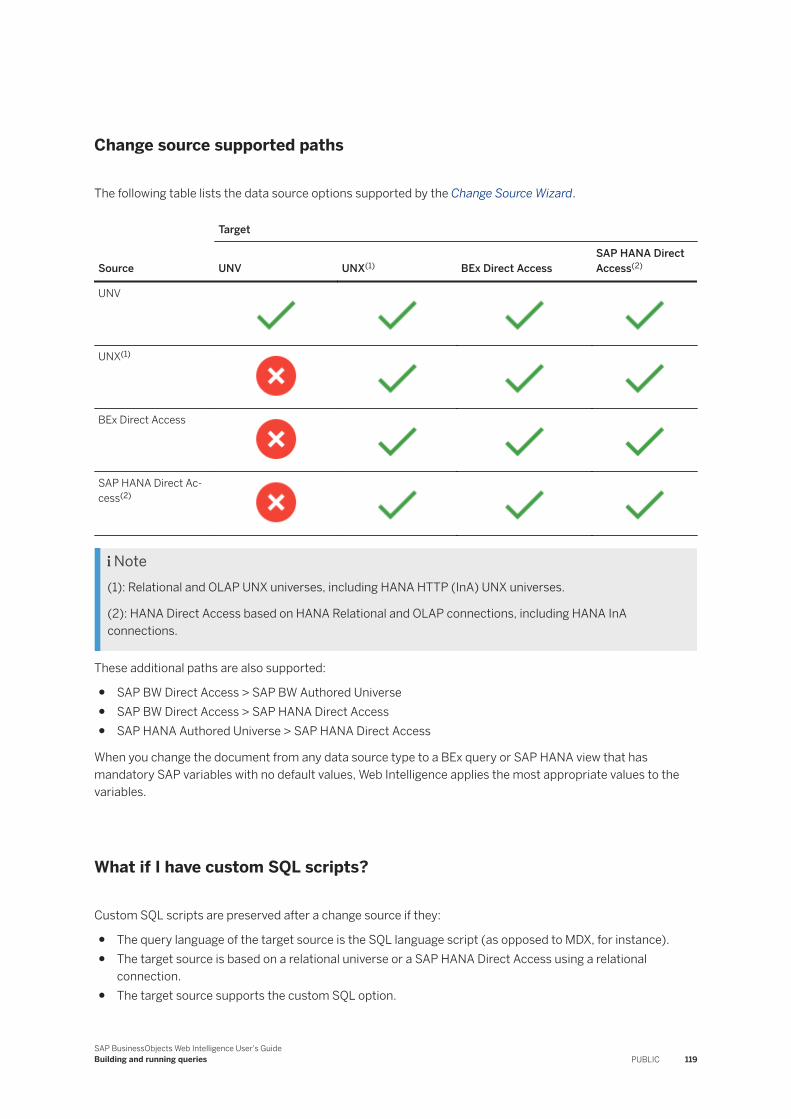
Change source supported paths
The following table lists the data source options supported by the Change Source Wizard.
Source
Target
UNV UNX(1) BEx Direct AccessSAP HANA Direct Access(2)
UNV
UNX(1)
BEx Direct Access
SAP HANA Direct Access(2)
Note(1): Relational and OLAP UNX universes, including HANA HTTP (InA) UNX universes.
(2): HANA Direct Access based on HANA Relational and OLAP connections, including HANA InA connections.
These additional paths are also supported:
● SAP BW Direct Access > SAP BW Authored Universe● SAP BW Direct Access > SAP HANA Direct Access● SAP HANA Authored Universe > SAP HANA Direct Access
When you change the document from any data source type to a BEx query or SAP HANA view that has mandatory SAP variables with no default values, Web Intelligence applies the most appropriate values to the variables.
What if I have custom SQL scripts?
Custom SQL scripts are preserved after a change source if they:
● The query language of the target source is the SQL language script (as opposed to MDX, for instance).● The target source is based on a relational universe or a SAP HANA Direct Access using a relational
connection.● The target source supports the custom SQL option.
SAP BusinessObjects Web Intelligence User's GuideBuilding and running queries PUBLIC 119
● The data structure is maintained in the target query:○ The number of result objects is the same.○ The data-type for each result object is the same.○ The combined queries structures, if there are combined queries based on custom SQL scripts, are the
same.
There's no SQL checking during the change source process. Web Intelligence runs a SQL check when you refresh the document after the change source.
Related Information
Object validation rules [page 121]Mapping strategies for data sources [page 120]
4.3.8.1 Mapping strategies for data sources
The Change Source Wizard uses a list of criteria to map objects in data sources.
By default, the Change Source Wizard uses the following mapping order strategy.
Strategy Name Strategy Description
Same ID To map with a valid object that has the same ID
Same technical name To map with a valid object that has the same technical name, if it exists.
Same path To map with a valid object that has the same path, the path including both the objects name and type.
Closest name To map with a valid object that has the closest name. If Web Intelligence encounters several objects with the same name but different object types, then it selects the first one in list based on the ID.
Same name To map with a valid object with exactly the same name.
The Change Source Wizard applies these strategies in the following order, until it finds an object to map in the target data source:
● Same ID● Same technical name● Same path● Closest name
If no matching object is found in the target data source, the Change Source Wizard flags it for removal. However, you can still select the strategies to apply.
120 PUBLICSAP BusinessObjects Web Intelligence User's Guide
Building and running queries
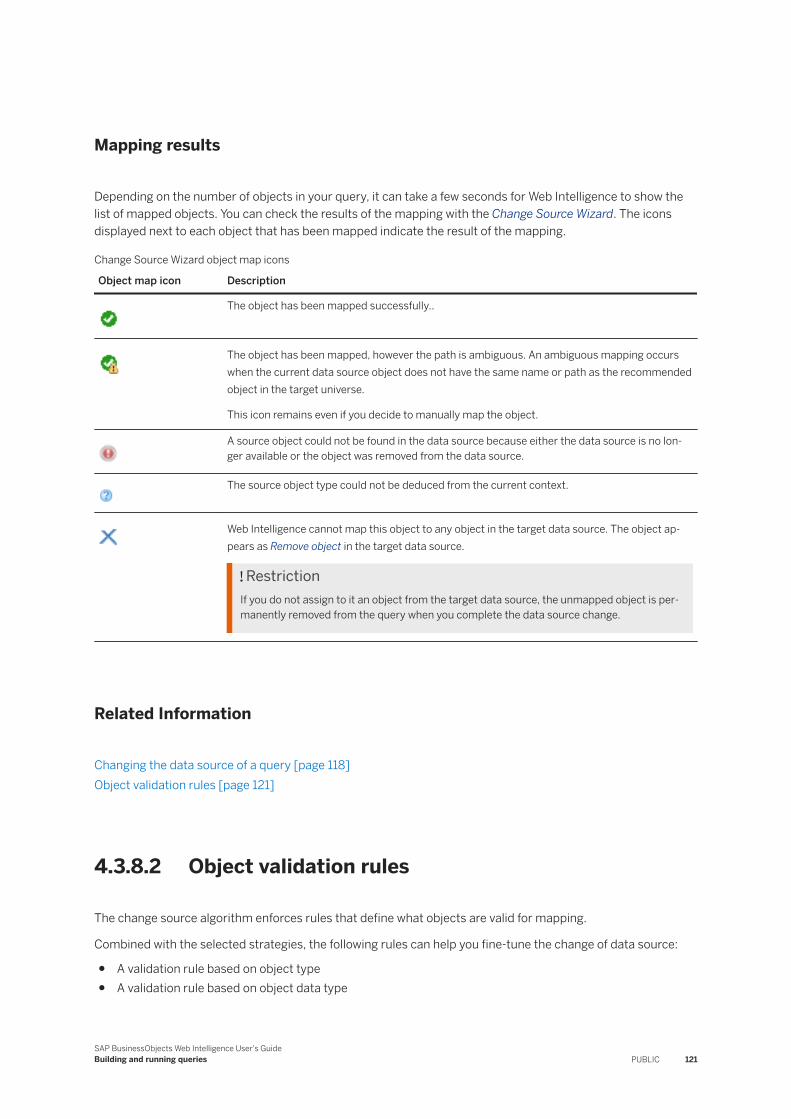
Mapping results
Depending on the number of objects in your query, it can take a few seconds for Web Intelligence to show the list of mapped objects. You can check the results of the mapping with the Change Source Wizard. The icons displayed next to each object that has been mapped indicate the result of the mapping.
Change Source Wizard object map icons
Object map icon Description
The object has been mapped successfully..
The object has been mapped, however the path is ambiguous. An ambiguous mapping occurs when the current data source object does not have the same name or path as the recommended object in the target universe.
This icon remains even if you decide to manually map the object.
A source object could not be found in the data source because either the data source is no longer available or the object was removed from the data source.
The source object type could not be deduced from the current context.
Web Intelligence cannot map this object to any object in the target data source. The object appears as Remove object in the target data source.
RestrictionIf you do not assign to it an object from the target data source, the unmapped object is permanently removed from the query when you complete the data source change.
Related Information
Changing the data source of a query [page 118]Object validation rules [page 121]
4.3.8.2 Object validation rules
The change source algorithm enforces rules that define what objects are valid for mapping.
Combined with the selected strategies, the following rules can help you fine-tune the change of data source:
● A validation rule based on object type● A validation rule based on object data type
SAP BusinessObjects Web Intelligence User's GuideBuilding and running queries PUBLIC 121
Mapping setting options
Mapping settings Description
Same object type only Select this option to map to an object of the same type.
Similar object type Select this option to map to an object that is of a similar type.
When you select this option, the following rules apply:
● A dimension can only be mapped to a hierarchy, a level, a dimension attribute or a measure attribute.
● A dimension attribute can only be mapped to a dimension.● A dimension or measure attribute can only be mapped to a dimension.
For example, if you want to convert a Dimension object to a Hierarchy object, you can choose Similar object type for the mapping setting.
Any object type Select this option to allow a mapping to any object type.
Same data type only Select this option to map to an object of the same data type.
Similar data type Select this option to allow a mapping to an object of a similar data type.
When you select this option, the following rules apply:
● An object of data type Member to an object of any data type● An object of any defined type to an object of type Member● Object of type Date, DateTime, Time, or CalendarDate type to any object
of type Date, DateTime, Time, or CalendarDate.
Any data type Select this option to allow a mapping to an object of any data type.
Related Information
Changing the data source of a query [page 118]To change the data source of a query [page 122]
4.3.8.3 To change the data source of a query
Whenever possible, the application maps source and target objects according to their name, object type, data type and location in the data source.
Note● The Change Source isn't available for Excel, Free Hand SQL, web service, CSV or text data sources.● If the query has custom SQL scripts, refer to Changing the data source of a query [page 118].
1. In Design mode, in the Data section of the toolbar, click .2. Click Change Source.3. Select a query and click OK.
122 PUBLICSAP BusinessObjects Web Intelligence User's Guide
Building and running queries
4. Specify whether you want to work with an existing data source that is already used in the document or a new one. To select a new data source, click the Select a data source drop down, select a data source type first, then you the browser to select either a universe, a BEx query, a HANA view, ...
NoteIf you have other queries in your document based on the data source you have selected, check Apply changes in all queries sharing the same data source option. When selecting this option, the Object Mapping list shows all the objects from all the queries in the same list.
5. Click Next.6. Optional: If the target data source has mandatory HANA variables or BEx variables with no default values,
answer the prompts in the Set Variables or Variable Manager dialogs and click OK.7. Define a mapping strategy order using the left and right arrows to add or remove strategies, and the up and
down arrows to order them as you see fit.
While editing the mapping strategy, you can also edit the mapping settings by clicking the Settings button. To know more about the mapping settings, refer to Mapping strategies for data sources [page 120] and Object validation rules [page 121].
8. Click Next to get to the mapping results.9. Optional: If you want to fine-tune the mapping results, select an object using the dedicated checkbox and
click Stategies to create your own custom mapping strategy, or click next to an object to map it manually.
10. Click Finish, and save the document to apply the change source.
Related Information
To edit a query based on a text file [page 73]To edit a query based on an Excel file [page 72]Object validation rules [page 121]
4.3.8.4 Changing the source path of a custom data provider
Excel, text and Free-Hand SQL data providers don't support the change source feature. However you can change their source path. Changing the file path enables you to modify the access path to a custom data provider you are using as a data source. Change the source path whenever you have moved your original data source and need to indicate its new path.
In the query panel click in the Query Properties section to indicate a different source path. The new source path must point to the original data source. For FHSQL data sources, use the same button to indicate any valid connection available.
SAP BusinessObjects Web Intelligence User's GuideBuilding and running queries PUBLIC 123
4.3.9 Working with multiple queries and data providers
You can include one or multiple queries in a document. These queries can be based on any supported data source.
For example, you can include product sales data and customer data in the same document. In this case, your corporate data for product line sales is available on one universe and customer data is available on another universe. You want to present product line sales results and information on customer age groups in the same report. To do this, you create a single document that includes two queries; one query on each universe. You can then include and format results from both queries in the same report.
Defining multiple queries in a single document is necessary when the data you want to include in a document is available in multiple data sources, or when you want to create several differently-focused queries on the same data source. You can define multiple queries when you create a document or add more queries to an existing document. You can present the information from all of the queries on a single report or on multiple reports in the same document.
NoteWe recommend that you use no more than 15 data providers in a Web Intelligence document. The amount of data providers you use can affect the time it takes to refresh document data and even the performance of the Web Intelligence Processing Server.
4.3.9.1 Multiple queries, combined queries and synchronized queries compared
Multiple queries can be related in a document in different ways.
● Basic multiple queries draw unrelated data from different sources.● Synchronized queries relate the data from different queries around a dimension that contains data
common to both queries. These dimensions are called merged dimensions.You merge dimensions after you have created and run your multiple queries.
● Combined queries generate SQL containing the UNION, INTERSECT and MINUS operators (if the database supports them) or simulate the effect of these operators.Combined queries allow you to answer complex business questions that are difficult to formulate using standard queries.
NoteThis option is not accessible for OLAP databases or for .unx relational databases. It is available only for .unv relational universes.
124 PUBLICSAP BusinessObjects Web Intelligence User's Guide
Building and running queries
4.3.10 Refreshing queries in parallel
Parallel Data Provider Refresh feature improves data refresh performance in Web Intelligence documents that contain multiple data providers.
To refresh queries in parallel, Web Intelligence spreads all data providers on several threads. This feature is on by default, and Web Intelligence can refresh up to 64 queries in parallel. Data providers based on relational, OLAP, and BICS connections are supported, as well as personal data providers (text files, FHSQL).
RestrictionExcel data providers are not supported.
If the hardware running Web Intelligence does not support such a workload, you can change that value in the Central Management Console. Make sure that your hardware has enough cores to guarantee optimal performance.
Two global parameters are available in the Central Management Console:
● Maximum Parallel Queries per document: set the maximum number of data providers Web Intelligence can refresh in parallel per document. The default value is set to 64.
● Enable Parallel Queries for Scheduling: enable or disable the parallel query processing when scheduling documents. This option is enabled by default.
We also encourage you to fine-tune each database connection with a parameter that lets you specify the number of queries that can be run in parallel. This parameter, called Maximum parallel queries, is available:
● In the Central Management Console or Information Design Tool for OLAP and BICS connections.● In Information Design Tool or Universe Design Tool for relational connections.
For each connection, the number of data providers that can be refreshed in parallel is set to 4 by default. The database administrator can change this value according to the database hardware. For text files however, the default value is set to 1.
Multi-source universes (MSU)
Several parameters allow you to fine-tune parallel query processing to have the right the balance between memory and performance when using multi-source universes (MSU). If you plan on refreshing multiple queries in parallel with MSUs, make sure your universes are configured correctly. They can be configured in three different places:
● In the Central Management Console, by setting the number of data providers that can run in parallel per connection with the parameters mentioned above.
● In the information Design Tool, using the MAX_PARALLEL_QUERIES_FOR_MSU_UNIVERSE parameter. This parameter applies only to the multi-source universe you are configuring. Refer to the Information Design Tool User Guide for more information.
● In the Data Federation Administration Tool, using the parameters that control parallel queries processing and memory management. These parameters are general and apply to all multi-source universes based on the specified Data Federator sever. Refer to the Data Federation Administration Tool Guide for more information.
SAP BusinessObjects Web Intelligence User's GuideBuilding and running queries PUBLIC 125
Example
In this example, all default values have been kept and each connection supports a maximum of four parallel refresh jobs.
Connection Number of Data Provider to Refresh
2 OLAP connections 6 (5 on Connection 1, 1 on Connection 2)
1 Relational connection 2
1 BICS connection 2
Excel files from a personal data provider 2
Both Excel files are refreshed sequentially as they are not supported by the parallel data provider refresh feature.
Four of the data providers of the first OLAP connection are refreshed in parallel on threads 1, 2, 3 and 4. The fifth one is queued and will be processed after one of the data providers (of any connection) has been refreshed, while the one coming from the second OLAP connection is refreshed on thread 5 since it is from a different connection.
The four data providers of both relational and BICS connection are refreshed in parallel on threads 5, 6, 7 and 8.
NoteWhenever there are more data providers of the same type than the defined value, they are queued and wait for other data providers to finish.
Related Information
To modify the number of data providers refreshed in parallel per document [page 126]To disable parallel query processing for scheduling [page 127]To modify the number of data providers refreshed in parallel for a specific OLAP connection [page 127]
4.3.10.1 To modify the number of data providers refreshed in parallel per document
1. On the CMC home screen, click Servers.2. Click Web Intelligence Services.3. Right-click Web Intelligence Processing Server and click Properties.4. In the Maximum Parallel Queries entry field, enter a number.
The possible values range from 0 to 64.
126 PUBLICSAP BusinessObjects Web Intelligence User's Guide
Building and running queries
NoteIf you enter 0, you disable the parallel data provider refresh function.
4.3.10.2 To disable parallel query processing for scheduling
1. On the CMC home screen, click Servers.2. Click Web Intelligence Services.3. Right-click Web Intelligence Processing Server and click Properties.4. Uncheck Enable Parallel Queries for Scheduling.
4.3.10.3 To modify the number of data providers refreshed in parallel for a specific OLAP connection
1. On the home screen, click OLAP Connections.2. Browse the connection you want to configure and right-click it.
3. Select Organize Edit .4. In the Maximum Parallel Queries entry field, enter a number.
The possible values range from 1 to 64.
NoteIf you enter 1, data providers will be refreshed sequentially.
4.4 Filtering queries
Filtering allows you to take into consideration only the relevant data for your business question.
As a report designer, filtering at the query level using query filters, prompts or subqueries allows you to limit the data retrieved from the data source and returned to the document. Compared to the filters you add when running an analysis after you’ve built a query, the data you exclude from the report is taken out of the report specification. The goal is twofold: optimize performance by restricting the data retrieved, and display data that is of direct interest to you and others when analyzing the report later on.
Depending on their security rights, your business analysts colleagues for instance might not have access to the query panel or be able to edit the query. In that case, you, as a report designer, must make sure that the data they work with in the report is of direct interest to them depending on their profiles, regions of interest or other criteria using query filters or subqueries. If you still want to provide them with some flexibility without editing
SAP BusinessObjects Web Intelligence User's GuideBuilding and running queries PUBLIC 127
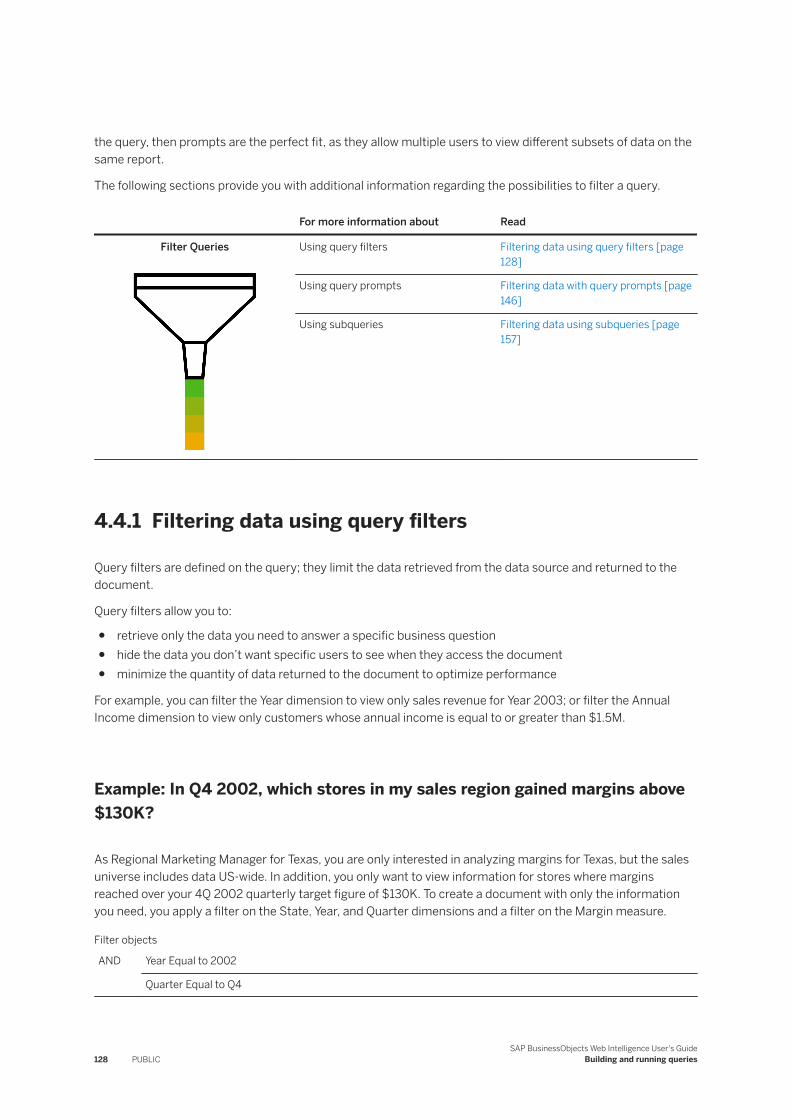
the query, then prompts are the perfect fit, as they allow multiple users to view different subsets of data on the same report.
The following sections provide you with additional information regarding the possibilities to filter a query.
For more information about Read
Filter Queries Using query filters Filtering data using query filters [page 128]
Using query prompts Filtering data with query prompts [page 146]
Using subqueries Filtering data using subqueries [page 157]
4.4.1 Filtering data using query filters
Query filters are defined on the query; they limit the data retrieved from the data source and returned to the document.
Query filters allow you to:
● retrieve only the data you need to answer a specific business question● hide the data you don’t want specific users to see when they access the document● minimize the quantity of data returned to the document to optimize performance
For example, you can filter the Year dimension to view only sales revenue for Year 2003; or filter the Annual Income dimension to view only customers whose annual income is equal to or greater than $1.5M.
Example: In Q4 2002, which stores in my sales region gained margins above $130K?
As Regional Marketing Manager for Texas, you are only interested in analyzing margins for Texas, but the sales universe includes data US-wide. In addition, you only want to view information for stores where margins reached over your 4Q 2002 quarterly target figure of $130K. To create a document with only the information you need, you apply a filter on the State, Year, and Quarter dimensions and a filter on the Margin measure.
Filter objects
AND Year Equal to 2002
Quarter Equal to Q4
128 PUBLICSAP BusinessObjects Web Intelligence User's Guide
Building and running queries
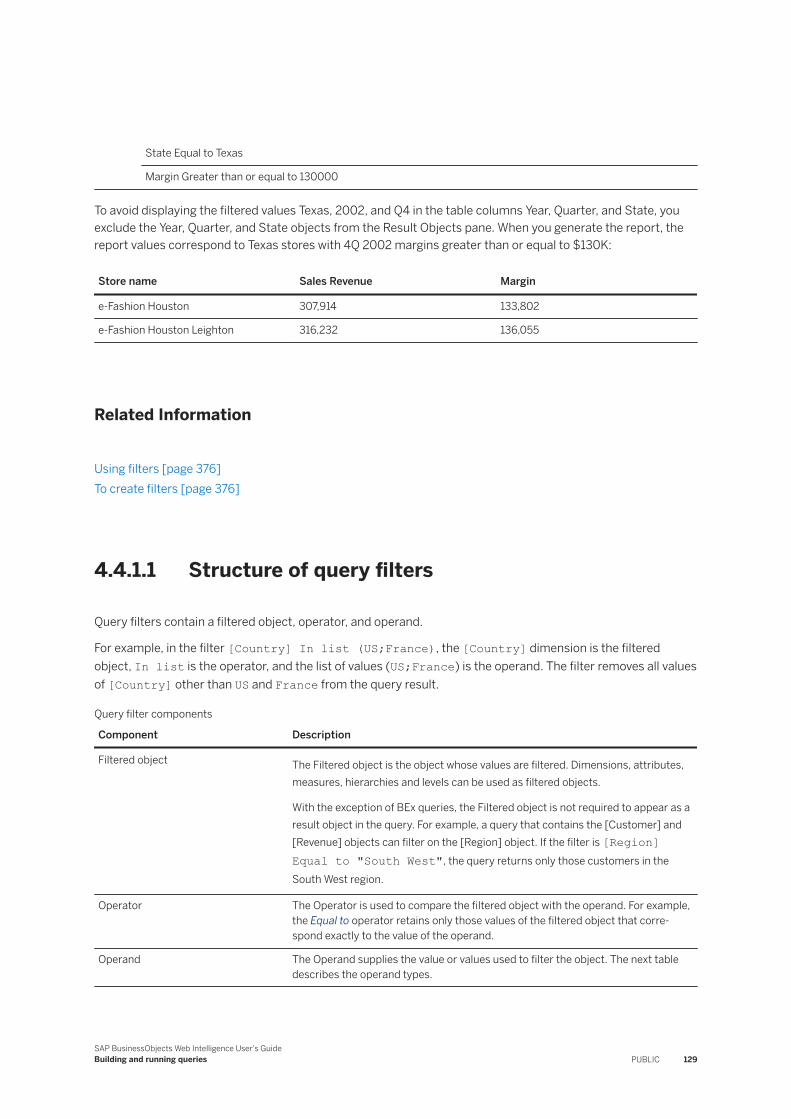
State Equal to Texas
Margin Greater than or equal to 130000
To avoid displaying the filtered values Texas, 2002, and Q4 in the table columns Year, Quarter, and State, you exclude the Year, Quarter, and State objects from the Result Objects pane. When you generate the report, the report values correspond to Texas stores with 4Q 2002 margins greater than or equal to $130K:
Store name Sales Revenue Margin
e-Fashion Houston 307,914 133,802
e-Fashion Houston Leighton 316,232 136,055
Related Information
Using filters [page 376]To create filters [page 376]
4.4.1.1 Structure of query filters
Query filters contain a filtered object, operator, and operand.
For example, in the filter [Country] In list (US;France), the [Country] dimension is the filtered object, In list is the operator, and the list of values (US;France) is the operand. The filter removes all values of [Country] other than US and France from the query result.
Query filter components
Component Description
Filtered object The Filtered object is the object whose values are filtered. Dimensions, attributes, measures, hierarchies and levels can be used as filtered objects.
With the exception of BEx queries, the Filtered object is not required to appear as a result object in the query. For example, a query that contains the [Customer] and [Revenue] objects can filter on the [Region] object. If the filter is [Region] Equal to "South West", the query returns only those customers in the South West region.
Operator The Operator is used to compare the filtered object with the operand. For example, the Equal to operator retains only those values of the filtered object that correspond exactly to the value of the operand.
Operand The Operand supplies the value or values used to filter the object. The next table describes the operand types.
SAP BusinessObjects Web Intelligence User's GuideBuilding and running queries PUBLIC 129
Operand types
Operand type Description
Constant The Constant operand is used to type values directly. For example, you can use a constant to type "France" into the filter [Country] Equal to France.
The operand cannot be a constant if the Filtered object is a hierarchy, unless the hierarchy is used in conjunction with the Matches pattern or Different from pattern operator.
List of Values The List of Values operand is used to select values from the list associated with the filtered object. For example, if the filtered object is [City], you can use List of Values to select one or more of the cities associated with the object.
Prompt A Prompt is a dynamic filter that is answered when the query is refreshed.
Universe object You can select an object from the universe to filter the filtered object against its values.
NoteYou cannot select a universe object as an operand on some OLAP data sources or the filtered object is a hierarchy.
Result from another query You can compare the filtered object against the values returned by another query.
Related Information
Building queries on SAP BW InfoProviders and BEx queries (incl. BW/4HANA and S/4HANA) [page 74]
4.4.1.1.1 Query filter and prompt operators
You use operators to compare filtered objects.
The function of each operator depends on its context. Operators can perform mathematical operations and concave concatenate strings, as well as perform a wide variety of comparisons yielding Boolean results.
4.4.1.1.1.1 Equal to operator
Use the Equal to operator to obtain data equal to a value.
For example, to return data for the US only, create the filter "[Country] Equal to US".
130 PUBLICSAP BusinessObjects Web Intelligence User's Guide
Building and running queries
4.4.1.1.1.2 Not Equal to operator
Use the Not Equal to operator to obtain data not equal to a value.
For example, to return data for all countries except the US create the filter "County Not Equal to US".
NoteThis operator cannot be used for OLAP .unx universe parent-child hierarchies or for BEx queries.
4.4.1.1.1.3 Greater than operator
Use the Greater than operator to retrieve data greater than a value.
For example, to retrieve data for customers aged over 60, create the filter "[Customer Age] Greater than 60".
NoteThis operator cannot be used for OLAP .unx universe parent-child hierarchies or for BEx queries.
4.4.1.1.1.4 Greater than or Equal to operator
Use the Greater than or equal to operator to retrieve data greater than or equal to a value.
For example, to retrieve data for revenue starting from $1.5M, create the filter "[Revenue] Greater than or equal to 1500000".
NoteThis operator cannot be used for OLAP .unx universe parent-child hierarchies or for BEx hierarchies.
4.4.1.1.1.5 Less than operator
Use the Less than operator to retrieve data lower than a value.
For example, to retrieve data for exam grades lower than 40, create the filter "[Exam Grade] Less than 40".
NoteThis operator cannot be used for OLAP .unx universes, hierarchies in filters, or for hierarchies in BEx queries.
SAP BusinessObjects Web Intelligence User's GuideBuilding and running queries PUBLIC 131

4.4.1.1.1.6 Less than or Equal to operator
Use the Less than or equal to operator to retrieve data less than or equal to a value.
For example, to retrieve data for customers whose age is 30 or less, create the filter "[Age] Less than or equal to 30".
NoteThis operator cannot be used for OLAP .unx universes, hierarchies in filters or for hierarchies in BEx queries.
4.4.1.1.1.7 Between operator
Use the Between operator to retrieve data between two boundary values including the two boundary values.
The first value declared must be lower than the second value.
For example, to retrieve data for weeks starting at week 25 and finishing at 36 (including week 25 and week 36), create the filter "[Week] Between 25 and 36".
NoteThis operator cannot be used for OLAP .unx universe or BEx hierarchies in filters.
4.4.1.1.1.8 Not between operator
Use the Not between operator to retrieve data outside the range of two values.
For example, to retrieve data for all the weeks of the year, except for and not including weeks 25 through 36, create the filter "[Week] Not between 25 and 36".
NoteThis operator cannot be used for OLAP .unx universes or for BEx hierachies in filters.
4.4.1.1.1.9 In list operator
Use the In list operator to retrieve data corresponding to values in a list of values.
For example, to retrieve data only for the US, UK and Japan, create the filter [Country] In list, when you can type values in the Type a value field, you enter US;UK;Japan.
When used in a query filter with a hierarchical list of values, either from a dimension associated with a hierarchical list of values or a hierarchy object, In list allows the selection of multiple members from any
132 PUBLICSAP BusinessObjects Web Intelligence User's Guide
Building and running queries
levels of the hierarchy. For example, a prompt on the [Geography] hierarchy using the In list operator allows the selection of [Paris] at the City level and [Canada] at the Country level in the prompt.
When used in a report filter, In list produces a flat list of values.
4.4.1.1.1.10 Not In List operator
Use the Not in list operator to retrieve data that does not correspond to multiple values.
For example, if you do not want to retrieve data for the US, UK and Japan, create the filter "[Country] Not in list". In the Type a value field, you enter US;UK;Japan.
When used with a hierarchical list of values, either from a dimension associated with a hierarchical list of values, a hierarchy object or a level object, Not in list allows the selection of multiple members from any levels of the hierarchy. For example, a prompt on the [Geography] hierarchy using the Not in list operator allows selection of [Paris] at the City level and [Canada] at the Country level in the prompt.
NoteThis operator can only be used in certain types of hierarchies, for example, it can be used in level-based hierarchies.
4.4.1.1.1.11 Matches Pattern operator
Use the Matches pattern operator to retrieve data that includes a specific string or part of a string.
For example, to retrieve customers whose date of birth is 1972, create the filter [DOB] Matches pattern "1972".
If you're using a wildcard, use the "%" character for every data source, except for BEx data sources. For BEx data sources, use the "*" character.
NoteThis operator cannot be used for BEx hierarchies.
4.4.1.1.1.12 Different From Pattern operator
Use the Different from pattern operator to return data that doesn't include a specific string.
For example, to retrieve customers whose date of birth is not 1972, create the filter [DOB] Different from pattern '72'.
NoteThis operator cannot be used for BEx or OLAP .unx universe parent-based hierarchies.
SAP BusinessObjects Web Intelligence User's GuideBuilding and running queries PUBLIC 133
4.4.1.1.1.13 Both operator
Use the Both operator to retrieve data that corresponds to two values.
For example, to retrieve customers who have both fixed and mobile telephone numbers, create the filter [Account Type] Both 'Fixed' And 'Mobile'.
NoteThis operator is not supported for filters based on hierarchy objects, or in universes based on OLAP data sources.
4.4.1.1.1.14 Except operator
Use the Except operator to retrieve data that corresponds to one value and excludes another.
For example, to retrieve customers who have only a fixed telephone number and no mobile telephone number, create the filter [Account Type] 'Fixed' Except 'Mobile'.
The Except operator is more restrictive than Different from or Not in list. For example, a report that returns customers and that includes the filter [Lines] Different From 'Accessories' excludes all sales records where the item sold is part of the 'Accessories' line. If the same customer has purchased Accessories and non-Accessories items, the customer still appears in the report, but their spending total includes only non-Accessories sales.
If the filter is [Lines] Except 'Accessories', only customers who have bought no accessories are included in the report.
NoteThis operator is not supported in universes based on OLAP data sources.
Related Information
Not In List operator [page 133]
134 PUBLICSAP BusinessObjects Web Intelligence User's Guide
Building and running queries
4.4.1.1.1.15 Restrictions on filter operators
The following table lists the restrictions on prompt and filter operators based on the filtered object and query type.
Object Available filters
Level-based hierarchy Equal to
Not equal to
In list
Not in list
Matches pattern
Different from pattern
Parent-child hierarchy Equal to
In list
Matches pattern
Hierarchy in BEx query Equal to
In list
4.4.1.2 Types of query filter
Several types of query filters are available in Web Intelligence.
Query filter Description
Predefined filters Filters created by the BI administrator.
Custom filters User-defined queries
Quick filters A simplified form of custom filter.
Prompts You can define these dynamic filters to display a question or a list of values so that you or other users can select different filter values at each run query.
You can mix different types of filters on a single query.
4.4.1.2.1 Predefined query filters
Predefined filters make the specific data you most typically need for reports permanently available.
They're created by a BI administrator and saved with the universe. Predefined filters often contain complex expressions that require a detailed knowledge of the database structure. Including predefined filters on the
SAP BusinessObjects Web Intelligence User's GuideBuilding and running queries PUBLIC 135
universe means you don’t need to create the same custom filters every time you create a new document based on the same universe. In the query panel, predefined query filters are list along with other objects in the objects list.
You can't view the component parts of predefined filters or edit predefined filters.
4.4.1.2.1.1 Sets
A set filter is a predefined query filter that is defined directly on the universe. It combines data from multiple objects that you may use in a query, or want to include in more complex queries.
Sets are built in the information design tool by your universe designer, but are consumed in Web Intelligence. They allow you to build and combine multiple lists of values with their restrictions, into a single entity called a set filter that is available to in the Query Panel. Ultimately, the goal is to create complex query filters that return data that would normally require time and skill to build in the Query Panel. A set filter saves time and provides information that is not always easy to get to.
For more information on how to create and manage sets, refer to the Information Design Tool User Guide.
4.4.1.2.1.2 To select a predefined query filter
When you select a predefined query filter and run the query, the data corresponding to the query filter you selected appears in the report.
1. In Design mode, click in the Data section of the toolbar to open the query panel.2. In the query panel, double-click a predefined filter or drag it from the objects list to the Query Filters
section of the query panel.
4.4.1.2.2 Quick filters
Quick filters allow you to quickly define the values you want to retrieve for a specific result object without launching the Filter Editor.
By default, Quick filters use the Equal to operator if you select a single value or the InList operator if you select multiple values.
For example:
● If you select the [Payment Status] dimension and the value “unpaid?", you are creating the following filter: [Payment Status] Equal to “unpaid?"
● If you select the [Country] dimension and the values US, Japan, Germany, you are creating the following filter: [Country] InList “US;Japan;Germany?"
NoteQuick filters are not available in BEx queries.
136 PUBLICSAP BusinessObjects Web Intelligence User's Guide
Building and running queries
Related Information
Building queries on SAP BW InfoProviders and BEx queries (incl. BW/4HANA and S/4HANA) [page 74]
4.4.1.2.2.1 To create or remove a quick filter
You can create and remove quick filters in the query panel.
1. In Design mode, click in the Data section of the toolbar to open the query panel.2. Select the object you want to filter in the Result Objects section of the query panel.
3. Click in the top corner of the Result Objects pane.A dialog appears with values for the selected object listed.
4. Select the values you want to retrieve from the database and click OK.For example, to filter the query for values in Q1, select the [Quarter] dimension, then select Q1 from the list of values.
If needed, you can sort the lists of values in ascending order, descending order, or keep the server order. In the prompts dialog, click in the column header and select the order in the dedicated dropdown. By default, lists of values are displayed according to the server order.
NoteIn hierarchical lists of values, the sort only applies to caption values and by level.
The new filter appears on the Query Filters pane.
5. To remove the filter, select it in the Query Filters pane and click .6. Click Run Query.7. Save the document.
4.4.1.2.3 Custom query filters
You create custom query filters to limit document data to information corresponding to a specific business question or the business information needs of a specific group of users.
For example, you can create custom filters to retrieve sales results data for specific dates, products, or services, or to view customer information only for customers who are high wage earners or who live in a particular region.
SAP BusinessObjects Web Intelligence User's GuideBuilding and running queries PUBLIC 137
4.4.1.2.3.1 To add and remove custom query filters
You can edit and remove custom query filters in the Query Filters pane.
1. In Design mode, click in the Data section of the toolbar to open the query panel.2. Select the object you want to filter and drag it from the objects list to the Query Filters pane.
The query filter appears in an outline in the Query Filters pane.3. Click the default operator dropdown (In list) and select a query operator from the list.
4. Hover over the filter and click to select the type of filter you want to apply:
Option Description
Constant You compare the object against a constant value to filter the query result.
Value(s) from List You compare the object against values from a list of values to filter the query result.
○ If the filtered object is a dimension, attribute or measure, you can select any of the values of the object.
○ If the filtered object is a hierarchy, you can select any members of the hierarchy.○ If the filtered object is a level, you can select any member from the level.
Prompt You create a filter which requires the user to supply filter values on data refresh.
Object from this query
You compare the object against the values returned by an object from in the same query.
Result from another query, Result from another query (Any), Result from another query (All)
You compare the object against the values returned by an object from another query (the filter-ing query) to filter the query result.
5. Type/select the constant, list of values or object you want to include in the filter.6. To remove the filter, you can either:
○ Select the filter and press Delete on your keyboard.○ Click Remove in the top corner of the Query Filters pane.○ To remove all filters, click Remove All in the top corner of the Query Filters pane.
4.4.1.2.3.2 To select values from a list of values
When selecting from a list of values in a query, items in the list can appear either as a single or multi-column list or a hierarchy, depending on the object.
In a multi-column list, additional columns provide related values to the main value. In a hierarchical list, values appear in a hierarchical relationship.
When you refresh a document with prompts, lists of values for the prompts appear in a flat list without multiple columns.
If needed, you can sort the lists of values in ascending order, descending order, or keep the server order. In the prompts dialog, click in the column header and select the order in the dedicated dropdown. By default, lists of values are displayed according to the server order.
138 PUBLICSAP BusinessObjects Web Intelligence User's Guide
Building and running queries
NoteIn hierarchical lists of values, the sort only applies to caption values and by level.
1. In a list of values, select items that you want to appear.○ If the list of values does not appear when a dialog box opens, refresh the list, or search the list to
retrieve values. Some list of values require an initial search to display values because the list is too large to be loaded in full.
○ If the list of values is divided into ranges, use the control above the list to navigate through the ranges. Some large lists of values are divided into ranges to reduce the amount of data retrieved from the database. When you select a range, the list displays the values in that range.
○ If the list of values depends on other lists of values, specify the dependent values in the prompt dialog box that appears. A list of values can be dependent on other lists of values, for example when it is part of a hierarchical list of values. For example, if the list of values contains cities, and the City object is part of the hierarchy Country > Region > City, you need to specify values for country and region first to filter the list of cities.
NoteDependent lists of values appear in queries only. They don't appear when you are selecting from a list of values in a report.
When you first display the list of values, you see the Prompts dialog in which you specify the dependent values. Once you have specified the dependent values, you can select the values from the filtered list.
○ To display the value keys in OLAP or BEx queries, click Show/hide key values.Key values are not indicated in the list of Selected Values, only in the list of available values. Some lists of values contain key values, which are unique values that can be used to identify values with the same display value. If the list of values contains multiple columns, only the key of the filtering column is displayed.
○ To search for values in the list, type the search text in the box below the list and select one of the following options from the Search icon dropdown list.
Option Description
Match case The search is case-sensitive.
This option is not available when the Search in keys or Search on database options are selected.
Search in keys The search uses unique value keys rather than display values.
This option is available only in lists of values that support key values.
SAP BusinessObjects Web Intelligence User's GuideBuilding and running queries PUBLIC 139
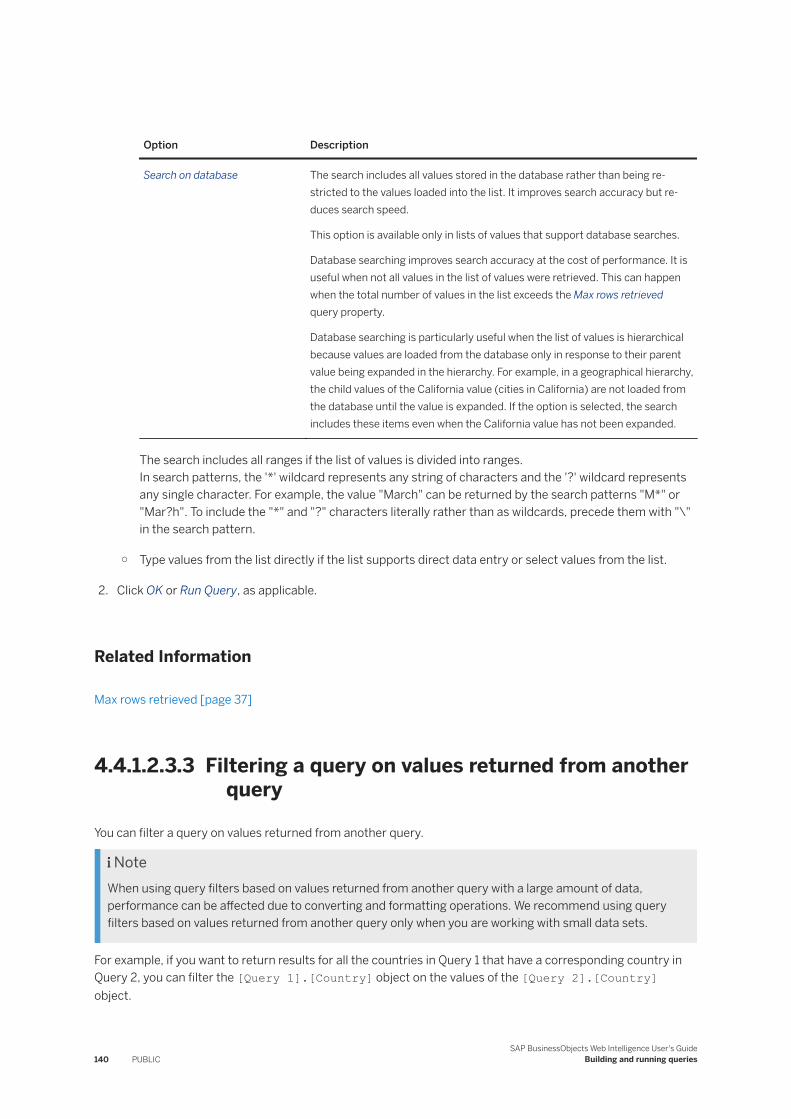
Option Description
Search on database The search includes all values stored in the database rather than being restricted to the values loaded into the list. It improves search accuracy but reduces search speed.
This option is available only in lists of values that support database searches.
Database searching improves search accuracy at the cost of performance. It is useful when not all values in the list of values were retrieved. This can happen when the total number of values in the list exceeds the Max rows retrieved query property.
Database searching is particularly useful when the list of values is hierarchical because values are loaded from the database only in response to their parent value being expanded in the hierarchy. For example, in a geographical hierarchy, the child values of the California value (cities in California) are not loaded from the database until the value is expanded. If the option is selected, the search includes these items even when the California value has not been expanded.
The search includes all ranges if the list of values is divided into ranges.In search patterns, the '*' wildcard represents any string of characters and the '?' wildcard represents any single character. For example, the value "March" can be returned by the search patterns "M*" or "Mar?h". To include the "*" and "?" characters literally rather than as wildcards, precede them with "\" in the search pattern.
○ Type values from the list directly if the list supports direct data entry or select values from the list.
2. Click OK or Run Query, as applicable.
Related Information
Max rows retrieved [page 37]
4.4.1.2.3.3 Filtering a query on values returned from another query
You can filter a query on values returned from another query.
NoteWhen using query filters based on values returned from another query with a large amount of data, performance can be affected due to converting and formatting operations. We recommend using query filters based on values returned from another query only when you are working with small data sets.
For example, if you want to return results for all the countries in Query 1 that have a corresponding country in Query 2, you can filter the [Query 1].[Country] object on the values of the [Query 2].[Country] object.
140 PUBLICSAP BusinessObjects Web Intelligence User's Guide
Building and running queries
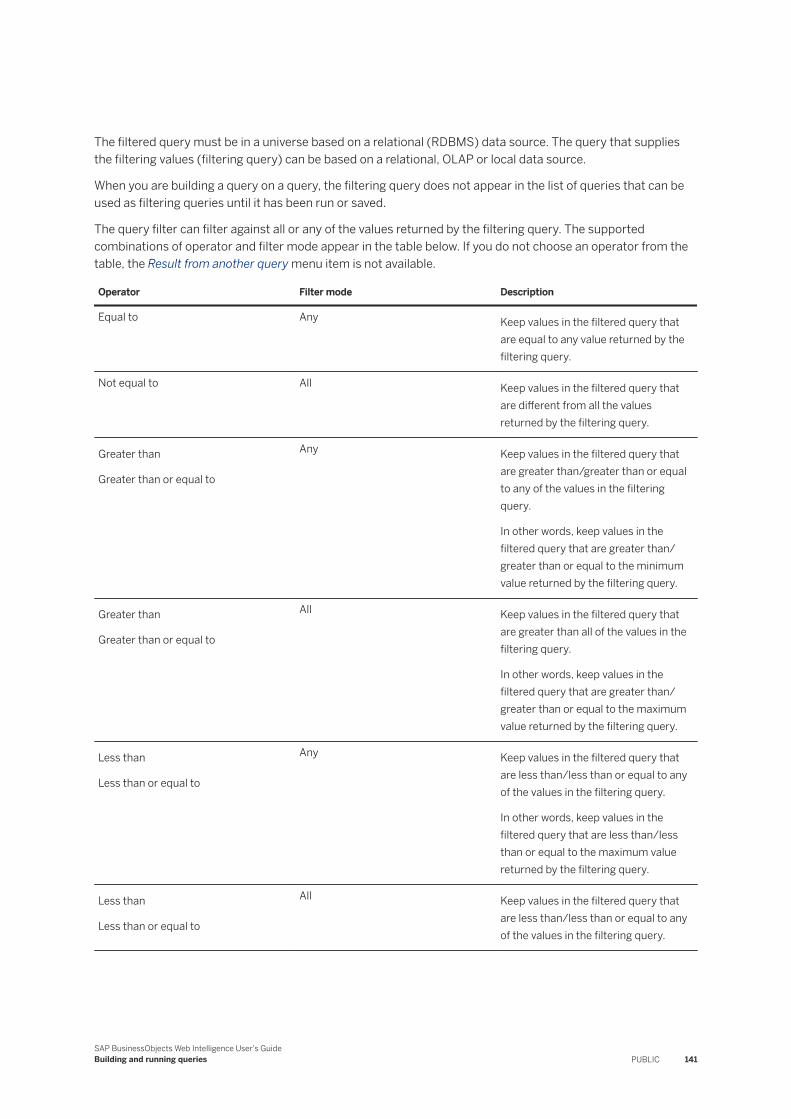
The filtered query must be in a universe based on a relational (RDBMS) data source. The query that supplies the filtering values (filtering query) can be based on a relational, OLAP or local data source.
When you are building a query on a query, the filtering query does not appear in the list of queries that can be used as filtering queries until it has been run or saved.
The query filter can filter against all or any of the values returned by the filtering query. The supported combinations of operator and filter mode appear in the table below. If you do not choose an operator from the table, the Result from another query menu item is not available.
Operator Filter mode Description
Equal to Any Keep values in the filtered query that are equal to any value returned by the filtering query.
Not equal to All Keep values in the filtered query that are different from all the values returned by the filtering query.
Greater than
Greater than or equal to
Any Keep values in the filtered query that are greater than/greater than or equal to any of the values in the filtering query.
In other words, keep values in the filtered query that are greater than/greater than or equal to the minimum value returned by the filtering query.
Greater than
Greater than or equal to
All Keep values in the filtered query that are greater than all of the values in the filtering query.
In other words, keep values in the filtered query that are greater than/greater than or equal to the maximum value returned by the filtering query.
Less than
Less than or equal to
Any Keep values in the filtered query that are less than/less than or equal to any of the values in the filtering query.
In other words, keep values in the filtered query that are less than/less than or equal to the maximum value returned by the filtering query.
Less than
Less than or equal to
All Keep values in the filtered query that are less than/less than or equal to any of the values in the filtering query.
SAP BusinessObjects Web Intelligence User's GuideBuilding and running queries PUBLIC 141
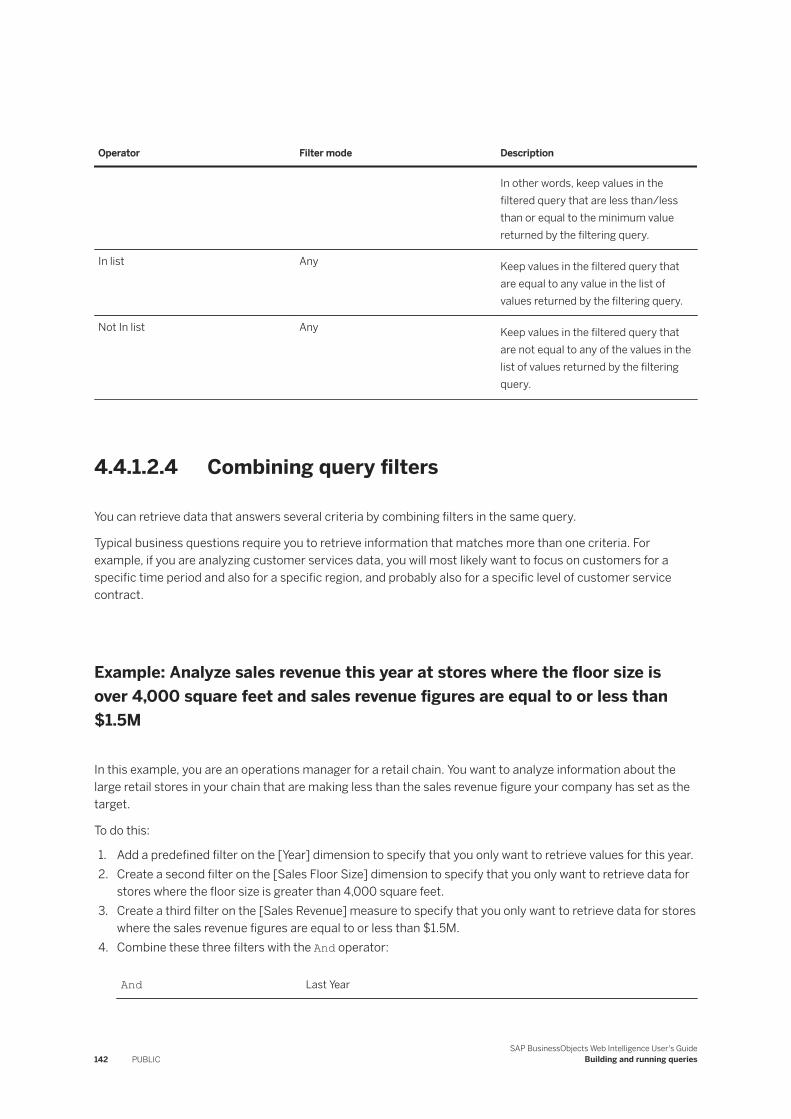
Operator Filter mode Description
In other words, keep values in the filtered query that are less than/less than or equal to the minimum value returned by the filtering query.
In list Any Keep values in the filtered query that are equal to any value in the list of values returned by the filtering query.
Not In list Any Keep values in the filtered query that are not equal to any of the values in the list of values returned by the filtering query.
4.4.1.2.4 Combining query filters
You can retrieve data that answers several criteria by combining filters in the same query.
Typical business questions require you to retrieve information that matches more than one criteria. For example, if you are analyzing customer services data, you will most likely want to focus on customers for a specific time period and also for a specific region, and probably also for a specific level of customer service contract.
Example: Analyze sales revenue this year at stores where the floor size is over 4,000 square feet and sales revenue figures are equal to or less than $1.5M
In this example, you are an operations manager for a retail chain. You want to analyze information about the large retail stores in your chain that are making less than the sales revenue figure your company has set as the target.
To do this:
1. Add a predefined filter on the [Year] dimension to specify that you only want to retrieve values for this year.2. Create a second filter on the [Sales Floor Size] dimension to specify that you only want to retrieve data for
stores where the floor size is greater than 4,000 square feet.3. Create a third filter on the [Sales Revenue] measure to specify that you only want to retrieve data for stores
where the sales revenue figures are equal to or less than $1.5M.4. Combine these three filters with the And operator:
And Last Year
142 PUBLICSAP BusinessObjects Web Intelligence User's Guide
Building and running queries
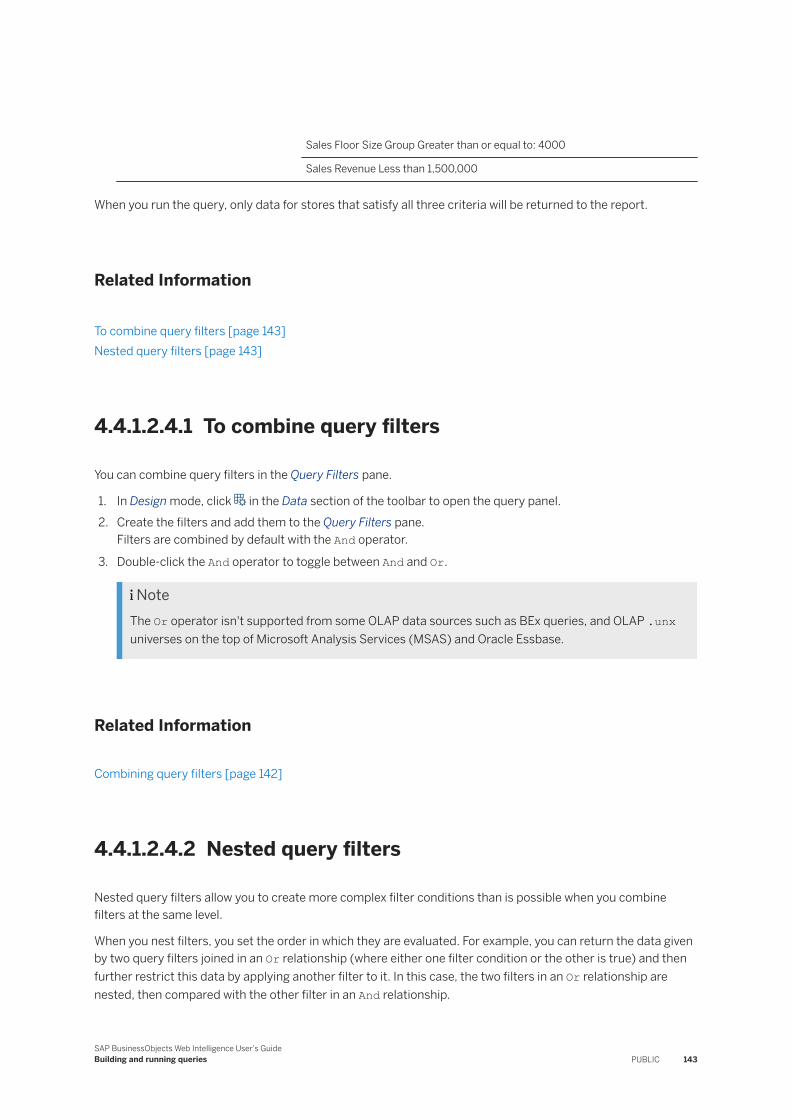
Sales Floor Size Group Greater than or equal to: 4000
Sales Revenue Less than 1,500,000
When you run the query, only data for stores that satisfy all three criteria will be returned to the report.
Related Information
To combine query filters [page 143]Nested query filters [page 143]
4.4.1.2.4.1 To combine query filters
You can combine query filters in the Query Filters pane.
1. In Design mode, click in the Data section of the toolbar to open the query panel.2. Create the filters and add them to the Query Filters pane.
Filters are combined by default with the And operator.
3. Double-click the And operator to toggle between And and Or.
NoteThe Or operator isn't supported from some OLAP data sources such as BEx queries, and OLAP .unx universes on the top of Microsoft Analysis Services (MSAS) and Oracle Essbase.
Related Information
Combining query filters [page 142]
4.4.1.2.4.2 Nested query filters
Nested query filters allow you to create more complex filter conditions than is possible when you combine filters at the same level.
When you nest filters, you set the order in which they are evaluated. For example, you can return the data given by two query filters joined in an Or relationship (where either one filter condition or the other is true) and then further restrict this data by applying another filter to it. In this case, the two filters in an Or relationship are nested, then compared with the other filter in an And relationship.
SAP BusinessObjects Web Intelligence User's GuideBuilding and running queries PUBLIC 143
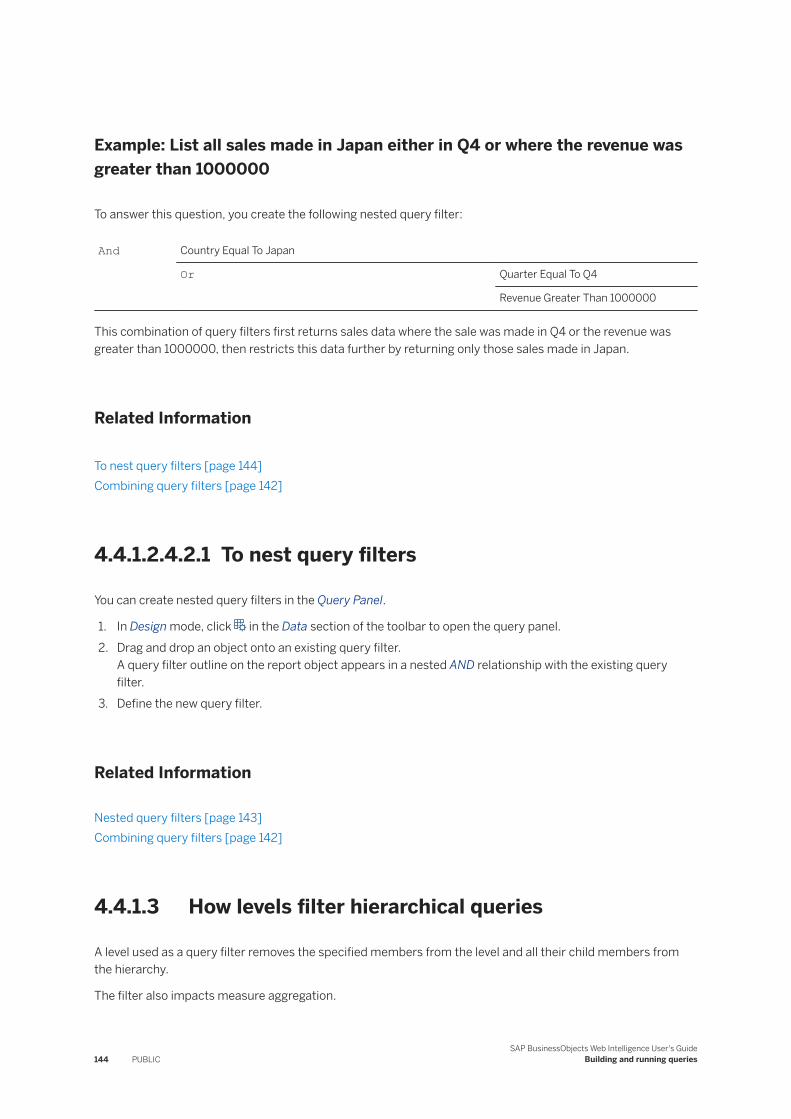
Example: List all sales made in Japan either in Q4 or where the revenue was greater than 1000000
To answer this question, you create the following nested query filter:
And Country Equal To Japan
Or Quarter Equal To Q4
Revenue Greater Than 1000000
This combination of query filters first returns sales data where the sale was made in Q4 or the revenue was greater than 1000000, then restricts this data further by returning only those sales made in Japan.
Related Information
To nest query filters [page 144]Combining query filters [page 142]
4.4.1.2.4.2.1 To nest query filters
You can create nested query filters in the Query Panel.
1. In Design mode, click in the Data section of the toolbar to open the query panel.2. Drag and drop an object onto an existing query filter.
A query filter outline on the report object appears in a nested AND relationship with the existing query filter.
3. Define the new query filter.
Related Information
Nested query filters [page 143]Combining query filters [page 142]
4.4.1.3 How levels filter hierarchical queries
A level used as a query filter removes the specified members from the level and all their child members from the hierarchy.
The filter also impacts measure aggregation.
144 PUBLICSAP BusinessObjects Web Intelligence User's Guide
Building and running queries
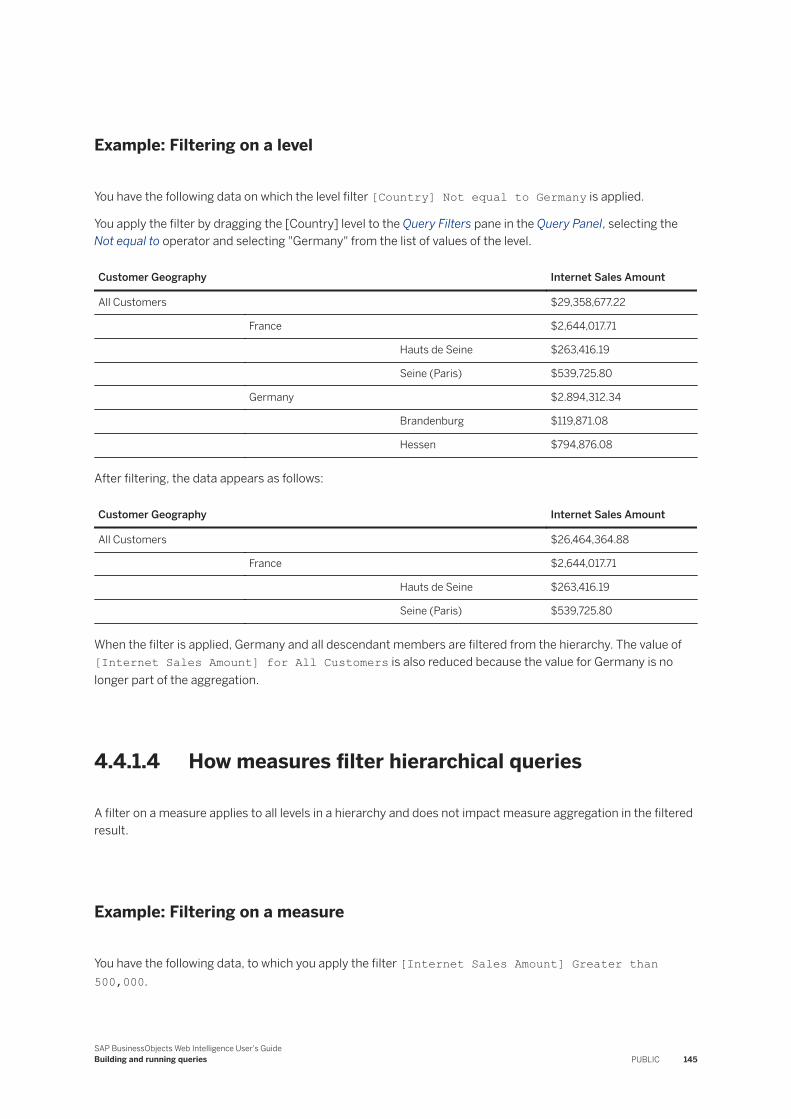
Example: Filtering on a level
You have the following data on which the level filter [Country] Not equal to Germany is applied.
You apply the filter by dragging the [Country] level to the Query Filters pane in the Query Panel, selecting the Not equal to operator and selecting "Germany" from the list of values of the level.
Customer Geography Internet Sales Amount
All Customers $29,358,677.22
France $2,644,017.71
Hauts de Seine $263,416.19
Seine (Paris) $539,725.80
Germany $2.894,312.34
Brandenburg $119,871.08
Hessen $794,876.08
After filtering, the data appears as follows:
Customer Geography Internet Sales Amount
All Customers $26,464,364.88
France $2,644,017.71
Hauts de Seine $263,416.19
Seine (Paris) $539,725.80
When the filter is applied, Germany and all descendant members are filtered from the hierarchy. The value of [Internet Sales Amount] for All Customers is also reduced because the value for Germany is no longer part of the aggregation.
4.4.1.4 How measures filter hierarchical queries
A filter on a measure applies to all levels in a hierarchy and does not impact measure aggregation in the filtered result.
Example: Filtering on a measure
You have the following data, to which you apply the filter [Internet Sales Amount] Greater than 500,000.
SAP BusinessObjects Web Intelligence User's GuideBuilding and running queries PUBLIC 145
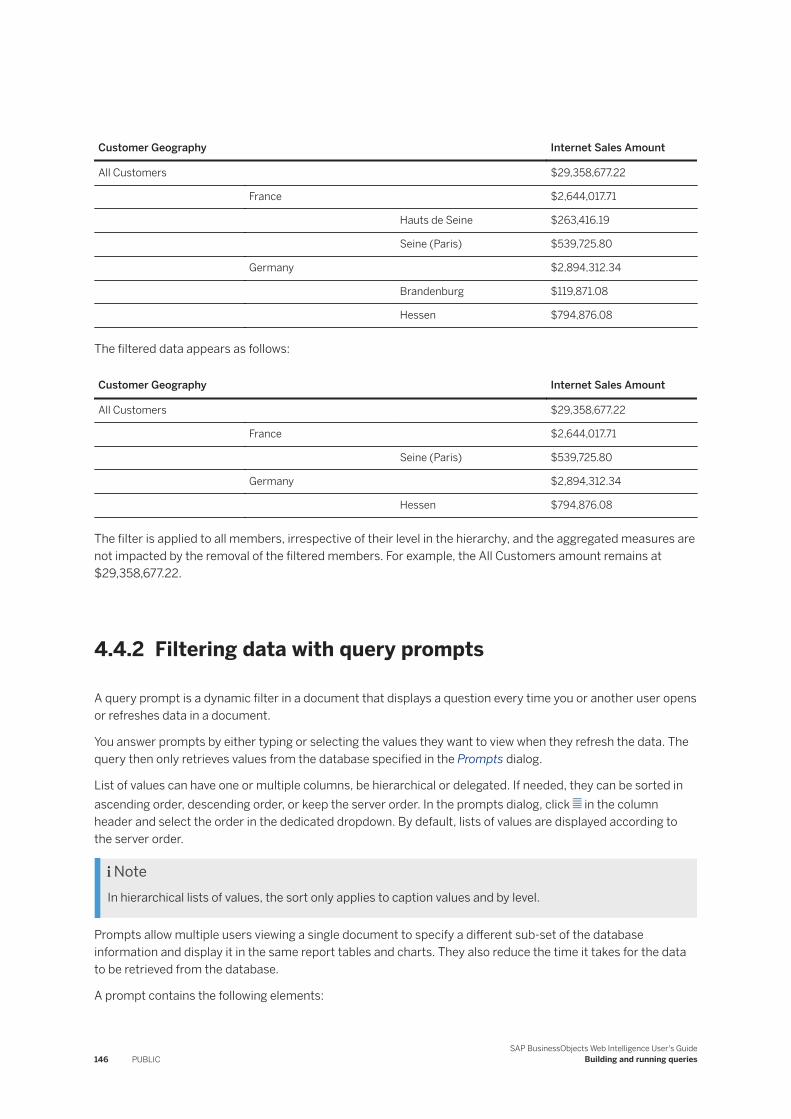
Customer Geography Internet Sales Amount
All Customers $29,358,677.22
France $2,644,017.71
Hauts de Seine $263,416.19
Seine (Paris) $539,725.80
Germany $2,894,312.34
Brandenburg $119,871.08
Hessen $794,876.08
The filtered data appears as follows:
Customer Geography Internet Sales Amount
All Customers $29,358,677.22
France $2,644,017.71
Seine (Paris) $539,725.80
Germany $2,894,312.34
Hessen $794,876.08
The filter is applied to all members, irrespective of their level in the hierarchy, and the aggregated measures are not impacted by the removal of the filtered members. For example, the All Customers amount remains at $29,358,677.22.
4.4.2 Filtering data with query prompts
A query prompt is a dynamic filter in a document that displays a question every time you or another user opens or refreshes data in a document.
You answer prompts by either typing or selecting the values they want to view when they refresh the data. The query then only retrieves values from the database specified in the Prompts dialog.
List of values can have one or multiple columns, be hierarchical or delegated. If needed, they can be sorted in ascending order, descending order, or keep the server order. In the prompts dialog, click in the column header and select the order in the dedicated dropdown. By default, lists of values are displayed according to the server order.
NoteIn hierarchical lists of values, the sort only applies to caption values and by level.
Prompts allow multiple users viewing a single document to specify a different sub-set of the database information and display it in the same report tables and charts. They also reduce the time it takes for the data to be retrieved from the database.
A prompt contains the following elements:
146 PUBLICSAP BusinessObjects Web Intelligence User's Guide
Building and running queries
● a filtered object● an operator● a message
For example, to prompt users to select a specific year, you define a prompt on the [Year] dimension:
Year Equal To ("Which year?")
In this prompt, the filtered object is [Year], the operator is Equal To, and the prompt message is "Which year?".
You can define prompts on dimensions, measures, attributes, hierarchies and levels. For example, you can filter the [Year] dimension to return values for a specific year, filter the [Sales Revenue] measure to return values for a range of revenue figures, or filter the [Geography] hierarchy to return members from the hierarchy.
Note● Prompts of type universe parameter can have dynamic default values set through a formula expression
in the information design tool. Web Intelligence displays them as regular default values.● In the Rich Client, for OLAP .unx universes, when filtering on measures, you can only type a constant.● In the Rich Client, you cannot add measures or detail objects in the filter panel for BEx queries.
You can create multiple prompts, related by the AND or OR operators, in the same query, nest them.
NoteOn BEx queries and OLAP .unx universes, you can only use the AND operator.
Prompts appear in the script generated by the query as either the value supplied in response to the prompt or as special prompt syntax. For example, a prompt on [Country] can appear in generated SQL as:
Resort_Country.country = @prompt('Enter Country:','A', 'Resort\Country', Mono,Free,Persistent,,User:0)
or as
Resort_country.country In ('UK')
Prompts can be optional. You don't have to specify values for optional prompts. If you don't, the prompt is ignored.
Related Information
To specify values for prompts [page 378]
4.4.2.1 Merged prompts
When a document contains multiple data providers, any prompts that include objects with the same data type, operators of the same operator type, and that use the same prompt text are merged.
When all the data providers are refreshed, a single prompt message appears for such prompts.
SAP BusinessObjects Web Intelligence User's GuideBuilding and running queries PUBLIC 147
The List of Values displayed by the merged prompt is the list associated with the object in the prompt that has the most display property constraints.
4.4.2.2 Complex prompts
Complex prompts let you provide multiple answer values to a single prompt.
You can create complex prompts on top of BEx variables of type Selection Option or SAP HANA variables of type Range.
The operators supported by complex prompts are:
● Between● Not Between● Equal to● Not Equal to● Greater than● Less than● Greater than or Equal to● Less than or Equal to
4.4.2.3 Hierarchical prompts
Depending on the filter operator in the prompt, you can select items from different levels of the list of values, or at the lowest level only.
The following objects display their lists of values hierarchically in a prompt:
● Hierarchies● Levels● Dimensions associated with a hierarchical list of values
A hierarchical list of values appears in tree form. You can navigate up and down the tree to the items you want.
4.4.2.4 HANA query prompts in Web Intelligence
In Web Intelligence, HANA universes behave like any other relational UNX universe; variables and input parameters in SAP HANA information models are associated with the corresponding tables in the data foundation.
If there are variables and input parameters, then when you run a query in the Query Panel, prompts will appear that require you to enter values for the variables and parameters, and also when the document is refreshed. The values available in the prompts come directly from a HANA source.
For more information on HANA universes and query prompts at the universe level, see the Information Design Tool User Guide.
148 PUBLICSAP BusinessObjects Web Intelligence User's Guide
Building and running queries
NoteIf you add prompts in the Query Panel, there could be a duplication of prompts. We recommend that you run the query prior to defining any query prompts to know what prompts may already exist.
4.4.2.5 Query filter and prompt operators
You use operators to compare filtered objects.
The function of each operator depends on its context. Operators can perform mathematical operations and concave concatenate strings, as well as perform a wide variety of comparisons yielding Boolean results.
4.4.2.5.1 Equal to operator
Use the Equal to operator to obtain data equal to a value.
For example, to return data for the US only, create the filter "[Country] Equal to US".
4.4.2.5.2 Not Equal to operator
Use the Not Equal to operator to obtain data not equal to a value.
For example, to return data for all countries except the US create the filter "County Not Equal to US".
NoteThis operator cannot be used for OLAP .unx universe parent-child hierarchies or for BEx queries.
4.4.2.5.3 Greater than operator
Use the Greater than operator to retrieve data greater than a value.
For example, to retrieve data for customers aged over 60, create the filter "[Customer Age] Greater than 60".
NoteThis operator cannot be used for OLAP .unx universe parent-child hierarchies or for BEx queries.
SAP BusinessObjects Web Intelligence User's GuideBuilding and running queries PUBLIC 149
4.4.2.5.4 Greater than or Equal to operator
Use the Greater than or equal to operator to retrieve data greater than or equal to a value.
For example, to retrieve data for revenue starting from $1.5M, create the filter "[Revenue] Greater than or equal to 1500000".
NoteThis operator cannot be used for OLAP .unx universe parent-child hierarchies or for BEx hierarchies.
4.4.2.5.5 Less than operator
Use the Less than operator to retrieve data lower than a value.
For example, to retrieve data for exam grades lower than 40, create the filter "[Exam Grade] Less than 40".
NoteThis operator cannot be used for OLAP .unx universes, hierarchies in filters, or for hierarchies in BEx queries.
4.4.2.5.6 Less than or Equal to operator
Use the Less than or equal to operator to retrieve data less than or equal to a value.
For example, to retrieve data for customers whose age is 30 or less, create the filter "[Age] Less than or equal to 30".
NoteThis operator cannot be used for OLAP .unx universes, hierarchies in filters or for hierarchies in BEx queries.
4.4.2.5.7 Between operator
Use the Between operator to retrieve data between two boundary values including the two boundary values.
The first value declared must be lower than the second value.
For example, to retrieve data for weeks starting at week 25 and finishing at 36 (including week 25 and week 36), create the filter "[Week] Between 25 and 36".
150 PUBLICSAP BusinessObjects Web Intelligence User's Guide
Building and running queries
NoteThis operator cannot be used for OLAP .unx universe or BEx hierarchies in filters.
4.4.2.5.8 Not between operator
Use the Not between operator to retrieve data outside the range of two values.
For example, to retrieve data for all the weeks of the year, except for and not including weeks 25 through 36, create the filter "[Week] Not between 25 and 36".
NoteThis operator cannot be used for OLAP .unx universes or for BEx hierachies in filters.
4.4.2.5.9 In list operator
Use the In list operator to retrieve data corresponding to values in a list of values.
For example, to retrieve data only for the US, UK and Japan, create the filter [Country] In list, when you can type values in the Type a value field, you enter US;UK;Japan.
When used in a query filter with a hierarchical list of values, either from a dimension associated with a hierarchical list of values or a hierarchy object, In list allows the selection of multiple members from any levels of the hierarchy. For example, a prompt on the [Geography] hierarchy using the In list operator allows the selection of [Paris] at the City level and [Canada] at the Country level in the prompt.
When used in a report filter, In list produces a flat list of values.
4.4.2.5.10 Not In List operator
Use the Not in list operator to retrieve data that does not correspond to multiple values.
For example, if you do not want to retrieve data for the US, UK and Japan, create the filter "[Country] Not in list". In the Type a value field, you enter US;UK;Japan.
When used with a hierarchical list of values, either from a dimension associated with a hierarchical list of values, a hierarchy object or a level object, Not in list allows the selection of multiple members from any levels of the hierarchy. For example, a prompt on the [Geography] hierarchy using the Not in list operator allows selection of [Paris] at the City level and [Canada] at the Country level in the prompt.
NoteThis operator can only be used in certain types of hierarchies, for example, it can be used in level-based hierarchies.
SAP BusinessObjects Web Intelligence User's GuideBuilding and running queries PUBLIC 151
4.4.2.5.11 Matches Pattern operator
Use the Matches pattern operator to retrieve data that includes a specific string or part of a string.
For example, to retrieve customers whose date of birth is 1972, create the filter [DOB] Matches pattern "1972".
If you're using a wildcard, use the "%" character for every data source, except for BEx data sources. For BEx data sources, use the "*" character.
NoteThis operator cannot be used for BEx hierarchies.
4.4.2.5.12 Different From Pattern operator
Use the Different from pattern operator to return data that doesn't include a specific string.
For example, to retrieve customers whose date of birth is not 1972, create the filter [DOB] Different from pattern '72'.
NoteThis operator cannot be used for BEx or OLAP .unx universe parent-based hierarchies.
4.4.2.5.13 Both operator
Use the Both operator to retrieve data that corresponds to two values.
For example, to retrieve customers who have both fixed and mobile telephone numbers, create the filter [Account Type] Both 'Fixed' And 'Mobile'.
NoteThis operator is not supported for filters based on hierarchy objects, or in universes based on OLAP data sources.
4.4.2.5.14 Except operator
Use the Except operator to retrieve data that corresponds to one value and excludes another.
For example, to retrieve customers who have only a fixed telephone number and no mobile telephone number, create the filter [Account Type] 'Fixed' Except 'Mobile'.
The Except operator is more restrictive than Different from or Not in list. For example, a report that returns customers and that includes the filter [Lines] Different From 'Accessories' excludes all
152 PUBLICSAP BusinessObjects Web Intelligence User's Guide
Building and running queries
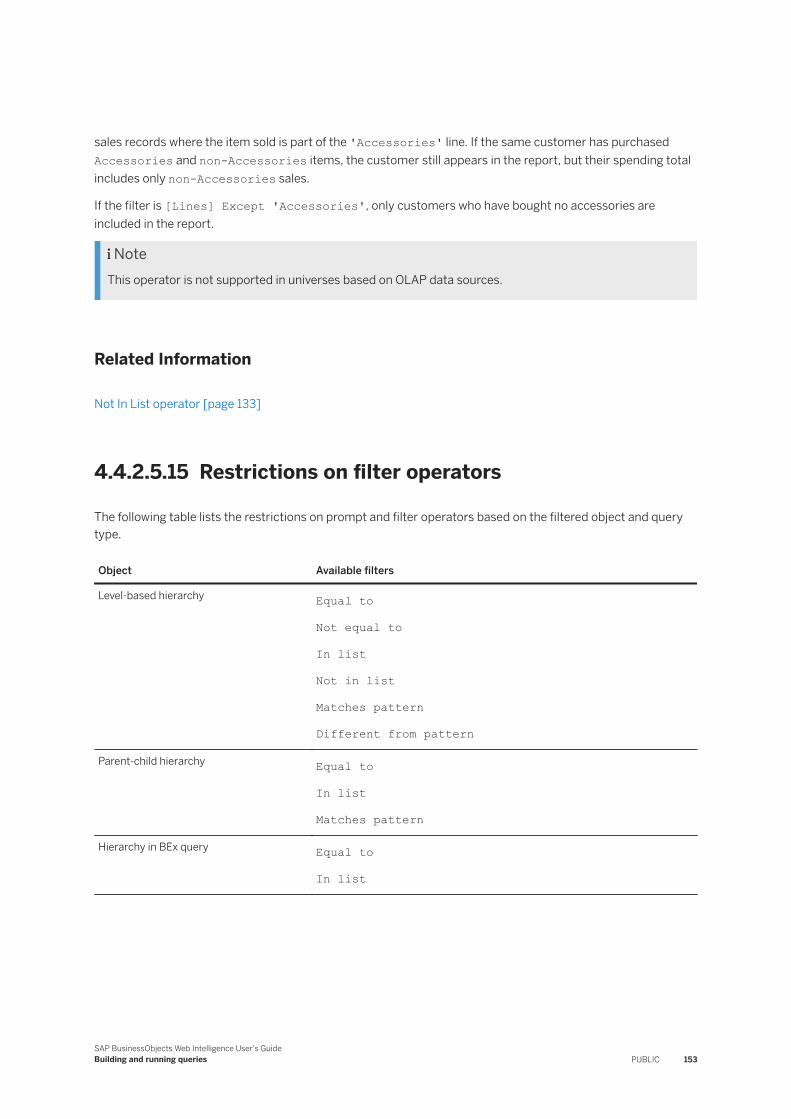
sales records where the item sold is part of the 'Accessories' line. If the same customer has purchased Accessories and non-Accessories items, the customer still appears in the report, but their spending total includes only non-Accessories sales.
If the filter is [Lines] Except 'Accessories', only customers who have bought no accessories are included in the report.
NoteThis operator is not supported in universes based on OLAP data sources.
Related Information
Not In List operator [page 133]
4.4.2.5.15 Restrictions on filter operators
The following table lists the restrictions on prompt and filter operators based on the filtered object and query type.
Object Available filters
Level-based hierarchy Equal to
Not equal to
In list
Not in list
Matches pattern
Different from pattern
Parent-child hierarchy Equal to
In list
Matches pattern
Hierarchy in BEx query Equal to
In list
SAP BusinessObjects Web Intelligence User's GuideBuilding and running queries PUBLIC 153
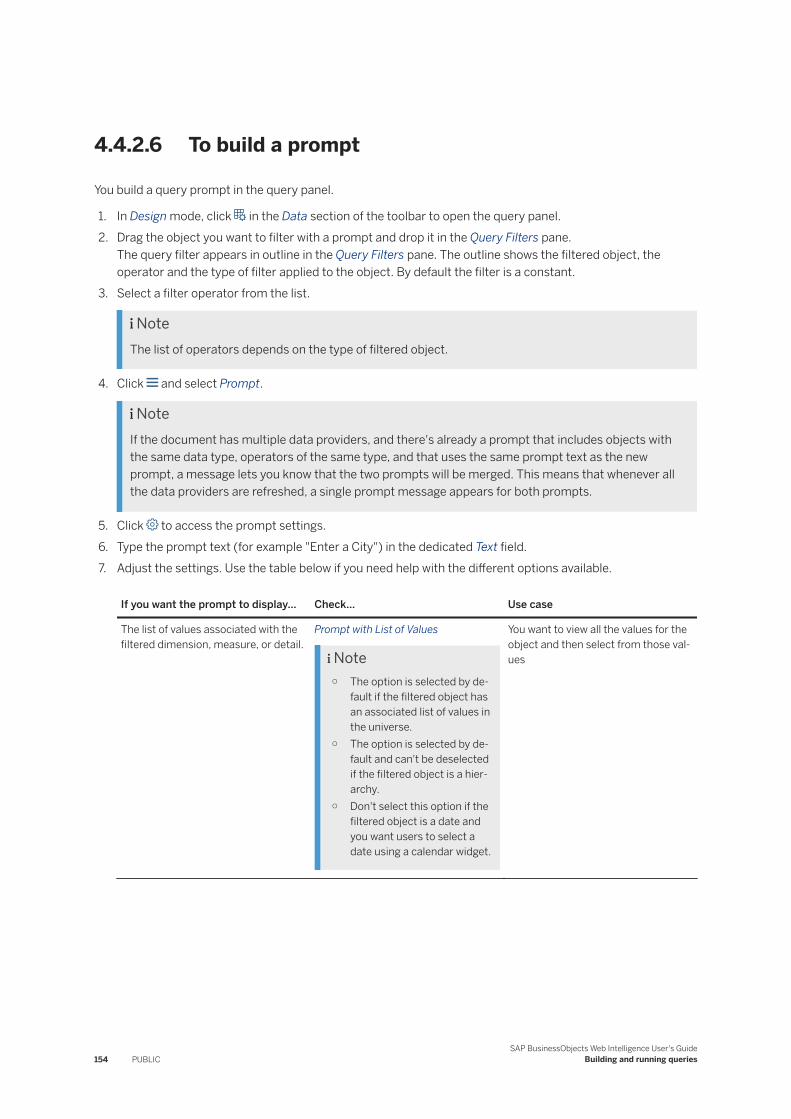
4.4.2.6 To build a prompt
You build a query prompt in the query panel.
1. In Design mode, click in the Data section of the toolbar to open the query panel.2. Drag the object you want to filter with a prompt and drop it in the Query Filters pane.
The query filter appears in outline in the Query Filters pane. The outline shows the filtered object, the operator and the type of filter applied to the object. By default the filter is a constant.
3. Select a filter operator from the list.
NoteThe list of operators depends on the type of filtered object.
4. Click and select Prompt.
NoteIf the document has multiple data providers, and there's already a prompt that includes objects with the same data type, operators of the same type, and that uses the same prompt text as the new prompt, a message lets you know that the two prompts will be merged. This means that whenever all the data providers are refreshed, a single prompt message appears for both prompts.
5. Click to access the prompt settings.6. Type the prompt text (for example "Enter a City") in the dedicated Text field.7. Adjust the settings. Use the table below if you need help with the different options available.
If you want the prompt to display... Check... Use case
The list of values associated with the filtered dimension, measure, or detail.
Prompt with List of Values
Note○ The option is selected by de
fault if the filtered object has an associated list of values in the universe.
○ The option is selected by default and can't be deselected if the filtered object is a hierarchy.
○ Don't select this option if the filtered object is a date and you want users to select a date using a calendar widget.
You want to view all the values for the object and then select from those values
154 PUBLICSAP BusinessObjects Web Intelligence User's Guide
Building and running queries
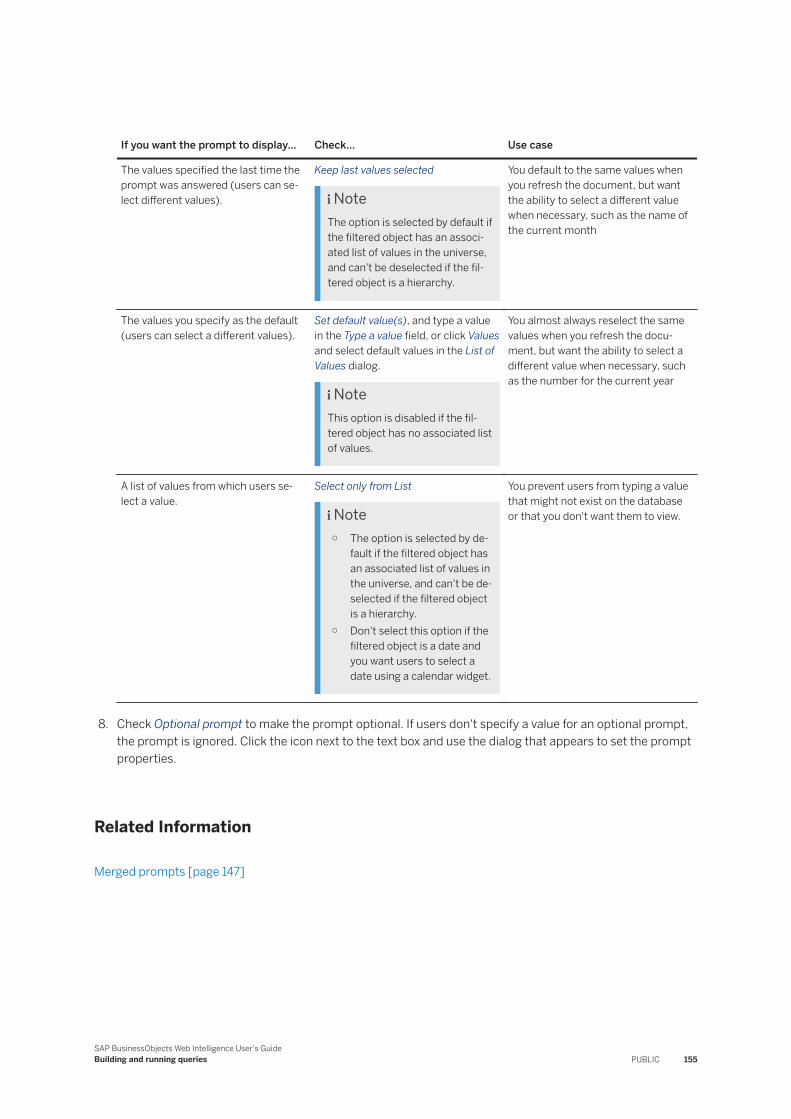
If you want the prompt to display... Check... Use case
The values specified the last time the prompt was answered (users can select different values).
Keep last values selected
NoteThe option is selected by default if the filtered object has an associated list of values in the universe, and can't be deselected if the fil-tered object is a hierarchy.
You default to the same values when you refresh the document, but want the ability to select a different value when necessary, such as the name of the current month
The values you specify as the default (users can select a different values).
Set default value(s), and type a value in the Type a value field, or click Values and select default values in the List of Values dialog.
NoteThis option is disabled if the fil-tered object has no associated list of values.
You almost always reselect the same values when you refresh the document, but want the ability to select a different value when necessary, such as the number for the current year
A list of values from which users select a value.
Select only from List
Note○ The option is selected by de
fault if the filtered object has an associated list of values in the universe, and can't be deselected if the filtered object is a hierarchy.
○ Don't select this option if the filtered object is a date and you want users to select a date using a calendar widget.
You prevent users from typing a value that might not exist on the database or that you don't want them to view.
8. Check Optional prompt to make the prompt optional. If users don't specify a value for an optional prompt, the prompt is ignored. Click the icon next to the text box and use the dialog that appears to set the prompt properties.
Related Information
Merged prompts [page 147]
SAP BusinessObjects Web Intelligence User's GuideBuilding and running queries PUBLIC 155
4.4.2.7 To select an existing prompt
You can select from pre-existing prompts to add to a query. Only pre-existing prompts that are compatible with the object you are filtering are displayed.
1. In Design mode, click in the Data section of the toolbar to open the query panel.2. Drag the object you want to filter with a prompt and drop it in the Query Filters pane.
The query filter appears in outline in the Query Filters pane. The outline shows the filtered object, the operator and the type of filter applied to the object. By default the filter is a constant.
3. Select a filter operator from the list.
NoteThe list of operators depends on the type of filtered object.
4. Click and select Prompt.5. Click Parameter from universe, select a prompt.
The list only displays prompts that are compatible with the object you are filtering. For example, the filtered object and the universe prompt must have the same data type.
6. Optional: If you want to make the prompt optional, check Optional prompt.7. Click OK.
Related Information
4.4.2.8 To remove a prompt
You can delete query prompts in the query panel.
1. In Design mode, click in the Data section of the toolbar to open the query panel.
2. Hover over the prompt you want to delete in the Query Filters pane and click .
Related Information
156 PUBLICSAP BusinessObjects Web Intelligence User's Guide
Building and running queries
4.4.2.9 Combining prompts
Combining multiple prompts on a single query enables you to filter the data returned to the document so that each person viewing the reports sees only the information relevant to their business need.
For example, you can combine the following three prompts on a Customer Accounts document:
● Which customer?● Which account?● Which calendar period: from? to?
This enables each accounts manager viewing the document to view report values for a specific customer account during a specific period.
You combine prompts in the same way that you combine query filters.
4.4.2.9.1 Combining prompts with query filters
Combining prompts and filters on a single query enables you decide the values for some of the selected objects on the query using filters and allow users to decide the values of other selected objects using prompts.
For example, if you combine the following filters and prompts on a Human Resources document:
● [Year] Equal to This Year● [Job title] Not equal to Senior Executive● Which employee?
Users viewing the document can choose which employee they view information for, but they can only view data for the current year and they can’t view data for senior executives.
4.4.2.10 To change the order of prompts
You change the order of query prompts in the query panel.
1. In Design mode, click in the Data section of the toolbar to open the query panel.
2. Click in the toolbar of the query panel to access the query properties.3. In the Prompt Order section, select a prompt and use the up and down arrows to move it.4. Click OK.
4.4.3 Filtering data using subqueries
A subquery is a flexible query filter that allows you to restrict values in more sophisticated ways than what's possible with a standard query filter.
Subqueries are more powerful than standard query filters for the following reasons:
SAP BusinessObjects Web Intelligence User's GuideBuilding and running queries PUBLIC 157
● They allow you to compare the values of the object whose values are used to restrict the query with values from other objects.
● They allow you to restrict the values returned by the subquery with a WHERE clause.● They allow you to ask complex questions that are difficult or impossible to formulate with simple query
filters. For example: what's the list of customers and their associated revenue where the customer purchased a service that had previously been reserved (by any customer) in Q1 of 2003?
Different parameters can help you create the right subquery depending on what you're trying to achieve:
Parameter Description
Filter objects The object whose values are used to filter the result objects.
You can include more than one filter object. If you do, the values of the objects you select are concatenated.
Filter by objects The object that determines which Filter object values the subquery returns.
You can include more than one Filter by object. If you do, the values of the objects you select are concatenated.
Operator The operator that specifies the relationship between the Filter object and the Filter by object.
Because of database restrictions, you can't use certain combinations of operators and Filter by objects together. For example, if you use the Equal to operator with a Filter by object that returns multiple values, the database rejects the SQL because this type of subquery requires the Filter by object to return one value only.
In cases where the generated SQL is rejected by the database, you see an error message showing the error description returned by the database
WHERE condition (optional) An additional condition that constrains the list of values of the Filter by object. You can use ordinary report objects, predefined conditions or existing query filters, including subqueries, in the WHERE condition.
Relationship operator If there is more than one subquery, this operator determines the relationship between the subqueries.
AND - the conditions in all of the subqueries must be satisfied.
OR - the conditions in any one of the subqueries must be satisfied.
Subqueries work by modifying the SQL that is generated to retrieve the query data. The SQL contains a subquery that restricts the data returned by an outer query. SQL is the query language supported by all relational databases (RDBMS), although each database has its own syntax. For more information on SQL subqueries, see any book on SQL.
NoteSubqueries aren't supported in all databases. If they aren't supported, the option to build subqueries doesn't appear in the query panel.
158 PUBLICSAP BusinessObjects Web Intelligence User's Guide
Building and running queries
NoteYou can build subqueries using dimensions, attributes and measures. You can't build subqueries using hierarchical objects.
Related Information
To build a subquery [page 159]
4.4.3.1 To build a subquery
You can build subqueries in the query panel.
1. In Design mode, click in the Data section of the toolbar to open the query panel.2. Add the objects you want to add to the query to the Result Objects pane.
3. Select the object you want to filter with a subquery in the Results Objects pane, and click in the Query Filters pane to add the subquery.The subquery outline appears in the Query Filters pane. By default the object you selected appears as the Filter object and Filter By object.
4. To add a WHERE condition to the subquery, drag and drop an object or a predefined filter to the dedicated zone.You can use an existing subquery or standard query filter as a WHERE condition in a subquery. To do so, drag and drop the existing filter or subquery to the area of the subquery below the Drop an object here boxes. To copy rather than move the existing filter to the WHERE condition, hold down the Control key while dragging and dropping. In this case the existing filter remains in its initial place and becomes part of the WHERE condition of the subquery.
5. Select the operator and values used to filter the object in the WHERE condition.
6. Optional: Click to add an additional subquery to the query filter.By default, both subqueries are linked in an AND relationship. Double-click the AND operator to toggle between AND and OR.
7. Optional: To nest a subquery (create a subquery within a subquery), drag an existing subquery onto another subquery.To copy rather than move the subquery to the WHERE condition, hold down the Control key while dragging and dropping. In this case the second subquery remains at the same level as the first, and becomes part of the WHERE clause of the first.The inner subquery becomes part of the WHERE condition of the outer subquery.
Related Information
Filtering data using subqueries [page 157]
SAP BusinessObjects Web Intelligence User's GuideBuilding and running queries PUBLIC 159
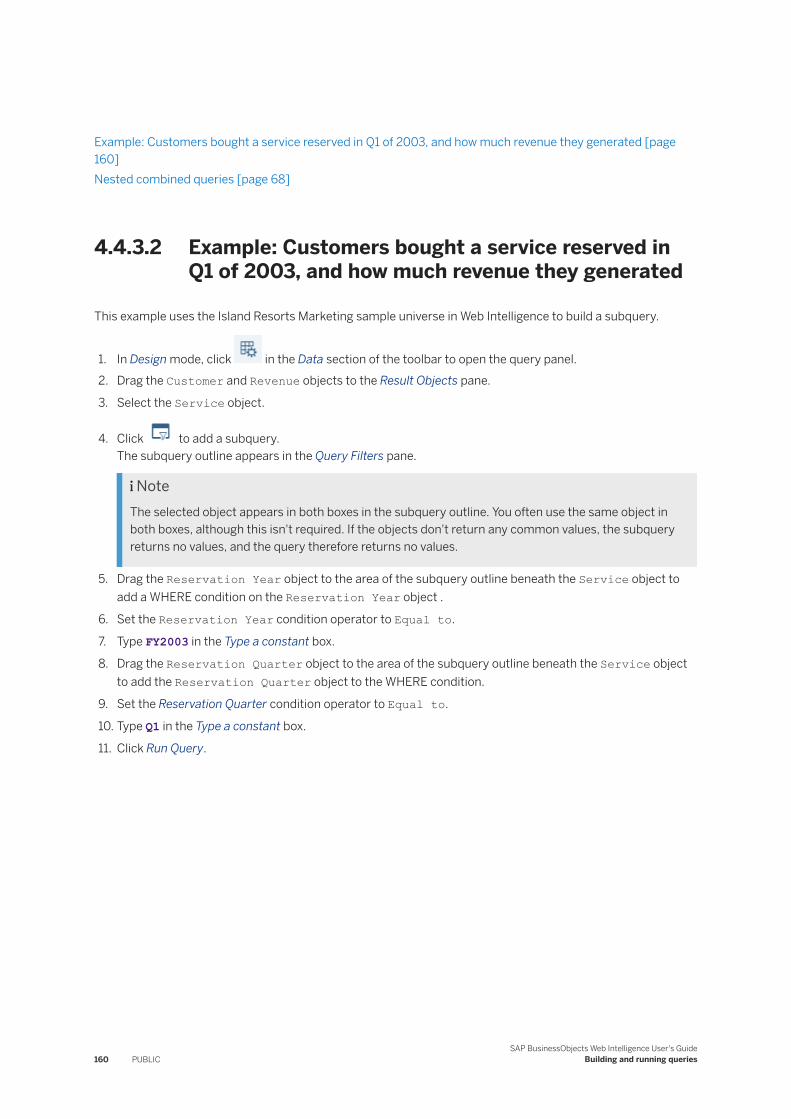
Example: Customers bought a service reserved in Q1 of 2003, and how much revenue they generated [page 160]Nested combined queries [page 68]
4.4.3.2 Example: Customers bought a service reserved in Q1 of 2003, and how much revenue they generated
This example uses the Island Resorts Marketing sample universe in Web Intelligence to build a subquery.
1. In Design mode, click in the Data section of the toolbar to open the query panel.2. Drag the Customer and Revenue objects to the Result Objects pane.
3. Select the Service object.
4. Click to add a subquery.The subquery outline appears in the Query Filters pane.
NoteThe selected object appears in both boxes in the subquery outline. You often use the same object in both boxes, although this isn't required. If the objects don't return any common values, the subquery returns no values, and the query therefore returns no values.
5. Drag the Reservation Year object to the area of the subquery outline beneath the Service object to add a WHERE condition on the Reservation Year object .
6. Set the Reservation Year condition operator to Equal to.
7. Type FY2003 in the Type a constant box.
8. Drag the Reservation Quarter object to the area of the subquery outline beneath the Service object to add the Reservation Quarter object to the WHERE condition.
9. Set the Reservation Quarter condition operator to Equal to.
10. Type Q1 in the Type a constant box.
11. Click Run Query.
160 PUBLICSAP BusinessObjects Web Intelligence User's Guide
Building and running queries
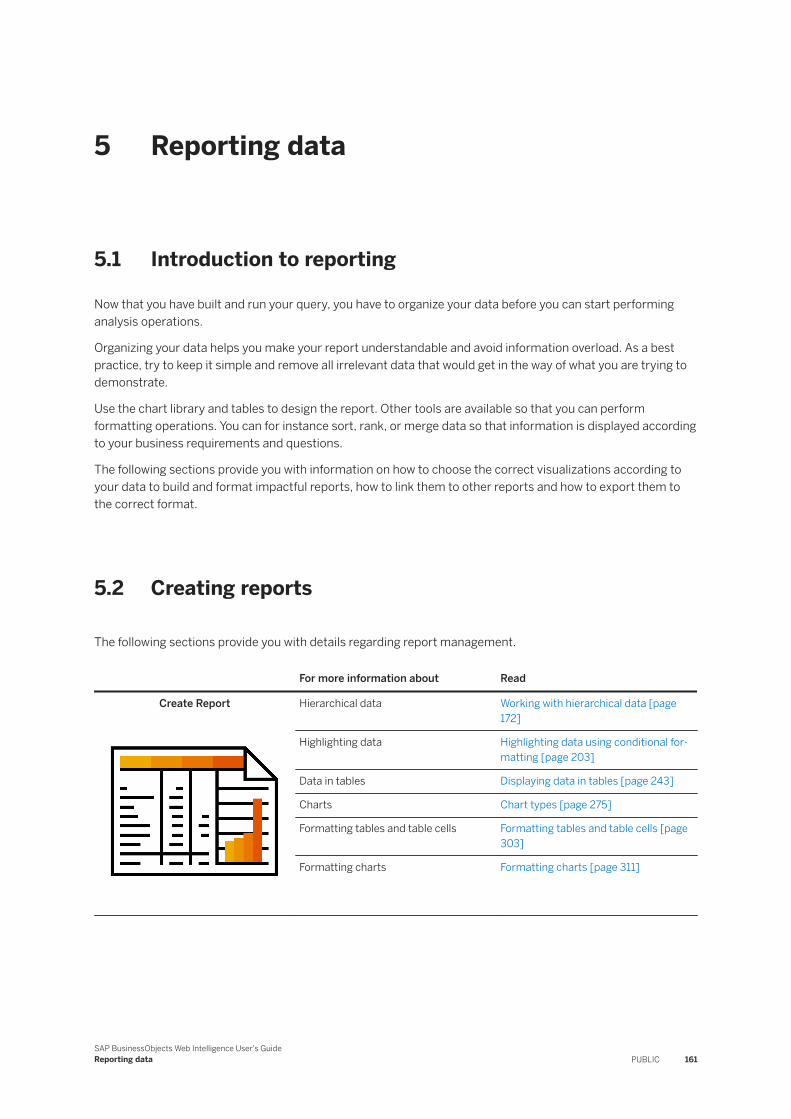
5 Reporting data
5.1 Introduction to reporting
Now that you have built and run your query, you have to organize your data before you can start performing analysis operations.
Organizing your data helps you make your report understandable and avoid information overload. As a best practice, try to keep it simple and remove all irrelevant data that would get in the way of what you are trying to demonstrate.
Use the chart library and tables to design the report. Other tools are available so that you can perform formatting operations. You can for instance sort, rank, or merge data so that information is displayed according to your business requirements and questions.
The following sections provide you with information on how to choose the correct visualizations according to your data to build and format impactful reports, how to link them to other reports and how to export them to the correct format.
5.2 Creating reports
The following sections provide you with details regarding report management.
For more information about Read
Create Report Hierarchical data Working with hierarchical data [page 172]
Highlighting data Highlighting data using conditional formatting [page 203]
Data in tables Displaying data in tables [page 243]
Charts Chart types [page 275]
Formatting tables and table cells Formatting tables and table cells [page 303]
Formatting charts Formatting charts [page 311]
SAP BusinessObjects Web Intelligence User's GuideReporting data PUBLIC 161
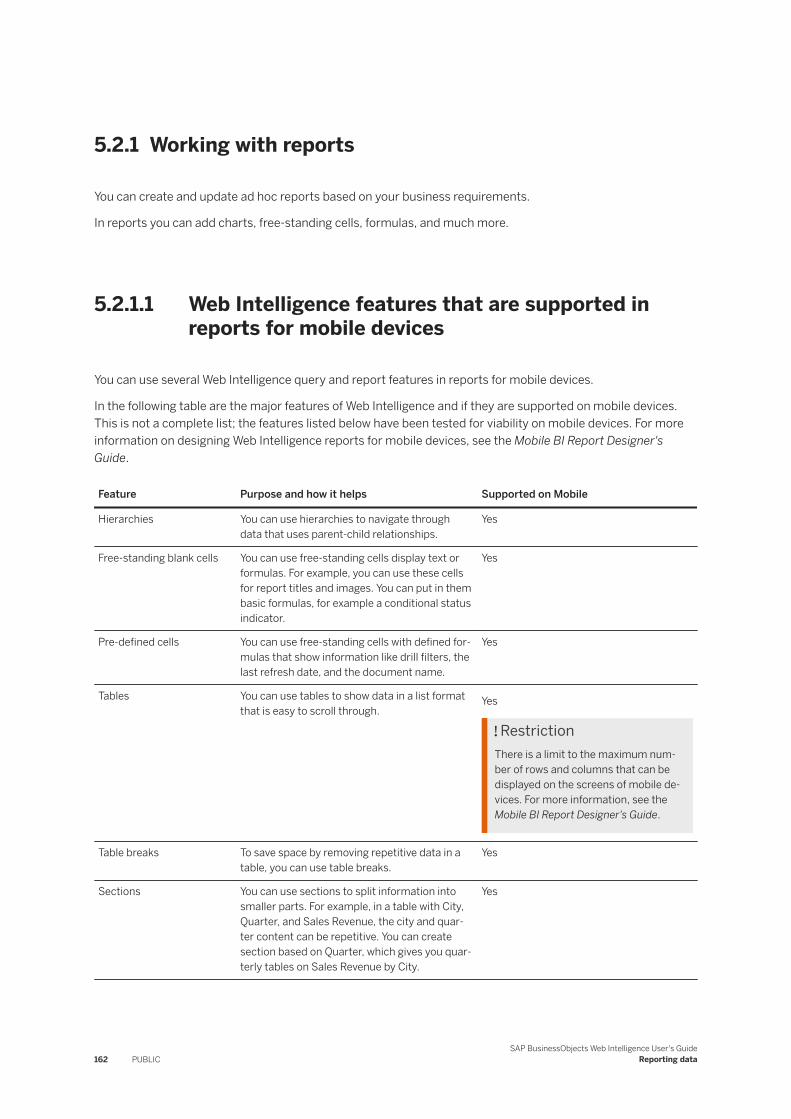
5.2.1 Working with reports
You can create and update ad hoc reports based on your business requirements.
In reports you can add charts, free-standing cells, formulas, and much more.
5.2.1.1 Web Intelligence features that are supported in reports for mobile devices
You can use several Web Intelligence query and report features in reports for mobile devices.
In the following table are the major features of Web Intelligence and if they are supported on mobile devices. This is not a complete list; the features listed below have been tested for viability on mobile devices. For more information on designing Web Intelligence reports for mobile devices, see the Mobile BI Report Designer's Guide.
Feature Purpose and how it helps Supported on Mobile
Hierarchies You can use hierarchies to navigate through data that uses parent-child relationships.
Yes
Free-standing blank cells You can use free-standing cells display text or formulas. For example, you can use these cells for report titles and images. You can put in them basic formulas, for example a conditional status indicator.
Yes
Pre-defined cells You can use free-standing cells with defined formulas that show information like drill filters, the last refresh date, and the document name.
Yes
Tables You can use tables to show data in a list format that is easy to scroll through.
Yes
RestrictionThere is a limit to the maximum number of rows and columns that can be displayed on the screens of mobile devices. For more information, see the Mobile BI Report Designer's Guide.
Table breaks To save space by removing repetitive data in a table, you can use table breaks.
Yes
Sections You can use sections to split information into smaller parts. For example, in a table with City, Quarter, and Sales Revenue, the city and quarter content can be repetitive. You can create section based on Quarter, which gives you quarterly tables on Sales Revenue by City.
Yes
162 PUBLICSAP BusinessObjects Web Intelligence User's Guide
Reporting data
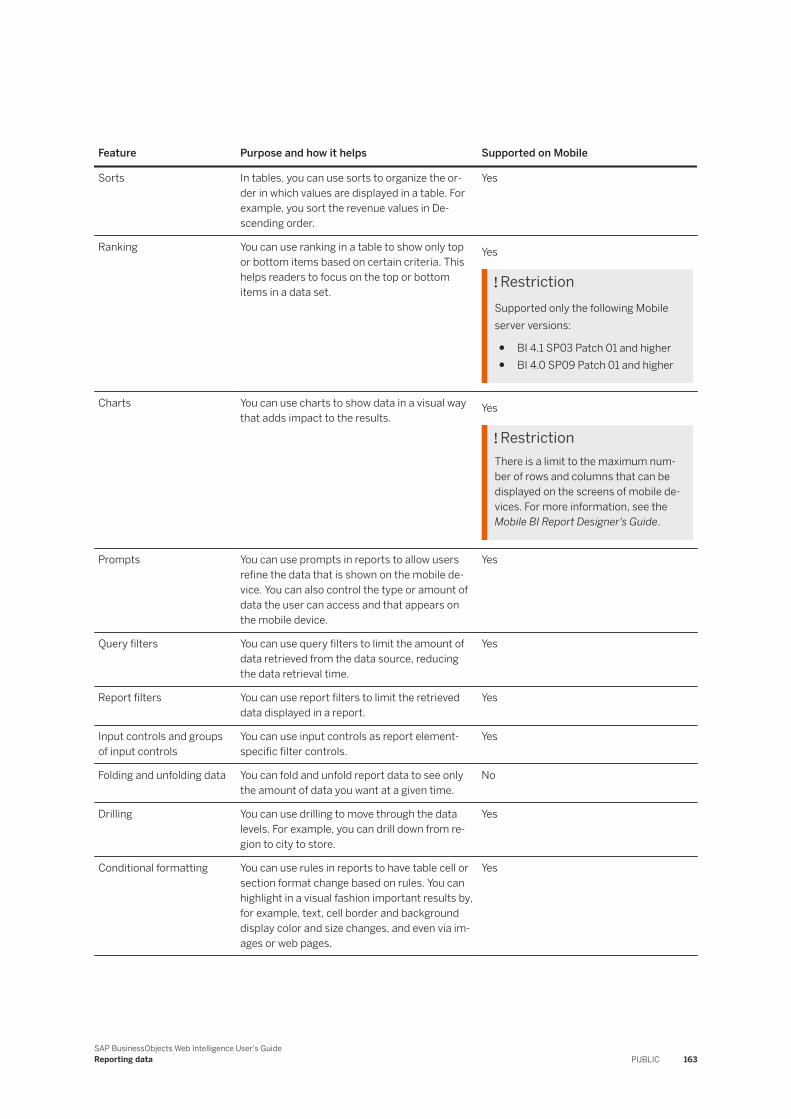
Feature Purpose and how it helps Supported on Mobile
Sorts In tables, you can use sorts to organize the order in which values are displayed in a table. For example, you sort the revenue values in Descending order.
Yes
Ranking You can use ranking in a table to show only top or bottom items based on certain criteria. This helps readers to focus on the top or bottom items in a data set.
Yes
RestrictionSupported only the following Mobile server versions:
● BI 4.1 SP03 Patch 01 and higher● BI 4.0 SP09 Patch 01 and higher
Charts You can use charts to show data in a visual way that adds impact to the results.
Yes
RestrictionThere is a limit to the maximum number of rows and columns that can be displayed on the screens of mobile devices. For more information, see the Mobile BI Report Designer's Guide.
Prompts You can use prompts in reports to allow users refine the data that is shown on the mobile device. You can also control the type or amount of data the user can access and that appears on the mobile device.
Yes
Query filters You can use query filters to limit the amount of data retrieved from the data source, reducing the data retrieval time.
Yes
Report filters You can use report filters to limit the retrieved data displayed in a report.
Yes
Input controls and groups of input controls
You can use input controls as report element-specific filter controls.
Yes
Folding and unfolding data You can fold and unfold report data to see only the amount of data you want at a given time.
No
Drilling You can use drilling to move through the data levels. For example, you can drill down from region to city to store.
Yes
Conditional formatting You can use rules in reports to have table cell or section format change based on rules. You can highlight in a visual fashion important results by, for example, text, cell border and background display color and size changes, and even via images or web pages.
Yes
SAP BusinessObjects Web Intelligence User's GuideReporting data PUBLIC 163
Feature Purpose and how it helps Supported on Mobile
Data tracking You can display data changes in a report in a document, for when the changes in data is the focus of a report.
No
5.2.1.2 To add a report
You can add a report to a document in Design mode.
In Design mode, click in the upper right hand corner of the toolbar, or click the down arrow next to a report name, and click New.
5.2.1.3 To rename a report
You can rename a report.
To rename a report, do one the following:
○ In Design mode, click next to a report name, click Rename and change the name of the report.○ In Design mode, make sure nothing is selceted in the canvas, and click > to open the Format panel.
Click the pen icon next to the report name, and change the name.
5.2.1.4 To duplicate a report
You can duplicate a report.
1. In Design mode, click next to a report name.2. Click Duplicate.3. Rename the duplicated report, if needed.
5.2.1.5 To delete a report
You can delete a report from a document.
1. In Design mode, click next to a report name.2. Click Delete.3. Click Delete to confirm.
164 PUBLICSAP BusinessObjects Web Intelligence User's Guide
Reporting data
5.2.1.6 To change the order of reports
You can change the order of reports.
1. In Design mode, click next to a report name.2. Click Move on the menu and select where to move the report.
5.2.1.7 Adjusting the report size
You can zoom in and out in reports using the zoom feature in the toolbar.
You can decrease and enlarge the report size from 10% to 200% in Design mode, by clicking the magnifying glass in the Display section of the toolbar, and adjusting the zoom slider.
5.2.1.8 Viewing document properties
The document properties recaps the properties and options enabled in a document.
You can check the document properties in the main panel by clicking > .
Property Description
Title The name of the document in the BI launch pad. This is displayed above the general properties and cannot be edited.
Type The type of document.
Author The creator of the document.
Creation date The date the document was created.
Locale Formatting locale of the document.
Content Alignment Alignment is set to left to right (LTR) by default. The alignment of the application interface is from right to left (RTL) when you select Arabic or Hebrew. The alignment of the document content may be RTL, depending on the system settings selected by the BI administrator.
Description Optional information that describes the document.
Keywords Optional keywords that can be used to search for the document in the BI launch pad.
Last refresh date The date of the last data refresh.
Last modified The date of the last modification made to the document.
Last modified by The last person who modified the document.
Duration of the previous refresh The duration of the last refresh.
SAP BusinessObjects Web Intelligence User's GuideReporting data PUBLIC 165
Property Description
Refresh on open Automatically refreshes the document with the latest data from the database each time you open the document.
When Refresh on open is on, data tracking doesn't display the difference between the data prior to the refresh and the data after the refresh. Data after the refresh is treated as new data because the refresh purges the document.
NoteThe Refresh on open option depends on several settings configured by your BI administrator in the Central Management Console (CMC):
● In the CMC, click Applications Web Intelligence . In the Automatic Document Refresh on Open Security Right Setting section, the property Automatic Refresh security setting is enabled.
● In the CMC, click Applications Web Intelligence User
Security . When you select a user profile and click View Security, check that the Document - disable automatic refresh on open security right is disabled.
Apply security filtering on open Automatically applies the security on data when opening the document, without any need to refresh the document.
This option is only available for a document created on a relational unx universe with Business Security Profiles.
Note● When the option Apply security filtering on open is selected, the option
Refresh on open is greyed out.● When the option Refresh on open is selected, the option Apply security
filtering on open is greyed out.
Chart animations Turns on/off chart animations.
Permanent regional formatting Formats the document according to the format locale with which it was saved.
Use query drill Allows drilling in query drill mode.
Allow query stripping Generates queries that only use objects that contribute to the reports in which they are used. Each time a query is refreshed, non-contributing objects are ignored. Only relevant data is retrieved from the data provider. This feature enhances performance.
NoteQuery stripping is enabled by default for BEx queries.
Hide warning icons in chart Hides general warning icons in order to enhance readability.
Change Default Style You can change the default style for the document. You can import a new style or export the current style.
Data tracking reference mode Indicates whether data tracking is turned on or off.
166 PUBLICSAP BusinessObjects Web Intelligence User's Guide
Reporting data
Property Description
Data tracking Tracks data changes such as insertions, deletions, edits, and increased or decreased values.
Auto-merge dimensions Automatically merges dimensions with the same name and from the same universe. You see the merged dimension in the list of available objects with the dimensions merged within it below.
Merged dimensions are the mechanism for synchronizing data from different data providers.
Extend merged dimension values When selected extends values of merged dimensions. Merged dimensions are the mechanism for synchronizing data from different data providers. This controls the results when a table contains synchronized data.
If a table contains a dimension used in a merge, this dimension returns the value of its query plus the values of the other dimensions merged from other data providers for which there is an object in the table.
When this option is disabled and a table contains a dimension used in a merge, this dimension returns the value of its query.
RestrictionWe recommend activating the Extend merged dimension values option only when you want to reproduce the merged dimension behavior of SAP BusinessObjects Desktop Intelligence.
Auto-refresh Refreshes the document automatically at regular intervals.
The Auto-refresh option applies to the use of delegated measures. Block elements that are affected by this include adding/deleting a column, inserting a break, including a footer, filter bar, input control. When this option is enabled, and an object is added to or removed from the query, or when a different value is selected from a list in the filter bar (all values, simple values), for example, the document is refreshed automatically. The #TOREFRESH message will not appear in the report because the refresh is automatic.
This option only applies to aggregated delegated measures. For example when you add a total to a table in a report.
Using this option can slow down the performance. If the drop in performance is a problem, consider deselecting this option. In this case #TOREFRESH will display when the report is modified.
NoteThis option can only be modified if the BI administrator has enabled it in the Web Intelligence application properties in the Central Management Console (CMC).
SAP BusinessObjects Web Intelligence User's GuideReporting data PUBLIC 167
Property Description
Default Style You can change the default style that is used for the document:
● Import a .css style sheet to replace the existing style sheet.● Export the current style sheet to save or use elsewhere.● Reset the document to use the original style sheet installed with the prod
uct. This option is only available when the current document style sheet is different from the original style sheet.
Merge prompts (BEx variables) Select this option if you want to merge prompts that are created in Web Intelligence from BEx variables in the original BEx query. Only BEx variables that have the same technical name are merged. When this option is unselected, any previously merged BEx variables are unmerged and treated as separate prompts.
Prompts Indicates prompt values entered for the current view of the document.
NoteKeydates, if there are any, are retrieved together with prompts.
Related Information
Merging data from dimensions and hierarchies [page 215]Drilling with query drill [page 368]Data tracking and Refresh on Open [page 201]
5.2.1.8.1 To configure document properties
You can configure the document properties.
1. In Design mode, in the toolbar, click > .2. Browse the different sections and toggle the properties on or off.3. Click Apply to save your changes.
Related Information
Viewing document properties [page 165]
168 PUBLICSAP BusinessObjects Web Intelligence User's Guide
Reporting data
5.2.1.8.2 To select default folders for local documents and universes
You can select a folder where local documents and universes are stored by default on your local machine.
1. Go to the application preferences.2. Click General.3. Use the Browse button next to the dedicated fields to select default storage folders for universes and
documents you import from the CMS.4. Click Save.
5.2.1.8.3 Query stripping
Query stripping optimizes performance by removing objects from a query if they aren't used in a report.
When query stripping is enabled, the query is rewritten to reference only objects that are used in the report. Let's take a query that has three result objects: Country, City, and Revenue. A report based on this query may contain only City and Revenue. If query stripping is enabled, when you refresh the report, the query only retrieves data for City and Revenue.
In relational universes, a report with query stripping enabled may return different data than when query stripping is disabled, depending on the schema of the data foundation. Let's look again at the example of a query that contains Country, City, and Sales Revenue. In the data foundation, a self-restricting join on the Country table restricts the country to the US. With query stripping disabled, the report on City and Revenue returns revenue only for cities in the US. With query stripping enabled, the report returns revenue for cities in every country, because the Country table was stripped out of the query.
CautionWeb Intelligence can't strip every object if there's no report element in the document: the report must contain at least one object.
For relational universes, query stripping is only enabled if:
● In the information design tool, the Allow query stripping option is on in the business layer properties in the information design tool.
● In Web Intelligence, the Allow query stripping option is on for the data provider in the query properties.● In Web Intelligence, the Allow query stripping option is on in the document properties.
For OLAP universes, query stripping is enabled by default. Query stripping is supported by:
● UNV BAPI Universes (i.e UNV BW Universes)● Relational and OLAP UNX universes● BW Direct Access from BW BICS connections● HANA Direct Access from HANA Relational connections● HANA Direct Access from HANA HTTP connections
For more information on query stripping, see the Information Design Tool User Guide.
SAP BusinessObjects Web Intelligence User's GuideReporting data PUBLIC 169
Related Information
Viewing document properties [page 165]Restrictions when using BEx queries and BW InfoProviders [page 76]
5.2.1.9 Applying security filtering when opening a document
When creating a document on a relational .unx universe, you can specify that security on data is applied when opening the document without any need to perform a refresh.
This saves time for all users of the document, especially for those who receive a document through the scheduling process.
Data security is also applied when you export the data of a document.
Applies to which universes?
This feature is available for documents created on relational .unx universes only, not for OLAP .unx universes.
Which security settings are applied?
When the option Apply security filtering on open is selected:
● The Business Security Profiles, which are defined by universe, are applied. Data Security Profiles are not applied.
● Within Business Security Profiles, Display Data and Filters are applied. Member Sets are not applied, as they are defined for OLAP unx universes.
In which cases do errors appear in a document?
Even when the option Apply security filtering on open is selected, security on data is not applied in the following situations:
● If the universe can't be accessed.● If the Business Security Filters refer to objects that are not included in the query.● If the Business Security Filters contain filter types not included in the folllowing list:
○ Comparison filters with operators =, <>, >=,>, <=,<, INLIST, NOT_INLIST, BETWEEN, NOT_BETWEEN○ Comparison filters based on @variable syntax on system variables such as BOUSER, UNVNAME, etc.○ Comparison filters based on @variable syntax on CMS User Attributes.
170 PUBLICSAP BusinessObjects Web Intelligence User's Guide
Reporting data
● If Business Security Display Data is applied on queries containing delegated measures.
When there is an error in a document, the data of the document is automatically purged.
5.2.1.9.1 To apply security filtering when opening a document
In Design mode, enable the Apply security filtering on open option in the Document Properties ( > ) pane, under Data Options, using the dedicated toggle. See To configure document properties [page 168].
Note○ This option isn't enabled by default. When this option is enabled, the Refresh on open option is greyed
out. And when the Refresh on open option is enabled, the Apply security filtering on open option is greyed out.
○ If you disable the Apply security filtering on open option, it means that the security on data won't be applied when a user opens the document. Then, as soon as the user refreshes the opened document, both data and security are applied. When you deselect the option, a message appears indicating that data will be purged.
Data security is also applied when you export the data of a document.
5.2.1.10 Hierarchical and non-hierarchical data
Depending on the data source for your reports, they can contain non-hierarchical or hierarchical data.
Non-hierarchical data behaves differently from hierarchical data and you work with them in different ways.
SAP BusinessObjects Web Intelligence User's GuideReporting data PUBLIC 171
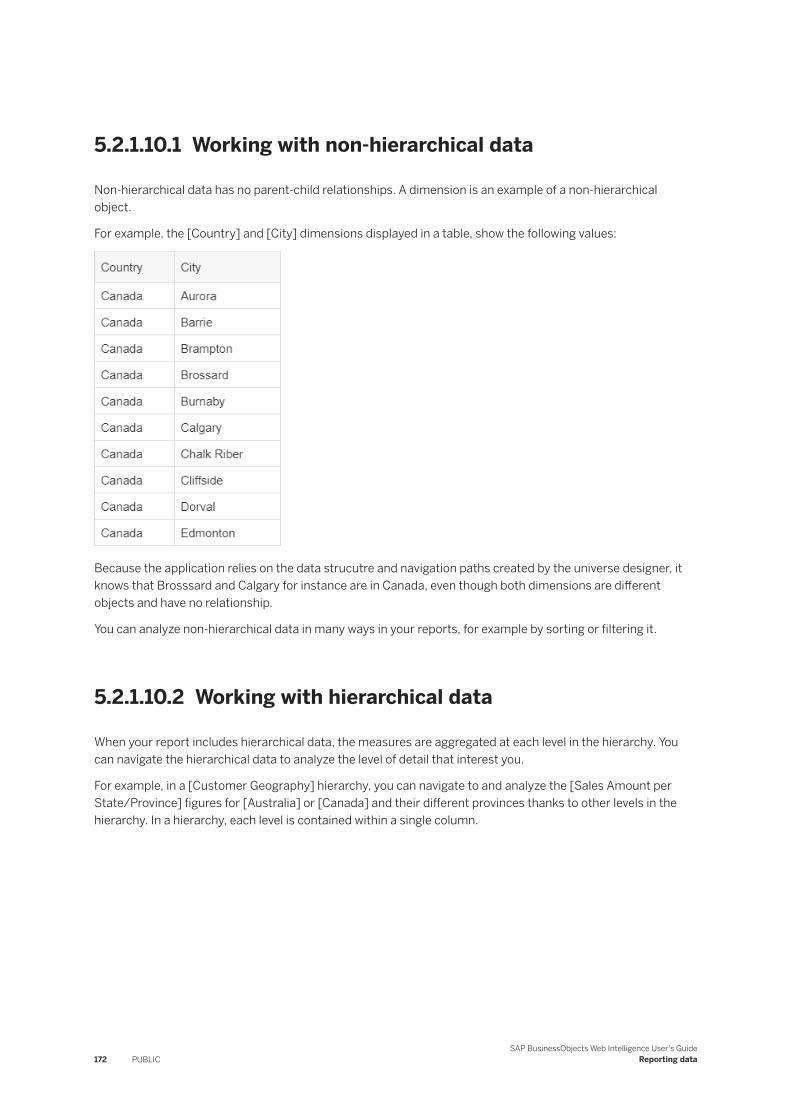
5.2.1.10.1 Working with non-hierarchical data
Non-hierarchical data has no parent-child relationships. A dimension is an example of a non-hierarchical object.
For example, the [Country] and [City] dimensions displayed in a table, show the following values:
Because the application relies on the data strucutre and navigation paths created by the universe designer, it knows that Brosssard and Calgary for instance are in Canada, even though both dimensions are different objects and have no relationship.
You can analyze non-hierarchical data in many ways in your reports, for example by sorting or filtering it.
5.2.1.10.2 Working with hierarchical data
When your report includes hierarchical data, the measures are aggregated at each level in the hierarchy. You can navigate the hierarchical data to analyze the level of detail that interest you.
For example, in a [Customer Geography] hierarchy, you can navigate to and analyze the [Sales Amount per State/Province] figures for [Australia] or [Canada] and their different provinces thanks to other levels in the hierarchy. In a hierarchy, each level is contained within a single column.
172 PUBLICSAP BusinessObjects Web Intelligence User's Guide
Reporting data
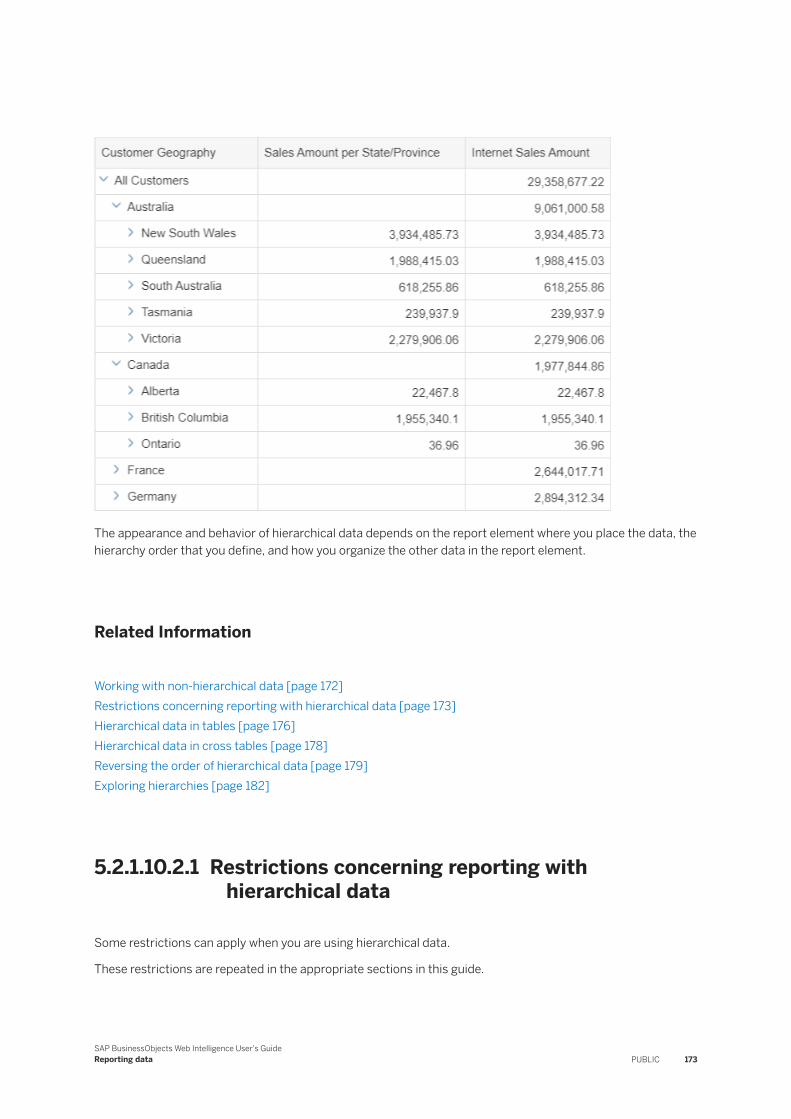
The appearance and behavior of hierarchical data depends on the report element where you place the data, the hierarchy order that you define, and how you organize the other data in the report element.
Related Information
Working with non-hierarchical data [page 172]Restrictions concerning reporting with hierarchical data [page 173]Hierarchical data in tables [page 176]Hierarchical data in cross tables [page 178]Reversing the order of hierarchical data [page 179]Exploring hierarchies [page 182]
5.2.1.10.2.1 Restrictions concerning reporting with hierarchical data
Some restrictions can apply when you are using hierarchical data.
These restrictions are repeated in the appropriate sections in this guide.
SAP BusinessObjects Web Intelligence User's GuideReporting data PUBLIC 173
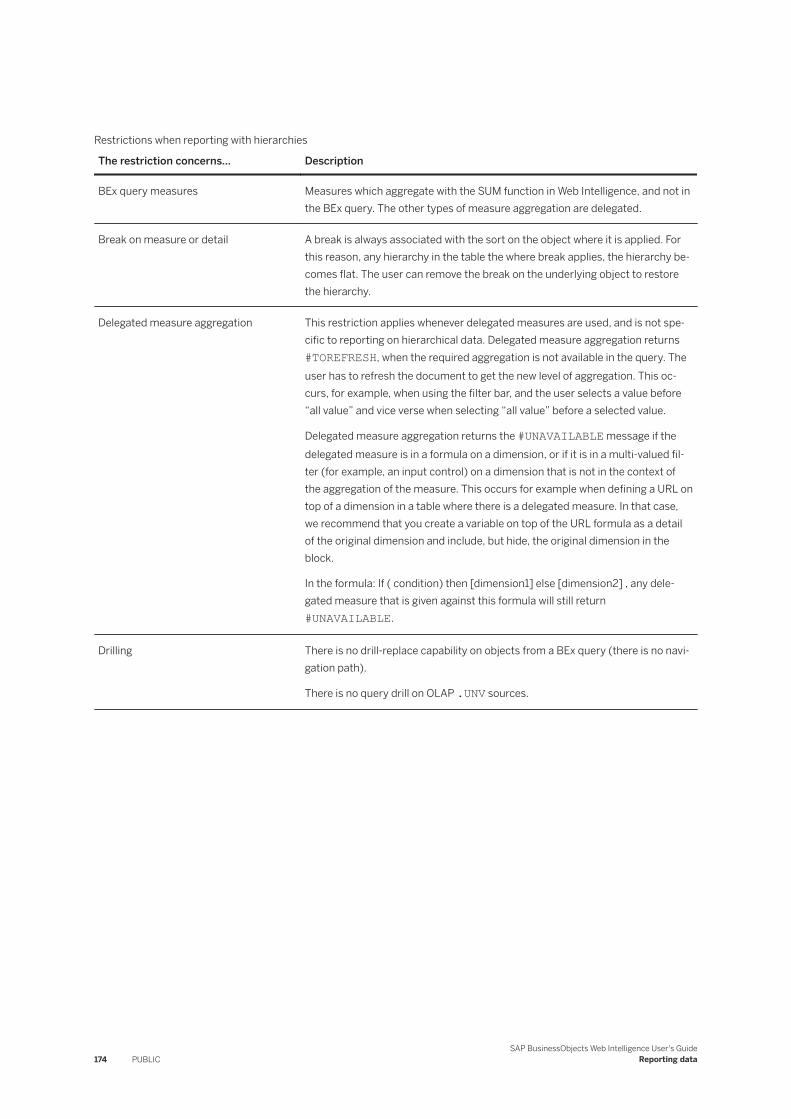
Restrictions when reporting with hierarchies
The restriction concerns... Description
BEx query measures Measures which aggregate with the SUM function in Web Intelligence, and not in the BEx query. The other types of measure aggregation are delegated.
Break on measure or detail A break is always associated with the sort on the object where it is applied. For this reason, any hierarchy in the table the where break applies, the hierarchy becomes flat. The user can remove the break on the underlying object to restore the hierarchy.
Delegated measure aggregation This restriction applies whenever delegated measures are used, and is not specific to reporting on hierarchical data. Delegated measure aggregation returns #TOREFRESH, when the required aggregation is not available in the query. The user has to refresh the document to get the new level of aggregation. This occurs, for example, when using the filter bar, and the user selects a value before “all value” and vice verse when selecting “all value” before a selected value.
Delegated measure aggregation returns the #UNAVAILABLE message if the delegated measure is in a formula on a dimension, or if it is in a multi-valued fil-ter (for example, an input control) on a dimension that is not in the context of the aggregation of the measure. This occurs for example when defining a URL on top of a dimension in a table where there is a delegated measure. In that case, we recommend that you create a variable on top of the URL formula as a detail of the original dimension and include, but hide, the original dimension in the block.
In the formula: If ( condition) then [dimension1] else [dimension2] , any delegated measure that is given against this formula will still return #UNAVAILABLE.
Drilling There is no drill-replace capability on objects from a BEx query (there is no navigation path).
There is no query drill on OLAP .UNV sources.
174 PUBLICSAP BusinessObjects Web Intelligence User's Guide
Reporting data
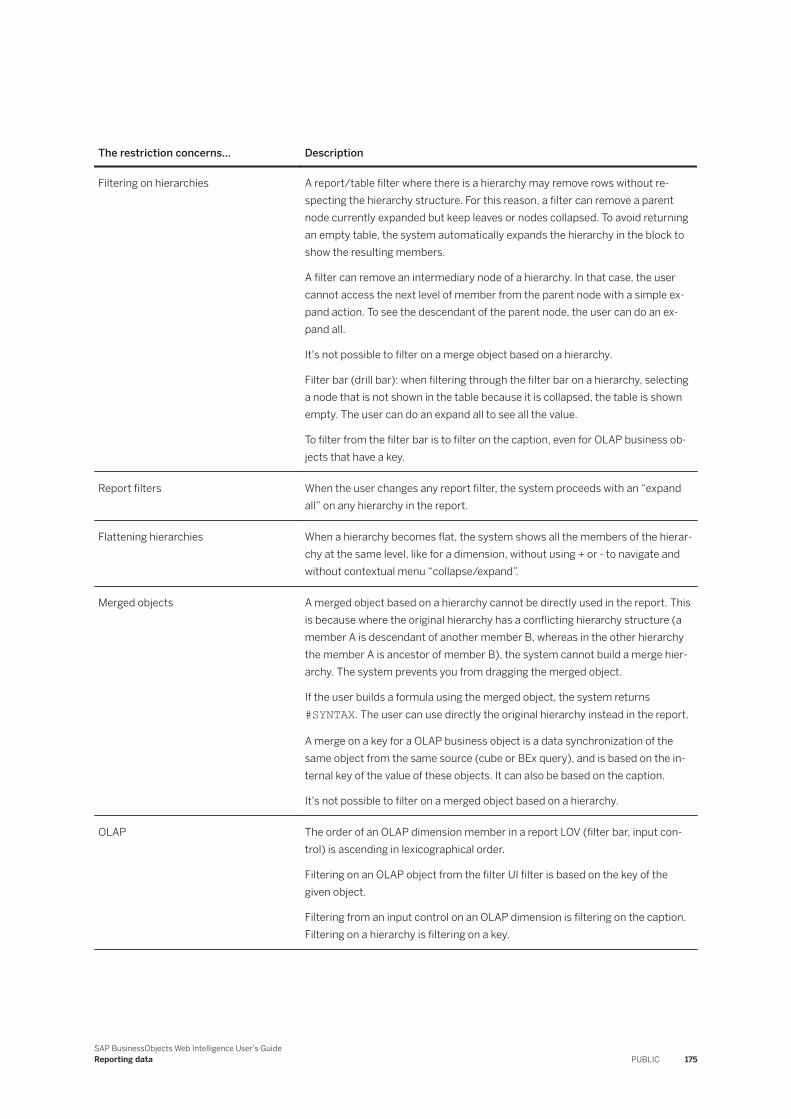
The restriction concerns... Description
Filtering on hierarchies A report/table filter where there is a hierarchy may remove rows without respecting the hierarchy structure. For this reason, a filter can remove a parent node currently expanded but keep leaves or nodes collapsed. To avoid returning an empty table, the system automatically expands the hierarchy in the block to show the resulting members.
A filter can remove an intermediary node of a hierarchy. In that case, the user cannot access the next level of member from the parent node with a simple expand action. To see the descendant of the parent node, the user can do an expand all.
It's not possible to filter on a merge object based on a hierarchy.
Filter bar (drill bar): when filtering through the filter bar on a hierarchy, selecting a node that is not shown in the table because it is collapsed, the table is shown empty. The user can do an expand all to see all the value.
To filter from the filter bar is to filter on the caption, even for OLAP business objects that have a key.
Report filters When the user changes any report filter, the system proceeds with an “expand all” on any hierarchy in the report.
Flattening hierarchies When a hierarchy becomes flat, the system shows all the members of the hierarchy at the same level, like for a dimension, without using + or - to navigate and without contextual menu “collapse/expand”.
Merged objects A merged object based on a hierarchy cannot be directly used in the report. This is because where the original hierarchy has a conflicting hierarchy structure (a member A is descendant of another member B, whereas in the other hierarchy the member A is ancestor of member B), the system cannot build a merge hierarchy. The system prevents you from dragging the merged object.
If the user builds a formula using the merged object, the system returns #SYNTAX. The user can use directly the original hierarchy instead in the report.
A merge on a key for a OLAP business object is a data synchronization of the same object from the same source (cube or BEx query), and is based on the internal key of the value of these objects. It can also be based on the caption.
It's not possible to filter on a merged object based on a hierarchy.
OLAP The order of an OLAP dimension member in a report LOV (filter bar, input control) is ascending in lexicographical order.
Filtering on an OLAP object from the filter UI filter is based on the key of the given object.
Filtering from an input control on an OLAP dimension is filtering on the caption. Filtering on a hierarchy is filtering on a key.
SAP BusinessObjects Web Intelligence User's GuideReporting data PUBLIC 175
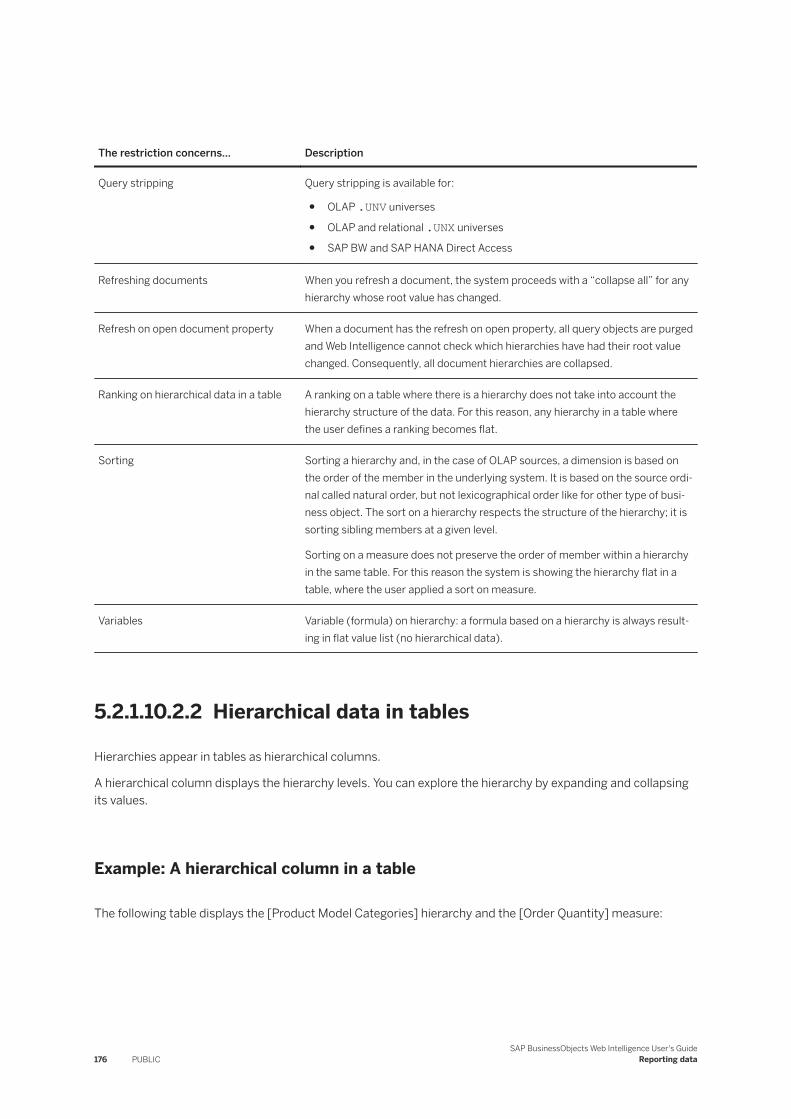
The restriction concerns... Description
Query stripping Query stripping is available for:
● OLAP .UNV universes
● OLAP and relational .UNX universes
● SAP BW and SAP HANA Direct Access
Refreshing documents When you refresh a document, the system proceeds with a “collapse all” for any hierarchy whose root value has changed.
Refresh on open document property When a document has the refresh on open property, all query objects are purged and Web Intelligence cannot check which hierarchies have had their root value changed. Consequently, all document hierarchies are collapsed.
Ranking on hierarchical data in a table A ranking on a table where there is a hierarchy does not take into account the hierarchy structure of the data. For this reason, any hierarchy in a table where the user defines a ranking becomes flat.
Sorting Sorting a hierarchy and, in the case of OLAP sources, a dimension is based on the order of the member in the underlying system. It is based on the source ordinal called natural order, but not lexicographical order like for other type of business object. The sort on a hierarchy respects the structure of the hierarchy; it is sorting sibling members at a given level.
Sorting on a measure does not preserve the order of member within a hierarchy in the same table. For this reason the system is showing the hierarchy flat in a table, where the user applied a sort on measure.
Variables Variable (formula) on hierarchy: a formula based on a hierarchy is always resulting in flat value list (no hierarchical data).
5.2.1.10.2.2 Hierarchical data in tables
Hierarchies appear in tables as hierarchical columns.
A hierarchical column displays the hierarchy levels. You can explore the hierarchy by expanding and collapsing its values.
Example: A hierarchical column in a table
The following table displays the [Product Model Categories] hierarchy and the [Order Quantity] measure:
176 PUBLICSAP BusinessObjects Web Intelligence User's Guide
Reporting data
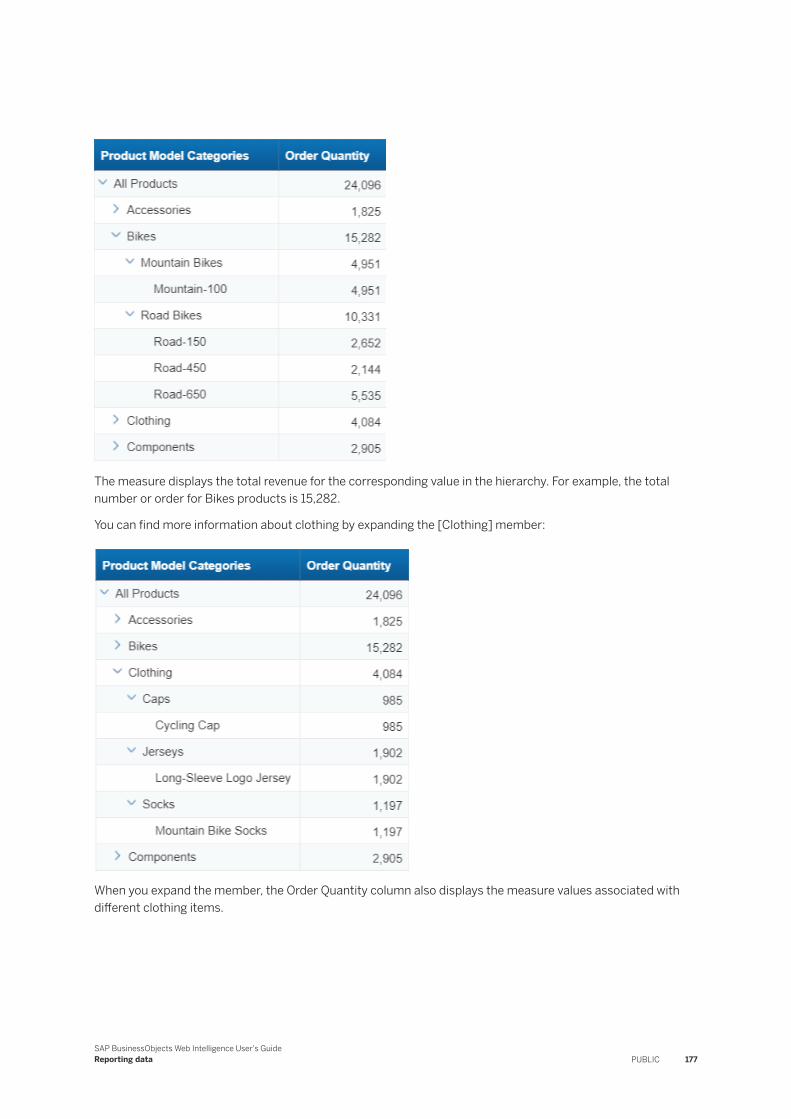
The measure displays the total revenue for the corresponding value in the hierarchy. For example, the total number or order for Bikes products is 15,282.
You can find more information about clothing by expanding the [Clothing] member:
When you expand the member, the Order Quantity column also displays the measure values associated with different clothing items.
SAP BusinessObjects Web Intelligence User's GuideReporting data PUBLIC 177
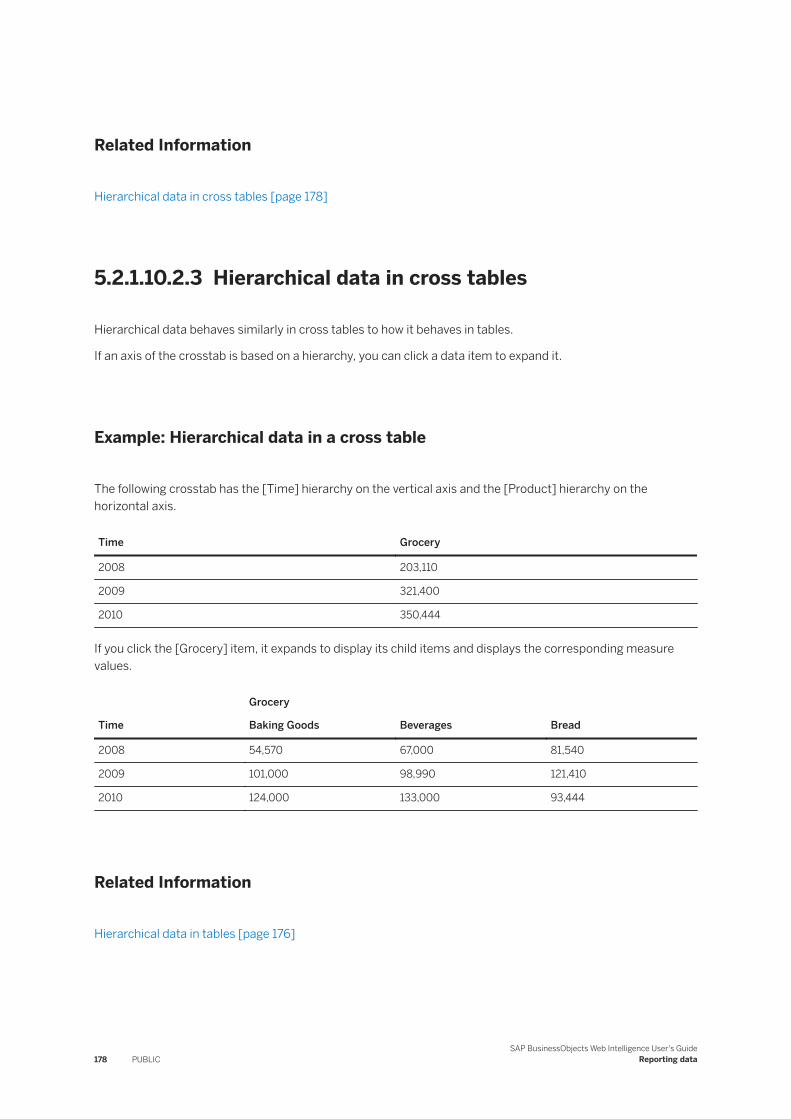
Related Information
Hierarchical data in cross tables [page 178]
5.2.1.10.2.3 Hierarchical data in cross tables
Hierarchical data behaves similarly in cross tables to how it behaves in tables.
If an axis of the crosstab is based on a hierarchy, you can click a data item to expand it.
Example: Hierarchical data in a cross table
The following crosstab has the [Time] hierarchy on the vertical axis and the [Product] hierarchy on the horizontal axis.
Time Grocery
2008 203,110
2009 321,400
2010 350,444
If you click the [Grocery] item, it expands to display its child items and displays the corresponding measure values.
Time
Grocery
Baking Goods Beverages Bread
2008 54,570 67,000 81,540
2009 101,000 98,990 121,410
2010 124,000 133,000 93,444
Related Information
Hierarchical data in tables [page 176]
178 PUBLICSAP BusinessObjects Web Intelligence User's Guide
Reporting data
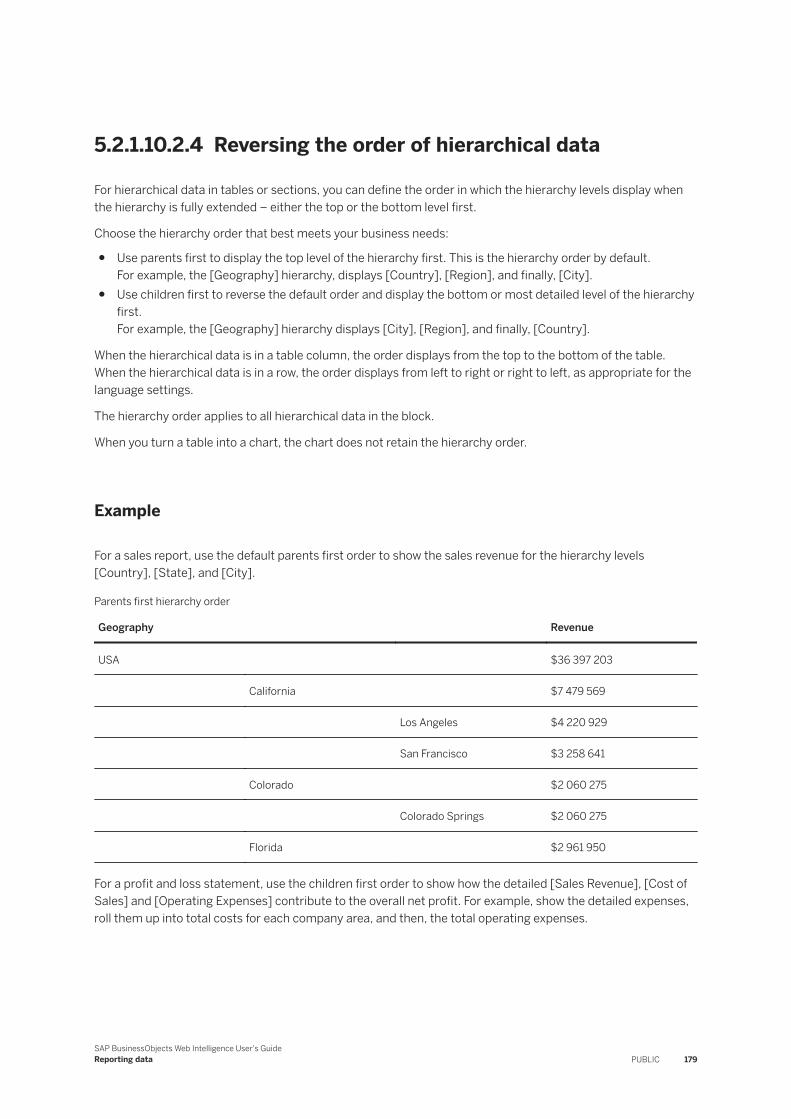
5.2.1.10.2.4 Reversing the order of hierarchical data
For hierarchical data in tables or sections, you can define the order in which the hierarchy levels display when the hierarchy is fully extended – either the top or the bottom level first.
Choose the hierarchy order that best meets your business needs:
● Use parents first to display the top level of the hierarchy first. This is the hierarchy order by default.For example, the [Geography] hierarchy, displays [Country], [Region], and finally, [City].
● Use children first to reverse the default order and display the bottom or most detailed level of the hierarchy first.For example, the [Geography] hierarchy displays [City], [Region], and finally, [Country].
When the hierarchical data is in a table column, the order displays from the top to the bottom of the table. When the hierarchical data is in a row, the order displays from left to right or right to left, as appropriate for the language settings.
The hierarchy order applies to all hierarchical data in the block.
When you turn a table into a chart, the chart does not retain the hierarchy order.
Example
For a sales report, use the default parents first order to show the sales revenue for the hierarchy levels [Country], [State], and [City].
Parents first hierarchy order
Geography Revenue
USA $36 397 203
California $7 479 569
Los Angeles $4 220 929
San Francisco $3 258 641
Colorado $2 060 275
Colorado Springs $2 060 275
Florida $2 961 950
For a profit and loss statement, use the children first order to show how the detailed [Sales Revenue], [Cost of Sales] and [Operating Expenses] contribute to the overall net profit. For example, show the detailed expenses, roll them up into total costs for each company area, and then, the total operating expenses.
SAP BusinessObjects Web Intelligence User's GuideReporting data PUBLIC 179
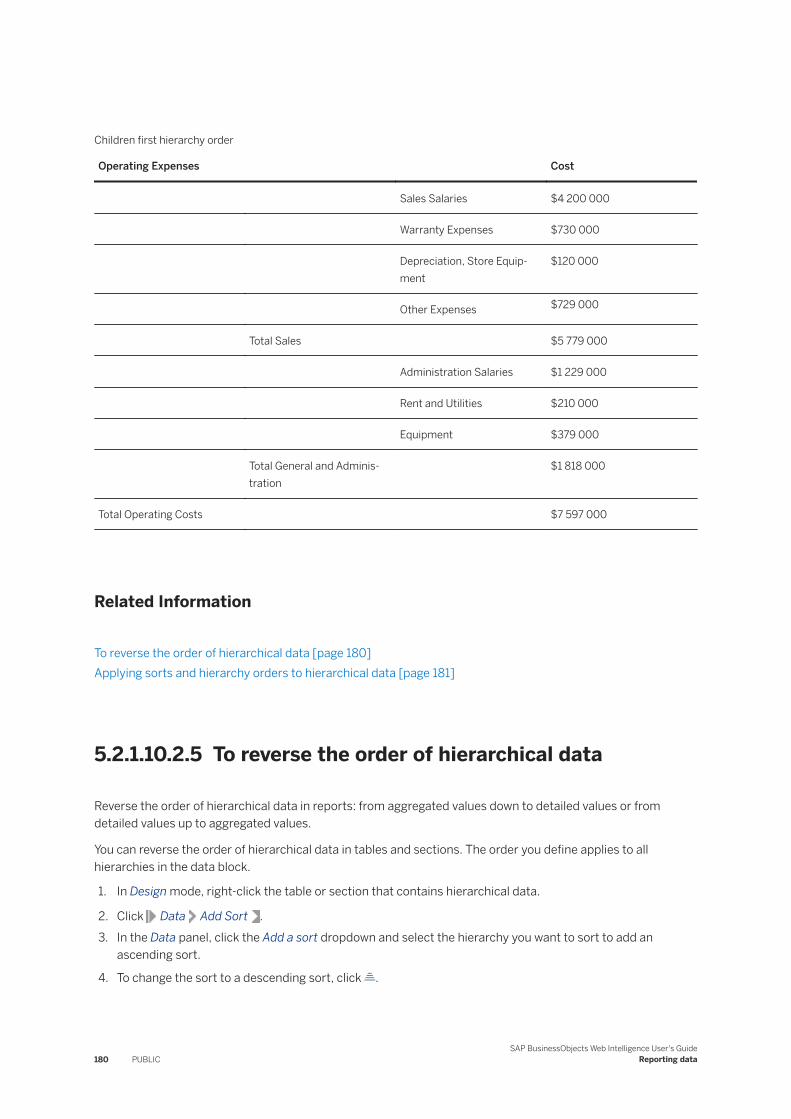
Children first hierarchy order
Operating Expenses Cost
Sales Salaries $4 200 000
Warranty Expenses $730 000
Depreciation, Store Equipment
$120 000
Other Expenses $729 000
Total Sales $5 779 000
Administration Salaries $1 229 000
Rent and Utilities $210 000
Equipment $379 000
Total General and Administration
$1 818 000
Total Operating Costs $7 597 000
Related Information
To reverse the order of hierarchical data [page 180]Applying sorts and hierarchy orders to hierarchical data [page 181]
5.2.1.10.2.5 To reverse the order of hierarchical data
Reverse the order of hierarchical data in reports: from aggregated values down to detailed values or from detailed values up to aggregated values.
You can reverse the order of hierarchical data in tables and sections. The order you define applies to all hierarchies in the data block.
1. In Design mode, right-click the table or section that contains hierarchical data.
2. Click Data Add Sort .3. In the Data panel, click the Add a sort dropdown and select the hierarchy you want to sort to add an
ascending sort.
4. To change the sort to a descending sort, click .
180 PUBLICSAP BusinessObjects Web Intelligence User's Guide
Reporting data
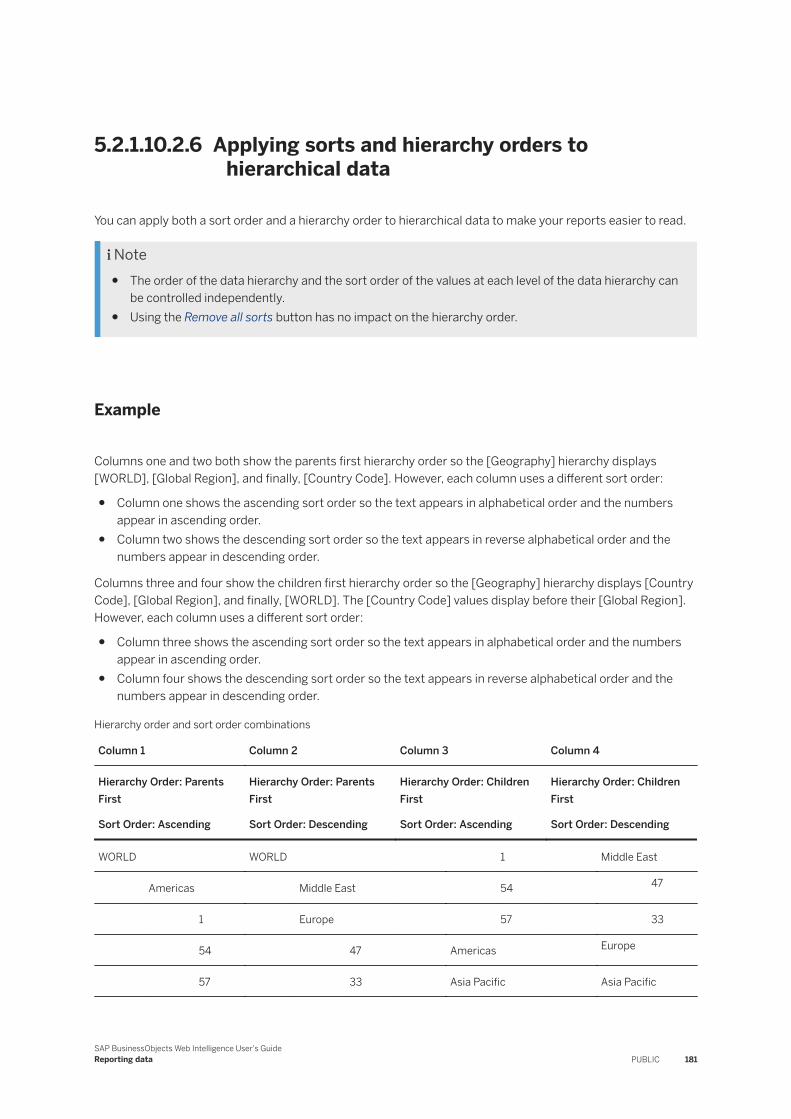
5.2.1.10.2.6 Applying sorts and hierarchy orders to hierarchical data
You can apply both a sort order and a hierarchy order to hierarchical data to make your reports easier to read.
Note● The order of the data hierarchy and the sort order of the values at each level of the data hierarchy can
be controlled independently.● Using the Remove all sorts button has no impact on the hierarchy order.
Example
Columns one and two both show the parents first hierarchy order so the [Geography] hierarchy displays [WORLD], [Global Region], and finally, [Country Code]. However, each column uses a different sort order:
● Column one shows the ascending sort order so the text appears in alphabetical order and the numbers appear in ascending order.
● Column two shows the descending sort order so the text appears in reverse alphabetical order and the numbers appear in descending order.
Columns three and four show the children first hierarchy order so the [Geography] hierarchy displays [Country Code], [Global Region], and finally, [WORLD]. The [Country Code] values display before their [Global Region]. However, each column uses a different sort order:
● Column three shows the ascending sort order so the text appears in alphabetical order and the numbers appear in ascending order.
● Column four shows the descending sort order so the text appears in reverse alphabetical order and the numbers appear in descending order.
Hierarchy order and sort order combinations
Column 1 Column 2 Column 3 Column 4
Hierarchy Order: Parents First
Sort Order: Ascending
Hierarchy Order: Parents First
Sort Order: Descending
Hierarchy Order: Children First
Sort Order: Ascending
Hierarchy Order: Children First
Sort Order: Descending
WORLD WORLD 1 Middle East
Americas Middle East 54 47
1 Europe 57 33
54 47 Americas Europe
57 33 Asia Pacific Asia Pacific
SAP BusinessObjects Web Intelligence User's GuideReporting data PUBLIC 181
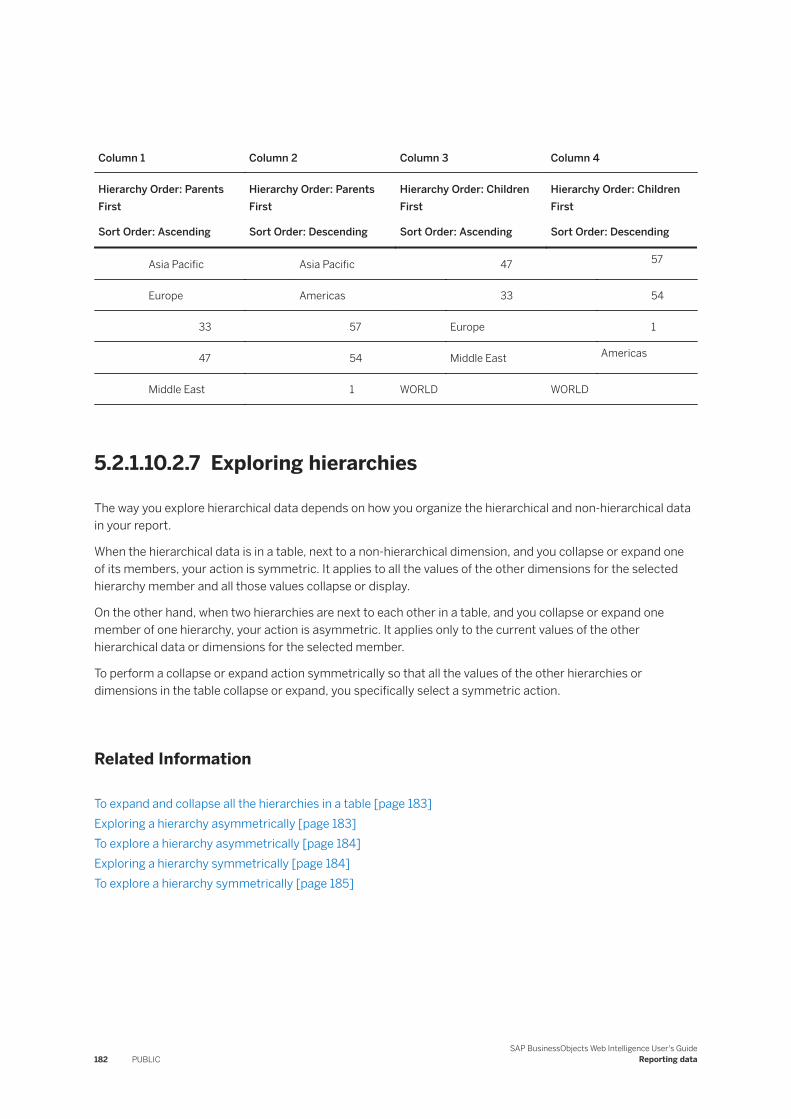
Column 1 Column 2 Column 3 Column 4
Hierarchy Order: Parents First
Sort Order: Ascending
Hierarchy Order: Parents First
Sort Order: Descending
Hierarchy Order: Children First
Sort Order: Ascending
Hierarchy Order: Children First
Sort Order: Descending
Asia Pacific Asia Pacific 47 57
Europe Americas 33 54
33 57 Europe 1
47 54 Middle East Americas
Middle East 1 WORLD WORLD
5.2.1.10.2.7 Exploring hierarchies
The way you explore hierarchical data depends on how you organize the hierarchical and non-hierarchical data in your report.
When the hierarchical data is in a table, next to a non-hierarchical dimension, and you collapse or expand one of its members, your action is symmetric. It applies to all the values of the other dimensions for the selected hierarchy member and all those values collapse or display.
On the other hand, when two hierarchies are next to each other in a table, and you collapse or expand one member of one hierarchy, your action is asymmetric. It applies only to the current values of the other hierarchical data or dimensions for the selected member.
To perform a collapse or expand action symmetrically so that all the values of the other hierarchies or dimensions in the table collapse or expand, you specifically select a symmetric action.
Related Information
To expand and collapse all the hierarchies in a table [page 183]Exploring a hierarchy asymmetrically [page 183]To explore a hierarchy asymmetrically [page 184]Exploring a hierarchy symmetrically [page 184]To explore a hierarchy symmetrically [page 185]
182 PUBLICSAP BusinessObjects Web Intelligence User's Guide
Reporting data
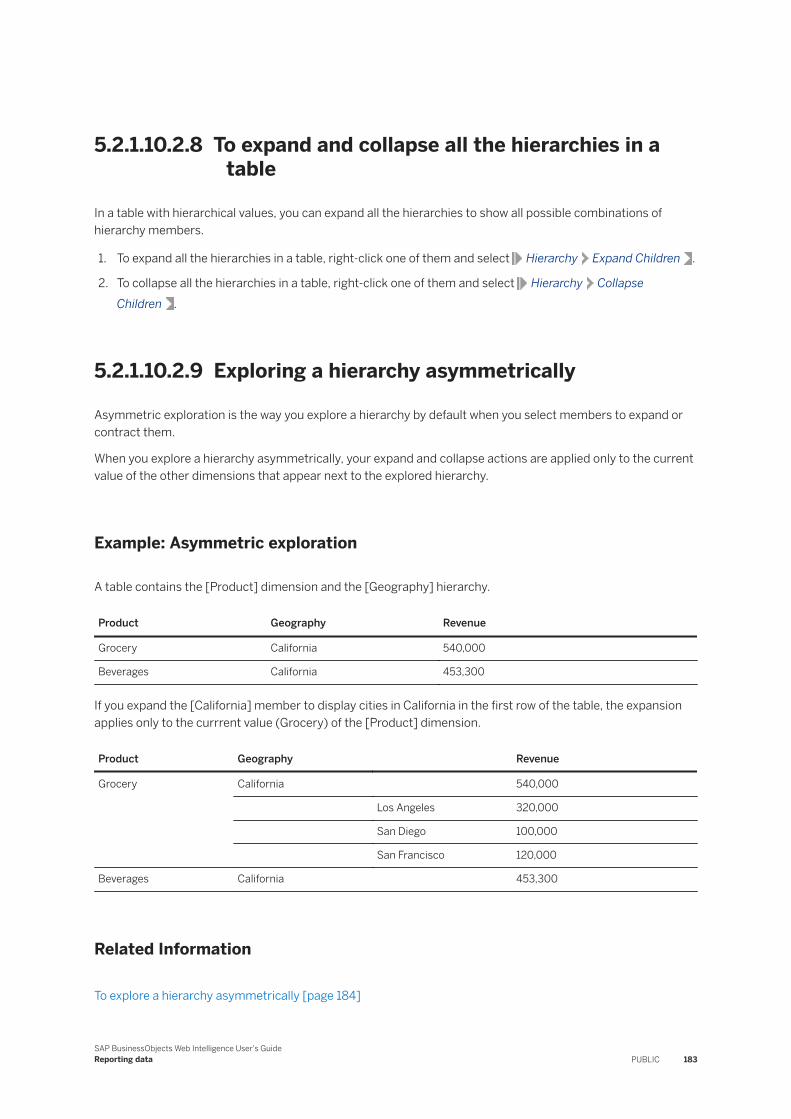
5.2.1.10.2.8 To expand and collapse all the hierarchies in a table
In a table with hierarchical values, you can expand all the hierarchies to show all possible combinations of hierarchy members.
1. To expand all the hierarchies in a table, right-click one of them and select Hierarchy Expand Children .
2. To collapse all the hierarchies in a table, right-click one of them and select Hierarchy Collapse Children .
5.2.1.10.2.9 Exploring a hierarchy asymmetrically
Asymmetric exploration is the way you explore a hierarchy by default when you select members to expand or contract them.
When you explore a hierarchy asymmetrically, your expand and collapse actions are applied only to the current value of the other dimensions that appear next to the explored hierarchy.
Example: Asymmetric exploration
A table contains the [Product] dimension and the [Geography] hierarchy.
Product Geography Revenue
Grocery California 540,000
Beverages California 453,300
If you expand the [California] member to display cities in California in the first row of the table, the expansion applies only to the currrent value (Grocery) of the [Product] dimension.
Product Geography Revenue
Grocery California 540,000
Los Angeles 320,000
San Diego 100,000
San Francisco 120,000
Beverages California 453,300
Related Information
To explore a hierarchy asymmetrically [page 184]
SAP BusinessObjects Web Intelligence User's GuideReporting data PUBLIC 183
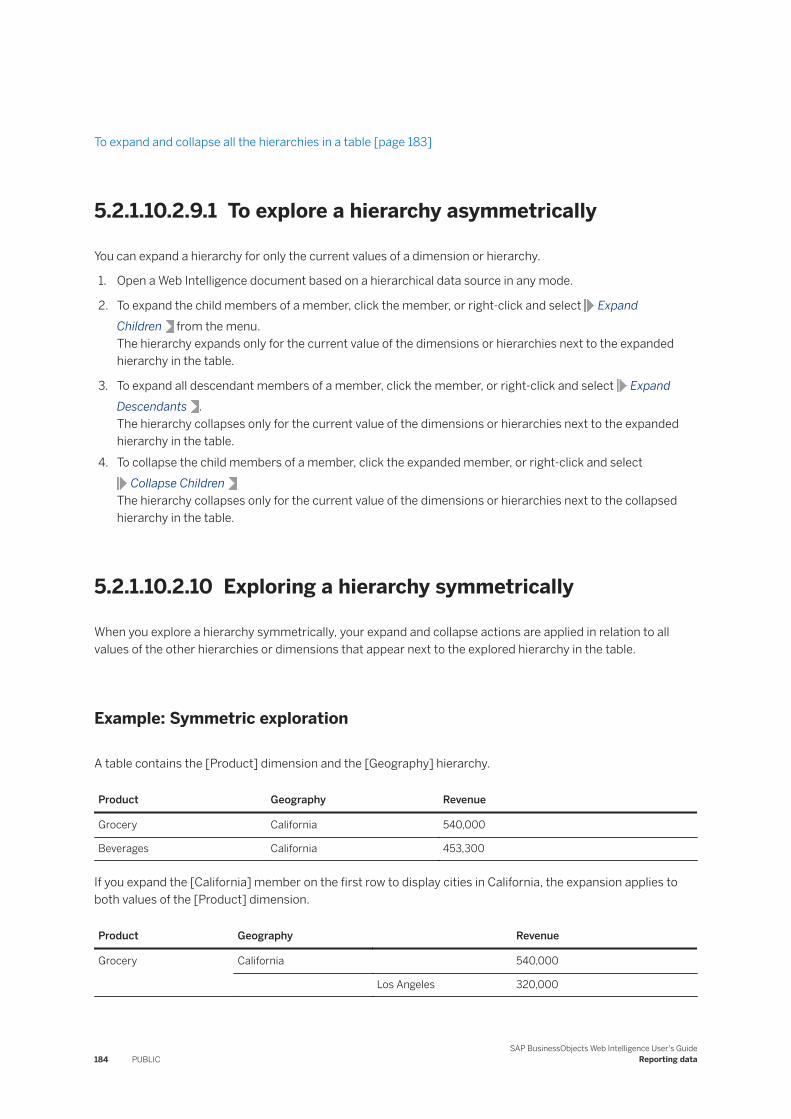
To expand and collapse all the hierarchies in a table [page 183]
5.2.1.10.2.9.1 To explore a hierarchy asymmetrically
You can expand a hierarchy for only the current values of a dimension or hierarchy.
1. Open a Web Intelligence document based on a hierarchical data source in any mode.
2. To expand the child members of a member, click the member, or right-click and select Expand Children from the menu.The hierarchy expands only for the current value of the dimensions or hierarchies next to the expanded hierarchy in the table.
3. To expand all descendant members of a member, click the member, or right-click and select Expand Descendants .The hierarchy collapses only for the current value of the dimensions or hierarchies next to the expanded hierarchy in the table.
4. To collapse the child members of a member, click the expanded member, or right-click and select Collapse Children
The hierarchy collapses only for the current value of the dimensions or hierarchies next to the collapsed hierarchy in the table.
5.2.1.10.2.10 Exploring a hierarchy symmetrically
When you explore a hierarchy symmetrically, your expand and collapse actions are applied in relation to all values of the other hierarchies or dimensions that appear next to the explored hierarchy in the table.
Example: Symmetric exploration
A table contains the [Product] dimension and the [Geography] hierarchy.
Product Geography Revenue
Grocery California 540,000
Beverages California 453,300
If you expand the [California] member on the first row to display cities in California, the expansion applies to both values of the [Product] dimension.
Product Geography Revenue
Grocery California 540,000
Los Angeles 320,000
184 PUBLICSAP BusinessObjects Web Intelligence User's Guide
Reporting data
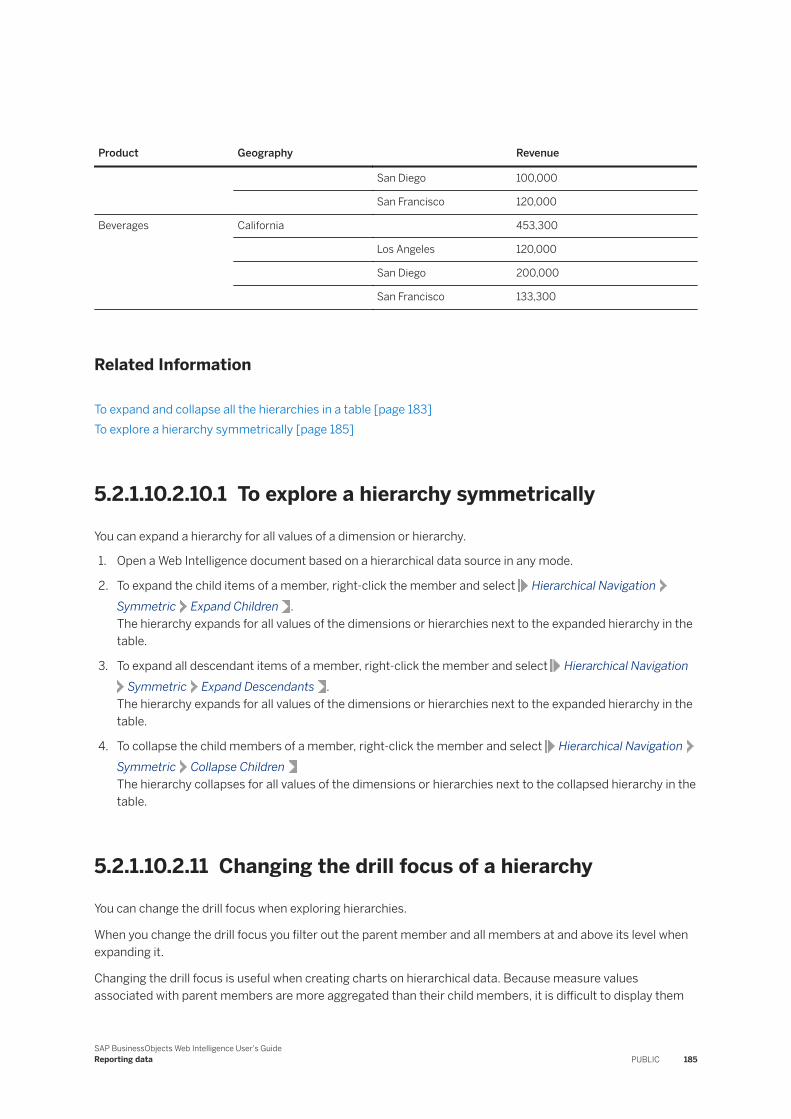
Product Geography Revenue
San Diego 100,000
San Francisco 120,000
Beverages California 453,300
Los Angeles 120,000
San Diego 200,000
San Francisco 133,300
Related Information
To expand and collapse all the hierarchies in a table [page 183]To explore a hierarchy symmetrically [page 185]
5.2.1.10.2.10.1 To explore a hierarchy symmetrically
You can expand a hierarchy for all values of a dimension or hierarchy.
1. Open a Web Intelligence document based on a hierarchical data source in any mode.
2. To expand the child items of a member, right-click the member and select Hierarchical NavigationSymmetric Expand Children .The hierarchy expands for all values of the dimensions or hierarchies next to the expanded hierarchy in the table.
3. To expand all descendant items of a member, right-click the member and select Hierarchical NavigationSymmetric Expand Descendants .
The hierarchy expands for all values of the dimensions or hierarchies next to the expanded hierarchy in the table.
4. To collapse the child members of a member, right-click the member and select Hierarchical NavigationSymmetric Collapse ChildrenThe hierarchy collapses for all values of the dimensions or hierarchies next to the collapsed hierarchy in the table.
5.2.1.10.2.11 Changing the drill focus of a hierarchy
You can change the drill focus when exploring hierarchies.
When you change the drill focus you filter out the parent member and all members at and above its level when expanding it.
Changing the drill focus is useful when creating charts on hierarchical data. Because measure values associated with parent members are more aggregated than their child members, it is difficult to display them
SAP BusinessObjects Web Intelligence User's GuideReporting data PUBLIC 185
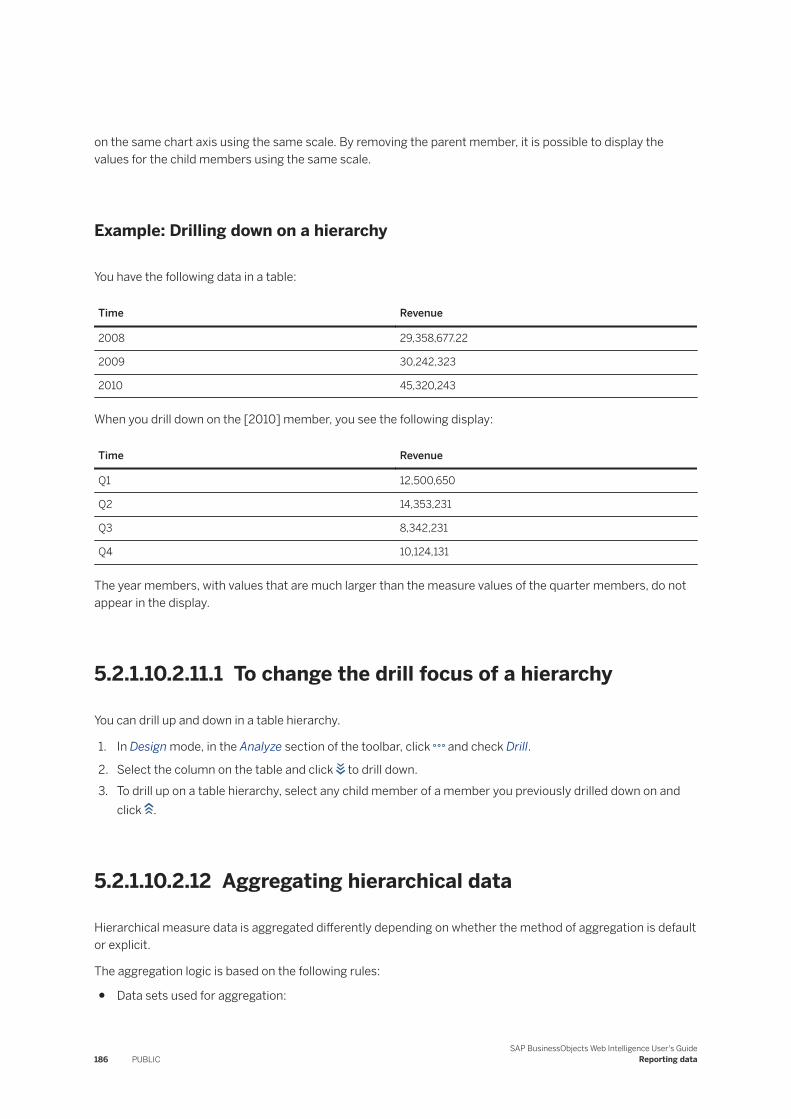
on the same chart axis using the same scale. By removing the parent member, it is possible to display the values for the child members using the same scale.
Example: Drilling down on a hierarchy
You have the following data in a table:
Time Revenue
2008 29,358,677.22
2009 30,242,323
2010 45,320,243
When you drill down on the [2010] member, you see the following display:
Time Revenue
Q1 12,500,650
Q2 14,353,231
Q3 8,342,231
Q4 10,124,131
The year members, with values that are much larger than the measure values of the quarter members, do not appear in the display.
5.2.1.10.2.11.1 To change the drill focus of a hierarchy
You can drill up and down in a table hierarchy.
1. In Design mode, in the Analyze section of the toolbar, click and check Drill.
2. Select the column on the table and click to drill down.3. To drill up on a table hierarchy, select any child member of a member you previously drilled down on and
click .
5.2.1.10.2.12 Aggregating hierarchical data
Hierarchical measure data is aggregated differently depending on whether the method of aggregation is default or explicit.
The aggregation logic is based on the following rules:
● Data sets used for aggregation:
186 PUBLICSAP BusinessObjects Web Intelligence User's Guide
Reporting data
1. When there is a hierarchy in a measure context the measure values for the root members of the hierarchy are aggregated - this is by default (the Aggregate() mechanism is not explicitly declared).
2. For explicit types (SUM, MAX, MIN), the hierarchical nature of the data is ignored. All the visible data is aggregated, including data that has already been aggregated (parent members already aggregated).
● Sensitivity to the collapse/expand status.1. Explicit aggregation only aggregates visible data, except when the set expression is used for a specific
hierarchy, then an aggregation is performed on the objects defined in the set expression.2. Default aggregation including the aggregate() function is not sensitive to the state of the collapse/
expand.
5.2.1.10.2.12.1 Default aggregation
In a default aggregation, the collapsed or expanded state of a hierarchy's item is not taken into account.
A measure in a report block is always aggregated with the context of that block. For example, if the block contains only one [Year] dimension, the measure will be aggregated for each value of the dimension: 2004, 2005, 2006 and so on. Also, if you aggregate every value of the measure for each quarter of each [Year] value using the Sum() function by default, Web Intelligence returns the sum of the measure for every quarter of each [Year] value.
This method of aggregation is called default aggregation, where it uses the default universe aggregation function specified by the universe designer at the universe creation. The default aggregation function is usually specified in the universe, although not always. For Excel data sources for instance, it is specified in the Query Panel. The aggregation is processed by Web Intelligence's calculator. The calculator can run aggregations using functions such as Sum(), Average(), Count(), Min() or Max().
A default aggregation uses the rolled-up values returned by the database. In other words, it is compatible with the aggregated values returned by the database. Default values are calculated by applying the default aggregation function to all the root values in the hierarchy. This means that a default aggregation does not count values more than once except in situations where the same value appears beneath different root items in a hierarchy.
Delegated aggregation
You can declare a function for a measure, which, by default, is delegated to the database. This means that when you use this measure in a report block, a query is sent to the database to retrieve the result of the aggregation depending on the context.
Delegated aggregations are mainly used for measures associated with hierarchical objects coming from SAP Business Explorer (BEx). That is because Web Intelligence cannot aggregate the values of a hierarchy that depends on the nodes and leaves retrieved by the query. Only the database knows the content of the hierarchical object in its entirety and is therefore able to aggregate a measure depending on that content.
SAP BusinessObjects Web Intelligence User's GuideReporting data PUBLIC 187
Related Information
Examples of default and explicit aggregation [page 188]
5.2.1.10.2.12.2 Explicit aggregation
In an explicit aggregation, you declare an aggregation function for the measure you want to aggregate.
In an explicit aggregation, Web Intelligence references the visual state of the hierarchy and uses the collapsed or expanded state of the members of the hierarchy to run calculations. As a result, values can be counted more than once, and the result of calculations can change depending on whether an item is collapsed or expanded.
For example, if an item is expanded and an explicit aggregation references both the item and one if its child items, depending on the rollup calculation, the value of the child may be counted twice: once for itself and once with the value of its parent. That is because Web Intelligence is adding the child and parent value.
Restriction concerning set-based explicit aggregation
When a measure is aggregated along hierarchies that are not part of the set expression declared in the aggregation function, the aggregation is not implicit.
For example, when hierarchies are present in a table and aggregation using set is in the table footer and the hierarchies in the table are not specified in the set expression, if there is a filter somewhere in the report which removes the initial roots of the hierarchy in the table, the system will not aggregate values for these roots, but along the original unfiltered roots (the original query result).
Related Information
Examples of default and explicit aggregation [page 188]
5.2.1.10.2.12.3 Examples of default and explicit aggregation
If you include a measure in a cell without specifiying an aggregation function, or if you use the Aggregate function, the measure is calculated using the default aggregation function.
Example: Default and explicit aggregation
You have a hierarchy with the following data and the hierarchy appears fully expanded in a report:
188 PUBLICSAP BusinessObjects Web Intelligence User's Guide
Reporting data
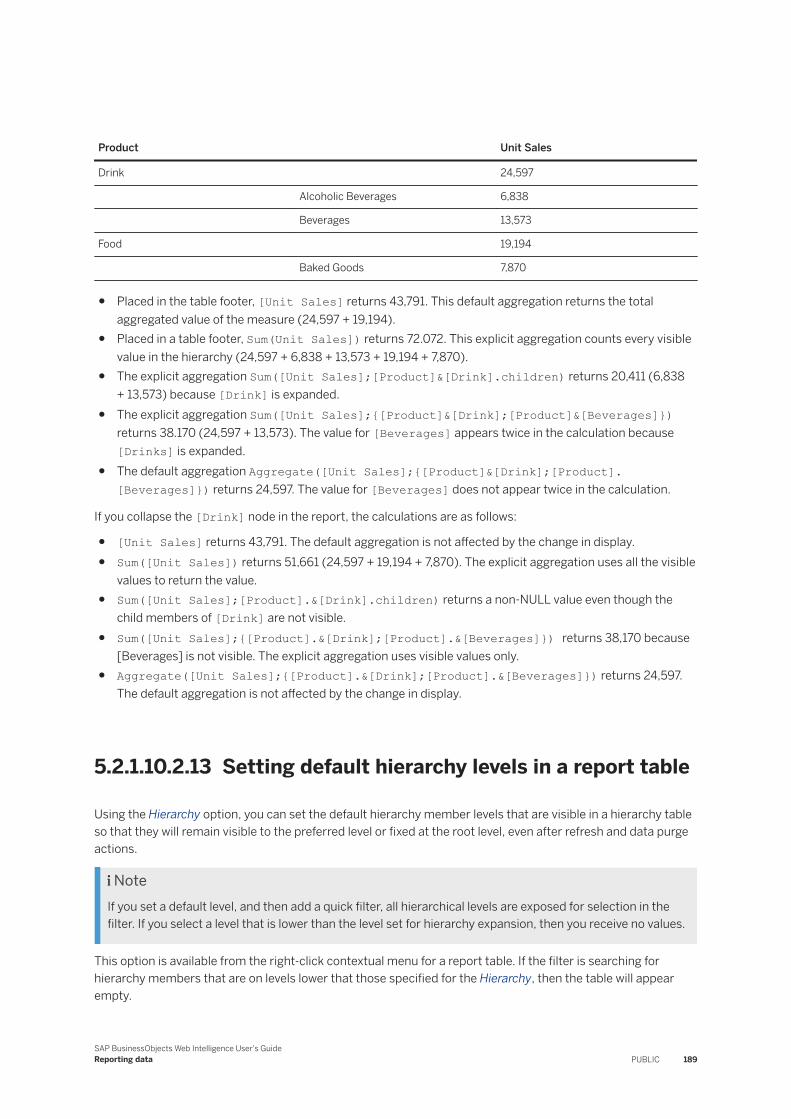
Product Unit Sales
Drink 24,597
Alcoholic Beverages 6,838
Beverages 13,573
Food 19,194
Baked Goods 7,870
● Placed in the table footer, [Unit Sales] returns 43,791. This default aggregation returns the total aggregated value of the measure (24,597 + 19,194).
● Placed in a table footer, Sum(Unit Sales]) returns 72.072. This explicit aggregation counts every visible value in the hierarchy (24,597 + 6,838 + 13,573 + 19,194 + 7,870).
● The explicit aggregation Sum([Unit Sales];[Product]&[Drink].children) returns 20,411 (6,838 + 13,573) because [Drink] is expanded.
● The explicit aggregation Sum([Unit Sales];{[Product]&[Drink];[Product]&[Beverages]}) returns 38.170 (24,597 + 13,573). The value for [Beverages] appears twice in the calculation because [Drinks] is expanded.
● The default aggregation Aggregate([Unit Sales];{[Product]&[Drink];[Product].[Beverages]}) returns 24,597. The value for [Beverages] does not appear twice in the calculation.
If you collapse the [Drink] node in the report, the calculations are as follows:
● [Unit Sales] returns 43,791. The default aggregation is not affected by the change in display.● Sum([Unit Sales]) returns 51,661 (24,597 + 19,194 + 7,870). The explicit aggregation uses all the visible
values to return the value.● Sum([Unit Sales];[Product].&[Drink].children) returns a non-NULL value even though the
child members of [Drink] are not visible.● Sum([Unit Sales];{[Product].&[Drink];[Product].&[Beverages]}) returns 38,170 because
[Beverages] is not visible. The explicit aggregation uses visible values only.● Aggregate([Unit Sales];{[Product].&[Drink];[Product].&[Beverages]}) returns 24,597.
The default aggregation is not affected by the change in display.
5.2.1.10.2.13 Setting default hierarchy levels in a report table
Using the Hierarchy option, you can set the default hierarchy member levels that are visible in a hierarchy table so that they will remain visible to the preferred level or fixed at the root level, even after refresh and data purge actions.
NoteIf you set a default level, and then add a quick filter, all hierarchical levels are exposed for selection in the filter. If you select a level that is lower than the level set for hierarchy expansion, then you receive no values.
This option is available from the right-click contextual menu for a report table. If the filter is searching for hierarchy members that are on levels lower that those specified for the Hierarchy, then the table will appear empty.
SAP BusinessObjects Web Intelligence User's GuideReporting data PUBLIC 189
Normally, the hierarchy in a table is automatically collapsed to the root hierarchy member in the following cases:
● You have just opened the document.● You have changed the root members of the hierarchy.● You have purged or refreshed a document.
If you don't use this option, then when a document is refreshed and the root members of the hierarchy are changed, or when the document has been purged and refreshed, the hierarchy in the table is automatically collapsed to the root hierarchy member.
Impact of a document refresh on hierarchies
Refreshing a document that contains hierarchies can impact the way they appear in a report. A collapsed hierarchy for example might expand after your refresh the document.
If the Refresh on open option is activated, the data is purged when you open the document. As a consequence, hierarchies are reset and collapsed to avoid having missing nodes after a refresh that could corrupt the document. However, if the document contains filters that apply to hierarchies, they are expanded to prevent the creation of empty blocks caused by a negative filter on the roots of a hierarchy that could potentially be filtered out.
This behavior doesn't apply when you do a standard refresh in a document because there's no data purge. Therefore, the application has a reference to compare with and doesn't need to reset the hierarchies.
5.2.1.10.2.13.1 Using the Default Level Expansion setting
To avoid expanding all levels of a hierarchy, you can use the Default Level Expansion setting to specify which levels of the hierarchy should be expanded.
In Web Intelligence, hierarchies support up to 99 levels. If you set the Default Level Expansion to None in a hierarchy that has four levels for instance, the setting does not apply to the hierarchy. In this instance, all levels will be collapsed in the report after a refresh with data purge or a refresh on open. However, if a filter is applied to that hierarchy, the four levels will be expanded.
CautionSetting the Default Level Expansion setting to None in a hierarchy does not mean that it will be collapsed. It means that you do not apply any default expansion level.
Related Information
Setting default hierarchy levels in a report table [page 189]To set the default hierarchy level in a report table [page 191]
190 PUBLICSAP BusinessObjects Web Intelligence User's Guide
Reporting data
5.2.1.10.2.13.2 To set the default hierarchy level in a report table
You can set the default number of hierarchy levels on a hierarchy member that are visible in a report table.
1. In Design mode, select the report that contains the table you want to configure.
2. Right-click in the table the hierarchy whose level you want to set, and select Hierarchy Set Default Level .
3. In the Set Default Level contextual list, do one of the following:
○ Set the default level expansion from None to 4.○ Select More to select or enter in the Set Default Level dialog box any level between 1 and 99.
5.2.1.11 Viewing modes
Depending on how you want to work with data and how you want the data to appear, you can switch between two viewing modes.
By default, the document opens in quick display mode. This mode displays tables, reports, and free standing cells in reports and a maximum number of vertical and horizontal records, depending on the settings. It also specifies the minimum page width and height and the amount of padding around the edges of the report. We recommending using the quick display mode when you want to focus on analyzing results, add calculations or formulas, or add breaks or sorts to tables to organize results. Note that the Avoid page break option has no effect in quick display mode.
The print layout mode simulates a printout or generated .PDF file, with headers, footers and margins. It's a pagination mode based on standard formats, such as A4, A3, … We recommend using the print layout when you want to fine-tune the formatting of tables and charts, and the layout of report pages.
In Design mode, you can switch between viewing modes using the toggle in the toolbar. If you're in Reading mode, the icon is in the vanishing toolbar at the bottom of the report canvas. When off, the report is in quick display mode. When on, the report is displayed in print layout.
In Design mode, there're multiple settings you can edit in the Format panel. Make sure no element is selected on the canvas, or you won't see these settings.
Parameter Description
Rows Number of horizontal records.
Table headers, footers, free standing cells, charts, and section cells when the section isn't empty, don't count as rows. Section cells count as vertical rows when the section is empty. This applies to quick display mode only.
Columns Number of vertical records. This applies to quick display mode only.
Size The page size of the report. This applies to print layout only.
SAP BusinessObjects Web Intelligence User's GuideReporting data PUBLIC 191
Parameter Description
Orientation The orientation of the report. This applies to print layout only.
Padding Sets the margins of the page. This applies to print layout only.
Adjust to Sets the report size using a specific percentage, and calculates the height and width automatically. Applies to print layout only.
Fit to Sets the report size using a specific number of page, both for height and width. Applies to print layout only.
5.2.1.12 Folding and unfolding report data
You can hide and display report data by folding and unfolding report elements.
You can fold and unfold sections, breaks and tables if they have a header or a footer. Data is concealed and displayed in different ways depending on the report element.
Report element Result
Section When a section is folded, section details are hidden and free cells only are displayed. In Reading mode, you can fold and unfold sections.
Table or break When a table or break is folded, the rows are concealed, and only headers and footers are displayed. Tables must have headers and footers to be folded and unfolded.
Vertical tables, horizontal tables and cross tables can be folded and unfolded.
In Reading mode, you can fold and unfold sections.
5.2.1.12.1 To fold and unfold report data
You can fold and unfold data in Reading and Design.
Only report elements that have a header or a footer can be folded or unfolded.
1. In the Analyze section of the toolbar, click .2. Check Fold/Unfold.
3. Click and to fold and unfold tables, breaks, and sections, and for cross tables. If you're folding/
unfolding a cross-table, after you've clicked , select whether you want to fold/unfold rows or columns in the dedicated contextual menu.
192 PUBLICSAP BusinessObjects Web Intelligence User's Guide
Reporting data
5.2.1.12.2 To redisplay all hidden content in a report
You can hide tables, cells and sections in reports.
1. Right-click the report containing hidden content.
2. Click Hide Show All Hidden Content .
5.2.1.13 Tracking changes in data
To make informed and effective business intelligence decisions, you need to understand how the data on which you base those decisions changes over time.
You can track and display data changes to help you focus your analysis on key areas and avoid wasting time exploring irrelevant data.
When you track data changes, you select a particular data refresh as a reference point. This data is known as the reference data. When you activate data tracking, you see your data in relation to the reference data.
Here are some examples of data tracking:
● If an outlet no longer appears in a list of the top outlets by sales, it would be interpreted as deleted from the list. You can use this information to investigate why the outlet is no longer a top performer.
● If sales have decreased in a region, data tracking displays the decrease. You can then drill down into the data for the region to understand why revenue is falling.
In both these cases, data tracking makes the current data more meaningful by placing it in context with older data. Without this context it's much more difficult to identify trends.
NoteStatus “changes” of tracking data changes is only for a detail value when displayed with its associated dimension in the table. When the detail is given without it is associated dimension it is considered as a dimension and does not show the status changes (but only shows when the detail is inserted/deleted).
Related Information
Types of data change [page 194]Automatic update tracking mode [page 194]Absolute reference data tracking mode [page 194]To activate data tracking [page 195]To display changed data [page 196]Configuring the appearance of changed data [page 195]To configure the appearance of changed data [page 195]How changed data is displayed in blocks [page 196]How changed data is displayed in blocks with breaks [page 200]How changed data is displayed in sections [page 198]
SAP BusinessObjects Web Intelligence User's GuideReporting data PUBLIC 193
How changed data is displayed in reports with merged dimensions [page 197]How changed data is displayed in charts [page 200]
5.2.1.13.1 Types of data change
You configure the display of data changes through the interface or formula language.
You can track the following types of data change:
● Inserted data● Deleted data● Changed data● Increased values● Decreased values
The formula language provides advanced users with additional power and flexibility in displaying and formatting changed data.
5.2.1.13.2 Automatic update tracking mode
In the Auto-update data tracking mode, you always compare the current data with the data before the last refresh.
This is achieved by automatically setting the current data as the reference data just before each refresh. The reference data is always one refresh behind the current data.
Automatic data tracking is appropriate for scheduled documents when you want to compare the current data with the data before the last refresh.
RestrictionThis applies only to documents scheduled to the Web Intelligence output format.
5.2.1.13.3 Absolute reference data tracking mode
In the Fixed data tracking mode, you manually select the reference data in the Data Tracking dialog box.
You continue to use this data as a reference point until you update the reference point.
194 PUBLICSAP BusinessObjects Web Intelligence User's Guide
Reporting data
5.2.1.13.4 To activate data tracking
Track and display data changes to help you focus your analysis on key areas.
1. In the Analyze section of the toolbar, click .2. Click Track Data Changes.3. Select one the options below for the reference data:
○ Compare with last data refreshThe current data becomes the reference data after each refresh. The report always shows the difference between the most recent data and the data before the last refresh.
○ Compare with data refresh fromThe data refresh you choose becomes the reference data. The report always shows the difference between the most recent data and the data refresh you chose.
4. Select the report(s) for which you want to enable data tracking.5. Optional: Check Refresh data now to refresh the data right after the dialog box closes.6. Optional: In the Tacking options tab, select the events you want to be displayed.7. Optional: Click OK.
5.2.1.13.5 Configuring the appearance of changed data
You can configure the appearance (font style, size and color) of changed data in your document.
You can seperately configure the appearance of the following changes:
● Inserted, deleted dimensions and changed detail values● Increased or decreased measure values
Measure values can also adopt the formatting of inserted or deleted dimension values. For example, if a dimension value disappears from a list of values in a block, and the block also shows a measure value for the dimension, both the dimension and measure values appear as deleted data.
The BI administrator defines the default appearance of changed data in the Central Management Console (CMC). When you configure the appearance of changed data locally, you override the CMC defaults. For more information on the configuration in the CMC, refer to To modify display settings for Web Intelligence in the Business Intelligence Platform CMC Help.
5.2.1.13.5.1 To configure the appearance of changed data
You can configure the appearance of changed data in the Data Tracking dialog.
1. In the Analyze section of the toolbar, click > Track Data Changes.2. Optional: By default, data tracking applies to the whole document. Select the reports to which you want to
apply data tracking using the dedicated checkboxes next to the reports' name in the Report section of the dialog.
SAP BusinessObjects Web Intelligence User's GuideReporting data PUBLIC 195
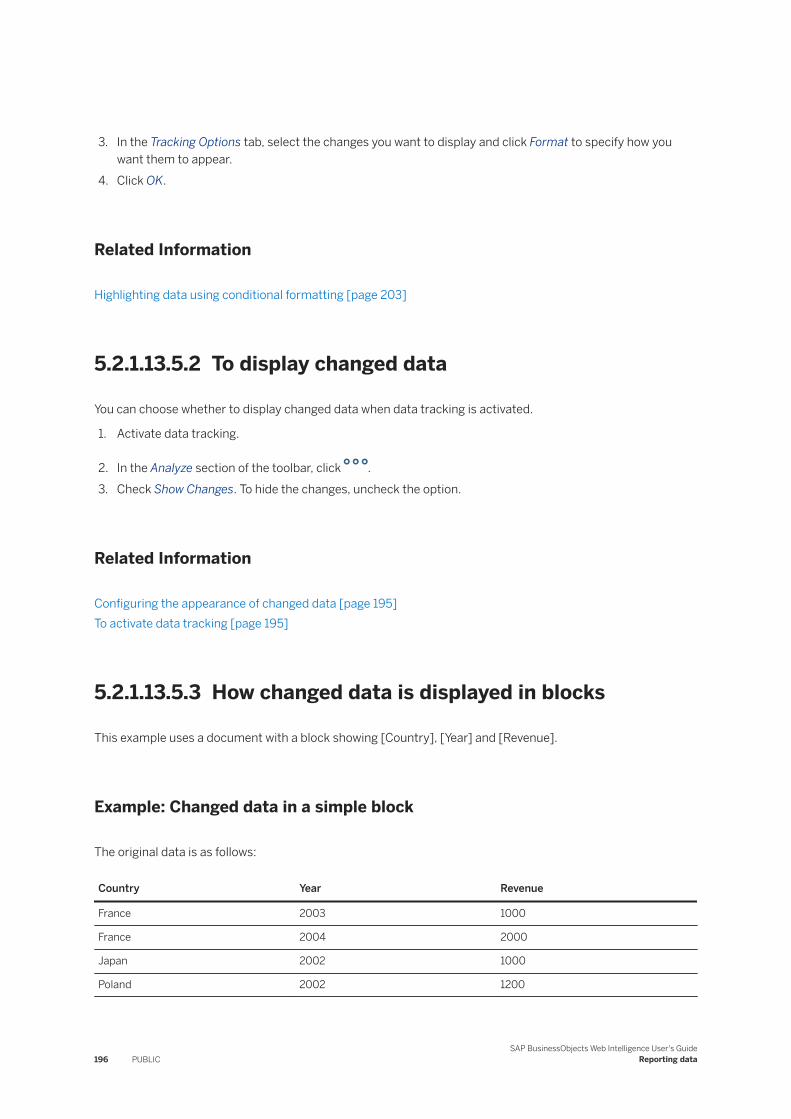
3. In the Tracking Options tab, select the changes you want to display and click Format to specify how you want them to appear.
4. Click OK.
Related Information
Highlighting data using conditional formatting [page 203]
5.2.1.13.5.2 To display changed data
You can choose whether to display changed data when data tracking is activated.
1. Activate data tracking.
2. In the Analyze section of the toolbar, click .3. Check Show Changes. To hide the changes, uncheck the option.
Related Information
Configuring the appearance of changed data [page 195]To activate data tracking [page 195]
5.2.1.13.5.3 How changed data is displayed in blocks
This example uses a document with a block showing [Country], [Year] and [Revenue].
Example: Changed data in a simple block
The original data is as follows:
Country Year Revenue
France 2003 1000
France 2004 2000
Japan 2002 1000
Poland 2002 1200
196 PUBLICSAP BusinessObjects Web Intelligence User's Guide
Reporting data
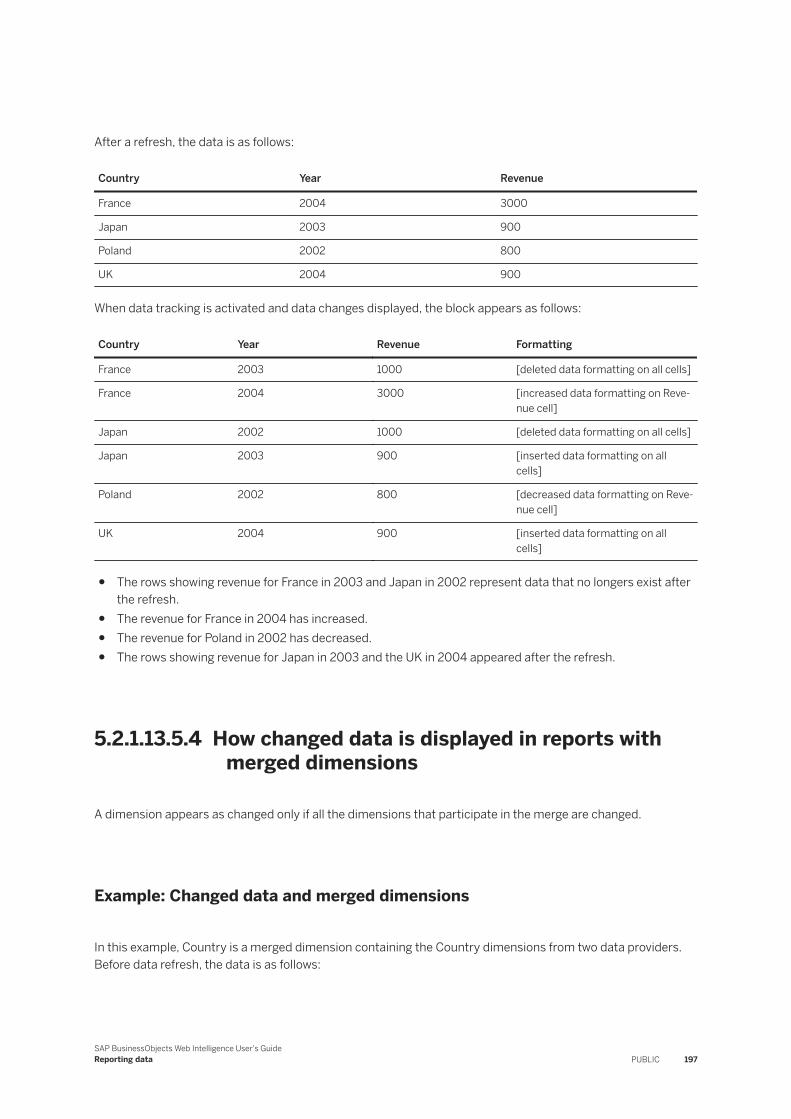
After a refresh, the data is as follows:
Country Year Revenue
France 2004 3000
Japan 2003 900
Poland 2002 800
UK 2004 900
When data tracking is activated and data changes displayed, the block appears as follows:
Country Year Revenue Formatting
France 2003 1000 [deleted data formatting on all cells]
France 2004 3000 [increased data formatting on Revenue cell]
Japan 2002 1000 [deleted data formatting on all cells]
Japan 2003 900 [inserted data formatting on all cells]
Poland 2002 800 [decreased data formatting on Revenue cell]
UK 2004 900 [inserted data formatting on all cells]
● The rows showing revenue for France in 2003 and Japan in 2002 represent data that no longers exist after the refresh.
● The revenue for France in 2004 has increased.● The revenue for Poland in 2002 has decreased.● The rows showing revenue for Japan in 2003 and the UK in 2004 appeared after the refresh.
5.2.1.13.5.4 How changed data is displayed in reports with merged dimensions
A dimension appears as changed only if all the dimensions that participate in the merge are changed.
Example: Changed data and merged dimensions
In this example, Country is a merged dimension containing the Country dimensions from two data providers. Before data refresh, the data is as follows:
SAP BusinessObjects Web Intelligence User's GuideReporting data PUBLIC 197
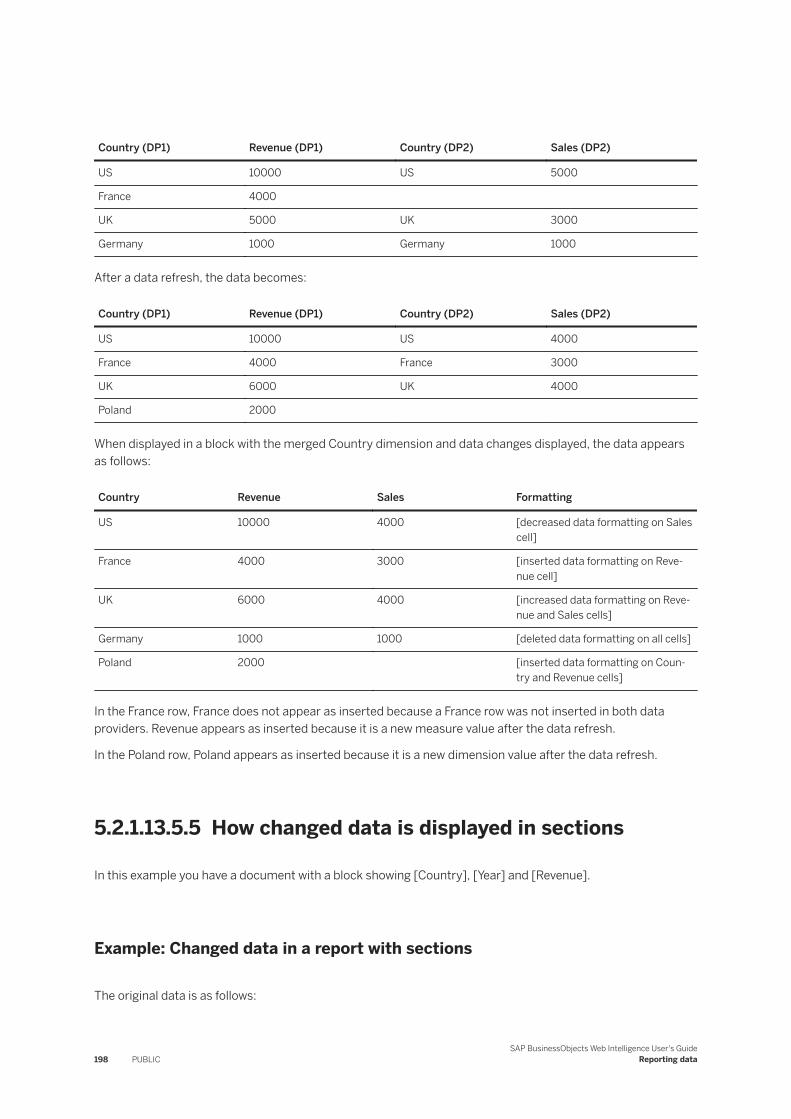
Country (DP1) Revenue (DP1) Country (DP2) Sales (DP2)
US 10000 US 5000
France 4000
UK 5000 UK 3000
Germany 1000 Germany 1000
After a data refresh, the data becomes:
Country (DP1) Revenue (DP1) Country (DP2) Sales (DP2)
US 10000 US 4000
France 4000 France 3000
UK 6000 UK 4000
Poland 2000
When displayed in a block with the merged Country dimension and data changes displayed, the data appears as follows:
Country Revenue Sales Formatting
US 10000 4000 [decreased data formatting on Sales cell]
France 4000 3000 [inserted data formatting on Revenue cell]
UK 6000 4000 [increased data formatting on Revenue and Sales cells]
Germany 1000 1000 [deleted data formatting on all cells]
Poland 2000 [inserted data formatting on Country and Revenue cells]
In the France row, France does not appear as inserted because a France row was not inserted in both data providers. Revenue appears as inserted because it is a new measure value after the data refresh.
In the Poland row, Poland appears as inserted because it is a new dimension value after the data refresh.
5.2.1.13.5.5 How changed data is displayed in sections
In this example you have a document with a block showing [Country], [Year] and [Revenue].
Example: Changed data in a report with sections
The original data is as follows:
198 PUBLICSAP BusinessObjects Web Intelligence User's Guide
Reporting data
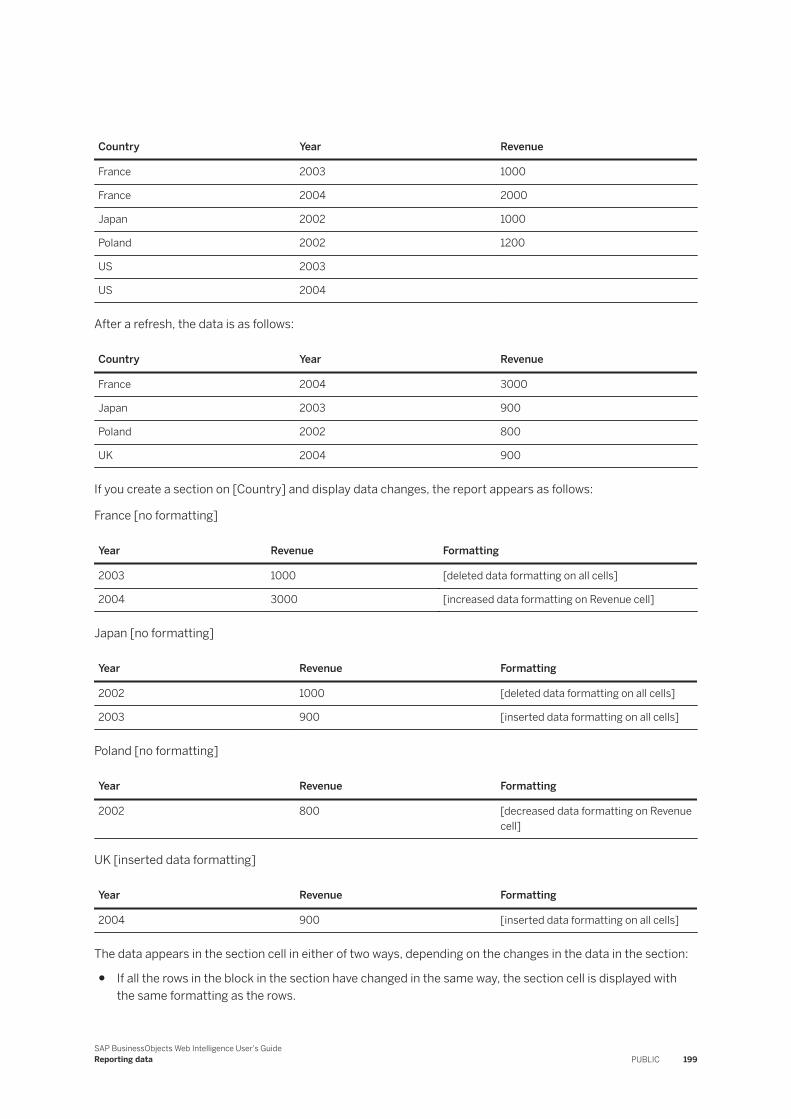
Country Year Revenue
France 2003 1000
France 2004 2000
Japan 2002 1000
Poland 2002 1200
US 2003
US 2004
After a refresh, the data is as follows:
Country Year Revenue
France 2004 3000
Japan 2003 900
Poland 2002 800
UK 2004 900
If you create a section on [Country] and display data changes, the report appears as follows:
France [no formatting]
Year Revenue Formatting
2003 1000 [deleted data formatting on all cells]
2004 3000 [increased data formatting on Revenue cell]
Japan [no formatting]
Year Revenue Formatting
2002 1000 [deleted data formatting on all cells]
2003 900 [inserted data formatting on all cells]
Poland [no formatting]
Year Revenue Formatting
2002 800 [decreased data formatting on Revenue cell]
UK [inserted data formatting]
Year Revenue Formatting
2004 900 [inserted data formatting on all cells]
The data appears in the section cell in either of two ways, depending on the changes in the data in the section:
● If all the rows in the block in the section have changed in the same way, the section cell is displayed with the same formatting as the rows.
SAP BusinessObjects Web Intelligence User's GuideReporting data PUBLIC 199
● If the rows have changed in different ways, or only some rows have changed, the section cell retains its default format.
5.2.1.13.5.6 How changed data is displayed in blocks with breaks
When a block contains a break and the Merge block property is set, the display of the centered value follows rules similar to those for section cells.
● If all the rows in the break have changed in the same way, the centered value is displayed with the same formatting as the rows.
● If the rows have changed in different ways, or only some rows have changed, the centered value retains the default formatting.
5.2.1.13.5.7 How changed data is displayed in charts
When the data in a chart has changed, a changed data icon appears above the chart.
When you click the icon, the chart changes to a table to allow you to see the details of the changes.
5.2.1.13.6 Data tracking restrictions
If you change or purge a data provider, the report no longer displays changed data.
If the data provider is changed, the current version of the document is no longer compatible with the reference version. If the data is cleared, the old data no longer exists for comparison.
As a result, the following actions are incompatible with data tracking:
● Drill out of scope● Query drill● Deleting a query● Any modification (including modifications to security rights) that changes the SQL generated by a data
provider● Purging the document
When you perform any of these actions, the data history of the document is cleared because the actions are incompatible with the display of changed data. For example, if you modify a query, the data in the document changes because of the modification. Any comparison between this data and old data generated from a different query is misleading.
NoteWhen you use query drill or drill out of scope, the data history is cleared because these actions change the data provider. This should not affect you because, when you start to drill, you have already identified the
200 PUBLICSAP BusinessObjects Web Intelligence User's Guide
Reporting data
data that requires further analysis. Data tracking has served its purpose and you can now continue with your data analysis.
Related Information
Drilling with query drill [page 368]
5.2.1.13.6.1 Data tracking and Refresh on Open
When a document is set to refresh its data on opening (when the Refresh on open document property is selected), data tracking does not display the difference between the data prior to the refresh and the data after the refresh.
The data after the refresh is considered to be new data because the refresh purges the document.
NoteWhen you enable the Refresh on open document property, the document displays the latest information each time you open the document. The Refresh on open option is dependent on the following settings in the CMC (configured by the BI administrator):
● In Applications Web Intelligence , from the Manage list, select Properties. In the Automatic Document Refresh on Open Security Right Setting section, the property Automatic Refresh security setting is enabled.
● In Applications Web Intelligence , from the Manage list, select User Security. When you select a user profile and click View Security, check that the Document - disable automatic refresh on open security right is disabled.
In the settings are set as listed above, then even if the document is not set as being Refresh on open, the data will still be refreshed when the document is opened.
Related Information
To save a document in the corporate repository [page 353]
5.2.1.13.7 Using formulas to track changed data
You can use formulas to create alerters that let you know when data has changed in a document.
These custom alerters do not appear in the list of standard alerters.
SAP BusinessObjects Web Intelligence User's GuideReporting data PUBLIC 201
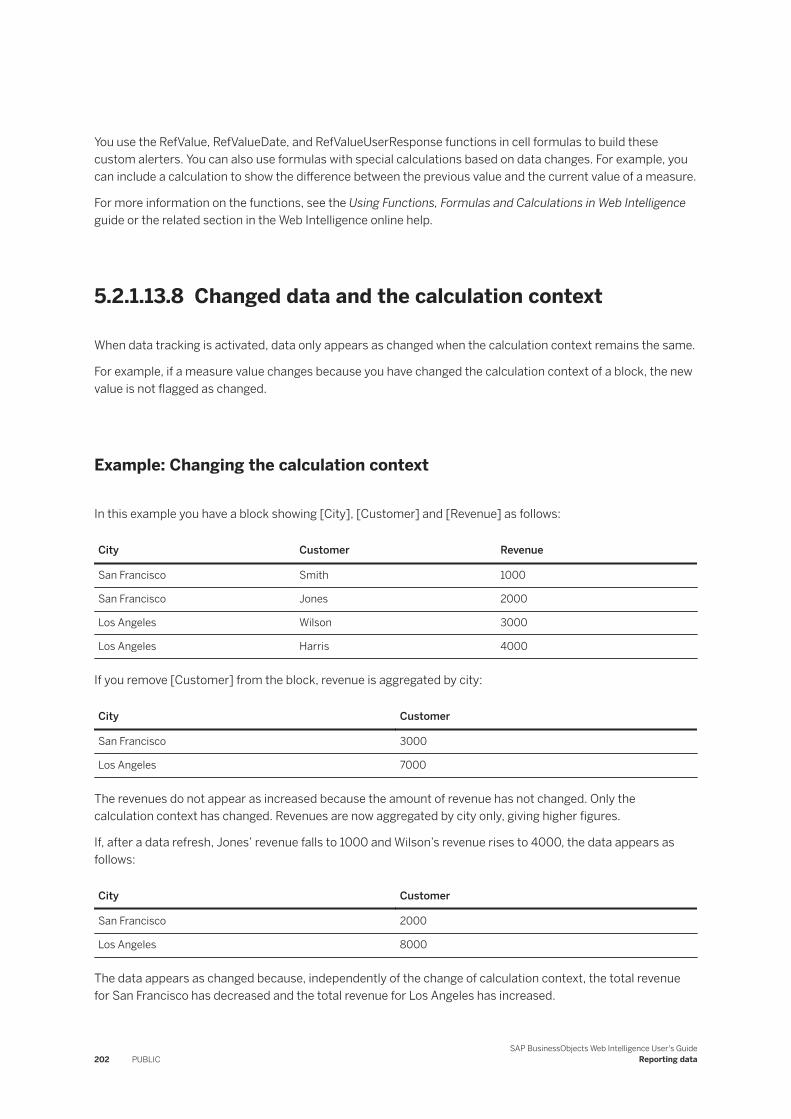
You use the RefValue, RefValueDate, and RefValueUserResponse functions in cell formulas to build these custom alerters. You can also use formulas with special calculations based on data changes. For example, you can include a calculation to show the difference between the previous value and the current value of a measure.
For more information on the functions, see the Using Functions, Formulas and Calculations in Web Intelligence guide or the related section in the Web Intelligence online help.
5.2.1.13.8 Changed data and the calculation context
When data tracking is activated, data only appears as changed when the calculation context remains the same.
For example, if a measure value changes because you have changed the calculation context of a block, the new value is not flagged as changed.
Example: Changing the calculation context
In this example you have a block showing [City], [Customer] and [Revenue] as follows:
City Customer Revenue
San Francisco Smith 1000
San Francisco Jones 2000
Los Angeles Wilson 3000
Los Angeles Harris 4000
If you remove [Customer] from the block, revenue is aggregated by city:
City Customer
San Francisco 3000
Los Angeles 7000
The revenues do not appear as increased because the amount of revenue has not changed. Only the calculation context has changed. Revenues are now aggregated by city only, giving higher figures.
If, after a data refresh, Jones’ revenue falls to 1000 and Wilson’s revenue rises to 4000, the data appears as follows:
City Customer
San Francisco 2000
Los Angeles 8000
The data appears as changed because, independently of the change of calculation context, the total revenue for San Francisco has decreased and the total revenue for Los Angeles has increased.
202 PUBLICSAP BusinessObjects Web Intelligence User's Guide
Reporting data
5.2.1.14 Highlighting data using conditional formatting
Conditional formatting enables you to highlight results or change formatting based on data.
You can, for example, conditionally format results to highlight particularly high or low results with specific colors or with text comments, such as High Performer or Low Performer.
Although the conditional formatting can only be defined in Design mode, the effects can be seen in both modes.
You can apply conditional formatting to:
● Columns in a vertical table● Rows in a horizontal table● Cells in forms and crosstables● Section cells● Free-standing cells
You can apply up to 30 conditional formatting rules in a document. You can apply these rules to a maximum of 20 table columns or rows, free-standing cells, or section cells on the reports. You can apply up to 10 different rules on a single table column or row, free-standing cell, or section cell.
You can define conditional formatting rules to activate the following formatting changes:
● Text color, size and style● Cell border colors and style● Cell background display – specific colors, images, or hyperlinks to web pages
You can also define rules that display text or a formula, an image, or a hyperlink. In this case, the results that meet the condition defined in the rule will be replaced by the text or formula.
NoteHyperlinks display as active only when your system administrator has authorized them in Web Intelligence.
Conditional formatting is dynamic. When you refresh reports with the latest data from the database, the rules highlight the new results accordingly.
If you apply conditional formatting to a table row or column with a break, the rule is only activated when the value that meets the conditional rule appears on the first row of that break.
5.2.1.14.1 Conditions in conditional formatting
Conditional formatting rules contain multiple conditions, allowing you to apply multiple formats depending on the data.
A conditional formatting rule operates as follows:
If <Main Condition> is true, Apply <Main Format> ElseIf <Second Condition> is true, Apply <Second Format>ElseIf <Third Condition> is true, Apply <Third Format>ElseIf... Else Apply <Default Format>
SAP BusinessObjects Web Intelligence User's GuideReporting data PUBLIC 203
In the above example, if <Main Condition> is Sales Revenue > 100,000 and <Main Format> formats the text in blue, the conditional formatting displays the measure in blue whenever the Sales Revenue measure is greater than 100,000.
If <Second Condition> is Sales Revenue < 10,000 and <Second Format> formats the text in red, the conditional formatting also displays the measure in red whenever its value is less than 10,000.
Each condition can contain multiple tests, and all tests must return True for the conditional formatting to be applied. For example, a condition can test the values of the [Country] and [Resort] objects. Both objects must return the value specified in the test for the formatting to be applied.
5.2.1.14.2 To build a conditional formatting rule
1. In Design mode, click in the Analyze section of the toolbar.2. Click Formatting Rules.
3. Click .4. Add a name and a description.5. Click ... next to the Filter field.
You can't define a rule on a cell containing a date or numeric type data (for example, a date or a calculation) because the application considers any value you type into the Value text box as a character string.
6. Select whether you want to filter the cell contents only, or an object or variable.7. Select an operator.8. Select an operand, either by typing it in, or by using the dedicated menu.
When typing the value directly, a placeholder lets you know how to fill the value field if the operand you select requires a particular format.
9. Optional: To add an additional test within the condition, click by the existing conditions to add one, and
repeat the steps above. To delete a condition, click .
10. To trigger the condition using a formula, click Condition Formula Editor .○ If you want your formula to return a text string, don't include quote marks before or after the text. For
example, if you want the alerter to display OVERDUE, simply type: OVERDUE.○ The formula must return True or False. True triggers the condition; False doesn't. For example, if the
formula is RowIndex()=3, the conditional formatting appears on the fourth row of the table.
11. Optional: To add a condition to the rule, click Add and define the condition or build a formula as described above.
12. After you've defined a condition, click Format and edit the styling options as you see fit. The format you create applies automatically to the data whenever the rule applies.
13. Click OK to save the formatting options, then OK to set the rule format in the report.
204 PUBLICSAP BusinessObjects Web Intelligence User's Guide
Reporting data
5.2.1.14.3 To set the format displayed by a conditional formatting rule
For your content to be read as HTML or a hyperlink, your system administrator must authorize HTML or hyperlinks.
1. In Design mode, click in the Analyze section of the toolbar.2. Click Formatting Rules.
3. Select a rule from the list and click .4. Click Format under the condition you want to edit.5. To display text or a formula, click the Display tab and build the formula. In the Display tab, build a formula
and using the Read content as field, decide whether you want to be read as HTML, a hyperlink and a URL to an image. You can also change the number format using predefined formats, and create a custom format.
NoteIf you read the content as HTML, the Autofit Width and Autofit Height properties don't work because the size of the HTML data in a cell can't be decoded by the browser properly. The browser render the HTML content you provide. The application doesn't modify your HTML code to set the width and height.
6. Browse through the different tabs to edit the text, background and border properties.
Related Information
To build a conditional formatting rule [page 204]
5.2.1.14.4 To apply conditional formatting
You can apply conditional formatting rules to report elements.
You can format:
● Columns in a vertical table● Rows in a horizontal table● Cells in forms and crosstables● Section cells● Free-standing cells
1. In Design mode, select a report element.
2. Click in the Analyze section of the toolbar.3. Click Formatting Rules and select a rule from the list.
SAP BusinessObjects Web Intelligence User's GuideReporting data PUBLIC 205
You can also apply several exisiting rules to table columns and rows using the contextual menu. Right-click a column or row, select Formatting Rules, and uses the checkboxes to select the rules.
5.2.1.14.5 To manage conditional formats
1. In Design mode, click in the Analyze section of the toolbar.2. Click Formatting Rules.3. Use the icons at the bottom of the dialog box to add, edit, remove or duplicate rules.
5.2.1.14.6 Using formulas to create advanced conditional formatting rules
You can build advanced conditional formatting rules using the formula language.
Example: Highlighting three ranges of quarterly sales revenue results calculated as percentages of the average sales revenue
In this example, you build three rules to color-code sales revenues, depending on their relationship to the average sales revenue. The table includes results for three years, and this is the average to which you want to compare each sales revenue result calculated per quarter per product line.
Using the formula option, create a rule with three conditions:
Condition:
[Sales revenue] < ((Average([Sales revenue]) In Block) * 0.8)
Else Condition:
=[Sales revenue] < ((Average([Sales revenue]) In Block) * 1.2)
Else Condition:
=[Sales revenue] > ((Average([Sales revenue]) In Block) * 1.2)
The formula you specify for each condition works as follows:
● The first condition applies when sales revenues are are < 0.8, or 80%, of the average.● The second condition applies when sales revenues are < 1.2, or less than 120%, of the average.● The third applies when sales revenue are > 1.2, or greater than 120%, of the average.
206 PUBLICSAP BusinessObjects Web Intelligence User's Guide
Reporting data
You can then format the data differently for each conditions:
● With the first condition, report cells containing sales revenue that's less than 80% of the average revenue display the revenue in red.
● With the second condition, report cells containing sales revenue that's less than 20% above the average revenue display the revenue in blue.
NoteThis condition covers values also covered by the first condition. For example, if the average is 100, 79 is less than 80% below the average and less than 20% above the average. In this case, the first condition takes precedence.
● With the third condition, report cells containing sales revenue that is greater than 20% above the average revenue display the revenue in green.
This formatting enables you to see at a glance which product lines are generating above average, below average, or close to average sales revenue.
5.2.1.15 Ranking report data
Ranking allows you to isolate the top and/or bottom records in a set based on a variety of criteria.
For example, if you have a block showing countries and associated revenues, ranking allows you to rank the data in the block to show the top 3 countries only, based on the revenue they generate.
Ranking allows you to answer business questions such as:
● Which 3 regions generate the most revenue?● Which are the bottom 10% of stores in terms of revenue generation?● What is the group of the best-performing stores that generates a combined revenue of up to $10,000,000?
You can rank data in many ways to answer these kinds of business questions. You can:
● Rank the top and/or bottom n records by dimension (for example Country) based on the sum of a related measure (for example Revenue).
● Rank the top and/or bottom n% of the total number of records by dimension. based on the value of a related measure as a percentage of the total value of the measure.
● Rank the top and/or bottom n records by dimension based on the cumulative sum of a related measure.● Rank the top and/or bottom n records by dimension based on the value of a related measure as a
cumulative percentage of the total value of the measure.
SAP BusinessObjects Web Intelligence User's GuideReporting data PUBLIC 207
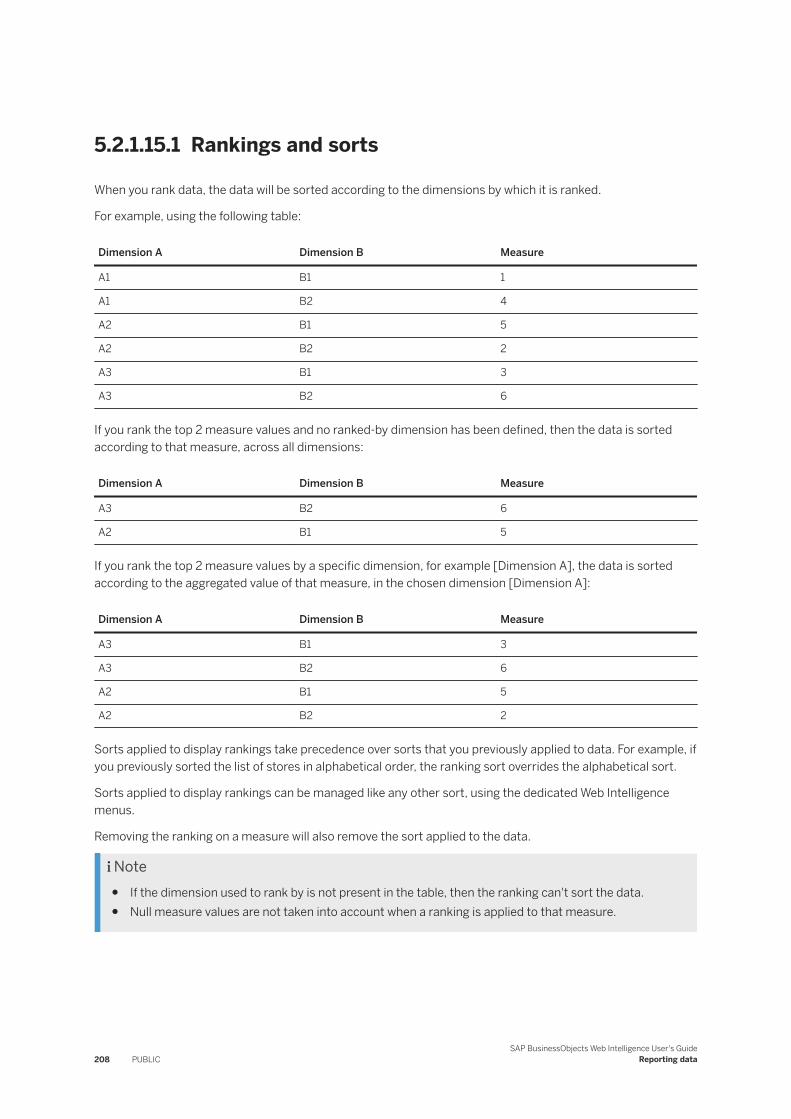
5.2.1.15.1 Rankings and sorts
When you rank data, the data will be sorted according to the dimensions by which it is ranked.
For example, using the following table:
Dimension A Dimension B Measure
A1 B1 1
A1 B2 4
A2 B1 5
A2 B2 2
A3 B1 3
A3 B2 6
If you rank the top 2 measure values and no ranked-by dimension has been defined, then the data is sorted according to that measure, across all dimensions:
Dimension A Dimension B Measure
A3 B2 6
A2 B1 5
If you rank the top 2 measure values by a specific dimension, for example [Dimension A], the data is sorted according to the aggregated value of that measure, in the chosen dimension [Dimension A]:
Dimension A Dimension B Measure
A3 B1 3
A3 B2 6
A2 B1 5
A2 B2 2
Sorts applied to display rankings take precedence over sorts that you previously applied to data. For example, if you previously sorted the list of stores in alphabetical order, the ranking sort overrides the alphabetical sort.
Sorts applied to display rankings can be managed like any other sort, using the dedicated Web Intelligence menus.
Removing the ranking on a measure will also remove the sort applied to the data.
Note● If the dimension used to rank by is not present in the table, then the ranking can't sort the data.● Null measure values are not taken into account when a ranking is applied to that measure.
208 PUBLICSAP BusinessObjects Web Intelligence User's Guide
Reporting data
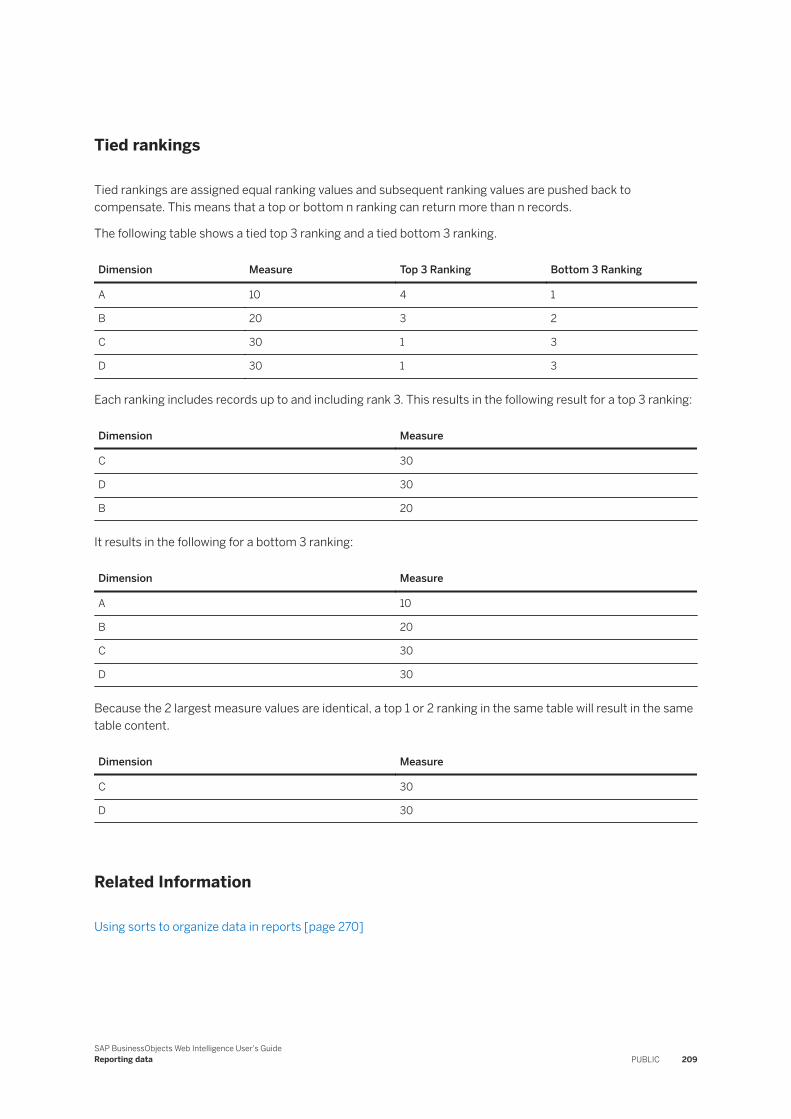
Tied rankings
Tied rankings are assigned equal ranking values and subsequent ranking values are pushed back to compensate. This means that a top or bottom n ranking can return more than n records.
The following table shows a tied top 3 ranking and a tied bottom 3 ranking.
Dimension Measure Top 3 Ranking Bottom 3 Ranking
A 10 4 1
B 20 3 2
C 30 1 3
D 30 1 3
Each ranking includes records up to and including rank 3. This results in the following result for a top 3 ranking:
Dimension Measure
C 30
D 30
B 20
It results in the following for a bottom 3 ranking:
Dimension Measure
A 10
B 20
C 30
D 30
Because the 2 largest measure values are identical, a top 1 or 2 ranking in the same table will result in the same table content.
Dimension Measure
C 30
D 30
Related Information
Using sorts to organize data in reports [page 270]
SAP BusinessObjects Web Intelligence User's GuideReporting data PUBLIC 209

5.2.1.15.2 Ranking and data order
You cannot rank on an object whose values depend on the data order because the ranking changes the data order.
If the data order is changed, the object data is changed and results in a recalculation of the ranking. The result is a circular dependency between the ranking and the object that cannot be resolved.
If you create a rank on a measure whose values depend on the data order, for example a measure that uses the Previous function, the #RANK error code appears in all cells in the block.
For similar reasons, ranking on a measure using a running aggregation function such as RunningSum will not give any meaningful result, however no error code will be displayed in the block cells. The ranking cannot be meaningful because running calculations depend on the data context, which will be modified by the ranking operation.
For more information on the functions, see the Using Functions, Formulas and Calculations in Web Intelligence guide or the Web Intelligence online help.
5.2.1.15.3 Ranking in sections
You can apply ranking on blocks located within sections.
However, ranking on a measure using a context modifier such as ForEach or ForAll is not supported. If you use a context modifier, you will encounter unexpected results, because of the interaction of the implicit filter defined by the section instance with the calculation context modifier that is used in the ranked measure.
For more information on the functions, see the Using Functions, Formulas and Calculations in Web Intelligence guide or the Web Intelligence online help.
210 PUBLICSAP BusinessObjects Web Intelligence User's Guide
Reporting data
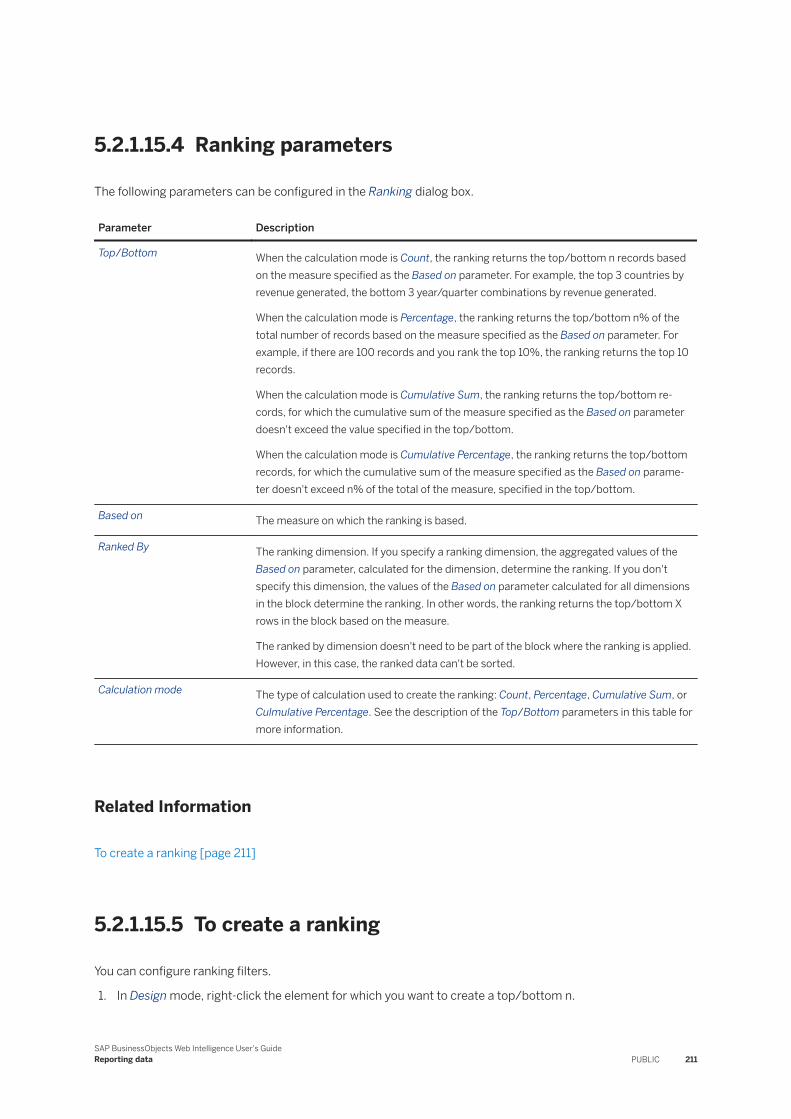
5.2.1.15.4 Ranking parameters
The following parameters can be configured in the Ranking dialog box.
Parameter Description
Top/Bottom When the calculation mode is Count, the ranking returns the top/bottom n records based on the measure specified as the Based on parameter. For example, the top 3 countries by revenue generated, the bottom 3 year/quarter combinations by revenue generated.
When the calculation mode is Percentage, the ranking returns the top/bottom n% of the total number of records based on the measure specified as the Based on parameter. For example, if there are 100 records and you rank the top 10%, the ranking returns the top 10 records.
When the calculation mode is Cumulative Sum, the ranking returns the top/bottom records, for which the cumulative sum of the measure specified as the Based on parameter doesn't exceed the value specified in the top/bottom.
When the calculation mode is Cumulative Percentage, the ranking returns the top/bottom records, for which the cumulative sum of the measure specified as the Based on parameter doesn't exceed n% of the total of the measure, specified in the top/bottom.
Based on The measure on which the ranking is based.
Ranked By The ranking dimension. If you specify a ranking dimension, the aggregated values of the Based on parameter, calculated for the dimension, determine the ranking. If you don't specify this dimension, the values of the Based on parameter calculated for all dimensions in the block determine the ranking. In other words, the ranking returns the top/bottom X rows in the block based on the measure.
The ranked by dimension doesn't need to be part of the block where the ranking is applied. However, in this case, the ranked data can't be sorted.
Calculation mode The type of calculation used to create the ranking: Count, Percentage, Cumulative Sum, or Culmulative Percentage. See the description of the Top/Bottom parameters in this table for more information.
Related Information
To create a ranking [page 211]
5.2.1.15.5 To create a ranking
You can configure ranking filters.
1. In Design mode, right-click the element for which you want to create a top/bottom n.
SAP BusinessObjects Web Intelligence User's GuideReporting data PUBLIC 211
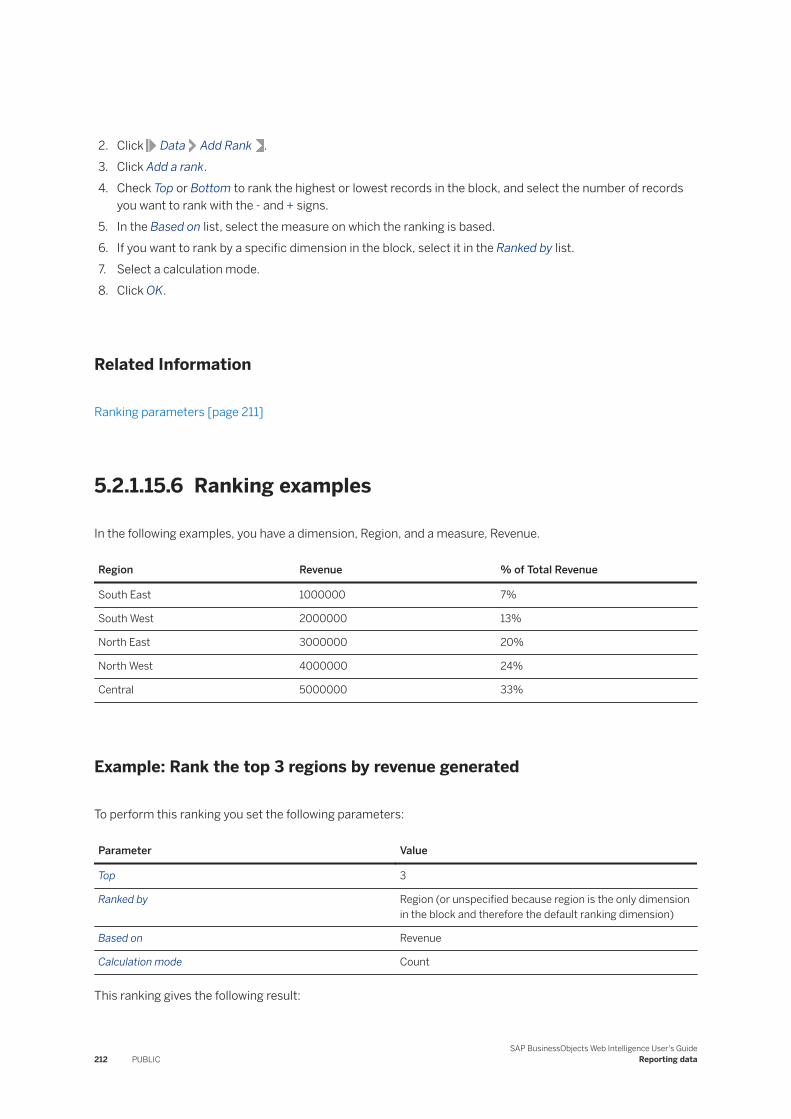
2. Click Data Add Rank .3. Click Add a rank.4. Check Top or Bottom to rank the highest or lowest records in the block, and select the number of records
you want to rank with the - and + signs.5. In the Based on list, select the measure on which the ranking is based.6. If you want to rank by a specific dimension in the block, select it in the Ranked by list.7. Select a calculation mode.8. Click OK.
Related Information
Ranking parameters [page 211]
5.2.1.15.6 Ranking examples
In the following examples, you have a dimension, Region, and a measure, Revenue.
Region Revenue % of Total Revenue
South East 1000000 7%
South West 2000000 13%
North East 3000000 20%
North West 4000000 24%
Central 5000000 33%
Example: Rank the top 3 regions by revenue generated
To perform this ranking you set the following parameters:
Parameter Value
Top 3
Ranked by Region (or unspecified because region is the only dimension in the block and therefore the default ranking dimension)
Based on Revenue
Calculation mode Count
This ranking gives the following result:
212 PUBLICSAP BusinessObjects Web Intelligence User's Guide
Reporting data
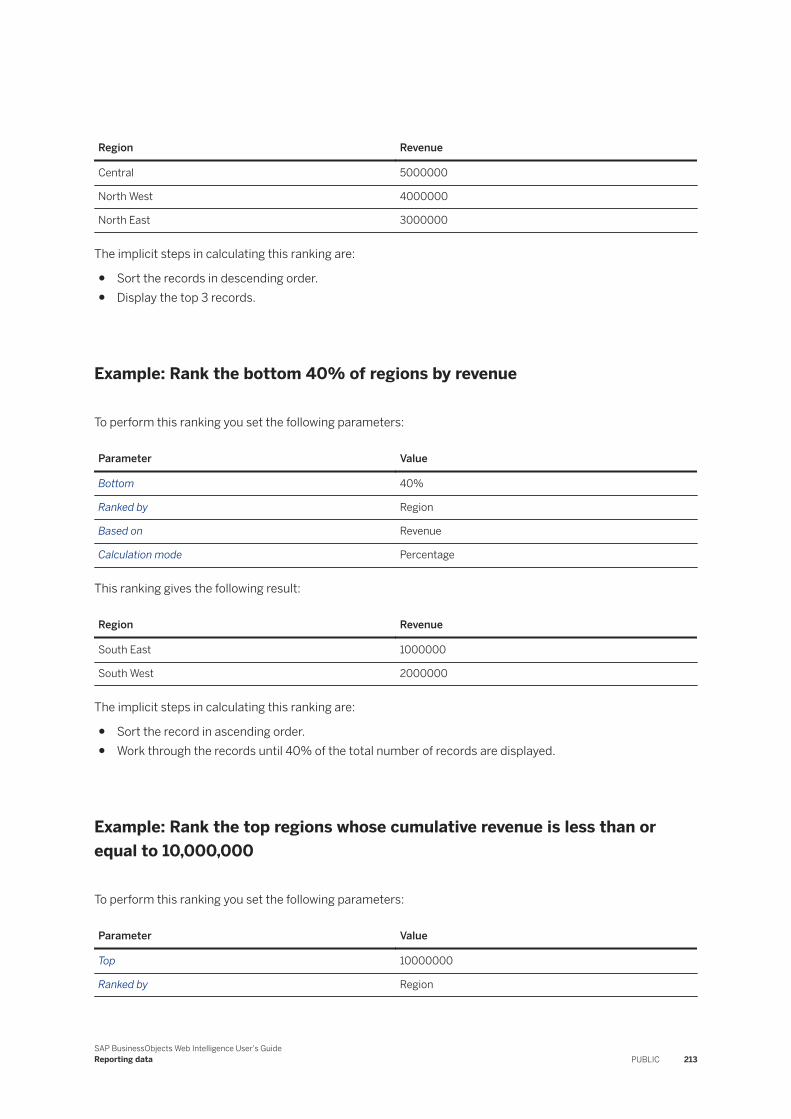
Region Revenue
Central 5000000
North West 4000000
North East 3000000
The implicit steps in calculating this ranking are:
● Sort the records in descending order.● Display the top 3 records.
Example: Rank the bottom 40% of regions by revenue
To perform this ranking you set the following parameters:
Parameter Value
Bottom 40%
Ranked by Region
Based on Revenue
Calculation mode Percentage
This ranking gives the following result:
Region Revenue
South East 1000000
South West 2000000
The implicit steps in calculating this ranking are:
● Sort the record in ascending order.● Work through the records until 40% of the total number of records are displayed.
Example: Rank the top regions whose cumulative revenue is less than or equal to 10,000,000
To perform this ranking you set the following parameters:
Parameter Value
Top 10000000
Ranked by Region
SAP BusinessObjects Web Intelligence User's GuideReporting data PUBLIC 213
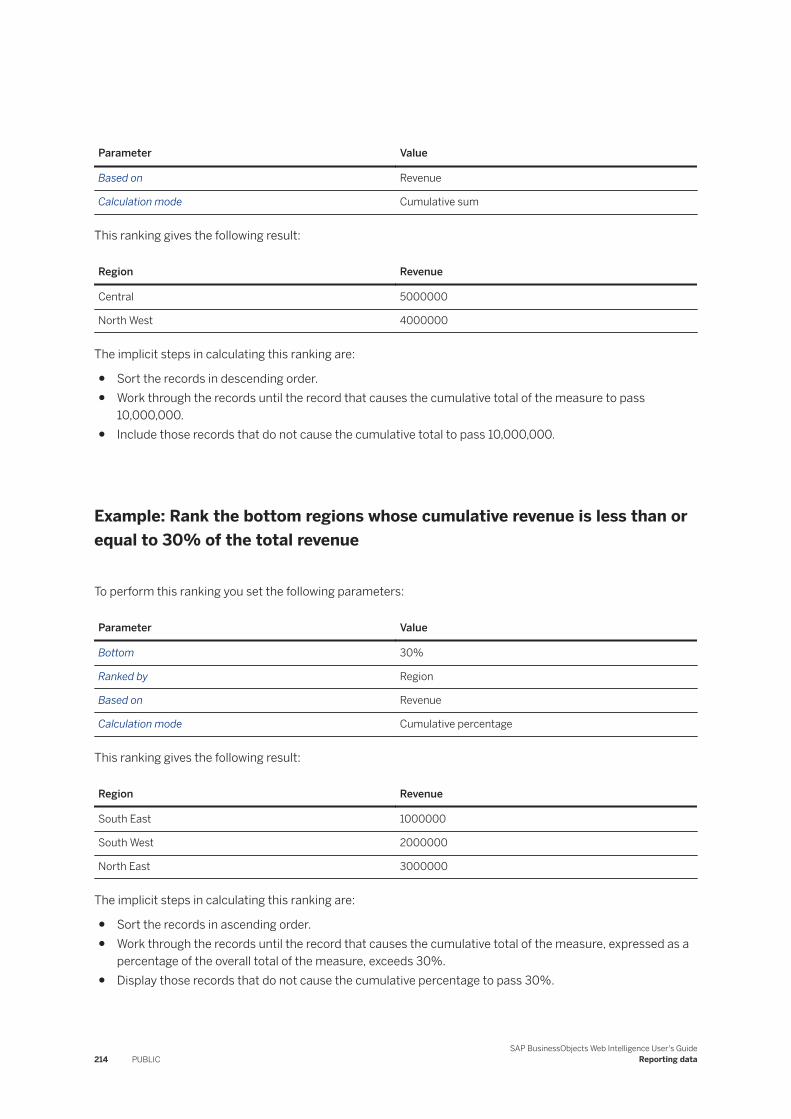
Parameter Value
Based on Revenue
Calculation mode Cumulative sum
This ranking gives the following result:
Region Revenue
Central 5000000
North West 4000000
The implicit steps in calculating this ranking are:
● Sort the records in descending order.● Work through the records until the record that causes the cumulative total of the measure to pass
10,000,000.● Include those records that do not cause the cumulative total to pass 10,000,000.
Example: Rank the bottom regions whose cumulative revenue is less than or equal to 30% of the total revenue
To perform this ranking you set the following parameters:
Parameter Value
Bottom 30%
Ranked by Region
Based on Revenue
Calculation mode Cumulative percentage
This ranking gives the following result:
Region Revenue
South East 1000000
South West 2000000
North East 3000000
The implicit steps in calculating this ranking are:
● Sort the records in ascending order.● Work through the records until the record that causes the cumulative total of the measure, expressed as a
percentage of the overall total of the measure, exceeds 30%.● Display those records that do not cause the cumulative percentage to pass 30%.
214 PUBLICSAP BusinessObjects Web Intelligence User's Guide
Reporting data
5.2.1.16 Merging data from dimensions and hierarchies
You can synchronize the data returned by dimensions, hierarchies or attributes by creating merged objects which incorporate them.
You merge data from different data providers. For example, if you have one data provider that contains detailed customer information and another data provider that contains sales data, you can synchronize the two data providers around the customer.
When you merge data from the same data source (for example the same universe or BEx query), the merge is based on the internal ID of each data member. When you merge data from different data sources, the merge is based on the caption of each data member. For example, if you synchronize two [Geography] hierarchies, the data member [Los Angeles] is merged with [Los Angeles] through its internal ID when the hierarchies are based on the same data source. The members are merged on the caption "Los Angeles" when the hierarchies are in different data sources.
In cases where merging is based on the caption, and different members with the same caption have different parent members, it is not possible to merge the members and the #MULTIVALUE error occurs.
When merged objects are from different data providers
When two merged objects are from different data providers, note the following restriction concerning the dimension value for a merged object and object participating in a merge:
● When merging variables, make sure they are not used with Set functions. Set functions are contextual and not supported when merging variables. Only scalar functions are supported.
● When [DIM1] coming from data provider 1, and [DIM2] coming from data provider 2), are merged, the value for the [MERGE] is the union of the values of [DIM1] and [DIM2].
● When you use [DIM1] ( or [DIM2]) in a table, the table shows only the value from [DIM1] (or [DIM2]) This behavior is as expected.
● When you filter (using an input control, drill bar, or filter panel) on one of these dimensions, this shows the list of values of the [MERGE] because it will result in a filter on the [MERGE].
● When [DIM1] (or [DIM2]) is used with a context modifier (In, foreach, forall), the calculation will be done based on the [MERGE]. For example, count([measure] foreach ([DIM1])) counts all the measure items given against [MERGE].
Related Information
Merging hierarchies [page 217]
SAP BusinessObjects Web Intelligence User's GuideReporting data PUBLIC 215
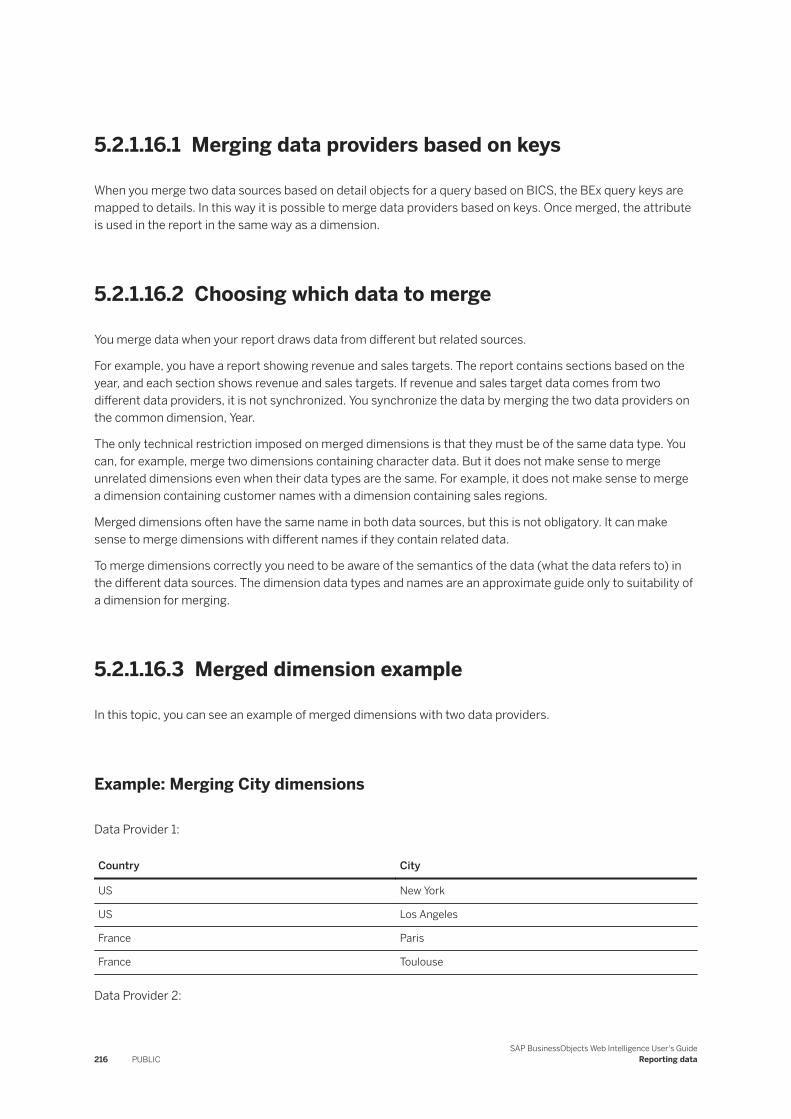
5.2.1.16.1 Merging data providers based on keys
When you merge two data sources based on detail objects for a query based on BICS, the BEx query keys are mapped to details. In this way it is possible to merge data providers based on keys. Once merged, the attribute is used in the report in the same way as a dimension.
5.2.1.16.2 Choosing which data to merge
You merge data when your report draws data from different but related sources.
For example, you have a report showing revenue and sales targets. The report contains sections based on the year, and each section shows revenue and sales targets. If revenue and sales target data comes from two different data providers, it is not synchronized. You synchronize the data by merging the two data providers on the common dimension, Year.
The only technical restriction imposed on merged dimensions is that they must be of the same data type. You can, for example, merge two dimensions containing character data. But it does not make sense to merge unrelated dimensions even when their data types are the same. For example, it does not make sense to merge a dimension containing customer names with a dimension containing sales regions.
Merged dimensions often have the same name in both data sources, but this is not obligatory. It can make sense to merge dimensions with different names if they contain related data.
To merge dimensions correctly you need to be aware of the semantics of the data (what the data refers to) in the different data sources. The dimension data types and names are an approximate guide only to suitability of a dimension for merging.
5.2.1.16.3 Merged dimension example
In this topic, you can see an example of merged dimensions with two data providers.
Example: Merging City dimensions
Data Provider 1:
Country City
US New York
US Los Angeles
France Paris
France Toulouse
Data Provider 2:
216 PUBLICSAP BusinessObjects Web Intelligence User's Guide
Reporting data
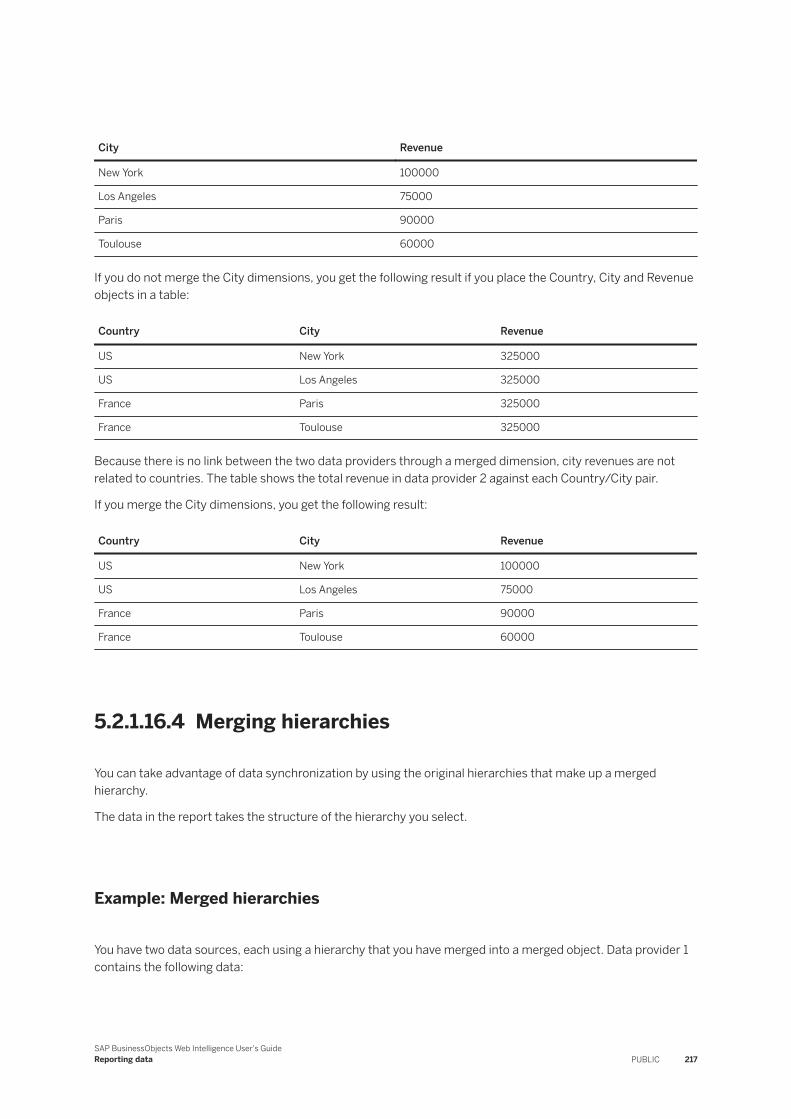
City Revenue
New York 100000
Los Angeles 75000
Paris 90000
Toulouse 60000
If you do not merge the City dimensions, you get the following result if you place the Country, City and Revenue objects in a table:
Country City Revenue
US New York 325000
US Los Angeles 325000
France Paris 325000
France Toulouse 325000
Because there is no link between the two data providers through a merged dimension, city revenues are not related to countries. The table shows the total revenue in data provider 2 against each Country/City pair.
If you merge the City dimensions, you get the following result:
Country City Revenue
US New York 100000
US Los Angeles 75000
France Paris 90000
France Toulouse 60000
5.2.1.16.4 Merging hierarchies
You can take advantage of data synchronization by using the original hierarchies that make up a merged hierarchy.
The data in the report takes the structure of the hierarchy you select.
Example: Merged hierarchies
You have two data sources, each using a hierarchy that you have merged into a merged object. Data provider 1 contains the following data:
SAP BusinessObjects Web Intelligence User's GuideReporting data PUBLIC 217
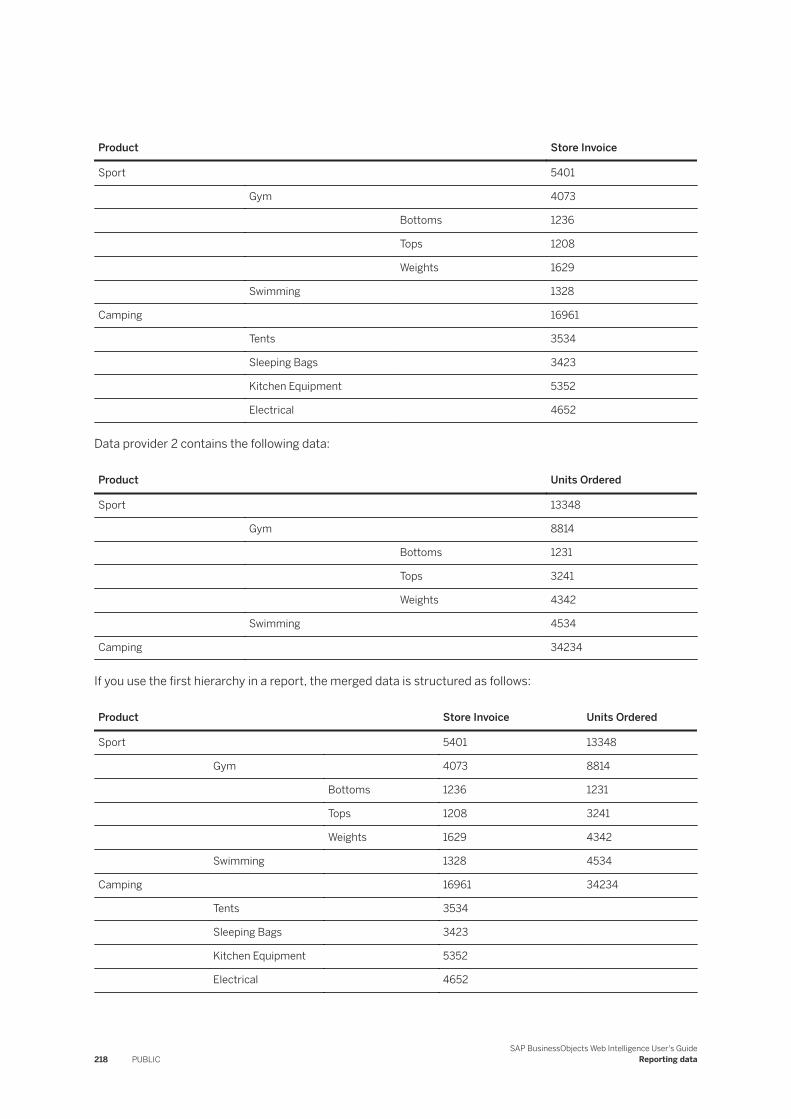
Product Store Invoice
Sport 5401
Gym 4073
Bottoms 1236
Tops 1208
Weights 1629
Swimming 1328
Camping 16961
Tents 3534
Sleeping Bags 3423
Kitchen Equipment 5352
Electrical 4652
Data provider 2 contains the following data:
Product Units Ordered
Sport 13348
Gym 8814
Bottoms 1231
Tops 3241
Weights 4342
Swimming 4534
Camping 34234
If you use the first hierarchy in a report, the merged data is structured as follows:
Product Store Invoice Units Ordered
Sport 5401 13348
Gym 4073 8814
Bottoms 1236 1231
Tops 1208 3241
Weights 1629 4342
Swimming 1328 4534
Camping 16961 34234
Tents 3534
Sleeping Bags 3423
Kitchen Equipment 5352
Electrical 4652
218 PUBLICSAP BusinessObjects Web Intelligence User's Guide
Reporting data
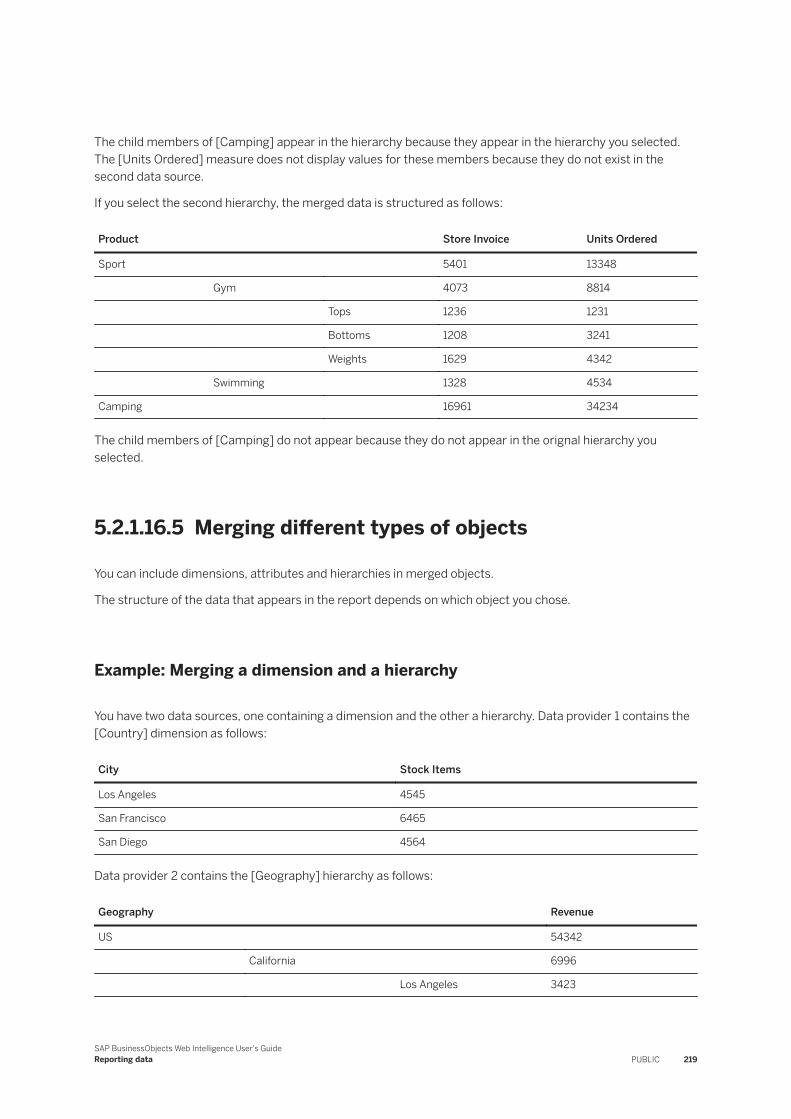
The child members of [Camping] appear in the hierarchy because they appear in the hierarchy you selected. The [Units Ordered] measure does not display values for these members because they do not exist in the second data source.
If you select the second hierarchy, the merged data is structured as follows:
Product Store Invoice Units Ordered
Sport 5401 13348
Gym 4073 8814
Tops 1236 1231
Bottoms 1208 3241
Weights 1629 4342
Swimming 1328 4534
Camping 16961 34234
The child members of [Camping] do not appear because they do not appear in the orignal hierarchy you selected.
5.2.1.16.5 Merging different types of objects
You can include dimensions, attributes and hierarchies in merged objects.
The structure of the data that appears in the report depends on which object you chose.
Example: Merging a dimension and a hierarchy
You have two data sources, one containing a dimension and the other a hierarchy. Data provider 1 contains the [Country] dimension as follows:
City Stock Items
Los Angeles 4545
San Francisco 6465
San Diego 4564
Data provider 2 contains the [Geography] hierarchy as follows:
Geography Revenue
US 54342
California 6996
Los Angeles 3423
SAP BusinessObjects Web Intelligence User's GuideReporting data PUBLIC 219
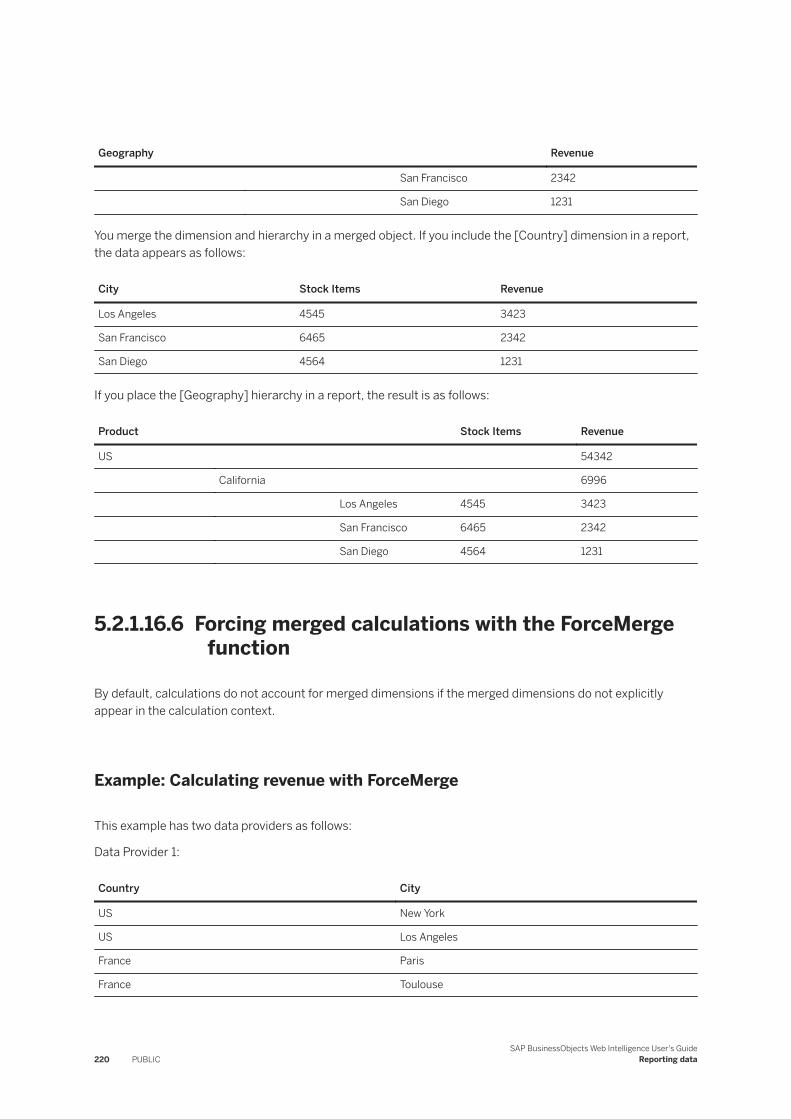
Geography Revenue
San Francisco 2342
San Diego 1231
You merge the dimension and hierarchy in a merged object. If you include the [Country] dimension in a report, the data appears as follows:
City Stock Items Revenue
Los Angeles 4545 3423
San Francisco 6465 2342
San Diego 4564 1231
If you place the [Geography] hierarchy in a report, the result is as follows:
Product Stock Items Revenue
US 54342
California 6996
Los Angeles 4545 3423
San Francisco 6465 2342
San Diego 4564 1231
5.2.1.16.6 Forcing merged calculations with the ForceMerge function
By default, calculations do not account for merged dimensions if the merged dimensions do not explicitly appear in the calculation context.
Example: Calculating revenue with ForceMerge
This example has two data providers as follows:
Data Provider 1:
Country City
US New York
US Los Angeles
France Paris
France Toulouse
220 PUBLICSAP BusinessObjects Web Intelligence User's Guide
Reporting data
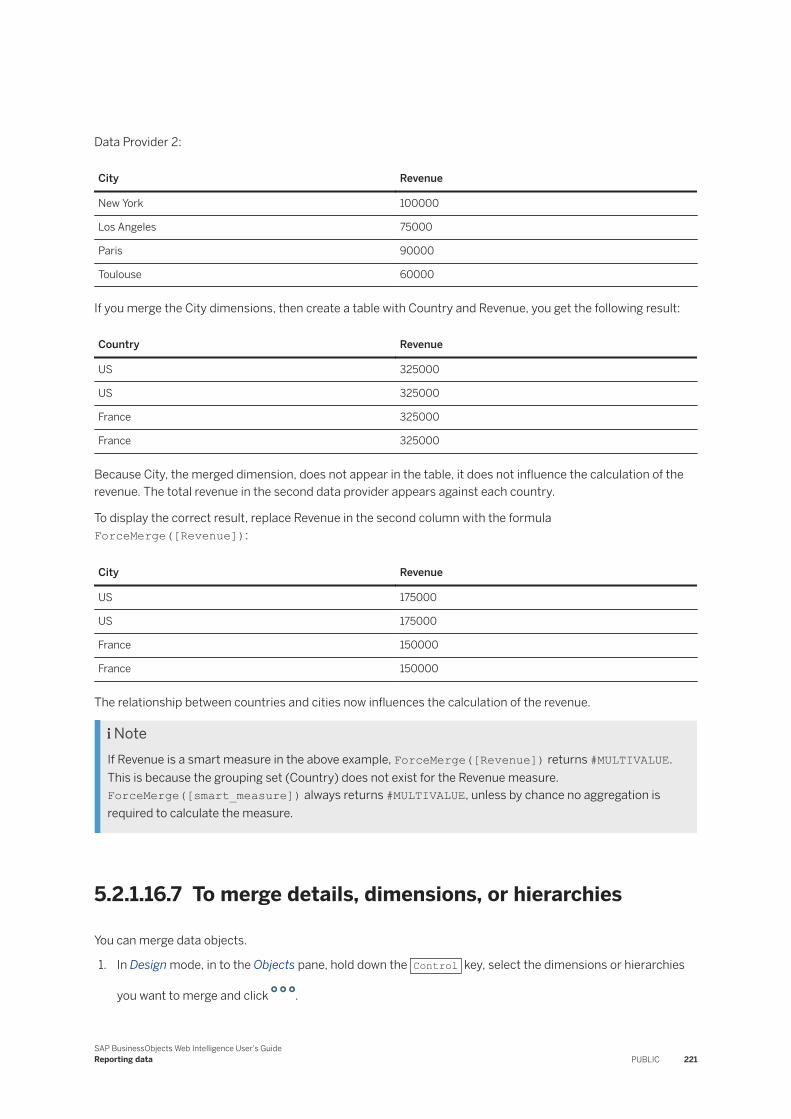
Data Provider 2:
City Revenue
New York 100000
Los Angeles 75000
Paris 90000
Toulouse 60000
If you merge the City dimensions, then create a table with Country and Revenue, you get the following result:
Country Revenue
US 325000
US 325000
France 325000
France 325000
Because City, the merged dimension, does not appear in the table, it does not influence the calculation of the revenue. The total revenue in the second data provider appears against each country.
To display the correct result, replace Revenue in the second column with the formula ForceMerge([Revenue]):
City Revenue
US 175000
US 175000
France 150000
France 150000
The relationship between countries and cities now influences the calculation of the revenue.
NoteIf Revenue is a smart measure in the above example, ForceMerge([Revenue]) returns #MULTIVALUE. This is because the grouping set (Country) does not exist for the Revenue measure. ForceMerge([smart_measure]) always returns #MULTIVALUE, unless by chance no aggregation is required to calculate the measure.
5.2.1.16.7 To merge details, dimensions, or hierarchies
You can merge data objects.
1. In Design mode, in to the Objects pane, hold down the Control key, select the dimensions or hierarchies
you want to merge and click .
SAP BusinessObjects Web Intelligence User's GuideReporting data PUBLIC 221
2. Click Merge.
You can view the merged object in the Objects pane. The original hierarchies or dimensions that make up the merged object appear beneath it. You can edit or remove the merged dimension or hierarchy in the Objects pane.
3. To add additional objects to a group of merged objects:a. In the Objects, select the merged object.b. Hold down the Control key on your keyboard and select one or several object you want to add to the
group.
NoteThe objects you select must be of the same data type as the objects already merged.
c. Click and select Add to Merge from the contextual menu.
Related Information
To unmerge objects [page 223]To edit merged objects [page 222]
5.2.1.16.8 To merge dimensions automatically
You can merge dimensions automatically if the dimensions have the same name and data type, and are in the same universe. The auto-merge happens only at the document level.
1. In Design mode, click > in the toolbar to open the document properties.2. In the Data Option section, switch the Auto-merge dimension toggle on.
RestrictionIf this option is activated, the application searches for all dimensions sharing the same name and data type in a universe and merges them. In the case where you have the same object with different names, we recommend merging dimensions manually.
5.2.1.16.9 To edit merged objects
You can edit merged objects in the Edit Merged Dimension dialog.
1. In Design mode, in the Objects pane, click next to a merged dimension.2. In the Edit Merged Dimension dialog, enter the new name of the merged dimension.3. Add a Description.
222 PUBLICSAP BusinessObjects Web Intelligence User's Guide
Reporting data
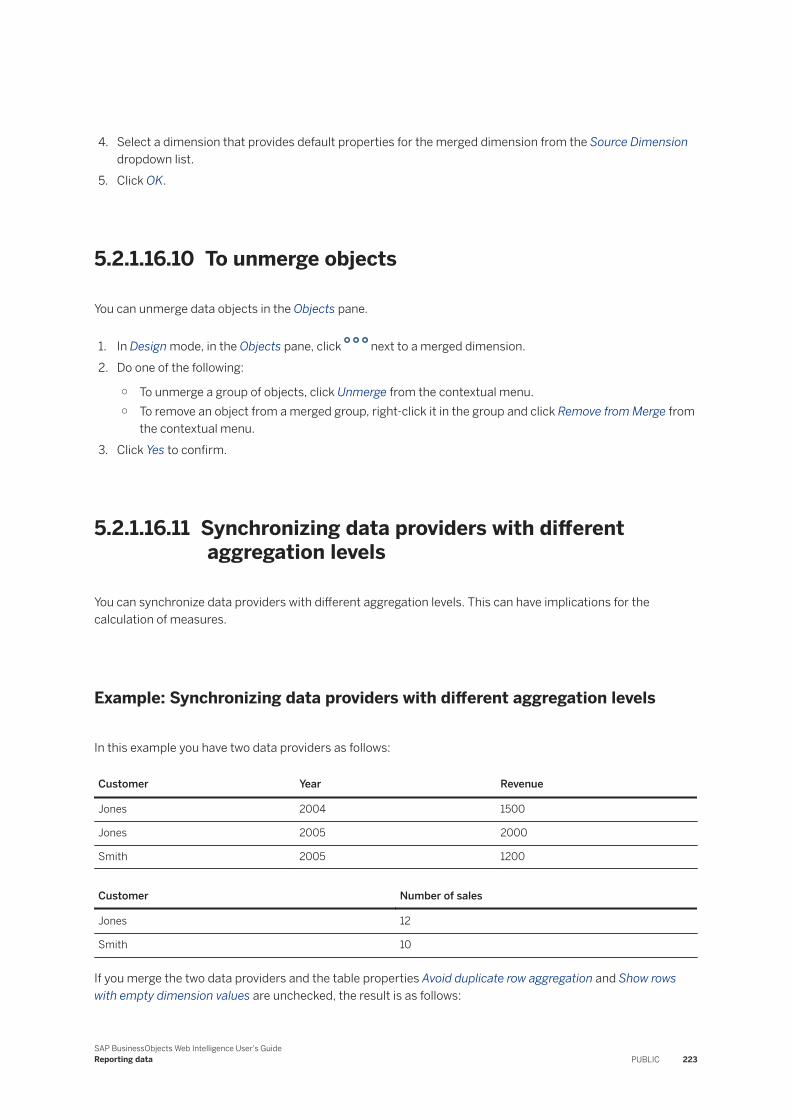
4. Select a dimension that provides default properties for the merged dimension from the Source Dimension dropdown list.
5. Click OK.
5.2.1.16.10 To unmerge objects
You can unmerge data objects in the Objects pane.
1. In Design mode, in the Objects pane, click next to a merged dimension.2. Do one of the following:
○ To unmerge a group of objects, click Unmerge from the contextual menu.○ To remove an object from a merged group, right-click it in the group and click Remove from Merge from
the contextual menu.3. Click Yes to confirm.
5.2.1.16.11 Synchronizing data providers with different aggregation levels
You can synchronize data providers with different aggregation levels. This can have implications for the calculation of measures.
Example: Synchronizing data providers with different aggregation levels
In this example you have two data providers as follows:
Customer Year Revenue
Jones 2004 1500
Jones 2005 2000
Smith 2005 1200
Customer Number of sales
Jones 12
Smith 10
If you merge the two data providers and the table properties Avoid duplicate row aggregation and Show rows with empty dimension values are unchecked, the result is as follows:
SAP BusinessObjects Web Intelligence User's GuideReporting data PUBLIC 223
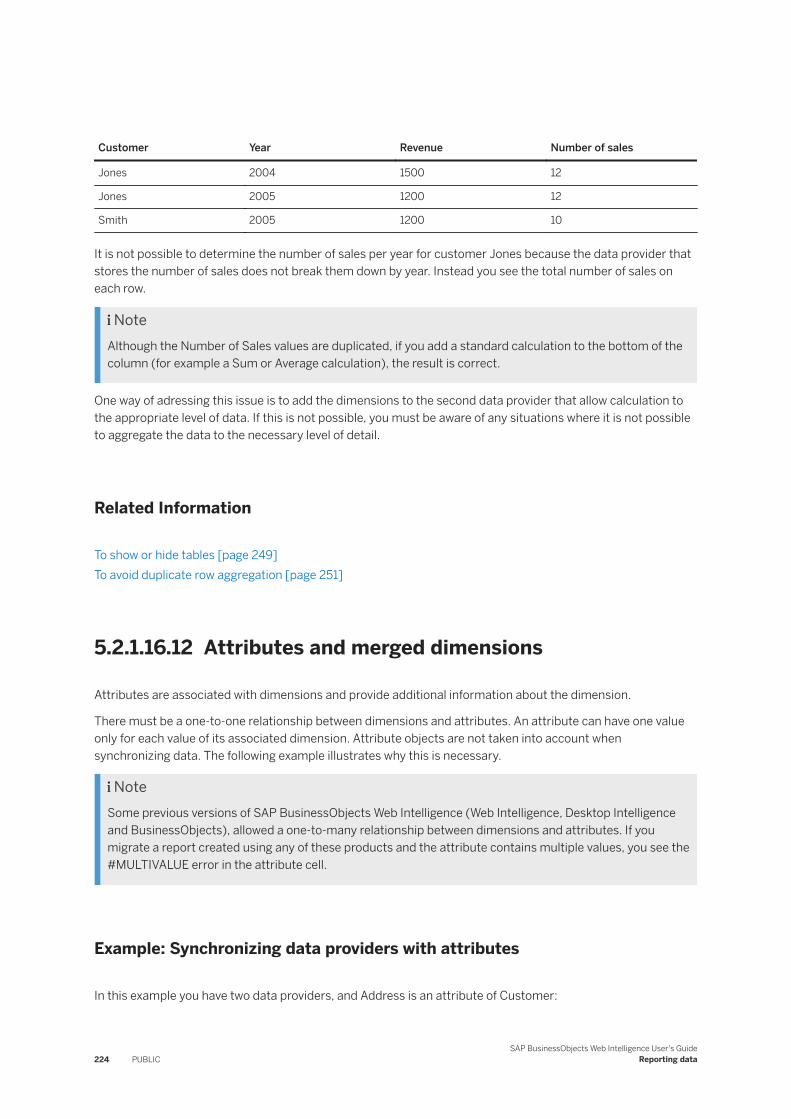
Customer Year Revenue Number of sales
Jones 2004 1500 12
Jones 2005 1200 12
Smith 2005 1200 10
It is not possible to determine the number of sales per year for customer Jones because the data provider that stores the number of sales does not break them down by year. Instead you see the total number of sales on each row.
NoteAlthough the Number of Sales values are duplicated, if you add a standard calculation to the bottom of the column (for example a Sum or Average calculation), the result is correct.
One way of adressing this issue is to add the dimensions to the second data provider that allow calculation to the appropriate level of data. If this is not possible, you must be aware of any situations where it is not possible to aggregate the data to the necessary level of detail.
Related Information
To show or hide tables [page 249]To avoid duplicate row aggregation [page 251]
5.2.1.16.12 Attributes and merged dimensions
Attributes are associated with dimensions and provide additional information about the dimension.
There must be a one-to-one relationship between dimensions and attributes. An attribute can have one value only for each value of its associated dimension. Attribute objects are not taken into account when synchronizing data. The following example illustrates why this is necessary.
NoteSome previous versions of SAP BusinessObjects Web Intelligence (Web Intelligence, Desktop Intelligence and BusinessObjects), allowed a one-to-many relationship between dimensions and attributes. If you migrate a report created using any of these products and the attribute contains multiple values, you see the #MULTIVALUE error in the attribute cell.
Example: Synchronizing data providers with attributes
In this example you have two data providers, and Address is an attribute of Customer:
224 PUBLICSAP BusinessObjects Web Intelligence User's Guide
Reporting data
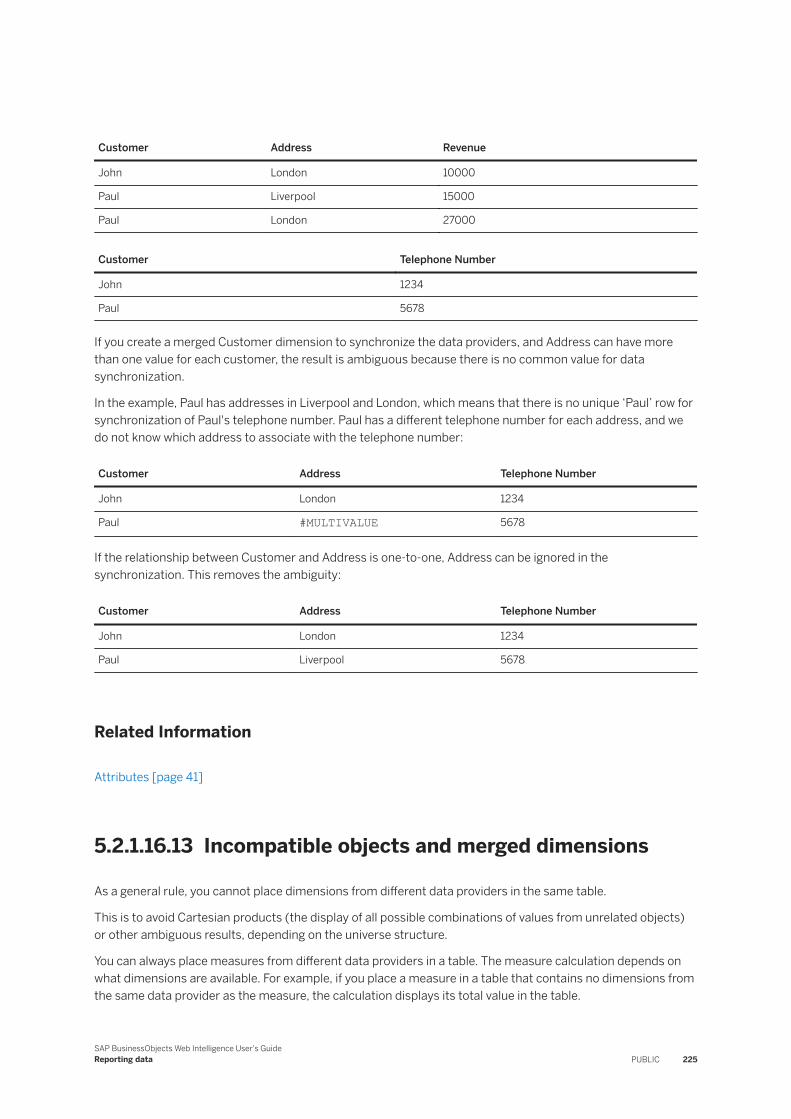
Customer Address Revenue
John London 10000
Paul Liverpool 15000
Paul London 27000
Customer Telephone Number
John 1234
Paul 5678
If you create a merged Customer dimension to synchronize the data providers, and Address can have more than one value for each customer, the result is ambiguous because there is no common value for data synchronization.
In the example, Paul has addresses in Liverpool and London, which means that there is no unique ‘Paul’ row for synchronization of Paul's telephone number. Paul has a different telephone number for each address, and we do not know which address to associate with the telephone number:
Customer Address Telephone Number
John London 1234
Paul #MULTIVALUE 5678
If the relationship between Customer and Address is one-to-one, Address can be ignored in the synchronization. This removes the ambiguity:
Customer Address Telephone Number
John London 1234
Paul Liverpool 5678
Related Information
Attributes [page 41]
5.2.1.16.13 Incompatible objects and merged dimensions
As a general rule, you cannot place dimensions from different data providers in the same table.
This is to avoid Cartesian products (the display of all possible combinations of values from unrelated objects) or other ambiguous results, depending on the universe structure.
You can always place measures from different data providers in a table. The measure calculation depends on what dimensions are available. For example, if you place a measure in a table that contains no dimensions from the same data provider as the measure, the calculation displays its total value in the table.
SAP BusinessObjects Web Intelligence User's GuideReporting data PUBLIC 225
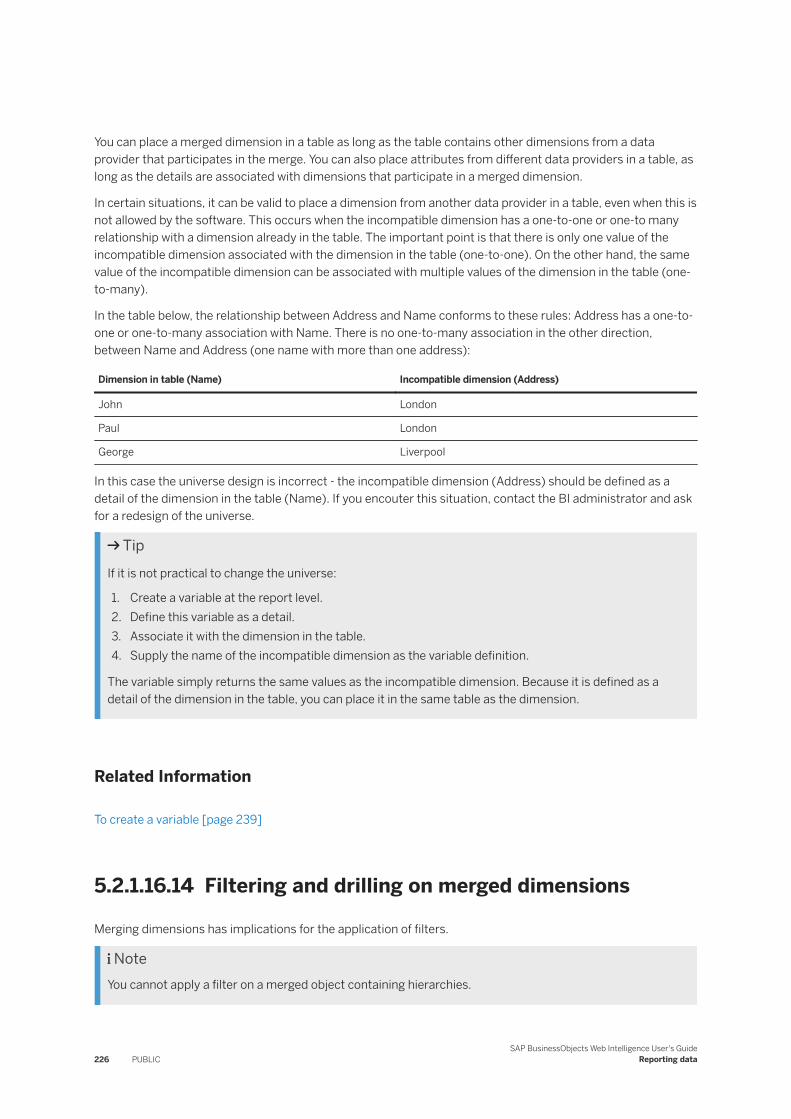
You can place a merged dimension in a table as long as the table contains other dimensions from a data provider that participates in the merge. You can also place attributes from different data providers in a table, as long as the details are associated with dimensions that participate in a merged dimension.
In certain situations, it can be valid to place a dimension from another data provider in a table, even when this is not allowed by the software. This occurs when the incompatible dimension has a one-to-one or one-to many relationship with a dimension already in the table. The important point is that there is only one value of the incompatible dimension associated with the dimension in the table (one-to-one). On the other hand, the same value of the incompatible dimension can be associated with multiple values of the dimension in the table (one-to-many).
In the table below, the relationship between Address and Name conforms to these rules: Address has a one-to-one or one-to-many association with Name. There is no one-to-many association in the other direction, between Name and Address (one name with more than one address):
Dimension in table (Name) Incompatible dimension (Address)
John London
Paul London
George Liverpool
In this case the universe design is incorrect - the incompatible dimension (Address) should be defined as a detail of the dimension in the table (Name). If you encouter this situation, contact the BI administrator and ask for a redesign of the universe.
TipIf it is not practical to change the universe:
1. Create a variable at the report level.2. Define this variable as a detail.3. Associate it with the dimension in the table.4. Supply the name of the incompatible dimension as the variable definition.
The variable simply returns the same values as the incompatible dimension. Because it is defined as a detail of the dimension in the table, you can place it in the same table as the dimension.
Related Information
To create a variable [page 239]
5.2.1.16.14 Filtering and drilling on merged dimensions
Merging dimensions has implications for the application of filters.
NoteYou cannot apply a filter on a merged object containing hierarchies.
226 PUBLICSAP BusinessObjects Web Intelligence User's Guide
Reporting data
Block filters and merged dimensions
When you apply a block filter to a dimension that is part of a merged dimension, the filter is applied to the block. It is not applied to other data providers synchronized through the merged dimension.
Section filters and merged dimensions
When a dimension that is part of a merged dimension is set as a section cell, any filter applied to the section also applies to blocks from synchronized data providers within the section.
Report filters and merged dimensions
When you apply a report filter to a dimension that is part of a merged dimension, then the filter will impact all related blocks in the report that use the merged dimension (or any dimensions that participate in the merge).
Example
When you have two queries with a common dimension that you have merged, and you have two tables in a report, each table with data coming from a different query, when you filter on the merged dimension in one query, the filter will also impact the corresponding dimension in the second query and therefore in the second table.
Drilling on merged dimensions
When you merge dimensions, the new merged dimension belongs to the hierarchies of all dimensions involved in the merge.
5.2.1.16.15 Extending the values returned by merged dimensions
When you merge dimensions from different data providers, Web Intelligence creates a merged dimension.
When you place the merged dimension in the report, only those dimension values that have corresponding values in the data providers synchronized through the merge are returned.
NoteWeb Intelligence and Desktop Intelligence handle merged dimensions differently, you need to be aware of this when migrating reports from Desktop Intelligence and Web Intelligence. Desktop Intelligence does not
SAP BusinessObjects Web Intelligence User's GuideReporting data PUBLIC 227
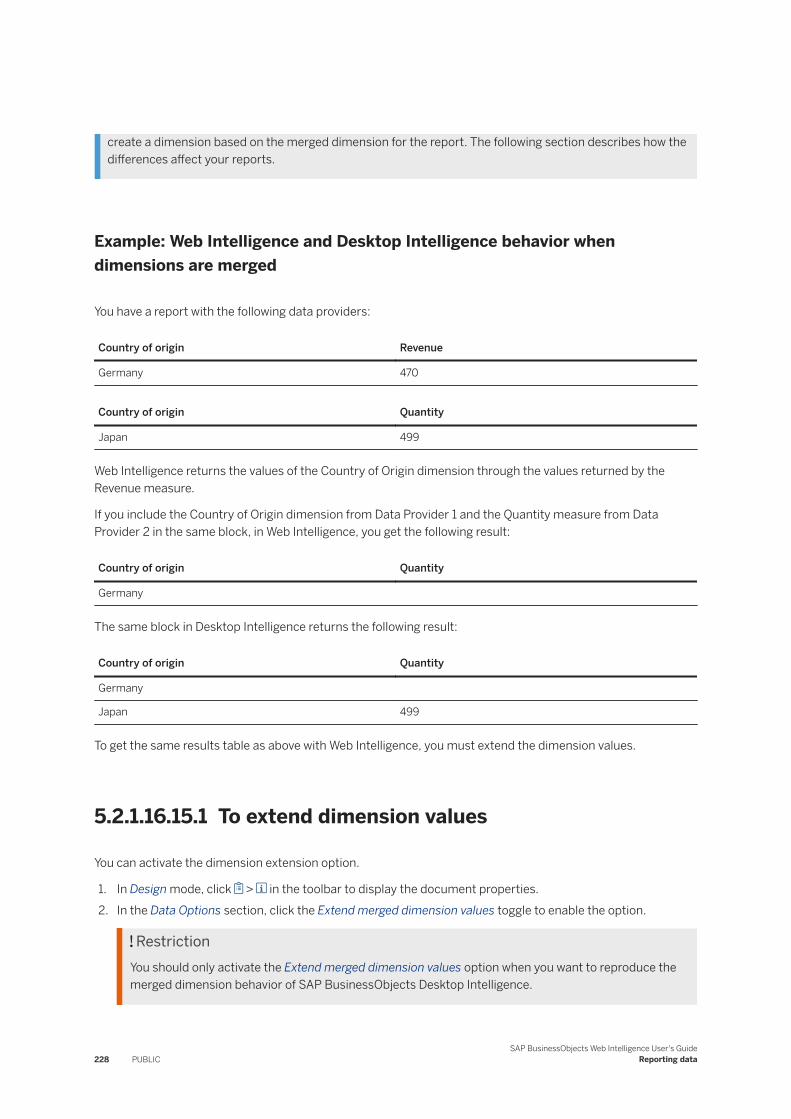
create a dimension based on the merged dimension for the report. The following section describes how the differences affect your reports.
Example: Web Intelligence and Desktop Intelligence behavior when dimensions are merged
You have a report with the following data providers:
Country of origin Revenue
Germany 470
Country of origin Quantity
Japan 499
Web Intelligence returns the values of the Country of Origin dimension through the values returned by the Revenue measure.
If you include the Country of Origin dimension from Data Provider 1 and the Quantity measure from Data Provider 2 in the same block, in Web Intelligence, you get the following result:
Country of origin Quantity
Germany
The same block in Desktop Intelligence returns the following result:
Country of origin Quantity
Germany
Japan 499
To get the same results table as above with Web Intelligence, you must extend the dimension values.
5.2.1.16.15.1 To extend dimension values
You can activate the dimension extension option.
1. In Design mode, click > in the toolbar to display the document properties.2. In the Data Options section, click the Extend merged dimension values toggle to enable the option.
RestrictionYou should only activate the Extend merged dimension values option when you want to reproduce the merged dimension behavior of SAP BusinessObjects Desktop Intelligence.
228 PUBLICSAP BusinessObjects Web Intelligence User's Guide
Reporting data
3. Click Apply.
5.2.1.17 Using time dimensions
A time dimension is a hierarchy whose members reflect several units of time such as years, semesters, quarters, months, weeks, days and so on.
A time dimension provides various levels of granularity, time levels, and is practical for time-based analysis and reporting. It allows for calendar customization, which is very common in financial reporting for instance. You can set up a calendar that reflects the fiscal year of your company, specify the first day of the week according to your company’s calendar, or set the first and last months of the year. Your customized calendar can have ranges dates that you define to set limits, which allows for a better analysis of the fiscal period you are interested in.
In Web Intelligence, a time dimension defines the units of time for a data model and how these unites aggregate. Its members are given in a chronological order in the hierarchy, making the analysis over time natural thanks to a logical navigation through the members within time levels.
You can create time dimensions using any DATE or DATETIME type object or variable. When creating a time dimension, time levels you select are automatically created so you can reuse them directly in reports. The time levels you select drive the analysis and how the data is reported.
You create time dimensions by generating a time hierarchy directly from a source dimension object. You can use the same dimension source object to create several time dimensions.
Time dimensions support filters, input controls, ranking, sorting, drill from one level to another and dynamic level change directly within a report block.
Restriction● Time dimensions aren't supported in SAP HANA Online mode.● Time dimensions don't support custom sorts.● Time dimensions don't support delegated measures.● Time dimensions don't support data tracking.● You can't use a report element that contains a time dimension as a shared element.
Related Information
To create a time hierarchy [page 229]
5.2.1.17.1 To create a time hierarchy
You create time hierarchy by generating a time dimension from a DATE or DATETIME type object or variable.
SAP BusinessObjects Web Intelligence User's GuideReporting data PUBLIC 229
1. Click next to a dimension of type DATE or DATETIME.2. Click Create Time Dimension.3. Add a name and a description.4. Select whether you want to display additional attributes for the time levels you have selected.5. Select the time level(s) you want to add to the hierarchy and rename them if necessary.
Note○ The Month time level is not compatible with the Week time level.○ The Week time level is not compatible with the Month, Quarter and Semester time levels.
6. Select the Fiscal Month and First Day of the Week to customize the calendar associated to your time dimension.
7. Optional: Set range dates to limit the size of the calendar.
NoteIn tables, data that is out of range is still aggregated, and displayed next to an empty cell in the time dimension column.
Related Information
Using time dimensions [page 229]
5.2.1.17.2 To change the levels of a time hierarchy
You can change the levels of a table dynamically to refine the data you want to display.
NoteYou can only choose the levels you have selected when you created the time dimension.
1. Right-click a table.2. Click Change Level.3. Select the level you want to display.
Related Information
Using time dimensions [page 229]To create a time hierarchy [page 229]
230 PUBLICSAP BusinessObjects Web Intelligence User's Guide
Reporting data
5.2.1.18 Using geo dimensions
Geomaps rely on a geographical database to render your data.
Before you start using geomaps in you reports, you need to set up your data and go through the geo-qualification process so that they can be bound to the geographical database. Geo-qualifying your data means that you match each value of an object with a specific location. Geomaps then use these locations to render your data on a map. The geo-qualification can be done using either a location's name, or its latitude and longitude coordinates.
CautionThe geographic database has been updated in Web Intelligence 4.3. The coverage of many countries has been improved with the addition of new cities, administrative regions and sub-regions, and obsolete locations like old French regions for instance have also been removed from the database.
Some geomap charts migrated from Web Intelligence 4.2 to 4.3 might not display all their data. If you're migrating a 4.2 document with geomap charts to 4.3, we strongly recommend redoing the geo-qualifying process of your data. The application prompts you with warning messages if you don't geo-qualify the data after a migration:
1. A general warning when opening a 4.2 document containing geo-qualified data in 4.3.2. A warning on geomap charts where data is missing.
Both messages are no longer displayed once you've geo-qualified the data. Note that charts geo-qualified using latitude and longitude coordinates aren't impacted by this update.
Geo-qualifying an object using a location's name
Web Intelligence uses an algorithm to match each value of the object with a geographic location. The search engine uses fuzzy logic to create three categories of values and automatically match them with locations:
● Resolved : only one location matches at 100%, and is automatically bound to the value.
● Unresolved : several locations match at 100% or higher than 85% but below 100%. There's no obvious match, and you have to select the most appropriate one.
● Missing : no location found, or locations match at lower than 85%. Search for the location you want to bind in the geographical database.
NoteIn order to be geo-qualified by its name, every value of a dimension must belong to the same geographical level. Hierarchical dimension objects can't be edited as geography because they contain several geographical levels (for example, Country, Region, Sub-Region and City).
You may select a different location in the dropdown list from the one selected by the automatic matching mechanism. To select a location manually, refer to To manually match values of a dimension with a location.
SAP BusinessObjects Web Intelligence User's GuideReporting data PUBLIC 231
Geo-qualifying an object using a location's latitude and longitude coordinates
Latitude and longitude coordinates are two objects that must be available as dimensions, dimensions' attributes or variables. They can be any object that can be added to a dimension as a detail, and do not necessarily have to be the same type of object. You can have latitude coordinates as a dimension and longitude coordinates as a variable for instance. However, make sure they both have Number as data type.
RestrictionLatitude and longitude objects can't be geo-qualified objects, measures, measures' attributes or hierarchies.
Coordinates must range from:
● -90.0° (South) to 90.0° (North) for latitude coordinates, 0° being the equator● -180.0° (West) to 180.0° (East) for longitude coordinates, 0° being the Greenwich meridian
It's possible to edit an object that has been geo-qualified using latitude and longitude coordinates, but only by latitude and longitude, not by name.
Related Information
Geomap [page 279]To match values of an object with a location [page 232]To match values of an object using latitude and longitude coordinates [page 235]
5.2.1.18.1 To match values of an object with a location
You can bind a geographic location to a value. Geomap charts for instance use locations to render data on a map.
The geo-qualification will automatically match values to a geographic database of name-latitude-longitude data using name lookup. If there's more than one matching location, all matches will be presented, allowing you to select the most appropriate location. It's possible to select a different location in the dropdown list from the one selected by the automatic matching mechanism. Refer to To manually match values of an object with a location for more information.
1. In Design mode, go to the Objects pane.
2. Hover over an object you want to geo-qualify and click .3. Click Geo-Qualify By: Name.4. Select a level in the dedicated drop down.
There are four possible levels: Country, Region, Sub-Region and City. In the United States for example, California is a region, Southern California is a sub-region, and Los Angeles is a city.
232 PUBLICSAP BusinessObjects Web Intelligence User's Guide
Reporting data
5. Optional: Use the Show drop down to filter the list on matching category.6. Click the dropdown list next to the value you want to edit and select one of the locations available.7. Click Apply.8. Click OK.
NoteAn error icon is displayed on the geomap and next to the geo-qualified object if a value hasn't been geo-qualified. This may occur when you refresh the document or add new locations. To fix this issue, make sure all objects values are geo-qualified by repeating the above procedure.
Related Information
5.2.1.18.2 To manually match values of an object with a location
You can manually match values of an object to a location. This is useful when the location you expect doesn't appear in the dropdown list for example, or when a value is assigned to an incorrect location.
NoteThe geographical database might not recognize a specific location you are looking for. If this is the case, try to select a substitute location, create a custom location or select an alternative location.
1. In Design mode, go to the Objects pane.
2. Hover over an object you want to geo-qualify and click .3. Click Geo-Qualify By: Name.4. Select a Level.
There are four possible levels: Country, Region, Sub-Region and City. In the United States for example, California is a region, Southern California is a sub-region, and Los Angeles is a city.
5. Click the dropdown list next to the value that you want to edit.If several locations appear in the dropdown list, select the one that is closest to the location you were originally looking for.
6. Optional: If you can't find the location you are looking for, Click Select location....7. Do one of the following:
○ Type in the name of the location, select the one you are looking for and click OK.○ Click Add Location, enter the coordinates of the location you are looking for and click OK.
NoteThe search applies to the level you have defined when you edited the dimension as geography: Country, Region, Sub-Region or City. Make sure you are using the correct level when doing a search.
SAP BusinessObjects Web Intelligence User's GuideReporting data PUBLIC 233
8. Click OK.
5.2.1.18.3 Matching values of a merged object with a location
Members of a geo-qualified merged object share a common list of values.
If you merge an object that is geo-qualified with another one that's not, it inherits the geo-qualification method, that is by name or latitude and longitude, of the member that was originally geo-qualified.
Depending on the geo-qualification scenario, you might have conflicts or unresolved and missing values. In that case, an icon is displayed next to the merged object with unresolved or missing values. Another icon is also displayed next to the member whose geo-qualification needs is incomplete. Conflicts, unresolved or missing values can happen in the following cases:
● You are merging two geo-qualified objects to create a geo-qualified merged objectEach member object comes with its own list of values resulting from a previous geo-qualification. If the lists of values conflict with one another or if there are unresolved and missing values, repeat the geo-qualification process.
● You are adding a new object to a merged object that's already geo-qualifiedThe member you are adding to the merged object is automatically geo-qualified. However, it can bring new and unresolved values. Repeat the geo-qualification process either for the merged object or one of its members to solve the issue.
RestrictionYou can't merge objects that have been geo-qualified using the latitude/longitude geo-qualification method. However, it is possible to merge an object that has been geo-qualified using the latitude/longitude geo-qualification method with an object that isn't geo-qualified.
Impact of an unmerge command on geo-qualification
Unmerging a geo-qualified object by name doesn't cancel the geo-qualification of its members. Unmerging a geo-qualified object by latitude and longitude returns all of its members to their original state.
CautionResetting the geo-qualification of a merged object, a merged object member or an object that is part of a merge will reset the geo-qualification of the merged object, its members and all its participating objects.
Related Information
To match values of an object with a location [page 232]To match values of an object using latitude and longitude coordinates [page 235]
234 PUBLICSAP BusinessObjects Web Intelligence User's Guide
Reporting data
5.2.1.18.4 To match values of an object using latitude and longitude coordinates
RestrictionYou can't use an object as latitude or longitude if it's already geo-qualified.
1. In Design mode, go to the Objects pane.
2. Hover over an object you want to geo-qualify and click .3. Click Geo-Qualify By: Latitude / Longitude.4. Select the latitude and longitude objects using the dedicated drop downs.5. Click Apply.6. Click OK.
5.2.1.18.5 To modify the location of a value
You can modify the geo-qualification of an object.
After a geo-qualified object has been modified, refresh the document for the new locations to be displayed on the map.
1. In Design mode, go to the Objects pane.
2. Hover over an object you want to edit and click .3. Click Geo-Qualify By: Name or Geo-Qualify By: Latitude / Longitude.4. Optional: Filter the results using the Show drop down.5. Click the drop down next to the value that you want to edit.6. Select one of the locations available.7. Repeat the process for every value you want to edit.8. Click Apply.9. Click OK.
5.2.1.18.6 To reset the location of a value
Reset the geo-qualification to remove the geography associated with an object.
CautionIf you reset a merged object, every member is reset and loses the geo-qualification. This also applies if you reset a geo-qualified object thats part of a merge.
1. In Design mode, go to the Objects pane.
SAP BusinessObjects Web Intelligence User's GuideReporting data PUBLIC 235
2. Hover over an object you want to reset and click .3. Click Reset Geography.
5.2.1.19 Enhancing reports with calculations, formulas and variables
You can use calculations, formulas and variables to manipulate data in reports.
Refer to the Using Functions, Formulas and Calculations in Web Intelligence guide for detailed information on the advanced calculation capabilities that you can use when you perform data analysis. This guide also provides a syntax reference to the available functions and operators.
5.2.1.19.1 Standard calculations
You can use standard calculation functions to make quick calculations on data.
The following standard calculations are available:
Calculation Description
Sum Calculates the sum of the selected data.
Count Counts all rows for a measure object or count distinct rows for a dimension or detail object.
Average Calculates the average of the data.
Min Displays the minimum value of the selected data.
Max Displays the maximum value of the selected data.
Percentage Displays the selected data as a percentage of the total. The results of the percentage are displayed in an additional column or row of the table.
NotePercentages are calculated for the selected measure compared to the total results for that measure on the table or break. To calculate the percentage of one measure compared to another measure, you need to build a custom calculation.
When you apply standard calculations to table columns, the calculation results appear in footers. One footer is added for each calculation.
236 PUBLICSAP BusinessObjects Web Intelligence User's Guide
Reporting data
5.2.1.19.1.1 To insert a standard calculation in a table or cross table
You can insert standard calculations in tables or cross tables to make quick calculations on table data.
For more information on the standard calculations, refer to the Using Functions, Formulas and Calculations in Web Intelligence guide.
You can insert multiple calculations in a table or cross table. When you apply two calculations to a table or crosstab, a footer is added for each calculation result. You insert multiple calculations in a table or cross table in the same way that you insert one calculation, but you repeat the procedure for as many calculations as you want to insert.
1. In Design mode, right-click the table cell that contains the data you want to calculate.2. Click Footer Calculation and select a calculation.
You can repeat this step to add multiple calculations to the same column.
TipDouble-click a cell to launch the Formula Editor toolbar, in which you can edit the formula.
A footer containing the result of the calculation is added below the column.
5.2.1.19.1.2 To remove a standard calculation
You can remove a standard calculation in Web Intelligence.
1. Open a Web Intelligence document in Design mode.2. Right-click that contains the calculation that you want to remove and select Delete.
5.2.1.19.2 Using formulas to build custom calculations
Custom calculations allow you to add additional calculations to your report beyond its base objects and standard calculations.
You add a custom calculation by writing a formula. A formula can consist of base report variables, functions, operators and calculation contexts.
A custom calculation is a formula that can consist of report objects, functions and operators. Formulas have a calculation context that you can specify explicitly if you choose.
SAP BusinessObjects Web Intelligence User's GuideReporting data PUBLIC 237
Example: Showing average revenue per sale
If you have a report with Sales Revenue and Number Sold objects and you want to add revenue per sale to the report, the calculation [Sales Revenue]/[Number Sold] gives this value by dividing the revenue by the number of items sold in order to give the revenue per item.
5.2.1.19.2.1 To build a formula manually
You can create formulas manually using the Formula Editor.
1. In Design mode, click in the Analyze section of the toolbar to show the formula bar.
2. In the Insert section of the toolbar, click > Blank Cell, and drag and drop the blank cell on the report canvas.
3. In the formula bar, build a formula in the dedicated field.
4. To build a formula using the Formula Editor, click in the formula bar.5. Build the formula.6. To confirm and apply the formula, click OK.
5.2.1.19.2.2 To build a formula in the Formula Editor
You can use the Formula Editor to build a formula for a table cell.
In the Formula Editor, you can define a formula and include a list of values or a prompt.
NoteFor more information about operators and functions, refer to the Using functions, formulas and calculations in Web Intelligence.
1. In Design mode, select the table cell where you want to insert the formula.
2. Click in the Analyze section of the toolbar to display the formula bar.
3. To build a formula using the Formula Editor, click in the formula bar.4. Double-click an object in the Objects pane to add it the formula.5. Double-click a function in the Functions pane to add it to the formula..6. Double-click an operator in the Operators pane to add it to the formula.
If your formula requires you to select one or more values from a list of values:a. Select an object in the Operators list.b. Double-click Prompts to open the prompt editor and define a prompt.c. Double-click the Values item to open the List of Values dialog.
238 PUBLICSAP BusinessObjects Web Intelligence User's Guide
Reporting data
d. Use the checkboxes to select one or multiple values.7. To confirm and apply the formula, click OK.
Related Information
Filtering data with prompts [page 378]
5.2.1.19.3 Using variables to simplify formulas
Variables are useful to break down formulas into manageable parts and make them easier to read. They also make building a formula less error-prone.
You'll find the variables in the Objects pane, under the Variables section, along with other objects in the query.
Use the Description field to provide context and details about a specific variable. The description is displayed in the Query Panel when you hover over the variable. You can edit this description when creating, editing or renaming a variable.
5.2.1.19.3.1 To create a variable
Create variables to break down formulas into manageable parts and make them easier to read.
1. In Design mode, in the Objects pane, click Add Variable.2. Add a name and a description.3. Select a qualification.4. Build a formula.
Note○ If a cell is selected before you open the Formula Editor, the formula you create is assigned to the
cell.○ For detailed information on building formulas, including a syntax reference to the available
functions and operators, refer to the Using functions, formulas and calculations in Web Intelligence guide.
5. Click to look for potential errors.If there's an error in the formula, a message will help you fix it.
6. Click OK.
SAP BusinessObjects Web Intelligence User's GuideReporting data PUBLIC 239
5.2.1.19.3.2 To edit a variable
You can edit a variable.
1. In Design mode, in the Objects pane, select a variable and click > Edit.2. Edit the variable.
NoteFor detailed information on how to build formulas, including a syntax reference to the available functions and operators, refer to the Using functions, formulas and calculations in Web Intelligence guide.
3. Click OK.
5.2.1.19.3.3 To delete a variable
You can delete a variable.
1. In Design mode, in the Objects pane, select a variable and click .2. In the contextual menu, click Delete.3. Click OK.
5.2.1.19.3.4 To rename a variable
You can rename variables.
1. In Design mode, in the Objects pane, select a variable and click .2. Click Rename.3. Rename the variable and click OK.
Related Information
To edit a variable [page 240]
240 PUBLICSAP BusinessObjects Web Intelligence User's Guide
Reporting data
5.2.1.19.3.5 To duplicate a variable
You can duplicate a variable in Web Intelligence.
1. In a Web Intelligence document in Design mode, in the Objects, click next to a variable.2. Click Duplicate.
The duplicated variable appears below the original variable, with a number in parenthesis in its name, for example (1) for the first duplicate, (2) for the second duplicate.
5.2.1.19.3.6 To merge variables
You can merge two variables, or merge a variable with another object.
The variables must be dimension objects, and must come from different queries. You cannot merge objects coming from the same query.
Tip
To have a better visibility of the variables you can merge, click > Queries View switch to the view in the Objects pane. Using this view, you can see the variables coming from the different queries.
1. In Design mode, in the Objects pane, select a variable.2. While holding the Ctrl or Cmd key, select a second variable.
3. On the second variable you've selected, click > Merge.
5.2.1.19.4 Using references to reuse data
A reference is a variable whose definition and content are based on another cell. It's useful whenever you want to leverage data of a cell that has been obtained using a complex formula.
You use a reference to point to another cell and reuse its value. Using a reference as a direct pointer to the content of a referenced cell is a direct shortcut to the value you are interested in. After you have created a reference in a document, it is replaced by the content of it referenced cell.
You can use references anywhere in a document, in any report or formula. As an example, you could use references to create a summary report that references figures from other reports.
A reference always inherits the type of the cell it references. If the referenced cell type is a string for instance, then the reference type is a string as well. If the referenced cell type changes, then the reference adapts so.
The definition of a reference is made of two elements:
● A name● The path of the cell it references
The following table lists the definitions related to references:
SAP BusinessObjects Web Intelligence User's GuideReporting data PUBLIC 241
Concept Definition
Reference Variable whose definition and value references a target cell
Referenced cell Target cell of the reference
Referenced cell content Data contained in the reference, reused from the referenced cell
Restriction● A reference doesn’t keep the format of its target cell. If a target cell has a specific color or font for
instance, it's not reflected in the reference.● When hiding a column table that contains a referenced cell or a commented cell, the reference is lost as
well as the comment.● When turning a table into a chart and then turning it back into a table, it's empty if the original table
contained a reference. That is because references are constant strings and aren't supported by charts.
References use the following icon:
5.2.1.19.4.1 To assign a reference
1. In Design mode, right-click a table cell and click Assign Reference.2. Select whether you want to assign a new reference to the cell or an existing one.3. Click OK.
The reference now appears in the Objects pane, under the References section. Note that if you copy and paste a cell using a reference, then the reference in the copied cell points to the same target cell.
5.2.1.19.4.2 To edit a reference
1. In the Objects pane, click the dots next to the reference you want to edit.2. Click Edit.3. Edit the properties of the reference.4. Click OK.
5.2.1.19.4.3 To delete a reference
1. In the Objects pane, click the dots next to the reference you want to delete.
242 PUBLICSAP BusinessObjects Web Intelligence User's Guide
Reporting data
2. Click Delete.3. Click OK.
5.2.1.19.4.4 To display a referenced cell
1. In the Objects pane, click the dots next to the reference whose referenced cell you want to display.2. Click Show Referenced Cell.
The cell is automatically selected on the report page.
5.2.1.20 Displaying data in tables
When you create a document and run the query the first time to display the results, the document contains a report that includes the query results in a vertical table.
You can do the following:
● Modify how the table is organized● Remove or add data● Insert other rows or columns● Hide columns (see note below)● Change the table type● Turn the table into a chart● Insert other tables
TipWhen you create a new name for a column, it becomes a custom header and it is no longer attached to the dimension. When you hide the column and show it again, it will revert to the original, default column name. If you want the custom header name to be permanent, you can create a variable.
Related Information
To create a variable [page 239]
5.2.1.20.1 Vertical tables
Vertical tables display header cells at the top of the table and the corresponding data in columns.
By default, the header cells display the names of the dimensions, details, and measures included in the table. The body cells display the corresponding values.
SAP BusinessObjects Web Intelligence User's GuideReporting data PUBLIC 243
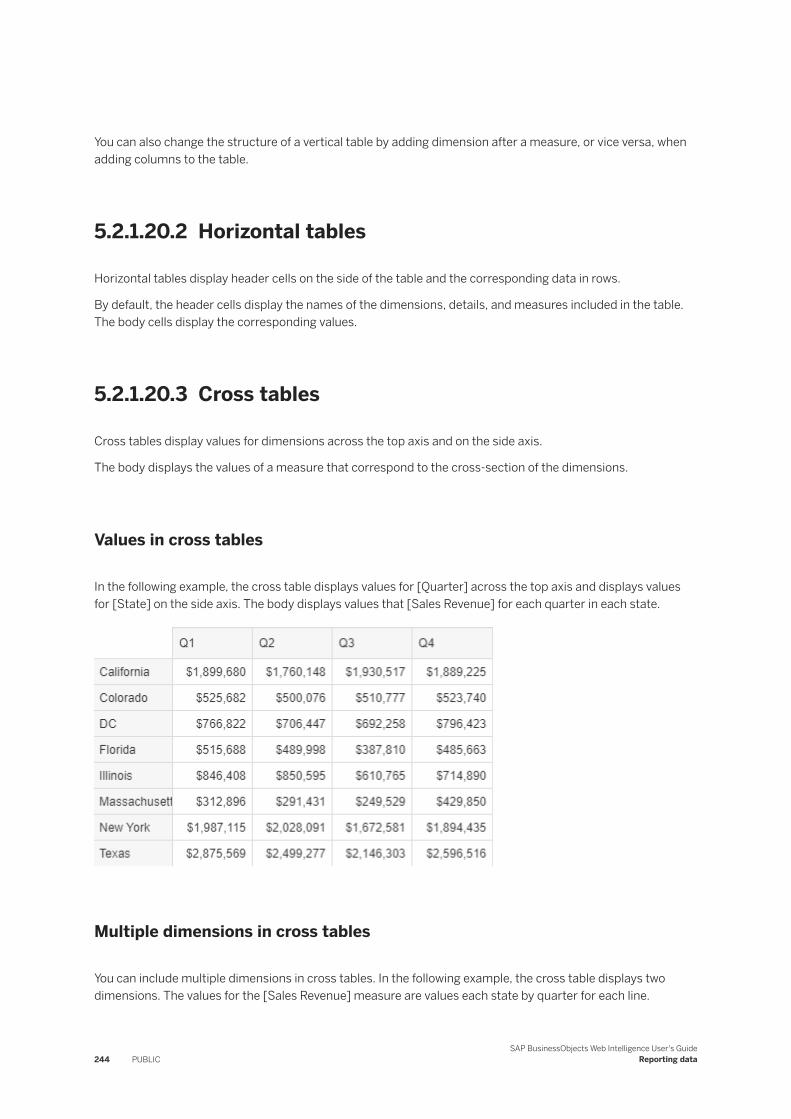
You can also change the structure of a vertical table by adding dimension after a measure, or vice versa, when adding columns to the table.
5.2.1.20.2 Horizontal tables
Horizontal tables display header cells on the side of the table and the corresponding data in rows.
By default, the header cells display the names of the dimensions, details, and measures included in the table. The body cells display the corresponding values.
5.2.1.20.3 Cross tables
Cross tables display values for dimensions across the top axis and on the side axis.
The body displays the values of a measure that correspond to the cross-section of the dimensions.
Values in cross tables
In the following example, the cross table displays values for [Quarter] across the top axis and displays values for [State] on the side axis. The body displays values that [Sales Revenue] for each quarter in each state.
Multiple dimensions in cross tables
You can include multiple dimensions in cross tables. In the following example, the cross table displays two dimensions. The values for the [Sales Revenue] measure are values each state by quarter for each line.
244 PUBLICSAP BusinessObjects Web Intelligence User's Guide
Reporting data
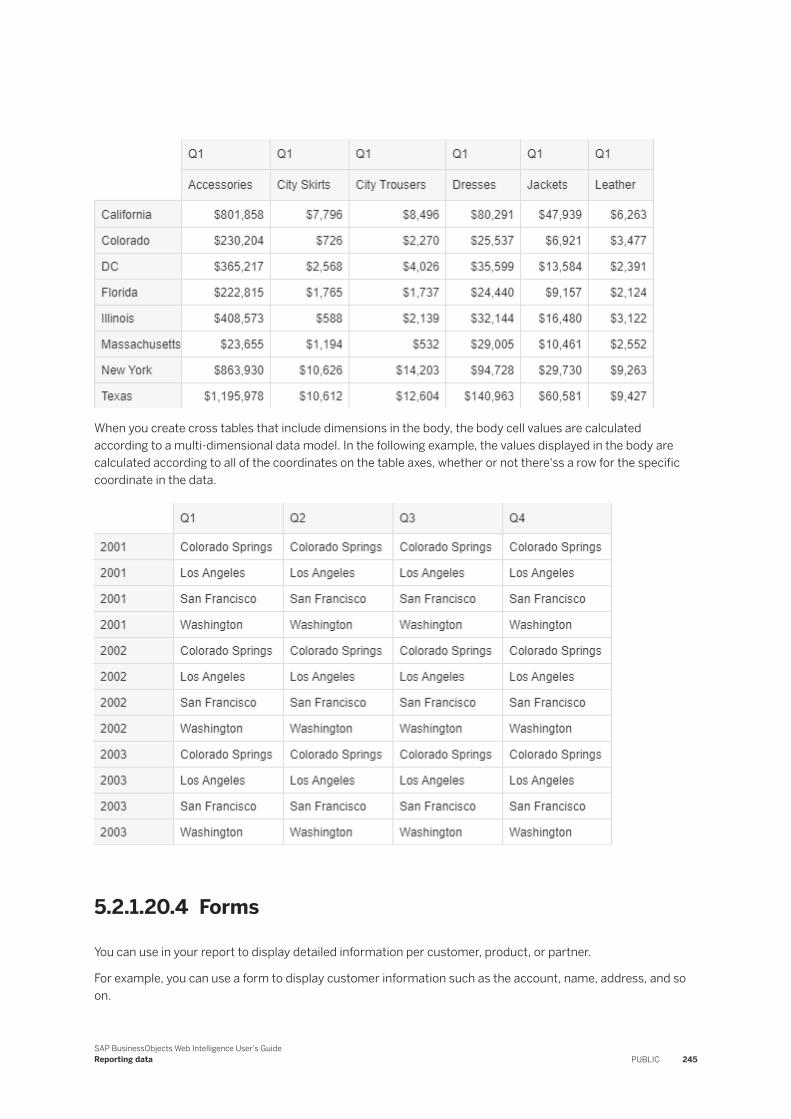
When you create cross tables that include dimensions in the body, the body cell values are calculated according to a multi-dimensional data model. In the following example, the values displayed in the body are calculated according to all of the coordinates on the table axes, whether or not there'ss a row for the specific coordinate in the data.
5.2.1.20.4 Forms
You can use in your report to display detailed information per customer, product, or partner.
For example, you can use a form to display customer information such as the account, name, address, and so on.
SAP BusinessObjects Web Intelligence User's GuideReporting data PUBLIC 245
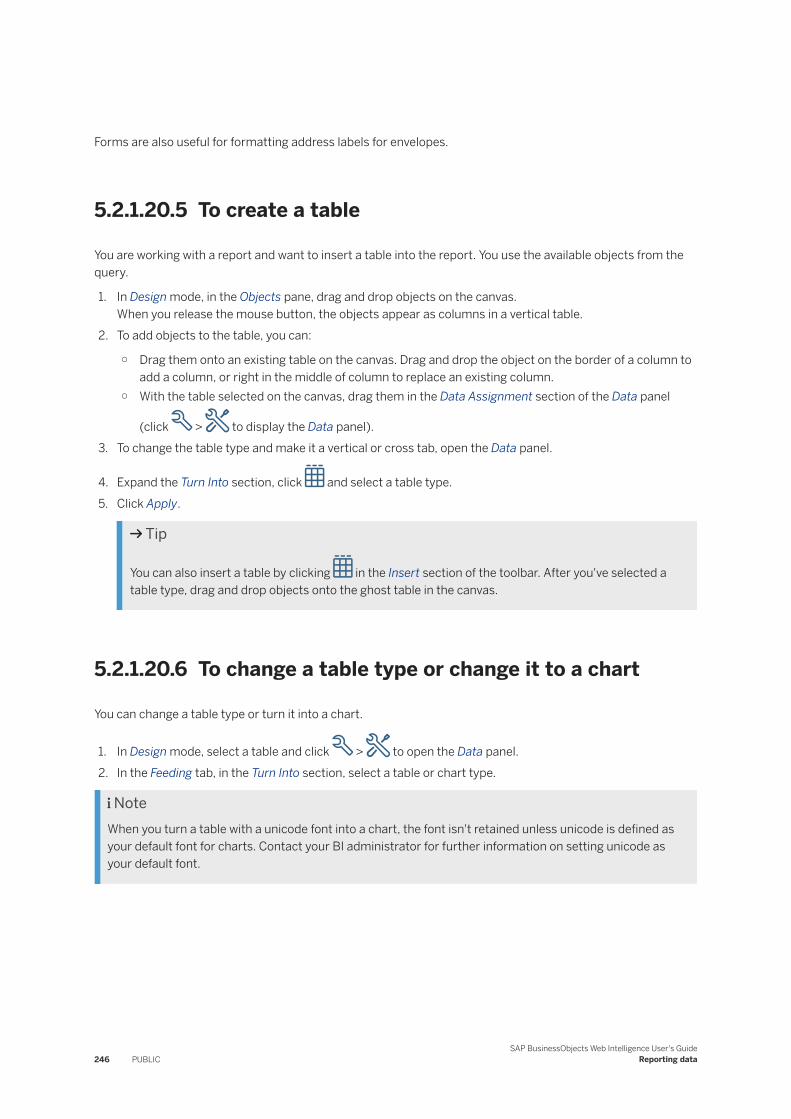
Forms are also useful for formatting address labels for envelopes.
5.2.1.20.5 To create a table
You are working with a report and want to insert a table into the report. You use the available objects from the query.
1. In Design mode, in the Objects pane, drag and drop objects on the canvas.When you release the mouse button, the objects appear as columns in a vertical table.
2. To add objects to the table, you can:
○ Drag them onto an existing table on the canvas. Drag and drop the object on the border of a column to add a column, or right in the middle of column to replace an existing column.
○ With the table selected on the canvas, drag them in the Data Assignment section of the Data panel
(click > to display the Data panel).3. To change the table type and make it a vertical or cross tab, open the Data panel.
4. Expand the Turn Into section, click and select a table type.5. Click Apply.
Tip
You can also insert a table by clicking in the Insert section of the toolbar. After you've selected a table type, drag and drop objects onto the ghost table in the canvas.
5.2.1.20.6 To change a table type or change it to a chart
You can change a table type or turn it into a chart.
1. In Design mode, select a table and click > to open the Data panel.2. In the Feeding tab, in the Turn Into section, select a table or chart type.
NoteWhen you turn a table with a unicode font into a chart, the font isn't retained unless unicode is defined as your default font for charts. Contact your BI administrator for further information on setting unicode as your default font.
246 PUBLICSAP BusinessObjects Web Intelligence User's Guide
Reporting data
5.2.1.20.7 To add table rows or columns
You can add table rows and columns.
1. In Design mode, right-click a cell in the column or row next to which you want to insert another column or row.
2. Click Insert, and select whether your want to add a row above or below, or a column on the left of the right.3. Drag an object from the Objects pane in the side panel to the empty column or row you inserted.
5.2.1.20.8 To remove table rows or columns
You can remove table rows or columns.
1. In Design mode, right-click the table column or row you want to remove and select Delete from the contextual menu.
2. Select Row or Column.3. Click OK.
5.2.1.20.9 To move a row or column
You can move a row or column in a table.
1. In Design mode, drag the selected column or row and drop it before or after another column or row on the table.When you drag a row or column, the column or row header displays next to your pointer.
2. You can also move rows and column in the Data panel:
a. Click > to open the Data panel.b. Select a table on the canvas.c. In the Feeding tab, under the Data Assignment section, drag an object above or below another object to
move its postion in the table.For example, if you want the table to display the years in the first column next to the quarters column, drag the [Year] object right above [Quarter].
5.2.1.20.10 To swap a row or column
You can swap rows and columns in tables.
1. In Design mode, drag the selected column or row onto the column or row that you want to swap.2. You can also swap rows or column in the Data panel:
a. Click > to open the Data panel.
SAP BusinessObjects Web Intelligence User's GuideReporting data PUBLIC 247
b. Select a table on the canvas.c. In the Feeding tab, under the Data Assignment section, drag an object onto the object you want to
swap.For example, to swap [Lines] for [Category], drag [Lines] onto [Category].
5.2.1.20.11 To clear cell contents from a table
You can clear different types of cells in a table.
You can clear the following types of cell in a table:
● Header cells – you can clear each header cell separately● Footer cells – you can clear each footer cell separately● Related body cells – when you clear one body cell, you automatically clear all of the body cells in the same
column or row of the table
1. In Design mode, select the cell you want to clear and right-click it.The cell borders are highlighted.
2. In the contextual menu, click Content Clear Content .
5.2.1.20.12 To remove a table
You can remove a table.
1. In Design mode, right-click the top edge of the table you want to remove.A highlighted border appears around the table.
2. In the contextual menu, click Delete.
5.2.1.20.13 To copy a table
You can copy and paste tables within a report or into external applications such as Microsoft Word and Excel.
1. In Design mode, select a table, and while maintaning the Ctrl or Cmd key, drag the table anywhere on the canvas.
2. Optional: You can also:a. Select and right-click the table you want to copy.b. In the contextual menu, click Copy.c. To paste the table to another part of the report, right-click where you want the table to appear and
select Paste.
RestrictionYou can't copy tables from one version of Web Intelligence to another.
248 PUBLICSAP BusinessObjects Web Intelligence User's Guide
Reporting data
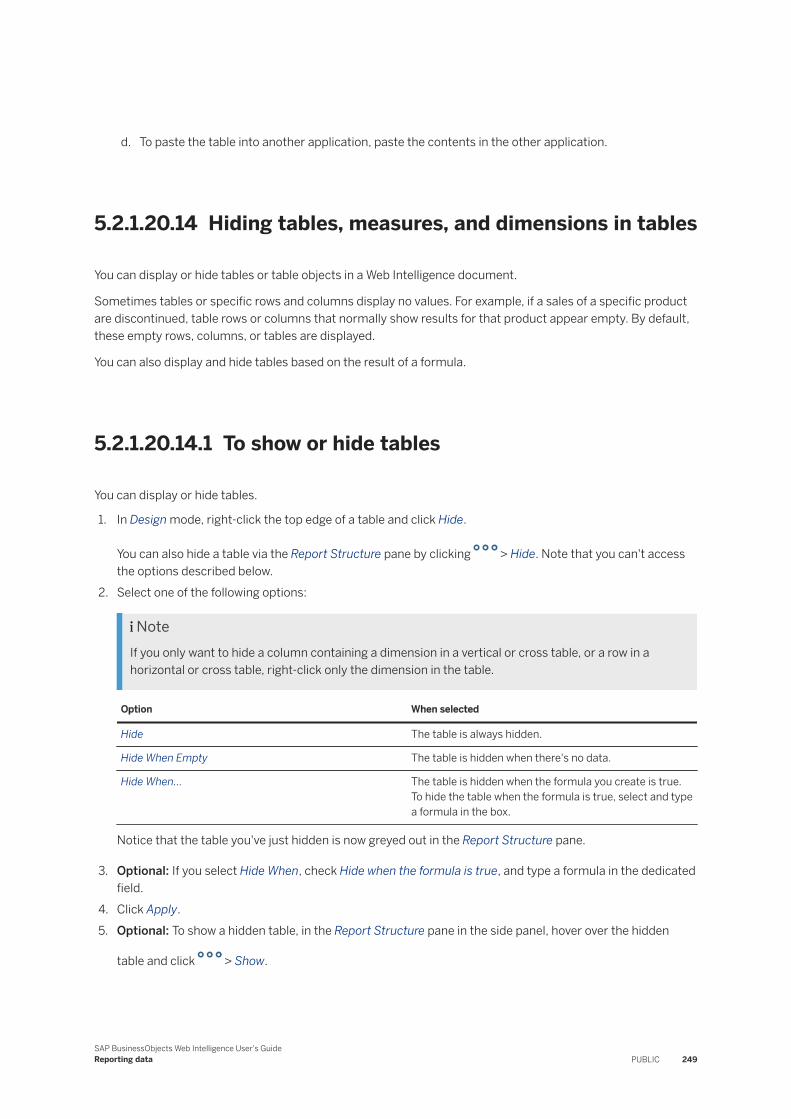
d. To paste the table into another application, paste the contents in the other application.
5.2.1.20.14 Hiding tables, measures, and dimensions in tables
You can display or hide tables or table objects in a Web Intelligence document.
Sometimes tables or specific rows and columns display no values. For example, if a sales of a specific product are discontinued, table rows or columns that normally show results for that product appear empty. By default, these empty rows, columns, or tables are displayed.
You can also display and hide tables based on the result of a formula.
5.2.1.20.14.1 To show or hide tables
You can display or hide tables.
1. In Design mode, right-click the top edge of a table and click Hide.
You can also hide a table via the Report Structure pane by clicking > Hide. Note that you can't access the options described below.
2. Select one of the following options:
NoteIf you only want to hide a column containing a dimension in a vertical or cross table, or a row in a horizontal or cross table, right-click only the dimension in the table.
Option When selected
Hide The table is always hidden.
Hide When Empty The table is hidden when there's no data.
Hide When... The table is hidden when the formula you create is true. To hide the table when the formula is true, select and type a formula in the box.
Notice that the table you've just hidden is now greyed out in the Report Structure pane.
3. Optional: If you select Hide When, check Hide when the formula is true, and type a formula in the dedicated field.
4. Click Apply.5. Optional: To show a hidden table, in the Report Structure pane in the side panel, hover over the hidden
table and click > Show.
SAP BusinessObjects Web Intelligence User's GuideReporting data PUBLIC 249
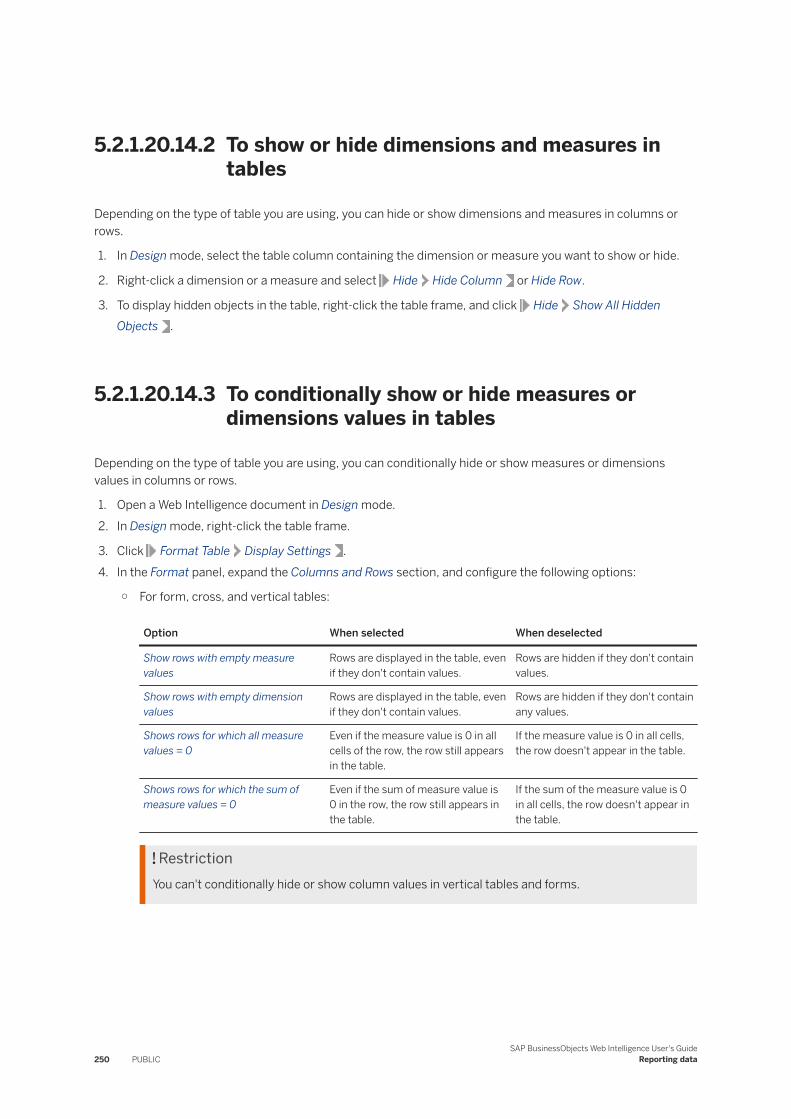
5.2.1.20.14.2 To show or hide dimensions and measures in tables
Depending on the type of table you are using, you can hide or show dimensions and measures in columns or rows.
1. In Design mode, select the table column containing the dimension or measure you want to show or hide.
2. Right-click a dimension or a measure and select Hide Hide Column or Hide Row.
3. To display hidden objects in the table, right-click the table frame, and click Hide Show All Hidden Objects .
5.2.1.20.14.3 To conditionally show or hide measures or dimensions values in tables
Depending on the type of table you are using, you can conditionally hide or show measures or dimensions values in columns or rows.
1. Open a Web Intelligence document in Design mode.2. In Design mode, right-click the table frame.
3. Click Format Table Display Settings .4. In the Format panel, expand the Columns and Rows section, and configure the following options:
○ For form, cross, and vertical tables:
Option When selected When deselected
Show rows with empty measure values
Rows are displayed in the table, even if they don't contain values.
Rows are hidden if they don't contain values.
Show rows with empty dimension values
Rows are displayed in the table, even if they don't contain values.
Rows are hidden if they don't contain any values.
Shows rows for which all measure values = 0
Even if the measure value is 0 in all cells of the row, the row still appears in the table.
If the measure value is 0 in all cells, the row doesn't appear in the table.
Shows rows for which the sum of measure values = 0
Even if the sum of measure value is 0 in the row, the row still appears in the table.
If the sum of the measure value is 0 in all cells, the row doesn't appear in the table.
RestrictionYou can't conditionally hide or show column values in vertical tables and forms.
250 PUBLICSAP BusinessObjects Web Intelligence User's Guide
Reporting data
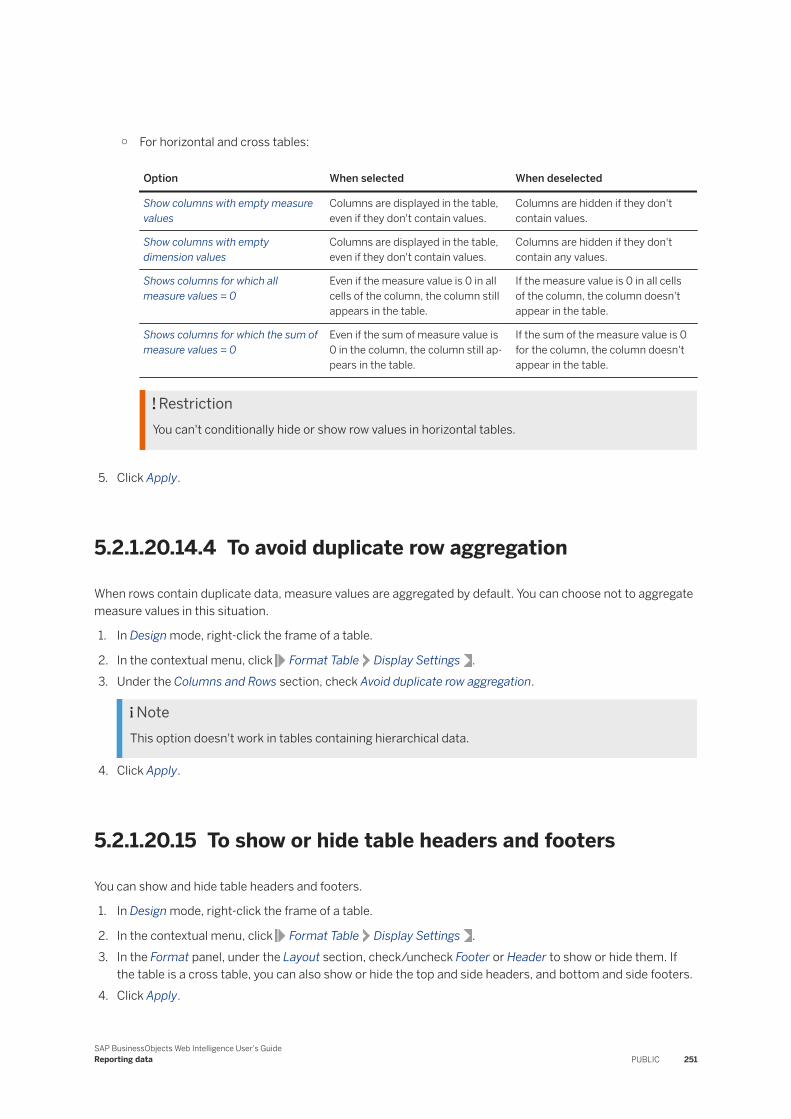
○ For horizontal and cross tables:
Option When selected When deselected
Show columns with empty measure values
Columns are displayed in the table, even if they don't contain values.
Columns are hidden if they don't contain values.
Show columns with empty dimension values
Columns are displayed in the table, even if they don't contain values.
Columns are hidden if they don't contain any values.
Shows columns for which all measure values = 0
Even if the measure value is 0 in all cells of the column, the column still appears in the table.
If the measure value is 0 in all cells of the column, the column doesn't appear in the table.
Shows columns for which the sum of measure values = 0
Even if the sum of measure value is 0 in the column, the column still appears in the table.
If the sum of the measure value is 0 for the column, the column doesn't appear in the table.
RestrictionYou can't conditionally hide or show row values in horizontal tables.
5. Click Apply.
5.2.1.20.14.4 To avoid duplicate row aggregation
When rows contain duplicate data, measure values are aggregated by default. You can choose not to aggregate measure values in this situation.
1. In Design mode, right-click the frame of a table.
2. In the contextual menu, click Format Table Display Settings .3. Under the Columns and Rows section, check Avoid duplicate row aggregation.
NoteThis option doesn't work in tables containing hierarchical data.
4. Click Apply.
5.2.1.20.15 To show or hide table headers and footers
You can show and hide table headers and footers.
1. In Design mode, right-click the frame of a table.
2. In the contextual menu, click Format Table Display Settings .3. In the Format panel, under the Layout section, check/uncheck Footer or Header to show or hide them. If
the table is a cross table, you can also show or hide the top and side headers, and bottom and side footers.4. Click Apply.
SAP BusinessObjects Web Intelligence User's GuideReporting data PUBLIC 251
5.2.1.20.16 To start tables on a new report page
You can set a table to start on a new report page.
1. In Design mode, right-click the frame of a table.
2. In the contextual menu, click Format Table Layout Settings .3. In the Format panel, under the Page Break section, Repeat on every page in the Vertical and Horizontal sub
sections, or both.4. Click Apply.
5.2.1.20.17 To display object names in headers on cross tables
You can display object names in headers in cross tables.
1. In Design mode, right-click a table frame.
2. In the contextual menu, click Format Table Display Settings .3. In the Format, under the Layout section, check Show object names.4. Click Apply.
5.2.1.20.18 To avoid page breaks in tables
You can stop page breaks from occurring in tables.
1. In Design mode, right-click a table frame.
2. In the contextual menu, click Format Table Layout Settings .3. Under the Page Break section, check Avoid page breaks in the Vertical or Horizontal sub sections.
The Horizontal and Vertical sub sections refer to the table axes.4. Click Apply.
5.2.1.20.19 To repeat a table on every page
You can repeat a table horizontally, vertically or both a every page of a report.
NoteWhen using this parameter, a banner is inserted at the top of the first page on which the table is repeated. If a repeated table is placed in the middle of a page next to a table that spreads across multiple pages, then on the second page, the rest of the table is displayed only below the banner. We recommend using this parameter only if the table you want to repeat is placed at the top of the page or all the way to the left. Otherwise, the banner takes too much space on the page.
252 PUBLICSAP BusinessObjects Web Intelligence User's Guide
Reporting data
If the repeated element is contained within a section, then its container is the section instance and the banner is up at the top of the section instance rather than at the top of page. If there's not enough space to display the report block that comes after the repeated element, then the parameter is ignored.
1. In Design mode, right-click a table frame.
2. In the contextual menu, click Format Table Layout Settings .3. Under the Page Break section, check Avoid page breaks either in the Vertical, Horizontal, or both sub
sections.4. Click Apply.
5.2.1.20.20 To repeat table headers or footers on report pages
You can repeat table headers and footers.
1. In Design mode, right-click a table frame.
2. In the contextual menu, click Format Table Layout Settings .3. Under the Layout section, depending on the table type, check Repeat vertical header on every page, Repeat
horizontal header on every page, Repeat vertical footer on every page or Repeat horizontal footer on every page.
4. Click Apply.
5.2.1.20.21 Transforming a dimension in a table using dimension value groups
In a table column, you can collect the values of a dimension into an aggregated group to which you can assign a unique name. For example, if your company has branch offices in the US cities of New York, Washington, and Boston, you can add them to a group called Eastern branch offices.
In a table, when you group the values of a dimension, they're no longer visible in the table as single entities; they and their data are aggregated into the group until you choose to remove any of the values of a dimension from the group.
You can group dimension values in Design mode in the Objects pane:
1. Select a dimension.
2. Click > Manage Groups.
The application automatically creates a variable object for the aggregated group Objects pane.
SAP BusinessObjects Web Intelligence User's GuideReporting data PUBLIC 253
Ungrouped values
Any ungrouped values of a dimension remain separate in the table column unless you enable the Automatically grouped option. If you select Automatically grouped for ungrouped values, then the values of a dimension are removed from the table and aggregated into the selected group’s data.
Tips about grouping values of a dimension in a table
● You can reuse the aggregated group variable in other tables.
NoteIf the original dimension can be used in the same or other tables and isn't affected by the group variable.
● A dimension value can only belong to one group.● A dimension value group is a text data type, even if the original values of a dimension are dates or numbers.● We recommend that you don't have more than 1,000 values of a dimension in a group. Having more than
1,000 values could cause performance issues.
5.2.1.20.21.1 To group or ungroup values of a dimension in a table
The Manage Group dialog allows you to assign two or more values of a dimension in a table column to an aggregated group and give it a unique name.
1. In Design mode, in the Objects pane, select a dimension.
2. Click > Manage Groups.3. In the Manage Groups dialog, check the values that you want to group.4. Click Group.5. In the New Group dialog, give a name to the group and click OK.
The group you've just created now shows in the All Groups drop down..6. Optional: If you want to have any ungrouped values of a dimension automatically grouped:
a. Click Ungrouped Values Automatically Grouped .b. In the Automatically Grouped Values dialog, give a name to the group.c. Click OK.
7. To remove values from a group, make sure that all values are displayed using the All Groups drop down, select the value(s) you want to remove, and click Ungroup.Notice how the group name is no longer displayed in the Group column for the value(s) you've just removed. If you have selected Automatically Grouped for ungrouped values, then the values of the dimension don't appear individually in the table column because they're aggregated into the "ungrouped" group data.
254 PUBLICSAP BusinessObjects Web Intelligence User's Guide
Reporting data
8. If you want to rename the group, click , and give a new name to the group.9. Click OK to close the Manage Groups dialog.
The values are grouped in the dimension column in the table, and the column header name changes to "[dimension name]+". For example, if you group values for dimension "City", the column header changes to show "City+". A group variable is created in the Variables section in the Objects pane. You can change the group variable name in the Manage Groups dialog or using the right-click contextual menu for the group variable in the Variables section.
Related Information
To edit group variables [page 255]
5.2.1.20.21.2 To add or move values of a dimension to an existing group
The Manage Group dialog allows you to add values of a dimension to an existing aggregated group in a table column.
1. In Design mode, in the Objects pane, select a group of values in the Variables section and click > Manage Groups.
2. In the Manage Groups dialog, select the values you want to add to a group.
NoteYou can also select values that are already part of an existing group, or a whole group of values, and move them to another group.
3. Click the Move to drop down, and select a group.The group name appears in the Groups column next to the variables that you have selected.
4. Click OK.
The selected values of the dimension disappear from the table column and are aggregated into the selected group.
5.2.1.20.21.3 To edit group variables
You can edit dimension group variables in the Objects.
1. In Design mode, in the Objects pane, select a group variable object in the Variables section and click .2. Depending on what you want to do, click Rename, Duplicate or Delete. If you want to edit the value in the
group, click Manage Groups to access the group editor and edit the values.
SAP BusinessObjects Web Intelligence User's GuideReporting data PUBLIC 255
Related Information
To group or ungroup values of a dimension in a table [page 254]To add or move values of a dimension to an existing group [page 255]
5.2.1.20.21.4 To rearrange values of a dimension
You can create a customer order and rearrange the values of a dimension.
1. In Design mode, in the Objects pane, select a dimension.
2. Click > Custom Order.3. Using either the up and down arrows, or drag and drop, rearrange the values as you see fit.4. Click OK.
5.2.1.21 Displaying data in free-standing cells
Free-standing cells are single cells that stand alone in a report.
You can place any text or formula in a blank free-standing cell, or you can use pre-defined free standing cells that display specific information.
For more information on the functions used in free-standing cells, see the Using Functions, Formulas and Calculations in Web Intelligence guide, or see the Web Intelligence online help.
Formula and text cell functions in free-standing cells
Function Description
Blank Cell Empty cell in which you can enter any text or formula.
Comment Empty cell in which you can type a general comment about the entire report.
Drill Filters Uses the DrillFilters function to display details of the drill filters applied to the report.
Last Refresh Date Uses the LastExecutionDate function to display the last date when the document was refreshed.
Document Name Uses the DocumentName function to display the document name.
Query Summary Uses the QuerySummary function to display details of the queries in the document.
Prompt Summary Uses the PromptSummary function to display details of the user prompt selections.
256 PUBLICSAP BusinessObjects Web Intelligence User's Guide
Reporting data
Function Description
Report Filter Summary Uses the ReportFilterSummary function to display the report filters applied to the report.
Page number cell functions in free-standing cells
Function Description
Page Number Uses the Page function to display the number of pages in the report.
Page Number/Total Pages Uses the Page and NumberOfPages functions to display the current page number and the total number of pages in the report.
Total Number of Pages Uses the NumberOfPages function to display the total number of pages in the report.
5.2.1.21.1 To insert a free-standing cell in a report
You can insert a free-standing cell in a report.
1. In Design mode, in the Insert section of the toolbar, click .2. Select a pre-defined cell in the contextual menu.3. Click on the report canvas to place the cell where you want it.4. Optional: If you have inserted a blank cell, type the text or formula of the cell in the formula bar.
Note
If you can't see the formula bar, click in the Analyze section of the toolbar to display it.
5.2.1.21.2 To hide free-standing cells
You can hide free-standing cells unconditionally, when they are empty, or based on the result of a formula.
1. In Design mode, right-click a free-standing cell and select Format Cell Hide in the contextual menu.2. In the Format pane, select an option:
○ To hide the cell unconditionally, select Hide always.○ To hide the cell when it is empty, select Hide when empty.○ To hide the cell based on the result of a formula, click Hide when formula is true and type the formula in
the box.3. Optional: If you've decided to hide the cell based on a formula, in the Format panel, check Hide when
formula is true, type a formula, and click Apply.
SAP BusinessObjects Web Intelligence User's GuideReporting data PUBLIC 257
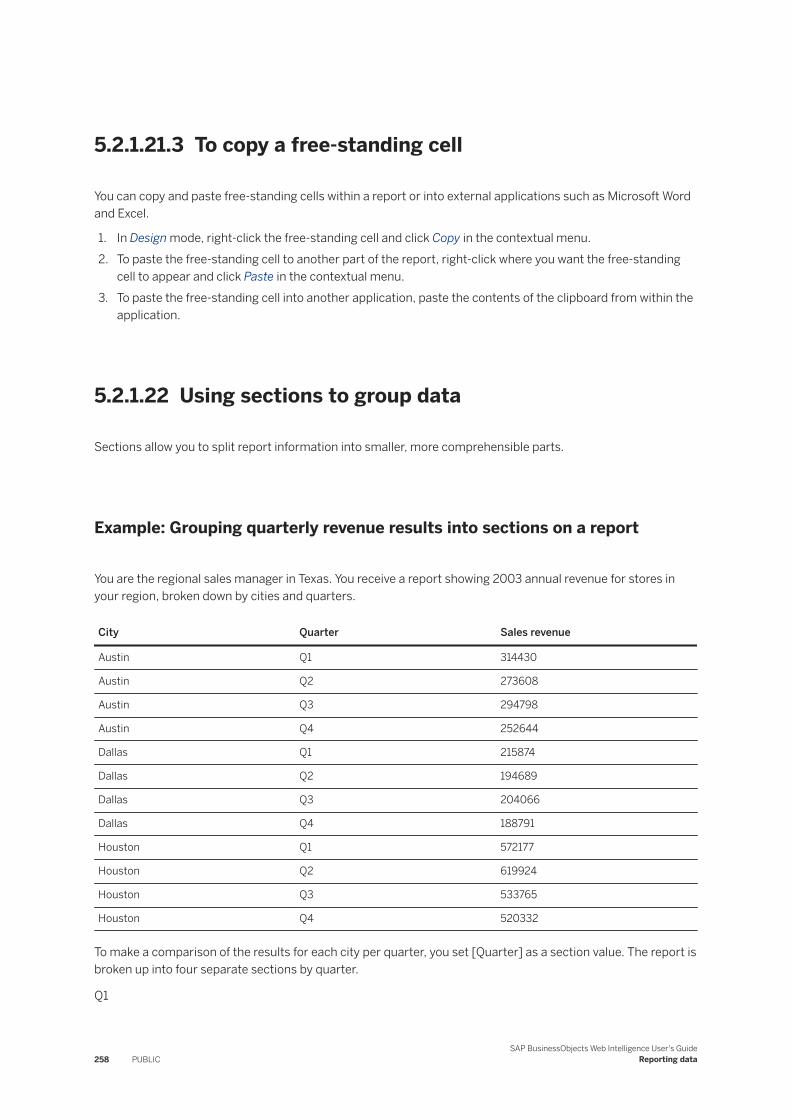
5.2.1.21.3 To copy a free-standing cell
You can copy and paste free-standing cells within a report or into external applications such as Microsoft Word and Excel.
1. In Design mode, right-click the free-standing cell and click Copy in the contextual menu.2. To paste the free-standing cell to another part of the report, right-click where you want the free-standing
cell to appear and click Paste in the contextual menu.3. To paste the free-standing cell into another application, paste the contents of the clipboard from within the
application.
5.2.1.22 Using sections to group data
Sections allow you to split report information into smaller, more comprehensible parts.
Example: Grouping quarterly revenue results into sections on a report
You are the regional sales manager in Texas. You receive a report showing 2003 annual revenue for stores in your region, broken down by cities and quarters.
City Quarter Sales revenue
Austin Q1 314430
Austin Q2 273608
Austin Q3 294798
Austin Q4 252644
Dallas Q1 215874
Dallas Q2 194689
Dallas Q3 204066
Dallas Q4 188791
Houston Q1 572177
Houston Q2 619924
Houston Q3 533765
Houston Q4 520332
To make a comparison of the results for each city per quarter, you set [Quarter] as a section value. The report is broken up into four separate sections by quarter.
Q1
258 PUBLICSAP BusinessObjects Web Intelligence User's Guide
Reporting data
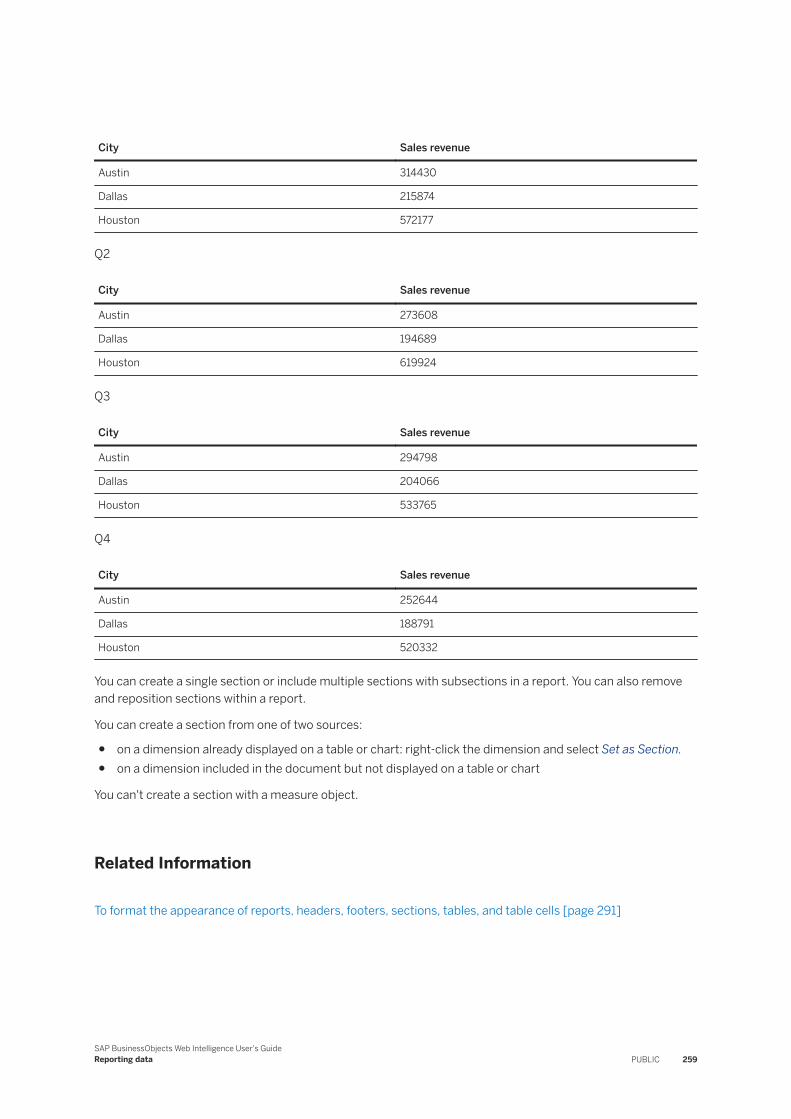
City Sales revenue
Austin 314430
Dallas 215874
Houston 572177
Q2
City Sales revenue
Austin 273608
Dallas 194689
Houston 619924
Q3
City Sales revenue
Austin 294798
Dallas 204066
Houston 533765
Q4
City Sales revenue
Austin 252644
Dallas 188791
Houston 520332
You can create a single section or include multiple sections with subsections in a report. You can also remove and reposition sections within a report.
You can create a section from one of two sources:
● on a dimension already displayed on a table or chart: right-click the dimension and select Set as Section.● on a dimension included in the document but not displayed on a table or chart
You can't create a section with a measure object.
Related Information
To format the appearance of reports, headers, footers, sections, tables, and table cells [page 291]
SAP BusinessObjects Web Intelligence User's GuideReporting data PUBLIC 259
5.2.1.22.1 To create a section from a column
You can create a section based on a table column.
1. In Design mode, right-click the column you want to define as a section.2. In the contextual menu, click Set as Section.
5.2.1.22.2 To create a section from a dimension
You can create a section.
1. In Design mode, in the Insert section of the toolbar, click .2. Click on the report canvas where you want to place the section.3. Select the dimension in the Define a New Section dialog, and click OK.
5.2.1.22.3 Using report filters in report sections
You can apply report filters to sections using values in the section cell or that appear within the section.
You access filters by right-clicking a section, and then select Data Add Filter to access the Filters tab of the Data panel.
Filters on a section cell
If you have a report with section [Country], you can use in the filter syntax [Country] = "US" to filter out all sections on countries that aren't "US".
Filters on section data
If you have a report with section [Region] and you use in the filter syntax [Product]="Drinks" in the section, the report contains all sections that contain the product "Drinks".
The filter is based on the data in the section, but applied indirectly to the data in the section cell.
260 PUBLICSAP BusinessObjects Web Intelligence User's Guide
Reporting data
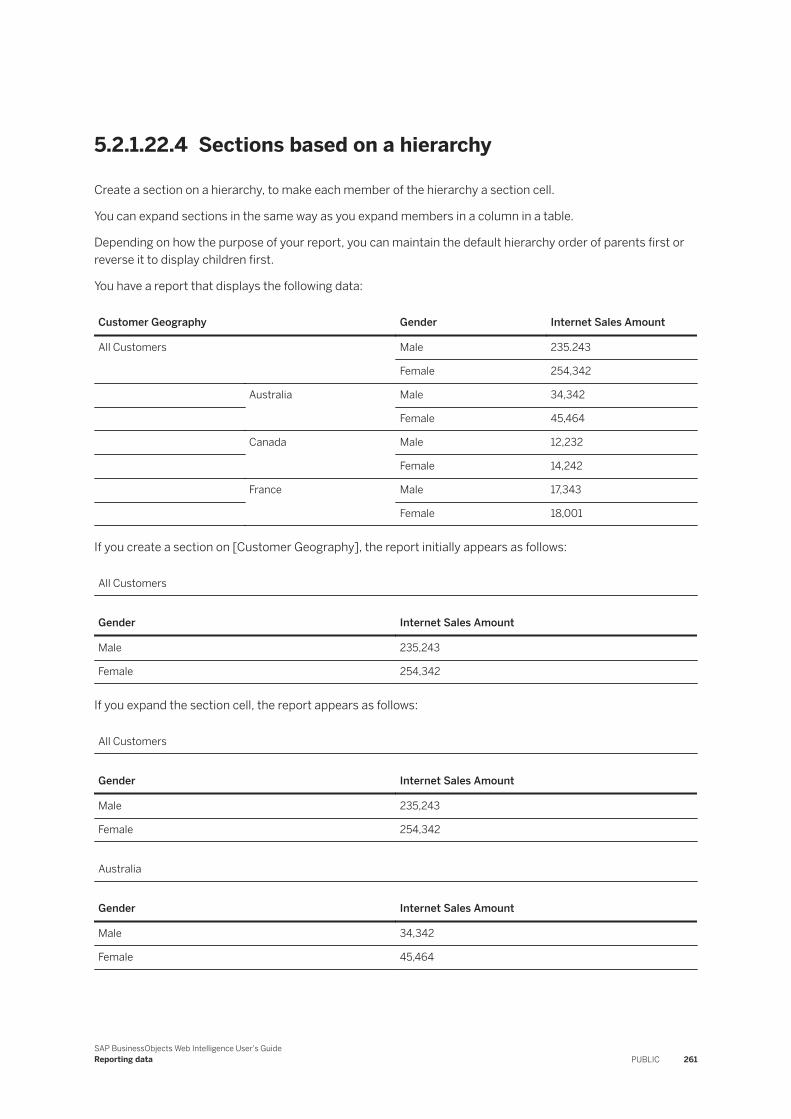
5.2.1.22.4 Sections based on a hierarchy
Create a section on a hierarchy, to make each member of the hierarchy a section cell.
You can expand sections in the same way as you expand members in a column in a table.
Depending on how the purpose of your report, you can maintain the default hierarchy order of parents first or reverse it to display children first.
You have a report that displays the following data:
Customer Geography Gender Internet Sales Amount
All Customers Male 235.243
Female 254,342
Australia Male 34,342
Female 45,464
Canada Male 12,232
Female 14,242
France Male 17,343
Female 18,001
If you create a section on [Customer Geography], the report initially appears as follows:
All Customers
Gender Internet Sales Amount
Male 235,243
Female 254,342
If you expand the section cell, the report appears as follows:
All Customers
Gender Internet Sales Amount
Male 235,243
Female 254,342
Australia
Gender Internet Sales Amount
Male 34,342
Female 45,464
SAP BusinessObjects Web Intelligence User's GuideReporting data PUBLIC 261
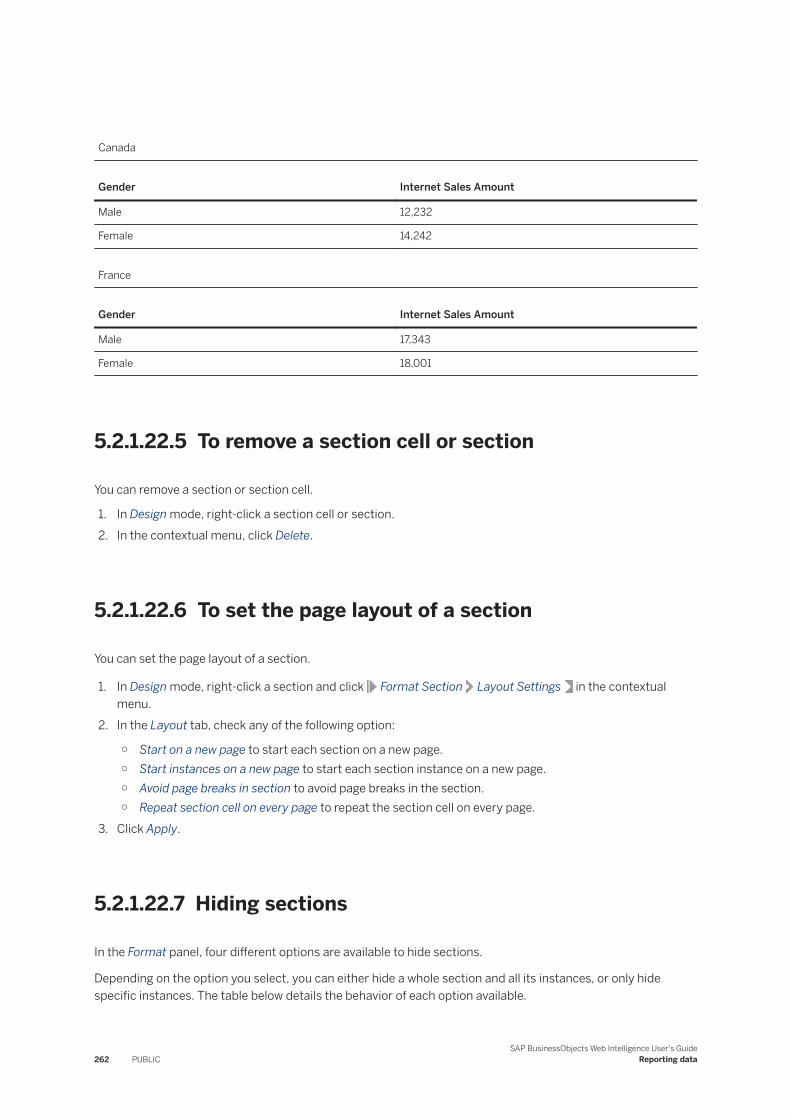
Canada
Gender Internet Sales Amount
Male 12,232
Female 14,242
France
Gender Internet Sales Amount
Male 17,343
Female 18,001
5.2.1.22.5 To remove a section cell or section
You can remove a section or section cell.
1. In Design mode, right-click a section cell or section.2. In the contextual menu, click Delete.
5.2.1.22.6 To set the page layout of a section
You can set the page layout of a section.
1. In Design mode, right-click a section and click Format Section Layout Settings in the contextual menu.
2. In the Layout tab, check any of the following option:
○ Start on a new page to start each section on a new page.○ Start instances on a new page to start each section instance on a new page.○ Avoid page breaks in section to avoid page breaks in the section.○ Repeat section cell on every page to repeat the section cell on every page.
3. Click Apply.
5.2.1.22.7 Hiding sections
In the Format panel, four different options are available to hide sections.
Depending on the option you select, you can either hide a whole section and all its instances, or only hide specific instances. The table below details the behavior of each option available.
262 PUBLICSAP BusinessObjects Web Intelligence User's Guide
Reporting data
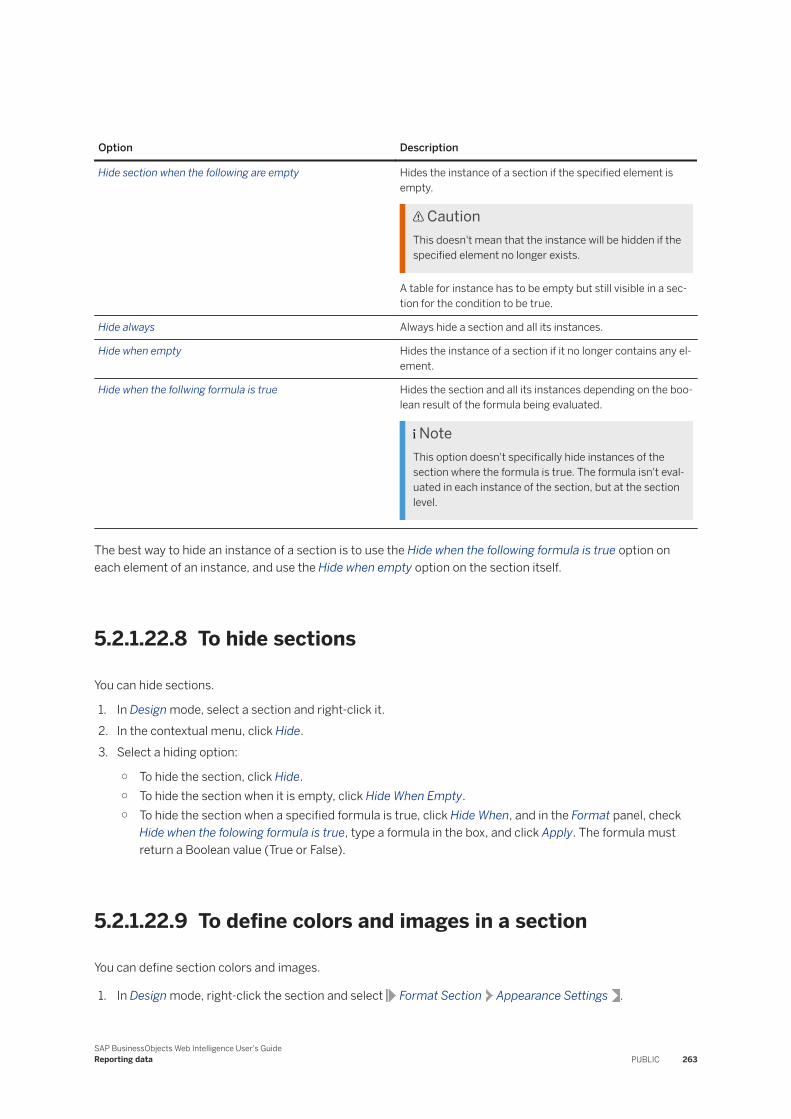
Option Description
Hide section when the following are empty Hides the instance of a section if the specified element is empty.
CautionThis doesn't mean that the instance will be hidden if the specified element no longer exists.
A table for instance has to be empty but still visible in a section for the condition to be true.
Hide always Always hide a section and all its instances.
Hide when empty Hides the instance of a section if it no longer contains any element.
Hide when the follwing formula is true Hides the section and all its instances depending on the boolean result of the formula being evaluated.
NoteThis option doesn't specifically hide instances of the section where the formula is true. The formula isn't evaluated in each instance of the section, but at the section level.
The best way to hide an instance of a section is to use the Hide when the following formula is true option on each element of an instance, and use the Hide when empty option on the section itself.
5.2.1.22.8 To hide sections
You can hide sections.
1. In Design mode, select a section and right-click it.2. In the contextual menu, click Hide.3. Select a hiding option:
○ To hide the section, click Hide.○ To hide the section when it is empty, click Hide When Empty.○ To hide the section when a specified formula is true, click Hide When, and in the Format panel, check
Hide when the folowing formula is true, type a formula in the box, and click Apply. The formula must return a Boolean value (True or False).
5.2.1.22.9 To define colors and images in a section
You can define section colors and images.
1. In Design mode, right-click the section and select Format Section Appearance Settings .
SAP BusinessObjects Web Intelligence User's GuideReporting data PUBLIC 263
2. In the Format panel, define the colors and images using the dedicated controls.3. Click Apply.
Related Information
To format the appearance of reports, headers, footers, sections, tables, and table cells [page 291]
5.2.1.23 Using breaks
A break is a division within a block in which data is grouped according to a selected dimension, detail, or measure into self-contained sections.
Break sections are represented as smaller tables within the same block of data.
You use breaks to display all the data for each unique value of an object in separate parts.
Breaks offer the following advantages:
● You can more efficiently organize how your data is represented.● You can display subtotals.● You can display sub-aggregations.
When you insert a break, the break footer is automatically filled with the appropriate amounts. The default measure aggregation is used. If the measure has no aggregation, then it is not added in the footer.
5.2.1.23.1 Breaks compared to sections
Breaks and sections separate data differently in Web Intelligence.
A section distributes the data into multiple free-standing cells called section headers. Each section cell contains one value for a dimension, with a block of data that corresponds to the dimension value.
A break divides the data up within one block. One column contains the values for a dimension, detail, or measure, which are repeated for each other row of values in the block.
5.2.1.23.2 Value based breaks
You can create breaks based on values that you have purposely selected.
When creating value based breaks, the headers and footers are only displayed for the values that you have selected, like in the example below.
NoteYou can't use value based breaks with measures or multiple objects.
264 PUBLICSAP BusinessObjects Web Intelligence User's Guide
Reporting data
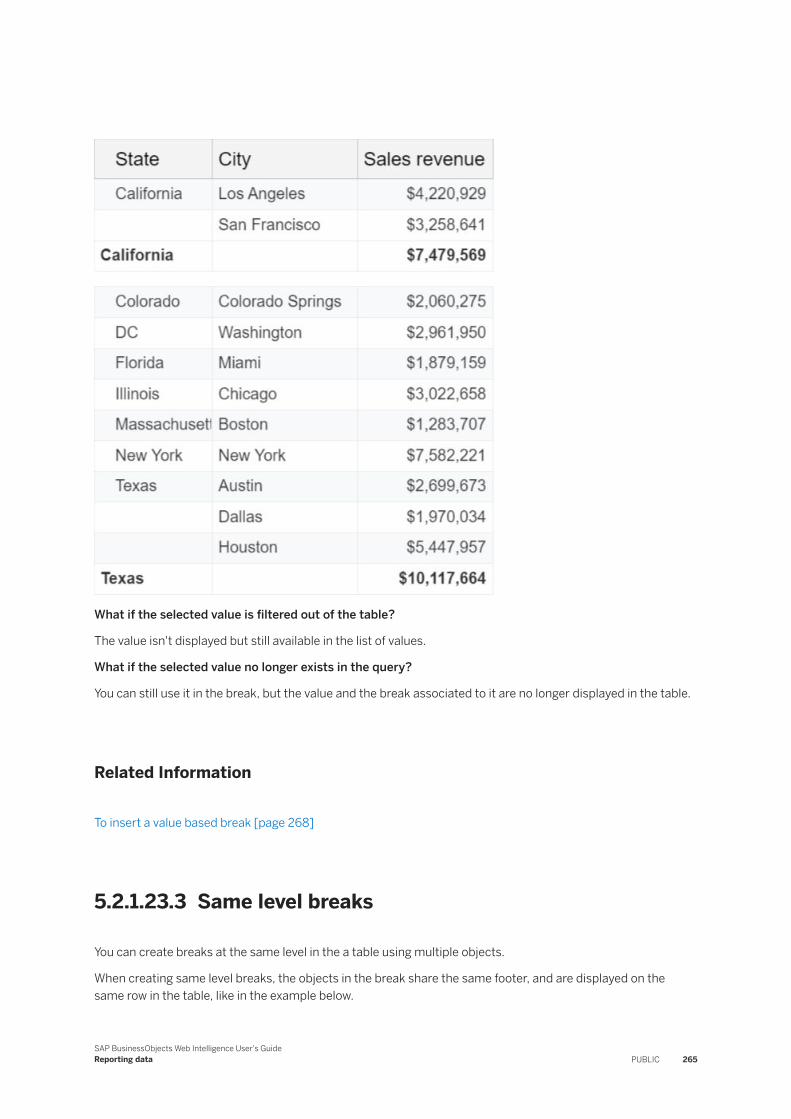
What if the selected value is filtered out of the table?
The value isn't displayed but still available in the list of values.
What if the selected value no longer exists in the query?
You can still use it in the break, but the value and the break associated to it are no longer displayed in the table.
Related Information
To insert a value based break [page 268]
5.2.1.23.3 Same level breaks
You can create breaks at the same level in the a table using multiple objects.
When creating same level breaks, the objects in the break share the same footer, and are displayed on the same row in the table, like in the example below.
SAP BusinessObjects Web Intelligence User's GuideReporting data PUBLIC 265
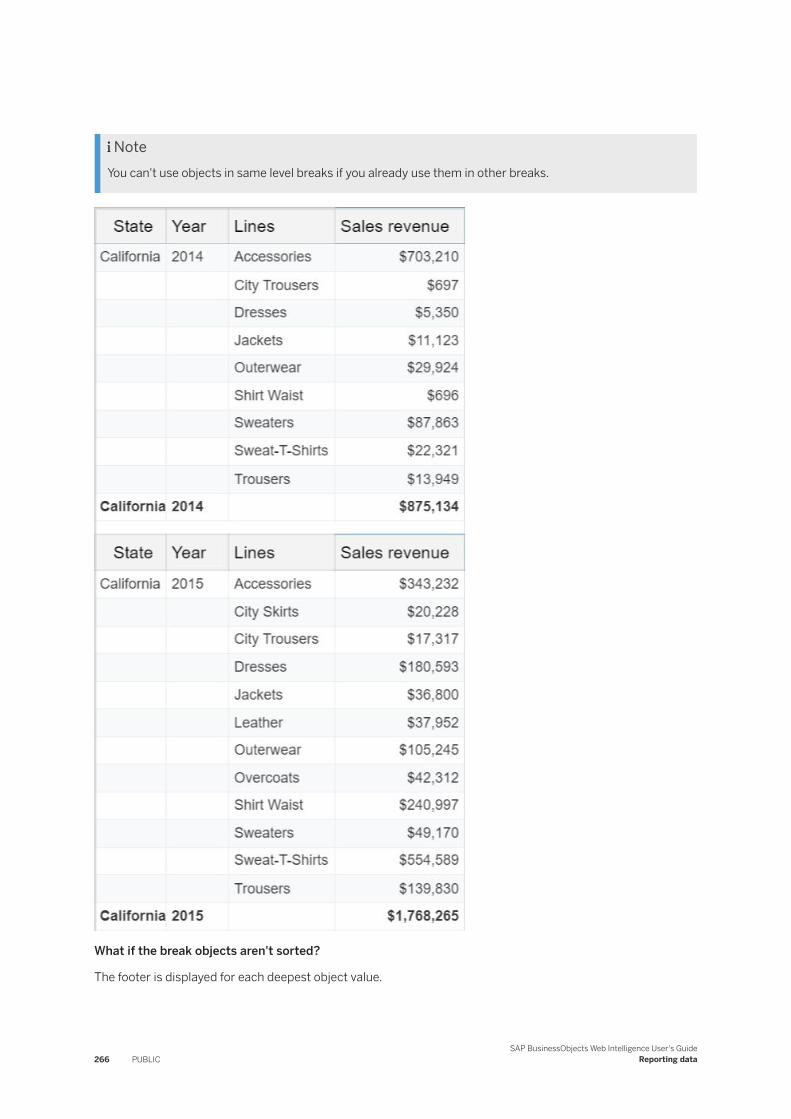
NoteYou can't use objects in same level breaks if you already use them in other breaks.
What if the break objects aren't sorted?
The footer is displayed for each deepest object value.
266 PUBLICSAP BusinessObjects Web Intelligence User's Guide
Reporting data
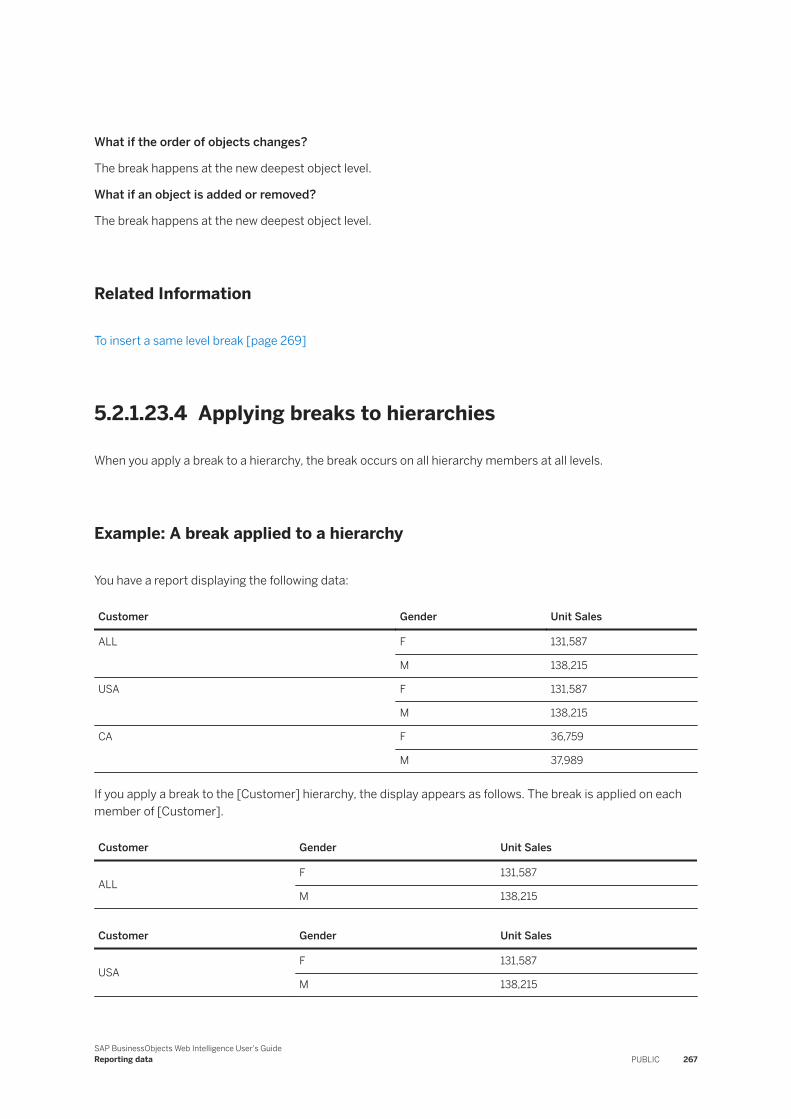
What if the order of objects changes?
The break happens at the new deepest object level.
What if an object is added or removed?
The break happens at the new deepest object level.
Related Information
To insert a same level break [page 269]
5.2.1.23.4 Applying breaks to hierarchies
When you apply a break to a hierarchy, the break occurs on all hierarchy members at all levels.
Example: A break applied to a hierarchy
You have a report displaying the following data:
Customer Gender Unit Sales
ALL F 131,587
M 138,215
USA F 131,587
M 138,215
CA F 36,759
M 37,989
If you apply a break to the [Customer] hierarchy, the display appears as follows. The break is applied on each member of [Customer].
Customer Gender Unit Sales
ALLF 131,587
M 138,215
Customer Gender Unit Sales
USAF 131,587
M 138,215
SAP BusinessObjects Web Intelligence User's GuideReporting data PUBLIC 267
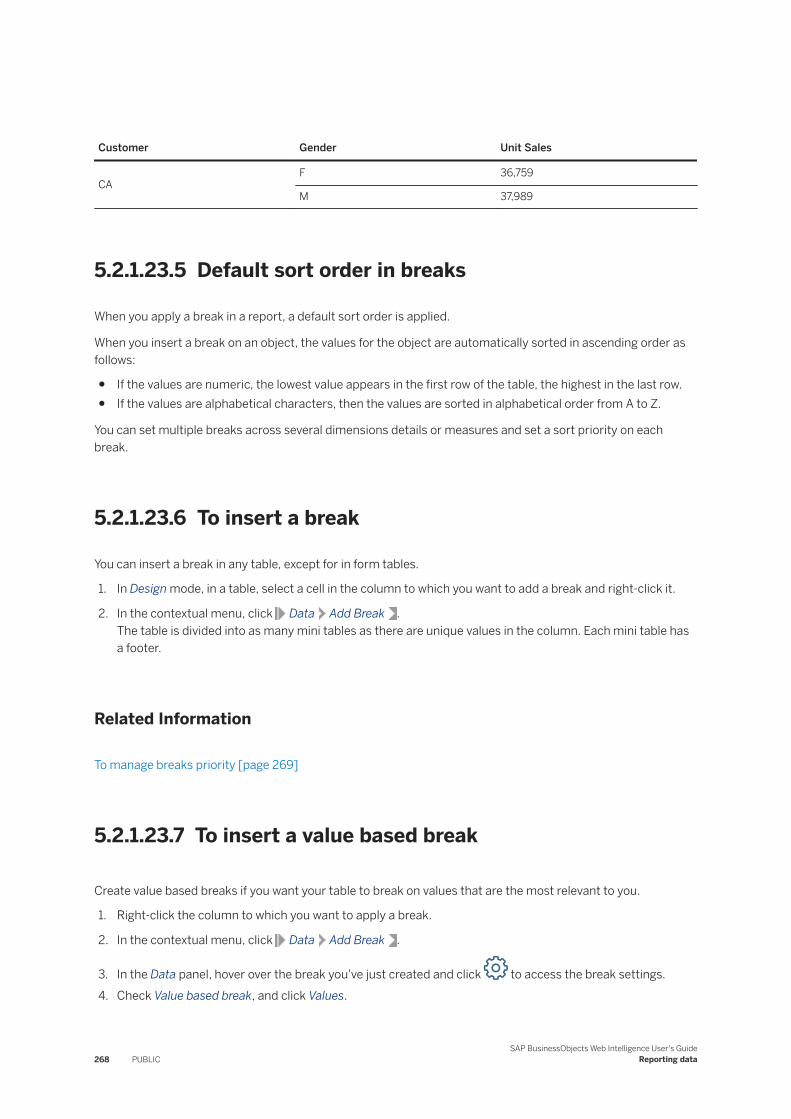
Customer Gender Unit Sales
CAF 36,759
M 37,989
5.2.1.23.5 Default sort order in breaks
When you apply a break in a report, a default sort order is applied.
When you insert a break on an object, the values for the object are automatically sorted in ascending order as follows:
● If the values are numeric, the lowest value appears in the first row of the table, the highest in the last row.● If the values are alphabetical characters, then the values are sorted in alphabetical order from A to Z.
You can set multiple breaks across several dimensions details or measures and set a sort priority on each break.
5.2.1.23.6 To insert a break
You can insert a break in any table, except for in form tables.
1. In Design mode, in a table, select a cell in the column to which you want to add a break and right-click it.
2. In the contextual menu, click Data Add Break .The table is divided into as many mini tables as there are unique values in the column. Each mini table has a footer.
Related Information
To manage breaks priority [page 269]
5.2.1.23.7 To insert a value based break
Create value based breaks if you want your table to break on values that are the most relevant to you.
1. Right-click the column to which you want to apply a break.
2. In the contextual menu, click Data Add Break .
3. In the Data panel, hover over the break you've just created and click to access the break settings.4. Check Value based break, and click Values.
268 PUBLICSAP BusinessObjects Web Intelligence User's Guide
Reporting data
5. Select the values you want to apply to the break and click OK.
The break footer and header are displayed only for the value(s) you've selected.
5.2.1.23.8 To insert a same level break
Create same level breaks to have multiple objects break at the same level in a table.
1. Right-click a cell column to which you want to apply a break.
2. In the contextual menu, click Data Add Break .3. In the Data panel, click the Add a Break drop down, select two or more objects and click OK.
NoteYou can't select objects that are already used in other breaks.
4. Click Apply.
The header and footer are displayed only for the deepest object level, that is the object that you have selected last in the Data panel.
5.2.1.23.9 To remove a break
You can remove a break in a table.
1. In Design mode, select the table column on which there's a break and right-click it.
2. In the contextual menu, click Data Remove Break .
5.2.1.23.10 To manage breaks priority
You can manage table column breaks.
1. In Design mode, click to open the side panel.
2. In the side panel, click to open the Data panel.
3. Click to access the break tab.The break tab shows the breaks defined in the table. If the table is a crosstab, you can see the breaks on both the horizontal and vertical axes. Each break is represented by the dimension on which it is defined. The order in which the dimensions appear indicates the order in which the breaks are applied.
4. Hover over a break and click > Move Break Down or Move Break Up.
5. To set the properties of a break, hover over a break and click . See the link at the bottom of this topic for more information on the break properties you can set.
SAP BusinessObjects Web Intelligence User's GuideReporting data PUBLIC 269
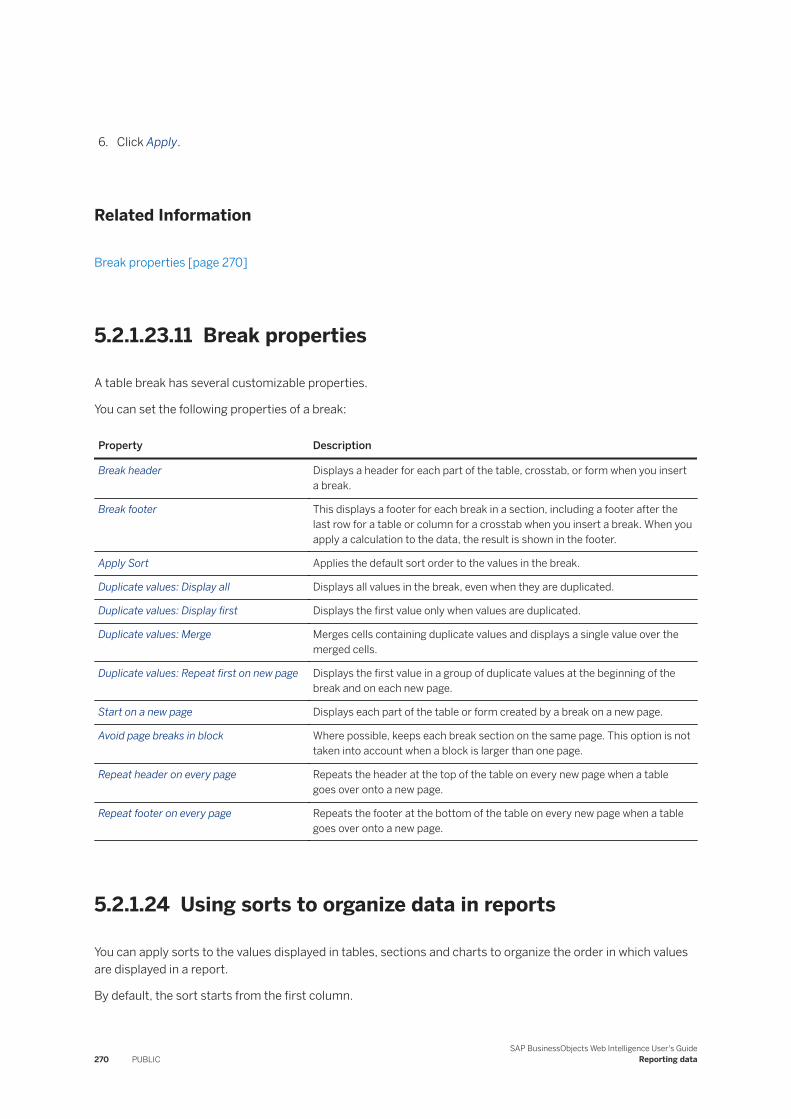
6. Click Apply.
Related Information
Break properties [page 270]
5.2.1.23.11 Break properties
A table break has several customizable properties.
You can set the following properties of a break:
Property Description
Break header Displays a header for each part of the table, crosstab, or form when you insert a break.
Break footer This displays a footer for each break in a section, including a footer after the last row for a table or column for a crosstab when you insert a break. When you apply a calculation to the data, the result is shown in the footer.
Apply Sort Applies the default sort order to the values in the break.
Duplicate values: Display all Displays all values in the break, even when they are duplicated.
Duplicate values: Display first Displays the first value only when values are duplicated.
Duplicate values: Merge Merges cells containing duplicate values and displays a single value over the merged cells.
Duplicate values: Repeat first on new page Displays the first value in a group of duplicate values at the beginning of the break and on each new page.
Start on a new page Displays each part of the table or form created by a break on a new page.
Avoid page breaks in block Where possible, keeps each break section on the same page. This option is not taken into account when a block is larger than one page.
Repeat header on every page Repeats the header at the top of the table on every new page when a table goes over onto a new page.
Repeat footer on every page Repeats the footer at the bottom of the table on every new page when a table goes over onto a new page.
5.2.1.24 Using sorts to organize data in reports
You can apply sorts to the values displayed in tables, sections and charts to organize the order in which values are displayed in a report.
By default, the sort starts from the first column.
270 PUBLICSAP BusinessObjects Web Intelligence User's Guide
Reporting data
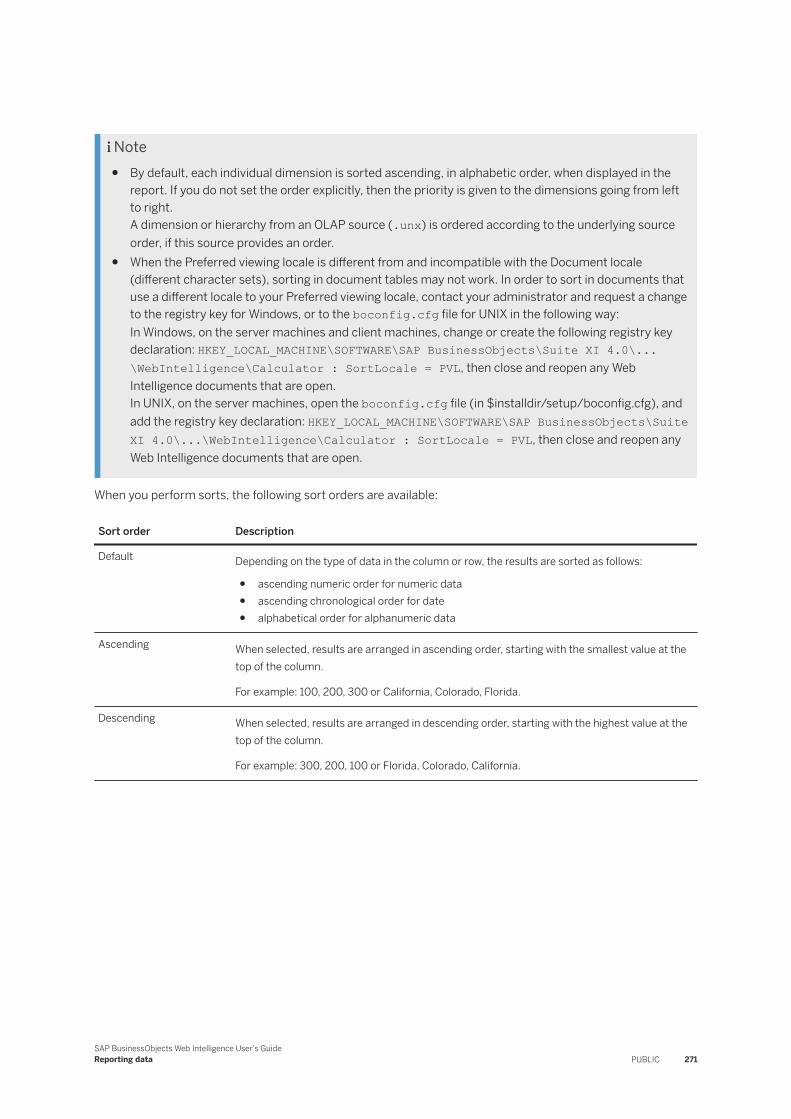
Note● By default, each individual dimension is sorted ascending, in alphabetic order, when displayed in the
report. If you do not set the order explicitly, then the priority is given to the dimensions going from left to right.A dimension or hierarchy from an OLAP source (.unx) is ordered according to the underlying source order, if this source provides an order.
● When the Preferred viewing locale is different from and incompatible with the Document locale (different character sets), sorting in document tables may not work. In order to sort in documents that use a different locale to your Preferred viewing locale, contact your administrator and request a change to the registry key for Windows, or to the boconfig.cfg file for UNIX in the following way:In Windows, on the server machines and client machines, change or create the following registry key declaration: HKEY_LOCAL_MACHINE\SOFTWARE\SAP BusinessObjects\Suite XI 4.0\...\WebIntelligence\Calculator : SortLocale = PVL, then close and reopen any Web Intelligence documents that are open.In UNIX, on the server machines, open the boconfig.cfg file (in $installdir/setup/boconfig.cfg), and add the registry key declaration: HKEY_LOCAL_MACHINE\SOFTWARE\SAP BusinessObjects\Suite XI 4.0\...\WebIntelligence\Calculator : SortLocale = PVL, then close and reopen any Web Intelligence documents that are open.
When you perform sorts, the following sort orders are available:
Sort order Description
Default Depending on the type of data in the column or row, the results are sorted as follows:
● ascending numeric order for numeric data● ascending chronological order for date● alphabetical order for alphanumeric data
Ascending When selected, results are arranged in ascending order, starting with the smallest value at the top of the column.
For example: 100, 200, 300 or California, Colorado, Florida.
Descending When selected, results are arranged in descending order, starting with the highest value at the top of the column.
For example: 300, 200, 100 or Florida, Colorado, California.
SAP BusinessObjects Web Intelligence User's GuideReporting data PUBLIC 271
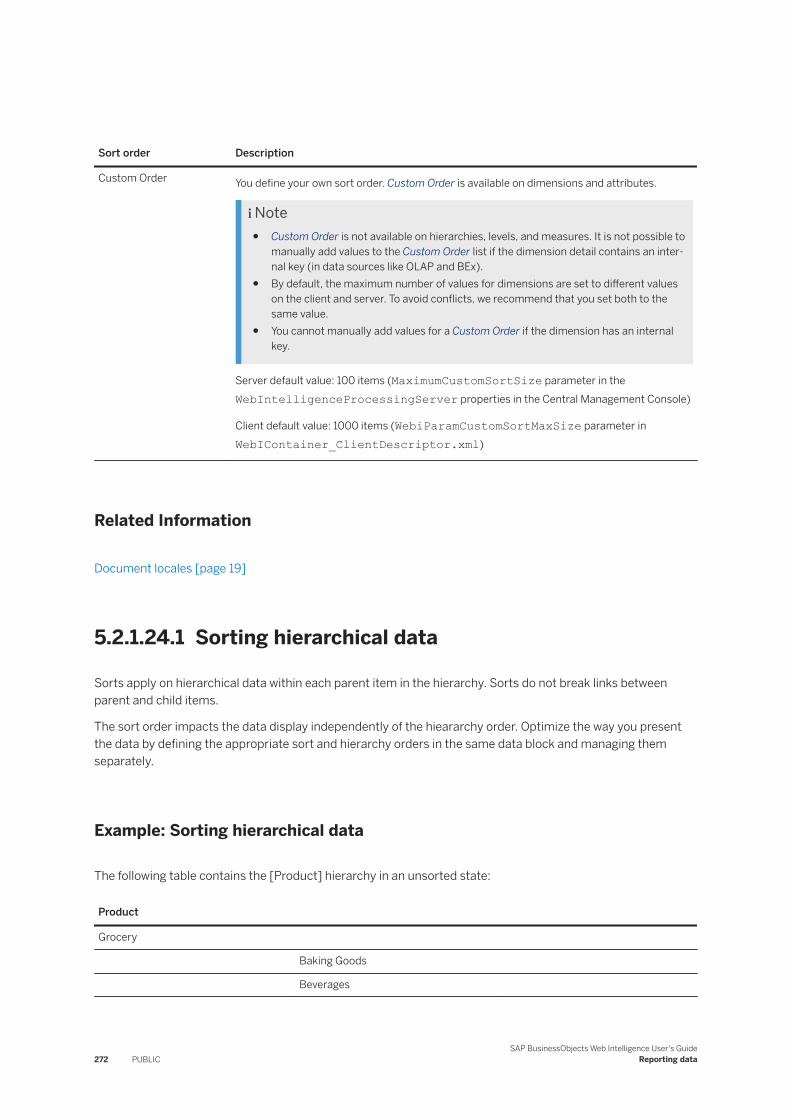
Sort order Description
Custom Order You define your own sort order. Custom Order is available on dimensions and attributes.
Note● Custom Order is not available on hierarchies, levels, and measures. It is not possible to
manually add values to the Custom Order list if the dimension detail contains an internal key (in data sources like OLAP and BEx).
● By default, the maximum number of values for dimensions are set to different values on the client and server. To avoid conflicts, we recommend that you set both to the same value.
● You cannot manually add values for a Custom Order if the dimension has an internal key.
Server default value: 100 items (MaximumCustomSortSize parameter in the WebIntelligenceProcessingServer properties in the Central Management Console)
Client default value: 1000 items (WebiParamCustomSortMaxSize parameter in WebIContainer_ClientDescriptor.xml)
Related Information
Document locales [page 19]
5.2.1.24.1 Sorting hierarchical data
Sorts apply on hierarchical data within each parent item in the hierarchy. Sorts do not break links between parent and child items.
The sort order impacts the data display independently of the hieararchy order. Optimize the way you present the data by defining the appropriate sort and hierarchy orders in the same data block and managing them separately.
Example: Sorting hierarchical data
The following table contains the [Product] hierarchy in an unsorted state:
Product
Grocery
Baking Goods
Beverages
272 PUBLICSAP BusinessObjects Web Intelligence User's Guide
Reporting data
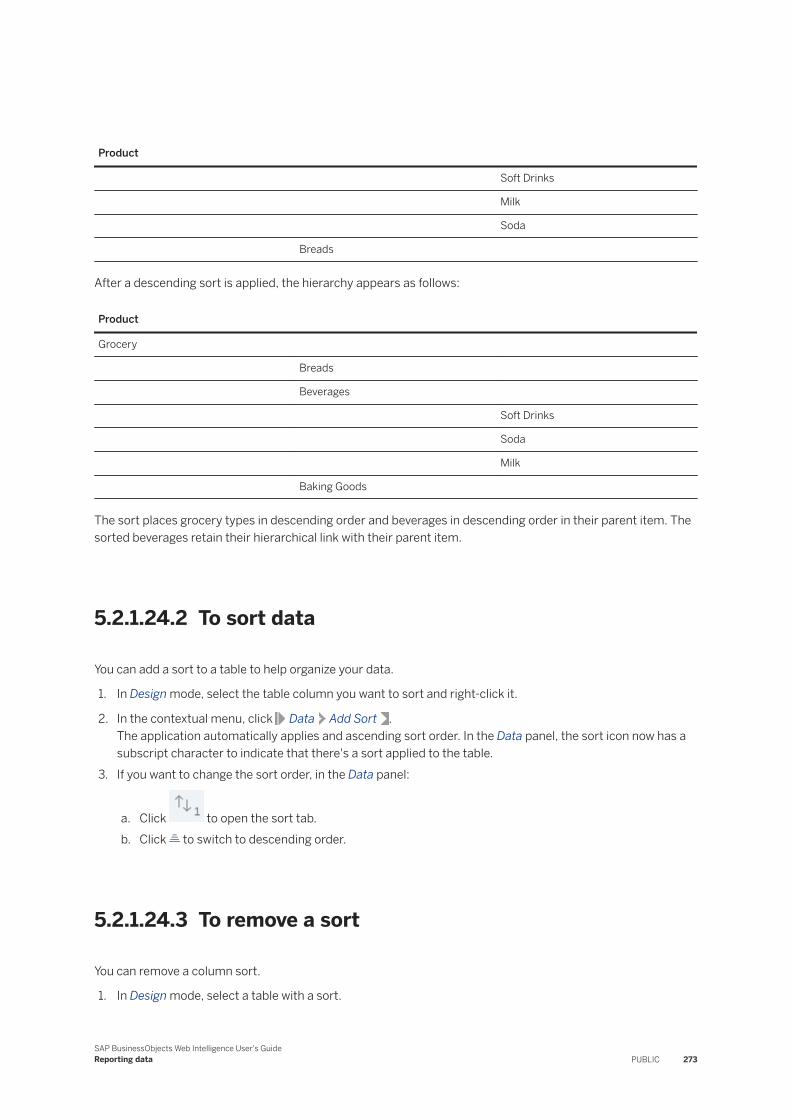
Product
Soft Drinks
Milk
Soda
Breads
After a descending sort is applied, the hierarchy appears as follows:
Product
Grocery
Breads
Beverages
Soft Drinks
Soda
Milk
Baking Goods
The sort places grocery types in descending order and beverages in descending order in their parent item. The sorted beverages retain their hierarchical link with their parent item.
5.2.1.24.2 To sort data
You can add a sort to a table to help organize your data.
1. In Design mode, select the table column you want to sort and right-click it.
2. In the contextual menu, click Data Add Sort .The application automatically applies and ascending sort order. In the Data panel, the sort icon now has a subscript character to indicate that there's a sort applied to the table.
3. If you want to change the sort order, in the Data panel:
a. Click to open the sort tab.b. Click to switch to descending order.
5.2.1.24.3 To remove a sort
You can remove a column sort.
1. In Design mode, select a table with a sort.
SAP BusinessObjects Web Intelligence User's GuideReporting data PUBLIC 273
2. In the Data panel, click to open the sort tab.
3. Hover over the object name with the sort applied, and click to delete it.
5.2.1.24.4 To manage sorts priority
If you're working with multiple sorts, you can arrange their priority to better control how your data is displayed.
In a cross table, the sorts on both the horizontal and vertical axes are displayed. Each sort is named after its associated dimension, and a pyramid indicates the sort direction (ascending or descending). The order in which the sorted dimensions appear indicates the order in which the sorts are applied.
1. In Design mode, select the table or chart in which you want to manage sorts.
2. In the Data panel, click to open the sort tab.
3. Hover over a dimension, and click .4. Click Move Up or Move Down to move priority of the sort if you have several.
NoteYou can't change the priority of a sort if a sorted break is defined on the dimension.
5. To create a custom sort order, hover over a dimension and click > Create Custom Oder. You can change the order of values with the up and down arrows, or add values with the Add Value button. You can also reset the order by clicking Reset Order.
Note○ The Values button is disabled if the custom sort isn't applicable.○ The custom order applies to the dimension in the entire document, not just in the selected block.
6. Click OK to save your changes.
Related Information
Using sorts to organize data in reports [page 270]
5.2.1.25 Printing reports
You can print one or multiple reports from a document.
When printing reports, the application generates a .PDF file first. Click > Print in the toolbar, set the printing options, and click Print to generate the .PDF file.
274 PUBLICSAP BusinessObjects Web Intelligence User's Guide
Reporting data
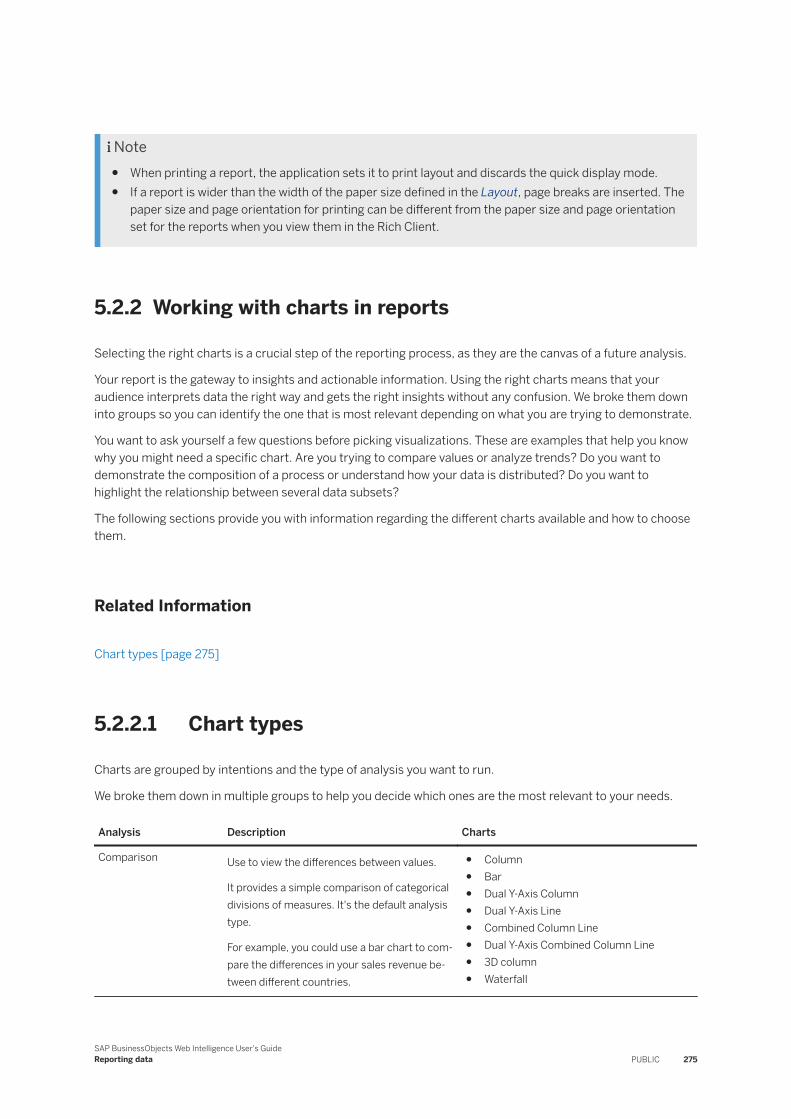
Note● When printing a report, the application sets it to print layout and discards the quick display mode.● If a report is wider than the width of the paper size defined in the Layout, page breaks are inserted. The
paper size and page orientation for printing can be different from the paper size and page orientation set for the reports when you view them in the Rich Client.
5.2.2 Working with charts in reports
Selecting the right charts is a crucial step of the reporting process, as they are the canvas of a future analysis.
Your report is the gateway to insights and actionable information. Using the right charts means that your audience interprets data the right way and gets the right insights without any confusion. We broke them down into groups so you can identify the one that is most relevant depending on what you are trying to demonstrate.
You want to ask yourself a few questions before picking visualizations. These are examples that help you know why you might need a specific chart. Are you trying to compare values or analyze trends? Do you want to demonstrate the composition of a process or understand how your data is distributed? Do you want to highlight the relationship between several data subsets?
The following sections provide you with information regarding the different charts available and how to choose them.
Related Information
Chart types [page 275]
5.2.2.1 Chart types
Charts are grouped by intentions and the type of analysis you want to run.
We broke them down in multiple groups to help you decide which ones are the most relevant to your needs.
Analysis Description Charts
Comparison Use to view the differences between values.
It provides a simple comparison of categorical divisions of measures. It's the default analysis type.
For example, you could use a bar chart to compare the differences in your sales revenue between different countries.
● Column● Bar● Dual Y-Axis Column● Dual Y-Axis Line● Combined Column Line● Dual Y-Axis Combined Column Line● 3D column● Waterfall
SAP BusinessObjects Web Intelligence User's GuideReporting data PUBLIC 275
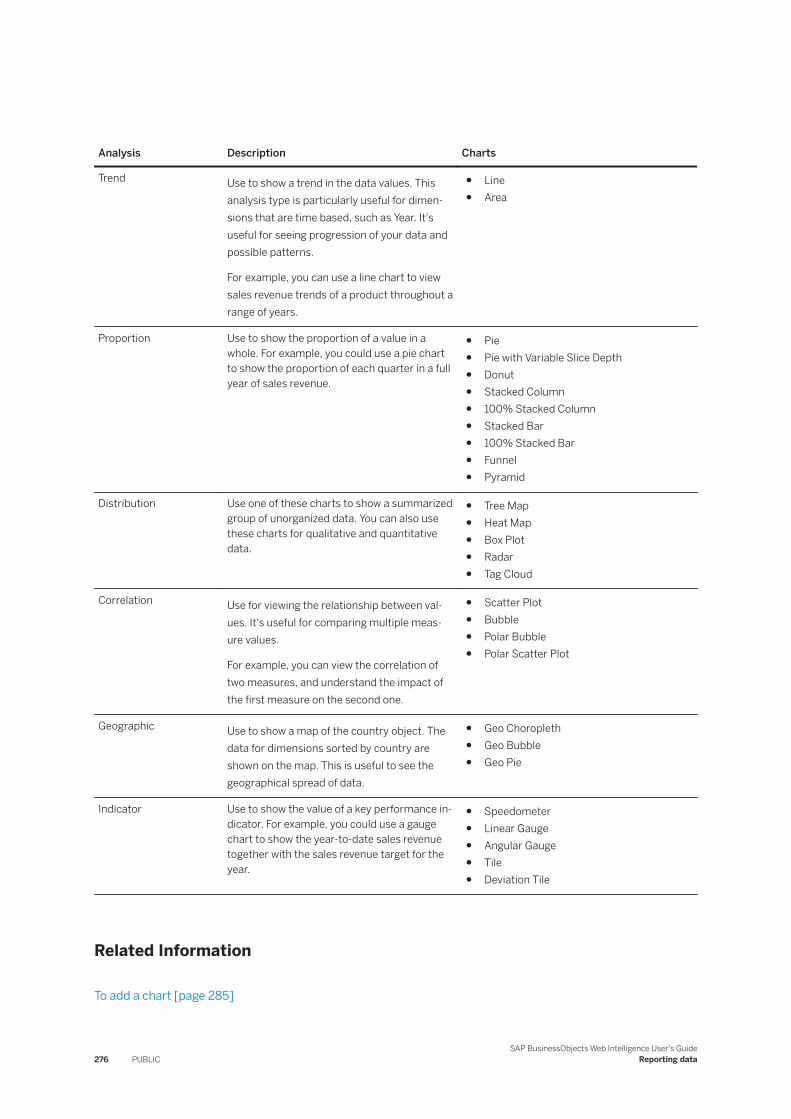
Analysis Description Charts
Trend Use to show a trend in the data values. This analysis type is particularly useful for dimensions that are time based, such as Year. It's useful for seeing progression of your data and possible patterns.
For example, you can use a line chart to view sales revenue trends of a product throughout a range of years.
● Line● Area
Proportion Use to show the proportion of a value in a whole. For example, you could use a pie chart to show the proportion of each quarter in a full year of sales revenue.
● Pie● Pie with Variable Slice Depth● Donut● Stacked Column● 100% Stacked Column● Stacked Bar● 100% Stacked Bar● Funnel● Pyramid
Distribution Use one of these charts to show a summarized group of unorganized data. You can also use these charts for qualitative and quantitative data.
● Tree Map● Heat Map● Box Plot● Radar● Tag Cloud
Correlation Use for viewing the relationship between values. It's useful for comparing multiple measure values.
For example, you can view the correlation of two measures, and understand the impact of the first measure on the second one.
● Scatter Plot● Bubble● Polar Bubble● Polar Scatter Plot
Geographic Use to show a map of the country object. The data for dimensions sorted by country are shown on the map. This is useful to see the geographical spread of data.
● Geo Choropleth● Geo Bubble● Geo Pie
Indicator Use to show the value of a key performance indicator. For example, you could use a gauge chart to show the year-to-date sales revenue together with the sales revenue target for the year.
● Speedometer● Linear Gauge● Angular Gauge● Tile● Deviation Tile
Related Information
To add a chart [page 285]
276 PUBLICSAP BusinessObjects Web Intelligence User's Guide
Reporting data
To change a chart type [page 337]
5.2.2.1.1 Bar
Bar charts display data in rectangular form horizontally.
Bar charts are useful if you want to compare similar groups of data; for example, revenue from one time period to another.
Types of bar charts
Chart type Description
Bar Chart A chart constructed of horizontally-oriented rectangles. The lengths of rectangles are proportional to the values associated to different category items.
Stacked Bar Chart A chart constructed of horizontally-oriented stacked colored rectangles . The heights of the rectangles are proportional to the values associated to different category items. Rectangles are colored according to legend entries.
100% Stacked Bar A chart with data displayed as parts of a whole (as percentages). A whole being a rectangle and a series being a subdivision of the rectangle.
5.2.2.1.2 Box Plot
A Box Plot Chart (also called a stock chart) displays a five-number summary based on the distribution of a dataset: the maximum, the minimum, the first quartile, the third quartile, and the median.
A Box Plot Chart can also show abnormal values called outliers.
5.2.2.1.3 Column
Column charts display a series as a set of vertical bars that are grouped by category.
Column charts are useful for showing data changes over a period of time or for illustrating comparisons among items.
Web Intelligence offers the following column charts.
Chart type Description
Column A chart constructed of vertically-oriented rectangles. The heights of the rectangles are proportional to the values associated to different category items.
SAP BusinessObjects Web Intelligence User's GuideReporting data PUBLIC 277
Chart type Description
Dual Y-Axis Column A chart with two value axes. It allows a part of a data series to be plotted against one axis and a part of the data series to be plotted against the other axis.
Combined Column Line A chart displaying a combination of a column chart and a line chart. The chart types share the same value axis.
Dual Y-Axis Combined Column Line A chart displaying a combination of a column chart and a line chart. The chart types each have their own value axis.
Stacked Column A chart constructed of vertically-oriented stacked colored rectangles. The heights of rectangles are proportional to the values associated to different category items. Rectangles are colored according to legend entries.
100% Stacked Column A chart with data displayed as parts of a whole (as percentages) with a whole being a column and a series being a subdivision of the column. If there is only one series in your chart, all the column bars will fit to 100% of the chart area.
3D Column A chart similar to a column chart with an added 3D dimension.
5.2.2.1.4 Funnel and Pyramid
Funnel charts display progressive decrease of data as it goes from one stage of a process to another, or hierachical structure.
Chart Type Description
Funnel It is mostly used in sales reporting to present the different stages of a sale process, but also to identify potential areas of improvement for that sales process. Each section represents a volume of transactions for a specific stage of the process. The height of each section is proportional to the value it represents.
Pyramid Pyramids are reversed funnels with no neck. You can use pyramids when you need your data to reflect a specific hierarchy. The height of each section is visually representative of a quantity. Sections are arranged from bottom to top, or top to bottom, according to the related topics they depict.
5.2.2.1.5 Gauge
Gauges are charts that indicate the location of data points across a particular range.
You can use gauge charts as value indicators in reports to display key performance indicators, progress indicators or quantity indicators.
278 PUBLICSAP BusinessObjects Web Intelligence User's Guide
Reporting data
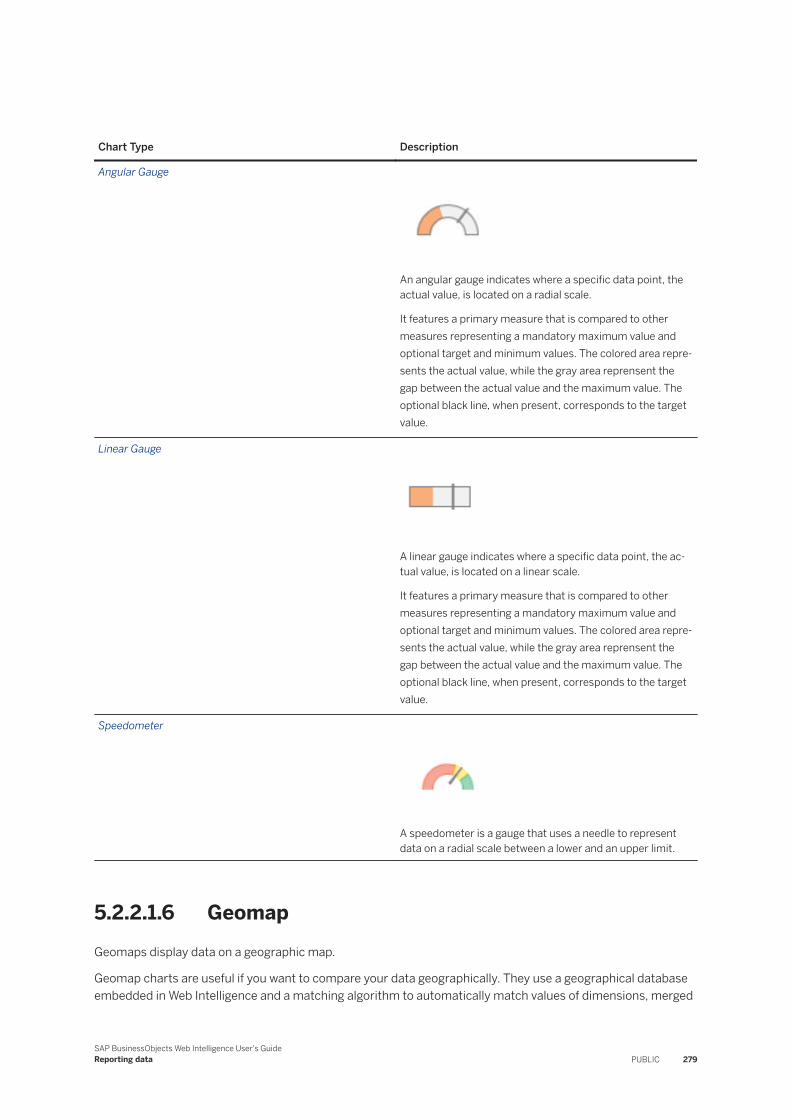
Chart Type Description
Angular Gauge
An angular gauge indicates where a specific data point, the actual value, is located on a radial scale.
It features a primary measure that is compared to other measures representing a mandatory maximum value and optional target and minimum values. The colored area represents the actual value, while the gray area reprensent the gap between the actual value and the maximum value. The optional black line, when present, corresponds to the target value.
Linear Gauge
A linear gauge indicates where a specific data point, the actual value, is located on a linear scale.
It features a primary measure that is compared to other measures representing a mandatory maximum value and optional target and minimum values. The colored area represents the actual value, while the gray area reprensent the gap between the actual value and the maximum value. The optional black line, when present, corresponds to the target value.
Speedometer
A speedometer is a gauge that uses a needle to represent data on a radial scale between a lower and an upper limit.
5.2.2.1.6 GeomapGeomaps display data on a geographic map.
Geomap charts are useful if you want to compare your data geographically. They use a geographical database embedded in Web Intelligence and a matching algorithm to automatically match values of dimensions, merged
SAP BusinessObjects Web Intelligence User's GuideReporting data PUBLIC 279
objects or a dimension variables with a location. When you match values with specific locations, you geo-qualify the values and their parent object so they can be rendered on a map. The geo-qualification can be done using either a location's name, or its latitude and longitude coordinates.
NoteThe database contains location names in multiple languages, called exonyms. When you geo-qualify an object, Web Intelligence selects the exonym according to your preferred viewing locale (PVL). If you decide later on to modify your PVL, you will need to geo-qualify the object again so that the new PVL is taken into account.
Chart Type Description
Choropleth Choropleth charts display values that are represented by colors on a geographic map. The colors of the geographic zones are determined by a measure value.
Geo Bubble Geo Bubble charts display values that are represented by bubbles on a geographic map. The size of the bubbles on each geographic zone is determined by a measure value.
Geo Pie Geo Pie charts display values that are represented by pies on a geographic map. The size of the pies on each geographic zone is determined by a measure value.
Once you have geo-qualified an object, an icon appears next to it. Click the right arrow to see the geographical details of the location it has been matched with, such as its name, its latitude and its longitude objects.
Available settings
The table below lists the settings available according to each type of Geomap chart.
Parameter Description Available for
Display invisible area as point Display choropleth areas as points when they are too small. This is typically the case for City level areas
Choropleth
Symbol Size Sets the choropleth symbol size when choropleth is represented as colored points
Choropleth
Draws unrelated geographic boundaries as background
Draws the country borders as background
All Geomaps
Ground Color Sets the color of the ground All Geomaps
280 PUBLICSAP BusinessObjects Web Intelligence User's Guide
Reporting data
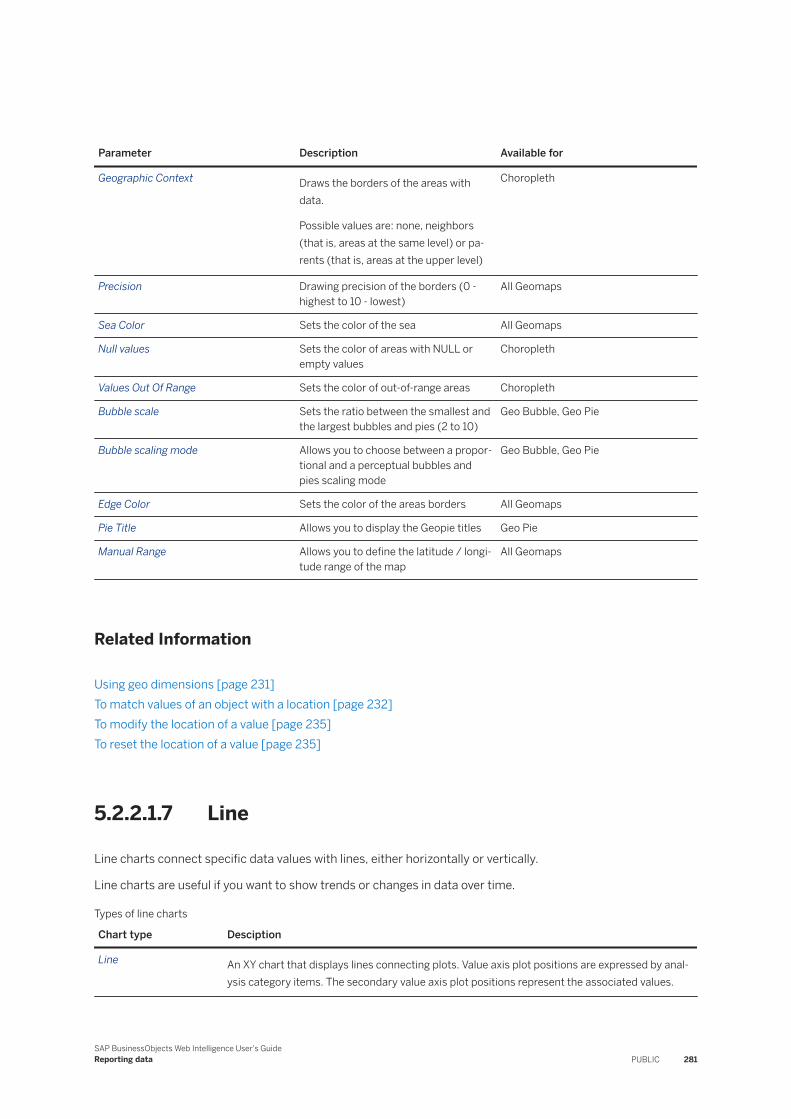
Parameter Description Available for
Geographic Context Draws the borders of the areas with data.
Possible values are: none, neighbors (that is, areas at the same level) or parents (that is, areas at the upper level)
Choropleth
Precision Drawing precision of the borders (0 - highest to 10 - lowest)
All Geomaps
Sea Color Sets the color of the sea All Geomaps
Null values Sets the color of areas with NULL or empty values
Choropleth
Values Out Of Range Sets the color of out-of-range areas Choropleth
Bubble scale Sets the ratio between the smallest and the largest bubbles and pies (2 to 10)
Geo Bubble, Geo Pie
Bubble scaling mode Allows you to choose between a proportional and a perceptual bubbles and pies scaling mode
Geo Bubble, Geo Pie
Edge Color Sets the color of the areas borders All Geomaps
Pie Title Allows you to display the Geopie titles Geo Pie
Manual Range Allows you to define the latitude / longitude range of the map
All Geomaps
Related Information
Using geo dimensions [page 231]To match values of an object with a location [page 232]To modify the location of a value [page 235]To reset the location of a value [page 235]
5.2.2.1.7 Line
Line charts connect specific data values with lines, either horizontally or vertically.
Line charts are useful if you want to show trends or changes in data over time.
Types of line charts
Chart type Desciption
Line An XY chart that displays lines connecting plots. Value axis plot positions are expressed by analysis category items. The secondary value axis plot positions represent the associated values.
SAP BusinessObjects Web Intelligence User's GuideReporting data PUBLIC 281
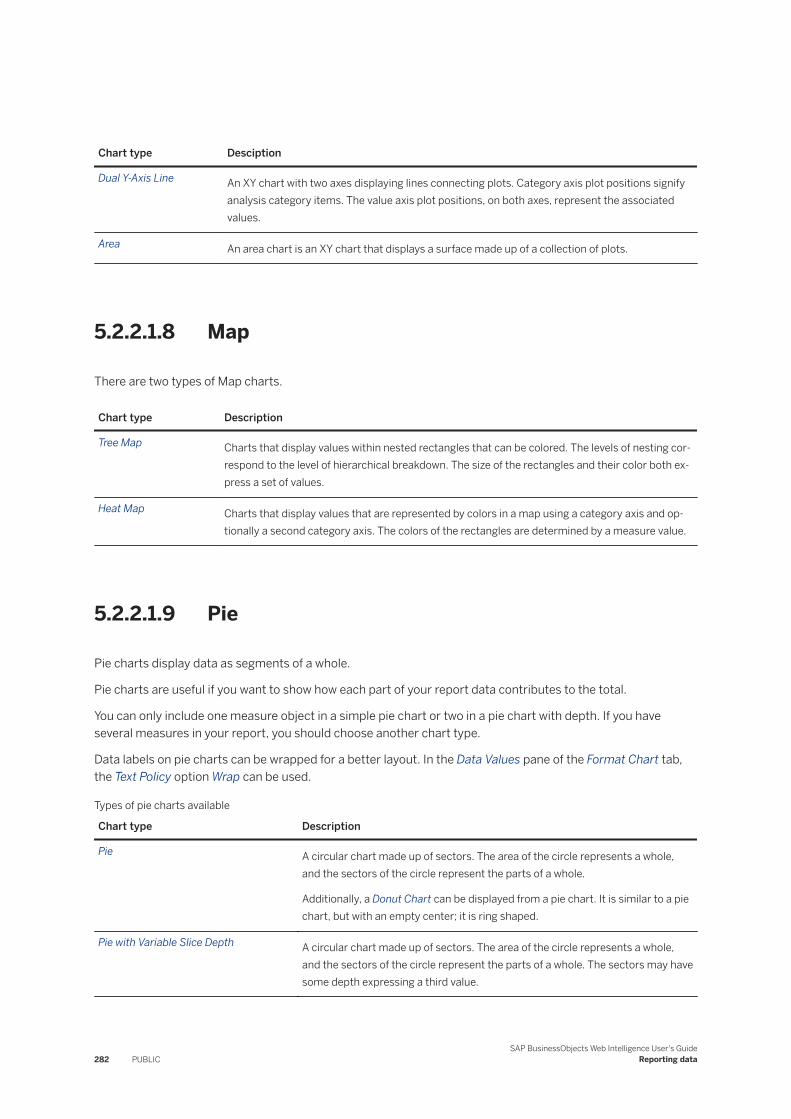
Chart type Desciption
Dual Y-Axis Line An XY chart with two axes displaying lines connecting plots. Category axis plot positions signify analysis category items. The value axis plot positions, on both axes, represent the associated values.
Area An area chart is an XY chart that displays a surface made up of a collection of plots.
5.2.2.1.8 Map
There are two types of Map charts.
Chart type Description
Tree Map Charts that display values within nested rectangles that can be colored. The levels of nesting correspond to the level of hierarchical breakdown. The size of the rectangles and their color both express a set of values.
Heat Map Charts that display values that are represented by colors in a map using a category axis and optionally a second category axis. The colors of the rectangles are determined by a measure value.
5.2.2.1.9 Pie
Pie charts display data as segments of a whole.
Pie charts are useful if you want to show how each part of your report data contributes to the total.
You can only include one measure object in a simple pie chart or two in a pie chart with depth. If you have several measures in your report, you should choose another chart type.
Data labels on pie charts can be wrapped for a better layout. In the Data Values pane of the Format Chart tab, the Text Policy option Wrap can be used.
Types of pie charts available
Chart type Description
Pie A circular chart made up of sectors. The area of the circle represents a whole, and the sectors of the circle represent the parts of a whole.
Additionally, a Donut Chart can be displayed from a pie chart. It is similar to a pie chart, but with an empty center; it is ring shaped.
Pie with Variable Slice Depth A circular chart made up of sectors. The area of the circle represents a whole, and the sectors of the circle represent the parts of a whole. The sectors may have some depth expressing a third value.
282 PUBLICSAP BusinessObjects Web Intelligence User's Guide
Reporting data
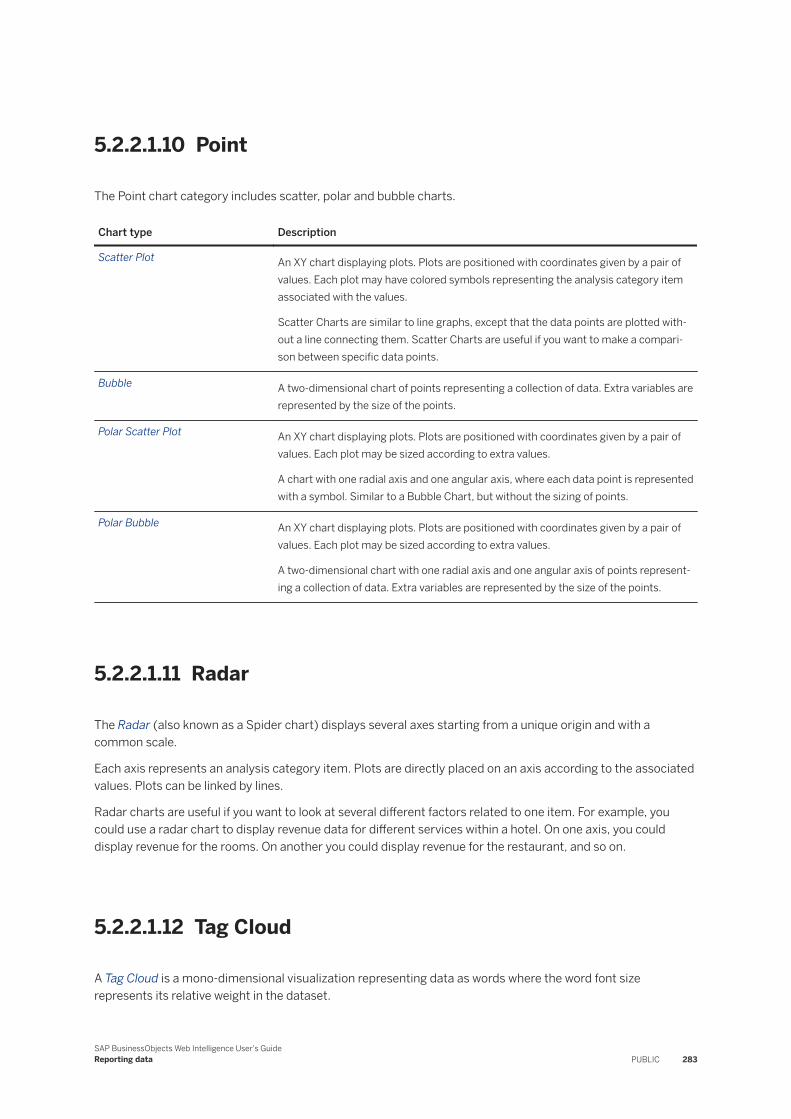
5.2.2.1.10 Point
The Point chart category includes scatter, polar and bubble charts.
Chart type Description
Scatter Plot An XY chart displaying plots. Plots are positioned with coordinates given by a pair of values. Each plot may have colored symbols representing the analysis category item associated with the values.
Scatter Charts are similar to line graphs, except that the data points are plotted without a line connecting them. Scatter Charts are useful if you want to make a comparison between specific data points.
Bubble A two-dimensional chart of points representing a collection of data. Extra variables are represented by the size of the points.
Polar Scatter Plot An XY chart displaying plots. Plots are positioned with coordinates given by a pair of values. Each plot may be sized according to extra values.
A chart with one radial axis and one angular axis, where each data point is represented with a symbol. Similar to a Bubble Chart, but without the sizing of points.
Polar Bubble An XY chart displaying plots. Plots are positioned with coordinates given by a pair of values. Each plot may be sized according to extra values.
A two-dimensional chart with one radial axis and one angular axis of points representing a collection of data. Extra variables are represented by the size of the points.
5.2.2.1.11 Radar
The Radar (also known as a Spider chart) displays several axes starting from a unique origin and with a common scale.
Each axis represents an analysis category item. Plots are directly placed on an axis according to the associated values. Plots can be linked by lines.
Radar charts are useful if you want to look at several different factors related to one item. For example, you could use a radar chart to display revenue data for different services within a hotel. On one axis, you could display revenue for the rooms. On another you could display revenue for the restaurant, and so on.
5.2.2.1.12 Tag Cloud
A Tag Cloud is a mono-dimensional visualization representing data as words where the word font size represents its relative weight in the dataset.
SAP BusinessObjects Web Intelligence User's GuideReporting data PUBLIC 283
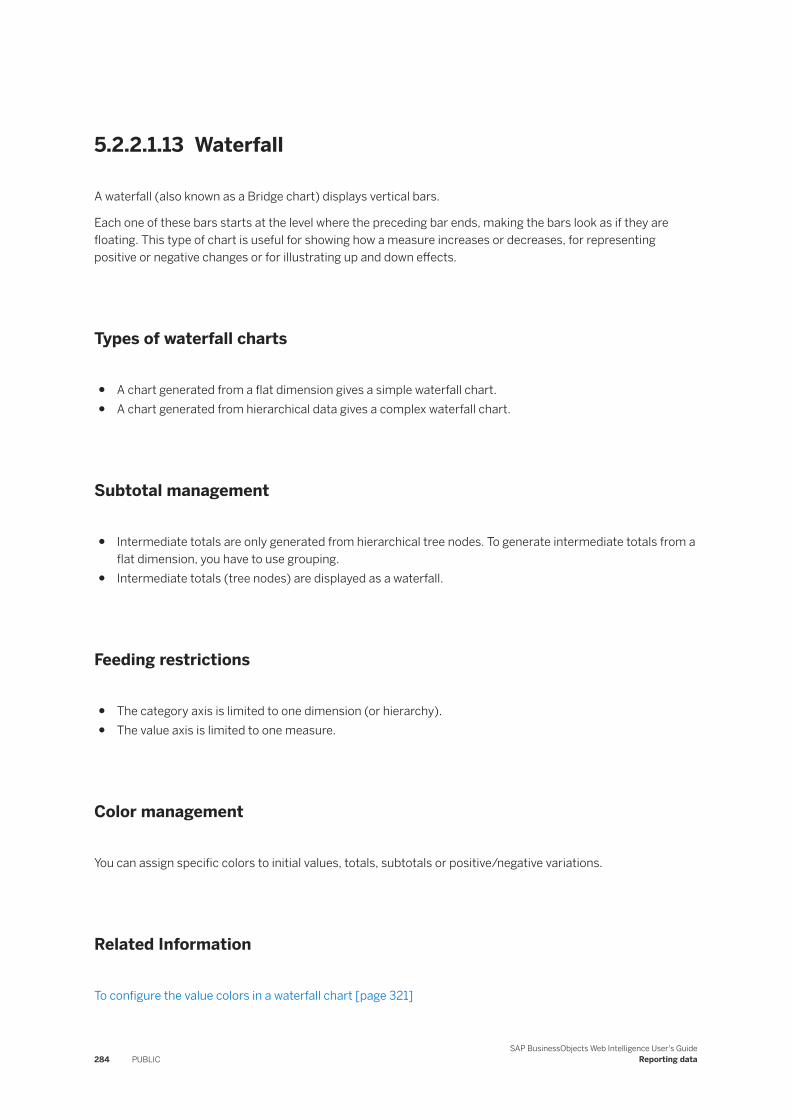
5.2.2.1.13 Waterfall
A waterfall (also known as a Bridge chart) displays vertical bars.
Each one of these bars starts at the level where the preceding bar ends, making the bars look as if they are floating. This type of chart is useful for showing how a measure increases or decreases, for representing positive or negative changes or for illustrating up and down effects.
Types of waterfall charts
● A chart generated from a flat dimension gives a simple waterfall chart.● A chart generated from hierarchical data gives a complex waterfall chart.
Subtotal management
● Intermediate totals are only generated from hierarchical tree nodes. To generate intermediate totals from a flat dimension, you have to use grouping.
● Intermediate totals (tree nodes) are displayed as a waterfall.
Feeding restrictions
● The category axis is limited to one dimension (or hierarchy).● The value axis is limited to one measure.
Color management
You can assign specific colors to initial values, totals, subtotals or positive/negative variations.
Related Information
To configure the value colors in a waterfall chart [page 321]
284 PUBLICSAP BusinessObjects Web Intelligence User's Guide
Reporting data
5.2.2.1.14 Custom Elements
Custom Elements are visualizations whose rendering is delegated to external rendering services outside of Web Intelligence.
In Web Intelligence documents, Custom Elements are integrated and displayed similarly to any other report elements like charts or tables. The feeding model is provided by the selected Custom Elements service, with a default number of axis. You can work with Custom Elements using the contextual menu when you right-click them. They are located at the bottom of the list of regular charts when you insert a report element.
To be able to use Custom Elements in Web Intelligence, you have to add a Custom Elements service in the CMC first. To know how to add a Custom Elements service, refer to the Business Intelligence Platform Administrator Guide.
CautionThe Custom Elements service you deploy adds code to Web Intelligence, and can generate potential security issues such as cross-site scripting. Cross-site scripting allows attackers to run code and execute scripts on other users' computers. A security warning asks for your explicit consent before your deploy you Custom Elements service. Your consent is mandatory to deploy your Custom Elements service.
NoteYou cannot drill on a custom element.
Using Custom Elements with the Rich Client
If a document that contains Custom Elements is saved locally on a computer, you can view and modify its full content in Web Intelligence Rich Client only if Rich Client is connected to the BI Platform where the document was created.
Related Information
To add a custom element [page 286]
5.2.2.2 To add a chart
Charts are grouped by intentions.
1. Click in the toolbar.2. Select a chart category.3. Select a chart.
SAP BusinessObjects Web Intelligence User's GuideReporting data PUBLIC 285
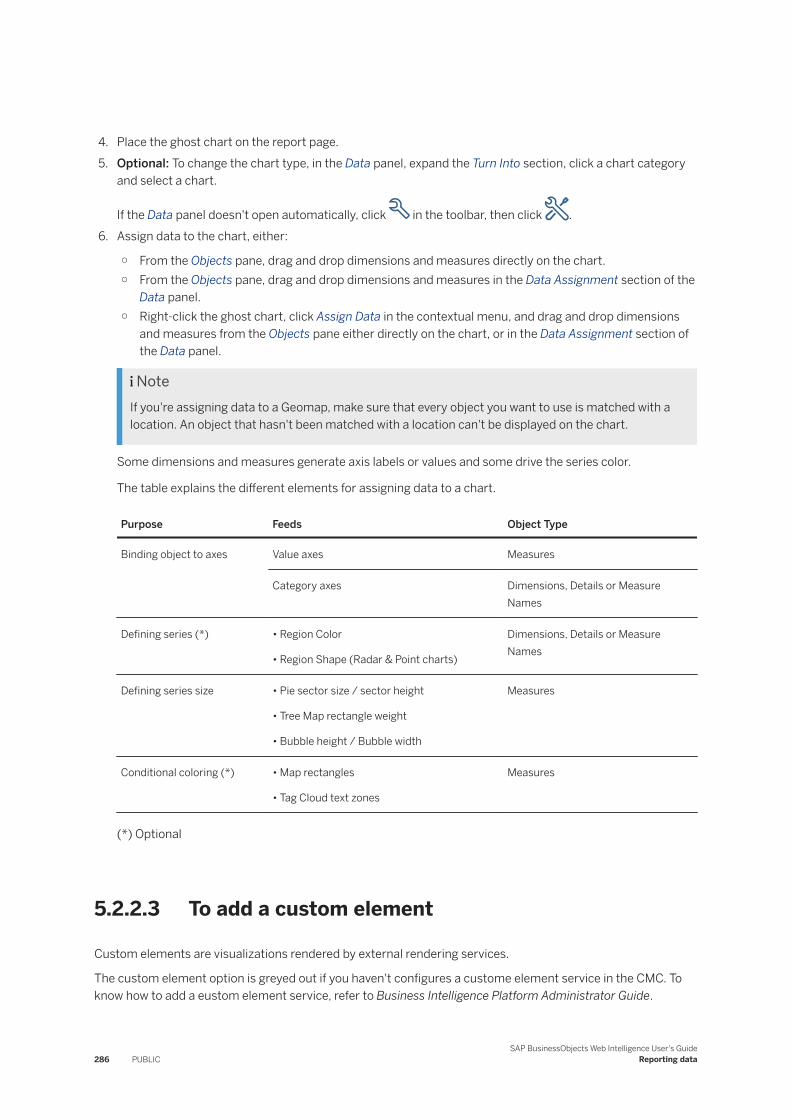
4. Place the ghost chart on the report page.5. Optional: To change the chart type, in the Data panel, expand the Turn Into section, click a chart category
and select a chart.
If the Data panel doesn't open automatically, click in the toolbar, then click .6. Assign data to the chart, either:
○ From the Objects pane, drag and drop dimensions and measures directly on the chart.○ From the Objects pane, drag and drop dimensions and measures in the Data Assignment section of the
Data panel.○ Right-click the ghost chart, click Assign Data in the contextual menu, and drag and drop dimensions
and measures from the Objects pane either directly on the chart, or in the Data Assignment section of the Data panel.
NoteIf you're assigning data to a Geomap, make sure that every object you want to use is matched with a location. An object that hasn't been matched with a location can't be displayed on the chart.
Some dimensions and measures generate axis labels or values and some drive the series color.
The table explains the different elements for assigning data to a chart.
Purpose Feeds Object Type
Binding object to axes Value axes Measures
Category axes Dimensions, Details or Measure Names
Defining series (*) • Region Color
• Region Shape (Radar & Point charts)
Dimensions, Details or Measure Names
Defining series size • Pie sector size / sector height
• Tree Map rectangle weight
• Bubble height / Bubble width
Measures
Conditional coloring (*) • Map rectangles
• Tag Cloud text zones
Measures
(*) Optional
5.2.2.3 To add a custom element
Custom elements are visualizations rendered by external rendering services.
The custom element option is greyed out if you haven't configures a custome element service in the CMC. To know how to add a eustom element service, refer to Business Intelligence Platform Administrator Guide.
286 PUBLICSAP BusinessObjects Web Intelligence User's Guide
Reporting data
1. In the Insert section of the toolbar, click in the toolbar.2. Click Custom Elements.3. Select a visualization.4. Place it onto the canvas.5. From the Objects pane, drag and drop the dimensions and measures you want to add to the chart.
CautionYou will lose the mouse focus if you move a custom element in the report page and the pointer hovers over a Custom Element in the process. That's because the focus is taken away by the interactions with the custom element content. To avoid this issue, make sure you don't hover over a custom element when you move the pointer. Also, if you want to move a custom element for instance, you can drag it by the bottom if you want to move it down, or by the top if you want to move it up.
Related Information
5.2.2.4 To remove a chart
The following task describes how to remove a chart from a report.
1. Open a Web Intelligence document in Design mode.2. Do one of the following:
○ Right-click the chart frame and click Delete.○ Select the Document Structure and Filters tab in the Side Panel. Right-click the chart name and select
Delete.○ Select the chart, and in the Side Panel toolbar, click the Delete icon.
The chart has been deleted.
Related Information
To format a chart [page 312]
5.2.2.5 To copy a chart
You can copy a chart dynamically to another report or as a picture in other applications.
1. In Design mode, right-click chart and select Copy.The chart is copied to the clipboard.
SAP BusinessObjects Web Intelligence User's GuideReporting data PUBLIC 287
2. To paste the chart to another part of the report, right-click where you want the chart to appear then select Paste.
Related Information
To format a chart [page 312]
5.2.2.6 Turning hierarchical queries into charts
You can turn a hierarchical query into a chart.
Displaying the totals may generate scale distortions, especially if the measure is an aggregate. Hierarchical totals shouldnt be displayed in pie charts or a tag clouds. To hide hierarchical totals, in the Format panel, uncheck Show parent nodes ( Format Chart Plot Area Appearance Settings ).
NoteUse only one hierarchy to feed a tree map.
Related Information
Hierarchical queries [page 46]To change a chart type [page 337]
5.2.2.7 To set the position of a table or chart on the report page
You can set the position of a table or chart in a report.
1. In Design mode, select a table or chart, and click > to open the Format panel.2. Click the Layout Settings tab, and in the Relative Position section, use the controls to specify the margins
and set the position of the table or chart in relation to other report elements.3. Click Apply.
Related Information
To format the appearance of reports, headers, footers, sections, tables, and table cells [page 291]
288 PUBLICSAP BusinessObjects Web Intelligence User's Guide
Reporting data
To select a background color for the table or cells [page 304]To define alternate row and column colors for a table [page 304]To format table or cell borders [page 305]To format text in table cells [page 306]To set cell height and width [page 307]To copy formatting using the Format Painter tool [page 308]To layer tables and cells [page 309]To merge table cells [page 311]Formatting the report layout [page 290]Formatting your reports using Cascading Style Sheets [page 293]Creating a corporate palette for charts [page 322]
5.2.2.8 To position a chart in relation to another chart or table
If you have more than one block (table, chart, or form) in your report, you can use relative positioning.
Relative positioning allows you to position a selected block (for example, a chart) in relation to other blocks in the report.
If new data on the database modifies the size of the tables or charts, relative positioning ensures that the different tables and charts display correctly without overlapping each other.
NoteIf you position a chart in relation to another block (that is, a chart, table, or form), the position of the chart changes automatically, if you reposition the reference block.
1. In Design mode, select a chart and click > to open the Format panel.2. Click the Layout Settings tab, and in the Relative Position section, adjust the left, right, top and bottom
margins.3. Specify whether the margins apply to the report edges or another report element using the corresponding
fields.
5.2.2.9 Formulas in chart elements
You can use the formula editor () to define and edit formulas in chart elements.
You can add formulas in:
Chart titleLegend titleAxis titlesMaximum and minimum values for axis scaling
SAP BusinessObjects Web Intelligence User's GuideReporting data PUBLIC 289
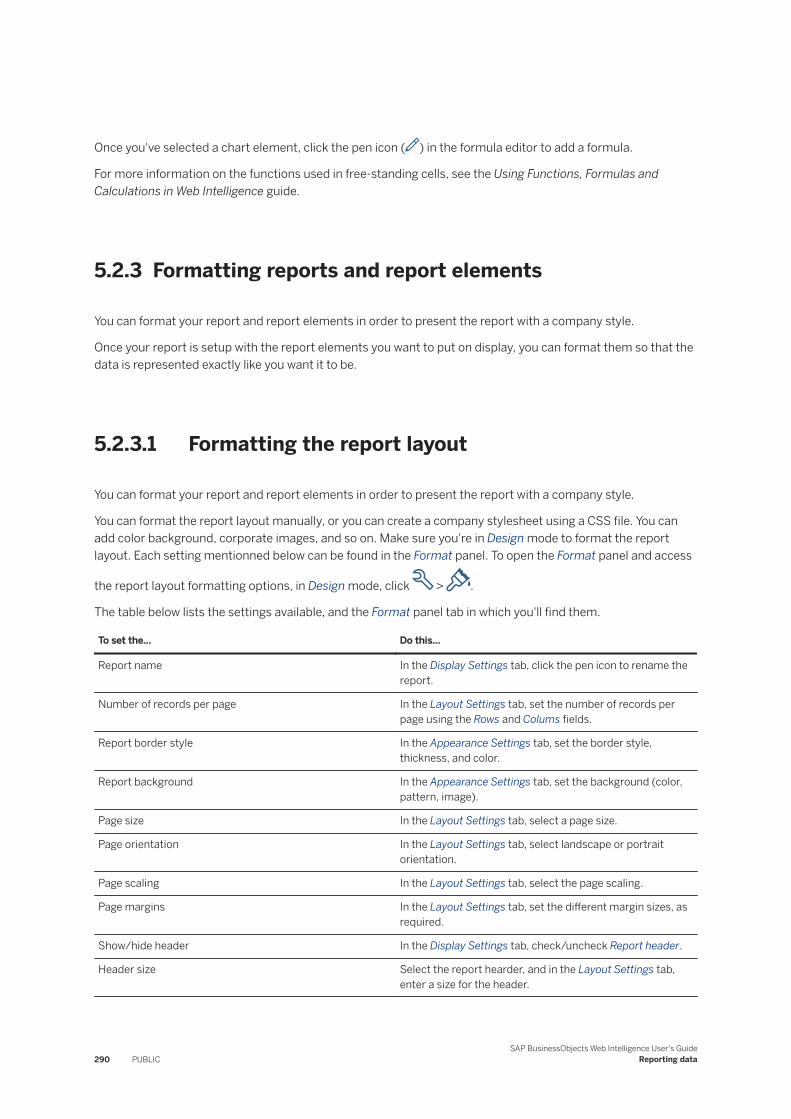
Once you've selected a chart element, click the pen icon () in the formula editor to add a formula.
For more information on the functions used in free-standing cells, see the Using Functions, Formulas and Calculations in Web Intelligence guide.
5.2.3 Formatting reports and report elements
You can format your report and report elements in order to present the report with a company style.
Once your report is setup with the report elements you want to put on display, you can format them so that the data is represented exactly like you want it to be.
5.2.3.1 Formatting the report layout
You can format your report and report elements in order to present the report with a company style.
You can format the report layout manually, or you can create a company stylesheet using a CSS file. You can add color background, corporate images, and so on. Make sure you're in Design mode to format the report layout. Each setting mentionned below can be found in the Format panel. To open the Format panel and access
the report layout formatting options, in Design mode, click > .
The table below lists the settings available, and the Format panel tab in which you'll find them.
To set the... Do this...
Report name In the Display Settings tab, click the pen icon to rename the report.
Number of records per page In the Layout Settings tab, set the number of records per page using the Rows and Colums fields.
Report border style In the Appearance Settings tab, set the border style, thickness, and color.
Report background In the Appearance Settings tab, set the background (color, pattern, image).
Page size In the Layout Settings tab, select a page size.
Page orientation In the Layout Settings tab, select landscape or portrait orientation.
Page scaling In the Layout Settings tab, select the page scaling.
Page margins In the Layout Settings tab, set the different margin sizes, as required.
Show/hide header In the Display Settings tab, check/uncheck Report header.
Header size Select the report hearder, and in the Layout Settings tab, enter a size for the header.
290 PUBLICSAP BusinessObjects Web Intelligence User's Guide
Reporting data
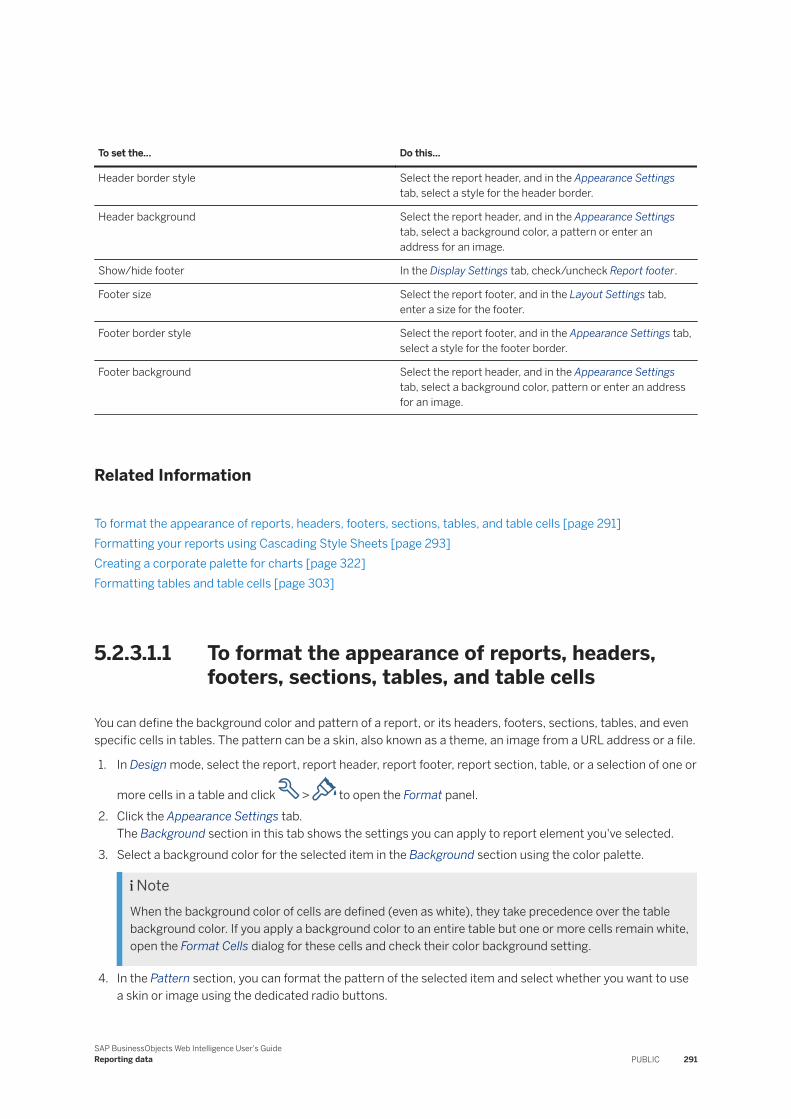
To set the... Do this...
Header border style Select the report header, and in the Appearance Settings tab, select a style for the header border.
Header background Select the report header, and in the Appearance Settings tab, select a background color, a pattern or enter an address for an image.
Show/hide footer In the Display Settings tab, check/uncheck Report footer.
Footer size Select the report footer, and in the Layout Settings tab, enter a size for the footer.
Footer border style Select the report footer, and in the Appearance Settings tab, select a style for the footer border.
Footer background Select the report header, and in the Appearance Settings tab, select a background color, pattern or enter an address for an image.
Related Information
To format the appearance of reports, headers, footers, sections, tables, and table cells [page 291]Formatting your reports using Cascading Style Sheets [page 293]Creating a corporate palette for charts [page 322]Formatting tables and table cells [page 303]
5.2.3.1.1 To format the appearance of reports, headers, footers, sections, tables, and table cells
You can define the background color and pattern of a report, or its headers, footers, sections, tables, and even specific cells in tables. The pattern can be a skin, also known as a theme, an image from a URL address or a file.
1. In Design mode, select the report, report header, report footer, report section, table, or a selection of one or
more cells in a table and click > to open the Format panel.2. Click the Appearance Settings tab.
The Background section in this tab shows the settings you can apply to report element you've selected.3. Select a background color for the selected item in the Background section using the color palette.
NoteWhen the background color of cells are defined (even as white), they take precedence over the table background color. If you apply a background color to an entire table but one or more cells remain white, open the Format Cells dialog for these cells and check their color background setting.
4. In the Pattern section, you can format the pattern of the selected item and select whether you want to use a skin or image using the dedicated radio buttons.
SAP BusinessObjects Web Intelligence User's GuideReporting data PUBLIC 291
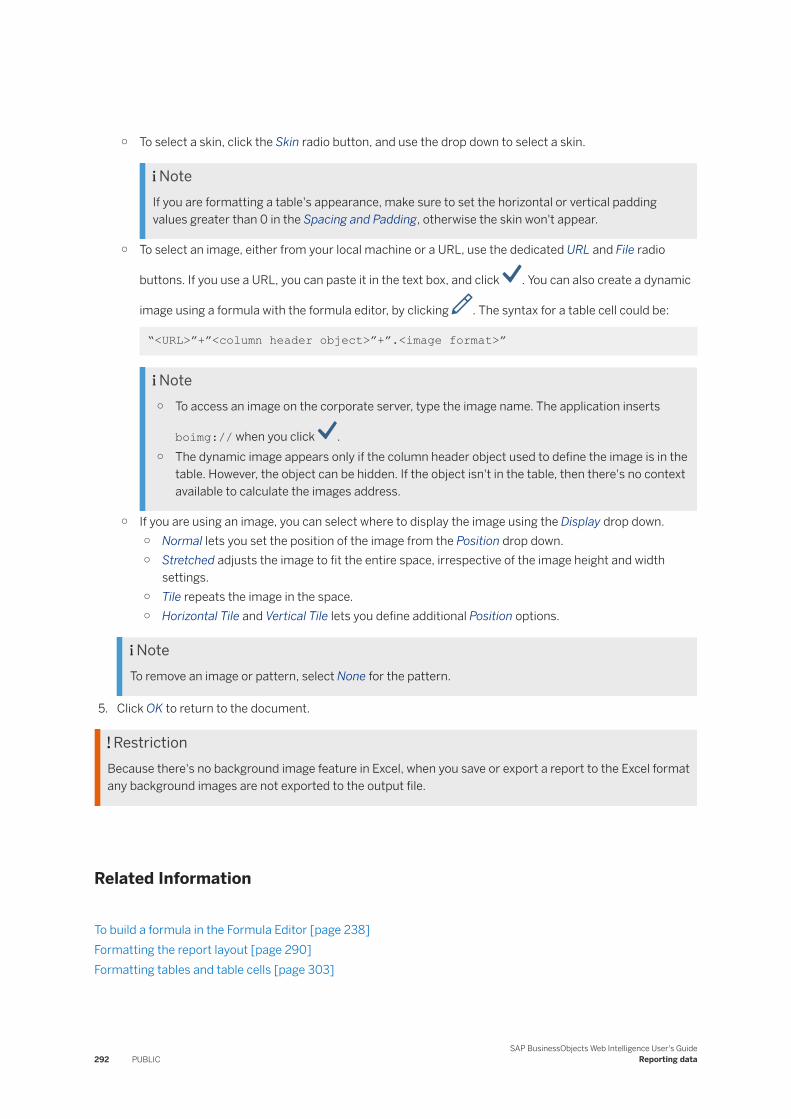
○ To select a skin, click the Skin radio button, and use the drop down to select a skin.
NoteIf you are formatting a table's appearance, make sure to set the horizontal or vertical padding values greater than 0 in the Spacing and Padding, otherwise the skin won't appear.
○ To select an image, either from your local machine or a URL, use the dedicated URL and File radio
buttons. If you use a URL, you can paste it in the text box, and click . You can also create a dynamic
image using a formula with the formula editor, by clicking . The syntax for a table cell could be:
“<URL>”+”<column header object>”+”.<image format>”
Note○ To access an image on the corporate server, type the image name. The application inserts
boimg:// when you click .○ The dynamic image appears only if the column header object used to define the image is in the
table. However, the object can be hidden. If the object isn't in the table, then there's no context available to calculate the images address.
○ If you are using an image, you can select where to display the image using the Display drop down.○ Normal lets you set the position of the image from the Position drop down.○ Stretched adjusts the image to fit the entire space, irrespective of the image height and width
settings.○ Tile repeats the image in the space.○ Horizontal Tile and Vertical Tile lets you define additional Position options.
NoteTo remove an image or pattern, select None for the pattern.
5. Click OK to return to the document.
RestrictionBecause there's no background image feature in Excel, when you save or export a report to the Excel format any background images are not exported to the output file.
Related Information
To build a formula in the Formula Editor [page 238]Formatting the report layout [page 290]Formatting tables and table cells [page 303]
292 PUBLICSAP BusinessObjects Web Intelligence User's Guide
Reporting data
5.2.3.2 Formatting your reports using Cascading Style Sheets
Web Intelligence Cascading Style Sheets (CSS) define how to display your reports and determine the presentation of documents.
You can edit the CSS to apply a specific style to the presentation of documents. You can export the file, modify the styles according to your needs and then import the file back. You can also distribute the style sheet to other users as a standard style.
The Web Intelligence CSS conforms to the W3C CSS core syntax. However, the core syntax doesn't imply anything about property names, types, and semantic. Web Intelligence CSS supports locale-specific style sheets.
From 4.3 onwards, Web Intelligence uses a CSS introduced in 4.2 SP6. It's used by default in new documents, and documents created in Web Inteligence 4.2 SP6 (or higher). If you want to use the new CSS in older documents created prior to the 4.2 SP6 release, or keep your corporate CSS you previously saved in new documents, make sure to import the correct CSS file. To do so, refer to the Modifying the document default style section.
NoteThe CSS style sheet doesn't control the color of charts. There's a separate file for defining corporate palettes for charts. For more information on how to assign colors to charts, see Assigning colors to charts [page 318].
NoteThe Cascading Style Sheets are derived from the W3C CSS. To modify the CSS of your documents, you must be familiar with the CSS core syntax of the W3C. For more information, see http://www.w3.org .
Using a CSS allows you to:
● Define a company-wide style sheet in order to define standard settings (such as a company logo).● Define different styles to present a specific type of information. For example, you can use one color for
products sold, another color for expenses and another color for revenues.● Create a style sheet in order to encode personal preferences.● Personalize the presentation of the documents you create.
Related Information
Formatting the report layout [page 290]Creating a corporate palette for charts [page 322]Formatting tables and table cells [page 303]Modifying the document default style [page 294]
SAP BusinessObjects Web Intelligence User's GuideReporting data PUBLIC 293
5.2.3.2.1 Using a Cascading Style Sheet in documents
When you create a report or a report element in a document, the formatting is entirely based on the default style.
If these elements have a specific formatting applied in the Format panel, the modified properties overwrite locally the values taken from the default style.
To remove this specific formatting, select the visualization, and in the Format panel, click > Reset Format.
5.2.3.2.2 Modifying the document default style
The document default style is stored in a Cascading Style Sheet (CSS) file attached to the document.
You can export and edit the default style in the Properties pane. In Design mode, click Default StyleExport . Once you're done with the changes, import the custom style by clicking Import.
If you want to apply the custom CSS to a visualization that's already been formatted, make sure to clear its
format first. To do so, select the visualization, and in the Format pane, click > Reset Format.
NoteThe CSS you import doesn't impact the properties you've set via the user interface (toolbox, contextual menu, dialog box,…).
If you decide to reset the format of all the visualization of the report, make sure to clear the headers and footers manaully, as they're not part of the report body.
You can restore the default style anytime in the Properties pane by clicking Reset Default Style.
5.2.3.2.3 Modifying and using the standard default style
The standard CSS file is named WebIDefaultStyleSheet.css.
This standard CSS file is located by default at:
C:\Program Files (x86)\SAP BusinessObjects\SAP BusinessObjects Enterprise XI 4.0\images
When you create a 4.X document, the standard CSS is embedded into the document to become the document style. This default style document diverges from the standard and can be locally modified.
To reset the document default style to the standard style, in the Properties pane, in the Default Style section, click Document Reset Default Style . The standard CSS will replace the previous CSS in the document.
To publish a standard default file, you must have access to the ../images/ folder of your servers and Web Intelligence Rich Client installations to put a new version of WebiDefaultStyleSheet.css.
294 PUBLICSAP BusinessObjects Web Intelligence User's Guide
Reporting data
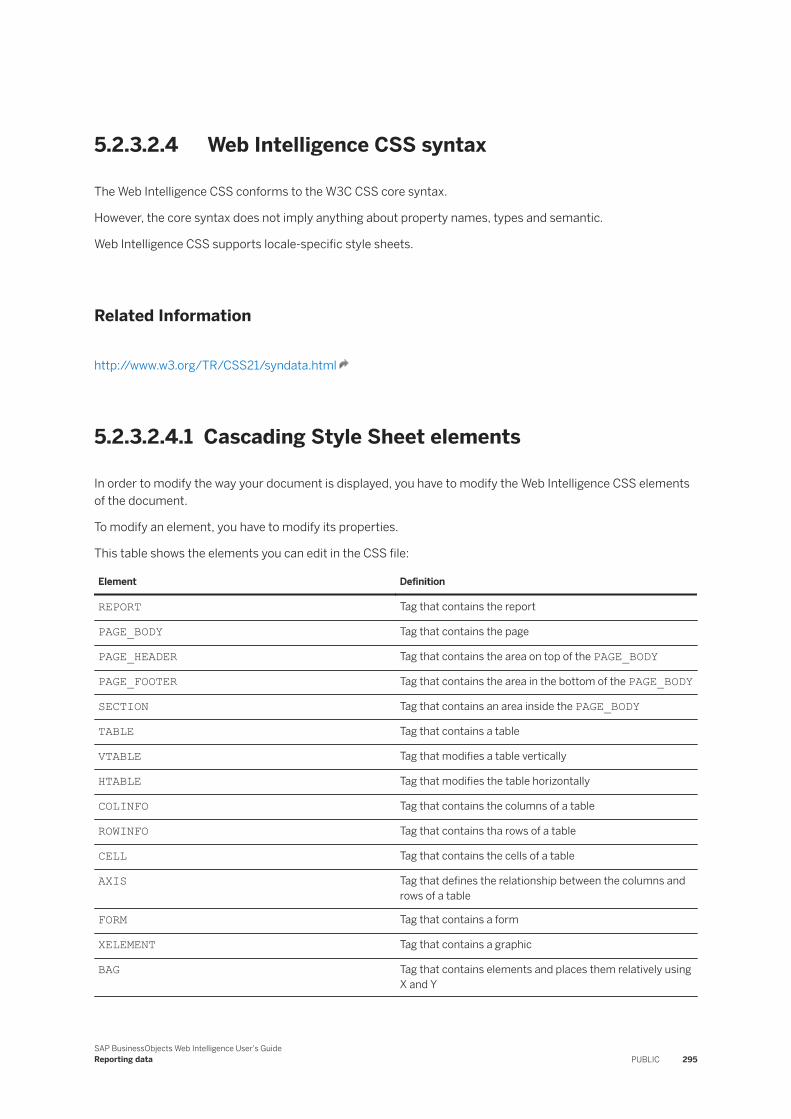
5.2.3.2.4 Web Intelligence CSS syntax
The Web Intelligence CSS conforms to the W3C CSS core syntax.
However, the core syntax does not imply anything about property names, types and semantic.
Web Intelligence CSS supports locale-specific style sheets.
Related Information
http://www.w3.org/TR/CSS21/syndata.html
5.2.3.2.4.1 Cascading Style Sheet elements
In order to modify the way your document is displayed, you have to modify the Web Intelligence CSS elements of the document.
To modify an element, you have to modify its properties.
This table shows the elements you can edit in the CSS file:
Element Definition
REPORT Tag that contains the report
PAGE_BODY Tag that contains the page
PAGE_HEADER Tag that contains the area on top of the PAGE_BODY
PAGE_FOOTER Tag that contains the area in the bottom of the PAGE_BODY
SECTION Tag that contains an area inside the PAGE_BODY
TABLE Tag that contains a table
VTABLE Tag that modifies a table vertically
HTABLE Tag that modifies the table horizontally
COLINFO Tag that contains the columns of a table
ROWINFO Tag that contains tha rows of a table
CELL Tag that contains the cells of a table
AXIS Tag that defines the relationship between the columns and rows of a table
FORM Tag that contains a form
XELEMENT Tag that contains a graphic
BAG Tag that contains elements and places them relatively using X and Y
SAP BusinessObjects Web Intelligence User's GuideReporting data PUBLIC 295
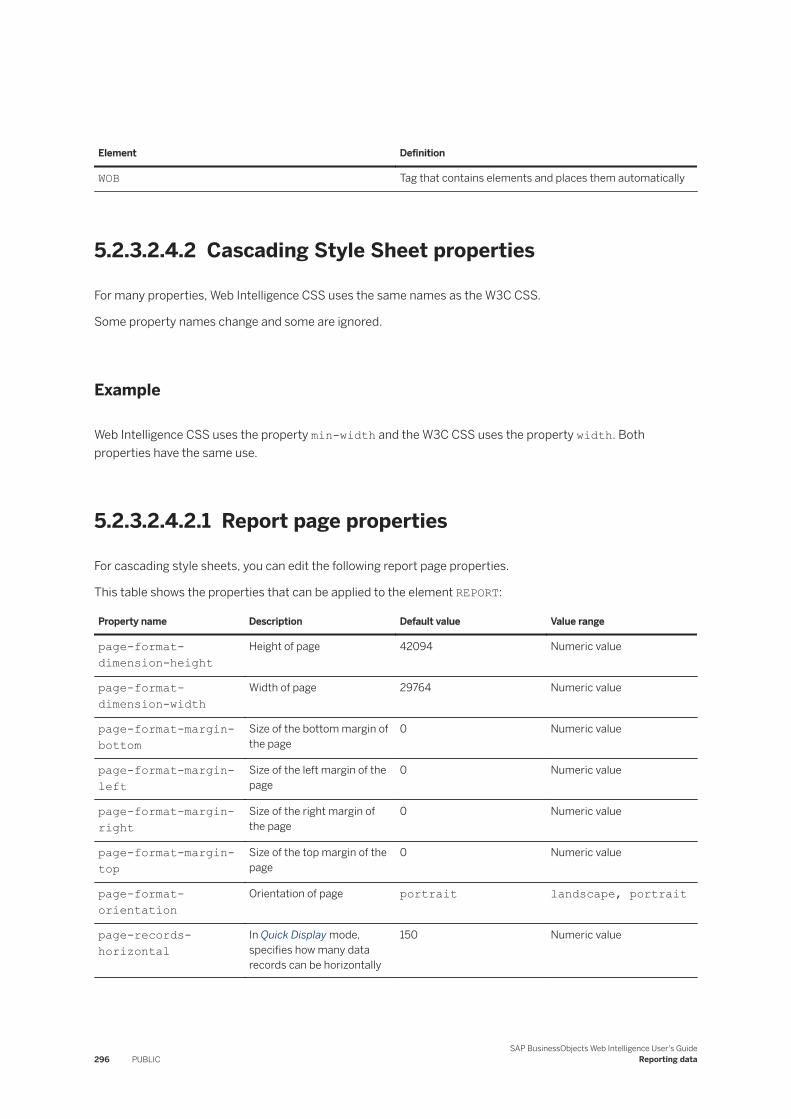
Element Definition
WOB Tag that contains elements and places them automatically
5.2.3.2.4.2 Cascading Style Sheet properties
For many properties, Web Intelligence CSS uses the same names as the W3C CSS.
Some property names change and some are ignored.
Example
Web Intelligence CSS uses the property min-width and the W3C CSS uses the property width. Both properties have the same use.
5.2.3.2.4.2.1 Report page properties
For cascading style sheets, you can edit the following report page properties.
This table shows the properties that can be applied to the element REPORT:
Property name Description Default value Value range
page-format-dimension-height
Height of page 42094 Numeric value
page-format-dimension-width
Width of page 29764 Numeric value
page-format-margin-bottom
Size of the bottom margin of the page
0 Numeric value
page-format-margin-left
Size of the left margin of the page
0 Numeric value
page-format-margin-right
Size of the right margin of the page
0 Numeric value
page-format-margin-top
Size of the top margin of the page
0 Numeric value
page-format-orientation
Orientation of page portrait landscape, portrait
page-records-horizontal
In Quick Display mode, specifies how many data records can be horizontally
150 Numeric value
296 PUBLICSAP BusinessObjects Web Intelligence User's Guide
Reporting data
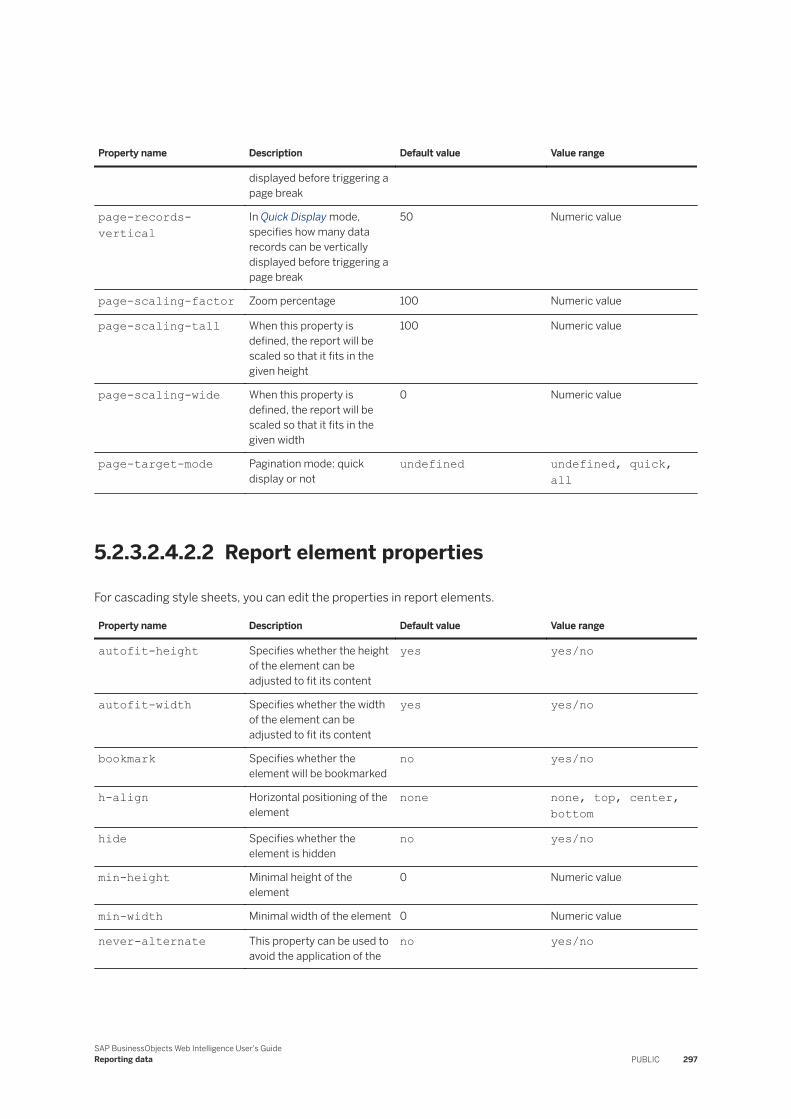
Property name Description Default value Value range
displayed before triggering a page break
page-records-vertical
In Quick Display mode, specifies how many data records can be vertically displayed before triggering a page break
50 Numeric value
page-scaling-factor Zoom percentage 100 Numeric value
page-scaling-tall When this property is defined, the report will be scaled so that it fits in the given height
100 Numeric value
page-scaling-wide When this property is defined, the report will be scaled so that it fits in the given width
0 Numeric value
page-target-mode Pagination mode: quick display or not
undefined undefined, quick, all
5.2.3.2.4.2.2 Report element properties
For cascading style sheets, you can edit the properties in report elements.
Property name Description Default value Value range
autofit-height Specifies whether the height of the element can be adjusted to fit its content
yes yes/no
autofit-width Specifies whether the width of the element can be adjusted to fit its content
yes yes/no
bookmark Specifies whether the element will be bookmarked
no yes/no
h-align Horizontal positioning of the element
none none, top, center, bottom
hide Specifies whether the element is hidden
no yes/no
min-height Minimal height of the element
0 Numeric value
min-width Minimal width of the element 0 Numeric value
never-alternate This property can be used to avoid the application of the
no yes/no
SAP BusinessObjects Web Intelligence User's GuideReporting data PUBLIC 297
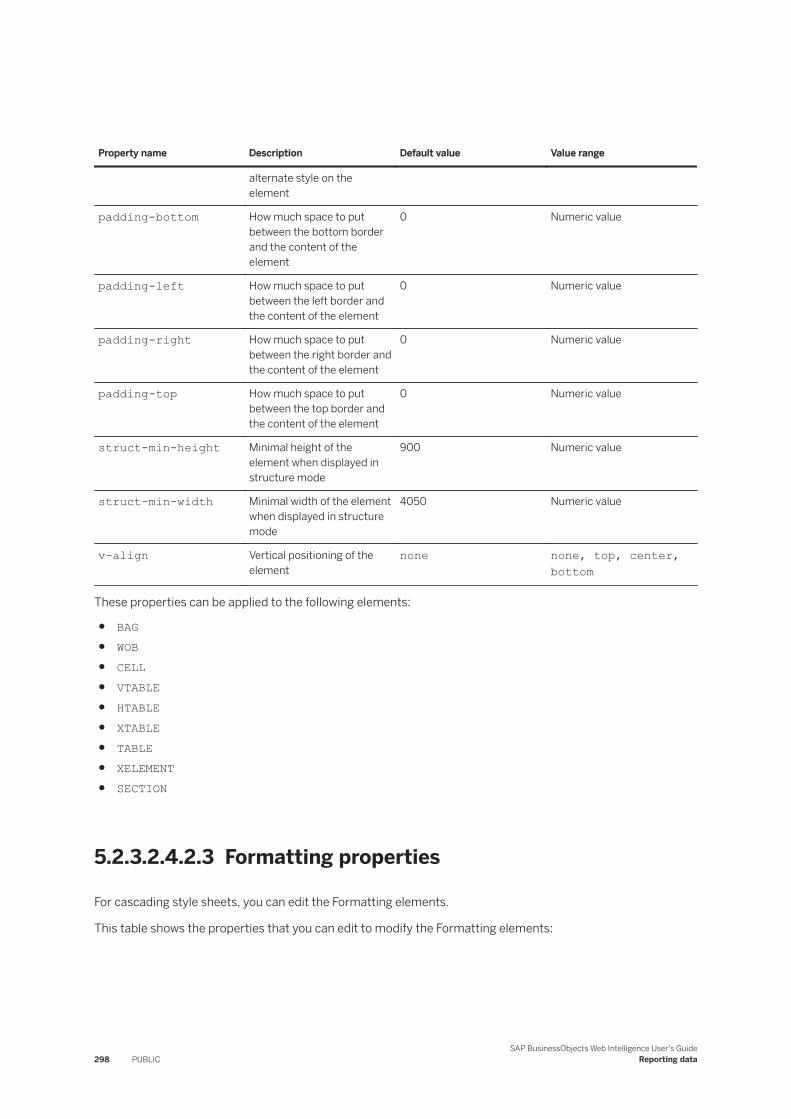
Property name Description Default value Value range
alternate style on the element
padding-bottom How much space to put between the bottom border and the content of the element
0 Numeric value
padding-left How much space to put between the left border and the content of the element
0 Numeric value
padding-right How much space to put between the right border and the content of the element
0 Numeric value
padding-top How much space to put between the top border and the content of the element
0 Numeric value
struct-min-height Minimal height of the element when displayed in structure mode
900 Numeric value
struct-min-width Minimal width of the element when displayed in structure mode
4050 Numeric value
v-align Vertical positioning of the element
none none, top, center, bottom
These properties can be applied to the following elements:
● BAG● WOB● CELL● VTABLE● HTABLE● XTABLE● TABLE● XELEMENT● SECTION
5.2.3.2.4.2.3 Formatting properties
For cascading style sheets, you can edit the Formatting elements.
This table shows the properties that you can edit to modify the Formatting elements:
298 PUBLICSAP BusinessObjects Web Intelligence User's Guide
Reporting data
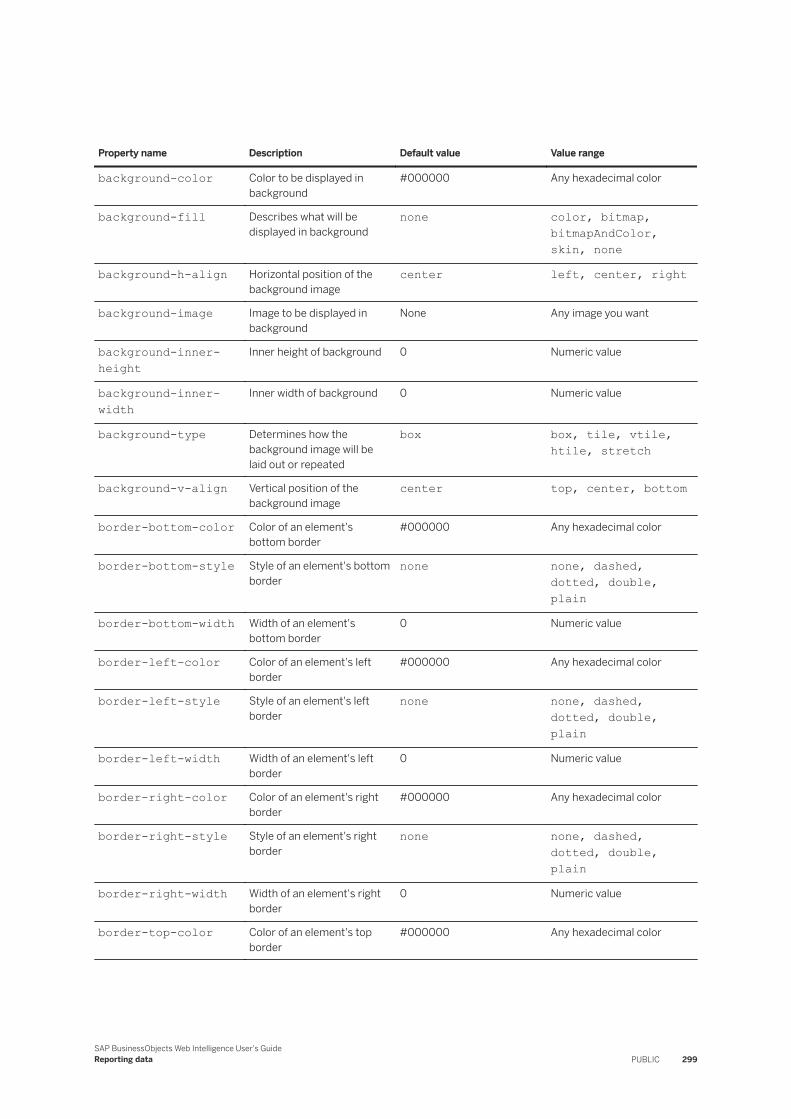
Property name Description Default value Value range
background-color Color to be displayed in background
#000000 Any hexadecimal color
background-fill Describes what will be displayed in background
none color, bitmap, bitmapAndColor, skin, none
background-h-align Horizontal position of the background image
center left, center, right
background-image Image to be displayed in background
None Any image you want
background-inner-height
Inner height of background 0 Numeric value
background-inner-width
Inner width of background 0 Numeric value
background-type Determines how the background image will be laid out or repeated
box box, tile, vtile, htile, stretch
background-v-align Vertical position of the background image
center top, center, bottom
border-bottom-color Color of an element's bottom border
#000000 Any hexadecimal color
border-bottom-style Style of an element's bottom border
none none, dashed, dotted, double, plain
border-bottom-width Width of an element's bottom border
0 Numeric value
border-left-color Color of an element's left border
#000000 Any hexadecimal color
border-left-style Style of an element's left border
none none, dashed, dotted, double, plain
border-left-width Width of an element's left border
0 Numeric value
border-right-color Color of an element's right border
#000000 Any hexadecimal color
border-right-style Style of an element's right border
none none, dashed, dotted, double, plain
border-right-width Width of an element's right border
0 Numeric value
border-top-color Color of an element's top border
#000000 Any hexadecimal color
SAP BusinessObjects Web Intelligence User's GuideReporting data PUBLIC 299
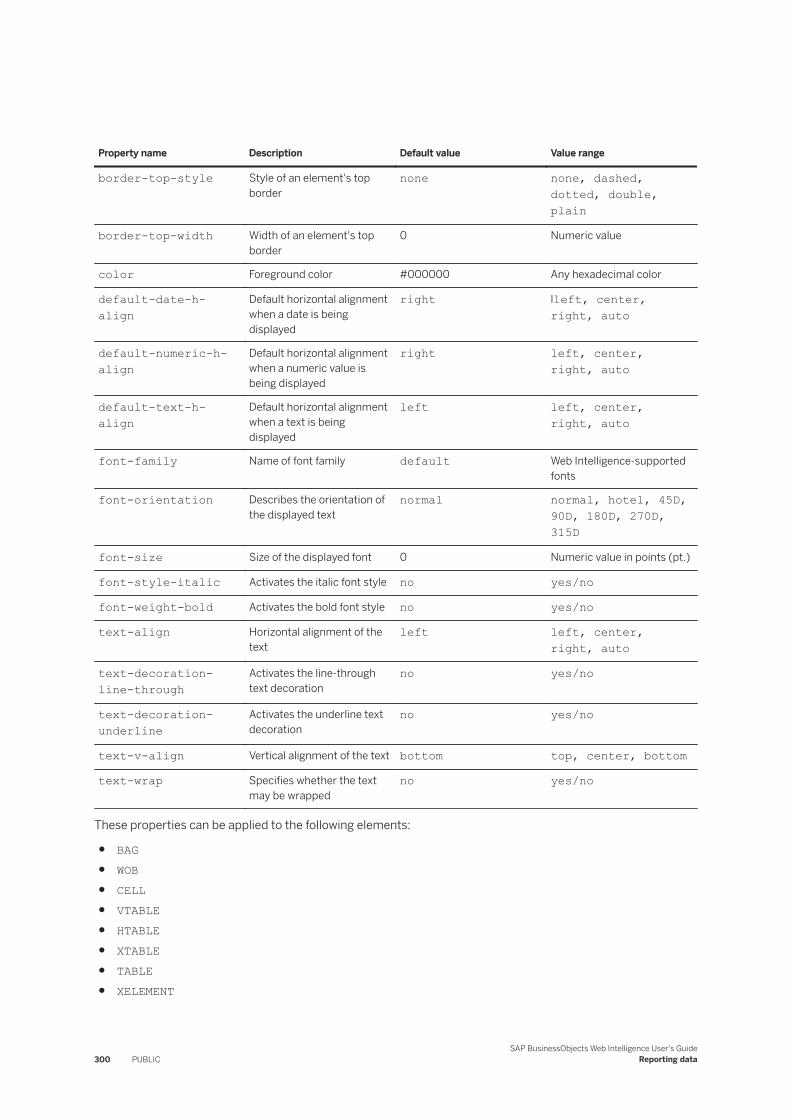
Property name Description Default value Value range
border-top-style Style of an element's top border
none none, dashed, dotted, double, plain
border-top-width Width of an element's top border
0 Numeric value
color Foreground color #000000 Any hexadecimal color
default-date-h-align
Default horizontal alignment when a date is being displayed
right lleft, center, right, auto
default-numeric-h-align
Default horizontal alignment when a numeric value is being displayed
right left, center, right, auto
default-text-h-align
Default horizontal alignment when a text is being displayed
left left, center, right, auto
font-family Name of font family default Web Intelligence-supported fonts
font-orientation Describes the orientation of the displayed text
normal normal, hotel, 45D, 90D, 180D, 270D, 315D
font-size Size of the displayed font 0 Numeric value in points (pt.)
font-style-italic Activates the italic font style no yes/no
font-weight-bold Activates the bold font style no yes/no
text-align Horizontal alignment of the text
left left, center, right, auto
text-decoration-line-through
Activates the line-through text decoration
no yes/no
text-decoration-underline
Activates the underline text decoration
no yes/no
text-v-align Vertical alignment of the text bottom top, center, bottom
text-wrap Specifies whether the text may be wrapped
no yes/no
These properties can be applied to the following elements:
● BAG● WOB● CELL● VTABLE● HTABLE● XTABLE● TABLE● XELEMENT
300 PUBLICSAP BusinessObjects Web Intelligence User's Guide
Reporting data
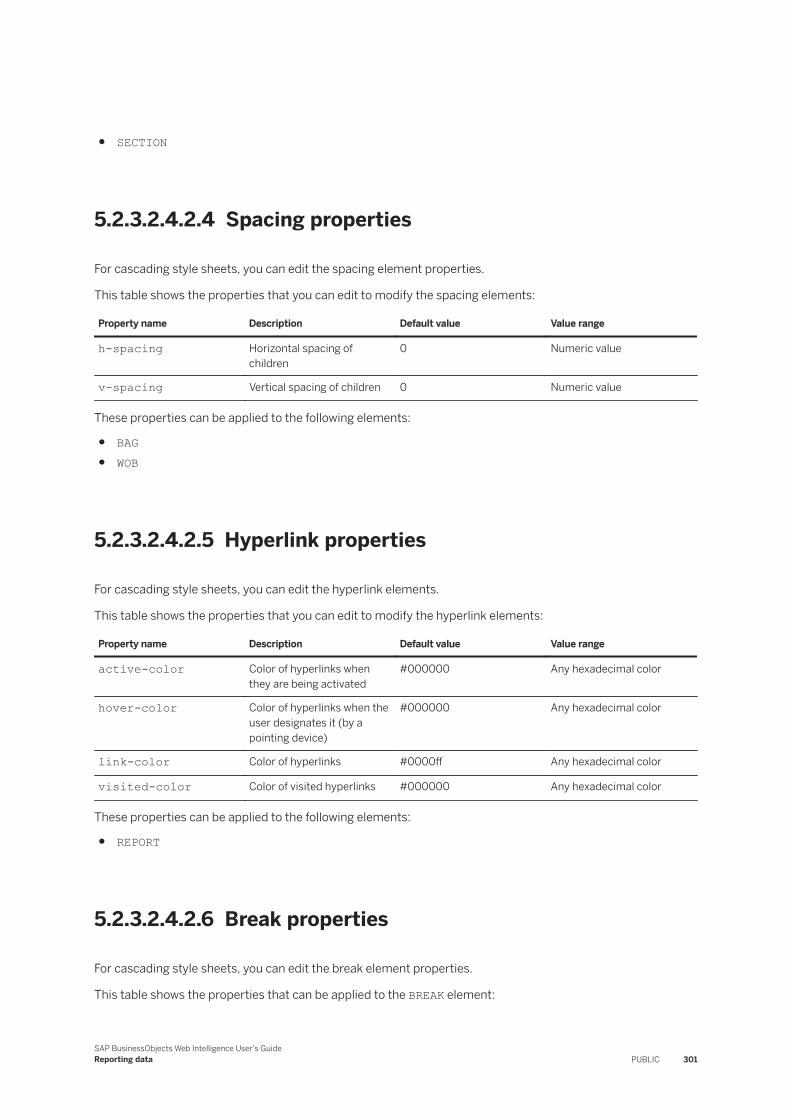
● SECTION
5.2.3.2.4.2.4 Spacing properties
For cascading style sheets, you can edit the spacing element properties.
This table shows the properties that you can edit to modify the spacing elements:
Property name Description Default value Value range
h-spacing Horizontal spacing of children
0 Numeric value
v-spacing Vertical spacing of children 0 Numeric value
These properties can be applied to the following elements:
● BAG● WOB
5.2.3.2.4.2.5 Hyperlink properties
For cascading style sheets, you can edit the hyperlink elements.
This table shows the properties that you can edit to modify the hyperlink elements:
Property name Description Default value Value range
active-color Color of hyperlinks when they are being activated
#000000 Any hexadecimal color
hover-color Color of hyperlinks when the user designates it (by a pointing device)
#000000 Any hexadecimal color
link-color Color of hyperlinks #0000ff Any hexadecimal color
visited-color Color of visited hyperlinks #000000 Any hexadecimal color
These properties can be applied to the following elements:
● REPORT
5.2.3.2.4.2.6 Break properties
For cascading style sheets, you can edit the break element properties.
This table shows the properties that can be applied to the BREAK element:
SAP BusinessObjects Web Intelligence User's GuideReporting data PUBLIC 301
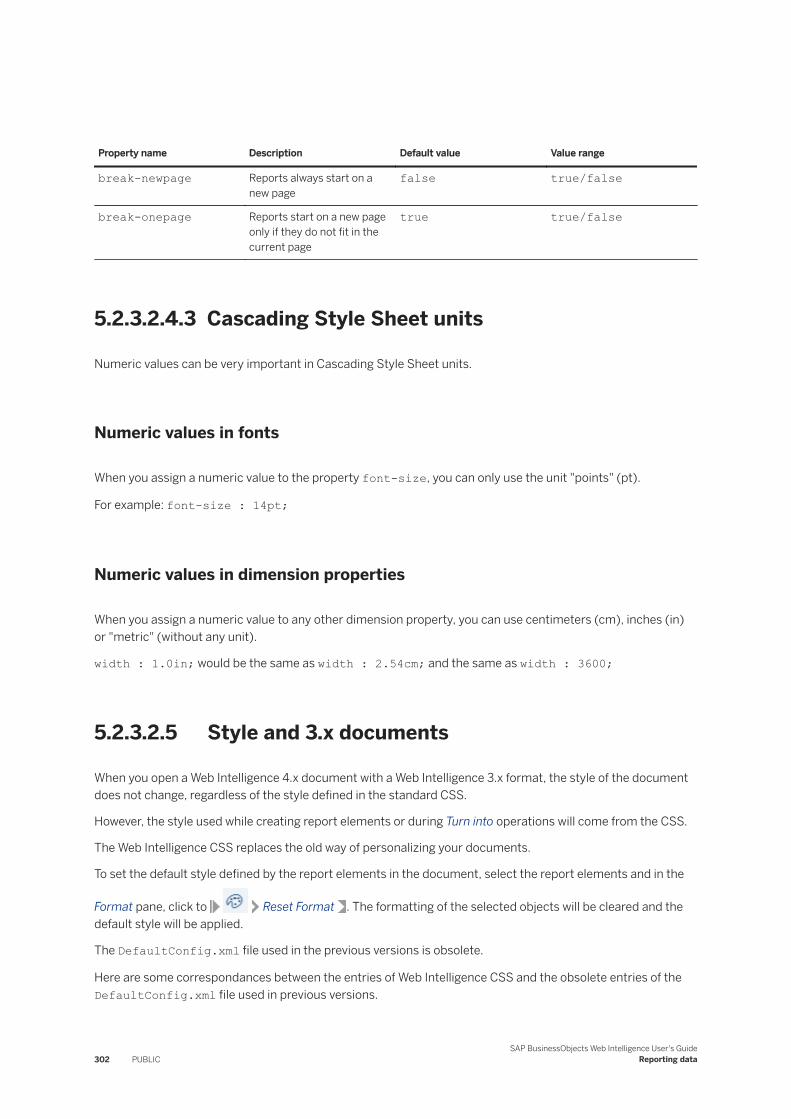
Property name Description Default value Value range
break-newpage Reports always start on a new page
false true/false
break-onepage Reports start on a new page only if they do not fit in the current page
true true/false
5.2.3.2.4.3 Cascading Style Sheet units
Numeric values can be very important in Cascading Style Sheet units.
Numeric values in fonts
When you assign a numeric value to the property font-size, you can only use the unit "points" (pt).
For example: font-size : 14pt;
Numeric values in dimension properties
When you assign a numeric value to any other dimension property, you can use centimeters (cm), inches (in) or "metric" (without any unit).
width : 1.0in; would be the same as width : 2.54cm; and the same as width : 3600;
5.2.3.2.5 Style and 3.x documents
When you open a Web Intelligence 4.x document with a Web Intelligence 3.x format, the style of the document does not change, regardless of the style defined in the standard CSS.
However, the style used while creating report elements or during Turn into operations will come from the CSS.
The Web Intelligence CSS replaces the old way of personalizing your documents.
To set the default style defined by the report elements in the document, select the report elements and in the
Format pane, click to Reset Format . The formatting of the selected objects will be cleared and the default style will be applied.
The DefaultConfig.xml file used in the previous versions is obsolete.
Here are some correspondances between the entries of Web Intelligence CSS and the obsolete entries of the DefaultConfig.xml file used in previous versions.
302 PUBLICSAP BusinessObjects Web Intelligence User's Guide
Reporting data
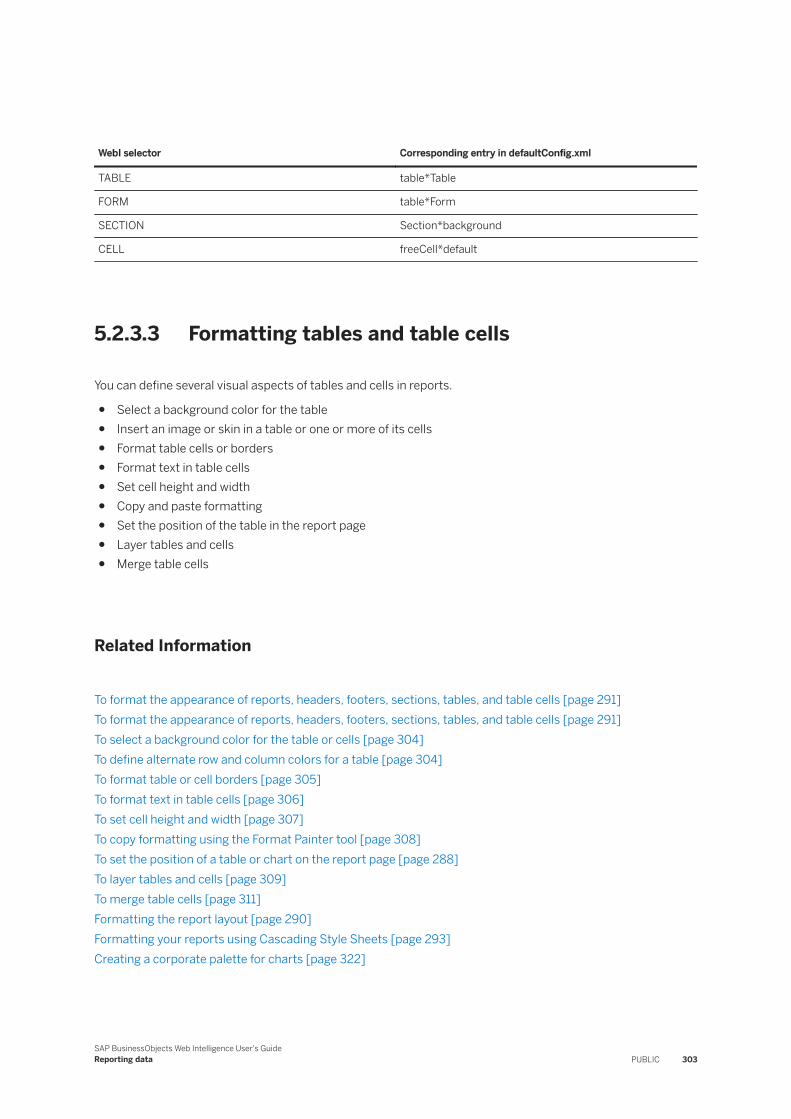
WebI selector Corresponding entry in defaultConfig.xml
TABLE table*Table
FORM table*Form
SECTION Section*background
CELL freeCell*default
5.2.3.3 Formatting tables and table cells
You can define several visual aspects of tables and cells in reports.
● Select a background color for the table● Insert an image or skin in a table or one or more of its cells● Format table cells or borders● Format text in table cells● Set cell height and width● Copy and paste formatting● Set the position of the table in the report page● Layer tables and cells● Merge table cells
Related Information
To format the appearance of reports, headers, footers, sections, tables, and table cells [page 291]To format the appearance of reports, headers, footers, sections, tables, and table cells [page 291]To select a background color for the table or cells [page 304]To define alternate row and column colors for a table [page 304]To format table or cell borders [page 305]To format text in table cells [page 306]To set cell height and width [page 307]To copy formatting using the Format Painter tool [page 308]To set the position of a table or chart on the report page [page 288]To layer tables and cells [page 309]To merge table cells [page 311]Formatting the report layout [page 290]Formatting your reports using Cascading Style Sheets [page 293]Creating a corporate palette for charts [page 322]
SAP BusinessObjects Web Intelligence User's GuideReporting data PUBLIC 303
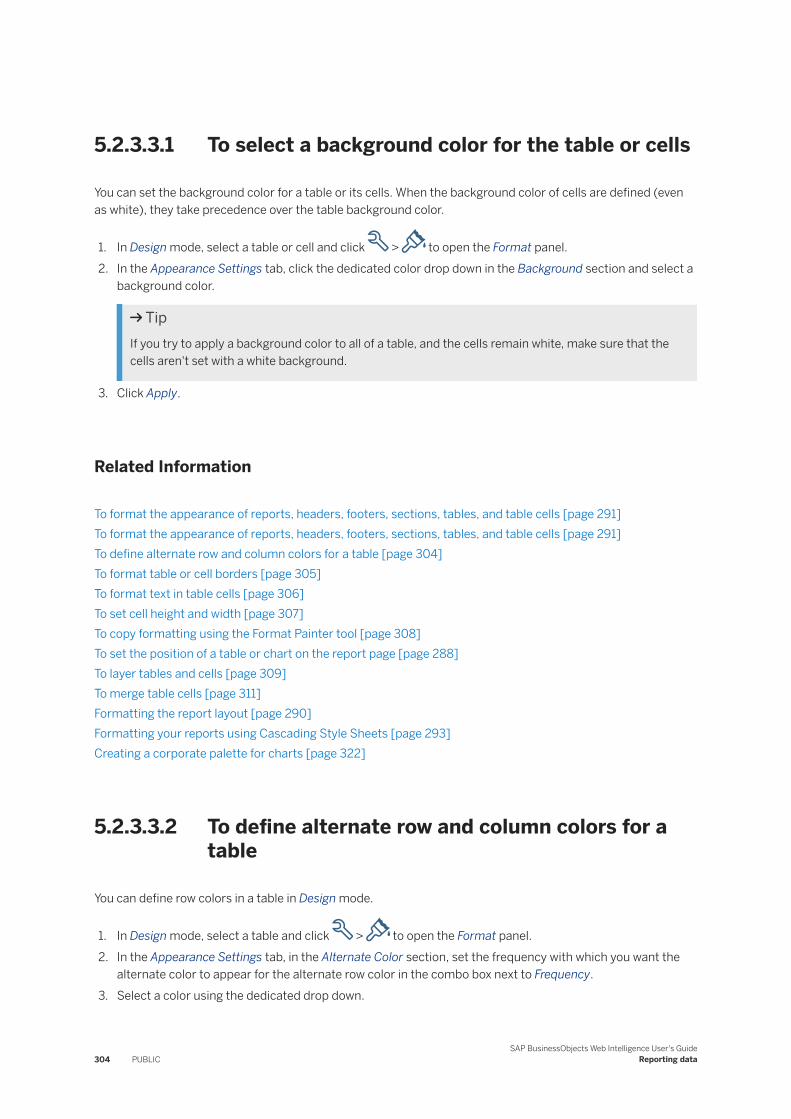
5.2.3.3.1 To select a background color for the table or cells
You can set the background color for a table or its cells. When the background color of cells are defined (even as white), they take precedence over the table background color.
1. In Design mode, select a table or cell and click > to open the Format panel.2. In the Appearance Settings tab, click the dedicated color drop down in the Background section and select a
background color.
TipIf you try to apply a background color to all of a table, and the cells remain white, make sure that the cells aren't set with a white background.
3. Click Apply.
Related Information
To format the appearance of reports, headers, footers, sections, tables, and table cells [page 291]To format the appearance of reports, headers, footers, sections, tables, and table cells [page 291]To define alternate row and column colors for a table [page 304]To format table or cell borders [page 305]To format text in table cells [page 306]To set cell height and width [page 307]To copy formatting using the Format Painter tool [page 308]To set the position of a table or chart on the report page [page 288]To layer tables and cells [page 309]To merge table cells [page 311]Formatting the report layout [page 290]Formatting your reports using Cascading Style Sheets [page 293]Creating a corporate palette for charts [page 322]
5.2.3.3.2 To define alternate row and column colors for a table
You can define row colors in a table in Design mode.
1. In Design mode, select a table and click > to open the Format panel.2. In the Appearance Settings tab, in the Alternate Color section, set the frequency with which you want the
alternate color to appear for the alternate row color in the combo box next to Frequency.3. Select a color using the dedicated drop down.
304 PUBLICSAP BusinessObjects Web Intelligence User's Guide
Reporting data
4. Click Apply.
Related Information
To format the appearance of reports, headers, footers, sections, tables, and table cells [page 291]To select a background color for the table or cells [page 304]To format table or cell borders [page 305]To format text in table cells [page 306]To set cell height and width [page 307]To copy formatting using the Format Painter tool [page 308]To set the position of a table or chart on the report page [page 288]To layer tables and cells [page 309]To merge table cells [page 311]Formatting the report layout [page 290]Formatting your reports using Cascading Style Sheets [page 293]Creating a corporate palette for charts [page 322]
5.2.3.3.3 To format table or cell borders
You can format the border of a table or cell in a table in Design mode.
1. In Design mode, select a table or cell and click > to open the Format panel.2. In the Appearance Settings tab, in the Border section, use the controls in the tab to configure the border
styles and colors.
When borders are defined between two adjacent cells, priority is given to lines in the order DoubleDashed Dotted Plain None . In case of equivalent priorities between the two cells, the right border of the left cell or the bottom border of the top cell will be shown.
3. Click Apply.
Related Information
To format the appearance of reports, headers, footers, sections, tables, and table cells [page 291]To select a background color for the table or cells [page 304]To define alternate row and column colors for a table [page 304]To format text in table cells [page 306]To set cell height and width [page 307]To copy formatting using the Format Painter tool [page 308]To set the position of a table or chart on the report page [page 288]To layer tables and cells [page 309]
SAP BusinessObjects Web Intelligence User's GuideReporting data PUBLIC 305
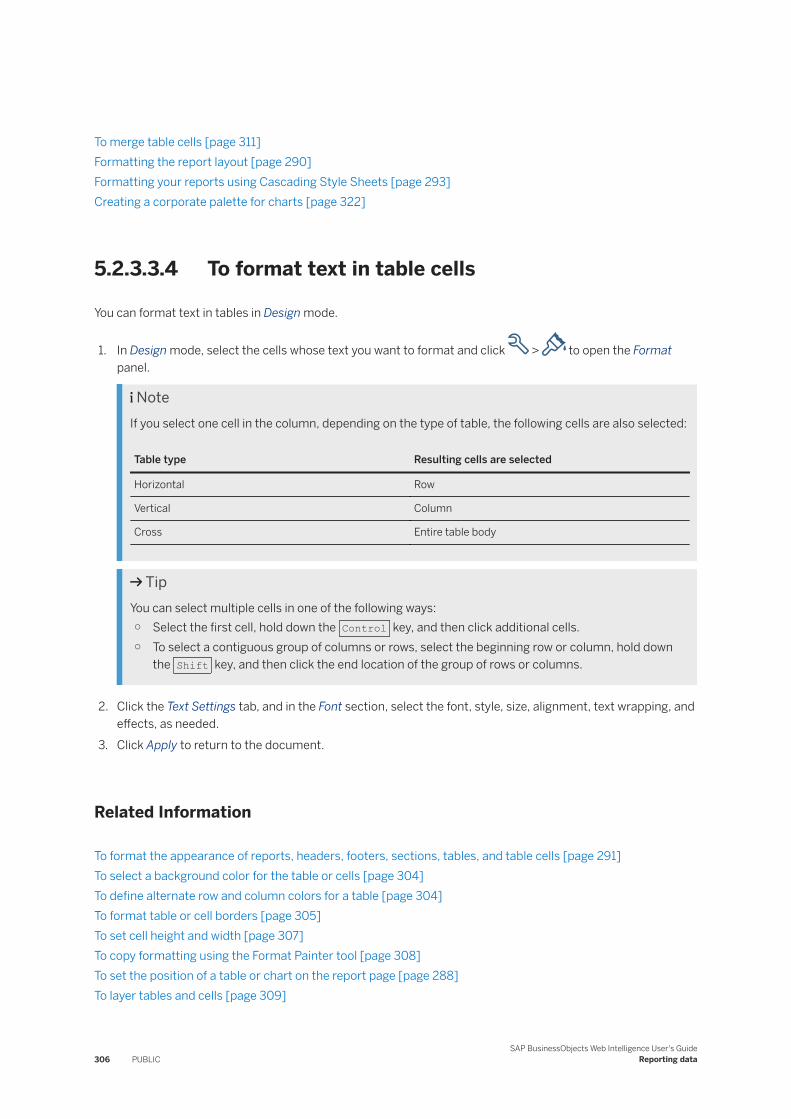
To merge table cells [page 311]Formatting the report layout [page 290]Formatting your reports using Cascading Style Sheets [page 293]Creating a corporate palette for charts [page 322]
5.2.3.3.4 To format text in table cells
You can format text in tables in Design mode.
1. In Design mode, select the cells whose text you want to format and click > to open the Format panel.
NoteIf you select one cell in the column, depending on the type of table, the following cells are also selected:
Table type Resulting cells are selected
Horizontal Row
Vertical Column
Cross Entire table body
TipYou can select multiple cells in one of the following ways:○ Select the first cell, hold down the Control key, and then click additional cells.○ To select a contiguous group of columns or rows, select the beginning row or column, hold down
the Shift key, and then click the end location of the group of rows or columns.
2. Click the Text Settings tab, and in the Font section, select the font, style, size, alignment, text wrapping, and effects, as needed.
3. Click Apply to return to the document.
Related Information
To format the appearance of reports, headers, footers, sections, tables, and table cells [page 291]To select a background color for the table or cells [page 304]To define alternate row and column colors for a table [page 304]To format table or cell borders [page 305]To set cell height and width [page 307]To copy formatting using the Format Painter tool [page 308]To set the position of a table or chart on the report page [page 288]To layer tables and cells [page 309]
306 PUBLICSAP BusinessObjects Web Intelligence User's Guide
Reporting data
To merge table cells [page 311]Formatting the report layout [page 290]Formatting your reports using Cascading Style Sheets [page 293]Creating a corporate palette for charts [page 322]
5.2.3.3.5 To set cell height and width
You can define the height and width of cells.
Tip
If you want to hide the contents of a cell, right-click the cell and select Hide Hide dimension .
1. In Design mode, to set a fixed cell height and width, do one of the following:
○ Drag the cell borders until the cell is the height and width you want.
○ Select the cells you want to change and click > to open the Format panel. In the Layout Settings tab, use the drop downs in the Size section to set the height and width. Check Autofit to have the cell fit to its text contents automatically.
Autofit retains the current cell size as the minimum size and enlarges the cell size if the string that the cell contains is larger than the minimum size specified.
Some functions are incompatible with autofitted cells. If you place any of these functions in an autofitted cell, the function returns the #RECURSIVE error message.
2. To set the cell to automatically fit to its text contents, do one of the following:
○ To set an autofit cell width, double-click either sides of the cell.○ To set an autofit cell height, double-click the bottom border of the cell.
Restriction○ Documents that contain tables with the cell size set to autofit take longer to display than
documents where tables contain cells with a fixed cell width and height.○ The Autofit property doesn't work as well when the Read content as option is set to HTML.
Related Information
To format the appearance of reports, headers, footers, sections, tables, and table cells [page 291]To select a background color for the table or cells [page 304]To define alternate row and column colors for a table [page 304]To format table or cell borders [page 305]To format text in table cells [page 306]To copy formatting using the Format Painter tool [page 308]To set the position of a table or chart on the report page [page 288]
SAP BusinessObjects Web Intelligence User's GuideReporting data PUBLIC 307
To layer tables and cells [page 309]To merge table cells [page 311]Formatting the report layout [page 290]Formatting your reports using Cascading Style Sheets [page 293]Creating a corporate palette for charts [page 322]
5.2.3.3.6 To copy formatting using the Format Painter tool
You can use the Format Painter tool to quickly apply the formatting from a report, table or cell to other reports, tables or cells.
The formatting options applied depend on the objects you choose as the source and target. In general, only properties that affect the visual formatting, for example font style, background color, are applied. Properties that affect the display of data, for example table properties such as Avoid duplicate row aggregation, aren't applied.
1. In Design mode, select the report, table or cell whose formatting you want to apply.
2. In the Format pane, click > Copy Format to copy the formatting of the selection.3. Click the report, table or cell to which you want to apply the formatting.
Related Information
To format the appearance of reports, headers, footers, sections, tables, and table cells [page 291]To select a background color for the table or cells [page 304]To define alternate row and column colors for a table [page 304]To format table or cell borders [page 305]To format text in table cells [page 306]To set cell height and width [page 307]To set the position of a table or chart on the report page [page 288]To layer tables and cells [page 309]To merge table cells [page 311]Formatting the report layout [page 290]Formatting your reports using Cascading Style Sheets [page 293]Creating a corporate palette for charts [page 322]
308 PUBLICSAP BusinessObjects Web Intelligence User's Guide
Reporting data
5.2.3.3.7 To set the position of a table or chart on the report page
You can set the position of a table or chart in a report.
1. In Design mode, select a table or chart, and click > to open the Format panel.2. Click the Layout Settings tab, and in the Relative Position section, use the controls to specify the margins
and set the position of the table or chart in relation to other report elements.3. Click Apply.
Related Information
To format the appearance of reports, headers, footers, sections, tables, and table cells [page 291]To select a background color for the table or cells [page 304]To define alternate row and column colors for a table [page 304]To format table or cell borders [page 305]To format text in table cells [page 306]To set cell height and width [page 307]To copy formatting using the Format Painter tool [page 308]To layer tables and cells [page 309]To merge table cells [page 311]Formatting the report layout [page 290]Formatting your reports using Cascading Style Sheets [page 293]Creating a corporate palette for charts [page 322]
5.2.3.3.8 To layer tables and cells
Layering determines how tables and cells appear when they occupy the same space in a report. An object further forward in the layering order appears over an object further backward in the layering order.
1. In Design mode, select the table or cell whose layer you want to set.2. Right-click the selection, click Order and select the layering option.
Option Description
Bring to Front Make the table or cell the first object in the layering order.
Send to Back Make the table or cell the last object in the layering order.
Bring Forward Bring the table or cell one layer forward in the layering order.
Send Backward Send the table or cell one layer backward in the layering order.
SAP BusinessObjects Web Intelligence User's GuideReporting data PUBLIC 309
Related Information
To format the appearance of reports, headers, footers, sections, tables, and table cells [page 291]To select a background color for the table or cells [page 304]To define alternate row and column colors for a table [page 304]To format table or cell borders [page 305]To format text in table cells [page 306]To set cell height and width [page 307]To copy formatting using the Format Painter tool [page 308]To set the position of a table or chart on the report page [page 288]To merge table cells [page 311]Formatting the report layout [page 290]Formatting your reports using Cascading Style Sheets [page 293]Creating a corporate palette for charts [page 322]
5.2.3.3.9 To exclude zero values in charts and tables
In charts and tables, you can exclude zero values from the displayed data.
If a chart or table has zero values, you can choose to remove them from the visible output. You can also have hidden items that have zero values.
If you disable one of the zero value options:
● In a chart, there are no items.● In a table, if the values in a column or row for an item equal zero, the column or row doesn't appear.
1. In Design mode, select a table or chart, and click > to open the Format panel.2. Click the Display Settings tab, and in the Columns and Rows section for tables, or Dimensions and Measures
section for charts, select the following options:
Option Description
Show rows for which all measure values = 0
In vertical and cross tables, to suppress rows where all measure values are equal to zero.
Show rows for which the sum of measure values = 0
In vertical and cross tables, to suppress rows where the sum of the measure values is equal to zero.
Show columns for which the sum of measure values = 0
In horizontal and cross tables, to suppress columns where all measure values are equal to zero.
Show columns for which all measure values = 0
In horizontal and cross tables, to suppress columns where the sum of the measure values is equal to zero.
Show measure values when values = 0 In charts, to suppress a chart item if its measure values are equal to zero.
Show measure values for which the sum of values = 0
In charts, to suppress a chart item where the sum of its measure values is equal to zero.
310 PUBLICSAP BusinessObjects Web Intelligence User's Guide
Reporting data
NoteIn charts and tables, empty values are considered the same as zero values, and therefore are also affected by these options.
3. Click Apply.
5.2.3.3.10 To merge table cells
You can merge table cells.
1. In Design mode, to select the cells you want to merge, hold down the Control key and click the cells.
2. Keep the Control key pressed, right-click the selected cells, and select Merge.
CautionWhen you merge cells, the resulting merged cell contains the data only from the first cell you selected only. Data from all the other cells is lost.
Related Information
To format the appearance of reports, headers, footers, sections, tables, and table cells [page 291]To select a background color for the table or cells [page 304]To define alternate row and column colors for a table [page 304]To format table or cell borders [page 305]To format text in table cells [page 306]To set cell height and width [page 307]To copy formatting using the Format Painter tool [page 308]To set the position of a table or chart on the report page [page 288]To layer tables and cells [page 309]Formatting the report layout [page 290]Formatting your reports using Cascading Style Sheets [page 293]Creating a corporate palette for charts [page 322]
5.2.3.4 Formatting charts
You can format a chart area or a selected chart area.
You can find the formatting options in Design mode. Select a chart and click > to open the Format panel and browse through the tabs to access the settings categories: Appearance, Display, Layout, or Style.
SAP BusinessObjects Web Intelligence User's GuideReporting data PUBLIC 311
5.2.3.4.1 To format a chart
You can format a chart in a report using options in the Format panel.
1. In Design mode, select a chart, and click > to open the Format panel.In the Format panel, you can see formatting options that apply to the whole chart. Click the tabs at the top
of the pane to navigate through the display (), appearance (), style (), and layout () settings categories.
2. Optional: Click the drop down next to the chart name at the top of the panel to access the options related to a specific chart component, like the title, legend, plot area, and so on...
3. Use the controls available in each section to change the formatting options.4. Click Apply to save your changes.
5.2.3.4.2 Data intervals in tree maps, heat maps and tag clouds
Data intervals are based on colors in tree maps, heat maps, and tag clouds that use intervals.
You can use one of the following shape coloring methods:
Coloring method Description
Custom Ranges The Custom Ranges method uses ranges that you set based on an increment or percentage, and you select the color that applies to each range.
Gradient The Gradient method uses a 2 or 3 color gradient definition, and you select the color that applies to each gradient.
Gradient With Polarity The Gradient With Polarity method not only uses a 2 or 3 color gradient definition, it also uses a 2 or 3 color neutral polarity definition.
Palette The Palette method applies a different color from the selected palette to each legend interval.
NoteYou shouldn't use these charts with hierarchical nodes for aggregate measures because the color scale can be distorted. To deactivate these nodes, in the Format panel, uncheck Show parent nodes ( Format Chart
Plot Area Appearance Settings ).
Palette coloring methods
In all of the palette coloring methods, the data range is defined in the Range Definition setting. This range defines the set of data that is distributed in the intervals.
312 PUBLICSAP BusinessObjects Web Intelligence User's Guide
Reporting data
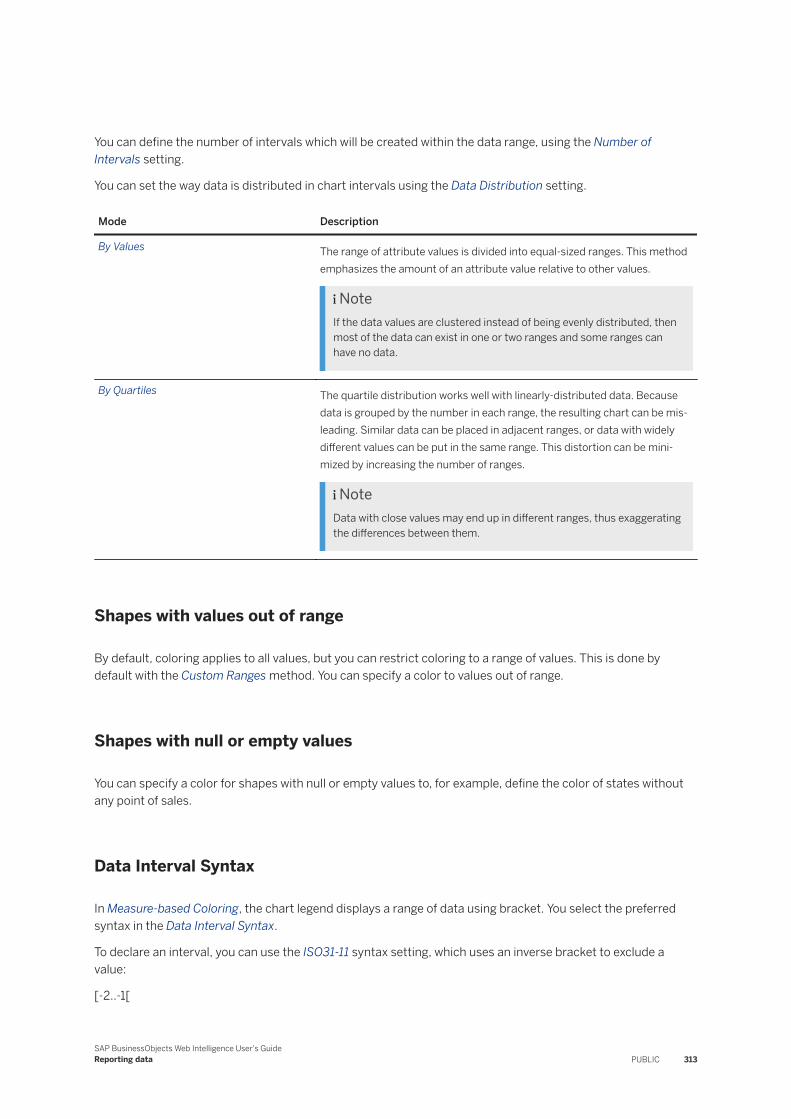
You can define the number of intervals which will be created within the data range, using the Number of Intervals setting.
You can set the way data is distributed in chart intervals using the Data Distribution setting.
Mode Description
By Values The range of attribute values is divided into equal-sized ranges. This method emphasizes the amount of an attribute value relative to other values.
NoteIf the data values are clustered instead of being evenly distributed, then most of the data can exist in one or two ranges and some ranges can have no data.
By Quartiles The quartile distribution works well with linearly-distributed data. Because data is grouped by the number in each range, the resulting chart can be misleading. Similar data can be placed in adjacent ranges, or data with widely different values can be put in the same range. This distortion can be minimized by increasing the number of ranges.
NoteData with close values may end up in different ranges, thus exaggerating the differences between them.
Shapes with values out of range
By default, coloring applies to all values, but you can restrict coloring to a range of values. This is done by default with the Custom Ranges method. You can specify a color to values out of range.
Shapes with null or empty values
You can specify a color for shapes with null or empty values to, for example, define the color of states without any point of sales.
Data Interval Syntax
In Measure-based Coloring, the chart legend displays a range of data using bracket. You select the preferred syntax in the Data Interval Syntax.
To declare an interval, you can use the ISO31-11 syntax setting, which uses an inverse bracket to exclude a value:
[-2..-1[
SAP BusinessObjects Web Intelligence User's GuideReporting data PUBLIC 313
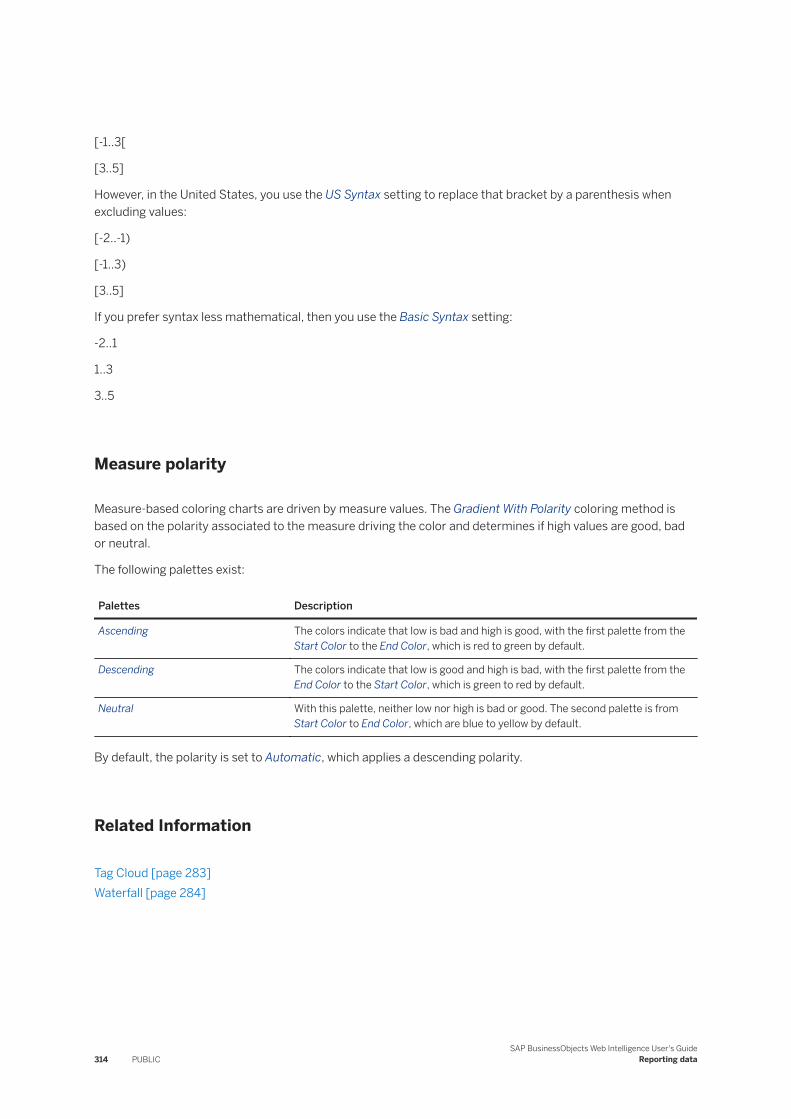
[-1..3[
[3..5]
However, in the United States, you use the US Syntax setting to replace that bracket by a parenthesis when excluding values:
[-2..-1)
[-1..3)
[3..5]
If you prefer syntax less mathematical, then you use the Basic Syntax setting:
-2..1
1..3
3..5
Measure polarity
Measure-based coloring charts are driven by measure values. The Gradient With Polarity coloring method is based on the polarity associated to the measure driving the color and determines if high values are good, bad or neutral.
The following palettes exist:
Palettes Description
Ascending The colors indicate that low is bad and high is good, with the first palette from the Start Color to the End Color, which is red to green by default.
Descending The colors indicate that low is good and high is bad, with the first palette from the End Color to the Start Color, which is green to red by default.
Neutral With this palette, neither low nor high is bad or good. The second palette is from Start Color to End Color, which are blue to yellow by default.
By default, the polarity is set to Automatic, which applies a descending polarity.
Related Information
Tag Cloud [page 283]Waterfall [page 284]
314 PUBLICSAP BusinessObjects Web Intelligence User's Guide
Reporting data
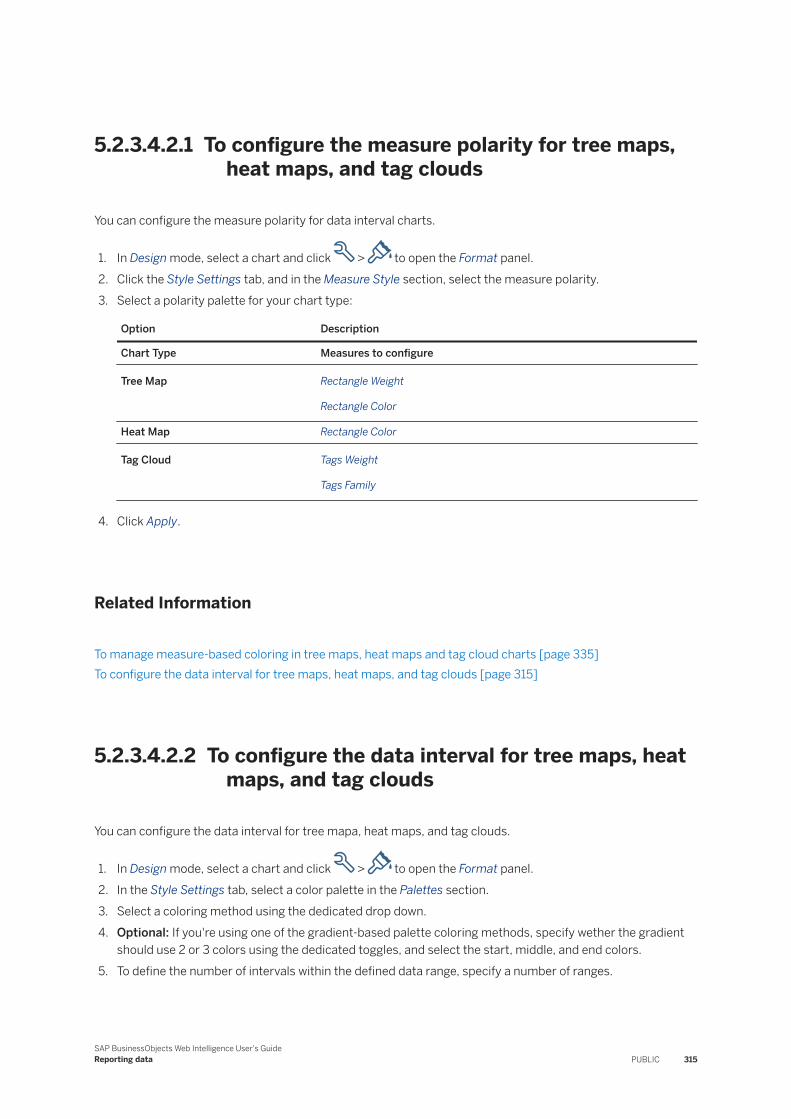
5.2.3.4.2.1 To configure the measure polarity for tree maps, heat maps, and tag clouds
You can configure the measure polarity for data interval charts.
1. In Design mode, select a chart and click > to open the Format panel.2. Click the Style Settings tab, and in the Measure Style section, select the measure polarity.3. Select a polarity palette for your chart type:
Option Description
Chart Type Measures to configure
Tree Map Rectangle Weight
Rectangle Color
Heat Map Rectangle Color
Tag Cloud Tags Weight
Tags Family
4. Click Apply.
Related Information
To manage measure-based coloring in tree maps, heat maps and tag cloud charts [page 335]To configure the data interval for tree maps, heat maps, and tag clouds [page 315]
5.2.3.4.2.2 To configure the data interval for tree maps, heat maps, and tag clouds
You can configure the data interval for tree mapa, heat maps, and tag clouds.
1. In Design mode, select a chart and click > to open the Format panel.2. In the Style Settings tab, select a color palette in the Palettes section.3. Select a coloring method using the dedicated drop down.4. Optional: If you're using one of the gradient-based palette coloring methods, specify wether the gradient
should use 2 or 3 colors using the dedicated toggles, and select the start, middle, and end colors.5. To define the number of intervals within the defined data range, specify a number of ranges.
SAP BusinessObjects Web Intelligence User's GuideReporting data PUBLIC 315
TipThe best number of ranges is typically 4 or 5. This amount can reveal data patterns without being confusing. If you have more than 7 colors, data with similar values can be hard to distinguish, and fewer than four ranges won't reveal much variation and therefore may reveal no clear pattern.
NoteThis setting doesn't apply to the Custom Ranges coloring method.
6. To define a specific range of data to appear in the chart, check the Range Definition checkbox, and adjust the upper and lower bounds using the dedicated controls.
NoteThis setting doesn't apply to the Custom Ranges coloring method.
7. To set the way data is distributed in chart intervals, select a data distribution mode, by values or quantiles, using the dedicated toggles.
NoteThis setting doesn't apply to the Custom Ranges coloring method.
8. Select colors for out of ranges and null values using the dedicated color pickers.9. Select a data interval syntax.10. Optional: If you're using the Gradient With Polarity coloring method, specify whether the gradient for
neutral measures should use 2 or 3 colors, and select the start, middle, and end colors11. Optional: If you're using the Custom Ranges coloring method, configure the ranges:
a. To have the ranges colored by percent instead of increments, check Percent.b. Enter the minimum and maximum zone parameters.c. Select colors using the color pickers for each value and set the opacity.d. Optional: To add or delete ranges, click the down arrow next to a value and click Insert or Delete.
Related Information
To configure the measure polarity for tree maps, heat maps, and tag clouds [page 315]Map [page 282]Tag Cloud [page 283]
5.2.3.4.3 Warning icons in charts
Warning icons in charts can let you know when there are chart and data object errors.
You can enable or disable warning icons in the Format panel in the Display Settings tab, under the Errors and Warnings section, using the Show alert when incompatible data present option.
316 PUBLICSAP BusinessObjects Web Intelligence User's Guide
Reporting data
Warning icons can signal:
● General warnings, icons displayed on the top left corner of the chart.
Red X in a white background: impossible to generate the chart. This could be due to a cache problem - try clearing temporary objects from cache.White X in a red circle: can't find the image, ask your BI administrator to check load balancing settings and enable service monitoring as described in the Business Intelligence Platform Administrator Guide.Yellow warning: for example dataset too large (technical limit of the server), need to refresh the dataset, other cube errors.Blue alert: limit for optimal rendering
The display of the general warning icons is controlled by the Hide warning icons in chart setting in the document properties. If this setting is activated, then no general warning icons are displayed in charts.
● An incompatible chart data warning, small yellow warning icon displayed on the data point.These happen if Show alert when incompatible data present is activated in the chart format options and the dataset is inconsistent with the chart parameters. For example, a warning can appear in a pie chart with negative values, negative values for a logarithmic scale, or inconsistent hierarchical values for a tree map.
Restriction Definition Result
Technical limits of the data received from the Visualization Service, which is responsible for displaying data in the chart
Max number of rows = 50,000
RestrictionThis is a non-configurable parameter. It's hard-coded into the product and can't be changed by properties of the APS server in CMC or by manually changing an XML file.
Only part of the dataset is rendered and a warning icon appears, as well as an informational tooltip.
Data restricted for optimal rendering The data is restricted by the chart type and size for optimal appearance.
An alert icon appears, as well as a tooltip showing optimization guidelines.
Related Information
Viewing document properties [page 165]
5.2.3.4.4 To edit and format a chart title
You can activate and set titles in charts in the Format panel.
By default, titles are generated automatically.
1. In Design mode, select a chart and click > to open the Format panel.
SAP BusinessObjects Web Intelligence User's GuideReporting data PUBLIC 317
2. In the Display Settings tab, in the Display section, check Title, and click the right arrow next to the option.3. Click Custom and add a title.4. Click Apply.
Related Information
To format a chart [page 312]
5.2.3.4.5 To display a chart with a 3D look
You can apply a 3D look to a chart.
1. In Design mode, select a chart and click > to open the Format panel.2. Click the Style Settings tab, in the 3D section, click 3D Look.3. Click Apply.
Related Information
To format a chart [page 312]
5.2.3.4.6 Assigning colors to charts
You can personalize the appearance of charts in Web Intelligence reports by assigning colors to dimension objects manually or by using built-in or customized color palettes. You can retain this color assignment to keep a color assigned to a dimension object.
When you create a chart in a Web Intelligence report, colors from the default color palette are automatically assigned to dimension objects in a top-to-bottom order. This order remains the same across sections and pages. However, the colors you assign using color palettes are not retained when the report is refreshed when opened, or when you change the number of objects displayed in a chart by filtering.
If you want to consistently display a specific object, such as a [Product Line] or [Sales Region], in a specific color, you can either assign a specific color to the object manually, or assign an in-built or custom color palette and set the color assignment as default.
When you set the color assignment as default, colors assigned to dimension objects do not change when you use filters, or when the report is refreshed when opened. You can reset all colors by applying a new palette to the chart or by using a dedicated option.
318 PUBLICSAP BusinessObjects Web Intelligence User's Guide
Reporting data
NoteWhen you turn a chart into another type of chart, the color mapping is maintained only if the following conditions are respected:
● The legend color for the primary dimension (assigned to Region Type color or Pie color) must be the same.
● The legend items must be the same ( no adding or removing a primary dimension for the Region Shape).
NoteYou cannot assign colors to dual value axis charts or to charts using Measured-Based Coloring (like Heat Map, Tree Map and Tag Cloud).
Related Information
To create a custom palette style for charts [page 320]To assign a color to an object in chart [page 321]
5.2.3.4.6.1 To select a palette for a chart
You can select a palette for a chart in the Format panel.
1. In Design mode, select a chart and click > to open the Format panel.2. Click the Style Settings tab, and in the Palettes section, use the dedicated drop down to select a palette.
The chart is displayed with the colors from the palette. If the colors aren't as you prefer, you can either select another palette style from the drop down, or create a custom one by clicking Customize Newat the end of the list.
NoteIn waterfall charts, settings other than Automatic in the Custom Colors section of the Format pane can override any custom Color Palette settings. To use the Color Palette settings in the waterfall chart, change all Custom Colors settings to Automatic.
Related Information
To edit a custom palette chart style [page 320]To create a custom palette style for charts [page 320]To configure the value colors in a waterfall chart [page 321]
SAP BusinessObjects Web Intelligence User's GuideReporting data PUBLIC 319
5.2.3.4.6.2 To create a custom palette style for charts
You can create a custom palette style based on an existing palette style.
1. In Design mode, select a chart and click > to open the Format panel.2. In the Style Settings tab, in the Palettes section, click the drop down and select Customize.3. In the Manage Palettes dialog:
○ If the currently selected palette is the one from which you want to create a custom palette, click New.○ If you want to create a palette based on another built-in palette, select that palette and click New.
4. In the Create Palette dialog, add a palette name.5. Click a cell in the Color Settings area and then select a different color from the Color drop down palette.6. Optional: Set the opacity if necessary.7. When you're done, click OK.
The custom palette now appears in the Custom section of the Manage Palettes dialog, and in the Palettes section in the Format pane.
NoteIn waterfall charts, settings other than Automatic in the Custom Format section of the Format pane can override any custom Color Palette settings. To use the Color Palette settings in the waterfall chart, change all Custom settings to Automatic.
Related Information
To edit a custom palette chart style [page 320]To select a palette for a chart [page 319]To configure the value colors in a waterfall chart [page 321]
5.2.3.4.6.3 To edit a custom palette chart style
You can edit custom chart styles.
1. In Design mode, select a chart and click > to open the Format panel.2. In the Style Settings tab, in the Palettes section, click the drop down and select Customize.3. Select the custom palette style that you want to edit and click Edit.
NoteBuilt-in chart styles can't be changed, however you can create a palette chart style from a built-in chart style.
320 PUBLICSAP BusinessObjects Web Intelligence User's Guide
Reporting data
4. Edit the palette settings as necessary.5. When you have completed your changes, click OK.
NoteIn waterfall charts, settings other than Automatic in the Custom Format section of the Format pane can override any custom Color Palette settings. To use the Color Palette settings in the waterfall chart, change all Custom settings to Automatic.
Related Information
To create a custom palette style for charts [page 320]To select a palette for a chart [page 319]To configure the value colors in a waterfall chart [page 321]
5.2.3.4.6.4 To assign a color to an object in chart
You can assign custom colors to dimension objects in charts.
1. In Design mode, select a dimension object or a legend item on a chart.2. Open the Format pane.3. Click the Custom Format toggle.4. Select a color in the Series Color drop down, or click More Colors to create a custom one.5. Click Apply.
The color is assigned to the dimension object.
5.2.3.4.6.5 To configure the value colors in a waterfall chart
You can configure the start, total, negative and positive values in a waterfall chart.
1. In Design mode, select a waterfall chart and click > to open the Format panel.2. In the Style Settings tab, in the Custom Colors section, configure the Fixed Value for any of the following:
○ The Start Value color affects the starting value bar.○ The Total color affects the final value bar.○ The Decrease color affects any bars that reflect negative values.○ The Increase color affects any bars that reflect positive values.
NoteSettings other than Automatic in the Custom Colors section can override the Color Palette settings. To return to the Color Palette settings, change all of the Custom Colors settings to Automatic.
SAP BusinessObjects Web Intelligence User's GuideReporting data PUBLIC 321
3. When you have completed your changes, click OK.
Related Information
To edit a custom palette chart style [page 320]
5.2.3.4.6.6 Creating a corporate palette for charts
You can define a corporate palette for charts so that your reports have the corporate style. The palette colors are defined in the configuration file called VisualizationConfig.xml. You can only define one corporate palette, and the palette ID must not be changed.
The default palette contains 32 defined colors. You can define more colors, but you must define at least two colors. You define a color by defining the strengths of red (R), green (G), blue (B), and the transparency (A).
Example
<COLOR R="200" G="0" B="0" A="255" />
Related Information
Formatting the report layout [page 290]Formatting your reports using Cascading Style Sheets [page 293]Formatting tables and table cells [page 303]
5.2.3.4.6.6.1 Corporate palette configuration file syntax
You can define a default corporate chart palette.
The corporate chart palette configuration file VisualizationConfig.xml is by default located in the following location:
C:\Program Files (x86)\SAP BusinessObjects\SAP BusinessObjects Enterprise XI 4.0\images
This file contains the following elements:
<?xml version="1.0" encoding="UTF-8"?> <CONFIG>
322 PUBLICSAP BusinessObjects Web Intelligence User's Guide
Reporting data
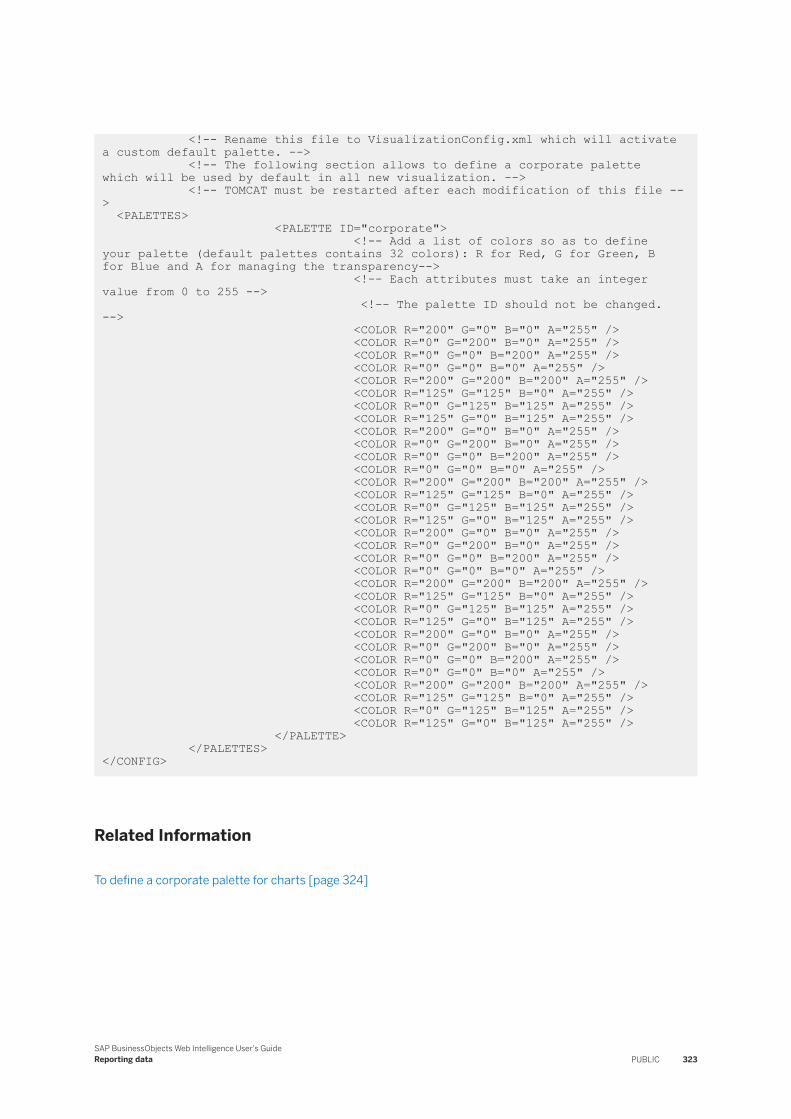
<!-- Rename this file to VisualizationConfig.xml which will activate a custom default palette. --> <!-- The following section allows to define a corporate palette which will be used by default in all new visualization. --> <!-- TOMCAT must be restarted after each modification of this file --> <PALETTES> <PALETTE ID="corporate"> <!-- Add a list of colors so as to define your palette (default palettes contains 32 colors): R for Red, G for Green, B for Blue and A for managing the transparency--> <!-- Each attributes must take an integer value from 0 to 255 --> <!-- The palette ID should not be changed. --> <COLOR R="200" G="0" B="0" A="255" /> <COLOR R="0" G="200" B="0" A="255" /> <COLOR R="0" G="0" B="200" A="255" /> <COLOR R="0" G="0" B="0" A="255" /> <COLOR R="200" G="200" B="200" A="255" /> <COLOR R="125" G="125" B="0" A="255" /> <COLOR R="0" G="125" B="125" A="255" /> <COLOR R="125" G="0" B="125" A="255" /> <COLOR R="200" G="0" B="0" A="255" /> <COLOR R="0" G="200" B="0" A="255" /> <COLOR R="0" G="0" B="200" A="255" /> <COLOR R="0" G="0" B="0" A="255" /> <COLOR R="200" G="200" B="200" A="255" /> <COLOR R="125" G="125" B="0" A="255" /> <COLOR R="0" G="125" B="125" A="255" /> <COLOR R="125" G="0" B="125" A="255" /> <COLOR R="200" G="0" B="0" A="255" /> <COLOR R="0" G="200" B="0" A="255" /> <COLOR R="0" G="0" B="200" A="255" /> <COLOR R="0" G="0" B="0" A="255" /> <COLOR R="200" G="200" B="200" A="255" /> <COLOR R="125" G="125" B="0" A="255" /> <COLOR R="0" G="125" B="125" A="255" /> <COLOR R="125" G="0" B="125" A="255" /> <COLOR R="200" G="0" B="0" A="255" /> <COLOR R="0" G="200" B="0" A="255" /> <COLOR R="0" G="0" B="200" A="255" /> <COLOR R="0" G="0" B="0" A="255" /> <COLOR R="200" G="200" B="200" A="255" /> <COLOR R="125" G="125" B="0" A="255" /> <COLOR R="0" G="125" B="125" A="255" /> <COLOR R="125" G="0" B="125" A="255" /> </PALETTE> </PALETTES></CONFIG>
Related Information
To define a corporate palette for charts [page 324]
SAP BusinessObjects Web Intelligence User's GuideReporting data PUBLIC 323
5.2.3.4.6.6.2 To define a corporate palette for charts
The BI administrator can use the following steps to define a corporate palette using the VisualizationConfig.xml configuration file. This corporate palette will then be used as default for all new charts.
1. In the following directory open the template file: VisualizationConfig.template.xml:C:\Program Files (x86)\SAP BusinessObjects\SAP BusinessObjects Enterprise XI 4.0\images
2. Define at least two colors or edit the ones present in the template file.3. Rename the file: VisualizationConfig.xml and save it in the same directory.
4. Restart Tomcat.
This corporate palette will be used as default for all new charts. Make sure there are no errors in the configuration file, otherwise the standard palette will be applied.
TipRestart Tomcat each time you modify this file.
5.2.3.4.7 To modify chart borders
You can modify the borders of a chart.
1. In Design mode, select a chart and click > to open the Format panel.2. In the Appearance Settings tab, use the controls to format the borders.3. Click Apply.
Related Information
To format a chart [page 312]
5.2.3.4.8 To format a chart background
You can format the background colors, grid colors, opacity, line type and transparency of charts.
NoteTree maps, tag clouds, and heat map don't have background configuration options.
The options available vary depending on the type of chart.
324 PUBLICSAP BusinessObjects Web Intelligence User's Guide
Reporting data
1. In Design mode, select a chart and click > to open the Format panel.2. In the Style Settings tab, click the drop down next to the chart's name and select Plot Area.3. In a 3D chart, you can show or hide the grid floor and edges.4. In the Background and Borders section select a Grid and Background style:
○ Plain○ Background Color (refers to the background of the plot area)○ Category Axis Grid Color (refers to the lines that are parallel to the category axis)○ Value Axis Grid Color (refers to the lines that are parallel to the value axis)○ Depth Grid Color (in a 3D chart, it refers to the lines parallel to the Value Axis Grid Color.
○ Striped (shows alternate colors, instead of a grid. The striped background option may not be available depending on the chart type, as in the case of Pie and 3D charts.
○ If you want the plot area lines to be dashed, select Dashed Lines.
NoteGrid options slightly differ depending on the chart type.
5. Click Apply.
Related Information
To format a chart [page 312]
5.2.3.4.9 To modify plot area settings in waterfall charts
You can activate or deactivate a reference line and set the spacing between objects in the waterfall chart plot area.
1. In Design mode, select a waterfall chart and click > to open the Format panel.2. Click the Style Settings tab, and click the drop down next to the chart's name and select Plot Area.3. In the Style section, check Reference Line.
4. To set the spacing between plot area items, click enter or select a number in the Relative Spacing Between Items field.
5. Click Apply.
Related Information
To format a chart background [page 324]
SAP BusinessObjects Web Intelligence User's GuideReporting data PUBLIC 325
5.2.3.4.10 To show and format chart legend
You can format the chart legend.
1. In Design mode, open the Format panel.2. Select the legend of a chart.3. In the Format pane, check Legend Title.4. You can adjust the symbol size, position and layout, group by dimension, adjust the text settings and
border and background settings. Use the different tabs at the top of the panel to access the different settings categories.
5. You can set the legend title by clicking the right arrow next to the Legend Title checkbox to access additional settings and generate or custom title or create a custom one.
6. Click Apply.
Related Information
To format a chart [page 312]Formulas in chart elements [page 289]
5.2.3.4.11 To reverse the legend order of a chart
You can reverse the legend order of a chart.
The legend is reversed by default for bar and stacked charts. It is available for all XY charts as well as Pie charts and derived charts (if the Clockwise setting is disabled).
1. In Design mode, open the Format panel.2. Select the legend of a chart.3. In the Format pane, check Legend Title.4. Click the right arrow next to the checkbox.
5. Click to access the style settings.6. Check Reverse legend order.7. Click Apply.
5.2.3.4.12 To avoid page breaks in charts
You can restrict page breaks in charts.
1. In Design mode, select a chart and click > to open the Format panel.
326 PUBLICSAP BusinessObjects Web Intelligence User's Guide
Reporting data
2. Click the Layout Settings tab, and in the Layout section, check Avoid page break. You can set the option for both horizontal and vertical breaks.
3. Click Apply.
Related Information
To format a chart [page 312]
5.2.3.4.13 To configure a stacked bar or column chart
In a stacked chart, the measure data is stacked in bars or columns. Stacking is done axis by axis and you can choose which data to stack. In a 100% stacked chart, the data is displayed as percentage parts of a whole, or 100%, of a bar or column.
NoteOnly charts with value axes can be stacked.
1. In Design mode, select a stacked bar or column chart and click > to open the Format panel.2. Click the Display Settings tab, and in the Value Axis section, click the right arrow next to the Value Axis
checkbox.
3. Click at the top of the pane to access the style settings.4. In the Style section, click the Stacking drop down and select a stacking option.
Option Description
Unstacked Unstacks all dimensions and measures in the chart.
Stacked Chart Slices one dimension by another. For example, in a chart containing revenue per state and year. Measures aren't stacked.
Globally Stacked Stacks dimensions and measures in one stack per bar or column.
5. Optional: Check 100% Stacked if you want to measure multiple series as a proportion vs. time, or if you have three or more data series and want to compare distributions within categories, and at the same time display the differences between categories. Each bar represents 100% of the amounts for that category.
6. If you are configuring a 100% stacked chart, and want bars or columns with zero values to be flat against the value axis:a. Click the drop down next to the chart name and select Plot Area.
b. Click to access the style settings.c. Check Flatten zero values.
SAP BusinessObjects Web Intelligence User's GuideReporting data PUBLIC 327
7. Click Apply.
Related Information
To format the category or value axis title [page 328]To format a chart background [page 324]To format axis grid values, numbers and text [page 331]To show a specific range of axis values [page 329]To display the Value Axis logarithmically [page 330]Linear and logarithmic axis scales [page 329]To show and format chart legend [page 326]
5.2.3.4.14 To manage overlap in bar charts
You can set the overlap between bars in a bar chart.
1. In Design mode, select a bar chart and click > to open the Format panel.2. In the Layout Settings tab, click the drop down next to the chart name, and select Plot Area.3. Use the Spacing Between Groups and Spacing Within Groups controls to adjust the spacing values.
○ Spacing Between Groups corresponds to a percentage of the total axis space dedicated to separate bars of category axis values, and defines the space allocated to each bar group.
○ Spacing Within Groups corresponds to the space allocated to each bar within a group. A negative value defines a percentage of the total group space dedicated to bar overlap. We recommend setting the Bar Width to Unlimited when using negative values.
4. Click Apply.
5.2.3.4.15 To format the category or value axis title
You can format the title of a category or value axis in a chart.
1. In Design mode, select a chart and click > to open the Format panel.2. In the Display Settings tab, in the Category Axis or Value Axis sections, check Title and click the right arrow
next to the checkbox.3. Use the tabs to move through the settings categories, and edit the title settings:
○ Title lable and visibility○ Layout spacing○ Text formatting○ Borders and the background
328 PUBLICSAP BusinessObjects Web Intelligence User's Guide
Reporting data
4. Click Apply.
Related Information
To format a chart [page 312]
5.2.3.4.16 To show a specific range of axis values
You can specify a range of values in a chart axis.
1. In Design mode, select a chart and click > to open the Format panel.2. Click the Display Settings tab, and in the Value Axis section, check Value Axis, and click the right arrow next
to the checkbox.
3. Click to access the style settings.4. Under Scaling, set the Minimum Value and Maximum Value to Fixed Value, and enter a value.
NoteOverscaling is a specific display that indicates that a bar is incomplete. Its value is out of the axis Max/Min values.
5. Click Apply.
Related Information
To format a chart [page 312]
5.2.3.4.17 Linear and logarithmic axis scales
Linear scales are based on addition. Logarithmic scales allow you to examine values that span many orders of magnitude without losing information on the smaller scales.
By default, the application displays the Value axis on charts as a linear scale. In a linear scale, the axis markers are evenly spaced.Consider, for example, the linear sequence: 1, 3, 5, 7, 9. To get the next number in the sequence, you add 2 to the previous number.
You can set the axis to a logarithmic scale. Logarithmic scales are based on multiplication rather than addition. In a logarithmic scale, the steps increase or decrease in size. Logarithmic scales are based on multiplication (or division). Consider, for example, the logarithmic sequence: 2, 4, 8, 16, 32
SAP BusinessObjects Web Intelligence User's GuideReporting data PUBLIC 329
To get the next number in the sequence, you multiply the previous number by 2. We can say that this sequence represents ``base 2.''
Consider the following sequence: 1, 10, 100, 1000, 10000.
This sequence represents ``base 10,'' because you get the next term in the sequence by multiplying the previous term by 10.
5.2.3.4.17.1 To display the Value Axis logarithmically
You can change the Value Axis to appear logarithmically in a chart.
1. In Design mode, select a chart and click > to open the Format panel.2. In the Display Settings tab, under the Value Axis section, check Value Axis, and click the right arrow next to
the checkbox.
3. Click to access the style settings.4. In the Scaling section, set the Axis Scaling option to Logarithmic.
A logarithmic scale uniformly presents percent changes rather than point changes. In other words, the distance from 1 to 2 (100% increase) is the same as the distance from 2 to 4 (another 100% increase).
5. Click Apply.
NoteYou can't represent negative values on a logarithmic scale. If you have enabled the Show alert when incompatible data present option, a yellow warning icon will appear on the data point if there is negative data.
Related Information
To format a chart [page 312]Linear and logarithmic axis scales [page 329]
5.2.3.4.18 To assign axis labels to data values
You can assign labels to an axis in charts.
1. In Design mode, select a chart and click > to open the Format panel.2. In the Display Settings tab, click to drop down next to the chart's name and select Plot Area.
3. Click to access the display settings.
330 PUBLICSAP BusinessObjects Web Intelligence User's Guide
Reporting data
4. Check Data Label and click the right arrow next to the checkbox.5. In the Style section, click the Data Type drop down and select a data type.6. Optional: You can also change other data value settings on this page, like the font, border, line and
background settings.7. Click Apply.
Related Information
To format a chart [page 312]
5.2.3.4.19 To format axis grid values, numbers and text
You can format the value and category axis settings.
1. In Design mode, select a chart and click > to open the Format panel.2. Click the Display Settings tab, and in the Display section, check Category Axis or Value Axis to make the
axis visible, and click the right arrow next to one of the checkboxes.3. Click the tabs at top of the panel to access the different settings categories.
○ Under Display, you can display the axis, show labels, ticks and titles using the checkboxes.○ Under Style, you can adjust the legend layout, adjust the ticks, automatically reduce the font size of
labels displayed in grid, reverse order on the category axis, set the axis borders and colors, set the axis label delete mode and show continuous axis layout.
NoteBy default the Value axis is the Y axis and the Category axis is the X axis. If you reverse the order of the chart, the X,Y relationship is broken. The horizontal line remains the X axis and the vertical axis remains the Y axis.
SAP BusinessObjects Web Intelligence User's GuideReporting data PUBLIC 331
To set the legend layout, click the drop down next to the chart name, select Legend and click to access the layout settings. Check Layout Information and configure the following options for the layout width and height:
Option Description
Automatic Select Automatic so that the legend width or height is automatically adjusted to the size of the legend contents.
NoteThe width adjusts as much as possible, however if the legend items are long, they can disappear from the legend cell.
Fixed Select Fixed to manually set the height or width of the legend cell.
Proportional Select Proportional to have the legend cell height or width appears relative to the size of the chart. You express this size as a 0.x value, where 0.2 means that the legend cell height will appear as 20% of the actual chart.
○ Under Text, you can adjust the font settings, change the orientation and text alignment, and the text policy (Wrap, No Wrap or Truncate).
○ Under Layout, you can set layout width and height.
4. Click Apply.
Related Information
To format a chart [page 312]
5.2.3.4.20 To unlock a value axis in a dual axis chart
In a chart that uses dual axes, the chart normally has axes that are locked and synchronized to the same origin.
In some data series where one axis has positive values and another data series has both negative and positive values, the chart results can appear flat. In this case, you can unlock the axes so that each has its own grid and origin, and the minimum and maximum values share one axis, each according to its data context.
1. In Design mode, select a chart and click > to open the Format panel.2. Click the Display Settings tab, and in the Display section, check Value Axis 2 and click the right arrow next
to the checkbox.
332 PUBLICSAP BusinessObjects Web Intelligence User's Guide
Reporting data
3. Click to access the style settings.4. Under Scaling, check Unlock the Axis.
When the axes are unlocked, the second value axis is freed from the grid.
Related Information
Linear and logarithmic axis scales [page 329]To format axis grid values, numbers and text [page 331]To assign axis labels to data values [page 330]To show a specific range of axis values [page 329]
5.2.3.4.21 To hide an empty chart
Sometimes charts display no values. For example, if sales of a specific product are discontinued, a chart that normally displays results for that product will appear empty. By default, the application displays such empty charts on reports. If wished, you set the application to hide charts whenever they are empty.
1. In Design mode, select a chart and click > to open the Format panel.2. Click the Display Settings tab, and in the Display section, select one of the following:
○ Select Hide always to hide the chart.○ Select Hide when empty to hide the chart when it's empty.○ Select Hide when formula is true and type a formula in the box to hide the chart when the formula is
true.3. Click Apply.
Related Information
To format a chart [page 312]
5.2.3.4.22 To exclude zero values in charts and tables
In charts and tables, you can exclude zero values from the displayed data.
If a chart or table has zero values, you can choose to remove them from the visible output. You can also have hidden items that have zero values.
If you disable one of the zero value options:
SAP BusinessObjects Web Intelligence User's GuideReporting data PUBLIC 333
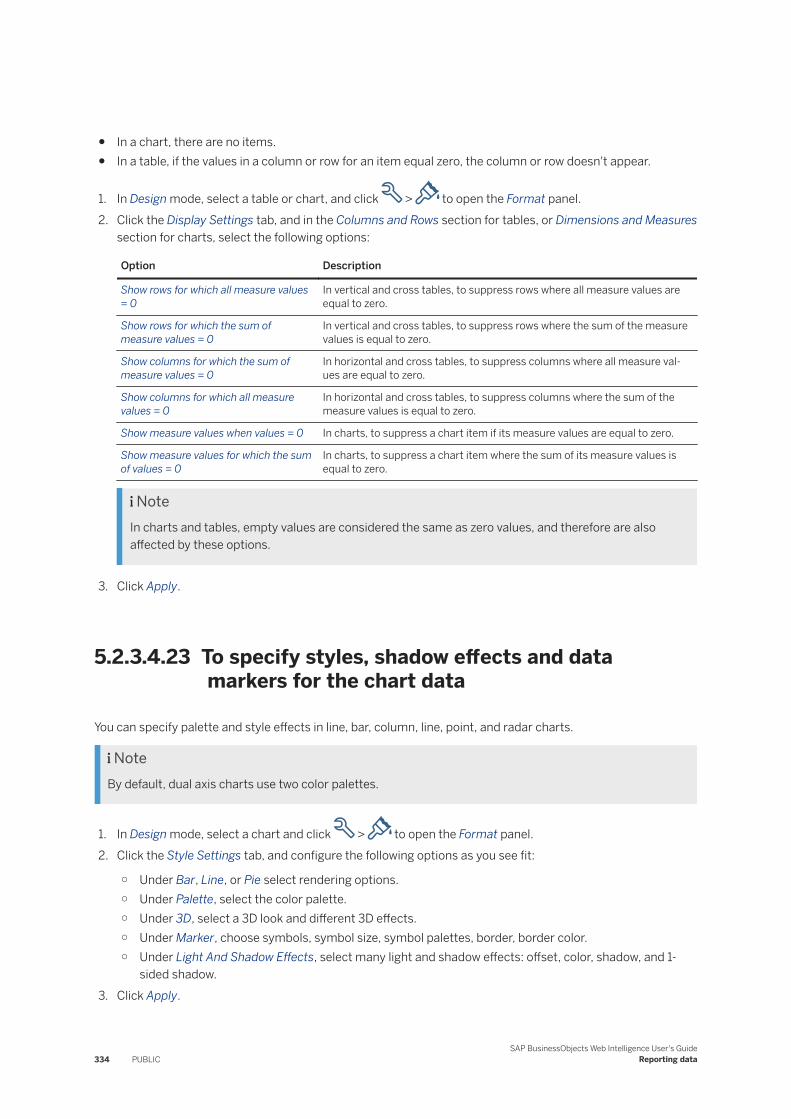
● In a chart, there are no items.● In a table, if the values in a column or row for an item equal zero, the column or row doesn't appear.
1. In Design mode, select a table or chart, and click > to open the Format panel.2. Click the Display Settings tab, and in the Columns and Rows section for tables, or Dimensions and Measures
section for charts, select the following options:
Option Description
Show rows for which all measure values = 0
In vertical and cross tables, to suppress rows where all measure values are equal to zero.
Show rows for which the sum of measure values = 0
In vertical and cross tables, to suppress rows where the sum of the measure values is equal to zero.
Show columns for which the sum of measure values = 0
In horizontal and cross tables, to suppress columns where all measure values are equal to zero.
Show columns for which all measure values = 0
In horizontal and cross tables, to suppress columns where the sum of the measure values is equal to zero.
Show measure values when values = 0 In charts, to suppress a chart item if its measure values are equal to zero.
Show measure values for which the sum of values = 0
In charts, to suppress a chart item where the sum of its measure values is equal to zero.
NoteIn charts and tables, empty values are considered the same as zero values, and therefore are also affected by these options.
3. Click Apply.
5.2.3.4.23 To specify styles, shadow effects and data markers for the chart data
You can specify palette and style effects in line, bar, column, line, point, and radar charts.
NoteBy default, dual axis charts use two color palettes.
1. In Design mode, select a chart and click > to open the Format panel.2. Click the Style Settings tab, and configure the following options as you see fit:
○ Under Bar, Line, or Pie select rendering options.○ Under Palette, select the color palette.○ Under 3D, select a 3D look and different 3D effects.○ Under Marker, choose symbols, symbol size, symbol palettes, border, border color.○ Under Light And Shadow Effects, select many light and shadow effects: offset, color, shadow, and 1-
sided shadow.3. Click Apply.
334 PUBLICSAP BusinessObjects Web Intelligence User's Guide
Reporting data
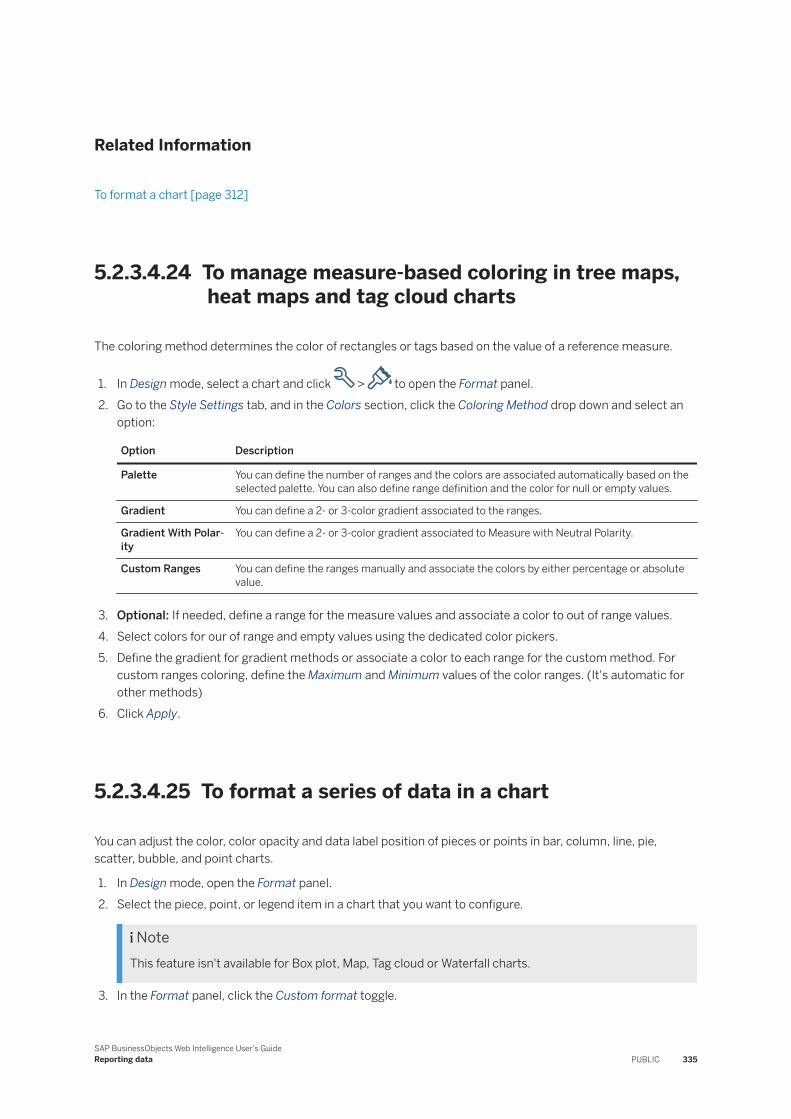
Related Information
To format a chart [page 312]
5.2.3.4.24 To manage measure-based coloring in tree maps, heat maps and tag cloud charts
The coloring method determines the color of rectangles or tags based on the value of a reference measure.
1. In Design mode, select a chart and click > to open the Format panel.2. Go to the Style Settings tab, and in the Colors section, click the Coloring Method drop down and select an
option:
Option Description
Palette You can define the number of ranges and the colors are associated automatically based on the selected palette. You can also define range definition and the color for null or empty values.
Gradient You can define a 2- or 3-color gradient associated to the ranges.
Gradient With Polarity
You can define a 2- or 3-color gradient associated to Measure with Neutral Polarity.
Custom Ranges You can define the ranges manually and associate the colors by either percentage or absolute value.
3. Optional: If needed, define a range for the measure values and associate a color to out of range values.4. Select colors for our of range and empty values using the dedicated color pickers.5. Define the gradient for gradient methods or associate a color to each range for the custom method. For
custom ranges coloring, define the Maximum and Minimum values of the color ranges. (It's automatic for other methods)
6. Click Apply.
5.2.3.4.25 To format a series of data in a chart
You can adjust the color, color opacity and data label position of pieces or points in bar, column, line, pie, scatter, bubble, and point charts.
1. In Design mode, open the Format panel.2. Select the piece, point, or legend item in a chart that you want to configure.
NoteThis feature isn't available for Box plot, Map, Tag cloud or Waterfall charts.
3. In the Format panel, click the Custom format toggle.
SAP BusinessObjects Web Intelligence User's GuideReporting data PUBLIC 335
NoteYou can reset the toggle at any time by setting it to No.
4. Select a series color and a border color using the drop downs.5. If you are formatting a Line chart and want to have a thicker line, select a Line Width number.6. To have a data label appear, in the case where a data label was hidden, or to customize the data label
position, select Show data values.
NoteUnselect this option if you want the data label hidden in the chart.
7. Select one of the following data position options:For all charts:
○ Select Outside if you want the label outside of the selected chart piece.○ Select Inside if you want the label inside the selected chart piece.
NoteData label positioning isn't available for polar, stacked bar or column charts.
For all charts except the Pie chart the following options are also available:
○ Select Inside First, Outside Otherwise if you prefer the label inside the selected chart item, but can allow it to be outside the chart piece if there isn't enough room for the label in the item.
○ Select Outside First, Inside Otherwise if you prefer the label outside the selected chart piece, but can allow it to be inside the chart piece if there isn't enough room for the label in the item.
8. Depending on your chart type, you can set the data label alignment when the data position is set to Outside:
○ If you are working with a Donut or Pie chart, select one of the following data label alignments:○ Select Side Layout for the data label to appear at the side of the chart block.○ Select Circular Layout for the data label to appear right next to the chart piece.
○ If you are working with a Line or Point chart, select one of the following data label alignments: Top, Below, Left, Right.
9. Click Apply.
5.2.3.4.26 To resize a chart
You can resize the chart.
1. In Design mode, select a chart and click > to open the Format panel.2. Click the Appearance Settings tab, and in the Size section, use the Height and Width controls to edit the
size of the chart.3. Click Apply.
336 PUBLICSAP BusinessObjects Web Intelligence User's Guide
Reporting data
Related Information
To format a chart [page 312]
5.2.3.4.27 To change a chart type
You can change the chart type using Turn Into.
1. In Design mode, select a chart and click > to open the Data panel.2. In the Feeding tab, under the Turn Into section, click the drop down next to one of the chart categories and
select a chart.Edit the chart values if necessary.
3. Click Apply.The selected template is applied to the block and displays the data in the chart type you chose.
Related Information
To format a chart [page 312]Line [page 281]Bar [page 277]Box Plot [page 277]Column [page 277]Geomap [page 279]Map [page 282]Pie [page 282]Point [page 283]Radar [page 283]Tag Cloud [page 283]Waterfall [page 284]
5.2.3.5 Formatting numbers and dates
You can change how values appear in specific cells or on chart axes using predefined formats available in the application, or by creating your own custom formats.
You can save your custom formats for reuse in more than one block and report in the same document.
SAP BusinessObjects Web Intelligence User's GuideReporting data PUBLIC 337
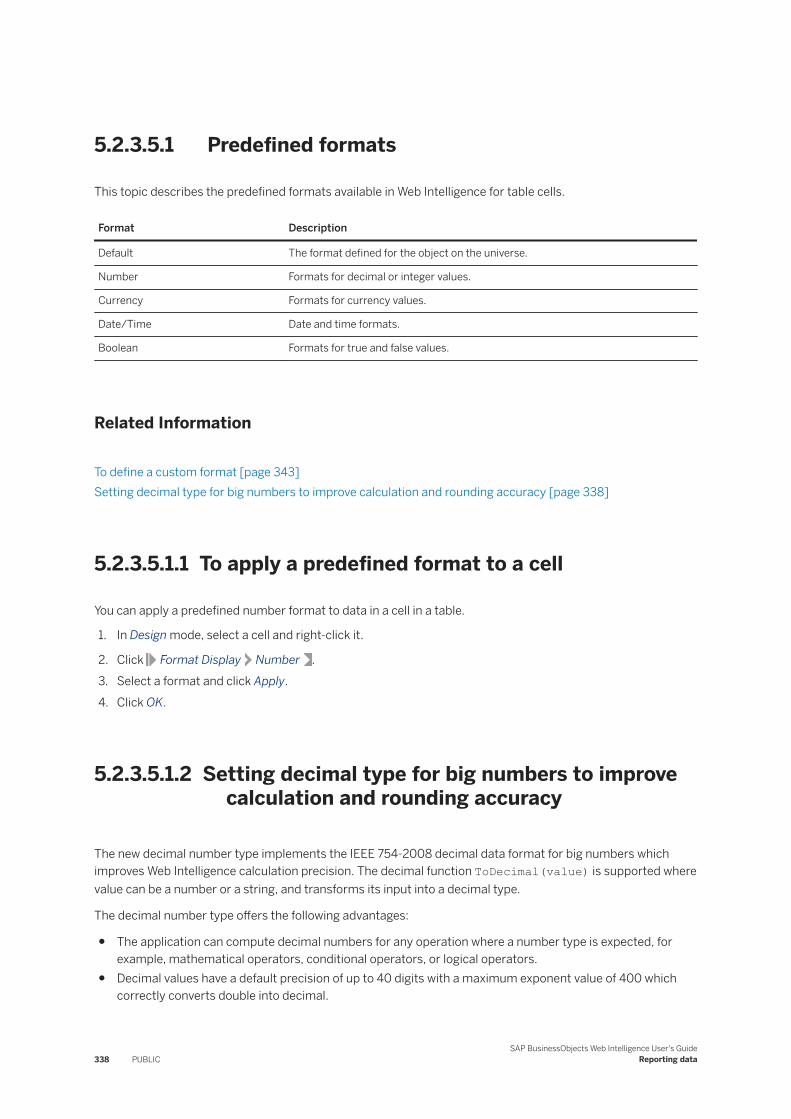
5.2.3.5.1 Predefined formats
This topic describes the predefined formats available in Web Intelligence for table cells.
Format Description
Default The format defined for the object on the universe.
Number Formats for decimal or integer values.
Currency Formats for currency values.
Date/Time Date and time formats.
Boolean Formats for true and false values.
Related Information
To define a custom format [page 343]Setting decimal type for big numbers to improve calculation and rounding accuracy [page 338]
5.2.3.5.1.1 To apply a predefined format to a cell
You can apply a predefined number format to data in a cell in a table.
1. In Design mode, select a cell and right-click it.
2. Click Format Display Number .3. Select a format and click Apply.4. Click OK.
5.2.3.5.1.2 Setting decimal type for big numbers to improve calculation and rounding accuracy
The new decimal number type implements the IEEE 754-2008 decimal data format for big numbers which improves Web Intelligence calculation precision. The decimal function ToDecimal(value) is supported where value can be a number or a string, and transforms its input into a decimal type.
The decimal number type offers the following advantages:
● The application can compute decimal numbers for any operation where a number type is expected, for example, mathematical operators, conditional operators, or logical operators.
● Decimal values have a default precision of up to 40 digits with a maximum exponent value of 400 which correctly converts double into decimal.
338 PUBLICSAP BusinessObjects Web Intelligence User's Guide
Reporting data
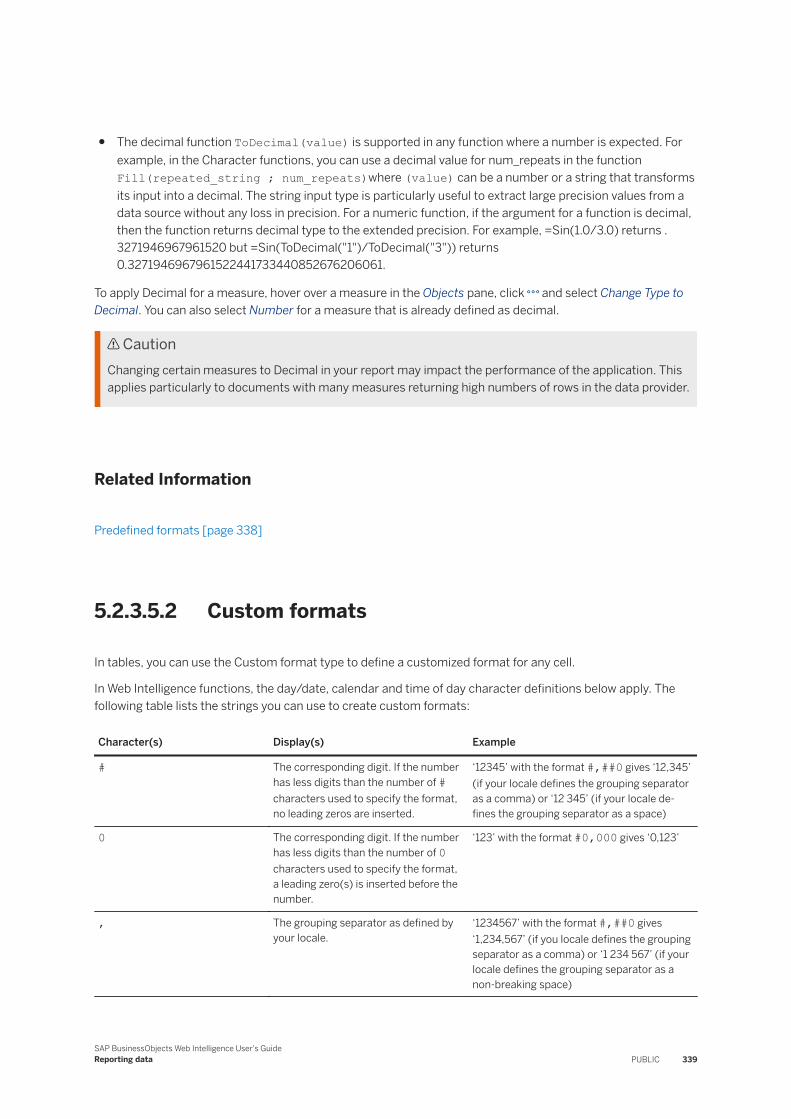
● The decimal function ToDecimal(value) is supported in any function where a number is expected. For example, in the Character functions, you can use a decimal value for num_repeats in the function Fill(repeated_string ; num_repeats)where (value) can be a number or a string that transforms its input into a decimal. The string input type is particularly useful to extract large precision values from a data source without any loss in precision. For a numeric function, if the argument for a function is decimal, then the function returns decimal type to the extended precision. For example, =Sin(1.0/3.0) returns .3271946967961520 but =Sin(ToDecimal("1")/ToDecimal("3")) returns 0.3271946967961522441733440852676206061.
To apply Decimal for a measure, hover over a measure in the Objects pane, click and select Change Type to Decimal. You can also select Number for a measure that is already defined as decimal.
CautionChanging certain measures to Decimal in your report may impact the performance of the application. This applies particularly to documents with many measures returning high numbers of rows in the data provider.
Related Information
Predefined formats [page 338]
5.2.3.5.2 Custom formats
In tables, you can use the Custom format type to define a customized format for any cell.
In Web Intelligence functions, the day/date, calendar and time of day character definitions below apply. The following table lists the strings you can use to create custom formats:
Character(s) Display(s) Example
# The corresponding digit. If the number has less digits than the number of # characters used to specify the format, no leading zeros are inserted.
‘12345’ with the format #,##0 gives ‘12,345’ (if your locale defines the grouping separator as a comma) or ‘12 345’ (if your locale defines the grouping separator as a space)
0 The corresponding digit. If the number has less digits than the number of 0 characters used to specify the format, a leading zero(s) is inserted before the number.
‘123’ with the format #0,000 gives ‘0,123’
, The grouping separator as defined by your locale.
‘1234567’ with the format #,##0 gives ‘1,234,567’ (if you locale defines the grouping separator as a comma) or ‘1 234 567’ (if your locale defines the grouping separator as a non-breaking space)
SAP BusinessObjects Web Intelligence User's GuideReporting data PUBLIC 339
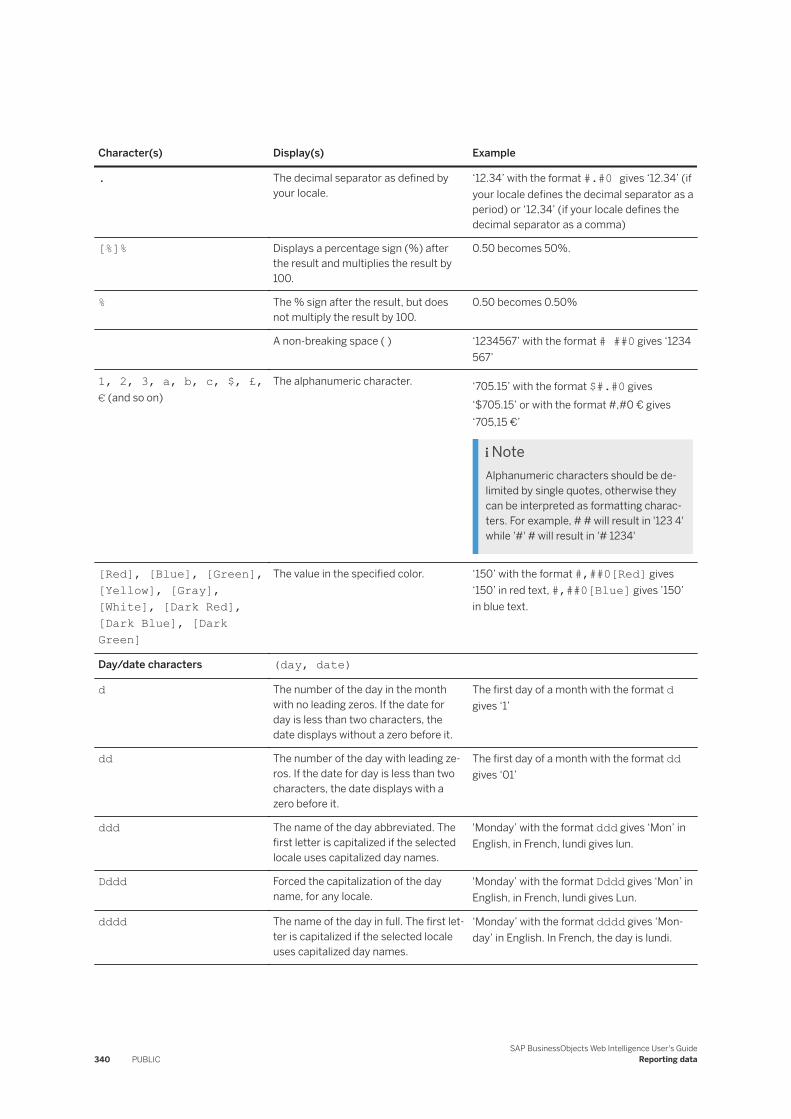
Character(s) Display(s) Example
. The decimal separator as defined by your locale.
‘12.34’ with the format #.#0 gives ‘12.34’ (if your locale defines the decimal separator as a period) or ‘12,34’ (if your locale defines the decimal separator as a comma)
[%]% Displays a percentage sign (%) after the result and multiplies the result by 100.
0.50 becomes 50%.
% The % sign after the result, but does not multiply the result by 100.
0.50 becomes 0.50%
A non-breaking space ( ) ‘1234567’ with the format # ##0 gives ‘1234 567’
1, 2, 3, a, b, c, $, £, € (and so on)
The alphanumeric character. ‘705.15’ with the format $#.#0 gives ‘$705.15’ or with the format #,#0 € gives ‘705,15 €’
NoteAlphanumeric characters should be delimited by single quotes, otherwise they can be interpreted as formatting characters. For example, # # will result in '123 4' while '#' # will result in '# 1234'
[Red], [Blue], [Green], [Yellow], [Gray], [White], [Dark Red], [Dark Blue], [Dark Green]
The value in the specified color. ‘150’ with the format #,##0[Red] gives ‘150’ in red text, #,##0[Blue] gives ’150’ in blue text.
Day/date characters (day, date)
d The number of the day in the month with no leading zeros. If the date for day is less than two characters, the date displays without a zero before it.
The first day of a month with the format d gives ‘1’
dd The number of the day with leading zeros. If the date for day is less than two characters, the date displays with a zero before it.
The first day of a month with the format dd gives ‘01’
ddd The name of the day abbreviated. The first letter is capitalized if the selected locale uses capitalized day names.
'Monday’ with the format ddd gives ‘Mon’ in English, in French, lundi gives lun.
Dddd Forced the capitalization of the day name, for any locale.
'Monday’ with the format Dddd gives ‘Mon’ in English, in French, lundi gives Lun.
dddd The name of the day in full. The first letter is capitalized if the selected locale uses capitalized day names.
‘Monday’ with the format dddd gives ‘Monday’ in English. In French, the day is lundi.
340 PUBLICSAP BusinessObjects Web Intelligence User's Guide
Reporting data
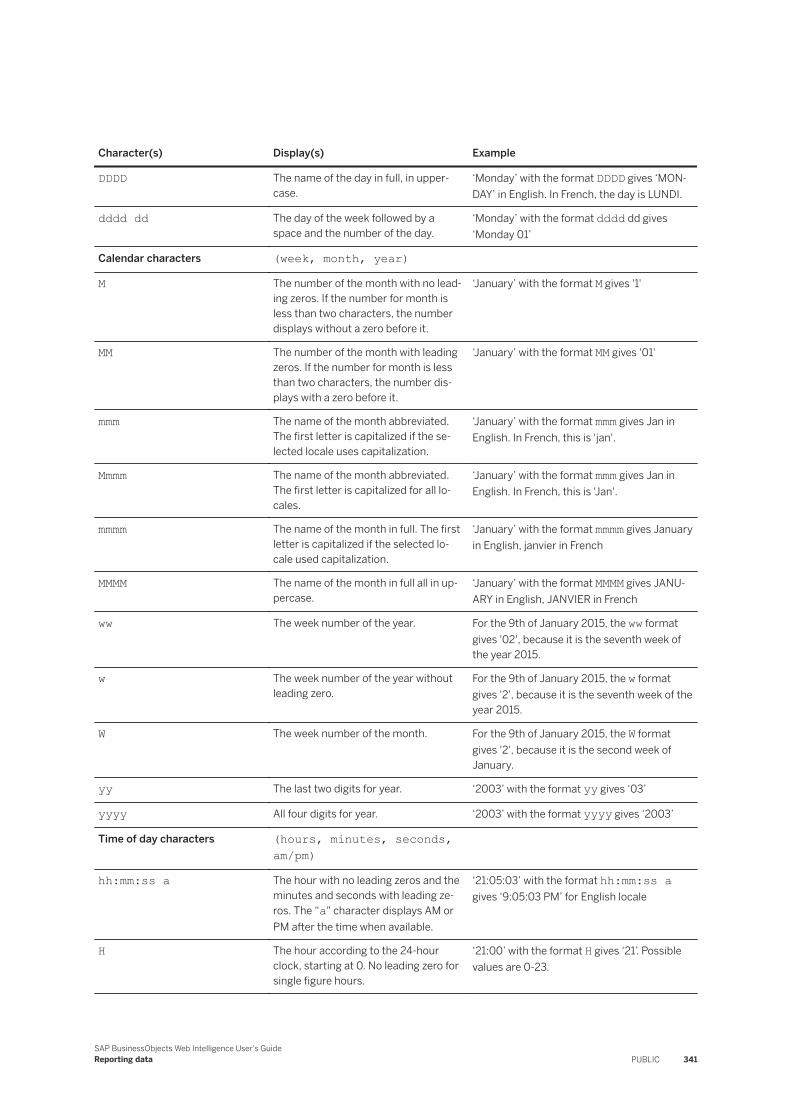
Character(s) Display(s) Example
DDDD The name of the day in full, in uppercase.
‘Monday’ with the format DDDD gives ‘MONDAY’ in English. In French, the day is LUNDI.
dddd dd The day of the week followed by a space and the number of the day.
‘Monday’ with the format dddd dd gives ‘Monday 01’
Calendar characters (week, month, year)
M The number of the month with no leading zeros. If the number for month is less than two characters, the number displays without a zero before it.
‘January’ with the format M gives '1'
MM The number of the month with leading zeros. If the number for month is less than two characters, the number displays with a zero before it.
‘January’ with the format MM gives '01'
mmm The name of the month abbreviated. The first letter is capitalized if the selected locale uses capitalization.
‘January’ with the format mmm gives Jan in English. In French, this is 'jan'.
Mmmm The name of the month abbreviated. The first letter is capitalized for all locales.
‘January’ with the format mmm gives Jan in English. In French, this is 'Jan'.
mmmm The name of the month in full. The first letter is capitalized if the selected locale used capitalization.
‘January’ with the format mmmm gives January in English, janvier in French
MMMM The name of the month in full all in uppercase.
‘January’ with the format MMMM gives JANUARY in English, JANVIER in French
ww The week number of the year. For the 9th of January 2015, the ww format gives '02', because it is the seventh week of the year 2015.
w The week number of the year without leading zero.
For the 9th of January 2015, the w format gives '2', because it is the seventh week of the year 2015.
W The week number of the month. For the 9th of January 2015, the W format gives '2', because it is the second week of January.
yy The last two digits for year. ‘2003’ with the format yy gives ‘03’
yyyy All four digits for year. ‘2003’ with the format yyyy gives ‘2003’
Time of day characters (hours, minutes, seconds, am/pm)
hh:mm:ss a The hour with no leading zeros and the minutes and seconds with leading zeros. The “a" character displays AM or PM after the time when available.
‘21:05:03’ with the format hh:mm:ss a gives ‘9:05:03 PM’ for English locale
H The hour according to the 24-hour clock, starting at 0. No leading zero for single figure hours.
‘21:00’ with the format H gives ‘21’. Possible values are 0-23.
SAP BusinessObjects Web Intelligence User's GuideReporting data PUBLIC 341
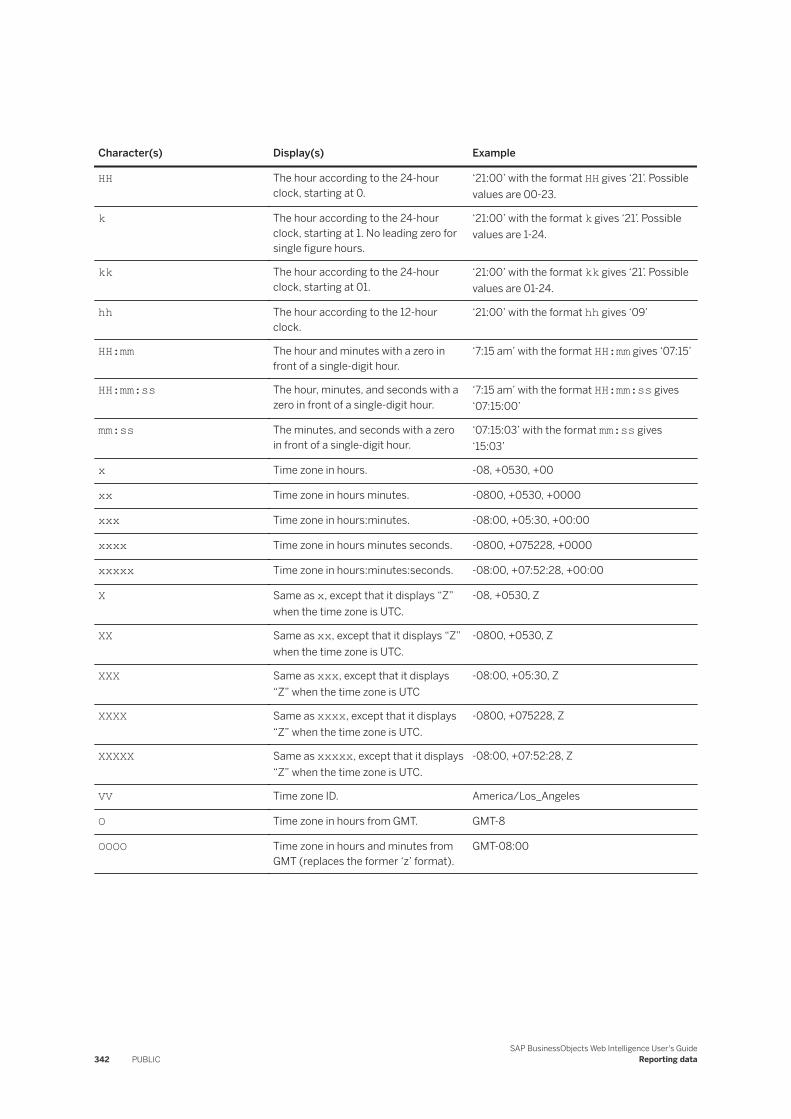
Character(s) Display(s) Example
HH The hour according to the 24-hour clock, starting at 0.
‘21:00’ with the format HH gives ‘21’. Possible values are 00-23.
k The hour according to the 24-hour clock, starting at 1. No leading zero for single figure hours.
‘21:00’ with the format k gives ‘21’. Possible values are 1-24.
kk The hour according to the 24-hour clock, starting at 01.
‘21:00’ with the format kk gives ‘21’. Possible values are 01-24.
hh The hour according to the 12-hour clock.
‘21:00’ with the format hh gives ‘09’
HH:mm The hour and minutes with a zero in front of a single-digit hour.
‘7:15 am’ with the format HH:mm gives ‘07:15’
HH:mm:ss The hour, minutes, and seconds with a zero in front of a single-digit hour.
‘7:15 am’ with the format HH:mm:ss gives ‘07:15:00’
mm:ss The minutes, and seconds with a zero in front of a single-digit hour.
‘07:15:03’ with the format mm:ss gives ‘15:03’
x Time zone in hours. -08, +0530, +00
xx Time zone in hours minutes. -0800, +0530, +0000
xxx Time zone in hours:minutes. -08:00, +05:30, +00:00
xxxx Time zone in hours minutes seconds. -0800, +075228, +0000
xxxxx Time zone in hours:minutes:seconds. -08:00, +07:52:28, +00:00
X Same as x, except that it displays “Z” when the time zone is UTC.
-08, +0530, Z
XX Same as xx, except that it displays “Z” when the time zone is UTC.
-0800, +0530, Z
XXX Same as xxx, except that it displays “Z” when the time zone is UTC
-08:00, +05:30, Z
XXXX Same as xxxx, except that it displays “Z” when the time zone is UTC.
-0800, +075228, Z
XXXXX Same as xxxxx, except that it displays “Z” when the time zone is UTC.
-08:00, +07:52:28, Z
VV Time zone ID. America/Los_Angeles
O Time zone in hours from GMT. GMT-8
OOOO Time zone in hours and minutes from GMT (replaces the former ‘z’ format).
GMT-08:00
342 PUBLICSAP BusinessObjects Web Intelligence User's Guide
Reporting data
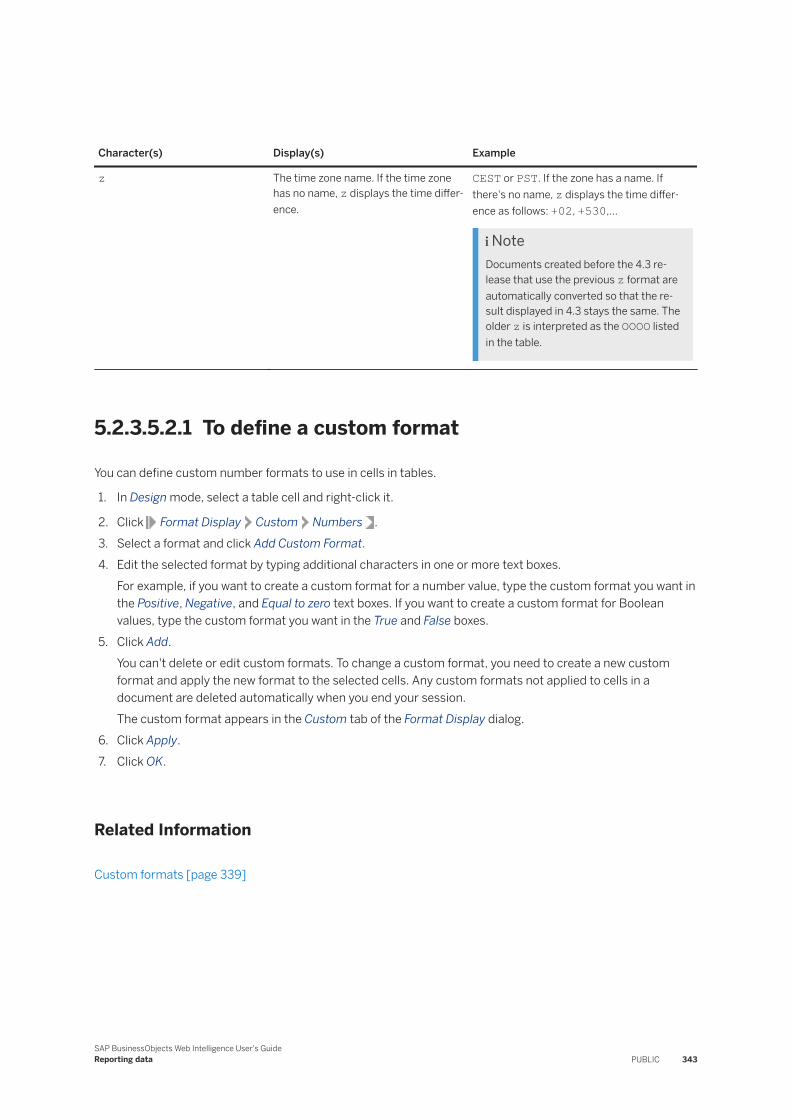
Character(s) Display(s) Example
z The time zone name. If the time zone has no name, z displays the time differ-ence.
CEST or PST. If the zone has a name. If there's no name, z displays the time differ-ence as follows: +02, +530,...
NoteDocuments created before the 4.3 release that use the previous z format are automatically converted so that the result displayed in 4.3 stays the same. The older z is interpreted as the OOOO listed in the table.
5.2.3.5.2.1 To define a custom format
You can define custom number formats to use in cells in tables.
1. In Design mode, select a table cell and right-click it.
2. Click Format Display Custom Numbers .3. Select a format and click Add Custom Format.4. Edit the selected format by typing additional characters in one or more text boxes.
For example, if you want to create a custom format for a number value, type the custom format you want in the Positive, Negative, and Equal to zero text boxes. If you want to create a custom format for Boolean values, type the custom format you want in the True and False boxes.
5. Click Add.You can't delete or edit custom formats. To change a custom format, you need to create a new custom format and apply the new format to the selected cells. Any custom formats not applied to cells in a document are deleted automatically when you end your session.The custom format appears in the Custom tab of the Format Display dialog.
6. Click Apply.7. Click OK.
Related Information
Custom formats [page 339]
SAP BusinessObjects Web Intelligence User's GuideReporting data PUBLIC 343
5.2.3.5.3 To format a number as a currency in a table cell
You can format the currency format in a cell in a table.
1. In Design mode, select a cell and right-click it.
2. Select Format Display Currency .3. Select a number format from the list.4. If the format you're looking for isn't in the list, Add Custom Format. Refer to the To define a custom format
topic for more information.5. Click Apply.6. Click OK.
Related Information
To define a custom format [page 343]
5.2.3.5.4 To apply a percentage format to a cell number
You can apply a percentage format.
1. In Design mode, select one or more cells and right-click the selection.
2. Click Format Display Percentage .3. Select one or more cells.4. Select 123,456.70%.5. Click Apply.6. Click OK.
The cell or cells change to the selected number format.
5.2.3.6 Formatting multiple report elements simultaneously
You can format several report element at the same time.
Resizing, aligning, defining borders, background colors, or relative positions are examples of what's possible when formatting multiple report elements simultaneously. The formatting options available depend on the report elements you select. There are three possible selections:
● selection of report elements of the same type, such as two vertical tables.● selection of report elements of different type, such as a vertical table and a horizontal table.● selection of report elements of heterogenous type, such as a pie chart and a free cell.
344 PUBLICSAP BusinessObjects Web Intelligence User's Guide
Reporting data
When editing mutliple elements simultaneously, the Format panel displays "Multi-Selection" rather than the name of each chart selected.
You can use the table below as a reference point to know the available formatting options in the Format panel, depending on the report elements you select.
NoteIf a custom element is part of your multi-selection, the Background and Palette options aren't available.
Options available within these tabs depend on the type of selection you make and the settings the report elements you select have in common. Also, some of these settings may appear as undetermined when the report elements have different values for the same setting. These settings are reset to make sure that the new value you enter applies to all the report elements you select.
5.3 Linking
Linking, whether that is to other documents or reports, gives you or your colleagues immediate access to information related to a report or document. There's a variety of links allowing you to access information quickly and efficiently.
Caution● By default, the execution of hyperlinks and Javascript is disabled. For hyperlinks to work properly, make
sure you set necessary security properties in the Central Management Console ( Applications Web Intelligence Properties ), and allow the execution of hyperlinks and Javascript.
● Web Intelligence enables embedded Javascript/HTML code in document cells thanks to its formula capabalities.This code can be enabled or disabled in the Central Management Console, and fine-tuned using a white list to filter the on authorized HTML tags and attributes.However, SAP is not responsible for the compatibility of this code and its possible side effects. For example, your code might require some adaptation due to browser updates, Javascript version support or the way the code is dynamically embedded in the web page. From a technical standpoint, as of the 4.3 release, the application runs as a Single Page Application. There is no technical separation between the report and the overall web page. The code might require adjustments to run in that new context.
The following sections provide you with details regarding these links and how to create them.
5.3.1 Linking to other documents
To give immediate access to information related to a report from that report, you can define cells as hyperlinks.
The user who consults the report can click the active hyperlink and open a web page with additional, related information.
SAP BusinessObjects Web Intelligence User's GuideReporting data PUBLIC 345
Restriction● When the hyperlink refers to a web site that can't be opened in other websites, there might be browser
errors.● To avoid having #ERROR displayed instead of hyperlinks you've created, we recommend avoiding hard
coded date formats. It causes #ERROR when changing the preferred viewing locale of the BI Launch Pad.
When you click a cell that contains a hyperlink, the target document specified in the link opens. The target document can be another Web Intelligence document, a website, a PDF, Excel or Word document, or any resource accessible through a hyperlink.
Hyperlinks can be either static or dynamic. A static hyperlink always links to the same document in the same way. A dynamic hyperlink can link differently depending on the data in the document containing the hyperlink.
You can create different types of hyperlink:
● A cell where the cell text is the hyperlink text.● A cell with an associated hyperlink.● A link to another document in the CMS. For target documents that refer to BEx queries, .unx or .unv
universes that contain prompts that use Index Awareness, there are additional parameters to set.
When you create a link, the link is defined using the OpenDocument syntax. You can also build links manually using OpenDocument. For detailed information on OpenDocument syntax, see the Viewing Documents using OpenDocument guide.
As well as linking between documents, you can also link report elements in the same report by defining elements as input controls that filter the values in other report elements.
NoteHyperlinks only display as active when your system administrator has authorized them in Web Intelligence.
5.3.1.1 Cells defined as a hyperlink
When you define a cell as a hyperlink, the cell text becomes an active hyperlink.
For example, if you define a free-standing cell containing the text http://www.sap.com as a hyperlink, clicking the cell takes you to the SAP web page.
This method is best suited for static hyperlinks, where the text in the cell always remains the same and links to the same resource in the same way.
NoteYou can make this type of hyperlink dynamic by using a cell formula to change the cell text based on report data.
346 PUBLICSAP BusinessObjects Web Intelligence User's Guide
Reporting data
5.3.1.1.1 To define a cell as a hyperlink
You define a cell as a hyperlink in a document.
1. In Design mode, select or type a hyperlink in a cell.
2. While the cell is selected, click to open the side panel.
3. In the side panel, click to open the Format panel.
4. Click to access the appearance settings.5. Under the Display section, select Hyperlink in the Read content as drop down.
5.3.1.2 A hyperlink associated with a cell
When you associate a hyperlink with a cell, you define a hyperlink that links to the source document when the cell is clicked.
The cell text itself is not the hyperlink.
This is the recommended method for creating dynamic hyperlinks, for the following reasons:
● It is specially tailored for working with the parameters in dynamic hyperlinks.● It shields you from the complexity of hyperlink syntax. You define your hyperlink using a graphical interface
and the hyperlink syntax is generated and managed behind the scenes.● It allows you to define hyperlink text that is different from the cell text.
5.3.1.2.1 To add a hyperlink to a cell
You configure cell hyperlinks.
1. In Design mode, select a cell and right-click it.
2. In the contextual menu, click Hyperlink Add Hyperlink .3. Type or paste the hyperlink in the dedicated field.4. Optional: If the URL has paramerters, click Customize URL Paramerters (Parse).
Dynamic hyperlinks have parameters whose values can change. Parameters appear as a name=value combination at the end of the hyperlink after a question mark. For example, the following URL has a reportname parameter, whose value is products:
http://salesandproductreport/default.asp?reportname=products
If the hyperlink is dynamic and has parameters, they're listed in the Customize URL Parameters area.
Each parameter has a dedicated field filled with its value and the parameter name above. The static part of the hyperlink, the part without the parameters, is shown above the parameters.
SAP BusinessObjects Web Intelligence User's GuideReporting data PUBLIC 347
5. Optional: To add or remove a parameter, click Edit URL, edit the hyperlink syntax, and click Customize URL Parameters (Parse).
6. Add the label of the hyperlink in the Label field.7. Using the Open In dropdown, select whether the link should open in a new window or in the current
window.8. Type the tooltip text in the Tooltip field.
The tooltip appears when you hover your mouse pointer over the cell containing the hyperlink.9. Click OK.
5.3.1.3 Linking to another document in the CMS
In the Web Intelligence HTML interface, you can link to another document in the CMS using the Create Hyperlink dialog box.
The link uses the OpenDocument function. The parameters passed to the function are determined by the choices you make in the dialog box.
You can also work with the OpenDocument function directly by typing the syntax into a cell.
Document instances and values passed to prompts
Hyperlinks supply values to prompts in the target document in two ways:
● Passing values directly to prompts.● Opening a document instance based on passed values.
In the first case, the hyperlink feeds values directly to the prompts in the target document. In the second case, the link opens the document instance whose stored prompt values correspond to the values passed by the hyperlink. When you click on the url, the target document is automaticaly refreshed, even if the Refresh on open option is deactivated.
It is more efficient to choose a document instance based on passed parameters if the target document is large.
Linking to large documents
When the target document contains a large amount of data, it is more efficient to link to an instance than to open and retrieve the document with a passed parameter value. You can schedule and pre-retreive multiple instances with different parameter values. This allows the document to be scheduled and pre-retrieved in advance with different parameter values.
When you click the hyperlink, the link opens the appropriate pre-retrieved instance rather than using the passed value to open the document and retrieve the data.
348 PUBLICSAP BusinessObjects Web Intelligence User's Guide
Reporting data
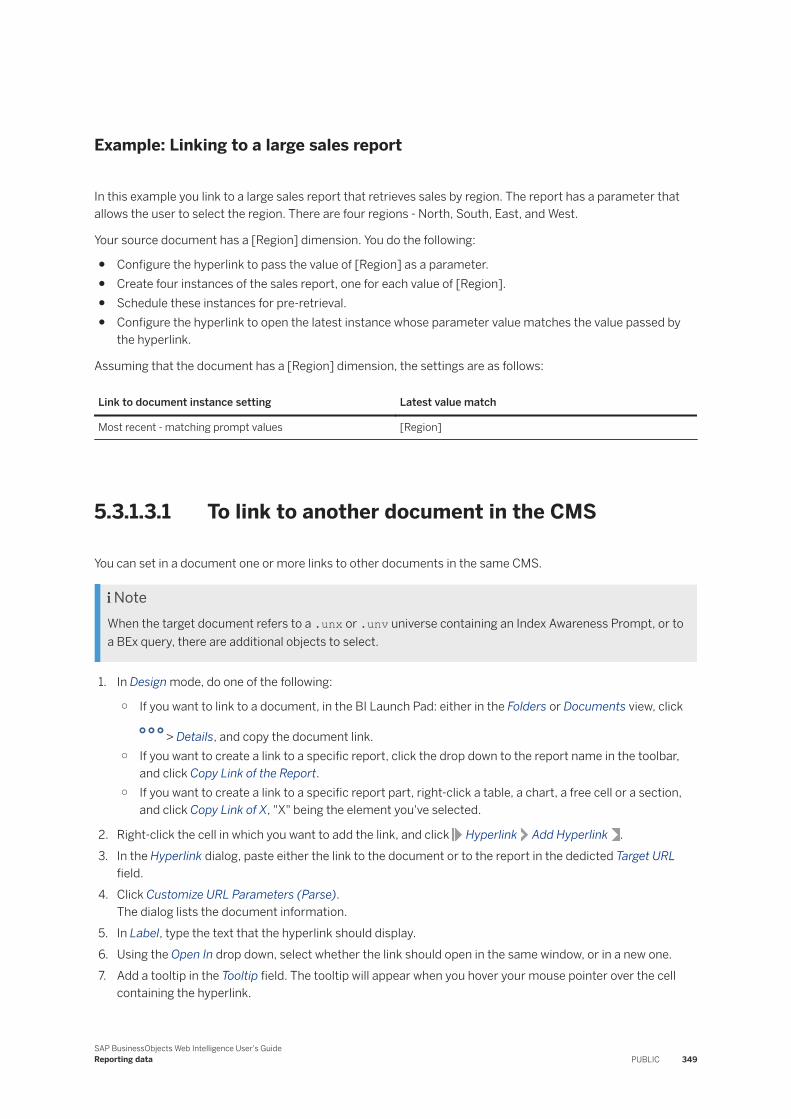
Example: Linking to a large sales report
In this example you link to a large sales report that retrieves sales by region. The report has a parameter that allows the user to select the region. There are four regions - North, South, East, and West.
Your source document has a [Region] dimension. You do the following:
● Configure the hyperlink to pass the value of [Region] as a parameter.● Create four instances of the sales report, one for each value of [Region].● Schedule these instances for pre-retrieval.● Configure the hyperlink to open the latest instance whose parameter value matches the value passed by
the hyperlink.
Assuming that the document has a [Region] dimension, the settings are as follows:
Link to document instance setting Latest value match
Most recent - matching prompt values [Region]
5.3.1.3.1 To link to another document in the CMS
You can set in a document one or more links to other documents in the same CMS.
NoteWhen the target document refers to a .unx or .unv universe containing an Index Awareness Prompt, or to a BEx query, there are additional objects to select.
1. In Design mode, do one of the following:
○ If you want to link to a document, in the BI Launch Pad: either in the Folders or Documents view, click
> Details, and copy the document link.○ If you want to create a link to a specific report, click the drop down to the report name in the toolbar,
and click Copy Link of the Report.○ If you want to create a link to a specific report part, right-click a table, a chart, a free cell or a section,
and click Copy Link of X, "X" being the element you've selected.
2. Right-click the cell in which you want to add the link, and click Hyperlink Add Hyperlink .3. In the Hyperlink dialog, paste either the link to the document or to the report in the dedicted Target URL
field.4. Click Customize URL Parameters (Parse).
The dialog lists the document information.5. In Label, type the text that the hyperlink should display.6. Using the Open In drop down, select whether the link should open in the same window, or in a new one.7. Add a tooltip in the Tooltip field. The tooltip will appear when you hover your mouse pointer over the cell
containing the hyperlink.
SAP BusinessObjects Web Intelligence User's GuideReporting data PUBLIC 349
5.3.1.4 OpenDocument links
OpenDocmuent is a web application that processes incoming URL requests for documents and any other viewable object type in the Central Management Server (CMS), and delivers the correct document to the end user in the appropriate viewer.
You can either open OpenDocument links or create them following a specifix syntax, depending on the client you want to the OpenDocument link to point, the report you want to open and so on.
For more information on the syntax of an OpenDocument link and the parameters you should include when creating one, refer to the Viewing Documents Using OpenDocument Guide.
5.3.1.4.1 To open a document from a hyperlink
You can set hyperlinks between documents.
1. In Design mode, hover your mouse pointer over a cell with a hyperlink to display the tooltip, if a tooltip is defined.
NoteThe generated syntax of the hyperlink appears in the Formula Bar. Do not modify this syntax directly. Instead, right-click the cell and click Hyperlink Edit Link if you need to update the link.
2. Click the hyperlink to open the target document.Depending on how the hyperlink is configured, the target document opens in a new browser window, or it replaces the current document in the current browser window.
5.3.1.5 To edit a hyperlink in a cell
You can set hyperlinks in table cells in the Web Intelligence HTML interface.
1. Open a Web Intelligence document in Design mode.
2. Right-click the cell containing the hyperlink and select Hyperlink Edit .3. In the Create Hyperlink dialog box, edit the hyperlink.4. Click OK to close the Create Hyperlink dialog box.
5.3.1.6 To delete a hyperlink
You can delete hyperlinks in documents in the Web Intelligence.
1. Open a Web Intelligence document in Design mode.
2. Select the cell containing the hyperlink and select Linking Remove .
350 PUBLICSAP BusinessObjects Web Intelligence User's Guide
Reporting data
5.3.1.7 Formatting hyperlink colors
You can define the colors used to display hyperlinks that have already been clicked (visited hyperlinks).
You can also define the colors for hyperlinks that have not been clicked (unvisited hyperlinks).
5.3.1.7.1 To set hyperlink colors
You can set the colors of hyperlinks in documents.
1. In Design mode, right-click a blank area on the report that contains hyperlinks and select Format ReportAppearance Settings to open the Format panel.
2. In the Format panel, in the Appearance tab, expand the Hyperlink section.3. Use the dedicated Visited and Unvisited controls to either select a predefined color or define a custom
color.Every link in the document will now be displayed in the color that you've just defined.
4. Click Apply to close.
5.3.2 Linking to other reports within the same document
You can define hyperlinks, called intra-document links, to give users immediate access to other reports within the same document.
You can create an intra-document link:
● In a free cell,● In a table cell (on any cell of the table and on any type of table).
CautionWhen you select a link, its formula is displayed in the formula bar. You should not change it or the link may break. Also, note that all the parameters are case-sensitive.
5.3.2.1 To link to another report within the same document
You can add one or multiple links in a document to other reports within the same document.
1. Open a Web Intelligence document in Design mode.
2. Right-click the cell (free cell or in a table) where you want to create the link and select Hyperlink Add Hyperlink... .
3. In the Hyperlink dialog, click the This Document tab.4. Select the report you want to link to using the dedicated dropdown.
SAP BusinessObjects Web Intelligence User's GuideReporting data PUBLIC 351
5. Add a label to the link using the object name, or select another object using the Select Object option. You can also build a dynamic label using the Build Formula option.
6. Enter text in the Tooltip box, or build a dynamic tooltip by using the Build Formula or Select Object options. The tooltip will appear when you hover your mouse pointer over the cell containing the hyperlink.
Option Description
Build Formula You build a formula in the Formula Editor to supply the formula output as the tooltip.
Select Object You choose the variable from the list in the Select an Object dialog to supply its value as the tooltip.
7. Click OK.
You may want to edit or delete the link afterwards. To do so, see To edit a hyperlink in a cell [page 350] and To delete a hyperlink [page 350].
5.4 Saving
Once your report is ready, you can save it and export it.
The format of your choice depends on who’s at the receiving end.
The following sections provide you with details regarding the different formats available, and how to save and export reports.
For more information about Read
Save and Export Reports Saving and exporting Saving and exporting documents, reports and data [page 353]
Exporting documents, reports, or data Exporting documents, reports or data [page 354]
From HTML Code, URLs, and Images to Excel Spreadsheets and PDF Files
Exporting HTML Code, URLs, and Images to Excel Spreadsheets and PDF Files [page 356]
352 PUBLICSAP BusinessObjects Web Intelligence User's Guide
Reporting data
5.4.1 Saving and exporting documents, reports and data
You can save or export documents in a multiple formats if you have the corresponding user rights granted.
CautionIf you don't have the right to save a document, please use the Save As function.
In both clients, you can save document as a .WID file, the Web Intelligence format.
You can also export documents in .CSV, .XLSX, .PDF, .TXT and HTML.
NoteThe .HTML and .CSV files are exported in a ZIP file.
Refer to the appropriate topics in this document for instructions on how to save and export document in different formats.
Related Information
To save a document in the corporate repository [page 353]Exporting documents, reports or data [page 354]
5.4.1.1 To save a document in the corporate repository
You can save a document in the corporate repository.
1. In the File section of the toolbar, click > Save As.2. Browse the folder in which you want to save the document.3. Give a name to the file.4. Click Options and add a description and keywords.5. Optional: Check Refresh on open to refresh the document each time it is opened.
NoteWhen you enable the Refresh on open document property, the document displays the latest information each time you open the document. The Refresh on open option is dependent on the following settings in the CMC (configured by the BI administrator):
○ In Applications Web Intelligence , from the Manage list, select Properties. In the Automatic Document Refresh on Open Security Right Setting section, the property Check the "Disable Automatic Refresh on Open for all documents" security right is enabled.
○ In Applications Web Intelligence , from the Manage list, select User Security. When you select a user profile and click View Security, check that the Document - disable automatic refresh on open security right is disabled.
SAP BusinessObjects Web Intelligence User's GuideReporting data PUBLIC 353
The Refreh on open property here is different from the Refresh on open option mentioned in the To link to another document in the CMS section. In this case, the document is purged from its data when you open it. This means that the document is empty when you open it, and is then refreshed to reflect the latest data available. There's no record of your data.
6. Optional: Check Permanent regional formatting to preserve the document regional formatting with the document.
7. Check Save document with comments if you want to keep the comments of the document.8. Click Categories.9. Select one or more categories.10. Click Save.
5.4.1.2 Exporting documents, reports or data
You can export a complete document or one or more reports to a .TXT, .PDF, .XLSX, .CSV, or .HTML file.
Each file type has its own settings, detailed in the sections below.
When exporting to a .PDF file, you can decide whether you want to export all reports if you have several reports in your document, or only the report you are currently viewing. If you decide to export only one report, then it's possible to select whether you want to export:
● All pages● The current page, only if you have selected to export the report you are currently viewing.● Specific pages, for example pages 10 to 15 only
You can also fine-tune the DPI for images using the Images DPI drop down under the Options section.
Check Display bookmarks to display the bookmarks tab by default when opening the file to make the navigation through the document easier.
.XLSX
When exporting to an Excel file, if you have several reports in your document, you can decide to export all of them or explicitly select the ones to export. Each report is saved as a spreadsheet in the Excel file. You can select between two options:
● Check Prioritize the formatting of the document to keep the formatting in the .XLSX file.● Check Prioritize ease data processing in Excel to avoid merging multiple cells into Excel cells as much as
possible and benefit from the data processing features of Excel.
You can also fine-tune the DPI for images using the Images DPI dropdown list.
354 PUBLICSAP BusinessObjects Web Intelligence User's Guide
Reporting data
.CSV
You can export either:
● Reports' data, by selecting the Reports radio button, and selecting the reports you want to export.● Documents' raw data by selecting the Data radio button, and selecting the queries you want to export.
You can also configure the text qualifier, column delimiter and charset. In the column delimiter drop down, you can also directly type in a custom charcacter you want to use, such as the pipe (|) for instance.
The class name is added to objects with identical names when exporting query data to a .CSV file. If the class names are also identical, then the parent class name is also attached, as shown in the example.
Example
Class Objects
Resort Country
Resort
Customer Country
City
Measure Revenue
When exporting the query data to a CSV file, the names of [Country] and [Country] are modified to [Resort.Country] and [Customer.Country].
NoteTo prevent malicious command injections from being triggered when you open the CSV file in Microsoft Excel, Web Intelligence adds a space before the following characters during the export process:
● = (Equal)● + (Plus)● - (Minus)● @ (At)
The additional space prevents values with these characters from being executed as commands, which could cause a security issue on your system.
If you want to disable this behavior, ask your administrator to create or change the registry key in Windows or in the boconfig.cfg in UNIX, as follows:
• In Windows, on the server machines and client machines, set the following registry key to false: HKEY_LOCAL_MACHINE\SOFTWARE\SAP BusinessObjects\Suite XI 4.0\default\WebIntelligence\EscapeCharactersForCSVExport.
• In UNIX, on the server machines, open the boconfig.cfg file (in $installdir/setup/boconfig.cfg), set the following registry declaration key to false HKEY_LOCAL_MACHINE\SOFTWARE\SAP BusinessObjects\Suite XI 4.0\default\WebIntelligence\EscapeCharactersForCSVExport.
After the change and before you perform the export, close and open Web Intelligence.
SAP BusinessObjects Web Intelligence User's GuideReporting data PUBLIC 355
.TXT
When you export a text file:
● In page mode, report elements are exported page by page.● The exported file in page mode can be different from the result in draft mode.● The separator used is a tab space.● Charts and images aren't exported.● Export size limit for text file is defined in the Central Management Console. The default value is 5 MB. An
error message appears if the size limit is exceeded.● If several reports are selected, they are appended one after another in the same text file.
5.4.1.3 To export a document
You can export a document to a specific location.
1. In the File section of the toolbar, click > Export.2. Select a format using the dedicated radio buttons.3. Select the reports you want to export using the dedicated checkboxes. To export the whole document,
check All.If you are exporting to CSV, you can select to export document's data by checking the Data radio button. Select the queries you want to export using the dedicated checkboxes. To export all queries, check All.
4. Adjust the settings available depending on the format.To know more about the options available, read Exporting documents, reports or data [page 354].
5. Click Export.6. Select where you want to export the file.7. Give a name to the file.8. Click Save.
5.4.1.4 Exporting HTML Code, URLs, and Images to Excel Spreadsheets and PDF Files
HTML code, URLs and images contained in Web Intelligence documents can be exported to Excel spreadsheets and to PDF files.
Exporting HTML Code to Excel Spreadsheets and PDF Files
HTML code contained in Web Intelligence tables and free cells is exported as text in Excel spreadsheets and isn't interpreted. In PDF files, HTML code contained in Web Intelligence tables and free cells will not be
356 PUBLICSAP BusinessObjects Web Intelligence User's Guide
Reporting data
exported, if these cells have been formatted to be read as HTML. Else, they will be exported as text without any interpretation.
Exporting URLs to Excel Spreadsheets and PDF Files
URLs contained in Web Intelligence tables and free cells are exported as URLs in Excel spreadsheets and PDF files, if these cells have been formatted to be read as hyperlinks. Else, they are exported as text.
Exporting Images to Excel Spreadsheets and PDF Files
Images as background or content, that is, cells formatted to be read as image hyperlinks, of Web Intelligence tables and free cells are exported as images in Excel spreadsheets and PDF files.
However, you must define the proxy server used by Web Intelligence to export these images.
On Windows
In the Windows registry HKEY_LOCAL_MACHINE\SOFTWARE\SAP BusinessObjects\Suite XI 4.0\default\WebIntelligence\BlobManager subkey, do the following:
1. Create or modify the ResolveHTTPUrl value to yes to have the following line:
"<ResolveHTTPUrl>"=string:"<yes>"
2. Create or modify the PROXY value to <customer-proxy>:<port>, where <customer-proxy> is your proxy server and <port> is the port of that server, to have the following line:
"<PROXY>"=string:"<customer-proxy>:<port>"
In the case of the Web Intelligence Rich Client, the BlobManager subkey is to be found in HKEY_LOCAL_MACHINE\SOFTWARE\Wow6432Node\SAP BusinessObjects\Suite XI 4.0\default\WebIntelligence.
On UNIX
You need to modify the boconfig.cfg file found in the $installdir/setup folder.
In the boconfig.cfg file, locate the Software\SAP BusinessObjects\Suite XI 4.0\default\WebIntelligence\BlobManager section and do the following:
1. Create or modify the ResolveHTTPUrl value to yes to have the following line:
"<ResolveHTTPUrl>"=string:"<yes>".
2. Create or modify the PROXY value to <proxy>:<port>, where <proxy> is your client proxy server and <port> is the port of that server, to have the following line:
"<PROXY>"=string:"<proxy>:<port>"
SAP BusinessObjects Web Intelligence User's GuideReporting data PUBLIC 357
6 Analyzing data
6.1 Introduction to data analysis
Data analysis is a crucial process that consists of inspecting your data to find useful information and take decisions.
To analyze your data, you have to break each component apart to get an understanding of why they give such results when put together. The underlying structure and variables of your data set provide you with an investigation plan and valuable insights.
Depending on the insight you are trying to gain from your data, you can use several methods of analysis such as drilling or filtering. These methods enable you to dig into your data and extract key messages that back up the decision you are going to take and help you decide what the next step is.
The following sections provide you with information on the several methods of data analysis, as well as how to use functions and calculations.
6.2 Drilling
Drilling is a data analysis method that gives you a deeper understanding of your data.
Dig into your data and discover insights that back up the decision you are going to take and help you decide what the next step is. The following sections provide you with details regarding drilling.
For more information about Read
Explore data Report data Drilling on report data [page 359]
Retrieving data Defining the scope of analysis [page 360]
Paths and hierarchies Drill paths and hierarchies [page 360]
Charts Drilling on charts [page 364]
Query drill Drilling with query drill [page 368]
358 PUBLICSAP BusinessObjects Web Intelligence User's Guide
Analyzing data
6.2.1 Drilling on report data
Drilling on reports lets you look deeper into your data to discover the details behind a good or bad summary result displayed in tables, charts, or sections.
You can drill on dimensions and measures, in charts, tables and sections. You can drill on both hierarchical or non-hierachical data. To drill, the application relies on:
● The definition of the hierarchy, for hierarchical data.● Navigation paths set up by the universe designer, for non-hierachical data.
When drilling on a dimension to see the data behind a specific result, the information retrieved depends on the values on which you drill. If your report calculates a region’s total sales revenue for a given year where a Sales Revenue measure is calculated based on the State and Year dimensions, drilling on Year displays the sales revenues by state and quarter, because Quarter is the next dimension in the time hierarchy below Year.
When drilling on a measure value, you drill down one level for each related dimension in the report element.
Drilling on charts, using the chart axes, chart legend and data bars, provides you with a graphical explanation of the results.
Depending on your needs, you can decide to drill either on a single element, or on multiple elements in the report. The Synchronize drill on report blocks option available in the BI launch pad preferences let you select the way you want to interact with the report and how you want to drive your analysis. You can either focus on a single element, or drive your analysis simultaneously on all elements when drilling.
To enable drilling, click in the Analyze section of the toolbar, and check Drill.
Restrictions
Restriction Description
Queries on BEx queries You can't use a Navigation path on BEx queries. Navigation path (previously called the drillpath) has been replaced by the collapse/expand workflow on the real hierarchy.
Queries on .unv and .unx universes You can only drill on a .unv or .unx universe if the drill paths are previously defined in the universe.
Example: Why did sales of accessories, outwear, and overcoats rise in Q3?
You work for a US national fashion retail chain, and are in charge of sales of accessories, outerwear and overcoat clothing lines in western states. You see that revenue is much higher for Q3 than the other quarters. To understand why, you drill down to look at the factors behind the result and you see that jewelry sales were much higher in July.
SAP BusinessObjects Web Intelligence User's GuideAnalyzing data PUBLIC 359
6.2.1.1 Defining the scope of analysisDefining the scope of analysis before drilling allows you to better control the amount of information the application should retrieve.
An object that’s part of the scope of analysis is also part of the query specification. This means that when you’re reaching that object when drilling up or down, the application doesn’t have to go through the database and run a new query to retrieve the data. If it’s not part of the scope, it’s not part of the query, and the application hits the database and runs a new query to retrieve the missing information. When that’s the case, a prompt asks you whether you want to hit the database and bring the missing data to the report.
You can display the scope of analysis pane by clicking in the query panel.
Defining the scope of analysis is important, as it can impact performance. You can specify the number of levels to which you want to drill up or down directly in the scope of analysis panel, if your security profile allows you to do so. If that's not the case, reach out to your BI administrator.
Scope of analysis levels
Level Description
None Disables the scope of analysis.
OneFor each object in the Result Objects pane, one, two or three objects lower down in the hierarchy are included in the query and stored in the cube.
Two
Three
Custom Every object you add manually to the scope is included in the query and stored in the cube.
NoteIf you plan on drilling out of scope on a Geomap chart, make sure that every additional dimension you specify is matched with a location. If no location is indicated, the additional dimensions won't show on the map.
6.2.1.2 Drill paths and hierarchiesWhen you analyze data in drill mode, you move along a drill path.
These paths are based on the dimension hierarchies set by the universe designer. Universe designers organize objects in classes in a hierarchy with the summary objects at the top and the most detailed at the bottom. So if you want to make a high-level report, you know that your query should include objects at the top of the list. If you want to see more detailed information, you can start drilling down on each dimension value displayed in the report.
For example, if the data from [Quarter] didn't sufficiently explain a result, you could drill down to [Month] or [Week], depending on how the universe designer set up the hierarchy. When you drill to a different level, measures, such as a [Revenue] or [Margin], are recalculated accordingly.
Drill paths usually follow the same hierarchy order as the classes on a universe. For example, a class called Time typically includes the [Year] dimension at the top of the class, followed by the [Quarter], [Month], and
360 PUBLICSAP BusinessObjects Web Intelligence User's Guide
Analyzing data
[Week] dimensions. The hierarchies for drill within the Time hierarchy typically follow the same order, because users want to drill annual results to analyze details for quarter, month, and so on. However, the universe designer can also define custom hierarchies. You can view the drill paths and hierarchies defined by the
universe designer in the query panel. Just click the icon next to the name of the universe, and select Display by Navigation Paths.
NoteA dimension can belong to several hierarchies. When you drill a result on a dimension that belongs to more than one hierarchy, you must answer a prompt to select the drill path.
6.2.1.3 To drill up or down
If you're in Reading mode, after you've enabled drilling, just click a cell or data point to drill down.
1. Optional: If you're working with non-hierachical data, click in the Analyze section in the toolbar and check Drill.It's not necessery to enable the drilling option when working with hierarchical data, since the drill path is controlled by the definition of the hierarchy.
2. Select a table cell or data point in chart.If you're trying to select a table cell, left-click it twice. The first click selects the table, and the second click selects the cell.
3. In the contextual menu, click Drill, and select Drill Up or Drill Down.
TipDrill up on a value to see how the more detailed data aggregates to a higher-level result, or down to see the lower-level data that makes up the summary results displayed in the report.
Notice the new drill filter that's been added to the filter bar. You can also see the new filter in the Data panel, in the filters section.
4. Optional: Repeat step 2 to drill further up or down.
You can also drill directly from the filter bar, by adding drill filters manually. Select a visualization, and click Drill Filters in the filter bar to add filters manually.
6.2.1.4 Drilling by other dimensions in a report
When you drill down or up, you move through a hierarchy one dimension at a time.
However, with non-hierarchical data, you can get another view of the data by slicing it in a different way. To drill on non-hierarchical data, the application relies on the navigation path set up by the universe designer. Using this navigation path, you can drill by other dimensions that interest you.
NoteYou can only use Drill by with a dimensions that are part of the scope of analysis of the document.
SAP BusinessObjects Web Intelligence User's GuideAnalyzing data PUBLIC 361
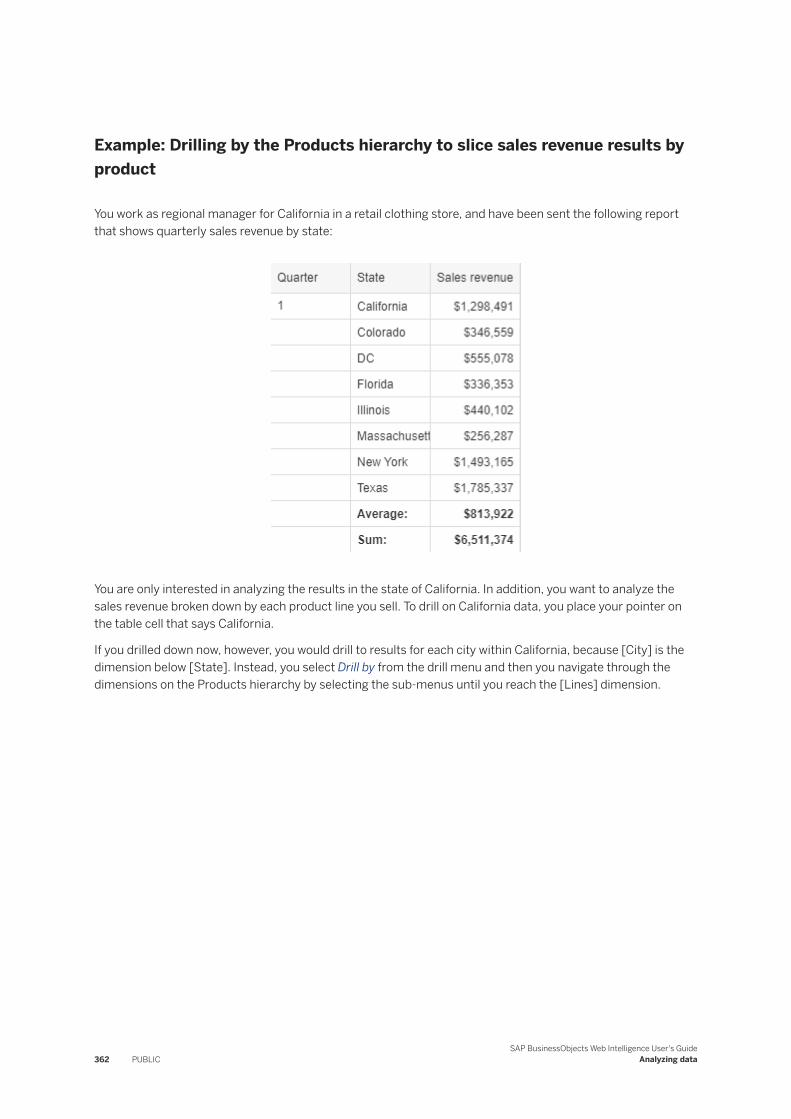
Example: Drilling by the Products hierarchy to slice sales revenue results by product
You work as regional manager for California in a retail clothing store, and have been sent the following report that shows quarterly sales revenue by state:
You are only interested in analyzing the results in the state of California. In addition, you want to analyze the sales revenue broken down by each product line you sell. To drill on California data, you place your pointer on the table cell that says California.
If you drilled down now, however, you would drill to results for each city within California, because [City] is the dimension below [State]. Instead, you select Drill by from the drill menu and then you navigate through the dimensions on the Products hierarchy by selecting the sub-menus until you reach the [Lines] dimension.
362 PUBLICSAP BusinessObjects Web Intelligence User's Guide
Analyzing data
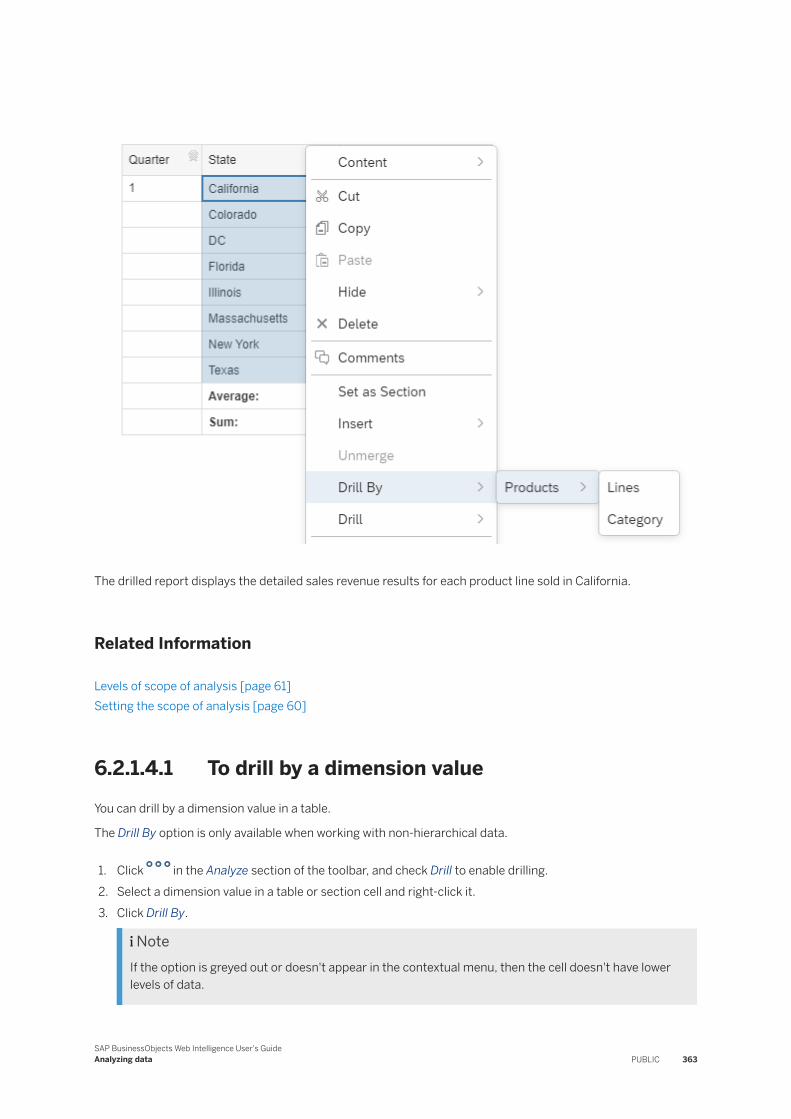
The drilled report displays the detailed sales revenue results for each product line sold in California.
Related Information
Levels of scope of analysis [page 61]Setting the scope of analysis [page 60]
6.2.1.4.1 To drill by a dimension valueYou can drill by a dimension value in a table.
The Drill By option is only available when working with non-hierarchical data.
1. Click in the Analyze section of the toolbar, and check Drill to enable drilling.2. Select a dimension value in a table or section cell and right-click it.3. Click Drill By.
NoteIf the option is greyed out or doesn't appear in the contextual menu, then the cell doesn't have lower levels of data.
SAP BusinessObjects Web Intelligence User's GuideAnalyzing data PUBLIC 363
4. Select the dimension to which you want to drill.The report now displays updated data according to the dimension you've selected.
6.2.1.5 Drilling on charts
Drilling down, up, or by on a chart, provides you with a graphical explanation for why summary results are particularly high or low.
You can drill on:
● dimensions – by drilling on chart axes or the chart legend● measures – by drilling on the data bars or markers in the body of the chart
You can't drill by dimensions on chart axes. However, you can drill by dimensions on chart legends.
Related Information
Drilling on axis legends [page 366]Drilling on dimensions via chart axes [page 364]Drilling on measures in charts [page 365]
6.2.1.5.1 Drilling on dimensions via chart axes
On 2D charts, you can drill on dimensions via the X Axis. On 3D charts, you can drill on dimensions via the X Axis and the Z Axis.
Charts can contain one or multiple dimensions on a single axis. When an axis contains multiple dimensions, each possible combination of the dimension values appear on the axis (this is sometimes referred to as a cartesian product).
When you drill on an axis value with multiple dimensions, the drilled results are filtered by both dimensions.
6.2.1.5.1.1 To drill on a chart axis
You can drill down or up on a dimension value in a chart axis.
1. Click in the Analyze section of the toolbar, and check Drill to enable drilling.2. In Design mode, make sure the Format panel is open, left-click or right a data point, and in the widget that
pops up, click Drill Down To X or Drill Up To X, X being the object you drill to.In Reading mode, left-click the data point to drill down, or right-click to open the drill widget and drill up or down.
364 PUBLICSAP BusinessObjects Web Intelligence User's Guide
Analyzing data
6.2.1.5.2 Drilling on measures in charts
When you drill on measures, the drill occurs on each dimension displayed on the chart axes.
You can drill on the measures displayed on the following types of chart:
● bar charts – by drilling on the bars● line and radar line charts – by drilling on the data markers● pie chart – by drilling on the segments
The new measure calculations displayed on the bars or data markers on the drilled chart, correspond to the lower or higher-level dimensions to which you drilled. The chart axis labels display the names of the drilled dimensions.
When you drill on measures in the following chart types, the drill action is performed only on the values in the axis legend:
● area charts – 2D, 3D, and stacked● radar and scatter charts – all types
NoteYou can't drill on measures in 3D area charts.
Example: Analyze detailed information for the sales revenue measure on a chart
For example, this 3D bar chart displays values for the [State] dimension on the X Axis and displays values for the [Lines] dimension on the Z Axis. This means that the chart bars display values for sales revenue per state per line.
SAP BusinessObjects Web Intelligence User's GuideAnalyzing data PUBLIC 365
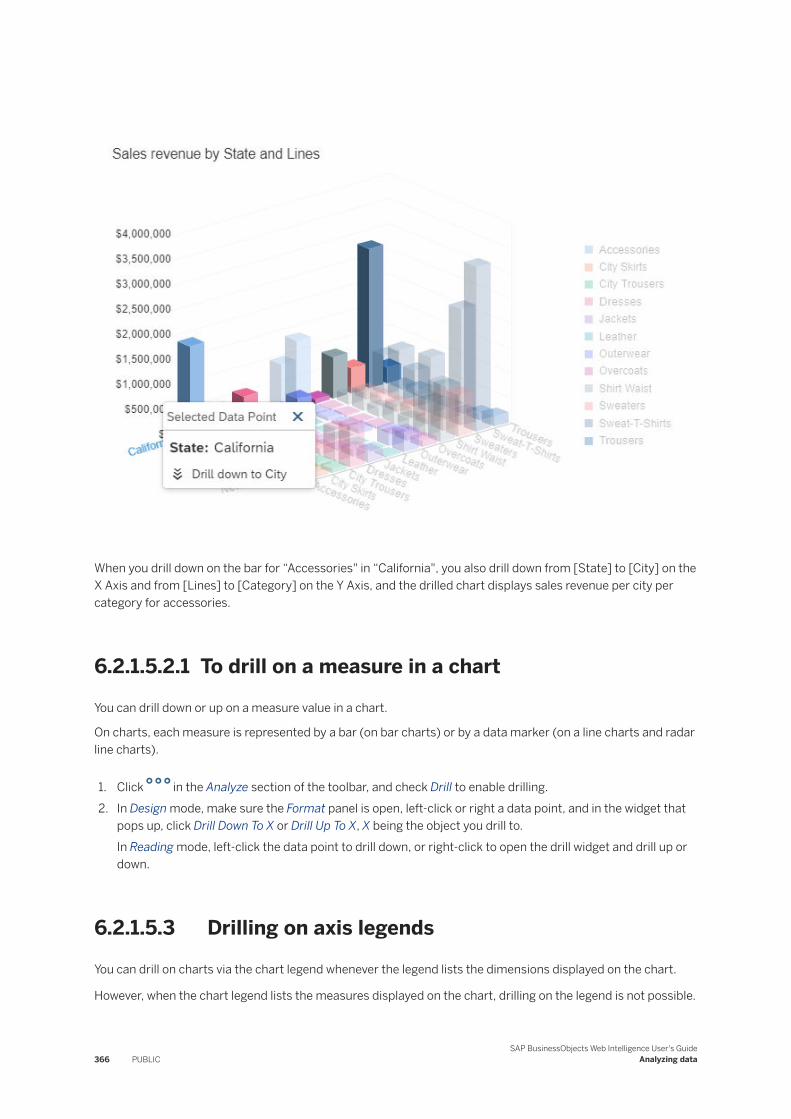
When you drill down on the bar for “Accessories" in “California", you also drill down from [State] to [City] on the X Axis and from [Lines] to [Category] on the Y Axis, and the drilled chart displays sales revenue per city per category for accessories.
6.2.1.5.2.1 To drill on a measure in a chart
You can drill down or up on a measure value in a chart.
On charts, each measure is represented by a bar (on bar charts) or by a data marker (on a line charts and radar line charts).
1. Click in the Analyze section of the toolbar, and check Drill to enable drilling.2. In Design mode, make sure the Format panel is open, left-click or right a data point, and in the widget that
pops up, click Drill Down To X or Drill Up To X, X being the object you drill to.In Reading mode, left-click the data point to drill down, or right-click to open the drill widget and drill up or down.
6.2.1.5.3 Drilling on axis legends
You can drill on charts via the chart legend whenever the legend lists the dimensions displayed on the chart.
However, when the chart legend lists the measures displayed on the chart, drilling on the legend is not possible.
366 PUBLICSAP BusinessObjects Web Intelligence User's Guide
Analyzing data
Drilling on a legend is useful if you are working with a pie chart, because the axis labels, which display the names of the dimensions represented by each pie segment, are not often displayed.
6.2.1.5.3.1 To drill on an axis legend
You can drill down on a dimension value, or drill up or by a dimension value.
1. Click in the Analyze section of the toolbar, and check Drill to enable drilling.2. In Design mode, make sure the Format panel is open, left-click or right a data point, and in the widget that
pops up, click Drill Down To X or Drill Up To X, X being the object you drill to.In Reading mode, left-click the data point to drill down, or right-click to open the drill widget and drill up or down.
6.2.1.6 Drilling with filters
When you drill on a dimension or measure value in a table or chart, the drilled results are filtered by the dimension or measure you drilled on.
Drill filters apply to all of the results displayed on the drilled report.
You can see them in the filter bar in the Drill Filters section. Each filters has one or more values associated. You select the data displayed in a table or chart by selecting the appropriate values from drill widget.
Example: Filtering drilled reports by different US states
For example, if you drill down on a table cell displaying “California" to view results for cities in California, you filter the values in the entire report for California and display results for California only in the report.
By changing the value of each filter, you can then see data for other values on the drilled dimension. For example, you can select Colorado in the filter on State.
Related Information
To create filters [page 376]
SAP BusinessObjects Web Intelligence User's GuideAnalyzing data PUBLIC 367
6.2.1.6.1 To add or remove a drill filter
You can add or remove a drill filter in a document.
1. Click in the Analyze section of the toolbar, and check Drill to enable drilling.
2. Click in the Analyze section of the toolbar to display the filter bar.
3. Click the Drill Filters section in the filter bar, then click to add a filter.4. Select an object using the widget.
The object you've selected now appears as a drill filter in the filter bar, and is set to All Values by default.5. Click the filter you've added, select a value, and click OK.6. Optional: To reset a drill filter, set it to All Values.
7. Optional: To remove a drill filter, hover over it in the filter bar and click to remove it.
6.2.1.7 Refreshing data in a drilled report with prompts
When you refresh a document, a prompt can appear that requires you to specify the values you want to retrieve from the database and return to the reports in the document.
For example, a prompt can require you to specify a year for which you want to retrieve data. This drilled report shows values for Year 2003, the year selected for the prompt.
If the drilled report is filtered for Year 2003, and you then refresh the document and select year 2002 to answer the prompt, the report displays results for 2002 instead of 2003.
6.2.1.8 Drilling with query drill
Drilling with query drill impacts the underlying query by adding or removing dimensions and query filters, in addition to applying drill filters.
You can use query drill when your report has aggregate measures calculated at the database level. It's designed specifically to provide a drill mode adapted to databases that contain aggregate functions not supported by the application, or that can't be accurately calculated in the report during a drill session.
Query drill is also useful for reducing the amount of data stored locally when drilling. Because query drill reduces the scope of analysis when you drill up, it purges unnecessary data.
To activate query drill, in Design mode, go to the document properties ( > ), and in the Data Options section, click the Use query drill toggle.
NoteIn query drill mode, new objects created when drilling out of scope are deleted when they're no longer needed. This means that dimensions used in geomaps lose the location they've been matched with.
368 PUBLICSAP BusinessObjects Web Intelligence User's Guide
Analyzing data
Example: Drilling down from month to week
In this example, Month is the lowest dimension currently available in the query from a time hierarchy, and Week is the dimension immediately below it in the hierarchy.
If you drill down on Month = January, three things happen:
● Week is added to the scope of analysis.● A query filter restricts Month to "January".● A drill filter is added to restrict Month to "January".
If you drill up from Week to Month, the process is reversed:
● Week is removed from the scope of analysis.● The query filter is removed.● The drill filter is removed.
NoteDrill filters aren't strictly necessary in query drill mode. They're applied for consistency with standard drill mode. For example, the DrillFilters function returns the correct value in query drill mode because a query drill applies drill filters to match the query filters.
Related Information
Setting the scope of analysis [page 60]Levels of scope of analysis [page 61]
6.2.1.8.1 Drilling down with query drill
When you drill down, query drill behaves similarly to standard drill at the point where the data moves outside the scope of analysis.
A drilled dimension is filtered in query drill mode by adding a query filter in addition to a drill filter. For example, if you drill on Year=2001, you add a query filter to restrict the Year dimension to 2001. For this reason, the only value that appears in the drill toolbar for the drilled dimension is the value on which you drilled (in this case 2001). This is different from standard drill mode, in which all values of the dimension are visible in the toolbar. As a result, you cannot change filter values in query drill mode (for example, drill on Year=2001 then switch to Year=2003) as you can in standard drill mode.
Because query drill automatically extends the scope of analysis, you can use it only if you have the right to drill outside the scope. Contact the BI administrator for more details.
SAP BusinessObjects Web Intelligence User's GuideAnalyzing data PUBLIC 369
Related Information
Setting the scope of analysis [page 60]Defining the scope of analysis [page 360]Levels of scope of analysis [page 61]
6.2.1.8.2 Drilling up with query drill
When you drill up, query drill removes dimensions from the query.
For example, if you drill up from Month to Quarter, you remove Month from the query. This means you can't drill up beyond any dimension that appears as one of the report objects. For example, if your report displays Year, Quarter and Revenue, you can't drill up from Quarter to Year because this would remove quarter from the list of report objects.
6.2.1.8.3 Query drill and other reports based on the same data provider
If your document contains other reports that contain dimensions on which you drill in query drill mode, these reports are affected because the query drill modifies the dimensions they contain.
You can avoid this (at the cost of retrieving duplicate data) by creating a new data provider and rebuilding the other report against it. Now when you drill in query drill mode, the other report remains unaffected.
Example: Drilling on a dimension that appears in another report
If you have two reports based on a query that contains Year, Quarter and Sales Revenue, and you use query drill to drill down to Year = 2001 on the first report, you also filter the data for Year in the second report to include 2001 only.
6.3 Filtering
Filtering is a data analysis method that gives you a deeper understanding of your data.
Dig into your data and extract key messages that back up the decision you are going to take and help you decide what the next step it. Filtering reports allows you to refine the results. The following sections provide you with details regarding filtering.
370 PUBLICSAP BusinessObjects Web Intelligence User's Guide
Analyzing data
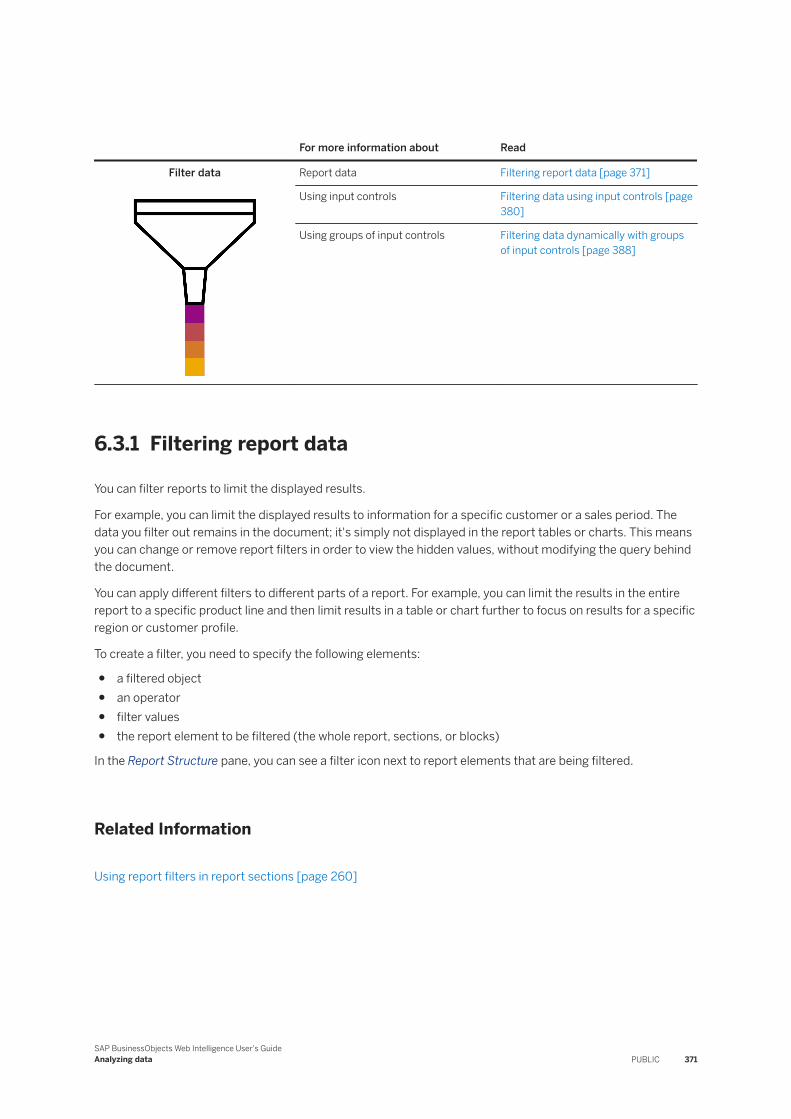
For more information about Read
Filter data Report data Filtering report data [page 371]
Using input controls Filtering data using input controls [page 380]
Using groups of input controls Filtering data dynamically with groups of input controls [page 388]
6.3.1 Filtering report data
You can filter reports to limit the displayed results.
For example, you can limit the displayed results to information for a specific customer or a sales period. The data you filter out remains in the document; it's simply not displayed in the report tables or charts. This means you can change or remove report filters in order to view the hidden values, without modifying the query behind the document.
You can apply different filters to different parts of a report. For example, you can limit the results in the entire report to a specific product line and then limit results in a table or chart further to focus on results for a specific region or customer profile.
To create a filter, you need to specify the following elements:
● a filtered object● an operator● filter values● the report element to be filtered (the whole report, sections, or blocks)
In the Report Structure pane, you can see a filter icon next to report elements that are being filtered.
Related Information
Using report filters in report sections [page 260]
SAP BusinessObjects Web Intelligence User's GuideAnalyzing data PUBLIC 371
6.3.1.1 Query filters and report filters compared
You can define the following types of filter in a document.
Type of document filter Description
Query filter Defined on the query to limit the data retrieved from the data source and returned to the document.
Report filter Defined within the report to limit values displayed in tables, charts, and sections within the document. Unlike the query filter, a report filter doesn’t modify the data that is retrieved from the data source; it simply hides values at the report level.
CautionUsers with document edit rights on a document have the right to modify any of your document report filter and can also access the document data.
Empty and null values in LOVs
The List of Values option [EMPTY_VALUE] for a filter appears in your filter list of values (LOV) when empty string values are present in your query. You can use [EMPTY_VALUE] only when filtering on empty strings, not when filtering on NULL values.
The [NULL_VALUE] option in a LOV allows you to select any null or empty string value in the list. This option always appears in a report filter LOV, and can appear in a Combo box, Radio buttons, List box, or Check boxes input control if the input control is set to allow selection of null values.
Related Information
Filtering data using query filters [page 128]
6.3.1.2 Filter operators
You use operators to compare filtered objects.
Operators can perform mathematical operations.
372 PUBLICSAP BusinessObjects Web Intelligence User's Guide
Analyzing data
6.3.1.2.1 Not Equal to operator
Use the Not Equal to operator to obtain data not equal to a value.
For example, to return data for all countries except the US create the filter "County Not Equal to US".
NoteThis operator cannot be used for OLAP .unx universe parent-child hierarchies or for BEx queries.
6.3.1.2.2 Greater than operator
Use the Greater than operator to retrieve data greater than a value.
For example, to retrieve data for customers aged over 60, create the filter "[Customer Age] Greater than 60".
NoteThis operator cannot be used for OLAP .unx universe parent-child hierarchies or for BEx queries.
6.3.1.2.3 Greater than or Equal to operator
Use the Greater than or equal to operator to retrieve data greater than or equal to a value.
For example, to retrieve data for revenue starting from $1.5M, create the filter "[Revenue] Greater than or equal to 1500000".
NoteThis operator cannot be used for OLAP .unx universe parent-child hierarchies or for BEx hierarchies.
6.3.1.2.4 Less than operator
Use the Less than operator to retrieve data lower than a value.
For example, to retrieve data for exam grades lower than 40, create the filter "[Exam Grade] Less than 40".
NoteThis operator cannot be used for OLAP .unx universes, hierarchies in filters, or for hierarchies in BEx queries.
SAP BusinessObjects Web Intelligence User's GuideAnalyzing data PUBLIC 373
6.3.1.2.5 Less than or Equal to operator
Use the Less than or equal to operator to retrieve data less than or equal to a value.
For example, to retrieve data for customers whose age is 30 or less, create the filter "[Age] Less than or equal to 30".
NoteThis operator cannot be used for OLAP .unx universes, hierarchies in filters or for hierarchies in BEx queries.
6.3.1.2.6 Between operator
Use the Between operator to retrieve data between two boundary values including the two boundary values.
The first value declared must be lower than the second value.
For example, to retrieve data for weeks starting at week 25 and finishing at 36 (including week 25 and week 36), create the filter "[Week] Between 25 and 36".
NoteThis operator cannot be used for OLAP .unx universe or BEx hierarchies in filters.
6.3.1.2.7 Not between operator
Use the Not between operator to retrieve data outside the range of two values.
For example, to retrieve data for all the weeks of the year, except for and not including weeks 25 through 36, create the filter "[Week] Not between 25 and 36".
NoteThis operator cannot be used for OLAP .unx universes or for BEx hierachies in filters.
6.3.1.2.8 In list operator
Use the In list operator to retrieve data corresponding to values in a list of values.
For example, to retrieve data only for the US, UK and Japan, create the filter [Country] In list, when you can type values in the Type a value field, you enter US;UK;Japan.
When used in a query filter with a hierarchical list of values, either from a dimension associated with a hierarchical list of values or a hierarchy object, In list allows the selection of multiple members from any
374 PUBLICSAP BusinessObjects Web Intelligence User's Guide
Analyzing data
levels of the hierarchy. For example, a prompt on the [Geography] hierarchy using the In list operator allows the selection of [Paris] at the City level and [Canada] at the Country level in the prompt.
When used in a report filter, In list produces a flat list of values.
6.3.1.2.9 Not In List operator
Use the Not in list operator to retrieve data that does not correspond to multiple values.
For example, if you do not want to retrieve data for the US, UK and Japan, create the filter "[Country] Not in list". In the Type a value field, you enter US;UK;Japan.
When used with a hierarchical list of values, either from a dimension associated with a hierarchical list of values, a hierarchy object or a level object, Not in list allows the selection of multiple members from any levels of the hierarchy. For example, a prompt on the [Geography] hierarchy using the Not in list operator allows selection of [Paris] at the City level and [Canada] at the Country level in the prompt.
NoteThis operator can only be used in certain types of hierarchies, for example, it can be used in level-based hierarchies.
6.3.1.2.10 IsNull operator
Use the IsNull operator to retrieve data for which there are no values in the database.
For example, to retrieve customers without children (the children column in the database has no value), create the filter [Children] IsNull.
6.3.1.2.11 Is not Null operator
Use the Is not Null operator to return data for which there is a value in the database.
For example, to return customers with children, create the filter [Children] Is not Null.
6.3.1.2.12 Equal to operator
Use the Equal to operator to obtain data equal to a value.
For example, to return data for the US only, create the filter "[Country] Equal to US".
SAP BusinessObjects Web Intelligence User's GuideAnalyzing data PUBLIC 375
6.3.1.3 Using filters
Filters refine data at a report level, or on specific objects.
The Data panel provides a quick method for adding or editing simple filters, using drag and drop.
NoteYou can add filters only in Design mode.
You can filter on the following objects:
● Dimension, measure or detail objects● Hierarchies, characteristics or attributes for OLAP universes or BEx queries (but not at the hierarchy level
or on measures)
Rreport filters can use any of the operators available in the application, filter on multiple values, and use the All values operator.
Related Information
To create filters [page 376]
6.3.1.3.1 To create filters
You can filter the whole report, or a report element, using the objects that are part of the query.
For example, if you select "US" from the list of values of the Country object, the report is filtered to exclude all rows where Country doesn't have the value "US".
1. In the Design mode, click in the toolbar to open the side panel.
2. Click in the side panel to open the Data panel.3. Select if you want to create a filter that applies to a visualization, or to the whole report:
○ If you want to filter a specific visualization, select it, and in the Data panel, click to open the Filters pane.
○ If you want to filter the whole report, make sure you have no active selection, and in the Data panel,
click to open the Filters pane.4. From the Objects pane, drag an object to the dedicated placeholder in the Filters section.
5. In the Select Values dialog, click to select the operator of the filter and access advanced search options. The default operator is In List.
376 PUBLICSAP BusinessObjects Web Intelligence User's Guide
Analyzing data
Option Description
Show keys (OLAP and BEx queries only)
Displays the key for each value in the list of values.
Match case The search is case-sensitive.
This option isn't available when the Search in keys option is enabled.
Search in keys The search uses unique value keys rather than display values.
This option is available only in lists of values that support key values.
The search includes all ranges if the list of values is divided into ranges. In search patterns, the '*' wildcard represents any string of characters and the '?' wildcard represents any single character. For example, the value "March" can be returned by the search patterns "M*" or "Mar?h". To include the "*" and "?" characters literally rather than as wildcards, precede them with "\" in the search pattern.
6. Select the value(s) you want to add to the filter.
The values you can type or select depend on the operator. For example, if you select the Equal to operator, you can type or select only one value.
To get data for rows or columns that have no data, add [NULL_VALUE] to the object. For example, if you want to see customers who haven't paid, then if you select [NULL_VALUE] for object “Invoice Date”, the resulting list shows only customers with no invoice date.
If the filtered object is a hierarchy, the values are displayed hierarchically. All members of the hierarchy are visible even if they're collapsed in the report. Make sure to select hierarchy members from the hierarchy, because you can't type them manually. All member values that have been selected in the query panel are displayed in gray and can't be selected if they aren't in the final report because they aren't linked to any measures. To help you select the right values, you can also click the key icon to see both the text and key ID value for the members.
If the filtered object is a level, the values are displayed in a list. It's not possible to type the values.7. Optional: Repeat these steps to add additional filters.
TipIf a visualization has multiple filters, the application uses the AND operator by default. To change the
operator, click > Manage Filters next to one of the filter. Double-click the operator to change it to OR.
6.3.1.3.2 To create nested filters in a report
A nested report filter contains more than one filter that use AND and OR clauses.
1. In Design mode, create a filter and add it to the existing filters list in the Data panel.
2. In the Data panel, click next to the Filters section.3. Click Manage Filters.
SAP BusinessObjects Web Intelligence User's GuideAnalyzing data PUBLIC 377
4. Double click the operator to change the type from AND to OR and vice versa.5. Click Apply.6. Click OK.
6.3.1.4 Filtering data with prompts
You can filter report data by supplying values for prompts.
When you refresh a document with prompts, the Prompts dialog displays a summary of all the defined prompts in the query. You can also see active prompts in the filter bar, and change their values when you refresh the document.
Depending on the prompt you select, you type values directly or select values from a list. A list of values can display values only, or values and their corresponding database key values. Database key values are unique values used to identify the display within the database.
Lists of values can be organized hierarchically if the list was defined as a hierarchy by the universe designer, or if the prompt is based on a hierarchy or level object. To improve performance, they're sometimes split into ranges.
Prompts are either optional or mandatory. If you don't supply a value for an optional prompt, the application ignores it. Make sure to specify values for all mandatory prompts before you can filter the data by running the prompts.
Prompts can depend on other prompts. For example, a prompt on a City object can be dependent on a prompt on a Region object. By specifying values to the Region prompt, you restrict the number of possible values of the City prompt.
You can specify values for dependent prompts only when you've specified values for all the prompts on which they depend. If you want to specify values to dependent prompts of an optional prompt, make sure you specify values for the optional prompt.
Related Information
To select values from a list of values [page 138]
6.3.1.4.1 To specify values for prompts
You can filter report data based on prompt values.
1. In Reading mode, click , or in Design mode, click > Refresh All to refresh the document.2. Click a prompt in the Prompts dialog to select it.
3. Click in the top right hand corner of the dialog to refresh the list of values.
378 PUBLICSAP BusinessObjects Web Intelligence User's Guide
Analyzing data
If the prompt is dependent on other prompts, the list of values displays links to the dependent prompts. You must specify values for the dependent prompts first before you can specify a value for the current prompt. Groups of dependent prompts appear in separate groups in the Prompt Summary pane.
Values can appear as single values, in multiple columns (where the additional columns give further information about the main filtering column), or hierarchically, depending on the prompt.
4. Select values using the radio buttons and click OK.You can't type values directly if the list of values is hierarchical. If the prompt requires a date, you can select it from the calendar that appears in the box in which you select the value.
NoteSAP Key Dates appear as date prompts, with other prompts in the same data provider appearing as dependent prompts.
If a prompt allows you to make multiple selections from a hierarchical list of values, you can select values at different levels of the hierarchy. If the prompt allows single values only, you can select values only from the bottom level of the hierarchy.
5. Click Run.
Related Information
To select values from a list of values [page 138]To build a prompt [page 154]
6.3.1.4.2 Prompt variant sets
You can save a group of often-used variable value sets as a prompt variant in the Prompts dialog.
After you've run and saved a document query the first time, you can access the prompt variants feature in the Prompts dialog when you refresh or open the document. Once you've selected the values for each prompt, you name and save the variable value set as a prompt variant.
For example, if you are a regional manager and prefer to have a prompt variant for each branch in your region, then when you refresh a report and select a prompt variant for branch A, the document displays only the data for branch A.
To save a variable value set as a prompt variant, click in the Prompts dialog. After you've saved it, you can
access it via the drop down at the top of the Prompts dialog.
Each prompt variant value is applied to a prompt if, and only if, the following match exactly:
● data type (as in string, date, and so on)● selection type (single, multiple, or interval)● structure (hierarchy, flat)
Unmatched prompts are ignored.
SAP BusinessObjects Web Intelligence User's GuideAnalyzing data PUBLIC 379
Restriction● You must create, run, and then save the document to the CMS to see the prompt variant options.● Only the user who created the prompt variants can view them and they only apply to the document in
which they have been created on.● When you delete a prompt variant, it's completely removed from the document. It can't be recovered.● Prompt variants aren't supported in the Rich Client in offline mode.
Related Information
6.3.2 Filtering data using input controls
Input controls provide a convenient, easily accessible way to filter and analyze report data.
Input controls are displayed in the filter bar, which is designed for consumtpion workflows. We recommend
using the Manage Filter Bar dialog to edit existing input controls ( > > Manage Filter Bar).
You can define input controls using standard windows controls such as lists or entry fields text boxes, and associate them with one or multiple elements such as tables, sections, and charts, or with all the elements in a document. When you select values in the input control, you filter the values in the associated report elements by the values you have selected.
You can use input controls to analyze different scenarios by changing the value of variables. For example, you can assign a slider input control to a variable with a constant value. If the variable is part of a formula, you use the slider control to examine different formula results based on the variable value.
NoteInput controls defined for simulation apply directly to the variables. You can't define dependencies on reports, report parts or documents. Also, input controls based on a constant variable are displayed as document input controls in the filter bar. This makes it easier to understand how the value you set for a particular variable affects the whole document. As a best practice, we recommend having a single input control document with a driving variable rather than multiple report input controls.
Filtering with element links
Element links are another kind of input control, also displayed in the filter bar. You can define tables and charts as input controls using element links. When you create an element link between a parent and child elements, you can select values in the parent table or chart to filter the child report elements.
380 PUBLICSAP BusinessObjects Web Intelligence User's Guide
Analyzing data
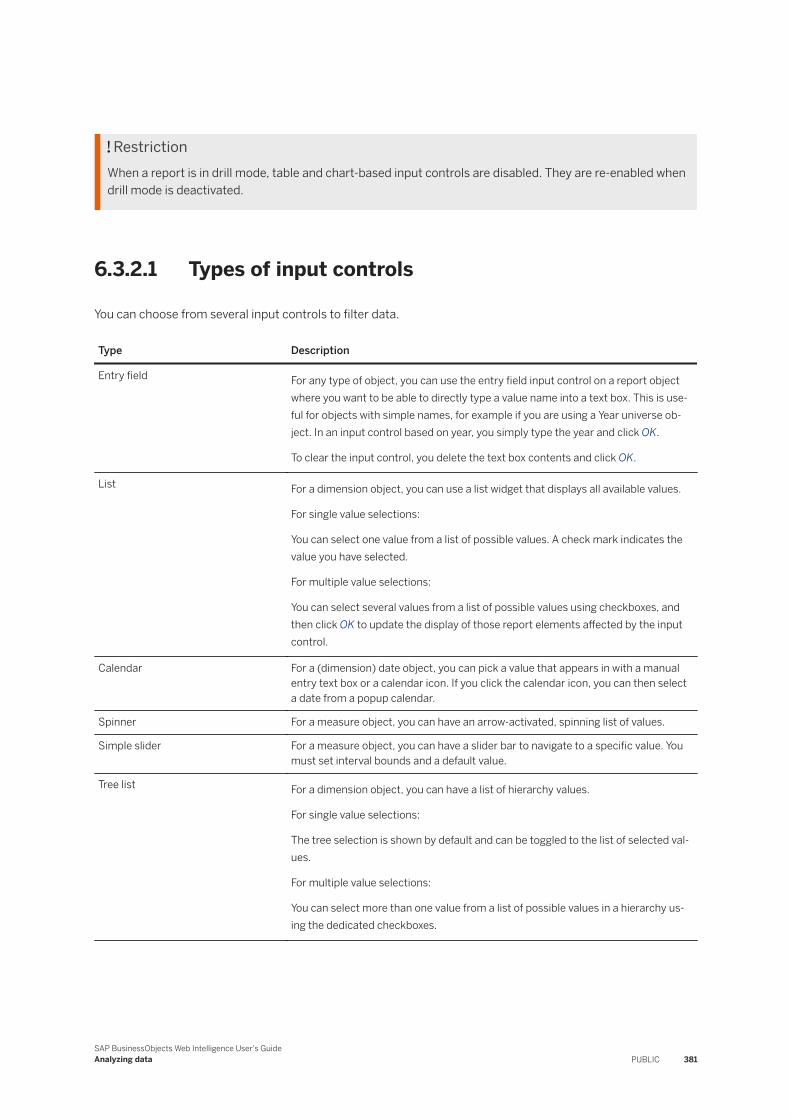
RestrictionWhen a report is in drill mode, table and chart-based input controls are disabled. They are re-enabled when drill mode is deactivated.
6.3.2.1 Types of input controls
You can choose from several input controls to filter data.
Type Description
Entry field For any type of object, you can use the entry field input control on a report object where you want to be able to directly type a value name into a text box. This is useful for objects with simple names, for example if you are using a Year universe object. In an input control based on year, you simply type the year and click OK.
To clear the input control, you delete the text box contents and click OK.
List For a dimension object, you can use a list widget that displays all available values.
For single value selections:
You can select one value from a list of possible values. A check mark indicates the value you have selected.
For multiple value selections:
You can select several values from a list of possible values using checkboxes, and then click OK to update the display of those report elements affected by the input control.
Calendar For a (dimension) date object, you can pick a value that appears in with a manual entry text box or a calendar icon. If you click the calendar icon, you can then select a date from a popup calendar.
Spinner For a measure object, you can have an arrow-activated, spinning list of values.
Simple slider For a measure object, you can have a slider bar to navigate to a specific value. You must set interval bounds and a default value.
Tree list For a dimension object, you can have a list of hierarchy values.
For single value selections:
The tree selection is shown by default and can be toggled to the list of selected values.
For multiple value selections:
You can select more than one value from a list of possible values in a hierarchy using the dedicated checkboxes.
SAP BusinessObjects Web Intelligence User's GuideAnalyzing data PUBLIC 381
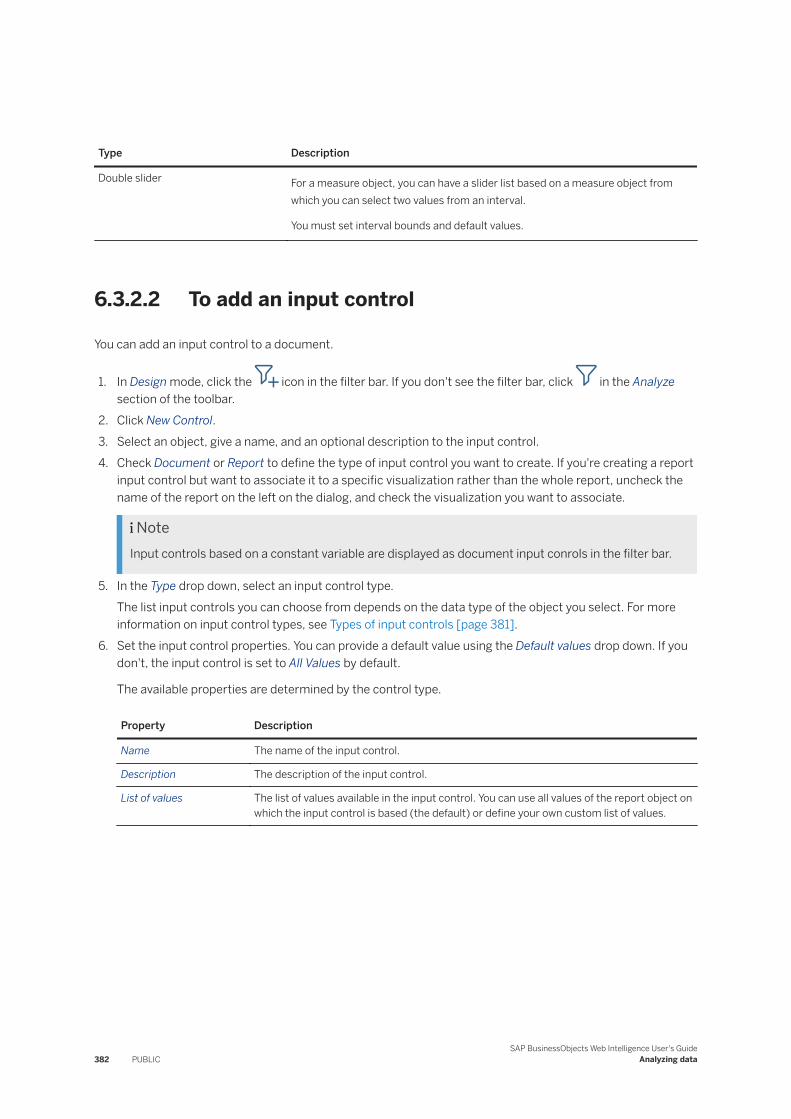
Type Description
Double slider For a measure object, you can have a slider list based on a measure object from which you can select two values from an interval.
You must set interval bounds and default values.
6.3.2.2 To add an input control
You can add an input control to a document.
1. In Design mode, click the icon in the filter bar. If you don't see the filter bar, click in the Analyze section of the toolbar.
2. Click New Control.3. Select an object, give a name, and an optional description to the input control.4. Check Document or Report to define the type of input control you want to create. If you're creating a report
input control but want to associate it to a specific visualization rather than the whole report, uncheck the name of the report on the left on the dialog, and check the visualization you want to associate.
NoteInput controls based on a constant variable are displayed as document input conrols in the filter bar.
5. In the Type drop down, select an input control type.The list input controls you can choose from depends on the data type of the object you select. For more information on input control types, see Types of input controls [page 381].
6. Set the input control properties. You can provide a default value using the Default values drop down. If you don't, the input control is set to All Values by default.
The available properties are determined by the control type.
Property Description
Name The name of the input control.
Description The description of the input control.
List of values The list of values available in the input control. You can use all values of the report object on which the input control is based (the default) or define your own custom list of values.
382 PUBLICSAP BusinessObjects Web Intelligence User's Guide
Analyzing data
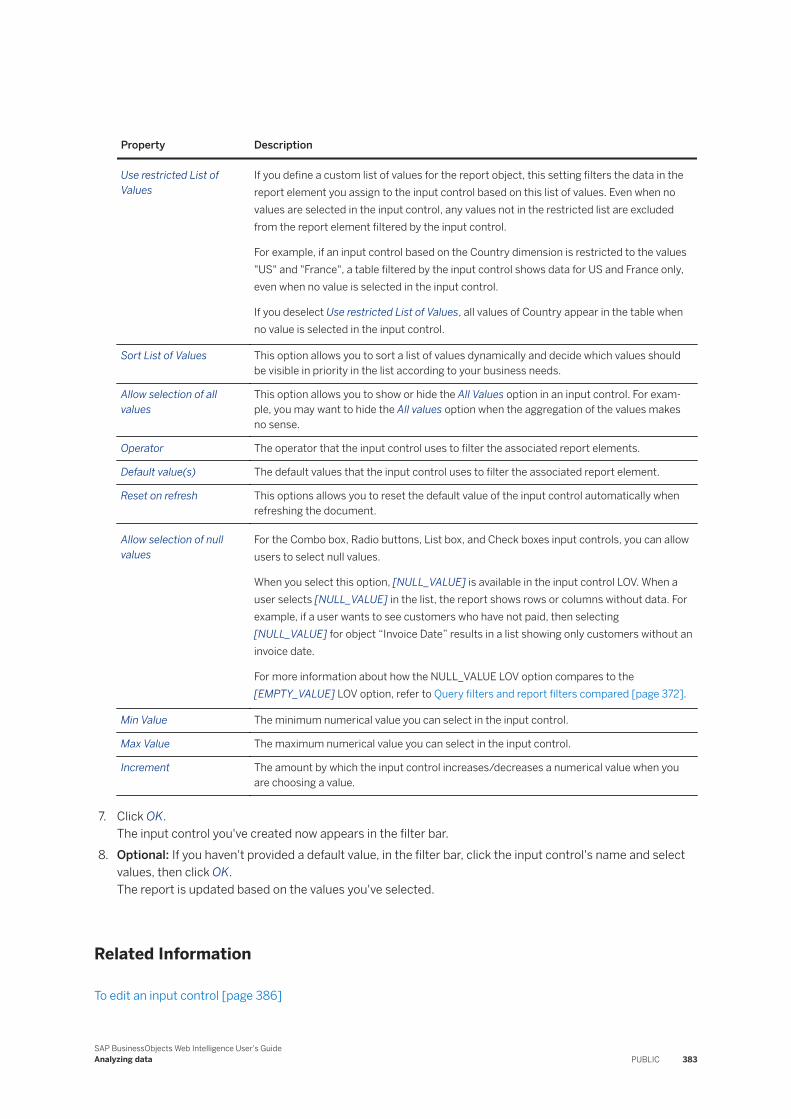
Property Description
Use restricted List of Values
If you define a custom list of values for the report object, this setting filters the data in the report element you assign to the input control based on this list of values. Even when no values are selected in the input control, any values not in the restricted list are excluded from the report element filtered by the input control.
For example, if an input control based on the Country dimension is restricted to the values "US" and "France", a table filtered by the input control shows data for US and France only, even when no value is selected in the input control.
If you deselect Use restricted List of Values, all values of Country appear in the table when no value is selected in the input control.
Sort List of Values This option allows you to sort a list of values dynamically and decide which values should be visible in priority in the list according to your business needs.
Allow selection of all values
This option allows you to show or hide the All Values option in an input control. For example, you may want to hide the All values option when the aggregation of the values makes no sense.
Operator The operator that the input control uses to filter the associated report elements.
Default value(s) The default values that the input control uses to filter the associated report element.
Reset on refresh This options allows you to reset the default value of the input control automatically when refreshing the document.
Allow selection of null values
For the Combo box, Radio buttons, List box, and Check boxes input controls, you can allow users to select null values.
When you select this option, [NULL_VALUE] is available in the input control LOV. When a user selects [NULL_VALUE] in the list, the report shows rows or columns without data. For example, if a user wants to see customers who have not paid, then selecting [NULL_VALUE] for object “Invoice Date” results in a list showing only customers without an invoice date.
For more information about how the NULL_VALUE LOV option compares to the [EMPTY_VALUE] LOV option, refer to Query filters and report filters compared [page 372].
Min Value The minimum numerical value you can select in the input control.
Max Value The maximum numerical value you can select in the input control.
Increment The amount by which the input control increases/decreases a numerical value when you are choosing a value.
7. Click OK.The input control you've created now appears in the filter bar.
8. Optional: If you haven't provided a default value, in the filter bar, click the input control's name and select values, then click OK.The report is updated based on the values you've selected.
Related Information
To edit an input control [page 386]
SAP BusinessObjects Web Intelligence User's GuideAnalyzing data PUBLIC 383
6.3.2.3 To filter data using input controls
You can filter data in a document using input control.
Input control widgets allow you to see the values selected when you created the input control, and search for values that are in the list.
1. Click to display the filter bar.2. Click the name of an input control.3. Select values.
The associated report elements are filtered based on the values you select. For example, if you select the "US" value of the [Country] dimension, the filter operator is Equal To, and there is a table associated with the input control, the table is filtered on the condition [Country] = "US".
Select [NULL_VALUE] to show rows or columns without data. For example, if you want to see customers who have not paid, [NULL_VALUE] for object “Invoice Date” results in a list showing only customers without an invoice date.
4. To filter using a table or chart defined as an input control, select dimension values in the table (rows, columns or cells) or chart (clickable data areas).
Note○ Tables or charts defined as input controls can only filter using dimension values.○ The input control shows the following message if the table or chart is no longer in the report: The
table or chart is not in the report. ○ The input control shows the following message if the filtering dimensions are no longer in the table
or chart: Filtering dimensions not available. The input control becomes usable again if you add the dimensions to the table or chart.
○ The input control shows the following message if the report is in drill mode: Control not usuable while the report is in drill mode. Drill mode must be turned off to make the input control usable.
5. To remove all values applied to the input controls or revert to the default value, click Reset.
6.3.2.4 Adding a dynamic default value to an input control
You can use existing variables as default values for input controls.
If you're a store manager dealing with daily sales figures for instance, you might want your report to automatically show figures from the day before when you open it, so that you can work with the most updated data right away. Having a dynamic default value that always displays the data for the last day rather than the last day you've selected saves you time.
When creating the input control, the expression of the variable you select defines the default value, and applies immediately to the report. The variable picker lets you choose between variables that are compatible with the base object, that is the object you selected when you created the input control.
If you want to reset the input control each time you refresh the document, check the Reset on refresh option in the Edit Control dialog when editing an input control, or in the Choose Control Type dialog when creating one. It resets the default value of the input control.
384 PUBLICSAP BusinessObjects Web Intelligence User's Guide
Analyzing data
RestrictionYou can't use a dynamic default value with tree lists, spinners, sliders, and double sliders input controls.
6.3.2.4.1 To add a dynamic default value to an input control
1. Depending on whether you're creating or editing an input control, in the New Control or Edit Control dialog, click the dropdown next to the Default value(s) field.
2. Click Select a variable.3. Select a variable.4. Click OK.
6.3.2.5 Sorting lists of values dynamically
Working with large and scalable lists of values can be time-consuming.
Dynamic sorting helps you keep them organize and decide which values should be visible in priority in the list. For instance, you might want your dates to be sorted by descending order, so that new values added to the list are displayed at the top automatically.
In Design mode, use the Sort List of Values option to add ascending or descending sorting by default to keep your lists organized according to your business needs. The sorting applies when you refresh the document.
If you apply a custom sort to a dimension at the report level, the sorting of the list of values applies to the custom order.
Restriction● You can't add dynamic sorting to lists of values that are restricted.● Dynamic sorting is incompatible with custom LOV sorting.
6.3.2.5.1 To add dynamic sorting to a list of values
1. In Design mode, in the New Control or Edit Input Control dialog, depending on whether you’re creating or editing an input control, click the Sort list of values dropdown menu.If you can't see the Sort list of values option, this means that it's a restricted list of values.
2. Select None, Ascending, or Descending.3. Click OK.
SAP BusinessObjects Web Intelligence User's GuideAnalyzing data PUBLIC 385
6.3.2.6 To edit an input control
You can edit values of an input control.
1. Click in the toolbar to display the filter bar.2. Click an input control's name to open the editing widget, select values and click OK.
3. If you want to edit the properties of the input control, in Design mode, click > > Manage Filter Bar.
You can also access the settings by clicking > Advanced Settings.4. In the Manage Filter Bar dialog, click the right arrow next the input control you want to edit.5. Edit the properties.6. Click OK.
6.3.2.7 To reset an input control
When resetting an input control, you revert it to its default value.
You can reset an input control either in Reading or Design mode. In Design mode, you can also reset an input control automatically using the Reset on refresh option in the avdanced settings.
1. Click in the Analyze section of the toolbar.2. Optional: If you want to reset all input controls:
○ In Reading mode, click .
○ In Design mode, click > Reset All.3. Click the name of an input control to open the editing widget.4. Click Reset.
TipIf you want to reset the input control automatically when you refresh the document, check the Reset on refresh checkbox in the input control's advanced settings. In Design mode, click the input control's
name in the filter bar, then click > Advanced Settings to access the advanced settings.
6.3.2.8 To organize input controls
You can change the order of input controls in the filter bar.
1. In Design mode, click in the toolbar to display the filter bar.
386 PUBLICSAP BusinessObjects Web Intelligence User's Guide
Analyzing data
2. In the filter bar, click > Manage Filter Bar.3. Use the up and down arrows to move input controls up or down in the hierarchy.
4. Click next to an input control's name to access its properties and edit them.
5. To delete an input control, click > Delete.6. Click OK.
6.3.2.9 To define a table or chart as an input control
You can use a table or a chart as an input control.
1. In Design mode, right-click a table or chart and select Element Link Add .2. By default, the filtering objects drop down is set to All Objects, so that each object filters other
visualizations in the report. If you want to have a single filtering object, select it in the drop down.
NoteOnly dimensions can be filtering objects.
3. Add a name and a description.4. If you want to refresh the element link automatically when rereshing the document, turn on Reset on
refresh.5. Select the target of the element link using the checkboxes in the Target Visualizations section of the dialog.6. Click OK.7. To modify the way a table or chart filters other report elements, right-click the table or chart and select
Element Link Edit .
8. To reset an element link, in the toolbar, click in the toolbar to display the filter, and click > .9. To remove a link between a table or chart and other report elements, right-click the table or chart and
select Element Link Remove .
NoteIf you delete either the source or target visualization, the element is automatically deleted.
Related Information
To edit an input control [page 386]
SAP BusinessObjects Web Intelligence User's GuideAnalyzing data PUBLIC 387
6.3.3 Filtering data dynamically with groups of input controls
You can use a filter path to help you refine your data in a report.
A filter path is a visual representation of the order of two or more input controls that are part of the same group. This order determines the progressive refinement of available values in the input controls’ lists of values.
You create a filter path by grouping several input controls together in a report, and then select each one in the order that you would like your values to be filtered. The filter path allows you to control the progressive refinement of your data.
CautionRestricting lists of values dependent on other input controls’ selections can decrease performance.
Example
Instead of selecting a city from a large list of values, it is easier to:
1. Select a value for the Country input control to narrow down the possible regions.2. Select a value from the restricted list of regions for the Region input control to further limit the number of
potential cities.3. Select a value from the restricted list of cities for the City input control.
Your filter path would then look like this: Country Region Cities .
TipYou can also group input controls to improve the layout of a report.
Related Information
To create a group of input controls [page 389]Input controls eligible to groups and dynamic filtering [page 388]Example: Creating a filter path [page 393]
6.3.3.1 Input controls eligible to groups and dynamic filtering
Depending on the input control and the properties you selected when you created it, it might not be eligible for grouping, or eligible with restrictions regarding dynamic filtering.
Web Intelligence notifies you whenever there are incompatibilities between the properties of an input control and grouping or dynamic filtering when you create a group of input controls.
388 PUBLICSAP BusinessObjects Web Intelligence User's Guide
Analyzing data
Input controls not eligible for grouping
Input controls can be ineligible for one of the reasons listed below:
● Restricted list of valuesYou have defined a list of values that might be incompatible with the restricted list of values resulting from dynamic filtering.
● Default valueThe default value of the input control might be incompatible with the restricted list of values resulting from dynamic filtering.
● Excluding <All values>The default value you have selected instead of <All values> might be incompatible with the restricted list of values resulting from dynamic filtering.
Input controls that cannot be added to a group are grayed out and cannot be selected. An information icon and a tooltip appear when you move the cursor over. When attempting to select them, a message is also displayed at the bottom of the dialog box. Elements links and tree lists for example aren't eligible to grouping.
Input controls eligible for grouping with restrictions regarding dynamic filtering
Several input controls are not associated to a list of values and therefore cannot be filtered dynamically:
● Calendar● Direct input● Spinner● Slider
If you select an input control from the list above to add it to a group, the incompatibility is explained in a tooltip when you move the cursor over the warning icon. A message is also displayed at the bottom of the dialog box.
6.3.3.2 To create a group of input controls
Before creating a filter path, you need to create a group of input controls in which you can apply a filter path. When creating the group, you can either add existing controls to the group, or create new controls from scratch.
1. In Design mode, click in the filter bar. If you don't see the filter bar, click in the Analyze section of the toolbar.
2. Click New Group of Controls, and select whether the group should apply to the report, or to the whole document.
3. In the New Group dialog, add a name to the group.4. Click Add Control. If there's no eligible control available, the application lets you create a new control from
scratch directly via the New Control dialog. If there are any, the application automatically shows existing eligible controls you can add to the group. In that case, you can either:
SAP BusinessObjects Web Intelligence User's GuideAnalyzing data PUBLIC 389
○ Select at least two input controls using the dedicated checkboxes and click OK. If there's only one exisitng input control displayed, the OK button is greyed out. Create a new input control and add it to the group first before adding the existing one.
○ Create a new input control from scratch by clicking New Control. The application automatically adds it to the group after you've created it.
A group can't have both report and document input controls, and won't accept input controls of a different type. If the group applies to the document, but the existing input control you want to add applies to the report, then it won't be displayed. If you can't see an exisiting input control when clicking Add Control in the New Group dialog, make sure both the group and the input control are the same type.
5. Repeat step 4 to add other controls to the group.
NoteYou can't have the same input control in two different groups. If you select an input control that already belongs to another group, the other group will be reset without the selected input control, and its filter path will be modified. Also, if you add an existing input control to a group, its value is reset to All values.
6. Use the up and down arrows in the New Group to move the controls up and down and change the order of the filter path.
7. By default, each input control you add to the group is automatically added to the filter path. If you want to create a filter path manually after you've created the group, uncheck Add all input controls to filter path.
8. Click OK.
The group is now created and displayed in the filter bar.
Related Information
To create a filter path [page 390]To reset a filter path [page 391]Input controls eligible to groups and dynamic filtering [page 388]
6.3.3.3 To create a filter path
When creating a filter path, make sure the first input control you select returns the most general values, followed by input controls with increasing specificity so the filter path narrows down your data selection in successive steps.
NoteIf you've checked the option when creating the group of input controls, the application has created a filter path automatically. If that's the case, you can skip this procedure.
1. You can create a filter path in both Reading and Design mode. Click in the Analyze section of the toolbar to display the filter bar.
390 PUBLICSAP BusinessObjects Web Intelligence User's Guide
Analyzing data
2. Optional: Click the group name for which you want to create a filter path.
3. Click to select the first input control, and in Available Controls widget, click next to the input control you want to add to the filter path.You can now see the input control in the filter bar.
4. Repeat the steps above for each input control of the group to add them to the filter path and refine the data.
5. Click an input control's name and select one or more values.
The report dynamically changes to display a restricted list of values filtered accordingly to the value of the first input control.
NoteYou can modify the selected values at any time by clearing current values or selecting new ones. The filter path will adapt accordingly.
Related Information
Filtering data dynamically with groups of input controls [page 388]Input controls eligible to groups and dynamic filtering [page 388]
6.3.3.4 To reset a filter path
1. In the filter bar, click next to an input control's name.2. Repeat this step for each input control in the filter path.
6.3.3.5 To add an input control to a group
1. In Design mode, click in the filter bar. If you don't see the filter bar, click in the Analyze section of the toolbar.
2. Click a group of input control.
3. Click , and in the Available Controls widget, click Manage Group.4. Click Add Control. If there's no eligible control available, the application lets you create a new control from
scratch directly via the New Control dialog. If there are any, the application automatically shows existing eligible controls you can add to the group. In that case, you can either:
○ Select an input control using the dedicated checkboxes and click OK.
SAP BusinessObjects Web Intelligence User's GuideAnalyzing data PUBLIC 391
○ Create a new input control from scratch by clicking New Control. The application automatically adds it to the group after you've created it.
6.3.3.6 To remove an input control from a group
CautionIf you remove an input control from a group that has only two input controls, the group is deleted. Also, if the input control you remove belongs to a filter path, the filter path is modified.
1. In Design mode, click in the filter bar. If you don't see the filter bar, click in the Analyze section of the toolbar.
2. Click the name of the group.
3. Click , and in the Available Controls widget, click Manage Group.
4. Hover over the control you want to remove from the group and click > Remove from Group.
6.3.3.7 To move an input control to another group
CautionIf the input control you move belongs to a group that has only two input controls, the group will be deleted. Also, if the input control is part of the filter path of its previous group, moving it to another group will remove it from the filter path and will reset the values of its previous group.
1. In Design mode, click in the filter bar. If you don't see the filter bar, click in the Analyze section of the toolbar.
2. Click the name of a group.
3. Click , and in the Available Controls widget, click Manage Group.4. Click Add Control.5. Select an input control using the dedicated checkboxes.6. Click OK.
6.3.3.8 To delete a group
When you delete a group, the input controls remain in the filter bar, but the filter path is removed.
392 PUBLICSAP BusinessObjects Web Intelligence User's Guide
Analyzing data

1. In Design mode, click > Manage Filter Bar in the filter bar. If you don't see the filter bar, click in the Analyze section of the toolbar.
2. Hover over the group you want to delete and click > Delete.
6.3.3.9 Example: Creating a filter path
You create a filter path by successively selecting value for different input controls in a group, so that you can narrow down the amount values you want to analyze in your report.
Checking the revenue generated by swimming suits in Kingston in 2019
As a regional marketing director for America, you want to check the revenue generated by the city of Kingston in 2019, for the swimming suits product line. You have the following information:
● Two input controls, <Year> and <Sales Revenue> have already been created in the report you are working on.
● There is also a group of three input controls, named <Business>, with the following input controls inside: <Country>, <City> and <Product>.
So, you would like to create a filter path to display the information you are interested in and filter your data. Since there's a group created already, the filter bar displays it automatically under <Business>, the name of the group.
1. Click the name of the group, then click the drop down icon to open the Available Controls list and select the input control you want to have placed first in the filter path. In this case, <Country>.
2. Select the value of the first input control of the group, <Country>: Jamaica.3. Repeat the first step to add <City>, the second input control of the filter path. When selecting the value,
you can that the list of possible values has been restricted, according the value selected for <Country>. The list of possible values for <City> decreased and displays only the value for Jamaica.Let’s say that you want to take a closer look at Kingston, to see if the results are better than last year.
4. Select Kingston as the value for the second input control, <City>.5. Repeat the first step to add the last input control to the filter path.6. Select the swimming suits in the third input control, <Product>, to get a quick view of the result you
wanted to get originally.
You can now see in the table the revenue generated by swimming suits in Kingston in 2019.
You can see the filter path as you go along in the filter bar. It should look like this: Jamaica KingstonSwimming Suits .
If you want to drill up and get a look a broader results, for the whole country for instance, reset the second input control to see the revenue generated by the other cities of the country.
SAP BusinessObjects Web Intelligence User's GuideAnalyzing data PUBLIC 393
6.4 Functions
Functions and formulas help you make quick calculations on data for a better data analysis.
The following sections provide you with details regarding functions and calculations.
For more information about Read
Functions Calculations Standard calculations [page 236]
Functions Functions [page 423]
Operators Function and formula operators [page 627]
Calculation contexts Understanding calculation contexts [page 403]
Smart measures Calculating values with smart measures [page 415]
Custom calculation Defining a custom calculation [page 655]
6.4.1 Using functions, formulas and calculations for data analysis
6.4.1.1 Document History: Web Intelligence Functions, Formulas and Calculations
The following table provides an overview of the most important document changes.
Version Date Description
SAP BusinessObjects Web Intelligence 4.3 SP1
December 2020 The following sections have been updated or added to the guide:
● New RPos [page 486] function added.
● Updated Pos [page 480].
SAP BusinessObjects Web Intelligence 4.3
June 2020 The following sections have been updated or added to the guide:
● New DocumentDescription [page 531], DocumentParentFolder [page 533], DocumentPath [page 535], and NumberOfColumns [page 521] functions added.
394 PUBLICSAP BusinessObjects Web Intelligence User's Guide
Analyzing data
Version Date Description
● You can now add comments within the code of a formula.
● Updated:○ Trim [page 488], LeftTrim
[page 477], and RightTrim [page 485]. You can now specify the characters you want to remove.
○ QuerySummary [page 539] and DataProviderType [page 516]. Both functions returns new data provider types.
6.4.1.2 About this guide
The Using Functions, Formulas and Calculations in Web Intelligence guide provides detailed information on the advanced calculation capabilities that you can use when you perform data analysis.
This guide also provides a syntax reference to the available functions and operators.
6.4.1.3 Using standard and custom calculations
6.4.1.3.1 Using standard and custom calculations
You can use standard calculation functions to make quick calculations on data.
If standard calculations are not sufficient for your needs, you can use the formula language to build custom calculations.
6.4.1.3.1.1 Standard calculations
You can use standard calculation functions to make quick calculations on data.
The following standard calculations are available:
Calculation Description
Sum Calculates the sum of the selected data.
Count Counts all rows for a measure object or count distinct rows for a dimension or detail object.
Average Calculates the average of the data.
SAP BusinessObjects Web Intelligence User's GuideAnalyzing data PUBLIC 395
Calculation Description
Min Displays the minimum value of the selected data.
Max Displays the maximum value of the selected data.
Percentage Displays the selected data as a percentage of the total. The results of the percentage are displayed in an additional column or row of the table.
NotePercentages are calculated for the selected measure compared to the total results for that measure on the table or break. To calculate the percentage of one measure compared to another measure, you need to build a custom calculation.
When you apply standard calculations to table columns, the calculation results appear in footers. One footer is added for each calculation.
6.4.1.3.1.2 Using formulas to build custom calculations
Custom calculations allow you to add additional calculations to your report beyond its base objects and standard calculations.
You add a custom calculation by writing a formula. A formula can consist of base report variables, functions, operators and calculation contexts.
A custom calculation is a formula that can consist of report objects, functions and operators. Formulas have a calculation context that you can specify explicitly if you choose.
Example: Showing average revenue per sale
If you have a report with Sales Revenue and Number Sold objects and you want to add revenue per sale to the report, the calculation [Sales Revenue]/[Number Sold] gives this value by dividing the revenue by the number of items sold in order to give the revenue per item.
6.4.1.3.1.2.1 Using variables to simplify formulas
Variables are useful to break down formulas into manageable parts and make them easier to read. They also make building a formula less error-prone.
You'll find the variables in the Objects pane, under the Variables section, along with other objects in the query.
Use the Description field to provide context and details about a specific variable. The description is displayed in the Query Panel when you hover over the variable. You can edit this description when creating, editing or renaming a variable.
396 PUBLICSAP BusinessObjects Web Intelligence User's Guide
Analyzing data
6.4.1.3.1.3 Working with functions
A custom calculation sometimes contains only report objects, for example [Sales Revenue]/[Number of Sales]. Calculations can also include functions in addition to report objects.
A function receives zero or more values as input and returns output based on those values. For example, the Sum function totals all the values in a measure and outputs the result. The formula Sum([Sales Revenue]) outputs a total of sales revenues. In this case, the function input is the Sales Revenue measure and the output is the total of all Sales Measures.
Related Information
Function and formula operators [page 627]Functions [page 423]
6.4.1.3.1.3.1 Including functions in cells
The text in report cells always begins with ‘=’ .
Literal text appears in quotation marks, while formulas appear without quotation marks. For example, the formula Average([Revenue]) appears in a cell as =Average([Revenue]). The text “Average Revenue?" appears as ="Average Revenue?"
You can use text alone in a cell, or mix formulas and text by using the ‘+’ operator. If you want a cell to display the average revenue preceded by the text “Average Revenue:", the cell text is as follows: ="Average Revenue: " + Average([Revenue])
Note the space at the end of the text string so that the text and the value are not placed directly side-by-side in the cell.
6.4.1.3.1.3.2 Function syntax
The Formula Editor displays the function syntax when you select the function.
To use a function you need to know its name, how many input values it requires and the data types of these input values. You also need to know the type of data that the function outputs.
For example, the Sum function takes a numerical object as input (for example a measure showing sales revenue) and outputs numeric data (the sum of all the values of the measure object).
Here is the syntax of the Abs function:
num Abs(number)
This syntax tells you that the Abs function takes a single number as input and returns a number as output.
SAP BusinessObjects Web Intelligence User's GuideAnalyzing data PUBLIC 397
6.4.1.3.1.3.3 Examples of functions
This topic offers examples of functions used in formulas.
Example: Showing prompt input with the UserResponse function
You have a report showing Year, Quarter and Sales revenue. The State object also appears in the report data, although it is not displayed. When the user runs the report they are presented with a prompt and they must choose a state. You want to show the state that they have chosen in the report title. If your data provider is called “eFashion" and the text in the prompt is “Choose a State", the formula for the title is:
"Quarterly Revenues for " + UserResponse([Query 1];"Enter values for State:")
The report is as follows when the user has chosen Illinois as the state when refreshing the data provider:
398 PUBLICSAP BusinessObjects Web Intelligence User's Guide
Analyzing data
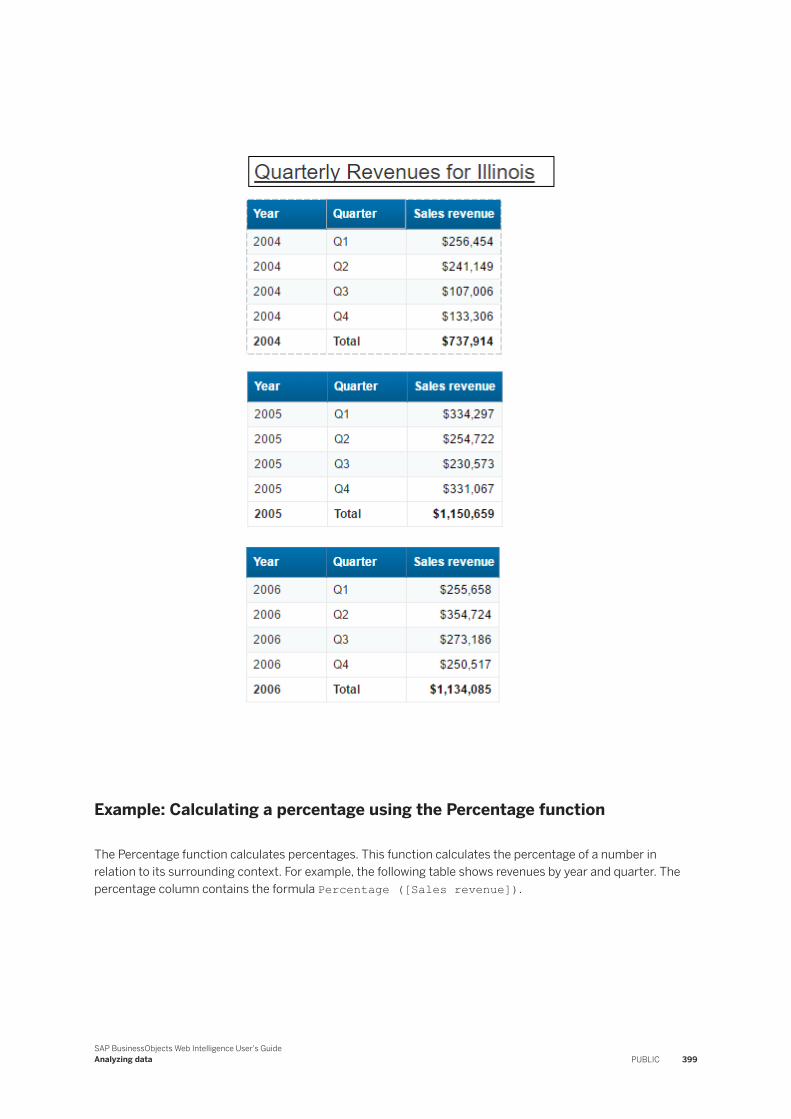
Example: Calculating a percentage using the Percentage function
The Percentage function calculates percentages. This function calculates the percentage of a number in relation to its surrounding context. For example, the following table shows revenues by year and quarter. The percentage column contains the formula Percentage ([Sales revenue]).
SAP BusinessObjects Web Intelligence User's GuideAnalyzing data PUBLIC 399
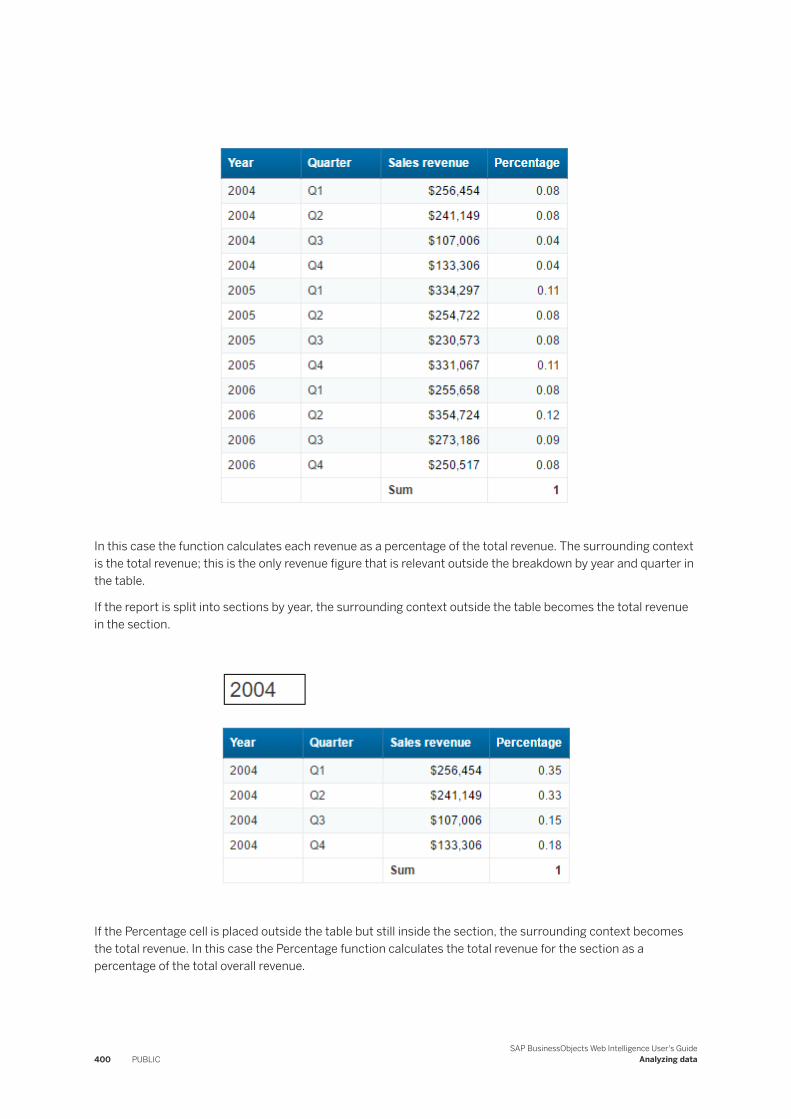
In this case the function calculates each revenue as a percentage of the total revenue. The surrounding context is the total revenue; this is the only revenue figure that is relevant outside the breakdown by year and quarter in the table.
If the report is split into sections by year, the surrounding context outside the table becomes the total revenue in the section.
If the Percentage cell is placed outside the table but still inside the section, the surrounding context becomes the total revenue. In this case the Percentage function calculates the total revenue for the section as a percentage of the total overall revenue.
400 PUBLICSAP BusinessObjects Web Intelligence User's Guide
Analyzing data
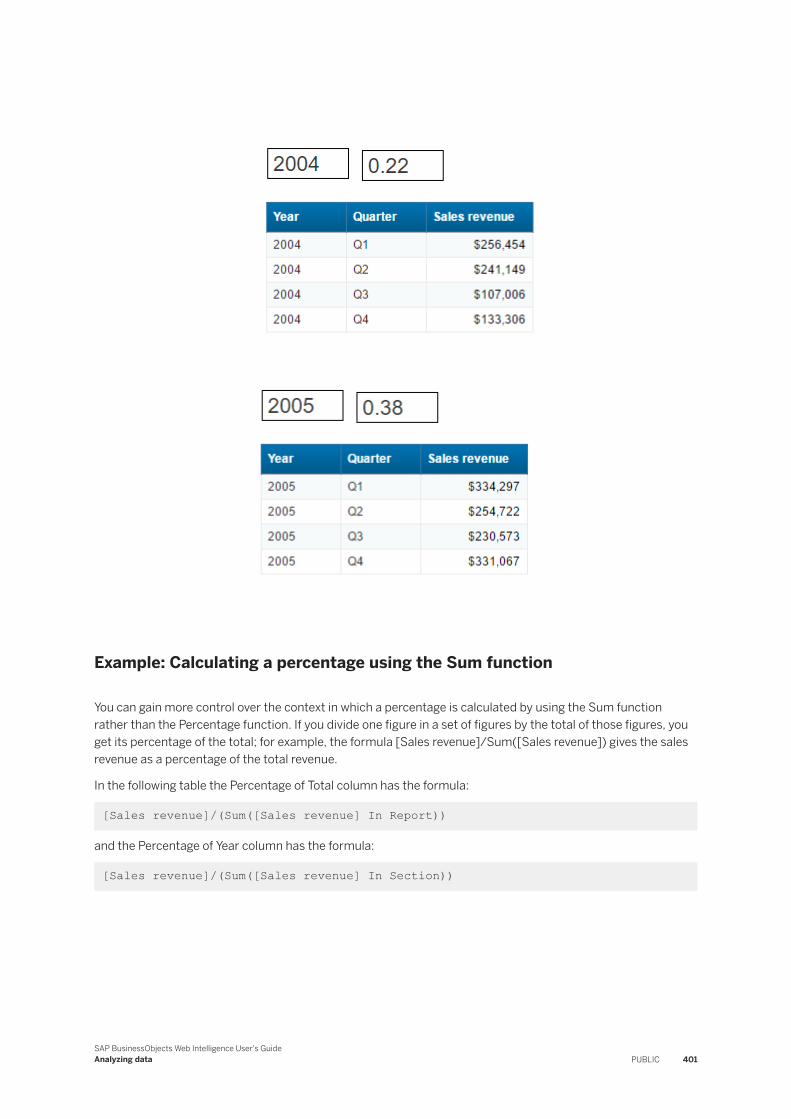
Example: Calculating a percentage using the Sum function
You can gain more control over the context in which a percentage is calculated by using the Sum function rather than the Percentage function. If you divide one figure in a set of figures by the total of those figures, you get its percentage of the total; for example, the formula [Sales revenue]/Sum([Sales revenue]) gives the sales revenue as a percentage of the total revenue.
In the following table the Percentage of Total column has the formula:
[Sales revenue]/(Sum([Sales revenue] In Report))
and the Percentage of Year column has the formula:
[Sales revenue]/(Sum([Sales revenue] In Section))
SAP BusinessObjects Web Intelligence User's GuideAnalyzing data PUBLIC 401
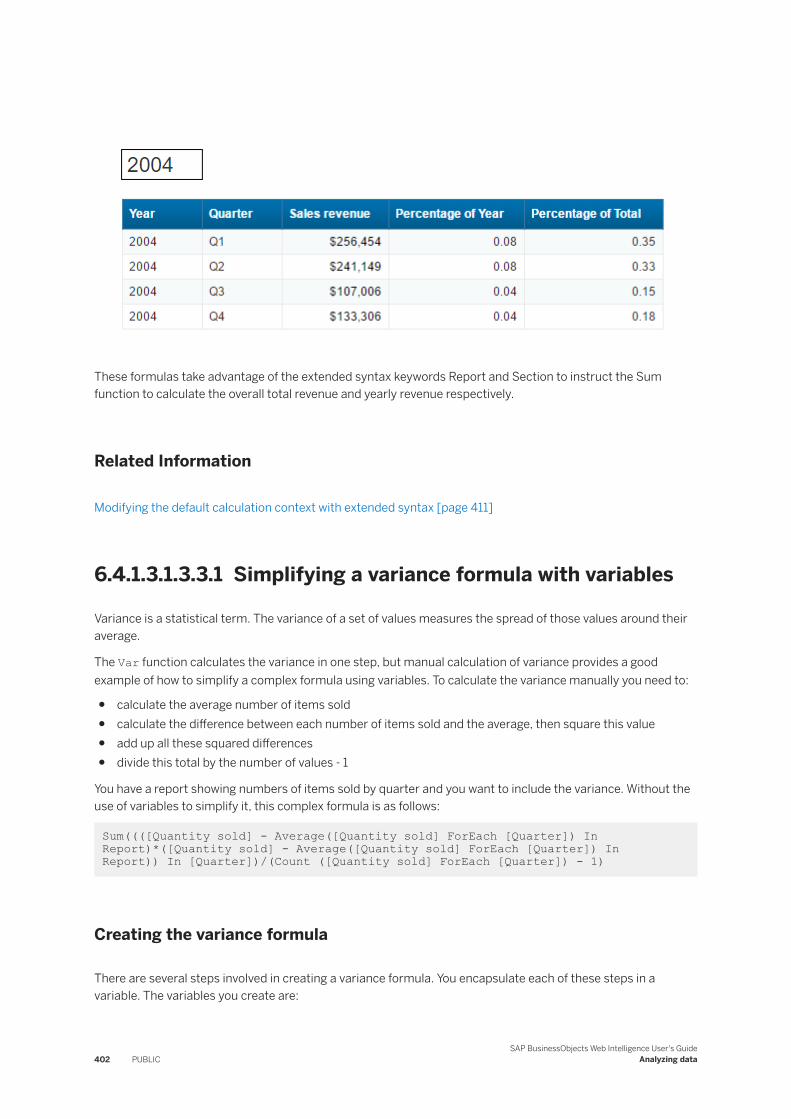
These formulas take advantage of the extended syntax keywords Report and Section to instruct the Sum function to calculate the overall total revenue and yearly revenue respectively.
Related Information
Modifying the default calculation context with extended syntax [page 411]
6.4.1.3.1.3.3.1 Simplifying a variance formula with variables
Variance is a statistical term. The variance of a set of values measures the spread of those values around their average.
The Var function calculates the variance in one step, but manual calculation of variance provides a good example of how to simplify a complex formula using variables. To calculate the variance manually you need to:
● calculate the average number of items sold● calculate the difference between each number of items sold and the average, then square this value● add up all these squared differences● divide this total by the number of values - 1
You have a report showing numbers of items sold by quarter and you want to include the variance. Without the use of variables to simplify it, this complex formula is as follows:
Sum((([Quantity sold] - Average([Quantity sold] ForEach [Quarter]) In Report)*([Quantity sold] - Average([Quantity sold] ForEach [Quarter]) In Report)) In [Quarter])/(Count ([Quantity sold] ForEach [Quarter]) - 1)
Creating the variance formula
There are several steps involved in creating a variance formula. You encapsulate each of these steps in a variable. The variables you create are:
402 PUBLICSAP BusinessObjects Web Intelligence User's Guide
Analyzing data
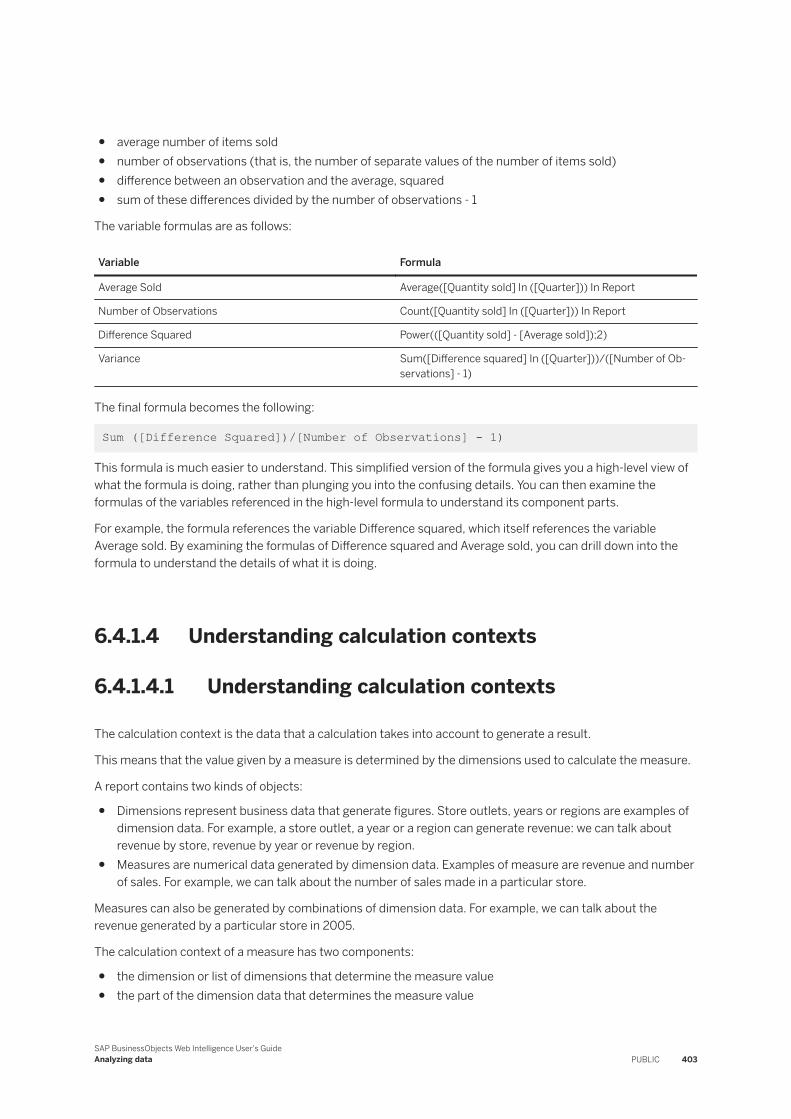
● average number of items sold● number of observations (that is, the number of separate values of the number of items sold)● difference between an observation and the average, squared● sum of these differences divided by the number of observations - 1
The variable formulas are as follows:
Variable Formula
Average Sold Average([Quantity sold] In ([Quarter])) In Report
Number of Observations Count([Quantity sold] In ([Quarter])) In Report
Difference Squared Power(([Quantity sold] - [Average sold]);2)
Variance Sum([Difference squared] In ([Quarter]))/([Number of Observations] - 1)
The final formula becomes the following:
Sum ([Difference Squared])/[Number of Observations] - 1)
This formula is much easier to understand. This simplified version of the formula gives you a high-level view of what the formula is doing, rather than plunging you into the confusing details. You can then examine the formulas of the variables referenced in the high-level formula to understand its component parts.
For example, the formula references the variable Difference squared, which itself references the variable Average sold. By examining the formulas of Difference squared and Average sold, you can drill down into the formula to understand the details of what it is doing.
6.4.1.4 Understanding calculation contexts
6.4.1.4.1 Understanding calculation contexts
The calculation context is the data that a calculation takes into account to generate a result.
This means that the value given by a measure is determined by the dimensions used to calculate the measure.
A report contains two kinds of objects:
● Dimensions represent business data that generate figures. Store outlets, years or regions are examples of dimension data. For example, a store outlet, a year or a region can generate revenue: we can talk about revenue by store, revenue by year or revenue by region.
● Measures are numerical data generated by dimension data. Examples of measure are revenue and number of sales. For example, we can talk about the number of sales made in a particular store.
Measures can also be generated by combinations of dimension data. For example, we can talk about the revenue generated by a particular store in 2005.
The calculation context of a measure has two components:
● the dimension or list of dimensions that determine the measure value● the part of the dimension data that determines the measure value
SAP BusinessObjects Web Intelligence User's GuideAnalyzing data PUBLIC 403
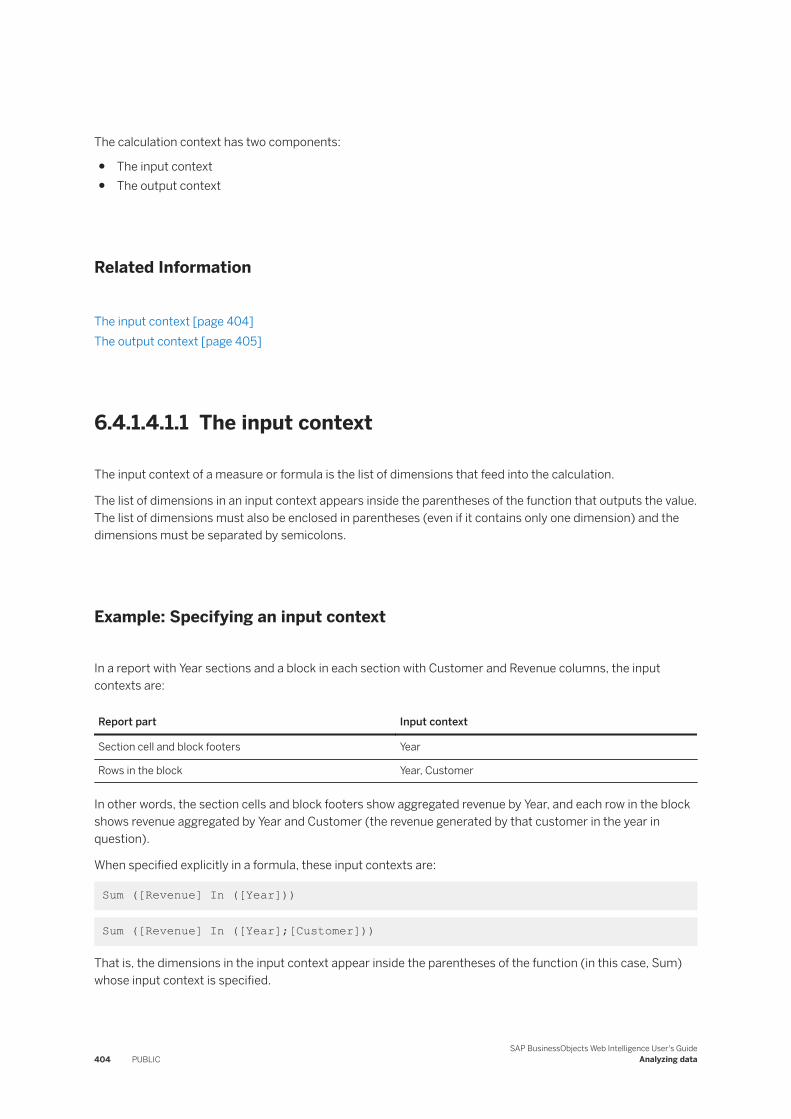
The calculation context has two components:
● The input context● The output context
Related Information
The input context [page 404]The output context [page 405]
6.4.1.4.1.1 The input context
The input context of a measure or formula is the list of dimensions that feed into the calculation.
The list of dimensions in an input context appears inside the parentheses of the function that outputs the value. The list of dimensions must also be enclosed in parentheses (even if it contains only one dimension) and the dimensions must be separated by semicolons.
Example: Specifying an input context
In a report with Year sections and a block in each section with Customer and Revenue columns, the input contexts are:
Report part Input context
Section cell and block footers Year
Rows in the block Year, Customer
In other words, the section cells and block footers show aggregated revenue by Year, and each row in the block shows revenue aggregated by Year and Customer (the revenue generated by that customer in the year in question).
When specified explicitly in a formula, these input contexts are:
Sum ([Revenue] In ([Year]))
Sum ([Revenue] In ([Year];[Customer]))
That is, the dimensions in the input context appear inside the parentheses of the function (in this case, Sum) whose input context is specified.
404 PUBLICSAP BusinessObjects Web Intelligence User's Guide
Analyzing data
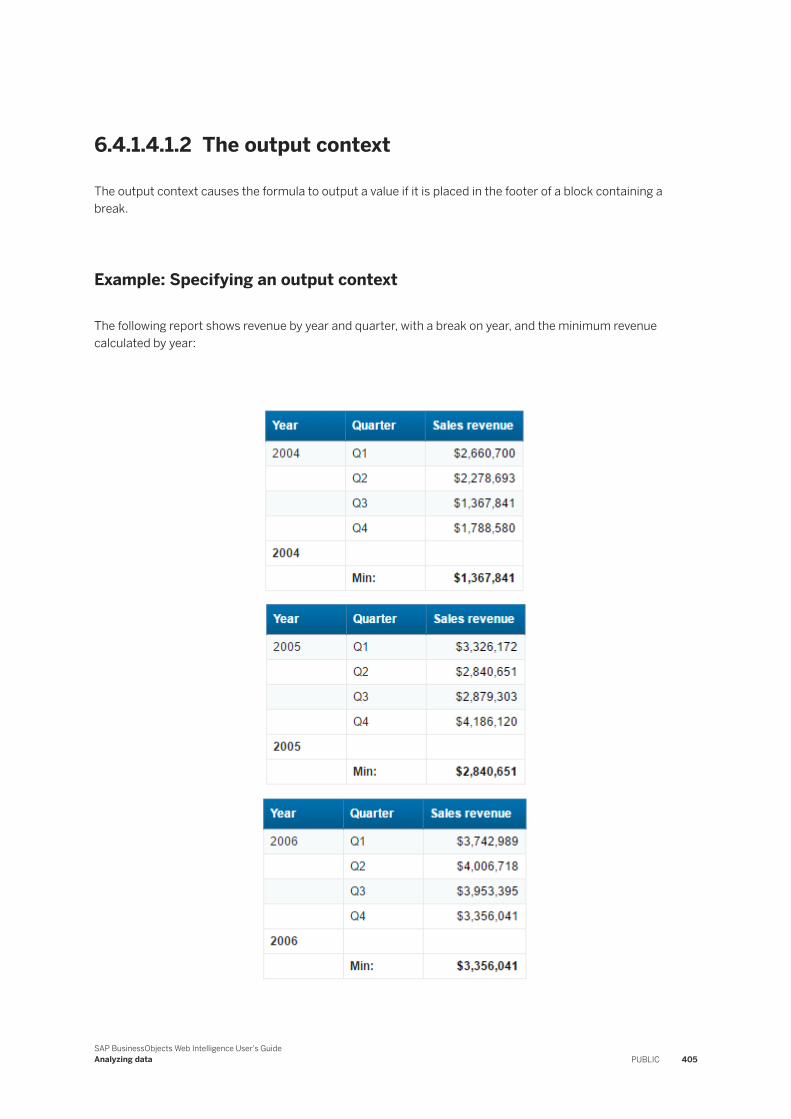
6.4.1.4.1.2 The output context
The output context causes the formula to output a value if it is placed in the footer of a block containing a break.
Example: Specifying an output context
The following report shows revenue by year and quarter, with a break on year, and the minimum revenue calculated by year:
SAP BusinessObjects Web Intelligence User's GuideAnalyzing data PUBLIC 405
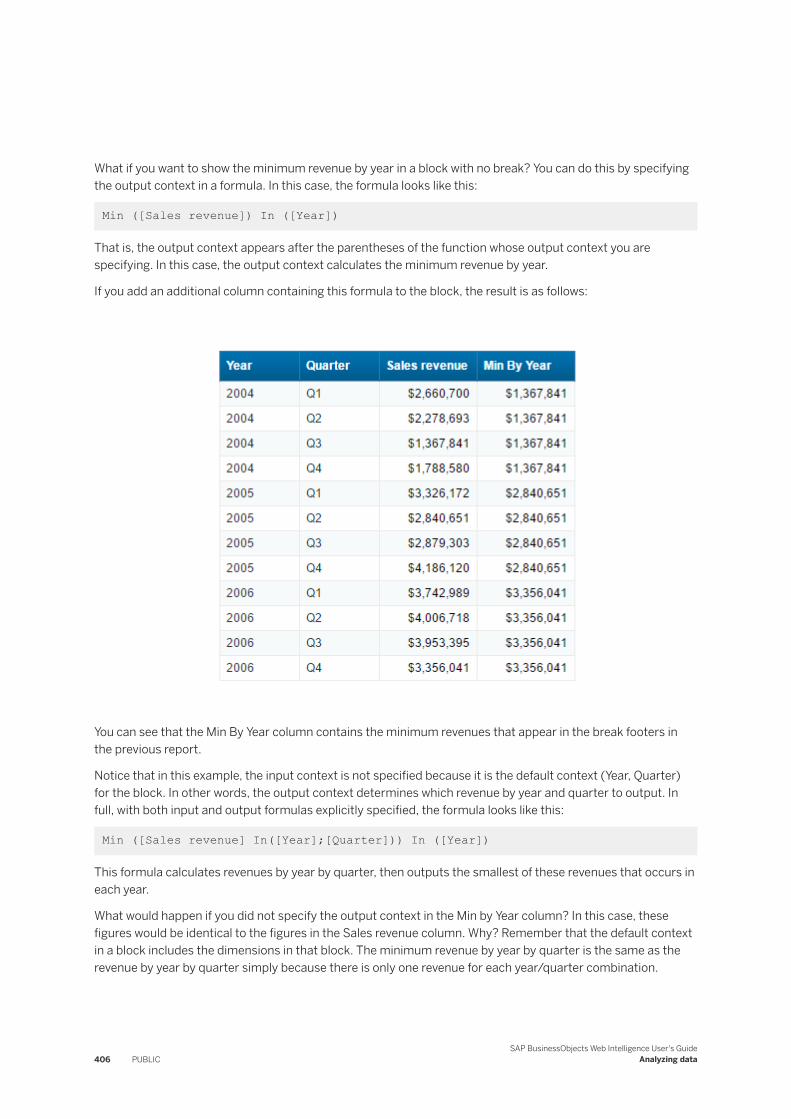
What if you want to show the minimum revenue by year in a block with no break? You can do this by specifying the output context in a formula. In this case, the formula looks like this:
Min ([Sales revenue]) In ([Year])
That is, the output context appears after the parentheses of the function whose output context you are specifying. In this case, the output context calculates the minimum revenue by year.
If you add an additional column containing this formula to the block, the result is as follows:
You can see that the Min By Year column contains the minimum revenues that appear in the break footers in the previous report.
Notice that in this example, the input context is not specified because it is the default context (Year, Quarter) for the block. In other words, the output context determines which revenue by year and quarter to output. In full, with both input and output formulas explicitly specified, the formula looks like this:
Min ([Sales revenue] In([Year];[Quarter])) In ([Year])
This formula calculates revenues by year by quarter, then outputs the smallest of these revenues that occurs in each year.
What would happen if you did not specify the output context in the Min by Year column? In this case, these figures would be identical to the figures in the Sales revenue column. Why? Remember that the default context in a block includes the dimensions in that block. The minimum revenue by year by quarter is the same as the revenue by year by quarter simply because there is only one revenue for each year/quarter combination.
406 PUBLICSAP BusinessObjects Web Intelligence User's Guide
Analyzing data
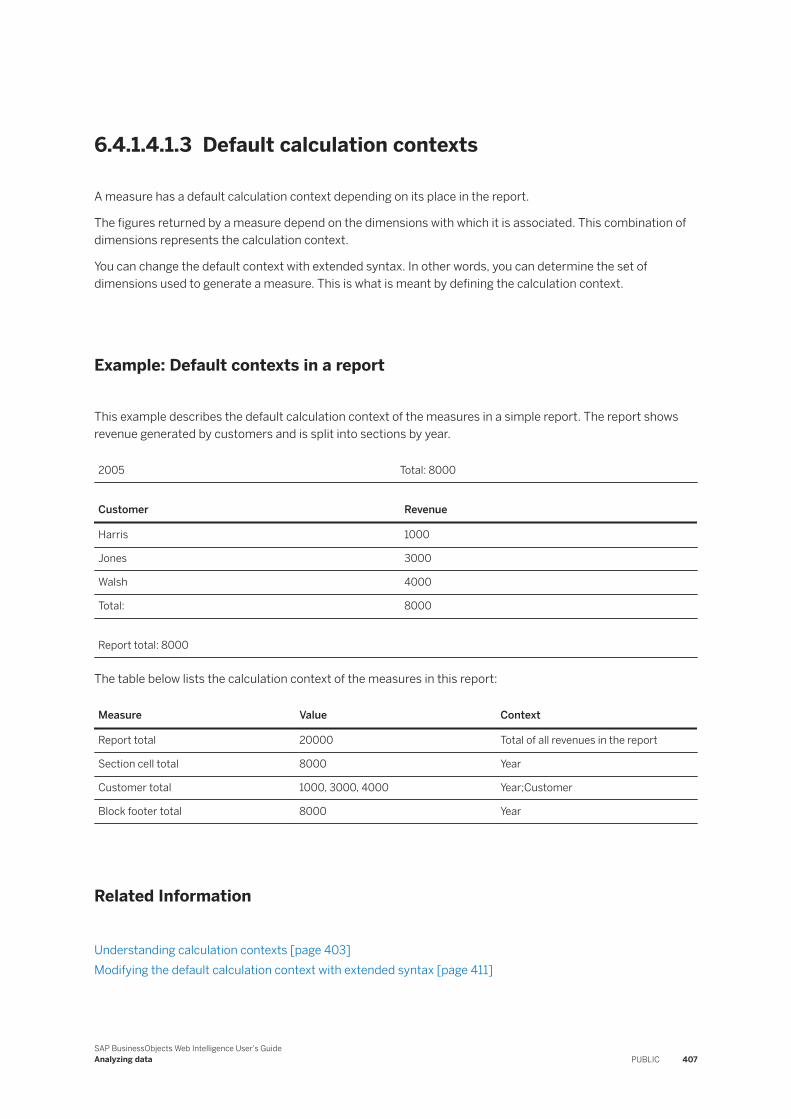
6.4.1.4.1.3 Default calculation contexts
A measure has a default calculation context depending on its place in the report.
The figures returned by a measure depend on the dimensions with which it is associated. This combination of dimensions represents the calculation context.
You can change the default context with extended syntax. In other words, you can determine the set of dimensions used to generate a measure. This is what is meant by defining the calculation context.
Example: Default contexts in a report
This example describes the default calculation context of the measures in a simple report. The report shows revenue generated by customers and is split into sections by year.
2005 Total: 8000
Customer Revenue
Harris 1000
Jones 3000
Walsh 4000
Total: 8000
Report total: 8000
The table below lists the calculation context of the measures in this report:
Measure Value Context
Report total 20000 Total of all revenues in the report
Section cell total 8000 Year
Customer total 1000, 3000, 4000 Year;Customer
Block footer total 8000 Year
Related Information
Understanding calculation contexts [page 403]Modifying the default calculation context with extended syntax [page 411]
SAP BusinessObjects Web Intelligence User's GuideAnalyzing data PUBLIC 407
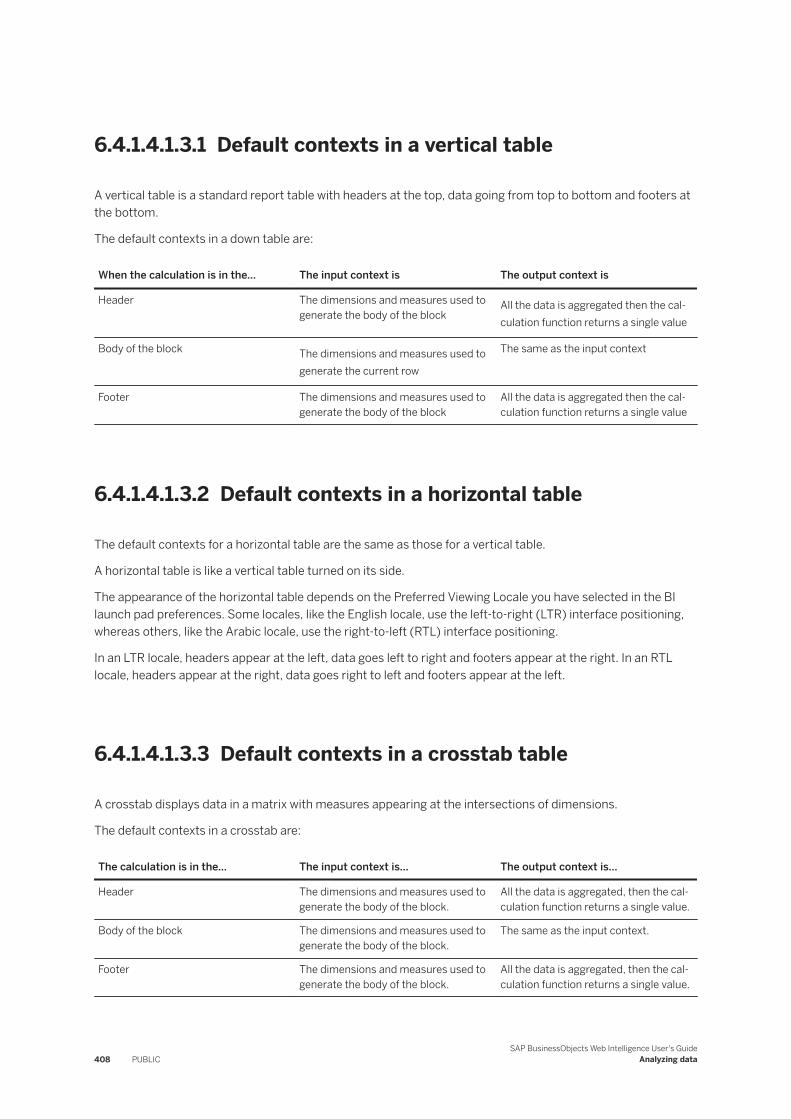
6.4.1.4.1.3.1 Default contexts in a vertical table
A vertical table is a standard report table with headers at the top, data going from top to bottom and footers at the bottom.
The default contexts in a down table are:
When the calculation is in the... The input context is The output context is
Header The dimensions and measures used to generate the body of the block
All the data is aggregated then the calculation function returns a single value
Body of the block The dimensions and measures used to generate the current row
The same as the input context
Footer The dimensions and measures used to generate the body of the block
All the data is aggregated then the calculation function returns a single value
6.4.1.4.1.3.2 Default contexts in a horizontal table
The default contexts for a horizontal table are the same as those for a vertical table.
A horizontal table is like a vertical table turned on its side.
The appearance of the horizontal table depends on the Preferred Viewing Locale you have selected in the BI launch pad preferences. Some locales, like the English locale, use the left-to-right (LTR) interface positioning, whereas others, like the Arabic locale, use the right-to-left (RTL) interface positioning.
In an LTR locale, headers appear at the left, data goes left to right and footers appear at the right. In an RTL locale, headers appear at the right, data goes right to left and footers appear at the left.
6.4.1.4.1.3.3 Default contexts in a crosstab table
A crosstab displays data in a matrix with measures appearing at the intersections of dimensions.
The default contexts in a crosstab are:
The calculation is in the... The input context is... The output context is...
Header The dimensions and measures used to generate the body of the block.
All the data is aggregated, then the calculation function returns a single value.
Body of the block The dimensions and measures used to generate the body of the block.
The same as the input context.
Footer The dimensions and measures used to generate the body of the block.
All the data is aggregated, then the calculation function returns a single value.
408 PUBLICSAP BusinessObjects Web Intelligence User's Guide
Analyzing data
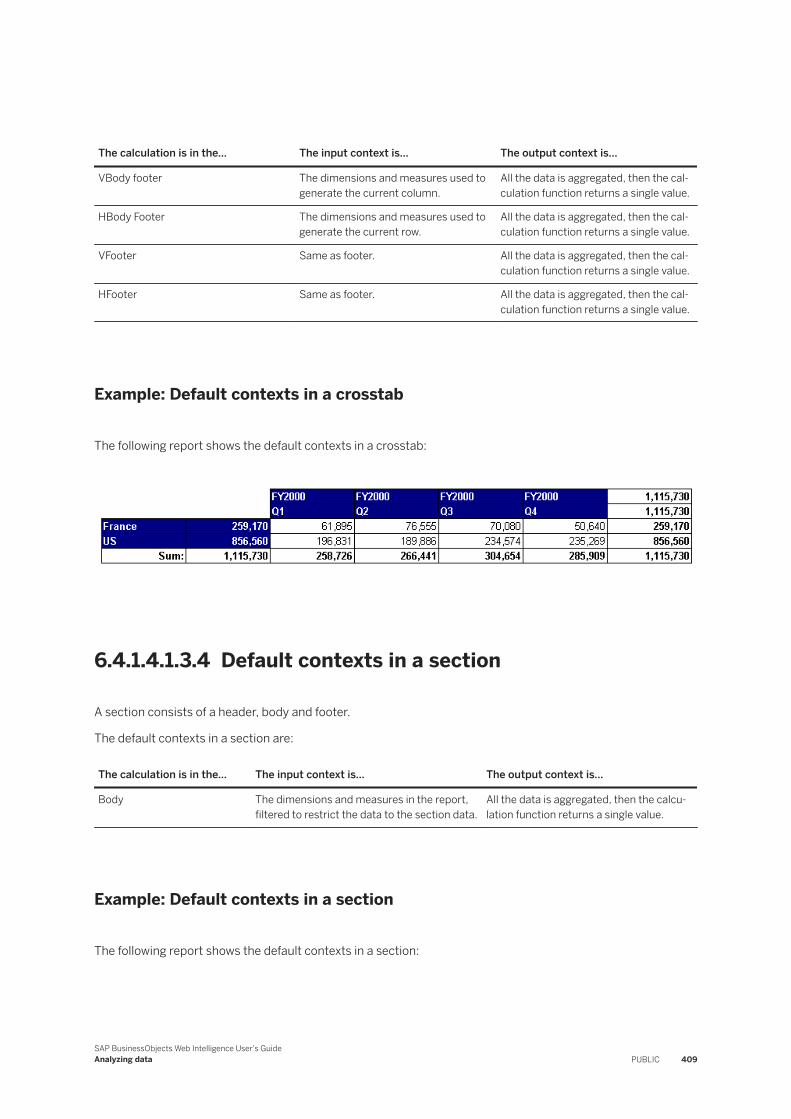
The calculation is in the... The input context is... The output context is...
VBody footer The dimensions and measures used to generate the current column.
All the data is aggregated, then the calculation function returns a single value.
HBody Footer The dimensions and measures used to generate the current row.
All the data is aggregated, then the calculation function returns a single value.
VFooter Same as footer. All the data is aggregated, then the calculation function returns a single value.
HFooter Same as footer. All the data is aggregated, then the calculation function returns a single value.
Example: Default contexts in a crosstab
The following report shows the default contexts in a crosstab:
6.4.1.4.1.3.4 Default contexts in a section
A section consists of a header, body and footer.
The default contexts in a section are:
The calculation is in the... The input context is... The output context is...
Body The dimensions and measures in the report, filtered to restrict the data to the section data.
All the data is aggregated, then the calculation function returns a single value.
Example: Default contexts in a section
The following report shows the default contexts in a section:
SAP BusinessObjects Web Intelligence User's GuideAnalyzing data PUBLIC 409
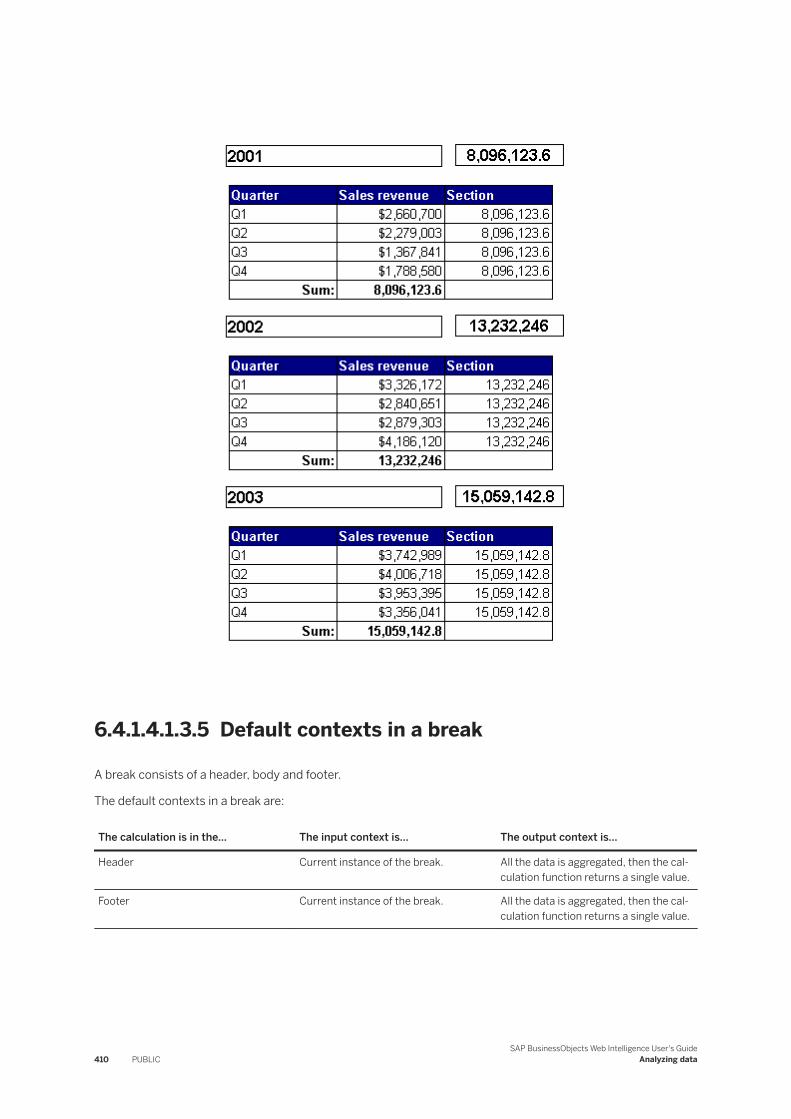
6.4.1.4.1.3.5 Default contexts in a break
A break consists of a header, body and footer.
The default contexts in a break are:
The calculation is in the... The input context is... The output context is...
Header Current instance of the break. All the data is aggregated, then the calculation function returns a single value.
Footer Current instance of the break. All the data is aggregated, then the calculation function returns a single value.
410 PUBLICSAP BusinessObjects Web Intelligence User's Guide
Analyzing data
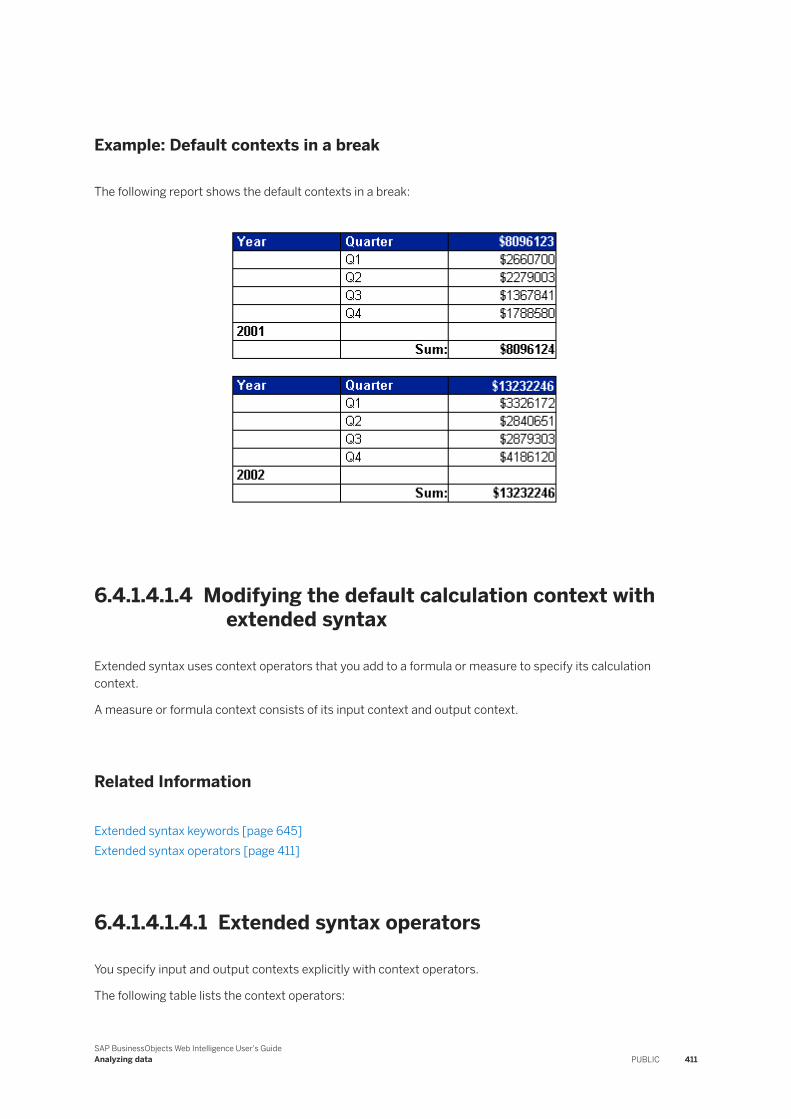
Example: Default contexts in a break
The following report shows the default contexts in a break:
6.4.1.4.1.4 Modifying the default calculation context with extended syntax
Extended syntax uses context operators that you add to a formula or measure to specify its calculation context.
A measure or formula context consists of its input context and output context.
Related Information
Extended syntax keywords [page 645]Extended syntax operators [page 411]
6.4.1.4.1.4.1 Extended syntax operators
You specify input and output contexts explicitly with context operators.
The following table lists the context operators:
SAP BusinessObjects Web Intelligence User's GuideAnalyzing data PUBLIC 411
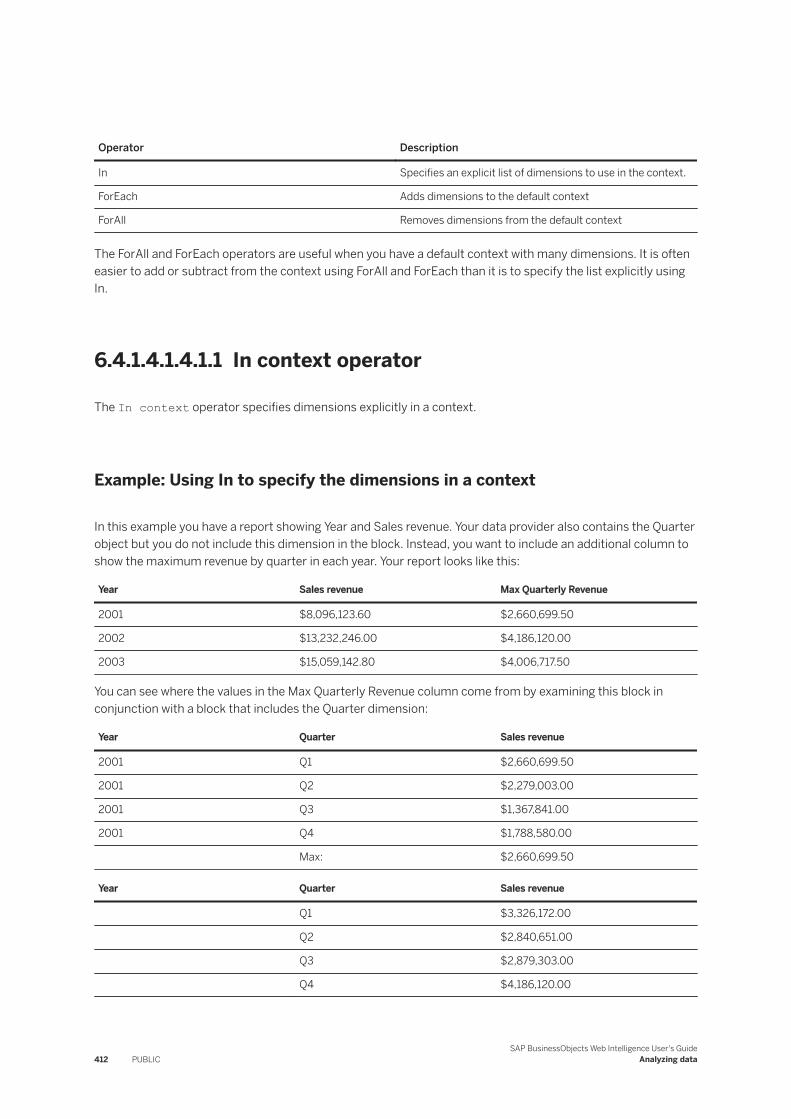
Operator Description
In Specifies an explicit list of dimensions to use in the context.
ForEach Adds dimensions to the default context
ForAll Removes dimensions from the default context
The ForAll and ForEach operators are useful when you have a default context with many dimensions. It is often easier to add or subtract from the context using ForAll and ForEach than it is to specify the list explicitly using In.
6.4.1.4.1.4.1.1 In context operator
The In context operator specifies dimensions explicitly in a context.
Example: Using In to specify the dimensions in a context
In this example you have a report showing Year and Sales revenue. Your data provider also contains the Quarter object but you do not include this dimension in the block. Instead, you want to include an additional column to show the maximum revenue by quarter in each year. Your report looks like this:
Year Sales revenue Max Quarterly Revenue
2001 $8,096,123.60 $2,660,699.50
2002 $13,232,246.00 $4,186,120.00
2003 $15,059,142.80 $4,006,717.50
You can see where the values in the Max Quarterly Revenue column come from by examining this block in conjunction with a block that includes the Quarter dimension:
Year Quarter Sales revenue
2001 Q1 $2,660,699.50
2001 Q2 $2,279,003.00
2001 Q3 $1,367,841.00
2001 Q4 $1,788,580.00
Max: $2,660,699.50
Year Quarter Sales revenue
Q1 $3,326,172.00
Q2 $2,840,651.00
Q3 $2,879,303.00
Q4 $4,186,120.00
412 PUBLICSAP BusinessObjects Web Intelligence User's Guide
Analyzing data
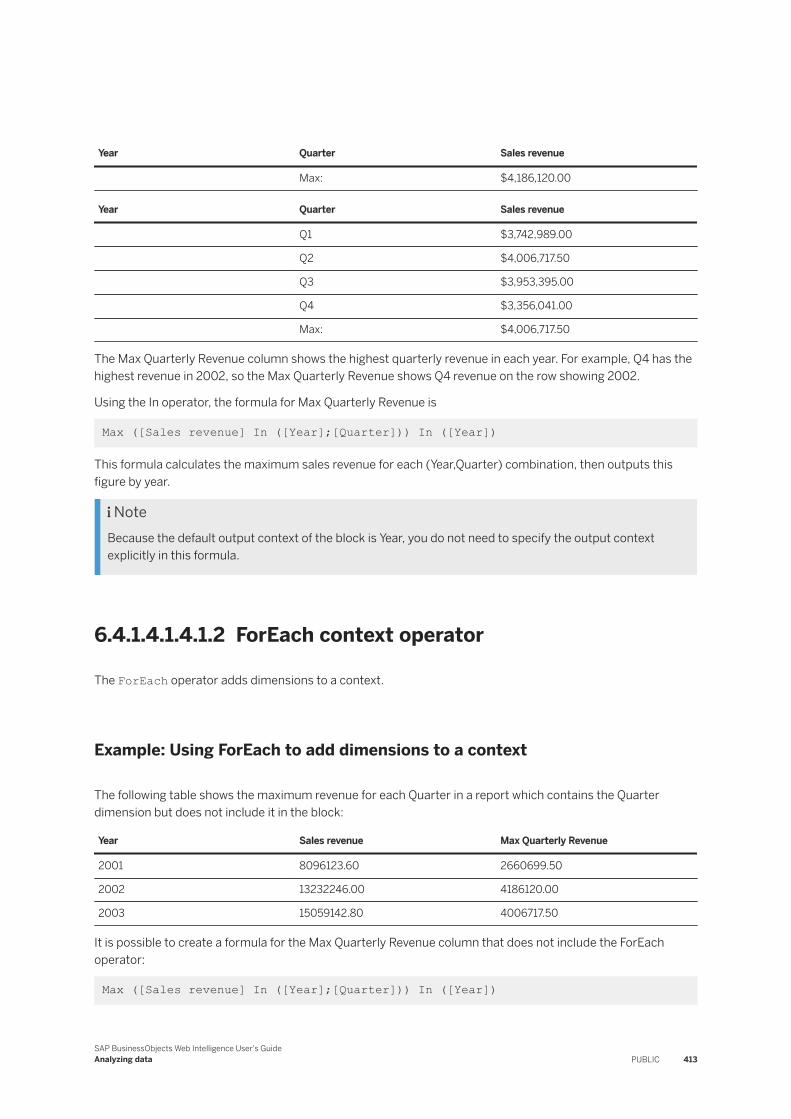
Year Quarter Sales revenue
Max: $4,186,120.00
Year Quarter Sales revenue
Q1 $3,742,989.00
Q2 $4,006,717.50
Q3 $3,953,395.00
Q4 $3,356,041.00
Max: $4,006,717.50
The Max Quarterly Revenue column shows the highest quarterly revenue in each year. For example, Q4 has the highest revenue in 2002, so the Max Quarterly Revenue shows Q4 revenue on the row showing 2002.
Using the In operator, the formula for Max Quarterly Revenue is
Max ([Sales revenue] In ([Year];[Quarter])) In ([Year])
This formula calculates the maximum sales revenue for each (Year,Quarter) combination, then outputs this figure by year.
NoteBecause the default output context of the block is Year, you do not need to specify the output context explicitly in this formula.
6.4.1.4.1.4.1.2 ForEach context operator
The ForEach operator adds dimensions to a context.
Example: Using ForEach to add dimensions to a context
The following table shows the maximum revenue for each Quarter in a report which contains the Quarter dimension but does not include it in the block:
Year Sales revenue Max Quarterly Revenue
2001 8096123.60 2660699.50
2002 13232246.00 4186120.00
2003 15059142.80 4006717.50
It is possible to create a formula for the Max Quarterly Revenue column that does not include the ForEach operator:
Max ([Sales revenue] In ([Year];[Quarter])) In ([Year])
SAP BusinessObjects Web Intelligence User's GuideAnalyzing data PUBLIC 413
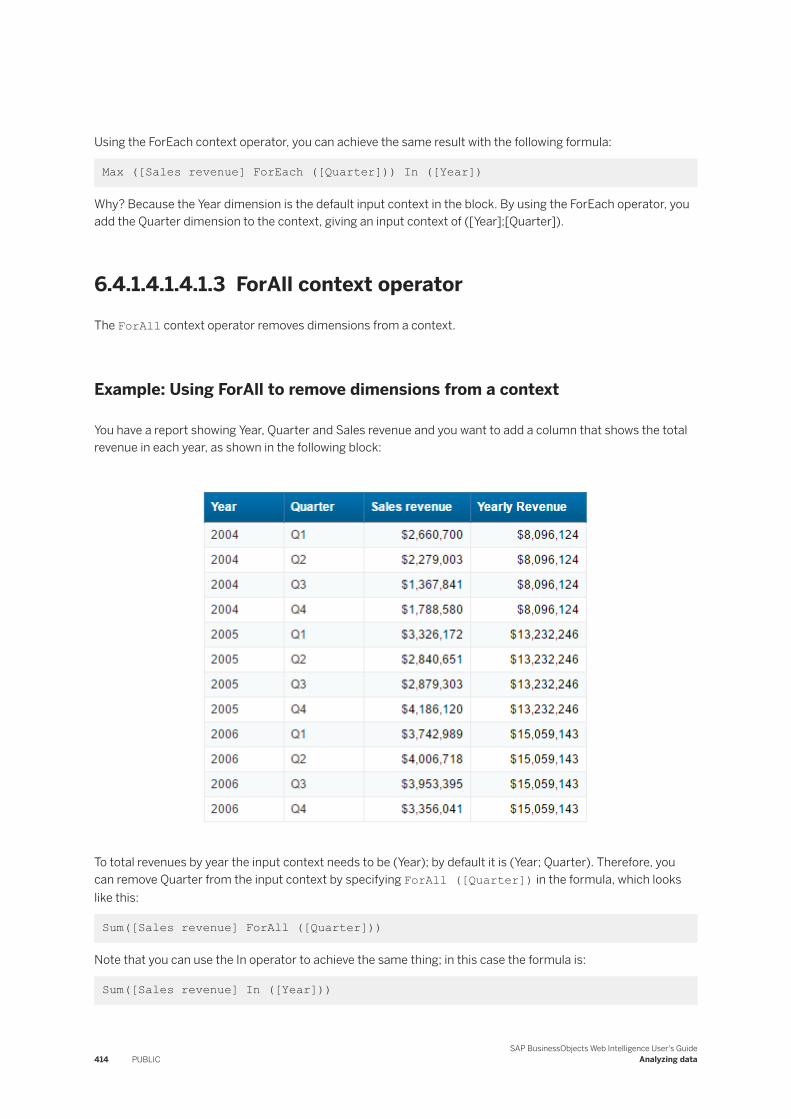
Using the ForEach context operator, you can achieve the same result with the following formula:
Max ([Sales revenue] ForEach ([Quarter])) In ([Year])
Why? Because the Year dimension is the default input context in the block. By using the ForEach operator, you add the Quarter dimension to the context, giving an input context of ([Year];[Quarter]).
6.4.1.4.1.4.1.3 ForAll context operator
The ForAll context operator removes dimensions from a context.
Example: Using ForAll to remove dimensions from a context
You have a report showing Year, Quarter and Sales revenue and you want to add a column that shows the total revenue in each year, as shown in the following block:
To total revenues by year the input context needs to be (Year); by default it is (Year; Quarter). Therefore, you can remove Quarter from the input context by specifying ForAll ([Quarter]) in the formula, which looks like this:
Sum([Sales revenue] ForAll ([Quarter]))
Note that you can use the In operator to achieve the same thing; in this case the formula is:
Sum([Sales revenue] In ([Year]))
414 PUBLICSAP BusinessObjects Web Intelligence User's Guide
Analyzing data
This version of the formula explicitly specifies Year as the context, rather than removing Quarter to leave Year.
6.4.1.5 Calculating values with smart measures
6.4.1.5.1 Calculating values with smart measures
Smart measures are measures whose values are calculated by the database (relational or OLAP) on which a universe is based.
They differ from classic measures, which are calculated from the detailed values returned by the database. The data returned by smart measures is aggregated in ways not supported natively by the Web Intelligence component of the SAP BusinessObjects Business Intelligence platform.
Queries that contain smart measures calculate the measures in all the calculation contexts required in a report. These contexts can change as the report changes. As a result, the query changes at each data refresh after the required contexts have changed.
When you edit such a report, automatically the #TOREFRESH message is inserted in the report reminding you that the report should be refreshed in order to reflect the changes. You can choose to update the report automatically by selecting the Auto-refresh document option in the Document properties dialog
NoteThe measure delegation is static and defined based on the report definition at design time. In some cases (formula based on “if [choice]= 1 then [dimension 1) else [dimension 2]” ) the dimensional context is variable at run time. In this case the system cannot delegate the measure calculation and returns an empty value.
Smart measures behave differently from classic measures, which support a basic set of aggregation functions (Max, Min, Count, Sum, Average) that can be calculated in all contexts without help from the database. For example, if you build a query containing the [Country] and [Region] dimensions and the [Revenue] measure (which calculates the sum of the revenue), the initial display shows Country, Region and Revenue in a block. If you remove Region from the block, the total revenue for each country can still be calculated without a data refresh by summing the revenues for all the regions in the country. A smart measure requires a data refresh in this situation.
Calculation contexts are represented by grouping sets in the generated query.
6.4.1.5.1.1 Grouping sets and smart measures
A grouping set is a set of dimensions that generates a result for a measure.
The generated SQL that returns the data in a smart measure includes grouping sets for all the aggregations of that measure that are included in the report.
SAP BusinessObjects Web Intelligence User's GuideAnalyzing data PUBLIC 415
Example: Grouping sets in a query
A query contains the [Country], [Region], [City] dimensions and the [Revenue] smart measure. These objects imply the following grouping sets to calculate revenue in all possible contexts:
● Total smart measure value● smart measure value by (Country, Region, City)● smart measure value by (Country, City)● smart measure value by (City)● smart measure value by (Region, City)● smart measure value by (Region)● smart measure value by (Country, Region)● smart measure value by (Country)
If the database supports UNION, each grouping set is represented in a UNION clause in the generated SQL.
The grouping sets are updated according to the calculation contexts required by the report, which can change in response to changes in the report structure.
6.4.1.5.1.1.1 Management of grouping sets
When you first build and run a query including smart measures, the generated SQL includes the grouping set necessary to calculate the smart measures at the most detailed level implied by the query objects.
For example, if you build a query containing the [Country], [Region] and [City] dimensions and the [Revenue] smart measure, the (Country, Region, City) grouping set appears in the generated SQL. The most detailed grouping set always appears in the SQL. Other grouping sets are added and removed in response to changes in the report.
If you remove the [City] dimension from the block, the (Country, Region) grouping set is required to return the revenue values. This grouping set is not yet available in the query SQL, so #TOREFRESH appears in the [Revenue] cells. When you refresh the data, #TOREFRESH is replaced with the revenue values.
If you then replace the [City] dimension in the block, the (Country, Region) grouping set is no longer needed. It is removed from the query SQL and its values discarded the next time you refresh the data.
Each time you refresh the report data, grouping sets are included or discarded according to the calculation contexts required by the report.
In certain situations, it is not possible to display the value of a smart measure. In this case, #UNAVAILABLE appears in the measure cells.
6.4.1.5.1.2 Smart measures and the scope of analysis
When you build a query with a scope of analysis, the initial grouping set contains the result objects, but not the scope objects.
The query does not generate all the possible grouping sets from the combination of the result objects and the scope objects.
416 PUBLICSAP BusinessObjects Web Intelligence User's Guide
Analyzing data
Example: A query with a scope of analysis and a smart measure
A query has the result objects [Country] and [Revenue]. The scope of analysis contains the [Region] and [City] dimensions. When you run the query, its SQL contains the (Country) grouping set and it displays [Country] and [Revenue] in a block.
6.4.1.5.1.3 Smart measures and SQL
6.4.1.5.1.3.1 Grouping sets and the UNION operator
Some databases support grouping sets explicitly with the GROUPING SETS operator.
When you build a query containing smart measures, the generated SQL uses multiple result sets and the UNION operator to simulate the effect of GROUPING SETS.
Example: Grouping sets retrieved with the UNION operator
This example describes a query containing [Country], [Region], [City] dimensions and the [Revenue] smart measure.
NoteFor simplicity, the smart measure calculates a sum. In practice, a smart measure is not needed for this aggregation because sums are supported natively in Web Intelligence.
When the query is first run, the grouping set is (Country, Region, City). The entire SQL query returns this grouping set and there is no need for the UNION operator in the SQL.
If you remove the [City] dimension from the table, the (Country, Region) grouping set is required to display the revenue (which appears initially as #TOREFRESH). After data refresh, the SQL is as follows:
SELECT SELECT 0 AS GID, country.country_name, region.region_name, NULL, sum(city.revenue)FROM country, region, cityWHERE ( country.country_id=region.country_id ) AND ( region.region_id=city.region_id )GROUP BY country.country_name, region.region_nameUNION SELECT 1 AS GID,
SAP BusinessObjects Web Intelligence User's GuideAnalyzing data PUBLIC 417
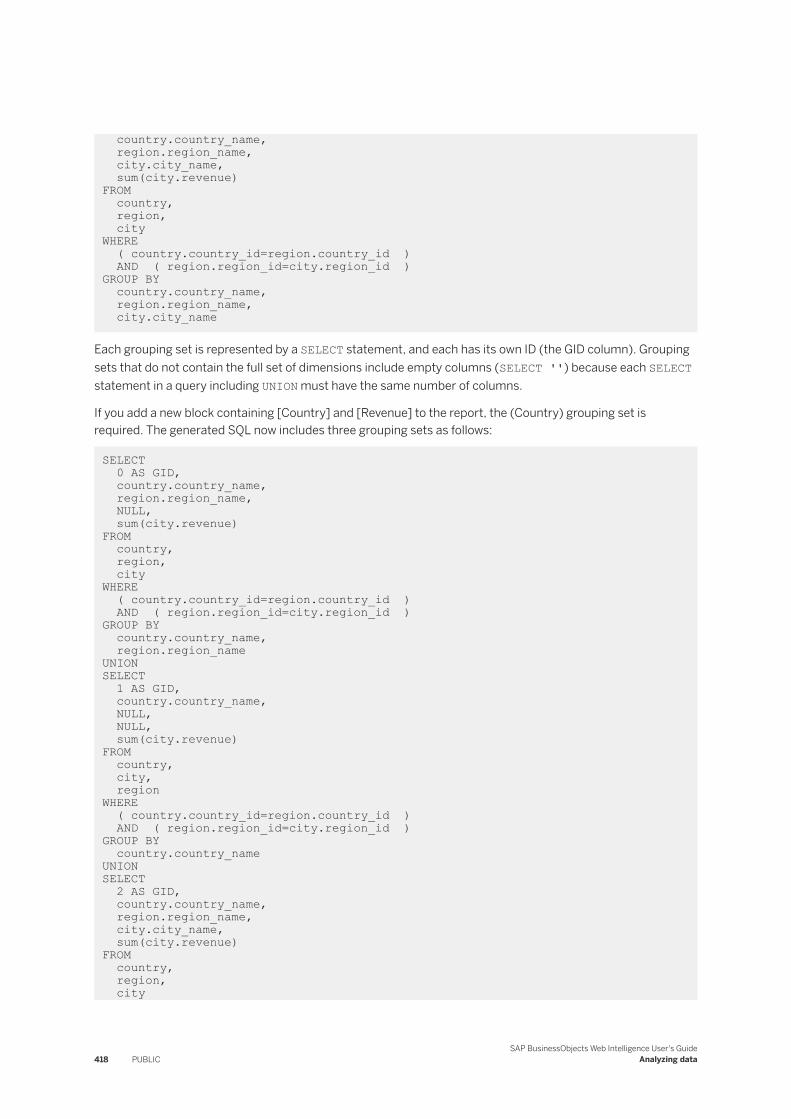
country.country_name, region.region_name, city.city_name, sum(city.revenue)FROM country, region, cityWHERE ( country.country_id=region.country_id ) AND ( region.region_id=city.region_id )GROUP BY country.country_name, region.region_name, city.city_name
Each grouping set is represented by a SELECT statement, and each has its own ID (the GID column). Grouping sets that do not contain the full set of dimensions include empty columns (SELECT '') because each SELECT statement in a query including UNION must have the same number of columns.
If you add a new block containing [Country] and [Revenue] to the report, the (Country) grouping set is required. The generated SQL now includes three grouping sets as follows:
SELECT 0 AS GID, country.country_name, region.region_name, NULL, sum(city.revenue)FROM country, region, cityWHERE ( country.country_id=region.country_id ) AND ( region.region_id=city.region_id )GROUP BY country.country_name, region.region_nameUNION SELECT 1 AS GID, country.country_name, NULL, NULL, sum(city.revenue)FROM country, city, regionWHERE ( country.country_id=region.country_id ) AND ( region.region_id=city.region_id )GROUP BY country.country_nameUNION SELECT 2 AS GID, country.country_name, region.region_name, city.city_name, sum(city.revenue)FROM country, region, city
418 PUBLICSAP BusinessObjects Web Intelligence User's Guide
Analyzing data
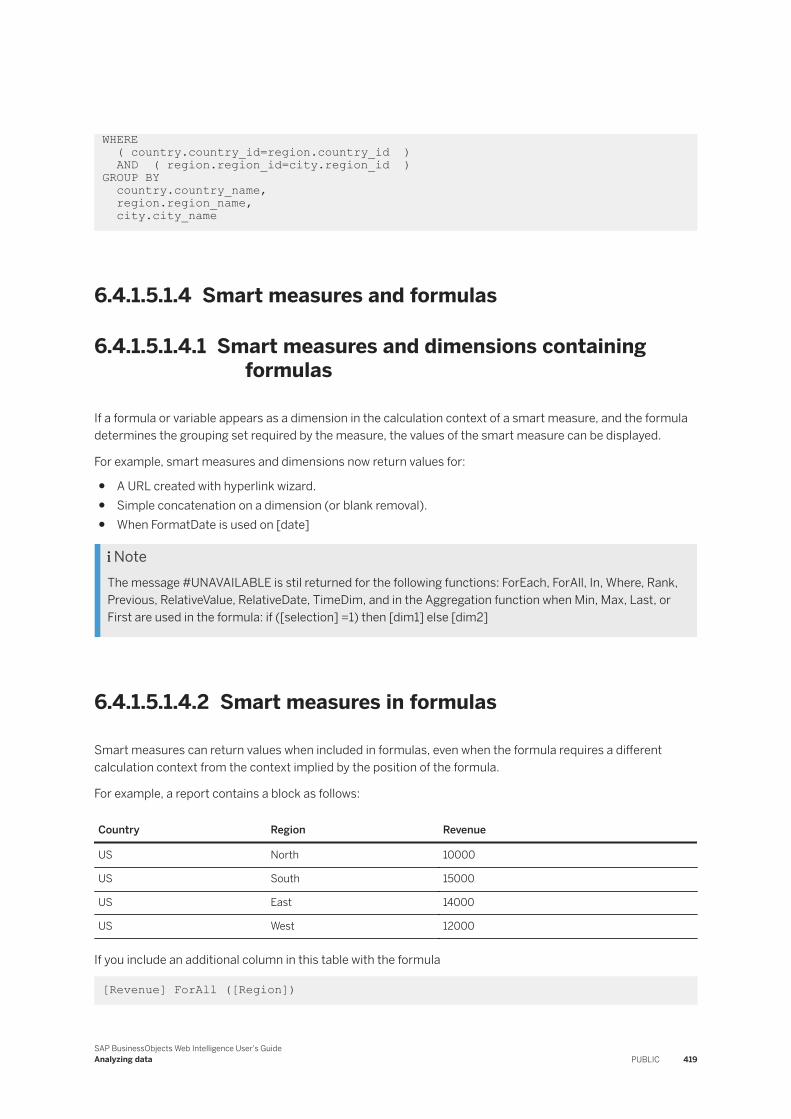
WHERE ( country.country_id=region.country_id ) AND ( region.region_id=city.region_id )GROUP BY country.country_name, region.region_name, city.city_name
6.4.1.5.1.4 Smart measures and formulas
6.4.1.5.1.4.1 Smart measures and dimensions containing formulas
If a formula or variable appears as a dimension in the calculation context of a smart measure, and the formula determines the grouping set required by the measure, the values of the smart measure can be displayed.
For example, smart measures and dimensions now return values for:
● A URL created with hyperlink wizard.● Simple concatenation on a dimension (or blank removal).● When FormatDate is used on [date]
NoteThe message #UNAVAILABLE is stil returned for the following functions: ForEach, ForAll, In, Where, Rank, Previous, RelativeValue, RelativeDate, TimeDim, and in the Aggregation function when Min, Max, Last, or First are used in the formula: if ([selection] =1) then [dim1] else [dim2]
6.4.1.5.1.4.2 Smart measures in formulas
Smart measures can return values when included in formulas, even when the formula requires a different calculation context from the context implied by the position of the formula.
For example, a report contains a block as follows:
Country Region Revenue
US North 10000
US South 15000
US East 14000
US West 12000
If you include an additional column in this table with the formula
[Revenue] ForAll ([Region])
SAP BusinessObjects Web Intelligence User's GuideAnalyzing data PUBLIC 419

the initial value of the column is #TOREFRESH because the formula, which excludes regions from the calculation, requires the grouping set (Country). Refreshing the data adds the (Country) grouping set to the query and displays the values of the measure.
Related Information
ForAll context operator [page 414]
6.4.1.5.1.5 Smart measures and filters
6.4.1.5.1.5.1 Restrictions concerning smart measures and filters
A smart measure can be evaluated in the body of a table when there is no filter in the table or in the parent context (a report filter).
The following table describes how smart measures are evaluated when filters are present.
How smart measures are evaluated when a filter is present in the report
When the filter is on a ... The smart measure is evalueated this way
Measure The smart measure will be correctly evaluated, but some rows will be removed from the table.
Dimension that is already part of the table axis The smart measure will be correctly evaluated, but some rows will be removed from the table. The smart measure can be evaluated, because there is no aggregation after the filter-ing.
Dimension that is not part of the axis of the table, and when the filter operand is mono-value (the filter will return one value/row).
The smart measure will be correctly evaluated. The smart measure can be evaluated because there is no aggregation after the filtering.
Dimension that is not part of the axis of the table, and if the filter operand is multivalue (the filter can return many values/rows).
The smart measure can’t be evaluated (#UNAVAILABLE is displayed) because in this case, filtering is done before aggregation, and for one row of the table, aggregation is required.
6.4.1.5.1.5.2 Smart measures and filters on dimensions
If you apply a multi-valued filter to a dimension on which the value of a smart value depends, but the dimension does not appear explicitly in the calculation context of the measure, the smart measure cannot return a value, and the cell displays #UNAVAILABLE.
This also applies when a report filter comes from an input control.
420 PUBLICSAP BusinessObjects Web Intelligence User's Guide
Analyzing data
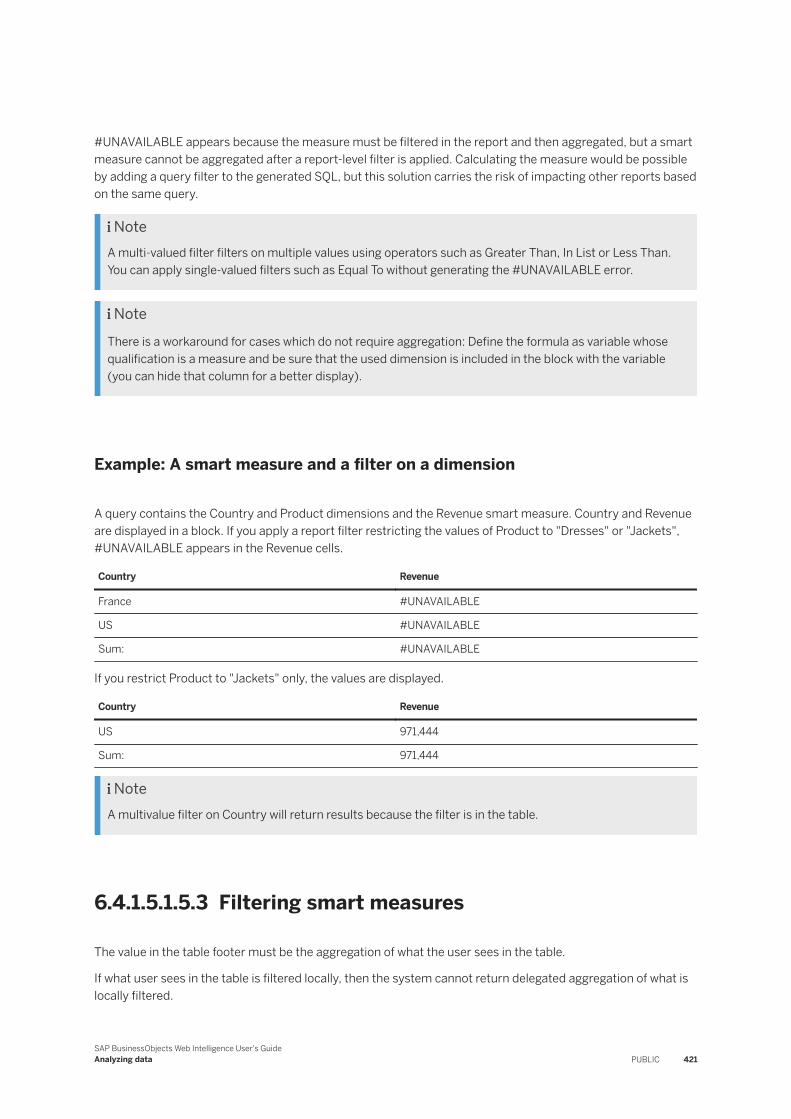
#UNAVAILABLE appears because the measure must be filtered in the report and then aggregated, but a smart measure cannot be aggregated after a report-level filter is applied. Calculating the measure would be possible by adding a query filter to the generated SQL, but this solution carries the risk of impacting other reports based on the same query.
NoteA multi-valued filter filters on multiple values using operators such as Greater Than, In List or Less Than. You can apply single-valued filters such as Equal To without generating the #UNAVAILABLE error.
NoteThere is a workaround for cases which do not require aggregation: Define the formula as variable whose qualification is a measure and be sure that the used dimension is included in the block with the variable (you can hide that column for a better display).
Example: A smart measure and a filter on a dimension
A query contains the Country and Product dimensions and the Revenue smart measure. Country and Revenue are displayed in a block. If you apply a report filter restricting the values of Product to "Dresses" or "Jackets", #UNAVAILABLE appears in the Revenue cells.
Country Revenue
France #UNAVAILABLE
US #UNAVAILABLE
Sum: #UNAVAILABLE
If you restrict Product to "Jackets" only, the values are displayed.
Country Revenue
US 971,444
Sum: 971,444
NoteA multivalue filter on Country will return results because the filter is in the table.
6.4.1.5.1.5.3 Filtering smart measures
The value in the table footer must be the aggregation of what the user sees in the table.
If what user sees in the table is filtered locally, then the system cannot return delegated aggregation of what is locally filtered.
SAP BusinessObjects Web Intelligence User's GuideAnalyzing data PUBLIC 421
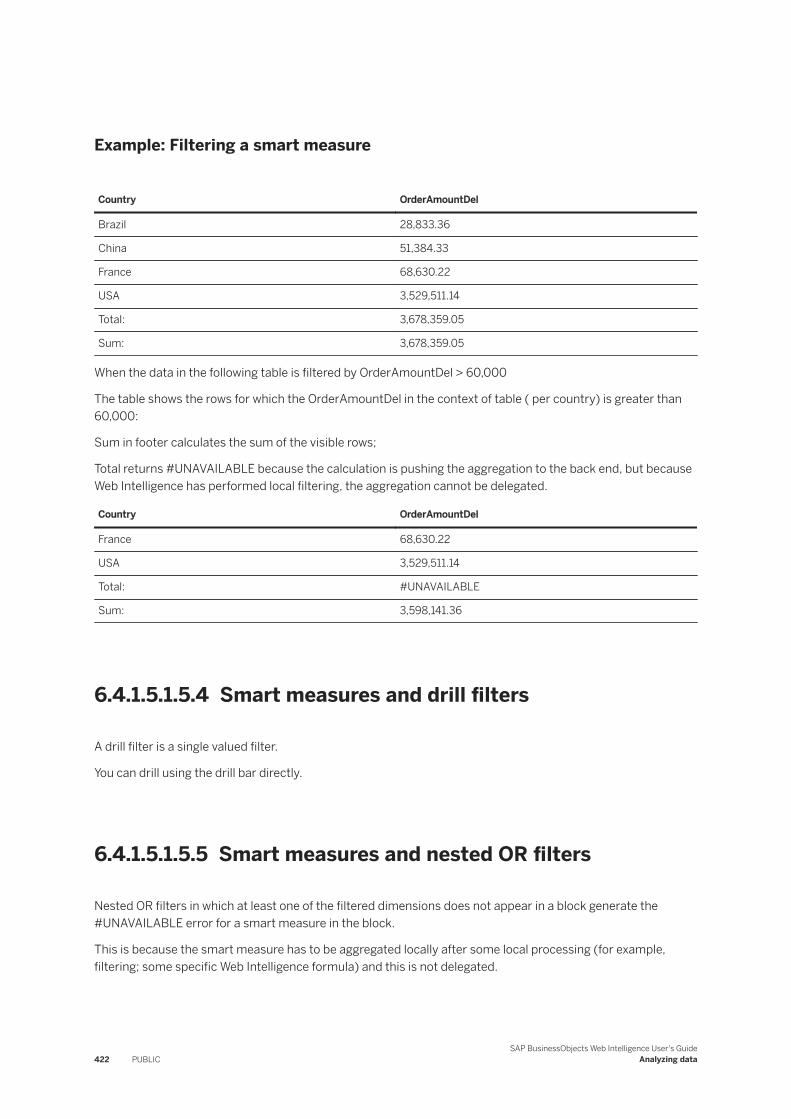
Example: Filtering a smart measure
Country OrderAmountDel
Brazil 28,833.36
China 51,384.33
France 68,630.22
USA 3,529,511.14
Total: 3,678,359.05
Sum: 3,678,359.05
When the data in the following table is filtered by OrderAmountDel > 60,000
The table shows the rows for which the OrderAmountDel in the context of table ( per country) is greater than 60,000:
Sum in footer calculates the sum of the visible rows;
Total returns #UNAVAILABLE because the calculation is pushing the aggregation to the back end, but because Web Intelligence has performed local filtering, the aggregation cannot be delegated.
Country OrderAmountDel
France 68,630.22
USA 3,529,511.14
Total: #UNAVAILABLE
Sum: 3,598,141.36
6.4.1.5.1.5.4 Smart measures and drill filters
A drill filter is a single valued filter.
You can drill using the drill bar directly.
6.4.1.5.1.5.5 Smart measures and nested OR filters
Nested OR filters in which at least one of the filtered dimensions does not appear in a block generate the #UNAVAILABLE error for a smart measure in the block.
This is because the smart measure has to be aggregated locally after some local processing (for example, filtering; some specific Web Intelligence formula) and this is not delegated.
422 PUBLICSAP BusinessObjects Web Intelligence User's Guide
Analyzing data
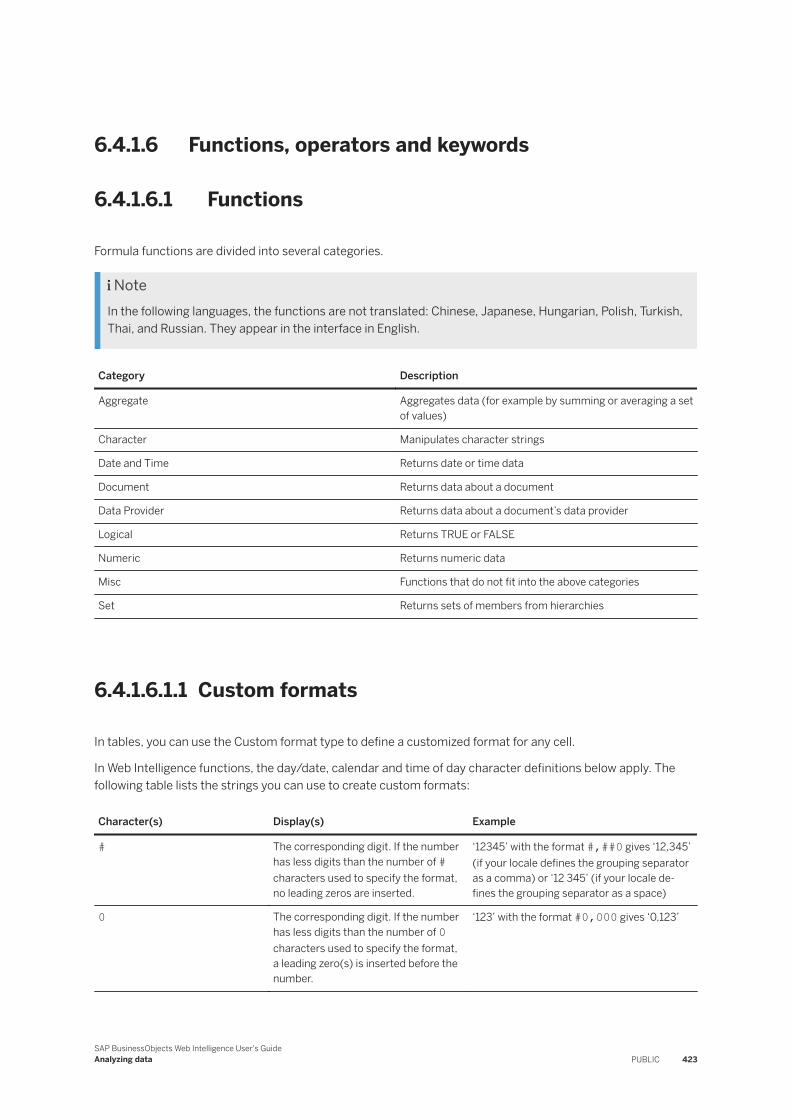
6.4.1.6 Functions, operators and keywords
6.4.1.6.1 Functions
Formula functions are divided into several categories.
NoteIn the following languages, the functions are not translated: Chinese, Japanese, Hungarian, Polish, Turkish, Thai, and Russian. They appear in the interface in English.
Category Description
Aggregate Aggregates data (for example by summing or averaging a set of values)
Character Manipulates character strings
Date and Time Returns date or time data
Document Returns data about a document
Data Provider Returns data about a document’s data provider
Logical Returns TRUE or FALSE
Numeric Returns numeric data
Misc Functions that do not fit into the above categories
Set Returns sets of members from hierarchies
6.4.1.6.1.1 Custom formats
In tables, you can use the Custom format type to define a customized format for any cell.
In Web Intelligence functions, the day/date, calendar and time of day character definitions below apply. The following table lists the strings you can use to create custom formats:
Character(s) Display(s) Example
# The corresponding digit. If the number has less digits than the number of # characters used to specify the format, no leading zeros are inserted.
‘12345’ with the format #,##0 gives ‘12,345’ (if your locale defines the grouping separator as a comma) or ‘12 345’ (if your locale defines the grouping separator as a space)
0 The corresponding digit. If the number has less digits than the number of 0 characters used to specify the format, a leading zero(s) is inserted before the number.
‘123’ with the format #0,000 gives ‘0,123’
SAP BusinessObjects Web Intelligence User's GuideAnalyzing data PUBLIC 423
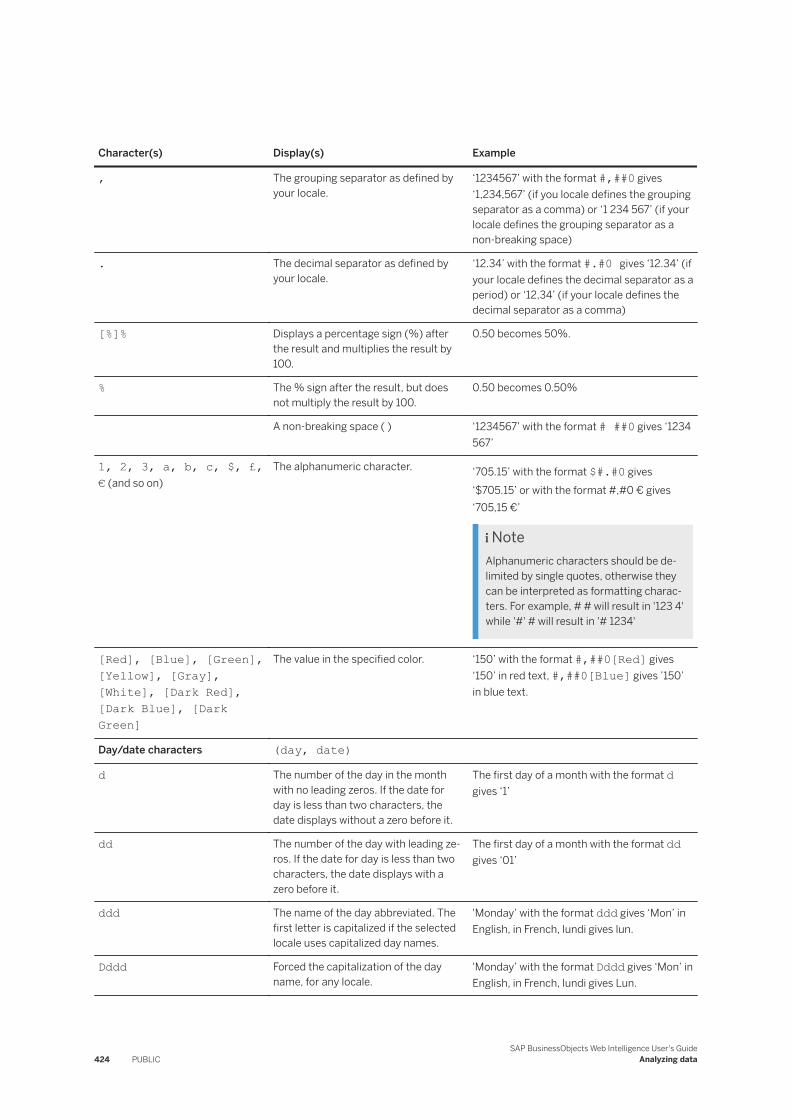
Character(s) Display(s) Example
, The grouping separator as defined by your locale.
‘1234567’ with the format #,##0 gives ‘1,234,567’ (if you locale defines the grouping separator as a comma) or ‘1 234 567’ (if your locale defines the grouping separator as a non-breaking space)
. The decimal separator as defined by your locale.
‘12.34’ with the format #.#0 gives ‘12.34’ (if your locale defines the decimal separator as a period) or ‘12,34’ (if your locale defines the decimal separator as a comma)
[%]% Displays a percentage sign (%) after the result and multiplies the result by 100.
0.50 becomes 50%.
% The % sign after the result, but does not multiply the result by 100.
0.50 becomes 0.50%
A non-breaking space ( ) ‘1234567’ with the format # ##0 gives ‘1234 567’
1, 2, 3, a, b, c, $, £, € (and so on)
The alphanumeric character. ‘705.15’ with the format $#.#0 gives ‘$705.15’ or with the format #,#0 € gives ‘705,15 €’
NoteAlphanumeric characters should be delimited by single quotes, otherwise they can be interpreted as formatting characters. For example, # # will result in '123 4' while '#' # will result in '# 1234'
[Red], [Blue], [Green], [Yellow], [Gray], [White], [Dark Red], [Dark Blue], [Dark Green]
The value in the specified color. ‘150’ with the format #,##0[Red] gives ‘150’ in red text, #,##0[Blue] gives ’150’ in blue text.
Day/date characters (day, date)
d The number of the day in the month with no leading zeros. If the date for day is less than two characters, the date displays without a zero before it.
The first day of a month with the format d gives ‘1’
dd The number of the day with leading zeros. If the date for day is less than two characters, the date displays with a zero before it.
The first day of a month with the format dd gives ‘01’
ddd The name of the day abbreviated. The first letter is capitalized if the selected locale uses capitalized day names.
'Monday’ with the format ddd gives ‘Mon’ in English, in French, lundi gives lun.
Dddd Forced the capitalization of the day name, for any locale.
'Monday’ with the format Dddd gives ‘Mon’ in English, in French, lundi gives Lun.
424 PUBLICSAP BusinessObjects Web Intelligence User's Guide
Analyzing data
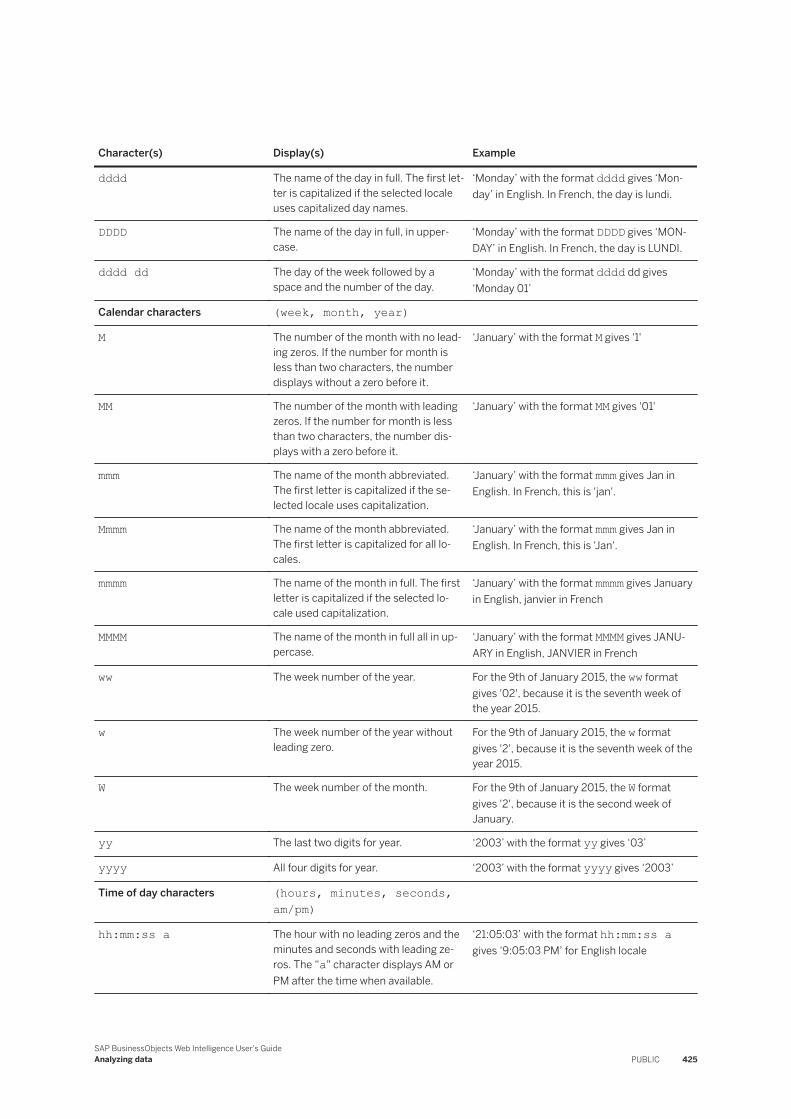
Character(s) Display(s) Example
dddd The name of the day in full. The first letter is capitalized if the selected locale uses capitalized day names.
‘Monday’ with the format dddd gives ‘Monday’ in English. In French, the day is lundi.
DDDD The name of the day in full, in uppercase.
‘Monday’ with the format DDDD gives ‘MONDAY’ in English. In French, the day is LUNDI.
dddd dd The day of the week followed by a space and the number of the day.
‘Monday’ with the format dddd dd gives ‘Monday 01’
Calendar characters (week, month, year)
M The number of the month with no leading zeros. If the number for month is less than two characters, the number displays without a zero before it.
‘January’ with the format M gives '1'
MM The number of the month with leading zeros. If the number for month is less than two characters, the number displays with a zero before it.
‘January’ with the format MM gives '01'
mmm The name of the month abbreviated. The first letter is capitalized if the selected locale uses capitalization.
‘January’ with the format mmm gives Jan in English. In French, this is 'jan'.
Mmmm The name of the month abbreviated. The first letter is capitalized for all locales.
‘January’ with the format mmm gives Jan in English. In French, this is 'Jan'.
mmmm The name of the month in full. The first letter is capitalized if the selected locale used capitalization.
‘January’ with the format mmmm gives January in English, janvier in French
MMMM The name of the month in full all in uppercase.
‘January’ with the format MMMM gives JANUARY in English, JANVIER in French
ww The week number of the year. For the 9th of January 2015, the ww format gives '02', because it is the seventh week of the year 2015.
w The week number of the year without leading zero.
For the 9th of January 2015, the w format gives '2', because it is the seventh week of the year 2015.
W The week number of the month. For the 9th of January 2015, the W format gives '2', because it is the second week of January.
yy The last two digits for year. ‘2003’ with the format yy gives ‘03’
yyyy All four digits for year. ‘2003’ with the format yyyy gives ‘2003’
Time of day characters (hours, minutes, seconds, am/pm)
hh:mm:ss a The hour with no leading zeros and the minutes and seconds with leading zeros. The “a" character displays AM or PM after the time when available.
‘21:05:03’ with the format hh:mm:ss a gives ‘9:05:03 PM’ for English locale
SAP BusinessObjects Web Intelligence User's GuideAnalyzing data PUBLIC 425
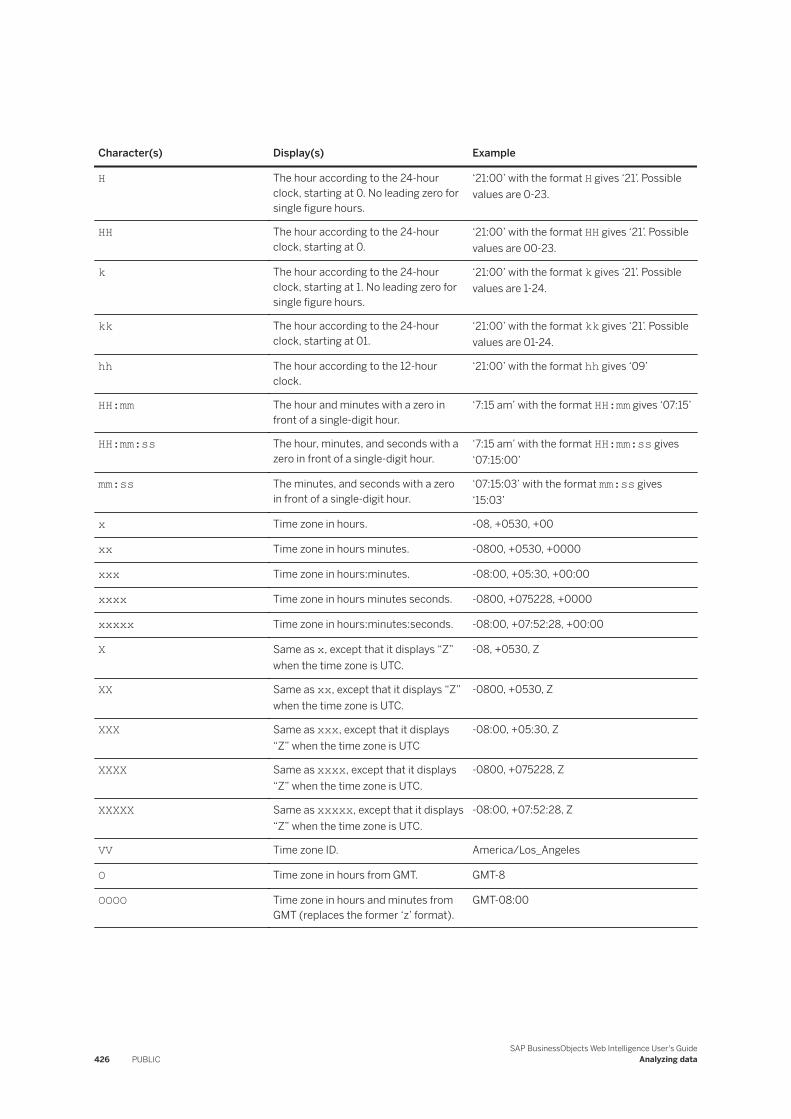
Character(s) Display(s) Example
H The hour according to the 24-hour clock, starting at 0. No leading zero for single figure hours.
‘21:00’ with the format H gives ‘21’. Possible values are 0-23.
HH The hour according to the 24-hour clock, starting at 0.
‘21:00’ with the format HH gives ‘21’. Possible values are 00-23.
k The hour according to the 24-hour clock, starting at 1. No leading zero for single figure hours.
‘21:00’ with the format k gives ‘21’. Possible values are 1-24.
kk The hour according to the 24-hour clock, starting at 01.
‘21:00’ with the format kk gives ‘21’. Possible values are 01-24.
hh The hour according to the 12-hour clock.
‘21:00’ with the format hh gives ‘09’
HH:mm The hour and minutes with a zero in front of a single-digit hour.
‘7:15 am’ with the format HH:mm gives ‘07:15’
HH:mm:ss The hour, minutes, and seconds with a zero in front of a single-digit hour.
‘7:15 am’ with the format HH:mm:ss gives ‘07:15:00’
mm:ss The minutes, and seconds with a zero in front of a single-digit hour.
‘07:15:03’ with the format mm:ss gives ‘15:03’
x Time zone in hours. -08, +0530, +00
xx Time zone in hours minutes. -0800, +0530, +0000
xxx Time zone in hours:minutes. -08:00, +05:30, +00:00
xxxx Time zone in hours minutes seconds. -0800, +075228, +0000
xxxxx Time zone in hours:minutes:seconds. -08:00, +07:52:28, +00:00
X Same as x, except that it displays “Z” when the time zone is UTC.
-08, +0530, Z
XX Same as xx, except that it displays “Z” when the time zone is UTC.
-0800, +0530, Z
XXX Same as xxx, except that it displays “Z” when the time zone is UTC
-08:00, +05:30, Z
XXXX Same as xxxx, except that it displays “Z” when the time zone is UTC.
-0800, +075228, Z
XXXXX Same as xxxxx, except that it displays “Z” when the time zone is UTC.
-08:00, +07:52:28, Z
VV Time zone ID. America/Los_Angeles
O Time zone in hours from GMT. GMT-8
OOOO Time zone in hours and minutes from GMT (replaces the former ‘z’ format).
GMT-08:00
426 PUBLICSAP BusinessObjects Web Intelligence User's Guide
Analyzing data
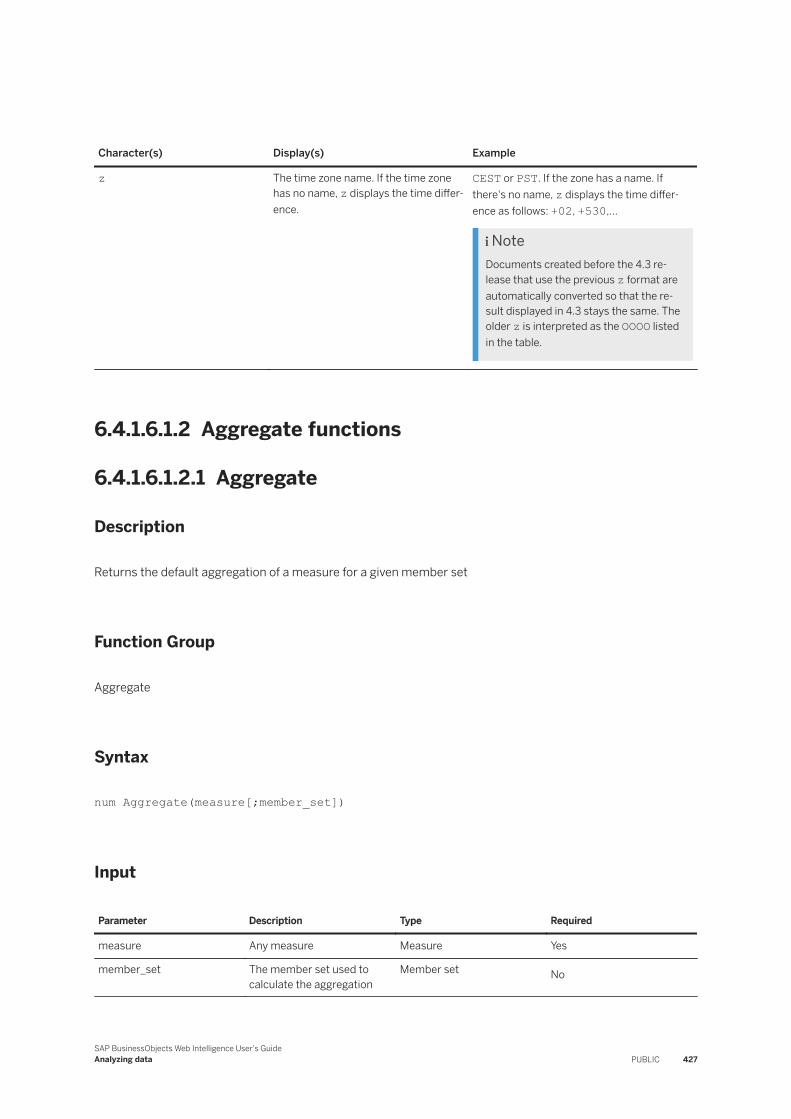
Character(s) Display(s) Example
z The time zone name. If the time zone has no name, z displays the time differ-ence.
CEST or PST. If the zone has a name. If there's no name, z displays the time differ-ence as follows: +02, +530,...
NoteDocuments created before the 4.3 release that use the previous z format are automatically converted so that the result displayed in 4.3 stays the same. The older z is interpreted as the OOOO listed in the table.
6.4.1.6.1.2 Aggregate functions
6.4.1.6.1.2.1 Aggregate
Description
Returns the default aggregation of a measure for a given member set
Function Group
Aggregate
Syntax
num Aggregate(measure[;member_set])
Input
Parameter Description Type Required
measure Any measure Measure Yes
member_set The member set used to calculate the aggregation
Member set No
SAP BusinessObjects Web Intelligence User's GuideAnalyzing data PUBLIC 427
Notes
● You can use extended syntax context operators with Aggregate.● If you include member_set, Aggregate returns the aggregate value of the measure for all members in the
member set.● member_set can include multiple sets separated by semicolons (;).● The list of member sets must be enclosed in {}.● If the member set expression does not specify a precise member or node, the hierarchy referenced must
be present in the table, then the member set expression references the current member in the hierarchy in the table. If the hierarchy is not in the table, the function returns the message #MULTIVALUE.
● Delegated measure aggregation returns #TOREFRESH when the required aggregation is not available in the query. The user has to refresh the document to get the new level of aggregation. This occurs for example when using the filter bar when the user selects a value before “all values” and vice versa when selecting “all values” before a selected value.
Examples
If the default aggregation of the [Sales Revenue] measure is Sum, and [California] is a member in the [Geography] hierarchy (Country > State > City), Aggregate([Sales Revenue];{Descendants([Geography]&[US].[California];1)}) returns the total sales revenue of all cities in California.
Related Information
Referring to members and member sets in hierarchies [page 651]
6.4.1.6.1.2.2 Member selection in aggregate functions
Description
For certain aggregate functions you can define a member selection to define the aggregation context when the block contains a hierarchy.
Function Group
Aggregate
428 PUBLICSAP BusinessObjects Web Intelligence User's Guide
Analyzing data
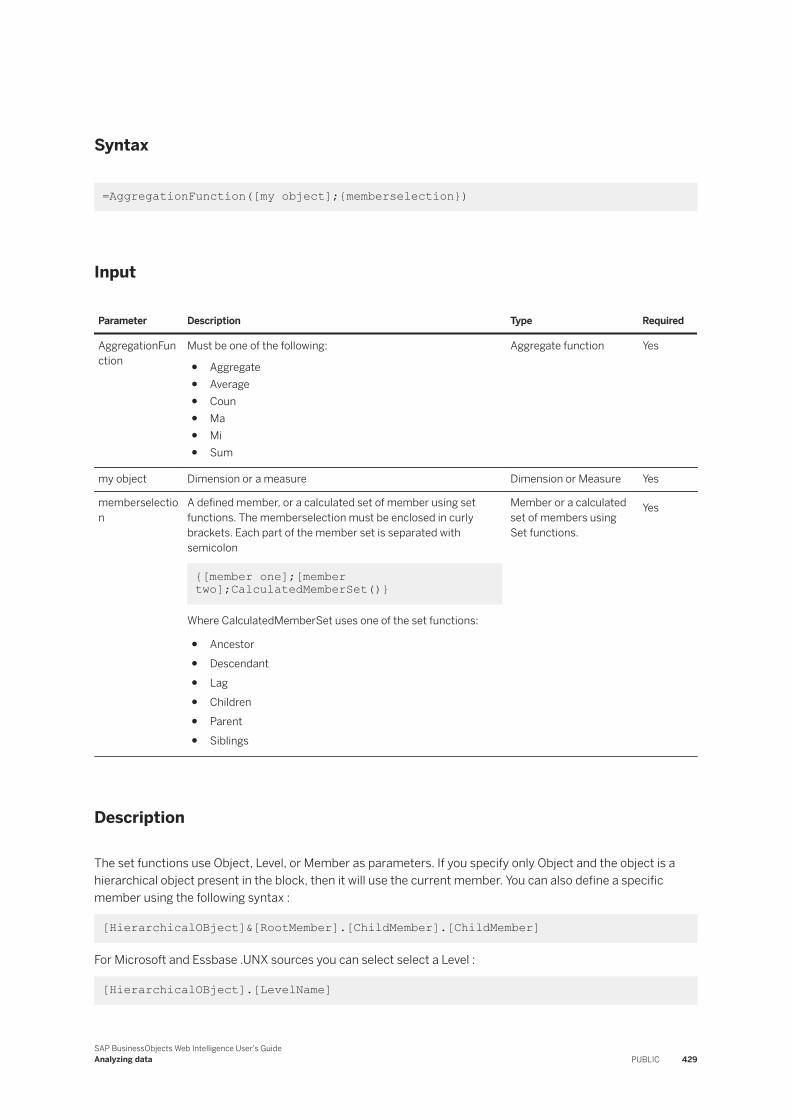
Syntax
=AggregationFunction([my object];{memberselection})
Input
Parameter Description Type Required
AggregationFunction
Must be one of the following:
● Aggregate● Average● Coun● Ma● Mi● Sum
Aggregate function Yes
my object Dimension or a measure Dimension or Measure Yes
memberselection
A defined member, or a calculated set of member using set functions. The memberselection must be enclosed in curly brackets. Each part of the member set is separated with semicolon
{[member one];[member two];CalculatedMemberSet()}
Where CalculatedMemberSet uses one of the set functions:
● Ancestor● Descendant● Lag● Children● Parent● Siblings
Member or a calculated set of members using Set functions.
Yes
Description
The set functions use Object, Level, or Member as parameters. If you specify only Object and the object is a hierarchical object present in the block, then it will use the current member. You can also define a specific member using the following syntax :
[HierarchicalOBject]&[RootMember].[ChildMember].[ChildMember]
For Microsoft and Essbase .UNX sources you can select select a Level :
[HierarchicalOBject].[LevelName]
SAP BusinessObjects Web Intelligence User's GuideAnalyzing data PUBLIC 429
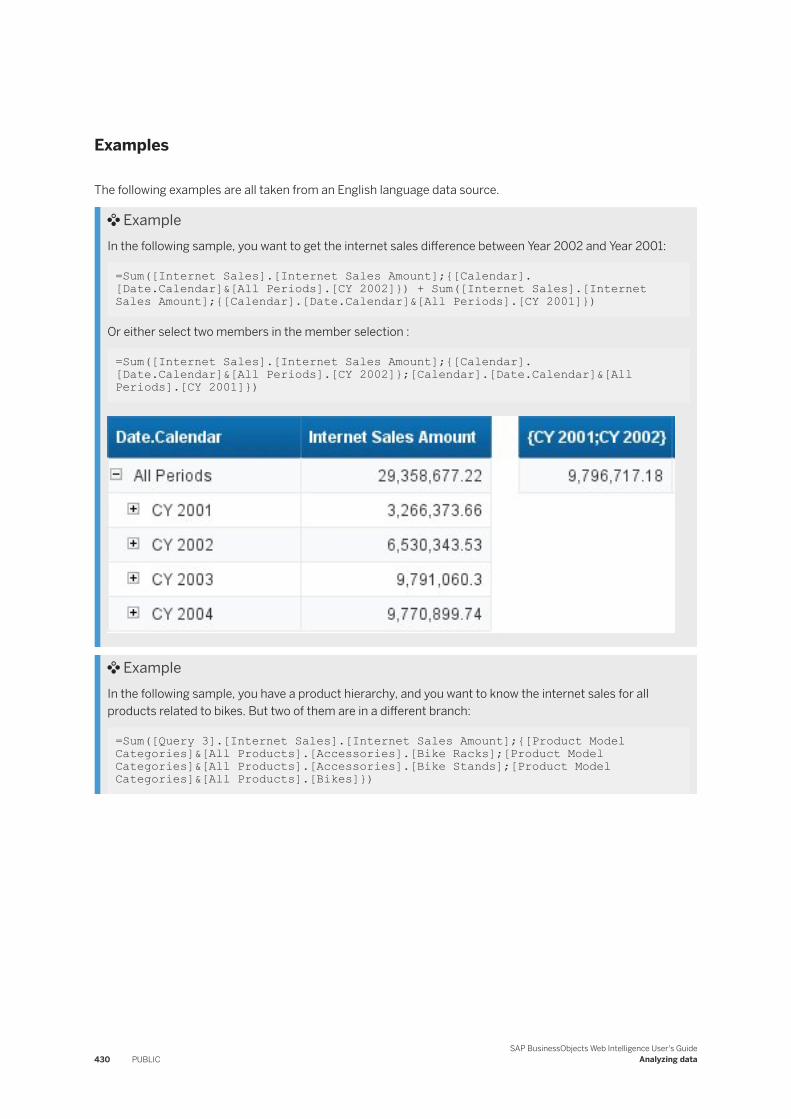
Examples
The following examples are all taken from an English language data source.
ExampleIn the following sample, you want to get the internet sales difference between Year 2002 and Year 2001:
=Sum([Internet Sales].[Internet Sales Amount];{[Calendar].[Date.Calendar]&[All Periods].[CY 2002]}) + Sum([Internet Sales].[Internet Sales Amount];{[Calendar].[Date.Calendar]&[All Periods].[CY 2001]})
Or either select two members in the member selection :
=Sum([Internet Sales].[Internet Sales Amount];{[Calendar].[Date.Calendar]&[All Periods].[CY 2002]};[Calendar].[Date.Calendar]&[All Periods].[CY 2001]})
ExampleIn the following sample, you have a product hierarchy, and you want to know the internet sales for all products related to bikes. But two of them are in a different branch:
=Sum([Query 3].[Internet Sales].[Internet Sales Amount];{[Product Model Categories]&[All Products].[Accessories].[Bike Racks];[Product Model Categories]&[All Products].[Accessories].[Bike Stands];[Product Model Categories]&[All Products].[Bikes]})
430 PUBLICSAP BusinessObjects Web Intelligence User's Guide
Analyzing data
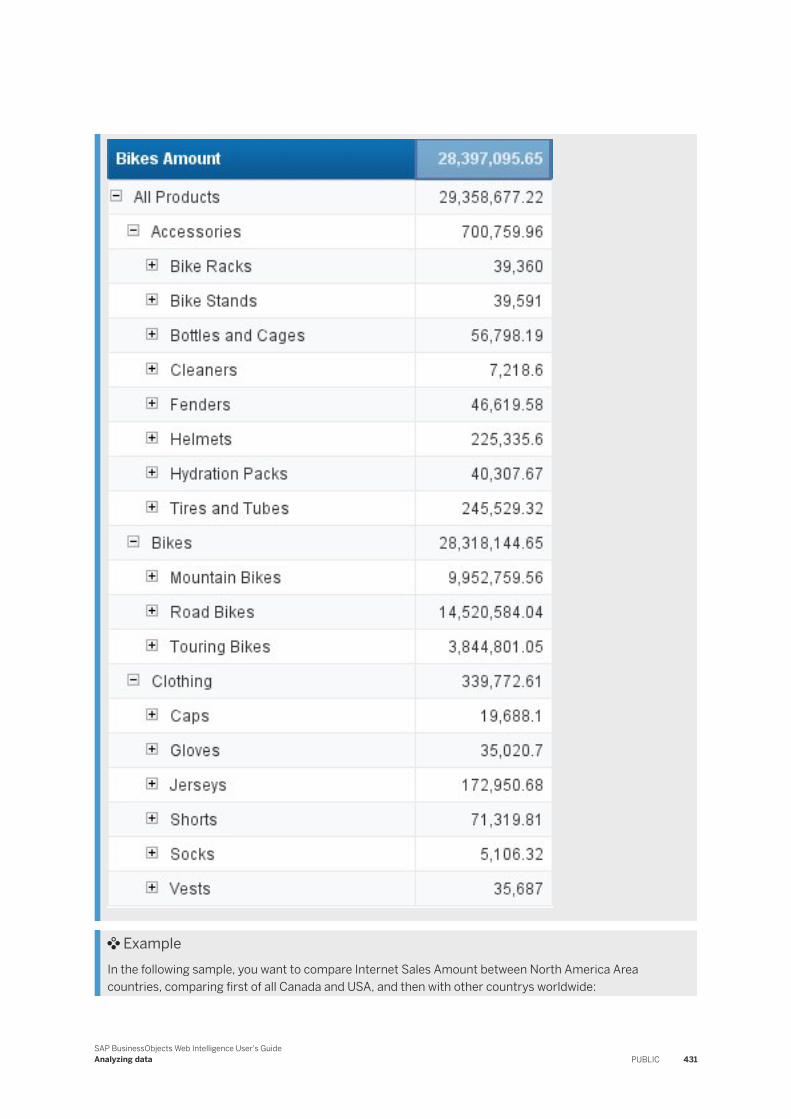
ExampleIn the following sample, you want to compare Internet Sales Amount between North America Area countries, comparing first of all Canada and USA, and then with other countrys worldwide:
SAP BusinessObjects Web Intelligence User's GuideAnalyzing data PUBLIC 431
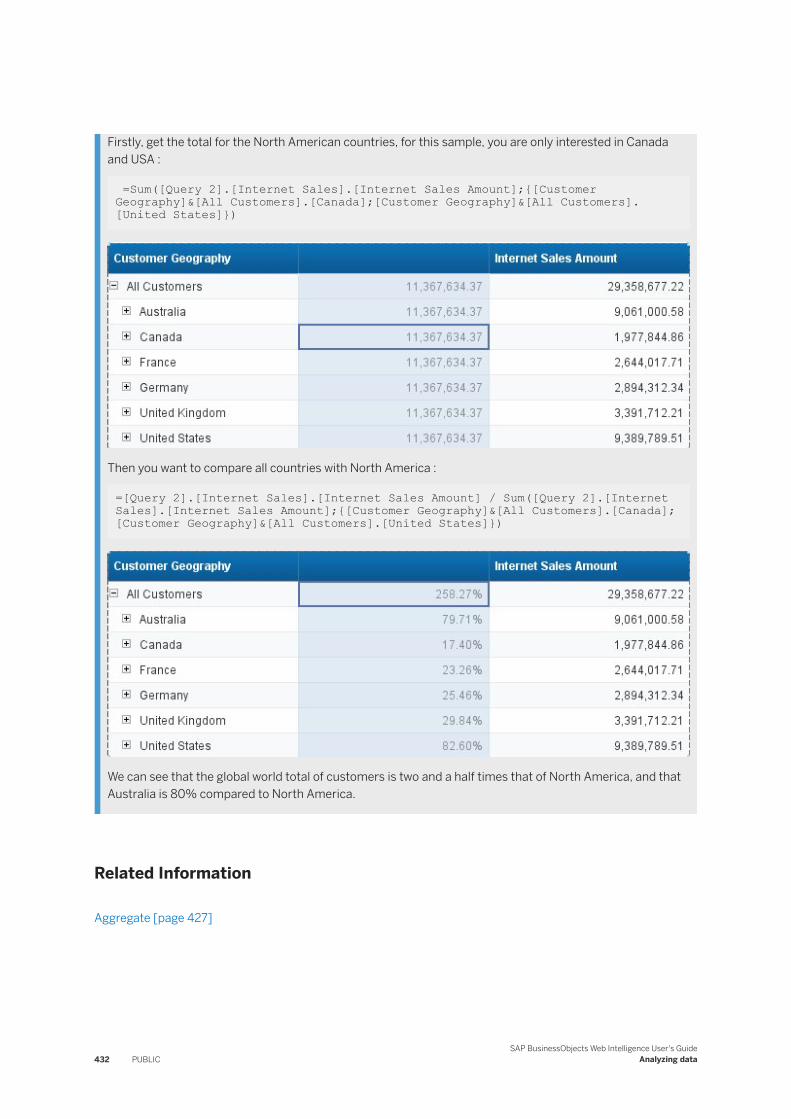
Firstly, get the total for the North American countries, for this sample, you are only interested in Canada and USA :
=Sum([Query 2].[Internet Sales].[Internet Sales Amount];{[Customer Geography]&[All Customers].[Canada];[Customer Geography]&[All Customers].[United States]})
Then you want to compare all countries with North America :
=[Query 2].[Internet Sales].[Internet Sales Amount] / Sum([Query 2].[Internet Sales].[Internet Sales Amount];{[Customer Geography]&[All Customers].[Canada];[Customer Geography]&[All Customers].[United States]})
We can see that the global world total of customers is two and a half times that of North America, and that Australia is 80% compared to North America.
Related Information
Aggregate [page 427]
432 PUBLICSAP BusinessObjects Web Intelligence User's Guide
Analyzing data
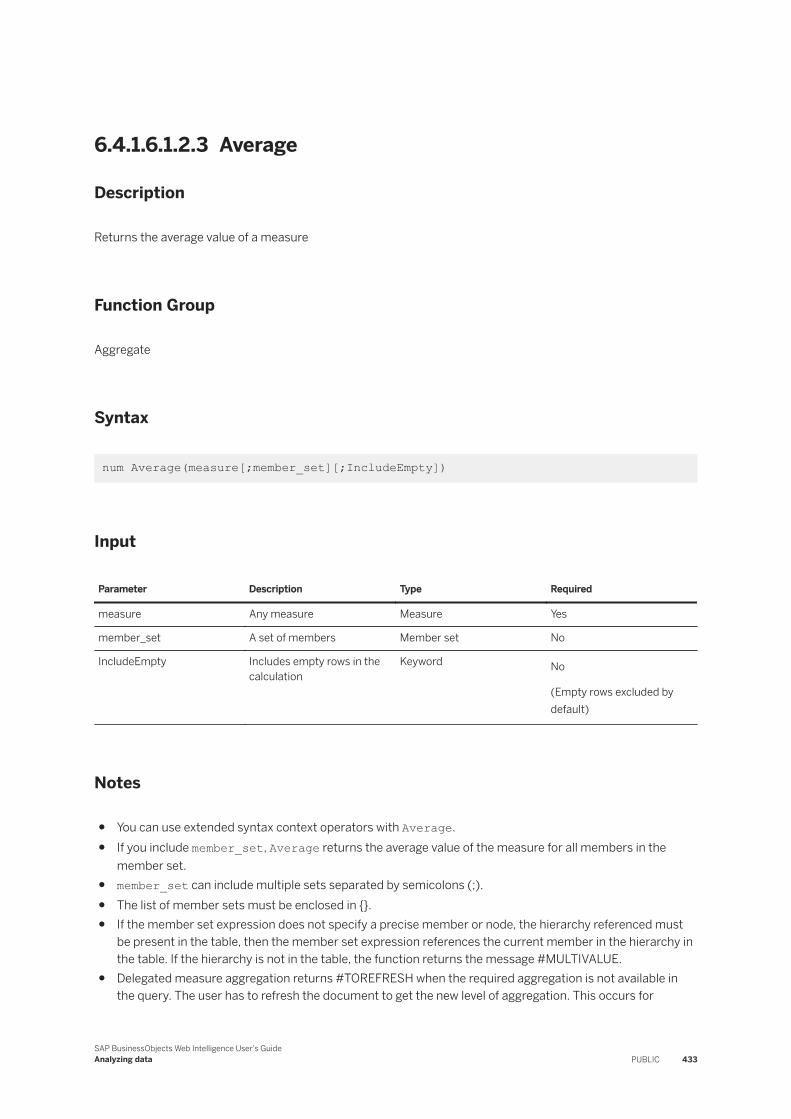
6.4.1.6.1.2.3 Average
Description
Returns the average value of a measure
Function Group
Aggregate
Syntax
num Average(measure[;member_set][;IncludeEmpty])
Input
Parameter Description Type Required
measure Any measure Measure Yes
member_set A set of members Member set No
IncludeEmpty Includes empty rows in the calculation
Keyword No
(Empty rows excluded by default)
Notes
● You can use extended syntax context operators with Average.● If you include member_set, Average returns the average value of the measure for all members in the
member set.● member_set can include multiple sets separated by semicolons (;).● The list of member sets must be enclosed in {}.● If the member set expression does not specify a precise member or node, the hierarchy referenced must
be present in the table, then the member set expression references the current member in the hierarchy in the table. If the hierarchy is not in the table, the function returns the message #MULTIVALUE.
● Delegated measure aggregation returns #TOREFRESH when the required aggregation is not available in the query. The user has to refresh the document to get the new level of aggregation. This occurs for
SAP BusinessObjects Web Intelligence User's GuideAnalyzing data PUBLIC 433
example when using the filter bar when the user selects a value before “all values” and vice versa when selecting “all values” before a selected value.
● A delegated measure given against a group returns #UNAVAILABLE as it requires local aggregation (aggregation of the measure value of the grouped values).Even when you force local aggregaton on a delegated measure against an "if then else" formula or group value it will still return the #MULTIVALUE message.
Examples
If the [Sales Revenue] measure has the values 41569, 30500, 40000 and 50138, Average([Sales Revenue]) returns 40552.
If [California] is a member in the [Geography] hierarchy (Country > State > City), Average([Sales Revenue];{[Geography]&[US].[California].children}) returns the average sales revenue of all cities in California.
Related Information
Referring to members and member sets in hierarchies [page 651]IncludeEmpty operator [page 635]
6.4.1.6.1.2.4 Count
Description
Returns the number of values in a set of values
Function Group
Aggregate
Syntax
integer Count(aggregated_data[;member_set][;IncludeEmpty][;Distinct|All])
434 PUBLICSAP BusinessObjects Web Intelligence User's Guide
Analyzing data
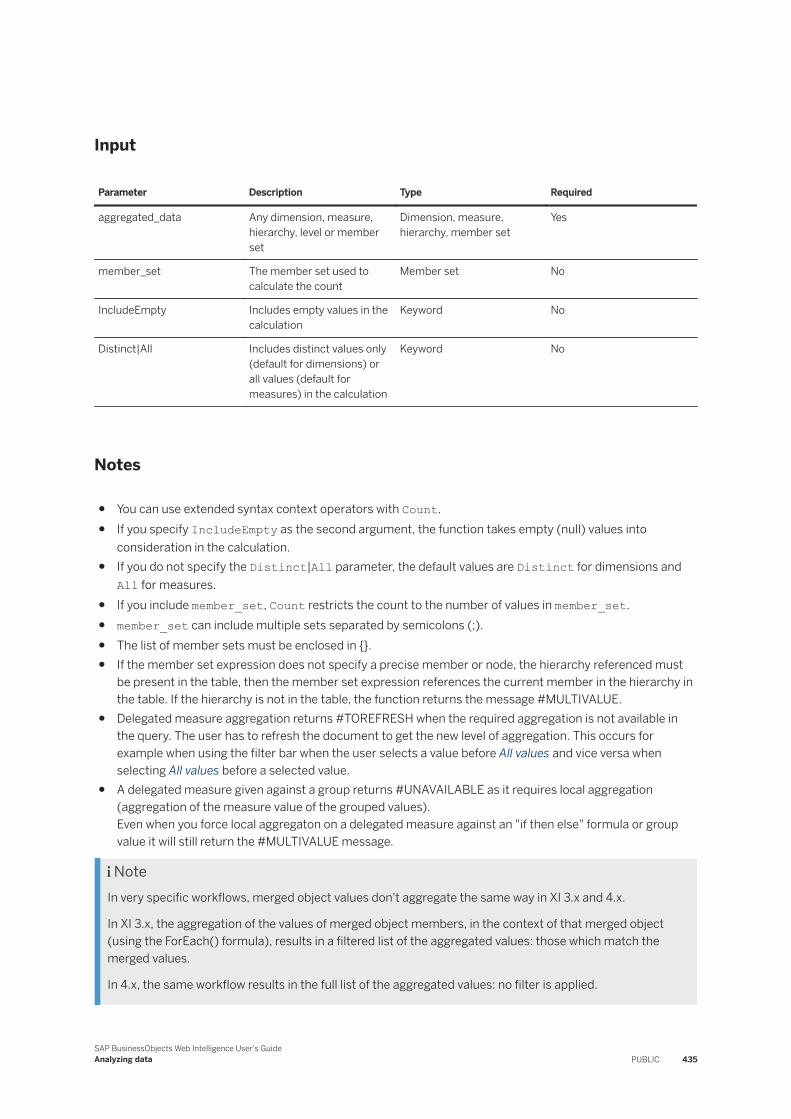
Input
Parameter Description Type Required
aggregated_data Any dimension, measure, hierarchy, level or member set
Dimension, measure, hierarchy, member set
Yes
member_set The member set used to calculate the count
Member set No
IncludeEmpty Includes empty values in the calculation
Keyword No
Distinct|All Includes distinct values only (default for dimensions) or all values (default for measures) in the calculation
Keyword No
Notes
● You can use extended syntax context operators with Count.● If you specify IncludeEmpty as the second argument, the function takes empty (null) values into
consideration in the calculation.● If you do not specify the Distinct|All parameter, the default values are Distinct for dimensions and
All for measures.● If you include member_set, Count restricts the count to the number of values in member_set.● member_set can include multiple sets separated by semicolons (;).● The list of member sets must be enclosed in {}.● If the member set expression does not specify a precise member or node, the hierarchy referenced must
be present in the table, then the member set expression references the current member in the hierarchy in the table. If the hierarchy is not in the table, the function returns the message #MULTIVALUE.
● Delegated measure aggregation returns #TOREFRESH when the required aggregation is not available in the query. The user has to refresh the document to get the new level of aggregation. This occurs for example when using the filter bar when the user selects a value before All values and vice versa when selecting All values before a selected value.
● A delegated measure given against a group returns #UNAVAILABLE as it requires local aggregation (aggregation of the measure value of the grouped values).Even when you force local aggregaton on a delegated measure against an "if then else" formula or group value it will still return the #MULTIVALUE message.
NoteIn very specific workflows, merged object values don't aggregate the same way in XI 3.x and 4.x.
In XI 3.x, the aggregation of the values of merged object members, in the context of that merged object (using the ForEach() formula), results in a filtered list of the aggregated values: those which match the merged values.
In 4.x, the same workflow results in the full list of the aggregated values: no filter is applied.
SAP BusinessObjects Web Intelligence User's GuideAnalyzing data PUBLIC 435
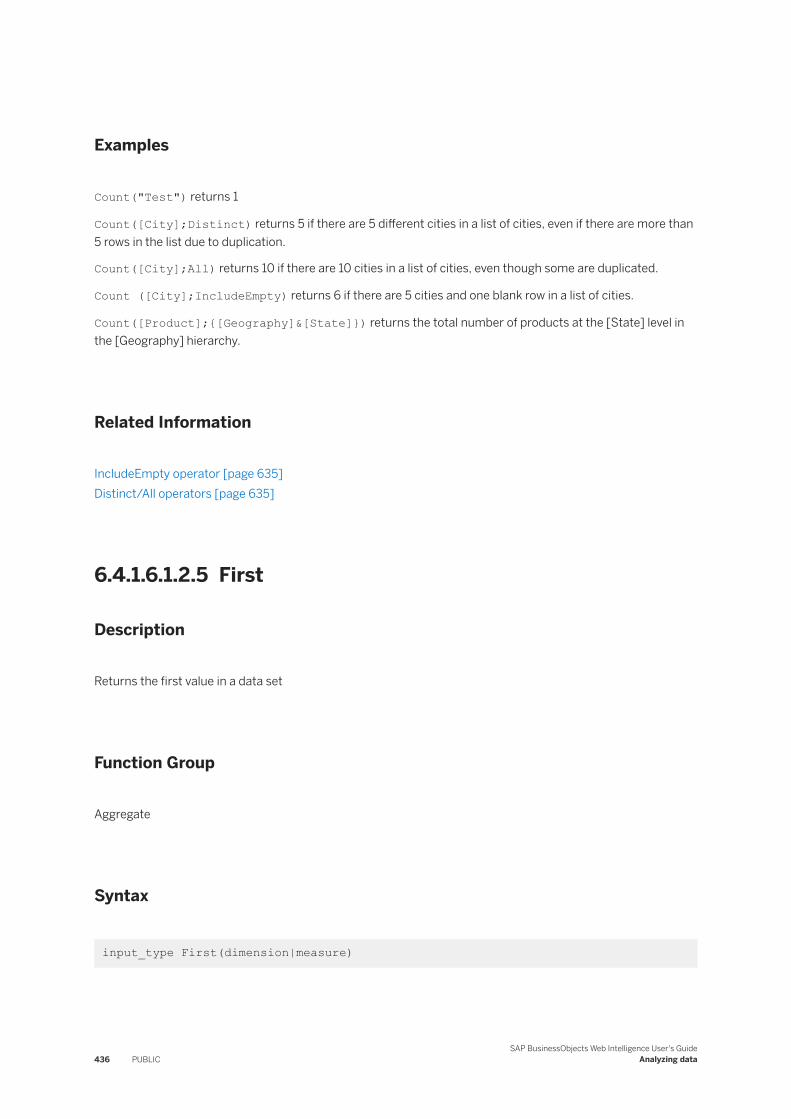
Examples
Count("Test") returns 1
Count([City];Distinct) returns 5 if there are 5 different cities in a list of cities, even if there are more than 5 rows in the list due to duplication.
Count([City];All) returns 10 if there are 10 cities in a list of cities, even though some are duplicated.
Count ([City];IncludeEmpty) returns 6 if there are 5 cities and one blank row in a list of cities.
Count([Product];{[Geography]&[State]}) returns the total number of products at the [State] level in the [Geography] hierarchy.
Related Information
IncludeEmpty operator [page 635]Distinct/All operators [page 635]
6.4.1.6.1.2.5 First
Description
Returns the first value in a data set
Function Group
Aggregate
Syntax
input_type First(dimension|measure)
436 PUBLICSAP BusinessObjects Web Intelligence User's Guide
Analyzing data
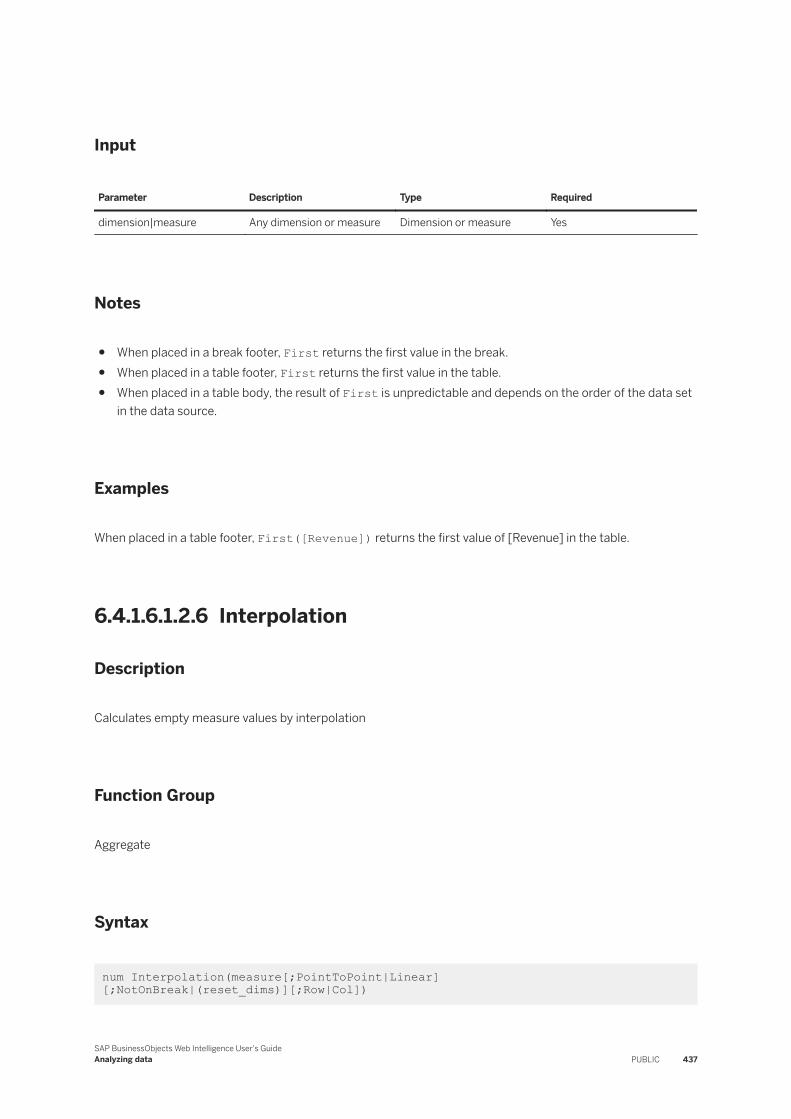
Input
Parameter Description Type Required
dimension|measure Any dimension or measure Dimension or measure Yes
Notes
● When placed in a break footer, First returns the first value in the break.● When placed in a table footer, First returns the first value in the table.● When placed in a table body, the result of First is unpredictable and depends on the order of the data set
in the data source.
Examples
When placed in a table footer, First([Revenue]) returns the first value of [Revenue] in the table.
6.4.1.6.1.2.6 Interpolation
Description
Calculates empty measure values by interpolation
Function Group
Aggregate
Syntax
num Interpolation(measure[;PointToPoint|Linear] [;NotOnBreak|(reset_dims)][;Row|Col])
SAP BusinessObjects Web Intelligence User's GuideAnalyzing data PUBLIC 437
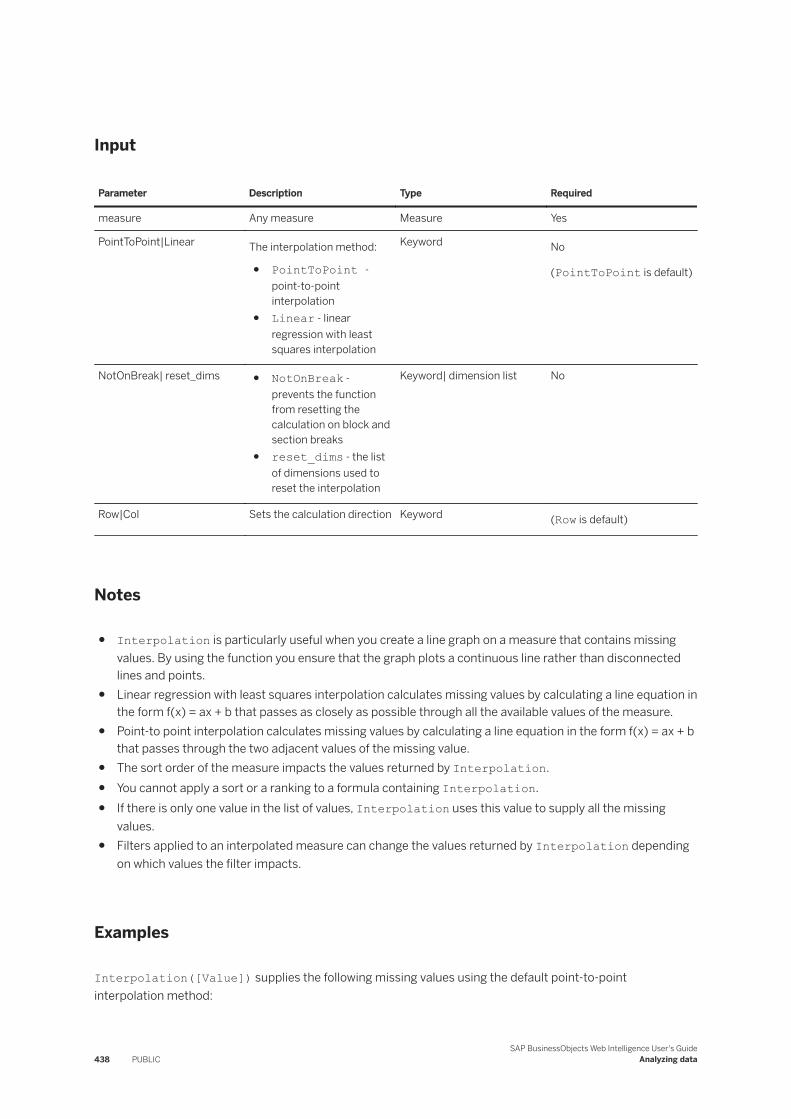
Input
Parameter Description Type Required
measure Any measure Measure Yes
PointToPoint|Linear The interpolation method:
● PointToPoint - point-to-point interpolation
● Linear - linear regression with least squares interpolation
Keyword No
(PointToPoint is default)
NotOnBreak| reset_dims ● NotOnBreak - prevents the function from resetting the calculation on block and section breaks
● reset_dims - the list of dimensions used to reset the interpolation
Keyword| dimension list No
Row|Col Sets the calculation direction Keyword (Row is default)
Notes
● Interpolation is particularly useful when you create a line graph on a measure that contains missing values. By using the function you ensure that the graph plots a continuous line rather than disconnected lines and points.
● Linear regression with least squares interpolation calculates missing values by calculating a line equation in the form f(x) = ax + b that passes as closely as possible through all the available values of the measure.
● Point-to point interpolation calculates missing values by calculating a line equation in the form f(x) = ax + b that passes through the two adjacent values of the missing value.
● The sort order of the measure impacts the values returned by Interpolation.● You cannot apply a sort or a ranking to a formula containing Interpolation.● If there is only one value in the list of values, Interpolation uses this value to supply all the missing
values.● Filters applied to an interpolated measure can change the values returned by Interpolation depending
on which values the filter impacts.
Examples
Interpolation([Value]) supplies the following missing values using the default point-to-point interpolation method:
438 PUBLICSAP BusinessObjects Web Intelligence User's Guide
Analyzing data
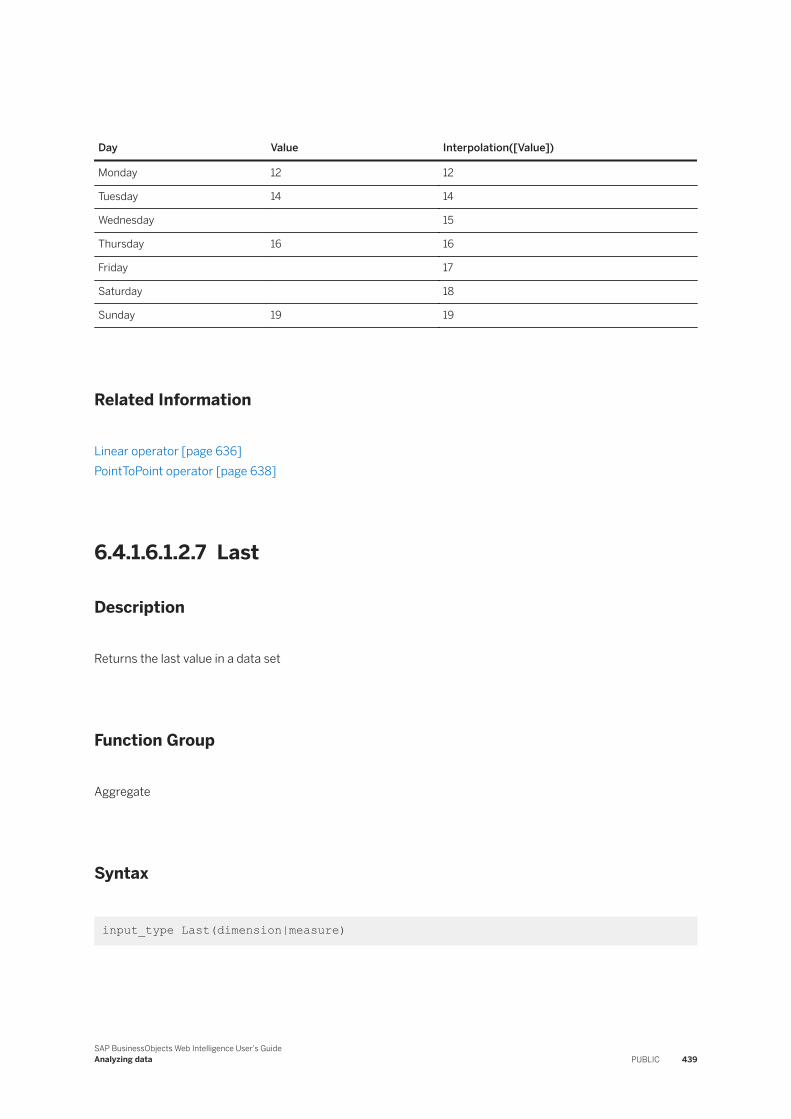
Day Value Interpolation([Value])
Monday 12 12
Tuesday 14 14
Wednesday 15
Thursday 16 16
Friday 17
Saturday 18
Sunday 19 19
Related Information
Linear operator [page 636]PointToPoint operator [page 638]
6.4.1.6.1.2.7 Last
Description
Returns the last value in a data set
Function Group
Aggregate
Syntax
input_type Last(dimension|measure)
SAP BusinessObjects Web Intelligence User's GuideAnalyzing data PUBLIC 439
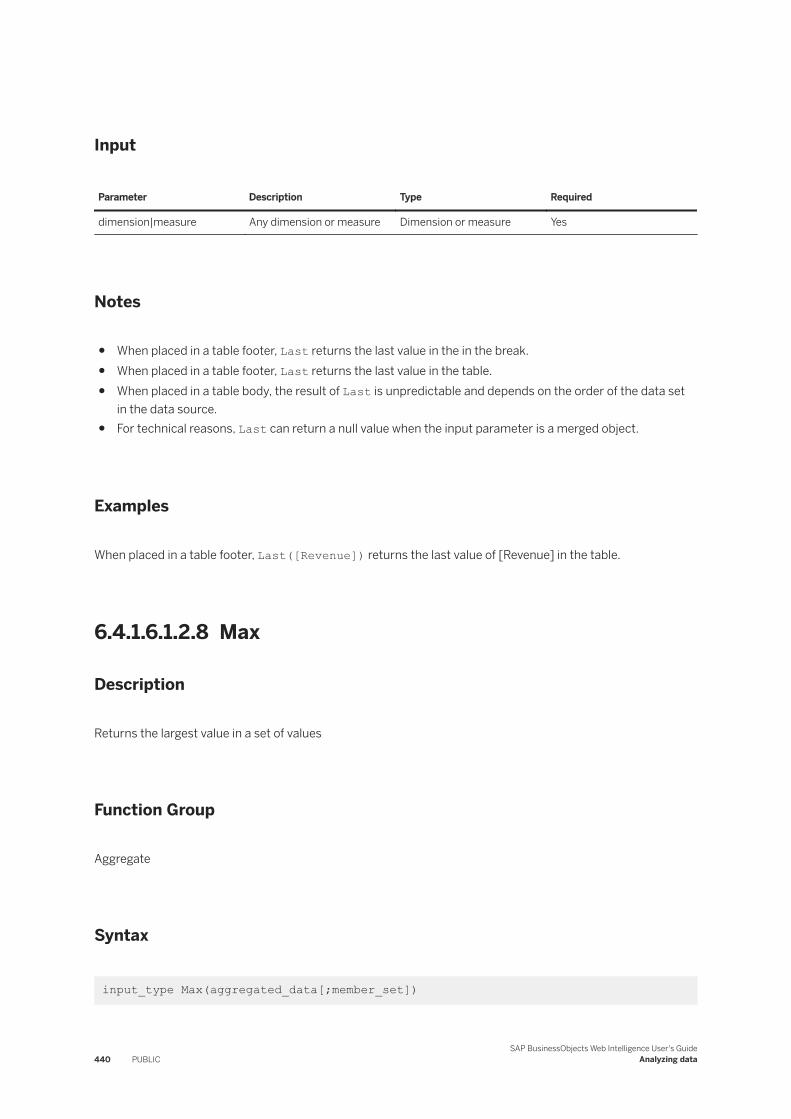
Input
Parameter Description Type Required
dimension|measure Any dimension or measure Dimension or measure Yes
Notes
● When placed in a table footer, Last returns the last value in the in the break.● When placed in a table footer, Last returns the last value in the table.● When placed in a table body, the result of Last is unpredictable and depends on the order of the data set
in the data source.● For technical reasons, Last can return a null value when the input parameter is a merged object.
Examples
When placed in a table footer, Last([Revenue]) returns the last value of [Revenue] in the table.
6.4.1.6.1.2.8 Max
Description
Returns the largest value in a set of values
Function Group
Aggregate
Syntax
input_type Max(aggregated_data[;member_set])
440 PUBLICSAP BusinessObjects Web Intelligence User's Guide
Analyzing data
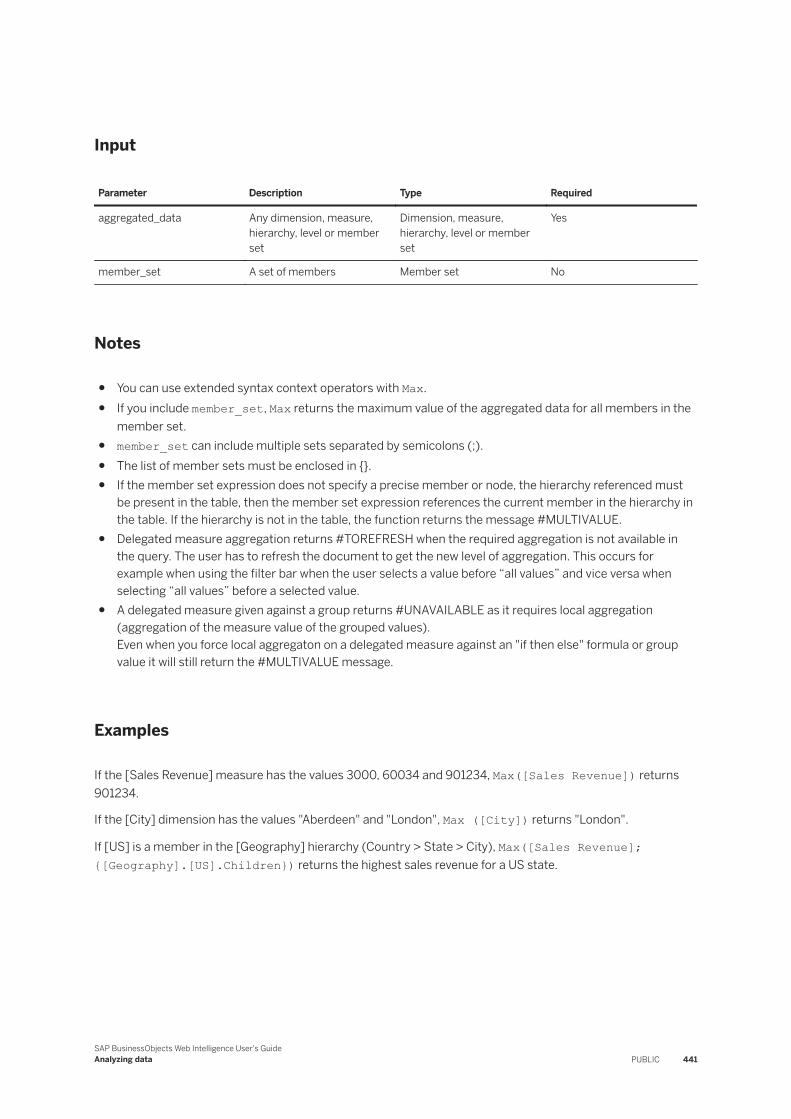
Input
Parameter Description Type Required
aggregated_data Any dimension, measure, hierarchy, level or member set
Dimension, measure, hierarchy, level or member set
Yes
member_set A set of members Member set No
Notes
● You can use extended syntax context operators with Max.● If you include member_set, Max returns the maximum value of the aggregated data for all members in the
member set.● member_set can include multiple sets separated by semicolons (;).● The list of member sets must be enclosed in {}.● If the member set expression does not specify a precise member or node, the hierarchy referenced must
be present in the table, then the member set expression references the current member in the hierarchy in the table. If the hierarchy is not in the table, the function returns the message #MULTIVALUE.
● Delegated measure aggregation returns #TOREFRESH when the required aggregation is not available in the query. The user has to refresh the document to get the new level of aggregation. This occurs for example when using the filter bar when the user selects a value before “all values” and vice versa when selecting “all values” before a selected value.
● A delegated measure given against a group returns #UNAVAILABLE as it requires local aggregation (aggregation of the measure value of the grouped values).Even when you force local aggregaton on a delegated measure against an "if then else" formula or group value it will still return the #MULTIVALUE message.
Examples
If the [Sales Revenue] measure has the values 3000, 60034 and 901234, Max([Sales Revenue]) returns 901234.
If the [City] dimension has the values "Aberdeen" and "London", Max ([City]) returns "London".
If [US] is a member in the [Geography] hierarchy (Country > State > City), Max([Sales Revenue];{[Geography].[US].Children}) returns the highest sales revenue for a US state.
SAP BusinessObjects Web Intelligence User's GuideAnalyzing data PUBLIC 441
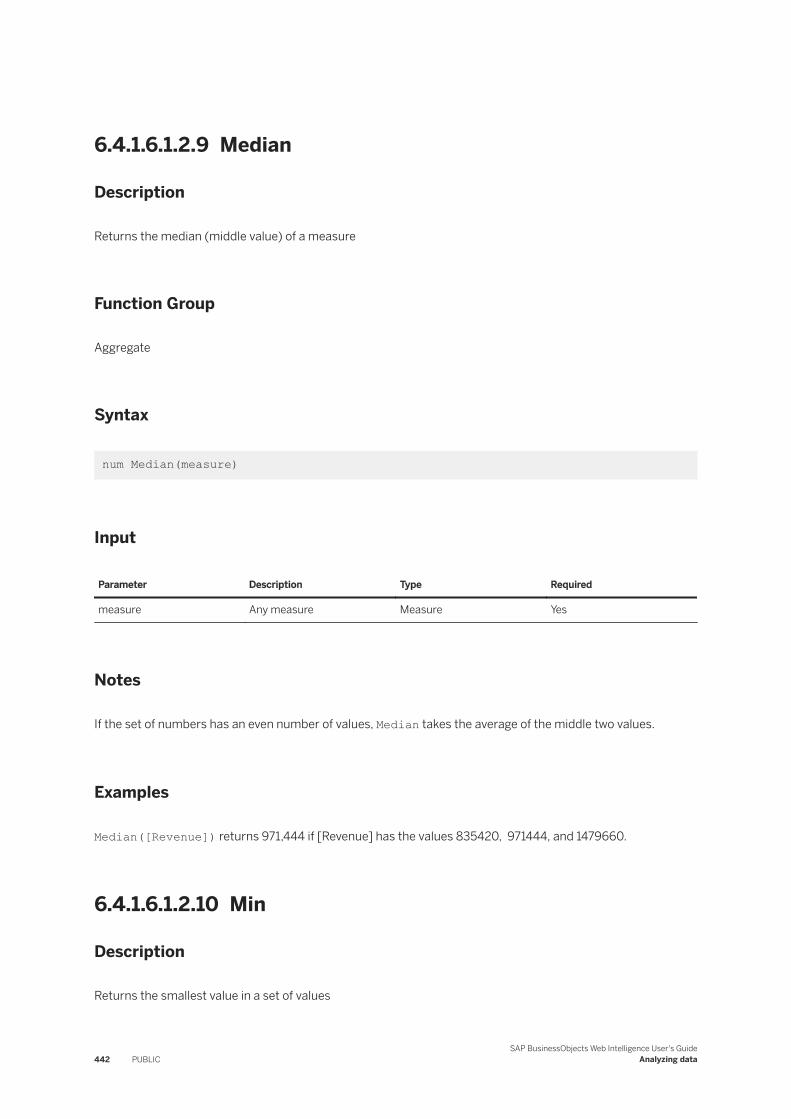
6.4.1.6.1.2.9 Median
Description
Returns the median (middle value) of a measure
Function Group
Aggregate
Syntax
num Median(measure)
Input
Parameter Description Type Required
measure Any measure Measure Yes
Notes
If the set of numbers has an even number of values, Median takes the average of the middle two values.
Examples
Median([Revenue]) returns 971,444 if [Revenue] has the values 835420, 971444, and 1479660.
6.4.1.6.1.2.10 Min
Description
Returns the smallest value in a set of values
442 PUBLICSAP BusinessObjects Web Intelligence User's Guide
Analyzing data
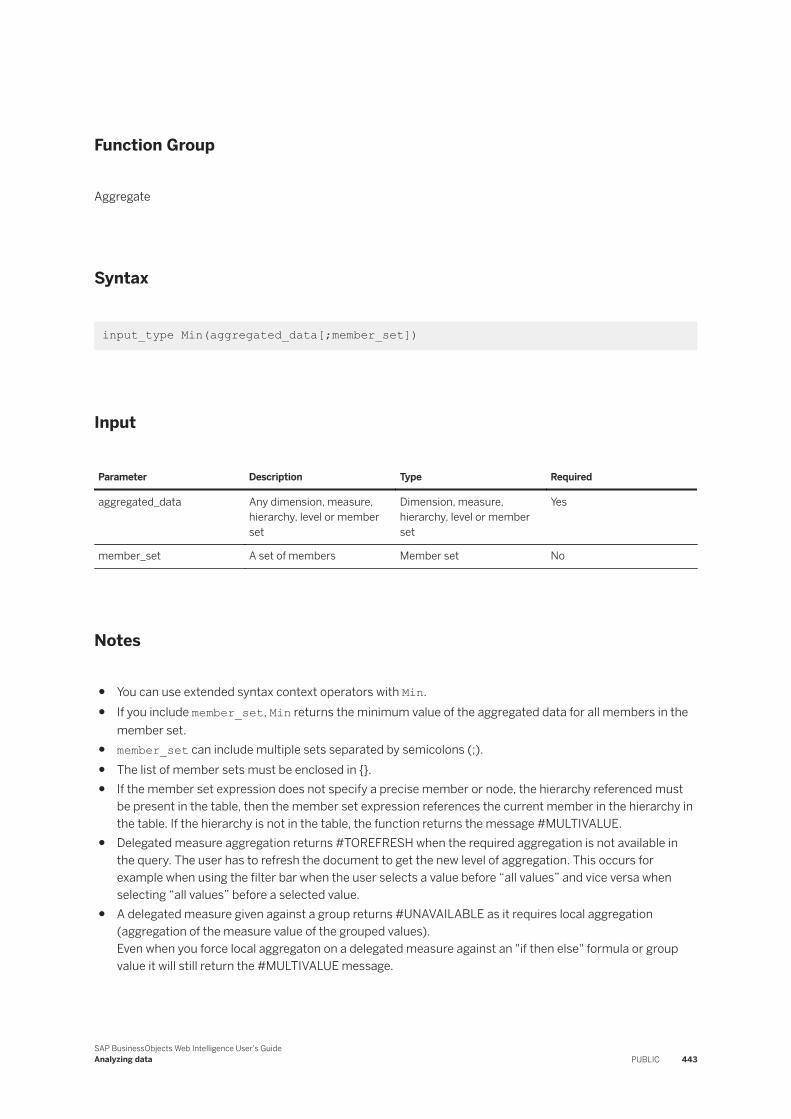
Function Group
Aggregate
Syntax
input_type Min(aggregated_data[;member_set])
Input
Parameter Description Type Required
aggregated_data Any dimension, measure, hierarchy, level or member set
Dimension, measure, hierarchy, level or member set
Yes
member_set A set of members Member set No
Notes
● You can use extended syntax context operators with Min.● If you include member_set, Min returns the minimum value of the aggregated data for all members in the
member set.● member_set can include multiple sets separated by semicolons (;).● The list of member sets must be enclosed in {}.● If the member set expression does not specify a precise member or node, the hierarchy referenced must
be present in the table, then the member set expression references the current member in the hierarchy in the table. If the hierarchy is not in the table, the function returns the message #MULTIVALUE.
● Delegated measure aggregation returns #TOREFRESH when the required aggregation is not available in the query. The user has to refresh the document to get the new level of aggregation. This occurs for example when using the filter bar when the user selects a value before “all values” and vice versa when selecting “all values” before a selected value.
● A delegated measure given against a group returns #UNAVAILABLE as it requires local aggregation (aggregation of the measure value of the grouped values).Even when you force local aggregaton on a delegated measure against an "if then else" formula or group value it will still return the #MULTIVALUE message.
SAP BusinessObjects Web Intelligence User's GuideAnalyzing data PUBLIC 443
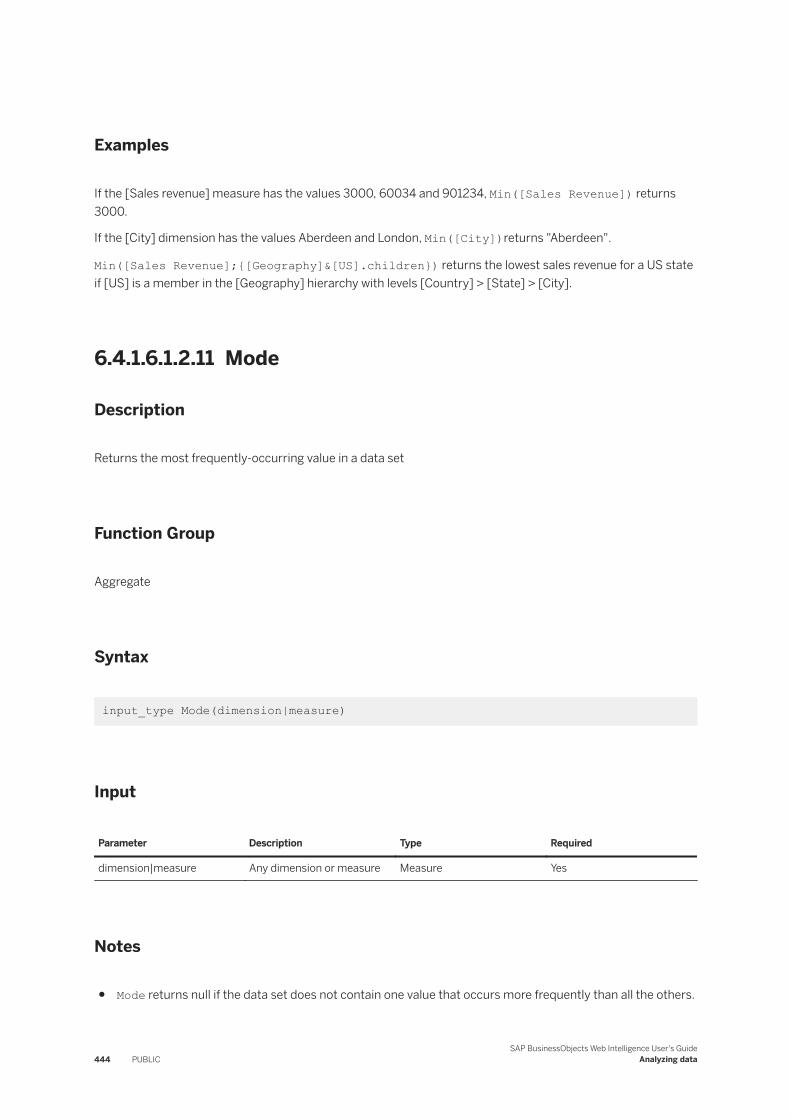
Examples
If the [Sales revenue] measure has the values 3000, 60034 and 901234, Min([Sales Revenue]) returns 3000.
If the [City] dimension has the values Aberdeen and London, Min([City])returns "Aberdeen".
Min([Sales Revenue];{[Geography]&[US].children}) returns the lowest sales revenue for a US state if [US] is a member in the [Geography] hierarchy with levels [Country] > [State] > [City].
6.4.1.6.1.2.11 Mode
Description
Returns the most frequently-occurring value in a data set
Function Group
Aggregate
Syntax
input_type Mode(dimension|measure)
Input
Parameter Description Type Required
dimension|measure Any dimension or measure Measure Yes
Notes
● Mode returns null if the data set does not contain one value that occurs more frequently than all the others.
444 PUBLICSAP BusinessObjects Web Intelligence User's Guide
Analyzing data
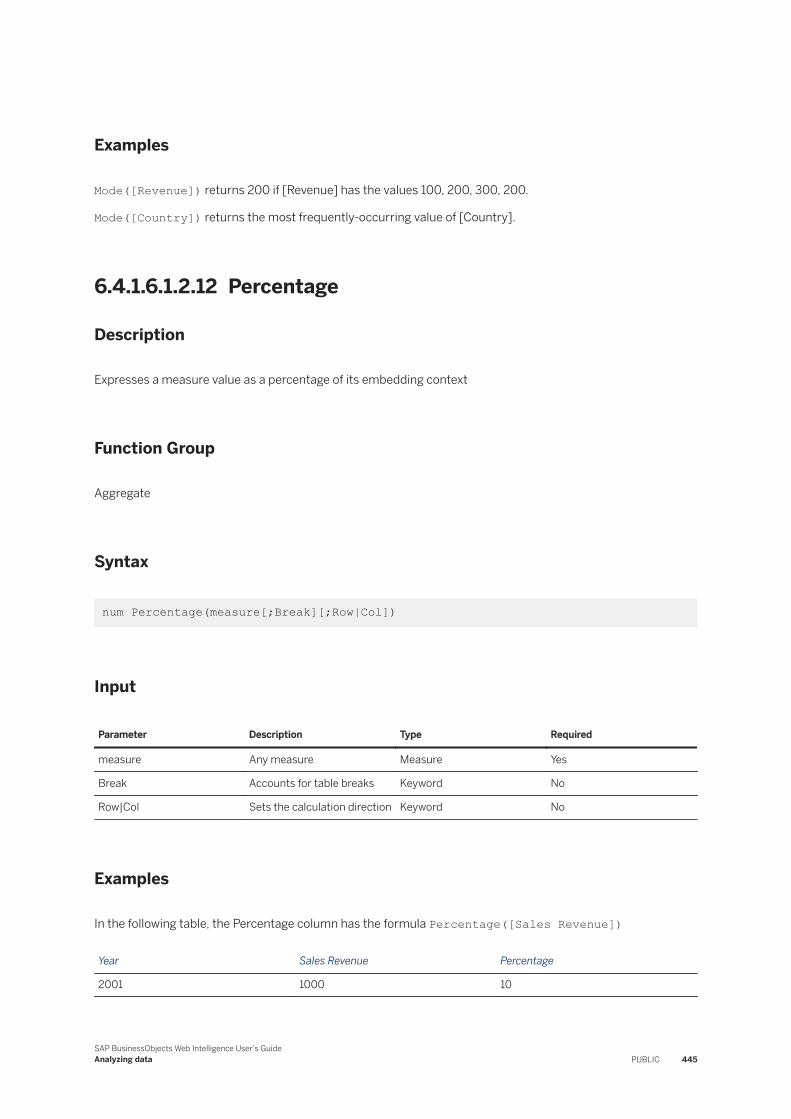
Examples
Mode([Revenue]) returns 200 if [Revenue] has the values 100, 200, 300, 200.
Mode([Country]) returns the most frequently-occurring value of [Country].
6.4.1.6.1.2.12 Percentage
Description
Expresses a measure value as a percentage of its embedding context
Function Group
Aggregate
Syntax
num Percentage(measure[;Break][;Row|Col])
Input
Parameter Description Type Required
measure Any measure Measure Yes
Break Accounts for table breaks Keyword No
Row|Col Sets the calculation direction Keyword No
Examples
In the following table, the Percentage column has the formula Percentage([Sales Revenue])
Year Sales Revenue Percentage
2001 1000 10
SAP BusinessObjects Web Intelligence User's GuideAnalyzing data PUBLIC 445
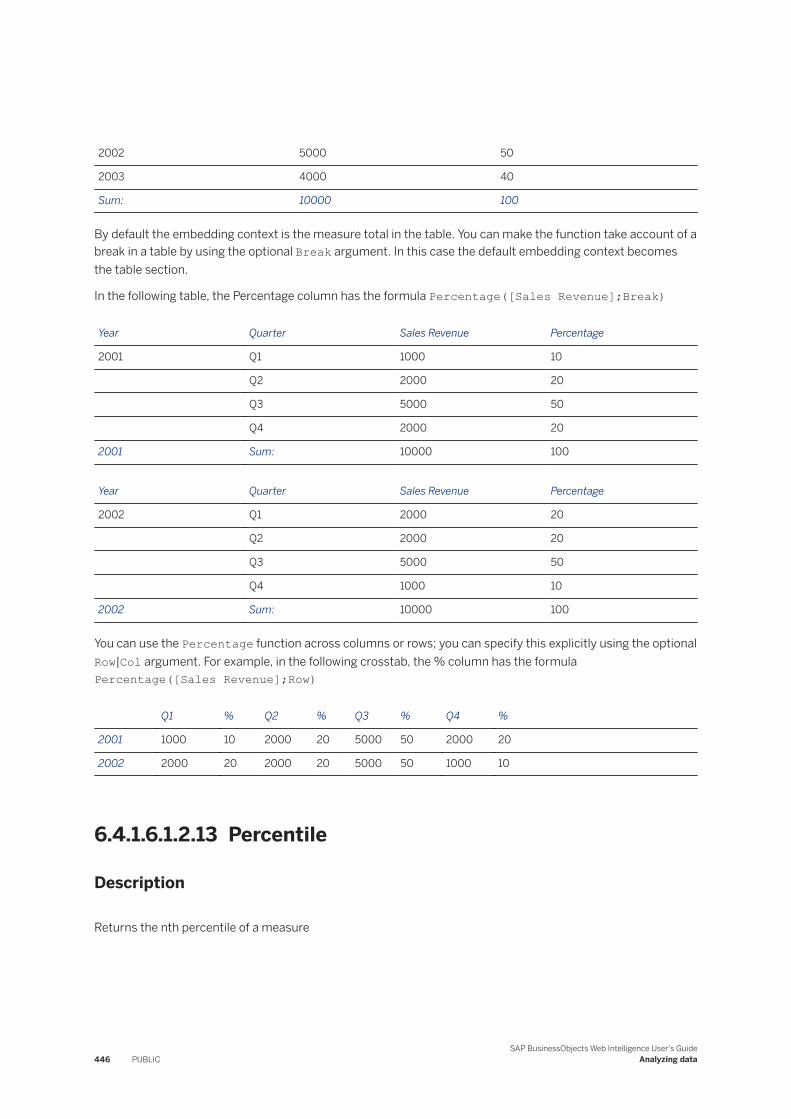
2002 5000 50
2003 4000 40
Sum: 10000 100
By default the embedding context is the measure total in the table. You can make the function take account of a break in a table by using the optional Break argument. In this case the default embedding context becomes the table section.
In the following table, the Percentage column has the formula Percentage([Sales Revenue];Break)
Year Quarter Sales Revenue Percentage
2001 Q1 1000 10
Q2 2000 20
Q3 5000 50
Q4 2000 20
2001 Sum: 10000 100
Year Quarter Sales Revenue Percentage
2002 Q1 2000 20
Q2 2000 20
Q3 5000 50
Q4 1000 10
2002 Sum: 10000 100
You can use the Percentage function across columns or rows; you can specify this explicitly using the optional Row|Col argument. For example, in the following crosstab, the % column has the formula Percentage([Sales Revenue];Row)
Q1 % Q2 % Q3 % Q4 %
2001 1000 10 2000 20 5000 50 2000 20
2002 2000 20 2000 20 5000 50 1000 10
6.4.1.6.1.2.13 Percentile
Description
Returns the nth percentile of a measure
446 PUBLICSAP BusinessObjects Web Intelligence User's Guide
Analyzing data
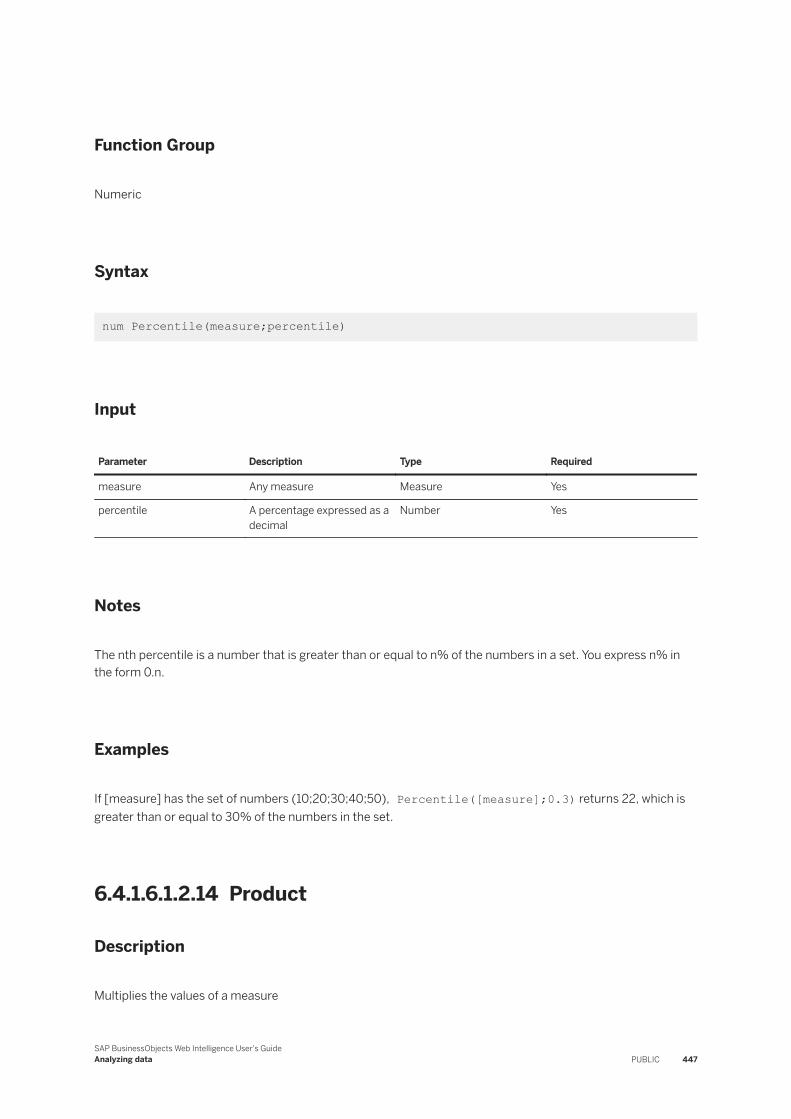
Function Group
Numeric
Syntax
num Percentile(measure;percentile)
Input
Parameter Description Type Required
measure Any measure Measure Yes
percentile A percentage expressed as a decimal
Number Yes
Notes
The nth percentile is a number that is greater than or equal to n% of the numbers in a set. You express n% in the form 0.n.
Examples
If [measure] has the set of numbers (10;20;30;40;50), Percentile([measure];0.3) returns 22, which is greater than or equal to 30% of the numbers in the set.
6.4.1.6.1.2.14 Product
Description
Multiplies the values of a measure
SAP BusinessObjects Web Intelligence User's GuideAnalyzing data PUBLIC 447
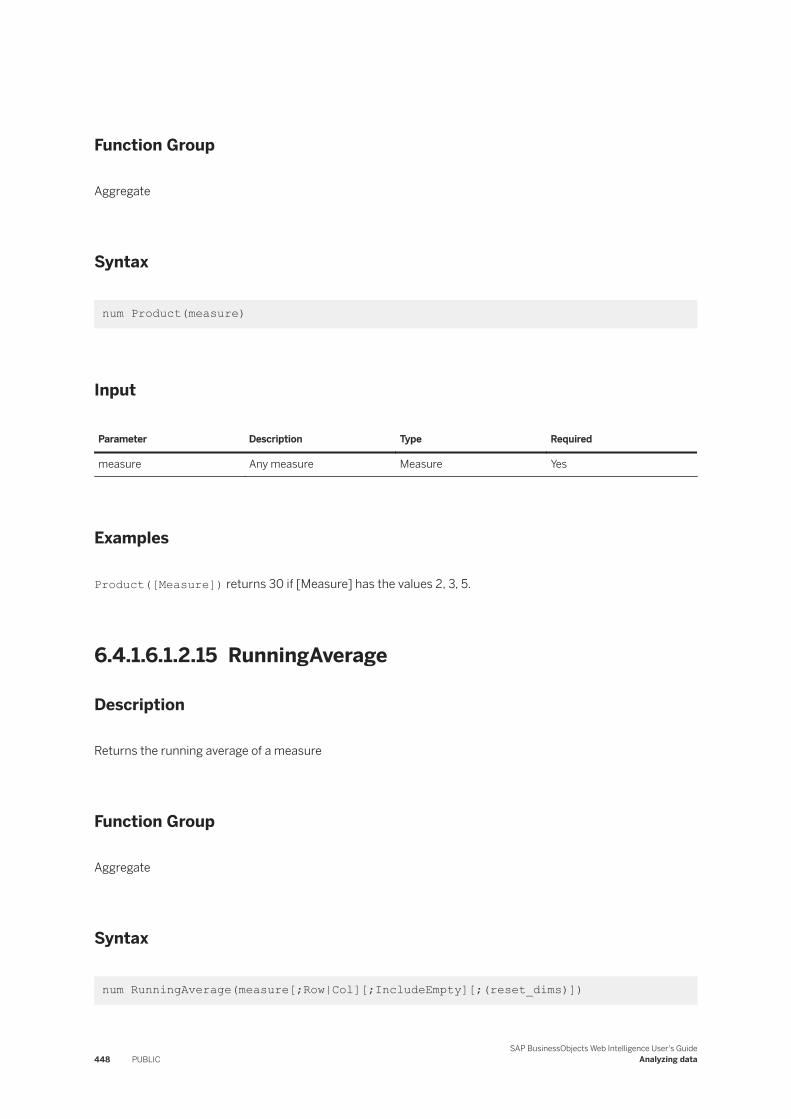
Function Group
Aggregate
Syntax
num Product(measure)
Input
Parameter Description Type Required
measure Any measure Measure Yes
Examples
Product([Measure]) returns 30 if [Measure] has the values 2, 3, 5.
6.4.1.6.1.2.15 RunningAverage
Description
Returns the running average of a measure
Function Group
Aggregate
Syntax
num RunningAverage(measure[;Row|Col][;IncludeEmpty][;(reset_dims)])
448 PUBLICSAP BusinessObjects Web Intelligence User's Guide
Analyzing data
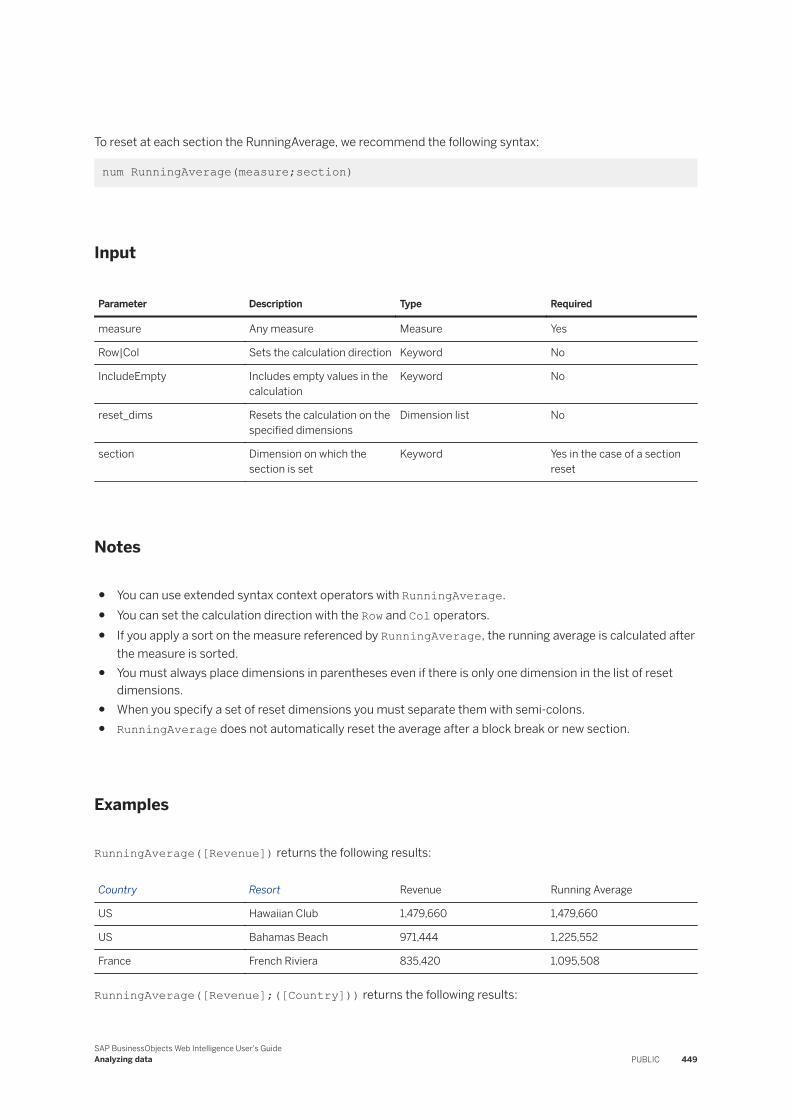
To reset at each section the RunningAverage, we recommend the following syntax:
num RunningAverage(measure;section)
Input
Parameter Description Type Required
measure Any measure Measure Yes
Row|Col Sets the calculation direction Keyword No
IncludeEmpty Includes empty values in the calculation
Keyword No
reset_dims Resets the calculation on the specified dimensions
Dimension list No
section Dimension on which the section is set
Keyword Yes in the case of a section reset
Notes
● You can use extended syntax context operators with RunningAverage.● You can set the calculation direction with the Row and Col operators.● If you apply a sort on the measure referenced by RunningAverage, the running average is calculated after
the measure is sorted.● You must always place dimensions in parentheses even if there is only one dimension in the list of reset
dimensions.● When you specify a set of reset dimensions you must separate them with semi-colons.● RunningAverage does not automatically reset the average after a block break or new section.
Examples
RunningAverage([Revenue]) returns the following results:
Country Resort Revenue Running Average
US Hawaiian Club 1,479,660 1,479,660
US Bahamas Beach 971,444 1,225,552
France French Riviera 835,420 1,095,508
RunningAverage([Revenue];([Country])) returns the following results:
SAP BusinessObjects Web Intelligence User's GuideAnalyzing data PUBLIC 449
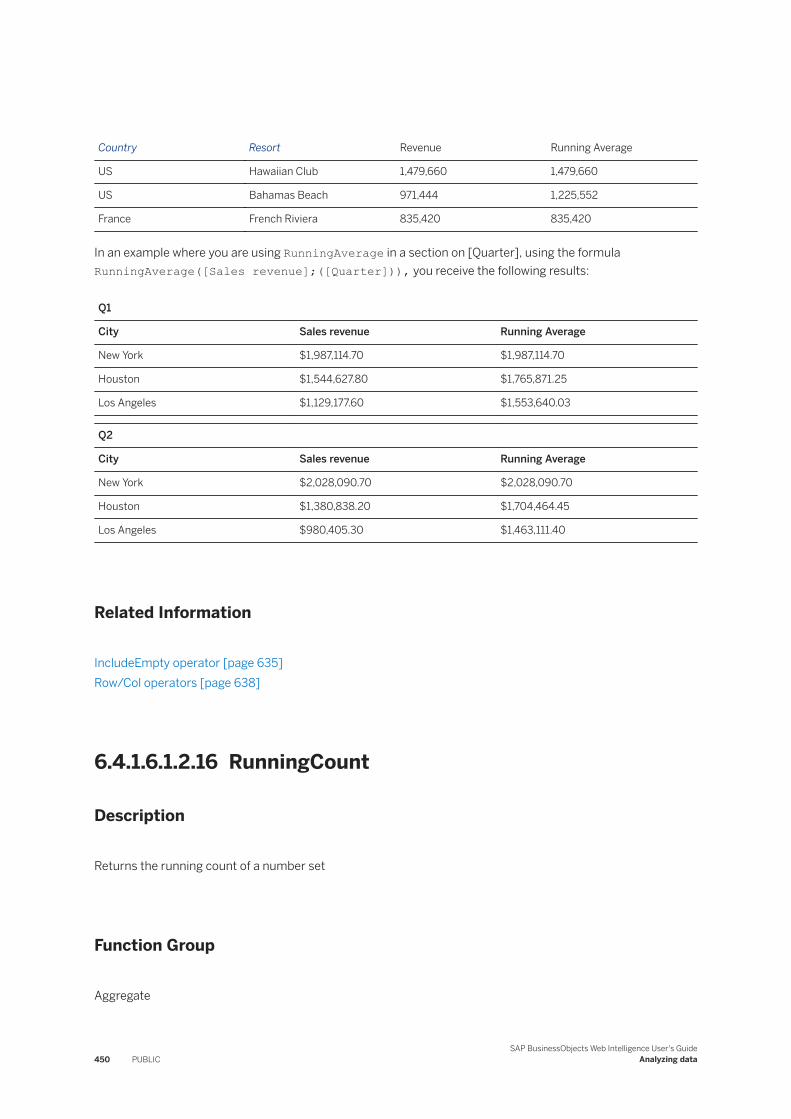
Country Resort Revenue Running Average
US Hawaiian Club 1,479,660 1,479,660
US Bahamas Beach 971,444 1,225,552
France French Riviera 835,420 835,420
In an example where you are using RunningAverage in a section on [Quarter], using the formula RunningAverage([Sales revenue];([Quarter])), you receive the following results:
Q1
City Sales revenue Running Average
New York $1,987,114.70 $1,987,114.70
Houston $1,544,627.80 $1,765,871.25
Los Angeles $1,129,177.60 $1,553,640.03
Q2
City Sales revenue Running Average
New York $2,028,090.70 $2,028,090.70
Houston $1,380,838.20 $1,704,464.45
Los Angeles $980,405.30 $1,463,111.40
Related Information
IncludeEmpty operator [page 635]Row/Col operators [page 638]
6.4.1.6.1.2.16 RunningCount
Description
Returns the running count of a number set
Function Group
Aggregate
450 PUBLICSAP BusinessObjects Web Intelligence User's Guide
Analyzing data
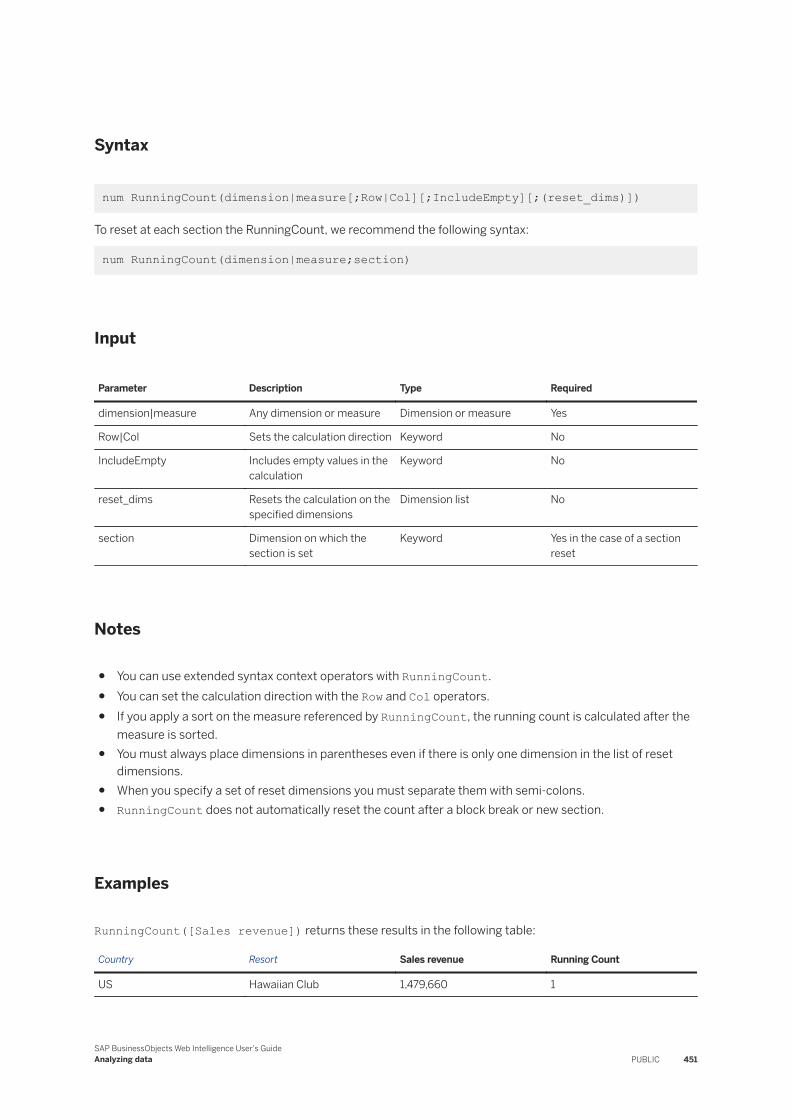
Syntax
num RunningCount(dimension|measure[;Row|Col][;IncludeEmpty][;(reset_dims)])
To reset at each section the RunningCount, we recommend the following syntax:
num RunningCount(dimension|measure;section)
Input
Parameter Description Type Required
dimension|measure Any dimension or measure Dimension or measure Yes
Row|Col Sets the calculation direction Keyword No
IncludeEmpty Includes empty values in the calculation
Keyword No
reset_dims Resets the calculation on the specified dimensions
Dimension list No
section Dimension on which the section is set
Keyword Yes in the case of a section reset
Notes
● You can use extended syntax context operators with RunningCount.● You can set the calculation direction with the Row and Col operators.● If you apply a sort on the measure referenced by RunningCount, the running count is calculated after the
measure is sorted.● You must always place dimensions in parentheses even if there is only one dimension in the list of reset
dimensions.● When you specify a set of reset dimensions you must separate them with semi-colons.● RunningCount does not automatically reset the count after a block break or new section.
Examples
RunningCount([Sales revenue]) returns these results in the following table:
Country Resort Sales revenue Running Count
US Hawaiian Club 1,479,660 1
SAP BusinessObjects Web Intelligence User's GuideAnalyzing data PUBLIC 451
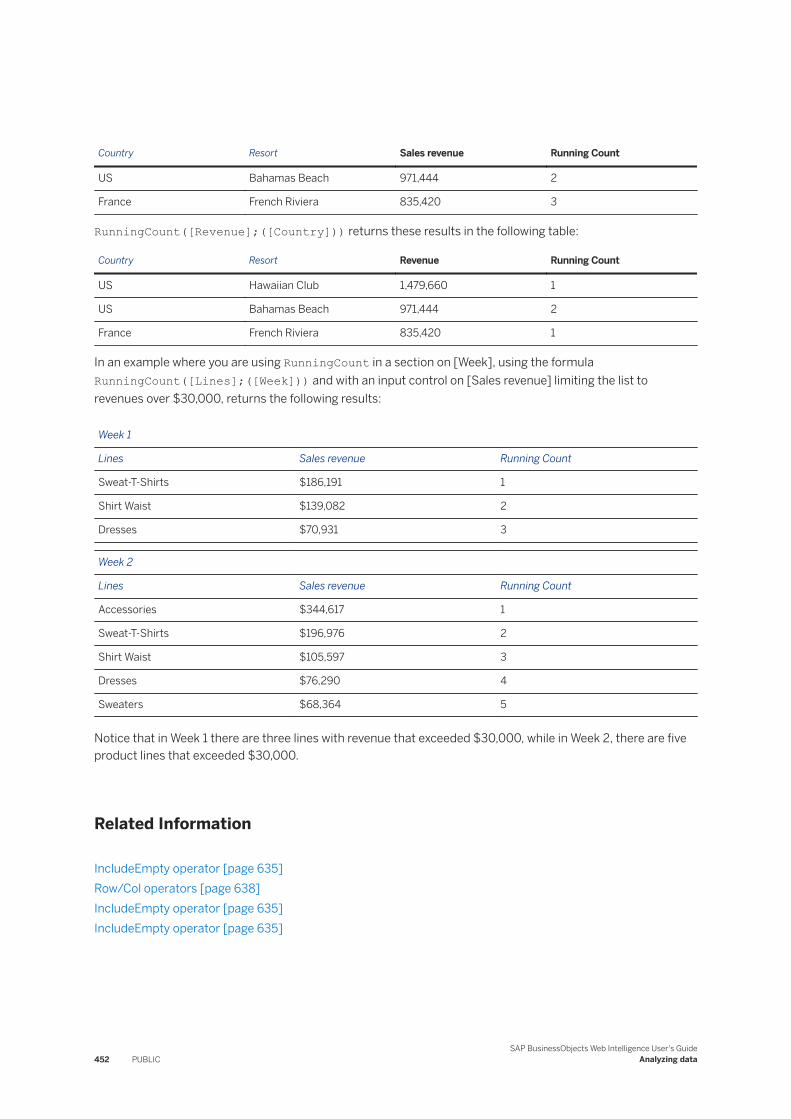
Country Resort Sales revenue Running Count
US Bahamas Beach 971,444 2
France French Riviera 835,420 3
RunningCount([Revenue];([Country])) returns these results in the following table:
Country Resort Revenue Running Count
US Hawaiian Club 1,479,660 1
US Bahamas Beach 971,444 2
France French Riviera 835,420 1
In an example where you are using RunningCount in a section on [Week], using the formula RunningCount([Lines];([Week])) and with an input control on [Sales revenue] limiting the list to revenues over $30,000, returns the following results:
Week 1
Lines Sales revenue Running Count
Sweat-T-Shirts $186,191 1
Shirt Waist $139,082 2
Dresses $70,931 3
Week 2
Lines Sales revenue Running Count
Accessories $344,617 1
Sweat-T-Shirts $196,976 2
Shirt Waist $105,597 3
Dresses $76,290 4
Sweaters $68,364 5
Notice that in Week 1 there are three lines with revenue that exceeded $30,000, while in Week 2, there are five product lines that exceeded $30,000.
Related Information
IncludeEmpty operator [page 635]Row/Col operators [page 638]IncludeEmpty operator [page 635]IncludeEmpty operator [page 635]
452 PUBLICSAP BusinessObjects Web Intelligence User's Guide
Analyzing data

6.4.1.6.1.2.17 RunningMax
Description
Returns the running maximum of a dimension or measure
Function Group
Aggregate
Syntax
input_type RunningMax(dimension|measure[;Row|Col][;(reset_dims)])
To reset at each section the RunningMax, we recommend the following syntax:
num RunningMax(measure;section)
Input
Parameter Description Type Reqiured
dimension|measure Any dimension or measure Dimension or measure Yes
Row|Col Sets the calculation direction Keyword No
reset_dims Resets the calculation on the specified dimensions
Dimension list No
section Dimension on which the section is set
Keyword Yes in the case of a section reset
Notes
● You can use extended syntax context operators with RunningMax.● You can set the calculation direction with the Row and Col operators.● If you apply a sort on the measure referenced by RunningMax, the running maximum is calculated after
the measure is sorted .● You must always place dimensions in parentheses even if there is only one dimension in the list of reset
dimensions.
SAP BusinessObjects Web Intelligence User's GuideAnalyzing data PUBLIC 453

● When you specify a set of reset dimensions you must separate them with semi-colons.● RunningMax does not automatically reset the max after a block break or new section.
Examples
RunningMax([Revenue]) returns these results in the following table:
Country Resort Revenue Running Max
France French Riviera 835,420 835,420
US Bahamas Beach 971,444 971,444
US Hawaiian Club 1,479,660 1,479,660
In an example where you are using RunningMax in a section on [City], using the formula RunningMax([Sales revenue];([City])), you receive the following results:
Austin
Quarter Sales revenue Running Max
Q1 $775,482.70 $775,482.70
Q2 $667,850.30 $775,482.70
Q3 $581,470.40 $775,482.70
Q4 $674,869.80 $775,482.70
Boston
Quarter Sales revenue Running Max
Q1 $312,896.40 $312,896.40
Q2 $291,431.00 $312,896.40
Q3 $249,529.00 $312,896.40
Q4 $429,850.20 $429,850.20
Related Information
IncludeEmpty operator [page 635]Row/Col operators [page 638]
454 PUBLICSAP BusinessObjects Web Intelligence User's Guide
Analyzing data
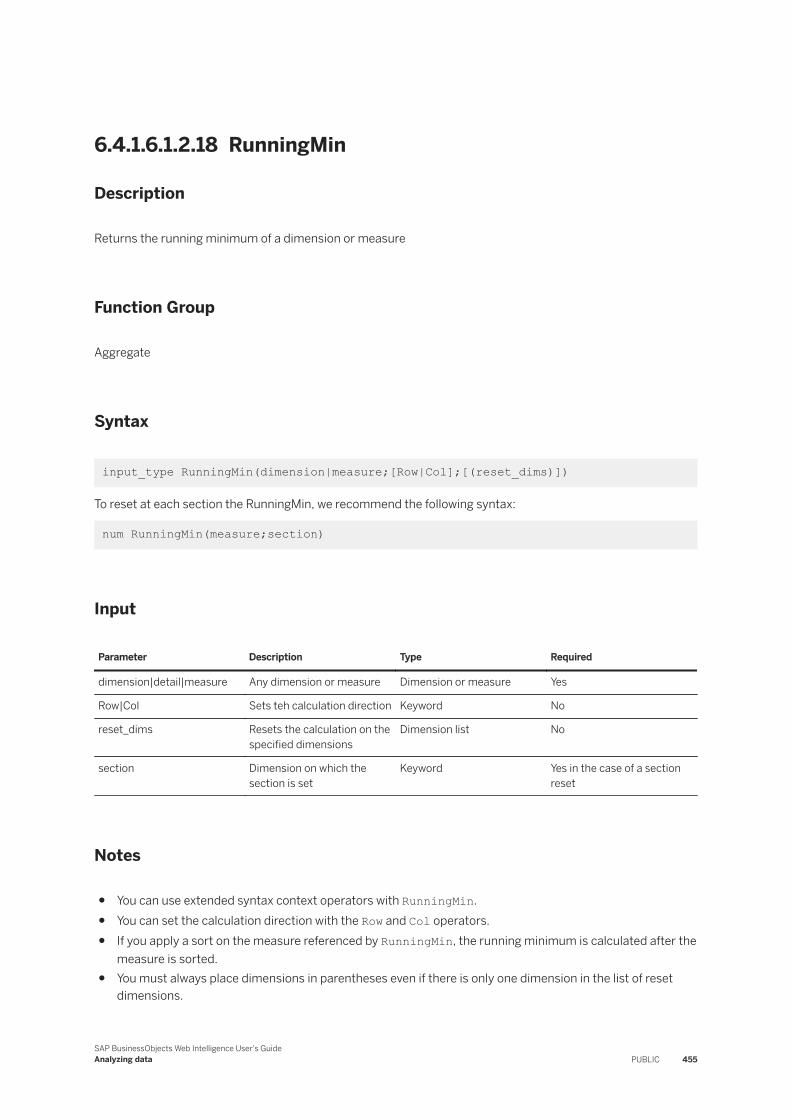
6.4.1.6.1.2.18 RunningMin
Description
Returns the running minimum of a dimension or measure
Function Group
Aggregate
Syntax
input_type RunningMin(dimension|measure;[Row|Col];[(reset_dims)])
To reset at each section the RunningMin, we recommend the following syntax:
num RunningMin(measure;section)
Input
Parameter Description Type Required
dimension|detail|measure Any dimension or measure Dimension or measure Yes
Row|Col Sets teh calculation direction Keyword No
reset_dims Resets the calculation on the specified dimensions
Dimension list No
section Dimension on which the section is set
Keyword Yes in the case of a section reset
Notes
● You can use extended syntax context operators with RunningMin.● You can set the calculation direction with the Row and Col operators.● If you apply a sort on the measure referenced by RunningMin, the running minimum is calculated after the
measure is sorted.● You must always place dimensions in parentheses even if there is only one dimension in the list of reset
dimensions.
SAP BusinessObjects Web Intelligence User's GuideAnalyzing data PUBLIC 455
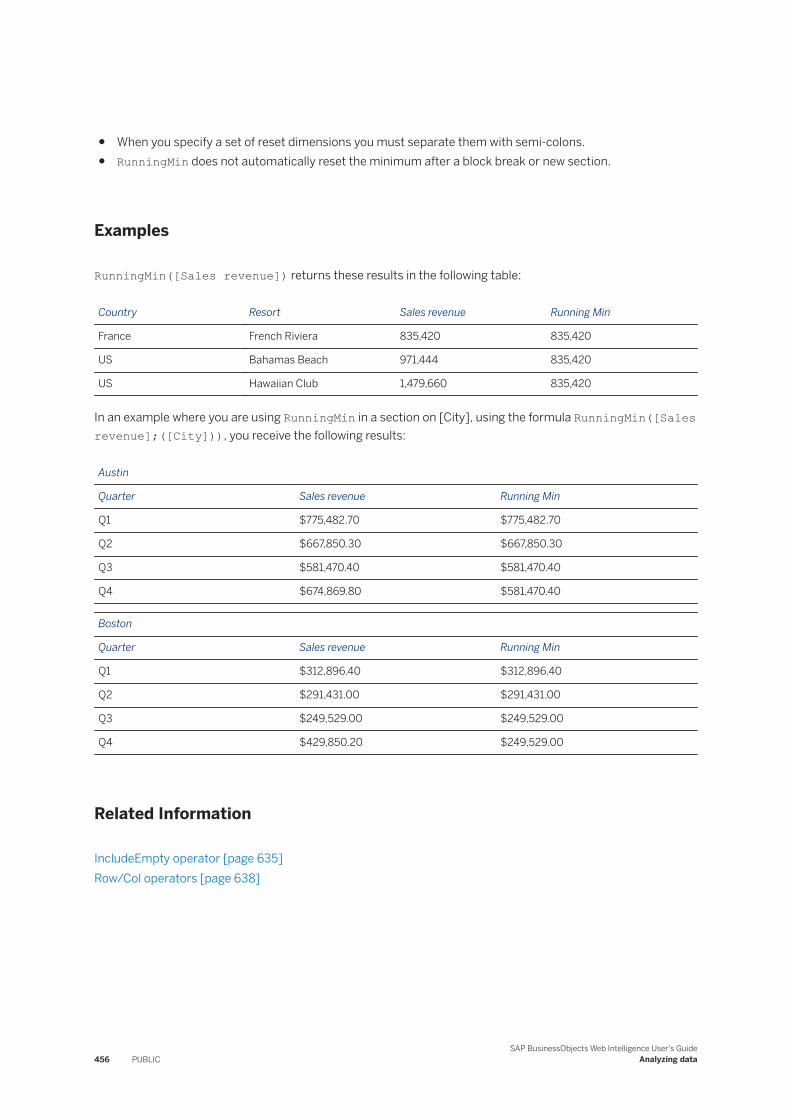
● When you specify a set of reset dimensions you must separate them with semi-colons.● RunningMin does not automatically reset the minimum after a block break or new section.
Examples
RunningMin([Sales revenue]) returns these results in the following table:
Country Resort Sales revenue Running Min
France French Riviera 835,420 835,420
US Bahamas Beach 971,444 835,420
US Hawaiian Club 1,479,660 835,420
In an example where you are using RunningMin in a section on [City], using the formula RunningMin([Sales revenue];([City])), you receive the following results:
Austin
Quarter Sales revenue Running Min
Q1 $775,482.70 $775,482.70
Q2 $667,850.30 $667,850.30
Q3 $581,470.40 $581,470.40
Q4 $674,869.80 $581,470.40
Boston
Quarter Sales revenue Running Min
Q1 $312,896.40 $312,896.40
Q2 $291,431.00 $291,431.00
Q3 $249,529.00 $249,529.00
Q4 $429,850.20 $249,529.00
Related Information
IncludeEmpty operator [page 635]Row/Col operators [page 638]
456 PUBLICSAP BusinessObjects Web Intelligence User's Guide
Analyzing data
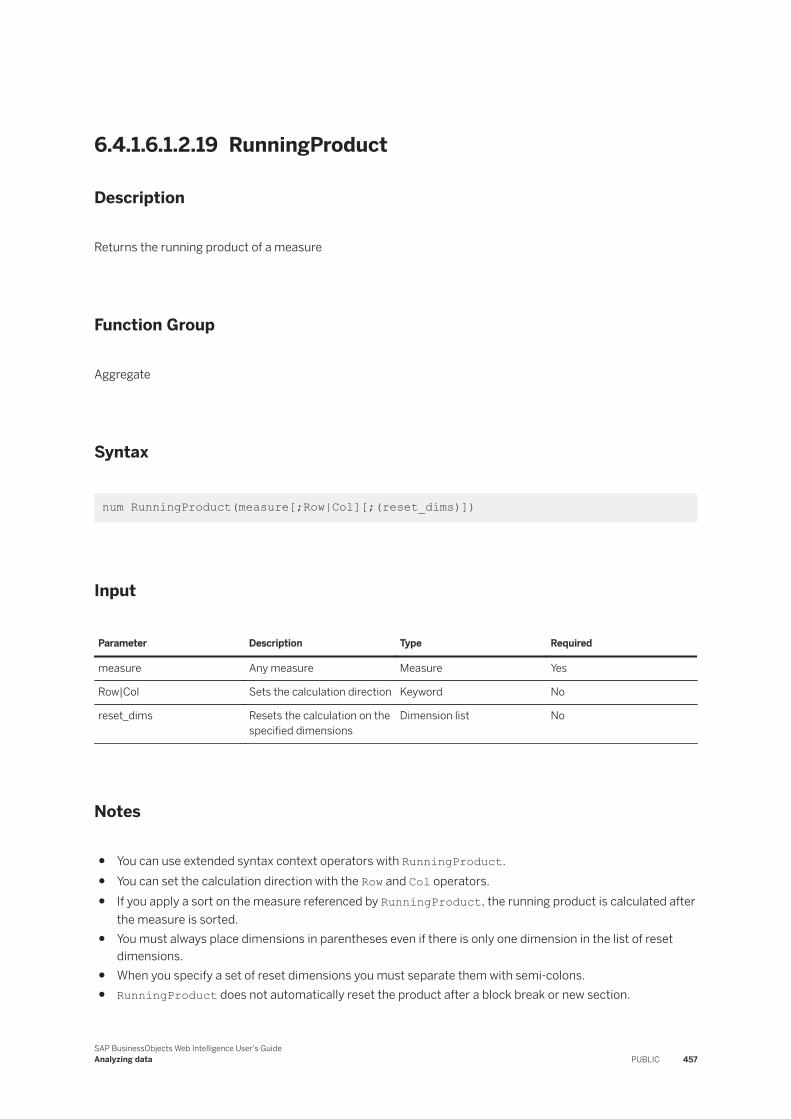
6.4.1.6.1.2.19 RunningProduct
Description
Returns the running product of a measure
Function Group
Aggregate
Syntax
num RunningProduct(measure[;Row|Col][;(reset_dims)])
Input
Parameter Description Type Required
measure Any measure Measure Yes
Row|Col Sets the calculation direction Keyword No
reset_dims Resets the calculation on the specified dimensions
Dimension list No
Notes
● You can use extended syntax context operators with RunningProduct.● You can set the calculation direction with the Row and Col operators.● If you apply a sort on the measure referenced by RunningProduct, the running product is calculated after
the measure is sorted.● You must always place dimensions in parentheses even if there is only one dimension in the list of reset
dimensions.● When you specify a set of reset dimensions you must separate them with semi-colons.● RunningProduct does not automatically reset the product after a block break or new section.
SAP BusinessObjects Web Intelligence User's GuideAnalyzing data PUBLIC 457
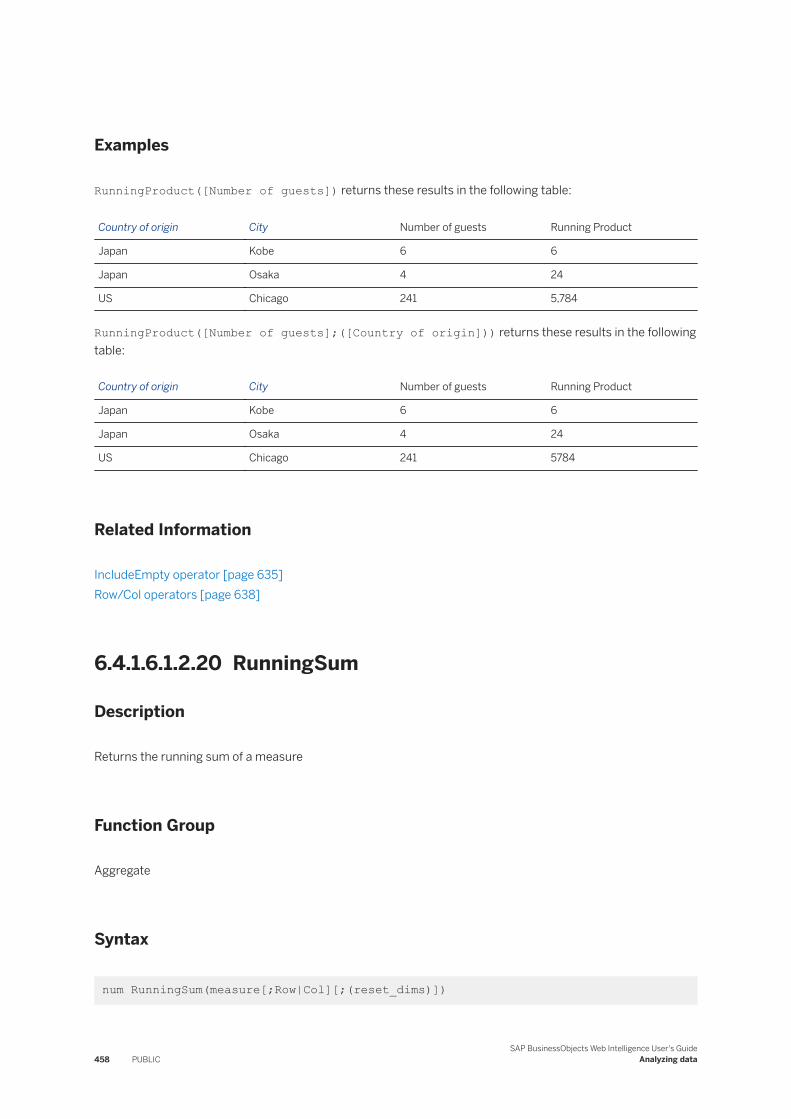
Examples
RunningProduct([Number of guests]) returns these results in the following table:
Country of origin City Number of guests Running Product
Japan Kobe 6 6
Japan Osaka 4 24
US Chicago 241 5,784
RunningProduct([Number of guests];([Country of origin])) returns these results in the following table:
Country of origin City Number of guests Running Product
Japan Kobe 6 6
Japan Osaka 4 24
US Chicago 241 5784
Related Information
IncludeEmpty operator [page 635]Row/Col operators [page 638]
6.4.1.6.1.2.20 RunningSum
Description
Returns the running sum of a measure
Function Group
Aggregate
Syntax
num RunningSum(measure[;Row|Col][;(reset_dims)])
458 PUBLICSAP BusinessObjects Web Intelligence User's Guide
Analyzing data
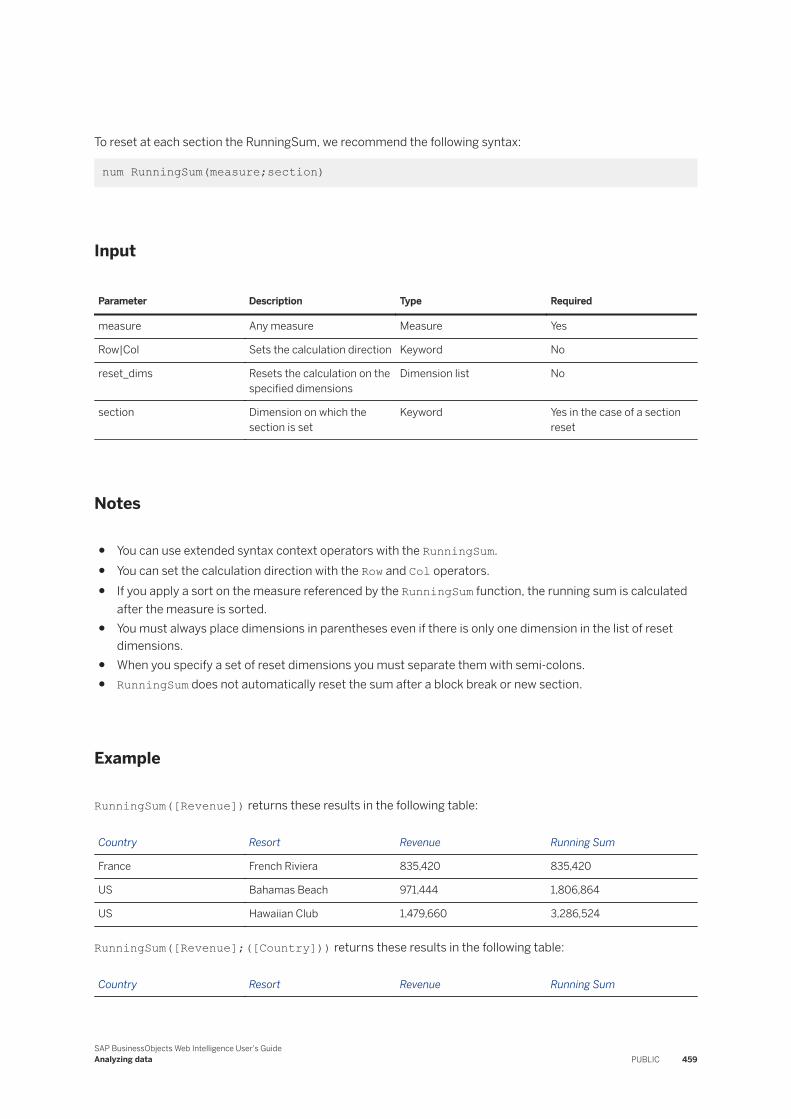
To reset at each section the RunningSum, we recommend the following syntax:
num RunningSum(measure;section)
Input
Parameter Description Type Required
measure Any measure Measure Yes
Row|Col Sets the calculation direction Keyword No
reset_dims Resets the calculation on the specified dimensions
Dimension list No
section Dimension on which the section is set
Keyword Yes in the case of a section reset
Notes
● You can use extended syntax context operators with the RunningSum.● You can set the calculation direction with the Row and Col operators.● If you apply a sort on the measure referenced by the RunningSum function, the running sum is calculated
after the measure is sorted.● You must always place dimensions in parentheses even if there is only one dimension in the list of reset
dimensions.● When you specify a set of reset dimensions you must separate them with semi-colons.● RunningSum does not automatically reset the sum after a block break or new section.
Example
RunningSum([Revenue]) returns these results in the following table:
Country Resort Revenue Running Sum
France French Riviera 835,420 835,420
US Bahamas Beach 971,444 1,806,864
US Hawaiian Club 1,479,660 3,286,524
RunningSum([Revenue];([Country])) returns these results in the following table:
Country Resort Revenue Running Sum
SAP BusinessObjects Web Intelligence User's GuideAnalyzing data PUBLIC 459
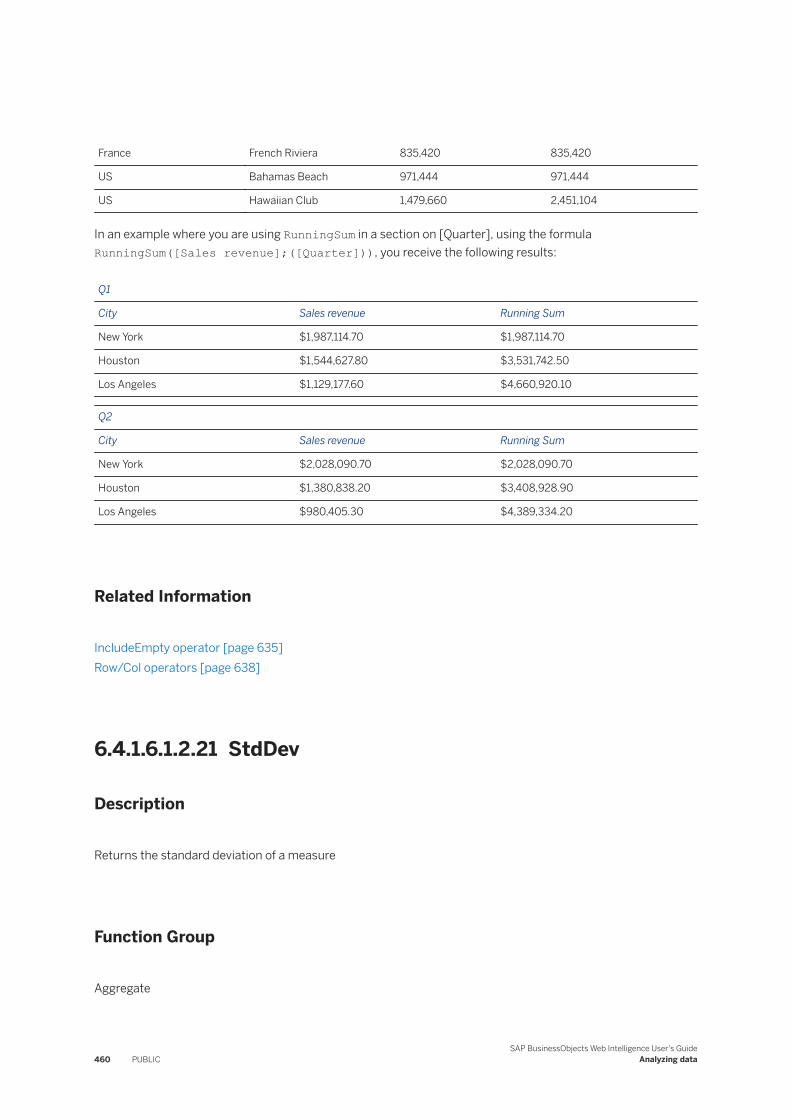
France French Riviera 835,420 835,420
US Bahamas Beach 971,444 971,444
US Hawaiian Club 1,479,660 2,451,104
In an example where you are using RunningSum in a section on [Quarter], using the formula RunningSum([Sales revenue];([Quarter])), you receive the following results:
Q1
City Sales revenue Running Sum
New York $1,987,114.70 $1,987,114.70
Houston $1,544,627.80 $3,531,742.50
Los Angeles $1,129,177.60 $4,660,920.10
Q2
City Sales revenue Running Sum
New York $2,028,090.70 $2,028,090.70
Houston $1,380,838.20 $3,408,928.90
Los Angeles $980,405.30 $4,389,334.20
Related Information
IncludeEmpty operator [page 635]Row/Col operators [page 638]
6.4.1.6.1.2.21 StdDev
Description
Returns the standard deviation of a measure
Function Group
Aggregate
460 PUBLICSAP BusinessObjects Web Intelligence User's Guide
Analyzing data
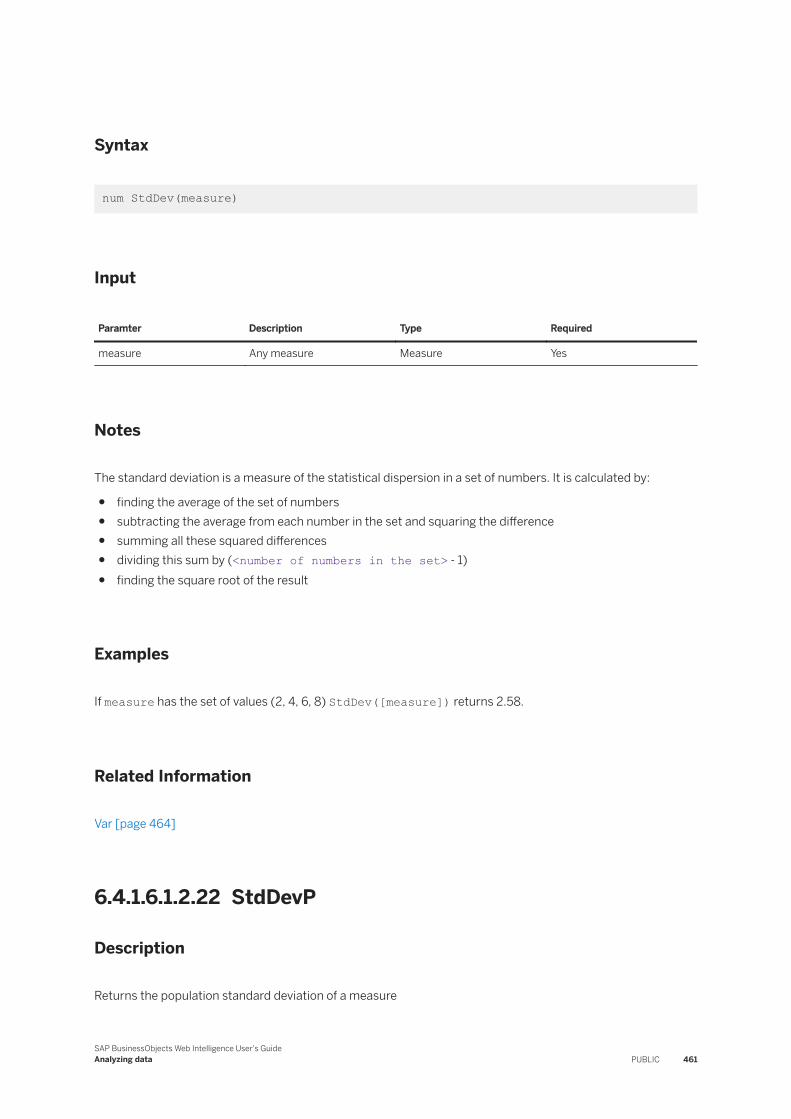
Syntax
num StdDev(measure)
Input
Paramter Description Type Required
measure Any measure Measure Yes
Notes
The standard deviation is a measure of the statistical dispersion in a set of numbers. It is calculated by:
● finding the average of the set of numbers● subtracting the average from each number in the set and squaring the difference● summing all these squared differences● dividing this sum by (<number of numbers in the set> - 1)● finding the square root of the result
Examples
If measure has the set of values (2, 4, 6, 8) StdDev([measure]) returns 2.58.
Related Information
Var [page 464]
6.4.1.6.1.2.22 StdDevP
Description
Returns the population standard deviation of a measure
SAP BusinessObjects Web Intelligence User's GuideAnalyzing data PUBLIC 461
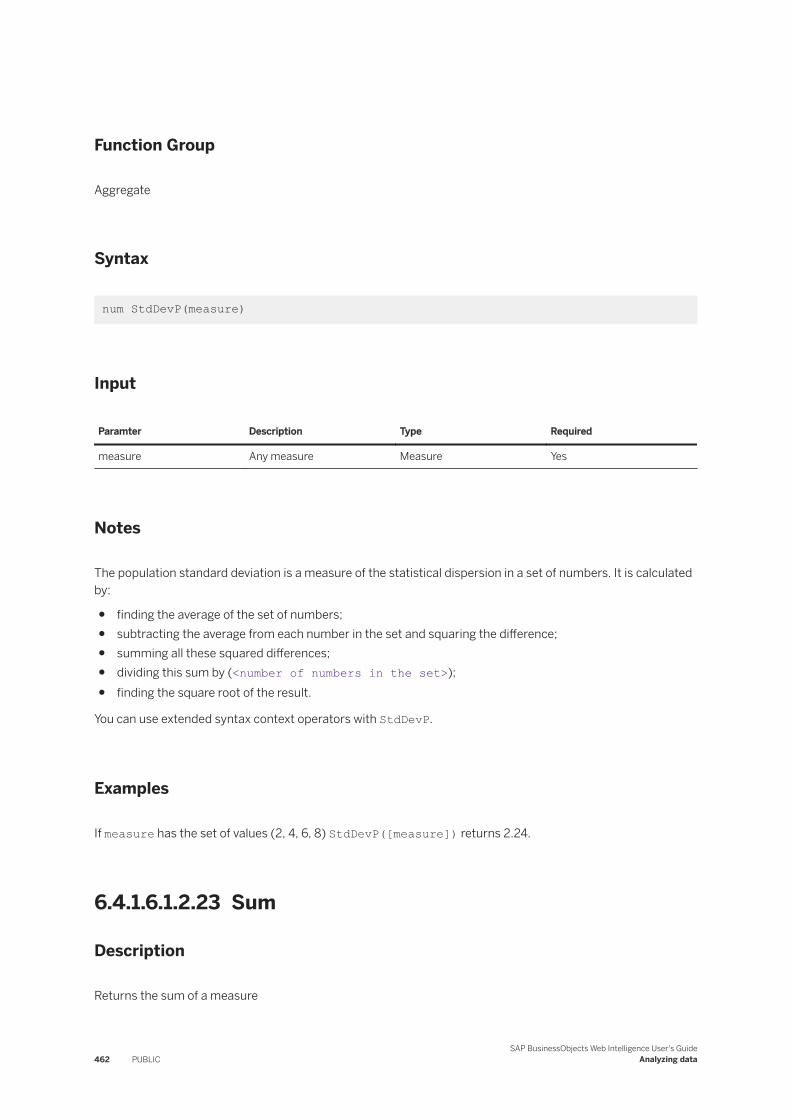
Function Group
Aggregate
Syntax
num StdDevP(measure)
Input
Paramter Description Type Required
measure Any measure Measure Yes
Notes
The population standard deviation is a measure of the statistical dispersion in a set of numbers. It is calculated by:
● finding the average of the set of numbers;● subtracting the average from each number in the set and squaring the difference;● summing all these squared differences;● dividing this sum by (<number of numbers in the set>);● finding the square root of the result.
You can use extended syntax context operators with StdDevP.
Examples
If measure has the set of values (2, 4, 6, 8) StdDevP([measure]) returns 2.24.
6.4.1.6.1.2.23 Sum
Description
Returns the sum of a measure
462 PUBLICSAP BusinessObjects Web Intelligence User's Guide
Analyzing data
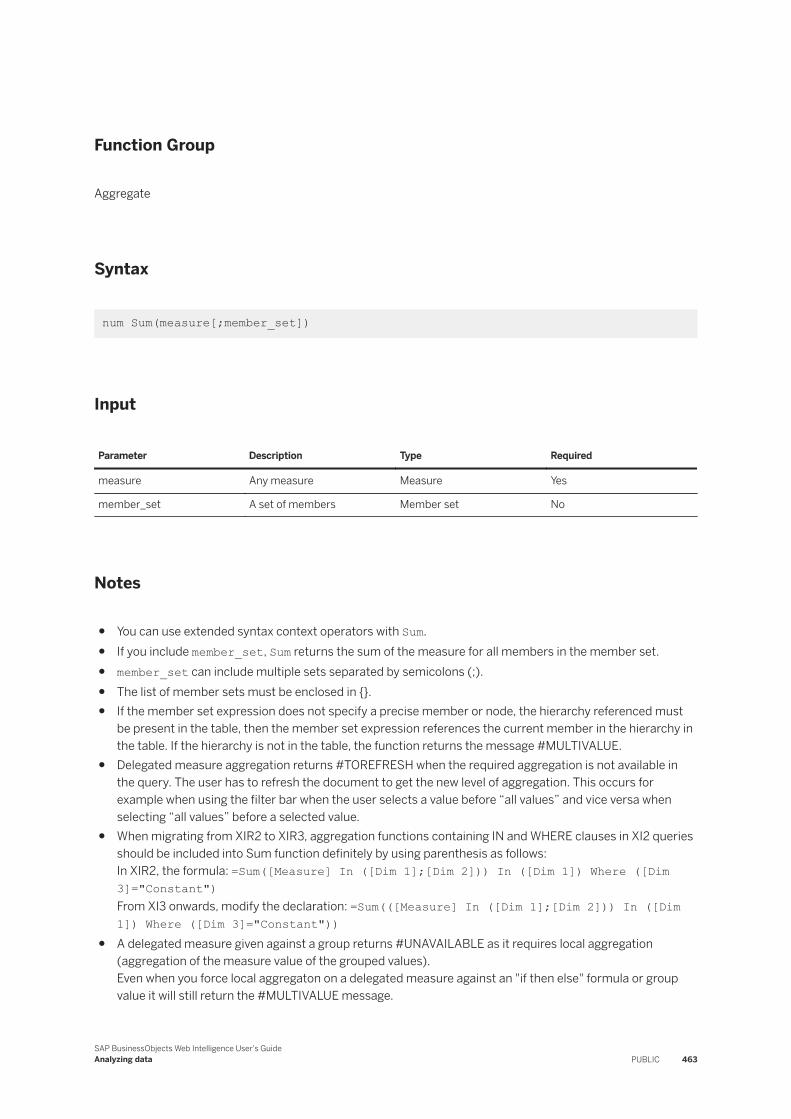
Function Group
Aggregate
Syntax
num Sum(measure[;member_set])
Input
Parameter Description Type Required
measure Any measure Measure Yes
member_set A set of members Member set No
Notes
● You can use extended syntax context operators with Sum.● If you include member_set, Sum returns the sum of the measure for all members in the member set.● member_set can include multiple sets separated by semicolons (;).● The list of member sets must be enclosed in {}.● If the member set expression does not specify a precise member or node, the hierarchy referenced must
be present in the table, then the member set expression references the current member in the hierarchy in the table. If the hierarchy is not in the table, the function returns the message #MULTIVALUE.
● Delegated measure aggregation returns #TOREFRESH when the required aggregation is not available in the query. The user has to refresh the document to get the new level of aggregation. This occurs for example when using the filter bar when the user selects a value before “all values” and vice versa when selecting “all values” before a selected value.
● When migrating from XIR2 to XIR3, aggregation functions containing IN and WHERE clauses in XI2 queries should be included into Sum function definitely by using parenthesis as follows:In XIR2, the formula: =Sum([Measure] In ([Dim 1];[Dim 2])) In ([Dim 1]) Where ([Dim 3]="Constant")From XI3 onwards, modify the declaration: =Sum(([Measure] In ([Dim 1];[Dim 2])) In ([Dim 1]) Where ([Dim 3]="Constant"))
● A delegated measure given against a group returns #UNAVAILABLE as it requires local aggregation (aggregation of the measure value of the grouped values).Even when you force local aggregaton on a delegated measure against an "if then else" formula or group value it will still return the #MULTIVALUE message.
SAP BusinessObjects Web Intelligence User's GuideAnalyzing data PUBLIC 463
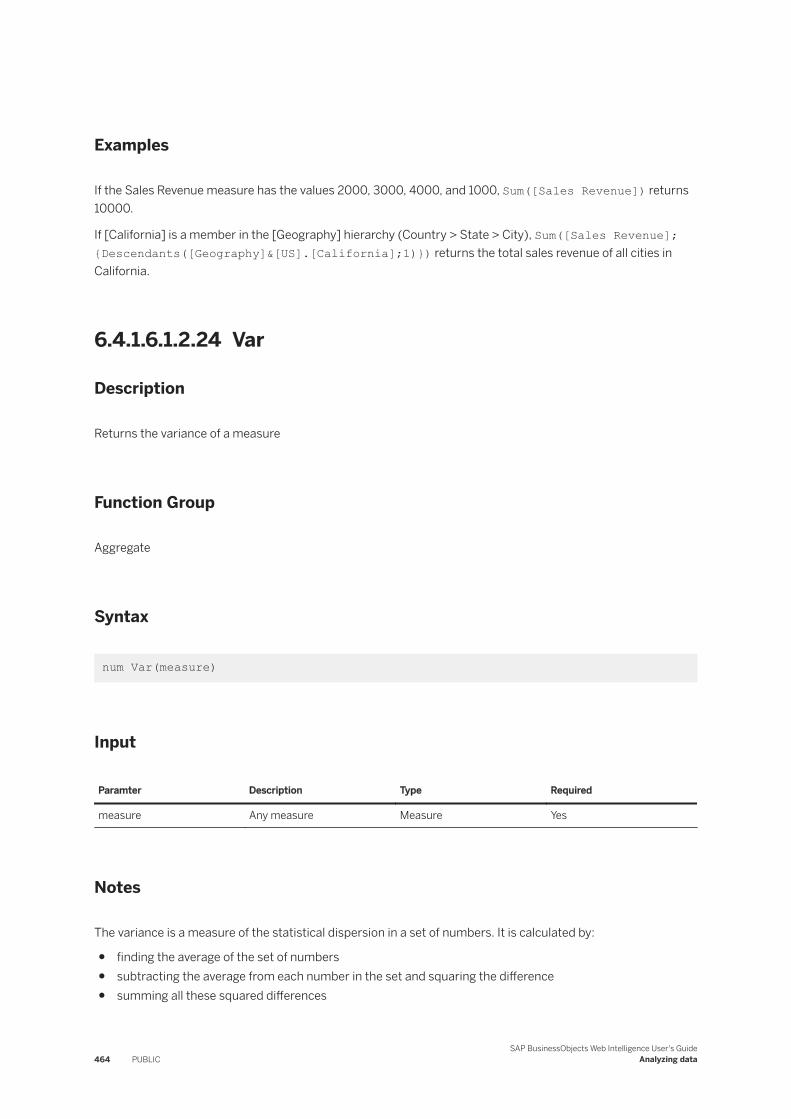
Examples
If the Sales Revenue measure has the values 2000, 3000, 4000, and 1000, Sum([Sales Revenue]) returns 10000.
If [California] is a member in the [Geography] hierarchy (Country > State > City), Sum([Sales Revenue];{Descendants([Geography]&[US].[California];1)}) returns the total sales revenue of all cities in California.
6.4.1.6.1.2.24 Var
Description
Returns the variance of a measure
Function Group
Aggregate
Syntax
num Var(measure)
Input
Paramter Description Type Required
measure Any measure Measure Yes
Notes
The variance is a measure of the statistical dispersion in a set of numbers. It is calculated by:
● finding the average of the set of numbers● subtracting the average from each number in the set and squaring the difference● summing all these squared differences
464 PUBLICSAP BusinessObjects Web Intelligence User's Guide
Analyzing data
● dividing this sum by (<number of numbers in the set> - 1)
The variance is the square of the standard deviation.
You can use extended syntax context operators with Var.
Examples
If measure has the set of values (2, 4, 6, 8) Var([measure]) returns 6.67.
Related Information
StdDev [page 460]
6.4.1.6.1.2.25 VarP
Description
Returns the population variance of a measure
Function Group
Aggregate
Syntax
num VarP(measure)
Input
Paramter Description Type Required
measure Any measure Measure Yes
SAP BusinessObjects Web Intelligence User's GuideAnalyzing data PUBLIC 465
Notes
The population variance is a measure of the statistical dispersion in a set of numbers. It is calculated by:
● finding the average of the set of numbers● subtracting the average from each number in the set and squaring the difference● summing all these squared differences● dividing this sum by (<number of numbers in the set>)
The population variance is the square of the population standard deviation.
You can use extended syntax context operators with VarP.
Examples
If measure has the set of values (2, 4, 6, 8) VarP([measure]) returns 5.
Related Information
StdDevP [page 461]
6.4.1.6.1.3 Character functions
6.4.1.6.1.3.1 Asc
Description
Returns the ASCII value of a character
Function Group
Character
Syntax
int Asc(string)
466 PUBLICSAP BusinessObjects Web Intelligence User's Guide
Analyzing data
Input
Parameter Description Type Required
string Any string String Yes
Notes
If string contains more than one character, the function returns the ASCII value of the first character in the string.
Examples
Asc("A") returns 65.
Asc("ab") returns 97.
Asc([Country]) returns 85 when the value of [Country] is "US".
6.4.1.6.1.3.2 Char
Description
Returns the character associated with an ASCII code
Function Group
Character
Syntax
string Char(ascii_code)
SAP BusinessObjects Web Intelligence User's GuideAnalyzing data PUBLIC 467
Input
Parameter Description Type Required
ascii_code An ASCII code Number Yes
Notes
If number is a decimal, the function ignores the decimal part.
Example
s
Char(123) returns "{".
6.4.1.6.1.3.3 Concatenation
Description
Concatenates (joins) two character strings. With numbers, the function will sum up the values rather than concatenate them.
NoteIf at least one of the input parameters is a string, then all other input parameters are converted into strings.
Function Group
Character
Syntax
string Concatenation(first_string;second_string)
468 PUBLICSAP BusinessObjects Web Intelligence User's Guide
Analyzing data
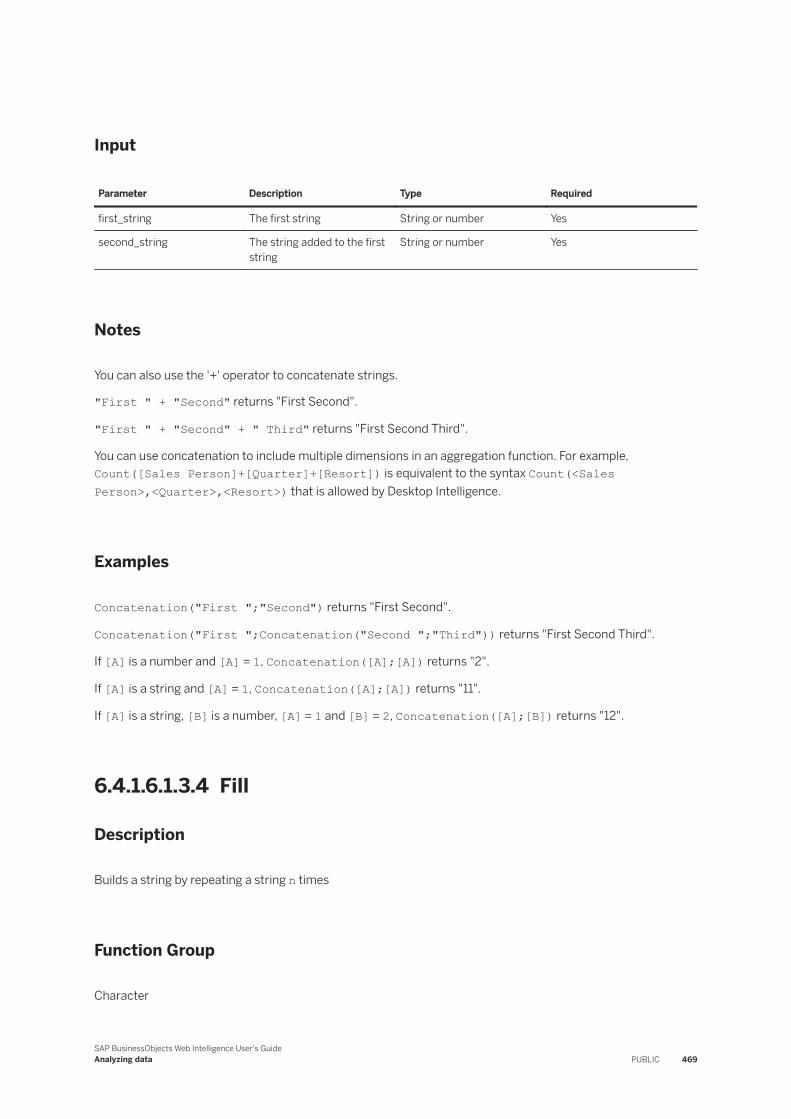
Input
Parameter Description Type Required
first_string The first string String or number Yes
second_string The string added to the first string
String or number Yes
Notes
You can also use the '+' operator to concatenate strings.
"First " + "Second" returns "First Second".
"First " + "Second" + " Third" returns "First Second Third".
You can use concatenation to include multiple dimensions in an aggregation function. For example, Count([Sales Person]+[Quarter]+[Resort]) is equivalent to the syntax Count(<Sales Person>,<Quarter>,<Resort>) that is allowed by Desktop Intelligence.
Examples
Concatenation("First ";"Second") returns "First Second".
Concatenation("First ";Concatenation("Second ";"Third")) returns "First Second Third".
If [A] is a number and [A] = 1, Concatenation([A];[A]) returns "2".
If [A] is a string and [A] = 1, Concatenation([A];[A]) returns "11".
If [A] is a string, [B] is a number, [A] = 1 and [B] = 2, Concatenation([A];[B]) returns "12".
6.4.1.6.1.3.4 Fill
Description
Builds a string by repeating a string n times
Function Group
Character
SAP BusinessObjects Web Intelligence User's GuideAnalyzing data PUBLIC 469
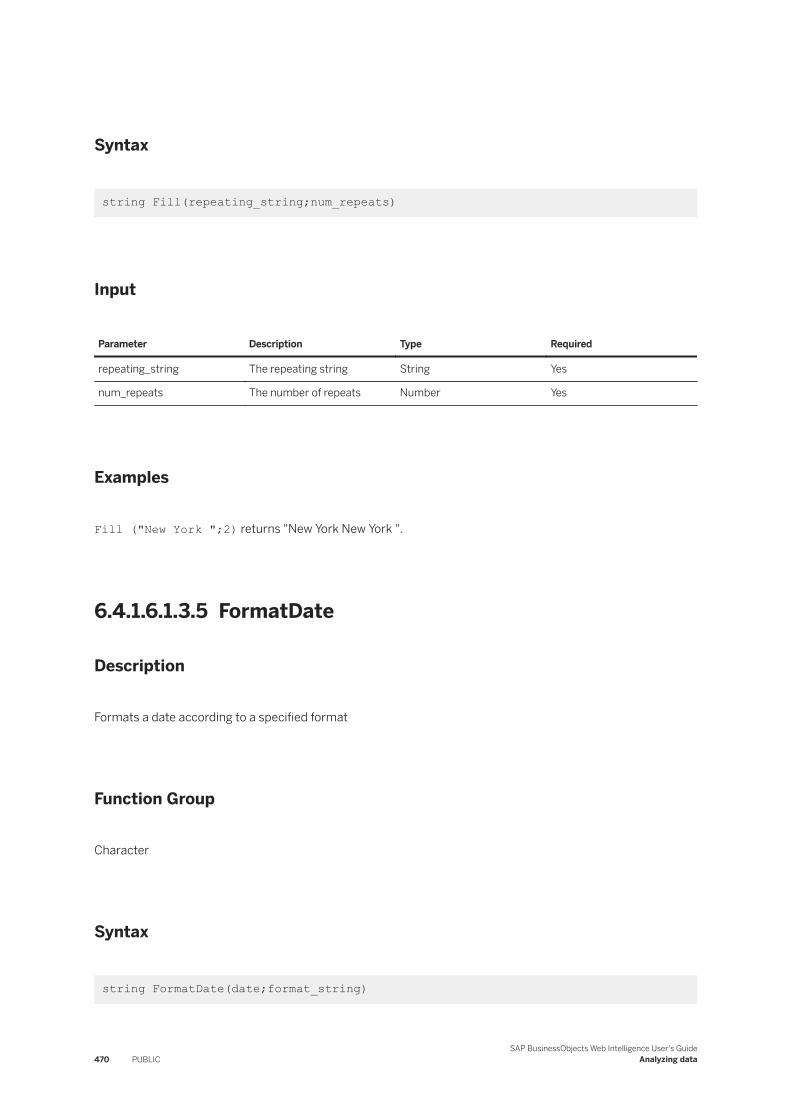
Syntax
string Fill(repeating_string;num_repeats)
Input
Parameter Description Type Required
repeating_string The repeating string String Yes
num_repeats The number of repeats Number Yes
Examples
Fill ("New York ";2) returns "New York New York ".
6.4.1.6.1.3.5 FormatDate
Description
Formats a date according to a specified format
Function Group
Character
Syntax
string FormatDate(date;format_string)
470 PUBLICSAP BusinessObjects Web Intelligence User's Guide
Analyzing data
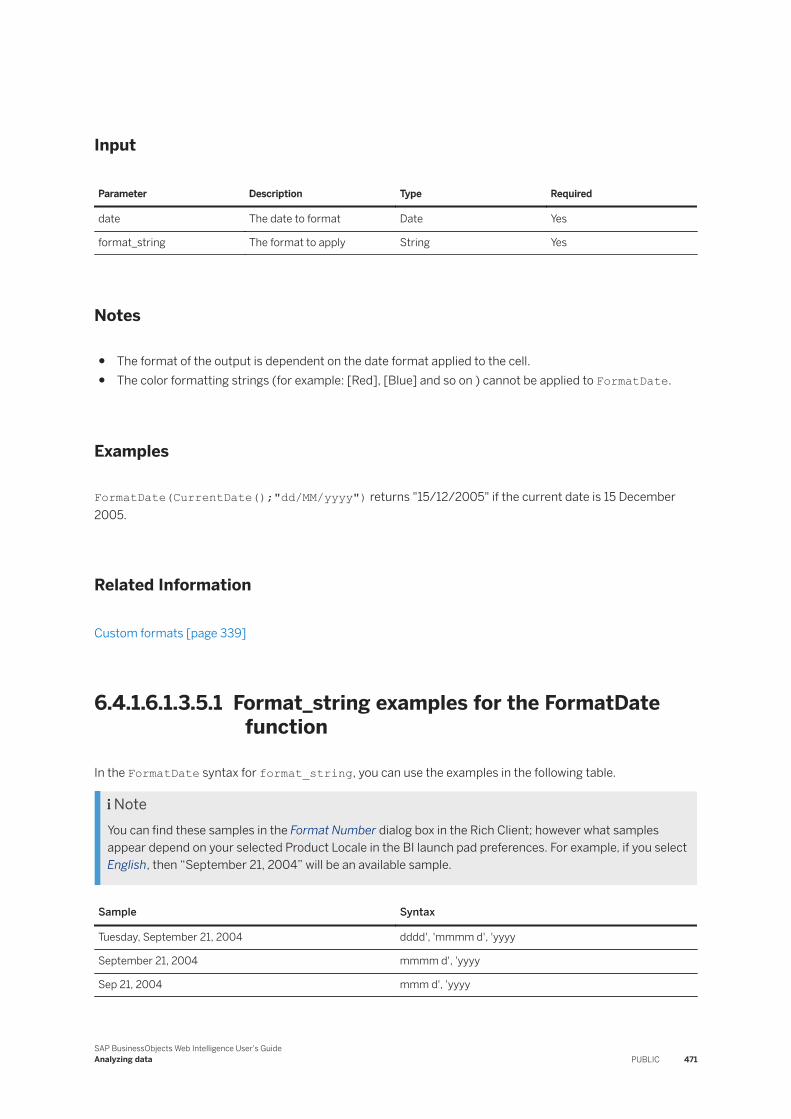
Input
Parameter Description Type Required
date The date to format Date Yes
format_string The format to apply String Yes
Notes
● The format of the output is dependent on the date format applied to the cell.● The color formatting strings (for example: [Red], [Blue] and so on ) cannot be applied to FormatDate.
Examples
FormatDate(CurrentDate();"dd/MM/yyyy") returns "15/12/2005" if the current date is 15 December 2005.
Related Information
Custom formats [page 339]
6.4.1.6.1.3.5.1 Format_string examples for the FormatDate function
In the FormatDate syntax for format_string, you can use the examples in the following table.
NoteYou can find these samples in the Format Number dialog box in the Rich Client; however what samples appear depend on your selected Product Locale in the BI launch pad preferences. For example, if you select English, then “September 21, 2004” will be an available sample.
Sample Syntax
Tuesday, September 21, 2004 dddd', 'mmmm d', 'yyyy
September 21, 2004 mmmm d', 'yyyy
Sep 21, 2004 mmm d', 'yyyy
SAP BusinessObjects Web Intelligence User's GuideAnalyzing data PUBLIC 471
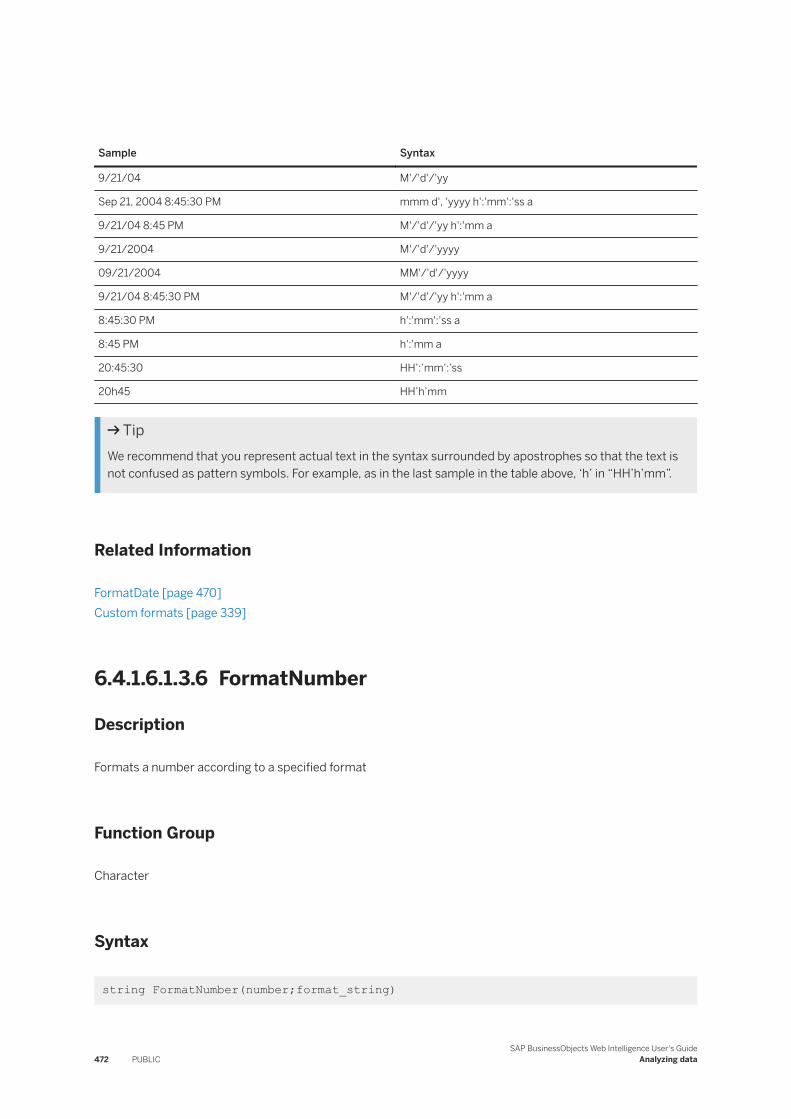
Sample Syntax
9/21/04 M'/'d'/'yy
Sep 21, 2004 8:45:30 PM mmm d', 'yyyy h':'mm':'ss a
9/21/04 8:45 PM M'/'d'/'yy h':'mm a
9/21/2004 M'/'d'/'yyyy
09/21/2004 MM'/'d'/'yyyy
9/21/04 8:45:30 PM M'/'d'/'yy h':'mm a
8:45:30 PM h':'mm':'ss a
8:45 PM h':'mm a
20:45:30 HH’:’mm’:’ss
20h45 HH’h’mm
TipWe recommend that you represent actual text in the syntax surrounded by apostrophes so that the text is not confused as pattern symbols. For example, as in the last sample in the table above, ‘h’ in “HH’h’mm”.
Related Information
FormatDate [page 470]Custom formats [page 339]
6.4.1.6.1.3.6 FormatNumber
Description
Formats a number according to a specified format
Function Group
Character
Syntax
string FormatNumber(number;format_string)
472 PUBLICSAP BusinessObjects Web Intelligence User's Guide
Analyzing data
Input
Parameter Description Type Required
number The number to format Number Yes
format_string The format to apply String Yes
Notes
● The format of the output is dependent on the number format applied to the cell.● The color formatting strings (for example: [Red], [Blue] and so on ) cannot be applied to FormatNumber.
Examples
FormatNumber([Revenue];"#,##.00") returns 835,420.00 if [Revenue] is 835,420.
Related Information
Custom formats [page 339]
6.4.1.6.1.3.7 HTMLEncode
Description
Applies HTML encoding rules to a string
Function Group
Character
Syntax
string HTMLEncode(html)
SAP BusinessObjects Web Intelligence User's GuideAnalyzing data PUBLIC 473
Input
Paramter Description Type Required
html An HTML string String Yes
Examples
HTMLEncode("<Hello World!>") returns "<Hello World!>", because the browser interprets the character. Internally, it returns "<Hello World!>".
6.4.1.6.1.3.8 InitCap
Description
Capitalizes the first letter of a string
Function Group
Character
Syntax
string InitCap(string)
Input
Parameter Description Type Required
string The string to capitalize String Yes
474 PUBLICSAP BusinessObjects Web Intelligence User's Guide
Analyzing data
Examples
InitCap("we hold these truths to be self-evident") returns "We hold these truths to be self-evident".
6.4.1.6.1.3.9 Left
Description
Returns the leftmost characters of a string.
NoteThis function returns the first characters from the logical start of the string. Right-To-Left display/reading languages, such as Arabic or Hebrew for example, are supported.
Function Group
Character
Syntax
string Left(string;num_chars)
Input
Parameter Description Type Required
string The input string string Yes
num_chars The number of characters to return from the start of the string
number Yes
Example
Left([Country];2) returns "Fr" if [Country] is "France".
SAP BusinessObjects Web Intelligence User's GuideAnalyzing data PUBLIC 475
6.4.1.6.1.3.10 LeftPad
Description
Pads a string to have a specified minimum length by adding a designated string to its left.
NoteThis function pads the strings from the logical start. Right-To-Left display/reading languages, such as Arabic or Hebrew for example, are supported.
Function Group
Character
Syntax
string LeftPad(padded_string;length;left_string)
Input
Parameter Description Type Required
padded_string The original string String Yes
length The length of the output string
Number Yes
left_string The string to be added to the start of padded_string
String Yes
Notes
● If length is less than the length of left_string and padded_string combined, left_string is truncated.
● If length is less than or equal to the length of padded_string, the function returns padded_string.● If length is greater than the lengths of padded_string and left_string combined, left_string is
repeated or partially repeated enough times to fill out the length.
476 PUBLICSAP BusinessObjects Web Intelligence User's Guide
Analyzing data
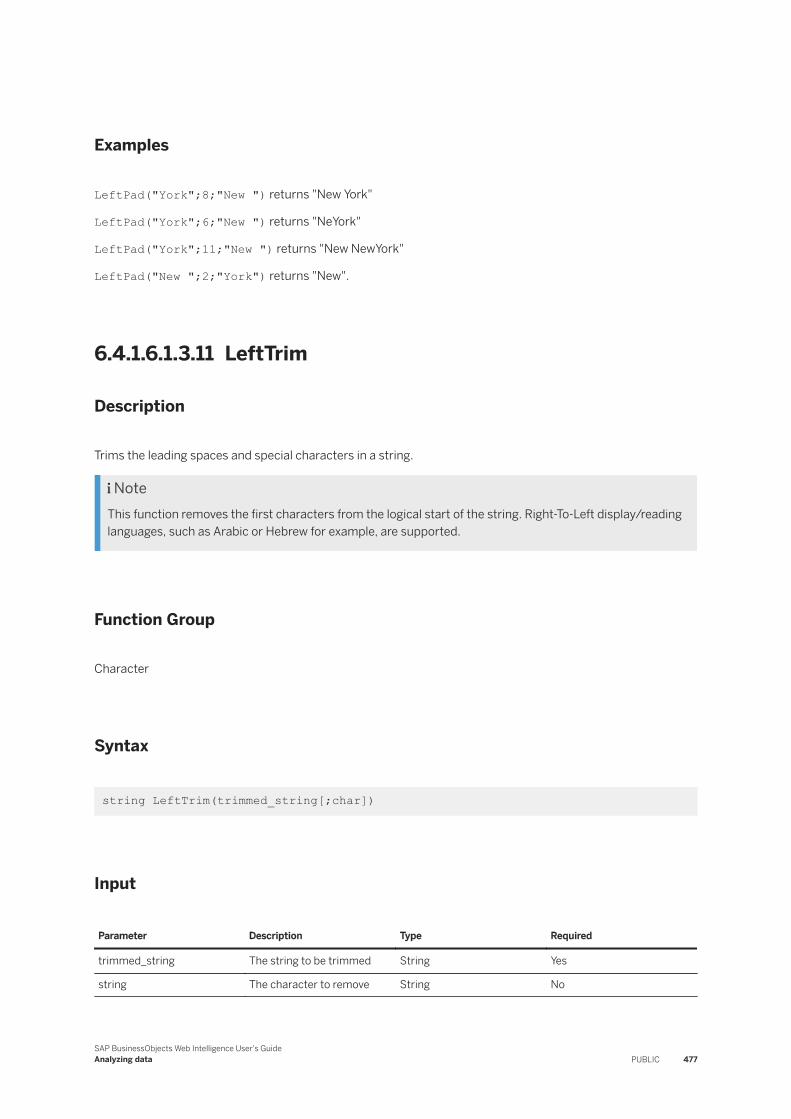
Examples
LeftPad("York";8;"New ") returns "New York"
LeftPad("York";6;"New ") returns "NeYork"
LeftPad("York";11;"New ") returns "New NewYork"
LeftPad("New ";2;"York") returns "New".
6.4.1.6.1.3.11 LeftTrim
Description
Trims the leading spaces and special characters in a string.
NoteThis function removes the first characters from the logical start of the string. Right-To-Left display/reading languages, such as Arabic or Hebrew for example, are supported.
Function Group
Character
Syntax
string LeftTrim(trimmed_string[;char])
Input
Parameter Description Type Required
trimmed_string The string to be trimmed String Yes
string The character to remove String No
SAP BusinessObjects Web Intelligence User's GuideAnalyzing data PUBLIC 477
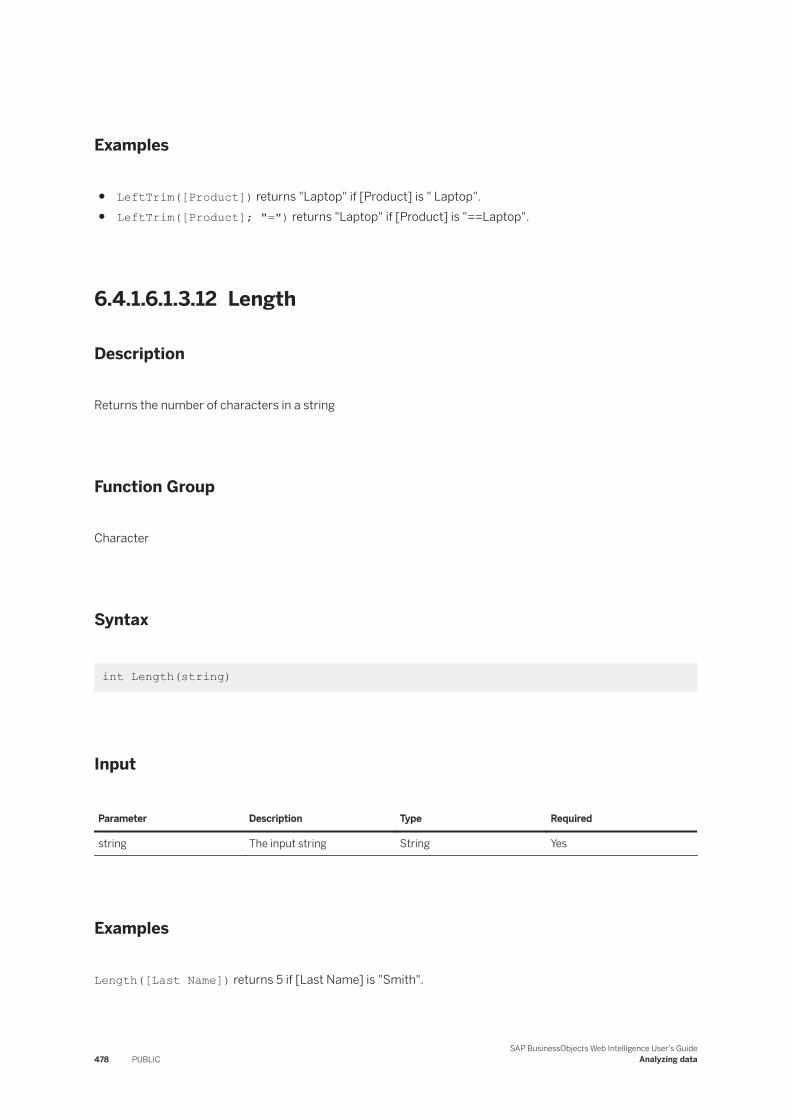
Examples
● LeftTrim([Product]) returns "Laptop" if [Product] is " Laptop".● LeftTrim([Product]; "=") returns "Laptop" if [Product] is "==Laptop".
6.4.1.6.1.3.12 Length
Description
Returns the number of characters in a string
Function Group
Character
Syntax
int Length(string)
Input
Parameter Description Type Required
string The input string String Yes
Examples
Length([Last Name]) returns 5 if [Last Name] is "Smith".
478 PUBLICSAP BusinessObjects Web Intelligence User's Guide
Analyzing data
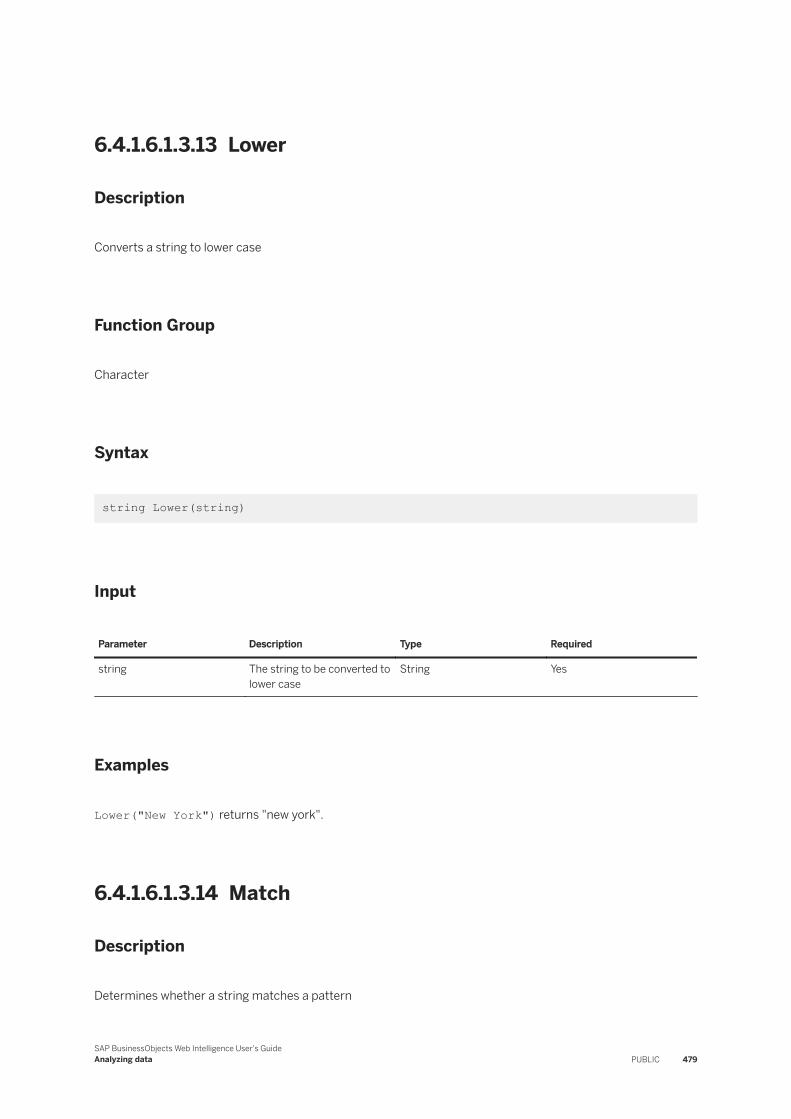
6.4.1.6.1.3.13 Lower
Description
Converts a string to lower case
Function Group
Character
Syntax
string Lower(string)
Input
Parameter Description Type Required
string The string to be converted to lower case
String Yes
Examples
Lower("New York") returns "new york".
6.4.1.6.1.3.14 Match
Description
Determines whether a string matches a pattern
SAP BusinessObjects Web Intelligence User's GuideAnalyzing data PUBLIC 479
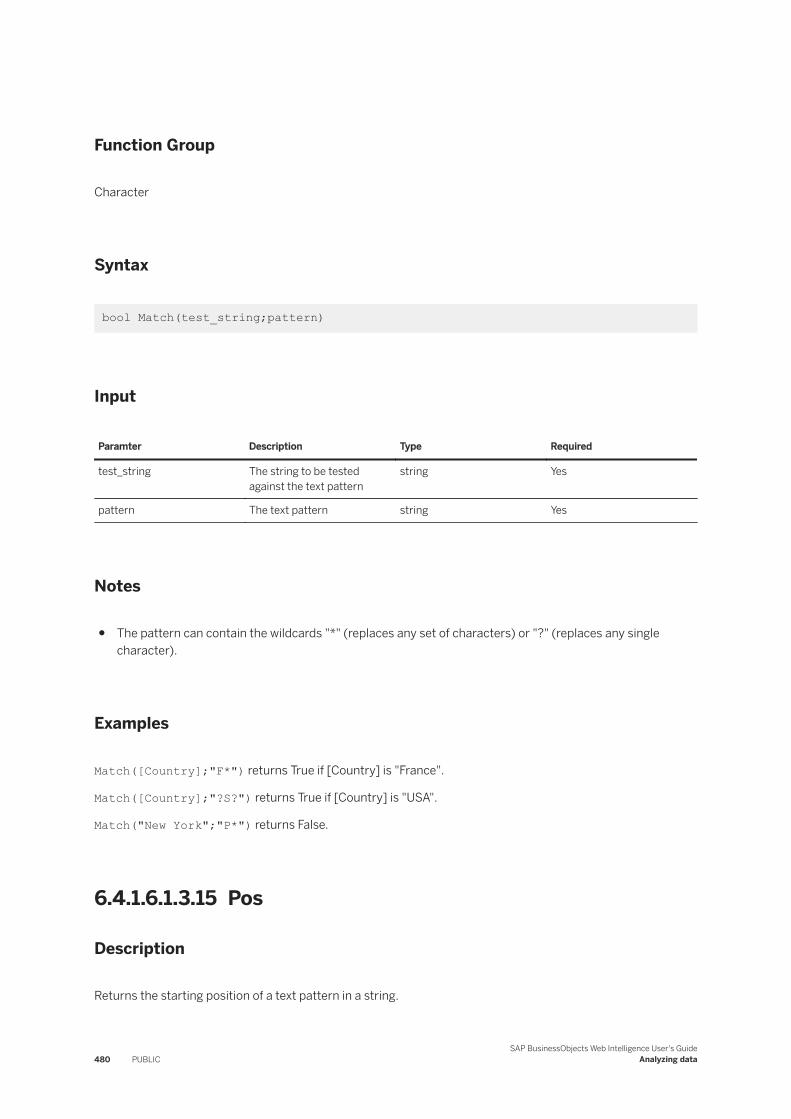
Function Group
Character
Syntax
bool Match(test_string;pattern)
Input
Paramter Description Type Required
test_string The string to be tested against the text pattern
string Yes
pattern The text pattern string Yes
Notes
● The pattern can contain the wildcards "*" (replaces any set of characters) or "?" (replaces any single character).
Examples
Match([Country];"F*") returns True if [Country] is "France".
Match([Country];"?S?") returns True if [Country] is "USA".
Match("New York";"P*") returns False.
6.4.1.6.1.3.15 Pos
Description
Returns the starting position of a text pattern in a string.
480 PUBLICSAP BusinessObjects Web Intelligence User's Guide
Analyzing data
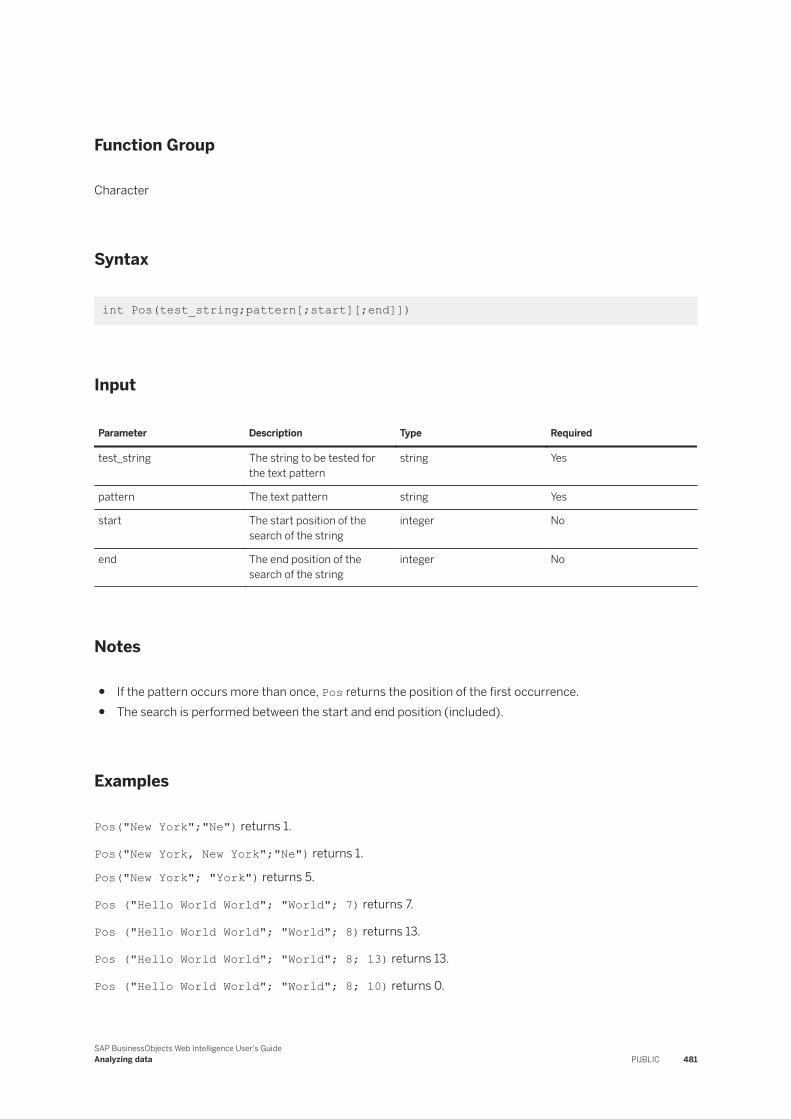
Function Group
Character
Syntax
int Pos(test_string;pattern[;start][;end]])
Input
Parameter Description Type Required
test_string The string to be tested for the text pattern
string Yes
pattern The text pattern string Yes
start The start position of the search of the string
integer No
end The end position of the search of the string
integer No
Notes
● If the pattern occurs more than once, Pos returns the position of the first occurrence.● The search is performed between the start and end position (included).
Examples
Pos("New York";"Ne") returns 1.
Pos("New York, New York";"Ne") returns 1.
Pos("New York"; "York") returns 5.
Pos ("Hello World World"; "World"; 7) returns 7.
Pos ("Hello World World"; "World"; 8) returns 13.
Pos ("Hello World World"; "World"; 8; 13) returns 13.
Pos ("Hello World World"; "World"; 8; 10) returns 0.
SAP BusinessObjects Web Intelligence User's GuideAnalyzing data PUBLIC 481
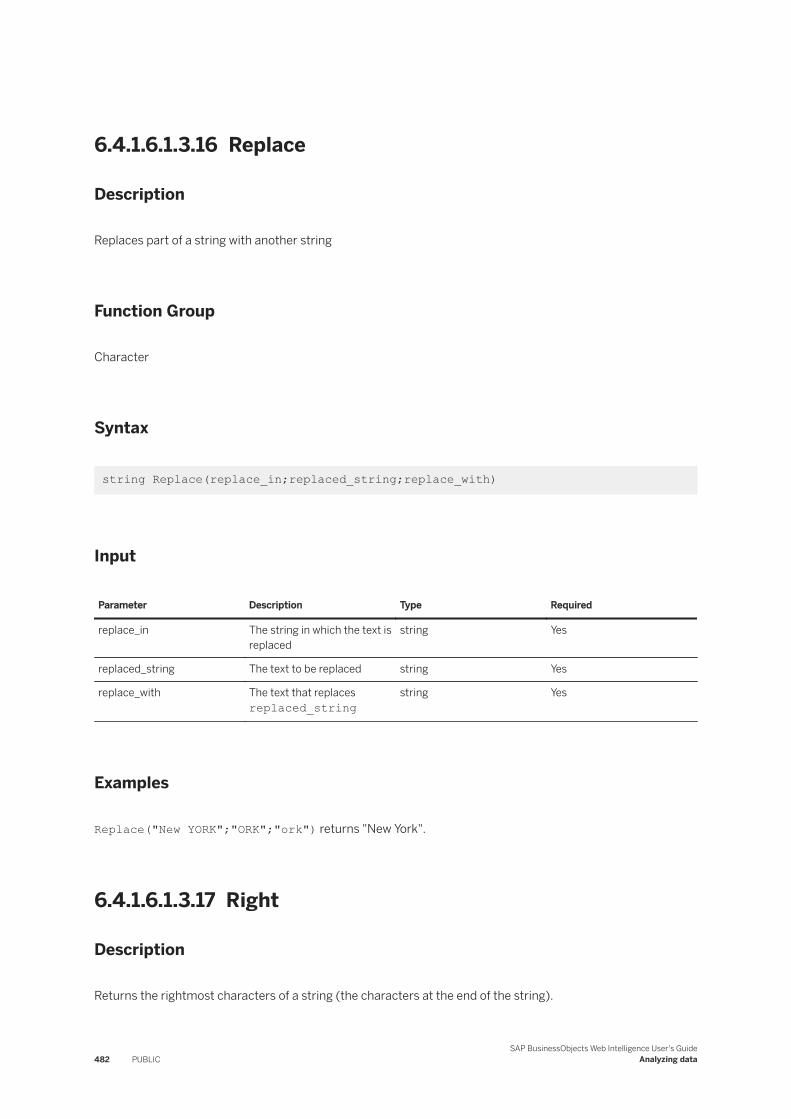
6.4.1.6.1.3.16 Replace
Description
Replaces part of a string with another string
Function Group
Character
Syntax
string Replace(replace_in;replaced_string;replace_with)
Input
Parameter Description Type Required
replace_in The string in which the text is replaced
string Yes
replaced_string The text to be replaced string Yes
replace_with The text that replaces replaced_string
string Yes
Examples
Replace("New YORK";"ORK";"ork") returns "New York".
6.4.1.6.1.3.17 Right
Description
Returns the rightmost characters of a string (the characters at the end of the string).
482 PUBLICSAP BusinessObjects Web Intelligence User's Guide
Analyzing data
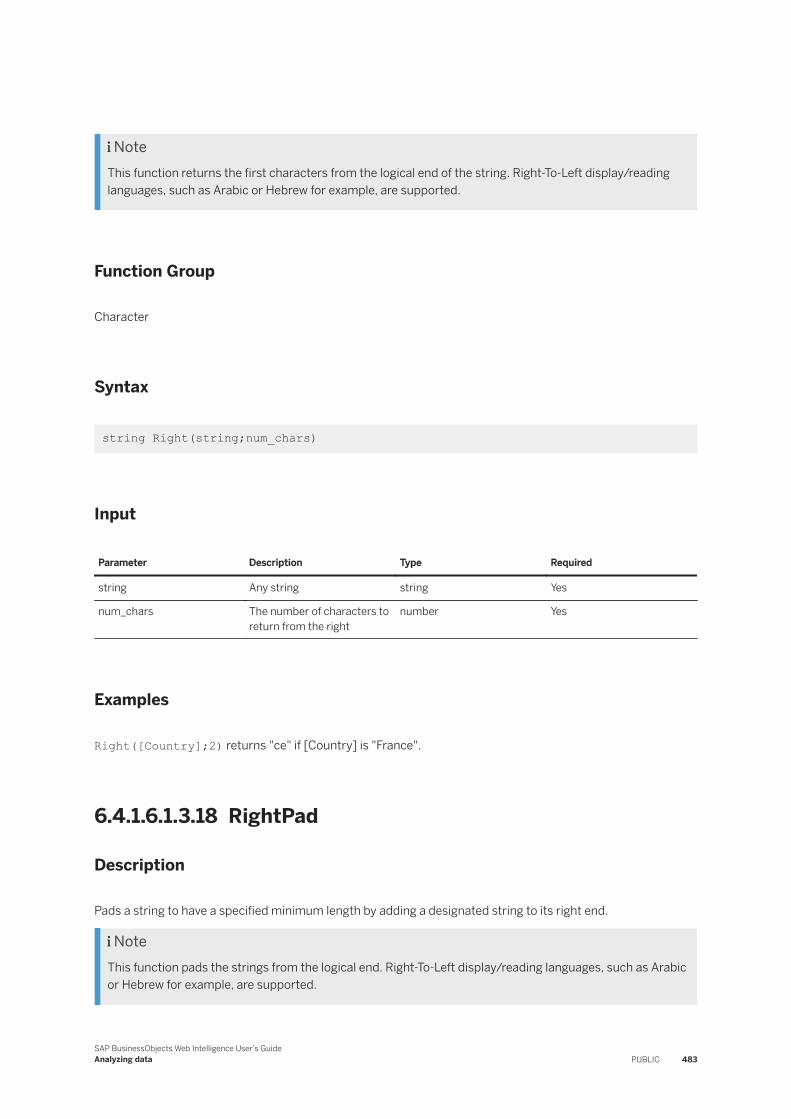
NoteThis function returns the first characters from the logical end of the string. Right-To-Left display/reading languages, such as Arabic or Hebrew for example, are supported.
Function Group
Character
Syntax
string Right(string;num_chars)
Input
Parameter Description Type Required
string Any string string Yes
num_chars The number of characters to return from the right
number Yes
Examples
Right([Country];2) returns "ce" if [Country] is "France".
6.4.1.6.1.3.18 RightPad
Description
Pads a string to have a specified minimum length by adding a designated string to its right end.
NoteThis function pads the strings from the logical end. Right-To-Left display/reading languages, such as Arabic or Hebrew for example, are supported.
SAP BusinessObjects Web Intelligence User's GuideAnalyzing data PUBLIC 483
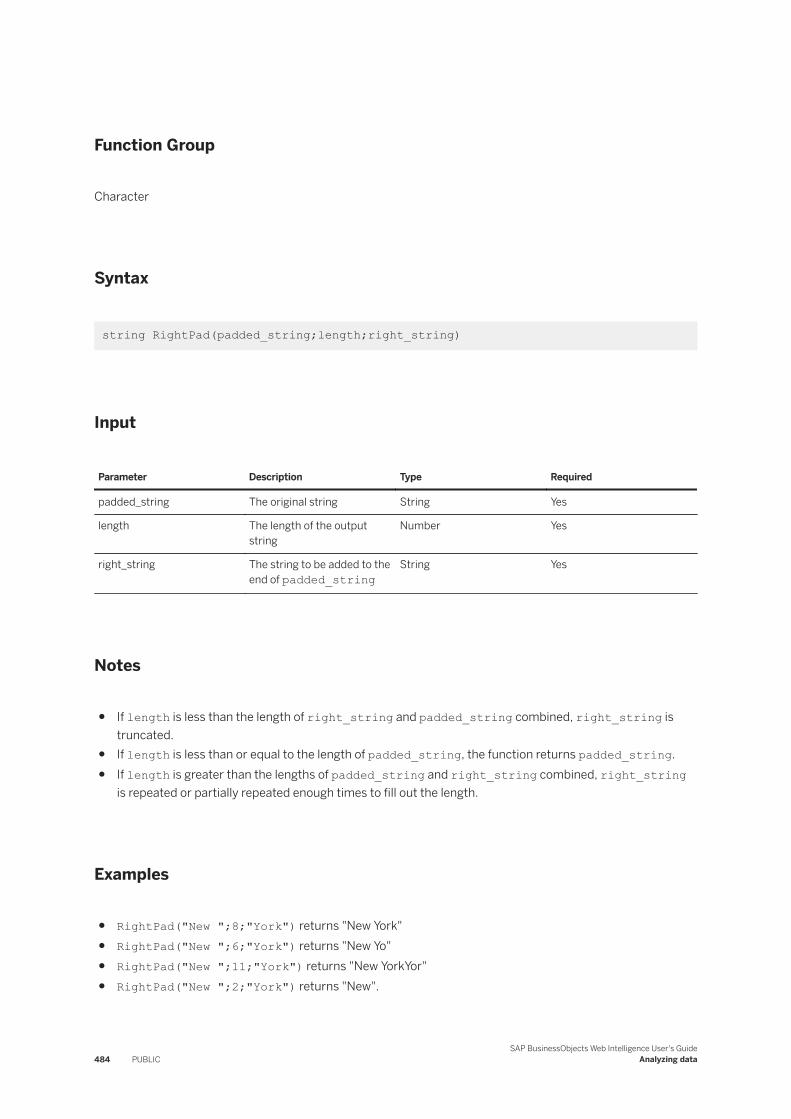
Function Group
Character
Syntax
string RightPad(padded_string;length;right_string)
Input
Parameter Description Type Required
padded_string The original string String Yes
length The length of the output string
Number Yes
right_string The string to be added to the end of padded_string
String Yes
Notes
● If length is less than the length of right_string and padded_string combined, right_string is truncated.
● If length is less than or equal to the length of padded_string, the function returns padded_string.● If length is greater than the lengths of padded_string and right_string combined, right_string
is repeated or partially repeated enough times to fill out the length.
Examples
● RightPad("New ";8;"York") returns "New York"● RightPad("New ";6;"York") returns "New Yo"● RightPad("New ";11;"York") returns "New YorkYor"● RightPad("New ";2;"York") returns "New".
484 PUBLICSAP BusinessObjects Web Intelligence User's Guide
Analyzing data
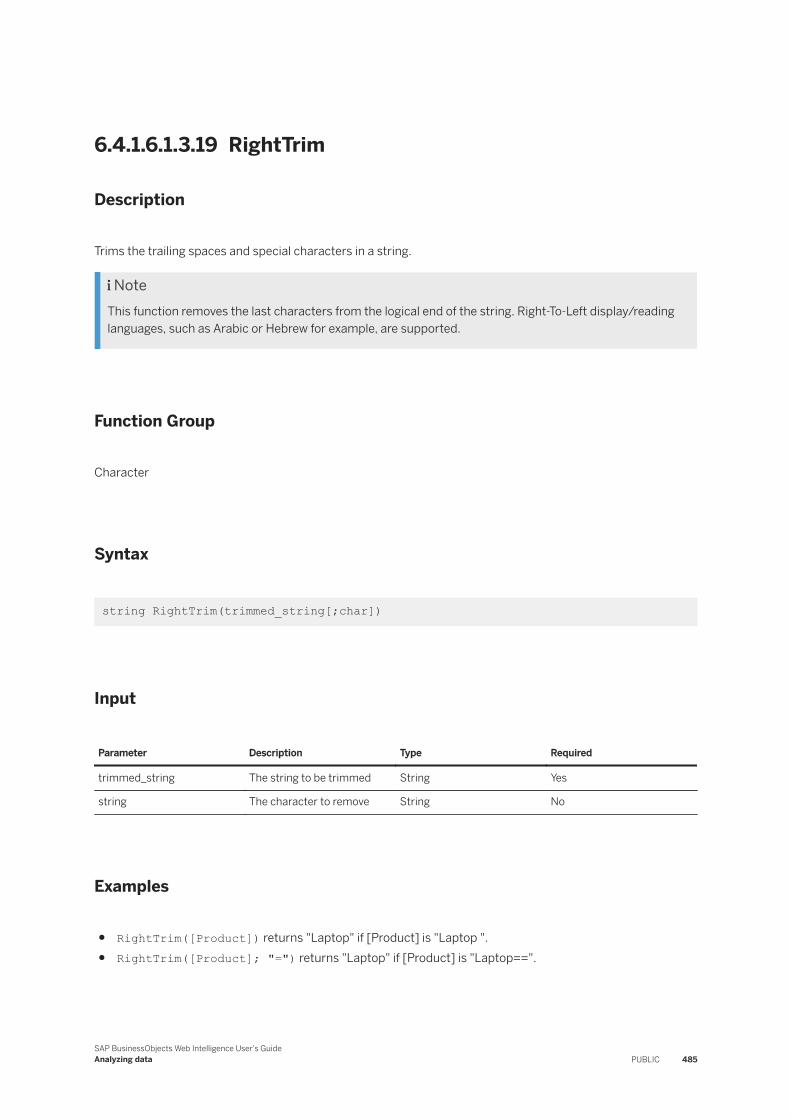
6.4.1.6.1.3.19 RightTrim
Description
Trims the trailing spaces and special characters in a string.
NoteThis function removes the last characters from the logical end of the string. Right-To-Left display/reading languages, such as Arabic or Hebrew for example, are supported.
Function Group
Character
Syntax
string RightTrim(trimmed_string[;char])
Input
Parameter Description Type Required
trimmed_string The string to be trimmed String Yes
string The character to remove String No
Examples
● RightTrim([Product]) returns "Laptop" if [Product] is "Laptop ".● RightTrim([Product]; "=") returns "Laptop" if [Product] is "Laptop==".
SAP BusinessObjects Web Intelligence User's GuideAnalyzing data PUBLIC 485
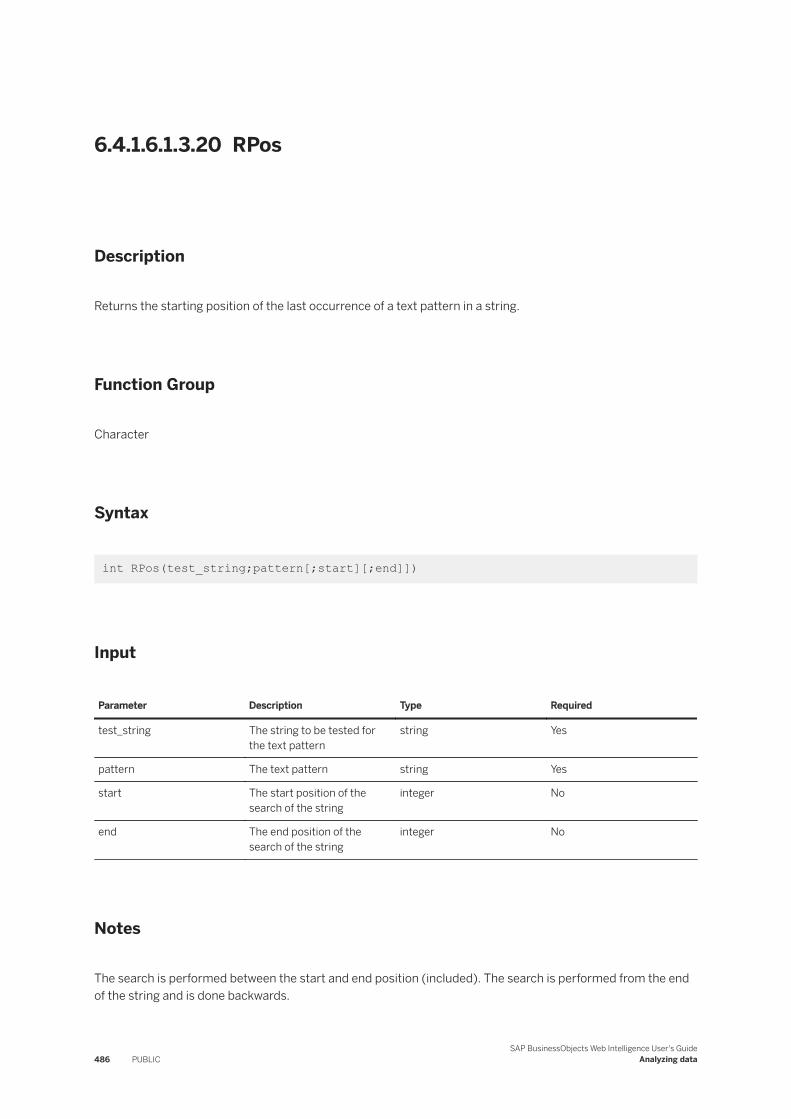
6.4.1.6.1.3.20 RPos
Description
Returns the starting position of the last occurrence of a text pattern in a string.
Function Group
Character
Syntax
int RPos(test_string;pattern[;start][;end]])
Input
Parameter Description Type Required
test_string The string to be tested for the text pattern
string Yes
pattern The text pattern string Yes
start The start position of the search of the string
integer No
end The end position of the search of the string
integer No
Notes
The search is performed between the start and end position (included). The search is performed from the end of the string and is done backwards.
486 PUBLICSAP BusinessObjects Web Intelligence User's Guide
Analyzing data
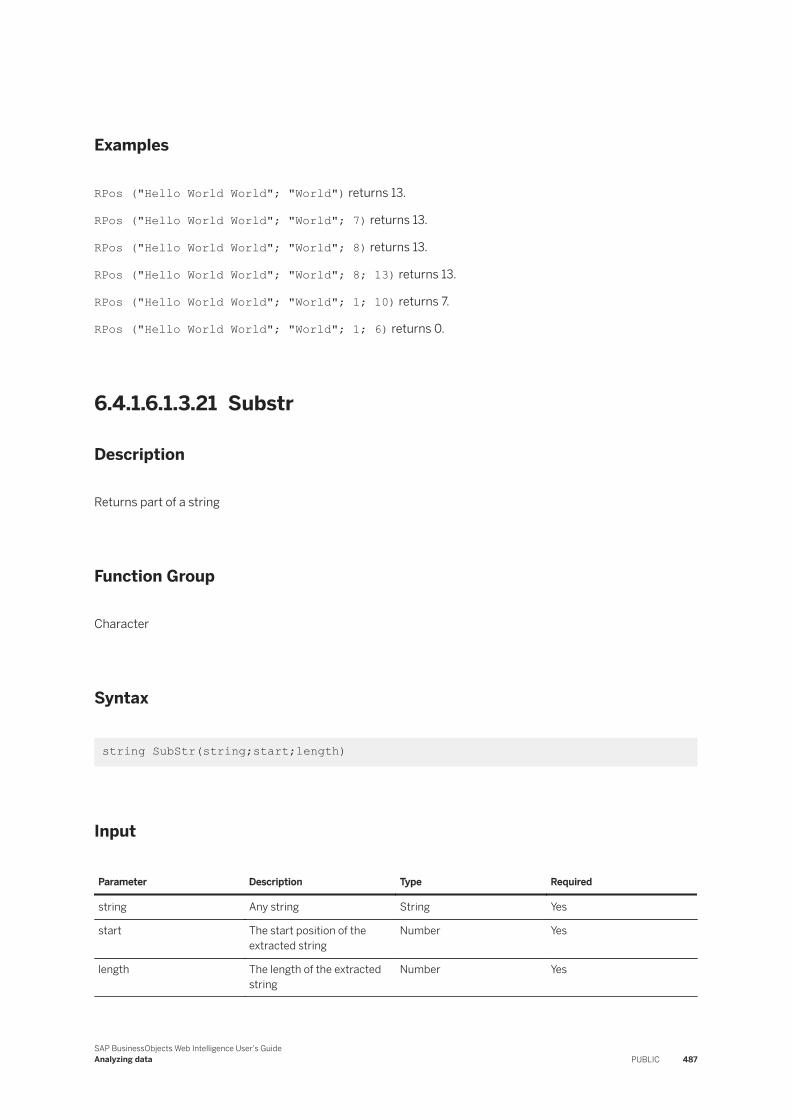
Examples
RPos ("Hello World World"; "World") returns 13.
RPos ("Hello World World"; "World"; 7) returns 13.
RPos ("Hello World World"; "World"; 8) returns 13.
RPos ("Hello World World"; "World"; 8; 13) returns 13.
RPos ("Hello World World"; "World"; 1; 10) returns 7.
RPos ("Hello World World"; "World"; 1; 6) returns 0.
6.4.1.6.1.3.21 Substr
Description
Returns part of a string
Function Group
Character
Syntax
string SubStr(string;start;length)
Input
Parameter Description Type Required
string Any string String Yes
start The start position of the extracted string
Number Yes
length The length of the extracted string
Number Yes
SAP BusinessObjects Web Intelligence User's GuideAnalyzing data PUBLIC 487
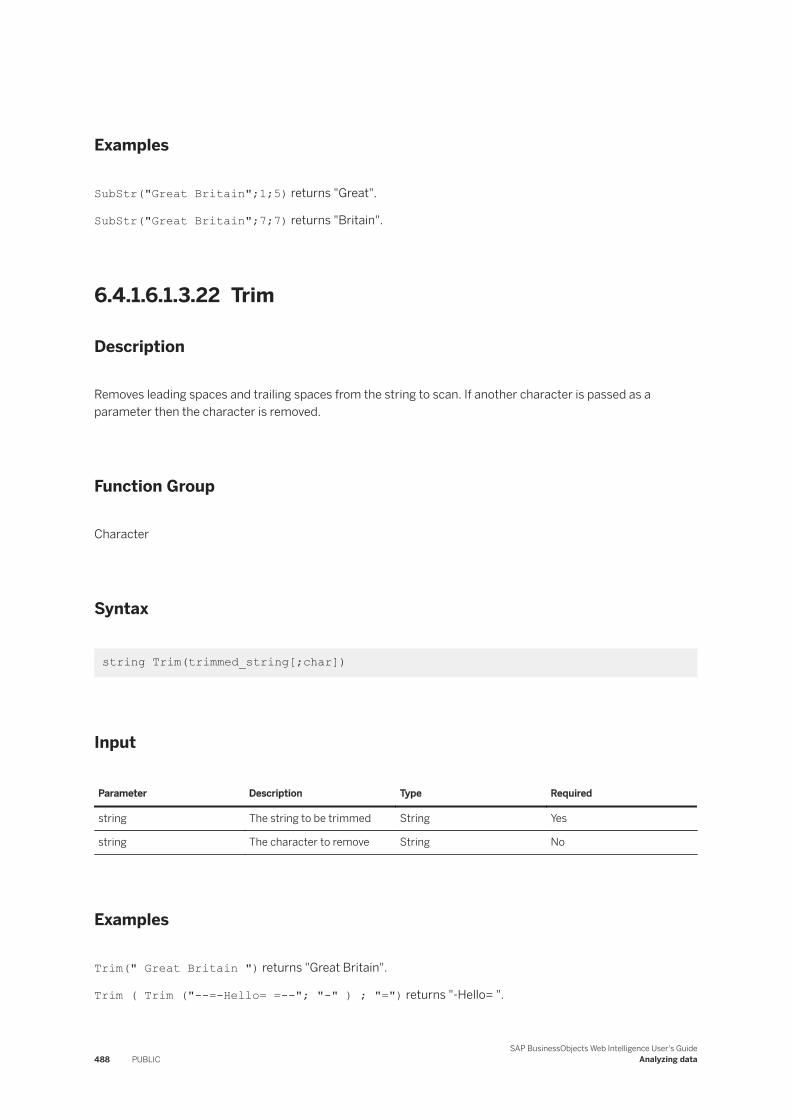
Examples
SubStr("Great Britain";1;5) returns "Great".
SubStr("Great Britain";7;7) returns "Britain".
6.4.1.6.1.3.22 Trim
Description
Removes leading spaces and trailing spaces from the string to scan. If another character is passed as a parameter then the character is removed.
Function Group
Character
Syntax
string Trim(trimmed_string[;char])
Input
Parameter Description Type Required
string The string to be trimmed String Yes
string The character to remove String No
Examples
Trim(" Great Britain ") returns "Great Britain".
Trim ( Trim ("--=-Hello= =--"; "-" ) ; "=") returns "-Hello= ".
488 PUBLICSAP BusinessObjects Web Intelligence User's Guide
Analyzing data
6.4.1.6.1.3.23 Upper
Description
Converts a string to upper case
Function Group
Character
Syntax
string Upper(string)
Input
Parameter Description Type Required
string The string to be converted String Yes
Examples
Upper("New York") returns "NEW YORK".
6.4.1.6.1.3.24 UrlEncode
Description
Applies URL encoding rules to a string
Function Group
Character
SAP BusinessObjects Web Intelligence User's GuideAnalyzing data PUBLIC 489
Syntax
string UrlEncode(html)
Input
Parameter Description Type Required
html The URL to be encoded String Yes
Examples
UrlEncode("http://www.sap.com") returns "http%3A%2F%2Fwww%2Esap%2Ecom".
6.4.1.6.1.3.25 WordCap
Description
Capitalizes the first letter of all the words in a string
Function Group
Character
Syntax
string WordCap(string)
490 PUBLICSAP BusinessObjects Web Intelligence User's Guide
Analyzing data
Input
Parameter Description Type Required
string The string to be capitalized String Yes
Examples
WordCap("Sales revenue for March") returns "Sales Revenue For March".
6.4.1.6.1.4 Date and Time functions
6.4.1.6.1.4.1 CurrentDate
Description
Returns the current date formatted according to the regional settings
Function Group
Date and Time
Syntax
date CurrentDate()
Examples
CurrentDate() returns 10 September 2002 if the date is 10 September 2002.
SAP BusinessObjects Web Intelligence User's GuideAnalyzing data PUBLIC 491
6.4.1.6.1.4.2 CurrentTime
Description
Returns the current time formatted according to the regional settings
Function Group
Date and Time
Syntax
time CurrentTime()
Examples
CurrentTime returns 11:15 if the current time is 11:15.
6.4.1.6.1.4.3 DatesBetween
Description
Returns the number of periods between two dates, irrespective of the time.
Function Group
Date and Time
Syntax
int DatesBetween(first_date;last_date;period)
492 PUBLICSAP BusinessObjects Web Intelligence User's Guide
Analyzing data
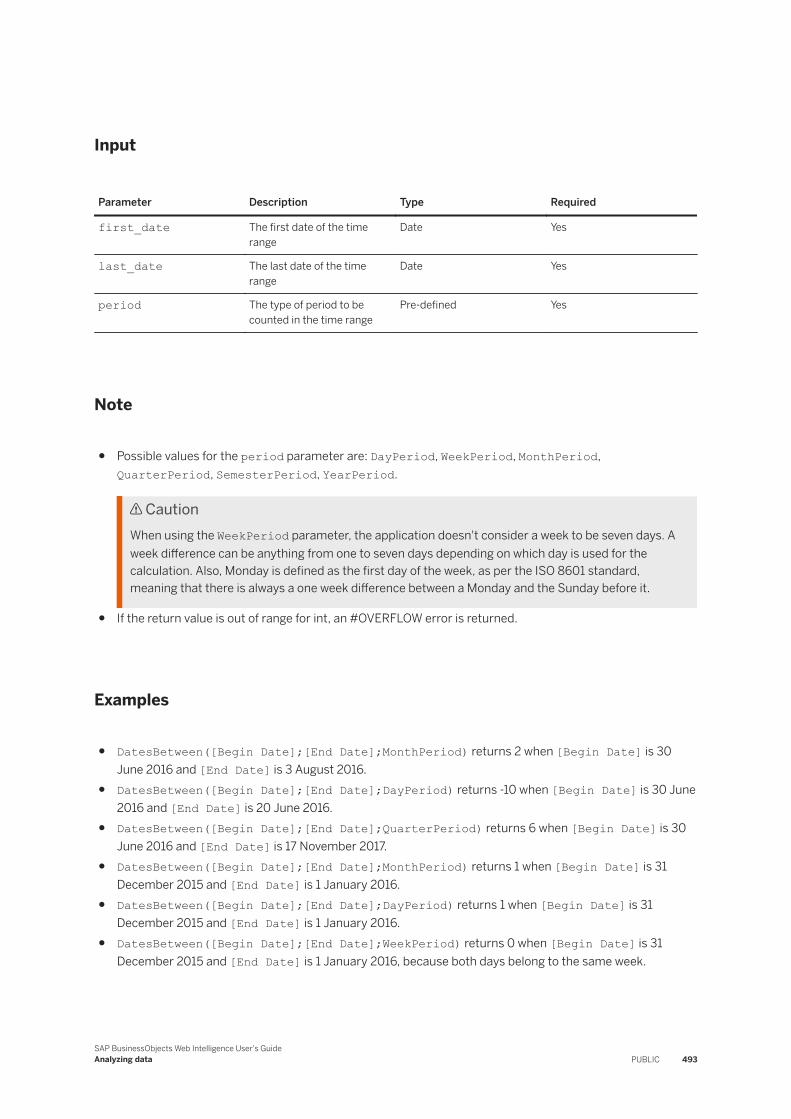
Input
Parameter Description Type Required
first_date The first date of the time range
Date Yes
last_date The last date of the time range
Date Yes
period The type of period to be counted in the time range
Pre-defined Yes
Note
● Possible values for the period parameter are: DayPeriod, WeekPeriod, MonthPeriod, QuarterPeriod, SemesterPeriod, YearPeriod.
CautionWhen using the WeekPeriod parameter, the application doesn't consider a week to be seven days. A week difference can be anything from one to seven days depending on which day is used for the calculation. Also, Monday is defined as the first day of the week, as per the ISO 8601 standard, meaning that there is always a one week difference between a Monday and the Sunday before it.
● If the return value is out of range for int, an #OVERFLOW error is returned.
Examples
● DatesBetween([Begin Date];[End Date];MonthPeriod) returns 2 when [Begin Date] is 30 June 2016 and [End Date] is 3 August 2016.
● DatesBetween([Begin Date];[End Date];DayPeriod) returns -10 when [Begin Date] is 30 June 2016 and [End Date] is 20 June 2016.
● DatesBetween([Begin Date];[End Date];QuarterPeriod) returns 6 when [Begin Date] is 30 June 2016 and [End Date] is 17 November 2017.
● DatesBetween([Begin Date];[End Date];MonthPeriod) returns 1 when [Begin Date] is 31 December 2015 and [End Date] is 1 January 2016.
● DatesBetween([Begin Date];[End Date];DayPeriod) returns 1 when [Begin Date] is 31 December 2015 and [End Date] is 1 January 2016.
● DatesBetween([Begin Date];[End Date];WeekPeriod) returns 0 when [Begin Date] is 31 December 2015 and [End Date] is 1 January 2016, because both days belong to the same week.
SAP BusinessObjects Web Intelligence User's GuideAnalyzing data PUBLIC 493
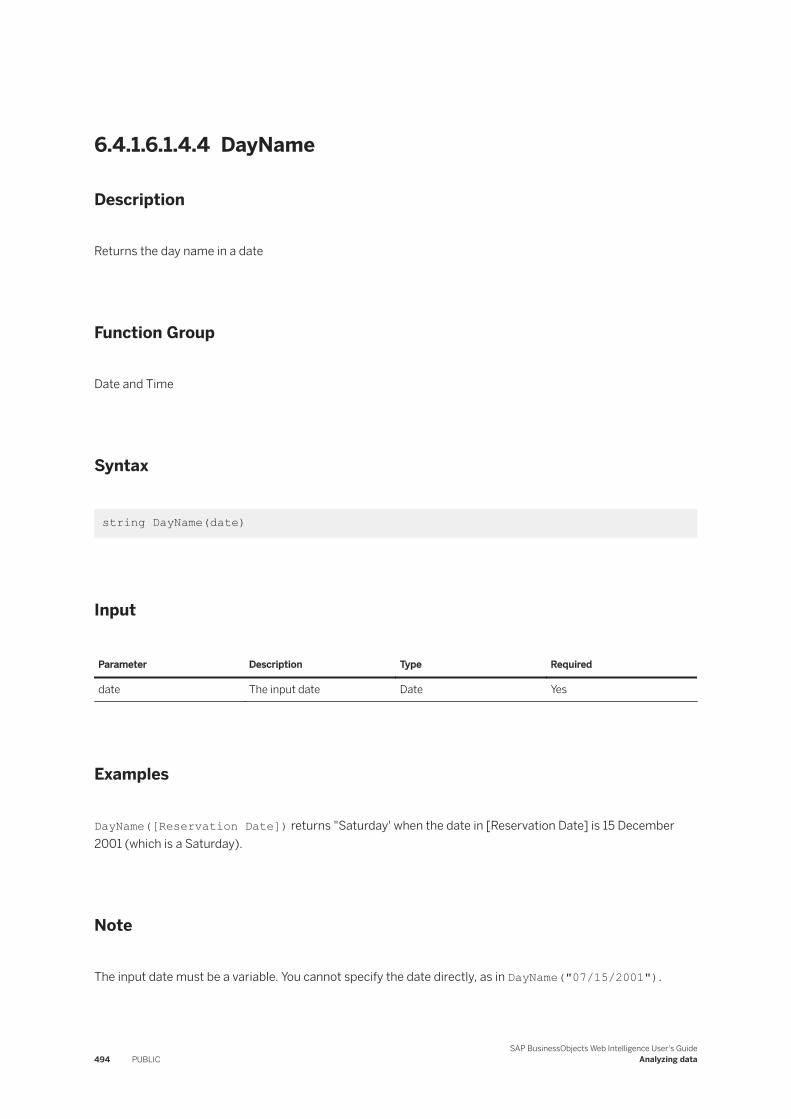
6.4.1.6.1.4.4 DayName
Description
Returns the day name in a date
Function Group
Date and Time
Syntax
string DayName(date)
Input
Parameter Description Type Required
date The input date Date Yes
Examples
DayName([Reservation Date]) returns "Saturday' when the date in [Reservation Date] is 15 December 2001 (which is a Saturday).
Note
The input date must be a variable. You cannot specify the date directly, as in DayName("07/15/2001").
494 PUBLICSAP BusinessObjects Web Intelligence User's Guide
Analyzing data
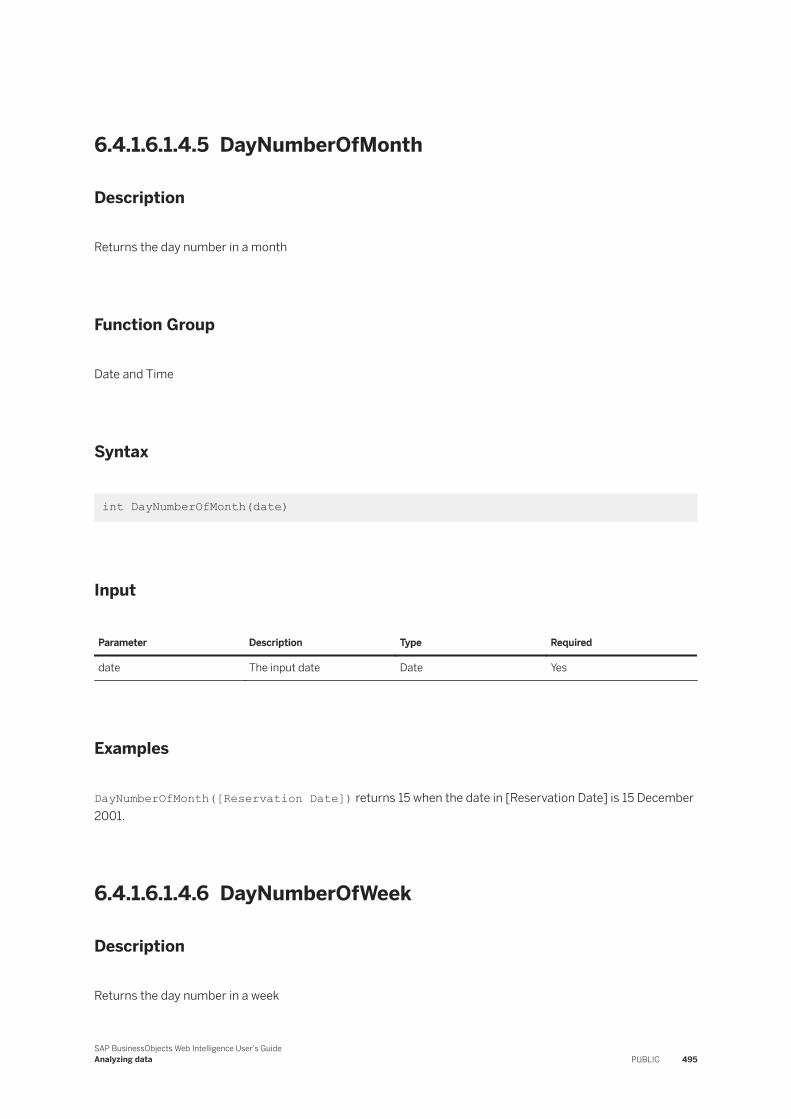
6.4.1.6.1.4.5 DayNumberOfMonth
Description
Returns the day number in a month
Function Group
Date and Time
Syntax
int DayNumberOfMonth(date)
Input
Parameter Description Type Required
date The input date Date Yes
Examples
DayNumberOfMonth([Reservation Date]) returns 15 when the date in [Reservation Date] is 15 December 2001.
6.4.1.6.1.4.6 DayNumberOfWeek
Description
Returns the day number in a week
SAP BusinessObjects Web Intelligence User's GuideAnalyzing data PUBLIC 495
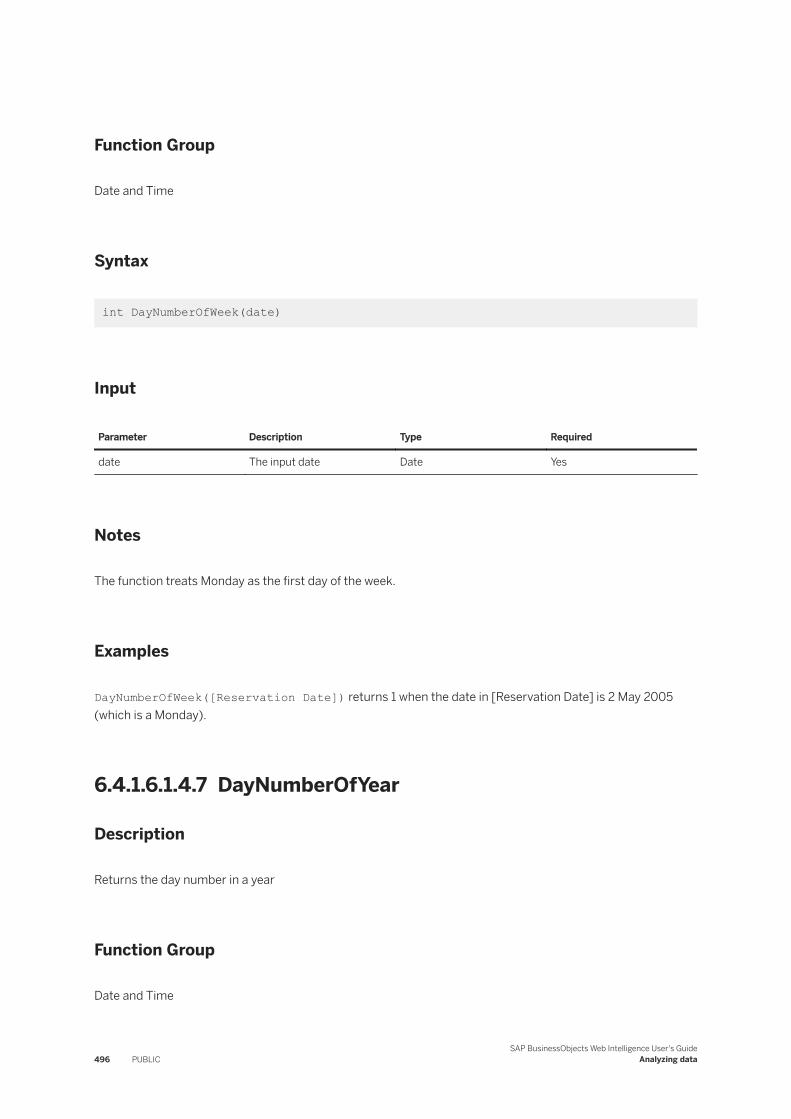
Function Group
Date and Time
Syntax
int DayNumberOfWeek(date)
Input
Parameter Description Type Required
date The input date Date Yes
Notes
The function treats Monday as the first day of the week.
Examples
DayNumberOfWeek([Reservation Date]) returns 1 when the date in [Reservation Date] is 2 May 2005 (which is a Monday).
6.4.1.6.1.4.7 DayNumberOfYear
Description
Returns the day number in a year
Function Group
Date and Time
496 PUBLICSAP BusinessObjects Web Intelligence User's Guide
Analyzing data

Syntax
int DayNumberOfYear(date)
Input
Parameter Description Type Required
date The input date Date Yes
Examples
DayNumberOfYear([Reservation Date]) returns 349 when the date in [Reservation Date] is 15 December 2001.
6.4.1.6.1.4.8 DaysBetween
Description
Returns the number of days between two dates
Function Group
Date and Time
Syntax
int DaysBetween(first_date;last_date)
NoteYou must ensure that the dates given in the arguments are in the same timezone. This applies to all date operations: comparison and calculation.
SAP BusinessObjects Web Intelligence User's GuideAnalyzing data PUBLIC 497
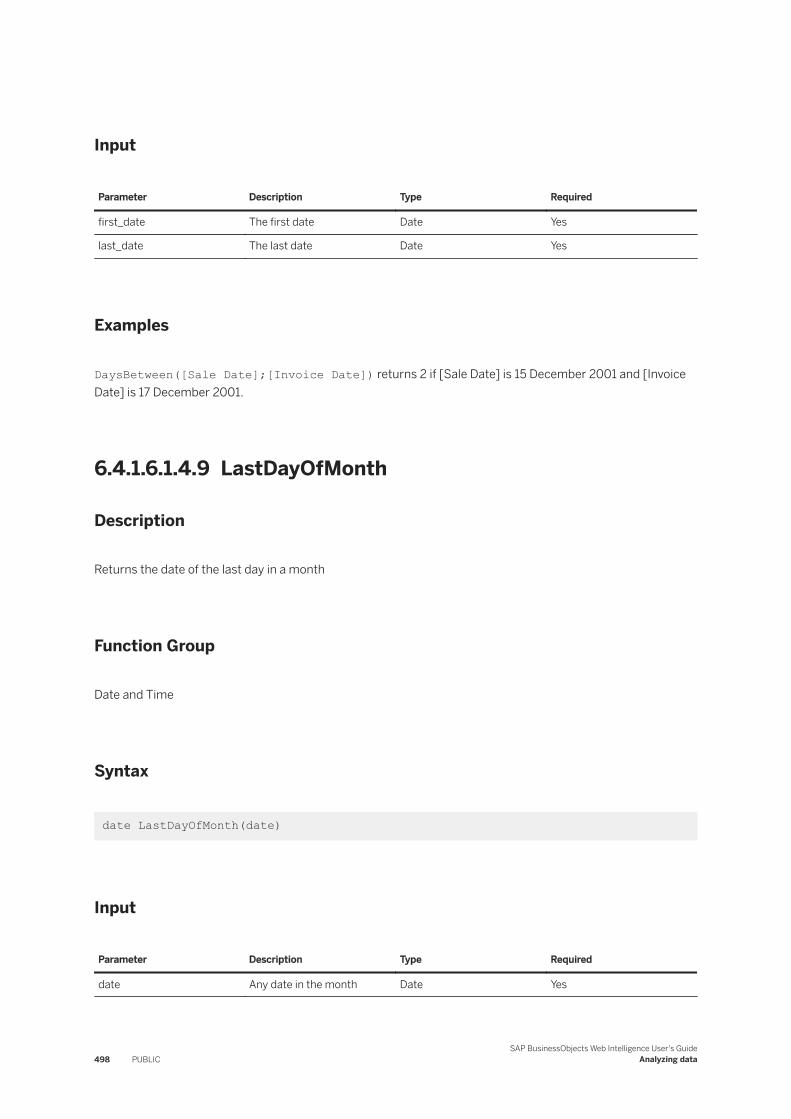
Input
Parameter Description Type Required
first_date The first date Date Yes
last_date The last date Date Yes
Examples
DaysBetween([Sale Date];[Invoice Date]) returns 2 if [Sale Date] is 15 December 2001 and [Invoice Date] is 17 December 2001.
6.4.1.6.1.4.9 LastDayOfMonth
Description
Returns the date of the last day in a month
Function Group
Date and Time
Syntax
date LastDayOfMonth(date)
Input
Parameter Description Type Required
date Any date in the month Date Yes
498 PUBLICSAP BusinessObjects Web Intelligence User's Guide
Analyzing data
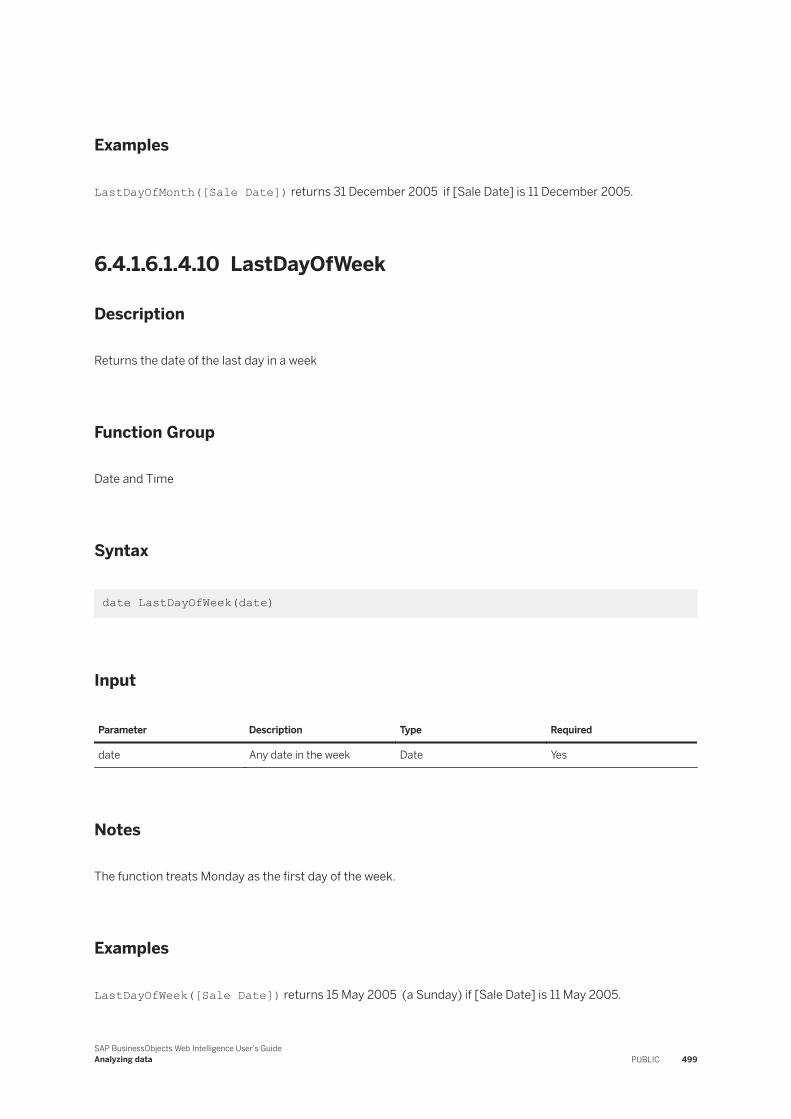
Examples
LastDayOfMonth([Sale Date]) returns 31 December 2005 if [Sale Date] is 11 December 2005.
6.4.1.6.1.4.10 LastDayOfWeek
Description
Returns the date of the last day in a week
Function Group
Date and Time
Syntax
date LastDayOfWeek(date)
Input
Parameter Description Type Required
date Any date in the week Date Yes
Notes
The function treats Monday as the first day of the week.
Examples
LastDayOfWeek([Sale Date]) returns 15 May 2005 (a Sunday) if [Sale Date] is 11 May 2005.
SAP BusinessObjects Web Intelligence User's GuideAnalyzing data PUBLIC 499
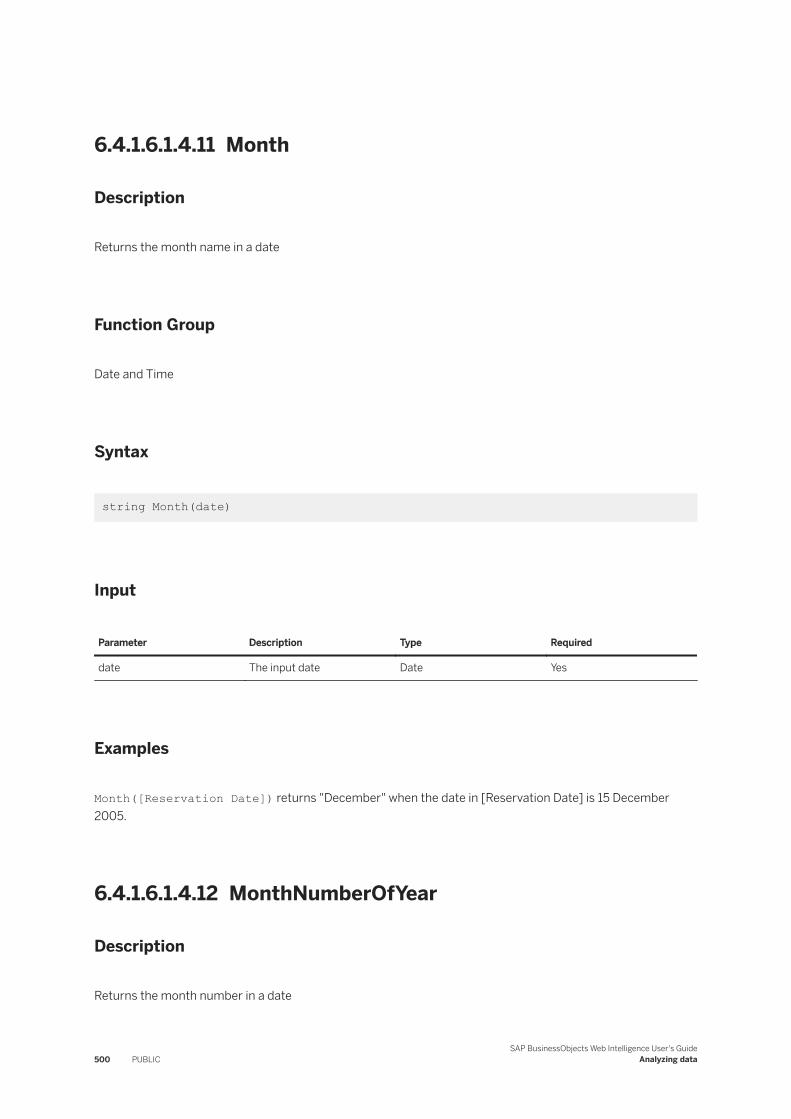
6.4.1.6.1.4.11 Month
Description
Returns the month name in a date
Function Group
Date and Time
Syntax
string Month(date)
Input
Parameter Description Type Required
date The input date Date Yes
Examples
Month([Reservation Date]) returns "December" when the date in [Reservation Date] is 15 December 2005.
6.4.1.6.1.4.12 MonthNumberOfYear
Description
Returns the month number in a date
500 PUBLICSAP BusinessObjects Web Intelligence User's Guide
Analyzing data

Function Group
Date and Time
Syntax
int MonthNumberOfYear(date)
Input
Parameter Description Type Required
date Any date in the year Date Yes
Example
MonthNumberOfYear([Reservation Date]) returns 12 when the date in [Reservation Date] is 15 December 2005.
6.4.1.6.1.4.13 MonthsBetween
Description
Returns the number of months between two dates
Function Group
Date and Time
Syntax
int MonthsBetween(first_date;last_date)
SAP BusinessObjects Web Intelligence User's GuideAnalyzing data PUBLIC 501
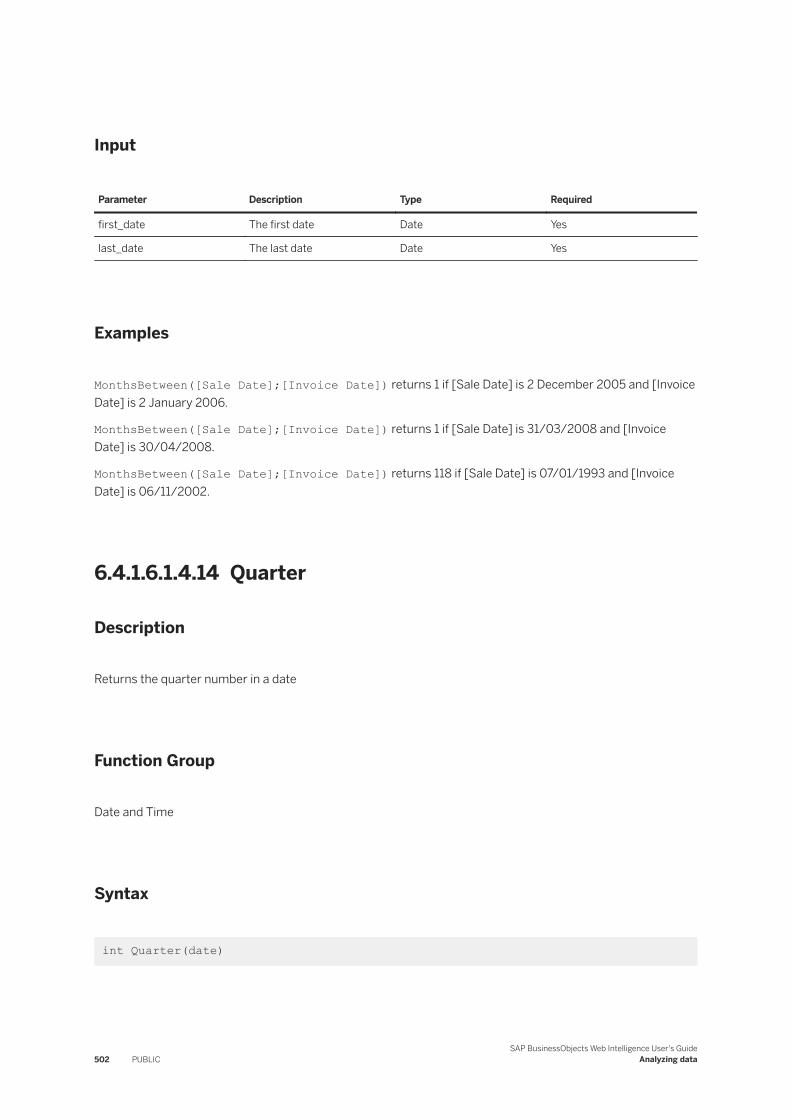
Input
Parameter Description Type Required
first_date The first date Date Yes
last_date The last date Date Yes
Examples
MonthsBetween([Sale Date];[Invoice Date]) returns 1 if [Sale Date] is 2 December 2005 and [Invoice Date] is 2 January 2006.
MonthsBetween([Sale Date];[Invoice Date]) returns 1 if [Sale Date] is 31/03/2008 and [Invoice Date] is 30/04/2008.
MonthsBetween([Sale Date];[Invoice Date]) returns 118 if [Sale Date] is 07/01/1993 and [Invoice Date] is 06/11/2002.
6.4.1.6.1.4.14 Quarter
Description
Returns the quarter number in a date
Function Group
Date and Time
Syntax
int Quarter(date)
502 PUBLICSAP BusinessObjects Web Intelligence User's Guide
Analyzing data
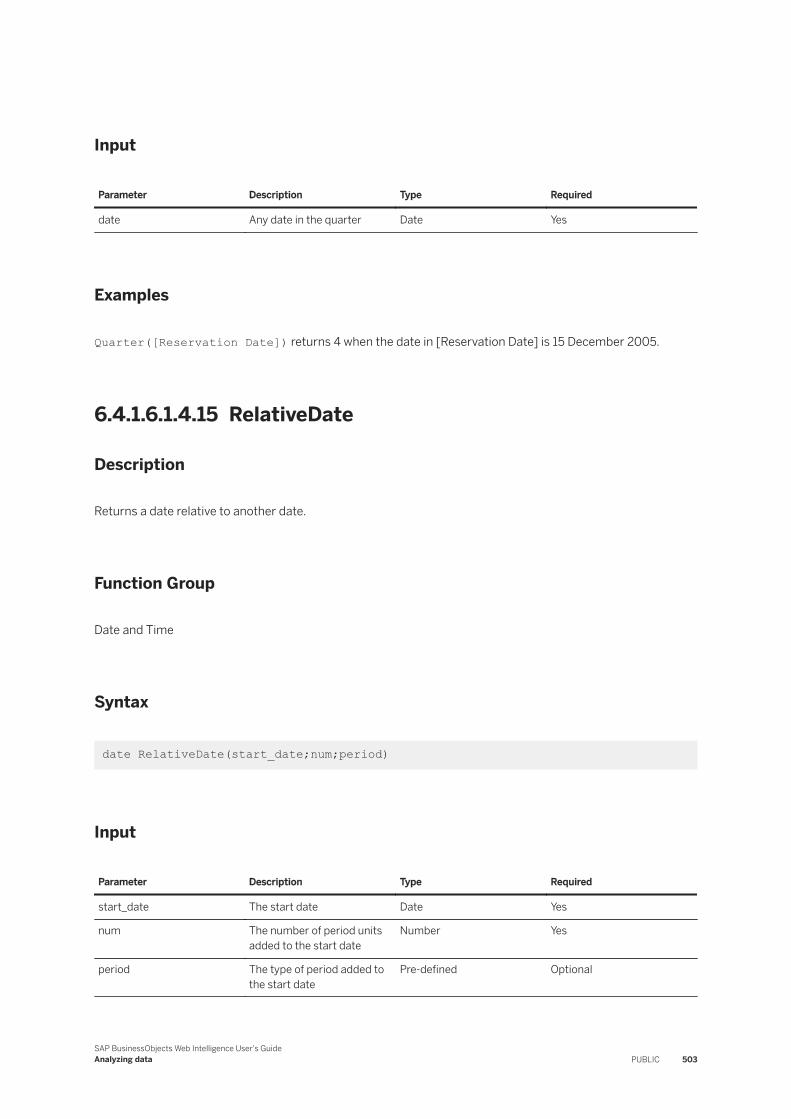
Input
Parameter Description Type Required
date Any date in the quarter Date Yes
Examples
Quarter([Reservation Date]) returns 4 when the date in [Reservation Date] is 15 December 2005.
6.4.1.6.1.4.15 RelativeDate
Description
Returns a date relative to another date.
Function Group
Date and Time
Syntax
date RelativeDate(start_date;num;period)
Input
Parameter Description Type Required
start_date The start date Date Yes
num The number of period units added to the start date
Number Yes
period The type of period added to the start date
Pre-defined Optional
SAP BusinessObjects Web Intelligence User's GuideAnalyzing data PUBLIC 503
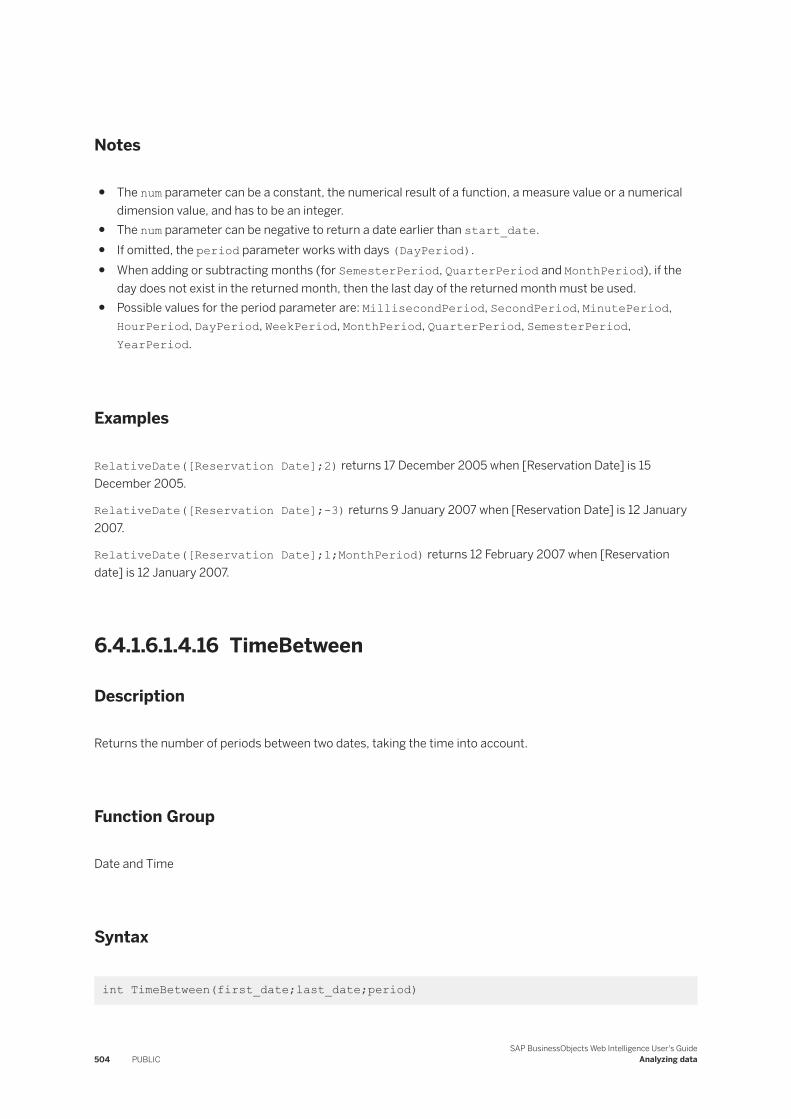
Notes
● The num parameter can be a constant, the numerical result of a function, a measure value or a numerical dimension value, and has to be an integer.
● The num parameter can be negative to return a date earlier than start_date.● If omitted, the period parameter works with days (DayPeriod).● When adding or subtracting months (for SemesterPeriod, QuarterPeriod and MonthPeriod), if the
day does not exist in the returned month, then the last day of the returned month must be used.● Possible values for the period parameter are: MillisecondPeriod, SecondPeriod, MinutePeriod,
HourPeriod, DayPeriod, WeekPeriod, MonthPeriod, QuarterPeriod, SemesterPeriod, YearPeriod.
Examples
RelativeDate([Reservation Date];2) returns 17 December 2005 when [Reservation Date] is 15 December 2005.
RelativeDate([Reservation Date];-3) returns 9 January 2007 when [Reservation Date] is 12 January 2007.
RelativeDate([Reservation Date];1;MonthPeriod) returns 12 February 2007 when [Reservation date] is 12 January 2007.
6.4.1.6.1.4.16 TimeBetween
Description
Returns the number of periods between two dates, taking the time into account.
Function Group
Date and Time
Syntax
int TimeBetween(first_date;last_date;period)
504 PUBLICSAP BusinessObjects Web Intelligence User's Guide
Analyzing data
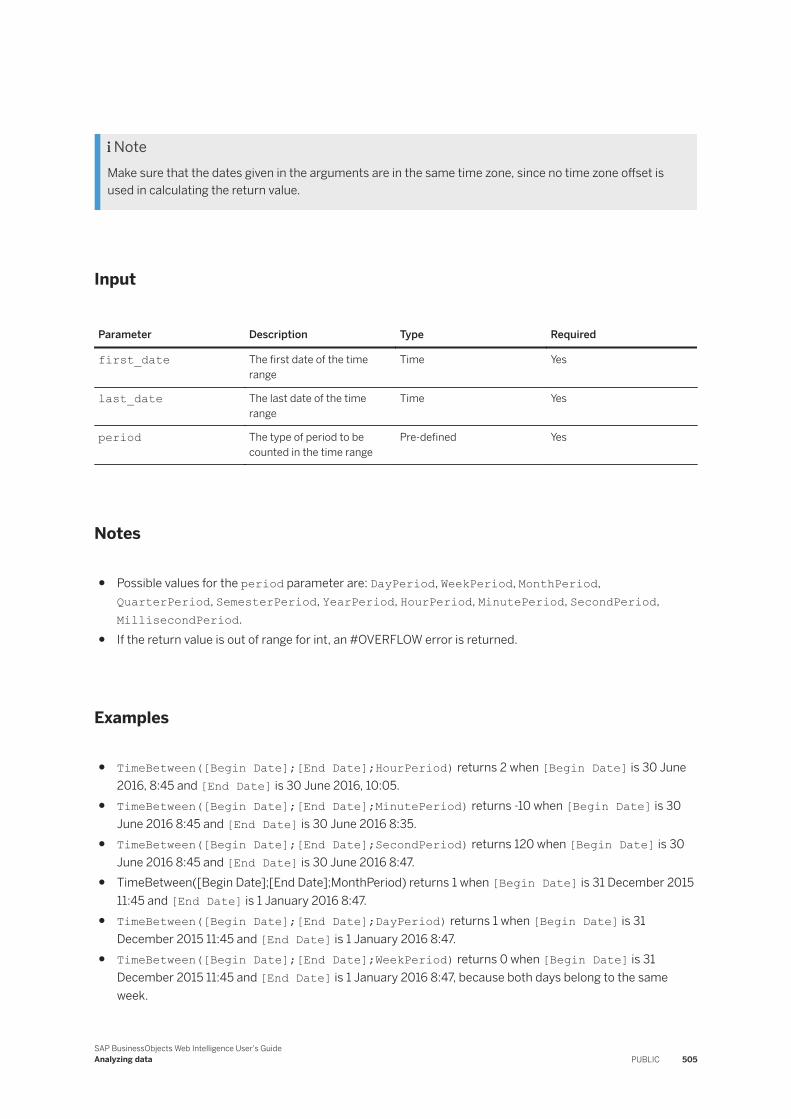
NoteMake sure that the dates given in the arguments are in the same time zone, since no time zone offset is used in calculating the return value.
Input
Parameter Description Type Required
first_date The first date of the time range
Time Yes
last_date The last date of the time range
Time Yes
period The type of period to be counted in the time range
Pre-defined Yes
Notes
● Possible values for the period parameter are: DayPeriod, WeekPeriod, MonthPeriod, QuarterPeriod, SemesterPeriod, YearPeriod, HourPeriod, MinutePeriod, SecondPeriod, MillisecondPeriod.
● If the return value is out of range for int, an #OVERFLOW error is returned.
Examples
● TimeBetween([Begin Date];[End Date];HourPeriod) returns 2 when [Begin Date] is 30 June 2016, 8:45 and [End Date] is 30 June 2016, 10:05.
● TimeBetween([Begin Date];[End Date];MinutePeriod) returns -10 when [Begin Date] is 30 June 2016 8:45 and [End Date] is 30 June 2016 8:35.
● TimeBetween([Begin Date];[End Date];SecondPeriod) returns 120 when [Begin Date] is 30 June 2016 8:45 and [End Date] is 30 June 2016 8:47.
● TimeBetween([Begin Date];[End Date];MonthPeriod) returns 1 when [Begin Date] is 31 December 2015 11:45 and [End Date] is 1 January 2016 8:47.
● TimeBetween([Begin Date];[End Date];DayPeriod) returns 1 when [Begin Date] is 31 December 2015 11:45 and [End Date] is 1 January 2016 8:47.
● TimeBetween([Begin Date];[End Date];WeekPeriod) returns 0 when [Begin Date] is 31 December 2015 11:45 and [End Date] is 1 January 2016 8:47, because both days belong to the same week.
SAP BusinessObjects Web Intelligence User's GuideAnalyzing data PUBLIC 505
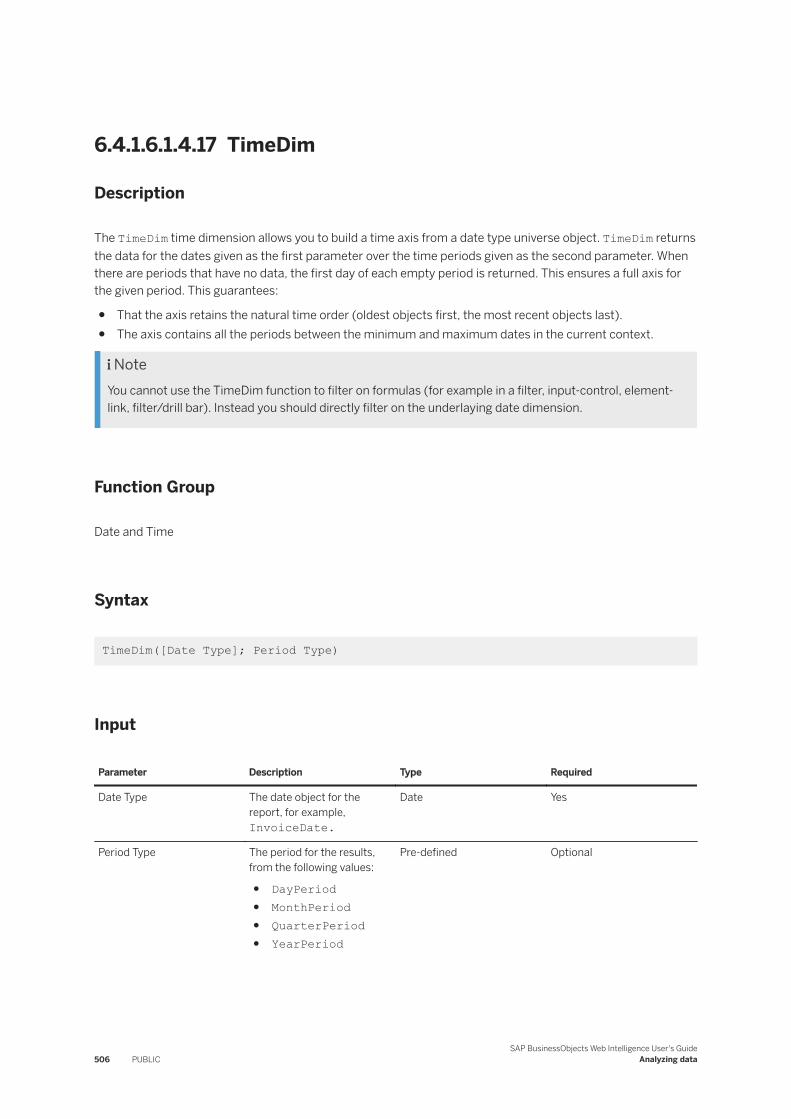
6.4.1.6.1.4.17 TimeDim
Description
The TimeDim time dimension allows you to build a time axis from a date type universe object. TimeDim returns the data for the dates given as the first parameter over the time periods given as the second parameter. When there are periods that have no data, the first day of each empty period is returned. This ensures a full axis for the given period. This guarantees:
● That the axis retains the natural time order (oldest objects first, the most recent objects last).● The axis contains all the periods between the minimum and maximum dates in the current context.
NoteYou cannot use the TimeDim function to filter on formulas (for example in a filter, input-control, element-link, filter/drill bar). Instead you should directly filter on the underlaying date dimension.
Function Group
Date and Time
Syntax
TimeDim([Date Type]; Period Type)
Input
Parameter Description Type Required
Date Type The date object for the report, for example, InvoiceDate.
Date Yes
Period Type The period for the results, from the following values:
● DayPeriod● MonthPeriod● QuarterPeriod● YearPeriod
Pre-defined Optional
506 PUBLICSAP BusinessObjects Web Intelligence User's Guide
Analyzing data
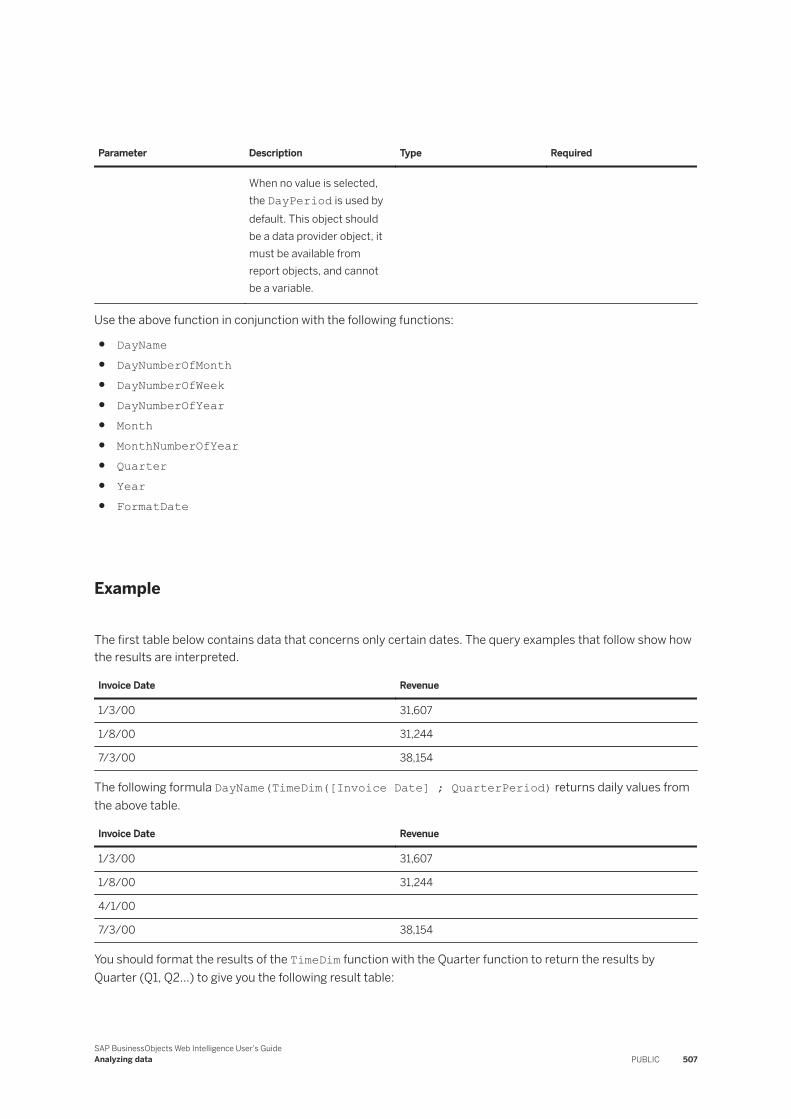
Parameter Description Type Required
When no value is selected, the DayPeriod is used by default. This object should be a data provider object, it must be available from report objects, and cannot be a variable.
Use the above function in conjunction with the following functions:
● DayName● DayNumberOfMonth● DayNumberOfWeek● DayNumberOfYear● Month● MonthNumberOfYear● Quarter● Year● FormatDate
Example
The first table below contains data that concerns only certain dates. The query examples that follow show how the results are interpreted.
Invoice Date Revenue
1/3/00 31,607
1/8/00 31,244
7/3/00 38,154
The following formula DayName(TimeDim([Invoice Date] ; QuarterPeriod) returns daily values from the above table.
Invoice Date Revenue
1/3/00 31,607
1/8/00 31,244
4/1/00
7/3/00 38,154
You should format the results of the TimeDim function with the Quarter function to return the results by Quarter (Q1, Q2...) to give you the following result table:
SAP BusinessObjects Web Intelligence User's GuideAnalyzing data PUBLIC 507
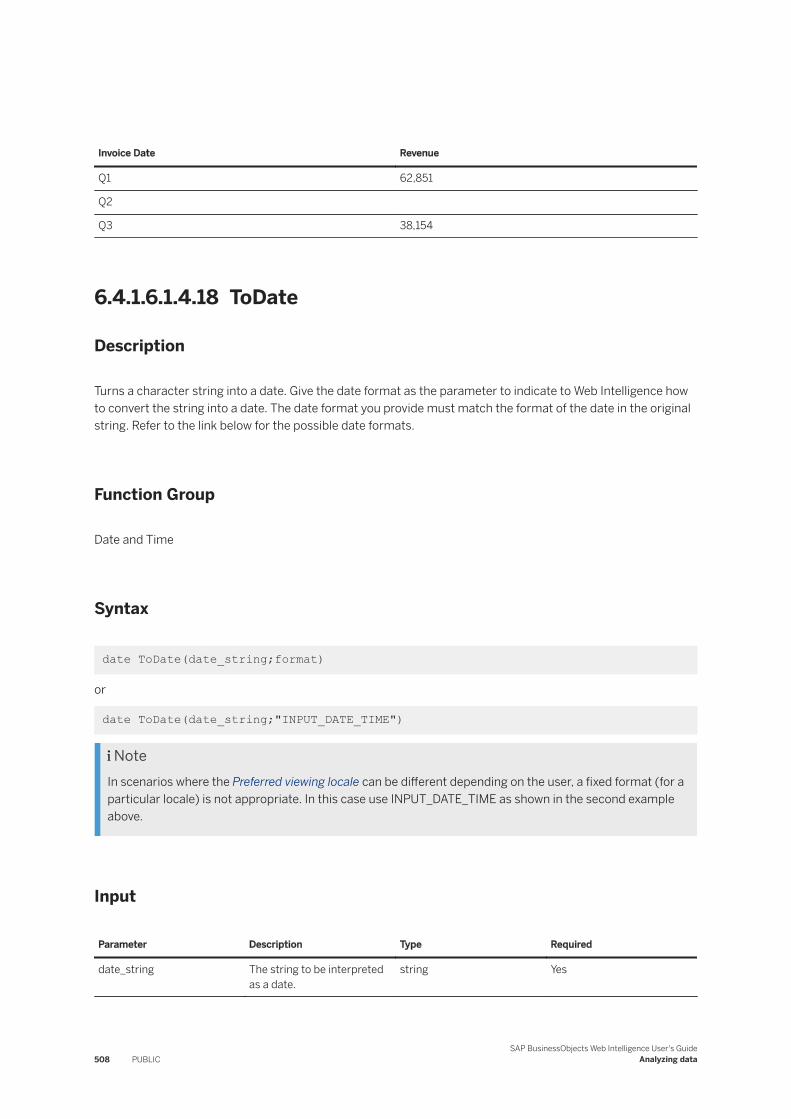
Invoice Date Revenue
Q1 62,851
Q2
Q3 38,154
6.4.1.6.1.4.18 ToDate
Description
Turns a character string into a date. Give the date format as the parameter to indicate to Web Intelligence how to convert the string into a date. The date format you provide must match the format of the date in the original string. Refer to the link below for the possible date formats.
Function Group
Date and Time
Syntax
date ToDate(date_string;format)
or
date ToDate(date_string;"INPUT_DATE_TIME")
NoteIn scenarios where the Preferred viewing locale can be different depending on the user, a fixed format (for a particular locale) is not appropriate. In this case use INPUT_DATE_TIME as shown in the second example above.
Input
Parameter Description Type Required
date_string The string to be interpreted as a date.
string Yes
508 PUBLICSAP BusinessObjects Web Intelligence User's Guide
Analyzing data
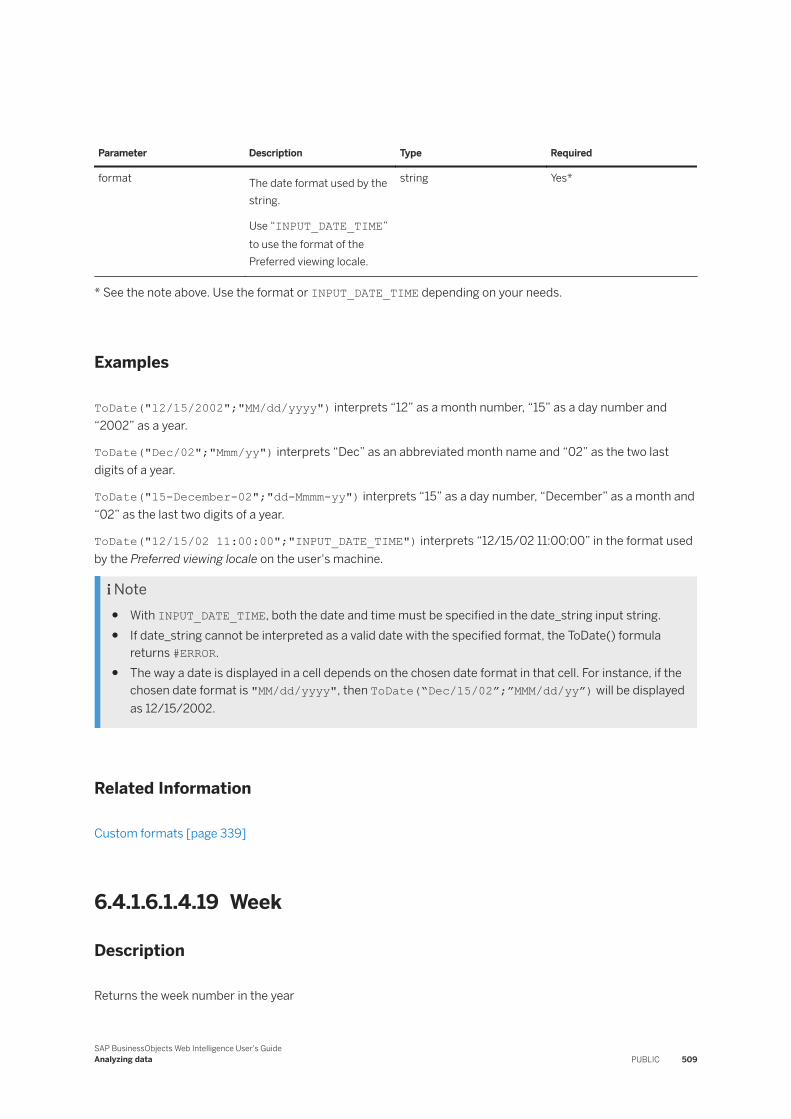
Parameter Description Type Required
format The date format used by the string.
Use “INPUT_DATE_TIME” to use the format of the Preferred viewing locale.
string Yes*
* See the note above. Use the format or INPUT_DATE_TIME depending on your needs.
Examples
ToDate("12/15/2002";"MM/dd/yyyy") interprets “12” as a month number, “15” as a day number and “2002” as a year.
ToDate("Dec/02";"Mmm/yy") interprets “Dec” as an abbreviated month name and “02” as the two last digits of a year.
ToDate("15-December-02";"dd-Mmmm-yy") interprets “15” as a day number, “December” as a month and “02” as the last two digits of a year.
ToDate("12/15/02 11:00:00";"INPUT_DATE_TIME") interprets “12/15/02 11:00:00” in the format used by the Preferred viewing locale on the user's machine.
Note● With INPUT_DATE_TIME, both the date and time must be specified in the date_string input string.● If date_string cannot be interpreted as a valid date with the specified format, the ToDate() formula
returns #ERROR.● The way a date is displayed in a cell depends on the chosen date format in that cell. For instance, if the
chosen date format is "MM/dd/yyyy", then ToDate(“Dec/15/02”;”MMM/dd/yy”) will be displayed as 12/15/2002.
Related Information
Custom formats [page 339]
6.4.1.6.1.4.19 Week
Description
Returns the week number in the year
SAP BusinessObjects Web Intelligence User's GuideAnalyzing data PUBLIC 509
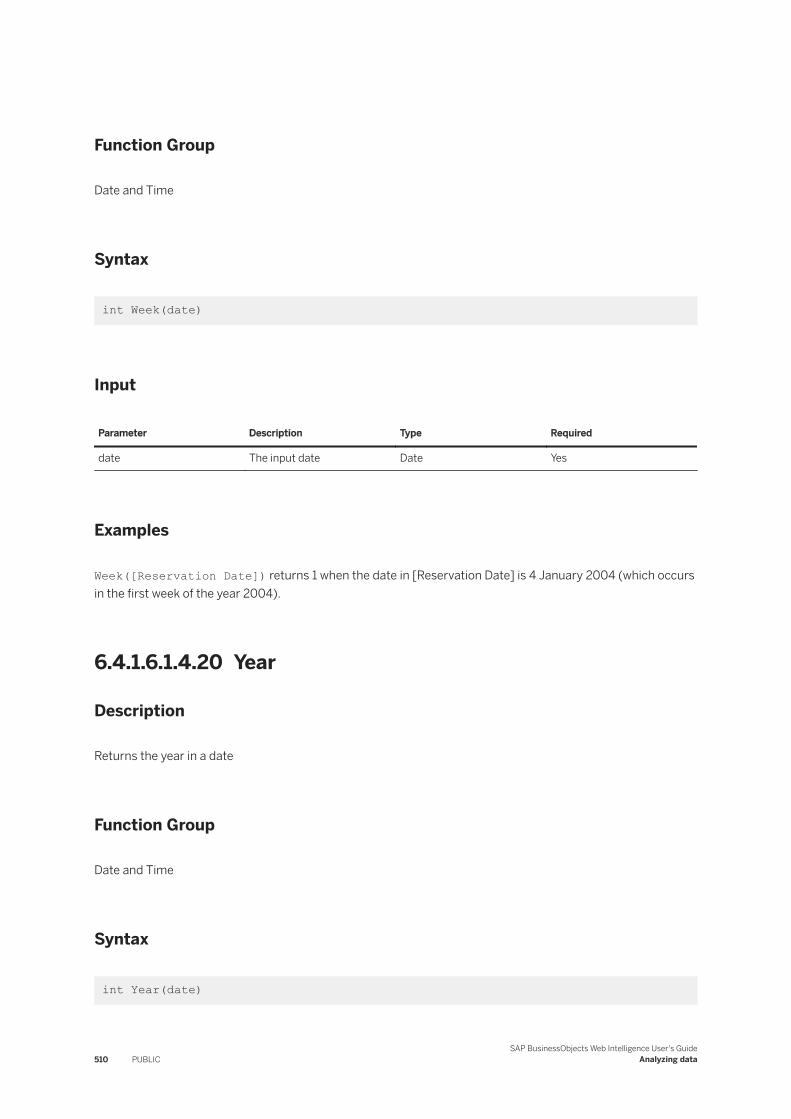
Function Group
Date and Time
Syntax
int Week(date)
Input
Parameter Description Type Required
date The input date Date Yes
Examples
Week([Reservation Date]) returns 1 when the date in [Reservation Date] is 4 January 2004 (which occurs in the first week of the year 2004).
6.4.1.6.1.4.20 Year
Description
Returns the year in a date
Function Group
Date and Time
Syntax
int Year(date)
510 PUBLICSAP BusinessObjects Web Intelligence User's Guide
Analyzing data
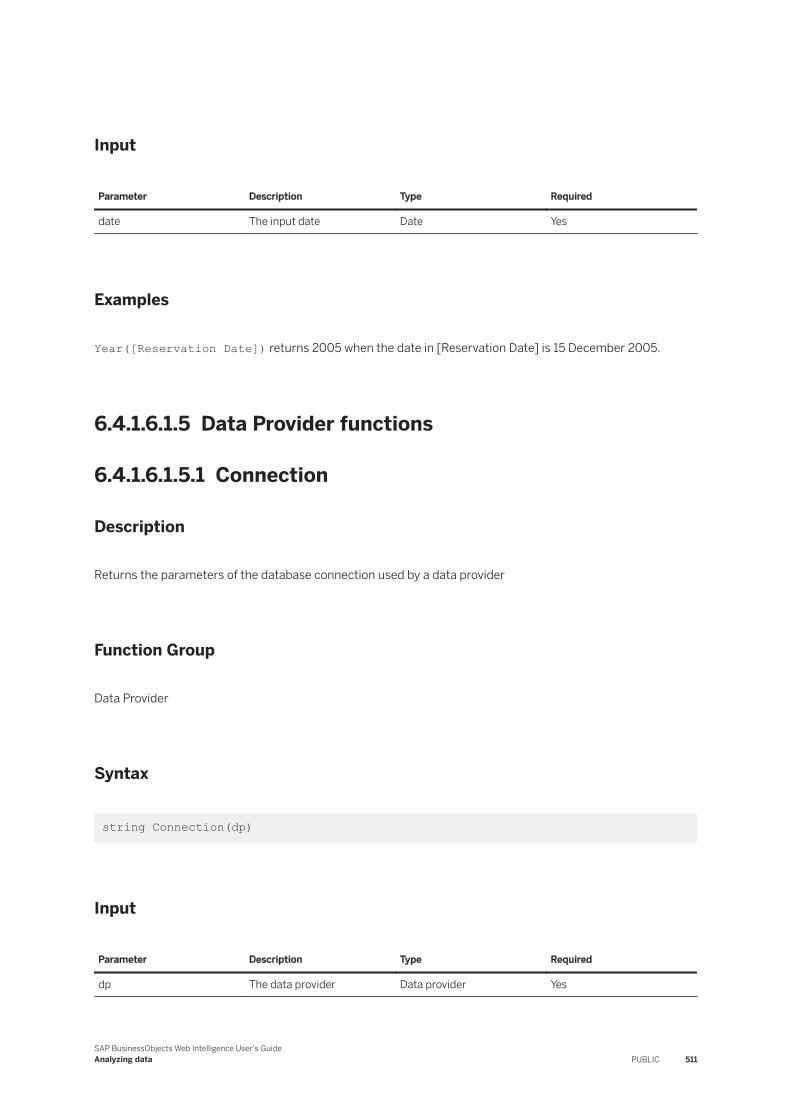
Input
Parameter Description Type Required
date The input date Date Yes
Examples
Year([Reservation Date]) returns 2005 when the date in [Reservation Date] is 15 December 2005.
6.4.1.6.1.5 Data Provider functions
6.4.1.6.1.5.1 Connection
Description
Returns the parameters of the database connection used by a data provider
Function Group
Data Provider
Syntax
string Connection(dp)
Input
Parameter Description Type Required
dp The data provider Data provider Yes
SAP BusinessObjects Web Intelligence User's GuideAnalyzing data PUBLIC 511
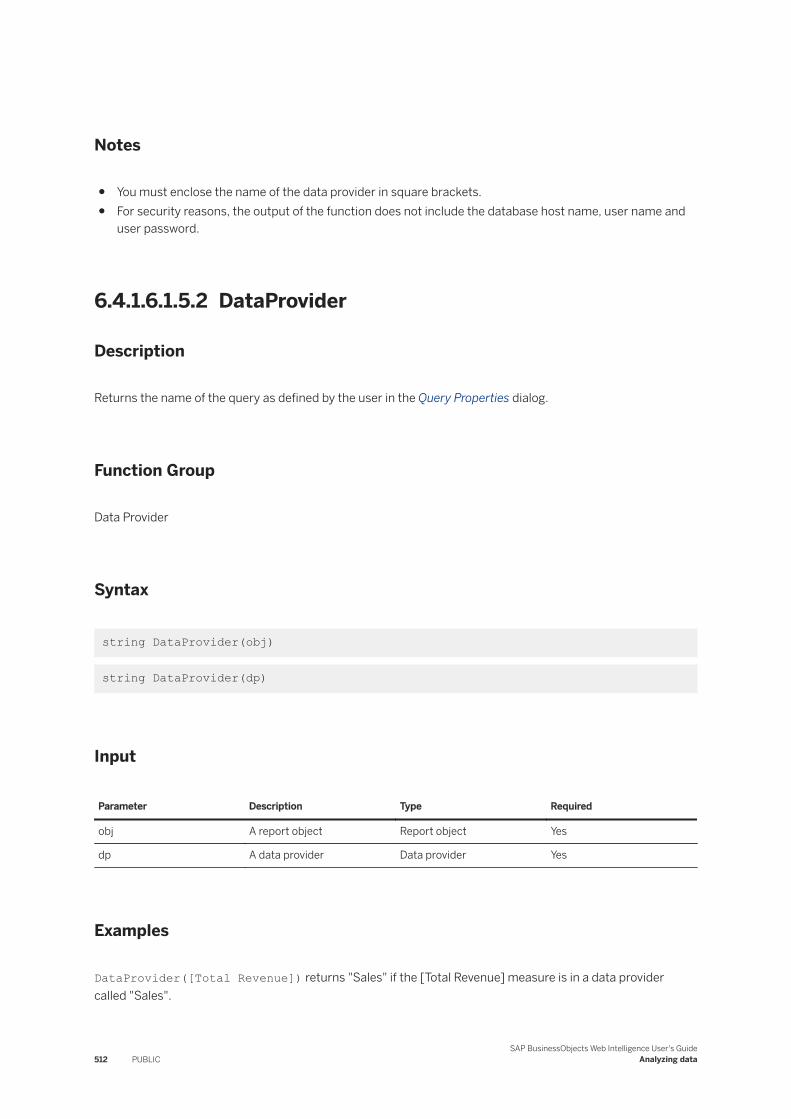
Notes
● You must enclose the name of the data provider in square brackets.● For security reasons, the output of the function does not include the database host name, user name and
user password.
6.4.1.6.1.5.2 DataProvider
Description
Returns the name of the query as defined by the user in the Query Properties dialog.
Function Group
Data Provider
Syntax
string DataProvider(obj)
string DataProvider(dp)
Input
Parameter Description Type Required
obj A report object Report object Yes
dp A data provider Data provider Yes
Examples
DataProvider([Total Revenue]) returns "Sales" if the [Total Revenue] measure is in a data provider called "Sales".
512 PUBLICSAP BusinessObjects Web Intelligence User's Guide
Analyzing data
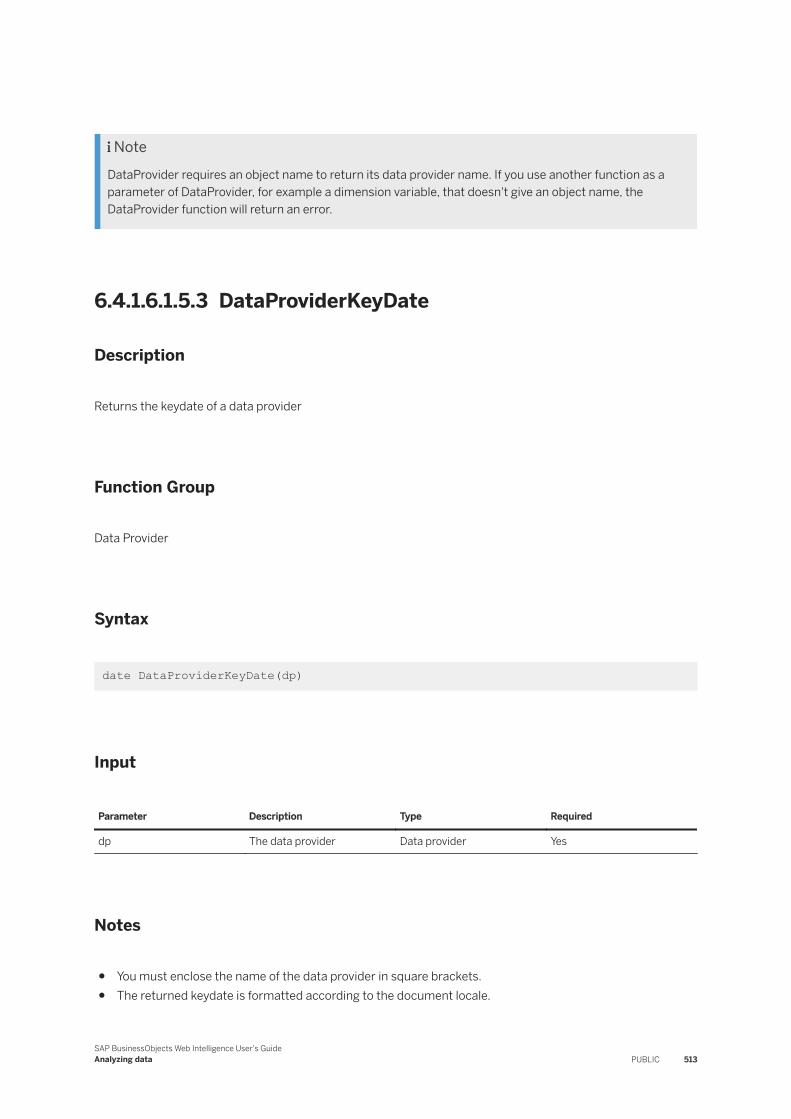
NoteDataProvider requires an object name to return its data provider name. If you use another function as a parameter of DataProvider, for example a dimension variable, that doesn't give an object name, the DataProvider function will return an error.
6.4.1.6.1.5.3 DataProviderKeyDate
Description
Returns the keydate of a data provider
Function Group
Data Provider
Syntax
date DataProviderKeyDate(dp)
Input
Parameter Description Type Required
dp The data provider Data provider Yes
Notes
● You must enclose the name of the data provider in square brackets.● The returned keydate is formatted according to the document locale.
SAP BusinessObjects Web Intelligence User's GuideAnalyzing data PUBLIC 513
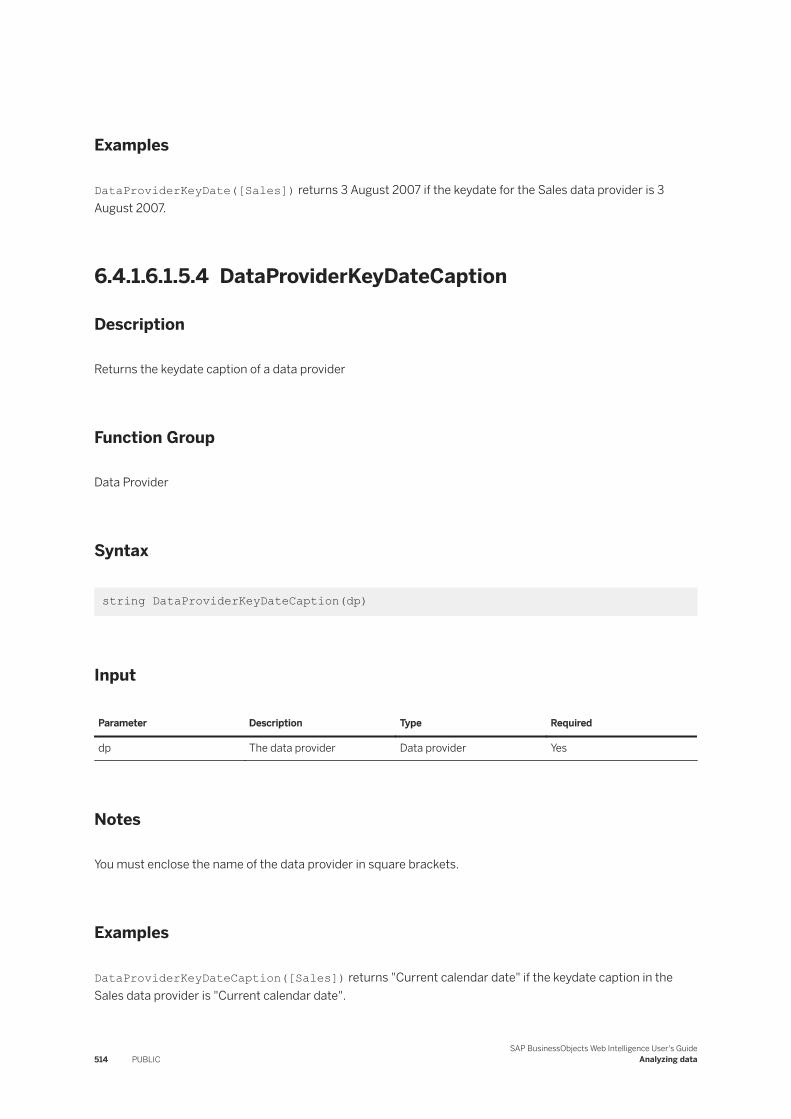
Examples
DataProviderKeyDate([Sales]) returns 3 August 2007 if the keydate for the Sales data provider is 3 August 2007.
6.4.1.6.1.5.4 DataProviderKeyDateCaption
Description
Returns the keydate caption of a data provider
Function Group
Data Provider
Syntax
string DataProviderKeyDateCaption(dp)
Input
Parameter Description Type Required
dp The data provider Data provider Yes
Notes
You must enclose the name of the data provider in square brackets.
Examples
DataProviderKeyDateCaption([Sales]) returns "Current calendar date" if the keydate caption in the Sales data provider is "Current calendar date".
514 PUBLICSAP BusinessObjects Web Intelligence User's Guide
Analyzing data
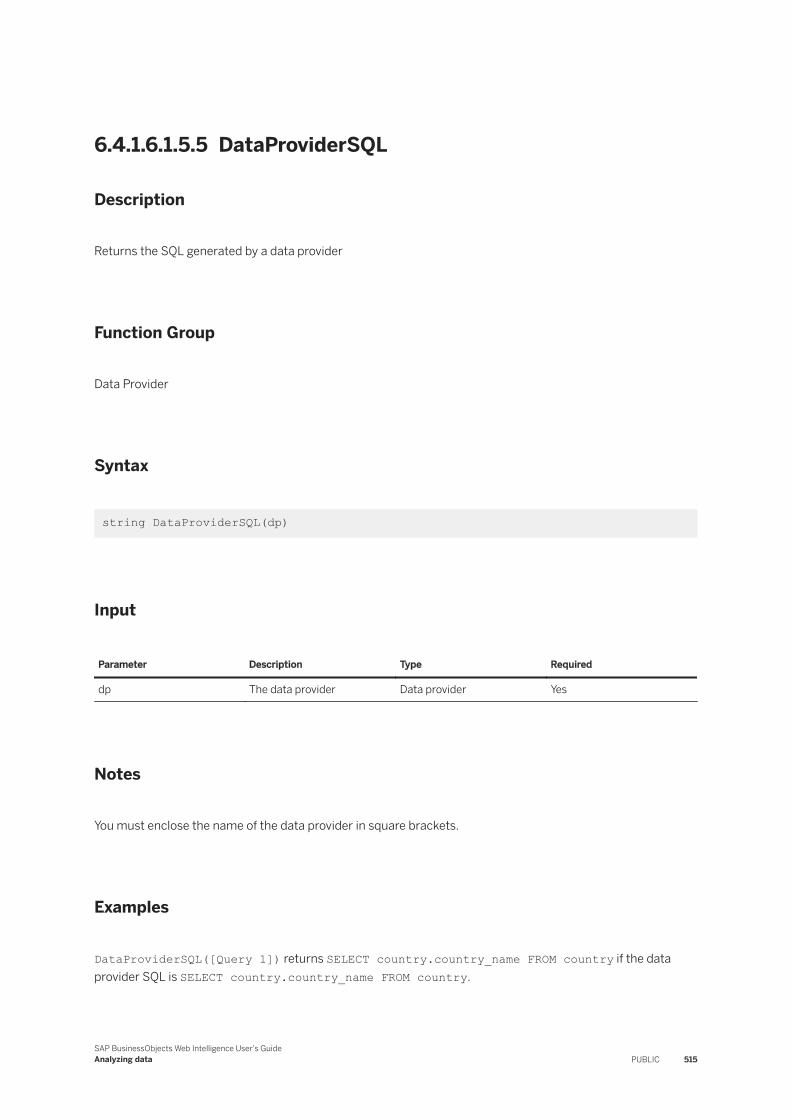
6.4.1.6.1.5.5 DataProviderSQL
Description
Returns the SQL generated by a data provider
Function Group
Data Provider
Syntax
string DataProviderSQL(dp)
Input
Parameter Description Type Required
dp The data provider Data provider Yes
Notes
You must enclose the name of the data provider in square brackets.
Examples
DataProviderSQL([Query 1]) returns SELECT country.country_name FROM country if the data provider SQL is SELECT country.country_name FROM country.
SAP BusinessObjects Web Intelligence User's GuideAnalyzing data PUBLIC 515
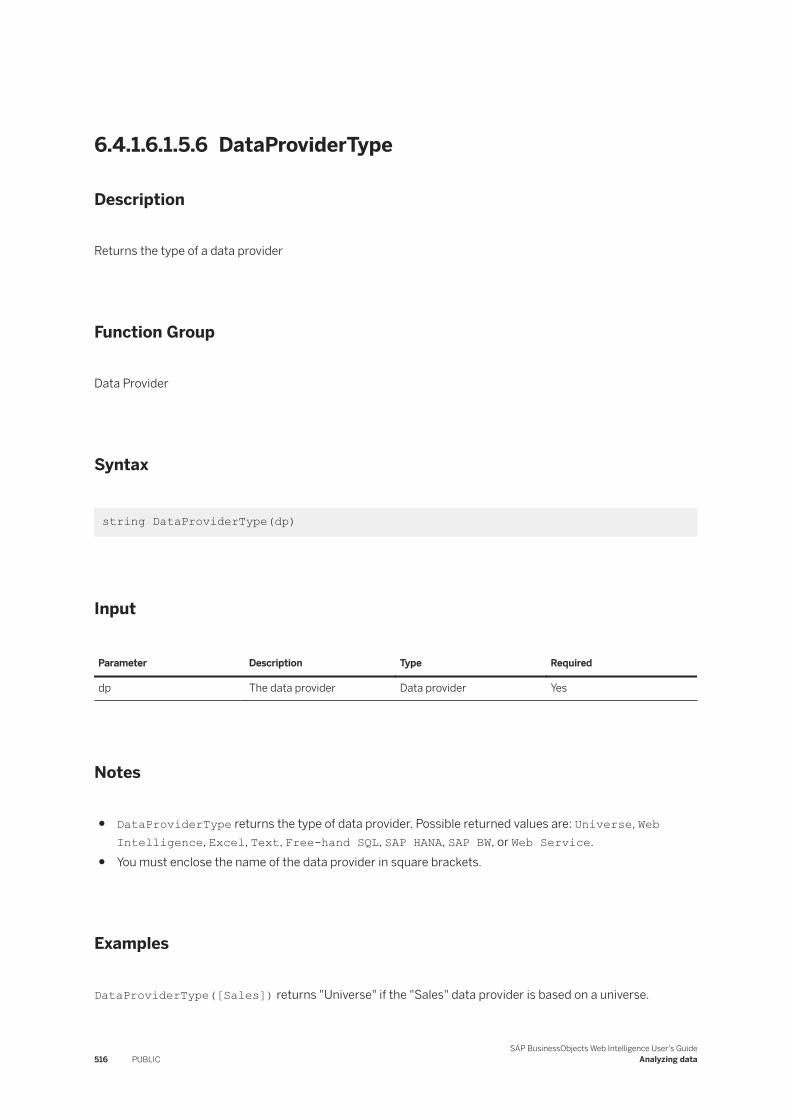
6.4.1.6.1.5.6 DataProviderType
Description
Returns the type of a data provider
Function Group
Data Provider
Syntax
string DataProviderType(dp)
Input
Parameter Description Type Required
dp The data provider Data provider Yes
Notes
● DataProviderType returns the type of data provider. Possible returned values are: Universe, Web Intelligence, Excel, Text, Free-hand SQL, SAP HANA, SAP BW, or Web Service.
● You must enclose the name of the data provider in square brackets.
Examples
DataProviderType([Sales]) returns "Universe" if the "Sales" data provider is based on a universe.
516 PUBLICSAP BusinessObjects Web Intelligence User's Guide
Analyzing data
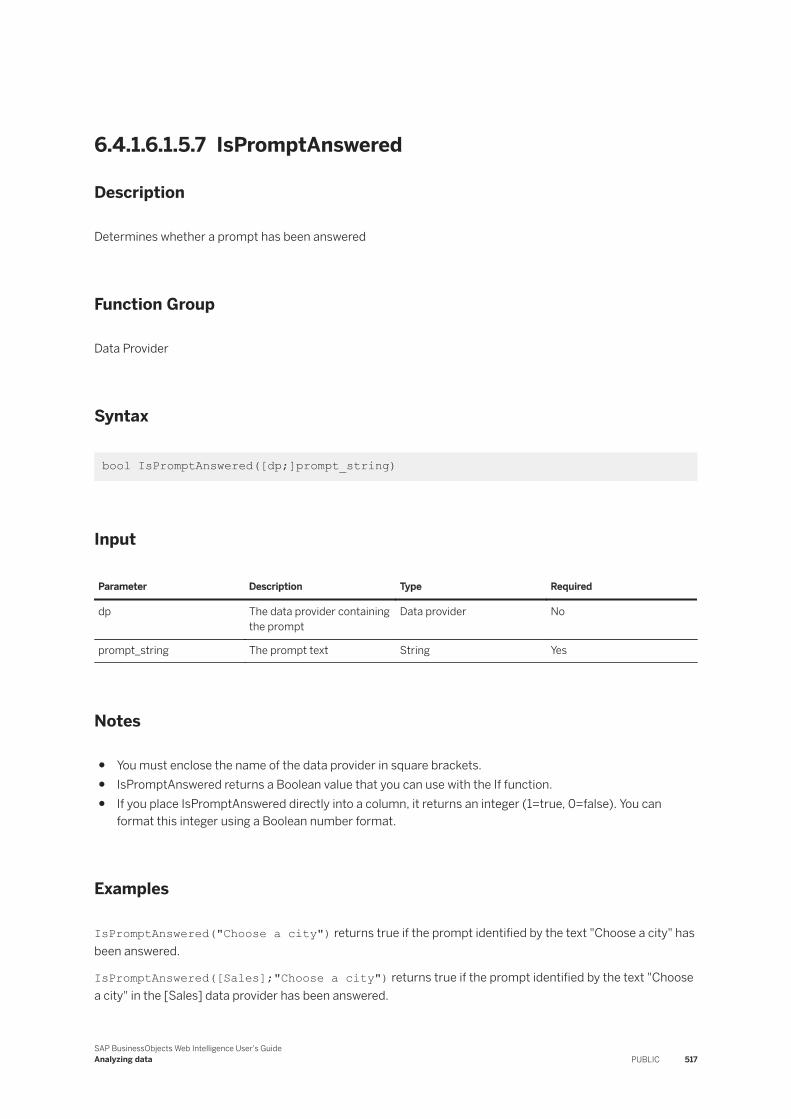
6.4.1.6.1.5.7 IsPromptAnswered
Description
Determines whether a prompt has been answered
Function Group
Data Provider
Syntax
bool IsPromptAnswered([dp;]prompt_string)
Input
Parameter Description Type Required
dp The data provider containing the prompt
Data provider No
prompt_string The prompt text String Yes
Notes
● You must enclose the name of the data provider in square brackets.● IsPromptAnswered returns a Boolean value that you can use with the If function.● If you place IsPromptAnswered directly into a column, it returns an integer (1=true, 0=false). You can
format this integer using a Boolean number format.
Examples
IsPromptAnswered("Choose a city") returns true if the prompt identified by the text "Choose a city" has been answered.
IsPromptAnswered([Sales];"Choose a city") returns true if the prompt identified by the text "Choose a city" in the [Sales] data provider has been answered.
SAP BusinessObjects Web Intelligence User's GuideAnalyzing data PUBLIC 517
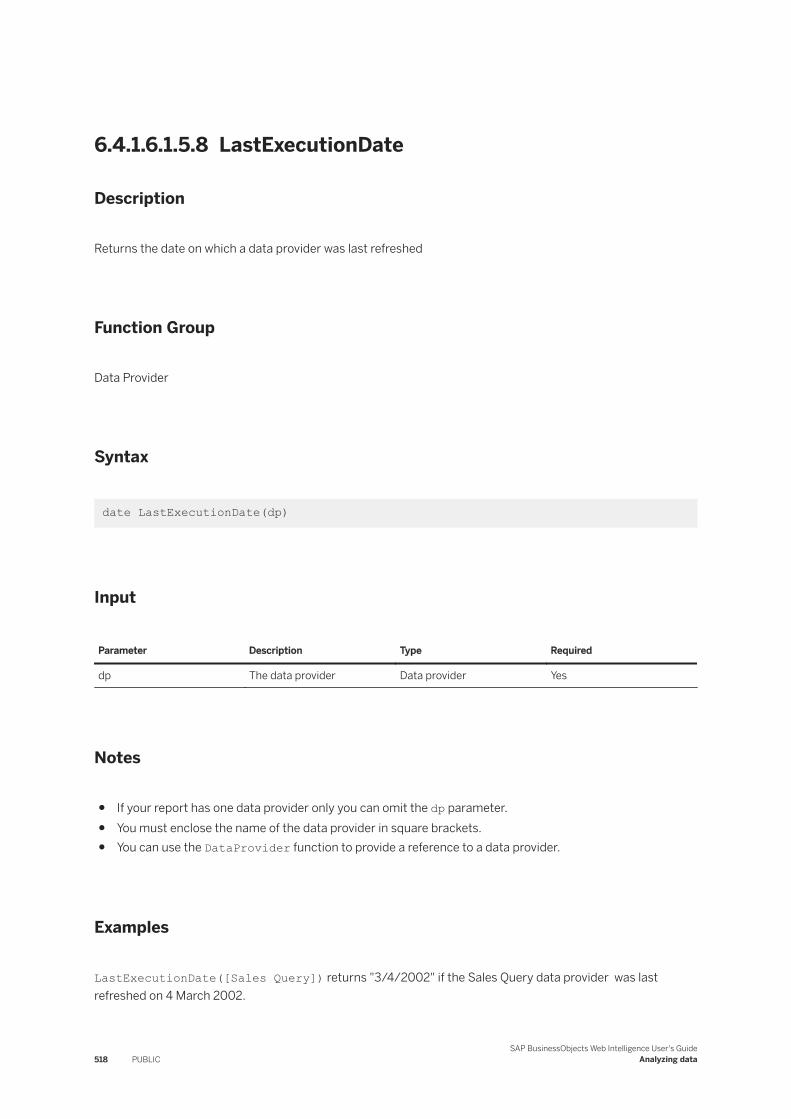
6.4.1.6.1.5.8 LastExecutionDate
Description
Returns the date on which a data provider was last refreshed
Function Group
Data Provider
Syntax
date LastExecutionDate(dp)
Input
Parameter Description Type Required
dp The data provider Data provider Yes
Notes
● If your report has one data provider only you can omit the dp parameter.● You must enclose the name of the data provider in square brackets.● You can use the DataProvider function to provide a reference to a data provider.
Examples
LastExecutionDate([Sales Query]) returns "3/4/2002" if the Sales Query data provider was last refreshed on 4 March 2002.
518 PUBLICSAP BusinessObjects Web Intelligence User's Guide
Analyzing data
Related Information
DataProvider [page 512]
6.4.1.6.1.5.9 LastExecutionDuration
Description
Returns the time in seconds taken by the last refresh of a data provider
Function Group
Data Provider
Syntax
num LastExecutionDuration(dp)
Input
Parameter Description Type Required
dp The data provider Data provider Yes
Notes
You must enclose the name of the data provider in square brackets.
Examples
LastExecutionDuration([Sales]) returns 3 if the "Sales" data provider took 3 second to return its data the last time it was run.
SAP BusinessObjects Web Intelligence User's GuideAnalyzing data PUBLIC 519
6.4.1.6.1.5.10 LastExecutionTime
Description
Returns the time at which a data provider was last refreshed
Function Group
Data Provider
Syntax
time LastExecutionTime(dp)
Input
Parameter Description Type Required
dp The data provider Data provider Yes
Notes
● If your report has one data provider only you can omit the dp parameter.● You can use the DataProvider function to provide a reference to a data provider.● You must enclose the name of the data provider in square brackets.
Examples
LastExecutionTime([Sales Query]) returns "2:48:00 PM" if the Sales Query data provider was last refreshed at 2:48:00 PM.
520 PUBLICSAP BusinessObjects Web Intelligence User's Guide
Analyzing data
Related Information
DataProvider [page 512]
6.4.1.6.1.5.11 NumberOfColumns
Description
Returns the number of columns in a data provider
Function Group
Data Provider
Syntax
int NumberOfColumns(dp)
Input
Parameter Description Type Required
dp The data provider Data provider Yes
Example
NumberOfColumns([Query 1]) returns 5 if the "Query 1" data provider has 5 rows.
SAP BusinessObjects Web Intelligence User's GuideAnalyzing data PUBLIC 521
6.4.1.6.1.5.12 NumberOfDataProviders
Description
Returns the number of data providers in a report
Function Group
Data Provider
Syntax
int NumberOfDataProviders()
Examples
NumberOfDataProviders() returns 2 if the report has two data providers.
6.4.1.6.1.5.13 NumberOfRows
Description
Returns the number of rows in a data provider
Function Group
Data Provider
Syntax
int NumberOfRows(dp)
522 PUBLICSAP BusinessObjects Web Intelligence User's Guide
Analyzing data
Input
Parameter Description Type Required
dp The data provider Data provider Yes
Notes
● You must enclose the name of the data provider in square brackets.● You can use the DataProvider function to provide a reference to a data provider.
Examples
NumberOfRows([Query 1]) returns 10 if the "Query 1" data provider has 10 rows.
Related Information
DataProvider [page 512]
6.4.1.6.1.5.14 RefValueDate
Description
Returns the date of the reference data used for data tracking
Function Group
Data Provider
Syntax
date RefValueDate()
SAP BusinessObjects Web Intelligence User's GuideAnalyzing data PUBLIC 523
Examples
RefValueDate() returns 15 December 2008 if the reference date is 15 December 2008.
6.4.1.6.1.5.15 RefValueUserReponse
Description
Returns the response to a prompt when the reference data was the current data
Function Group
Data Provider
Syntax
string RefValueUserResponse([dp;]prompt_string[;Index])
Input
Parameter Description Type Required
dp The data provider Data provider No
prompt_string The prompt text String Yes
Index Tells the function to return the database primary keys of the prompt values
Keyword No
Notes
● The function returns an empty string if data tracking is not activated.● You must enclose the name of the data provider in square brackets.● You can use the DataProvider function to provide a reference to a data provider.● If you selected more than one value in answer to a prompt, the function returns a string consisting of a list
of values (or primary keys if the Index operator is specified) separated by semi-colons.
524 PUBLICSAP BusinessObjects Web Intelligence User's Guide
Analyzing data

Examples
RefValueUserResponse( "Which city?" ) returns "Los Angeles" if you entered "Los Angeles" in the "Which City?" prompt at the time when the reference data was the current data.
RefValueUserResponse([Sales Query];"Which city?") returns "Los Angeles," if you entered "Los Angeles" in the "Which City?" prompt in the "Sales Query" data provider at the time when the reference data was the current data.
6.4.1.6.1.5.16 ServerValue
Description
Returns the database value of a measure
Function Group
Data Provider
Syntax
num ServerValue([measure])
Input
Parameter Description Type Required
measure Any measure Measure Yes
Notes
● ServerValue ignores all local filters applied to dimensions or hierarchies used to calculate the measure
SAP BusinessObjects Web Intelligence User's GuideAnalyzing data PUBLIC 525
Example
ServerValue([Internet Sales Amount] returns the database value of the measure [Internet Sales Amount]
6.4.1.6.1.5.17 UniverseName
Description
Returns the name of the universe or file name on which a data provider is based for universes, text, Excel and FHSQL data sources.
Function Group
Data Provider
Syntax
string UniverseName(dp[,string])
string UniverseName(obj[,string])
Input
Parameter Description Type Required
dp The data provider Data provider Yes
Notes
● For SAP BW and SAP HANA data sources the functions returns the view name. The opt can be used:○ key: to return the view’s technical name○ caption: to return the view’s caption○ full: to return the view’s full path (package + key). For exemple, "sales.sales::revenue" for SAP
HANA or "xxx" for SAP BW
526 PUBLICSAP BusinessObjects Web Intelligence User's Guide
Analyzing data
● The value of dp in the formula is automatically updated if the name of the data provider changes. If the data provider is renamed to "Q1", the formula becomes UniverseName([Q1]).
● You must enclose the name of the data provider in square brackets.● You can use the DataProvider function to provide a reference to a data provider.
Examples
UniverseName([Query 1]) returns "eFashion" if the [Query 1] data provider is based on the eFashion universe.
Related Information
DataProvider [page 512]
6.4.1.6.1.5.18 UserResponse
Description
Returns the response to a prompt
Function Group
Data Provider
Syntax
string UserResponse([dp;]prompt_string[;Index])
Input
Parameter Description Type Required
dp The data provider Data provider No
SAP BusinessObjects Web Intelligence User's GuideAnalyzing data PUBLIC 527
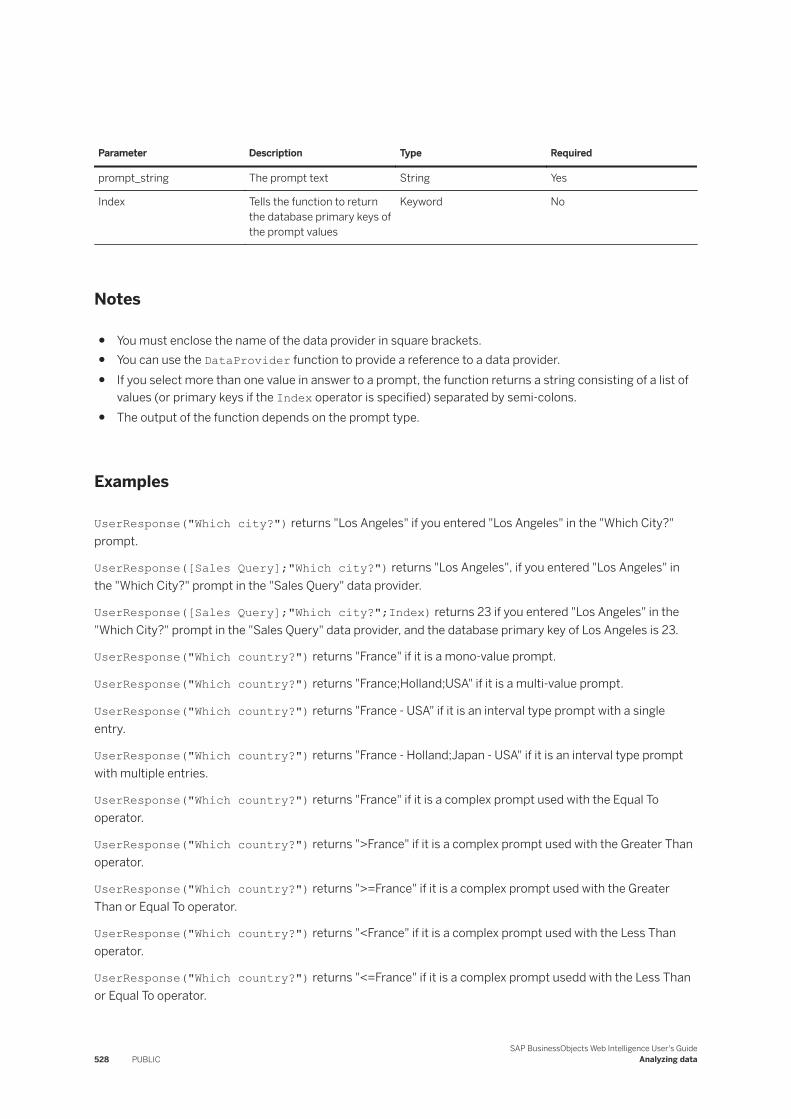
Parameter Description Type Required
prompt_string The prompt text String Yes
Index Tells the function to return the database primary keys of the prompt values
Keyword No
Notes
● You must enclose the name of the data provider in square brackets.● You can use the DataProvider function to provide a reference to a data provider.● If you select more than one value in answer to a prompt, the function returns a string consisting of a list of
values (or primary keys if the Index operator is specified) separated by semi-colons.● The output of the function depends on the prompt type.
Examples
UserResponse("Which city?") returns "Los Angeles" if you entered "Los Angeles" in the "Which City?" prompt.
UserResponse([Sales Query];"Which city?") returns "Los Angeles", if you entered "Los Angeles" in the "Which City?" prompt in the "Sales Query" data provider.
UserResponse([Sales Query];"Which city?";Index) returns 23 if you entered "Los Angeles" in the "Which City?" prompt in the "Sales Query" data provider, and the database primary key of Los Angeles is 23.
UserResponse("Which country?") returns "France" if it is a mono-value prompt.
UserResponse("Which country?") returns "France;Holland;USA" if it is a multi-value prompt.
UserResponse("Which country?") returns "France - USA" if it is an interval type prompt with a single entry.
UserResponse("Which country?") returns "France - Holland;Japan - USA" if it is an interval type prompt with multiple entries.
UserResponse("Which country?") returns "France" if it is a complex prompt used with the Equal To operator.
UserResponse("Which country?") returns ">France" if it is a complex prompt used with the Greater Than operator.
UserResponse("Which country?") returns ">=France" if it is a complex prompt used with the Greater Than or Equal To operator.
UserResponse("Which country?") returns "<France" if it is a complex prompt used with the Less Than operator.
UserResponse("Which country?") returns "<=France" if it is a complex prompt usedd with the Less Than or Equal To operator.
528 PUBLICSAP BusinessObjects Web Intelligence User's Guide
Analyzing data
UserResponse("Which country?") returns "France - USA" if it is a complex prompt used with the Between operator.
UserResponse("Which country?") returns "!France" if it is a complex prompt used with the Not Equal To operator.
UserResponse("Which country?") returns "Austria;France - Holland;>Japan" if it is a complex prompt with multiple entries.
6.4.1.6.1.6 Document functions
6.4.1.6.1.6.1 DocumentAuthor
Description
Returns the InfoView logon of the document creator
Function Group
Document
Syntax
string DocumentAuthor()
Examples
DocumentAuthor() returns "gkn" if the document author's login is "gkn".
6.4.1.6.1.6.2 DocumentCreationDate
Description
Returns the date on which a document was created
SAP BusinessObjects Web Intelligence User's GuideAnalyzing data PUBLIC 529
Function Group
Document
Syntax
date DocumentCreationDate()
Examples
DocumentCreationDate() returns 15 December 2008 if the document was created on 15 December 2008.
6.4.1.6.1.6.3 DocumentCreationTime
Description
Returns the time when a document was created
Function Group
Document
Syntax
time DocumentCreationTime()
Examples
DocumentCreationTime() returns 11:15 if the document was created at 11:15.
530 PUBLICSAP BusinessObjects Web Intelligence User's Guide
Analyzing data
6.4.1.6.1.6.4 DocumentDate
Description
Returns the date on which a document was last saved
Function Group
Document
Syntax
date DocumentDate()
Examples
DocumentDate() returns 8 August 2005 if the document was last saved on 8 August 2005.
6.4.1.6.1.6.5 DocumentDescription
Description
Returns the document description in the user's preferred viewing locale.
Function Group
Document
SAP BusinessObjects Web Intelligence User's GuideAnalyzing data PUBLIC 531
Syntax
string DocumentDescription()
Example
DocumentDescription() "Sales figures analysis of 2019's four quarters" returns if the document description is "Sales figures analysis of 2019's four quarters".
6.4.1.6.1.6.6 DocumentName
Description
Returns the document name
Function Group
Document
Syntax
string DocumentName()
Examples
DocumentName() returns "Sales Report" if the document is called "Sales Report".
532 PUBLICSAP BusinessObjects Web Intelligence User's Guide
Analyzing data
6.4.1.6.1.6.7 DocumentOwner
Description
Returns the BI launch pad logon/user name of the owner of the document (the last person who saved the document). (To return the original author/creator of the document, use the DocumentAuthor function.)
Function Group
Document
Syntax
string DocumentOwner()
Examples
DocumentOwner() returns "gkn" if the last person who saved the document has the user name or login "gkn".
6.4.1.6.1.6.8 DocumentParentFolder
Description
Returns the name of the folder that contains the document.
Function Group
Document
SAP BusinessObjects Web Intelligence User's GuideAnalyzing data PUBLIC 533
Syntax
string DocumentParentFolder()
Notes
● This function returns the folder containing the current document where this function is used.● If used in an instance, this function returns the folder containing the scheduled document.● If the document is stored in a user's Inbox or Favorites, then it returns this user's name.
Examples
● DocumentParentFolder() returns "Root Folder" if it is used in a document located in the Public Folders.
● DocumentParentFolder() returns "Web Intelligence Samples" for a document stored in this folder.
● DocumentParentFolder() returns "userA" if the document is located in the userA’s Favorites or Inbox folder.
● DocumentParentFolder() returns "ZZ_Charting" if it's an instance of this document.
6.4.1.6.1.6.9 DocumentPartiallyRefreshed
Description
Determines whether a document is partially refreshed
Function Group
Document
Syntax
bool DocumentPartiallyRefreshed()
534 PUBLICSAP BusinessObjects Web Intelligence User's Guide
Analyzing data
Notes
DocumentPartiallyRefreshed returns a boolean value that you can use in the If function.
Examples
DocumentPartiallyRefreshed() returns True if the document is partially refreshed.
6.4.1.6.1.6.10 DocumentPath
Description
Returns the document path. In a document's instance, returns the document's path and its name.
Function Group
Document
Syntax
string DocumentPath()
Notes
For a document, the path is suffixed with "/". This is not the case for a document's instance.
Examples
● DocumentPath() returns "Public Folders/Web Intelligence Samples/" for a document stored in this folder.
SAP BusinessObjects Web Intelligence User's GuideAnalyzing data PUBLIC 535
● DocumentPath() returns "Public Folders/Web Intelligence Samples/ZZ_Charting" if it's used in an instance of this scheduled document.
6.4.1.6.1.6.11 DocumentTime
Description
Returns the time when a document was last saved
Function Group
Document
Syntax
time DocumentTime()
Notes
The format of the returned time varies depending on the cell format.
Example
DocumentTime() returns 15:45 if the document was last saved at 15:45.
6.4.1.6.1.6.12 DrillFilters
Description
Returns the results of drill filters applied to a document or object in an declared report in drill mode. You can declare a different report within the document. If you do not declare a report, the current active report is used.
536 PUBLICSAP BusinessObjects Web Intelligence User's Guide
Analyzing data
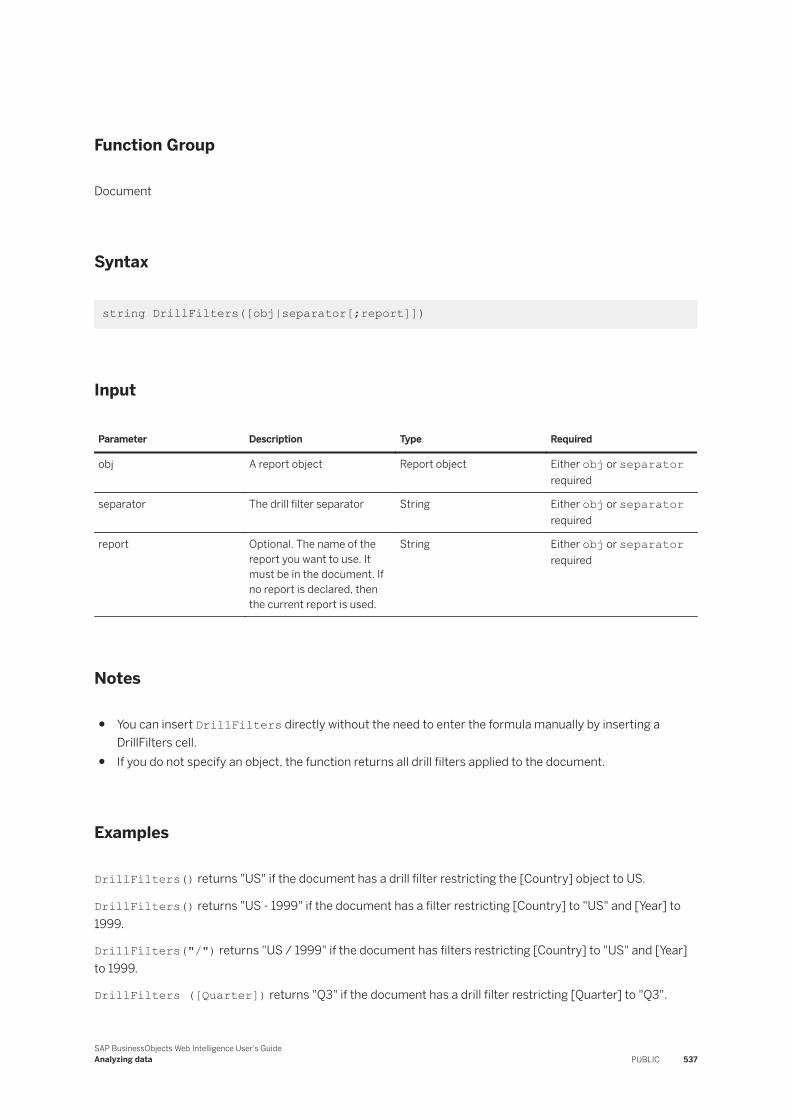
Function Group
Document
Syntax
string DrillFilters([obj|separator[;report]])
Input
Parameter Description Type Required
obj A report object Report object Either obj or separator required
separator The drill filter separator String Either obj or separator required
report Optional. The name of the report you want to use. It must be in the document. If no report is declared, then the current report is used.
String Either obj or separator required
Notes
● You can insert DrillFilters directly without the need to enter the formula manually by inserting a DrillFilters cell.
● If you do not specify an object, the function returns all drill filters applied to the document.
Examples
DrillFilters() returns "US" if the document has a drill filter restricting the [Country] object to US.
DrillFilters() returns "US - 1999" if the document has a filter restricting [Country] to "US" and [Year] to 1999.
DrillFilters("/") returns "US / 1999" if the document has filters restricting [Country] to "US" and [Year] to 1999.
DrillFilters ([Quarter]) returns "Q3" if the document has a drill filter restricting [Quarter] to "Q3".
SAP BusinessObjects Web Intelligence User's GuideAnalyzing data PUBLIC 537
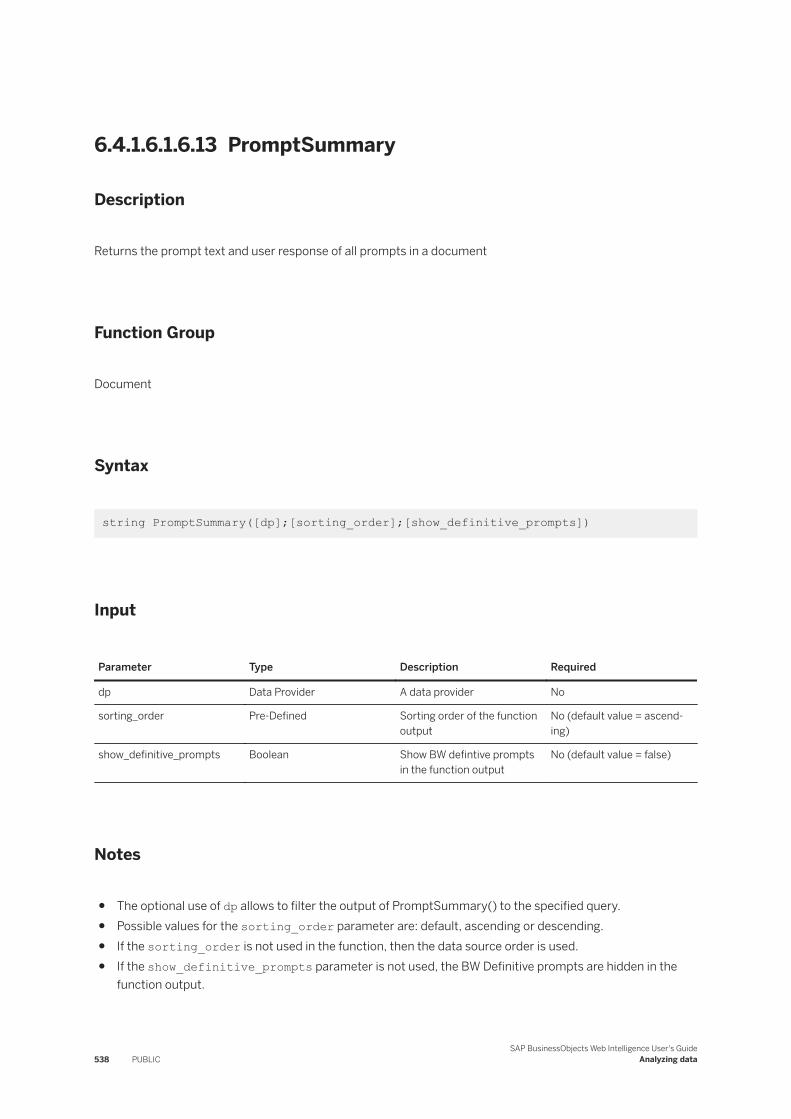
6.4.1.6.1.6.13 PromptSummary
Description
Returns the prompt text and user response of all prompts in a document
Function Group
Document
Syntax
string PromptSummary([dp];[sorting_order];[show_definitive_prompts])
Input
Parameter Type Description Required
dp Data Provider A data provider No
sorting_order Pre-Defined Sorting order of the function output
No (default value = ascending)
show_definitive_prompts Boolean Show BW defintive prompts in the function output
No (default value = false)
Notes
● The optional use of dp allows to filter the output of PromptSummary() to the specified query.● Possible values for the sorting_order parameter are: default, ascending or descending.● If the sorting_order is not used in the function, then the data source order is used.● If the show_definitive_prompts parameter is not used, the BW Definitive prompts are hidden in the
function output.
538 PUBLICSAP BusinessObjects Web Intelligence User's Guide
Analyzing data
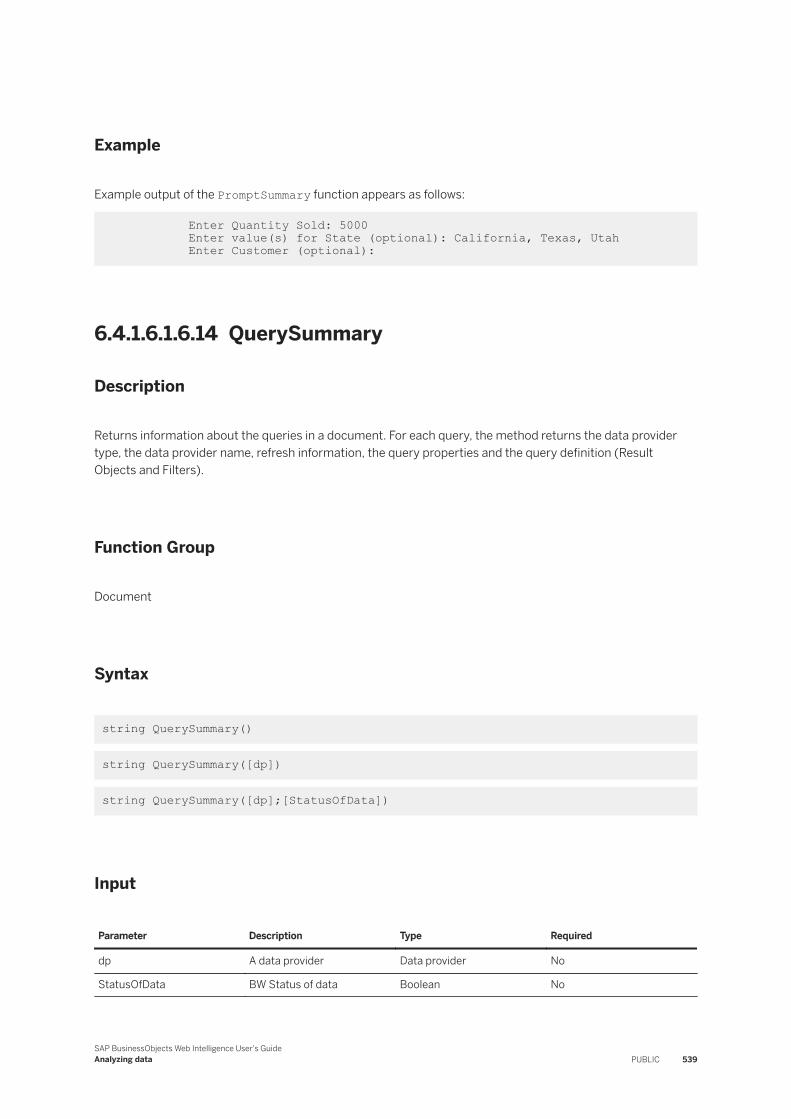
Example
Example output of the PromptSummary function appears as follows:
Enter Quantity Sold: 5000 Enter value(s) for State (optional): California, Texas, Utah Enter Customer (optional):
6.4.1.6.1.6.14 QuerySummary
Description
Returns information about the queries in a document. For each query, the method returns the data provider type, the data provider name, refresh information, the query properties and the query definition (Result Objects and Filters).
Function Group
Document
Syntax
string QuerySummary()
string QuerySummary([dp])
string QuerySummary([dp];[StatusOfData])
Input
Parameter Description Type Required
dp A data provider Data provider No
StatusOfData BW Status of data Boolean No
SAP BusinessObjects Web Intelligence User's GuideAnalyzing data PUBLIC 539
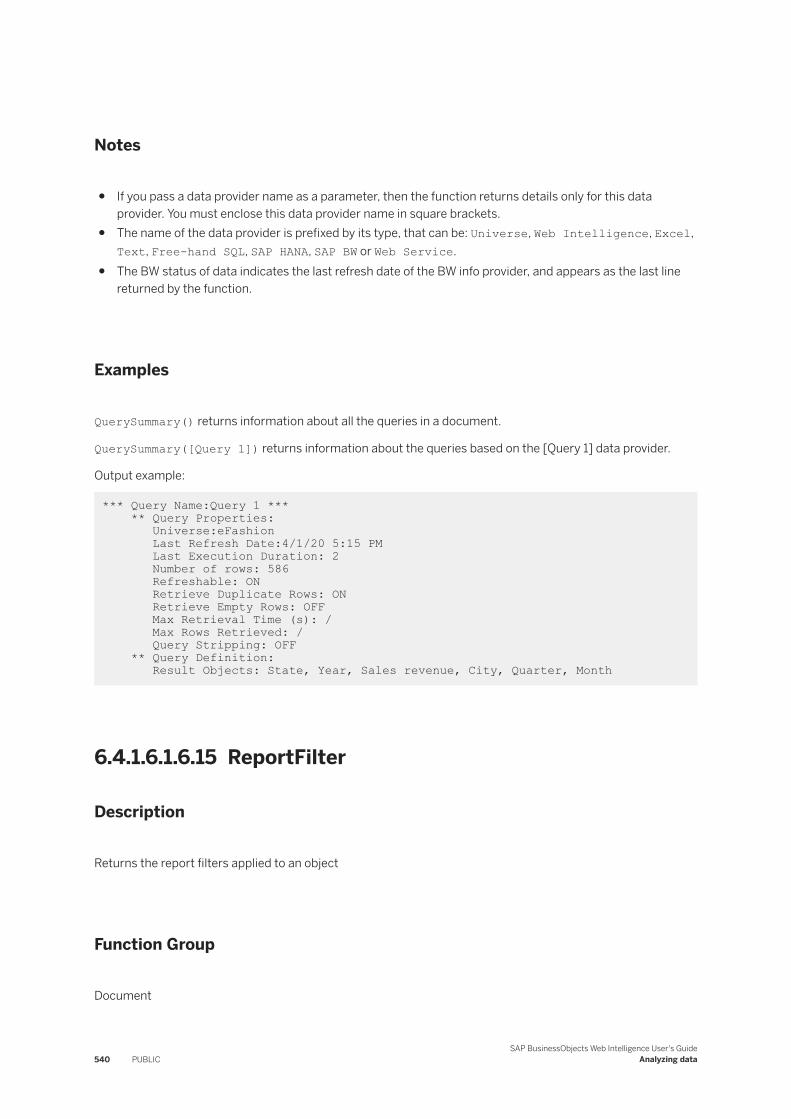
Notes
● If you pass a data provider name as a parameter, then the function returns details only for this data provider. You must enclose this data provider name in square brackets.
● The name of the data provider is prefixed by its type, that can be: Universe, Web Intelligence, Excel, Text, Free-hand SQL, SAP HANA, SAP BW or Web Service.
● The BW status of data indicates the last refresh date of the BW info provider, and appears as the last line returned by the function.
Examples
QuerySummary() returns information about all the queries in a document.
QuerySummary([Query 1]) returns information about the queries based on the [Query 1] data provider.
Output example:
*** Query Name:Query 1 *** ** Query Properties: Universe:eFashion Last Refresh Date:4/1/20 5:15 PM Last Execution Duration: 2 Number of rows: 586 Refreshable: ON Retrieve Duplicate Rows: ON Retrieve Empty Rows: OFF Max Retrieval Time (s): / Max Rows Retrieved: / Query Stripping: OFF ** Query Definition: Result Objects: State, Year, Sales revenue, City, Quarter, Month
6.4.1.6.1.6.15 ReportFilter
Description
Returns the report filters applied to an object
Function Group
Document
540 PUBLICSAP BusinessObjects Web Intelligence User's Guide
Analyzing data
Syntax
string ReportFilter(obj)
Input
Parameter Description Type Required
obj A report object Report object Yes
Examples
ReportFilter([Country]) returns "US" if there is a report filter on the Country object that restricts it to "US".
6.4.1.6.1.6.16 ReportFilterSummary
Description
Returns a summary of the report filters in a document or report
Function Group
Document
Syntax
string ReportFilterSummary(report_name)
SAP BusinessObjects Web Intelligence User's GuideAnalyzing data PUBLIC 541
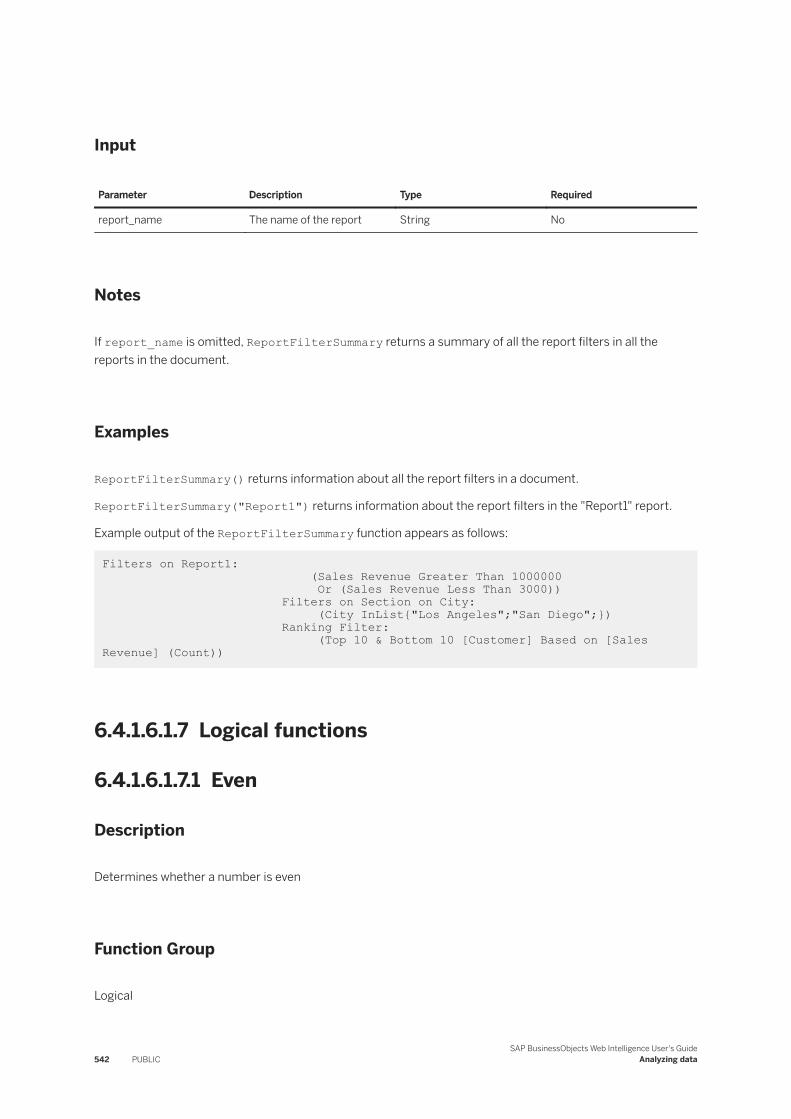
Input
Parameter Description Type Required
report_name The name of the report String No
Notes
If report_name is omitted, ReportFilterSummary returns a summary of all the report filters in all the reports in the document.
Examples
ReportFilterSummary() returns information about all the report filters in a document.
ReportFilterSummary("Report1") returns information about the report filters in the "Report1" report.
Example output of the ReportFilterSummary function appears as follows:
Filters on Report1: (Sales Revenue Greater Than 1000000 Or (Sales Revenue Less Than 3000)) Filters on Section on City: (City InList{"Los Angeles";"San Diego";}) Ranking Filter: (Top 10 & Bottom 10 [Customer] Based on [Sales Revenue] (Count))
6.4.1.6.1.7 Logical functions
6.4.1.6.1.7.1 Even
Description
Determines whether a number is even
Function Group
Logical
542 PUBLICSAP BusinessObjects Web Intelligence User's Guide
Analyzing data
Syntax
bool Even(number)
Input
Parameter Description Type Required
number Any number Number Yes
Notes
● Even returns a boolean value that you can use in the If function.● If you place Even directly into a column, it returns an integer (1=true; 0=false). You can format this integer
using a Boolean number format.● Even returns True for every even integer, and False for every decimal number.
Examples
Even(4) returns True.
Even(3) returns False.
Even(23.2) returns False.
Even(-4) returns True.
Even(-2.2) returns False.
6.4.1.6.1.7.2 IsDate
Description
Determines whether a value is a date
SAP BusinessObjects Web Intelligence User's GuideAnalyzing data PUBLIC 543
Function Group
Logical
Syntax
bool IsDate(obj)
Input
Parameter Description Type Required
obj Any report object Report object Yes
Notes
● IsDate returns a boolean value that you can use in the If function.● If you place IsDate directly into a column, it returns an integer (1=true; 0=false). You can format this
integer using a Boolean number format.
Examples
IsDate([Reservation Date]) returns True if [Reservation Date] is a date.
Or one of the following to return "Date" if [Reservation Date] is a date:
● If(IsDate([Reservation Date])) Then "Date" Else "Not a date"● If IsDate([Reservation Date]) Then "Date" Else "Not a date"
Related Information
If...Then...Else [page 611]
544 PUBLICSAP BusinessObjects Web Intelligence User's Guide
Analyzing data
6.4.1.6.1.7.3 IsError
Description
Determines whether an object returns an error
Function Group
Logical
Syntax
bool IsError(obj)
Input
Parameter Description Type Required
obj Any report object Report object Yes
Notes
● IsError returns a boolean value that you can use in the If function.● If you place IsError directly into a column, it returns an integer (1=true; 0=false). You can format this
integer using a Boolean number format.
Examples
IsError([Revenue]) returns False if the [Revenue] variable does not return an error.
IsError([Average Guests]) returns True if the [Average Guests] variable returns a division by zero (#DIV/0) error.
If IsError([Average Guests]) Then "Error" Else "No error" returns "Error" if the [Average Guests] variable returns a division by zero (#DIV/0) error.
SAP BusinessObjects Web Intelligence User's GuideAnalyzing data PUBLIC 545
Related Information
If...Then...Else [page 611]
6.4.1.6.1.7.4 IsLogical
Description
Determines whether a value is boolean
Function Group
Logical
Syntax
bool IsLogical(obj)
Input
Parameter Description Type Required
obj Any report object Report object Yes
Notes
● IsLogical returns a boolean value that you can use in the If function.● If you place IsLogical directly into a column, it returns an integer (1=true; 0=false). You can format this
integer using a Boolean number format.
Examples
IsLogical(IsString([Country])) returns True.
546 PUBLICSAP BusinessObjects Web Intelligence User's Guide
Analyzing data
IsLogical([Country]) returns False if country returns any data type other than boolean.
If IsLogical(IsDate([Country])) Then "Boolean" Else "Not boolean" returns "Boolean".
Related Information
If...Then...Else [page 611]
6.4.1.6.1.7.5 IsNull
Description
Determines whether a value is null
Function Group
Logical
Syntax
bool IsNull(obj)
Input
Parameter Description Type Required
obj Any report object Report object Yes
Notes
● IsNull returns a boolean value that you can use in the If function.● If you place IsNull directly into a column, it returns an integer (1=true; 0=false). You can format this
integer using a Boolean number format.
SAP BusinessObjects Web Intelligence User's GuideAnalyzing data PUBLIC 547
Examples
IsNull([Revenue]) returns False if the [Revenue] variable is not null.
IsNull([Average Guests]) returns True if the [Average Guests] variable is null.
Related Information
If...Then...Else [page 611]
6.4.1.6.1.7.6 IsNumber
Description
Determines whether a value is a number
Function Group
Logical
Syntax
bool IsNumber(obj)
Input
Parameter Description Type Required
obj Any report object Report object Yes
Notes
● IsNumber returns a boolean value that you can use in the If function.
548 PUBLICSAP BusinessObjects Web Intelligence User's Guide
Analyzing data
● If you place IsNumber directly into a column, it returns an integer (1=true; 0=false). You can format this integer using a Boolean number format.
Examples
IsNumber([Revenue]) returns True if the [Revenue] variable is a number.
IsNumber([Customer Name]) returns False if the [Customer Name] variable is not a number.
If IsNumber([Customer Name]) Then "Number" Else "Not a number" returns "Not a number" if the [Customer Name] variable is not a number.
Related Information
If...Then...Else [page 611]
6.4.1.6.1.7.7 IsString
Description
Determines whether a value is a string
Function Group
Logical
Syntax
bool IsString(obj)
SAP BusinessObjects Web Intelligence User's GuideAnalyzing data PUBLIC 549
Input
Parameter Description Type Required
obj Any report object Report object Yes
Notes
● IsString returns a boolean value that you can use in the If function.● If you place IsString directly into a column, it returns an integer (1=true; 0=false). You can format this
integer using a Boolean number format.
Examples
IsString([Revenue]) returns false if the [Revenue] variable is not a string.
IsString([Customer Name]) returns true if the [Customer Name] variable is a string.
If IsString([Customer Name]) Then "String" Else "Not a string" returns "String" if the [Customer Name] variable is a string.
Related Information
If...Then...Else [page 611]
6.4.1.6.1.7.8 IsTime
Description
Determines whether a variable is a time variable
Function Group
Logical
550 PUBLICSAP BusinessObjects Web Intelligence User's Guide
Analyzing data
Syntax
bool IsTime(obj)
Input
Parameter Description Type Required
obj Any report object Report object Yes
Notes
● IsTime returns a boolean value that you can use in the If function.● If you place IsTime directly into a column, it returns an integer (1=true; 0=false). You can format this
integer using a Boolean number format.
Examples
IsTime([Reservation Time]) returns true if the [Reservation Time] variable is a time variable.
IsTime([Average Guests]) returns false if the [Average Guests] variable is not a time variable.
If IsTime([Average Guests]) Then "Time" Else "Not time" returns "Not time" if the [Average Guests] variable is not a time variable.
Related Information
If...Then...Else [page 611]
6.4.1.6.1.7.9 Odd
Description
Determines whether a number is odd
SAP BusinessObjects Web Intelligence User's GuideAnalyzing data PUBLIC 551
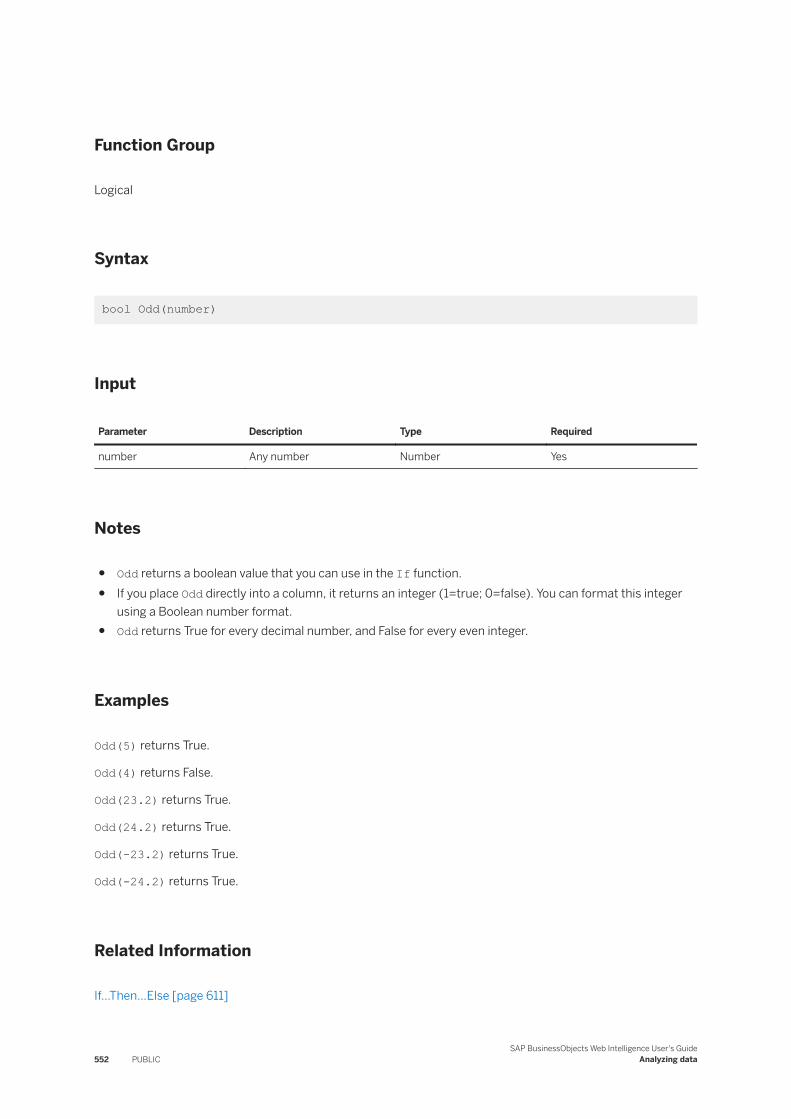
Function Group
Logical
Syntax
bool Odd(number)
Input
Parameter Description Type Required
number Any number Number Yes
Notes
● Odd returns a boolean value that you can use in the If function.● If you place Odd directly into a column, it returns an integer (1=true; 0=false). You can format this integer
using a Boolean number format.● Odd returns True for every decimal number, and False for every even integer.
Examples
Odd(5) returns True.
Odd(4) returns False.
Odd(23.2) returns True.
Odd(24.2) returns True.
Odd(-23.2) returns True.
Odd(-24.2) returns True.
Related Information
If...Then...Else [page 611]
552 PUBLICSAP BusinessObjects Web Intelligence User's Guide
Analyzing data
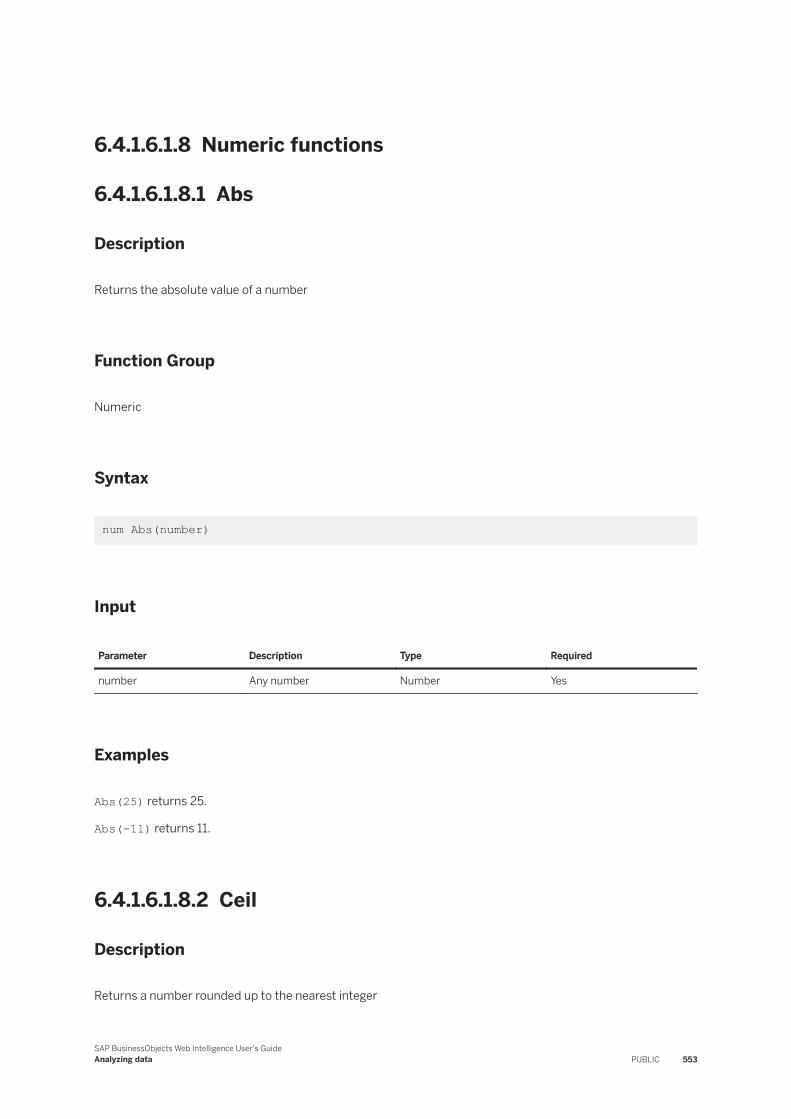
6.4.1.6.1.8 Numeric functions
6.4.1.6.1.8.1 Abs
Description
Returns the absolute value of a number
Function Group
Numeric
Syntax
num Abs(number)
Input
Parameter Description Type Required
number Any number Number Yes
Examples
Abs(25) returns 25.
Abs(-11) returns 11.
6.4.1.6.1.8.2 Ceil
Description
Returns a number rounded up to the nearest integer
SAP BusinessObjects Web Intelligence User's GuideAnalyzing data PUBLIC 553
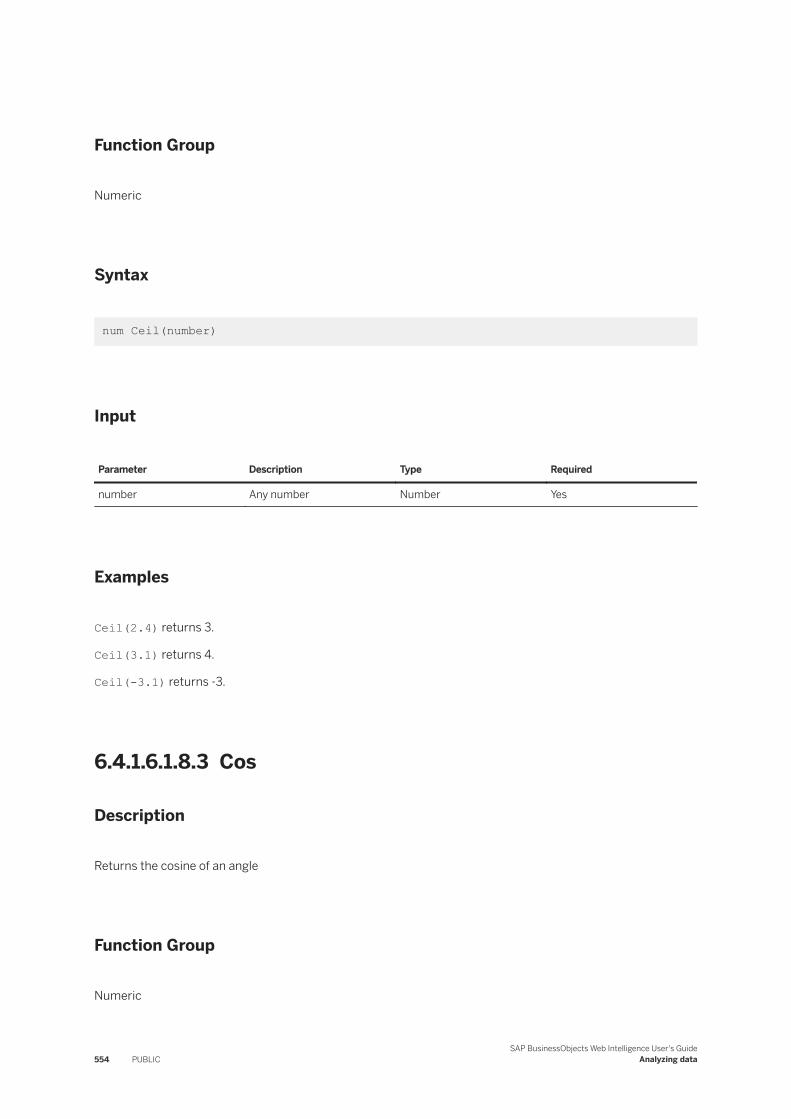
Function Group
Numeric
Syntax
num Ceil(number)
Input
Parameter Description Type Required
number Any number Number Yes
Examples
Ceil(2.4) returns 3.
Ceil(3.1) returns 4.
Ceil(-3.1) returns -3.
6.4.1.6.1.8.3 Cos
Description
Returns the cosine of an angle
Function Group
Numeric
554 PUBLICSAP BusinessObjects Web Intelligence User's Guide
Analyzing data
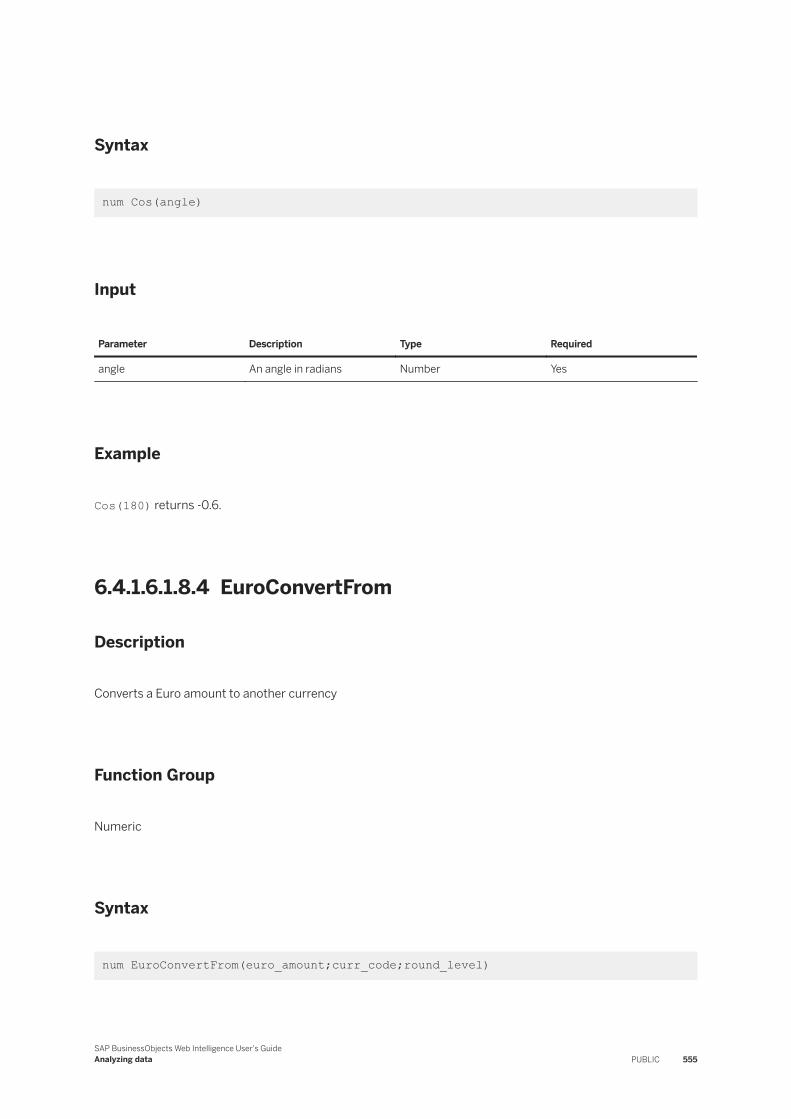
Syntax
num Cos(angle)
Input
Parameter Description Type Required
angle An angle in radians Number Yes
Example
Cos(180) returns -0.6.
6.4.1.6.1.8.4 EuroConvertFrom
Description
Converts a Euro amount to another currency
Function Group
Numeric
Syntax
num EuroConvertFrom(euro_amount;curr_code;round_level)
SAP BusinessObjects Web Intelligence User's GuideAnalyzing data PUBLIC 555
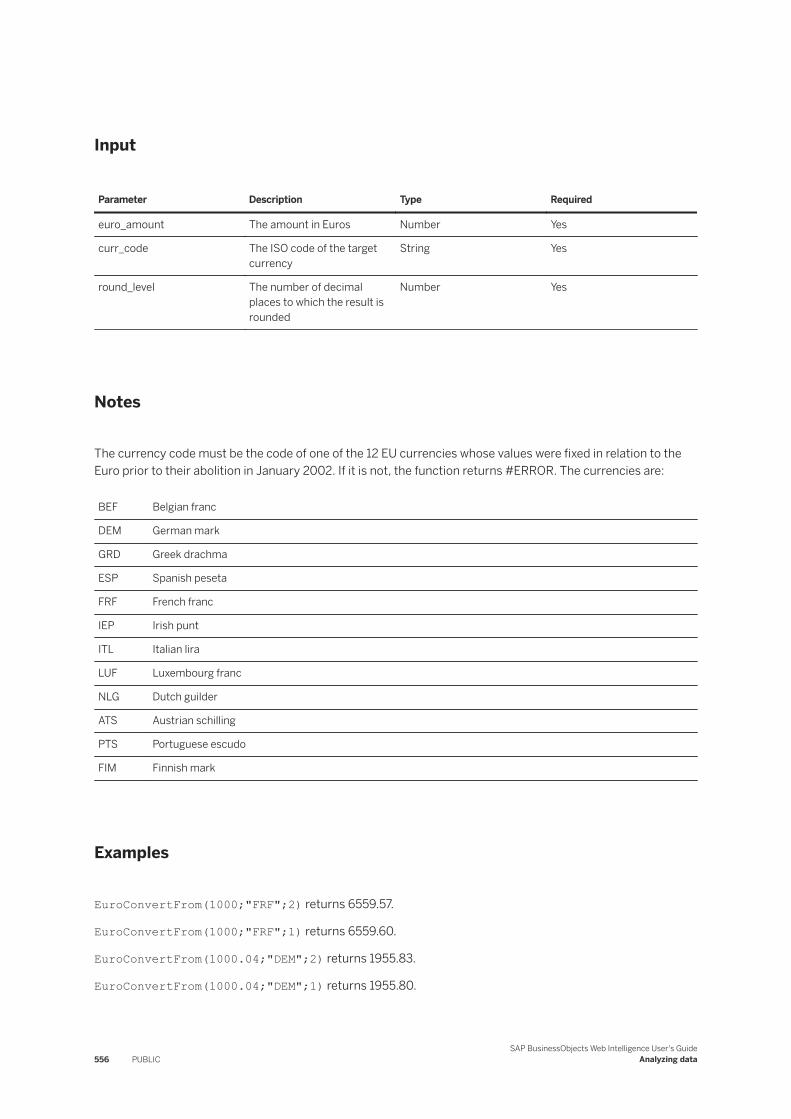
Input
Parameter Description Type Required
euro_amount The amount in Euros Number Yes
curr_code The ISO code of the target currency
String Yes
round_level The number of decimal places to which the result is rounded
Number Yes
Notes
The currency code must be the code of one of the 12 EU currencies whose values were fixed in relation to the Euro prior to their abolition in January 2002. If it is not, the function returns #ERROR. The currencies are:
BEF Belgian franc
DEM German mark
GRD Greek drachma
ESP Spanish peseta
FRF French franc
IEP Irish punt
ITL Italian lira
LUF Luxembourg franc
NLG Dutch guilder
ATS Austrian schilling
PTS Portuguese escudo
FIM Finnish mark
Examples
EuroConvertFrom(1000;"FRF";2) returns 6559.57.
EuroConvertFrom(1000;"FRF";1) returns 6559.60.
EuroConvertFrom(1000.04;"DEM";2) returns 1955.83.
EuroConvertFrom(1000.04;"DEM";1) returns 1955.80.
556 PUBLICSAP BusinessObjects Web Intelligence User's Guide
Analyzing data
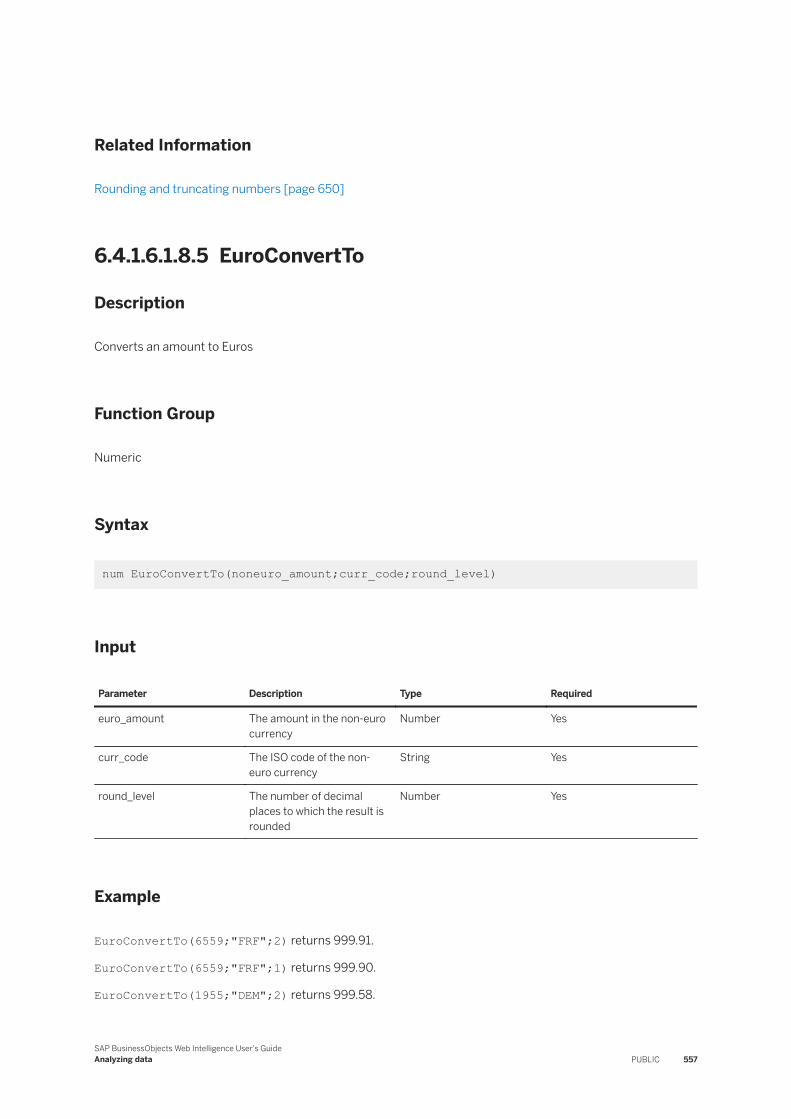
Related Information
Rounding and truncating numbers [page 650]
6.4.1.6.1.8.5 EuroConvertTo
Description
Converts an amount to Euros
Function Group
Numeric
Syntax
num EuroConvertTo(noneuro_amount;curr_code;round_level)
Input
Parameter Description Type Required
euro_amount The amount in the non-euro currency
Number Yes
curr_code The ISO code of the non-euro currency
String Yes
round_level The number of decimal places to which the result is rounded
Number Yes
Example
EuroConvertTo(6559;"FRF";2) returns 999.91.
EuroConvertTo(6559;"FRF";1) returns 999.90.
EuroConvertTo(1955;"DEM";2) returns 999.58.
SAP BusinessObjects Web Intelligence User's GuideAnalyzing data PUBLIC 557
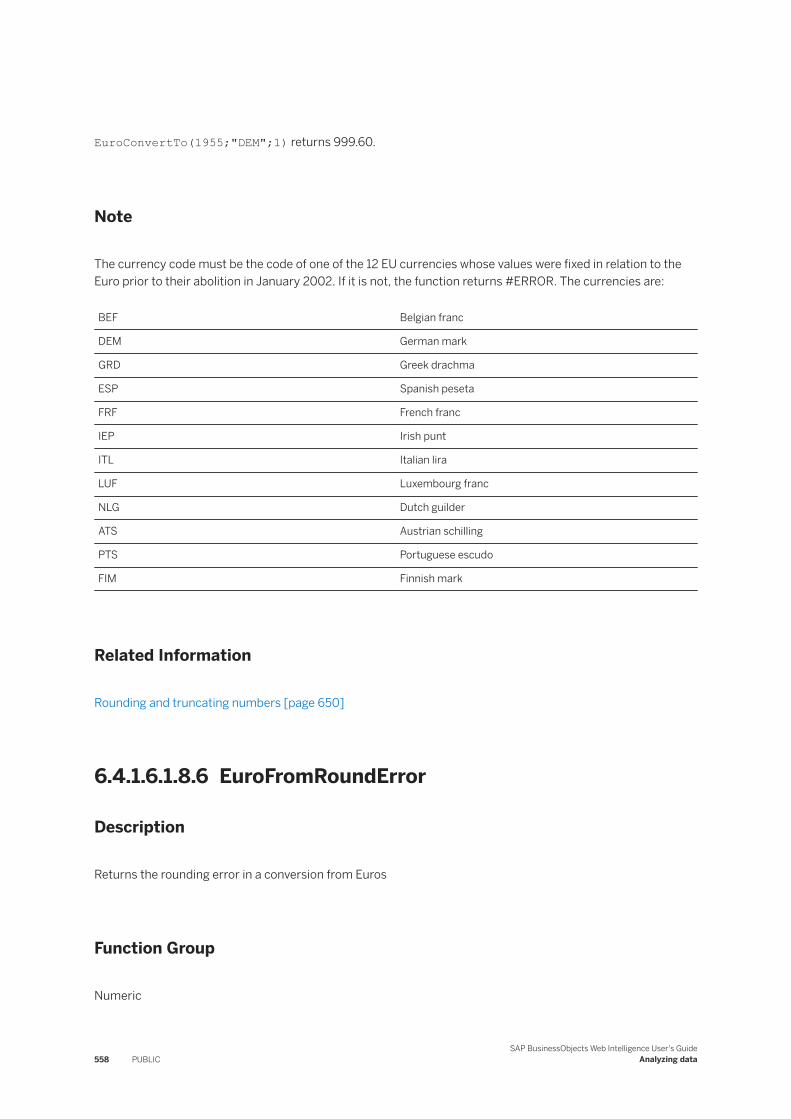
EuroConvertTo(1955;"DEM";1) returns 999.60.
Note
The currency code must be the code of one of the 12 EU currencies whose values were fixed in relation to the Euro prior to their abolition in January 2002. If it is not, the function returns #ERROR. The currencies are:
BEF Belgian franc
DEM German mark
GRD Greek drachma
ESP Spanish peseta
FRF French franc
IEP Irish punt
ITL Italian lira
LUF Luxembourg franc
NLG Dutch guilder
ATS Austrian schilling
PTS Portuguese escudo
FIM Finnish mark
Related Information
Rounding and truncating numbers [page 650]
6.4.1.6.1.8.6 EuroFromRoundError
Description
Returns the rounding error in a conversion from Euros
Function Group
Numeric
558 PUBLICSAP BusinessObjects Web Intelligence User's Guide
Analyzing data
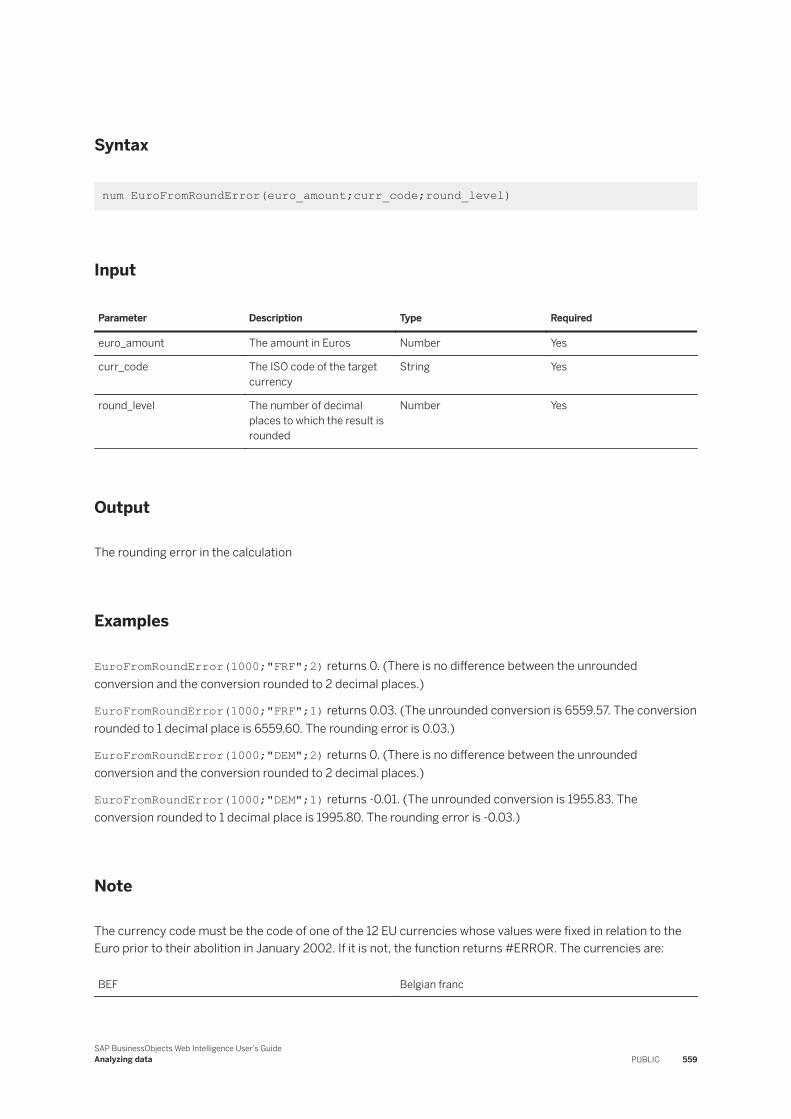
Syntax
num EuroFromRoundError(euro_amount;curr_code;round_level)
Input
Parameter Description Type Required
euro_amount The amount in Euros Number Yes
curr_code The ISO code of the target currency
String Yes
round_level The number of decimal places to which the result is rounded
Number Yes
Output
The rounding error in the calculation
Examples
EuroFromRoundError(1000;"FRF";2) returns 0. (There is no difference between the unrounded conversion and the conversion rounded to 2 decimal places.)
EuroFromRoundError(1000;"FRF";1) returns 0.03. (The unrounded conversion is 6559.57. The conversion rounded to 1 decimal place is 6559.60. The rounding error is 0.03.)
EuroFromRoundError(1000;"DEM";2) returns 0. (There is no difference between the unrounded conversion and the conversion rounded to 2 decimal places.)
EuroFromRoundError(1000;"DEM";1) returns -0.01. (The unrounded conversion is 1955.83. The conversion rounded to 1 decimal place is 1995.80. The rounding error is -0.03.)
Note
The currency code must be the code of one of the 12 EU currencies whose values were fixed in relation to the Euro prior to their abolition in January 2002. If it is not, the function returns #ERROR. The currencies are:
BEF Belgian franc
SAP BusinessObjects Web Intelligence User's GuideAnalyzing data PUBLIC 559
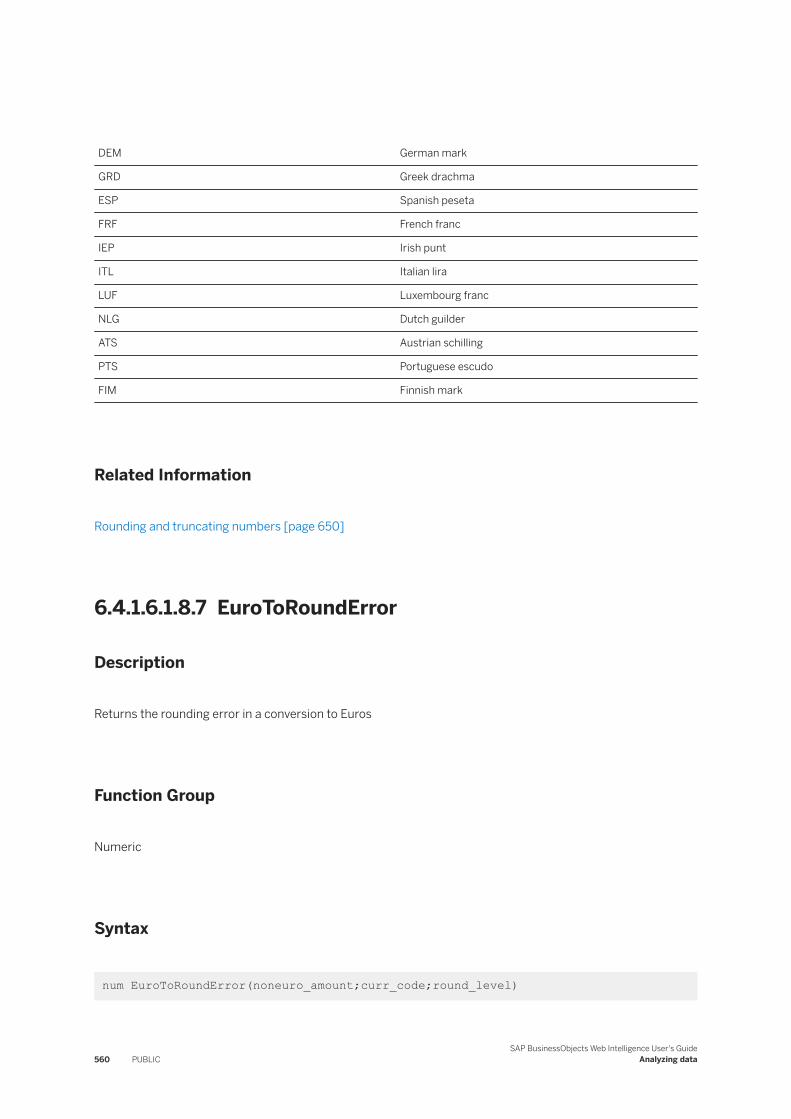
DEM German mark
GRD Greek drachma
ESP Spanish peseta
FRF French franc
IEP Irish punt
ITL Italian lira
LUF Luxembourg franc
NLG Dutch guilder
ATS Austrian schilling
PTS Portuguese escudo
FIM Finnish mark
Related Information
Rounding and truncating numbers [page 650]
6.4.1.6.1.8.7 EuroToRoundError
Description
Returns the rounding error in a conversion to Euros
Function Group
Numeric
Syntax
num EuroToRoundError(noneuro_amount;curr_code;round_level)
560 PUBLICSAP BusinessObjects Web Intelligence User's Guide
Analyzing data
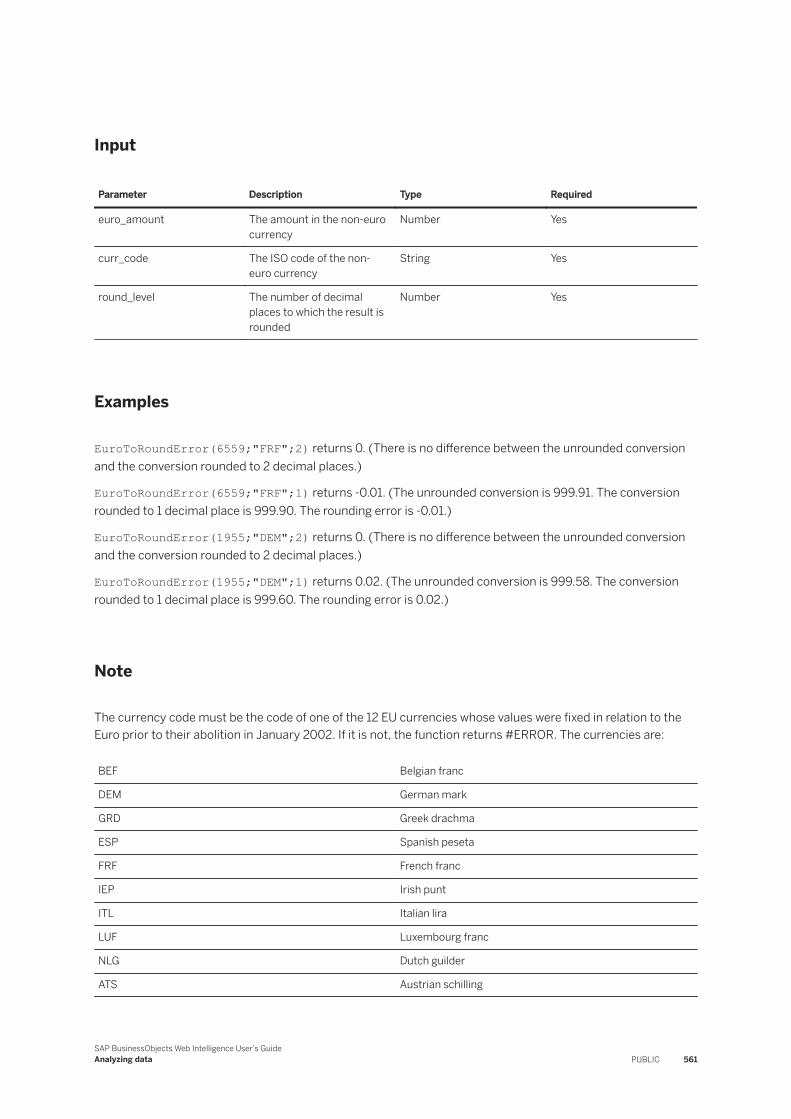
Input
Parameter Description Type Required
euro_amount The amount in the non-euro currency
Number Yes
curr_code The ISO code of the non-euro currency
String Yes
round_level The number of decimal places to which the result is rounded
Number Yes
Examples
EuroToRoundError(6559;"FRF";2) returns 0. (There is no difference between the unrounded conversion and the conversion rounded to 2 decimal places.)
EuroToRoundError(6559;"FRF";1) returns -0.01. (The unrounded conversion is 999.91. The conversion rounded to 1 decimal place is 999.90. The rounding error is -0.01.)
EuroToRoundError(1955;"DEM";2) returns 0. (There is no difference between the unrounded conversion and the conversion rounded to 2 decimal places.)
EuroToRoundError(1955;"DEM";1) returns 0.02. (The unrounded conversion is 999.58. The conversion rounded to 1 decimal place is 999.60. The rounding error is 0.02.)
Note
The currency code must be the code of one of the 12 EU currencies whose values were fixed in relation to the Euro prior to their abolition in January 2002. If it is not, the function returns #ERROR. The currencies are:
BEF Belgian franc
DEM German mark
GRD Greek drachma
ESP Spanish peseta
FRF French franc
IEP Irish punt
ITL Italian lira
LUF Luxembourg franc
NLG Dutch guilder
ATS Austrian schilling
SAP BusinessObjects Web Intelligence User's GuideAnalyzing data PUBLIC 561
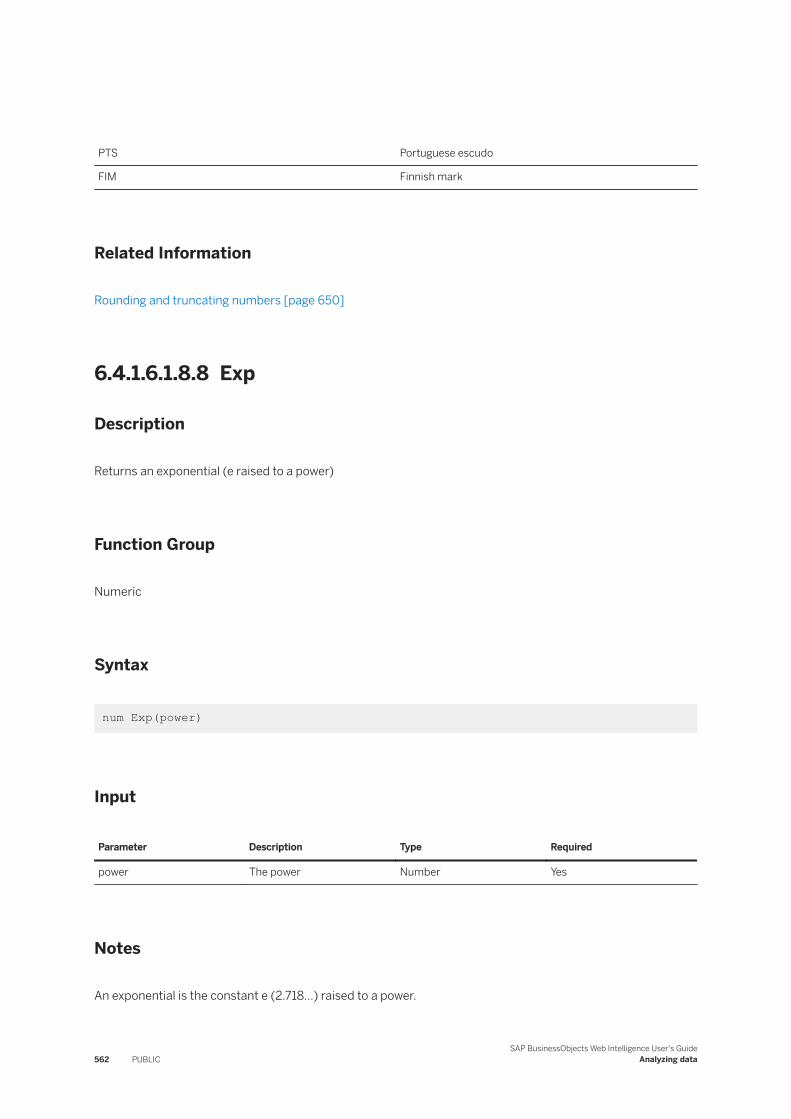
PTS Portuguese escudo
FIM Finnish mark
Related Information
Rounding and truncating numbers [page 650]
6.4.1.6.1.8.8 Exp
Description
Returns an exponential (e raised to a power)
Function Group
Numeric
Syntax
num Exp(power)
Input
Parameter Description Type Required
power The power Number Yes
Notes
An exponential is the constant e (2.718...) raised to a power.
562 PUBLICSAP BusinessObjects Web Intelligence User's Guide
Analyzing data
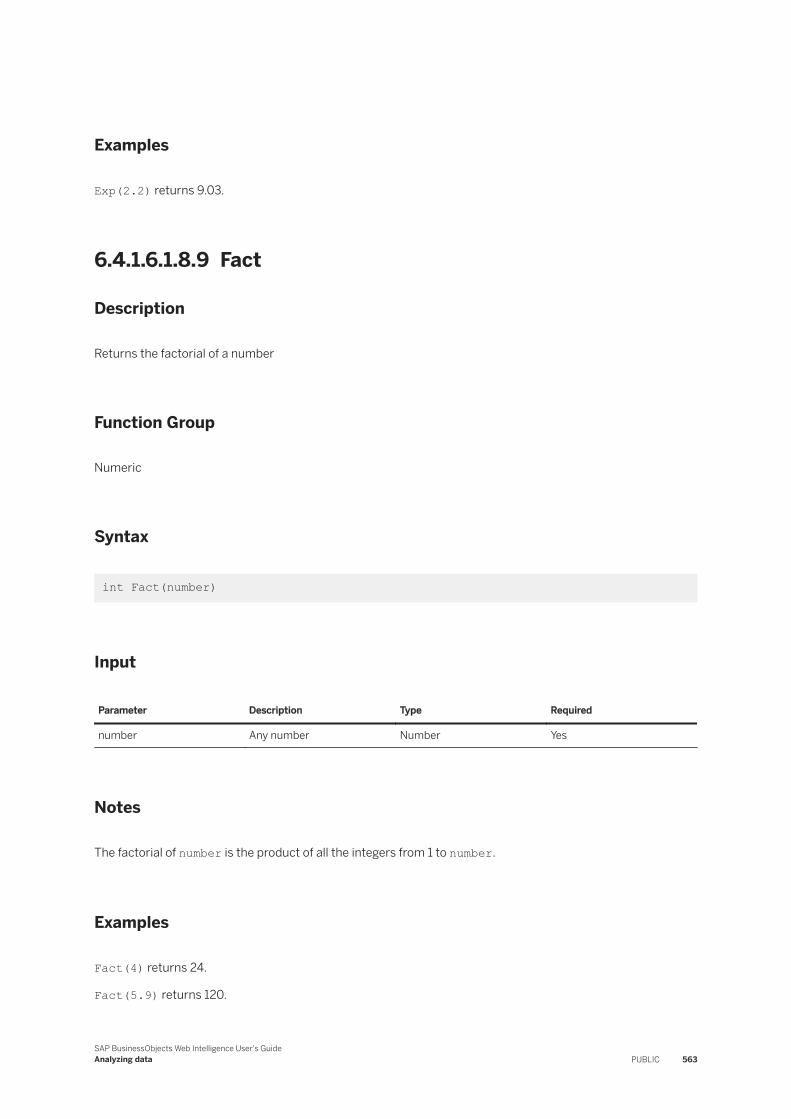
Examples
Exp(2.2) returns 9.03.
6.4.1.6.1.8.9 Fact
Description
Returns the factorial of a number
Function Group
Numeric
Syntax
int Fact(number)
Input
Parameter Description Type Required
number Any number Number Yes
Notes
The factorial of number is the product of all the integers from 1 to number.
Examples
Fact(4) returns 24.
Fact(5.9) returns 120.
SAP BusinessObjects Web Intelligence User's GuideAnalyzing data PUBLIC 563
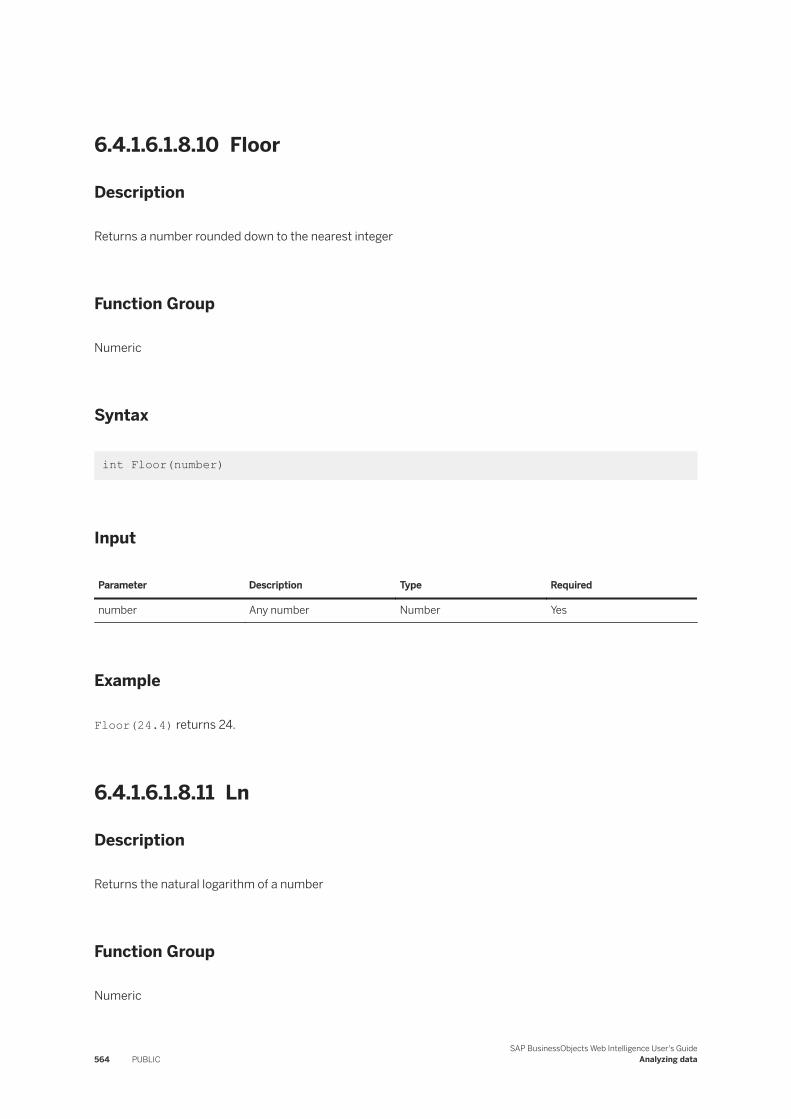
6.4.1.6.1.8.10 Floor
Description
Returns a number rounded down to the nearest integer
Function Group
Numeric
Syntax
int Floor(number)
Input
Parameter Description Type Required
number Any number Number Yes
Example
Floor(24.4) returns 24.
6.4.1.6.1.8.11 Ln
Description
Returns the natural logarithm of a number
Function Group
Numeric
564 PUBLICSAP BusinessObjects Web Intelligence User's Guide
Analyzing data
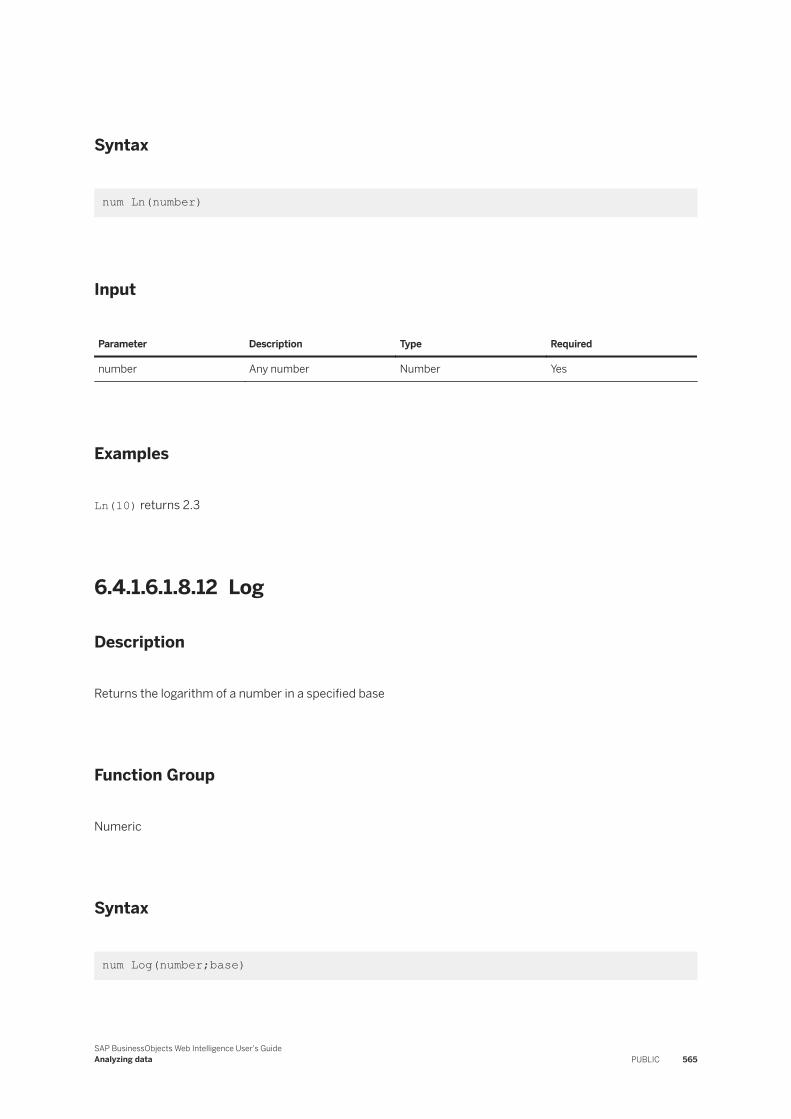
Syntax
num Ln(number)
Input
Parameter Description Type Required
number Any number Number Yes
Examples
Ln(10) returns 2.3
6.4.1.6.1.8.12 Log
Description
Returns the logarithm of a number in a specified base
Function Group
Numeric
Syntax
num Log(number;base)
SAP BusinessObjects Web Intelligence User's GuideAnalyzing data PUBLIC 565
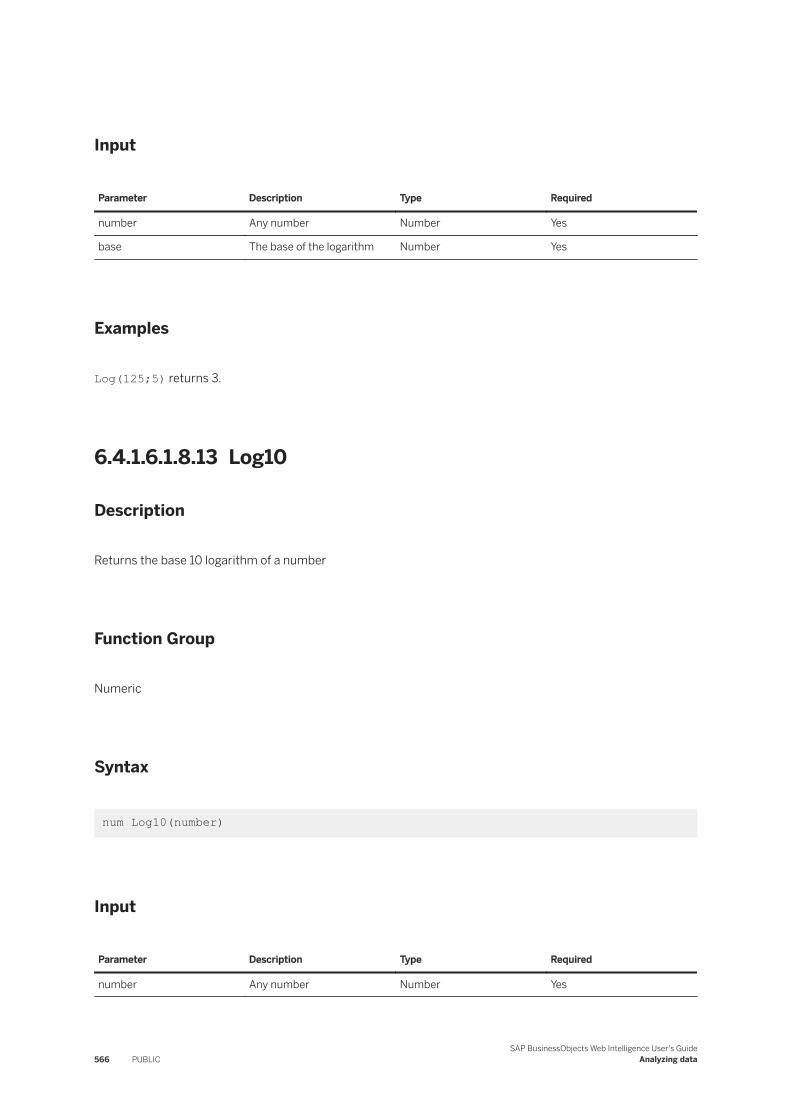
Input
Parameter Description Type Required
number Any number Number Yes
base The base of the logarithm Number Yes
Examples
Log(125;5) returns 3.
6.4.1.6.1.8.13 Log10
Description
Returns the base 10 logarithm of a number
Function Group
Numeric
Syntax
num Log10(number)
Input
Parameter Description Type Required
number Any number Number Yes
566 PUBLICSAP BusinessObjects Web Intelligence User's Guide
Analyzing data
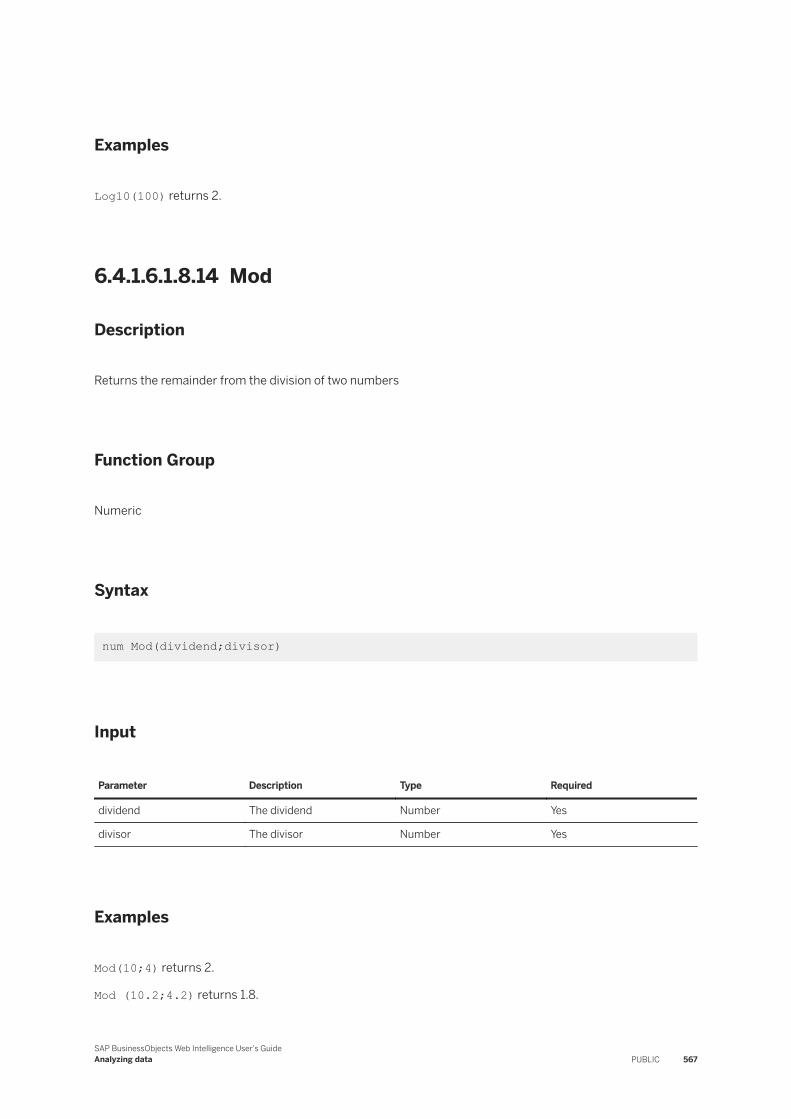
Examples
Log10(100) returns 2.
6.4.1.6.1.8.14 Mod
Description
Returns the remainder from the division of two numbers
Function Group
Numeric
Syntax
num Mod(dividend;divisor)
Input
Parameter Description Type Required
dividend The dividend Number Yes
divisor The divisor Number Yes
Examples
Mod(10;4) returns 2.
Mod (10.2;4.2) returns 1.8.
SAP BusinessObjects Web Intelligence User's GuideAnalyzing data PUBLIC 567
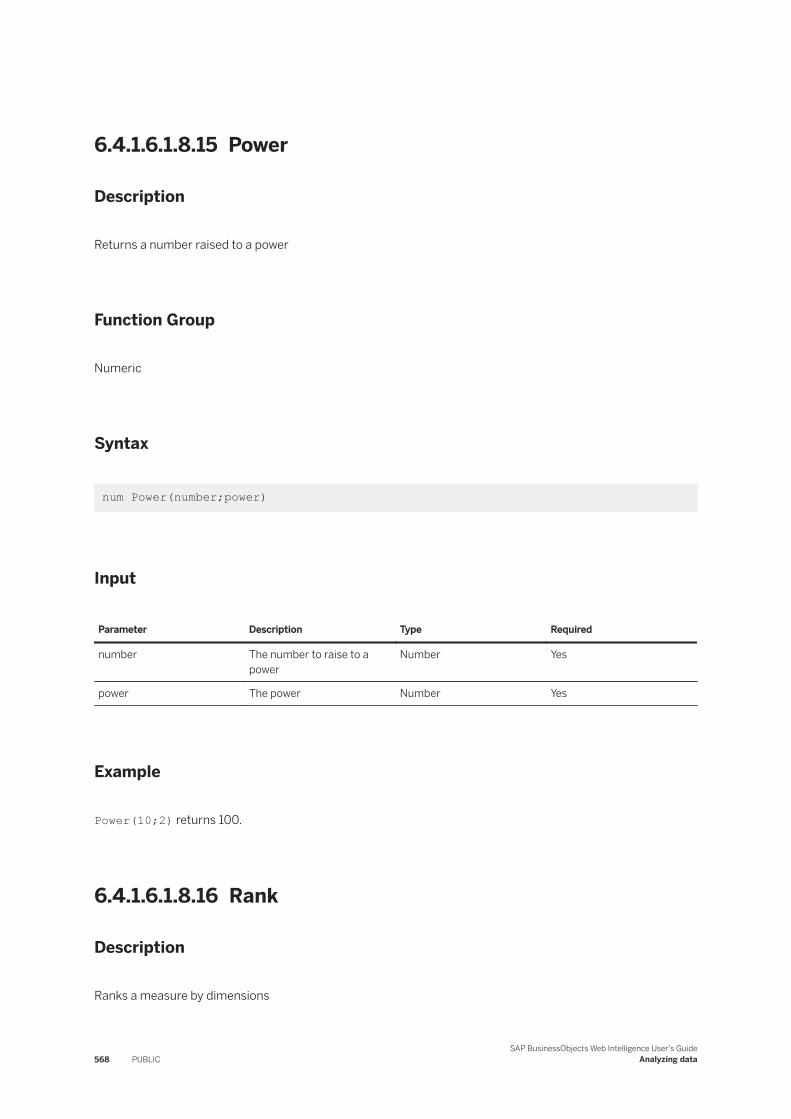
6.4.1.6.1.8.15 Power
Description
Returns a number raised to a power
Function Group
Numeric
Syntax
num Power(number;power)
Input
Parameter Description Type Required
number The number to raise to a power
Number Yes
power The power Number Yes
Example
Power(10;2) returns 100.
6.4.1.6.1.8.16 Rank
Description
Ranks a measure by dimensions
568 PUBLICSAP BusinessObjects Web Intelligence User's Guide
Analyzing data
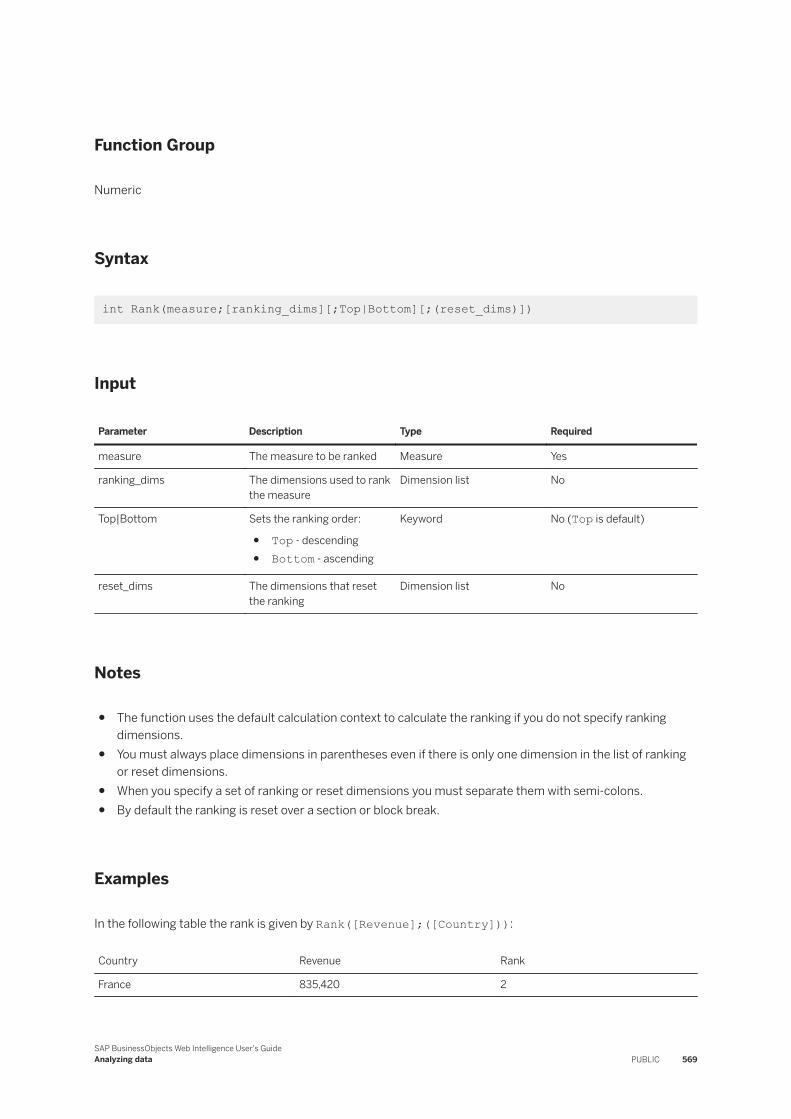
Function Group
Numeric
Syntax
int Rank(measure;[ranking_dims][;Top|Bottom][;(reset_dims)])
Input
Parameter Description Type Required
measure The measure to be ranked Measure Yes
ranking_dims The dimensions used to rank the measure
Dimension list No
Top|Bottom Sets the ranking order:
● Top - descending● Bottom - ascending
Keyword No (Top is default)
reset_dims The dimensions that reset the ranking
Dimension list No
Notes
● The function uses the default calculation context to calculate the ranking if you do not specify ranking dimensions.
● You must always place dimensions in parentheses even if there is only one dimension in the list of ranking or reset dimensions.
● When you specify a set of ranking or reset dimensions you must separate them with semi-colons.● By default the ranking is reset over a section or block break.
Examples
In the following table the rank is given by Rank([Revenue];([Country])):
Country Revenue Rank
France 835,420 2
SAP BusinessObjects Web Intelligence User's GuideAnalyzing data PUBLIC 569
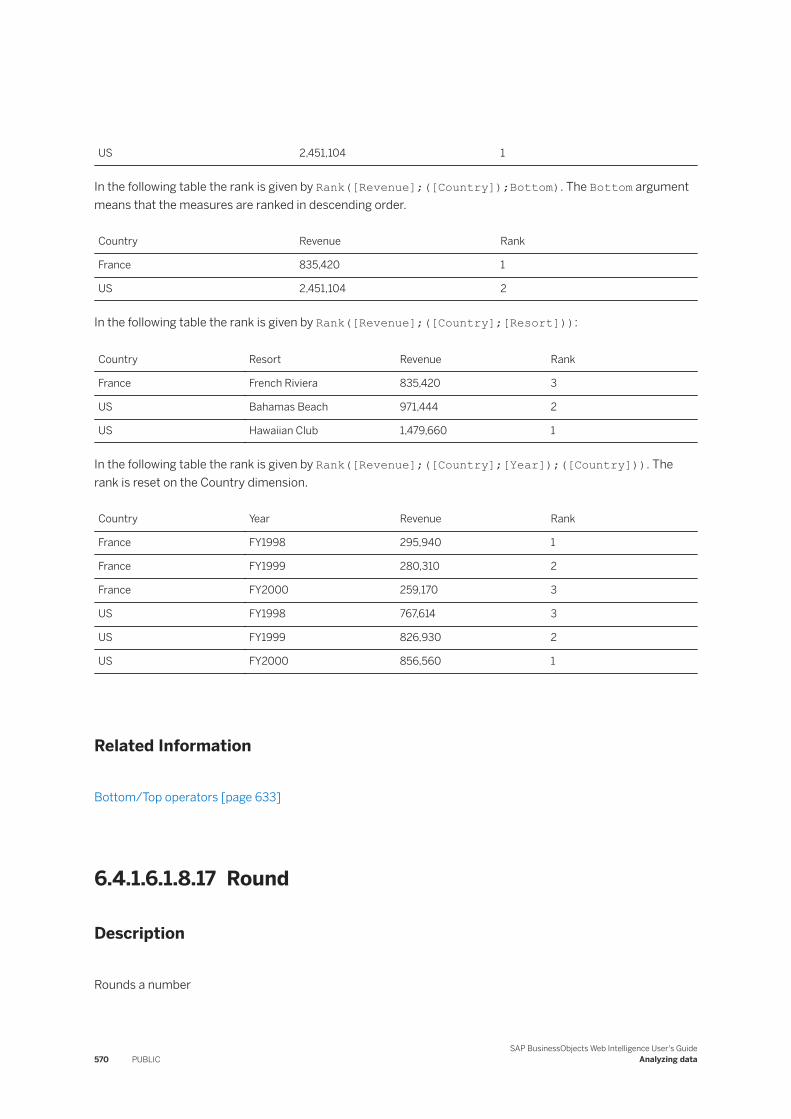
US 2,451,104 1
In the following table the rank is given by Rank([Revenue];([Country]);Bottom). The Bottom argument means that the measures are ranked in descending order.
Country Revenue Rank
France 835,420 1
US 2,451,104 2
In the following table the rank is given by Rank([Revenue];([Country];[Resort])):
Country Resort Revenue Rank
France French Riviera 835,420 3
US Bahamas Beach 971,444 2
US Hawaiian Club 1,479,660 1
In the following table the rank is given by Rank([Revenue];([Country];[Year]);([Country])). The rank is reset on the Country dimension.
Country Year Revenue Rank
France FY1998 295,940 1
France FY1999 280,310 2
France FY2000 259,170 3
US FY1998 767,614 3
US FY1999 826,930 2
US FY2000 856,560 1
Related Information
Bottom/Top operators [page 633]
6.4.1.6.1.8.17 Round
Description
Rounds a number
570 PUBLICSAP BusinessObjects Web Intelligence User's Guide
Analyzing data
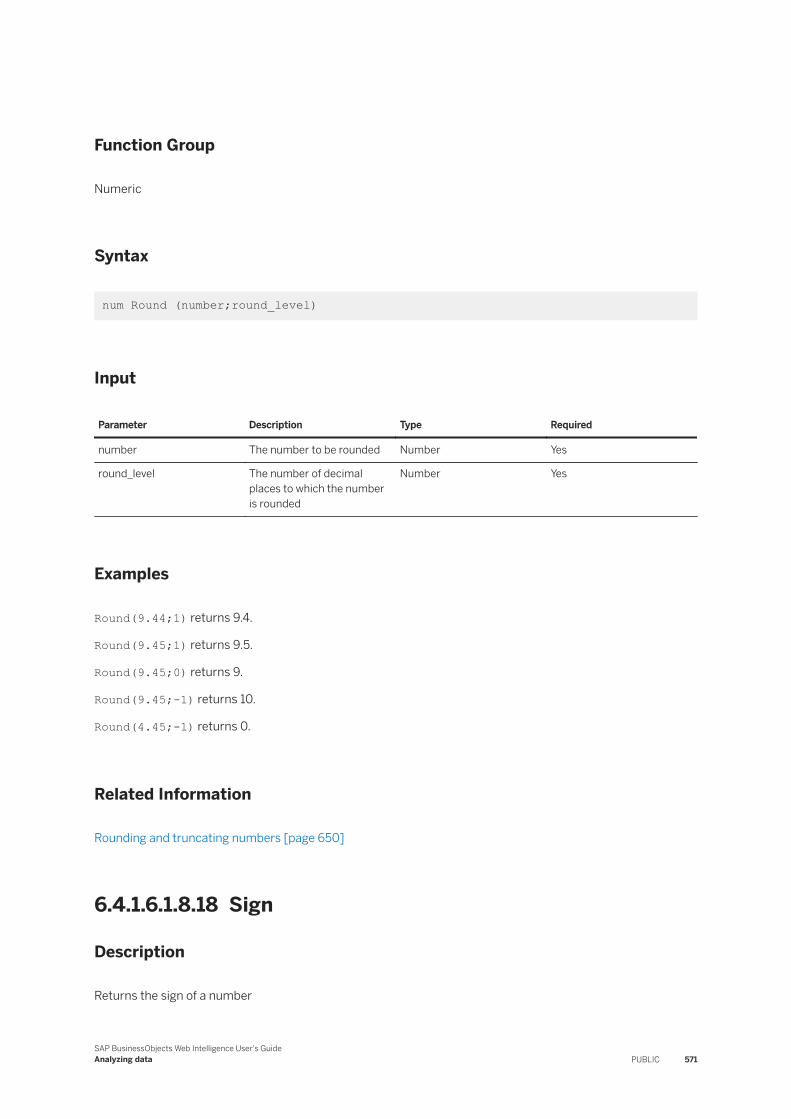
Function Group
Numeric
Syntax
num Round (number;round_level)
Input
Parameter Description Type Required
number The number to be rounded Number Yes
round_level The number of decimal places to which the number is rounded
Number Yes
Examples
Round(9.44;1) returns 9.4.
Round(9.45;1) returns 9.5.
Round(9.45;0) returns 9.
Round(9.45;-1) returns 10.
Round(4.45;-1) returns 0.
Related Information
Rounding and truncating numbers [page 650]
6.4.1.6.1.8.18 Sign
Description
Returns the sign of a number
SAP BusinessObjects Web Intelligence User's GuideAnalyzing data PUBLIC 571
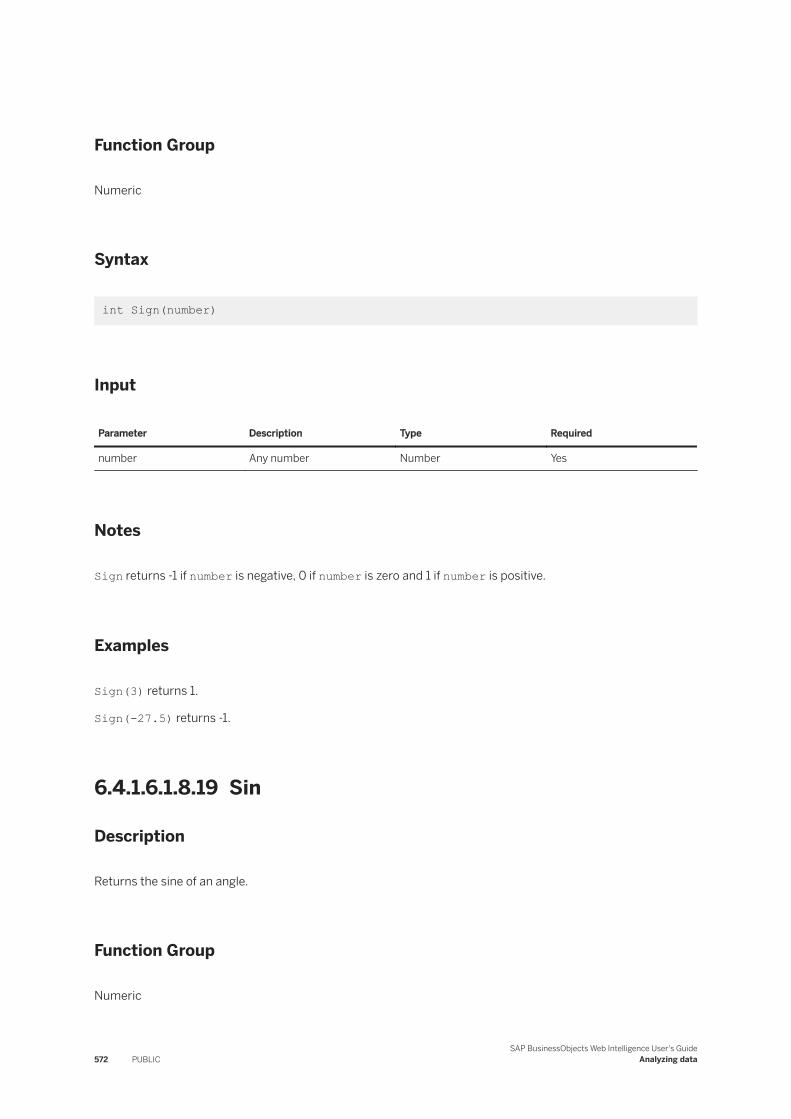
Function Group
Numeric
Syntax
int Sign(number)
Input
Parameter Description Type Required
number Any number Number Yes
Notes
Sign returns -1 if number is negative, 0 if number is zero and 1 if number is positive.
Examples
Sign(3) returns 1.
Sign(-27.5) returns -1.
6.4.1.6.1.8.19 Sin
Description
Returns the sine of an angle.
Function Group
Numeric
572 PUBLICSAP BusinessObjects Web Intelligence User's Guide
Analyzing data
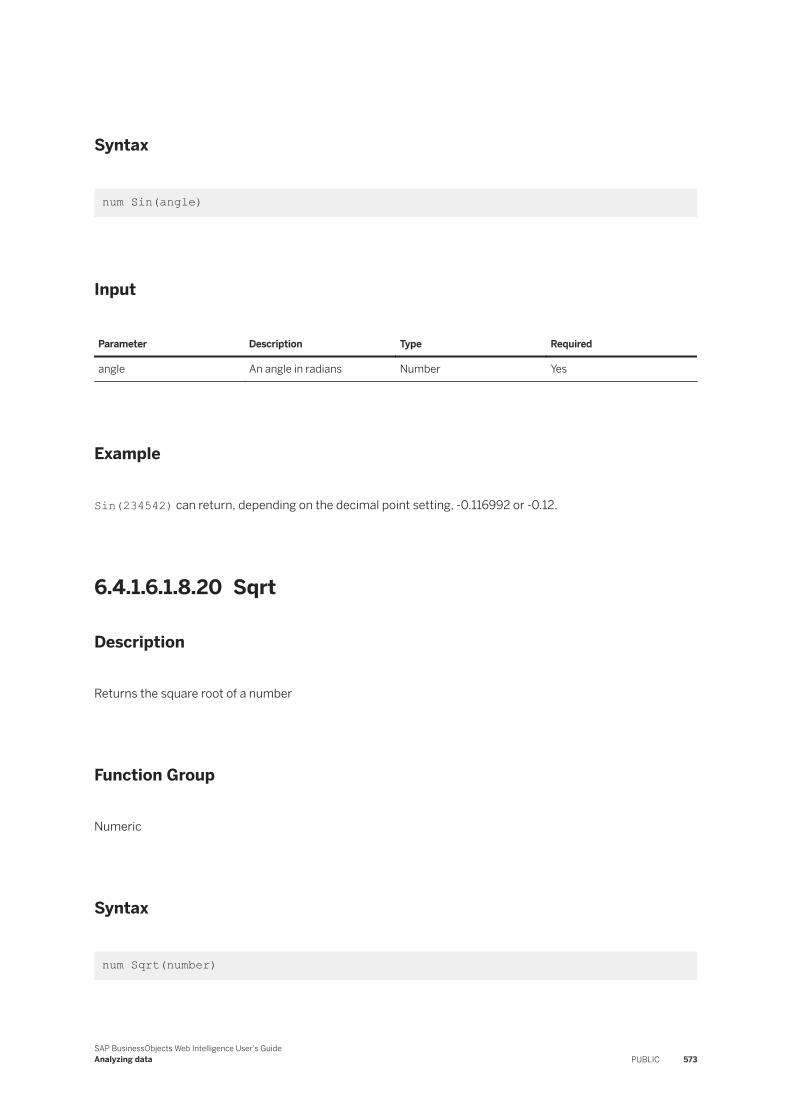
Syntax
num Sin(angle)
Input
Parameter Description Type Required
angle An angle in radians Number Yes
Example
Sin(234542) can return, depending on the decimal point setting, -0.116992 or -0.12.
6.4.1.6.1.8.20 Sqrt
Description
Returns the square root of a number
Function Group
Numeric
Syntax
num Sqrt(number)
SAP BusinessObjects Web Intelligence User's GuideAnalyzing data PUBLIC 573
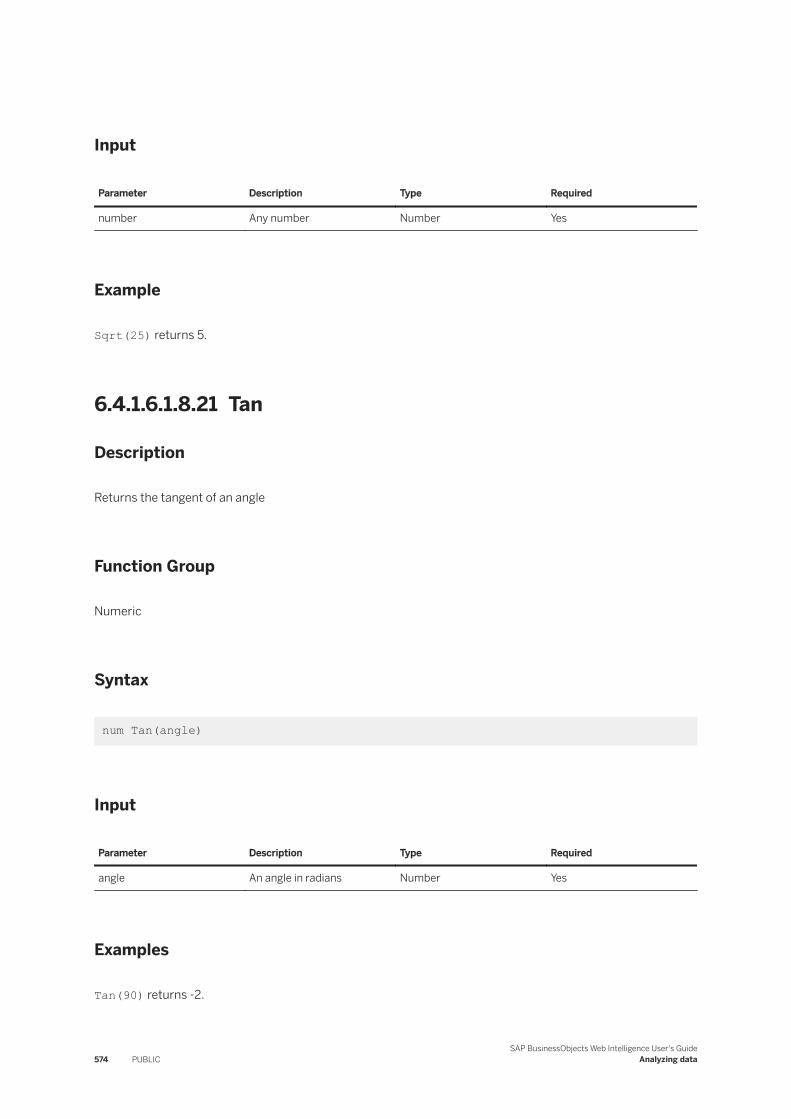
Input
Parameter Description Type Required
number Any number Number Yes
Example
Sqrt(25) returns 5.
6.4.1.6.1.8.21 Tan
Description
Returns the tangent of an angle
Function Group
Numeric
Syntax
num Tan(angle)
Input
Parameter Description Type Required
angle An angle in radians Number Yes
Examples
Tan(90) returns -2.
574 PUBLICSAP BusinessObjects Web Intelligence User's Guide
Analyzing data
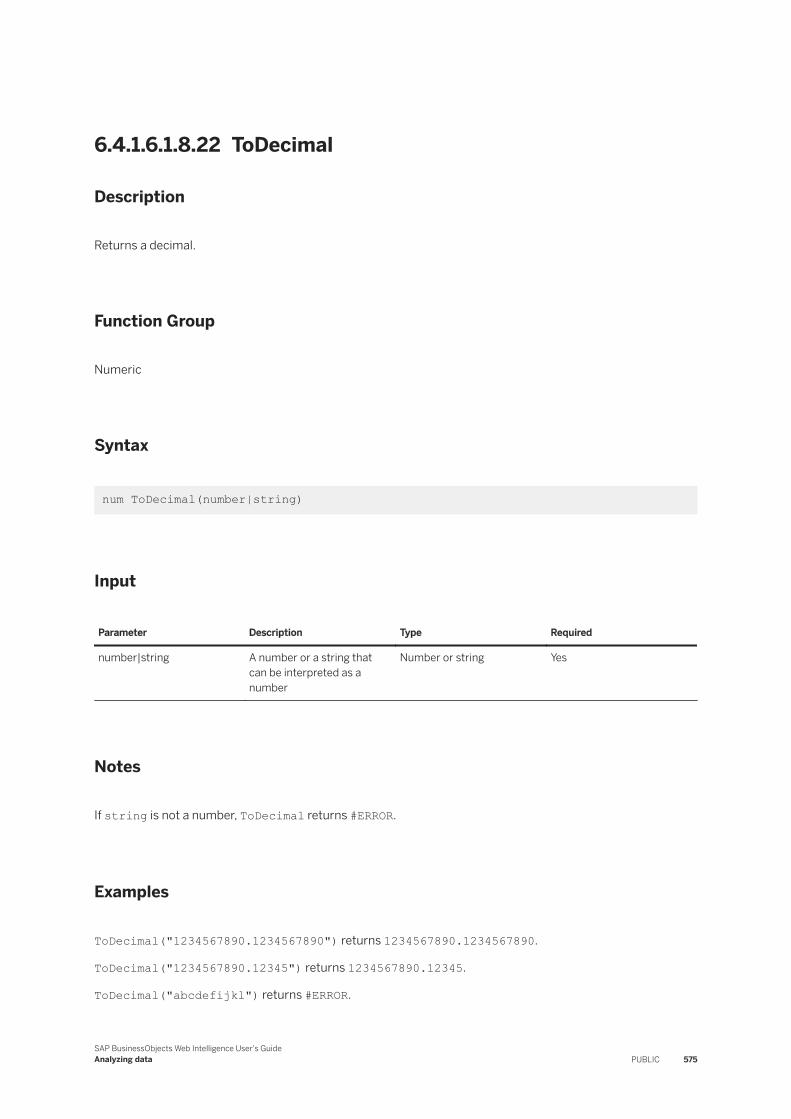
6.4.1.6.1.8.22 ToDecimal
Description
Returns a decimal.
Function Group
Numeric
Syntax
num ToDecimal(number|string)
Input
Parameter Description Type Required
number|string A number or a string that can be interpreted as a number
Number or string Yes
Notes
If string is not a number, ToDecimal returns #ERROR.
Examples
ToDecimal("1234567890.1234567890") returns 1234567890.1234567890.
ToDecimal("1234567890.12345") returns 1234567890.12345.
ToDecimal("abcdefijkl") returns #ERROR.
SAP BusinessObjects Web Intelligence User's GuideAnalyzing data PUBLIC 575
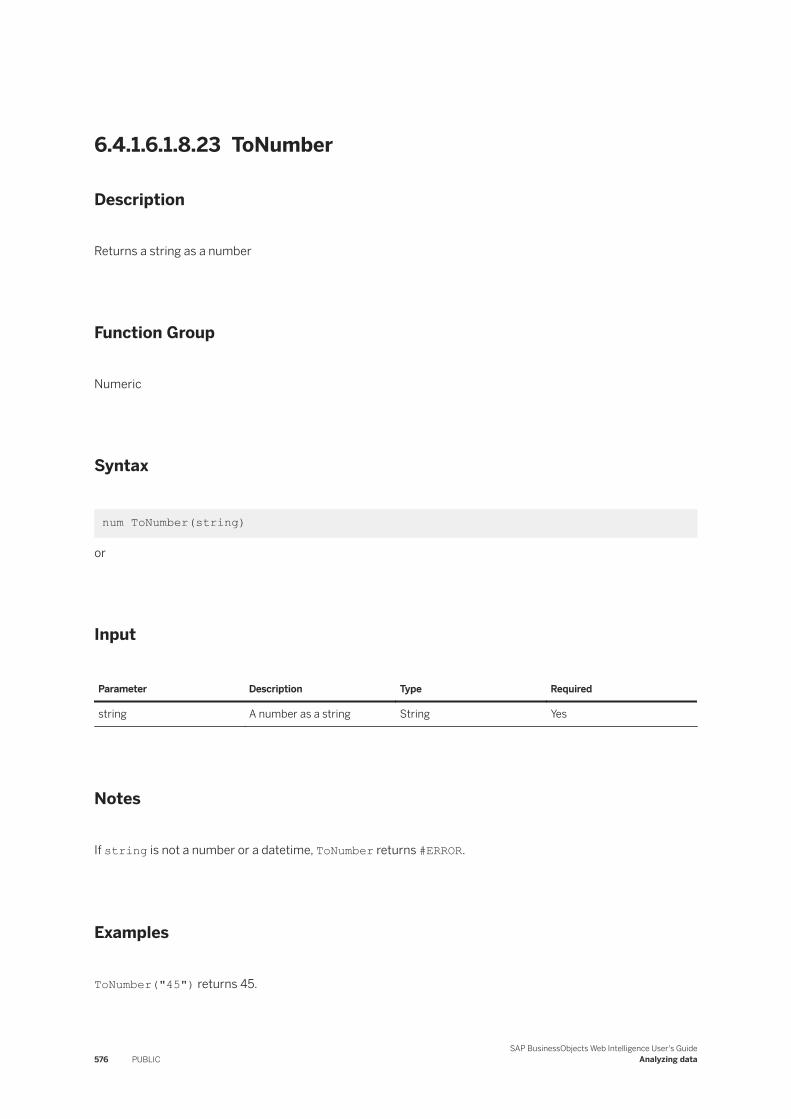
6.4.1.6.1.8.23 ToNumber
Description
Returns a string as a number
Function Group
Numeric
Syntax
num ToNumber(string)
or
Input
Parameter Description Type Required
string A number as a string String Yes
Notes
If string is not a number or a datetime, ToNumber returns #ERROR.
Examples
ToNumber("45") returns 45.
576 PUBLICSAP BusinessObjects Web Intelligence User's Guide
Analyzing data
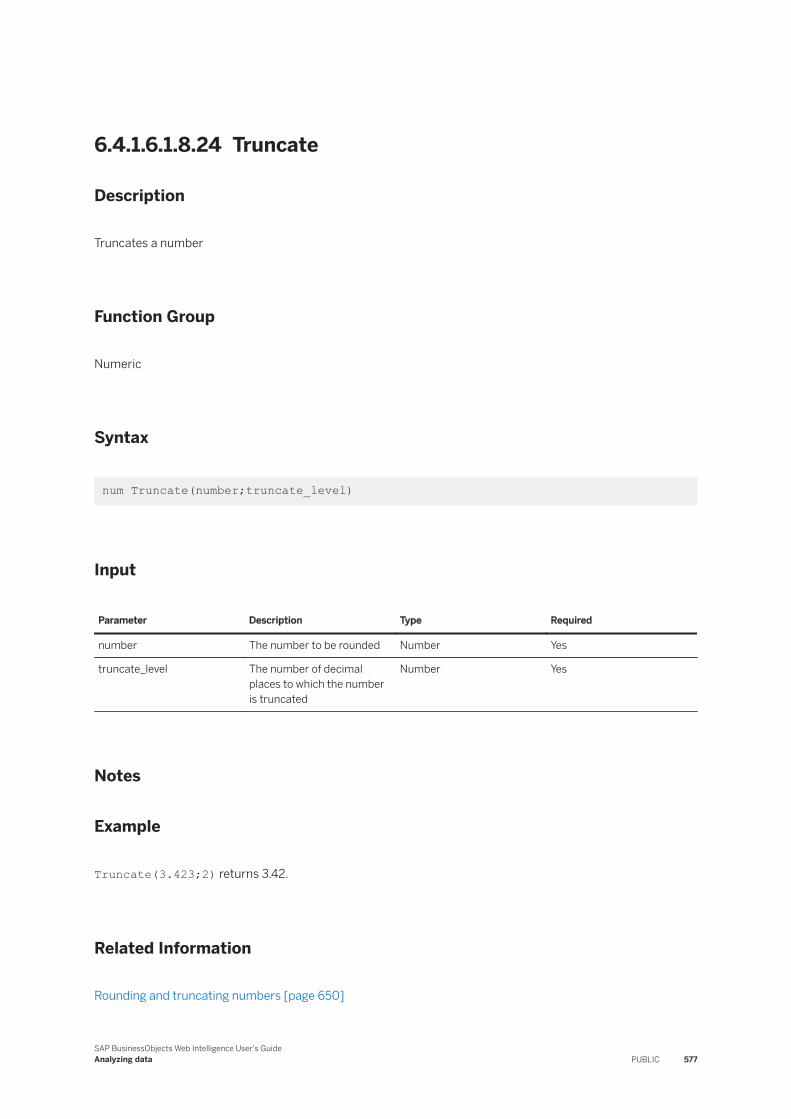
6.4.1.6.1.8.24 Truncate
Description
Truncates a number
Function Group
Numeric
Syntax
num Truncate(number;truncate_level)
Input
Parameter Description Type Required
number The number to be rounded Number Yes
truncate_level The number of decimal places to which the number is truncated
Number Yes
Notes
Example
Truncate(3.423;2) returns 3.42.
Related Information
Rounding and truncating numbers [page 650]
SAP BusinessObjects Web Intelligence User's GuideAnalyzing data PUBLIC 577
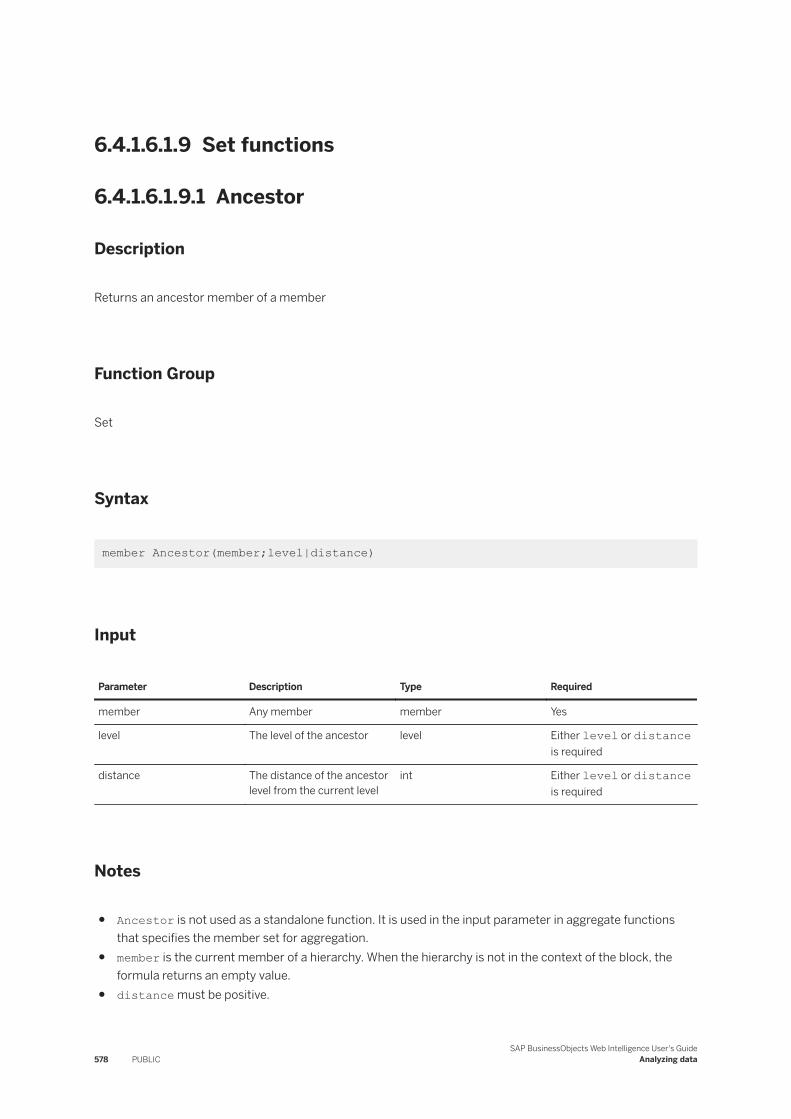
6.4.1.6.1.9 Set functions
6.4.1.6.1.9.1 Ancestor
Description
Returns an ancestor member of a member
Function Group
Set
Syntax
member Ancestor(member;level|distance)
Input
Parameter Description Type Required
member Any member member Yes
level The level of the ancestor level Either level or distance is required
distance The distance of the ancestor level from the current level
int Either level or distance is required
Notes
● Ancestor is not used as a standalone function. It is used in the input parameter in aggregate functions that specifies the member set for aggregation.
● member is the current member of a hierarchy. When the hierarchy is not in the context of the block, the formula returns an empty value.
● distance must be positive.
578 PUBLICSAP BusinessObjects Web Intelligence User's Guide
Analyzing data
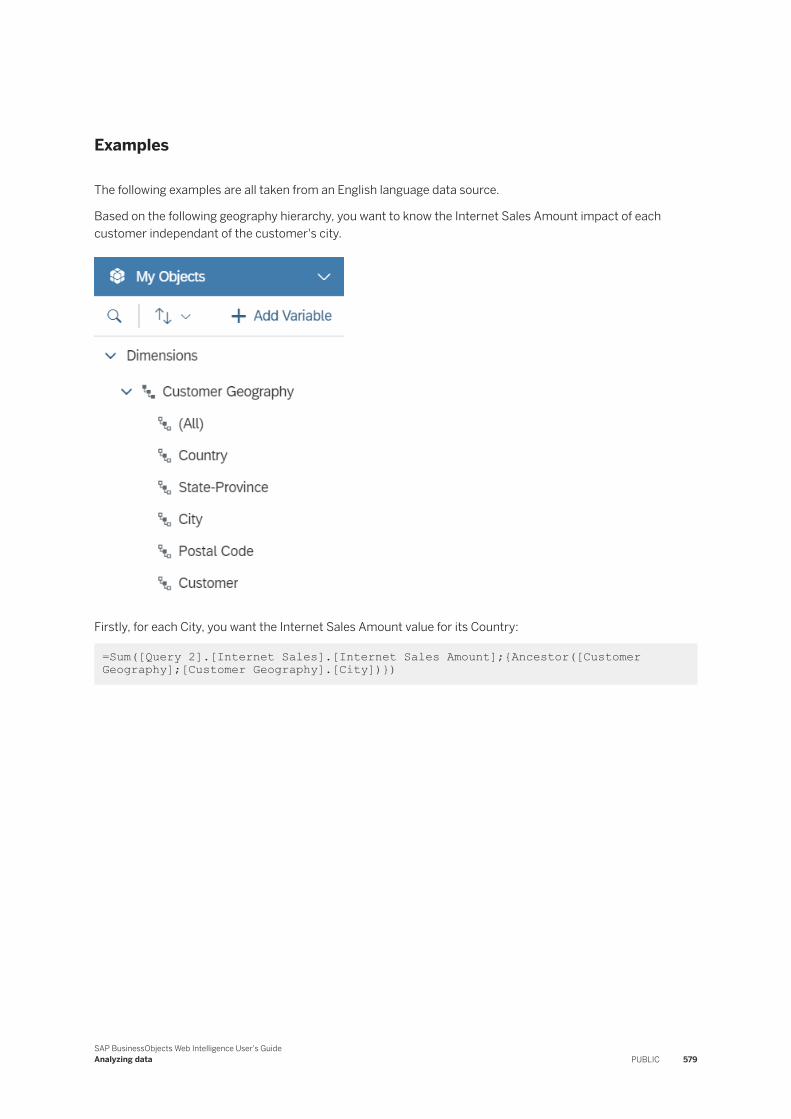
Examples
The following examples are all taken from an English language data source.
Based on the following geography hierarchy, you want to know the Internet Sales Amount impact of each customer independant of the customer's city.
Firstly, for each City, you want the Internet Sales Amount value for its Country:
=Sum([Query 2].[Internet Sales].[Internet Sales Amount];{Ancestor([Customer Geography];[Customer Geography].[City])})
SAP BusinessObjects Web Intelligence User's GuideAnalyzing data PUBLIC 579
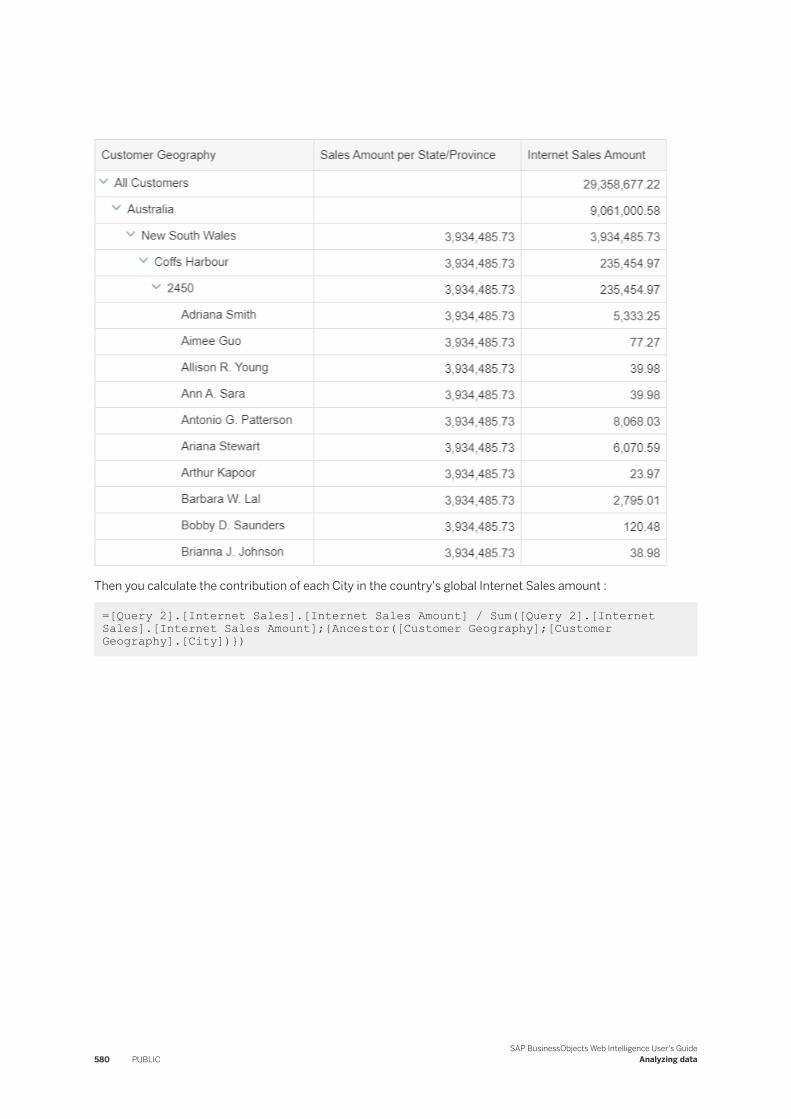
Then you calculate the contribution of each City in the country's global Internet Sales amount :
=[Query 2].[Internet Sales].[Internet Sales Amount] / Sum([Query 2].[Internet Sales].[Internet Sales Amount];{Ancestor([Customer Geography];[Customer Geography].[City])})
580 PUBLICSAP BusinessObjects Web Intelligence User's Guide
Analyzing data
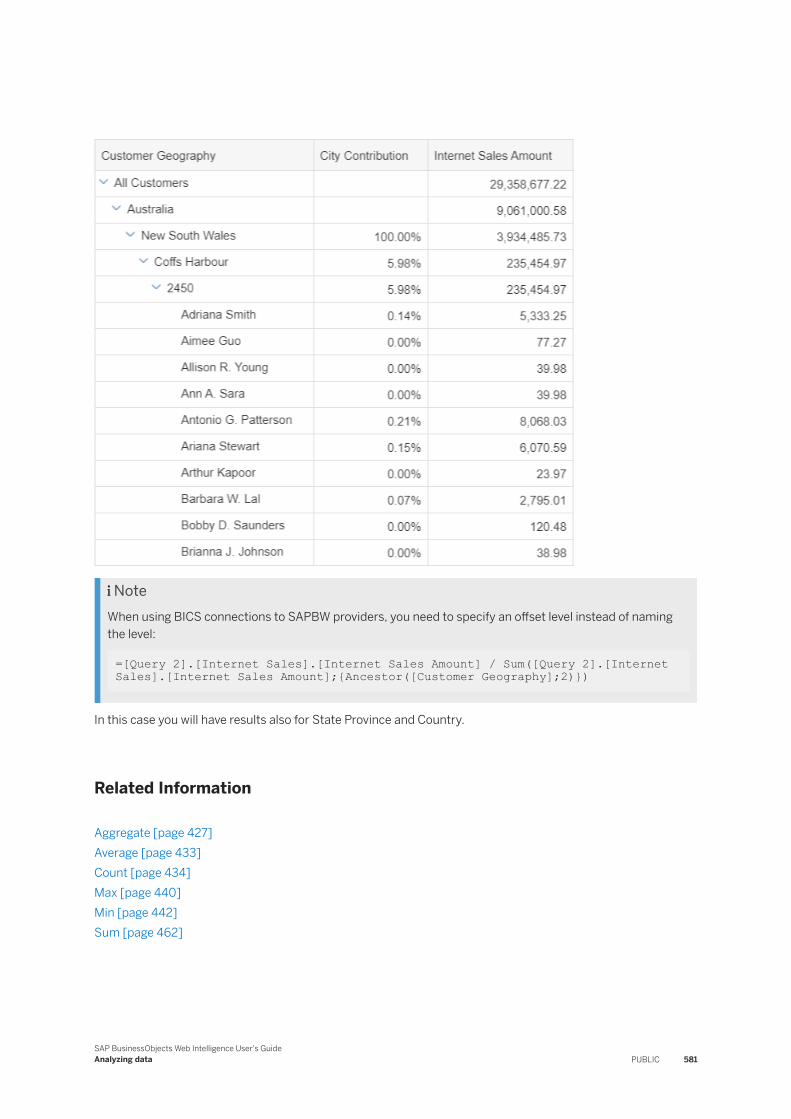
NoteWhen using BICS connections to SAPBW providers, you need to specify an offset level instead of naming the level:
=[Query 2].[Internet Sales].[Internet Sales Amount] / Sum([Query 2].[Internet Sales].[Internet Sales Amount];{Ancestor([Customer Geography];2)})
In this case you will have results also for State Province and Country.
Related Information
Aggregate [page 427]Average [page 433]Count [page 434]Max [page 440]Min [page 442]Sum [page 462]
SAP BusinessObjects Web Intelligence User's GuideAnalyzing data PUBLIC 581
6.4.1.6.1.9.2 Children
Description
Returns the child members of a hierarchy member within an aggregate function.
Function Group
Set
Syntax
member_set member.Children
Input
Parameter Description Type Required
member Any member member Yes
Notes
● Children is not used as a standalone function. It is used in the input parameter in aggregate functions that specifies the member set for aggregation.
● member is the current member of a hierarchy. When the hierarchy is not in the context of the block, the formula returns an empty value.
Examples
[Geography].[US].[California].Children returns [Los Angeles], [San Francisco], [San Diego].
[Geography].Children returns [Los Angeles], [San Francisco], [San Diego] if [California] is the current member in the [Geography] hierarchy.
582 PUBLICSAP BusinessObjects Web Intelligence User's Guide
Analyzing data
Related Information
Aggregate [page 427]Average [page 433]Count [page 434]Max [page 440]Min [page 442]Sum [page 462]
6.4.1.6.1.9.3 Depth
Description
Returns the depth of a member in a hierarchy
Function Group
Set
Syntax
int member.Depth
Input
Parameter Description Type Required
member Any member member Yes
Notes
● The depth is the distance of the member from top level of the hierarchy.● The top level of the hierarchy is level 0.● member is the current member of a hierarchy. When the hierarchy is not in the context of the block, the
formula returns an empty value.
SAP BusinessObjects Web Intelligence User's GuideAnalyzing data PUBLIC 583
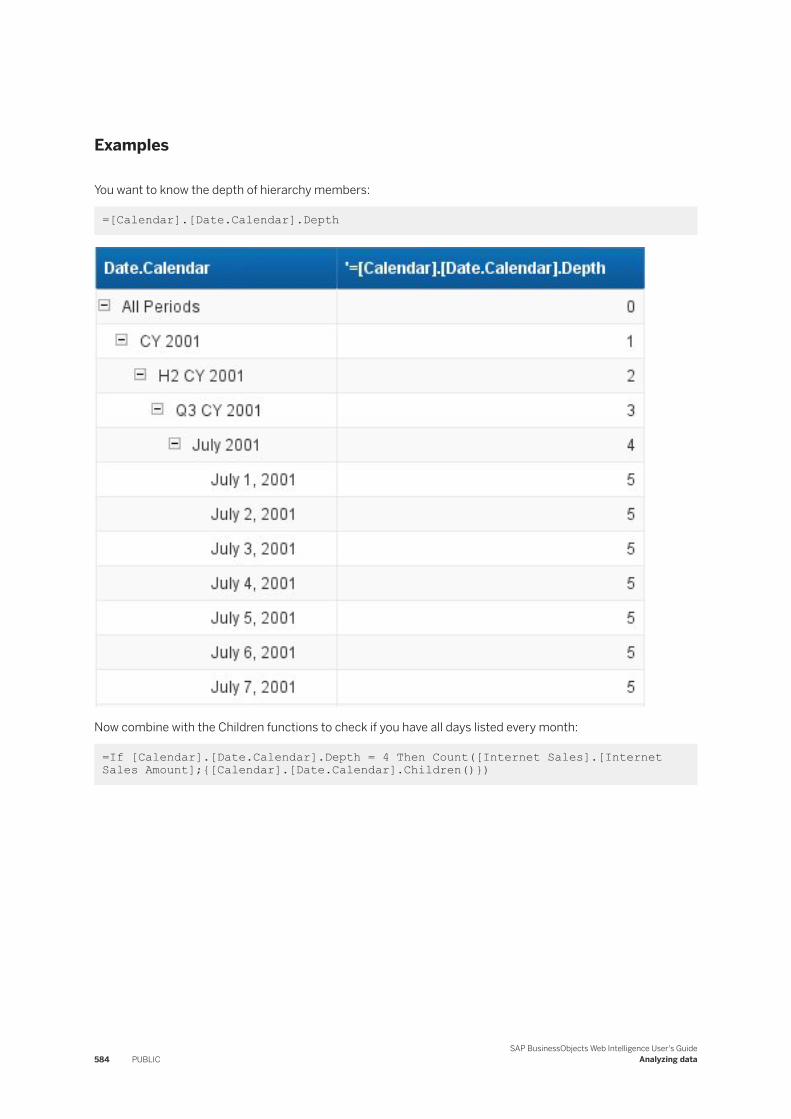
Examples
You want to know the depth of hierarchy members:
=[Calendar].[Date.Calendar].Depth
Now combine with the Children functions to check if you have all days listed every month:
=If [Calendar].[Date.Calendar].Depth = 4 Then Count([Internet Sales].[Internet Sales Amount];{[Calendar].[Date.Calendar].Children()})
584 PUBLICSAP BusinessObjects Web Intelligence User's Guide
Analyzing data
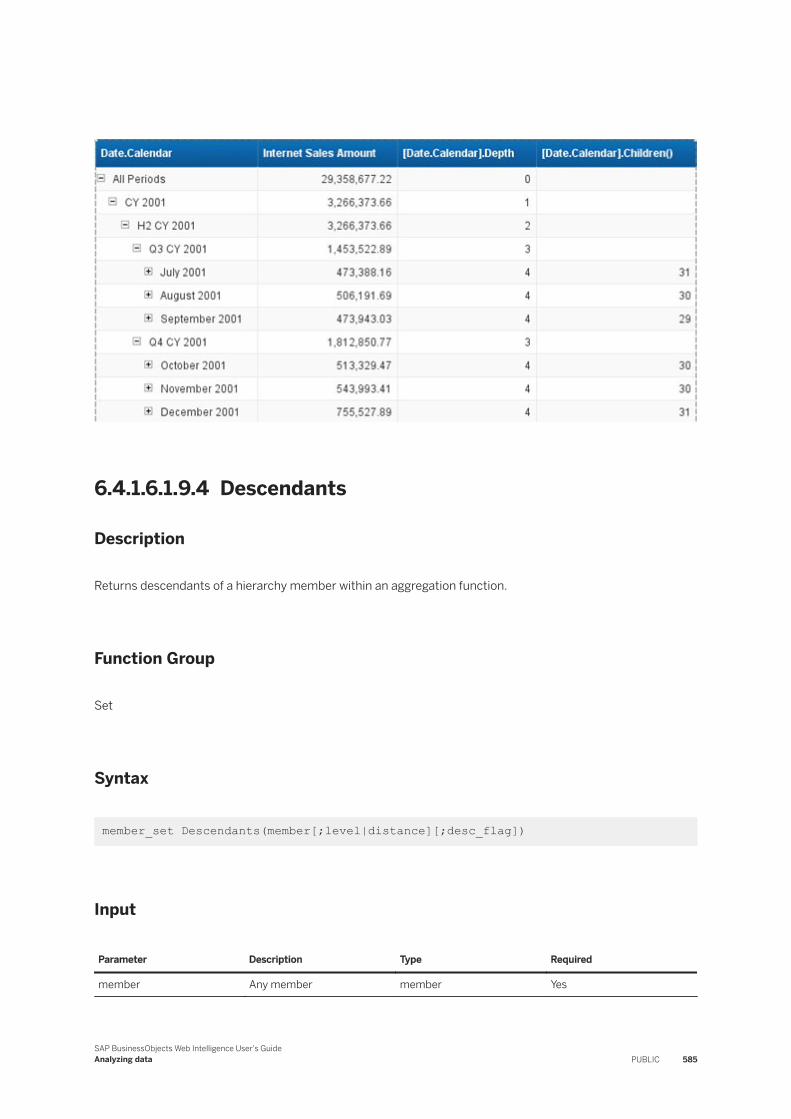
6.4.1.6.1.9.4 Descendants
Description
Returns descendants of a hierarchy member within an aggregation function.
Function Group
Set
Syntax
member_set Descendants(member[;level|distance][;desc_flag])
Input
Parameter Description Type Required
member Any member member Yes
SAP BusinessObjects Web Intelligence User's GuideAnalyzing data PUBLIC 585
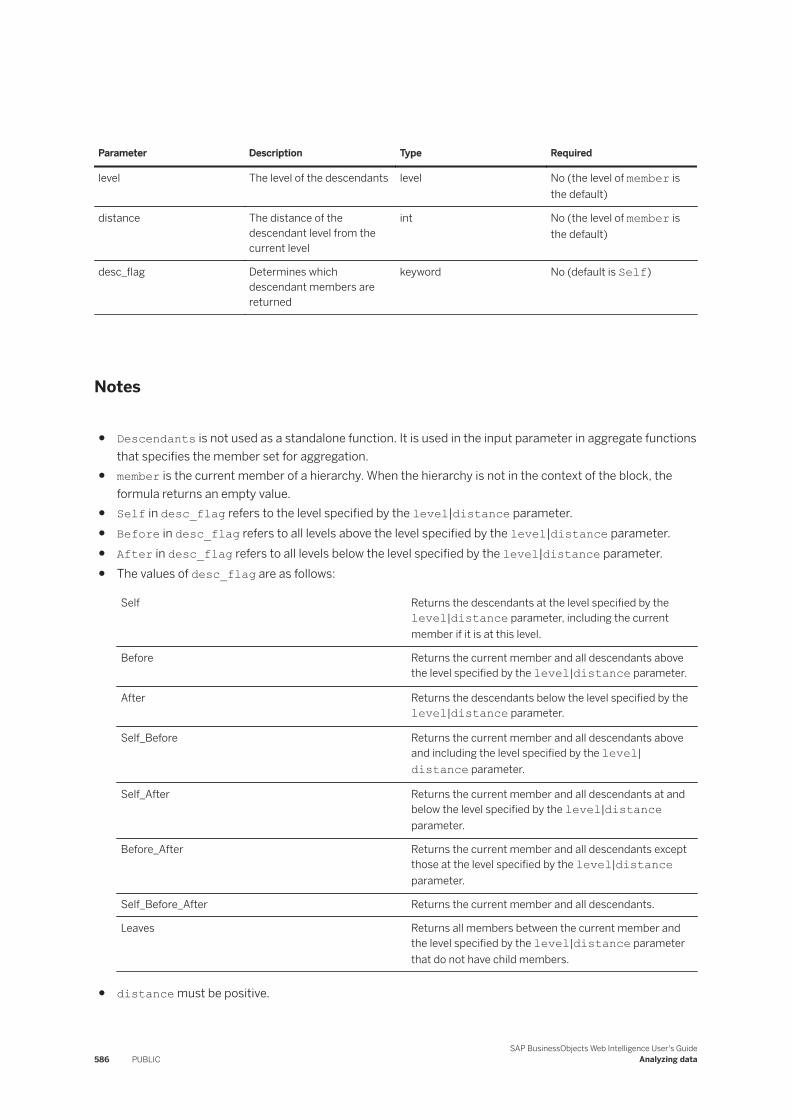
Parameter Description Type Required
level The level of the descendants level No (the level of member is the default)
distance The distance of the descendant level from the current level
int No (the level of member is the default)
desc_flag Determines which descendant members are returned
keyword No (default is Self)
Notes
● Descendants is not used as a standalone function. It is used in the input parameter in aggregate functions that specifies the member set for aggregation.
● member is the current member of a hierarchy. When the hierarchy is not in the context of the block, the formula returns an empty value.
● Self in desc_flag refers to the level specified by the level|distance parameter.● Before in desc_flag refers to all levels above the level specified by the level|distance parameter.● After in desc_flag refers to all levels below the level specified by the level|distance parameter.● The values of desc_flag are as follows:
Self Returns the descendants at the level specified by the level|distance parameter, including the current member if it is at this level.
Before Returns the current member and all descendants above the level specified by the level|distance parameter.
After Returns the descendants below the level specified by the level|distance parameter.
Self_Before Returns the current member and all descendants above and including the level specified by the level|distance parameter.
Self_After Returns the current member and all descendants at and below the level specified by the level|distance parameter.
Before_After Returns the current member and all descendants except those at the level specified by the level|distance parameter.
Self_Before_After Returns the current member and all descendants.
Leaves Returns all members between the current member and the level specified by the level|distance parameter that do not have child members.
● distance must be positive.
586 PUBLICSAP BusinessObjects Web Intelligence User's Guide
Analyzing data
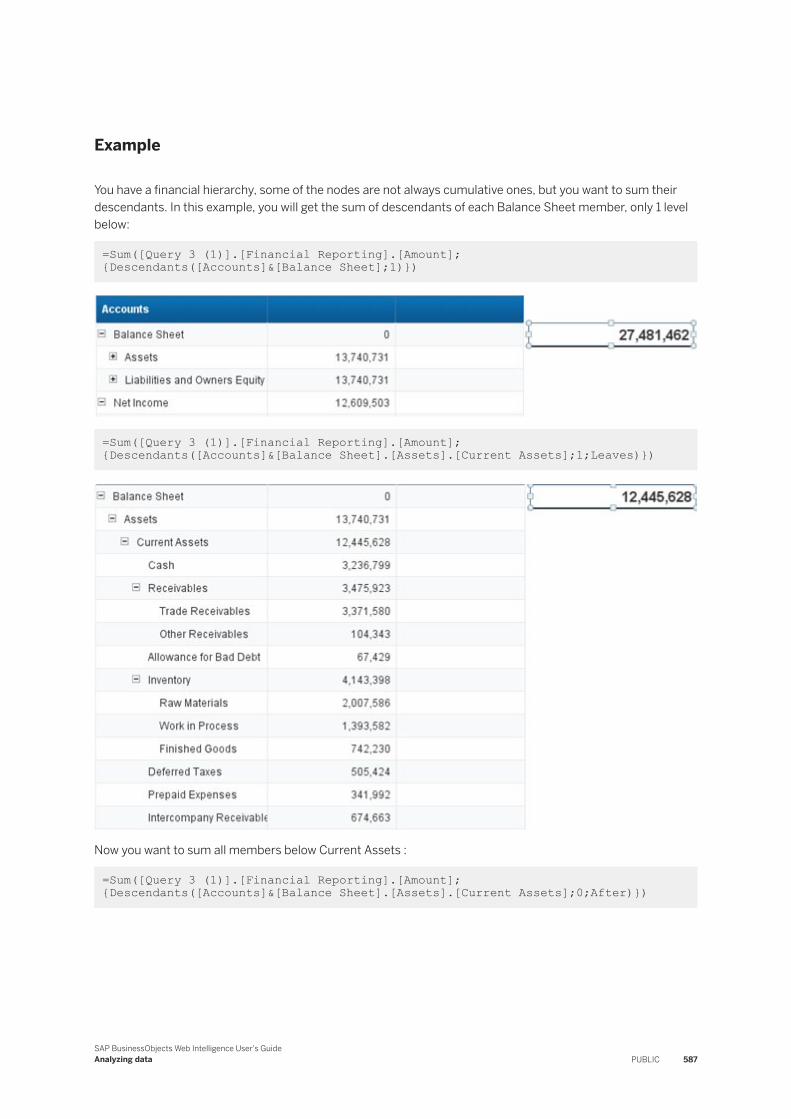
Example
You have a financial hierarchy, some of the nodes are not always cumulative ones, but you want to sum their descendants. In this example, you will get the sum of descendants of each Balance Sheet member, only 1 level below:
=Sum([Query 3 (1)].[Financial Reporting].[Amount];{Descendants([Accounts]&[Balance Sheet];1)})
=Sum([Query 3 (1)].[Financial Reporting].[Amount];{Descendants([Accounts]&[Balance Sheet].[Assets].[Current Assets];1;Leaves)})
Now you want to sum all members below Current Assets :
=Sum([Query 3 (1)].[Financial Reporting].[Amount];{Descendants([Accounts]&[Balance Sheet].[Assets].[Current Assets];0;After)})
SAP BusinessObjects Web Intelligence User's GuideAnalyzing data PUBLIC 587
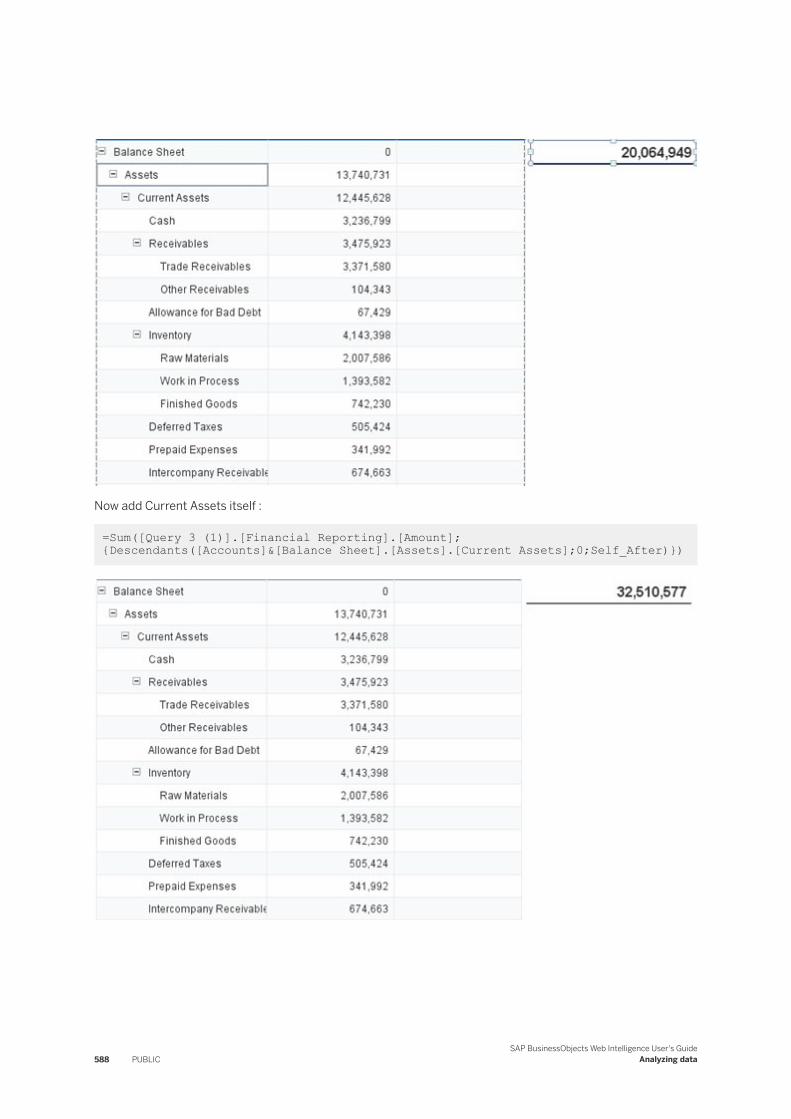
Now add Current Assets itself :
=Sum([Query 3 (1)].[Financial Reporting].[Amount];{Descendants([Accounts]&[Balance Sheet].[Assets].[Current Assets];0;Self_After)})
588 PUBLICSAP BusinessObjects Web Intelligence User's Guide
Analyzing data
Related Information
Aggregate [page 427]Average [page 433]Count [page 434]Max [page 440]Min [page 442]Sum [page 462]
6.4.1.6.1.9.5 IsLeaf
Description
Determines whether a member is a leaf member
Function Group
Misc
Syntax
bool member.IsLeaf
Input
Parameter Description Type Required
member Any member member Yes
Notes
● A leaf member is a member that does not have any child members.● member is the current member of a hierarchy. When the hierarchy is not in the context of the block, the
formula returns an empty value.
SAP BusinessObjects Web Intelligence User's GuideAnalyzing data PUBLIC 589
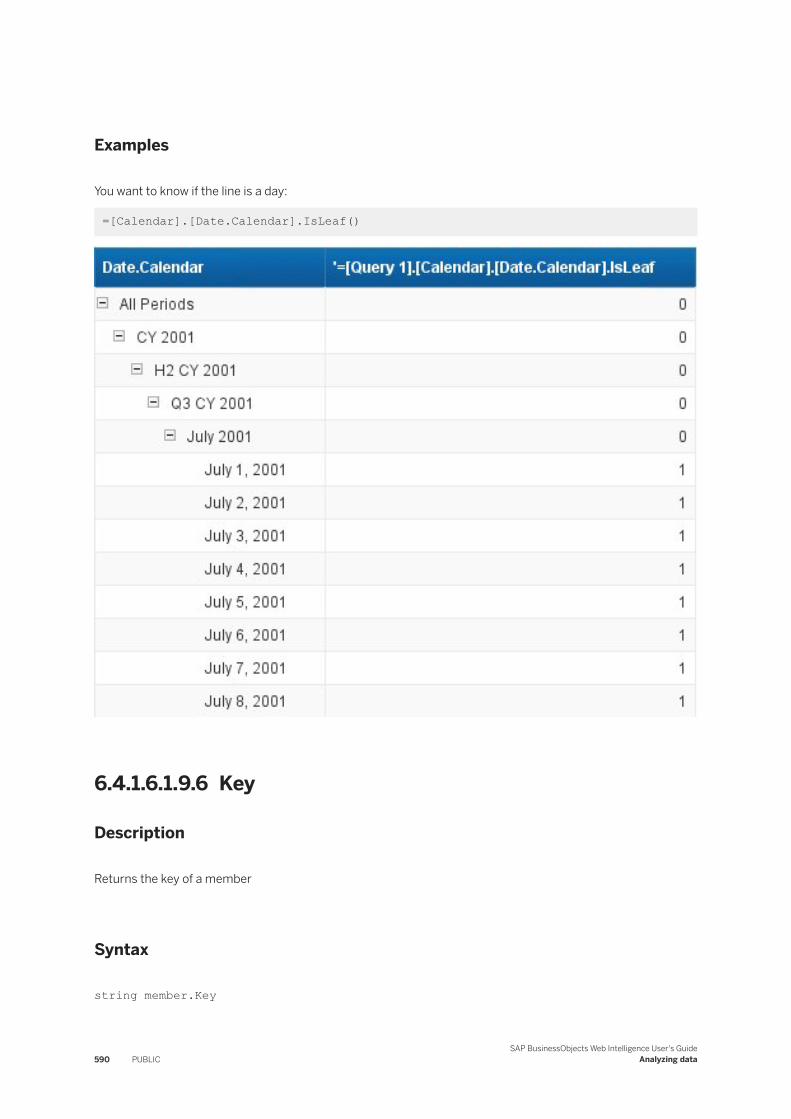
Examples
You want to know if the line is a day:
=[Calendar].[Date.Calendar].IsLeaf()
6.4.1.6.1.9.6 Key
Description
Returns the key of a member
Syntax
string member.Key
590 PUBLICSAP BusinessObjects Web Intelligence User's Guide
Analyzing data
Function Group
Set
Input
Parameter Description Type Required
member Any member member Yes
Notes
● The key is the internal identifier of a member.● member is the current member of a hierarchy. When the hierarchy is not in the context of the block, the
formula returns an empty value.
Example
[Geography].[US].Key returns "XYZ" if the key of the [US] member is "XYZ".
6.4.1.6.1.9.7 Lag
Description
Returns a member at the same level as the current member and a given distance after it, within an aggregate function.
Syntax
member member.Lag(distance)
SAP BusinessObjects Web Intelligence User's GuideAnalyzing data PUBLIC 591
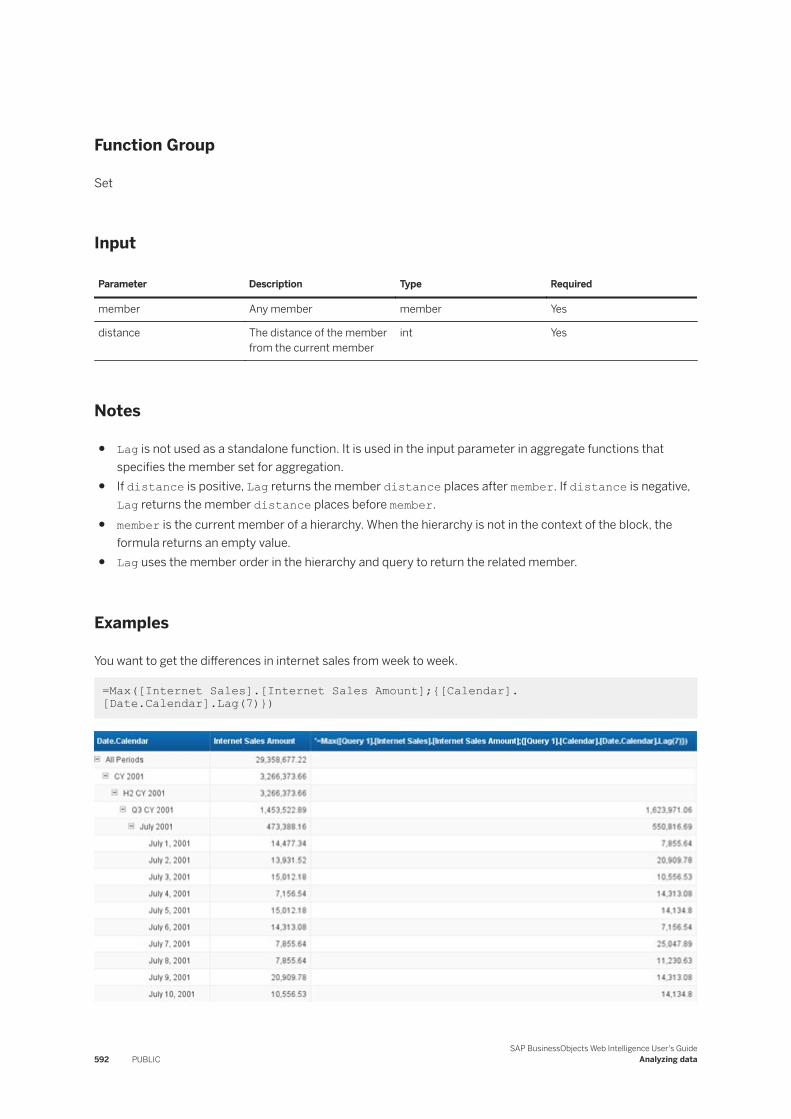
Function Group
Set
Input
Parameter Description Type Required
member Any member member Yes
distance The distance of the member from the current member
int Yes
Notes
● Lag is not used as a standalone function. It is used in the input parameter in aggregate functions that specifies the member set for aggregation.
● If distance is positive, Lag returns the member distance places after member. If distance is negative, Lag returns the member distance places before member.
● member is the current member of a hierarchy. When the hierarchy is not in the context of the block, the formula returns an empty value.
● Lag uses the member order in the hierarchy and query to return the related member.
Examples
You want to get the differences in internet sales from week to week.
=Max([Internet Sales].[Internet Sales Amount];{[Calendar].[Date.Calendar].Lag(7)})
592 PUBLICSAP BusinessObjects Web Intelligence User's Guide
Analyzing data
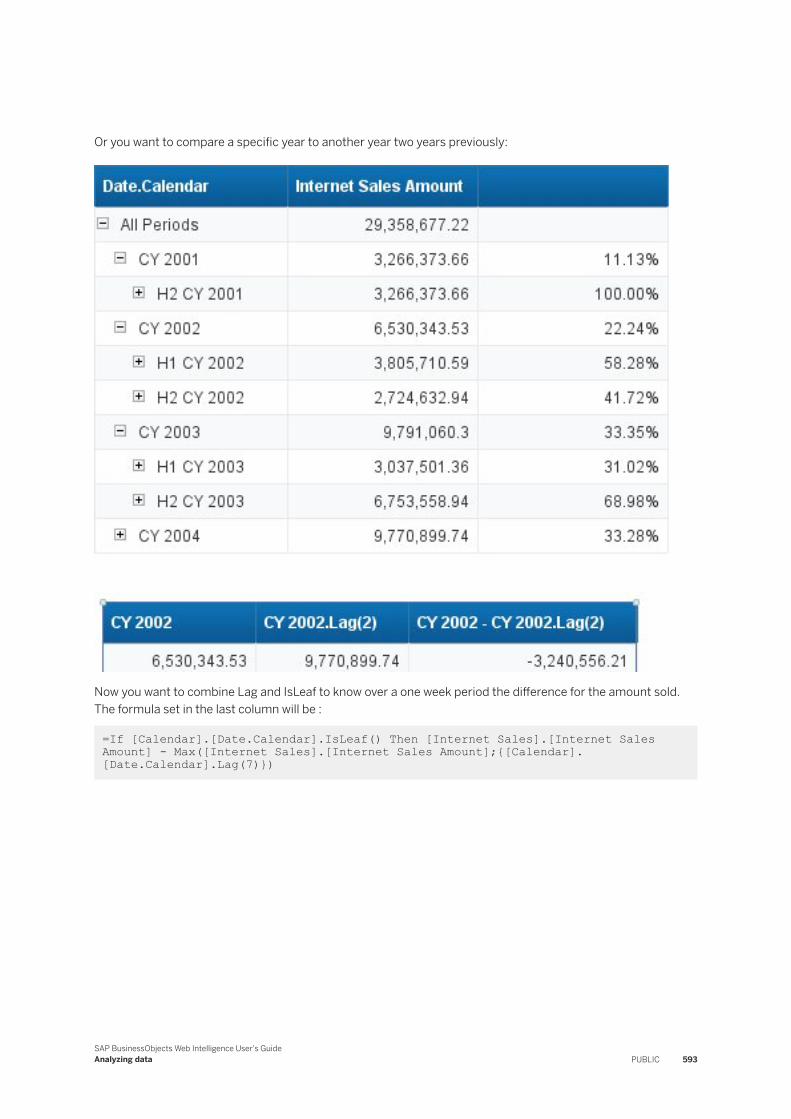
Or you want to compare a specific year to another year two years previously:
Now you want to combine Lag and IsLeaf to know over a one week period the difference for the amount sold. The formula set in the last column will be :
=If [Calendar].[Date.Calendar].IsLeaf() Then [Internet Sales].[Internet Sales Amount] - Max([Internet Sales].[Internet Sales Amount];{[Calendar].[Date.Calendar].Lag(7)})
SAP BusinessObjects Web Intelligence User's GuideAnalyzing data PUBLIC 593
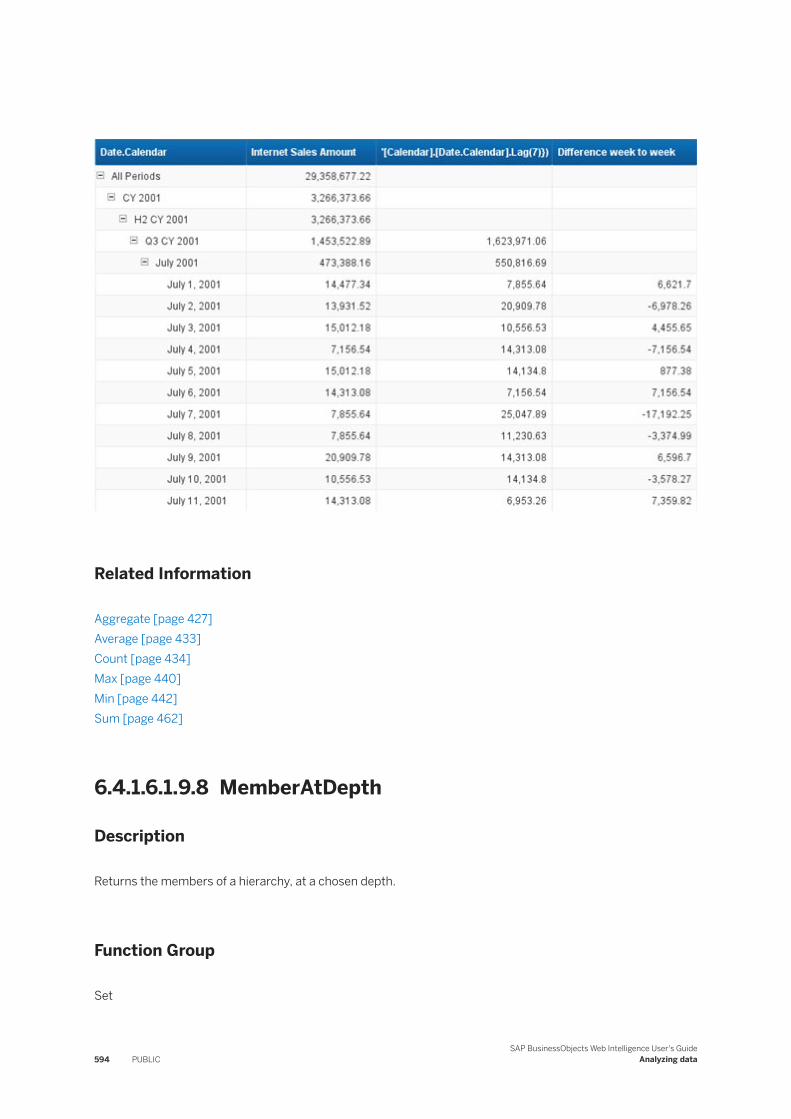
Related Information
Aggregate [page 427]Average [page 433]Count [page 434]Max [page 440]Min [page 442]Sum [page 462]
6.4.1.6.1.9.8 MemberAtDepth
Description
Returns the members of a hierarchy, at a chosen depth.
Function Group
Set
594 PUBLICSAP BusinessObjects Web Intelligence User's Guide
Analyzing data
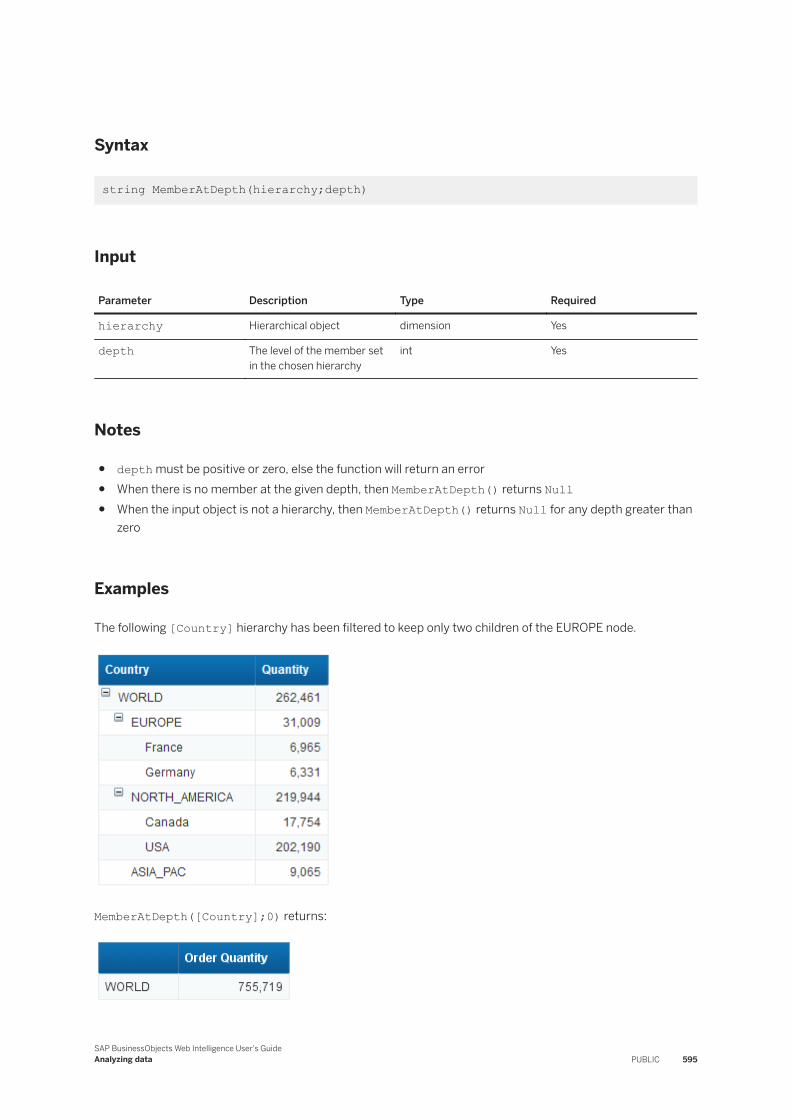
Syntax
string MemberAtDepth(hierarchy;depth)
Input
Parameter Description Type Required
hierarchy Hierarchical object dimension Yes
depth The level of the member set in the chosen hierarchy
int Yes
Notes
● depth must be positive or zero, else the function will return an error● When there is no member at the given depth, then MemberAtDepth() returns Null● When the input object is not a hierarchy, then MemberAtDepth() returns Null for any depth greater than
zero
Examples
The following [Country] hierarchy has been filtered to keep only two children of the EUROPE node.
MemberAtDepth([Country];0) returns:
SAP BusinessObjects Web Intelligence User's GuideAnalyzing data PUBLIC 595
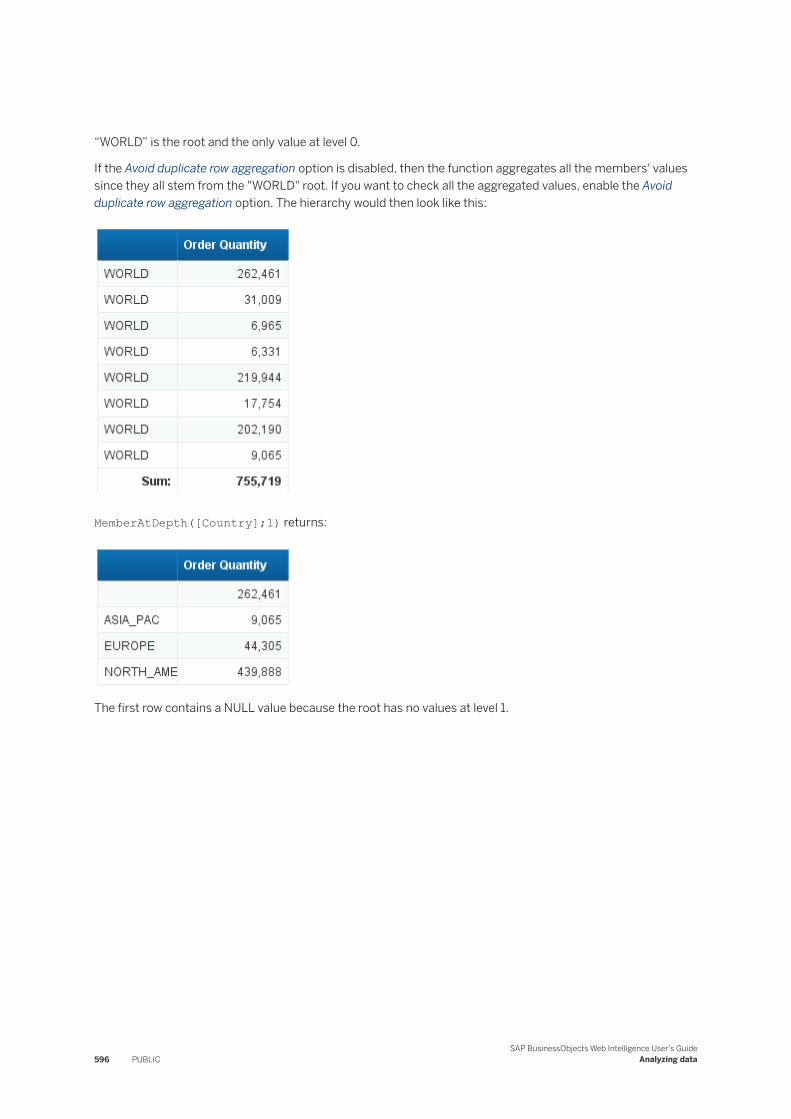
“WORLD” is the root and the only value at level 0.
If the Avoid duplicate row aggregation option is disabled, then the function aggregates all the members' values since they all stem from the "WORLD" root. If you want to check all the aggregated values, enable the Avoid duplicate row aggregation option. The hierarchy would then look like this:
MemberAtDepth([Country];1) returns:
The first row contains a NULL value because the root has no values at level 1.
596 PUBLICSAP BusinessObjects Web Intelligence User's Guide
Analyzing data
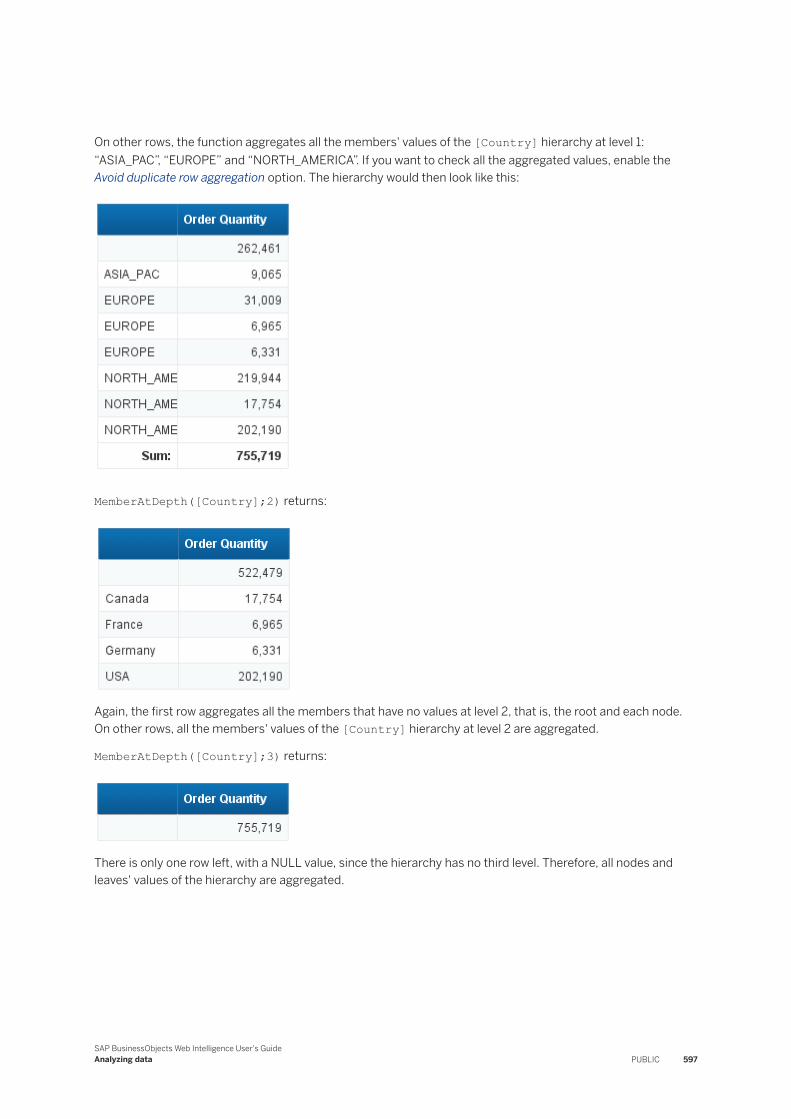
On other rows, the function aggregates all the members' values of the [Country] hierarchy at level 1: “ASIA_PAC”, “EUROPE” and “NORTH_AMERICA”. If you want to check all the aggregated values, enable the Avoid duplicate row aggregation option. The hierarchy would then look like this:
MemberAtDepth([Country];2) returns:
Again, the first row aggregates all the members that have no values at level 2, that is, the root and each node. On other rows, all the members' values of the [Country] hierarchy at level 2 are aggregated.
MemberAtDepth([Country];3) returns:
There is only one row left, with a NULL value, since the hierarchy has no third level. Therefore, all nodes and leaves' values of the hierarchy are aggregated.
SAP BusinessObjects Web Intelligence User's GuideAnalyzing data PUBLIC 597
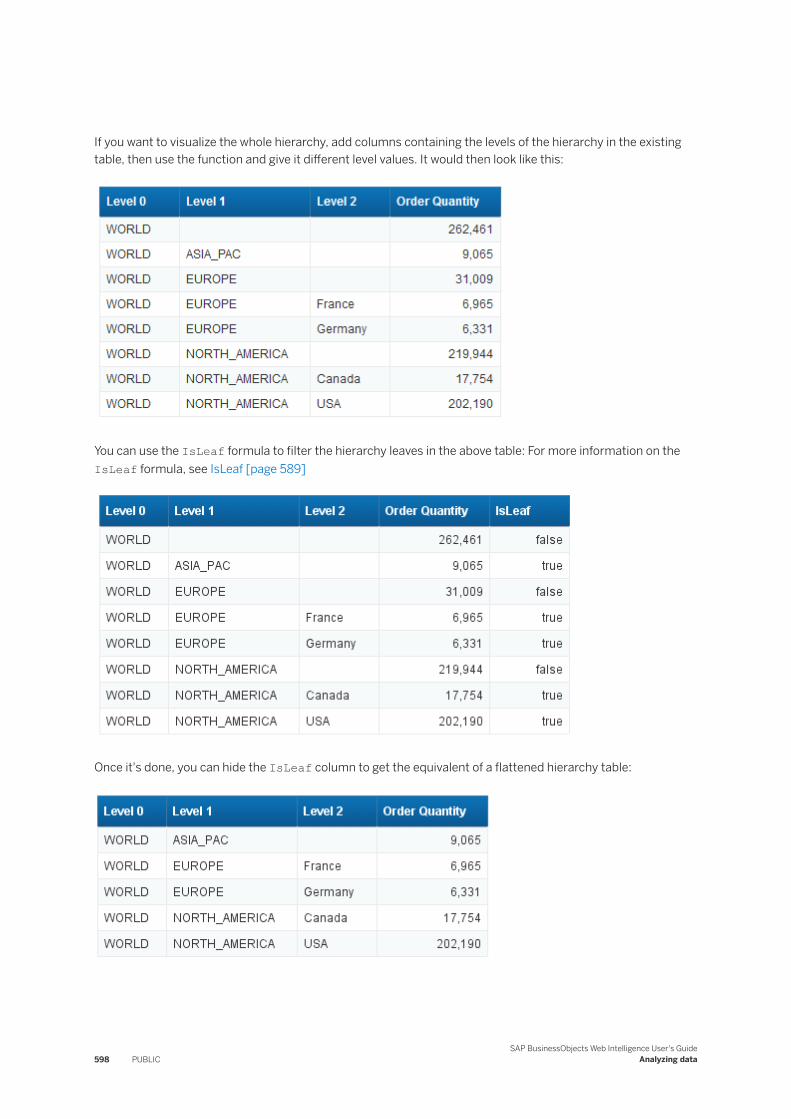
If you want to visualize the whole hierarchy, add columns containing the levels of the hierarchy in the existing table, then use the function and give it different level values. It would then look like this:
You can use the IsLeaf formula to filter the hierarchy leaves in the above table: For more information on the IsLeaf formula, see IsLeaf [page 589]
Once it's done, you can hide the IsLeaf column to get the equivalent of a flattened hierarchy table:
598 PUBLICSAP BusinessObjects Web Intelligence User's Guide
Analyzing data
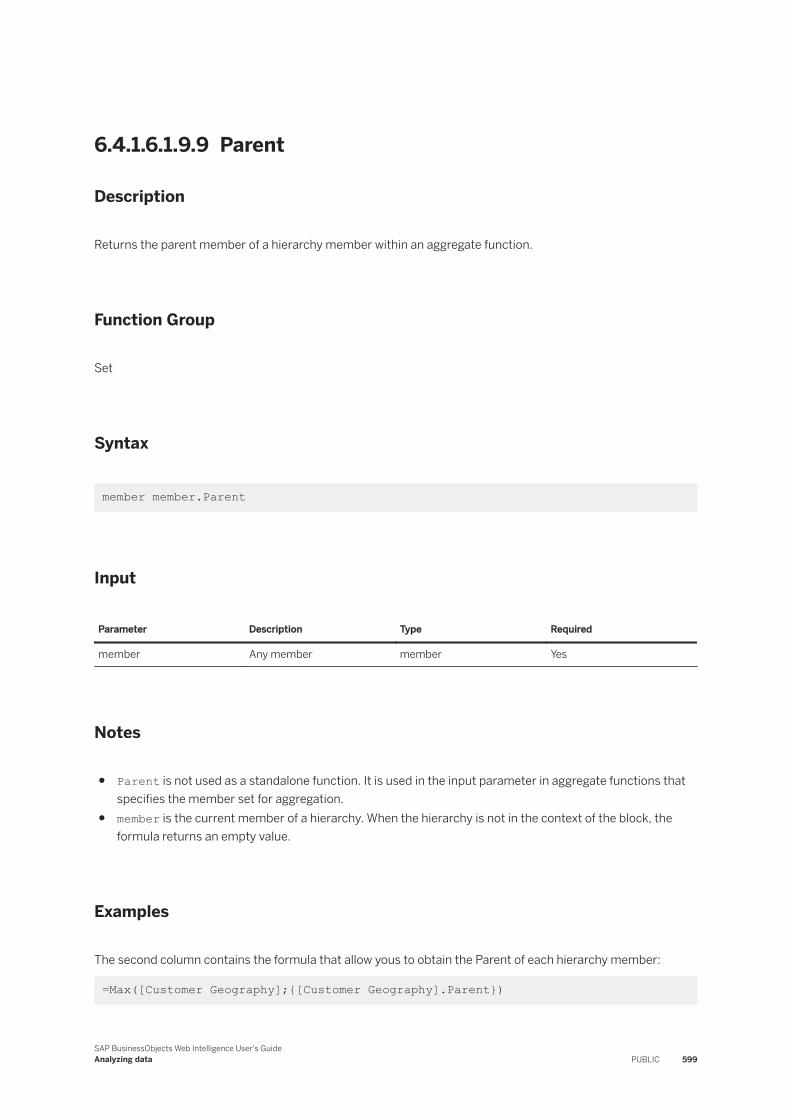
6.4.1.6.1.9.9 Parent
Description
Returns the parent member of a hierarchy member within an aggregate function.
Function Group
Set
Syntax
member member.Parent
Input
Parameter Description Type Required
member Any member member Yes
Notes
● Parent is not used as a standalone function. It is used in the input parameter in aggregate functions that specifies the member set for aggregation.
● member is the current member of a hierarchy. When the hierarchy is not in the context of the block, the formula returns an empty value.
Examples
The second column contains the formula that allow yous to obtain the Parent of each hierarchy member:
=Max([Customer Geography];{[Customer Geography].Parent})
SAP BusinessObjects Web Intelligence User's GuideAnalyzing data PUBLIC 599
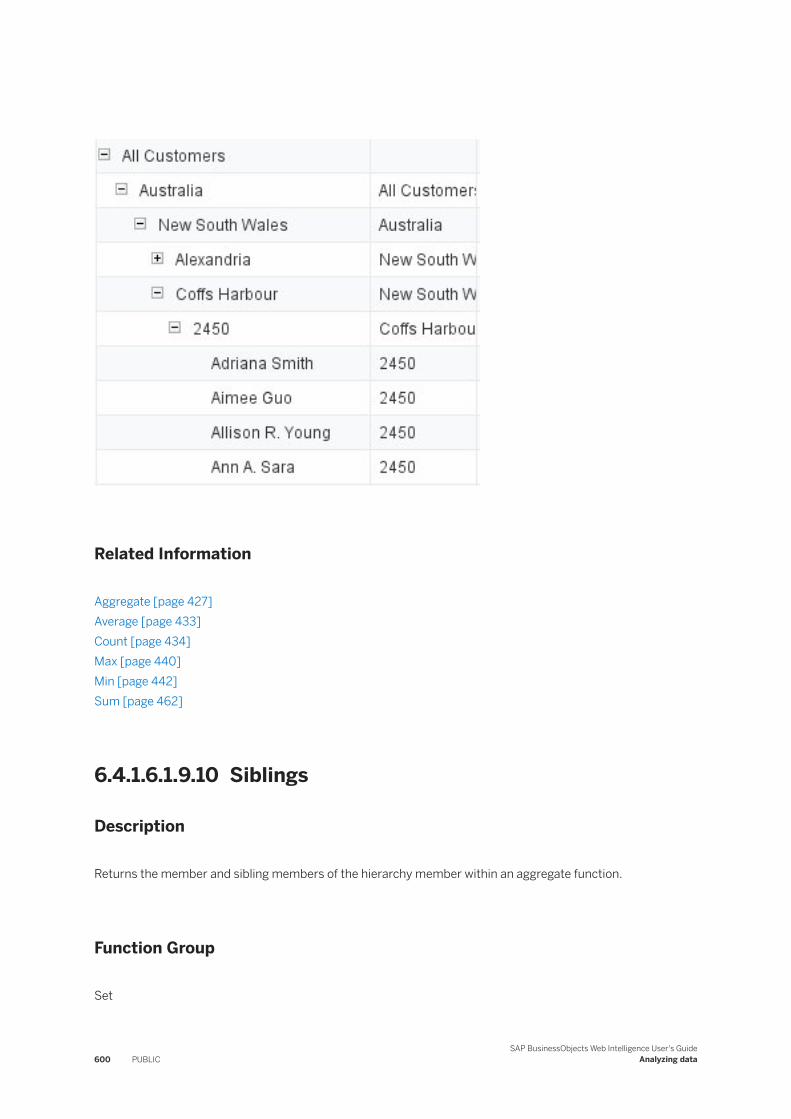
Related Information
Aggregate [page 427]Average [page 433]Count [page 434]Max [page 440]Min [page 442]Sum [page 462]
6.4.1.6.1.9.10 Siblings
Description
Returns the member and sibling members of the hierarchy member within an aggregate function.
Function Group
Set
600 PUBLICSAP BusinessObjects Web Intelligence User's Guide
Analyzing data
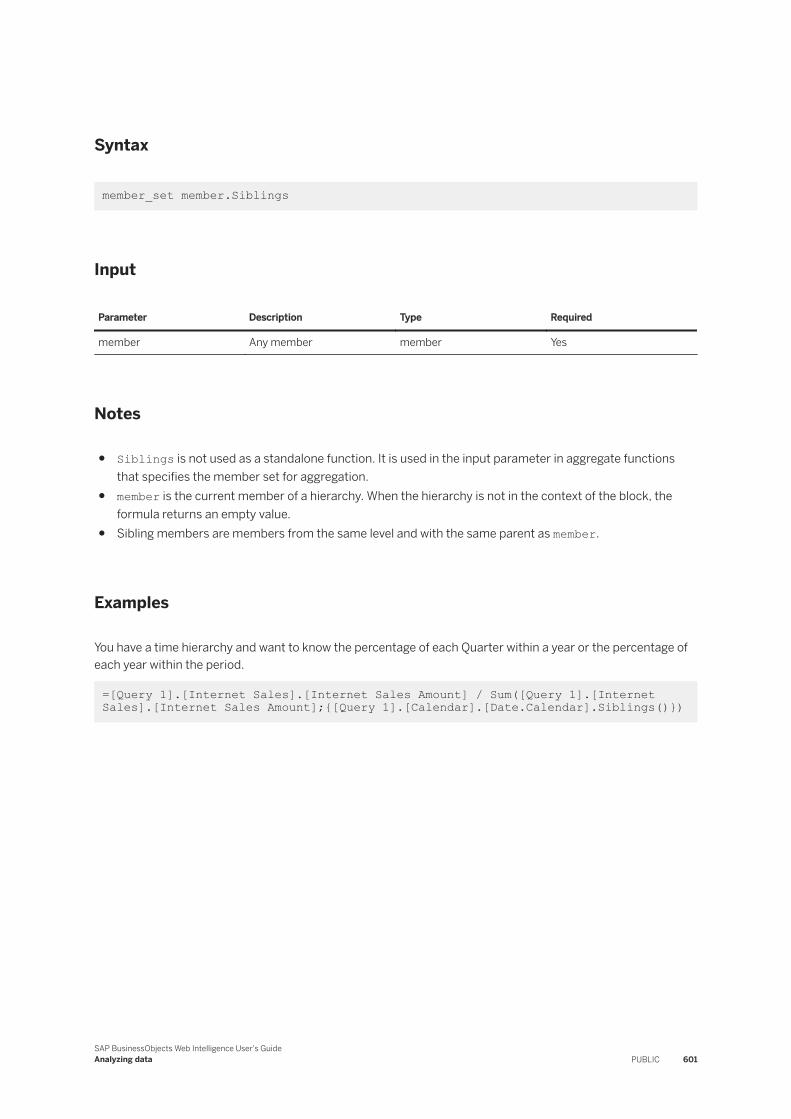
Syntax
member_set member.Siblings
Input
Parameter Description Type Required
member Any member member Yes
Notes
● Siblings is not used as a standalone function. It is used in the input parameter in aggregate functions that specifies the member set for aggregation.
● member is the current member of a hierarchy. When the hierarchy is not in the context of the block, the formula returns an empty value.
● Sibling members are members from the same level and with the same parent as member.
Examples
You have a time hierarchy and want to know the percentage of each Quarter within a year or the percentage of each year within the period.
=[Query 1].[Internet Sales].[Internet Sales Amount] / Sum([Query 1].[Internet Sales].[Internet Sales Amount];{[Query 1].[Calendar].[Date.Calendar].Siblings()})
SAP BusinessObjects Web Intelligence User's GuideAnalyzing data PUBLIC 601
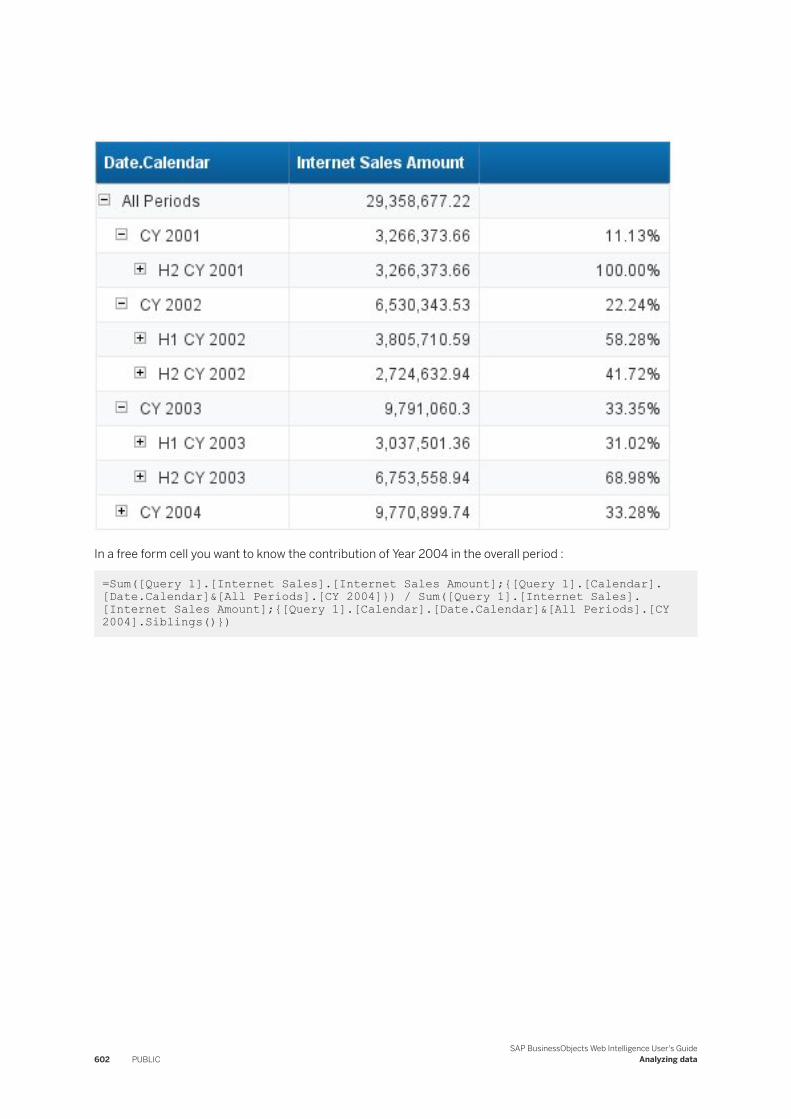
In a free form cell you want to know the contribution of Year 2004 in the overall period :
=Sum([Query 1].[Internet Sales].[Internet Sales Amount];{[Query 1].[Calendar].[Date.Calendar]&[All Periods].[CY 2004]}) / Sum([Query 1].[Internet Sales].[Internet Sales Amount];{[Query 1].[Calendar].[Date.Calendar]&[All Periods].[CY 2004].Siblings()})
602 PUBLICSAP BusinessObjects Web Intelligence User's Guide
Analyzing data
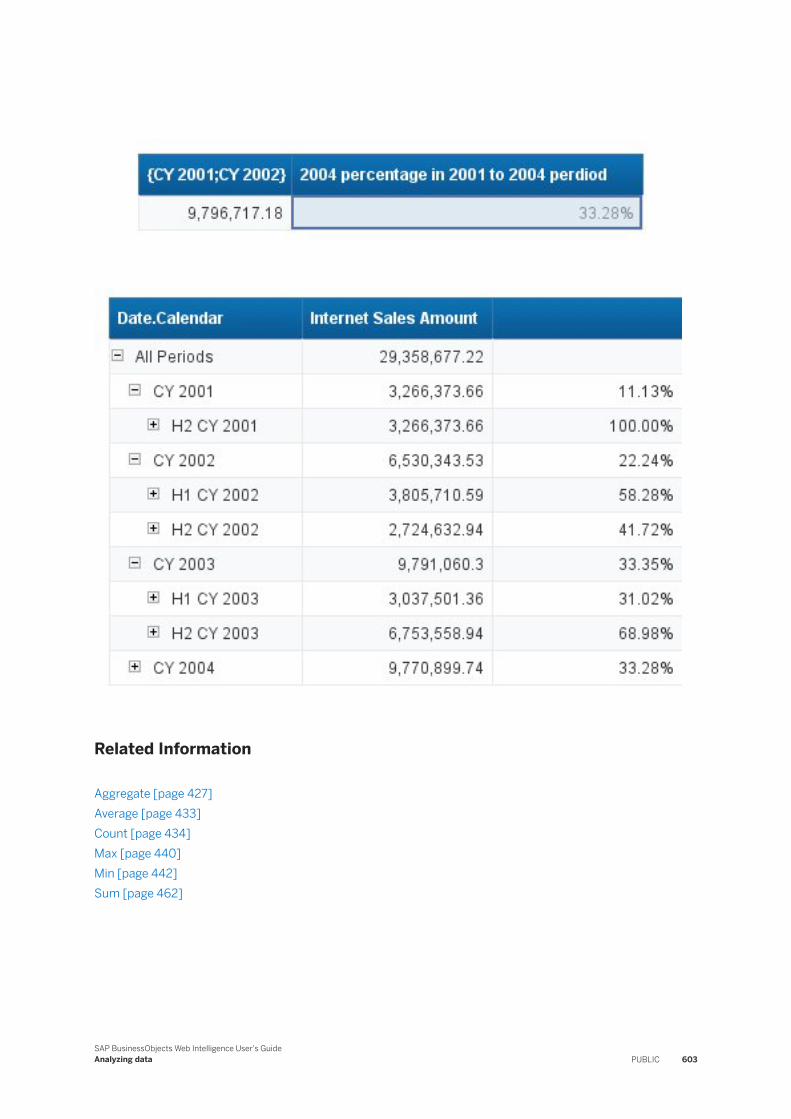
Related Information
Aggregate [page 427]Average [page 433]Count [page 434]Max [page 440]Min [page 442]Sum [page 462]
SAP BusinessObjects Web Intelligence User's GuideAnalyzing data PUBLIC 603
6.4.1.6.1.10 Misc functions
6.4.1.6.1.10.1 BlockName
Description
Returns the block name
Function Group
Misc
Syntax
string BlockName()
Examples
BlockName() returns "Block1" if it is placed in a block called "Block1".
6.4.1.6.1.10.2 ColumnNumber
Description
Returns the column number
Function Group
Misc
604 PUBLICSAP BusinessObjects Web Intelligence User's Guide
Analyzing data
Syntax
int ColumnNumber()
Examples
ColumnNumber() returns 2 if the formula is placed in the second column of a table.
6.4.1.6.1.10.3 Comment
Description
Returns the comment of a cell
Function Group
Misc
Syntax
string Comment()
Note
The comment returned by the function is either the first or last comment entered in the cell, depending on how you have set the parameter in the Document Properties.
Example
Comment() returns "Increase the gross margin in Q3" if the comment in the cell is "Increase the gross margin in Q3".
SAP BusinessObjects Web Intelligence User's GuideAnalyzing data PUBLIC 605
6.4.1.6.1.10.4 CurrentUser
Description
Returns the BI launch pad login of the current user
Function Group
Misc
Syntax
string CurrentUser()
Examples
CurrentUser() returns "gkn" if the current user's login is "gkn".
6.4.1.6.1.10.5 ForceMerge
Description
Includes synchronized dimensions in measure calculations when the dimensions are not in the measure's calculation context
Function Group
Misc
Syntax
num ForceMerge(measure)
606 PUBLICSAP BusinessObjects Web Intelligence User's Guide
Analyzing data
Input
Parameter Description Type Required
measure Any measure Measure Yes
Output
The result of the calculation with the synchronized dimensions taken into account
Notes
● ForceMerge returns #MULTIVALUE if applied to a smart measure because the grouping set necessary to calculate the smart measure does not exist.
● ForceMerge is the equivalent of the BusinessObjects/Desktop Intelligence Multicube function.
Examples
ForceMerge([Revenue]) returns the value of [Revenue], taking into account any synchronized dimensions that do not appear in the same block as the [Revenue] measure.
6.4.1.6.1.10.6 GetContentLocale
Description
Returns the locale of the data contained in the document (the Document Locale)
Function Group
Misc
Syntax
string GetContentLocale()
SAP BusinessObjects Web Intelligence User's GuideAnalyzing data PUBLIC 607
Notes
The Document Locale is used to format the data in a document.
Examples
GetContentLocale() returns "fr_FR" if the Document Locale is "French (France)".
6.4.1.6.1.10.7 GetDominantPreferredViewingLocale
Description
Returns the dominant locale in the user's Preferred Viewing Locale group
Function Group
Misc
Syntax
string GetDominantPreferredViewingLocale()
Notes
● Each group of related locales has a dominant locale, used as a base for all the other locales in the group. For example, US English ("en_US") is the dominant locale in the English locales group. New Zealand English ("en_NZ") is also a member of this group.
● The Translation Manager Guide lists all the Dominant Preferred Viewing Locales.
Examples
GetDominantPreferredViewingLocale returns "en_US" when the Preferred Viewing Locale is "English (New Zealand)".
608 PUBLICSAP BusinessObjects Web Intelligence User's Guide
Analyzing data
Related Information
GetPreferredViewingLocale [page 611]
6.4.1.6.1.10.8 GetLocale
Description
Returns the user's locale used to format the user interface (the Product Locale)
Function Group
Misc
Syntax
string GetLocale()
Notes
The Product Locale is the locale of the user interface (for example, menu items and button text).
Examples
GetLocale() returns "en_US" if the user's Product Locale is "English (US)".
6.4.1.6.1.10.9 GetLocalized
Description
Returns a string localized according to the user's Preferred Viewing Locale
SAP BusinessObjects Web Intelligence User's GuideAnalyzing data PUBLIC 609
Syntax
string GetLocalized(string[;comment])
Input
Parameter Description Type Required
string The string to be translated string Yes
comment A comment to aid translators
string No
Notes
● The string parameter can be a string in any formula (for example, in a cell, an alerter message or a variable definition).
● When designing a report, you can use the comment parameter to provide further information to help translators translate the string. The comment appears with the string in the Translation Manager tool which translators use to translate reports.
● Each string + comment pair generates a separate string to be translated in the Translation Manager tool. As a result, GetLocalized("Product Total";"Max 20 characters") and GetLocalized("Product Total";"Use no more than 20 characters") might return different translations.
Examples
GetLocalized("Total for all products") returns the French translation of "Total for all products" if the Preferred Viewing Locale is "fr_FR".
GetLocalized("Total for all products";"Try not to use more than 20 characters") returns the German translation of "Total for all products" if the Preferred Viewing Locale is "de_DE". The function also tells the translator of the report not to use more than 20 characters if possible when translating the string.
Related Information
GetPreferredViewingLocale [page 611]
610 PUBLICSAP BusinessObjects Web Intelligence User's Guide
Analyzing data
6.4.1.6.1.10.10 GetPreferredViewingLocale
Description
Returns the user's preferred locale for viewing document data (the Preferred Viewing Locale)
Function Group
Misc
Syntax
string GetPreferredViewingLocale()
Examples
GetPreferredViewingLocale returns "en_US" if the Preferred Viewing Locale is "English (US)".
Related Information
GetLocalized [page 609]GetDominantPreferredViewingLocale [page 608]
6.4.1.6.1.10.11 If...Then...Else
Description
Returns a value based on whether an expression is true or false
Function Group
Misc
SAP BusinessObjects Web Intelligence User's GuideAnalyzing data PUBLIC 611
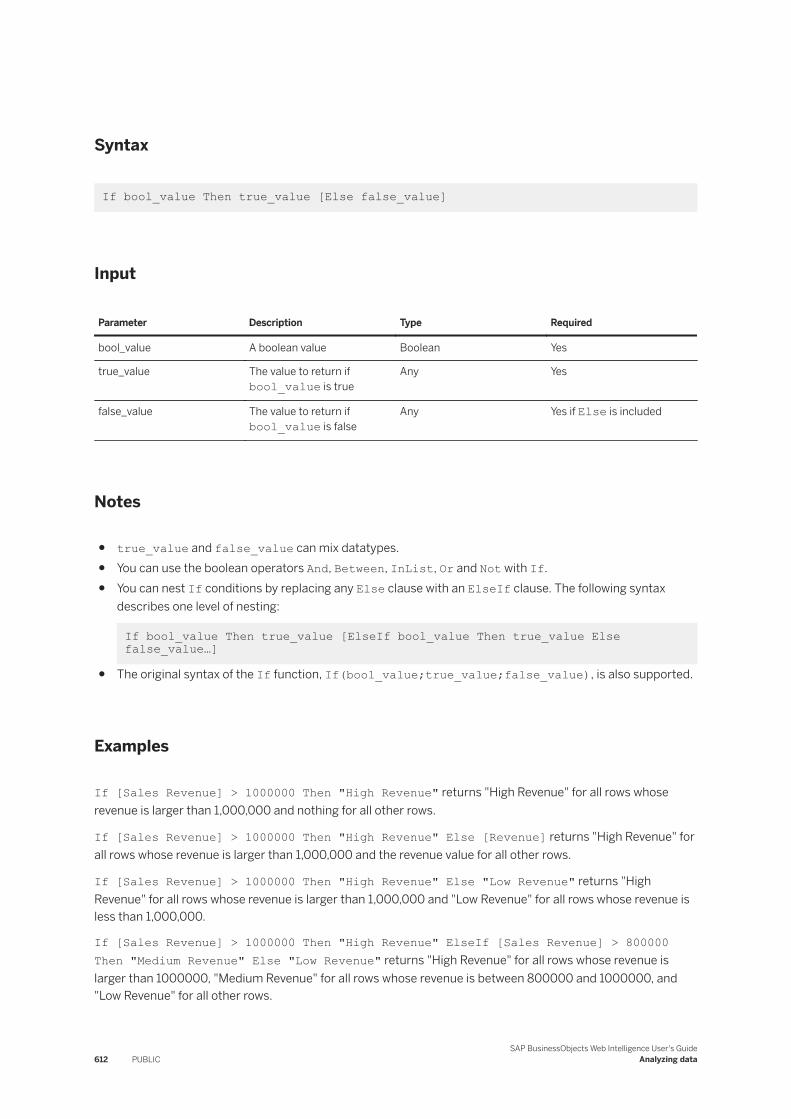
Syntax
If bool_value Then true_value [Else false_value]
Input
Parameter Description Type Required
bool_value A boolean value Boolean Yes
true_value The value to return if bool_value is true
Any Yes
false_value The value to return if bool_value is false
Any Yes if Else is included
Notes
● true_value and false_value can mix datatypes.● You can use the boolean operators And, Between, InList, Or and Not with If.● You can nest If conditions by replacing any Else clause with an ElseIf clause. The following syntax
describes one level of nesting:
If bool_value Then true_value [ElseIf bool_value Then true_value Else false_value…]
● The original syntax of the If function, If(bool_value;true_value;false_value), is also supported.
Examples
If [Sales Revenue] > 1000000 Then "High Revenue" returns "High Revenue" for all rows whose revenue is larger than 1,000,000 and nothing for all other rows.
If [Sales Revenue] > 1000000 Then "High Revenue" Else [Revenue] returns "High Revenue" for all rows whose revenue is larger than 1,000,000 and the revenue value for all other rows.
If [Sales Revenue] > 1000000 Then "High Revenue" Else "Low Revenue" returns "High Revenue" for all rows whose revenue is larger than 1,000,000 and "Low Revenue" for all rows whose revenue is less than 1,000,000.
If [Sales Revenue] > 1000000 Then "High Revenue" ElseIf [Sales Revenue] > 800000 Then "Medium Revenue" Else "Low Revenue" returns "High Revenue" for all rows whose revenue is larger than 1000000, "Medium Revenue" for all rows whose revenue is between 800000 and 1000000, and "Low Revenue" for all other rows.
612 PUBLICSAP BusinessObjects Web Intelligence User's Guide
Analyzing data
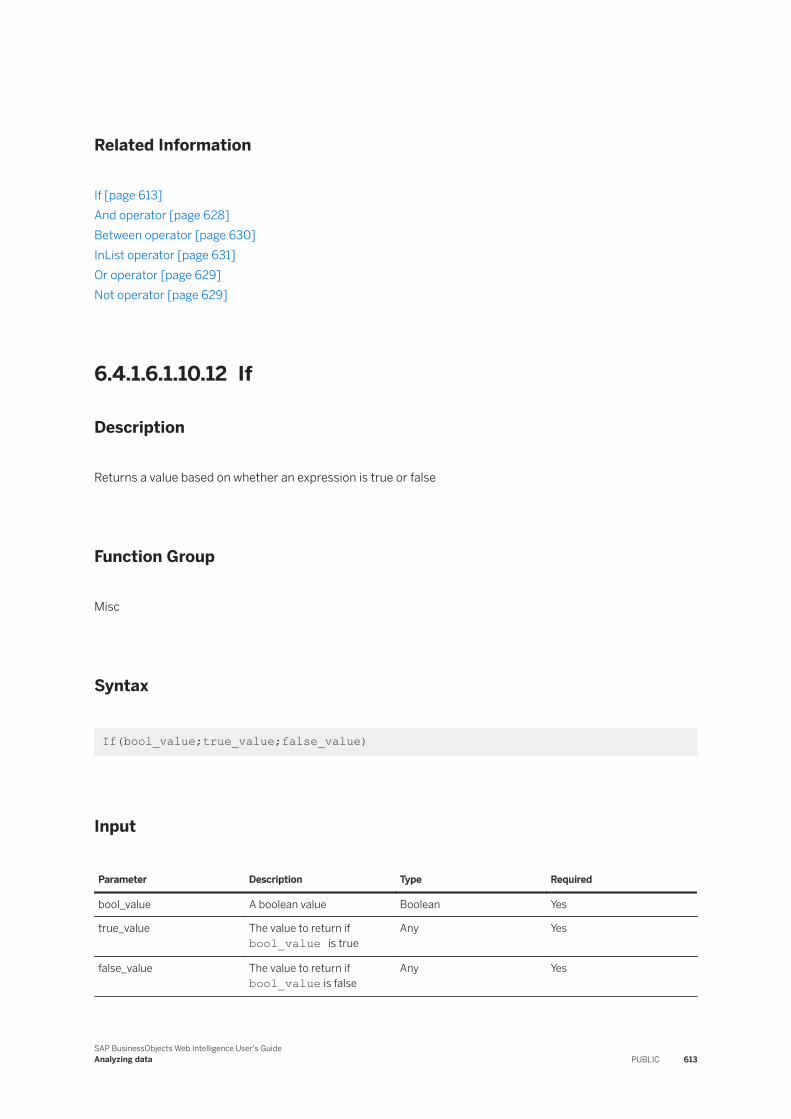
Related Information
If [page 613]And operator [page 628]Between operator [page 630]InList operator [page 631]Or operator [page 629]Not operator [page 629]
6.4.1.6.1.10.12 If
Description
Returns a value based on whether an expression is true or false
Function Group
Misc
Syntax
If(bool_value;true_value;false_value)
Input
Parameter Description Type Required
bool_value A boolean value Boolean Yes
true_value The value to return if bool_value is true
Any Yes
false_value The value to return if bool_value is false
Any Yes
SAP BusinessObjects Web Intelligence User's GuideAnalyzing data PUBLIC 613
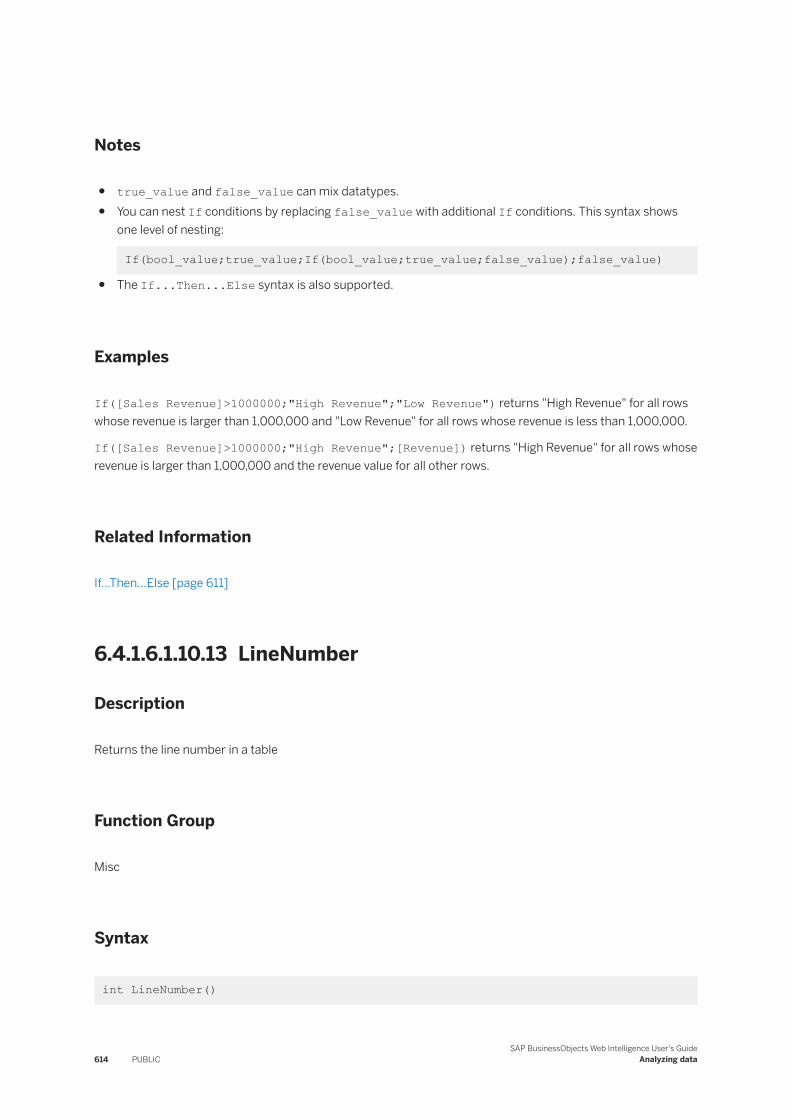
Notes
● true_value and false_value can mix datatypes.● You can nest If conditions by replacing false_value with additional If conditions. This syntax shows
one level of nesting:
If(bool_value;true_value;If(bool_value;true_value;false_value);false_value)
● The If...Then...Else syntax is also supported.
Examples
If([Sales Revenue]>1000000;"High Revenue";"Low Revenue") returns "High Revenue" for all rows whose revenue is larger than 1,000,000 and "Low Revenue" for all rows whose revenue is less than 1,000,000.
If([Sales Revenue]>1000000;"High Revenue";[Revenue]) returns "High Revenue" for all rows whose revenue is larger than 1,000,000 and the revenue value for all other rows.
Related Information
If...Then...Else [page 611]
6.4.1.6.1.10.13 LineNumber
Description
Returns the line number in a table
Function Group
Misc
Syntax
int LineNumber()
614 PUBLICSAP BusinessObjects Web Intelligence User's Guide
Analyzing data
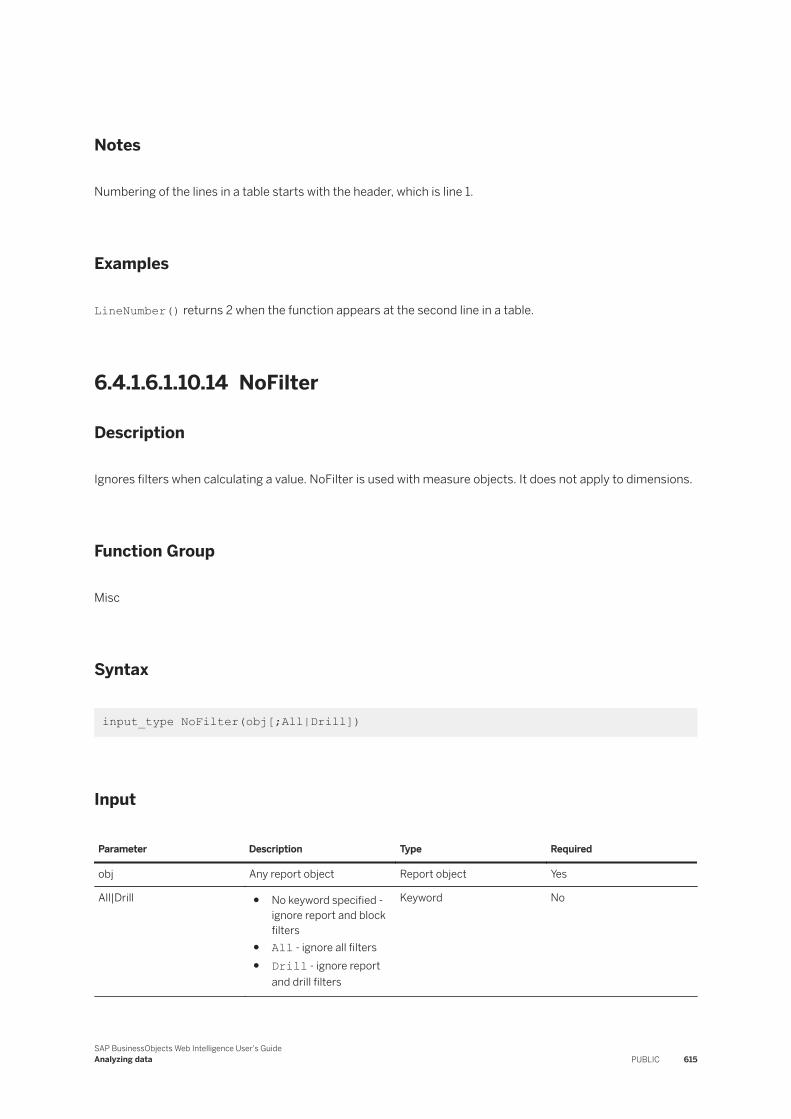
Notes
Numbering of the lines in a table starts with the header, which is line 1.
Examples
LineNumber() returns 2 when the function appears at the second line in a table.
6.4.1.6.1.10.14 NoFilter
Description
Ignores filters when calculating a value. NoFilter is used with measure objects. It does not apply to dimensions.
Function Group
Misc
Syntax
input_type NoFilter(obj[;All|Drill])
Input
Parameter Description Type Required
obj Any report object Report object Yes
All|Drill ● No keyword specified - ignore report and block filters
● All - ignore all filters● Drill - ignore report
and drill filters
Keyword No
SAP BusinessObjects Web Intelligence User's GuideAnalyzing data PUBLIC 615
Notes
● NoFilter(obj;Drill) does not work in query drill mode because the drill filters are added to the query rather than applied to the report data.
● If you end drill mode with drill filters applied, the drill filters become report filters and can change the value of any objects to which NoFilter(obj;Drill) is applied.
Examples
When placed in a block footer, NoFilter(Sum([Sales Revenue])) returns the total sales revenue of all possible rows in the block, even when rows are filtered out of the block.
NoFilter(Sum([Sales Revenue]);All) returns the sum of the sales revenue for all countries including France, even though there is a filter that excludes France from the report.
NoFilter(Sum([Sales Revenue]);Drill) returns the sum of the sales revenue for all countries, even when there is a drill filter on the [Country] dimension.
6.4.1.6.1.10.15 NumberOfPages
Description
Returns the number of pages in a report
Function Group
Misc
Syntax
integer NumberOfPages()
Notes
If you place the NumberOfPages function in a cell whose Autofit Height or Autofit Width properties are set, the cell returns #RECURSIVE because the placing of this formula in an Autofit cell creates a circular dependency.
616 PUBLICSAP BusinessObjects Web Intelligence User's Guide
Analyzing data
This function needs the exact size of the report to return a value, but the size of the cell, which affects the size of the report, is determined by the cell content.
Examples
NumberOfDataPages() returns 2 if the report has two pages.
6.4.1.6.1.10.16 Page
Description
Returns the current page number in a report
Function Group
Misc
Syntax
integer Page()
Notes
If you place the Page function in a cell whose Autofit Height or Autofit Width properties are set, the cell returns #RECURSIVE because the placing of this formula in an Autofit cell creates a circular dependency. This function needs the exact size of the report to return a value, but the size of the cell, which affects the size of the report, is determined by the cell content.
Example
Page() returns 2 if it appears in the second page of the report.
SAP BusinessObjects Web Intelligence User's GuideAnalyzing data PUBLIC 617
6.4.1.6.1.10.17 PageInSection
Description
Returns the page number within the current section instance in a specified section
Function Group
Misc
Syntax
integer PageInSection([section_level)]
Input
Parameter Description Type Required
section_level Hierarchical level of the section
integer No
Notes
● If you place the PageInSection function in a cell whose Autofit Height or Autofit Width properties are set, the cell returns #RECURSIVE because the placing of this formula in an Autofit cell creates a circular dependency. This function needs the exact size of the report to return a value, but the size of the cell, which affects the size of the report, is determined by the cell content.
● PageInSection() must be within a section instance. Otherwise, it returns 0.● The section hierarchical levels start at 1 (top level).● If section_level is not specified, the function returns the number in the current section level.● If you specifiy a section level that does not exist, the function returns 0.● Variables created with the function must be measures.
618 PUBLICSAP BusinessObjects Web Intelligence User's Guide
Analyzing data
Examples
In a document with a section on Year (= 2010, 2011, 2012) and a sub-section on State (= California, Florida, Texas):
● PageInSection(1) repeated in the Year section returns 2 on the second page of 2010, 2011 and 2012.● PageInSection(2) repeated in the State sub-section returns 1 on the first page of California, Florida and
Texas.
6.4.1.6.1.10.18 Previous
Description
Returns a previous value of an object
Function Group
Misc
Syntax
input_type Previous(dimension|measure|Self [;Row|col][;(reset_dims)][;offset][;NoNull])
Input
Parameter Description Type Required
dimension|measure|Self The dimension or measure whose previous value the function returns, or the Self keyword
Dimension, measure or keyword
Yes
Row/Col Sets the calculation direction Keyword No
reset_dims The list of dimensions used to reset the calculation
Dimension list No
offset Specifies the value of dimension or measure
Integer No (default is 1)
SAP BusinessObjects Web Intelligence User's GuideAnalyzing data PUBLIC 619
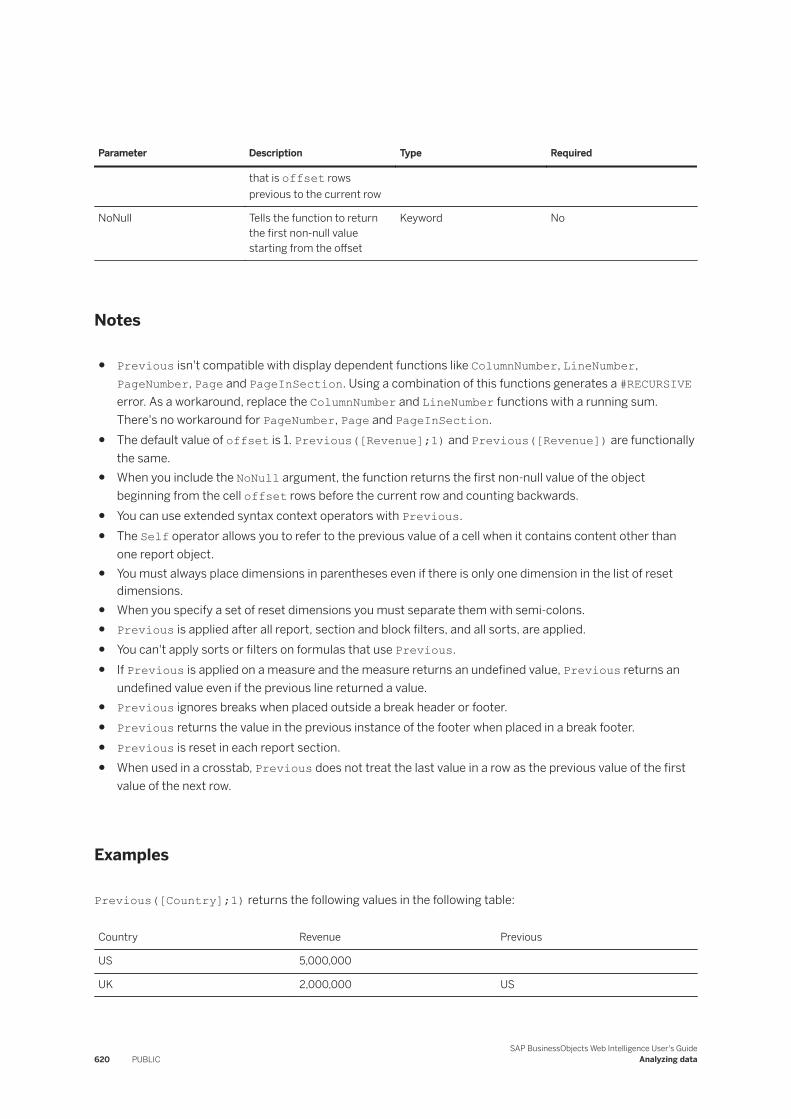
Parameter Description Type Required
that is offset rows previous to the current row
NoNull Tells the function to return the first non-null value starting from the offset
Keyword No
Notes
● Previous isn't compatible with display dependent functions like ColumnNumber, LineNumber, PageNumber, Page and PageInSection. Using a combination of this functions generates a #RECURSIVE error. As a workaround, replace the ColumnNumber and LineNumber functions with a running sum. There's no workaround for PageNumber, Page and PageInSection.
● The default value of offset is 1. Previous([Revenue];1) and Previous([Revenue]) are functionally the same.
● When you include the NoNull argument, the function returns the first non-null value of the object beginning from the cell offset rows before the current row and counting backwards.
● You can use extended syntax context operators with Previous.● The Self operator allows you to refer to the previous value of a cell when it contains content other than
one report object.● You must always place dimensions in parentheses even if there is only one dimension in the list of reset
dimensions.● When you specify a set of reset dimensions you must separate them with semi-colons.● Previous is applied after all report, section and block filters, and all sorts, are applied.● You can't apply sorts or filters on formulas that use Previous.● If Previous is applied on a measure and the measure returns an undefined value, Previous returns an
undefined value even if the previous line returned a value.● Previous ignores breaks when placed outside a break header or footer.● Previous returns the value in the previous instance of the footer when placed in a break footer.● Previous is reset in each report section.● When used in a crosstab, Previous does not treat the last value in a row as the previous value of the first
value of the next row.
Examples
Previous([Country];1) returns the following values in the following table:
Country Revenue Previous
US 5,000,000
UK 2,000,000 US
620 PUBLICSAP BusinessObjects Web Intelligence User's Guide
Analyzing data
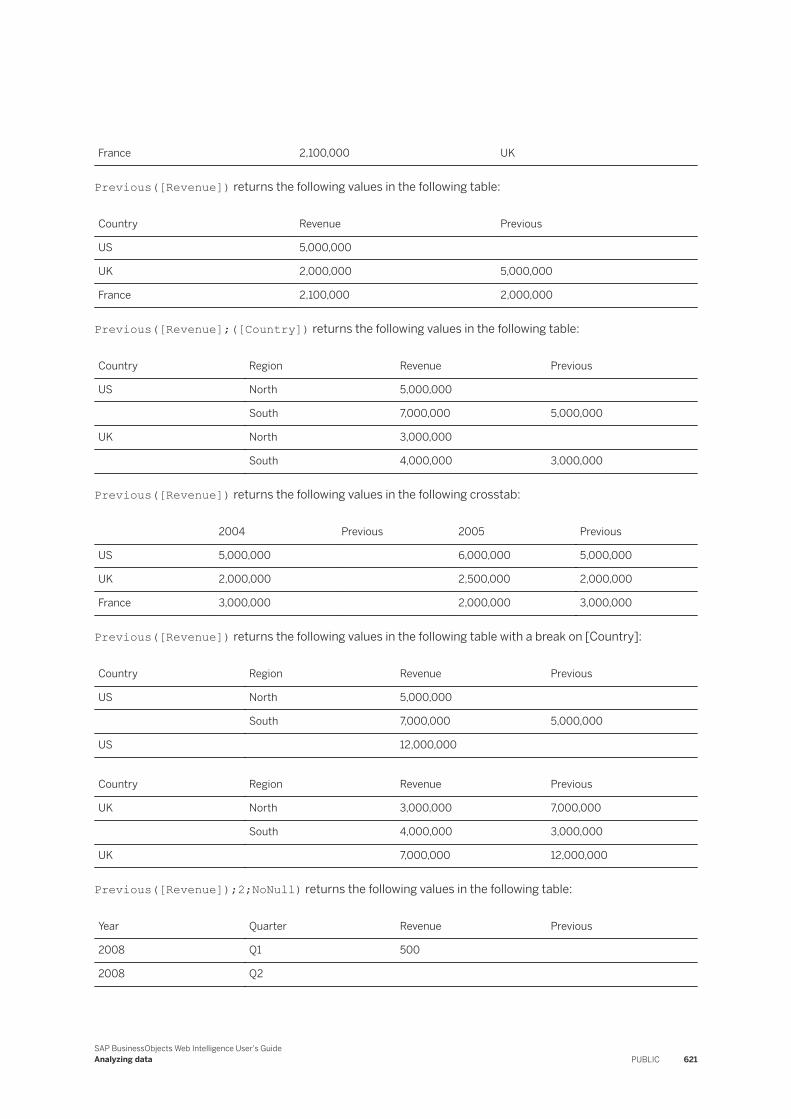
France 2,100,000 UK
Previous([Revenue]) returns the following values in the following table:
Country Revenue Previous
US 5,000,000
UK 2,000,000 5,000,000
France 2,100,000 2,000,000
Previous([Revenue];([Country]) returns the following values in the following table:
Country Region Revenue Previous
US North 5,000,000
South 7,000,000 5,000,000
UK North 3,000,000
South 4,000,000 3,000,000
Previous([Revenue]) returns the following values in the following crosstab:
2004 Previous 2005 Previous
US 5,000,000 6,000,000 5,000,000
UK 2,000,000 2,500,000 2,000,000
France 3,000,000 2,000,000 3,000,000
Previous([Revenue]) returns the following values in the following table with a break on [Country]:
Country Region Revenue Previous
US North 5,000,000
South 7,000,000 5,000,000
US 12,000,000
Country Region Revenue Previous
UK North 3,000,000 7,000,000
South 4,000,000 3,000,000
UK 7,000,000 12,000,000
Previous([Revenue]);2;NoNull) returns the following values in the following table:
Year Quarter Revenue Previous
2008 Q1 500
2008 Q2
SAP BusinessObjects Web Intelligence User's GuideAnalyzing data PUBLIC 621
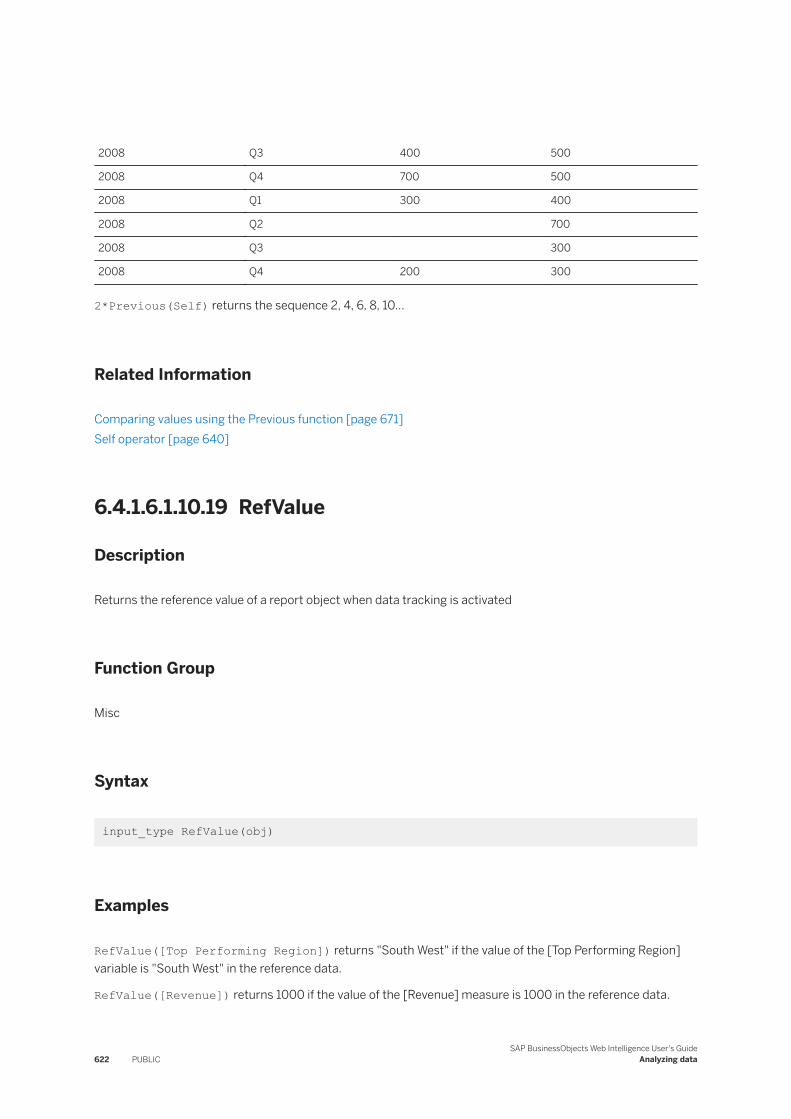
2008 Q3 400 500
2008 Q4 700 500
2008 Q1 300 400
2008 Q2 700
2008 Q3 300
2008 Q4 200 300
2*Previous(Self) returns the sequence 2, 4, 6, 8, 10...
Related Information
Comparing values using the Previous function [page 671]Self operator [page 640]
6.4.1.6.1.10.19 RefValue
Description
Returns the reference value of a report object when data tracking is activated
Function Group
Misc
Syntax
input_type RefValue(obj)
Examples
RefValue([Top Performing Region]) returns "South West" if the value of the [Top Performing Region] variable is "South West" in the reference data.
RefValue([Revenue]) returns 1000 if the value of the [Revenue] measure is 1000 in the reference data.
622 PUBLICSAP BusinessObjects Web Intelligence User's Guide
Analyzing data
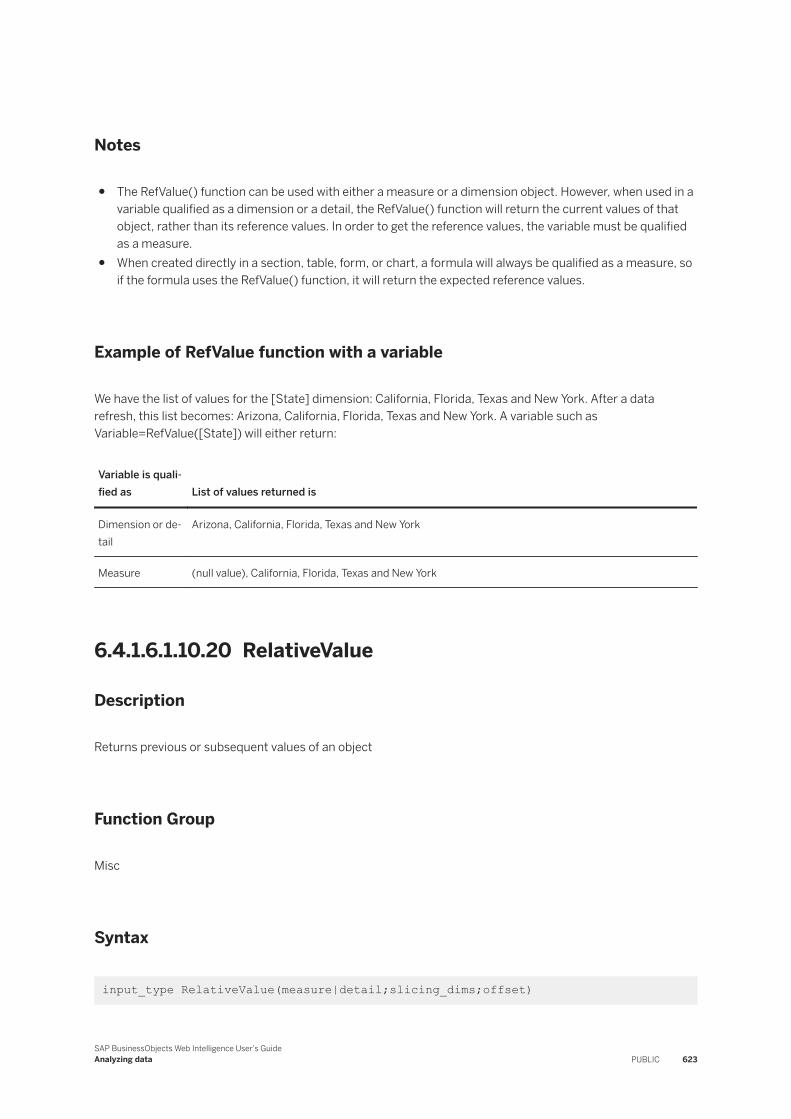
Notes
● The RefValue() function can be used with either a measure or a dimension object. However, when used in a variable qualified as a dimension or a detail, the RefValue() function will return the current values of that object, rather than its reference values. In order to get the reference values, the variable must be qualified as a measure.
● When created directly in a section, table, form, or chart, a formula will always be qualified as a measure, so if the formula uses the RefValue() function, it will return the expected reference values.
Example of RefValue function with a variable
We have the list of values for the [State] dimension: California, Florida, Texas and New York. After a data refresh, this list becomes: Arizona, California, Florida, Texas and New York. A variable such as Variable=RefValue([State]) will either return:
Variable is qualified as List of values returned is
Dimension or detail
Arizona, California, Florida, Texas and New York
Measure (null value), California, Florida, Texas and New York
6.4.1.6.1.10.20 RelativeValue
Description
Returns previous or subsequent values of an object
Function Group
Misc
Syntax
input_type RelativeValue(measure|detail;slicing_dims;offset)
SAP BusinessObjects Web Intelligence User's GuideAnalyzing data PUBLIC 623
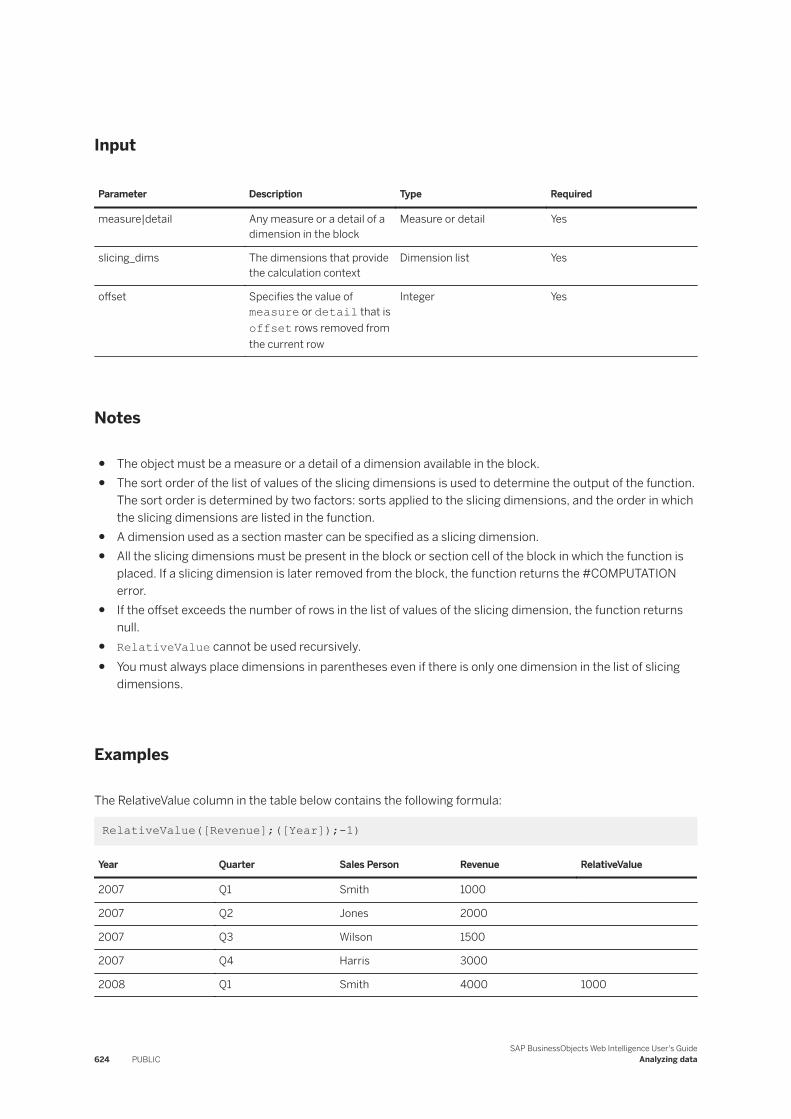
Input
Parameter Description Type Required
measure|detail Any measure or a detail of a dimension in the block
Measure or detail Yes
slicing_dims The dimensions that provide the calculation context
Dimension list Yes
offset Specifies the value of measure or detail that is offset rows removed from the current row
Integer Yes
Notes
● The object must be a measure or a detail of a dimension available in the block.● The sort order of the list of values of the slicing dimensions is used to determine the output of the function.
The sort order is determined by two factors: sorts applied to the slicing dimensions, and the order in which the slicing dimensions are listed in the function.
● A dimension used as a section master can be specified as a slicing dimension.● All the slicing dimensions must be present in the block or section cell of the block in which the function is
placed. If a slicing dimension is later removed from the block, the function returns the #COMPUTATION error.
● If the offset exceeds the number of rows in the list of values of the slicing dimension, the function returns null.
● RelativeValue cannot be used recursively.● You must always place dimensions in parentheses even if there is only one dimension in the list of slicing
dimensions.
Examples
The RelativeValue column in the table below contains the following formula:
RelativeValue([Revenue];([Year]);-1)
Year Quarter Sales Person Revenue RelativeValue
2007 Q1 Smith 1000
2007 Q2 Jones 2000
2007 Q3 Wilson 1500
2007 Q4 Harris 3000
2008 Q1 Smith 4000 1000
624 PUBLICSAP BusinessObjects Web Intelligence User's Guide
Analyzing data
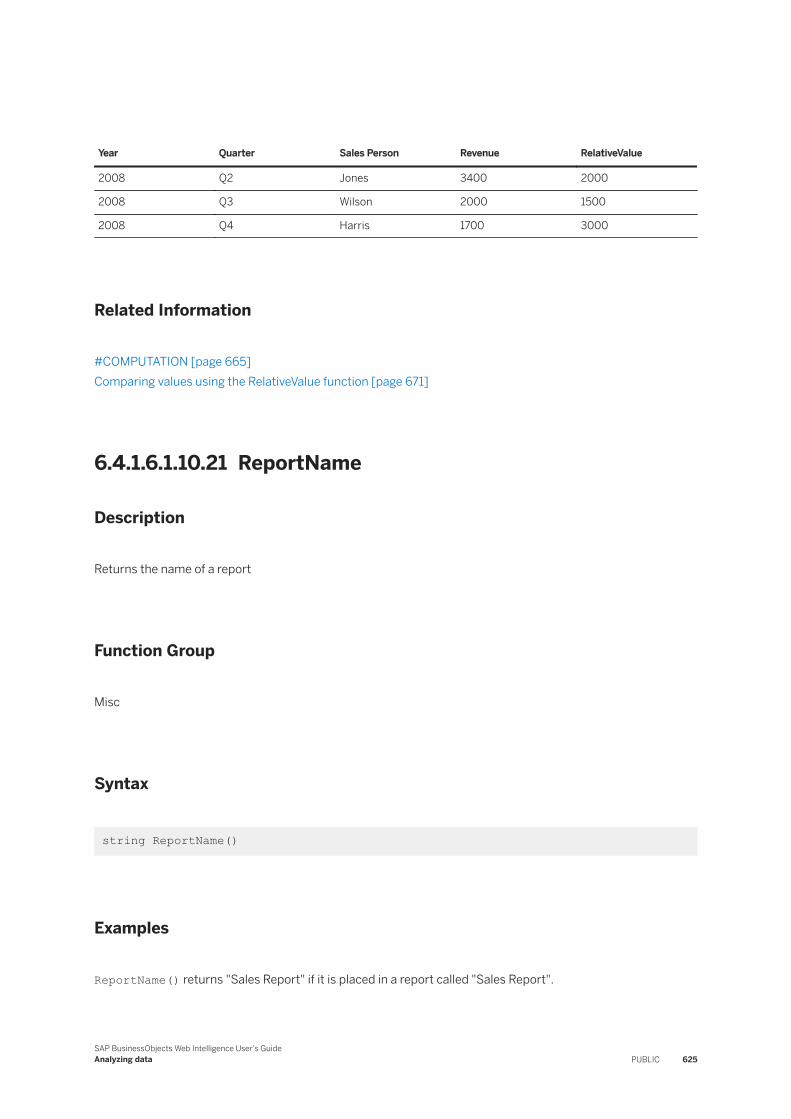
Year Quarter Sales Person Revenue RelativeValue
2008 Q2 Jones 3400 2000
2008 Q3 Wilson 2000 1500
2008 Q4 Harris 1700 3000
Related Information
#COMPUTATION [page 665]Comparing values using the RelativeValue function [page 671]
6.4.1.6.1.10.21 ReportName
Description
Returns the name of a report
Function Group
Misc
Syntax
string ReportName()
Examples
ReportName() returns "Sales Report" if it is placed in a report called "Sales Report".
SAP BusinessObjects Web Intelligence User's GuideAnalyzing data PUBLIC 625
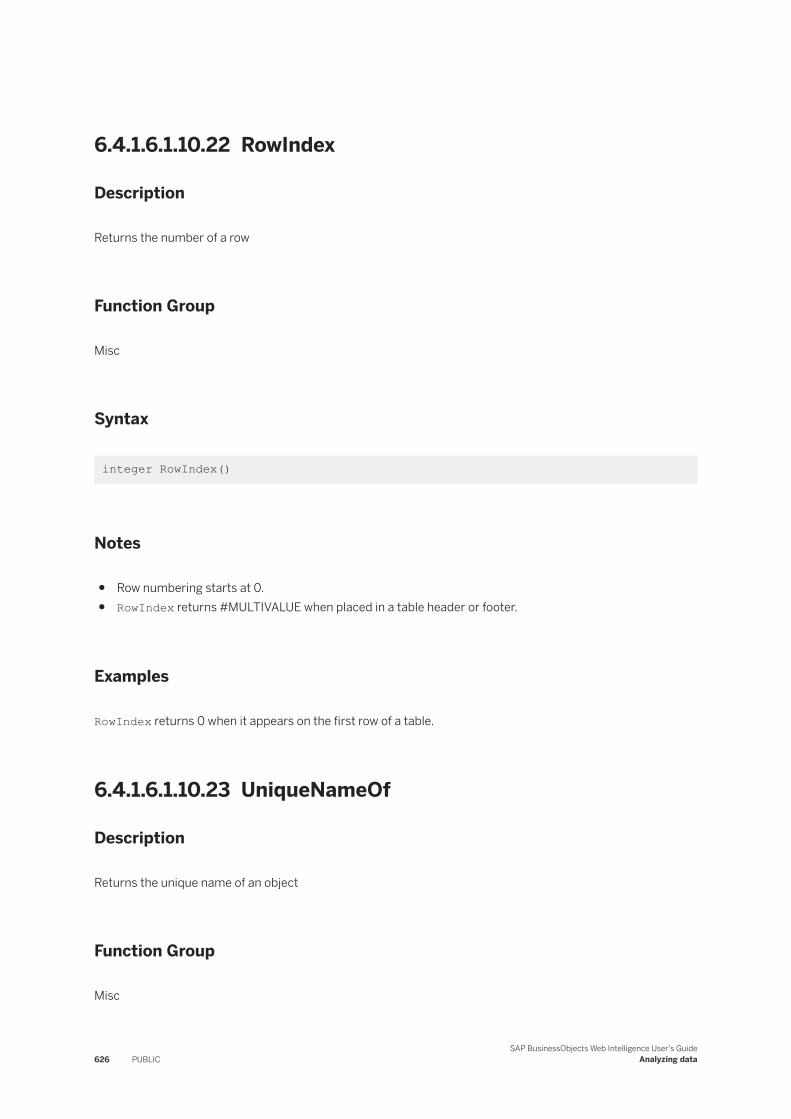
6.4.1.6.1.10.22 RowIndex
Description
Returns the number of a row
Function Group
Misc
Syntax
integer RowIndex()
Notes
● Row numbering starts at 0.● RowIndex returns #MULTIVALUE when placed in a table header or footer.
Examples
RowIndex returns 0 when it appears on the first row of a table.
6.4.1.6.1.10.23 UniqueNameOf
Description
Returns the unique name of an object
Function Group
Misc
626 PUBLICSAP BusinessObjects Web Intelligence User's Guide
Analyzing data
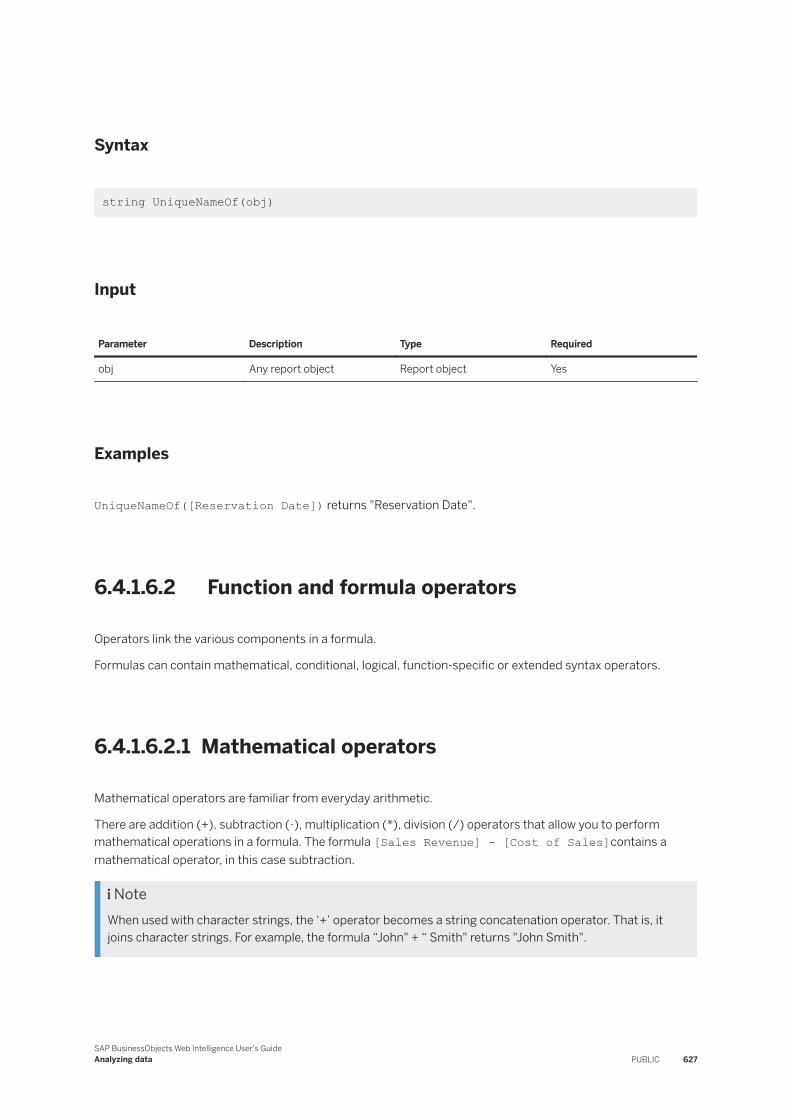
Syntax
string UniqueNameOf(obj)
Input
Parameter Description Type Required
obj Any report object Report object Yes
Examples
UniqueNameOf([Reservation Date]) returns "Reservation Date".
6.4.1.6.2 Function and formula operators
Operators link the various components in a formula.
Formulas can contain mathematical, conditional, logical, function-specific or extended syntax operators.
6.4.1.6.2.1 Mathematical operators
Mathematical operators are familiar from everyday arithmetic.
There are addition (+), subtraction (-), multiplication (*), division (/) operators that allow you to perform mathematical operations in a formula. The formula [Sales Revenue] - [Cost of Sales]contains a mathematical operator, in this case subtraction.
NoteWhen used with character strings, the ‘+’ operator becomes a string concatenation operator. That is, it joins character strings. For example, the formula “John" + “ Smith" returns "John Smith".
SAP BusinessObjects Web Intelligence User's GuideAnalyzing data PUBLIC 627
6.4.1.6.2.2 Conditional operators
Conditional operators determine the type of comparison to be made between values.
Operator Description
= Equal to
> Greater than
< Less than
>= Greater than or equal to
<= Less than or equal to
<> Not equal to
You use conditional operators with the If function, as in:
If [Revenue]>10000 Then "High" Else "Low"
which returns “High" for all rows where the revenue is greater than or equal to 10000 and “Low" for all other rows.
6.4.1.6.2.3 Logical operators
The logical operators are And, Or, Not, Between and InList.
Logical operators are used in boolean expressions, which return True or False.
6.4.1.6.2.3.1 And operator
The And operator links boolean values.
Description
If all the boolean values linked by And return true, the combination of all the values also returns true.
Syntax
bool_value And bool_value [And bool_value...]
628 PUBLICSAP BusinessObjects Web Intelligence User's Guide
Analyzing data
Examples
If [Resort] = "Bahamas Beach" And [Revenue]>100000 Then "High Bahamas Revenue" returns "High Bahamas Revenue" if [Resort] = "Bahamas Beach" And [Revenue]>100000.
6.4.1.6.2.3.2 Or operator
The Or operator links boolean values.
Description
If any one boolean value linked by Or returns true, the combination of all the values also returns true.
Syntax
bool_value Or bool_value [Or bool_value...]
Examples
If [Resort] = "Bahamas Beach" Or [Resort]="Hawaiian Club" Then "US" Else "France" returns "US" if [Resort]="Bahamas Beach" or "Hawaiian Club", or "France" otherwise.
6.4.1.6.2.3.3 Not operator
Description
The Not operator returns the opposite of a boolean value.
Syntax
bool Not(bool_value)
SAP BusinessObjects Web Intelligence User's GuideAnalyzing data PUBLIC 629
Examples
If Not([Country] = "US") Then "Not US" returns "Not US" if [Country] has any value other than "US".
6.4.1.6.2.3.4 Between operator
Description
The Between operator determines if a variable is between two values.
Syntax
bool Between(first_value;second_value)
Notes
● You use Between with the If function and the Where operator.● Changing the document locale can impact the result returned by the Between operator.
Examples
If [Sales revenue] Between(800000;900000) Then "Medium revenue" returns "Medium revenue" if [Sales revenue] is between 800000 and 900000.
[Sales revenue] Between (10000;20000) returns true if the Sales revenue is between 10000 and 20000.
If ([Sales revenue] Between (200000;500000);"Medium revenue";"Low/High revenue") returns "Medium revenue" if [Sales revenue] is 300000.
Related Information
If...Then...Else [page 611]Where operator [page 640]
630 PUBLICSAP BusinessObjects Web Intelligence User's Guide
Analyzing data
6.4.1.6.2.3.5 InList operator
Description
The InList operator determines if a value is in a list of values.
Syntax
bool test_value InList(value_list)
Notes
It is the combination of test_value + InList that returns a boolean value, not InList alone.
Examples
If Not ([Country] InList("England";"Scotland";"Wales")) Then "Not Britain" Else "Britain" returns "Not Britain" if [Country] is not equal to "England", "Scotland" or "Wales", or "Britain" otherwise.
If [Resort] InList("Bahamas Beach";"Hawaiian Club") Then "US Resort" returns "US Resort" if [Resort] is equal to "Bahamas Beach" or "Hawaiian Club".
Related Information
If...Then...Else [page 611]Where operator [page 640]
6.4.1.6.2.4 Function-specific operators
Some functions can take specific operators as arguments.
For example, the Previous function can take the Self operator.
All functions use ) and ( to enclose function arguments. Functions that accept multiple parameters use ; to separate the parameters.
SAP BusinessObjects Web Intelligence User's GuideAnalyzing data PUBLIC 631
6.4.1.6.2.4.1 All operator
The All operator tells the NoFilter function to ignore all filters.
The All operator can also tell the Count function to count all values, including duplicates.
Related Information
Count [page 434]Distinct/All operators [page 635]NoFilter [page 615]All/Drill operators [page 632]
6.4.1.6.2.4.2 All/Drill operators
The All/Drill operators work with the NoFilter function.
Description
The All/Drill operators determine which filters the NoFilter function ignores.
● Not specified - NoFilter ignores report and block filters● All - NoFilter ignores all filters● Drill - NoFilter ignores report filters and drill filters
6.4.1.6.2.4.3 Ascending
The Ascending operator is an argument of the PromptSummary function.
Description
When set, the PromptSummary function sorts the prompts in the ascending order.
632 PUBLICSAP BusinessObjects Web Intelligence User's Guide
Analyzing data
Related Information
PromptSummary [page 538]
6.4.1.6.2.4.4 Bottom/Top operators
The Bottom/Top operators work with the Rank function.
Description
The Bottom/Top operators tell the Rank function to rank in descending or ascending order.
● Top - ranks in descending order● Bottom - ranks in ascending order
Examples
Rank([Revenue];([Country]);Top) ranks countries by revenue from highest to lowest.
Related Information
Rank [page 568]
6.4.1.6.2.4.5 Break operator
The Break operator works with the Percentage function.
Description
The Break operator tells Percentage function to account for table breaks.
SAP BusinessObjects Web Intelligence User's GuideAnalyzing data PUBLIC 633
Examples
The formula Percentage([Revenue]) gives the following result in the following table (percentages are calculated on the total revenue in the block):
Year Quarter Revenue Percentage
2005 Q1 10000 10%
2005 Q2 20000 20%
2006 Q1 30000 30%
2006 Q2 40000 40%
The formula Percentage([Revenue];Break) gives the following result in the following table (percentages are calculated on the total revenue in each part of the block):
Year Quarter Revenue Percentage
2005 Q1 10000 33.3%
2005 Q2 20000 66.6%
2006 Q1 30000 42.9%
2006 Q2 40000 57.1%
Related Information
Percentage [page 445]
6.4.1.6.2.4.6 Descending
The Descending operator is an argument of the PromptSummary function.
Description
When set, the PromptSummary function sorts the prompts in the descending order.
634 PUBLICSAP BusinessObjects Web Intelligence User's Guide
Analyzing data
Related Information
PromptSummary [page 538]
6.4.1.6.2.4.7 Distinct/All operators
The Distinct/All operators work with the Count function.
The Distinct/All operators tell the Count function to count distinct values only, or all values.
Examples
Count([Revenue];Distinct) returns 3 if [Revenue] has the values (5;5;6;4).
Count([Revenue];All) returns 4 if [Revenue] has the values (5;5;6;4).
Related Information
Count [page 434]
6.4.1.6.2.4.8 IncludeEmpty operator
The IncludeEmpty operator works with aggregate functions.
Description
The IncludeEmpty operator tells some aggregate functions (Average, Count, RunningAverage, RunningCount) to include empty values in calculations.
Examples
Average([Revenue];IncludeEmpty) returns 3 if [Revenue] has the values (5;3;<empty>;4).
SAP BusinessObjects Web Intelligence User's GuideAnalyzing data PUBLIC 635
Related Information
Average [page 433]Count [page 434]RunningAverage [page 448]RunningCount [page 450]
6.4.1.6.2.4.9 Index operator
The Index operator works with the UserResponse and RefValueUserResponse functions.
Description
The Index operator tells the UserResponse and RefValueUserResponse functions to return the database primary key of the prompt response.
Related Information
UserResponse [page 527]RefValueUserReponse [page 524]
6.4.1.6.2.4.10 Linear operator
The Linear operator works with the Interpolation function.
Description
The Linear operator tells the Interpolation function to use linear regression with least squares interpolation to supply missing measure values.
Linear regression with least squares interpolation calculates missing values by calculating a line equation in the form f(x) = ax + b that passes as closely as possible through all the available values of the measure.
636 PUBLICSAP BusinessObjects Web Intelligence User's Guide
Analyzing data
Related Information
Interpolation [page 437]
6.4.1.6.2.4.11 NoNull operator
The NoNull operator works with the Previous function.
Description
The NoNull operator tells the Previous function to ignore null values.
When used with NoNull, Previous returns the first non-null value of the object, beginning from the cell offset rows before the current row and counting backwards.
Related Information
Previous [page 619]
6.4.1.6.2.4.12 NotOnBreak operator
The NotOnBreak operator works with the Interpolation function.
Description
The NotOnBreak operator tells the Interpolation function to ignore section and block breaks.
Related Information
Interpolation [page 437]
SAP BusinessObjects Web Intelligence User's GuideAnalyzing data PUBLIC 637
6.4.1.6.2.4.13 PointToPoint operator
The PointToPoint operator tells the Interpolation function to use point-to-point interpolation to supply missing measure values.
Description
Point-to point interpolation calculates missing values by calculating a line equation in the form f(x) = ax + b that passes through the two adjacent values of the missing value.
Related Information
Interpolation [page 437]
6.4.1.6.2.4.14 Row/Col operators
The Row operator calculates each value in the row as a percentage of the total value of all the rows in the embedding context. The Col operator calculates each value in the column as a percentage of the total value of all the columns in the embedding context.
Description
The Row/Col operators set the calculation direction of the following functions: Percentage, Previous, RunningAverage, RunningCount, RunningMax, RunningMin, RunningProduct, RunningSum.
Notes
In a crosstab, the value in each cell is calculated by default as a percentage of the total value in the crosstab. The Row operator calculates the values in the rows as percentages of the total value for the row. The Col operator calculates the values in the columns as percentages of the total value in the column.
Examples
In a crosstab, Percentage([Measure]) gives the following result:
638 PUBLICSAP BusinessObjects Web Intelligence User's Guide
Analyzing data
Measure Percentage Measure Percentage
100 10% 500 50%
200 20% 200 20%
Percentage([Measure];Row) gives the following result:
Measure Percentage Measure Percentage
100 16.7% 500 83.3%
200 50% 200 50%
Percentage([Measure];Col) gives the following result:
Measure Percentage Measure Percentage
100 33.3% 500 83.3%
200 66.6% 200 16.7%
The Row operator calculates the running aggregate by row. The Col operator calculates the running aggregate by column.
In a crosstab, RunningSum([Measure]) or RunningSum([Measure];Row) gives the following result:
Measure RunningSum Measure RunningSum
100 100 200 300
400 700 250 950
In a crosstab, RunningSum([Measure];Col) gives the following result:
Measure RunningSum Measure RunningSum
100 100 200 700
400 500 250 950
Related Information
Percentage [page 445]RunningAverage [page 448]RunningCount [page 450]RunningMax [page 453]RunningMin [page 455]RunningProduct [page 457]RunningSum [page 458]
SAP BusinessObjects Web Intelligence User's GuideAnalyzing data PUBLIC 639
6.4.1.6.2.4.15 Self operator
The Self operator works with the Previous function.
Description
Refers the Previous function to the previous cell when it does not contain a report object.
Examples
5 + Previous(Self) returns the sequence 5, 10, 15, 20, 25, 30...
1 + 0.5 * Previous(Self) returns the sequence 1, 1.5, 1.75, 1.88...
Related Information
Previous [page 619]
6.4.1.6.2.4.16 Where operator
Description
The Where operator restricts the data used to calculate a measure.
Examples
The formula Average ([Sales Revenue]) Where ([Country] = "US") calculates the average sales where the country is "US".
The formula Average ([Sales Revenue]) Where ([Country] = "US" Or [Country] = "France") calculates the average sales where the country is "US" or "France".
The formula [Revenue] Where (Not ([Country] Inlist ("US"; "France"))) calculates the revenue for the countries other than US and France.
The variable [High Revenue] has the formula [Revenue] Where [Revenue > 500000]. When placed in a block, [High Revenue] displays either the revenue when its value is greater than 500000, or nothing. When
640 PUBLICSAP BusinessObjects Web Intelligence User's Guide
Analyzing data
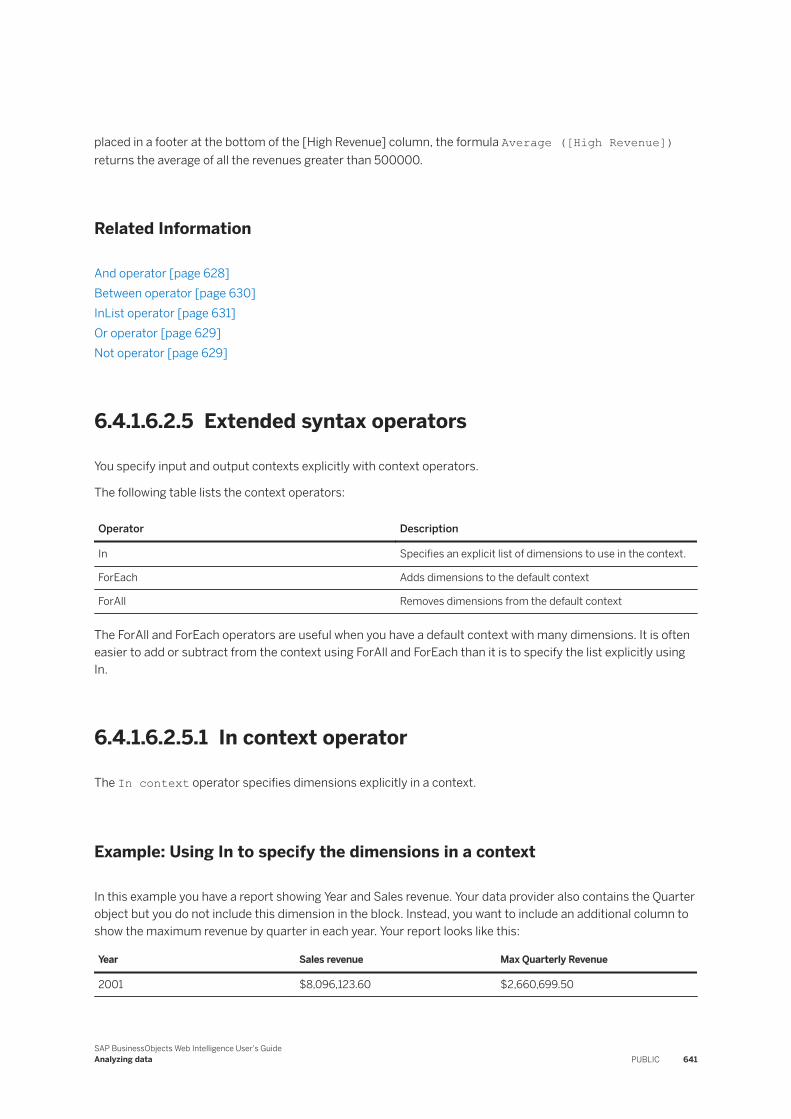
placed in a footer at the bottom of the [High Revenue] column, the formula Average ([High Revenue]) returns the average of all the revenues greater than 500000.
Related Information
And operator [page 628]Between operator [page 630]InList operator [page 631]Or operator [page 629]Not operator [page 629]
6.4.1.6.2.5 Extended syntax operators
You specify input and output contexts explicitly with context operators.
The following table lists the context operators:
Operator Description
In Specifies an explicit list of dimensions to use in the context.
ForEach Adds dimensions to the default context
ForAll Removes dimensions from the default context
The ForAll and ForEach operators are useful when you have a default context with many dimensions. It is often easier to add or subtract from the context using ForAll and ForEach than it is to specify the list explicitly using In.
6.4.1.6.2.5.1 In context operator
The In context operator specifies dimensions explicitly in a context.
Example: Using In to specify the dimensions in a context
In this example you have a report showing Year and Sales revenue. Your data provider also contains the Quarter object but you do not include this dimension in the block. Instead, you want to include an additional column to show the maximum revenue by quarter in each year. Your report looks like this:
Year Sales revenue Max Quarterly Revenue
2001 $8,096,123.60 $2,660,699.50
SAP BusinessObjects Web Intelligence User's GuideAnalyzing data PUBLIC 641
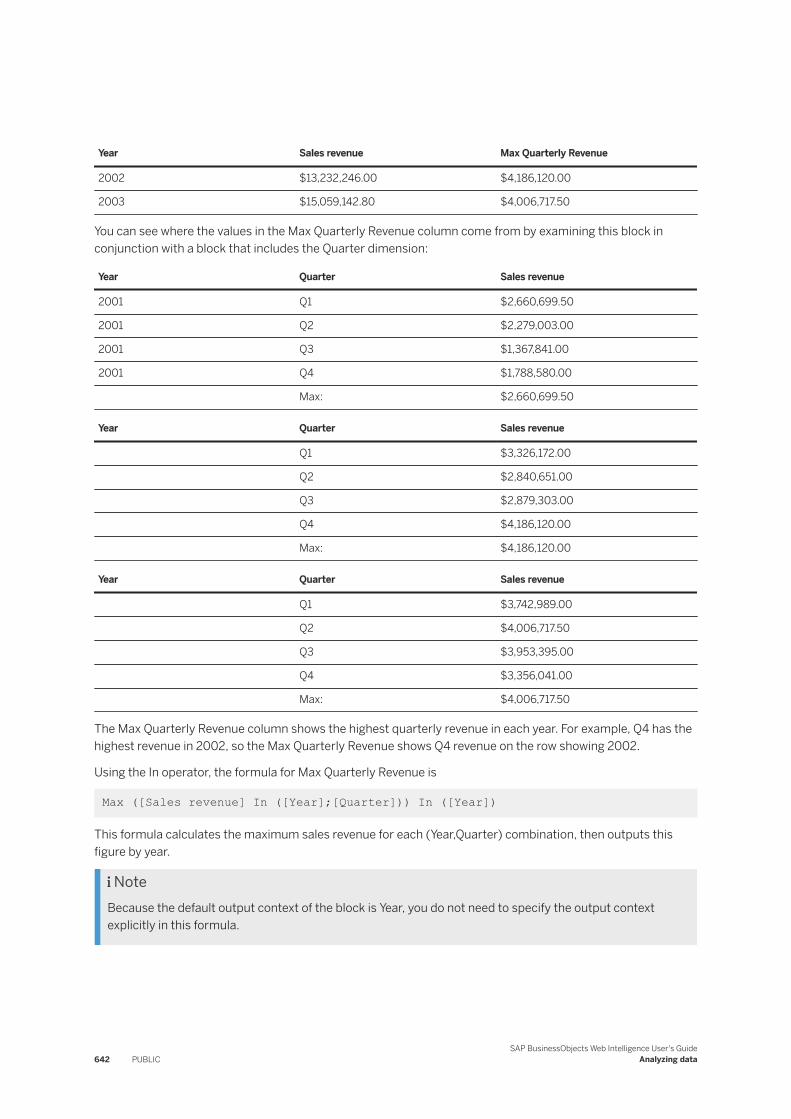
Year Sales revenue Max Quarterly Revenue
2002 $13,232,246.00 $4,186,120.00
2003 $15,059,142.80 $4,006,717.50
You can see where the values in the Max Quarterly Revenue column come from by examining this block in conjunction with a block that includes the Quarter dimension:
Year Quarter Sales revenue
2001 Q1 $2,660,699.50
2001 Q2 $2,279,003.00
2001 Q3 $1,367,841.00
2001 Q4 $1,788,580.00
Max: $2,660,699.50
Year Quarter Sales revenue
Q1 $3,326,172.00
Q2 $2,840,651.00
Q3 $2,879,303.00
Q4 $4,186,120.00
Max: $4,186,120.00
Year Quarter Sales revenue
Q1 $3,742,989.00
Q2 $4,006,717.50
Q3 $3,953,395.00
Q4 $3,356,041.00
Max: $4,006,717.50
The Max Quarterly Revenue column shows the highest quarterly revenue in each year. For example, Q4 has the highest revenue in 2002, so the Max Quarterly Revenue shows Q4 revenue on the row showing 2002.
Using the In operator, the formula for Max Quarterly Revenue is
Max ([Sales revenue] In ([Year];[Quarter])) In ([Year])
This formula calculates the maximum sales revenue for each (Year,Quarter) combination, then outputs this figure by year.
NoteBecause the default output context of the block is Year, you do not need to specify the output context explicitly in this formula.
642 PUBLICSAP BusinessObjects Web Intelligence User's Guide
Analyzing data
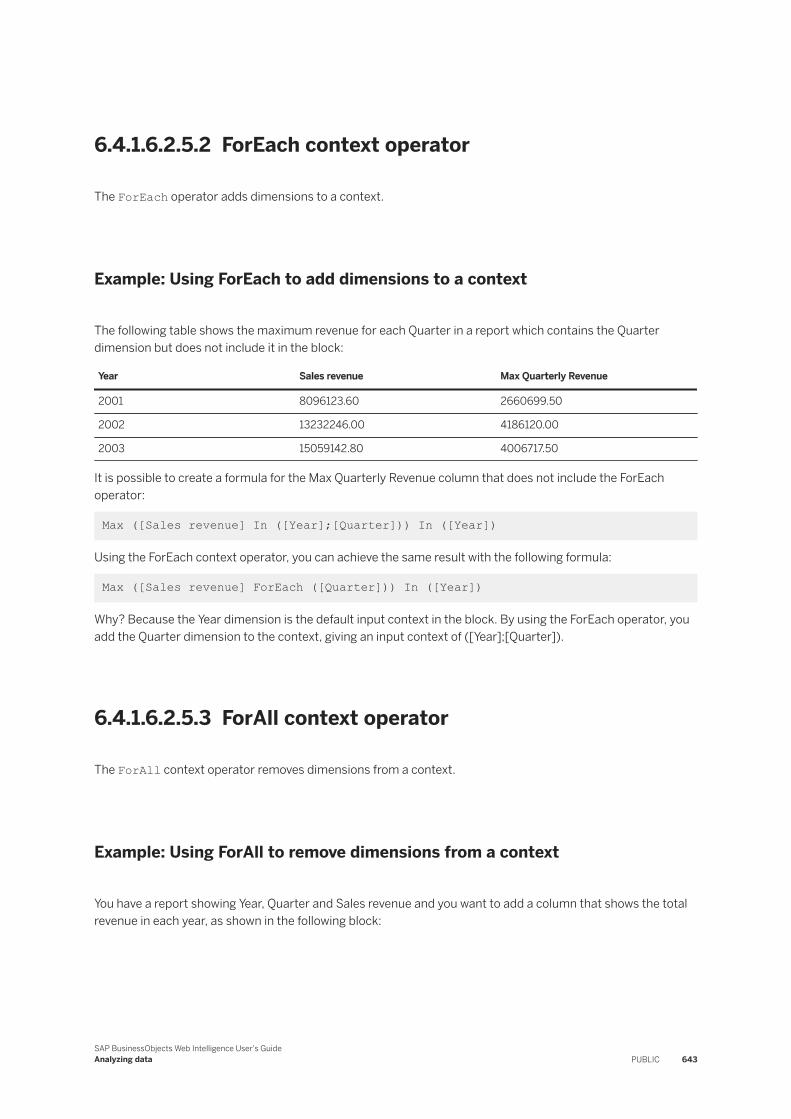
6.4.1.6.2.5.2 ForEach context operator
The ForEach operator adds dimensions to a context.
Example: Using ForEach to add dimensions to a context
The following table shows the maximum revenue for each Quarter in a report which contains the Quarter dimension but does not include it in the block:
Year Sales revenue Max Quarterly Revenue
2001 8096123.60 2660699.50
2002 13232246.00 4186120.00
2003 15059142.80 4006717.50
It is possible to create a formula for the Max Quarterly Revenue column that does not include the ForEach operator:
Max ([Sales revenue] In ([Year];[Quarter])) In ([Year])
Using the ForEach context operator, you can achieve the same result with the following formula:
Max ([Sales revenue] ForEach ([Quarter])) In ([Year])
Why? Because the Year dimension is the default input context in the block. By using the ForEach operator, you add the Quarter dimension to the context, giving an input context of ([Year];[Quarter]).
6.4.1.6.2.5.3 ForAll context operator
The ForAll context operator removes dimensions from a context.
Example: Using ForAll to remove dimensions from a context
You have a report showing Year, Quarter and Sales revenue and you want to add a column that shows the total revenue in each year, as shown in the following block:
SAP BusinessObjects Web Intelligence User's GuideAnalyzing data PUBLIC 643
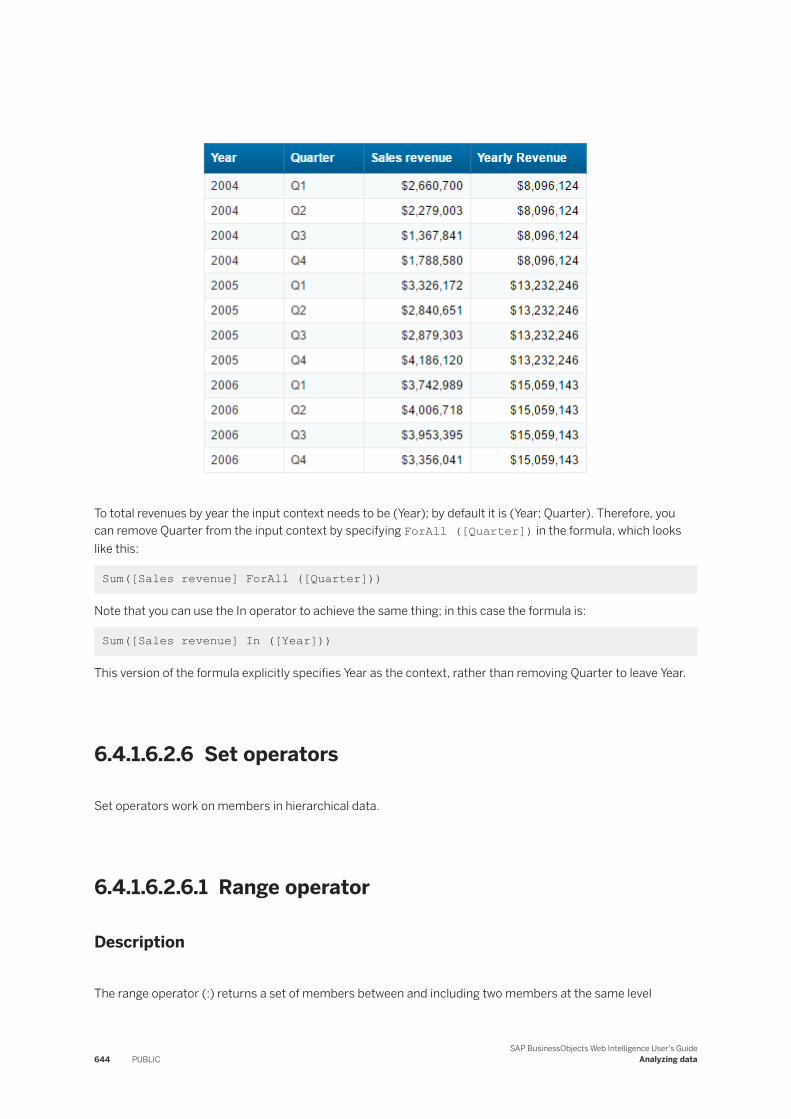
To total revenues by year the input context needs to be (Year); by default it is (Year; Quarter). Therefore, you can remove Quarter from the input context by specifying ForAll ([Quarter]) in the formula, which looks like this:
Sum([Sales revenue] ForAll ([Quarter]))
Note that you can use the In operator to achieve the same thing; in this case the formula is:
Sum([Sales revenue] In ([Year]))
This version of the formula explicitly specifies Year as the context, rather than removing Quarter to leave Year.
6.4.1.6.2.6 Set operators
Set operators work on members in hierarchical data.
6.4.1.6.2.6.1 Range operator
Description
The range operator (:) returns a set of members between and including two members at the same level
644 PUBLICSAP BusinessObjects Web Intelligence User's Guide
Analyzing data
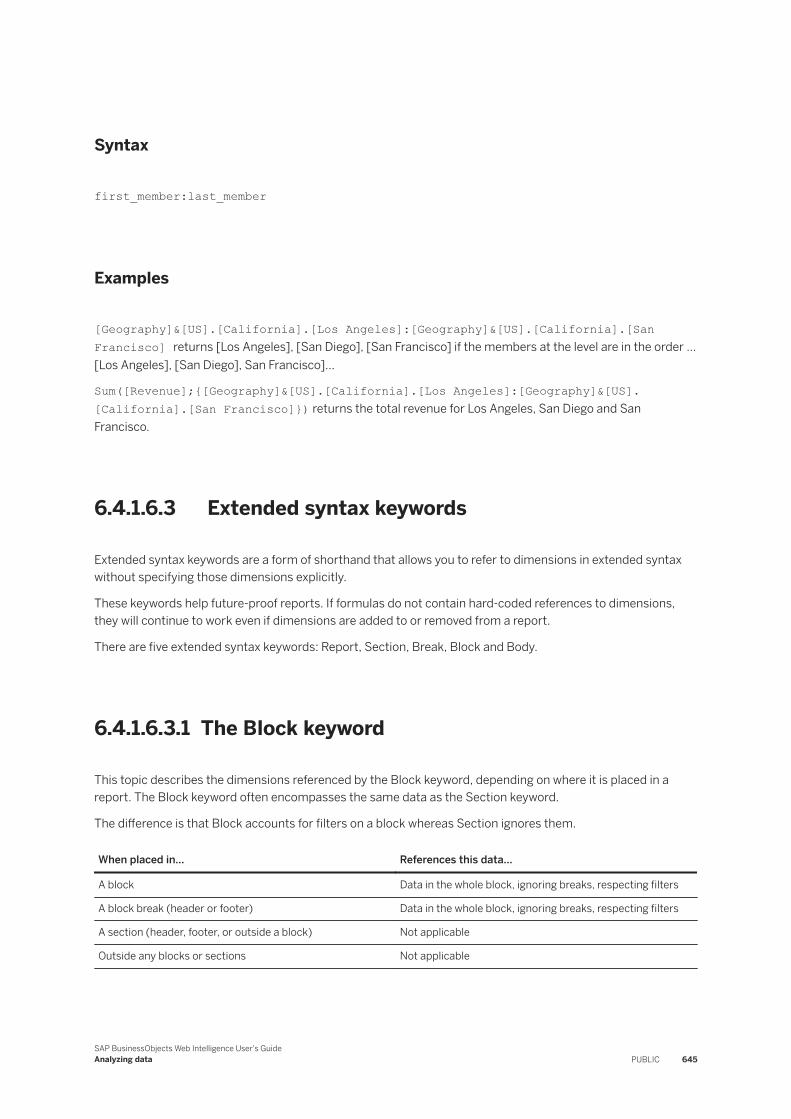
Syntax
first_member:last_member
Examples
[Geography]&[US].[California].[Los Angeles]:[Geography]&[US].[California].[San Francisco] returns [Los Angeles], [San Diego], [San Francisco] if the members at the level are in the order ...[Los Angeles], [San Diego], San Francisco]...
Sum([Revenue];{[Geography]&[US].[California].[Los Angeles]:[Geography]&[US].[California].[San Francisco]}) returns the total revenue for Los Angeles, San Diego and San Francisco.
6.4.1.6.3 Extended syntax keywords
Extended syntax keywords are a form of shorthand that allows you to refer to dimensions in extended syntax without specifying those dimensions explicitly.
These keywords help future-proof reports. If formulas do not contain hard-coded references to dimensions, they will continue to work even if dimensions are added to or removed from a report.
There are five extended syntax keywords: Report, Section, Break, Block and Body.
6.4.1.6.3.1 The Block keyword
This topic describes the dimensions referenced by the Block keyword, depending on where it is placed in a report. The Block keyword often encompasses the same data as the Section keyword.
The difference is that Block accounts for filters on a block whereas Section ignores them.
When placed in... References this data...
A block Data in the whole block, ignoring breaks, respecting filters
A block break (header or footer) Data in the whole block, ignoring breaks, respecting filters
A section (header, footer, or outside a block) Not applicable
Outside any blocks or sections Not applicable
SAP BusinessObjects Web Intelligence User's GuideAnalyzing data PUBLIC 645
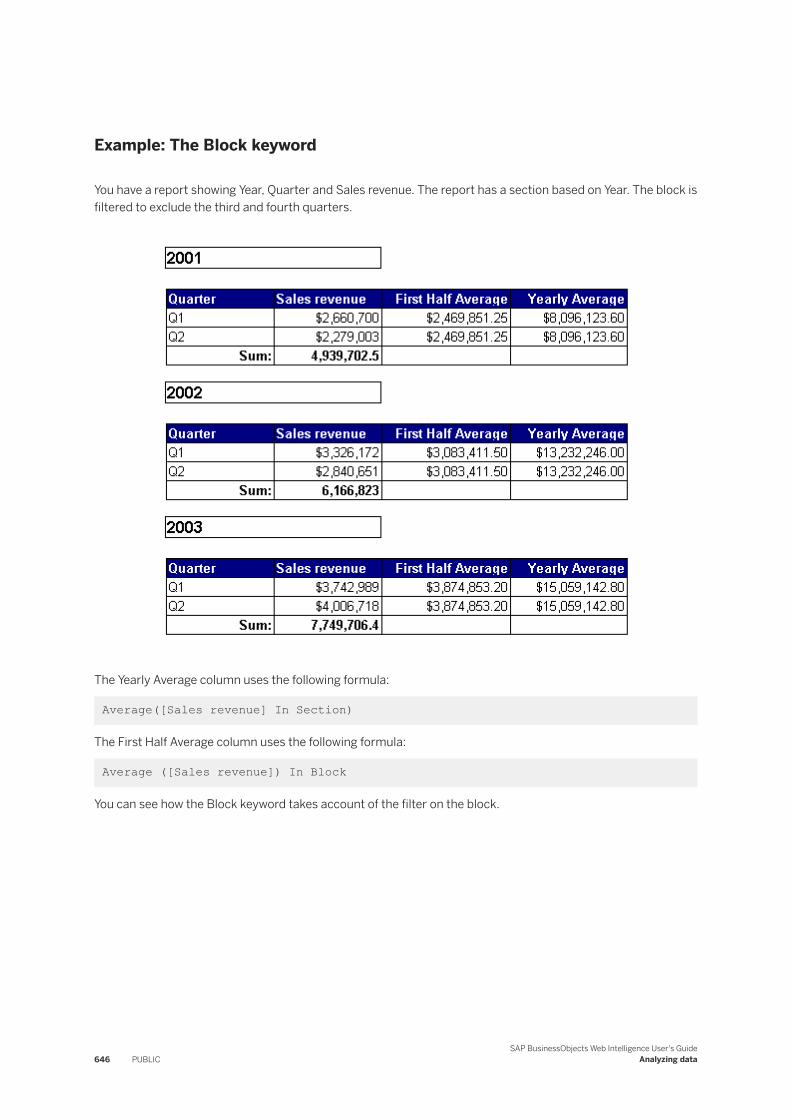
Example: The Block keyword
You have a report showing Year, Quarter and Sales revenue. The report has a section based on Year. The block is filtered to exclude the third and fourth quarters.
The Yearly Average column uses the following formula:
Average([Sales revenue] In Section)
The First Half Average column uses the following formula:
Average ([Sales revenue]) In Block
You can see how the Block keyword takes account of the filter on the block.
646 PUBLICSAP BusinessObjects Web Intelligence User's Guide
Analyzing data
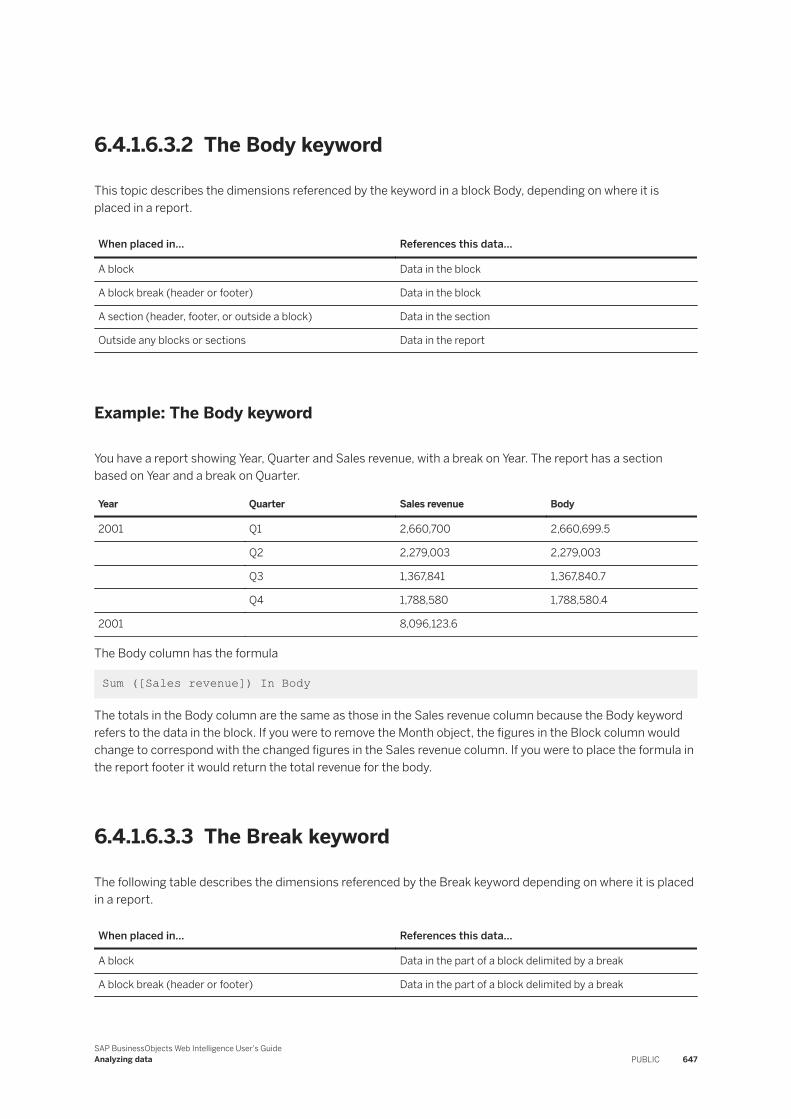
6.4.1.6.3.2 The Body keyword
This topic describes the dimensions referenced by the keyword in a block Body, depending on where it is placed in a report.
When placed in... References this data...
A block Data in the block
A block break (header or footer) Data in the block
A section (header, footer, or outside a block) Data in the section
Outside any blocks or sections Data in the report
Example: The Body keyword
You have a report showing Year, Quarter and Sales revenue, with a break on Year. The report has a section based on Year and a break on Quarter.
Year Quarter Sales revenue Body
2001 Q1 2,660,700 2,660,699.5
Q2 2,279,003 2,279,003
Q3 1,367,841 1,367,840.7
Q4 1,788,580 1,788,580.4
2001 8,096,123.6
The Body column has the formula
Sum ([Sales revenue]) In Body
The totals in the Body column are the same as those in the Sales revenue column because the Body keyword refers to the data in the block. If you were to remove the Month object, the figures in the Block column would change to correspond with the changed figures in the Sales revenue column. If you were to place the formula in the report footer it would return the total revenue for the body.
6.4.1.6.3.3 The Break keyword
The following table describes the dimensions referenced by the Break keyword depending on where it is placed in a report.
When placed in... References this data...
A block Data in the part of a block delimited by a break
A block break (header or footer) Data in the part of a block delimited by a break
SAP BusinessObjects Web Intelligence User's GuideAnalyzing data PUBLIC 647

When placed in... References this data...
A section (header, footer, or outside a block) Not applicable
Outside any blocks or sections Not applicable
Example: The Break keyword
You have a report showing Year, Quarter and Sales revenue:
Year Quarter Sales revenue Break Total
2001 Q1 $2,660,700 $8,096,124
Q2 $2,279,003 $8,096,124
Q3 $1,367,841 $8,096,124
Q4 $1,788,580 $8,096,124
The report has break on Year. The Break Total column has the formula:
Sum ([Sales revenue]) In Break
Without the Break keyword this column would duplicate the figures in the Sales revenue column, because it would use the default output context ([Year];[Quarter]).
6.4.1.6.3.4 The Report keyword
This topic describes the data referenced by the Report keyword, depending on where it is placed in a report:
When placed in... References this data...
A block All data in the report
A block break (header or footer) All data in the report
A section (header, footer, or outside a block) All data in the report
Outside any blocks or sections All data in the report
Example: The Report keyword
You have a report showing Year, Quarter and Sales revenue. The report has a column, Report Total, that shows the total of all revenue in the report.
648 PUBLICSAP BusinessObjects Web Intelligence User's Guide
Analyzing data
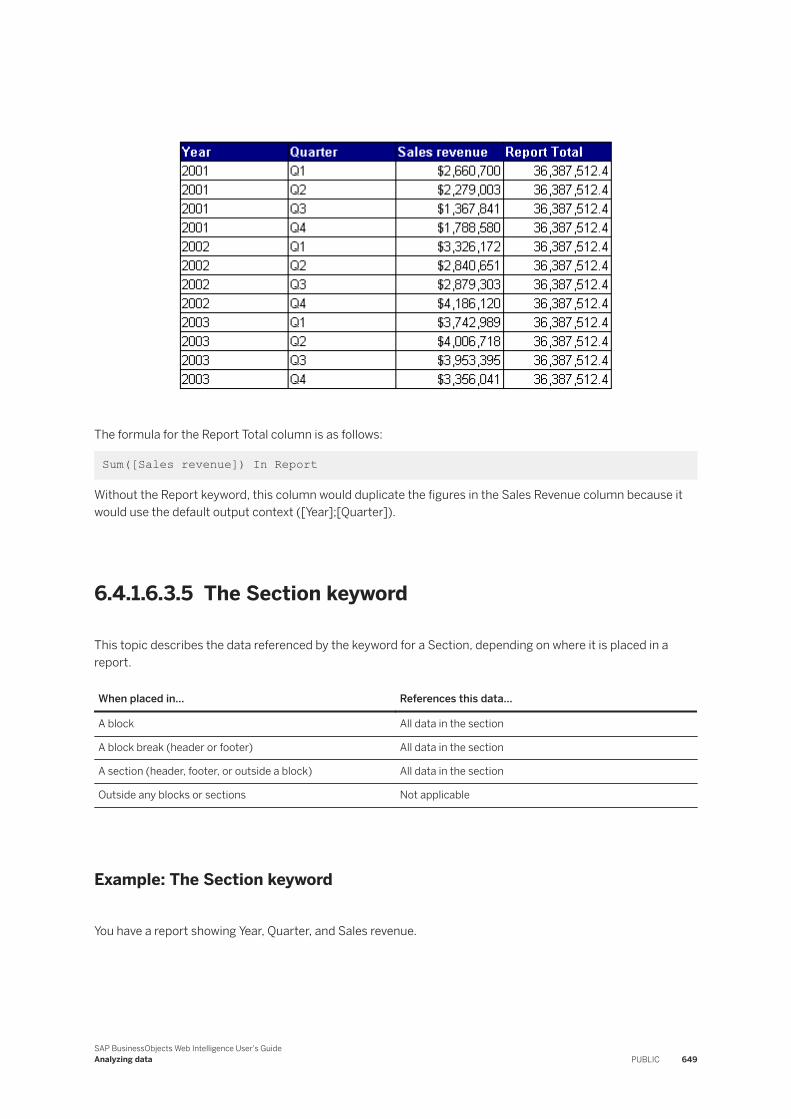
The formula for the Report Total column is as follows:
Sum([Sales revenue]) In Report
Without the Report keyword, this column would duplicate the figures in the Sales Revenue column because it would use the default output context ([Year];[Quarter]).
6.4.1.6.3.5 The Section keyword
This topic describes the data referenced by the keyword for a Section, depending on where it is placed in a report.
When placed in... References this data...
A block All data in the section
A block break (header or footer) All data in the section
A section (header, footer, or outside a block) All data in the section
Outside any blocks or sections Not applicable
Example: The Section keyword
You have a report showing Year, Quarter, and Sales revenue.
SAP BusinessObjects Web Intelligence User's GuideAnalyzing data PUBLIC 649
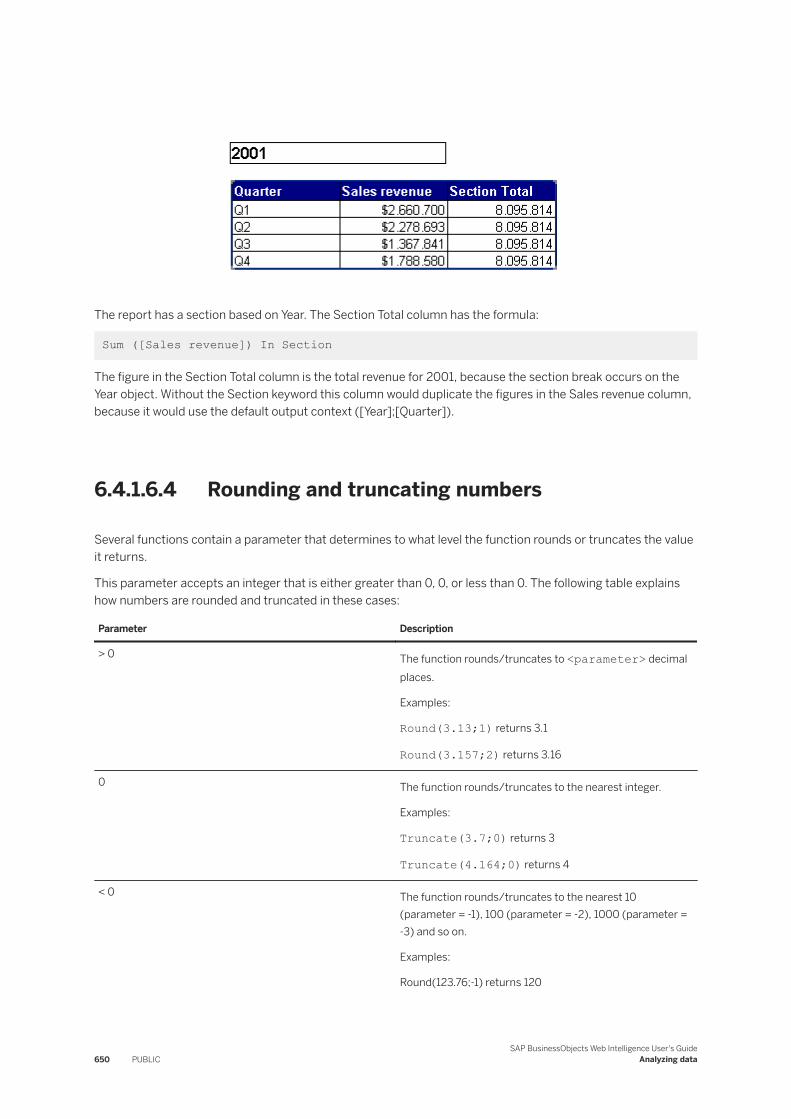
The report has a section based on Year. The Section Total column has the formula:
Sum ([Sales revenue]) In Section
The figure in the Section Total column is the total revenue for 2001, because the section break occurs on the Year object. Without the Section keyword this column would duplicate the figures in the Sales revenue column, because it would use the default output context ([Year];[Quarter]).
6.4.1.6.4 Rounding and truncating numbers
Several functions contain a parameter that determines to what level the function rounds or truncates the value it returns.
This parameter accepts an integer that is either greater than 0, 0, or less than 0. The following table explains how numbers are rounded and truncated in these cases:
Parameter Description
> 0 The function rounds/truncates to <parameter> decimal places.
Examples:
Round(3.13;1) returns 3.1
Round(3.157;2) returns 3.16
0 The function rounds/truncates to the nearest integer.
Examples:
Truncate(3.7;0) returns 3
Truncate(4.164;0) returns 4
< 0 The function rounds/truncates to the nearest 10 (parameter = -1), 100 (parameter = -2), 1000 (parameter = -3) and so on.
Examples:
Round(123.76;-1) returns 120
650 PUBLICSAP BusinessObjects Web Intelligence User's Guide
Analyzing data
Parameter Description
Round(459.9;-2) returns 500
Truncate(1600;-3) returns 1000
NoteNumbers are represented internally using double-precision floating-point formats and have 15 to 17 digits of precision.
Related Information
Round [page 570]Truncate [page 577]EuroConvertTo [page 557]EuroConvertFrom [page 555]EuroFromRoundError [page 558]EuroToRoundError [page 560]
6.4.1.6.5 Referring to members and member sets in hierarchies
You refer to members and member sets in functions using the syntax [hierarchy]&path.function.
The path and function parts are optional. In path, you refer to each member in square brackets, with members separated by full stops. The names of members and levels are case-sensitive.
NoteYou use member sets to override the default calculation context for a hierarchy. In functions that accept member sets, you enclose the member set in {}.
You refer to ranges of members using a colon (:) between the start and end member, and with the full path specified for each member. A range includes all members at the same level as the specified members.
An example of range syntax is: [Sales Hierarchy]&[Customer_Type].[ENTERPRISE];[Large].[Nancy Davolio]: [Sales Hierarchy]&[Customer_Type].[ENTERPRISE];[Large].[Andrew Smith].
Example: Referring to members and member sets
You have the following hierarchy:
SAP BusinessObjects Web Intelligence User's GuideAnalyzing data PUBLIC 651
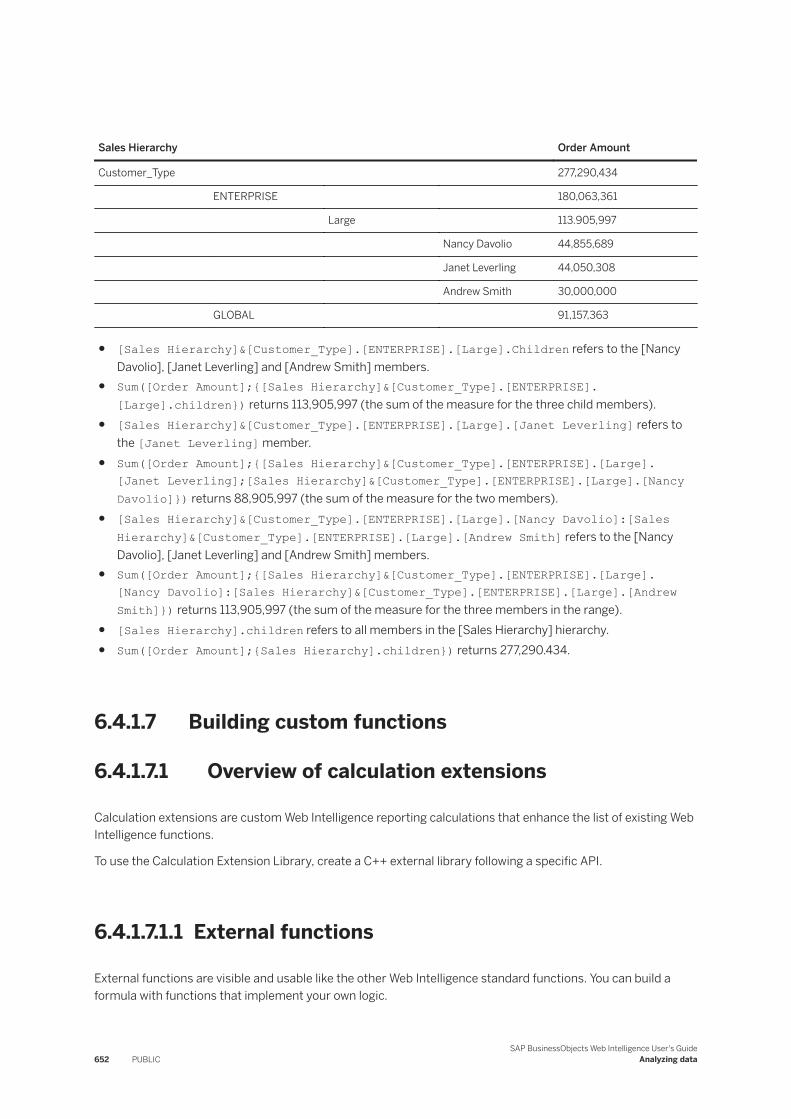
Sales Hierarchy Order Amount
Customer_Type 277,290,434
ENTERPRISE 180,063,361
Large 113.905,997
Nancy Davolio 44,855,689
Janet Leverling 44,050,308
Andrew Smith 30,000,000
GLOBAL 91,157,363
● [Sales Hierarchy]&[Customer_Type].[ENTERPRISE].[Large].Children refers to the [Nancy Davolio], [Janet Leverling] and [Andrew Smith] members.
● Sum([Order Amount];{[Sales Hierarchy]&[Customer_Type].[ENTERPRISE].[Large].children}) returns 113,905,997 (the sum of the measure for the three child members).
● [Sales Hierarchy]&[Customer_Type].[ENTERPRISE].[Large].[Janet Leverling] refers to the [Janet Leverling] member.
● Sum([Order Amount];{[Sales Hierarchy]&[Customer_Type].[ENTERPRISE].[Large].[Janet Leverling];[Sales Hierarchy]&[Customer_Type].[ENTERPRISE].[Large].[Nancy Davolio]}) returns 88,905,997 (the sum of the measure for the two members).
● [Sales Hierarchy]&[Customer_Type].[ENTERPRISE].[Large].[Nancy Davolio]:[Sales Hierarchy]&[Customer_Type].[ENTERPRISE].[Large].[Andrew Smith] refers to the [Nancy Davolio], [Janet Leverling] and [Andrew Smith] members.
● Sum([Order Amount];{[Sales Hierarchy]&[Customer_Type].[ENTERPRISE].[Large].[Nancy Davolio]:[Sales Hierarchy]&[Customer_Type].[ENTERPRISE].[Large].[Andrew Smith]}) returns 113,905,997 (the sum of the measure for the three members in the range).
● [Sales Hierarchy].children refers to all members in the [Sales Hierarchy] hierarchy.● Sum([Order Amount];{Sales Hierarchy].children}) returns 277,290.434.
6.4.1.7 Building custom functions
6.4.1.7.1 Overview of calculation extensions
Calculation extensions are custom Web Intelligence reporting calculations that enhance the list of existing Web Intelligence functions.
To use the Calculation Extension Library, create a C++ external library following a specific API.
6.4.1.7.1.1 External functions
External functions are visible and usable like the other Web Intelligence standard functions. You can build a formula with functions that implement your own logic.
652 PUBLICSAP BusinessObjects Web Intelligence User's Guide
Analyzing data
NoteYou can define as many functions as you need. Only functions that use single value parameters are supported. You can have a maximum of five single value parameters.
To define a function:
1. Declare in an XML file the description of the external function using a given XML structure.2. Implement the function in a C++ library using a given API.3. Copy the XML file and library to the appropriate folder in your Business Objects Enterprise installation
directory folder for the server and the desktop client.4. Restart the system to automatically add the external function to the list of the functions available for
creating formulas.
The external function is based on a unique identifier so that when it is used in a report, it cannot be misinterpreted in case of using a different external library.
If the system cannot load a library or is missing information for an external function, has an inconsistent XML declaration, missing library, or duplicated function, an error message appears. The system also writes errors in the trace log.
Related Information
#EXTERNAL error message [page 662]
6.4.1.7.1.2 Deploying the custom functions
Deployment of custom functions requires a few manual steps. The BusinessObjects administrator must place the XML file and related library DLL file in the library folder for the server, as well as on every machine where desktop rich-client is installed.
CautionReplacing or adding a library in the custom library folder can represent a threat to the system. Since the library is automatically loaded, an external library can access internal critical data or processes, putting the system in danger.
Make sure that the site administrator implements the appropriate security access to the related folder, so that only authorized people access the custom library folder.
6.4.1.7.1.3 The library declaration
The library file extensions are different depending on the operating system:
● DLL for Windows
SAP BusinessObjects Web Intelligence User's GuideAnalyzing data PUBLIC 653
● SO for Linux or UNIX
The file types are:
Type Description
XML catalogs declaration There is only one file of this type, and it should be named externalcatalogs.xml. This file contains the list of all XML function definition files.
XML functions declaration This file defines a list of functions and their associated library and is listed in the XML catalogs declaration file.
NoteThe catalogs file can either contain or reference the function declaration libraries.
library file This file contains the code in C++ for the user functions.
The library file contains the user function implementation as defined in the XML function declaration.
6.4.1.7.1.4 Using the Web Intelligence sample files
Make sure to have the following applications installed:
● Visual Studio C++ VS2015 or higher● Web Intelligence 4.1 or higher
The examples in this document use the sample files in the Samples.zip file located in [Install directory]\userlibs\WebI\Samples\.
1. Unzip Samples.zip.
2. To open the samples, launch OpenSolution.bat.
The OpenSolution.bat sets the temporary <WEBICALCPLUGINAPI> variable environment that is used by the solution to find Web Intelligence specific headers files.
CautionIf the required version of Web Intelligence is not installed, you cannot use the OpenSolution.bat. If that is the case, manually set the <WEBICALCPLUGINAPI> variable environment to the path of the folder that contains the Web Intelligence header files and open Samples\WebICalcPlugIn.
Related Information
Examples [page 661]
654 PUBLICSAP BusinessObjects Web Intelligence User's Guide
Analyzing data
6.4.1.7.2 Defining a custom calculation
To customize a function within Web Intelligence:
1. Define the XML function declaration2. Define the XML catalog declaration.3. Implement the library in C++ using the specific API for external function.4. Compile the source file.5. Copy the XML definition and the library into the dedicated WebiCalcPlugin folder (server side and any
rich client).6. Restart the Web Intelligence server.
NoteThe chapter's examples use the sample files delivered with Web Intelligence.
The system automatically adds the function to the function list in the formula editor and formula bar contextual help.
If a formula is using a function for which no external library is available, the #EXTERNAL error message appears.
NoteOnly functions that use single value parameters are supported. Table parameters for instance aren't supported.
6.4.1.7.2.1 XML function objects
The XML definition contains objects which define the custom function. XML custom functions extend the function list of the formula language so that a formula using this function can be parsed according its XML signature and turn into a tokenized form. You assign the external function a global unique ID (GUID) so that it cannot be reused or confused with other custom libraries.
The XML definition contains the following objects:
Tag XML attribute XML definition object
<CATALOG> The XML root
<LIBRARY> file The name of the library file that contains the C++ implementation code
The library file can contain several functions. The library extension should not be specified.
SAP BusinessObjects Web Intelligence User's GuideAnalyzing data PUBLIC 655
Tag XML attribute XML definition object
<FUNCTION> guid The unique function GUID
TipDefine all GUIDs in advance and make sure that all GUIDs are unique from a global point of view.
For Windows you can use the GUID tool provided with Visual Studio or download it from the Microsoft website. For Linux, the tool usr/bin/uuidgen can be found in the libuuid1 (Debian) package.
name The function name that appears in the formula editor
The function name must:
● be a simple, unique name for the function● start with a letter
● use lower and upper case letters, number characters, or the _ character
● not already exist in the Web Intelligence library
NoteThe name will not be translated to another language.
<ARGLIST> The list of parameters
The number of parameters should be lower than or equal to five.
<ARG> type The parameter types
The possible parameter types are as follows:
● Numeric● Boolean● Date● String
name The name of each parameter as it should appear in the Formula Editor
The name shows the prototype of the method to the user. Use only alphanumeric characters.
<RETURN> type The return values type
Return values can be:
● Numeric● Boolean● Date● String
656 PUBLICSAP BusinessObjects Web Intelligence User's Guide
Analyzing data
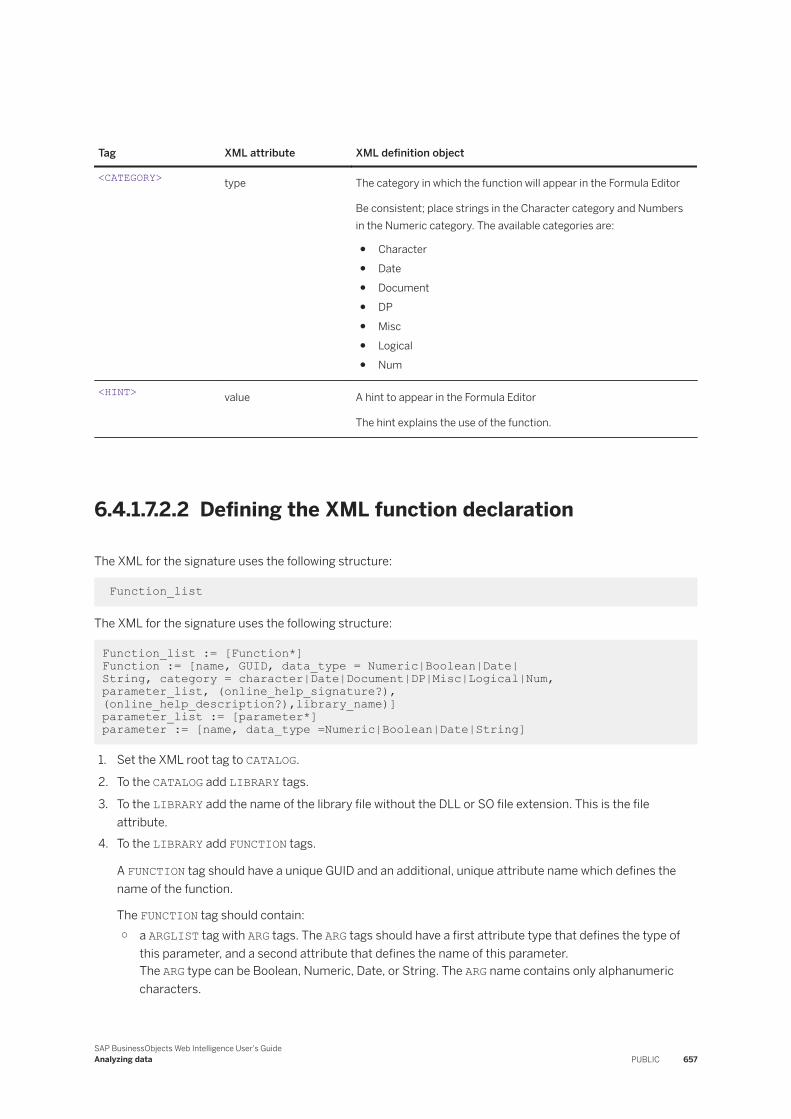
Tag XML attribute XML definition object
<CATEGORY> type The category in which the function will appear in the Formula Editor
Be consistent; place strings in the Character category and Numbers in the Numeric category. The available categories are:
● Character● Date● Document● DP● Misc● Logical● Num
<HINT> value A hint to appear in the Formula Editor
The hint explains the use of the function.
6.4.1.7.2.2 Defining the XML function declaration
The XML for the signature uses the following structure:
Function_list
The XML for the signature uses the following structure:
Function_list := [Function*] Function := [name, GUID, data_type = Numeric|Boolean|Date|String, category = character|Date|Document|DP|Misc|Logical|Num,parameter_list, (online_help_signature?), (online_help_description?),library_name)]parameter_list := [parameter*] parameter := [name, data_type =Numeric|Boolean|Date|String]
1. Set the XML root tag to CATALOG.
2. To the CATALOG add LIBRARY tags.
3. To the LIBRARY add the name of the library file without the DLL or SO file extension. This is the file attribute.
4. To the LIBRARY add FUNCTION tags.
A FUNCTION tag should have a unique GUID and an additional, unique attribute name which defines the name of the function.
The FUNCTION tag should contain:○ a ARGLIST tag with ARG tags. The ARG tags should have a first attribute type that defines the type of
this parameter, and a second attribute that defines the name of this parameter.The ARG type can be Boolean, Numeric, Date, or String. The ARG name contains only alphanumeric characters.
SAP BusinessObjects Web Intelligence User's GuideAnalyzing data PUBLIC 657
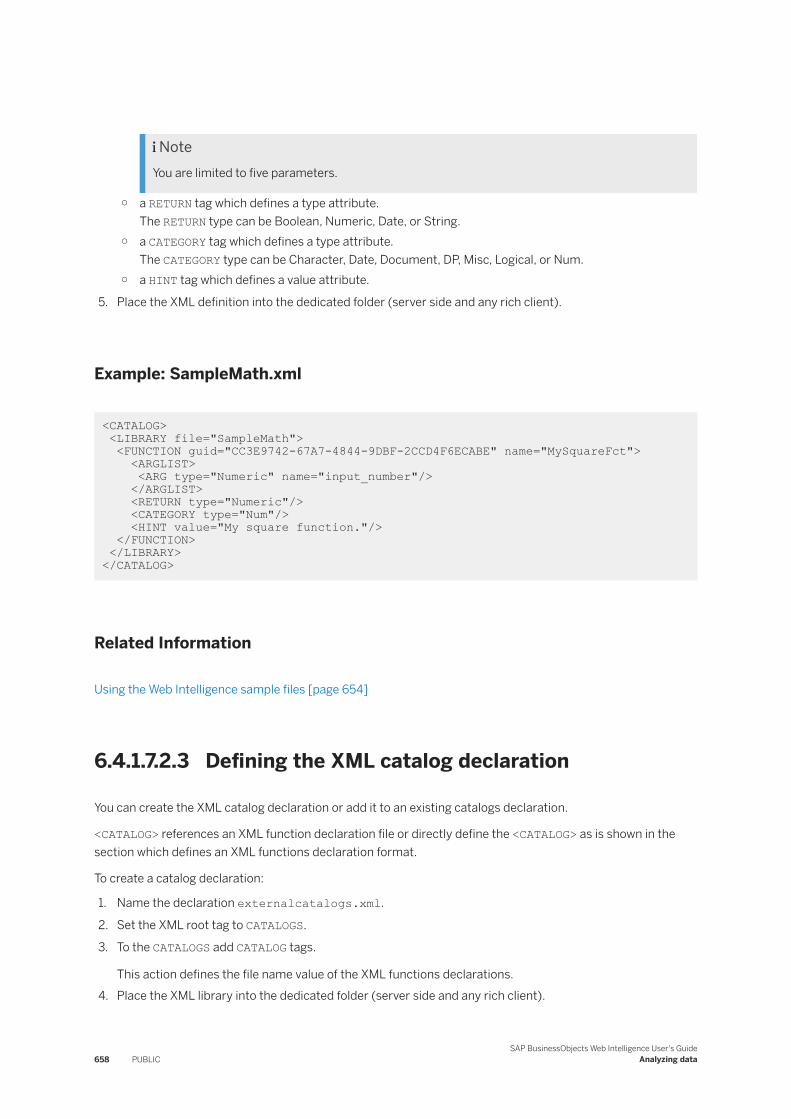
NoteYou are limited to five parameters.
○ a RETURN tag which defines a type attribute.The RETURN type can be Boolean, Numeric, Date, or String.
○ a CATEGORY tag which defines a type attribute.The CATEGORY type can be Character, Date, Document, DP, Misc, Logical, or Num.
○ a HINT tag which defines a value attribute.
5. Place the XML definition into the dedicated folder (server side and any rich client).
Example: SampleMath.xml
<CATALOG> <LIBRARY file="SampleMath"> <FUNCTION guid="CC3E9742-67A7-4844-9DBF-2CCD4F6ECABE" name="MySquareFct"> <ARGLIST> <ARG type="Numeric" name="input_number"/> </ARGLIST> <RETURN type="Numeric"/> <CATEGORY type="Num"/> <HINT value="My square function."/> </FUNCTION> </LIBRARY> </CATALOG>
Related Information
Using the Web Intelligence sample files [page 654]
6.4.1.7.2.3 Defining the XML catalog declaration
You can create the XML catalog declaration or add it to an existing catalogs declaration.
<CATALOG> references an XML function declaration file or directly define the <CATALOG> as is shown in the section which defines an XML functions declaration format.
To create a catalog declaration:
1. Name the declaration externalcatalogs.xml.
2. Set the XML root tag to CATALOGS.
3. To the CATALOGS add CATALOG tags.
This action defines the file name value of the XML functions declarations.4. Place the XML library into the dedicated folder (server side and any rich client).
658 PUBLICSAP BusinessObjects Web Intelligence User's Guide
Analyzing data
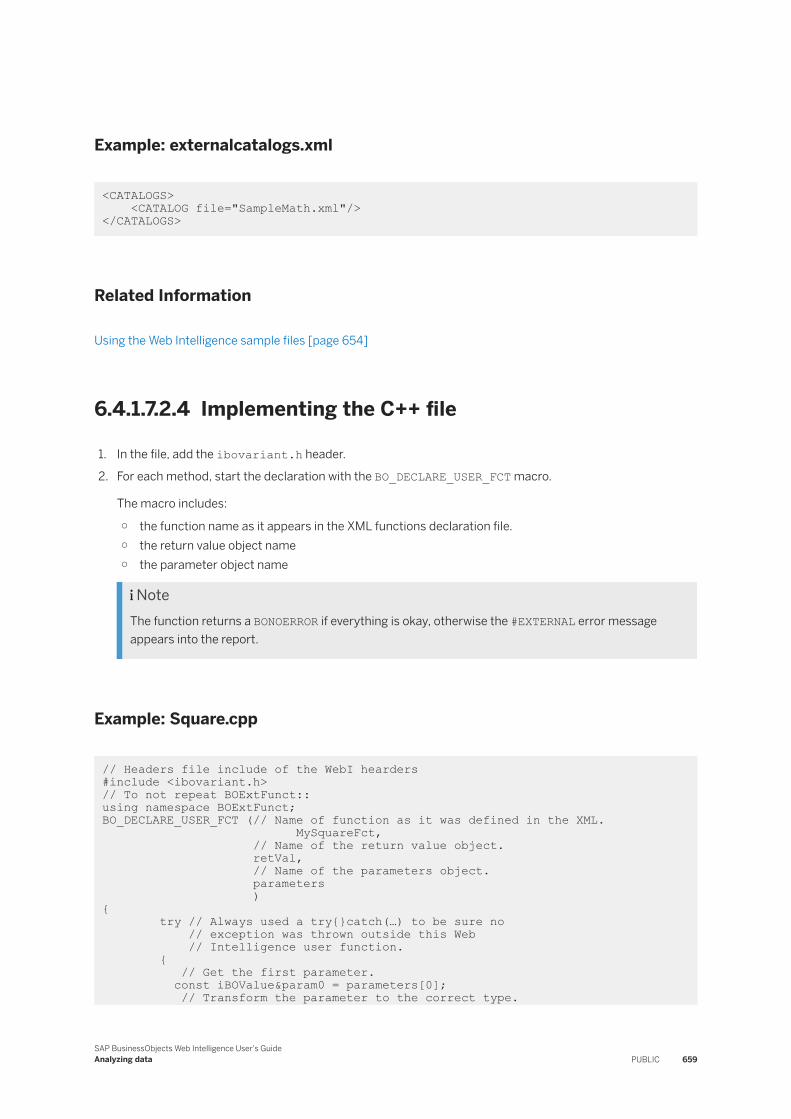
Example: externalcatalogs.xml
<CATALOGS> <CATALOG file="SampleMath.xml"/> </CATALOGS>
Related Information
Using the Web Intelligence sample files [page 654]
6.4.1.7.2.4 Implementing the C++ file
1. In the file, add the ibovariant.h header.
2. For each method, start the declaration with the BO_DECLARE_USER_FCT macro.
The macro includes:
○ the function name as it appears in the XML functions declaration file.○ the return value object name○ the parameter object name
NoteThe function returns a BONOERROR if everything is okay, otherwise the #EXTERNAL error message appears into the report.
Example: Square.cpp
// Headers file include of the WebI hearders #include <ibovariant.h>// To not repeat BOExtFunct::using namespace BOExtFunct;BO_DECLARE_USER_FCT (// Name of function as it was defined in the XML. MySquareFct, // Name of the return value object. retVal, // Name of the parameters object. parameters ){ try // Always used a try{}catch(…) to be sure no // exception was thrown outside this Web // Intelligence user function. { // Get the first parameter. const iBOValue¶m0 = parameters[0]; // Transform the parameter to the correct type.
SAP BusinessObjects Web Intelligence User's GuideAnalyzing data PUBLIC 659
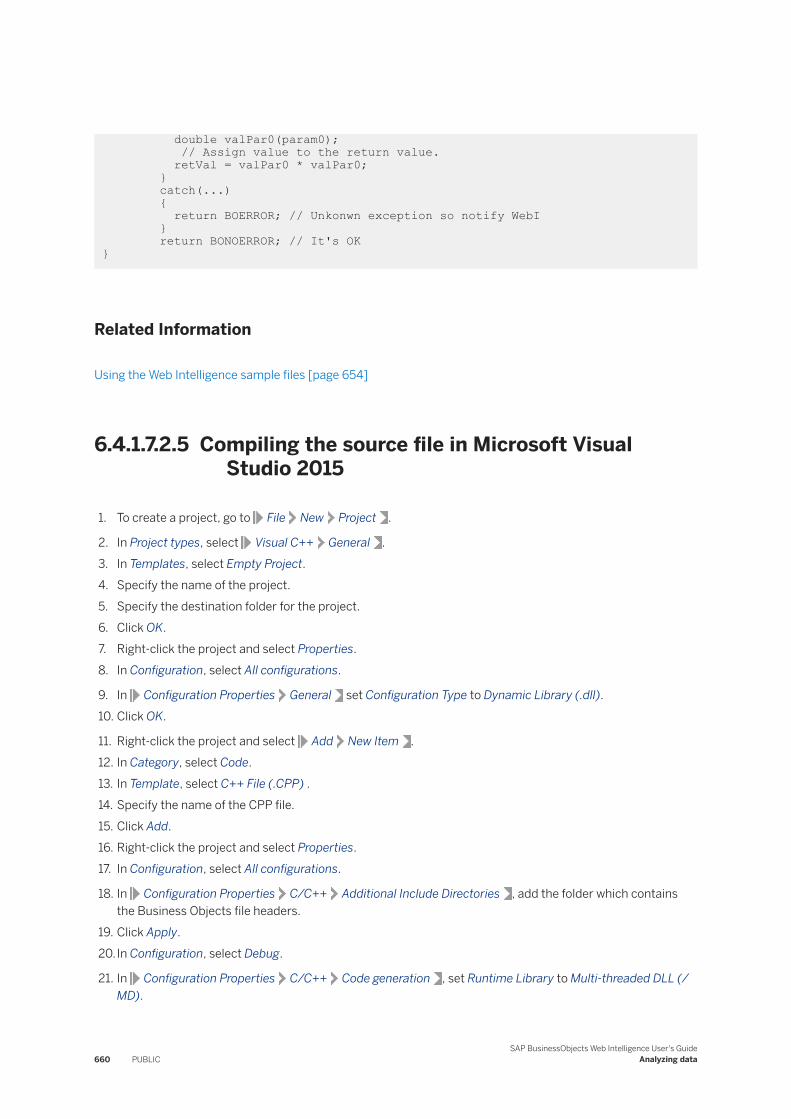
double valPar0(param0); // Assign value to the return value. retVal = valPar0 * valPar0; } catch(...) { return BOERROR; // Unkonwn exception so notify WebI } return BONOERROR; // It's OK }
Related Information
Using the Web Intelligence sample files [page 654]
6.4.1.7.2.5 Compiling the source file in Microsoft Visual Studio 2015
1. To create a project, go to File New Project .
2. In Project types, select Visual C++ General .3. In Templates, select Empty Project.4. Specify the name of the project.5. Specify the destination folder for the project.6. Click OK.7. Right-click the project and select Properties.8. In Configuration, select All configurations.
9. In Configuration Properties General set Configuration Type to Dynamic Library (.dll).10. Click OK.
11. Right-click the project and select Add New Item .12. In Category, select Code.13. In Template, select C++ File (.CPP) .14. Specify the name of the CPP file.15. Click Add.16. Right-click the project and select Properties.17. In Configuration, select All configurations.
18. In Configuration Properties C/C++ Additional Include Directories , add the folder which contains the Business Objects file headers.
19. Click Apply.20.In Configuration, select Debug.
21. In Configuration Properties C/C++ Code generation , set Runtime Library to Multi-threaded DLL (/MD).
660 PUBLICSAP BusinessObjects Web Intelligence User's Guide
Analyzing data
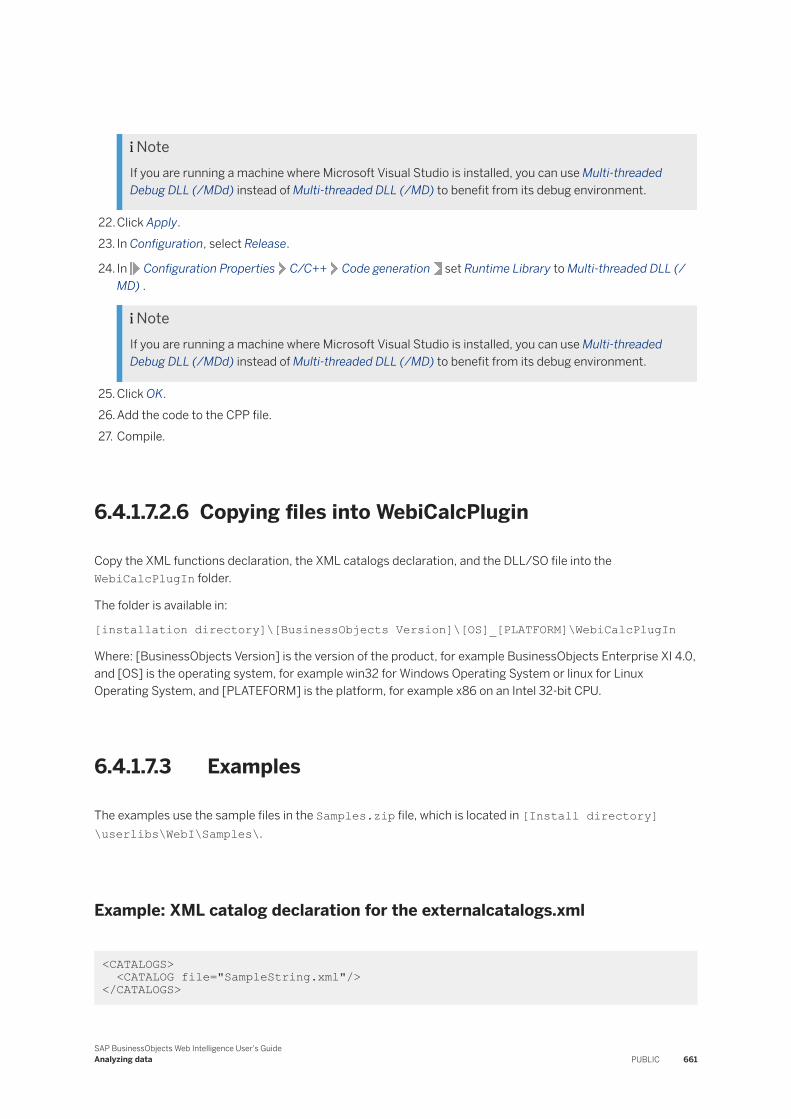
NoteIf you are running a machine where Microsoft Visual Studio is installed, you can use Multi-threaded Debug DLL (/MDd) instead of Multi-threaded DLL (/MD) to benefit from its debug environment.
22. Click Apply.23. In Configuration, select Release.
24. In Configuration Properties C/C++ Code generation set Runtime Library to Multi-threaded DLL (/MD) .
NoteIf you are running a machine where Microsoft Visual Studio is installed, you can use Multi-threaded Debug DLL (/MDd) instead of Multi-threaded DLL (/MD) to benefit from its debug environment.
25. Click OK.26. Add the code to the CPP file.27. Compile.
6.4.1.7.2.6 Copying files into WebiCalcPlugin
Copy the XML functions declaration, the XML catalogs declaration, and the DLL/SO file into the WebiCalcPlugIn folder.
The folder is available in:
[installation directory]\[BusinessObjects Version]\[OS]_[PLATFORM]\WebiCalcPlugIn
Where: [BusinessObjects Version] is the version of the product, for example BusinessObjects Enterprise XI 4.0, and [OS] is the operating system, for example win32 for Windows Operating System or linux for Linux Operating System, and [PLATEFORM] is the platform, for example x86 on an Intel 32-bit CPU.
6.4.1.7.3 Examples
The examples use the sample files in the Samples.zip file, which is located in [Install directory]\userlibs\WebI\Samples\.
Example: XML catalog declaration for the externalcatalogs.xml
<CATALOGS> <CATALOG file="SampleString.xml"/> </CATALOGS>
SAP BusinessObjects Web Intelligence User's GuideAnalyzing data PUBLIC 661
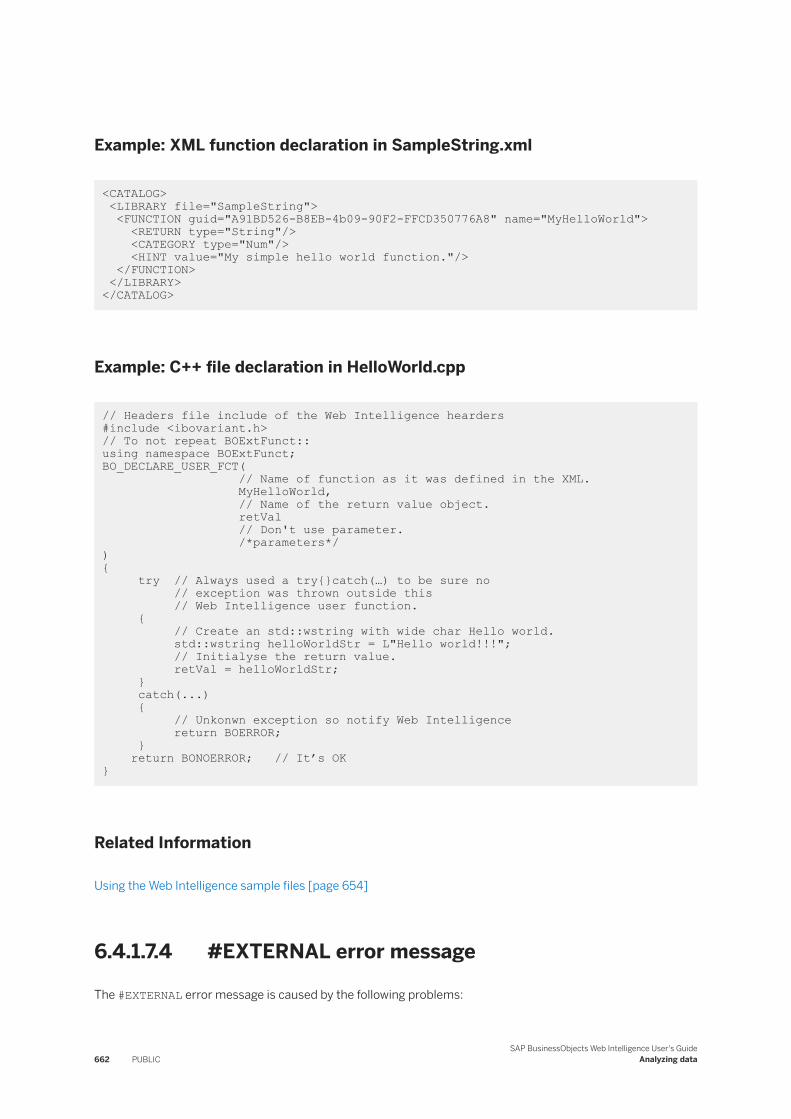
Example: XML function declaration in SampleString.xml
<CATALOG> <LIBRARY file="SampleString"> <FUNCTION guid="A91BD526-B8EB-4b09-90F2-FFCD350776A8" name="MyHelloWorld"> <RETURN type="String"/> <CATEGORY type="Num"/> <HINT value="My simple hello world function."/> </FUNCTION> </LIBRARY> </CATALOG>
Example: C++ file declaration in HelloWorld.cpp
// Headers file include of the Web Intelligence hearders #include <ibovariant.h>// To not repeat BOExtFunct::using namespace BOExtFunct; BO_DECLARE_USER_FCT( // Name of function as it was defined in the XML. MyHelloWorld, // Name of the return value object. retVal // Don't use parameter. /*parameters*/){ try // Always used a try{}catch(…) to be sure no // exception was thrown outside this // Web Intelligence user function. { // Create an std::wstring with wide char Hello world. std::wstring helloWorldStr = L"Hello world!!!"; // Initialyse the return value. retVal = helloWorldStr; } catch(...) { // Unkonwn exception so notify Web Intelligence return BOERROR; } return BONOERROR; // It’s OK }
Related Information
Using the Web Intelligence sample files [page 654]
6.4.1.7.4 #EXTERNAL error message
The #EXTERNAL error message is caused by the following problems:
662 PUBLICSAP BusinessObjects Web Intelligence User's Guide
Analyzing data
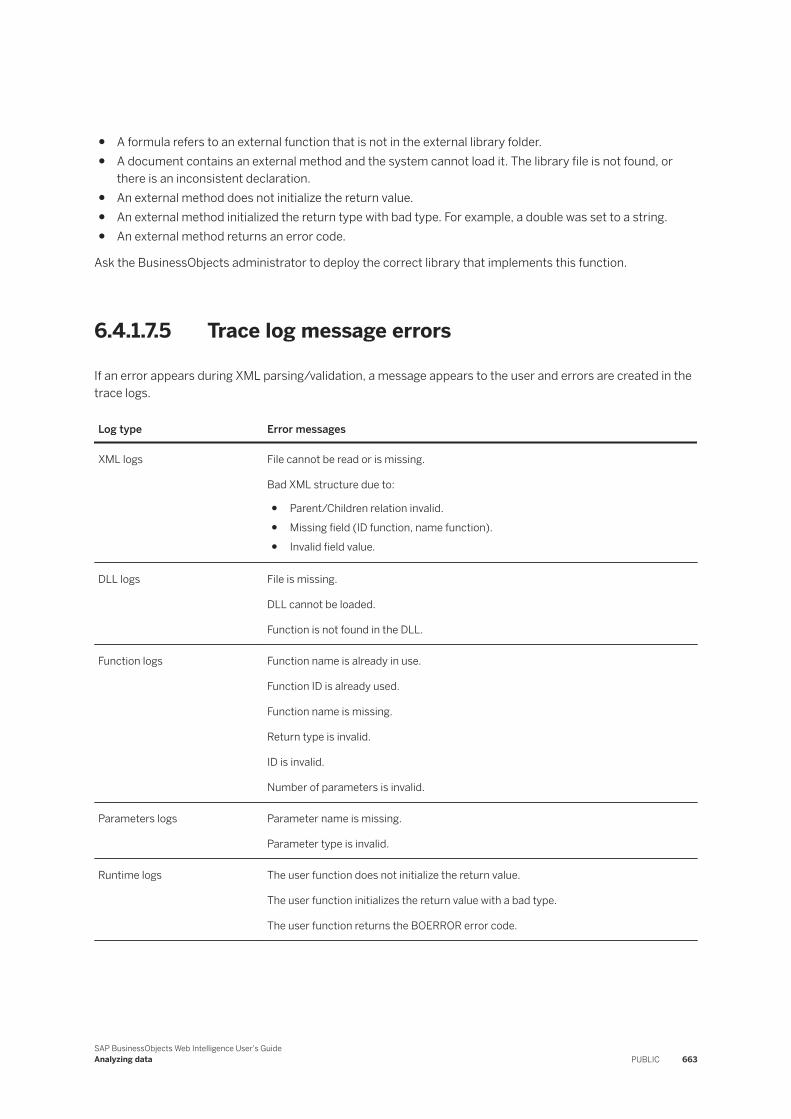
● A formula refers to an external function that is not in the external library folder.● A document contains an external method and the system cannot load it. The library file is not found, or
there is an inconsistent declaration.● An external method does not initialize the return value.● An external method initialized the return type with bad type. For example, a double was set to a string.● An external method returns an error code.
Ask the BusinessObjects administrator to deploy the correct library that implements this function.
6.4.1.7.5 Trace log message errors
If an error appears during XML parsing/validation, a message appears to the user and errors are created in the trace logs.
Log type Error messages
XML logs File cannot be read or is missing.
Bad XML structure due to:
● Parent/Children relation invalid.● Missing field (ID function, name function).● Invalid field value.
DLL logs File is missing.
DLL cannot be loaded.
Function is not found in the DLL.
Function logs Function name is already in use.
Function ID is already used.
Function name is missing.
Return type is invalid.
ID is invalid.
Number of parameters is invalid.
Parameters logs Parameter name is missing.
Parameter type is invalid.
Runtime logs The user function does not initialize the return value.
The user function initializes the return value with a bad type.
The user function returns the BOERROR error code.
SAP BusinessObjects Web Intelligence User's GuideAnalyzing data PUBLIC 663
6.4.1.8 Troubleshooting formulas
6.4.1.8.1 Automatic rewrite formula mechanism
The succession of corrective maintenance releases for Web Intelligence can sometimes lead to calculation result differences between versions.
Since version 4.1 SP3, Web Intelligence provides an Automatic Formula Rewrite mechanism that automatically modifies a selection of formulas (see list below) in a document migrated from a previous version. These formulas follow a certain pattern. After modification, the formulas return the same result than before the calculation change. Therefore, it is recommended to save the document so that the modifications are stored in the document, thus completing the formula rewrite mechanism.
The Automatic Formula Rewrite mechanism is available by default for documents migrated to BI 4.1 SP3 and later, for the following formula patterns:
1. Where() operator with a dimension as parameter in a condition,2. Running calculations with reset in sections,3. Running calculations with reset in cross-tables.
This list of rules could be extended in future releases with more formula patterns.
Rule(1)
In previous versions, the data was calculated in a specific way if you had a Where() operator with a dimension as a parameter in a condition. Indeed, the dimension was added to the measure context. Rule(1) reproduces the former behavior.
This rules applies to every document migrated from XI 3.1 FP3.6, XI 3.1 FP4.1, XI 3.1 FP5.1 and. 4.0 SP5.
Rule(2)
In previous versions, running calculations in sections was not properly executed, as calculations would reset at each section instance. Rule(2) reproduces the former behavior.
This rules applies to every document migrated from XI R2 SP4.
Rule(3)
In previous versions, running calculations with reset cross-tables meant that calculations were executed in an “N” pattern (column after column) instead of a “Z” pattern (row after row).
Rule(3) introduced a FORCE_COL keyword that forces Web Intelligence to run calculations in a “N” pattern.
664 PUBLICSAP BusinessObjects Web Intelligence User's Guide
Analyzing data
For example, with Rule(3), the RunningSum([Sales revenue];([State])) formula will be forced to execute column after column when modified as RunningSum([Sales revenue];FORCE_COL;([State])).
This rule applies to every document migrated from every version of XI 3.x, 4.0 Patch 2.20, 4.0 SP5, 4.0 SP6, 4.0 SP7, 4.1 and 4.1 SP1.
6.4.1.8.2 Formula error and information messages
You can format report data that returns error messages using conditional formatting.
In some cases a formula cannot return a value and returns an error or information message beginning with '#". The message appears in the cell in which the formula is placed.
6.4.1.8.2.1 #COMPUTATION
#COMPUTATION occurs when a slicing dimension specified in the RelativeValue function is no longer available in the calculation context of the block where the function is placed.
#COMPUTATION also occurs when a merged object containing a hierarchy is included in a report.
#COMPUTATION is also related to the misuse of context operators in a formula.
Related Information
RelativeValue [page 623]
6.4.1.8.2.2 #CONTEXT
#CONTEXT appears in a measure when the measure has a non-existent calculation context.
#CONTEXT is related to the #INCOMPATIBLE and #DATASYNC error messages, which appear in dimensions when a block contains a non-existent calculation context.
In the case of #INCOMPATIBLE the context is non-existent because the dimensions are incompatible; in the case of #DATASYNC the context is non-existent because the dimensions are from multiple unsynchronized data providers.
SAP BusinessObjects Web Intelligence User's GuideAnalyzing data PUBLIC 665
Example: Non-existent calculation context in a query
If a block based on the Island Resorts Marketing universe contains the Reservation Year and Revenue objects, the #CONTEXT error message appears because it is not possible to aggregate revenue by reservation year. (Reservations have not yet generated any revenue.)
6.4.1.8.2.3 #DATASYNC
#DATASYNC occurs when you place a dimension from a different data provider in a block containing dimensions from another data provider, and the two data providers are not synchronized through a merged dimension.
#DATASYNC appears in all dimensions in the block and #CONTEXT in the measures.
Example: Dimensions from different data providers in a block
If a report based on the Island Resorts Marketing universe contains data providers with the objects (Year, Revenue) and (Quarter), a block containing Year, Quarter and Revenue displays #DATASYNC in the Year and Quarter columns because the two data providers are not synchronized through a merged dimension.
6.4.1.8.2.4 #DIV/0
#DIV/0 occurs when a formula tries to divide a number by zero, which is mathematically impossible.
Zero can never appear as a divisor.
Example: Determining revenue per item
You have a report showing sales revenues, numbers of items sold and the revenue per item (which is calculated by dividing the sales revenue by the number of items sold).
You had a very bad quarter in which you didn’t create any revenue; the Revenue per Item column returns #DIV/0 for this quarter, because the formula is attempting to divide by zero; that is, divide the revenue by zero number of items sold.
6.4.1.8.2.5 #ERROR
#ERROR is the default error message that covers all errors not covered by other error messages.
666 PUBLICSAP BusinessObjects Web Intelligence User's Guide
Analyzing data
6.4.1.8.2.6 #EXTERNAL
#EXTERNAL occurs when a formula references an external function that is not available to use in Web Intelligence.
6.4.1.8.2.7 #INCOMPATIBLE
#INCOMPATIBLE occurs when a block contains incompatible objects.
Example: Incompatible objects in a query
If a block based on the Island Resorts Marketing universe contains the Year and Reservation Year dimensions, the columns containing these dimensions show #INCOMPATIBLE because these objects are incompatible.
6.4.1.8.2.8 #MIX
#MIX occurs when an aggregated measure has different units.
For example, a cell shows #MIX if it aggregates currency values denominated in different currencies.
6.4.1.8.2.9 #MULTIVALUE
#MULTIVALUE occurs when you place a formula that returns more than one value in a cell that outputs one value only.
Example: Multivalue in a cell
You have a report showing Country, Resort and Revenue and you add a cell to the report containing the formula [Revenue] ForEach ([Country]). This cell returns #MULTIVALUE because Country has two values in the report: ‘US’ and ‘France’.
One cell cannot display the revenues for both the US and France. Placed outside the table, a cell containing revenue can only aggregate the revenues in the table in some way (for example by summing or averaging them).
If the report is broken into sections on Country, the formula is correct when placed in a section because there is only one value of Country per section. Outside a section, however, the formula still returns #MULTIVALUE
SAP BusinessObjects Web Intelligence User's GuideAnalyzing data PUBLIC 667
6.4.1.8.2.10 #N/A
When there is a value for a cell in report that is based on a value from a report that is not available on the underlying data base (for example, a BW error in a BEx Cell), the cell displays #N/A (not available), meaning that the cell is empty because the data cannot be retrieved.
6.4.1.8.2.11 #OVERFLOW
#OVERFLOW occurs when a calculation returns a value that is too large for the software to handle.
This value, in exponential form, is 1.7E308 (1.7 followed by 307 zeros).
6.4.1.8.2.12 #PARTIALRESULT
#PARTIALRESULT occurs when all rows associated with a report object were not retrieved.
If #PARTIALRESULT occurs often in your reports and you have the appropriate security rights, modify the MaxRowsRetrieved query property to allow the retrieval of more data. If you do not have the right to modify the query, contact the BI administrator.
If your report contains smart measures it is more likely to display #PARTIALRESULT because smart measures require the retrieval of larger amounts of data than classic measures.
6.4.1.8.2.13 #RANK
#RANK occurs when you try to rank data based on an object that depends on the order of values.
Objects that use the Previous function or any running aggregate function depend on the order of values.
Ranking causes these objects to recalculate their values, which then changes the ranking, resulting in a circular dependency. Such a dependency can occur either when you use the Rank dialog box to create a ranking, or when you use the Rank function.
Example: Ranking on running average or previous values
If you attempt to rank a block on a column that contains the Previous function or any running aggregate function, the entire block returns #RANK.
668 PUBLICSAP BusinessObjects Web Intelligence User's Guide
Analyzing data
6.4.1.8.2.14 #RECURSIVE
#RECURSIVE occurs when it is not possible to perform a calculation due to a circular dependency.
Example: Using the NumberOfPages(), Page() and PageInSection() functions
If you place the NumberOfPages, Page and PageInSection functions in a cell whose Autofit Height or Autofit Width properties are set, the cell returns #RECURSIVE because the placing of these formulas in an Autofit cell creates a circular dependency. These functions need the exact size of the report to return a value, but the size of the cell, which affects the size of the report, is determined by the cell content.
6.4.1.8.2.15 #REFRESH
#REFRESH appears in report cells whose values are derived from objects that were stripped from a query and then re-added to the query.
Objects are stripped from a query when the Enable query stripping query property is selected and the objects do not contribute to any reports based on the query.
The cells are re-populated with values from the objects when the query is refreshed.
6.4.1.8.2.16 #SECURITY
#SECURITY occurs when you attempt to use a function for which you do not have security rights.
Example: Using the DataProviderSQL() function
If a user who does not have the right to view data provider SQL places the DataProviderSQL() function in a cell, the #SECURITY message appears in the cell.
SAP BusinessObjects Web Intelligence User's GuideAnalyzing data PUBLIC 669
6.4.1.8.2.17 #SYNTAX
#SYNTAX occurs when a formula references an object that no longer exists in the report.
Example: Referencing a non-existent object
You have a report that originally showed Year, Quarter and Sales revenue, with an additional column showing difference between the revenue and the average yearly revenue. This figure is given by the variable Difference from Yearly Average.
If the Difference from Yearly Average variable is deleted from the report, the column containing it returns #SYNTAX.
6.4.1.8.2.18 #TOREFRESH
#TOREFRESH appears in cells based on smart measures when the value returned by the smart measure is not available.
This situation occurs when the grouping set containing the value is not available in the data provider.
You remove the #TOREFRESH error by refreshing the data.
Some of the measures are “delegated” (for BW, this refers to a measure which is not aggregating with SUM); when you define a table or calculation on a measure, this measure is queried in specific context of aggregation (the measure is given for a set of dimensions). If this set of dimensions is a subset of the query dimension set, the measure has to be aggregated along the given dimension set (or grouping set that is referring to a group by clause in SQL).
For normal measures the system is carrying out the aggregation, for delegated measures this aggregation is delegated to the underlying database. For this the system needs to query again this database. Since this is not automatic, it displays #TOREFRESH and waits for the user to proceed with a refresh. Once the user refreshes, the system will run the additional query to get the requested aggregation and then replace #TOREFRESH by the appropriate value.
6.4.1.8.2.19 #UNAVAILABLE
#UNAVAILABLE appears when it is not possible to calculate the value of a smart measure.
This occurs when it is not possible to display the values in a filtered smart measure without applying a filter to the query. Because this carries a risk of impacting other reports based on the same query, no filter is applied.
670 PUBLICSAP BusinessObjects Web Intelligence User's Guide
Analyzing data
6.4.1.9 Comparing values using functions
6.4.1.9.1 Comparing values using the Previous function
The Previous function returns a comparative previous value of an expression.
The value returned depends on the layout of the report.
For more powerful comparison capabilities, use the RelativeValue function. RelativeValue returns a previous or subsequent comparative value of an expression. The value returned does not depend on the layout of the report.
Related Information
Previous [page 619]RelativeValue [page 623]Comparing values using the RelativeValue function [page 671]
6.4.1.9.2 Comparing values using the RelativeValue function
The RelativeValue function returns comparative values of an expression. The function returns these values independently of the layout of a report.
When using RelativeValue, you specify the following:
● The expression whose comparative value you want to find (the expression must be a measure or a detail of a dimension available in the block)
● The list of slicing dimensions● The offset.
The function uses the slicing dimensions, the offset, and the sub-axis dimensions (which are implied by the slicing dimensions) to return a comparative value. The sub-axis dimensions are all the other dimensions in the calculation context apart from the slicing dimensions.
Expressed in general terms, RelativeValue returns the value of the expression in the row which, in the list of values of the slicing dimensions, is offset rows removed from the current row, and where the values of the sub-axis dimensions are the same as in the current row.
NoteAll slicing dimensions must always be in the calculation context of the block in which the function is placed. If a slicing dimension is subsequently removed, the function returns #COMPUTATION.
SAP BusinessObjects Web Intelligence User's GuideAnalyzing data PUBLIC 671
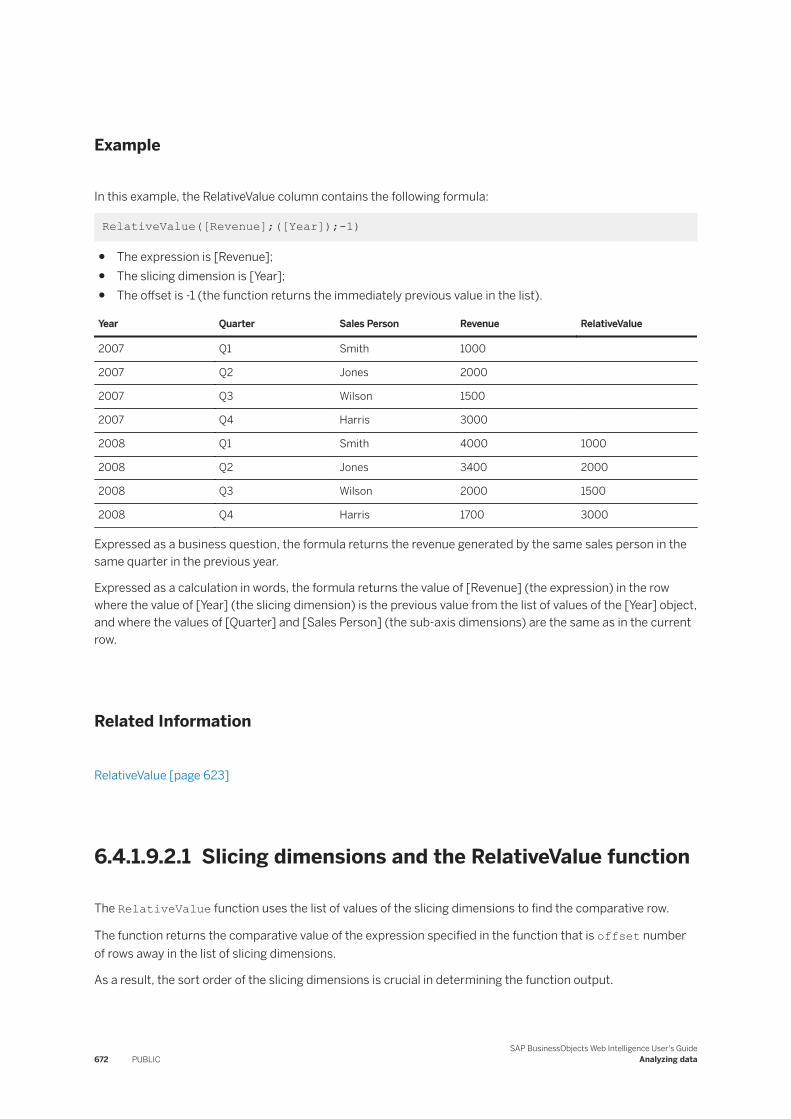
Example
In this example, the RelativeValue column contains the following formula:
RelativeValue([Revenue];([Year]);-1)
● The expression is [Revenue];● The slicing dimension is [Year];● The offset is -1 (the function returns the immediately previous value in the list).
Year Quarter Sales Person Revenue RelativeValue
2007 Q1 Smith 1000
2007 Q2 Jones 2000
2007 Q3 Wilson 1500
2007 Q4 Harris 3000
2008 Q1 Smith 4000 1000
2008 Q2 Jones 3400 2000
2008 Q3 Wilson 2000 1500
2008 Q4 Harris 1700 3000
Expressed as a business question, the formula returns the revenue generated by the same sales person in the same quarter in the previous year.
Expressed as a calculation in words, the formula returns the value of [Revenue] (the expression) in the row where the value of [Year] (the slicing dimension) is the previous value from the list of values of the [Year] object, and where the values of [Quarter] and [Sales Person] (the sub-axis dimensions) are the same as in the current row.
Related Information
RelativeValue [page 623]
6.4.1.9.2.1 Slicing dimensions and the RelativeValue function
The RelativeValue function uses the list of values of the slicing dimensions to find the comparative row.
The function returns the comparative value of the expression specified in the function that is offset number of rows away in the list of slicing dimensions.
As a result, the sort order of the slicing dimensions is crucial in determining the function output.
672 PUBLICSAP BusinessObjects Web Intelligence User's Guide
Analyzing data
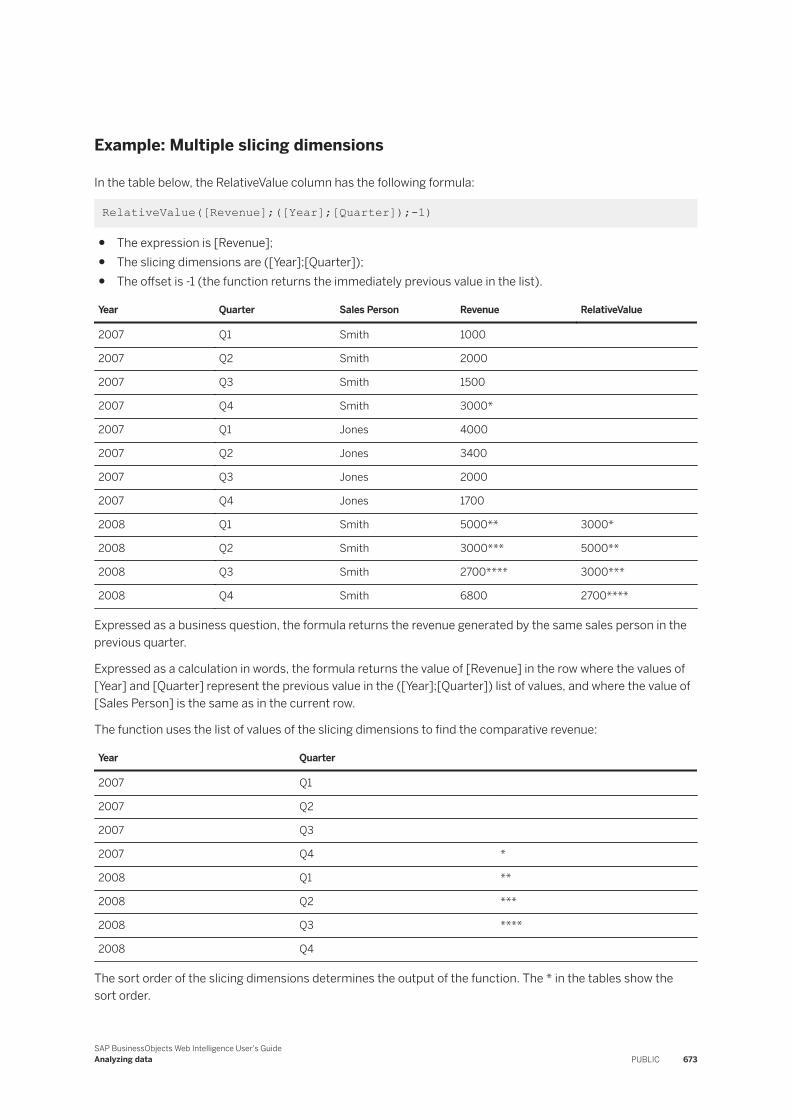
Example: Multiple slicing dimensions
In the table below, the RelativeValue column has the following formula:
RelativeValue([Revenue];([Year];[Quarter]);-1)
● The expression is [Revenue];● The slicing dimensions are ([Year];[Quarter]);● The offset is -1 (the function returns the immediately previous value in the list).
Year Quarter Sales Person Revenue RelativeValue
2007 Q1 Smith 1000
2007 Q2 Smith 2000
2007 Q3 Smith 1500
2007 Q4 Smith 3000*
2007 Q1 Jones 4000
2007 Q2 Jones 3400
2007 Q3 Jones 2000
2007 Q4 Jones 1700
2008 Q1 Smith 5000** 3000*
2008 Q2 Smith 3000*** 5000**
2008 Q3 Smith 2700**** 3000***
2008 Q4 Smith 6800 2700****
Expressed as a business question, the formula returns the revenue generated by the same sales person in the previous quarter.
Expressed as a calculation in words, the formula returns the value of [Revenue] in the row where the values of [Year] and [Quarter] represent the previous value in the ([Year];[Quarter]) list of values, and where the value of [Sales Person] is the same as in the current row.
The function uses the list of values of the slicing dimensions to find the comparative revenue:
Year Quarter
2007 Q1
2007 Q2
2007 Q3
2007 Q4 *
2008 Q1 **
2008 Q2 ***
2008 Q3 ****
2008 Q4
The sort order of the slicing dimensions determines the output of the function. The * in the tables show the sort order.
SAP BusinessObjects Web Intelligence User's GuideAnalyzing data PUBLIC 673
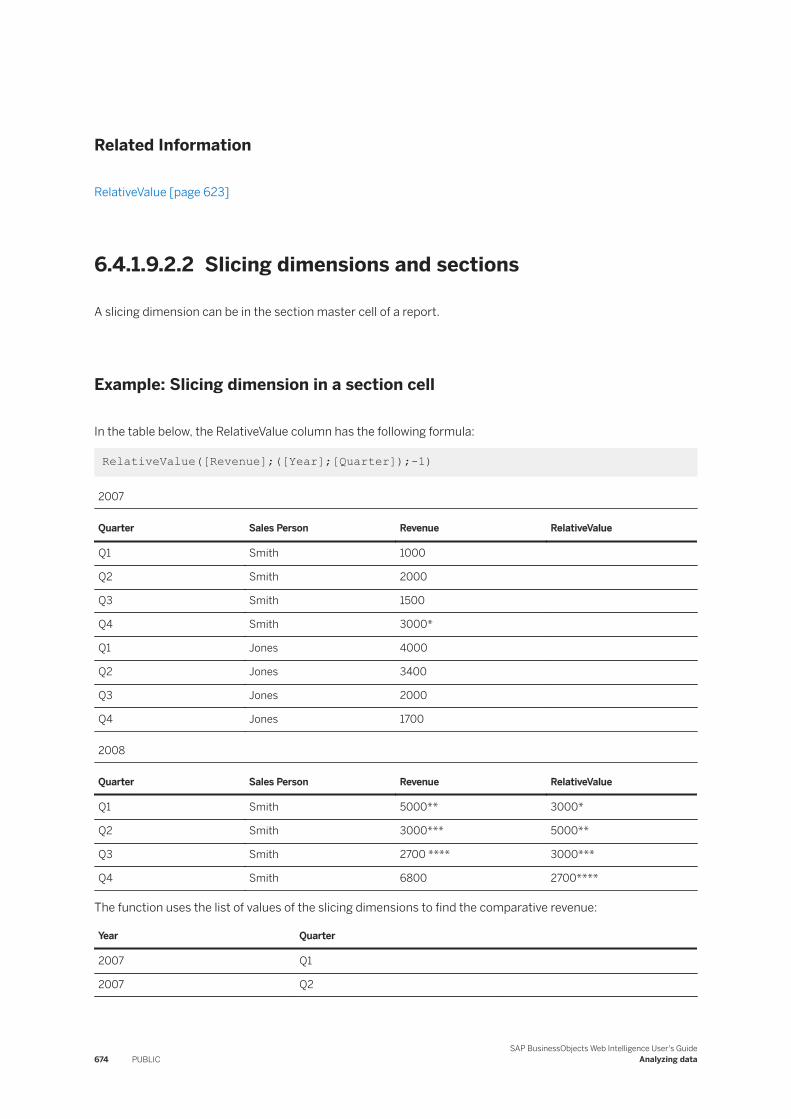
Related Information
RelativeValue [page 623]
6.4.1.9.2.2 Slicing dimensions and sections
A slicing dimension can be in the section master cell of a report.
Example: Slicing dimension in a section cell
In the table below, the RelativeValue column has the following formula:
RelativeValue([Revenue];([Year];[Quarter]);-1)
2007
Quarter Sales Person Revenue RelativeValue
Q1 Smith 1000
Q2 Smith 2000
Q3 Smith 1500
Q4 Smith 3000*
Q1 Jones 4000
Q2 Jones 3400
Q3 Jones 2000
Q4 Jones 1700
2008
Quarter Sales Person Revenue RelativeValue
Q1 Smith 5000** 3000*
Q2 Smith 3000*** 5000**
Q3 Smith 2700 **** 3000***
Q4 Smith 6800 2700****
The function uses the list of values of the slicing dimensions to find the comparative revenue:
Year Quarter
2007 Q1
2007 Q2
674 PUBLICSAP BusinessObjects Web Intelligence User's Guide
Analyzing data
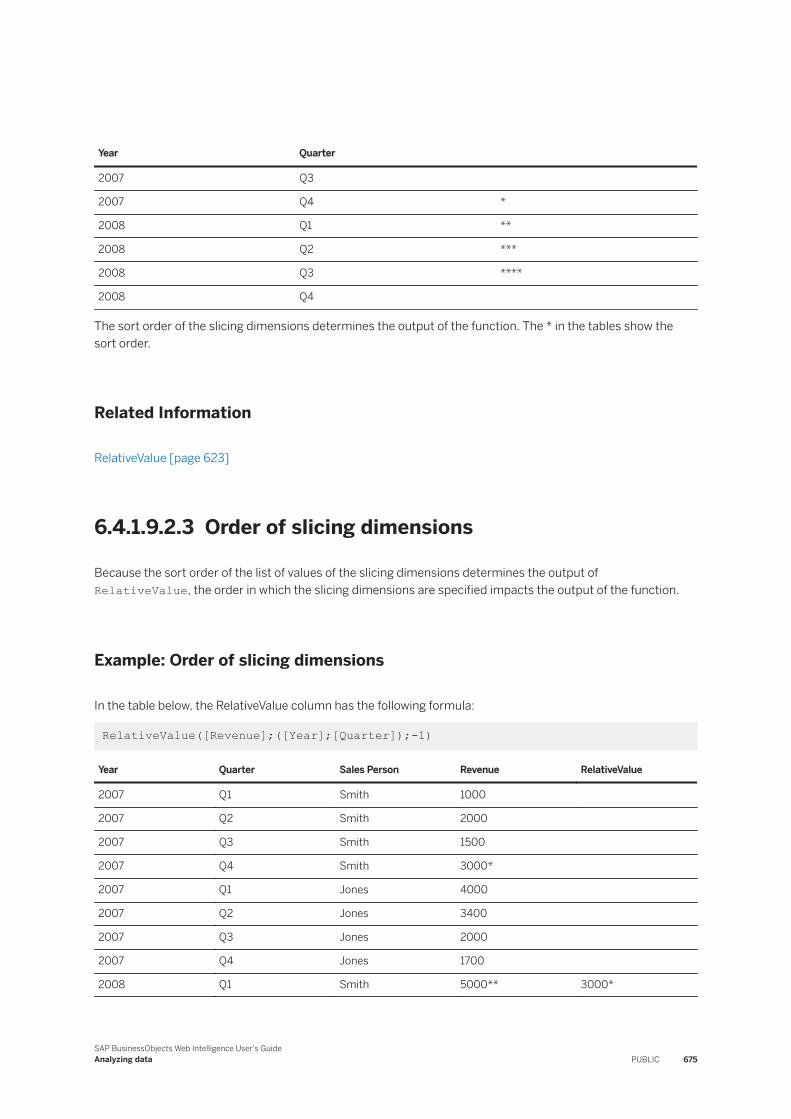
Year Quarter
2007 Q3
2007 Q4 *
2008 Q1 **
2008 Q2 ***
2008 Q3 ****
2008 Q4
The sort order of the slicing dimensions determines the output of the function. The * in the tables show the sort order.
Related Information
RelativeValue [page 623]
6.4.1.9.2.3 Order of slicing dimensions
Because the sort order of the list of values of the slicing dimensions determines the output of RelativeValue, the order in which the slicing dimensions are specified impacts the output of the function.
Example: Order of slicing dimensions
In the table below, the RelativeValue column has the following formula:
RelativeValue([Revenue];([Year];[Quarter]);-1)
Year Quarter Sales Person Revenue RelativeValue
2007 Q1 Smith 1000
2007 Q2 Smith 2000
2007 Q3 Smith 1500
2007 Q4 Smith 3000*
2007 Q1 Jones 4000
2007 Q2 Jones 3400
2007 Q3 Jones 2000
2007 Q4 Jones 1700
2008 Q1 Smith 5000** 3000*
SAP BusinessObjects Web Intelligence User's GuideAnalyzing data PUBLIC 675
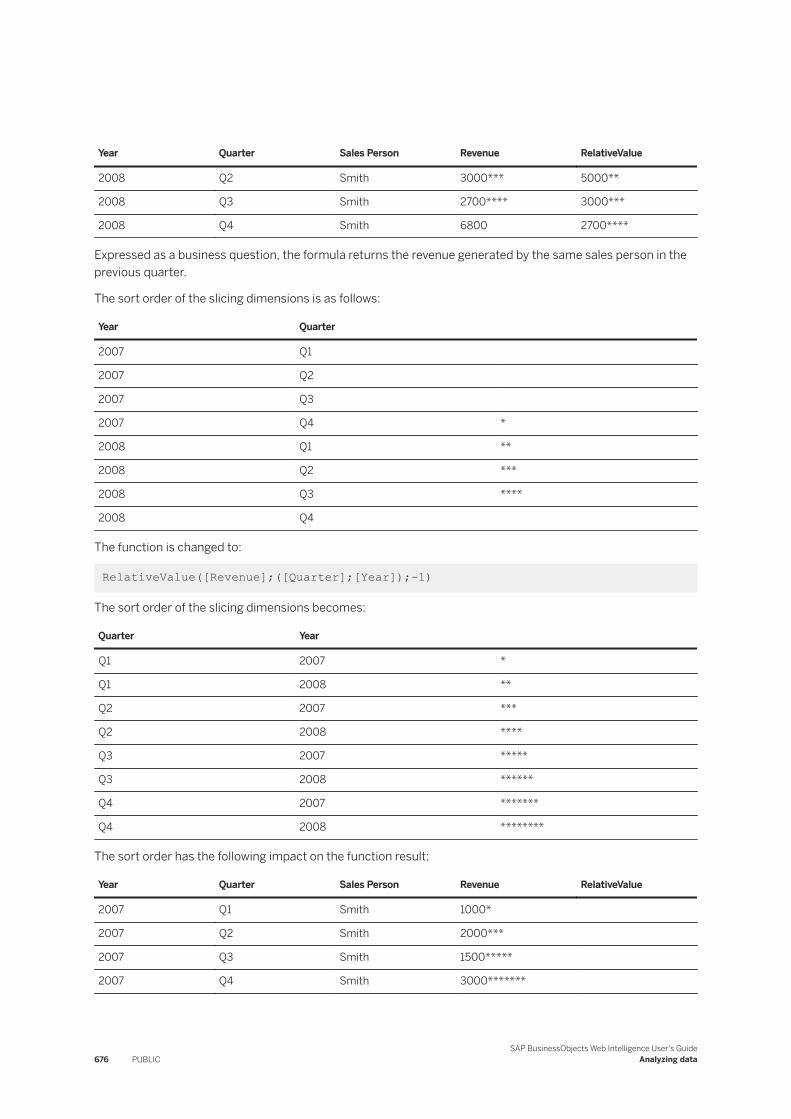
Year Quarter Sales Person Revenue RelativeValue
2008 Q2 Smith 3000*** 5000**
2008 Q3 Smith 2700**** 3000***
2008 Q4 Smith 6800 2700****
Expressed as a business question, the formula returns the revenue generated by the same sales person in the previous quarter.
The sort order of the slicing dimensions is as follows:
Year Quarter
2007 Q1
2007 Q2
2007 Q3
2007 Q4 *
2008 Q1 **
2008 Q2 ***
2008 Q3 ****
2008 Q4
The function is changed to:
RelativeValue([Revenue];([Quarter];[Year]);-1)
The sort order of the slicing dimensions becomes:
Quarter Year
Q1 2007 *
Q1 2008 **
Q2 2007 ***
Q2 2008 ****
Q3 2007 *****
Q3 2008 ******
Q4 2007 *******
Q4 2008 ********
The sort order has the following impact on the function result:
Year Quarter Sales Person Revenue RelativeValue
2007 Q1 Smith 1000*
2007 Q2 Smith 2000***
2007 Q3 Smith 1500*****
2007 Q4 Smith 3000*******
676 PUBLICSAP BusinessObjects Web Intelligence User's Guide
Analyzing data
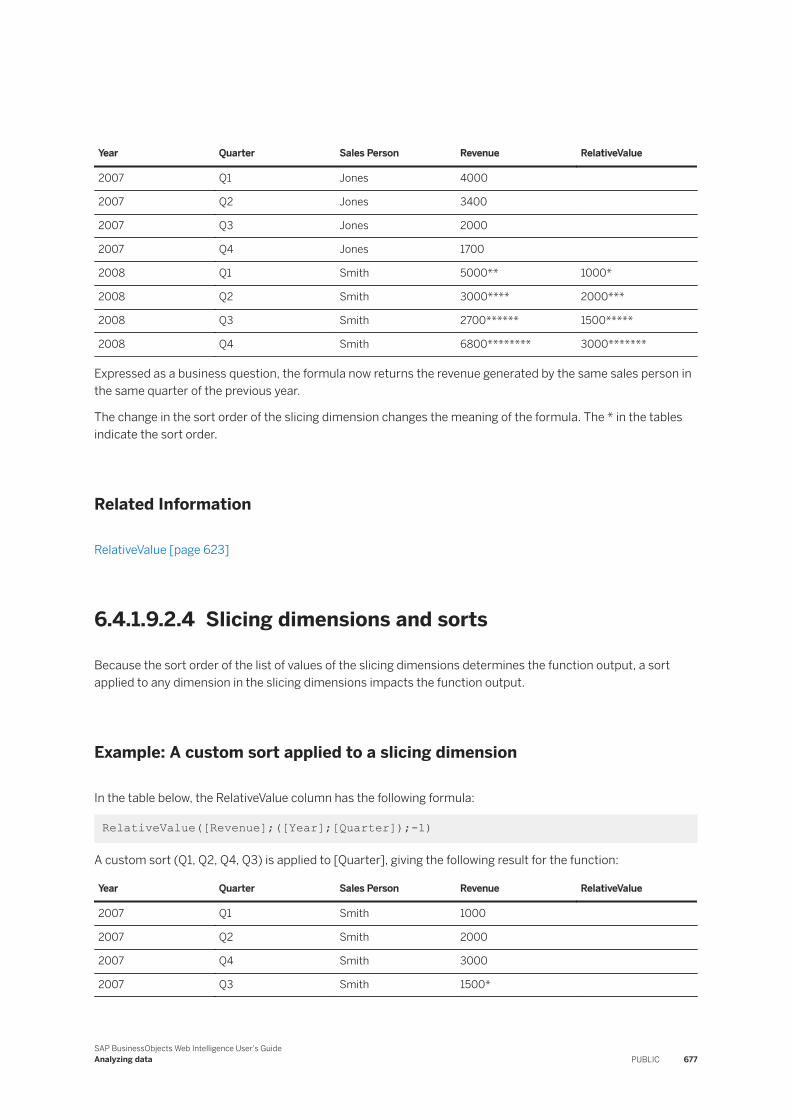
Year Quarter Sales Person Revenue RelativeValue
2007 Q1 Jones 4000
2007 Q2 Jones 3400
2007 Q3 Jones 2000
2007 Q4 Jones 1700
2008 Q1 Smith 5000** 1000*
2008 Q2 Smith 3000**** 2000***
2008 Q3 Smith 2700****** 1500*****
2008 Q4 Smith 6800******** 3000*******
Expressed as a business question, the formula now returns the revenue generated by the same sales person in the same quarter of the previous year.
The change in the sort order of the slicing dimension changes the meaning of the formula. The * in the tables indicate the sort order.
Related Information
RelativeValue [page 623]
6.4.1.9.2.4 Slicing dimensions and sorts
Because the sort order of the list of values of the slicing dimensions determines the function output, a sort applied to any dimension in the slicing dimensions impacts the function output.
Example: A custom sort applied to a slicing dimension
In the table below, the RelativeValue column has the following formula:
RelativeValue([Revenue];([Year];[Quarter]);-1)
A custom sort (Q1, Q2, Q4, Q3) is applied to [Quarter], giving the following result for the function:
Year Quarter Sales Person Revenue RelativeValue
2007 Q1 Smith 1000
2007 Q2 Smith 2000
2007 Q4 Smith 3000
2007 Q3 Smith 1500*
SAP BusinessObjects Web Intelligence User's GuideAnalyzing data PUBLIC 677
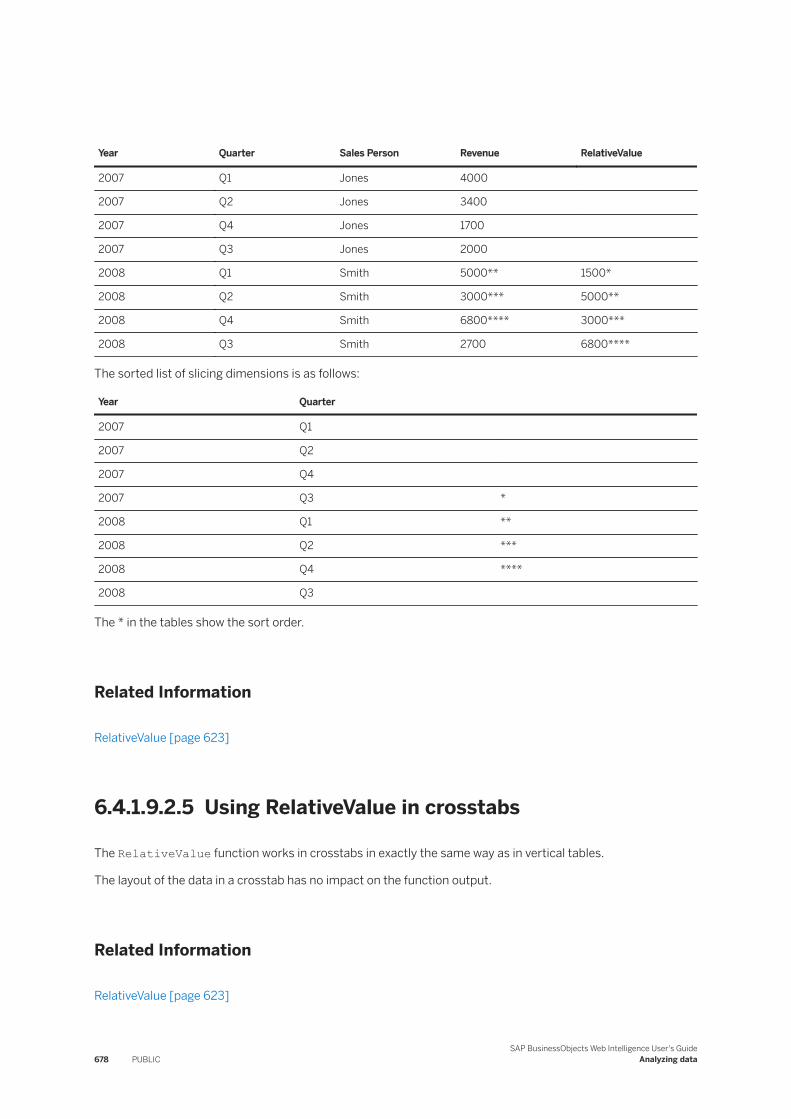
Year Quarter Sales Person Revenue RelativeValue
2007 Q1 Jones 4000
2007 Q2 Jones 3400
2007 Q4 Jones 1700
2007 Q3 Jones 2000
2008 Q1 Smith 5000** 1500*
2008 Q2 Smith 3000*** 5000**
2008 Q4 Smith 6800**** 3000***
2008 Q3 Smith 2700 6800****
The sorted list of slicing dimensions is as follows:
Year Quarter
2007 Q1
2007 Q2
2007 Q4
2007 Q3 *
2008 Q1 **
2008 Q2 ***
2008 Q4 ****
2008 Q3
The * in the tables show the sort order.
Related Information
RelativeValue [page 623]
6.4.1.9.2.5 Using RelativeValue in crosstabs
The RelativeValue function works in crosstabs in exactly the same way as in vertical tables.
The layout of the data in a crosstab has no impact on the function output.
Related Information
RelativeValue [page 623]
678 PUBLICSAP BusinessObjects Web Intelligence User's Guide
Analyzing data
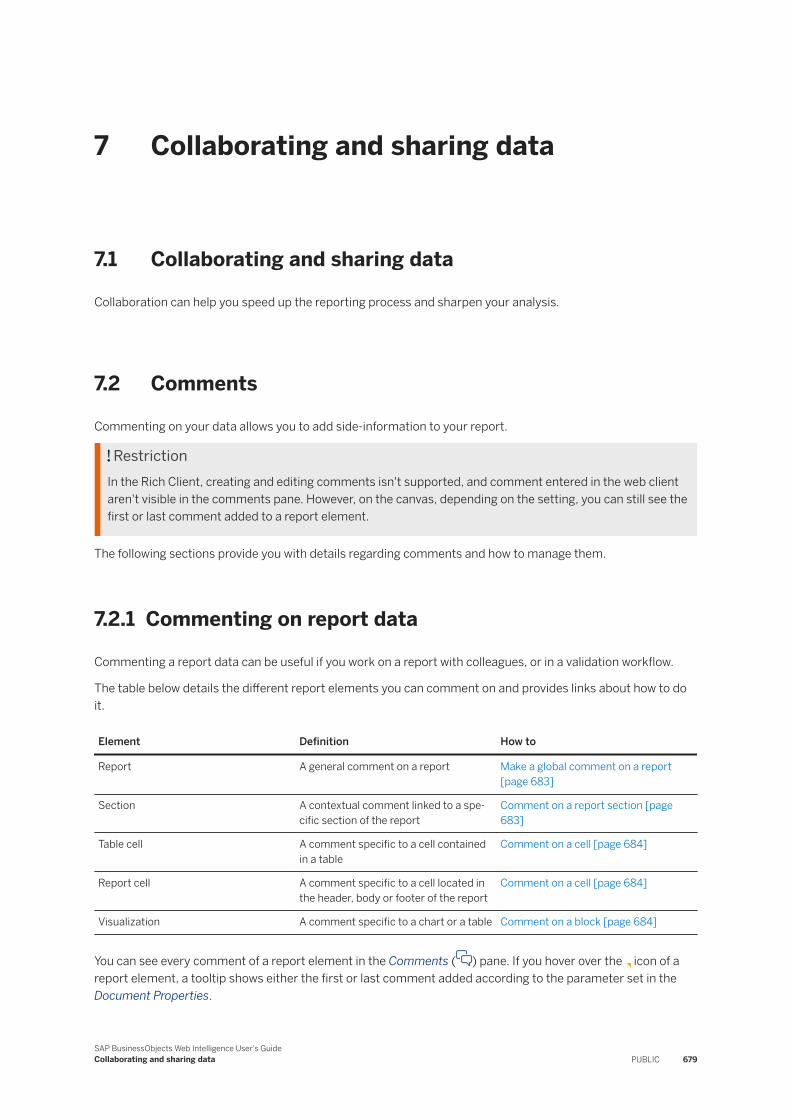
7 Collaborating and sharing data
7.1 Collaborating and sharing data
Collaboration can help you speed up the reporting process and sharpen your analysis.
7.2 Comments
Commenting on your data allows you to add side-information to your report.
RestrictionIn the Rich Client, creating and editing comments isn't supported, and comment entered in the web client aren't visible in the comments pane. However, on the canvas, depending on the setting, you can still see the first or last comment added to a report element.
The following sections provide you with details regarding comments and how to manage them.
7.2.1 Commenting on report data
Commenting a report data can be useful if you work on a report with colleagues, or in a validation workflow.
The table below details the different report elements you can comment on and provides links about how to do it.
Element Definition How to
Report A general comment on a report Make a global comment on a report [page 683]
Section A contextual comment linked to a specific section of the report
Comment on a report section [page 683]
Table cell A comment specific to a cell contained in a table
Comment on a cell [page 684]
Report cell A comment specific to a cell located in the header, body or footer of the report
Comment on a cell [page 684]
Visualization A comment specific to a chart or a table Comment on a block [page 684]
You can see every comment of a report element in the Comments () pane. If you hover over the icon of a report element, a tooltip shows either the first or last comment added according to the parameter set in the Document Properties.
SAP BusinessObjects Web Intelligence User's GuideCollaborating and sharing data PUBLIC 679
Make sure to save the document first before trying to add comments. If you save a document using the Save As method, it's possible to save the comments with the Save document with comments option. The option is disabled by default and greyed out if you don't have the necessary rights to use it.
Restriction● You can't add comments to a document’s instance. To do so, either use the original document or save
the instance as a new document.● The comments of a document you copy aren't persisted in the instance that you paste.● You can't filter, sort, rank on comments.● When sending a document, the recipient's version doesn't contain the comments of the source
document.● When entering a comment, the text field is limited to 600 characters (2000 UTF-8 bytes).
Related Information
To comment on a report [page 683]To comment on a report section [page 683]To comment on a report section [page 683]To comment on a visualization [page 684]To delete a comment [page 685]
7.2.1.1 Comments restrictions and limitations
Depending on how you interact with the report, you might run into limitations regarding the commenting possibilities.
Commenting in Design mode
The commentary service is only available in Reading mode or Design with Data mode.
CautionTo be able to create a comment cell in Design mode, you must be granted the Reporting - Enable Formatting security right. If you don't have this right, contact your system administrator.
Commenting in a report header, body, or footer
You cannot comment on a report header, body, or footer. As a workaround, create an empty cell, comment it and then place it in the header, body, or header of the report.
680 PUBLICSAP BusinessObjects Web Intelligence User's Guide
Collaborating and sharing data
Database and report desynchronization
To make sure that you are viewing the latest comments entered in the report, refresh the document.
Changing the context on cells that contain comments
If you change the context of a table by changing a column using the Assign Data method or by editing a measure using the formula editor, comments that were entered for a cell are still displayed in the Comments pane even though the data have changed.
As a workaround, delete the column and create a new one with the new measure.
Filters, rank and sort
Comments aren't part of the microcube. You can't filter, rank or sort them.
Filters and prompts
When you add a comment to a table cell and apply filters or prompts to the table, the comment cell can sometimes disappear. That is because the comment is not linked to the filtered result, but to the table cell itself. If you remove the filters or prompts you have applied, then the comment cell is displayed again.
Hierarchies
If you comment on a cell within a hierarchy, the comment is displayed as long as the hierarchy is expanded. If you collapse the hierarchy, then the comment disappears.
Drilling
If you comment on a table cell and drill down on the table, the comment disappears. Drill back up to see the comment again.
SAP BusinessObjects Web Intelligence User's GuideCollaborating and sharing data PUBLIC 681
Shared elements
When you create a shared element from a report element, comment attached to it is not saved with the shared element.
Non-aggregated data in tables
You cannot comment on non-aggregated data.
Scheduling documents with comments
If you schedule a document several times and modify or delete comments between two sheduling jobs, the previous instances will reflect these modifications or deletions. Note that if you add new comments between two instances, previous instances will only contain the comments that were in the document at the time of the scheduling job.
7.2.1.2 Security rights
You need to be granted specific rights by your administrator to manage comments.
You can access the security rights in the Central Management Console in the Folders section.
NoteThese rights are not Web Intelligence specific, they apply to the whole Business Intelligence platform. For more information, refer the Business Intelligence Platform Administrator Guide.
The table below lists the differents rights.
Action Description
Create Comments Enter or reply to a comment
Read Comments Display all the comments in the Comments pane
Read Comments You Own Display only the comments you own in the Comments pane
Edit All Comments Edit comments you have not entered yourself
Edit Comments You Own Edit your comments
682 PUBLICSAP BusinessObjects Web Intelligence User's Guide
Collaborating and sharing data
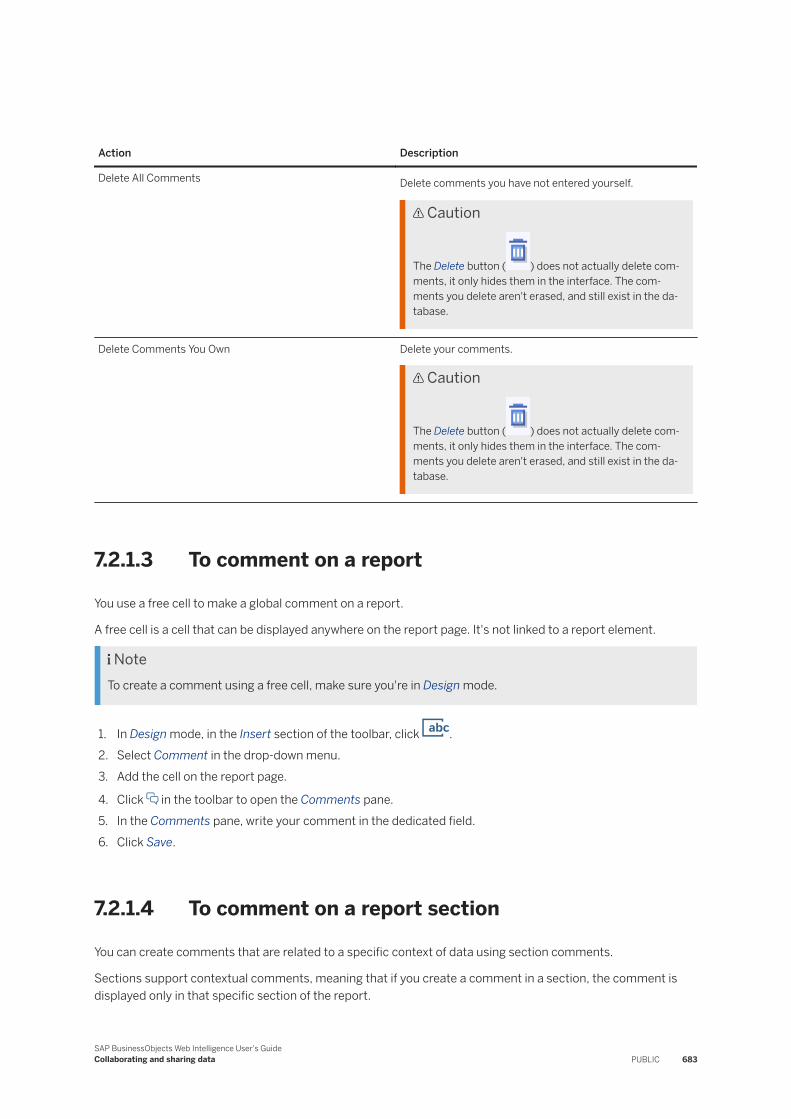
Action Description
Delete All Comments Delete comments you have not entered yourself.
Caution
The Delete button ( ) does not actually delete comments, it only hides them in the interface. The comments you delete aren't erased, and still exist in the database.
Delete Comments You Own Delete your comments.
Caution
The Delete button ( ) does not actually delete comments, it only hides them in the interface. The comments you delete aren't erased, and still exist in the database.
7.2.1.3 To comment on a report
You use a free cell to make a global comment on a report.
A free cell is a cell that can be displayed anywhere on the report page. It's not linked to a report element.
NoteTo create a comment using a free cell, make sure you're in Design mode.
1. In Design mode, in the Insert section of the toolbar, click .2. Select Comment in the drop-down menu.3. Add the cell on the report page.
4. Click in the toolbar to open the Comments pane.5. In the Comments pane, write your comment in the dedicated field.6. Click Save.
7.2.1.4 To comment on a report section
You can create comments that are related to a specific context of data using section comments.
Sections support contextual comments, meaning that if you create a comment in a section, the comment is displayed only in that specific section of the report.
SAP BusinessObjects Web Intelligence User's GuideCollaborating and sharing data PUBLIC 683
1. In Design mode, the Insert section of the toolbar, click .2. Click Comment in the drop-down menu.3. Add the cell in a section.
4. Click in the toolbar to open the Comments pane.5. In the Comments pane, write your comment in the dedicated field.6. Click Save.
7.2.1.5 To comment on a cell
As opposed to the free cell that contains general comments on a report or a report section, comments on a cell are related to a specific cell of your report.
A cell can be a table cell or a report cell is in the header, body or footer of the report but not part of table. If you add a comment to report cell that is in a section, then the comment is contextual and displayed only in that specific section of the report.
TipYou can't comment directly on the header, body or footer of a report. As a workaround, create an empty cell, comment it and then place it in the header, body or header of the report.
1. Right-click the cell twice if it's a table cell, or once if it's a report cell.
2. In Reading mode, click in the quick actions widget if you want to add a comment to a report cell, or click Comments in the contextual menu if you want to add a comment to a table cell. If you're working in Design mode, click Comments in the contextual menu.
3. Write your comment.
A yellow ribbon is now displayed in the top-right hand corner of the cell. Hover over the ribbon to see the comment.
7.2.1.6 To comment on a visualization
As opposed to the free cell that contains general comments on a report or report section, comments on a visualization are related to that specific visualization.
A visualization can be a chart or a table.
1. Right-click a visualization.
2. In Reading mode, click in the quick actions widget. In Design mode, click Comments in the contextual menu.
3. Write your comment.
A yellow ribbon is now displayed in the top-right hand corner of the visualization. Hover over the icon to see the comment.
684 PUBLICSAP BusinessObjects Web Intelligence User's Guide
Collaborating and sharing data
7.2.1.7 To copy a comments thread
1. Select a report element with comments.
2. Optional: If it's not yet open, click > to open the Comments pane3. Click Copy All.4. In the Copy Comments dialog, highlight either the whole thread or the text you want to copy and press
Ctrl + C or Cmd + C .
5. Press Ctrl + V or Cmd + V wherever you want to paste the text.
7.2.1.8 To delete a comment
The delete action doesn't delete comments in the database, it only hides them in the interface. The comments you delete are still stored in the database.
NoteMake sure that you have the necessary rights to delete comments.
1. Click the yellow ribbon on a cell or a visualization.
2. In the Comment pane, click next to the comment you want to delete.
Related Information
Security rights [page 682]To clean up comments in the database [page 687]
7.2.1.9 Displaying a specific comment
You can add parameters to the Comment() function to display a specific comment whenever a cell contains several comments.
The Comment() function is useful whenever you are in a validation workflow and need to display comments that have been validated. The function only works with empty cells that do not contain data, and you can use it either with free comment cells or with empty table cells. As a best practice, we recommend creating an extra column with empty cells in your table dedicated to comments if you intend to use the function with table cells.
After comments have been entered in a cell, all you need to do is pass parameters to the function and assign them values that are then registered in the database to display the comment that has been validated.
SAP BusinessObjects Web Intelligence User's GuideCollaborating and sharing data PUBLIC 685
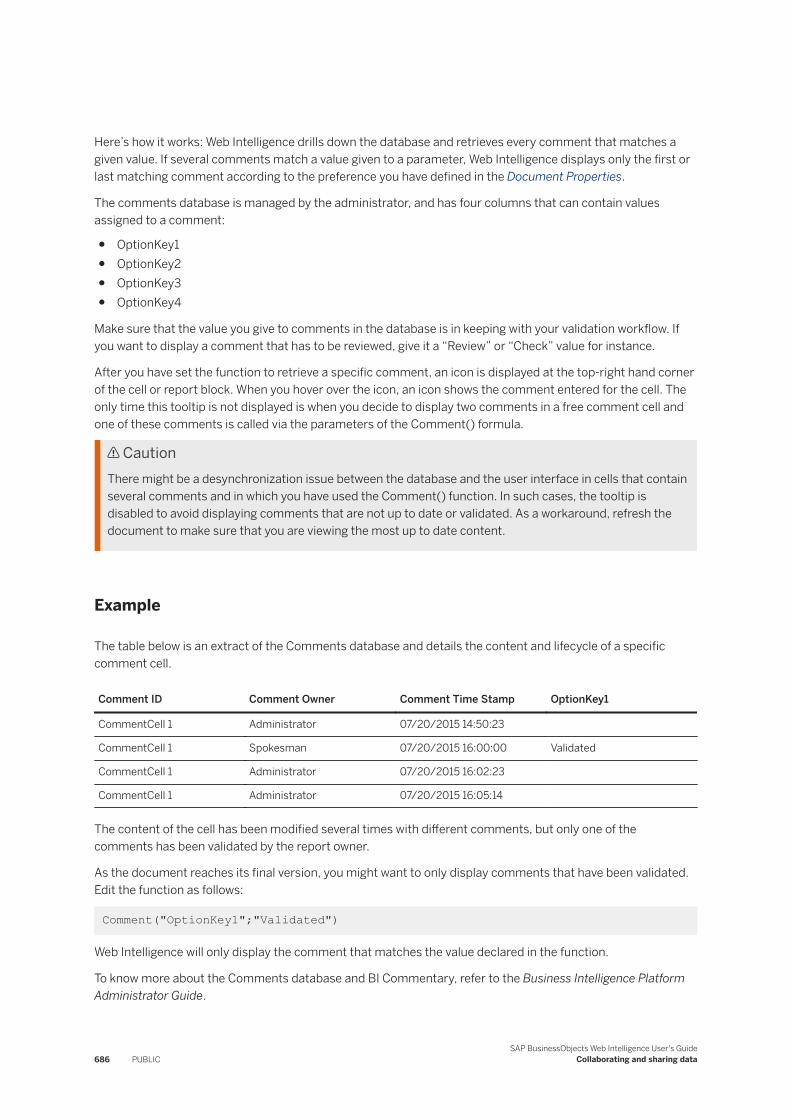
Here’s how it works: Web Intelligence drills down the database and retrieves every comment that matches a given value. If several comments match a value given to a parameter, Web Intelligence displays only the first or last matching comment according to the preference you have defined in the Document Properties.
The comments database is managed by the administrator, and has four columns that can contain values assigned to a comment:
● OptionKey1● OptionKey2● OptionKey3● OptionKey4
Make sure that the value you give to comments in the database is in keeping with your validation workflow. If you want to display a comment that has to be reviewed, give it a “Review” or “Check” value for instance.
After you have set the function to retrieve a specific comment, an icon is displayed at the top-right hand corner of the cell or report block. When you hover over the icon, an icon shows the comment entered for the cell. The only time this tooltip is not displayed is when you decide to display two comments in a free comment cell and one of these comments is called via the parameters of the Comment() formula.
CautionThere might be a desynchronization issue between the database and the user interface in cells that contain several comments and in which you have used the Comment() function. In such cases, the tooltip is disabled to avoid displaying comments that are not up to date or validated. As a workaround, refresh the document to make sure that you are viewing the most up to date content.
Example
The table below is an extract of the Comments database and details the content and lifecycle of a specific comment cell.
Comment ID Comment Owner Comment Time Stamp OptionKey1
CommentCell 1 Administrator 07/20/2015 14:50:23
CommentCell 1 Spokesman 07/20/2015 16:00:00 Validated
CommentCell 1 Administrator 07/20/2015 16:02:23
CommentCell 1 Administrator 07/20/2015 16:05:14
The content of the cell has been modified several times with different comments, but only one of the comments has been validated by the report owner.
As the document reaches its final version, you might want to only display comments that have been validated. Edit the function as follows:
Comment("OptionKey1";"Validated")
Web Intelligence will only display the comment that matches the value declared in the function.
To know more about the Comments database and BI Commentary, refer to the Business Intelligence Platform Administrator Guide.
686 PUBLICSAP BusinessObjects Web Intelligence User's Guide
Collaborating and sharing data
7.2.1.10 Cleaning up comments from the database
You can delete comments from the database using the CMC.
An option, called Delete all comments older than X days, allows you to schedule a recurrent cleaning operation in the database. When enabled, comments older than the specific number of days you have entered are automatically deleted from the database. By default, the option is disabled.
CautionIf you have hidden comments in the interface, a desynchronization can happen between the database and the Web Intelligence client. In such a case, Web Intelligence displays the cache rather than the updated content of the database. To make sure that you are viewing the latest comments entered, refresh the document.
7.2.1.10.1 To clean up comments in the database
1. On the CMC home screen, click Applications.2. Click BI Commentary Application.3. Check Delete comments olders than X days.4. Enter a number of days after which comments should be deleted.
7.2.1.11 Saving a document with its comments
A document that has not been saved cannot contain comments, so make sure to save it first before you try to add comments to it. If you save a document using the Save As method, it's possible to save the comments as well with the Save document with comments option, available in the Save dialog under Options.
SAP BusinessObjects Web Intelligence User's GuideCollaborating and sharing data PUBLIC 687
8 Scheduling and publishing documents
8.1 Introduction to scheduling and publishing
The following sections introduce you to the basic concepts and main functionalities of the scheduling and publishing services offered by the Business Intelligence Platform.
With scheduling and publishing operations, you can send documents with the latest information and data.
Both services are about managing assets of your Central Management Server (CMS) such as Web Intelligence documents. At the end of this section, you will be able to schedule documents, publish them, and fine-tune both processes along the way.
This section focuses mainly on the scheduling and publishing possibilities offered by the Business Intelligence Launch Pad. However, the Central Management Console (CMC) lets you schedule and publish documents as well.
8.2 Concepts
Multiple elements and parameters can help you schedule the content objects.
The following sections provide you with details about concepts related to scheduling the reports.
For more information about Read
Get Started Instances Instances [page 689]
Prompts Prompts [page 690]
Formats Formats [page 691]
Destinations Destinations [page 693]
Delivery rules for sheduled documents Delivery rules for scheduling [page 702]
688 PUBLICSAP BusinessObjects Web Intelligence User's Guide
Scheduling and publishing documents
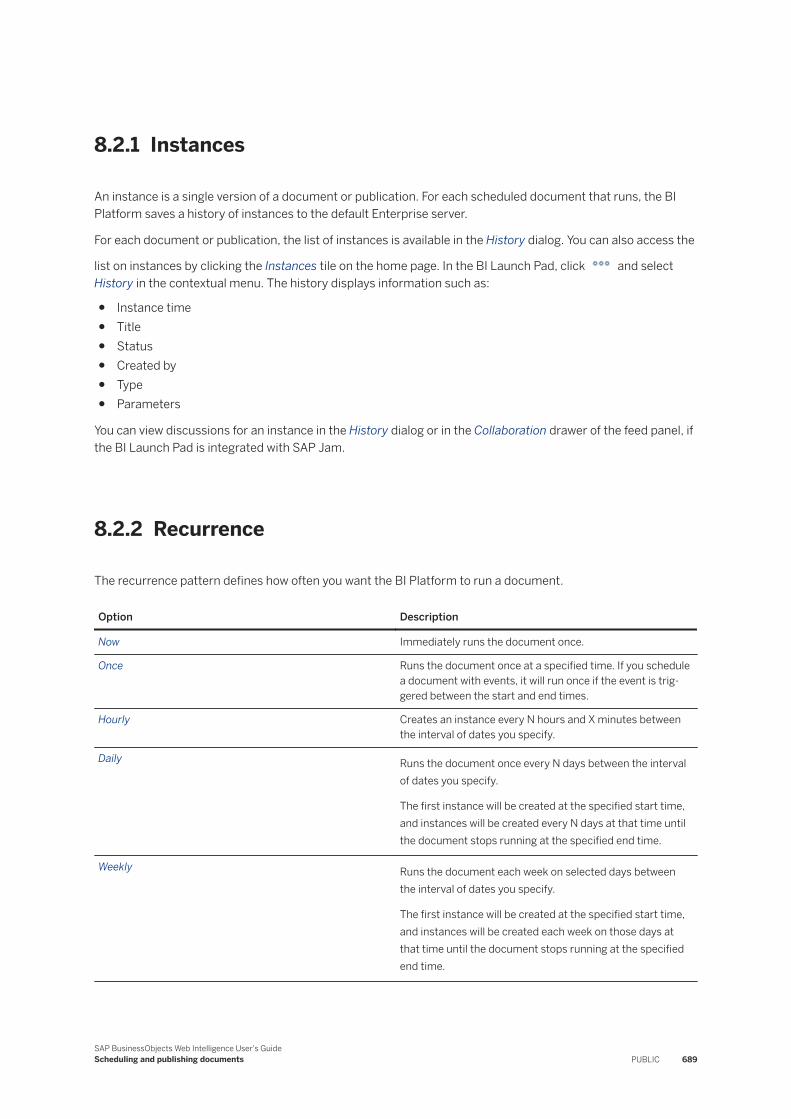
8.2.1 Instances
An instance is a single version of a document or publication. For each scheduled document that runs, the BI Platform saves a history of instances to the default Enterprise server.
For each document or publication, the list of instances is available in the History dialog. You can also access the
list on instances by clicking the Instances tile on the home page. In the BI Launch Pad, click and select History in the contextual menu. The history displays information such as:
● Instance time● Title● Status● Created by● Type● Parameters
You can view discussions for an instance in the History dialog or in the Collaboration drawer of the feed panel, if the BI Launch Pad is integrated with SAP Jam.
8.2.2 Recurrence
The recurrence pattern defines how often you want the BI Platform to run a document.
Option Description
Now Immediately runs the document once.
Once Runs the document once at a specified time. If you schedule a document with events, it will run once if the event is triggered between the start and end times.
Hourly Creates an instance every N hours and X minutes between the interval of dates you specify.
Daily Runs the document once every N days between the interval of dates you specify.
The first instance will be created at the specified start time, and instances will be created every N days at that time until the document stops running at the specified end time.
Weekly Runs the document each week on selected days between the interval of dates you specify.
The first instance will be created at the specified start time, and instances will be created each week on those days at that time until the document stops running at the specified end time.
SAP BusinessObjects Web Intelligence User's GuideScheduling and publishing documents PUBLIC 689
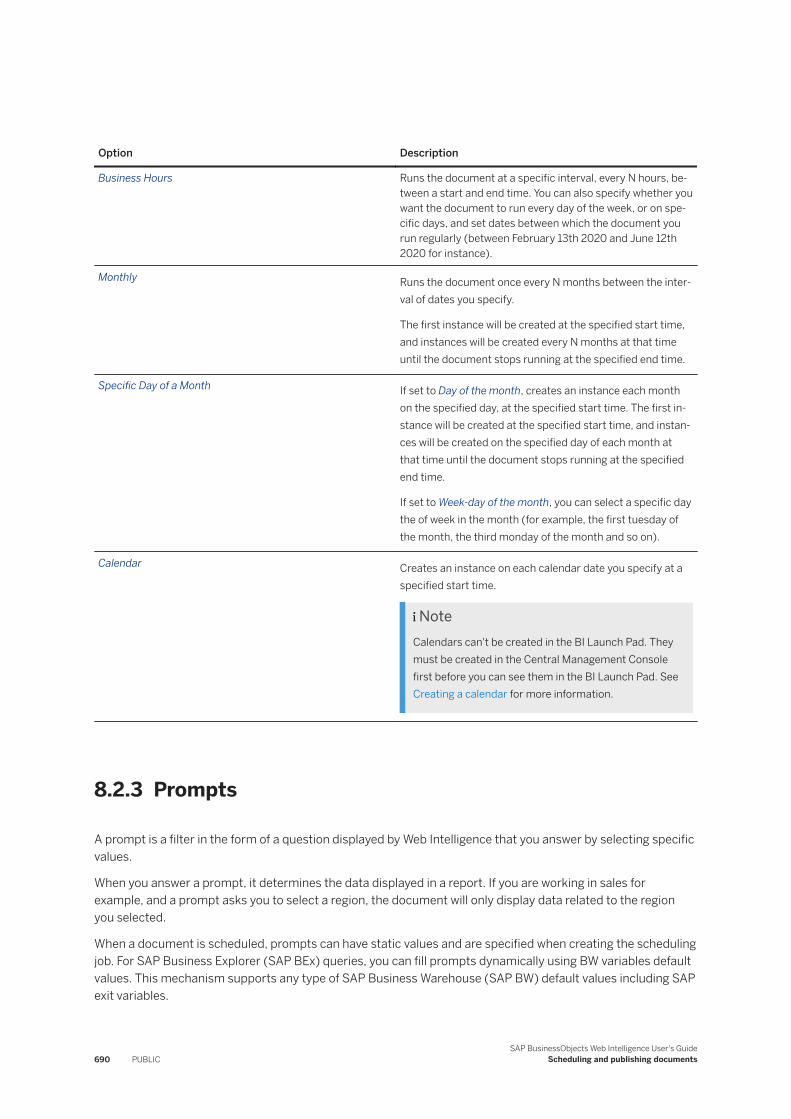
Option Description
Business Hours Runs the document at a specific interval, every N hours, between a start and end time. You can also specify whether you want the document to run every day of the week, or on specific days, and set dates between which the document you run regularly (between February 13th 2020 and June 12th 2020 for instance).
Monthly Runs the document once every N months between the interval of dates you specify.
The first instance will be created at the specified start time, and instances will be created every N months at that time until the document stops running at the specified end time.
Specific Day of a Month If set to Day of the month, creates an instance each month on the specified day, at the specified start time. The first instance will be created at the specified start time, and instances will be created on the specified day of each month at that time until the document stops running at the specified end time.
If set to Week-day of the month, you can select a specific day the of week in the month (for example, the first tuesday of the month, the third monday of the month and so on).
Calendar Creates an instance on each calendar date you specify at a specified start time.
NoteCalendars can't be created in the BI Launch Pad. They must be created in the Central Management Console first before you can see them in the BI Launch Pad. See Creating a calendar for more information.
8.2.3 Prompts
A prompt is a filter in the form of a question displayed by Web Intelligence that you answer by selecting specific values.
When you answer a prompt, it determines the data displayed in a report. If you are working in sales for example, and a prompt asks you to select a region, the document will only display data related to the region you selected.
When a document is scheduled, prompts can have static values and are specified when creating the scheduling job. For SAP Business Explorer (SAP BEx) queries, you can fill prompts dynamically using BW variables default values. This mechanism supports any type of SAP Business Warehouse (SAP BW) default values including SAP exit variables.
690 PUBLICSAP BusinessObjects Web Intelligence User's Guide
Scheduling and publishing documents
The support of dynamic prompt values is also available for SAP HANA variables and universe prompts parameters that contain dynamic expressions in their default values.
NoteTo have dynamic prompt values in a scheduled document on BEx, make sure that:
● You select the Use BEx query defined default values at runtime option in the Variable Manager wizard.● You purge document data using the Purge Last Selected Prompt Values option.● You purge the prompt(s) value(s) when creating the scheduling job.
The way that options appear in the tab might differ from a document to another, depending on how the system administrator has configured the prompts.
NoteIf you cannot see the Prompts tab, that is because the document you are scheduling doesn't contain prompts.
Constant and dynamic values processing
You can modify a prompt's value by clicking either Modify to edit a value, Constant Value or Dynamic Value to set it to dynamic or constant.
Constant values are fixed values that don't require calculations. Web Intelligence can schedule documents with constant values immediately.
Dynamics values are processed based on other documents to filter and compute the values.
SAP BEx variables, SAP HANA variables and Universe variables can support dynamic values. Dynamic values contain expressions and require calculations at runtime. Web Intelligence delegates the calculations to the backend (either the Universe Information Engine, SAP BEx or SAP HANA), and schedules the document after the values are computed. SAP BW exit or customer exit variables for example are often used as dynamic variables in prompts.
8.2.4 Formats
You can save an instance in different formats after the BI Platform generates it.
When you schedule a document you can save an instance in the following formats:
● Web Intelligence: .WID● Microsoft Excel: .XLSX● Adobe Acrobat: .PDF● Comma Separated Values (CSV) - Data: .CSV● Comma Separated Values (CSV) Archive - Reports: .ZIP● Plain text: .TXT● HTML archive: .ZIP
SAP BusinessObjects Web Intelligence User's GuideScheduling and publishing documents PUBLIC 691
When you publish a document you can save an instance in the following formats:
● Web Intelligence: .WID● Microsoft Excel: .XLSX● Adobe Acrobat: .PDF● MIME HTML: .MHTML
CSV formats
You can choose to save the following CSV options:
● CSV - Data: Generates a CSV file with the contents of the data provider.● CSV Archive - Reports: Generates a ZIP file of CSV files. Each CSV corresponds to one report and contains
the report data.
Regardless of the format you select, you can edit the CSV options by setting the Default options toggle to off, and specify a text qualifier, a column delimiter and the charset. In the column delimiter drop down, you can also directly type in a custom charcacter you want to use, such as the pipe (|) for instance. If needed, you can generate one CSV file per data provider by checking the dedicated option.
Chart resolution configuration
When you schedule a document to save an HTML archive, you select the reports to include in the archive and make sure that each report has a unique name.
The HTML archive contains the following files and folders in a single ZIP file that you can download:
● A default index.html file that contains links to the reports in the archive. To see a report, you click the link with the report name.You can replace the default index.html file with one you create to suit your business needs.
● A JavaScript file, report.js returns the report names from the document included in the archive. This script is used to generate the links in the index.html file.
● A sub-folder for each report in the archive. The sub-folder contains additional content for the report.
Note that your administrator manages the resolution (DPI) for charts rendered as pictures through scheduling in the C:\Program Files (x86)\SAP BusinessObjects\SAP BusinessObjects Enterprise XI 4.0\java\lib\procWebiPublishing.properties file.
#webi scheduling/publishing properties #Tue Dec 20 09:47:08 CET 2016concurrency.minimum_documents_per_connection=20processing.disable_refresh=falseconcurrency.number_of_connections=1filtering.keep_existing_filters=true rendering.pdf.dpi=96
When the destination for a ZIP file is File System, FTP or Secured FTP and you are defining a schedule, you can choose between the options to automatically name the ZIP file based on BI Platform rule or to name it explicitly.
692 PUBLICSAP BusinessObjects Web Intelligence User's Guide
Scheduling and publishing documents
Related Information
Exporting documents, reports or data [page 354]
8.2.5 Events
Event-based scheduling and publishing provides you with additional control over scheduled documents and publications. You can set up events so that documents are processed only after a specified event occurs.
To successfully schedule a document with an event, you need to create the event first and then schedule the document. After you have created the event, you can select it as a mandatory condition to trigger the scheduling job. If and only if the event occurs, the BI Platform triggers the scheduling job.
You create events in the Central Management Console (CMC), and then select them in the BI Launch Pad when you schedule documents. For more information on how to create event, refer to the dedicated sections of the SAP BusinessObjects Business Intelligence Platform User Guide.
8.2.6 Scheduling server group
You can set the default server to run the scheduled document.
There are three available options regarding the server group:
● Use first available server: Runs the document on the server with the most resources free at the time of scheduling. This is the default selection.
● Give priority to a server group: Runs the document on servers in a particular server group. If no servers in the selected server group are available, the document runs on the next available server.
● Use this server group: Runs the document only on servers in a particular server group. If no servers in the selected server group are available, the document runs on the next available server.
As a best practice, if your deployment of the BI Platform uses federation and you want to run the document at the site where it is located, check the Run at origin site option.
8.2.7 Destinations
You can schedule a document instance to be sent to a specific destination.
In the schedule page, you can see different destinations such as BI Inbox, FTP and SFTP Server, File System etc.,
You can now choose multiple destinations as per your needs at one go and schedule the report. Even an administrator can perform this operation from Central Management Console while scheduling any BI report. This lets you optimize the number of schedules.
The destinations available depend on the destinations your system administrator has enabled and on your access rights. If your administrator specified a destination for an object, that destination option is listed in the
SAP BusinessObjects Web Intelligence User's GuideScheduling and publishing documents PUBLIC 693
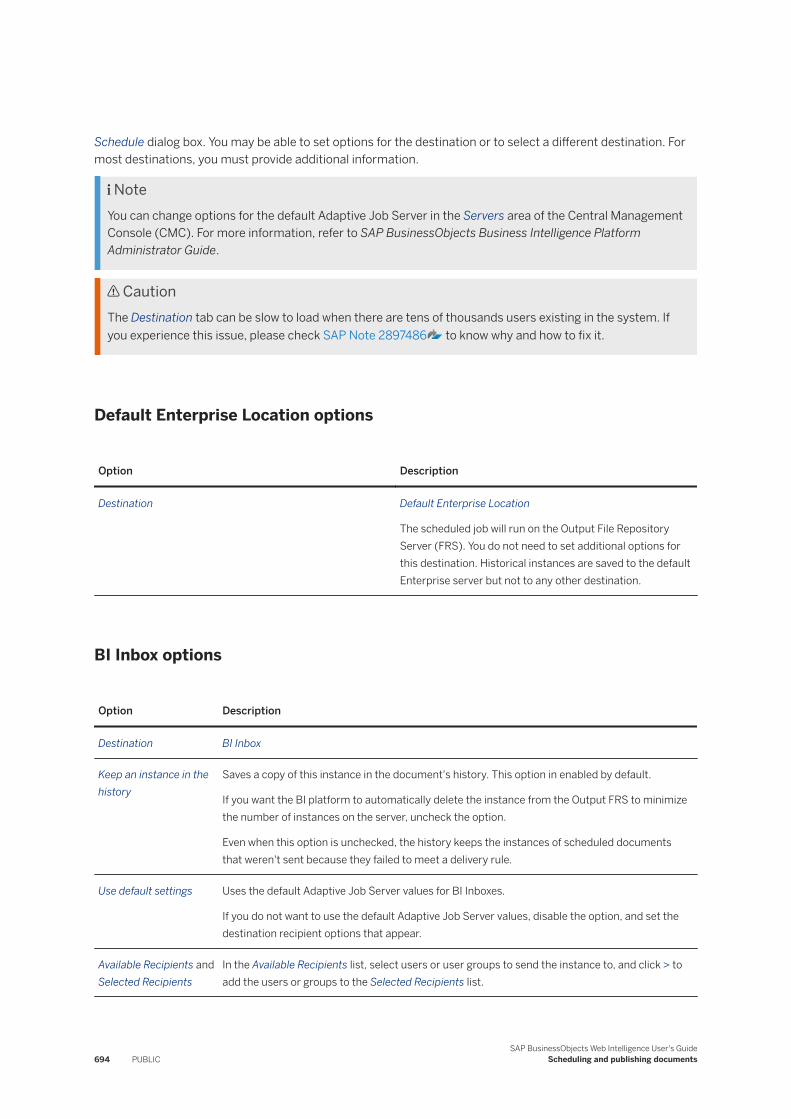
Schedule dialog box. You may be able to set options for the destination or to select a different destination. For most destinations, you must provide additional information.
NoteYou can change options for the default Adaptive Job Server in the Servers area of the Central Management Console (CMC). For more information, refer to SAP BusinessObjects Business Intelligence Platform Administrator Guide.
CautionThe Destination tab can be slow to load when there are tens of thousands users existing in the system. If you experience this issue, please check SAP Note 2897486 to know why and how to fix it.
Default Enterprise Location options
Option Description
Destination Default Enterprise Location
The scheduled job will run on the Output File Repository Server (FRS). You do not need to set additional options for this destination. Historical instances are saved to the default Enterprise server but not to any other destination.
BI Inbox options
Option Description
Destination BI Inbox
Keep an instance in the history
Saves a copy of this instance in the document's history. This option in enabled by default.
If you want the BI platform to automatically delete the instance from the Output FRS to minimize the number of instances on the server, uncheck the option.
Even when this option is unchecked, the history keeps the instances of scheduled documents that weren't sent because they failed to meet a delivery rule.
Use default settings Uses the default Adaptive Job Server values for BI Inboxes.
If you do not want to use the default Adaptive Job Server values, disable the option, and set the destination recipient options that appear.
Available Recipients and Selected Recipients
In the Available Recipients list, select users or user groups to send the instance to, and click > to add the users or groups to the Selected Recipients list.
694 PUBLICSAP BusinessObjects Web Intelligence User's Guide
Scheduling and publishing documents
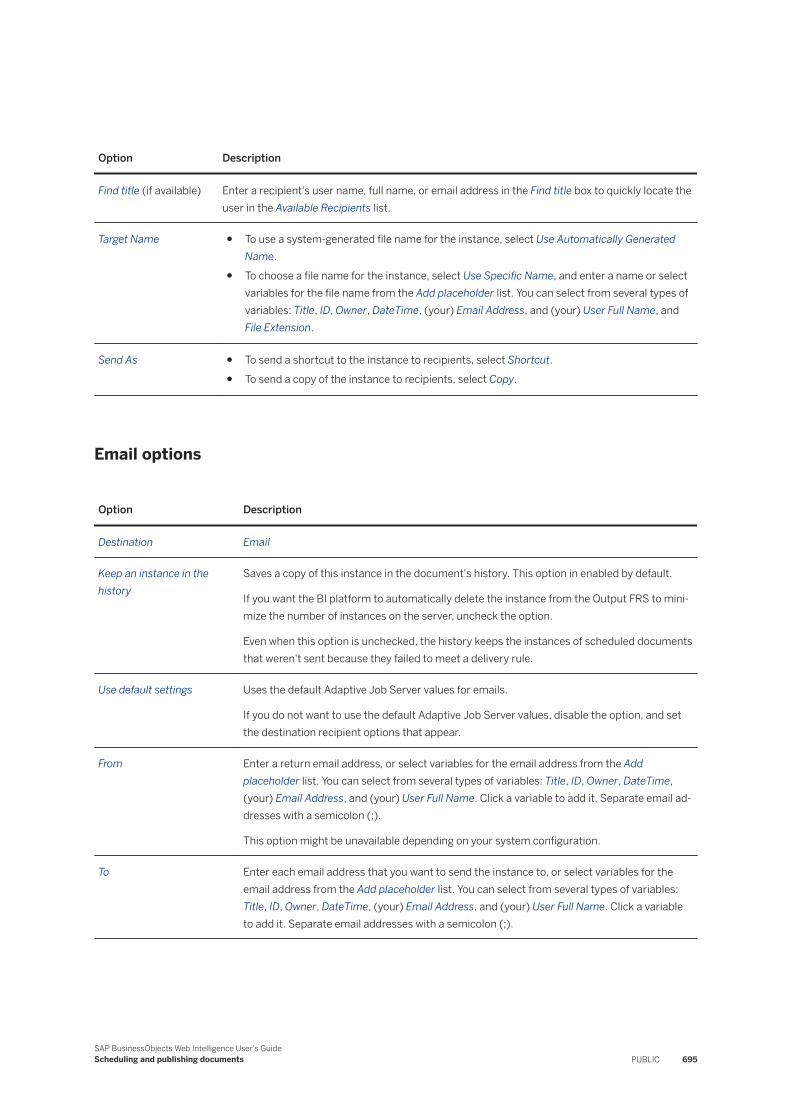
Option Description
Find title (if available) Enter a recipient's user name, full name, or email address in the Find title box to quickly locate the user in the Available Recipients list.
Target Name ● To use a system-generated file name for the instance, select Use Automatically Generated Name.
● To choose a file name for the instance, select Use Specific Name, and enter a name or select variables for the file name from the Add placeholder list. You can select from several types of variables: Title, ID, Owner, DateTime, (your) Email Address, and (your) User Full Name, and File Extension.
Send As ● To send a shortcut to the instance to recipients, select Shortcut.● To send a copy of the instance to recipients, select Copy.
Email options
Option Description
Destination Email
Keep an instance in the history
Saves a copy of this instance in the document's history. This option in enabled by default.
If you want the BI platform to automatically delete the instance from the Output FRS to minimize the number of instances on the server, uncheck the option.
Even when this option is unchecked, the history keeps the instances of scheduled documents that weren't sent because they failed to meet a delivery rule.
Use default settings Uses the default Adaptive Job Server values for emails.
If you do not want to use the default Adaptive Job Server values, disable the option, and set the destination recipient options that appear.
From Enter a return email address, or select variables for the email address from the Add placeholder list. You can select from several types of variables: Title, ID, Owner, DateTime, (your) Email Address, and (your) User Full Name. Click a variable to add it. Separate email addresses with a semicolon (;).
This option might be unavailable depending on your system configuration.
To Enter each email address that you want to send the instance to, or select variables for the email address from the Add placeholder list. You can select from several types of variables: Title, ID, Owner, DateTime, (your) Email Address, and (your) User Full Name. Click a variable to add it. Separate email addresses with a semicolon (;).
SAP BusinessObjects Web Intelligence User's GuideScheduling and publishing documents PUBLIC 695
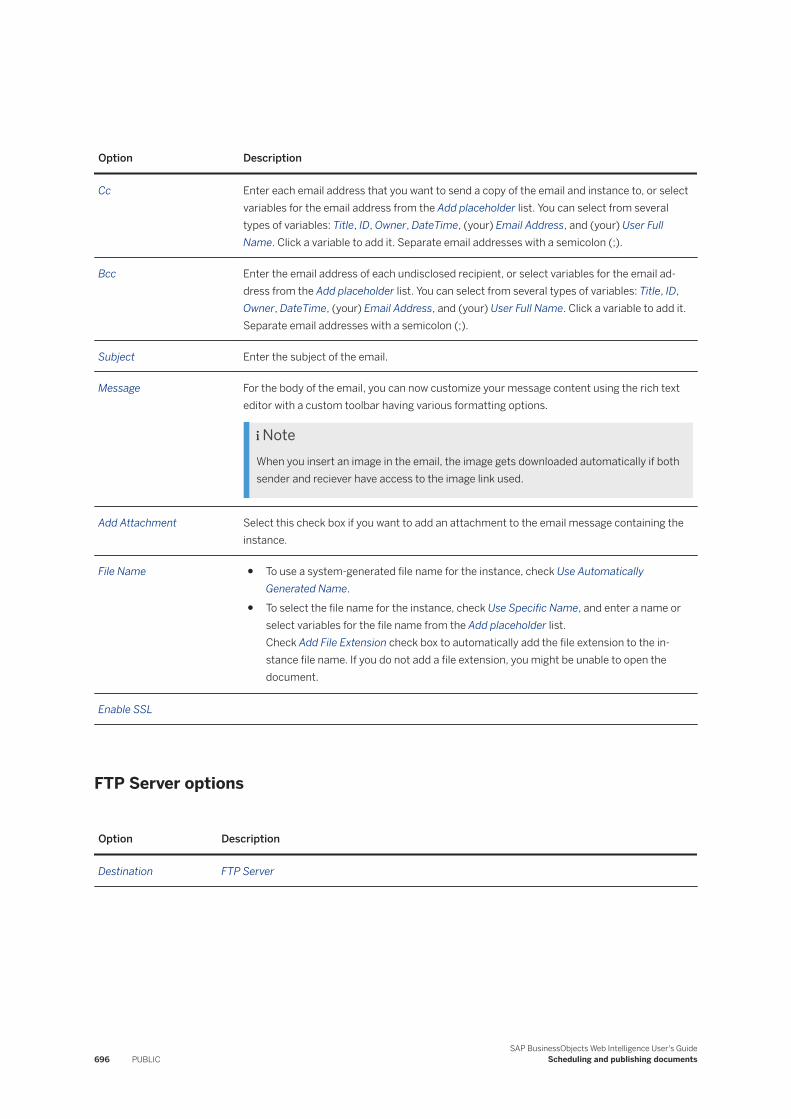
Option Description
Cc Enter each email address that you want to send a copy of the email and instance to, or select variables for the email address from the Add placeholder list. You can select from several types of variables: Title, ID, Owner, DateTime, (your) Email Address, and (your) User Full Name. Click a variable to add it. Separate email addresses with a semicolon (;).
Bcc Enter the email address of each undisclosed recipient, or select variables for the email address from the Add placeholder list. You can select from several types of variables: Title, ID, Owner, DateTime, (your) Email Address, and (your) User Full Name. Click a variable to add it. Separate email addresses with a semicolon (;).
Subject Enter the subject of the email.
Message For the body of the email, you can now customize your message content using the rich text editor with a custom toolbar having various formatting options.
NoteWhen you insert an image in the email, the image gets downloaded automatically if both sender and reciever have access to the image link used.
Add Attachment Select this check box if you want to add an attachment to the email message containing the instance.
File Name ● To use a system-generated file name for the instance, check Use Automatically Generated Name.
● To select the file name for the instance, check Use Specific Name, and enter a name or select variables for the file name from the Add placeholder list.Check Add File Extension check box to automatically add the file extension to the instance file name. If you do not add a file extension, you might be unable to open the document.
Enable SSL
FTP Server options
Option Description
Destination FTP Server
696 PUBLICSAP BusinessObjects Web Intelligence User's Guide
Scheduling and publishing documents
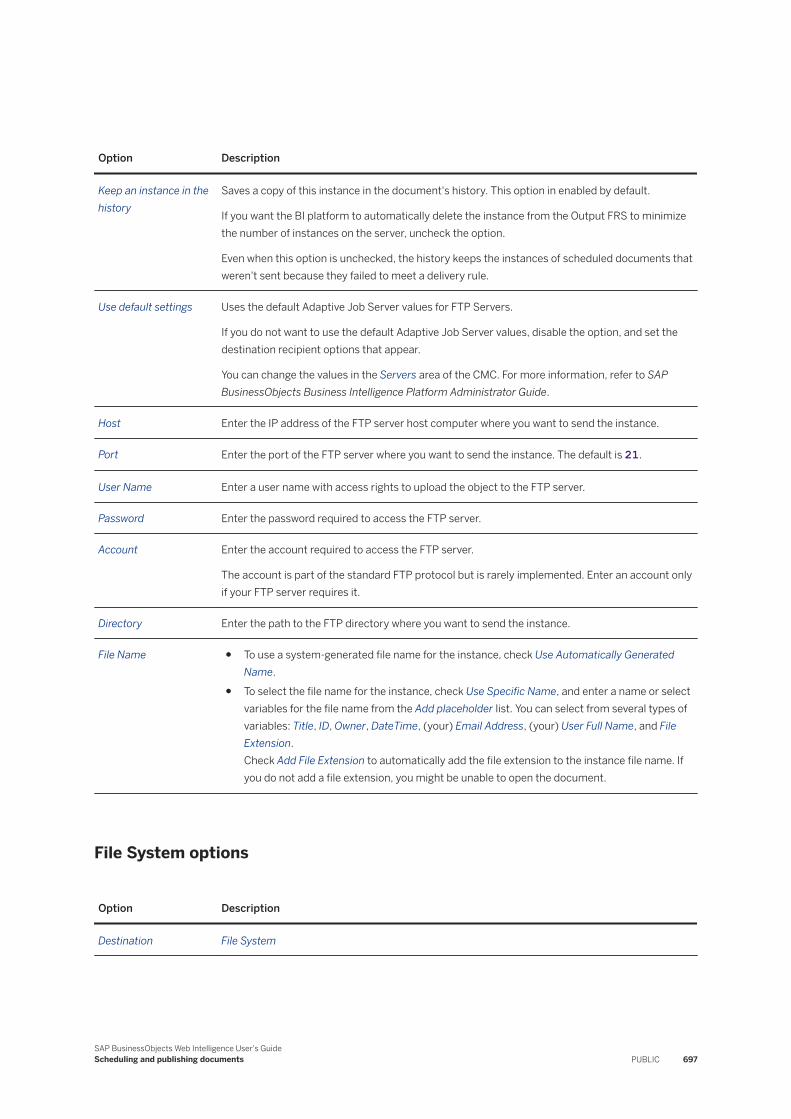
Option Description
Keep an instance in the history
Saves a copy of this instance in the document's history. This option in enabled by default.
If you want the BI platform to automatically delete the instance from the Output FRS to minimize the number of instances on the server, uncheck the option.
Even when this option is unchecked, the history keeps the instances of scheduled documents that weren't sent because they failed to meet a delivery rule.
Use default settings Uses the default Adaptive Job Server values for FTP Servers.
If you do not want to use the default Adaptive Job Server values, disable the option, and set the destination recipient options that appear.
You can change the values in the Servers area of the CMC. For more information, refer to SAP BusinessObjects Business Intelligence Platform Administrator Guide.
Host Enter the IP address of the FTP server host computer where you want to send the instance.
Port Enter the port of the FTP server where you want to send the instance. The default is 21.
User Name Enter a user name with access rights to upload the object to the FTP server.
Password Enter the password required to access the FTP server.
Account Enter the account required to access the FTP server.
The account is part of the standard FTP protocol but is rarely implemented. Enter an account only if your FTP server requires it.
Directory Enter the path to the FTP directory where you want to send the instance.
File Name ● To use a system-generated file name for the instance, check Use Automatically Generated Name.
● To select the file name for the instance, check Use Specific Name, and enter a name or select variables for the file name from the Add placeholder list. You can select from several types of variables: Title, ID, Owner, DateTime, (your) Email Address, (your) User Full Name, and File Extension.Check Add File Extension to automatically add the file extension to the instance file name. If you do not add a file extension, you might be unable to open the document.
File System options
Option Description
Destination File System
SAP BusinessObjects Web Intelligence User's GuideScheduling and publishing documents PUBLIC 697
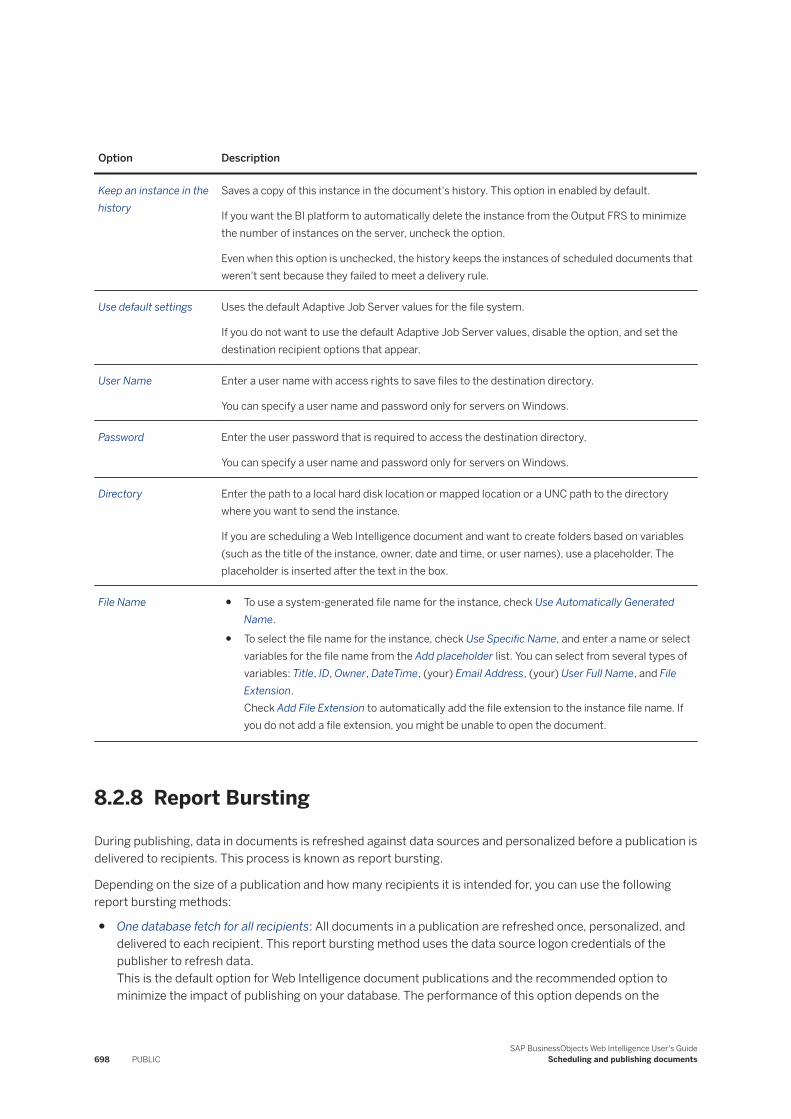
Option Description
Keep an instance in the history
Saves a copy of this instance in the document's history. This option in enabled by default.
If you want the BI platform to automatically delete the instance from the Output FRS to minimize the number of instances on the server, uncheck the option.
Even when this option is unchecked, the history keeps the instances of scheduled documents that weren't sent because they failed to meet a delivery rule.
Use default settings Uses the default Adaptive Job Server values for the file system.
If you do not want to use the default Adaptive Job Server values, disable the option, and set the destination recipient options that appear.
User Name Enter a user name with access rights to save files to the destination directory.
You can specify a user name and password only for servers on Windows.
Password Enter the user password that is required to access the destination directory.
You can specify a user name and password only for servers on Windows.
Directory Enter the path to a local hard disk location or mapped location or a UNC path to the directory where you want to send the instance.
If you are scheduling a Web Intelligence document and want to create folders based on variables (such as the title of the instance, owner, date and time, or user names), use a placeholder. The placeholder is inserted after the text in the box.
File Name ● To use a system-generated file name for the instance, check Use Automatically Generated Name.
● To select the file name for the instance, check Use Specific Name, and enter a name or select variables for the file name from the Add placeholder list. You can select from several types of variables: Title, ID, Owner, DateTime, (your) Email Address, (your) User Full Name, and File Extension.Check Add File Extension to automatically add the file extension to the instance file name. If you do not add a file extension, you might be unable to open the document.
8.2.8 Report Bursting
During publishing, data in documents is refreshed against data sources and personalized before a publication is delivered to recipients. This process is known as report bursting.
Depending on the size of a publication and how many recipients it is intended for, you can use the following report bursting methods:
● One database fetch for all recipients: All documents in a publication are refreshed once, personalized, and delivered to each recipient. This report bursting method uses the data source logon credentials of the publisher to refresh data.This is the default option for Web Intelligence document publications and the recommended option to minimize the impact of publishing on your database. The performance of this option depends on the
698 PUBLICSAP BusinessObjects Web Intelligence User's Guide
Scheduling and publishing documents
number of recipients. This option is secure only when source documents are delivered as static documents. For example, a recipient who receives a Web Intelligence document in its original format can modify the document and view data associated with other recipients. However, if the document is delivered as a PDF file, data is secure.
● One database fetch per recipient: Data in a document is refreshed for every recipient. This report bursting method uses the data source logon credentials of the recipient to refresh data. For example, if there are five recipients for a publication, the publication is refreshed five times. This option is recommended for maximum security for delivered publications.
8.2.8.1 To select a report bursting method in the CMC
You select a report bursting method to determine how source documents are personalized, processed, and delivered in a publication.
Before selecting a report bursting method, ensure that the publication contains Web Intelligence documents intended for Enterprise recipients and that profiles used for personalization have filter expressions.
Report bursting methods use different filter types to personalize and process documents. For example, the One database fetch for all recipients option uses a report filter and the One database fetch per recipient option uses a query filter. Each filter type supports a different set of operators. If a filter expression uses an operator that the report bursting method does not support, the publication can fail.
You can select a report bursting method only in the Central Management Console (CMC).
1. In the CMC, click Folders, and locate the publication to select a report bursting method for.2. Right-click the publication job and select Schedule.3. In the Schedule dialog box, expand Additional Options, and click Advanced.4. Under Report Bursting Method, select a report bursting method.5. Click Schedule.
8.2.9 Personalization
Personalization is the process of filtering data in source documents so that only relevant data appears to publication recipients.
With personalization, you alter the view of data but don't change the data being queried from the data source.
The following illustration explains how personalization works. You have created a document that contains different types of data, all included in the document: 1, 2, and 3. You have to send the document to three diferent recipients, each one them receiving a single type of data. The first recipient receives data of type 1, the second recipient receives data of type 2, and the third recipient receives data of type 3.
SAP BusinessObjects Web Intelligence User's GuideScheduling and publishing documents PUBLIC 699
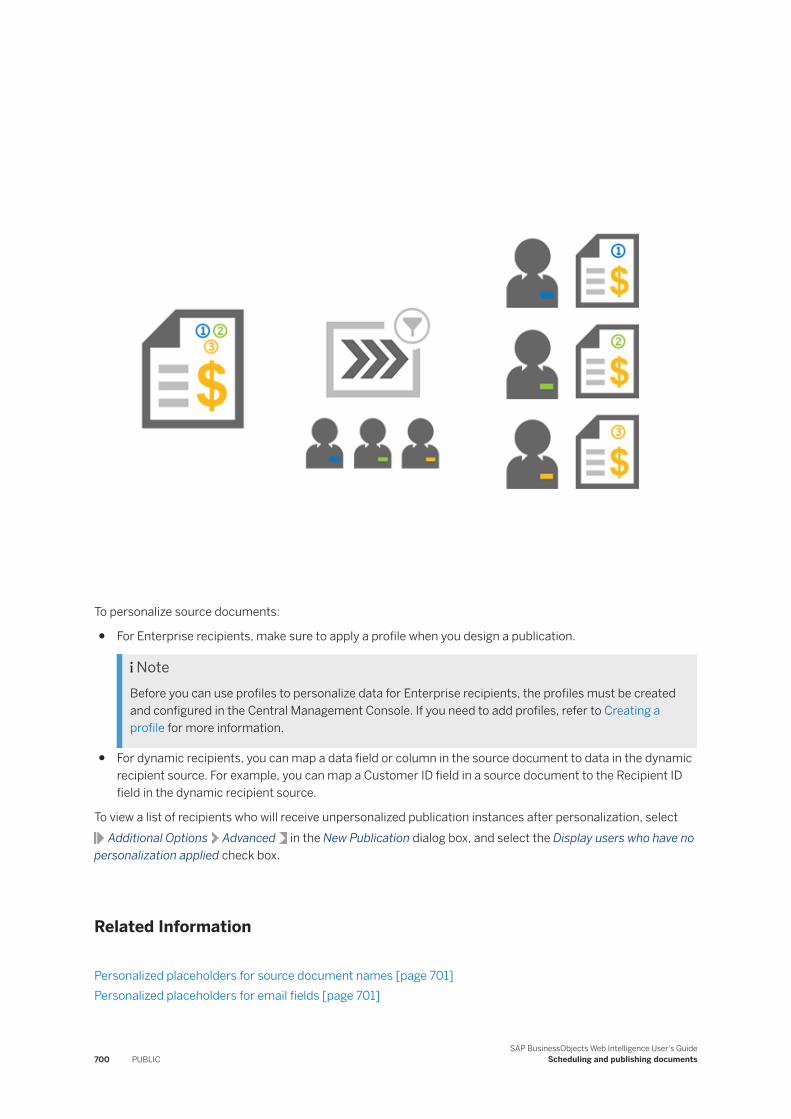
To personalize source documents:
● For Enterprise recipients, make sure to apply a profile when you design a publication.
NoteBefore you can use profiles to personalize data for Enterprise recipients, the profiles must be created and configured in the Central Management Console. If you need to add profiles, refer to Creating a profile for more information.
● For dynamic recipients, you can map a data field or column in the source document to data in the dynamic recipient source. For example, you can map a Customer ID field in a source document to the Recipient ID field in the dynamic recipient source.
To view a list of recipients who will receive unpersonalized publication instances after personalization, select Additional Options Advanced in the New Publication dialog box, and select the Display users who have no
personalization applied check box.
Related Information
Personalized placeholders for source document names [page 701]Personalized placeholders for email fields [page 701]
700 PUBLICSAP BusinessObjects Web Intelligence User's Guide
Scheduling and publishing documents
To select personalized placeholders for source documents [page 715]To select personalized placeholders for email fields [page 715]To personalize a document with a global profile target [page 716]To personalize a document by filtering fields [page 717]
8.2.9.1 Personalized placeholders for source document names
A placeholder is a container for variable data. Adding personalized placeholders to source file names helps recipients identify filtered data.
Recipients who belong to multiple user groups with different personalization values can distinguish between multiple versions of the same source document, without viewing its contents. If a publication contains more than one source document, the Add placeholder list for Use Specific Name contains personalized placeholders only if all source documents were filtered on the same field.
The following personalized placeholders are available for reports:
● %fieldname_VALUE%For example, when selecting the Email Address placeholder, %SI_EMAIL_ADDRESS% appears in the Use Specific Name box. At run-time, the placeholder is replaced by the value of the field used to filter the document. This placeholder is unique for each recipient.
● %fieldname_NAME%For example, when selecting the Title placeholder, %SI_Name% appears in the Use Specific Name box. At run-time, the placeholder is replaced by the actual name of the field. This placeholder is the same for all recipients.
Related Information
To select personalized placeholders for source documents [page 715]
8.2.9.2 Personalized placeholders for email fields
A placeholder is a container for variable data. You can use personalized placeholders in the Subject box and the Message box when sending a publication via email.
For each filter used in a document during personalization, the following placeholders appear in the Add placeholder list:
● %Field - Query 1-VALUE%At run-time, the placeholder is replaced by the personalized value used to filter the document. This placeholder is unique for each recipient.
● %Field - Query 1-NAME%At run-time, the placeholder is replaced by the name of the field. This placeholder is the same for all recipients.
SAP BusinessObjects Web Intelligence User's GuideScheduling and publishing documents PUBLIC 701
Before being able to use personalized placeholders in the Subject or Message box, make sure to personalize all source documents for the publication on the same field. If a publication contains several source documents, the Add placeholder list for the Subject and Message boxes displays personalization parameters only when all source documents are filtered on the same field(s).
Related Information
To select personalized placeholders for email fields [page 715]
8.2.10 Delivery rules for scheduling
Prevent the sending of erroneous or empty documents by setting delivery rules for scheduled documents. Define a status for the documents that fail to meet the rules so you can identify them and reschedule them, change the connection details, or take other, appropriate action.
You define conditions that the document must meet for it to be sent to the following destinations:
● BI Inbox● Email● FTP Server● File System● SFTP server
When the document fails to meet those conditions, it is not sent. You can choose one or both of the following conditions for a document:
● The scheduled content has been successfully refreshed and is not partial: The document is sent only when all the data providers for the document have been successfully refreshed. A document that contains data from incomplete results isn't sent.
● The scheduled content contains data: The document is sent only when at least one report in the document contains data. An empty document isn't sent.
When you select a condition, you can also define the status that displays in the history for a document that fails to meet the condition, as follows:
● Warning (by default)● Failed
If a report in your document has multiple queries and one or multiple queries return partials results, when you select the The scheduled content has been successfully refreshed and is not partial rule, the report is sent in case of Warning status, but is not sent in case of Failed status.
When you select both conditions and the status of one condition is Warning while the status of the other condition is Failed, the history shows Failed.
702 PUBLICSAP BusinessObjects Web Intelligence User's Guide
Scheduling and publishing documents
8.2.11 Delivery rules for publishing
You can set delivery rules to fine-tune the processing and distribution of publications.
When you set delivery rules for a document, the publication is delivered to recipients only if it meets certain conditions. The BI platform supports several types of delivery rules. For Web Intelligence documents however, you can only set recipient delivery rules. There are two recipient delivery rules available:
● Deliver individual document when condition is met● Deliver all documents only when all conditions are met
For each document of the publication, a delivery rule is always coupled with a condition. As a publisher, this is a way to fine-tune the publication process according to the recipients you want to deliver the publication to. There are four conditions you can choose from:
● Always deliver● Never deliver● If scheduled content contains data● If scheduled content has been fully refreshed
If a document fails to meet the condition you have purposely selected, you can either cancel the delivery of that specific document or cancel the whole publication.
8.2.12 Publication extensions
A publication extension is a library of code that applies business logic to publications.
Use a publication extension to automatically customize publications after processing or delivery. You can use publication extensions to perform the following tasks:
● Merge documents of the same type (for example, merge multiple Excel spreadsheets into a single Excel workbook)
● Add password protection to or encrypt a document● Convert a document to a different format● Create custom log files for a publication job
You add publication extensions to publications in the Central Management Console (CMC) of the BI platform. (You cannot use publication extensions when designing a publication in the BI launch pad.) However, before you can add a publication extension, the extension must be deployed on machines that run the Adaptive Processing Server. The location of the server varies, depending on the operating system:
● On Windows, the location is <InstallDir>\SAP BusinessObjects\SAP BusinessObjects Enterprise XI 4.0\java\lib\.
● On Unix, the location is <InstallDir>/sap_bobj/enterprise_xi40/java/lib/.
Once an extension is deployed, you must restart the Adaptive Processing Server and any other servers that host a Publishing Service. For more information about publication extensions, see the SAP BusinessObjects Business Intelligence Platform Java SDK Developer Guide.
SAP BusinessObjects Web Intelligence User's GuideScheduling and publishing documents PUBLIC 703
8.2.12.1 To add a publication extension in the CMC
1. In the CMC, click Folders, and locate the publication to add a publication extension to.2. Right-click the publication and select Properties
3. Click Additional Options Publication Extension .4. Give a name for the extension.5. In the Class Name box, enter the fully qualified class name for the extension.6. Optional: In the Parameter box, enter a parameter name.7. To use the extension after processing before or after delivery, above the Before Publication Delivery or After
Publication Delivery list, click Add.8. Click Save.
8.2.13 Publications for Live Office
When you design publications for use with SAP BusinessObjects Live Office, consider this information.
● Dynamic content documents can consist only of Web Intelligence documents in the original format.● Dynamic recipients are not supported.● The only destination option available is Default Enterprise Location.● If recipients receive multiple publication instances after personalization, they can view only the first
publication instance in the Live Office Client. Recipients who inherit multiple profile values from group membership may receive multiple instances. To avoid sending multiple instances, assign only necessary profile values to recipients.
8.2.14 Subscriptions
A subscription enables users who are not publication recipients to view the latest instance.
Enterprise recipients can unsubscribe from a publication at any time. Dynamic recipients can neither subscribe to or unsubscribe from a publication.
Users with the appropriate access rights can subscribe and unsubscribe other users. To subscribe to or unsubscribe from a publication, the following items are required:
● A BI Platform account● Access to the BI Launch Pad or to the Central Management Console (CMC) in the platform● View rights to see the publication● Subscriber rights for the user account (Enterprise recipients)
704 PUBLICSAP BusinessObjects Web Intelligence User's Guide
Scheduling and publishing documents
Related Information
To subscribe to or unsubscribe from a publication [page 718]To subscribe to or unsubscribe from a publication instance [page 719]
8.2.15 Viewing publications results
Results of a publications can be viewed by the publisher or recipients. A log file is also available for the publication job.
Viewing results as a publisher
After a publication runs, the publication history appears, listing publication instances, the times when the publication ran, and whether the publication succeeded or failed. In the Instance Time column, you can click a link to a publication instance to view instances generated for all recipients when the publication ran.
Viewing results as a recipient
The following table summarizes the ways you can view a publication.
Destination To view the publication result
Default Enterprise Location Dynamic recipients cannot log on to the BI platform to view publication results.
As a recipient, you can view only your own personalized publication instances in the platform. You cannot view publication instances that are personalized for other recipients.
BI inbox Dynamic recipients cannot log on to the BI launch pad to view publication results.
Email Log on to your email to view embedded publication content or to download the attachment or attachments.
FTP Server Log on to your FTP host.
SFTP Server Log on to your SFTP host.
Local disk Go to the location specified when the publication was designed.
SAP BusinessObjects Web Intelligence User's GuideScheduling and publishing documents PUBLIC 705
Viewing log files for publications jobs
Log files are useful for troubleshooting a publication and for identifying which recipients did not receive a publication instance. The BI Platform logs publication job information as each batch of personalized publication instances is processed and then consolidates the details into one or more log files. The maximum log file size is 10 MB and is non-editable. If you run a high-volume publication with many details, expect the publication instance to have several log files.
You can view log files for a publication instance in the following ways in the History dialog box:
● To view the last log file in a series, in the Status column, click the status (Success, Failed, or Running), and click View Log File at the bottom of the Instance Details dialog box. You can view the last log file while a publication is running.
● To view all log files, in the Instance Time column, click the link for a publication instance. Log files are listed after the personalized instances.
Log files are updated with new information every two minutes. If a publication job has been running less than two minutes, the log file may have a status of Pending.
8.3 Scheduling documents
You can schedule documents to automatically run at specified times. Each time a scheduled document runs successfully, an instance of that document is created.
An instance is a version of the document containing data from the time the document is run. You can access the list of instances in the document's history. You can check the status of an instance to see whether the instance was sent and, if not, why not. If you have access rights to view documents on demand, you can view and refresh any instance to retrieve the latest data from the data source. By scheduling and viewing instances, you ensure that documents have the most up-to-date information available for viewing, printing, and distributing.
The default time zone is local to the web server that runs the BI platform, not to the Central Management Server (CMS) that your machine connects to. Before scheduling documents, confirm that your local time zone is selected in the BI Launch Pad preferences. If you do not have access rights to view or to set your preferences, contact your system administrator.
For more information about Read
Schedule DocumentsScheduling documents Scheduling documents [page 706]
To schedule a document To schedule a document [page 707]
706 PUBLICSAP BusinessObjects Web Intelligence User's Guide
Scheduling and publishing documents
For more information about Read
The latest instance To view instances of a document [page 708]
8.3.1 To schedule a document
When scheduling a document, options are sometimes set up with specific settings by default. Feel free to modify these settings according to your needs.
Before scheduling a document, confirm that a context is set in the document. If the document has multiple contexts, refresh the document with the correct context before you schedule it.
CautionWhen using the navigation tabs to schedule a document, the Destination tab can be slow to load when there are tens of thousands users existing in the system. If you experience this issue, please check SAP Note 2897486 to know why and how to fix it.
1. In the BI Launch Pad, browse to the document you want to schedule using either the Recent Documents section, the Documents tile, or the Folders tile.
2. Click > Schedule.3. In the Instance Title tab, give a name to the instance you want to schedule. By default, the instance name is
the document's name.4. Click Add in the Select delivery destinations section. By default, the destination is set to Default Enterprise
Location.5. Select a destination in the Destination drop down.6. Set the Recurrence, Events and Scheduling Server Group options in their dedicated sections.7. Click the Report Features tab.8. Set the Output Format, Prompts and Delivery Rules options in their dedicated sections.9. Click Schedule.
SAP BusinessObjects Web Intelligence User's GuideScheduling and publishing documents PUBLIC 707
8.3.2 To view instances of a document
You can view instances of a scheduled document.
1. In the BI Launch Pad, on the home page, click the Instances tile.You can also browse to the document you're looking for using either the Recent Documents section, the Documents tile, or the Folders tile.
2. Click > History.
3. To view an instance, click > View.
You can also check the latest instance of a scheduled document by clicking > View Latest Instance. You'll be able to edit a Web Intelligence instance, but you won't be able to save it and erase it. Use the Save As function instead.
8.3.3 To pause or resume an instance
You can pause and resume instances of scheduled documents with a Pending or Recurring status.
For example, if a job server is down for maintenance, you can pause a scheduled instance to prevent the BI Platform from running the document. Scheduled jobs fail when the job server is not running. When the job server is running again, you can resume the scheduled instance.
1. In the BI Launch Pad, on the home page, click the Instances tile.You can also browse to the document you're looking for using either the Recent Documents section, the Documents tile, or the Folders tile.
2. Click > History.
3. Using the dedicated checkboxes, select one or multiple documents, and click next to the instance(s) you want to pause or resume.
4. Click Pause or Resume.
8.3.4 To delete instances from your BI Inbox
You can delete all instances from your BI Inbox.
1. In the BI Launch Pad, click BI Inbox.
2. Click Organize Delete All Messages .3. When prompted, click OK to confirm the deletion.
708 PUBLICSAP BusinessObjects Web Intelligence User's Guide
Scheduling and publishing documents
8.4 Publishing documents
Publishing documents means that you make them available to an audience by sending them via email or an FTP sever and saving them to a disk. You can view, archive, retrieve or schedule published documents via the BI Platform.
Using the BI launch pad or the Central Management Console (CMC), you can tailor documents according to users and recipients you wan to send documents to, schedule them to run at a specific time, and send documents to multiple destinations, including BI Inboxes and email addresses.
For more information about Read
Publish Documents Publishing Publishing documents [page 709]
Creating a publication To create a publication [page 713]
Testing a publication To test a publication [page 718]
Best Practices Best practices for publications [page 721]
8.4.1 About publications
A publication is a collection of documents that you send to a mass audience. Before distributing the documents, you, as the publisher, define the publication using a collection of metadata. The metadata include the publication source, its recipients, and the personalization applied.
Using publications, you send information to your organization efficiently. You can:
● Distribute information to users or groups of users and personalize the information each user or group receives.
● Deliver targeted business information to users or groups of users through a password-protected portal or across an intranet, an extranet, or the Internet.
● Minimize database access by eliminating the need for users to send process requests.
You can create publications using either the BI Launch Pad or the CMC.
Rights appendix
As a publisher, you own the publication and are responsible for scheduling it. You can view all publication instances for all recipients. Recipients can view only their own personalized publication instances.
SAP BusinessObjects Web Intelligence User's GuideScheduling and publishing documents PUBLIC 709
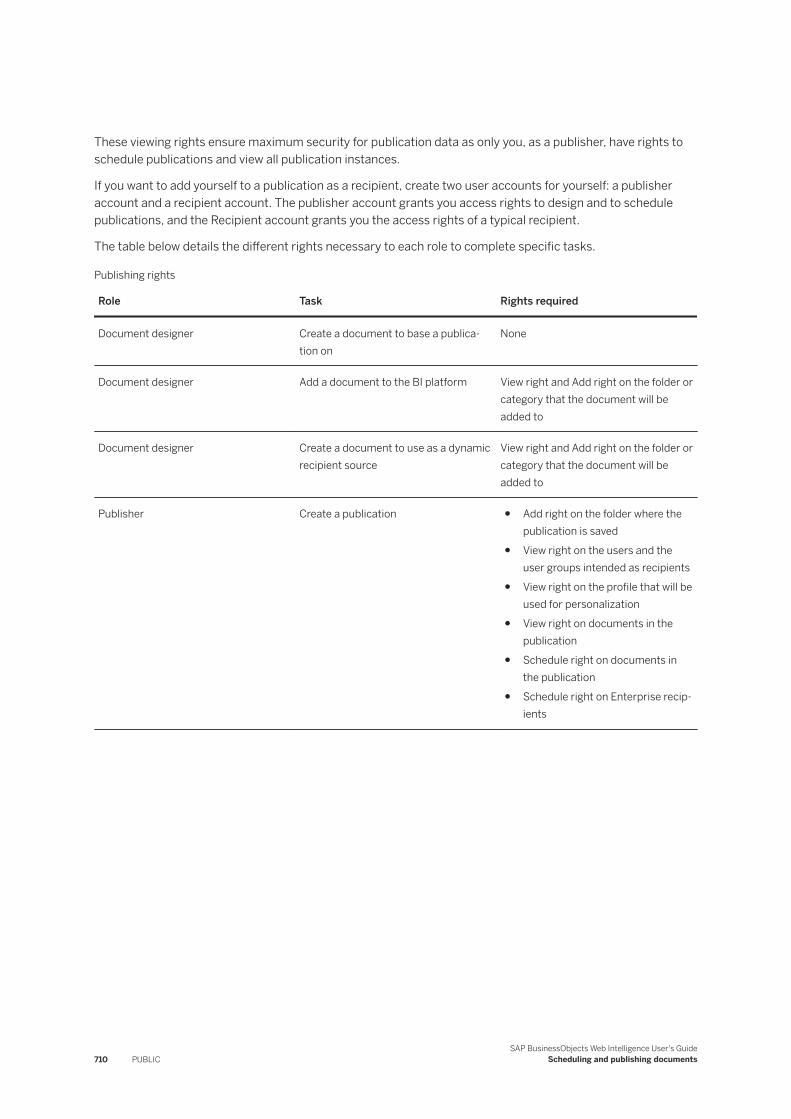
These viewing rights ensure maximum security for publication data as only you, as a publisher, have rights to schedule publications and view all publication instances.
If you want to add yourself to a publication as a recipient, create two user accounts for yourself: a publisher account and a recipient account. The publisher account grants you access rights to design and to schedule publications, and the Recipient account grants you the access rights of a typical recipient.
The table below details the different rights necessary to each role to complete specific tasks.
Publishing rights
Role Task Rights required
Document designer Create a document to base a publication on
None
Document designer Add a document to the BI platform View right and Add right on the folder or category that the document will be added to
Document designer Create a document to use as a dynamic recipient source
View right and Add right on the folder or category that the document will be added to
Publisher Create a publication ● Add right on the folder where the publication is saved
● View right on the users and the user groups intended as recipients
● View right on the profile that will be used for personalization
● View right on documents in the publication
● Schedule right on documents in the publication
● Schedule right on Enterprise recipients
710 PUBLICSAP BusinessObjects Web Intelligence User's Guide
Scheduling and publishing documents
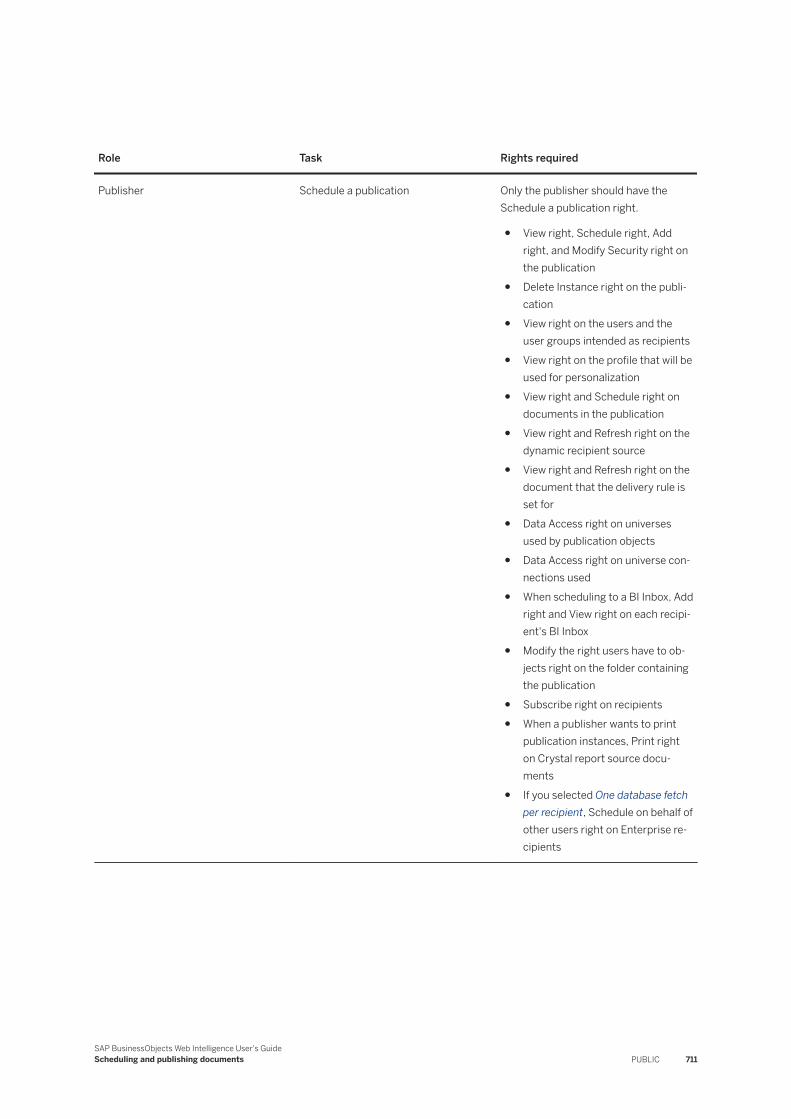
Role Task Rights required
Publisher Schedule a publication Only the publisher should have the Schedule a publication right.
● View right, Schedule right, Add right, and Modify Security right on the publication
● Delete Instance right on the publication
● View right on the users and the user groups intended as recipients
● View right on the profile that will be used for personalization
● View right and Schedule right on documents in the publication
● View right and Refresh right on the dynamic recipient source
● View right and Refresh right on the document that the delivery rule is set for
● Data Access right on universes used by publication objects
● Data Access right on universe connections used
● When scheduling to a BI Inbox, Add right and View right on each recipient's BI Inbox
● Modify the right users have to objects right on the folder containing the publication
● Subscribe right on recipients● When a publisher wants to print
publication instances, Print right on Crystal report source documents
● If you selected One database fetch per recipient, Schedule on behalf of other users right on Enterprise recipients
SAP BusinessObjects Web Intelligence User's GuideScheduling and publishing documents PUBLIC 711
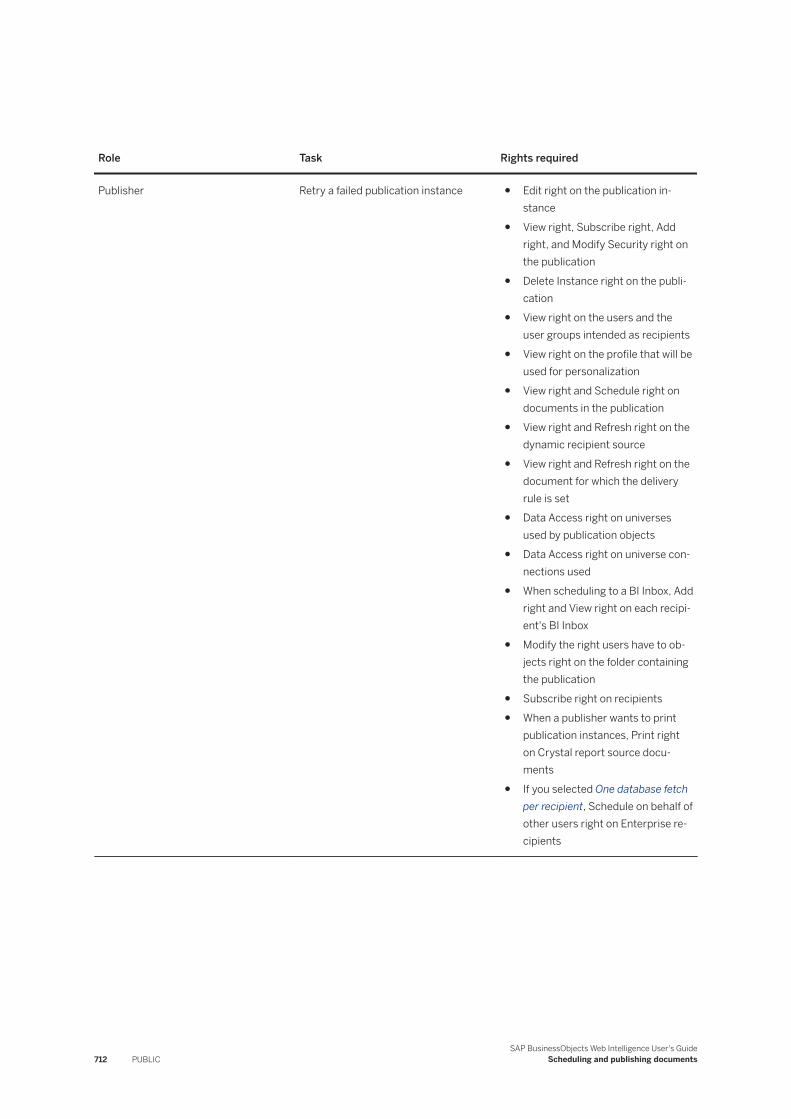
Role Task Rights required
Publisher Retry a failed publication instance ● Edit right on the publication instance
● View right, Subscribe right, Add right, and Modify Security right on the publication
● Delete Instance right on the publication
● View right on the users and the user groups intended as recipients
● View right on the profile that will be used for personalization
● View right and Schedule right on documents in the publication
● View right and Refresh right on the dynamic recipient source
● View right and Refresh right on the document for which the delivery rule is set
● Data Access right on universes used by publication objects
● Data Access right on universe connections used
● When scheduling to a BI Inbox, Add right and View right on each recipient's BI Inbox
● Modify the right users have to objects right on the folder containing the publication
● Subscribe right on recipients● When a publisher wants to print
publication instances, Print right on Crystal report source documents
● If you selected One database fetch per recipient, Schedule on behalf of other users right on Enterprise recipients
712 PUBLICSAP BusinessObjects Web Intelligence User's Guide
Scheduling and publishing documents
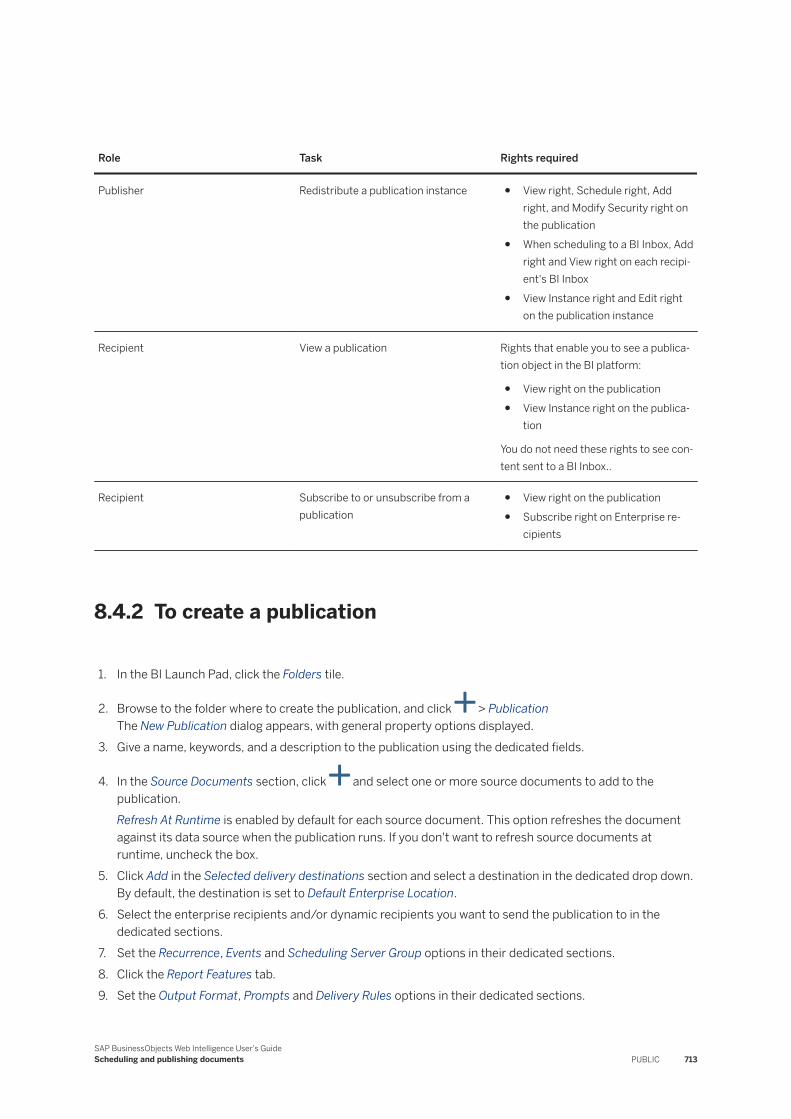
Role Task Rights required
Publisher Redistribute a publication instance ● View right, Schedule right, Add right, and Modify Security right on the publication
● When scheduling to a BI Inbox, Add right and View right on each recipient's BI Inbox
● View Instance right and Edit right on the publication instance
Recipient View a publication Rights that enable you to see a publication object in the BI platform:
● View right on the publication● View Instance right on the publica
tion
You do not need these rights to see content sent to a BI Inbox..
Recipient Subscribe to or unsubscribe from a publication
● View right on the publication● Subscribe right on Enterprise re
cipients
8.4.2 To create a publication
1. In the BI Launch Pad, click the Folders tile.
2. Browse to the folder where to create the publication, and click > PublicationThe New Publication dialog appears, with general property options displayed.
3. Give a name, keywords, and a description to the publication using the dedicated fields.
4. In the Source Documents section, click and select one or more source documents to add to the publication.Refresh At Runtime is enabled by default for each source document. This option refreshes the document against its data source when the publication runs. If you don't want to refresh source documents at runtime, uncheck the box.
5. Click Add in the Selected delivery destinations section and select a destination in the dedicated drop down. By default, the destination is set to Default Enterprise Location.
6. Select the enterprise recipients and/or dynamic recipients you want to send the publication to in the dedicated sections.
7. Set the Recurrence, Events and Scheduling Server Group options in their dedicated sections.8. Click the Report Features tab.9. Set the Output Format, Prompts and Delivery Rules options in their dedicated sections.
SAP BusinessObjects Web Intelligence User's GuideScheduling and publishing documents PUBLIC 713
The Recurrence, Prompts, Formats, Events, Scheduling Server Group, and Destinations categories have the exact same content as that of the Schedule dialog when you schedule document. For more information about options available in these categories, use the links at the end of this topic to access the dedicated documentation.
10. Click Save & Close.
Related Information
Recurrence [page 689]Prompts [page 690]Formats [page 691]Events [page 693]Scheduling server group [page 693]Destinations [page 693]
8.4.3 To open a publication
1. In the BI Launch Pad, click the Folders tile and navigate to the publication.
2. Click > View.
8.4.4 To select an event to trigger a publication
Event-based scheduling gives you additional control over when a publication runs. Use events to trigger a publication to run or use a publication job to trigger an event.
For more information about events, refer to SAP BusinessObjects Business Intelligence Platform User Guide.
1. In the BI Launch Pad, click the Folders tile.2. Browse to the folder containing your publication.
3. Click next to a publication's name and click Schedule.4. Scroll down to the Events section.5. Use the Wait For drop down to select the event that triggers the publication, or the Trigger drop down to
select the event to trigger when the publication job has run.6. Click Schedule.
714 PUBLICSAP BusinessObjects Web Intelligence User's Guide
Scheduling and publishing documents
8.4.5 To select personalized placeholders for source documents
You select personalized placeholders for a publication in the Schedule dialog.
Before being able to use personalized placeholders in publication instance names, the publication’s source documents must use personalization to filter data.
When scheduling a publication instance, you can use placeholders in the Use Specific Name field for source documents, and combine text and multiple placeholders in a publication name.
1. In the BI Launch Pad, click the Folders tile.2. Browse to the folder containing your publication.
3. Click next to a publication's name, then click Schedule.4. Scroll down to the Destinations section.5. Click Add.6. Select a destination using the drop down.7. In the Target Name section, check Use specific name and select a placeholder for the publication name
from the Add Placholder list.
TipIf the publication has multiple documents, you can add different placeholders for each document by clicking the Use specific name per document toggle.
8. Click OK.
8.4.6 To select personalized placeholders for email fields
You select personalized placeholders for a publication in the Schedule dialog.
You can combine text and multiple placeholders in any email field. When scheduling a publication to an email destination, you can use placeholders in the From, To, Cc, Bcc, Subject, Message, and Use specific name fields.
1. In the BI Launch Pad, click the Folders tile.2. Browse to the folder containing your publication.
3. Click next to a publication's name, then click Schedule.4. Scroll down to the Destinations section, and click Add.5. Select Email from the drop down list.6. Set the destination options, including placeholders, in the System Details section.7. Click OK.
SAP BusinessObjects Web Intelligence User's GuideScheduling and publishing documents PUBLIC 715
8.4.7 To embed content from a dynamic source document in an email
You embed content from a source document for a publication in the Schedule dialog.
You can embed content from dynamic content documents in the body of an email. You can embed an entire document or a single report tab.
1. In the BI Launch Pad, click the Folders tile and browse to the folder containing your publication.
2. Click next to a publication's name, then click Schedule.3. Click the Report Features tab, and in the Output Formats section, click the format next to a document name
to open the format selection widget.4. Select HTML, and specify whether you want to publish the entire document or a single report using the
dedicated drop down.5. Click the General tab and scroll down to the Destinations section and click Add.6. In the drop down, select Email.7. Fill in the fields manually or select placeholders from the Add Placeholders list.
In the From entry field, you can enter Robert, Publisher, or [email protected]. If you enter a name, the name is appended to your email server—for example, Publisher@<EmailServer>.
8. To embed dynamic content in the Message entry field, place the cursor where you want to embed content, and in the Add Placeholder drop down, select Report HTML Content.%SI_DOCUMENT_HTML_CONTENT% appears in the Message entry field. When the publication runs, the placeholder is replaced by personalized content from the dynamic content document.
9. Optional: If the publication has other source documents, check Add attachment.Other source documents will be added to the email as attachments when the publication runs.
10. Click OK.
8.4.8 To personalize a document with a global profile target
You can personalize a document for Enterprise recipients by filtering with a global profile target.
● Before being able to use a profile to personalize data for Enterprise recipients, the profile must be configured in the BI Platform. If a profile isn't configured in the platform, personalization will fail.
● Before personalizing a document, make sure that the profile has a global profile target. For more information on how to create a profile, refer to Creating a profile in the Central Management Console Help Guide.
1. In the BI Launch Pad, click the Folders tile and browse to the folder containing your publication.
2. Click next to a publication's name, then click Schedule.3. Click the Report Features tab.4. Scroll down to the Personalization section, and select a global profile in the dedicated drop down.
This profile maps the document to the universe field that's filtered for Enterprise recipients.5. Click OK.
716 PUBLICSAP BusinessObjects Web Intelligence User's Guide
Scheduling and publishing documents
8.4.9 To personalize a document by filtering fields
Before being able to use a profile to personalize data for Enterprise recipients, the profile must be configured in the BI Platform. If a profile isn't configured in the platform, personalization will fail.
Static-value profiles can filter only string fields in source documents. To filter other types of fields, use expression profile values. If you map an incorrect type of field to the profile, personalization will fail. If you need profiles added to the platform, contact your system administrator.
Scheduling and publishing a document to .WID format generates a .WID file. Filters in .WID files can be removed by any recipient with appropriate security rights. When sending the .WID file to recipients or destinations, use filters carefully. For example, if you filter a document to limit the information that recipients can see and then send the published .wid file to recipients, any recipient with security rights to edit the document can remove or update the filter and access data that should not be visible.
1. In the BI Launch Pad, click the Folders tile and browse to the folder containing your publication.
2. Click next to a publication's name, then click Schedule.3. Click the Report Features tab.4. Scroll down to the Personalization section, and select a local profile in the dedicated drop down.
This profile maps the report field to profile values for Enterprise recipients.5. Under Local Profiles, for each profile listed in the Title column, select a profile from the list in the Report
Field column.This profile maps the report field to profile values for Enterprise recipients.
6. Under Local Profiles, in the Enterprise Recipient Mapping column, select a profile.This profile maps the document to the universe field (global profile target) that is filtered for Enterprise recipients.
7. In the Dynamic Recipient Mapping column, select a profile.The field in the source document is mapped to the column that contains corresponding values in the dynamic recipient source.
8. Repeat steps 3 to 5 for each field to filter.9. Click OK.
8.5 Managing publications and instances
After you've saved a publication, you can can you view a summary of its properties, such as the publication's title, location, description, source documents, the number of recipients who will receive the publication (sorted by recipient type, Enterprise or dynamic), how the publication is personalized, the distribution format, and the destination.
Find the publication in the folders browser, and click > Properties > Summary.
SAP BusinessObjects Web Intelligence User's GuideScheduling and publishing documents PUBLIC 717
8.5.1 To test a publication
Use the test mode in the BI Launch Pad to send a publication to yourself before sending it to recipients.
When testing a publication, you receive the exact same contact your recipients will receive. Destinations are automatically updated so that your BI Inbox or your email address is used instead of publication recipients' BI Inbox or email address. If necessary, you can exclude selected recipients from the original group of recipients in test mode.
1. In the BI Launch Pad, click the Folders tile and browse to the folder containing your publication.
2. Click next to a publication's name, then click Test Mode.3. Optional: Click Select in the Enterprise Recipients section to add Enterprise recipients.4. Optional: Click Browse in the Dynamic Recipients section to add dynamic recipients:
a. Fill in the fields.
b. To add specific recipients, click Select recipients from list Select Recipients and select the recipients, then click OK.
5. Click Test.
The publication runs in test mode and, once done, is sent to intended "test" recipients.
8.5.2 To view the progress or history of a publication
1. On the home page, click the Instances tile.The application displays a list with all jobs and basic information about each of them and shows their status (Success, Failed, or Running) in the Status column.
2. To view the log file of a job, click > Details, and click Download Log.
8.5.3 To subscribe to or unsubscribe from a publication
To subscribe to a publication after it is scheduled, subscribe to its recurring instance or reschedule the publication.
You must have appropriate access rights to a publication before you can subscribe to it.
A subscription enables users who aren't recipients of a publication, to view the latest instance. Enterprise recipients can unsubscribe from a publication at any time. Dynamic recipients can neither subscribe to nor unsubscribe from a publication. Users with the appropriate access rights can subscribe and unsubscribe other users. To subscribe to or unsubscribe from a publication, the following are required:
● A BI platform account● Access to the BI Launch Pad in the platform● View rights to the publication● Subscriber rights for the user account (Enterprise recipients)
718 PUBLICSAP BusinessObjects Web Intelligence User's Guide
Scheduling and publishing documents
1. In the Folders drawer on the Documents tab, locate and select the publication to subscribe to or unsubscribe from.
2. Do one of the following:
○ In the BI Launch Pad, right-click the publication and select Subscribe or Unsubscribe.
○ In the Central Management Console (CMC), select Actions Subscribe or Unsubscribe.
8.5.4 To subscribe to or unsubscribe from a publication instance
After a recurring publication has been scheduled, Enterprise recipients can subscribe to its first recurring instance. For example, when a publication is scheduled to run twice a week, you can subscribe to the first publication instance but not the second one.
You must have appropriate access rights to a publication before you can subscribe to its instances.
1. Do one of the following:
○ In the BI Launch Pad, right-click the instance and select History.
○ In the Central Management Console (CMC), select Actions History .2. Do one of the following:
○ In the BI Launch Pad, right-click the instance and select Subscribe or Unsubscribe.
○ In the Central Management Console (CMC), select Actions Subscribe or Unsubscribe.
8.5.5 To view publications sent to the Default Enterprise Location
As a recipient, you can view only your own personalized publication instances in the BI platform.
1. In the CMC, go to the Folders area, right-click a publication, and select History.2. Click the link in the Instance Time column.3. Double-click the instance to view.
8.5.6 To view publications sent to a BI Inbox
Dynamic recipients can view publications sent to a BI Inbox. They cannot log on to the BI launch pad to view publication results.
1. In the BI launch pad home screen, click My Inbox.2. Double-click the instance to view.
SAP BusinessObjects Web Intelligence User's GuideScheduling and publishing documents PUBLIC 719
8.5.7 To redistribute a publication instance
When you want to resend an instance to a recipient but do not want to rerun an entire publication, you can redistribute successful publication instances to all or some of the original recipients.
Only recipients specified when the publication was originally run can receive redistributed instances.
1. Do one of the following:
○ In the BI launch pad, right-click a publication and select History.
○ In the Central Management Console (CMC), right-click a publication and select Actions History .2. Select a successful publication instance.3. Do one of the following:
○ In the BI launch pad, right-click a publication and select More Actions Reschedule .
○ In the Central Management Console (CMC), right-click a publication and select ActionsReschedule .
4. Choose which recipients will receive redistributed instances:
○ To redistribute an instance to Enterprise recipients, click Enterprise Recipients, and click > to move recipients from the Available list to the Selected list.
○ To redistribute an instance to dynamic recipients:1. Click Dynamic Recipients, and confirm that columns mapped to recipient IDs, full names, and
email addresses are correct.2. Select Use entire list to redistribute the publication to all dynamic recipients or click > to move
recipients from the Available list to the Selected list to select from a restricted list of dynamic recipients.
5. Click Redistribute.
The publication history appears, and the redistributed instance has a status of Running. The date in the Instance Time column is updated to reflect the redistribution time.
8.5.8 To retry a failed publication
Before retrying a failed publication, view the log file for the publication instance, address any errors, and reschedule the publication.
Using the option to “Retry” failed instances of a publication, you can:
● overwrite the failed instance (Run Now and Reschedule create new instances whereas Retry uses the failed instance).
● process only the failed recipients, in case of a partial failure.● run the full job without creating a new instance, in case of a complete failure.
NoteYou can also perform auto-retry by setting the Number of retries allowed and the Retry interval in seconds options under the Recurrence property of the publication. In case of a failure, it attempts to run the publication again.
720 PUBLICSAP BusinessObjects Web Intelligence User's Guide
Scheduling and publishing documents
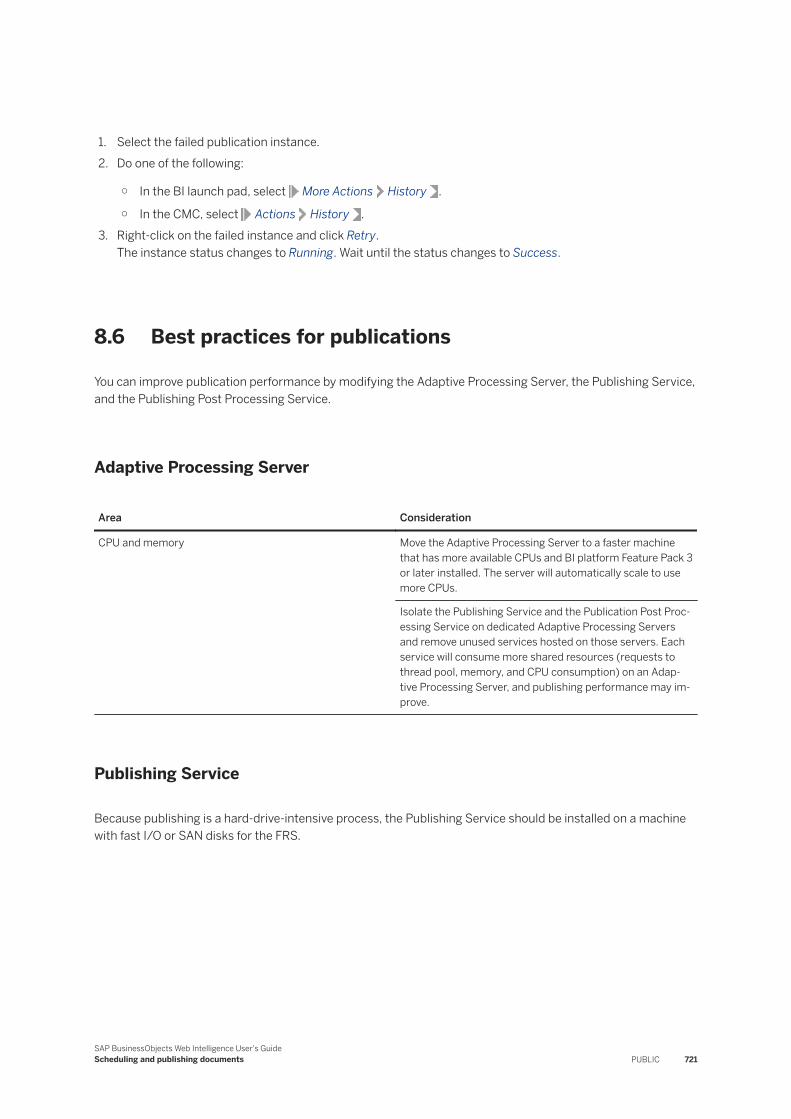
1. Select the failed publication instance.2. Do one of the following:
○ In the BI launch pad, select More Actions History .
○ In the CMC, select Actions History .3. Right-click on the failed instance and click Retry.
The instance status changes to Running. Wait until the status changes to Success.
8.6 Best practices for publications
You can improve publication performance by modifying the Adaptive Processing Server, the Publishing Service, and the Publishing Post Processing Service.
Adaptive Processing Server
Area Consideration
CPU and memory Move the Adaptive Processing Server to a faster machine that has more available CPUs and BI platform Feature Pack 3 or later installed. The server will automatically scale to use more CPUs.
Isolate the Publishing Service and the Publication Post Processing Service on dedicated Adaptive Processing Servers and remove unused services hosted on those servers. Each service will consume more shared resources (requests to thread pool, memory, and CPU consumption) on an Adaptive Processing Server, and publishing performance may improve.
Publishing Service
Because publishing is a hard-drive-intensive process, the Publishing Service should be installed on a machine with fast I/O or SAN disks for the FRS.
SAP BusinessObjects Web Intelligence User's GuideScheduling and publishing documents PUBLIC 721
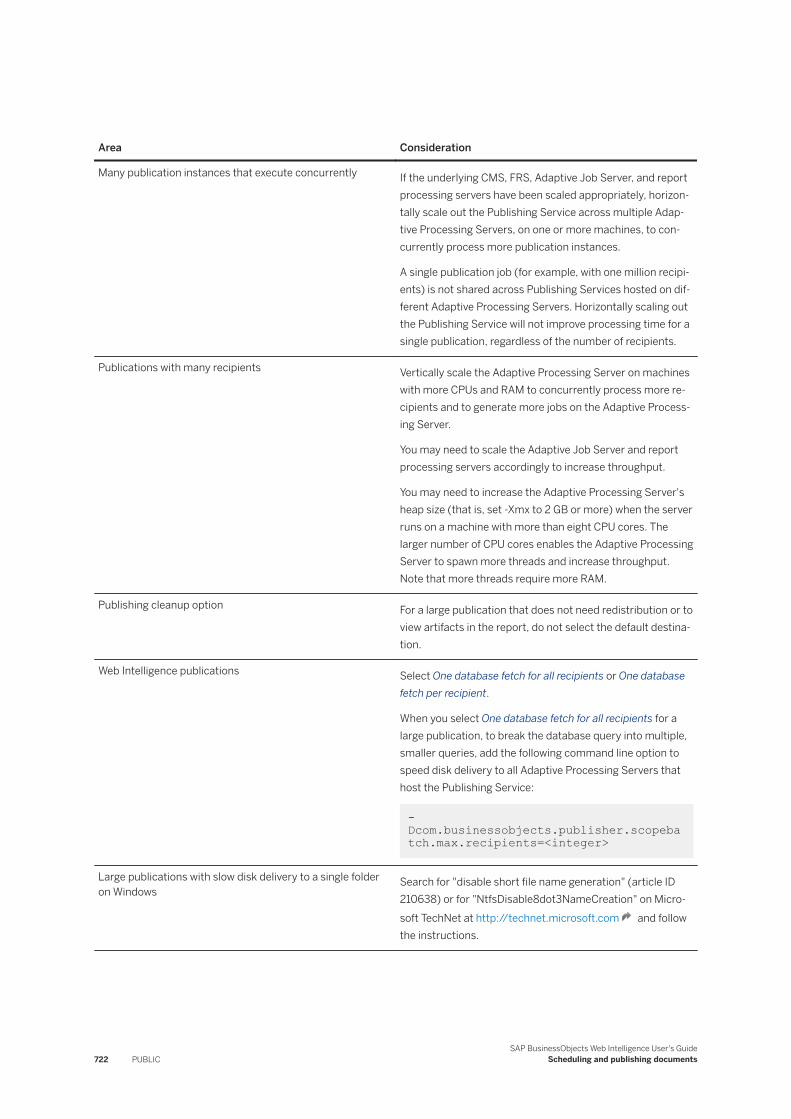
Area Consideration
Many publication instances that execute concurrently If the underlying CMS, FRS, Adaptive Job Server, and report processing servers have been scaled appropriately, horizontally scale out the Publishing Service across multiple Adaptive Processing Servers, on one or more machines, to concurrently process more publication instances.
A single publication job (for example, with one million recipients) is not shared across Publishing Services hosted on different Adaptive Processing Servers. Horizontally scaling out the Publishing Service will not improve processing time for a single publication, regardless of the number of recipients.
Publications with many recipients Vertically scale the Adaptive Processing Server on machines with more CPUs and RAM to concurrently process more recipients and to generate more jobs on the Adaptive Processing Server.
You may need to scale the Adaptive Job Server and report processing servers accordingly to increase throughput.
You may need to increase the Adaptive Processing Server's heap size (that is, set -Xmx to 2 GB or more) when the server runs on a machine with more than eight CPU cores. The larger number of CPU cores enables the Adaptive Processing Server to spawn more threads and increase throughput. Note that more threads require more RAM.
Publishing cleanup option For a large publication that does not need redistribution or to view artifacts in the report, do not select the default destination.
Web Intelligence publications Select One database fetch for all recipients or One database fetch per recipient.
When you select One database fetch for all recipients for a large publication, to break the database query into multiple, smaller queries, add the following command line option to speed disk delivery to all Adaptive Processing Servers that host the Publishing Service:
-Dcom.businessobjects.publisher.scopebatch.max.recipients=<integer>
Large publications with slow disk delivery to a single folder on Windows
Search for "disable short file name generation" (article ID 210638) or for "NtfsDisable8dot3NameCreation" on Microsoft TechNet at http://technet.microsoft.com and follow the instructions.
722 PUBLICSAP BusinessObjects Web Intelligence User's Guide
Scheduling and publishing documents
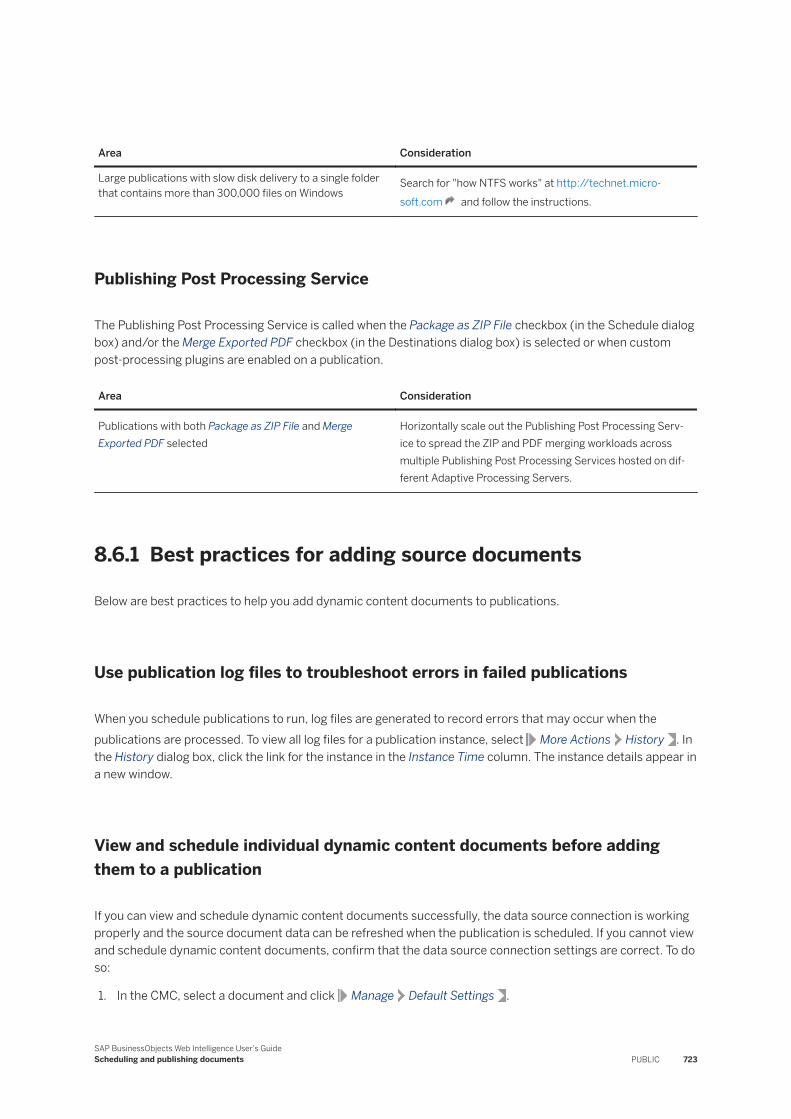
Area Consideration
Large publications with slow disk delivery to a single folder that contains more than 300,000 files on Windows
Search for "how NTFS works" at http://technet.microsoft.com and follow the instructions.
Publishing Post Processing Service
The Publishing Post Processing Service is called when the Package as ZIP File checkbox (in the Schedule dialog box) and/or the Merge Exported PDF checkbox (in the Destinations dialog box) is selected or when custom post-processing plugins are enabled on a publication.
Area Consideration
Publications with both Package as ZIP File and Merge Exported PDF selected
Horizontally scale out the Publishing Post Processing Service to spread the ZIP and PDF merging workloads across multiple Publishing Post Processing Services hosted on different Adaptive Processing Servers.
8.6.1 Best practices for adding source documents
Below are best practices to help you add dynamic content documents to publications.
Use publication log files to troubleshoot errors in failed publications
When you schedule publications to run, log files are generated to record errors that may occur when the publications are processed. To view all log files for a publication instance, select More Actions History . In the History dialog box, click the link for the instance in the Instance Time column. The instance details appear in a new window.
View and schedule individual dynamic content documents before adding them to a publication
If you can view and schedule dynamic content documents successfully, the data source connection is working properly and the source document data can be refreshed when the publication is scheduled. If you cannot view and schedule dynamic content documents, confirm that the data source connection settings are correct. To do so:
1. In the CMC, select a document and click Manage Default Settings .
SAP BusinessObjects Web Intelligence User's GuideScheduling and publishing documents PUBLIC 723
2. In the Default Settings dialog box, click Report universes on the navigation panel.
In some cases, you may have to open a dynamic content document in the designer to configure the data source connection and to re-export the file to the CMS repository and overwrite the previous copy. For more information about configuring data source connections for dynamic content documents, see the designer documentation.
Avoid unnecessary data refreshes
If a data refresh is unnecessary for a dynamic content document, in the Source Documents section, uncheck Refresh At Runtime for that document to improve overall publication performance.
8.6.2 Best practices for using dynamic recipient sources
Make sure to sort your dynamic recipients according to the Recipient ID column
In general, you should sort dynamic recipient sources by the Recipient ID column. This is especially important when you are running a high-volume publication because it can reduce the number of deliveries to recipients with multiple personalization values.
8.6.3 Best practices for sending and receiving email publication instances
If possible, view embedded-content email-publication instances in Outlook 2003
View embedded content in email publication instances in Outlook 2003 whenever possible. Embedded content in email publication instances may have formatting issues when viewed in Outlook 2007 or in web email accounts, such as Hotmail or Gmail.
Contact your administrator to confirm that the email settings are configured properly for the Destination Job Server
Make sure that email settings are properly configured for the Destination Job Server. Publications intended for email destinations may fail because email has not been configured properly as a destination for the Adaptive
724 PUBLICSAP BusinessObjects Web Intelligence User's Guide
Scheduling and publishing documents

Job Server. For more information, refer to the SAP BusinessObjects Business Intelligence Platform Administrator Guide.
SAP BusinessObjects Web Intelligence User's GuideScheduling and publishing documents PUBLIC 725
9 Working with documents in Reading mode
9.1 Interacting with documents in Reading mode
Web Intelligence shows complex and varied data in reports that you can understand quickly and easily.
Web Intelligence documents, based on queries created in one of several available applications (for example BEx or OLAP), are designed in Design mode to be viewed in Reading mode by any number of general or specific groups or individuals. This section explains or directs you to information on the functions you can perform while in Reading mode.
Depending on you user security and access rights set by the BI administrator, when you open a document in Reading mode, there are several actions you can perform:
● Open, save, print, refresh, export, and send documents.● Enable the auto-refresh mode.● Track changes in a document.● Fold or unfold data.● Refine the data displayed using input controls and drilling.
Related Information
Features available in Reading mode [page 727]To start Web Intelligence in the BI Launch Pad [page 17]What is Web Intelligence? [page 11]Setting preferences in the BI Launch Pad [page 18]Saving and exporting documents in Reading mode [page 728]Viewing modes [page 191]Tracking changes in data [page 193]
726 PUBLICSAP BusinessObjects Web Intelligence User's Guide
Working with documents in Reading mode

9.1.1 Features available in Reading mode
When viewing documents in the Reading mode, there are several buttons, icons and other features that you can use, depending on the user security and access rights set for you by the BI administrator.
Reading mode features
Task Icon Description
Save documents
Click to save a document to the personal folder or to a corporate folder to which access has been granted by the BI administrator.
Print documents > Print
Click to generate a PDF you can print.
Export documents or one of its reports > Export
Click to export document's report(s) or data in a variety of formats.
Send a document to a BI inbox > Send to BI Inbox
Click to send a document or one of its reports.
Undo or redo an action
Click to undo or redo an action performed on a report in a document.
Refresh a document
Click to refresh a document to work with the latest data.
Enable auto-refresh mode > Auto-Refresh
Click to schedule a refresh every X minutes.
Access help > Help
Click to access the user help.
Track changes in a document > Track Data Changes
Click to activate the change tracking for a document.
Drill on data > Drill
Click to activate drilling in the document on any objects with more than one level.
Fold or unfold data > Fold/Unfold
Click to activate fold/unfold.
Filter document data
Click to display the filter bar and edit existing input controls and refine the data.
Page browser
. The page browser is in the vanishing toolbar, at the bottom of the report.
You can move forward or backwards one page, enter a specific page number, or toggle to the beginning or end of a report in a document.
Toggle between page displays. The icon is in the vanishing toolbar, at the bottom of the report.
You can switch between the quick display mode and the print layout.
Zoom in a report. The icon is in the vanishing toolbar, at the bottom of the report.
You can zoom in and out in a report.
SAP BusinessObjects Web Intelligence User's GuideWorking with documents in Reading mode PUBLIC 727
9.1.2 Saving and exporting documents in Reading mode
You can save and export the current document or active report in one or more locations or formats.
The Save As functionality only saves document in the .WID format, which is the Web Intelligence document format. If you're looking to save a document or a report in another format, use the Export feature to save the
document in .PDF, .CSV, .XLS, .TXT or .HTML format. Click > Save As or > Export in the toolbar to save or export the document.
Related Information
To save a document in the corporate repository [page 353]Exporting documents, reports or data [page 354]
9.1.3 Printing reports
You can print one or multiple reports from a document.
When printing reports, the application generates a .PDF file first. Click > Print in the toolbar, set the printing options, and click Print to generate the .PDF file.
Note● When printing a report, the application sets it to print layout and discards the quick display mode.● If a report is wider than the width of the paper size defined in the Layout, page breaks are inserted. The
paper size and page orientation for printing can be different from the paper size and page orientation set for the reports when you view them in the Rich Client.
9.1.4 To send a document to a BI Inbox
You can share documents with colleagues and send them to a BI Inbox.
1. In the File section of the toolbar, click .2. Click Send to BI Inbox.3. In the Users/Groups tab, select the people with who you want to share the document.4. In the Options tab, check Use automatically generated filename to send the document with an
automatically-generated name, or Use specific name to rename the document.5. Click Send as copy to send a copy, or Send as shortcut to share a link to the document.6. Click OK.
728 PUBLICSAP BusinessObjects Web Intelligence User's Guide
Working with documents in Reading mode
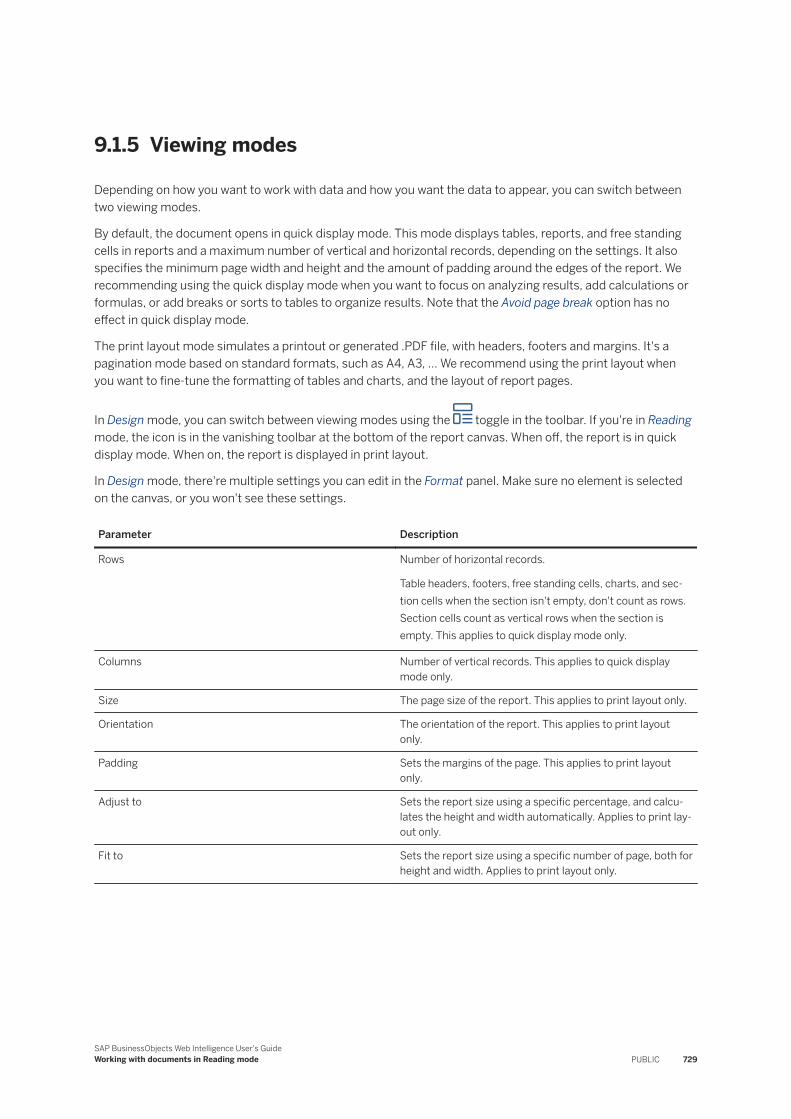
9.1.5 Viewing modes
Depending on how you want to work with data and how you want the data to appear, you can switch between two viewing modes.
By default, the document opens in quick display mode. This mode displays tables, reports, and free standing cells in reports and a maximum number of vertical and horizontal records, depending on the settings. It also specifies the minimum page width and height and the amount of padding around the edges of the report. We recommending using the quick display mode when you want to focus on analyzing results, add calculations or formulas, or add breaks or sorts to tables to organize results. Note that the Avoid page break option has no effect in quick display mode.
The print layout mode simulates a printout or generated .PDF file, with headers, footers and margins. It's a pagination mode based on standard formats, such as A4, A3, … We recommend using the print layout when you want to fine-tune the formatting of tables and charts, and the layout of report pages.
In Design mode, you can switch between viewing modes using the toggle in the toolbar. If you're in Reading mode, the icon is in the vanishing toolbar at the bottom of the report canvas. When off, the report is in quick display mode. When on, the report is displayed in print layout.
In Design mode, there're multiple settings you can edit in the Format panel. Make sure no element is selected on the canvas, or you won't see these settings.
Parameter Description
Rows Number of horizontal records.
Table headers, footers, free standing cells, charts, and section cells when the section isn't empty, don't count as rows. Section cells count as vertical rows when the section is empty. This applies to quick display mode only.
Columns Number of vertical records. This applies to quick display mode only.
Size The page size of the report. This applies to print layout only.
Orientation The orientation of the report. This applies to print layout only.
Padding Sets the margins of the page. This applies to print layout only.
Adjust to Sets the report size using a specific percentage, and calculates the height and width automatically. Applies to print layout only.
Fit to Sets the report size using a specific number of page, both for height and width. Applies to print layout only.
SAP BusinessObjects Web Intelligence User's GuideWorking with documents in Reading mode PUBLIC 729
9.1.6 Tracking changes in data
To make informed and effective business intelligence decisions, you need to understand how the data on which you base those decisions changes over time.
You can track and display data changes to help you focus your analysis on key areas and avoid wasting time exploring irrelevant data.
When you track data changes, you select a particular data refresh as a reference point. This data is known as the reference data. When you activate data tracking, you see your data in relation to the reference data.
Here are some examples of data tracking:
● If an outlet no longer appears in a list of the top outlets by sales, it would be interpreted as deleted from the list. You can use this information to investigate why the outlet is no longer a top performer.
● If sales have decreased in a region, data tracking displays the decrease. You can then drill down into the data for the region to understand why revenue is falling.
In both these cases, data tracking makes the current data more meaningful by placing it in context with older data. Without this context it's much more difficult to identify trends.
NoteStatus “changes” of tracking data changes is only for a detail value when displayed with its associated dimension in the table. When the detail is given without it is associated dimension it is considered as a dimension and does not show the status changes (but only shows when the detail is inserted/deleted).
Related Information
Types of data change [page 194]Automatic update tracking mode [page 194]Absolute reference data tracking mode [page 194]To activate data tracking [page 195]To display changed data [page 196]Configuring the appearance of changed data [page 195]To configure the appearance of changed data [page 195]How changed data is displayed in blocks [page 196]How changed data is displayed in blocks with breaks [page 200]How changed data is displayed in sections [page 198]How changed data is displayed in reports with merged dimensions [page 197]How changed data is displayed in charts [page 200]
730 PUBLICSAP BusinessObjects Web Intelligence User's Guide
Working with documents in Reading mode
9.1.7 Drilling on report data in Reading mode
Drilling on reports lets you look deeper into your data to discover the details behind a good or bad summary result displayed in tables, charts, or sections.
Example: Why did sales of accessories, outwear, and overcoats rise in Q3?
You work for a US national fashion retail chain, and are in charge of sales of accessories, outerwear and overcoat clothing lines in western states. You see that revenue is much higher for Q3 than the other quarters. To understand why, you drill down to look at the factors behind the result and you see that jewelry sales were much higher in July.
9.1.7.1 Drilling on measures in tables and sections
When you drill on a measure value, you drill one level down for each related dimension in the block, and you see the measure calculated for the displayed dimensions.
Example: Drill on annual sales revenue results to see the breakdown by city and quarter
For example, you drill down on the year 2003 sales revenue value for California, which is displayed on a crosstab that shows sales revenue by year and by state.
The drilled report displays sales revenue by quarter (one level below Year) and by city (one level below State) for California.
9.1.7.2 Drilling on dimensions in tables and sections
When you drill on a dimension to see the more data behind the displayed result, it is calculated according to the values to which you drill.
Dimensions typically represent character data, such as customer or business names, and dates. Calculations are based around the dimensions in a report. For example, a report calculates a region’s total sales revenue for a given year where a Sales Revenue measure is calculated based on the State and Year dimensions.
If you drill on Year, you display sales revenue by state and quarter, because Quarter is the next dimension in the time hierarchy below Year.
NoteDetail objects cannot be drilled on in reports.
SAP BusinessObjects Web Intelligence User's GuideWorking with documents in Reading mode PUBLIC 731
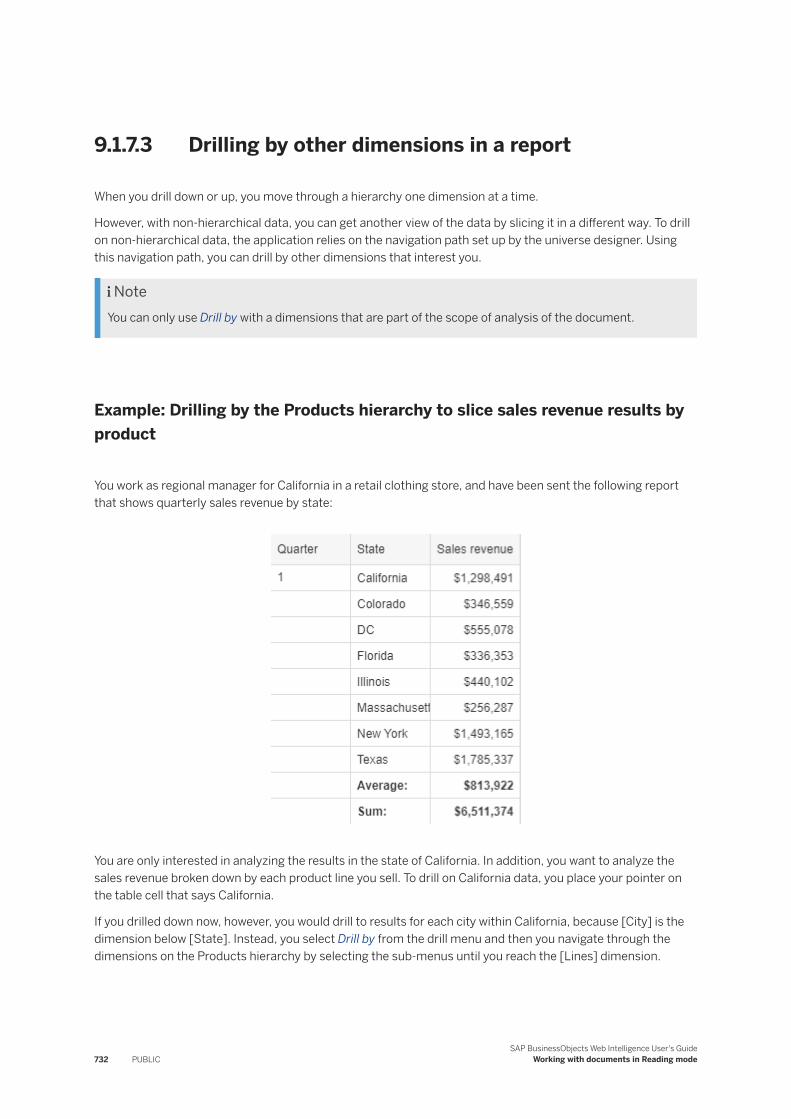
9.1.7.3 Drilling by other dimensions in a report
When you drill down or up, you move through a hierarchy one dimension at a time.
However, with non-hierarchical data, you can get another view of the data by slicing it in a different way. To drill on non-hierarchical data, the application relies on the navigation path set up by the universe designer. Using this navigation path, you can drill by other dimensions that interest you.
NoteYou can only use Drill by with a dimensions that are part of the scope of analysis of the document.
Example: Drilling by the Products hierarchy to slice sales revenue results by product
You work as regional manager for California in a retail clothing store, and have been sent the following report that shows quarterly sales revenue by state:
You are only interested in analyzing the results in the state of California. In addition, you want to analyze the sales revenue broken down by each product line you sell. To drill on California data, you place your pointer on the table cell that says California.
If you drilled down now, however, you would drill to results for each city within California, because [City] is the dimension below [State]. Instead, you select Drill by from the drill menu and then you navigate through the dimensions on the Products hierarchy by selecting the sub-menus until you reach the [Lines] dimension.
732 PUBLICSAP BusinessObjects Web Intelligence User's Guide
Working with documents in Reading mode
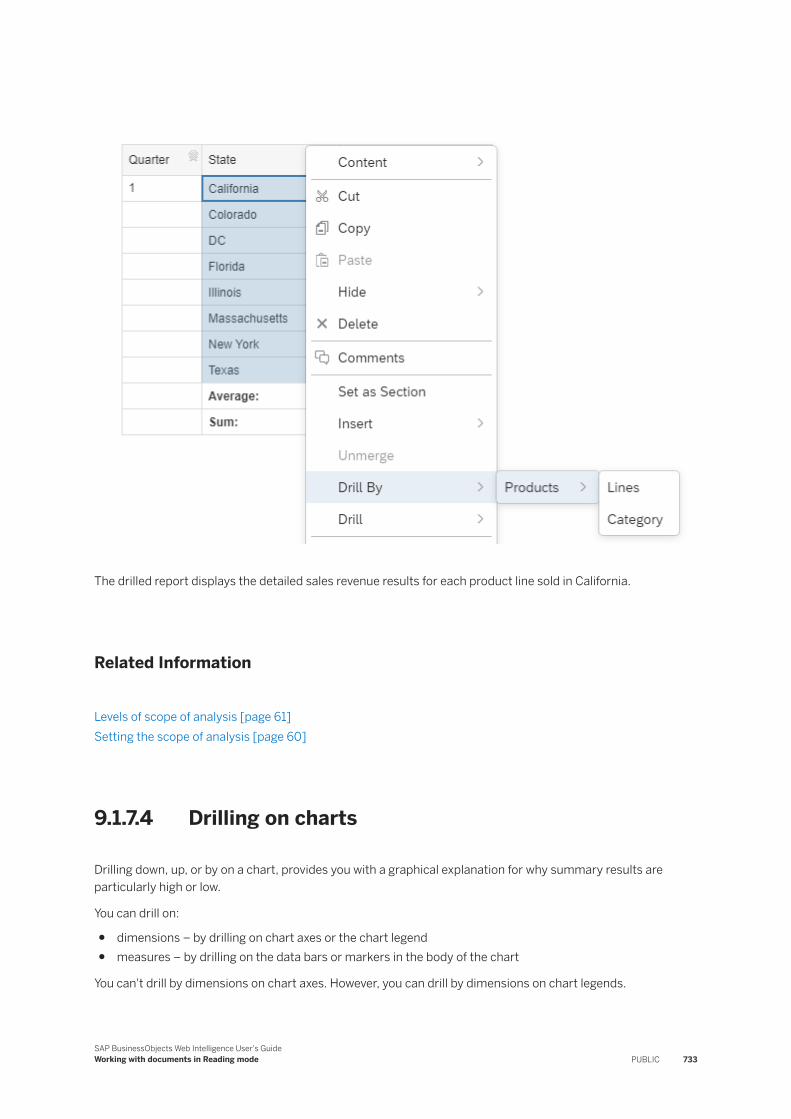
The drilled report displays the detailed sales revenue results for each product line sold in California.
Related Information
Levels of scope of analysis [page 61]Setting the scope of analysis [page 60]
9.1.7.4 Drilling on charts
Drilling down, up, or by on a chart, provides you with a graphical explanation for why summary results are particularly high or low.
You can drill on:
● dimensions – by drilling on chart axes or the chart legend● measures – by drilling on the data bars or markers in the body of the chart
You can't drill by dimensions on chart axes. However, you can drill by dimensions on chart legends.
SAP BusinessObjects Web Intelligence User's GuideWorking with documents in Reading mode PUBLIC 733
Related Information
Drilling on axis legends [page 366]Drilling on dimensions via chart axes [page 364]Drilling on measures in charts [page 365]
9.1.8 Editing values of input controls in Reading mode
Input controls provide a convenient, easily accessible way to filter and analyze report data.
You can edit the values of existing input controls in Reading mode. If you click display the filter bar, you get instant access to the input controls of the report. Click them to edit their values.
9.1.9 Folding and unfolding report data
You can hide and display report data by folding and unfolding report elements.
You can fold and unfold sections, breaks and tables if they have a header or a footer. Data is concealed and displayed in different ways depending on the report element.
Report element Result
Section When a section is folded, section details are hidden and free cells only are displayed. In Reading mode, you can fold and unfold sections.
Table or break When a table or break is folded, the rows are concealed, and only headers and footers are displayed. Tables must have headers and footers to be folded and unfolded.
Vertical tables, horizontal tables and cross tables can be folded and unfolded.
In Reading mode, you can fold and unfold sections.
9.1.9.1 To fold and unfold report data
You can fold and unfold data in Reading and Design.
Only report elements that have a header or a footer can be folded or unfolded.
1. In the Analyze section of the toolbar, click .2. Check Fold/Unfold.
734 PUBLICSAP BusinessObjects Web Intelligence User's Guide
Working with documents in Reading mode
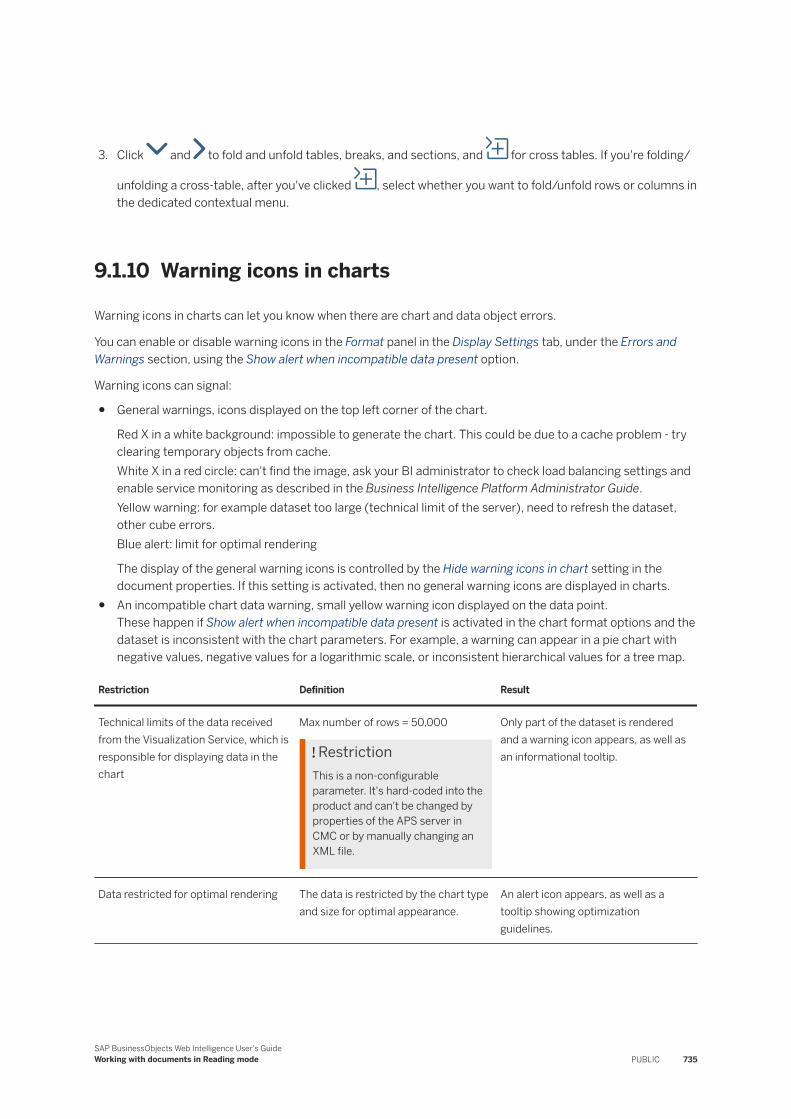
3. Click and to fold and unfold tables, breaks, and sections, and for cross tables. If you're folding/
unfolding a cross-table, after you've clicked , select whether you want to fold/unfold rows or columns in the dedicated contextual menu.
9.1.10 Warning icons in charts
Warning icons in charts can let you know when there are chart and data object errors.
You can enable or disable warning icons in the Format panel in the Display Settings tab, under the Errors and Warnings section, using the Show alert when incompatible data present option.
Warning icons can signal:
● General warnings, icons displayed on the top left corner of the chart.
Red X in a white background: impossible to generate the chart. This could be due to a cache problem - try clearing temporary objects from cache.White X in a red circle: can't find the image, ask your BI administrator to check load balancing settings and enable service monitoring as described in the Business Intelligence Platform Administrator Guide.Yellow warning: for example dataset too large (technical limit of the server), need to refresh the dataset, other cube errors.Blue alert: limit for optimal rendering
The display of the general warning icons is controlled by the Hide warning icons in chart setting in the document properties. If this setting is activated, then no general warning icons are displayed in charts.
● An incompatible chart data warning, small yellow warning icon displayed on the data point.These happen if Show alert when incompatible data present is activated in the chart format options and the dataset is inconsistent with the chart parameters. For example, a warning can appear in a pie chart with negative values, negative values for a logarithmic scale, or inconsistent hierarchical values for a tree map.
Restriction Definition Result
Technical limits of the data received from the Visualization Service, which is responsible for displaying data in the chart
Max number of rows = 50,000
RestrictionThis is a non-configurable parameter. It's hard-coded into the product and can't be changed by properties of the APS server in CMC or by manually changing an XML file.
Only part of the dataset is rendered and a warning icon appears, as well as an informational tooltip.
Data restricted for optimal rendering The data is restricted by the chart type and size for optimal appearance.
An alert icon appears, as well as a tooltip showing optimization guidelines.
SAP BusinessObjects Web Intelligence User's GuideWorking with documents in Reading mode PUBLIC 735

Related Information
Viewing document properties [page 165]
736 PUBLICSAP BusinessObjects Web Intelligence User's Guide
Working with documents in Reading mode
10 Security
10.1 Data protection and privacy
Data protection is associated with numerous legal requirements and privacy concerns. In addition to compliance with applicable data privacy regulations, it is necessary to consider compliance with industry-specific legislation in different countries. SAP provides specific features and functions to support compliance with regards to relevant legal requirements, including data protection. SAP does not give any advice on whether these features and functions are the best method to support company, industry, regional, or country-specific requirements. Furthermore, this information does not give any advice or recommendation in regards to additional features that would be required in particular IT environments; decisions related to data protection must be made on a case-by-case basis, under consideration of the given system landscape and the applicable legal requirements.
NoteIn the majority of cases, compliance with applicable data protection and privacy laws will not be covered by a product feature. SAP software supports data protection compliance by providing security features and specific data protection-relevant functions, such as simplified blocking and deletion of personal data. SAP does not provide legal advice in any form. Definitions and other terms used in this document are not taken from any given legal source.
10.2 General principles
Web Intelligence documents are stored in the Business Intelligence Platform to ensure that only authenticated and authorized users can access them. Web Intelligence doesn’t collect personal data, and processes data in a generic manner, meaning that the application cannot determine whether metadata should be processed as personal.
To fulfill most of General Data Protection Regulation (GDPR) requirements, Web Intelligence documents must be built so that the content is always synchronized with that of underlying databases. We recommend leveraging the Refresh on Open and Scheduling capabilities. Open or freely configurable text fields should not contain personal data.
10.3 Building Web Intelligence reports
Web Intelligence reports must be built leveraging the Refresh on Open feature. When enabled, the document is purged from its content and refreshed each time you open it. That is a way to always keep the document up to
SAP BusinessObjects Web Intelligence User's GuideSecurity PUBLIC 737
date. The document is also set according to the user's rights. This ensures that data that is no longer available in the database is also removed from tables, charts and other report elements that are part of the document.
Since the refresh is performed after the purge, users will not be able to display previous content, even in case of errors during the refresh process. This behavior is also applicable if the document is saved locally.
10.4 Retention policy
The BI Platform offers a scheduling feature that you can use to implement a retention policy. These functionalities create instances of a document periodically. A document can be refreshed and stored every morning, for instance. Administrators can then create rules that allow for the deletion of these instances after a period that they have configured up front. For more information, read this blog post: https://blogs.sap.com/2013/04/03/businessobjects-instance-management/ . These rules can be configured either at the BI platform, that is for a specific folder and all the documents it contains, or at a document level.
10.5 Read access logging
Administrators can enable auditing for Web Intelligence documents by enabling logs for document access or refreshes on given universes. Logs are then stored in a database, and use the BI platform to build a Web Intelligence document on that database that you can later use to determine which documents each user has read access to.
Web Intelligence doesn’t collect personal data, and processes data in a generic manner, meaning that the application cannot determine whether metadata should be processed as personal. It’s customer responsibility to identify documents that contain personal data.
10.6 Logs
Server logs may contain pieces of information that allow to establish a connection between users and the document they have launched. To fulfill GDPR requirements, administrators must ensure to set up regular log deletion in the Central Management Console, or even disable them altogether if necessary.
738 PUBLICSAP BusinessObjects Web Intelligence User's Guide
Security
10.7 Reporting
GDPR compliant products must offer capabilities to display report of the data related to a specific user. Web Intelligence being a adhoc reporting tool, customers can build reports that suit their specific usage of Web Intelligence. The Auditing database can be a great help for this purpose.
10.8 Saving documents locally
When saving documents outside of the BI Platform repository, it's customer's responsibility to protect their content. We recommend installing third party tools that support operating system level encryption.
SAP BusinessObjects Web Intelligence User's GuideSecurity PUBLIC 739
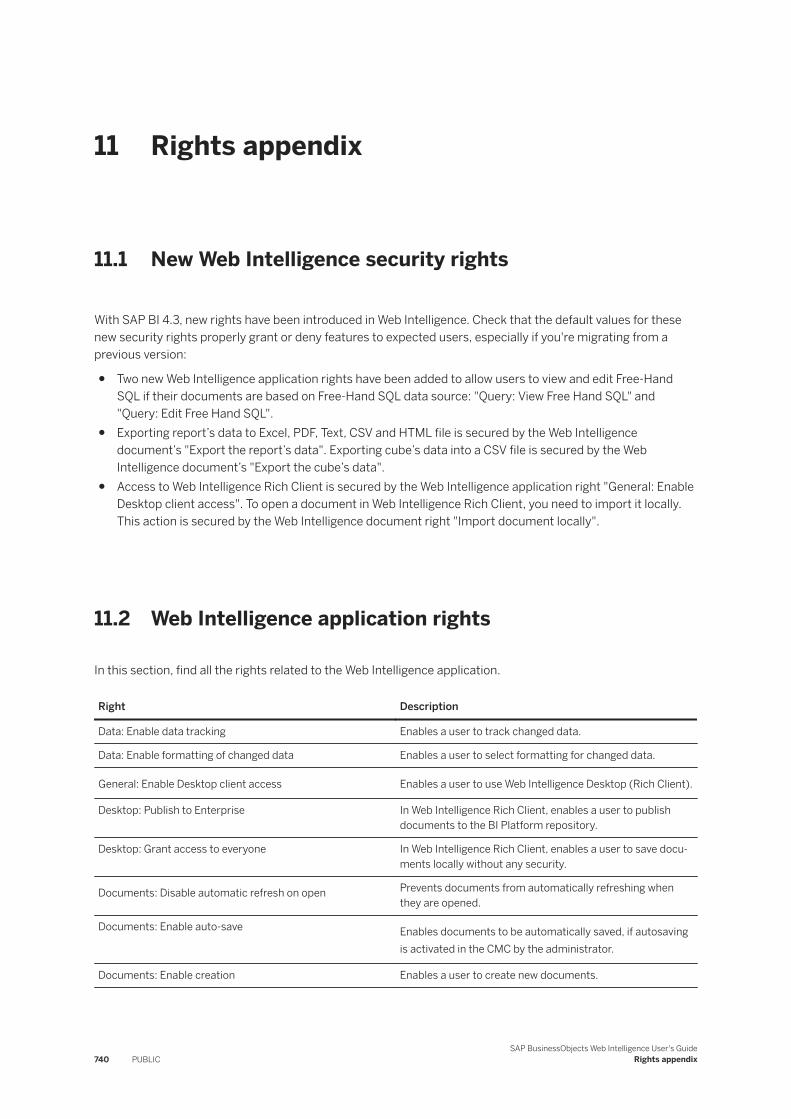
11 Rights appendix
11.1 New Web Intelligence security rights
With SAP BI 4.3, new rights have been introduced in Web Intelligence. Check that the default values for these new security rights properly grant or deny features to expected users, especially if you're migrating from a previous version:
● Two new Web Intelligence application rights have been added to allow users to view and edit Free-Hand SQL if their documents are based on Free-Hand SQL data source: "Query: View Free Hand SQL" and "Query: Edit Free Hand SQL".
● Exporting report’s data to Excel, PDF, Text, CSV and HTML file is secured by the Web Intelligence document’s "Export the report’s data". Exporting cube’s data into a CSV file is secured by the Web Intelligence document’s "Export the cube’s data".
● Access to Web Intelligence Rich Client is secured by the Web Intelligence application right "General: Enable Desktop client access". To open a document in Web Intelligence Rich Client, you need to import it locally. This action is secured by the Web Intelligence document right "Import document locally".
11.2 Web Intelligence application rights
In this section, find all the rights related to the Web Intelligence application.
Right Description
Data: Enable data tracking Enables a user to track changed data.
Data: Enable formatting of changed data Enables a user to select formatting for changed data.
General: Enable Desktop client access Enables a user to use Web Intelligence Desktop (Rich Client).
Desktop: Publish to Enterprise In Web Intelligence Rich Client, enables a user to publish documents to the BI Platform repository.
Desktop: Grant access to everyone In Web Intelligence Rich Client, enables a user to save documents locally without any security.
Documents: Disable automatic refresh on open Prevents documents from automatically refreshing when they are opened.
Documents: Enable auto-save Enables documents to be automatically saved, if autosaving is activated in the CMC by the administrator.
Documents: Enable creation Enables a user to create new documents.
740 PUBLICSAP BusinessObjects Web Intelligence User's Guide
Rights appendix
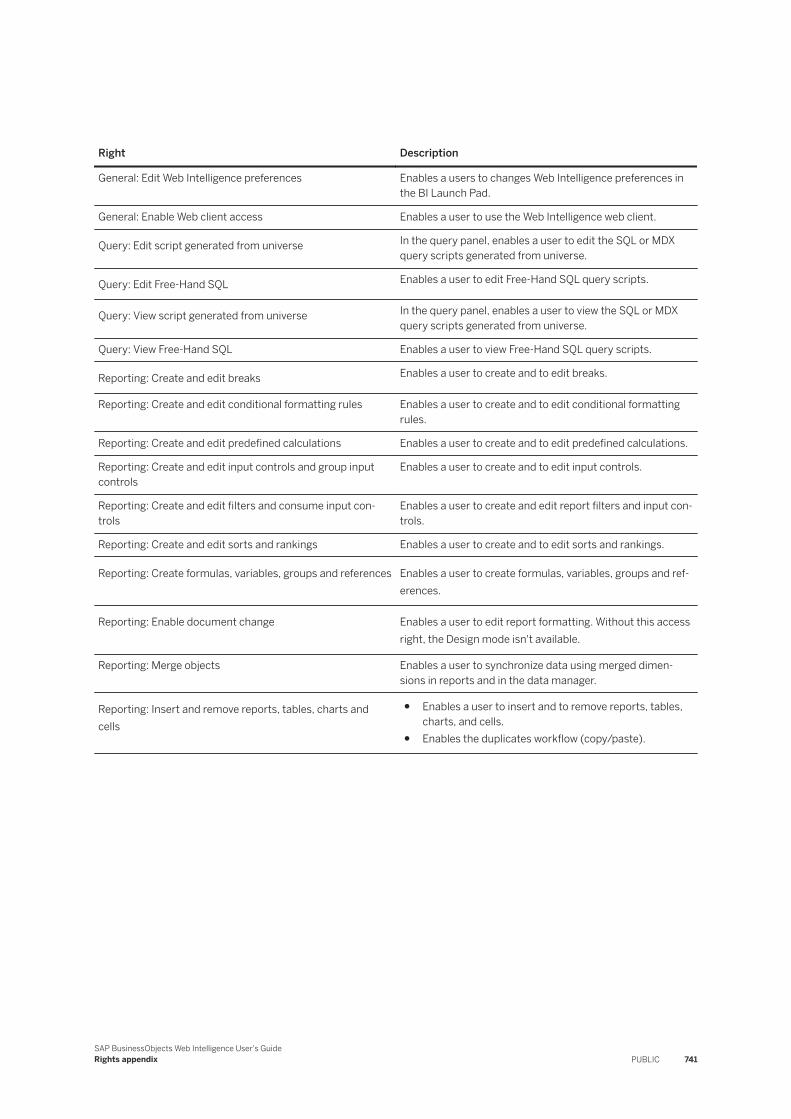
Right Description
General: Edit Web Intelligence preferences Enables a users to changes Web Intelligence preferences in the BI Launch Pad.
General: Enable Web client access Enables a user to use the Web Intelligence web client.
Query: Edit script generated from universe In the query panel, enables a user to edit the SQL or MDX query scripts generated from universe.
Query: Edit Free-Hand SQL Enables a user to edit Free-Hand SQL query scripts.
Query: View script generated from universe In the query panel, enables a user to view the SQL or MDX query scripts generated from universe.
Query: View Free-Hand SQL Enables a user to view Free-Hand SQL query scripts.
Reporting: Create and edit breaks Enables a user to create and to edit breaks.
Reporting: Create and edit conditional formatting rules Enables a user to create and to edit conditional formatting rules.
Reporting: Create and edit predefined calculations Enables a user to create and to edit predefined calculations.
Reporting: Create and edit input controls and group input controls
Enables a user to create and to edit input controls.
Reporting: Create and edit filters and consume input controls
Enables a user to create and edit report filters and input controls.
Reporting: Create and edit sorts and rankings Enables a user to create and to edit sorts and rankings.
Reporting: Create formulas, variables, groups and references Enables a user to create formulas, variables, groups and references.
Reporting: Enable document change Enables a user to edit report formatting. Without this access right, the Design mode isn't available.
Reporting: Merge objects Enables a user to synchronize data using merged dimensions in reports and in the data manager.
Reporting: Insert and remove reports, tables, charts and cells
● Enables a user to insert and to remove reports, tables, charts, and cells.
● Enables the duplicates workflow (copy/paste).
SAP BusinessObjects Web Intelligence User's GuideRights appendix PUBLIC 741
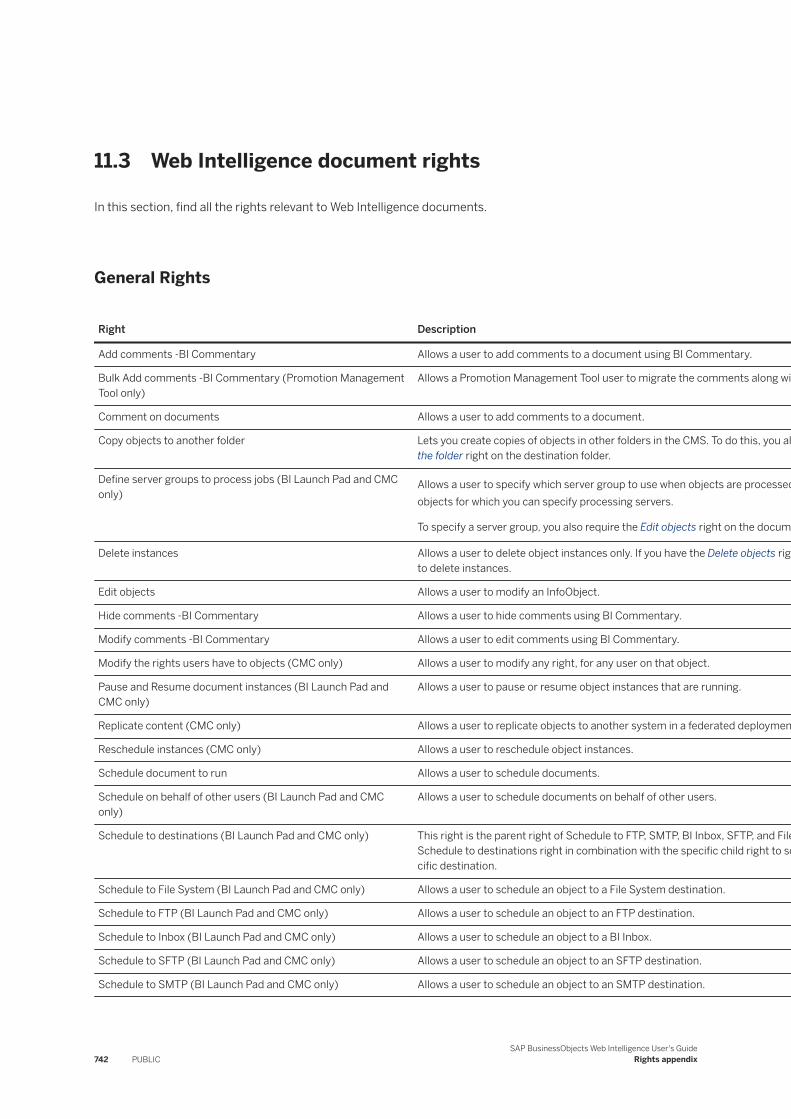
11.3 Web Intelligence document rights
In this section, find all the rights relevant to Web Intelligence documents.
General Rights
Right Description
Add comments -BI Commentary Allows a user to add comments to a document using BI Commentary.
Bulk Add comments -BI Commentary (Promotion Management Tool only)
Allows a Promotion Management Tool user to migrate the comments along with the document.
Comment on documents Allows a user to add comments to a document.
Copy objects to another folder Lets you create copies of objects in other folders in the CMS. To do this, you also require the Add objects to the folder right on the destination folder.
Define server groups to process jobs (BI Launch Pad and CMC only)
Allows a user to specify which server group to use when objects are processed. This right only applies to objects for which you can specify processing servers.
To specify a server group, you also require the Edit objects right on the document.
Delete instances Allows a user to delete object instances only. If you have the Delete objects right, you don't require this right to delete instances.
Edit objects Allows a user to modify an InfoObject.
Hide comments -BI Commentary Allows a user to hide comments using BI Commentary.
Modify comments -BI Commentary Allows a user to edit comments using BI Commentary.
Modify the rights users have to objects (CMC only) Allows a user to modify any right, for any user on that object.
Pause and Resume document instances (BI Launch Pad and CMC only)
Allows a user to pause or resume object instances that are running.
Replicate content (CMC only) Allows a user to replicate objects to another system in a federated deployment.
Reschedule instances (CMC only) Allows a user to reschedule object instances.
Schedule document to run Allows a user to schedule documents.
Schedule on behalf of other users (BI Launch Pad and CMC only)
Allows a user to schedule documents on behalf of other users.
Schedule to destinations (BI Launch Pad and CMC only) This right is the parent right of Schedule to FTP, SMTP, BI Inbox, SFTP, and File System. You should select Schedule to destinations right in combination with the specific child right to schedule an object to the specific destination.
Schedule to File System (BI Launch Pad and CMC only) Allows a user to schedule an object to a File System destination.
Schedule to FTP (BI Launch Pad and CMC only) Allows a user to schedule an object to an FTP destination.
Schedule to Inbox (BI Launch Pad and CMC only) Allows a user to schedule an object to a BI Inbox.
Schedule to SFTP (BI Launch Pad and CMC only) Allows a user to schedule an object to an SFTP destination.
Schedule to SMTP (BI Launch Pad and CMC only) Allows a user to schedule an object to an SMTP destination.
742 PUBLICSAP BusinessObjects Web Intelligence User's Guide
Rights appendix
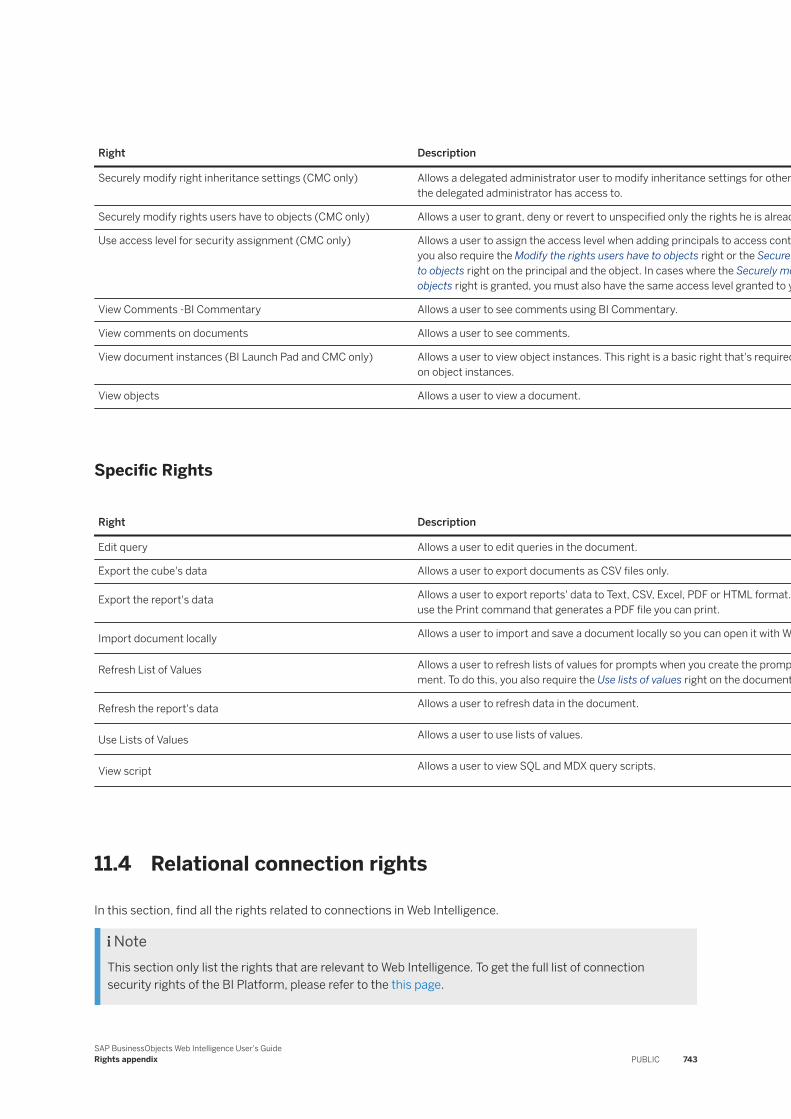
Right Description
Securely modify right inheritance settings (CMC only) Allows a delegated administrator user to modify inheritance settings for other principals on the objects that the delegated administrator has access to.
Securely modify rights users have to objects (CMC only) Allows a user to grant, deny or revert to unspecified only the rights he is already granted.
Use access level for security assignment (CMC only) Allows a user to assign the access level when adding principals to access control lists for objects. To do this, you also require the Modify the rights users have to objects right or the Securely modify the rights users have to objects right on the principal and the object. In cases where the Securely modify the rights users have to objects right is granted, you must also have the same access level granted to yourself on the object.
View Comments -BI Commentary Allows a user to see comments using BI Commentary.
View comments on documents Allows a user to see comments.
View document instances (BI Launch Pad and CMC only) Allows a user to view object instances. This right is a basic right that's required for all tasks that you perform on object instances.
View objects Allows a user to view a document.
Specific Rights
Right Description
Edit query Allows a user to edit queries in the document.
Export the cube's data Allows a user to export documents as CSV files only.
Export the report's data Allows a user to export reports' data to Text, CSV, Excel, PDF or HTML format. This command also allows to use the Print command that generates a PDF file you can print.
Import document locally Allows a user to import and save a document locally so you can open it with Web Intelligence Rich Client.
Refresh List of Values Allows a user to refresh lists of values for prompts when you create the prompt or when you view the document. To do this, you also require the Use lists of values right on the document.
Refresh the report's data Allows a user to refresh data in the document.
Use Lists of Values Allows a user to use lists of values.
View script Allows a user to view SQL and MDX query scripts.
11.4 Relational connection rights
In this section, find all the rights related to connections in Web Intelligence.
NoteThis section only list the rights that are relevant to Web Intelligence. To get the full list of connection security rights of the BI Platform, please refer to the this page.
SAP BusinessObjects Web Intelligence User's GuideRights appendix PUBLIC 743
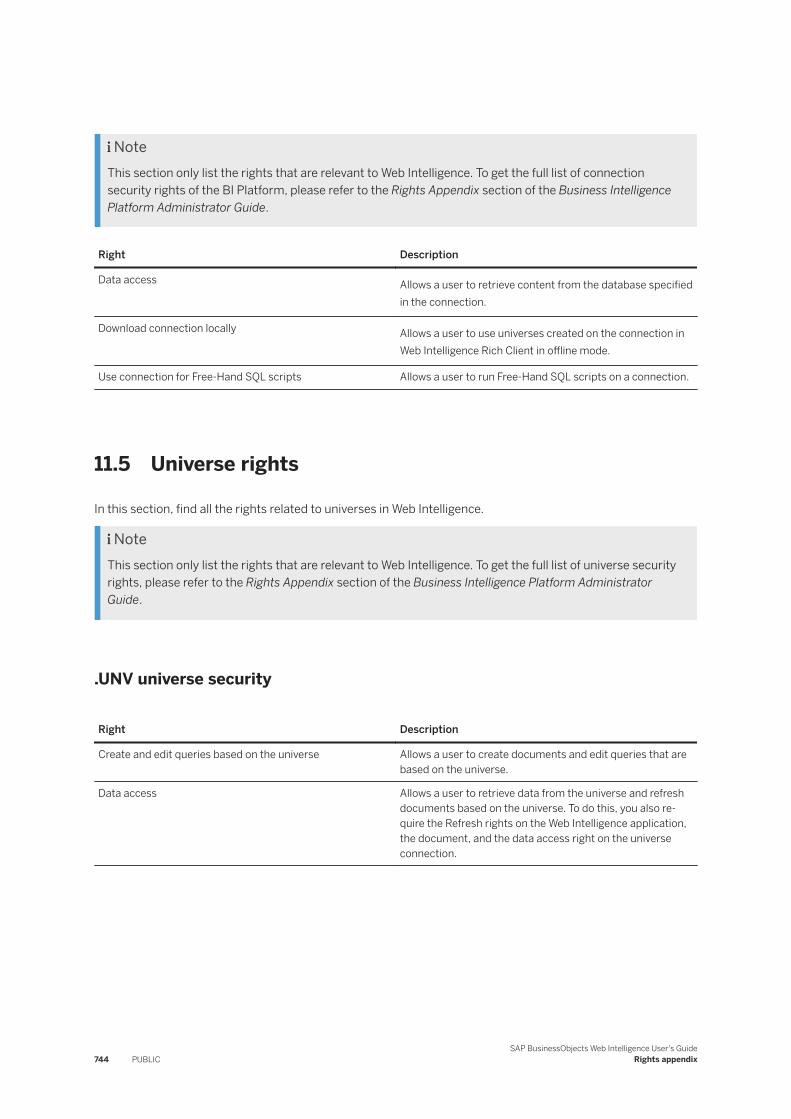
NoteThis section only list the rights that are relevant to Web Intelligence. To get the full list of connection security rights of the BI Platform, please refer to the Rights Appendix section of the Business Intelligence Platform Administrator Guide.
Right Description
Data access Allows a user to retrieve content from the database specified in the connection.
Download connection locally Allows a user to use universes created on the connection in Web Intelligence Rich Client in offline mode.
Use connection for Free-Hand SQL scripts Allows a user to run Free-Hand SQL scripts on a connection.
11.5 Universe rights
In this section, find all the rights related to universes in Web Intelligence.
NoteThis section only list the rights that are relevant to Web Intelligence. To get the full list of universe security rights, please refer to the Rights Appendix section of the Business Intelligence Platform Administrator Guide.
.UNV universe security
Right Description
Create and edit queries based on the universe Allows a user to create documents and edit queries that are based on the universe.
Data access Allows a user to retrieve data from the universe and refresh documents based on the universe. To do this, you also require the Refresh rights on the Web Intelligence application, the document, and the data access right on the universe connection.
744 PUBLICSAP BusinessObjects Web Intelligence User's Guide
Rights appendix
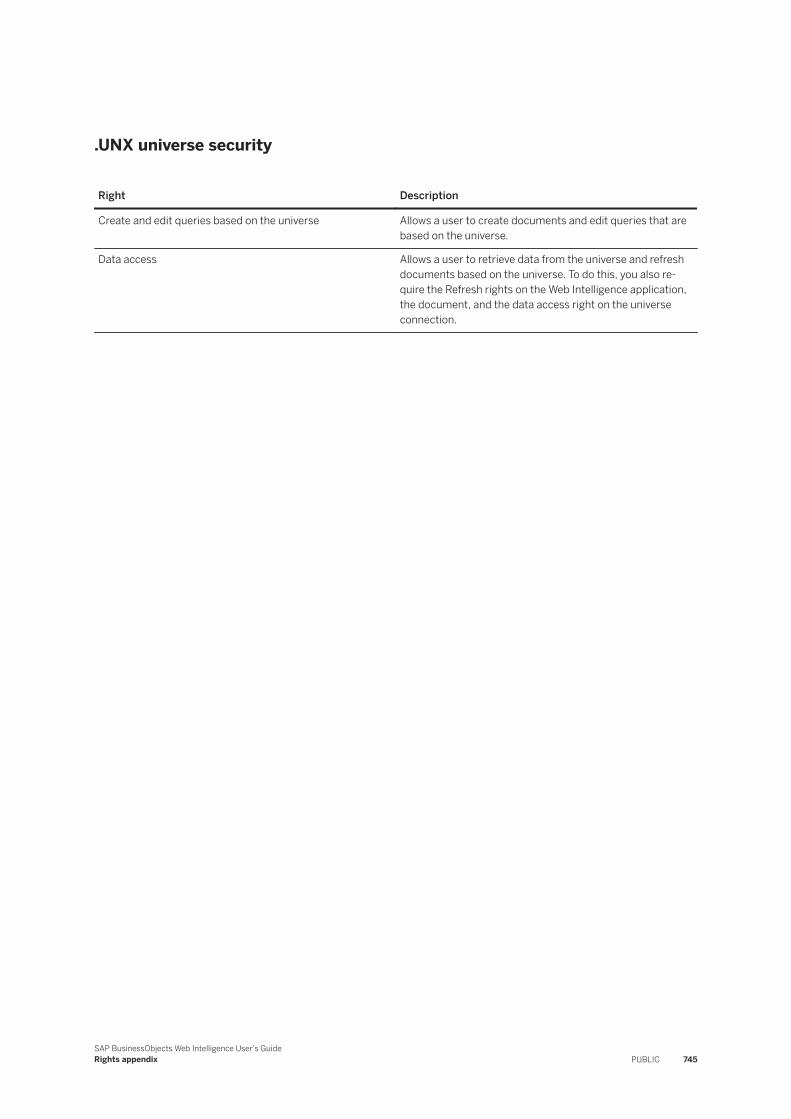
.UNX universe security
Right Description
Create and edit queries based on the universe Allows a user to create documents and edit queries that are based on the universe.
Data access Allows a user to retrieve data from the universe and refresh documents based on the universe. To do this, you also require the Refresh rights on the Web Intelligence application, the document, and the data access right on the universe connection.
SAP BusinessObjects Web Intelligence User's GuideRights appendix PUBLIC 745
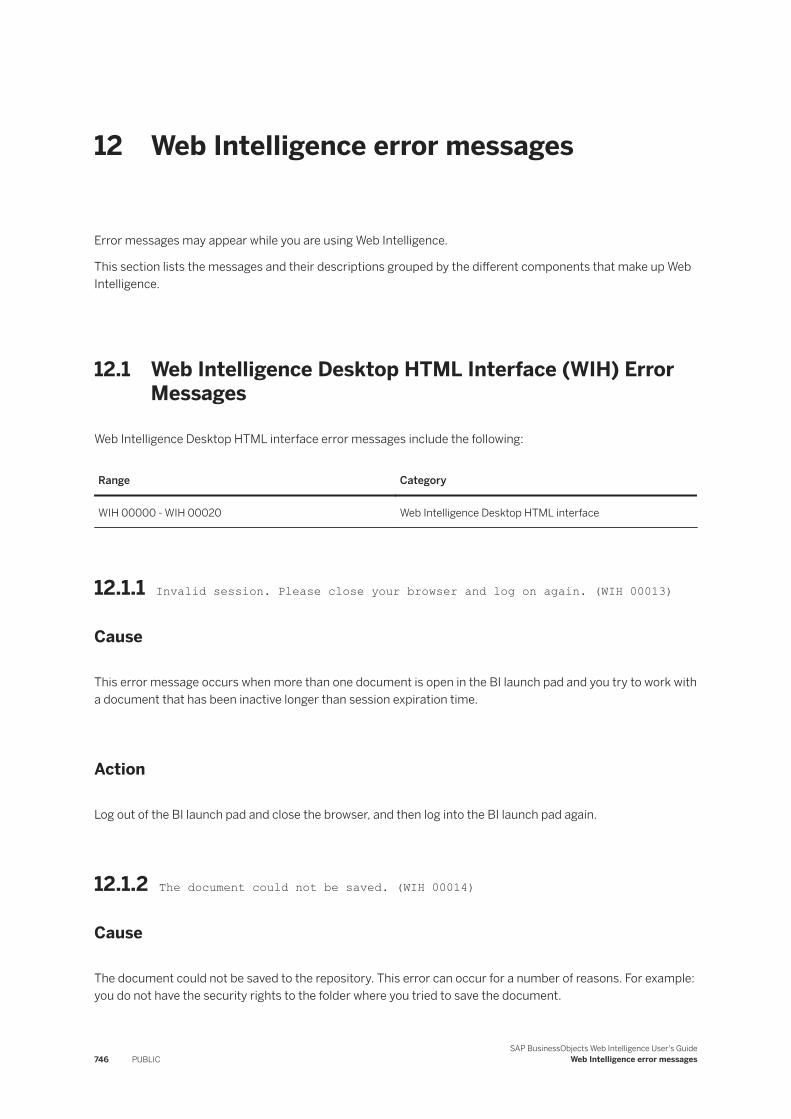
12 Web Intelligence error messages
Error messages may appear while you are using Web Intelligence.
This section lists the messages and their descriptions grouped by the different components that make up Web Intelligence.
12.1 Web Intelligence Desktop HTML Interface (WIH) Error Messages
Web Intelligence Desktop HTML interface error messages include the following:
Range Category
WIH 00000 - WIH 00020 Web Intelligence Desktop HTML interface
12.1.1 Invalid session. Please close your browser and log on again. (WIH 00013)
Cause
This error message occurs when more than one document is open in the BI launch pad and you try to work with a document that has been inactive longer than session expiration time.
Action
Log out of the BI launch pad and close the browser, and then log into the BI launch pad again.
12.1.2 The document could not be saved. (WIH 00014)
Cause
The document could not be saved to the repository. This error can occur for a number of reasons. For example: you do not have the security rights to the folder where you tried to save the document.
746 PUBLICSAP BusinessObjects Web Intelligence User's Guide
Web Intelligence error messages
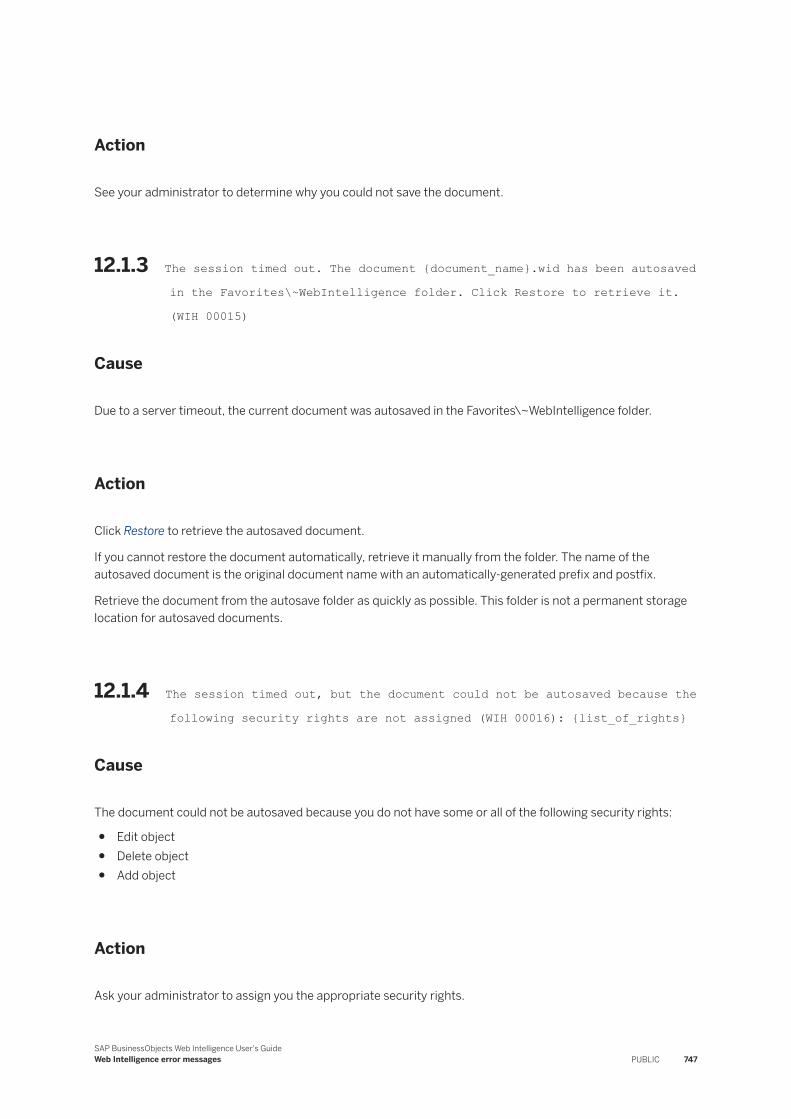
Action
See your administrator to determine why you could not save the document.
12.1.3 The session timed out. The document {document_name}.wid has been autosaved in the Favorites\~WebIntelligence folder. Click Restore to retrieve it. (WIH 00015)
Cause
Due to a server timeout, the current document was autosaved in the Favorites\~WebIntelligence folder.
Action
Click Restore to retrieve the autosaved document.
If you cannot restore the document automatically, retrieve it manually from the folder. The name of the autosaved document is the original document name with an automatically-generated prefix and postfix.
Retrieve the document from the autosave folder as quickly as possible. This folder is not a permanent storage location for autosaved documents.
12.1.4 The session timed out, but the document could not be autosaved because the following security rights are not assigned (WIH 00016): {list_of_rights}
Cause
The document could not be autosaved because you do not have some or all of the following security rights:
● Edit object● Delete object● Add object
Action
Ask your administrator to assign you the appropriate security rights.
SAP BusinessObjects Web Intelligence User's GuideWeb Intelligence error messages PUBLIC 747
12.1.5 An unexpected error occurred. For information about this error, please refer to SAP Knowledge Base Article 2054722 on the SAP Support Portal. (WIH 44444)
Cause
The server has failed without able to identify the root cause of the error.
Action
Close the document and reopen it again.
If this does not resolve the issue, contact your BI administrator.
If you are a BI administrator and need more information about this error, please refer to the SAP Knowledge Base Article 2054722 on the SAP Support Portal.
12.2 Web Intelligence Desktop (WIO) Error Messages
Web Intelligence Desktop (Rich Client) error messages include the following:
Range Category
WIO 00001 - WIS 30284 Web Intelligence Desktop
12.2.1 Web Intelligence Desktop cannot log in. (WIO 00001)
Cause
The browser cache might be full – under certain circumstances this can prevent Web Intelligence Desktop from logging in.
Action
Empty the browser cache if it is full. If Web Intelligence Desktop still cannot log in, see your administrator.
748 PUBLICSAP BusinessObjects Web Intelligence User's Guide
Web Intelligence error messages
12.2.2 Cannot open the hyperlink (WIO 00002).
Cause
● The URL in the hyperlink is incorrectly constructed.● The hyperlink references a document in the Central Management Console (CMC). Documents in the CMC
are not always accessible from Web Intelligence Rich Client for two reasons:○ The hyperlink does not specify the name of the server hosting the document because the Use
complete URL path to build document hyperlink setting is not selected. Incomplete URLs are invalid when used outside the BI launch pad.
○ The hyperlink builds the complete URL, but the server specified in the URL is not accessible from the computer running Web Intelligence Rich Client.
Action
Correct the hyperlink or see your IT administrator for help.
12.2.3 There is no more memory available. (WIS 30280) (WIO 30280)
Cause
Your system is out of memory.
Action
Close open documents to free memory.
12.2.4 Cannot continue because memory is low. Please close documents to free memory. (WIO 30284)
Cause
Your system memory is low.
SAP BusinessObjects Web Intelligence User's GuideWeb Intelligence error messages PUBLIC 749
Action
Close open documents to free memory.
12.3 Web Intelligence Server (WIS) Error Messages
Web Intelligence Server error messages include the following:
Range Category
WIS 30000 - WIS 40000 Web Intelligence Server
12.3.1 The query in this document is empty. (WIS 30000)
Cause
No data is defined for this document.
Action
Add result objects to the query.
12.3.2 At least one query in the document is empty. (WIS 30001)
Cause
No data is defined for at least one of the queries in this document.
Action
Add result objects to the query.
750 PUBLICSAP BusinessObjects Web Intelligence User's Guide
Web Intelligence error messages
12.3.3 Your security profile does not include permission to edit queries. (WIS 30251)
Cause
You do not have the right to edit queries.
Action
Contact your administrator to request the ability to edit the queries in documents.
12.3.4 Your security profile does not include permission to edit documents. (WIS 30252)
Cause
You do not have the right to edit documents.
Action
Contact your administrator and request the ability to edit documents.
12.3.5 Your security profile does not include permission to refresh documents. (WIS 30253)
Cause
You do not have the right to refresh documents.
Action
Contact your administrator to request the ability to refresh documents.
SAP BusinessObjects Web Intelligence User's GuideWeb Intelligence error messages PUBLIC 751
12.3.6 Your security profile does not include permission to refresh lists of values. (WIS 30254)
Cause
You do not have permission to refresh lists of values.
Action
Contact your administrator to request the ability to refresh lists of values in documents.
12.3.7 Your security profile does not include permission to use lists of values. (WIS 30255)
Cause
You do not have permission to use lists of values.
Action
Contact your administrator to request the ability to use lists of values in documents.
12.3.8 Your security profile does not include permission to view the script generated by the query. (WIS 30256)
Cause
You do not have the permission to view the script generated by the query.
Action
Contact your administrator to request the ability to view the script in queries.
752 PUBLICSAP BusinessObjects Web Intelligence User's Guide
Web Intelligence error messages
12.3.9 Your security profile does not include permission to use the formula language. (WIS 30257)
Cause
You do not have permission to use the formula language or create variables.
Action
Contact your administrator to request the ability to use the formula language and create variables in documents.
12.3.10 Your security profile does not include permission to perform drill analysis. (WIS 30258)
Cause
You do not have permission to perform drill analysis.
Action
Contact your administrator to request the ability to drill on reports.
12.3.11 Your security profile does not include permission to extend the scope of analysis. (WIS 30259)
Cause
You attempted to perform a drill operation outside the defined scope of analysis, and you do not have permission to drill outside the scope of analysis.
Action
Contact your administrator.
SAP BusinessObjects Web Intelligence User's GuideWeb Intelligence error messages PUBLIC 753
12.3.12 An internal error occurred while calling the {api_name} API. (WIS 30270)
Cause
Information about the document or the data source is invalid or not available.
Action
Your administrator can trace the problem that caused the error by activating the tracking and verifying the trace associated with the API.
12.3.13 The document is too large to be processed by the server. (WIS 30271)
Cause
When you view a document in Portable Document Format (PDF) or Microsoft Excel format, the server generates binary based output, which is then interpreted by your web browser. This error occurs if the size of the binary output is greater than the maximum size specified by your administrator for the server.
Action
Contact your administrator and ask them to increase the maximum size.
12.3.14 The document is too large to be processed by the server. (WIS 30272)
Cause
When you view a document in HTML format, the server generates character-based output, which is then interpreted by your web browser. This error occurs if the size of the character output is greater than the maximum size specified by your administrator for the server.
Action
Ask your administrator to increase the maximum document size.
754 PUBLICSAP BusinessObjects Web Intelligence User's Guide
Web Intelligence error messages
12.3.15 The query or report could not be generated.(WIS 30351)
Cause
It was not possible to complete one or more of the steps required to define a query and generate a report. This is due to one of the following reasons:
● the document was not initialized● the data source is not valid● the query was not defined● the query context was not defined at the universe level● no values were specified for prompts at the universe level
Action
Contact your administrator and ask them to check the connection to the data source, and that the universe does not contain unspecified contexts and prompt values.
12.3.16 A query with this name already exists. (WIS 30371)
Cause
Another query used in this document already has this name.
Action
Enter a different name for this query.
12.3.17 The Web Intelligence server memory is full. Log off and try to connect later. If the problem persists, contact your administrator. (Error: ERR_WIS_30280) (WIS 30280)
Cause
The server memory is full.
SAP BusinessObjects Web Intelligence User's GuideWeb Intelligence error messages PUBLIC 755
Action
Try again later. If the problem persists, see your administrator.
12.3.18 The Web Intelligence server is busy. Save any pending change and try again later. If the problem persists, contact your administrator. (Error: ERR_WIS_30284) (WIS 30284)
Cause
The server is busy.
Action
Save any changes and try again later. If the problem persists, see your administrator.
12.3.19 The Web Intelligence server is running out of memory, your document has been closed. If the problem persists, contact your administrator. (Error: ERR_WIS_30285) (WIS 30285)
Cause
The server memory is full.
Action
Try again later. If the problem persists, see your administrator.
756 PUBLICSAP BusinessObjects Web Intelligence User's Guide
Web Intelligence error messages
12.3.20 This document has been migrated. We recommend saving the document to improve its performance next time you open it. (WIS 30374)
Cause
This document comes from an older version of Web Intelligence, requiring the document to be converted.
Action
Save the document to persist the conversion.
12.3.21 This document contains geo-qualified data from a previous version of Web Intelligence. We strongly recommend you to check the geo-qualification of this data to fix potential mismatches, and avoid any loss of information in Geomap charts (WIS 30375)
Cause
Web Intelligence’s geographical database has been updated and some location identifiers may have change.
Action
Run the geo-qualification by name again to update all locations.
SAP BusinessObjects Web Intelligence User's GuideWeb Intelligence error messages PUBLIC 757
12.3.22 You cannot edit this document because the query property option "Allow other users to edit the query" was not enabled when the document was created. (WIS 30381)
Cause
The creator of the document did not select the query property option: "Allow other users to edit the query".
Action
Do one of the following:
● Ask the document creator to enable the option and re-save the document.● Save a copy of the document as a personal document and then edit the query in the copy.
12.3.23 An internal error has been generated by the WIQT. (WIS 30551)
Cause
An unexpected error occurred on the WIQT.
Action
Contact your administrator.
12.3.24 Your WIQT session has reached timeout. Log out and log in again to the BI launch pad. (WIS 30553)
Cause
You have remained logged into the BI launch pad without using Web Intelligence for longer than the maximum time allowed by the system.
758 PUBLICSAP BusinessObjects Web Intelligence User's Guide
Web Intelligence error messages
Action
Log out and then log back into the BI launch pad (you will lose any unsaved modifications you made previous to timeout).
To increase the length of time you are allowed to remain logged in to the BI launch pad, ask your administrator to increase your session timeout parameter.
12.3.25 No more WIQT servers are available. The maximum number of concurrent users is already logged in. (WIS 30554)
Cause
The maximum number users are already logged in.
Action
Try again later, or ask your administrator to increase the maximum number of concurrent users.
12.3.26 Your security profile does not include permission to save documents as corporate documents or to send documents using the BI launch pad. (WIS 30555)
Cause
Your security profile does not allow you to save documents as personal or corporate documents, or to schedule documents.
Action
Contact your administrator to request the ability to do the following:
● Save corporate documents● Send documents to users in own groups● Send documents to users in other groups
SAP BusinessObjects Web Intelligence User's GuideWeb Intelligence error messages PUBLIC 759
12.3.27 A corporate document with this name already exists. Your security profile does not include permission to delete corporate documents created by other users. (WIS 30556)
Cause
Your security profile does not allow you to overwrite existing corporate documents.
Action
Contact your administrator to request the ability to delete corporate documents saved by other users.
12.3.28 There is no document with this name in the repository. Specify a different document name. (WIS 30557)
Cause
There is no document with this name in the repository for one of the following reasons:
● You have typed the document name incorrectly● The document with this name has been deleted from the repository
Action
Check that you have entered the document correctly.
NoteDeleted documents cannot be retrieved.
12.3.29 Cannot perform the intended action on this document. (WIS 30650)
Cause
The server is unable to complete the current task because of lack of resources or access problems.
760 PUBLICSAP BusinessObjects Web Intelligence User's Guide
Web Intelligence error messages
Action
Do one of the following:
● Close your session, log out of the BI launch pad then log in again.● Ask your administrator to verify that your security profile allows you access to the corporate repository.
12.3.30 The server failed to load the XML document. (WIS 30751)
Cause
When you migrate a BusinessObjects document to Web Intelligence 6.x, an XML file is created that can be opened by the Web Intelligence Report Server. (The related module on the Administration Console is called the WIReportServer). In this case an unexpected error occurred on the Web Intelligence Report Server while migrating a document to Web Intelligence 6.x.
Action
Your administrator can trace the problem that caused this error by activating the tracking and verifying the trace associated with the WIReportServer. Contact your administrator with this information.
12.3.31 The XML file for this document cannot be opened. Contact your administrator. (WIS 30752)
Cause
When you migrate a Desktop Intelligence document to Web Intelligence 6.x, an XML file is created that can be opened by the server. This error occurs when the XML file cannot be opened by the server, and so migration cannot be completed. There are two common causes:
● The XML is Read Only.● The file path to the XML file is incorrect.
Action
Contact your administrator with this information.
SAP BusinessObjects Web Intelligence User's GuideWeb Intelligence error messages PUBLIC 761
12.3.32 An error occurred while parsing the XML document. Contact your administrator. (WIS 30753)
Cause
When you migrate a Desktop Intelligence document to Web Intelligence 6.x, an XML file is created that can be opened by the server. This error occurs when the XML file contains structural anomalies that the server cannot interpret, and so migration cannot be completed.
Action
There are two possible actions that an administrator can take to solve this problem:
● Open the XML file with an XML editing tool and verify the structure of the document.● Activate the tracking and verify the trace associated with the WIReportServer.
12.3.33 Your user profile does not provide you with access to a document domain to save corporate documents. Save this document as a personal document or contact your administrator. (WIS 40000)
Cause
Your user profile does not include permission to save documents to a corporate document domain in the repository.
Action
Do one of the following:
● Save the document as a personal document.● Contact your administrator and request access to a corporate document domain.
12.4 Information Engine Services (IES) Error Messages
Information Engine Services error messages include the following:
762 PUBLICSAP BusinessObjects Web Intelligence User's Guide
Web Intelligence error messages
Range Category
IES 00001 - IES 01031 Query execution errors
IES 01501 - IES 01513 Graph execution errors
IES 10001 - IES 10903 Query execution errors (specific to Web Intelligence)
12.4.1 IES 00001 -IES 01031 Query execution errors
12.4.1.1 Some objects are no longer available in the universe. (IES 00001)
Cause
One or more objects in a universe are no longer available to a document.
Action
Delete the missing objects from the query by comparing the objects in the query with the available objects.
12.4.1.2 Query can’t be refreshed. You don’t have sufficient rights or some objects are not available to your user profile. Contact your administrator to request the necessary rights. (IES 00002)
Cause
You do not have the correct user rights to access the data for one or more objects included in a query or the object is not available in your profile. Therefore, you cannot refresh the report.
Action
Ask your administrator to change your user profile to make these objects accessible.
SAP BusinessObjects Web Intelligence User's GuideWeb Intelligence error messages PUBLIC 763
12.4.1.3 Some pre-defined filters are no longer available in the universe. (IES 00003)
Cause
Compare the available universe objects with query objects. Perhaps the objects are no longer available or you don't have the rights.
Action
Compare universe objects with query objects. If you don't have rights, contact your universe designer or administrator.
12.4.1.4 Some database tables are no longer available in the universe. (IES 00004)
Cause
One or more database tables referenced by objects in the universe are no longer available. The tables may have been renamed, or removed from the database.
Action
Ask your universe designer to refresh the universe to remove non-existent tables or update table names.
12.4.1.5 Invalid prompt definition. (IES 00005)
Cause
The syntax in a prompt is not valid, or the prompt makes reference to an object that no longer exists in the universe
764 PUBLICSAP BusinessObjects Web Intelligence User's Guide
Web Intelligence error messages
Action
Ask your universe designer to verify the prompt.
12.4.1.6 Invalid aggregate aware definition. (IES 00006)
Cause
One or more objects in the query use aggregate awareness, and the aggregate awareness syntax in the universe is not valid.
Action
Ask your universe designer to verify the aggregate awareness syntax.
12.4.1.7 A filter contains a wrong value. You cannot run this query. (IES 00007)
Cause
A filter has a incorrect operand. For example, a filter has an empty constant, or a filter that expects a numeric value is defined with an alphanumeric value.
Action
Correct the filter.
12.4.1.8 The query cannot run because it contains objects that reference incompatible tables. (IES 00008)
Cause
The query contains objects that return data sets that cannot be combined or synchronized, possibly because the universe does not allow multiple SQL statements for each context or measure.
SAP BusinessObjects Web Intelligence User's GuideWeb Intelligence error messages PUBLIC 765
Action
Ask your universe designer to do the following:
● Allow multiple SQL statements for each context and measure.● Create a new context that includes the incompatible objects.
12.4.1.9 You cannot run the query because an advanced filter contains an incompatible object. Try simplifying the filter set and run your query again. (IES 00009)
Cause
An advanced filter uses incompatible objects.
Action
Change the advanced filter to use compatible objects only.
12.4.1.10 The universe does not allow using a complex expression in a GROUP BY statement. You cannot run this query. (IES 00010)
Cause
A query contains a GROUP BY clause that uses formulas or aliases. The universe does not allow these expressions in GROUP BY clauses. The behavior is determined by the parameter
<Parameter Name="GROUPBY_EXCLUDE_COMPLEX">Y</Parameter>
in the PRM file for the target RDBMS.
Action
● Modify the query so that objects using formulas or aliases are not included in the query.● If your RDBMS supports complex GROUP BY expressions, ask your universe designer to change the value
of the GROUPBY_EXCLUDE_COMPLEX parameter to N.
766 PUBLICSAP BusinessObjects Web Intelligence User's Guide
Web Intelligence error messages
12.4.1.11 The expression "{0}" contains multiple attributes. This syntax is not supported in this version. (IES 00011)
Cause
One or more objects in the query use a comma (",") instead of a concatenation operator in their definition. This syntax is no longer supported.
Action
Ask your universe designer to perform one of the following actions:
● Redefine the objects that use the comma to concatenate the data for two objects using the standard concatenation operator for the RDBMS.
● Add the following line to the PRM file for the target RDBMS:
<Parameter Name = "REPLACE_COMMA_BY_SEPARATOR"=Y>
This will enable the comma to be accepted syntax for concatenation in object definitions.● Set the value of REPLACE_COMMA_BY_CONCAT to "Yes" in the universe.
12.4.1.12 You cannot run this query because it will produce a Cartesian product. (IES 00012)
Cause
The query will produce a Cartesian product. A Cartesian product returns all possible combinations of rows from the tables referenced by objects in the query and is rarely correct.
Action
Ask your universe designer to perform one of the following actions:
● Prevent Cartesian products by modifying the universe table schema to include appropriate joins and restrictions.
● Allow the universe to return Cartesian products if they are acceptable.
SAP BusinessObjects Web Intelligence User's GuideWeb Intelligence error messages PUBLIC 767
12.4.1.13 Query script generation failed. See your administrator. {0} (IES 00013)
Cause
Errors occurred during generation of the query SQL.
Action
Ask your universe designer to verify the SQL.
12.4.1.14 Aggregate aware resolution failed. (IES 00014)
Cause
The query objects exclude all possible SQL choices for an aggregate aware function.
Action
Ask your universe designer to remove the incompatibility between the objects.
12.4.1.15 Multiple Query Filters contain a prompt with the same text, but different operand type or operator count of values. (IES 00015)
Cause
The query has multiple prompts that display the same message. Prompts with the same message are usually combined, but this is not possible if some require you to enter one value and others require multiple values.
Action
Modify the prompts so they all require one or multiple values.
768 PUBLICSAP BusinessObjects Web Intelligence User's Guide
Web Intelligence error messages
12.4.1.16 The query contains a @script() function, which is not supported. (IES 00016)
Cause
The SQL generated by the query for this document includes a @script() function, which is not supported.
Action
Ask your universe designer to remove the @script() function.
12.4.1.17 The following objects cannot be used as Result Objects: {0}. See your administrator. (IES 00017)
Cause
The query includes objects that cannot be used as result objects in queries.
Action
Remove the objects, or ask your universe designer to allow the objects to be included in as result objects in queries.
12.4.1.18 The following objects cannot be used as query filters: {0}. Contact your administrator. (IES 00018)
Cause
The query contains objects used as query filters that are not valid as query filters.
Action
Remove the objects, or ask your universe designer to allow them as query filters.
SAP BusinessObjects Web Intelligence User's GuideWeb Intelligence error messages PUBLIC 769
12.4.1.19 A query filter object contains too many values for the object to be used in a query filter. (IES 00019)
Cause
A query filter contains too many values.
Action
Select fewer values.
12.4.1.20 The only authorized SQL statement is SELECT. {0} (IES 00020)
Cause
The SQL generated by the query is invalid.
Action
Ask your universe designer to verify the SQL.
12.4.1.21 The combined query cannot run because one of the queries contains incompatible objects. (IES 00021)
Cause
A query in a combined query contains incompatible objects.
Action
Remove the incompatible objects.
770 PUBLICSAP BusinessObjects Web Intelligence User's Guide
Web Intelligence error messages
12.4.1.22 The query does not reference any table when attempting to build the WHERE clause. (IES 00022)
Cause
The WHERE clause of the generated SQL does not reference a table.
Action
Modify the query to reference a table.
12.4.1.23 Invalid sub-query filter. Either data cannot be retrieved (null) or no result objects are defined. (IES 00023)
Cause
The query contains an invalid sub-query. Either data cannot be retrieved or no result objects are defined.
Action
Modify the sub-query.
12.4.1.24 Incompatible object types in the sub-query filter. (IES 00024)
Cause
The subquery contains incompatible object types.
Action
Remove the incompatible object types.
SAP BusinessObjects Web Intelligence User's GuideWeb Intelligence error messages PUBLIC 771
12.4.1.25 The query is too complex to apply a sampling function. When the function is applied, no SQL is generated so query aborts. Try to simplify your query (such as, combined query, or query with JOIN or SYNCHRO operators). (IES 00025)
Cause
The query is too complex to apply a sampling function.
Action
Try to simplify the query.
12.4.1.26 Failed to regenerate SQL for optional prompts, the following required prompts were skipped: {0}.(IES 00026)
Cause
The SQL relating to optional prompts could not be regenerated.
Action
See your universe designer.
12.4.1.27 Removing optional prompts from the query will introduce new prompts. This introduces complexities that cannot be supported. (IES 00027)
Cause
The query cannot be processed due to optional prompts.
772 PUBLICSAP BusinessObjects Web Intelligence User's Guide
Web Intelligence error messages
Action
Remove the optional prompts from the query.
12.4.1.28 No value specified for the Keydate parameter. (IES 00028)
Cause
No value was specified for the Keydate parameter.
Action
Specify a value for the Keydate.
12.4.1.29 The universe is already open with write permission by another user. (IES 00029)
Cause
The universe could not be opened because it is already opened with write permission by another user.
Action
See your administrator.
12.4.1.30 Queries that do not contain a measure are not allowed to run on this universe. (IES 00030)
Cause
The query does not contain a measure, and therefore cannot be used with the universe.
SAP BusinessObjects Web Intelligence User's GuideWeb Intelligence error messages PUBLIC 773
Action
Check that the query definition is correct, add the relevant measure if necessary.
12.4.1.31 The Free-hand SQL query does not contain a valid executable statement: {detail_message} (IES 00031)
Cause
Either the SQL contains forbidden SQL keys, or the SQL statement or the call to a stored procedure is invalid.
Action
Remove the forbidden SQL keys from the SQL and verify the SQL statement.
If the issue is still not resolved, contact your IT administrator for assistance.
12.4.1.32 Universe not found. Either the universe was deleted from the repository or you do not have sufficient rights to see the universe in the repository. (IES 00501)
Cause
Cannot find the universe.
Action
Check with your administrator or universe designer to find out why the universe is not available.
774 PUBLICSAP BusinessObjects Web Intelligence User's Guide
Web Intelligence error messages
12.4.1.33 The appropriate user rights were not found. Contact your administrator. (IES 00502)
Cause
You cannot perform this action because your user rights cannot be found.
Action
Ensure that you have used the correct logon credentials. If the are correct, verify with your IT administrator that your user rights have not been deleted.
12.4.1.34 You are not authorized to access the universe {0}. Contact your administrator to request the appropriate rights. (IES 00503)
Cause
Your user rights do not permit this action.
Action
Ask your IT administrator to check that your user credentials are correctly defined.
12.4.1.35 You do not have the right to access data for this universe. Contact your administrator to request the appropriate rights. (IES 00504)
Cause
Your current user rights do not allow you to access the data.
Action
Ask your IT administrator to check that your user credentials are correctly defined.
SAP BusinessObjects Web Intelligence User's GuideWeb Intelligence error messages PUBLIC 775
12.4.1.36 You do not have the right to access data for this universe connection. Contact your administrator to request the appropriate rights. (IES 00505)
Cause
Your current user rights do not allow you to access the connection.
Action
Ask your IT administrator to check that your user credentials are correctly defined.
12.4.1.37 Failed to download universe {0} from repository {1}. Check that there is enough memory available and try again. (IES 00506)
Cause
Cannot download the universe.
Action
Contact your administrator to report the problem.
12.4.1.38 You do not have the right to access data for this core universe. Contact your administrator to request the appropriate rights. (IES 00507)
Cause
Your current user rights do not allow you to access the data.
776 PUBLICSAP BusinessObjects Web Intelligence User's Guide
Web Intelligence error messages
Action
Ask your IT administrator to check that your user credentials are correctly defined.
12.4.1.39 Universe data connection could not be found. The connection has been deleted or you do not have the right to use it. (IES 00509)
Cause
The connection has been lost.
Action
Contact your administrator to report the problem.
12.4.1.40 Cannot generate the SQL for this query because one of its objects is based on a derived table (table_name) that contains a loop in its definition. (IES 00510)
Cause
When a derived table contains a loop, it is not possible to generate the SQL.
Action
Redefine your query, or try to avoid having a loop in the derived table.
12.4.1.41 Cannot generate the SQL for this query because one of its objects is based on a derived table (table_name) that is unknown. (IES 00511)
Cause
The SQL cannot be generated.
SAP BusinessObjects Web Intelligence User's GuideWeb Intelligence error messages PUBLIC 777
Action
Check that the derived table is correctly defined and can be used. Check that your query is correct.
12.4.1.42 Cannot generate the SQL for this query because one of its objects is based on a derived table (table_name) with an incorrect definition. (IES 00512)
Cause
The dervied table is not correctly defined.
Action
Check the definition of the derived table and correct it if necessary.
12.4.1.43 The query statement cannot be generated because of a syntax error. Check the syntax of the statement that uses the @Variable function. (IES 00513)
Cause
Your query contains one or more syntax errors.
Action
Check the syntax of the SQL statement that uses the @Variable function. Refer to the @Functions section of the Universe Designer user documentation (pdf document or online help)
778 PUBLICSAP BusinessObjects Web Intelligence User's Guide
Web Intelligence error messages
12.4.1.44 The database SQL generation parameters file could not be loaded ({database_name}, {network_layer}) . (IES 00514)
Cause
Cannot find the relevant SQL parameter file.
Action
Contact your administrator.
12.4.1.45 Unexpected enumerated type {0}. (IES 01001)
Cause
A new enumerated type has been declared but is not supported.
Action
Contact your administrator.
12.4.1.46 Nested @aggregate_aware functions are not supported. (IES 01002)
Cause
The expression contains nested @aggregate_aware functions.
Action
The designer can edit the business layer and remove nested @agreggate_aware functions.
SAP BusinessObjects Web Intelligence User's GuideWeb Intelligence error messages PUBLIC 779
12.4.1.47 Circular references: check the references to other business layer objects in the expression. (IES 01003)
Cause
The expression contains circular references.
Action
The designer can edit the business layer and check for circular references between business layer objects.
12.4.1.48 Invalid @Select reference. Check the definition of the @Select declaration. (IES 01004)
Cause
The expression contains and invalid reference to the @Select function.
Action
The designer can edit the business layer and validate the use of the @Select function in the object expression.
12.4.1.49 Invalid @Where reference. Check the definition of the @Where declaration. (IES 01005)
Cause
The expression contains and invalid reference to the @Where function.
Action
The designer can edit the business layer and validate the use of the @Where function in the object expression.
780 PUBLICSAP BusinessObjects Web Intelligence User's Guide
Web Intelligence error messages
12.4.1.50 Some prompt parameters are no longer available in the universe. (IES 01006)
Cause
The expression contains and invalid reference to the @Prompt function.
Action
The designer can edit the query or the business layer and validate the use of the @Prompt function in the object expression.
12.4.1.51 Bad hierarchy reference. (IES 01007)
Cause
The hierarchy declared in the query contains an error.
Action
Check the query expression for errors.
12.4.1.52 Catalog for source "{0}" cannot be retrieved. Check Data Foundation connection. (IES 01008)
Cause
Catalog for source "{0}" cannot be retrieved.
Action
Check the connection to the data source in the data foundation.
SAP BusinessObjects Web Intelligence User's GuideWeb Intelligence error messages PUBLIC 781
12.4.1.53 The prompt cannot be validated but it may be correct. Associate a list of values or at least one default value to the prompt. (IES 01010)
Cause
The prompt cannot be validated but it may be correct.
Action
Associate a list of values or at least one default value to the prompt.
12.4.1.54 More than 100 levels of nested derived tables is not supported. (IES 01015)
Cause
There are more than 100 levels of nested derived tables.
Action
Edit the @DerivedTable expression to reduce the number of nested levels.
12.4.1.55 The definiton of the list of values {0} is invalid. The list or the current column is hidden. (IES 01025)
Cause
The list of values is hidden, or the current column is hidden.
Action
Check for hidden objects in the universe or business layer. Either make the objects active or redefine the list of values expression.
782 PUBLICSAP BusinessObjects Web Intelligence User's Guide
Web Intelligence error messages
12.4.2 IES 01501 - IES 01513 Graph execution errors
12.4.2.1 Detection cannot take place because the data foundation contains cycles. Use the Visualize Loops command to visualize the cycles. Modify the cardinality of the joins involved in the cycles before detecting aliases or contexts. (IES 01501)
Cause
The data foundation contains loops.
Action
In the information design tool, edit the data foundation and use the Visualize Loops command to find loops in the data foundation. Modify the cardinality of the joins involved in the loops before detecting aliases or contexts.
12.4.2.2 Detection cannot take place because some tables have at least two joins with opposite cardinalities: {0}. Modify the joins between these tables. (IES 01502)
Cause
Some tables in the data foundation have at least two joins with opposite cardinalities.
Action
In the information design tool, edit the data foundation and modify the joins between these tables.
12.4.2.3 Detection cannot take place because all join cardinalities have not been set. Set all the join cardinalities. (IES 01504)
Cause
All join cardinalities have not been set in the data foundation.
SAP BusinessObjects Web Intelligence User's GuideWeb Intelligence error messages PUBLIC 783
Action
In the information design tool, edit the data foundation and detect or set the cardinalities for all joins.
12.4.2.4 Automatic detections will fail as long as some cardinalities are many-to-many. (IES 01505)
Cause
Some joins in the data foundation have cardinality many-to-many.
Action
In the information design tool, edit the data foundation modify the cardinality for these joins.
12.4.2.5 Detection cannot take place because no fact table was detected. A fact table is always joined to other tables with a 'many to one' join, with the 'many' side of the join connected to the fact table... (IES 01510)
Cause
No fact table was detected. A fact table relates other tables only with many-to-one cardinality joins, with many being on the side of the join connected to the fact table.
Action
In the information design tool, edit the data foundation check the cardinality of the joins. There might be a problem with the cardinalities that are currently set on the data foundation joins or with the way the database schema is built.
784 PUBLICSAP BusinessObjects Web Intelligence User's Guide
Web Intelligence error messages
12.4.2.6 Detection cannot take place because there are loops in the schema. Use the Detect Aliases command to detect the alias tables that will resolve the loops. (IES 01512)
Cause
The data foundation contains loops.
Action
In the information design tool, edit the data foundation and use the Detect Aliases command to detect the alias tables that will resolve the loops.
12.4.3 IES 10001 - IES 10903 Query execution errors (Web Intelligence only)
12.4.3.1 Syntax error in formula '%1%' at position %2%. (IES 10001)
Cause
There is a syntax error in your formula at the position indicated.
Action
Correct the formula.
12.4.3.2 Problem initializing the dictionary of functions. (IES 10002)
Cause
The dictionary of functions could not be initialized.
SAP BusinessObjects Web Intelligence User's GuideWeb Intelligence error messages PUBLIC 785
Action
See your administrator.
12.4.3.3 The object '%1%' at position '%2%' is not unique in the report. (IES 10005)
Cause
An object has a name that conflicts with the name of another object in the report
Action
Use the fully-qualified name for the object.
12.4.3.4 The object '%1%' at position '%2%' does not exist in the report. (IES 10006)
Cause
The formula refers to an object that no longer exists in the report.
Action
Remove the reference to the object from the formula.
12.4.3.5 Unexpected empty expression after '='. (IES 10009)
Cause
The expression appears to be incomplete.
786 PUBLICSAP BusinessObjects Web Intelligence User's Guide
Web Intelligence error messages
Action
Check the syntax of your expression and correct it.
12.4.3.6 The integer '%1%' at position '%2%' is too long. (IES 10013)
Cause
An integer in a formula exceeds the maximum limit.
Action
Edit the formula.
12.4.3.7 The number '%1%' at position '%2%' has a format that is incompatible with your regional settings. (IES 10014)
Cause
The format of the real number {number} is not compatible with your regional settings.
Action
Change the number format to conform with the format permitted by your regional settings.
12.4.3.8 Missing quotation mark after '%1%' at position '%2%'. (IES 10016)
Cause
There is a missing closing quotation mark in the formula.
SAP BusinessObjects Web Intelligence User's GuideWeb Intelligence error messages PUBLIC 787
Action
Add the closing quotation mark.
12.4.3.9 The list of dimensions in the input or output context is empty. (IES 10032)
Cause
The list of dimensions in the input or output context is empty.
Action
Specify a list of dimensions.
12.4.3.10 The variable '%1%' cannot be deleted because it has dependant formulas or variables linked to: '%2%'. (IES 10033)
Cause
The variable cannot be deleted because it is referenced by other variables or formulas.
Action
Delete the dependent formulas/variables before deleting the variable.
12.4.3.11 You attempted to create a variable or update a variable name using a variable name that already exists. (IES 10034)
Cause
You attempted to create a variable or update a variable name using a variable name that already exists.
788 PUBLICSAP BusinessObjects Web Intelligence User's Guide
Web Intelligence error messages
Action
Choose a variable name that does not already exist.
12.4.3.12 The date or time format '%1%' at position '%2%' is not valid. (IES 10035)
Cause
The formula contains an invalid date/time format (for example, "bb/MM/yyyy").
Action
Specify a valid date/time format in the formula.
12.4.3.13 The expression or sub-expression at position '%2%' is not valid. (IES 10036)
Cause
The formula contains an invalid expression/sub-expression.
Action
Specify a valid expression/sub-expression.
12.4.3.14 The expression or sub-expression at position '%2%' in the '%1%' function uses an invalid data type. (IES 10037)
Cause
An expression contains an invalid data type. (For example, you have attempted to pass a string to a function that requires a date.)
SAP BusinessObjects Web Intelligence User's GuideWeb Intelligence error messages PUBLIC 789
Action
Use a valid data type in the expression.
12.4.3.15 Invalid character '%1%' in variable name at position '%2%'. (IES 10038)
Cause
The character {character} is not valid in the variable name.
Action
Remove {character} from the variable name.
12.4.3.16 The formula for variable '%1%' contains a reference to a variable with the same short name. (IES 10040)
Cause
The formula of a variable references another variable with the same short name.
Action
To resolve this issue, remove the reference to the variable with the same short name from the formula.
12.4.3.17 Incorrect use of multiple comparison operators (<,>,<>,<=,>=,=) at position '%2%'. (IES 10041)
Cause
The formula uses multiple comparison operators incorrectly (for example: if(1<2=3;0;-1)).
790 PUBLICSAP BusinessObjects Web Intelligence User's Guide
Web Intelligence error messages
Action
Re-structure the formula to avoid using comparison operators incorrectly.
12.4.3.18 There is a circular reference because the formula for variable '%1%' references a variable whose formula references '%1%' .(IES 10042)
Cause
A formula contains a circular reference.
Action
Remove the circular reference.
12.4.3.19 There is no opening parenthesis after function '%1%' at position %2%. (IES 10060)
Cause
There is no opening parenthesis in the location indicated by the error message.
Action
Add an opening parenthesis in the location indicated.
12.4.3.20 The function '%1%' has missing arguments or closing parenthesis at position %2%. (IES 10061)
Cause
Arguments or a closing parenthesis are missing from the formula.
SAP BusinessObjects Web Intelligence User's GuideWeb Intelligence error messages PUBLIC 791
Action
Supply the arguments or closing parenthesis.
12.4.3.21 Missing ';' before argument in function '%1%' at position %2%.(IES 10062)
Cause
The syntax of your expression is incorrect
Action
Check the syntax and correct the expression.
12.4.3.22 Missing ';' or closing parenthesis in function '%1%' at position %2%. (IES 10063)
Cause
The syntax is incorrect.
Action
Check the syntax and correct your expression.
12.4.3.23 Missing ';' or closing parenthesis in list '%1%' at position %2%. (IES 10064)
Cause
A semicolon or closing parenthesis is missing from the formula.
792 PUBLICSAP BusinessObjects Web Intelligence User's Guide
Web Intelligence error messages
Action
Supply the semicolon or closing parenthesis.
12.4.3.24 Missing closing parenthesis in function '%1%' at position %2%. (IES 10065)
Cause
The syntax is incorrect.
Action
Check the expression and correct the syntax.
12.4.3.25 Missing aggregate operator or closing parenthesis in function '%1%' at position %2%. (IES 10066)
Cause
The syntax is incorrect.
Action
Check the expression and correct the syntax.
12.4.3.26 Missing operator or closing parenthesis in '%1%' at position %2%. (IES 10067)
Cause
The syntax is incorrect.
SAP BusinessObjects Web Intelligence User's GuideWeb Intelligence error messages PUBLIC 793
Action
Check the expression and correct the syntax.
12.4.3.27 Missing list element in '%1%' at position %2%. (IES 10068)
Cause
The syntax is incorrect. An element is missing.
Action
Check the expression and correct the issue.
12.4.3.28 Missing object identifier in '%1%' at position %2%. (IES 10069)
Cause
An object identifier is missing from the formula.
Action
Correct the formula.
12.4.3.29 Missing or bad operand in '%1%' expression at position %2%. (IES 10070)
Cause
EIther the operand is not compatible, or the operand is missing.
794 PUBLICSAP BusinessObjects Web Intelligence User's Guide
Web Intelligence error messages
Action
Check the syntax and correct the expression.
12.4.3.30 Incorrect calculation context %1%' at position %2%. (IES 10071)
Cause
The calculation context is incorrect.
Action
Check the syntax of your expression and correct it.
12.4.3.31 Incorrect reset context at position %2%. (IES 10072)
Cause
The formula contains an incorrect reset context.
Action
Correct the reset context.
12.4.3.32 Invalid Where clause in function '%1%': a dimension is missing at position %2%. (IES 10073)
Cause
The expression is missing an expression.
SAP BusinessObjects Web Intelligence User's GuideWeb Intelligence error messages PUBLIC 795
Action
Check the syntax of the expression and ensure that there is the expected dimension.
12.4.3.33 Incompatible object '%1%' at position %2%. (IES 10076)
Cause
You cannot use this type of object.
Action
Ensure that the correct object has been declared.
12.4.3.34 The object '%1%' at position %2% is incompatible. (IES 10077)
Cause
The formula contains an incompatible object.
Action
Correct the formula.
12.4.3.35 Invalid character '%1%' at position %2%. (IES 10080)
Cause
There is an invalid character in the expression.
Action
Check the syntax of the expression.
796 PUBLICSAP BusinessObjects Web Intelligence User's Guide
Web Intelligence error messages
12.4.3.36 Invalid string '%1%' at position %2%. (IES 10082)
Cause
The formula contains an invalid string.
Action
Correct the string.
12.4.3.37 The qualification of the variable '%1%' cannot be changed. (IES 10083)
Cause
You cannot change the qualification of the variable. (For example, you cannot change a measure to a dimension if its definition includes an aggregate.)
Action
Create a new variable with the appropriate qualification.
12.4.3.38 Expecting object member in '%1%' at position %2%. (IES 10084)
Cause
There is no object member.
Action
Check the syntax of teh expression and correct it as necessary.
SAP BusinessObjects Web Intelligence User's GuideWeb Intelligence error messages PUBLIC 797
12.4.3.39 Invalid member '%1%' at position %2%. (IES 10085)
Cause
You cannot use this type of member in this context.
Action
Correct the expression.
12.4.3.40 Invalid set definition. (IES 10086)
Cause
A query contains an invalid set definition.
Action
Verify the query.
12.4.3.41 Custom functions could not be loaded. (IES 10100)
Cause
The custom function library could not be loaded because it is not correctly defined. This could be due to invalid XML, a duplicate function name or duplicate function ID.
Action
See the trace log for more details and provide these details to your administrator.
798 PUBLICSAP BusinessObjects Web Intelligence User's Guide
Web Intelligence error messages
12.4.3.42 Source document is not available. (IES 10501)
Cause
The application couldn’t retrieve the document.
Action
Make sure the document hasn’t been moved or deleted.
12.4.3.43 Cannot retreive source document from repository. (IES 10502)
Cause
The application couldn’t not retrieve the document.
Action
Check that the document is still in the repository.
12.4.3.44 Cannot read document. Application can't recognize the document format. (IES 10503)
Cause
The application can’t read the document format.
SAP BusinessObjects Web Intelligence User's GuideWeb Intelligence error messages PUBLIC 799
Action
Try resetting the document format.
12.4.3.45 Source document '{DocName}' cannot be used as a source. (IES 10510)
Cause
The document can’t be used as a source document for one of these reasons:
● The document is in online mode or has the “Refresh on open” option.● The “Export the report’s data” right is denied for the document you have selected.● The document would create a loop dependency.
Action
Check the possible cause and try to fix the issue, or contact your administrator.
12.4.3.46 Source document '{DocName}' is 'refresh on open' : it can't be used as a source. (IES 10511)
Cause
The document has the refresh on open property.
Action
Turn off the refresh on open property.
800 PUBLICSAP BusinessObjects Web Intelligence User's Guide
Web Intelligence error messages
12.4.3.47 Source document '{DocName}' is 'Online' : it can't be used as a source. (IES 10512)
Cause
The document is in online mode.
Action
Contact your administrator.
12.4.3.48 Invalid source document '{DocName}' : circular dependencies not supported. (IES 10513)
Cause
Selecting this document as a source would create a loop dependency.
Action
Select another document as a source.
12.4.3.49 Query Object '{ObjName}' is missing in source document. (IES 10520)
Cause
An object from the source document is missing.
SAP BusinessObjects Web Intelligence User's GuideWeb Intelligence error messages PUBLIC 801
Action
Locate the missing object, or remove it from the query.
12.4.3.50 Your database server does not support the Both and Except operators. (IES 10701)
Cause
The database on which this document is based does not support the Both and Except operators. This means that you cannot use the Both operator or the Except operator when you define filters on the query.
Action
Remove the operators from the query filters.
12.4.3.51 A filter is defined on an object that is incompatible with the result objects. (IES 10702)
Cause
One of the query filters is defined on an object which is incompatible with all the result objects returned by the query.
Action
Remove the query filter or the result objects.
12.4.3.52 The numeric value for the query filter based on '{object}' is invalid. (IES 10703)
Cause
You specified an invalid numeric value for a query filter.
802 PUBLICSAP BusinessObjects Web Intelligence User's Guide
Web Intelligence error messages
Action
Edit the query filter and specify a valid numeric value.
12.4.3.53 The date for the prompt '{prompt}' is invalid. (IES 1070) (IES 10704)
Cause
You specified an invalid date for a query filter.
Action
Edit the query filter and specify a valid date.
12.4.3.54 The prompt '{prompt}' contains an invalid numeric value. (IES 10705)
Cause
You specified an invalid numeric value for a prompt.
Action
Specify a valid numeric value.
12.4.3.55 The date for the prompt '{prompt}' is invalid. (IES 10706)
Cause
You specified an invalid date for a prompt.
Action
Edit the prompt and specify a valid date.
SAP BusinessObjects Web Intelligence User's GuideWeb Intelligence error messages PUBLIC 803
12.4.3.56 The server cannot build the SQL for the query. (IES 10707)
Cause
Your query cannot be converted to SQL to run against the database.
Action
Reformulate the query or see your administrator.
12.4.3.57 The object '{ObjName}' in the prompt '{PromptName}' can no longer display a list of values. Remove the prompt from the query or contact your administrator to clear the "Select only from list" option of the object properties tab. (IES 10708)
Cause
The object in the prompt can no longer display a list of values.
Action
Remove the prompt, or ask your administrator to allow the prompt to accept values not selected from a list.
12.4.3.58 A class already exists with this name : '{ClassName}' . (IES 10709)
Cause
You cannot have two classes with the same name.
Action
Use a different name for the class.
804 PUBLICSAP BusinessObjects Web Intelligence User's Guide
Web Intelligence error messages
12.4.3.59 You don't have the right to refresh this document. (IES 10801)
Cause
Your user profile does not permit you to view data for one of the objects included in the query for this document.
Action
Cancel the refresh, or ask your administrator for the security rights necessary to refresh the document.
12.4.3.60 A data source of this document has been updated. We recommend saving the document to improve its performance next time you refresh it. (IES 10805)
Cause
One of the universes consumed by this document has been updated, requiring the document to be converted.
Action
Save the document to persist the conversion.
12.4.3.61 The query SQL has {nbHaving} instead of {nbWanted} columns. (IES 10810)
Cause
The SQL generated by the query has an invalid number of columns.
SAP BusinessObjects Web Intelligence User's GuideWeb Intelligence error messages PUBLIC 805
Action
See your administrator.
12.4.3.62 The data type of a column in the query is incorrect. Try changing its data type and try again. (IES 10811)
Cause
The data type of a column in the query is not valid.
Action
See your administrator.
12.4.3.63 Custom SQL isn't compatible with optional prompts. Please remove the optional prompts and try again. (IES 10812)
Cause
Optional prompts aren't supported in custom SQL.
Action
Remove the optional prompts.
12.4.3.64 Combined queries don't support incompatible objects. Please remove the incompatible objects from the query. (IES 10820)
Cause
A combined query contains incompatible objects.
806 PUBLICSAP BusinessObjects Web Intelligence User's Guide
Web Intelligence error messages
Action
Edit the combined query and remove the incompatible objects.
12.4.3.65 A subquery in the '{dp_name}' data provider has missing objects. (IES 10830)
Cause
Objects necessary to generate query SQL are missing from a subquery in the {dp_name} data provider.
Action
Edit the subquery and add the missing objects.
12.4.3.66 The filtered object is missing in a ranking in the '{dp_name}' data provider. (IES 10831)
Cause
The filtered object is missing in a ranking.
Action
Edit the ranking and add the filtered object.
12.4.3.67 The rank-based object is missing in a ranking in the '{dp_name}' data provider. (IES 10832)
Cause
The rank-based object is missing in a ranking.
SAP BusinessObjects Web Intelligence User's GuideWeb Intelligence error messages PUBLIC 807
Action
Edit the ranking and add the rank-based object.
12.4.3.68 The document cannot be loaded. (IES 10833)
Cause
The interactive analysis document could not be loaded.
Action
See your administrator.
12.4.3.69 Additional context resolution is not supported with optional prompts. (IES 10834)
Cause
The optional prompts in a query generate additional query context resolution that is not supported.
Action
Remove the optional prompts or make them obligatory.
12.4.3.70 Invalid data in column "{col_name}". (IES 10840)
Cause
A database column referenced by the query contains invalid data.
808 PUBLICSAP BusinessObjects Web Intelligence User's Guide
Web Intelligence error messages
Action
See your administrator.
12.4.3.71 Invalid UTF-8 string in column "{col_name}". (IES 10841)
Cause
A database column referenced by the query contains invalid data.
Action
See your administrator.
12.4.3.72 Sorry, your Data Refresh action cannot be completed because the maximum amount of concurrent Data Refresh actions is currently being processed by the server {nb_thread} / {nb_max_thread}. Please, try again later. (IES 10845)
Cause
You have used the data refresh option more than the maximum refresh actions allowed.
Action
Please wait and retry the refresh action later.
SAP BusinessObjects Web Intelligence User's GuideWeb Intelligence error messages PUBLIC 809
12.4.3.73 Database error: {error_db}. (IES 10846)
Cause
The database returned the error given in the message.
Action
See your administrator with the details of the error that occurred.
12.4.3.74 Query exceeded fixed time limit: {error_db}. (IES 10847)
Cause
The query could not return data because it took too long to run.
Action
Run the query again. If the problem persists, see your administrator.
12.4.3.75 The file that is required to create or update the query cannot be found on the file system. File not found: "{filename}". (IES 10850)
Cause
The file {filename} cannot be found on the file system.
810 PUBLICSAP BusinessObjects Web Intelligence User's Guide
Web Intelligence error messages
Action
Check the location of {filename} or see your administrator.
12.4.3.76 The file that is required to refresh the query cannot be found on the file system. File not found: "{filename}" (IES 10851)
Cause
The file seems to be missing, deleted, or renamed.
Action
Check with your administrator.
12.4.3.77 Unable to refresh the query on this file: the structure of file "{filename}" does not match. (IES 10852)
Cause
The file might have been modified since the query was last run.
Action
Check with the administrator or universe designer that the file has not been modified.
12.4.3.78 Error originates from the Personal Data Provider: {message}. (IES 10853)
Cause
The file that supplies data to a personal data provider might be corrupt or missing.
SAP BusinessObjects Web Intelligence User's GuideWeb Intelligence error messages PUBLIC 811
Action
Check that the file is present, and that it does not contain errors.
12.4.3.79 The query cannot be refreshed; the structure of "{dpName}" does not match. (IES 10854)
Cause
The columns returned by the database do not match with those of data provider objects.
Action
In the Web Intelligence document, open the Query Panel and check that you have the right objects in your query compared to the database.
12.4.3.80 Unable to create or update the Excel personal data provider: the file path is invalid. (IES 10870)
Cause
The Excel file could not be found on the file system.
Action
See your administrator.
12.4.3.81 Unable to create or update the Excel personal data provider: cannot retrieve the named ranges. (IES 10872) (IES 10871)
Cause
The Excel personal data provider could not be created or updated because the workbook is protected.
812 PUBLICSAP BusinessObjects Web Intelligence User's Guide
Web Intelligence error messages
Action
Remove the protection from the Excel workbook or see your administrator if you do not have access to the Excel file.
12.4.3.82 Unable to create or update the Excel personal data provider: cannot open the workbook. (IES 10872)
Cause
The Excel file could not be opened.
Action
Verify the Excel file or see your administrator.
12.4.3.83 Unable to create or update the Excel personal data provider: cannot retrieve the named ranges. (IES 10873)
Cause
Data could not be retrieved from a named range of cells.
Action
Check the Excel file or see your administrator.
12.4.3.84 Unable to create or update the Excel personal data provider: cannot retrieve data from the file. (IES 10874)
Cause
Data could not be retirieved from the Excel file.
SAP BusinessObjects Web Intelligence User's GuideWeb Intelligence error messages PUBLIC 813
Action
Verify the file or see your administrator.
12.4.3.85 Unable to create or update the Excel personal data provider: cannot retrieve data from the file. (IES 10875)
Cause
No data could be retrieved from the Excel file.
Action
Verify the file or see your administrator.
12.4.3.86 Unable to create or update the Excel personal data provider: cannot build the iterator on the data set. (IES 10876)
Cause
An error occurred when retrieving data from the Excel file.
Action
Verify the file or see your administrator.
12.4.3.87 Unable to create or update the Excel personal data provider: no worksheet available. (IES 10877)
Cause
No worksheet could be found in the Excel file.
814 PUBLICSAP BusinessObjects Web Intelligence User's Guide
Web Intelligence error messages
Action
Verify the file or see your administrator.
12.4.3.88 Unable to create or update the Excel personal data provider: unable to retrieve the list of worksheets. (IES 10878)
Cause
The list of worksheets could not be retrieved from the Excel file.
Action
Verify the file or see your administrator.
12.4.3.89 Unable to create or update the Excel personal data provider: invalid data retrieved from the selected range. (IES 10879)
Cause
The data retrieved from a range in the Excel file is invalid.
Action
Verify the file or see your administrator.
12.4.3.90 Unable to create or update the Excel personal data provider: the selected worksheet is invalid. (IES 10880)
Cause
The Excel worksheet is invalid.
SAP BusinessObjects Web Intelligence User's GuideWeb Intelligence error messages PUBLIC 815
Action
Verify the Excel file or see your administrator.
12.4.3.91 Unable to create or update the Excel personal data provider: an error occurred while retrieving the data sampling. (IES 10881)
Cause
An error occurred during data retrieval from the Excel file.
Action
Verify the file or see your administrator.
12.4.3.92 Unable to create or update the Excel personal data provider: an error occurred while creating the data iterator. (IES 10882)
Cause
An error occurred during data retrieval from the Excel file.
Action
See your administrator.
12.4.3.93 Unable to create or update the Excel personal data provider: an error occurred during data retrieval. (IES 10883)
Cause
An error occurred during data retrieval from the Excel file.
816 PUBLICSAP BusinessObjects Web Intelligence User's Guide
Web Intelligence error messages
Action
See your administrator.
12.4.3.94 Unable to create or update the Excel personal data provider: an internal error occurred. (IES 10884)
Cause
An error occurred during data retrieval from the Excel file.
Action
See your administrator.
12.4.3.95 Unable to create or update the Excel personal data provider: the range selection is invalid. (IES 10885)
Cause
An error occurred during data retrieval from the Excel file because the range selected was not valid.
Action
Verify the file or see your administrator.
12.4.3.96 Unable to create or update the Excel personal data provider: the range selection does not match the worksheet. (IES 10886)
Cause
An error occurred during data retrieval from the Excel file because the range selection does not match the worksheet.
SAP BusinessObjects Web Intelligence User's GuideWeb Intelligence error messages PUBLIC 817
Action
Verify the file or see your administrator.
12.4.3.97 A condition on an object refers to an object from another query that has a different type. (IES 10887)
Cause
The object in the other query has a different data type from the object in the condition.
Action
Correct the condition.
12.4.3.98 A condition on an object refers to an object in another query that does not exist. (IES 10888)
Cause
Either the object or query referred to by the condition does not exist.
Action
Correct the condition.
12.4.3.99 There is a circular dependency in the query. (IES 10889)
Cause
The query has a circular dependency.
818 PUBLICSAP BusinessObjects Web Intelligence User's Guide
Web Intelligence error messages
Action
Edit the query to remove the circular dependency.
12.4.3.100 The universe has been updated. Please save the document to synchronize it.(IES 10901)
Cause
The database returned the error given in the message.
Action
See your administrator with the details of the error that occurred.
12.4.3.101 Query exceeded fixed time limit: {error_db}. (IES 10902)
Cause
The query could not return data because it took too long to run.
Action
Run the query again. If the problem persists see your administrator.
12.4.3.102 Invalid Database Field Type : {db_fieldname}. (IES 10903)
Cause
The database field given in the message contains an invalid data type.
SAP BusinessObjects Web Intelligence User's GuideWeb Intelligence error messages PUBLIC 819
Action
See your administrator.
12.5 ReportEngine Web Intelligence (RWI) Error Messages
ReportEngine Web Intelligence error messages include the following:
Range Category
RWI 00000 - RWI 00850 ReportEngine Web Intelligence
12.5.1 RWI 00000 - RWI 00314
12.5.1.1 User input is required for the prompt in the query. (RWI 00000)
Cause
The server requires prompt values in order to fulfill the request.
Action
Enter values for all mandatory prompts.
12.5.1.2 User input is required to select an universe context for the query. (RWI 00001)
Cause
The server requires context(s) selection in order to fulfill the request.
Action
Supply context(s) choice.
820 PUBLICSAP BusinessObjects Web Intelligence User's Guide
Web Intelligence error messages
12.5.1.3 The argument cannot be null. (RWI 00010)
Cause
The specified argument is "null".
Action
Enter a non-null value for the argument.
12.5.1.4 Invalid value: {0}. (RWI 00011)
Cause
The specified argument value is invalid.
Action
Enter a valid value for the argument.
12.5.1.5 The argument is out of range. (RWI 00012)
Cause
The specified argument value is not within the allowed range.
Action
Specify a value within the allowed range.
SAP BusinessObjects Web Intelligence User's GuideWeb Intelligence error messages PUBLIC 821
12.5.1.6 Unable to retrieve the requested report part(s). Either the report part references are invalid, or the corresponding data does not exist anymore. (RWI 00013)
Cause
One or more report part references are invalid, or the corresponding data is not available.
Action
Ensure that you are using valid report part references. Subsequently, ensure that the requested data is available after refreshing the document's data providers.
12.5.1.7 Cannot retrieve more than one report part simultaneously in DHTML output format. (RWI 00014)
Cause
You cannot retrieve more than one report part in DHTML output format simultaneously.
Action
Enter a single report part reference.
12.5.1.8 Cannot turn off search mode for delegated search. (RWI 00015)
Cause
A list of values defined as "delegated" search cannot have search mode disabled.
Action
Before disabling the search mode, check if the list of values is defined as "delegated search".
822 PUBLICSAP BusinessObjects Web Intelligence User's Guide
Web Intelligence error messages
12.5.1.9 One of the supplied OutputCacheEntry instances is invalid or not supported by the Web Intelligence server. (RWI 00016)
Cause
While preloading the server output cache, one or more output formats specified are invalid or unsupported.
Action
Ensure that the requested output formats are valid and supported.
12.5.1.10 Could not read {0}bytes from the specified stream. (RWI 00017)
Cause
Upon upload of the resource into a document, the supplied data could not be read.
Action
Ensure that the specified parameters are correct and consistent.
12.5.1.11 The Web Intelligence server returned an invalid XML output. Contact your administrator. (RWI 00200)
Cause
The server returned an invalid or incorrect XML output.
Action
Contact your technical support.
SAP BusinessObjects Web Intelligence User's GuideWeb Intelligence error messages PUBLIC 823
12.5.1.12 Could not get page number. (RWI 00223)
Cause
The requested page could not be retrieved because of an invalid page number.
Action
Ensure that the requested page number is valid.
12.5.1.13 Cannot initialize Report Engine server. (RWI 00226)
Cause
Communication with the server could not be established. This may occur when attempting to create or open a document.
Action
Ensure that the server is installed correctly. Also, check if the server is started and enabled.
12.5.1.14 Your Web Intelligence session is no longer valid because of a timeout. (RWI 00235)
Cause
The server session allocated to a particular document has been closed, either explicitly or because of a timeout.
Action
Ensure that the document has not been explicitly closed. Alternatively, increase the <server session ttmeout> value.
To modify the server session timeout value:
824 PUBLICSAP BusinessObjects Web Intelligence User's Guide
Web Intelligence error messages
1. Log on to the Business Intelligence platform Central Management Console (CMC).2. Click Servers.3. Expand Server Categories, and click Web Intelligence Services.4. Under Server name, double-click WebIntelligenceProcessingServer. The Properties window appears.5. In Properties window, under Web Intelligence Core Service, enter the value for Idle Connection Timeout.
12.5.1.15 The Web Intelligence server cannot be reached. Contact your administrator. (RWI 00236)
Cause
An error occurred while attempting to communicate with the server.
Action
Contact the administrator to ensure that the server is enabled and running. Also, check for network problems.
12.5.1.16 Cannot write output stream. Contact your administrator. (RWI 00237)
Cause
An I/O error occurred when writing data in response to a view request.
Action
Contact the administrator to ensure that the specified destination parameter is valid.
12.5.1.17 Connection failed. The server has reached the maximum number of simultaneous connections. (RWI 00239)
Cause
The maximum number of server connections allowed has been reached.
SAP BusinessObjects Web Intelligence User's GuideWeb Intelligence error messages PUBLIC 825
Action
Either raise the value of the <maximum connections> server parameter, or add another server instance.
To modify the maximum connections value:
1. Log on to the Business Intelligence platform Central Management Console (CMC).2. Click Servers.3. Expand Server Categories, and click Web Intelligence.4. Under Server name, double-click WebIntelligenceProcessingServer. The Properties window appears.5. In Properties window, under Web Intelligence Core Service, enter the value for Maximum Connections.
12.5.1.18 Your server version is incompatible with this client version. Contact your administrator. (RWI 00240)
Cause
The server does not support this SDK version.
Action
Contact the administrator to ensure that the server version is compatible with the client version.
12.5.1.19 Cannot find an XML transformer. (RWI 00301)
Cause
Unable to instantiate the XSLT transformer used for XML to HTML transformation.
Action
Try again later.
826 PUBLICSAP BusinessObjects Web Intelligence User's Guide
Web Intelligence error messages
12.5.1.20 Cannot create translet. (RWI 00309)
Cause
Unable to compile the XSLT stylesheet used for XML to HTML transformation.
Action
Try again later.
12.5.1.21 Cannot get an output file for the document. (RWI 00314)
Cause
While serializing a document state, an error occurred. This might be due to insufficient memory or an I/O error.
Action
Ensure that there is sufficient memory available. Also, check for any <webi.properties> customization.
12.5.2 RWI 00315 - RWI 00605
12.5.2.1 Cannot retrieve an XML parser ID. (RWI 00316)
Cause
An error occurred during XSLT transformation. This might be because you are requesting output in XML format using a client supplied stylesheet.
Action
Ensure that the specified XSLT stylesheet is correct.
SAP BusinessObjects Web Intelligence User's GuideWeb Intelligence error messages PUBLIC 827
12.5.2.2 Cannot transform XML to HTML. (RWI 00317)
Cause
During XSLT transformation, an error occurred while requesting output in HTML.
Action
Try again later.
12.5.2.3 The Java Runtime Environment does not support UTF-8 encoding. (RWI 00321)
Cause
The JRE does not support UTF-8 encoding.
Action
Switch to a JRE that supports UTF-8 encoding.
12.5.2.4 An error occurred while retrieving the document from the storage token. (RWI 00322)
Cause
An error occurred during document state deserialization. This might be due to insufficient memory or an I/O error.
Action
Ensure that there is sufficient memory available. Also check for any <webi.properties> customization.
828 PUBLICSAP BusinessObjects Web Intelligence User's Guide
Web Intelligence error messages
12.5.2.5 Cannot retrieve the document with the passed obsolete token. (RWI 00323)
Cause
An error occurred during document state deserialization. This might be caused by a storage token that identifies a document state, which is no longer available in the storage tokens stack.
Action
In the <webi.properties> file, increase the value of < storage tokens stack size>. Also, ensure that the storage token is valid before using it.
12.5.2.6 Cannot retrieve the document with the passed malformed token. (RWI 00324)
Cause
An error occurred during document state deserialization. This might be due to an invalid storage token.
Action
Specify a valid storage token.
12.5.2.7 There are too many operands for the current operator. (RWI 00501)
Cause
For the current operator, the condition or filter has too many operands to be able to add a new one.
Action
Remove existing operands before attempting to add a new one.
SAP BusinessObjects Web Intelligence User's GuideWeb Intelligence error messages PUBLIC 829
12.5.2.8 There are not enough operands for the current operator. (RWI 00502)
Cause
The condition or filter does not have enough operands with respect to the current operator.
Action
Add operand(s) to the condition or filter.
12.5.2.9 Prompts are not supported on filters created at the report level. (RWI 00503)
Cause
Report filters do not support prompts. Only query conditions support prompts.
Action
Do not use prompts in report filters.
12.5.2.10 You cannot modify operators and operands in predefined filters. (RWI 00504)
Cause
While using a pre-defined condition, you cannot specify an operator for a condition or filter.
Action
Ensure that the operator in the pre-defined condition does not have any filters or conditions.
830 PUBLICSAP BusinessObjects Web Intelligence User's Guide
Web Intelligence error messages
12.5.2.11 LIKE and NOT_LIKE operators are allowed only on ObjectType.TEXT objects. (RWI 00506)
Cause
You attempted to use "LIKE" or "NOT_LIKE" operators for objects that are not of character type.
Action
When the object used in a filter is not of <character> type, ensure that you do not use the "LIKE" and "NOT_LIKE" operators.
12.5.2.12 The specified operator cannot be applied to a document filter. (RWI 00507)
Cause
The specified operator cannot be used with report filters. It can be used only with query conditions.
Action
Do not use this operator when working with report filters.
12.5.2.13 Web Intelligence is unable to attach a LOV (List of Values) to the prompt because the associated source object does not have a LOV. (RWI 00508)
Cause
Cannot use a list of values with the prompt being defined. This is because the object used in this condition does not contain a LOV.
SAP BusinessObjects Web Intelligence User's GuideWeb Intelligence error messages PUBLIC 831
Action
Before requesting the prompt to use the list of values, ensure that the object used within the condition has a defined list of values.
12.5.2.14 There are incompatible data source objects in the filter condition comparison. (RWI 00509)
Cause
You have attempted to compare two objects of different types within a condition.
Action
Use objects of the same type.
12.5.2.15 Cannot create a report filter on a formula. (RWI 00511)
Cause
Formulas cannot be used as report filters. Only data providers and variable expressions can be used.
Action
Use a data provider or variable expression when defining a report filter.
12.5.2.16 A percentage rank cannot have values greater than 100. (RWI 00512)
Cause
When you defined the percentage ranking, you chose a rank size that was greater than 100.
832 PUBLICSAP BusinessObjects Web Intelligence User's Guide
Web Intelligence error messages
Action
Ensure that the rank size is less than 100.
12.5.2.17 The expression is not available in the axis. (RWI 00602)
Cause
You have attempted to create a break, calculation, or sort using an expression that is not in the axis.
Action
Use an expression that is available in the axis.
12.5.2.18 Only measure objects can be included on the y-axis. (RWI 00603)
Cause
You have attempted to add an expression to the axis, where the expression is not of <measure> type.
Action
Specify an expression of <measure> type.
12.5.2.19 You cannot base a section on a measure. (RWI 00604)
Cause
A section cannot be based on an expression of <measure> type.
SAP BusinessObjects Web Intelligence User's GuideWeb Intelligence error messages PUBLIC 833
Action
Do not use an expression of <measure> type as the basis for a section.
12.5.2.20 You cannot add more than one expression to a section axis. (RWI 00605)
Cause
A section axis does not support more than one expression.
Action
Do not use several expressions in a section axis.
12.5.3 RWI 00606 - RWI 00850
12.5.3.1 You cannot include a circular attachment in a document. (RWI 00606)
Cause
You have attempted to define a report attachment that causes a circular attachment.
Action
Define a report that does not generate a circular attachment.
12.5.3.2 The expression is different from the table cell expression. (RWI 00607)
Cause
You have attempted to create a calculation on a table cell, specifying an expression different from the one contained in the table cell.
834 PUBLICSAP BusinessObjects Web Intelligence User's Guide
Web Intelligence error messages
Action
Create a calculation table with the expression that is already defined in the table cell.
12.5.3.3 You cannot copy a ReportElement object to an element in a different ReportElementContainer. (RWI 00608)
Cause
Report attachments can only be defined between report elements belonging to the same container.
Action
Ensure that you are creating report attachments between report elements that belong to the same container.
12.5.3.4 You cannot create a horizontal attachment on a section. (RWI 00609)
Cause
You have attempted to create a horizontal attachment in a section.
Action
Do not create horizontal attachments in a section, as sections cannot exceed the maximum allowed width.
12.5.3.5 You cannot remove all rows and columns from the table body. The table must contain at least one row and column. (RWI 00610)
Cause
You have attempted to remove the last row or column in a table body.
SAP BusinessObjects Web Intelligence User's GuideWeb Intelligence error messages PUBLIC 835
Action
Ensure that the table contains at least one row and column.
12.5.3.6 Dimension and detail objects only are allowed on this axis. (RWI 00611)
Cause
You have attempted to add an expression of incompatible type on an axis where only dimension and detail expression types are allowed.
Action
Specify an expression of compatible type.
12.5.3.7 Additional objects cannot be added to the block axis based on the block shape. (RWI 00612)
Cause
Cannot add more expressions to the specified block axis.
Action
Do not add more expressions.
12.5.3.8 This report element cannot have a double side attachment. (RWI 00613)
Cause
A report element cannot be horizontally and vertically attached to two distinct report elements.
836 PUBLICSAP BusinessObjects Web Intelligence User's Guide
Web Intelligence error messages
Action
Ensure that the report element is attached (horizontally and vertically) to the same report element.
12.5.3.9 The table cell has been removed from its table. (RWI 00614)
Cause
You have attempted to use a table cell that has been removed from its containing table.
Action
You cannot use a table cell after it has been removed from its containing table.
12.5.3.10 Alerter isn't defined in current document. (RWI 00619)
Cause
Alerter referenced in report doesn't belong to alerter dictionary of document.
Action
Add alerter in dictionary.
12.5.3.11 Track data change mode should be active to perform a track data change action. (RWI 00620)
Cause
Unable to perform track data change action because track data was not activated.
SAP BusinessObjects Web Intelligence User's GuideWeb Intelligence error messages PUBLIC 837
Action
Enable track data changes mode in the Web Intelligence document.
12.5.3.12 An exception occured in the visualization framework. (RWI 00621)
Cause
An exception occured in the visualization framework.
Action
Check the inner exception.
12.5.3.13 Drill mode should be active to perform drill actions (RWI 00624)
Cause
Unable to perform drill action due to drill state.
Action
Activate the drill mode in the Web Intelligence document.
12.5.3.14 You cannot run an empty query. (RWI 00701)
Cause
You have attempted to run an empty query.
Action
Before running a query, add result objects to it.
838 PUBLICSAP BusinessObjects Web Intelligence User's Guide
Web Intelligence error messages
12.5.3.15 Cannot delete the last data provider. (RWI 00702)
Cause
You have attempted to delete the last data provider in a document.
Action
A document must contain at least one data provider.
12.5.3.16 A data provider with this name already exists. (RWI 00703)
Cause
You have attempted to give a data provider a name that already exists in the document.
Action
Every data provider within a document must have a unique name.
12.5.3.17 Combined queries are incompatible with sampling mode activated. (RWI 00706)
Cause
Sampling cannot be used with combined queries.
Action
Do not use sampling with combined queries.
SAP BusinessObjects Web Intelligence User's GuideWeb Intelligence error messages PUBLIC 839
12.5.3.18 Processing remove data source objects while there are only two data source expressions. (RWI 00800)
Cause
You have attempted to remove an expression from a synchronized dimension that contains only two expressions.
Action
Ensure that a synchronized dimension always contains at least two expressions.
12.5.3.19 Cannot create a Link with a name that already exists ({0}). (RWI 00801)
Cause
You have attempted to create a synchronized dimension with a name that already exists.
Action
Provide a unique name for each synchronized dimension.
12.5.3.20 Cannot update CustomSortLov with a new list of values more than the size supported by CustomSortLov. (RWI 00825)
Cause
You have attempted to update the list of values of a custom sort definition with more values than allowed.
Action
Ensure that the number of values in the list is within the specified custom sort range.
840 PUBLICSAP BusinessObjects Web Intelligence User's Guide
Web Intelligence error messages
12.5.3.21 Cannot create CustomSortLov while Report Expression's Lov size is greater than the size supported by CustomSortLov . (RWI 00826)
Cause
You have attempted to create the list of values of a custom sort definition with more values than allowed.
Action
Ensure that the number of values in the list is within the specified custom sort range.
12.5.3.22 The provided expression violates one of the feed restrictions. (RWI 00830)
Cause
The provided expression violates one of the feed restrictions.
Action
There is an error in the formula. Check the feed restrictions before adding a formula.
12.5.3.23 {0} feature is not supported. (RWI 00850)
Cause
You have attempted to use a particular feature that is not supported in the current context.
Action
Before using this feature, ensure that it is supported.
SAP BusinessObjects Web Intelligence User's GuideWeb Intelligence error messages PUBLIC 841
12.6 Custom Data Source (CDS) Framework Error Messages
Custom Data Source (CDS) Framework error messages include the following categories:
Range Category
CDS 00001 - CDS 00013 Custom Data Source User Interface Framework error messages
CDS 10100 - CDS 10400 Web Services Custom Data Source Plugin error messages
CDS 15102 - CDS 15122 Custom Data Source Framework error messages
12.6.1 Custom Data Source User Interface Framework error messages
12.6.1.1 The selected file extension is not correct. (CDS 00001)
Cause
The extension of the file is not as expected or is different from the previously selected file.
Action
Check whether the correct file is selected.
12.6.1.2 Cannot access the file. (CDS 00002)
Cause
You have entered an incorrect file path.
Action
Check whether the correct path is entered.
842 PUBLICSAP BusinessObjects Web Intelligence User's Guide
Web Intelligence error messages
12.6.1.3 The file does not exist. (CDS 00003)
Cause
The file does not exist at the path specified.
Action
Check whether you have specified valid path and filename.
12.6.1.4 The selected file is a directory. (CDS 00004)
Cause
The path entered points to a directory instead of a file.
Action
Enter the correct filename.
12.6.1.5 Error in processing data source - There was an invalid operation for the plug-in. (CDS 00005)
Cause
The plugin is not able to retrieve all the data source parameters.
Action
Check the logs and verify that the plug-in code is working properly.
SAP BusinessObjects Web Intelligence User's GuideWeb Intelligence error messages PUBLIC 843
12.6.1.6 An error occurred in the user interface of the plug-in. (CDS 00006)
Cause
An error has occurred in the plug-in user interface.
Action
Check the logs and verify that the plug-in code is working properly.
12.6.1.7 An error occurred while accessing the updated inputs. (CDS 00007)
Cause
An error occurred while accessing the data source parameters retrieved from the plug-in.
Action
Check the logs and verify that the plug-in code is working properly.
12.6.1.8 An object with this name already exists. (CDS 00008)
Cause
Another object with this name exists.
Action
Change the name of the object to a unique value.
844 PUBLICSAP BusinessObjects Web Intelligence User's Guide
Web Intelligence error messages
12.6.1.9 The query with this name already exists. (CDS 00009)
Cause
Another query with this name exists.
Action
Change the name of the query to a unique value.
12.6.1.10 A problem was detected with the install. Please check and try again. (CDS 00010)
Cause
A problem was detected with the install.
Action
Check the installation setup. Refer to the documentation for more details.
12.6.1.11 Error in processing data source. (CDS 00011)
Cause
A problem was detected while identifying the data source.
Action
Check the logs to get the detailed error message.
SAP BusinessObjects Web Intelligence User's GuideWeb Intelligence error messages PUBLIC 845
12.6.1.12 The requested action could not be completed. (CDS 00012)
Cause
An error was detected.
Action
Check the logs to get the detailed error message.
12.6.1.13 Could not retrieve plug-in display component. (CDS 00013)
Cause
A error occurred while retrieving the plug-in component.
Action
Check the logs to get the detailed error message. Verify that the plugin-in code is correct.
12.6.2 Web Services Custom Data Source Plugin error messages
12.6.2.1 An error occurred while processing the requested action. (CDS 10100)
Cause
An unexpected error occurred while processing the requested action.
Action
Contact your enterprise administrator.
846 PUBLICSAP BusinessObjects Web Intelligence User's Guide
Web Intelligence error messages
12.6.2.2 No selection made in Output Message panel. (CDS 10101)
Cause
User has not selected the field(s) for the query from the Output Message panel.
Action
Select the field(s) that need to be displayed in the report from the Output Message panel.
12.6.2.3 An error occurred while invoking Web Service. {0}(CDS 10200)
Cause
An error occurred while invoking a web service.
Action
Contact your enterprise administrator.
12.6.2.4 Error executing web service: "{0}" (CDS 10201)
Cause
The Web Service Endpoint could not be invoked because of incorrect input parameters.
Action
Enter the correct values while invoking the Web Service.
SAP BusinessObjects Web Intelligence User's GuideWeb Intelligence error messages PUBLIC 847
12.6.2.5 An error occurred while instantiating the Web Service plugin. (CDS 10202)
Cause
The extension descriptor of the web service plug-in did not return the correct dstype.
Action
Contact your administrator to fix the problem.
12.6.2.6 Parsing Exception: The input WSDL type or structure is not supported. (CDS 10203)
Cause
The structure of the WSDL is not supported by Web Services Custom Data Source plug-in.
Action
Refer the documentation for supported WSDLs.
12.6.2.7 WSDLs that refer to Microsoft's types namespace are not supported. (CDS 10204)
Cause
WSDLs that refer to http://microsoft.com/wsdl/types/ namespace are not supported.
Action
Modify the WSDL or select the supported WSDL.
848 PUBLICSAP BusinessObjects Web Intelligence User's Guide
Web Intelligence error messages
12.6.2.8 WSDLs that have cyclical references are not supported. (CDS 10205)
Cause
WSDL type definitions contain cyclical references.
Action
Modify the WSDL or select the supported WSDL.
12.6.2.9 WSDLs that do not have type definitions are not supported. (CDS 10206)
Cause
WSDL does not contain any type definitions in <types> tags.
Action
Modify the WSDL or select the supported WSDL.
12.6.2.10 Unable to send SOAP request as the target URL is malformed. (CDS 10207)
Cause
The SOAP action target URL mentioned for this service in the WSDL is malformed.
Action
Modify the WSDL or select another WSDL that is supported.
SAP BusinessObjects Web Intelligence User's GuideWeb Intelligence error messages PUBLIC 849
12.6.2.11 WSDLs that use encoded messages are not supported. (CDS 10208)
Cause
The WSDL has operations that expect encoded messages.
Action
Modify the WSDL or select another WSDL that is supported.
12.6.2.12 An error was detected while parsing the response. (CDS 10400 )
Cause
An error was detected while parsing the response from server.
Action
Check the product logs to get the actual cause of error.
12.6.3 Custom Data Source Framework error messages
12.6.3.1 Unable to create or update the Custom Data Provider : unable to retrieve information from the provided source. (CDS 15102)
Cause
An unexpected error occurred while trying to retrieve information from the provided source.
Action
Contact your administrator to resolve the error.
850 PUBLICSAP BusinessObjects Web Intelligence User's Guide
Web Intelligence error messages
12.6.3.2 Unable to create or update the Custom Data Provider : unable to retrieve structure information from the provided source. (CDS 15103)
Cause
An unexpected error occurred while trying to retrieve the structure information from the provided source.
Action
Contact the plug-in support to verify that the plug-in is working properly. If the error is not resolved contact SAP support to resolve the error.
12.6.3.3 Unable to create or update the Custom Data Provider : unable to build the iterator on the data set. (CDS 15104)
Cause
An unexpected error occurred while trying to build the iterator on the dataset.
Action
Contact the plug-in support to verify that the plug-in is working properly. If the error is not resolved contac support to resolve the error.
12.6.3.4 Unable to create or update the Custom Data Provider : a problem was encountered in Data Source plug-in management and the requested action cannot be completed. (CDS 15106)
Cause
An unexpected error has occurred.
SAP BusinessObjects Web Intelligence User's GuideWeb Intelligence error messages PUBLIC 851
Action
Contact support to resolve the error.
12.6.3.5 Unable to create or update the query on this file : the file "{filename}" does not exist in the file system. (CDS 15107)
Cause
The file does not exist at the specified location.
Action
Check whether the file path specified for source file is correct.
12.6.3.6 Unable to create or update the Custom Data Provider : the path is invalid. (CDS 15108)
Cause
The file path mentioned is incorrect.
Action
Check that the path specified for the source is correct.
12.6.3.7 Unable to create or update the Custom Data Provider : invalid information retrieved while trying to get the structure. (CDS 15109)
Cause
An error occurred while trying to retrieve the structure information from the data provider.
852 PUBLICSAP BusinessObjects Web Intelligence User's Guide
Web Intelligence error messages
Action
Contact the plug-in support to verify that the plug-in is working properly. If the error is not resolved, contact support to resolve the error.
12.6.3.8 Unable to create or update the Custom Data Provider : could not find matching Data Source plug-in for this request. (CDS 15110)
Cause
An error occurred while trying to retrieve the plug-in information.
Action
Check that plug-in implementation returns required plug-in information correctly. Refer to documentation for information on configuring the plug-in.
12.6.3.9 Unable to create or update the Custom Data Provider : could not instantiate matching Data Source plug-in for this request. (CDS 15111)
Cause
An error occurred while trying to instantiate the plug-in.
Action
Check that the plug-in details and MODULE-PATH in the plug-in MANIFEST file is correct. Refer to the documentation for information on configuring the plug-in.
SAP BusinessObjects Web Intelligence User's GuideWeb Intelligence error messages PUBLIC 853
12.6.3.10 Unable to create or update the Custom Data Provider : could not instantiate Data Source plug-in's Data Provider for this request. (CDS 15112)
Cause
An error occurred while trying to instantiate the Data Provider component of the plug-in extension.
Action
Contact the plug-in support to verify if the plug-in is working properly.
12.6.3.11 Unable to create or update the Custom Data Provider : an error occurred while retrieving the data sampling. (CDS 15113)
Cause
An error occurred in the plug-in while trying to retrieve sample data from the data provider.
Action
Contact the plug-in support to verify if the plug-in is working properly.
12.6.3.12 Unable to retrieve data from the Custom Data Provider : an error occurred while creating the data iterator. (CDS 15114)
Cause
An error occurred in the plug-in while trying to retrieve the data iterator.
Action
Contact the plug-in support to verify if the plug-in is working properly.
854 PUBLICSAP BusinessObjects Web Intelligence User's Guide
Web Intelligence error messages
12.6.3.13 Unable to retrieve data from the Custom Data Provider : an error occurred while fetching data through the iterator. (CDS 15115)
Cause
An error occurred in the plug-in while trying to fetch the data through the iterator.
Action
Contact the plug-in support to verify if the plug-in is working properly.
12.6.3.14 Unable to create or update the Custom Data Provider : unsupported object type was provided by the Data Source plug-in while trying to get the structure. (CDS 15116)
Cause
The plug-in has data types that are not supported.
Action
Refer to the documentation for the list of supported data types.
12.6.3.15 Unable to create or update the Custom Data Provider : an internal error occurred while trying to open the session. (CDS 15117)
Cause
An error occurred in the plug-in while trying to open a session.
Action
Contact the plug-in support to verify if the plug-in is working properly.
SAP BusinessObjects Web Intelligence User's GuideWeb Intelligence error messages PUBLIC 855
12.6.3.16 Unable to create or update the Custom Data Provider : the source in the provided path is protected. (CDS 15118)
Cause
The plug-in could not proceed as the source file provided is a password-protected file.
Action
Refer to the plug-in documentation.
12.6.3.17 Unable to create or update the Custom Data Provider : the provided URL is invalid. (CDS 15119)
Cause
The plug-in could not proceed as the URL is invalid.
Action
Refer to the plug-in documentation.
12.6.3.18 Unable to create or update the Custom Data Provider : the provided URL cannot be found. (CDS 15120)
Cause
The plug-in could not proceed as the provided URL could not be found.
Action
Refer to the plug-in documentation.
856 PUBLICSAP BusinessObjects Web Intelligence User's Guide
Web Intelligence error messages
12.6.3.19 Unable to interact with the Custom Data Provider on the provided source. (CDS 15121)
Cause
An unexpected error has occurred.
Action
Contact support to resolve the error.
12.6.3.20 A problem was encountered. The requested action cannot be completed. (CDS 15122)
Cause
An unexpected error has occurred.
Action
Contact support to resolve the error.
SAP BusinessObjects Web Intelligence User's GuideWeb Intelligence error messages PUBLIC 857
Important Disclaimers and Legal Information
HyperlinksSome links are classified by an icon and/or a mouseover text. These links provide additional information.About the icons:
● Links with the icon : You are entering a Web site that is not hosted by SAP. By using such links, you agree (unless expressly stated otherwise in your agreements with SAP) to this:
● The content of the linked-to site is not SAP documentation. You may not infer any product claims against SAP based on this information.● SAP does not agree or disagree with the content on the linked-to site, nor does SAP warrant the availability and correctness. SAP shall not be liable for any
damages caused by the use of such content unless damages have been caused by SAP's gross negligence or willful misconduct.
● Links with the icon : You are leaving the documentation for that particular SAP product or service and are entering a SAP-hosted Web site. By using such links, you agree that (unless expressly stated otherwise in your agreements with SAP) you may not infer any product claims against SAP based on this information.
Videos Hosted on External PlatformsSome videos may point to third-party video hosting platforms. SAP cannot guarantee the future availability of videos stored on these platforms. Furthermore, any advertisements or other content hosted on these platforms (for example, suggested videos or by navigating to other videos hosted on the same site), are not within the control or responsibility of SAP.
Beta and Other Experimental FeaturesExperimental features are not part of the officially delivered scope that SAP guarantees for future releases. This means that experimental features may be changed by SAP at any time for any reason without notice. Experimental features are not for productive use. You may not demonstrate, test, examine, evaluate or otherwise use the experimental features in a live operating environment or with data that has not been sufficiently backed up.The purpose of experimental features is to get feedback early on, allowing customers and partners to influence the future product accordingly. By providing your feedback (e.g. in the SAP Community), you accept that intellectual property rights of the contributions or derivative works shall remain the exclusive property of SAP.
Example CodeAny software coding and/or code snippets are examples. They are not for productive use. The example code is only intended to better explain and visualize the syntax and phrasing rules. SAP does not warrant the correctness and completeness of the example code. SAP shall not be liable for errors or damages caused by the use of example code unless damages have been caused by SAP's gross negligence or willful misconduct.
Gender-Related LanguageWe try not to use gender-specific word forms and formulations. As appropriate for context and readability, SAP may use masculine word forms to refer to all genders.
858 PUBLICSAP BusinessObjects Web Intelligence User's Guide
Important Disclaimers and Legal Information

SAP BusinessObjects Web Intelligence User's GuideImportant Disclaimers and Legal Information PUBLIC 859
www.sap.com/contactsap
© 2020 SAP SE or an SAP affiliate company. All rights reserved.
No part of this publication may be reproduced or transmitted in any form or for any purpose without the express permission of SAP SE or an SAP affiliate company. The information contained herein may be changed without prior notice.
Some software products marketed by SAP SE and its distributors contain proprietary software components of other software vendors. National product specifications may vary.
These materials are provided by SAP SE or an SAP affiliate company for informational purposes only, without representation or warranty of any kind, and SAP or its affiliated companies shall not be liable for errors or omissions with respect to the materials. The only warranties for SAP or SAP affiliate company products and services are those that are set forth in the express warranty statements accompanying such products and services, if any. Nothing herein should be construed as constituting an additional warranty.
SAP and other SAP products and services mentioned herein as well as their respective logos are trademarks or registered trademarks of SAP SE (or an SAP affiliate company) in Germany and other countries. All other product and service names mentioned are the trademarks of their respective companies.
Please see https://www.sap.com/about/legal/trademark.html for additional trademark information and notices.
THE BEST RUN


