Embed Size (px)
Citation preview
Influence of Camembert consumption on the composition and metabolismof intestinal microbiota: a study in human microbiota-associated rats
Christophe Lay1, Malene Sutren1, Pascale Lepercq1, Catherine Juste1, Lionel Rigottier-Gois1,Evelyne Lhoste1, Riwanon Lemee2, Pascale Le Ruyet2, Joel Dore1 and Claude Andrieux1*1UEPSD, Centre de Recherche de Jouy en Josas, INRA, 78352 Jouy en Josas Cedex, France2Lactalis Recherche et Developpement, 53089 Laval Cedex, France
(Received 3 November 2003 – Revised 25 February 2004 – Accepted 30 March 2004)
The objective of the present study was to evaluate the consequence of Camembert consumption on the composition and metabolism ofhuman intestinal microbiota. Camembert cheese was compared with milk fermented by yoghurt starters and Lactobacillus casei as a pro-biotic reference. The experimental model was the human microbiota-associated (HM) rat. HM rats were fed a basal diet (HMB group), adiet containing Camembert made from pasteurised milk (HMCp group) or a diet containing fermented milk (HMfm group). The level ofmicro-organisms from dairy products was measured in faeces using cultures on a specific medium and PCR–temporal temperature gra-dient gel electrophoresis. The metabolic characteristics of the caecal microbiota were also studied: SCFA, NH3, glycosidase and reductaseactivities, and bile acid degradations. The results showed that micro-organisms from cheese comprised 105–108 bacteria/g faecal sample inthe HMCp group. Lactobacillus species from fermented milk were detected in HMfm rats. Consumption of cheese and fermented milk ledto similar changes in bacterial metabolism: a decrease in azoreductase activity and NH3 concentration and an increase in mucolytic activi-ties. However, specific changes were observed: in HMCp rats, the proportion of ursodeoxycholic resulting from chenodeoxycholic epimer-isation was higher; in HMfm rats, a and b-galactosidases were higher than in other groups and both azoreductases and nitrate reductaseswere lower. The results show that, as for fermented milk, Camembert consumption did not greatly modify the microbiota profile or itsmajor metabolic activities. Ingested micro-organisms were able to survive in part during intestinal transit. These dairy products exert apotentially beneficial influence on intestinal metabolism.
Cheese: Camembert: Human microbiota-associated rats: Intestinal microbiota: Probiotics
There is growing evidence that the balance of gastrointes-tinal microbiota and microbiota functions play an import-ant role in maintaining health and preventing diseases.The colonic microbiota is a complex ecosystem, whichuntil recently was identified using cultures of specificmedium and phenotypic characteristics. During the last10 years, molecular methods have revealed that 70–80 %of micro-organisms escape analysis by bacteriological cul-ture methods (Suau et al. 1999). The molecular techniquesbased on the detection of nucleotide sequence of 16SrRNA and the amplification of 16S rDNA sequences,coupled with separation by denaturing gel electrophoresis,allow a better assessment of the microbiota compositionand dominant species complexity (Blaut et al. 2002).
Functional foods contain ingredients that beneficiallyaffect the health of consumers (Salminen et al. 1998).Among these functional foods, yoghurt and fermentedmilks provide live bacteria called probiotics, belongingmainly to Lactobacillus and Bifidobacterium species,although some other species or other micro-organisms,
such as yeast, have been a matter of interest (De Roos &Katan, 2000; Heyman & Menard, 2002). In human sub-jects, several studies have shown that these micro-organ-isms resist endogenous digestion during intestinal transitand are found at high levels in the stools during fermentedmilk consumption (Marteau et al. 1994; Bezkorovainy,2001). There is also some evidence that probiotics improvethe intestinal metabolism, modulate immunity and preventintestinal diseases such as diarrhoea (Goldin, 1998;Marteau et al. 2002). However, experimental studiessuggest that each strain and each association of strainslead to specific effects (Sanders, 1993; Reid, 1999).
One of the possible mechanisms of action of probioticsis an effect on the composition and the metabolism ofthe intestinal microbiota. In children, we have previouslyshown that fermented milk containing Lactobacillus caseiDN-114 001 and yoghurt symbiosis have positive effectson diarrhoea and regulate some deleterious bacterial activi-ties, such as reductase and b-glucuronidase (Guerin-Dananet al. 1998). Similar observations have been obtained in
* Corresponding author: Dr Claude Andrieux, faxþ33 1 34 652492, email [email protected]
Abbreviations: HM, human microbiota-associated; HMB, group fed on basal diet; HMCp, group fed on diet containing Camembert made from pasteurised
milk; HMfm, group fed on diet containing fermented milk; Psc, Pearson similarity coefficient; TTGE, temporal temperature gradient gel electrophoresis.
British Journal of Nutrition (2004), 92, 429–438 DOI: 10.1079/BJN20041192q The Authors 2004
human microbiota-associated (HM) rats (Djouzi et al.1997).
In an effort to expand the products providing probiotics,food such as Cheddar cheese, Gouda cheese, cottagecheese or ice-cream have been studied as food-carriers ofboth Bifidobacterium and Lactobacillus probiotic strains(Stanton et al. 1998). However, nothing is known aboutthe effect of flowered-rind soft cheese containing live bac-teria such as Camembert, which is traditionally consumedin France and many other countries worldwide (Lenoiret al. 1995).
The objective of the present study was to evaluate theconsequence of Camembert on intestinal microbiota com-position and metabolism. The model used is the HM rat,as described by Djouzi et al. (1997). The influence ofCamembert consumption on dominant intestinal microbiotawas evaluated using PCR–temporal temperature gradientelectrophoresis (TTGE) analysis. The concentration ofcommon cheese micro-organisms was measured in faecalsamples using both cultures on specific medium andPCR–TTGE analysis with specific primers. The metaboliccharacteristics of the faecal microbiota were studied: SCFAas markers for glycolytic fermentation, NH3 and iso-acidsas markers for proteolytic fermentation, and glycosidasesinvolved in carbohydrate hydrolysis (a- and b-galactosi-dase, a- and b-glucosidase) and in mucin degradation(neuraminidase, b-N-acetyl-galactosaminidase and a-L-fucosidase). The b-glucuronidase, nitrate reductase andazoreductase activities and bile acid conversions leadingto the release of toxic substances were also investigated.Milk fermented by yoghurt starters and Lactobacilluscasei was used as a probiotic-containing reference product.
Methods
Animals and diets
Germ-free male Fischer rats (2·5 months old, n 30;UEPSD, Jouy en Josas, France) were reared in threeTexler-type isolators (La Cahlene, Velizy, France). Therats were fed the basal diet B (Table 1) for 1 week. Theywere then inoculated through a single oral gavage with
1 ml of a 1022 dilution of a faecal sample from a 30-year-old healthy female volunteer, who had not receivedantibiotics for at least 3 months before stool collection.The faecal dilution was performed from a frozen 1021
dilution of the faecal sample (–808C into glycerol) in ananaerobic cabinet (N2–H2–CO2 (85:10:5, by vol.)) in (g/l): NaCl 5·0, glucose 2·0, cysteine hydrochloride 0·3. Forthe following 3 weeks, rats were maintained on the basaldiet. At t0, rats received the Cp diet (Table 1) containingCamembert made from pasteurised milk (HMCp rats),the fm diet (Table 1) containing fermented milk (HMfmrats) or were kept on the basal diet B (HMB rats) for 6weeks. The basal diets was sterilised by g-irradiation at45 kGy in plastic vacuum bags and offered as a paste pre-pared daily (described in Table 1).
The microbial compositions of Camembert and fermen-ted milk are shown in Tables 2 and 3. They were con-ditioned in sterile pots sealed with a double cover. Thepots were placed daily in the isolators using peraceticacid (100 ml/l).
Sample collection
Several samples of faeces were collected from the rectumof each individually identified rat before (t0), at 3 weeks(t3) and 6 weeks (t6) under the three dietary conditions.Fresh faecal samples collected at t6 were pooled for enu-meration of bacteria of dairy-product origin. The othersamples were frozen at 2808C until analyses. For molecu-lar analyses, faecal samples from three rats (no. 1, no. 2,no. 3) of each dietary group collected at t0, t3 and t6were used individually and in pools. For steroid analysis,faeces were collected at t6 over two consecutive 24 hperiods from each cage and stored at 2808C until analysis.The two sequential 24 h samples were pooled to give asingle sample per cage (five rats per dietary group).
Rats were killed using CO2 and their caeca wereremoved and weighed. The caecal contents were immedi-ately frozen in liquid N2 and stored at 2808C until deter-minations of enzymic activities and metabolites. Thecaecal samples from the three rats, no. 1, no. 2 and no. 3of each group, were used for PCR–TTGE analysis.
All procedures were conducted in accordance with theInstitute’s Guide for the Care and Use of LaboratoryAnimals.
Micro-organism enumeration
The dairy products were provided from regular factory pro-ducts every 2 weeks during the experiment. They weremaintained at 48C and introduced in isolators three timesper week. Microbiological analyses were performed twiceon each of the three batches of products: at the beginningand at the end of their use (after 2 weeks storage at 48C).The crust and the inside of Camembert were analysedseparately. Pimaricine (25 g/l water; 1 ml/l medium)(Sigma-Aldrich, Saint Quentin Fallavier, France) wasadded to analyse the crust of cheese in order to eliminatefungal micro-organisms.
The dairy products were analysed using culture inspecific medium. Samples were diluted from 1021 to
Table 1. Composition of the diets
Diet. . . B Cp fm
Basal diet components (g/kg)Casein 50 0 50Soyabean-protein isolate 120 120 120Maize starch 280 280 280Mashed potato 280 280 280Sucrose 40 40 40Maize oil 30 30 30Lard 50 0 50Cellulose 70 70 70Mineral and vitamins 80 80 80
Diet preparation (g/d per rat)Basal diet 15 15 15Cheese* 0 50 0Fermented milk 0 0 50Water 20 20 15
* Protein 200 g/kg; fat 220 g/kg.
C. Lay et al.430
1029 in medium containing tryptone (1 g/l; Biokar, Beau-vais, France) and NaCl (9 g/l; Merck, Nogent sur Maine,France) and then surface-plated (0·1 ml) in duplicate onselective agars.
For lactic acid bacteria, De Mann–Rugosa–Sharpemedium (Difco, Becton Dickinson, Le Pont de Clair,France) was incubated at 308C (mesophile) or 458C (ther-mophile) for 48 h in anaerobiosis (Anaerocult; Merck).For Streptococcus thermophilus, M17 medium (Biokar)was used and plates were incubated at 458C for 48 h inaerobiosis. For Leuconostoc, medium containing tomatojuice (Difco) with 5 g calcium citrate/l (Merck) and 6 mgvancomycine/l (Sigma) was incubated for 3 d at 228C.Enterococci were enumerated after 24 h incubation at378C using citrate azide Tween carbonate (Merck).
Micrococcaceae, Enterobacteriaceae and Coryneformbacteria were determined using tryptone soyabean agar(Oxoid, Dardilly, France) with and without NaCl (30 g/l).Bacteria were enumerated after 3 d incubation at 308C.
Geotrichum and yeast were enumerated using modifiedCzapeck medium (g/l): (NH4)2SO4 (Panreac, Lyons,France) 2, KH2PO4 (Merck) 1; KCl (Merck) 0·5,MgSO4.7H2O (Merck) 0·5, FeSO4.7H2O (VWR, Fontenaysous Bois, France) 0·01, glucose (Merck) 10, yeast extract(Difco) 2, agar (Biokar) 20. Plates were incubated for 6 dat 258C. For Penicillium analysis, medium contained (g/l):glucose (Merck) 30, NaCl (Merck) 80, NaNO3 (Merck) 3,KCl (Merck) 0·5, MgSO4.7H2O (Merck) 0·5, K2HPO4
(Merck) 1, FeSO4 (VWR) 0·01, yeast extract 5, agar(Biokar) 20. Plates were incubated for 6 d at 258C.
Faecal samples were analysed at the end of the experi-ment using pools from each group. Because the objectivewas to analyse the microbiota from the dairy productsingested, nalidixic acid (30 g/l; Sigma) and pimaricine(25 g/l water, 1 ml/l medium; Sigma), were added to inhibitGram-negative bacteria.
Gram staining, catalase production and APIw plates werealso used (BioMerieux, Marcy l’Etoile, France) to improvebacterial identification.
DNA isolation
Total DNA was extracted from 0·2 g faecal samples, 1·5 gcheese or 2 ml fermented milk (pellet from centrifugationat 15 000 g for 15 min) in 2·2 ml screw-capped tubes (Sar-stedt International, Orsay, France), as described previously(Godon et al. 1997). The concentration and integrity of thenucleic acids were determined visually by electrophoresison agarose (10 g/l) gel containing ethidium bromide.
PCR amplification
Primers U968-GC (50-CGC CCG GGG CGC GCC CCGGGC GGG GCG GGG GCA CGG GGG GAA CGCGAA GAA CCT TAC-30) and L1401 (50-GCG TGTGTA CAA GAC CC-30) were used to amplify the V6 to
Table 2. Microbiological analyses (log colony-forming units/g) of Camembert and offaecal samples*
Micro-organism Camembert† Faeces HMCp‡ Faeces HMB‡
Streptococcus thermophilus 7·8–8·2 7·5 NDLactococcus 8·1–9·1 ND NDLeuconostoc mesenteroides 6·0–7·5 ND 7·5Thermophilic Lactobacillus 0–4 ND NDMesophilic Lactobacillus 0–7·3 7·7 NDHafnia alvei 4·7–8·6 ND NDCorynebacteria 0–5·1 6·1 NDMicrococcaceae 2·7–6·8 6·8 NDGeotrichum 7·7–7·9 7·0 NDYeast 3·7–6·8 5·3 NDPenicillium 5·5–6·5 ND NDEnterobacteria ND 6·8 5·75Enterococcus ND 7·5 9·0
ND, not detected.* Rats were fed the basal diet (HMB group) or Camembert diet (HMCp group) for 6 weeks; for
details of diets and procedures, see Table 1 and p. 430.† Range from six analyses.‡ From a pool of faecal samples collected at t6 (after 6 weeks feeding of experimental diets).
Table 3. Microbiological analyses (log colony forming units/g) of fermented milk and of faecalsamples*
Micro-organism Fermented milk† Faeces HMfm‡ Faeces HMB‡
Streptococcus thermophilus 8·8–8·3 ND NDLactobacillus casei 8·2–8·5 8·3 NDLactobacillus delbruecki bulgaricus 6·3–7·1 ND ND
ND, not detected.* Rats were fed the basal diet (HMB group) or fermented milk diet (HMfm group) for 6 weeks; for details of
diets and procedures, see Table 1 and p. 430.† Range from six analyses.‡ From a pool of faecal samples collected at t6 (after 6 weeks feeding of experimental diets).
Cheese and intestinal microbiota 431
V8 regions of the bacterial 16S rDNA (Zoetendal et al.1998). Primers Lac1 or Lac 352-f (50-AGC AGT AGGGAA TCT TCC A-30) and Lac 2GC or Lac 679-GC-r(50-CGC CCG CCG CGC GCG CGG CGG GCG GGGGCG GGG GCG GGG CAC GGG GGG ATT YCACCG CTA CAC ATG-30) (Walter et al. 2001) were usedfor specific amplification of the 16S rDNA sequences ofLactobacillus, Pediococcus, Leuconostoc and Weissellagenera, belonging to the Lactobacilli group. These twosets of primers produced approximatively 433 and 327 bpPCR amplicons respectively. All primers were purchasedfrom Qbiogene Research Services (Evry, France).
PCR was performed using HotStar Taq DNA polymer-ase (Qiagen, Courtaboeuf, France). The PCR mix (50ml)contained 1 £ PCR buffer, 1 mM-MgCl2, 200mM eachdNTP, 20 pmol each primer, 2·5 U Hot Star Taq polymer-ase and approximately 2 ng DNA. The samples wereamplified in a PCT 100 thermocycler (MJ Research, Inc.,Albertville, MN, USA) using the following program:958C for 15 min, thirty cycles of 978C for 1 min, 588Cfor 1 min and 728C for 90 s, and finally 728C for 15 minfor the first set of primers. Hybridation temperature was618C for 1 min for the primers Lac1 and Lac 2GC. PCRproducts were analysed by electrophoresis on agarose(10 g/l) gel containing ethidium bromide to check theirsize and estimate their concentration.
Temporal temperature gradient gel electrophoresis
PCR amplification allowed generation of DNA fragmentsthat were of the same size, but variable in sequence.TTGE allows separation of the various DNA sequencesas discrete bands by migration in a denaturing polyacryl-amide gel containing urea, with a concomitant increasein temperature during electrophoresis.
The DCode Universal Mutation Detection System(Bio-Rad, Paris, France) was used for sequence-specificseparation of PCR products. Electrophoresis was per-formed, as previously described (Seksik et al. 2003),through a 1 mm thick, 160 £ 160 mm polyacrylamide(80 g/l) gel–acrylamide/Bis (37·5:1·0, v/v), 7 M-urea,1·25 £ Tris–acetate–EDTA, and 55ml and 550mlTEMED (Eurobio, Les Ulis, France) and ammonium per-sulfate (100 g/l) respectively using 7 litres 1·25 £ Tris–acetate–EDTA as the electrophoresis buffer.
At the beginning of electrophoresis, for better resolutionthe voltage was fixed at 20 V for 15 min. For the first set ofamplicons, electrophoresis was run for 16 h at 64 V with aninitial temperature of 668C and a ramp rate of 0·28C per h.For amplicons obtained with primers Lac1 and Lac 2GC,the temperature range was 63·8–70·08C with ramp rate of0·48C per h and at 66 V.
Each well was loaded with 100–200 ng amplified DNAplus an equal volume of 2 £ gel loading dye (BromophenolBlue (0·5 g/l)–xylene cyanol (0·5 g/l)–glycerol (700 g/l)).For each gel, three lanes were loaded with a marker obtainedby mixing PCR products of seven rDNA clones isolatedfrom one molecular inventory of one human faecal sample(Suau et al. 1999). Clones were related to members of theClostridium coccoides group, Clostridium leptum subgroup,Bacteroides group and Bifidobacterium group. After the
completion of electrophoresis, the gels were stained in thedark by immersion for 30 min in a solution of SYBRGreen I Nucleic Acid Gel Stain (Roche Diagnostics,Meylan, France) and read on a Storm system (MolecularDynamics, Amersham Biosciences, Orsay, France).
Biochemical analyses
Enzyme activities were measured in caecal samples using athermo-regulated anaerobic chamber (H2–CO2–N2
(10:10:80, by vol.)), as previously described (Andrieuxet al. 2002). Samples were diluted 1:20 using pre-reducedPBS (pH 6·7). a- and b-galactosidase, a- and b-glucosi-dase, b-glucuronidase, b-N-acetyl-galactosaminidase anda-L-fucosidase activities were measured by determiningthe rate of p-nitrophenol released from p-nitrophenyl gly-cosides. Azoreductase activity was determined using amar-anth (5 mM) as substrate. Neuraminidase activity wasmeasured using 4-methylumbelliferyl-N-acetylneuraminicacid as substrate. Nitrate reductase was determined bythe generation of nitrite. Enzyme activities were expressedasmmol metabolised substrate per min and per g protein.
Protein concentration was determined in triplicate by themethod of Lowry et al. (1951) on 1:500 faecal dilution inNa2CO3 (20 g/l) and NaOH (0·1 M). Bovine serum albuminwas used as the standard.
SCFA concentrations in caecal samples were analysed induplicate after water extraction of acidified samples usingGC (Perkin-Elmer 1020 GC; Saint Quentin, France)(Andrieux et al. 2002). NH3 was determined using theBerthelot method adapted by Dropsy & Boy (1961).
For bile acid analysis in faeces, 4 g faeces wasthoroughly homogenised in a minimal volume of distilledwater; lipids were extracted with 100 ml ethanol underreflux for 48 h in a Soxhlet apparatus. Ethanolic extracts(4 ml) were then saponified (1208C, 3 h, under pressure)in the presence of 1 ml 10 M-NaOH. Neutral steroidswere removed from the saponified mixture, with3 £ 10 ml light petroleum (40–608C) and bile acids wereextracted from the remaining acidified (pH 2) aqueousphase with 3 £ 10 ml diethyl ether. After evaporation ofthe solvent, bile acids were redissolved in 2 ml methanol.For chromatographic analysis, free bile acids weremethylated with diazomethane, then sylilated withN,O-bis(trimethylsilyl)trifluoroacetamide–triethylchlorosi-lane and trimethylsilylimidazole–pyridine (1:4, v/v)(Supelco, Saint Quentin Fallavier, France) in dichloro-methane. Trimethylsilyl derivates were analysed using aGC Peri 2000 (Perichrom, Saulx-les-Chartreux, France)equipped with a Ross injector and an OV-1 column(30 m £ 0·32mm £ 0·2mm; Perichrom). Respective pro-portions of the different molecular species of bile acidswere determined using calibration lines obtained from theanalysis of standard mixtures and 5a-cholestan as externalstandard.
Statistical analyses
PCR–TTGE profiles were compared using GelComparsoftware (GelComparIIe, version 2.0; Applied Maths,Kortrigk, Belgium). Analyses take into account number,
C. Lay et al.432
intensity and position of PCR–TTGE bands (PCR-ampli-fied 16S rDNA fragments) in the gel. Pearson correlationprovided similarity based upon densitometric curves. Simi-larity coefficients of Pearson were calculated to generate asimilarity matrix. The dendrogram was obtained from thismatrix by using the algorithm UPGMA (Unweighted PairGroup Method using Arithmetic averages).
Results of biochemical analyses were expressed as meanvalues with their standard errors of the mean. Data wereanalysed using ANOVA (StatView; Abacus Concepts,Berkeley, CA, USA). Where ANOVA indicated significanttreatment effects, mean values were compared using theNewman–Keuls procedure. Statistical significance wasaccepted at P,0·05.
Results
Bacterial PCR–temporal temperature gradient gelelectrophoresis analysis of faecal samples
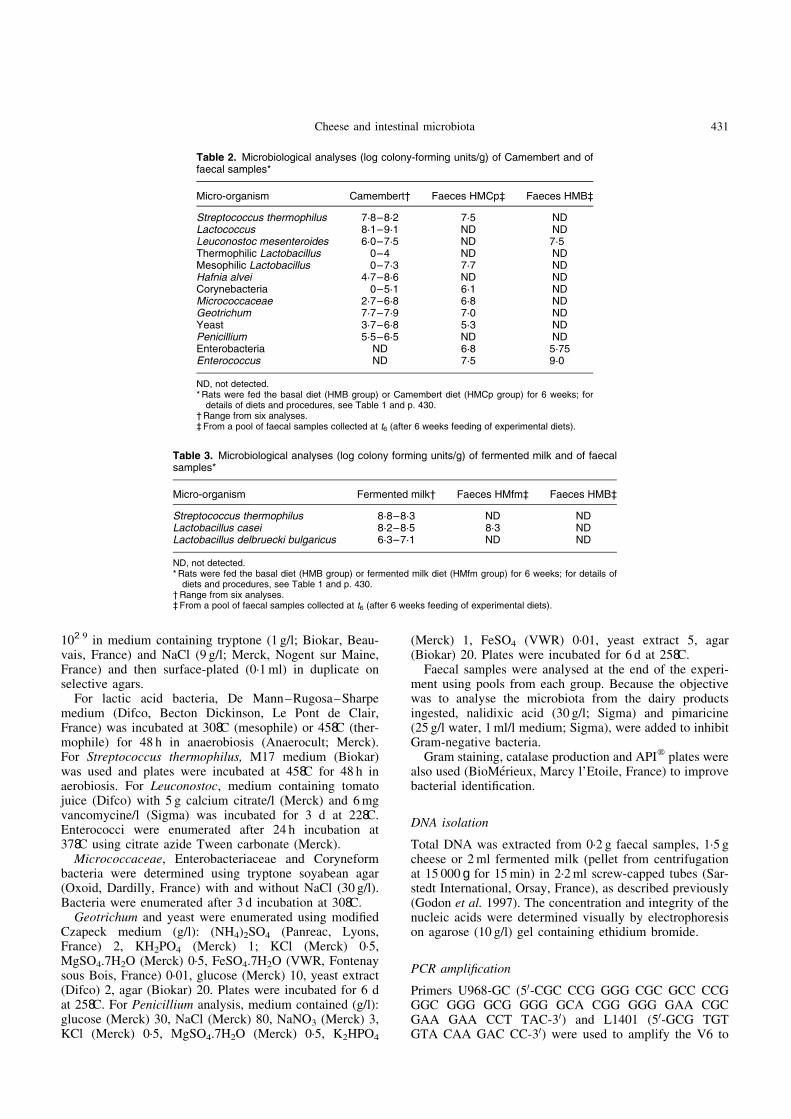
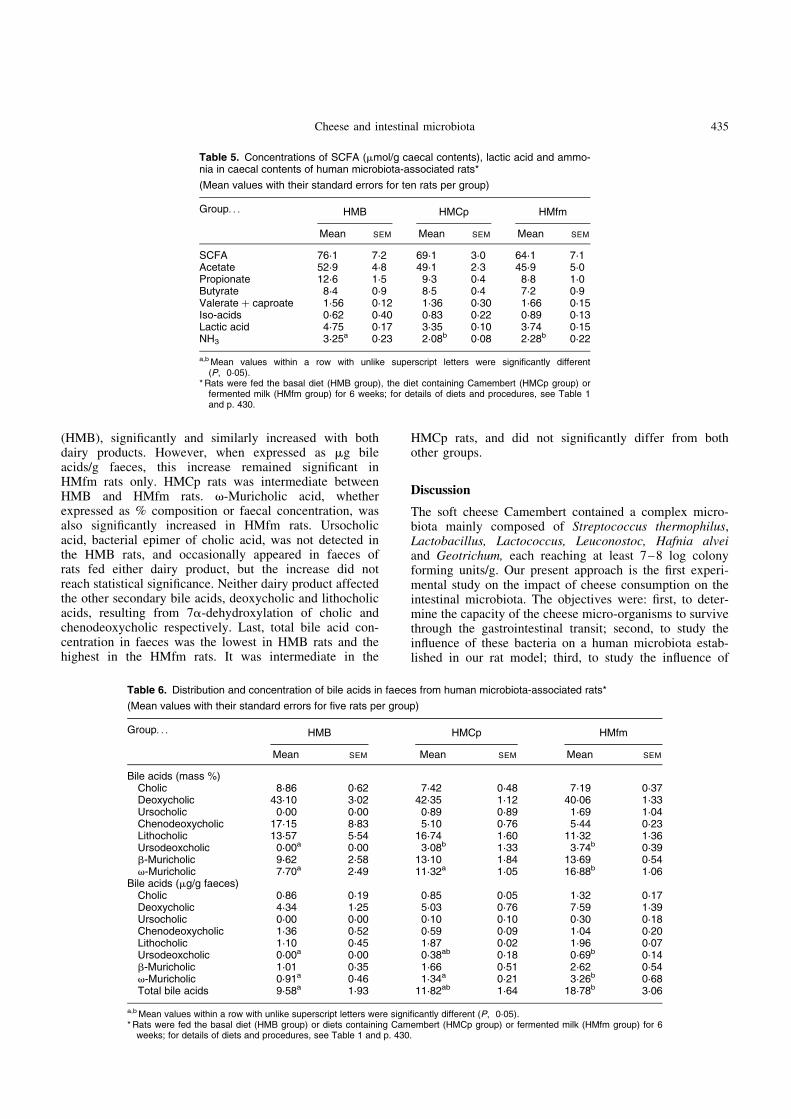
At t0, 3 weeks after the human microbiota inoculation andbefore the dairy products were given, faecal samples ofthree rats per group were analysed individually and inpools. The PCR–TTGE profiles of faecal pools were repre-sentative of the profile of individual samples within thepool (Pearson similarity coefficient (Psc) .94 %) (Fig. 1).Faecal microbiota profiles were similar between the threeexperimental groups (Psc .95·9 %).
In the control group (HMB), the comparison betweenPCR–TTGE profiles of pools of faecal samples at differenttimes (3 weeks (t0), 6 weeks (t3) and 9 weeks (t6) afterhuman faecal inoculation) indicated a high stability ofthe microbiota over time for the period of 9 weeks.
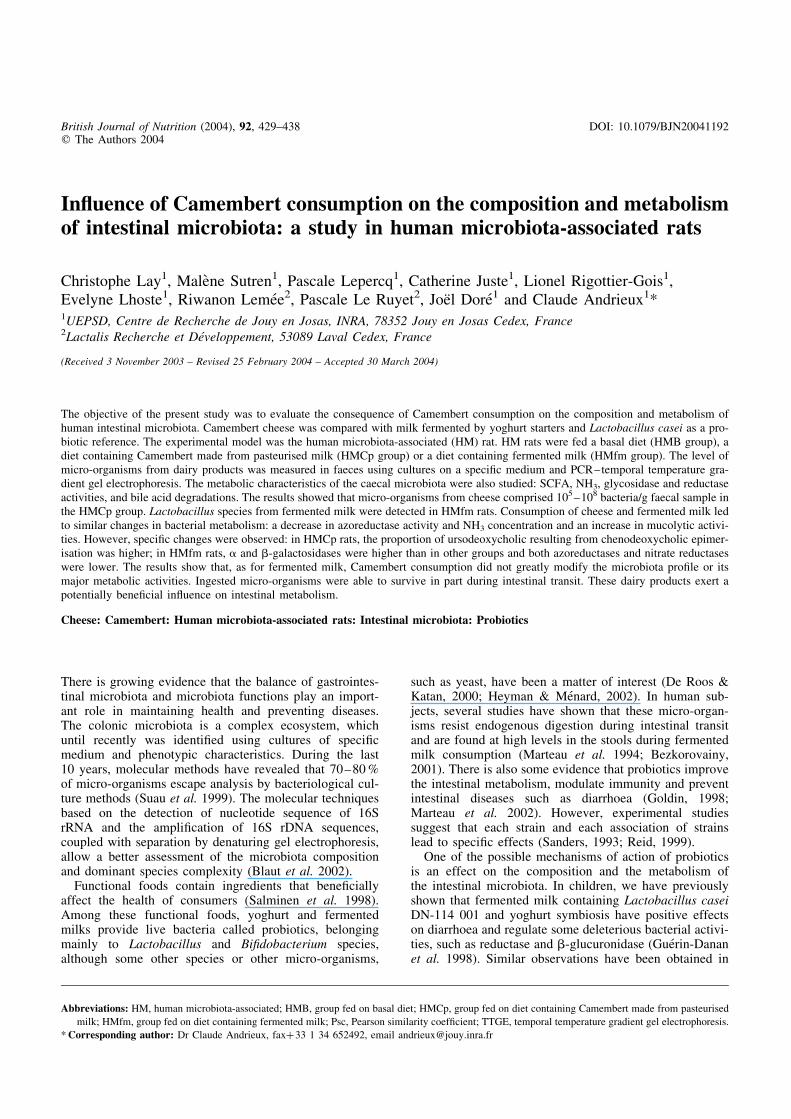
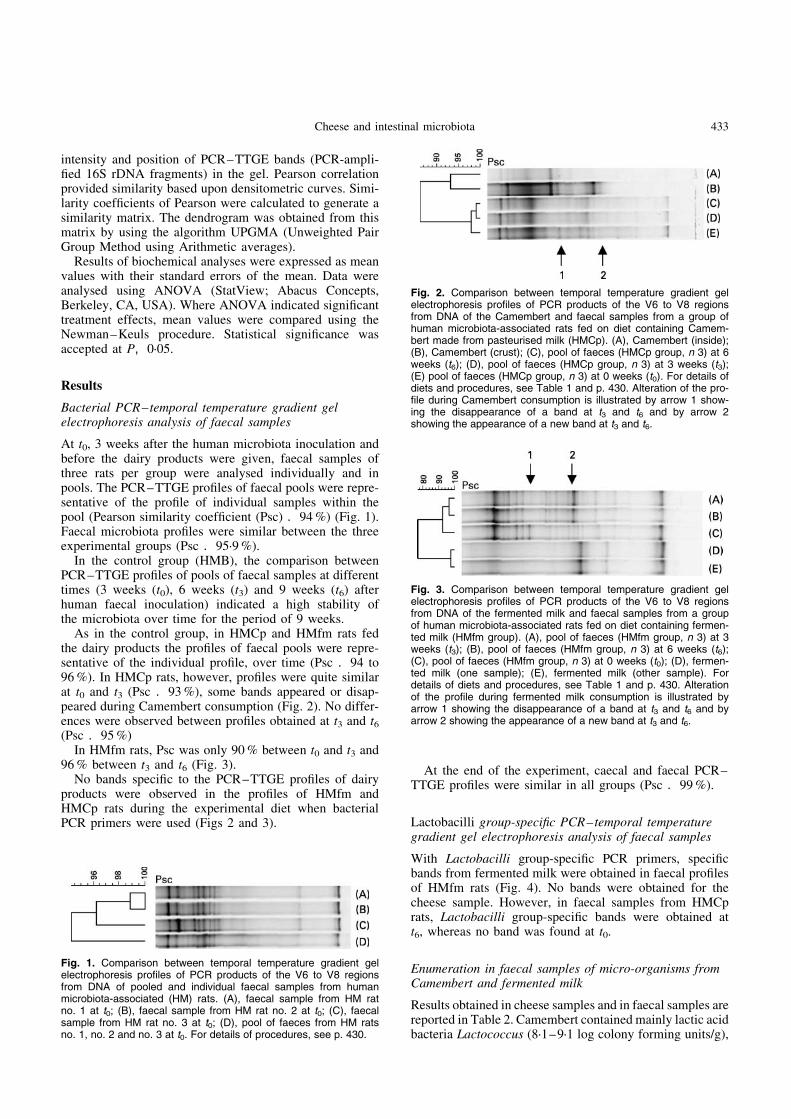
As in the control group, in HMCp and HMfm rats fedthe dairy products the profiles of faecal pools were repre-sentative of the individual profile, over time (Psc .94 to96 %). In HMCp rats, however, profiles were quite similarat t0 and t3 (Psc .93 %), some bands appeared or disap-peared during Camembert consumption (Fig. 2). No differ-ences were observed between profiles obtained at t3 and t6(Psc .95 %)
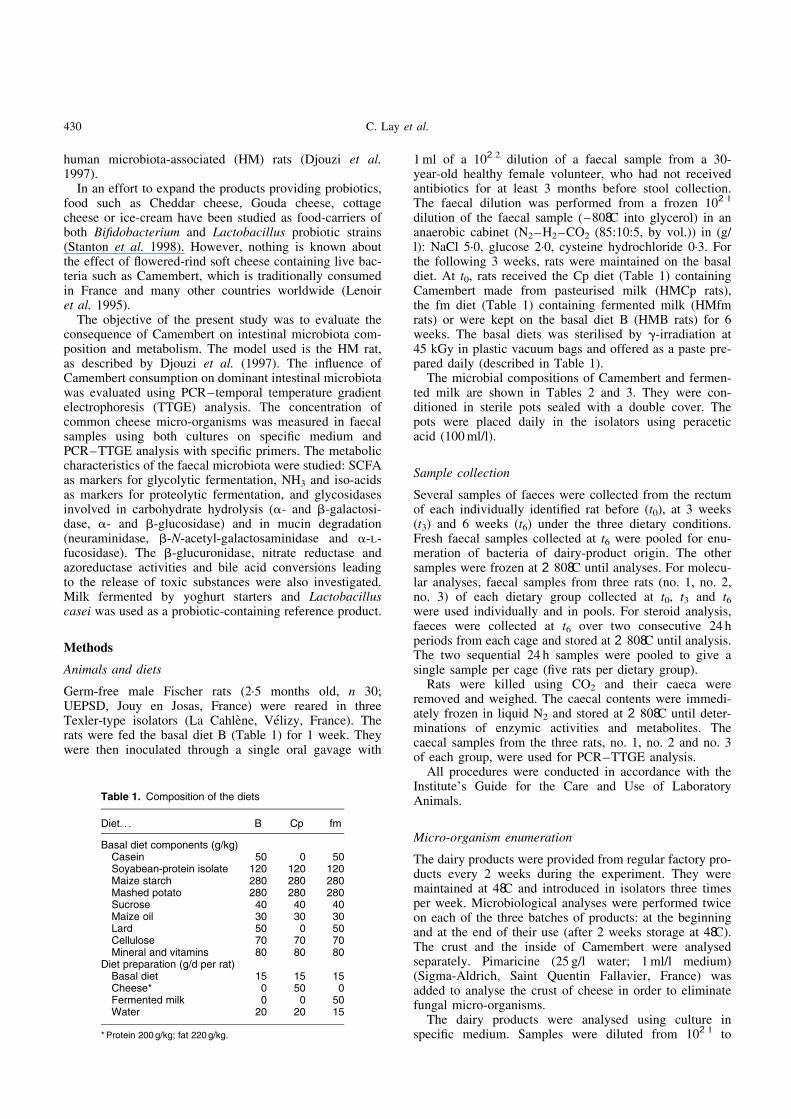
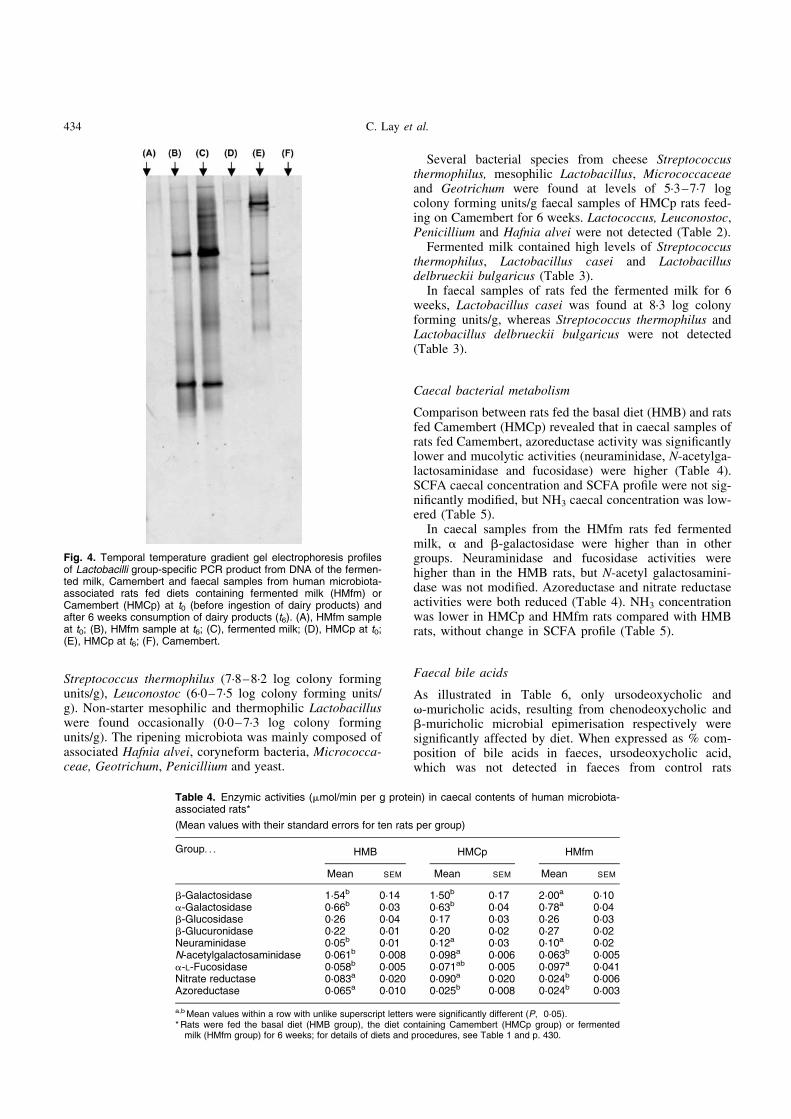
In HMfm rats, Psc was only 90 % between t0 and t3 and96 % between t3 and t6 (Fig. 3).
No bands specific to the PCR–TTGE profiles of dairyproducts were observed in the profiles of HMfm andHMCp rats during the experimental diet when bacterialPCR primers were used (Figs 2 and 3).
At the end of the experiment, caecal and faecal PCR–TTGE profiles were similar in all groups (Psc .99 %).
Lactobacilli group-specific PCR–temporal temperaturegradient gel electrophoresis analysis of faecal samples
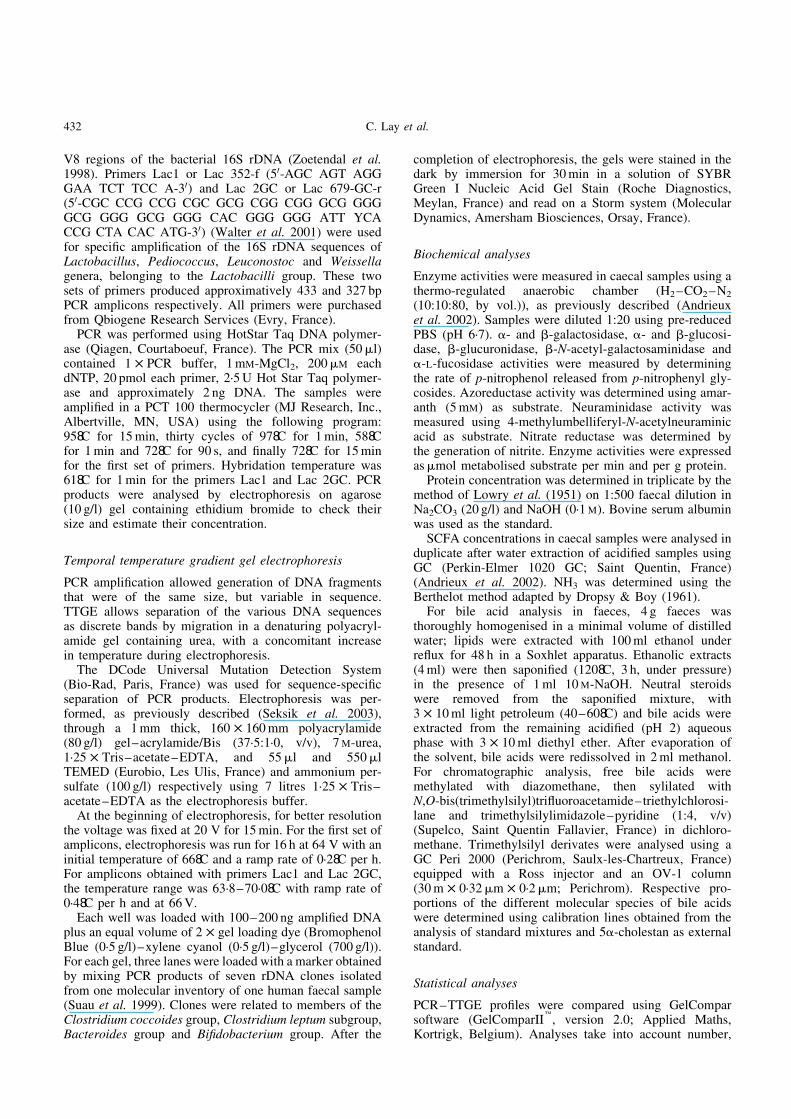
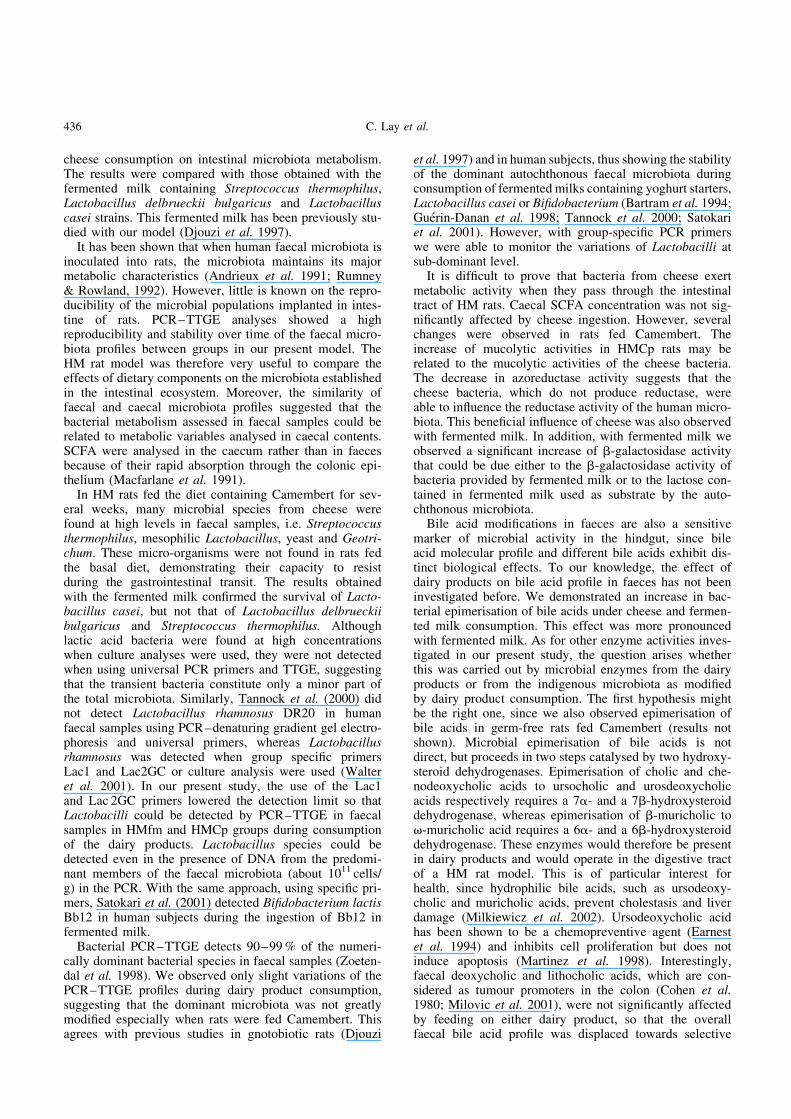
With Lactobacilli group-specific PCR primers, specificbands from fermented milk were obtained in faecal profilesof HMfm rats (Fig. 4). No bands were obtained for thecheese sample. However, in faecal samples from HMCprats, Lactobacilli group-specific bands were obtained att6, whereas no band was found at t0.
Enumeration in faecal samples of micro-organisms fromCamembert and fermented milk
Results obtained in cheese samples and in faecal samples arereported in Table 2. Camembert contained mainly lactic acidbacteria Lactococcus (8·1–9·1 log colony forming units/g),
Fig. 2. Comparison between temporal temperature gradient gelelectrophoresis profiles of PCR products of the V6 to V8 regionsfrom DNA of the Camembert and faecal samples from a group ofhuman microbiota-associated rats fed on diet containing Camem-bert made from pasteurised milk (HMCp). (A), Camembert (inside);(B), Camembert (crust); (C), pool of faeces (HMCp group, n 3) at 6weeks (t6); (D), pool of faeces (HMCp group, n 3) at 3 weeks (t3);(E) pool of faeces (HMCp group, n 3) at 0 weeks (t0). For details ofdiets and procedures, see Table 1 and p. 430. Alteration of the pro-file during Camembert consumption is illustrated by arrow 1 show-ing the disappearance of a band at t3 and t6 and by arrow 2showing the appearance of a new band at t3 and t6.
Fig. 3. Comparison between temporal temperature gradient gelelectrophoresis profiles of PCR products of the V6 to V8 regionsfrom DNA of the fermented milk and faecal samples from a groupof human microbiota-associated rats fed on diet containing fermen-ted milk (HMfm group). (A), pool of faeces (HMfm group, n 3) at 3weeks (t3); (B), pool of faeces (HMfm group, n 3) at 6 weeks (t6);(C), pool of faeces (HMfm group, n 3) at 0 weeks (t0); (D), fermen-ted milk (one sample); (E), fermented milk (other sample). Fordetails of diets and procedures, see Table 1 and p. 430. Alterationof the profile during fermented milk consumption is illustrated byarrow 1 showing the disappearance of a band at t3 and t6 and byarrow 2 showing the appearance of a new band at t3 and t6.
Fig. 1. Comparison between temporal temperature gradient gelelectrophoresis profiles of PCR products of the V6 to V8 regionsfrom DNA of pooled and individual faecal samples from humanmicrobiota-associated (HM) rats. (A), faecal sample from HM ratno. 1 at t0; (B), faecal sample from HM rat no. 2 at t0; (C), faecalsample from HM rat no. 3 at t0; (D), pool of faeces from HM ratsno. 1, no. 2 and no. 3 at t0. For details of procedures, see p. 430.
Cheese and intestinal microbiota 433
Streptococcus thermophilus (7·8–8·2 log colony formingunits/g), Leuconostoc (6·0–7·5 log colony forming units/g). Non-starter mesophilic and thermophilic Lactobacilluswere found occasionally (0·0–7·3 log colony formingunits/g). The ripening microbiota was mainly composed ofassociated Hafnia alvei, coryneform bacteria, Micrococca-ceae, Geotrichum, Penicillium and yeast.
Several bacterial species from cheese Streptococcusthermophilus, mesophilic Lactobacillus, Micrococcaceaeand Geotrichum were found at levels of 5·3–7·7 logcolony forming units/g faecal samples of HMCp rats feed-ing on Camembert for 6 weeks. Lactococcus, Leuconostoc,Penicillium and Hafnia alvei were not detected (Table 2).
Fermented milk contained high levels of Streptococcusthermophilus, Lactobacillus casei and Lactobacillusdelbrueckii bulgaricus (Table 3).
In faecal samples of rats fed the fermented milk for 6weeks, Lactobacillus casei was found at 8·3 log colonyforming units/g, whereas Streptococcus thermophilus andLactobacillus delbrueckii bulgaricus were not detected(Table 3).
Caecal bacterial metabolism
Comparison between rats fed the basal diet (HMB) and ratsfed Camembert (HMCp) revealed that in caecal samples ofrats fed Camembert, azoreductase activity was significantlylower and mucolytic activities (neuraminidase, N-acetylga-lactosaminidase and fucosidase) were higher (Table 4).SCFA caecal concentration and SCFA profile were not sig-nificantly modified, but NH3 caecal concentration was low-ered (Table 5).
In caecal samples from the HMfm rats fed fermentedmilk, a and b-galactosidase were higher than in othergroups. Neuraminidase and fucosidase activities werehigher than in the HMB rats, but N-acetyl galactosamini-dase was not modified. Azoreductase and nitrate reductaseactivities were both reduced (Table 4). NH3 concentrationwas lower in HMCp and HMfm rats compared with HMBrats, without change in SCFA profile (Table 5).
Faecal bile acids
As illustrated in Table 6, only ursodeoxycholic andv-muricholic acids, resulting from chenodeoxycholic andb-muricholic microbial epimerisation respectively weresignificantly affected by diet. When expressed as % com-position of bile acids in faeces, ursodeoxycholic acid,which was not detected in faeces from control rats
Fig. 4. Temporal temperature gradient gel electrophoresis profilesof Lactobacilli group-specific PCR product from DNA of the fermen-ted milk, Camembert and faecal samples from human microbiota-associated rats fed diets containing fermented milk (HMfm) orCamembert (HMCp) at t0 (before ingestion of dairy products) andafter 6 weeks consumption of dairy products (t6). (A), HMfm sampleat t0; (B), HMfm sample at t6; (C), fermented milk; (D), HMCp at t0;(E), HMCp at t6; (F), Camembert.
Table 4. Enzymic activities (mmol/min per g protein) in caecal contents of human microbiota-associated rats*
(Mean values with their standard errors for ten rats per group)
Group. . . HMB HMCp HMfm
Mean SEM Mean SEM Mean SEM
b-Galactosidase 1·54b 0·14 1·50b 0·17 2·00a 0·10a-Galactosidase 0·66b 0·03 0·63b 0·04 0·78a 0·04b-Glucosidase 0·26 0·04 0·17 0·03 0·26 0·03b-Glucuronidase 0·22 0·01 0·20 0·02 0·27 0·02Neuraminidase 0·05b 0·01 0·12a 0·03 0·10a 0·02N-acetylgalactosaminidase 0·061b 0·008 0·098a 0·006 0·063b 0·005a-L-Fucosidase 0·058b 0·005 0·071ab 0·005 0·097a 0·041Nitrate reductase 0·083a 0·020 0·090a 0·020 0·024b 0·006Azoreductase 0·065a 0·010 0·025b 0·008 0·024b 0·003
a,b Mean values within a row with unlike superscript letters were significantly different (P,0·05).* Rats were fed the basal diet (HMB group), the diet containing Camembert (HMCp group) or fermented
milk (HMfm group) for 6 weeks; for details of diets and procedures, see Table 1 and p. 430.
C. Lay et al.434
(HMB), significantly and similarly increased with bothdairy products. However, when expressed as mg bileacids/g faeces, this increase remained significant inHMfm rats only. HMCp rats was intermediate betweenHMB and HMfm rats. v-Muricholic acid, whetherexpressed as % composition or faecal concentration, wasalso significantly increased in HMfm rats. Ursocholicacid, bacterial epimer of cholic acid, was not detected inthe HMB rats, and occasionally appeared in faeces ofrats fed either dairy product, but the increase did notreach statistical significance. Neither dairy product affectedthe other secondary bile acids, deoxycholic and lithocholicacids, resulting from 7a-dehydroxylation of cholic andchenodeoxycholic respectively. Last, total bile acid con-centration in faeces was the lowest in HMB rats and thehighest in the HMfm rats. It was intermediate in the
HMCp rats, and did not significantly differ from bothother groups.
Discussion
The soft cheese Camembert contained a complex micro-biota mainly composed of Streptococcus thermophilus,Lactobacillus, Lactococcus, Leuconostoc, Hafnia alveiand Geotrichum, each reaching at least 7–8 log colonyforming units/g. Our present approach is the first experi-mental study on the impact of cheese consumption on theintestinal microbiota. The objectives were: first, to deter-mine the capacity of the cheese micro-organisms to survivethrough the gastrointestinal transit; second, to study theinfluence of these bacteria on a human microbiota estab-lished in our rat model; third, to study the influence of
Table 5. Concentrations of SCFA (mmol/g caecal contents), lactic acid and ammo-nia in caecal contents of human microbiota-associated rats*
(Mean values with their standard errors for ten rats per group)
Group. . . HMB HMCp HMfm
Mean SEM Mean SEM Mean SEM
SCFA 76·1 7·2 69·1 3·0 64·1 7·1Acetate 52·9 4·8 49·1 2·3 45·9 5·0Propionate 12·6 1·5 9·3 0·4 8·8 1·0Butyrate 8·4 0·9 8·5 0·4 7·2 0·9Valerate þ caproate 1·56 0·12 1·36 0·30 1·66 0·15Iso-acids 0·62 0·40 0·83 0·22 0·89 0·13Lactic acid 4·75 0·17 3·35 0·10 3·74 0·15NH3 3·25a 0·23 2·08b 0·08 2·28b 0·22
a,b Mean values within a row with unlike superscript letters were significantly different(P,0·05).
* Rats were fed the basal diet (HMB group), the diet containing Camembert (HMCp group) orfermented milk (HMfm group) for 6 weeks; for details of diets and procedures, see Table 1and p. 430.
Table 6. Distribution and concentration of bile acids in faeces from human microbiota-associated rats*
(Mean values with their standard errors for five rats per group)
Group. . . HMB HMCp HMfm
Mean SEM Mean SEM Mean SEM
Bile acids (mass %)Cholic 8·86 0·62 7·42 0·48 7·19 0·37Deoxycholic 43·10 3·02 42·35 1·12 40·06 1·33Ursocholic 0·00 0·00 0·89 0·89 1·69 1·04Chenodeoxycholic 17·15 8·83 5·10 0·76 5·44 0·23Lithocholic 13·57 5·54 16·74 1·60 11·32 1·36Ursodeoxcholic 0·00a 0·00 3·08b 1·33 3·74b 0·39b-Muricholic 9·62 2·58 13·10 1·84 13·69 0·54v-Muricholic 7·70a 2·49 11·32a 1·05 16·88b 1·06
Bile acids (mg/g faeces)Cholic 0·86 0·19 0·85 0·05 1·32 0·17Deoxycholic 4·34 1·25 5·03 0·76 7·59 1·39Ursocholic 0·00 0·00 0·10 0·10 0·30 0·18Chenodeoxycholic 1·36 0·52 0·59 0·09 1·04 0·20Lithocholic 1·10 0·45 1·87 0·02 1·96 0·07Ursodeoxcholic 0·00a 0·00 0·38ab 0·18 0·69b 0·14b-Muricholic 1·01 0·35 1·66 0·51 2·62 0·54v-Muricholic 0·91a 0·46 1·34a 0·21 3·26b 0·68Total bile acids 9·58a 1·93 11·82ab 1·64 18·78b 3·06
a,b Mean values within a row with unlike superscript letters were significantly different (P,0·05).* Rats were fed the basal diet (HMB group) or diets containing Camembert (HMCp group) or fermented milk (HMfm group) for 6
weeks; for details of diets and procedures, see Table 1 and p. 430.
Cheese and intestinal microbiota 435
cheese consumption on intestinal microbiota metabolism.The results were compared with those obtained with thefermented milk containing Streptococcus thermophilus,Lactobacillus delbrueckii bulgaricus and Lactobacilluscasei strains. This fermented milk has been previously stu-died with our model (Djouzi et al. 1997).
It has been shown that when human faecal microbiota isinoculated into rats, the microbiota maintains its majormetabolic characteristics (Andrieux et al. 1991; Rumney& Rowland, 1992). However, little is known on the repro-ducibility of the microbial populations implanted in intes-tine of rats. PCR–TTGE analyses showed a highreproducibility and stability over time of the faecal micro-biota profiles between groups in our present model. TheHM rat model was therefore very useful to compare theeffects of dietary components on the microbiota establishedin the intestinal ecosystem. Moreover, the similarity offaecal and caecal microbiota profiles suggested that thebacterial metabolism assessed in faecal samples could berelated to metabolic variables analysed in caecal contents.SCFA were analysed in the caecum rather than in faecesbecause of their rapid absorption through the colonic epi-thelium (Macfarlane et al. 1991).
In HM rats fed the diet containing Camembert for sev-eral weeks, many microbial species from cheese werefound at high levels in faecal samples, i.e. Streptococcusthermophilus, mesophilic Lactobacillus, yeast and Geotri-chum. These micro-organisms were not found in rats fedthe basal diet, demonstrating their capacity to resistduring the gastrointestinal transit. The results obtainedwith the fermented milk confirmed the survival of Lacto-bacillus casei, but not that of Lactobacillus delbrueckiibulgaricus and Streptococcus thermophilus. Althoughlactic acid bacteria were found at high concentrationswhen culture analyses were used, they were not detectedwhen using universal PCR primers and TTGE, suggestingthat the transient bacteria constitute only a minor part ofthe total microbiota. Similarly, Tannock et al. (2000) didnot detect Lactobacillus rhamnosus DR20 in humanfaecal samples using PCR–denaturing gradient gel electro-phoresis and universal primers, whereas Lactobacillusrhamnosus was detected when group specific primersLac1 and Lac2GC or culture analysis were used (Walteret al. 2001). In our present study, the use of the Lac1and Lac 2GC primers lowered the detection limit so thatLactobacilli could be detected by PCR–TTGE in faecalsamples in HMfm and HMCp groups during consumptionof the dairy products. Lactobacillus species could bedetected even in the presence of DNA from the predomi-nant members of the faecal microbiota (about 1011 cells/g) in the PCR. With the same approach, using specific pri-mers, Satokari et al. (2001) detected Bifidobacterium lactisBb12 in human subjects during the ingestion of Bb12 infermented milk.
Bacterial PCR–TTGE detects 90–99 % of the numeri-cally dominant bacterial species in faecal samples (Zoeten-dal et al. 1998). We observed only slight variations of thePCR–TTGE profiles during dairy product consumption,suggesting that the dominant microbiota was not greatlymodified especially when rats were fed Camembert. Thisagrees with previous studies in gnotobiotic rats (Djouzi
et al. 1997) and in human subjects, thus showing the stabilityof the dominant autochthonous faecal microbiota duringconsumption of fermented milks containing yoghurt starters,Lactobacillus casei or Bifidobacterium (Bartram et al. 1994;Guerin-Danan et al. 1998; Tannock et al. 2000; Satokariet al. 2001). However, with group-specific PCR primerswe were able to monitor the variations of Lactobacilli atsub-dominant level.
It is difficult to prove that bacteria from cheese exertmetabolic activity when they pass through the intestinaltract of HM rats. Caecal SCFA concentration was not sig-nificantly affected by cheese ingestion. However, severalchanges were observed in rats fed Camembert. Theincrease of mucolytic activities in HMCp rats may berelated to the mucolytic activities of the cheese bacteria.The decrease in azoreductase activity suggests that thecheese bacteria, which do not produce reductase, wereable to influence the reductase activity of the human micro-biota. This beneficial influence of cheese was also observedwith fermented milk. In addition, with fermented milk weobserved a significant increase of b-galactosidase activitythat could be due either to the b-galactosidase activity ofbacteria provided by fermented milk or to the lactose con-tained in fermented milk used as substrate by the auto-chthonous microbiota.
Bile acid modifications in faeces are also a sensitivemarker of microbial activity in the hindgut, since bileacid molecular profile and different bile acids exhibit dis-tinct biological effects. To our knowledge, the effect ofdairy products on bile acid profile in faeces has not beeninvestigated before. We demonstrated an increase in bac-terial epimerisation of bile acids under cheese and fermen-ted milk consumption. This effect was more pronouncedwith fermented milk. As for other enzyme activities inves-tigated in our present study, the question arises whetherthis was carried out by microbial enzymes from the dairyproducts or from the indigenous microbiota as modifiedby dairy product consumption. The first hypothesis mightbe the right one, since we also observed epimerisation ofbile acids in germ-free rats fed Camembert (results notshown). Microbial epimerisation of bile acids is notdirect, but proceeds in two steps catalysed by two hydroxy-steroid dehydrogenases. Epimerisation of cholic and che-nodeoxycholic acids to ursocholic and urosdeoxycholicacids respectively requires a 7a- and a 7b-hydroxysteroiddehydrogenase, whereas epimerisation of b-muricholic tov-muricholic acid requires a 6a- and a 6b-hydroxysteroiddehydrogenase. These enzymes would therefore be presentin dairy products and would operate in the digestive tractof a HM rat model. This is of particular interest forhealth, since hydrophilic bile acids, such as ursodeoxy-cholic and muricholic acids, prevent cholestasis and liverdamage (Milkiewicz et al. 2002). Ursodeoxycholic acidhas been shown to be a chemopreventive agent (Earnestet al. 1994) and inhibits cell proliferation but does notinduce apoptosis (Martinez et al. 1998). Interestingly,faecal deoxycholic and lithocholic acids, which are con-sidered as tumour promoters in the colon (Cohen et al.1980; Milovic et al. 2001), were not significantly affectedby feeding on either dairy product, so that the overallfaecal bile acid profile was displaced towards selective
C. Lay et al.436
enrichment in beneficial bile acids. This of course shouldbe further evaluated in human subjects.
The results obtained here show that, as fermented milk,Camembert consumption did not greatly modify the domi-nant intestinal microbiota or the major metabolic activities.But, we observed that micro-organisms from cheese micro-biota were able to partly survive the intestinal transit.Moreover, cheese consumption led to a potentially bene-ficial influence on the intestinal metabolism such as adecrease in azoreductase activity, a decrease in NH3
concentration and an increase of the proportion ofursodeoxycholic.
Because great variability was observed between humansubjects (Andrieux et al. 2002), we cannot generalise onthe results obtained with a single microbiota. Nevertheless,several animal and human studies have observed thedecrease of deleterious activities or metabolite productionduring probiotic administration (Bezkorovainy, 2001).
More information should be obtained in human volunteersto confirm our present results and identify the micro-organ-isms from cheese able to survive in the human intestinal tractand exert metabolic activities. Moreover, other investi-gations will be necessary to investigate mechanismsunderlying potentially beneficial effects of cheese.
Acknowledgements
The authors thank the manufacturers Lactalis Beurreet Fromage for providing the Camembert (CamembertPresident).
References
Andrieux C, Lory S, Dufour-Lescoat C, de Baynast R & Szylit O(1991) Physiological effects of inulin in germ-free rats and inheteroxenic rats inoculated with a human flora. Food Hydrocol-loid 5, 49–56.
Andrieux C, Membre JM, Cayuela C & Antoine JM (2002) Meta-bolic characteristics of the fecal microflora in humans fromthree age groups. Scand J Gastroenterol 7, 792–798.
Bartram HP, Sheppach W, Gerlach S, Ruckdeschel G, Kelber E &Kasper H (1994) Does yogurt enriched with Bifidobacteriumlongum affect colonic microbiology and fecal metabolism inhealthy subjects? Am J Clin Nutr 59, 428–432.
Bezkorovainy A (2001) Probiotics: determinants of survival andgrowth in the gut. Am J Clin Nutr 73, 399S–405S.
Blaut M, Collins MD, Welling GW, Dore J, van Loo J & de VosW (2002) Molecular biological methods for studying the gutmicrobiota: the EU human gut flora project. Br J Nutr 87,S203–S211.
Cohen BI, Raicht RF, Deschner EE, Takahashi M, Sarwal AN &Fazzini E (1980) Effect of cholic acid feeeding on N-methyl-N-nitrosourea-induced colon tumors and cell kinetics in rats. JNatl Cancer Inst 64, 573–578.
De Roos NM & Katan MB (2000) Effects of probiotic bacteria ondiarrhea, lipid metabolism, and carcinogenesis: a review ofpapers between 1988 and 1998. Am J Clin Nutr 71, 405–411.
Djouzi Z, Andrieux C, Degivry MC, Bouley C & Szylit O (1997)The association of yogurt starters with Lactobacillus casei DN114.001 in fermented milk alters the composition and metab-olism of intestinal microflora in Germ-free rats and in humanflora-associated rats. J Nutr 127, 2260–2266.
Drospy G & Boy J (1961) Determination de l’ammoniemie
(methode automatique par dialyse) (Determination of ammoniain the blood (automatic method using dialysis)). Ann Biol Clin(Paris) 19, 313–318.
Earnest DL, Holubec H, Wali RK, Jolley CS, Bissonette M,Bhattacharyya AK, Roy H, Khare S & Brasitus TA (1994)Chemoprevention of azoxymethane-induced colonic carcino-genesis by supplemented dietary ursodeoxycholic acid.Cancer Res 54, 5071–5074.
Godon JJ, Zumstein E, Dabert P, Habouzit F & Moletta R (1997)Diversity of microbial genes encoding small-subunit rRNA inan anerobic digestor. Appl Environ Microbiol 63, 2802–2813.
Goldin BR (1998) Health benefits of probiotics. Br J Nutr 80,S203–S207.
Guerin-Danan C, Chabanet C, Pedone C, Popot F, Vaissade P,Bouley C, Szylit O & Andrieux C (1998) Milk fermentedwith yogurt cultures and Lactobacillus casei compared withyogurt and gelled milk: influence on intestinal microflora inhealthy infants. Am J Clin Nutr 67, 111–117.
Heyman M & Menard S (2002) Probiotic microorganisms: howthey affect intestinal pathophysiology. Cell Mol Life Sci 59,1151–1165.
Lenoir J, Lamberet G & Schmidt JL (1995) L’elaboration d’unfromage: l’exemple du Camembert (Cheese making: exampleof Camembert). Pour la Science, Dossier hors serie, March,pp. 64–73.
Lowry OH, Rosebrough NJ, Farr AL & Randall RJ (1951) Proteinmeasurement with the Folin-phenol reagent. J Biol Chem 193,265–275.
Macfarlane GT & Cummings JH (1991) The colonic flora, fer-mentation and large bowel digestive function. In The LargeIntestine: Physiology, Pathophysiology and Disease, pp.51–92 [SF Phillips, JH Pemberton and RG Shorter, editors].New York: Raven Press.
Marteau Ph, Pochard Ph, Bouhnik Y & Rambaud JC (1994)Survie et effets de lactobacilles acidophiles et bifidobacteriesde produits laitiers fermentes dans le tube digestif del’homme (Survival and effects of acidophilic lactobacilli andbifidobacteria from fermented milk products in the humandigestive tract). Cah Nutr Diet 6, 336–340.
Marteau P, Seksik P & Jian R (2002) Probiotics and intestinalhealth effects: a clinical perspective. Br J Nutr 88, S51–S57.
Martinez JD, Stratagoules ED, LaRue JM, Powell AA, Gause PR,Craven MT, Payne CM, Powell MB, Gerner EW & Earnest DL(1998) Different bile acids exhibit distinct biological effects:the tumor promoter deoxycholic acid induces apoptosis andthe chemopreventive agent ursodeoxycholic acid inhibits cellproliferation. Nutr Cancer 3, 111–118.
Milkiewicz P, Roma MG, Elias E & Coleman R (2002) Hepato-protection with tauroursodeoxycholate and betammuricholateagainst taurolithocholate induced cholestasis: involvement ofsignal transduction pathways. Gut 51, 113–119.
Milovic V, Teller IC, Murphy GM, Caspary WF & Stein J (2001)Deoxycholic acid stimulates migration in colon cancer cells.Eur J Gastroenterol Hepatol 13, 945–949.
Reid G (1999) The scientific basis for probiotics strains of Lacto-bacillus. Appl Environ Microbiol 65, 3763–3768.
Rumney CJ & Rowland IR (1992) In vivo and in vitro modelsof the human colonic flora. Crit Rev Food Sci Nutr 31,299–331.
Satokari RM, Vaughan EE, Akkermans ADL, Saarela M & DeVos WM (2001) Bifidobacterial diversity in human fecesdetected by genus-specific PCR and denaturating gradiant gelelectrophoresis. Appl Environ Microbiol 67, 504–513.
Salminen S, Bouley C, Boutron-Ruault MC, Cummins JH, FranckA, Gibson GR, Isoluari E, Moreau MC, Roberfroid M &Rowland I (1998) Functional food science and gastrointestinalphysiology and function. Br J Nutr 80, S147–S171.
Cheese and intestinal microbiota 437
Sanders ME (1993) Summary of conclusions from a consensuspanel of experts on health attributes of lactic cultures: signifi-cance to fluid milk products containing cultures. J Dairy Sci76, 1819–1828.
Seksik P, Rigottier-Gois L, Gramet G, Sutren M, Pochart P,Marteau P, Jian R & Dore J (2003) Alterations of the dominantfaecal bacterial groups in patients with Crohn’s disease of thecolon. Gut 52, 237–242.
Stanton C, Gardiner G, Lynch PB, Collins JK, Fitzgerald G &Ross RP (1998) Probiotic cheese. Int Dairy J 8, 491–496.
Suau A, Bonnet R, Sutren M, Godon JJ, Gibson GR, Collins MD& Dore J (1999) Direct analysis of genes endocoding 16SrRNA from complex communities reveals many novel molecu-lar species within the human gut. Appl Environ Microbiol 65,4799–4807.
Tannock GW, Munro K, Harmsen HJM, Welling GW, Smart J &Gopal PK (2000) Analysis of the fecal microflora of humansubjects consuming a probiotic product containing Lacto-bacillus rhamnosus DR20. Appl Environ Microbiol 66,2578–2588.
Walter J, Hertel C, Tannock GW, Lis CM, Munro K &Hammes WP (2001) Detection of Lactobacillus, Pediococ-cus, Leuconostoc, and Weissella species in human fecesby using group-pecific PCR primers and denaturing gradientgel electrophoresis. Appl Environ Microbiol 67, 2578–2585.
Zoetendal EG, Akkermans ADL & De Vos WM (1998) Tempera-ture gradient gel electrophoresis analysis of 16S rRNA fromhuman fecal samples reveals stable and hosts specific commu-nities of active bacteria. Appl Environ Microbiol 64,3854–3859.
C. Lay et al.438


