Embed Size (px)
Citation preview

Tesis Doctoral
ROLE OF INTESTINAL MICROBIOTA COMPOSITION IN COLORECTAL CANCER AND IN THE RESPONSE
TO NEOADJUVANT RADIOCHEMOTHERAPY PREVIOUS TO SURGERY
Lidia Sánchez Alcoholado
UNIVERSIDAD DE MÁLAGA
Programa de Doctorado de Biomedicina, InvestigaciónTraslacional y Nuevas Tecnologías en Salud
Facultad de Medicina
2021
Directores:María Isabel Queipo Ortuño
Fernando Cardona Díaz

AUTOR: Lidia Sánchez Alcoholado
https://orcid.org/0000-0002-5410-1638
EDITA: Publicaciones y Divulgación Científica. Universidad de Málaga
Esta obra está bajo una licencia de Creative Commons Reconocimiento-NoComercial-SinObraDerivada 4.0 Internacional: http://creativecommons.org/licenses/by-nc-nd/4.0/legalcode Cualquier parte de esta obra se puede reproducir sin autorización pero con el reconocimiento y atribución de los autores. No se puede hacer uso comercial de la obra y no se puede alterar, transformar o hacer obras derivadas.
Esta Tesis Doctoral está depositada en el Repositorio Institucional de la Universidad de Málaga (RIUMA): riuma.uma.es


INDEX INDEX

INDEX
INTRODUCTION ……………………………………….………………..…………. 10
1. COLORECTAL CANCER ………......………………………………..………. 11
1.1. Epidemiology ………………………………………...……………………..… 11
1.2. Risk factors …………………………………………..……………………….. 13
1.2.1. Age ……………………….…………………………………………... 14
1.2.2. Genetic factors ……………….……………………………………… 14
1.2.3. Lifestyle factors ………………….………………………………….. 16
1.3. Mechanisms/pathophysiology ………………………...……………………... 25
1.3.1. Intestinal epitelium ……….………………………………………… 25
1.3.2. Carcinogenic mechanisms ………….………………………………. 26
1.3.3. Carcinogenic paths ……..…………………………………………… 30
2. GUT MICROBIOTA …………………………………………………………... 31
2.1. Healthy gut microbiota ………………………………………………………. 31
2.2. Disbiosis in colorectal cancer …………………………………………...……. 33
2.3. Changes in gut microbiota in colorectal cancer …………………………….. 35
2.4. Inflammation and regulation of the immune system by gut microbiota in colorectal cancer ……………………………………………………….........……. 37
2.5. Production of genotoxins in colorectal cancer ……...………………………. 40
2.6. Mediators of colorectal cancer carcinogenesis ……………………………… 42
2.6.1. Short chain fatty acids ……….……………………………………... 43
2.6.2. Bile acids …………………….…………………………………….… 45
2.6.3. Polyamines ……………………………….………………………….. 47
2.6.4. Trimethylamine/Trimethylamine N-oxide ………………...………. 49
3. OBESITY, GUT MICROBIOTA, COLORECTAL CANCER ……...……… 51
4. MODULATING MICROBIOTA FOR COLORECTAL CANCERPREVENTION …………………………………………………...………………. 54
4.1. Fiber ………………………………….………………………………... 54
4.2. Polyunsaturated fatty acids …………...……………………………… 56
4.3. Polyphenols …………………………………………………….……… 59

INDEX
5. GUT MICROBIOTA ON THE RESPONSE TO COLORECTAL CANCER TREATMENT AND ITS TOXICITY ………………………………………….... 61
HYPOTHESIS …………………………………………………………..…………… 64 OBJETIVES ………………………………………………………...……………….. 66 MATERIALS AND METHODS ………………...…………..……………………… 69
1. Study patients ………......………………………………………………………. 70
2. Laboratory measurements ……………………………………..……………… 71
3. DNA extraction and gut microbiota sequencing ……………..………………. 72
4. Intestinal permeability analysis …………………………………..………….... 72
5. Cytokine analysis ………………………………………………..……………... 73
6. Quantification trimethylamine N-oxide in serum samples ……………….…. 73
7. Analysis of serum polyamine levels by ultra-highperformance liquid chromatography tandem mass spectrometry ………………………..………….. 74
8. Extraction and analysis of short chain fatty acids from fecal samples by GC-fid …………………………………………………………………...…...……........ 75
9. Bioinformatics analysis ………………………………………………...…..…... 76
10. Statistical analysis ………………………………………………...……...…… 77
RESULTS …………………………………………………………………………….. 78
1. STUDY 1: Gut microbiota-mediated inflammation and gut permeability in patients with obesity and CRC ……………………………………………...……. 79
1.1. Clinical characteristics of the patients and healthy controls ………………. 79
1.2. Richness and diversity of fecal microbiota ……………….……………….… 80
1.3. Taxonomy of fecal microbiota in the study groups ………………………… 82
1.4. Serum zonulin levels ……………………………………………...………….. 88
1.5. Relationship between the fecal microbiota and serum levels of zonulin, trimethylamine N-oxide and inflamatory mediators in the study groups ..…… 88
1.6. Predicted functional metagenome analysis …………...……………...……... 90
INDEX
2. STUDY 2: Changes in the gut microbiota composition and functionality of colorectal cancer patients after neoadjunvant radiochemotherapy is associated with the pathologic response ………………………………………………...…… 92
2.1. Clinical characteristics of the patients and healthy control ………………... 92
2.2. Differences in taxonomic composition and diversity of gut microbiota between colorectal cancer patients and healthy controls …………………...…... 93
2.3. Changes in gut microbiota diversity and composition in response to neoadjuvant radiochemotherapy treatment in colorectal cancer patients …..… 96
2.4. Post-treatment microbiota diversity and composition is associate to clinical response to neoadjuvant radiochemotherapy in colorectal cancer patients …... 99
2.5. Baseline microbiota composition could predict response to radiochemotherapy treatment in colorectal cancer patients ………………….. 103
2.6. Differences in the gut microbiota functions between responder and non-responder ………………………………………………………………….…...… 104
2.7. Changes in serum leve lof polyamines and zonulin, and fecal leve lof short chain fatty acids after radiochemotherapy in colorectal cancer patients …….. 106
DISCUSSION ……………………………...……………………………………….. 111 CONCLUSIONS …………………………………...………………………………. 123 ABBREVIATIONS ………………………………………...…………………….… 126 REFERENCES ………………………………………………...………………....… 133 RESUMEN (ESPAÑOL) ………………...…………………………….………...… 186

INTRODUCTION
INTRODUCTION

INTRODUCTION
~ 11 ~
1. COLORECTAL CANCER
1.1. EPIDEMIOLOGY
We live in an era in which access to health care has increased and the diagnosis and
treatment of disease has improved, which has had an impact on average life expectancy
in most regions of the world. As a result of these medical improvements, disease-
associated mortality has generally decreased, however, cancer-associated mortality has
increased in recent decades. According to the latest data from the World Health
Organization (WHO), cancer is the second leading cause of death in the world, it is
estimated that in 2018, cancer caused 9.6 million deaths, being responsible for one of
every six deaths in the world.
Every year more than a quarter of a million people around the world are affected by
colorectal cancers (CRC). In industrialized nations the risk of developing CRC is
approximately 5%, this probability increases up to 20% in the case of developing an
adenoma or a non-cancerous colon tumor [1].
When the disease is localized, effective treatment success rates range from 70–90%;
however, advanced CRC has a high mortality rate, consistently ranking in the top three
causes of cancer-related death worldwide.
The geographical location is an important factor to take into account in the study of the
appearance of new cases of cancer, since it determines different lifestyles and cultures, as
well as differences for some types of cancers, between men and women [2] or between
different ethnic and racial groups. Areas of low incidence have been seen in the study of
CRC, such as Africa and parts of Asia, where a risk range of approximately 5 per 100,000
is estimated, while areas of high incidence such as the United States, Western Europe,

INTRODUCTION
~ 12 ~
Australia and New Zealand can reach a range of 40 per 100,000 [3], being higher in Japan
[4]. However, the increased risk of CRC in some countries does not necessarily
correspond to a higher mortality rate. The United States has a high incidence rate of CRC,
while it has a low mortality. In Brazil, India, China and some African countries the
opposite occurs, the incidence of suffering from the disease is low while the mortality
rate remains high [5]. Access to treatment is very important in reducing the mortality rate,
however the implementation of screening programs has been a determining factor for
early detection, as early as 1992 the first screening programs were established in Italy and
Israel [6]. The Spanish CRC incidence rate exceeds the European average, being 30.4 per
100,000, with the mortality rate remaining at the average, 13.3 per 100,000 [7, 8]. In
Spain, CRC is the first most common type of cancer and the second in mortality, if men
and women are studied together [9].
In the difference between males and females, the CRC seems to have a higher incidence
in males [10] especially at younger ages even having lifestyles similar to those of females.
There are studies that affirm that the risk of developing this type of cancer in males and
females is equal in later ages [2]. However, other studies have estimated a small statistical
difference in the possibility of developing colorectal adenomas for males with respect to
females, being the mean age of the groups 65 years [11]. And according to the 2018 data
from GLOBOCAN, both the incidence and mortality rates due to CRC worldwide are
higher for males than for females, being more evident above 50 years [10].
The development of cancer in general depends on a wide range of factors. The human
large intestine is a very common place for adenocarcinomas development, but it is also
the place where one of the most densely populated microbial ecosystems exists on the
planet. Although the appearance of CRC is highly heterogeneous from the genetic and
INTRODUCTION
~ 13 ~
epigenetic point of view, the possible role of intestinal microorganisms in colorectal
carcinogenesis should not be ignored [12].
1.2. RISK FACTORS
The etiology of CRC is very heterogeneous, age is considered to be a highly influential
factor in the onset of the disease [9], but the combination of genetic alterations and
environmental factors is which confers it variability. Most CRC cases are sporadic in
patients with no family history of the disease, occurring in three-quarters of cases [13].
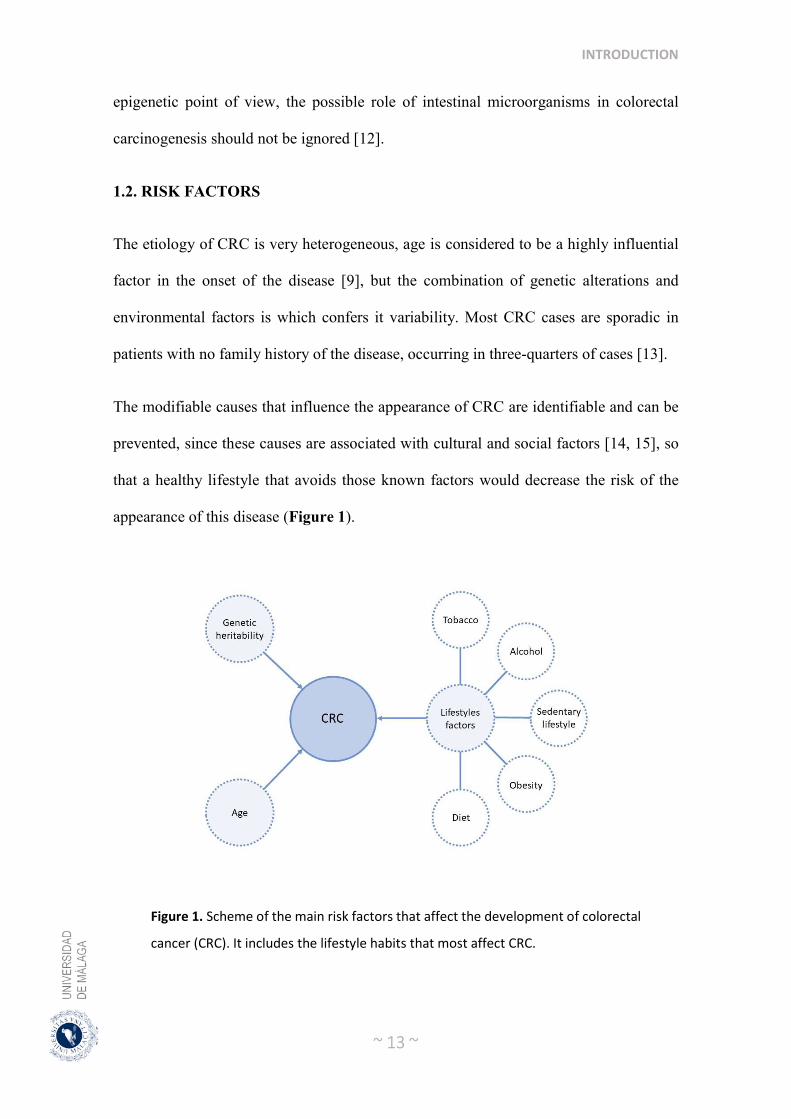
The modifiable causes that influence the appearance of CRC are identifiable and can be
prevented, since these causes are associated with cultural and social factors [14, 15], so
that a healthy lifestyle that avoids those known factors would decrease the risk of the
appearance of this disease (Figure 1).
Figure 1. Scheme of the main risk factors that affect the development of colorectal
cancer (CRC). It includes the lifestyle habits that most affect CRC.

INTRODUCTION
~ 14 ~
1.2.1. AGE
The older the age, the greater the probability of developing CRC, greatly increasing this
probability after 50 years of age. However, in recent times, studies have been carried out
in different regions and it has been seen that patients under 50 years of age have shown a
significantly higher probability [16, 17]. Patients under 50 years of age are less likely to
have CRC, however, there are studies that show an increase in cases diagnosed at those
ages, which tend to be in advanced stages. The survival prognosis is significantly worse
when the diagnosis of the disease occurs at an advanced stage regardless of age [18].
The fact that advanced cases of CRC are more commonly diagnosed in patients under 50
can be attributed to genetic predisposition, previous misdiagnoses, or overlook of the
symptoms of the disease [10,19]. However, the increase in diagnosed cases of CRC in
those under 50 years of age, regardless of stage, usually associated with risk factors
related to lifestyle, such as the dietary factors [20].
1.2.2. GENETIC FACTORS
The majority of CRC cases are sporadic and only a small proportion of them occur as a
consequence of genetic inheritance, as a result of familial adenomatous polyposis (<1%),
MYH gene associated polyposis (< 1%), or hereditary CRC without polyposis, also
known as Lynch syndrome (2-5%) [21]. The risk of developing this disease is higher if
there is a family history. If the number of family members with a positive diagnosis for
the disease increases, the risk of developing CRC also increases [13]. Regardless of age,
people with inherited cancer syndromes have a higher risk of CRC than the rest of the
population because they have germline mutations for high penetrance genes that are
usually autosomal dominant, thus that people with no family history could develop
hereditary cancer syndrome [10].

INTRODUCTION
~ 15 ~
A definite characteristic of CRC is genomic instability [22] that includes genetic or
genomic changes that can be a point mutation or chromosomal rearrangement [23].
The most frequent acquired genetic alterations that appear in CRC are due to
chromosomal instability, which includes numeric or subchronic chromosomal
aberrations, loss of heterozygosity, and amplifications [24]. The loss of tumor suppressor
genes is the main negative effect that will lead to carcinogenesis. Various genes such as
Adenomatous polyposis coli gene (APC), Kristen rat sarcoma virus gen (KRAS), Tumor
protein 53 gene (TP53), Phosphatidylinositol-4,5-Biphosphate 3- Kinase catalytic subunit
alpha gene (PI3KCA) and SMAD family member 4 gene (SMAD4) or Deleted in
pancreatic cancer 4 gene (DPC4) play an important role in the development of CRC [24].
Poor chromosomal segregation can lead to mutations in the APC gene that activate the
Wnt signaling pathway, a key step in the initiation of 80% of CRCs [22]. When the TP53
gene is mutated, a cell cycle checkpoint is lost and uncontrolled cell proliferation occurs
and drives the progression of carcinogenesis [25, 26].
Microsatellite instabilities are somatic alterations in specific regions of DNA called
microsatellites which are short sequences of nucleotide bases, repeated multiple times
[24]. The repair of mismatches during replication results in the accumulation of DNA
mutations mainly in the DNA fragments of microsatellites with repetitive nucleotide
sequence. This microsatellite instability can be identified using the polymerase chain
reaction (PCR) test, comparing normal and tumor DNA from the same patient [13]. Lynch
syndrome, the most common inherited CRC syndrome, is characterized by a mutation in
one of the genes responsible for repairing the DNA mismatch (MutL Homolog 1 (MLH1),
Epithelial cellular adhesion molecule (EPCAM), Postmeiotic Segregation Increased 2
(PMS2), MutS Homolog 2 (MSH2), or MutS Homolog 6 (MSH6)) [13]. The

INTRODUCTION
~ 16 ~
accumulation of mating alterations occurs mainly in the microsatellite regions of DNA
with repeating nucleotide sequences.
Epigenetic alterations appear commonly in polyps and CRC, probably in association with
carcinogenesis promoting mutations [27, 28]. DNA methylation is a modification of DNA
that has been identified as the third route of carcinogenesis [9]. The CpG (Dinucleotide
Citosin-Guanine) rich regions or CpG islands are the regions of DNA that are affected by
methylation. Hypermethylation can cause transcriptional silencing [29] including tumor
suppressor genes [9, 24]. Hypomethylation of repetitive genetic elements is associated
with the activation of oncogenes and genomic instability [30].
1.2.3. LIFESTYLE FACTORS
The development of CRC is associated, in addition to genetic predisposition, to a series
of environmental factors, which are identifiable and modifiable, which would help to
prevent the appearance of CRC to some extent. These known causes are widely related to
cultural and social factors [14, 15] so that the prevalence of these modifiable factors that
are related to lifestyle, could explain, to a large extent, the variation in the geographic and
socioeconomic status of the onset of this disease [31].
Thus, genetics individually influence the appearance of CRC, while factors associated
with lifestyle affect the incidence of the population suffering from the disease. This has
been seen in studies with migratory populations, in which it has been observed that the
incidence rate of CRC in the migrating population varied rapidly to reach the rate of the
host population [1, 32, 33].

INTRODUCTION
~ 17 ~
The identified factors whose modification can help prevent the appearance of CRC are:
smoking, alcohol consumption, obesity, sedentary lifestyle, high consumption of red and
processed meats and low fiber intake.
Tobacco
Tobacco is associated with up to 12% of deaths caused by CRC [34]. The carcinogens
present in tobacco are carried by smoke and can reach the colonic mucosa through the
circulatory system or directly by ingesting them, where they can induce genetic and
epigenetic aberrations responsible for the formation of CRC [35]. As previously
mentioned, CRC is a very heterogeneous disease, both in its origin and its development,
there are different subtypes which are not equally influenced by factors. In this case, the
tobacco, (responsible for the increase in the rate of formation and development of
adenomatous polyps that are the precursor lesion of CRC) [36, 37], in addition to
presenting differences in anatomical subtypes. In a study that included patients from 10
European countries an increased risk of developing proximal colon cancer was observed
[10].
Epigenetic alterations are strongly associated with smoking-induced neoplasms, which
was determined in a study in which the methylation of the human genome was studied
and the presence of DNA methylation patterns appeared in smokers but not in non-
smokers [38]. In the same study, it was observed that the methylation patterns of ex-
smokers were more similar to those of people who had never smoked, suggesting that
aberrant methylation may revert to normal after smoking cessation. Remembering the
existence of different subtypes of CRC, only some benefit from the short-term reversible
effect of quitting smoking, reducing the risk of CRC by approximately 50% after 10 years
of cessation of smoking [39]. While on the other hand, smoking also has an irreversible

INTRODUCTION
~ 18 ~
effect that takes time to emerge, which is the consequence of the action of tobacco
carcinogens (such as polycyclic aromatic hydrocarbons) that have an action on DNA
creating adducts that damage it irreversibly although quit smoking [35].
Alcohol
Currently, the consumption of alcoholic beverages is associated with an increase in the
diagnosis of patients with CRC at an early age [1, 10, 40]. Some studies have shown that
people with a consumption of 30 grams of alcohol per day (equivalent to 3 glasses of
wine) increases the probability of the appearance of polyps in the distal colon and rectum
almost twice compared to people whose consumption was less [40]. Subsequent analyzes
showed that the consumption of 30 or more grams of alcohol per day carried an increased
risk of developing CRC.
Although a minimum level of alcohol consumption has not been established to produce
an increase in the probability of developing the disease, in a meta-analysis that included
several studies with European, North American and Asian cohorts, even light
consumption alcoholic beverages (≤ 1 per day) was determined to produce a slightly and
significantly increased risk of developing CRC compared to individuals whose alcoholic
beverage consumption was occasional or not consume [41].
The risk factor for CRC associated with any type of alcoholic beverage is due to the
ethanol they contain. Ethanol will give rise to metabolites, the first of which,
acetaldehyde, is classified as carcinogenic to humans according to the International
Agency for Research.
The ingested alcohol reaches the colonocytes through the systemic circulation, where the
ethanol diffuses through the lumen of the intestine where the microbial alcohol

INTRODUCTION
~ 19 ~
dehydrogenase metabolizes it, giving rise to acetaldehyde [42]. The acetaldehyde found
in the lumen causes damage to the mucosa and its consequent cell proliferation to
regenerate it [43]. But this molecule also enters intestinal epithelial cells where it has a
toxic effect, since the low activity of acetoaldehyde dehydrogenase in the colon mucosa
causes it to accumulate inside the cell [42]. The intracellular accumulation of the ethanol
metabolite causes DNA damage and destroys folate, a molecule necessary for the correct
synthesis and methylation of DNA, which favors colorectal carcinogenesis [43, 44].
The social relationship between alcohol consumption and smoking must also be taken
into account [34]. Alcohol and tobacco when acting together increase the incidence of
CRC. The presence of alcohol makes the repair of tobacco-induced DNA mutations less
efficient, in addition, alcohol can act as a solvent for other carcinogenic molecules,
favoring their entry into mucosal cells [45].
Sedentary lifestyle
Lack of physical activity is a risk factor for CRC [46] being the third most important
socio-cultural factor that affects this disease [1]. There is strong evidence that a higher
level of physical activity is associated with a lower risk of various types of cancer [46-
48]. And convincing evidence of the beneficial effect of physical activity on the risk of
colon and breast cancer and probable evidence for other cancers [49-51]. According to
the National Institutes of Health (NIH), the data that relate more physical activity with a
lower risk of cancer come mainly from observational studies in which people who report
their physical activity are followed for several years to later determine cancer diagnoses.
Although no chance relationship is found in these types of studies, when similar results
are obtained in studies with different populations a possible connection casual is
evidences.

INTRODUCTION
~ 20 ~
Original scientific articles and systematic reviews have demonstrated a dose–response
relationship between physical activity and cancer risk [46, 49]. In the case of CRC, data
from multiple epidemiological studies indicate that physical activity after a CRC
diagnosis is associated with a 30% lower risk of death from CRC and a 38% lower risk
of death from any cause [48]. A meta-analysis of numerous prospective studies,
examining the association between physical activity of various intensity levels and the
risk of developing CRC have been evaluated, showing that increased levels of physical
activity considerably decrease the colon and rectal cancer risk [52]. In another meta-
analysis of 126 studies, people who participated in the highest level of physical activity
had a 19% lower risk of colon cancer than people with the lowest level of physical activity
[53]. In a study in which individuals with different levels of activity were compared, it
was observed that the appearance of adenomatous polyps was inversely and significantly
associated with physical activity, producing a 16% decrease in risk in individuals with
greater activity with respect to those of minor activity [40].
The frequency and intensity of physical activity are known to be inversely related to the
risk of CRC, although the optimal activity pattern to reduce risk and prevent the disease
is not known [54, 55]. The benefit of physical activity is associated with the accumulation
of energy expenditure due to exercise, not related to diets, which allows great flexibility
when choosing exercise and its intensity, which leads to a reduction in the risk of cancer
of the colon the weekly hours devoted to physical activity [10]. Currently, the rhythm of
life requires us to spend a large part of the time sitting, regardless of the physical activity
we do, it has been estimated that for each increase of 2 hours a day that we spend sitting,
the risk of CRC increases by 7% [56, 57].
The link between physical activity and reduced risk of CRC could be established through
the beneficial effects of physical activity on intestinal motility, reduction of inflammation,

INTRODUCTION
~ 21 ~
improvement of the immune system and the action of metabolic hormones [40, 58]. These
effects could be a direct consequence of physical activity, although they are also regulated
by the reduction of visceral adipose tissue [59]. The most commonly hypothesized
mechanisms proposed for relationship between physical activity and reduced cancer risk
are summarized in Figure 2.
Figure 2. The effects of physical activity that advantage a decrease in the risk of
cancer.
Obesity
There is a positive relationship between elevated body mass index (BMI) and the
development of adenomas and CRC [40]. Increasing the BMI by 5 units produces a
significant 19% increase in the relative risk of developing adenomas [60], which implies
a 6% increase in risk if the BMI is high. In the case of serrated polyps, when comparing
individuals with low and high BMI, it was observed that the risk of polyps appearing also
increased with BMI [61].

INTRODUCTION
~ 22 ~
The mechanisms that control the relationship between BMI and CRC risk are associated
with insulin resistance and associated hyperinsulinemia, which act on the insulin/insulin-
like growth factor, inducing mitogenic and antiapoptotic signaling pathways [1, 62].
Insulin-like growth factors (IGFs) play an important role in the development and
evolution of various types of cancers, not just CRC. In cancer cells, both IGF and its
receptors are overexpressed in such way that the cell cycle is promoted and apoptosis is
inhibited [63]. The activation of insulin receptors by insulin, initiates a sequence of
consequences that trigger in the promotion of cancer. Thus, insulin stimulates its receptors
and the levels of IGF-binding proteins are reduced, the levels of free IGF are increased,
which activates different pathways of regulation of cell growth and proliferation such as
phosphatidylinositol 3-kinase-AKT-mammalian target of rapamycin pathway and the
Ras-Raf-MEK-Mitogen-Activated Protein Kinase pathway, producing a greater cellular
metabolic activity that leads to higher oxidative stress and increased DNA damage [64].
Another reason that excess weight increases the risk of CRC is due to inflammation, since
obesity is a low-grade chronic inflammatory state, and inflammation as such increases
the probability of CRC [65].
Diet
Another risk factor that increases the probability of CRC is diet. The diet includes a large
amount of substances and molecules that really affect the disease, which when combined
have more influence. Many studies have been done to determine the dietary patterns that
could be considered healthy and unhealthy, since those considered healthy could reduce
the risk of CRC by 70% [66]. A healthy pattern would include high intakes of fruits and
vegetables, whole grains, nuts, legumes, fish/shellfish, and low-fat milk and dairy

INTRODUCTION
~ 23 ~
products, while reducing or eliminating red and processed meats, refined grains, and
products with sugars processed as desserts or sugar-sweetened beverage [67].
Comparing the dietary habits of CRC patients with healthy individuals, certain foods that
can contribute to CRC have been highlighted, such as high amounts of red meat, pork,
animal oils, fish, and eggs [68, 69]. Consumption of red meat, processed meat and canned
foods carries an increased risk of CRC [68, 70, 71]. Therefore, moderate consumption of
these foods is recommended in clinical guidelines to reduce the risk of CRC [3]. The
World Cancer Research Fund (WCRF) and the American Institute for Cancer Research
(AICR) conducted a meta-analysis of prospective studies showing that every 100 g/day
increase in the intake of red and/or processed meat translates into in a 12% increase in the
risk of CRC [72], being the effect of processed meat greater than that of red meat. Other
studies showed that, when comparing individuals with high and low intakes of
red/processed meat, individuals with the highest intake of red/processed meat had an
increase of around 20% in the risk of adenomatous polyps [71], being similarly estimate
for serrated polyps [61]. The influence of red meat and processed meat on the increased
risk of CRC is estimated to be due to carcinogenic compounds derived from them, such
as haem iron from red meat, exogenous N-nitroso compounds from processed meat,
ionized fatty acids and secondary bile acids attributable to fat in meats, and heterocyclic
amines and polycyclic aromatic hydrocarbons formed when meats are cooked at high
temperatures [73-76].
On the other hand, the reduction in the risk of CRC has been associated with a high intake
of fruits and vegetables, an increase in fiber and micronutrients such as vitamin C,
carotene and vitamin E [68, 69].

INTRODUCTION
~ 24 ~
As early as the 1970s, the low prevalence of CRC was studied in rural areas of many
African countries, where it was observed that there was a higher intake of fiber and bulky
stools with rapid evacuation [77].
The beneficial effect of dietary fiber to reduce the risk of CRC is based on the fact that it
increases the volume of the stool and reduces the transit time, so that the exposure of the
colorectal epithelium to carcinogens is reduced [78]. Although another mechanism of
action involves the interaction of fiber with the intestinal microbiota. Soluble fiber
reaches the colon undigested, where it is fermented by the anaerobic intestinal microbiota
into short chain fatty acids, mainly acetate, butyrate and propionate [79]. Among its
actions is the reduction of pro-inflammatory pathways [80], but also that of favoring the
survival of normal colonocytes and apoptosis of neoplastic colonocytes, as shown by in
vitro studies carried out with human intestinal cells [81].
Although dietary fiber has been inversely associated with the risk of CRC, that the source
of the fiber is important should be noted. Thus, fiber from whole grains has been
significantly related to reducing the risk of CRC [82] and adenomas [83], but not although
not all studies show significant differences for fiber from fruits, vegetables and legumes.
Even the amount of fiber from whole grains has been inversely associated with the
incidence and mortality of CRC [82, 84].
Since living beings are a network of biological pathways, different pathways may appear
that relate diet to CRC. Thus, there are foods that can predict levels of circulating C-
peptide (indicator of insulin secretion) and inflammatory markers (such as C-reactive
protein (CRP), Interleukin 6 (IL-6), Tumor necrosis factor (TNF) receptor 2) [85]. In a
healthy diet with intake of whole grains the levels of peptide-c and inflammatory markers
are low, but in an unhealthy diet pattern with high intake of meat, the levels of C-peptide

INTRODUCTION
~ 25 ~
and pro-inflammatory markers increase and this increase is associated positively with
CRC risk [86], suggesting that the effects of diet on CRC risk could be mediated, in part,
by insulin levels and inflammation.
1.3. MECHANISMS/PATHOLOGY
1.3.1. INTESTINAL EPITELIUM
The small intestine and the colon are maintained for life thanks to progenitor cells with
an extraordinary capacity for proliferation and differentiation, which gives the intestine a
great capacity for self-renewal. Both the epithelium of the small intestine and that of the
colon are structured in finger-shaped protrusions called villi that are designed to
maximize the absorption surface. These villi are surrounded by epithelial invaginations
called crypts, forming structural and functional units of the intestine, which are the place
where progenitor cells are found [87].
The different cells that make up the intestinal epithelium are:
Enterocyte, polarized cells that are responsible for absorption, are the majority
cell type.
Goblet cells, secrete mucin.
Enteroendocrine cells, participate in the release of hormones.
Plume cells, in charge of detecting the content of the lumen.
Microfold cells act as portals for light antigens and are located in Peyer's patches.
Paneth cells are located exclusively within the crypts, secrete bactericidal proteins
and help protect intestinal stem cells.
Intestinal stem cells, are located in the deepest area of the crypts and are
responsible for the self-renewal of the intestinal epithelium.

INTRODUCTION
~ 26 ~
All these cell types have a strict arrangement, stem cells are located at the bottom of the
intestinal crypts, where they produce highly proliferative cells which differentiate as they
move up the crypts and give rise to various types of mature epithelial cells that make up
the intestinal lining [22]. After differentiation, the stem cells remain at the bottom of the
crypts, while their progeny moves up the walls of the crypt, creating different levels of
differentiation [88].
Most crypt cells have a short half-life, except for Tuft cells, neuroendocrine cells, and
Paneth cells, which are specialized cells with a long half-life. Due to the short half-life of
these cells, a large number of colon epithelial cells, on the order of 1014, must be produced
during the half-life of humans [24]. This great proliferation of colonocytes occurs from
the epithelial stem cells of the colon, through a strongly regulated pathway, which allows
to regulate proliferation to the physiological needs of the individual.
Stem cell maintenance is mainly carried out by Wnt signaling pathways [89]. The
importance of the Wnt pathway in the maintenance, proliferation and differentiation of
intestinal stem cells is based on the fact that the target genes Wnt/β-catenin show their
maximum expression in cells at the base of the crypt [24]. The interest of the Wnt pathway
focuses on the fact that high signaling in stem cells leads to uncontrolled proliferation
and, this in turn, to tumor formation. In fact, most colon cancers are associated with some
mutation that activates the Wnt pathway [22].
1.3.2. CARCINOGENIC MECHANISMS
CRC is a very heterogeneous disease that manifests itself in various clinical and molecular
characteristics, in addition to sensitivity to treatments and its prognosis. Both genetic and
environmental factors gradually modify the cells of the intestinal epithelium of the colon
until they acquire the characteristics of cancer cells [90, 91].

INTRODUCTION
~ 27 ~
The origin of most cases of CRC is in a stem cell or a stem cell-like cell that resides at
the base of the crypts of the colon [92]. These epithelial cells of the colorectal mucosa are
subjected to the loss of genetic/epigenetic stability, which is why mutations and
alterations in the oncogenes and tumor suppressor genes accumulate, leading to the
malignant transformation of the cells and their subsequent clonal expansion [25, 93, 94].
The current pattern of CRC formation suggests that most arise from a polyp, from an
aberrant crypt. Therefore, they invariably arise from benign precursor polyps that show a
progressive and staggered accumulation of genetic and epigenetic changes that are the
main drivers of tumor development [95], these changes that induce the formation of
glandular structures called adenocarcinomas [96], from which most of the CRCs will
develop according to the adenoma-carcinoma sequence [9].
Regardless of the reason for the genetic or epigenetic changes, for CRC to develop, single
mutations are not enough to trigger the carcinogenic process in the intestinal epithelium
[96], but rather originate as a consequence of the accumulation of mutations in oncogenes,
tumor suppressor genes and DNA repair genes, leading to loss of normal mechanisms of
cell growth and differentiation.
The molecular changes associated with the tumor progression of CRC are mainly
attributed to genomic instability by which the accumulation of somatic aberrations occurs,
the three main routes of action are: control of gene expression by microsatelites,
chromosomal instability (CIN) and DNA methylation, especially of the CpG island [1,
95].
Genomic instability is associated with 85% of CRC cases and was proposed by Fearon et
al [25] such as the suppressive pathway or CIN pathway [97]. CIN is characterized by
changes in the number of chromosomes [98], as well as by structural abnormalities and

INTRODUCTION
~ 28 ~
loss of heterozygosity and amplifications, in addition to the inevitable mutations in
oncogenes and tumor suppressor genes [24, 97]. Poor chromosomal segregation can lead
to mutations in the APC gene that activate the Wnt signaling pathway, a key step in the
initiation of 80% of CRCs [22]. When the TP53 gene is mutated, a cell cycle checkpoint
is lost and uncontrolled cell proliferation occurs and drives the progression of
carcinogenesis [25, 26].
On the other hand, microsatellite instability (MSI) pathway, also called the mutator
pathway, is responsible for 15-20% of sporadic CRC [9, 97, 98]. It is characterized by the
production of errors in the mismatched base repair (MMR) mechanisms. The MMR genes
act in the S phase, repairing errors in the DNA produced by base mismatch or as a
consequence of the slippage of DNA polymerase during the replication of highly repeated
sequences [99]. Defects in these genes result in point mutations as well as
insertions/deletions that change the reading frame and produce a premature stop codon,
which codes for a non-functional protein [100]. Genes that contain repeating sequences
within the coding region [101], such as APC, MLH1, transforming growth factor beta
receptor 2 (TGF/BRII), and BCL2 Associated X (BAX) [102], have an increased risk of
MMR. The MMR system is made up of seven repair genes: MLH1, MLH3, MSH2,
MSH3, MSH6, PMS1 and PMS2 [103, 104]. This pathway produces DNA instability,
generating somatic alterations in specific regions of microsatellites [24], and leads to
CRC through the accumulation of mutations that occur at high speed and inactivate genes
responsible for the base-pairing repair system [98]. The accumulation of pairing
alterations occurs mainly in the microsatellite regions of DNA with repetitive nucleotide
sequences [13]. MSI is detected by comparing the microsatellite copy number of tumor
cells with that of normal cells; tumor cells generally have higher microsatellite copy
numbers [97].

INTRODUCTION
~ 29 ~
Epigenetic mechanisms can also play a role in the development of CRC, mainly via DNA
methylation. Epigenetic modifications can involve methylation of cytosine residues in
DNA and/or changes in chromatin structure that regulate gene expression [105]. DNA
methylation in CpG dinucleotides is one of the epigenetic mechanisms involved in the
regulation of gene expression in mammals and the methylation patterns are specific for
each species and type of tissue. The machinery involved comprises different regulatory
proteins including DNA methyltransferases, putative demethylases, methylated CpG-
binding proteins, histone modifying enzymes, and chromatin remodeling complexes
[106]. DNA methylation is of vital importance to maintain gene silencing in normal
development, genomic imprinting and inactivation of the X chromosome, in contrast,
alterations in it are implicated in some human diseases, especially those related to defects
in development and the neoplastic process [106]. In this way, 15% of sporadic CRC is
generated [9, 97]. Epigenetic alterations appear commonly in polyps and CRC, it seems
that associated with genetic mutations promote carcinogenesis [27, 28]. DNA methylation
is a modification of DNA that has been identified as the third route of carcinogenesis [9].
The CpG rich regions or CpG islands are the regions of DNA that are affected by
methylation. A crucial determinant of repression is the density of methylation in CpG
regions near the promoter, weak promoters are fully repressed by sparse methylation, if
the density of methylation is further increased, even the enhanced promoter cannot prevail
and repression remains complete [105]. Hypermethylation can cause transcriptional
silencing [29] including tumor suppressor genes [9, 24]. Hypomethylation of repetitive
genetic elements is associated with the activation of oncogenes and genomic instability
[30]. Tumors produced by methylation are more frequent in women and the elderly, with
preferential location on the right side of the colon and do not benefit from treatment with
5-fluorouracil (5-FU).

INTRODUCTION
~ 30 ~
1.3.3. CARCINOGENIC PATHS
Most CRCs begin as a growth of the inner lining of the intestinal epithelium that projects
over the mucosa, these structures called polyps are benign tumors. Over time (usually
many years), some polyps turn into cancer. Adenomatous polyps, or adenomas, are
important precursor lesions of CRC [107], although they do not always lead to cancer.
The carcinogenesis of CRC can occur by three known pathways: adenoma-carcinoma
sequence, serrated pathway and inflammatory pathway. The most common is the
adenoma-carcinoma sequence, a process by which CRC originates from an adenoma [10].
This model includes the gradual and staggered accumulation of genetic and epigenetic
alterations that will lead to the transformation of adenoma into adenocarcinoma. The
serrated pathway is an alternative carcinogenic pathway in which CRC develops from
serrated adenomas [108, 109]. In this way, 20-30% of sporadic CRC cases develop [110].
The inflammatory pathway is the third suggested carcinogenic pathway for the
development of CRC. Chronic inflammation increases the risk of CRC, in a study carried
out with patients with inflammatory bowel disease it was found that the increase was up
to 2.4 times greater than that of the general population [111]. In this path, the evolution
of dysplasia to CRC occurs [112]. It is estimated that less than 2% of CRC cases originate
through the inflammatory pathway [113].
Then, in addition to genetic alterations, the tumor microenvironment plays a critical role
in the initiation and promotion of CRC, with dietary intake and the intestinal microbiota
being the most dominant factors in the luminal microenvironment of the intestine.
Therefore, it has been suggested that differences in diet and gut microbiota could be
responsible for variations in the prevalence of CRC between two similar human
populations.

INTRODUCTION
~ 31 ~
2. GUT MICROBIOTA
2.1. HEALTHY MICROBIOTA
The microbiota encompasses enormous biodiversity and plays an important role in
ecosystems by supporting all living things, including humans. The human microbiota is
composed of different populations of bacteria that reside in the epithelial barriers of
different organs of the host with which they have a mutualistic relationship. Knowledge
about the human microbiota is becoming more extensive, new taxa are being discovered
in different anatomical sites and also their benefits or damages on human health, since
the microbiota is an active ecosystem that interacts with the host. In 2018 the number of
cultured bacterial species associated with humans was 2776, in 2020 the number
increased to 3253, an increase of 17% in less than 2 years [114].
The importance of the intestinal microbiota on the health of the host has been known for
more than a century [105], intensifying this interest in recent decades. The intestinal
microbiota carries out different fundamental functions directly related to food, such as
the production of essential vitamins. But it also has health-related functions such as the
production of important metabolites, prevention of infestation by pathogens and the
control of bacterial groups to avoid the increase of toxin-producing bacteria [115], in
addition to intervening in the activation of the immune system [116].
Intestinal microbiota is a very wide term, since the diversity of bacterial groups and their
quantity varies throughout the digestive tract, increasing from the stomach to the colon,
where the densest and metabolically active bacterial community is found [117]. The
digestive tract is home to between 1013 and 1014 microorganisms, a number that is almost
100 times the number of cells that make up the human body [118, 119]. Of the large
number of existing intestinal microbes, the highly predominant domain is that of bacteria,

INTRODUCTION
~ 32 ~
the number of species estimated is 500-1000 [118]. Of which 90% belong to the bacterial
phyla Bacteroidetes and Firmicutes, and a lower presence of Verrucomicrobia and
Actinobacteria. Although the phylum Firmicutes has more than 200 genera in the
intestinal microbiota, Clostridium, Lactobacillus, Enterococcus, Bacillus and
Ruminococcus stand out. From the phylum Actinobacteria, the genus Bifidobacterium
[120].
The intestinal microbiota has been highly studied by sequencing the 16S ribosomal DNA
of fecal samples. With this technique it has been observed that there is a great individual
variation, the bacterial profile of each individual being different, these variations are
greater as age advances [118].
However, when comparing the microbiota of different healthy individuals, similarities
are observed that are relatively stable over time [118]. After birth, in a period that can last
up to 3 years, an early bacterial composition is established that remains stable for years.
Although there are studies that show that gut microbiota patterns can be transmitted from
generation to generation [119]. Despite the great variability of the intestinal microbiota
due to genetic influence [121] and the environmental factors that affect it (diet, chemical
substances, drugs and antibiotics), a relatively stable composition of the intestinal
microbiota has been established for healthy adults [122]. But the microbiota reacts to the
dietary and health conditions of the host and to the environment of the intestine, which is
conditioned by the epigenetics of the host, which in turn, responds to the environmental
conditions in which it develops host [118].
Currently, multiple diseases, both intestinal and non-intestinal, have been associated with
the intestinal microbiota, among which are several types of cancer with characteristic
microbiome patterns and dysbiosis [123].

INTRODUCTION
~ 33 ~
2.2. DYSBIOSIS IN COLORECTAL CANCER
Currently, it is known that the intestinal microbiota participates in physiological and
pathophysiological processes that are related to various diseases, such as type II diabetes,
obesity, atherosclerosis, inflammatory bowel disease or gastrointestinal cancer [119].
As early as the 1960s a study in rodents was carried out which demonstrated the
carcinogenic effect of cycasin in conventional rats, but without the development of cancer
in germ-free rats [124]. Which put on alert the relationship of the intestinal microbiota in
the development of cancer. A subsequent study in which rodents were treated with
another carcinogenic molecule, 1,2-dimethylhydrazine, identified the genera Bacteroides,
Clostridium, Enterococcus, and Escherichia as possible promoters of colorectal
carcinogenesis of carcinogen-induced aberrant crypt foci [125].
It has been established that there are significant changes in the composition of the
intestinal microbiota when comparing the microbiota of healthy individuals with that of
patients with CRC [119]. Recent studies have shown that in the case of CRC patients,
bacterial diversity and richness is lower [126, 127]. With a lower abundance of potentially
protective taxa (such as Roseburia) and a higher abundance of taxa considered
procarcinogens (such as Bacteroides, Fusobacterium, Escherichia or Porphyromonas)
[128].
This change in the composition of the intestinal microbiota that favors the enrichment of
pro-inflammatory opportunistic pathogens and the decrease of butyrate-producing
bacteria lead to an imbalance in intestinal homeostasis or dysbiosis plays an important
role in the appearance and development of CRC [129, 130] since the intestinal microbiota
creates a favorable tumor microenvironment [120, 128]. The fact that the intestinal
microbiota is one of the important factors associated with CRC is currently indisputable,

INTRODUCTION
~ 34 ~
identifying bacteria closely related to the disease [120]. This is the case of Fusobacterium
and Streptococcus that activate metabolic cascades that are associated with an increased
risk of CRC [119]. The association of Fusobacterium with genetic mutations in CRChas
even been confirmed [131]. CpG island methylation phenotype status, MSI status, and
wild-type p53 from tumor tissue are associated with increased abundance of
Fusobacterium [119]. And some studies have even proposed the possible use of the
abundance and detection rate of certain bacterial groups, as is the case of species
belonging to Fusobacterium, Bacteroides and Methanobacteriales, which could be useful
for the early detection of CRC [129]. Animal studies have shown the colorectal
carcinogenic action of Fusobacterium nucleatum, Escherichia coli, Bacteroides fragillis
[130], as well as Enterococcus faecalis and Streptococcus gallolyticus, which are
individually associated with the development of CRC [128]. Thanks to metagenomics, it
has been possible to carry out studies in humans in which new bacterial genera related to
CRC have been identified, such as Parvimonas, Peptostreptococcus, Phorphyromonas
and Prevotella, present in greater abundance in stool samples and tumor tissue of patients
with CRC [128].
Bacterial groups such as Bacteroides fragilis, Fusobacterium nucleatum,
Enterococcaceae or Campylobacter, Peptostreptococus, Enterococus faecalis,
Escherichia coli, Shigella, and Stolyreptococus were significant increases, while
Faecalibacterium, Blautia, Clostridium, Bifidobacterium and Roseburia were
significantly decreased [132]. In another studies have been also described a decrease in
the abundances of Clostridium butyicum [133] belonging to a family of Gram-positive
fiber-fermenting bacteria [134] and Streptococcus thermophilus, both probiotic bacterial
species used to prevent antibiotic-associated diarrhea [128].

INTRODUCTION
~ 35 ~
2.3. CHANGES IN THE GUT MICROBIOTA IN COLORECTAL CANCER
The gut microbiota is partly responsible for the origin, development, and evolution of
CRC. These microorganisms create a microenvironment conducive to carcinogenesis, but
it is a changing environment that evolves together with CRC, so bacterial populations
also tend to change. In 2012, Tjalsma et al., proposed a driver-passenger bacterial model
through which it was intended to explain the participation of bacterial populations and
their changes during the development of CRC [135]. This model may contribute to the
genetic paradigm of the adenoma-carcinoma sequence.
The process begins when the colon mucosa of the individual at risk of CRC is colonized
by pathogenic driver bacteria, which are intestinal bacteria with pro-inflammatory
potential and procarcinogenic characteristics (Bacteroides fragilis and Escherichia coli
in particular) [136]. Driver bacteria produce genotoxins and induce inflammation that
lead to damage to the DNA of epithelial cells, which leads to the initiation of early
mutations of the adenoma-carcinoma sequence [124, 137] and to modify the tumor
environment whose changes will favor that driver bacteria are gradually replaced by
opportunistic bacteria with competitive advantages in the new environment [138]. These
opportunistic bacteria or passenger bacteria (Fusobacterium nucleatum and
Streptococcus gallolyticus in particular) have the ability to promote further development
of CRC [139].
Therefore, there are no bacteria that affect the appearance and development of CRC by
themselves, but it is a process in which the bacterial community participates jointly or
sequentially throughout the carcinogenesis process [139, 140].
A look at the large bacterial taxa of the intestinal microbiota shows us how in the initial
stage of the tumor, when comparing a model group of mice with CRC induced by 1,2-

INTRODUCTION
~ 36 ~
Dimethylhydrazine with a control group, there are significant differences in Bacteroidetes
and a lower relative abundance of Firmicutes and Proteobacteria [141].
Among the driving bacteria we find Bacteroides fragilis and genotoxic Escherichia coli,
which produce genotoxic substances that cause DNA damage [128]. Colibactin is
produced by E. coli, this genotoxin is capable of inducing single-stranded DNA breaks,
which results in increased mutations in affected cells [142]. Shigella spp is a potentially
pathogenic enterobacteria and, as such, it tends to appear rarely in healthy individuals,
however it is overrepresented in samples from patients with non-malignant adenomas
[136, 143]. Other species with high initial representation and that decrease when the
tumor develops are Clostridium lactatifermentans and Bacteroides dorei, with a
proinflammatory character and induce hyperproliferation. They are also from the group
of enterotoxigenic inflammatory bacteria Bacteroides fragilis or the Enterobacteriaceae
family, which can also cause dysplasia, hyperplasia and genotoxins [141].
Unlike driver bacteria, passenger bacteria are not good colonizers of a healthy colon, but
the tumor microenvironment gives them a competitive advantage [96] since there is a
breakdown of the colonic barrier, increased tumor vascularization and infiltration of
immune cells that are correlated with local physiological and metabolic changes [144].
Streptococcus gallolyticus subsp. gallolyticus is more prevalent in patients with colon
adenomas [145-147] which is due to the fact that these bacteria use exposed collagen
fibers of the basement membrane of a tumor environment to access the affected tissue
[148].
Fusobacterium spp is overrepresented in tumor samples [145, 146], it is considered a
transient bacterium [135] with inflammatory capacity [149] and invade tissues [150], thus
contributing to the change of the tumor environment [151, 152]. The higher abundance

INTRODUCTION
~ 37 ~
of Fusobacterium nucleatum in the early phases of dysbiosis in patients with adenomas
was related to a higher expression of pro-inflammatory cytokines [153, 154].
2.4. INFLAMMATION AND REGULATION OF THE IMMUNE SYSTEM BY
GUT MICROBIOTA IN CRC
Inflammation has been proposed as a promoter of carcinogenesis, and it plays an
important role in the initiation and evolution of CRC. Chronic inflammation has been
established as a mark of the appearance of cancer [91] due to the greater risk that patients
with chronic inflammatory disease have to develop it [155]. It is estimated that up to 20%
of cancer cases are preceded by chronic inflammatory processes [156].
In view of some studies that have been carried out to date, it has been established that
there is an association between colorectal adenoma and circulating levels of CRP, which
is a marker of systemic inflammation although it is not specific [157]. High levels of pro-
inflammatory cytokines have also been observed in adenomatous tissues, such as tumor
necrosis factor alpha (TNF-α) or interleukin-6 (IL-6), both of which participate in the
processes of cell growth, differentiation and apoptosis [158, 159].
Enterotoxigenic Bacteroides fragilis (ETBF) is also enriched in CRC patients and
produces inflammation through the action of interleukin 17 (IL-17), signal transducer and
activator of transcription 3 (STAT3) and nuclear factor-kappa B (NF-kB), all activated
by its virulence factor [128]. ETBF is capable of colonizing Adenomatous polyposis
coli/multiple intestinal neoplasia (APC/Min+) mice and activating the STAT3 pathway
[113, 140] and stimulates the cells of the intestinal epithelium of the colon to produce
particles necessary for the recruitment of helper T lymphocytes 17 and the activation of
IL-17, favoring the growth and survival of tumor cells [160]. ETBF also promotes

INTRODUCTION
~ 38 ~
inflammation by altering the intestinal barrier, as it can induce the degradation of E-
cadherin in the colon epithelium [161].
A study carried out in germ-free mice that were fed by gavage with feces from patients
with CRC, showed an increase in inflammatory genetic markers and histological
inflammation since the microorganisms induced the production of chemotactic factors in
the gut, such as the C-X-C motif chemokines ligands 9 and 10 (CXCL9 and CXCL10),
for cytotoxic T lymphocytes and type 1 helper T lymphocytes, and as C-C motif
chemokines ligands 17 and 20 (CCL17 and CCL20), for IL-17 producing helper T cells
[160]. Cancer cells are also known to release inflammatory cytokines and chemokines
that attract pro-inflammatory helper T cells. Thus, a tumorigenic microenvironment is
created in which growth and angiogenic factors and tissue remodeling enzymes abound,
and the antitumor response of T cells is suppressed [162].
Moreover, currently, a practically indivisible association between the gut microbiota,
inflammation and the immune system is assumed in CRC. Gut bacteria induce an immune
response that can cause ongoing low-grade inflammation, which can promote
tumorigenesis. Although it has been seen that inflammation cannot induce the tumor
without the presence of the microbiota or its derived compounds [163]. Inflammation of
the colon could be a key factor in the development of CRC and is extremely associated
with bacterial dysbiosis and increased intestinal permeability [164]. Changes in the
balance of commensal bacteria can lead to increased intestinal permeability, bacterial
translocation, and activation of the innate and adaptive immune system that stimulate
chronic inflammation [165].
Mice studies have shown that there is a relationship between the appearance of polyps
and defects in the intestinal barrier of the colon, bacterial invasion and a greater

INTRODUCTION
~ 39 ~
expression of inflammatory factors such as TNF-α, IL-1, IL-17 and C-X-C motif
chemokines ligand 2 (CXCL2). Alterations in the intestinal mucosa barrier are key for
the microorganisms to induce local inflammation [166]. As a result of this inflammation,
cytokines and chemokines are secreted that act as growth factors and angiogenesis is
stimulated [162].
When the barrier of the intestinal mucosa is altered, intestinal bacteria and their
degradation products (such as lipopolysaccharides of the outer membranes of some
bacterial groups) can penetrate into the tumorigenic tissue where the host recognizes them
through receptors, such as Toll-like receptors (TLR), which control the inflammatory
response to microorganims associated molecular patterns (such as lipopolysaccharides)
[167]. During carcinogenesis, tumor cells produce pro-inflammatory cytokines and
chemokines that attract immature myeloid cells or pro-inflammatory helper T cells [168].
Invasive commensal bacteria of tumor tissue and their components activate the TLR
receptors of the myeloid cells present, after activation of myeloid differentiation factor
88 (MyD88) through the production of inflammatory cytokines, the most notable of
which are IL-23, which in turn activates IL-17, IL-6 and IL-22 [167, 169, 170], thus
activating the NF-kB and the STAT3 signaling pathway, promoting the proliferation of
tumor cells [171, 172]. The activation of NF-kB, STAT3, the production of reactive
oxygen species (ROS) and the related oxidative stress and the damage produced in the
DNA, favor an abnormal cell proliferation that leads to the development of colorectal
adenomas and CRC [173, 174].
More specifically, some bacterial species and their relationship with CRC inflammation
have been identified. When Fusobacterium nucleatum is enriched in cases of human
CRC, interleukin IL-17A has an increase in its expression [175]. It has also been seen in
mouse casts that F. nucleatum generates a pro-inflammatory environment that allows the
INTRODUCTION
~ 40 ~
activation of the NF-kB pathway and the infiltration of the tissue by immune cells,
allowing the progression of colorectal neoplasia in APC/Min mouse models (a common
mouse model of CRC) [140, 149]. F. nucleatum can activate TLR4 signaling to promote
tumor development in mice [176].
Peptostreptococcus anaerobius also favors tumorigenesis by participating in the
formation of a pro-inflammatory environment through the induction of inflammatory
cytokines, recruitment of immune cells in tumor tissue, especially immunosuppressive
myeloid-derived suppressor cells, tumor-associated macrophages, and granulocytic
tumor-associated neutrophils, to promote tumor progression [177]. It has also been seen
in mice that this CRC-enriched bacterium can promote tumorigenesis by activating the
TLR2 and/or TLR4 pathways [178].
2.5. PRODUCTION OF GENOTOXINS IN COLORECTAL CANCER
Microorganisms also affect the carcinogenic process through the production of toxins that
damage DNA, which is known as genotoxins. Among toxins of this type is the cytolethal
strain toxin (CDT), which is produced by enteric pathogens such as Escherichia and
Campylobacter spp and is capable of inducing double-stranded DNA breakage through
its deoxyribonuclease activity [128, 140]. The carcinogenic process has been shown to be
attenuated in mouse models that are deficient in CDT [179].
Colibactin is produced by the Enterobacteriaceae family, being known as the Escherichia
coli. Colibactin causes DNA cross-linking and double-stranded DNA breaks [180]. In
addition to DNA damage in eukaryotic cells and chromosomal instability, colibactin
induces apoptosis of immune cells [130]. The participation of this toxin in carcinogenesis
has been demonstrated when the use of small molecule inhibitors targeting colibactin
reduced the tumor burden of a mouse model [181].

INTRODUCTION
~ 41 ~
Bacteroides fragilis toxin is a zinc-dependent metalloprotease that induces the breakdown
of E-cadhenin (tumor suppressor protein), increasing the signaling of the Wnt/β-catenin
pathway, as a result, an increase in the permeability of the intestinal barrere, the
expression of the MYC oncogene and the greater proliferation of the tumor cells of the
colon [12]. This toxin also triggers the NF-kB signaling pathway that contributes to
inflammation through cytokine production by mucosal epithelial cells [182]. In addition,
the toxin from B. fragilis has been studied in vitro and has been associated with DNA
damage and genomic instability [128]. Furthermore, it has been seen that B. fragilis
induces the action of the catabolic enzyme polyamine spermine oxidase, which converts
spermine into spermidine at the same time as it generates H2O2, this ROS form causes
DNA damage [96].
By the way, Enterococcus faecalis produces reactive oxygen species that damage DNA
and cause genomic instability, as seen in vitro in human cells [96, 128]. In colon epithelial
cell cultures, E. faecalis activates DNA damage pathways, causes cell cycle arrest in G2,
and induces erroneous chromosome segregation. The carcinogenic effect has also been
demonstrated in vivo in a study carried out with IL-10 deficient gnotobiotic mice that
were colonized with E. faecalis [96]. The AvrA protein from Salmonella influences
eukaryotic cell pathways by regulating ubiquitination and acetylation [183], inducing β-
catenin signaling and enhances colonic tumorigenesis by activating the STAT3 pathway,
as seen in mouse models with CRC [140, 184].
Finally, Fusobacterium nucleatum has an exclusive membrane adhesin called FadA
through which it can bind to E-cadherin on the surface of colon cells, when this occurs
the activation of the Wnt/β-catenin signaling pathway occurs and the consequent
inflammatory response and oncogenesis [140, 185]. Another F. nucleatum surface
adhesin, Fap2, can bind to the inhibitory immune receptor TIGIT (T-cell immune receptor

INTRODUCTION
~ 42 ~
with immunoglobulin and immunoreceptor tyrosine-based inhibitory motif domains) and
alter the function of natural killer and tumor cells [186].
2. 6. MEDIATORS OF COLORECTAL CANCER CARCINOGENESIS
Figure 3. Mechanisms of action of short-chain fatty acids, bile acids and polyamines
(microbiota-derived metabolites) in the inflammation, apoptosis and cellular
proliferation of colon cancer cells. The green arrows indicate the mechanisms that
favor a healthy state. The red arrows indicate the mechanisms that increase cancer
risk. SCFAs: short chain fatty acids; ODC: ornitina descarboxilasa; GPR109a: G-
protein-coupled receptors; IL: interleukin.
The variety of bacteria that are part of the intestinal microbiota contribute to the
physiological and health status of the host through biochemical pathways related to their
versatile metabolic genes [187]. The gut microbiota can influence colorectal
carcinogenesis through a variety of mechanisms, including metabolites derived from the
anaerobic fermentation of undigested exogenic dietary compounds. Today there are

INTRODUCTION
~ 43 ~
multiple studies that have shown that metabolites such as short-chain fatty acids
contribute by protecting the host against CRC, in contrast to other metabolites such as
secondary bile acids or polyamines [187] (Figure 3).
2.6.1. SHORT CHAIN FATTY ACIDS
Short chain fatty acids (SCFAs) are molecules derived from microbial metabolism from
components of the diet. These metabolites (mainly butyrate, propionate and acetate) are
very important in the digestive tract where they promote the health of the host [140].
SCFAs are produced through the anaerobic fermentation of some bacterial groups, the
major producers of butyrate belong to Firmicutes [188], those of propionate to
Bacteroides, Firmicutes and Propionibacterium [188, 189] and those for acetate are
Acetobacterium, Clostridium aceticum and Propionibacterium [188, 190]. SCFAs
influence the control of gene expression through epigenetics, mediate the inflammatory
response, help maintain the intestinal barrier and protect against oxidative stress [191].
The rate of production of SCFAs and the amount present depends on the bacterial groups
existing in the colon and their abundance, the source of the substrate and the intestinal
transit time [192]. The increased risk of CRC is associated with a bacterial dysbiosis that
leads to a reduction in the production of SCFAs [192, 193] especially of butyrate which
is the most potent as a protector against cancer [140]. The reduction in pH of colonic
stools produced by the presence of SCFAs (especially butyrate) inhibits the proliferation
of pathogens and DNA damage, in addition, it prevents the proliferation of tumor cells
and improves apoptosis [140], this pH is elevated in CRC patients compared to healthy
individuals, which could be due to a lower amount of SCFAs [194].

INTRODUCTION
~ 44 ~
The main source of energy for colonocytes are SCFAs, however, CRC-altered
colonocytes obtain energy mainly from aerobic glycolysis [194]. Despite this, CRCcells
are prone to uptake SCFAs [195], which denotes the importance of these molecules in
cell homeostasis. Normally, intestinal bacteria exist in a mutually beneficial symbiotic
relationship with the human colon, providing the necessary amount of SCFAs to maintain
colon homeostasis [194].
SCFAs (mainly butyrate) participate in the maintenance of the integrity of the intestinal
barrier through the regulation of tight junction proteins [187], in particular claudin-1
[191]. They also produce increased release of the anti-inflammatory cytokine IL-10 which
protects against cancer formation. In a recent study, the low levels of IL-10 in patients
with obesity and CRC were associated with a lower abundance of butyrate-producing
bacteria such as Blautia and Faecalibacterium prausnitzii, when compared with healthy
individuals [196].
SCFAs are also capable of inducing the production of antimicrobial peptides and regulate
the functions of regulatory T cells, thus participating in the host's immune response [191].
It has been seen in animal models that butyrate and propionate can influence the
regulatory T cells of the colon [140] producing an important anti-inflammatory effect
[128]. SCFAs participate in this process by interacting with certain receptors on the
membrane of host cells, such as G-protein coupled receptor 43 (GPR43) for acetate, G-
protein coupled receptor 41 (GPR41) for propionate, or G-protein coupled receptor 109
(GPR109) for butyrate [140, 187]. Specifically, the union of butyrate with the GPR109
receptor activates the production of IL-18, which in turn induces the release of IL-22 by
regulatory T cells, which will stimulate the repair of the epithelial mucosa tissues and the
decreased inflammation [197]. In studies with mice, the absence of IL-18 has been related

INTRODUCTION
~ 45 ~
to bacterial dysbiosis and alterations in the immune response, mucosal repair and
homeostasis [198], which favors tumorigenesis.
In vivo observations have shown that the loss of SCFA receptors can contribute to colon
tumorigenesis due to the change in the intestinal microbiome, the alteration in the
integrity of the intestinal barrier, the over-activation of dendritic cells and the inactivation
of CD8+ T cells [187]. Butyrate is particularly credited with the ability to induce the
expansion of regulatory T cells, regulating the local immune response and suppressing
colon inflammation and, therefore, tumorigenesis [199].
2.6.2. BILE ACIDS
Bile acids are important bacterial metabolites that participate in the digestion of food, in
the health of the host and, therefore, their imbalance or malfunction also participate in
disease processes. Through the breakdown of cholesterol, primary bile acids such as
cholic acid (CA) and chenodeoxycholic acid (CDCA) are synthesized in the liver, which
are transformed by intestinal bacteria through the 7α/β-dehydroxylation pathway into
secondary bile acids, such as deoxycholic acid (DCA) and litholic acid (LCA) [128, 187,
200].
Bile acids, especially secondary bile acids, are potent carcinogens, high physiological
levels of them for a long time can induce CRC [200]. The imbalance in the levels of bile
acids induces inflammation and damages the colon epithelium, because they are related
to the production of ROS [201]. Moreover, the bile acid, also favoring genomic instability
and to inhibit cell apoptosis [201]. In vitro and in vivo studies using colon biopsies, it was
seen how secondary bile acids stimulated the proliferation of colonic epithelial cells,
DNA fragmentation and oxidative damage, which resulted in an increase in the expression
of cyclin D1, a molecule that participates in the cell cycle through the Wnt/β-catenin
INTRODUCTION
~ 46 ~
signaling pathway and to degrade the tumor-suppressor p53, while promoting resistance
to apoptosis [202]. Mutations affecting the Wnt/β-catenin signaling pathway [203] have
been detected in more than 90% of CRC cases, and in a study with rodents administered
DCA, the levels of β-catenin and cyclin D1 increased, which favored low-grade intestinal
inflammation, the alteration of the intestinal barrier and, as a consequence the,
tumorigenesis [202].
Among the receptors that bile acids interact with are the Farnesoid X receptor (FXR) and
the G protein-coupled receptor (GPBAR1 or TGR5) [204]. Bile acids bind and activate
these receptors, thus maintaining energy and metabolic homeostasis [201]. Recently a
relationship between FXR and the Wnt/β-catenin signaling pathway has been found
[203]. Silencing FXR expression in APC/Min+ mice showed tumorogenic progression
and accelerated mortality through activation of the Wnt/β-catenin signaling pathway
[201]. Whereas FXR overexpression in CRC cells, both in vitro and in vivo, suppressed
tumor progression [203].
The secondary bile acid LCA, have been associated not only with the promotion of
colorectal tumorigenesis, but also with metastasis and poor prognosis of the patient
through stimulation of interleukin 8 (IL-8) or C-X-C motif chemokine ligand 8 (CXCL8)
[205]. CXCL8 is a pro-inflammatory interleukin that regulates pathological angiogenesis,
tumor growth, and metastasis, and their levels are elevated in CRC patients [187, 205].
The transcription factors NF-kB and activator protein (AP-1) have long been known to
be involved in the expression of CXCL8 [206]. An in vitro study showed that LCA-
induced upregulation of CXCL8 can be eliminated with metformin, which is able to
suppresses the activity of NF-kB and Nicotinamide adenine dinucleotide phosphate
(NADPH) oxidase (an important enzyme in ROS production) [207]. More recently,
Nguyen et al. demonstrated that LCA induced CXCL8 expression in CRC HCT116 cells

INTRODUCTION
~ 47 ~
by activating the extracellularly regulated kinases 1 and 2 (ERK1 and ERK2) and
suppressing STAT3 [205].
Secondary bile acids can induce the mitogen-activated protein kinase (MAPK) pathway
to stimulate the progression of CRC. DCA was shown as a possible inducer of
tumorigenesis through the positive regulation of MAPK (mediated by calcium signaling)
[187], the downregulation of apoptosis, the inhibition of tumor suppressors of the Erk1/2
and caspase-3 signaling pathways, the increase of ROS levels and the DNA damage [208].
In a study carried out in an African-American population, it was seen that lower levels of
bile acids and DCA-producing bacteria as a consequence of the modification of the diet
(less fat and more fiber), was correlated with the alteration of the associated mucosal
markers at the risk of CRC, with cell proliferation, and also with the infiltration of
immune cells (CD3+ and CD68+) in colonic tissue [209].
2.6.3. POLYAMINES
Polymianes are small polycationic aliphatic amines derived from L-arginine metabolism.
Polyamines are produced by all eukaryotic cells although the main source is their ingested
food and the microbiota [210].
Due to the high rate of turnover of the intestine there is a continuous cell proliferation
that requires the presence of polyamines to facilitate the process of protein translation. It
has been seen in rodents that in the proliferation zones of the crypts of the small intestine
and colon, the concentration of polyamines is higher than in the rest of the gastrointestinal
tract [211].
The relationship of polyamines with cancer has been known since the end of the 20th
century, elevated levels of urinary polyamines were observed in patients with some types
INTRODUCTION
~ 48 ~
of tumors as well as higher concentration of polyamines were found in cancerous tissues
compared to healthy tissues [212]. Therefore, the metabolism of polyamines has been
found deregulated in several types of cancer, including the CRC [196].
The involvement of polyamines in carcinogenesis may be linked to the adenomatous
polyposis coli gene APC/c-MYC pathway. The APC protein is an important tumor
suppressor whose gene is mutated in most CRCs. APC binds to β-catenin and activates
the Wnt signaling pathway. In CRC tumor tissues, the defective APC causes that β-
catenin to accumulate in the cell nucleus, activating a series of reactions that end the
transduction of the c-MYC and KRAS genes, which activate the expression of genes such
as ornithine decarboxylase (ODC) [213].
ODC is the key enzyme in the biosynthesis of polyamines and has been shown to have
greater expression in tumor tissues compared to underlying tissues in the case of CRC
[214, 215], which may indicate the possible relationship between polyamines. and cancer.
Several in vitro studies have shown that a treatment with an ODC inhibitor, α-
Difluoromethylornithine (DFMO), is effective in reducing the levels of putrescine and
spermidine polyamines, but not always those of spermine effect that is reversible with
exogenous polyamines [216]. Since endogenously synthesized polyamines can be
replaced by exogenous polyamines, for DFMO treatment for colorectal adenoma to be
promising, it should be used in combination with steroidal anti-inflammatory drugs [217].
Since the CRC tumor cells are in contact with intestinal bacteria capable of producing
high levels of polyamines, studies with mice showed that the combination of DFMO with
antibiotics improved the cytostatic effect of the treatment [218].
The catabolic enzyme polyamine spermine oxidase (SMO) is another enzyme of
polyamine metabolism that can influence tumorigenesis through the production of ROS.

INTRODUCTION
~ 49 ~
SMO intervenes in the conversion of spermine into spermidine, generating H2O2. It has
been seen that in Helicobacter pylori and Bacteroides fragilis infections the main source
of ROS is associated with SMO [96]. These bacteria promptly induce SMO, which
generates ROS and causes DNA damage.
In addition, acetylated forms of polyamines have been shown to be more specific for
cancer, it has been seen that levels of N1, N12-diacetylspermine are increased in CRC
and dysplasic colorectal lesions [219]. In a study CRC patient, when tumor tissues and
adjacen healthy tissues were compared, the appearance of a bacterial biofilm was
described. This biofilm was able to affect both tumor tissue and healthy colon tissue and
it was associated with a greater proliferation of colonocytes and an improvement in the
metabolism of polyamines [220]. Metabolomic analyzes showed an association between
the increase levels of N1, N12-diacetylspermine and the bacterial biofilm present in the
intestine of the CRC patients, regardless of whether it was cancerous or healthy tissue
[221]. Moreover, how the polyamines from the lumen of the intestine can be carried into
the host cells, human HT-29 colon cancer cells were exposed to N1, N12-
diacetylspermine and this polyamine can be detected intracellularly 24 hours after the
dosage [211].
2.6.4. TRIMETHYLAMINE/TRIMETHYLAMINE N-OXIDE
Trimethylamine N-oxide (TMAO) is an oxidized metabolite of trimethylamine (TMA)
that can be produced by the intestinal microbiota [222] and its level is related to risk of
suffering from cancer, including CRC [223], with a positive correlation between TMAO
levels and the increased risk of carcinogenesis. TMAO is considered as a potential
indicator of CRC [187].

INTRODUCTION
~ 50 ~
Precursor molecules such as choline or L-carnitine from the diet are converted to TMA
by TMA-producing intestinal bacteria. TMA is absorbed by the intestinal mucosa and
travels to the liver where it is metabolized into TMAO through oxidation catalyzed by the
Flavin Monooxygenase (FMO) family, FMO-3 [223] and FMO-1 are the main isoforms,
although its operation depends on genetic variability [224].
The importance of the role of the intestinal microbiota in the production of TMAO was
described in a study in which participants were treated with antibiotics to eliminate their
intestinal microbiota and were given carnitine. In these patients the levels of TMAO were
measured in plasma and urine and they were significantly reduced when compared to
untreated controls [223]. The relationship of the intestinal microbiota with the formation
of TMA was also seen in another study, in which the levels of TMA were increased after
an in vitro incubation of mouse intestinal medium supplemented with choline. In choline
metabolism a carbon-nitrogen bond is cleaved, which can be carried out by intestinal
bacteria [224]. Romano et al. related the increase in TMA with bacteria of the phyla
Firmicutes and Proteobacteria, but not with Bacteroidetes, despite being one of the most
abundant phyla in the human intestine [225].
Although there are some studies in which there is no relationship between TMAO and the
risk of CRC, there are more and more studies that relate plasma levels of TMAO with the
risk and development of CRC [223, 226] or with an unfavorable prognosis in CRC
patients [226]. It has even been determined that the possible routes of action of TMAO in
the pathogenesis of cancer (not only CRC) include cell progression and the Wnt signaling
pathway [223].
TMAO has a pro-inflammatory role through the expression of genes that include IL-6 and
chemokine ligands, as has been seen in cases of Helicobacter pylori infection. Or the

INTRODUCTION
~ 51 ~
positive correlation between serum levels of TMAO and pro-inflammatory mediators,
such as TNF-α and IL-6, in diabetic patients with chronic kidney disease. It is shown that
this pro-inflammatory function does participate in the progression of cancer since TNF-α
and IL-6 are involved in tumorigenesis through chronic inflammation [223].
Inflammation-activated oxidative stress linked to TMAO is also associated with cancer.
Circulating TMAO levels have been shown to induce the production of ROS related to
oxidative stress [223], which was also demonstrated in an in vitro assay [227]. Although
there could also be links between TMAO and CRC, DNA damage and alteration of
protein folding could also play a role in CRC development [134].
A recent study such as the recent study in which it has been proved that obese patients
with CRC had higher levels of TMAO than non-obese patients with CRC or individuals
healthy [228].
Although the course of action is still being elucidated, there are many studies proposing
TMAO as a marker linked to CRC risk [222, 226, 229].
3. OBESITY, MICROBIOTA, COLORECTAL CANCER
There are more and more studies that show the relationship between obesity and CRC,
both diseases have been studied separately and the role that the intestinal microbiota plays
in each of them has been seen. We currently have evidence indicating the importance of
the pathogenic potential of the gut microbiota on obesity and associated metabolic
disorders, including cancer [201] (Figure 4).
The BMI according to the WHO gives us the definition of overweight, considering
overweight a BMI of 25-29.9 kg/m2 and obesity if the BMI is equal to or greater than 30
kg/m2. Overweight and obesity alone are a major health risk and ranks fifth in overall risk

INTRODUCTION
~ 52 ~
of death globally [230]. It must be taken into account that BMI is a crude measure, so
other parameters such as waist circumference or adipokines would provide information
to better understand the relationship of obesity, inflammation, and the microbiota with
CRC [231]. As demonstrated for cases of lung cancer where a high BMI suggested a
lower risk of cancer, however, in the same patients, the waist-hip ratio or the
circumference of the waist were associated with a higher risk of lung cancer [231].
Figure 4. Influence relationship between obesity, the gut microbiota and colorectal
cancer through intestinal dysbiosis and the processes of inflammation and
intestinal permeability. CRC: colorectal cancer.
For many types of solid cancers, especially CRC, obesity is considered an important risk
factor [232]. 14% of CRC cases are attributed to overweight and obesity [223]. Previous
studies have determined an increased CRC risk of 7-60% in obese people compared to
people with normal weight [232].
There is currently much speculation about the mechanisms that link obesity and CRC.
Although in a meta-analysis it was determined that the composition of the intestinal

INTRODUCTION
~ 53 ~
microbiota shows a weak effect in determining the risk of CRC in obese individuals
compared to individuals with normal weight [231], the intestinal microbiota has been
nominated as a link between both diseases. A recent study has found a similar
microbiological profile in CRC patients and obese individuals [233]. Dysbiosis is
generally observed in obese people which can lead to the proliferation of opportunistic
pathogens and driver bacteria that will induce low-grade inflammation in the intestinal
mucosa, which, when persisting over time, increases the probability and conditions that
will favor the development of cancer.
In a study comparing the composition of the intestinal microbiota of patients with CRC,
obese patients and healthy controls, it was observed that the species Hafnia alvei
(Proteobacteria phyla) and Akkermansia muciniphila (Verrucomicrobia phyla) increased
in the groups with CRC and with obesity [233]. These microorganisms are mucin
degraders, which can lead to inflammation and tissue damage.
On occasions it has been suggested that it is diet and not obesity that induces the pro-
inflammatory gut microbiota capable of increasing the risk of CRC [223].
Lipopolysaccharide (LPS) is an endotoxin produced in the intestine by gram-negative
bacteria and is attributed with the production of low-grade chronic inflammation. Obesity
induced by a high-fat diet favors an increase in LPS-producing bacteria and, therefore,
circulating LPS levels. Colitis and associated CRC worsen with increased systemic
endotoxemia and permeability of the intestinal barrier [201].
Germ-free animal models have been a great resource for studying the relationship of the
gut microbiota with obesity and CRC. When dietary-induced obesity models were used,
it was found that germ-free animals ingested more food and gained less weight than
control animals with microbiota. They have also been seen as models of colon cancer,

INTRODUCTION
~ 54 ~
spontaneous and induced by carcinogens, did not develop tumors in most cases in germ-
free animals [201]. The specific case of the study carried out with rats that were treated
with azoxymethane (AOM), a carcinogen for CRC, showed that germ-free rats had a
lower rate of cancer development and a higher immune response for CRC compared to
conventional rats [234].
In view of all that has been said and supported by reviews in which it is stated that the
development of tumorigenesis may be due to effects of the microbiota such as
inflammation, bacterial toxicity, alteration of the intestinal barrier and the immune system
[235] or to the fact that obesity and dysbiosis are correlated [236] so the existence of a
link between obesity, microbiota and CRC could be affirmed.
4. MODULATING MICROBIOTA FOR COLORECTAL CANCER
PREVENTION
Modifiable dietary factors are largely responsible for the incidence of CRC in a
population, to such an extent that in studies conducted with immigrants it was observed
that people who moved to countries with a high rate of CRC quickly acquired that higher
rate of CRC risk [32, 33].
Some of the components that are part of food are capable of influencing the intestinal
microenvironment favoring different bacterial groups. In turn, these changes in the gut
microbiota can affect the risk rate for CRC. That is why some compounds could be used
to some extent as bacterial modulators for the prevention of CRC.
4.1. FIBER
The metabolic activities of the digestive tract have been shown to be positively influenced
by dietary fiber [79, 237]. The hypothesis that dietary fiber affects the rate of CRC

INTRODUCTION
~ 55 ~
development appears to originate from the study by Burkitt et al. in which the relationship
between a high fiber diet and a low prevalence of CRC in many African countries [40,
77, 238] was shown. Being diverse the observational studies that agree with the protective
effect of the fiber of the diet in the CRC [40]. The European Prospective Research on
Cancer and Nutrition (EPIC) study concluded that the risk of developing CRC could be
reduced by up to 40% by increasing fiber intake [239]. This same observational study,
EPIC, determined that the inverse relationship between fiber intake and incidence of CRC
was independent of the source of fiber ingested [240]. However, a meta-analysis of
observational studies inversely associated the risk of CRC with fiber from cereals but not
with fiber from fruits, vegetables, or legumes [82]. After monitoring more than 10,000
participants for 15 years, the National Institutes of Health and American Association of
Retirees (NIH-AARP) Diet and Health Study confirmed the inverse relationship of
dietary fiber intake from whole grains with CRC risk, a reduction of up to 16%, but not
for other fiber sources [241].
It has been determined that in order for dietary fiber to influence the body, the food eaten
must provide at least 25 g/day of fiber [242]. Dietary fiber favors an increase in stool
volume, a decrease in transit time and, therefore, reduces the time of exposure of the
colorectal epithelium to carcinogens that pass through the intestine [78]. Colon health is
also supported by dietary fiber due to its relationship with the gut microbiota. The action
of the intestinal microbiota on dietary fiber may be related to its anti-CRC effect [238].
The undigested soluble fiber is fermented in anaerobiosis and SCFAs (mainly butyrate,
propionate and acetate) are produced [79, 243], with the known protective effect of
SCFAs on the mucosa of the colon, especially butyrate [243]. The SCFAs produced
regulate colonic metabolism and the immune system and reduce the risk of CRC. The
fiber supplementation in the diet produces an effect on the intestinal microbiota, the

INTRODUCTION
~ 56 ~
populations of Bifidobacterium and Lactobacillus spp. [238] lactate and acetate
producers. Furthermore, some butyrate-producing bacteria, Eubacterium rectole,
Roseburia spp, and Faecalibacterium prausnitzii increase in the colon [238]. During this
fermentation the fecal pH is reduced, therefore the bacterial carcinogens derived from the
metabolism of bile acids also decrease [243].
But increased dietary fiber intake is not only related to a lower risk of CRC, but also to
an improvement in survival rate after diagnosis [84]. Whole grains are considered the
most important source of dietary fiber inversely associated with the risk and mortality of
CRC [82, 84, 243].
Finally, dietary fiber is also attributed a chemoprotective effect, where different sources
of fiber may have a greater or lesser protective effect in different locations of the colon
[243].
4.2. POLYUNSATURATED FATTY ACIDS
The components of the diet that have the greatest impact on the development of tumors
are fat and fiber, of which the type and origin are very important for their greater or lesser
influence on tumorigenesis [244]. Current preclinical and epidemiological studies support
the theory that polyunsaturated fatty acids (PUFAs), especially omega 3 polyunsaturated
fatty acids (PUFA ω-3), have preventive effects for CRC [245]. At the end of the 20th
century, Scholss et al. observed the lowest incidence of CRC among fisher populations
[106]. Shortly thereafter, Rose and Connolly encouraged the implementation of clinical
trials with PUFA ω-3 supplementation, recognizing its effect on reducing the risk of
development of some cancers, including CRC [246].

INTRODUCTION
~ 57 ~
More than 520,000 subjects participated in the European EPIC study, in which a wide
variation in fish intake was used and circulating levels of PUFA ω-3 and its relationship
with the risk of CRC were observed, confirming an inverse relationship between the fish
consumption and CRC [239]. The follow-up of this cohort for 11 more years associated
the intake of 100-200 g/week of fish or the intake of dietary PUFA ω-3 with a 7%
reduction in the risk of CRC, although circulating PUFA ω-3 did not were associated with
CRC, these relationships were independent of the type of fish consumed, fatty or lean
[247].
The importance of PUFAs on the health of the individual is based on the direct antitumor
activity, the anti-inflammatory properties and the improvement of the antitumor immune
response [248], being more important in the large intestine due to the greater influence of
ingested substances [249]. The importance of PUFAs at this level of the digestive tract
has also been seen, since it is where they have an impact on the intestinal microbiota
[250]. In contrast to saturated fats that alter the intestinal microbiota in a negative way
for health, PUFAs produce favorable effects [244]. The supplementation of the diet with
PUFAs in healthy individuals produces a decrease in Faecalibacterium and an increase
in Bacteroidetes [251] and bacteria producing SCFAs, mainly of butyrate. SCFAs
promote apoptosis of colorectal epithelial cells and enhance the antitumor immune
response [248]. When butyrate is metabolized, it gives rise to ROS, which affects dietary
PUFAs that are incorporated into cell membranes and which are susceptible to being
oxidized due to their high degree of unsaturation [244]. Apoptotic factors are released
from the mitochondria to the cytosol as a consequence of lipid oxidation. All this added
to the fact that the cancer cells of CRC preferentially uptake PUFAs [195] shows one of
the possible mechanisms of action by which the anticancer effect of this type of fatty
acids occurs.

INTRODUCTION
~ 58 ~
The presence of eicosapentaenoic acid and docosahexaenoic acid in the diet produces an
increase in Lactobacillus and Bifidobacteria and a reduction in Helicobacter and
Fusobacteria nucleatum. Lactobacillus and Bifidobacteria are inversely associated with
inflammation and Helicobacter and Fusobacteria nucleatum are opportunistic pathogens
[244]. PUFAs favor the development of beneficial bacterial populations in the digestive
tract and the reduction of pathogens, so that dysbiosis of the intestinal microbiota is
reduced [252].
The regulation of differentiation and apoptosis of colonocytes are the main mechanisms
through which PUFAs exert their anticancer role [253, 254]. A reduction of proliferating
cells and an increase in apoptosis in tumor cells was observed in C57BL/6J mice with
CRC induced by azoxymethane-dextran sodium sulfate after treatment with
eicosapentaenoic acid, in addition to an increase in Lactobacillus [255].
In APC/Min+ mouse model of spontaneous intestinal cancer, polyposis was reduced
when treated with a mixture of PUFAs [256, 257]. Dietary supplementation with
eicosapentaenoic acid decreased the incidence of tumors in chemically induced CRC
model mice [256] and suppressed liver metastasis in BALB/c mice [258]. It has also been
observed that PUFA ω-3 can improve the action of anticancer treatments and reduce their
toxicity. The tumor growth of the HCT116 xenograft was jointly inhibited by oxaliplatin
and docosahexaenoic acid [259]. Currently, PUFA ω-3 supplementation has been
proposed as an adjuvant in the treatment of CRC [260]. It has been seen in vitro that
docosahexaenoic acid acts on the toxicity of arabinosylcytosine, causing it to act only in
tumor cells [261]. Or like rats with colon cancer and subjected to treatment with 5-FU,
they decreased the growth of tumors and increased chemosensitivity after being
supplemented with fish oil [262]. The reduction in tumor burden and DNA damage and
INTRODUCTION
~ 59 ~
the increase in apoptosis associated with 5-FU treatment has been enhanced by PUFAs
[263].
Dietary PUFAs have also been associated with decreased microsatellite instability
(reduced CRC risk) [247] and with improvement in the DNA repair system [264].
And supplementation with PUFA ω-3 pre- or post-operatively significantly improved the
inflammatory and immune responses after CRC resection [260].
4.3. POLYPHENOLS
Dietary polyphenols are present in a wide variety of foods such as fruits, vegetables,
cereals, nuts, wine and tea, and are widely related to chemical protection both in animal
models and in human epidemiological studies [194]. The biological activities of many
pathologies are enhanced by this family of natural compounds, such as diabetes, diseases
related to obesity and inflammation, cardiovascular diseases, neurodegenerative diseases
and cancer [194, 265]. Polyphenols have been much investigated lately for their
protective effect on CRC [266]. The required amount of phenolic compound (10 mL/kg
of dietary fiber) that could reduce the risk of CRC by modifying the expression of
oncogenes, tumor suppressor genes, apoptosis and even affecting the cell cycle was
estimated [267]. The modulation of the immune system [268] and antioxidant, anti-
inflammatory and anticancer properties are attributed to polyphenols, in addition to the
indirect effects derived from the modulation of the intestinal microbiota [269].
Insoluble polyphenols reach the colon, these individual polyphenols have beneficial
effects on the gastrointestinal tract [270], but are also metabolized by intestinal bacteria
and derived metabolites have positive health effects at the systemic level [269]. But
polyphenols also have an antibacterial function against certain pathogens [265, 268] and

INTRODUCTION
~ 60 ~
a prebiotic effect that favors the population of Lactobacilli and Bifidobacteria [271]. This
turns the relationship between polyphenols and microbiota into a bidirectional interaction,
where polyphenols affect the composition of the intestinal microbiota [271] and in turn,
this microbiota metabolizes polyphenols which will have other effects. Clostridium spp.
(C. histolyticum), Pseudomonas spp., Salmonella spp., Bacillus spp., Escherichia coli,
Helicobacter pylori are among the bacteria that see their populations reduced as a
consequence of polyphenols, while Lactobacillus spp., Bifidobacterium spp.,
Akkermansia spp. (A. muciniphila) and Faecalobacterium spp. (F. prausnitzii) increase
within the intestinal microbial community, some of them being capable of metabolizing
the polyphenols present [268].
The antioxidant action of polyphenols causes these compounds to affect different
metabolic pathways, such as cytochrome P450 and signaling pathways mediated by
MAPK, Phosphoinositide 3 - kinases (PI3K), ROS, NF-kB and Insulin-like growth factor
1 (IGF-1), either in normal or pathological processes of cells. Phenolic derivatives focus
their action on cell adhesion, cell migration and tumor angiogenesis [224]. With regard
to inflammation, polyphenols are also capable of acting on it by reducing the nuclear
factor NF-kB, modulating the signaling pathways that associate inflammation and cancer
[265]. In a study in which the phenolic compounds in olive oil were tested, it was seen
that they were capable of affecting the inflammatory processes of the colon mediated by
NF-kB, inducible nitric oxide synthase, IL-8 and IL-6 [272]. In dextran sodium sulfate
(DSS) induced mice, the antioxidant response was improved and the levels of
inflammatory markers, TNF-α, IL-6 and serum amyloid A, were reduced after being
treated with tea polyphenols [265]. As well as the phenolic compounds of blueberries,
grapes or cocoa demonstrated their antitumor activity, suppressing the expression of

INTRODUCTION
~ 61 ~
various cytokines (IL-1β, TNF-α, IL-6, IL-17, Interferon gamma (IFN-γ)), in addition to
reducing the infiltration of CD3 T cells in colon tissue [268].
In various studies with colon cells HCT116, it has been seen how the polyphenols of
Pleurotus eryngii (edible fungus) reduce the proliferation of cells [265], epigenin was
related to the blocking of the cell cycle, the induction of apoptosis and the inhibition of
autophagy [273] or how curcumin induced DNA methylation in this cell line [270].
Although it has been seen that the polyphenols with the greatest potential to alter
methylation by inhibiting the methyltransferase enzyme are the polyphenols from green
tea [270]. The beneficial effect of phenolic compounds in cancer pathology is observed
in the inhibitory action of the early or advanced stages and of the metastatic process [224].
The chemoresistance and toxicity of CRC therapies make treatment of the disease
difficult [265]. Currently, beneficial effects have also been detected at this level, where
some polyphenols reduce the methylation of micro-RNA 149 (miR-149). And miR-149
can stop the cell cycle, and decrease the expression of cyclin B1, Serine/threonine kinase
(AKT) and Cyclin-dependent kinase 1 (CDK1), improving chemosensitivity in CRC
treatments [274].
5. GUT MICROBIOTA ON THE RESPONSE TO CRC TREATMENT AND ITS
TOXICITY
Currently, preoperative radiochemotherapy has become a standard process in the
treatment of CRC [275, 276]. There are more and more studies in which the gut
microbiota is related to the efficacy and/or toxicity of chemotherapeutic and
immunotherapeutic treatments [277, 278]. Being translocation, immunomodulation,
metabolism, ecological variation and reduction of diversity the mechanisms through

INTRODUCTION
~ 62 ~
which the intestinal microbiota influences the response to drugs and toxicity in patients
with CRC [279] (Figure 5.).
Figure 5. Beneficial effects of dietary supplementation with PUFAs, polyphenols
and fiber on the intestinal microbiota and colon cells for the reduction of CRC risk
or to enhance the response to cancer therapy when are used as adjuvant to
conventional treatment. PUFAs: polyunsaturated fatty acids; 5-FU: 5-fluorouracil;
SCFAs: short chain fatty acids.
Dysbiosis of the gut microbiota has been suggested as an influence on the response of the
host to various cancer therapies, whether chemotherapy, radiotherapy or immunotherapy
[280, 281]. Intestinal microbiota modulated the efficacy and toxicity through key
mechanisms, such as the translocation, immunomodulation, metabolism, reduced
diversity, and ecological variation [282].

INTRODUCTION
~ 63 ~
As seen in a study by Yuan et al. in which the efficacy of 5-FU treatment was diminished
due to dysbiosis caused by the use of antibiotics [283]. In addition to affecting the efficacy
of chemotherapy, antibiotic-induced dysbiosis prior to 5-FU treatment was also
associated with worse overall survival in patients with metastatic CRC [284].
Several bacterial phyla are known for their influence on drugs, either by physical
adherence to them or by participating in their metabolism, through proteolytic
degradation reactions, isoxazole cleavage, denitrification, deconjugation,
acetylation/deacetylation, amine formation and/or hydrolysis [285].
In mice with CRC, intestinal mucosis induced by 5-FU/oxyliplatin was reduced thanks to
L. casei variety rhamnosus [286]. The frequency of diarrhea and abdominal distress and
avoided the dose reduction caused by intestinal toxicity was decreased in patients with L.
rhamnosus supplementation compared to patients taking placebo [287]. For this reason,
more and more studies use probiotics in relation to radiotherapy treatments, since certain
intestinal bacteria participate in the repair of injuries and reduce the incidence and severity
of diarrhea derived from the treatment [288]. Approximately forty chemotherapeutic
drugs have been shown to be metabolized by the gut microbiota [289].

HYPOTHESIS
HYPOTHESIS

HYPOTHESIS
~ 65 ~
Previous studies have demonstrated that patients with CRC present a different intestinal
microbiota and capable of carrying out different functions than healthy subjects, and these
differences may be one of the causes responsible for the development of cancer. In
addition, the presence of obesity is an important risk factor associated with the
development of CRC. Moreover, the dysbiosis associated with obesity can cause
physiological changes that could increase the risk of cancer. In fact, obesity is a low-grade
inflammatory state and tumorogenesis is favored by inflammation, consequently, obesity
can increase the risk of CRC. The presence of obesity in patients with CRC is associated
with changes in the composition of the intestinal microbiota, which entails a different
systemic inflammatory response compared to CRC patients without obesity and healthy
controls, this situation may influence the immune response against the tumor and in its
development. Then, obese patients with CRC have a different gut microbiota capable of
carrying out different functions from healthy lean subjects and lean CRC patients. Finally,
there is a bidirectional interaction between the neoadjuvant radiochemotherapy (RCT)
and the gut microbiome in CRC patients: RCT might induce alterations in the gut
microbiome; and that these alterations might in turn influence the effectiveness of RCT
by directly interact with the treatment and/or by stimulating the host’s immune response.
The intestinal microbiota also produces important molecules such as SCFAs, TMAO and
polyamines, which can be beneficial or harmful for the oncological process, which would
demonstrate that the microbiota could play an important role in the evolution of CRC
patients subjected to neoadjuvant RCT. Further, in patients with CRC, intestinal
permeability increases after treatment with RCT, possible due to the loss of a specific
commensal microbiota responsible for increasing the expression of tight junction proteins
and contributing to maintaining the integrity of the intestine.

OBJETIVES
OBJETIVES

OBJETIVES
~ 67 ~
Study 1
1. To determine the gut microbiota composition and functions in fecal samples from
CRC patients with (OB-CRC) and without obesity (L-CRC).
2. To compare the gut microbiota profile present in OB-CRC and L-CRC with the
microbiota present in non-obese healthy controls (L-HC).
3. To analyze the fecal levels of the microbial-derived metabolite TMAO in the
study groups.
4. To study the intestinal permeability and inflammatory status in the study groups.
5. To unravel the possible relationship between gut microbiota and microbial-
derived metabolite TMAO, the inflammatory status, and the intestinal
permeability in the context of obesity-associated CRC.
Study 2.
1. To stablish the differences in gut microbiota composition and diversity between
CRC patients and healthy controls.
2. To study the changes in diversity and composition of the intestinal microbiota of
CRC patients before, during, and after completing the neoadyuvant
radiochemotherapy treatment.
3. To analyzed the differences in gut microbiota composition and function after the
classification of CRC patients in good (responders) and poor or non-responders
to treatment (non-responders).
4. To measure metabolites produced by the intestinal microbiota such as short-chain
fatty acids and polyamines before and after radiochemotherapy in responders and
non-responders and study their relationship with the composition of their
intestinal microbiota

OBJETIVES
~ 68 ~
5. To measure markers of inflammation and intestinal permeability in plasma
samples from responders and non-responders at baseline and at the end of
radiochemotherapy treatment and study their relationship the composition of their
intestinal microbiota.
6. To establish if initial microbiota composition could predict response to
radichemotherapy treatment in CRC patients.

MATERIALS AND METHODS
MATERIALS AND METHODS

MATERIALS AND METHODS
~ 70 ~
1. STUDY PATIENTS
Study 1
Forty-five patients aged 35-75 years with stages II–III (T2-T4 and/or N1-N2) were
recruited at the Radiotherapy Oncology Service at Virgen de la Victoria Hospital. Patients
were enrolled at initial diagnosis and did not receive any treatment before collection of
fecal and peripheral blood samples. Patients were dichotomized into non-obese (BMI <
30 kg/m2) (L-CRC) and obese (BMI ≥ 30 kg/m2) (OB-CRC) according to the WHO
guidelines. Exclusion criteria were familial CRC, presence of inflammatory bowel
disease, food allergies, use of antibiotics within the past 3 months before sampling, or
regular use of non-steroidal anti-inflammatory drugs, statins, or probiotics.
Additionally, 20 non-obese healthy controls (L-HC) (BMI < 30 kg/m2) (age- and gender-
matched controls) were recruited for the study. The exclusion criteria for healthy controls
included gut disease diagnosis and/or medication, and previous CRC diagnosis.
Study 2
Forty patients aged 35-75 years, who were newly diagnosed with CRC in stages II-III
(T2-T4 and/or N1-N2) from the Radiotherapy Oncology Service at the Virgen de la
Victoria Hospital were enrolled in the study and were followed-up for at least 1 year. All
the CRC patients received only neoadjuvant treatment for 5 weeks with pelvic radiation
therapy (50 Gy in fractions of 2 Gy/session) and oral Capecitabine (825 mg/m2/12h)
during radiotherapy treatment. Patients with a history of CRC or bowel resection, chronic
inflammatory bowel disease and hereditary colorectal cancer syndromes were excluded
from the study. Patients who received pelvic cancer radiation therapy in the previous 2
years, used antibiotics in the previous 2 months, or regularly used non-steroidal anti-

MATERIALS AND METHODS
~ 71 ~
inflammatory drugs, statins or probiotics before the study were also excluded. A
pathologist examined surgical specimens and tumor response after neoadjuvant
radiochemotherapy was determined in surgical specimens according to the tumor
regression grades (TRG) system described by Mandard et al. [290]. We divided CRC
patients into TRG1-2 (patients with good response or responders (R)) and TRG 3-5
(patients with poor or non-response (NR)). Blood and feces samples were collected at
baseline (T0), 2 and 4 weeks after starting radiochemotherapy (T1 and T2, respectively),
and 7 weeks after finishing treatment (T3).
In the study we also included fecal samples from 20 healthy patients matched ac-cording
to sex, age and BMI with CRC patients. Healthy controls did not have gastro-intestinal
tract disorders or other complications and were not administered antibiotics or probiotics
during the 2 months prior to sample collection.
The study protocol was approved by the Medical Ethics Committee at the Virgen de la
Victoria University Hospital and conducted in accordance with the Declaration of
Helsinki. Written informed consent was provided by all study participants.
2. LABORATORY MEASUREMENTS
Fasting venous blood samples were collected and centrifuged to 4000 × g for 15 min
isolate the plasma and serum that will be aliquoted and stored at -80ºC until analysis.
Levels of serum glucose, total cholesterol, triglycerides, high density lipoprotein (HDL)
cholesterol, low density lipoprotein (LDL) cholesterol and a glycated hemoglobin
(HbA1c) were measured in duplicated using a Dimension autoanalyzer (Dade Behring
Inc., Deerfield, IL) by enzymatic methods (Randox Laboratories Ltd., UK).

MATERIALS AND METHODS
~ 72 ~
3. DNA EXTRACTION AND GUT MICROBIOTA SEQUENCING
The walnut-sized stool samples will be collected in the morning before breakfast in a
sterile wide-mouth flask and frozen as soon as possible at -80ºC until further analysis.
Thawing of the samples will take place gradually over 24 hours at 4ºC to minimize the
possible loss of the bacterial groups most sensitive to temperature changes.
DNA extraction from 200 mg of faecal material was performed using the QIAamp DNA
stool Mini kit (Qiagen, Hilden, Germany) following the manufacturer's instructions. DNA
concentration was determined by absorbance at 260 nm (A260), and purity was estimated
by determining the A260/A280 ratio with a Nanodrop spectrophotometer (Nanodrop
Technologies, Wilmington, DE, USA).
DNA was amplified using the Ion 16S Metagenomics kit (Thermo Fisher Scientific,
Madrid, ES) that contains a primer pool to amplify multiple variable regions (V2, 3, 4, 6-
7, 8 and 9) of the 16S rRNA gene. The Ion PlusTM Fragment Library Kit (Thermo Fisher
Scientific, Madrid, ES) was used to ligate the barcoded adapters to the generated
amplicons and create the barcoded libraries, which were pooled and templated on the
automated Ion Chef system (Thermo Fisher Scientific, Madrid, ES). The sequencing was
done on an Ion S5 platform (Thermo Fisher Scientific, Madrid, ES).
4. INTESTINAL PERMEABILITY ANALYSIS
Plasma level of zonulin was determined by enzyme linked immunosorbent assay (ELISA)
using commercial kits (Immunodiagnostik AG, Bensheim, Germany). Measurements
were done in duplicate, and mean values were used for analysis. The detection limit for
zonulin was 0.22 ng/mL. Intra and interassay coefficients of variation were between 3-
10%.

MATERIALS AND METHODS
~ 73 ~
5. CYTOKINE ANALYSIS
Serum levels of IL-10 and IL-1β were measured by ELISA assays (Novex, Life
Technology). Detection ranges were 7.8-500 and 3.9-250 pg/mL for IL-10 and IL-1β,
respectively.
6. QUANTIFICATION TRIMETHYLAMINE N-OXIDE IN SERUM SAMPLES
Trimethylamine N-oxide was quantified in serum samples using Nuclear Magnetic
Resonance (NMR) (Embade et al., 2016). For NMR analysis, serum samples were thawed
for 30 min and aliquots of 300 μL were mixed with 300 μL of phosphate buffer (pH 7.0)
containing 5 mmol/L Trimethylsilyl propionate and 5% v/v Deuterium oxide (D2O). The
final mixtures were gently shaken and transferred to NMR 96 rack tubes. NMR spectra
were measured at 300 K on a Bruker Avance IVDr 600 MHz spectrometer (Bruker
Biospin, Germany) and a Sample Jet Robot (Bruker Biospin, Germany) was used for
automatization of the measurements. For each sample, three complementary NMR
spectra were recorded. A standard 1H spectrum with water suppression (Nuclear
overhauser effect spectroscopy (NOESY)) was assessed. We repeated the same
experiment with an appended T2 relaxation filter implemented as a CPMG module to
decrease broad signals from proteins and lipoproteins. Finally, a two dimensional 1H,1H
JRES was measured to help with the identification of the metabolites. All spectra were
acquired and processed within the TopSpin program (TSP) (Bruker Biospin, Germany)
applying an automatic phase correction and referenced against internal TSP (δ = 0.00
ppm). To identify and quantify the desired metabolites (TMAO) different amounts of
these compounds were added to the serum samples, were measured by NMR and the
values of the intensity peaks were represented against concentration. The pure metabolite
molecules used for referencing were all obtained from Sigma-Aldrich (St. Louis, MO,

MATERIALS AND METHODS
~ 74 ~
United States). For all the spectra we measured the intensity of the peaks corresponding
to TMAO (singlets) and the concentrations in the samples were calculated with the power
fitted calibration curves.
7. ANALYSIS OF SERUM POLYAMINE LEVELS BY ULTRA-HIGH
PERFORMANCE LIQUID CHROMATOGRAPHY TANDEM MASS
SPECTROMETRY
Fifty microliters of serum aliquoted in 1.5 mL Eppendorf LoBind tube were mixed with
5 μL of internal standard and 167 μL of methanol and vortexing for 1 minute for protein
precipitation. Then, 334 μL of chloroform was added to the mixture, vortexed for 1 min
and centrifuged for 10 min at 15,000 rpm and 4°C. The upper layer was collected and
transferred to a new tube. In order to derivatize the sample, 100 μL of carbonate-
bicarbonate buffer (pH 9) and 50 μL of dansyl chloride (10 mg/mL in acetone) were
added. The mixture was vortexed and placed in the dark for 1 hour at room temperature.
The compounds were extracted with 250 μL of ethyl acetate twice; prior to the second
extraction, 2.5 μL of trifluoroacetic acid were added. The combined organic phases were
evaporated in a SpeedVac at 45°C and stored at −20°C until analysis. Samples were
reconstituted in 50 μL of ammonium acetate 0.2 M:acetonitrile (30:70).
Chromatography was performed with an Agilent ultra-high performance liquid
chromatography (UHPLC) 1290 series binary pump (Agilent Technologies, Santa Clara,
CA, USA), and separation was carried out on a Kinetex EVO C18 column (2.6 µm
particle size, 2.1 mm internal diameter × 150 mm length) (Phenomenex, Torrance, CA,
USA) held at 25°C. The mobile phase for elution was a gradient established between
water acidified with 0.1% formic acid (A) and acetonitrile acidified with 0.1% formic
acid (B) at a flow rate of 400 µL/min. The injected amount was 2.5 µL.

MATERIALS AND METHODS
~ 75 ~
Tandem mass spectrometry (MS/MS) analysis was performed on an Agilent QqQ 6490
Series mass spectrometer operating in AJS + ESI. The ionization source parameters were
optimized using MassHunter Optimizer (Agilent Technologies, version 6.0) as follows:
nebulizer gas (nitrogen) with a pressure of 15 psi, a gas flow of 15 L/min at 200°C, a
sheath gas flow of 11 L/min at 350°C, a capillary voltage of 2.5 kV, and a nozzle voltage
of 1000 V.
Liquid chromatography tandem mass spectrometry (LC-MS/MS) analysis was performed
using an Agilent UHPLC 1290 Infinity II Series coupled to an Agilent QqQ/MS 6490
Series (Agilent Technologies, Sta. Clara, CA, USA). Chromatographic separation was
performed using a Kinetex EVO C18 analytical column (2.6 µm; 2.1 mm × 150 mm)
(Phenomenex, Torrance, CA, USA).
Quantification was performed with the commercial standards arginine, ornithine, N1-
acetylspermidine (N1-AcSPD), N8-acetylspermidine (N8-AcSPD), N-acetylputrescine
(N1-AcPUT), N-acetylspermine (N1-AcSP), spermine (SP), spermidine (SPD),
putrescine (PUT), N1, N12-diacetylspermine (N1,N12-DiAcSP), and N1, N8-
diacetylspermidine (N1,N8-DiAcSPD) (Toronto Research Chemicals, North York, ON,
Canada). Amino acid internal standards were lysine (13C6, 15N2) and arginine (13C6,
15N4) (Cambridge Isotope Laboratories) and for polyamines spermine-d20, spermidine-
d6, putrescine-d8 and N8-acetylspermidine-d3 (Toronto Research Chemicals).
8. EXTRACTION AND ANALYSIS OF SHORT CHAIN FATTY ACIDS FROM
FECAL SAMPLES BY GC-FID
After thawing, fecal samples were homogenized with the help of a spatula and aliquot of
100 mg were acidified with 0.25 mL of sulfuric acid 50% w/v. The solution was vortex
for 3 min and 50 μL of internal standard solution were added. The organic phase

MATERIALS AND METHODS
~ 76 ~
extraction was done by adding 1 mL of ethyl ether and centrifuging for 5 min at 2800 ×
g. The organic phase was collected into another vial. At the end, 0.5 μL of the collected
organic phase were injected into the GC for analysis. The analysis was done using a gas
chromatograph Agilent Technologies 6850 GC (Santa Clara, CA, USA) equipped with a
split/splitless injector and FID (Agilent Technologies, Santa Clara, CA, USA). The
identity of SCFAs detected in the fecal samples was confirmed by comparison of their
retention times and their mass spectra with those of the analytical standards (Sigma–
Aldrich).
9. BIOINFORMATICS ANALYSIS
Analysis of 16S rRNA amplicons was done with QIIME 2-2019.4. Raw sequence data
were quality filtered and denoised, dereplicated and chimera filtered using the q-dada2
plugin with DADA2 pipeline. Q2-feature-table plugin was used to merge into a single
feature table the sequence variants obtained by DADA2 pipeline. All amplicon sequence
variants from the merged feature table were clustered into OTU’s (Operational taxonomic
units) with Open Reference Clustering method against the Greengenes version 13_8 with
97% of similarity from OTUs reference sequences using the q2-vsearch plugin with 97%
similarity of sequence. The OTUs were aligned with MAFFT (via q2-alignment) and used
to construct a phylogeny with fasttree2 (via q2-phylogeny). Taxonomy was assigned to
OTUs using the q2-feature-classifier classify-sklearn naïve Bayes taxonomy classifier.
Alpha diversity metrics (Shannon and Chao1), beta diversity metrics (Bray Curtis
dissimilarity), and Principal Coordinate Analysis (PCoA) were estimated using q2-
diversity after samples were rarefied to 994 sequences per sample. Alpha diversity
significance was estimated with Kruskal Wallis test using q2-diversity plugin. Beta
diversity significance was estimated using ANOSIM.

MATERIALS AND METHODS
~ 77 ~
10. STATISTICAL ANALYSIS
The Kruskal-Wallis rank-sum test was used to compare the bacterial abundance between
study groups and false discovery rate (FDR) using the Benjamini-Hochberg method was
applied to correct the significant p-values (q < 0.05). Kruskal-Wallis rank-sum test and
subsequent post hoc Bonferroni, analyzed differences in the clinical and biochemical
variables between three study groups and the differences between two groups were
analyzed using Mann-Whitney U test. Inter-group comparison among post-treatment
changes in polyamines, SCFAs and zonulin by a covariance model (ANCOVA) adjusted
for baseline were carried out. Wilcoxon signed-rank test was used to calculate differences
in SCFAs, polyamines and zonulin between baseline and post-treatment timepoint T3
(study 2). The Spearman correlation coefficients were calculated to estimate the
correlations between bacterial taxa and gut microbiota derived-metabolites and
permeability. A linear regression analysis was done to identify what bacteria was an
independent predictor for serum inflammatory mediators, TMAO, and zonulin levels in
each study group (study 1). Statistical analyses were carried out with the statistical
software package SPSS version 26.0 (SPSS Inc., Chicago, IL, United States). Random
forests (RF) were used to predict baseline bacteria (species-level relative abundance data)
related to the neoadjuvant RCT response using the default parameters of the R
implementation of the algorithm (R package “randomForest”), and bootstrapping (n =
500) was used to assess the classification accuracy. Values were considered to be
statistically significant when the p < 0.05.

RESULTS
RESULTS

RESULTS
~ 79 ~
1. STUDY 1: Gut microbiota-mediated inflammation and gut permeability in
patients with obesity and colorectal cancer
1.1. CLINICAL CHARACTERISTICS OF THE PATIENTS AND HEALTHY
CONTROLS
Table 1. Clinical and biochemical characteristics, serum levels of trimethylamine N-oxide
(TMAO) and inflammatory markers in the study groups.
L-HC L-CRC OB-CRC p
N = 20 N = 23 N = 22 Age (years) 61.42 ± 7.40 62.52 ± 7.99 64.43 ± 7.31 0.208 Gender, n (M/F) 10/10 12/11 11/11
BMI (kg/m2) 25.45 ± 3.23a 25.32 ± 3.67a 35.82 ± 3.83b 0.001 Constipation, n (%) 6 (20%) 8 (26.6%) 10 (33.3%) 0.383 Alcohol consumption, n (%) 4 (13.3%) 4 (13.3%) 3 (10%) 0.997 Current smoking, n (%) 9 (30%) 12 (40%) 10 (33.3%) 0.588 Biochemical data
Glucose (mg/dL) 94.85 ± 9.86 92.04 ± 10.91 108.42 ± 10.53 0.456 Total cholesterol (mg/dL) 175.2 ± 33.6 187.12 ± 20.74 193.09 ± 19.91 0.325 Triglycerides (mg/dL) 112.67 ± 34.51 110.32 ± 33.03 127.7 ± 22.6 0.510 HDL-cholesterol (mg/dL) 60.7 ± 15.1 54.84 ± 18.41 47.28 ± 15.6 0.755 LDL-cholesterol (mg/dL) 107.78 ± 27.12 109.84 ± 25.98 112.80 ± 25.34 0.678 IL-1Β (pg/mL) 76.40 ± 9.81a 103.32 ± 9.43b 110.65 ± 12.98c 0.006
IL-10 (pg/mL) 155.19 ± 9.60a 121.96 ± 15.22b 102.21 ± 9.82c 0.004
TMAO (ng/mL) 12.72 ± 9.57a 20.07 ± 15.23b 26.57 ± 14.95c 0.003 Histological variables
Stages
II 10 (43.47%) 12 (54.54%) 0.998 III 13 (56.52%) 10 (45.45%) 0.997 Tumor depthpenetration (T)
T2-T3 14 (60.86%) 15 (68.18%) 0.775 T4 9 (39.13%) 7 (31.81%) 0.768 Grade of differentiation
G1 9 (39.13%) 10 (45.45%) 0.995 G2 6 (26.08%) 5 (22.72%) 0.438 G3 4 (17.39%) 5 (22.72%) 0.998 No differentiation 3 (13.04%) 2 (9.09%) 0.997
BMI: body mass index; HDL: high density lipoprotein; LDL: low density lipoprotein TMAO:
trimethylamine N-oxide; IL-1β: interleukin-1 beta; IL-10: interleukin 10. Values are
expressed as mean ± SD. Different superscript letters indicate significant differences
between study groups p < 0.05.

RESULTS
~ 80 ~
The clinical and anthropometric characteristics of study subjects are summarized in Table
1. No significant differences in age, gender, race, alcohol, and tobacco consumption,
constipation, total cholesterol, triglycerides, HDL-cholesterol, LDL-cholesterol, fasting
glucose, and HbA1c levels were found between study groups (p > 0.05).
As expected, significant differences were found in BMI between the CRC patients with
obesity (OB-CRC) and non-obese healthy controls (L-HC). In addition, significantly
higher levels of serum proinflammatory IL-1β and TMAO, and lower levels of anti-
inflammatory IL-10 were found in the OB-CRC and non-obese CRC (L-CRC) groups
compared to L-HC individuals. Moreover, these differences were even more pronounced
when the OB-CRC patients were compared to L-HC subjects. No significant differences
with respect to tumor stage and grade of tumor differentiation (p > 0.05) were found
between L-CRC and OB-CRC groups.
1.2. RICHNESS AND DIVERSITY OF FECAL MICROBIOTA
A total of 5,206,881 good quality 16S rRNA gene sequences (average of 80,105.86 ±
34,581.61 sequences per sample) were obtained after trimming. The microbiota of all
fecal samples after QIIME2 was composed of 2606 OTUS with a relative abundance
higher than 1% in at least two samples (97% similarity cut-off). The Chao1 index
(community richness) and Shannon index (microbiota diversity) were calculated at genus
level to estimate the alpha diversity of the components of the fecal microbiota in the study
groups. The Chao1 index values for each group suggested a significant decrease in
richness in both CRC groups compared to healthy controls (L-CRC vs. L-HC, p < 0.001;
OB-CRC vs. L-HC, p = 0.035) (Figure 6A). Moreover, a significant decrease in Shannon
diversity was found in L-CRC and OB-CRC patients compared to L-HC controls (L-CRC
vs. L-HC, p = 0.0014; OB-CRC vs. L-HC, p = 0.039) (Figure 6B). The alpha diversity

RESULTS
~ 81 ~
comparison revealed no different levels of diversity and richness between L-CRC and
OB-CRC patients (Shannon: L-CRC vs. OB-CRC, p = 0.34; Chao1: L-CRC vs. OB-CRC,
p = 0.37) (Figure 6C).
Figure 6. Richness (Chao1 index) and diversity (Shannon index) indices between microbial
communities from feces of CRC patients with obesity (OB-CRC), non-obese CRC patients (L-CRC),
and non-obese healthy controls (L-HC) at the genus level. (A) L-CRC vs. L-HC, (B) L-HC vs. OB-CRC,
and (C) L-CRC vs. OB-CRC.
On the other hand, differences in microbiota communities (beta diversity) between study
groups were determined by calculating the Bray-Curtis dissimilarity index. The
ordination plots showed a significant separation in the bacterial communities in both L-

RESULTS
~ 82 ~
CRC and OB-CRC patients with respect to L-HC controls (L-CRC vs. L-HC, p = 0.004;
OB-CRC vs. L-HC, p = 0.007, ANOSIM) (Figure 7A, B). Again, no significant
differences in beta diversity was found between L-CRC and OB-CRC groups (p = 0.485,
ANOSIM) (Figure 7C).
Figure 7. Clustering of fecal bacterial communities according to the different study groups by PCoA
using Bray–Curtis dissimilarity matrix. Each point corresponds to a community coded according to
the study groups. The percentage of variation explained by the plotted principal coordinates is
indicated on the axes. (A) L-HC vs. OB-CRC, (B) L-CRC vs. L-HC, and (C) L-CRC vs. OB-CRC.
1.3. TAXONOMY OF FECAL MICROBIOTA IN THE STUDY GROUPS
The analysis of the distribution of the fecal microbiota at the phylum level indicated that
Bacteroides and Firmicutes were the predominant phyla in the three study groups. Other

RESULTS
~ 83 ~
phyla such as Proteobacteria, Actinobacteria, Fusobacteria, and Lentisphaerae were also
relatively abundant in all groups, while Tenericutes, Synergistetes Verrumicrobia,
Spirochaetes, and WS6 were detected a low relative abundance (< 0.001; OB-CRC vs. L-
HC, q = 0.005), Fusobacteria (L-CRC vs. L-HC, q = 0.002; OB-LCR vs. L-HC, q =
0.001), and Proteobacteria (L-CRC vs. L-HC, q = 0.012; OB-CRC vs. L-HC, q = 0.014),
and a significant decrease in the abundance of Bacteroidetes (L-CRC vs. L-HC, q < 0.001;
OB-CRC vs. L-HC, q = 0.005) in the CRC groups (non-obese and obese) compared to
Figure 8. Phylum-level distributions of bacteria in fecal samples of (A) OB-CRC, (B) L-CRC, and (C) L-
HC groups. Data are shown as a percentage of the total identified sequences per group. (D)
Differentially abundant phyla in the stool samples of OB-CRC and L-CRC patients compared to L-HC
* p < 0.05, ** p < 0.001. The bars indicate mean ± SD.

RESULTS
~ 84 ~
the non-obese healthy controls. Additionally, we found a significantly higher abundance
of the phylum Lentisphaerae in L-CRC subjects compared to L-HC controls (q = 0.010).
Significantly higher levels of Firmicutes (q = 0.008) and Proteobacteria (q = 0.013) were
also found in the OB-CRC group with respect to the L-CRC group (Figure 8).
Twenty-seven bacterial families were detected in all study patients. Both CRC groups (L-
CRC and OB-CRC) displayed a significantly higher abundance of the Fusobacteriaceae
(L-CRC vs. L-HC, q = 0.002; OB-CRC vs. L-HC, q = 0.001), Prevotellacea (L-CRC vs.
L-HC, q = 0.010; OB-CRC vs. L-HC, q = 0.003), Clostridiaceae (L-CRC vs. L-HC, q =
0.019; OB-CRC vs. L-HC, q = 0.020), Barnesiellaceae (L-CRC vs. L-HC, q = 0.002; OB-
CRC vs. L-HC, q = 0.025), Porphyromonadaceae (L-CRC vs. L-HC, q = 0.010; OB-CRC
vs. L-HC, q = 0.035), and Desulfovibrionaceae (L-CRC vs. L-HC, q = 0.005; OB-CRC
vs. L-HC, q = 0.003) when compared to L-HC controls. Furthermore, a significantly
lower abundance of Ruminoccocacea (L-CRC vs. L-HC, q = 0.018; OB-CRC vs. L-HC,
q = 0.001) and Bacteroidaceae (L-CRC vs. L-HC, q = 0.002; OB-CRC vs. L-HC, q =
0.010) were found in the CRC groups with respect to the L-HC group. Victivallaceae was
also significantly enriched in L-CRC patients compared to L-HC subjects (q = 0.010),
while Enterobacteraceae (OB-CRC vs. L-CRC, q = 0.040; OB-CRC vs. L-HC, q = 0.029)
and Streptococcaceae (OB-CRC vs. L-CRC, q = 0.004; OB-CRC vs. L-HC, q = 0.016)
were significantly increased in the OB-CRC group compared to L-CRC and L-HC groups
(Figure 9).

RESULTS
~ 85 ~
Figure 9. Family-level microbial classification of bacteria from OB-CRC, L-CRC, and L-HC stool
samples. (A) Data are shown as a percentage of the total identified sequences per group. (B)
Differentially abundant families in the stool samples of OB-CRC and L-CRC patients compared to L-
HC * p < 0.05, ** p < 0.001. The bars indicate mean ± SD.
Further analysis revealed significant differences in the microbial composition at the genus
level between the study groups. A total of 39 genera were identified among the 60 fecal
samples, with only significant differences in 14 genera between CRC patients and healthy
individuals. Thus, the genera Prevotella (L-CRC vs. L-HC, q = 0.001; OB-CRC vs. L-

RESULTS
~ 86 ~
HC, q = 0.003), Clostridium (L-CRC vs. L-HC, q = 0.019; OB-CRC vs. L-HC, q = 0.030),
Desulfovibrio (L-CRC vs. L-HC, q = 0.002; OB-CRC vs. L-HC, q = 0.006) and
Enterococcus (L-CRC vs. L-HC, q = 0.031; OB-CRC vs. L-HC, q = 0.05) were
significantly increased in both CRC groups compared to the L-HC group. In addition, the
relative abundance of Bacteroides (L-CRC vs. L-HC, q = 0.003; OB-CRC vs. L-HC, q =
0.045), Butyricimonas (L-CRC vs. L-HC, q = 0.001; OB-CRC vs. L-HC, q = 0.012),
Roseburia (L-CRC vs. L-HC, q = 0.021; OB-CRC vs. L-HC, q = 0.019), Ruminococcus
(L-CRC vs. L-HC, q = 0.018; OB-CRC vs. L-HC, q = 0.035), and Alistipes (L-CRC vs.
L-HC, q = 0.005; OB-CRC vs. L-HC, q = 0.037) were significantly decreased in both
CRC groups with respect to the L-HC group. Finally, other genera such as Victivallis was
significantly elevated in the L-CRC compared to L-HC controls (q = 0.012). In OB-CRC
patients we found that Enterobacter (OB-CRC vs. L-CRC, q = 0.038; OB-CRC vs. L-
HC, q = 0.002), Escherichia (OB-CRC vs. L-CRC, q = 0.024; OB-CRC vs. L-HC, q =
0.006), Fusobacterium (OB-LCR vs. L-CRC, q = 0.003; OB-CRC vs. L-HC, q = 0.002),
and Streptococcus (OB-CRC vs. L-CRC, q = 0.038; OB-CRC vs. L-HC, q = 0.05) were
significantly enriched, while the relative abundance of Blautia (OB-CRC vs. L-CRC, q =
0.012; OBCRC vs. L-HC, q = 0.019) and Faecalibacterium (OB-CRC vs. L-CRC, q =
0.030, OB-CRC vs. L-HC, q = 0.024) were significantly lower when compared to L-CRC
and L-HC individuals (Figure 10).
At the species levels, we found a significant rise in the abundance of Enterococcus
faecalis (L-CRC vs. L-HC, q = 0.004; OB-CRC vs. L-HC, q = 0.012), and a significant
decline in the abundance of Bacteroides caccae (L-CRC vs. L-HC, q = 0.007; OB-CRC
vs. L-HC, q = 0.029), Ruminoccocus lactaris (L-CRC vs. L-HC, q = 0.05; OB-CRC vs.
L-HC, q = 0.019), Alistipes putredinis (L-CRC vs. L-HC, q = 0.011; OB-CRC vs. L-HC,
q = 0.05), and Alistipes indistinctus (L-CRC vs. L-HC, q = 0.008; OB-CRC vs. L-HC,

RESULTS
~ 87 ~
Figure 10. Relative abundance of bacterial genera in the microbiota of OB-CRC, L-CRC, and L-HC
controls. (A) Bacteroidetes genera, (B) Firmicutes genera, (C) Fusabacteria, Actinobacteria,
Lentisphaerae, and Proteobacteria genera. Data are shown as a percentage of the total identified
sequences per group. (D) Differentially abundant genera in the stool samples of OB-CRC and L-CRC
patients compared to L-HC. * p < 0.05, ** p < 0.001. The bars indicate mean ± SD.
q = 0.010), in both L-CRC and OB-CRC patients in comparison to L-HC controls.
Victivallis vadensis (q = 0.012) was significantly higher and Bacteroides uniformis (q =
0.010) was significantly lower in L-CRC patients compared to healthy controls. Finally,
Clostridium septicum (OB-CRC vs. L-CRC, q = 0.025; OB-CRC vs. L-HC, q = 0.004),

RESULTS
~ 88 ~
Escherichia coli (OB-CRC vs. L-CRC, q = 0.027; OB-CRC vs. L-HC, q = 0.007),
Fusobacterium nucleatum (OB-CRC vs. L-CRC, q = 0.003; OB-CRC vs. L-HC, q =
0.001), Enterobacter cloacae (OB-CRC vs. L-CRC, q = 0.013; OB-CRC vs. L-HC, q =
0.009), and Streptoccoccus bovis (OB-CRC vs. L-CRC, q = 0.011; OB-CRC vs. L-HC, q
= 0.027) were significantly enriched, while Faecalibacterium prausnitzii (OB-CRC vs.
L-CRC q = 0.011; OB-CRC vs. L-HC q = 0.043) was significantly reduced in OB-CRC
patients compared to L-CRC and L-HC subjects.
1.4. SERUM ZONULIN LEVELS
Serum zonulin levels were significantly higher in the OB-CRC group compared to L-HC
(26.57 ± 14.95 vs. 14.72 ± 9.57, p < 0.001) and L-CRC groups (26.57 ± 14.95 vs. 20.07
± 15.23, p = 0.013). Furthermore, the zonulin levels showed a non-significant trend
towards increased concentrations in L-CRC patients compared to L-HC controls (20.07
± 15.23 vs. 14.72 ± 9.57, p = 0.804).
1.5. RELATIONSHIP BETWEEN THE FECAL MICROBIOTA AND SERUM
LEVELS OF ZONULIN, TRIMETHYLAMINE N-OXIDE AND
INFLAMMATORY MEDIATORS IN THE STUDY GROUPS
Correlation analyses between the abundance of specific bacteria at different taxa levels
and serum levels of zonulin, TMAO, and inflammatory mediators (IL-1β and IL-10) in
all study groups are shown in Tables 2 and 3.
Subsequent lineal regression analysis showed that the relative abundances of
Ruminococcus (R2 = 0.33, β = −0.554, p = 0.014) and Blautia (R2 = 0.33, β = −0.925, p
= 0.024) were negatively associated with zonulin levels in the L-HC control group.
Nevertheless, the abundance of Prevotella (R2 = 0.33, β = 0.978, p = 0.003) was positively

RESULTS
~ 89 ~
associated with serum zonulin level in OB-CRC patients, while abundance of
Desulfovibrio (R2 = 0.33, β = 0.787, p = 0.014) was positively associated to serum zonulin
levels in L-CRC patients.
Similarly, regression analysis showed that, in the case of L-HC control subjects, the levels
of the anti-inflammatory factor IL-10 were positively associated with the abundance of
Roseburia (R2 = 0.38, β = 0.681, p = 0.001), while the levels of the inflammatory factor
IL-1β were positively associated with the abundance of Enterobacter (R2 = 0.38, β =
0.435, p = 0.048). In addition, the level of IL-1β in OB-CRC patients was positively
associated with the abundance of Fusobacterium nucleatum (R2 = 0.38, β = 0.1963, p =
0.050), while the level of IL-10 was positively associated with the abundance of Blautia
(R2 = 0.38, β = 0.555, p = 0.009) and Faecalibacterium prausnitzii (R2 = 0.38, β = 0.456,
p = 0.026). Finally, in the L-CRC group the levels of IL-1β and IL-10 were positively
associated with the abundance of Enterococcus faecalis (R2 = 0.41, β = 0.418, p = 0.037)
and the abundance of Ruminococcus (R2 = 0.41, β = 0.418, p = 0.022), respectively.
Table 2. Correlations of gut microbiota composition and serum levels of IL-1B and IL-10 in
the L-CRC, OB-CRC, and L-HC groups.
Table 3. Correlations of gut microbiota composition and serum levels of zonulin and
TMAO in the study groups.
L-HC L-CRC OB-CRC L-HC L-CRC OB-CRC
Blautia −0.621 (p = 0.024) −0.812 (p = 0.021) −0.656 (p = 0.024) 0.734 (p = 0.022) 0.912 (p = 0.003) 0.867 (p = 0.021)Roseburia −0.625 (p = 0.032) −0.467 (p = 0.008) −0.503 (p = 0.025) 0.865 (p = 0.008) 0.608 (p = 0.013) 0.854 (p = 0.017)
Ruminoccocus −0.745 (p = 0.038) −0.656 (p = 0.044) −0.763 (p = 0.033) 0.898 (p = 0.005) 0.675 (p = 0.038) 0.854 (p = 0.018)Enterobacter 0.843 (p = 0.015) 0.827 (p = 0.017) 0.834 (p = 0.015) −0.892 (p = 0.011) −0.912 (p = 0.021) −0.895 (p = 0.012)
Fusobacterium nucleatum 0.865 (p = 0.187) 0.975 (p = 0.007) 0.965 (p = 0.009) −0.878 (p = 0.523) −0.997 (p = 0.003) −0.898 (p = 0.003)Streptoccocus 0.721 (p = 0.211) 0.815 (p = 0.0234) 0.834 (p = 0.0267) −0.754 (p = 0.323) −0.932 (p = 0.009) −0.891 (p = 0.019)
Enteroccocus faecalis 0.674 (p = 0.252) 0.765 (p = 0.028) 0.793 (p = 0.017) −0.763 (p = 0.237) −0.911 (p = 0.015) −0.870 (p = 0.029)Escherichia coli 0.620 (p = 0.146) 0.645 (p = 0.019) 0.720 (p = 0.024) −0.911 (p = 0.109) −0.867 (p = 0.012) −0.745 (p = 0.020)
IL-1 B IL-10
L-HC L-CRC OB-CRC L-CRC OB-CRC
Ruminococcus −0.645(p = 0.034) −0.523 (p = 0.031) −0.6490 (p = 0.031) Enterobacteraceae 0.689 (p =0.033) 0.632(p = 0.021)Prevotella 0.445 (p = 0.443) 0.678 (p = 0.032) 0.858 (p = 0.033) Clostridium 0.658 (p = 0.028) 0.778 (p = 0.020)
Blautia −0.718(p = 0.026) −0.593 (p = 0.043) −0.631 (p = 0.049) Streptococcus 0.631 (p = 0.049) 0.593 (p = 0.043)Escherichia coli 0.751 (p = 0.404) 0.545 (p = 0.019) 0.564 (p = 0.035) Escherichia coli 0.763 (p = 0.021) 0.790 (p = 0.019)
Desulfovibrio 0.578(p = 0.367) 0.748 (p = 0.035) 0.804 (p = 0.031) Desulfovibrio 0.904 (p = 0.011) 0.7489(p = 0.038)
Zonulin TMAO

RESULTS
~ 90 ~
On the other hand, serum levels of TMAO were found to be positively associated with
the abundance of Enterobacteriaceae (R2 = 0.43, β = 0.618, p = 0.005) and Escherichia
coli (R2 = 0.43, β = 0.812, p = 0.012) in OB-CRC patients, and with the abundance of
Desulfovibrio (R2 = 0.52, β = 0.576, p = 0.003) in L-CRC patients. No significant
associations were found between any bacterial group and the serum TMAO levels in L-
HC controls.
1.6. PREDICTED FUNCTIONAL METAGENOME ANALYSIS
Phylogenetic Investigation of Communities by Reconstruction of Unobserved States
(PICRUSt) was used to identify differences in metagenome functional prediction based
on Greengenes 16S rRNA database and Kyoto Encyclopedia of Genes and Genomes
(KEGG) Orthologs. The PICRUSt analysis showed that genes involved in energy
metabolism (oxidative phosphorylation, q = 0.022), methane and sulfur metabolism (q =
0.015 and q = 0.023, respectively), and glycan biosynthesis and metabolism
(lipopolysaccharide biosynthesis, q = 0.05; glycosiltransferases, q = 0.043) were
significantly over-represented according to the BMI increase when CRC groups and the
L-HC group were compared. Moreover, carbohydrate metabolism (Citrate cycle (TCA
cycle), q = 0.032), butanoate metabolism, q = 0.035, and pentose phosphate pathway, q =
0.016), amino acid metabolism (glycine, serine, and threonine metabolism, q = 0.005;
valine, leucine, and isoleucine biosynthesis, q = 0.005), metabolism of other amino acids
(selenocompound metabolism, q = 0.006) and protein processing in endoplasmic
reticulum (q = 0.047) were over-represented in the L-CRC group when compared to the
OB-CRC group (Figure 11).
Finally, when comparing L-HC controls to both CRC groups we found that gut microbiota
from CRC patients was significantly enriched with genes implicated in antigen processing

RESULTS
~ 91 ~
and presentation (p = 0.004), bacterial chemotaxis (q = 0.013), bacterial secretion system
(q = 0.007), and bacterial toxin (q = 0.007) and significantly reduced in genes related to
ATP-binding cassette (ABC) transporters (q = 0.022), xenobiotic degradation and
metabolism (ethylbenzene degradation q = 0.026) and lipid metabolism functions (fatty
acid biosynthesis and degradation (q = 0.017), glycerophopholipid metabolism (q =
0.034), and arachidonic acid metabolism (q = 0.04)) (Figure 11).
Figure 11. Predicted functional composition of metagenomes based on 16S rRNA gene sequencing
data of OB-CRC, L-CRC, and L-HC controls. Heatmap of differentially abundant KEGG pathways
identified in the three study groups. The values of color in the heatmap represent the normalized
relative abundance of KEGG pathways.

RESULTS
~ 92 ~
2. RESULTS STUDY 2: Changes in the gut microbiota composition and
functionality of colorectal cancer patients after neoadjunvant radiochemotherapy is
associated with the pathologic response.
2.1. CLINICAL CHARACTERISTICS OF THE PATIENTS AND HEALTHY
CONTROLS
Table 4. Clinical characteristics in the study groups.
Healthy
controls
(N=20)
CRC-patients
(N=40)
*P R patients
(N=28)
NR patients
(N=12)
*P
Age (years) 61.42±7.40 63.35±6.97 0.326 62.93±8.27 63.12±6.34 0.928
Gender, n (M/F) 10 /10 23/17 0.783 16 /12 7/5 0.780
BMI (kg/m2) 25.45±3.23 26.42±4.71 0.412 26.22±4.22 25.92±3.92 0.835
Constipation, n (%) 6 (20%) 10 (25%) 0.914 7 (25%) 3 (25%) 0.690
Alcohol consumption, n (%) 4 (13.3%) 6 (15%) 0.831 4 (14.28%) 2 (16.16%) 0.740
Current smoking, n (%) 9 (30%) 15 (37.5%) 0.774 11 (39.28%) 4 (33.33%) 0.990
Biochemical data
Glucose (mg/dl) 94.85±19.86 104.79±27.94 0.161 102.83±26.38 104.15±23.56 0.882
Total cholesterol (mg/dl) 175.2±33.6 183.95±25.71 0.268 184.17±21.64 181.67±26.12 0.755
Triglycerides (mg/dl) 112.67±34.51 114.85±33.62 0.815 109.25±32.12 118.32±27.12 0.398
HDL-cholesterol (mg/dl) 60.7±15.1 54.83±18.23 0.219 55.32±16.21 53.89±18.34 0.807
LDL-cholesterol (mg/dl) 107.78±27.12 112.07±33.45 0.621 109.68±30.29 112.36±33.21 0.805
Histological variables
Disease stage
II 22 (55%) - 15 (53.57%) 7 (58.33%) 0.945
III 18 (45%) - 13 (46.42%) 5 (41.66%) 0.950
Tumor depth
penetration (T)
T2-T3 26 (65%) - 18(64.28%) 8 (66.66%) 0.828
T4 14 (35%) - 10 (35.71%) 4 (33.33%) 0.832
Grade of differentiation
G1 18 (45%) - 12 (42.85%) 6 (50%) 0.944
G2 10 (25%) - 7 (25%) 3 (25%) 0.690
G3 7 (17.5%) - 5 (18.85%) 2 (16.16%) 0.806
No differentiation 5 (12.5%) - 3 (10.71%) 2 (16.66%) 0.777
CRC: colorectal cancer; R: responders; NR: non-responders; BMI: body mass index; HDL: high
density lipoprotein; LDL: low density lipoprotein. Values are expressed as mean ± SD. *P< 0.05 was
considered statistically significant.

RESULTS
~ 93 ~
CRC patients and healthy controls had comparable eating habits to exclude the influence
of dietary differences (data not shown). All CRC patients completed the neoadjuvant
radiochemotherapy and underwent surgical resection. There was no significant difference
between CRC patients and healthy controls in terms of age, sex, BMI, and biochemical
data (Table 4). 28 of the 40 CRC patients (70%) had a good response to the neoadju-vant
radiochemotherapy (responders, R) (TGR 1-2), whereby 12 (30%) has a poor or non-
response (non-responders, NR) (TGR 3-5) to therapy. Both R and NR patients were
similar in terms of sex, age, BMI and stage of the cancer, as shown in Table 4.
2.2. DIFFERENCES IN TAXNOMIC COMPOSITION AND DIVERSITY OF
GUT MICROBIOTA BETWEEN COLORECTAL CANCER PATIENTS AND
HEALTHY CONTROLS
A total of 17496823 reads of the 16S rRNA gene (hypervariable V2-V9 regions) were
generated from the analyzed stool samples, with an average of 105632 (±10825) reads for
each sample, ranging from 359 to 398783. A total of 52844 high quality reads were
obtained after trimming and filtering. In the OTUS clustering process a total of 15326
OTUs were obtained, and after alignment of the OTU representative sequences, 2582
OTUs with a relative abundance higher than 1% in at least four samples (97% similarity
cut-off) were identified. In the taxonomical assignment process these OTUs were binned
in 7 phyla, 39 families, 45 genera and 53 species using QIIME2 pipeline, with Greengenes
v13.8 as reference database for sequence classification and alignment.
We first compared the landscape of the gut microbiome in the stool samples of all CRC
patients at baseline and in healthy controls in order to define a normal gut microbiota
profile. As expected, we found a significant higher diversity and richness (defined by the
Shannon and Chao1 indexes, respectively) in the fecal samples of healthy controls with

RESULTS
~ 94 ~
respect to those of CRC patients (Shannon p = 0.026 and Chao1 p = 0.001) (Figure 12
A, B). The beta diversity (Bray-Curtis dissimilarity) comparison of baseline CRC patients
and healthy controls indicated that the two cohorts had significantly different genus
compositions of intestinal bacteria (p = 0.0001, ANOSIM) (Figure 12 C).
Figure 12. Comparison of alpha and beta diversity among CRC patients at baseline (CRC-T0) and
healthy controls (HC). (A) Shannon index (p = 0.026); (B) Chao1 index (p= 0.001). (C) Principal
component plot based on Bray-Curtis distance matrix from patients with CRC and healthy controls
using Bray-Curtis dissimilarity index al genus-levels (p = 0.0001). The first two coordinates are
plotted with the percentage of variability explained indicated on the axis.
Furthermore, the analysis of gut microbiota profiles between CRC patients and healthy
controls at baseline revealed significant differences in the abundance at different

RESULTS
~ 95 ~
taxonomic levels. At phylum level, the relative abundance of Fusobacteria (q < 0.001),
Firmicutes (q < 0.001) and Lentisphaerae (q = 0.007) and Proteobacteria (q = 0.003) was
increased in patients with CRC, while the relative abundance of Bacteroidetes (q < 0.001)
and Actinobacteria (q = 0.034) were significantly decreased in CRC patients when
compared to controls (Figure 13 A).
Figure 13. Relative abundance at phylum (A) and genera (B) levels of differentially
abundant bacteria in the stool samples of CRC patients at baseline (CRC-T0) and
healthy controls (HC). * p < 0.05, ** p < 0.001.

RESULTS
~ 96 ~
At the genus level, the results indicated significant differences in the microbial
composition of dominant genera between CRC patients at baseline and healthy con-trols.
Compared with healthy controls, patients with CRC displayed an enrichment in the
genera Prevotella (q < 0.001), Oscillospira (q < 0.001), Fusobacterium (q = 0.001),
Enterobacter (q = 0.020), Victivallis (q = 0.012), Escherichia (q = 0.046) and
Desulfovibrio (q < 0.001). Conversely, the abundance of Bacteroides (q = 0.003),
Roseburia (q < 0.001), Ruminococcus (q = 0.006), Faecalibacterium (q = 0.01),
Bifidobacterium (q = 0.023) and Blautia (q = 0.014) were enriched in healthy controls
compared to CRC patients (Figure 13 B).
At specie level, while healthy subjects showed a significant higher abundance of
Bifidobacterium bifidum (q = 0.034) and Faecalibacterium prausnitzii (q = 0.040) with
respect to CRC patients, Fusobacterium nucleatum (q = 0.020), Bacteroides fragilis (q =
0.024) and Escherichia coli (q = 0.016) were significantly increased in the fecal samples
of CRC patients in comparison to controls.
2.3. CHANGES IN GUT MICROBIOTA DIVERSITY AND COMPOSITION IN
RESPONSE TO NEOADJUVANT RADIOCHEMOTHERAPY TREATMENT IN
COLORECTAL CANCER PATIENTS
We compared the gut microbiota communities at baseline (T0) versus post-treatment time
points (T1, T2 and T3) to study the effect of neoadjuvant RCT on gut microbial diversity
and composition in CRC patients. The alpha diversity comparison showed no significant
differences in the levels of richness (Chao 1) and diversity (Shannon) between the
baseline and the different time points: (Shannon p = 0.75 and Chao1 p = 0.61) (Figure
14 A, B). Moreover, the PCoA plot based on the beta diversity (Bray-Curtis dissimilarity)
revealed that the differences of the gut microbial community at T1, T2 and T3 compared

RESULTS
~ 97 ~
to baseline (T0) were not significant (p = 0.716, ANOSIM) (Figure 14 C).
Figure 14. Gut microbiota diversity and richness at baseline and during RTC
treatment and post-treatment points in CRC patients. (A) Shannon index (p = 0.75);
(B) Chao1 index (p = 0.61); (C) principal component analysis representation based
on Bray–Curtis distance matrix of patient distribution based on bacterial genera
composition at baseline and during RTC treatment and at post-treatment points (p
= 0.716). The first two coordinates are plotted with the percentage of variability,
which is explained and indicated on the axis.

RESULTS
~ 98 ~
The main bacterial phyla (Firmicutes and Bacteroidetes) remained stable over time, while
other less abundant phyla such as Fusobacteria and Proteobacteria were significantly
decrease at T3 compared to T0 (q = 0.042 and q = 0.039, respectively) in CRC patients.
Although bacterial family and genera proportions differed between the different time
points, they were not significantly altered by the RCT treatment (Wilcoxon test p > 0.05)
apart from the genera Fusobacterium (q = 0.015), Escherichia (q = 0.04) and Klebsiella
(q = 0.035), which were significantly decreased after treatment, and the genus
Bifidobacterium (q = 0.049) that was significantly raised at T3 compared to T0 (Figure
15).
Figure 15. Heatmap diagram of the gut microbiota composition at different taxa
levels for baseline (CRC-T0), treatment points with neoadjuvant RCT (CRC-T1, CRC-
T2 and CRC-T3), and the healthy control subjects (HC). The 29 phylum and genera
that were shared by all of the tested samples (core microbiome) are displayed.

RESULTS
~ 99 ~
2.4. POST-TREATMENT MICROBIOTA DIVERSITY AND COMPOSITION IS
ASSOCIATE TO CLINICAL RESPONSE TO NEOADJUVANT
RADIOCHEMOTHERAPY IN CRC PATIENTS
To evaluate the relationship between microbial community and the treatment outcome,
we classified the patients based on their response to RCT in categories such as responders
(R) and non-responders (NR). As shown in Table 1, no significant differences in terms of
stage of cancer, sex, age, and BMI were observed between study groups (R vs. NR).
Figure 16. Comparison of alpha and beta diversity in CRC patients according to their
response to therapy. (A) Shannon index; (B) Chao1index; (C) principal component
plot based on the Bray–Curtis distance matrix and the Jaccard indices from the
responder (R) and non-responder (NR) patients at genus-level. The first two
coordinates are plotted with the percentage of variability, which is explained and
indicated on the axis.
A) B)
C)

RESULTS
~ 100 ~
An analysis of alpha diversity at T3 revealed that the R group had higher diversity
(Shannon index, q < 0.001; Simpson index, q = 0.039) and richness that the NR group
(Chao1 index, q = 0.015) at genus level (Figure 16 A, B). Furthermore, the ordination
plot based on Bray-Curtis dissimilarities and Jaccard index showed different intestinal
microbial compositions at the genus level between both the R and the NR groups at T3
(Bray-Curtis index, q = 0.038; Jaccard index, q = 0.035; non-parametric ANOSIM test)
(Figure 16 C).
Next, we searched for differentially abundant taxa in the gut microbiome of R versus NR
at T3. The analysis revealed that, at the phylum level, there were a significant enrichment
in Actinobacteria (q = 0.0025) and Firmicutes (q = 0.0017) populations and a significant
decrease in Fusobacterias (q = 0.025) and Proteobacterias (q = 0.037) populations in the
R group in comparison to the NR group (Figure 17 A, B). At the family level, a significant
higher abundance of Ruminococcaceae (q = 0.004) and Bifidobacteriaceae (q = 0.03),
accompanied by a significant lower abundance of Prevotellaceae (q = 0.045),
Enterobactericeae (q = 0.027) and Fusobacteriaceae (q = 0.014) were showed in the R
group compared to NR group (Figure 17 C).
In addition, at the genera level, we identified a significant increase in Ruminococcus (q =
0.035), Bilophila (q = 0.008), Collinsiella (q = 0.015), Bifidobacterium (q = 0.024),
Roseburia (q = 0.032), and Faecalibacterium (q = 0.041) in R patients with respect to
NR, while a significant increase in Prevotella (q = 0.05), Fusobacterium (q = 0.045),
Escherichia (q = 0.037), Bacteroides (q = 0.027) and Klebsiella (q = 0.035) were observed
in NR patients compared to the R group (Figure 18 A, B). Finally, at the specie level, we
found a significant overabundance of Prevotella copri (q < 0.001), Escherichia coli (q =
0.029), Fusobacterium nucleatum (q = 0.015) and Bacteroides fragilis (q = 0.029) in the
NR group, while the R group displayed a significantly higher abundance of

RESULTS
~ 101 ~
Bifidobacterium bifidum (q = 0.043), Ruminococcus albus (q= 0.019), Collinsella
aerofaciens (q = 0.018) and Faecalibacterium prausnitzii (q = 0.027).
Figure 17. Heatmap of the fecal microbiota composition at the phylum and family
levels in the responder (R) and non-responder (NR) patients (A). Relative
abundance at phylum (B) and family (C) levels of differentially abundant OTUs in
the stool samples of N patients compared to the NR patients. * p < 0.05.
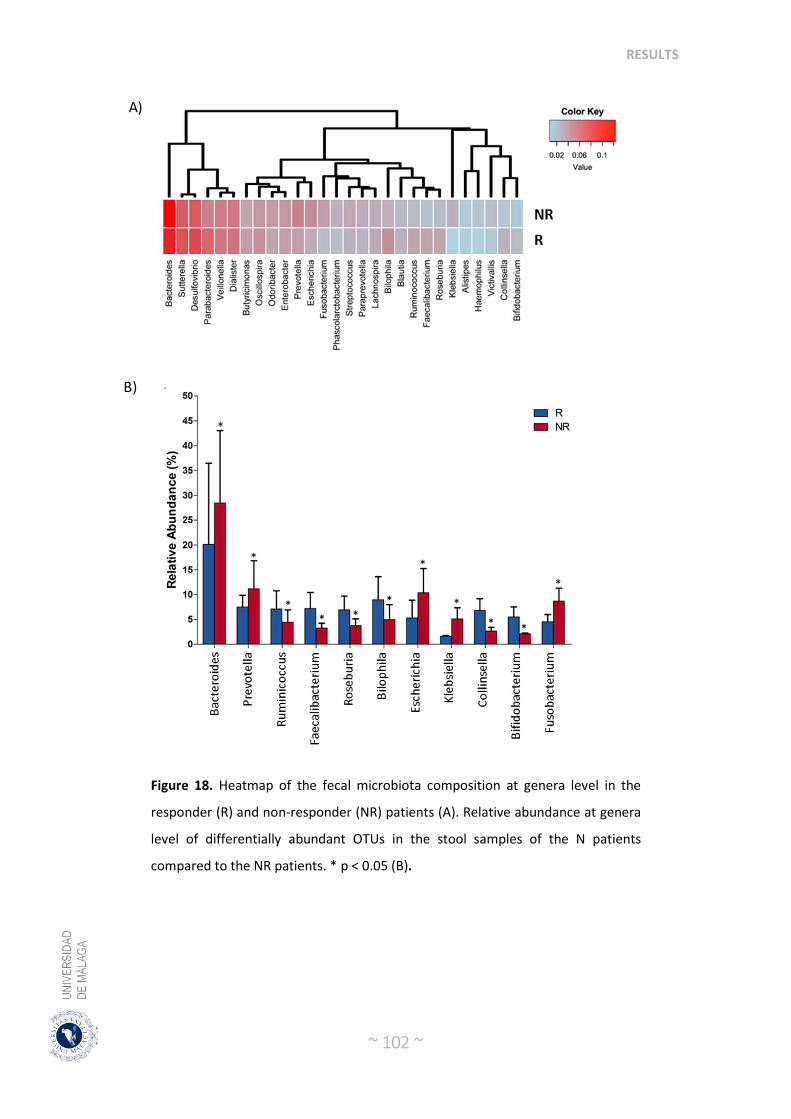
RESULTS
~ 102 ~
Figure 18. Heatmap of the fecal microbiota composition at genera level in the
responder (R) and non-responder (NR) patients (A). Relative abundance at genera
level of differentially abundant OTUs in the stool samples of the N patients
compared to the NR patients. * p < 0.05 (B).

RESULTS
~ 103 ~
2.5. BASELINE MICROBIOTA COMPOSITION COULD PREDICT RESPONSE
TO RADIOCHEMOTHERAPY TREATMENT IN COLORECTAL CANCER
PATIENTS
After described significant differences in intestinal microbial composition be-tween R
and NR after RCT treatment, we next assessed the predictive power of gut microbiome
related to neoadjuvant RCT response. We used Random (RF) to build a predictive model
based on the overall gut microbiota profile using the species-level abundance data as
input. After RF analysis with 500 bootstrap samples, we found that overall gut microbiota
composition data had a significant accuracy of 80% and area under the curve (AUC) of
0.71. The main species accounting for this stratification were Ruminococcus albus,
Bifidobacterium bifidum, Faecalibacterium prausnitzii, Fusobacterium nucleatum, and
Bacteroides fragilis, and when proportions of these bacterial species were only used for
testing the accuracy of the RF classifier this increased to 96% (AUC = 0.925). Thus, the
response to RTC or the lack of it were identified with an accuracy of 94% (AUC = 0.95)
and of 91% (AUC = 0.92), respectively (Figure 19 A). The validation cohort consisted
of 84 CRC patients under neoadjuvant RCT (45 R patients and 39 NR patients) (data
collected from the Genome Sequence Archive in National Genomics Data Center,
accession number CRA002850). After RF analysis in this validation cohort, an accuracy
of 92.0% (AUC = 0.93) and 90.0% (AUC = 0.91) were obtained for the response to RTC
or the lack of it, respectively (Figure 19 B). Among the five species variables,
Fusobacterium nucleatum, and Bacteroides fragilis were biomarkers of R patients, and
Ruminococcus albus, Bifidobacterium bifidum, and Faecalibacterium prausnitzii were
biomarkers of NR patients.

RESULTS
~ 104 ~
Figure 19. Receiver operating characteristic (ROC) curve based on the random
forest classifier constructed using microbial variables (Ruminococcus albus,
Bifidobacterium bifidum, Faecalibacterium prausnitzii, Fusobacterium nucleatum,
and Bacteroides fragilis). (A) Training cohort. The area under the ROC curve (AUC)
was 0.95, and the 95% confidence interval (CI) was 0.901–1 for the R patients
(green), and the AUG was 0.92 and 95% the IC was 0.827–1 for the NR patients
(red). (B) Validation cohort. The AUG was 0.93 and the 95% IC was 0.877–0.987 for
the R patients (green), and the AUG was 0.91 and 95% the IC was 0.835–0.984 for
the NR patients (red).
2.6. DIFFERENCES IN THE GUT MICROBIOTA FUNCTIONS BETWEEN
RESPONDER AND NON-RESPONDER
KEGG pathway enrichment analysis of the metagenomic data showed that genes for
energy metabolism such as methane metabolism (q < 0.004), carbohydrate metabolism
such as pentose phosphate pathway (q = 0.0022), pyruvate metabolism (q < 0.001), starch
and sucrose metabolism (q = 0.008), galactose metabolism (q = 0.007), butanoate
metabolism (q = 0.005) and glycolysis-gluconeogenessis (q = 0.0028) and xenobiotics
biodegradation and metabolism pathways including benzoate degradation (q = 0.038) and
nitrotoluene degradation (q = 0.005) and membrane transport such as ABC transporters

RESULTS
~ 105 ~
(q = 0.012) and transporters (q = 0.012) were significantly depleted in NR compared to
R patients.
Figure 20. Heatmap of bacterial gene functional predictions using the PICRUSt
algorithm from the fecal samples from the responder (R) patients and the non-
responder (NR) patients.
Nevertheless, NR patients compared to R, there was a significant over-representation of
genes for the lipid metabolism such as araquidonic acid metabolism (q = 0.006), amino
acid metabolism pathways, such as for arginine and proline metabolism (q = 0.029) and
glycine, serine and threonine metabolism (q = 0.001), as well as in genes for metabolism

RESULTS
~ 106 ~
of other amino acids such as glutathione metabolism (q = 0.003), metabolism of cofactors
and vitamins such as riboflavin metabolism (q = 0.003), ubiquinone and other terpenoid
metabolism (q < 0.001) and folate biosynthesis (q = 0.014), glycan biosynthesis and
metabolism such as lipopolysaccharide biosynthesis (q = 0.007) and lipopolysaccharide
biosynthesis proteins (q = 0.001), cellular processes and signaling that contains cell
motility and secretion (q = 0.0018) and oxidative phosphorylation (q < 0.001) and
pathways in cancer (q < 0.001) (Figure 20).
2.7. CHANGES IN SERUM LEVEL OF POLYAMINES AND ZONULIN AND
FECAL LEVEL OF SHORT CHAIN FATTY ACIDS AFTER
RADIOCHEMOTHERAPYTREATMENT IN COLORECTAL CANCER
PATIENTS
Significant differences in the serum levels of several polyamines and acetyl derivatives
of polyamines were found in R and NR patients at post-treatment point (T3). Then, we
have found in NR a significant increase in the levels of spermine, N1-acetyl spermine
(N1-AcSP), N1, N12-diacetylspermine (N1,N12-DiAcSP), N1-acetylspermidine (N1-
AcSPD), N1, N8- diacetylspermidine (N1,N8-DiAcSPD) and N1-acetylputrescine (N1-
AcPUT) compared to R patients. On the other hand, within-group there were also
significant changes in the levels of N1-AcSPD and spermine in both R and NR patients
and in the serum levels of N8-AcSPD only in the NR group (Table 5).

RESULTS
~ 107 ~
Table 5. Serum polyamine and zonulin levels in baseline (T0) and post-treatment (T3).
R NR Between-group P2
(N=28) (N=12) Difference1 Agmatine (ng/mL)
Baseline 0.11±0.13 0.13±0.15
Post-treatment 0.25±0.24 0.17±0.15 -0.025 (-0.11, 0.63) 0.571
Change 0.14 (-0.27, -0.13) 0.035 (-0.13, 0.061)
Arginine (µg/mL)
Baseline 23.18±4.20 24.54±4.76
Post-treatment 22.82±4.16 23.10±4.48 -1.35 (-4.05, 1.35) 0.319 Change -0.36 (-1.5, 2.27) -1.43 (-1.13, 4.0)
Ornithine (µg/mL)
Baseline 19.46±5.74 23.31±8.06
Post-treatment 20.21±4.16 22.80±7.55 -3.85 (-8.07, 0,37) 0.073 Change 0.74 (-3.69, 2.19) -0.51 (-3.72, 4.74)
N1,N12-DiAcSP (ng/mL)
Baseline 1.08±0.43 1.68±1.34
Post-treatment 0.90±0.52 1.22±0.57 -0.59 (-1.20, 0.06) 0.015 Change -0.18 (0.017, 0.34) 0.46 (-0.152, 1.07)
N1,N8-DiAcSPD (ng/mL)
Baseline 0.71±0.26 0.99±1.03
Post-treatment 0.74±0.34 0.88±0.38 -0.28 (-0.74, 0.17) 0.007 Change 0.03 (-0.13, 0.059) -0.11 (-0.34, 0.57)
N1-AcSPD (ng/mL)
Baseline 22.47±7.10 27.68±13.47
Post-treatment 23.42±8.26 28.89±10.38 -5.21 (-11.73, 1.3) 0.021 Change 0.94 (-3.88, 1.99)* 1.20 (-6.10, 3.68)*
N8-AcSPD (ng/mL)
Baseline 14.52±3.48 14.88±3.27
Post-treatment 14.69±3.39 16.10±2.33 -0.35 (-2.38, 1.67) 0.727
Change 0.16 (-0.90, 0.57) 1.22 (-2.42, -0.20)*
N-AcPUT (ng/mL)
Baseline 5.04±1.60 5.92±5.38
Post-treatment 5.39±3.79 4.77±1.70 -0.88 (-3.29, 1.53) 0.030 Change 0.34 (-1.78, 1.09) -1.15 (-1.01, 3.32)
Putrescine (ng/mL)
Baseline 8.84±4.40 7.95±3.52
Post-treatment 8.06±3.89 7.47±3.09 0.89 (-1.49, 3.28) 0.457 Change -0.78 (-0.39, 1.96) -0.47 (-1.07, 2.02)
Spermidine (ng/mL)
Baseline 17.14±7.19 22.26±12.69
Post-treatment 20.42±12.40 20.90±10.81 -5.11 (-11.36, 1.12) 0.106 Change 3.28 (-7.42, 0.85) -1.35 (-2.01, 4.73)
N1-AcSP (ng/mL)

RESULTS
~ 108 ~
Baseline 0.89±0.33 1.48±0.70
Post-treatment 1.19±0.63 1.33±0.62 -0.58 (-0.92, -0.25) 0.014
Change 0.29 (-0.55, -0.046) -0.14 (-0.11, 0.40)
Spermine (ng/mL)
Baseline 3.77±1.30 12.10±7.85
Post-treatment 4.80±2.88 7.35±3.66 -8.32 (-11.74, -4,89) 0.001
Change 1.03 (-2.17, 0.107)* -4.74 (1.71, 7.77)*
Zonulin (ng/mL)
Baseline 257.6±65.4 272.6±35.1
Post-treatment 218.1±76.4 298.4±47.5 -22.2 (7.6, -10.2) 0.004 Change -39.3 (-29.2, 23.9) 25.2 (11.3, 37.1)
Serum polyamine levels were measured by means of ultra-high performance liquid
chromatography tandem mass spectrometry (UHPLCMS/MS). Values are expressed as
mean ± SD for baseline and post-treatment values or mean (95% CI) for the mean
differences between baseline and post-treament timepoint T3. R: responder; NR: non-
responder. 1 Difference between R and NR patients at post-treatment when adjusted for
baseline. 2 Comparison among post-treatment changes was conducted with a covariance
model (ANCOVA) adjusted for baseline. * Wilcoxon signed-rank test was used to calculate
differences in polyamines between baseline and post-treatment in R and NR patients. p <
0.05 was considered statistically significant.
SCFAs are bacterial-derived metabolites with important physiological functions in the
host and with anti-cancer properties. Analysis of the fecal levels of SCFAs revealed
significant differences in the concentrations of acetic, butyric, isobutyric, valeric,
isovaleric and hexanoic acids between the R and NR study groups at post-treatment time
point T3. Moreover, we found several significant differences in the within-group
comparison of the fecal concentrations of acetic and butyric acids, which significatively
increased after RCT treatment in the R group. On the other hand, serum zonulin levels (a
circulating marker of gut permeability) were significantly increased in the NR group (but
not in R group) after RCT treatment (Table 6).

RESULTS
~ 109 ~
Table 6. Fecal SCFAs concentrations in Baseline (T0) and post-treatment (T3).
R NR Between-group P2 (N=28) (N=12) Difference1 Acetic acid Baseline 0.83±0.39 0.71±0.15 0.26 (-0.03, 0.56) 0.012 Post-treatment 1.04±0.40 0.77±0.17
Change 0.20 (-0.39, -0.007)* 0.06 (-0.30, 0.18)
Propionic acid
Baseline 1.40±1.27 2.02±1.35 0.79 (-0.16, 1.76) 0.102 Post-treatment 1.50±1.10 0.70±1.52
Change 0.09 (-0.59, 0.79) -1.31 (-2.9, 0.36)
Butyric acid 0.93±0.68 1.37±0.45 1.33 (-0.04, 2.71) 0.016 Baseline 2.36±1.82 1.02±1.07
Post-trearment 1.43 (-2.15, -0.70)* -0.344 (-0.65, 1.34)
Change
Isobutyric acid 0.31±0.33 0.58±0.33 0.15 (0.03, 0.26) 0.010 Baseline 0.24±0.15 0.09±0.05
Post-trearment -0.07 (-0.07, 0.21) -0.49 (0.23, 0.76)
Change
Valeric acid
Baseline 0.30±0.16 0.61±0.32 0.15 (0.005, 0.29) 0.002 Post-trearment 0.29±0.19 0.13±0.07
Change -0.01 (-0.07, 0.09) -0.47 (0.18, 0.76)
Isovaleric acid
Baseline 0.50±0.49 0.90±0.44 0.18 (0.05, 0.29) 0.009 Post-trearment 0.39±0.24 0.20±0.13
Change -0.11 (-0.09, 0.31) -0.69 (0.36, 1.02)
4-methylvaleric acid
Baseline 0.13±0.23 0.37±0.64 0.02 (-0.05, 0.10) 0.216 Post-trearment 0.07±0.10 0.04±0.01
Change -0.06 (-0.02, 0.15) -0.33 (-0.20, 0.86)
Hexanoic acid
Baseline 0.15±0.20 0.11±0.08 0.05 (-0.19, 0.13) 0.007 Post-trearment 0.10±0.10 0.05±0.09
Change -0.04 (-0.01, 0.10) -0.05 (-0.01, 0.13)
Heptanoic acid
Baseline 0.09±0.15 0.07±0.06 0.02 (-0.007, 0.04) 0.171 Post-trearment 0.06±0.06 0.05±0.01
Change -0.02 (-0.01, 0.07) -0.028 (-0.02, 0.08) Short-chain fatty acids (SCFAs) in fecal samples were analyzed by means of gas
chromatography coupled with a flame-ionization detector (GC-FID). Values are expressed
as mean ± SD for baseline and post-treatment values or mean (95% CI) for the mean
differences between baseline and post-treament timepoint T3. R: responder; NR: non-
responder. 1 Difference between R and NR patients at post-treatment when adjusted for
baseline. 2 Comparison among post-treatment changes was conducted with a covariance

RESULTS
~ 110 ~
model (ANCOVA) adjusted for baseline. * Wilcoxon signed-rank test was used to calculate
differences in the SCFAs and zonulin between the baseline and post-treatment in R and
NR patients. p < 0.05 was considered statistically significant.
In addition, pairwise comparisons using Spearman rank correlation analysis were then
performed between bacterial species enriched in the gut microbiome of both R and NR
patients and the fecal SCFAs and serum zonulin and polyamines levels. Interestingly, we
found a statistically significant positive correlation between the fecal levels of butyrate
and the abundance of the Faecalibacterium prausnitzii (r = 0.816; p < 0.001) and
Ruminoccocus albus (r = 0.924; p = 0.008) in the R group and between the concentration
of propionic acid and Bacteroides fragilis in the NR group.
In addition, negative associations of Faecalibacterium prausnitzii with the serum levels
of spermine (r = -0.619; p = 0.018) and N,N12-DiAcSP (r = -0.793; p = 0.01) in the R
patients were described, while there was a positive association between de abundance of
Bacteroides fragilis and Fusobacterium nucletum with the levels of N,N12-DiAcSP (r =
0.436; p = 0.043; r = 0.637; p = 0.001, respectively) and N8-AcSPD (r = 0.547; p = 0.014;
r = 0.752; p < 0.001) in the NR patients. Finally, Prevotella copri was positively
associated to the serum zonulin levels in the NR patients.

DISCUSSIONS
DISCUSSIONS

DISCUSSIONS
~ 112 ~
In these studies, we showed that the composition of the gut microbiome from CRC
patients (both obese and non-obese) was significantly different to the gut eubiotic
microbiota of non-obese healthy subjects. Moreover, we found an obesity-related
microbial profile linked to CRC, that could be responsible for the significantly higher
serum levels of zonulin (marker of intestinal permeability), TMAO (cardio-vascular-
diseases-related microbial metabolite), and IL-1β (pro-inflammatory factor) and the lower
levels of IL-10 (anti-inflammatory factor) compared to non-obese CRC patients and
controls.
Loss of microbial diversity has been associated with chronic health conditions [291, 292]
and cancer [293, 294], and with poor outcomes to certain forms of cancer therapy [295-
297]. Accordingly, recent works have also reported that patients with CRC display a
lower bacterial diversity and richness in fecal samples and intestinal mucosa compared to
healthy individuals [126, 127]. We found that compared to healthy controls, the CRC
microbiota exhibited a state of dysbiosis with a reduced overall bacterial richness and
diversity.
Moreover, the analysis of the alpha diversity (community composition) of the gut
microbiome from the OB-CRC, L-CRC and L-HC controls revealed a decreased richness
(Chao1 index) and diversity (Shannon index) in the OB-CRC and L-CRC groups
compared to L-HC controls. Nevertheless, no significant differences in Chao1 and
Shannon indices were found between OB-CRC and L-CRC groups. These results may
suggest that the decrease in gut microbiota diversity of CRC patients could not be entirely
related to a history of obesity. In addition, the Bray–Curtis dissimilarity plot analysis to
detect microbial community differences in structure clustered OBC-CRC and L-CRC
patients together, but clustered L-HC controls separately, confirming that obesity does

DISCUSSIONS
~ 113 ~
not introduce important changes to the overall structure of the gut microbial community
in CRC patients. In this regard, a recent meta-analysis done by Greathouse et al. described
no universal differences in alpha and beta diversity between obese and non-obese patients
with CRC, suggesting that, similarly to the community composition, community structure
is not associated with BMI in CRC patients [231].
Furthermore, we have showed that CRC patients exhibit clear differences in gut
microbiota composition when compared to healthy individuals, independently of the BMI
of the patient. On one hand we identified an increase of Firmicutes, Fusobacteria, and
Proteobacteria phyla in fecal samples from CRC patients. Remarkably, these phyla have
been previously associated with gut dysbiosis, inflammation, and CRC [298]. On the
other hand, genus-level analyses confirmed that the intestinal microbiota of CRC patients
with or without obesity is characterized by a reduction of butyrate-producing bacteria and
an increase in harmful bacterial species that could act as opportunist pathogens with pro-
inflammatory and pro-carcinogenic properties. Accordingly, other works have shown that
CRC patients display an enrichment in pro-inflammatory opportunistic pathogens and a
decrease in butyrate-producing bacteria, which may lead to an imbalance in intestinal
homeostasis (dysbiosis) that could ultimately lead to tumor formation [136, 299]. These
CRC-related significant alterations in specific bacterial groups suggest that microbial
dysbiosis was already present in CRC at the time of diagnosis and have been proposed to
have a potential impact on mucosal immune response [127].
Nevertheless, we found a significant increase in the abundance of several specific taxa of
opportunist pathogens in the gut microbiome of OB-CRC patients compared to L-CRC
and L-HC subjects. In particular, in the obese CRC group we detected a significant rise
in the abundance of the families Enterobacteraceae and Streptococcaceae and the
genera/species Enterobacter (E. cloacae), Escherichia (E. coli), and Streptococcus (S.

DISCUSSIONS
~ 114 ~
bovis). Enterobacteriaceae are normal commensal bacteria in the human gut. However,
the family includes numerous genera of bacteria that are potentially pathogenic, such as
Salmonella, Shigella, Escherichia, Enterobacter, Proteus, and Klebsiella [300]. Previous
studies have reported that Enterobacteriaceae is more abundant in patients with
inflammatory bowel disease or CRC in comparison to healthy individuals [129].
Gut microbiota might directly influence the relationship between obesity and CRC. In
this study, we found that OB-CRC patients have significantly higher plasma levels of
TMAO when compared with L-CRC and L-HC subjects. Barrea et al. demonstrated that
circulating levels of TMAO increased along with BMI in patients with overweight or
obesity [301]. Another recent study also reported increased serum TMAO levels among
CRC patients, compared to healthy controls, rendering TMAO as a potential prognostic
marker for CRC [226]. Additionally, we found that the presence of certain specific
bacterial taxa in human feces of both CRC groups were associated with the concentration
of plasma TMAO. We observed that the serum TMAO concentrations were significantly
and positively associated with the abundance of the family Enterobacteriaceae and
species Escherichia coli in OB-CRC patients and the abundance of Desulfovibrio in L-
CRC patients. In agreement with our results, other human and animal studies have
suggested that several families of bacteria are involved in the production of TMA/TMAO
such as Prevotellaceae [302] and Enterobacteriaceae [303, 304]. Moreover, a novel
microbial, the cntA/B, has been found to be able to convert carnitine into TMA and this
gene was reported to exist among only few species including Escherichia coli, Klebsiella
spp., and Citrobacter spp. [305]. Additionally, it has been previously described that the
increase in the conversion of choline to TMA can be caused also by the expression of the
cutC gene by bacteria such as Desulfovibrio [303]. Then, the increase of specific
pathogenic bacteria such as Escherichia coli in OB-CRC patients can be responsible (at

DISCUSSIONS
~ 115 ~
least partially) for the significant increase in microbial-derived proinflammatory
molecules such as TMAO.
Nevertheless, blood TMAO levels not only depend on the gut microbiota composition
and metabolic activities [306], but also on the functioning of the gut–blood barrier that
controls the access of gut-derived molecules to the bloodstream [307]. Accordingly, we
found that plasma zonulin levels were significantly higher in the OB-CRC patients
compared to L-CRC and L-HC controls. Increased zonulin level was associated with the
abundance of Prevotella in OB-CRC patients. Prevotella contains enzymes that are
important in mucin degradation, which may disrupt the colonic mucus barrier and impair
the intestinal barrier function [308], and therefore may contribute to increase the
circulating levels of TMAO. Recent evidence has suggested that TMAO could play a role
in the inflammatory process and that this inflammation induction could be a possible
factor that provides a link between TMAO and cancer. Serum level of TMAO was found
to synergize the pro-inflammatory effects of Helicobacter pylori infections on gastric
epithelial cells, through the increase in the expression level of pro-inflammatory genes
such as IL-6 and chemokine ligands [309], which play roles in cancer progression [310].
In another study, Yue et al. also demonstrated that TMAO can trigger the activation of
the NOD-like receptor family pyrin domain containing 3 (NLRP3) inflammasome [227],
which has been suggested to be implicated in the growth and/or metastasis of a variety of
cancers including CRC [311]. Nevertheless, further research is necessary to specify the
mechanism by which TMAO is linked to CRC via inflammation induction.
With respect to the obesity-specific microbiota observed in in OB-CRC patients, the
passenger Fusobacterium nucleatum has been reported to be more abundant in people
who are obese than in lean people [312]. Fusobacterium nucleatum is an opportunistic
pathogen closely associated with the occurrence and development of periodontitis, whose

DISCUSSIONS
~ 116 ~
relationship with CRC has been widely reported [151, 313, 314]. We found an association
of this species with the higher levels of the proinflammatory IL-1β in OB-CRC patients.
Increased abundance of Fusobacterium nucleatum has been previously associated to a
higher expression of pro-inflammatory cytokines in colonic tissue from CRC patients
[153, 154]. Thus, Kostic et al. suggested that Fusobacterium nucleatum induced a NF-
κB-driven proinflammatory response to promote CRC [315]. In addition, Rubinstein et
al. described that Fusobacterium spp. function includes the induction of inflammatory
responses and colon tumor cell growth promotion via β-catenin activation [115].
Furthermore, IL-1β induces the activation of the Wnt signaling pathway by
phosphorylation of Glycogen synthase kinase 3 beta (GSK3β) [316], a key signaling
pathway for intestinal tumorigenesis [317], supporting the central role of IL-1β in CRC
pathogenesis
On the other hand, previous studies have described that IL-10 deficiency leads to elevated
levels of TNF-α, IL-6, and IL-17, triggering chronic inflammation and promoting tumor
growth [318]. In this study, the lowest levels of anti-inflammatory IL-10 found in the OB-
CRC patients were associated to the lowest abundance of Blautia and Faecalibacterium
prausnitzii. All these bacteria are important suppliers of butyrate to the colonic
epithelium. Butyrate is a SCFA considered as the most important nutrient for epithelial
cells of the colon and has a role in the epigenetic control of gene expression, while also
functioning as a mediator of anti-inflammatory responses, the maintenance of the
intestinal barrier integrity, and the protection against oxidative stress [289, 319].
Therefore, butyrate promotes the integrity of gut epithelial tight junctions as well as
increases the release of the anti-inflammatory cytokine IL-10 [320], that protects against
cancer formation.

DISCUSSIONS
~ 117 ~
Finally, our PICRUSt analysis suggests a lower relative abundance of genes responsible
for carbohydrate metabolism functions such as butanoate metabolism and pentose
phosphate pathway, together with genes for the amino acid metabolism and protein
processing in endoplasmic reticulum were found depleted in OB-CRC patients compared
to L-CRC patients. The relative abundance of genes of the pentose phosphate pathway is
critical for cancer cells due to the generation of high levels of NADPH, which may be
utilized for the nucleic and fatty acids synthesis and in the cell survival under stress
conditions [321]. Moreover, a significant over-representation of genes for energy
metabolism such as oxidative phosphorylation, methane metabolism, and sulfur
metabolism as well as for lipopolysaccharide biosynthesis were found increase in OB-
CRC patients with respect to L-CRC patients and L-HC controls. Sulfur-metabolizing
microbes, which convert dietary sources of sulfur into genotoxic hydrogen sulfide (H2S),
have been previously associated with development of CRC [322]. Moreover, gut-derived
H2S may fragment the mucus bilayer of the gastrointestinal tract and this breach may
precede tumorigenesis by exposing gut epithelium to immunogenic luminal bacteria
[323]. The significant increase of genes for lipopolysaccharide biosynthesis found in the
OB-CRC groups could be in part attributed to the significant increase in the abundance
of Escherichia coli and other species of the family Enterobacteriaceae, which contain
specific enzymes to produce LPS [324]. These results suggest that the microbial
differences observed in OB-CRC patients could be associated with changes in functional
pathways.
In addition, we have also demonstrated the existence of a significant association between
the gut microbiota and the anti-cancer response of CRC patients treated with neoadjuvant
radiochemotherapy. Moreover, we have found that some microbial-derived metabolites
such as SCFAs could be at least partially responsible of the response to
DISCUSSIONS
~ 118 ~
radiochemotherapy in these CRC patients. Finally, we have identified a consortium of
baseline CRC-enriched bacteria (Ruminococcus albus, Bifidobacterium bifidum,
Faecalibacterium prausnitzii, Fusobacterium nucleatum, and Bacteroides fragilis),
which may potentially serve as diagnostic bacterial markers of good or bad response to
neoadjuvant radiochemotherapy.
We observed that gut microbiota composition was relatively stable over treatment time
following radiochemotherapy treatment, with the exception of a significant decrease in
the abundance of Fusobacterium, Escherichia and Klebsiella and a significant increase
in Bifidobacterium at post-treatment time compared to baseline. Klebsiella and
Fusobacterium are pathogens normally found in the human intestine that cause diarrhea,
bloodstream infections and considerably increase the rates of treatment failure and death
[325].
After treatment, CRC patients were classified as responders (N) versus non-responders
(NR) based on their good or poor response to the radiochemotherapy. Interestingly, we
found significant differences in alpha diversity at genus level, with an increase in the
diversity (Shannon) and richness (Chao 1) in R compared to NR patients. Similarly, there
was a statistically significant difference in beta diversity (Bray-Curtis dissimilarities and
Jaccard index), finding a notable clustering effect by response status in the gut
microbiome of these patients, indicating a difference in bacterial community composition
between R and NR patients.
At taxa levels we found a significant enrichment of probiotic and butyrate producer-
bacteria such as Bifidobacterium bifidum, Ruminoccous albus, Roseburia and
Faecalibacterium prausnitzii in R patients, while NR patients showed an enrichment of
unfavorable microbial taxa such as Fusobacterium nucleatum, Bacteroides fragilis,

DISCUSSIONS
~ 119 ~
Escherichia coli, Prevotella copri and Klebsiella. Several studies have shown that
butyrate-producing bacteria are negatively related to irritable bowel disease and CRC
[326, 327].
Additionally, both Fusobacterium and Prevotella have been related to recurrent CRC
after chemotherapy. Given that Fusobacterium nucleatum has been previously correlated
with chemoresistance [154], our results may suggest that the higher load of
Fusobacterium nucleatum present in NR patients could be a potential promoter of CRC
chemoresistance and therefore of a poor response to CRC treatment. Similarly, the
enterotoxigenic Bacteroides fragilis also enriched in the NR patients is a significant
source of chronic inflammation and it has been previously associated with the
development and aggressiveness of CRC and poor patient outcome [280, 328].
Afterwards, these data suggest that gut microbiota composition of the R patients shifted
towards a microbial profile that has great similarity to the gut microbiota of healthy
control.
Next, we sought to gain insight into the mechanism through which the gut microbiome
may influence response to radiochemotherapy. Regarding metabolic function of gut
microbiota, in the current study Picrust analysis showed significant differences between
R and NR patients. In NR patients we have found an increase in the abundance of genes
for lipopolysaccharide biosynthesis as well as for araquidonic acid metabolism, and gluta-
thione metabolism compared to R patients. The significant increase of genes for lipo-
polysaccharide biosynthesis could be related to the significant increase in the abundance
of gram-negative bacteria such as Escherichia coli in the NR patients, these bacteria
contain specific enzymes to produce LPS, that can induce toll-like receptor 4 signaling
and promote cell survival and proliferation in CRC patients [329]. Similarly, the
arachidonic acid pathway is important in the development and progression of numerous

DISCUSSIONS
~ 120 ~
malignant diseases, including CRC, due that araquidonic acid stimulates key downstream
signaling cascades that regulate cell proliferation, apoptosis, angiogenesis, inflammation,
and immune surveillance [330, 331]. With respect to the increase in gene for glutathione
metabolism in NR patients, some studies have described that the elevated levels of
glutathione in tumor cells are able to protect such cells in bone marrow, breast, colon,
larynx, and lung cancers by conferring resistance to several chemotherapeutic drugs [332,
333]. Other bacterial functions involving metabolism of cofactors and vitamins and
energy production pathways such as oxidative phosphorylation was also increase in NR
patients. These pathways may serve as alternative bioenergetic sources for metabolically
stressed cancer cells [334].
Remarkably, a recent metagenomic analysis reported that the CRC-associated
microbiome showed an association with alterations in polyamine metabolism, indicating
that these metabolites could be particularly important in CRC development and
progression [335]. In our study significant differences in the serum levels of several
polyamines and acetyl derivatives of polyamines were found between R and NR patients
at post-treatment point. Moreover, we observed that the abundance of N1, N12-DiAcSP
and N8-AcSPD were positively associated to the increase abundance of Bacteroides
fragilis and Fusobacterium nucleatum in NR patients.
In fact, Bacteroides spp. and Fusobacterium spp. can synthesize putrescine and
spermidine in vitro and in vivo [336]. Goodwin et al demonstrate that purified Bacteroides
fragilis toxin (BFT) up-regulates spermine oxidase in HT29/c1 and T84 colonic epithelial
cells, producing spermine oxidase-dependent generation of ROS and induction of a
marker of DNA damage such as H2A histone family member X phosphorilated (γ-
H2A.x) [337]. In another study Johnson et al found that following antibiotic treatment,
resected colorectal cancer tissues harbored disrupted bacterial biofilms and lowered N1,

DISCUSSIONS
~ 121 ~
N12-DiAcSP tissue concentrations compare to biofilm-negative colon cancer tissues,
suggesting that gut microbes can induce an increase of host generated N1,N12-DiAcSP
[338].
Moreover, the activation of the amino acid metabolic pathways by the intestinal
microbiota of NR patients could contribute to the increase of polyamines, which are
actively assimilated by the cells of the intestinal epithelium and induces rapid cell
proliferation and favoring the tumorigenesis [339, 340].
On the other hand, CRC has been associated to alterations in the metabolism of SCFAs,
which have been shown to exhibit potential anti-carcinogenic effects in cellular and
animal models of colon cancer [341, 342]. Here, we have found that R patients displayed
a significant increase in the fecal abundance of several SCFAs such as acetic and butyric
acid after radiochemotherapy treatment. Moreover, there was a positive correlation
between the fecal levels of butyrate and the abundance of the Faecalibacterium
prausnitzii and Ruminoccocus albus in these patients. Faecalibacterium praustnitzii is
considered important in health promotion, as it is able to produce butyrate from dietary
fibre and possesses anti-inflammatory properties [343]. A decrease in Faecalibacterium
prausnitzii and butyrate levels defines microbiota dysbiosis in patients suffering
inflammatory bowel disease [344]. In addition, Faecalibacterium is able to use the acetate
produced by Bifidobacterium (also increased in N patients) with the subsequent
modulation of the intestinal mucus barrier by modification of goblet cells and mucin
glycosylation [345]. Butyrate is required for colonic epithelium repair and Treg cells
production, which regulate the local immune response and suppressing colonic
inflammation and carcinogenesis [199]. Moreover, butyrate has been shown to be able to
induce IL-18 production in intestinal epithelial cells by activating GPR109a receptor,
which stimulates the mucosal tissue repair through the regulation of the production and

DISCUSSIONS
~ 122 ~
availability of IL-22 [197]. The absence of IL-18 has been associated with gut microbiota
dysbiosis, alterations of the inflammatory response, and a dysregulation of the
homeostatic and mucosal repair, resulting in increased susceptibility to carcinogenesis
[198]. In addition, after radiochemotherapy treatment we have found in the NR study
group a significant decrease in the fecal levels of acetic, butyric, isobutyric, and hexanoic
acids compared to R patients, indicating the exhaustion of butyric acid-producing
microbiota in their colon [346]. In a previous study, hexanoic acid has been shown to
reduce the coloniza-tion and dysbiotic expansion of potentially pathogenic bacteria in the
gut [347].
Finally, we found that plasma zonulin levels were significantly higher in the NR patients
compared to R. Increased zonulin level was associated with the abundance of Prevotella
copri in R patients. Zonulin is a protein synthesized in intestinal and liver cells that
reversibly modulates the intestinal permeability of the intestinal epithelial barrier by
modulating intercellular tight junctions [348]. As as we have indicated previously,
Prevotella contains enzymes that are important in mucin degradation, which may disrupt
the colonic mucus barrier and increase intestinal permeability, allowing the diffusion of
pathogens, toxins, and antigens from the luminal environment into the mucosal tissues
and circulatory system [349], resulting in immune activation and tissue inflammation
which modulate cancer initiation, progression and response to anticancer treatment [281].
Then, the significant increase in Prevotella abundance found in our study could be in part
associated with the poor or non-response to radiochemotherapy in NR patients.

CONCLUSIONS
CONCLUSIONS

CONCLUSIONS
~ 124 ~
1. We have demonstrated that the gut microbiota in CRC patients differs in intestinal
microbiota composition in comparison with healthy controls. Moreover, there is an
association between inflammation, BMI, and gut microbiota in CRC patients.
2. In CRC patients gut microbiota is characterized by a significantly lower bacterial
diversity and richness, a significant increase in proinflammatory opportunistic pathogens,
and a decrease in the relative abundance of beneficial or commensal butyrate-producing
bacteria compared to HC subjects. Nevertheless, the presence of obesity does not induce
significant changes in the alpha diversity of intestinal bacteria of these CRC patients.
3. Compared to L-CRC patients and L-HC controls the gut microbiota of OB-CRC
patients is characterized by the presence of a higher abundance Prevotella, Fusobacterium
nucleatum, Enterobacteriaceae, and Escherichia coli (opportunistic pathogens), which
may impair intestinal barrier function (increased circulating zonulin levels), and may
contribute to inflammatory processes related to CRC by means of increasing the
production of inflammatory molecules such as IL-1β and TMAO.
4. In addition, the presence of obesity in CRC patients is also associated to changes
in the functionality of the gut microbiota, with a significant over-representation of genes
for energy metabolism such as oxidative phosphorylation, methane metabolism, and
sulfur metabolism as well as for lipopolysaccharide biosynthesis in OB-CRC patients
with respect to L-CRC patients and L-HC controls, pathways associated with
inflammation, metabolism and intestinal permeability homeostasis.
5. Neoadjuvant radiochemotherapy treatment in CRC patients did not induce
significant changes in gut microbiota diversity and composition, with the exception of a
CONCLUSIONS
~ 125 ~
significant decrease in Fusobacterium, Escherichia and Klebsiella and a significant
increase in Bifidobacterium at post-treatment time compared to baseline.
6. After the classification of CRC patients in responder (R) and poor or non-
responder (NR) to the neoadjuvant radiochemotherapy we have observed a significant
increase in the diversity and richness in R patients compared to NR.
7. Compositional changes were showed between both study patients, with a
significant enriched of probiotic and butyrate producer-bacteria in R patients,
accompanied by an enriched in unfavorable pro-inflammatory bacteria in NR patients.
8. NR patients had significantly higher levels of spermine and some acetyl
derivatives of polyamines as well as serum zonulin and significantly lower levels of fecal
of acetic, butyric, isobutyric, and hexanoic acids than R patients.
9. PICRUSt analysis found in N patients an over-representation of genes involved in
lipopolysaccharide biosynthesis as well as in araquidonic acid and glutathione
metabolism, genes from pathways associated with bacterial pathogenesis, inflammation,
cell survival, proliferation and therapy response.
10. Finally, we have identified a consortium of baseline CRC-enriched bacteria that
potentially could predict cancer treatment outcome.
These finding could provide new clues for the development of diagnostic tools for CRC
prevention.

ABBREVIATIONS
ABBREVIATIONS

ABBREVIATIONS
~ 127 ~
5-FU 5-Fluorouracil.
AC Cholic acid.
AICR American Institute for Cancer Research.
AKT Serine/threonine kinase.
AOM Azoxymethane.
AP-1 Transcripcion factor activator protein 1.
APC gene Adenomatous polyposis coli gene.
APC/Min mice Adenomatous polyposis coli/multiple intestinal neoplasia mice.
AUC Area under the curve.
BAX gene BCL2 associated X gene.
BFT Bacteroides fragilis toxin.
BMI Body mass index.
CCL17 C-C motif chemokine ligand 17.
CCL20 C-C motif chemokine ligand 20 or liver activation regulated
chemokine (LARC) or macrophage inflammatory protein-3
(MIP3A).
CD3 Cluster of differentiation 3.
CD8 Cluster of differentiation 8.
CD68 Cluster of differentiation 68.
CDCA Chenodeoxycholic acid.
CDK1 Cyclin-dependent kinase 1.
CDT Cytolethal strain toxin.
CIN Chromosomal instability.
CpG Dinucleotide citosin-guanine.
CPMG module Car-Purcell-Meiboom-Gill module.
ABBREVIATIONS
~ 128 ~
CRC Colorectal cancers.
CRP C-reactive protein.
CXCL2 C-X-C motif chemokine ligand 2.
CXCL8 C-X-C motif chemokine ligand 8.
CXCL9 C-X-C motif chemokine ligand 9.
CXCL10 C-X-C motif chemokine ligand 10 also known as Interferon
gamma-induced protein 10 (IP-10).
D2O Deuterium oxide.
DCA Deoxycholic acid.
DFMO Difluoromethylornithine.
DNA Deoxyribonucleic acid.
DPC4 gene Deleted in pancreatic cancer 4 gene.
DSS mice Dextran sulfate sodium - induced colitis in mice.
ELISA Enzyme-linked immunosorbent assay.
EPCAM gene Epithelial cellular adhesion molecule gene.
EPIC European Prospective Research on Cancer and Nutrition.
ERK1 Extracellularly regulated kinases 1.
ERK2 Extracellularly regulated kinases 2.
ETBF Enterotoxigenic Bacteroides fragilis.
FDR False discovery rate.
FMO Flavin monooxygenase.
FXR Farnesoid X receptor.
GPBAR1 G-protein-coupled bile acid receptor 1 or TGR5.
GPR41 G-protein-coupled receptor 41 for propionate.
GPR43 G-protein-coupled receptor 43 for acetate.

ABBREVIATIONS
~ 129 ~
GPR109 G-protein-coupled receptor 109 for butyrate.
GSK3β Glycogen synthase kinase 3 beta.
H2S Hydrogen sulfide.
HbA1c Glycated hemoglobin.
HCT116 HCT116 human colon cancer cell line.
HDL High density lipoprotein.
HT-29 HT-29 human colon cancer cell line.
IFN-γ Interferon gamma.
IGF Insulin-like growth factors.
IL Interleukin.
KEGG Kyoto Encyclopedia of Genes and Genomes.
KRAS gene Kristen rat sarcoma virus gene (KRAS Proto-Oncogene, GTPase).
LC-MS/MS Liquid chromatography tandem mass spectrometry.
LCA Litholic acid.
L-CRC Group of patients with colorectal cancer and without obesity.
LDL Low density lipoprotein.
L-HC Non-obese healthy controls.
LPS Lipopolysaccharide.
MAPK Mitogen-activated protein kinase.
miR-149 Micro RNA 149.
MLH1 gene MutL Homolog 1 gene.
MLH3 gene MutL Homolog 3 gene.
MMR Mismatched base repair.
MSH2 gene MutS Homolog 2 gene.
MSH3 gene MutS Homolog 3 gene.

ABBREVIATIONS
~ 130 ~
MSH6 gene MutS Homolog 6 gene.
MSI Microsatellite instability.
MS/MS Tandem mass spectrometry.
MyD88 Myeloid differentiation factor 88.
N1,N12-DiAcSP N1, N12-Diacetylspermine.
N1,N8-DiAcSPD N1, N8- Diacetylspermidine.
N1-AcPUT N1-Acetylputrescine.
N1-AcSP N1-Acetylspermine.
N1-AcSPD N1-Acetylspermidine.
N8-AcSPD N8-Acetylspermidine.
NADPH Nicotinamide adenine dinucleotide phosphate.
NF-kB Nuclear factor-kappa B.
NIH National Institutes of Health.
NIH-AARP National Institutes of Health and American Association of Retirees.
NLRP3 NOD-like receptor family pyrin domain containing 3.
NMR Nuclear magnetic resonance.
NOESY Nuclear overhauser effect spectroscopy.
NR Patients with poor or non-response to treatment.
OB-CRC Group of patients with colorectal cancer and obesity.
ODC Ornithine decarboxylase.
OUT Operational taxonomic units.
PCoA Principal coordinate analysis.
PCR Polymerase chain reaction.
PI3K Phosphatidyl inositol 3 kinase.
ABBREVIATIONS
~ 131 ~
PICRUS Phylogenetic Investigation of Communities by Reconstruction of
Unobserved States.
PIK3CA gene Phosphatidylinositol-4,5-Bisphosphate 3-Kinase Catalytic subunit
alpha gene.
PMS1 gene Postmeiotic Segregation Increased 1 gene.
PMS2 gene Postmeiotic Segregation Increased 2 gene.
PMS2 gene Postmeiotic Segregation Increased 2 gene.
PUFA Polyunsaturated fatty acid.
PUFA ω-3 Omega 3 polyunsaturated fatty acid.
PUT Putrescine.
R Patients with good response to treatment or responders.
RCT Radiochemotherapy.
RF Random Forest.
ROS Reactive oxygen species.
SCFA Short chain fatty acids.
SMAD4 gene SMAD family member 4 gene.
SMO Spermine oxidase.
SP Spermine.
SPD Spermidine.
STAT3 Signal transducer and activator of transcription 3.
T84 Transplantable human carcinoma cell line derived from a lung
metastasis of a colon carcinoma (colonic epithelial cells).
TCA Citrate cycle.
TGF/BRII Transforming growth factor beta receptor 2.
TGR5 G-protein-coupled receptor 5 or GPBAR1.

ABBREVIATIONS
~ 132 ~
TIGIT T-cell immune receptor with immunoglobulin and immunoreceptor
tyrosine-based inhibitory motif domains.
TLR Toll-like receptors.
TMA Trimethylamine.
TMAO Trimethylamine N-oxide.
TNF Tumor necrosis factor.
TNF-α Tumor necrosis factor alpha.
TP53 gene Tumor protein 53 gene.
TSP TopSpin program.
UHPLC Ultra-high performance liquid chromatography.
WCRF World Cancer Research Fund.
WHO World Health Organization.
Wnt Wingless-related integration site.
γ-H2A.x H2A histone family member X phosphorylated.

REFERENCES
REFERENCES

REFERENCES
~ 134 ~
1. Hull R, Francies FZ, Oyomno M, Dlamini Z. Colorectal Cancer Genetics,
Incidence and Risk Factors: In Search for Targeted Therapies. Cancer Manag Res, 2020.
12:9869-9882. Doi: 10.2147/CMAR.S251223.
2. Kim S-E, Paik HY, Yoon H, Lee JE, Kim N, Sung M-K. Sex- and gender-specific
disparities in colorectal cancer risk. World J Gastroenterol, 2015. 21(17):5167-5175.
Doi:10.3748/wjg.v21.i17.5167.
3. Wiseman M. The second World Cancer Research Fund/American Institute for
Cancer Research expert report. Food, nutrition, physical activity, and the prevention of
cancer: a global perspective. Proc Nutr Soc, 2008. 67(3):253-6. Doi:
10.1017/S002966510800712X.
4. Ferlay J, Shin HR, Bray F, Forman D, Mathers C, Parkin DM. Estimates of
worldwide burden of cancer in 2008: GLOBOCAN 2008. Int J Cancer, 2010.
127(12):2893-917. Doi: 10.1002/ijc.25516.
5. Torre LA, Siegel RL, Ward EM, Jemal A. Global Cancer Incidence and Mortality
Rates and Trends--An Update. Cancer Epidemiol Biomarkers Prev, 2016. 25(1):16-27.
Doi: 10.1158/1055-9965.EPI-15-0578.
6. Saito H. Screening for colorectal cancer by immunochemical fecal occult blood
testing. Jpn J Cancer Res, 1996. 87(10):1011-24. Doi: 10.1111/j.1349-
7006.1996.tb03103.x.
7. Ferlay J, Steliarova-Foucher E, Lortet-Tieulent J, Rosso S, Coebergh JW, Comber
H, Forman D, Bray F. Cancer incidence and mortality patterns in Europe: estimates for
40 countries in 2012. Eur J Cancer, 2013. 49(6):1374-403. Doi:
10.1016/j.ejca.2012.12.027.

REFERENCES
~ 135 ~
8. López-Abente G, Ardanaz E, Torrella-Ramos A, Mateos A, Delgado-Sanz C,
Chirlaque MD; Colorectal Cancer Working Group. Changes in colorectal cancer
incidence and mortality trends in Spain. Ann Oncol, 2010. 21 Suppl 3:iii76-82. Doi:
10.1093/annonc/mdq091.
9. Binefa G, Rodríguez-Moranta F, Teule A, Medina-Hayas M. Colorectal cancer:
From prevention to personalized medicine. World J Gastroenterol, 2014. 20(22):6786-
808. Doi: 10.3748/wjg.v20.i22.6786.
10. Keum N, Giovannucci E. Global burden of colorectal cancer: emerging trends,
risk factors and prevention strategies. Nat Rev Gastroenterol Hepatol, 2019. 16(12):713-
732. Doi: 10.1038/s41575-019-0189-8.
11. Goedert JJ, Gong Y, Hua X, Zhong H, He Y, Peng P, Yu G, Wang W, Ravel J,
Shi J, Zheng Y. Fecal Microbiota Characteristics of Patients with Colorectal Adenoma
Detected by Screening: A Population-based Study. EBioMedicine, 2015. 2(6):597-603.
Doi: 10.1016/j.ebiom.2015.04.010.
12. Sears CL, Garret WS. Microbes, microbiota, and colon cancer. Cell Host Microbe,
2014. 15(3):317-28. Doi: 10.1016/j.chom.2014.02.007.
13. Kuipers EJ, Grady WM, Lieberman D, Seufferlein T, Sung JJ, Boelens PG, van
de Velde CJH, Watanabe T. Colorectal cancer. Nat Rev Dis Primers, 2015. 1:15065. Doi:
10.1038/nrdp.2015.65.
14. Bovell LC, Shanmugam C, Putcha BD, et al. The prognostic value of microRNAs
varies with patient race/ethnicity and stage of colorectal cancer. Clin Cancer Res, 2013.
19(14):3955–3965. Doi:10.1158/1078- 0432.CCR-12-3302

REFERENCES
~ 136 ~
15. Johnson IT, Lund EK. Review article: nutrition, obesity and colorectal cancer.
Aliment Pharmacol Ther, 2007. 26(2):161–181. Doi:10.1111/j.1365-2036.2007.03371.x
16. Venugopal A, Stoffel EM. Colorectal Cancer in Young Adults. Curr Treat Options
Gastroenterol, 2019. 17(1):89-98. Doi: 10.1007/s11938-019-00219-4.
17. Moore KJ, Sussman DA, Koru-Sengul T. Age-Specific Risk Factors for Advanced
Stage Colorectal Cancer, 1981–2013. Prev Chronic Dis, 2018. 15:E106. Doi:
10.5888/pcd15.170274.
18. Tannenbaum SL, Hernandez M, Zheng DD, Sussman DA, Lee DJ. Individual-
and neighborhood-level predictors of mortality in Florida colorectal cancer patients.
PLoS One, 2014. 9(8):e106322. doi: 10.1371/journal.pone.0106322. eCollection 2014.
19. O'Connell JB, Maggard MA, Liu JH, Etzioni DA, Livingston EH, Ko CY. Do
young colon cancer patients have worse outcomes? World J Surg, 2004. 28(6):558-62.
Doi: 10.1007/s00268-004-7306-7.
20. Garrett WS. The gut microbiota and colon cancer. Science, 2019.
364(6446):1133-1135. Doi: 10.1126/science.aaw2367.
21. Farrington SM, Tenesa A, Barnetson R, Wiltshire A, Prendergast J, Porteous M,
Campbell H, Dunlop MG. Germline susceptibility to colorectal cancer due to base-
excision repair gene defects. Am J Hum Genet, 2005. 77(1):112-9. Doi: 10.1086/431213.
22. Hong SN. Genetic and epigenetic alterations of colorectal cancer. Intest Res,
2018. 16(3):327-337. Doi: 10.5217/ir.2018.16.3.327.
23. Rao CV, Yamada HY. Genomic instability and colon carcinogenesis: from the
perspective of genes. Front Oncol, 2013. 3:130. Doi: 10.3389/fonc.2013.00130.

REFERENCES
~ 137 ~
24. Testa U, Pelosi E, Castelli G. Colorectal cancer: genetic abnormalities, tumor
progression, tumor heterogeneity, clonal evolution and tumor-initiating cells. Med Sci
(Basel), 2018. 6(2):31. Doi: 10.3390/medsci6020031.
25. Fearon ER, Vogelstein B. A genetic model for colorectal tumorigenesis. Cell,
1990. 61(5):759-67. Doi: 10.1016/0092-8674(90)90186-i.
26. Pino MS, Chung DC. The chromosomal instability pathway in colon cancer.
Gastroenterology, 2010. 138(6):2059-72. Doi: 10.1053/j.gastro.2009.12.065.
27. Jubb AM, Bell SM, Quirke P. Methylation and colorectal cancer. J Pathol, 2001.
195(1):111-34. Doi: 10.1002/path.923.
28. Lao VV, Grady WM. Epigenetics and colorectal cancer. Nat Rev Gastroenterol
Hepatol, 2011. 8(12):686-700. Doi: 10.1038/nrgastro.2011.173.
29. Bird A. The essentials of DNA methylation. Cell, 1992. 70(1):5-8. Doi:
10.1016/0092-8674(92)90526-i.
30. Worthley DL, Whitehall VL, Buttenshaw RL, Irahara N, Greco SA, Ramsnes I,
Mallitt KA, Le Leu RK, Winter J, Hu Y, Ogino S, Young GP, Leggett BA. DNA
methylation within the normal colorectal mucosa is associated with pathway-specific
predisposition to cancer. Oncogene, 2010. 29(11):1653-62. Doi: 10.1038/onc.2009.449.
31. Doubeni CA, Major JM, Laiyemo AO, Schootman M, Zauber AG, Hollenbeck
AR, Sinha R, Allison J. Contribution of behavioral risk factors and obesity to
socioeconomic differences in colorectal cancer incidence. J Natl Cancer Inst, 2012.
104(18):1353-62. Doi: 10.1093/jnci/djs346.

REFERENCES
~ 138 ~
32. Imamura F, Micha R, Khatibzadeh S, Fahimi S, Shi P, Powles J, Mozaffarian D,
Global Burden of Diseases Nutrition and Chronic Diseases Expert Group (NutriCoDE).
Dietary quality among men and women in 187 countries in 1990 and 2010: a systematic
assessment. Lancet Glob Health, 2015. 3(3):e132-42. Doi: 10.1016/S2214-
109X(14)70381-X.
33. Kune GA. The Melbourne Colorectal Cancer Study: reflections on a 30-year
experience. Med J Aust, 2010. 193(11-12):648-52. Doi: 10.5694/j.1326-
5377.2010.tb04093.x.
34. Zisman AL, Nickolov A, Brand RE, Gorchow A, Roy HK. Associations between
the age at diagnosis and location of colorectal cancer and the use of alcohol and tobacco:
implications for screening. Arch Intern Med, 2006. 166(6):629-34. Doi:
10.1001/archinte.166.6.629.
35. Giovannucci E, Martínez ME. Tobacco, colorectal cancer, and adenomas: a
review of the evidence. J Natl Cancer Inst, 1996. 88(23):1717-30. Doi:
10.1093/jnci/88.23.1717.
36. Botteri E, Iodice S, Bagnardi V, Raimondi S, Lowenfels AB, Maisonneuve P.
Smoking and colorectal cancer: a meta-analysis. JAMA, 2008. 300(23):2765-78. Doi:
10.1001/jama.2008.839.
37. Botteri E, Iodice S, Raimondi S, Maisonneuve P, Lowenfels AB. Cigarette
smoking and adenomatous polyps: a meta-analysis. Gastroenterology, 2008. 134(2):388-
95. Doi: 10.1053/j.gastro.2007.11.007.
38. Zeilinger S, Kühnel B, Klopp N, Baurecht H, Kleinschmidt A, Gieger C,
Weidinger S, Lattka E, Adamski J, Peters A, Strauch K, Waldenberger M, Illig T.

REFERENCES
~ 139 ~
Tobacco smoking leads to extensive genome-wide changes in DNA methylation. PLoS
One, 2013. 8(5):e63812. Doi: 10.1371/journal.pone.0063812.
39. Nishihara R, Morikawa T, Kuchiba A, Lochhead P, Yamauchi M, Liao X,
Imamura Y, Nosho K, Shima K, Kawachi I, Qian ZR, Fuchs CS, Chan AT, Giovannucci
E, Ogino S. A prospective study of duration of smoking cessation and colorectal cancer
risk by epigenetics-related tumor classification. Am J Epidemiol, 2013. 178(1):84-100.
Doi: 10.1093/aje/kws431.
40. Øines M, Helsingen LM, Bretthauer M, Emilsson L. Epidemiology and risk
factors of colorectal polyps. Best Pract Res Clin Gastroenterol, 2017. 31(4):419-424. Doi:
10.1016/j.bpg.2017.06.004.
41. Choi YJ, Myung SK, Lee JH. Light Alcohol Drinking and Risk of Cancer: A
Meta-Analysis of Cohort Studies. Cancer Res Treat, 2018. 50(2):474-487. Doi:
10.4143/crt.2017.094.
42. Salaspuro, M. Microbial metabolism of ethanol and acetaldehyde and clinical
consequences. Addict Biol, 1997. 2(1):35-46. doi: 10.1080/13556219772840.
43. Seitz, H. K. & Stickel, F. Molecular mechanisms of alcohol-mediated
carcinogenesis. Nat Rev Cancer, 2007. 7(8):599-612. doi: 10.1038/nrc2191.
44. Giovannucci E. Alcohol, one-carbon metabolism, and colorectal cancer: recent
insights from molecular studies. J Nutr, 2004. 134(9):2475S-2481S. Doi:
10.1093/jn/134.9.2475S.
45. Pöschl G, Seitz HK. Alcohol and cancer. Alcohol Alcohol, 2004. 39(3):155-65.
Doi: 10.1093/alcalc/agh057.
REFERENCES
~ 140 ~
46. Rezende LFM, Sá TH, Markozannes G, Rey-López JP, Lee IM, Tsilidis KK,
Ioannidis JPA, Eluf-Neto J. Physical activity and cancer: an umbrella review of the
literature including 22 major anatomical sites and 770 000 cancer cases. Br J Sports Med,
2018. 52(13):826-833. Doi: 10.1136/bjsports-2017-098391.
47. McTiernan A, Friedenreich CM, Katzmarzyk PT, et al. Physical activity in cancer
prevention and survival: A systematic review. Medicine and Science in Sports and
Exercise, 2019. 51(6):1252-1261.
48. Patel AV, Friedenreich CM, Moore SC, et al. American College of Sports
Medicine Roundtable Report on physical activity, sedentary behavior, and cancer
prevention and control. Medicine and Science in Sports and Exercise, 2019. 51(11):2391-
2402.
49. Matthews CE, Moore SC, Arem H, Cook MB, Trabert B, Håkansson N, et al.
Amount and intensity of leisure-time physical activity and lower cancer risk. J Clin Oncol,
2020. 38: 686-97. Doi: 10.1200/JCO.19.02407.
50. Friedenreich CM. Physical activity and breast cancer: review of the epidemiologic
evidence and biologic mechanisms. Recent Results Cancer Res, 2011. 188: 125-39. Doi:
10.1007/978-3-642-10858-7_11.
51. Thune I, Furberg AS. Physical activity and cancer risk: dose-response and cancer,
all sites and site-specific. Med Sci Sports Exerc, 2001. 33: S530-S610. Doi:
10.1097/00005768-200106001-00025.
52. Oruç Z, Kaplan MA. Effect of exercise on colorectal cancer prevention and
treatment. World J Gastrointest Oncol, 2019. 11: 348-66. Doi: 10.4251/wjgo.

REFERENCES
~ 141 ~
53. Liu L, Shi Y, Li T, et al. Leisure time physical activity and cancer risk: evaluation
of the WHO's recommendation based on 126 high-quality epidemiological studies.
British Journal of Sports Medicine, 2016. 50(6):372-378.
54. de Jong AE, Morreau H, Nagengast FM, Mathus-Vliegen EM, Kleibeuker JH,
Griffioen G, Cats A, Vasen HF. Prevalence of adenomas among young individuals at
average risk for colorectal cancer. Am J Gastroenterol, 2005. 100(1):139-43. Doi:
10.1111/j.1572-0241.2005.41000.x.
55. Lee KJ, Inoue M, Otani T, Iwasaki M, Sasazuki S, Tsugane S; JPHC Study Group.
Physical activity and risk of colorectal cancer in Japanese men and women: the Japan
Public Health Center-based prospective study. Cancer Causes Control, 2007. 18(2):199-
209. Doi: 10.1007/s10552-006-0098-3.
56. Schmid D, Leitzmann MF. Television viewing and time spent sedentary in
relation to cancer risk: a meta-analysis. J Natl Cancer Inst, 2014. 106(7):dju098. Doi:
10.1093/jnci/dju098.
57. Ma P, Yao Y, Sun W, Dai S, Zhou C. Daily sedentary time and its association
with risk for colorectal cancer in adults: A dose-response meta-analysis of prospective
cohort studies. Medicine (Baltimore), 2017. 96(22):e7049. Doi:
10.1097/MD.0000000000007049.
58. Ruiz-Casado A, Martín-Ruiz A, Pérez LM, Provencio M, Fiuza-Luces C, Lucia
A. Exercise and the Hallmarks of Cancer. Trends Cancer, 2017. 3(6):423-441. Doi:
10.1016/j.trecan.2017.04.007.

REFERENCES
~ 142 ~
59. Giovannucci E. An Integrative Approach for Deciphering the Causal Associations
of Physical Activity and Cancer Risk: The Role of Adiposity. J Natl Cancer Inst, 2018.
110(9):935-941. Doi: 10.1093/jnci/djy091.
60. Ben Q, An W, Jiang Y, Zhan X, Du Y, Cai QC, et al. Body mass index increases
risk for colorectal adenomas based on meta-analysis. Gastroenterology, 2012.
142(4):762-72.
61. Bailie L, Loughrey MB, Coleman HG. Lifestyle Risk Factors for Serrated
Colorectal Polyps: A Systematic Review and Meta-analysis. Gastroenterology, 2017.
152(1):92-104. Doi: 10.1053/j.gastro.2016.09.003.
62. Clayton PE, Banerjee I, Murray PG, Renehan AG. Growth hormone, the insulin-
like growth factor axis, insulin and cancer risk. Nat Rev Endocrinol, 2011. 7(1):11-24.
63. Kunzmann AT, Coleman HG, Huang WY, Cantwell MM, Kitahara CM, Berndt
SI. Fruit and vegetable intakes and risk of colorectal cancer and incident and recurrent
adenomas in the PLCO cancer screening trial. Int J Cancer, 2016. 138(8):1851-61.
64. Greenberg ER, Baron JA, Tosteson TD, Freeman DH, Jr., Beck GJ, Bond JH, et
al. A clinical trial of antioxidant vitamins to prevent colorectal adenoma. Polyp
Prevention Study Group. N Engl J Med, 1994. 331(3):141-7.
65. Kim S, Keku TO, Martin C, Galanko J, Woosley JT, Schroeder JC, et al.
Circulating levels of inflammatory cytokines and risk of colorectal adenomas. Cancer
Res, 2008. 68(1):323-8. doi: 10.1158/0008-5472.CAN-07-2924.
66. Willett WC. Diet and cancer: an evolving picture. JAMA, 2005. 293 (2):233–234.
Doi:10.1001/jama.293.2.233.

REFERENCES
~ 143 ~
67. Tabung FK, Brown LS, Fung TT. Dietary Patterns and Colorectal Cancer Risk: A
Review of 17 Years of Evidence (2000-2016). Curr Colorectal Cancer Rep, 2017.
13(6):440-454. Doi: 10.1007/s11888-017-0390-5.
68. Rosenblatt KA, Gao DL, Ray RM, Nelson ZC, Thomas DB. Contraceptive
methods and induced abortions and their association with the risk of colon cancer in
Shanghai, China. Eur J Cancer, 2004. 40(4):590–593. Doi:10.1016/j.ejca.2003.09.037
69. Wang X, Lei T, Ma X. [Colon cancer risk factors in Jiashan county, Zhejiang
province, the highest incidence area in China]. Zhonghua Zhong Liu Za Zhi, 2001.
23(6):480–482.
70. Chan DS, Lau R, Aune D, Vieira R, Greenwood DC, Kampman E, et al. Red and
processed meat and colorectal cancer incidence: meta-analysis of prospective studies.
PLoS One, 2011. 6(6):e20456.
71. Aune D, Chan DS, Vieira AR, Navarro Rosenblatt DA, Vieira R, Greenwood DC,
et al. Red and processed meat intake and risk of colorectal adenomas: a systematic review
and meta-analysis of epidemiological studies. Cancer Causes Control, 2013. 24(4):611-
27.
72. Vieira AR, Abar L, Chan DSM, Vingeliene S, Polemiti E, Stevens C, Greenwood
D, Norat T. Vieira AR, Abar L, Chan DSM, Vingeliene S, Polemiti E, Stevens C,
Greenwood D, Norat T. Ann Oncol, 2017. 28(8):1788-1802. Doi:
10.1093/annonc/mdx171.
73. Cascella M, Bimonte S, Barbieri A, Del Vecchio V, Caliendo D, Schiavone V,
Fusco R, Granata V, Arra C, Cuomo A. Dissecting the mechanisms and molecules
underlying the potential carcinogenicity of red and processed meat in colorectal cancer

REFERENCES
~ 144 ~
(CRC): an overview on the current state of knowledge. Infect Agent Cancer, 2018. 13:3.
Doi: 10.1186/s13027-018-0174-9.
74. Helmus DS, Thompson CL, Zelenskiy S, Tucker TC, Li L. Red meat-derived
heterocyclic amines increase risk of colon cancer: a population-based case-control study.
Nutr Cancer, 2013. 65(8):1141-50. Doi: 10.1080/01635581.2013.834945.
75. Bastide NM, Pierre FH, Corpet DE. Heme iron from meat and risk of colorectal
cancer: a meta-analysis and a review of the mechanisms involved. Cancer Prev Res
(Phila), 2011. 4(2):177-84. Doi: 10.1158/1940-6207.CAPR-10-0113.
76. Gamage SMK, Dissabandara L, Lam AK, Gopalan V. The role of heme iron
molecules derived from red and processed meat in the pathogenesis of colorectal
carcinoma. Crit Rev Oncol Hematol, 2018. 126:121-128. Doi:
10.1016/j.critrevonc.2018.03.025.
77. Burkitt DP. Epidemiology of cancer of the colon and rectum. Cancer, 1971.
28(1):3-13. Doi: 10.1002/1097-0142(197107)28:1<3::aid-cncr2820280104>3.0.co;2-n.
78. Holscher HD. Dietary fiber and prebiotics and the gastrointestinal microbiota. Gut
Microbes, 2017. 8(2):172-184. Doi: 10.1080/19490976.2017.1290756.
79. Zeng H, Lazarova DL, Bordonaro M. Mechanisms linking dietary fiber, gut
microbiota and colon cancer prevention. World J Gastrointest Oncol, 2014. 6(2):41-51.
Doi: 10.4251/wjgo.v6.i2.41.
80. Elce A, Amato F, Zarrilli F, Calignano A, Troncone R, Castaldo G, Canani RB.
Butyrate modulating effects on pro-inflammatory pathways in human intestinal epithelial
cells. Benef Microbes, 2017. 8(5):841-847. Doi: 10.3920/BM2016.0197.

REFERENCES
~ 145 ~
81. Zeng H, Taussig DP, Cheng WH, Johnson LK, Hakkak R. Butyrate Inhibits
Cancerous HCT116 Colon Cell Proliferation but to a Lesser Extent in Noncancerous
NCM460 Colon Cells. Nutrients, 2017. 9(1):25. Doi: 10.3390/nu9010025.
82. Aune D, Chan DS, Lau R, Vieira R, Greenwood DC, Kampman E, Norat T.
Dietary fibre, whole grains, and risk of colorectal cancer: systematic review and dose-
response meta-analysis of prospective studies. BMJ, 2011. 343:d6617. Doi:
10.1136/bmj.d6617.
83. Kunzmann AT, Coleman HG, Huang WY, Kitahara CM, Cantwell MM, Berndt
SI. Dietary fiber intake and risk of colorectal cancer and incident and recurrent adenoma
in the Prostate, Lung, Colorectal, and Ovarian Cancer Screening Trial. Am J Clin Nutr,
2015. 102(4):881-90. Doi: 10.3945/ajcn.115.113282.
84. Song M, Wu K, Meyerhardt JA, Ogino S, Wang M, Fuchs CS, Giovannucci EL,
Chan AT. Fiber intake and survival after colorectal cancer diagnosis. JAMA Oncol, 2018.
4(1):71-79. Doi: 10.1001/jamaoncol.2017.3684.
85. Fung TT, Hu FB, Schulze M, Pollak M, Wu T, Fuchs CS, Giovannucci E. A
dietary pattern that is associated with C-peptide and risk of colorectal cancer in women.
Cancer Causes Control, 2012. 23(6):959-65. Doi: 10.1007/s10552-012-9969-y.
86. Tabung FK, Liu L, Wang W, Fung TT, Wu K, Smith-Warner SA, Cao Y, Hu FB,
Ogino S, Fuchs CS, Giovannucci EL. Association of Dietary Inflammatory Potential with
Colorectal Cancer Risk in Men and Women. JAMA Oncol, 2018. 4(3):366-373. Doi:
10.1001/jamaoncol.2017.4844.
87. Samuelson LC. Debate over the identity of an intestinal niche-cell population
settled. Nature, 2018. 558(7710):380-381. Doi: 10.1038/d41586-018-05281-z.

REFERENCES
~ 146 ~
88. Barker N, van de Wetering M, Clevers H. The intestinal stem cell. Genes Dev,
2008. 22(14):1856-64. Doi: 10.1101/gad.1674008.
89. Muñoz-Bellvis L, Fontanillo C, González-González M, Garcia E, Iglesias M,
Esteban C, Gutierrez ML, Abad MM, Bengoechea O, De Las Rivas J, Orfao A, Sayagués
JM. Unique genetic profile of sporadic colorectal cancer liver metastasis versus primary
tumors as defined by high-density single-nucleotide polymorphism arrays. Mod Pathol,
2012. 25(4):590-601. Doi: 10.1038/modpathol.2011.195.
90. Hanahan D, Weinberg RA. The hallmarks of cancer. Cell, 2000. 100(1):57-70.
Doi: 10.1016/s0092-8674(00)81683-9.
91. Hanahan D, Weinberg RA. Hallmarks of cancer: the next generation. Cell, 2011.
144(5):646-74. Doi: 10.1016/j.cell.2011.02.013.
92. Zeki SS, Graham TA, Wright NA. Stem cells and their implications for colorectal
cancer. Nat Rev Gastroenterol Hepatol, 2011. 8(2):90-100. Doi:
10.1038/nrgastro.2010.211.
93. Lengauer C, Kinzler KW, Vogelstein B. Genetic instabilities in human cancers.
Nature, 1998. 396(6712):643-9. Doi: 10.1038/25292.
94. Kinzler KW, Vogelstein B. Lessons from hereditary colorectal cancer. Cell, 1996.
87(2):159-70. Doi: 10.1016/s0092-8674(00)81333-1.
95. Rodriguez-Salas N, Dominguez G, Barderas R, Mendiola M, García-Albéniz X,
Maurel J, Batlle JF. Clinical relevance of colorectal cancer molecular subtypes. Crit Rev
Oncol Hematol, 2017. 109:9-19. Doi: 10.1016/j.critrevonc.2016.11.007.

REFERENCES
~ 147 ~
96. Coleman OI, Nunes T. Role of the Microbiota in Colorectal Cancer: Updates on
Microbial Associations and Therapeutic Implications. Biores Open Access, 2016.
5(1):279-288. Doi: 10.1089/biores.2016.0028.
97. Palacio-Rúa KA, Muñetón-Peña CM. Bases moleculares del cáncer colorrectal.
Iatreia, 2012. Vol. 25 (2): 137-148.
98. Cruz-Bustillo Clarens D. Genomic instability and colorectal cancer. Rev Esp
Enferm Dig, 2005. 97(10):683-7. Doi: 10.4321/s1130-01082005001000001.
99. Calvacanti-Carneiro da Silva F, Dominguez-Valentin M, de Oliveira-Ferreira F,
Carraro DM, Rossi BM. Mismatch repair genes in Lynch syndrome: a review. Sao Paulo
Medical Journal, 2009. 127(1):46-51.
100. Boland CR, Goel A. Microsatellite instability in colorectal cancer.
Gastroenterology, 2010. 138(6):2073-87 e3.
101. Tejpar S, Van Cutsem E. Molecular and genetic defects in colorectal
tumorigenesis. Best Pract Res Clin Gastroenterol, 2002. 16(2):171-85.
102. Caruso ML. Role of Mismatch Repair Proteins and Microsateilite Instability in
Colon Carcinoma. Handbook of Immunohistochemistry and in situ Hybridization of
Human Carcinomas, 2005.2:215-26.
103. Markowitz SD, Bertagnolli MM. Molecular origins of cancer: Molecular basis of
colorectal cancer. N Engl J Med, 2009. 361(25):2449-60.
104. Worthley DL, Whitehall VL, Spring KJ, Leggett BA. Colorectal carcinogenesis:
road maps to cancer. World J Gastroenterol, 2007. 13(28):3784-91.

REFERENCES
~ 148 ~
105. Kolmeder CA, de Vos WM. Roadmap to functional characterization of the human
intestinal microbiota in its interaction with the host. J Pharm Biomed Anal, 2021.
194:113751. Doi: 10.1016/j.jpba.2020.113751.
106. Schloss I, Kidd MS, Tichelaar HY, Young GO, O'Keefe SJ. Dietary factors
associated with a low risk of colon cancer in coloured west coast fishermen. S Afr Med
J, 1997. 87(2):152-8.
107. Fearon ER. Molecular genetics of colorectal cancer. Annu Rev Pathol, 2011.
6:479-507. Doi: 10.1146/annurev-pathol-011110-130235.
108. Leggett B, Whitehall V. Role of the serrated pathway in colorectal cancer
pathogenesis. Gastroenterology, 2010. 138(6):2088-100. Doi:
10.1053/j.gastro.2009.12.066.
109. Kedrin D, Gala MK. Genetics of the serrated pathway to colorectal cancer. Clin
Transl Gastroenterol, 2015. 6(4):e84. Doi: 10.1038/ctg.2015.12.
110. Kuroki Y, Endo T, Iwahashi K, Miyao N, Suzuki R, Asonuma K, Yamamoto Y,
Nagahama M. Acceptability of endoscopic submucosal dissection for sessile serrated
lesions: comparison with non-sessile serrated lesions. Endosc Int Open, 2020.
8(12):E1832-E1839. Doi: 10.1055/a-1268-7353.
111. Jess T, Rungoe C, Peyrin-Biroulet L. Risk of colorectal cancer in patients with
ulcerative colitis: a meta-analysis of population-based cohort studies. Clin Gastroenterol
Hepatol, 2012. 10(6):639-45. Doi: 10.1016/j.cgh.2012.01.010.

REFERENCES
~ 149 ~
112. Itzkowitz SH, Yio X. Inflammation and cancer IV. Colorectal cancer in
inflammatory bowel disease: the role of inflammation. Am J Physiol Gastrointest Liver
Physiol, 2004. 287(1):G7-17. Doi: 10.1152/ajpgi.00079.2004.
113. Triantafillidis JK, Nasioulas G, Kosmidis PA. Colorectal cancer and
inflammatory bowel disease: epidemiology, risk factors, mechanisms of carcinogenesis
and prevention strategies. Anticancer Res, 2009. 29(7):2727-37.
114. Diakite A, Dubourg G, Raoult D. Updating the repertoire of cultured bacteria from
the human being. Microb Pathog, 2021. 150:104698. Doi:
10.1016/j.micpath.2020.104698.
115. Rubinstein MR, Wang X, Liu W, Hao Y, Cai G, Han YW. Fusobacterium
nucleatum promotes colorectal carcinogenesis by modulating E-cadherin/β-catenin
signaling via its FadA adhesin. Cell Host Microbe, 2013. 14(2):195-206. Doi:
10.1016/j.chom.2013.07.012.
116. D'Amelio P, Sassi F. Gut Microbiota, Immune System, and Bone. Calcif Tissue
Int, 2018. 102(4):415-425. Doi: 10.1007/s00223-017-0331-y.
117. Rooks MG, Garrett WS. Gut microbiota, metabolites and host immunity. Nat.
Rev. Immunol, 2016. 16, 341–352. Doi:10.1038/nri.2016.42.
118. Kim S, Jazwinski SM. The gut microbiota and healthy aging. Gerontology, 2018.
64(6):513-520. Doi: 10.1159/000490615.
119. Gao R, Kong C, Huang L, Li H, Qu X, Liu Z, Lan P, Wang J, Qin H. Mucosa-
associated microbiota signature in colorectal cancer. Eur J Clin Microbiol Infect Dis,
2017. 36(11):2073-2083. Doi: 10.1007/s10096-017-3026-4.

REFERENCES
~ 150 ~
120. Liu X, Cheng Y, Shao L, Ling Z. Alterations of the Predominant Fecal Microbiota
and Disruption of the Gut Mucosal Barrier in Patients with Early-Stage Colorectal
Cancer. Biomed Res Int, 2020. 2020:2948282. Doi: 10.1155/2020/2948282.
121. Benson AK, Kelly SA, Legge R, Ma F, Low SJ, Kim J, Zhang M, Oh PL,
Nehrenberg D, Hua K, et al. Individuality in gut microbiota composition is a complex
polygenic trait shaped by multiple environmental and host genetic factors. Proc Natl Acad
Sci USA, 2010. 107:18933-18938. Doi:10.1073/pnas.1007028107.
122. Costello EK, Lauber CL, Hamady M, Fierer N, Gordon JI, Knight R. Bacterial
Community Variation in Human Body Habitats Across Space and Time. Science, 2009.
326: 1694–1697. Doi:10.1126/science.1177486.
123. Gagnière J, Raisch J, Veziant J, Barnich N, Bonnet R, Buc E, Bringer MA, Pezet
D, Bonnet M. Gut microbiota imbalance and colorectal cancer. World J. Gastroenterol,
2016. 22: 501-518. Doi:10.3748/wjg.v22.i2.501.
124. Laqueur GL, McDaniel EG, Matsumoto H. Tumor induction in germfree rats with
methylazoxymethanol (MAM) and synthetic MAM acetate. J Natl Cancer Inst, 1967.
39(2):355-71.
125. Onoue M, Kado S, Sakaitani Y, Uchida K, Morotomi M. Specific species of
intestinal bacteria influence the induction of aberrant crypt foci by 1,2-dimethylhydrazine
in rats. Cancer Lett, 1997. 113(1-2):179-86. Doi: 10.1016/s0304-3835(97)04698-3.
126. Chen W, Liu F, Ling Z, Tong X, Xiang C. Human intestinal lumen and mucosa-
associated microbiota in patients with colorectal cancer. PLoS One, 2012. 7(6):e39743.
Doi: 10.1371/journal.pone.0039743.

REFERENCES
~ 151 ~
127. Saffarian A, Mulet C, Regnault B, Amiot A, Tran-Van-Nhieu J, Ravel J, Sobhani
I, Sansonetti PJ, Pédron T. Crypt- and Mucosa-Associated Core Microbiotas in Humans
and Their Alteration in Colon Cancer Patients. mBio, 2019. 10(4):e01315-19. Doi:
10.112.
128. Wong SH, Yu J. Gut microbiota in colorectal cancer: mechanisms of action and
clinical applications. Nat Rev Gastroenterol Hepatol, 2019. 16(11):690-704. Doi:
10.1038/s41575-019-0209-8.
129. Mira-Pascual L, Cabrera-Rubio R, Ocon S, Costales P, Parra A, Suarez A, Moris
F, Rodrigo L, Mira A, Collado MC. Microbial mucosal colonic shifts associated with the
development of colorectal cancer reveal the presence of different bacterial and archaeal
biomarkers. J Gastroenterol, 2015. 50(2):167-79. Doi: 10.1007/s00535-014-0963-x.
130. Vacante M, Ciuni R, Basile F, Biondi A. Gut Microbiota and Colorectal Cancer
Development: A Closer Look to the Adenoma-Carcinoma Sequence. Biomedicines,
2020. 8(11):489. Doi: 10.3390/biomedicines8110489.
131. Tahara T, Yamamoto E, Suzuki H, Maruyama R, Chung W, Garriga J, Jelinek J,
Yamano HO, Sugai T, An B, Shureiqi I, Toyota M, Kondo Y, Estécio MR, Issa JP.
Fusobacterium in colonic flora and molecular features of colorectal carcinoma. Cancer
Res, 2014. 74(5):1311-8. Doi: 10.1158/0008-5472.CAN-13-1865.
132. Wang T, Cai G, Qiu Y, Fei N, Zhang M, Pang X, Jia W, Cai S, Zhao L. Structural
segregation of gut microbiota between colorectal cancer patients and healthy volunteers.
ISME J, 2012. 6(2):320-9. Doi: 10.1038/ismej.2011.109.
133. Seki H, Shiohara M, Matsumura T, Miyagawa N, Tanaka M, Komiyama A,
Kurata S. Prevention of antibiotic-associated diarrhea in children by Clostridium
REFERENCES
~ 152 ~
butyricum MIYAIRI. Pediatr Int, 2003. 45(1):86-90. Doi: 10.1046/j.1442-
200x.2003.01671.x.
134. Ahn J, Sinha R, Pei Z, Dominianni C, Wu J, Shi J, Goedert JJ, Hayes RB, Yang
L. Human gut microbiome and risk for colorectal cancer. J Natl Cancer Inst, 2013.
105(24):1907-11. Doi: 10.1093/jnci/djt300.
135. Tjalsma H, Boleij A, Marchesi JR, Dutilh BE. A bacterial driver-passenger model
for colorectal cancer: beyond the usual suspects. Nat Rev Microbiol, 2012. 10(8):575-82.
Doi: 10.1038/nrmicro2819.
136. Shen XJ, Rawls JF, Randall T, Burcal L, Mpande CN, Jenkins N, Jovov B, Abdo
Z, Sandler RS, Keku TO. Molecular characterization of mucosal adherent bacteria and
associations with colorectal adenomas. Gut Microbes, 2010. 1(3):138-47. Doi:
10.4161/gmic.1.3.12360.
137. Snover DC. Update on the serrated pathway to colorectal carcinoma. Hum Pathol,
2011. 42(1):1-10. Doi: 10.1016/j.humpath.2010.06.002.
138. Avril M, DePaolo RW. "Driver-passenger" bacteria and their metabolites in the
pathogenesis of colorectal cancer. Gut Microbes, 2021. 13(1):1941710. Doi:
10.1080/19490976.2021.1941710.
139. Janati AI, Karp I, Laprise C, Sabri H, Emami E. Detection of Fusobaterium
nucleatum in feces and colorectal mucosa as a risk factor for colorectal cancer: a
systematic review and meta-analysis. Syst Rev, 2020. 9(1):276. Doi: 10.1186/s13643-
020-01526-z.

REFERENCES
~ 153 ~
140. Cheng Y, Ling Z, Li L. The Intestinal Microbiota and Colorectal Cancer. Front
Immunol, 2020. 11:615056. Doi: 10.3389/fimmu.2020.615056.
141. Sun T, Liu S, Zhou Y, Yao Z, Zhang D, Cao S, Wei Z, Tan B, Li Y, Lian Z, Wang
S. Evolutionary biologic changes of gut microbiota in an ‘adenoma-carcinoma sequence’
mouse colorectal cancer model induced by 1, 2-Dimethylhydrazine. Oncotarget, 2017.
8(1):444-457. Doi: 10.18632/oncotarget.13443.
142. Cuevas-Ramos G, Petit CR, Marcq I, Boury M, Oswald E, Nougayrède JP.
Escherichia coli induces DNA damage in vivo and triggers genomic instability in
mammalian cells. Proc Natl Acad Sci USA, 2010. 107(25):11537-42. Doi:
10.1073/pnas.1001261107. Epub 2010 Jun 7.
143. Ahmed S, Macfarlane GT, Fite A, McBain AJ, Gilbert P, Macfarlane S. Mucosa-
associated bacterial diversity in relation to human terminal ileum and colonic biopsy
samples. Appl Environ Microbiol, 2007. 73(22):7435-42. Doi: 10.1128/AEM.01143-07.
144. Koliaraki V, Pallangyo CK, Greten FR, Kollias G. Mesenchymal Cells in Colon
Cancer. Gastroenterology, 2017. 152(5):964-979. Doi: 10.1053/j.gastro.2016.11.049.
145. Marchesi JR, Dutilh BE, Hall N, Peters WH, Roelofs R, Boleij A, Tjalsma H.
Towards the human colorectal cancer microbiome. PLoS One, 2011. 6(5):e20447. Doi:
10.1371/journal.pone.0020447.
146. Kostic AD, Gevers D, Pedamallu CS, Michaud M, Duke F, Earl AM, Ojesina AI,
Jung J, Bass AJ, Tabernero J, Baselga J, Liu C, Shivdasani RA, Ogino S, Birren BW,
Huttenhower C, Garrett WS, Meyerson M. Genomic analysis identifies association of
Fusobacterium with colorectal carcinoma. Genome Res, 2012. 22(2):292-8. Doi:
10.1101/gr.126573.111.

REFERENCES
~ 154 ~
147. Boleij A, van Gelder MM, Swinkels DW, Tjalsma H. Clinical Importance of
Streptococcus gallolyticus infection among colorectal cancer patients: systematic review
and meta-analysis. Clin Infect Dis, 2011. 53(9):870-8. Doi: 10.1093/cid/cir609.
148. Boleij A, Muytjens CM, Bukhari SI, Cayet N, Glaser P, Hermans PW, Swinkels
DW, Bolhuis A, Tjalsma H. Novel clues on the specific association of Streptococcus
gallolyticus subsp gallolyticus with colorectal cancer. J Infect Dis, 2011. 203(8):1101-9.
Doi: 10.1093/infdis/jiq169.
149. Warren RL, Freeman DJ, Pleasance S, Watson P, Moore RA, Cochrane K, Allen-
Vercoe E, Holt RA. Co-occurrence of anaerobic bacteria in colorectal carcinomas.
Microbiome, 2013. 1(1):16. Doi: 10.1186/2049-2618-1-16.
150. Manson McGuire A, Cochrane K, Griggs AD, Haas BJ, Abeel T, Zeng Q, Nice
JB, MacDonald H, Birren BW, Berger BW, Allen-Vercoe E, Earl AM. Evolution of
invasion in a diverse set of Fusobacterium species. mBio, 2014. 5(6):e01864. Doi:
10.1128/mBio.01864-14.
151. Brennan CA, Garrett WS. Fusobacterium nucleatum-symbiont, opportunist and
oncobacterium. Nat Rev Microbiol, 2019. 17(3):156-166. Doi: 10.1038/s41579-018-
0129-6.
152. Flynn KJ, Baxter NT, Schloss PD. Metabolic and Community Synergy of Oral
Bacteria in Colorectal Cancer. mSphere, 2016. 1(3):e00102-16. Doi:
10.1128/mSphere.00102-16.
153. Peters BA, Dominianni C, Shapiro JA, Church TR, Wu J, Miller G, Yuen E,
Freiman H, Lustbader I, Salik J, Friedlander C, Hayes RB, Ahn J. The gut microbiota in

REFERENCES
~ 155 ~
conventional and serrated precursors of colorectal cancer. Microbiome, 2016. 4(1):69.
Doi: 10.1186/s40168-016-0218-6.
154. Yu T, Guo F, Yu Y, Sun T, Ma D, Han J, Qian Y, Kryczek I, Sun D, Nagarsheth
N, Chen Y, Chen H, Hong J, Zou W, Fang JY. Fusobacterium nucleatum Promotes
Chemoresistance to Colorectal Cancer by Modulating Autophagy. Cell, 2017.
170(3):548-563.e16. Doi: 10.1016/j.cell.2017.07.008.
155. Beaugerie L, Itzkowitz SH. Cancers complicating inflammatory bowel disease. N
Engl J Med, 2015. 372(15):1441-52. Doi: 10.1056/NEJMra1403718.
156. Grivennikov SI. Inflammation and colorectal cancer: colitis-associated neoplasia.
Semin Immunopathol, 2013. 35(2):229-44. Doi: 10.1007/s00281-012-0352-6.
157. Godos J, Biondi A, Galvano F, Basile F, Sciacca S, Giovannucci EL, Grosso G.
Markers of systemic inflammation and colorectal adenoma risk: Meta-analysis of
observational studies. World J Gastroenterol, 2017. 23(10):1909-1919. Doi:
10.3748/wjg.v23.i10.1909.
158. Luo Y, Zheng SG. Hall of Fame among Pro-inflammatory Cytokines: Interleukin-
6 Gene and Its Transcriptional Regulation Mechanisms. Front Immunol, 2016. 7:604. doi:
10.3389/fimmu.2016.00604.
159. Comstock SS, Xu D, Hortos K, Kovan B, McCaskey S, Pathak DR, Fenton JI.
Association of serum cytokines with colorectal polyp number and type in adult males.
Eur J Cancer Prev, 2016. 25(3):173-81. Doi: 10.1097/CEJ.0000000000000160.

REFERENCES
~ 156 ~
160. Wu S, Rhee KJ, Zhang M, Franco A, Sears CL. Bacteroides fragilis toxin
stimulates intestinal epithelial cell shedding and gamma-secretasedependent E-cadherin
cleavage. J Cell Sci, 2007. 120(Pt 11):1944–52. Doi: 10.1242/jcs.03455.
161. Deng Z, Mu J, Tseng M, Wattenberg B, Zhuang X, Egilmez NK, et al.
Enterobacteria-secreted particles induce production of exosome-like S1Pcontaining
particles by intestinal epithelium to drive Th17-mediated tumorigenesis. Nat Commun,
2015. 6:6956-6. Doi: 10.1038/ncomms7956.
162. Francescone R, Hou V, Grivennikov SI. Microbiome, inflammation, and cancer.
Cancer J, 2014. 20(3):181-9. Doi: 10.1097/PPO.0000000000000048.
163. Arthur JC, Perez-Chanona E, Mühlbauer M, Tomkovich S, Uronis JM, Fan TJ,
Campbell BJ, Abujamel T, Dogan B, Rogers AB, Rhodes JM, Stintzi A, Simpson KW,
Hansen JJ, Keku TO, Fodor AA, Jobin C. Intestinal inflammation targets cancer-inducing
activity of the microbiota. Science, 2012. 338(6103):120-3. Doi:
10.1126/science.1224820.
164. Dzutsev A, Goldszmid RS, Viaud S, Zitvogel L, Trinchieri G. The role of the
microbiota in inflammation, carcinogenesis, and cancer therapy. Eur J Immunol, 2015.
45(1):17-31. Doi: 10.1002/eji.201444972.
165. Keku TO, Dulal S, Deveaux A, Jovov B, Han X. The gastrointestinal microbiota
and colorectal cancer. Am J Physiol Gastrointest Liver Physiol, 2015. 308(5):G351-63.
Doi: 10.1152/ajpgi.00360.2012.
166. Bongers G, Pacer ME, Geraldino TH, Chen L, He Z, Hashimoto D, Furtado GC,
Ochando J, Kelley KA, Clemente JC, Merad M, van Bakel H, Lira SA. Interplay of host
microbiota, genetic perturbations, and inflammation promotes local development of

REFERENCES
~ 157 ~
intestinal neoplasms in mice. J Exp Med. 2014 Mar 10;211(3):457-72. Doi:
10.1084/jem.20131587.
167. Goodman B, Gardner H. The microbiome and cancer. J Pathol. 2018
Apr;244(5):667-676. Doi: 10.1002/path.5047.
168. Sánchez-Alcoholado L, Ramos-Molina B, Otero A, Laborda-Illanes A, Ordóñez
R, Medina JA, Gómez-Millán J, Queipo-Ortuño MI. The role of the gut microbiome in
colorectal cancer development and therapy response. Cancers (Basel). 2020 May
29;12(6):1406. doi: 10.3390/cancers12061406.
169. Grivennikov SI, Wang K, Mucida D, Stewart CA, Schnabl B, Jauch D, Taniguchi
K, Yu GY, Osterreicher CH, Hung KE, Datz C, Feng Y, Fearon ER, Oukka M, Tessarollo
L, Coppola V, Yarovinsky F, Cheroutre H, Eckmann L, Trinchieri G, Karin M. Adenoma-
linked barrier defects and microbial products drive IL-23/IL-17-mediated tumour growth.
Nature. 2012 Nov 8;491(7423):254-8. Doi: 10.1038/nature11465.
170. Song X, Gao H, Lin Y, Yao Y, Zhu S, Wang J, Liu Y, Yao X, Meng G, Shen N,
Shi Y, Iwakura Y, Qian Y. Alterations in the microbiota drive interleukin-17C production
from intestinal epithelial cells to promote tumorigenesis. Immunity. 2014 Jan
16;40(1):140-52. doi: 10.1016/j.immuni.2013.11.018.
171. Kortylewski M, Xin H, Kujawski M, Lee H, Liu Y, Harris T, Drake C, Pardoll D,
Yu H. Regulation of the IL-23 and IL-12 balance by Stat3 signaling in the tumor
microenvironment. Cancer Cell. 2009 Feb 3;15(2):114-23. Doi:
10.1016/j.ccr.2008.12.018.
172. Wang K, Kim MK, Di Caro G, Wong J, Shalapour S, Wan J, Zhang W, Zhong Z,
Sanchez-Lopez E, Wu LW, Taniguchi K, Feng Y, Fearon E, Grivennikov SI, Karin M.

REFERENCES
~ 158 ~
Interleukin-17 receptor a signaling in transformed enterocytes promotes early colorectal
tumorigenesis. Immunity. 2014 Dec 18;41(6):1052-63. Doi:
10.1016/j.immuni.2014.11.009.
173. Hnatyszyn A, Hryhorowicz S, Kaczmarek-Ryś M, Lis E, Słomski R, Scott RJ,
Pławski A. Colorectal carcinoma in the course of inflammatory bowel diseases. Hered
Cancer Clin Pract. 2019 Jul 12;17:18. Doi: 10.1186/s13053-019-0118-4.
174. Cheng WT, Kantilal HK, Davamani F. The Mechanism of Bacteroides fragilis
Toxin Contributes to Colon Cancer Formation. Malays J Med Sci. 2020 Jul;27(4):9-21.
Doi: 10.21315/mjms2020.27.4.2.
175. Ye X, Wang R, Bhattacharya R, Boulbes DR, Fan F, Xia L, Adoni H, Ajami NJ,
Wong MC, Smith DP, Petrosino JF, Venable S, Qiao W, Baladandayuthapani V, Maru
D, Ellis LM. Fusobacterium Nucleatum Subspecies Animalis Influences
Proinflammatory Cytokine Expression and Monocyte Activation in Human Colorectal
Tumors. Cancer Prev Res (Phila). 2017 Jul;10(7):398-409. Doi: 10.1158/1940-
6207.CAPR-16-0178.
176. Wu Y, Wu J, Chen T, Li Q, Peng W, Li H, Tang X, Fu X. Fusobacterium
nucleatum Potentiates Intestinal Tumorigenesis in Mice via a Toll-Like Receptor 4/p21-
Activated Kinase 1 Cascade. Dig Dis Sci. 2018 May;63(5):1210-1218. Doi:
10.1007/s10620-018-4999-2.
177. Long X, Wong CC, Tong L, Chu ESH, Ho Szeto C, Go MYY, Coker OO, Chan
AWH, Chan FKL, Sung JJY, Yu J. Peptostreptococcus anaerobius promotes colorectal
carcinogenesis and modulates tumour immunity. Nat Microbiol. 2019 Dec;4(12):2319-
2330. Doi: 10.1038/s41564-019-0541-3.

REFERENCES
~ 159 ~
178. Tsoi H, Chu ESH, Zhang X, Sheng J, Nakatsu G, Ng SC, Chan AWH, Chan FKL,
Sung JJY, Yu J. Peptostreptococcus anaerobius Induces Intracellular Cholesterol
Biosynthesis in Colon Cells to Induce Proliferation and Causes Dysplasia in Mice.
Gastroenterology. 2017 May;152(6):1419-1433.e5. Doi: 10.1053/j.gastro.2017.01.009.
179. Shen Z, Feng Y, Rogers AB, Rickman B, Whary MT, Xu S, Clapp KM, Boutin
SR, Fox JG. Cytolethal distending toxin promotes Helicobacter cinaedi-associated
typhlocolitis in interleukin-10-deficient mice. Infect Immun. 2009 Jun;77(6):2508-16.
Doi: 10.1128/IAI.00166-09.
180. Vizcaino MI, Crawford JM. The colibactin warhead crosslinks DNA. Nat Chem.
2015 May;7(5):411-7. Doi: 10.1038/nchem.2221.
181. Cougnoux A, Delmas J, Gibold L, Faïs T, Romagnoli C, Robin F, Cuevas-Ramos
G, Oswald E, Darfeuille-Michaud A, Prati F, Dalmasso G, Bonnet R. Small-molecule
inhibitors prevent the genotoxic and protumoural effects induced by colibactin-producing
bacteria. Gut. 2016 Feb;65(2):278-85. Doi: 10.1136/gutjnl-2014-307241.
182. Sears CL. Enterotoxigenic Bacteroides fragilis: a rogue among symbiotes. Clin
Microbiol Rev. 2009 Apr;22(2):349-69, Table of Contents. Doi: 10.1128/CMR.00053-
08.
183. Lu R, Wu S, Zhang YG, Xia Y, Zhou Z, Kato I, Dong H, Bissonnette M, Sun J.
Salmonella Protein AvrA Activates the STAT3 Signaling Pathway in Colon Cancer.
Neoplasia. 2016 May;18(5):307-316. Doi: 10.1016/j.neo.2016.04.001.
184. Wu S, Shin J, Zhang G, Cohen M, Franco A, Sears CL. The Bacteroides fragilis
toxin binds to a specific intestinal epithelial cell receptor. Infect Immun. 2006
Sep;74(9):5382-90. Doi: 10.1128/IAI.00060-06.

REFERENCES
~ 160 ~
185. Rubinstein MR, Baik JE, Lagana SM, Han RP, Raab WJ, Sahoo D, Dalerba P,
Wang TC, Han YW. Fusobacterium nucleatum promotes colorectal cancer by inducing
Wnt/β-catenin modulator Annexin A1. EMBO Rep. 2019 Apr;20(4):e47638. Doi:
10.15252/embr.201847638.
186. Gur C, Ibrahim Y, Isaacson B, Yamin R, Abed J, Gamliel M, Enk J, Bar-On Y,
Stanietsky-Kaynan N, Coppenhagen-Glazer S, Shussman N, Almogy G, Cuapio A, Hofer
E, Mevorach D, Tabib A, Ortenberg R, Markel G, Miklić K, Jonjic S, Brennan CA,
Garrett WS, Bachrach G, Mandelboim O. Binding of the Fap2 protein of Fusobacterium
nucleatum to human inhibitory receptor TIGIT protects tumors from immune cell attack.
Immunity. 2015 Feb 17;42(2):344-355. Doi: 10.1016/j.immuni.2015.01.010.
187. Mohseni AH, Taghinezhad-S S, Fu X. Gut microbiota-derived metabolites and
colorectal cancer: New insights and updates. Microb Pathog. 2020 Dec;149:104569. Doi:
10.1016/j.micpath.2020.104569.
188. Kim CH, Park J, Kim M. Gut microbiota-derived short-chain Fatty acids, T cells,
and inflammation. Immune Netw. 2014 Dec;14(6):277-88. Doi:
10.4110/in.2014.14.6.277.
189. Hosseini E, Grootaert C, Verstraete W, Van de Wiele T. Propionate as a health-
promoting microbial metabolite in the human gut. Nutr Rev. 2011 May;69(5):245-58.
Doi: 10.1111/j.1753-4887.2011.00388.x.
190. Russell WR, Hoyles L, Flint HJ, Dumas ME. Colonic bacterial metabolites and
human health. Curr Opin Microbiol. 2013 Jun;16(3):246-54. Doi:
10.1016/j.mib.2013.07.002.

REFERENCES
~ 161 ~
191. Niccolai E, Baldi S, Ricci F, Russo E, Nannini G, Menicatti M, Poli G, Taddei A,
Bartolucci G, Calabrò AS, Stingo FC, Amedei A. Evaluation and comparison of short
chain fatty acids composition in gut diseases. World J Gastroenterol. 2019 Sep
28;25(36):5543-5558. Doi: 10.3748/wjg.v25.i36.5543.
192. Wong JM, de Souza R, Kendall CW, Emam A, Jenkins DJ. Colonic Health:
Fermentation and Short Chain Fatty Acids. J Clin Gastroenterol. 2006 Mar;40(3):235-43.
Doi: 10.1097/00004836-200603000-00015.
193. Yang Q, Ouyang J, Sun F, Yang J. Short-Chain Fatty Acids: A Soldier Fighting
Against Inflammation and Protecting From Tumorigenesis in People With Diabetes.
Front Immunol. 2020 Dec 8;11:590685. Doi: 10.3389/fimmu.2020.590685.
194. Wang G, Yu Y, Wang YZ, Wang JJ, Guan R, Sun Y, Shi F, Gao J, Fu XL. Role
of SCFAs in gut microbiome and glycolysis for colorectal cancer therapy. J Cell Physiol.
2019 Aug;234(10):17023-17049. Doi: 10.1002/jcp.28436.
195. Mika A, Kobiela J, Pakiet A, Czumaj A, Sokołowska E, Makarewicz W,
Chmielewski M, Stepnowski P, Marino-Gammazza A, Sledzinski T. Preferential uptake
of polyunsaturated fatty acids by colorectal cancer cells. Sci Rep. 2020 Feb 6;10(1):1954.
Doi: 10.1038/s41598-020-58895-7.
196. Casero RA Jr, Murray Stewart T, Pegg AE. Polyamine metabolism and cancer:
treatments, challenges and opportunities. Nat Rev Cancer. 2018 Nov;18(11):681-695.
Doi: 10.1038/s41568-018-0050-3.
197. Salcedo R, Worschech A, Cardone M, Jones Y, Gyulai Z, Dai RM, Wang E, Ma
W, Haines D, O'hUigin C, Marincola FM, Trinchieri G. MyD88-mediated signaling

REFERENCES
~ 162 ~
prevents development of adenocarcinomas of the colon: role of interleukin 18. J Exp Med.
2010 Aug 2;207(8):1625-36. Doi: 10.1084/jem.20100199.
198. Vaishnava S, Behrendt CL, Ismail AS, Eckmann L, Hooper LV. Paneth cells
directly sense gut commensals and maintain homeostasis at the intestinal host-microbial
interface. Proc Natl Acad Sci USA. 2008 Dec 30;105(52):20858-63. Doi:
10.1073/pnas.0808723105.
199. Singh N, Gurav A, Sivaprakasam S, Brady E, Padia R, Shi H, Thangaraju M,
Prasad PD, Manicassamy S, Munn DH, Lee JR, Offermanns S, Ganapathy V. Activation
of Gpr109a, receptor for niacin and the commensal metabolite butyrate, suppresses
colonic inflammation and carcinogenesis. Immunity. 2014 Jan 16;40(1):128-39. Doi:
10.1016/j.immuni.2013.12.007.
200. Liu T, Song X, Khan S, Li Y, Guo Z, Li C, Wang S, Dong W, Liu W, Wang B,
Cao H. The gut microbiota at the intersection of bile acids and intestinal carcinogenesis:
An old story, yet mesmerizing. Int J Cancer. 2020 Apr 1;146(7):1780-1790. Doi:
10.1002/ijc.32563.
201. Ye P, Xi Y, Huang Z, Xu P. Linking Obesity with Colorectal Cancer:
Epidemiology and Mechanistic Insights. Cancers (Basel). 2020 May 29;12(6):1408. Doi:
10.3390/cancers12061408.
202. Ocvirk S, O'Keefe SJD. Dietary fat, bile acid metabolism and colorectal cancer.
Semin Cancer Biol. 2020 Oct 16:S1044-579X(20)30208-X. Doi:
10.1016/j.semcancer.2020.10.003.

REFERENCES
~ 163 ~
203. Mao J, Chen X, Wang C, Li W, Li J. Effects and mechanism of the bile acid
(farnesoid X) receptor on the Wnt/β‑catenin signaling pathway in colon cancer. Oncol
Lett. 2020 Jul;20(1):337-345. Doi: 10.3892/ol.2020.11545.
204. Ethridge AD, Bazzi MH, Lukacs NW, Huffnagle GB. Inter-Kingdom
Communication and Regulation of Mucosal Immunity by the Microbiome. J Infect Dis.
2020 Dec 17:jiaa748. Doi: 10.1093/infdis/jiaa748.
205. Nguyen TT, Lian S, Ung TT, Xia Y, Han JY, Jung YD. Lithocholic acid stimulates
IL-8 expression in human colorectal cancer cells via activation of Erk1/2 MAPK and
suppression of STAT3 activity. J Cell Biochem. 2017 Sep;118(9):2958-2967. Doi:
10.1002/jcb.25955.
206. Shan J, Oshima T, Fukui H, Watari J, Miwa H. Acidic deoxycholic acid and
chenodeoxycholic acid induce interleukin-8 production through p38 mitogen-activated
protein kinase and protein kinase A in a squamous epithelial model. J Gastroenterol
Hepatol. 2013 May;28(5):823-8. Doi: 10.1111/jgh.12139.
207. Nguyen TT, Ung TT, Li S, Lian S, Xia Y, Park SY, Do Jung Y. Metformin inhibits
lithocholic acidinduced interleukin 8 upregulation in colorectal cancer cells by
suppressing ROS production and NF-kB activity. Sci Rep. 2019 Feb 14;9(1):2003. Doi:
10.1038/s41598-019-38778-2.
208. Zeng H, Claycombe KJ, Reindl KM. Butyrate and deoxycholic acid play common
and distinct roles in HCT116 human colon cell proliferation. J Nutr Biochem. 2015
Oct;26(10):1022-8. Doi: 10.1016/j.jnutbio.2015.04.007.
209. Armand L, Andriamihaja M, Gellenoncourt S, Bitane V, Lan A, Blachier F. In
vitro impact of amino acid-derived bacterial metabolites on colonocyte mitochondrial

REFERENCES
~ 164 ~
activity, oxidative stress response and DNA integrity. Biochim Biophys Acta Gen Subj.
2019 Aug;1863(8):1292-1301. Doi: 10.1016/j.bbagen.2019.04.018.
210. Carriche GM, Almeida L, Stüve P, Velasquez L, Dhillon-LaBrooy A, Roy U,
Lindenberg M, Strowig T, Plaza-Sirvent C, Schmitz I, Lochner M, Simon AK,
Sparwasser T. Regulating T-cell differentiation through the polyamine spermidine. J
Allergy Clin Immunol. 2021 Jan;147(1):335-348.e11. Doi: 10.1016/j.jaci.2020.04.037.
211. Bekebrede AF, Keijer J, Gerrits WJJ, Boer VCJ. The Molecular and Physiological
Effects of Protein-Derived Polyamines in the Intestine. Nutrients. 2020 Jan 11;12(1):197.
Doi: 10.3390/nu12010197.
212. Damiani E, Wallace HM. Polyamines and Cancer. Methods Mol Biol.
2018;1694:469-488. Doi: 10.1007/978-1-4939-7398-9_39.
213. Villalobos C, Hernández-Morales M, Gutiérrez LG, Núñez L. TRPC1 and ORAI1
channels in colon cancer. Cell Calcium. 2019 Jul;81:59-66. Doi:
10.1016/j.ceca.2019.06.003.
214. Love RR, Surawicz TS, Morrissey JF, Verma AK. Levels of colorectal ornithine
decarboxylase activity in patients with colon cancer, a family history of nonpolyposis
hereditary colorectal cancer, and adenomas. Cancer Epidemiol Biomarkers Prev. 1992
Mar-Apr;1(3):195-8.
215. Linsalata M, Russo F, Cavallini A, Berloco P, Di Leo A. Polyamines, diamine
oxidase, and ornithine decarboxylase activity in colorectal cancer and in normal
surrounding mucosa. Dis Colon Rectum. 1993 Jul;36(7):662-7. Doi:
10.1007/BF02238593.

REFERENCES
~ 165 ~
216. Alexiou GA, Lianos GD, Ragos V, Galani V, Kyritsis AP.
Difluoromethylornithine in cancer: new advances. Future Oncol. 2017 Apr;13(9):809-
819. Doi: 10.2217/fon-2016-0266.
217. Raj KP, Zell JA, Rock CL, McLaren CE, Zoumas-Morse C, Gerner EW,
Meyskens FL. Role of dietary polyamines in a phase III clinical trial of
difluoromethylornithine (DFMO) and sulindac for prevention of sporadic colorectal
adenomas. Br J Cancer. 2013 Feb 19;108(3):512-8. Doi: 10.1038/bjc.2013.15. Epub 2013
Jan 22.
218. Quemener V, Blanchard Y, Chamaillard L, Havouis R, Cipolla B, Moulinoux JP.
Polyamine deprivation: a new tool in cancer treatment. Anticancer Res. 1994 Mar-
Apr;14(2A):443-8.
219. Venäläinen MK, Roine AN, Häkkinen MR, Vepsäläinen JJ, Kumpulainen PS,
Kiviniemi MS, Lehtimäki T, Oksala NK, Rantanen TK. Altered Polyamine Profiles in
Colorectal Cancer. Anticancer Res. 2018 Jun;38(6):3601-3607. Doi:
10.21873/anticanres.12634.
220. Dejea CM et al. Microbiota organization is a distinct feature of proximal
colorectal cancers. Proc Natl Acad Sci USA. 2014 Dec 23;111(51):18321-6. Doi:
10.1073/pnas.1406199111.
221. Gerner EW, Bruckheimer E, Cohen A. Cancer pharmacoprevention: Targeting
polyamine metabolism to manage risk factors for colon cancer. J Biol Chem. 2018 Nov
30;293(48):18770-18778. Doi: 10.1074/jbc.TM118.003343.
222. Hoyles L, Jiménez-Pranteda ML, Chilloux J, Brial F, Myridakis A, Aranias T,
Magnan C, Gibson GR, Sanderson JD, Nicholson JK, Gauguier D, McCartney AL,

REFERENCES
~ 166 ~
Dumas ME. Metabolic retroconversion of trimethylamine N-oxide and the gut
microbiota. Microbiome. 2018 Apr 20;6(1):73. Doi: 10.1186/s40168-018-0461-0.
223. Chan CWH, Law BMH, Waye MMY, Chan JYW, So WKW, Chow KM.
Trimethylamine-N-oxide as One Hypothetical Link for the Relationship between
Intestinal Microbiota and Cancer – Where We Are and Where Shall We Go? J Cancer.
2019 Oct 8;10(23):5874-5882. Doi: 10.7150/jca.31737.
224. Oellgaard J, Winther SA, Hansen TS, Rossing P, von Scholten BJ.
Trimethylamine N oxide (TMAO) as a New Potential Therapeutic Target for Insulin
Resistance and Cancer. Curr Pharm Des. 2017;23(25):3699-3712. Doi:
10.2174/1381612823666170622095324.
225. Romano KA, Vivas EI, Amador-Noguez D, Rey FE. Intestinal microbiota
composition modulates choline bioavailability from diet and accumulation of the
proatherogenic metabolite trimethylamine-N-oxide. mBio. 2015 Mar 17;6(2):e02481.
Doi: 10.1128/mBio.02481-14.
226. Liu X, Liu H, Yuan C, Zhang Y, Wang W, Hu S, Liu L, Wang Y. Preoperative
serum TMAO level is a new prognostic marker for colorectal cancer. Biomark Med. 2017
May;11(5):443-447. Doi: 10.2217/bmm-2016-0262.
227. Yue C, Yang X, Li J, Chen X, Zhao X, Chen Y, Wen Y. Trimethylamine N-oxide
prime NLRP3 inflammasome via inhibiting ATG16L1-induced autophagy in colonic
epithelial cells. Biochem Biophys Res Commun. 2017 Aug 19;490(2):541-551. Doi:
10.1016/j.bbrc.2017.06.075.
228. Sánchez-Alcoholado L, Ordóñez R, Otero A, Plaza-Andrade I, Laborda-Illanes A,
Medina JA, Ramos-Molina B, Gómez-Millán J, Queipo-Ortuño MI. Gut Microbiota-

REFERENCES
~ 167 ~
Mediated Inflammation and Gut Permeability in Patients with Obesity and Colorectal
Cancer. Int J Mol Sci. 2020 Sep 16;21(18):6782. Doi: 10.3390/ijms21186782.
229. Griffin LE, Djuric Z, Angiletta CJ, Mitchell CM, Baugh ME, Davy KP, Neilson
AP. A Mediterranean diet does not alter plasma trimethylamine Noxide concentrations in
healthy adults at risk for colon cancer. Food Funct. 2019 Apr 1;10(4):2138-2147. Doi:
10.1039/c9fo00333a.
230. Bardou M, Barkun AN, Martel M. Obesity and colorectal cancer. Gut. 2013
Jun;62(6):933-47. Doi: 10.1136/gutjnl-2013-304701.
231. Greathouse KL, White JR, Padgett RN, Perrotta BG, Jenkins GD, Chia N, Chen
J. Gut microbiome meta-analysis reveals dysbiosis is independent of body mass index in
predicting risk of obesityassociated CRC. BMJ Open Gastroenterol. 2019 Feb
28;6(1):e000247. Doi: 10.1136/bmjgast-2018-000247.
232. Ma Y, Yang Y, Wang F, Zhang P, Shi C, Zou Y, Qin H. Obesity and Risk of
Colorectal Cancer: A Systematic Review of Prospective Studies. PLoS One.
2013;8(1):e53916. Doi: 10.1371/journal.pone.0053916.
233. Campisciano G, de Manzini N, Delbue S, Cason C, Cosola D, Basile G, Ferrante
P, Comar M, Palmisano S. The Obesity-Related Gut Bacterial and Viral Dysbiosis Can
Impact the Risk of Colon Cancer Development. Microorganisms. 2020 Mar 19;8(3):431.
Doi: 10.3390/microorganisms8030431.
234. Vannucci L, Stepankova R, Kozakova H, Fiserova A, Rossmann P, Tlaskalova-
Hogenova H. Colorectal carcinogenesis in germ-free and conventionally reared rats:
different intestinal environments affect the systemic immunity. Int J Oncol. 2008
Mar;32(3):609-17.

REFERENCES
~ 168 ~
235. Janney A, Powrie F, Mann EH. Host-microbiota maladaptation in colorectal
cancer. Nature. 2020 Sep;585(7826):509-517. Doi: 10.1038/s41586-020-2729-3.
236. Loke YL, Chew MT, Ngeow YF, Lim WWD, Peh SC. Colon Carcinogenesis: The
Interplay Between Diet and Gut Microbiota. Front Cell Infect Microbiol. 2020 Dec
8;10:603086. Doi: 10.3389/fcimb.2020.603086.
237. Lattimer JM, Haub MD. Effects of dietary fiber and its components on metabolic
health. Nutrients. 2010 Dec;2(12):1266-89. Doi: 10.3390/nu2121266.
238. Song M, Chan AT, Sun J. Influence of the Gut Microbiome, Diet, and
Environment on Risk of Colorectal Cancer. Gastroenterology. 2020 Jan;158(2):322-340.
Doi: 10.1053/j.gastro.2019.06.048.
239. Norat T et al. Meat, fish, and colorectal cancer risk: the European Prospective
Investigation into cancer and nutrition. J Natl Cancer Inst. 2005 Jun 15;97(12):906-16.
Doi: 10.1093/jnci/dji164.
240. Bingham SA et al. Dietary fibre in food and protection against colorectal cancer
in the European Prospective Investigation into Cancer and Nutrition (EPIC): an
observational study. Lancet. 2003 May 3;361(9368):1496-501. Doi: 10.1016/s0140-
6736(03)13174-1.
241. Hullings AG, Sinha R, Liao LM, Freedman ND, Graubard BI, Loftfield E. Whole
grain and dietary fiber intake and risk of colorectal cancer in the NIH-AARP Diet and
Health Study cohort. Am J Clin Nutr. 2020 Sep 1;112(3):603-612. Doi:
10.1093/ajcn/nqaa161.

REFERENCES
~ 169 ~
242. Baena R, Salinas P. Diet and colorectal cancer. Maturitas. 2015 Mar;80(3):258-
64. Doi: 10.1016/j.maturitas.2014.12.017.
243. Vernia F, Longo S, Stefanelli G, Viscido A, Latella G. Dietary Factors Modulating
Colorectal Carcinogenesis. Nutrients. 2021 Jan 3;13(1):143. Doi: 10.3390/nu13010143.
244. Chapkin RS, Navarro SL, Hullar MAJ, Lampe JW. Diet and Gut Microbes Act
Coordinately to Enhance Programmed Cell Death and Reduce Colorectal Cancer Risk.
Dig Dis Sci. 2020 Mar;65(3):840-851. Doi: 10.1007/s10620-020-06106-8.
245. Tu M, Wang W, Zhang G, Hammock BD. ω-3 Polyunsaturated Fatty Acids on
Colonic Inflammation and Colon Cancer: Roles of Lipid-Metabolizing Enzymes
Involved. Nutrients. 2020 Oct 28;12(11):3301. Doi: 10.3390/nu12113301.
246. Rose DP, Connolly JM. Omega-3 fatty acids as cancer chemopreventive agents.
Pharmacol Ther. 1999 Sep;83(3):217-44. Doi: 10.1016/s0163-7258(99)00026-1.
247. Aglago EK, Huybrechts I, Murphy N, Casagrande C, Nicolas G, Pischon T,
Fedirko V, Severi G, Boutron-Ruault MC, Fournier A, Katzke V, Kühn T, Olsen A,
Tjønneland A, Dahm CC, Overvad K, Lasheras C, Agudo A, Sánchez MJ, Amiano P,
Huerta JM, Ardanaz E, Perez-Cornago A, Trichopoulou A, Karakatsani A, Martimianaki
G, Palli D, Pala V, Tumino R, Naccarati A, Panico S, Bueno-de-Mesquita B, May A,
Derksen JWG, Hellstrand S, Ohlsson B, Wennberg M, Van Guelpen B, Skeie G, Brustad
M, Weiderpass E, Cross AJ, Ward H, Riboli E, Norat T, Chajes V, Gunter MJ.
Consumption of Fish and Long-chain n-3 Polyunsaturated Fatty Acids Is Associated With
Reduced Risk of Colorectal Cancer in a Large European Cohort. Clin Gastroenterol
Hepatol. 2020 Mar;18(3):654-666.e6. Doi: 10.1016/j.cgh.2019.06.031.

REFERENCES
~ 170 ~
248. Hull MA. Nutritional prevention of colorectal cancer. Proc Nutr Soc. 2020 Feb
5:1-6. Doi: 10.1017/S0029665120000051.
249. Miccadei S, Masella R, Mileo AM, Gessani S. ω3 Polyunsaturated Fatty Acids as
Immunomodulators in Colorectal Cancer: New Potential Role in Adjuvant Therapies.
Front Immunol. 2016 Nov 15;7:486. Doi: 10.3389/fimmu.2016.00486.
250. Volpato M, Hull MA. Omega-3 polyunsaturated fatty acids as adjuvant therapy of
colorectal cancer. Cancer Metastasis Rev. 2018 Sep;37(2-3):545-555. Doi:
10.1007/s10555-018-9744-y.
251. Costantini L, Molinari R, Farinon B, Merendino N. Impact of Omega-3 Fatty
Acids on the Gut Microbiota. Int J Mol Sci. 2017 Dec 7;18(12):2645. Doi:
10.3390/ijms18122645.
252. Watson H, Mitra S, Croden FC, Taylor M, Wood HM, Perry SL, Spencer JA,
Quirke P, Toogood GJ, Lawton CL, Dye L, Loadman PM, Hull MA. A randomised trial
of the effect of omega-3 polyunsaturated fatty acid supplements on the human intestinal
microbiota. Gut. 2018 Nov;67(11):1974-1983. Doi: 10.1136/gutjnl-2017-314968.
253. Cho Y, Turner ND, Davidson LA, Chapkin RS, Carroll RJ, Lupton JR. Colon
cancer cell apoptosis is induced by combined exposure to the n-3 fatty acid
docosahexaenoic acid and butyrate through promoter methylation. Exp Biol Med
(Maywood). 2014 Mar;239(3):302-10. Doi: 10.1177/1535370213514927.
254. Triff K, Kim E, Chapkin RS. Chemoprotective epigenetic mechanisms in a
colorectal cancer model: Modulation by n-3 PUFA in combination with fermentable fiber.
Curr Pharmacol Rep. 2015 Feb;1(1):11-20. Doi: 10.1007/s40495-014-0005-7.

REFERENCES
~ 171 ~
255. Piazzi G et al. Eicosapentaenoic acid free fatty acid prevents and suppresses
colonic neoplasia in colitis-associated colorectal cancer acting on Notch signaling and gut
microbiota. Int J Cancer. 2014 Nov 1;135(9):2004-13. Doi: 10.1002/ijc.28853. Epub
2014 Mar 28.
256. Notarnicola M, Tutino V, De Nunzio V, Dituri F, Caruso MG, Giannelli G.
Dietary ω-3 Polyunsaturated Fatty Acids Inhibit Tumor Growth in Transgenic Apc Min/+
Mice, Correlating with CB1 Receptor Up-Regulation. Int J Mol Sci. 2017 Feb
24;18(3):485. Doi: 10.3390/ijms18030485.
257. Fini L, Piazzi G, Ceccarelli C, Daoud Y, Belluzzi A, Munarini A, Graziani G,
Fogliano V, Selgrad M, Garcia M, Gasbarrini A, Genta RM, Boland CR, Ricciardiello L.
Highly purified eicosapentaenoic acid as free fatty acids strongly suppresses polyps in
Apc(Min/+) mice. Clin Cancer Res. 2010 Dec 1;16(23):5703-11. Doi: 10.1158/1078-
0432.CCR-10-1990.
258. Hawcroft G, Volpato M, Marston G, Ingram N, Perry SL, Cockbain AJ, Race AD,
Munarini A, Belluzzi A, Loadman PM, Coletta PL, Hull MA. The omega-3
polyunsaturated fatty acid eicosapentaenoic acid inhibits mouse MC-26 colorectal cancer
cell liver metastasis via inhibition of PGE2-dependent cell motility. Br J Pharmacol. 2012
Jul;166(5):1724-37. Doi: 10.1111/j.1476-5381.2012.01882.x.
259. Jeong S, Kim DY, Kang SH, Yun HK, Kim JL, Kim BR, Park SH, Na YJ, Jo MJ,
Jeong YA, Kim BG, Lee DH, Oh SC. Docosahexaenoic Acid Enhances Oxaliplatin-
Induced Autophagic Cell Death via the ER Stress/Sesn2 Pathway in Colorectal Cancer.
Cancers (Basel). 2019 Jul 14;11(7):982. Doi: 10.3390/cancers11070982.

REFERENCES
~ 172 ~
260. Irún P, Lanas A, Piazuelo E. Omega-3 Polyunsaturated Fatty Acids and Their
Bioactive Metabolites in Gastrointestinal Malignancies Related to Unresolved
Inflammation. Front Pharmacol. 2019 Aug 2;10:852. Doi: 10.3389/fphar.2019.00852.
261. Cha MC, Lin A, Meckling KA. Low dose docosahexaenoic acid protects normal
colonic epithelial cells from araC toxicity. BMC Pharmacol. 2005 Mar 23;5:7. Doi:
10.1186/1471-2210-5-7.
262. Xue H, Le Roy S, Sawyer MB, Field CJ, Dieleman LA, Baracos VE. Single and
combined supplementation of glutamine and n-3 polyunsaturated fatty acids on host
tolerance and tumour response to 7-ethyl-10-[4-(1-piperidino)-1-piperidino]carbonyloxy-
camptothecin (CPT-11)/5-FU chemotherapy in rats bearing Ward colon tumour. Br J
Nutr. 2009 Aug;102(3):434-42. Doi: 10.1017/S0007114508199482.
263. Rani I, Sharma B, Kumar S, Kaur S, Agnihotri N. Apoptosis mediated
chemosensitization of tumor cells to 5-fluorouracil on supplementation of fish oil in
experimental colon carcinoma. Tumour Biol. 2017 Mar;39(3):1010428317695019. Doi:
10.1177/1010428317695019.
264. Song M, Nishihara R, Wu K, Qian ZR, Kim SA, Sukawa Y, Mima K, Inamura K,
Masuda A, Yang J, Fuchs CS, Giovannucci EL, Ogino S, Chan AT. Marine ω-3
polyunsaturated fatty acids and risk of colorectal cancer according to microsatellite
instability. J Natl Cancer Inst. 2015 Mar 25;107(4):djv007. Doi: 10.1093/jnci/djv007.
265. Mileo AM, Nisticò P, Miccadei S. Polyphenols: Immunomodulatory and
Therapeutic Implication in Colorectal Cancer. Front Immunol. 2019 Apr 11;10:729. Doi:
10.3389/fimmu.2019.00729.

REFERENCES
~ 173 ~
266. Araújo JR, Gonçalves P, Martel F. Chemopreventive effect of dietary polyphenols
in colorectal cancer cell lines. Nutr Res. 2011 Feb;31(2):77-87. Doi:
10.1016/j.nutres.2011.01.006.
267. Lizarraga D, Vinardell MP, Noé V, van Delft JH, Alcarraz-Vizán G, van Breda
SG, Staal Y, Günther UL, Carrigan JB, Reed MA, Ciudad CJ, Torres JL, Cascante M. A
lyophilized red grape pomace containing proanthocyanidin-rich dietary fiber induces
genetic and metabolic alterations in colon mucosa of female C57BL/6J mice. J Nutr. 2011
Sep;141(9):1597-604. Doi: 10.3945/jn.110.133199.
268. Cueva C, Silva M, Pinillos I, Bartolomé B, Moreno-Arribas MV. Interplay
between Dietary Polyphenols and Oral and Gut Microbiota in the Development of
Colorectal Cancer. Nutrients. 2020 Feb 27;12(3):625. Doi: 10.3390/nu12030625.
269. Espín JC, González-Sarrías A, Tomás-Barberán FA. The gut microbiota: A key
factor in the therapeutic effects of (poly) phenols. Biochem Pharmacol. 2017 Sep
1;139:82-93. Doi: 10.1016/j.bcp.2017.04.033.
270. Ding S, Xu S, Fang J, Jiang H. The Protective Effect of Polyphenols for Colorectal
Cancer. Front Immunol. 2020 Jul 10;11:1407. Doi: 10.3389/fimmu.2020.01407.
271. Tomás-Barberán FA, Selma MV, Espín JC. Interactions of gut microbiota with
dietary polyphenols and consequences to human health. Curr Opin Clin Nutr Metab Care.
2016 Nov;19(6):471-476. Doi: 10.1097/MCO.0000000000000314.
272. Serra G, Incani A, Serreli G, Porru L, Melis MP, Tuberoso CIG, Rossin D, Biasi
F, Deiana M. Olive oil polyphenols reduce oxysterols -induced redox imbalance and pro-
inflammatory response in intestinal cells. Redox Biol. 2018 Jul;17:348-354. Doi:
10.1016/j.redox.2018.05.006.

REFERENCES
~ 174 ~
273. Lee Y, Sung B, Kang YJ, Kim DH, Jang JY, Hwang SY, Kim M, Lim HS, Yoon
JH, Chung HY, Kim ND. Apigenin-induced apoptosis is enhanced by inhibition of
autophagy formation in HCT116 human colon cancer cells. Int J Oncol. 2014
May;44(5):1599-606. Doi: 10.3892/ijo.2014.2339.
274. Shan S, Lu Y, Zhang X, Shi J, Li H, Li Z. Inhibitory efect of bound polyphenol
from foxtail millet bran on miR‑149 methylation increases the chemosensitivity of human
colorectal cancer HCT‑8/Fu cells. Mol Cell Biochem. 2021 Feb;476(2):513-523. Doi:
10.1007/s11010-020-03906-4.
275. Sauer R, Becker H, Hohenberger W, Rödel C, Wittekind C, Fietkau R, Martus P,
Tschmelitsch J, Hager E, Hess CF, Karstens JH, Liersch T, Schmidberger H, Raab R;
German Rectal Cancer Study Group. Preoperative versus postoperative
chemoradiotherapy for rectal cancer. N Engl J Med. 2004 Oct 21;351(17):1731-40. Doi:
10.1056/NEJMoa040694.
276. Ma B, Gao P, Wang H, Xu Q, Song Y, Huang X, Sun J, Zhao J, Luo J, Sun Y,
Wang Z. What has preoperative radio(chemo)therapy brought to localized rectal cancer
patients in terms of perioperative and long-term outcomes over the past decades? A
systematic review and meta-analysis based on 41,121 patients.Int J Cancer. 2017 Sep
1;141(5):1052-1065. Doi: 10.1002/ijc.30805.
277. Pouncey AL, Scott AJ, Alexander JL, Marchesi J, Kinross J. Gut microbiota,
chemotherapy and the host: the influence of the gut microbiota on cancer treatment.
Ecancermedicalscience. 2018 Sep 5;12:868. Doi: 10.3332/ecancer.2018.868.
278. Iida N, Dzutsev A, Stewart CA, Smith L, Bouladoux N, Weingarten RA, Molina
DA, Salcedo R, Back T, Cramer S, Dai RM, Kiu H, Cardone M, Naik S, Patri AK, Wang

REFERENCES
~ 175 ~
E, Marincola FM, Frank KM, Belkaid Y, Trinchieri G, Goldszmid RS. Commensal
bacteria control cancer response to therapy by modulating the tumor microenvironment.
Science. 2013 Nov 22;342(6161):967-70. Doi: 10.1126/science.1240527.
279. Haiser HJ, Gootenberg DB, Chatman K, Sirasani G, Balskus EP, Turnbaugh PJ.
Predicting and manipulating cardiac drug inactivation by the human gut bacterium
Eggerthella lenta. Science. 2013 Jul 19;341(6143):295-8. Doi: 10.1126/science.1235872.
280. McQuade JL, Daniel CR, Helmink BA, Wargo JA. Modulating the microbiome
to improve therapeutic response in cancer. Lancet Oncol. 2019 Feb;20(2):e77-e91. Doi:
10.1016/S1470-2045(18)30952-5.
281. Roy S, Trinchieri G. Microbiota: a key orchestrator of cancer therapy. Nat Rev
Cancer. 2017 May;17(5):271-285. Doi: 10.1038/nrc.2017.13.
282. Alexander JL, Wilson ID, Teare J, Marchesi JR, Nicholson JK, Kinross JM. Gut
microbiota modulation of chemotherapy efficacy and toxicity. Nat Rev Gastroenterol
Hepatol. 2017 Jun;14(6):356-365. Doi: 10.1038/nrgastro.2017.20.
283. Yuan L, Zhang S, Li H, Yang F, Mushtaq N, Ullah S, Shi Y, An C, Xu J. The
influence of gut microbiota dysbiosis to the efficacy of 5-Fluorouracil treatment on
colorectal cancer. Biomed Pharmacother. 2018 Dec;108:184-193. Doi:
10.1016/j.biopha.2018.08.165.
284. Abdel-Rahman O, Ghosh S, Walker J. Outcomes of metastatic colorectal cancer
patients in relationship to prior and concurrent antibiotics use; individual patient data
analysis of three clinical trials. Clin Transl Oncol. 2020 Sep;22(9):1651-1656. Doi:
10.1007/s12094-020-02301-1.

REFERENCES
~ 176 ~
285. Parida S, Sharma D. The power of small changes: Comprehensive analyses of
microbial dysbiosis in breast cancer. Biochim Biophys Acta Rev Cancer. 2019
Apr;1871(2):392-405. Doi: 10.1016/j.bbcan.2019.04.001.
286. Chang CW, Liu CY, Lee HC, Huang YH, Li LH, Chiau JC, Wang TE, Chu CH,
Shih SC, Tsai TH, Chen YJ. Lactobacillus casei Variety rhamnosus Probiotic
Preventively Attenuates 5-Fluorouracil/Oxaliplatin-Induced Intestinal Injury in a
Syngeneic Colorectal Cancer Model. Front Microbiol. 2018 May 15;9:983. Doi:
10.3389/fmicb.2018.00983.
287. Routy B et al. Gut microbiome influences efficacy of PD-1-based immunotherapy
against epithelial tumors. Science. 2018 Jan 5;359(6371):91-97. Doi:
10.1126/science.aan3706.
288. Packey CD, Ciorba MA. Microbial influences on the small intestinal response to
radiation injury. Curr Opin Gastroenterol. 2010 Mar;26(2):88-94. Doi:
10.1097/MOG.0b013e3283361927.
289. Koppel N, Maini Rekdal V, Balskus EP. Chemical transformation of xenobiotics
by the human gut microbiota. Science. 2017 Jun 23;356(6344):eaag2770. Doi:
10.1126/science.aag2770.
290. Mandard AM, Dalibard F, Mandard JC, et al. Pathologic assessment of tumor
regression after preoperative chemoradiotherapy of esophageal arcinoma.
Clinicopathologic correlations. Cancer 1994; 73: 2680-2686
291. Human Microbiome Project Consortium. Structure, function and diversity of the
healthy human microbiome. Nature. 2012 Jun 13;486(7402):207-14. Doi:
10.1038/nature11234.

REFERENCES
~ 177 ~
292. Qin J et al. A human gut microbial gene catalogue established by metagenomic
sequencing. Nature. 2010 Mar 4;464(7285):59-65. Doi: 10.1038/nature08821.
293. Garrett WS. Cancer and the microbiota. Science. 2015 Apr 3;348(6230):80-6.
Doi: 10.1126/science.aaa4972.
294. Drewes JL, Housseau F, Sears CL. Sporadic colorectal cancer: microbial
contributors to disease prevention, development and therapy. Br J Cancer. 2016 Jul
26;115(3):273-80. Doi: 10.1038/bjc.2016.189.
295. Taghinezhad-S S, Mohseni AH, Fu X. Intervention on gut microbiota may change
the strategy for management of colorectal cancer. J Gastroenterol Hepatol. 2020 Dec 8.
Doi: 10.1111/jgh.15369.
296. Gopalakrishnan V et al. Gut microbiome modulates response to anti-PD-1
immunotherapy in melanoma patients. Science. 2018 Jan 5;359(6371):97-103. Doi:
10.1126/science.aan4236.
297. Heshiki Y, Vazquez-Uribe R, Li J, Ni Y, Quainoo S, Imamovic L, Li J, Sørensen
M, Chow BKC, Weiss GJ, Xu A, Sommer MOA, Panagiotou G. Predictable modulation
of cancer treatment outcomes by the gut microbiota. Microbiome. 2020 Mar 5;8(1):28.
Doi: 10.1186/s40168-020-00811-2.
298. Gao Z, Guo B, Gao R, Zhu Q, Qin H. Microbiota disbiosis is associated with
colorectal cancer. Front Microbiol. 2015 Feb 2;6:20. Doi: 10.3389/fmicb.2015.00020.
299. Feng Q, Liang S, Jia H, Stadlmayr A, Tang L, Lan Z, Zhang D, Xia H, Xu X, Jie
Z, Su L, Li X, Li X, Li J, Xiao L, Huber-Schönauer U, Niederseer D, Xu X, Al-Aama JY,
Yang H, Wang J, Kristiansen K, Arumugam M, Tilg H, Datz C, Wang J. Gut microbiome

REFERENCES
~ 178 ~
development along the colorectal adenoma-carcinoma sequence. Nat Commun. 2015 Mar
11;6:6528. Doi: 10.1038/ncomms7528.
300. Bruno ME, Rogier EW, Frantz AL, Stefka AT, Thompson SN, Kaetzel CS.
Regulation of the polymeric immunoglobulin receptor in intestinal epithelial cells by
Enterobacteriaceae: implications for mucosal homeostasis. Immunol Invest. 2010;39(4-
5):356-82. Doi: 10.3109/08820131003622809.
301. Barrea L, Annunziata G, Muscogiuri G, Di Somma C, Laudisio D, Maisto M, de
Alteriis G, Tenore GC, Colao A, Savastano S. Trimethylamine-N-oxide (TMAO) as
Novel Potential Biomarker of Early Predictors of Metabolic Syndrome. Nutrients. 2018
Dec 13;10(12):1971. Doi: 10.3390/nu10121971.
302. Koeth RA, Wang Z, Levison BS, Buffa JA, Org E, Sheehy BT, Britt EB, Fu X,
Wu Y, Li L, Smith JD, DiDonato JA, Chen J, Li H, Wu GD, Lewis JD, Warrier M, Brown
JM, Krauss RM, Tang WH, Bushman FD, Lusis AJ, Hazen SL. Intestinal microbiota
metabolism of L-carnitine, a nutrient in red meat, promotes atherosclerosis. Nat Med.
2013 May;19(5):576-85. Doi: 10.1038/nm.3145.
303. Craciun S, Balskus EP. Microbial conversion of choline to trimethylamine
requires a glycyl radical enzyme. Proc Natl Acad Sci USA. 2012 Dec 26;109(52):21307-
12. Doi: 10.1073/pnas.1215689109.
304. Zhu Y, Jameson E, Crosatti M, Schäfer H, Rajakumar K, Bugg TD, Chen Y. Proc
Natl Acad Sci USA. 2014 Mar 18;111(11):4268-73. Doi: 10.1073/pnas.1316569111.
305. Wu WK, Chen CC, Liu PY, Panyod S, Liao BY, Chen PC, Kao HL, Kuo HC, Kuo
CH, Chiu THT, Chen RA, Chuang HL, Huang YT, Zou HB, Hsu CC, Chang TY, Lin CL,
Ho CT, Yu HT, Sheen LY, Wu MS. Identification of TMAO-producer phenotype and

REFERENCES
~ 179 ~
host-diet-gut dysbiosis by carnitine challenge test in human and germ-free mice. Gut.
2019 Aug;68(8):1439-1449. Doi: 10.1136/gutjnl-2018-317155.
306. Xu R, Wang Q, Li L. A genome-wide systems analysis reveals strong link between
colorectal cancer and trimethylamine N-oxide (TMAO), a gut microbial metabolite of
dietary meat and fat. BMC Genomics. 2015;16 Suppl 7(Suppl 7):S4. Doi: 10.1186/1471-
2164-16-S7.
307. Ufnal M, Pham K. The gut-blood barrier permeability - A new marker in
cardiovascular and metabolic diseases? Med Hypotheses. 2017 Jan;98:35-37. Doi:
10.1016/j.mehy.2016.11.012.
308. Su T, Liu R, Lee A, Long Y, Du L, Lai S, Chen X, Wang L, Si J, Owyang C, Chen
S. Altered Intestinal Microbiota with Increased Abundance of Prevotella Is Associated
with High Risk of Diarrhea-Predominant Irritable Bowel Syndrome. Gastroenterol Res
Pract. 2018 Jun 5;2018:6961783. Doi: 10.1155/2018/6961783.
309. Wu D, Cao M, Peng J, Li N, Yi S, Song L, Wang X, Zhang M, Zhao J. The effect
of trimethylamine N-oxide on Helicobacter pylori-induced changes of
immunoinflammatory genes expression in gastric epithelial cells. Int Immunopharmacol.
2017 Feb;43:172-178. Doi: 10.1016/j.intimp.2016.11.032.
310. Kumari N, Dwarakanath BS, Das A, Bhatt AN.Role of interleukin-6 in cancer
progression and therapeutic resistance. Tumour Biol. 2016 Sep;37(9):11553-11572. Doi:
10.1007/s13277-016-5098-7.
311. He Q, Fu Y, Tian D, Yan W. The contrasting roles of inflammasomes in cancer.
Am J Cancer Res. 2018 Apr 1;8(4):566-583.

REFERENCES
~ 180 ~
312. Andoh A, Nishida A, Takahashi K, Inatomi O, Imaeda H, Bamba S, Kito K,
Sugimoto M, Kobayashi T. Comparison of the gut microbial community between obese
and lean peoples using 16S gene sequencing in a Japanese population. J Clin Biochem
Nutr. 2016 Jul;59(1):65-70. Doi: 10.3164/jcbn.15-152.
313. Sun CH, Li BB, Wang B, Zhao J, Zhang XY, Li TT, Li WB, Tang D, Qiu MJ,
Wang XC, Zhu CM, Qian ZR. The role of Fusobacterium nucleatum in colorectal cancer:
from carcinogenesis to clinical management. Chronic Dis Transl Med. 2019 Oct
1;5(3):178-187. Doi: 10.1016/j.cdtm.2019.09.001.
314. Yang Z, Ji G. Fusobacterium nucleatum-positive colorectal cancer. Oncol Lett.
2019 Aug;18(2):975-982. Doi: 10.3892/ol.2019.10433.
315. Murff HJ, Shu XO, Li H, Dai Q, Kallianpur A, Yang G, Cai H, Wen W, Gao YT,
Zheng W. A prospective study of dietary polyunsaturated fatty acids and colorectal cancer
risk in Chinese women. Cancer Epidemiol Biomarkers Prev. 2009 Aug;18(8):2283-91.
doi: 10.1158/1055-9965.EPI-08-1196.
316. Kaler P, Augenlicht L, Klampfer L. Macrophage-derived IL-1beta stimulates Wnt
signaling and growth of colon cancer cells: a crosstalk interrupted by vitamin D3.
Oncogene. 2009 Nov 5;28(44):3892-902. Doi: 10.1038/onc.2009.247.
317. Mager LF, Wasmer MH, Rau TT, Krebs P. Cytokine-Induced Modulation of
Colorectal Cancer. Front Oncol. 2016 Apr 19;6:96. Doi: 10.3389/fonc.2016.00096.
318. Hue S, Ahern P, Buonocore S, Kullberg MC, Cua DJ, McKenzie BS, Powrie F,
Maloy KJ. Interleukin-23 drives innate and T cell-mediated intestinal inflammation. J
Exp Med. 2006 Oct 30;203(11):2473-83. Doi: 10.1084/jem.20061099.

REFERENCES
~ 181 ~
319. O'Keefe SJ. Diet, microorganisms and their metabolites, and colon cancer. Nat
Rev Gastroenterol Hepatol. 2016 Dec;13(12):691-706. Doi: 10.1038/nrgastro.2016.165.
320. Parada Venegas D, De la Fuente MK, Landskron G, González MJ, Quera R,
Dijkstra G, Harmsen HJM, Faber KN, Hermoso MA. Short Chain Fatty Acids (SCFAs)-
Mediated Gut Epithelial and Immune Regulation and Its Relevance for Inflammatory
Bowel Diseases. Front Immunol. 2019 Mar 11;10:277. Doi: 10.3389/fimmu.2019.00277.
321. Hagland HR, Søreide K. Cellular metabolism in colorectal carcinogenesis:
Influence of lifestyle, gut microbiome and metabolic pathways. Cancer Lett. 2015 Jan
28;356(2 Pt A):273-80. Doi: 10.1016/j.canlet.2014.02.026.
322. Nguyen LH et al. Association Between Sulfur-Metabolizing Bacterial
Communities in Stool and Risk of Distal Colorectal Cancer in Men. Gastroenterology.
2020 Apr;158(5):1313-1325. Doi: 10.1053/j.gastro.2019.12.029.
323. Ijssennagger N, van der Meer R, van Mil SWC. Sulfide as a Mucus Barrier-
Breaker in Inflammatory Bowel Disease? Trends Mol Med. 2016 Mar;22(3):190-199.
Doi: 10.1016/j.molmed.2016.01.002.
324. Brix S, Eriksen C, Larsen JM, Bisgaard H. Metagenomic heterogeneity explains
dual immune effects of endotoxins. J Allergy Clin Immunol. 2015 Jan;135(1):277-80.
Doi: 10.1016/j.jaci.2014.09.036.
325. Yan X, Liu L, Li H, Qin H, Sun Z. Clinical significance of Fusobacterium
nucleatum, epithelial-mesenchymal transition, and cancer stem cell markers in stage
III/IV colorectal cancer patients. Onco Targets Ther. 2017 Oct 17;10:5031-5046. Doi:
10.2147/OTT.S145949.

REFERENCES
~ 182 ~
326. Gevers D et al. The treatment-naive microbiome in new-onset Crohn's disease.
Cell Host Microbe. 2014 Mar 12;15(3):382-392. Doi: 10.1016/j.chom.2014.02.005.
327. Wu N et al. Dysbiosis signature of fecal microbiota in colorectal cancer patients.
Microb Ecol. 2013 Aug;66(2):462-70. Doi: 10.1007/s00248-013-0245-9.
328. Bao Y, Tang J, Qian Y, Sun T, Chen H, Chen Z, Sun D, Zhong M, Chen H, Hong
J, Chen Y, Fang JY. Long noncoding RNA BFAL1 mediates enterotoxigenic Bacteroides
fragilis-related carcinogenesis in colorectal cancer via the RHEB/mTOR pathway. Cell
Death Dis. 2019 Sep 12;10(9):675. Doi: 10.1038/s41419-019-1925-2.
329. Hsu RY, Chan CH, Spicer JD, Rousseau MC, Giannias B, Rousseau S, Ferri LE.
LPS-induced TLR4 signaling in human colorectal cancer cells increases beta1 integrin-
mediated cell adhesion and liver metastasis. Cancer Res. 2011 Mar 1;71(5):1989-98. Doi:
10.1158/0008-5472.CAN-10-2833.
330. Murff HJ, Shu XO, Li H, Dai Q, Kallianpur A, Yang G, Cai H, Wen W, Gao YT,
Zheng W. A prospective study of dietary polyunsaturated fatty acids and colorectal cancer
risk in Chinese women. Cancer Epidemiol Biomarkers Prev. 2009 Aug;18(8):2283-91.
Doi: 10.1158/1055-9965.EPI-08-1196.
331. Wang D, Mann JR, DuBois RN. The role of prostaglandins and other eicosanoids
in the gastrointestinal tract. Gastroenterology. 2005 May;128(5):1445-61. Doi:
10.1053/j.gastro.2004.09.080.
332. Bansal A, Simon MC. Glutathione metabolism in cancer progression and
treatment resistance. J Cell Biol. 2018 Jul 2;217(7):2291-2298. Doi:
10.1083/jcb.201804161.

REFERENCES
~ 183 ~
333. Lu S.C. Regulation of glutathione synthesis. Mol Aspects Med. 2009, 30(1-2), 42-
59. Doi: 10.1016/j.mam.2008.05.005.
334. Coffelt SB, Wellenstein MD, de Visser KE. Neutrophils in cancer: neutral no
more. Nat Rev Cancer. 2016 Jul;16(7):431-46. Doi: 10.1038/nrc.2016.52.
335. Thomas AM, Manghi P, Asnicar F, Pasolli E, Armanini F, Zolfo M, Beghini F,
Manara S, et al. Metagenomic analysis of colorectal cancer datasets identifies cross-
cohort microbial diagnostic signatures and a link with choline degradation. Nat Med.
2019 Apr;25(4):667-678. Doi: 10.1038/s41591-019-0405-7.
336. Noack J, Dongowski G, Hartmann L, Blaut M. The human gut bacteria
Bacteroides thetaiotaomicron and Fusobacterium varium produce putrescine and
spermidine in cecum of pectin-fed gnotobiotic rats. J Nutr. 2000 May;130(5):1225-31.
Doi: 10.1093/jn/130.5.1225.
337. Goodwin AC, Destefano Shields CE, Wu S, Huso DL, Wu X, Murray-Stewart
TR, Hacker-Prietz A, Rabizadeh S, Woster PM, Sears CL, Casero RA Jr. Polyamine
catabolism contributes to enterotoxigenic Bacteroides fragilis-induced colon
tumorigenesis. Proc Natl Acad Sci USA. 2011 Sep 13;108(37):15354-9. Doi:
10.1073/pnas.1010203108.
338. Johnson CH, Dejea CM, Edler D, Hoang LT, Santidrian AF, Felding BH,
Ivanisevic J, Cho K, Wick EC, Hechenbleikner EM, Uritboonthai W, Goetz L, Casero
RA Jr, Pardoll DM, White JR, Patti GJ, Sears CL, Siuzdak G. Metabolism links bacterial
biofilms and colon carcinogenesis. Cell Metab. 2015 Jun 2;21(6):891-7. Doi:
10.1016/j.cmet.2015.04.011.

REFERENCES
~ 184 ~
339. Mendez R, Kesh K, Arora N, Di Martino L, McAllister F, Merchant N, Banerjee
S, Banerjee S. Microbial dysbiosis and polyamine metabolism as predictive markers for
early detection of pancreatic cancer. Carcinogenesis. 2020 Jul 10;41(5):561-570. Doi:
10.1093/carcin/bgz116.
340. Arruabarrena-Aristorena A, Zabala-Letona A, Carracedo A. Oil for the cancer
engine: The cross-talk between oncogenic signaling and polyamine metabolism. Sci Adv.
2018 Jan 24;4(1):eaar2606. Doi: 10.1126/sciadv.aar2606.
341. Bhat MI, Kapila R. Dietary metabolites derived from gut microbiota: critical
modulators of epigenetic changes in mammals. Nutr Rev. 2017 May 1;75(5):374-389.
Doi: 10.1093/nutrit/nux001.
342. Jahani-Sherafat S, Alebouyeh M, Moghim S, Ahmadi Amoli H, Ghasemian-
Safaei H. Role of gut microbiota in the pathogenesis of colorectal cancer; a review article.
Gastroenterol Hepatol Bed Bench. 2018 Spring;11(2):101-109.
343. Sokol H, Seksik P, Furet JP, Firmesse O, Nion-Larmurier I, Beaugerie L, Cosnes
J, Corthier G, Marteau P, Doré J. Low counts of Faecalibacterium prausnitzii in colitis
microbiota. Inflamm Bowel Dis. 2009 Aug;15(8):1183-9. Doi: 10.1002/ibd.20903.
344. Lopez-Siles M, Martinez-Medina M, Abellà C, Busquets D, Sabat-Mir M, Duncan
SH, Aldeguer X, Flint HJ, Garcia-Gil LJ. Mucosa-associated Faecalibacterium prausnitzii
phylotype richness is reduced in patients with inflammatory bowel disease. Appl Environ
Microbiol. 2015 Nov;81(21):7582-92. Doi: 10.1128/AEM.02006-15.
345. Rios-Covian D, Gueimonde M, Duncan SH, Flint HJ, de los Reyes-Gavilan CG.
Enhanced butyrate formation by cross-feeding between Faecalibacterium prausnitzii and

REFERENCES
~ 185 ~
Bifidobacterium adolescentis. FEMS Microbiol Lett. 2015 Nov;362(21):fnv176. Doi:
10.1093/femsle/fnv176.
346. Guinane CM, Cotter PD. Role of the gut microbiota in health and chronic
gastrointestinal disease: understanding a hidden metabolic organ. Therap Adv
Gastroenterol. 2013;6:295–308. Doi: 10.1177/1756283X13482996.
347. Van Immerseel F, De Buck J, Boyen F, Bohez L, Pasmans F, Volf J, Sevcik M,
Rychlik I, Haesebrouck F, Ducatelle R. Medium-chain fatty acids decrease colonization
and invasion through hilA suppression shortly after infection of chickens with Salmonella
enterica serovar Enteritidis. Appl Environ Microbiol. 2004, 70(6), 3582-3587. Doi:
10.1128/AEM.70.6.3582-3587.2004.
348. Sturgeon C, Fasano A. Zonulin, a regulator of epithelial and endothelial barrier
functions, and its involvement in chronic inflammatory diseases. Tissue Barriers. 2016
Oct 21;4(4):e1251384. Doi: 10.1080/21688370.2016.1251384.
349. Wright DP, Rosendale DI, Robertson AM. Prevotella enzymes involved in mucin
oligosaccharide degradation and evidence for a small operon of genes expressed during
growth on mucin. FEMS Microbiol Lett. 2000 Sep 1;190(1):73-9.

RESUMEN (ESPAÑOL)
RESUMEN (ESPAÑOL)

RESUMEN
~ 187 ~
PAPEL DE LA COMPOSICIÓN DE LA MICROBIOTA INTESTINAL EN EL
CÁNCER COLORRECTAL Y EN LA RESPUESTA A LA
RADIOQUIMIOTERAPIA NEOADYUVANTE PREVIA A CIRUGÍA
Vivimos en una era en la que el acceso a la atención médica, el diagnóstico y el
tratamiento de las enfermedades ha mejorado, lo que ha tenido un impacto en la esperanza
de vida media en la mayoría de las regiones del mundo. Como resultado de estas mejoras
médicas, la mortalidad asociada a enfermedades ha disminuido de manera general, sin
embargo, la mortalidad asociada a la patología del cáncer ha aumentado en las últimas
décadas. Según los últimos datos analizados por la Organización Mundial de la Salud
(OMS), el cáncer es la segunda causa de muerte en el mundo, se estima que en 2018 esta
enfermedad provocó 9,6 millones de muerte, siendo responsable de una de cada seis
muertes en el mundo.
El cáncer colorrectal (CRC, del inglés “colorectal cancer”) es en la actualidad el segundo
tipo de cáncer que mayor número de muertes causa al año a nivel mundial, con una mayor
incidencia en los países industrializados, ya que el riesgo de desarrollar CRC, además de
estar relacionado con la heredabilidad genética y con la edad, se asocia con una gran
variedad de factores ambientales que incluyen factores culturales y sociales. El estilo de
vida de los países occidentales ha contribuido sustancialmente al aumento de la tasa de
CRC en las dos últimas décadas. Los factores que influyen en el estilo de vida incluyen
el consumo de alcohol, el tabaquismo, el estilo de vida sedentaria, la dieta y la obesidad.
Así, diversos estudios, han demostrado que la microbiota intestinal es otro factor
ambiental crítico que contribuye al desarrollo y a la progresión del CRC, potencialmente
a través de una respuesta inflamatoria, de los niveles de algunos metabolitos producidos
por las bacterias y de la interferencia con el equilibrio energético de las células

RESUMEN
~ 188 ~
cancerosas. Además, el CRC se ha asociado con una disbiosis en la composición
microbiana asociada al tumor y a la mucosa adyacente.
La obesidad está reconocida como un factor que influye sobre diferentes enfermedades,
entre las que se encuentran varios tipos de cánceres y enfermedades crónicas. La obesidad
está considerada un factor de riesgo muy importante en el CRC, hasta tal punto que el
14% de los casos de CRC se atribuyen al sobrepeso o a la obesidad. La existencia de una
relación entre la obesidad y el CRC ha sido ampliamente observada, tanto en estudios
epidemiológicos como en estudios con modelos animales. Aunque los mecanismos
subyacentes a esta relación no han sido desenmarañados completamente, son los procesos
inflamatorios los que han ganado atención con respecto a esta asociación. La obesidad
existe vinculada a un estado inflamatorio de bajo grado y el proceso de carcinogénesis se
ve favorecido por la inflamación, es por ello que la obesidad aumenta el riesgo de padecer
CRC. Si se indaga más en el proceso inflamatorio, ya sea inducido o potenciado por la
obesidad, encontramos que la inflamación está causada en gran parte por un aumento en
la infiltración de los macrófagos en el tejido adiposo, lo que induce la secreción de
citocinas inflamatorias, como IL-6, TNF-α y MCP-1. Estas citocinas también han sido
relacionadas con el desarrollo del CRC. Hay estudios que nos ayudan a comprender estas
relaciones, como el caso de un estudio reciente realizado con ratones a los que se les
implantaron tumores MC38 subcutáneamente, donde la obesidad inducida por una dieta
alta en grasa fue asociada con un mayor desarrollo de tumores, además del aumento de la
adiposidad local, una mayor concentración de macrófagos en el tejido y un aumento de
la inflamación. La obesidad influye sobre el organismo a distintos niveles, en el intestino
es capaz de inducir alteraciones en la barrera de la mucosa intestinal, esta modificación
provoca un aumento de la permeabilidad intestinal y como consecuencia se produce un
incremento de la endotoxemia metabólica, la cual actúa de manera conjunta con la

RESUMEN
~ 189 ~
inflamación existente en el tejido adiposo potenciando la producción de citocinas
inflamatorias, de esta forma la inflamación resultante podría favorecer la carcinogénesis.
A nivel intestinal la inflamación está muy unida a la composición de la microbiota
intestinal, la cual también ha sido vinculada con la obesidad y con el CRC. La microbiota
intestinal puede inducir la inflamación, la alteración en la permeabilidad intestinal, la
toxicidad bacteriana y puede potenciar al sistema inmunológico, siendo todo esto causas
posibles del desarrollo de la carcinogénesis. Además, estos efectos causados por la
microbiota intestinal se ven potenciados en caso de disbiosis, que está asociada con la
obesidad. Por tanto, a la vista de las relaciones conocidas, obesidad con CRC, obesidad
con microbiota intestinal y CRC con microbiota intestinal, se nos plantea la existencia de
una red de interacciones que asocia a los tres factores: CRC, obesidad y microbiota
intestinal. Esta triple relación ha sido asumida como un mayor riesgo de padecer cáncer
provocado por los cambios fisiológicos derivados de la obesidad asociada a una disbiosis
intestinal.
El N-óxido de trimetilamina (TMAO) es un metabolito derivado del metabolismo de las
bacterias, su origen se encuentra en la acción de la microbiota intestinal sobre la colina y
la L-carnitina de la dieta, que están contenidos en las carnes rojas y otros alimentos de
origen animal. Los niveles plasmáticos de TMAO han sido asociados con un mayor riesgo
de padecer CRC, obesidad, enfermedades cardiovasculares y diabetes. Los niveles
plasmáticos de TMAO parecen estar relacionados tanto con el riesgo de desarrollar CRC
como con un pronóstico desfavorable de su evolución. Se sabe que TMAO participa en
la inducción de citocinas inflamatorias, como IL-6 y TNF-α, lo que propone a la
inflamación como vínculo entre TMAO y el CRC. Y, por tanto, TMAO podría ser un
indicador intermediario de la relación entre la microbiota intestinal y el CRC.

RESUMEN
~ 190 ~
Por otra parte, hoy en día la radioquimioterapia neoadyuvante seguida de cirugía se ha
convertido en un procedimiento estándar en el tratamiento de pacientes con CRC. Son
varios los estudios que han sugerido que la disbiosis intestinal puede influir en la
respuesta del cuerpo a una variedad de terapias contra el cáncer, que incluyen
radioterapia, quimioterapia e inmunoterapia. Estudios recientes han señalado a la
microbiota intestinal como un factor capaz de influir en la respuesta farmacológica y en
la toxicidad de los pacientes con CRC sometidos a tratamiento a través de mecanismos
clave, como la translocación, la inmunomodulación, el metabolismo, la reducción de la
diversidad y la variación ecológica. Hasta el momento, se ha demostrado que
aproximadamente cuarenta fármacos quimioterapéuticos son metabolizados por la
microbiota intestinal. Además, se han identificado bacterias intestinales específicas
capaces de modificar la efectividad de los tratamientos contra el cáncer a través del
metabolismo directo de los fármacos y/o la modulación de la respuesta inmune del
hospedador, como especies de Bifidobacterium, Lactobacillus y Streptococcus que
alivian la diarrea y la toxicidad inducida por la quimioterapia basada en irinotecán en
pacientes con CRC, Lactobacillus rhamnosus que tiene un efecto sinérgico con la
aplicación de radioterapia en las actividades antiproliferativas y antiinflamatorias o
Veillonella dispar y el género Sutterella asociados a la quimiorresistencia. Y se sabe que
varios filos bacterianos median en el metabolismo de los fármacos a través de reacciones
como degradación proteolítica, la escisión de isoxazol, la desnitrificación, la
desconjugación, la acetilación/desacetilación, la formación y/o hidrólisis de aminas, así
como por adherencia física a los fármacos. Scott y cols. describieron la influencia de la
microbiota intestinal en la eficacia de las fluoropirimidinas (uno de los tratamientos de
primera línea para el CRC) a través de una interconversión del fármaco que involucra la
vitamina B6 y B9 bacteriana y el metabolismo de los ribonucleótidos. También se ha visto

RESUMEN
~ 191 ~
que el efecto letal del 5-fluorouracilo sobre las células de CRC puede ser incrementado
bajo la influencia de los metabolitos de la microbiota intestinal. En concreto se ha
señalado el papel de Fusobacterium nucleatum, el cual es capaz de promover la
resistencia del CRC frente a la quimioterapia mediante vías de señalización de la
inmunidad innata a través de TLR-4, MYD88 y de microARNs específicos capaces de
activar la vía de la autofagia, alterando la respuesta quimioterapéutica en el CRC. Además
de la acción de las bacterias sobre los fármacos, la radiación provoca alteraciones en la
composición de la microbiota intestinal. Recientemente se ha evaluado la composición
de la microbiota fecal de ratones que habían sido sometidos a radiación y se vio que la
radiación inducía alteraciones significativas en la composición microbiana del tracto
intestinal a nivel de género. Por lo tanto, aunque se conoce la influencia de la microbiota
intestinal en la regulación de la respuesta del hospedador a la radioterapia, los
mecanismos implicados no están totalmente determinados. No obstante, ha sido sugerido
que si la radioterapia ejerce respuestas antitumorales que están mediadas por la respuesta
inmune, la microbiota intestinal podría jugar un papel importante en el efecto
inmunogénico de dicha radioterapia.
Por otro lado, las bacterias producen metabolitos microbianos que pueden modificar la
proliferación de las células cancerosas y la respuesta a la quimioterapia, como se ha visto
en un estudio de cáncer de mama. Ross y cols. vincularon al butirato y al propionato (dos
ácidos grasos de cadena corta derivados del metabolismo bacteriano) con una respuesta
patológica completa a la quimioterapia neoadyuvante en mujeres con cáncer de mama en
estadio temprano. De estos ácidos grasos de cadena corta se sabe que pueden inducir
disfunción en la barrera epitelial intestinal, activando mediadores inflamatorios como las
citocinas IL-6 y TNF-α que dañan las células epiteliales y sus uniones. Otro tipo de
metabolito derivado de las bacterias son las poliaminas, entre ellas la espermina, la

RESUMEN
~ 192 ~
espermidina y la putrescina, que han sido implicadas en casi todos los pasos de la
carcinogénesis colorrectal. Las poliaminas son moléculas indispensables en el
crecimiento celular normal, en la expresión génica y son necesarias en la proliferación
celular, pero sus concentraciones van en aumento durante la transición de una célula sana
a una célula tumoral. Recientemente se ha demostrado que las poliaminas acetiladas son
más específicas para el cáncer. Por ejemplo, se ha visto que N1, N12-diacetilespermina
sufre un considerable aumento en los casos de CRC y también en las lesiones
colorrectales displásicas.
En la presente tesis doctoral hemos tratado de descifrar las incógnitas presentes en la
asociación entre la composición de la microbiota intestinal y el CRC incluyendo la
respuesta a la radioquimioterapia neoadyuvante previa a cirugía. En primer lugar, nos
fijamos objetivos para determinar la composición y las funciones de la microbiota
intestinal en muestras fecales de pacientes con CRC con (OB-CRC) y sin obesidad (L-
CRC), para ello comparamos los perfiles de microbiota intestinal presentes en pacientes
OB-CRC y L-CRC con la microbiota de controles sanos no obesos (L-HC). Además, se
analizarón los niveles fecales de TMAO, la permeabilidad intestinal y el estado
inflamatorio en los diferentes grupos de estudio para así tratar de desvelar la posible
relación entre la microbiota intestinal los niveles plasmáticos de TMAO, el estado
inflamatorio y la permeabilidad intestinal en el contexto del CRC asociado a la obesidad.
Para llevar a cabo el estudio se reclutaron 45 pacientes con CRC en estadíos II-III (T2-
T4 y/o N1-N2) cuyo rango de edad fue 35-75 años y que fueron clasificados según su
IMC (de acuerdo a los criterios de la OMS) en no obesos (IMC < 30 kg/m2) (L-CRC) y
obesos (IMC ≥ 30 kg/m2) (OB-CRC), además de un grupo control formado por 20 sujetos
sanos y no obesos (L-HC). A estos pacientes y controles se les recogieron muestras de
sangre y de heces a nivel basal, previo a cualquier tipo de tratamiento. En dichas muestras

RESUMEN
~ 193 ~
de sangre se realizaron análisis de los niveles de glucosa sérica, colesterol total,
triglicéridos, colesterol HDL, colesterol LDL y hemoglobina glucosilada (HbA1c) por
métodos enzimáticos. Además, en muestras de plasma se midieron los niveles de zonulina
mediante ELISA y los de TMAO fueron cuantificados mediante resonancia magnética
nuclear en muestras de suero. Las muestras de heces fueron utilizadas para el análisis de
ARNr 16S mediante secuenciación NGS utilizando plataforma Ion S5 (ThermoFisher) y
los datos obtenidos tras la secuenciación fueron analizados mediante la plataforma
Qiime2 y PICRUSt (Galaxy).
Cuando comparamos la composición de la microbiota fecal de los tres grupos de estudio
(OB-CRC, L-CRC y L-HC) se observó que los dos grupos de pacientes con CRC tenían
mayor similitud entre sí que con el grupo control. El análisis de la diversidad alfa
(composición de la comunidad) del microbioma intestinal de los tres grupos reveló una
disminución de la riqueza (índice Chao1) y la diversidad (índice de Shannon) en los
grupos OB-CRC y L-CRC en comparación con los controles L-HC. Sin embargo, no se
encontraron diferencias significativas en los índices de Chao1 y Shannon entre los grupos
OB-CRC y L-CRC. Estos resultados pueden sugerir que la disminución en la diversidad
de la microbiota intestinal de los pacientes con CRC no podría estar completamente
relacionada con la presencia de obesidad. Además, el análisis de disimilitud de Bray-
Curtis para detectar diferencias de la comunidad microbiana en la estructura mostró una
agrupación de los pacientes con OBC-CRC y L-CRC juntos, pero separados de los
controles L-HC, lo que sugiere que la obesidad no introduce cambios importantes en la
estructura general de la comunidad microbiana intestinal de pacientes con CRC. No
obstante, el presente estudio demostró que los pacientes con CRC exhiben claras
diferencias en la composición de la microbiota intestinal en comparación con los
individuos sanos, independientemente del IMC del paciente. Se encontraron diferencias

RESUMEN
~ 194 ~
significativas entre los grupos a nivel de filo para Bacteroidetes, Firmicutes, Fusobacteria
y Proteobacteria. De las 20 familias bacterinas presentes en los tres grupos de estudio, se
encontraron diferencias significativas en la abundancia de Bacteriodaceae,
Porphyromonaceae, Prevotellaceae, Streptococaceae, Clostridiaceae, Ruminococaceae,
Fusobacteriaceae, Desulfovibriaceae, Enterobacteriaceae y Victivallaceae. Los análisis a
nivel de género confirmaron que la microbiota intestinal de los pacientes con CRC con o
sin obesidad se caracteriza por una reducción de las bacterias productoras de butirato
(Butyricimonas, Roseburia, Blautia, Faecalibacterium y Ruminococcus) y un aumento
de especies bacterianas nocivas que podrían actuar como patógenos oportunistas con
propiedades proinflamatorias y procarcinogénicas (Fusobacterium, Clostridium,
Prevotella, Desulfovibrio y Enterococcus) en comparación con los controles L-HC.
Finalmente, se observó un aumento significativo en la abundancia de los taxones de
patógenos oportunistas en el microbioma intestinal de pacientes OB-CRC en
comparación con sujetos L-CRC y L-HC. El perfil microbiano encontrado en los
pacientes OB-CRC, podría ser responsable de los niveles séricos significativamente más
altos de zonulina (marcador de permeabilidad intestinal), TMAO (metabolito microbiano
relacionado con la ECV) e IL-1β (factor proinflamatorio) y los niveles más bajos de IL-
10 (factor antiinflamatorio) en comparación con los controles y pacientes con CRC no
obesos. Estudios previos han descrito el aumento de los niveles circulantes de TMAO en
pacientes con sobrepeso u obesidad y también en pacientes con CRC, en el presente
estudio encontramos que la presencia de ciertos taxones bacterianos específicos en las
heces humanas de ambos grupos con CRC se asociaron con la concentración de TMAO
en plasma. Observamos que las concentraciones séricas de TMAO se asociaron
significativa y positivamente con la abundancia de la familia Enterobacteriaceae y la
especie Escherichia coli en pacientes OB-CRC y la abundancia de Desulfovibrio en

RESUMEN
~ 195 ~
pacientes L-CRC. De acuerdo con nuestros resultados, otros estudios en humanos y
animales han sugerido que varias familias de bacterias están involucradas en la
producción de TMA/TMAO como Prevotellaceae y Enterobacteriaceae. Por lo tanto, el
aumento de bacterias patógenas específicas como Escherichia coli en pacientes OB-CRC
puede ser responsable (al menos parcialmente) del aumento significativo de moléculas
proinflamatorias derivadas del metabolismo bacteriano como TMAO. Estudios recientes
han sugerido que el TMAO podría desempeñar un papel clave en el proceso inflamatorio
y que esta inducción de la inflamación podría ser un posible factor que proporcione un
vínculo entre el TMAO y el cáncer. No obstante, los niveles de TMAO en sangre no sólo
dependen de la composición de la microbiota intestinal y de su actividad metabólica, sino
también del funcionamiento de la barrera intestinal que controla el acceso de las
moléculas entre el intestino y el torrente sanguíneo. En consecuencia, en nuestro estudio
encontramos que los niveles plasmáticos de zonulina fueron significativamente más altos
en el grupo OB-CRC en comparación con los grupos L-CRC y L-HC. Además, este
aumento del nivel de zonulina se asoció con la abundancia de Prevotella en pacientes con
OB-CRC. Una bacteria asociada a la degradación de mucina de la capa de mucosa de la
barrera intestinal y en consecuencia al aumento de la permeabilidad intestinal.
Con respecto a la microbiota específica, significativamente incrementada en pacientes
OB-CRC, otros autores han descrito un incremento de Fusobacterium nucleatum en
personas obesas que en comparación con personas delgadas. Es más, nosotros hemos
descrito una asociación de esta especie bacteriana con la abundancia de IL-1β en pacientes
OB-CRC, una interleucina proinflamatoria que induce la activación de la vía Wnt, una
vía clave para la tumorogénesis intestinal. Estos datos podrían respaldar el papel de esta
molécula en la patogenia del CRC. Por otro lado, la presencia de niveles bajos IL-10 en
pacientes OB-CRC se asociaron con una disminución en la abundancia de Blautia y

RESUMEN
~ 196 ~
Faecalibacterium prausnitzii, ambas bacterias son importantes proveedores de butirato
para el epitelio colónico. El butirato es un ácido graso de cadena corta que contribuye a
mantener la integridad de la barrera intestinal y disminuir la permeabilidad intestinal.
Finalmente, los análisis de funcionalidad de la microbiota intestinal encontrada en los tres
grupos de estudio, sugieren una menor abundancia relativa de genes responsables de las
funciones del metabolismo de los carbohidratos, como el metabolismo del butanoato y la
vía de la pentosa fosfato, junto con genes responsables del metabolismo de aminoácidos
y el procesamiento de proteínas en el retículo endoplásmico en pacientes con OB-CRC
en comparación con pacientes con L-CRC. La abundancia de genes de la vía de la pentosa
fosfato es fundamental para las células cancerosas debido a la generación de niveles
elevados de NADPH, que pueden utilizarse para la síntesis de ácidos grasos y nucleicos
y para la supervivencia celular en condiciones de estrés. Además, en estos pacientes OB-
CRC encontramos una sobrexpresión de genes implicados en el metabolismo energético,
como la fosforilación oxidativa, el metabolismo del metano y el metabolismo del azufre,
así como para la biosíntesis de lipopolisacáridos con respecto a los pacientes L-CRC y
los controles L-HC. Los microbios metabolizadores del azufre, que convierten las fuentes
dietéticas de azufre en sulfuro de hidrógeno genotóxico (H2S), se han asociado
previamente con el desarrollo de CRC. Además, el H2S derivado del intestino puede
fragmentar la bicapa mucosa del tracto gastrointestinal y esta ruptura puede preceder a la
tumorigénesis al exponer el epitelio intestinal a bacterias luminales inmunogénicas.
Finalmente, el aumento significativo de genes para la biosíntesis de lipopolisacáridos
encontrados en el grupo OB-CRC podría atribuirse en parte al aumento significativo de
la abundancia de Escherichia coli y otras especies de la familia Enterobacteriaceae, que
contienen enzimas específicas para producir LPS.

RESUMEN
~ 197 ~
En conclusión, en este estudio se ha puesto de manifiesto la existencia de una asociación
entre la inflamación, el IMC y la microbiota intestinal de los pacientes con CRC. En
primer lugar, mostramos que la obesidad no induce cambios significativos ni en la
diversidad ni en la riqueza de las bacterias intestinales de los pacientes con CRC. En
segundo lugar, demostramos que la presencia de obesidad en pacientes con CRC está
asociada a cambios en la composición y en la funcionalidad de la microbiota intestinal.
Así, la microbiota intestinal de los pacientes con CRC y con obesidad se caracteriza por
la presencia de una mayor abundancia de patógenos oportunistas (como Prevotella,
Fusobacterium nucleatum, Enterobacteriaceae y Escherichia coli), que pueden alterar la
función de la barrera intestinal (determinado por el aumento de los niveles de zonulina
circulante), y pueden contribuir a los procesos inflamatorios relacionados con el CRC
mediante el aumento de la producción de moléculas inflamatorias como IL-1β y TMAO.
Aunque es posible que nuestro estudio tenga algunas limitaciones en el análisis estadístico
debido a las múltiples pruebas y debería replicarse en cohortes más grandes (incluidas
otras poblaciones con diferentes patrones de alimentación y hábitos culturales), en
general, nuestros resultados sugieren un papel importante la microbiota intestinal en el
desarrollo de CRC en pacientes con obesidad. Además, estos hallazgos podrían
proporcionar nuevas pistas para el desarrollo de herramientas de diagnóstico para la
prevención del CRC.
Por otra parte en la presente tesis doctoral hemos establecido las diferencias en la
composición y en la diversidad de la microbiota intestinal entre pacientes con CRC y
controles sanos; estudiado los cambios en la diversidad y composición de la microbiota
intestinal de los pacientes con CRC antes, durante y después de completar el tratamiento
con radioquimioterapia neoadyuvante previo a cirugía y analizado las diferencias en la
composición y función de la microbiota intestinal después de la clasificación de los

RESUMEN
~ 198 ~
pacientes con CRC en buenos (respondedores) y malos o no respondedores (no
respondedores) a la radioquimioterapia neoadyuvante. Además, hemos medido
metabolitos producidos por la microbiota intestinal (como los ácidos grasos de cadena
corta y las poliaminas), marcadores de inflamación y de permeabilidad intestinal antes y
después de la radioquimioterapia en pacientes respondedores y no respondedores y
estudiado su relación con la composición de su microbiota intestinal. Finalmente, hemos
establecido si la composición inicial de la microbiota podría predecir la respuesta al
tratamiento con radioquimioterapia neoadyuvante en pacientes con CRC.
Para llevar a cabo esta parte del estudio se reclutaron 40 pacientes con CRC en estadíos
II-II (T2-T4 y/o N1-N2) y con rango de edad entre 35-75 años, que recibieron tratamiento
con radioquimioterapia neoadyuvante durante 5 semanas (radioterapia pélvica (50 Gy en
fracciones de 2 Gy/sesion) y Capecitabina oral (825 mg/m2/12h). También se incluyó un
grupo control de 20 sujetos sanos pareados por edad, sexo e IMC con el grupo de
pacientes. En el grupo de pacientes, las muestras de sangre y heces se recogieron al inicio
(T0), 2 y 4 semanas después del inicio de la radioquimioterapia (T1 y T2) y al final del
tratamiento (7 semanas después de finalizar el tratamiento) (T3). Las muestras se
combinaron en tres grupos: basal (T0), puntos de tratamiento (T1 y T2) y postratamiento
(T3).
Las muestras de heces fueron utilizadas para el análisis de ARNr 16S mediante
secuenciación NGS utilizando plataforma Ion S5 (ThermoFisher) y los datos obtenidos
tras la secuenciación fueron analizados mediante la plataforma Qiime2 y Picrust
(Galaxy). Los niveles de poliaminas séricas se determinaron mediante cromatografía
líquida junto con una espectrometría de masas de alto rendimiento y la extracción y el
análisis de los ácidos grasos de cadena corta se realizaron en muestras de heces mediante

RESUMEN
~ 199 ~
cromatografía de gases con detector de ionización de llama (GC-FID). Finalmente, en
muestras de plasma se midieron los niveles de zonulina mediante ELISA.
En este estudio, al comparar la microbiota intestinal presente en las muestras de heces de
pacientes con CRC y controles sanos encontramos una disminución significativa en la
diversidad (índice de Shannon) y riqueza (índice de Chao1) en las muestras de los
pacientes con CRC. Además, el análisis de beta-diversida de Bray-Curtis mostró que los
pacientes con CRC se agruparon en un cluster diferente a los controles sanos, lo que
sugiere importantes diferencias en la estructura de la microbiota intestinal entre pacientes
con CRC y controles sanos.
En relación con la composición de la microbiota intestinal, el análisis de los perfiles de la
microbiota intestinal entre ambos grupos de estudio mostró diferencias significativas en
la abundancia de diferentes taxones. A nivel de filo, en comparación con los controles
sanos, encontramos un incremento significativo en la abundancia relativa de
Fusobacteria, Firmicutes y Lentisphaerae y Proteobacterias en los pacientes con CRC,
acompañada por un descenso en la abundancia de Bacteroidetes y Actinobacteria. La
microbiota intestinal de los pacientes con CRC se estuvo enriquecida en patógenos
oportunistas proinflamatorios y disminuida en bacterias productoras de butirato,
esenciales para el mantenimiento de la homeostasis intestinal.
Por otra parte, al analizar los posibles cambios en la diversidad y composición de la
microbiota intestinal de los pacientes con CRC en respuesta al tratamiento con
radioquimioterapia neoadyuvante en pacientes con CRC, se observó que la composición
de la microbiota intestinal era relativamente estable durante el tiempo de tratamiento.
Encontramos que los principales filos bacterianos, Firmicutes y Bacteroidetes se
mantuvieron estables con el tiempo, mientras que Fusobacterium y Proteobacterias

RESUMEN
~ 200 ~
disminuyeron significativamente en T3 en comparación con T0 en pacientes con CRC.
Además, aunque las proporciones de las familias y géneros bacterianos difirieron entre
los diferentes tiempos del seguimiento, no mostraron alteraciones significativas durante
el tratamiento con radioquimioterapia excepto para los géneros Fusobacterium,
Escherichia y Klebsiella, que disminuyeron significativamente, y el género
Bifidobacterium que aumentó significativamente en T3 en comparación con T0.
Una vez finalizado el tratamiento (T3), los pacientes con CRC se clasificaron como
respondedores (N) versus no respondedores (NR) en función de su buena o mala respuesta
a la radioquimioterapia. Despues de dicha clasificación, encontramos diferencias
significativas en la diversidad alfa a nivel de género, con un aumento en la diversidad
(Shannnon) y la riqueza (Chao 1) en R en comparación con los pacientes NR. De manera
similar, hubo una diferencia estadísticamente significativa en la beta diversidad
(disimilitud de Bray-Curtis e índice de Jaccard), encontramos un efecto de agrupamiento
notable en función del estado de respuesta del microbioma intestinal de estos pacientes,
lo que indica una diferencia en la composición de la comunidad bacteriana entre R y NR
pacientes.
Al estudiar los cambios composicionales en la microbiota intestinal a nivel taxonomico,
encontramos un enriquecimiento significativo en pacientes R de bacterias productoras de
probióticos y butiratos como Bifidobacterium, Ruminoccous, Roseburia y
Faecalibacterium praustnizii, mientras que los pacientes NR mostraron un
enriquecimiento en taxones microbianos desfavorables como Fusobacterium nucleatum,
Bacteroides fragilis, Escherichia coli, Prevotella copri y Klebsiella. Al mismo tiempo,
tanto Fusobacterium como Prevotella se han relacionado con CRC recurrente después de
la quimioterapia, especialmente Fusobacterium nucleatum se ha correlacionado con
quimiorresistencia, lo que sugiere que la mayor abundancia de Fusobacterium nucleatum

RESUMEN
~ 201 ~
presente en pacientes NR es un promotor potencial de la quimiorresistencia y, por lo tanto,
de una mala respuesta al tratamiento en estos pacientes. De manera similar, Bacteroides
fragilis enterotoxigénico también enriquecido en los pacientes NR es una fuente
significativa de inflamación crónica y se ha asociado previamente con el desarrollo y la
agresividad del CRC y la mala evolución del paciente. Estos datos sugieren que la
composición de la microbiota intestinal de los pacientes R cambió hacia un perfil
microbiano que tiene una gran similitud con la microbiota intestinal de controles sanos
A continuación, buscamos conocer el mecanismo a través del cual el microbioma
intestinal puede influir en la respuesta a la radioquimioterapia. Con respecto a la función
metabólica de la microbiota intestinal, en el estudio actual, el análisis de funcionalidad
bacteriana mostró diferencias significativas entre los pacientes R y NR. En los pacientes
NR hemos encontrado un aumento en la abundancia de genes implicados en la biosíntesis
de lipopolisacáridos, así como para el metabolismo del ácido araquidónico y el
metabolismo del glutatión en comparación con los pacientes R. El aumento significativo
de genes para la biosíntesis de lipopolisacáridos podría estar relacionado con el aumento
significativo en la abundancia de bacterias gram-negativas como Escherichia coli en los
pacientes NR, esta bacteria contiene enzimas específicas para producir LPS, que pueden
promover la supervivencia y la proliferación celular en pacientes con CRC. Otras
funciones bacterianas que involucran el metabolismo de cofactores y vitaminas y vías de
producción de energía, como la fosforilación oxidativa, también estuvieron aumentadas
en pacientes NR. Estas vías pueden servir como fuentes bioenergéticas alternativas para
las células cancerosas sometidas a estrés metabólico.
Un análisis metagenómico reciente ha descrito la asociación de la microbiota intestinal
de pacientes con CRC con alteraciones en el metabolismo de las poliaminas. En nuestro
estudio hemos encontrado diferencias significativas en los niveles séricos de varias
RESUMEN
~ 202 ~
poliaminas y derivados acetilados de poliaminas entre pacientes R y NR. Además,
observamos que la abundancia de N1, N12-DiAcSP y N8-AcSPD se asociaron
positivamente con el aumento de la abundancia de Bacteroides fragilis y Fusobacterium
nucletum en pacientes NR.
Con respecto al metabolismo de los AGCC, hemos encontrado en pacientes R un aumento
significativo en la abundancia fecal de varios AGCC como el ácido acético y el butírico.
Además, hubo una correlación positiva entre los niveles fecales de butirato y la
abundancia de Faecalibacterium praustnizii y Ruminoccocus albus en estos pacientes.
Finalmente, encontramos que los niveles plasmáticos de zonulina eran significativamente
más altos en los pacientes NR en comparación con R. El aumento del nivel de zonulina
se asoció con la abundancia de Prevotella copri en los pacientes R.
En conclusión, este estudio mostró que la microbiota intestinal en pacientes con CRC
difiere en la composición de la microbiota intestinal en comparación con los controles
sanos. El CRC se asoció con una diversidad y riqueza de microbiota significativamente
menor, una abundancia relativa significativamente mayor de patógenos oportunistas
proinflamatorios y una abundancia menor de bacterias beneficiosas o comensales
productoras de butirato.
Además, no hemos encontrado cambios significativos en la diversidad y composición de
la microbiota intestinal en respuesta a la radioquimioterapia neoadyuvante en pacientes
con CRC, con la excepción de una disminución significativa de Fusobacterium,
Escherichia y Klebsiella y un aumento significativo de Bifidobacterium en el tiempo
postratamiento en comparación con el tiempo basal. Sin embargo, después de la
clasificación de los pacientes con CRC en R y NR a la radioquimioterapia neoadyuvante,
hemos observado un aumento significativo en la diversidad y riqueza en pacientes R en

RESUMEN
~ 203 ~
comparación con NR. Asimismo, se evidenció un cambio de composición entre grupos
de estudio, con un importante enriquecimiento de bacterias productoras de probióticos y
butirato (como Bifidobacterium, Ruminoccous, Roseburia y Faecalibacterium
praustnizii) en pacientes R, acompañado de un enriquecido en bacterias proinflamatorias
desfavorables (como Fusobacterium nucleatum, Bacteroides fragilis, Escherichia coli,
Prevotella copri y Klebsiella) en pacientes NR. Además, los pacientes NR mostraron
niveles significativamente más altos de algunos derivados acetilados de poliaminas y de
zonulina sérica y niveles significativamente más bajos de ácido butírico fecal que los
pacientes R. Estos metabolitos derivados de bacterias son factores importantes que
conectan la microbiota intestinal con el CRC y podrían ser responsables de la eficacia de
la radioquimioterapia. El análisis PICRUSt encontró en pacientes NR una
sobrerrepresentación de genes involucrados en la biosíntesis de lipopolisacáridos, así
como en el metabolismo del ácido araquidónico y glutatión, de genes de vías asociadas
con la patogénesis bacteriana, la inflamación, la supervivencia celular, la proliferación y
la respuesta a la terapia.
Finalmente, hemos identificado a tiempo basal T0 un consorcio de bacterias enriquecidas
con CRC (Ruminococcus albus, Bifidobacterium bifidum, Faecalibacterium praustnizii,
Fusobacterium nucleatum) que potencialmente podrían predecir la respuesta a la
radioquimioterapia adyuvante. Indicando, que la composición de la microbiota inicial es
decir a T0 de pacientes con CRC es importante para predecir la respuesta a la
radioquimioterapia neoadyuvante. Entonces, una microbiota intestinal sana es
indispensable para una respuesta terapéutica óptima y la microbiota disbiótica podría ser
la razón subyacente de la respuesta variable a estrategias terapéuticas similares en
diferentes pacientes.


