Embed Size (px)
Citation preview
Microbiotawithin theperennial ice coverof LakeVida, AntarcticaAnnika C. Mosier, Alison E. Murray & Christian H. Fritsen
Desert Research Institute, Division of Earth and Ecosystem Sciences, Reno, NV, USA
Correspondence: Christian H. Fritsen, Desert
Research Institute, Division of Earth and
Ecosystem Sciences, 2215 Raggio Parkway,
Reno, NV 89512, USA. Tel.: 11 775 6737487;
e-mail: [email protected]
Present address: Annika C. Mosier,
Department of Geological and Environmental
Sciences, Stanford University, Stanford, CA,
USA.
Received 1 May 2006; revised 23 August 2006;
accepted 29 August 2006.
First published online 9 November 2006.
DOI:10.1111/j.1574-6941.2006.00220.x
Editor: Max Haggblom
Keywords
perennially ice covered lake; Antarctica;
McMurdo Dry Valleys; microbial assemblages;
phylogenetic diversity.
Abstract
Lake Vida, located in the McMurdo Dry Valleys, Antarctica, is an ‘ice-sealed’ lake
with �19 m of ice covering a highly saline water column (�245 ppt). The lower
portions of the ice cover and the lake beneath have been isolated from the
atmosphere and land for circa 2800 years. Analysis of microbial assemblages within
the perennial ice cover of the lake revealed a diverse array of bacteria and eukarya.
Bacterial and eukaryal denaturing gradient gel electrophoresis phylotype profile
similarities were low (o 59%) between all of the depths compared (five depths
spanning 11 m of the ice cover), with the greatest differences occurring between
surface and deep ice. The majority of bacterial 16S rRNA gene sequences in the
surface ice were related to Actinobacteria (42%) while Gammaproteobacteria (52%)
dominated the deep ice community. Comparisons of assemblage composition
suggest differences in ice habitability and organismal origin in the upper and lower
portions of ice cover. Specifically, the upper ice cover microbiota likely reflect the
modern day transport and colonization of biota from the terrestrial landscape,
whereas assemblages in the deeper ice are more likely to be persistent remnant
biota that originated from the ancient liquid water column of the lake that froze.
Introduction
Many of the earth’s perennially ice covered lakes are located
in the McMurdo Dry Valleys, Antarctica (e.g. Lakes Bonney,
Fryxell, Joyce, Miers, Vanda and Vida). These lakes are
ice-covered (3–6 m on average) year round because of
continuously cold air temperatures (annual average tem-
perature � 20 1C, Wharton et al., 1993). The thickness of ice
is typically controlled by sublimation off the top
(�30 cm year�1) and freezing on the bottom.
Several of the perennially ice covered lakes within the
McMurdo Dry Valleys sustain biotic life. Microbiota have
been described within the perennial ice covers of these lakes
(Fritsen & Priscu, 1998; Priscu et al., 1998; Doran et al.,
2003) and their water columns (Ward & Priscu, 1997;
Voytek et al., 1999; Stackebrandt & Brambilla, 2002; Glatz
et al., 2006). During warmer summers when air tempera-
tures 4 0 1C persist for several days, peripheral moats form
around the edges of many of the ice covers (Wharton et al.,
1993). The ice-free margins, often several meters wide, allow
glacial melt water (formed during periodic melting of glacial
ice) and associated biota to recharge the lakes. Aeolian
transport deposits organisms directly onto the surface of
the ice covers.
Lake Vida is an atypical perennially ice-covered lake
in the McMurdo Dry Valleys with c. 19 m of ice covering
a highly saline liquid brine (Doran et al., 2003).
Organic matter locked within the Lake Vida ice at 12 m
beneath the surface was radiocarbon dated at circa 2800
years old (Doran et al., 2003). Incoming glacial melt water
during warm summer months periodically floods the
frozen surface. This flooding was observed in the 1980s
(C.P. McKay, pers. commun.) and again during the austral
summer of 2001/2002 (J.C. Priscu, pers. commun.). The
thickness of the Lake Vida ice cover presumably prevents
the glacial melt water from flowing beneath the ice cover.
Consequently, the periodic flooding and freezing of the
Lake Vida ice cover increases the thickness of the ice from
the top surface, unlike other perennially ice-covered lakes
in the Dry Valleys. A net freezing of �7 cm year�1 also may
occur on the bottom of the Vida ice cover (Doran et al.,
2003). To date, microbial community composition within
the Lake Vida ice cover or brine pocket had not been
evaluated.
FEMS Microbiol Ecol 59 (2007) 274–288c� 2006 Federation of European Microbiological SocietiesPublished by Blackwell Publishing Ltd. All rights reserved
Biotic distribution and diversity were examined in the ice
cover of Lake Vida to augment the paucity of data on
microbial communities within perennial ice covers and to
better understand the habitability of these ecosystems. Here,
enumeration, diversity, and putative activity of microbial
populations at five depths in the ice cover of Lake Vida are
described. These results enable better resolution of the
origin of microbiota in the Lake Vida ice cover and
determination of whether the ice cover contains organisms
indicative of the biota that may lie within the briny water
column of the lake.
Materials and methods
Study site
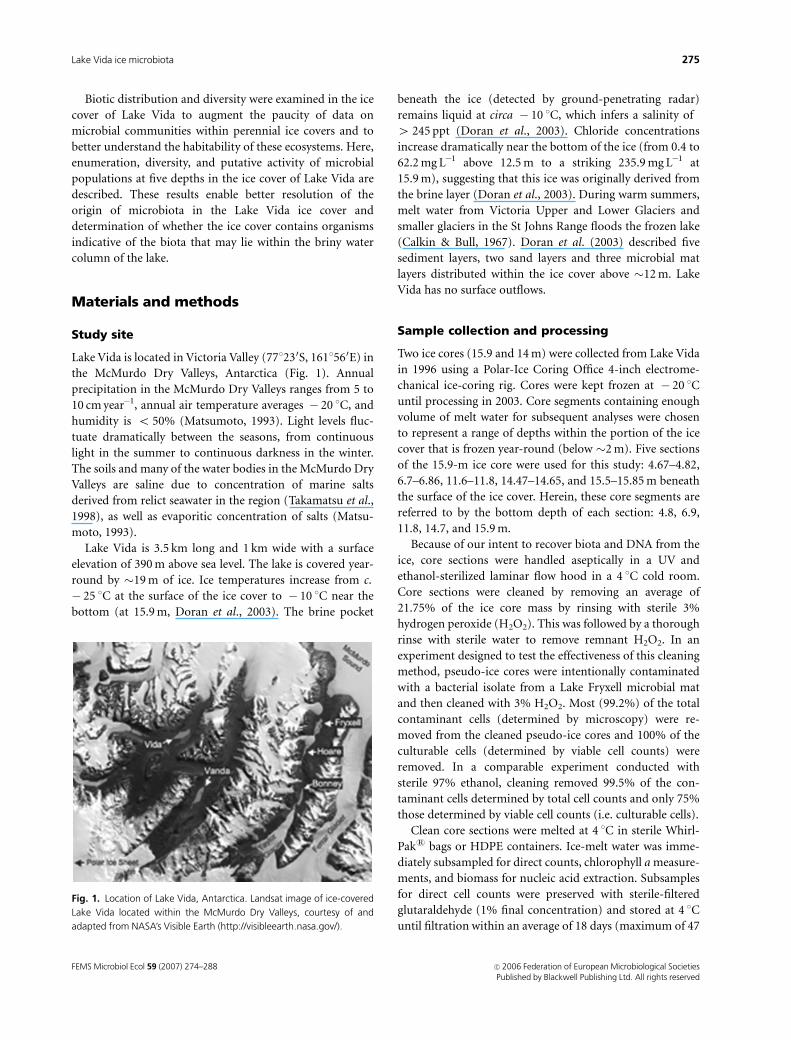
Lake Vida is located in Victoria Valley (771230S, 1611560E) in
the McMurdo Dry Valleys, Antarctica (Fig. 1). Annual
precipitation in the McMurdo Dry Valleys ranges from 5 to
10 cm year�1, annual air temperature averages � 20 1C, and
humidity is o 50% (Matsumoto, 1993). Light levels fluc-
tuate dramatically between the seasons, from continuous
light in the summer to continuous darkness in the winter.
The soils and many of the water bodies in the McMurdo Dry
Valleys are saline due to concentration of marine salts
derived from relict seawater in the region (Takamatsu et al.,
1998), as well as evaporitic concentration of salts (Matsu-
moto, 1993).
Lake Vida is 3.5 km long and 1 km wide with a surface
elevation of 390 m above sea level. The lake is covered year-
round by �19 m of ice. Ice temperatures increase from c.
� 25 1C at the surface of the ice cover to � 10 1C near the
bottom (at 15.9 m, Doran et al., 2003). The brine pocket
beneath the ice (detected by ground-penetrating radar)
remains liquid at circa � 10 1C, which infers a salinity of
4 245 ppt (Doran et al., 2003). Chloride concentrations
increase dramatically near the bottom of the ice (from 0.4 to
62.2 mg L�1 above 12.5 m to a striking 235.9 mg L�1 at
15.9 m), suggesting that this ice was originally derived from
the brine layer (Doran et al., 2003). During warm summers,
melt water from Victoria Upper and Lower Glaciers and
smaller glaciers in the St Johns Range floods the frozen lake
(Calkin & Bull, 1967). Doran et al. (2003) described five
sediment layers, two sand layers and three microbial mat
layers distributed within the ice cover above �12 m. Lake
Vida has no surface outflows.
Sample collection and processing
Two ice cores (15.9 and 14 m) were collected from Lake Vida
in 1996 using a Polar-Ice Coring Office 4-inch electrome-
chanical ice-coring rig. Cores were kept frozen at � 20 1C
until processing in 2003. Core segments containing enough
volume of melt water for subsequent analyses were chosen
to represent a range of depths within the portion of the ice
cover that is frozen year-round (below �2 m). Five sections
of the 15.9-m ice core were used for this study: 4.67–4.82,
6.7–6.86, 11.6–11.8, 14.47–14.65, and 15.5–15.85 m beneath
the surface of the ice cover. Herein, these core segments are
referred to by the bottom depth of each section: 4.8, 6.9,
11.8, 14.7, and 15.9 m.
Because of our intent to recover biota and DNA from the
ice, core sections were handled aseptically in a UV and
ethanol-sterilized laminar flow hood in a 4 1C cold room.
Core sections were cleaned by removing an average of
21.75% of the ice core mass by rinsing with sterile 3%
hydrogen peroxide (H2O2). This was followed by a thorough
rinse with sterile water to remove remnant H2O2. In an
experiment designed to test the effectiveness of this cleaning
method, pseudo-ice cores were intentionally contaminated
with a bacterial isolate from a Lake Fryxell microbial mat
and then cleaned with 3% H2O2. Most (99.2%) of the total
contaminant cells (determined by microscopy) were re-
moved from the cleaned pseudo-ice cores and 100% of the
culturable cells (determined by viable cell counts) were
removed. In a comparable experiment conducted with
sterile 97% ethanol, cleaning removed 99.5% of the con-
taminant cells determined by total cell counts and only 75%
those determined by viable cell counts (i.e. culturable cells).
Clean core sections were melted at 4 1C in sterile Whirl-
Paks bags or HDPE containers. Ice-melt water was imme-
diately subsampled for direct counts, chlorophyll a measure-
ments, and biomass for nucleic acid extraction. Subsamples
for direct cell counts were preserved with sterile-filtered
glutaraldehyde (1% final concentration) and stored at 4 1C
until filtration within an average of 18 days (maximum of 47
Fig. 1. Location of Lake Vida, Antarctica. Landsat image of ice-covered
Lake Vida located within the McMurdo Dry Valleys, courtesy of and
adapted from NASA’s Visible Earth (http://visibleearth.nasa.gov/).
FEMS Microbiol Ecol 59 (2007) 274–288 c� 2006 Federation of European Microbiological SocietiesPublished by Blackwell Publishing Ltd. All rights reserved
275Lake Vida ice microbiota
days). Melt water (50–250 mL) was filtered onto 25 mm
Whatman 0.4-mm pore size GF/F filters for chlorophyll a
analysis and frozen at � 80 1C. Melt water (60–780 mL) for
nucleic acid extraction was syringe-filtered through 0.2-mm
pore size Supor (Gelman Scientific) sterivex filters. Filter
cartridges were filled with 1.8 mL of sucrose lysis buffer
(40 mM EDTA, 50 mM Tris-HCl, 0.75 M sucrose) and
frozen at � 80 1C.
Chlorophyll a analysis, enumeration and sizing
Chlorophyll a from biomass collected on GF/F filters was
extracted with cold 90% acetone overnight. Fluorescence
(Fo) was determined with a Turner Designs 10AU Fluorom-
eter calibrated with pure chlorophyll a (Sigma Corp.)
(Welschmeyer, 1994). Direct bacterial counts were deter-
mined by epifluorescent microscopy (Hobbie et al., 1977)
using the generalized nucleic acid DAPI (40,6-diamidino-2-
phenylindole) stain. Cell sizes (20 cells per depth) were
determined with IMAGE-PRO PLUS (Media Cybernetics Inc.)
image analysis software calibrated with fluorescent beads
(Duke Scientific Corp.). Cell biovolume (mm3) was based on
mean length and width of spheres (cocci) or cylinders with
hemispherical caps (rods) (Simon & Azam, 1989).
Environmental genomic DNA extraction and PCRamplification
DNA extraction methods (Pospiech & Neumann, 1995;
Massana et al., 1997; Sheridan et al., 2003) were tested for
robustness by extracting nucleic acids from gram-positive
cell cultures (Rhodococcus sp.). Additionally, the Massana
et al. (1997) and Pospiech & Neumann (1995) methods were
compared on a duplicate Vida ice section. The enzymatic
and lysis method (Massana et al., 1997) had comparable
nucleic acid recovery values, amplified better using PCR
(brighter PCR bands), and produced more bacterial dena-
turing gradient gel electrophoresis (DGGE) bands on the
duplicate ice sample. DNA from the Lake Vida ice sections
was extracted using this method as previously described
(Massana et al., 1997). Nucleic acids were quantified using
the PicoGreen (Molecular Probes Inc.) dsDNA quantitation
method.
PCR amplifications were carried out in an automated
thermal cycler (Applied Biosystems). PCR mixtures con-
tained 0.1–10 ng of template DNA, 1� PCR reaction buffer,
0.2 mM dNTPs, 1 mM of each primer, 2.5–3.5 mM Mg21 and
0.5 U Taq DNA polymerase. Initially, samples were screened
with primers targeting the three domains of life using
primers Bact27F (Lane, 1991) and Univ1492R (Kane et al.,
1993) for bacteria, Arch20F (Massana et al., 1997) and
Arch958R (DeLong, 1992) for archaea, and Euk1A (Diez
et al., 2001) and Univ1492R for eukaryotes. Mixed template
DNA was amplified for DGGE with bacterial (GC358F and
517R, Murray et al., 1996) and eukaryal (960FbGC and
1200R, Lin et al., 1996; Gast et al., 2004) primers with hot
start conditions (Erlich et al., 1991). The thermal cycling
program was similar to that described to Muyzer et al.
(1993). In brief, the denaturing temperature began at 94 1C
and decreased 2 1C every second cycle until annealing at
55 1C for 20 cycles, followed by primer extension at 72 1C for
7 min. Multiple PCR reactions were pooled (three reactions
for eukarya and 8–11 reactions for bacteria) and purified
with Microcon YM-100 concentrators (Millipore) for
DGGE analysis. Bacterial clone libraries were generated by
amplifying the 16S rRNA gene with 27F and 1492R primers.
The conditions consisted of denaturation at 94 1C for 5 min,
30 cycles of 941 for 1 min, 55 1C for 1 min, and 72 1C for
1 min, followed by extension at 72 1C for 7 min.
Eukaryal and bacterial DGGE analysis
Eukaryal and bacterial DGGE analyses were performed
using the BioRad D CodeTM System and methods detailed
by Murray et al. (1996). Equal amounts of PCR product
(800 ng for bacteria and 300 ng for eukarya) were loaded
onto 8% (w/v) polyacrylamide gels, 1 mm thick, and run in
1� TAE (20 mM Tris acetate, 10 mM acetate, 0.5 mM
disodium EDTA). The denaturing gradient contained
25–55% denaturant for the eukaryal DGGE and 30–60%
denaturant for the bacterial DGGE (100% denaturant
corresponds to 7 M urea and 40% v/v, formamide). Electro-
phoresis proceeded for 1000 V-h. Gels were stained with 1�SYBR Gold (Molecular Probes) for 10 min, viewed on a UV-
transilluminator, and photo-documented with a Kodak
EDAS 290 System.
Gel images were analyzed using GELCOMPAR II software
(Applied Maths) in which bands were automatically de-
tected and matched by the program. Band calling and
matching was confirmed manually. In this study, DGGE
was used to evaluate community changes between ice depths
by analyzing shifts in banding patterns between samples.
Pairwise comparisons of DGGE band similarities between
samples were determined using Sorenson’s index (Murray
et al., 1996): Cs = 2j/(a1b), where j is the number of bands
common to two samples, and a and b are the number of
bands in samples A and B, respectively.
Numerous eukaryal DGGE bands were selected for se-
quencing. Bands were excised from gels with a sterile
surgical knife and placed in a 2-mL screw cap tube with
400 mL sterile distilled H2O and �200 mg sterile glass beads
(Sigma). Acrylamide pieces were disrupted by vigorous
shaking (5000 r.p.m. for 1 min) on a Mini Beadbeater and
then the tubes were left at 4 1C overnight. The gel-free DNA
(5–10 mL) was reamplified as described previously with non-
GC clamped primers (960Fb/1200R). The new PCR product
was directly sequenced with the same forward and reverse
FEMS Microbiol Ecol 59 (2007) 274–288c� 2006 Federation of European Microbiological SocietiesPublished by Blackwell Publishing Ltd. All rights reserved
276 A.C. Mosier et al.
primers on an Applied Biosystems ABI Prism 3730 DNA
Analyzer (Nevada Genomics Center). Bands that resulted in
high quality sequence data (15 in total) were matched via
BLAST (Altschul et al., 1997) to the nearest identified
sequence in the GenBank database.
16S rRNA gene clone library construction andsequencing
Clone libraries of nearly full-length bacterial 16S rRNA
genes (27F and 1492R primers) were constructed for two
depths in the ice cover: 4.8 and 15.9 m. PCR products were
pooled from five individual reactions, purified, ligated into
cloning vectors (TOPO TA cloning kit, Invitrogen), and
transformed following the manufacturer’s instructions.
Clones containing inserts (as indicated by blue/white
screening) were isolated (672 clones per depth).
From each library, 192 clones were sequenced unidirec-
tionally. Twenty-three poor quality sequences (determined
by ambiguous nucleotide identities) were removed from the
analysis. All remaining sequences were checked for chimeras
using the BELLEROPHON (Huber et al., 2004) and CHECK-
CHIMERA programs (Cole et al., 2003): nine potential chi-
meras were identified and removed. An additional 37 short
sequences (�200 bp) were removed from the 4.8-m library.
These sequences had the highest identities to cyanobacteria
and were likely an effect of mispriming of the bacterial 27F
primer. The short sequences aligned to the 30 end of
cyanobacterial 16S rRNA gene sequences. The remaining
dataset contained 315 clone sequences ranging in length
from 534 to 716 bp.
The frequency of unique phylotypes was determined by
assembling sequences with 4 99% similarity using Se-
quencher (Gene Codes Corp.). Clone library phylotype
richness (SChao1) and coverage (CACE) estimates were calcu-
lated using the web interface created by Kemp & Aller
(2004a, b). SChao1 (Chao, 1984; Chao, 1987) is a nonpara-
metric richness estimator and CACE (Chao et al., 1993; Lee &
Chao, 1994) is a coverage estimate defined as the proportion
of sequences from phylotypes with o 10 clones that occur
more than once in a library.
Near-full length, single-stranded 16S rRNA gene se-
quences were obtained for one representative clone from
each unique phylotype. Phylotype sequences were matched
via BLAST (Altschul et al., 1997) to the nearest identified
sequence in the GenBank nr. and env_nt databases.
Phylogenetic analysis
Vida phylotypes with the highest BLAST identities to Actino-
bacteria and Gammaproteobacteria were analyzed for phylo-
genetic relatedness. Sequences were aligned (using Genetic
Data Environment) to the secondary structure of neighbor-
ing 16S rRNA gene sequences downloaded from the Ribo-
somal Database Project. Aligned sequences were analyzed
with the maximum likelihood method using fastDNAml
(Felsenstein, 1981; Olsen et al., 1994) and a consensus tree
was plotted. One hundred bootstraps were run using the
fastDNAml_boot script. A mask excluded highly variable
regions of the 16S rRNA gene from the analysis.
Nucleotide sequence accession numbers
Sequences generated in this study can be found under
accession numbers DQ521452–DQ521569 in GenBank.
Results
The core sections chosen for this study spanned the length of
a 15.9-m ice core (collected in 1996) and contained variable
amounts of sediments: high amounts of sediments at 4.8 m,
some sediment and flaky mat-like material at 6.9 m, fine-
grained sand at 11.8 m, clear ice with faint flocculent-like
matter at 14.8 m, and clear ice at 15.9 m. Chlorophyll a
concentrations ranged from 0.3 mg (at 4.8 m) to 1.9 mg (at
11.8 m) per liter of ice core melt water (Table 1). Chlorophyll
a was very low or nondetectable at 6.9 and 15.9 m (chlor-
ophyll a was not measured in the 14.7-m ice section due to a
limited amount of melt water). Total cell concentrations
recovered from the ice core decreased an order of magnitude
from 2.09� 106 mL�1 at 4.8 m to 0.12� 106 mL�1 at 15.9 m
(Table 1) and exhibit the highest concentrations in the ice
sections with sediments. The average coefficient of variation
among the grids counted (5–20) was 44.95, which is high
but not uncommon for samples with sedimentary material.
The average cell volume across all five depths was
0.06 mm3 cell�1 (n = 100, SE 0.01, Table 1), with an average
length of 0.62mm (SE 0.02) and width of 0.35 mm (SE 0.01).
Several large diatom frustules were observed at 4.8 and
11.8 m.
Nucleic acid extraction values ranged from 0.37 to
10.16 ng DNA mL�1 ice melt water filtered. PCR screening
indicated that bacterial and eukaryal DNA was present at all
depths studied, whereas no archaeal DNA was amplified
from the ice sections studied.
Table 1. Chlorophyll a values, total prokaryotic cell counts, and cell
volume estimates for the Lake Vida ice cover microbial community
Sample
depth (m)
Chlorophyll
a (mg L�1)�Prokaryote
count (cells mL�1)�Avg. biovolume
(mm3 cell�1)
4.8 0.3 2.09� 106 0.043
6.9 0.0 1.33� 106 0.052
11.8 1.9 0.47� 106 0.028
14.7 n/aw 0.54� 106 0.044
15.9 0.0 0.12� 106 0.083
�Volume of ice melt water.wNot measured due to insufficient melt water volume.
FEMS Microbiol Ecol 59 (2007) 274–288 c� 2006 Federation of European Microbiological SocietiesPublished by Blackwell Publishing Ltd. All rights reserved
277Lake Vida ice microbiota
Eukaryal and bacterial DGGE
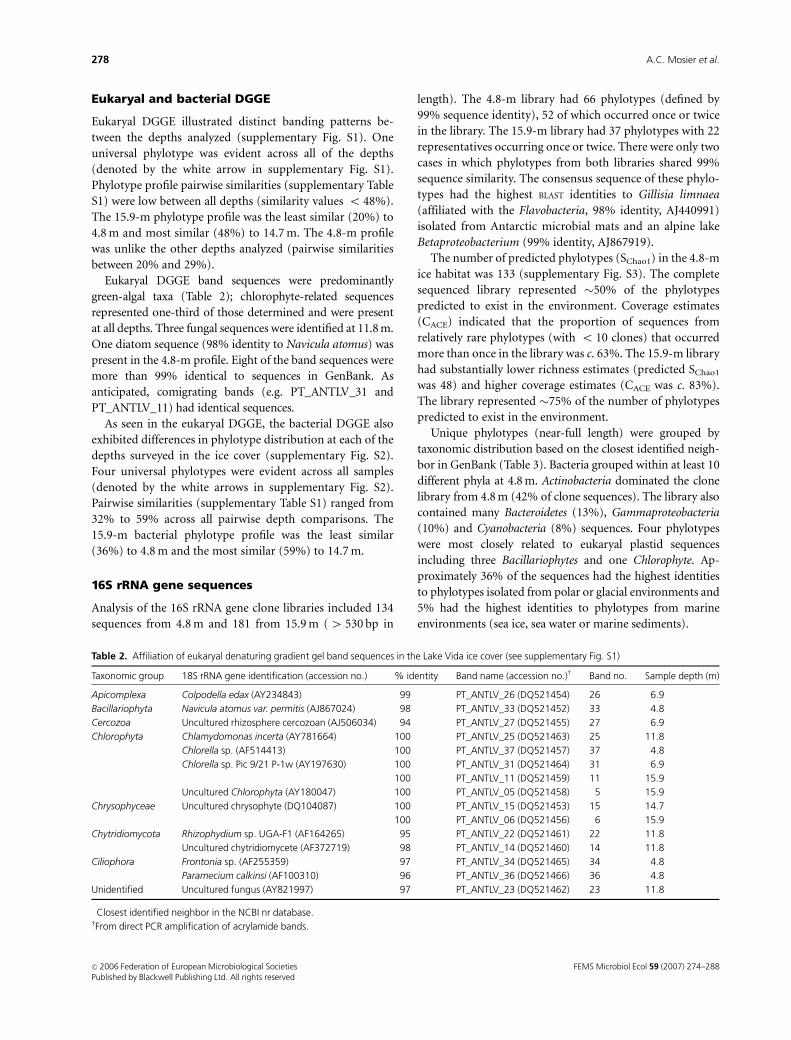
Eukaryal DGGE illustrated distinct banding patterns be-
tween the depths analyzed (supplementary Fig. S1). One
universal phylotype was evident across all of the depths
(denoted by the white arrow in supplementary Fig. S1).
Phylotype profile pairwise similarities (supplementary Table
S1) were low between all depths (similarity values o 48%).
The 15.9-m phylotype profile was the least similar (20%) to
4.8 m and most similar (48%) to 14.7 m. The 4.8-m profile
was unlike the other depths analyzed (pairwise similarities
between 20% and 29%).
Eukaryal DGGE band sequences were predominantly
green-algal taxa (Table 2); chlorophyte-related sequences
represented one-third of those determined and were present
at all depths. Three fungal sequences were identified at 11.8 m.
One diatom sequence (98% identity to Navicula atomus) was
present in the 4.8-m profile. Eight of the band sequences were
more than 99% identical to sequences in GenBank. As
anticipated, comigrating bands (e.g. PT_ANTLV_31 and
PT_ANTLV_11) had identical sequences.
As seen in the eukaryal DGGE, the bacterial DGGE also
exhibited differences in phylotype distribution at each of the
depths surveyed in the ice cover (supplementary Fig. S2).
Four universal phylotypes were evident across all samples
(denoted by the white arrows in supplementary Fig. S2).
Pairwise similarities (supplementary Table S1) ranged from
32% to 59% across all pairwise depth comparisons. The
15.9-m bacterial phylotype profile was the least similar
(36%) to 4.8 m and the most similar (59%) to 14.7 m.
16S rRNA gene sequences
Analysis of the 16S rRNA gene clone libraries included 134
sequences from 4.8 m and 181 from 15.9 m (4 530 bp in
length). The 4.8-m library had 66 phylotypes (defined by
99% sequence identity), 52 of which occurred once or twice
in the library. The 15.9-m library had 37 phylotypes with 22
representatives occurring once or twice. There were only two
cases in which phylotypes from both libraries shared 99%
sequence similarity. The consensus sequence of these phylo-
types had the highest BLAST identities to Gillisia limnaea
(affiliated with the Flavobacteria, 98% identity, AJ440991)
isolated from Antarctic microbial mats and an alpine lake
Betaproteobacterium (99% identity, AJ867919).
The number of predicted phylotypes (SChao1) in the 4.8-m
ice habitat was 133 (supplementary Fig. S3). The complete
sequenced library represented �50% of the phylotypes
predicted to exist in the environment. Coverage estimates
(CACE) indicated that the proportion of sequences from
relatively rare phylotypes (with o 10 clones) that occurred
more than once in the library was c. 63%. The 15.9-m library
had substantially lower richness estimates (predicted SChao1
was 48) and higher coverage estimates (CACE was c. 83%).
The library represented �75% of the number of phylotypes
predicted to exist in the environment.
Unique phylotypes (near-full length) were grouped by
taxonomic distribution based on the closest identified neigh-
bor in GenBank (Table 3). Bacteria grouped within at least 10
different phyla at 4.8 m. Actinobacteria dominated the clone
library from 4.8 m (42% of clone sequences). The library also
contained many Bacteroidetes (13%), Gammaproteobacteria
(10%) and Cyanobacteria (8%) sequences. Four phylotypes
were most closely related to eukaryal plastid sequences
including three Bacillariophytes and one Chlorophyte. Ap-
proximately 36% of the sequences had the highest identities
to phylotypes isolated from polar or glacial environments and
5% had the highest identities to phylotypes from marine
environments (sea ice, sea water or marine sediments).
Table 2. Affiliation of eukaryal denaturing gradient gel band sequences in the Lake Vida ice cover (see supplementary Fig. S1)
Taxonomic group 18S rRNA gene identification (accession no.)� % identity Band name (accession no.)w Band no. Sample depth (m)
Apicomplexa Colpodella edax (AY234843) 99 PT_ANTLV_26 (DQ521454) 26 6.9
Bacillariophyta Navicula atomus var. permitis (AJ867024) 98 PT_ANTLV_33 (DQ521452) 33 4.8
Cercozoa Uncultured rhizosphere cercozoan (AJ506034) 94 PT_ANTLV_27 (DQ521455) 27 6.9
Chlorophyta Chlamydomonas incerta (AY781664) 100 PT_ANTLV_25 (DQ521463) 25 11.8
Chlorella sp. (AF514413) 100 PT_ANTLV_37 (DQ521457) 37 4.8
Chlorella sp. Pic 9/21 P-1w (AY197630) 100 PT_ANTLV_31 (DQ521464) 31 6.9
100 PT_ANTLV_11 (DQ521459) 11 15.9
Uncultured Chlorophyta (AY180047) 100 PT_ANTLV_05 (DQ521458) 5 15.9
Chrysophyceae Uncultured chrysophyte (DQ104087) 100 PT_ANTLV_15 (DQ521453) 15 14.7
100 PT_ANTLV_06 (DQ521456) 6 15.9
Chytridiomycota Rhizophydium sp. UGA-F1 (AF164265) 95 PT_ANTLV_22 (DQ521461) 22 11.8
Uncultured chytridiomycete (AF372719) 98 PT_ANTLV_14 (DQ521460) 14 11.8
Ciliophora Frontonia sp. (AF255359) 97 PT_ANTLV_34 (DQ521465) 34 4.8
Paramecium calkinsi (AF100310) 96 PT_ANTLV_36 (DQ521466) 36 4.8
Unidentified Uncultured fungus (AY821997) 97 PT_ANTLV_23 (DQ521462) 23 11.8
�Closest identified neighbor in the NCBI nr database.wFrom direct PCR amplification of acrylamide bands.
FEMS Microbiol Ecol 59 (2007) 274–288c� 2006 Federation of European Microbiological SocietiesPublished by Blackwell Publishing Ltd. All rights reserved
278 A.C. Mosier et al.
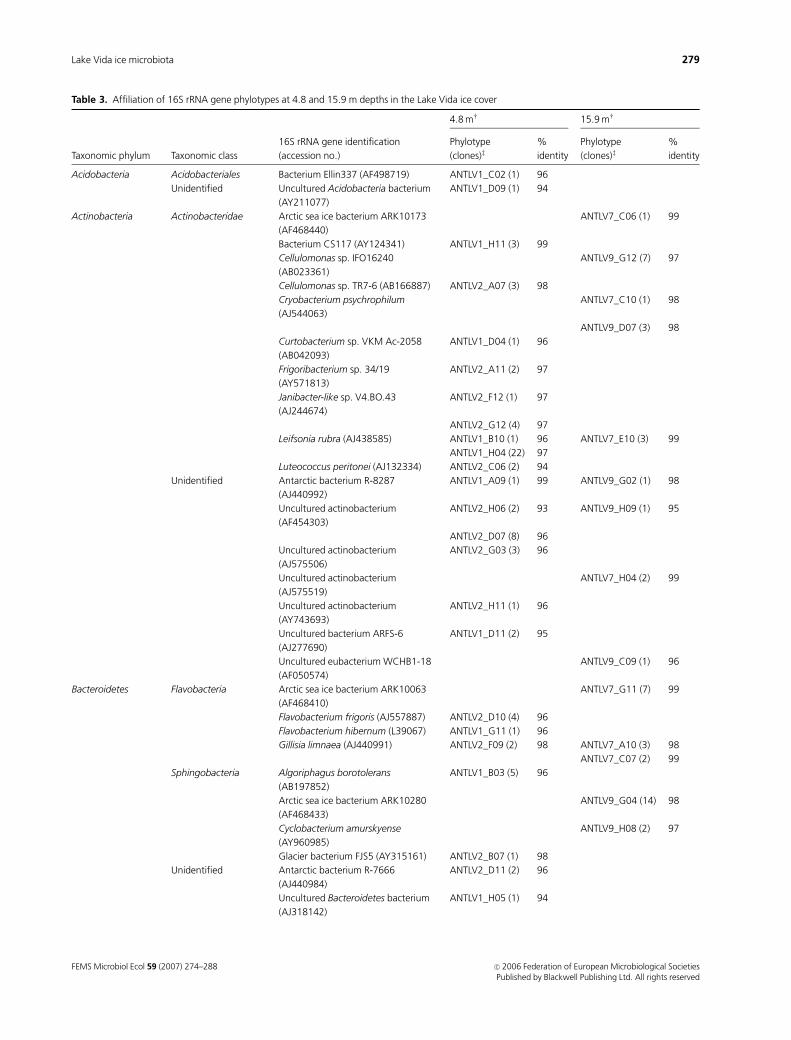
Table 3. Affiliation of 16S rRNA gene phylotypes at 4.8 and 15.9 m depths in the Lake Vida ice cover
Taxonomic phylum Taxonomic class
16S rRNA gene identification
(accession no.)�
4.8 mw 15.9 mw
Phylotype
(clones)z%
identity
Phylotype
(clones)z%
identity
Acidobacteria Acidobacteriales Bacterium Ellin337 (AF498719) ANTLV1_C02 (1) 96
Unidentified Uncultured Acidobacteria bacterium
(AY211077)
ANTLV1_D09 (1) 94
Actinobacteria Actinobacteridae Arctic sea ice bacterium ARK10173
(AF468440)
ANTLV7_C06 (1) 99
Bacterium CS117 (AY124341) ANTLV1_H11 (3) 99
Cellulomonas sp. IFO16240
(AB023361)
ANTLV9_G12 (7) 97
Cellulomonas sp. TR7-6 (AB166887) ANTLV2_A07 (3) 98
Cryobacterium psychrophilum
(AJ544063)
ANTLV7_C10 (1) 98
ANTLV9_D07 (3) 98
Curtobacterium sp. VKM Ac-2058
(AB042093)
ANTLV1_D04 (1) 96
Frigoribacterium sp. 34/19
(AY571813)
ANTLV2_A11 (2) 97
Janibacter-like sp. V4.BO.43
(AJ244674)
ANTLV2_F12 (1) 97
ANTLV2_G12 (4) 97
Leifsonia rubra (AJ438585) ANTLV1_B10 (1) 96 ANTLV7_E10 (3) 99
ANTLV1_H04 (22) 97
Luteococcus peritonei (AJ132334) ANTLV2_C06 (2) 94
Unidentified Antarctic bacterium R-8287
(AJ440992)
ANTLV1_A09 (1) 99 ANTLV9_G02 (1) 98
Uncultured actinobacterium
(AF454303)
ANTLV2_H06 (2) 93 ANTLV9_H09 (1) 95
ANTLV2_D07 (8) 96
Uncultured actinobacterium
(AJ575506)
ANTLV2_G03 (3) 96
Uncultured actinobacterium
(AJ575519)
ANTLV7_H04 (2) 99
Uncultured actinobacterium
(AY743693)
ANTLV2_H11 (1) 96
Uncultured bacterium ARFS-6
(AJ277690)
ANTLV1_D11 (2) 95
Uncultured eubacterium WCHB1-18
(AF050574)
ANTLV9_C09 (1) 96
Bacteroidetes Flavobacteria Arctic sea ice bacterium ARK10063
(AF468410)
ANTLV7_G11 (7) 99
Flavobacterium frigoris (AJ557887) ANTLV2_D10 (4) 96
Flavobacterium hibernum (L39067) ANTLV1_G11 (1) 96
Gillisia limnaea (AJ440991) ANTLV2_F09 (2) 98 ANTLV7_A10 (3) 98
ANTLV7_C07 (2) 99
Sphingobacteria Algoriphagus borotolerans
(AB197852)
ANTLV1_B03 (5) 96
Arctic sea ice bacterium ARK10280
(AF468433)
ANTLV9_G04 (14) 98
Cyclobacterium amurskyense
(AY960985)
ANTLV9_H08 (2) 97
Glacier bacterium FJS5 (AY315161) ANTLV2_B07 (1) 98
Unidentified Antarctic bacterium R-7666
(AJ440984)
ANTLV2_D11 (2) 96
Uncultured Bacteroidetes bacterium
(AJ318142)
ANTLV1_H05 (1) 94
FEMS Microbiol Ecol 59 (2007) 274–288 c� 2006 Federation of European Microbiological SocietiesPublished by Blackwell Publishing Ltd. All rights reserved
279Lake Vida ice microbiota
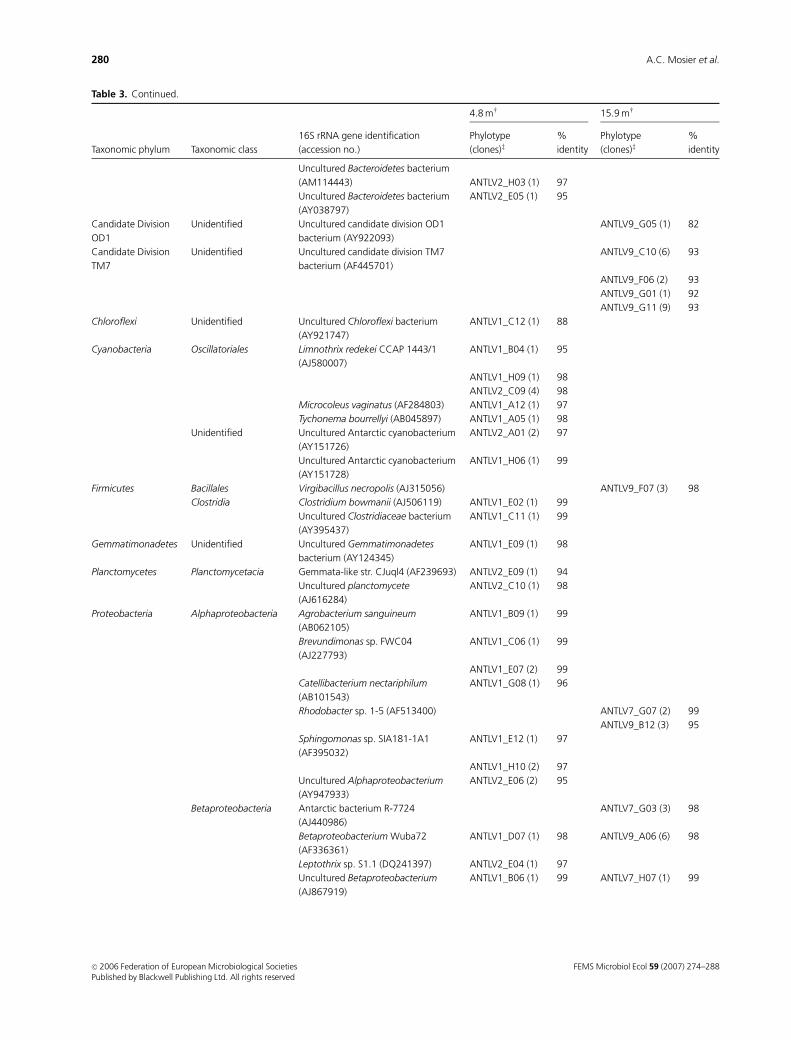
Table 3. Continued.
Taxonomic phylum Taxonomic class
16S rRNA gene identification
(accession no.)�
4.8 mw 15.9 mw
Phylotype
(clones)z%
identity
Phylotype
(clones)z%
identity
Uncultured Bacteroidetes bacterium
(AM114443) ANTLV2_H03 (1) 97
Uncultured Bacteroidetes bacterium
(AY038797)
ANTLV2_E05 (1) 95
Candidate Division
OD1
Unidentified Uncultured candidate division OD1
bacterium (AY922093)
ANTLV9_G05 (1) 82
Candidate Division
TM7
Unidentified Uncultured candidate division TM7
bacterium (AF445701)
ANTLV9_C10 (6) 93
ANTLV9_F06 (2) 93
ANTLV9_G01 (1) 92
ANTLV9_G11 (9) 93
Chloroflexi Unidentified Uncultured Chloroflexi bacterium
(AY921747)
ANTLV1_C12 (1) 88
Cyanobacteria Oscillatoriales Limnothrix redekei CCAP 1443/1
(AJ580007)
ANTLV1_B04 (1) 95
ANTLV1_H09 (1) 98
ANTLV2_C09 (4) 98
Microcoleus vaginatus (AF284803) ANTLV1_A12 (1) 97
Tychonema bourrellyi (AB045897) ANTLV1_A05 (1) 98
Unidentified Uncultured Antarctic cyanobacterium
(AY151726)
ANTLV2_A01 (2) 97
Uncultured Antarctic cyanobacterium
(AY151728)
ANTLV1_H06 (1) 99
Firmicutes Bacillales Virgibacillus necropolis (AJ315056) ANTLV9_F07 (3) 98
Clostridia Clostridium bowmanii (AJ506119) ANTLV1_E02 (1) 99
Uncultured Clostridiaceae bacterium
(AY395437)
ANTLV1_C11 (1) 99
Gemmatimonadetes Unidentified Uncultured Gemmatimonadetes
bacterium (AY124345)
ANTLV1_E09 (1) 98
Planctomycetes Planctomycetacia Gemmata-like str. CJuql4 (AF239693) ANTLV2_E09 (1) 94
Uncultured planctomycete
(AJ616284)
ANTLV2_C10 (1) 98
Proteobacteria Alphaproteobacteria Agrobacterium sanguineum
(AB062105)
ANTLV1_B09 (1) 99
Brevundimonas sp. FWC04
(AJ227793)
ANTLV1_C06 (1) 99
ANTLV1_E07 (2) 99
Catellibacterium nectariphilum
(AB101543)
ANTLV1_G08 (1) 96
Rhodobacter sp. 1-5 (AF513400) ANTLV7_G07 (2) 99
ANTLV9_B12 (3) 95
Sphingomonas sp. SIA181-1A1
(AF395032)
ANTLV1_E12 (1) 97
ANTLV1_H10 (2) 97
Uncultured Alphaproteobacterium
(AY947933)
ANTLV2_E06 (2) 95
Betaproteobacteria Antarctic bacterium R-7724
(AJ440986)
ANTLV7_G03 (3) 98
Betaproteobacterium Wuba72
(AF336361)
ANTLV1_D07 (1) 98 ANTLV9_A06 (6) 98
Leptothrix sp. S1.1 (DQ241397) ANTLV2_E04 (1) 97
Uncultured Betaproteobacterium
(AJ867919)
ANTLV1_B06 (1) 99 ANTLV7_H07 (1) 99
FEMS Microbiol Ecol 59 (2007) 274–288c� 2006 Federation of European Microbiological SocietiesPublished by Blackwell Publishing Ltd. All rights reserved
280 A.C. Mosier et al.
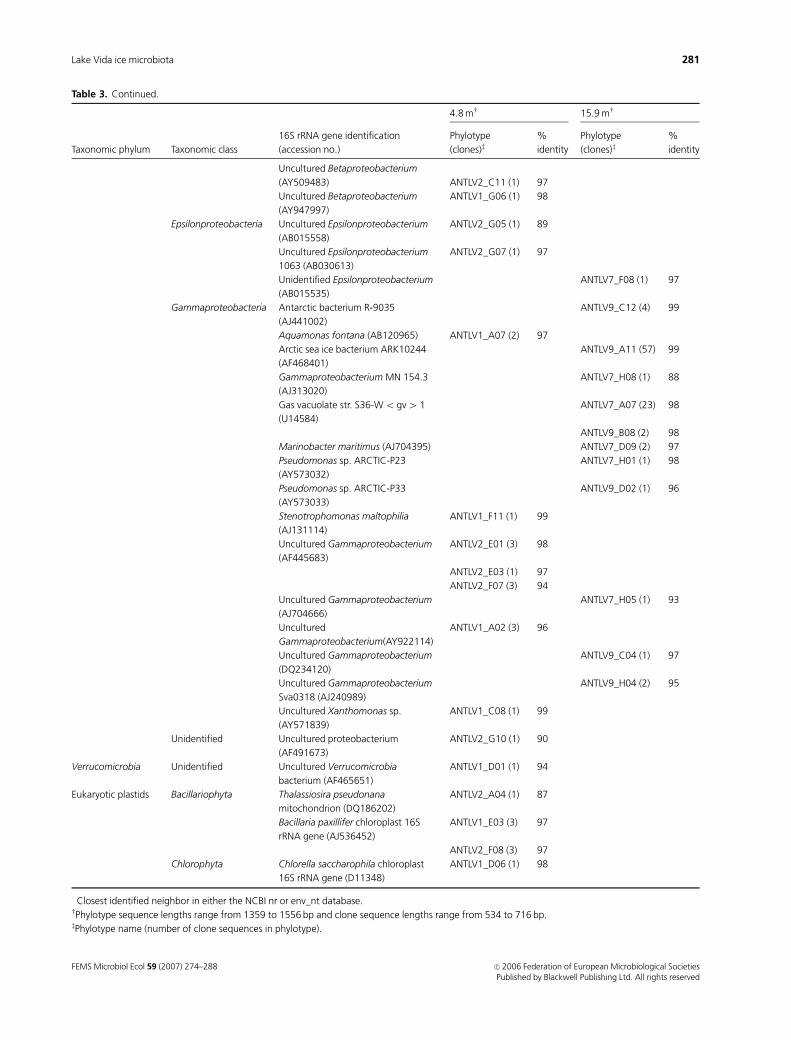
Table 3. Continued.
Taxonomic phylum Taxonomic class
16S rRNA gene identification
(accession no.)�
4.8 mw 15.9 mw
Phylotype
(clones)z%
identity
Phylotype
(clones)z%
identity
Uncultured Betaproteobacterium
(AY509483) ANTLV2_C11 (1) 97
Uncultured Betaproteobacterium
(AY947997)
ANTLV1_G06 (1) 98
Epsilonproteobacteria Uncultured Epsilonproteobacterium
(AB015558)
ANTLV2_G05 (1) 89
Uncultured Epsilonproteobacterium
1063 (AB030613)
ANTLV2_G07 (1) 97
Unidentified Epsilonproteobacterium
(AB015535)
ANTLV7_F08 (1) 97
Gammaproteobacteria Antarctic bacterium R-9035
(AJ441002)
ANTLV9_C12 (4) 99
Aquamonas fontana (AB120965) ANTLV1_A07 (2) 97
Arctic sea ice bacterium ARK10244
(AF468401)
ANTLV9_A11 (57) 99
Gammaproteobacterium MN 154.3
(AJ313020)
ANTLV7_H08 (1) 88
Gas vacuolate str. S36-Wo gv4 1
(U14584)
ANTLV7_A07 (23) 98
ANTLV9_B08 (2) 98
Marinobacter maritimus (AJ704395) ANTLV7_D09 (2) 97
Pseudomonas sp. ARCTIC-P23
(AY573032)
ANTLV7_H01 (1) 98
Pseudomonas sp. ARCTIC-P33
(AY573033)
ANTLV9_D02 (1) 96
Stenotrophomonas maltophilia
(AJ131114)
ANTLV1_F11 (1) 99
Uncultured Gammaproteobacterium
(AF445683)
ANTLV2_E01 (3) 98
ANTLV2_E03 (1) 97
ANTLV2_F07 (3) 94
Uncultured Gammaproteobacterium
(AJ704666)
ANTLV7_H05 (1) 93
Uncultured
Gammaproteobacterium(AY922114)
ANTLV1_A02 (3) 96
Uncultured Gammaproteobacterium
(DQ234120)
ANTLV9_C04 (1) 97
Uncultured Gammaproteobacterium
Sva0318 (AJ240989)
ANTLV9_H04 (2) 95
Uncultured Xanthomonas sp.
(AY571839)
ANTLV1_C08 (1) 99
Unidentified Uncultured proteobacterium
(AF491673)
ANTLV2_G10 (1) 90
Verrucomicrobia Unidentified Uncultured Verrucomicrobia
bacterium (AF465651)
ANTLV1_D01 (1) 94
Eukaryotic plastids Bacillariophyta Thalassiosira pseudonana
mitochondrion (DQ186202)
ANTLV2_A04 (1) 87
Bacillaria paxillifer chloroplast 16S
rRNA gene (AJ536452)
ANTLV1_E03 (3) 97
ANTLV2_F08 (3) 97
Chlorophyta Chlorella saccharophila chloroplast
16S rRNA gene (D11348)
ANTLV1_D06 (1) 98
�Closest identified neighbor in either the NCBI nr or env_nt database.wPhylotype sequence lengths range from 1359 to 1556 bp and clone sequence lengths range from 534 to 716 bp.zPhylotype name (number of clone sequences in phylotype).
FEMS Microbiol Ecol 59 (2007) 274–288 c� 2006 Federation of European Microbiological SocietiesPublished by Blackwell Publishing Ltd. All rights reserved
281Lake Vida ice microbiota

Sequences in the 15.9-m library grouped within six
different bacterial phyla. The library was dominated by
Gammaproteobacteria (52% of clone sequences). The library
also contained many Bacteroidetes (15%), Actinobacteria
(11%), and sequences from the candidate division TM7
(10%). Approximately 72% of the sequences from the 15.9-
m library had the highest identities to phylotypes isolated
from polar or glacial environments, including Arctic and
Antarctic sea ice (Gosink & Staley, 1995; Brinkmeyer et al.,
2003), Antarctic microbial mats (Van Trappen et al., 2002),
and an Antarctic pond (Reddy et al., 2003). Roughly 65% of
the sequences had the highest identities to phylotypes from
marine environments.
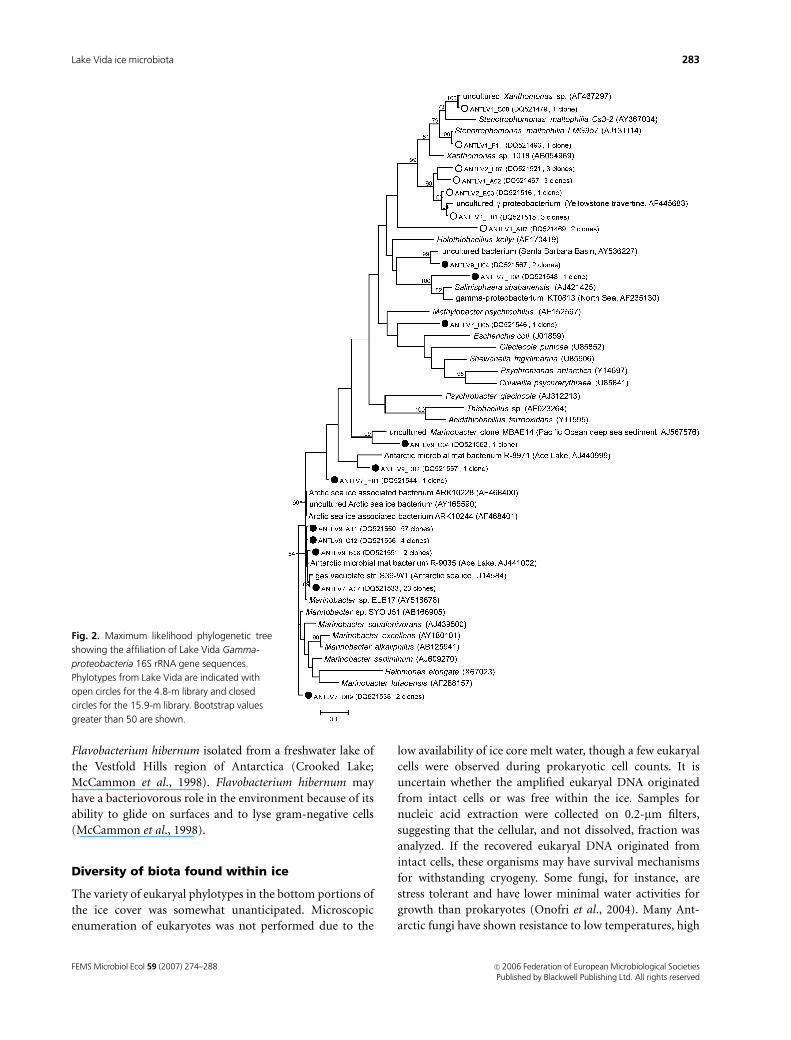
Gammaproteobacteria and Actinobacteriaphylogeny
Phylogenetic trees were constructed from Lake Vida ice-
associated Gammaproteobacteria and Actinobacteria 16S
rRNA gene sequences based on maximum likelihood analy-
sis. Many 15.9-m ice Gammaproteobacteria phylogenetically
clustered with sequences from Antarctic and Arctic environ-
ments (Fig. 2), including an Antarctic Marinobacter isolate
from Lake Bonney that is psychrophilic, moderately halo-
philic, and capable of denitrification (Marinobacter sp.
ELB17, Ward & Priscu, 1997). Sequences from the 4.8-m
library were phylogenetically distinct from the 15.9-m
sequences and were more closely related to Xanthomonas
and Stenotrophomonas sequences.
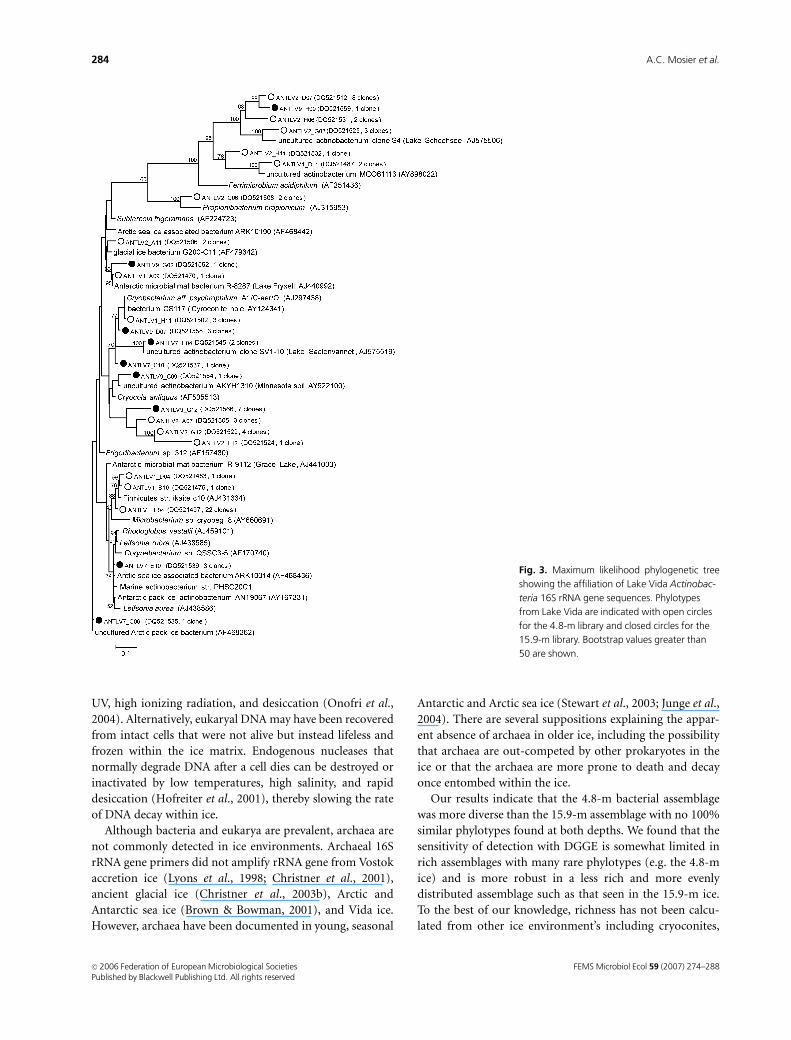
The Lake Vida ice-associated actinobacterial 16S rRNA
gene sequences grouped with a broad range of distantly
related clusters (Fig. 3). Phylotypes from the 4.8- and 15.9-
m libraries clustered closely with each other in several cases.
Many of the Actinobacteria from Lake Vida ice shared close
relationships with other Arctic and Antarctic organisms,
including organisms associated with Antarctic microbial
mats (from Lake Fryxell and Grace Lake) and polar sea ice.
Several phylotypes were phylogenetically related to the
Antarctic psychrophile Leifsonia rubra (AJ438585, Reddy
et al., 2003), including the three phylotypes (representing
26 clones) with L. rubra as their nearest identified neighbor
in GenBank. This group also contained the marine actino-
bacterium PHSC20C (Murray et al., 2006) and represents a
cold-adapted lineage found in both marine and freshwater
environments.
Discussion
Distribution of Lake Vida biota
Bacterial numbers in the Lake Vida ice were comparable
to data obtained from other studies of microorganisms
in ice. Total bacterial cell counts in the Vida ice core
(0.12� 106–2� 106 cells mL�1) are comparable to those
found in many polar environments, including cryoconite
holes (C.H. Fritsen, pers. commun.), Arctic sea ice (e.g.
Junge et al., 2002; Brinkmeyer et al., 2003), Antarctic sea ice
(e.g. Helmke & Weyland, 1995; Gowing et al., 2004), and the
ice covers and water columns (Ward & Priscu, 1997; Priscu
et al., 1998, respectively) of perennially ice-covered lakes.
The Lake Vida total bacterial cell counts were orders of
magnitude higher than bacterial numbers (102–103) in Lake
Vostok accretion ice (Karl et al., 1999; Priscu et al., 1999),
which is covered by several thousand meters of glacial ice.
Lake Vida ice and Greenland ice (Sheridan et al., 2003;
Miteva & Brenchley, 2005) cells were similar in size
(o 0.1 mm3). These small cell sizes may be an adaptation to
stresses induced within the ice (Fogg, 1998), including
nutrient limitation via reductive cell division or adaptation
to oligotrophy.
Putative activity
The 16S rRNA gene similarity of many Vida sequences (178)
and isolates (e.g. seven that are related to Cryobacterium
psychrophilum; data not shown) to organisms isolated from
polar or glacial environments is not direct evidence for in
situ activity. However, a previous study reported detectable
primary production and thymidine incorporation in ice
melt water throughout a 15-m Lake Vida ice core with the
highest rates in the upper 4 m (Doran et al., 2003). The
abundance of chlorophyll a at 4.8 m and presence of
cyanobacteria at 4.8 and 6.9 m (as evidenced by representa-
tion in the 4.8-m clone library and culturing; data not
shown) supports the potential for photoautotrophic pri-
mary production above 6.9 m in the ice cover. In ice covers,
photosynthetically available radiation is attenuated by high
gas bubble density and entrained sediment (McKay et al.,
1994; Fritsen & Priscu, 1999). This does not necessarily mean
that the phototrophic cells are inactive. Light saturation of
photosynthesis occurs at low irradiances (30mmol photo-
ns m�2 s�3) within Lake Bonney (Neale & Priscu, 1998) and
phytoplankton exhibit mixotrophy in Lake Fryxell and Lake
Hoare (Roberts & Laybourn-Parry, 1999; Marshall & Lay-
bourn-Parry, 2002). Thus, phototrophs in Lake Vida ice may
photosynthesize below 6 m in low light conditions or may
exhibit heterotrophy.
Bacteroidetes was one of the most abundant groups in
both of the Lake Vida ice clone libraries and may be major
contributors of heterotrophic activity in the ice cover.
Bacteroidetes play an important role in remineralization
processes in aquatic systems (Kirchman, 2002) and may also
be important in ice systems. Some Bacteroidetes can utilize
cellulose, chitin, DNA, lipids, or proteins that would be
trapped within the ice after cell decay. Many of the Vida
sequences had nearest identified neighbors to Bacteroidetes
from polar environments, including the psychrotroph
FEMS Microbiol Ecol 59 (2007) 274–288c� 2006 Federation of European Microbiological SocietiesPublished by Blackwell Publishing Ltd. All rights reserved
282 A.C. Mosier et al.
Flavobacterium hibernum isolated from a freshwater lake of
the Vestfold Hills region of Antarctica (Crooked Lake;
McCammon et al., 1998). Flavobacterium hibernum may
have a bacteriovorous role in the environment because of its
ability to glide on surfaces and to lyse gram-negative cells
(McCammon et al., 1998).
Diversity of biota found within ice
The variety of eukaryal phylotypes in the bottom portions of
the ice cover was somewhat unanticipated. Microscopic
enumeration of eukaryotes was not performed due to the
low availability of ice core melt water, though a few eukaryal
cells were observed during prokaryotic cell counts. It is
uncertain whether the amplified eukaryal DNA originated
from intact cells or was free within the ice. Samples for
nucleic acid extraction were collected on 0.2-mm filters,
suggesting that the cellular, and not dissolved, fraction was
analyzed. If the recovered eukaryal DNA originated from
intact cells, these organisms may have survival mechanisms
for withstanding cryogeny. Some fungi, for instance, are
stress tolerant and have lower minimal water activities for
growth than prokaryotes (Onofri et al., 2004). Many Ant-
arctic fungi have shown resistance to low temperatures, high
Fig. 2. Maximum likelihood phylogenetic tree
showing the affiliation of Lake Vida Gamma-
proteobacteria 16S rRNA gene sequences.
Phylotypes from Lake Vida are indicated with
open circles for the 4.8-m library and closed
circles for the 15.9-m library. Bootstrap values
greater than 50 are shown.
FEMS Microbiol Ecol 59 (2007) 274–288 c� 2006 Federation of European Microbiological SocietiesPublished by Blackwell Publishing Ltd. All rights reserved
283Lake Vida ice microbiota
UV, high ionizing radiation, and desiccation (Onofri et al.,
2004). Alternatively, eukaryal DNA may have been recovered
from intact cells that were not alive but instead lifeless and
frozen within the ice matrix. Endogenous nucleases that
normally degrade DNA after a cell dies can be destroyed or
inactivated by low temperatures, high salinity, and rapid
desiccation (Hofreiter et al., 2001), thereby slowing the rate
of DNA decay within ice.
Although bacteria and eukarya are prevalent, archaea are
not commonly detected in ice environments. Archaeal 16S
rRNA gene primers did not amplify rRNA gene from Vostok
accretion ice (Lyons et al., 1998; Christner et al., 2001),
ancient glacial ice (Christner et al., 2003b), Arctic and
Antarctic sea ice (Brown & Bowman, 2001), and Vida ice.
However, archaea have been documented in young, seasonal
Antarctic and Arctic sea ice (Stewart et al., 2003; Junge et al.,
2004). There are several suppositions explaining the appar-
ent absence of archaea in older ice, including the possibility
that archaea are out-competed by other prokaryotes in the
ice or that the archaea are more prone to death and decay
once entombed within the ice.
Our results indicate that the 4.8-m bacterial assemblage
was more diverse than the 15.9-m assemblage with no 100%
similar phylotypes found at both depths. We found that the
sensitivity of detection with DGGE is somewhat limited in
rich assemblages with many rare phylotypes (e.g. the 4.8-m
ice) and is more robust in a less rich and more evenly
distributed assemblage such as that seen in the 15.9-m ice.
To the best of our knowledge, richness has not been calcu-
lated from other ice environment’s including cryoconites,
Fig. 3. Maximum likelihood phylogenetic tree
showing the affiliation of Lake Vida Actinobac-
teria 16S rRNA gene sequences. Phylotypes
from Lake Vida are indicated with open circles
for the 4.8-m library and closed circles for the
15.9-m library. Bootstrap values greater than
50 are shown.
FEMS Microbiol Ecol 59 (2007) 274–288c� 2006 Federation of European Microbiological SocietiesPublished by Blackwell Publishing Ltd. All rights reserved
284 A.C. Mosier et al.
glacial ice, permanent lake ice, and sea ice. Richness esti-
mates calculated for the water column of Lake Bonney based
on unique restriction fragment length polymorphism
(RFLP) patterns (20–392 phylotypes; Glatz et al., 2006) were
within the range seen in the Vida ice libraries. Richness
estimates were also calculated for low temperature marine
sediments: 541-1128 phylotypes in Antarctic sediments
from the continental shelf (Bowman & McCuaig, 2003) and
2716 phylotypes in Arctic marine sediments (Kemp & Aller,
2004a, b). As expected, richness for the Vida libraries is low
in comparison with sediment environments.
PCR biases (Reysenbach et al., 1992; Suzuki & Giovanno-
ni, 1996; Suzuki et al., 1998) and multiple rRNA gene copies
per cell (Klappenbach et al., 2000) can affect the distribution
and relative frequency of phylotypes within clone libraries.
Therefore, the abundance of Gammaproteobacteria (c. 50%
of the sequences) in the 15.9-m Vida clone library elicits
guarded interpretation (as does the relative abundance data
for both libraries). It is also important to note that the Vida
15.9-m library was estimated to have a high percent coverage
of the natural community – roughly 70% of the community
was described with only 50 clone sequences. Though the
Vida 16S rRNA gene clone libraries are potentially subject to
biases, Gammaproteobacteria were also abundant in several
other polar studies, including Arctic (Junge et al., 2002;
Brinkmeyer et al., 2003) and Antarctic sea ice (Bowman
et al., 1997; Brinkmeyer et al., 2003) and the water column
of Lake Bonney (Glatz et al., 2006). These data suggest that
certain Gammaproteobacteria (e.g. Colwellia and Marino-
bacter) are common among these habitats.
Bacteria isolated from ice cores have likely endured a
number of environmental stresses (including freezing, de-
siccation, and starvation). Therefore, spore-forming bacter-
ia are expected to be present in large numbers in ice
environments. Interestingly, the Vida ice clone libraries had
only a few representatives of known endospore-forming
genera (two phylotypes at 4.8 m and one at 15.9 m). How-
ever, both of the libraries contained many Actinobacteria-
related (high G1C, gram positives) sequences (�25% of
unique phylotypes detected in each library). Similar trends
were also seen in a Greenland glacier (Sheridan et al., 2003;
Miteva et al., 2004) and an Antarctic cryoconite hole
(Christner et al., 2003a). Willerslev et al. (2004) showed that
Actinobacteria outlast low G1C gram-positive and gram-
negative cells in old permafrost, shifting from c. 30% to
100% of the taxonomic distribution of clones after
300 000–600 000 years. They concluded that this group has
survival mechanisms that are not fully understood at this
point but which may include transition to resting forms
with low level metabolic activity (i.e. anabiosis; Mulyukin
et al., 2001). The 15.9-m library also had many representa-
tives of candidate division TM7, which contain gram-
positive cell envelopes (Hugenholtz et al., 2001).
Source and origin
While a few taxa may be ubiquitous in the Lake Vida ice
cover (e.g. Chlorella sp. as evident by the universal eukaryal
DGGE band), the low DGGE pairwise similarities between
the depths and the depth-specific phylotypes are indicative
of differences in ice habitability (i.e. the ability of the
physical-chemical environment within the ice to sustain
life) or organismal origin in the upper and lower portions
of ice cover. The source of the organisms in the upper ice is
thought to be a combination of modern aeolian deposition
and glacial melt water that flows through streams and
sediments before flooding the ice cover. Thus, it is not
surprising that the biotic community in the 4.8-m ice
contains many bacteria and eukarya that have high simila-
rities to organisms from soil and freshwater habitats.
The bottom of the Vida ice cover is likely to have
fluctuated through periods of melting and freezing over the
2800-year period of its presumed existence. Cycling of the
thickness and mass of the ice cover is likely controlled by
winter and summer fluctuations that determine the net
annual mean temperature at the bottom of the ice cover.
Despite the present-day seasonal fluctuations, thermody-
namic modeling suggests a net annual accretion of ice (Doran
et al., 2003). Net accretions at the bottom further imply that
ice near the bottom is expected to be of lake water origin. The
significant increase in chloride concentrations in the 15.9-m
ice (Doran et al., 2003) supports the notion that this ice
formed at or in the transition from a freshwater water column
to one with higher dissolved salts (Doran et al., 2003). If the
15.9-m ice did indeed form from the water column of the
lake, the biota found in the deep ice may also be present in the
lake itself, including a diverse array of bacteria and eukar-
yotes. The high percentage (�65%) of clone sequences in the
15.9-m library with the highest identities to sequences from
marine environments (compared to only �5% at 4.8 m)
suggests that these organisms may be able to sustain activity
or viability within the high salinity of the water column.
Christner et al. (2001) suggest that organisms found in
the Lake Vostok (Antarctica) accretion ice regularly seed the
water column of the lake. Similarly, the organisms found at
the bottom of the Vida ice cover may seed the water column
during periods of ice melt. The population of microorgan-
isms existing within the deep ice has the potential to seed the
underlying brine pocket of Lake Vida during periods of
bottom-ice ablation. Thus, a dynamic exchange of biota may
occur between the water column and deep ice during
melting and freezing cycles at the bottom of the ice cover,
where the lake water and ice are both seeds and sinks.
Conclusion
A diverse range of bacteria and eukarya are present at all
depths in the Lake Vida ice cover. The conundrum of
FEMS Microbiol Ecol 59 (2007) 274–288 c� 2006 Federation of European Microbiological SocietiesPublished by Blackwell Publishing Ltd. All rights reserved
285Lake Vida ice microbiota
whether these organisms are active within the ice has not
been solved. The data suggest that there are differences in ice
habitability or organismal origin in the upper and lower
portions of the ice cover. We suggest that the 4.8-m ice
community has a terrestrial origin (e.g. McMurdo Dry
Valleys soil and freshwater) and that the 15.9-m community
has likely been derived from the water column. A dynamic
exchange of biota may occur between the water column and
deep ice when the bottom of the ice cover melts or freezes.
The Lake Vida water column may be a refuge from the harsh
environmental conditions within the McMurdo Dry Valleys.
Acknowledgements
This work was supported by: Nevada Space Grant Consor-
tium, Desert Research Institute Research Foundation, NASA
ASTEP (Grant NAG5-12889), NASA EPSCoR (Grant
NCC5-583), NSF LExEN (Grant OPP-9814972), and NSF
Office of Polar Programs. We would like to thank B. Carter
and J. Grzymski for their assistance during stages of this
research as well as P. Doran and J. Priscu for providing the
initial efforts in obtaining the Lake Vida ice core.
References
Altschul SF, Madden TL, Schaffer AA, Zhang JH, Zhang Z, Miller
W & Lipman DJ (1997) Gapped BLAST and PSI-BLAST: a new
generation of protein database search programs. Nucleic Acids
Res 25: 3389–3402.
Bowman JP & McCuaig RD (2003) Biodiversity, community
structural shifts, and biogeography of prokaryotes within
Antarctic continental shelf sediment. Appl Environ Microbiol
69: 2463–2483.
Bowman JP, McCammon SA, Brown MV, Nichols DS &
McMeekin TA (1997) Diversity and association of
psychrophilic bacteria in Antarctic sea ice. Appl Environ
Microbiol 63: 3068–3078.
Brinkmeyer R, Knittel K, Jurgens J, Weyland H, Amann R &
Helmke E (2003) Diversity and structure of bacterial
communities in arctic versus antarctic pack ice. Appl Environ
Microbiol 69: 6610–6619.
Brown MV & Bowman JP (2001) A molecular phylogenetic
survey of sea-ice microbial communities (SIMCO). FEMS
Microbiol Ecol 35: 267–275.
Calkin PE & Bull C (1967) Lake Vida, Victoria Valley Antarctica.
J Glaciol 6: 833–836.
Chao A (1984) Nonparametric-estimation of the number of
classes in a population. Scand J Stat 11: 265–270.
Chao A (1987) Estimating the population-size for capture
recapture data with unequal catchability. Biometrics 43:
783–791.
Chao A, Ma MC & Yang MCK (1993) Stopping rules and
estimation for recapture debugging with unequal failure rates.
Biometrika 80: 193–201.
Christner BC, Mosley-Thompson E, Thompson LG & Reeve JN
(2001) Isolation of bacteria and 16S rDNA’s from Lake Vostok
accretion ice. Environ Microbiol 3: 570–577.
Christner BC, Kvitko BH & Reeve JN (2003a) Molecular
identification of Bacteria and Eukarya inhabiting an Antarctic
cryoconite hole. Extremophiles 7: 117–183.
Christner BC, Mosley-Thompson E, Thompson LG & Reeve JN
(2003b) Bacterial recovery from ancient glacial ice. Environ
Microbiol 5: 433–436.
Cole JR, Chai B, Marsh TL et al. (2003) The Ribosomal Database
Project (RDP-II): previewing a new autoaligner that allows
regular updates and the new prokaryotic taxonomy. Nucleic
Acids Res 31: 442–443.
DeLong EF (1992) Archaea in coastal marine environments. Proc
Natl Acad Sci 89: 5685–5689.
Diez B, Pedros-Alio C, Marsh T & Massana R (2001) Application
of denaturing gradient gel electrophoresis (DGGE) to study
the diversity of marine picoeukaryotic assemblages and
comparison of DGGE with other molecular techniques. Appl
Environ Microbiol 67: 2942–2951.
Doran PT, Fritsen CF, McKay CP, Priscu JC & Adams EE (2003)
Formation and character of an ancient 19-m ice cover and
underlying trapped brine in an ‘‘ice-sealed’’ east Antarctic lake.
Proc Natl Acad Sci 100: 26–31.
Erlich HA, Gelfand D & Sninsky JJ (1991) Recent advances in the
polymerase chain-reaction. Science 252: 1643–1651.
Felsenstein J (1981) Evolutionary trees from DNA sequences: a
maximum likelihood approach. J Mol Evol 17: 368–376.
Fogg GE (1998) The Biology of Polar Habitats. Oxford University
Press, New York.
Fritsen CH & Priscu JC (1998) Cyanobacterial assemblages in
permanent ice covers on Antarctic lakes: distribution, growth
rate, and temperature response of photosynthesis. J Phycol 34:
587–597.
Fritsen CH & Priscu JC (1999) Seasonal change in the optical
properties of the permanent ice cover on Lake Bonney,
Antarctica: consequences for lake productivity and
phytoplankton dynamics. Limnol Oceanogr 44: 447–454.
Gast RJ, Dennett MR & Caron DA (2004) Characterization of
protistan assemblages in the Ross Sea, Antarctica, by
denaturing gradient gel electrophoresis. Appl Environ
Microbiol 70: 2028–2037.
Glatz RE, Lepp PW, Ward BB & Francis CA (2006) Planktonic
microbial community composition across steep physical/
chemical gradients in permanently ice-coverd Lake Bonney,
Antarctica. Geobiology 4: 53–67.
Gosink JJ & Staley JT (1995) Biodiversity of gas vacuolate bacteria
from Antarctic sea-ice and water. Appl Environ Microbiol 61:
3486–3489.
Gowing MM, Garrison DL, Gibson AH, Krupp JM, Jeffries MO &
Fritsen CH (2004) Bacterial and viral abundance in Ross Sea
summer pack ice communities. Mar Ecol Prog Ser 279: 3–12.
Helmke E & Weyland H (1995) Bacteria in sea-ice and underlying
water of the eastern Weddell Sea in midwinter. Mar Ecol Prog
Ser 117: 269–287.
FEMS Microbiol Ecol 59 (2007) 274–288c� 2006 Federation of European Microbiological SocietiesPublished by Blackwell Publishing Ltd. All rights reserved
286 A.C. Mosier et al.
Hobbie JE, Daley RJ & Jasper S (1977) Use of nucleopore filters
for counting bacteria by fluorescence microscopy. Appl
Environ Microbiol 33: 1225–1228.
Hofreiter M, Serre D, Poinar HN, Kuch M & Paabo S (2001)
Ancient DNA. Nat Rev Genet 2: 353–359.
Huber T, Faulkner G & Hugenholtz P (2004) Bellerophon: a
program to detect chimeric sequences in multiple sequence
alignments. Bioinformatics 20: 2317–2319.
Hugenholtz P, Tyson GW, Webb RI, Wagner AM & Blackall LL
(2001) Investigation of candidate division TM7, a recently
recognized major lineage of the domain bacteria with no
known pure-culture representatives. Appl Environ Microbiol
67: 411–419.
Junge K, Imhoff F, Staley T & Deming JW (2002) Phylogenetic
diversity of numerically important Arctic sea-ice bacteria at
subzero temperature. Microb Ecol 43: 315–328.
Junge K, Eicken H & Deming JW (2004) Bacterial activity at � 2
to � 20 degrees C in Arctic wintertime sea ice. Appl Environ
Microbiol 70: 550–557.
Kane MD, Poulsen LK & Stahl DA (1993) Monitoring the
enrichment and isolation of sulfate-reducing bacteria by using
oligonucleotide hybridization probes designed from
environmentally derived 16S rRNA sequences. Appl Environ
Microbiol 59: 682–686.
Karl DM, Bird DF, Bjorkman K, Houlihan T, Shackelford R &
Tupas L (1999) Microorganisms in the accreted ice of Lake
Vostok, Antarctica. Science 286: 2144–2147.
Kemp PF & Aller JY (2004a) Bacterial diversity in aquatic and
other environments: what 16S rDNA libraries can tell us.
FEMS Microbiol Ecol 47: 161–177.
Kemp PF & Aller JY (2004b) Estimating prokaryotic diversity:
When are 16S rDNA libraries large enough? Limnol Oceanogr:
Methods 2: 114–125.
Kirchman DL (2002) The ecology of Cytophaga-Flavobacteria in
aquatic environments. FEMS Microbiol Ecol 39: 91.
Klappenbach JA, Dunbar JM & Schmidt TM (2000) rRNA
operon copy number reflects ecological strategies of bacteria.
Appl Environ Microbiol 66: 1328–1333.
Lane DJ (1991) 16S/23S rRNA Sequencing (Stackebrandt E &
Goodfellow M, eds), pp. 130–141. Wiley Press, Chichester.
Lee SM & Chao A (1994) Estimating population-size via sample
coverage for closed capture-recapture models. Biometrics 50:
88–97.
Lin E, Caron D & DeLong E (1996) Development and field
application of a quantitative method for examining natural
assemblages of protists with oligonucleotide probes. Appl
Environ Microbiol 62: 1416–1423.
Lyons WB, Tyler SW, Wharton RA, McKnight DM & Vaughn BH
(1998) A late Holocene desiccation of Lake Hoare and Lake
Fryxell, McMurdo Dry Valleys, Antarctica. Antarct Sci 10:
247–256.
Marshall W & Laybourn-Parry J (2002) The balance between
photosynthesis and grazing in Antarctic mixotrophic
cryptophytes during summer. Freshwater Biol 47: 2060–2070.
Massana R, Murray AE, Preston CM & DeLong EF (1997) Vertical
distribution and phylogenetic characterization of marine
planktonic Archaea in the Santa Barbara Channel. Appl
Environ Microbiol 63: 50–56.
Matsumoto GI (1993) Geochemical Features of the McMurdo Dry
Valley Lakes, Antarctica, Vol. 59 (Green WJ & Friedmann EI,
eds), pp. 95–118. American Geophysical Union, Washington,
DC.
McCammon SA, Innes BH, Bowman JP, Franzmann PD, Dobson
SJ, Holloway PE, Skerratt JH, Nichols PD & Rankin LM (1998)
Flavobacterium hibernum sp. nov., a lactose-utilizing
bacterium from a freshwater Antarctic lake. Int J Syst Bacteriol
48: 1405.
McKay CP, Clow GD, Andersen DT & Wharton RAJ (1994) Light
transmission and reflection in perennially ice-covered Lake
Hoare, Antarctica. J Geophys Res 99: 20427–20444.
Miteva VI & Brenchley JE (2005) Detection and isolation of
ultrasmall microorganisms from a 120,000-year-old
Greenland glacier ice core. Appl Environ Microbiol 71:
7806–7818.
Miteva VI, Sheridan PP & Brenchley JE (2004) Phylogenetic and
physiological diversity of microorganisms isolated from a deep
Greenland glacier ice core. Appl Environ Microbiol 70:
202–213.
Mulyukin AL, Demkina EV, Kozlova AN, Soina VS & El’-Registan
GI (2001) Synthesis of anabiosis autoinducers by non-
sporeforming bacteria as a mechanism regulating their activity
in soil and subsoil sedimentary rocks. Microbiology 70:
535–541.
Murray AE, Hollibaugh JT & Orrego C (1996) Phylogenetic
compositions of bacterioplankton from two California
estuaries compared by denaturing gradient gel electrophoresis
of 16S rDNA fragments. Appl Environ Microbiol 2676–2680.
Murray A, Ferriera S, Johnson J et al. (2006) Marine
actinobacterium PHSC20C1 genome, direct GenBank
submission.
Muyzer G, de Waal EC & Uitterlinden AG (1993) Profiling of
complex microbial populations by denaturing gradient gel
electrophoresis analysis of polymerase chain reaction-
amplified genes coding for 16S rRNA. Appl Environ Microbiol
59: 695–700.
Neale PJ & Priscu JC (1998) Fluorescence Quenching in
Phytoplankton of the McMurdo Dry Valley Lakes (Antarctica):
Implications for the Structure and Function of the Photosynthetic
Apparatus, Vol. 72 (Priscu J, ed), pp. 241–253. American
Geophysical Union, Washington, DC.
Olsen GJ, Matsuda H, Hagstrom R & Overbeek R (1994)
fastDNAml: a tool for construction of phylogenetic trees of
DNA sequences using maximum likelihood. Comput Appl
Biosci 10: 41–48.
Onofri S, Selbmann L, Zucconi L & Pagano S (2004) Antarctic
microfungi as models for exobiology. Planet Space Sci 52:
229–237.
FEMS Microbiol Ecol 59 (2007) 274–288 c� 2006 Federation of European Microbiological SocietiesPublished by Blackwell Publishing Ltd. All rights reserved
287Lake Vida ice microbiota
Pospiech A & Neumann B (1995) A Versatile Quick-Prep of
Genomic DNA from Gram-Positive Bacteria. Trends Genet 11:
217–218.
Priscu JC, Fritsen CH, Adams EE, Giovannoni SJ, Paerl HW,
McKay CP, Doran PT, Gordon DA, Lanoil BD & Pinckney JL
(1998) Perennial Antarctic lake ice: an oasis for life in a polar
desert. Science 280: 2095–2098.
Priscu JC, Adams EE, Lyons WB et al. (1999) Geomicrobiology of
subglacial ice above Lake Vostok, Antarctica. Science 286:
2141–2144.
Reddy GSN, Prakash JSS, Srinivas R, Matsumoto GI & Shivaji S
(2003) Leifsonia rubra sp. nov. and Leifsonia aurea sp. nov.,
psychrophiles from a pond in Antarctica. Int J Syst Evol
Microbiol 53: 977–984.
Reysenbach AL, Giver LJ, Wickham GS & Pace NR (1992)
Differential Amplification of Ribosomal-RNA Genes by
Polymerase Chain-Reaction. Appl Environ Microbiol 58:
3417–3418.
Roberts EC & Laybourn-Parry J (1999) Mixotrophic
cryptophytes and their predators in the Dry Valley lakes of
Antarctica. Freshwater Biol 41: 737–746.
Sheridan PP, Miteva VI & Brenchley JE (2003) Phylogenetic
analysis of anaerobic psychrophilic enrichment cultures
obtained from a Greenland glacier ice core. Appl Environ
Microbiol 69: 2153–2160.
Simon M & Azam F (1989) Protein content and protein synthesis
rates of planktonic marine bacteria. Mar Ecol Prog Ser 51:
201–213.
Stackebrandt E & Brambilla E (2002) Life in Cold Lakes (Horneck
G & Baumstark-Khan C, eds), pp. 161–168. Springer, Berlin.
Stewart FJ, Fritsen CH, Murray AE & Carter BJ (2003) Prokaryotic
Diversity in Antarctic Sea Ice: Inter-Habitat Variability.
American Society of Limnology and Oceanography 2003 Aquatic
Sciences Meeting: The Earth’s Eyes: Aquatic Sciences Through
Space and Time. Salt Lake City, Utah.
Suzuki MT & Giovannoni SJ (1996) Bias caused by template
annealing in the amplification of mixtures of 16S rRNA genes
by PCR. Appl Environ Microbiol 62: 625–630.
Suzuki M, Rappe MS & Giovannoni SJ (1998) Kinetic bias in
estimates of coastal picoplankton community structure
obtained by measurements of small-subunit rRNA gene PCR
amplicon length heterogeneity. Appl Environ Microbiol 64:
4522–4529.
Takamatsu N, Kato N, Matsumoto GI & Torii T (1998) The
origins of salts in water bodies of the McMurdo Dry Valleys.
Antarct Sci 10: 439–448.
Van Trappen S, Mergaert J, Van Eygen S, Dawyndt P, Cnockaert
MC & Swings J (2002) Diversity of 746 heterotrophic bacteria
isolated from microbial mats from ten Antarctic lakes. Syst
Appl Microbiol 25: 603–610.
Voytek MA, Priscu JC & Ward BB (1999) The distribution and
relative abundance of ammonia-oxidizing bacteria in lakes of
the McMurdo Dry Valley, Antarctica. Hydrobiologia 401:
113–130.
Ward BB & Priscu JC (1997) Detection and characterization of
denitrifying bacteria from a permanently ice-covered Antarctic
lake. Hydrobiologia 347: 57–68.
Welschmeyer N (1994) Fluorometric analysis of chlorophyll a in
the presence of chlorophyll b and pheopigments. Limnol
Oceanogr 38: 1985–1992.
Wharton RAJ, McKay CP, Clow GD & Andersen DT (1993)
Perennial Ice Covers and their Influence on Antarctic Lake
Ecosystems, Vol. 59 (Green WJ & Friedmann EI, eds), pp.
53–70. American Geophysical Union, Washington, DC.
Willerslev E, Hansen AJ, Ronn R, Brand TB, Barnes I, Wiuf C,
Gilichinsky D, Mitchell D & Cooper A (2004) Long-term
persistence of bacterial DNA. Curr Biol 14: R9–R10.
Supplementarymaterial
The following supplementary material is available for this
article online.
Table S1. Eukaryal and bacterial DGGE profile pairwise
similarities (Sorenson’s index).
Fig. S1 Eukaryal 18S rRNA gene denaturing gradient
electrophoresis gel showing distribution of phylotypes at
different depths in the ice cover. Total number of bands per
sample (as determined by GelComparII and visually con-
firmed) listed at the bottom of each lane. Numbers to the
left of individual bands indicate bands that were excised and
sequenced. Arrow pointing to the only universal phylotype
(note low intensity in some samples).
Fig. S2 Bacterial 16S rRNA gene denaturing gradient
electrophoresis gel showing distribution of phylotypes at
different depths in the ice cover. Total number of bands per
sample (as determined by GelComparII and visually con-
firmed) listed at the bottom of each lane. Arrows pointing to
universal phylotypes (note low intensity in some samples).
Fig. S3 16S rRNA gene clone library richness and
coverage estimates. Predicted SChaol values (panel A) and
predicted CACE values (panel B) for the Lake Vida 4.8 m
(filled circles) and 15.9 m (open circles) clone libraries.
This material is available as part of the online article
from: http://www.blackwell-synergy.com/doi/abs/10.1111/
j.1574-6968.2006.00220.x (This link will take you to the
article abstract).
Please note: Blackwell Publishing are not responsible
for the content or functionality of any supplementary
materials supplied by the authors. Any queries (other than
missing material) should be directed to the corresponding
author for the article.
FEMS Microbiol Ecol 59 (2007) 274–288c� 2006 Federation of European Microbiological SocietiesPublished by Blackwell Publishing Ltd. All rights reserved
288 A.C. Mosier et al.


