Embed Size (px)
Citation preview
11th ITC Specialist Seminar on Multimedia and Nomadic Communications, Yokohama, Oct 27-29 1998 1
HTTP Interactions with TCP
Parag Pruthi, Ajit K. Jena, and Adrian Popescu �
Abstract
In this paper we describe our simulation models forevaluating end-to-end performance of HTTP transac-tions. We �rst analyze several gigabytes of collectedtra�c traces from a production Frame Relay network.Using these traces we extract web tra�c and ana-lyze the server web pages accessed by actual users.We analyze over 25000 web pages and develop a webclient/server interaction model based upon our analy-sis of many server contents. We make speci�c contribu-tions by analyzing the popularity of web servers and thenumber of bytes transferred from them during a busyhour. We also compute the distribution of the num-ber of embedded items within a web document. Wethen use these models to drive a network simulationand show the interactions between the TCP/IP ow-control and retransmission mechanism on source pa-rameters. One of our important contributions has beento show that the Hurst parameter is robust with regardto TCP/IP ow and error control. Using the simula-tion studies we show that the distribution of end-to-endapplication message delay has a heavy-tail distributionand we discuss how these distributions arise in the net-work context.
1 Introduction
The self-similar phenomenon in network packet tra�chas been attributed to 1) individual sources showingON-OFF behaviour with highly variable ON and OFFperiods, and 2) the aggregation of a large number ofsuch ON-OFF sources [15, 11]. Further investigationof tra�c sources have revealed that the highly variableON-OFF behaviour is a property of client/server inter-action. For example, the document size distribution onweb servers has been shown to have a Pareto distribu-tion [1], SS7 tra�c analysis has revealed long holdingtimes, data connections for FTP �le transfers are alsowell modeled by hyperbolic distributions, and analysisof VBR video sequences show the presence of long-range
� Parag Pruthi is President of Qmetrix International Inc.and Niksun Inc., East Brunswick, NJ. Email:[email protected] K. Jena is Ph.D. student at University of Karl-skrona/Ronneby, Sweden. Email:[email protected]. AdrianPopescu is Professor at University of Karlskrona/Ronneby, Swe-den. Email: [email protected].
dependence [15].
On the Internet and even in many LAN/WAN cor-porate environments, application sources use IP (TCP,UDP) as the transport protocol of choice. The e�ect ofthese protocols on shaping the source dynamics has notreceived much attention in the literature. The e�ects ofshaping the source and hence the tra�c dynamics has afundamental impact on the application level tra�c de-scriptors; i.e. the estimated tra�c descriptors may notat all accurately describe the source once the tra�c hasbeen shaped by network controls. We are mainly inter-ested in investigating the e�ects of network controls onthe self-similar tra�c descriptors which include m; a;and H for a FBM tra�c model[9].
Generally, there is a lack of results showing quan-titative contributions of protocol stacks and their ef-fects on source parameters. At the application level,heavy-tailed distributions of the server responses (re-sulting from heavy-tailed distributions of �le sizes) re-sult in fractal or self-similar aggregate tra�c at the net-work link. How do the long-range dependence (LRD)parameters which characterize the server message sizedistributions get modi�ed by various network level pro-tocols such as TCP/IP? A preliminary study reportedin [12] showed that the message level LRD parame-ters were modi�ed by the e�ect of TCP ow controland error recovery mechanisms but quantitative detailswere not provided. In this paper we extend the workof Pruthi and Popescu and present quantitative resultswhich clearly show the e�ects of network congestion,impairements and ow control on source descriptors.
It is important to understand the e�ect of controls,such as TCP ow control, on application-level parame-ters since the management of the application tra�c hasdi�erent requirements than the management of trans-port level tra�c. Application level tra�c managementoccurs by decisions on the admission control and re-source management hierarchy whereas transport andnetwork level management requires the delivery of im-plied or contracted QoS. Thus, in delivering end-to-endguaranteed service it is not just important to under-stand the tra�c parameters at the application layer,but it is also important to model and quantify thee�ects of network control mechanisms on the appli-cation level parameters. For example, if the applica-tion happens to be delivering multimedia service, thena stream of video and audio may be delivered to the
11th ITC Specialist Seminar on Multimedia and Nomadic Communications, Yokohama, Oct 27-29 1998 2
client where the parameters of the video and audiostream are impacted by network congestion and recov-ery mechanisms. By the time the stream arrives at theclient node, it may have been shaped signi�cantly andthe parameters of the stream may have changed dras-tically from the actual parameters negotiated duringclient/server connection setup. The case of interactivemultimedia communications is more challenging as thesource itself will shape the stream based upon feedbackfrom the client. For the purpose of this study we onlyconsider the case where the feedback loop is only closedbetween the transport layers (i.e. TCP) and not the ap-plication layers (e.g. image retrieval, streaming video,which is typically the case on the Internet today).Perhaps WWW is the single most dominant service
deployed in the Internet today. However, the tremen-dous growth in demand has led to service degradationsuch as long response times. To better characterize theinteraction between the WWW service and the networkprotocols and quantify its e�ects on application perfor-mance, we are developing analytical application mod-els based on network tra�c ow measurements. Thesemodels are used to drive network simulations and studythe e�ects of various application parameters and net-work topologies on end-to-end application performance.In this paper we show the results of our model-
ing studies and describe the details of our simulationtoolkit. We make signi�cant contributions in the fol-lowing areas:
� Simulation of a Client-Server environment forWWW
{ Distribution of the total number of bytes ac-cessed from various servers on the Internetduring a busy hour. Using data obtained fromFrame Relay Internet access links, we extractWeb tra�c during a busy hour and computethis statistic.
{ Distribution of the number of embedded itemswithin web documents. Embedded items arede�ned as those items within web documentswhich need to be fetched seperately by theclient after parsing the HTML document (e.g.gif images, applets). We study the distribu-tion of the number of embedded items withinweb documents. We also study the statisticsof local vs. non-local documents, i.e. we com-pute the distribution of the number of embed-ded items in a web page and the probability ofthe embedded item residing on the same webserver as opposed to a di�erent web server.
� Interaction between Protocols
{ We study the interactions between the HTTPand TCP/IP protocols in terms of self-
similarity in network tra�c. In particular, wefocus on how TCP ow and congestion controlmechanisms a�ect the HTTP performance aswell as application parameters.
In this paper we will develop a model for client/serverbased web transactions. Based upon analysis of severalGigabytes of tra�c data, we analyzed several thousandweb pages accessed by end users. This analysis of webtransactions resulted in the development of several keyweb server access and document statistics. We use thesestatistics to e�ciently model web client/server interac-tion in a simulation environment. Using our simula-tion environment, we analyze the e�ects of TCP per-formance on application end-to-end performance. Wealso show how application level parameters are modi�edby the TCP ow and congestion control mechanisms.
2 Performance Model
Our goal is to study the contribution of protocol stackssuch as TCP/IP on the tra�c descriptors and end-to-end performance. We decided to start our investiga-tion by using WWW as an application environment.WWW is based on a simple REQUEST-RESPONSEprotocol (HTTP). In this paper, we report the resultsof the e�ect of TCP congestion and ow control mech-anisms on HTTP performance. TCP is better suitedfor the transport of large �les and imposes a high over-head for short transactions whereas HTTP transactionscan range from very short sessions during which only asmall number of bytes are transferred (e.g. small textdocuments or tiny gif �les: \bullets", \lines", etc.) toextremely long sessions where a large number of bytesare transferred. We develop a simulation model to an-alyze application level performance. In this paper wereport the e�ect of network congestion on the tra�cparameters and end-to-end delays.
2.1 HTTP Layer Modeling
The HTTP application protocol di�ers from other In-ternet applications in the nature of document contents,their encodings, their orgazinational structures, andtheir on-line rendering on the browser screen.Traditionally, HTTP has used TCP as the transport
methodology but it could also be built on top of a trans-port mechanism such as UDP or T/TCP [14]. Thereare some concerns which show that TCP is not verywell suited to the peculiar demands of HTTP [3].To better investigate the performance impacts of such
interactions, we have built a HTTP model which closelymimics the real-life events that occur in an Internetconsisting of clients and servers. The client and theserver software reside on hosts connected by an Internet
11th ITC Specialist Seminar on Multimedia and Nomadic Communications, Yokohama, Oct 27-29 1998 3
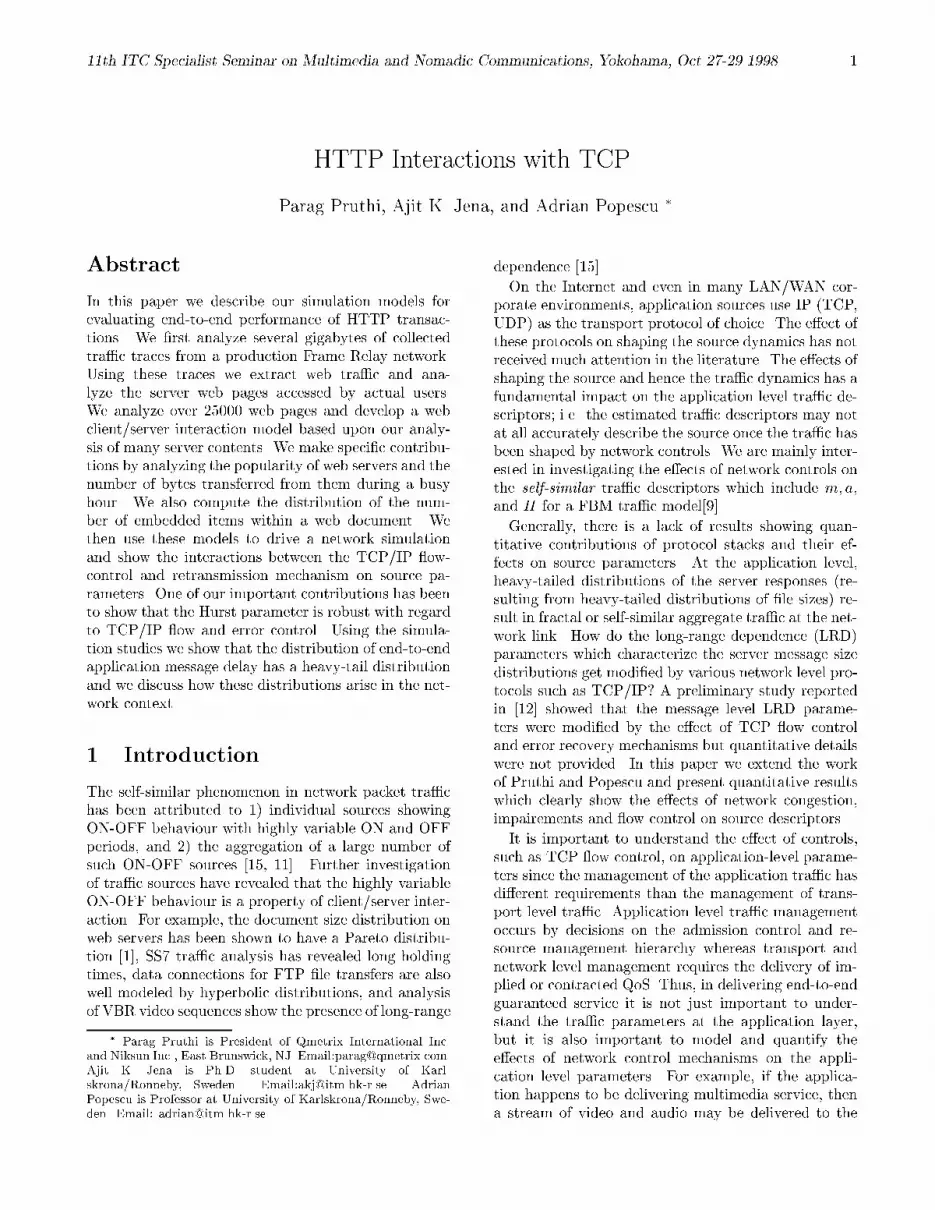
cloud. The hosts are capable of other Internet applica-tions such as FTP, SMTP, NNTP, etc. The frameworkis shown in Figure 1.
In this paper, we only report our results from thestudy of WWW client/server interaction. We simulatethe HTTP client and server using the simulation mod-els we describe in this paper. A client can choose aserver at random and target its requests to that server.The server processes the request and replies back to theclient. The processing of client requests at the serverare a function of the instantaneous server workload.The client analyzes the server response and creates alayout template to be mapped onto the browser screen.The server response may contain embedded items whichare resident on the parent server or on some otherserver. Each of the embedded items must be fetchedbefore the page can be displayed on the screen.
Client
INTERNET CLOUD
TCP/IPTCP/IP
HTTP,FTP....ServerHTTP,FTP....
Figure 1: The WWW client/server framework devel-oped in our simulaiton environment.
2.2 Web Document Structure
Web documents are stored or dynamically created (e.g.\cgi" scripts) as HTML pages. The users retrieve thesepages by asking for them by their names (i.e. by navi-gating the web using a standard browser). Let us callsuch references as the mainpage references. Apart from
the basic textual information content, the mainpagescontain objects such as frames, links, applets, images,maps, and forms. A few of these objects are embeddedobjects or in-line objects. Such objects, though physi-cally di�erent from the mainpage object, are essentialcomponents of the mainpage object and have to be re-trieved implicitly by the users. The embedded objectscan either be co-located on the same server as the main-page document (internal) or they can be hosted by adi�erent server (external).
Given the important role played by the embeddedobjects (or items) in web transactions, it is very impor-tant to characterize the number of embedded objectsin a mainpage object. Further, these embedded ob-jects must be categorized as internal, i.e. residing onthe same server or external, i.e. residing on a di�er-ent server. This distinction is important because nomatter what version of HTTP (1.0 or 1.1) the clientsand servers use, the external objects have to be trans-ferred by opening a separate TCP connection to theexternal host. We present results on the distribution ofembedded items from analyis of documents from a fewthousand web servers and several thousand web docu-ments.
The web consists of various types of sources. Com-mercial servers tend to be multimedia oriented withhigher number of embedded references. On the otherhand, document archives predominantly contain tex-tual information with small number of embedded refer-ences.
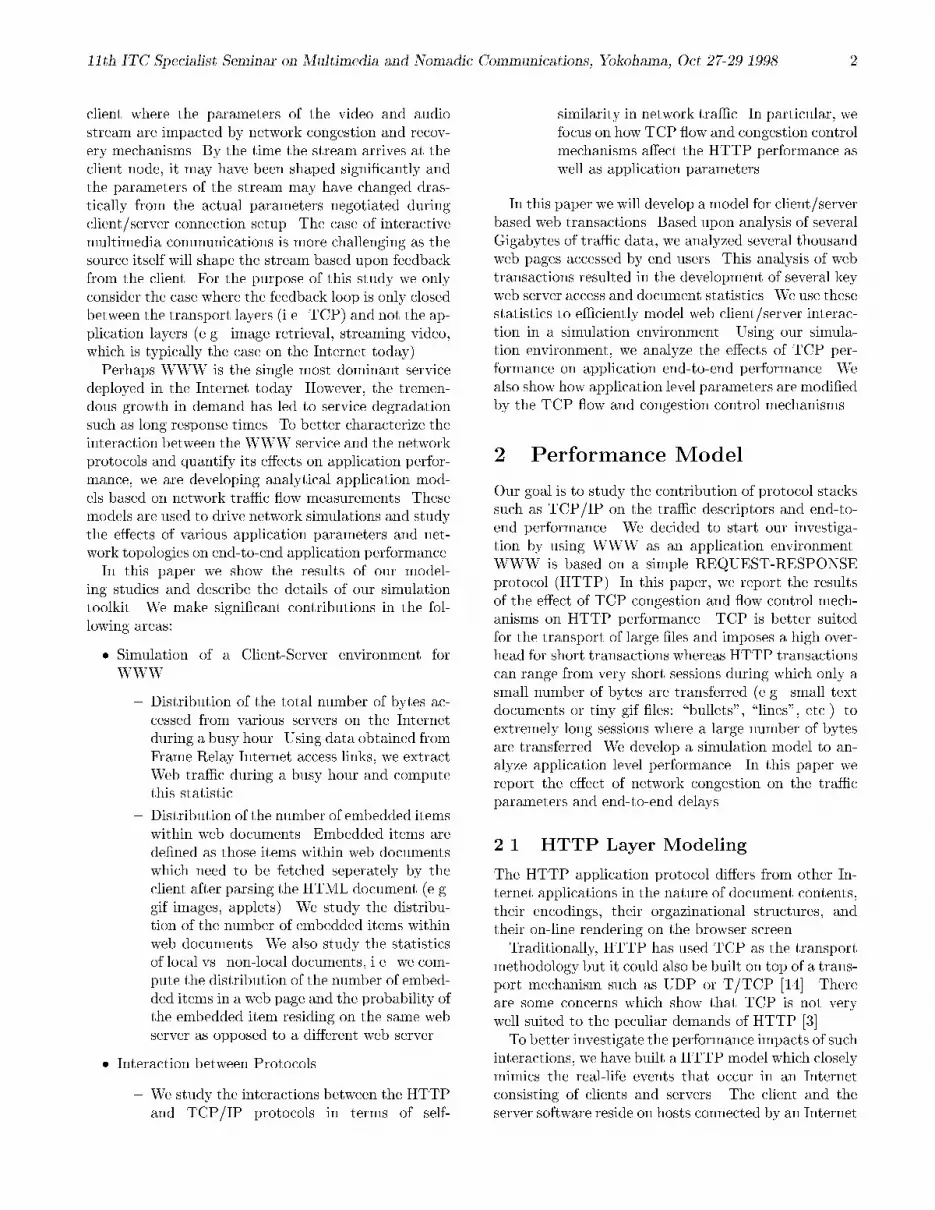
We began our study by analyzing data collected froma production Frame Relay network. A portion of theFrame Relay network constitutes a part of Paci�c Bell'sInternet access network and is operating commerciallyas one of the most e�ciently utilized networks [2]. Fromthe gathered Frame Relay tra�c data, we extracted andanalyzed web tra�c during a busy hour. About 1800web servers were accessed by several hundred clients viaone Frame Relay trunk during this interval. We alsoanalyzed the tra�c data for the total number of bytesdownloaded from various web servers on a particularFrame Relay interface during a busy hour. Figure 2shows the total number of bytes received on a FrameRelay interface from the top most popular web servers.In particular, let the list of web servers be sorted indescending order according to the total number of bytesreceived from them during a busy hour. We label theweb servers as i 2 f1; 2; 3; 4; : : :g (i.e. in descendingorder of activity, so that i = 1 is the most active serverand i = 2 is the 2nd most active server, . . . ); then let
BX =PX
i=1 bi where bi is the total number of bytestransferred from web server i during the busy hour (asseen on one particular interface). Figure 2 plots BX vs.X .
Analysis of the total number of bytes transferred by
11th ITC Specialist Seminar on Multimedia and Nomadic Communications, Yokohama, Oct 27-29 1998 4
0
5e+07
1e+08
1.5e+08
2e+08
2.5e+08
3e+08
0 200 400 600 800 1000 1200 1400
Num
ber
of B
ytes
Number of Web Servers
Figure 2: The total number of bytes received during abusy hour from the �rst X most popular servers (whereX is the value on the horizontal axis).
the web servers shows a good �t to a logarithmic growthas the number of web servers grows large. However, therate of increase in the number of bytes transferred fromthe �rst few (less than 20) most active web servers grewmuch faster. We are currently investigating a good �tand a physical explanation for these observations. Inthe meantime, we will use the emperical data to drivesimulations with multiple servers.
From the initial set of 1800 web servers, we analyzedthe contents of each one of these servers in further de-tail. From our analysis, this set is representative of abroad spectrum of activities that goes on in the webtoday. We visited these sites and accessed the defaultweb page in each of the cases. We analyzed the webpage contents and extracted the embedded item refer-ences. We also extracted the link references containedin those pages. This enabled us to enlarge the origi-nal set of 1800 web pages to over 25000 pages. Duringthe data collection phase there were several problemsencountered. There were links pointing at physicallynon-existant objects. Certain HTML pages sense thetype of the browser software and accordingly a di�er-ent version of the page is returned by the server. Allsuch minute details had to be accounted for by our datacollection and analysis software. Finally there are webserver administrators who forbid attempts to downloada large subset of their documents in quick succession1.
1Just as an aside we would like to point out that this process ofgathering web document statistics is not so easy. We have actu-ally been banned by several sites for simply \hitting" their sitesonce every 10 seconds for periods not more than a few minutesat a time. It is amazing to note that some system administratorshave absolutely nothing else to do but to keep an eye on webactivity. It is even more surprising to note that these servers areso badly instrumented that they are unable to cope with 1 hitevery 10 seconds and result in threatening phone calls from theiradministrators!
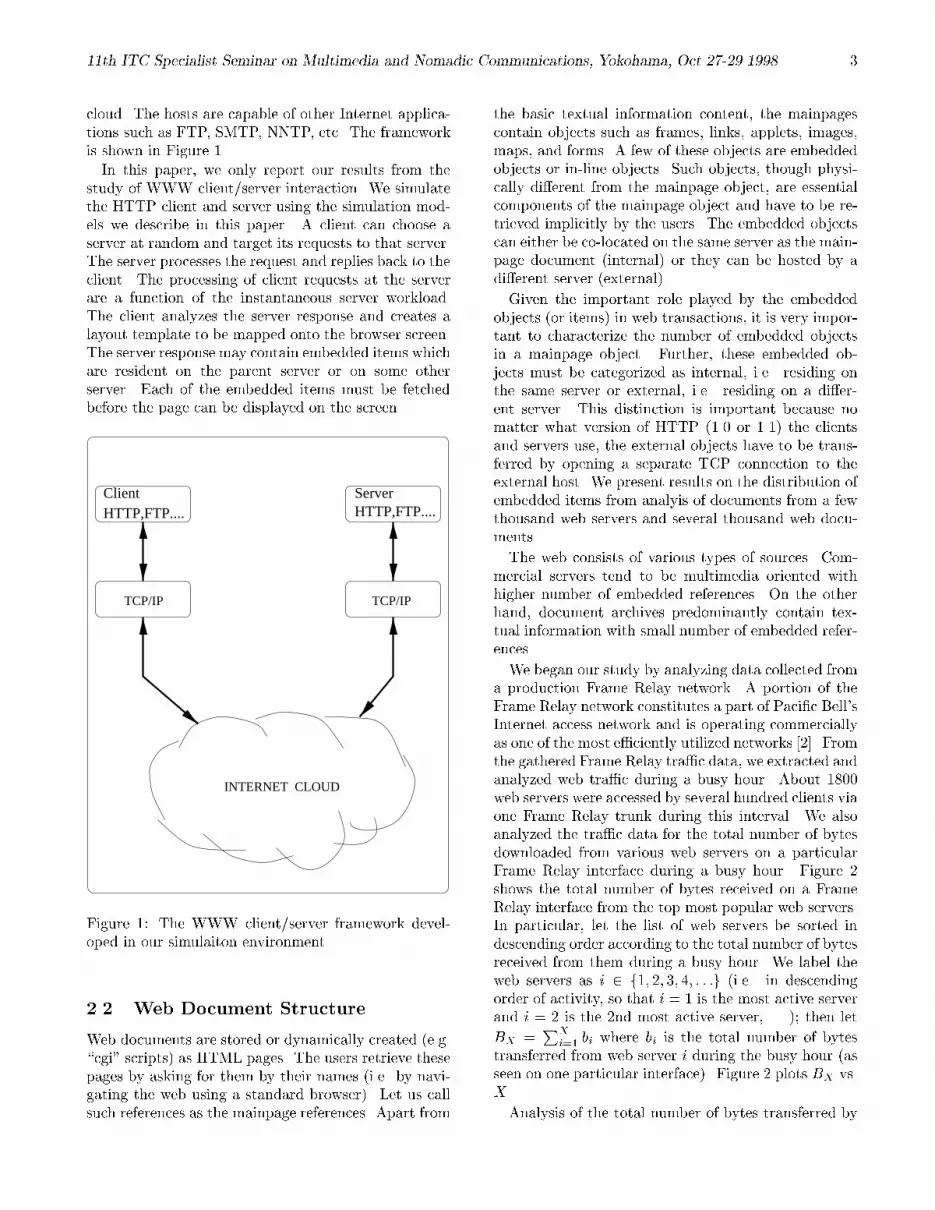
Currently, no statistics are available on the distribu-tion of the number of embedded items within a main-page document. In [8] it is mentioned that there canbe 20 or more embedded items inside a mainpage doc-ument but no further statistics are provided.From our large data-set we are now able to compute
this distribution. First, our analysis of the collecteddata re ects that there are about 6% of the web pageswhere external embedded items are present. Typicallythe external embedded items appear to come from webadvertisements and the page-hit counters. Occasionaly,we encountered a few web pages where the number ofexternal embedded items is higher than the number ofinternal embedded items. Since the presence of externalembedded items is not very signi�cant, we did not doany further analysis on the external embedded items.Second, an initial analysis of total number of embeddeditems (given that the total number was larger than 1),gave a good �t to the geometric distribution. Furtheranalysis revealed that the entire distribution was better�t by a negative binomial distribution and a mass at 0for documents having no embedded documents. Figure3 shows the distribution of the number of embeddeditems as computed from web document analysis and as�tted by a negative binomial distribution:
P (Z = x) =
�� + x � 1
� � 1
�(
�
1 + �)x(1�
�
1 + �)�:
Note the excellent �t for the number of embeddeditems using this distribution. The mean of the numberof embedded items was found to be approximately 10and the maximum number observed was 752.
No. of embedded items
CD
F
0 50 100 150
0.0
0.2
0.4
0.6
0.8
1.0
Observed CDFFitted CDF
Figure 3: Number of embedded items : Actual vs. as�tted by the negative binomial distribution.
2A simple logical argument based upon mixtures of Poissondistributions easily leads to this distribution and will be discussedin detail in an upcoming paper.

11th ITC Specialist Seminar on Multimedia and Nomadic Communications, Yokohama, Oct 27-29 1998 5
3 Network Level Simulation
We use the OPNET3 simulation tool as our simulationenvironment [10]. OPNET is a discrete event simula-tion package that provides a layered framework. Thelowest layer is the process layer. This layer handles thecore of the system functionalities and is organized inthe form of �nite-state machines. In our context, eachof the protocol layers such as HTTP, TCP, IP etc areprocess models. The next level of hierarchy is the nodelayer. This layer uses process models as building blocksand interconnects them to form nodes. For example,our client and server nodes consist of HTTP, TCP, andIP process models interconnected in a hierarchical fash-ion. The OPNET network layer is the topmost layerand consists of nodes interconnected via links. In oursimulation experiments we have the clients and serversgrouped into two 10 MBPS ethernet networks. The twoethernets are interconnected by a fractional T1 link. Allour experiments are focussed on this bottleneck link.
3.1 Modeling Aspects of Client-Server
Interactions
The client and server in the WWW interact by exchang-ing a series of HTTP protocol messages. The clientestablishes a TCP connection to the server, sends a re-quest message, and processes the response message.
The HTTP client is usually a Web browser, althoughit does not necessarily have to be. The client initi-ates almost all the Web sessions; an exception is PUSHbased services, but most of the implementations of theseservices such as news broadcasts, stock quotes, etc. arestill based upon the client initiating the beginning of asession.
In the traditional web browsing mode, the humanuser initiates the transfer of information from a serverby clicking on links on a web document. Each of theclient nodes in our simulation can mimic the behaviourof upto 60 users and multiple client nodes can be used tosimulate larger communities. Each of these users canindependently choose a server. In the results we re-port here, we have limited ourselves to the single servercase as we are more interested in reporting the e�ectsof HTTP performance as opposed to studying cachingstrategies or e�ective network dimensioning algorithms.
Although we do not model the details of the userbehavior, we use data obtained from Internet links to
3Readers who would like to recreate this simulation environ-ment using the latest version of OPNET, i.e. release 4.0.A arewarned that they will have to apply their own �xes to severalOPNET routines due to major bugs related to passing simulationparameters across many of the modules. Unfortunately, there isno patch available from MIL3 at this time. Obviously, we havefound these bugs (the hard way) and have patched our own copies(the hard way)!
model the behavior of the aggregate of hundreds ofclients. Using our models of client behavior we willthen be able to use the simulation toolkit to generateHTTP requests to the servers.
Each client is modeled as an ON/OFF source; i.e. itis either active or waiting to be activated. Once a clientis activated, it forms a HTTP request for a randomdocument and sends the request to the server using thestandard TCP/IP connection establishment and HTTPGET methods. Once the HTTP requests are receivedby the server (note multiple clients and users can beactive simultaneously), they are �rst queued and thenserviced in a FIFO order. The time when the request isprocessed and the response is routed back to the clientis dependent on the prevalent workload at the server.
The initial (or �rst) web document requested by aclient from a server during each session is named \main-page" requests in our convention.
The server replies to mainpage events by sending anHTTP message consisting of a header followed by thecontent. The client analyzes the content to \�nd out"the embedded items contained in the mainpage docu-ment. In the previous section we have shown an ex-tremely good �t to the observed distribution, namelythe negative binomial distribution. It was relativelyeasy to program this distribution into our simulator.
After receiving the mainpage document, the clientissues \REQUEST" messages to fetch each of the em-bedded items. The embedded items can be internal orexternal. We assume that the think-times between re-ceiving an embedded item and issuing the next requestsis zero; the premise is that embedded items are auto-matically fetched by the browser and these think-timeswill be negligible compared to the actual end-to-enddelays.
The web page request sent by a client process caneither result in success or failure in case the documentis not available at the server (\outdated links"). Inthe case of failure, the server returns a \Document NotFound" or other similar error. From our observations ofserver tra�c, we �x the probability of success as 90%.Secondly, the target web object can be an HTML �leor it can be of other type such as image, audio, videoetc. For this other object type, the number of em-bedded items are set to zero. From our observation ofserver tra�c, we use a value of 50% as the probabilityof an object being of HTML type. It is important tonote that browsers often cache the web pages to im-prove performance. This aspect is important because,cached documents are not transferred. We do not ex-plicitly model browser caching in our simulations butuse a value of 4% as the probability that a requesteddocument has not changed since it was last transferredby the client browser.
Figure 4 shows a typical log-log plot of the �le size
11th ITC Specialist Seminar on Multimedia and Nomadic Communications, Yokohama, Oct 27-29 1998 6
P[S
ize
> s
]
Document size (s)
Figure 4: Typical CCDF (on a log-log plot) of webdocument sizes observed from studies of several webserver contents.
distribution of web documents. A simple model for thisdistribution is a uniform for the initial part of the distri-bution followed by a hyperbolic tail. The �le size dis-tribution for both HTML and non-HTML documentshave been modeled as as a combination of uniform bulkwith hyperbolic tails. The crossover probability fromUniform to Pareto distribution is calculated from theother parameters observed in actual web transfers suchas mean �le size, lower cuto�s of the Pareto distribu-tion (i.e. �), the mean of the Pareto distribution, andthe minimum �le sizes. The details of the �le size dis-tributions are given in the table below:
� � mean size minimumHTML 1.36 4200 12888 100
non-HTML 1.06 1024 12000 100The time interval between successive browsing ses-
sions (i.e. client sleep times) is drawn from an Expo-nential distribution with a mean of 15 seconds. Theactual client OFF period characteristics are still underinvestigation and currently we have used this distribu-tion to load our system with a relatively few number ofclients (�fty or so clients, as opposed to a few hundredwhich are observed from measurements).
3.2 Results
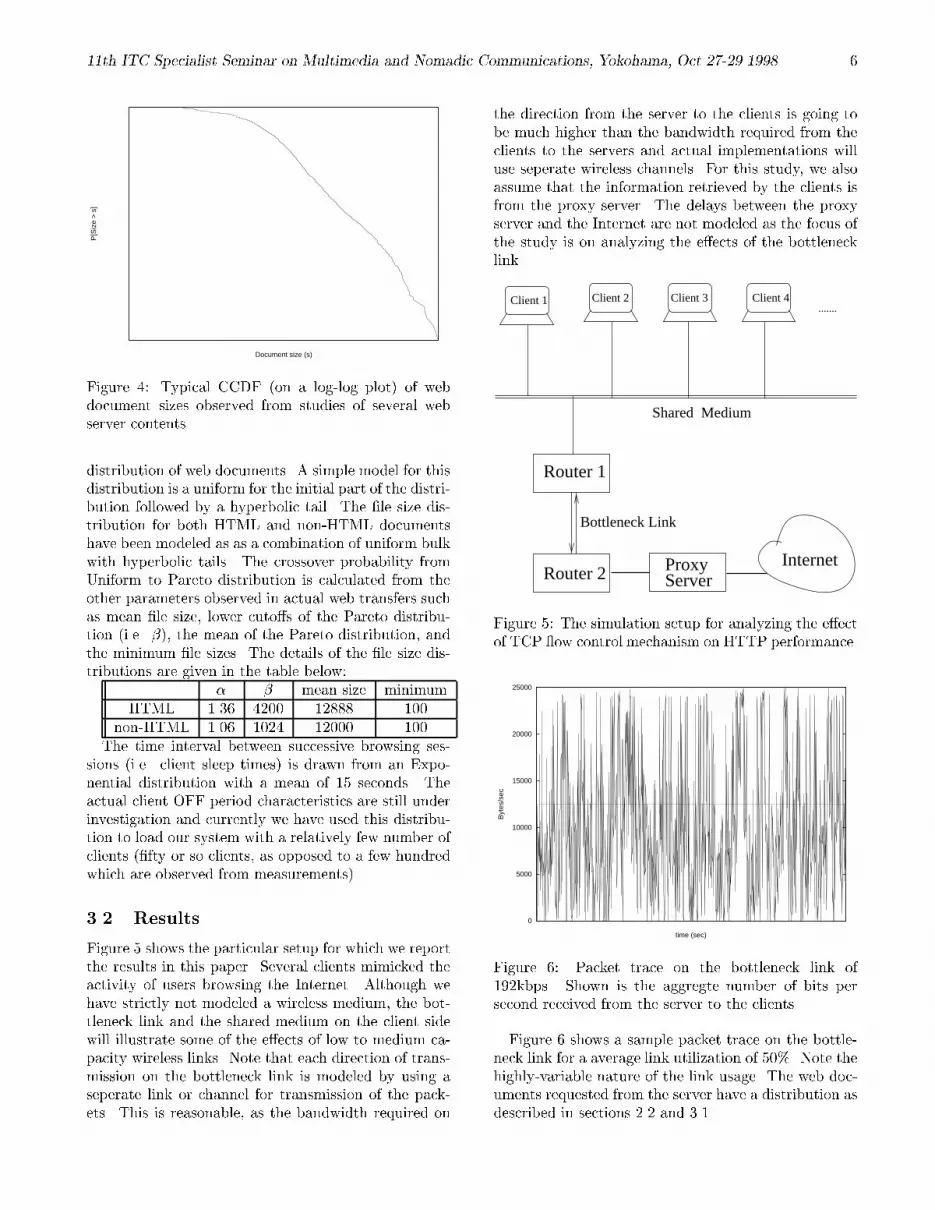
Figure 5 shows the particular setup for which we reportthe results in this paper. Several clients mimicked theactivity of users browsing the Internet. Although wehave strictly not modeled a wireless medium, the bot-tleneck link and the shared medium on the client sidewill illustrate some of the e�ects of low to medium ca-pacity wireless links. Note that each direction of trans-mission on the bottleneck link is modeled by using aseperate link or channel for transmission of the pack-ets. This is reasonable, as the bandwidth required on
the direction from the server to the clients is going tobe much higher than the bandwidth required from theclients to the servers and actual implementations willuse seperate wireless channels. For this study, we alsoassume that the information retrieved by the clients isfrom the proxy server. The delays between the proxyserver and the Internet are not modeled as the focus ofthe study is on analyzing the e�ects of the bottlenecklink.
.......
Router 1
Router 2
Client 1 Client 2 Client 4Client 3
Shared Medium
InternetProxyServer
Bottleneck Link
Figure 5: The simulation setup for analyzing the e�ectof TCP ow control mechanism on HTTP performance.
0
5000
10000
15000
20000
25000
Byt
es/s
ec
time (sec)
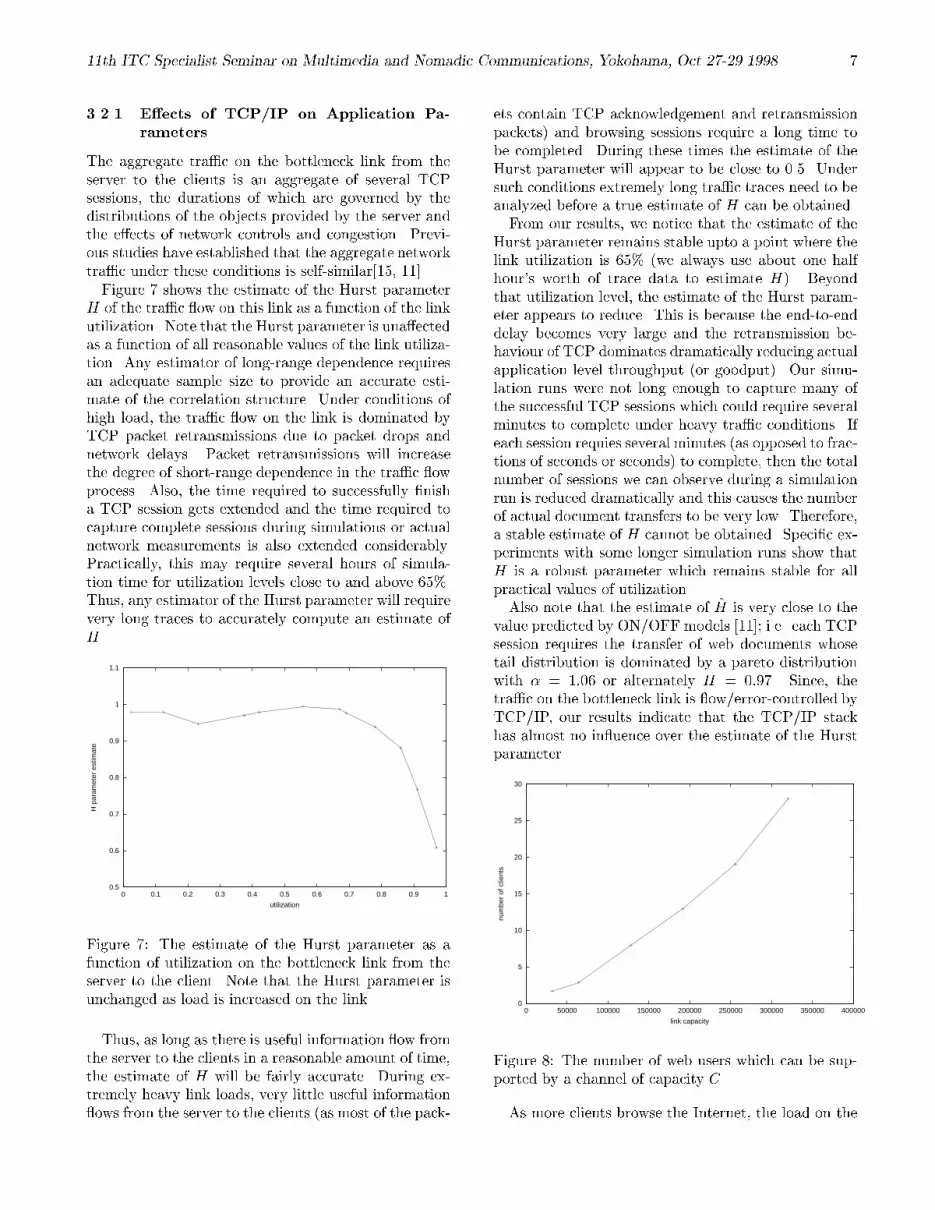
Figure 6: Packet trace on the bottleneck link of192kbps. Shown is the aggregte number of bits persecond received from the server to the clients.
Figure 6 shows a sample packet trace on the bottle-neck link for a average link utilization of 50%. Note thehighly-variable nature of the link usage. The web doc-uments requested from the server have a distribution asdescribed in sections 2.2 and 3.1.
11th ITC Specialist Seminar on Multimedia and Nomadic Communications, Yokohama, Oct 27-29 1998 7
3.2.1 E�ects of TCP/IP on Application Pa-rameters
The aggregate tra�c on the bottleneck link from theserver to the clients is an aggregate of several TCPsessions, the durations of which are governed by thedistributions of the objects provided by the server andthe e�ects of network controls and congestion. Previ-ous studies have established that the aggregate networktra�c under these conditions is self-similar[15, 11].Figure 7 shows the estimate of the Hurst parameter
H of the tra�c ow on this link as a function of the linkutilization. Note that the Hurst parameter is una�ectedas a function of all reasonable values of the link utiliza-tion. Any estimator of long-range dependence requiresan adequate sample size to provide an accurate esti-mate of the correlation structure. Under conditions ofhigh load, the tra�c ow on the link is dominated byTCP packet retransmissions due to packet drops andnetwork delays. Packet retransmissions will increasethe degree of short-range dependence in the tra�c owprocess. Also, the time required to successfully �nisha TCP session gets extended and the time required tocapture complete sessions during simulations or actualnetwork measurements is also extended considerably.Practically, this may require several hours of simula-tion time for utilization levels close to and above 65%.Thus, any estimator of the Hurst parameter will requirevery long traces to accurately compute an estimate ofH .
0.5
0.6
0.7
0.8
0.9
1
1.1
0 0.1 0.2 0.3 0.4 0.5 0.6 0.7 0.8 0.9 1
H p
aram
eter
est
imat
e
utilization
Figure 7: The estimate of the Hurst parameter as afunction of utilization on the bottleneck link from theserver to the client. Note that the Hurst parameter isunchanged as load is increased on the link.
Thus, as long as there is useful information ow fromthe server to the clients in a reasonable amount of time,the estimate of H will be fairly accurate. During ex-tremely heavy link loads, very little useful information ows from the server to the clients (as most of the pack-
ets contain TCP acknowledgement and retransmissionpackets) and browsing sessions require a long time tobe completed. During these times the estimate of theHurst parameter will appear to be close to 0.5. Undersuch conditions extremely long tra�c traces need to beanalyzed before a true estimate of H can be obtained.From our results, we notice that the estimate of the
Hurst parameter remains stable upto a point where thelink utilization is 65% (we always use about one halfhour's worth of trace data to estimate H). Beyondthat utilization level, the estimate of the Hurst param-eter appears to reduce. This is because the end-to-enddelay becomes very large and the retransmission be-haviour of TCP dominates dramatically reducing actualapplication level throughput (or goodput). Our simu-lation runs were not long enough to capture many ofthe successful TCP sessions which could require severalminutes to complete under heavy tra�c conditions. Ifeach session requies several minutes (as opposed to frac-tions of seconds or seconds) to complete, then the totalnumber of sessions we can observe during a simulationrun is reduced dramatically and this causes the numberof actual document transfers to be very low. Therefore,a stable estimate of H cannot be obtained. Speci�c ex-periments with some longer simulation runs show thatH is a robust parameter which remains stable for allpractical values of utilization.Also note that the estimate of H is very close to the
value predicted by ON/OFF models [11]; i.e. each TCPsession requires the transfer of web documents whosetail distribution is dominated by a pareto distributionwith � = 1:06 or alternately H = 0:97. Since, thetra�c on the bottleneck link is ow/error-controlled byTCP/IP, our results indicate that the TCP/IP stackhas almost no in uence over the estimate of the Hurstparameter.
0
5
10
15
20
25
30
0 50000 100000 150000 200000 250000 300000 350000 400000
num
ber
of c
lient
s
link capacity
Figure 8: The number of web users which can be sup-ported by a channel of capacity C.
As more clients browse the Internet, the load on the

11th ITC Specialist Seminar on Multimedia and Nomadic Communications, Yokohama, Oct 27-29 1998 8
link grows increasing the mean tra�c rate on the bot-tleneck link from the server to the clients. Due to sta-tistical multiplexing gains across sources, the capacityrequired by n sources increases to less than n times themean rate required by each source. Figure 8 shows themaximum number of web users which can be supportedby a channel of capacity C (from 32kbps to 320kbps).Since we are not modeling overheads required for a wire-less channel, the a reference link utilization of 30% hasbeen used. Typically, links carrying long-range depen-dent tra�c with utilizations above 40% can lead to ex-tremely large delays and/or packet losses (see [2] formeasurement results from a production network). Forall these simulations, the bu�ers in the routers weredimensioned to constrain the maximum delay to 0.3seconds. Note, that the statistical multiplexing gainslarger than 1 are achieved. As a reference, our sim-ulations indicate that with a link capacity of 384kbps(channel capacity of some next generation wireless net-work proposals - e.g. GPRS over GSM) about 35 In-ternet users can be reasonably supported.
0
2000
4000
6000
8000
10000
12000
14000
0 0.1 0.2 0.3 0.4 0.5 0.6 0.7 0.8 0.9 1
Pea
kedn
ess
estim
ate
utilization
Figure 9: The estimate of the FBM peakedness param-eter as a function of link utilization.
Next we study the e�ects of TCP dynamics on thepeakedness parameter, i.e. the parameter referred toas \a" in an FBM tra�c model [9, 11]. The parame-ter, a measures the varition in the tra�c process andwe expect it to reduce as the link utilization increases.Figure 9 shows the estimated values of the peakednessas a function of utilization from our simulation experi-ments. Note the almost linear drop in the estimate ofthe peakedness from its maximum value down almost 0for very high utilizations.Currently, no analytical results exist for the change
in the peakedness as a function of utilization. Thus,one must rely on simulation results until analyticalresults can be developed. The result presented hereis a very important result, since all models for net-work engineering with self-similar tra�c implicitly as-
sume that the peakedness parameter is not modi�edby the network. The peakedness parameter is as-sumed to be based upon the source characteristics. Us-ing the Weibullian approximation to the tail of thequeue length distribution[11], the capacity required byFBM(m; a;H) tra�c with link bu�er size B for a targetloss rate � is:
C1 ' m+
��
2am log �
B2(1�H)g(H)
�(1=2H)
where
g(H) = 1=(HH(1�H)1�H)2:
Using scaling formulas for self-similar tra�c [4], thecapacity required for n sources for the same target lossrate � is:
Cn = mn+ [C1 �m]n1=2H
Thus, the resulting formula based upon scaling anal-ysis for the capacity required by n sources makes noaccomodation for the alteration of a as a result of �xedchannel capacity. Thus, the resulting analytical formu-las need to be modi�ed when networks must be engi-neered on the basis of end source characteristics.
Also, if these parameters are exchanged before handfor sizing of virtual bandwidth through the network todeliver end-to-end quality of service, then such subtlepoints must be taken into account. Based upon end-to-end negotiations for the mean rate required by a sourceand the network conditions, approprite values for a canbe estimated. As shown earlier, the Hurst parameteris robust, thus no further computation is required toestimate H .
The above results can now form the basis for Inter-net link engineering. Given a source (or equivalently,web server �le and access statistics) characterization asde�ned in this paper, an estimate of H can be easilycomputed as
H =3� �min
2:
Similarly, given the link capacity, the average num-ber of embedded items per HTML document and theaverage web document size (see section 2.2), the sourcemean rate can be computed. The peakedness parame-ter, a, can be similarly computed. Lacking analyticalresults, one can then use tabulated or simulation resultsto compute the changes to a as a function of number ofsources multiplexed. This characterization can now beused to more accurately apply analytical formulas andengineer Internet virtual circuits and links.

11th ITC Specialist Seminar on Multimedia and Nomadic Communications, Yokohama, Oct 27-29 1998 9
0
10
20
30
40
50
60
70
80
90
End
-to-
End
Del
ays
(sec
)
time (sec)
Figure 10: The sample trace of the observed end-to-endweb object retrieval delays.
3.2.2 End-to-End Performance
One of our goals while building this simulator was tostudy end-to-end application level performance. In ourmodel we have deliberately kept the bottleneck to be onthe link from the server (Internet) to the clients. Fig-ure 10 shows a sample trace of the message (web ob-ject) transmission delays from a server to several clients.The trace illustrated was for a simulation run wherethe bottleneck link was dimensioned with a capacity of192kbps and the router bu�ers had a capacity of 57.6kbits. The delays actually represent the delays for ev-ery object (document or embedded item) fetched bythe client from the web server on the Internet. Notethe highly variable application level end-to-end delays.Also note that the actual delays observed by the clientin displaying a document is some mixture of the delaysgraphed here and depends upon the number of embed-ded items which need to be retrieved.
0.0001
0.001
0.01
0.1
1
0 5 10 15 20 25 30 35
P[D
>t]
Delay t (sec)
Figure 11: The CCDF of the observed end-to-end ap-plication delays. Note the semi-log plot.
0.0001
0.001
0.01
0.1
1
0.01 0.1 1 10 100
P[D
>t]
Delay t (sec)
Figure 12: The CCDF of the observed end-to-end ap-plication delays. Note the log-log plot.
Figures 11 and 12 show the complementary cumula-tive distribution of the delays shown in Figure 10. Notethe semi-log and log-log plots and the heavy-tailed na-ture of the end-to-end delay distribution. The qualita-tive aspects of these delays is in stark similarity to thoseobserved in actual switch delay measurements [2], butone must be careful in the comparison because cross-switch delay measurements only measure the packet de-lay through the switch and the delays shown by us areend-to-end message delays.Although no results are present which show the end-
to-end delays through a network, the cross switch de-lay distribution was found to closely match a Weibulldistribution[2]. This implys that end-to-end packetdelays could be modeled as a convolution of Weibulldistributions. This in general is di�cult and perhapssome speci�c numerical approximations could be used.End-to-end application delays can be further gen-
eralized as convolutions of end-to-end packet delays.But TCP/IP dynamics must be further studied asclient/server interactions must be taken into account(e.g. for retransmissions, ow-control mechanisms,etc.). We simply note here that the end-to-end applica-tion delays exhibit heavy-tail behavior. The documentretrieval (i.e. mainpage document and all embeddeditems) end-to-end delay distribution appears to be aextremely di�cult quantity to compute analytically asit involves further mixing of a negative binomial distri-bution with the convolutions of Weibull distributions.For the moment, we will rely solely on simulation exper-iments or actual measurements to estimate these distri-butions.
4 Summary
In this paper we have shown how end-to-end HTTP ap-plication performance can be studied by accurate mod-

11th ITC Specialist Seminar on Multimedia and Nomadic Communications, Yokohama, Oct 27-29 1998 10
els of client/server interaction. Using data obtainedfrom Frame Relay Internet access links, we extractedand analyzed web tra�c. We were able to use the webtra�c to identify popular web sites. The number ofbytes transferred from various web servers over a busyhour had a lograthmic growth as a function of the num-ber of web servers accessed. The statistics of this quan-tity are important to model as it can be used not onlyfor engineering virtual circuits within a network butthe information can also be very useful for developingcaching strategies (for example in a proxy server).We also collected statistics from sevaral thousand
web pages and showed that the embedded item dis-tribution within a web page had a negative binomialdistribution. This distribution is important to charac-terize as it can be used for studying end-to-end appli-cation delays. Using this and other web server accessstatistics, we developed a simulation tool which wasused to study the end-to-end application performance.We showed that the end-to-end delays are heavy tailedand described how such distributions may arise in thenetwork context.
We also studied the impact of TCP/IP ow and con-gestion control on application source parameters andshowed that the Hurst parameter is a robust metricand is not modi�ed by network impairements or con-trol algorithms. On the other hand, the peakednessparameter was shown to be dependent upon networkload. Using these observations we hinted on accurateengineering of trunks and network resources to obtainend-to-end quality of service. Further work must beconducted to develop stable algorithms which can beused to dimension and engineer Internet trunks and ac-cess links.Acknowledgements: The authors would like to
thank Siddhartha Y. Devadhar of Paci�c Bell for pro-viding us access to Frame Relay tra�c data for the pur-pose of developing web tra�c statistics. The authorsalso thank Dr. T. V. Kurien of Qmetrix InternationalInc. for many useful discussions on the topics of statis-tics and modelling.
5 References
[1] Crovella M.E. and Bestavros A. Explaining WorldWide Web Tra�c Self-Similarity, Technical Re-port: TR-95-015, Computer Science Department,Boston University.
[2] Devadhar D., Pruthi P. and Gerla M. Delayin Public Frame Relay Networks: Measurements,Modeling and Simulation, 11th ITC SpecialistSeminar: Multimedia and Nomadic Communica-tions, Yokohama, Japan, 27-29 October 98.
[3] Heidemann J. Performance Interactions Between
P-HTTP and TCP Implementations, ACM Com-puter Communication Review, April 1997.
[4] Krishnan K., Neidhardt A., Erramilli A. Scal-ing Analysis in Tra�c Management of Self-SimilarProcesses, Proceedings of ITC'15, Washington,D.C., June 1997, V. Ramaswami and P.E. Wirth,eds., pages 1087{1096, 1997.
[5] Leland W., Taqqu M., Willinger W. and WilsonD. On the Self-similar Nature of Ethernet Tra�c(Extended Version), IEEE/ACM Transactions onNetworking, February 1994.
[6] Mogul J.C. et al. Potential bene�ts of delta encod-ing and data compression for HTTP, ACM SIG-COMM 1997, Cannes, France.
[7] Nagle J. Congestion Control in IP/TCP Internet-works, RFC 896, January 1984.
[8] Nielsen H.F et al. Network Performance E�ectsof HTTP/1.1, CSS1, and PNG, SIGCOMM '97,Cannes, France.
[9] Norros I. A storage model with self-similar input,Queueing Systems Theory and Applications, Vol.16, Iss. 3-4, 387-396, 1994.
[10] Mil3 Inc. OPNET Modeler version 4.0.A,http://www.mil3.com, Mil3 Inc. Washington,USA.
[11] Pruthi P. An Application of Chaotic Maps toPacket Tra�c Modeling, Ph.D. Dissertation,Royal Institute of Technology, Stockholm, Sweden,ISRN KTH/IT/R-95/19{SE, 1995.
[12] Pruthi P. and Popescu A. E�ect of Controls onSelf-Similar Tra�c, 5th IFIP Workshop in Per-formance Modeling and Evaluation of ATM Net-works: ATM97 Ilkley, UK, July 97.
[13] Spero S.E. Analysis of HTTP Performance Prob-lems, http://sunsite.unc.edu/mdma-release/http-prob.html, July 1994.
[14] Touch J., Heidemann J. and Obraczka K. Analysisof HTTP Performance, Technical Report, Univer-sity of Southern California/Information SciencesInstitute, June 1996.
[15] Willinger W., Taqqu, M., Sherman, R., and Wil-son, D. Self-similarity through High Variability:Statistical Analysis of Ethernet LAN Tra�c at theSource Level, IEEE/ACM Transactions on Net-working, February 1997.