Embed Size (px)
Citation preview

The World Bank’s Country Policy and Institutional Assessment
An IEG Evaluation
Pub
lic D
iscl
osur
e A
utho
rized
Pub
lic D
iscl
osur
e A
utho
rized
Pub
lic D
iscl
osur
e A
utho
rized
Pub
lic D
iscl
osur
e A
utho
rized
Pub
lic D
iscl
osur
e A
utho
rized
Pub
lic D
iscl
osur
e A
utho
rized
Pub
lic D
iscl
osur
e A
utho
rized
Pub
lic D
iscl
osur
e A
utho
rized

WORKING FOR A WORLD FREE OF POVERTY
The World Bank Group consists of five institutions—the International Bank for Reconstruction and Development (IBRD), the International Finance Corporation (IFC), the International Development Association (IDA), the Multilateral Investment Guarantee Agency (MIGA), and the International Centre for the Settlement of Investment Disputes (ICSID). Its mission is to fight poverty for lasting results and to help people help themselves and their environment by providing resources, sharing knowledge, building capacity, and forging partnerships in the public and private sectors.
THE WORLD BANK GROUP
IMPROVING DEVELOPMENT RESULTS THROUGH EXCELLENCE IN EVALUATION
The Independent Evaluation Group (IEG) is an independent, three-part unit within the World Bank Group. IEG-World Bank is charged with evaluating the activities of the IBRD (The World Bank) and IDA, IEG-IFC focuses on assessment of IFC’s work toward private sector development, and IEG-MIGA evaluates the contributions of MIGA guarantee projects and services. IEG reports directly to the Bank’s Board of Directors through the Director-General, Evaluation.
The goals of evaluation are to learn from experience, to provide an objective basis for assessing the results of the Bank Group’s work, and to provide accountability in the achievement of its objectives. It also improves Bank Group work by identifying and disseminating the lessons learned from experience and by framing recommendations drawn from evaluation findings.
THE INDEPENDENT EVALUATION GROUP

The World Bank’s Country Policy and
Institutional AssessmentAn IEG Evaluation
2010
The World Bank
Washington, D.C.http://www.worldbank.org/ieg

Printed on Recycled Paper
© The International Bank for Reconstruction and Development / The World Bank
1818 H Street NW
Washington, DC 20433
Telephone: 202-473-1000
Internet: www.worldbank.org
E-mail: [email protected]
All rights reserved
1 2 3 4 13 12 11 10
This volume is a product of the staff of the International Bank for Reconstruction and Development / The World Bank Group. The findings, interpre-
tations, and conclusions expressed in this volume do not necessarily reflect the views of the Executive Directors of The World Bank or the govern-
ments they represent.
The World Bank does not guarantee the accuracy of the data in this work. The boundaries, colors, denominations, and other information shown
on any map in this work do not imply any judgment on the part of The World Bank concerning the legal status of any territory or the endorsement
or acceptance of such boundaries.
Rights and Permissions
The material in this publication is copyrighted. Copying and/or transmitting portions or all of this work without permission may be a violation of
applicable law. The International Bank for Reconstruction and Development / The World Bank encourages a dissemination of its work and will
normally grant permission to reproduce portions of the work promptly.
For permission to photocopy or reprint any part of this work, please send a request with complete information to the Copyright Clearance
Center Inc., 222 Rosewood Drive, Danvers, MA 01923, USA; telephone: 978-750-8400; fax: 978-750-4470; Internet: www.copyrights.com.
All other queries on rights and licenses, including subsidiary rights, should be addressed to the Office of the Publisher, The World Bank, 1818 H
Street, NW, Washington, DC 20433, USA: fax:202-522-2422; email:[email protected].
Cover image: Unisphere at Flushing Meadows – Corona Park. New York, New York. © Rudy Sulgan/Corbis. The Unisphere was built as the theme
symbol for the 1964–65 World’s Fair.
ISBN: 978-0-8213-8427-5
e-ISBN: 978-0-8213-8429-9
DOI: 1596/978-0-8213-8427-5
Library of Congress Cataloging-in-Publication data have been applied for.
World Bank InfoShop
E-mail: [email protected]
Telephone: 202-458-5454
Facsimile: 202-522-1500
Independent Evaluation Group
Communications, Strategy, and Learning
E-mail: [email protected]
Telephone: 202-458-4497
Facsimile: 202-522-3125

i i i
vii Abbreviations
ix Acknowledgments
xi Foreword
xiii Executive Summary
xix Management Response
xxv Chairman’s Summary: Committee on Development Effectiveness (CODE)
xxvii Advisory Panel Statement
1 1 Introduction and Evolution of the CPIA 4 Evolution in the Content of the CPIA
8 Other Changes in the CPIA
9 Role of the CPIA in IDA Allocation
13 2 Relevance of the CPIA for Growth, Poverty Reduction, and Effective Use of Development Assistance
15 The CPIA and Determinants of Sustained Growth
25 The CPIA and Determinants of Poverty Reduction
29 The CPIA and the Effective Use of Development Assistance
31 Findings and Recommendations
39 3 Reliability of the CPIA Ratings 41 Comparability with Other Indicators
48 CPIA Ratings Generation Process
57 4 Findings and Recommendations 59 Overview
59 Main Findings
62 Recommendations
65 Appendixes 67 A: 2008 Country Policy and Institutional Assessment Criteria
71 B: Public Sector Literature Review
81 C: 2007 CPIA Criteria on Economic Management, Structural Policies, and
Policies for Social Inclusion/Equity and Evidence in the Literature
91 D: Literature Review on Aid Effectiveness
93 E: Examples of Positive Impacts of Aid Projects from Randomized
Evaluations in Education, Health, Infrastructure, and Agriculture
95 F: Review of Financial Sector Criterion
99 G: Country Policy and Institutional Assessment (CPIA) and
Loan Performance
Contents

i v
T H E W O R L D B A N K ’ S C O U N T RY P O L I C Y A N D I N S T I T U T I O N A L A S S E S S M E N T
103 H: Comparing Country Policy and Institutional Assessment Ratings by
the World Bank, African Development Bank, and Asian Development
Bank
105 I: Comparator Indices of the CPIA
109 J: Number of IDA and IBRD Countries for Which External Data are Available
111 K: Comments by Network on Regional CPIA Rating Proposals, 2007
113 Endnotes
119 References
Boxes 4 1.1 Changes to the CPIA Criteria in 1998 That Reflect the Emphasis on
Institutions
11 1.2 The Governance Adjustment in IDA’s Country Performance Ratings,
FY1998–2008
19 2.1 Channels through Which Inequality Affects Growth
44 3.1 Comparator Indicators
50 3.2 The Process of Preparing CPIA Ratings
51 3.3 The Network Reviews of CPIA Ratings
Figure25 2.1 Relat ionship between Changes in PBA and the Ratio of Cluster D Ratings
to Ratings on Other Clusters for “Core IDA” Countries
Tables5 1.1 CPIA Criteria 1998–2008
10 1.2 Evolution of IDA’s Performance-Based Allocation Formula and the
Adjustment for Governance
16 2.1 Mapping of the “Consensus” Determinants for Sustained Growth and the
CPIA Criteria
22 2.2 Correlations between Ratings of CPIA Clusters, 2007
22 2.3 Correlations between CPIA with Different Cluster Weights and CPIA
with Equal Cluster Weights, 2007
23 2.4 Simulation Results: Effects on Performance-Based Allocations for “Core
IDA” Countries Arising from a Larger Weight on the “Governance”
Cluster Compared to Equal Weights on All Clusters
33 2.5 Simulation Results: Changes in PBA from Dropping q8
34 2.6 Simulation Results: Changes in Trade Ratings Arising from Changes
in Weights of Trade Subcriteria by Numbers and Shares of IBRD
and IDA Countries
35 2.7 Simulation Results: IBRD and IDA Countries That Would Experience
Changes in Trade Ratings due to Changes in Weights for Trade
Subcriteria
37 2.8 Simulation Results: Changes in PBA Arising from Changes in Weights for
Trade Subcriteria
42 3.1 Rank Correlation Coefficients between CPIA Ratings and Comparator
Ratings for 2007
45 3.2 Other Indicators—Expert Judgment or Hard Data?
46 3.3 Are Other Comparator Indicators Closer to the Bank or to AfDB and ADB?
47 3.4 Comparison of Changes in CPIA Ratings 2006–07 between the Bank,
AfDB, and ADB
i v

v
C O N T E N T S
49 3.5 Rank Correlations between the CPIA and Other Indicators: IBRD versus
IDA Countries
52 3.6 Numbers and Shares of Initial Regional Rating Proposals on Which the
Networks Disagreed with the Regions, by Criteria, for 2007
53 3.7 Number and Share of Initial Regional Rating Proposals on Which the
Networks Disagreed with the Regions, by Region and IBRD and IDA
Countries for 2007
53 3.8 Network Disagreements with Initial Regional Rating Proposals
54 3.9 Share of Instances Where Networks Prevailed When Networks Disagreed
with Regions over Proposed Increases in Ratings from 2006
54 3.10 Share of Instances Where Networks Prevailed When Networks
Disagreed with Regions, 2007
55 3.11 Shares of Countries on Which Networks Commented in 2007 When
Regions Proposed the Same Ratings as in 2006

v i
Energy transmission and power lines, Tajikistan. Photo by Gennadiy Ratushenko/World Bank

v i i
ADB Asian Development Bank
AfDB African Development Bank
AML-CFT Anti-money laundering and combating the fi nancing of terrorists
ARPP Annual review of project performance
BCP Basel core principles
CGAP Consultative Group to Assist the Poor
CPIA Country policy and institutional assessment
CPR Country performance ratings
DAC Development Assistance Committee of the Organisation for Economic Co-operation
and Development
DB Doing Business
ESI Environmental Sustainability Index
ETI Enabling Trade Index
GCI Global Competitiveness Index
GDP Gross domestic product
GNIpc Gross national income per capita
GNPpc Gross national product per capita
HIV-AIDS Human immunodefi ciency virus-acquired immunodefi ciency syndrome
IBRD International Bank for Reconstruction and Development
ICP IDA country performance
ICRG International Country Risk Guide
IDA International Development Association
IEG Independent Evaluation Group
IMF International Monetary Fund
IP Implementation progress
ISR Implementation Status and Results Report
IT Information technology
MDGs Millennium Development Goals
NGOs Non-governmental organizations
NPLs Non-performing loans
NTB Non-tariff barrier
OECD Organisation for Economic Co-operation and Development
OED Operations Evaluation Department (the previous name of IEG)
OLS Ordinary least squares
OPCS Operations Policy and Country Services
PBA Performance-based allocation
PRMED Economic Policy and Debt Department
QAG Quality Assurance Group
SMEs Small and medium enterprises
UNDP United Nations Development Programme
VAT Value-added tax
WGI Worldwide Governance Indicators
v i i
Abbreviations

Harvesting rice fields, Vietnam. Photo by Tran Thi Hoa/World Bank

i x
Acknowledgments
by Agnes Santos. Barbara Balaj copy edited the
study for publication.
The peer reviewers were Victoria Elliott, Aart
Kraay, and Steven Webb. The team received
guidance and support from the IEG management
team, and also benefited from the comments
received from the various IEG units.
The evaluation team extends its thanks to the
staff from all six Regions, the various networks,
Operations Policy and Country Services, and
Resource Mobilization who were interviewed for
the report.
This evaluation of the World Bank’s Country
Policy and Institutional Assessment was
prepared by the Country Evaluation and
Regional Relations division of the Independent
Evaluation Group.
The evaluation was led by Helena Tang, the
author of the report. Saubhik Deb carried out
the statistical and econometric analyses for the
report. Background papers were prepared by
Julia Cage, Shailaja Fennel, Patrick Honohan, and
Biaoyun Qiao. Inputs were provided by Carla
Pazce, Rupa Ranganathan, and Dusan Vujovic.
Production and logistical support was provided
Director-General, Evaluation: Vinod Thomas
Director, Independent Evaluation Group – World Bank: Cheryl Gray
Senior Manager, IEGCR: Ali M. Khadr
Task Manager: Helena Tang

Woman in India. Photo by Curt Carnemark/World Bank

x i
Foreword
narrower sense—specifically, the performance of
Bank loans.
The CPIA’s 16 criteria are grouped into four
clusters—economic management, structural
policies, policies for social inclusion and equity,
and public sector management and institutions.
These clusters are weighted equally to derive the
overall CPIA rating. In contrast, the IDA allocation
formula weights the clusters unevenly—the first
three clusters are each given a weight of 8 percent,
and the last cluster (the governance cluster) a
weight of 68 percent and portfolio performance
the remaining weight of 8 percent. The literature
offers no evidence to justify any particular set of
weights on the four clusters, whether in deriving
the overall CPIA rating or in calculating the IDA
allocation. Neither is there justification for why
the clustering is as it is—having all social sectors
combined with the environment in one cluster,
for example. There is also insufficient evidence
to conclude that the governance cluster associ-
ates better with Bank loan performance than the
other three clusters.
The report lays out four recommendations:
disclose International Bank for Reconstruction
and Development ratings; discontinue the “stage
of development” adjustment to the ratings;
review and revise the content and clustering of
the criteria; and discontinue the current aggrega-
tion of the criteria into an overall index.
Vinod Thomas
Director-General, Evaluation
The Bank’s Country Policy and Institutional
Assessment (CPIA) assesses the conduciveness
of a country’s policy and institutional framework
to poverty reduction, sustainable growth, and
the effective use of development assistance. The
CPIA enters the calculation of country perfor-
mance ratings that, since 1980, have been used
to allocate International Development Associa-
tion (IDA) resources to eligible client countries.
This evaluation was undertaken at the request of
Board members to assess the appropriateness
of the CPIA as a broad indicator of development
effectiveness and as a determinant of the alloca-
tion of IDA funds. As indicated in the Approach
Paper, this evaluation reviews the effects of the
CPIA ratings on IDA allocations but does not
review the IDA allocation formula itself.
The evaluation finds that the CPIA content
broadly reflects the determinants of economic
growth and poverty reduction identified in the
economics literature, but some criteria need
to be revised (such as the trade criterion that
places much greater emphasis on imports than
exports) and streamlined, and one criterion
(assessment of disadvantaged socioeconomic
categories other than gender) added. The CPIA
ratings also correlate well with ratings of similar
indicators, and more so for International Bank
for Reconstruction and Development than for
IDA countries. In part, this could be caused by
the CPIA exercise’s practice over the past several
years of taking into account a country’s stage
of development, which also means that the
CPIA is no longer an index in the true sense of
the word. It is difficult to establish an empirical
link between the CPIA and economic growth
outcomes, although CPIA ratings are found to be
positively associated with aid effectiveness in the

Girl in classroom, Mexico. Photo by Curt Carnemark/World Bank

x i i i
regarding the relevance of the content of the
CPIA for aid effectiveness broadly defined—that
is, that it represents the policies and institutions
important for aid to lead to growth. However, the
CPIA is associated with aid effectiveness defined
more narrowly as the better performance of
Bank loans. But there is insufficient evidence to
conclude that the most heavily weighted CPIA
cluster associates better with loan performance
than the other three clusters.
The CPIA ratings are generally reliable and
correlate well with similar indicators, but it is
difficult to establish an empirical link between the
CPIA and growth outcomes. Network reviewers’
validation of ratings helps guard against potential
biases in having Bank staff rate countries on
which their work programs depend. The CPIA
ratings correlate better with similar indicators
for International Bank for Reconstruction and
Development (IBRD) than for IDA countries.
This correlation could in part be because more
information is available on IBRD countries,
and in part because the CPIA ratings are meant
to take into account the stage of development
(which is more pertinent for IDA countries and
which means ratings for these countries are
more subject to judgment than those for IBRD
countries). This tendency is exacerbated by the
different practices with respect to accounting for
the stage of development, as none of the regional
Executive Summary
The CPIA consists of 16 criteria grouped into four
clusters—economic management, structural
policies, policies for social inclusion and equity,
and public sector management and institutions—
weighted equally to derive the overall CPIA
rating. Since the beginning of fiscal 2009, IDA
has made transparent the weights of the clusters
used in the IDA allocation formula—24 percent
on the first three CPIA clusters combined and 68
percent on the fourth (governance) cluster, with
the remaining 8 percent weighted on portfolio
performance. In other words, the governance
cluster has eight and a half times the weight of
each of the other three clusters in the formula.
This has also made transparent the weak link
between the overall CPIA index and IDA alloca-
tions, with a country’s governance performance
(particularly relative to its performance in the
other clusters) being more important in the
latter.
The content of the CPIA broadly reflects the
determinants of growth and poverty reduction
identified in the economics literature. However,
some criteria need to be revised and streamlined
and one criterion added. The literature offers no
evidence to justify any particular set of weights
on the four clusters used for IDA allocation or
the way the criteria are clustered (for example,
having social sectors and environment in one
cluster). The literature offers only mixed evidence
The World Bank’s Country Policy and Institutional Assessment (CPIA)
assesses the conduciveness of a country’s policy and institutional
framework to poverty reduction, sustainable growth, and the effec-
tive use of development assistance. It plays an important role in the country
performance ratings that have been used for allocating resources from the
International Development Association (IDA) to eligible countries since 1980.

x i v
T H E W O R L D B A N K ’ S C O U N T RY P O L I C Y A N D I N S T I T U T I O N A L A S S E S S M E N T
indicates there is little consensus on the impact
of aid on growth itself and on the conditions
under which aid can have a positive impact on
growth.
However, the CPIA is associated with aid
effectiveness in a narrower sense—that is,
with respect to the performance of World
Bank loans. Empirical analysis finds that the
overall CPIA ratings are negatively associated
with the share of problem loans that in turn is
correlated with loan outcomes.
Empirical analysis indicates that there
is insufficient evidence to conclude that
the governance cluster associates better
with loan performance than with the
other clusters. Based on this finding, as well
as the lack of consensus in the literature on the
conditions under which aid has an impact on
growth, it can be surmised that the way in which
the CPIA enters the formula for the allocation
of IDA funds is driven much more by fiduciary
and possibly other concerns of donors than by
the objectives of achieving sustained growth and
poverty reduction.
The CPIA strives to allow for country
specificity, that is, that different sets of
policies and institutions can achieve
similar outcomes. However, there are
some pitfalls. The CPIA instructions to staff
indicate that outcomes need to be taken into
account when assessing policies and institu-
tions, which helps to account for country
specificity. Indeed, outcome indicators are
included in the assessment of some criteria.
They could also be added to other criteria, in
particular trade.
The trade criterion does not adequately
allow for country specificity. The specifica-
tion of particular tariff rates for different ratings
reflects a one-size-fits-all approach to trade
liberalization that is not supported by country
experience. Export performance (an outcome
indicator) needs to be included in the assess-
ment and would help to allow for country
specificity.
reviewers of the CPIA do this, whereas network
reviewers vary in their practices.
The International Evaluation Group (IEG) makes
four recommendations. First, disclose the ratings
for IBRD countries in the interest of accountabil-
ity and transparency. Second, remove account-
ing for the stage of development in the rating
exercise to reduce subjectivity. Third, undertake
a thorough review of the adequacy of each
criterion, including a review of experience and
the literature, and revise as necessary, based on,
among other things, the findings of this evalua-
tion. Fourth, consider not producing an overall
CPIA index although continue to produce and
publish the separate CPIA components.
OverviewThis evaluation takes the premise that beyond
informing IDA allocation, the CPIA is useful as
a broad indicator of development effectiveness.
It reviews the appropriateness of the CPIA as
an indicator that assesses the conduciveness of
a country’s policies and institutions to foster-
ing poverty reduction, sustainable growth, and
the effective use of development assistance. It
assesses the relevance of the content of the CPIA
through a review of the economics literature. It
also assesses the reliability of CPIA ratings in two
ways— through comparing CPIA ratings with
similar indicators, and through reviewing the
CPIA ratings generation process. Based on these
assessments, the evaluation derives recommen-
dations for enhancing the CPIA.
Relevance of CPIA The contents of the CPIA are largely
relevant for growth and poverty reduction.
The CPIA criteria map well with the determi-
nants—policies and institutions—of growth and
poverty reduction identified in the literature,
although some criteria can usefully be revised
and streamlined and one can be added (see
recommendations).
The evidence is mixed regarding the
relevance of the content of the CPIA for
aid effectiveness as broadly defined in the
literature. Indeed, the review of the literature

E X E C U T I V E S U M M A RY
x v
those of the African Development Bank and the
Asian Development Bank, the closest compara-
tors to the Bank, as they use almost exactly the
same CPIA guidelines.
CPIA ratings correlate better with similar
indicators for IBRD than for IDA countries.
This could be due in part to the greater amount
of information available on IBRD than on IDA
countries, which increases the likelihood of
different institutions having similar assessments
on IBRD countries. It could also be due partly to
the fact that the CPIA rating exercise takes into
account the stage of development (introduced
since 2004). This is more pertinent for IDA
countries and hence would subject ratings of
those countries to more judgment in an exercise
that is already centered on staff judgment.
Accounting for the stage of development
in the CPIA ratings is problematic. In
addition to the judgment involved, accounting
for the stage of development is also problematic
because of the different practices adopted across
the Bank. Regional reviewers do not take this
into account, whereas network reviewers vary in
their practices. Further, accounting for the stage
of development means that the CPIA is no longer
an index in the true sense of the word.
The review process for the CPIA, which gives
the networks responsibility for validat-
ing the ratings, helps to guard against
potential biases in ratings, although there
are exceptions. A major advantage of the CPIA
exercise is having well-informed professional
judgment of staff as the central determinant of
the ratings. At the same time, however, having
staff rate the countries on which their work
programs depend could lead to rating biases.
Analysis of the 2007 review process indicates that
for instances where the networks challenged
the regions’ initial proposals of a rating increase
from 2006, the networks prevailed 73 percent
of the time for IDA countries. They prevailed
more often—86 percent of the time—for IBRD
countries. However, these instances made up
only 6 percent of the ratings for IDA countries
The trade criterion also does not reflect
the importance of complementary institu-
tions for successful liberalization. The
two-thirds weight on trade restrictiveness and
one-third weight on trade facilitation is not
supported by country experience that shows
that at moderate tariff levels (which practically
all countries currently have), complementary
factors (macroeconomic stability and trade facili-
tation) are more important than further tariff
reduction to promote integration into the global
economy.
The CPIA is missing an assessment of
disadvantaged socioeconomic groups
other than gender. Currently, only gender
is being assessed with respect to equality, yet
country evidence indicates that social exclusion
of other marginalized groups could have severe
poverty and growth implications.
Important linkages among certain criteria
are not reflected in the CPIA. Except for the
three economic management criteria, all of the
CPIA criteria are assessed independently. This
could be problematic in two instances. First, the
assessment of trade liberalization needs to take
into account the extent of intersectoral labor
mobility because liberalization in the absence of
labor mobility could exacerbate poverty. Second,
fiscal policy needs to be assessed in conjunc-
tion with the quality of budgetary and financial
management to ensure that the fiscal condition of
the country in its entirety is realistically captured.
Reliability of CPIA RatingsThe Bank has made efforts over time
to improve the definition of the CPIA
rating scale to enhance the reliability of
the ratings. These efforts have been aimed at
reducing staff discretion in providing ratings.
The CPIA ratings correlate well with similar
indicators in terms of relative rankings of
countries and direction of change. For each
of the 16 criteria, the rank correlation coefficients
of CPIA ratings with similar indicators average
between 0.7 and 0.8. Other indicators correlate
better with the Bank’s CPIA ratings than with

x v i
T H E W O R L D B A N K ’ S C O U N T RY P O L I C Y A N D I N S T I T U T I O N A L A S S E S S M E N T
environment, which limit the emphasis accorded
to these aspects. Guideposts for assessing the
criteria need to be reviewed at the same time.
The following points also need to be taken into
account in the review and revisions:
• Revising the trade criterion to include a sub-
component on exports that evaluates perfor-
mance as well as policies and institutions to
reduce anti-export bias. This subcomponent
and those on trade restrictiveness and trade
facilitation need to all get equal weights. The
trade restrictiveness subcomponent needs to
be revised to reflect country experience that
at moderate levels of tariffs (which almost all
countries have), any further reduction would
be less important than complementary factors
for global integration.
• Dropping or reformulating the criterion on
equity of public resource use, as much of its
content is already covered by other CPIA cri-
teria (specifically, property rights, access to
education and to credit, income transfers) or
information is lacking for an adequate assess-
ment (specifically, the progressivity or regres-
sivity of taxes).
• Adding an assessment of other disadvantaged
socioeconomic groups to the CPIA. This could
either replace the criterion on equity of public
resource use or be added to that criterion if it
were to be reformulated.
• Revising the financial sector criterion. This
needs to entail (i) revising of the weights for
the three subcomponents—stability, depth
and efficiency, and access—in light of the im-
portance of financial stability as reflected by re-
cent global evidence, and the mixed evidence
on the importance of microfinance; (ii) adding
assessment of policies, regulations, and insti-
tutions for fostering an enabling environment
for the financial sector taking into account
lessons learned, notably from the current cri-
sis; and (iii) strengthening the assessment of
financial stability.
• Combining the assessment of tax policy with
fiscal policy.
• Streamlining the assessment of judicial inde-
pendence and the assessment of corruption in
the public sector management and institutions
and 5 percent of the ratings for IBRD countries;
hence, there does not seem to be a strong upward
bias in ratings for either group of countries.
RecommendationsBased on its findings, IEG has derived recommen-
dations to enhance the CPIA as an indicator of
policies and institutions that are important for
growth, poverty reduction (or welfare more
broadly), and the effective use of development
assistance.
Adoption of these recommendations could result
in a discontinuity in the CPIA ratings, which
Bank management has been trying to avoid.
However, it is important that the CPIA reflect the
latest thinking in development as well as lessons
learned—both of which are stated intentions of
the Bank. It would also provide the opportunity
to address an issue that some network reviewers
have raised regarding the quality of the ratings
for some criteria because of what they perceive
as inflated baseline ratings from a few years ago.
The recommendations are as follows.
First, disclose the ratings for IBRD
countries. Disclosure is important for account-
ability and transparency and would further
enhance the quality of the ratings.
Second, remove accounting for the stage of
development from the CPIA exercise. If this
cannot be done, at the very least it is important to
clarify and justify in the guidelines which criteria
need to take into account the stage of develop-
ment and how such adjustments need to be
made.
Third, undertake a thorough review of the
CPIA and revise the criteria as necessary.
IEG recommends that the review entail an
in-depth literature review for each criterion and
reflect the latest thinking on development and
lessons learned. The review needs to reflect an
appropriate balance between liberalization and
regulation. The review needs to also examine
whether the clustering of criteria is appropriate.
In particular, it needs to examine the appropri-
ateness of combining the social sectors with the

E X E C U T I V E S U M M A RY
x v i i
publish the separate CPIA components.
The overall CPIA index is not used as such for
the allocation of IDA funds. With respect to the
broader use of the CPIA as an index of policies and
institutions, country specificity implies that the
appropriate weights of the different clusters could
differ depending on a country’s initial conditions
and stage of development. Producing the differ-
ent components of the CPIA without assigning
weights to them to arrive at an aggregate index
would allow for different weights to be applied
according to country contexts and use.
cluster, as they are currently assessed in more
than one criterion in this cluster.
• Strengthening the assessment of the environ-
ment criterion and making the process more
efficient. Currently, staff need to answer 85
questions for only one rating.
• Reporting only one consolidated rating for
the three economic management criteria to
avoid confusion.
Fourth, consider not producing an overall
CPIA index, and continue to produce and

Students building houses in Kahyelitsha township, South Africa. Photo by Trevor Samson/World Bank

x i x
Management Response
The report makes four recommendations:
• Disclose the ratings for International Bank
for Reconstruction and Development (IBRD)
countries.
• Remove accounting for the stage of develop-
ment from the CPIA exercise, or, if this cannot
be done, clarify and justify in the guidelines
which criteria should be subject to the ad-
justments and how the adjustments should
be made.
• Undertake a thorough review of the CPIA and
revise the criteria as needed (the evaluation
contains recommendations regarding a few
specific criteria, such as trade and financial
sector).
• Consider not producing an overall CPIA index
although continuing to produce and publish
the separate CPIA components. Except for
the recommendation on disclosing the CPIA
ratings for the IBRD countries, management
broadly concurs with the recommendations
emanating from this evaluation.
Relevance of the CPIA. The evaluation finds
that the contents of the CPIA are largely relevant
for growth and poverty reduction and that they
map well with the policies and institutions that are
identified in the literature as relevant for growth
and poverty reduction. On the basis of a review
of the literature, the IEG evaluation concludes
that there is little consensus on the impact of
aid on growth and poverty reduction and on
the conditions, including the role of policies
and institutions, under which aid can influence
growth. The IEG evaluation finds, however, that
the CPIA is associated with aid effectiveness in the
narrower context of the performance of World
Bank loans. Poor CPIA scores are correlated
with the share of problem loans, which in turn is
correlated with loan outcomes.
CPIA criteria. The evaluation also contains
recommendations on a few CPIA criteria, such
as the criteria covering trade, the financial sector,
and the equity of public resource use, which
IEG finds could be streamlined and revisited.
Management considers these recommenda-
tions useful and intends to use them to inform
the next review of the CPIA. After assessing
gaps in coverage, the IEG evaluation notes that
the CPIA is missing an assessment of disadvan-
taged socioeconomic groups other than gender.
Management intends to address this issue in the
context of the CPIA review.
Reliability. The IEG evaluation notes the efforts
the Bank has made over time to strengthen the
CPIA and enhance the reliability of the scores. It
finds that in terms of relative ranking and directions
of change, the CPIA scores are correlated well
with existing indicators, but it notes that the
correlations are higher for IBRD than for Interna-
tional Development Association (IDA) countries.
The report also analyzes the process used by
the World Bank to generate the CPIA scores—a
Management welcomes the Independent Evaluation Group (IEG)
report on the World Bank’s Country Policy and Institutional As-
sessment (CPIA). In management’s view the findings of the review
include several useful insights that will contribute to further strengthen
the CPIA.

x x
T H E W O R L D B A N K ’ S C O U N T RY P O L I C Y A N D I N S T I T U T I O N A L A S S E S S M E N T
Management disagrees with the recommenda-
tion to disclose the IBRD scores and prefers
restricting the coverage of the CPIA exercise to
the IDA-only countries. In the context of the
forthcoming CPIA review, management will
analyze in more depth the value added and the
costs of preparing CPIA scores for IBRD countries
for internal Bank uses, as well as other relevant
aspects. The conclusions of this work will inform
management’s decision on how to go forward,
namely regarding the coverage of the CPIA, and,
if warranted, the consideration of alternative
approaches to disclosure. In the meantime the
CPIA exercise will continue to cover the IBRD
countries.
Accounting for development stage. The
CPIA guidelines state that staff may need to take
into account the size of the economy and its
degree of sophistication in their assessments.
The criteria were developed so that higher
scores could be attained by a country that,
given its stage of development, has a policy and
institutional framework that fosters growth and
poverty reduction. This approach recognizes
that in many areas, countries cannot be judged
by the same yardstick if they are at very differ-
ent stages of development. Some of the policy
objectives may be considered to be invariant to
income—for example, the desirability of having
a well-managed budget. But others depend, for
example, on the sophistication of the financial
system (expectations regarding regulatory
capacity would be different for a high-income
country than for a low-income country) or on
the degree of urbanization. Social protection in a
largely urban, formal economy (unemployment
insurance, pensions, and so on) is fundamentally
different from the problem of protecting a poor
rural subsistence economy from weather-related
harvest shocks.
The report raises a number of concerns regard-
ing the CPIA treatment of the stage of develop-
ment. At the same time, the evaluation and the
recommendations (including those concerning
the revision of the financial sector criterion)
recognize that stage of development consid-
erations are important (appendix box F.1).
process in which the regions put forward a set of
proposals for country scores that are then subject
to review by the networks and central depart-
ments. IEG finds that this internal review process
gives the networks an important role in validat-
ing the scores, helping to prevent potential bias
in the scores and to address possible conflicts of
interest. The review concluded that there is no
strong evidence of upward bias for either the IDA
or IBRD country scores. Management welcomes
these findings and views them as useful inputs for
further strengthening the CPIA process.
General CommentsDisclosure of IBRD scores. The objective of
the CPIA exercise is first and foremost to provide
an assessment of country performance that will be
used to determine IDA allocations. To underscore
this point, by the suggestion of the Board, these
scores are disclosed as the IDA Resource Alloca-
tion Index. IEG argues that disclosure of the
IBRD scores is important from an accountability
and transparency standpoint and will strengthen
the ratings. The report neither elaborates on the
argument nor discusses trade-offs. Accountabil-
ity and transparency are important, but there are
other issues to consider.
A major reason not to disclose the IBRD scores
is the possible effect on market perceptions
and credit ratings and associated financial
consequences for the countries concerned.
Moreover, the Bank would not want to be seen as
a credit rating agency. Unlike the scores for IDA
countries, the scores are not discussed or shared
by Bank staff with their IBRD counterparts; the
IBRD country scores do not play a role in lending
decisions, and their confidentiality limits their
use. They have been used internally in analytic
work and by the Quality Assurance Group and
IEG on portfolio-related issues. When the 2004
external panel reviewed the CPIA and discussed
these issues, it leaned toward dropping the IBRD
countries from the exercise. IEG notes (chapter
4) that the report recommendations are aimed at
enhancing the CPIA beyond its use for IDA alloca-
tions, and that if the CPIA is viewed only in an
IDA-allocation context, the need to include IBRD
countries can be questioned.

x x i
M A N A G E M E N T R E S P O N S E
the time IDA 16 is launched. Management wishes
to point out, however, several important consid-
erations to take into account in planning the
timing of the review. First, in revising the CPIA,
it is important to balance making the instrument
flexible enough to reflect new developments with
maintaining some stability in the criteria that
will allow for comparisons of scores over time.
Revisions will create another break in the CPIA
series, and, as in 2004, there will be substantial cost
in reworking the country scores and in explain-
ing to the governments and external audiences
the new criteria, the differences in relation to
the previous criteria, and the rationale for the
changes. Second, following the introduction of
a new set of criteria, changes in some scores do
not necessarily reflect a deterioration or improve-
ment in performance, but result from the changes
in the criteria. Because the scores are used for
IDA allocations, the revisions of the criteria could
result in aid volatility. And third, the CPIA criteria
are used by other multilateral development banks,
and management also intends to consult them
throughout the process of revising the instru-
ment. Management would add, however, with
respect to the IEG report’s detailed recommenda-
tions on how some criteria could be revised, that it
finds these suggestions useful and intends to use
them to inform the next revision.
Caveats. Although management broadly agrees
with the thrust of the findings of the IEG evalua-
tion, it would like to point out that the report
contains a few examples of statements—specifi-
cally, regarding the interpretation of some of
the findings—that would have benefited from
further elaboration or qualification. Overall,
management agrees with most of the IEG
findings and, with the exception noted above,
accepts its recommendations. Management’s
specific responses to the IEG recommendations
are given in the Management Action Record.
Unless this dimension is considered, some of
the criteria scores may be linearly correlated
with income—which is not the objective of the
exercise. Controlling for a country’s stage of
development seems necessary, as what consti-
tutes good policy in many of the areas covered
by the CPIA is linked to stage of development
as well as to country-specific characteristics. The
report points out that accounting for the stage
of development in the CPIA exercise may not
always have been uniformly applied. It suggests
that, if the approach continues to be used,
the guidelines should clarify and provide the
rationale for its use in specific criteria, showing
how the adjustment should be carried out in
determining the final scores. Management
agrees with this recommendation and in the
context of the review of the CPIA will revise the
guidelines accordingly.
Review of the CPIA criteria. Periodic reviews
of the CPIA to update and refine the content of
the criteria and the conduct of the exercise have
been a mainstay of the CPIA’s history, and they
should continue to remain so going forward. But
these reviews should also be done at sufficient
intervals so that the CPIA scores have some
validity over time. Consensus on development
thinking moves slowly. As the IEG report notes,
these periodic reviews resulted in several breaks
in the CPIA series, as some criteria were dropped,
some were added, and some were revised. As the
report notes, the last major revision took place
in 2004, informed by the recommendations of an
external panel that undertook an in-depth review
of the CPIA.
The IEG report suggests that perhaps the time
has come for Bank management to undertake a
thorough review and revision of the CPIA. Manage-
ment generally concurs with this suggestion and
plans a revision of the CPIA, to be completed by

x x i i
T H E W O R L D B A N K ’ S C O U N T RY P O L I C Y A N D I N S T I T U T I O N A L A S S E S S M E N T
Management Action Record
Independ ent Evaluation Group (IEG) Recommendations Requiring a Response Management Response
Disclose ratings for International Bank for Reconstruction and Development (IBRD) countries.
Disagree. The objective of the Country Policy and Institutional Assessment (CPIA) exercise is first and foremost to provide an assessment of country performance that will be used in determining International Development Association (IDA) allocations. IEG argues without elaboration that disclosure of the IBRD ratings is important for accountability and transparency and would further enhance the quality of the ratings. Whether “disclosure” will further the quality of the ratings is not self-evident. Accountability and transparency are important in their own right, but there are other issues to consider. A major reason not to disclose the ratings is the possible effect on market perceptions and credit ratings and the associated financial consequences for the countries concerned. IEG notes (chapter 4) that the report recommendations are aimed at enhancing the CPIA beyond its use for IDA allocations. It suggests that if the CPIA is viewed only in an IDA-allocation context, the need to rate IBRD countries can be questioned. Management disagrees with the recommendation to disclose the IBRD scores and prefers to limit the coverage of the CPIA to the IDA-eligible countries only. Given that the IBRD scores are used internally by the Bank, the forthcoming CPIA review will include a more in-depth analysis of the value added and the costs of preparing for internal uses CPIA scores for IBRD countries. The conclusions of this work will inform management’s decision on next steps. In the meantime the CPIA exercise will continue to cover the IBRD countries.
Remove accounting for the stage of development from the CPIA rating exercise.
Partially agreed. As the report notes (for example, chapter 2), there is relative consensus in the literature that there is no single recipe for growth and that country specificities, including the stage of development, need to be taken into account. Some of the policy objectives may be invariant to income (for example, desirability of well-managed budgets), but others are not (for example, expectations regarding regulatory capacity in low-income countries versus middle-income countries; social protection in a largely urban formal economy versus a poor rural subsistence economy). The IEG report suggests (the recommendations in the executive summary and chapter 4) that if accounting for the stage of development stage cannot be removed, then it is important to clarify in the guidelines which criteria should take into account the stage of development, what the rationale is for doing so, and how the adjustments should be made. Management agrees with this suggestion. Therefore, as part of the broad review of the CPIA (see below), the guidelines will be revised to clarify which criteria should be adjusted to account for stage of development and how the adjustment should be made.
Undertake a thorough review of the CPIA and revise the criteria as necessary. This needs to entail a detailed review of the literature for each criterion and needs to reflect the latest thinking on development and lessons learned. It also needs to take into account the recommendations of IEG on specific changes to the criteria that were derived from the evaluation.
Agreed. Periodic reviews of the content and methodology have been a fixture of the evolution of the CPIA, and going forward they should continue to be. As the IEG evaluation recognizes, these reviews create discontinuities, as some criteria are added, dropped, or revised. The last major revision took place in 2004, informed by the recommendations of an external panel that undertook an in-depth review of the CPIA. Consensus on development thinking moves slowly, and revisions should be undertaken with sufficient intervals so that the CPIA scores have some consistency over time. From the standpoint of country relations and aid volatility, it is also important to avoid situations where changes in scores result from modifications in the criteria rather than from a deterioration or improvement in country performance. The CPIA is used by other multilateral development banks and an extensive consultation process would be necessary. The IEG evaluation found that “perhaps the time has come… for a thorough review of the CPIA” (chapter 2). Management broadly agrees but underscores that such a review needs to be carefully planned and done in the context of IDA 16. The specific suggestions provided in the IEG evaluation will inform this review, to be completed by the time IDA 16 is launched.
(continued on next page)

x x i i i
M A N A G E M E N T R E S P O N S E
Management Action Record
Independ ent Evaluation Group (IEG) Recommendations Requiring a Response Management Response
Consider not producing an overall CPIA index although continue to produce and publish the separate CPIA components.
Agreed. Management will take this IEG recommendation into consideration in the context of the review of the CPIA mentioned above. IEG’s rationale for this recommendation is that producing the different components of the CPIA without assigning weights to them in order to arrive at an aggregate index would allow different weights to be applied according to country context and uses. In management’s view, in the absence of robust evidence as to what these weights should be, there is value in applying a uniform weighting scheme across all countries and producing an overall index that summarizes the information contained in the different criteria and provides a clear reference point. Moreover, because the scores for all the criteria are disclosed, nothing prevents the users from creating an alternative index based on their preferred set of weights. As part of the review of the CPIA, management will consider whether or not to produce an overall index.

x x i v
Young boy sitting by centuries-old cistern, Hababa, Republic of Yemen. Photo by Bill Lyons/World Bank

x x v
Chairman’s Summary:Committee on Development
Effectiveness (CODE)
before further considering the matter. Others
endorsed the recommendation and the benefits
of disclosure for accountability and transparency,
although they recognized the complexity of this
issue. There was general consensus that further
review and consultations would be needed
with a view to consider improving transparency
over time. Regarding “accounting for the stage
of development” in the CPIA exercise, some
members believed that this dimension should
still be incorporated in CPIA and supported
management’s proposal to clarify the relevant
staff guidelines.
Recommendations and Next StepsThe Committee recommended to management
the following:
The review of the CPIA should take into
account the comments and suggestions raised
at the meeting to enhance its quality. This
would include reviewing the CPIA criteria
as called for in the evaluation—for example,
with respect to trade and finance, social and
environmental components, and incorpo-
ration of criteria on disadvantaged groups
SummaryThe Committee welcomed the timely discussion
of the IEG report, which confirms the useful-
ness of CPIA as a broad indicator of develop-
ment effectiveness. The Committee noted that
the CPIA is not only being used for allocation of
International Development Association (IDA)
resources, but also for other purposes such as
the debt sustainability framework, for which an
assessment on the impact of the CPIA review was
requested. In this vein, there was an agreement
that the purpose of the CODE discussion was not
to address the use of CPIA in the performance-
based allocation formula for IDA.
The discussion focused on the four recommen-
dations in the evaluation. Members and manage-
ment broadly agreed with IEG’s findings on the
content of the CPIA and the recommendation
to review the individual CPIA criteria. There was
extensive discussion about IEG recommendation
to disclose International Bank for Reconstruc-
tion and Development (IBRD) ratings. Some
members questioned the value added of disclos-
ing CPIA for IBRD and stressed the importance
of consultations with the countries being rated
The Committee on Development Effectiveness (CODE) considered the
report The World Bank’s Country Policy and Institutional Assessment
(CPIA) – An Evaluation, prepared by the Independent Evaluation
Group (IEG), and the draft Management Response. A statement by the external
advisory panel on the IEG report was distributed as background document
for the meeting.

x x v i
T H E W O R L D B A N K ’ S C O U N T RY P O L I C Y A N D I N S T I T U T I O N A L A S S E S S M E N T
development” on IDA allocations before endors-
ing the recommendation. One speaker stressed
the need for CPIA to guide allocations in a fair,
transparent, and effective manner. In this regard,
members raised questions on how to synthesize
effectively or prioritize specific issues such as
governance, and how to strike a balance on “soft”
versus “hard” macro issues. In particular, there
was support for strengthening the “soft” indica-
tors in the CPIA.
Review of CPIA. Members broadly encouraged
management to undertake a thorough review of
the CPIA and revise the content and criteria as
recommended by IEG. In this regard, there were
comments on the lack of agreement in the litera-
ture on the impact of aid assistance on growth
and on the evidence to justify the large emphasis
on governance; the need to avoid overlaps and
further enhance the reliability of CPIA ratings;
the linkage with Country Assistance Strategies
and single country exposure framework; and
disclosure of the CPIA methodology. Manage-
ment indicated that the review of the CPIA will
also analyze the issues of the value added and
cost of preparing a CPIA for IBRD countries.
The conclusion of this work will inform manage-
ment’s decision on how to go forward.
Overall CPIA Index. There were different views
expressed on the need to produce an overall
CPIA index although continue producing and
publishing the separate CPIA component. Some
speakers noted that it was inevitable to have one
overall index.
Giovanni Majnoni, Chairperson
in addition to gender, and engaging client
countries. The next steps are:
• Management will undertake a thorough review
of the CPIA in the context of IDA 16.
• IEG will disclose its report together with the
Management Response and the summary of
CODE discussion.
Main Issues DiscussedDisclosure of IBRD ratings. Differing views
were expressed on this recommendation. Some
speakers disagreed and recommended a more
prudent and cautious approach to consider
the value added of CPIA for IBRD countries. It
was noted that the disclosure of CPIA for IDA
countries was related to its use for the allocation
of IDA resources, that the CPIA did not play a
role in determining IBRD lending envelopes, and
that IBRD countries were not consulted on their
CPIA. Others supported the IEG recommenda-
tion to extend disclosure to IBRD countries in
the spirit of transparency and accountability,
suggesting that this may be done on a voluntary
basis or for selected clusters of indicators, and
always consulting the concerned countries
before moving to disclosure. There was also a
proposal to extend the indicator to industrial-
ized countries. One speaker underscored that
the CPIA is an indicator that tries to measure very
different countries against a single benchmark.
Stage of development. Some members agreed
with management on the importance of clarify-
ing the staff guidelines rather than removing
the “accounting for the stage of development”
in the CPIA exercise as recommended by IEG.
Others pointed out the need to know the effect
of removing the “accounting for the stage of

x x v i i
• Criterion 8 can be dropped or reformulated
possibly measuring policies aimed at poverty
reduction such as agriculture (as proposed in
the review) or even infrastructure.
• Assessment of other marginalized socio-
economic groups besides gender should be
definitely integrated. In general, participation
and minority protection could be integrated
(possibly in the governance cluster).
• There should be a separation of social sectors
and environment, possibly creating a separate
environmental cluster with more differenti-
ated criteria, but with a reduced number of
questions for the reviewers.
IEG suggests that there is no proof that the high
weight of the governance cluster increases loan
performance.
• Establishing good governance is one of the
core and most difficult tasks for a fragile state
or a least-developed country and managing to
do so could be especially rewarded by weigh-
ing the governance cluster higher.
IEG suggests the disclosure of CPIA ratings
for International Bank for Reconstruction and
Development (IBRD) countries to increase
transparency. I support this.
• However, there might be many further issues
where transparency and accountability can
be better addressed (such as publishing the
margin of error, and increased use of exter-
nal sources for double-checking). The review
could have touched upon more issues.
We would like to emphasize our support for
the contents of the articles in chapter 2 regard-
ing revising the trade and financial sector
criteria.
Comments by Jürgen Zattler on some of the recommendationsDeputy Director General, Federal Ministry of Economic Cooperation and Development, Germany
The Independent Evaluation Group (IEG)
suggests removing accounting for the stages
of development from the Country Policy and
Institutional Assessment (CPIA) exercise:
• It is much more difficult for a small fragile state
to account for all standards that the CPIA de-
mands than for India. Hence, there would be
an unfair treatment for less-developed coun-
tries to receive a fair allocation.
• Alternatively to accounting for stages of devel-
opment by regional and network reviewers,
there could be a more differentiated weighting
of the various criteria. The most important
criteria to fulfill for a least-developed country
in fragility should be weighed higher. Hence,
fragile states can achieve a higher rating
quickly if they concentrate on the most ur-
gent criteria first. This measure also provides
an incentive system to sequence measures for
development.
IEG recommends that it should be considered
not to produce an overall CPIA index although
continue producing and publishing the separate
CPIA components.
• If the separate clusters should be weighed in-
dividually according to the individual country
situation, then this would be in line with my
proposal above to weigh criteria according to
their importance for development.
IEG recommends a thorough review of CPIA and
revise criteria if necessary. This I can fully support.
Advisory Panel Statement

x x v i i i
T H E W O R L D B A N K ’ S C O U N T RY P O L I C Y A N D I N S T I T U T I O N A L A S S E S S M E N T
particularly since governance challenges tend
to be country specific. Furthermore, reliable
information may not exist to make objective
assessments, and staff of the World Bank may not
possess the required skills/competencies to make
the right calls on these issues that require deep
appreciation of the political economies. There is
a need for more work on the governance criteria
to strengthen the relevance of governance indica-
tors, identify gaps in information and take steps
to close those gaps. Work in this area would gain
from the use on national and regional governance
experts that are close to the scene.
The recommendation that the Bank not produce
an overall CPIA index, although continuing
to produce and publish the separate CPIA
component, is a good one. An aggregate index is
not likely to be a basis for informed policy discus-
sions and probably takes away the focus on the
component ratings, where debate and analysis
would be most useful.
The report notes that “the strength of the CPIA
ratings is Bank staff professional judgment.” Thus
the process through which the Bank harvests its
considerable expertise for the CPIA is important.
The evaluation report assumes that the process
is fine. Nonetheless one may question whether
the existing process, which could be viewed
as overly bureaucratic, is best for tapping the
expertise in the World Bank. Other related issues
include the nature of consultations with govern-
ments and other informed stakeholders, support
for economic and sector work and the quality
of the statistical information base. For low-
income countries, the Bank is the main source
of economic and sector analysis and support for
statistics development invariably depends on
external assistance. Countries with a combina-
tion of relevant World Bank staff with limited
experience, limited recent economic and sector
work and lack of good statistics, may end up with
unreliable CPIA ratings.
The CPIA is carried out every year. This could
be too frequent as the policies, institutions and
performance do not change that rapidly. Further-
more, the annual revisions of the International
Comments by K.Y.AmoakoExecutive Secretary, Economic Commission for AfricaUnited Nations Under-Secretary General
The IEG report should provide a sound basis for
streamlining the structure, criteria and indica-
tors of the CPIA to enhance its alignment to the
goals of economic growth, poverty reduction
and development effectiveness. The report also
provides the basis to discuss where to position
the CPIA’s process and results in the World
Bank’s toolkit for improving the effectiveness
of its support for economic growth and poverty
reduction.
The recommendations for changes in the criteria
for trade to include exports and reduce the weight
given to trade protection, and for the inclusion of
agriculture as a criteria in the CPIA, are welcome.
These are particularly germane for growth and
poverty in Sub-Saharan Africa. On trade, indica-
tors of export diversification and compliance with
regional integration obligations would be useful.
Indicators for the agriculture criterion should
not only focus on public expenditures on agricul-
ture, but should also seek to reflect progress in
research and extension services, adoption of
new technologies, strengthening land tenure,
provision of credit to farmers, as well as market-
ing, distribution and pricing issues.
Expanding microcredit and developing microcredit
institutions can help to enhance financial interme-
diation and to develop financial services and
contribute to the deepening of the financial sector
in general. Thus, the inconclusive evidence on the
growth impact of microfinance notwithstanding,
its place in the CPIA should be retained.
The overarching nature of governance would
justify the large overweighting. Besides, for
those countries with long periods of poor
governance, the potential impact of improve-
ments in governance may be large compared
to other clusters. However, the indicators in the
governance cluster, particularly in q15 and q16,
may not be the most relevant indicators to assess
progress in governance in low-income countries,

x x i x
A D V I S O RY PA N E L S TAT E M E N T
CPIA components that this report calls for (see
below). I think the report should make this an
explicit recommendation (or subrecommenda-
tion) to get management’s response to it.
A second suggestion is that when the ratings are
disclosed each year, the Bank should engage in
a debate and discussion with local scholars and
analysts on a country’s ratings. A group of us did
this a couple of years ago in Ghana, with some
surprising results—some local scholars thought
the Bank was being too soft on some scores.
A more radical option is to bring in local expertise
at the time of rating—perhaps in the form of a
standing panel of distinguished country experts
who can provide their inputs to the Bank country
team.
Second, remove accounting for the stage of
development from the CPIA exercise.
The central issue here is country specificity (see
also my comments on the third recommenda-
tion below). The conceptual foundation of the
CPIA is a cross-country econometric regression
of a development outcome (usually growth but
it could be a social indicator as well) against a
number of “right hand side” (RHS) variables.
It is these RHS variables that the CPIA clusters
and categories are meant to capture. But in any
regression there are points above and below
the line. The question is, do these deviations
contain information, or are the deviations purely
random, with no information content whatso-
ever? The difficulty for a CPIA type exercise arises
because we think that there is indeed informa-
tion content in the deviations—that the “Bangla-
desh paradox” (why does a country with such
poor governance ratings does so well on social
indicators?) is indeed a paradox.
As noted in the report, the “stage of develop-
ment” accounting is a way of trying to put back
country specificity. The intention is good but, as
documented by the report, the way it is done is
not. I support the recommendation to remove
accounting for the stage of development as it
is currently done, but this still leaves open the
Development Association (IDA) allocations
cannot be helpful to country programming by
the World Bank and budget planning by the
governments. Although the CPIA does stimulate
thinking about a range of development issues, it
is not a substitute for detailed policy and institu-
tional analysis that would help the countries
make policy and build institutions. Is the CPIA
crowding essential country work in the environ-
ment of constrained administrative budgets? In
particular, there is the question of value addition
of the CPIA for non-IDA countries and thus the
need for CPIA for non-IDA countries.
Comments by Ravi KanburT.H. Lee Professor of World Affairs and EconomicsCornell University
I welcome this report on the CPIA. It is a
thorough assessment and it raises a number of
important issues that Bank management needs
to address. Moreover, given the key role played
by the CPIA in the IDA allocation process, and
in many analytical contributions to the develop-
ment literature, the report’s assessments are of
interest to the broader development community
as well. By and large, I support the analysis and
the recommendations of the report. However, in
my comments I will highlight where I think the
conclusions could have been much sharper.
I will structure my comments around the four
principal recommendations of the report.
First, disclose the ratings for IBRD
countries.
I agree. But the report could call for more
transparency all around.
One suggestion is that all previous ratings, IBRD
and IDA, in all previous years, should be made
public. There is no reason why this cannot be
done. This will allow analysts in general, and not
just Bank researchers, to analyze the relation-
ships between the different components of
the CPIA and development performance. The
debate will serve to strengthen the review of

x x x
T H E W O R L D B A N K ’ S C O U N T RY P O L I C Y A N D I N S T I T U T I O N A L A S S E S S M E N T
My basic point is that the major review of the
CPIA that is recommended in the report must
explicitly address the question of systematic
inclusion of outcome variables in the assessment
as part of an overall investigation of how country
specificity is to be brought into the assessment,
which itself is part of the fundamental question
which the review must start with—”What observ-
able variables are good predictors of develop-
ment performance along the dimensions we are
interested in?”
Fourth, consider not producing an overall
CPIA index although continuing to produce
and publish the separate CPIA components.
I support this recommendation. It will then
render transparent how different uses, for
example the IDA allocation process, weight the
different components. It will allow researchers to
try out different weights for different purposes
and advance the development debate in that way.
But (see my comments on the first recommenda-
tion), in order for the research and the debate to
be comprehensive, the Bank should release all
previous ratings, component by component, for
all previous years.
To conclude, let me say again that I welcome this
report and I trust Bank management will respond
to it positively.
question of how country specificity is to be
brought in to the assessment (see below).
Third, undertake a thorough review of the
CPIA and revise the criteria as necessary.
I support this recommendation strongly. Indeed,
after this major review I would suggest something
like a cycle of three-year reviews. An alternative is
to have a standing committee of external experts
keep a watch on the CPIA process, with a major
review every three-to-five years to incorporate
new knowledge of the development process.
By and large I support the specific subrecom-
mendations under this category. However,
I would like to highlight a point which, although
it is present in the report, is not emphasized
enough. This is the importance of bringing in
actual outcome variables in the CPIA. I have
argued elsewhere (Kanbur 2005) —that bringing
in the evolution of outcome variables is one
way of factoring in country specificity that, for
whatever reason, is not easily captured by the
CPIA variables (think again of the Bangladesh
paradox). As noted in the report, some outcome
variables are already brought in to the CPIA
assessment. The report itself argues for some
more outcome variables, for example when it
recommends “Revision of the trade criterion
to include a subcomponent on exports that
evaluates performance as well as policies and
institutions.”

Evaluation Highlights• This evaluation assesses the rel-
evance of the CPIA criteria and the reliability of the ratings.
• The CPIA has evolved since its in-ception to cover 16 criteria in four clusters.
• Since IDA 12 the CPIA has been used to allocate IDA funds with a larger weight on the governance criteria—specifically, the gover-nance cluster has 8.5 times the weight of each of the other three clusters.
Chapter 1

Students in classroom, Turkey. Photo by Scott Wallace/World Bank

3
Although CPIA ratings were initiated and used for
IDA allocation purposes, they can and are being
used for wider purposes. For example, the Bank
uses CPIA ratings for other corporate activities
including the Global Monitoring Report. This
evaluation takes the premise that beyond inform-
ing IDA allocations, the CPIA is useful as a broad
indicator of development effectiveness.
Currently the CPIA consists of 16 criteria grouped
into four clusters, with each cluster having equal
weight in the overall CPIA rating. The four clusters
are: economic management (cluster A); structural
policies (cluster B); policies for social inclusion
and equity (cluster C); and public sector manage-
ment and institutions (cluster D) (see appendix A
for a summary of the contents of each criterion).
This is the first self-standing evaluation of the
CPIA by the Independent Evaluation Group
(IEG). Prior to this, IEG had undertaken a review
of the CPIA in the context of a “Review of the
Performance-Based Allocation System” for its
IDA 10–12 Review in 2001.1
Since the 2001 IEG review, there have been
several developments and changes pertaining
to the CPIA. These include two restructurings of
the CPIA: in 2001 following the IEG2 review, and
in 2004 following an external panel review.3 The
external panel review of CPIA ratings and method-
ology was instituted by Bank management in the
context of the discussions about broadening
the disclosure of CPIA ratings for IDA-eligible
countries. Other developments pertaining to the
CPIA include IDA negotiations and the result-
ing changes in the country performance ratings
used in the performance-based allocation (PBA)
system for allocating IDA resources.
This evaluation will address the following
questions:
The Country Policy and Institutional Assessment (CPIA) assesses the
quality of a country’s present policy and institutional framework, with
“quality” referring to the conduciveness of the framework to fostering
poverty reduction, sustainable growth, and the effective use of development
assistance (World Bank 2008b, p.1). It plays an important role in the country
performance ratings (CPRs) that have been established annually since 1980
as a basis for the allocation of resources from the International Development
Association (IDA) to eligible countries.
Introduction and Evolution of the CPIA

4
T H E W O R L D B A N K ’ S C O U N T RY P O L I C Y A N D I N S T I T U T I O N A L A S S E S S M E N T
The remainder of this chapter presents a brief
discussion on the following: (i) the evolution in
the content of the CPIA, including its relationship
with the underlying development paradigm and
IDA negotiations outcomes; (ii) other changes in
the CPIA; and (iii) the role of the CPIA in the IDA
allocation formula.
Evolution in the Content of the CPIAThe CPIA has been evolving since its introduc-
tion due either to changes in the Bank’s thinking
with respect to the development paradigm or
to IDA negotiations, or to both. As stated by the
Bank, “The [CPIA] methodology has evolved
over time, reflecting lessons learned and
mirroring the development paradigm”(World
Bank 2004d).
Among the most prominent changes made to the
CPIA were those introduced in 1998, the spirit
of which has remained in place to date. The
most important of the changes was the greater
emphasis placed on institutions. Criteria were
added to the CPIA on the capacity to manage
and implement policies, and existing criteria
were revised to include/emphasize institutional
aspects (box 1.1). Greater weight was given to
the public sector management cluster, which was
raised from 14 percent of the CPIA in 1997 to 20
percent in 1998 (table 1.1).4
In addition, the Bank started emphasizing
that the CPIA assess countries’ policies and
1. What is the relevance of the CPIA criteria
with respect to the policies and institutions
that are important for sustained growth,
poverty reduction, and the effective use of
development assistance?
2. How reliable are the CPIA
ratings (focusing on the most
recently available ratings at the time
of this writing, the 2007 ratings, in
reflecting such policies and institu-
tions in the countries concerned?
Chapter 2 of this report will evaluate the
relevance of the CPIA criteria with respect to
growth, poverty reduction, and the effective use
of development assistance based on a review of
the economics literature.
Chapter 3 will address the second
question—the reliability of the CPIA
ratings in two ways. First, it will
compare the ratings of the various
CPIA criteria with those of other indicators that
measure similar criteria. Second, it will review the
CPIA ratings generation process within the Bank.
Chapter 4 will summarize the findings presented
in the previous chapters. Recommendations
will be drawn aimed at strengthening the CPIA
as an indicator that represents the factors in the
country important for sustaining growth, foster-
ing poverty reduction, and the effectiveness of
development assistance.
The evaluation assesses the relevance of CPIA
criteria and the reliability of the CPIA ratings.
Changes to the CPIA in 1998 increased emphasis
on institutions.
Two criteria were added to the macroeconomic cluster, “mac-roeconomic management capacity” and “sustainability of structural reforms.” The latter evaluates the commitment of the authorities to reforms and the support of such reforms from the society at large.
The criterion legal and regulatory framework was renamed property rights and rule-based governance, and specific refer-ences were added on contract enforcement, impartial judicial
decisions, time spent by businessmen negotiating with bureau-crats, and theft and crime that raise the cost of doing business.
A specific reference to environmental regulations was added to the environment criterion.
The civil administration criterion was replaced by the criterion on accountability of the public service, with specific references added regarding accountability mechanisms, and the voice and participation of the general public in public activities.
Source: IEG, based on World Bank documents.
Box 1.1: Changes to the CPIA Criteria in 1998 That Reflect the Emphasis on Institutions

5
INT
RO
DU
CT
ION
AN
D E
VO
LU
TIO
N O
F T
HE
CP
IA
Table 1.1: CPIA Criteria 1998–2008
1998 2000 2004–08
Macroeconomic Management and Sustainability of Reforms(0.25)
General Macroeconomic Performance (0.05)
Economic Management(0.20)
Management of Inflation and Current Account (0.05)
Economic Management(0.25)
Macroeconomic Management (0.08) (q1)
Fiscal Policy (0.05) Fiscal Policy (0.05) Fiscal Policy (0.08) (q2)
Management of External Debt (0.05)
Management of External Debt (0.05)
Debt Policy (0.08) (q3)
Macroeconomic Management Capacity (0.05)
Management and Sustainability of the Development Program (0.05)Sustainability of Structural
Reforms (0.05)
Policies for Sustainable and Equitable Growth(0.40)
Trade Policy (0.05)
Structural Policies(0.30)
Trade Policy and Foreign Exchange Regime (0.05)
Structural Policies(0.25)
Trade (0.08) (q4)
Foreign Exchange Regime (0.05)
Financial Stability and Depth (0.05)
Financial Stability and Depth (0.05)
Financial Sector (0.08) (q5)
Banking Sector Efficiency and Resource Mobilization (0.05)
Banking Sector Efficiency and Resource Mobilization (0.05)
Competitive Environment for the Private Sector (0.05)
Competitive Environment for the Private Sector (0.05)
Business Regulatory Environment(0.08) (q6)Property Rights and Rule-
Based Governance (0.05)
Factor and Product Markets (0.05)
Factor and Product Markets (0.05)
Environmental Policies and Regulations (0.05)
Policies and Institutions for Environmental Sustainability (0.05)
(continued on next page)

6 TH
E W
OR
LD
BA
NK
’S C
OU
NT
RY
PO
LIC
Y A
ND
INS
TIT
UT
ION
AL
AS
SE
SS
ME
NT
Table 1.1: CPIA Criteria 1998–2008
1998 2000 2004–08
Policies for Reducing Inequalities(0.15)
Pro-Poor Targeting of Programs (0.05)
Policies for Social Inclusion/ Equity(0.25)
Gender (0.05)
Policies for Social Inclusion/ Equity(0.25)
Gender Equality (0.05) (q7)
Safety Nets (0.05) Equity of Public Resource Use (0.05)
Equity of Public Resource Use (0.05) (q8)
Building Human Resources (0.05)
Building Human Resources (0.05) (q9)
Social Protection and Labor (0.05)
Social Protection and Labor (0.05) (q10)
Poverty Monitoring and Analysis (0.05)
Poverty Monitoring and Analysis (0.05)
Policies and Institutions for Environmental Sustainability (0.05) (q11)
Public Sector Management(0.20)
Quality of Budget and Public Investment Process(0.05)
Public Sector Management and Institutions(0.25)
Property Rights and Rule-Based Governance (0.05)
Public Sector Management and Institutions(0.25)
Property Rights and Rule-Based Governance (0.05) (q12)
Quality of Budgetary and Financial Management (0.05)
Quality of Budgetary and Financial Management (0.05) (q13)
Efficiency and Equity of Revenue Mobilization (0.05)
Efficiency of Revenue Mobilization (0.05)
Efficiency of Revenue Mobilization (0.05) (q14)
Efficiency and Equity of Public Expenditures (0.05)
Efficiency of Public Expenditures (0.05)
Quality of Public Administration (0.05) (q15)
Accountability of the Public Service (0.05)
Transparency, Accountability, and Corruption in the Public Sector (0.05)
Transparency, Accountability, and Corruption in the Public Sector (0.05) (q16)
Source: IEG, based on World Bank documents.Note: Weight of the criterion in parenthesis.

7
I N T R O D U C T I O N A N D E V O L U T I O N O F T H E C P I A
and the weights for the four clusters remained
unchanged. The few prominent changes during
this period included the replacement of the
criterion on equality of economic opportunity
by a criterion on gender in 2000. This effectively
excluded discriminatory effects by socioeco-
nomic group (for example, by race, caste, and
ethnic group) from the assessment. Another
change was the replacement of the criterion on
social safety net by a criterion on social protec-
tion and labor. This broadened the
assessment of the protection of the
poor beyond safety nets, and reflected
the new social protection strategy that
was launched by the Bank at the time
(World Bank 2000b).
The changes in 2001 included the addition of
an explicit reference to economic growth in the
assessment of fiscal policy. In 2002, domestic
debt was included in the public debt criterion
(formerly only external debt was covered),
and other communicable diseases (in addition
to human immunodeficiency virus/acquired
immunodeficiency syndrome [HIV/AIDS], which
was there already), was added to the building
human resources criterion.
Finally, the most recent and major restructuring
of the CPIA occurred in 2004. It was based on the
recommendations of an external panel review
of the CPIA noted above. Several changes were
introduced. The number of criteria was reduced
from 20 to 16. This entailed collapsing four
criteria into two5 and dropping two that were
covered by other CPIA criteria.6
The content of virtually all the criteria
was revised. For example, more detailed
specification was provided on what
was being assessed under each of the
three criteria of the economic manage-
ment cluster. Greater emphasis was also placed
on customs and trade facilitation for the trade
criterion. Assessment of gender disparities in politi-
cal participation was added to the gender criterion.
Tuberculosis and malaria were added to HIV/AIDS
in the assessment of building human resources
criterion, among other changes.
the institutions that implement these policies,
rather than development outcomes. Finally, the
ratings were to be given based on the “level”
of the countries’ policies and institutions at the
time, rather than the changes in these policies
and institutions compared to the previous year,
as had been done in the past. This in turn was
predicated on the assumption that the levels
of such policies and institutions were the main
determinants of aid effectiveness.
The focus on the public sector continued in 1999.
This reflected the interest of IDA deputies during
the IDA 12 replenishment exercise. They noted
that “accountability, transparency, the rule of law
and participation represent four major pillars of
governance that are critical to the development
process and the effective use of IDA resources.”
This was also indicative of the new thinking by the
Bank on public sector effectiveness. The weight
of the public sector cluster was raised by another
5 percent to 25 percent with the transference
of the criterion property rights and rule-based
governance from the policies for sustainable
and equitable growth cluster to the public sector
cluster.
There was also a large increase in emphasis on
social policies in 1999, reflecting the interest of
IDA deputies during the IDA 12 Replenishment
exercise. Two criteria were added to the social
policy cluster: equality of economic opportunity
and building human resources. The addition of
these two criteria increased the weight of the
social policy cluster from 15 percent in 1998 to
25 percent in 1999.
In sum, the changes in 1998 and 1999 resulted
in much greater emphasis on social policies and
on the public sector in the CPIA. The weights for
these two clusters rose from 15 and 14 percent,
respectively, to 25 percent each, and the weight
for the economic management cluster fell from 25
to 20 percent, and that for the structural policies
cluster fell similarly, from 40 to 30 percent.
Adjustments continued to be made to the CPIA
after 1999 through 2003, although these were
less extensive than those made in 1998 and 1999,
In 1999, emphasis on social policies was increased in the CPIA.
All the CPIA criteria were revised in 2004 and equal weights were given to each cluster.

8
T H E W O R L D B A N K ’ S C O U N T RY P O L I C Y A N D I N S T I T U T I O N A L A S S E S S M E N T
The Bank’s six regions, the networks, and the
central departments are all involved in the
selection of a representative sample of countries
that cover all the regions and include IBRD- and
IDA-eligible borrowers. Both good and poor
performers are included in the sample, and the
ratings of these countries have a similar distribu-
tion as the overall distribution of CPIA ratings.
The set of benchmark countries is reviewed
every year, taking into account the need to both
maintain some continuity in the sample and to
refresh it. The number of benchmark countries
has increased from 11 in 1998 to 19 in 2008, with
the inclusion of additional IDA countries compris-
ing all of this increase. Over the same period,
the share of IDA countries in the benchmarking
group has risen from 45 to 68 percent.
Policies/institutions versus outcomes. As
mentioned earlier regarding the evolution in the
content of the CPIA, as part of the 1998 restruc-
turing of the CPIA, the Bank emphasized that
countries’ policies and institutions are being
assessed rather than outcomes. Nonetheless,
in the instructions to staff (the CPIA question-
naire) with respect to preparing the ratings, it
was clearly stated that Bank staff need to take
into account country outcomes when assigning
ratings, a statement that has remained in each
of the CPIA questionnaires since then. Further,
although most of the metrics and indicators
specified for the assessment of various CPIA
criteria are policies and institutions, for a few
criteria outcome indicators were also included,
in particular for the financial sector and for
gender.
Rating scale and definition. In 1998, the rating
scale was changed from five points to six points.
In 2001, explicit definitions were provided for
the rating levels of 2, 3, 4, and 5 for each of the
CPIA criteria (previously only the 2 and 5 rating
levels were defined). In 2004, the definition of
rating levels was extended to rating levels 1 and
6. Prior to 2004, a “6” rating was given for criteria
that had received a “5” rating for three or more
years, and a “1” rating was given for criteria that
had received a “2” rating for three or more years
(World Bank 2003a).
Equal weights for each criterion were replaced
by equal weights for each cluster. This raised the
weight of the economic management cluster from
20 to 25 percent (bringing it back to the 1997–98
weight). The additional 5 percent weight given to
the economic management cluster was effected
by dropping the monitoring and analysis of
poverty outcomes and impacts criterion from
the social polices cluster. Although, ostensibly,
the weight of the social policy cluster
remained at 25 percent, it was only
because the environment criterion
was transferred to this cluster (from
the structural policy cluster). In effect,
therefore, the weight is lower for
the non-environment social criteria.
Between 2004 and 2008, the CPIA
criteria and their weights remained
unchanged.7
In sum, over the past decade adjustments
have been made to the CPIA with respect to
the content, the number of criteria, and the
weights of the criteria. Notwithstanding these
adjustments, the coverage of the CPIA has
remained largely unchanged since the changes
in 1998–2000, which introduced
the emphasis on the public sector
and social policies (with the latter
including the gender criterion)
(table 1.1).
Other Changes in the CPIAMany changes have been made over time in the
preparation process of the CPIA ratings, some
resulting from the findings of the IEG review of
2001 and the external panel review of 2004. The
changes are as follows.
Benc hmarking . Beginning in 1998, a
benchmarking step has been introduced to the
ratings process to strengthen the comparability
of country scores. This entails the introduction of
an initial phase in the CPIA preparation process
of selecting and rating benchmark countries
(IDA and IBRD), against which ratings for other
countries would be compared during the CPIA
preparation process.
In 2004, the weight on the economic management
cluster was raised from 20 to 25 percent, whereas the weight on
the social policy cluster (excluding environment)
was reduced from 25 to 20 percent.
Although the CPIA is intended to assess policies and institutions, outcomes
also affect ratings.

9
I N T R O D U C T I O N A N D E V O L U T I O N O F T H E C P I A
sector management and institutions (referred
to as the governance criteria)—have played a
greater role in IDA allocation than others, and
their role in IDA allocation has received increased
attention over the last decade.
Beginning in 1998 with IDA 12, and in response to
IDA Deputies’ suggestions, IDA allocations have
been adjusted by the country’s perfor-
mance in the governance-related CPIA
criteria and in procurement practices.
According to IDA, “The stress on
governance has evolved over the past
decade and was put in place by donors
because of its importance for improv-
ing the development performance of
partner countries and for mitigating fiduciary
risks to aid funds” (World Bank 2006b, p. i.).
The governance adjustment was first introduced
in 1998 for IDA allocations in the form of a
governance discount. This was replaced by
the governance factor in 2001 to address
the problem of discontinuity in allocations
under the governance discount. For both the
governance discount and the governance factor,
the adjustment took into account the ratings of
the CPIA governance criteria and that
of the procurement criterion of the
Annual Review of Project Performance
(ARPP).
In 2004, the number of CPIA
governance criteria included in the governance
factor fell from six to five, as the 2004 restructur-
ing of CPIA had removed one of the governance
criteria. This reduced the effective weight of the
governance criteria in the country performance
rating from 68 to 66 percent. (See box 1.2 for a
more detailed discussion of the evolution of the
governance adjustment.)
Adjusting the country performance rating by
the governance factor rendered the allocation
formula more complex. The CPIA governance
cluster and the procurement flag from the
ARPP were double counted (see table 1.2). The
exponential multiplier (of 1.5) on the governance
rating (to arrive at the governance factor) made
Guideposts. These were introduced in 2001
and by 2005 were provided for each criterion.
There have been both additions to and removal
of guideposts since their introduction.
Country context. Since 2004, following the
recommendations of the external panel review,
a specific instruction has been added in the CPIA
questionnaire that staff may need to take into
account “the size of the economy and its degree of
sophistication in implementing the guidelines.”
Specific references regarding this point have
been added to the criteria on the financial
sector and social protection and labor.
Written record. This requirement was
introduced in 2001 for staff to provide written
justification to accompany their rating proposals.
The practice has been maintained since then.
Disclo sure. At the start of IDA 12 in fiscal 2000, IDA
initiated the disclosure, in quintile format, of the
CPIA and IDA Country Performance (ICP) relative
ratings for IDA eligible-countries. Management
instructed country teams of IDA-eligible countries
to discuss with each country’s authorities their
country's CPIA and ICP ratings and the resulting
country IDA allocation. The quintile-based rating
results for the CPIA, its four clusters, the country
portfolio, and the quintile-based ICP rating were
then posted on the external World Bank Web site.
On Sep tember 7, 2005, following the recommen-
dation of the external review panel, the Board
approved the disclosure of CPIA ratings for IDA
eligible countries. For the first time in June 2006,
IDA disclosed the numerical scores for all CPIA
criteria and the overall score for all IDA-eligible
countries as the “IDA Resource Allocation
Index.” This index is a misnomer, though, as IDA
resources are actually not allocated according to
this index, as will be discussed in the next section.
Role of the CPIA in IDA AllocationThe role of the CPIA in country performance
assessments, and in turn in the allocation of IDA
funds through the PBA formula, has evolved over
time (see table 1.2). In particular, certain CPIA
criteria—specifically those in the cluster on public
Since 2004, the rating exercise is meant to take into account the size of the country and sophistication of its economy.
Since IDA 12, greater weight has been given to the governance criteria for allocating IDA funds.

1 0
T H E W O R L D B A N K ’ S C O U N T RY P O L I C Y A N D I N S T I T U T I O N A L A S S E S S M E N T
the calculation and interpretation of
the performance rating more complex.
The complexity of the allocation formula was
especially problematic as IDA was taking steps
to be transparent about how its resources were
allocated, which led to the decision to disclose
CPIA and country performance ratings beginning
in June 2006 (see chapter 1, section on disclo-
sure). In this light, at the Mid-Term Review of
The formula used was very complex.
Table 1. 2: Evolution of IDA’s Performance-Based Allocation Formula and the Adjustment for Governance
Period
Elements in the performance-based allocation formula
(per capita)
Country Performance Rating
Governance adjustments in IDA allocation formulaCPIA
Portfolio performance
rating
1991–96 GNPpc–0.25, CPR1.8 100%a 0% n.a.
1997 GNPpc–0.125, CPR0.5 CPR < 2 100%b — n.a.
GNPpc–0.125, CPR1.6 2 < CPR < 2.9
GNPpc–0.125, CPR1.95 CPR >2.9
1998–2000 GNPpc–0.125, (CPR/3)1.75 CPR < 3 80% 20% Governance discount (introduced fiscal 2000):For countries with 3 or more ratings of 2 or below out of the 6 CPIA governance criteria, and over 30% of projects with deficient procurement practices (according to the ARPP rating), the CPR is cut by one-third.
GNPpc–0.125, CPR2 CPR > 3
2001–08 GNPpc–0.125, CPR2 CPR = (0.8*CPIA + 0.2*ARPP) *governance factor
where governance factor = (governance rating/3.5)1.5
2001–03: governance rating = average of 7 governance criteria (6 CPIA criteria plus procurement criterion of the ARPP portfolio rating).
2004–07: governance rating = average of 6 governance criteria (5 CPIA criteria plus a 3-year moving average of the procurement flag of the ARPP portfolio rating).
Fiscal 2008: governance rating = average of 5 governance criteria
From fiscal 2009
GNPpc–0.125, CPR5 CPR = 0.24*CPIAA-C + 0.68*CPIAD+ 0.08*Portfolio performance rating c
Governance rating = average of 5 governance criteria
Source: IEG, based on various IDA reports.Note: ARPP = Annual Review of Project Performance; CPR = Country Performance Rating; GNPpc = Gross National Product Per Capita. a. From 1998 through fiscal 2007, this was represented by the projects at risk rating in the ARPP. Projects at risk consist of actual and potential problem projects. Ratings of actual problem projects are done by task managers and reported in the implementation supervision reports. Ratings of potential problem projects are done by the Quality Assurance Group which looks at a number of criteria including the country’s history of failure rate, defined as over 50 percent unsatisfactory outcome ratings by IEG. Beginning in 2001, the measurement of procurement enhancement was improved to capture not only the timeliness of the procurement process but also its quality. Beginning in fiscal 2008, only actual problem projects were included in the portfolio performance rating for the CPR. Hence, from then, the procurement flag has been dropped from the governance factor.b. The CPIA included a portfolio performance element which made up 20 percent of the weight in 1994, 10 percent in 1995–96, and 7 percent in 1997.c. CPIAA-C refers to CPIA clusters A (economic management), B (structural policies), and C (policies for social inclusion/equity), and CPIAD refers to CPIA cluster D (public sector manage-ment and institutions).

1 1
I N T R O D U C T I O N A N D E V O L U T I O N O F T H E C P I A
IDA introduced adjustments to the country performance rat-ings used in the performance-based allocation system in 1998, under IDA 12. These adjustments initially took the form of a governance discount. Specifically, IDA reduced the country performance rating in the allocation formula by one-third for those countries with three or more highly unsatisfactory rat-ings out of seven governance factors. Effectively, this reduced IDA allocations for those countries affected by the discount on average by half.
The 7 governance factors were 6 CPIA criteria plus the coun-try’s performance on procurement practices, according to the ARPP. The 6 CPIA criteria were: (i) management and sustainability of structural reforms; (ii) property rights and rule-based gover-nance; (iii) quality of budget and public investment process; (iv) efficiency and equity of revenue mobilization; (v) efficiency and equity of public expenditures; and (vi) accountability of the public service. Ratings were considered to be highly unsatisfactory if they were “2” or below for the CPIA criteria and in the case of ARPP procurement criterion, if over 30 percent of projects had deficient procurement practices.
The governance discount produced a discontinuity effect at the point where the discount was triggered, with allocations dropping by one-half when only one criterion dropped from 2.5 to 2.0 (World Bank 2001b, p. 4). Perhaps because of this, there were upward pressures on the ratings at the cut-off point (World Bank 2002b, p. 4). IDA deputies were also concerned about the punitive bias of the governance discount, and the fact that it was not affecting all countries with weak governance (World Bank, 2002b, p. 4).
To address these drawbacks, the governance discount was replaced by a governance factor in 2001 (World Bank 2002b, p. 4),
which is equivalent to (governance rating/3.5).1.5 The governance rating is derived from the country’s average rating for the seven governance criteria mentioned above, with 3.5 being the mid-point of the rating. This governance factor is applied to the overall country performance rating. Under this new design, governance performance at all levels is taken into account in IDA allocations: countries that score above the mid-point on governance-related criteria receive a premium, and those that score below receive a discount.
There was still a discontinuity in allocation despite the replace-ment of the governance discount with the governance factor. Specifically, a one point drop in just one of the seven governance criteria results in a 7.5 percent drop in the overall IDA rating, and in turn a 15 percent drop in the country’s allocation (World Bank 2003b, p. 2).
The seven governance criteria together had an effective weight of 68 percent in the IDA CPR. The effective weight fell slightly to 66 percent (World Bank 2004a, p. 3) in 2004 with the restructuring of the CPIA criteria that removed one of the governance criteria (the one on management and sustainability of the development program).
Adjusting the country performance ratings by the governance criteria raised the dispersion of these ratings, as was intended by IDA to better differentiate the allocated resources depending on the country’s quality of governance. The governance adjustment also raised the volatility of the country performance ratings. The procurement ratings, in particular, were more volatile than ratings of the CPIA governance criteria. To address this issue, in 2004, IDA 14 introduced a three-year moving average for the procurement ratings (World Bank 2006a, p. 13).
Source: IEG, based on IDA documents.
Box 1.2: T he Governance Adjustment in IDA’s Country Performance Ratings, FY1998–2008
IDA 14, IDA Deputies requested Bank manage-
ment to “…simplify the allocation formula and
reduce unwarranted ratings volatility” (World
Bank 2006a).
IDA deputies decided that, beginning with IDA 15
(fiscal 2009), the country performance rating will be
simplified to make the weights of the components
more explicit. Specifically, the country perfor-
mance rating (CPR) will be changed to:
CPR = (0.24 * CPIAA–C
+ 0.68 * CPIAD + 0.08*
portfolio performance),
where CPIAA–C
refers to the average of the ratings
of CPIA clusters A (economic management), B
(structural policies) and C (policies for social
inclusion/equity), and CPIAD refers to ratings of
CPIA cluster D (public sector management and
policies). Correspondingly, the PBA formula was
changed from:

1 2
These ch anges in the CPR (and associated
change in the PBA) have made the IDA allocation
formula more transparent—specifically that CPIA
cluster D has 8.5 times the weight of each of the
clusters A–C in the CPR. Yet, at the same time, by
breaking up the CPIA into the different constitu-
ent parts that are used in the CPR, the changes
have also made transparent the weakness of the
link between the overall CPIA index and IDA
allocations.
PBA = f(CPR2, population,
GNIpc–0.125)
to PBA = f(CPR5, population,
GNIpc–0.125),
where GNIpc is gross national income
per capita. The exponent on the CPR
was changed from 2 to 5 to maintain
the same dispersion of ratings and
therefore of allocations as before.8
The formula has been simplified for IDA 15,
making transparent the relative weights
of the different CPIA clusters in the allocation
formula—that is, that the governance cluster has 8.5 times the weight of
each of the other clusters.
T H E W O R L D B A N K ’ S C O U N T RY P O L I C Y A N D I N S T I T U T I O N A L A S S E S S M E N T

Evaluation Highlights• The CPIA covers the main deter-
minants of sustained growth and poverty reduction, although some criteria can be usefully revised and streamlined and one added.
• The evidence is less clear regarding the relevance of the content of the CPIA for aid effectiveness broadly, that is, that it represents the policies and institutions important for aid to lead to growth.
• CPIA ratings are associated with a narrow definition of aid effective-ness, specifically the better perfor-mance of Bank loans.
• There is insufficient evidence to conclude that the governance clus-ter associates better with loan per-formance than the other clusters.
• The effects of a larger weight on governance in the IDA allocation formula (compared to equal weights on each cluster) are not due just to the governance rating but to how different that rating is compared to ratings on the other clusters.
Chapter 2

Hong Kong, China

1 5
Relevance of the CPIA for Growth, Poverty Reduction,
and Effective Use of Development Assistance
According to the Bank, the CPIA assesses the quality of a country’s pres-
ent policy and institutional framework, where quality refers to how
conducive that framework is to fostering poverty reduction, sustainable
growth, and the effective use of development assistance (World Bank 2008b).
The review of economic literature (theoretical/
conceptual as well as empirical) indicates that,
by and large, the CPIA criteria pertain to policies
and institutions that are found to be important
for sustained growth and poverty reduction (and
welfare more generally). The evidence is more
mixed as to the criteria’s importance for aid
effectiveness.
The CPIA and Determinants of Sustained GrowthThe literature on the determinants of sustained
growth has undergone a significant evolution
during the last 50 years. In the 1950s and 1960s,
it was widely argued that long-run economic
performance depends on capital investment
and that raising savings through a “big push”
(Rosenstein-Rodan 1943) would launch countries
into self-sustaining growth or “take-off ” (Rostow
1960). In the 1980s, the literature begins to
emphasize the importance of a good economic
policy environment (Williamson 1990; World
Bank 1993) characterized by reduced tariffs,
appropriate foreign exchange rates, and low
inflation.1 Then, in the 1990s, the literature
emphasizes that these policies would have only
limited impact in the absence of more fundamen-
tal institutional reforms (World Bank 1998).
Today, there is relative consensus in the literature
around the idea that there is no single recipe for
growth and that country specificities—includ-
ing the country’s stage of development—need
to be taken into account.2 Of course, countries
can learn from each other, but no simple recipe
can be pulled off the shelf to stimulate growth.
Each country needs to learn through trial and
error what works for it (World Bank 2004e).
This does not mean, however, that there are no
growth determinants. What it does point to is
the need “…to identify the exact set of policies
and institutional changes needed to address
binding constraints on growth, based on first
principles in each instance” (World Bank 2005).
By and large, this evaluation finds that the CPIA
covers those growth determinants over which there
is relative consensus in the literature.
These are: institutions and governance;
education; productivity and technologi-
cal innovation; and equity and equality
of opportunity (table 2.1).
The CPIA covers determinants of growth for which there is relative consensus.

1 6
T H E W O R L D B A N K ’ S C O U N T RY P O L I C Y A N D I N S T I T U T I O N A L A S S E S S M E N T
determinants and how they are treated in the
CPIA will also be addressed.
Institutions and governanceInstitutions and governance are among the
main growth determinants around which there
is relative consensus, and on which there is a
sizeable literature (appendix B). In this literature,
institutions refer to, variously, private property
rights protection, contract enforceability,
operation of the rule of law (including effective-
ness and predictability of the judiciary, percep-
tion of the incidence of crime), the quality of the
bureaucracy, accountability of the government
(including independence of the media), and the
extent of corruption.
The existing evidence on the impact of virtually
all of these indicators on growth is positive. The
Three CPIA criteria do not appear in the above
table: trade (q4), equity of public resource use
(q8), and environment (q11). This does not mean,
however, that they are not important for growth,
only that there is less consensus in the literature
on their impact on growth (specifically pertaining
to trade and environment), or what is important
for the criteria already covered by other criteria in
the CPIA (in the case of equity of public
resource use). The evidence on the
impact of health (part of q9) on growth
is also inconclusive, although health is
clearly important for welfare.
The rest of this section provides a brief summary
of the literature on each of these determinants
of growth—both those for which there is more
consensus and those for which there is continu-
ing controversy. The relationship between these
Table 2.1: Mapping of the “Consensus” Determinants for Sustained Growth and the CPIA Criteria
Institutions and Governance Security of Property rights q12 Property Rights and Rule-Based Governance
Rule of Law q12 Property Rights and Rule-Based Governance
Government Credibility, Corruption
q16 Transparency, Accountability, and Corruption in the Public Sector
Quality of the Bureaucracy q15 Quality of Public Administration
Human Capital Education q9 Building Human Resources
Investment, Productivity and Technological Innovation
Private investment• Stable fiscal policy• Stable monetary policy• Sound financial systems• Stable investment
regimes• Clear and transparent
business environment• Labor mobility• Rule of law• Fighting corruption
q2q3q13q14q1q5q6q6q6q12q16
Fiscal policyDebt policyBudgetary and financial managementRevenue mobilizationMacroeconomic managementFinancial sectorBusiness regulatory environmentBusiness regulatory environmentBusiness regulatory environmentProperty rights and rule-based governanceTransparency, accountability, and corruption in the public sector
Public investment and infrastructure
q2 Fiscal policy
Equity and Equality of Opportunity
• Property rights• Access to credit• Access to education• Gender equality• Income transfers
q12q5q9q7q10
Property rights and rule-based governanceFinancial sectorBuilding human resourcesGender equalitySocial protection and labor
Sources: IEG, based on Cage (2009), background paper for this evaluation, and the CPIA 2008 questionnaire.
The trade and environment criteria
have less consensus in the literature.

1 7
R E L E VA N C E O F T H E C P I A
This is particularly pertinent for low
income countries which may perform
well on the macro/fiscal stability front,
yet have weak fiscal management
capacity. In such cases, a good rating
for q2 needs to be tempered by an
appropriate rating for q13 in order that the fiscal
aspect of the country in its entirety is realistically
captured.
Similarly, finance depends on institutions, includ-
ing informational and regulatory institutions,
institutions that strengthen creditor rights,
contract enforcement, and accounting practices
and the legal and judicial framework (Levine,
Loayza, and Beck 2000; World Bank 2005). These
institutions are covered in the CPIA criteria on
the financial sector (q5) and on property rights
and rule-based governance (q12).
Human capitalHuman capital—and in particular education—
is one of the main determinants of sustained
growth around which there is consensus in
the literature. In particular, the link between
primary enrollment and subsequent growth is
well established in the literature (see appendix
C). In addition, improvements in secondary and
tertiary education systems are also important,
depending on the stage of development of the
country.3 Education is adequately covered in the
building human resources criterion (q9) of the
CPIA, which includes assessment of
both basic and post-basic education.
Although the importance of education
on growth is clearly and strongly
supported by evidence, the evidence
on the impact of health on both the level of
economic development (per capita incomes) and
economic growth is less conclusive,
mainly because population increases
that result from better health have a
negative effect on per capita income
(see appendix C). Nonetheless, it
is clear that health is important for
welfare (the non-income dimension
of poverty—see discussion later in this
chapter).
one exception is corruption, where some earlier
literature (from the mid-1960s to the mid-1990s)
posits that corruption can have a positive
impact on growth in instances where there are
pre-existing policy distortions such as pervasive
and cumbersome regulations, in which case
corruption can help efficiency and growth. But
all of the literature from the mid-1990s onward
has found that corruption has a negative impact
on growth (appendix B).
The institution and governance indicators identi-
fied in this literature are covered in three of the
five governance indicators under the public
sector management and institutions cluster of
the CPIA. These are the criteria on property
rights and rule-based governance (q12), the
quality of the bureaucracy (q15), and transpar-
ency, accountability, and corruption in the
public sector (q16).
The importance of institutions goes beyond
these indicators. In particular, the institutional
context within which policies are formulated
is also important. For example, regarding
macroeconomic policies, it is not just low and
stable inflation that is important, but the convic-
tion of the private sector that low and stable
inflation is a permanent feature of the economic
environment. The latter requires an appropri-
ate institutional underpinning for price stability
(World Bank 2005; Montiel and Servén 2006).
In the fiscal arena, an appropriate institutional
setting needs to also ensure transparency,
sustainable solvency, flexibility, and a pro-growth
structure of the budget. The institutional aspects
of macroeconomic (and fiscal) policy are covered
in the macroeconomic management criterion
(q1), the fiscal policy criterion (q2), the quality
of budgetary and financial management
criterion (q13), and the efficiency of revenue
mobilization criterion (q14) of the CPIA.
Although there is adequate coverage of the policy
(q2) and institutional (q13) aspects of fiscal
management, an issue arises over the coordina-
tion of the assessment of these two criteria (in
the Bank they are assessed by different groups).
The evidence on the impact of most institutional indicators on growth is positive.
The institutional context in which economic policies are formulated is important.
Although education is clearly important for economic growth, the evidence of health on economic growth is more mixed— although health is clearly important for welfare.

1 8
T H E W O R L D B A N K ’ S C O U N T RY P O L I C Y A N D I N S T I T U T I O N A L A S S E S S M E N T
three macroeconomic criteria can be usefully
assessed as one.
Public investmentPrivate investment needs to be complemented by
public investment to enhance competitiveness and
create new market opportunities. Complementary
public investment in expanding infrastructure and
communications and in upgrading the skills of the
labor force is particularly important (Easterly and
Rebelo 1993; World Bank 1994; Sachs 2005, 2008;
Collier 2007; World Bank 2008a).
In fast-growing Asia, for example, public invest-
ment in infrastructure accounts for 5–7 percent
of gross domestic product (GDP) or more. In
China, Thailand and Vietnam, total infrastruc-
ture investment exceeds 7 percent of GDP.
History suggests that this is the correct order
of magnitude for high and sustained growth,
although it is difficult to be precise (World Bank
2008a). Finally, public investment can be used as
a tool to increase equality of opportunity, which
is another determinant of sustained growth,
discussed next. The CPIA covers public invest-
ment in it criterion on fiscal policy (q2), where
there is an explicit reference to “the provision
of public goods, including infrastructure….
consistent with medium-term growth.”
Equity and equality of opportunityDevelopment economics has seen a major shift in
view regarding the role of inequality on growth,
from one that initially saw increases in equality
as a natural accompaniment to development
(Kuznets 1955) or actually facilitating develop-
ment (through the incentives it provides)
(Lewis 1954) to the current view that inequality
is detrimental to growth (Todaro 1997; Aghion,
Caroli, and García-Peñalosa 1999; Bardhan 2000;
Hoff and Stiglitz 2001). This view is supported
by the results of several empirical (Alesina and
Rodrick 1994; Perotti 1992, 1993, 1996; Persson
and Tabellini 1994) and other studies (box 2.1).
Equality of opportunity is an important element,
and indeed the starting point, of equity.5 System-
atic denial of opportunities to a group because
of its ethnicity, religion, caste, or gender could
Investment, productivity, and technological innovationIt is widely acknowledged among economists
that strong, enduring growth requires high rates
of investment (World Bank 2008a; Aghion and
Howitt 2009). All of the different growth theories
have investment of one type or another driving
growth.4 Both private and public investments are
important. Further, savings is equally important;
indeed, the evidence shows that there is no case
of a sustained high investment (and high growth)
path that is not backed up by high savings (with
the latter aided by fiscal prudence) (World Bank
2008a).
Private investmentFostering private investment requires
reducing risks for private investors,
through stable fiscal and monetary
policy, stable investment regimes,
sound financial systems, and a clear and transpar-
ent business environment including flexibility of
the labor market. It also requires ensuring the
rule of law, and measures to fight corruption
(World Bank 2001a).
The CPIA covers all these elements important
for private investment in several of its criteria,
including those on macroeconomic manage-
ment (q1), fiscal (and debt) policies (q2 and
q3), the financial sector (q5), business regula-
tory environment (q6), property rights and
rule-based governance (q12), and transpar-
ency, accountability, and corruption in the
public sector (q16).
All of the above criteria are concep-
tually distinct except for macroeco-
nomic management, fiscal, and debt
policies. Debt policies are clearly an
intrinsic part of fiscal policies, and
fiscal policies in turn are clearly also
an intrinsic part of macroeconomic manage-
ment. Indeed, the macroeconomic manage-
ment criterion refers to public spending. It also
refers to monetary/exchange rate policies aimed
at price stability, which cannot be achieved
without taking into account fiscal policies at the
same time. Thus, it appears that the existing
The CPIA covers the multiple elements
necessary to foster private investment.
Public investment, including for
infrastructure, is covered in the criterion
for fiscal policy.

1 9
R E L E VA N C E O F T H E C P I A
gnon 2004). There is a debate, however, as to how
important microfinance is compared with overall
financial development (as measured by private
sector credit as a share of GDP interme-
diated through the formal banking
sector). There are individual success
stories of microfinance, including from
impact assessments that show microfi-
nance in general helps the poor, although all partic-
ipants may not benefit equally.8 However, other
studies find that overall financial development
(measured by financial depth) has had a larger and
more certain impact on growth and
poverty reduction than the expansion
of microfinance (Honohan 2004b; Beck,
Demirguc-Kunt, and Levine 2004).
The CPIA covers the measures for equity (redistri-
bution) and for equality of opportunity identified
in the literature. These include property rights
(q12); access to credit (q5); access to education
(q9); gender equality (q7); and income transfers
(q10) (table 2.1). The financial sector criterion
covers both financial depth and microfinance.
Thus, it covers all relevant ground irrespective of
whether microfinance is important.
There are two issues related to the equity and
equality aspect of growth that are important for
the CPIA. The first is that only gender issues are
undermine social peace and spark political
unrest (World Bank 2008a). There is evidence
that gender inequality—particularly in access to
education—reduces economic growth as it fails
to make adequate use of female resources (World
Bank 2001a; Klasen 2002; Knowles, Lorgelly, and
Owen 2002; Klasen and Lamanna 2003).
The literature has provided some measures that
can improve equality and equality of opportu-
nity. These include strengthening property rights
over land (Besley and Burgess 2003), expanding
access to education (Bardhan 2000; Dreze and
Sen 2002; Chhibber and Nayyar 2007), and means-
tested income transfers.6 Strengthening property
rights over rural land has resulted in higher
agricultural productivity and output in China (Lin
1992) and India (Banerjee, Gertler, and Ghatak
2002); and strengthening land rights in urban
areas can help poor households gain access to
credit (De Soto 2000; Field 2002). Redistribution
of land has played an important role in fostering
economic growth;7 today, such reforms would
take the form of subsidized transactions in the
land market (Bardhan 2000; Bourguignon 2004).
Access to credit is also important for reducing
inequality (Aghion, Caroli, and Garcia-Penalosa
1999; Bardhan 2000; Besley and Burgess 2003;
Beck, Demirguc-Kunt, and Levine 2004; Bourgui-
Inequality can have adverse consequences on efficiency, and hence growth, through various channels. Inequality of wealth affects investment in physical and human capital. A better distri-bution of wealth reduces credit constraints; broader availability of credit has a significant and positive effect on growth (Perotti 1992; Bardhan 2000; World Bank 2005). Micropanel studies show that households with few physical and human assets are often caught in a poverty trap that sharply reduces their chance of economic advancement and thus harms the overall economic performance of the economy (Christiaensen, Demery, and Pa-ternostro 2002; Woolard and Klasen 2005).
Inequality often induces more political instability, as well as crime and insecurity of property rights, all of which depress invest-ment and productivity growth (Alesina and Perotti 1996; Bardhan 2000). Inequality (in the form of unequal access to investment op-portunities) can lead to macroeconomic volatility (Aghion, Caroli, and Garcia-Penalosa 1999), which in turn has been found to reduce growth (Hausmann and Gavin 1996; Breen and Garcia-Penalosa 2005). Finally, too much inequality may also lead to social tension expressed through violent redistribution, which has a negative impact on growth (Bourguignon 2004).
Source: Cage (2009a)
Box 2.1: Cha nnels Through Which Inequality Affects Growth
Although access to credit is clearly important, the importance of microfinance is less clear.
Equality of opportunity is an important starting point for equity.

2 0
T H E W O R L D B A N K ’ S C O U N T RY P O L I C Y A N D I N S T I T U T I O N A L A S S E S S M E N T
by other CPIA criteria, although there is not
enough information to meaningfully rate the
public revenue subcomponent. At the same time,
some socioeconomic groups that are discrimi-
nated against are not included in the assess-
ment on equity and equality of opportunity.
The recommendation is to replace the criterion
on equity of resource use with a criterion on
equity and equality of opportunity for other
socioeconomic groups. Alternatively, there can
be a reformulation of the criterion on equity of
resource use by, among other things, incorporat-
ing an assessment of other socioeconomic groups.
Integration into the global economyIntegration into the global economy is a
widely accepted determinant of growth
although there is considerable debate in the
literature on how this can be achieved. The
experience of the 1990s demonstrates that
there are many possible ways to integrate
globally (World Bank 2005). The challenge is
for policy makers to identify which best suits
their country’s political economy, institutional
constraints, and initial conditions. Some analysts
are in favor of granting temporary modest levels
of import protection to emerging industries
where there is a demonstrated need (Williamson
2004). Others have focused on choosing the right
form of protection, advocating subsidies to initial
entrants rather than the use of import duties.
Indeed, when tariffs (the reduction of which is
the most common policy prescription for trade
openness) are tried as an explanatory variable
for growth, they are not found to be statistically
significant (Rodrik 2000).
The experience of the 1990s also indicates that
trade reforms need to be part of a comprehen-
sive growth strategy in order to be successful.
Efforts to promote exports would need to be
part of such a growth strategy, as the experience
also shows that the successful liberalizers either
explicitly or implicitly promote export growth
(World Bank 2005). Many complementary
factors are needed for export growth, the most
important of which are macroeconomic stability
and the building of trade-related infrastructure
and institutions.
included in the assessment. Concerns related to
other socioeconomic groups that are discrimi-
nated against (due to race, caste, ethnic group) are
not included. Yet evidence indicates that poverty
can have a strong ethnic dimension in some
countries (Bodewig and Sethi 2005). This implies
that tackling social exclusion of such groups is
important not only for reducing poverty, but also
for raising growth for the country as a whole.
The second issue is whether a
criterion on equity of public resource
use is needed. The criterion has two
subcomponents: public expenditures
(66.6 percent weight) and revenue
collection (33.3 percent weight) that
affect the poor. According to the
relevant network’s review team, the
assessment of public expenditures
focuses on spending on education,
health, rural infrastructure, and safety nets. Of
these, education and safety nets have been identi-
fied in the literature as being important and,
as mentioned in the previous paragraph, they
are already covered by two other CPIA criteria,
q9 (education) and q10 (safety nets). As for
the other two items, spending on health is also
covered in q9, and spending on rural infrastruc-
ture could be explicitly mentioned in the fiscal
policy criterion (which already mentions public
spending on infrastructure).
According also to the network review
team, the public revenue subcom-
ponent, which focuses on whether
taxes are progressive or regressive, is
very difficult to assess. Such an assess-
ment needs to be based on incidence
analyses, which are typically not
undertaken for many countries (or at
best undertaken sporadically), so that results are
generally outdated even if existent. In other words,
Bank staff does not have enough information to
meaningfully rate this subcomponent. The lack of
information is even more acute for IBRD countries,
as the issue is not as important for them.
In sum, the public expenditure subcomponent of
the equity of resource use criterion is captured
Integration into the global economy is important
for growth, but the CPIA trade criterion does not
allow for flexibility in the approach or give adequate
attention to exports.
Although equity is important, it is already
covered in other CPIA criteria and in ways
more amenable to assessment than the
criterion on equity of public resource use.

2 1
R E L E VA N C E O F T H E C P I A
According to that IEG evaluation, the costs associ-
ated with environmental degradation—such as
public health costs of pollution or soil nutrient loss
from uncontrolled erosion—often reduce produc-
tivity, resulting in lower rates of economic growth
than would otherwise be the case. Beyond this,
people are frequently impoverished by a declining
resource base and forced by their circumstances
to further degrade the environment.
Hence, it seems reasonable that growth
strategies in developing countries
need to take into account environ-
mental concerns from the outset,
even if they do not immediately adopt
the toughest environmental standards applied in
developed countries (World Bank 2008a). The
CPIA has a criterion that assesses environmental
policy and regulations on pollution and natural
resources.
Country specificityThe CPIA does take into account
country specificity, and in particular the
stage of development. Specifically, the
CPIA guidelines indicate that “Staff may
need to take into account the size of the
economy and its degree of sophistica-
tion in implementing the guidelines.”
Specific references are added on this
for the financial sector and social protection
and labor criteria. Yet there are significant issues
pertaining to the implementation of this in the
CPIA exercise, which are discussed in chapter 3.
In addition to the stage of develop-
ment, another important aspect of
country specificity is the notion that
different policies and/or institutions
can produce similar outcomes. The
CPIA instruction to staff to take into
account outcomes when assessing policies and
institutions could help to address this aspect of
country specificity. Some criteria already assess
outcomes, although outcome variables could be
added to other criteria, in particular trade.
Yet another aspect of country specificity is the fact
that different countries may face different sets of
The CPIA criterion on trade (q4) covers trade
policy restrictions (tariffs and non-tariff barriers)
and custom and trade facilitation, with 75 and
25 percent weights, respectively. The CPIA
guidelines provide instructions on the specific
tariff rates for each of the ratings. This is
problematic on at least two fronts. It does not
allow for flexibility in trade reform approaches
that have proven to work in different countries.
Also, the implicit assumption behind the relative
weights—that tariff reduction is much more
important than complementary institutions for
successful liberalization—is not supported by
the evidence.9 In particular, country experience
in the 1990s indicates that at moderate levels of
tariffs (which practically all countries currently
have), further tariff reduction is not as important
as complementary factors for successful integra-
tion into the global economy.
Further, the trade criterion in the CPIA
does not give adequate attention to exports.
Granted, a reduction in tariffs should promote
exports,10 and there is evidence that this was
indeed the case in the 1990s (World Bank
2005). At the same time, however, tariff
reduction by itself is not enough, especially in
light of the possibility of different approaches
to trade liberalization.
It would be useful if the CPIA trade criterion
could add a subcomponent on exports (with
equal weights, as for trade restrictions and trade
facilitation) that assesses export performance,
restrictions on exports (such as export taxes), and
policies/institutions to reduce anti-export bias,
such as having a functional export rebate or duty
drawback system. The last is one of the indicators
covered under the efficiency of revenue mobili-
zation criterion, which could usefully be shifted
to the trade criterion.
Environmental sustainabilityA recent IEG evaluation (IEG 2008) on the
environment finds that links among growth,
poverty, and environment are complex and run
in both directions. Many, if not all, environmental
problems improve as output levels rise, but they
may get worse before they get better.11
Links between growth, poverty, and the environment are complex and run in both directions.
The CPIA takes account of country specificity such as the size of the economy and stage of development.
The application of equal weights to all four clusters does not allow for country specificity in the sense that different countries may face different policy and institutional priorities.

2 2
T H E W O R L D B A N K ’ S C O U N T RY P O L I C Y A N D I N S T I T U T I O N A L A S S E S S M E N T
Second, it follows from the relatively high
correlations that the weighting scheme used for
the CPIA does not matter very much in terms
of representing the overall policies and institu-
tions of a country. This can be seen from the
relatively high correlations between an unequally
weighted CPIA (no matter which cluster gets the
greater weight) and a CPIA with equal weights on
the four clusters (table 2.3).
Third, different weights on the CPIA clusters do,
however, and very importantly, matter for the
allocation of IDA funds, as discussed below.
As an illustration, this evaluation undertook
simulations to compare the PBA under a weight-
ing scheme of equal weights for each cluster
(as is done for the CPIA overall country score)
and a scheme of greater weight on governance
(as is done in the PBA formula). The simulation
replaced the country performance ratings (CPR)
in the PBA formula with equal weights on the
four clusters, holding all the other factors that
affect the PBA constant.12 The simulation was
performed on “core” IDA countries—that is,
those that are not subject to exceptions to the
PBA due to post-conflict or re-engaging status or
to caps on allocations.13
The simulation results indicate quite substan-
tial changes to the PBA of countries (table 2.4).
Although the simulations are based on data on
institutional or policy priorities. Taking this into
account would require larger weights to be applied
to those criteria/clusters that are more important
(or are the “binding constraints”) to
growth. The Global Competitiveness
Index has, as of 2009, taken steps in
this direction by applying different
weights (derived based on econometric
analysis) to different components of the
index for countries at different stages of
development (World Economic Forum
2008). Currently, the application of
equal weights to each of the four CPIA
clusters does not allow for this aspect of
country specificity. Chapter 3 will discuss the ways
in which the different aspects of country specificity
are addressed in the CPIA rating exercise.
Weighting scheme of the CPIACountry specificity aside, the question of how to
weight the various criteria in the CPIA has also
drawn a lot of attention because of the much
greater weight given to cluster D (the governance
cluster) in the formula for IDA allocation (see
chapter 1). There are three main observations
pertaining to weighting.
First, the CPIA ratings for the four clusters are
relatively highly correlated (table 2.2), with
the correlation coefficients ranging from 0.65
between clusters A and B to 0.88 between clusters
C and D. This implies that countries that perform
well on one cluster generally perform well on the
other clusters.
Table 2.2: Co rrelations between Ratings of CPIA Clusters, 2007
CPIAA CPIAB CPIAC CPIAoverall
CPIAA 1.00 0.65 0.71 0.87
CPIAB 0.65 1.00 0.77 0.89
CPIAC 0.71 0.77 1.00 0.91
CPIAD 0.73 0.84 0.88 0.94
Source: IEG.
Table 2.3: Corr elations between CPIA with Different Cluster Weights and CPIA with Equal Cluster Weights, 2007
Cluster that has the greater weight (as in PBA formula)
Correlation with overall CPIA (equal-weighted
clusters)
Cluster A 0.93
Cluster B 0.95
Cluster C 0.96
Cluster D 0.97
Source: IEG.
The four CPIA clusters are highly correlated,
so the weighting scheme does not matter much
for representing the overall policies and
institutions of a country, but they do matter for the
allocation of IDA funds.

2 3
R E L E VA N C E O F T H E C P I A
Table 2.4: Simul ation Results: Effects on Performance-Based Allocations for “Core IDA” Countries Arising from a Larger Weight on the “Governance” Cluster Compared to Equal Weights on All Clusters
Change in performance-based allocation (%)
Rating of governance cluster (cluster D)
Average rating of clusters A to C
Rating of cluster D as a share of average rating of
clusters A to C (%)
Country 1 31.4 3.4 3.4 99.7
Country 2 31.4 3.4 3.4 99.7
Country 3 27.4 3.9 4.0 98.3
Country 4 20.5 3.2 3.3 96.0
Country 5 19.5 3.3 3.5 95.5
Country 6 16.8 3.5 3.7 94.3
Country 7 15.3 3.7 3.9 94.1
Country 8 15.0 3.3 3.5 94.0
Country 9 14.3 3.5 3.7 93.7
Country 10 13.1 3.5 3.8 93.2
Country 11 11.4 3.5 3.8 92.6
Country 12 9.5 3.5 3.8 92.1
Country 13 6.2 3.2 3.5 90.9
Country 14 5.9 3.0 3.3 90.6
Country 15 4.6 3.3 3.7 90.3
Country 16 4.1 3.5 3.9 90.0
Country 17 2.8 3.2 3.6 89.4
Country 18 1.0 3.3 3.7 88.9
Country 19 0.3 3.3 3.7 88.4
Country 20 –0.2 3.5 4.0 88.5
Country 21 –1.5 2.8 3.2 87.8
Country 22 –1.6 3.4 3.9 87.9
Country 23 –1.9 3.4 3.9 86.9
Country 24 –2.1 2.9 3.3 87.0
Country 25 –4.1 2.7 3.1 86.8
Country 26 –4.2 3.3 3.8 86.6
Country 27 –6.2 3.0 3.5 85.7
Country 28 –8.3 2.9 3.5 83.9
Country 29 –8.7 3.3 3.9 85.1
Country 30 –12.7 3.7 4.4 83.3
Country 31 –13.0 2.7 3.3 82.1
Country 32 –15.2 3.0 3.6 82.3
(continued on next page)

2 4
T H E W O R L D B A N K ’ S C O U N T RY P O L I C Y A N D I N S T I T U T I O N A L A S S E S S M E N T
At the same time, however, the much larger
weight on the governance cluster (compared
to equal weights on each cluster) has also led
to perhaps unexpected results. Specifically, the
simulation results indicate that the effects of the
much larger weight on governance on the PBA
are not due just to the governance rating, but
to how different the governance rating is from
ratings on other clusters.
Two countries, country 4 and country 30, can be
used as examples to illustrate this point. Country
30 has a better governance rating (3.7) than
country 4 (3.2). Country 30 also performs better
on all the other clusters compared to country 4,
with the ratings for clusters A to C averaging 4.4
compared to country 4’s average rating of 3.3.
Yet, country 30 suffers a loss in PBA of 13 percent
under the current PBA formula (compared to a
formula with equal weights on all four clusters),
whereas country 4 actually gains 20.5 percent.
These results are attributable to the fact that
country 30’s governance rating is much worse
than its ratings on other clusters, whereas country
4’s ratings on governance are only slightly worse
actual countries, the names of the countries
are not presented in the table. It should be
noted that the PBA constitutes only part of the
overall IDA allocation, which also includes a
base allocation of special drawing rights (SDR)
1.5 million per country per year. The simulation
results demonstrate that, as intended by the PBA
formula, a country that has a higher rating on the
governance cluster but the same average ratings
on the other three clusters compared to another
country would gain (from the larger weight on
governance compared to equal weights for all
clusters), whereas the other country would lose.
This can be seen from the simulation results for
country 5 and country 27, both of
which have the same average rating
of 3.5 for clusters A–C, but country 5
has a higher rating of 3.3 for cluster
D compared to country 27’s rating of
3.0. Under the current PBA formula,
country 5 would have a PBA nearly
20 percent higher than a formula for
which all clusters have equal weights,
whereas country 27 would have a PBA
of 6 percent lower.
Table 2.4: Simul ation Results: Effects on Performance-Based Allocations for “Core IDA” Countries Arising from a Larger Weight on the “Governance” Cluster Compared to Equal Weights on All Clusters
Change in performance-based allocation (%)
Rating of governance cluster (cluster D)
Average rating of clusters A to C
Rating of cluster D as a share of average rating of
clusters A to C (%)
Country 33 –16.0 2.9 3.6 81.3
Country 34 –16.3 2.2 2.7 81.5
Country 35 –17.1 3.7 4.6 81.0
Country 36 –18.2 3.3 4.1 80.9
Country 37 –18.6 3.2 4.0 80.9
Country 38 –20.4 2.7 3.4 79.9
Country 39 –27.3 2.5 3.3 74.8
Country 40 –29.4 2.6 3.5 75.2
Country 41 –32.5 2.9 3.9 73.9
Source: IEG.Note: “Core IDA” countries refer to those IDA countries that are not subject to exceptions to the PBA due to post-conflict or re-engaging status or to caps on allocations. Small states are also excluded because their base allocations exceed the PBA.
The effects of a larger weight on governance
(compared to equal weights for each cluster)
on the PBA are not due just to the governance
rating, but also to how different that rating is
compared to ratings on other clusters.
(continued)

2 5
R E L E VA N C E O F T H E C P I A
change with changes in per capita income, which
in turn means that, on average, growth leads
to reduction in poverty. Indeed, it is
well-established in the literature that,
again on average, economic growth is
associated with a reduction in poverty
(Ames and others 2001; Besley
and Burgess 2000; Ravallion 2001;
White and Anderson 2002; Christi-
aensen, Demergy, and Paternostro
2002; Dollar and Kraay 2002; Besley
and Burgess 2003; Klasen 2002).
Hence, the determinants of growth
discussed in the preceding section
are as important as the determinants
of poverty reduction.
Although, on average, growth leads to poverty
reduction, this is by no means the case for all
countries or for everyone in a country. Actual
data show considerable variation—there are
cases where inequality goes up with growth, and
cases where inequality goes down with growth
(Kanbur 2004). One paper finds a huge range
in the gains to the poor from a given rate of
growth.15 The reasons behind this wide range of
than its ratings on the other clusters. In other
words, country 30 suffers a loss under the current
PBA formula not because it has poor governance,
but because its governance performance relative
to performance on other fronts is worse than
that of country 4, even though it performs better
than country 4 on all fronts.
More generally, table 2.4 shows that all core IDA
countries (excluding small states) have worse
governance ratings than ratings on other clusters,
yet some countries gain and other countries lose
from the larger weight on governance. Whether
they gain or lose depends on how much worse
the ratio of their governance ratings to ratings on
other clusters is than other countries (figure 2.1).
The CPIA and Determinants of Poverty ReductionIt is a straightforward supposition that growth
will lead to poverty reduction— if it does not
lead to greater inequality at the same time. A
large empirical literature on the relationship
between growth and changes in inequality finds
no statistical correlation between the two.14 This
means that, on average, inequality does not
For countries that have worse governance ratings than ratings on other clusters, some gain and others lose from the larger weight on governance in the PBA formula depending on how much worse the ratio of their governance ratings to ratings on the other clusters is compared to other countries.
Figure 2.1: Relat ionship between Changes in PBA and the Ratio of Cluster D Ratings to Ratings on Other Clusters for “Core IDA” Countries
Source: IEG.
Note: “Core IDA” countries refer to those IDA countries that are not subject to exceptions to the PBA due to post-conflict or re-engaging status or to caps on allocations. Small states are
also excluded because their base allocations exceed the PBA.
Ratio
of c
lust
er D
ratin
g to
ratin
g on
ot
her c
lust
ers
Change in performance-based allocations
100%
95%
90%
85%
80%
75%
70%–40% –30% –20% –10% 0% 10% 20% 30% 40%

2 6
T H E W O R L D B A N K ’ S C O U N T RY P O L I C Y A N D I N S T I T U T I O N A L A S S E S S M E N T
disproportionately boosting the incomes of the
poor (Beck, Demirguc-Kunt, and Levine 2004).
Financial depth is addressed in the CPIA criterion
for the financial sector.
As discussed earlier, education improves the
equality of opportunity for the poor and other
disadvantaged groups (including women). An
empirical study on Brazil finds that investments
in human capital are very important to make
growth more pro-poor (Menezes-Filho and
Vasconcellos 2004). Education is covered in the
CPIA criterion on building human resources.
Not only does inequality have a negative impact
on growth, but higher initial levels of inequal-
ity also lower the poverty reduction impact of
growth (Ravallion 2001; Bourguignon 2004;
Chhibber and Nayyar 2007). Hence, changing
the initial level of inequality enhances pro-poor
growth. This requires measures to redistribute
wealth as well as to improve equality of opportu-
nity. (Such measures and how they are addressed
in the CPIA are discussed earlier in this chapter.)
Regarding institutions and governance,
establishing property rights can help the poor
access credit (Fleisig 1995; de Soto 2000; Field
2002) and enhance their ability to utilize and
invest in land they cultivate (Deolalikar and
others 2002). It has been empirically found
that increased protection of property rights has
strong effects in reducing poverty (Acemoglu,
Johnson, and Robinson 2001). One estimate
finds that increasing the protection of property
rights across the globe by half of one standard
deviation would halve global poverty (Besley and
Burgess 2003).
Protection of property rights requires the
presence of rule of law, specifically controls over
crime and violence. Studies also find that the
victims of crimes are more likely to come from
the poorer part of the population (Bourguignon
1999; Deolalikar and others 2002; Heinemann and
Verner 2006). One study finds that police corrup-
tion, especially in slum areas of poorer countries,
may increase the uncertainty of property rights
of the very poor (Andvig and Fjeldstad 2008).
effects include differences in initial inequalities
between countries and between regions within
countries that create differences in how much
the poor share in aggregate growth (or contrac-
tion). Another paper finds that the incomes of
the poor do not grow one-for-one with increases
in average income (Foster and Svékely 2008).
This evidence implies that growth that
reduces inequality will have a larger
impact on poverty. Therefore, policies
need to take into account the distribu-
tional impact of economic growth (the so-called
“pro-poor growth” policies) (Ghura, Leite, and
Tsangarides 2002; Besley and Burgess 2003). In
addition, there are also policies that can have
a direct impact on poverty independent of the
growth channel (the so-called “super pro-poor”
policies).16
The rest of this section will discuss the determi-
nants of pro-poor growth and super pro-poor
policies. This will be followed by
a discussion on two controversial
determinants of poverty reduction—
trade and the environment. Finally,
other non-income dimensions of
poverty will be addressed.
Pro-poor growth and super pro-poor policiesThere is a significant overlap between the determi-
nants of pro-poor growth and of super pro-poor
policies identified in the literature. Financial
depth, human capital, equality, and institutions
and governance are found to be important for
poverty reduction directly as well as through
the growth channel. They are also important for
reducing inequality and hence enhancing the
poverty reduction effects of economic growth.
Quite apart from reducing poverty through
growth, financial sector development may
benefit the poor directly by facilitating access to
credit and improving risk sharing.17 Empirically,
there is evidence that financial (banking) depth
is negatively associated with headcount poverty,
even after taking into account mean income and
inequality.18 Further, financial development has
also been found to reduce income inequality by
Financial depth, human capital, equality,
and institutions and governance directly affect
poverty reduction.
Growth that reduces inequality will have a
larger impact on poverty.

2 7
R E L E VA N C E O F T H E C P I A
Indeed, a review of the East Asian
experience indicates that “the
countries that have been most success-
ful in attacking poverty have achieved
rapid agricultural growth and broader
economic growth that makes efficient
use of labor and have invested in the
human capital of the poor”(Rosegrant
and Hazell 2000). Another paper finds
that rural growth reduced poverty in both rural
and urban areas, although urban growth had only
some impact on urban poverty (Ravallion and
Datt 2002).
Improvements in labor productivity in agriculture
are found (in both cross-country analyses and
country case studies) to have been more pro-poor
than such improvements in non-agricultural
sectors (Eastwood and Lipton 2001). Increases
in agricultural yields by 20 percent are found to
reduce the numbers of the poor by 18 percent
in a cross-country empirical investigation (Irz and
others 2001). Agricultural research, in particular, is
important in this respect, as it has led to crop yield
gains in the past. Some researchers conclude from
this that “it is unlikely that there are many other
development interventions capable of reducing
the numbers in poverty so effectively” (Irz and
others 2001; Hazell and Haddad 2001). The CPIA
does not explicitly cover agriculture—nor does
it cover any other economic sectors. It does,
however, allow for the provision of public goods
in the fiscal policy criterion. This is pertinent for
agriculture, in view of its importance identified in
the literature. Hence, the CPIA instructions may
usefully include a specific reference to public
goods in agriculture (in addition to the current
mention of infrastructure) for the fiscal policy
criterion.
Trade and povertyFrom an analytical point of view, the relationship
between trade and poverty is ambiguous—that
is, trade can have a positive or a negative impact
on poverty, as it does on growth (Agenor 2004;
World Bank 2005). Indeed, there are several
channels through which trade can affect poverty,
and they can have opposite effects. These
channels are household production, household
Corruption also directly affects poverty by increas-
ing income inequality. One possible reason could
be that the benefits of corruption are likely to
accrue to the better-connected individuals in
the society, who belong mostly to high-income
groups (Gupta, Davoodi, and Terme 1998). It is
also possible that corruption distorts government
allocations of goods and services (Tanzi 1998).
One study finds that an increase in the corrup-
tion index of a country by one standard deviation
(2.52 points on a scale of 1–10) increases the
Gini coefficient by 5.4 points (Gupta, Davoodi,
and Terme 1998, 2002). Another study finds that
corruption decreases the share of government
expenditures on health and education (Gupta,
Davoodi, and Terme 2002).
Finally, government accountability can have a
direct impact on poverty. It has been argued that
no country with a free press has ever had a major
famine (Dreze and Sen 1989), and that a free flow
of information pressures (even non-democratic)
governments into public action (Dreze and Sen
1995).
All of these different elements of institutions
and governance that have been identified in the
literature as being important determinants of
pro-poor growth or super pro-poor policies are
covered in various criteria under the CPIA cluster
on public sector management and institutions.
Aside from these four determinants of pro-poor
growth, which are also determinants of growth,
agriculture has been identified in the literature
as being important for pro-poor growth. Pro-poor
growth needs to take place in sectors where the
poor are active and draw on the factors of produc-
tion that the poor possess. The vast majority of
the poor live in rural areas, and a majority of
them depend directly or indirectly on agricul-
ture for their livelihood. The factor of production
that the poor possess and use most is labor, and
sometimes land as well (World Bank 2000c; Ames
and others 2000; World Bank 2000a; Ravallion
and Datt 2002; Eastwood and Lipton 2001).
Therefore, pro-poor growth must focus on rural
areas, improve incomes in agriculture, and make
intensive use of labor (Klasen 2002).
Agriculture is important for pro-poor growth; it would be useful to add a reference on the provision of public goods in agriculture to the fiscal policy criterion of the CPIA.

2 8
T H E W O R L D B A N K ’ S C O U N T RY P O L I C Y A N D I N S T I T U T I O N A L A S S E S S M E N T
(specifically flexibility in hiring and firing) in its
criterion on business regulatory environment
(q6). However, it is important that such mobility
be ensured before trade liberalization proceeds,
lest liberalization exacerbate poverty. Therefore,
assessment of the trade criterion needs to take
into account the extent of labor mobility.
Environment and povertyAs in the case of linkages between the environ-
ment and growth, the linkages between the
environment and poverty are similarly complex.
On the one hand, there is evidence that environ-
mental regulations have a negative impact on
poverty. One paper finds that although, in general,
low-income households appear to bear a dispro-
portionate share of existing environmental risks,
policies that reduce environmental risks are not
necessarily progressive (Parry and others 2005).
Another paper studying the distributional effects
of environmental policy finds that many effects
of such policies are likely regressive (Fullerton
2008). On the other hand, there is also evidence
that resource degradation has a negative impact
on the poor (World Bank 2008f).
Nonetheless, the impact of the environment
on welfare is clear—environmental pollution
is clearly detrimental to health (World Bank
2008d). Given that poverty needs to be viewed
as a multidimensional concept that includes
welfare, environmental sustainability should
clearly be taken into account as an important
factor in poverty reduction.
Multidimensional povertyOver the last decade or so, there has been
increasing recognition that the notion of
poverty encompasses more than just income
poverty. Indeed, poverty includes a host of
other dimensions that are central to the Millen-
nium Development Goals (MDGs). These other
dimensions are education, health, gender
equality, and environmental sustainability, all of
which are covered by the CPIA.
The notion has also been advanced that poverty
goes beyond these income and non-income
measures of physiological deprivation (inability to
consumption, participation in the
labor markets, government revenues,
and social expenditures.19 Given that
theory is ambiguous with respect to
the impact of trade on poverty, the
issue becomes an empirical one. Alas,
the empirical literature—both cross-country and
case studies—is equally inconclusive (Winters,
McCulloch, and McKay 2004; Ravallion 2004;
Harrison 2006).
What seems to be clear, though, is that impedi-
ments to exports exacerbate poverty (although it
is less definitive as to what the effects of import
liberalization are). One study finds that informal
export barriers to trade (such as transport costs,
cumbersome customs practices, and costly
regulations and bribes) have significant adverse
effects on poverty in Moldova.20 Another study
(Balat, Brambilla, and Porto 2007) finds that
lower export marketing costs encour-
age agricultural exports and lower the
poverty levels of those engaged in
export cropping compared to others
in the rural areas. Export market-
ing costs could be reduced by investments
in infrastructure such as roads, provision of
marketing information, provision of credit and
technical assistance to farmers, and promotion
of out-grower schemes among others (Balat,
Brambilla, and Porto 2007; Otsuka 2002;
Anderson 2003; Harrison 2006).
Labor mobility is another important complemen-
tary factor. The negative impact of trade reforms
on poverty in India is found to be related to the
extremely limited mobility of labor across regions
and industries in the country (Topalova 2004,
2005). Similarly, labor market reforms are found
to be important for minimizing the adverse
effects of trade reform on the poor in Colombia
(Goldberg and Pavcnik 2005).
The CPIA does not adequately take into account the
importance of complementary factors in the trade
criterion to avert the potential negative impacts
of trade liberalization on poverty. Specifically,
this relates to the complementary factor of labor
mobility. The CPIA does address labor mobility
Assessment of the trade criterion needs to
take into account the extent of intersectoral
labor mobility.
Linkages between the environment and poverty are complex.

2 9
R E L E VA N C E O F T H E C P I A
This theoretical foundation has been
questioned by several researchers,
dating back to the 1960s. Their main
criticism is the key assumption of the
theory that foreign aid finances invest-
ment instead of financing consump-
tion. Perhaps partly reflecting this less than
robust theoretical foundation, no consensus in
the empirical literature can be found through the
mid-1990s of the impact of aid on growth. The
various reviewers of this literature come to differ-
ing conclusions. One review (Hansen and Tarp
2000) concludes that a majority of the literature
up to the mid-1990s finds that aid has a positive
impact on growth. Two other reviews (Clemens,
Radelet, and Bhavnani 2004; McGillivray and
others 2005) find no consensus.
A watershed in the empirical literature was
reached in the mid-1990s with the publication of
a seminal paper in 1994 that empirically tested
the assumption that aid financed investment
(Boone 1994).24 The paper finds that aid did
not finance investment but financed public and
private consumption instead. Furthermore, the
higher consumption did not benefit the poor, as
reflected in the absence of a significant impact of
aid on improvements in infant mortality, primary
schooling ratios, and life expectancy.25 This paper
demarcates the earlier generation of aid impact
literature based on the financing gap models from
the latest generation, that is, underpinned by the
new growth theory. The latter generation of litera-
ture specifically takes into account the effect of
economic policies and institutions on growth.26
For many researchers, the Boone 1994 paper
confirms the “macro-micro paradox”: that many
aid-funded projects report positive microlevel
economic returns which are somehow undetect-
able at the macrolevel. The literature that emerges
after this paper can be classified into three strands:
those that deny the existence of the macro-micro
paradox; those that try to explain it; and those
that, like the 1994 paper, do not find any impact
of aid at all (see appendix D for the list of papers).
Those that belong to the first strand find that
aid works on average, without conditions (the
meet basic material needs) to incorporate measures
of social deprivation (for example, access to the
components of power such as decision making).21
The World Bank has indicated that “poverty is
more than inadequate income or human develop-
ment—it is also vulnerability and a lack of voice,
power, and representation” (World Bank 2000c).
It is in this context that the concept of empower-
ment of the poor has emerged. Specifically, it
is thought that because the poor are the main
actors in the fight against poverty, they must be
brought to center stage in designing, implement-
ing, and monitoring anti-poverty strategies.
This requires, among other things, empowering
“pro-poor” coalitions, which can involve parts of
governments, non-governmental organizations,
donors, and civil society (World Bank 2000a).
Such coalitions can be helped by a free press,
democratic institutions, and accountable govern-
ments— particularly in countries where the poor
are the majority. The CPIA covers media freedom
and accountability in its criterion on transpar-
ency, accountability, and corruption in the
public sector.
The CPIA and the Effective Use of Development AssistanceThe notion of using the CPIA as an indica-
tor in the allocation of IDA resources is based
on two premises. The first premise is that IDA
resources are important for supporting “…the
world’s poorest countries in their efforts to boost
economic growth, lower poverty and improve the
living conditions of people” (World Bank 2008e).
The second premise is that such resources could
only be used effectively in the presence of sound
policies and institutions that are assessed under
the CPIA. This section reviews the theoretical
and empirical bases for these two notions.
The theoretical foundation of the effect of aid
on growth22 is the neoclassical growth model.23
Under this model, aid fills the gap in domestic
savings or foreign savings to finance investment,
leading to growth. This theoretical foundation
underpins a sizeable empirical literature (of well
over 100 papers) on the impact of aid on growth
from the 1960s through the mid-1990s.
The notion of poverty encompasses both income and non-income dimensions as well as social deprivation.

3 0
T H E W O R L D B A N K ’ S C O U N T RY P O L I C Y A N D I N S T I T U T I O N A L A S S E S S M E N T
ing the fragility of the empirical results of these
papers.
Yet none of the researchers who find no impact
of aid on growth, or who overturn the findings
of aid having an impact on growth, conclude
definitively that aid is not effective, or that
policies, governance, or exogenous conditions
do not matter for aid to be effective. What they do
conclude is that cross-country empirics may not
be very useful for analyzing whether and when aid
works, fraught as they are with data problems.30
In the midst of this ongoing controversy, some
researchers have forged new ground by analyz-
ing the impact of different types of aid on growth.
One type of disaggregation is by donor objectives,
based on the rationale that donors have strategic
as well as developmental objectives for giving
aid; hence, not all aid will lead to higher growth.
In general, bilateral aid has strategic/geopoliti-
cal objectives (although bilateral aid from some
countries has developmental goals), whereas
multilateral aid has developmental objectives. By
and large, the emerging literature on this finds
that multilateral aid leads to higher growth, but
not bilateral aid.31
Another type of disaggregation focuses on aid
that could have an impact in the short run.
One analysis finds that such “short-impact aid”
(that includes budget and balance of payments
support, investments in infrastructure, and aid
for productive sectors such as agriculture and
industry) causes growth, on average, regard-
less of the recipient’s quality of institutions and
policies.32
Hence, a decade after the publication of the World
Bank working paper that put the conditional aid
effectiveness literature on the map, there is no
consensus in the cross-country literature on the
impact of aid on growth.
Findings of this literature range from (i) aid
having no impact on growth to (ii) aid having a
positive impact on growth conditional on policies
or exogenous factors (but with no consensus on
which policies and institutions matter) to (iii) aid
“unconditional” strand). Then there are those
that accept the contention that aid does not work
on average but seek to identify conditions under
which it could be effective (the “conditional”
strand). Foremost among the conditional strand
is the 1997 World Bank working paper (Burnside
and Dollar 2000) that spearheads this strand of
literature with the finding that aid is effective (that
is, has a positive impact on growth) only in the
presence of good policies (specifically
fiscal, monetary, and trade policies27),
which are themselves important for
growth. Further, the paper finds that
aid does not lead to good policies,
but that having the right policies in
place matters for aid to be effective in
terms of higher growth.
A number of other empirical papers that
followed find other conditions to be important
for aid effectiveness. These conditions range
from countries emerging from civil war and have
good policies, to countries prone
to external shocks such as climatic
and trade shocks (or terms of trade
shocks), to countries outside of the
tropics.
The third strand of literature finds that aid
has no impact on growth at all. In addition to
the seminal paper of 1994 mentioned above,
two others find that by and large aid did not
increase investment and that investment did
not raise growth (Easterly 2001, 2003). A recent
paper that takes into account the motivations of
donors in granting aid28 also finds it
“… difficult to discern any systematic
effect of aid on growth” (Rajan and
Subramaniam 2008).
Not only are the findings of this latest generation
of literature diverse, they are also not robust. A
paper that tested many of these studies (belong-
ing to both the “conditional” and the “uncondi-
tional” strands) for robustness finds that none of
the results of these studies withstood the tests.29
Perhaps the most striking outcome of the tests is
that modification of the sample period affects the
regression results the most, thereby highlight-
Among those researchers who find that aid has an impact on growth,
one group finds that it works unconditionally
and the other group finds that it only works under
specific conditions.
Some analyses find that aid has no
impact on growth.
Different analyses find that different conditions
matter for aid to have an impact on growth.

3 1
R E L E VA N C E O F T H E C P I A
Econometric analysis finds that the
policies and institutions that are
assessed by the CPIA matter for loan
performance (see appendix G). Specif-
ically, overall CPIA ratings are found
to be negatively associated with the
share of problem projects as assessed
by Bank staff in loan implementation
status reports. (The share of problem
projects is also found to be positively
associated with loan outcomes with a
correlation coefficient of 0.63).
Further, ratings of each of the four CPIA clusters
are also found to be negatively associated with loan
performance. It is not possible, however, to discern
the relative importance of the four CPIA clusters
on loan performance because the ratings of the
four clusters are highly correlated with each other.
Hence, there is not sufficient evidence to conclude
that the governance cluster associates better with
loan performance than the other clusters.
Findings and RecommendationsBy and large, the CPIA criteria cover
the main determinants of sustained
growth and poverty reduction identi-
fied in the literature. The CPIA covers
important determinants for both income and
non-income poverty, with the latter includ-
ing many of the MDGs (specifically, education,
health, gender equality, and environmental
sustainability). It also covers some of the key
aspects of another important notion of poverty—
empowerment.
It would have been useful to analyze empiri-
cally the impact of CPIA ratings including when
present together with IDA assistance, on the
actual growth performances of the countries
rated. However, this was not possible because
of the major restructuring of the CPIA content
as well as the 2004 rating scale. The discontinu-
ity in the CPIA ratings implied by the
restructuring would invalidate any
analysis using data that spans 2004.
Using only data from 2004 onward
would not allow for a long enough
time period for such analysis.
having a positive impact on growth regardless of
policies and institutions.
Yet, despite the ambiguity of the impact of aid
from the cross-country empirical literature, there
are many specific examples of aid being effective.
These examples range from the eradication
of certain diseases (for example, smallpox
globally and polio in the western hemisphere)
or the Green Revolution in India in the 1960s,
to improvements in school attendance and
health indicators resulting from conditional cash
transfer programs more recently.
Yet another strand of aid effectiveness literature
has emerged, whereby efforts are focused on
narrower evaluations of the impact of specific
aid project interventions. Such evaluations have
been conducted in the context of so-called
impact evaluations—or randomized evalua-
tions—that evaluate the impact of specific
interventions by comparing the effects on those
who received the intervention with a compara-
ble group who did not.33
Randomized evaluations over the last 10 years
or so have found positive benefits of aid projects
in education, health, physical infrastructure,
and agriculture, among others (see appendix
E). This has led some researchers to propose
that development assistance should be mainly
devoted to such project-specific efforts.
Empirical analysis of CPIA and loan performanceThe preceding discussion indicates that the
evidence is mixed regarding the relevance
of the content of the CPIA on aid effective-
ness in the broad sense—that is, whether the
CPIA represents the policies and institutions
important for aid to lead to growth. An empirical
analysis of the association between CPIA ratings
and aid effectiveness is fraught with data difficul-
ties (see chapter 2, section on findings and
recommendations). Therefore, this evaluation
takes a different approach and examines the
relevance of the CPIA in a narrower sense—that
is, whether it is associated with the performance
of Bank loans.
Empirical analysis finds that policies and institutions assessed by the CPIA matter for loan performance, although there is insufficient evidence to conclude that the governance cluster matters more than the others.
The CPIA covers the main determinants of sustained growth and poverty reduction.
Data constraints limit the use of econometric analysis to establish a link between CPIA ratings and growth outcomes.

3 2
T H E W O R L D B A N K ’ S C O U N T RY P O L I C Y A N D I N S T I T U T I O N A L A S S E S S M E N T
largely covered by other criteria; consideration
needs to be given to dropping or reformulat-
ing it. This criterion has two subcomponents.
The first subcomponent on public expenditures
is by and large covered by other CPIA criteria,
though Bank staff do not have enough informa-
tion to meaningfully rate the second one on tax
revenues. Dropping q8 would lead to only minor
changes in the relative rankings of countries—
the rank correlation between the CPIA with q8
and one without is 0.999—as well as only small
changes to the PBA (table 2.5). A few more
countries would gain than would lose. However,
the changes on both the upside and downside
would be rather small, with the largest loser
experiencing a 1.7 percent drop in PBA and the
largest winner a 2.5 percent gain.
Second, currently t ax policy is assessed in the
criterion on efficiency of revenue mobiliza-
tion (q14a). Yet tax policy is an intrinsic part
of fiscal policy, and it would be reasonable to
combine the assessment of the two in the fiscal
policy (q2) criterion. Further, the part of the tax
policy subcriterion that deals with trade—specif-
ically import taxes and export rebate or duty
drawback—really belongs to the trade criterion
(q4). In fact, q4 already deals with import taxes,
so there is an overlap that needs to be removed.
Export rebate or duty drawback needs to be
incorporated into the trade criterion, given the
importance of promoting exports for integration
into the global economy.
Third, there are some overlaps in content
between various criteria in the public sector
management and institutions cluster that could
be usefully streamlined. Judicial independence
is covered in both the criterion on property
rights and governance (q12) and the criterion
on transparency, accountability, and corrup-
tion in the public sector (q16). Administra-
tive corruption is assessed in the criteria on
efficiency of revenue mobilization (q14) (in the
subcomponent on tax administration), quality
of public administration (q15) (in the subcom-
ponent on merit and ethics), and transparency,
accountability, and corruption in the public
sector (q16).
Although data limitations make it difficult to
establish an empirical link between the CPIA and
growth outcomes and hence aid effectiveness
broadly, the CPIA is found to be associated with
aid effectiveness in a narrower sense—specifi-
cally in the performance of Bank loans. However,
there is insufficient evidence to conclude that any
one of the four CPIA clusters is more important
for loan performance than the others.
Based on the findings in this chapter, the evalua-
tion derives recommendations regarding the
following broad issues.
Weighting of the CPIAThe findings indicate that when the
CPIA is considered broadly as an index
of a country’s policies and institu-
tions, the weighting scheme is not so
important because the various CPIA clusters are
highly correlated. However, the weighting of the
different clusters in the PBA formula does matter
for a country’s allocations of IDA funds.
These findings raise the question
of the usefulness of aggregating the
various CPIA clusters into an overall
index according to any predeter-
mined weighting scheme. In the case
of the broad use of the CPIA, it does not allow
for country specificity which could imply differ-
ent weights on the different clusters, depending
on the initial conditions and stage of develop-
ment of the country. In the case of IDA alloca-
tion, the overall index is already not used as such
(see chapter 1). The recommendation, then, is
for Bank management to consider not produc-
ing an overall CPIA index, although continuing to
produce and publish the separate components
of the CPIA.
Streamlining CPIA criteriaThe CPIA is quite exhaustive in its coverage of
the main determinants of growth and poverty
reduction. Indeed, consideration
needs to be given to streamlining it.
First, the criterion regarding the
equity of public resource use (q8) is
Equity of public resource use is covered in other
criteria and could be dropped or reformulated.
The utility of aggregating the CPIA clusters into
an overall index is questionable.
Tax policy could reasonably be
combined with the fiscal policy criterion.

3 3
R E L E VA N C E O F T H E C P I A
Coordinating assessment of CPIA criteriaThe reviews of a few criteria need to
be coordinated. This has emerged
in the context of the trade criterion,
which needs to be evaluated in connection
with the assessment of the labor criterion.
Similarly, fiscal policy (q2) needs to
be evaluated in conjunction with the
quality of budgetary and financial
management (q13).
Fourth, interviews with Bank staff conducted
for this evaluation suggest that it is onerous for
country teams to have to answer 85 questions
to arrive at one rating for the environment
criterion.34 This is particularly the case in light
of the mixed evidence of the environment on
growth, as well as the mixed evidence of the
environment on poverty. IEG recommends that
Bank management drastically simplify the assess-
ment of this criterion.
Fifth, the three economic management criteria
are not conceptually distinct from each other,
unlike the rest of the CPIA criteria. Discussions
with the relevant network reviewer indicate
that the three criteria are indeed assessed as an
integral whole. Yet separate scores are prepared
and reported for each of the three criteria,
which could lead to double (or triple) counting
or confusion. For example, a country that has
suffered deterioration in fiscal policy would
experience a reduction in both the fiscal policy
and the macroeconomic management ratings,
which means that such deterioration would be
double counted. Yet if Bank staff tries to avoid
double counting by downgrading only the fiscal
policy but not the macroeconomic management
rating, the resulting ratings would appear contra-
dictory. Although there may be merit in preparing
three separate scores, Bank management needs
to consider publishing only the consolidated
economic management rating to avoid the
impression of contradictory scores when staff are
avoiding double (or triple) counting.
Omissions to the CPIA criteriaNotwithstanding the exhaustiveness of the CPIA
coverage, there are a few omissions. First, there
is the exclusion of socioeconomic groups other
than gender (such as by race, caste, and ethnic-
ity). IEG recommends that assessment of the
treatment of such socioeconomic groups be
included in the CPIA.
Second is the absence of any reference at all to
agriculture. As mentioned, this can be remedied
by adding a reference to agriculture in the
criterion on fiscal policy with reference to public
goods.
Table 2.5: Simulati on Results: Changes in PBA from Dropping q8
Countries that would lose PBA Countries that would gain PBA
CountryPercentage
lost CountryPercentage
gained
Armenia –0.04 Mozambique 0.12
Honduras –0.13 Bolivia 0.13
Madagascar –0.13 Tanzania 0.18
Azerbaijan –0.18 Sierra Leone 0.37
Nigeria –0.23 Nepal 0.41
Lao PDR –0.27 Zambia 0.42
Tajikistan –0.32 Senegal 0.43
Burkina Faso –0.39 Malawi 0.44
Nicaragua –0.44 Mongolia 0.44
Georgia –0.57 Ghana 0.46
Vietnam –0.69 Mali 0.72
Niger –0.85 Mauritania 0.72
Yemen, Rep. –0.88 Guinea 0.72
Chad –0.98 Kyrgyz Republic 1.04
Uganda –1.01 Bangladesh 1.05
Rwanda –1.14 Cameroon 1.05
Ethiopia –1.63 Kenya 1.31
Papua New Guinea –1.71 Sri Lanka 1.33
Uzbekistan 1.40
Benin 1.64
Cambodia 1.79
Moldova 1.81
Bosnia and Herzegovina
2.49
Source: IEG.Note: PBA=performance-based allocation.
Overlaps could be reduced between the criteria in the public sector management and institutions cluster.
Assessment of the environment criterion needs to be simplified.

3 4
T H E W O R L D B A N K ’ S C O U N T RY P O L I C Y A N D I N S T I T U T I O N A L A S S E S S M E N T
criterion derives findings and recommendations
for revising that criterion.
Revise trade criterionThe importance of co mplementary institutions
for global integration is not adequately reflected
in the weighting scheme for the trade criterion,
nor is adequate attention given to exports. IEG
recommends that trade restrictiveness and trade
facilitation be given equal weights (replacing the
current weighting scheme of 75 and 25 percent,
respectively, on these two subcomponents).
In addition, a subcomponent on exports needs
to be added (with the same weight as the other
two) to assess export performance and policies
and institutions to reduce anti-export bias. The
subcomponent on exports needs to include the
assessment of export rebate and duty drawback
that should be transferred from the criterion
on efficiency of revenue mobilization (q14) as
suggested in chapter 2 (in the section pertain-
ing to streamlining CPIA criteria). All three trade
subcomponents—trade restrictiveness, trade
facilitation, and exports—need to be given equal
weights.
Simulations of equal weights for the trade
subcomponents on restrictiveness and facilita-
tion indicate that there will be no change in
ratings on trade for half of the countries (70 of
140 countries), with slightly more than half of the
IBRD countries (52 percent) and slightly less than
half of the IDA countries (48 percent) experienc-
ing no rating changes (table 2.6).
About equal numbers of IBRD countries will gain
and lose ratings on trade (16 and 15 countries,
respectively), although many more IDA countries
would lose (27 countries) than would gain (12
countries). This implies that IDA countries have
worse ratings for trade facilitation than for trade
restrictiveness compared with IBRD countries.
For all but one country, the change in ratings
(whether up or down) is 0.5 points; the exception
is Tunisia, which would gain 1 point (table 2.7).
The proposed change would increase the
comparability of the CPIA trade rating with that
Content of the CPIA criteriaThe 2004 restructuring of the CPIA was
the last time its criteria were reviewed
and revised. Bank management
also agreed with the external panel
recommendation at the time that, for the sake
of continuity and comparability, the CPIA criteria
will not be revised too frequently (World Bank
2004d). Bank management further indicated that
periodic reviews (for example, every three years)
of the CPIA will be undertaken by an external
technical advisory committee charged with
reviewing the CPIA methodology, procedure,
and ratings quality.
This evaluation has found that the time has come
for Bank management to undertake a thorough
review and revision of the CPIA. The
general growth literature review
conducted for this evaluation derives
findings and recommendations for
restructuring the trade criterion;
likewise, an in-depth literature review
undertaken for the financial sector
The absence of agriculture and socioeconomic
groups other than gender needs to be addressed.
Add a subcomponent on exports to the trade criterion; assign equal
weights to exports, trade restrictiveness,
and trade facilitation.
Table 2.6: Simulati on Results: Changes in Trade Ratings Arising from Changes in Weights of Trade Subcriteria by Numbers and Shares of IBRD and IDA Countries
No change in ratings on
trade
Rise in ratings on
trade
Fall in ratings on
trade Total
Number of countries
IBRD 34 16 15 65
IDA 36 12 27 75
Total 70 28 42 140
Share of countries (%)
IBRD 52 25 23 100
IDA 48 16 36 100
Total 50 20 30 100
Source: IEG.Note: IBRD= International Bank for Reconstruction and Development; IDA= International Development Association.

3 5
R E L E VA N C E O F T H E C P I A
0.75.36 This in turn reflects the greater compara-
bility of the ratings on customs/border adminis-
tration than on trade restrictiveness (tariffs and
nontariff barriers) between the CPIA and the ETI.
of a comparator—the Enabling Trade Index
(ETI). Specifically, the rank correlation coeffi-
cient between the proposed CPIA trade rating
and one based on the ETI35 will rise from 0.70 to
Table 2.7: Simulation Results: IBRD and IDA Countries That Would Experience Changes in Trade Ratings Due to Changes in Weights for Trade Subcriteria
Fall in ratings on trade Rise in ratings on trade
IDA IBRD IDA IBRD
Malawi Trinidad and Tobago Cape Verde Morocco
Burkina Faso Colombia Uganda Iran, Islamic Rep.
São Tomé and Principe Montenegro Senegal Malaysia
Niger Micronesia, Fed. Sts. Nigeria Guatemala
Tajikistan Thailand Ethiopia Uruguay
Guyana Ukraine Rwanda Swaziland
Azerbaijan Chile Bosnia and Herzegovina Algeria
Lao PDR Albania Bangladesh Namibia
Moldova Croatia Lesotho St. Kitts and Nevis
Mauritania Bulgaria Sri Lanka Estonia
Yemen, Rep. Lebanon Eritrea Botswana
Mongolia Kazakhstan Pakistan South Africa
Armenia Dominican Republic Korea, Rep.
Papau New Guinea Paraguay Belize
Chad Costa Rica Latvia
Comoros Tunisia
Bolivia
Honduras
Kyrgyz Republic
Georgia
Congo, Dem. Rep.
Togo
Timor-Leste
Côte d’Ivoire
Haiti
Angola
Congo, Rep.
Source: IEG.Note: All changes are 0.5 points, with the exception of Tunisia which would experience a 1-point gain.IBRD= International Bank for Reconstruction and Development; IDA= International Development Association.

3 6
T H E W O R L D B A N K ’ S C O U N T RY P O L I C Y A N D I N S T I T U T I O N A L A S S E S S M E N T
Second, compared to almost every other CPIA
criteria, there is a greater focus in this criterion
on assessing intermediate outcomes rather than
policies and institutions. This is particularly
the case in the assessment of financial depth,
which focuses almost entirely on intermedi-
ate outcomes, such as size of financial markets,
interest rate spreads, and so on. It would be
useful to include in the assessment policies and
institutions that foster an enabling environment
for the financial sector such as the legal, contrac-
tual, informational, and governance framework.
Third, some of the indicators used in the assess-
ment of the financial sector criterion can be
strengthened. One example is the indicator on
banking system soundness, which specifies two
alternative intermediate outcome measures
related to non-performing loans (NPLs).40
Although NPLs may predict crises to some extent,
they are typically a lagging indicator, with high
values suggestive of a problem that has already
crystallized. Hence these NPL measures are crude
and inadequate even as indicators of current or
imminent problems. This is clearly reflected in
the fact that NPLs for residential mortgages did
not provide a sensitive early warning system in
the recent crisis in advanced economies. There
are other good or even better flags for systemic
risk, for example, indicators of foreign exchange
risk in finance such as the dollarization of banking
deposits or assets (De Nicoló, Honohan, and
Ize 2005; Cashin and Duttagupta 2008). Rapid
growth of credit also needs to be monitored as
a possible warning sign. The assessment of this
dimension would be strengthened by taking into
account such indicators.
Appendix F presents a more detailed discussion
of the indicators in the CPIA financial sector
criterion based on a review of the literature. It
also offers recommendations for restructuring
and strengthening the criterion.
Indeed, the rank correlation for customs/border
administration between those two indexes is
0.77, compared with a rank correla-
tion of 0.59 for trade restrictiveness.
The proposed change would alter
the PBA, although not very signifi-
cantly.37 Many more countries would
lose than would gain, reflecting the
larger number of countries that have
worse ratings on trade facilitation
than on trade restrictiveness. The
magnitudes of the changes would be
small, however. Bangladesh would gain the most
(by 1.6 percent), whereas Chad would lose the
most (3.4 percent) (table 2.8).
Financial sector criterionA review of the literature indicates that the
financial sector criterion does cover the
dimensions along which finance is currently
thought to be important: stability; depth and
efficiency; and access. However, the way in which
some of the dimensions are currently being
assessed can be strengthened.
First, the application of equal weights to the three
financial sector dimensions can be revisited,
particularly in light of the ongoing global financial
crisis, as well as the considerable evidence of a
large impact of banking crises on output losses
(Hoggarth, Reis, and Saporta 2002)38 and on the
national budget (Laeven and Valenciana 2008;
Honohan 2008b).39 Further, it is also
widely accepted that financial stabil-
ity is a prerequisite for the effective
deployment of many types of develop-
ment assistance (although there is
less systematic evidence on this front
(Honohan 2009). Hence, it would be useful for
Bank management to consider giving financial
stability a larger weight than the other two
dimensions in the CPIA criterion.
The financial sector criterion focuses more on
intermediate outcomes. It would be useful to
include in the assessment those policies and
institutions that foster an enabling environment
for the financial sector.
Some of the indicators of the financial sector
criterion need to be strengthened.

3 7
R E L E VA N C E O F T H E C P I A
Table 2.8: Simulation R esults: Changes in PBA Arising from Changes in Weights for Trade Subcriteria
Countries that will lose PBA (%) Countries that will gain PBA (%)
Country Percentage lost Country Percentage gained
Mali –0.6 Rwanda 1.2
Zambia –0.6 Senegal 1.3
Benin –0.6 Uganda 1.4
Cambodia –0.6 Bosnia and Herzegovina 1.4
Cameroon –0.6 Ethiopia 1.4
Ghana –0.6 Sri Lanka 1.4
Guinea –0.6 Nigeria 1.5
Kenya –0.6 Bangladesh 1.6
Madagascar –0.6
Mozambique –0.6
Nepal –0.6
Nicaragua –0.6
Sierra Leone –0.6
Tanzania –0.6
Uzbekistan –0.6
Vietnam –0.6
Armenia –2.2
Georgia –2.3
Moldova –2.3
Burkina Faso –2.4
Malawi –2.4
Mongolia –2.4
Honduras –2.4
Bolivia –2.5
Azerbaijan –2.6
Papau New Guinea –2.6
Kyrgyz Republic –2.6
Niger –2.6
Mauritania –2.7
Yemen, Rep. –2.7
Lao PDR –2.8
Tajikistan –2.9
Chad –3.4
Source: IEG. Note: PBA= Performance-based allocation. Ranking changes based on equal weights for all CPIA criteria.

3 8
Women weaving on loom, China. Photo by Curt Carnemark/World Bank

Evaluation Highlights• The CPIA correlates well with simi-
lar indicators in terms of both the relative rankings of countries and the direction of change.
• CPIA ratings correlate better for IBRD than for IDA countries with ratings of similar indicators—this could be because ratings for IDA countries take into account the stage of development.
• Accounting for the stage of devel-opment is problematic because of the judgment involved and because of uneven practice across the Bank.
• Having network reviewers validate ratings helps minimize potential bias in the ratings.
Chapter 3

Morocco. Photo by Curt Carnemark/World Bank.

4 1
development differently, which means that even
more unevenness is introduced into the CPIA
ratings exercise.
The quality of CPIA ratings could be enhanced by
minimizing the amount of subjectivity involved
in the rating exercise. This could be done by
excluding accounting for the stage of develop-
ment from the ratings exercise.
Comparability with Other IndicatorsFourteen indicators are identified that could be
compared with the CPIA (table 3.1). Two of the
14 are strictly comparable with the CPIA—these
are the CPIA ratings by the Asian Development
Bank (ADB) and the African Development Bank
(AfDB) (appendix H). The ADB uses exactly the
same questionnaire as the Bank. For the AfDB, all
the questions are either exactly the same or very
close to those of the Bank with the exception of
the question on trade (q4), for which the AfDB
includes an assessment on economic coopera-
tion and regional integration.1 The rest of the
indicators are selected to match as closely as
possible with relevant CPIA criteria, some of
With respect to the former, CPIA ratings are found
to correlate well with similar indicators in terms of
the rankings of countries and in terms of direction
of change. This means that the CPIA ratings are
not out of line with other indicators that measure
similar policies and institutions. With respect to
the latter, the Bank’s review processes are found
to guard against potential biases in ratings.
CPIA ratings are found to correlate better for
IBRD than for IDA countries. One reason for this
could be that more information is available on
IBRD than on IDA countries, which increases the
likelihood of different institutions having similar
assessments on IBRD countries. Another reason
for this could be the need to take into account
the stage of development in the CPIA ratings. This
means that more judgment is involved in rating
IDA countries, because accounting for the stage
of development is more important for IDA than
for IBRD countries. This introduces additional
subjectivity into the rating exercise, which is
already centered on the expert judgment of staff.
The issue is further complicated by the fact that
different networks treat the issue of the stage of
Assessing the reliability of the CPIA ratings is an intrinsically difficult if
not impossible task, given that a benchmark (that is, the “true” rat-
ing) does not exist. Recognizing this major limitation, this evaluation
assesses reliability in two ways: it compares the CPIA ratings with those of
similar indicators, and it reviews the Bank’s CPIA ratings generation process.
Reliability of the CPIA Ratings

42
TH
E W
OR
LD
BA
NK
’S C
OU
NT
RY
PO
LIC
Y A
ND
INS
TIT
UT
ION
AL
AS
SE
SS
ME
NT
Table 3.1: Rank Correlation Coefficients between CPIA Ratings and Comparator Ratings for 2007
CPIA ADB AfDB ICRG GCI ETI DB
Bertelsmann Transformation
Index
Index of Economic Freedom WGI
Corruption Perception
Index
Ibrahim Index of African
Governance ESI
Gender Gap
Index
Gender Empowerment
Measure Average
q1 0.74 0.82 0.78
(26) (50)
q2 0.61 0.82 0.72
(26) (50)
q3 0.67 0.91 0.79
(26) (50)
q4 0.67 0.72 0.71 0.70
(26) (91) (85)
q5 0.62 0.75 0.71 0.67 0.69
(26) (50) (91) (139)
q6 0.80 0.84 0.62 0.55 0.57 0.79 0.67 0.89 0.72
(26) (50) (90) (85) (139) (111) (114) (140)
q7 0.78 0.66 0.67 0.61 0.68
(26) (50) (93) (60)
q8 0.58 0.80 0.69
(26) (50)
q9 0.80 0.68 0.69 0.72
(26) (50) (91)
q10 0.72 0.77 0.72 0.74
(26) (50) (111)(continued on next page)

43
RE
LIA
BIL
ITY
OF
TH
E C
PIA
RA
TIN
GS
Table 3.1: Rank Correlation Coefficients between CPIA Ratings and Comparator Ratings for 2007
CPIA ADB AfDB ICRG GCI ETI DB
Bertelsmann Transformation
Index
Index of Economic Freedom WGI
Corruption Perception
Index
Ibrahim Index of African
Governance ESI
Gender Gap
Index
Gender Empowerment
Measure Average
q11 0.71 0.77 0.59 0.69
(26) (50) (110)
q12 0.75 0.82 0.73 0.69 0.74 0.69 0.88 0.76
(26) (50) (95) (92) (111) (114) (140)
q13 0.54 0.89 0.72
(26) (50)
q14 0.61 0.72 0.67
(26) (50)
q15 0.68 0.80 0.66 0.83 0.74
(26) (50) (95) (140)
q16 0.72 0.79 0.51 0.82 0.75 0.86 0.86 0.77 0.76
(26) (50) (95) (111) (114) (140) (135) (46)
Average 0.69 0.79 0.63 0.69 0.63 0.62 0.77 0.70 0.87 0.86 0.77 0.59 0.67 0.61 0.72
Source: IEG. Note: The number of observations is presented in parenthesis below the correlation coefficients. All correlations are for 2007 ratings except for the Ibrahim Index of African Governance (2006 ratings) and Environmental Sustainability Index (ESI) (2005 ratings). ADB = Asian Development Bank; AfDB = African Development Bank; DB = Doing Business; ETI = Enabling Trade Index; GCI = Global Competitiveness Index; ICRG = International Country Risk Guide; WGI = Worldwide Governance Indicators. All coefficients are significant at the 1 percent level.
(continued)

4 4
T H E W O R L D B A N K ’ S C O U N T RY P O L I C Y A N D I N S T I T U T I O N A L A S S E S S M E N T
the CPIA criteria varies. Some overlap much
better with the content of certain CPIA criteria
than others. Nonetheless, for each criterion the
correlation coefficients with both the develop-
ment and nondevelopment bank comparators
are similar and relatively high, averaging between
0.7 and 0.8 (see last column of table 3.1). This
provides some assurance that the CPIA ratings
are not out of line with those of other indicators
that assess similar policies and institutions. The
correlation coefficients presented in table 3.1
also indicate that there is not much difference
between all 16 CPIA criteria in terms of their
comparability with other indicators.
Although on average the CPIA ratings correlate
well with other indicators, there is a dispersion to
the correlation coefficients that range from a low
of 0.54 (for q13 with ADB) to a high of 0.89 (for
q13 with AfDB and q6 with the World Governance
Indicators). Several possible reasons may account
for this dispersion. First, as mentioned, except
for the AfDB and the ADB, the other indicators
are not assessing the exact same criteria as the
CPIA. Second, judgment is involved in the rating
exercise (by the Bank and by virtually all the other
institutions; see table 3.2), which is exacerbated
when there is not enough information available
on the criteria.
which are guideposts for certain CPIA criteria
(box 3.1).
For certain CPIA criteria, very few comparators
can be identified. In particular, it is difficult to
identify comparators other than those by the
ADB and AfDB for the three economic manage-
ment criteria (q1, q2, and q3),2 and the criteria on
equity of public resource use (q8), the quality of
budgetary and financial management (q13),3
and efficiency of revenue mobilization (q14).
Hence, for those criteria, only comparisons with
ratings by ADB and AfDB are made.
In contrast, quite a few more comparators are
found for the criteria on business regulatory
environment (q6) and transparency, account-
ability, and corruption in the public sector
(q16). For both these criteria, six other indicators
in addition to the ones from ADB and AfDB are
found.
Rank correlationsInterpretation of the correlation coefficients4 of
the CPIA ratings with other indicators is compli-
cated by the fact that the content of the indica-
tors, other than those of the other development
banks, is not exactly the same as the CPIA. The
overlap between these other indicators and
This evaluation selected 12 other indicators, in addition to the CPIA ratings produced by the AfDB and the ADB, to compare with the Bank’s CPIA:
• Three are produced by the Bank—the Logistics Performance Index, Doing Business, and the Worldwide Governance In-dicators.
• Four are produced by the World Economic Forum—the En-abling Trade Index, the Environmental Sustainability Index, the Global Gender Gap Index, and the Global Competitive-ness Index.
• The rest are produced by the Bertelsmann Foundation (Ber-telsmann Transformation Index), Heritage Foundation (Index of Economic Freedom), the Political Risk Services Group (the International Country Risk Guide), Transparency International (Corruption Perception Index), the United Nations Devel-opment Programme (the Gender Empowerment Measure), and the Mo Ibrahim Foundation (Ibrahim Index of African Governance).
Appendix I provides details on the specific subindicators used for comparison.
Source: IEG.
Box 3.1: Comparator Indicator s

4 5
R E L I A B I L I T Y O F T H E C P I A R AT I N G S
Table 3.2: Other Indicator s—Expert Judgment or Hard Data?
External data source CPIA CriterionExpert Judgment/
Survey Hard dataExpert Judgment/Survey
and Hard Data
ADB q1 to q16
AfDB q1 to q16 ✓
Global Competitiveness Index q4 ✓
q5 ✓
q6 ✓
q9 ✓
q12 ✓
International Country Risk Guide q12 ✓
q15 ✓
q16 ✓
Enabling Trade Index q4 ✓
q6 ✓
Doing Business q5 ✓
q6 ✓
Bertelsmann Transformation Index q6 ✓
q10 ✓
q12 ✓
q16 ✓
Index of Economic Freedom q6 ✓
q12 ✓
q16 ✓
Worldwide Governance Indicators q6 ✓
q12 ✓
q15 ✓
q16 ✓
Corruption Perception Index q16 ✓
Ibrahim Index of African Governance q16 ✓
Environmental Sustainability Index q11 ✓
Gender Gap Index q7 ✓
Gender Empowerment Measure q7 ✓
Source: IEG.Note: ADB= Asian Development Bank; AfDB= African Development Bank.

4 6
T H E W O R L D B A N K ’ S C O U N T RY P O L I C Y A N D I N S T I T U T I O N A L A S S E S S M E N T
the points of reference here because they are the
most comparable with the Bank’s ratings both
because of their content, and because all three
institutions take into account country context in
the ratings whereas the other indicators do not.)
The comparisons indicate that, overwhelm-
ingly, these other indicators correlate better
with the Bank’s ratings than with ratings by
AfDB and ADB (table 3.3).
Comparing changes in ratingsThe two previous sections indicate that the
level of the CPIA ratings (and implied rankings)
compare relatively well with other indicators.
This section examines how well the changes in
ratings compare with changes in the comparator
indicators between 2006 and 2007.
Strictly speaking, a similar assessment of a partic-
ular criterion by different institutions would
imply that a change or no change in ratings by
one institution would be associated with similar
movements in ratings by the other institu-
tions. Because the timing of the CPIA assess-
ment exercise varies across these institutions, a
For example, even though the ADB uses the same
CPIA questionnaire as the Bank, the correlation
coefficients for two criteria, q8 and q13, are
relatively low (the respective correlation coeffi-
cients are 0.58 and 0.54). Very different rankings
for two to three countries (of 26 countries) are
responsible for the relatively low correlations
overall. In the case of q8, these are Micronesia,
Cambodia, and Timor-Leste, and for q13, these
are Azerbaijan and Tonga. Two of these countries
are Pacific Islands, for which the Bank has little
up-to-date or firsthand information (accord-
ing to region and network reviewers who were
interviewed for this evaluation).
For all of the criteria for which there are compara-
ble indicators other than those from ADB and
AfDB (that is, all criteria except for q1, q2, q3,
q8, q13, and q14 as discussed above),
comparisons of rank correlations were
undertaken to assess whether these
other indicators correlate better5 with
the Bank’s CPIA or with those of the
other two development banks. (The
ratings by the AfDB and the ADB are
Table 3.3: Are Other Comparator Indica tors Closer to the Bank or to AfDB and ADB?
CPIA criterion
Majority of other indicators correlates better with Majority of other indicators correlates better with
Bank AfDB Bank ADB
q4 n.a. n.a. ✓
q5 ✓ ✓
q6 ✓ No difference
q7 ✓ ✓
q9 No difference No difference
q10 No difference ✓
q11 ✓
q12 ✓ ✓
q15 ✓ ✓
q16 ✓ ✓
Source: IEG.Note: The comparison for q4 is not valid with AfDB because AfDB defines q4 differently from the Bank. ADB= Asian Development Bank; AfDB= African Development Bank; n.a.= not applicable.
Other comparator indicators correlate
better with the Bank’s CPIA ratings than
with the ratings by the AfDB and the ADB.

4 7
R E L I A B I L I T Y O F T H E C P I A R AT I N G S
In the comparison with the AfDB, for
10 of the 15 criteria (q4 is excluded
from the analysis for reasons stated
earlier), none of the countries has
ratings that move in the opposite
direction. For four criteria—q2
(fiscal policy), q7 (gender), q8 (equity of public
resource use) and q13 (quality of budgetary
and financial management)—the ratings
move in the opposite direction for only 2 percent
of the countries (one out of 50 countries). For
q1 (macroeconomic management), a slightly
higher 4 percent of the countries (2 out of
50 countries) have ratings that move in the
change in the assessment by one institution may
not always be associated with a similar change in
assessment by the other institution. However,
at the very least, these assessments—if they are
similar—would not contradict each other or,
in other words, the ratings would not move in
opposite directions.
The comparisons of changes in ratings indicate
that the Bank’s assessments are very similar to
those of the AfDB and the ADB. Only for a few
criteria and a very small share of countries do
the ratings of the Bank and AfDB/ADB move in
opposite directions (table 3.4).
The Bank’s CPIA ratings and those of AfDB and ADB correlate well in terms of direction of change.
Table 3.4. Comparison of Changes in CPIA Ratings 2006–07 between the Bank,AfDB, and ADB
Comparison with AfDB Comparison with ADB
Criterion
Change in the same
direction(%)
Change in the opposite direction (%)
Change for one institution but no change in the other (%)
Change in the same direction
(%)
Change in the opposite direction (%)
Change for one institution but no change in the other (%)
q1 60.0 4.0 36.0 50.0 4.2 45.8
q2 42.0 2.0 56.0 41.7 0.0 58.3
q3 64.0 0.0 36.0 33.3 0.0 66.7
q4 n.a. n.a. n.a. 58.3 0.0 41.7
q5 72.0 0.0 28.0 54.2 4.2 41.7
q6 66.0 0.0 34.0 75.0 0.0 25.0
q7 58.0 2.0 40.0 62.5 0.0 37.5
q8 52.0 2.0 46.0 54.2 0.0 45.8
q9 66.0 0.0 34.0 66.7 0.0 33.3
q10 74.0 0.0 26.0 50.0 0.0 50.0
q11 64.0 0.0 36.0 66.7 4.2 29.2
q12 80.0 0.0 20.0 50.0 0.0 50.0
q13 56.0 2.0 42.0 33.3 0.0 66.7
q14 72.0 0.0 28.0 54.2 0.0 45.8
q15 70.0 0.0 30.0 70.8 0.0 29.2
q16 56.0 0.0 44.0 54.2 0.0 45.8
Source: IEG.Note: q4 is excluded from this analysis because of the additional dimension of regional integration that is included in q4 by AfDB but not the Bank. ADB= Asian Development Bank; AfDB= African Development Bank.

4 8
T H E W O R L D B A N K ’ S C O U N T RY P O L I C Y A N D I N S T I T U T I O N A L A S S E S S M E N T
Two possible reasons may account for these
findings. First, in general, more information
is available on IBRD countries than on IDA
countries (see appendix J) which increases the
likelihood of different institutions (AfDB as well
as other institutions) having similar assessments
on IBRD countries as the Bank. Second, the stage
of development (taken into account by the Bank
and the AfDB) is more pertinent for IDA than
for IBRD countries, and the additional judgment
involved in accounting for the stage of develop-
ment would likely make ratings for IDA countries
less comparable. Regardless of whether one
or both reasons are valid here, CPIA ratings
correlate better with those of other indicators
for IBRD than for IDA countries.
Conclusions on comparability of CPIA with other indicatorsThe findings indicate that CPIA ratings for all
16 criteria correlate relatively well with those of
similar indicators in terms of both the relative
rankings of countries as well as the direction of
change. The rank correlations of CPIA ratings
with ratings of other indicators average between
0.7 and 0.8 for each of the 16 CPIA criteria. Ratings
of other indicators correlate better with CPIA
ratings by the Bank than those by the AfDB and
the ADB. Finally, CPIA ratings correlate better for
IBRD than for IDA countries with ratings of other
indicators.
CPIA Ratings Generation ProcessThe central determinant of CPIA ratings is the
professional judgment of Bank staff, who can also
draw on other indicators (including outcome
indicators/hard data) provided as guideposts
in the CPIA Questionnaire. The ratings are
produced in a multistep process, which entails
two levels of review—first at the regional level,
and then at the network level (see box 3.2).
In cases where the regions and the networks
disagree over the final ratings, the networks have
the final say unless the regions have supporting
evidence.
Regional reviewInterviews with regional reviewers indicate that
there is no one standard review practice across
opposite direction. In the comparison with
ADB, for 13 of 16 criteria, none of the countries
have ratings move in the opposite direction. For
the remaining 3 criteria—q1 (macroeconomic
management), q5 (financial sector), and q11
(environmental sustainability), 4 percent of
the countries (1 of 26 countries) have ratings
move in the opposite direction.
The same comparison with the other indicators
is not reported here because the CPIA ratings (by
the Bank and the other two development banks)
are more discrete (with intervals of 0.5) than the
other indicators. This implies that changes in the
ratings of the other indicators may not correspond
to changes in CPIA ratings, even if the assessments
are similar to those of the Bank. In other words,
small changes in policies and institutions may lead
to a change in a rating that is on a more continuous
scale (such as the Global Competitiveness Index),
whereas the same small change would not be
reflected in changes in the CPIA rating because it
takes a relatively significant change in policies and
institutions for the CPIA rating to change by 0.5.
Therefore, comparisons of changes in CPIA ratings
with changes in the ratings of other indicators could
only be made for instances where the CPIA ratings
change. They cannot be made in cases when CPIA
ratings do not change. This restricts the number
of observations significantly, because CPIA ratings
do not change very much over time. The restricted
number of observations per criterion (these are at
most slightly above 20, and in many instances well
below 20) weakens the confidence in the analysis;
hence the results are not reported here.
IBRD versus IDA ratingsThe Bank’s CPIA ratings correlate better with
ratings from AfDB and other institutions for IBRD
countries than for IDA countries6 (table 3.5). AfDB
ratings are closer to those of the Bank for twice
as many criteria for IBRD than for IDA countries
(6 versus 3 criteria). Ratings of other
indicators are overwhelmingly closer
to Bank ratings for IBRD than for IDA
countries. They are closer to Bank
ratings for 8 criteria for IBRD countries
and for no criteria for IDA countries.
CPIA ratings correlate better with other
comparator indicators for IBRD than for
IDA countries.

4 9
R E L I A B I L I T Y O F T H E C P I A R AT I N G S
generally knowledgeable about their
sectors for many countries in the
region, whereas staff in the Chief
Economist’s office are knowledgeable
about all the countries in the region.
Hence these regional reviews do not entail cross-
country statistical exercises.
Further, though a regional review is meant to
ensure intraregional rating comparability prior
to submitting the first round of rating propos-
als to OPCS, interviews with regional reviewers
indicate that not all regions do that. The varying
extents to which regions undertake this review
may account for the varying extents to which
regions. One factor that influences the regional
review practices is the size of the region.
For regions with numerous countries, such as the
Africa and the Europe and Central Asia Regions,
reviewers undertake statistical exercises using
external indicators to review country team rating
proposals. In the Africa Region, sector special-
ists undertake such exercises, which are used as
inputs in the regionwide review process before
the first round of rating proposals are submitted
to Operations Policy and Country Studies (OPCS).
In smaller regions, such as the Middle East and
North Africa and South Asia, sectoral staff are
Table 3 .5: Rank Correlations between the CPIA and Other Indicators:IBRD versus IDA Countries
CPIA Criterion
Bank ratings correlate better with AfDB ratings for
Bank ratings correlate better with other Indicators for
IBRD countries IDA countries IBRD countries IDA countries
q1 ✓ n.a. n.a.
q2 No difference n.a. n.a.
q3 ✓ n.a. n.a.
q4 n.a. n.a. ✓
q5 ✓ ✓
q6 No difference ✓
q7 ✓ No difference
q8 No difference n.a. n.a.
q9 No difference ✓
q10 ✓ No difference
q11 No difference ✓
q12 ✓ ✓
q13 ✓ n.a. n.a.
q14 ✓ n.a. n.a.
q15 No difference ✓
q16 ✓ ✓
Source: IEG.Notes: a. A better correlation is defined here as a correlation coefficient that is higher by at least 0.05.b. q4 is excluded from the comparison with AfDB because AfDB defines q4 differently from the Bank. c. For q1, q2, q3, q8, q13, and q14, no other indicators except for AfDB (and ADB) can be identified as comparators, as mentioned.ADB= Asian Development Bank; AfDB= African Development Bank; IBRD= International Bank for Reconstruction and Development; IDA= International Development Association; n. a. = not applicable.
There is no one standard CPIA review practice across regions.

5 0
T H E W O R L D B A N K ’ S C O U N T RY P O L I C Y A N D I N S T I T U T I O N A L A S S E S S M E N T
the review, which varies quite significantly across
criteria (box 3.3).
Expert judgment and potential conflict of interestAs indicated by the external panel in the 2004
review of the CPIA (World Bank 2004a), the
depth of country knowledge by Bank staff is a
major strength of the exercise. The practice of
relying on expert judgment for ratings is also
used by virtually all of the other indicators against
which the CPIA was compared in the previous
section (table 3.2).
Although the expert judgment of Bank staff is
clearly an asset in the CPIA exercise, at the same
time there is a potential conflict of interest in
having staff provide ratings, particularly for IDA
countries. This potential for conflict of interest
arises from the fact that ratings produced by
staff are in turn used for allocating IDA resources
for the same countries on which the work
programs of those staff depend. Therefore, staff
may potentially be upwardly biased in assigning
ratings for their countries. The regional review is
meant to adjust for such potential biases at the
regional level, although there could still be issues
networks disagree with the regions over the
initial rating proposals (table 3.7).
All regional reviewers were asked the open-ended
question of which criteria are difficult to assess.
Reviewers found that the criteria in the public
sector management and institutions cluster were
the most difficult, pointing to the lack of data
and the judgment involved. One of the network
reviewers for this cluster indicated that a lot of
judgment is involved in most of the criteria in
that cluster and pointed out the criterion on
transparency, accountability, and corruption
as an example.
Network reviewThe review practices of the networks
vary depending on various factors,
including: (i) the extent to which other quanti-
tative indicators are available for cross-checking
the CPIA ratings; (ii) the extent to which any
other information is available on the criteria at
all; (iii) the importance the particular network
accords to the exercise (and hence the amount
of resources devoted to it); and (iv) the clarity
of the criteria content and associated ease of
assessment. These factors affect the extent of
The process begins with a benchmarking phase, which entails rating a small representative sample of countries drawn from all the regions (see chapter 1, “Other Changes in the CPIA”). This is followed by a roll-out phase, during which the rest of the countries are rated. Both phases entail a multistep procedure.
In the first step, the country teams generate a set of proposed ratings for their respective countries. This step is usually led by country economists with participation from sector specialists and country management.
In the second step, the Regional Chief Economist offices review and revise (as necessary) the ratings for the countries within the respective regions to ensure cross-country comparability within each region.
In the third step, the network anchors and other central units review the ratings at the Bank-wide (global) level to ensure cross-regional comparability of ratings.
The fourth step is somewhat different for the benchmarking versus the roll-out phase. For the benchmarking phase, the fourth step entails a meeting of representatives from Operations Policy and Country Services (OPCS), the regions, networks, and central departments to review the proposed ratings for all of the criteria and for all of the benchmark countries, after which the ratings are “frozen” and the roll-out phase proceeds. For the fourth step of the roll-out phase, most of the ratings are finalized through virtual communication because of the large number of countries involved. Meetings are only held to discuss the few cases that have not been resolved by virtual communication.
Source: IEG, based on interview with OPCS.
Box 3.2: The Process of Preparing CPIA Ratings
Network review practices also vary.

5 1
R E L I A B I L I T Y O F T H E C P I A R AT I N G S
and the Caribbean, the networks challenged
initial regional proposals for a larger share of
IDA than IBRD countries. For both IBRD and
IDA countries, there was greater disagreement
between network and regions for Europe and
Central Asia than for all the other regions (for 16
and 20 percent of Europe and Central
Asia countries, respectively). For 7 of
the 16 criteria, the networks disagreed
more often with regional proposals of
ratings for IBRD countries, whereas
for 9 of the 16 criteria, they disagreed
more often with ratings for IDA
countries (table 3.7).
Ratings were more likely to be challenged by
the networks when the regions proposed an
increase from 2006, and much more so for IDA
than for IBRD countries. Specifically, when the
networks challenged regional proposals, it was
with the levels of the ratings even if the relative
rankings of countries are adjusted at the regional
level.
The network review—among other functions—is
meant to adjust potential biases in the levels of
ratings across regions (box 3.3). The evidence from
the 2007 review process indicates that there was not
much difference between IBRD and IDA countries
in terms of the extent of network disagreement
with the regions’ initial rating proposals. For all
countries, the networks disagreed with about 12.5
percent of the initial regional ratings proposed
for IDA countries, compared with only a slightly
lower share of 11.8 percent of the ratings for IBRD
countries (table 3.6).
The differences were much more significant
when the comparison was made at the regional
level. For every region except Latin America
For the economic management cluster (criteria q1 to q3), the reviewers read every write-up submitted by the region, as well as reports from the International Monetary Fund, Debt Sustain-ability Assessments, and private sector reports for the country being reviewed. Many reviewers in the Economic Policy and Debt Department (PRMED) are involved in this exercise, with each reviewer assigned about six countries. A coordinator then reviews about 60 percent of all the reviewers’ comments to ensure consistency of ratings across countries.
Perhaps because of the resource-intensiveness of the review, these were also the criteria on which there were the most com-ments. In 2007, for each of the criteria q1, q2, and q3, the network commented on 86 percent of the countries, compared with com-ments on an average of 38 percent of the countries for all 16 CPIA criteria (appendix K). Further, these were also the criteria for which the network disagreed with the regional proposals for a higher share of countries than for most other criteria (see table 3.7).
For the criteria on trade (q4), business regulatory environment (q5), financial sector (q6) up to last year, gender (q7), property rights and rule-based governance (q12), quality of budgetary and financial management (q13), parts (c) and (d) of quality of public
administration (q15), and transparency, accountability, and corrup-tion in the public sector (q16), the networks use other quantitative indicators to cross-check the ratings.
For the gender criterion (q7), the network actually first generate the ratings based on quantitative indicators which are passed onto the region for review. These initial gender ratings are then adjusted if country teams provide additional country-specific information that is not captured by the ratings. Some networks supplement assessments based on quantitative indicators with the write-ups submitted by the regions.
For the financial sector (q5) for fiscal 2009, building human resources (q9), and efficiency of revenue mobilization (q14), the networks review all of the write-ups that were submitted. The network reviewer for q14 supplements these with quantitative indicators from various other sources.
For the equity of public resource use (q8) and social pro-tection and labor (q10), the networks' review focuses only on countries for which the proposed ratings are different from the previous years. For the environment (q11), the network relies more on the region’s judgment because it has little other infor-mation on the criterion.
Source: IEG, based on interviews with network reviewers.
Box 3.3: The Network Reviews of CPI A Ratings
The networks challenged the regional proposals more often for IDA than for IBRD countries for all regions except Latin America and the Caribbean.

5 2
T H E W O R L D B A N K ’ S C O U N T RY P O L I C Y A N D I N S T I T U T I O N A L A S S E S S M E N T
higher for IBRD countries (86 percent) than for
IDA countries (73 percent) (table 3.9). Thus, the
conclusion can be drawn that for those 73 and 86
percent of instances, there was indeed an upward
bias in ratings. However, these instances made up
only 6 percent of the ratings for IDA countries and
about 5 percent of the ratings for IBRD countries,
which implies that there was not a severe upward
bias in ratings for either group of countries.
Taking into account all disagreements—that is,
including also instances where regions proposed
no change or a decrease in ratings in addition to
an increase in ratings—the 73 percent in which
network views prevailed dropped somewhat to
found that in 59 percent of the time
the regions had proposed an increase.
This ratio was 66 percent for IDA
countries compared to a much lower
50 percent for IBRD countries (table
3.8). This indicates that the networks
perceived more of an upward bias in
the ratings for IDA countries than
for IBRD countries.
Regarding the instances in which the
networks challenged a rating increase
from the regions, the networks
prevailed in an overwhelming majority
of 77 percent of the time. The share was
Table 3.6: Numbers and Shares o f Initial Regional Rating Proposals on Which the Networks Disagreed with the Regions, by Criteria, for 2007
CPIA criterion
Total For IBRD countries For IDA countries
No. of times networks differed
Share of all ratings (%)
No. of times networks differed
Share of all ratings (%)
No. of times networks differed
Share of all ratings (%)
q1 24 17.1 12 18.5 12 16.0
q2 28 20.0 12 18.5 16 21.3
q3 27 19.3 12 18.5 15 20.0
q4 12 8.6 6 9.2 6 8.0
q5 15 10.7 9 13.8 6 8.0
q6 11 7.9 6 9.2 5 6.7
q7 28 20.0 11 16.9 17 22.7
q8 8 5.7 3 4.6 5 6.7
q9 22 15.7 10 15.4 12 16.0
q10 6 4.3 2 3.1 4 5.3
q11 10 7.1 4 6.2 6 8.0
q12 10 7.1 5 7.7 5 6.7
q13 17 12.1 4 6.2 13 17.3
q14 22 15.7 12 18.5 10 13.3
q15 13 9.3 7 10.8 6 8.0
q16 20 14.3 8 12.3 12 16.0
Total 273 12.2 123 11.8 150 12.5
Source: IEG, based on World Bank data.Note: IBRD= International Bank for Reconstruction and Development; IDA= International Development Association.
Networks challenged regional proposals more
often for Europe and Central Asia—for 18
percent of the ratings compared to 12 percent
for all regions.
The role of the networks in validating the ratings
helps to minimize the potential for bias
in the ratings.

5 3
R E L I A B I L I T Y O F T H E C P I A R AT I N G S
the criterion on building human resources. For
these four criteria, the networks commented on
the initial regional rating proposals even when
the regions did not propose a change in ratings
from the previous year (table 3.11). As discussed
in box 3.3, these were also the criteria on which
the networks had invested the most time. For the
four criteria the reviewer read all of the write-ups.
Additionally, for the three criteria on economic
management, each reviewer was responsible for
68 percent, which is still high (table 3.10). In
sum, the evidence reflects the central role of the
networks in the review process, which helps to
minimize potential biases in ratings.
The networks prevailed in the majority of the cases
for all regions except South Asia and prevailed
most often for Latin America and the Caribbean.
The networks also prevailed more often for IBRD
than for IDA countries overall (77 versus 61
percent of the time). This could either mean that
the regions have more supporting evidence for
the ratings they proposed for IDA than for IBRD
countries, or that the regions make a bigger effort
for IDA countries because IDA funds are involved
(this evaluation has obtained anecdotal evidence
from interviews with World Bank staff on this).
The nature of the network review (that is, the
resource-intensiveness of the review) appears to
have an effect on the extent of the review, and
hence possibly on the quality of the ratings. The
evidence from the 2007 review process indicated
that four criteria stood out as having been more
rigorously reviewed than other criteria, including
the three economic management criteria and
Table 3.8: Network Disagreements with Initial Regional Rating Proposals
Regional proposalsAll countries
(%)
IBRD countries
(%)
IDA countries
(%)
Lower rating than 2006 1.9 2.7 1.3
Same rating as 2006 39.2 47.8 32.7
Higher rating than 2006 58.9 49.6 66.0
Source: IEG based on World Bank data. Note: IBRD= International Bank for Reconstruction and Development; IDA= International Development Association.
Table 3.7: Number and Share of Initial Regional Rating Proposals on Which the Networks Disagreed with the Regions, by Region and IBRD and IDA Countries for 2007
Region
Number of rating proposals on which networks disagreed with regions
Share of rating proposals on which networks disagreed with regions (%)
Total IBRD IDA Total IBRD IDA
Africa 82 10 72 11.4 7.8 12.2
East Asia and Pacific 28 6 22 8.8 4.2 12.5
Europe and Central Asia
81 55 26 17.5 16.4 20.3
Latin America and Caribbean
55 40 15 12.3 13.2 10.4
Middle East and North Africa
16 12 4 10.0 9.4 12.5
South Asia 11 n.a. 11 8.6 n.a. 8.6
Total 273 123 150 12.2 11.8 12.5
Source: IEG, based on data from OPCS.Note: IBRD= International Bank for Reconstruction and Development; IDA= International Development Association.

5 4
T H E W O R L D B A N K ’ S C O U N T RY P O L I C Y A N D I N S T I T U T I O N A L A S S E S S M E N T
ConclusionsAnalysis of the 2007 review process indicates that
the networks perceived more of an upward bias
in ratings for IDA than for IBRD countries. This
upward bias did not seem very severe, as it could
only be detected in about 6 percent of the ratings
for IDA countries and about 5 percent of the
ratings for IBRD countries. Analysis of the 2007
review process also indicates that the networks did
have a central role in the ratings review process,
as they prevailed in the majority—although not
all—of the cases when there were initial disagree-
ments between them and the regions. This helps
to minimize potential biases in the ratings. Finally,
the quality of the ratings is likely to be enhanced
by greater intensiveness in the network review,
which would entail more resources than have
been provided for the exercise.
Country contextThe greater comparability of the ratings on IBRD
than IDA countries with other indicators highlights
one issue with respect to the CPIA ratings genera-
tion process—that aspect of country context
that refers to the stage of development. Specifi-
cally, the questionnaire stated, “The criteria were
developed to ensure that, to the extent possible,
their contents are developmental neutral; that
the higher scores do not set unduly demanding
standards, and can be attained by a country that,
about six countries for which he or she also read
reports from the International Monetary Fund
(IMF), Debt Sustainability Assessments, and the
private sector reports.
Table 3.9: Share of Instances Wher e Networks Prevailed When Networks Disagreed with Regions over Proposed Increases in Ratings from 2006
RegionAll countries
(%)IBRD countries
(%)IDA countries
(%)
Africa 74.5 83.3 73.5
East Asia and Pacific
80.0 100.0 78.6
Europe and Central Asia
69.8 82.6 55.0
Latin America and Caribbean
92.6 89.5 100.0
Middle East and North Africa
81.8 85.7 75.0
South Asia 75.0 n.a. 75.0
Total 77.4 85.7 72.7
Source: IEG, based on OPCS data.Note: IBRD= International Bank for Reconstruction and Development; IDA= International Development Association.
Table 3.10: Share of Instances Wher e Networks Prevailed When Networks Disagreed with Regions, 2007
Region All countries (%) IBRD countries (%) IDA countries (%)
Africa 68.3 90.0 65.3
East Asia and Pacific 60.7 66.7 59.1
Europe and Central Asia 63.0 70.9 46.2
Latin America and Caribbean 87.3 87.5 86.7
Middle East and North Africa 68.8 66.7 75.0
South Asia 27.3 n.a. 27.3
Total 68.1 77.2 60.7
Source: IEG, based on OPCS data.Note: IBRD= International Bank for Reconstruction and Development; IDA= International Development Association.

5 5
R E L I A B I L I T Y O F T H E C P I A R AT I N G S
achieve similar results. Still others interpret it to
mean the stage of development, but account for
it in different ways, with some ways being more
subjective than others. Those who account for
the stage of development objectively
adjust the indicators they are assessing
by per capita incomes (for the gender
criterion, and for the finance criterion
until two years ago). Regardless of
how country context is interpreted,
many network reviewers find the
concept difficult to implement, and
had comments such as “...this is the
single toughest thing.”
Aside from the mixed interpretation of “country
context”—which can distort the quality of the
ratings—the fact that judgment is involved in
accounting for “country context” introduces
given its stage of development [italics by IEG],
has a policy and institutional framework that
strongly fosters growth and poverty reduction.”
(CPIA Questionnaires 2004–08). (The most
recent CPIA Questionnaire available at the time
of this writing was for 2008).
Different practices are adopted by the regions
and networks with respect to country context.
Discussions with regional reviewers indicate
that none of the regions take country context
into account in the rating exercise. Discussions
with network reviewers indicate that “country
context” is interpreted quite differently by differ-
ent network reviewers. Some interpret it to mean
that the country-specific information provided
by the country teams needs to be taken into
account in the assessment. Some interpret it to
mean that different policies and institutions can
Table 3.11: Shares of Countries o n Which Networks Commented in 2007 When Regions Proposed the Same Ratings as in 2006
CPIA criterion All countries (%) IBRD countries (%) IDA countries (%)
q1 89.2 88.9 89.6
q2 84.5 89.6 80.0
q3 85.3 88.6 82.4
q4 50.8 58.5 44.8
q5 3.4 5.9 1.5
q6 3.6 5.7 1.7
q7 28.8 28.8 28.8
q8 9.2 9.3 9.2
q9 83.8 88.5 80.0
q10 44.6 44.6 44.6
q11 0.0 0.0 0.0
q12 13.7 16.7 11.4
q13 1.0 0.0 1.9
q14 14.0 18.0 10.9
q15 5.0 7.4 3.1
q16 8.4 8.0 8.8
Total 31.5 33.7 29.6
Source: IEG, based on data from OPCS.Note: IBRD= International Bank for Reconstruction and Development; IDA= International Development Association.
The greater comparability of the ratings for IBRD than for IDA countries with other indicators highlights the problem with accounting for the stage of development in the CPIA ratings.

5 6
T H E W O R L D B A N K ’ S C O U N T RY P O L I C Y A N D I N S T I T U T I O N A L A S S E S S M E N T
to adjust the ratings quantitatively, using per
capita incomes. The issue then arises as to which
criteria or subcriteria to adjust, because the stage
of development is only pertinent for some (sub)
criteria but not others. For example, the develop-
ment of the financial sector clearly depends
on the stage of development of the country.
Therefore, it is reasonable to adjust the indicator
being assessed (for example, private sector credit
as a GDP) by per capita incomes, which had
previously been, but is no longer, done by the
network reviewer. It is not clear how much the
stage of development matters for other criteria.
Thus, deciding which criteria or subcriteria to
adjust for the stage of development would itself
be controversial.
In addition to which (sub)criteria to adjust
for stage of development, how to adjust such
(sub)criteria is also an issue. Although it is
more straightforward to adjust quantitative
indicators (although the methodology can be
subject to debate), when it comes to qualita-
tive indicators (and many CPIA criteria are
assessed on such indicators), it is very difficult
to adjust and the process could be open to a lot
of arbitrariness.
The adjustment of CPIA ratings by the stage of
development has affected the quality of these
ratings, to the extent that some network review-
ers indicated to the IEG team that they do not
use the ratings for their own analytical work. In
contrast, network reviewers who do not adjust
the CPIA ratings for the stage of development
indicated to the IEG team that they do use the
ratings for their own analytical work, reflecting
the confidence they have in the ratings.
IEG recommends excluding accounting for the
stage of development from the CPIA exercise. If
this cannot be done, at the very least it is important
to clarify and justify in the CPIA guidelines which
criteria need to take into account the stage of
development and how such adjustments need to
be made.
further subjectivity to an exercise that
already relies centrally on judgment.
Minimizing the amount of subjectivity
involved in the rating exercise would
help to enhance the quality of the
ratings.
The first interpretation of country context by
network reviewers—taking into account country-
specific information—is reasonable. After all,
the deep country knowledge of Bank staff is the
major value added that the Bank brings to the
CPIA rating exercise.
An example can be found in the gender
criterion, which assesses, among
other things, the share and growth
rate of parliamentary seats occupied
by women. However, a straightfor-
ward use of these indicators could
be misleading. For example, a recent
study on Bangladesh revealed that although
gender quotas increased the total number of
women in political arenas, their representation in
the decision-making process is still not ensured
as elected female representatives in Bangladesh
face social, cultural, and religious challenges
which hinder their participation (Panday 2008).
This is the very kind of useful qualitative informa-
tion that the country team could potentially
provide in terms of “country context.”
Regarding the second interpretation that differ-
ent policies and institutions can lead to similar
results, the literature review conducted for this
evaluation indicates that, by and large, the CPIA
criteria overlap with what are considered as the
consensus determinants of growth and poverty
reduction by the wider research community, and
not just by the Bank (chapter 2). However, the
trade criterion is problematic and needs to be
revised, as discussed in chapter 2.
Implementation of the third interpretation of
country context—the stage of development—
is also problematic. The simplest way would be
Regardless of how it is interpreted, network
reviewers find the concept of country context
difficult to implement.
Accounting for the stage of development is problematic because of the judgment involved
and the uneven practice across the Bank.

Chapter 4

Quay crane on docks, Sri Lanka. Photo by Dominic Sansoni, World Bank

5 9
OverviewThis evaluation takes the premise that beyond
informing IDA allocation, the CPIA is useful as
a broad indicator of development effectiveness.
It reviews the appropriateness of the CPIA as
an indicator that assesses the conduciveness of
a country's policies and institutions to foster-
ing poverty reduction, sustainable growth, and
the effective use of development assistance. It
assesses the relevance of the content of the CPIA
through a review of the economics literature.
It also assesses the reliability of CPIA ratings in
two ways—through comparing CPIA ratings with
similar indicators, and through reviewing the
CPIA ratings generation process. Based on these
assessments, the main findings and recommen-
dations are as follows.
Main FindingsCPIA contentThe evidence is mixed as to whether the
CPIA criteria are relevant for aid effective-
ness as defined in the literature—that is,
whether the criteria represent the policies
and institutions that are important for aid
to lead to growth. Much of the literature on
aid effectiveness uses cross-country empirics to
estimate the impact of aid on growth, with growth
representing aid effectiveness. The review of the
literature indicates that there is limited consensus
on the impact of aid on growth itself, and on the
conditions under which aid can have a positive
impact on growth. Also, this evaluation could not
estimate the impact of IDA assistance and CPIA
ratings on growth because the restructuring of
the CPIA in 2004 has resulted in a discontinuity
in the CPIA series.
However, CPIA ratings are found to be
positively associated with Bank loan perfor-
mance. Specifically, empirical analysis conducted
for this evaluation finds that the ratings of the
overall CPIA as well as those for each of the CPIA
clusters are negatively associated with the share
of problem loans (that are in turn correlated with
loan performance).
Findings and Recommendations
The CPIA criteria are largely relevant for sustaining growth and
improving welfare. By and large, the CPIA covers the determinants—
policies and institutions—of growth and poverty reduction identified
in the literature. However, some criteria can be streamlined and one needs to
be added. The assessment of certain criteria needs to be coordinated, and the
content of all criteria reviewed (see recommendations later in this chapter).
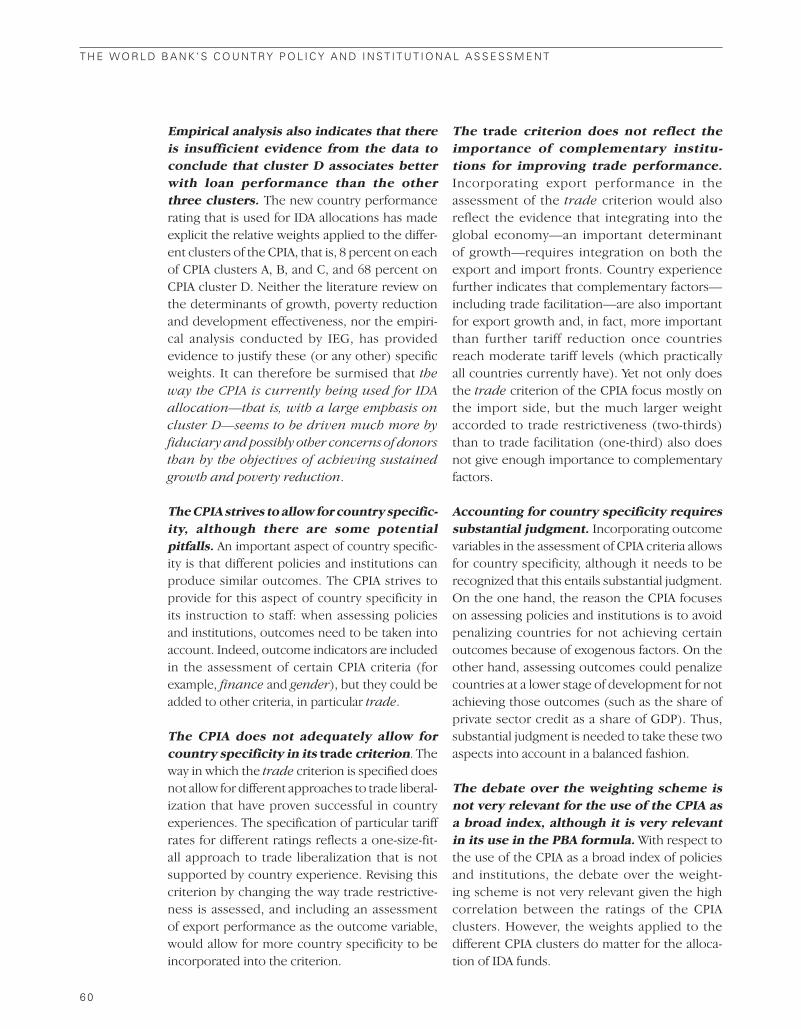
6 0
T H E W O R L D B A N K ’ S C O U N T RY P O L I C Y A N D I N S T I T U T I O N A L A S S E S S M E N T
The trade criterion does not reflect the
importance of complementary institu-
tions for improving trade performance.
Incorporating export performance in the
assessment of the trade criterion would also
reflect the evidence that integrating into the
global economy—an important determinant
of growth—requires integration on both the
export and import fronts. Country experience
further indicates that complementary factors—
including trade facilitation—are also important
for export growth and, in fact, more important
than further tariff reduction once countries
reach moderate tariff levels (which practically
all countries currently have). Yet not only does
the trade criterion of the CPIA focus mostly on
the import side, but the much larger weight
accorded to trade restrictiveness (two-thirds)
than to trade facilitation (one-third) also does
not give enough importance to complementary
factors.
Accounting for country specificity requires
substantial judgment. Incorporating outcome
variables in the assessment of CPIA criteria allows
for country specificity, although it needs to be
recognized that this entails substantial judgment.
On the one hand, the reason the CPIA focuses
on assessing policies and institutions is to avoid
penalizing countries for not achieving certain
outcomes because of exogenous factors. On the
other hand, assessing outcomes could penalize
countries at a lower stage of development for not
achieving those outcomes (such as the share of
private sector credit as a share of GDP). Thus,
substantial judgment is needed to take these two
aspects into account in a balanced fashion.
The debate over the weighting scheme is
not very relevant for the use of the CPIA as
a broad index, although it is very relevant
in its use in the PBA formula. With respect to
the use of the CPIA as a broad index of policies
and institutions, the debate over the weight-
ing scheme is not very relevant given the high
correlation between the ratings of the CPIA
clusters. However, the weights applied to the
different CPIA clusters do matter for the alloca-
tion of IDA funds.
Empirical analysis also indicates that there
is insufficient evidence from the data to
conclude that cluster D associates better
with loan performance than the other
three clusters. The new country performance
rating that is used for IDA allocations has made
explicit the relative weights applied to the differ-
ent clusters of the CPIA, that is, 8 percent on each
of CPIA clusters A, B, and C, and 68 percent on
CPIA cluster D. Neither the literature review on
the determinants of growth, poverty reduction
and development effectiveness, nor the empiri-
cal analysis conducted by IEG, has provided
evidence to justify these (or any other) specific
weights. It can therefore be surmised that the
way the CPIA is currently being used for IDA
allocation—that is, with a large emphasis on
cluster D—seems to be driven much more by
fiduciary and possibly other concerns of donors
than by the objectives of achieving sustained
growth and poverty reduction.
The CPIA strives to allow for country specific-
ity, although there are some potential
pitfalls. An important aspect of country specific-
ity is that different policies and institutions can
produce similar outcomes. The CPIA strives to
provide for this aspect of country specificity in
its instruction to staff: when assessing policies
and institutions, outcomes need to be taken into
account. Indeed, outcome indicators are included
in the assessment of certain CPIA criteria (for
example, finance and gender), but they could be
added to other criteria, in particular trade.
The CPIA does not adequately allow for
country specificity in its trade criterion. The
way in which the trade criterion is specified does
not allow for different approaches to trade liberal-
ization that have proven successful in country
experiences. The specification of particular tariff
rates for different ratings reflects a one-size-fit-
all approach to trade liberalization that is not
supported by country experience. Revising this
criterion by changing the way trade restrictive-
ness is assessed, and including an assessment
of export performance as the outcome variable,
would allow for more country specificity to be
incorporated into the criterion.

6 1
F I N D I N G S A N D R E C O M M E N D AT I O N S
have enough information to meaningfully rate
this subcomponent.
There are overlaps in the assessment of some
criteria. Tax policy is an intrinsic part of fiscal
policy and can be assessed as part of it rather than
separately, as is the case now. Judicial indepen-
dence is assessed in two different criteria and
corruption in three different criteria of cluster D,
all of which can be streamlined.
The assessment of the environment criterion is
onerous. It requires country teams to answer 85
questions to arrive at one rating.
The three economic management criteria—
macroeconomic management, fiscal policy,
and debt policy—are conceptually not distinct
from each other, and hence need to be, and
indeed are assessed together. Yet separate scores
are prepared and published for each of the three
criteria (for IDA countries), which could lead to
confusion.
The in-depth literature review of the
financial sector criterion reveals room for
improvement. Although the criterion covers
the dimensions along which finance is currently
thought to be important—stability, depth and
efficiency, and access—the relative weights of the
three dimensions (which are currently equally
weighted) need to be revisited. This follows
from the considerable evidence of a large impact
of banking crises on output losses and on the
national budget. At the same time, the evidence
on microfinance is mixed. Further, there is
a greater focus in this criterion on assessing
intermediate outcomes rather than policies and
institutions, in particular regarding the financial
depth dimension. It would be useful to include
policies and institutions for fostering an enabling
environment for the financial sector here,
namely the legal, contractual, informational, and
governance framework. Also, the indicators for
assessing financial stability can be strengthened.
CPIA ratingsThe CPIA ratings correlate relatively well
with similar indicators in terms of relative
These findings raise the question of the useful-
ness of aggregating the different CPIA clusters
into an overall index according to any predeter-
mined weighting scheme. In the case of the CPIA
as a broad index of development effectiveness, it
does not allow for country specificity which would
imply different weights on the clusters depend-
ing on the initial conditions and the countries’
stage of development. In the case of the CPIA as
an indicator for the allocation of IDA funds, the
overall CPIA index is no longer used as such.
The CPIA is missing an assessment on other
disadvantaged socioeconomic groups aside
from gender. Currently, only gender is being
assessed with respect to equality. Yet country
evidence indicates that social exclusion of other
groups could have severe poverty and growth
implications.
Important interlinkages between certain
criteria are not reflected in the CPIA. Country
evidence indicates that intersectoral labor mobility
needs to be ensured before trade liberalization
proceeds. Otherwise, trade liberalization could
exacerbate poverty. Similarly, the assessment
of fiscal policy (q2) and the quality of budget-
ary and financial management (q13) needs to
go hand-in-hand so that the fiscal aspect of the
country in its entirety is realistically captured.
Assessment or reporting of certain CPIA
criteria can be streamlined or restruc-
tured. The current content of the criterion on
equity of public resource use is redundant. This
does not mean that equity is not important. In
fact, equity has been identified in the literature
as one of the determinants of growth on which
there is consensus. However, the measures
identified in the literature as being important
for equity—property rights, access to credit,
access to education, gender equality, and income
transfers—are already covered by other CPIA
criteria. The criterion is currently assessed on
two fronts—the public expenditure and public
revenues sides. The former is covered by other
CPIA criteria, whereas the assessment of the
latter requires incidence analysis of taxes, which
is rarely done. As a result, Bank staff does not

6 2
T H E W O R L D B A N K ’ S C O U N T RY P O L I C Y A N D I N S T I T U T I O N A L A S S E S S M E N T
of Bank staff depend. However, analysis of the
2007 review process indicates that there did not
seem to be much of an upward bias in ratings for
either IDA or IBRD countries. Such an upward
bias could be detected in only 6 percent of the
ratings for IDA countries, and a slightly lower 5
percent of the ratings for IBRD countries.
The multistep review process of the CPIA,
with the networks having the central role
in the validation of the ratings, helps guard
against the potential biases in ratings. Specifi-
cally, the networks were found to prevail for a large
majority of the time when they disagreed with the
regions over the latter’s initial rating proposals in
2007. Interestingly, the networks prevailed more
often for IBRD countries than for IDA countries.
This could either mean that the regions have more
supporting evidence for the ratings they proposed
for IDA than for IBRD countries, or that the
regions put up a greater effort for IDA countries
because IDA funds are involved (this evaluation
has obtained anecdotal evidence on that front).
Both the regional and network reviewers
pointed out the high degree of judgment
involved in rating the criteria in the public
sector management and institutions
cluster (D). This calls into further question
the large weight this cluster has in the IDA
allocation formula. All of the regional review-
ers who were asked the open-ended question
of which criteria they found particularly difficult
to rate gave cluster D as their response. One of
the network reviewers for cluster D indicated
that a lot of judgment was involved in most of
the criteria in that cluster and pointed to the
criterion on transparency, accountability, and
corruption as an example.
RecommendationsBased on the above findings, IEG has several
recommendations to Bank management
for improving the CPIA as an indicator that
represents the policies and institutions that
are important for sustaining growth, fostering
poverty reduction (or enhancing welfare more
broadly), and the effective use of development
assistance.
rankings of countries and direction of
change. For each of the 16 CPIA criteria, the
rank correlations of CPIA ratings with similar
indicators average between 0.7 and 0.8. Other
indicators are found to correlate better with the
CPIA ratings by the Bank than by the AfDB and
the ADB, which are the closest comparators to
the Bank, as they use almost exactly the same
CPIA guidelines as the Bank.
CPIA ratings correlate better with other
indicators for IBRD than for IDA countries.
This could be because more information
is available on IBRD countries than on IDA
countries, which increases the likelihood of
different institutions having similar assess-
ments on IBRD countries. This could also be
because the Bank takes into account the stage of
development when rating countries. This is more
pertinent for IDA countries and entails judgment,
which would likely make ratings for IDA countries
less comparable with those by other institutions.
Accounting for the stage of development
in the CPIA ratings is problematic. As noted,
accounting for the stage of development could
have affected the quality of the CPIA ratings,
not only because of the judgment involved, but
also because of the different practices employed
across the Bank. None of the regional reviewers
and only some of the network reviewers take
the stage of development into account in their
ratings. The network reviewers who take stage
of development into account do it in a variety of
ways—some by adjusting quantitative indicators
with per capita incomes, and some by their own
judgment. Further, accounting for the stage of
development means that the CPIA is no longer
an index in the true sense of the word.
The strength of the CPIA ratings is Bank
staff ’s professional judgment. The central
determinant of the ratings is the expert judgment
of Bank staff (with deep country knowledge),
which is clearly the major asset of this exercise.
At the same time, however, there is a potential
conflict of interest in having Bank staff provide
ratings that are used for allocating IDA resources
to those countries on which the work programs

6 3
F I N D I N G S A N D R E C O M M E N D AT I O N S
• Revision of the trade criterion (q4). A sub-
component on exports needs to be added that
assesses export performance and policies and
institutions to reduce anti-export bias (such as
export rebate and duty drawback). This new
subcomponent, and the existing subcompo-
nents on trade restrictiveness and trade facili-
tation, need to all receive equal weights (that
is, one-third weight each). The tariff rates in
the trade restrictiveness subcomponent need
to be revised to reflect country experience
that at moderate tariff levels (which almost
all countries have), further tariff reduction is
less important than complementary factors
(such as macroeconomic stability and trade
facilitation) for global integration.
• Dropping or reformulating the criterion on eq-
uity of public resource use (q8), as the current
content is already covered by other criteria.
• Addition of an assessment of other marginal-
ized socioeconomic groups to the CPIA. The
assessment of other marginalized socioeco-
nomic groups could either be added as a new
criterion (in place of the criterion on equity of
public resource use, which IEG recommends
dropping) or added to a reformulated crite-
rion on equity of public resource use.
• Revision of the financial sector criterion (q5).
The weights on the three subcomponents—
stability, depth and efficiency, access—need
to be revisited in light of the importance of
stability and the mixed evidence on microfi-
nance. Policies, regulations, and institutions
for fostering an enabling environment for the
financial sector need to be added. The indica-
tors used in the assessment of financial stabil-
ity need to be strengthened.
• Combining the assessment of tax policy
(q14a) with the assessment of fiscal policy.
That part of tax policy that assesses import
tariffs is already being assessed in the trade
criterion, whereas the part on export rebate
and duty drawback need to be incorporated
into the revised trade criterion as suggested
above.
• Streamlining the assessment of judicial inde-
pendence in the public sector management
and institutions cluster. Currently, judicial in-
dependence is assessed in both the criterion
These recommendations are aimed at enhanc-
ing the CPIA as a broad indicator of policies and
institutions, more than just as an indicator for the
allocation of IDA funds. If the CPIA were viewed
only in the latter context, then the question
could be raised as to the necessity of rating IBRD
countries.
Adoption of these recommendations could result
in a discontinuity in the CPIA ratings, which Bank
management has been trying to avoid. However,
it is important that the CPIA reflect the latest
thinking in development paradigm and lessons
learned (both of which are stated intentions
of the Bank regarding the CPIA). It would also
provide the opportunity to address an issue that
some network reviewers have raised regarding
the quality of the ratings for some criteria because
of what they perceive as inflated baseline ratings
from a few years ago. The proposed recommen-
dations are as follows:
Disclose ratings for IBRD countries. Disclo-
sure is important for accountability and transpar-
ency and would further enhance the quality of
the ratings.
Remove accounting for the stage of
development in the CPIA rating exercise.
If this cannot be done, at the very least the CPIA
guidelines need to specify and justify which
criteria should take into account the stage of
development and how the adjustments should
be made.
Undertake a thorough review of each
CPIA criterion and revise as necessary. It is
recommended that the review entail an in-depth
literature review for each criterion and reflect
the latest thinking on development and lessons
learned. The review needs to take into account
the balance between liberalization and regula-
tion. It also needs to examine the clustering of
the criteria, in particular having social sectors
and the environment in one cluster. Guideposts
for assessing the criteria need to be reviewed at
the same time. It is also recommended that the
following be taken into account in the review and
revisions:

6 4
T H E W O R L D B A N K ’ S C O U N T RY P O L I C Y A N D I N S T I T U T I O N A L A S S E S S M E N T
Consider not producing an overall CPIA
index although continue to produce and
publish the separate CPIA components.
IDA is already using the components separately
in the PBA formula. With respect to the use of
the CPIA as a broad index of policies and institu-
tions, this would allow for country specificity,
as different weights could be assigned to the
different clusters depending on the country’s
initial conditions and stage of development.
Producing the different components of the
CPIA without assigning weights to them to
arrive at an aggregate index would allow for
different weights to be applied according to
country contexts and use.
on property rights and governance (q12) and
the criterion on transparency, accountability,
and corruption in the public sector (q16).
• Streamlining the assessment of corruption in
the public sector management and institutions
cluster. Currently corruption is assessed in the
criteria on efficiency of revenue mobilization
(q14), the quality of public administration
(q15), and transparency, accountability, and
corruption in the public sector (q16).
• Strengthening the assessment of the environ-
ment criterion (q11) and make the process
more efficient. Currently, staff need to answer
85 questions to arrive at one rating.
• Reporting only the consolidated score for the
economic management cluster.

6 5
Appendixes

6 6
Landscape view of water, glaciers and mountains, Chile. Photo by Curt Carnemark/World Bank.

6 7
APPENDIX A. 2008 COUNTRY POLICY AND INSTITUTIONAL ASSESSMENT CRITERIA
CLUSTER(weight in index)
CRITERIA(weight in index)
INDICATORS(weight in index)
Economic management(0.25)
q1 Macroeconomic management(0.083)
• Monetary/exchange rate policy with clearly defined price stability objectives• Aggregate demand policies focus on maintaining short- and medium-term external balance.• Avoid crowding out private investment
q2 Fiscal policy(0.083)
• Primary balance managed to ensure sustainability of public finances• Public expenditure/revenue can be adjusted to absorb shocks• Provision of public goods including infrastructure consistent with medium-term growth
q3 Debt policy(0.083)
• Debt burden indicators do not signal debt servicing difficulties• External and internal debt contracted with view to achieving/maintaining debt sustainability• Coordination between debt management and other macroeconomic policies• Debt management unit well established, has adequate system for recording and monitoring
debt, and good analytical capacity as indicated by regular analytical work on debt• Accurate, timely, and publicly available debt data• Government has clear financing strategy and the legal framework for borrowing is clearly
defined.
Structural policies(0.25)
q4 Trade(0.083)
• 75 percent weight for trade restrictiveness: (0.063)• Average tariff rates, number of tariff bands, maximum tariff band• Internal taxes do not discriminate between imported and local products• Transparency and predictability of trade regime including in the use of non-tariff barriers• 25 percent weight for customs/trade facilitation: (0.02)• Reputation of customs with respect to professionalism and corruption• Use of risk management, information technology (IT), physical examination• Processing of collections and refunds• Documentation of customs procedures• Resolutions of appeals of customs decisions.
q5 Financial Sector(0.083)
Financial stability• Banking sector’s vulnerability to shocks• Banking system soundness (share of non-performing loans [NPLs] and level of capital at risk)• Adherence to Basel Core Principles• Quality of risk management in financial institutions• Quality of supervision.Financial sector efficiency, depth, and resource mobilization• Size and reach of financial markets• Development of capital markets• Interest rate spreads• Private sector credit/GDP• Efficiency of microfinance.
(continued on next page)

6 8
T H E W O R L D B A N K ’ S C O U N T RY P O L I C Y A N D I N S T I T U T I O N A L A S S E S S M E N T
CLUSTER(weight in index)
CRITERIA(weight in index)
INDICATORS(weight in index)
Structural policies(0.25)(cont.)
Access to financial services• Development of payment, clearance, and credit reporting systems• Share of population with access to formal sector financial services• Access of small and medium enterprises (SMEs) to finance• Legal and regulatory framework supporting access to finance.
q6 Business Regulatory Environment (0.083)
Regulations affecting entry, exit, and competition (0.028)• Bans on, or, investment licensing requirements• Entry and exit procedures• Legal framework (and implementation thereof) to address anti-competitive conduct by firms• Procurement by public sector firms.Regulations of ongoing business operations (0.028)• Operational licensing, permits, compliance and inspection requirements including taxes and
customs• State intervention in goods markets (state ownership in competitive sectors, price controls,
state making administrative allocation/decisions about production)• Corporate governance laws (and enforcement thereof) to encourage disclosure and protect
shareholders rights.Regulations of goods and factor markets (0.028)• Employment law provides for flexibility in hiring and firing• State intervention in labor and land markets limited to regulation and/or legislation to
smooth out market imperfections• Procedures to register property are simple and low-cost.
Policies for Social Inclusion/Equity(0.25)
q7 Gender Equality (0.05)
Human capital development (0.017)• Differences (between male and female) in primary completion rates, and access to
secondary education (female to male enrollment)• Access to delivery care and family planning services• Adolescent fertility rate.Access to economic and productive resources (0.017)• Gender disparities in labor force participation, land tenure, property ownership, and
inheritance practices.Status and protection under the law (0.017)• The law gives men and women equal individual and family rights• Violence against women considered a crime• Gender disparities in political participation at the national level.
q8 Equity of Public Resource Use (0.05)
Government spending (0.033)• Identification of individuals, groups, or localities that are poor, vulnerable, or have unequal
access to services and opportunities• Adoption of national development strategy with explicit interventions to assist groups
identified above• Systematic tracking of composition and incidence of public expenditures and their results
feedback into subsequent allocations.Revenue collection (0.017)• Incidence of major taxes (progressive or regressive) and their alignment with poverty
reduction priorities.
q9 Building Human Resources (0.05)
Health and nutrition including reproductive health (0.017)• Equitable access to basic health services• Prevention of malnutrition.

6 9
A P P E N D I X A . 2 0 0 8 C O U N T RY P O L I C Y A N D I N S T I T U T I O N A L A S S E S S M E N T C R I T E R I A
CLUSTER(weight in index)
CRITERIA(weight in index)
INDICATORS(weight in index)
Policies for Social Inclusion/Equity(0.25)(cont.)
q9(cont.)
Building Human Resources (0.05)
Education (0.017)• Sustained progress toward universal basic education, literacy, and more equitable access to
early child development program services• Standards for teacher preparation, student learning, and oversight of private/non-
governmental organization (NGO) providers• Systematic tracking of school performance and student learning outcomes and feedback to
schools and parents• Policies for post-basic education and training services• Quality, equity of access, and efficiency of resource use.Human immunodeficiency virus/Acquired immunodeficiency syndrome (HIV/AIDS), tuberculosis, malaria• Prevention, treatment, care and support of HIV/AIDS, tuberculosis, and malaria• Track disease prevalence, resources, and program implementation.
• Quality and timeliness of services• Focus on the poor• Cost-effective use of public resources
q10 Social Protection and Labor (0.05)
Social safety net programs (0.01)• Social protection programs provide income support to poor and vulnerable groups.Protection of basic labor standards (0.01)• Ratification and implementation of international core labor standards.Labor market regulations (0.01)• Labor market regulations on health and safety, working conditions, and hiring and firing.Community-driven initiatives (0.01)• Encourage and support communities’ own development initiatives or local accountability
mechanisms.Pension and old-age savings programs (0.01)• Pension and savings programs provide income security to most potentially vulnerable
groups.
q11 Policies and Institutions for Environmental Sustainability (0.05)
• Regulations and policies (and implementation thereof) for pollution and natural resource• Information widely available• Priority setting• Sector ministries incorporate environmental concerns.
Public Sector Management and Institutions(0.25)
q12 Property Rights and Rule-Based Governance (0.05)
Legal basis for secure property and contract rights (0.017)• Transparent and well-protected property rights• Current and non-corrupt property registries• Enforced contracts.Predictability, transparency, and impartiality of laws and regulations affecting economic activity (0.017)• Transparent and predictable laws and regulations affecting businesses and individuals• Low-cost means for pursuing small claims• Impartial and predictable applications of laws and regulations.Crime and violence as impediment to economic activity (0.017)• Well-functioning and accountable police force protects citizens and their property from
crime and violence.
(continued on next page)

7 0
T H E W O R L D B A N K ’ S C O U N T RY P O L I C Y A N D I N S T I T U T I O N A L A S S E S S M E N T
CLUSTER(weight in index)
CRITERIA(weight in index)
INDICATORS(weight in index)
Public Sector Management and Institutions(0.25)(cont.)
q13 Quality of Budgetary and Financial Management (0.05)
Comprehensive and credible budget linked to policy priorities (0.017)• Multiyear expenditure projections integrated into budget formulation process• Spending ministries and the legislature consulted in budget formulation, adhering to fixed
budget calendar• Budget classification system comprehensive and consistent with international standards• Minimal and transparent off-budget items.Financial management (0.017)• Budget implemented as planned• Budget monitoring based on management information systems• Negligible payment arrears.Fiscal reporting (0.017)• Reconciliation of banking and fiscal records• Regular in-year fiscal reporting• Timely preparation of public accounts• Timely auditing of accounts and appropriate action taken on budget reports and audit
findings.
q14 Efficiency of Revenue Mobilization (0.05)
Tax policy (0.025)• Bulk of revenues from low-distortion taxes such as sales/value-added tax (VAT), property,
and so forth• Low and relatively uniform import taxes• Functional export rebate or duty drawback• Broad tax base• Few arbitrary exemptions.Tax administration (0.025)• Rule-based tax administration• Low administrative and compliance costs• Taxpayer service and information program• Efficient and effective appeals mechanism.
q15 Quality of Public Administration (0.05)
Policy coordination and responsiveness (0.0125)• Effective coordination mechanism to ensure high degree of policy consistency.Service delivery and operational efficiency (0.0125)• Organizational structures along functional lines with little duplication; regular review of
business processes to ensure efficient decision making.Merit and ethics (0.0125)• Hiring and promotion based on merit and performance; ethics prevail.Pay adequacy and management of the wage bill (0.0125)• Sustainable wage bill that does not crowd out public services spending• Pay and benefit levels adequate• Flexibility in paying higher wages for hard-to-fill positions.
q16 Transparency, Accountability, and Corruption in the Public Sector (0.05)
Accountability of the executive to oversight institutions and of public employees for their performance (0.017)• Strong public service ethic reinforced by audits, inspections, and adverse publicity for
performance failures• Independent and impartial judiciary• Corruption monitored and sanctions implemented.Access of civil society to information on public affairs (0.017)• Results and costs of government decisions clear and communicated to public• Citizens can access government documents at nominal cost• Media independent of government and can fulfill critical oversight roles.State capture by narrow vested interests (0.017)• Conflict of interest and ethics rules for public servants observed and enforced• Top government officials required to disclose income and assets and can be prosecuted for
malfeasance.

7 1
APPENDIX B: PUBLIC SECTOR LITERATURE REVIEW
Country Policy and Institutional Assessment (CPIA) Criteria/Indicators
Literature on:
Sustained growth Poverty reductionDevelopment effectiveness
Property Rights and Rule-Based Governance
Legal basis for secure property and contract rights
Transparent and well-protected property rights
• Property rights associated with per capita incomes (Besley 1995).
• Property rights associated with investments (Acemoglu, Johnson, and Robinson 2005; Bardhan 2006b).
• Existence of market exchange presupposes property rights (Rodrik 2003).
• Positive correlation between property rights and growth—cross-country studies (Knack and Keefer 1995; Mauro 1995; Hall and Jones 1999; Rodrik 1999; De Soto 2000; Rodrik, Subramanian, and Trebbi 2002; Summers 2003; Kerekes and Williamson 2008).
• Positive correlation between property rights and growth—micro studies (Mazingo 1999; Johnson, McMillan, and Woodruff 2002).
• Governments can help the poor with access to credit by establishing functioning property rights (Fleisig 1995).
• Obtaining property rights over land in urban areas helps poor households gain access to credit (De Soto 2000; Fields and others 2002).
• Giving the poor land rights enhances their ability to utilize and invest in land they cultivate (Deolalikar and others 2002).
• Increase in protection of property rights across the globe of half of one standard deviation would halve global poverty (Besley and Burgess 2003).
• Increased protection of property rights has strong effects in reducing poverty (Acemoglu, Johnson, and Robinson 2001).
Current and non-corrupt registries
• Use of registration system to establish identity of property owners (Shavell 2003).
• De Soto (2000) used counter-examples from Malawi and Peru to underline the importance of a current and non-corrupt registry system.
Enforced contracts • Contract enforcement and growth (North 1990; Knack and Keefer 1995; Levine 1998; Hall and Jones 1999; Kaufmann, Kraay, and Mastruzzi 1999; Hellman, Jones, and Kaufmann 2003; Summers 2003).
(continued on next page)

7 2
T H E W O R L D B A N K ’ S C O U N T RY P O L I C Y A N D I N S T I T U T I O N A L A S S E S S M E N T
Country Policy and Institutional Assessment (CPIA) Criteria/Indicators
Literature on:
Sustained growth Poverty reductionDevelopment effectiveness
Predictability, transparency, and impartiality of laws and regulations affecting economic activity
Transparent and predictable laws and regulations affecting businesses and individuals
• Laws and regulations should be transparent to enable very imperfect courts to verify violations and correct wrongs (Hay, Shleifer, and Vishny 1996).
• Unpredictable regulations are a disincentive to investment and hence lower growth: example (Gyimah-Brempong and Munoz de Camacho 2006).
• Growth depends positively on the rule of law (Barro 2003).
Low-cost means for pursuing small claims
• La Porta, Lopez-de-Silanes, and Shleifer (2008) emphasize that costly contract claims do not protect investors [and hence would be a disincentive to investment].
Impartial and predictable applications of laws and regulations
• Predictability and impartiality characterizes the quality of the law enforcement, and richer countries have higher quality law enforcement (La Porta and others 1998).
Crime and violence as impediment to economic activity
Well-functioning and accountable police force to protect citizens and their property from crime and violence
• The police (and the courts) are most directly involved in determining and defending property rights (Andvig and Fjeldstad 2008).
• High crime rates may have devastating impacts on investments and economic growth (Andvig and Fjeldstad 2008).
• Crime has direct costs on firms through theft losses and security-related expenses, which reduce competitiveness and lower investment (Bourguignon 1998).
• Security issues must be addressed to fully comprehend the nature and possibilities for socioeconomic development (Londono 1996; Moser 1996; Moser and Holland 1997; Inter-American Development Bank 1997; Ayers 1997; Buvinic, Morrison, and Shifter 1998; Call 2000).
• Crime and violence are major obstacles to development objectives including lost growth in Latin America and the Caribbean (Schneidman 1996; Ayers 1997; Buvinic and Morrison 2000) and through losses in human capital (Heinemann and Verner 2006).
• Police corruption especially in slum areas of poorer countries may increase uncertainty of property rights of the very poor (Andvig and Fjeldstad 2008).
• Violence disproportionately affects the poor in Latin America, eroding their assets and livelihoods (Heinemann and Verner 2006).
• Victims of crimes are more likely to be the poorer part of the population (Bourguignon 1999; Deolalikar and others 2002).
Quality of budgetary and financial management
Good budgetary and financial management is of particular importance in developing countries because the absence of aggregate fiscal discipline could result in large unsustainable deficits that translate into an unstable macroeconomic environment (high inflation, high interest rates, burgeoning current account deficits) that ultimately retard growth (Fischer 1991; Easterly, Rodriguez and Schmidt-Hebbel, 1995; Gupta and others 2005). More effective public expenditure management and macroeconomic and budget stability are important for public expenditures to better serve the poor (Foster and others 2002).

7 3
A P P E N D I X B : P U B L I C S E C T O R L I T E R AT U R E R E V I E W
Country Policy and Institutional Assessment (CPIA) Criteria/Indicators
Literature on:
Sustained growth Poverty reductionDevelopment effectiveness
Comprehensive and credible budget linked to policy priorities
Multiyear expenditure projections integrated into budget formulation process
• Aggregate fiscal discipline depends on the existence of a medium-term expenditure framework (Campos and Pradhan 1996).
• Rationale for multiyear budget approach based on several potential benefits (Boex, Martinez-Vasquez, and McNab 2000).
Evidence is mixed:• Serving the poor more
effectively through public expenditure requires a medium–term process for budget allocation (Foster and others 2002).
• Changes in budgeting and expenditure planning unlikely to generate significantly improved performance where core functions continue to operate inadequately (Fozzard and Foster 2001).
Spending ministries and the legislature consulted in budget formulation, adhering to fixed budget calendar
• Consulting spending ministries is important for them to have the correct perception of their budget constraints, which in turn reduces the possibility of excess spending (resulting from “aid illusion”) (McGillivray and Morrissey 2001a, 2001b).
• Explicit rules that put specific limits on spending and borrowing and that impose penalties on overspending by line ministries give central ministries more leverage over claimants (Campos and Pradhan1996).
Budget classification system comprehensive and consistent with international standards
• No evidence available • No evidence available • No evidence available
Minimal and transparent off-budget items
• Integration of all expenditures in budget can help improve accountability and transparency by imposing political costs on politicians and bureaucrats for violating rules, and raise quality of budgetary and financial management (Campos and Pradhan 1996).
Financial management
Budget implemented as planned
• No evidence available • No evidence available • No evidence available
Budget monitoring based on management information systems
• No evidence available • No evidence available • No evidence available
Negligible payments arrears
• No evidence available • No evidence available • No evidence available
(continued on next page)

7 4
T H E W O R L D B A N K ’ S C O U N T RY P O L I C Y A N D I N S T I T U T I O N A L A S S E S S M E N T
Country Policy and Institutional Assessment (CPIA) Criteria/Indicators
Literature on:
Sustained growth Poverty reductionDevelopment effectiveness
Fiscal Reporting. This seems to be important for economic growth. In Latin America, countries with better fiscal transparency and additional spending controls have average fiscal surpluses of 1.7 percent of gross domestic product (GDP), whereas those with fewer spending controls and lowest levels of transparency have average deficits of 1.8 percent of GDP (Alesina 1997). Fiscal transparency—and transparency of the banking sector—is crucial in reducing vulnerability to economic shocks, particularly following the Asian Economic Crisis (International Monetary Fund 2000). The latter stemmed from inadequate disclosure of risks by government and banks (Fozzard and Foster 2001). Fiscal reporting is a core element of transparency, empowerment, and accountability (World Bank 2004g).
Reconciliation of banking and fiscal records
• No evidence available • No evidence available • No evidence available
Regular in-year fiscal reporting
• No evidence available • No evidence available • No evidence available
Timely preparation of public accounts
• No evidence available • No evidence available • No evidence available
Timely auditing of accounts and appropriate action taken on budget reports and audit findings
• No evidence available • No evidence available • No evidence available
Efficiency of revenue mobilization
Tax policy
Bulk of revenues from low-distortion taxes (sales/VAT, property, and so on)
Value-Added Tax (VAT)• VAT is central to a good tax system in most
countries (Bird 2005; Bahl and Bird 2008).• It is a low distortionary manner to raise taxes,
non-cascading, and does not interfere with production efficiency (Burgess and Stern 1993).
• It is also a good instrument to reduce potential for corruption as it minimizes contact between taxpayers and tax administrators and moves toward self-assessment (Bahl and Bird 2008).
• It is a broad-based tax which is an important part of tax policy (Ames and others 2001).
Land (Property) Tax• If well designed and political opposition is well
handled, property taxes and especially land taxes can raise substantial revenues (Heady 2001).
• Property taxation is a potential source of significant income for many municipal and metropolitan authorities to whom central governments have devolved increasing responsibilities without commensurate increases in fiscal transfers (Bird and Slack 2002; Dillinger 1992; Mikesell 2003).
• Taxing property is much easier now because of digital databases of modern property registries (Fjeldstad and Moore 2007).
VAT• Although VAT has long
been known to be likely regressive (Ahmad and Stern 1987; Cnossen 2004; Bird 2005), a recent survey of studies of consumption tax incidence have shown significantly less regressive results than those reported for similar taxes in earlier surveys (Bird and Gendron 2006).
• VATs in developing countries are not always, or not necessarily, regressive (Bird and Gendron 2007).
• Even when VAT is regressive, it is found to be more progressive than the import and excise taxes that it replaced (Gemmell and Morrissey 2003).

7 5
A P P E N D I X B : P U B L I C S E C T O R L I T E R AT U R E R E V I E W
Country Policy and Institutional Assessment (CPIA) Criteria/Indicators
Literature on:
Sustained growth Poverty reductionDevelopment effectiveness
Tax policy(cont.)
• To the extent that the poorest sectors of the society remain outside of the market economy, a VAT may be broadly progressive (Bird and Gendron 2007; Bird and Zolt 2007).
Property Tax• Property incomes and
property wealth are significantly undertaxed and an important source of inequity (Fjeldstad and Moore 2007).
Broad tax base and few arbitrary exemptions
• Exemptions in many developing countries generally protect the interest of powerful groups, so reducing exemptions not only raises revenues, but also improves economic efficiency and income distribution (Heady 2001).
• Most developing countries do not have the right conditions (macroeconomic stability and a stable political and administrative system) under which exemptions work, with the result that exemptions reduce revenues and complicate the fiscal system without achieving their stated objectives (Bird and Zolt 2007).
• Tax incentives (through exemptions) are often distortive and inefficient and divert scarce resources into less than optimal use (McLure 1999).
• There may be a limited role for simple incentives, for example as part of a growth-oriented fiscal strategy as the East Asian experience suggests (Bird and Chen 1998).
• Exemptions in many developing countries generally protect the interest of powerful groups, so reducing exemptions not only raises revenues, but also improves economic efficiency and income distribution (Heady 2001).
• Exempting only five narrowly defined items in Jamaica cut the VAT burden on the lowest 40 percent of the income distribution in half (Bird and Miller1989).
Tax administration. Reforms to tax administration are just as important as tax policy reforms for overall fiscal reform (Mookherjee and Das-Gupta 1995; Devas, Delay, and Hubbard 2001). It is estimated that two-thirds of the rapid increase in Argentina’s tax revenues (from 13 to 23 percent of GDP) over the 1989–92 period was attributable to improved administration effort.
Rule-based tax administration
• An efficient tax administration has to be rule based—the legal environment is important (Bird 2003).
• A stable transparent tax system inspires more confidence in its fairness and will result in greater compliance (Boskin 2006).
• A less discretionary tax administration is likely to encourage political mobilization of taxpayers around taxation issues, and reduce temptations to pursue corrupt deals (Moore 2004).
(continued on next page)

7 6
T H E W O R L D B A N K ’ S C O U N T RY P O L I C Y A N D I N S T I T U T I O N A L A S S E S S M E N T
Country Policy and Institutional Assessment (CPIA) Criteria/Indicators
Literature on:
Sustained growth Poverty reductionDevelopment effectiveness
Low administrative and compliance costs
• One of the most efficient ways to facilitate tax compliance is to decrease compliance costs (Bird 2003).
• Low compliance costs also lower the potential of corruption as they lower the amount of a bribe a taxpayer might be willing to pay to avoid taxes (Bahl and Bird 2008).
• It lowers the costs of operating in the formal sector and hence facilitates growth (Bird 2008).
• It has a direct effect on economic growth since high compliance costs divert resources toward administering and complying with taxes (Bird 2008).
Tax payer service and information program
• Provision of extensive information for taxpayers reduces compliance costs (Bird 2003; Braithwaite 2003; Fjeldstad and Moore 2007).
• Taxpayer information programs reduce the potential of corruption, and of non-compliance (Bahl and Bird 2008).
Efficient and effective appeals mechanism
• A time-bound appeal procedure reduces delays in payments (Mexico versus India) (Mookherjee and Das-Gupta 1995).
Quality of public administration
This is a very important element in the literature on sustained growth. The literature finds that administrative reforms can foster faster economic growth and sustain poverty reduction by removing the obstacles to private sector development that a poorly performing public sector creates. Reforms can also: increase public resources for priority spending; reduce corruption; and increase accountability of the public sector. A seminal paper (Mauro 1995) finds that the efficiency of the bureaucracy is associated with better rates of investment and growth. Deolalikar and others (2002) underline that administrative reforms, including reform of the bureaucracy and civil service, are one of the major areas of reform involving public institutions for poverty reduction.
Policy coordination and responsiveness; service delivery and operational efficiency
Effective coordination and organizational structures along functional lines
• Improving the quality of the bureaucracy requires improving coordination among agencies with overlapping functions; organizational structures should be formed along functional lines (Deolalikar and others 2002).
Merit and ethics
Hiring and promotion based on merit and performance; ethics prevail
• Inefficiency of public administration stems from constraints imposed by the civil service system on human resource management, especially hiring, firing, promotion, and rewards (Devas, Delay, and Hubbard 2001).

7 7
A P P E N D I X B : P U B L I C S E C T O R L I T E R AT U R E R E V I E W
Country Policy and Institutional Assessment (CPIA) Criteria/Indicators
Literature on:
Sustained growth Poverty reductionDevelopment effectiveness
Quality of public administration(cont.)
• Using a “Weberianness Scale” that measures meritocratic recruitment and long-term, predictable, rewarding careers, Evans and Rauch (1999) found that these characteristics significantly enhance prospects for economic growth even after taking into account initial levels of per capita GDP and human capital. This is because longer–term horizons associated with predictable, rewarding careers will increase the bureaucracy’s propensity to advocate public sector infrastructure rather than consumption expenditures. Meritocratic recruitment also increases competence.
• Effective bureaucracy is important, or even essential, for implementing or maintaining a policy environment conducive to economic growth (Rauch and Evans 2000).
Pay adequacy and management of wage bill
Sustainable wage bill does not crowd out public services spending
• Containing salary expenditures (through downsizing) will help increase public resources for priority spending (Deolalikar and others 2002; Bardhan 2006b).
Pay adequacy and management of the wage bill
Mixed evidence:• Seminal paper (Becker and Stigler 1974) shows
that high wages paired with non-zero audit probability could be used to deter misbehavior and corruption.
• Empirically, no evidence that wages deter corruption (Van Rijckeghem and Weder 1997; Rauch and Evans 2000; Treisman 2000).
• Higher wages are correlated with higher corruption (La Porta and others 1999).
• Di Tella and Schargrodsky (2003) explain the apparent empirical failure of the Becker-Stigler hypothesis because the empirical studies include observations from environments with no active audits where the probability of being punished for corruption is near zero, or very high auditing levels where the probability of being punished is near one.
• Incentive pay structure is one of the most effective ways of fighting corruption (Bardhan 1997, 2006a; Chand and Moene 1999; Van Rijckeghem and Weder 2001; Di Tella and Schargrodsky 2003; Andvig and Fjeldstad 2008).
(continued on next page)

7 8
T H E W O R L D B A N K ’ S C O U N T RY P O L I C Y A N D I N S T I T U T I O N A L A S S E S S M E N T
Country Policy and Institutional Assessment (CPIA) Criteria/Indicators
Literature on:
Sustained growth Poverty reductionDevelopment effectiveness
Pay adequacy and management of wage bill(cont.)
• Consensus among international organizations and leaders of African states that one of the causes of poor tax administration is low wages of officials (Werlin 1979; Due 1988; Kiser and Sacks 2007; Jenkins 1994; Devas, Delay, and Hubbard 2001).
• Adequate pay needed to attract competent individuals for budgetary institutions (Campos and Pradhan 1996) and for the judiciary (Posner 1998).
Flexibility in paying higher wages
• Adequate compensation is particularly important for tax officials in developing countries (with large informal sectors, low levels of literacy and public morality, poor salary structure for public servants, poor communications, malfunctioning judicial systems, and entrenched interests against radical reforms) (Bird 2003).
• Reforms in tax enforcement in many countries which include a bonus to the tax officer based on tax collection have often been associated with greater tax compliance, higher revenues, and lower corruption (Mookherjee 1995; Mookherjee and Das-Gupta 1995).
Transparency, accountability, and corruption in the public sector
Accountability of the executive to oversight institutions and of public employees for their performance.Accountability is very important in the literature on sustained growth, poverty reduction and the effective use of development assistance. A number of empirical studies show the benefits of accountability for the quality of government (Besley and Case 1995; La Porta and others 1999; Adsera, Boix, and Payne 2003; Eijffinger and Geraats 2005; Olken 2007; Dyck, Moss, and Zingales 2008; Ferraz and Finan 2008; Bjorkman and Svensson 2009; Djankov and others 2009). Accountability of elected officials is also found to be directly important for economic growth (Kaufmann, Kraay, and Zoido-Lobaton 1999; Besley and Burgess 2003).
Strong public service ethic reinforced by audits, inspections, and adverse publicity for performance failures
• A randomized field experiment using over 600 village road projects in Indonesia finds that the probability of external audits substantially reduces missing funds in the project, and the benefits of the audits exceeded their costs (Olken 2007).
• Monitoring policies (together with doubling of wages) results in a large decline in prices paid by all public hospitals in Buenos Aires for a number of very basic supplies (Di Tella and Schargrodsky 2003).
• Increased government monitoring and media campaign informing local communities of their entitlement to school funds from the central government of Uganda reduced diversion of funds by intermediating provincial governments from 80 to 20 percent (Reinikka and Svensson 2004).
• For development assistance to be used more effectively, donors should reinforce or support audit findings of Auditor Generals of the countries (Stevens 1999).
Independent and impartial judiciary
• Discussed in the property rights and rule-based governance section.

7 9
A P P E N D I X B : P U B L I C S E C T O R L I T E R AT U R E R E V I E W
Country Policy and Institutional Assessment (CPIA) Criteria/Indicators
Literature on:
Sustained growth Poverty reductionDevelopment effectiveness
Transparency, accountability, and corruption in the public sector(cont.)
Corruption monitored and sanctions implemented
There are two strands of literature, with the strand that finds corruption having a negative impact on growth dominating.
Corruption has a positive impact on growth:• Where there are pre-existing policy distortions
including pervasive and cumbersome regulations, corruption may help efficiency and growth (Leff 1964; Huntington 1968; Lui 1985; Beck and Maher 1986; Lien 1986; Bardhan 1997).
Corruption has a negative impact on growth when:• Corruption is directly related to variations in the
growth of per capita income (Knack and Keefer 1995).
• Corruption and red tape are significantly associated with increased levels of investment, which is shown empirically to be one of the most powerful predictors of growth (Mauro 1995).
• Corruption has adverse effects on investment and growth (Bardhan 1997, 2006a).
• Corruption is associated with higher military spending as a share of GDP, hence reduction in corruption will improve composition of government spending toward more productive, non-military outlays (Gupta, de Mello, and Sharan 2000).
• Higher bribes imply lower profitability of productive relative to rent-seeking investments (Kaufmann, Kraay, and Zoido-Lobaton 1999; Tanzi 1998; Acemoglu and Verdier 2000).
• Corruption increases uncertainty, hence reducing investment in physical and human capital (Wei 2000; Alesina and Weder 2002).
• Societies’ willingness to tax themselves depends on perception that government institutions are honest; hence corruption, VAT evasion, and size of underground economy are found to be closely linked (Bird and Gendron 2006).
• Corrupt police may have a negative impact on growth by taxing businesses through predation, or by supplying protection in competition or in cooperation with organized crime units (Andvig and Fjeldstad 2008); police corruption is shown to have significant negative impacts on business activities (Wei 2000).
Corruption increases income inequality: a worsening in the corruption index by one standard deviation increases the Gini coefficient by 5.4 points (Gupta and others 1998).Corruption increases income inequality in a sample of developing countries and decreases the share of government expenditures on education and health (Gupta, Davoodi, and Terme 2002).
Aid has a larger effect in displacing domestic revenues in countries with higher levels of corruption—doubling of grants as a share of GDP is associated with a 1.3 percentage point decline in revenues as a share of GDP in relatively corrupt countries, and as much as 3.8 percentage point decrease in the most corrupt countries (Gupta and others 2003).
(continued on next page)

8 0
T H E W O R L D B A N K ’ S C O U N T RY P O L I C Y A N D I N S T I T U T I O N A L A S S E S S M E N T
Country Policy and Institutional Assessment (CPIA) Criteria/Indicators
Literature on:
Sustained growth Poverty reductionDevelopment effectiveness
Access of civil society to information on public affairs
Media independent of government and fulfill critical oversight roles
• Free flow of information pressures (even nondemocratic) governments to public action (Dreze and Sen 1995).
• Local newspapers increase responsiveness of Indian state governments to natural disasters (Besley and Burgess 2002).
• Media campaign via radio and newspapers informing local communities of their entitlement to school funds from the central government of Uganda (along with increased government monitoring) reduced diversion of funds by intermediating provincial governments from 80 to 20 percent (Reinikka and Svensson 2004).
• Negative correlation between press freedom and corruption (Ahrend 2001; Brunetti and Weder 1999).
• Mass media makes governments more accountable (Besley, Burgess, and Prat 2002).
• Media can provide a counterbalance to the power of vested interests especially by informing voters (Dyck, Moss, and Zingales 2008).
• No country with a free press has ever had a major famine (Dreze and Sen 1989).
• Provision of more information (for example through the use of local newspapers) increases aid efficiency and reduces the negative impact of aid volatility on aid efficiency (Cagé 2009b).
State capture by narrow vested interests. Vested interests are a restraint for economic growth (Mokyr 1990; Maine 1980; and Landes 1983). Vested interests (such as those arising from import substitution policies or capital taxes) can be detrimental to economic growth (Krusell and Rios-Rull 1996; Acemoglu and Robinson 2000).
Top government officials required to disclose income and assets and can be prosecuted for malfeasance
• Disclosure is correlated with lower corruption when it is public, identifies sources of income and conflicts of interest, and when a country is a democracy; but there is no significant evidence of benefits from disclosure of values of income, consumption, and wealth (Djankov and others 2009).

8 1
APPENDIX C: 2007 CPIA CRITERIA ON ECONOMIC MANAGEMENT, STRUCTURAL POLICIES, AND POLICIES FOR SOCIAL INCLUSION/EQUITY AND EVIDENCE IN THE LITERATURE
CPIA criteria/indicators Sustained growth Poverty reductionDevelopment effectiveness
Macroeconomic Management(0.083)
• Monetary/exchange rate policy with clearly defined price stability objectives.
• Aggregate demand policies focus on maintaining short- and medium-term external balance.
• Avoid crowding out private investment.
• Sound money and fiscal solvency (Rodrik 2003).
• Keep inflation low and stable; monetary policy stance consistent with low and stable inflation (World Bank 2005).
• Adverse impact of inflation on the poor (Easterly and Fisher 2001).
• Inflation hurts the poor (Dollar and Kraay 2002; Ravallion and Datt 2002).
• Potential effect of inflation on poverty, once controlled for direct effect of growth on poverty, is mixed (Epaulard 2003).
Fiscal Policy(0.083)
• Primary balance managed to ensure sustainability of public finances.
• Public expenditure/revenue can be adjusted to absorb shocks.
• Provision of public goods including infrastructure consistent with medium-term growth.
• Transparency, sustainable solvency, flexibility, pro-growth structure of budgets (World Bank 2005).
• Infrastructure (Easterly 2001; World Bank 1994; Sachs 2005, 2008; Collier 2007).
• Public investment in basic infrastructure facilitates access of the poor to markets or to basic social services (Loayza 1996; Calderon and Serven 2003, 2004).
• Randomized literature on infrastructure: water and sanitation infrastructure (Ashraf, Berry, and Shapiro 2007; Kremer and others 2008).
Debt Policy(0.083)
• Debt burden indicators do not signal debt servicing difficulties.
• External and internal debt contracted with view to achieving/maintaining debt sustainability.
• Coordination between debt management and other macroeconomic policies.
• Reduce recourse to external debt (World Bank 2005).
(continued on next page)

8 2
T H E W O R L D B A N K ’ S C O U N T RY P O L I C Y A N D I N S T I T U T I O N A L A S S E S S M E N T
CPIA criteria/indicators Sustained growth Poverty reductionDevelopment effectiveness
Debt Policy(0.083)(cont.)
• Debt management unit well established, has adequate system for recording and monitoring debt, and good analytical capacity as indicated by regular analytical work on debt.
• Accurate, timely, and publicly available debt data.
• Government has clear financing strategy and the legal framework for borrowing is clearly defined.
Trade(0.083)
75 percent weight for trade restrictiveness: (0.063)• Average tariff rates,
number of tariff bands, maximum tariff band.
• Internal taxes do not discriminate between imported and local products.
• Transparency and predictability of trade regime including in the use of non-tariff barriers.
25 percent weight for customs/trade facilitation: (0.02)• Reputation of customs with
respect to professionalism and corruption.
• Use of risk management, information technology, physical examination.
• Processing of collections and refunds.
• Need to take into account promotion of export growth (World Bank 2005, 2008a).
• Need to have complementary policies (World Bank 2005).
• No conclusive evidence in the relationship between trade liberalization and poverty (Winters, McCulloch, and McKay 2004; Harrison 2006; Ravallion 2004).
• For trade liberalization to have positive impact on poverty reduction, needs to be accompanied by improved infrastructure, adequate competition policies, enhanced access to credit, better education and health, and low marketing or intermediation costs (Balat, Brambilla, and Porto 2007; Harrison 2006).
• When trade reforms are accompanied by labor market reforms (hire and fire, relocation), the adverse impact of trade liberalization on poverty disappears (Goldberg and Pavcnik 2005).

8 3
A P P E N D I X C : 2 0 0 7 C P I A C R I T E R I A F O R C L U S T E R S A , B A N D C A N D E V I D E N C E I N T H E L I T E R AT U R E
CPIA criteria/indicators Sustained growth Poverty reductionDevelopment effectiveness
Trade(0.083)(cont.)
• Documentation of customs procedures.
• Resolutions of appeals of customs decisions.
• Negative impact of trade reforms on poverty is due to limited labor mobility (Topalova 2004, 2005).
Financial Sector(0.083)
Financial stability• Banking sector vulnerability
to shocks• Banking system soundness
(share of non-performing loans and level of capital at risk).
• Adherence to Basel Core Principles.
• Quality of risk management in financial institutions.
• Quality of supervision.
• Considerable evidence of large impact of banking crises on output losses (Hoggarth, Reis, and Saporta 2002).
• Crises do not systematically worsen the Gini coefficient although the poor are likely less able to absorb adverse shocks (Honohan 2004a).
Financial sector efficiency, depth, and resource mobilization• Size and reach of financial
markets.• Development of capital
markets.• Interest rate spreads• Private sector credit/gross
domestic product (GDP).• Efficiency of microfinance.
Access to financial services• Development of payment,
clearance, and credit reporting systems.
• Share of population with access to formal sector financial services.
• Access of small and medium enterprises (SMEs) to finance.
• Legal and regulatory framework supporting access to finance.
• Finance is a determinant of sustained growth (Aghion, Howitt, and Mayer-Foulkes 2005; Krebs 2003; Levine 1997, 2003, 2005; Levine, Loayza, and Beck 2000).
• Efficient domestic financial system is important for growth (World Bank 2005).
• Cross-country regressions do not suggest any strong influence of household financial access on growth or poverty reduction (Honohan 2008a).
• Access of SMEs to finance promotes firm entry, firm growth, innovation, and size distribution of firms (Beck, Demirguc-Kunt, and Levine 2005; Ayyagari, Demirguc-Kunt, and Maksimovic 2007; Klapper, Laeven, and Rajan 2006).
• Financial (banking) depth is negatively associated with headcount poverty (Honohan 2004b).
• Impact of national income volatility on child labor is insignificant for countries with deep financial systems (Dehejia and Gatti 2002).
• Financial development reduces income inequality by disproportionately boosting the incomes of the poor (Beck, Demirguc-Kunt, and Levine 2004).
• Emergence of microfinance as a source of credit is both efficient and equitable as it has enabled the poor to invest, thereby promoting growth and reducing poverty (Khandeker 2005).
(continued on next page)

8 4
T H E W O R L D B A N K ’ S C O U N T RY P O L I C Y A N D I N S T I T U T I O N A L A S S E S S M E N T
CPIA criteria/indicators Sustained growth Poverty reductionDevelopment effectiveness
Financial Sector(0.083)(cont.)
• Informational, regulatory, legal, and judicial framework (World Bank 2005).
• Massive social banking experiment in India has led to significant falls in rural poverty (Burgess and Pande 2005).
• Impact assessments show microfinance in general helps the poor (Hossain 1988; Hashemi, Schuler, and Riley 1996; Khandker 1998, 2005; Khandker and Pitt 2003).
Business Regulatory Environment (0.083)
Regulations affecting entry, exit, and competition (0.028)• Bans on or investment
licensing requirements.• Procedures to enter or exit.• Legal framework (and
implementation thereof) to address anti-competitive conduct by firms.
• Procurement by public sector firms.
• Red tape (Mauro 1995).
• Reducing risks for private investors (World Bank 2000c).
• Clear and transparent business environment (World Bank 2000c).
• Improve climate for doing business (Besley and Burgess 2003).
Regulations of ongoing business operations (0.028)• Operational licensing,
permits, compliance and inspection requirements including taxes and customs.
• State intervention in goods markets (state ownership in competitive sectors, price controls, state making administrative allocation/decisions about production).
• Corporate governance laws (and enforcement thereof) to encourage disclosure and protect shareholders rights.
• Importance of investor protection (La Porta and others 2000).
• Importance of labor market reforms for minimizing adverse effects of trade reform on the poor (Goldberg and Pavcnik 2005; Topalova 2004, 2005; Welch, MacMillan, and Rodrik 2004).
• Getting the labor market right (World Bank 2008a; Ocampo 2003; Cardenas, Ocampo, and Thorp 2000).
Regulations of goods and factor markets (0.028)• Employment law provides
for flexibility in hiring and firing.

8 5
A P P E N D I X C : 2 0 0 7 C P I A C R I T E R I A F O R C L U S T E R S A , B A N D C A N D E V I D E N C E I N T H E L I T E R AT U R E
CPIA criteria/indicators Sustained growth Poverty reductionDevelopment effectiveness
Business Regulatory Environment (0.083)(cont.)
• State intervention in labor and land markets limited to regulation and/or legislation to smooth out market imperfections.
• Procedures to register property are simple and low cost.
Gender Equality (0.05)
Human capital development (0.017)• Differences (between
male and female) in primary completion rates, and access to secondary education (female to male enrollment).
• Access to delivery care and family planning services.
• Adolescent fertility rate.
• Education for girls (World Bank 2006b, 2008a).
• Fertility (Easterly 2001).
• Higher gender inequality increases poverty, and female literacy is one of the most important determinants of the effects of growth on income poverty (World Bank 2001a; Ravallion and Datt 2002).
Access to economic and productive resources (0.017)• Gender disparities in labor
force participation, land tenure, property ownership and inheritance practices.
Status and protection under the law (0.017)• The law gives men and
women equal individual and family rights.
• Violence against women considered a crime.
• Gender disparities in political participation at national level.
• Educating girls and integrating them into the workforce is one way to break the intergenerational cycle of poverty (World Bank 2008a).
Equity of Public Resource Use (0.05)
Government spending (0.033)• Identification of individuals,
groups or localities that are poor, vulnerable, or have unequal access to services and opportunities.
• Adoption of national development strategy with explicit interventions to assist groups identified above.
• Systematic tracking of composition and incidence of public expenditures and their results feed back into subsequent allocations.
• Inequality is negatively related to growth: conceptual papers (Todaro 1997; Aghion, Caroli, and Garcia-Penalosa 1999; Bardhan 2000; Hoff and Stiglitz 2001).
• Inequality is negatively related to growth: empirical evidence (Alesina and Rodrick 1994; Perotti 1992, 1993, 1996; Persson and Tabellini 1994).
• Inequality reduces the poverty reduction impact on growth (Ravallion 2001).
(continued on next page)

8 6
T H E W O R L D B A N K ’ S C O U N T RY P O L I C Y A N D I N S T I T U T I O N A L A S S E S S M E N T
CPIA criteria/indicators Sustained growth Poverty reductionDevelopment effectiveness
Equity of Public Resource Use (0.05)(cont.)
Revenue collection (0.017)• Incidence of major taxes
(progressive or regressive) and their alignment with poverty reduction priorities.
• Channels through which inequality affects growth: credit constraints (Perotti 1992; Bardhan 2000; the World Bank 2005); political instability, crime, insecurity of property rights (Alesina and Perotti 1996; Bardhan 2000); volatility (Aghion, Caroli, and Garcia-Penalosa 1999); social tension and violent redistribution (Bourguignon 2004).
• Micropanel studies show households with few physical and human assets caught in poverty trap reducing chance of economic advancement and lowering overall growth (Christiaensen, Demery, and Paternostro 2002; Woolard and Klasen 2005).
• Redistribution measures—income transfers (Skoufias, Davis, and de la Vega 2001; Bourguignon Ferreira, and Leite 2003).
Building Human Resources (0.05)
Health and nutrition including reproductive health (0.017)• Equitable access to basic
health services.• Prevention of malnutrition.
Mixed evidence:• Higher life expectancy
raises growth (Jamison, Sachs, and Wang 2001), per capita income (Weil 2005), and incentive to acquire schooling (Kalemli-Ozcan, Ryder, and Weil 2000).
• Positive effects of health interventions by aid agencies and non-governmental organizations (NGOs) (see appendix E).

8 7
A P P E N D I X C : 2 0 0 7 C P I A C R I T E R I A F O R C L U S T E R S A , B A N D C A N D E V I D E N C E I N T H E L I T E R AT U R E
CPIA criteria/indicators Sustained growth Poverty reductionDevelopment effectiveness
Building Human Resources (0.05)(cont.)
• Major international health improvements since 1940s have led to a larger increase in population than incomes, hence there is no evidence that health improvements raised income per capita (Acemoglu and Johnson 2007).
• Randomized literature has found a number of aid interventions to be effective in education (see appendix E).
Education (0.017)• Sustained progress toward
universal basic education, literacy, and more equitable access to early child development program services.
• Standards for teacher preparation, student learning, and oversight of private/NGO providers.
• Systematic tracking of school performance and student learning outcomes and feedback to schools and parents.
• Policies for post-basic education and training services.
• Quality, equity of access, and efficiency of resource use.
• Educational attainment (Easterly 2001).
• Primary enrollment rate (Hanushek and Kimko 2000; Barro and Sala-i-Martin 2003; Doppelhofer, Miller, and Sala-I Martin 2004; Hanushek and Woessmann 2008).
• Secondary and tertiary education (World Bank 1999; Vandenbussche, Aghion, and Meghir 2006; Aghion and Howitt 2009).
• Adequate and effective delivery of education, health, and social infrastructure (World Bank 2004e).
• Education enables people to make use of economic opportunities created by the growth process (Dreze and Sen 2002).
• Improving literacy facilitates more pro-poor growth (Chhibber and Nayyar 2007).
• Poor educational outcomes reduce the poverty-reducing impact of growth (Menezes-Filho and Vasconcellos 2004).
• Investment in education can be used to attack poverty as a method to redistribute to the poor (Besley and Burgess 2003).
Human immunodeficiency virus/acquired immunodeficiency syndrome (HIV/AIDS), tuberculosis, malaria• Prevention, treatment, care
and support of HIV/AIDS, tuberculosis, and malaria.
• Track disease prevalence, resources, and program implementation.
Mixed evidence:• Greater the
prevalence of malaria, lower the per capita income (Sachs 2003).
(continued on next page)

8 8
T H E W O R L D B A N K ’ S C O U N T RY P O L I C Y A N D I N S T I T U T I O N A L A S S E S S M E N T
CPIA criteria/indicators Sustained growth Poverty reductionDevelopment effectiveness
Building Human Resources (0.05)(cont.)
• Quality and timeliness of services.
• Focus on the poor.• Cost-effective use of public
resources.
• Short-run eradication of malaria lowers per capita income (because malaria affects mainly young children) whereas it raises per capita income only slightly over long run (Ashraf, Lester, and Weil 2008).
• Eradication of tuberculosis raises per capita income slightly in both short and long run (Ashraf, Lester, and Weil 2008).
• HIV/AIDS associated with small reduction in per capita income over long-run (Kambou, Devarajan, and Over 1992; Over 1992; Cuddington 1993; Cuddington and Hancock 1994; Haacker 2002).
• HIV/AIDs has no impact on per capita income (Bloom and Mahal 1997).
• HIV/AIDS has large negative impact on per capita income (Bell, Devarajan, and Gersbach 2006).
• HIV/AIDS increases per capita income of survivors (Young 2004).
Social Protection and Labor (0.05)
Social safety net programs (0.01)• Social protection programs
provide income support to poor and vulnerable groups.
Protection of basic labor standards (0.01)• Ratification and
implementation of international core labor standards.
• Getting the labor market right to foster growth and, at the same time, protecting people (not jobs) through establishing social safety nets (World Bank 2008a; Ocampo 2003).
Child labor may lead to intergenerational transmission of poverty: “child labor traps” (Barham and others 1995; Ilahi, Orazem, and Sedlacek 2001; Emerson and Souza 2003; Edmonds 2007).

8 9
A P P E N D I X C : 2 0 0 7 C P I A C R I T E R I A F O R C L U S T E R S A , B A N D C A N D E V I D E N C E I N T H E L I T E R AT U R E
CPIA criteria/indicators Sustained growth Poverty reductionDevelopment effectiveness
Social Protection and Labor (0.05)(cont.)
Labor market regulations (0.01)• Labor market regulations
on health and safety, working conditions, and hiring and firing.
Community-driven initiatives (0.01)• Encourage and support
communities’ own development initiatives or local accountability mechanisms.
Pension and old-age savings programs (0.01)• Pension and savings
programs provide income security to most potentially vulnerable groups.
• Empowerment of communities as a determinant of sustained growth (Stern 2001; World Bank 2000c, 2004e).
Policies and Institutions for Environmental Sustainability (0.05)
• Regulations and policies (and implementation thereof) for pollution and natural resources.
• Information widely available.
• Priority setting.• Sector ministries
incorporate environmental concerns.
• Debate on whether environmental regulation can raise growth rate (Bovenberg and Smulders 1995, 1996; Hettich 1998; and Esty and Porter 2005; versus Fullerton and Kim 2006).
• Policies reducing environmental risk not necessarily progressive (Parry and others 2005; Fullerton 2008).

9 0
Water supply in Marracuene, Mozambique. Photo by Eric Miller/World Bank

9 1
APPENDIX D: LITERATURE REVIEW ON AID EFFECTIVENESS
A. Aid ➔ Growth with No Conditions
Article (year) Type of aidShort /Long-term impact
Period of analysis
Hansen and Tarp (2000) All aid Short-term (4 years) 1974–1993
Dalgaard and Hansen (2001)
All aid Short-term (4 years) 1974–1993
Hansen and Tarp (2001) All aid Short-term (4 years) 1974–1993
Ram (2003) Bilateral Short-term (4 years) 1970–1993
Clemens, Radelet, and Bhavnani (2004)
Short impact aid (budget support or “program” aid for any purpose, and project aid given for real sector investments for infrastructure or to directly support production in transportation, communications, energy, banking, agriculture, and industry).
Short-term (4 years) 1970–2001
Headey (2005) Multilateral and bilateral, separately Short-term (4 years) 1970–2001
Reddy and Minoiu (2006) Developmental (multilateral and bilateral) Long-term (2 decades) 1960–2000

9 2
T H E W O R L D B A N K ’ S C O U N T RY P O L I C Y A N D I N S T I T U T I O N A L A S S E S S M E N T
B. Aid ➔ Growth with Conditions
Article (year)Type of aid
Short /Long-term impact
Period of analysis Conditions
Burnside and Dollar (2000) All aid (net flow)
Short-term (4 years) 1970–1993 Index of policies: trade openness (Sachs-Warner), fiscal policy (budget surplus), monetary policy (inflation rate).
Guillaumont and Chauvet (2001)
All aid Long-term (12 years) 1970–1993 Index of environment/vulnerability: climatic shocks (stability of agricultural value added), trade shocks (stability of real value of exports, trend of terms of trade), and structural exposure to these shocks (population size).
Collier and Dehn (2001) All aid (net flow)
Short-term (4 years) 1970–1993 Countries suffering sharp price drops in key commodity exports.
Collier and Dollar (2002) All aid Short-term (4 years) 1974–1997 Country Policy and Institutional Assessment (CPIA) (overall for 20 components).
Collier and Hoeffler (2004) All aid Short-term (4 years) 1974–1997 A few years after civil war with good policies (first social, then sectoral, then macro).
Dalgaard, Hansen, and Tarp (2003)
All aid Short-term (4 years) 1970–1993 Countries outside of the tropics.
C. Aid Has No Impact on Growth
Article (year) Type of aid Short/Long-term impact Period of analysis
Boone (1994)
Easterly, Levine, and Roodman (2004)
All aid Short-term (4 years) 1970–1997
Easterly (2003) All aid Long-term (12 or 24 years) 1970–1993
Roodman (2007a) All aid Tested Hansen and Tarp (2001) in section A and all six papers in section B above
Rajan and Subramanian (2008) All aid Medium (10–20 years) and long-term (30–40 years)
1960–2000
D. Aid Has Negative Impact on Growth
Article (year) Type of aid Short/Long-term impact Period of analysis
Ram (2003) Multilateral Short-term 1970–1993
Reddy and Minoiu (2006) Geopolitical (all aid-developmental aid) Long-term (2 decades) 1960–2000

9 3
APPENDIX E. EXAMPLES OF POSITIVE IMPACTS OF AID PROJECTS FROM RANDOMIZED EVALUATIONS IN EDUCATION, HEALTH, INFRASTRUCTURE, AND AGRICULTURE
cash-for-schooling program in Mexico, which
had health components, also had a major health
impact. The Bobonis, Miguel, and Puri-Sharma
(2006) study on anemia and school participation
finds that iron supplements and de-worming
drugs were effective in increasing children’s
weight-for-height and weight-for-age scores.
Another area in which randomized evaluations
found success is in preventing or treating infant
diarrhea (Zwane and Kremer 2007).
InfrastructureAshraf, Berry, and Shapiro (2007) find that water
purification tablets in Zambia are an inexpensive
way of avoiding waterborne illness. Kremer and
others (2008) show that investment in protecting
naturally occurring springs from contamination
led to dramatic improvements in water quality in
rural Kenya.
AgricultureDuflo, Kremer, and Robinson (2007) find
that selling vouchers earmarked for fertilizer
purchases to the farmers right after harvest
solved the problem of the farmers not setting
aside funds for fertilizer for the next season.
Duflo, Kremer, and Robinson (2008) find a large
positive return to fertilizer use in maize farms
in Kenya, whereas too little or too much fertil-
izer renders the return unfavorable. Conley
and Udry (2007) find that farmers learn how
much fertilizer to apply from their successful
neighbors in a new technology for pineapple
growing in Ghana.
EducationAngrist and others (2002) find that lottery winners
of vouchers for private schools in Colombia
had 0.12–0.16 additional years of schooling,
test scores that were higher by 0.2 standard
deviations, and higher secondary school comple-
tion (the last finding was confirmed in a follow-up
study by Angrist, Bettinger, and Kremer (2006).
Vermeersch and Kremer (2003) find that a school
meals program in preschools in Kenya raised
attendance rates from 21 to 29 percent. Kremer
and Holla (2008) find that a merit scholarship
for high school girls in Kenya seemed to induce
greater study effort and raised the girls’ test
scores, and even had some externalities to boys’
performance in the same classroom.
More generally, as underlined by Kremer and
Holla (2008), evidence is accumulating on the
effectiveness of certain school inputs such as
extra teachers and textbooks (for example, see
Banerjee and others 2005; Duflo, Kremer, and
Robinson 2007; and Glewwe, Kremer, and Moulin
2007); provider incentives (Glewwe, Holla, and
Kremer 2008 and Muralidharan and Sundara-
raman 2007); remedial education (Banerjee
and others 2007; Duflo, Kremer, and Robinson
2007; He, Linden, and MacLeod 2007); citizens’
report cards; the hiring of contract teachers;
or increased oversight of local school commit-
tees (Bjorkman and Svensson 2009; and Duflo,
Kremer, and Robinson 2007); and school choice
programs (Angrist, Bettinger, and Kremer 2002,
2006; Bettinger, Kremer, and Saavedra 2008).
HealthGertler (2004) finds that the Programa de
Educación, Salud y Alimentación (PROGRESA)

9 4
Fisherman, Colombia. Photo by Edwin Huffman/World Bank

9 5
APPENDIX F. REVIEW OF FINANCIAL SECTOR CRITERION
measures related to non-performing loans
(NPLs).4 Although NPLs may predict crises to
some extent, they are typically a lagging indicator,
with high values suggestive of a problem that has
already crystallized. Hence these NPL measures
are crude and inadequate even as indicators of
current or imminent problems. This is clearly
reflected to the fact that NPLs for residential
mortgages did not provide a sensitive early
warning system in the recent crisis in advanced
economies.
The indicator on adherence to Basel Core Princi-
ples (BCP) does embody a set of regulatory
policies and practices on most points on which
there is broad consensus.
However, the econometric evidence between
BCP compliance and financial sector perfor-
mance is not very strong.
The indicator on tools and resources for banking
supervision is subject to a lot of controversy.
An extensive data collection and econometric
exercise (Barth, Caprio, and Levine 2006) fails to
uncover any statistically significant relationship
between their measures of banking supervision
and regulation on the one hand, and financial
sector performance including stability on the
other. The alternative approach that emphasizes
market discipline (enforced through regulations
that provide market participants with information
and incentives to monitor firms) has not worked
either as evidenced by the current financial crisis.
What is clearly missing in the CPIA is explicit
attention to the information (for example,
accounting and disclosure requirements) and
incentive structures (for example, deposit
A review of the literature indicates that the
financial sector criterion does cover the
dimensions along which finance is currently
thought to be important: stability, that is, depth
and efficiency; and access. However, not all
three finance dimensions are equally important
for growth and poverty reduction. Further, the
way some of the dimensions are currently being
assessed can be strengthened.
Financial StabilityThere is considerable evidence of a large impact
of banking crises on output losses (Hoggarth,
Reis, and Saporta 2002)1 as well as on the national
budget (Laeven and Valenciana 2008; Honohan
2008b).2 On the other hand, the evidence as to
which policies work to limit banking crises is
ambiguous and controversial (discussed below).
In light of the controversies over what constitute
appropriate policies for financial stability, the fact
that the Country Policy and Institutional Assess-
ment (CPIA) assesses intermediate outcomes
in addition to policies and institutions (it is
supposed to only assess the latter) is perhaps
reasonable.
There is quite a lot of controversy in the literature
on the current CPIA indicators used for assessing
the stability of the financial system. The indicator
on the banking sector’s vulnerability to shocks,
although relevant, is extremely vague. It evokes
the concept of stress testing,3 which has not
been very effective, as clearly demonstrated by
the recent wave of systemic failures in mature
economies, all of whose prudential regulators
were using stress tests.
The indicator for banking system soundness
specifies two alternative intermediate outcome

9 6
T H E W O R L D B A N K ’ S C O U N T RY P O L I C Y A N D I N S T I T U T I O N A L A S S E S S M E N T
The indicator “interest rate spreads” measures
efficiency of intermediation, which is affected
by both administrative efficiency as well as the
degree of competition in the sector. Policy in
the form of taxation of financial intermediation
(implicit or explicit) and in the form of adminis-
trative controls (such as holding interest spreads
below breakeven rates) can strongly influence
the spread, so there is no unambiguous link
between spreads and sustainable growth.
The indicator efficiency of microfinance is vague,
as efficiency presumably relates to the cost of
achieving some goal. Yet the CPIA instructions
neither specify the goal nor how to judge the
cost. Further, this indicator might fit better under
the access dimension.
In addition to these problems with the outcome
indicators, this dimension has also neglected the
policies that are important for achieving financial
depth. A recent paper (Tressel and Detragiache
2008) using a large cross-country panel finds
that policies that facilitate entry, liberalize pricing
and the provision of services, and reduce state
ownership in finance do help deepen finance—
although only where complementary deep legal
institutions protecting private property from
expropriation are present.
Access to Financial ServicesThere are individual success stories of microfi-
nance (Littlefield, Morduch, and Hashemi 2003),
but because of the formidable selection biases in
the data, there is little firm evidence of a sizeable
growth or poverty reduction impact of microfi-
nance. Indeed, the indications are that overall
financial development, as measured by financial
depth, has had a larger and more certain impact
not just on growth but also on poverty reduction
than the expansion of microfinance (World Bank
2008b).
Aside from the lack of strong empirical evidence
of this dimension on growth and poverty
reduction, the indicators specified under this
dimension also suffer from a lack of clarity and
specificity. The indicator on the payments system
is unclear. To the extent that it refers to the
insurance) for market discipline. This is supported
by an extensive literature on moral hazard of
deposit insurance schemes and other crisis
management policies which show that fiscal costs
of crises are higher in cases where policy design
neglects moral hazard (Honohan and Klingebiel
2003; Demirguc-Kunt, Kane, and Laeven 2006).
Financial Sector Efficiency, Depth, and Resource MobilizationThere is a convincing literature that financial
depth (usually measured as outstanding bank
credit to the private sector as a share of gross
domestic product [GDP] drives economic
growth (Honohan 2009). At the same time, there
is a wide range of policies both in finance and
in other sectors that influence the depth and
efficiency of finance. In this light, it is perhaps
not unreasonable that most of the indicators
under this dimension are outcome indicators.
Yet many of the indicators specified in the CPIA
are problematic.
The indicator “size and reach of financial markets”
is vague, and is already captured by another
indicator “private sector credit as a share of GDP.”
The latter corresponds directly to the measure of
financial depth most commonly used in empiri-
cal analyses of the finance-growth link. However,
private sector credit as a share of GDP is not an
ideal measure. Rapid increases in financial depth
are often unsustainable, and yet can be mistaken
for finance-supported sustainable growth
(Honohan 2004b). Further, the term “reach”
normally refers to access, which is covered in the
third dimension of the CPIA finance criterion.
The indicator “development of capital markets”
is typically measured in terms of overall stock
market capitalization. But the free-float of shares
may be a tiny fraction of total capitalization, so
some correction needs to be made to address
this. Also there is little or no empirical evidence
that confirms a causal link between market
capitalization and subsequent economic growth.
One paper (Levine and Zervos 1998) finds a
relationship between stock market turnover and
growth, although this is also not very strongly
supported by the evidence.

9 7
A P P E N D I X F. R E V I E W O F F I N A N C I A L S E C T O R C R I T E R I O N
Regarding the indicators on access, cross-country
regressions do not suggest any strong influence
of household financial access on growth or on
poverty (taking into account the average level of
income) (Honohan 2008a). However, access of
small and medium enterprises (SMEs) to formal
sector financial services has been found to be
important for firm entry, firm growth, innovation,
and size distribution of firms (Beck, Demirguc-
Kunt, and Levine 2005; Ayyagari, Demirguc-Kunt,
and Maksimovic 2007).
The indicator regarding the legal and regula-
tory framework supporting access to finance is
vague. Also, the cross-country empirical litera-
ture suggests that although legal and political
institutions that protect private property against
the state are important for financial depth, the
protection of contracts between private agents
is important for determining access (Beck,
Demirguc-Kunt, and Levine 2005; World Bank
2008b).
RecommendationsThe above review suggests that the CPIA indica-
tors for all three dimensions could be strength-
ened. Suggestions for such strengthening are
presented in appendix box F. 1.
wholesale payments system, it is not an access
issue but rather relates to the cost and security
of a minor part of the banking system (Honohan
2009). At the same time, however, there is no
empirical evidence that a wholesale payments
system failure could trigger a banking collapse.
To the extent that the payments system refers to
the retail system, it relates to access but it is not
clear what is being assessed in the CPIA.
The indicator on the credit reporting system is
relevant, as credit registries are known to have the
potential to expand access to finance, particularly
to small and medium enterprises (SMEs) (Miller
2003; Berger, Frame, and Miller 2005; Djankov,
McLiesh, and Shleifer 2007). However, the CPIA
falls short in specifying how this is to be assessed,
although the literature has established a standard
set of good practices. Such good practices include
facilitating entry of private providers of registries
where possible, including as wide a set of
information providers as possible, and ensuring
privacy laws do not unduly constrain reporting of
“positive information” (Miller 2003). There is also
evidence that quality matters in ensuring that a
credit registry does expand availability of finance
(Brown, Jappelli, and Pagano 2009, and Lutoto,
McIntosh, and Wydick 2007).

9 8
T H E W O R L D B A N K ’ S C O U N T RY P O L I C Y A N D I N S T I T U T I O N A L A S S E S S M E N T
Each of the three dimensions currently covered by the CPIA financial sector criterion can be revised and strengthened, as follows:
Financial StabilityWhether policy creates good incentives for prudential man-agement of financial firms. This would include enforcement of prudential regulations and the safety net policy (including the nature and extent of deposit insurance).
How good are supervisory powers and effectiveness (including the tools and resources for risk assessment)? This would entail assessment of the compliance with Basel Core Principles (BCP) (already included in the CPIA), which is a useful summary for banking. However, non-bank finance also needs to be considered where it is sizeable.
The vulnerability of financial institutions to shocks. This can be informed by measures of bank capitalization (for example, whether regulatory minima sufficient for the economy’s risk, well measured and enforced; whether all banks satisfy regulatory minima; how is capital measured). Non-performing loans (NPLs) (especially net of provision) should be taken into account but supplemented by exposure to foreign exchange risk. Rapid growth of credit should be monitored as a possible warning sign.
Financial Depth and EfficiencyDepth. The key measure is the size of private sector credit as a share of gross domestic product (GDP), adjusted for the country’s overall level of development. (However, rapid growth in this indicator should be assessed as negative). Other mea-sures are market capitalization (total and free-float) and stock market turnover.
Efficiency of intermediation. The measures are intermediation spreads (ideally distinguishing what is attributable to taxes
and quasi-taxes, inadequate legal protection, exogenous risk and market power), and bank operating costs (for example as a share of total assets).
Policy barriers to efficiency and depth. Among the relevant indi-cators are: distorting financial sector taxes and quasi-taxes on intermediation including binding interest rate ceilings; and directed credit programs. The preconditions for the BCP (which are not graded) also provide a useful summary of key policy dimensions as relevant to depth and efficiency as to stability.
AccessPolicy. Has policy created an enabling environment for expand-ing outreach of the financial system? For example, is the legal framework for debt recovery and insolvency economically and administratively efficient (including time taken and cost of in-solvency and debt recovery)? Is there a good credit reporting system? Are there legal or regulatory barriers to creating one? Is there an adequate legal basis for the leasing industry? Is the regulatory framework for microfinance supportive? Is anti-money laundering and combating the financing of terrorism (AML-CFT) policy well adapted to protecting financial service providers focusing on the poor from undue costs (for example, are microfinance firms able to operate depository and money transmission services without crippling regulatory burden?) (Isern and others 2005).
Outcomes. Measures could include: the percentage of the popu-lation with access to formal financial services; how good the access of small and medium enterprises (SMEs) to financial services is (such as from responses to the Investment Climate Assessment surveys); how financially secure the microfinance industry is; and whether retail money transmission costs (inter-nal and international) are low.
Source: Honohan 2009.
Appendix Box F.1: Suggestions for Strengthe ning of the Country Policy and Institutional Assessment (CPIA) Indicators for the Financial Sector

9 9
APPENDIX G: COUNTRY POLICY AND INSTITUTIONAL ASSESSMENT (CPIA) AND LOAN PERFORMANCE
approved and closed between 2004 and 2007.
This, in turn, would have reduced the sample
size substantially as well as biased the sample
because those loans would have consisted mostly
of development policy loans. Estimates based
on data for loans approved since 1998 found a
relatively good correlation between the share
of problem loans and IEG loan outcome ratings
(the correlation coefficient is 0.63).
The flags for problem loans are based on
self-evaluation by Bank staff of loans where
implementation progress or development
objective is rated unsatisfactory. For this analysis,
a loan is identified as a problem if it has been
flagged as a problem loan anytime between 2004
and 2007. The sample is restricted to all countries
that had at least three loans approved during
the period. For each country the share of loans
(approved between 2004 and 2007) that had
been flagged as problem loans was used as the
dependent variable.1
Control variablesThe following control variables are used in the
econometric analysis:2
• Average aid as a share of gross domestic prod-
uct (following Dollar and Levin 2005) which
could influence loan performance in opposite
ways. On the one hand, there could be in-
creasing returns in the sense that a lot of aid
may create a better environment of supporting
services and resources. On the other hand,
there could be diminishing returns or absorp-
tive capacity constraints. The data are from
the Organisation for Economic Co-operation
and Development (OECD) Development As-
sistance Committee (DAC) database.
This appendix presents the econometric
analysis undertaken to estimate the relationship
between the CPIA and Bank loan performance.
The methodology draws on a similar exercise
by Dollar and Levin (2005) who find a strong
association between institutional quality and loan
success rate using the property rights/rule of law
measure from the International Country Risk
Guide and democracy measure from Freedom
House as proxies for institutional quality, and
(Independent Evaluation Group) IEG’s loan
outcome ratings as a measure of loan perfor-
mance. This analysis uses a very similar specifica-
tion to that of Dollar and Levin, but a different
measure of loan performance (see below) and
the CPIA for the institutional quality variables.
DataPolicy and institutionsThe average overall CPIA rating for the country
from 2004–07 was used as the explanatory
variable. The average ratings for each of the four
CPIA clusters were also used alternatively as
explanatory variables. The time period 2004–07
was selected because of the major restructuring
of the CPIA in 2004, and in particular because of
the change in the definition of the rating scale,
which resulted in a discontinuity in the data that
year.
Loan performanceThis analysis uses the Implementation Status and
Results Report (ISR) flags for problem loans as
the proxy for loan performance because of the
need to match the loan performance data with
the CPIA data which confines the analysis to this
period of 2004–07. Given this restriction, it is not
possible to use IEG loan outcome ratings because
the analysis would have been restricted to loans

1 0 0
T H E W O R L D B A N K ’ S C O U N T RY P O L I C Y A N D I N S T I T U T I O N A L A S S E S S M E N T
signs are not consistent across specifications—a
manifestation of multicollinearity.
To reduce the multicollinearity problem, specifi-
cations were estimated using ratings from all the
possible combinations of two CPIA clusters as
explanatory variables, in turn. The coefficients
on all the combinations of the two CPIA variables
are not significant but their signs are consistently
negative across specifications. An F-test of the
joint null hypothesis that the coefficients of both
CPIA variables are equal to zero was rejected,
which implies that one or both CPIA ratings have
significant negative association with the share
of problem projects. However, their individual
contributions cannot be discerned because of
their high degree of correlation with each other.
Further, an F-test of the null hypothesis that the
coefficient of the CPIA rating for one cluster is
not different from the coefficient of the rating of
the other CPIA cluster cannot be rejected. Similar
results were obtained when the share of problem
projects in a country was regressed on the average
ratings of the first three clusters combined and the
ratings for cluster D. In sum, there is not sufficient
evidence to conclude that the policies and institu-
tions measured by one cluster are relatively more
important than those measured by the other
clusters for better project performance.
ConclusionsThe analysis finds that higher CPIA ratings
are associated with better Bank loan portfo-
lio performance. This association is found for
overall CPIA ratings as well as ratings for each
of the four CPIA clusters. There is insufficient
evidence to conclude that any one of the four
CPIA clusters is more important than the others
for loan performance.
• Geographic constraints to development as
represented by the share of a country’s terri-
tory in the tropics that has been found to af-
fect economic performance (Dollar and Levin
2005, following Gallup, Sachs, and Mellinger
1999).
• Extent of ethnic fractionalization that has been
found to affect political stability and policies
and institutions (see, for example, Mauro
1995; Easterly and Levine 1997; Alesina and
others 2003).
• Regional dummies to control for region-spe-
cific effects on loan performance.
Econometric Specification and ResultsOrdinary least squares regressions3 are used for
the estimations. The results are presented in
appendix table G.1. There is a significant negative
association between the overall CPIA rating of a
country and the percentage of problem loans in
that country. The results are similar when each of
the four CPIA cluster ratings are used separately
instead of using the overall CPIA rating. There is
some evidence that a higher level of aid as a share
of GDP is associated with better portfolio perfor-
mance, and countries with a higher proportion
of land in tropics are more likely to have a higher
proportion of problem loans. However, the
respective coefficients are not always significant
across the different specifications.
Attempts were made to estimate the relative
importance of the four CPIA clusters on the Bank’s
loan portfolio performance. This was difficult
because of the high degree of correlation among
the ratings of the four clusters (table G.2). Indeed
when all four clusters were included as explana-
tory variables along with other control variables,
none of them are found to be significant and their

10
1
AP
PE
ND
IX G
: CO
UN
TR
Y P
OL
ICY
AN
D IN
ST
ITU
TIO
NA
L A
SS
ES
SM
EN
T (C
PIA
) AN
D L
OA
N P
ER
FO
RM
AN
CE
Table G.1: CPIA and Loan Perfo rmance: Ordinary Least Squares RegressionsDependent Variable: Percent of Problem Loans
Independent Variables
Overall CPIA CPIA Cluster A CPIA Cluster B CPIA Cluster C CPIA Cluster D
(1) (2) (3) (1) (2) (3) (1) (2) (3) (1) (2) (3) (1) (2) (3)
CPIA ratings –13.4*** –16.1* ** –17.9** –9.1*** –9.0** –10.1*** –11.4*** –14.4*** –16.0*** –9.7** –13.7** –14.4*** –10.5** –11.4** –13.4***
Aid/GDP –0.5* –0.4* –0.4 –0.3 –0.5 –0.4 –0.4 –0.3 –0.4 –0.3
% Tropical Land 10.5 10.6 12.5 13.6* 10.3
Ethnic Fractionalization
1.7 6.0 2.5 –0.7 2.8
Africa Dummy –18.8*** –18.7** –16.7*** –16.5*** –17.7** –14.0** –18.8*** –19.5** –17.3*** –17.7*** –18.9** –16.9*** –16.6*** –16.3** –14.4**
Europe and Central Asia Dummy
–20.6*** –15.5* –21.9*** –19.8*** –13.5 –19.8*** –21.1*** –14.3 –22.4*** –20.5*** –13.3 –21.9*** –22.2*** –16.9* –23.6***
East Asia and Pacific Dummy
–25.2*** –25.7*** –23.6*** –21.6*** –21.6** –19.5** –26.5*** –27.4*** –26.1*** –23.7*** –25.1*** –23.0*** –24.2*** –24.7*** –22.8***
Middle East and North Africa Dummy
–26.2*** –16.3 –28.0*** –25.0*** –14.4 –25.5*** –25.7*** –15.2 –27.6*** –25.2*** –13.6 –27.2*** –24.2*** –13.4 –25.1***
South Asia Dummy –22.8*** –17.2* –22.5*** –20.0** –13.9 –18.8** –23.9*** –16.4 –24.5*** –21.5** –15.8 –21.7** –21.1** –15.2 –20.4**
Constant 85.5*** 90.9*** 104.1*** 71.1 *** 63.1*** 75.9*** 78.9*** 83.6** 98.5*** 71.0*** 79.3*** 89.9*** 71.0*** 68.6*** 82.5***
Observations 92 79 87 92 79 87 92 79 87 92 79 87 92 79 87
R-squared 0.23 0.29 0.26 0.22 0.26 0.22 0.21 0.28 0.24 0.19 0.26 0.22 0.21 0.25 0.23
Source: IEG estimates.Note: *** significant at 1% level; ** significant at 5% level; * significant at 10% level.

1 0 2
T H E W O R L D B A N K ’ S C O U N T RY P O L I C Y A N D I N S T I T U T I O N A L A S S E S S M E N T
Table G.2: Correlations among Average 2004– 07 CPIA Ratings for the Four Country Policy and In-stitutional Assessment (CPIA) Clusters
CPIA Cluster A Cluster B Cluster C Cluster D Overall CPIA
Cluster A 1.00
Cluster B 0.61 1.00
Cluster C 0.66 0.74 1.00
Cluster D 0.74 0.81 0.84 1.00
Overall CPIA 0.86 0.87 0.90 0.94 1.00
Source: IEG estimates.Notes: a. Based on 92 observations. b. All correlations are significant at 1% level

1 0 3
APPENDIX H: COMPARING COUNTRY POLICY AND INSTITUTIONAL ASSESSMENT RATINGS BY THE WORLD BANK, AFRICAN DEVELOPMENT BANK, AND ASIAN DEVELOPMENT BANK
ratings by the AfDB were higher than those by
the Bank for all 16 CPIA criteria; for 12 of the 16,
the ratings were statistically significantly higher
at the 5 percent level. The ratings by the ADB
were higher than those of the Bank for 14 of
the 16 CPIA criteria; for 5 of the 14, the ratings
were statistically significantly higher. For the
two criteria for which the Bank’s ratings were
higher than those of the ADB, the differences in
the ratings were not significantly different (see
appendix table H.1).
Comparison of the CPIA ratings (rather than
relative rankings implied by the ratings) can
only be done for the CPIA ratings by the World
Bank, the AfDB, and the ADB. Ratings by these
three development banks are on the exact same
scale, with each rating having the exact same
meaning, which is not the case with the other
indicators.
Generally speaking, it is found that the 2007 CPIA
ratings by the AfDB and ADB are higher than
the CPIA ratings by the Bank. Specifically, the

1 0 4
T H E W O R L D B A N K ’ S C O U N T RY P O L I C Y A N D I N S T I T U T I O N A L A S S E S S M E N T
Appendix H.1: 2007 CPIA Ratings by the World Ba nk, AfDB and ADB
Average for common World Bank and AFDB member countries
Average for common World Bank and ADB member countries
Criterion World Bank AfDB World Bank ADB
q1 3.64 3.99 3.83 4.00
q2 3.38 3.74 3.44 3.67
q3 3.31 3.67 3.90 4.00
q4 3.58 3.62 3.87 3.65
q5 3.20 3.48 3.17 3.42
q6 3.25 3.38 3.35 3.27
q7 3.24 3.55 3.56 3.62
q8 3.24 3.53 3.58 3.63
q9 3.31 3.45 3.48 3.58
q10 3.01 3.22 3.23 3.29
q11 3.24 3.45 3.13 3.25
q12 2.90 3.23 3.00 3.21
q13 3.16 3.52 3.29 3.60
q14 3.46 3.55 3.35 3.58
q15 3.02 3.27 3.10 3.13
q16 2.85 3.24 2.87 3.06
Sources: World Bank, AfDB, and ADB.Note: Bold figures denote ratings that are significantly different at the 5 percent level between the World Bank and the AfDB, and the World Bank and the ADB. ADB= Asian Development Bank; AfDB= African Development Bank.

1 0 5
APPENDIX I: COMPARATOR INDICES OF THE CPIA
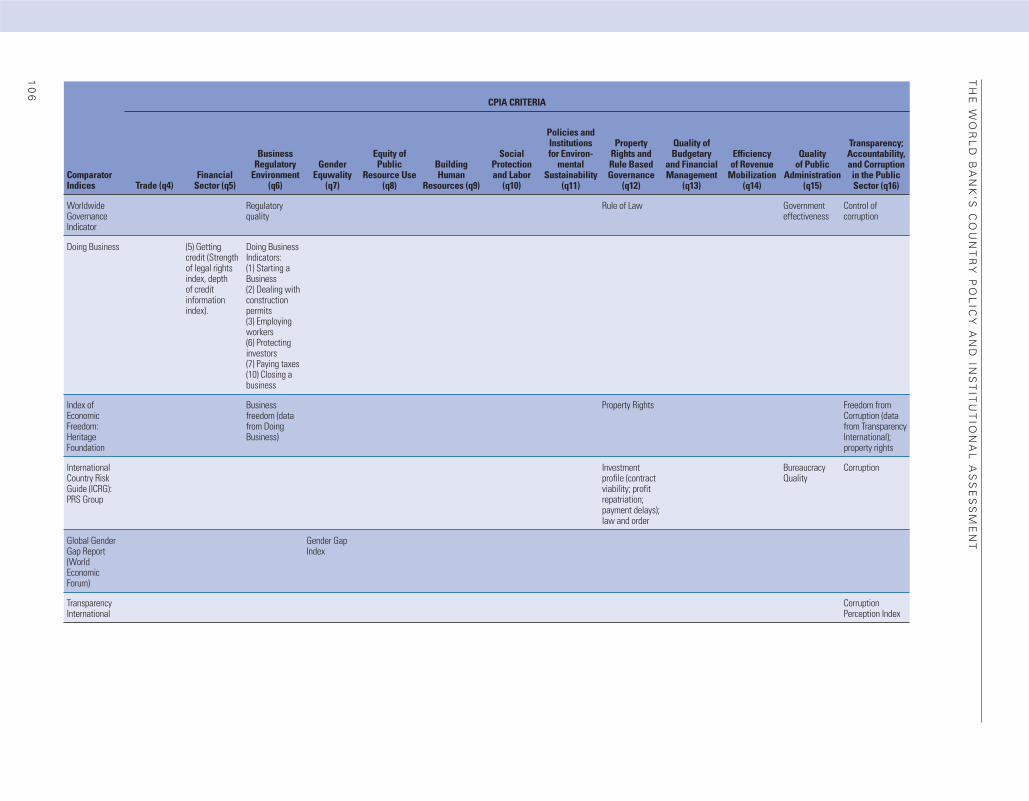
10
6
TH
E W
OR
LD
BA
NK
’S C
OU
NT
RY
PO
LIC
Y A
ND
INS
TIT
UT
ION
AL
AS
SE
SS
ME
NT
Comparator Indices
CPIA CRITERIA
Trade (q4)Financial
Sector (q5)
Business Regulatory
Environment (q6)
Gender Equwality
(q7)
Equity of Public
Resource Use (q8)
Building Human
Resources (q9)
Social Protection and Labor
(q10)
Policies and Institutions for Environ-
mental Sustainability
(q11)
Property Rights and Rule Based Governance
(q12)
Quality of Budgetary
and Financial Management
(q13)
Efficiency of Revenue
Mobilization (q14)
Quality of Public
Administration (q15)
Transparency; Accountability, and Corruption in the Public Sector (q16)
Worldwide Governance Indicator
Regulatory quality
Rule of Law Government effectiveness
Control of corruption
Doing Business (5) Getting credit (Strength of legal rights index, depth of credit information index).
Doing Business Indicators:(1) Starting a Business(2) Dealing with construction permits(3) Employing workers(6) Protecting investors(7) Paying taxes(10) Closing a business
Index of Economic Freedom: Heritage Foundation
Business freedom (data from Doing Business)
Property Rights Freedom from Corruption (data from Transparency International); property rights
International Country Risk Guide (ICRG): PRS Group
Investment profile (contract viability; profit repatriation; payment delays); law and order
Bureaucracy Quality
Corruption
Global Gender Gap Report (World Economic Forum)
Gender Gap Index
Transparency International
Corruption Perception Index

10
7
AP
PE
ND
IX I: C
OM
PA
RA
TO
R IN
DIC
ES
OF
TH
E C
PIA
Comparator Indices
CPIA CRITERIA
Trade (q4)Financial
Sector (q5)
Business Regulatory
Environment (q6)
Gender Equwality
(q7)
Equity of Public
Resource Use (q8)
Building Human
Resources (q9)
Social Protection and Labor
(q10)
Policies and Institutions for Environ-
mental Sustainability
(q11)
Property Rights and Rule Based Governance
(q12)
Quality of Budgetary
and Financial Management
(q13)
Efficiency of Revenue
Mobilization (q14)
Quality of Public
Administration (q15)
Transparency; Accountability, and Corruption in the Public Sector (q16)
Gender Empowerment Measure United Nations Development Programme (UNDP) Human Development Report
Gender Empowerment Measure
Ibrahim Index of African Governance
Rule of law, transparency, and corruption
Bertelsmann Transformation Index
Private property Social safety nets
Private property Q3.2 Does an independent judiciary exist? Q3.3 Are there legal or political penalties for officeholders who abuse their position?
Global Enabling Trade Report (World Economic Forum)
Enabling Trade Index:(1) Market access—tariffs and non-tariff barriers,(2) Border administration
Enabling Trade Index: (4) the business environment—regulatory environment
2005 Environmental Sustainability Index
Social and institutional capacity
Global Competitive-ness Index
Prevalence of trade barriers
Interest rate spread (hard data)
Burden of government regulation
Business impact of malaria
Property rights
Trade-weighted tariff rate (hard data)
Financial market sophistication
Strength of auditing and reporting standards
Malaria incidence (hard data)
Efficiency of legal framework
Burden of customs procedures
Financing through local equity market
Efficacy of corporate boards
Business impact of tuberculosis
Business costs of crime and violence
(continued on next page)

10
8
TH
E W
OR
LD
BA
NK
’S C
OU
NT
RY
PO
LIC
Y A
ND
INS
TIT
UT
ION
AL
AS
SE
SS
ME
NT
Comparator Indices
CPIA CRITERIA
Trade (q4)Financial
Sector (q5)
Business Regulatory
Environment (q6)
Gender Equwality
(q7)
Equity of Public
Resource Use (q8)
Building Human
Resources (q9)
Social Protection and Labor
(q10)
Policies and Institutions for Environ-
mental Sustainability
(q11)
Property Rights and Rule Based Governance
(q12)
Quality of Budgetary
and Financial Management
(q13)
Efficiency of Revenue
Mobilization (q14)
Quality of Public
Administration (q15)
Transparency; Accountability, and Corruption in the Public Sector (q16)
Global Competitiveness Index (cont.)
Ease of access to loans
Protection of minority shareholders’ interests
Tuberculosis incidence (hard data)
Reliability of police services
Soundness of banks
Intensity of local competition
Business impact of HIV/AIDS
Regulation of securities exchanges
Extent of market dominance
Human immunodeficiency virus (HIV) prevalence (hard data)
Legal rights index (hard data)
Effectiveness of anti-monopoly policy
Infant mortality (hard data)
Extent and effect of taxation
Life expectancy (hard data)
Total tax rate (hard data)
Quality of primary education
Number of procedures required to start a business (hard data)
Primary enrollment (hard data)
Time required to start a business (hard data)
Education expenditure (hard data)
Strength of investor protection (hard data)
Secondary enrollment (hard data)
Cooperation in labor-employer relations
Tertiary enrollment (hard data)
Flexibility of wage determination
Quality of the educational system
Hiring and firing practices
Source: IEG.

1 0 9
APPENDIX J. NUMBER OF IDA AND IBRD COUNTRIES FOR WHICH EXTERNAL DATA ARE AVAILABLE

11
0
TH
E W
OR
LD
BA
NK
’S C
OU
NT
RY
PO
LIC
Y A
ND
INS
TIT
UT
ION
AL
AS
SE
SS
ME
NT
CPIA ICRG GCI ETI DB
Bertelsmann Transformation
Index
Index ofEconomic Freedom WGI
Corruption Perception
Index
Ibrahim Index of African
Governance
Environmental Sustainability
IndexGender Gap
Index
GenderEmpowerment
Measure
q1 IDAIBRD
q2 IDAIBRD
q3 IDAIBRD
q4 IDA 39 37IBRD 52 48
q5 IDA 39 75IBRD 52 64
q6 IDA 38 37 75 56 55 75IBRD 52 48 64 55 59 65
q7 IDA 40 17IBRD 53 43
q8 IDAIBRD
q9 IDA 39IBRD 52
q10 IDA 56IBRD 55
q11 IDA 57IBRD 53
q12 IDA 42 40 56 55 75IBRD 53 52 55 59 65
q13 IDAIBRD
q14 IDAIBRD
q15 IDA 42 75IBRD 53 65
q16 IDA 42 56 55 75 74 38IBRD 53 55 59 65 61 8
Source: IEG. Note: DB= Doing business; ETI=Enabling Trade Index; GCI= Global Competitiveness Index; IBRD= International Bank for Reconstruction and Development; ICRG= International Country Risk Guide; IDA= International Development Association; WGI= World Governance Indicators.

1 1 1
APPENDIX K. COMMENTS BY NETWORK ON REGIONAL CPIA RATING PROPOSALS, 2007
CPIA criterion
IBRD IDA Total
Number of network
comments
Share of countries
with network comments
(%)
Number of network
comments
Share of countries
with network comments
(%)
Number of network
comments
Share of countries
with network comments
(%)
q1 59 90.8 62 82.7 121 86.4
q2 59 90.8 62 82.7 121 86.4
q3 59 90.8 62 82.7 121 86.4
q4 43 66.2 37 49.3 80 57.1
q5 10 15.4 8 10.7 18 12.9
q6 7 10.8 7 9.3 14 10.0
q7 16 24.6 25 33.3 41 29.3
q8 12 18.5 10 13.3 22 15.7
q9 50 76.9 48 64.0 98 70.0
q10 34 52.3 38 50.7 72 51.4
q11 4 6.2 7 9.3 11 7.9
q12 13 20.0 11 14.7 24 17.1
q13 10 15.4 19 25.3 29 20.7
q14 14 21.5 13 17.3 27 19.3
q15 7 10.8 6 8.0 13 9.3
q16 10 15.4 14 18.7 24 17.1
Total 407 39.1 429 35.8 836 37.3
Source: IEG calculations based on World Bank information. Note: IBRD= International Bank for Reconstruction and Development;; IDA= International Development Association.

1 1 2
Elephants, Kenya. Photo by Curt Carnemark/World Bank

1 1 3
Chapter 21. These are some of the key elements of the
so-called Washington Consensus view.
2. The point of view of Rodrik and others seems to
be accepted by the majority of the economists today
(even if this consensus is obviously quite recent).
Aghion and Howitt (2009) reconcile new growth theory
with what they call “Gerschenkron’s views,” thereby
addressing development economists’ concern that
growth theory can only deliver universal, one-size-
fits-all policy prescriptions (legal reform to enforce
property rights, investment climate favorable to
entrepreneurship, education, macrostability, and so
on) to maximize the growth prospects of a country
or sector, and does not apprehend structural transfor-
mations in the process of convergence. (New growth
theory calls for better property rights protection and
higher education investment in all countries under all
latitudes. Gerschenkron’s view is the idea that relatively
backward economies could more rapidly catch up with
more advanced economies by introducing appropriate
institutions that are growth enhancing at an early stage
of development but may cease to be so at a later stage).
More specifically, they analyze some general implica-
tions of the notion of “distance-dependent” appropri-
ate institutions, by which they mean institutions that are
growth enhancing only for countries at a certain stage
of technological development. In particular, they show
how the failure to adapt institutions to technological
development may generate non-convergence traps
whereby a country’s average productivity (or per capita
GDP) remains bounded away from frontier levels.
3. The theoretical and empirical analyses of
Vandenbussche, Aghion, and Meghir (2006) suggest
that countries with productivities far from the techno-
logical frontier should put more emphasis on primary/
secondary education, whereas countries closer to
the frontier should put more emphasis on tertiary
education.
Chapter 11. This is an evaluation of the implementation of
the IDA10–12 Replenishment Agreements.
2. The previous name of the Independent Evalua-
tion Group (IEG) name was the Operations Evaluation
Department (OED). The name changed from OED to
IEG in December 2005. Relevant documents pertain-
ing to the CPIA and other evaluations from the earlier
period may still be catalogued under OED in some
databases.
3. The external panel consisted of nine academics
and public officials from developed and developing
countries. The panel met at the Bank on February
17–18, 2004, and reviewed the coverage of the CPIA
system, methodology, database, and cross-country
comparability. The panel submitted its final report to
Management on April 2, 2004. See World Bank 2004a.
4. The cluster was renamed from “public finance/
civil administration” in 1997.
5. The criteria on financial stability and financial
sector depth, efficiency and resource mobilization
were collapsed into a new financial sector criterion,
and the competitive environment for the private
sector and goods and factor markets criteria were
collapsed into the new business regulatory environ-
ment criterion.
6. One of these is the criterion on management
and sustainability of the development program,
which is covered in almost all of the other criteria. The
other is the criterion on monitoring and analysis of
poverty outcomes and impacts. This criterion covers
the availability of up-to-date household surveys and
analysis, which is necessary for the criterion on equity
of public resource use, and the criterion on building
human resources. (World Bank 2004d).
7. There were some changes in the instructions
for some criteria mainly aimed at reducing overlap
between criteria, and improving consistency.
8. World Bank (2008e, annex 1, p. 2).
ENDNOTES

1 1 4
T H E W O R L D B A N K ’ S C O U N T RY P O L I C Y A N D I N S T I T U T I O N A L A S S E S S M E N T
from The World Bank’s internal database. Because the
simulations focused on changes in allocations, they
did not require data on the overall IDA envelope.
13. In fiscal 2009, the post-conflict countries are
Afghanistan, Angola, Burundi, Democratic Republic
of Congo, Republic of Congo, Côte d’Ivoire, Eritrea,
Liberia, and Timor-Leste. The re-engaging countries
are Central African Republic, Haiti, and Togo. The
capped countries are India and Pakistan.
14. References are cited in Kanbur (2004).
15. A 1 percent rate of growth in average household
income or consumption brought anything from a
modest drop in the poverty rate of 0.6 percent to a
more dramatic 3.5 percent annual decline. (Ravallion
2001).
16. This is a term coined by Ghura, Leite, and
Tsangarides (2002).
17. Besley and Burgess (2003) underline that
expanding access to credit for the poor may increase
the elasticity between economic growth and poverty
reduction, in addition to being a form of redistribution.
18. Honahan (2004b), based on analysis of a cross-
section of some 70-odd developing countries.
19. According to Winters, McCulloch, and McKay
(2004), these channels are: (i) job opportunities and
wages of the poor; (ii) prices that poor consumers
pay for the goods they buy; (iii) government revenues
and in turn social expenditures; (iv) income instabil-
ity and workers’ chances of becoming poor. Goldberg
and Pavcnik (2004) identify three other channels:
(i) participation of household members in the
labor market; (ii) household consumption; and (iii)
household production.
20. Porto (2005) shows that reducing such barriers
would reduce poverty from an initial headcount ratio
of 48.3 percent to a poverty rate from 43.3 to 45.5
percent. In other words, it would lift between 100,000
to 180,000 Moldovan citizens (out of a population of
3.5 million) out of poverty.
21. Notably, this has followed Amartya Sen’s work
on poverty and freedom (Sen 1997, 1999).
22. It is recognized that economic development
encompasses more dimensions than just growth,
although growth is certainly the key dimension, and
moreover the only dimension for which a theoreti-
cal foundation exists. Poverty reduction is another
dimension of economic development, and it is also
recognized that although growth is not sufficient
for poverty reduction, it is necessary. Therefore, the
4. See Aghion and Howitt (2009) for a discussion.
For the neoclassical and endogenous growth theories,
it is investment in physical and human capital that
drives growth, whereas for the product variety and
Schumpeterian theories, it is investment in technology
(in the form of research). In the hybrid model, invest-
ment in capital and technology are both important.
5. The discussion in this paragraph is drawn from
World Bank (2008a).
6. Bourguignon (2004) indicated that a serious
evaluation of Mexico’s PROGRESA/Oportunidades and
Brazil’s Bolsa Escola/Bolsa Families, essentially means-
tested income transfer programs with conditionalities,
finds that these programs were effective in raising
school enrollment rates and health outcomes in
targeted populations. The sources cited for this were
Skoufias (2001) on PROGRESA, and Bourguignon,
Ferreira, and Leite (2003) on Bolsa Escola; and World
Bank (2004g).
7. This has especially been the case with East
Asian countries. See World Bank (1993).
8. An early study of Grameen Bank finds that it
generated employment and income for the poor,
especially women (Hossain 1988). The most compre-
hensive impact studies of microfinance, a joint research
project of the Bangladesh Institute of Development
Studies and the World Bank find strong evidence that
the programs help the poor through asset building
(and consumption smoothing) (Khandker 1998; Pitt
and Khandker 2003).
9. A very recent paper (Freund and Rocha 2010)
estimates that for African exports, a one-day reduction in
inland travel times translates into nearly a 3 percentage
point reduction in all importing country tariffs.
10. This is in accordance with the so-called Lerner’s
symmetry, whereby taxing imports has the same effect
on international trade as taxing exports.
11. The phenomenon is called the “environmental
Kuznets curve” whereby pollution levels, initially fairly
low, rise as national income increases up to a certain
point, then begin to decline with further economic
growth as cleaner technologies are adopted and
environmental sanitation infrastructure investments
begin to catch up with expanding local needs (IEG
2008, chapter 1, footnote 3).
12. The allocations were calculated using the PBA
formula. The GNI per capita and population data are
from World Development Indicators, and the portfo-
lio performance ratings are constructed using data

1 1 5
E N D N O T E S
30. Such problems include difficulties with: (i)
accounting for endogeneity (in particular, which
instruments to use); (ii) the specification of the regres-
sion equation (including the timing of the impact of
aid on growth); and (iii) the treatment of outliers; data
limitations, among others.
31. Headey (2005) and Reddy and Minoiu (2006)
find that multilateral or developmental aid has a
positive impact on growth, whereas geopolitical and
bilateral aid do not (except for bilateral aid that is not
politically motivated). Ram (2003) finds that bilateral
but not multilateral aid has a large and positive impact
on growth (although this paper has been criticized for
not taking the endogeneity of aid into account).
32. Clemens, Radelet, and Bhavnani (2004) also
find that the impact on growth is somewhat larger
in countries with stronger institutions or longer life
expectancies.
33. The concept of such evaluations originates
from the scientific/medical realm of randomized trials,
whereby the effects of medicines are tested by compar-
ing the group of patients who received the medicine
with a group who received the placebo. The selection
of the “comparable” group is therefore key and, in the
context of aid project evaluations, needs to ensure that
the differential effects between the two groups could
not be due to some characteristic of the recipient
group that is not present in the control group.
34. A request made by the IEG team to the network
on April 23, 2009, for the number of responses to the
environment questionnaire for 2008 was not answered.
35. This is constructed by applying the relevant
weights to the ratings for market access and border
administration, respectively, of the Enabling Trade
Index.
36. Although the rank correlation coefficient with
one based on the Global Competitiveness Index (GCI)
will remain unchanged at 0.70. The one based on the
GCI is constructed by applying the relevant weights to
the combined rating for tariffs and trade barriers (50
percent each) and the rating for burden of customs
administration.
37. As in the simulation on dropping q8, this
simulation is conducted based on a CPIA implied by
the IDA allocation formula—that is, 25 percent weight
given to CPIA clusters A through C, and 75 percent
weight on cluster D.
38. There is room for debate as to the causality
between every banking crisis and output losses, as
discussion on the theoretical and empirical literature
of the impact of aid on growth also pertains to the
impact of aid on reduction of income poverty.
23. These are the Harrod-Domar model and its
extension the Solow growth model.
24. Boone (1994). According to Clemens, Radelet,
and Bhavnani (2004), parts of the analysis of Boone
(1994) were published in Boone (1996) without the
growth regressions.
25. The exception was small countries, where aid
flows which made up a large share of GDP were found
to lead to higher investments, which Boone attributed
to the lack of fungibility of aid flows. Boone provided
an example that in a small country one dam or a large
public infrastructure project can represent a sizeable
portion of GNP, and the project is unlikely to be fungible.
26. Other innovations in this later generation of
empirical literature include: larger datasets that cover
more countries and more years; accounting for the
endogeneity of aid (that is, in addition to growth
being an outcome of aid, aid can also be influenced by
the growth performances of countries); and allowing
for a non-linear aid-growth relationship (in particular
diminishing returns to aid, or in other words, decreas-
ing impact of aid on growth after reaching a point of
maximum impact).
27. In Burnside and Dollar (1997, 2000), fiscal
policy is measured by the budget surplus (following
Easterly and Rebelo 1993), monetary policy by the
inflation rate (following Fischer 1993) and trade by
trade openness (as measured by Sachs and Warner
1995).
28. Including the relative size of the donor versus
the recipient (the larger the ratio, the greater the
influence, and presumably the larger amounts of aid),
commonality of language, and colonial ties (either
current or past).
29. Roodman (2007a). He performed the tests on
Burnside and Dollar (2000), Collier and Dehn (2001),
Collier and Dollar (2002), Collier and Hoeffler (2004),
Hansen and Tarp (2001), Dalgaard, Hansen, and Tarp
(2004), and Guillaumont and Chauvet (2001). The
tests were designed to minimize arbitrariness and
were derived mainly from the differences among the
papers themselves. The tests included: (i) changing
the control set (using the control sets of other papers
being tested); (ii) redefining aid; (iii) redefining good
policy; (iv) changing periodization; (v) changing
outliers; and (vi) expanding the sample.

1 1 6
T H E W O R L D B A N K ’ S C O U N T RY P O L I C Y A N D I N S T I T U T I O N A L A S S E S S M E N T
global integrity indicators produced by Global Integrity
that rate the budget process, and the Open Budget
Index produced by the Open Budget Initiative that rates
the transparency of the budget. However, both these
indicators comprise only part of what is being assessed
under q13, so are not strictly comparable with q13, and
hence the team did not include them as comparators.
4. Rank correlations are used instead of pair-wise
correlations for comparing the different indicators
because of the less restrictive assumption underlying
rank correlations (they do not require the assump-
tion of a linear relationship between the indica-
tors). Nonetheless, the IEG team for this evaluation
performed both types of correlations and obtained
very similar results from them.
5. A better correlation denotes a rank correlation
coefficient that is at least 5 percent higher.
6. Ratings from ADB are excluded from this
comparison because only 3 IBRD countries are rated
by ADB, whereas 12 are rated by AfDB.
Appendix F1. There is room for debate as to the causality
between every banking crisis and output losses, as
there have certainly been instances in the past where
fiscal or political crises have triggered banking crises,
such as Argentina in 1981, in the transition countries,
and in several African countries.
2. At the same time, however, what evidence there
is does not suggest that crises systematically worsen
the Gini coefficient (Honohan 2004a), that is, that
banking crises have a disproportionate effect on the
poor, although the poor are likely less able than others
to absorb adverse shocks.
3. Stress tests model the impact of extreme but
plausible shocks, and measure the capacity of banks to
absorb the shocks with available liquidity and capital.
4. One is the stock of NPLs as a share of total loans;
the other, the “level of capital at risk,” is a net figure
which subtracts provisions already taken against these
NPLs.
Appendix G1. For loans approved from 1998 onward, the
correlation between the share of problem projects in a
country and the share of loans receiving an unsatisfac-
tory IEG outcome rating for that country is 0.63.
2. The level of per capita GDP was not included
as a control variable due to its high correlation with
there have certainly been instances in the past where
fiscal or political crises have triggered banking crises,
such as Argentina in 1981, in the transition countries,
and in several African countries.
39. At the same time, however, what evidence
there is does not suggest that crises systematically
worsen the Gini coefficient (Honohan 2004a), that is,
that banking crises have a disproportionate effect on
the poor, although the poor are likely less able than
others to absorb adverse shocks.
40. One is the stock of NPLs as a share of total
loans; the other, the “level of capital at risk,” is a net
figure which subtracts provisions already taken against
these NPLs.
Chapter 31. For the criteria on gender (q7), property rights
and rule-based governance (q12), and quality of
budgetary and financial management (q13), the
2007 AfDB questionnaire is identical to the pre-2005
Bank CPIA questionnaire that has since been updated,
although the differences are not substantial. Further,
the Bank’s ratings for the criterion on policies and
institutions for environmental sustainability (q11)
are relatively stringent compared with those of the
AfDB. For example, the Bank gives a “1” rating on q11
if “For both pollution and natural resource issues:
regulations and policies are lacking. Environmental
information is not published. Environmental Assess-
ment legislation is lacking. No data are available for
priority setting. Sector ministries do not incorporate
environmental concerns.” A “1” rating is given by AfDB
if “For two years or more, government policies have a
negative effect on environment (for example agricul-
ture policies that stimulate expansion into marginal
land or tropical forest; subsidized prices on the exploi-
tation of scarce and/or non-renewable resources).
Government has no environmental action plans or
similar national framework, and no institutions to
sustainably manage the environment and support the
various dimensions of sustainable development.”
2. It is difficult to find good comparators for
the economic management criteria because both
outcomes and policies are taken into account in the
CPIA ratings, whereas other indicators focus only on
outcomes (such as the economic risk index produced
by the International Country Risk Guide).
3. The IEG team examined two indicators that are
possible comparators for q13. These are one of the

1 1 7
E N D N O T E S
and Aid to GDP variable were instrumented using the
share of population speaking English, the share of
population speaking a continental European language,
distance from equator, level of population, and each of
the above four instruments multiplied by population
(see Dollar and Levin 2005). The first-stage regressions
suggest that the instruments are weak (the F-statis-
tics are relatively low). The Durbin-Wu-Hausman
test for endogeneity suggests that both variables are
exogenous and the OLS estimates are consistent.
the overall CPIA rating. The percent of problem loans
might also depend on the quality of the Bank staff
working on those loans; ratings on task team quality
are provided by the Quality Assurance Group (QAG)
in its quality at entry ratings for loans. However, due
to limited data availability, the quality of Bank staff was
not included as a control variable.
3. To account for the possible endogeneity of both
the CPIA ratings and the Aid to GDP variable, two-stage
least square specifications were estimated. The CPIA

1 1 8
Women preparing food, Nigeria. Photo by Curt Carnemark/World Bank

1 1 9
REFERENCES
Development on Convergence: Theory and
Evidence.” Quarterly Journal of Economics
120 (1): 173–222.
Ahmad, Ehtisham, and Nicholas Stern. 1987.
“Alternative Sources of Government Revenue:
Illustrations from India, 1979–80.” In The
Theory of Taxation for Developing Countries.
David M. G. Newbery, and Nicholas H. Stern
(editors), New York: Published for The World
Bank by Oxford University Press.
Ahrend, Rudiger. 2001. “Press Freedom, Human
Capital and Corruption.” Mimeo.
Alesina, Alberto. 1997. “Politics, Procedures and
Budget Deficits.” Background Paper prepared
for The World Development Report 1997.
World Bank, Washington, DC.
Alesina, Alberto, and George-Marios Angeletos.
2005. “Corruption, Inequality and Fairness.”
National Bureau of Economic Research
(NBER) Working Paper No. 11399.
Alesina, Alberto, and Roberto Perotti. 1996.
“Income Distribution, Political Instability, and
Investment.” European Economic Review 40
(6): 1203–28.
Alesina, Alberto, and Dani Rodrik. 1994.
“Distributive Politics and Economic Growth.”
Quarterly Journal of Economics 109 (2):
465–90.
Alesina, Alberto, and Beatrice Weder. 2002. “Do
Corrupt Governments Receive Less Foreign
Aid?” The American Economic Review 92 (4):
1126–37.
Alesina, Alberto, Arnaud Devleeschauwer,
William Easterly, Sergio Kurlat, and Romain
Wacziarg. 2003. “Fractionalization.” Journal
of Economic Growth 8 (2): 155–94.
Ames, Brian, Ward Brown, Shanta Devarajan, and
Alejandro Izquierdo. 2001. “Macroeconomic
Policy and Poverty Reduction.” Prepared by
Acemoglu, Daron, and Simon Johnson. 2007.
“Disease and Development: The Effect of Life
Expectancy on Economic Growth.” Journal
of Political Economy 115 (61): 925–985.
Acemoglu, Daron, and James A. Robinson. 2000.
“Political Losers as a Barrier to Economic
Development.” American Economic Review
Papers and Proceedings 90: 126–44.
Acemoglu, Daron, and Thierry A. Verdier. 2000.
“The Choice Between Market Failures and
Corruption.” American Economic Review 90
(1): 194–211.
———. 2001. “The Colonial Origins of Compar-
ative Development: An Empirical Investi-
gation.” American Economic Review 91
(5): 1369–401.
Acemoglu, Daron, Simon Johnson, and James A.
Robinson. 2005. “The Rise of Europe: Atlantic
Trade, Institutional Change, and Economic
Growth.” American Economic Review 95 (3):
546–79.
Adsera, Alicia, Carles Boix, and Mark Payne. 2003.
“Are You Being Served? Political Accountabil-
ity and Quality of Government.” Journal of
Law, Economics, & Organization 19 (2):
445–90.
Agenor, Pierre-Richard. 2004. “Does Globaliza-
tion Hurt the Poor?” International Econom-
ics and Economic Policy 1 (1): 21–51.
Aghion, Philippe, and Peter Howitt. 2009. The
Economics of Growth. Cambridge, Mass.: The
MIT Press.
Aghion, Philippe, Eve Caroli, and Cecilia García-
Peñalosa. 1999. “Inequality and Economic
Growth: The Perspective of the New Growth
Theories.” Journal of Economic Literature
37 (4): 1615–60.
Aghion, Philippe, Peter Howitt, and David
Mayer-Foulkes. 2005. “The Effect of Financial

1 2 0
T H E W O R L D B A N K ’ S C O U N T RY P O L I C Y A N D I N S T I T U T I O N A L A S S E S S M E N T
Balat, Jorge, Irene Brambilla, and Guido Porto.
2007. “Realizing the Gains from Trade: Export
Crops, Marketing Costs, and Poverty.” NBER
Working Paper No. 13395.
Banerjee, Abhijit, Paul Gertler, and Maitresh
Ghatak. 2002. “Empowerment and Efficiency:
Tenancy Reform in West Bengal.” The Journal
of Political Economy 110 (2): 239–80.
Banerjee, Abhijit, Shawn Cole, Esther Duflo, and
Leigh Linden. 2005. “Remedying Education
Evidence from Two Randomized Experiments
in India.” NBER Working Paper No. 11904.
———. 2007. “Remedying Education: Evidence
from Two Randomized Experiments in India.”
Quarterly Journal of Economics, 122 (3):
1235–64.
Bardhan, Pranab. 1997. “Corruption and
Development: A Review of Issues.” Journal
of Economic Literature 35 (3): 1320–46.
———. 2000. “Social Justice in the Global
Economy.” International Labor Organiza-
tion Social Policy Lecture, University of the
Western Cape, South Africa. September 1–6.
———. 2006a. “The Economist’s Approach to
the Problem of Corruption.” World Develop-
ment 34 (2): 341–48.
———. 2006b. “Institutional Economics of
Development: Some General Reflections.”
Opening Lecture at CESifo/BREAD Confer-
ence on Institutional Economics at San
Servolo, Italy.
———. 2006c. “Institutions, Trade and Develop-
ment.” Paper prepared for UNCTAD, Geneva,
Switzerland.
Barham, Vicky, Robin Boadway, Maurice March-
and, and Pierre Pestieau. 1995. “Education
and the Poverty Trap.” European Economic
Review 39 (7): 1257–75.
Barro, Robert. 1999. “Determinants of Democra-
cy.” Journal of Political Economy 107 (6) 2.
———. 2003. “Determinants of Economic
Growth in a Panel of Countries.” Annals of
Economics and Finance 4: 231–74.
Barro, Robert, and Xavier Sala-i Martin. 2003.
Economic Growth. Cambridge, Mass.: The
MIT Press.
Barth, James, Gerard Caprio, and Ross Levine.
2006. Rethinking Bank Regulation: Till Angels
Govern. New York: Cambridge University Press.
The International Monetary Fund and The
World Bank.
Anderson, Kym. 2003. “Trade Liberalization,
Agriculture, and Poverty in Low-income
Countries.” WIDER Discussion Paper No.
2003/25. United Nations University.
Andvig, Jens, and Odd-Helge Fjeldstad. 2008.
“Crime, Poverty and Police Corruption in
Developing Countries.” Christian Michelsen
Institute (CMI) Working Paper No. 2008:7.
Angrist, Joshua, Eric Bettinger, and Michael
Kremer. 2006. “Long-Term Educational
Consequences of Secondary School Vouchers:
Evidence from Administrative Records in
Colombia.” American Economic Review 96
(3): 847–62.
Angrist, Joshua, Eric Bettinger, Erik Bloom,
Elizabeth King, and Michael Kremer. 2002.
“Vouchers for Private Schooling in Colombia:
Evidence from a Randomized Natural Experi-
ment.” American Economic Review 92 (5):
1535–58.
Ashraf, Nava, James N. Berry, and Jesse Shapiro.
2007. “Can Higher Prices Stimulate Product
Use? Evidence from a Field Experiment in
Zambia.” NBER Working Paper No. 13247.
Ashraf, Quamrul, Ashley Lester, and David Weil.
2008. “When Does Improving Health Raise
GDP?” NBER Working Paper No. 14449.
Ayers, Robert. 1997. “Crime and Violence as
Development Issues in Latin America and the
Caribbean.” Paper prepared for a World Bank
Seminar on Urban Criminal Violence, Rio de
Janeiro, March 2–4.
Ayyagari, Meghana, Asli Demirguc-Kunt, and
Vojislav Maksimovic. 2007. “Firm Innovation
in Emerging Markets: Role of Governance and
Finance.” Policy Research Working Paper No.
4157. World Bank, Washington, DC.
Azfar, Omar, Young Lee, and Anand Swamy. 2001.
“The Causes and Consequences of Corrup-
tion.” Annals of the American Academy of
Political and Social Science 573: 42–56.
Bahl, Roy, and Richard Bird. 2008. “Tax Policy
in Developing Countries: Looking Back
and Forward.” Institute for International
Business Working Paper No. 13. Joseph L.
Rotman School of Management, University
of Toronto.

1 2 1
R E F E R E N C E S
Bettinger, Eric, Michael Kremer, and Juan
Saavedra. 2008. “Are Educational Vouchers
Only Redistributive?” Draft, prepared for the
CESifo/PEPG joint conference “Economic
Incentives: Do They Work in Education?”
Munich, Germany, May 16–17.
Bird, Richard. 2003. “Administrative Dimensions
of Tax Reform.” International Tax Program
Paper No. 0302. Joseph L. Rotman School of
Management, University of Toronto.
———. 2005. “Value-Added Taxes in Develop-
ing and Transitional Countries: Lessons and
Questions.” International Tax Program Paper
No. 0505. Joseph L. Rotman School of Manage-
ment, University of Toronto.
———. 2008. “Tax Challenges Facing Develop-
ing Countries.” Institute for International
Business Working Paper No. 12.
Bird, Richard, and Duanjie Chen. 1998. “The
Fiscal Framework for Business in Asia.” In
Fiscal Framework and Financial System
in East Asia: How Much Do They Matter?,
Wendy Dobson (ed.). Toronto: University of
Toronto Press.
Bird, Richard, and Pierre-Pascal Gendron. 2006.
“Is VAT the Best Way to Impose a General
Consumption Tax in Developing Countries?”
International Tax Program Paper No. 0602.
Joseph L. Rotman School of Management,
University of Toronto.
———. 2007. The VAT in Developing and Transi-
tional Countries. New York: Cambridge
University Press.
Bird, Richard, and Barbara Miller. 1989. “The
Incidence of Indirect Taxation on Low-Income
Households in Jamaica.” Economic Develop-
ment and Cultural Change 37 (2): 393–409.
Bird, Richard, and Enid Slack. 2002. “Land and
Property Taxation around the World: A
Review.” Journal of Property Tax Assessment
and Administration 7 (3): 31–80.
Bird, Richard, and Eric Zolt. 2007. “Tax Policy
in Emerging Countries.” International Tax
Program Paper No. 0707. Joseph L. Rotman
School of Management, University of Toronto.
Bjorkman, Martina, and Jakob Svensson. 2009.
“Power to the People: Evidence from a
Randomized Field Experiment of Community-
Based Monitoring in Uganda.” Policy Research
Beck, Paul, and Michael Maher. 1986. “A Compari-
son of Bribery and Bidding in Thin Market,”
Economics Letters 20: 1–5.
Beck, Thorsten, Asli Demirguc-Kunt, and Ross
Levine. 2004. “Finance, Inequality, and
Poverty: Cross-Country Evidence.” NBER
Working Paper No. 10979.
———. 2005. “Law and Firms’ Access to Finance.”
American Law and Economics Review 7 (1):
211–52.
Becker, Gary, and George Stigler. 1974. “Law
Enforcement, Malfeasance and the Compen-
sation of Enforcers.” Journal of Legal Studies
3 (1): 1–19.
Bell, Clive, Shantayanan Devarajan, and Hans
Gersbach. 2006. “The Long-Run Economic
Costs of AIDS: A Model with an Application
to South Africa.” The World Bank Economic
Review 20 (1): 55–89.
Berger, Allen N., W. Scott Frame, and Nathan H.
Miller. 2005. “Credit Scoring and the Availabil-
ity, Price, and Risk of Small Business Credit.”
Journal of Money, Credit, and Banking 37
(2): 191–222.
Besley, Timothy. 1995. “Property Rights and
Investment Incentives: Theory and Evidence
from Ghana.” The Journal of Political
Economy 103 (5): 903–37.
Besley, Timothy, and Robin Burgess. 2000. “Land
Reform, Poverty Reduction, and Growth:
Evidence from India.” Quarterly Journal of
Economics 115 (2): 389–430.
———. 2002. “The Political Economy of Govern-
ment Responsiveness: Theory and Evidence.”
Quarterly Journal of Economics 117 (4):
1415–51.
———. 2003. “Halving Global Poverty.” The
Journal of Economic Perspectives 17 (3):
3–22.
Besley, Timothy, and Anne Case. 1995. “Does
Electoral Accountability Affect Economic
Policy Choices? Evidence from Gubernatorial
Term Limits.” Quarterly Journal of Econom-
ics 110 (3): 769–98.
Besley, Timothy, Robin Burgess, and Andrea Prat.
2002. “Mass Media and Political Accountabil-
ity.” In The Right to Know: Institutions and
the Media, Roumeen Islam (ed.). World Bank,
Washington, DC.

1 2 2
T H E W O R L D B A N K ’ S C O U N T RY P O L I C Y A N D I N S T I T U T I O N A L A S S E S S M E N T
simulating Brazil’s Bolsa Escola Program.”
World Bank Economic Review 17 (2).
Bovenberg, A. Lans, and Sjak Smulders. 1995.
“Environmental Quality and Pollution-
Augmenting Technical Change in a Two-Sector
Endogenous Growth Model.” Journal of
Public Economics 57 (3): 369–91.
———. 1996. “Transitional Impacts of Environmen-
tal Policy in an Endogenous Growth Model.”
International Economic Review 37 (4): 861–93.
Braithwaite, Valerie. 2003. Taxing Democracy.
Understanding Tax Avoidance and Evasion.
Aldershot and Burlington, VT: Ashgate.
Brautigam, Deborah. 2000. Aid Dependence and
Governance. Stockholm: Almqvist & Wiksell.
International for the Swedish Ministry of
Foreign Affairs.
Breen, Richard, and Cecilia García-Peñalosa.
2005. “Income Inequality and Macroeconomic
Volatility: An Empirical Investigation.” Review
of Development Economics 9 (3): 380–98.
Brown, Michael, Tulio Jappelli, and Marco
Pagano. 2009. “Information Sharing and
Credit: Firm-Level Evidence from Transition
Countries.” Journal of Financial Interme-
diation 18 (2): 151–72.
Brunetti, Aymo, and Beatrice Weder. 1999. “A Free
Press is Bad News for Corruption.” Mimeo.
Basel, Switzerland: University of Basel.
Burgess, Robin, and Rohini Pande. 2005. “Do
Rural Banks Matter? Evidence from the Indian
Social Banking Experiment.” American
Economic Review 95 (3): 780–95.
Burgess, Robin, and Nicholas Stern. 1993.
“Taxation and Development.” Journal of
Economic Literature 31 (2): 762–830.
Burnside, Craig, and David Dollar. 1997. “Aid,
Policies, and Growth.” Policy Research
Working Paper No. 1777. World Bank,
Washington, DC.
———. 2000. “Aid, Policies, and Growth.”
American Economic Review 90 (4): 847–68.
———. 2004. “Aid, Policies, and Growth: Reply.”
American Economic Review 94 (3): 781–84.
Buvinic, Mayra, and Andrew R. Morrison. 2000.
“Living in a More Violent World.” Foreign
Policy 118: 58–72.
Buvinic, Mayra, Andrew R. Morrison, and Michael
Shifter. 1998. “Violence in Latin America and
Working Paper No. 4268. World Bank,
Washington, D.C.
Bloom, David E. and Ajay S. Mahal. 1995. “Does
the AIDS Epidemic Really Threaten Economic
Growth?” NBER Working Paper No. 5148.
———. 1997. “Does the AIDS Epidemic Threaten
Economic Growth?” Journal of Econometrics
77 (1): 105–24.
Bobonis, Gustavo J., Edward Miguel, and Charu
Puri-Sharma. 2006. “Anemia and School Partic-
ipation.” Journal of Human Resources 41
(4): 692–721.
Bodewig, Christian, and Akshay Sethi. 2005.
Poverty, Social Exclusion and Ethnicity in
Serbia and Montenegro: The Case of Roma.
World Bank, Washington, DC.
Boex, L., F. Jameson, Jorge Martinez-Vazquez,
and Robert McNab. 2000. “Multi-Year Budget-
ing: A Review of International Practices and
Applications for Developing and Transitional
Economies.” Public Budgeting and Finance
20 (2).
Boone, Peter. 1994. “The Impact of Foreign Aid
on Savings and Growth.” Center for Economic
Performance Working Paper No. 677, London
School of Economics.
———. 1996. “Politics and the Effectiveness of
Foreign Aid.” European Economic Review 40
(2): 289–329.
Boskin, Michael. 2006. “Eight Lessons for Public
Finance in Developing Economies.” China
Development Forum, State Council of the
PRC, Beijing, March.
Bourguignon, Francois. 1998. “Crime as a Social
Cost of Poverty and Inequality: A Review
Focusing on Developing Countries.” DELTA,
Paris. Mimeo.
———. 1999. “Crime, Violence and Inequita-
ble Development.” Paper prepared for the
Annual World Bank Conference on Develop-
ment Economics, Washington, D.C., April
28–30.
———. 2004. “The Poverty-Growth-Inequality
Triangle.” Paper presented at the Indian
Council for Research on International
Economic Relations, New Delhi, February 4.
Bourguignon, Francois, Francisco Ferreira, and
Phillippe Leite. 2003. “Conditional Cash
Transfers, Schooling and Child Labor: Micro-

1 2 3
R E F E R E N C E S
Review of Recent Literature.” United States
Agency for International Development
(USAID) Final Report.
Chhibber, Ajay, and Gaurav Nayyar. 2007.
“Pro-Poor Growth: Explaining the Cross-
Country Variation in the Growth Elasticity
of Poverty.” Brooks World Poverty Institute
(BWPI) Working Paper No. 14, The University
of Manchester.
Chong, Alberto, and Cesar Calderon. 2000.
“Causality and Feedback between Institutional
Measures and Economic Growth.” Econom-
ics and Politics 12 (1): 69–81.
Christiaensen, Luc, Lionel Demery, and Stefano
Paternostro. 2002. “Growth, Distribution, and
Poverty in Africa: Messages from the 1990s.”
Policy Research Working Paper No. 2810.
World Bank, Washington, DC.
Clemens, Michael, Steven Radelet and Rikhil
Bhavnani. 2004. “Counting Chickens when
They Hatch: The Short Term Effect of Aid
on Growth.” Center for Global Development
Working Paper No. 44.
Cnossen, Sijbren. 2004. “VAT in South Africa:
What Kind of Rate Structure?” International
VAT Monitor 15 (1): 19–24.
Collier, Paul. 2007. The Bottom Billion: Why the
Poorest Countries Are Failing and What
Can Be Done About It. New-York and Oxford:
Oxford University Press.
Collier, Paul, and Jan Dehn. 2001. “Aid, Shocks
and Growth.” Policy Research Working Paper
No. 2688. World Bank, Washington, DC.
Collier, Paul, and David Dollar. 2002. “Aid Alloca-
tion and Poverty Reduction.” European
Economic Review 46 (8): 1475–1500.
———. 2004. “Development Effectiveness.”
Economic Journal 114 (496): F244–F271.
Collier, Paul, and Anke Hoeffler. 2002. “Aid,
Policy and Peace: Reducing the Risks of Civil
Conflict.” Journal of Defense Economics and
Peace 13 (6): 435–50.
———. 2004. “Aid, Policy and Growth in
Post-Conflict Societies.” European Economic
Review 48 (5): 1125–45.
Conley, Timothy G., and Christopher R. Udry. 2007.
“Learning About a New Technology: Pineapple
in Ghana.” Economic Growth Center Discus-
sion Paper No. 817, Yale University.
the Caribbean: A Framework for Action.” Paper
presented at an Inter-American Develop-
ment Bank (IDB) Seminar on “Building
Peaceful Societies: A Framework for Action.”
Cartagena, Columbia.
Cagé, Julia. 2009a. “Literature Review for a
Special Study by the Independent Evaluation
Group on the Country Policy and Institutional
Assessment of The World Bank.” Background
Paper for this CPIA evaluation.
———. 2009b. “Asymmetric Information,
Rent Extraction and Aid Efficiency.” Agence
Française de Développement Working Paper.
Calderon, Cesar, and Luis Serven. 2003. “The
Output Cost of Latin America’s Infrastruc-
ture Gap.” In The Limits of Stabilization:
Infrastructure, Public Deficits and Growth
in Latin America, William Easterly and Luis
Serven (editors). Palo Alto, CA: Stanford
University Press, and The World Bank.
———. 2004. “The Effects of Infrastructure
Development on Growth and Income Distri-
bution.” Policy Research Working Paper No.
3400. World Bank, Washington, DC.
Call, Charles. 2000. “Sustainable Development in
Central America: The Challenges of Violence,
Injustice and Insecurity.” Hamburg Institut für
Iberoamerika-Kunde, CA 2020 Working Paper
No. 8.
Campos, Edgardo, and Sanjay Pradhan. 1996.
“Budgetary Institutions and Expenditure
Outcomes. Binding Governments to Fiscal
Performance.” Policy Research Working Paper
No. 1646. World Bank, Washington, DC.
Cardenas, Enrique, Jose. Ocampo, and
Rosemary Thorp. 2000. The Export Age:
The Latin American Economies in the Late
Nineteenth and Early Twentieth Centuries.
(Vol. 1, An Economic History of Twentieth
Century Latin America). New York: Palgrave
Press.
Cashin, Paul Anthony, and Rupa Duttagupta.
2008. “The Anatomy of Banking Crises.” IMF
Working Paper WP/08/93.
Chand, Sheetal, and Karl Moene. 1999. “Control-
ling Fiscal Corruption.” World Development
27(7): 1129–40.
Chetwynd, Eric, Frances Chetwynd, and Bertram
Spector. 2003. “Corruption and Poverty: A

1 2 4
T H E W O R L D B A N K ’ S C O U N T RY P O L I C Y A N D I N S T I T U T I O N A L A S S E S S M E N T
Dillinger, William. 1992. Urban Property Tax
Reform. Guidelines and Recommendations.
World Bank, Washington, DC.
Di Tella, Rafael, and Ernesto Schargrodsky. 2003.
“The Role of Wages and Auditing during a
Crackdown on Corruption in the City of
Buenos Aires.” Journal of Law and Econom-
ics 46 (1): 269–92.
Dixit, Avinash. 2007. “Evaluating Recipes for
Development Success.” World Bank Research
Observer 22 (2): 131–57.
Djankov, Simeon, Rafael La Porta, Florencio
Lopez-de Silanes, and Andrei Shleifer. 2009.
“Disclosure by Politicians.” NBER Working
Paper No. 14703.
Djankov, Simeon, Caralee McLiesh and Andrei
Shleifer. 2007. “Private Credit in 129
Countries.” Journal of Financial Economics
84 (2): 299–329.
Dollar, David, and Aart Kraay. 2002. “Growth is
Good for the Poor.” Journal of Economic
Growth 7 (3): 195–225.
Dollar, David, and Victoria Levin. 2005. “Sowing
and Reaping: Institutional Quality and Project
Outcomes in Developing Countries.” Policy
Research Working Paper No. 3524. World
Bank, Washington, DC.
Doppelhofer, Gernot, Ronald Miller, and
Xavier Sala-i Martin. 2004. “Determinants
of Long-Term Growth: A Bayesian Averaging
of Classical Estimates (BACE) Approach.”
American Economic Review 94 (4): 813–35.
Dreze, Jacques, and Amartya Sen. 1989. Hunger
and Public Action. New York: Oxford Univer-
sity Press.
———. 1995. India: Economic Development
and Social Opportunity. New Delhi: Oxford
University Press.
———. 2002. India Development and Partici-
pation. New Delhi: Oxford University Press.
Duncan-Waite, Imani, and Michael Woolcock.
2008. “Arrested Development: The Political
Origins and Socio-Economic Foundations of
Common Violence in Jamaica.” Brooks World
Poverty Institute (BWPI) Working Paper 46,
University of Manchester, U.K.
Due, John. 1988. Indirect Taxation in Develop-
ing Countries. Baltimore: Johns Hopkins
University Press.
Cuddington, John T. 1993. “Modeling the
Macroeconomic Effects of AIDS, with an
Application to Tanzania.” The World Bank
Economic Review 7 (2): 173–189.
Cuddington, John T., and John D. Hancock. 1994.
“Assessing the Impact of AIDS on the Growth
Path of the Malawian Economy.” Journal of
Development Economics 43 (2): 363–68.
Dalgaard, Carl-Johan, and Henrik Hansen. 2001.
“On Aid, Growth and Good Policies.” Journal
of Development Studies 37 (6): 17–41.
Dalgaard, Carl-Johan, Henrik Hansen, and Finn
Tarp. 2003. “On the Empirics of Foreign Aid
and Growth.” The Economic Journal 114
(496): F191–F216.
Dehejia, Rajeev, and Roberta Gatti. 2002. “Child
Labor: The Role of Income Variability and
Access to Credit across Countries.” NBER
Working Paper No. 9018.
De la Croix, David, and Clara Delavallade. 2006.
“Growth, Public Investment and Corrup-
tion with Failing Institutions.” Center for
Operations Research and Econometrics
(CORE) Discussion Paper No. 2006/101.
Demirgüç-Kunt, Asli, Edward J. Kane, and Luc
Laeven. 2006. “Deposit Insurance Design
and Implementation: Policy Lessons from
Research and Practice.” Policy Research
Working Paper No. 3969. World Bank,
Washington, DC.
De Nicoló, Gianni, Patrick Honohan, and Alain
Ize. 2005. “Dollarization of Bank Deposits:
Causes and Consequences.” Journal of
Banking and Finance 29 (7): 1697–1727.
Deolalikar, Anil, Alex Brillantes Jr., Raghav Gaiha,
Ernesto Pernia, and Mary Racelis. 2002.
“Poverty Reduction and the Role of Institu-
tions in Developing Asia.” Asian Development
Bank Economics and Research Department
Working Paper No. 10.
De Soto, Hernando. 2000. The Mystery of
Capital: Why Capitalism Triumphs in the
West and Fails Everywhere Else. New York:
Random House.
Devas, Nick, Simon Delay, and Michael Hubbard.
2001. “Revenue Authorities: Are They the
Right Vehicle for Improved Tax Administra-
tion?” Public Administration and Develop-
ment 21 (3): 211–22.

1 2 5
R E F E R E N C E S
Edmonds, E.V. 2007. “Child Labor.” NBER Working
Paper No. 12926.
Eijffinger, Sylvester, and Petra Geraats. 2005.
“How Transparent Are Central Banks?”
European Journal of Political Economy 22
(1): 1–21.
Emerson, Patrick, and Andre Souza. 2003. “Is
There a Child Labor Trap? Intergenerational
Persistence of Child Labor in Brazil.” Economic
Development and Cultural Change 51 (2):
375–98.
Epaulard, Anne. 2003. “Macroeconomic Perfor-
mance and Poverty Reduction.” IMF Working
Paper WP/03/72.
Esty, David C., and Michael E. Porter. 2005.
“National Environmental Performance: An
Empirical Analysis of Policy Results and
Determinants.” Environment and Develop-
ment Economics 10 (4): 391–434.
Evans, Peter, and James Rauch. 1999. “Bureau-
cracy and Growth: A Cross-National Analysis
of the Effects of ‘Weberian’ State Structures
on Economic Growth.” American Sociologi-
cal Review 64 (5): 748–65.
Ferraz, Claudio, and Federico Finan. 2008.
“Exposing Corrupt Politicians: The Effects of
Brazil’s Publicly Released Audits on Electoral
Outcomes.” Quarterly Journal of Economics
123 (2): 703–46.
Fischer, Stanley. 1991. “Growth, Macroeconom-
ics and Development.” NBER Working Paper
No. 3702.
———. 1993. “The Role of Macroeconomic
Factors in Growth.” Journal of Monetary
Economics 32 (3): 485–512.
Field, Erica. 2002. “Entitled to Work: Urban
Property Rights and Labor Supply in Peru.”
Princeton, N.J.: Princeton University.
Fields, Gary, Paul Cichello, Samuel Freije, Marta
Menéndez, and David Newhouse. 2002.
“Escaping Poverty: Household Income
Dynamics in Indonesia, South Africa, Spain,
and Venezuela.” In Pathways Out of Poverty:
Private Firms and Economic Mobility in
Developing Countries. Gary S. Fields, and
Guy Pfefferman (editors). Washington D.C.:
International Finance Corporation.
Fjeldstad, Odd-Helge, and Mick Moore. 2007.
“Taxation and State-Building: Poor Countries
Duflo, Esther, Michael Kremer, and Jonathan
Robinson. 2007. “Why Don’t Farmers Use
Fertilizer? Experimental Evidence from
Kenya.” Massachusetts Institute of Technol-
ogy and Harvard University, Working Paper.
———. 2008. “How High Are Rates of Return to
Fertilizer? Evidence from Field Experiments in
Kenya.” American Economic Review 98 (2):
482–88.
Dyck, Alexander, David Moss, and Luigi Zingales.
2008. “Media versus Special Interests.” NBER
Working Paper No. 14360.
Easterly, William. 2001. The Elusive Quest for
Growth: Economists’ Adventures and
Misadventures in the Tropics. Cambridge,
Massachusetts: MIT Press.
———. 2003. “Can Foreign Aid Buy Growth?”
Journal of Economic Perspectives 17 (3):
23–48.
———. 2006. “Inequality Does Cause Underde-
velopment: Insights from a New Instrument.”
Mimeo.
Easterly, William, and Stanley Fischer. 2001.
“Inflation and the Poor.” Journal of Money,
Credit and Banking 33 (2): 160–78.
Easterly, William, and Ross Levine. 1997.
“Africa’s Growth Tragedy: Policies and Ethnic
Divisions.” Quarterly Journal of Economics
112 (4): 1203–50.
———. 2003. “Tropics, Germs, and Crops: How
Endowments Influence Economic Develop-
ment.” Journal of Monetary Economics 50
(1): 3–39.
Easterly, William, Ross Levine, and David
Roodman. 2004. “Aid, Policies, and Growth:
Comment.” American Economic Review 94
(3): 774–80.
Easterly, William, and Sergio Rebelo. 1993. “Fiscal
Policy and Economic Growth: An Empirical
Investigation.” NBER Working Paper No. 4499.
Easterly, William, Carlos Rodriguez, and Klaus
Schmidt-Hebbel (editors). 1995. Public Sector
Deficits and Macroeconomic Performance.
New York: Oxford University Press.
Eastwood, Robert, and Michael Lipton. 2001.
“Pro-Poor Growth and Pro-Growth Poverty
Reduction: Meaning, Evidence, and Policy
Implications.” Asian Development Review 18
(2): 22–58. The Asian Development Bank.

1 2 6
T H E W O R L D B A N K ’ S C O U N T RY P O L I C Y A N D I N S T I T U T I O N A L A S S E S S M E N T
Ghura, Dhaneshwar, Carlos Leite, and
Charalambos Tsangarides. 2002. “Is Growth
Enough? Macroeconomic Policy and Poverty
Reduction.” IMF Working Paper WP/02/118.
Glewwe, Paul, Alaka Holla, and Michael Kremer.
2008. “Teacher Incentives in the Developing
World.” Mimeo.
Glewwe, Paul, Michael Kremer, and Sylvie Moulin.
2007. “Many Children Left Behind? Textbooks
and Test Scores in Kenya.” NBER Working
Paper No. 13300.
Goldberg, Pinelopi, and Nina Pavcnik. 2004.
“Trade, Inequality, and Poverty: What Do We
Know? Evidence from Recent Trade Liberal-
ization Episodes in Developing Countries.”
NBER Working Paper No. 10593.
———. 2005. “The Effects of the Colombian
Trade Liberalization on Urban Poverty.” NBER
Working Paper No. 11081.
Guillaumont, Patrick, and Lisa Chauvet. 2001.
“Aid and Performance: A Reassessment.” The
Journal of Development Studies, Taylor and
Francis Journals 37 (6): 66–92.
Gupta, Sanjeev, Benedict Clements, Emanuele
Baldacci, and Carlos Mulas-Granados. 2005.
“Fiscal Policy, Expenditure Composition, and
Growth in Low-Income Countries.” Journal
of International Money and Finance 24 (3):
441–63.
Gupta, Sanjeev, Benedict Clements, Alexan-
der Pivovarsky, and Erwin Tiongson. 2003.
“Foreign Aid and Revenue Response: Does
the Composition of Aid Matter?” IMF Working
Paper WP/03/176.
Gupta, Sanjeev, Hamid Davoodi, and Rosa Alonso
Terme. 1998. “Does Corruption Affect Income
Equality and Poverty?” IMF Working Paper
WP/98/76.
———. 2002. “Does Corruption Affect Income
Distribution?” Economic Governance 3 (1):
23–45.
Gupta, Sanjeev, Luis de Mello, and Raju Sharan.
2000. “Corruption and Military Spending.”
IMF Working Paper WP/00/23.
Gyimah-Brempong, Kwabena, and Samaria
Munoz de Camacho. 2006. “Corruption,
Growth, and Income Distribution: Are
There Regional Differences?” Economics of
Governance 7 (3): 245–69.
in a Globalised World.” Chr. Michelsen
Institute Working Paper No. 2007:11.
Fleisig, Heywood. 1995. “The Right to Borrow:
Legal and Regulatory Barriers that Limit Access
to Credit by Small Farms and Businesses.”
Public Policy for the Private Sector Note 44.
The World Bank, Washington DC.
Foster, James, and Miguel Székely. 2008. “Is
Economic Growth Good for the Poor?
Tracking Low Incomes Using General Means.”
International Economic Review 49 (4):
1143–72.
Foster, Mick, Adrian Fozzard, Felix Naschold,
and Tim Conway. 2002. “How, When and Why
Does Poverty Get Budget Priority? Poverty
Reduction Strategy and Public Expenditure
in Five African Countries.” Overseas Develop-
ment Institute Working Paper No. 168.
Fozzard, Adrian, and Mick Foster. 2001.
“Changing Approaches to Public Expenditure
Management in Low-Income Aid Dependent
Countries.” World Institute for Development
Economics Research (WIDER) Discussion
Paper No. 2001/17.
Freund, Caroline, and Nadia Rocha. 2010. “What
Constrains Africa’s Exports?” The World Bank,
Washington, DC.
Fullerton, Don. 2008. “Distributional Effects of
Environmental and Energy Policy: An Introduc-
tion.” NBER Working Paper No. 14241.
Fullerton, Don, and Seung-Rae Kim. 2006.
“Environmental Investment and Policy
with Distortionary Taxes and Endogenous
Growth.” NBER Working Paper No. 12070.
Gallup, John L., and Jeffrey D. Sachs, with Andrew
Mellinger. 1999. “Geography and Economic
Development.” Center for International
Development Working Paper No. 1, Harvard
University.
Gemmell, Norman, and Oliver Morrissey. 2003.
“Tax Structure and the Incidence on the Poor
in Developing Countries.” Centre for Research
on Economic Development and International
Trade Research Paper No. 03/18.
Gertler, Paul. 2004. “Do Conditional Cash
Transfers Improve Child Health? Evidence
from PROGRESA’s Control Randomized
Experiment.” American Economic Review
Papers and Proceedings 94 (2): 336–41.

1 2 7
R E F E R E N C E S
Discussion Paper 34. International Food Policy
Research Institute (IFPRI), Washington, D.C.
He, Fang, Leigh L. Linden, and Margaret MacLeod.
2007. “Helping Teach What Teachers Don’t
Know: An Assessment of the Pratham English
Language Program.” Columbia University.
Mimeo.
Heady, Christopher. 2001. “Taxation Policy in
Low-Income Countries.” WIDER Discussion
Paper No. 2001/81.
Headey, Derek. 2005. “Foreign Aid and Foreign
Policy: How Donors Undermine the Effective-
ness of Overseas Development Assistance.”
Centre for Efficiency and Productivity Analysis
Working Paper Series No. 05/2005, Austra-
lia, School of Economics, University of
Queensland.
Heinemann, Alessandra, and Dorte Verner.
2006. “Crime and Violence in Development.
A Literature Review of Latin America and the
Caribbean.” Policy Research Working Paper
4041. The World Bank, Washington, DC.
Hellman, Joel, Geraint Jones, and Daniel
Kaufmann. 2000. “Seize the State, Seize the
Day: State Capture, Corruption, and Influence
in Transition.” Policy Research Working Paper
No. 2444. The World Bank, Washington, DC.
Hettich, Frank. 1998. “Growth Effects of a
Revenue-Neutral Environmental Tax Reform.”
Journal of Economics 67 (3): 287–316.
Hoff, Karla, and Joseph Stiglitz. 2001. “Modern
Economic Theory and Development.” In
Frontiers of Development Economics: The
Future in Perspective. New York: Oxford
University Press.
Hoggarth, Glenn, Ricardo Reis, and Victoria
Saporta. 2002. “Costs of Banking System
Instability: Some Empirical Evidence.” Journal
of Banking and Finance 26 (5): 825–55.
Holmes, K.R., B. T. Johnson, and M. Kirkpatrick.
1997. The 1997 Index of Economic Freedom.
New York, New York: The Heritage Founda-
tion, Dow Jones and Company, Incorpo-
rated.
Honohan, Patrick, editor. 2003. Taxation of
Financial Intermediation: Theory and
Practice for Emerging Economies. New York:
Oxford University Press and Washington, D.C.:
The World Bank.
Haacker, Markus. 2002. “The Economic
Consequences of HIV/AIDS in Southern
Africa.” IMF Working Paper WP/02/38.
———. 2004. “HIV/AIDS: The Impact on the Social
Fabric and the Economy.” In The Macroeco-
nomics of HIV/AIDS, Markus Haacker, editor.
Washington D.C.: The International Monetary
Fund.
Hall, Robert, and Charles Jones. 1999. “Why
Do Some Countries Produce So Much More
Output per Worker Than Others?” The
Quarterly Journal of Economics 114 (1):
83–116.
Hansen, Henrik, and Finn Tarp. 2000. “Aid
Effectiveness Disputed.” Journal of Interna-
tional Development 12 (3): 375–98.
———. 2001. “Aid and Growth Regressions.”
Journal of Development Economics 64 (2):
547–70.
Hanushek, Eric, and Dennis Kimko. 2000.
“Schooling, Labor-Force Quality, and the
Growth of Nations.” American Economic
Review 90 (5): 1184–1208.
Hanushek, Eric, and Ludger Woesmann. 2008.
“The Role of Cognitive Skills in Economic
Development.” Journal of Economic Litera-
ture 46 (3): 607–68.
Harrison, Ann. 2006. “Globalization and Poverty.”
NBER Working Paper No. 12347.
Hashemi, Syed M., Sidney Ruth Schuler, and
Ann P. Riley. 1996. “Rural Credit Programs
and Women’s Empowerment in Bangladesh.”
World Development 24 (4): 635–53.
Hausmann, Ricardo, and Michael Gavin. 1996.
“Securing Stability and Growth in a Shock-
Prone Region: The Policy Challenges for Latin
America.” In Securing Stability and Growth
in Latin America, Ricardo Hausmann and
Helmut Reisen (eds.). Paris: Organization for
Economic Cooperation and Development
(OECD).
Hay, Jonathan R., Andrei Shleifer, and Robert
W. Vishny. 1996. “Privatization in Transi-
tion Economies, Toward a Theory of Legal
Reform.” European Economic Review 40
(3–5): 559–67.
Hazell, Peter, and Lawrence Haddad. 2001.
“Agricultural Research and Poverty Reduction.”
Food, Agriculture, and the Environment

1 2 8
T H E W O R L D B A N K ’ S C O U N T RY P O L I C Y A N D I N S T I T U T I O N A L A S S E S S M E N T
International Monetary Fund. 2000. “Mozambique
Fiscal Transparency Study.” Aide Memoire.
Irz, Xavier, Lin Lin, Colin Thirtle, and Steve
Wiggins. 2001. “Agricultural Productivity
Growth and Poverty Alleviation.” Develop-
ment Policy Review 19 (4): 449–66.
Isern, Jennifer, David Porteous, Raul Hernandez-
Coss, and Chinyere Egwuagu. 2005. “AML/CFT
Regulation: Implications for Financial Service
Providers That Serve Low-Income People.”
The Consultative Group to Assist the Poor
(CGAP) Focus Note 29.
Jamison, Dean, Jeffrey Sachs, and Jia Wang.
2001. “The Effect of the AIDS Epidemic on
Economic Welfare in Sub-Saharan Africa.”
World Health Organization Commission on
Macroeconomics and Health, Working Group
1, Working Paper No. 13.
Jenkins, Glenn. 1994. “Modernization of Tax Ad-
ministration: Revenue Boards and Privatization
as Instruments of Change.” Bulletin for Inter-
national Fiscal Documentation 48 (2): 75–81.
Johnson, Simon, John McMillan, and Christo-
pher Woodruff. 2002. “Property Rights and
Finance.” The American Economic Review
92 (5): 1335–56.
Kalemli-Ozcan, Sebnem, Harl E. Ryder, and David
N. Weil. 2000. “Mortality Decline, Human
Capital Investment, and Economic Growth.”
Journal of Development Economics 62 (1):
1–23.
Kambou, Gerard, Shantayanan Devarajan, and
Mead Over. 1992. “The Economic Impact of
AIDS in an African Country: Simulations with
a Computable General Equilibrium Model of
Cameroon.” Journal of African Economies 1
(1): 109–130.
Kanbur, Ravi. 2004. “Growth, Inequality and
Poverty: Some Hard Questions.” Mimeo.
———. 2005. “Reforming the Formula: A Modest
Proposal for Introducing Development
Outcomes in IDA Allocation Procedures.”
Revised version published in Revue d’Econo-
mie du Developpment.
Kaufmann, Daniel. 2003. “Rethinking Governance:
Empirical Lessons Challenge Orthodoxy.”
Discussion draft. The World Bank.
Kaufmann, Daniel, Aart Kraay, and Pablo Zoido-
Lobaton. 1999. “Governance Matters.” Policy
Honohan, Patrick. 2004a. Financial Sector Policy
and the Poor. World Bank Working Paper No.
43. The World Bank, Washington, DC.
———. 2004b. “Financial Development, Growth
and Poverty: How Close are the Links?” In
Financial Development and Economic
Growth: Explaining the Links, Charles
Goodhart (ed.). London: Palgrave.
———. 2008a. “Cross-Country Variation in
Household Access to Financial Services.”
Journal of Banking and Finance 32
(11):2493–2500.
———. 2008b. “Risk Management and the Costs
of the Banking Crisis.” National Institute
Economic Review 206 (1): 15–24.
———. 2009. “Country Policy and Institutional
Assessment (CPIA) Indicators and the Role of
Finance in the Development Process.” Draft
background paper for The CPIA: An Evalua-
tion, Independent Evaluation Group, The
World Bank.
Honohan, Patrick, and Daniela Klingebiel. 2003.
“The Fiscal Cost Implications of an Accommo-
dating Approach to Banking Crises.” Journal
of Banking and Finance 27 (8):1539–60.
Hossain, Mahabub. 1988. “Credit for Alleviation of
Rural Poverty: The Grameen Bank in Bangla-
desh.” Research Report 65. International Food
Policy Research Institute, Washington, DC.
Huntington, Samuel. 1968. Political Order in
Changing Societies. New Haven: Yale Univer-
sity Press.
Ilahi, Nadeem, Peter Orazem, and Guilherme
Sedlacek. 2001. “The Implications of Child
Labor for Adult Wages, Income and Poverty:
Retrospective Evidence from Brazil.” The
International Monetary Fund. Mimeo.
IEG (Independent Evaluation Group). 2008.
Environmental Sustainability: An Evalua-
tion of World Bank Group Support. Washing-
ton, D.C.: The World Bank.
Inter-American Development Bank. 1997
“Studies of the Magnitude, Costs and Policies
Against Violence in Six Places: Lima, Rio de
Janeiro, San Salvador, Mexico, Venezuela and
Colombia.” Prepared for the Chief Economic
Officer of the Inter-American Development
Bank. Inter-American Development Bank,
Washington, DC.

1 2 9
R E F E R E N C E S
Knowles, Stephan, Paula Lorgelly, and Dorian
Owen. 2002. “Are Educational Gender Gaps
a Brake on Economic Development: Some
Cross-Country Empirical Evidence.” Oxford
Economic Papers 54 (1): 118–49.
Krebs, Tom. 2003. “Human Capital Risk and
Economic Growth.” Quarterly Journal of
Economics 118 (2):709–44.
Kremer, Michael, and Alaka Holla. 2008. “Pricing
and Access: Lessons from Randomized
Evaluations in Education and Health.” Center
for Global Development Working Paper No.
158.
Kremer, Michael, Jessica Leino, Edward Miguel,
and Alix Peterson Zwane. 2008. “Spring
Cleaning: A Randomized Evaluation of Source
Water Quality Improvement.” Harvard Univer-
sity, Department of Economics. Mimeo.
Krusell, Per, and Jose-Voctor Ríos-Rull. 1996.
“Vested Interests in a Positive Theory of
Stagnation and Growth.” The Review of
Economic Studies 63 (2): 301–29.
Kuznets, Simon. 1955. “Economic Growth and
Income Inequality.” American Economic
Review 45 (1): 1–28.
Landes, David. 1983. Revolution in Time.
Cambridge, MA: Harvard University Press.
Laeven, Luc, and Fabian Valencia. 2008. “The Use
of Blanket Guarantees in Banking Crises.”
IMF Working Paper WP/08/250.
La Porta, Rafael, Florencio Lopez-de-Silanes,
and Andrei Shleifer. 2008. “The Economic
Consequences of Legal Origins.” Journal of
Economic Literature 46 (2): 285–332.
La Porta, Rafael, Florencio Lopez-de-Silanes,
Andrei Shleifer, and Robert W. Vishny. 1998.
“Law and Finance.” Journal of Political
Economy 106 (6): 1113–55.
———. 1999. “The Quality of Government.”
Journal of Law, Economics and Organiza-
tion 15: 222–79.
———. 2000. “Investor Protection and Corporate
Governance.” Journal of Financial Econom-
ics 58: 3–27.
Leff, Nathaniel. 1964. “Economic Development
through Bureaucratic Corruption.” The
American Behavioural Scientist 8 (3): 8–14.
Levine, Ross. 1997. “Financial Development
and Economic Growth: Views and Agenda.”
Research Working Paper No. 2196. The World
Bank, Washington, DC.
———. 2002. “Governance Matters II: Updated
Indicators for 2000/01.” Policy Research
Working Paper No. 2772. The World Bank,
Washington, DC.
Kaufmann, Daniel, Aart Kraay, and Massimo
Mastruzzi. 2003. “Governance Matters III.”
Policy Research Working Paper No. 3106. The
World Bank, Washington, DC.
Kerekes, Carrie, and Claudia Williamson. 2008.
“Unveiling de Soto’s Mystery: Property Rights,
Capital Formation, and Development.”
Journal of Institutional Economics 4 (3):
299–325.
Khandker, Shahidur. 1998. Fighting Poverty with
Microcredit: Experience in Bangladesh. New
York: Oxford University Press.
Khandker, Shahidur, 2005. “Microfinance and
Poverty: Evidence Using Panel Data from
Bangladesh.” The World Bank Economic
Review 19 (2): 263–86.
Khandker, Shahidur, and Mark Pitt. 2003.
“The Impact of Group-Based Credit on
Poor Households: An Analysis of Panel
Data from Bangladesh.” The World Bank,
Washington, DC.
Kiser, Edgar, and Audrey Sacks. 2007. “Improving
Tax Administration in Contemporary African
States: Lessons from History.” Prepared
for The Thunder of History: Taxation in
Comparative and Historical Perspective.
Northwestern University, May 4–5.
Klapper, Leora, Luc Laeven, and Raghuram
Rajan. 2006. “Entry Regulation as a Barrier
to Entrepreneurship.” Journal of Financial
Economics 82 (3): 591–629.
Klasen, Stephan. 2002. “Low Schooling for
Girls, Slower Growth for All?” World Bank
Economic Review 16 (3): 345–73.
Klasen, Stephan, and Francesca Lamanna.
2003. “The Impact of Gender Inequality in
Education and Employment on Economic
Growth: Updated Estimates.” Mimeo.
Knack, Stephen, and Philip Keefer. 1995. “Institu-
tions and Economic Performance: Cross
Country Tests Using Alternative Institutional
Measures.” Economics and Politics 7 (3):
207–27.

1 3 0
T H E W O R L D B A N K ’ S C O U N T RY P O L I C Y A N D I N S T I T U T I O N A L A S S E S S M E N T
Luoto, Jill, Craig McIntosh, and Bruce Wydick.
2007. “Credit Information Systems in
Less-Developed Countries: A Test with
Microfinance in Guatemala.” Economic
Development and Cultural Change 55 (2):
313–34.
Maine, Henry. 1980. Popular Government.
London: John Murray.
Martinez-Vazquez, Jorge, and Jameson Boex.
2001. “Russia’s Transition to a New Federal-
ism.” World Bank Institute, Washington, DC.
Mauro, Paolo. 1995. “Corruption and Growth.”
Quarterly Journal of Economics 110 (3):
681–712.
Mazingo, Christopher. 1999. “Effects of Property
Rights on Economic Activity: Lessons from
the Stolypin Land Reform.” Massachusetts
Institute of Technology. Mimeo.
McGillivray, Mark, Simon Feeny, Niels Hermes,
and Robert Lensink. 2005. “It Works; It
Doesn’t; It Can, But That Depends? 50 Years
of Controversy over the Macroeconomic
Impact of Development Aid.” World Institute
for Development Economics Research Paper
No. 2005/54. United Nations University.
McGillivray, Mark, and Oliver Morrissey.
2001a. “Aid Illusion and Public Sector Fiscal
Behaviour.” The Journal of Development
Studies 37 (6): 118–36.
———. 2001b. “Fiscal Effects of Aid.” World
Institute for Development Economic Research
Discussion Paper No. 2001/61, United Nations
University.
McLure, Charles. 1999 “Tax Holidays and Invest-
ment Incentives: A Comparative Analysis.”
Bulletin for International Fiscal Documen-
tation 53(8–9) 326–39.
Menezes-Filho, Naercio, and Ligia Vasconcellos.
2004. “Operationalising Pro-Poor Growth: A
Case Study on Brazil.” Prepared as part of the
Operationalizing Pro-Poor Growth research
program.
Mikesell, John. 2003. International Experiences
with Administration of Local Taxes: A Review
of Practices and Issues. School of Public and
Environmental Affairs, Indiana University.
Miller, Margaret, editor. 2003. Credit Reporting
Systems and the International Economy.
Cambridge, Massachusetts: MIT Press.
Journal of Economic Literature 35 (2):
688–726.
———. 1998. “The Legal Environment, Banks,
and Long-Run Economic Growth.” Journal
of Money, Credit, and Banking 30 (3):
596–613.
———. 2003. “More on Finance and Growth:
More Finance, More Growth?” The Federal
Reserve Bank of St. Louis.
———. 2005. “Law, Endowments and Property
Rights.” Journal of Economic Perspectives 19
(3):61–88.
Levine, Ross, Norman Loayza, and Thorsten Beck.
2000. “Financial Intermediation and Growth:
Causality and Causes.” Journal of Monetary
Economics 16 (46).
Levine, Ross, and Sara Zervos. 1998. “Stock
Markets, Bank and Economic Growth.”
American Economic Review 88 (3): 537–58.
Lewis, W. Arthur. 1954. “Economic Development
with Unlimited Supplies of Labour.” Manches-
ter School of Economic and Social Sciences
22 (2): 139–91.
Lien, Da Hsiang Donald. 1986. “A Note on
Competitive Bribery Game.” Economics
Letters 22: 337–41.
Lin, Justin Yifu. 1992. “Rural Reforms and Agricul-
tural Growth in China.” American Economic
Review 82 (1): 34–51.
Littlefield, Elizabeth, Jonathan Morduch, and
Syed Hashemi. 2003. “Is Microfinance an
Effective Strategy to Reach the Millennium
Development Goals?” CGAP Focus Note 24.
Loayza, Norman. 1996. “The Economics of the
Informal Sector: A Simple Model and Some
Empirical Evidence from Latin America.”
Carnegie-Rochester Conference Series on
Public Policy 45 (1): 129–62.
Londono, Juan Luis. 1996. “Violencia y Capital
Social.” Paper presented at the Second Annual
Conference of the World Bank on Develop-
ment in Latin America and the Caribbean.
Bogotá, Colombia.
Lopez de Silanes Florencio, Simon Johnson,
Rafael La Porta, and Andrei Shleifer. 2000.
“Tunnelling.” NBER Working Paper No. 7523.
Lui, Francis. 1985. “An Equilibrium Queuing Model
of Bribery.” Journal of Political Economics 93
(4): 760–81.

1 3 1
R E F E R E N C E S
Village Economy Perspective.” Asian Develop-
ment Review 19 (1): 98–116.
Over, Mead. 1992. The Macroeconomic Impact of
AIDS in Sub-Saharan Africa. Working Paper.
Population and Human Resources Depart-
ment. The World Bank, Washington, DC.
Panday, Pranab Kumar. 2008. “Representation
Without Participation: Quotas for Women in
Bangladesh.” International Political Science
Review 29 (4): 489–512.
Parry, Ian, Hilary Sigman, Margaret Walls, and
Roberton Williams. 2005. “The Incidence of
Pollution Control Policies.” Rutgers Univer-
sity, Department of Economics, Departmental
Working Paper No. 2005–04.
Perotti, Roberto. 1992. “Fiscal Policy, Income
Distribution, and Growth.” Review of
Economics and Statistics 60 (4): 755–76.
———. 1993. “Political Equilibrium, Income
Distribution, and Growth.” Review of
Economic Studies 60 (4): 755–56.
———. 1996. “Growth, Income Distribution,
and Democracy: What the Data Say.” Journal
of Economic Growth 1 (2): 149–87.
Persson, T., and G. Tabellini. 1994. “Is Inequal-
ity Harmful for Growth?” The American
Economic Review 84 (3): 600–21.
Porto, Guido. 2005. “Informal Export Barriers and
Poverty.” Journal of International Econom-
ics 66 (2): 447–70.
Posner, Richard. 1981. “The Economics of
Privacy.” American Economic Review Papers
and Proceedings 71 (2): 405–9.
———. 1998. “Creating a Legal Framework for
Economic Development.” The World Bank
Research Observer 13 (1): 1–11.
Rajan, Raghuram, and Arvind Subramaniam.
2008. “Aid and Growth: What Does the Cross-
Country Evidence Really Show?” The Review
of Economics and Statistics 90 (4): 643–65.
Rajkumar, Andrew, and Vinaya Swaroop. 2002.
“Public Spending and Outcomes: Does Gover-
nance Matter?” Policy Research Working Paper
No. 2840. The World Bank, Washington, DC.
Ram, Rati. 2003. “Roles of Bilateral and Multilat-
eral Aid in Economic Growth of Developing
Countries.” Kyklos 56 (1):95–110.
Rauch, James, and Peter Evans. 2000. “Bureau-
cratic Structure and Bureaucratic Performance
Mocan, Naci. 2004. “What Determines Corrup-
tion? International Evidence from Micro
Data.” NBER Working Paper No. 10460.
Mokyr, Joel. 1990. The Lever of Riches: Techno-
logical Creativity and Economic Progress.
New York: Oxford University Press.
Montiel, Peter, and Luis Servén. 2006. “Macroeco-
nomic Stability in Developing Countries: How
Much Is Enough? “World Bank Research
Observer 21 (2): 151–78. Oxford University
Press.
Mookherjee, Dilip. 1995. “Reforms in Income Tax
Enforcement in Mexico.” IRIS-India Working
Paper No. 6. University of Maryland.
Mookherjee, Dileep, and Arindam Das-Gupta.
1995. “Reforming Indian Income Tax Enforce-
ment.” IRIS-India Working Paper No. 3,
University of Maryland.
Moore, Mick. 2004. “Taxation and the Politi-
cal Agenda, North and South.” Forum for
Development Studies 31 (1): 7–32.
Moser, Caroline. 1996. “Urban Poverty and
Violence: Consolidation or Erosion of Social
Capital?” Second Annual World Bank Confer-
ence on Development in Latin America,
Bogota.
Moser, Caroline, and Jeremy Holland. 1997.
Urban Poverty and Violence in Jamaica.
Washington, DC.: The World Bank.
Muralidharan, Karthik, and Venkatesh Sundara-
raman. 2007. “Teacher Incentives in Develop-
ing Countries: Experimental Evidence from
India.” The World Bank, Washington, DC.
September. Mimeo.
North, Douglas. 1990. Institutions, Institutional
Change and Economic Performance. New
York: Cambridge University Press.
Ocampo, Jose. 2003. “Structural Dynamics and
Economic Growth in Developing Countries.”
Mimeo.
Olken, Benjamin. 2007. “Monitoring Corruption:
Evidence from a Field Experiment in Indone-
sia.” Journal of Political Economy 115 (2):
200–49.
OED (Operations Evaluation Department). 2001.
“Review of the Performance-Based Alloca-
tion System, IDA10–12.” The World Bank,
Washington, DC, February 14.
Otsuka, Keijiro. 2002, “Poverty Reduction Issues:
1 3 2
T H E W O R L D B A N K ’ S C O U N T RY P O L I C Y A N D I N S T I T U T I O N A L A S S E S S M E N T
Paper No. 134. Center for Global Develop-
ment, December.
Rosegrant, Mark, and Peter Hazell. 2000.
“Transforming the Rural Asian Economy:
The Unfinished Revolution.” In Study of
Rural Asia (Vol. 1), Asian Development
Bank, copublished by the Oxford University
Press.
Rosenstein-Rodan, Paul. 1943. “Problems of
Industrialisation of Eastern and South-
Eastern Europe.” The Economic Journal 53
(210/211): 202–11.
Rostow, W. Walt. 1960. The Stages of Economic
Growth: A Non-Communist Manifesto.
Cambridge: Cambridge University Press.
Sachs, Jeffrey. 2003. “Institutions Don’t Rule:
Direct Effects of Geography on Per Capita
Income.” NBER Working Paper No. 9490.
———. 2005. The End of Poverty: Economic
Possibilities for Our Time. New York: Penguin
USA.
———. 2008. Common Wealth: Economics for
a Crowded Planet. New York: Penguin USA.
Sachs, Jeffrey D., and Andrew Warner. 1995.
“Economic Reform and the Process of Global
Integration.” Brookings Papers on Economic
Activity. (1): 1–118.
Schneidman, Miriam. 1996. “Targeting At-Risk-
Youth: Rationales, Approaches to Service
Delivery, and Monitoring and Evaluation
Issues.” Latin America and Caribbean Human
and Social Development Group Paper Series
No. 2. The World Bank, Washington, DC.
Sen, Amartya. 1992. Inequality Re-examined.
Cambridge: Harvard University Press.
———. 1997. On Economic Inequality. Oxford:
Clarendon Press.
———. 1999. Development as Freedom. Oxford:
Oxford University Press.
Shavell, Steven. 2003. “Economic Analysis of
Property Law.” NBER Working Paper No. 9695.
Shleifer, Andrei, and Robert Vishny. 1993.
“Corruption.” The Quarterly Journal of
Economics 108 (3): 599–617.
Skoufias, Emmanuel, Benjamin Davis, and Sergio
de la Vega. 2001. “Targeting the Poor in Mexico:
An Evaluation of the Selection of Households
into PROGRESA.” World Development 29
(10): 1769–84.
in Less Developed Countries.” Journal of
Public Economics 75: 49–71.
Ravallion, Martin. 2001. “Growth, Inequality and
Poverty: Looking Beyond Averages.” World
Development 29 (11): 1803–15.
———. 2004. “Looking Beyond Averages in the
Trade and Poverty Debate.” Policy Research
Working Paper No. 3461. The World Bank,
Washington, DC.
Ravallion, Martin, and Gaurav Datt. 2002. “Why
Has Economic Growth Been More Pro-Poor in
Some States of India than Others?” Journal of
Development Economics 68: 381–400.
Reddy, Sanjay, and Camelia Minoiu. 2006.
“Development Aid and Economic Growth: A
Positive Long-Run Relation.” Working Paper
No. 29. United Nations, Department of
Economics and Social Affairs.
Reinikka, Ritva, and Jakob Svensson. 2004.
“Local Capture: Evidence from a Central
Government Transfer Program in Uganda.”
Quarterly Journal of Economics 119:
679–705.
Rigobon, Roberto, and Dani Rodrik. 2004. “Rule
of Law, Democracy, Openness, and Income:
Estimating the Interrelationships.” NBER
Working Paper No. 10750.
Rodrik, Dani. 1999. “Institutions for High-Quality
Growth: What They Are and How to Acquire
Them.” Draft paper prepared for The Interna-
tional Monetary Fund Conference on Second-
Generation Reforms. Washington, D.C.,
November 8–9.
———. 2000. “Comments on “Trade, Growth,
and Poverty” by David Dollar and Aart Kraay
(editors). Mimeo.
———. 2003. “Growth Strategies.” NBER
Working Paper No. 10050.
Rodrik, Dani, Arvind Subramanian, and Francesco
Trebbi. 2002. “Institutions Rule: The Primacy
of Institutions over Geography and Integra-
tion in Economic Development.” NBER
Working Paper No. 9305.
Roodman, David. 2007a. “The Anarchy of
Numbers: Aid, Development, and Cross-
Country Empirics.” The World Bank
Economic Review 21 (2): 255–77.
———. 2007b. “Macro Aid Effectiveness
Research: A Guide for the Perplexed.” Working

1 3 3
R E F E R E N C E S
Wei, Shang-Jin. 2000. “How Taxing Is Corrup-
tion on International Investors?” Review of
Economics and Statistics 82 (1): 1–11.
Weil, David N. 2005. “Accounting for the Effect of
Health on Economic Growth.” NBER Working
Paper No. 11455.
Welch, Karen Horn, Margaret McMillan, and Dani
Rodrik. 2004. “When Economic Reform Goes
Wrong: Cashews in Mozambique.” Brookings
Trade Forum 2003.
Werlin, Herbert. 1979. “The Consequences
of Corruption: Ghanaian Experience.” In
Bureaucratic Corruption in Sub-Saharan
Africa, Monday U. Ekpo, editor,. Washington,
D.C.: University Press of America.
White, H., and E. Anderson. 2002. “Growth versus
Distribution: Does the Pattern of Growth
Matter?” Development Policy Review 19 (3):
267–89.
Williamson, John. 1990. “What Washington Means
by Policy Reform.” In Latin American Adjust-
ment: How Much Has Happened? Washington
D.C.: Institute for International Economics.
———. 2004. “The Washington Consensus
as Policy Prescription for Development.” A
lecture in the series “Practitioners of Develop-
ment” delivered at The World Bank on January
13, 2004.
Winters, Alain, Neil McCulloch, and Andrew
McKay. 2004. “Trade Liberalization and
Poverty: The Evidence So Far.” Journal of
Economic Literature 42 (1): 72–115.
Woolard, Ingrid, and Stephan Klasen. 2005.
“Determinants of Income Mobility and
Household Poverty Dynamics in South Africa.”
The Journal of Development Studies 41 (5):
865–97.
World Bank. 1992. Development and Environ-
ment. New York: Oxford University Press.
———. 1993. The East Asian Miracle: Economic
Growth and Public Policy. New York and
Oxford: Oxford University Press for The World
Bank.
———. 1994. World Development Report, 1994:
Infrastructure for Development. Washing-
ton, D.C.: The World Bank.
———. 1997. World Development Report, 1997:
The State in a Changing World. Washington,
D.C.: The World Bank.
Steets, Julia. 2008. “Adaptation and Refinement of
the World Bank’s Country Policy and Institu-
tional Assessment.” Global Public Policy
Institute on behalf of the German Federal
Ministry for Economic Cooperation and
Development.
Stern, Nicholas. 2001. A Strategy for Develop-
ment. Washington, D.C.: The World Bank.
Stevens, Michael. 1999. “Interview.” The World
Bank, Washington, DC, January 6.
Summers, Lawrence. 2003. “Godkin Lectures.”
Harvard University. Mimeo.
Tanzi, Vito. 1998. “Corruption around the World:
Causes, Scope, and Cures.” IMF Working
Paper WP/98/63.
Todaro, Michael. 1997. Economic Development.
London: Longman.
Topalova, Petia. 2004. “Factor Immobility and
Regional Effects of Trade Liberalization:
Evidence from India.” MIT. Mimeo.
———. 2005. “Trade Liberalization, Poverty and
Inequality: Evidence from Indian Districts.”
NBER Working Paper No. 11614.
Treisman, Daniel. 2000. “The Causes of Corrup-
tion: A Cross-National Study.” Journal of
Public Economics 76 (3): 399–457.
Tressel, Thierry, and Enrica Detragiache. 2008.
“Do Financial Sector Reforms Lead to Financial
Development? Evidence from a New Dataset.”
IMF Working Paper WP/08/265.
Van Rijckeghem, Caroline, and Beatrice Weder.
1997. “Corruption and the Rate of Tempta-
tion: Do Low Wages in the Civil Service Cause
Corruption?” IMF Working Paper WP/97/73.
———. 2001. “Bureaucratic Corruption and
the Rate of Temptation: Do Wages in the
Civil Service Affect Corruption, and by How
Much?” Journal of Development Economics
65 (2): 307–31.
Vandenbussche, Jerome, Philippe Aghion, and
Costas Meghir. 2006. “Growth, Distance
to Frontier and Composition of Human
Capital.” Journal of Economic Growth 11
(2): 97–127.
Vermeersch, Christel, and Michael Kremer.
2003. “School Meals, Educational Achieve-
ment and School Competition: Evidence
from a Randomized Evaluation.” University
of Oxford.

1 3 4
T H E W O R L D B A N K ’ S C O U N T RY P O L I C Y A N D I N S T I T U T I O N A L A S S E S S M E N T
World Bank. Operations Policy and Country
Services.
———. 2004e. “Reducing Poverty: Sustaining
Growth.” Scaling up Poverty Reduction. A
Global Learning Process and Conference in
Shanghai, The World Bank, May 25–27.
———. 2004f. 2003 Annual Review of Develop-
ment Effectiveness. The Effectiveness of Bank
Support for Policy Reform.
———. 2004g. World Development Report 2004:
Making Services Work for Poor People. New
York, NY: Oxford University Press.
———. 2004h. Building State Capacity in
Africa: New Approaches, Emerging Lessons.
Washington, D.C.: World Bank Institute, The
World Bank.
———. 2005. Economic Growth in the 1990s:
Learning from a Decade of Reform. The
International Bank for Reconstruction and
Development/The World Bank.
———. 2006a. “Chairman’s Summary: IDA 14
Mid-Term Review Meeting.” November.
———. 2006b. World Development Report. New
York: Oxford University Press.
———. 2007. “Country Policy and Institutional
Assessment 2007: Assessment Question-
naire.” The World Bank, Washington, DC.
———. 2008a. Commission on Growth and
Development: “The Growth Report. Strate-
gies for Sustained Growth and Inclusive
Development.” Discussion Paper. The World
Bank, Washington, DC.
———. 2008b. “Country Policy and Institutional
Assessment 2008: Assessment Questionnaire.”
Operations Policy and Country Services.
September 5. World Bank, Washington, DC
———. 2008c. Demirguc-Kunt, Asli, Thorsten
Beck, and Patrick Honohan, Finance for All?
Policies and Pitfalls in Expanding Access.
Washington, D.C.
———. 2008d. Environmental Health and Child
Survival: Epidemiology, Economics, Experi-
ences. Washington, D.C.: The World Bank.
———. 2008e. “IDA: The Platform for Achieving
Results at the Country Level.” Additions to
IDA Resources: the Fifteenth Replenishment.
February.
———. 2008f. Poverty and the Environment:
Understanding Linkages at the Household
———. 1998. Beyond the Washington Consen-
sus: Institutions Matter. New York: Oxford
University Press.
———. 1999. World Development Report
1998/99: Knowledge for Development. New
York: Oxford University Press.
———. 2000a. Can Africa Claim the 21st
Century? New York: Oxford University Press.
———. 2000b. World Development Report
2000/2001: Attacking Poverty. New York:
Oxford University Press.
———. 2000c. Poverty Reduction and Strategy
Paper Source Book.
———. 2001a. Engendering Development. New
York: Oxford University Press.
———. 2001b. “Enhancing IDA’s Performance-
Based Allocation System.” September
————.2001c. Poverty Reduction Strategy
Sourcebook: A Resource to Assist Countries
in Developing Poverty Reduction Strategies.
Washington, D.C.: The World Bank.
———. 2002a. Globalization, Growth and
Poverty. Washington, D.C.: The World Bank.
———. 2002b. “Linking IDA Support to Country
Performance.” Third Annual Report on IDA’s
Country Assessment and Allocation Process.
April 30.
———. 2002c. World Bank Group Work in
Low-Income Countries Under Stress: A Task
Force Report. Washington, D.C.: The World
Bank.
———. 2003a. “Country Policy and Institutional
Assessment 2003: Assessment Question-
naire.” Washington, D.C.: The World Bank.
———. 2003b. “IDA’s Performance-Based Alloca-
tion System: Current and Emerging Issues.”
October.
———. 2004a. “Country Policy and Institutional
Assessment: An External Panel Review.” The
World Bank, April 5.
———. 2004b. “IDA’s Performance-Based Alloca-
tion System: IDA Rating Disclosure and
Fine-Tuning the Governance Factor.” Septem-
ber.
———. 2004c. “IDA’s Performance-Based Alloca-
tion System: Update on Outstanding Issues.”
February.
————.2004d. “Disclosing IDA Country
Performance Ratings.” Washington, D.C.: The

1 3 5
R E F E R E N C E S
Zwane, Alix Peterson, and Michael Kremer. 2007.
“What Works in Fighting Diarrheal Diseases
in Developing Countries? A Critical Review.”
NBER Working Paper No. 12987.
Level. Washington, D.C.: The World Bank.
World Economic Forum. 2008. Global Competi-
tiveness Report 2008–2009.
Young, Alwyn. 2004. “The Gift of the Dying: The
Tragedy of AIDS and the Welfare of Future
African Generations.” NBER Working Paper
No. 10991.


Annual Review of Development Effectiveness 2009: Achieving Sustainable Development
Addressing the Challenges of Globalization: An Independent Evaluation of the World Bank’s Approach to Global Programs
Assessing World Bank Support for Trade, 1987–2004: An IEG Evaluation
Books, Building, and Learning Outcomes: An Impact Evaluation of World Bank Support to Basic Education in Ghana
Bridging Troubled Waters: Assessing the World Bank Water Resources Strategy
Climate Change and the World Bank Group—Phase I: An Evaluation of World Bank Win-Win energy Policy Reforms
Debt Relief for the Poorest: An Evaluation Update of the HIPC Initiative
A Decade of Action in Transport: An Evaluation of World Bank Assistance to the Transport Sector, 1995–2005
The Development Potential of Regional Programs: An Evaluation of World Bank Support of Multicountry Operations
Development Results in Middle-Income Countries: An Evaluation of World Bank Support
Doing Business: An Independent Evaluation—Taking the Measure of the World Bank–IFC Doing Business Indicators
Egypt: Positive Results from Knowledge Sharing and Modest Lending—An IEG Country Assistance Evaluation 1999 –2007
Engaging with Fragile States: An IEG Review of World Bank Support to Low-Income Countries Under Stress
Environmental Sustainability: An Evaluation of World Bank Group Support
Evaluation of World Bank Assistance to Pacific Member Countries, 1992–2002
Extractive Industries and Sustainable Development: An Evaluation of World Bank Group Experience
Financial Sector Assessment Program: IEG Review of the Joint World Bank and IMF Initiative
From Schooling Access to Learning Outcomes: An Unfinished Agenda—An Evaluation of World Bank Support to Primary Education
Hazards of Nature, Risks to Development: An IEG Evaluation of World Bank Assistance for Natural Disasters
How to Build M&E Systems to Support Better Government
IEG Review of World Bank Assistance for Financial Sector Reform
An Impact Evaluation of India’s Second and Third Andhra Pradesh Irrigation Projects: A Case of Poverty Reduction with Low Economic Returns
Improving Effectiveness and Outcomes for the Poor in Health, Nutrition, and Population
Improving the Lives of the Poor through Investment in Cities
Improving Municipal Management for Cities to Succeed: An IEG Special Study
Improving the World Bank’s Development Assistance: What Does Evaluation Show:
Maintaining Momentum to 2015: An Impact Evaluation of Interventions to Improve Maternal and Child Health and Nutrition Outcomes in Bangladesh
New Renewable Energy: A Review of the World Bank’s Assistance
Pakistan: An Evaluation of the World Bank’s Assistance
Pension Reform and the Development of Pension Systems: An Evaluation of World Bank Assistance
The Poverty Reduction Strategy Initiative: An Independent Evaluation of the World Bank’s Support Through 2003
The Poverty Reduction Strategy Initiative: Findings from 10 Country Case Studies of World Bank and IMF Support
Power for Development: A Review of the World Bank Group’s Experience with Private Participation in the Electricity Sector
Public Sector Reform: What Works and Why? An IEG Evaluation of World Bank Support
Small States: Making the Most of Development Assistance—A Synthesis of World Bank Findings
Social Funds: Assessing Effectiveness
Sourcebook for Evaluating Global and Regional Partnership Programs
Using Knowledge to Improve Development Effectiveness: An Evaluation of World Bank Economic and Sector Work and Technical Assistance, 2000–2006
Using Training to Build Capacity for Development: An Evaluation of the World Bank’s Project-Based and WBI Training
The Welfare Impact of Rural Electrification: A Reassessment of the Costs and Benefits—An IEG Impact Evaluation
World Bank Assistance to Agriculture in Sub-Saharan Africa: An IEG Review
World Bank Assistance to the Financial Sector: A Synthesis of IEG Evaluations
World Bank Group Guarantee Instruments 1990–2007: An Independent Evaluation
The World Bank in Turkey: 1993–2004—An IEG Country Assistance Evaluation
World Bank Engagement at the State Level: The Cases of Brazil, India, Nigeria, and Russia
IEG PUBLICATIONS
All IEG evaluations are available, in whole or in part, in languages other than English. For our multilingual section, please visit
http://www.worldbank.org/ieg.

ISBN 978-0-8213-8427-5
SKU 18427


