Embed Size (px)
Citation preview
POLIC;Y RESEARCH WORKING PAPER 23 18
RegLilat ory Reform, Regulatory reform can spurinnovations in infrastructure
Comapetition, and service;, generating new
Inn ovaticon downsi:ream activities andmagnifying the economywide
benefits of reform. The
A Case Study of the M exican national competition agency
Road Frelght -ndustry can help greatly in laying thegroundwork for reform by
makin(g a compelling case ForMark A. Dutz the reform's expectedAydin Hlayri benefis.
Pablo Ibarra
The World Bank
Develcpment Research GroupPublic Econonmics
April 2000
Pub
lic D
iscl
osur
e A
utho
rized
Pub
lic D
iscl
osur
e A
utho
rized
Pub
lic D
iscl
osur
e A
utho
rized
Pub
lic D
iscl
osur
e A
utho
rized
Pub
lic D
iscl
osur
e A
utho
rized
Pub
lic D
iscl
osur
e A
utho
rized
Pub
lic D
iscl
osur
e A
utho
rized
Pub
lic D
iscl
osur
e A
utho
rized

POLICY RESEARCH WORKING PAPER 23 18
Summary findings
Discussions of competition and regulatory reform company, the benefits of reform included a IO percenttypically focus on price and quantity effects. But improvement in operating margin.improving certain infrastructure services can also Successful reform requires careful planning andstimulate entry and competitioni in user industries execution and political support at high levels. Regulatorydownstream, allowing new firms to enter, incumbent reform also profoundly changes the sectoral institutionusers to offer new products, and rivalry to intensify. formerly responsible for the regulation. Enough
Dutz, Hayri, and Ibarra present a case study of how resources should be provided to help organizations in theinnovations in road freight services affect selected reformed industry make the transition to the post-reformdownstream users of those services after regulatory environment - helping witlh such tasks as defining thereform. After a period of rigid regulation and hieavy organization's new role and facilitating the redeploymentgovernment interference, Mexico in 1989 developed a of staff.new policy framework for road transport, with free entry The national competition agency can help greatly inand market-based price setting. The result: faster, more laying the groundwork for reform by making areliable trucking has allowed user companies to offer compelling case for the reform's expected benefits. Afternew, previously unavailable products and to reach new reform, the competition agency should also help withareas with existing products. Cheaper, more customer- enforcement, to ensure that the cozy, cartel-like behaviorresponsive trucking services have allowed logistical stimulated by tight entry restrictions does not persist. Ininnovations in user firms, and some user firms have Mexico, three strong interventions were requi:red todecided not to keep their own fleets of trucks but to discipline attempted anticompetitive practices in theoutsource trucking services on the open market, thereby trucking industry in the years following reform.converting fixed costs to variable costs. For one fertilizer
This paper is a product of Public Economics, Development Research Group. The study was funded by the Bank's ResearchSupport Budget under the research project "Competition and Barriers to Entrepreneurship" (RPO 682-57). Copies of thispaper are available free from the World Bank, 1818 H Street NW, Washington, DC 20433. Please contact Hedy Sladovich,room MC2-609, telephone 202-473-7698, fax 202-522-1154, email address [email protected]. Policy ResearchWorking Papers are also posted on the Web atrwv-wwv.worldbank.org/research/workingpapers. The authors may be contactedat [email protected], [email protected], or [email protected]. April 2000. (48 pages)
The Policy Research Working Paper Series dissenzinates the findings of work in progress to encourage the exchange of ideas about
development issues. An objective of the series is to get the findings out quickly, even ifthe presentations are less than fully polished. The
papers carry the names of the authors and should be cited accordingly. The findings, interpretations, and conclusions expressed in this
paper are entirely those of the authors. They do not necessarily represent the view of the World Banzk, its Executive Directors, or the
countries they represent.
Produced by the Policy Research Dissemination Center
Regulatory Reform, Competitioin, and InnolvationA Case Stucly of the Mexican Road Freight Industry
Mark ]Dutz, Aydin Hayri and Pablo l[barra
The invaluable field work assistance of Guillermo Abdel Musik (as survey team leader)and Sergio Garza, both at the Centro de Estudios Estralegicos at ITAM, MeXico City isgratefully acknowledged. The paper benefited fromr helpful suggestions by CesarCordova-Novion, Scott Jacobs and Benedicte Larre. The project was prepared underfunding from the World Bank research preparation gramt 'Competition and barriers toentrepreneurship' (RPO-1682-57). This research reflects the work of the authors and doesnot reflect the views and policies of the World Bank nor the countries it represents.Correspondence: mdutz(@worldbank.org, [email protected], [email protected].


Outline
Executive Summary
1.0 Introduction
2.0 Regulatory Struct.ures and Their Reform2.1 The Political Economy of Regulatory Reform2.2 Regulations and Related Policy Instruments2.2.1 The Preregulatory Reform Environment
Market AccessMarket ConductPrices
2.2.2 Regulatory ReformMarket AccessMarket ConductPrices
3.0 Market Stiructuire and Entry
3.1 Evolution of Industry Structure3.2 Industry Conduct and Intensity Of Competition
4.0 Performance
4.1 Impact of Reform on Performance in the Road Freight ][ndustry4.1.1 Output and Prices4.1.2 Innovations and Productivity4.1.3 Profits, Wages and Employment4.2 Imlpact of Reform on Performance in Downstream Industries4.2.1 Costs4.2.2 Innovations and New Products4.2.3 Additional Ecornomywide Impacts
5.0 Policy Options For Reform5.1 Successes and Failures of Reform5.2 Potential Benefits and Costs of Further Regulatory Reforms
AppendixesAppendix 1. The Road Freight Industry in MexicoAppendix 2. Structured Survey Instrument Example: Fertilizer CompanyAppendix 3. Foour Case Studies
FiguresFigure 1. Road Freight Hau:lage Units of the Mexican Public Federal System, 1980-1996Figure 2. Road Freight E,nterprises According to Number of Haulage Units, 1996Figure 3. Quality-Price Tra(le Off in the Road Freight IndustryFigure 4. Age of Equipment (Motor Units) 1990-97, and Projections, 1998-2010


Executive Summary
Typically, discussions of the benefits of competition and regulatory reform focus on price andquantity effects in the market under consideration. However, improvements in certaininfrastructure services also can stimulate entry and competition in do-wnstream user industries,allowing new firms to enter, incumbent users to offer new products, and rivalry to intensify. Tothe extent that refor m spurs innovations in infrastructure services, and these innovations in turngenerate substantial new downstream activities, the econoniywide benefits of regulatoryreform are likely to be substantially greater.
In this case study, we quantify the positive benefits achievable from innovations in roadfreight services on selected downstream firms that are intensive users, of such services,following regulatory reform. From a particularly extreme degree of rigid regulatien with a highdegree of government interference, Mexico put in place beginning in 1989 a new -policyframework for the road transport industry based on free entry and market-based price setting.Besides expectecd gains from reductions in trucking prices, there have been a number ofadditional sources of downstream gains. Importantly, faster and more reliable trucking hasallowed user companies to offer new goods, both introducing previously unavailable productsas well as making it possible for existing products to reach new areas. Cheaper and morecustomer-responsive trucking services have also led to a number of other logistics-relatedinnovations within user f.-irms. Finally, some user firms, instead of co:ntinuing to invest andmaintain a private own-account fleet of trucks, have outsourced and purchased the services onthe now more efi'icient open market. Although such costs are not largely sunk, tapping capitalmarkets may not be an option for prospective entrants lacking reputaltion. An importantadditional benefit of a more competitive trucking service market, therefore, is to allow firms tooutsource their transport requirements, in effect converting fixed into variable costs. The totalup-side benefits are sizeable: the improvement in operating margin d:irectly attributable to roadfreight innovations for a representative fertilizer company is a surprisingly large 10 percent.
An important political economy lesson is that successfiul reform requires careful planning,execution and high-level political support. Regulatory reform also causes profound changes inthe sectoral institution formerly responsible for the regulation. Any regulatory reform effortshould assign sufficient resources to assist such organizaticn in making the transition topostregulatory reformi conditions, assisting with such tasks as defining the organization's newrole and facilitating redeployment of staff. Finally, the national competition agency can play acritical role in helping lay the groundwork for reform, by nmaking as compelling a case aspossible for the expected benefits of reform. In addition, the competition agency rnust play acareful post-reform enforcement role to ensure that cozy cartel-like behavior stimulated bytight entry restrictions does not persist. At least three separate strong interventions wererequired to discipline attempted anticompetitive practices by the trucking industry in the yearsfollowing the initial regulatory reforms.


1. Introduction
The transport of freighit is an input to the production of capital, intermediate, and consumergoods and services. As can be verified by input-output tables, it is almost impossible to thinkof a line of business that does not use transport. As such, any inefficiencies in transportationservices as well as any monopolistic structures in its markets constitule an additional cost andat times a bottleneck for all other sectors of the economy. WVhen adding unnecessary costs,inefficient transport services are equivalent to additional import or export tariffs. Whenconstituting a bottleneck due to lack of capacity to move more freight in a more tirmely manner,they become equivalent to quantitative restrictions. Importa:ntly, in addition to being seen as ameans to reduce costs, more efficient transport and logistics systems are increasingly regardedas a means of boosting revenues and a source of competitive advantagre. With the increasingemphasis of businesses on revenue-enhancement opportunities from logistics management andoutsourcing, inefficiencies in freight transport can cripple a country's efforts to enhance itsoverall competitiveness. IBox 1]
In the Mexican transport sector, road freight transport oni federal highways prior to 1989was subject to a rigid regulation with a high degree of interference by government. Importantgovernment-imposed barriers to competition included entry restrictions to operate on federalhighways, discretionary allocations of freight among truckers, and strong restrictions onmoving cargo outside the established transport corridors. Of'ficial tarii'fs applied to all cargoand a semipublic company held a monopoly in handling containers. Regulations did not allowcompanies to cha:rge higher rates for better service and hence no incentive to offer betterservices. Neither did they allow them to compete with one another by offering lower rates. Asa result, the trucking indu,stry was characterised by a limitec. number of firms operating withminimal competilion. Moreover, to maintain this highly ineifficient and archaic system, thegovernment employed a sizeable bureaucracy.
In 1989, the govern-ment formulated a new policy framework to deregulate the roadtransport industry. The government's vision was to create a competitive trucking industry withfree exit and entry and market-based pricing, without intrusive government regulation. Thegovernment focused its deregulation efforts in transportation and telecommunications with thebelief that they accounted for major supply bottlenecks and market im.perfections. Their reformwas deemed essential to achieve more rapid and sustainable growth.
This study assesses the impact of regulatory reform in the Mexican road freight industry byfocusing on selected dlownstream users. Following an overview of the political economy ofregulatory reform, the evolution of regulatory structures is examined to provide a context forthe subsequent inmpact- assessment. The market impact of regulatory reform is assessed first byexamining the evolution of market structure and conduct, and then by quantifying changes inperformance. The: major theme in the assessment of perfonrmance is the positive impact ofremoving bottlenecks for competition. In particular, we emphasise the large magnitude ofdownstream benefits possible from innovation and new products that accompany rmore intenserivalry in the provision of this essential upstream business s -rvice. The study concludes byhighlighting remaining areas where further regulatory refonn may yield additionaleconomywide benefits.
1
Box 1: Supply Chain Logistics - Moving Up the Corporate and Policy AgendaTransportation and the somewhat broader concept of logistics (including warehousing, inventory andadministration in addition to physical transport) have long been seen as minor cost items. Businesses did notbelieve that they could build competitive advantage based on logistics and hence ignored it. Similarly economicanalysis recognised only the direct benefits of lower transportation costs. That was before the supply chainrevolution in the industrialised world (supply chain management refers to the integration of the flow of gooc[s,information and finance to move products from suppliers to manufacturers to retailers as efficiently andinexpensively as possible). First came the innovation ofjust-in-time inventory systems in 1980s. The idea wassimple: the bigger a firm's inventories the larger its operating capital requirements. With more cost-focusedmanagement, such as ordering inputs just when needed, companies leamed to slim down inventories. Importantly,they also realised that the infrastructure for just-in-time input deliveries could be useful for quickly changingydesigns and customising products. More cost-focused inventory management and flexible production technologieswent hand in hand, leading companies to realise that supply chain management is not simply a means to redulcecosts but a means to gain competitive advantage over rivals. Companies introducing overnight deliveries to theirretailers and next-day service for their customers began to win substantial market shares from establishedcompetitors. The dynamic aspects of supply chain management for a manufacturer require feedback from retailerson daily sales mix and volume. The manufacturer responds to the feedback by changing design, sourcing andproduction volumes. Flexible manufacturing became the darling of business academics towards the end of 1 980s.'
A key component of this process was the development of an efficient communications interface withsuppliers, cutting back on transaction costs. On-line computer systems allowed companies to communicate withtheir suppliers as easily as they do intemally. Efficient communications, however, lead to maximum gains only ifgoods flow as quickly as information. Logistics and communications are highly complementary factors especiallyfor businesses that manufacture or distribute and market consumer goods. Top European industrial and servicesector companies have reduced logistics costs to 7.5 percent of revenues in 1998 from 14.3 percent in 1987, andcycle times to 12 days from 27.2
As companies have leamed to establish flexible links to their suppliers and customers, they grew moreconfident about aggressive outsourcing. It is now a mantra of management that except for a few core functi cinseverything else should be outsourced.3 Remarkably, about 70 percent of all U.S. Fortune 500 companies outsourcesome or all of their logistics activities.4
Outsourcing has an important feedback effect on logistics. Without outsourcing producers must eitherestablish their own in-house distribution networks (costly to set up and difficult to manage) or rely on distributorsor end-users to accept delivery at factories. Using third-party distributors or public warehousing and transportationfacilities, even a small producer can have access to an extensive distribution network and pay only for usage. Thisbrings down entry barriers created by large capital requirements, especially significant for countries with poorlyperforming capital markets and for prospective entrants lacking reputation. Despite improvements in financialmarkets, capital requirements remain as the only entry barrier that has a robust, positive correlation withsupernormal profits. Therefore, the conversion of fixed costs into variable costs should spur competition in manyindustries.
In the new world of flexible manufacturing and outsourcing, linkages are becoming more important.Information and goods now flow faster and more accurately. As companies can exploit market opportunitieswithout significant fixed costs, they compete more vigorously. Only companies that are able to communicate andinteract efficiently and effectively with others stand a chance of expanding their business. They too have tCl sharethese benefits with consumers in the form of better service and lower prices. The backbone of this system is third-party providers of efficient logistics and communication services. Using their services, any firm, no matter howsmall and where located, can reach world markets.
In order to facilitate the benefits of the logistics revolution in their countries, policy makers should understandhow third-party suppliers of logistics services emerge. This study is a first step in that direction. By taking a deeperlook into the logistics operations of downstream user companies in Mexico that could have taken advantage of therecent deregulation of the road freight industry, we identify potential benefits as well as opportunities forimprovement.
i See Sable and Piori (1990) on the emergence and relevance of flexible manufacturing.2 See AT Keamey (1998).3 See Porter (1997).4Based on an October 1998 survey for the US Council of Logistics Management, as reported by E. Alden,'Complexity prompts calls for third party', in Financial Times, Supply Chain Logistics, FT Survey, 1998.
2
A novel part of this study is that it benefits from an in-depth survey of 30 firms, 15trucking companies and 15 intensive users of trucking services in Mexico's heartlandundertaken in midl-i998.5 The survey of shippers focused or, three types of industriesrepresenting different cormmon users in Mexico: agroindustrial, electronics and auto-partsfirms, as well as general import distributors. The most detailed survey instrument combinestechnical data and subjective assessments of respondents in a consistent framework, therebygenerating a set of numbers measuring the value to individual downstream firms of keyupstream innovations associated with regulatory reform.6
2. Regulatory Structures and Their Reform
2.1 The political economy of regulatory reform
Rationales for regulation. Government regulation of the trucking industry in Mexicoextends back to thie late 1940s. However, lack of enforcement of existing regulation since itsorigin until 1977 was the main characteristic of this period. Most of the trucking companies didnot have legal registration and most of the trucks did not have official authorization tocirculate. In 1974. more than 7000 trucks did not have the corresponding permit or concession,while only 338 out of 1500 existing companies were legally registered.7 In 1977, a gradualprocess of increasing reguLlation started with SCT's (the Mexican Ministry of Communicationand Transport) Programn of Development for Federal Trucking (Progreama de Desarrollo delAutotrans,porte Federal, i977-1982).
The Pirogram [Fostered the revision of the consitutive deeds (escrituras constitutivas) oftrucking companies. It also created three different committees: (1) state committeesresponsible for coordinating actions between SCT and the state authorities, including theconstruction of freight centers; (2) route committees to emit opinions for the grant of newconcessions on specific corridors; and (3) technical committes to review 'broader' aspects-such as economic. industrial, or legal-to be consider for future reformis. Both the r oute andtechnical committees opened the door for an increasing involvement of trucking leaders in thedesign of governmental policy.
The regulation of roacl freight transport has been normally justified on grounds of safety,reliability of service and stability of rates. In the case of Mexico, the intcreasing regulation wasjustified on the need to provide a more reliable service and to protect transport infrastructure.
5 Of the carriers, 8 have their headquarters in Mexico City and the othLer 7 in Guadalajara, Jalisco. Of theshippers, 4 :have their headquarters in Mexico City and 11 in Guadalajara. Of the 15 carriers, 6 are smallcompanies with fleets of less than 30 trucks and 8 are larger companies with fleets ranging from 50 to over400 trucks. The final transpo:rt firm interviewed, a multi-modal freight broker, owns no trucks and isrepresentative of a new segment that operates as a link between Mexican trucking firms and internationalshipping companies.6 Our approach does not rely on measuring actual operational results of individual companies like the studiesmeasuring the impact of privatization. Instead, we go through each major operating parameter of thecompany and construct counterfactuals. Thus we reconstruct each data point rather than simply measuring it.This allows us to achLieve greater reliability with fewer data points. See Appendix 2 for an illustrativeexample of the most detailed survey instrument.7 As cited in Islas (1990), p. 117.
3

The apparent rationale was that open competition might: (1) disrupt economic activity throughprobable high price variability and uncertain service availability especially to less accessibleregions of the country, and (2) lead to cost cutting practices that might result in increases inaccidents and pollution (due to usage of older trucks, less maintenance, etc.).' However, thechanges could also be interpreted as a set of measures that protect the interest of a handful oftrucking families, and allowed the latter to implement more strict controls in the market.Before trucking deregulation, about 15 families controlled the whole industry, although itcontained several thousand individual truckers.9 Some of the most prominent truckers did notown a truck, but their power came from the control and ownership of freight terminals. As, ithappened in 1989, the decision to open the sector to competition unavoidably disrupted someof the most profitable operations.
A broad market-based reform context. Trucking deregulation was undertaken within thecontext of general reform rather than as an isolated action. From 1983 onwards, Mexico begana process of macroeconomic and structural reforms following the debt crisis and the collapseof oil prices. One of the many facets of reforms was to increase the reliance on market forces.International trade was liberalised through elimination of quantitative restrictions andreductions in tariffs as part of Mexico's commitments due to its new GATT membership in1986.
Trade liberalization directly impacted the trucking industry. The collusion of truckers inMexico was maintained through enforced territorial and cargo distribution of the market.Market distribution responded to transportation flows generated under the import substitutionstrategies followed for over 35 years. Trade liberalization brought changes to both trade flowsand the structure of cargo movements. Exports increased three-fold over 5 years. Cargoincreased substantially in the routes connected with international trade (Mexico City-Monterrey-Laredo, Mexico City-Veracruz, and Manzanillo-Guadalajara) but decreasedrelatively in domestic routes (Mexico City-Guadalajara and Guadalajara-Monterrey).'0 Thesechanges altered the interest of the members of the trucking chamber and truckers in general.Truckers previously locked into unprofitable routes, individual truckers exploited by freightterminals and all downstream users could be expected to be strong supporters of trucking;deregulation. The realignment of interest within the industry played in favour of the Salinasadministration's goal of increasing competition and enhancing market contestability throughderegulation.
Institutional forces for change in trucking. During the period 1988-89, major structuralreforms were introduced by the Salinas administration including efforts to expand that miaLrketeconomy and strengthen the forces of competition. Within this context, the Ministry of Finance(Secretaria de Hacienda y Credito Publico, or SHCP) and the Office of EconomicDeregulation within the Ministry of Industry and Trade (Secretaria de Comercio y FomentoIndustrial, or SECOFI) argued for the deregulation of trucking. The deregulation of trucking in
' World Bank (1993), p. 8.9 See Fernandez (1993), p. 105.°0 Idem.
4
the United States in the early 1 980s must have been an impor-tant facto:r because researchesgenerally attached relatively high welfare gains to deregulation. One study, for exarmple,estimated that the gains from deregulation as high as one third of total income generated fromtrucking." Since the M:exican regulation was even more heavy-handed, the authorities hadevery reason to expect even bigger welfare gains from deregulation. A1987 report by theMinistry of Commnunications and Transport (Secretaria de C9municacjones y Transporte,SCT) estimated the welfare costs of trucking regulation at 0.'i percent of GNP.12
As part of the larger program of structural reforns to strengthen competition, S]-JCP andSECOFI took the initiative for the deregulation of trucking. The reformrers had to deal with thepossibility that the National Trucking Association could have immobili sed the country in theiropposition. Although deregulation was expected to benefit a large number of previouslydisadvantaged truckers, the real power of the trucking leaders had yet to be tested. This threatcoupled with the absence of visible strong support from potenitial winners effectively led thereforming bureaucrats to adopt the following gradualist three-stage strategy. This process isyet to work itself out completely, since intra-state trucking still remains heavily regulated andtechnical regulations were largely ignored at the time.
A three-stage approach. In order to avoid interest-group pressures, the draft proposal wasprepared by a small group, without open consultations with SCT or other parties. Alter thedraft documents were prepared, the first stage of implementation was to solicit support fromthe affected industry associations, emphasising modernizatioin rather than deregulation withoutever openly mentioning strengthening of competition as an explicit objective. In accordancewith the recently issued National Development Policy for 19139-94, which outlined lhe generalpolicy framework, the government negotiated an agreement with the national truckingassociation (Camara Nacional de Autotransporte de Carga, CANACAR) under the terms ofwhich CANACAR. agreed to cooperate with the government in the deregulation and.modernization of the industry. The agreement was signed on July 6, 1989. The agreementstressed the advantages of restructuring and modernising the industry. As a gesture t'oCANACAR, the goveniment offered loans at preferential rates to truckers who wanted torenovate their fleets.'3
The second stage, was the approval by decree on July 7, L989 of new regulationseliminating most e:ntry restrictions. Through this decree, the government effectively abandonedthe public service notion that was behind the concept that trucking operations require aconcession. The July regulations also allowed 'official' tariffs to be regarded as maxcimumrates. The third stage (deregulation part two) was the issuance of a decree in January 1990abandoning tariff ceilings thus allowing rates to be freely negotiated between truckers and
"' See Moore (1975).12 As cited in World Bank (1990), p. 1 1.13 The authorities were reportedly aware that deregulation would lead to a substantial increase in supply,given the excess capacity created by the former regulation (private fleets were prevented from providingservice to the broader public, route restrictions created a large number of empty return hauls, ancl freightcenter controls led to excessively long waiting times). Stimulating further supply through soft klans at thattime can therefore nol be explained by economic motives.
5
customers. The principal reason for issuing two decrees separated by six months was SCT' sconcern that if all deregulation actions were taken at once, the forces of competition mayinitially be too weak to prevent sharp price rises.
Initial reform by decree. Regulation was implemented by Presidential decree. It was notuntil late 1993 that the new law was published. The new regulation was only published in late1994. This delay in publication of laws generated substantial uncertainty among carriercompanies as many were not clearly informed of the new rules of the game, or expected aneventual reversal. Apparently, the signing of NAFTA accelerated the effective implementationof these regulatory reforms. The motivation for this phased approach, however, was strategic.It was expected by the reformers that a constitutional reform would take substantial time andmeet stiff resistance within Congress. Although the PRI had a majority in Congress, transportassociation leaders had close connections with representatives in Congress who could havestalled the reform. It was therefore deemed more expedient to initiate reforms through decree(under executive authority) while carefully choosing the wording of texts in order not tocontravene existing constitutional pronouncements. As an illustrative example, the prevailinglaw in 1989 stipulated that the provision of public road freight services requires a concessionthat must specify the specific route(s) that can be served by the concession holder. Themodification introduced by the July 1989 decree eliminated all route restrictions by merelychanging the definition of 'route' to 'any route covering the entire national territory'. Theperiod between 1989 and 1993 was seen by the government as a test period during which theycould have back-tracked had they faced excessive resistance. In spite of the uncertainty createdby ambiguous rules of the game, the approach taken was a pragmatic approach that mininmsisedthe risk of a reversal.
Concessions, permits and the public service provision. To improve transparency andensure the permanence of the reforms, a radical step was the reform of the law that took pl;acein 1993. Prior to that date, public road transport services (freight and passenger) had by law thecharacter of a 'public service', which required any nonstate provider to hold a 'concession:'granted by the federal government. Through the concession system, the federal state had fulldiscretion to give and take away authorization to operate vehicles. By basing entry into roadtransport services on the simple obtaining of a permit, the 1993 law effectively abandoned thepublic service character of road transport. Through the permit system, the federal state nolonger has any discretion regarding authorization but rather must grant it obligatorily as lo]ng asthe applicant meets the established requirements. Of greater potential economywide efficiencyconsequence, the change to nonconcessioned service has automatically transferred, through aconstitutional mechanism, the main regulatory powers from the federal government to therespective local governments (states and municipalities) depending on the road the trucker isusing.'4 This change has opened the potential for substantial differences in the extent of federaland state-level liberalization, with attendant costs to business arising from lack ofharmonization.
14 For a more detailed analysis of these issues, see Sempe (1997) pp. 79-83.
6

Changes in SCT's role. The elimination of entry control and rate regulations greatlyreduced the responsibilities and activities of SCT, particularly within the General Directorateof Land Transport and Tariffs. The remaining functions of SC'T with respect to road transportinclude supervision of road maintenance, monitoring transport and formulating transportpolicy. SCT also assumed some new functions, such as super,ision of highway safely.However, there was a long delay in reducing the number of personnel. Only by May 1994, didSCT significantly reduce the number personnel in departments previously involved in entrycontrol and rate reg;ulations. SCT assigned the remaining personnel in these departments toothers. Reportedly, as the beneficial effects of the new policy have become evident andfollowing the departure of certain SCT staff previously involved in regulatory matters, thecommitment of scr to the new policy has become very strong.'5
Deregulation ait the federal level, affecting only interstate trucking. Under the federalistsystem and the 1993 law, states have autonomy to regulate inlrastate trucking. However, thefederal government encouraged state governments to undertake similar deregulation withintheir own jurisdictions. sc rdevised a plan for harmonising federal trucking regulations withstate regulations through a series of bilateral agreements between the federal government andthe states. These agreemenl.s were expected to be finalised by March 31, 1991.16 Altfloughsome states, such as Chiapas, have deregulated intrastate trucking, the harmonizationagreements have not been finalised yet. SCT recognises that the progress with bilateralagreements has been much slower than planned. SCT also has doubts regarding the legalauthority of the Federal Competition Commission to eliminate intra-state tariffs, schedules andreserved routes. The continued lack of harmonization between federal and state-levelregulations, if unaddressed. could lead to a bottom-up backtracking of regulatory reforms,affecting market power as well as environmental and safety objectives -- with the possiblerebuilding of cartels at state level, and conflicting stringency requirements regardingenvironmental, safety and Nveights and dimensions standards.
Postreform gradual adjustment-attempts to revive the cartel. The former marketintervention policies through segmentation and control of prices and quantities have left astrong imprint on postreform market conduct that has continued to manifest itself. Althoughregulation by government has been removed, there has been a natural tendency amongpreviously favoured market participants to replace government control by interfirmagreements. The efi-orts of the Mexican Federal Competition Commission have played animportant role to oppose anticompetitive practices and complement the deregulation goal ofenhancing market contestability.
In 1994, the Mexican Federal Competition Commission carried out an ex officioinvestigation into an alleged absolute monopolistic practice by CANACAR. It involved anagreement among the Chamber's members to fix the prices applicable tc their cargo iransportservices. The practiae arose from a reference price guide for negotiations between users andtruckers. CANACAR hald written the guide and distributed it among its members. The
15 World Bank (1995), p.33.16 World Bank (1990), p.16.
7

document specifically established the aim of setting minimum prices for road transportservices. This arrangement between competitors was found to constitute a violation of thecompetition law. As a result CANACAR was fined on its members' behalf. The Chamber alsowas ordered to withdraw from circulation those copies of the price guide already among itsmembers; to refrain from issuing any other kind of guide with the aim of fixing prices orminimum costs for the services provided by its members; and to desist from establishingpricing policies aimed at creating minimum conditions for the hiring of road transport services.
Subsequently, CANACAR consulted the Commission regarding the development of a costaccounting program for its members. This program involved dissemination of a costingmethod, examples of its use, and training courses or meetings at the national level. To enablemembers to use the costing methodology more easily, CANACAR prepared a questionnaire forthe use of each transport company to identify the elements that make up fixed and variablecosts and to estimate the latter. The Commission decided that the use of this costingmethodology could lead to greater efficiency in road transport operations - and was thereforenot in itself a violation of the competition law. In this context, information on costs coulddirect transport companies' investments in more efficient units and assist towards a betterorganization of routes. The Commission did, however, take into consideration the precedent ofCANACAR's prior price fixing activity. It therefore warned the Chamber that the example onhow to use the methodology would have to be strictly illustrative in nature, avoiding at alltimes the possibility that the estimates it contained might serve to fix service prices. TheCommission ruled that the material used to disseminate the costing method must indicate ithatthe use of methodologies and estimates as ways to fix prices between competing road transportcompanies constitutes an absolute monopolistic practice and, as such, is sanctioned by thecompetition law.
As another example, in 1997 the Federal Competition Commission carried out an exofficio investigation on possible anticompetitive practices in the transport and distribution ofdiesel fuel. The investigation determined the existence of agreements (1) to divide markets intogeographic zones for the purposes of transport and distribution and (2) to limit supply oftransport services for fuel oil, in order to strengthen the ability to divide markets. The marketdivision of transport services included two explicit agreements, with the allocation of explicitdistribution concessions that acted as entry barriers. In one, transporters divided the transportto consumer enterprises of the product sold directly by Pemex-Refinacion, with the tacit initialacceptance of this parastatal enterprise. The other consisted of the division of transport servicesof hydrocarbon sold by two distribution companies,'7 with their consent and participation. TheCommission declared the practices illegal, imposed dissuasive economic sanctions, andpromoted conditions favouring competition, ordering the producer-distributors to assign routsin a transparent manner.
Regarding subsidies, some official entities have in the initial years following deregulationstill rewarded affiliation to trucking chambers. For example, the National Bank for Public
17 The two companies were Distribuidora de Combustoleo de Cd. Juarez and Distribuidora de Combustoleo.
8

Works and Services (BANOBRAS, Banco Nacional de Obrzs y Servicios Pablicos) reportedlyrequired a letter from CANACAR to ensure the suitability of the trucking company as potentialbeneficiary for loans at subsidised rates in the early years following deregulation. Ourempirical work corroborated that carriers who are not affifiated to trucking chambeirs-oftensmall-owned operators-do not have either the information or the access to any availablesubsidised loans.
Without doubt, the continuing presence of trucking chamrbers has fiacilitated incumbents'control over service supply in some regions. Their contact network has continued to functionas an instrument to disitribute higher volume cargo among their members. Neverthe'less, theforceful interventions of the competition agency, together with the development of formalfreight forwarders has gradually eroded CANACAR's power, particulazrly in intermodaltransport.
2.2 Regulations and relatedpolicy instruments
Road transporl: regulation was encompassed in the Law of General Communication Modes(Ley de Vias Generales de Comunicaci6n) and its accompanying implementing regulation.'8
For road transport. this law was replaced on December 22, 1993 by the Law of Federal Roads,Bridges and Trucking (Ley de Caminos, Puentes y Autotrans,orte Federal), and supplementedon November 22, 1994 by the Regulation for Federal Cargo Trucking ('Reglamento para elAutotransporte Federal de Carga).'9
2.2.1 The preregulatory r eform environment
Market access. Federal policy strictly controlled entry. Entry regulation differed for publicfor-hire trucking companies and for private own-account trucking fleels that are owned andoperated by firms :in other industries primarily for their own purposes. Main restrictions wereon entry to operate on ifederal highways, on cargo movement between established corridors, oncargo assignments, on container handling, and on the handling of cargo at railroad stations andinternational borders:
* Mandatory concessions based on agreement from incumbents. T'o provide publicgeneral freight services, truckers were required to obtain a federal trucking concessionfrom SCT. Concessions were specific to class of service, route, number of haulageunits that can be used, and technical characteristics. By law, the concessions granted toany individual could not be for the operation of more than five vehicles. Cormpanyaffiliation for a concession holder was compulsory. If am individual was grarnted such aconcession for general freight, he still had to be accepted by an established companyand this constituted an impassable barrier to entry. The administrative procedures fordetermining the need for additional service depended on the opinion of existing serviceproviders. Incumbent firms had both preferential treaktent whenever it was necessary
18 Reglamento al Capitulo de Explotacion de Caminos y de la Ley de Vias Generales de Comunicacion. Fora detailed analysis of this regulation, see Davila Capellaja (1994).19 Dates reflect publication in the official gazette (Diario Oficial de la Federacion,).
9

to increase the number of trucks and the right to object to future increases in installedcapacity. These procedures strengthened the position of existing firms and led to theformation of cartels.
* Reserved routes. The country was divided into eleven corridors and each truckerneeded a concession to operate within a specific corridor. By being route-specific, theconcession system controlled installed capacity for each corridor, creating a ceiling toton-kilometres per route. The corridor system favoured existing spatial concentrationsince the corridors tended to radiate from Mexico City. Down-time was high and loadfactors low as the restrictions constrained their options for back-hauling and made itmore difficult to match their supply with available demand. For shippers requiringcross-corridor shipments or requiring services beyond the established route capacity,special arrangements with higher tariffs permitting the use of trucks allocated to otherroutes had to be made. This segmentation was critical to prevent market forces fromgenerating more competition.
* All traffic through freight centers. Truckers must load and unload cargo at specifiedfreight centers (centrales de carga) and shippers must channel requests through thesecenters. While originally motivated by economies in provision of common services(such as provision of spare parts, insurance and paperwork), many freight centersbegan limiting entry and forming cartels in the assignment of cargo. Moreover, freightcenters were increasingly reluctant to grant return-load facilities to other centers evenon the same route, and opposed allowing vehicles from other routes to operate withintheir service area even when transport was in short supply. Centers at ports or borderzones were even more restrictive because cargo could be easily centralised andcontrolled.
3 Monopoly provision of intenational container movements. Multimodal, a semipubliccompany granted monopoly status for the handling of international container traffic,was created by SCT in 1981 - with the exclusive right to provide door-to-doormultimodal services. Collusion between Multimodal and the freight centers led to asystem of surcharges and unofficial payments which often far exceeded the statedtariffs. Service standards were low and deliveries often delayed, resulting in a tendencyfor container traffic to be confined to port areas (and thereby foregoing the benefits ofdoor-to-door delivery). In addition, customs regulations did not permit import-bearingcontainers that were temporarily brought into the country to transport domesticcargoes, resulting in empty outbound movement of containers.
* Limited licenses for cargo handling. SCT granted concessions for handling cargomovements at railroad stations and border customs facilities as well as for the drayageservices to cross the border. In most cases, goods could not be moved without the,services of the concessionaire. As with other concessions, entry was limited and cartelswere formed.
For private own-account carriers, permission was required to haul their own goods. 'Privatefleets could not compete for back-haul and more broadly were not allowed to transport third-party cargo, again segmentation to prevent competition but in practice leading to sizeableunused capacity in the system. Eventually, a temporal permit allowed private truckers to offer
10

their services when public companies' supply was insufficient. However, private truckers weresanctioned with the loss of the truck if they offered the service wit;hout acquiring the permit.
Companies that offer specialised freight services were regulated under separate rules.Specialised freight services included haulage of hazardous materials, objects of high volume orgreat weight, securities, industrial cranes and cars direct from the factory. These carriersrequired a different permission, but then could haul on all the federal roads. However, theycould only operate the registered specialised trucks and transport a restricted nimber ofspecific cargoes (a subset of animals, perishable food, bottled liquids, construction andelectrical material, furniture, automobiles).
With respect to international competition, though cargo trailers were allowed to crossinternational borders and proceed to their final destination, the tractors (power units) were notpermitted to cross borders, neither by Mexico nor by the United States. Drayage services havedeveloped to undertake the exchange of power units at the border. The regulations for theseservices vary depending on the cities and states involved on both sides. In most cases theMexican drayage firms are allowed to bring and take trailers across the U.S. border within acommercial zone l[imited to the urban area at the border. The U.S. drayage operations aregenerally more restricted as a result of Mexican regulations, at times not permitting bordercrossing nor the pick-up of return loads.20 An additional difficulty has been that the high-growth in-bond assembly (maquiladora) industries have: not been permitted to transport theirown products in their own private fleets. Finally, foreign carriers wvere prohibited from owningMexican trucking cornpanies.
In additio:n to Federal regulations that affect interstate traffic, some states have restrictionsthat affect intrastate movement of cargo. In some cases, concessions are required for specificcargo and/or route movements on state highways. A review of state regulations in Chihuahua,Jalisco, Puebla, Veracruz and the state of Mexico has indicated that state regulations have not,in general, posed major issues as exclusive intrastate traffic is not very significant incomparison to interstate transport. Nevertheless, state regulations have been found to affect themovement of some agriculture, forestry and construction industry products.2 '
Market conduict. The cartel-like behavior stimulated by tight entry restriclions profoundlyaffected market ccinduict. Trucking companies especially small operators that offered similarservices and loaded freight in similar locations were compelled to establish societies (lineas deconcesionarios) and offer their services through freight centers. Some freight centers (like theones in Mexico City and Guadalajara) reportedly restrained themselves to leasing spots totrucking firms that had direct contact with their clients, stamping the loading documentation(talones de emnbarque) and promoting with the authorities sanctions against those who offeredthe service without legal allowance. Other centers (like ihose in M:atamoros, Veracruz andTampico) acted as inescapable intermediaries between truckers and shippers, preventing direct
20 For a detailed account of truck-related border crossing problerms, their persistence after regulatory reformsand their associated high transactions and congestion costs, see Giermanski (1995).21 See World Bank (1990), p.14.
11
negotiation between carriers and shippers. They determined who carries a shipper's load,destroying carmers' incentives to build up reputation. Some freight centers compelled truckersto follow a roll call, first-come first-serve queuing system when loading freight.
The fixed terms dictated by the freight center for the provision of the loading and deliveryservice were extremely generous: loading, one day; each 200 kilometres-segment transport,one day; unloading, one day. The sanctions for delays were restrained to partial losses of therate, which favoured trucking companies: from I to 5 days, 5 percent; from 5 to 10 days, 15percent, more than 10 days, 30 percent. This created incentives for excessively long deliverytimes, enabling the vehicle to wait a substantial time in order to find a return-load and not needto return empty. Thus, a trip from Mexico to the nearby city of Cuernavaca (a roughly 60-minute trip by car) could take 8 days with the shipper being required to pay 95 percent of theprescribed tariff. On the other hand, shippers who did not pick up their freight within the first48 hours after cargo arrival to the destination had to pay warehousing charges.22
Important additional regulations or the lack of appropriate regulations affected vehiclemaintenance and loading practices, vehicle fleet purchasing practices, as well as related safetyand environmental practices. Main areas included:
* Absence of dimension and weight regulations. Mexico lacked any regulationcontrolling vehicle weight and size. Axle overloading (excessive weight per axle) wassuspected to be most serious on roads connecting major port areas, where cargoes areconcentrated and heavy industries are located. Overloaded axles cause severe damageto highway pavements and bridges, which in turn increases the risk of accidents, limitsroad life and raises maintenance costs.
- Absence of technical vehicle safety regulations. Mexico also lacked an inspectionsystem to monitor vehicle safety. The present system allows potentially dangerousvehicles to use the public roads. At least 7 percent of accidents are due to vehiclefactors such as bad tires and brakes. The proportion of number of persons killed onMexican highways to the number of accidents was six times higher in Mexico than inSweden. 2 3
* Fleet purchase restrictions. The automotive industry, consisting of auto, truck, bus andparts producers faced numerous restrictions which greatly increased the effective costsof vehicle purchase and maintenance. For automotive production, the effectiveprotection in 1989 was estimated at about 50 percent compared with a 15 percentaverage for manufacturing as a whole. In addition, imports of tractors and trailers wereprohibited.
* Absence of environmental regulations. Mexico lacked any norms controlling trucknoise and air pollution. There were also only minimal programs in place affecting thequality of fuels.
* Exemption from taxation. The Mexican transport sector was exempt from income taxesas well as value added and ownership taxes. Instead, since 1966, truckers were required
22 This account is based on Davila (1994), p.12 9 .23 The latter is based on a rough estimnate by World Bank staff. See World Bank (1990), p.17-8 .
12

to pay a direct tax that was a fixed amount per operated vehicle. The armount variedaccording to the type of vehicle and service rendered, but was very small. Theecclusiorn provided a significant avenue for tax evasion since a manufacturer could starta trucking operation to escape corporate income taxes.
Prices. Fixedjprces for routes. Official trucking tariffs were set by SCT, presumablyabove the corapetitive level and high enough to balance, on average, both fixecl and variablecosts and yield "reasonable" profits. The rate was uniform for all seasons and for all regions ofthe country. l'he rates were classified in five different categories, each with its own variablefactor per ton-kilometre. However all the categories shared the same fixed factor per ton. Theclassification complied loosely with the difficulty of handling different products, and itdiscriminated between the value of the goods. Trucking companies provided the costinforr.nation that the authorities evaluated and used as a reference :For setting rates, but ratesoften bore little or no relationship with the costs of a specific shipment. Concessionaires werenot allowed to chaLrge prices above or under the authorised rates.24 Neither could privatetruckers charge over or under the official rates when meeting extraordinary demand for theservice.25 Additional application rates set values for other services such as pick-up delivery,exclusively served customers, empty back-hauls and warehouse spaces.
Insurance liability limitations for carriers. Trucking companies' responsibi:Lities fordamaged or missing freight were uniformly established for all the different kinds of cargo andwere explicitly limited to very reduced quantities, unless the shipper paid an additional fee inproportion to the declared value of the good. The government had fixed the ceiling on thetrucker's responsibiliity for cargo loss or damage to only US$0.3 l/ton. A further regulationprevented negotiation of incremental insurance by fixing the rate at which the shipper couldinsure his cargo irrespective of the product-specific shipping risks (at 3 mills per declaredvalue).
Non cost-reflective tariffs. While overall road costs were being recovered, there wereimportant cross-subsidies between automobiles and trucks. By 1989, trucks were only payingfor a small fractioin, roughly 15 percent, of the costs thali they caused to the highway network.This was essentially clue to the relatively low Mexican price of diesel fuel, which in late 1989was roughly IJS$0.65;/gallon, insufficient to allow adequate cost recovery, coupled with theabsence of significant license fees or direct taxes levied on truckers.2 6
2.2.2 Regulai'ory refiorm
Market access. The basis of the deregulation program was that private investment andcompetition in trucking would be encouraged and the development of multimodaltransportation would be pursued. The new access regulations included:
24 Some specific products such as corn, wheat, rice, sorghurm, sugar, salt, cement, coarse sand, gravel, sulfur,coal, raw oil and gasoline were subject to an 8% discount that functioned as a cross subsidy.25 See Davila (1994), pp. 127-12826 World Bank (1990), p. 19.
13

* Free entry into trucking with a simple permit. Any trucker wishing to operate one ormore trucks need only prove his identity and vehicle ownership to get a federaltrucking pernit. The changes abolished both limits on the number of concessions andon the partnership of incumbent trucking companies in the allocation process of newconcessions. Specialised trucking firms are treated equally, allowed to transport anycargo whenever their trucks were technically suited for doing so. Private own-accountoperators are allowed to transport third-party cargo. All restrictions on backhaul areeliminated.
* Free entry on all routes. Trucks have been freed to offer their services and transportinterstate cargo throughout Mexico. Direct shipments between former corridors arepermitted without additional costs.
* Traffic can flow independently of freight terminals. Truckers do not have to belong tofreight centers to obtain cargo and shippers are free to use the trucker of their choice.Freight centers no longer control cargo shipments nor certify the bill of lading.
* Free entry into container handling. Entry into the provision of multimodal services hasbeen opened up and containers can be transported without Multimodal's services. InJanuary 1990, customs regulation restrictions on the use of international containers forthe transport of domestic cargo were lifted.
* Free entry into cargo handling. In January 1990, new regulations forbid givingexclusive rights for the provision of cargo handling services in federal areas,specifically at railroad stations, customs facilities and border crossings (drayageservices). Any operator with a federal trucking permit is automatically allowed toprovide such services.
The current Regulation for Federal Cargo Trucking establishes the following requirementsto obtain a permit: (1) fulfil the registration form that SCT issues (what it must include ormaximum permissible items to include are not specified in the Regulation); (2) show evidenceof third-party damages insurance; (3) declare the vehicle characteristics; and (4) show thecertificate of low pollution emissions. For the case of incorporated legal entities (personas
morales), the regulation also requires them to show the constitutive deed (escrituraconstitutiva) which establishes trucking service as their main activity (Arts. 7 and 9). Theauthorities' response to the application must not exceed thirty days (Art. 15).
With respect to international competition, foreign carriers are still not permitted to makeuse of federal roads for international transport. NAFTA established a schedule of liberalizationof the transportation sector in three, five and ten years. However, integration of systemsbetween the United States and Mexico has been slowed by a U.S. unilateral decision topostpone NAFTA in trucking.2 7 Foreign carriers are not allowed to own Mexican truckingcompanies until 2004. One positive development is that January 1990 changes have permittedthe maquiladoras to transport their own products in their own trucks across the border.
27 Based on arguments of divergent coordination in standards, lack of security in Mexican main highwaysand low technology of Mexican carriers. See Ibarra-Yunez (1999), p.6.
14
Althoughl the federal government developed a plan of action for federal-stateharmonization of trucking regulation, the federal government has no jurisdiction overexclusive intrastate transport on state or local roads.
Market conduct. Deregulation eliminated all restrictions on routes. It defined a newunitary route for public trucking that embodied all the roads of fedleral jurisdiction. Since it isno longer mandatory to contact clients through freight terminals, shippers have direct contactwith their preferred trucking company and can make their choices on the basis of quality andprice differernces. Otlher regulatory changes include:
* Liberal dimension and weight regulations. Mexico introduced very liberal vehicleweight limits?W2Among the consequences are that Mexican roads need to beconstructed at higher standards and costs than U.S. roads. In turn, Mexican vehicleoperating; costs per unit of cargo are much lower as the higher road costs are notrecovere(d in road user charges. On the other hand, regarding vehicle length limitations,Mexican standards are typically more restrictive than U.S. ones. In particular, Mexicanstandards do not allow the haulage of 51 feet trailers, the most common U.S. size. Inpractice, the size and weight limits are rarely enforced, due to the absence of sufficientplatform-.scales. An insufficient number of inspectors also lack mobile umits and thereis a reported lack of scales to enforce the weight regulations. This is an area where theauthorities and trucking representatives of both eciuntries are still negotiating to reach amutually acceptable agreement, under the guise of the post-implementationnegotiations of NAFTA. If Mexican trucks are allowed to operate up to their ownweight limit, Mexican operators would be at an advantage over U.S. operators and railtransport. On the other hand, if U.S. standards are adopted, Mexican operators will bedisadvanl:aged as' their vehicles are designed to carry much higher loads and thereforehave higher unit operating costs.
* Liberalization of fleet purchases. The regulations governing the automotive industrywere changed to ensure that truckers are able to purchase Units of international qualityat international prices. Starting with model year 1991, the import of tractor-trailers wasallowed if domestic prices exceed the international level, and for 1992 also heavytrucks. In addition, restrictive regulations on the organization of truck p:roduction, suchas national integration requirements, compulsory incorporalion of domesticcomponents into vehicles and the majority national ownership requirement have beeneliminated. The privatization of the national truck producer DINA in the early 1990sand the market entry of aggressive truck producer 3 like Mercedes and V'olvo withfinancial lending leverage was critical.
Level-playing field taxation. Within the 1990 budget approved by Congress, theexemption of the trucking industry from income, vialue added and ownership taxes waseliminated.
Prices. The reform abolished official rates. The current regulation explicitly establishesthat truckers rnust freely determine rates (Art. 65). These amendments fostered qualitydifferentiation of the service, as rates reflecting differing quality were now freely negotiable
28 See World Bank (1994), Table 3.2, p.67 .
15
directly between trucking service providers and users. As a complement, to protect shippersfrom cargo loss or damage, the regulation establishes that trucking companies will pay theequivalent to the declared value by the shipper (Art. 84). On December 1, 1989, the price ofdiesel was increased by 5.6 percent and this increased cost recovery to the highway networkfrom trucks from roughly 15 to 50 percent.
3. Market Structure and Entry
3.1 Evolution of industry structure
A dramatic increase in haulage units. Between 1989 and 1996, the number of haulageunits increased from 164,010 to 315,318 (a 92 percent increase, or 13 percent per year,significantly higher than the economy average growth rate). The most striking increase wasbetween 1989 and 1992, precisely concurrent with the regulatory reform period. As shown infigure 1, the total number of haulage units increased most dramatically between 1989 and1990, by 36 percent, and by another 24 percent between 1990 and 1991. By the end of 1991,available capacity was more than 60 percent higher than in 1989. The total increase between1989 and 1992 was of 85 percent (growth from 1989 to 1994 was 91%).29 What is alsostriking from figure 1 is that in spite of the 6.8 percentage fall in number of registered haulageunits between 1993 and 1994, the number of units in 1996 had again surpassed 1993 levels,suggesting a relatively minor consolidation to date.
This dramatic increase can be explained by: (1) the entry of new firms; (2) the expansionLof existing firms through acquisition of new haulage units; and (3) the legal registration of anumber of formerly nonregistered firms (the transportistas piratas). As could be expected, therigid regulatory restrictions not only stimulated collusion among formal truckers butsimultaneously led to the development of a substantial informal trucking sector. This sectorwas comprised of small-owned operators (transportistas piratas) who avoided all legalconstraints. Even though informal truckers could not take advantage of scale economies, theyavoided indirect costs, did not pay taxes nor any other required fees. The transportistas piraw'asdid not have offices or any other kind of administrative costs, and they secured their freightthrough informal freight forwarders (coyotes).3 0 As a result of easing entry barriers, manyinformal carriers decided on their own to register with SCT and avoid the risks and costs ofoperating illegally.
In order to assess the extent of new entry as opposed to relabelling of existing trucks fro-minformal to formal status, it is important to examine the numbers in greater detail. By the endof August 1990, a total of 50,694 federal road permits for freight transport had been issued. Ofthis total, 30,153 (60%) were for new entrants, 13,830 (27%) for previously illegal operators.
29 In addition to being driven by the dynamics of regulatory reform, a portion of this increase may also berelated to the prospect of NAFTA, even though in the early years its subsequent passage was far from takenfor granted.30 Even though one of the main outcomes of trucking deregulation was the inclusion of most of the informaltruckers, some still subsist to avoid remaining regulations including taxation.
16

and the remainder (13%) for expansion of existing fleets.3' Based on this evidence, the mostimportant group accounting for the increase was new entrants, suggesting that the amount ofcompetition among truckers may have increased substantially.
The combination of lower tariffs and improved service reportedly has induced someagricultural and industrial producers to give up their own in-house: truck fleets. They nowoutsource and contract their transport services from public providers. It is the elimination ofsome of these private fleets which has provided a significant portion of the physical vehiclesfor the expansion of the public for-hire fleet.32
A preponderance of small owner-operators. Under the preregulatory refarm period, intheory there were no 'large companies since no individual could be granted more than fivevehicle franchises. In practice, however, some individuals controlled up to 500 vehiclesthrough nominees. In any case, prereform official data vwas therefore not particularlymeaningful. Bly 1996., the 315,318 haulage units were divided among 60,531 registered firms.Of this total number of firms, 90 percent were owner-operators (between 1-5 trucks), 8.3percent were small firms (6-30 trucks), 2 percent were niedium firms (31- 100 trucks) and afurther 3 percent were large firms (plus 100 trucks). Both the large number of owner-operators(54,292) as well as the relatively small number of large firms (187) are striking, as highlightedin figure 2. Of course, in terms of number of haulage units controlled by each size class, thelarge firm category becomes more significant, with almost 10 percent of units (9%).
A dual segmented structure of technologically more advanced, concenirated largefirms and low-technology, small fringe firms. Although large firms are relatively small innumbers, with 18 7 in 1996 (up from 148 in 1988), their market and contracting access andgreater technological sophistication has reportedly maintained the system as a r elativelyconcentrated, dominant firm market structure. In 1994, the large firms with more than 100trucks represented 65 percent of national haulage and 87 percent of transborder transport.33 Thelarge firms provide services based on long-term contracl:s and cover main routes, while owner-operators and small firms cover short hauls, urban markets and cargo consolidation. Tentativeevidence of th,e degree of segmentation is provided by evidence that: (1) large manufacturingclients of trucking finns generally do not use fringe carriers or subcontractors in case ofnonanticipated demand; (2) large tucking companies generally do not consider lower prices offringe companies as a signal of price competition; and (3) reputation, differentiation of serviceand quality are present in large trucking firms and not evident in the residual short haulcariers.3 4
31 World Bank (1995), p.29. 'Previously illegal operators' are those that indicated start dates prior to July1989 but that were not previously registered; reporting was likely to be truthful as there were no ex postsanctions for such prior illegal activities though the number in this category may have beern substantiallylarger, at the expense of the 'new entrants' category.32 Worild Bank (1994), p. 9.33 As reported by Iba[rra-Yunez (1999), p.7.34 Based on a survey of i13 leading trucking carriers (accounting for 26% of total road freight transportation)and 25 manufacturing producers users of trucking services in Northeastern Mexico in 1993 and updated in1995. Out of the 25 industrial users, 18 did not use fringe carriers in case of non-anticipated demand, and
17

In response to the continuing foreign ownership restrictions, non-Mexican companies haveto hire the services of domestic carriers who haul the trailers within Mexico. These regulationshave fostered formal agreements and alliance between U.S. carriers and the larger Mexicantrucking companies. Some of them prefer exclusive partnership arrangements (for exampleJ.B. Hunt of U.S. has a partnership arrangement with TMM of Mexico) while others develop a.network of cooperative ventures (such as Contract Freighters Inc. that works with more than 20Mexican companies).35
A relative scarcity of trailers. Another structural feature of the Mexican industry is thescarcity of trailers relative to motor units (both two and three-axle tractors and integratedtrucks). While U.S. motor carriers typically operate 1.5 to 2 trailers for every motor unit, inMexico, the ratio was 0.3 in 1989, rising to 0.5 trailers per motor unit by 1996 (figure 1). Theobvious result for U.S.-Mexico trade is an overreliance on U.S. equipment in cross-bordertraffic. Put another way, the thousands of U.S. trailers operating in Mexico are there bynecessity.16 This point is related to the fact that Mexican truckers are undercapitalised and theythus take every opportunity to operate without further capital outlays. In this context, it isinteresting to note the increase in capital expenditures between 1989 and 1995 that underliesthe rise in trailer to motor unit ratio over that period.
3.2 Industry conduct and intensity of competition
Prereform low-quality equilibrium. As a result of the rigid prereform system, informaltruckers found a market segment that was willing to take some risks in order to pay lowerrates. It therefore appears that even under extensive regulation, the low-end of the Mexicanmarket had a certain degree of competition, with illegal operators offering bargain prices. Thebiggest impact of the regulatory regime appears to have been in limiting the supply of higher-quality logistics services. For shippers that required better and faster service, it apparentlycould be obtained at a negotiated higher-than-official price. But even a larger truckingcompany could in general not position itself to consistently provide such a service due to peermonitoring and due to the impersonal system for matching loads and truckers. Consequently.no one invested significantly to improve quality, though there appears to have been someimprovization to provide better quality service when paid to do so.
The freight center system and CANACAR's intervention usually prevented shippers andcarriers from developing long-term relationships where reputation and quality of servicematters. As illustrated in figure 3, under regulation Mexico had a limited range of qualityavailable, compared to the United States. Also note that rigorously enforced U.S. technicalregulations would not have allowed Mexican-style low-quality trucking operations in any case.
none of the 13 carriers used fringe company pricing as relevant to their own pricing decisions. See lbarra-Yunez (1999).5 Supply Chain Directions for New North America, 1995. In addition to TMM-JB Hunt, other reported
alliances include Celadon-Grupo Hermes, Carolina Freight Corp.-Tresguerras and Yellow Freight-Transportes Sierra; see Ibarra-Yunez (1999), p.7 .16 ATA (1995).
18

Increased intensity of competition. Two types of measures -reflecting changes in intensityof competition were explored in the enterprise survey. A first question asked carriers toquantify for 1989 and 1997 the number of direct competitors whc, have or may have asignificant impact on their business, asking them to report only the number of competitors whocan take away significant chunks of business or from whom they can take away significantamounts of business. According to this measure, intensity of competition has increasedsignificantly across the board, with carriers on average reporting an increase of roughly 50percent in numbe:r of' such direct competitors. Intensity of competition has increased muchmore starkly for smaller firms (less than 30 trucks), who report an increase of over 85 percent,in contrast to large firms who report an increase of under 20 percent.
A second question asked carriers to qualitatively rank five different classes of competitors(small owner-operators, large for-hire, private, affiliates of foreign carriers, othler transportmodes) according, to intensity of competitive threat for :heir operations, both in 1989 and 1997.On average across al'l carriers, increases in competitive pressure were reported as coming fromall classes of competitors. In terms of absolute levels for 1997, both small and large carriersreport that the largest. competitive threat comes from large operators, followed by competitionfrom affiliates of foreign carriers. Interestingly, in terms of changes between 1989 and 1997,the largest number oifcarriers reported increases in intensity of competitive threat coming fromaffiliates of foreign carriers. Both small and large firms report this finding. Small firms thenreport that the seconci most important increase comes from large operators, while large firmsfeel a stronger change in pressure from other transport mnodes. Only a minority number ofcarriers reported increases in intensity of competitive pressure from private carriers or fromsmall owner-operators.
After deregulation, prices for the existing quality of logistics services have fallen by atleast 30 percent.3 7 Moreover, the NAFTA agreement has allowed large retailers andmanufacturers to adopt faster and more complicated logistics systnems, forcing truckers toimprove their services. This process is also helped along by U.S. truckers' interest to formalliances with Mexican truckers. Some U.S. finns work with different Mexican firms with onlya formal agreement for trailer haulage. However, through a few more intensive alliances, someU.S. truckers are 1ransferring know-how, computer software, and equipment. As a result,higher quality trucking services are now available in Mexico. However, these services areoffered by only a handful companies and therefore are cquite expensive (only albout 10 Mexicancarriers own more than 500 vehicles). Consequently, the price-quality profile of Mexicantrucking changed substantially (see figure 3).
4. Performance
The followxing, analysis considers the impact of regulatory reform in road freight onindustry-specific and broader economywide performance. Although it is always difficult toisolate the impact of policy from other changes in the economic environment, attempting to
37 Our surveys confirtned this widely believed figure.
19

quantify the importance of a specific set of policy changes is even more problematic during atime when so much else was changing simultaneously - including concomitant regulatorychanges in related sectors, a drastic trade opening with Mexico's most significant tradepartners, important related tax changes, and a severe economic downturn in 1995. In assessingdownstream impact, therefore, we focus on the more modest objective of quantifying themaximum benefits for selected downstream users from key road freight logistics innovations.More generally, the detailed findings from the survey of both carriers and shippers supplementwhere possible and corroborate the trends in the official statistics.
4.1 Impact of reform on performance in the roadfreight industry
4.1.1 Output andprices
Significant increases in output levels. Between 1989 and 1995 the traffic volumes in ton-km of domestic public road freight transport increased by 52 percent, from 107,243 to 162,827million ton-kilometres. The average annual increase per year since reforms began, at 8.6percent per year is more than double that during the 1980-89 prereform period (3.4% per year).Interestingly, the average distance carried increased by almost 30 percent, from 346 to 444 kni,after having been roughly constant for the previous nine years since 1980. A similar picturearises based on the volume of freight hauled. Between 1989 and 1995, there was an 18 percentincrease in domestic road freight transported, from 309.8 to 366.7 million tons. The averageannual increase since reforms began, at 3 percent, again is greater than during the prereformperiod (at 2.5% per year).38 In comparing these two series of output-related statistics, what isinteresting to note is that although both increased significantly more during the postreformperiod, distances travelled increased substantially more than volumes carried, in effect longertrips to new and further locations.
The survey data collected corroborates this significant increase in road freight haulagevolumes since 1989. Of incumbent trucking firms reporting data for both 1989 and 1997, totalannual kilometres hauled increased by roughly 60 percent. This increase masks importantchanges at the individual trucking company level, with some firms more than doublingdistances covered, while two of the smaller firms decreased distances covered.
A complementary indicator for freight haulage volume is changes in the number of trucksby firm. These figures show a clear redefinition of the market structure, with the growth offreight haulage volumes in the period mainly attributed to larger firms:
* The average growth rate for trucking firms expanding their fleet was 125 percent: 9 o-utof 14 (64%) reported an increase in their fleet;
* The average growth rate for large firms was 175 percent: 7 out of 8 large firms reportedan increase in the number of trucks, while only 1 reported a decrease;
See IMT (1997), Tables 4.1.1-2.
20

* The average growth rate for small firms was 69 rpercent: 3 out of 6 small firns reportedno changes in the number of trucks, only 2 of them reported an increase and 1 reporteda, reduction.
The number of states in which a firm has sizeable ciperations (deriving at l east 4 percent ofits total income in terms of inter and intrastate traffic) rnay be a useful proxy for output mix,reflecting the transport of either existing or new products to new locations. According to thisdefinition, trucking firms in the sample were active in between one and ten states, typically intwo to five states. Based on this indicator, it appears that regulatory reform and liberalizationof routes was associated with a broader range of services offered. The largest number ofrespondents reported an increase in the states that accolnt for an important portion of theiroperations, with 5 out of these 6 firms being in the larger size grcuping. Some of theseexpanding firms more than doubled the number of states accounting for sizeable operations,from four to eight, o;r from one to seven. The expansion in geographical area of operation isgenerally associated with the opening of one or more additional termninals or bases ofoperation. However, the fact that Mexico has 31 states and that the largest firm interviewedoperates in only 10 of these suggests scope for continued consolidation of routes.
Prices fall overall, but fastest in lower quality-of-service segments. Rate analysts inSCT found that between 1987 and 1994 trucking rates nationwide declined 23 percent in realterms. One official in SCT estimated that general cargo trucking cargo rates in 1994 on themajor route between Laredo and Mexico City were about 30 percent lower in real terms thanthe prevailin,g rates i:n 1987.39 Another study concludes that while there is only incidental andanecdotal evidence on changes in truck tariffs, all the e vidence points to reduction of the orderof 25 percent: in real terms.40
T he substantial reduction in overall tariff levels documented in available n1ationwidestudies is corroborated by survey results. Almost all do wnstream users of trucking servicesinterviewed reported that the cost of hiring a truck had fallen in real terms since 1989.Estimates of the size of the decline generally ranged between 5 anid 15 percent. More carefulprobing of aclditional exogenous factors confirm that there have been significant declines inreal prices of a given. service delivered, though the magnitude of the price change is difficult toquantify given the variations in the actual service provided. For instance, one shipper estimatedthat an additional 20 percent price fall for the originall) available service should be attributedto the higher quality levels now available, including newer trucks, faster delivery, and morereliable shipping facilitated by more sophisticated tracking systerns. Another shipper estimatedthat the price fall would have been even more substantial if it did not incorporate the effect ofnew toll roads, which he estimated added 6 percent to the cost of a typical trip.
Regarding rate structure, there appears to have been an important differentiation of pricesto reflect diflferentiation of services provided to distinct classes of users. Customers who shiphigh value-to-weight components where timeliness and reliability of delivery are critical are
9 World Bank (1995), p.29.40 World Bank (1994), p.8.
21
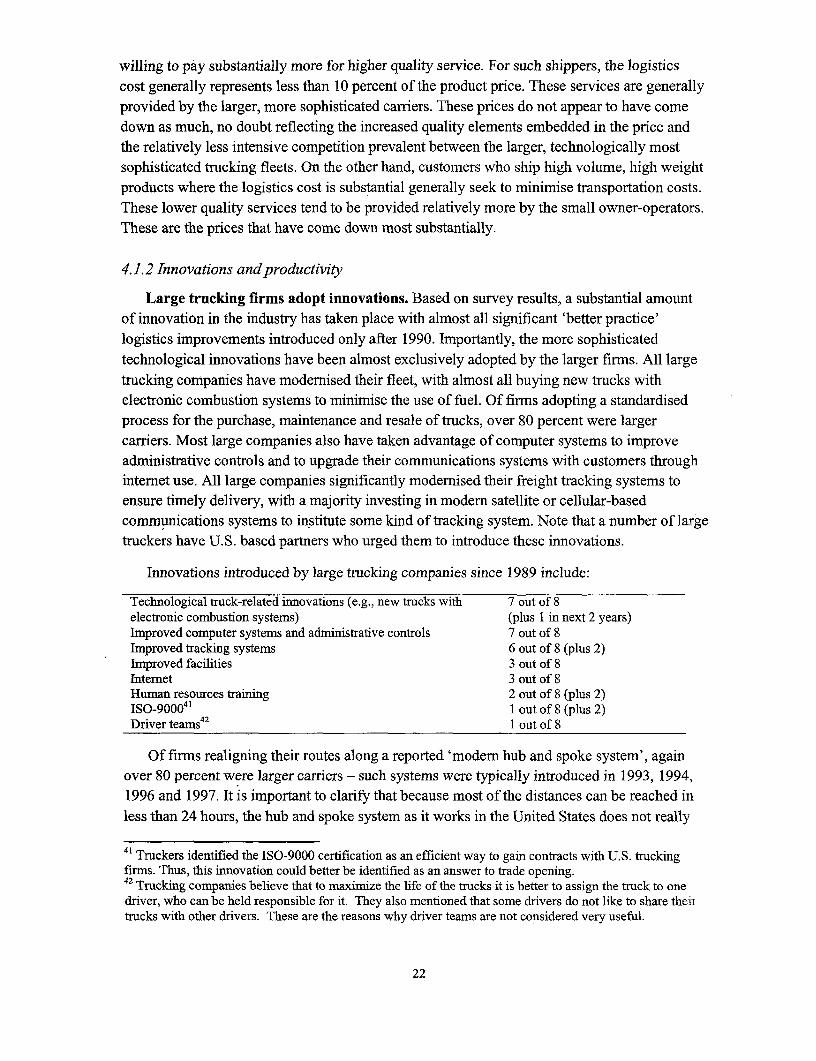
willing to pay substantially more for higher quality service. For such shippers, the logisticscost generally represents less than 10 percent of the product price. These services are generallyprovided by the larger, more sophisticated carriers. These prices do not appear to have comedown as much, no doubt reflecting the increased quality elements embedded in the price andthe relatively less intensive competition prevalent between the larger, technologically mostsophisticated trucking fleets. On the other hand, customers who ship high volume, high weightproducts where the logistics cost is substantial generally seek to minimise transportation costs.These lower quality services tend to be provided relatively more by the small owner-operators.These are the prices that have come down most substantially.
4.1.2 Innovations andproductivity
Large trucking firms adopt innovations. Based on survey results, a substantial amountof innovation in the industry has taken place with almost all significant 'better practice'logistics improvements introduced only after 1990. Importantly, the more sophisticatedtechnological innovations have been almost exclusively adopted by the larger firms. All largetrucking companies have modernised their fleet, with almost all buying new trucks withelectronic combustion systems to minimise the use of fuel. Of firms adopting a standardisedprocess for the purchase, maintenance and resale of trucks, over 80 percent were largercarriers. Most large companies also have taken advantage of computer systems to improveadministrative controls and to upgrade their communications systems with customers throughinternet use. All large companies significantly modernised their freight tracking systems toensure timely delivery, with a majority investing in modern satellite or cellular-basedcommunications systems to institute some kind of tracking system. Note that a number of largetruckers have U.S. based partners who urged them to introduce these innovations.
Innovations introduced by large trucking companies since 1989 include:
Technological truck-related innovations (e.g., new trucks with 7 out of 8electronic combustion systems) (plus 1 in next 2 years)Irnproved computer systems and administrative controls 7 out of 8Tnproved tracking systems 6 out of 8 (plus 2)Improved facilities 3 out of 8Internet 3 out of 8Human resources training 2 out of 8 (plus 2)ISO-900041 1 out of 8 (plus 2)Driver teams42 1 out of 8
Of firms realigning their routes along a reported 'modern hub and spoke system', againover 80 percent were larger carriers - such systems were typically introduced in 1993, 1994,1996 and 1997. It is important to clarify that because most of the distances can be reached inless than 24 hours, the hub and spoke system as it works in the United States does not really
41 Truckers identified the ISO-9000 certification as an efficient way to gain contracts with U.S. truckingfirms. Thus, this innovation could better be identified as an answer to trade opening.42 Trucking companies believe that to maxiimize the life of the trucks it is better to assign the truck to onedriver, who can be held responsible for it. They also mentioned that some drivers do not like to share theittrucks with other drivers. These are the reasons why driver teams are not considered very useful.
22

exist in Mexico. 'Based on the survey results, large firms generally focus on a few main routesinstead of having a wide national coverage. The trucking firm with the highest coverage, forinstance, provides road haulage services only in ten of the 31 states in the country. Large firmstry to maxurLise their market share in the most profitable routes (e.g., Mexico City-Laredo,Mexico City-Guadalajara). What larger firms reportedly do is maintain loading and unloadingterminals in the main cities, and switch from larger long-distance to smaller trucks to haul thetrailers within the cilty. In this way, whenever a driver arrives to aL city he can switch trailersand continue working. There is no need to spend additional time in loading or unloading, andthe trucking companies do not have to plan their trips i:n accordanice with clielnts' workinghours. Generally., the trucks used for deliveries in the city have a higher average age.
Accordinlg to a relevant industry study,43 the three leading LTL (less-than truck load) U.S.carriers now have full-time Mexican partners. On the urging of their U.S. partners, these LTLcarriers adopted U.S. style management and operation procedures. This may partly be due tothe fact that LTL was unheard of in Mexico before NAFTA and therefore U.S. firms had theopportunity to set up systems from scratch. Now LTL delivery standards are almost on parwith those of the U.S., except that the Mexican LTL carriers do not have a large number ofpick-up and delivery points which limits their volume, and they currently do not expect a bigchange in volume to enlarge their networks.
Based on qualitative feedback during surveys, the incentives to introduce innovations forlarger firms come from the dual imperatives under the new environment both to minimise costsin order to raise profilts and to improve service quality in order to gain new clients. Asevidenced by the relatively low trailer to tractor ratios, Mexican truckers, especially the smallones, are undercapitalised. Following the economic crisis of 1994, most of them could notmodernise or expand their fleets. This provided larger firms ample opportunities to invest toincrease their market share. Larger trucking firms are reportedly also conscious that railprivatization will increase competition in the sector. Thus, the irrmprovements in quality aremotivated by a desire to differentiate their service from both small trucking companies and railcarriers.
Small truckiing firms struggle to survive. The contrast with small firms is extremelystark. Some reportedly have introduced no innovations whatsoever since 1989, while othershave only been able to limit innovations to radio communications or limited improvements inoffice equipment.44 Only two out of the six small firms interviewed have been able to invest infleet modernization and computer systems. Their planled innovations are more modest inscope, limited to modernization of existing equipment:
* Only 3 out of 6 small firms introduced or were planning to introduce technologyinnovations in the next two years.
4 3 Supply Chain Directions for New North America, 199544 This finding of low ar no investment in technological upgrading by smaller firms is consistent with thefindings of an earlier suirvey by Ibarra-Yunez (1999), where he concludes "reputation, differentiation ofservice or quality were not evidenced by the survey from the residual carriers of short hauls" (p.2 1).
23

* Small firms are more concerned to meet adequate spending levels for trucks'maintenance (3 out of 6). A few of them have trucks that cannot be used because theydo not have the financial resources to afford the repairs. During the crises years theyused old trucks to provide parts for the newer trucks.
* A limited number have targeted improvement of the most basic administrative controls(3 out of 6).
* One company was about to close because it faced stiffer competition that it could notmeet, and it could not recover from the economic crisis.
* Only one out of six interviewed was undertaking a serious effort to update the fleet,invest in computer systems and facilities.
In general, small trucking companies do not have direct contact with their clients. They
deal with freight forwarders (formal and informal) or larger trucking firms, and provide theservice within a region. When they were asked how sector deregulation impacted oninnovations, 2 out of 6 answered that higher competition in prices due to deregulation impededthe introduction of innovations. In the last years they have been mostly concerned about
survival.
Greater client responsiveness. Perhaps even more important than operational innovations,trucking companies introduced significant innovations in their relations with downstreamusers. This greater responsiveness to user needs has been the most widespread adopted newpractice, instituted by over two-thirds of all surveyed carriers - and typically introduced in theyears 1993, 1995 and 1997. Again, over two-thirds of the carriers introducing these behavior-type innovations were larger firms:
* Exclusive transport contracts with large clients (adopted by 6 out of 8 large firms, butonly 2 out of 6 small firms);
* Cooperation with other carriers to improve return capacity utilization (4 out of 8 largefirms, and 2 more will introduce it next year, while only 1 out of 6 small firms has suchcontracts);
• Exchange agreements with other carriers to broaden geographical reach (4 out of 6large firms, and 1 more will introduce it this year, while only 1 small firm hasexchange agreements).
* Specialised staff assigned to provide comprehensive logistics solutions rather thanmerely taking orders (6 out of 8 large companies, and 1 more will introduce it this year,while only 2 out of 6 small firms have specialised staff).
* Standardised process for purchasing, maintaining, and reselling trucks (5 out of 8 largefirms and 1 more is considering to introduce it, while only 1 out of 6 small firms hassuch process).
Productivity on the rise. These innovations appear to have had a significant impact onproductivity in the industry. Based on nationwide statistics, productivity as measured byoutput measures per employee increased substantially, as traffic volumes measured in ton-km increased by 8.6 percent per year since 1989 and measured in tons by 3 percent per
24
year, while employment increased at less than 1 percent per year (see below). Anothermeasurable dimension of productivity change, the average age of the entire nationwidepower units fleet (tractors for pulling trailers and integrated tractor-trailers, including anoverwhelming majority of older owner-operated vehicles) has also improved, though onlyslightly with the average age falling from roughly 14 years in 1990 to 13 years in 1997. Asshown in figure 4, purchases of new more technologically advanced equipment felldrastically during the debt crisis years of 1995-96, bujt have started increasing again.Projections of fuiture purchases and renovations anticipate the average fleet age falling toroughly 6 years over the next decade. 4
Survey resulits corroborate these nationwide statistbcs:
* Total kilometres per truck have either stayed corLstant or increased between 1989 and1997, on a carrier by carrier basis. Overall, total kilometres per truck increased by 42percent and total kilometres per employee increased by 75 percent.
* Average delivery times fell from 2.5 to 2 days (although the average distance carriedwas not controlled for in the question and may have varied somewhat between 1989and 1997);
* Average truck fleet age of large companies fell from 5.8 to 4.8 years. It rose from 6.1to 9.7 years for small companies.
4.1.3 Profits, wages and employment
Sharp falls in profit margins especially by small[er firms. Based on survey results,profits defined as pretax operating income as a percentage of revenues fell substantially in theindustry. The fall in profits for smaller carriers was particularly severe, in the order of 50percent between 1989 and 1997. Five out of 6 small firms reported that their profit margins hadbeen reduced. Large firms also experienced falls in profit levels, but more modest ones in theorder of 30 percent. Out of 8 large firms, only 3 reported reductions in profit margins, while 3more reported no change and one actually reported an increase in profit margins.46 Theseresults suggest that small firms on average had to sacrifice their profits to stay in the market,while aggressive large firms found in differentiating the service by quality an, answer to stiffercompetition.
Labor reallocation in favour of larger firms. Nationwide road freight statistics indicatean overall modest increase in employment in the industry betwe en 1989 and 1995 of 5.2percent, from 509.5 to 536.1 thousand average annual remunerated employees (or roughly 0.9
45 Based on information elaborated by CANACAR from histc rical 1990-97 data from ANPACT and SCT.46 These findings of low profits even for large firms may be at least in part driven by deterioration inmacroeconomic ccinditions as a result of the 1995 debt crisis. Prior to that downtum, an earlier survey of 13carriers found an average pre-tax profitability of 17% between 1993-94. 'In contrast, average profitability inthe US sector of large carriers was close to 21% between 1989 and 1994. A similar substantial variation inprofitability between large finns was found in that survey, with the leading carrier showing 12% growth inprofitability between 1993-94 while the poorest performer registered a fa]l of 25%. See Ibarra-Yunez (1999),p.18.
25
percent per year). This increase masks a surprising increase of 9 percent over the initial two-year reform period, between 1989 and 1991, followed by relative stagnation between 1991 and1993, an upturn in 1994 and then a sizeable decline in 1995 alongside the generalmacroeconomic downturn associated with the debt crisis.47 The survey results suggest thatthere was a substantial reallocation of employment in the industry. Incumbent small firmsgenerally stay small, either contracting or expanding by a few workers. Among larger firms,less agile firms contract substantially, with one firm shedding three-quarters of its work force,from 1000 to 250 workers, while more aggressive firms expand substantially, expanding two,three or four-fold, with one firm growing from 150 to 720 workers and another from 180 to447.
4.2 Impact of reform on performance in downstream industries
The survey of users of trucking services focused on three broad types of industries asrepresentative of different types of common users in Mexico: agroindustrial, electronics andauto-parts firms. In addition, two companies that specialise in the import and distribution ofgeneral goods also were interviewed. For purposes of analysis, it is useful to group the 15interviewed companies into two classes of users: (1) high-intensity users of road freightservices-shippers of higher volume or higher weight bulk products where the averagetrucking costs account for over 10 percent of sales, consisting of agroindustrial and importdistribution companies (7 companies); (2) less-intensive users - shippers of lower volume orhigher value-to-weight components where average trucking costs are less than 10 percent ofsales, consisting of electronics and auto-parts firms, plus one producer of plastic parts forphones, printers and other electrical appliances. In the former category, trucking was alwaysreported as the logistics service with the most important impact on costs, while in the secondcategory air freight was frequently mentioned as more important though efficient truckingservices were still deemed as essential for the firms' continued competitiveness. A set of moredetailed follow-up interviews were conducted with two agroindustrial and two electronicscompanies in order to attempt to control more carefully for other exogenous changes in theoperating environment facing these firms, as reported in separate boxes (based on the surveyinstrument of appendix 2). See appendix 3 for these case studies.
4.2.1 Costs
Lower costs and higher quality. There are many factors that affect the inflation-adjustedcost of trucking services faced by downstream user firms. Especially among intensive users,substantial improvements in quality-including reductions in delivery times and transitlosses-have positively affected the basic product provided, making an assessment of costimpact less straightforward:
* Delivery times have decreased substantially according to 6 of 7 intensive users, withthe impact directly linked to trucking deregulation. Better equipment and a reduction inthe number of stops taken by drivers were cited as the key factors responsible for the
4 See IMT (1997), Table 1.1.4.
26
decrease. The average decrease was over 40 percent. Amorng less intensive users,delivery times decreased for 2 respondents, and remained unchanged for 4 out of 8.
* Transit losses have also decreased substantially according to 5 of 7 intensive users,with higher q[uality equipment and higher levels cf security provided on federal roads(especially on toll roads) cited as the main factors. The average decrease was in theorder of 35 percent. Among less intensive users, iransit-related losses also declined for3 respondents, and remained unchanged for 4.
* Reduced inventory levels have led to reported cost savings in 4 out of 1]2 respondingfirns, with all four being intensive users. More reliable and rapid transport servicespermit user firns to make more intensive use of both just-in-time delivery of rawmaterials, parts and components as well as build-to-order manufacturing for outboundshipmernts. In one agroindustry firm interviewed, in spite of increased sales, inboundinventory levels have fallen on average from 45 tD 18 days, while inventories offinished goo(ds have fallen from 7 to 3 days.
* Direct truckiing costs were reported to have fallen. in real terns for 4 of the users, andall three are intensive users. Reported cost decreases related to trucking ranged from 33percent to 15 and 5 percent declines. Upon more careful probing during, follow-upinterviews, even those users that reported increases of 5 or 15 percent in real termsacknowledged the importance of reversing factors such as increases in the cost of tollroads or highier qluality trucking services as reflected in more rapid delivery times andsignificantly lower transit losses.
4.2.2 Innovations and new products
New products - new goods, new areas and direcit deliveries. Since the onset ofregulatory reformn, a number of intensive users have reported the ability to deliver newproducts to inarket as a direct result of cheaper or higher quality trucking services. 'New'products can include products that were previously not available on the market due topreviously prohibitively costly or inflexible transportation services, as well as existingproducts thal can be economically shipped to new areas and new forms of delivering existingproducts (direct to customer rather than via wholesalers or retailers):
* An expandecl range of distinct products has been offered by 8 of 13 respondents,includingo 4 of the 7 intensive users. As a specific example., a producer of fertilizerproducts reported increasing the range of producl:s sold from 12 to 32, with sales ofnew products accounting for 30 percent of total current sales. Of this increase 70percent was directly attributable to lower cost and higher quality trucking services,with the remainder attributable to growth in demand due to the higher ]Level of fertilizeruse in Mexican fields. As another concrete example, faster delivery times reportedlyhave helped a tequila producer expand the number of products (separalte brands) from 3to 45, with average delivery times falling by 20 percent (half of this decline in deliverytimes is directly attributed to faster trucking services, with the other half attributed tofaster loading and unloading at warehouses and ports).
* Expansion of sales of existing products to new areas has been the main impact ofimprovements in trucking services for a number Df users, including 4 of 12 survey
27
respondents. A large Mexican producer of time-sensitive electronic components usedby other downstream firns attributes 30 percent of expanded sales (which account for50 percent of current total sales) to higher quality trucking services, with otherexplanatory factors behind the increase in new clients being Nafta-related tax changesand other internal logistics-related changes such as the introduction of bar code tagsand computerised systems for faster and more reliable documentation handling. Asanother example, sales in new areas as a fraction of total sales of a companyspecialising in the production and distribution of Mexican peppers account for 90percent of total current sales. Improvements in the quality of trucking services, withlosses from transit-related problems falling from 5 percent of sales to 4 percent of now-higher total sales and a 10 percent reduction in delivery times, have reportedly played asignificant role in generating these expanded sales.
Direct delivery to retailers or end-users has allowed some user companies to earnhigher net margins. Based on a more in-depth set interview with an agroindustry firm,the gain from direct delivery was in the order of 0.4 percent improvement in the firm'soperating margin, with the benefit arising from the joint impact of new end-usercustomers that receive direct deliveries and the higher net margin on such direct sales(after controlling for other factors that could also have accounted for increased directdeliveries).
More efficient logistics systems. Cheaper or more customer-responsive trucking servicescan and reportedly have led to a number of other logistics-related innovations within userfinns:
* Centralizing manufacturing, using cheaper or more efficient trucking to concentratemanufacturing in fewer locations has led to reported cost savings in at least one firm.Centralizing warehousing, concentrating warehousing operations in fewer locationsalso has had a similar cost saving impact. The joint impact of both factors, controllingfor other factors such as changes in demand and rail shipping, was in the order of a 0.6percent improvement in a specific intensive user's operating margin.
* Rationalising loads, both through adopting standard lot sizes and containerization, hasled to further cost savings for some user firms. Containerization, in turn, bothcontributes to cheaper transport and can play a role in decreasing damages and lossesduring transit. A number of interviewed firms have reported costs savings from theselogistics-related changes, which in turn have generally been introduced only in the posilderegulation period.
* Yet another example of improved logistics services has been the emergence of twolarge integrated logistics companies, each with about one million square feet ofwarehousing space.
4.2.3 Additional economywide impacts
Outsourcing and enhanced rivalry. For a variety of infrastructure services essential forentrepreneurial activity, the absence of a well-functioning market in such services requiresfirms to establish in-house capabilities or forego production. For road freight services, the
28

alternative to purchasing transport services responsive to specific user needs on the openmarket is to invest and maintain a private own-account fleet of trucks. From an industrywideperspective, such required fixed cost expenditures may be prohibitive for cash-starved newentrepreneurs. Altholugh such costs are not largely sunk, tapping capital markets may not be anoption for prospective entrants lacking reputation. An imnportant additional benefit of a morecompetitive trucking market, therefore, is to allow firms to outsource their transportrequirements, in e ffect converting a fixed cost into a variable cost. The benefits from enhancednew entry and rivalry for markets intensive in the use of trucking services are likely to besubstantial.
Other benefits. As a result of reductions in truck tariffs, SECOFI has estimated that theoverall distri'bution costs of commodities in Mexico has declined about 25 percent in real termsbetween 1987 and 1994. Deregulation of trucking also had an impact on the then-publiclyowned railway company, Ferrocarriles Nacionales de Mexico (FN4M). The reduction oftrucking rates after 1989 enabled truckers to compete miore effectively with FNM, causingdiversion from the railway to truck transport, particularly during the period 19I89-91 when railtraffic declined si,gnificantly.
5. Conclusions and Policy Options for Reform
5.1 Successes andf,4ilures of reform
The Mexican trucking sector is going through a radical transif'ormation followingderegulation and Mexico's entry into NAFTA. Regulatory reform should be credited withincreasing competition. Its impact was smallest in the lower-end of the market that was alreadycompetitive with a large number illegal owner-operators. Mid- and large-size shippers,however, hadL a chance to take advantage of deregulation to reduce their trucking costs. Withthe overall fiall in trucking prices, inefficient operators with inadequate equipment have beenexiting the market. Regulatory reform also had an impact at the upper-end of the market whereshippers reqirire faster and more reliable service and are ready to pay for it. Under the formerrigid regulation regime, no carrier had the incentive to offer high quality services. However,NAFTA gave a bigger boost to this market segment. VWith closet trading ties to the UnitedStates, Mexican firms had to upgrade their logistics operations. Large carriers, often aspartners of U. S. trucking companies, have begun to of ter improved services.
Main lessons of Mexico's experience for other coLuntries include:
The positive role of increased competition in the road freight industry in fosteringeconomywide innovation and growth. Besides expected gains from lower truckingprices, the removal of access barriers to transport infrastructure matter's by generatingsubstanLial downstream benefits, facilitating entry and new products. D)elivery timesand transit losses have decreased substantially. More reliable and rapid transportservices hav e permitted user companies to reduce inventory levels and make moreintensive use of both just-in-time delivery of rawv materials, parts and components aswell as build-to-order manufacturing for outbound shipments. More irnportantly, fasterand more reliable trucking has allowed user comipanies to offer new goods, both
29
introducing previously unavailable products as well as making it possible for existingproducts to reach new areas. More customer-responsive trucking services havereportedly also led to a number of other logistics-related innovations within user firms,such as centralizing manufacturing and rationalising loads. Finally, some user firmshave outsourced their transport requirements, in effect converting a fixed into avariable cost and thereby significantly lowering entry barriers.
Successful reform requires careful planning, execution and high-level political support.A project with the objective of reforming existing regulations and introducingincreased competition must devise a strategy to carefully take into account keyinterested stakeholders, both supporters and opponents. In the late 1980s, transportregulation in Mexico was viewed with growing disdain, particularly as a result ofstudies documenting the high economic costs associated with the prevailing system.The concurrent general program of structural reform was a favourable context forregulatory reform of the trucking industry. Arguably even more could have been donein the early stages of implementation to disseminate the costs of the existing systemand the expected economywide benefits from increased competition. Given thepotential for blockage of reforms by the trucking chamber and its members that hadbeen benefiting from the officially sanctioned cartel, certain key steps in Mexicanplanning and implementation include: preparation of the initial reformn by a small groupindependent from SCT (where certain officials who had traditionally had clientelistrelations with truckers or who feared losing their positions could have sabotaged theinitiative early on); presentation of the reforms to recalcitrant truckers as a'modernization' effort rather than an antioligopoly competition thrust, with the promiseof soft loans for fleet modernization in exchange for the charnber's non-opposition; asequenced deregulation, eliminating tariff ceilings with a lag following the elimination,of entry restrictions to prevent a possible consumer backlash if the forces ofcompetition would have been initially too weak to prevent sharp price rises;unconditional support from the highest political levels, in this case from PresidentSalinas himself.
- Sufficient attention and resources should be devoted to assist the oversight institutionin adapting to postregulatory reform conditions. Regulatory reform causes profoundchanges in the sectoral institution of government that formerly had responsibility forthe regulation. Any regulatory reform effort should assign sufficient resources to assistthe organization in making the transition to postregulatory reform conditions, assistingwith such tasks as defining the organization's new role, reorganizing its structure andfacilitating redeployment of staff.
* Promarket rules to offset remaining market failures should be introduced concurrentlywith removal of distortionary anticompetition rules. Ideally, any new regulations to beintroduced as appropriate complements to a more market-oriented framework (such asprograms of highway safety, control of vehicle weights and dimensions, andinspections of vehicle emissions) should be implemented at the same time as thederegulation actions. In this way, there can be a smoother transition from thegovernment-controlled to the postreform market-determined regime.
* The competition agency has a critical role to play in any regulatory reform initiative,both in terms of up-front advocacy and ex post enforcement activities. The national
30

competition agency should play a critical role in hlelping lay the groundwork forreform, bym aking as compelling a case as possible for the costs of the prereformregime and for the expected benefits of refonn, through media relations and moresystematic relationships with representatives of consumer and producer interests(chambers of commerce, small business and entrepreneurship organizations, consumerprotection institutions, consumer groups, local training and research institutes and otherrelevant interested parties). In addition to this prereformn advocacy and education role,the competition agency must play a careful postreform enforcement role to ensure thatcosy cartel-like behavior stimulated by tight entry restrictions does not persist. It isvery natural lthalt public policies of segmentation and control of prices and quantitiesleave a strong iraprint on postreform market conduct. Inefficient, anticompetitivepublic regulation should not be allowed to be repLaced by socially inappropriateanticompetitive interfirm agreements. The experience of Alexico is instructive in thisregard. At least three separate strong interventions were required by the MexicanFederal Competition Commission to discipline attempted anticompetitive practices bythe trucking 'industry in the years following the irLitial regulatory refomis.
5.2 Potential beniefits and costs offurther regulatory reforms
An interesting indicator of the need for further reforms can be derived from the perceptionsof providers of road freight services themselves. Two questions wiere explored in surveyformat, a first on renmaining problems facing the indust-y and a second on features of thecurrent legal and regulatory framework that restrict operations or inhibit growth.
When questioned about remaining most important problems facing the road freightindustry, trucking companies were near unanimous in highlighting the security problem,including robberies on highways and additional required payments and costs, as the numberone outstanding policy issue (1 1 out of the 14 trucking companies surveyed idlentified it as oneof three of four key issues, with most listing it first). The second issue in order of importancewas the continuiniig pressure felt by increased intensity of competition. This issue wasreflected in answers ranging from excessive competition from abroad or from the informaleconomy by larger carriers, unfair competition by smaller carriers (presumably from owner-operators in the informal sector who avoid all taxes), and as a problem of access of credit bysome small and larger carriers (who presumably cannot raise finance at suffic:iently attractiveterms given rates of return in the sector). At least one large carrier reported that they did notwant more foreign firms to enter given their larger size, scale economies and better financing,which suggests still insufficient (at least international) competition. A number of the carriersemphasised ihat 1hey do not have access to loans at the same low rates of interest as their U.S.competitors. Interestingly, the multimodal freight broker surveyed highlightecl problems oftimeliness of delivery and delays in service as the most important problem, suggesting thatcompetitive pressure still had not been sufficient to stirnulate broad service satisfaction.48
Finally, the third issue raised most frequently concerns vehicle roDad safety, vwith the issue
48 This view is supported by the Ibarra-Yunez (1999) survey, where 17 out of 25 industrial users respondedin the negative to the question of whether users find supply of iroad freight service adequate in volume, price-competitive, complete and dependable (p.20).
31

arising either under the heading of excessive number of accidents, better required control ofdrivers, or poor condition of highways (6 of the respondents highlighted one or more of thesetopics, with it being one of the two issues raised by the multimodal freight broker as well).
When asked about the more specific question of key features of the current legal andregulatory framework that restrict operations or inhibit growth, the most frequently reportedissue related to the weights and dimensions rules (5 out of 11 respondents). Answers rangedfrom absence of rules, lack of clarity of rules to inconsistent application (allowing old, tooheavy trucks to remain on the roads in the case of a modem fleet owner, preventing old, tooheavy trucks to circulate in the case of a struggling, nonmodernised company). The secondmost frequent issue was the relatively high level of per-truck license payment (tenencia) nowrequired in order to operate a vehicle, allowing closer to full-cost recovery of highwaymaintenance expenditures. Other issues mentioned by more than one carrier include remainingambiguities in the foreign investment law, and shortcomings of the labor law. Interestingly, theonly legal/regulatory issue raised by the multimodal freight broker was problems withremaining labor unions in ports, suggesting that prior legal and regulatory barriers in truckinghave largely been addressed.
Further improvements in Mexican logistics will materialise only through closer links to theU.S. truckers. Currently the truly international market segment is populated by a few Mexicantrucking companies that have established different forms of partnership with U.S. carriers. Thissegment is probably awaiting year 2004 when U.S. trucking companies will be allowed to ownMexican companies. If and when Mexican truckers are allowed to operate into the UnitedStates, it may inject a boost to productivity improvements. These developments will benefitmainly those parts of the Mexican economy that operate internationally. As far as logistics isconcerned, there is an enormous amount of know-how and experience that Mexican companiescould benefit from. Moreover, Mexican companies could benefit from improved logisticsservices without incurring substantial restructuring costs (unlike, say, taking advantage ofequity markets in the United States).
There are three main factors that hold back a full-scale logistics revolution in Mexico:
* The persistent segmentation between large, technologically sophisticated providers o froad freight services and low-technology fringe providers. The parts of the broaderMexican economy that are not operating internationally still remain much lessdeveloped, relying on informal establishments for distribution and retail sales. This partof the economy cannot afford and does not seem to need improved services. Luckilyfor them there is a large fringe of small owner-operators to provide haphazard butinexpensive transportation services. In fact, the existence of low quality but cheaptrucking is an important lifeline for small, informal businessmen. However, this fringeexists at a bigger cost to the rest of the economy. Their technically inadequate trucksare a threat to road safety, and their inadequate consolidation continues to shelter thelarger carriers from more intense competition.
* The Mexican govenrnent's unwillingness to enforce technical standards and maximumload restrictions. By refusing to implement technical standards rigorously, the Mexican
32

government is allowing the informal sector to can.Ty on. It is allowing a dual structure topersist that hinders more systemic modernization and more homogenous growth. Betterenforcemnent of technical standards in trucking as well as in other areas of the smallbusiness enviroiLment will no doubt put some informal businessmen oult of work, butthe ensuing consolidation could very well create new opportunities of greater benefit tothe economy.
* Failure to full implement the transportation related provis.lons of NAFTA and toensure more ]nomnogeneous federal-state regulatory reforms. Although pressure fromincreasecd intensity of competition is being felt in Mexico, there appears to be scope forfurther significant gains from additional competition that a full opening with the UnitedStates could provide, as suggested by users' emphasis on continued service qualityshortcomings. U.S.-Mexico integration has lagged behind the needs of the market, withnegative consequences for Mexico's international competitiveness. In addition, failureto ensure more homogeneous federal-state regulatory refon:ns risks underminingprogress to-date in the areas of competition, environmental standards anid road safetyguidelines.
Progress on these remaining internal and international obstacles could yield substantialadditional benefits. Indeed, answers to a final question posed to users of road fLreight servicessuggest scope for significant further economywide benefits from increased trucking serviceefficiency. Under the hypothetical scenario that transport and storage costs could fall by afurther 50 percent, the market value of user firms was estimated by respective managers to anaverage of 20 percent with some firms estimating up to a 100 percent increase. Under thehypothetical scenario that the frequency of deliveries to clients could double without additionalcharges while maintaining the volume of sales constant, similar substantial gains to the valueof user enterprises were reported.
33
References
ATA (American Trucking Association), 1995, South of the Border, 2nd edition.A.T. Kearney, 1998, Survey of Supply Chain Management, 1998, as reported in Financial Times, Supply
Chain Logistics, FT Survey, Dec. 1.Comisi6n Federal de Competencia, 1996, Infonne Annual de Competencia Econ6mica 1995-1996,
Mexico City, Mexico.Davila Capalleja, Enrique Rafael, 1994, "La Reglamentaci6n del Autotransporte de Carga en Mexico,"
in Francisco Gil Diaz and Arturo M. Femrndez (eds.), El Efecto de la Regulaci6n en AlgunosSectores de la Economia Mexicana, ITAM-CINDE-FCE (Lecturas de El Trimestre Economico No.70), Mexico City, Mexico.
Davila Capalleja, E., 1995, "El tratado Trilateral de Libre Comercio en materia de transporte de carga'',Chapter 9 in Lo Negociado del TLC
Femrandez, Arturo, 1993, "Trucking Deregulation in Mexico" in Jose Carbajo (ed.) Regulatory Refomriin Transport. Some Recent Experiences, A World Bank Symposium, Washington, D.C.
Giermanski, James R., 1995, "Texas to Mexico: A Border to Avoid", mimeo, Texas A&M InternationalUniversity (September 26, 1995).
Ibarra-Yunez, Alejandro, 1999, "Dominant firm and company integration: The case of transportation inMexico and the U.S.", Latin American Business Review, Vol.2, No.4, USD-ITESM, InternationalBusiness Press.
IMT (Instituto Mexicano del Transporte), Secretearia de Communiciones y Transporte, 1997, ManualEstadistico del Sector Transporte 1995, IMT, Sanfandila, Queretaro.
Islas, Victor 1990, Estructura y Desarrollo del Sector Transporte en M6xico, El Colegio de Mexico,Mexico City, Mexico.
Martinez, Gabriel and G.Farber, 1994, Desregulacion Economica (1989-1993), Fondo de CulturaEconomica.
Moore, T. Gale, 1975, "Deregulating surface freight transportation" in A.Phillips (ed.), Promotingcompetition in regulated markets, The Brookings Institution, Washington, D.C.
Murray-Lasso, Marco Antonio, 1994, "Canales de Comercio: una Estrechez Comprometedora," inGabriel Martinez y Guillermo Farber, Desregulaci6n Econ6mica (1989-1993), Fondo de CulturaEcon6mica, Mexico City, Mexico.
Porter, Michael, 1997, "What is Strategy?" Harvard Business Review.Rico, Oscar, 1996, "Algunos Indicadores de la Evoluci6n de las Empresas de Autotransporte de Carga
en Mexico, 1988-1993", in Instituto Mexicano del Transporte, Notas, num. 31, Quer6taro, Mexico.Sable, Charles, and Michael Piori, 1990, The Second Industrial Divide, Basic Books.Secretaria de Comunicaciones y Transporte (SCT), 1996, Estadisticas Basicas del Autotransporte
Federal, Mexico City, Mexico.Sempe Minvielle, Carlos, 1997, Tecnica Legislativa y Desregulacion, Editorial Porrua, Mexico City,
Mexico.U.S. Department of Transportation, 1996, Census Surface Trade Flow Data. Washington, D.C.Viscusi, W.Kip, John M.Vernon and Joseph E.Harrington, 1995, Economics of Regulation and
Antitrust, The MIT Press, Cambridge, Mass, 2nd edition.World Bank, 1995, Perforrmance Audit Report - Mexico: Road Transport and Telecomnmunications
Sector Adjustment Loan, Report No. 14400, The World Bank, Washington, D.C. (April 21, 1995)..World Bank, 1994, Mexico: The end of transition - A review of the transport sector, Report No. 12654-
ME, The World Bank, Washington, D.C. (May 31, 1994).World Bank, 1993, Project Completion Report -- Mexico: Road Transport and Telecommunications
Sector Adjustment Loan, Report No. 12623 (December 23, 1993).World Bank, 1990, Report and Recommendation of the President - Mexico: Road Transport and
Telecommunications Sector Adjustment Project, Report No. P-5254-ME (May 3, 1990).
34
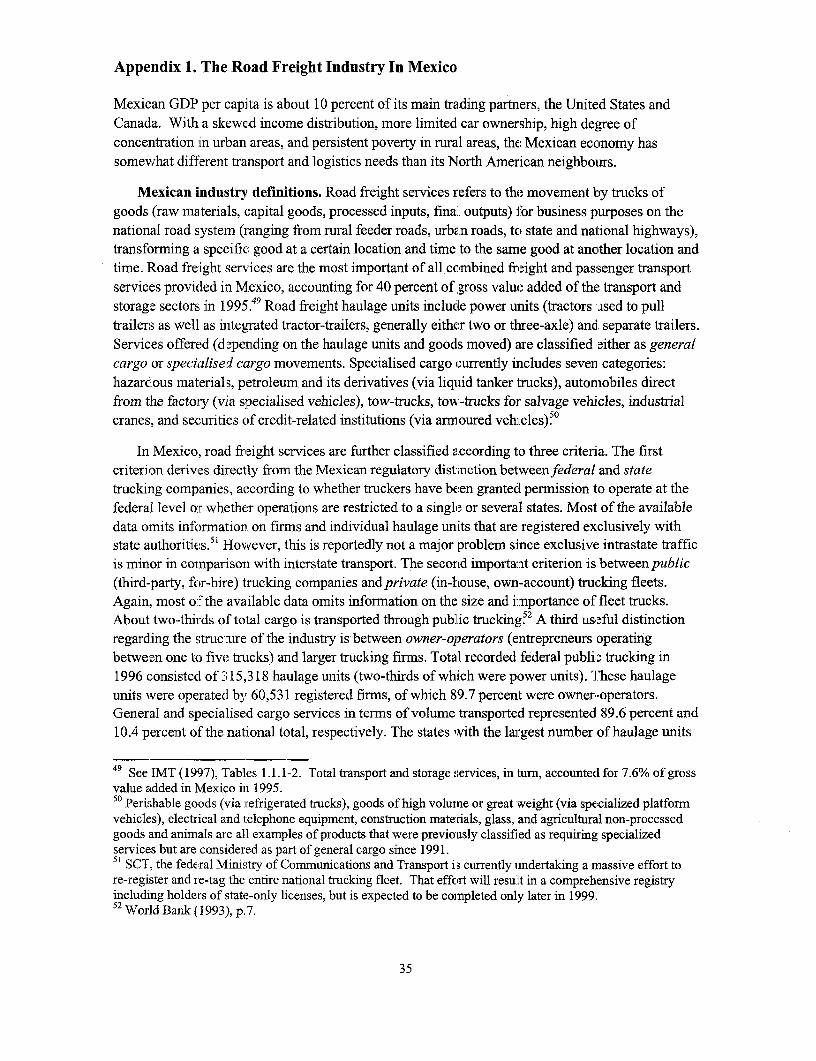
Appendix 1. The Road Freight Industry In Mexico
Mexican GDP per capita is about 10 percent of its main trading partners, the United States andCanada. With a skewed income distribution, more limited car ownership, high degree ofconcentration in urban areas, and persistent poverty in rural areas, the Mexican economy hassomewhat difftrent transport and logistics needs than its North American neighbours.
Mexican industry definitions. Road freight services refers to the movement by trucks ofgoods (raw materials, capital goods, processed inputs, finalL outputs) for business purposes on thenational road system (ranging from rural feeder roads, urban roads, to state and nalional highways),transforming a specific good at a certain location and time to the same good at another location andtime. Road freight services are the most important of all combined freight and passenger transportservices provi(led in M:exico, accounting for 40 percent of gross value added of the transport andstorage sectors in 1995. 49 Road freight haulage units include power units (tractors used to pulltrailers as well as integTated tractor-trailers, generally either two or three-axle) and separate trailers.Services offered (depending on the haulage units and goods moved) are classified either as generalcargo or specialised cargo movements. Specialised cargo currently includes seven categories:hazardous materials, petroleum and its derivatives (via liquid tanker trucks), automobiles directfrom the factoiy (via specialised vehicles), tow-trucks, tow-trucks for salvage vehicles, industrialcranes, and securities of credit-related institutions (via armnoured vehicles).0
In Mexico, road freight services are further classified according to three criteria. The firstcriterion derives directly from the Mexican regulatory distinction betweenfederal and statetrucking companies, according to whether truckers have been granted permission to operate at thefederal level or whether operations are restricted to a single or several states. Most of the availabledata omits information on firms and individual haulage units that are registered exclusively withstate authorities.51 HIoNwever, this is reportedly not a major problem since exclusive intrastate trafficis minor in comparison with interstate transport. The seconid important criterion is between public(third-party, for-hire) trucking companies andprivate (in-house, own-account) trucking fleets.Again, most of the available data omits information on the size and iimportance of fleet trucks.About two-thirds of total cargo is transported through public trucking 2 A third useful distinctionregarding the structure of the industry is between owner-operators (entrepreneurs operatingbetween one to five trucks) and larger trucking firms. Total recorded federal public trucking in1996 consisted of 315,318 haulage units (two-thirds of which were power units). These haulageunits were operated by 60,531 registered firms, of which 89.7 percent were owner-operators.General and specialised cargo services in terms of volume transported represented 89.6 percent and10.4 percent of the national total, respectively. The states wvith the largest number of haulage units
4 See IMT (1997), Tables 1.1.1-2. Total transport and storage services, in turn, accounted for 7.6% of grossvalue added in Mexico in 1995.50 Perishable goods (via refrigerated trucks), goods of high volumne or great weight (via specialized platformvehicles), electrical and telephone equipment, construction materials, glass, and agricultural non-processedgoods and animals are all examples of products that were previo usly classified as requiring specializedservices but are considered as part of general cargo since 1991.5 SCT, the federal Ministry of Communications and Transport is currently umdertaking a rnassive effort tore-register and re-tag the entire national trucking fleet. That effcirt will result in a comprehensive registryincluding holders of state-only licenses, but is expected to be comnpleted only later in 1999.52 World Bank (1993), p. 7.
35
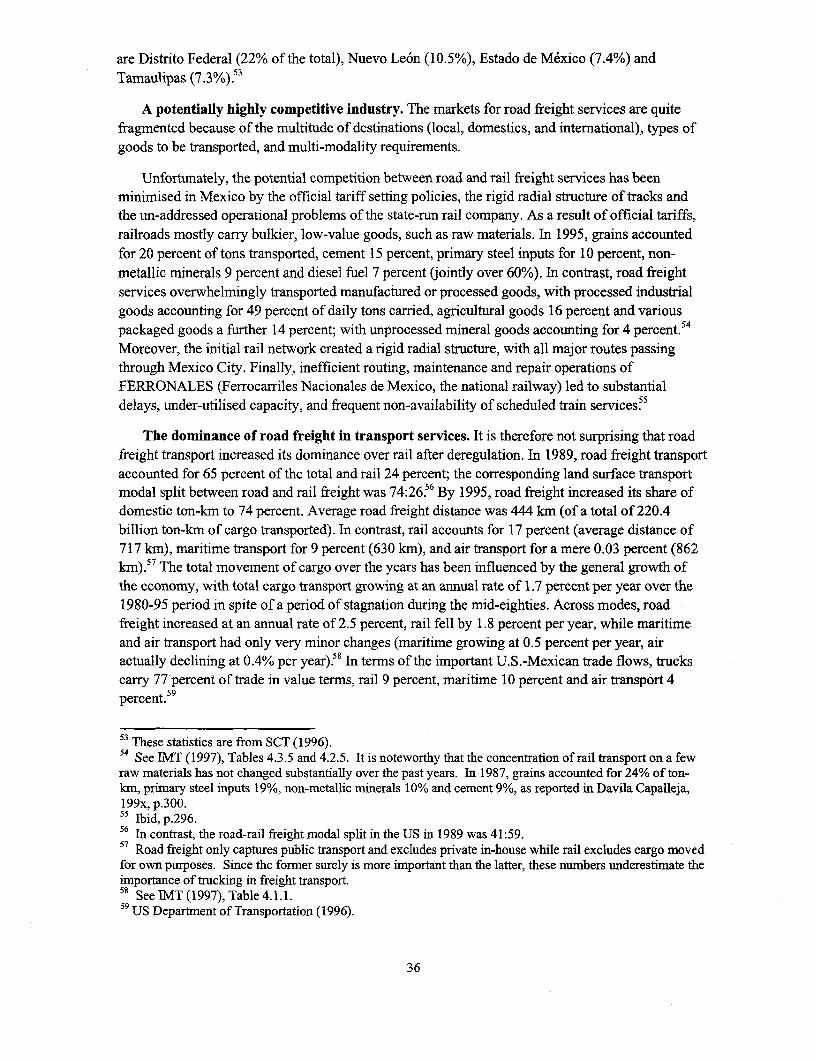
are Distrito Federal (22% of the total), Nuevo Le6n (10.5%), Estado de Mexico (7.4%) andTamaulipas (7.3/%). 53
A potentially highly competitive industry. The markets for road freight services are quitefragmented because of the multitude of destinations (local, domestics, and international), types ofgoods to be transported, and multi-modality requirements.
Unfortunately, the potential competition between road and rail freight services has beenminimised in Mexico by the official tariff setting policies, the rigid radial structure of tracks andthe un-addressed operational problems of the state-run rail company. As a result of official tariffs,railroads mostly carry bulkier, low-value goods, such as raw materials. In 1995, grains accountedfor 20 percent of tons transported, cement 15 percent, primary steel inputs for 10 percent, non-metallic minerals 9 percent and diesel fuel 7 percent (ointly over 60%). In contrast, road freightservices overwhelmingly transported manufactured or processed goods, with processed industrialgoods accounting for 49 percent of daily tons carried, agricultural goods 16 percent and variouspackaged goods a further 14 percent; with unprocessed mineral goods accounting for 4 percent.54
Moreover, the initial rail network created a rigid radial structure, with all major routes passingthrough Mexico City. Finally, inefficient routing, maintenance and repair operations ofFERRONALES (Ferrocarriles Nacionales de Mexico, the national railway) led to substantialdelays, under-utilised capacity, and frequent non-availability of scheduled train services.5
The dominance of road freight in transport services. It is therefore not surprising that roadfreight transport increased its dominance over rail after deregulation. In 1989, road freight transportaccounted for 65 percent of the total and rail 24 percent; the corresponding land surface transportmodal split between road and rail freight was 74:2656 By 1995, road freight increased its share ofdomestic ton-km to 74 percent. Average road freight distance was 444 km (of a total of 220.4billion ton-km of cargo transported). In contrast, rail accounts for 17 percent (average distance of717 km), maritime transport for 9 percent (630 kin), and air transport for a mere 0.03 percent (862km).'7 The total movement of cargo over the years has been influenced by the general growth ofthe economy, with total cargo transport growing at an annual rate of 1.7 percent per year over the1980-95 period in spite of a period of stagnation during the mid-eighties. Across modes, roadfreight increased at an annual rate of 2.5 percent, rail fell by 1.8 percent per year, while maritimeand air transport had only very minor changes (maritime growing at 0.5 percent per year, airactually declining at 0.4% per year) 58 In terms of the important U.S.-Mexican trade flows, truckscarry 77 percent of trade in value terms, rail 9 percent, maritime 10 percent and air transport 4percent.59
5 These statistics are from SCT (1996).54 See IMT (1997), Tables 4.3.5 and 4.2.5. It is noteworthy that the concentration of rail transport on a fewraw materials has not changed substantially over the past years. In 1987, grains accounted for 24% of ton-km, primary steel inputs 19%, non-metallic minerals 10% and cement 9%, as reported in Davila Capalleja,199x, p.300.55 Ibid, p.296.56 In contrast, the road-rail freight modal split in the US in 1989 was 41:59.57 Road freight only captures public transport and excludes private in-house while rail excludes cargo movedfor own purposes. Since the former surely is more important than the latter, these numbers underestimate theimportance of trucking in freight transport.s See IMT (1997), Table 4.1.1.59 US Department of Transportation (1996).
36

Infrastructure shortcomings. Despite heavy reliance on trucking, Mexico has a sparse andinadequate highway system of only 48,087 km of paved federal roads, referred to as trunkhighways (com.pare to 'Canada's 800,000). Of this total, roughly 6,000 km are so-called concessionhighways, which are privately owned toll roads; this is a recent development, as concessionhighways only accounted for about 1,000 km in 1989.60 Although a welcome development, thesenew highways are grossly under-utilised, mostly because they are very expensive (a trip fromNuevo Laredo at the U.S. border to Acapulco can cost a trucker about US$400). The nationalsystem is deepened by an additional 46,000 km of paved state roads, r eferred to as feeder roads.6
Broader transport reform initiatives. An attempt is currently under way to address thetraditional under-utilization of rail in Mexico. As part of a recent effort to restructure andmodeniise the Mexican rail system, the Constitution was reformed in February 1995 to open thesector to private participation through the awarding of long-term concessions on groups of lines. Asubsequent May 1995 law has created the legal framework for privatization. Licenses to build andoperate railways were granted, with the national grid having been divided into three main verticallyintegrated regional companies. The Northeast line (Ferrocarril del Noreste), one of the country'sbusiest, was sold to a Mexican-United States consortium ir, January 1997. The Northwest section(Ferrocarril del Pacifico-Norte) was sold in August 1997, and the Southeast line (Ferrocarril delSureste) in June 1998. Interconnection services in the Mex:ico City valley (Terminal Ferroviaria delValle de Mexico) are provided by a separate company joinl:y owned by three big railroad lines.This structure encourages competition within the rail network via regional comparisons of costsand prices. Competition with road transport is promoted by eliminating the possibility of crosssubsidies between regions and by stimulating the efficiency of the network.
Mexican ports also have been plagued with problems cif inadequate equipment, lack ofwarehouse or terminal space and poor road and rail connections. Mexican ports have beendecentralised since 1992, with port management -includin o negotiation of wharfage rates directlywith steamship lines under maximum rate guidelines-- fonnally transferred to newly createdIntegrated Port Authorities (APIs) in the second half of 1994. Concessions for container and otherhandling services at three of the country's four major ports (Altamira, Lazaro Cardenas andManzanillo) were sold during summer 1995. Other port concessions, including handling services inEnsenada and further such services in Lazaro Cardenas and Manzanillo were sold in 1996-8.Finally, the aiiport infi-astructure sector also has been operled up. The sale of concessions tomanage the 35 (of 61) airports that do not require subsidised operations has been organized intofour regional groupings, with the sales expected to be completed during 1999.
60 The govermnent handed over the construction of all four-lane toll roads to the private sector in the early1990s.61 See IMT (1997), Table 6.2.2.
37
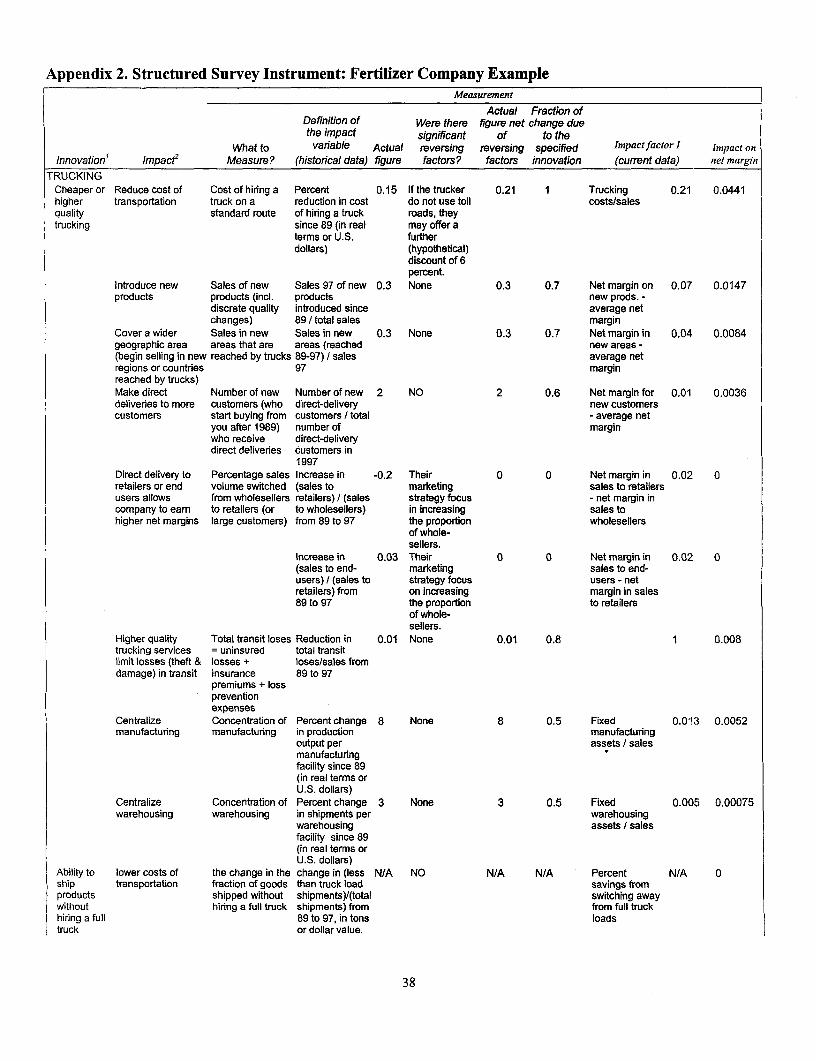
Appendix 2. Structured Survey Instrument: Fertilizer Company ExampleMeasurement
Actual Fraction ofDefinition of Were there figure net change duethe impact signiricant of to the
What to variable Actual reversing reversing specified Impact factor I Impact onInnovation' Impace2 Measure? (historical data) figure factors? factors innovation (current data) net margin
TRUCKINGCheaper or Reduce cost of Cost of hiring a Percent 0.15 If the trucker 0.21 1 Trucking 0.21 0.0441higher transportation truck on a reduction in cost do not use toll costs/salesquality standard route of hiring a truck roads, theytrucking since 89 (in real may offer a
terms or U.S. furtherdollars) (hypothetical)
discount of 6percent.
Introduce new Sales of new Sales 97 of new 0.3 None 0.3 0.7 Net margin on 0.07 0.0147products products (incl. products new prods. -
discrete quality introduced since average netchanges) 89/ total sales margin
Cover a wider Sales in new Sales in new 0.3 None 0.3 0.7 Net margin in 0.04 0.0084geographic area areas that are areas (reached new areas -(begin selling in new reached by trucks 89-97) I sales average netregions or countries 97 marginreached by trucks)Make direct Number of new Number of new 2 NO 2 0.6 Net margin for 0.01 0.0036deliveries to more customers (who direct-delivery new customerscustomers start buying from customers / total - average net
you after 1989) number of marginwho receive direct-deliverydirect deliveries customers in
1997Direct delivery to Percentage sales Increase in -0.2 Their 0 0 Net margin in 0.02 0retailers or end volume switched (sales to marketing sales to retailersusers allows from wholesellers retailers) / (sales strategy focus - net margin incompany to eam to retailers (or to wholesellers) in increasing sales tohigher net margins large customers) from 89 to 97 the proportion wholesellers
of whole-sellers.
Increase in 0.03 Their 0 0 Net margin in 0.02 0(sales to end- marketing sales to end-users) / (sales to strategy focus users - netretailers) from on increasing margin in sales89 to 97 the proportion to retailers
of whole-sellers.
Higher quality Total transit loses Reduction in 0.01 None 0.01 0.8 1 0.008trucking services = uninsured total transitlimit losses (theft & losses + loses/sales fromdamage) in transit insurance 89 to 97
premiums + losspreventionexpenses
Centralize Concentration of Percent change 8 None 8 0.5 Fixed 0.01 3 0.0052manufacturing manufacturing in production manufacturing
output per assets / salesmanufacturingfacility since 89(in real terms orU.S. dollars)
Centralize Concentration of Percent change 3 None 3 0.5 Fixed 0.005 0.00075warehousing warehousing in shipments per warehousing
warehousing assets I salesfacility since 89(in real terms orU.S. dollars)
Ability to lower costs of the change in the change in (less N/A NO N/A N/A Percent N/A 0ship transportation fraction of goods than truck load savings fromproducts shipped without shipments)/(total switching awaywithout hiring a full truck shipments) from from full truckhiring a full 89 to 97, in tons loadstruck or dollar value.
38

RATIONALIZING LOADSAdopt standard Lower costs of Average size of a Percent change 3 Sending out 0 0.6 Ouibound 0.2 0lot sizes handling and shiprnent to in average larger truc:king + other
transportation customers (units outbound shipments trans. /totalor tons per shipment size does not leai trucking + othershipment) since 89 to any cost trans.
savingsContainerization Decrease Damagecd goods Reduction in N/A NO 0.005 0 1 0
damages and and losses in (losses inlosses in transit transit as a transit)/sales
percentage of from 89 to 97sales (annual)
Allow cheaper Increase in N/A End of 0.05 1 Percent cost 0.3 0transportation (containerized government savings fromopportunities transport) / (total subsidized shipping in a
transport) from container container89 to 97 recycling inslead of other
program mel:hods (openreduced the bulk orgrowth of packaged)containerizatiDn
MODALITYExploiting Lower Change in the Increase in non- -0.02 Better trucking 0 0.8 Percent cost 0.1 0multi-model transportation composition of truck transport / services led to savings fromtransportation costs, faster transport use total a substitution using otheropportunities service (trucks, rail, transportation away from rail modes instead
maritimel from 89 to 97 of IruckingINVENTORIES
Higher quality Using just-in-time Reduction in in- Reduction in 1.5 NO 1.5 0.7 Conversion of 0.003 0.000287transport delivery of raw bound inventory average days of days 671services allow material, parts, levels in-boundmore timely and components inventory fromdeliveries or cuts down 89 to 97shipments inventory levelsBuild-to-order Reduction in Chainge in out- Reduction in -30 Without the 60 0.7 Conversion of 0.003 0.011506manufacturing finished goods bound inventory average days of trucking dalys 849
inventories levels out-bound improvemerts,inventory from the average89 to 97 outbound
inventorywould be 4months(instead of l).
Reduc:tion in Obsolete Reduction in N/A N/A 1 1 0obsolescence products written obsolescence/
off or marked sales from 89 todown 97
WAREHOUSINGRestructure Lower costs of Warehousing Percent N/A 0 1 Number of N/A 0and warehouse operations require reduction in wcrkers incomputerize operation fewer workers (number of warehousing/warehousing workers)/ total number ofoperations (annual volume employees
of warehouseoperations, intons or pesos)from 89 to 97
Warehousing Percent N/A 0 1 warehousing N/A 0operations require reduction in assets/fixedless capital (total assets
warehousingassets)/(annualvolume ofwarehouseoperations, intons or pesos)from 89 to 97
INSURANCEGet Limit losses Total transit loses = Reduction in 0.01 This reduction 0 0 1 0comprehensive (theft & uninsured losses + total transit has nothinc toinsurance damage) in insurance premiums loses/sales from do withcoverage transit F loss prevention 89 to 97 insurance.
costsCheaper How much the Increase in 0 NO 0 0 (Loss claims 0 0
39
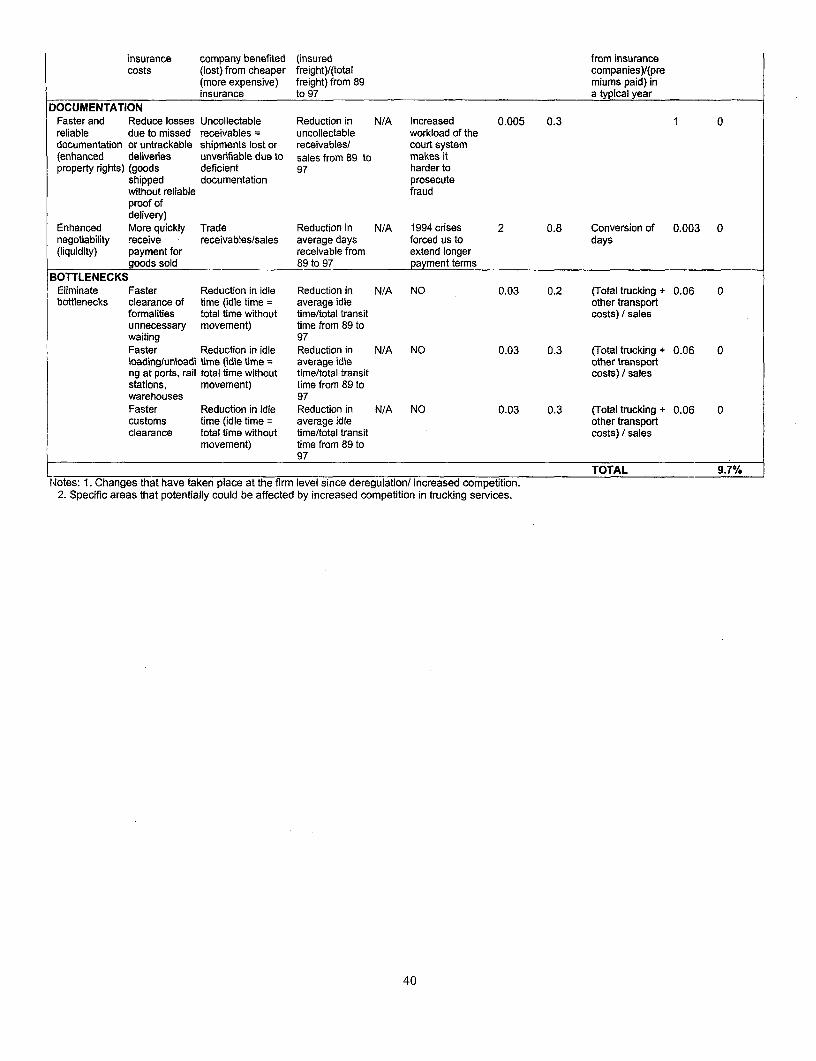
insurance company benefited (insured from insurancecosts (lost) from cheaper freight)/(total companies)/(pre
(more expensive) freight) from 89 miums paid) ininsurance to 97 a typical year
DOCUMENTATIONFaster and Reduce losses Uncollectable Reduction in N/A Increased 0.005 0.3 1 0reliable due to missed receivables = uncollectable workload of thedocumentation or untrackable shipments lost or receivables/ court system(enhanced deliveries unverifiable due to sales from 89 to makes itproperty rights) (goods deficient 97 harder to
shipped documentation prosecutewithout reliable fraudproof ofdelivery)
Enhanced More quickly Trade Reduction in N/A 1994 crises 2 0.8 Conversion of 0.003 0negotiability receive receivables/sales average days forced us to days(liquidity) payment for receivable from extend longer
goods sold 89 to 97 payment termsBOTTLENECKS
Eliminate Faster Reduction in idle Reduction in N/A NO 0.03 0.2 (Total trucking + 0.06 0bottlenecks clearance of time (idle time = average idle other transport
formalities total time without time/total transit costs) / salesunnecessary movement) time from 89 towaiting 97Faster Reduction in idle Reduction in N/A NO 0.03 0.3 (Total trucking + 0.06 0loading/unloadi time (idle time = average idle other transportng at ports, rail total time without time/total transit costs) / salesstations, movement) time from 89 towarehouses 97Faster Reduction in idle Reduction in N/A NO 0.03 0.3 (Total trucking + 0.06 0customs time (idle time = average idle other transportclearance total time without time/total transit costs) / sales
movement) time from 89 to97
TOTAL 9.7%Notes: 1. Changes that have taken place at the firm level since deregulation/ increased competition.
2. Specific areas that potentially could be affected by increased competition in trucking services.
40
Appendix 3. Four Case Studies
1. Fertilizer Coinpany
A Mexican. fertilizer company producing and distributing urea and DAP, creatted in 1993,provides one of the starkest examples of the downstream benefits of rmore competitive, market-driven trucking services. In terms of inbound logistics, roughly 80 percent of the raw materials
arrive by ocean shipment to the nearest port with the remainder arriving by train from the UnitedStates. In the end, 94 percent of the inbound raw materials make the final leg of the trip to the oneproduction plant by truck. In terms of finished goods outbound logistcs, 98 percent is transportedby truck to clients, with 70 percent of this total volume accounted for by trucking services directlycontracted for by the company and the remainder picked UI) at the plant by various larger clients
(retailers) who have their own in-house trucking fleet or outsource it. Inbound and outboundtrucking costs jointly account for 19 percent of total costs. Total trucking costs account for 21percent of sales (total transport costs, all modes, account fcr 32 percent of sales, of which 65percent is trucking, 30 percent ocean shipping and 5 percent rail shipping). In terms of number of
trucking service suppliers ideally suited to meet the company's inbound logistics reeds, there wasan increase from 2 to 4; in terms of outbound logistics, the number increased from 6 to 9,
confirming an incrceased intensity of competition in service supply. In turn, the intensity of
competition at the downstream level has also increased, with the number of direct competitors thatcould take over a significant part of its operations increasing from 4 to 10.
The cost faced by this company of hiring a truck on a standard route has reportedly fallen by 15percent in real terms over the past five years. If the truckers were not to use toll roads, they wouldbe able to offe:r the service for an additional estimated 6 percent less. The quality of the truckingservices also increased, with losses in merchandise during transit falling by 50 percent. Of thisreduction in total transit losses, 80 percent is estimated to be due to higher quality truckingservices, with the remaining 20 percent attributed higher levels of security provided on federalroads. Higher quality transport services also allow more timely deliveries and shipments, withsignificant cost reductions from lower inventory holding costs. The average days of inboundinventory fell 87.5 percent, from 2 days to 6 hours, with 70 percent of this change reportedly due toimproved trucking services and the remainder due to improved market conditions. The averagedays of outbound inventory rose from 1 to 2 months, but without trucking improvements theaverage outboumd inventory reportedly would be 4 months (so it is actually 50 percent lower thanotherwise).
These changes, in turn, have had a significant impact on innovat:ions and new productsintroduced by the company. Since the onset of regulatory reform, thc company has increased thenumber of distinct products that it sells from 12 to 32, with these chEnges reportedly almost totallydue to improvements in trucking services. Sales of new products introduced over the past yearsrepresent 30 percent of total current sales. Of this increase, 70 percent is reportedly directlyattributable to lower cost and higher quality trucking services, with the remaining 30 percentattributable to growvth in demand due to the higher level of fertilizer use in Mexican fields. The
41
average distance in trucking-based transit from plant to sales points has increased three-fold, from
60 to 180 kilometres, suggesting that many locations that previously were not profitable now havebecome so. Delivery times have also been reduced by 50 percent, with a regular trip that used totake 8 hours now taking 4 hours, reportedly mainly due to better equipment and a reduction in
number of stops taken by drivers. Number of employees have increased from 20 to 60.
Based on an intensive matrix survey instrument administered to this firm, the overallimprovement in operating margin directly attributable to road freight innovations is 9.7 percent:reductions in trucking costs directly related to road freight innovations accounted for 4.4 percent,
gains from new or improved products accounted for 3.5 percent (including reaching new areas and
more direct deliveries), and savings from improved logistics accounted for the remaining 1.8percent (including savings from centralized manufacturing and warehouses).62
2. Vegetable-producing Company
Another type of company where trucking services account for a substantial part of total costs isan agroindustrial company that produces and distributes a specific class of Mexican vegetable,peppers. The company sells 10 percent of its production in the Mexican domestic market, exporting90 percent with all foreign sales going to California (the company accounts for 4 percent of the
entire California pepper market). Trucking costs account for 18 percent of total sales (the companydoes not use any other transport modes).
Between 1991 and 1997, the total logistics cost of the company decreased from 42 to 23
percent of average price, with trucking being the logistics service with the greatest impact on costs.In real terms, trucking costs are reported to have fallen by 5 percent. An important additional costelement that has been falling substantially is the cost of inventory holdings. Input inventories havefallen from 45 to 18 days on average, or 60 percent. Inventories of finished goods have fallen from7 to 3 days. Without doubt, an important driving force of these changes has been the increasedintensity of competition in trucking services, with the number of providers that can offer therequired specialised trucking delivery services of finished goods for this type of company
increasing three-fold, from 5 to 15.
Since 1991, sales in new areas as a fraction of total sales account for 90 percent of total sales.The respondent was not able to estimate, however, the extent to which this increase was due tocheaper or higher quality trucking versus other factors. Certainly, idiosyncratic factors such as thedevelopment of an array of personal contacts in California played a big part in the increasedpotential sales outlets. Improvements in the quality of trucking services, however, were estimatedto be fally responsible for a 2 percent reduction in losses from transit-related problems (which fellfrom 5 percent of sales to 4 percent of now higher total sales). A fall of 10 percent in delivery timeswas also reported to be due to changes brought about by trucking deregulation. Number ofemployees have increased from 12 to 52.
62 See Appendix 2.
42

3. Eiectronie Components Company
A large Mexican producer of electronic components provides an interesting picture of acompany for which transport and logistics costs represent a much smaller percentage of total costs.
The company has downsized, with total employees falling from 500 1:0 350 between 1989 and
1997. It produces mainrly passive components such as elecirolytic capacitors (50% of total currentsales), polyester, polypropylene and ceramic capacitors, and resistors. They build t:o order from oneproduction plant, and sell only to wholesalers. The electronic components are shipped to the UnitedStates (Michigan) along the Mexico City - Laredo corrido-, and to the airport for container
shipments to Europe and Asia. For U.S. shipments, they use the services of a smaller trucking
company who transports the product to the border. The prcduct is then transferred to a largercompany for within-U.S. transport. However, the U.S. trucking company is responsible for theentire trip and quotes a single price. Total trucking costs account for roughly 2 percent of sales
(total transport costs, aLir and trucking, are double, at approximately 4 percent of sales). In terms of
number of trucking service suppliers ideally suited to meelt the company's outbound logisticsneeds, there was an increase from 5 to 10. The intensity of competition at the downstream levelincreased in each individual product category, on average from 2 otheir firms that could take away a
significant part of shipments to 4.
The cost of the Mexico City to Michigan route has increased by r oughly 15 percent in U.S.dollar terms between 1]993 and 1997. However, the respondent was not able to provide any
estimates on the impor-tance of reversing factors, such as increases in the cost of toll roads, higherquality trucking services or more timely deliveries. It is clear that the quality of tmcking servicesincreased substantially, with transit-related losses declining by a spectacular 90 percent. Half of
this increase is reportedly due to trucking services, while the remainder is due to improved in-housepackaging. Delivery times on a given segment have also decreased by 40 percent.
The main impact of improvements in trucking services appears to have been in expandingsales, with sales in new areas accounting for 50 percent of total sales, and 30 percent of thisincrease accounted for by higher quality trucking services. In addition, there has been a 20 percentincrease in direct delivery customers, and in this case 70 percent of the increase is reported due tohigher quality trucking services. There also has been a significant increase in new products, with
the range of individual products in stock rising from 100 to 200; in terms of value of sales, newproducts only account for a reported 7 percent of total 1997 sales. In this case, improved truckingservices accotut for less than 20 percent of this increase, with most of the change attributed to theincreased price attractiveness of individual components as a result of Nafta-relateid tax changes andto internal measures to raise quality. There have been a number of olher logistics-related internalchanges, such as introducing bar code tags to improve maeerial handling and introducingcomputerised systems and telecoms improvements for faster and more reliable documentationhandling.
43

4. Electronics Company
A large multinational electronics company provides a useful illustration of impact of roadfreight reform where the cost of logistics is a very small fraction of total costs. The company
employs 1330 workers, a slight downsizing from 1500 in 1989. It mainly produces semiconductor-rectifiers (accounting for 40 percent of sales) and 'surmeticos' (for an additional 20 percent), inaddition to an array of other electronic components for export. Most of the output (80 percent) is
for in-house use in other worldwide production and assembly plants, with the remainder solddirectly to other companies. Total trucking costs account for 1.8 percent of sales (total transportcosts, all modes, account for 4 percent of sales, of which air cargo is 50%, trucking 45% and oceanshipping 5%). In terms of inbound logistics, roughly 60 percent comes from the United States viatruck, and the remainder from Europe and Asia via air and sea. In terms of outbound logistics,which is more time-sensitive, roughly 30 percent is shipped back to the United States via truck
while the remainder is shipped by air to Europe and Asia. Of the five more intensively surveyed
companies, it is the two electronics component producers for which air cargo is the logistics service
perceived to have the greatest impact on costs. In terms of number of suppliers that are ideallysuited to meet the company's inbound and outbound trucking requirements, the number hasincreased from 1 to 2. In terms of intensity of competition as measured by direct competitors thatcan take away a significant part of shipments, whereas the company was the only game in town in1989, there are now 2 other close competitors.
The cost of a standard trucking route to end-points in the United States has increased in realterms by roughly 5 percent. The respondent mentioned a number of reversing factors, includingnewer trucks and tracking systems, but could not accurately estimate the impact of thoseimprovements. The main improvements appear related to quality of service, with losses related tologistics problems having decreased by 75 percent (from 4% to 1% of sales). In addition, deliverytimes on a given segment have decreased by 20 percent. However, it was again not clear to therespondent how much of the increase was actually due to improved road freight services versus
other factors such as improved loading and unloading facilities and more sophisticated internalsoftware that facilitates planning and tracking.
In comparison with 1989, the firm has introduced new products, with the stock of individua.lproducts increasing from 20 to 30. Sales of new products account for 15 percent of total 1997 sales.The firm also covers a wider geographic area, with sales in new areas also accounting for roughly15 percent of total 1997 sales. Finally, there has also been a significant increase in the number ofnew direct-delivery customers. However, in all these areas, it was difficult for the respondent toquantify with any degree of certainty the proportion of such new sales attributed to improvementsin road freight services. It is possible that part of the difficulty especially in this instance stemsfrom the inherent additional complexities of a multinational firm where key strategic sourcing andlogistics decisions are made in headquarters located in another country.
44
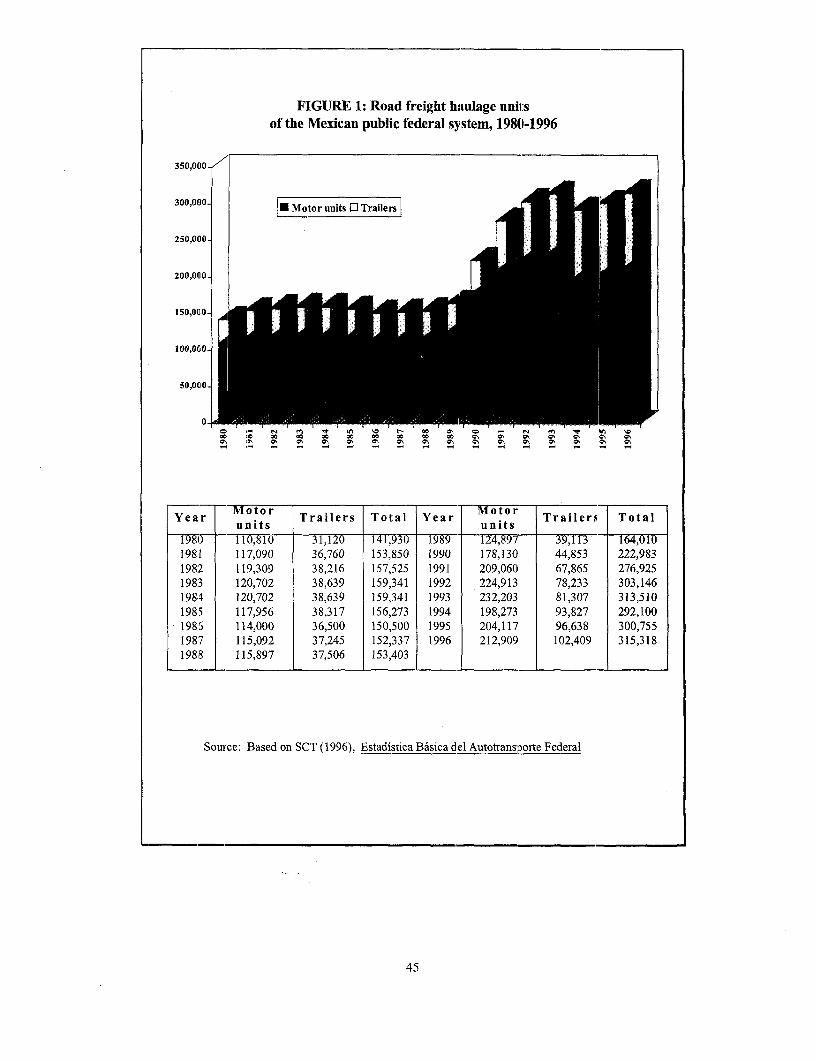
FIGURE 1: Road freight haulage unitsof the Mexican public federal system, 1980-1996
350,000-
300,000 | Motor units C Trailers
250,000-
200,000-
150,000 Tri iiI100,0~0
50,0(00
o -
.0 ' 00 Go Go Go o a, OV Io. j 0.,,,, ON O N O ~O N O , 0, ,,,- O O
tOr.- MottrYear ui its Trailers Total Year unit s Trailers Total
198Tr7-0,1 31,20 141793W 1r989 124,87- 39,11~73 W14,11981 117,090 36,760 153,850 1990 178,130 44,853 222,9831982 119,309 38,216 157,525 1991 209,060 67,865 276,9251983 120,702 38,639 159,341 1992 224,913 78,233 303,146198 4 120,702 38,639 159,341 1993 232,203 81,307 313,510198.5 117,956 38,317 156,273 1994 198,273 93,827 292,1001985 114,000 36,500 150,500 1995 204,117 96,638 300,7551987 115,092 37,245 152,337 1996 212,909 102,409 315,3181988 115,897 37,506 153,403
Source: Based on SCT (1996), Estadistica Basica del Autotrans3orte Federal
45

FIGURE 2: Road freight enterprisesaccording to number of haulage units, 1996
60,000 160,000
50,000Q. =No. ofenterprises + No. of hauluit 140,00050,000 000S:f 2C0
120,000
40,000100,000
30,000 80,000
60,000
10,000 20,000
0 0
C~~~~~~~~~~~~~
Type of enterprise No. of units per No. of No. of haulage uiitsenterprise enterprises
Owner-operator 1 - 5 54,292 144,158Srnml 6 -30 4,991 90,052
Medium 31-100 1 53,032Large 101 + 187 28,076Total , 315,318
Source: Elaboratedby CANACARbased on information fromINEGI, Censos Xly Xfl de Comunicaciones y Transportes.
46
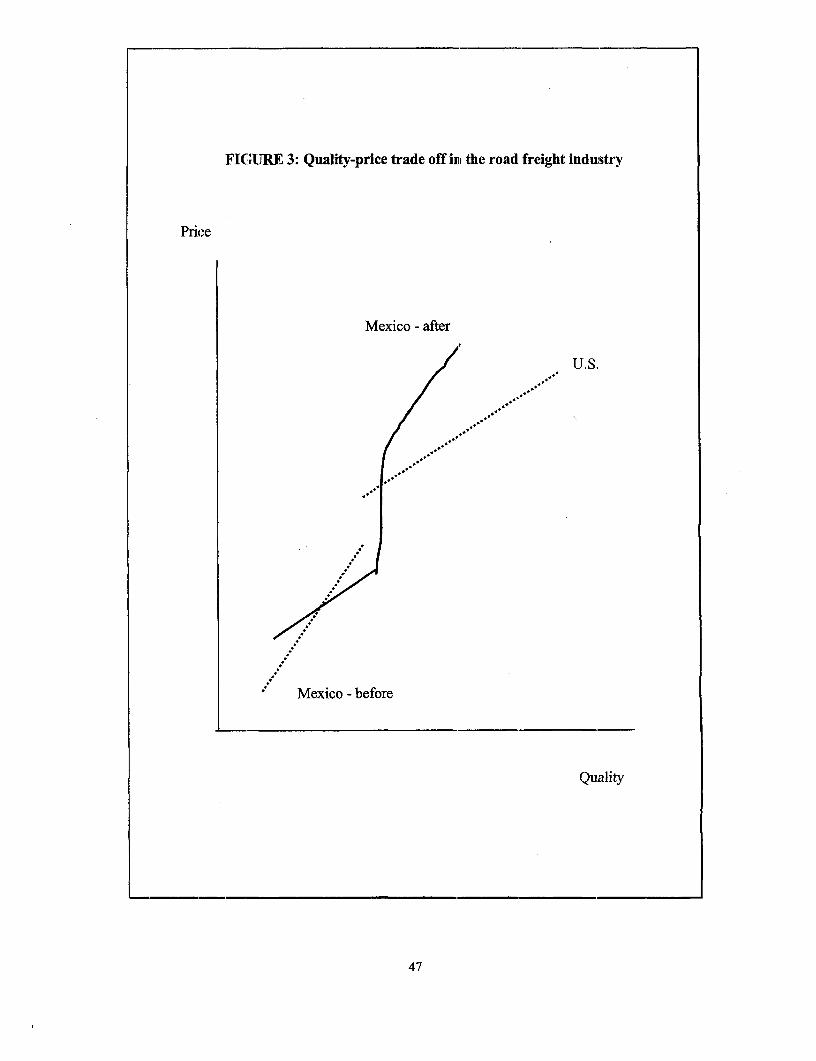
]FIGURE 3: Quality-price trade off ir the road freight industry
Price
Mexico - after
U.S.
' Mexico - before
Quality
47

FIGURE 4: Age of equipment (motor units) 1990-97 and projections 1998 -2010
: New fleet purchasesM Renovations
--- Ave rage ap e
n y e
40,000 a a20,0001.I
-4
I 000; z,<v X,,00 0 2
a00U00o 0 ifV fffff f)0t: ^ ' f ;0 20t0i 012
yw - ~W A m Nw A W N A - YM NM A1990 13,125 13 1 4,375 148 - 4 78 991 7
r99- 2l07-f.5 W- -7T- 35,2014F - 957- 5,-7
rT9,cW- t -MTo5oo-- -7Y6-- -f -00 NT4000000 A;0000 0f.7-0 ; 00T1 - w -3T0 -; -65,155- - T
Source: Elaborated by CANACAR based on information from ANPACT and SCT(historical data 1990 - 1997)
48
Policy Research Worlking Paper Series
ContactTitle Author Date for paper
WPS2302 Why Liberalization Alone Has Not Klaus Deininger March 2000 M. FernandezImprcved Agricultural Productivity Pedro Olinto 33766in Zarnbia: The Role of AssetOwnership ancl Working CapitalConstraints
WPS2303 Malar a and Growth F. Desmond McCarthy March 2000 H. SladovichHolger Wolf 37698Yi Wu
WPS2304 Disinf ation and the Supply Side Pierre-Richard Ag6nor March 2000 T. LoftusLodovico Pizzati 36317
WPS230)5 The Irnpact of Banking Crises on Maria Soledad M0artinez March 2000 A. YaptemcoMoney Dernand and Price Stability Peria 31823
WPS2306 International Contagion: Implications Roberto Chang March 2000 E. Mekhovafor Pclicy Giovanni Majnoni 85984
WPS2307 Surveying Surveys and Questioning Francesca Racanatini March 2000 P. Sintim-AboagyeQuestions: Learning from World Bank Scott J. Wallsten 37644Experience Lixin Colin Xu
WPS2308 How Small Should an Economy's Paul Beckermai March 2000 H. VargasFiscal Deficit Be? A Monetary 38546Programming Approach
WPS2309 What Drives Private Saving around Norman Loayza March 2000 E. Khinethe World? Klaus Schmidt-Hlebbel 37471
Luis Serven
WPS231 0 How FPolitics and Institutions Affect Mitchell A. Orenstein March 2000 M. LeenaertsPension Reform in Three 84264Postcommunisl. Countries
WPS2311 The Buenos Aires Water Concession Lorena Alcazar April 2000 P. Sintim-AboagyeManuel A. Abdala 38526Mary M. Shirley
WPS2312 Measuring Governance, Corruption, Joel S. Hellman April 2000 D. Bouvetand State Capture: How Firms and Geraint Jones 35818Bureaucrats Shape the Business Daniel KaufmannEnvironment in Transition Economies Mark Schankerrnan
WPS2313 How Interest Rates Changed under Patrick Honohan April 2000 A. YaptencoFinancial Liberealization: A Cross- 31823Country Revievw

Policy Research Working Paper Series
ContactTitle Author Date for paper
WPS2314 Technological Leadership and Beata K. Smarzynska April 2000 L. TabadaForeign Investors' Choice of 36896Entry Mode
WPS2315 Investment in Natural Gas Pipelines Alejandro Jadresic April 2000 M. Salehiin the Southern Cone of Latin America 37157
WPS2316 Distrubutional Outcomes of a Emanuela Galasso April 2000 P. SaderDecentralized Welfare Program Martin Ravallion 33902
WPS2317 Trade Negotiations in the Presence of Keiko Kubota April 2000 L. TabadaNetwork Externalities 36896


