Embed Size (px)
Citation preview
RESTRICTED
o X CvrY Report No. EMA- 3a
\nrFPoIRTS DQES1<\
twas prepared for use within the Bank and its affilioted organizations.
n be071 not accept responsibility for its accuracy or completeness. The -eport maynot be published nor may it be quoted as representing their views.
INTERNATIONAL BANK FOR RECONSTRUCTION AND DEVELOPMENT
INTERNATIONAL DEVELOPMENT ASSOCIATION
THE FOURTH DEVETT4 .fT OPMENTr tPT.ATN\
AND THE ECONOMIC 1 i-RO-SuPECTS
OF
IRAN
(in two volumes)
VOLUME I
OVERALL VIEW
February 25, 1969
Europe, Middle East and North Africa Department
Pub
lic D
iscl
osur
e A
utho
rized
Pub
lic D
iscl
osur
e A
utho
rized
Pub
lic D
iscl
osur
e A
utho
rized
Pub
lic D
iscl
osur
e A
utho
rized
Pub
lic D
iscl
osur
e A
utho
rized
Pub
lic D
iscl
osur
e A
utho
rized
Pub
lic D
iscl
osur
e A
utho
rized
Pub
lic D
iscl
osur
e A
utho
rized
CURRENCY EQUIVALENTS
1 U., S. dollar = 75. 75 rials1 rial = 0. 0132 U.S. dollar
1. bllion ri.s = 13.2 million TU C. t'.dollars
T,Thi lOTTTTR - T) .T.nPT4TfP TRMT1 PT.AT\T
aNTD TIUEW ECrlTO1I PROSEC'PTS
OF' TP1t\
Volume I - Overall View
Volume II - Agriculture

VOLUIvE I
TABLE OF CONTENTS
Page No.
BASIC DATA i - ii
STIViAARNY AND CONCLUSIONS iii - v
T_ Tntroncitiion 1
II. Economic Develnopments in 1'6I2-1Q7 3
A R"nn.mii TxNnnns'in3
Output Growth
Income Distribution
B. The Investment Program 6napit 4al LIenAi4u4-UQ... L I.X -"L UJ Ur
The Financing of Government Expenditurerublic un Ubpi-±ses
C_.. ilne Moe iUary UdUI±bil ly 14
Price StabilityCredit PoliciesBalance of Payments
III. The Fourth Plan Targets 18
A.. Overall View 18
B. Prospects in the Main Sectors 21AcricultureIndustryPetroleumTransportation
C. Summary Evaluation 28
IV. Financial Prospects 32
A. National Savings 32
B. Public Savings 36The Need for Policy ChangesIMonetary Pressures
Page No.
(J. Foreign Financing Requirements 39Private InvestmentFuture Debt ServiceAmount. Terms andi C'onditi Hns of
Future Borrowing
V. Conclusion
ANNEXE',
I 'Statistical Tables
II Public Enterprises
This report was prepared by a Mission that visited Iran in July-August 1968. The members of the Mission were: Robert Mlaubouch6,Chief of Mission; Gabriele Sciolli, General Fconomist; PercivalBono, Livestock Specialist; Donald Campbell, Irrigation Engineer;Hans Kordik, Agronomist; Gustave Massiah, Transport Economist;David Reese, Agricultural Economist; Stanislaw Wellisz, IndustrialAdviser; Myrtle Timmins, Secretary.
BASIC DATA
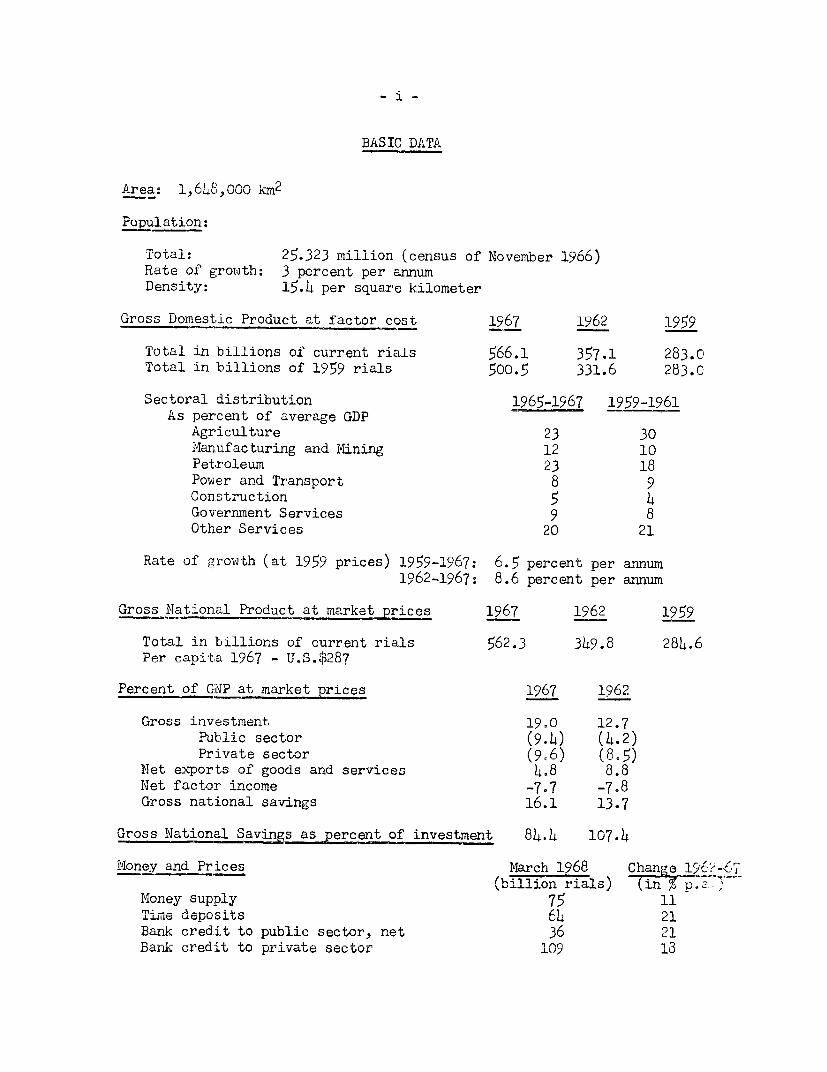
AArea: 1,618,000 km2
Pulation:
Total: 25.323 million (census of Novenber 1966)Rate of growth: 3 percent per annumDensity: 15.4 per square kilometer
Gross Domestic Product at factor cost 1967 1962 1959
Total in billions of current rials 566.1 357.1 283.0Total in billions of 1959 rials 500.5 331.6 283.0
Sectoral distribution 1965-1967 1959-1961As percent of average GDP
Agriculture 23 3014anufacturing and iMining 12 10Petroleum 23 18Pouer and Transport 8 9Construction 5 4Gov-ernment Services 9 8Other Services 20 21
Rate of growth (at 1959 prices) 1959-1967: 6.5 percent per annum1962-1967: 8.6 percent per annum
Gross National Product at market prices 1967 1962 1959
Total in billions of current rials 562.3 349.8 284.6Per capita 1967 - U.S-$287
Percent of GINP at market prices 1967 1962
(Tross investment 19.0 12.7Public sector (9,4) (4.2)Privqte srector () (8-
Met exports of goods and services 4.8 8.8NeT,-. facntr income -7-7 -7.8Gross national savings 16.1 13.7
Gross National Savin s as percent fivsmn 1.4 1713rsE;~~~~L_ t1j of i.-nvesment 84.4 1G7.4
Money and Prices March 1968 Change 19612-7(billion-a ia.j (inJ . fS-.I
Money supply 75 11Ii,i,e UeposiLUs Al 2
Bank credit to public sector, net 36 21DanIL- credit to private sec'uor 19 13

Annual ChangeRate of change in prices (in percent) 1967 1]962-1967
JFholesale price index - 1.2Cost of living index 0.1 1.5
As % of GDP1967 (at market prices
Government Ope-rations (billion rials) T=7 193Government current receipts 107.6 17.7 15.2Government current expenditure 76.5 12.6 12.3Current surplus 31.1 5.1 2.8Government capital outlays 61.2 10.1 4.4
As % of GDP Change1967 (1967) 1962-1967
Excternal Trade (billion rials) at market prices (in % p,a7Exports of goods and services 139.2 23.0 11.3
of which petroleum ship-ments a/ (116.0) (19.1) (l. )
Imports of goods and services 112.L 1865 17.3
Comnositiorn of merchandise exDorts 1967 1962(as a of export earnings)
Petroleum. net 82.L 78.1Cotton 3.6 h.8Carnpt.s 1h.8 L.OFruits 2.0 4L.3Others 7.2 8-8
Ballanc,- o%f' Pn,ment- (TU .S. $i millionn) 1967 I962Trade, net 47
Government capital receipts, net 200 8Others, net 9Change in reserves, net 13 -27
Foreign Exchange Position (U.S. $ million) March 1968GrLoss foeg xhnereserves 393 DLF position
Drawings 31
External Public Debt1ULa-l outsUAL1U±I1r kg (U-ILh2, 1968U/ : US. 7 Y e,IL4) miLL.LiLon
Debt service ratio (% of 1967 net export earnings): 12.1
a/ Valued on the basis of posted prices.
- 112i -
SUIMRY AIND CONCLUSIONS
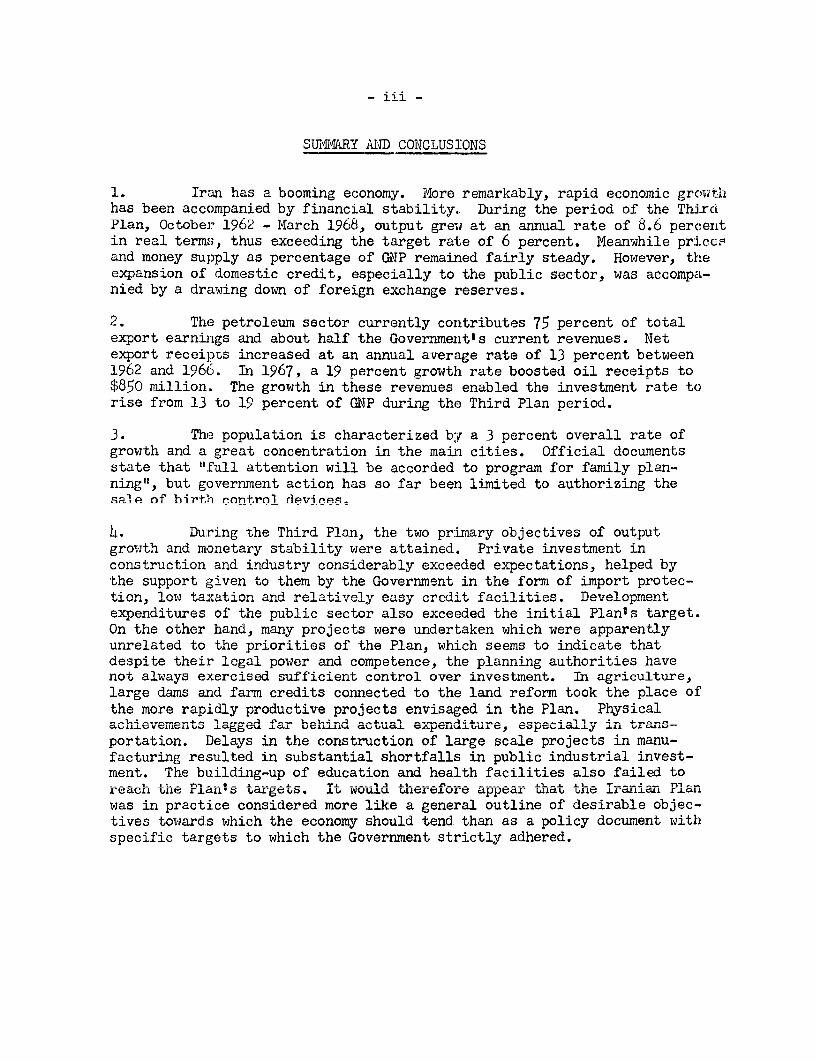
1. Iran has a booming economy. More remarkably, rapid economic growtlhas been accompanied by financial stability., During the period of the ThirdPlan, October 1962 - March 1968, output grew at an annual rate of' 8.6 percentin real terms, thus exceeding the target rate of 6 percent. Meanwhile priccsand money supply as percentage of GNP remained fairly steady. However, theexpansion of domestic credit, especially to the public sector, was accompa-nied by a drawing down of foreign exchange reserves.
2. The petroleum sector currently contributes 75 percent of totalexport earnings and about half the Government's current revenues. Netexport receipts increased at an annual average rate of 13 percent between1962 and 1966. In 1967, a 19 percent growth rate boosted oil receipts to$850 million. The growth in these revenues enabled the investment rate torise from 13 to 19 percent of GNP during the Third Plan period.
3. The population is characterized by a 3 percent overall rate ofgrowth and a great concentration in the main cities. Official documentsstate that "full attention will be accorded to nrogram for familv plan-ning", but government action has so far been limited to authorizing thesale of birth control devines
h1. Dring the Third Plan, the two primarry objectives of outplltgrowth and monetary stability were attained. Private investment in
constrlction~~~ an n .sr conside. -- , ex.ceeded- expec-aions, helped by,the support given to them by the Government in the form of import protec-tin, low~, taxat ion rad relativel+ easy credit facili4 ie. flor, -ment
expenditures of the public sector also exceeded the initial Plants target.Ofn +the- owthes,r hanrd, Mnr.,ry projects were undertaken whL.bi4 c*h w e r e app ---.-- l
unrelated to the priorities of the Plan, which seems to indicate that~j .L. U L4U ± I.JI d.L L-VL P VU CLI A UULjJYUUWIBUA, UL±U P-CLIi U1 CLdAJ± J. I-L.-LV 11-~v ~
not always exercised sufficient control over investment. In agriculture,'large da-. -an fa.,- --redits- cornete 4to the --- refo... 4ook the plac of
the more rapidly productive projects envisaged in the Plan. Physical
portation. Delays in the construction of large scale projects in manu-±dact-u.Ing resu'Lt±edu in subOstLaUtLia1 s± UVor U faL.L±s 1in pUbli±±Uc industrialL invest-ment. The building-up of education and health facilities also failed toreach thle Pl rants tciargets. Jb wouiud LrIO.LeL't! appearW UlUdL Lthe LraniaL rPlanwas in practice considered more like a general outline of desirable objec-tives towards which the economy shloU tenu. thnaL -a policy udcumlentl wispecific targets to which the Government strictly adhered.
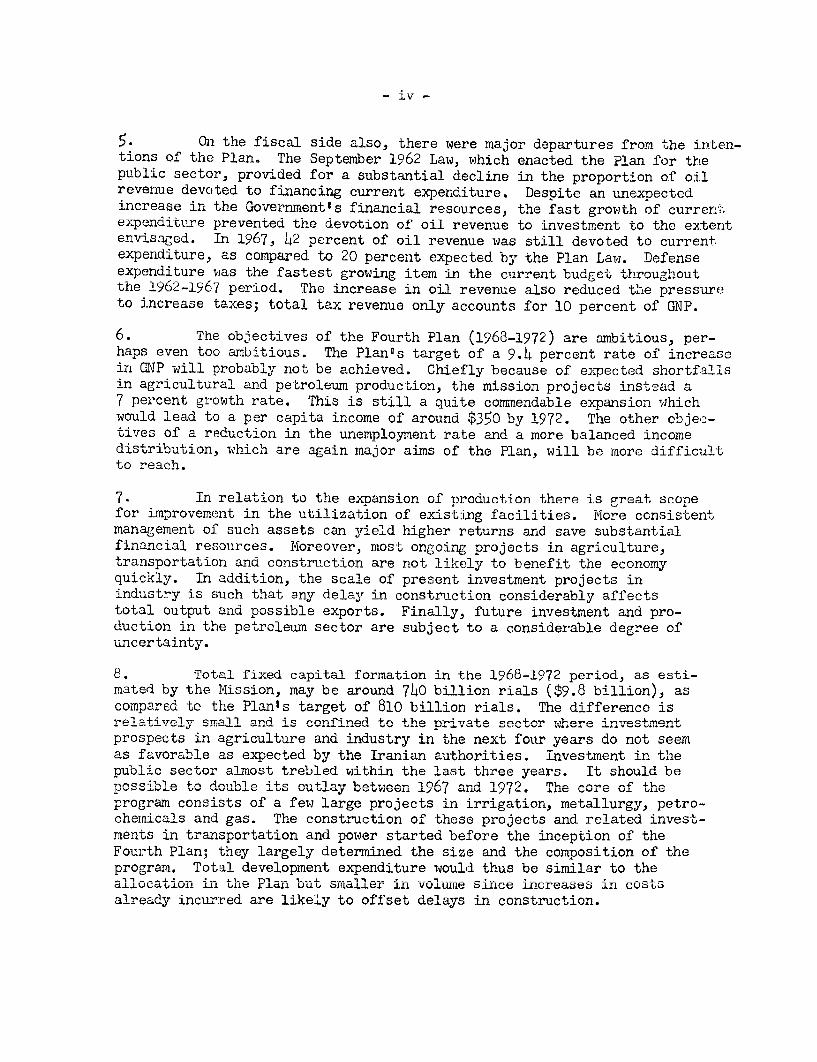
5. On the fiscal side also, there were major departures from 'he inten-tions of the Plan. T-he September 1962 Law, which enacted the Plan for thepublic sector, provided for a substantial decline in the proportion of oilreven-aue devoted to financing current expenditure. Desoite an unexpectedincrease in the Government's financial resources, the fast growth of currerr;;expenditure prevented the devotion of oil revenue to investment to the exteritenvisaged. In 1967, 42 percent of oil revenue was still devoted to current.expenditure, as compared to 20 percent expected by the Plan Law. Defenseexpenditure was the fastest growing item in. the current budget throughoutthe 1962-1967 period. The increase in oil revenue also reduced the pressureto increase taxes; total tax revenue only accounts for 10 percent of GNP.
6. The objectives of the Fourth Plan (1963-1972) are ambitious, per-haps even too ambitious. The Plants target of a 9.4 percent rate of increasein GNP will probably not be achieved. Chiefly because of expected shortfallsin agricultural and petroleum production, the mission projects instead a7 percent growth rate. This is still a quite commendable expansion whichwould lead to a per capita income of around $350 by 1972. The other objec-tives of a reduction in the unemployment rate and a more balanced incomedistribution, which are again major aims of the Plan, will be more difficultto reach.
7. In relation to the exDansion of oroduction there is great scopefor improvement in the utilization of existing facilities. More consistentmanagement of such assets can yield higher returns and save substantialfinancial resources. Moreover, most ongoing projects in agriculture,transportation and construction are not likely -tn bhnefit. the economyMquickly. In addition, the scale of present investment projects inindustrv is such that any delay in Pnnqtr,ttion 'considrably affectstotal output and possible exports. Finally, future investment and pro-duntion in the nP'rolenim sertrn are subject to a c vonsi6nyble degree ofuncertainty.
8. Total fixed capital formation in the 1968-1972 period, as esti-mated by the Missionn may be nrolnd 7d40 billion rials ($9.8 billion) aScompared to the Plants target of 810 billion rials. The difference isrelatively* unnl, ar.d i co -nfined to +he rivate sector..J-n~ *e .JinVsJmsn
prospects in agriculture and industry in the next four years do not seemas favorable as expected byi, 4t- T-arkan authorlties. 4 ,-e-i4ent4 thepublic sector almost trebled within the last three years. It should bepossile to double its outlay between 1967 and 19720 The core of theprogram consists of a few large projects in irrigation, metallurgy, petro-
h Q} n ]~~'L 1C!e-1 -- nA con s Alt;u llo o , AA 4Lh s pr j c s _ a_nd A t1 ; -4
ments in transportation and power started before the inception of theFourth Plan; they largely determl,Iinzed the size and the compositionL of theprogram. Total development expenditure would thus be similar to theallocation in the Plan but smaller in vol-we since increases in costsalready incurred are like'ly to offset delays in construction.
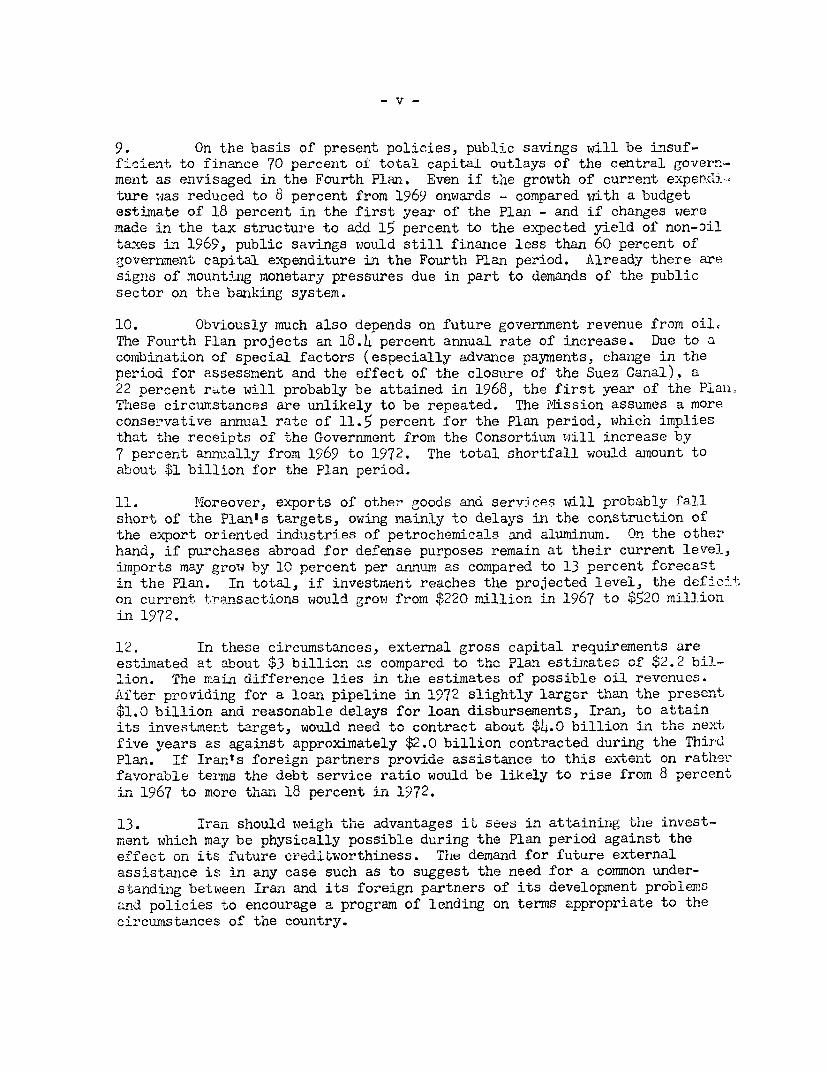
9. On the basis of present policies, public savings will be insuf-f^cient to finance 70 percent of total capital outlays of the central govern-ment as envisaged in the Fourth Plan. Even if the growth of current expenldi.,ture was reduced to 8 percent from 1969 onwards - compared with a budgetestimate of 18 percent in the first year of the Plan - and if changes weremade in the tax structure to add 15 percent to the expected yield of non-oiltaxes in 1969, public savings would still finance less than 60 percent ofgovernment capital expenditure in the Fourth Plan period. Already there aresigns of mountinig monetary pressures due in part to demands of the publicsector on the banking system.
10. Obviously much also depends on future government revenue from oil.The Fourth Plan projects an 18.4 percent annual rate of increase. Due to acombination of special factors (especially advance payments, change in theperiod for assessment and the effect of the closure of the Suez Canal), a22 percent rite will probably be attained in 1968, the first year of the Plan.,Thlese circumstances are unlikely to be repeated. The NLission assumes a moreconservative annual rate of 11.5 percent for the Plan period, which impliesthat the receipts of the Government from the Consortium will increase by7 percent annually from 1969 to 1972. The total shortfall would amount toabout $1 billion for the Plan period.
11. Moreover, exports of other goods and services wil probably fallshort of the Plants targets, owing mainly to delays in the construction ofthe export oriented industries of petrochemicals and alulminium. On the otherhand, if purchases abroad for defense purposes remain at their current level,imports may grow by 10 nercent ner anm_1« as compared to 13 percent forecastin the Plan. In total, if investment reaches the projected level, the deficiton current transactions Twould grow from $220 millIon in 1967 to $520 mil]ionin 1972.
12. In these circumstances, external gross capital requirements areest-A-Timated at about $3" billion as cor.pared to the Pla- es.ait 4es of $2.2 billion. The main difference lies in the estimates of possible oil revenues.After providlin for a loan pi-pe-line in 1972 -1igly larger thcar the present$1.0 billion and reasonable delays for loan disbursements, Iran, to attainits investment target, wod need to contract about - 'hL.0 bilo in, the ne.x4five years as against approximately $2.0 billion contracted during the ThirdPlan. If IrnTs foreign partners provide ass-isance to this extent on rather'favorable terms the debt service ratio would be likely to rise from 8 percent>, 1967 4to r,ore t'han l8 percentu ir 1972-"LU J.7U .J LI.J1 d'.L A I.L 1 L ±7 f .
13. IIrar, should weigh the au-vauuages ±u sees in attaining the inves-ment which may be physically possible during the Plan period against theeflect on its future creditworthiness. The uemand for future externalassistance is in any case such as to suggest the need for a common under-standing between Iran and its foreign partners of its development problersand policies to encourage a program of lending on terms appropriate to thecircumstances of the country.
CHAPTER I
INTRODUCTION
1. Iran has a booming economy. Moreover, economic growth has beenaccompanied by financial stability. Such achievements are sufficientlyuncommon to raise the question of whether l;his achievement is likely tocontinue. :[ran has the natural, mineral and energy resources, the domesticmarket and the labor supply to support development changes. Until the latefift.ies, howiever, the Government did not express its determination to pursuethose changes by direct and comprehensive action. A nurnber of major projectswere undertaken by the Plan Organizati-on during the Seronnd Plan neriod bhutthe Government relied mainly on private initiative and capital for promol;ingeconomic growth. This WaS snfficienf to assunre satisfactory growth ratesbut, in the early sixties, the Government felt that more drastic changeswere needed if T->'n ran +.to +tvun in fa m ondrn inter !at+eA eonTmir
2. The increase i n petroleum reverues provided the mean.s to financesome structural changes. The major undertaking along those lines was the1-and reform. The second step -,-was a more de-Lib1erate pollcy towards -i-trialization. While continuing its assistance to private industry, theaGerlei L recently elmllbar)Ked. Cn, a prog r,i of larg scal 4nes --n
These actions were prompted by the desire to diversify the economy andspread tAhe nLVetmeUntUU beLftsL toUUtU tAhe couLLltry. BuU 0U CLua
charges are costly. In fact, the Government waited until petroleum exportsL 1.L I I 11 _hcad reac'ieu such a volume that new policies did not entail urasti.c shliftsin the allocation of resources.
3. The Plan Organization is the executive body of the High PlanningCouncil which meets every week under the chairmanship of the Prime Minister.The Plan Organization has responsibilities for programning, allocating andchanneling funds for the public sector. It therefore has the legal authorityand means to orient government economic activities. The balanced manner inwhich the Third and Fourth Development Plans were written is an evidence ofthe ability of government officials to formulate economic problems. Thesetwo elements of power and competence are rarely combined in a developingcountry.
4. Nevertheless, although the planning mechanisms are formallyadequate and the human competence favorable to successful planning, itcannot be said that there has been a determined policy of adhering to thePlanes specific targets after these have been approved. In fact, theThird Development Plan was never approved in its entirety and substantialsectoral and project allocations of capital were apparently unrelated tcthe Plan priorities. The global investment target and a rough breakdownof public sector allocations were revised a number of times with the latestrevision taking place four years after the inception of the Plan. Thescrevisions could mean that the Plan was adapted to changing economic ccnd-Xtions and therefore was a permanent policy instrument, but there is evi-dence to suggest that they were rather a reflection of changes in overallfinancial availabilities.
2 * iLjVU'1jU~ P.dLCLIa"11 -LO ±±IUt-L±UfzU uu C.L;jiJt-VU LAit O):-j a] d.lucdiull Vi.L
scarce resources, it is only one element in the promotion of growth.WVile its pUannirg has been rather loose, the GoverrmMente s policieshave been quite deliberate in preserving price stability, implementingte 'land refo.rm adu stimuJ.ating investment generally anra private ini-tiative in particular. These policies, together with other reformsintended to modernize Iran have benefitted from tne considerableincrease in financial resources in recent years.
- 3 -
CHlIPTER II
ECONOMIC DEVELOPiMENTS IN 1962-19671/
6. The Third Development Plan terminated its five and a half yearperiod in M4arch 1968. A new five-year Plan has just begun. These develop--ment plans are not only useful tools for assessing economic prospects; theyare also an expression of choice between policies or at least between objec-tives. As such, they give information on the Government's intentions ineconomic matters. Beyond the nurelv nant itative approach which is somelhat.deceiving in Iran, it is therefore interesting to compare what the Governi-ment 1 s develonment priorities were in the early sixties and the eS.tent otheir achievements during the Third Plan period.
7. The two primary objectives of the Third Plan were output growthand monetary stabili+yr. economic perfo .ar Jn this respec was rwm-Lb'e
and the Plan reached its objectives. However, the Government had some dif-ficulties, at least initially, in the util:ization of the mian lnstrIent Orimplementation, namely the public investment program.
A. Economic Expansion
Output Growth
8. Output during the Third Plan grew at an annual rate of 8.6 perzentin real termus, thus exceeding the o percent target of the Plan. The expan-sion of the economy was steady, starting from a somewhat depressed situationin the early sixties. Tne rapid growth over the period is somewhat exagger-ated by the fact that national accounts underestimated the value of outputin the early years, particularly for industry and agriculture. 2/
T'Tne Iranian year is based on the solar calendar recently run from Marchto M4arch. Year 1345 is thus March 21, 1966-March 20, 1967. For the sakeof simplicity the solar year is equated to the closest Gregorian yearthroughout this report as often done in Iran. For instance 1345 is shownas 1966 (or a difference of 621 years).
2/ The implied aggregate capital-output ratio for the Third Plan peried wasabout 2.1:1 which is rather low for a developing country. In additionto the overestimation of the growth of GDP other possible explanationsare (i) a possible underestimation of gross fixed capital formation(e.g. private investment in agriculture); (ii) the existence of under-utilized capacity at the end of the Second Plan; (iii) the high growthin agricultural production which was essentially the result of goodweather conditions; and (iv) the rise in petroleum production. On thesebases, the overall capital-output ratio is not very significant. Sectoralcapital-output ratios which usually are more meaningful cannot be computedbecause of lack or unreliability of data on sectoral investment and pro-duction.
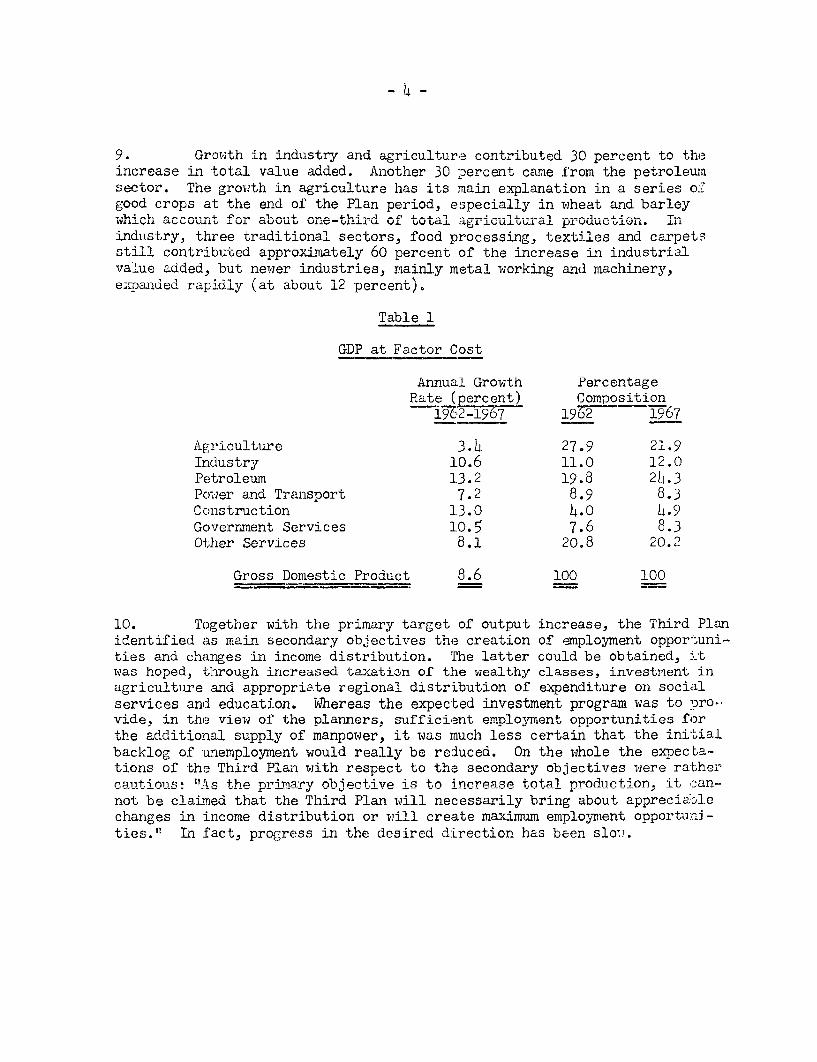
9.* Gr-n-th in indust-r and agriculture 3 percent to th4-
increase in total value added. Another 30 percent came from the petroleum-s'- u'Jo . Thie growVth -iI c%Miclture has LaI e planaton in a series o:Ugood crops at the end of the Plan period, especially in wheat and barleywhieri acicount for about one-third of to-tal agricultural producuion. _"nindustry, three traditional sectors, food processing, textiles and carpetsstill contributed dpprxuWIuately. 60 percent of the lncrease ±in lidustrialvalue added, but newer industries, mainly metal working and machinery,e:.oanded rapidly (at about 12 percent).
Table 1
GDP at Factor Cost
Annual Growth PercentageRate (percent) Composition
T12-1967 1962 1967
Agriculture 3.4 27.9 21.9Industry 10.6 11.0 12.0Petroleum 1.3.2 19.8 24.3Power and Transport 7.2 8.9 8.3Construction 1.3.0 4.0 4.9Government Services 10.5 7.6 8.3Other Services 8.1 20.8 20.2
Gross Domestic Product 8.6 100 100
10. Together with the primary target of output increase, the Third Planidentified as main secondary objectives the creation of employment opportuni-ties and chang-es in income distribution. The latter could be obtained, -itwas hoped, through increased taxatizn of the wealthy classes, investment inagriculture and appropriate regional distribution of expenditure on socialservices and education. Whereas the expected investment program was to pro-vide, in the viewz of the planners, sufficient employment opportunities forthe additional supply of manpower, it was much less certain that the initialbacklog of inemnloovment would really be reduced. On the whole the expoecta-tions of the Third Plan with respect to the secondary objectives were rather_nqt.ioiis! "AsA the primary ohveetive is to innrease total nroduetion. it can-not be claimed that the Third Plan will necessarily bring about appreciabler,hAncrPq in inonTn Hi.c+.rihiit.inn nr T,ill rntp. m-2;mimm Pmn ov-me-rnt. onnorturi-ties." In fact, progress in the desired direction has been slou.
Bnploymnent
11. Between 1956 and 1966 2/, employment of persons in the labor force(i.e. between 15 and 64 years of age) increased at an average rate oI .6c pe3'cent. 2/ AS the labor force grew by 2.2 percent, unemployment somewhatincreased. 3/ Unemployment is concentrated in the cities where the creationof new job opportunities did not keep pace wi'h urbanization which took p2aceat a 5 percent annual rate. The unemployed mainly consist of unskilledworkers. Apart from some surpluses in the service sector, especially inpublic admin4stration and a few government enterprises, underemploymentmainly exists in agriculture. Agriculture still remains the predominantemployment sector with close to half of the total, a'lthough it contributedonly 24 percent to domestic output in 1966. There is no large scale pro;ramdevised specifically for the resorption of unemployed workers. The mainlabor absorptive industries in Iran, i.e. textiles and food processing, pro-vide less than 10 percent of total employment.
12. The labor market is not organizecd and scanty information on wagesand salaries is available. Wages in agriculture and for unskilled workersin general are still in the neighborhood of' 60 to 70 rials (i.e. less than$1) per day, except for temporary .obs in construction where they go up to110 rials. They have only slightly increased in the recent years and lagbehind the advances in average labor productivity and per capita income.The salaries of technical and managerial personnel have considerably goneup and stand at levels comparable to European standards. Workers in theprivate sec-tor do not yet enjoy any health, employment or retirementbp,npA7its .
Inconme ni qtribhiiti on
13. Per capita GNP was equivalent to $2R7 i n 1 6(7. 0ver the last tenyears, the average rate of increase of per capita income has probably beenabout 4 percent annually. ruring the Third Plan period, it was about 5> percent in reaL terms. This income grovwth has been accompanied by an expanSionof the middle cl alss cin the cities ancni n t-nnqr-1A1i±+.ion crf inonmT in the a ulrnoerclasses of Iranian society. The increase in income has been quite differentin ,,ral nnd urbann areas.
L/ -i±"UimL-U..LVJ1 nll WV t LhLe lbon- forc&nd v..ploJ.y.en is -availaL- ble only -n the
basis of the last two demographic censuses.
2/ Employnent of persons between 10 and 14 years of age increased by 8 per-cent a-nd accounted Ju n966 f`Uor more than L.L percent ofJ tJotal employmeOt
(mostly in the carpet industry).
3/ In Novemiber 1966, 9.5 percent of the active population was apparently unm-employed according to the Iranian definition of the active populationwhich includes some children but excludes most women.
- 6 -
14. RLural consumption per capita increased between 1959 and 1S66 at.an annual rate of about 2 nercent in real terms 1/. Tn 1959 ner nanitacouisumption in rural areas was less than heilf of that in the cities. Italso greiw more slowlv and was es-timated at less than 1,000- rials in 1Q6(-it the lower level of income, the increase in per capita income in ruralareas was probahli qimi1]r t+n th.t. i n pr capita consu-mnj tiion. Since IQ 9'zthe discrepancy between urban and rural incomes has thus probably widene-..
B. Tenetret >.n,... _
Capital Expenditure
15. ThIe Third Plan assumed that the growth in output cf 6 percent perarlnumcou.U aW ~1.LZVe'.LUU IL.- LJdU.VUg JVUOUI1[MLUI ±It U U11i Ud~1 u
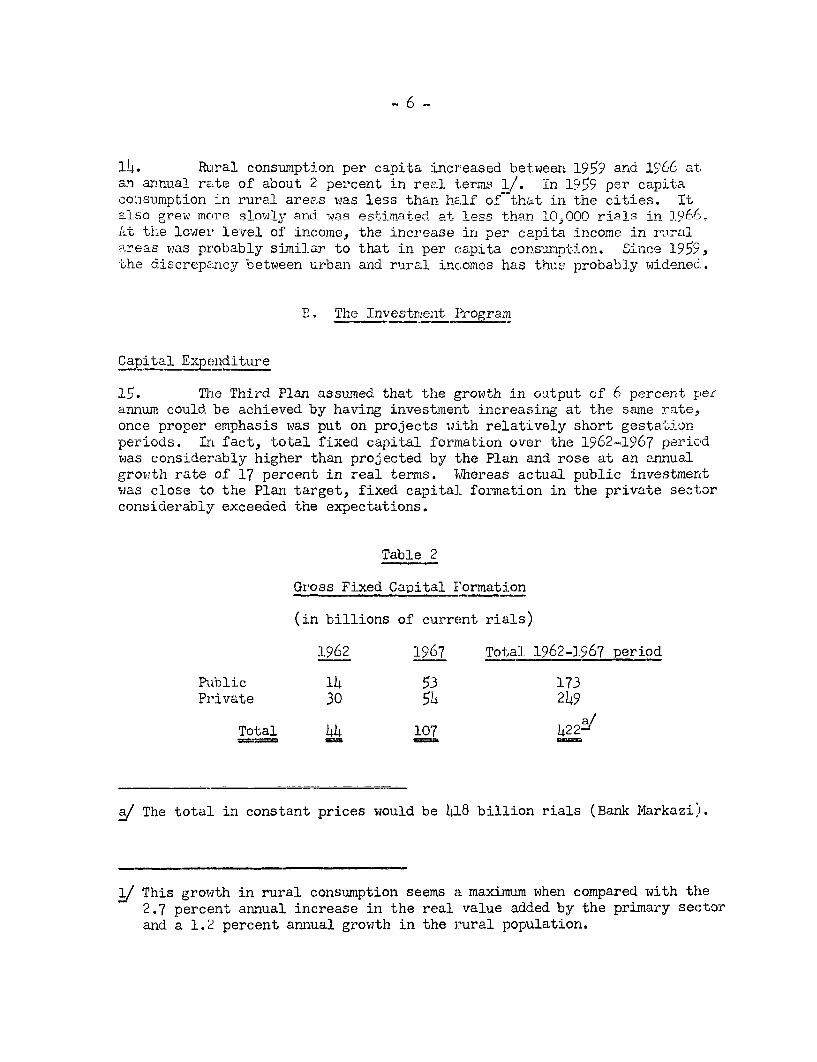
once proper emphasis was put on projects tjith relatively short gestationpe-VriUo. ±1I faCt, toUt al ±i x capi-tal formation over the 1962-19Y6 per-icU
was considerably higher than projected by the Plan and rose at an ennualgrowth rate of 17 percent in real terms. FJhereas actual public investmentwas close to the Plan target, fixed capital formation in the private sect,orconsiderably exceeded the expectations.
Table 2
Gross Fixed Capital Formation
(in billions of current rials)
1962 1967 Total 1962-1967 period
Piblic 14 53 173Private 30 54 249
a/Total 44 107 422-/
a/ The total in constant prices would be M 8 billion rials (Bank Markazi).
1/ This growth in rural consumption seems a maximum when compared with the2.7 percent annual increase in the real value added by the primary sectorand a 1.2 percent annual growth in the rural population.
-7-
16. Li~t44+le 4rfnmation is available on the pri;vate sector except for
irdustry and construction, which accounted for 60 percent of total privateinve-+esr,. Pri;vate i;nv-+es.nt Jin industr 1as 14 billion ri a-1s f4or 4th,e
-4 ~V JIL 4 Lv I V- -U - ,Ve ~JIL ±I LI .L i J. L us' ry ~± was L4u U±±..1±L%JA ±OL. ±L J± t
1962-1967 period thus exceeding the Plan target of 30 billion rials. No.iinvest" how14A iuAever UUAJu3 'p.LacL n ally Uof hII J a JV±VtUU pi eiUU0U1Iris for-
seen in the Plan, namely wallboard, paper and viscose manufacturing. Onthe other hand, several imHportant enterprises, not 1mlentioned n1 the Plan,came into being, including truck and bus assembly plants, rubber tireplanlts aid a rolling mill. This indicates tne difficuity Of planning forthe private sector.
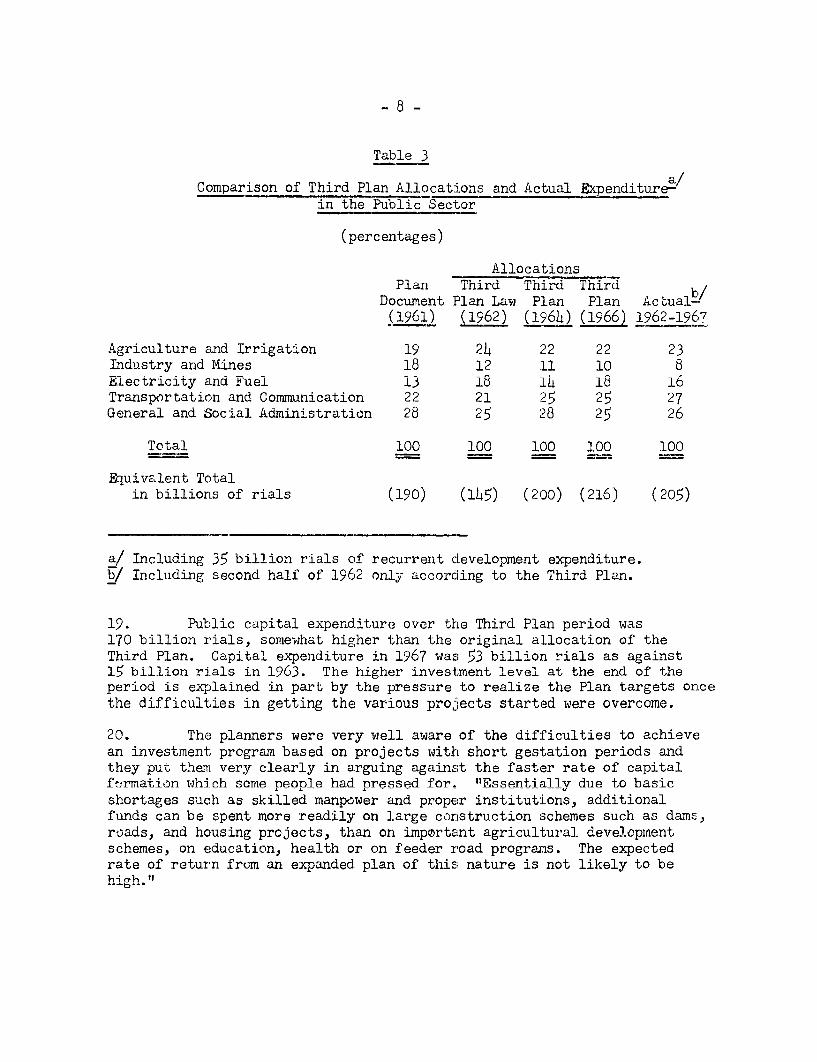
17. The public development program underwent several changes duringthe Plan period. The first draft of the Third Plan, prepared in 1961, wasa comprehensive Plan including sectorial chapters. Financial difficulties,which the Third Plan document had anticipated, called for an immediate re-duction of the projected investment. The development program for the publicsector eventually became the only part of the Third Plan presented to theParliament in September 1962. This Law regulated the distribution of oilrevenues between the ordinary and iivestment budgets and put a ceiling tothe growth in current expenditures. The revised version of the publicdevelopment program reduced the original allocation of 190 billion rials(of which 158 billion for fixed investment) to 145 billion rials. It alsoentailed son:e changes in the con.position with less emphasis on industry andmore on agriculture, power and oil. An unexpected rise in oil revenues ledto major revisions in 196)4 and 1966 which, however, did not change signifi-cantly the shares of the various sectors.
18. Generally speaking, one of the most important problems of the pa;,thas been the control by the Plan Organization over the implementation of thepublic investment program. The Plan Organization is the executive agency ofthe High Planning Council. In addition to its planning role, it allocatesfunds to the! various ministries and other public agencies. Scrutiny of theuse of these funds by the Plan Organization has not, so far, been sufficientto prevent waste and distortion, which have been aggravated by the existenceof various ministries and agencies operating in the same area (as in the caseof agriculture or education).
-8-
_ e
OComnpyarison of-L Tlhird Plar.- Allob^-4o,an cta 4-itr~ j.~/IL 'J. .L LL.LI L ±L I Xi _L .L 'J O uLVJLID cIIIU. Z1.L UU±LL £5J.qJU11U.LL UL-U
in the Public Sector
(percentages)
AllocationsPlan Tnird Third Third
Document Plan Law Plan Plan Actual--(D96i) (1962) (l96h) (1966) 1962--1967
Agriculture and Irrigation 19 22 22 23Industry and Mines 18 12 11 10 8Electricity and Fuel 13 18 14 18 16Transportation and Communication 22 21 25 25 27General and Social Administration 28 25 28 25 26
Total 100 100 100 100 100
Equivalent Totalin billions of rials (190) (145) (200) (216) (205)
a/ Including 35 billion rials of recurrent clevelopment expenditure.b/ Including second half of 1962 only according to the Third Plan.
19. Public capital expenditure over the Third Plan period was170 billion rials, somewlhat higher than the original allocation of theThird Plan. Capital exDenditure in 1967 was 53 billion rials as against15 billion rials in 1963. The higher investment level at the end of theperiod is explained in part by the pressure to realize the Plan targets or,cethe difficulties in getting the various projects started were overcome.
20. The planners were very well aware of the difficulties to achievean investment, nrogram based on prolects with short gestation neriods andthey put them very clearly in arguing against the faster rate of capitalfThrmation which some neonle had nressed for. "Essentially due to basicshortages such as skilled manpower and proper institutions, additionalfinnds n.an hp snAnt. more readily on 1 lari nnstr,iit.i an sche.mes such as damns.roads, and housing projects, than on imp0rtant agricultural developmentschemes, on enducation health or on feeder road programs. The eypectedrate of return from an expanded plan of this nature is not likely to behigh." I
21. Capital expenditures have actual:ly been very high in irnra-structure, .1s indicated by the fact that three-quarters of the fi.xedcapital formation in the public sector wen-t for construction. Dams andother irrigation schemes, which account for 60 percent of total investmentin agriculture, and main roads have absorbed a very substantial amount ofpublic expenditure allocations. Large investments also took place ingovernment buildings and staff housing which, as stated in official Iraniar.documents, dio nrot seem to have been justified.
22. A large proportion of expenditurea in agriculture, outside irriga-tion, uas for the land reform. Part was used to buy land to be resold oncredit to landless cultivators. An equally large share went for short-termcredit to the latter to finance current consumption. As a result, relativel,'.little was spent for those production support proarams aimed at i;creasingthe productivity of the agricultural sector.
23. In the transport sector, which s:hows the highest financial ach:ieve-ment- clelav:> in the prenaration of nrniojc.t.; and inadequatp engineeringpreparaticn have had a serious impact on the physical realizations, parti-cularly in the case of roads where, even though disbursements have exceededthe Plan al:locations, actual construction represented less than 60 percentof the Plan targets. Notwithstanding these shortfalls, transport capaci-ywas on the whole adequate with the exception of feeder roads where the P'Lanfailed to c03ne up wlith the desirable exFan i on.
1. 4.As to i±-1-s-J, there was a subst.tial shotfl in te
program for which only 17 sf the 22 billion rials allocated by the Plan inits latest .1966 revisi on 1/ wiere sp . "re than hlf of the shortfall
is attributable to delays in construction of major public sector enterpr:ises.Oni±y D.,) b1.i:llon riaVls- Uof Utz PhLelUieuU -14 b:iJllon rials invesmn I -4in steel
and petrochemicals was actually invested. The construction of a number ofimportanlt projectjs was largely delayed until the Fo-urth Plan. Finally, or,eshould stress the very low investment, even in financial terms, in educ.a-uionl andLK Ihea' lihl which thi-±e ±11-ird Plan hiiu considee a verIy LU1ptj'J com=
plementary facilities for the longer term development of the economy.
The Financing of Government Expenditure
25. The absolute level of public savings and their role in financingpublic investment (about 6) percent of the actual expenditure in the Planperiod) was not on the whole substantially different from what the ThirdPlan had envisaged. Total public savings during the Third Plan periodwere 111 billion rials, compared with the 98 billion rials projected bythe Plan. However, the Third Flan document had stated that the projectedsavings-investment gap of the public sector could not be covered entirely Thy
1/ The original allocation of the Third Plan was 31 billion rials.
- 10 -
prospective borrowing and that therefore "an increase in taxation and sub-stantial economies in non-development expenditure" would be necessary inorder to finance the projected level of investment.
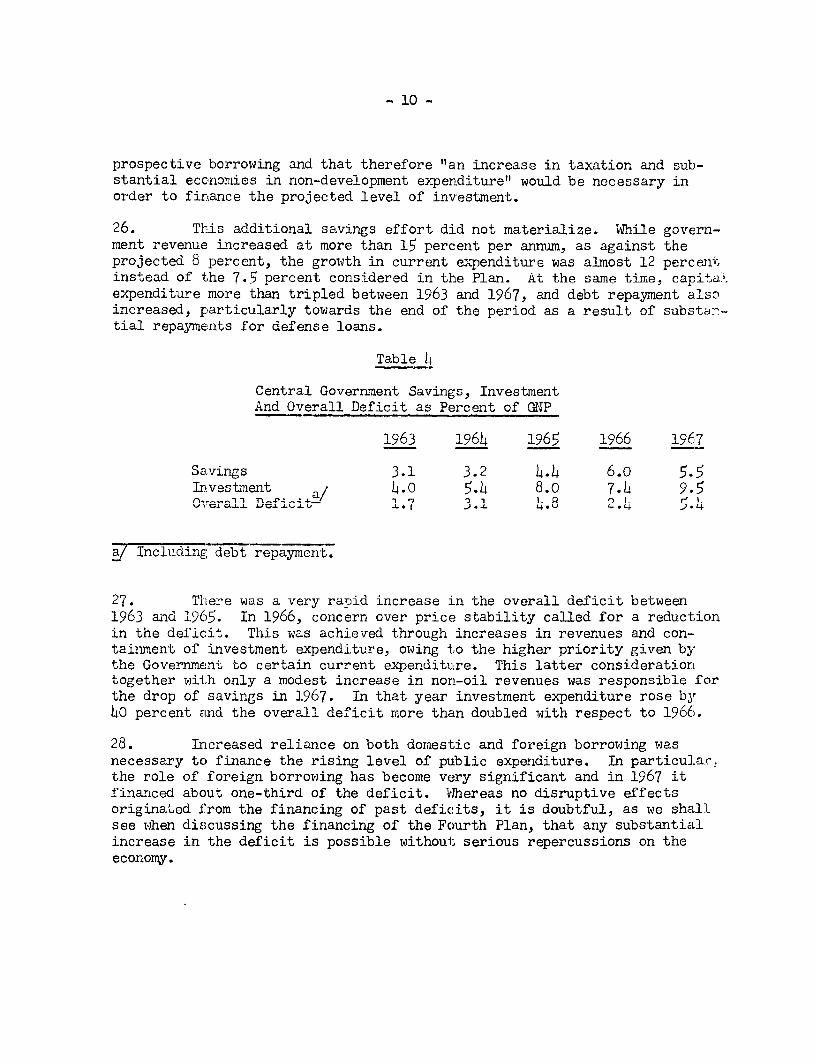
26. This additional savings effort did not materialize. While govern-ment revenue increased at more than 15 percent per annum, as against theprojected 8 percent, the growth in current expenditure was almost 12 percemitinstead of the 7.5 percent considered in the Plan. At the same time, canita2.expenditure more than tripled between 1963 and 1967, and debt repayment alsoincreased, particularlv towards the end of the npriod as a resiult, of snhst,tial repayments for defense loans.
Table L
Central Government Savings, InvestmentAnd Overall Deficit as Percen-+ ofP rMTp
I1963 O). - OA6 if6 -1966 -1 O7
. .4.4 .v - '
Investmaent a/ 4.O 5.4 8.o 7.4 9.5O vrerall DefiL 1J. 3.1 L.8.1 e.4J.
a/ Including debt repayment.
27. There was a very rapid increase in the overall deficit between1963 and 1965. In 1966, concern over price stability called for a reductionin the deficit. This was achieved through increases in revenues and con-taiznent of investment expenditure, owing to the higher priority given bythe Government to certain current expenditure. This latter considerationtogether with only a modest increase in non-oil revenues was responsible forthe drop of savings in 1967. In that year investment expenditure rose by4O percent and the overall deficit more than doubled with respect to 1966.
28. Increased reliance on both dormestic and foreign borrowing wasnecessary to finance the rising level of puLblic expenditure. In particula,cthe role of foreign borrowing has become very significant and in 1967 itfinanced about one-third of the deficit. Whereas no disruptive effectsoriginated from the financing of past deficits, it is doubtful, as we shallsee when discussing the financing of the Fourth Plan, that any substantialincrease in the deficit is possible without serious repercussions on theeconomy.
- 11 -
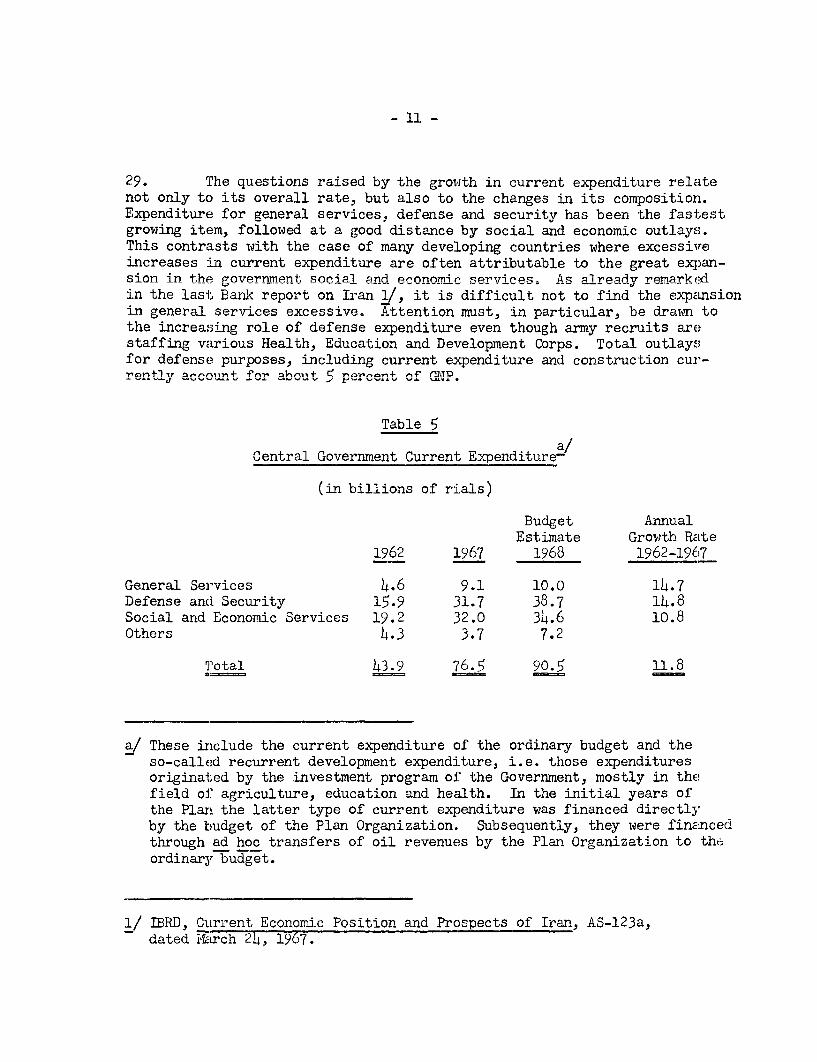
29. The questions raised by the growith in current expenditure relatenot only to its overall rate, but also to the changes in its composition.Expenditure for general services, defense and securitv has been the fastestgrowing item, followed at a good distance by social and economic outlays.This contrasts with the case of many deve:Loning countries where excessiveincreases in current expenditure are often attributable to the great expan-sion in the government. social and economic services. As already rpmrarkodin the laslt Ballk report on Iran 2 , it is difficult not to find the expansionin genernI services excessiue. Att-ePnt.ion rmiq.f- in pn-rticlar, 'h HvrqTJwn to
the increasing role of defense expenditure even though army recruits arestaffing v.arious Health, Education and DevelopmTen.t Corps. rTotalz Tn .l
for defense purposes, including current expenditure and construction cur-rent-rl-ir acorrollrt forw abouoll C r%n-"-nn+ n,f rMTT
Table 5
Central Government Currenl Expenditure-
(in billions of rials)
Budget AnnualEstimate G.rowth Ravte
1962 1967 1968 1962-1967
General Services 4.6 9.1 10.0 14.7Defense and Security 15.9 :31.7 38.7 14.8Social and Economic Services 19.2 32.0 34.6 10.8Others 4.3 3.7 7.2
Total 43.9 -76.5 90.5 11.8
a/ These include the current expenditure of the ordinary budget and theso-called recurrent development expenditure, i.e. those expendituresoriginated by the investment program of the Government, mostly in thefield of agriculture, education and health. In the initial years ofthe Plan the latter type of current expenditure was financed directlyby the budget of the Plan Organization.. Subsequently, they were financedthrough ad hoc transfers of oil revenues by the Plan Organization to theordinary budget.
1/ IBRD, Current Economic Position and Prospects of Iran, AS-123a,dated MIarch 24, 1967.
- 12 -
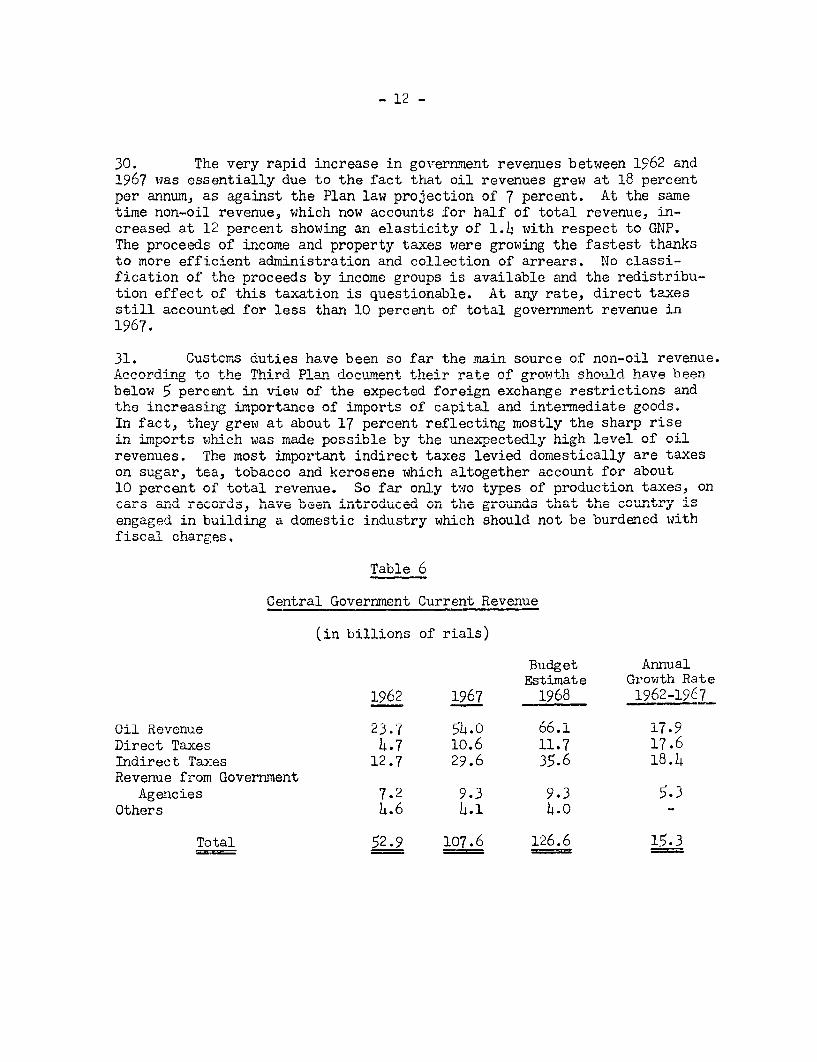
30. The very rapid increase in government revenues between 1962 and1967 was essentially due to the fact that oil revenues grew at 18 percentper annum, as against the Plan law projection of 7 percent. At the sametime non-oil. revenue, which now accounts for half of total revenue, in-creased at 1.2 percent showing an elasticity of 1., with respect to GNP.The proceeds of income and property taxes were growing the fastest thanksto more efficient administration and collection of arrears. No classi-fication of the proceeds by income groups is available and the redistribu-tion effect of this taxation is questionable. At any rate, direct taxesstill accounted for less than 10 nercent of total government revenue in1967.
31. Custcms duties have been so far the main source of non-oil revenue.Acording tn the Thir(d Plan diocimpn+. t.heir rnate of grnwl^t.h should haver bhenbelow 5 percent in view of the expected foreign exchange restrictions andthe increasinr importance of imports of capital and intermediate gri oodIn fact, they grew at about 17 percent reflecting mostly the sharp risen imports whjch was madse possible by the unexpec+vedly high leelofolrevenues. I'he most important indirect taxes levied domestically are taxeson sugar,, tea, tobacco and kerosene whi chll altogethV6SAer account for aboUt
10 percent of total revenue. So far only two types of production taxes, oncars ar 4 ±V J-±1~±UUUVIbII LI .LOU, 4-k- iQLtS~casa. rec;ords, h'ave lbeen i^ntroduced 0on the grV,1 d V thatC V the co+r is~ -- A-J-
engaged in building a domestic industry which should not be burdened withfiscal charges.
Table 6
Central Government Current Revenue
(in billions of rials)
Budget AnnualEstimate Growth Rate
1962 1967 1968 1962-19(7
Oil Revenue 23.7 S,4.0 66.1 17.9Direct Taxes 4.7 10.6 11.7 17.6Indirect Taxes 12.7 29.6 35.6 18.4Revenue from Goverrnent
Agencies 7.2 9.3 9.3 5.3Others 4.6 4.1 4.o
Total 52.9 107.6 126.6 15.3
- 13 -
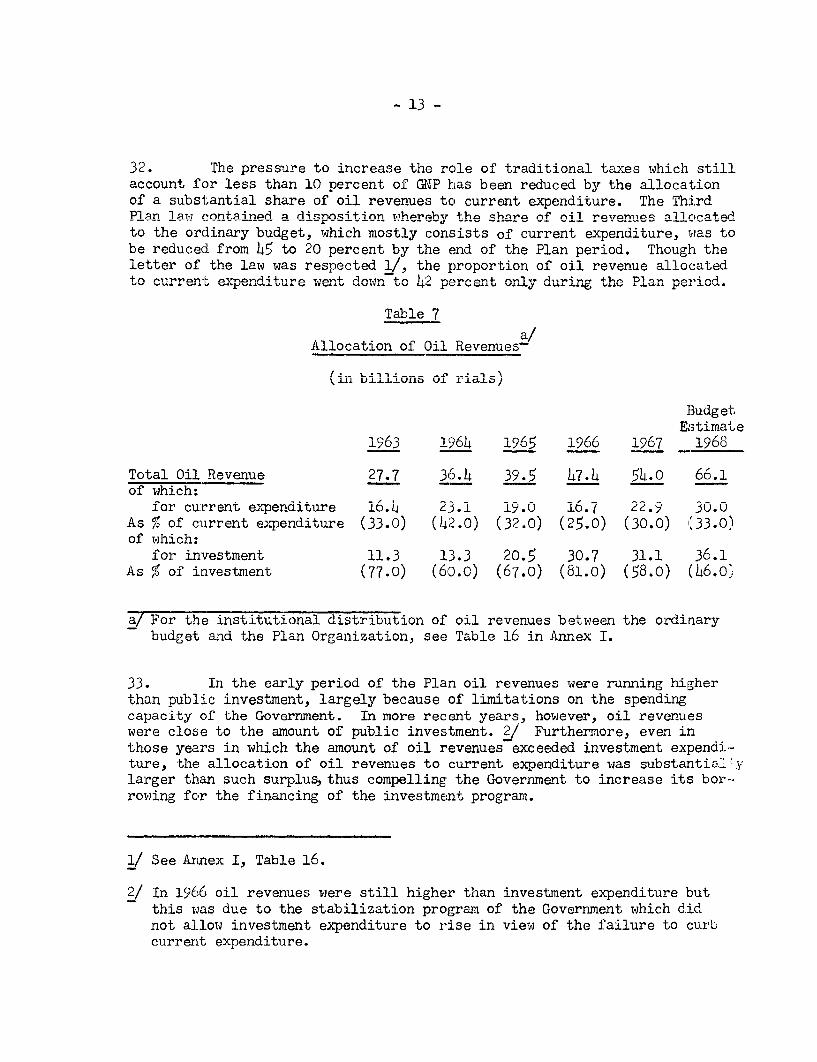
32. The pressure to increase the role of traditional taxes which stillaccount for less than 10 nercent of CXP has behpn reduiced bh thei nllocationof a substantial share of oil revenues to current expenditure. The ThirdPI an I ati r-ontai npe a di snos-i ton T,7h1e-reT + sh a e-i of o-i IvrevnTe I 1l or'+c2ted
to the ordinary budget, which mostly consists of current expenditure, was tobh redurcednrl from )!6 to 20O preoyn+ Vir +1k cnn r%f- +hn Plan nr * 'lnholl' +hn
letter of the law was respected 1/, the proportion of oil revenue allocatedto curren-t A^Tr.ditur wwnt dowr. toii IJJ pecn only duri the Ta prio
Tabl1e '7
a/All"ocati- on of Oil Reenes
~~~~~~~~~~~~~~~~~~~~~~~~~~~~~~~~ .~±-L .L~ lRvnus
(,±I1 biLLions of rials
Budget
Es,timate196`3 1964 196 19660 19`7 1968
Total Oil Revenue 27.7 36.4 39.5 47.4 54.u 66.1of which:
for current expenditure 16.4 23.1 19.0 16.7 22.9 30.0As % of current expenditure (33.0) (42.0) (32.0) (25.0) (30.0) (33.0)of which:
for investment 11.3 13.3 20.5 30.7 31.1 36.1As % of investment (77.0) (60.0) (67.0) (61.0) (58.0) (46.o;
a/ For the institutional distribution of oil revenues between the ordinarybudget and the Plan Organization, see Table 16 in Annex I.
33. In the early period of the Plan oil revenues were running higherthan public investment, largely because of limitations on the spendingcapacity of the Government. In more recent years, however, oil revenueswere close to the amount of public investment. P/ Furthermore, even inthose years in which the amount of oil revenues exceeded investment expendi-ture, the allocation of oil revenues to current expenditure was substantia_ ylarger than such surplus,thus compelling the Government to increase its bor--rowing for the financing of the investment program.
1/ See Annex I, Table 16.
2/ In 1966 oil revenues were still higher than investment expenditure butthis was due to the stabilization program of the Government which didnot allow investment expenditure to rise in view of the failure to curbcurre,nt exnenditure.
- 14 -
J* v4.LJ.L t LS eU.'~ ri. ..
1'2 E:).A-, 4 ,-rsI ,,nrs; c,e ar or, n, on 4 nn .4- 0n V,l a1 Qr YmOfi lJtYr IrS aQn+ nr
24* ~~* Uv j J ,.LU FULjO jJJ J.Jh CAL L±uw. LJC.4JA .1.; SJLC V .. iILL fi s L CCAJL'CA'v,,,,U.J&
including power, railways, banking, petroleum and steel. Most of theirprol. U.- ,'J± .L -.L1 L -.L11 .LLL eVJ gUV moLilie L(te U\ , U sugar. , tobacco), /
and the National Iranian Oil Company, were transferred to the centralgovernmTent . AtU 'Uhe 0-W-me tiMIe 4,he LZoVt:rrHmenL r,1 ad II subsania -ca.pitlv-
contributions to enterprises in the power, steel, gas and petrochemicalsectors. ia 'J.68, more thxi.1 _50 percuptu ou goverriuriu uncap.LUtl± tp i±&tU ui
was to be transferred to these enterprises for the expansion or starting(as in the case of the steel mill) of tneir investment programs.
35. The main problems with tne public enterprises whicn operate inthe modern sectors (such as petrochemical, mechanical industry, etc.) iE:one of adecLuate managerial and organizational setup. For a number ofenterprises engaged in the production of final consumers goods, which haveoften been taken over by the Government as a result of salvage operatiorns,it is a question of struggling against obsolete machinery, weak marketposition, etc. However, since no accounts are available it is impossibleto appraise the actual financial performance of the enterprises. Nor isit possible to appraise the relationship between the operations of thepublic enterprises and those of the central government. 1/ Budget estimnatesare available since 1965 and they are presented together with the centralgovernment budget. More detailed discuss:ion, based on the budget estimatesis given ina Annex II.
C. The Monetary Stability
Price Stability
36. Price stability has been one of the most important targets ofthe Iraniajn Government because of its impact on the balance of paymentsand the real income of a large portion of the population. Furthermore,price increases call for adjustments in unit wages which would have beendifficult for the productive system to absorb in view of the relative inef-ficiency of a number of industries. In fact, prices remained relativelystable, with the wholesale and cost of living indexes increasing respec-tivelv by 6 and 8 percent between 1962 and 1967. The stability has beenparticularly remarkable over the last three years of the period in whichthe wholesale price index was virtuallv unchanged and the cost of livingindex increased by only 2 percent.
1/ Actual data on the Special Accounts of the Treasury are also unavailable.These fiundc arp fi;nnrori hv wqrmarked revenles-. esneniallv the proceeds
of various fines and penalties, shares of municipalities revenues andseveral contributions by indivriduals and enterprises 0nly some ofthese funds have recently been integrated into the ordinary budget.
- 15 -
37. A first explanation of the behavior in prices is of a statisticalnature, namely that the two indexes are by now ten years old and do notadequately reflect the intervening changes in GDP and the consumer basket.There was also a series of very good crops starting in 1965, following aperiod of adverse weather conditions which culminated in 1964 with foodLprices increasing by more than 7 percent over 1963. In addition, oneshould mention the existence of unutilized productive capacity in thecountry in the early period of the Plan. Finally pressures of domestic:demand were met by substantial increases in imports financed in part bydrawing down exchange reserves.
Credit Po:Licies
38. Institutional credit plays a relatively limited role in satisfyingthe requirements of the economy, because of the traditional reliance on thenon-organized money market. Its role, however, has been rapidly increasingover the Last five years. Bank domestic credit exnanded at an average rateof 19 percent. The expansion in domestic credit has been made pessible innart by a very sharp innGreae in tim-e denoits 1/ whic-h rose from 7 to 11percent of GNP between 1962 and 1967. Since 19A declines in net foreignassets accompanied credit expansion. Money supply remained fai_rly stabat about 13 percent of GNP throughout the Plan period.
39. Credit to the private sector increased by 18 percent, with a mod-er-ate slo0wdown in .19/65 and 1067, when 4the publi sector relieheailyr on
the banking system. Net drawing on the banking system by the central goverw.-mment increased at ar average rate of 30 percet between 1962 and 1967, butduring this period government agencies showed a continuous accumulation of
thei ne deposits. / Tf,ereas 'ur-ig the mh-rdPlnteroeayauh-Ul,ieLr ne~t UtJ" ' ±L * .U t/ V dL UU Ii4i, t1AI ±ILILLLL £±.± L*.LIIWM 1J1i11W1L. LUIL
ities have been able to assure a constant credit expansien to the privatesector, while at LWe same time satisfying the credlt requiren1ients of tpublic sector, there are now indications that any substantial increase inthe public sector cla-im may lead 'o a squeeze on the private sector ifprice stability is to be maintained and adequate foreign exchange reservesare tf be ass-ured.
4o. Expansion of credit during the Third Plan was not accompanied uythe development of institutions to channel private savings. The absence o`a capital market may retard the expansion of the private sector or at leastthe satisfactory allocation of private financial resources. Private enter-prises have, up to now, mainly relied on money lenders establisned in the
1/ Excluding importers' deposits initiated in 1964.
2/ The deposit of an oil bonus amounting to 13.9 billion rials on accountof government agencies explains the absolute decline in net credit. tothe public sector for 1964.
- 16 -
Bazaar, where interest rates are very high, often above 20 percent. Largeccmpanies are still largely run on a family basis, and the public is re:Luc-tant to bu;y more companiesl capital shares. A stock exchange was recentlyestablished but only few stocks are being traded by the Industrial andMining Develonment Bank of Iran. The proposed reform of the Trade Code.which requires compliance with standard accounting rules, would certaiiLyincrAase thA confidenrce of the nulbli. in investinD their savings throug]lthe organized capital market. At present, increasing speculation in landancd urhba on1-n.-,tritinn is Muvertingf a btantial Amqmaiint. 'f nrivate savingsfrom more productive uses.
Balance of Payments
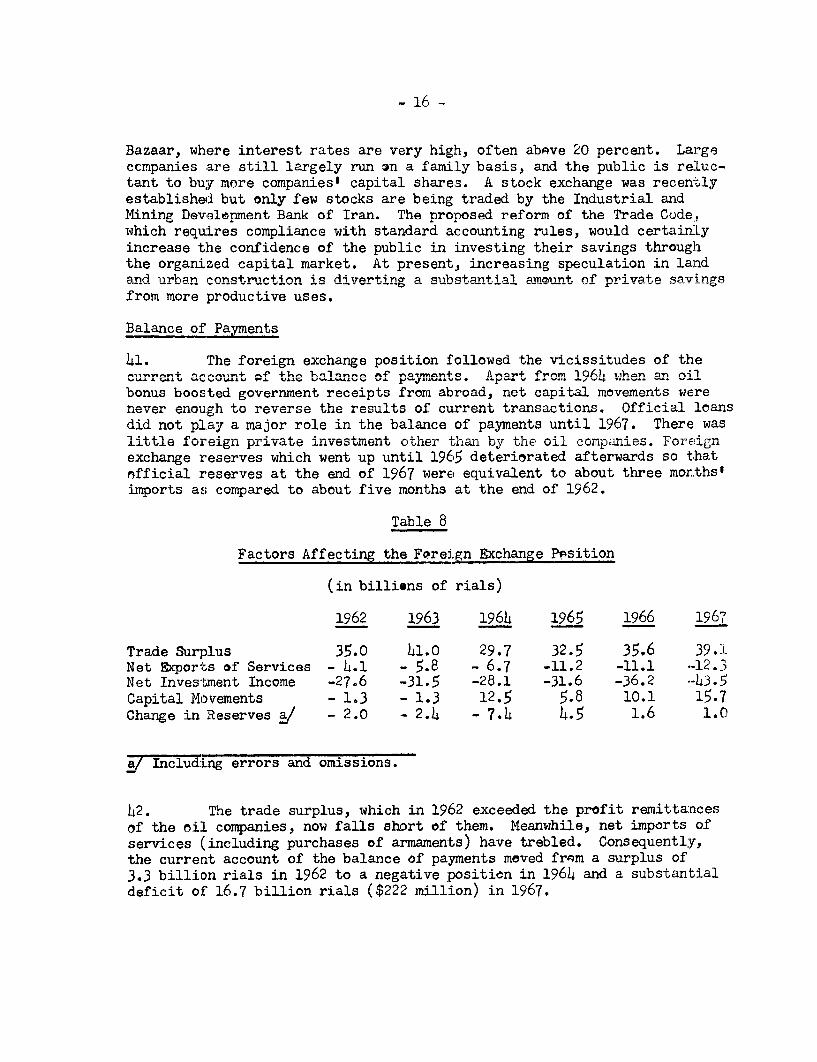
41. The foreign exchange position followed the vicissitudes of thecurent a^ccount-+ t+he +^.9- OC n Arnv.+ f-,^r%M l96). i.I1Hn nn rvil
Q~~~~U._A 9SU _ El~ QU VfI sW L JICOV - "k ' - ' _/a - _J --- -- --
bonus boosted government receipts from abroad, net capital movements werenever enough t4o reverse 4th.A e results W oVf currer.t trar.sactior,so. Official .o'JqnQdid not play a major role in the balance of payments until 1967. There waslittle foVeign private investmVent other tan by- t;he oil compniesY For-eignexchange reserves which went up until 1965 deteriorated afterwards so thatnfficial reserves at thne end of 1y67 Weru equvailent to aoutu tUh-ee montJ.himports as compared to about five months at the end of 1962.
Table 8
Factors Affecting the Foreign Exchange Position
(in billions of rials)
1962 1963 1964 1965 1966 1967
Trade Surplus 35.0 41.0 29.7 32.5 35,6 39.1Net EXports of Services - 4.1 - 5.8 - 6.7 -11.2 -11.1 .-12.3Net Investment Income -27.6 -31.5 -28.1 -31.6 -36.2 -43.5Capital Movements - 1.3 - 1.3 12.5 5.8 10.1 15.7Change in Reserves a/ - 2.0 - 2.4 - 7.4 4.5 1.6 1.0
a/ Including errors and omissions.
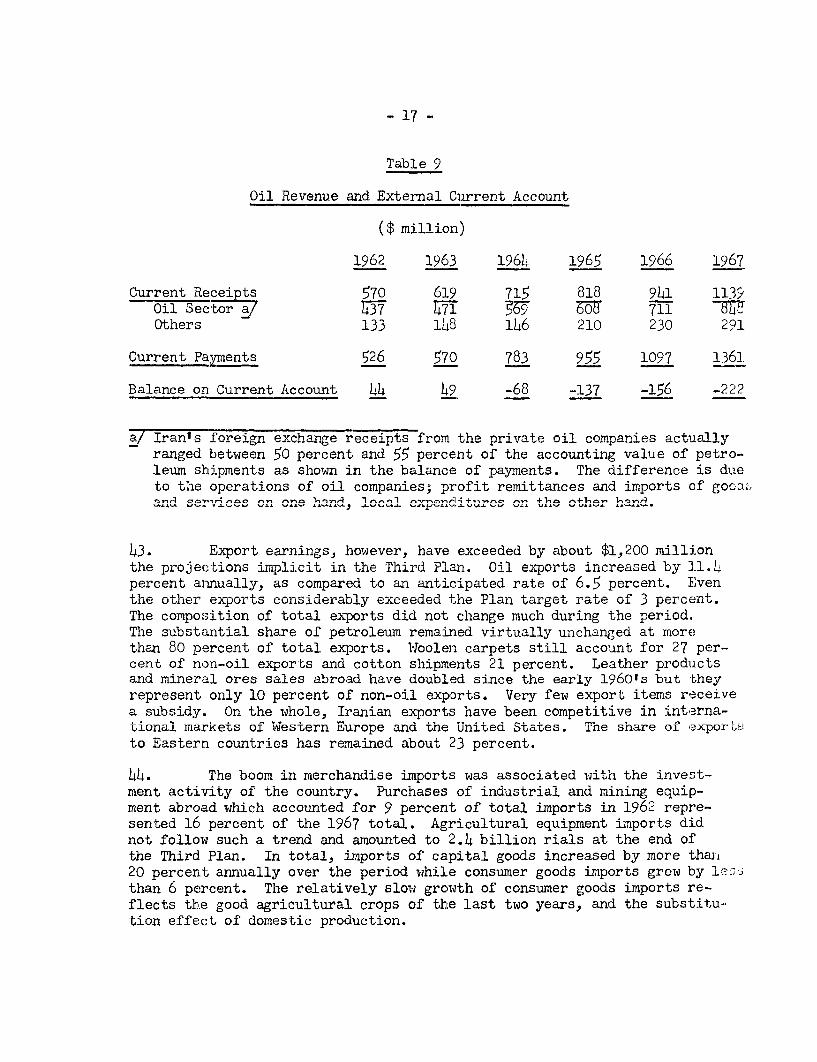
42. The trade surplus, which in 1962 exceeded the profit remittancesof the oil companies, now falls short of them. Meanwhile, net imports ofservices (including purchases of armaments) have trebled. Consequently,the current account of the balance of payments moved frqm a surplus of3.3 billion rials in 1962 to a negative position in 1964 and a substantialdeficit of 16.7 billion rials ($222 million) in 1967.
- 17 -
Table 9
Oil Revenue and External Current Account
($ million)
1962 1963 1964 1965 1966 1967
Current Receipts 570 619 715 818 941 1139Oil Sector a/ T3 T7i -57 705 711Others 133 148 1h6 210 230 291
Current Payments 526 570 783 955 1097 1363.
Balance on Current Account 44 49 -68 -137 -156 _222
a/ Iran ts -ore ^.exchange receipts~ f'rom t.he flri rat!eC oi Al1?V compa11i 1cun
Z-
ranged between 50 percent and 55 percent of the accounting value of petro-leimn ship.m.ents as shown in the bnanncec of paments. The difference is dueto the operations of oil companies; profit remittances and imports cf gocc-;and services on one hand, local expenditures on the other hnd.
43. Export earnings, however, have exceeded by about $1,200 million.the pj.e ;tkU LoUns JIjJ±±U±L, ±1 U-mp licite TLLhru PCLU . V0.L VdJtsIUO JJIUncLrae LJy 1.-L.
percent annually, as compared to an anticipated rate of 6.5 percent. Eventhe ot>her exports considerably- exceeded the Plan target rate of 3 perce.nt.The composition of total exports did not change much during the period..The substLi-ntial share of petroleutr remained virtuaily unchanged at morethan 80 plercent of total exports. Woolen carpets still account for 27 per-cent of non-oil exports and cotton shipments 21 percent. Leather productsand mineril ores sales abroad have doubled sirnce the early 1960's but theyrepresent only i0 percent of non-oil exports. Very few export items receivea subsidy. On the whole, Iranian exports have been competitive in interna-tional markets of western Europe and the United States. The share of expor'E;to Eastern countries has remained about 23 percent.
44. The boom in merchandise imports was associated with the invest-ment activity of the country. Purchases of industrial and mining equip-ment abroad which accounted for 9 percent of total imports in 1962 repre-sented 16 percent of the 1967 total. Agricultural equipment imports didnot follow such a trend and amounted to 2.4 billion rials at the end ofthe Third Plan. In total, imports of capital goods increased by more than20 percent annually over the period while consumer goods imports grew by lecsthan 6 percent. The relatively slow growth of consumer goods imports re-flects the good agricultural crops of the last two years, and the substitu-tion effect of domestic production.
- 18 -
rWAPTP.R TTIT
THE FOURTH PLAN TARGETS
A. Overall V .L W
415. Planning in Iran has been handicapped by the scarcity of reliableS+tst-cs.Basic data on agr4cultual andir.dustri 41 ---oduction -r 1-ct-
ing. Most government institutions make up their own statistics; several]st's ofL na1~l;onalJ -accounts are 4husl issuue ever.Ly yecz:-. vit:;-,e dr-ctu-ngr ithe
Fourth Plan, the Plan Organization borrowed parts of the accounts preparedUy 14th CsenLtra.L Barus. culdI t uJiYiLutry of rconuirQvl separauely. SinLce uLei
these accounts have been revised and the statistical foundation of thePlan is ISi longer auequate. 1ne Baink iqzidsion has modlfied tne oJJXLic.LaJ
series prepared by the Central Bank with the main purpose of eliminating.statisticaL discrepancies. Strong reservaitions can still be expressedabout the accuracy of production and investment figures as finally shown.
46. Probably because of the difficulty in appraising the presentstate of the economy quantitatively and thus in spelling out the natureof future government activities in physical and economic terms, theFourth Plan appears on several occasions as a collection of financialallocationS. These allocations are mainly budgetary appropriations ofthe Plan Organization to the various miniStries. Scanty information isavailable as regards the public sector as a whole, including other govern-ment institutions and public enterprises. Private investment, finance orproduction often are residuals, once overall targets were set.
47. The precision of the quantitative targets of the Plan or therevisions miade here could thus be misleading. To a certain degree also,the uncertainty about future oil revenue can inhibit planning efforts.This uncertainty should not be exaggeratecd, nonetheless, when appraisingthe economic prospects of Iran. With a total investment target of $10.6billion the Iranian authorities estimate that the need for gross borrowingwill be $2.2 billion. They assume that oil revenue will be $6.5 billion,an amount which implies an 18.4 percent rate of increase between 1967 and1972. The Mission projects oil revenues at a more conservative rate of11.5 percent, or a shortfall of about one billion dollars from the Plantargets; at the same time, projected expernditure for investment is alsoapproximately one billion dollars lower than the Plan projection. Never-theless, the external gap is one billio:n dollars higher. the implicatiorbeing that internal savings are likely to fall far short of the Plan'sexpectation.
- 19 -
48. The general objectives of the Fourth Plan are commendable: anacceleration of economic growth, a more equitable distribution of income,a reduction in the dependence upon imports and a diversification of exports.A fifth objective, the improvement of administrative services is to beattained by the introduction of basic reforms, the extension of modernmanagement techniques and the strengthening of the defense power of thecountry. No more explanation is given in the Plan about the steps to betaken in those matters.
49. Growth was the major achievement of the economy in recent years.It was the primary goal of the Third Plan together with monetary stability.The Fourth Plan projects that GNP will grow at an annual rate of 9.4 per-cent in the 1968-1972 period. This is to be attained thanks to largeinvestments in industry and agriculture and also increases in productivity.Such a target appears to the M4ission to be somewhat too ambitious. Thougha relatively high rate of growth is likely to be achieved, the Mission'sprojections lead to more moderate estimates.
50. A better income distribution is the second objective of the FourthPlan as it wJas that of the Third Plan The pnrovision of more empnloment isclaimed to be the major source of improvement. About one million new jobsare to he created duzring the 1968-1972 neriod._ This seems a dlfficuilt tar-get to reach, the more since it implies that 200,000 new jobs will be avail-able in the agricultural sector. Even if' this target s reached, +heapparent unemployment will still be close to 10 percent of the activepopulation in 1972. NoT traxnsfer of income through labor intensive publicworks in rural areas or more progressive taxation is envisaged. On thecrontvrarr th-n Plan .++Q +. st-te; Soil andA wwelfW^oQ SeQ-Vri;,8QS T141 1 h.e-mVilyt'. l U..-. J * UCS . L Ut U .V 0V V-V . .1 OW± V . t WV V. ' V
rely on the self-help principle and that one-third of rural developmentproWvects *wLJ L bJf-Jey CAL sIaving. T oLILV,Jeive Vo c i.L
the discrepancy between rural and urban incomes and of improving the lot ofth±AVe poorest cLasses in uilhe cities is a difclt onUU LIJIiZ, dl[U Wit V VLLI Fourth FLai
does not seem to contain precise indicatiors on how it is to be attained.
51. On the other hand, government protection of domestic productionCL,C~LIIQ L ~.U wptiiy . U.L V%- _LLUpjJ7L. uo 1CL Ut::tII1 t±~u _L tL ±.ve d.lIu ullfz U1IL.LIU UVJ'~Lu ±Vt5 %I.L
the Fourth Plan is likely to be reached in several sectors. The Plan aimsat reducing the dependerlce on bailc cunsur1er goods impOrtS first, and thenon raw materials, capital goods and services. The Plan does not make clear,ho-we-ver, to wnat exXent this would be attained tnrough tne continuation ofimport protections and government assistance or an improvement in producti;.'L_and competitiveness. The economic and financial implications oI such p'±i .
differ considerably.
52. Finally, the diversification of export products is to be achievedthrough a gradual reduction of dependence on export of oil and agricultaralraw materials. This will mainly result from the implementation of Third P1uprojects in gas, aluminum, and petrochemicals. Some delays are likely tooccur in these undertakings, but the objective will ultimately be reachled.
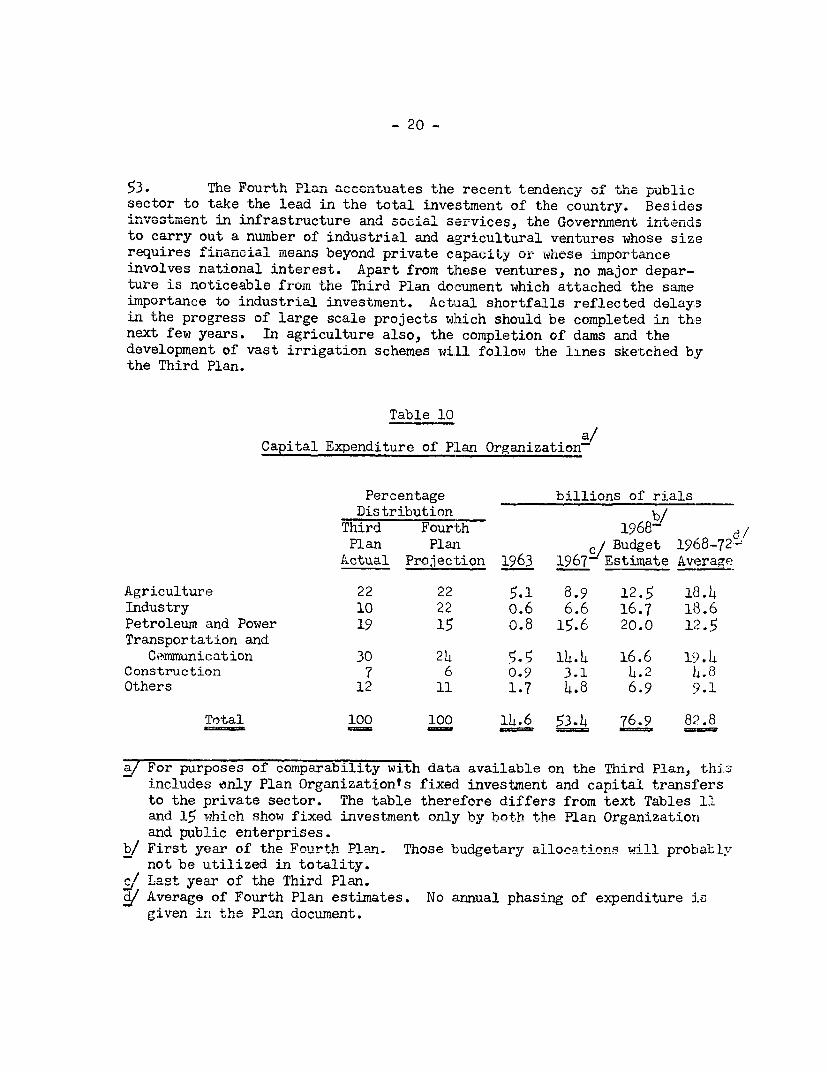
t3. .'Te F-'ourt-h P1Ia accent-at es t[he recent tediency of Il-e public.11 LIJ' .SL. IL. L. L4 u LL 1 1~ III A~ u u ULL J U11 V JUU±L
sector to take the lead in the total investment of the country. Besidesinvestment -.l. LL u L; U UU r Wd socu La.L.J s er-rices, uthe GoUvernim inu tendus
to carry out a number of industrial and agricultural ventures whose sizerequires financial meaLs beyond pri-vate capacity or whose imnportanceinvolves national interest. Apart from these ventures, no major depar-uure is noticeable from the Tnird Plan document which attached the sameimportance to industrial investment. Actulal shortfalls reflected delayisin the progress of large scale projects which should be completed in thenext few years. In agriculture also, the completion of dams and thedevelopment of vast irrigation schemes will follow the lines sketched bythe Third Plan.
Table 10a/
Capital Expenditure of Plan Organization-
Percentage billions of rialsDistribution bJ
Third Four th 1968 ,Plan Plan c/ Budget 1968-72-
Actual Projection 1963 1967- Estimate Average
Agriculture 22 22 5.1 8.9 12.5 18.14Industry 10 22 o.6 6.6 16.7 18.6Petroleum and Power 19 15 0.8 15.6 20.0 12;5Transportation and
COerunication 30 24 5.5 11L.4 16.6 19.14Construction 7 6 0.9 3.1 4.2 l1.8Others 12 11 1.7 L4.8 6.9 9}.1
'Total 100 100 114.6 53.1 76.9 82.8
a/ For purposes of comparability with data available on the Third Plan, thioincludes onlv Plan Organization'ts fixecd investment and canital transfersto the private sector. The table therefore differs from text Tables 11and 15 Thich show fixed invest+ment on]iy bv both the Plan Organizatiorand public enterprises.
b/ First yea_r of the Fourth Plan= Those budgetary allocations will nronhahlv
not be utilized in totality.e- Last year of the Third Plan.t/ Average of Fourth Plan estimates. No annual phasing of expenditure is
given -r t-e Plan doImen1.
- 21 -
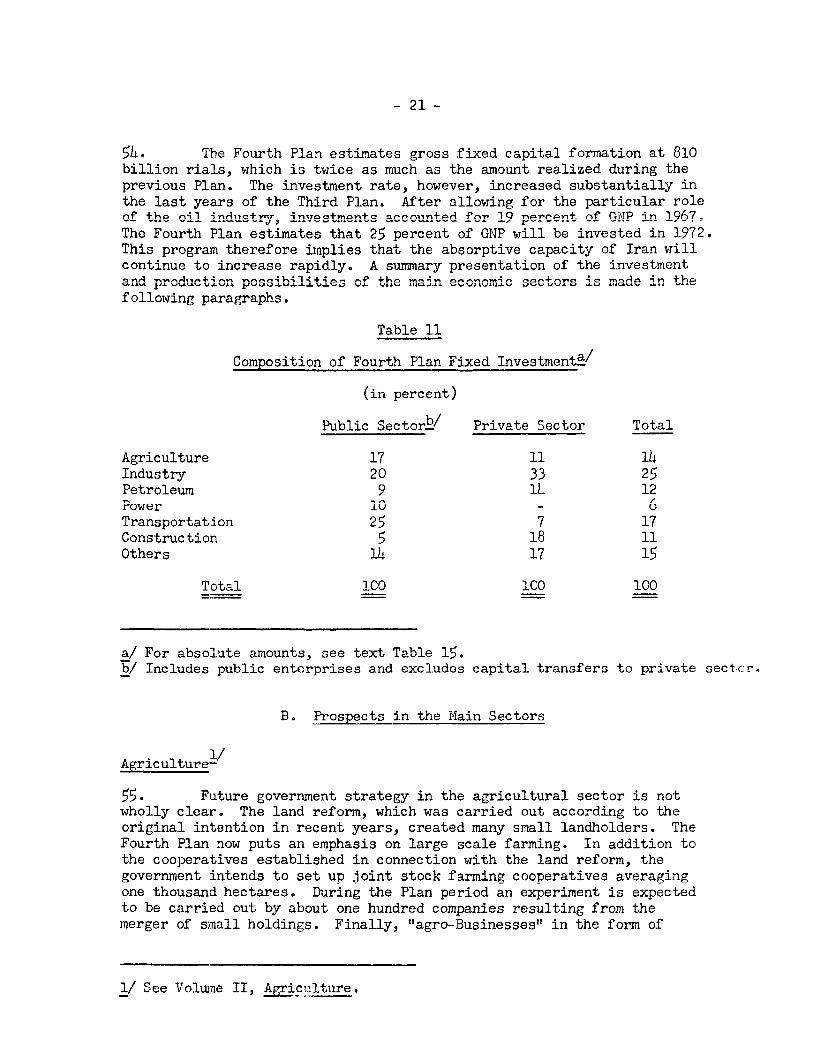
C;)[ Thin. Fouirth Plan a arnq59 fine capif-al forTnation at. Sinbillion rials, which is twice as much as the amount realized during theprepvinous Plann. The in-%s+.mont rte howeveor, lnc-reasedo siiqt.ntinllv in
the last years of the Third Plan. After allowing for the particular roleof the oil inrdustry irn.vestm.ents accounted for 19 percent of GNP in 196 7.The Fourth Plan estimates that 25 percent of GNP will be invested in 1972.This program therefore mplies tha+ the absorptive capacity of Iran willcontinue to increase rapidly. A summary presentation of the investmentand productior. possibilrities o-.f4- -4e m .an,econor m iade n the
following paragraphs.
Table 11
Composition of Fourth Plan Fixed Investmenta/
(in percent)
Public SectorY' Private Sector Total
Agriculture 17 11 14Inuustry 2u 33Petroleum 9 1 12Power 0 - 6Transportation 25 7 17Construction 5 11Others 14 17 15
Total 100 1CO 100
a/ For absolute amounts, see text Table 15.b/ Includes public enterprises and excludes capital transfers to private sect.cr.
B. Prospects in the Main Sectors
Agriculturet/
55. Future government strategy in the agricultural sector is notwholly clear. The land reform, which was carried out according to theoriginal intention in recent years, created many small landholders. TheFourth Plan now puts an emphasis on large scale farming. In addition tothe cooperatives established in connection with the land reform, thegovernment intends to set up joint stock farming cooperatives averagingone thousand hectares. During the Plan period an experiment is expectedto be carried out by about one hundred companies resulting from themerger of small holdings. Finally, "agro-Businesses" in the form of
1/ See Volume II, Agric.lture.
- 22 -
.. LV" L M V14UL_1LV0 W.L.LIU VVOLULI J± LA.U_LL;U±± p ±.U;JA.P1.±VL1 art: 'Uj4UPP t(U .UV
play a major role in developing and farming newly irrigated areas. On theoUtIher had[lU, tlhle goversnm-rtent seemDs tuo concEantratu,e more un liiuteu prujuctsjthan on the development of the rural sector as a whole. There are re-gional pro,jecVs such as Ghazvin, many of whicn were begun in prior years.There are also crop production processes in which package of seed,machinery and suDsidized fertilizer and credit are supplied to farmers.Two programs for rice and oil seeds production were thus recently ini-tiated in specific areas; they have some promise of success. Otnerprograms for wheat, cotton, sugar beets and fodder have yet to be putinto operation.
56. The diversity of goals and means will not be harmful to futureagricultural growth if the Government is able to support all these pro-grams satisfactorily and set priorities among them. Too many publicinstitutions, including several ministries, deal with agricultural mat-ters, each one pursuing different policies with insufficient coordination.Very limited extension services are provided to the farmers despite theassistance of the Army Development Corps. Research is generally notadequately oriented and carried out. Institutional credit extended tofarmers has mainly been absorbed by land purchase to carry out the landreform and for non-productive purposes. Some improvement in marketingand price policies, which do not at present offer adequate incentive tofarmers, can be expected in the near future if the changes now under con-sideration are given sufficient support by the Government.
57. On balance, most Fourth Plan targets appear to be overstated inview of the limitations in government capacity and other institutional con-straints. Probable physical achievements in investment for irrigation willbe considerablv less than the Plan nrolections. but canital expenditureshould be close to the Plan estimates owing to cost revisions. The mainshortfalls in the PxYnPnr1i tre out, of the planned illonations should oseurin the agricultural sector proper, especially for livestock and the pro-tection of natural resources. Total develonment exnenditures in the nextfive years can be expected to amount to about 100 billion rials, or roughlyone-fifth below the Fourth Plan taret. I/
58_ It is also uinlikely that agricul+ural output in Iran will increasr (as rapidly as the Fourth Plan anticipates. Still the existence of a dyna-mism .and a willingnecss +to dotn+ imn.prc.A t methods of nrodnut-ion nmornn mn-nv
Iranian farmers suggests that there is scope for reasonable growth duringthe next fivhe . T use of feill playr an Jport.nt. ro1lin this respect. The Fertilizer Distribution Company, which was recentlyestablished by the flfl-r-.-.----rt, will therefore be hard=pressed by the pr-iatdemand which is expected to almost double in the Plan period. The avail--141:1 -4: -4U- 4 -. r _:_ |a:mA A i A -4-C A _: -4 - -1- l M so1 me.l;-r CIsl | L-L,y U. VUL=1 L.1.UIJQ--.111P VVV" DUCUO, .[JOt,. LUU Wuo sU at- C&6 A.UL oL U LCA-L szo
ery--will probably not be a major impediment. In addition to these act:ions
1/ See Volume II, Table 17, page 4h.
- 23 -
on yi1eJ.l ±--.iproumenV%fWt;11, the e&pcI.a1n.LUIi of thLe iXrrgat.eu area sLnUUU drLirg aLbout
increases iLn the output of fodder and most cash crops, particularly oil seedsand sugar beets. There is much room ior, but little likelihood of, a majorexpansion in livestock feeding based upon fodder crop production, agricul-tural by-products or feed concentrates. The Plan targets for the productionof meat and milk will probably not be reached. For the agricultural sectoras a whole, annual output growth should not exceed 3.5 percent annually inthe next five years. On the basis of detailed projections, the Bank antici-pates that the value added by agriculture will increase by about 2.6 percentper year in the 1967-1972 period, as compared to the very ambitious Plantarget of i.h percent.
58 a. C'ontinued agricultural growth depends to a great extent on changesto raise the efficiency of the institutional framework and to improve exist-ing methods of cultivation, including the use of water. The coordination ofgovernment policies as regards research, extension and credit will be essen-tial. There will also have to be a marked improvement in the overall emnploy-ment climate, policies which affect careers in agriculture and the capacityof institutions to provide agricultural edlucation and training. In non-irrigated areas, extensive investigation should be followed by active pro-grams to obtain changes in the current system of fallowing, better integrateddry farming with fodder cultivation, improved techniques of soil managementand crops and varieties most suitable for dry land farming. Future livestockdevelopment will depend largely upon the establishment of fattening opera-tions, better integration of animal husbandry with crop farming, rehabilita-tion of pastures, control of animal disease. and improvement of local breeds.With respect to irrigation, ground water development deserves highest priorityin the immediate future. In the lonaer run. there is pressing need for acountrywid.e study of both surface and ground water resources and the formu-lation nf nuhlic. policy to encourage their economi eplroitat.inn
Trnnian ind istrv still C-nnqipqst mainly of t.he. qmr .qr-Sn1le nrndutwGtionof consume!r goods for the domestic market. Steps were taken, however, duringthe Third Plan, towr-ds the constitution of a new pattern of prod1u+cirtiLarge-scale investments have begun in capital goods industries, especially
in the nest few years, mainly in petrochemicals. Investment and productictiduring the Fourth Pan. period will be do,dinated by these c0..meLnts Theywill also depend upon future policies with respect to the protection of'
A,.dst +r ' Q1 enterpr-1 0iC-,s.
60.~ LI Tel_U,ita-1on of corr.pet"ton wras one of th Ja n nt-, sO'JV ± L~ !LfLL id U.LO. p.A UL LI±ULI W je V L uj. ldl JJ 44Z LJJ ULI1J0 L.'UJt:U V-.L
the industrialization policies. The Government tried to assure what it cal±sa 1reasioic-bie uegree uO cuir0petitlu±l. prLpurk cunrlrui. anu a 1Lc(UL-J..Ug zi itUv
of new investments were the means to achieve this policy. Quantitative meas-
1/ See Volume II, Table 16, page 43.
- 24 -
ures prhbttemoto .>bro pcfcgos*hose dretcsplis considered sufficient to meet local demand. This supplements the importtaY:xation w.hich is! areoady substontial. Beccsidescustomc!rsdutie, mnost imponrtsare subject to ad valorem commercial taxes whose rates usually range fron25 to 80 percen.+ A system of registration fees and advance deposits alsoincreases the cost of imports. Domestic competition is also controlled bythe requirement of an authorization for investm4ent. -
has been effectively enforced in the most modern branches of manufacturing.Protection ofL industries andu of uncom,petiu.iv producto, a-ULCt. homeA- -Ls tusIAassured.
61. It is difficult to assess the effect on the efficiency of Iran'sindustry and the cost of ind-ustrialization for domestiLc consumers. Compe-tition varies from industry to industry. On the whole, ex-factory pricessubstantially exceed the CostS of competing foreign goods as a result ofhigh profit margins but above all of high production costs. Availableequipment is used with lowi intensity since idie time is nign owing to in-adequate lay-outs and production schedules. Poor quality control resultsin a high percentage of rejects and in disruption of the productive processes.The size of the domestic marlcet limits production, like car manufacturing, toan uneconomically small scale. Iranian producers prefer to purchase inter-mediate goods from foreign sources or to manufacture their own because ofpoor quality and the uncertain delivery schedule of domestic goods. As aconsequence, there is a high degree of vertical integration and needlessduplication and underutilization of specialized facilities.
62. Nlining is still in its infancy, with small mines scattered tnrough-out the country. Extraction of the Bafk iron ore, at an initial rate of oriemillion tons per year, and of the Kerman coal deposits will begin during theFourth Plan to provide raw materials and fuel for the Esfahan steel mill.Negotiations for the exploitation of what may be considerable copper depositsare in progress, but actual production is unlikely to start before 1973.Because of the mounting interest in those deposits, investment for copperwill probably surpass the Plan's provisions.
63. The Fourth Plan foresees a total industrial investment of 210billion rials for 1968-1972, that is about three times as much as realizedin the previous five years. In contrast to the Third Plan, the allocationfor industry in the public sector will probably be utilized because short-falls on new projects are likely to be balanced by overruns on on-goinginvestments. However, private investment will probably fall short of thetarget. Production goals, calling for an annual increase of 13 percent invalue added by manufacturing also appear somewhat excessive, if one takesinto account that some projects may not materialize, that the start-up cfnew investmrents has been delayed and that final completion of others willprobably spill over into the Fourth Plan period. Considerable contributionto industrial output is expected to be made by the steel mill and petro-
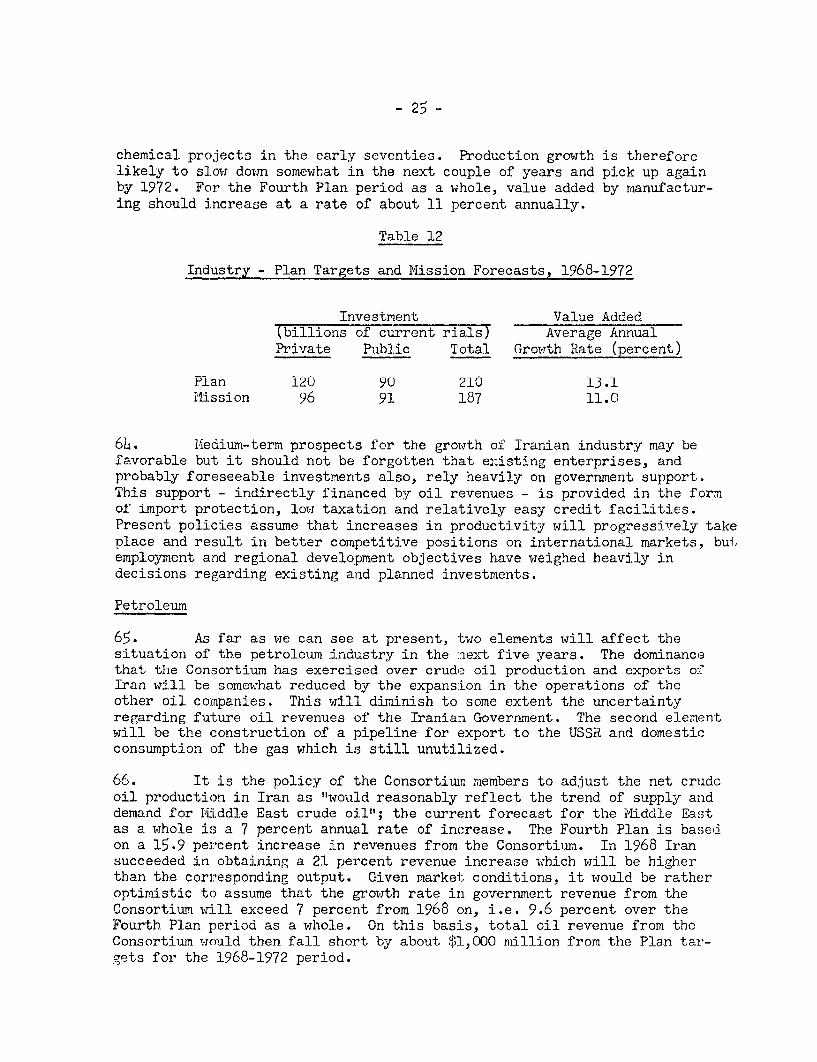
chemic-al p_rrjec+s in the early seventiJes. Production g-ro-wt1h 1is twhCrefore
likely to slowu donm somewhat in the next couple of years and pick up againbr1070. F-or the1 Foth-1 Plan -erio as a whle,- -alue added by1- lrtatZ./ ( t * ULi ILIZ- .4 ~L" U4 ViJ 4. JL 1 PJCI -L%Jk.A 1) WILJC, VCI±I4.C ~MUUCI.4. ildLii .UV
ing should increase at a rate of about 11 percent annually.
Table 12
Industry - Plan Targets and Mission Forecasts, 1968-1972
Investment Value Added(billions of current rials) Average AnnualPrivate Public Total Growrth Rate (percent)
Plan 120 90 210 13.1llission 96 91 187 11.0
64. MiIedium-term prospects for the growth of Iranian industry may befavorable but it should not be forgotten that existing enterprises, andprobably foreseeable investments also, rely heavily on government support.This support - indirectly financed by oil revenues - is provided in the formof import protection, low taxation and relatively easy credit facilities.Present policies assume that increases in productivity will progressively takeplace and result in better competitive positions on international markets, bui,employment and regional development objectives have weighed heavily indecisions regarding existing and planned investments.
Petroleum
65. As far as we can see at present, two elements will affect thesituation of the petroleum industry in the next five years. The dominancethat the Consortium has exercised over crude oil production and exports ofIran will be somewhat reduced by the expansion in the operations of theother oil companies. This will dirinish to some extent the uncertaintyregarding future oil revenues of the Iranian Government. The second elementwill be the construction of a pipeline for export to the USSR and domesticconsumption of the gas which is still unuti:Lized.
66. It is the policy of the Consortium members to adjust the net crudcoil production in Iran as "would reasonably reflect the trend of supply anddemand for MtLddle East crude oil"; the current forecast for the Middle Eastas a whole is a 7 percent annual rate of increase. The Fourth Plan is basedon a 15.9 percent increase in revenues from the Consortium. In 1968 Iransucceeded in obtaining a 21 percent revenue increase which will be higherthan the corresponding output. Given markelt conditions, it would be ratheroptimistic to assume that the growth rate in government revenue from theConsortium will exceed 7 percent from 1968 on. i.e. 9.6 percent over theFourth Plan period as a whole. On this basis, total oil revenue from theConsortium would then fall short by about M - 000 mil i on from the Plan tar-gets for the 1968-1972 period.
- 26 -
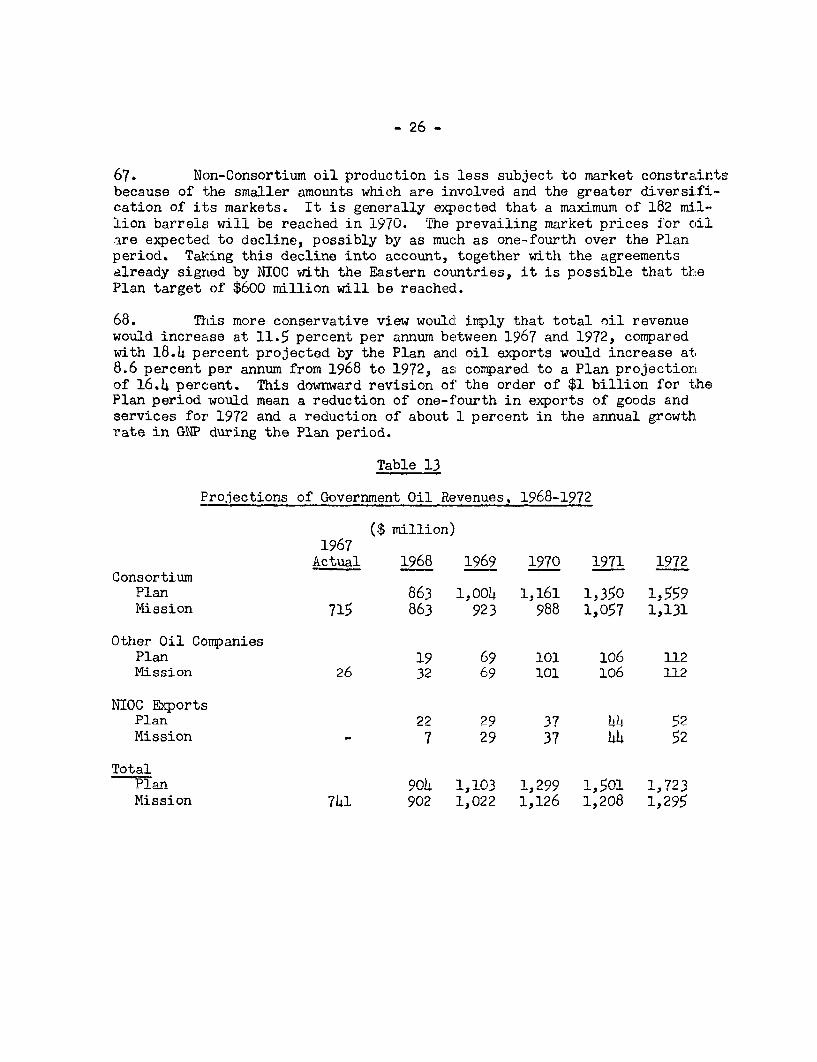
67. Non-Consortium oil production is less subject to market constraintsbecause of the smaller amounts which are irnvolved and the greater diversifi-cation of its markets. It is generally expected that a maximum of 182 mi.l-'lion barrels will be reached in 1970. The prevailing market prices for oilare expectecd to decline, possibly by as much as one-fourth over the Planperiod. Taking this decline into account, together with the agreementsalready signed by NIOC with the Eastern coumtries, it is possible that thePlan target of $600 million will be reached.
68. This more conservative view would imply that total oil revenuewould increase at 11.5 percent per annum between 1967 and 1972, comparedwith 18.4 percent projected by the Plan ancl oil exports would increase at8.6 percent per annum from 1968 to 1972, as compared to a Plan projectionof 16.4 percent. This downward revision of the order of $1 billion for thePlan period would mean a reduction of one-f'ourth in exports of goods andservices for 1972 and a reduction of about 1 percent in the annual growth.rate in GNP during the Plan period.
Table 13
Projections of Government Oil Revenues, 1968-1972
($ million)1967Actual 1968 1969 1970 1971 1972
ConsortiumPlan 863 1o0oo 1,161 1,350 1,559Mission 715 863 923 988 1,057 1,131
Other Oil CompaniesPlan 19 69 101 106 112Mission 26 32 69 101 106 112
NIOC ExportsPlan 22 29 37 44 5Mission - 7 29 37 44 52
TotalPlnn 904 1,103 1,299 1ifl1 1-723Mission 741 902 1,022 1,126 1,208 1,295
- 27 -
69. It is difficult to say to what extent the utilization of Iran1sgas reserves, according to the present Plian, will be a profitable opera-tion. The construction of 750 miles of pipeline from the Iranian oilfielus to the uSSR border witn brancn iines to Esfanan and Tehran hasalready begun. The first phase of the project to be completed in 1970would reportedly cost 33.8 billion rials ($450 million), excluding engi-neering costs. It will be financed in part by a USSR loan of $75 millionand credits from European contractors. By 1970, sales to USSR should amnountto about 3.0 billion rials. The completion of the second phase in 1973 isexpected to increase exports to 4.7 billion rials. By that time, the totalcost of the project is reckoned at 50 billion rials. Prices of futuredomestic sales are currently under study; the tariff will probably bedesigned to yield a joint maximum profit for gas and petroleum products.
Transportation
70. There have been great changes in Irants transport facilities,particularly highways, during the past ten years. A decade ago therewere few all-weather highway connections between major population centers;these were either served by the railway or remained virtually isolated.Now almost every major town in the country is linked by major roads; manyare also served by railways and scheduled airlines. Port capacity morethan doubled in the last five years with a heavy concentration in theKhorramshahr-Bandar Shahpur complex in the Persian Gulf.
71. Emportant changes are taking place both in volume and in directionof traffic. The decentralization of industries is increasing the deman(d fortransport away frcm the traditional Trans.-Iranian axis from the Persian Gulfto Tehran. The exnented growth in agriu:Itural nroduction should result in.a reduction of imports and an increase in the general internal exchangebetween surplus and deficit regions. The increasing trade with the USSRhas added to the importance of the transportation network in the northernnart of the rouintrv- The prospects for eadj z,inrnG and copper mininFp are
likely to require a further expansion of both land transport and portfnni 1 i t.;i .c n +.Ti c t.cr ,an
72. Tith these develor-- ents- the Go.verment I. c+Ait1ve requ:ire-ments have become considerably more complex. But under the present organi-za+-ion,rsosbltfo nvew.+ prgm ng nd plic deisos
transport matters is diffused among various agencies, without effectivecoordinatio mu--- ----.anae.nt- o- anl eacl;or Ieaves someth-ing to be desired.Improvement is expected to take place, however, in the planning of futureroa(s and t1he organization.Jw. o Lf L the .L pots
- 28 -
73. The Fourth Plan provides 80 billion rials for public investmentin transportation, or about 20 percent of the total pufblic investment pro-gram for the next five years. Because of possible delays in project pre-paration and construction, physical achievements will fall short of Plantargets. On the other hand the Plan document often underestimates invest-ment costs. On the basis of present costs and likely physical achievements,total public investment in transportation will probably be of a magnituiesimilar to that projected by the Plan. However, if improvements in manage-ment and productivity were realized, especially for the ports and the rail-way, a number of projects could be delayed without creating any seriousbottleneck.
C. Summary Evaluation
74. The Fourth Plants targets for production are probably too ambL-tious. The growth rate in the value added by the three sectors of agricul-ture, industry and petroleum altogether is not likely to exceed about 7.3percent as compared to the Plan rate of 11.3 percent. Other sectors shouldgrow by approximately 7.8 percent annually. 1/ Total GDP at current factorcosts is therefore projected to increase at an average annual rate of 7..5percent. B3ecause of their faster growth, petroleum and industry will assumea relative]y greater share of GDP in 1972 than at the beginning of the Fourti;Plan. The contribution of agriculture to GDP will drep from 22 percent in1967 to 17 nercent in 1972.
1 / 7T. h ve4-Fo 1t Plnt projecioa.+n of thea wvn1 ue ade byAa k.r nc,-.al 4re.-1 ... '- - 1 e , L'J - -_ . "- --- ----- - J. i. . L
industry, construction and water, power and gas implies an 8.5percer.t- an-.ual growthb r-ate whereas 4..- othe --- --- ^-- cor.trib4u-tion to GDP would increase by 7.5 percent (excluding petroleum).±L1 'ie ~ 1pi.LI- PIUJ J±% Q U.LVIL ±LL Lt, .VVL _V _ U. 4 jJ. '.i1IJU OLIIU U. 7
percent wjhich probably reflects more accurately the relationshipUe,,-ween physical outiU± putu onUH twhe pruouuuion of sU-ervices.
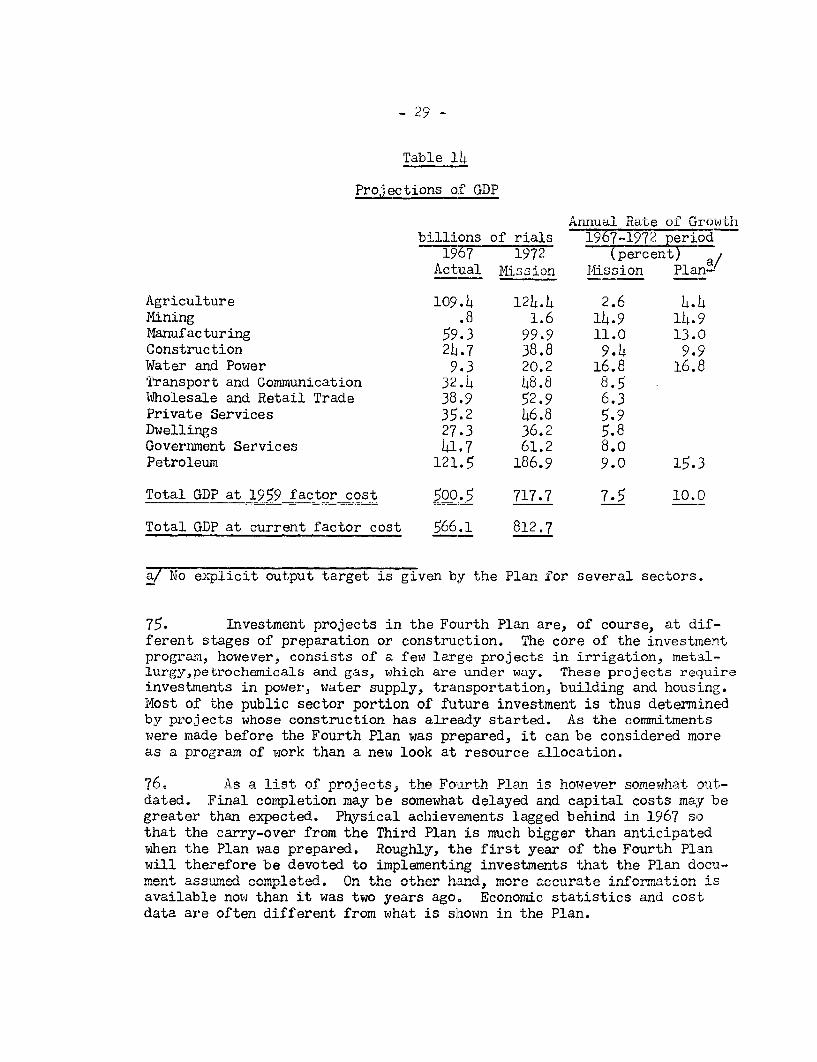
- 29 -
I '- ' Ie ' Table 11,
Pro; ections of GDP
Annual Rate of Growthlbillions of rials 1967-1972 period
1967 1972 (percent) a/Actual Mission Mission Plan-
Agriculture 109.4 124.4 2.6 4.4Mining .8 1.6 14.9 14.9Manufacturing 59.3 99.9 11.0 13.0Construction 24.7 38.8 9.4 9.9Water and Power 9.3 20.2 16.8 16.8Transport and Communication 32.4 48.8 8.5W4holesale and Retail Trade 38.9 52.9 6.3Private Services 35.2 46.8 5.9Dwellings 27.3 36.2 5.8Government Services 441.7 61.2 8.0Petroleum 121.5 186.9 9.0 15.3
Total GDP at 1959 factor cost 500.5 717.7 7.5 10._
Total GDP at current factor cost 566.1 812.7
a/ No explicit output target is given by the Plan for several sectors.
75. Investment projects in the Fourth Plan are, of course, at dif-ferent stages of preparation or construction. The core of the investmentprogram, however, consists of a few large nrojects in irrigation, metal-lurgy,petrochemicals and gas, which are under way. These projects reqjuireinvestments in power, water supply, transportation, building and housing.Most of the public sector portion of future investment is thus determinedby projects whose construction has already started. As the conmitmentswere made before the Fourth Plan was prepared, it can be considered moreas a program of work than a new look at resource allocation.
76. As a li9t of nroinctsj the Fouirth Plqn is howe-ve-r qom'-T.hat onnt-dated. Final completion may be somewhat delayed and capital costs may begreater than neYpected. Phrsical acIievements laggd hbhi nrid in 1 67 sothat the carry-over from the Third Plan is much bigger than anticipatedTw.ihen the Plan was prepared. Roughly, the first year of the Four+h PI awill therefore be devoted to implementing investments that the Plan docu-ment ass d,.,s comrpleted. On +1h o+her h^v.d more a t irfoma+ionv¶ is
available now than it was two years ago. Economic statistics and costdata are often diffrernt from what is s1h,own in. the Plan.
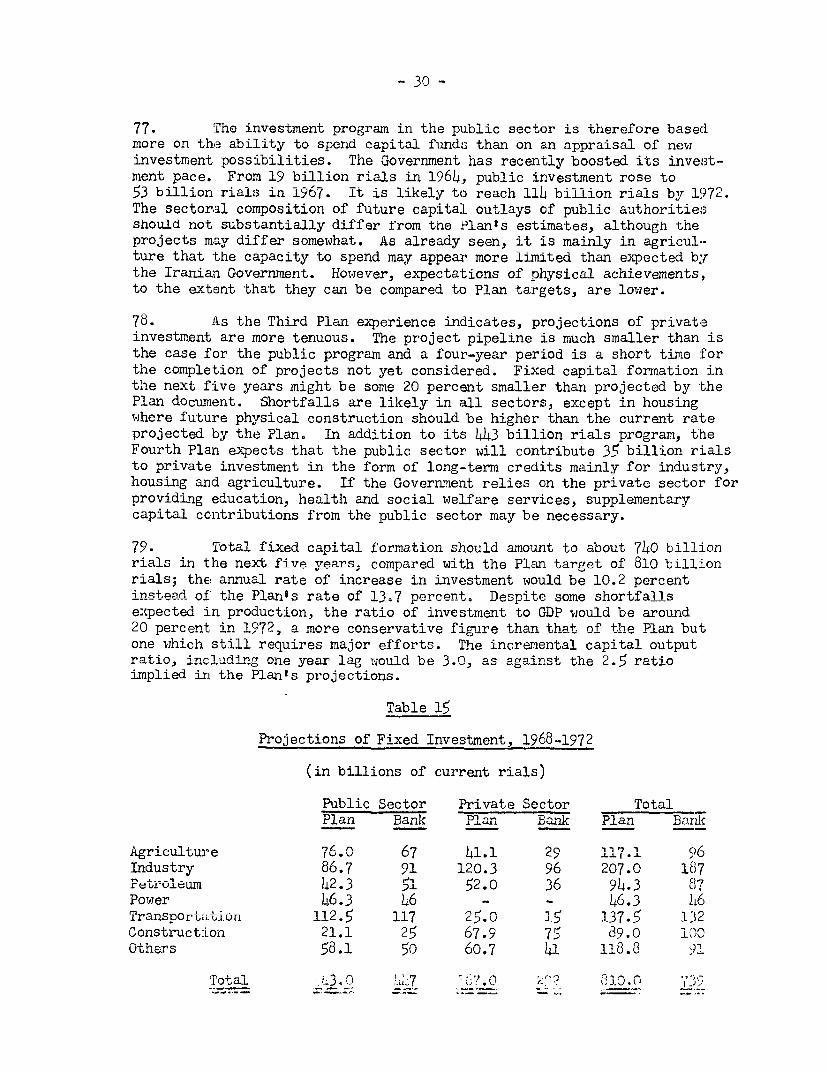
- 30 -
77. The investment program in the pUblic sector is therefore basedimore on the ability to spend capital funds than on an appraisal of newinvestment possibilities. The Government has recently boosted its invest-ment pace. From 19 billion rials in 1964, public investment rose to53 billion rials in 1967. It is likely to reach 114 billion rials by 1972.The sectoral composition of future capita:L outlays of public authoritiesshould not substantially differ from the Plants estimates, although theprojects may differ somewhat. As already seen, it is mainly in agricul*-ture that the capacity to spend may appear more limited than expected bythe Iranian Government. However, expectations of physical achievements,to the extent that they can be compared to Plan targets, are lower.
78. As the Third Plan experience indicates, projections of privateinvestment are more tenuous. The project pipeline is much smaller than isthe case for the public program and a four-year period is a short time forthe completion of projects not yet considered. Fixed capital formation inthe next five years might be some 20 percent smaller than projected by thePlan document. Shortfalls are likely in all sectors, except in housingwhere future physical construction should be higher than the current rateprojected by the Plan. In addition to its 443 billion rials program, theFourth Plan expects that the public sector will contribute 35 billion rialsto private investment in the form of long-term credits mainly for industry,housing and agriculture. If the Government relies on the private sector forproviding education, health and social welfare services, supplementarycapital contributions from the public sector may be necessary.
79. Total fixed capital formation should amount to about 740 billionrials in the next five years; compared with the Plan target of 810 billionrials; the annual rate of increase in investment would be 10.2 percentinstead nf t1he Planis rate of 1l.7 percento Desnite some shortfallsexpected in production, the ratio of investment to GDP would be around20 percent in 1972, a more conservative figure than that of the Plan butone which still requires major efforts. The incremental capital outputratio, including one yer l_g would be 3.0, as against the 2.5 ratioimplied in the Plants projections.
Table 15
Projections of Fixed Investment, 1968-1972
(in billions of current rials)
Public Sector Private Sector TotalPlan nank Plan Bar'- Plan Bank
'76.0 67 411 29 117. 1 -
Industry 86.7 91 120.3 96 207.0 187reuto±e-aur 42.3 5u 5 0 364.3 8l
Power 46.3 46 _ - 46.3 46Transportcation 112.5 117 I.0 15 137.5 12Construction 21.1 25 67.9 75 89.0 100Others 58.1 50 60.7 41 118. 9
Total 123. 0 7Y.7 .; : '.J .u I
- 31 -
80. The manpower aspects of future economic development are rightlystressed in the Fourth Plan. Nevertheless, the Plan is probably too opti-mistic with regard to the possibilities to satisfy the needs. Even if theprogram for expanding the existing educational facilities is implemented,it is likely that the insufficiency of skilled manpower and management willbe felt in industry, administration and education. It is difficult toappreciate! quantitatively future shortages and the Plan projections ofsupply and demand are of little guidance. The Government has gone to somelengths tc attract the many trained Iranian technicians living abroad.Nevertheless, a certain deterioration in the quality and some slowdown inproductivity growth will probably occur in the next five years. In thelonger run, much depends on the Governmernt's readiness to undertakedrastic reforms in the education system.
81. There is an urgent need for bet-ter coordination of policies andcontrol of program implementation. The existing institutions engaged ineconomic management also are too numerous and too diffuse. The FourthPlan docurment takes stock of the need for improvement in most sectors.Assuming that such charnes take place. il. envisages a substantial expan-asion in development expenditure. The Plan does not provide, however, iorsufficie.nt steprs to hb taken to imnrovn dPer-ision-makina 2nd imnli mpntal;ion
controls. Considerable progress in these matters is within reach in Iran.Should thi-s not occur, inves.-ent costs will be higher and physical achieve-ments lower. After a review of the various economic sectors, the Missionconsiders that the situation with respec+ to the Plnin inves+r.eirt target-s
has alreaidy deteriorated along these lines. If this continues, difficul-ties in the executive cam.city ill only magnify the probable financiaLproblem.
- 32 -
CAEPTER TJ
FIUAICTIAL P7.OS PECTS
82= Finance was not the rmain -nn.tra-int during the imnlementation ofthe Third P'lan as a whole. With the increase in the absorptive capacityof the country in the last years of the Plajn it 'became; hnwever. a grea,;ermatter of concern. The Fourth Plan targets, even after some dowznward revi-sion, are ambiAtilous. The financial requirement s are such that Iran cannotmeet them through its own savings effort. In this effort, the public sectorhas to cor.tribulte =Uch; the manritud o£ +-n reniii-PaA Preian
will depend, to a large extent, on future government policies.
A. National Sav-ings
83. Whereas national savings exceeded investment in the first twoyears of the Plan, they Penancedonl I8O57 p_cn i - - - --- e-
however, took place in the last year of the Third Plan, when 27 percent of4the inr l in oupu - was4 sa- d -- u ther- efforts- 4along tl1 Jine w-Jill beneeded if Iran wants to implement its investment program.
6L. Total exports of goods and services are likely to increase muchmore modest'Ly than as projected by the Four-h Plan. It is proUably truethat petroleum exports will increase in 1968 at a rate similar, if notsuperior, to the 17 .1 percent rate projected for the 1967-1972 period. Lt
is nevertheless quite doubtful that such a growth will be maintained there--after. F or the Plan period as a whole, O1L exports are more likely to growat about a 'LO percent rate. 1/ NIon-oil exports should also go up more slowlythan expected by the Iranian authorities. Hiinerai ore saies may double whileexports of carpets would increase bY 35 percent and leather products by one-fourth. A very slow growth should be expected for the other export items.The shipment of these traditional products altogether should increase at arate of abolt 3.3 percent, as compared to the rlan projectea rate of 4.percent. Considerable shortfalls are like:Ly to occur in the Plai projectiornfor future exports resulting from current investments in petrochericals andaluminum. Some delays in the entry into production of the plants at the endof the period will probably cut projected exports of petrochemicals in 1972by some 60 percent and aluminum products by 75 percent. Though it is possiblethat difficulties in the pipeline construction will affect gas exports,available information confirms the Plan projection in this matter. With anincrease in the receipts for services, allowing for some development intourism activities, total exports should r:ise by about 10 percent annual:Ly,as compared to the Plan projection of an annual rate of increase of 15.6percent.
'L/ Oil revenue accruing to the Government wJould increase by 11.5 percentannually as compared to the Plan target of 18.4 percent in the 1967-1972period.
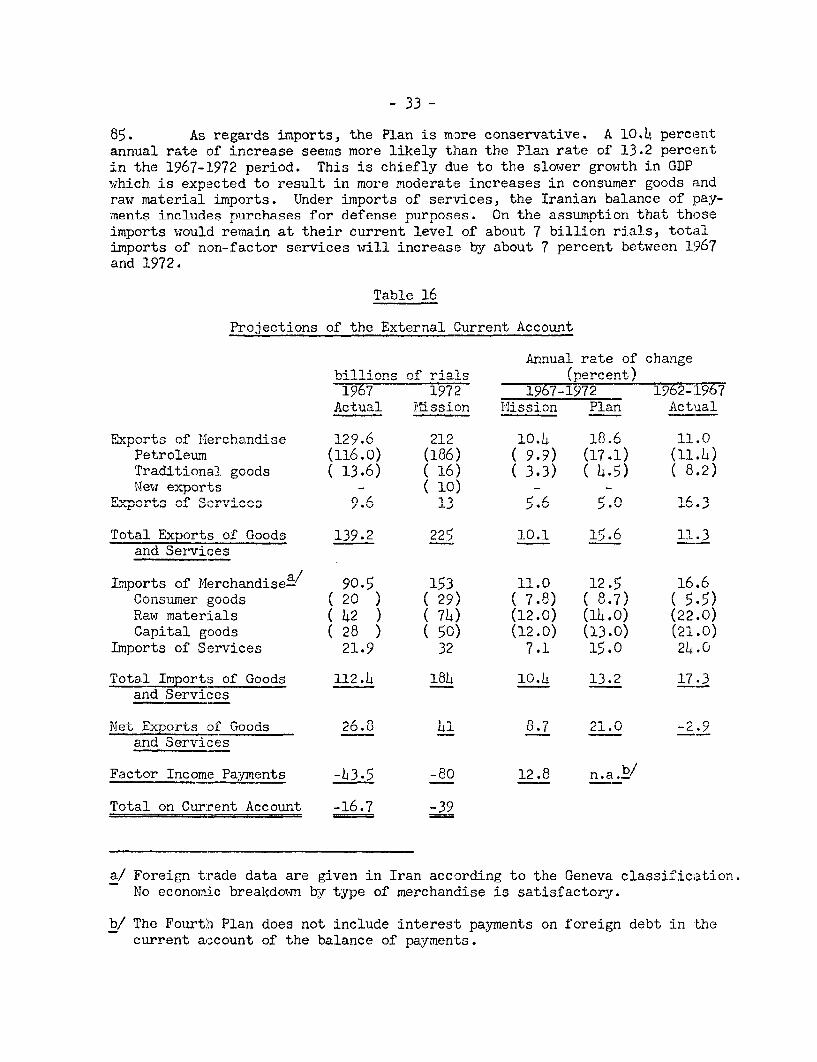
- 33 -
85. As regards imports, the Plan is more conservative. A 10.4 percentannual rate of increase seems more likely than the Plan rate of 13.2 percentin the 1967-1972 period. This is chiefly due to the slower growth in GDPwhich is exnected to result in more moderate increases in consumer goods andraw material imports. Under imports of ser-vices, the Iranian balance of pay-ments includes purchases for defense nurposes. On the assumption that thoseimports would remain at their current level of about 7 billion rials, totalimports of non-factor services will increase by about 7 nercent between 1967and 1972.
Table 16
Projections of the External Current Account
Annual rate of changebillions_of_rlals (perrcent)1967 1972 1967-1972 1962- 1967
Actual i-f; ai on 1li cs; in Pl an Ac+talnl
Vcports of Pierchandise 129.6 212 10,L� 18.6 11.0Petroleum (116.0) (186) ( 9.9) (17-1) (11.)
r.-t -Ia . goods ( 13.6) ( 1 ( 3.) ( L4-5 '.C)
New exports - ( 10) - -v Forts of -; Services 9.6 II CA c.o IA6.
VJ 'SA. ~~C~~L V..,~SQ / *-J J._J _;. %J .'; .5.'.
TPotal Exports o., G-oods 139. 22 01 1565
and Services
Imports of Merchandisea/ 90$5 153 11.0 12.5 16.6/ n f -%I N I ., Q% 1 0 17N s, ,Consumer goods J 20c )2) ( I.U) ( L.) ( 5. "-5)
Raw materials ( 42 ) ( 74) (12.0) (1h40) (22.0)Capital goods ( 28. 1.0).uj .0)
Imports of Services 21.9 32 7.1 15.0 2h_0
Total Imports of Goods 112.4 18h 10.4 13.2 17.3and Ser-vics
Net Exports of Goods 26. 8 4L o.7 21.0 -2.9
and Services
Factor Income Payments 43.5 -80 12.8 n.a._ /
Total on Current Account -16.7 -39
a/ Foreign trade data are given in Iran according to the Geneva classification.No economic breakdow%n by type of merchandise is satisfactory.
b/ The Fourth Plan does not include interest payments on foreign debt in -thecurrent account of the balance of payments.
- 34 -
86. Because of substantial profit remittances from the oil companies,the resource surplus will be accompanied by a financial gap on externalaccount. Factor income payments amounted to 43.5 billion rials in 1968bringing the deficit of the nation on current account to 16.7 billion riials.Besides profit remittances of the oil companies this included the payment ofinterest on external public debt for an amount of 1.8 billion rials. TheFourth Plan document does not include future interest pavments in the currentaccount of the balance of payments and thus projects a cumulative deficit of66 billion rials for the Plan period. On the same grounds the deficit in-plied by the Mission's projections would be 138 billion rials. If one adldsfuture interest payments on the existing debt and the debt to be contractedto finance this gap, the deficit on the balance of pavments would more thandouble within the Plan period.
87. National savings would only amount to 17.0 percent of GNP in 1972,comnared with 16=1 nercent. in 1967. The imnlied marginal savings ratio is19.3 which is similar to that of the Third Plan period. The projected rapidinrereas in far-- incnme payments ePwlains in nprt. the modest imTprovempent innational savings in the course of the Fourth Plan. 1/ This would allow annn.nual increase in per capita cons-um.ption of 3.4 percent wheres +the Planprojected a 4.1 percent rate. If private consumption is not to be furtherreduced, sLhe rrlwvmnt+ .:4 111 kninn +r Mnl great effo+rt cntrol itcurrent expenditure.
1/ The ratio of domestic savings to GDP will increase fran 22.1 percent ini9607 to 24.6 percent in 1972. This implies a marginadi savinrgs ratio of30 percent, probably more realistic than the ratio of 46 percent pro-jected in the Fourth Plan.
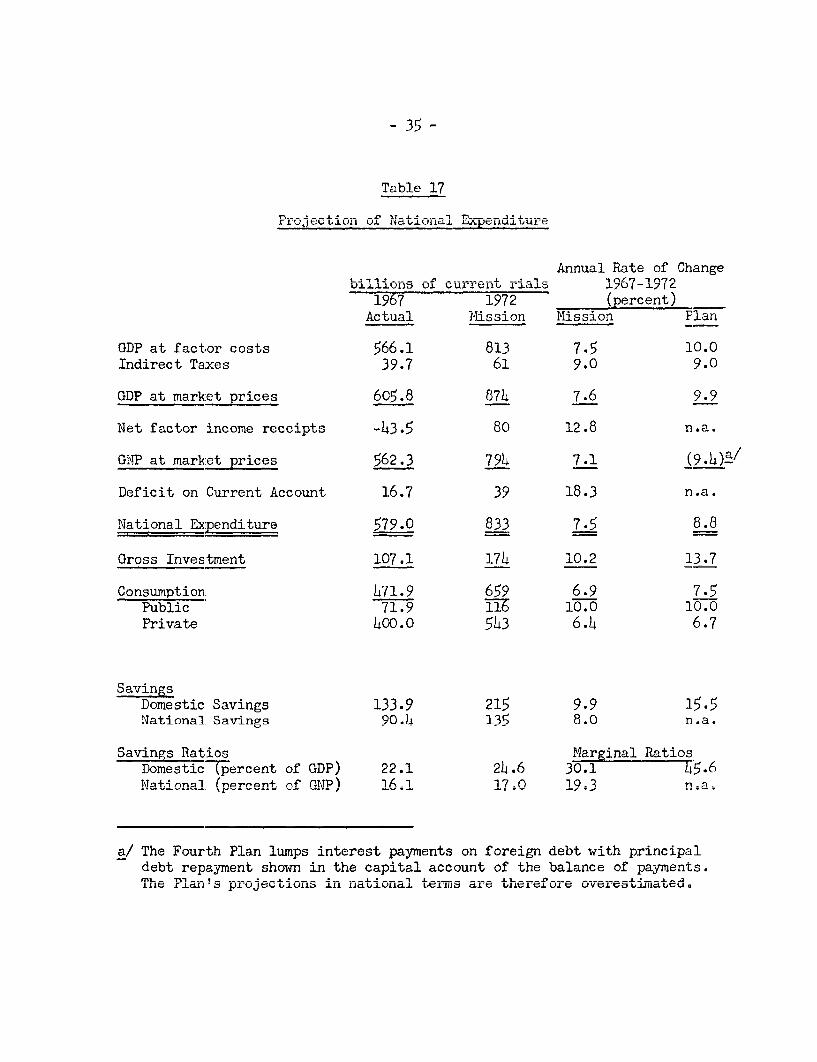
Tabl&e 17
rot-ection . 0f. i o,aUL1tJ £ diDu±
Annual Rate of ChangeU±lXlions ofL curreriu rial s 17I -.'97 I2
1967 1972 (percent)Actual Mission Mission rlan
GDP at factor costs 566.1 813 7.5 10.0Indirect Taxes 39.7 61 9.0 9.0
GDP at market prices 605.8 874 7.6 9.9
Net factor income receipts -43.5 80 12.8 n.a.
GNP at market prices 562.3 794 7.1 (9.4)a/
Deficit on Current Account 16.7 39 18.3 n.a.
National Expenditure 579.0 833 7.5 8.8
Gross Investment 107.1 174 10.2 13.7
Consumption 471.9 659 6.9 7.5Public 71.9 116 10.0 10.0Private 400.0 543 6.4 6.7
SavingsDomestic Savings 133.9 215 9.9 15.5National Savings 90.4 135 8.0 n.a.
Saqvi n a.- 'R nt, OS n4 ;nn Rqtnt. wqDomestic7(percent of GDP) 22.1 24.6 30.1 45.6National (percent of GNP) 16.1 17;0 19.3 n.a
a/ The Fourth PLa 1I LLUJLIJJ L11U;.LtZsIL, j 1UL1UOn forei debt £ principl
debt repayment shown in the capital account of the balance of payments.ThIe (±WJ !s pVUJect±ions n1 rI±ational teLJnar-ed~L1~~.VL therfor L,JJstILdUteU
- 36 -
B. Public Savings
88. The contribution to national savings by the public sector mayfall from 35 percent in 1967 to 22 percent in i972 if present policies arecontinued. If one assumes a erowth rate for oil revenues of 9.5 percentafter 1968 (as opposed to the 17.5 percent envisaged by the Plan) publicsavings will be about half the Plan target. This forecast is based on twoother assumptions as well. First, since the Plan target for the increase inGNP is unlikely to be achieved. a growth rate in non-oil revenues of 8 ner-cent per annum is reasonable after allowing for some built-in elasticity inthe tax system. Secondly, the budget fSr 1968 implies a growth rate nf 1iRpercent in current expenditure compared with the average 10 percent projectedby the Plqn? An incre2se in d ex-pnj+ih,vnrih of 2pre is l n-rg1v
responsible for this. If no restrictive measures are taken by the Government,there is no reason to suppose that current expenditure will increase after1968 by less than 12 percent annually, the rate attained during the ThirdPlan. On these assmpt+ ions about -60) percenta olf oil reve.ue wo ',id be alloated
to current expenditure for the 1968-1972 period, compared with 48 percent
The lNeed fLor Policy Chq1jnges
0J7 * UISU .LL Y.L d.;Ltc~C%±- U_1ULe±ULV1- 'v£ .. Lq' UV~ I-L otL ' j.JUU.L.ALU D1V±JLlr"
at least to '0 percent of the projected pub:Lic investment. First, it isnecessary to curb the growth in currevnt expenditure starting in 1969. itshould be within the power of the Government to limit future annual increasesto u percenlt,, thus achieving the 10 percenrt aanual growth envisaged by urlthPlan for the 1967-1972 period. 1/ This expansion, after allowing for quacl-rupling in interest payments between 1968 and 1972, wouid permit a growthin social and economic expenditure of 8 percent if both general servicesand defense expenditure are kept within a rate of 4 percent.
., An attempt to improve the process of public expenditure is now being madethrough a regionalization of the budget whereby the peripheral units,starting ELt the village level, will report on their requirements to thenext level and up to the ministry which, together with the elan Organiza--tion, will decide on the allocations. Education has been chosen as apilot sector and the region of Kermanshah as first territorial unit.Guidelines have been provided for the purpose of reporting whereby theneeds are to be expressed in terms of teachers and number of classrooms.Lack of experienced personnel and the tendency by reporting units tooverestimate their requirements are the main difficulties which thisexperiment is facing.
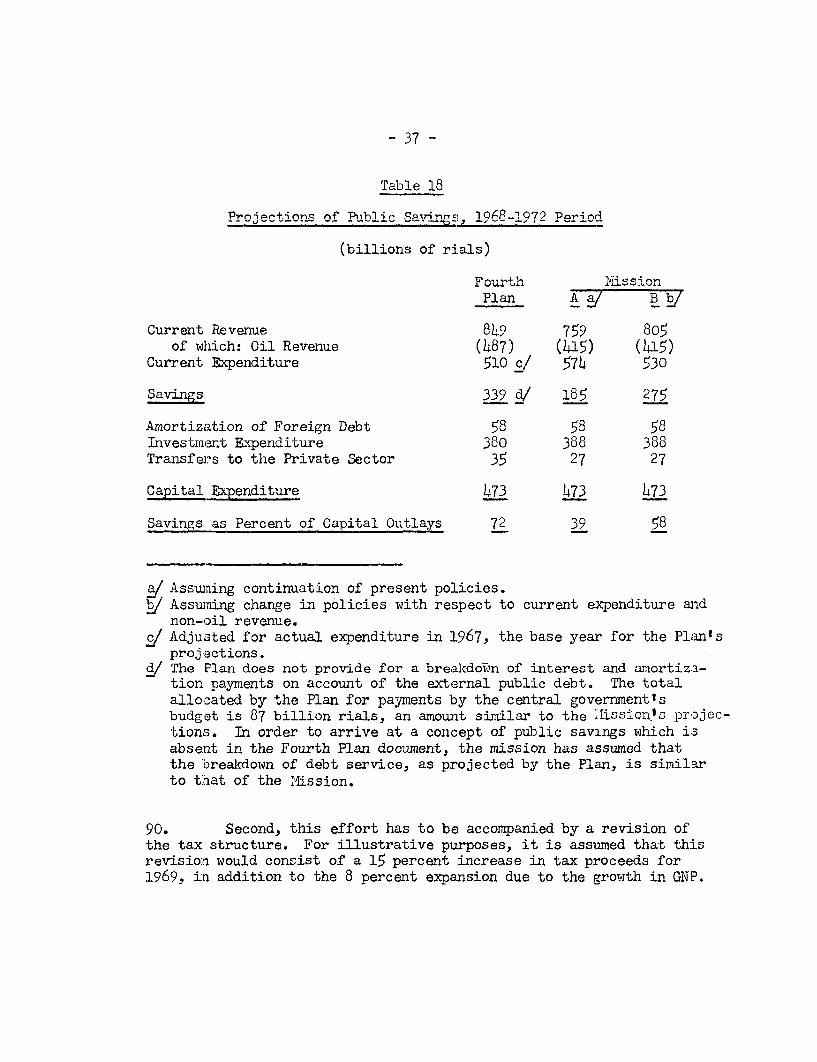
- 37 -
Projectionq of A1bLiC Sa1rZnT,4;,~~~ our4- 197 PeriOd
Plan B b/
Current Revenue 849 759 805of wh1ich: Oil- Rever.ue (487() ( 415) I 41_)I
Current Expenditure 510 c/ 574 530
Savings 339 d/ 185 275
Amortization of Foreign Debt 58 58 58Investment Expenditure 380 388 3n8Transfers to the Private Sector 35 27 27
Capital Expenditure h73 473 473
Savings as Percent of Capital Outlays 72 39 58
a/ Assuming continuation of present poLicies.b/ Assuning change in policies with respect to current expenditure and
non-oil revenue./ Adjusted for actual expenditure in 1L967, the base year for the Plan's
projections.d/ The Plan does not provide for a breakdown of interest and amortiza-
tion payments on account of the external public debt. The totalallocated by the Plan for payments by the central government'sbudget is 87 billion rials, an amount similar to the 11fiss-jQnIs projec-tions. In order to arrive at a concept of public savings which isabsent in the Fourth Plan document, the mission has assumed thatthe breakdown of debt service, as projected by the Plan, is similarto that of the Mission.
90. Second, this effort has to be accompanied by a revision ofthe tax structure. For illustrative purposes, it is assumed that thisrevision would consist of a 15 percent increase in tax proceeds for1969, in addition to the 8 percent expansion due to the growth in GNP.
- 30 -
A 15 percent increase in direct taxes is not beyond reach if the Governmentaccompanies a moderate increase in the effective rates with a strong actionagainst tax evasion which is at present rather high among self-employed andbusiness firms. ' But similar increases in customs duties and the fewexcise taxes on large consumption goods (tobacco, fuel, tea, etc.) willeither aggravate the existing degree of protectionism or burden the lowestincome groups. These changes in rates should be supplemented by the aciop-tion of sa:Les taxes on a large number of ciomestic products, with selectedrates for 'luxury goods. Greater reliance on direct taxes and general salestaxes would also provide a more modern tax structure, better suited to thepresent development stage of the country.
91. 'Tae recommended increase in revenues, including oil receipts,would bring the overall tax burden to 23 percent of the projected GNP for1972. This compares with a tax burden of 19 in 1967 which is rather lowamong deve:Loping countries with comparable per capita income and degreeof openness. Future increases should be obtained without serious disincen-tive effec-t on the economy. Under these projections the allocation of oilrevenue wviould also be more development oriented since only 35 percent oftheir amount will be necessary to finance current expenditure. This target,implying some improvement over the Third Plan performance, should be coIn-sidered, however, as a minimum effort on the part of the Government.
1Monetary Pressures
92. Domestic borrowing cannot be considered a feasible alternativeto tax innreasps- Tn viAw of the various investment onnortunities forprivate funds, it is unlikely that much cam be expected from sales of1 oncT.P-.0rrn covrnmont. bhnds t tn theh nrmhl i - The nnocsihii1 iesP q for fi nan-cing the government cash deficit through the banking system are also
l/ A laW passed in March 1967 has transformed the income tax into a globalprogrsslve+<. or. ai ll pe-.rsonal innco.m.e Twhile in+.?,r0iirina q=vero-r1 n-Hinr
innovations aiming at a more efficient administration of the tax as wellaso a more euit2ble dist+-rbibu+tr. of the burden. There was vno fall in
revenue in 1967 despite the necessary adjustments in the administrat:ivem-chinery. Nevertheless, the implementation of the new law is encoun-tering {some difficulties. For instance a numJber of self-employed tax-payers are requ-ired ILI keep reor oftei~r inco..e W-Ad ez er.di+vure. Ps.
accounting is not a current practice in Iran, not even for industriald.LU UV±IIIr,:UU.Lct.l enteLrtU±Js.L±, teLIU l.±± IlUIN kJne VL.O"LLLe W.J..L irplJ.y La
tax burden, the individual taxpayer is evidently reluctant to accept it.k(or a dea ed discuss-ion ofL th;Uie n.ew -Law-1, SeeU DRD, Cu rreint EoUVnLomi,
Position and Prospects, op. cit.)
- 39 -
limited. Total domestic credit is unlikely to inc:rease by more than10 percent per annum between 1967 and 1972, even assuming that time andsavings deposits will expand at a rate of 15 percenit, comparable with thetrend in recent years. The public sector will therefore have to limit itsrecourse to the banking system if it does not want to squeeze the expansionof credit to the private sector.
93. Some pressures are already buil(ling un in the first venr of thePlan. Tentative projections for 1968 by the Central Bank indicate creditto the private sector increasing at 14 nercent (or 20 billi2n rials) asagainst 18 percent in 1967. If the envisaged level of public expenditureis to be carried out. net claims on the public sector will expand by17 billion rials /, which is higher than the amount of 10 billion rialsproijcted bv the Central Bank. It is like-ly thatn+ some m.eas'j'es 4 11 betaken to limit the expansion of credit to the private sector. Otherwise,it. will be diffic-lit to satisfyr total c-e(44t requ4rem,en.ts withV.,out f1 therdrawdown on foreign reserves or an expansion in money supply substantia:Llyabove the . greT.wth of MNTDP.
). The Fourth Plan was awarecf lthese possiJbe pressures arnd pro-
jected a total ameount of government domestic borrcwing for the 1968-1972per"od of about 60 billion rials. This seems a maxinrum expansion since itwould not allow credit to the private sector to ircrease by more than6 percet per anam. The Goverrment will therefore have to face the alter-native of limiting its reliance on the banking syE tem or of abandoning itsprice stability policy.
9D. Tne above projections which are in line with the Fourth Planassumptions imply an increase in net foreign exchange reserves of 47.5 bil-lion rials throughout the period. If Iran wants t;o maintain reserves equi-valent to about three months' imports of goods and services in 1972, grossreserves should increase by about 20 billion rialE: over the 1967 level.
C. Foreign Financing Requirements
96. It thus appears that the size of pcssible fixed capital formatienand the savings prospects are such that Iran will have to rely on foreigncapital on an unprecedented scale. Future profit remittances, chiefly fromthe oil companies, are likely to exceed by about :L40 billion rials ($1,850million) net exports of goods and services in the Fourth Plan period. Th:sis twice ELS much as projected by the Irarnian authorities. The need to pro-vide for an increase in net foreign exchange reserves and possible capitaloutflows is similarly estimated at about 47 billion rials ($630 million).The extent, to which the Government will have to borrow abroad will thereforedepend on future private capital inflows and service on external public debt.
1/ After allewing for an increase in the deposits of government agencies 6fabeut 3 billion rials.
- 40 -
Private Investment
94. The Governmentls attitude vis-&.-vis foreign private capital israther ambiguous. Its policies proceed on the one hand from the will topromote industrialization by all means, including tax incentives and pro-tection of the domestic market. Foreign capital brings not only funds butalso managerial and technical talents which are greatly needed in Iran.This implies that foreign investors are attracted by comparatively highprofits, security of investment and the possibility to transfer incomesabroad. But in this respect, the Government is reluctant to allowforeigners to benefit from policies which are mainly aimed at stimula-ting domestic investment. The procedure for obtaining "cc.i-nmencementpermits" often discourages patential foreign investors.
98. Foreign private investment anart from the pet.roleum sector waslimited in the Third Plan; it accounted for 5.5 billion rials out of atotal caDital inflow of 88. billion rials (.$1i20 rillion). ives+t-me-ntsmainly took place in light manufacturing industriEs. Expenditures cf theoil camDanies for research; development and construction were estimated at18.0 billion rials in the same period while their capital remittancesamounted to 7?4 billion rials. In addition to this net ineflowl, ITanreceived a bonus of 1-4.3 billion rials in 1964 anc 1965 for granting newoi1 ce-ncessi ons to non-Gonsortium compar.ies.
99. There is little basis for evaluating prospects for privatecapital inflows. It can be assumed with the Fourth Plan that investmentof the oil companies will increase by 25 percert Eam inua'ly over the averageof the last three years. Another component of future investment is deter-MrJned 'by t1he joint vent-ares inpetrochermi-icals and al-marrlnumW.-hich are totake place within the Plan period. Because of the rapid amortizationaILowed to the foreign partners, it should be expected that a major partof the capital entering the country for those prolects at the beginningof the Plan period will be rem±ait aUbroad before 197-2. xher foreigninvestments are assumed to be somewhat offset by capital outflows. j Netprivate capital inflo-ws are likely to be in line idth the Fourth Planprojections.
1/ Plan projections provide for speculative capital. outflow at a rate cf7 billion rials a year, similar to the amount of errors and omissionsin 1966.
- 41 -
Future Debt Service
100. Debt servicing problems are not unknown in Iran. The heavy ieli-ance on medium-term credits in the late flifties was accompanied by a rapidrisep in sfzrvin- n.vmtnts. The stahi1-zation progma m uindertaken in 1961brought this increase to a halt. As export earnings continued to go up andofficial ald WaS obtained from the Unitel States nd TRRnTj the balanre of'payments improved in the first years of the Third Plan. More recently,1Anc-±eI¶, 102n~ cai< has _gai beo.. insufficiDent to carry out theexpenditure program and Iran has started borrowing from foreign suppliersor private barbs. ..n a large sc_e. .eas8phnto rigexhIe
earnings wvere devoted to debt service in 1967, in 1968 the ratio will beabove 11li percent-. 1/I
.101. Tlhe ex'Uernal pJubice Ae.t o LfLL .L4i±cUU.L1iig UL.L1LA.L.LUU1Q V o.a1JLU1UIedA
to $1,745 million as of March 22, 1968. About one-third is privately heldd3et. Of:Fincn loans frnnTn ar,.;-,intUeU LI V±LLL.LJc±d± ±J_VcU1, HIfd±.ILII± ±UIII If UI1.LbUU at, DUU- US)LWL ±DUJ dJLI.
to more than $1,000 million. Estimated future se-.vice payments on the totalA, -so - . /a t _'_ S'_ 61 --external debt are to increase from $38 million in 1968 tO a peak $P2c4 r,,l-
lion in 1971.
102. In addition to the service of loans alraady obtained, Iran willhave to assure payments for the debt to be contracted in the next five years.On the basis of present policies, the time requir3d to obtain official loansand recent cost increases of international capital, it is assumed tnat futurecapital w:Lll be obtained by Iran at an average interest rate of 7 perceXntwith terms to maturity of 17 years including a two-year grace period. Debtservice on this account will rise from about $11 nillion in 1969 to $143million at the end of the Plan period.
103. Debt service payments would therefore anount to 27 billion rials($370 mil:Lion) in 1972 in this hypothesis. v Total exports of goods andservices including only net receipts frorn petrole.nm are projected at 145billion rials. On these grounds, the debt servic 3 ratio will increase fromd percent in 1967 to 18.6 percent in 1972. The debt burden could thereforebe a matter of concern; how much concern depends on the terms at which Iranwill borrow.
1/ Based on estimates of public debt service as projected by IBRD.The corresponding ratio based on Iran:Lan projections would be12.3 in 1968.
2/ Despite a smaller external gap, the Fourth Plan projects higherservice payments. The Plan possibly assumed greater reliance onmedium-term financing than implied in the iission s hypothesis ofservice terms on future borrowing.
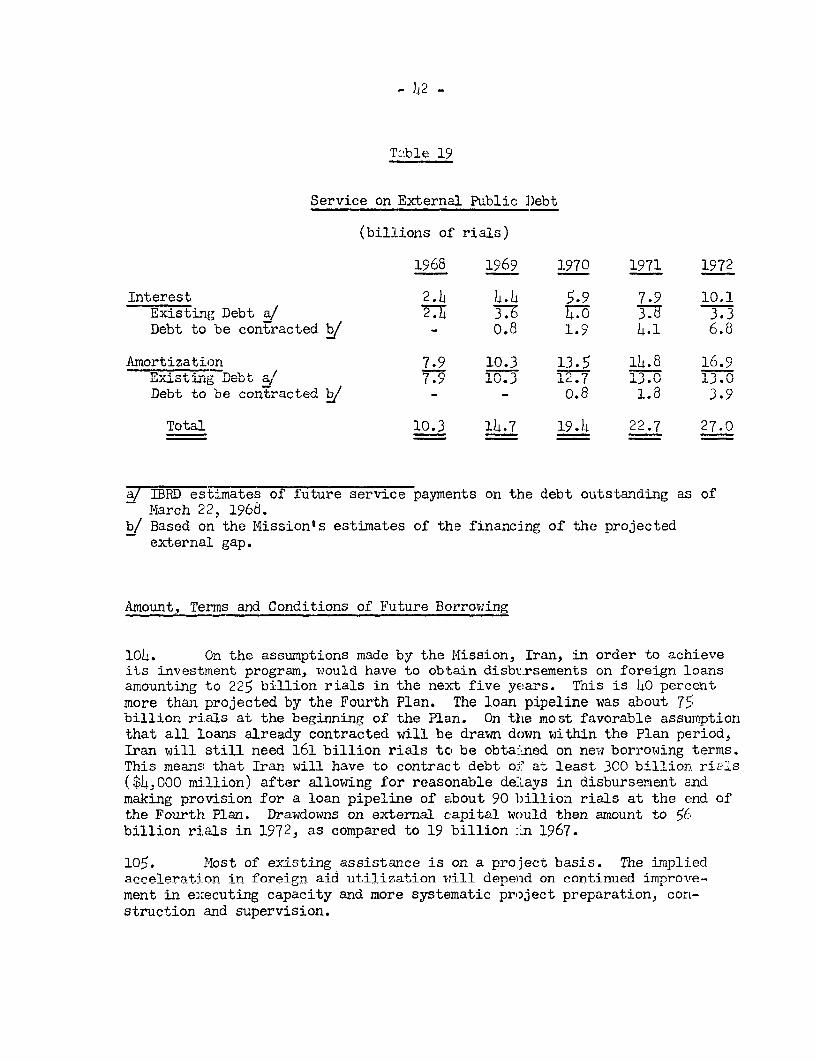
- L2 -
Service on External Public Debt
(billions of rials)
1968 1969 1970 1971 1972
Interest 2.4 414 5.9 7.9 10.1;osirTr -n,+ =4 / -t}.n =1 Q )
Debt to be contracted bJ - o.8 1.9 4.1 6.8
Amortization 7.9 10.3 13.5 14.8 16.9ti8 _ z: l | / 7~~1 n ............ 0r s5-
JJA:LL ± s,JJ%;U IJ . ( . 7 iU .) ±Lf C rl) .UWv
Debt to be contracted b - - o.8 1.8 3.9
Total 10.3 14.7 19.4 22.7 27.0
f IBRD estimates of future service payments on the debt outstanding as ofYarch 22, 196d.
b/ Based on the Mission's estimates of the financing of the projectedexternal gap.
Amount, Terms and Conditions of Future Borrowing
104. On the assumptions made by the Mission, Iran, in order to achieveits investment program, would have to obtain disbt.rsements on foreign loansamounting to 225 billion rials in the next five yEars. Tnis is 40 percentmore than projected by the Fourth Plan. The loan pipeline was about 75billion rials at the beginning of the Plan. On the most favorable assumptionthat all loans already contracted will be drawn down within the Plan period,Iran will still need 161 billion rials to be obta-ined on new borrowing terms.This means that Iran will have to contract debt o37 at least 300 billion riaLs($1,000 mi.llion) after allowing for reasonable deLays in disbursement andmaking provision for a loan pipeline of about 90 billion rials at the e!nd ofthe Fourth Plan. Drawdowns on external capital would then amount to 56billion ri.als in 1972, as compared to 19 billion :Ln 1967.
105. Most of existing assistance is on a project basis. The impli.edaort-1 ration in foreign aid utilization Till denpend on continued imorovre-ment in executing capacity and more systematic project preparation, con-struction and supervision.

- 43 -
Table 20
Foreign Capital Requirements
(billions of rials)
1967 1972 Total 1968-1972TO -7a I 9 s,i on miion iP ;Tn
rlndR nnd qRrvices, net 26 160 3)42.6Profit Remittances, net - 41.7 - 7C - 298 - 4083.7Privat+ Capitalj net 3 .9 10 5)4 52.L.Other Operations a/ - 3.4 - 6 - 27 ) 47- 5Changce in Reserve / 1/ = L =
Public Debt Service i - 5.8 _ 27 - 94 - 103.0T,terst (= 1.8) (- 1) (- 31) n.
Amortization (- 4.0) (- i) ( 63) n.a.
External borrowing, gross 19.2 56 ( 225) (164.2)L ±oans already con -lacted ( 1.2 ( i(J) (2) n.a.Loans to be contracted - ( 46) ( 150) n.a.
a/ including transfer and errors and omissions.b/ Assumes no change in foreign liabilities so that gross foreign exchange
reserves will be equivalent to three months! i3nports in 1972.c/ See Table 19.
106. Iran should weigh the advantages it sees in attaining the invest-ment which may be physically possible during the Plan period against theeffect on its future creditworthiness. The demand for future externalassistance is in any case such as to suggest the need for a common under-standing between Iran and its foreign partners of its development problemsand policies to encourage a program of lending on terms appropriate to thecircumstances of the country.
- 44 -
CHAPTER V
CONCLUSION
107. The obirntiven nf the FPnurth P a-n are amFit4i0u; perhaps even tooambitious. Economic grotwth will continue, though at a rate somewhat lowerthan in recent years, chiefly because exceptionnl conditions for agricultl1reand petroleum are unlikely to be repeated. The possible 7 percent annua:Lag-nTai-h rate ci+sll r. 1 k-b-IA -s,A +le t aper 4-t 4-m o:F
around $350 by 1972. It will be much more difficult to attain a reductionin~~~~~~~- -h u.mpo.n rate %nd al J.Ur bacn AiC,e 4tbution, which are
major aims of the Fourth Plan, as they were of the previous Plan also.
lv8. The investment program formulated by the Fourth Plan will have4 _4 - - - A -- _ _ -J. -- - _ 1- _- InL _ -_ - -_ _1 _ _ _n _ __L-LUo litaJIJ- UiL_iAU U J11 UUit: .L7.Vi 6 WIuIu IIlU;U wJ. Ulle _Livge QUJe l±IvetitiiluD±
will come to fruition. Though there were umcertainties about their eco-nu1rI±c jusb1t-lfcation, comirutments were made. These major projects werestarted before the inception of the Plan; they largely determined the sizeand composition of the program.
109. In the next five years, the volune of investment in the publicsector will fall short of the Plants targets despite recent increases inthe absorptive capacity of the Iranian economy, but since cost increaseswill tend to offset delays in construction, the financial allocations arelikely to be fully used. The major constraint on future investments wil:Lbe of a financial nature. Even if the rate of saving is substantiallyimproved, Iran will have to rely heavily on foreign capital in order toinvest as expected.
110. Starting from a comfortable credit position in 1967, Iran'sforeign conmmitments will sharply increase within the Plan period. Thisgrowth in indebtedness should be given due consideration since the debtburden in 1972 will absorb more than 18 percent of its export earnings ifIran borrows externally to the extent required to finance the projectedexternal gal?. The main impact of future borrowing, however, will be feltin the period after 1972. Iran's creditworthiness depends, at least in :part,on the prospects of the economy in the 1970's. They are uncertain, parti-cularly in respect to the growth of petroleum revenues on which Iran willcontinue to rely heavily for the financing of domestic expenditure andexternal payments, including debt service. On the other hand. the recentlydiscovered copper mines may bring additional resources to the economy.
111. These prospects will be substantially enhanced if more attentionis paid to the management of assets as well as their nreation. Heavy bor-rowing abroad will be justified mainly to -the extent that Iran succeedsin estahlishling an effiGient productive system decreasingly dpndnent ongovernment support. In any development po:Licy there is a gamble. In Iranthis gamhle is magnified by the high targets of the Grvernment+._ The wiil!l tobuild up an economy, however, should not bes compromised by laying its folnda-UXt[i n too h11aSst.il.y.
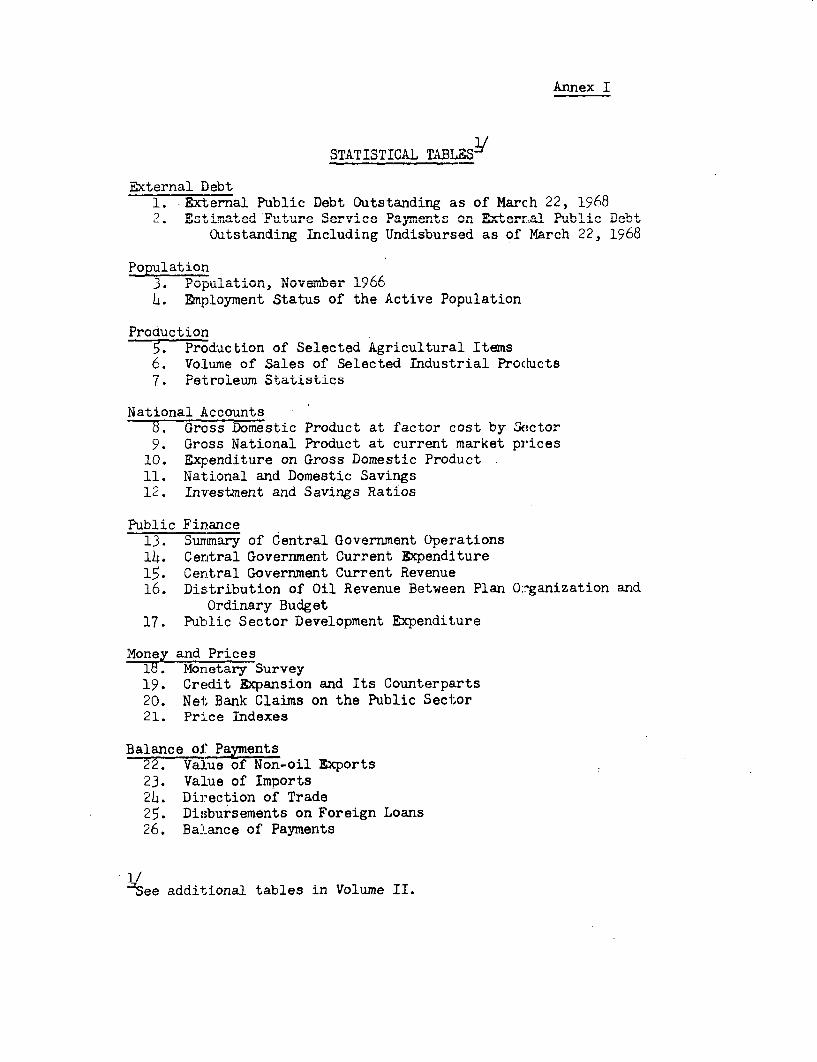
Annex I
STATTPTrAl T.;RLq2
1. External Public Debt Outstanding as of March 22, 19682. EOstim4ated 'Futunre S-r^e Pa .-.. eW+ or n .l terr.' l neb+
Outstanding Including Undisbursed as of March 22, 1968
Population3 ropulat0.L, IIIv IwJ J.7SU
L. Employment Status of the Active Population
Production5. Production of Selected Agricultural Itri8s6. Volume of Sales of Selected Industrial Proclucts7. Petroleum Statistics
National Accounts7. Gross Domestic Product at factor cost by Sector9. Gross National Product at current market prices
10. Expenditure on Gross Domestic Productll. Nat.ional and Domestic Savings12. Investment and Savings Ratios
Public Finance13. Summary of Central Government Operations14. Central Government Current Expenditure15. Central Government Current Revenue16. Distribution of Oil Revenue Between Plan O:^ganization and
Ordinary Budget17. Public Sector Development Expenditure
Money and Prices18. Monetary Survey19. Credit Expansion and Its CounterpaLrts20. Net; Bank Claims on the Public Sector21. Price Indexes
Balance of' Payments22. Value of Non-oil Exports23. Va.lue of Imports24. Direction of Trade25. Disbursements on Foreign Loans26. Balance of Payments
1/aSee additional tables in Volume II.

Tahle 1: IRAhl - PYXT17IJAT PllBIC DEBT OUTSTA-iTnDII V.S OF MARCdT 22- 196S /I
Debt Repay.able in Forein Currmncy
(In thousands of U.S. dollars)
Debt Outstandirl,,Source March 22, 1968
Disbursed Includingonly undisbursed
TOTAL EXTERN%IAL PUBLIC DEEBr 2 ,237 1h, 33
Privately held debt 176,140 587,3?±()
Aiistri a 3,013 *- 5 Fraqnc 33,068 91;89.
Germary 26,960 63,119India k88 3,531Italy 193 19,503Japan 3,A 69 9.h7.2Switzerland /3 - 2,03-7United Kingdom 7,670 87,520Unitedl States 11,980 19,902Yzzg,oslavia - 2,033
Financiza2 institutions 89,567 2Il1267Austria 56 5,73France 6,259 45,504
t0aly - 26,55SUnited Kingdom 713 10,32.3united States 82,539 153,016
LoanAs frorm international organizations - IBRD 128,262 2 5
Loans from governments 338.565 955,728Bulga.ria - 8,000Czechostovakia 4,763 5,071Denmark - 2,800Ger-raxy 39,124 h8,000Hun[ ar:y 219 930Israel 167 6,oooPbland 3,530 3,987Rvr-ania 13,016 h 5, 301Unite.d Kingdom 7,092 9,31:8United ;tates 2h3,366 L2h,399U.S.S.R. 26,967 Lol,obhYI1,; a=viLa 32184a
IJUL)U Wiuji all W-iginal or euxtended mat-urity of one year or more.v E-^ludes unallocated portions of frario agreements where knowM:
- d~~~~~ .1 I ,~ 7n" ^P\
France 96,545,ooo
Poland. 10,7814,COO
Tot.l e Jo7 Of kxrlw'--. aprl-,irat.&l.y f 'C) -C) parl; of a ';T.ccs cplli.ers' cred; v-hic h-s
not becn allocat'ed to specific prSjects. Statistical Services Divisinon
zconc,r)cz I^.; pairti rnt
NOVc;;5bcr 15, 12J:
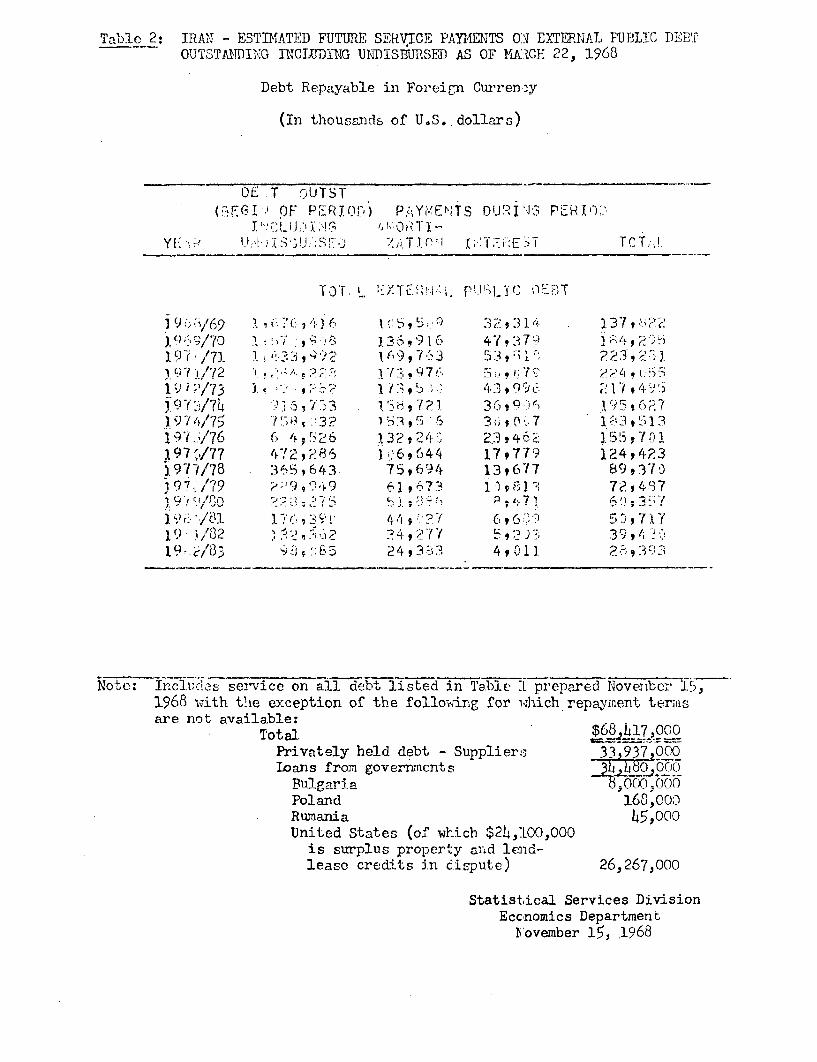
Table 2: IRAN - ESTIMATED FUTURE SEHVICE PAYMIETS O0N EXTRNAAL PUTILTOC DEETOUTSTANDMING INCLUIJllNG UNTISBURSED AS OF MA:RCHi 22, 1968
Debt Repayable in Foreign Curren:y
(In thousands of U.S. dollars)
DE .T WUTSTEG I !F PERIO'r) P.AYi;AEN'TS DIJ'JI \j,3 P-(R I 3
y. . i J ;! .7,' 1-I
Yf L& IJA I S'3'J~S~ ~ T 'T ; IelE 7 TCT' I'
TO T: L X~. ~I; e~~
1 69/ L7352 .3; 3 2 9 3 I 137 9,i4i lps I 9 I-b 7241 3.$79 )
j9 /7 . , ;; 3 ? If) 4 5 3 2 I - -'i ;(7,i7 7 . :' - ;vi,, 9, 7 .6 3 ,;1,723 ,.i
1. "/731! l ' 'p; '" 17 3 # :s .1S7 -- !S. "D '. 9i t)t f '
1 Ci-i--i/7 -/>, - tj _ 1 'nif *7?-1 i;r- * 9 i() (iS -r;
]9 7 475 t r V i0 3? 1 ;, I ' 3 1(*7 1 3- 9 1 3"~~~~~~~ f~ -i 7 6 I'I ., ; ri 32_r i 2 3 /4 . :L 1 5; 7 , 1
1974- f77 4 7 2?, t- 11 '6tCi644 17,779 124t423i-' 7/7 R7 2Aq - 6t-1 7r h'fh !3 -4 , A7 7¢ A4 3 J' 1
'97 J,/79 9 91 ,9 tl1 t 73 i 1, 7?, 437~~~ ~ ~ ~ 5~~7* P *t7
0 - . '. . i.. - 57 i 3- 7 1 S ' 3 . -
1 r .c/ 8 3 ;) wi 85 ? f Z4 , 3' 4 , v 1)] 2 , 3 1i
NOtC: IT.C1l;d2S service on all debt listed in Table :L prepared Noveriber IL,1968 With the exception of the follow0ing for 1which repaY,rent termisare not available:
Total $66 417 000Privatelv held debt - SunDlier, 11.917.000Loans fron governments E 000
Poland 16 Soo0RT1mnni a 5,000United States (of Which $2!>,:lOO,OOO
lease credits in dispute) 26,267,000
Statistical Services DivisionEccnomics Departmentc
IYovember 15, .1968
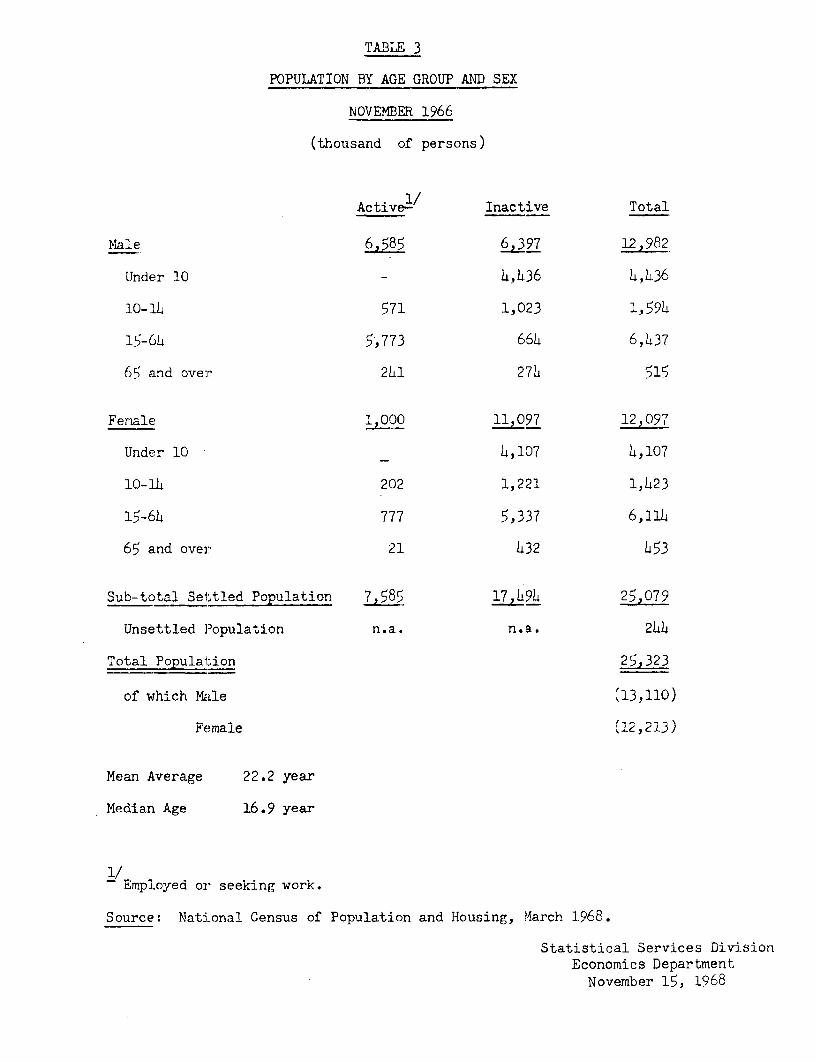
TABLE 3
POPULATION BY AGE GROUP AND SEX
NOVEMBER 1966
(thousand of persons)
Active- Inactive Total
Male 6,585 6,397 12,982
Under 10 - 4,L36 4,L36
10-lb 571 1,023 1,59h
15-6L 5.773 664 6,437
65 and over 2L1 27L 515
Female 1290O 11,097 12,097
Under 10 4,107 4,107
10-1i 202 1,221 1,L23
15-64 777 5,337 6,11
65 and over 21 432 453
Sub=total. Set+le Ptleaidon 7 (R,q 17 X),, 92,079
Unsettled ]'opulation n.a.* n.a. 2sTotal++e, 1opuopul, 2-,32
of which Male '3,11)
Female (12,213)
Mean Average 22.2 year
Median Age 16.9 year
1/
- Employed or seeking work.
Source: National Census of Population and Housing, March 1968.
Statistical Services DivisionEconomics DepartmentNovember 15, 1968
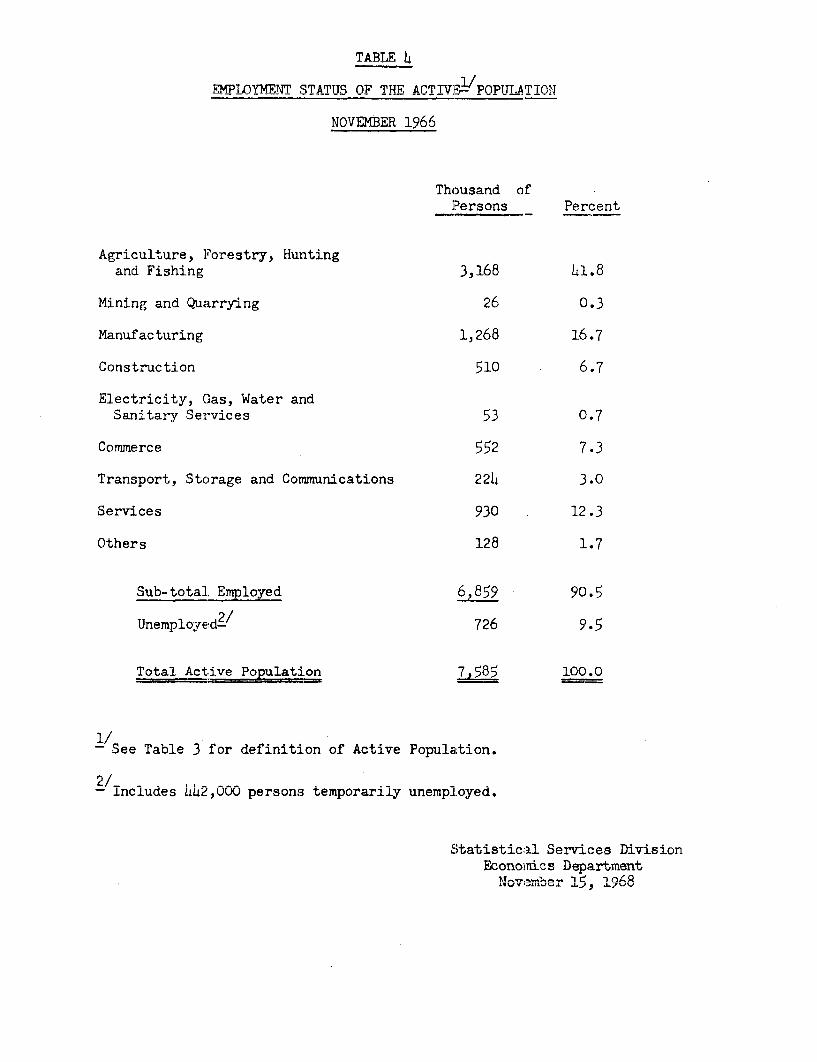
TABLE h
EMPT.YMENT STATTV; OF TWE ArTTVP'R,POPTTT.ATTPN
NOVrMPFR 16QA
Thousand of
Persons Percent
Agriculture, Forestry, Huntingand Fishing 3,168 L1.8
Mining and Quarrying 26 0.3
Manufacturing 1,268 16.7
Construction 510 6.7
Electricity, Gas, Water andSanitary Services 53 0.7
Commerce 552 7.3
Transport, Storage and Communications 22h 3.0
Services 930 12.3
Others 128 1.7
Sub-total Employed 6,859 90.5
Unewplve!d2/ 726 9.5
Total Active Population 7,585 100.0= =~~~~_
-See Table 3 for definition of Active PopulaLtion.
-/includes 442,000 persons temporarily unemployed.
Econo}mics Department1II.bV IILer , 1968
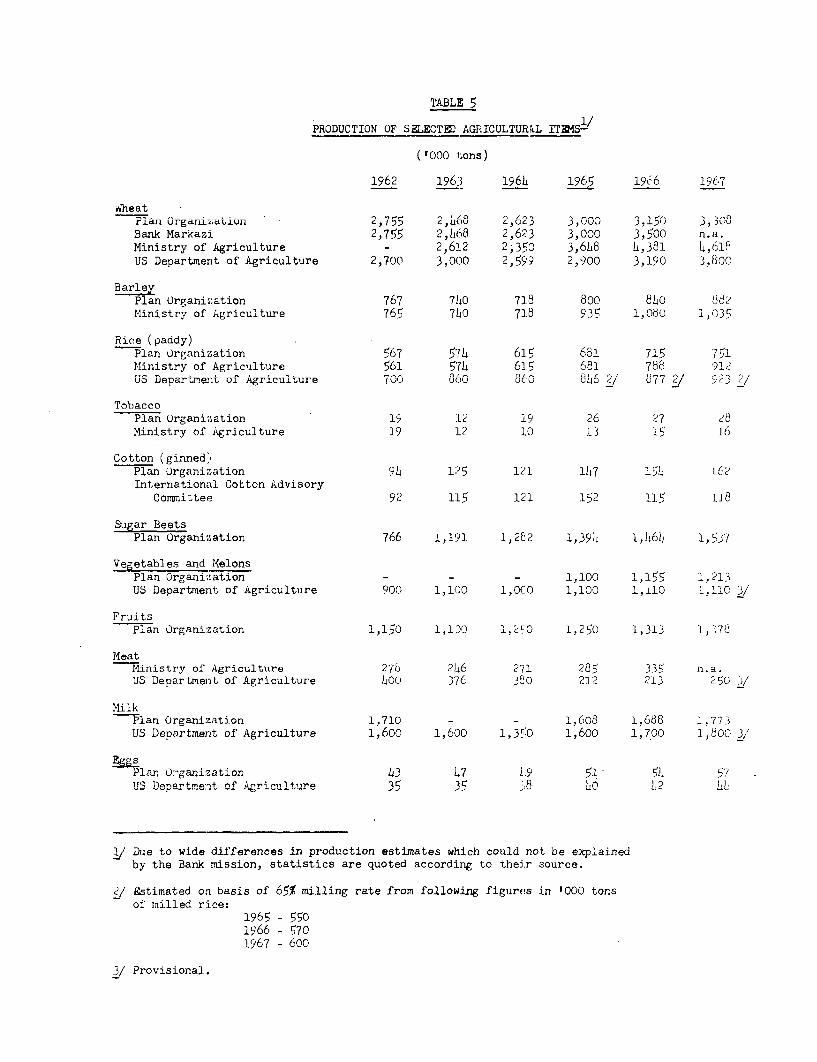
TABLE _
PRODUCTION OF SELECTED AGRICULTUR4L ITrmS-
1962 1963 1966 1965 1966 1967
WheatPlan Organi,zation ' 2,755 2,8 2,623 3,000 3,150 3,308Bank Markazi. 2,755 2,b68 2,623 3,000 3,500 n.a.Ministrv of Agriculture - 2.612 2.350 3.6L8 L.381 L.6118US Department of Agriculture 2,700 3,000 2,59? 2,900 3,190 3,800
BarleyPlan Organization 767 7640 718 800 86o 8U2112*&2U -J41±..L&LU4 .- Is.. I. -L,'"-1 , 0'-">oM^ nis-t ry oLf A g r ic u ltu-e 765 7 1 7l.8 93, 108 ,3
Rice (paddy)Plan Organization 567 574 615 681 715 751Ministry of Agriculture 561 576 6]5 681 788 912US Departmenlt of Agriculture 700 oo6 86O0 86 2/ 877 2/ 523 /
TohaccoPlan Organization '19 L2 19 26 27 28Ministry of Agriculture 19 1L2 10 13 15 16
Cotton (ginned)a.n41 r g'ani .V4a ti '.o'n I> 125121, 1L71L.
International Cotton AdvisoryCommittee 92 115 121 152 115 1]8
Sugar BeetsPlan Organization 766 1,191 1,282 1,391 1,66 1,537
Vf-7tabhes and MelonsPlan Organization - - _ 1,100 1,155 1,213US Departmnent of Agriculture 900 1,100 1,0C0 1,100 1,110 1,11 3/
Fruits'Dian Or g a nization 1,15f0 14. 1 ,2'0 I,250 1,313 I ,l' I.7,
MeatMinistry of Agriculture 2j8 2,66 271 285 335 n.a.US Depar-tment of Agriculture 400 376 380 212 213 250 ,/
MilkPlan Organization 1,710 - - 1,608 1,688 1.773US Department of Agriculture 1,600 1,600 IJ3'O 1,600 1,700 1,0o0 3,'
Plan O-ganization 63 67 19 51 ',. 57US Department of Agriculture 35 35 _!8 610 2J,
Duie to wide di LLfferences iWn prodductinLLu.l ')t4.LLI wlhe Uc n explained
by the Bank mission, statistics are quoted according to their source.
E/ Estimated on basis of 65% milling rate from following figures in '000 tonsof milled rice:
1965 - 5501966 - 57019c'7 - 600
3/ Provisional.
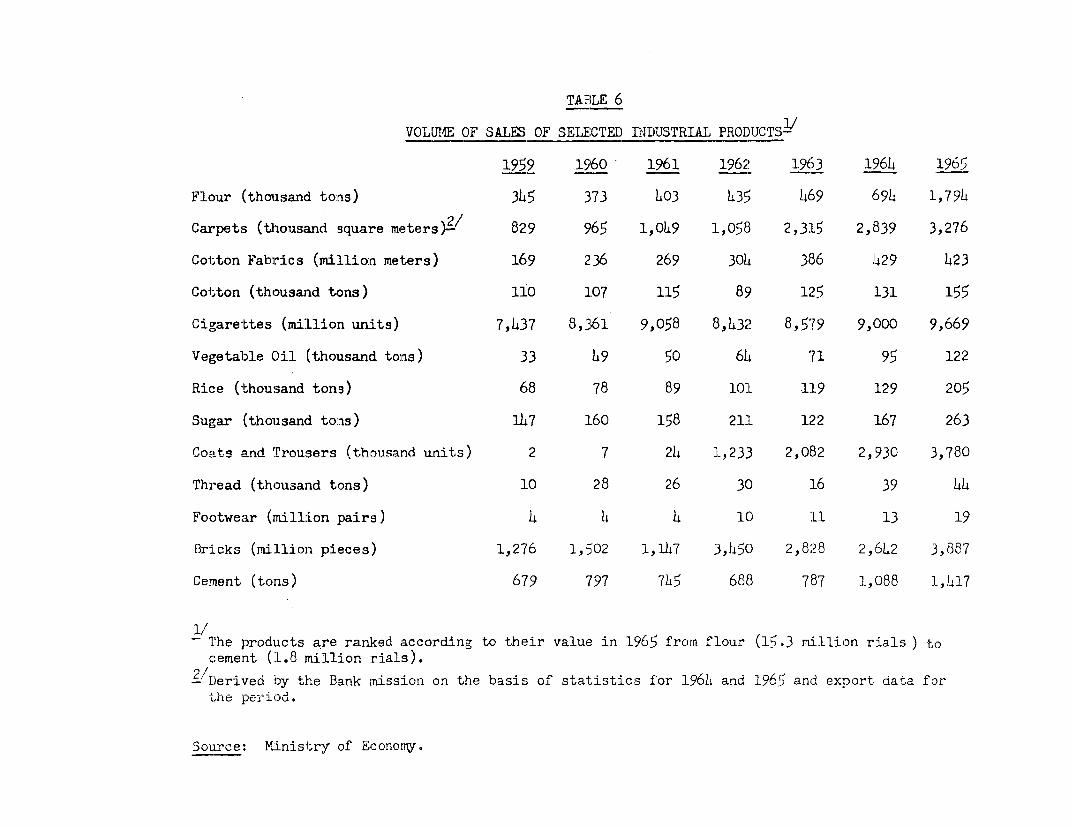
TAB9LE 6,
VOLUNIE OF SALES OF SE;LECTED INDUSTRIAL PRODUCTS-i
1959 15960 1961 1962' 196 3 1,964 1965
Flour i(thousand tons) 345 373 403 435 469 694 1,794
Carpets (thousand square meters)J 829 5965 1,049 1,058 2,3315 2,839 3,276
Cotton Fabrics (million meters) 169 236 269 30hl 386 429 423
Cotton (thousanid tons) 110 1.07 115 89 12>5 131 155
Cigarettes (mi:Llio:n units) 7,437 8,361 9,058 8,h32 8,579 9,000 9,669
Vegetable Oil (thousand tons) 33 4 9 50 64 71 95 122
Rice (thousand tons) 68 78 89 101 1L9 129 205
Sugar (thousand tons) 1L47 1.60 158 211 122 167 263
Coats and Trousers (thousand units) 2 7 21 1,233 2,082 2,930 3,780
Thread (thousan-d tons) 10 28 26 30 1L6 39 44
Footwear (million ]pairs) 4 4 4 1) L1 13 19
Bricks (mi:Llion piieces) 1,276 1,502 1,1L7 3,450 2,828 2, L2 3,887
Cement (tonls) 679 797 7h5 688 787 1,088 1,!417
T The products are ranked according to their value in 1965 from flour (15.3 rmillion rials ) toc:ement (:L.8 mrillion rials).
t'Derived by the Bank imss:ion on the basis of statistics f'or 196L and 1965 and export data forthe )eri,od,Sou MnU t of E
SouLrce: M-inisl;ry of Ec^onomyW.
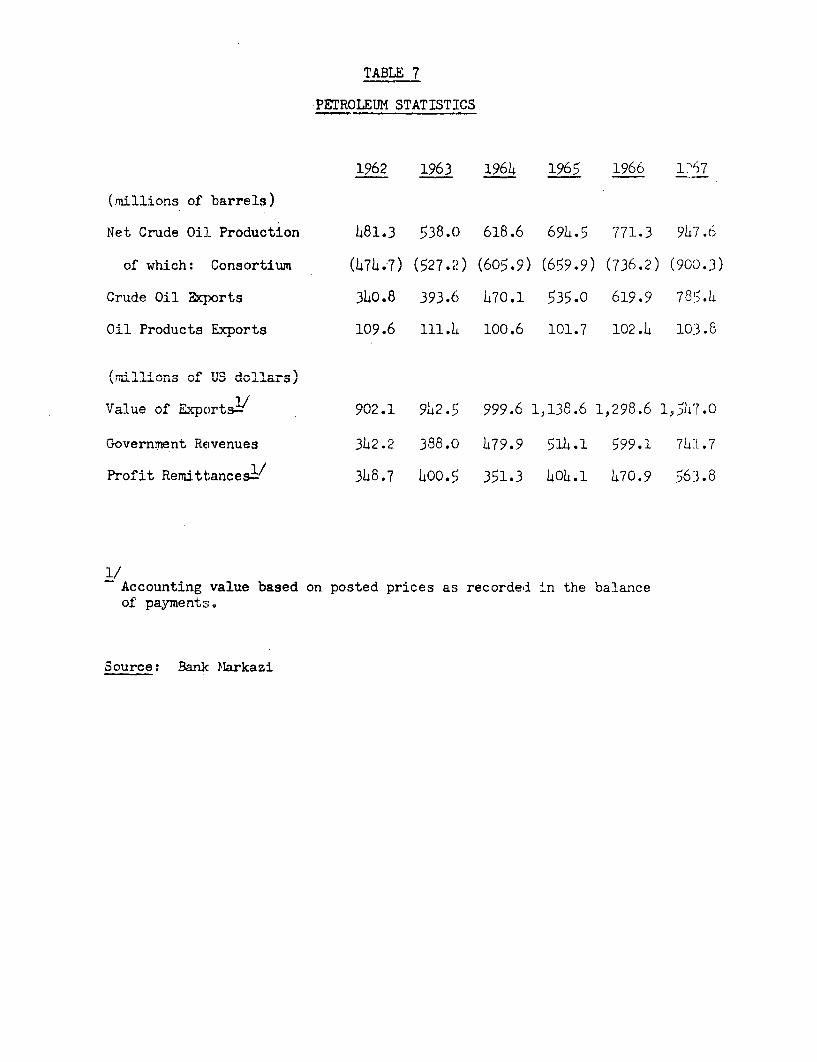
TABLE 7
PETROLEUM STATISTICS
1962 1963 1964 1965 1966 l`67
(millions of barrels)
Net Crude Oil Production 481.3 538.() 618.6 69L.5 771.3 927.6
of which: Consortium (474.7) (527.2) (605.9) (659.9) (736.2) (90(.3)
Crude Oil Mcports 340.8 393.6 170.1 535.0 619.9 78'5.4
Oil Products Exports 109.6 111.4 100.6 101.7 102.1 10:3.8
Government Revenues 342.2 388.0 479.9 514.1 599.1 741.7
Profit Remittances= 318.7 400.5 351.3 140u4.1 470.9 563.8
- Accounting value based on posted prices as recorded in the balanceof payments.
Source: Ban:k Markazi
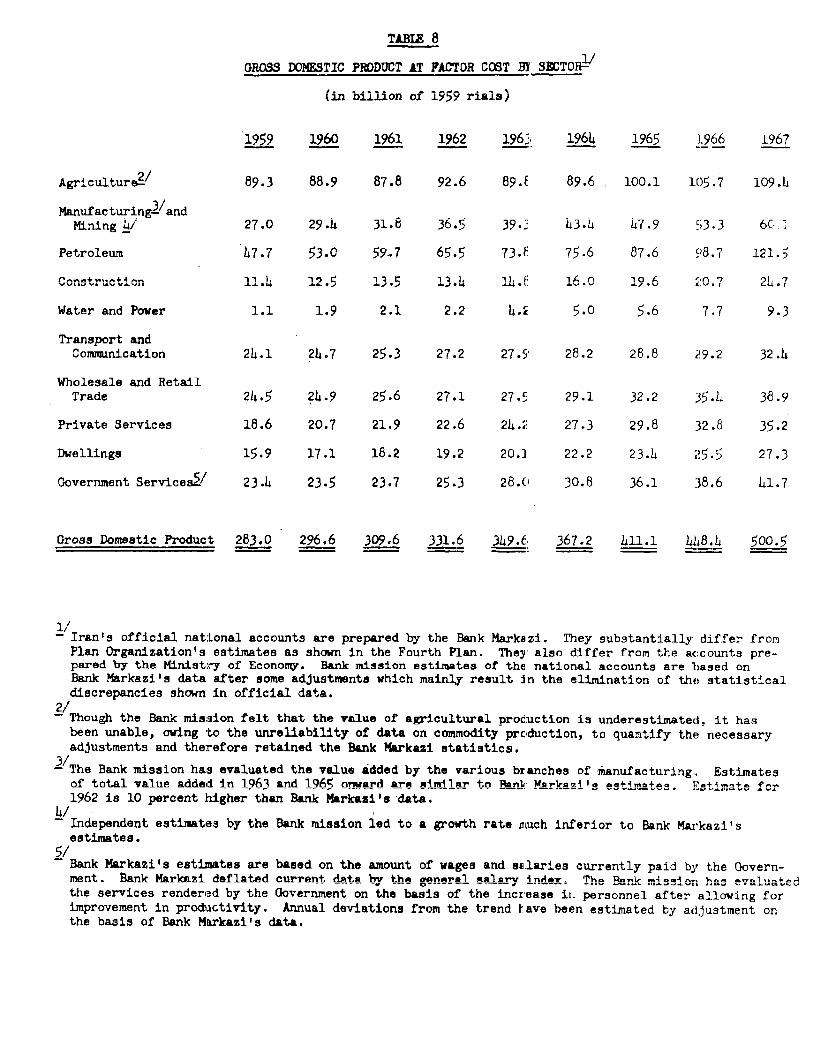
TABIE o
GROSS DOMESTIC PRODUCT AT FACTOR COST BY SECTOR=
(in billion of 1959 rials)
1959 1960 1961 1962 1962 1964 1965 1966 1967
Agricultures 89.3 88.9 87.8 92.6 89.E 89.6 100.1 15.7 109.h
Manufacturing3/andMining 4i 27.0 29.4 31.8 36.5 39._ 43.4 h7.9 53.3 6C0
Petroleum 7.77 3 59Y..7 0).5 (.) C 75.o U( .D 1'O.( i2.
Construction 1.} 12.5 13.I 13.LL l-.. 16.0 19.6 0ro.7 2L.7
Water and Pover 1.1 1.9 2.1 2.2 h. 5.0 7.6 7.7 9.3
Transport andComminication 2!.1 2h.7 25.3 27.2 27.5 28.2 28.8 Z9.2 32.h
Wholesale and RetailTrade 2h.5 24-9 25.6 27.1 27.c 29.1 32.2 35.l 38.9
Private Services 18.6 20.7 21.9 22.6 2h.2 27.3 29.8 32.8 35.2
Dwellings 15.9 17.1 18.2 19.2 20.2 22.2 23.h 25.5 27.3
Government Services5/ 23.4 23.5 23.7 25.3 28.C 30.8 36.1 38.6 41.7
Gross Domestic Product 283.0 296.6 309.6 331.6 3499.& 367.2 h11.1 4h8. 500.5
- Iran's official national accounts are prepared by the Bank Markazi. They substantially differ fromPlan Organization's estimates as shcwn in the Fourth Plan. They also differ from the accounts pre-pared by the Ministry of Economy. Bank mission estimates of the national accounts are based onBank Markazi's data after some adjustments which mainly result in the elimination of the statistical%discrepancies sh.., ikn ow"4icial dt.416
2/2 Though the Bank mission felt that the value of agricultural proc,uction is underestimated, it has
been unable, owing to the unreliability of data on commodity prc.duction, to quantify the necessaryadjustments and therefore retained the Bank Markazi statistics.
3 /The Bank mission has evaluated the value added by the various branches of manufacturing.. Estimatesof total value added in 1963 and 1965 onrard are similar to Rnk Mairkam'i 0sti?S+. Es+timate for1962 is 10 percent higher than Bank Markazi's data.
4/independent estimates by the Bank mission led to a growth rate omuch inferior to Bank Mavkazi t sestimates.
Bank Markazi's estimates are based on the amount of wages and selaries currently paid by the Govern-ment. Bank Markazi deflated current dAta hb the general salary intixa The -r- mission has evaluatedthe services rendered by the Government on the basis of the increase iL personnel after allowing forimprovement in productivity. Annual deviations from the trend have been estimated by adlustment onthe basis of Bank Markazi's data.
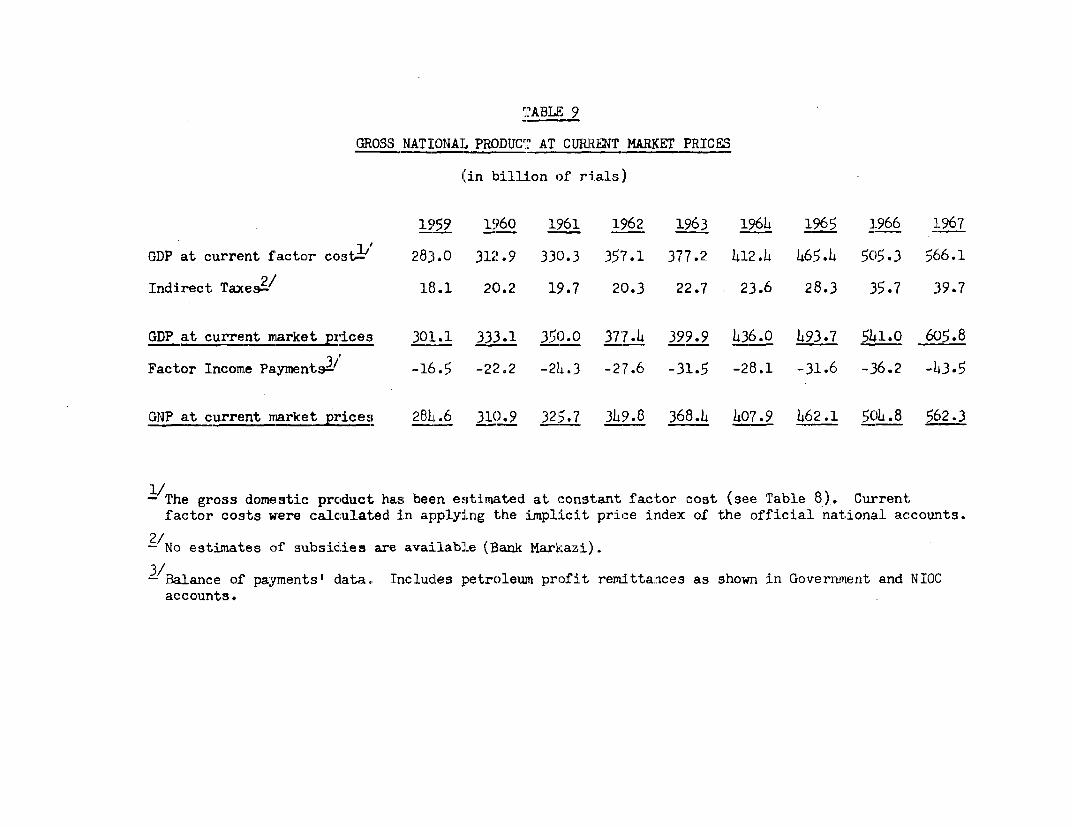
TABLE 9
GtOSS NATIONAL PRODUCT AT CURRIENT MARKET PRICES
(in billion of r ials)
19 59 i960 1961 1962 1963 1964. 1.965 1-966 1-967
GDP at current f'actor cost1, 283.0 312.9 330.3 35'7.1 377.2 412. 4 465.4 505.3 566.1
Indirect Taxe__ 18.1 20.2 19.7 20.3 22.7 23.6 28.3 315.7 39.7
GDP at current market prices 301.1 333.1 350.0 377.4 399.9 436.0 493.7 5Ll.o 6(5.8
Factor Income Paymentsz" -16.5 -22.2 -21h.3 -27.6 -31.5 -28.1 -31.6 -3,6.2 -43.5
GNP at current rrarket ices 28L.6 310.9 321.7 349.8 368.4 4so7.9 462.1 50l.8 562.3
The gross domestic product; has beein estimriated at constant factor cost (see Table 8).. Current,factor costs were calculated in applying the implicit price index of the official, national accounts.
- No estimates of subsidies are available (Bank Markazi).
3/- Balance of payments' dLata., Includes petroleum profit remittances as shown in Government and NIOC;accounts.
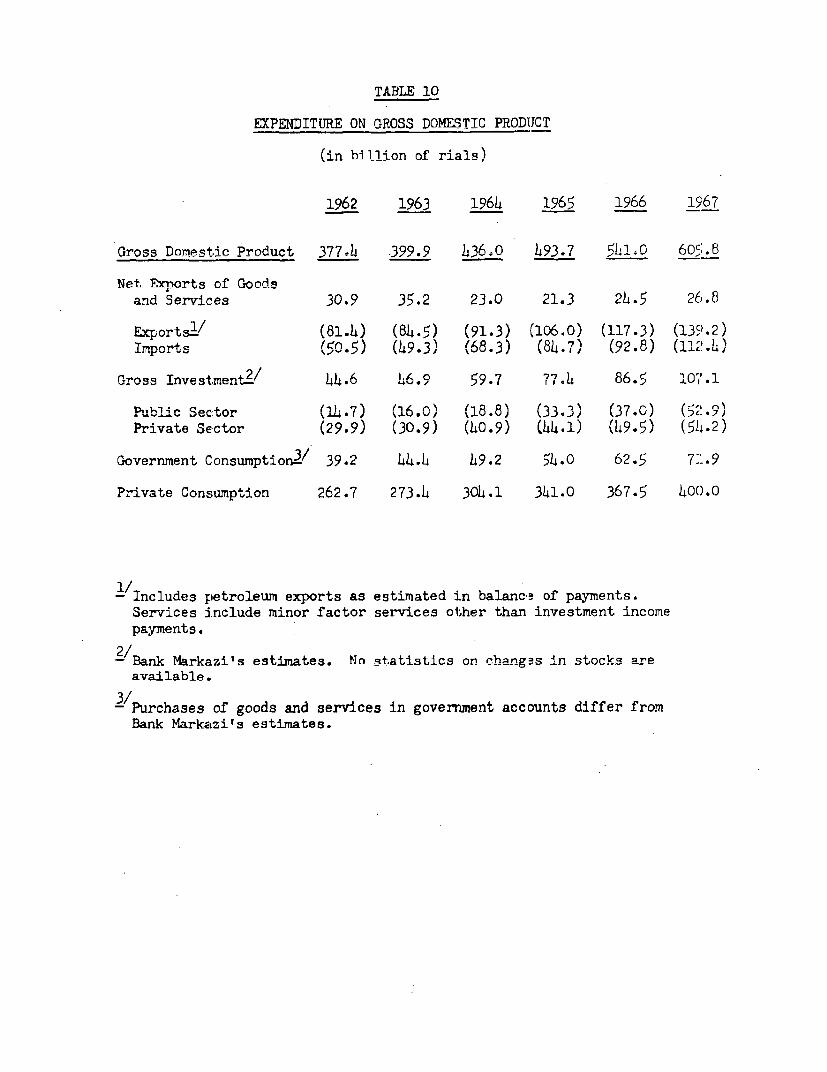
TABLE 10
EXPENDITURE ON GROSS DOMESTIC PRODIJCT
(in billion nf rials)
1962 1963 1964 1965 1966 1967
Gross Domestin Prodiit 3774 .39°.Q l,36.0 )49317 51.O 605. 8
Net Exmorts of Goodsand Services 30.9 35.2 23.0 21.3 2h.5 26.8
Exports / (81.4) (84.5) (91.3) (106.0) (117.3) (139.2)s(50.5) (h. 3) (68.3) (h.7) (92.) (112-)
Gross Invesatm+en+2/ )-L.6 A. 59.7 77. 5 .1.
Flu,bli,c Sector k(') -7L)7) (16.0) (18.8) (333) (. r\
Private Sector (29.9) (30.9) (L0.9) (44.1) (h965) (54.2)
Government Consumption ' 39.2 44.4 h9.2 5h.0 62.5 7L.9
Private Consumption 262.7 273.4 30h.1 341.0 367.5 40(.O
- Includes petroleum exports as estimated in balance of payments.Services include minor factor services other than investment incomepayments.
-/Bank MarkaLzi's estimates. No statistics on -hanngs in stocks areavailable..
-'I" Purchases of goods and services in government accounts differ from
Bank Markaczi's estimates.
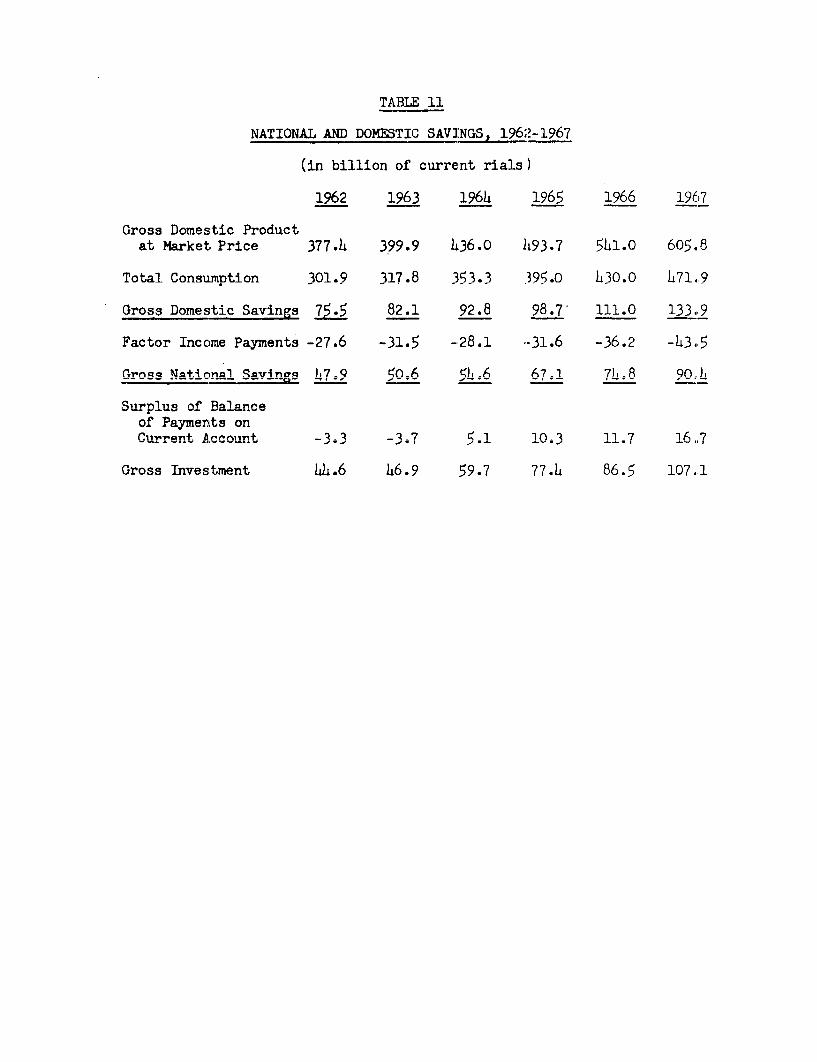
TABLE 11
NATIONAL AND DOMESTIC SAVINGS, 196.'-1967
(in billion of current rials)
1962 1963 1964 1965 1966 1967
Gross Domestic Productat Market, Price 377.L 399.9 L.36.0 493.7 541.0 605.8
Total ConsUmntion 301.9 317.8 353.3 395.0 L30.0 L71.,9
Gross Domestic Savings 75.5 82.1 92.8 98.7' 111.0 133.9
Factor Incrime PAVmentS -27.6 -31.5 -28.1 -. 31.6 -36.2 -L3.5
Gross NatMC'nAr Ravincm OA79 50n - 54=6 67.1 7.8 R ,90.)
Surplus of Baacof Payments onCurrent A.ccount - 3 . 3 .3- -7 5.1 10.3 11.7 16,,7
Gross Investment MA L69 59 7 77 86. 5 107 1
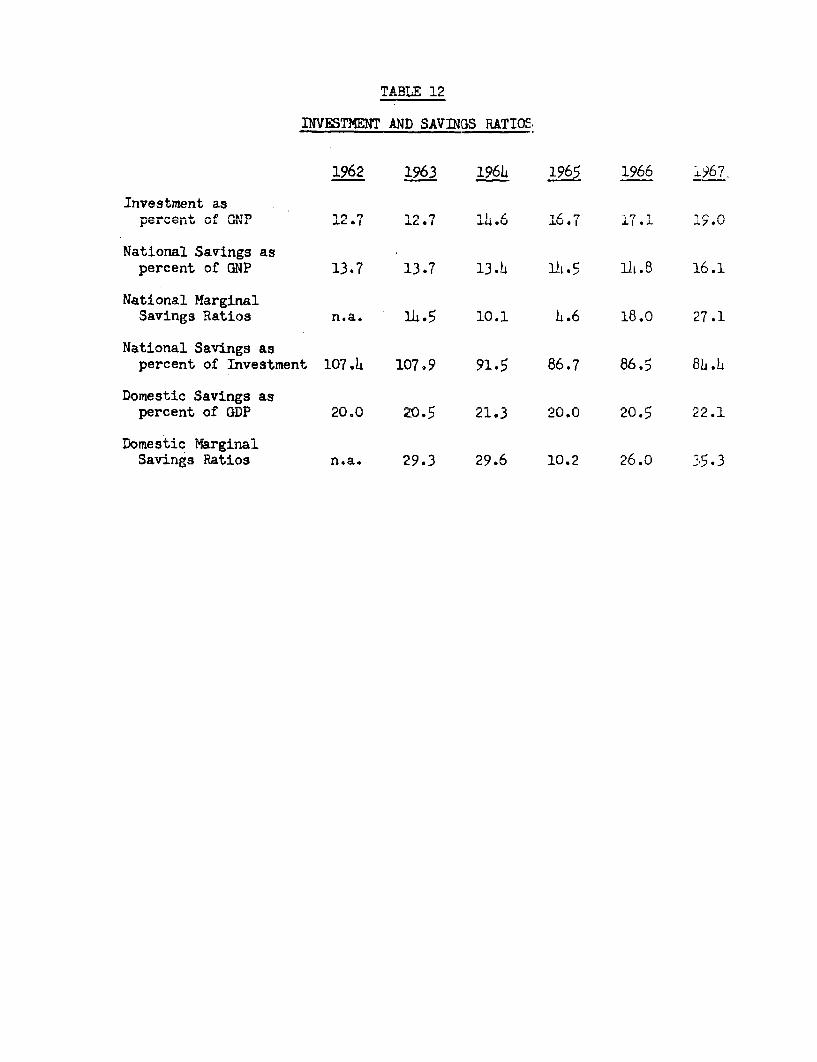
1hTWflTWl'MTJ1 hMTh CAUThYr-C DAMTnTfl
1962 1963 1964 1965 1966 _6_
Investment aspercent 0T I 2.7 '2 .7 -IL Z -1'.7 17.l 1.
at.ional SavinLgs aspercent of GNP 13.7 13.7 13.4 14.5 1h.8 16.1
National MarginalSavings Ratios n.a. 14.5 iO.1 u.6 18.0 27.1
National Sa-vings aspercent of Investment 107.4 107.9 91.5 86.7 86.5 84.4
Domestic Savings aspercent of GDP 20.0 zu.5 21.3 20.0 20.5 22.1
Domestic MarginalSavings Ratios n.a. 29.3 29.6 10.2 26.0 3563
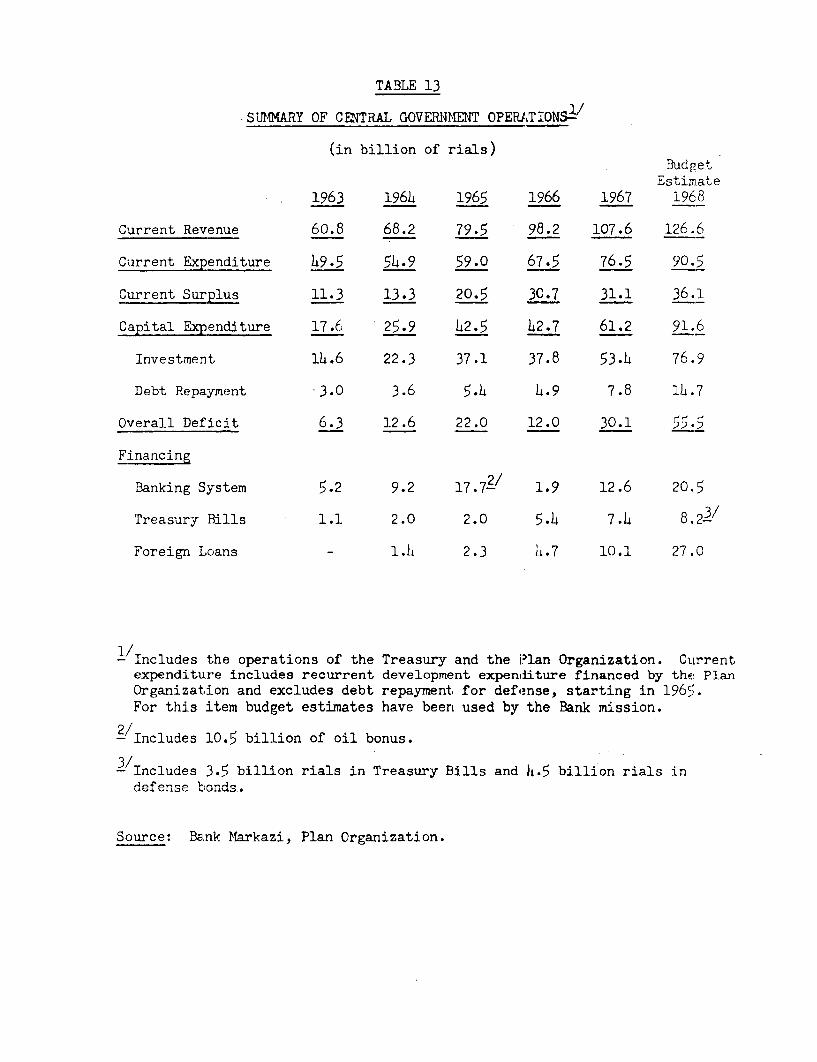
TABLE 13
SU2MMARY OF CENTRAL GOVENMMENT OPERA,TIONS-V/
(in billion of rials)Budpet
Estimate1963 1964 1965 1966 1967 1968
Current Revenue 60.8 68.2 79.5 98.2 107.6 126.6
Current Expenditure 49.5 5h.9 59.0 67.5 76.5 90.5
Current Surplus 11.3 13.3 20.5 30.7 31.1 36.1
Capital Expenditure 17.6 25.9 42.5 42.7 61.2 91.6
Investment 1h.6 22.3 37.1 37.8 53.4 76.9
Debt Repayment 3.0 3.6 5.4 h.9 7.8 1L.7
Overall Deficit 6.3 12.6 22.0 12.0 30.1 55.5
Financing
Banking System 5.2 9.2 17.72/ 1.9 12.6 20.5
Treasury Bills 1.1 2.0 2.0 5.4 7.L 8,23
Foreign Loans - 1.h 2.3 h.7 10.1 27.0
l/TIn,cuiiesa the ope+rtionna of th TreasTry and the e ?lan Organiza+i.on. Currentexpenditure includes recurrent development expenditure financed by the PlanOrgan-i z.ati on andi Pe-lu ii debt ri ephi a r- rmPn+. fo-r defense- starting in 19OC,
For this item budget estimates have been used by the Bank mission.
-Includes 10.5 billion of oil bonus.
3/Includes 3.5 billion rials in Treasury Bills and h.5 billion rials indSef e Bnse kzPoOndan.a.
Source: Ba.nk M4arkazi, Plan Organization.
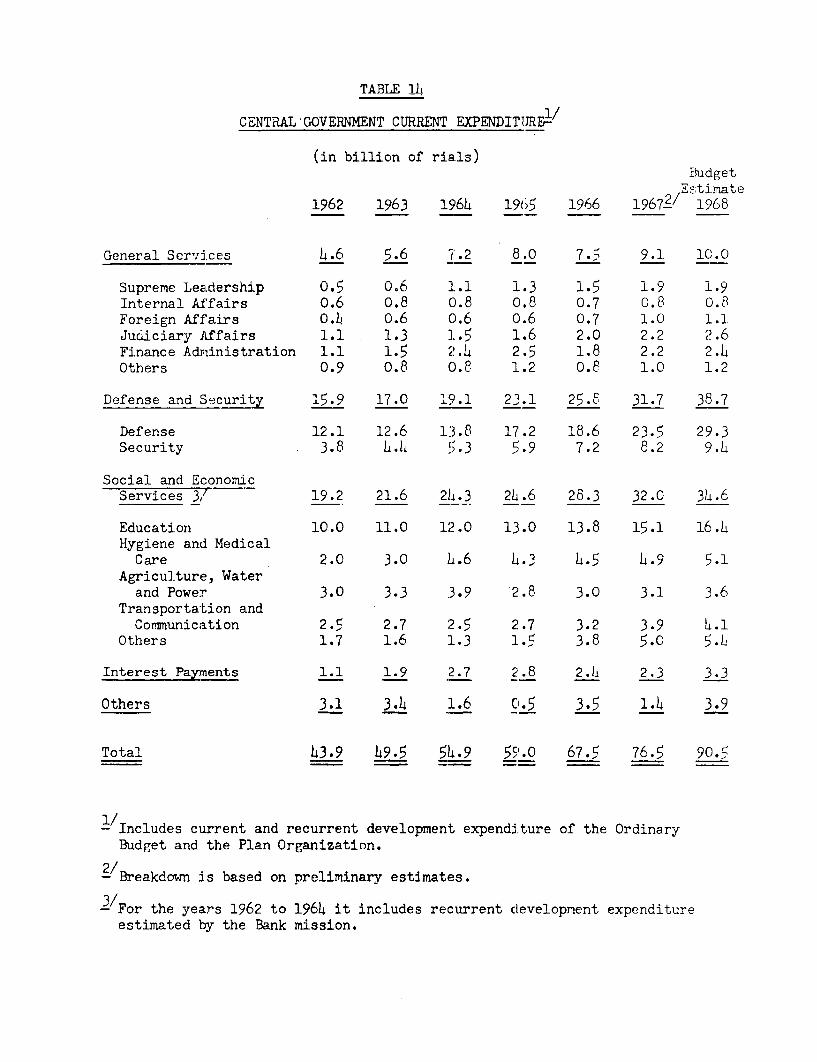
TABLE lh
(.RTJT'?AT.'rOfVERNMWrNT rTTR MEN YPDTTITTRE-/
(in Ublion Ofl ria,ls)Budget
1962 1963 15961 1965 1966 1967V/ 1968
General Services 4.6 5.6 7.2 8.0 7. 9.1 10.u
Supreme Leadership 0.5 0.6 1.1 1.3 1.5 1.9 1.9Internal Affairs 0.6 0.8 0.8 0.8 0.7 0.8 0.8Foreign Aff'airs 0.4 0.6 o).6 0.6 0.7 1.0 1.1JuGiciary lAffairs 1.1 1.3 1.5 1.6 2.0 2.2 2.6Finance Admiinistration 1.1 1.5 2.4 2.5 1.8 2.2 2.1Others 0.9 0.8 0.8 1.2 0.8 1.0 1.2
Defense and Security 15.9 17.0 19.1 23.1 25.8 31.7 38.7
Defense 12.1 12.6 1:3.8 17.2 18.6 23.5 29.3Security 3.8 1.4 5.3 5.9 7.2 8.2 9.4
Social and EconomicServices 3/ 19.2 21.6 21.3 2b. 6 28.3 32.0 31.6
Education 10.0 11.0 12.0 13.0 13.8 15.1 16.4Hygiene and Medical
Care 2.0 3.0 1.6 L.3 L.5 4.9 5.1Agriculture, Water
and Power 3.0 3.3 3.9 2.8 3.0 3.1 3.6Transporta-tion and
Communication 2.5 2.7 :2.5 2.7 3.2 3.9 L.1Others 1.7 1.6 1.3 1.5 3.8 5.0 5.1
Interest Parnents 1.1 1.9 2.7 2.8 2.L 2.3 3.3
Others 3.1 3.4 1.6 Cl.5 3.5 1.4 3.9
Tnt.nl h1.9 h9.q q)l 9 q5q,. (k7. 1 7k, 90 sn El
-'/Includes current and recurrent development expenditure of the OrdinaryBudget and the Plan Organization.
!/Breakdown is based on preliminary estimates.
3/For the years 1962 to 1961 it includes recurrent clevelopment expenditureestimated by the Bank mission.
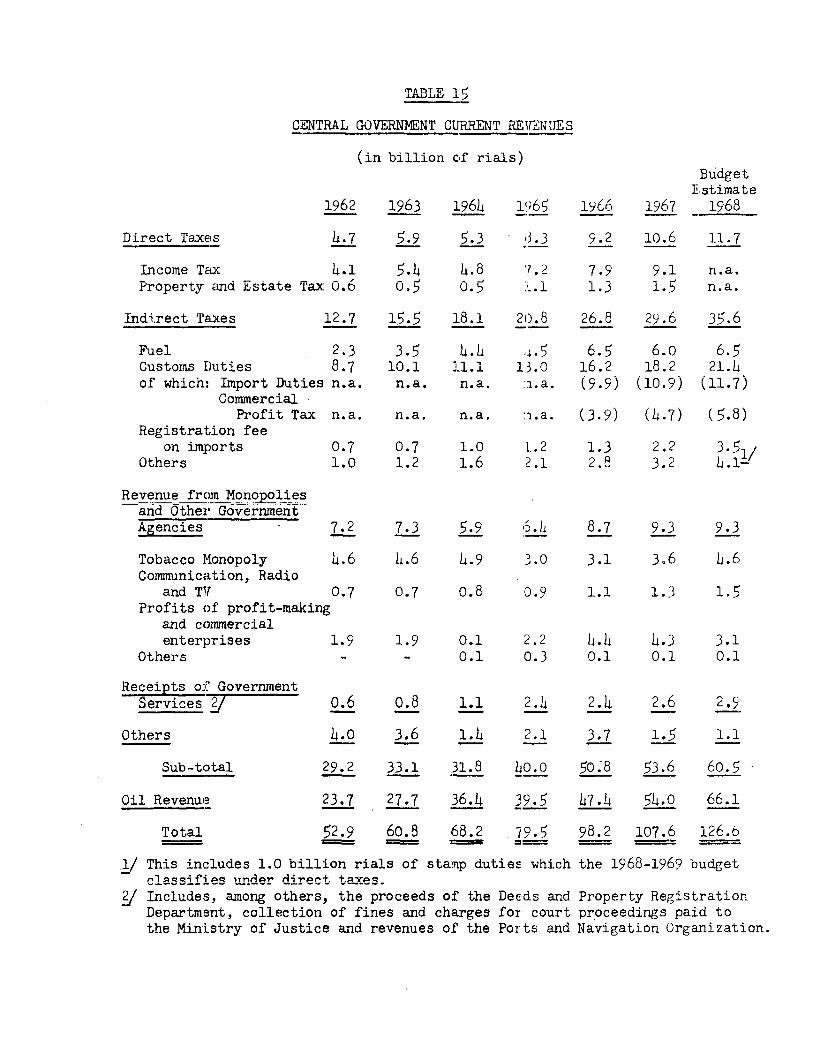
'ttTP w v A T f' {N T~T t,T0 7TrWAn T n TT r Tki~J.LI IllJt.4jL UiJ v "UI L~'Ji'd I j.,UfllD'Z414 I DJ2 ItFI WrA 1, a
BudgetEstimate
1962 1963 1964 1<?65 19c6 1967 1968
Direct Taxes 4.7 5.9 5.3 3.3 9.2 10.6 11.7
Income Tax 4.1 5.4 4.8 '7.2 7.9 9.1 n.a.Property and Estate Tax o.6 0.5 0.5 'L.1 1.3 1.5 n.a.
indirect TExes 12.7 15.5 18.1 2o.8 26.8 29.6 35.6
Fuel 2.3 3.5 4.4 ' 5 6.5 6.o 6.5Customs Duties 8.7 10.1 1.1.1 1.3.0 16.2 18.2 21.4of which: Import Duties n.a. n.a. n.a. :a.a. (9.9) (10.9) (11.7)
CommercialProfit Tax n.a. n.a. n.a. :a.a. (3.9) (4.7) (5.8)
Registration feeon imports 0.7 0.7 1.0 1.2 1.3 2.2 3.51/
Others 1.0 1.2 1.6 2.1 2.8 3.2 h.1-
Revenue from Monopoliesand Other GovernmentAgencies 7.2 7.3 5.9 6.4 8.7 9.3 9.3
Tobacco Monopoly 4.6 4.6 4.9 3 3.1 3.6 4.6Communication, Radio
and TV 0.7 0.7 o.8 0.9 1.1 1.3 1.5Profits of profit-making
and commercialenterprises 1.9 1.9 0.1 2.2 4.4 4.3 3.1
Others - - 0.1 0.3 0.1 0.1 0.1
Receipts of GovernmentServices g 0.6 0.8 1.1 2.4 2.4 2.6 2.9
Others 4.0 3.6 1.4 2.1 3.7 1.5 1.1
Sub-total 29.2 33.1 31.8 LO.0 50.8 53.6 60.5
Oil Revenue 23.7 27.7 36.4 39.5 47.4 54.0 66.1
Total 52.9 60.8 68.2 79.'5 98.2 107.6 126.o
.1/ This includes 1.0 billion rials of stamp dutieE which the 1968-1969 budgetclassqi f-i es i7nider Airvecttxe
2/ Includes, among others, the proceeds of the Deeds and Property RegistrationDepartm-ent, collection. of fines and charges for court proceedings paid tothe Ministry of Justice and revenues of the Ports and Navigation Organization.
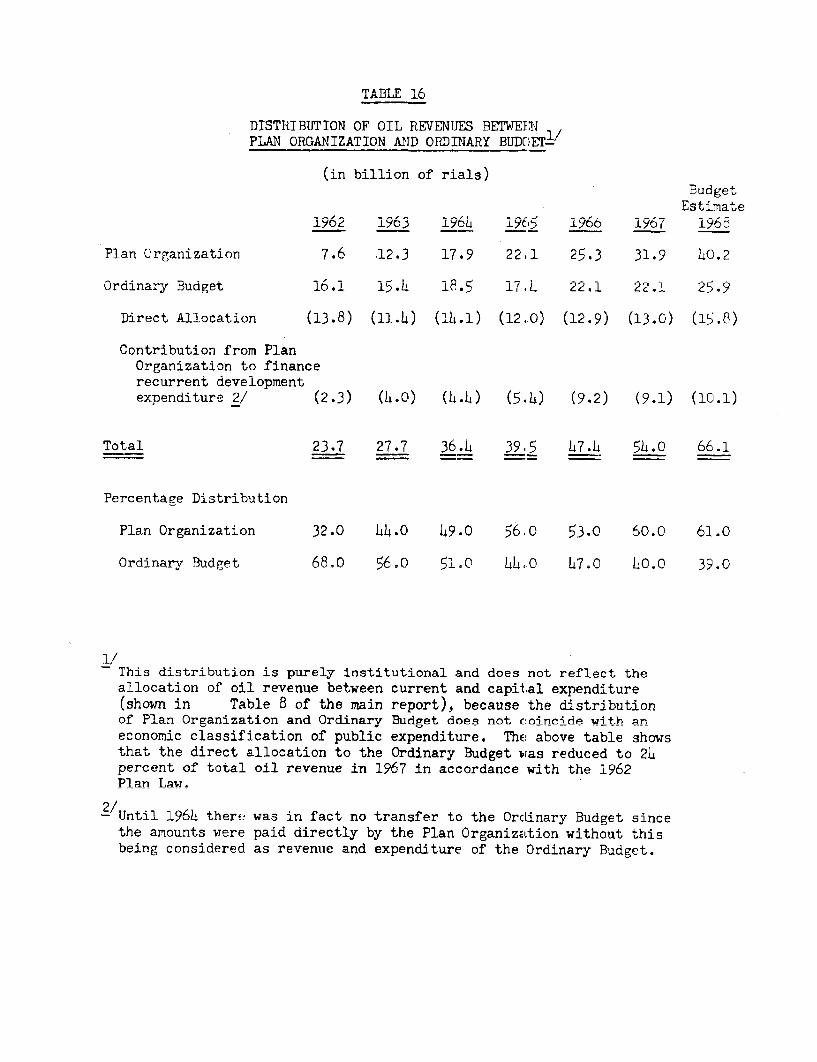
mAntA 16
PLAN ORGANIZATION AND ORDINARY BUDCETl/
(in billion of rials)BudgetEstimate
1962 1963 1yoL 196,5 1966 1967 1966
Plan Organization 7.6 .12.3 17.9 22.1 25.3 31.9 Lo.2
Ordinary Budget 16.1 15.4 18.5 17,4 22.1 22.1 25.9
Direct Allocation (13.8) (11.4) (1J4.1) (12.0) (12.9) (13.0) (15-8)
Contribution from PlanOrganization to financerecurrent developmentexpenditure 2/ (2.3) (h.O) (L.L) (5.4) (9.2) (9.1) (10.1)
Total 23.7 27.7 36.h 39.5 h7.h 5L.O 66.1
Percentage Distribution
Plan Organization 32.0 3L.0 L9.0 56.O 53.0 60.0 61 0
Ordinarv Budget 68.0 56.0 51o ),, 0 L ,7n 0 Jon LO n 39n
1/This distribution is purely institutional and does not reflect theallocation of oil revenue between current and canital exnenditure(shown in Table 8 of the main report), because the distributionof Plan Organization and Ordinarv Budget does not e:oincidei with aneconomic classification of public expenditure. The above table showsthat the direct allocation to thp Ordinary rdigieut. waqs rpediuce to 29percent of total oil revenue in 1967 in accordance with the-1962Plan Law.
2/Until 1960) ther- was in fact. no transfer to the OrHinary Budget sincethe amounts were paid directly by the Plan Organization without thisbeing rconsidered as revenue and expendetlre of +he Ordinar Budget.
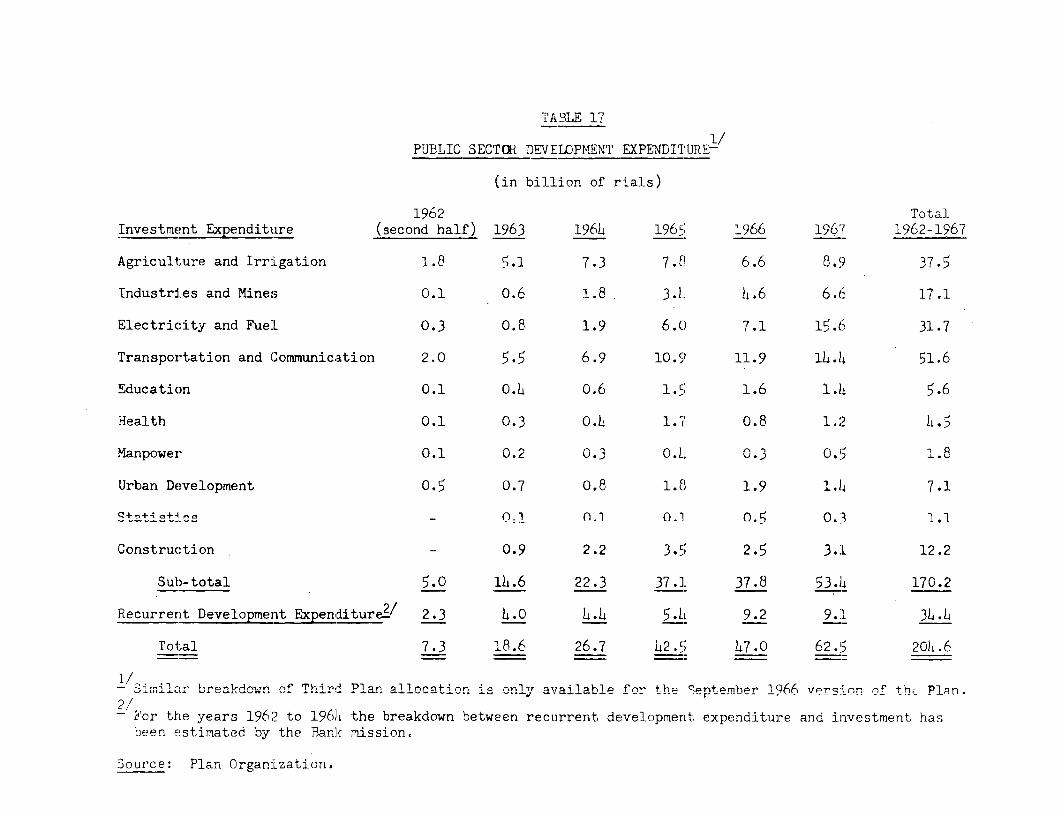
TABLE 17
PUBLIC SECTOR DEVELOPM4ENT EXPENDITURE-
(in billion of rials)
1962 TotalInvestment Expenditure (second half) 1963 196L 1965 1966 1967 1962-1967
Agriculture and IrrLgat-ion 1.8 5.1 7.3 7.8I 6.6 8.93 37.5
Industries and Mines 0.1 0.6 1.8 3.L l.6 6. 6 17.1
Electricity and Fue:L 0.3 0.8 1.9 6.C) 7.1 15.6 31.7
Transportation and Communication 2.0 5.5 6.9 10.C9 11.9 iL.lh 51.6
Education 0.1 0.L 0.6 1.5; 1.6 L.lh 5.6
Health 0.1 0.3 0.L 1.7 (.8 1.2 4-5
Manpower O.i 0.2 C.3 0.L 0).3 0- 1.8
Urban Development 0.5 0.7 CI.8 1.8 1 1.9 1.l 7.1
~+atl+*-; .lni n ll 021 O. 0.3 1.1
Construction 0.9 2.2 3.5 2 .5 3..1 12.2
Sub-total 5.0 1h.6 22.3 37.1 37i.8 53.L> 170.2
Recurrernt Development Expenditure-/ 2.3 4.0 L.L 5. - 9.2 9.1 3b.h
Tot;al 7.3 18.6 26.7 42.5 L"7.0 62.5 20L.6
1/SimilaMr breakdown of Third4 Plan allocation. is onl aTailahI f the qept;embler 1Q66A iipr;ir,,n of t.h- Plnn.
2,/- For the years 1962 to i961) the breakdown between recurrent development expenditure and investment has
been ejstimated by the Bank mission.
Source: Plan Organization.

TABLE 18
MONIETARY SURVEY
(billion of rials - at end of the yvar)
1961 1962 1963 L964 1965 1966 1967
Foreign Assetsi/ 16.7 18.5 20.8 ?8.3 2h.h 23.0 29.5
Claims on Government 28.2 25.9 31.5 37.2 h2.1 50.2 69.6
Claims on Private Sector 38.6 L8.9 58.3 69.0 78.9 92.7 109.4
Claims on SpecializedBanks 2.L 2.2 2.8 L.3 2.0 3.1 2.1
A sset3= T 4 4-14 1 4 RC Alf 0 O 11 I iP P 1.7 1 lAo n 91( A;G- a iU | f V WWCO VJ . / W2 2 LJ_ - 64 ~1 ..4 j 4 i a*.
T. ,Jab .... 1 o 0.6 0TJ 1. 1. 0 1
Currency iin a..±-c-uLauiZ±n 7.1 9.8 2.6 u 25.5 2 34.8~~~~~~~~~~~~~' 17 ' I , -z 5 n a 1 7 1 . 1 A1
Demana Deposits 2>u 0 L. 4o.o .u.u )).7 )t . .u
Time Deposits 15.8 24.2 31.7 37.3 43.7 $2.1 6L.2
Public Sector Deposits-2/ 12.8 i2-. i6. - 30.^3 e-.0 2. .V
Importer,s Deposits - - - 2.6 a.8 7.1
Capital Accounts 12.0 12.3 12.3 11.6 12.2 12.9 14.1
Other Items, net 4.2 1.7 3.3 2.7 L.5 3.7 4.3
- Includes holdings of gold and foreign exchange, net credits of payments-6eemen+ts, DTM net jbO9ition a-id Iran's- sh^-ae in i ntera?n=atinal or- ganri z -ii lojnn5 -" I U~ .. a a..-- 'fJa-...'.. ,.* "
-/Includes counterpart fu.ds.
Source: ..LCL.I Iank Markazi
Source: Bank Markazi
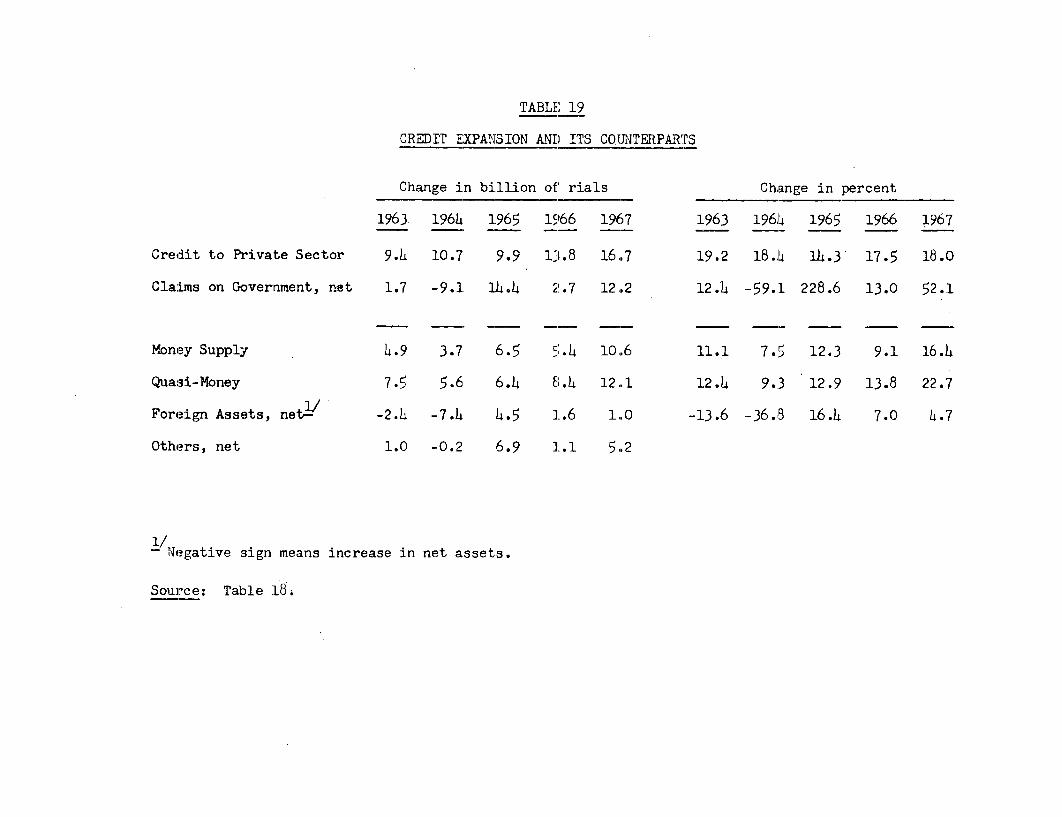
TABLE' 19
CREDIT EXPANFSION ANI) ITS COUITERPARTS
Change in billion of' ricls Chiange in percent
1963 1964 1965 1966 1967 19653 1964L 1965 1966 1967
Credit to Private Sector 9.4 10.7 9.9 13.8 16,.7 19.2 18.,! 1L..3 17.5 16.0
Claims on GDvernment, net 1.7 -9.1 11.4L 2.7 12,2 12.4L -59.1 228.6 13.0 52.1
Money Supply L.9 3.7 6.5 5.4 10,.6 11.1 7.5 12.3 9.1 16.4
Quasi-Money 7.5 5.6 6.4 E1.L 12.1 12.h 9.3 12.9 13.8 22.7
Foreign Assets, netY -2.4 -7.4 4.5 1.6 1.0 -13.6 -36.o 16.4 7.0 4.7
Others, net 1.0 -0.2 6.9 1.1 5.2
- Negat:ive sign means increase in net assets.
Source: Table L8.
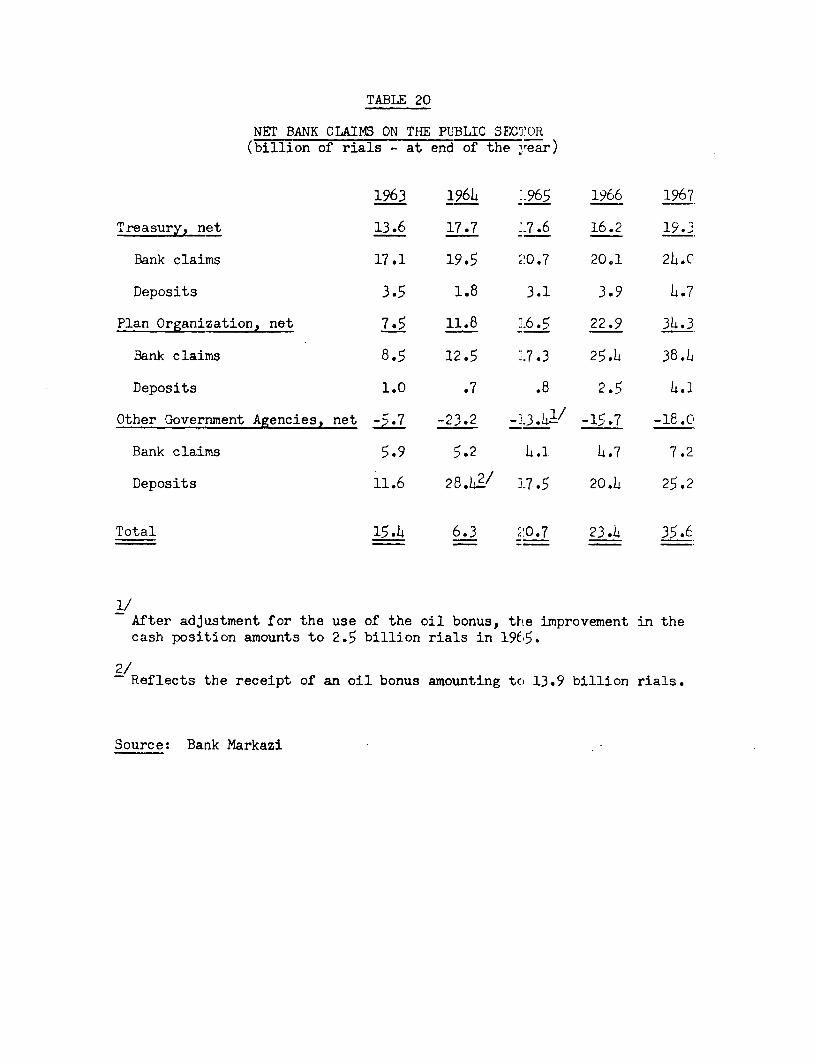
TABLE 20
NET BANK CLAINS ON THE PUBLIC SECj'OR(billion of rials - at end of the rear)
1963 196h -:965 1966 1967
Treasury, net 13.6 17.7 L7.6 16.2 19.3)
Bank claims 17.1 19.5 20.7 20.1 2b.0
Deposits 3.5 1.8 3.1 3.9 h.7
Plan Organization, net 7.5 11.8 -6.5 22.9 34.3
Bank claims 8.5 12.5 1.7.3 25.h 38.t
Deposits 1.0 .7 .8 2.5 4.1
Other Government Agencies, net -5.7 -23.2 -13 3.21 -15.7 -18.C'
Bank claims 5.9 5.2 4.1 h.7 7.2
Deposits 11.6 28.L/ 17..5 20.4 25.2
Total tA 2 0.7 2J )I 1N (
1/After adjustment for the use of the oil bonus, thie improvement in thecash position amounts to 2.5 billion rials in 1965.
2/Reflects the receipt of an oil bonus amounting to 13.9 billion rials.
Source: Bank Markazi
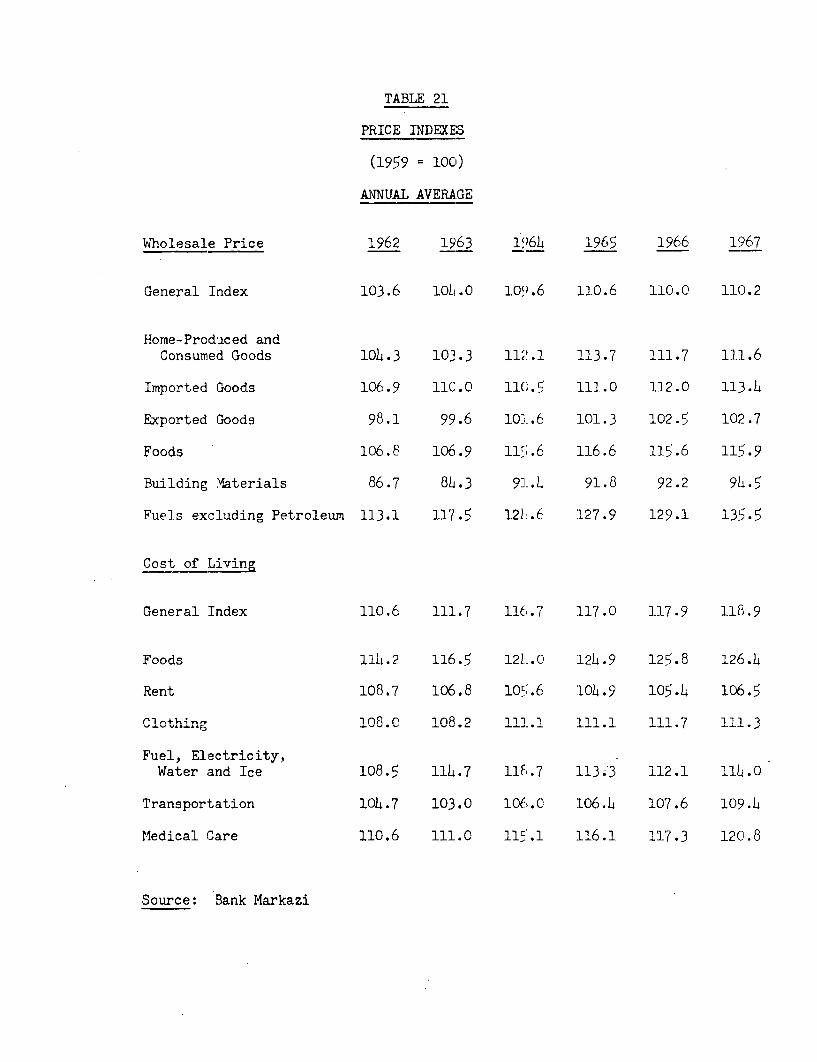
TABLE 21
PRICE INDEXES
(1959 = lOC')
ANNUAL AVERAGE
Wholesale Price 1962 1963 1964 1965 1966 1967
General Index 103.6 101.0 109.6 110.6 110.0 110.2
Home-Produced andConsumed Goods 10.3 103.3 112.1 113.7 111.7 111.6
Imported Goods 106.9 l1C.0 110.5 111.0 112.0 113.L
Exported Goods 98.1 99.6 101.6 101.3 102.5 102.7
Foods 106.8 106.9 11'.6 116.6 115.6 115.9
Building Materials 86.7 8b.3 91.L 91.8 92.2 9lo.5
Fuels excluding Petroleum 113.1 117.5 12L.6 127.9 129.1 135.5
Gosct. nf Liv4ng,
General Index 110.6 111.7 116.7 117.0 117.9 118.9
Foods III,.? 116. 121,.0 12nL.9 125.8 126.L
Rent 108.,q7 10. n0;. 10t. I0.L 106.5N -o i c A I
Clothing 108.0 108.2 11].1 111.1 111.7 111.3
;ue| .1 A' e 4-I A._ 4- .,Water and Ice 108.' 114.7 11,.7 113.3 112.1 114.0
Transportation 104.7 103.0 106l.0 106.L 107.6 109.b
Medical Care 110.6 111.0 l1'.1 116.1 117.3 120.8
Source: Bank Markazi
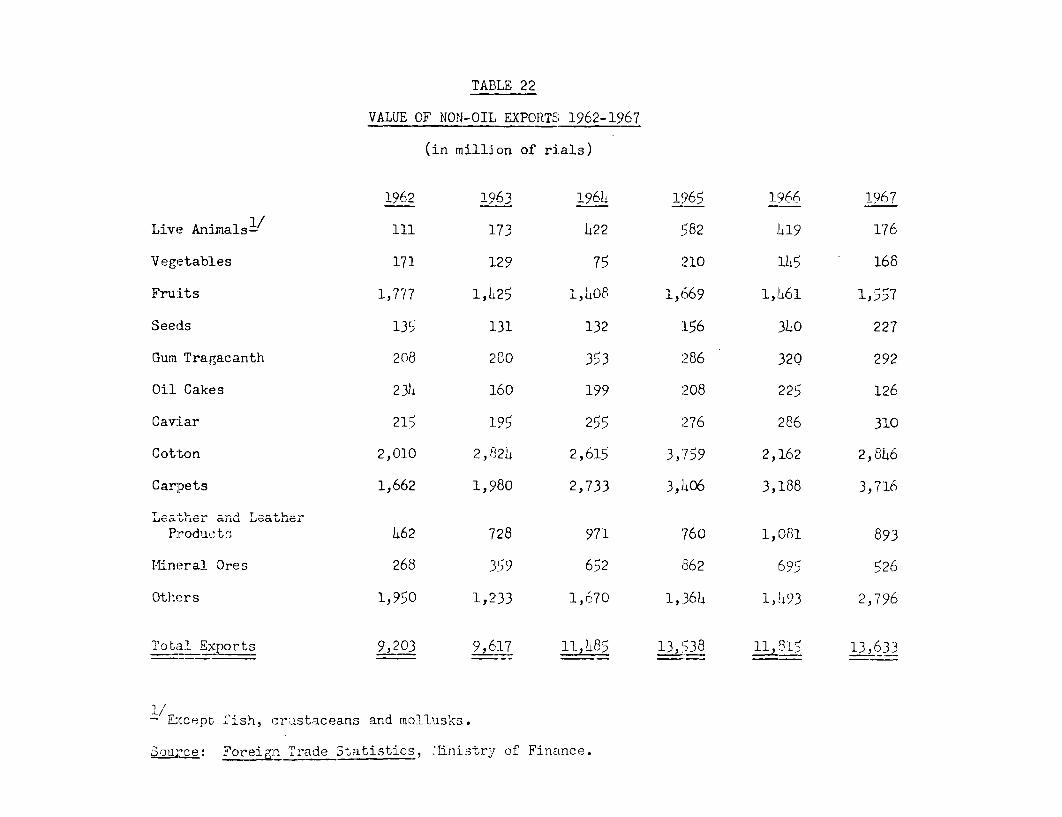
TABLE 22
VALUE OF NON-OII, EXPORTS 1962-1967
(in million of rials)
1962 1QAwh4 iQAh), 19A)hI9A 1 967
Live An:imaals 111 1.73 l22 582 h1419 176
Vegetables 171 1.29 75 210 15 168
Fru:its 1,777 1,L25 1,l08 1,669 1,46i 1,5 7
Seeds 135 131 132 :56 340 227
Gum Tragacanth 208 280 353 ;286 32Q 292
Oil Cak,es 23h ]60 199 ;208 225 126
Caviar 215 195 255 276 286 310
Cotton 2,010 2,*2X 2,61!l 3,759 2,162 2,846
Carpets 1,662 1,5980 2,733 3,1106 3,188 3,716
T I __ _ T A ;_
Produc t, 462 728 971 760 1,081 893
Mineral Ores 268 9 652 862 695 526
Others 1,950 1,233 1,670 1,.36)4 1,493 2,796
Total E:orts 9,203 9,617 11L,85 13,538 11,81, 13,633
i,'
- Excepiu fish, crustaceans and mollusks.
2ou-se: Foreigr Tiade 3tatistics, Iinistry of Finance.
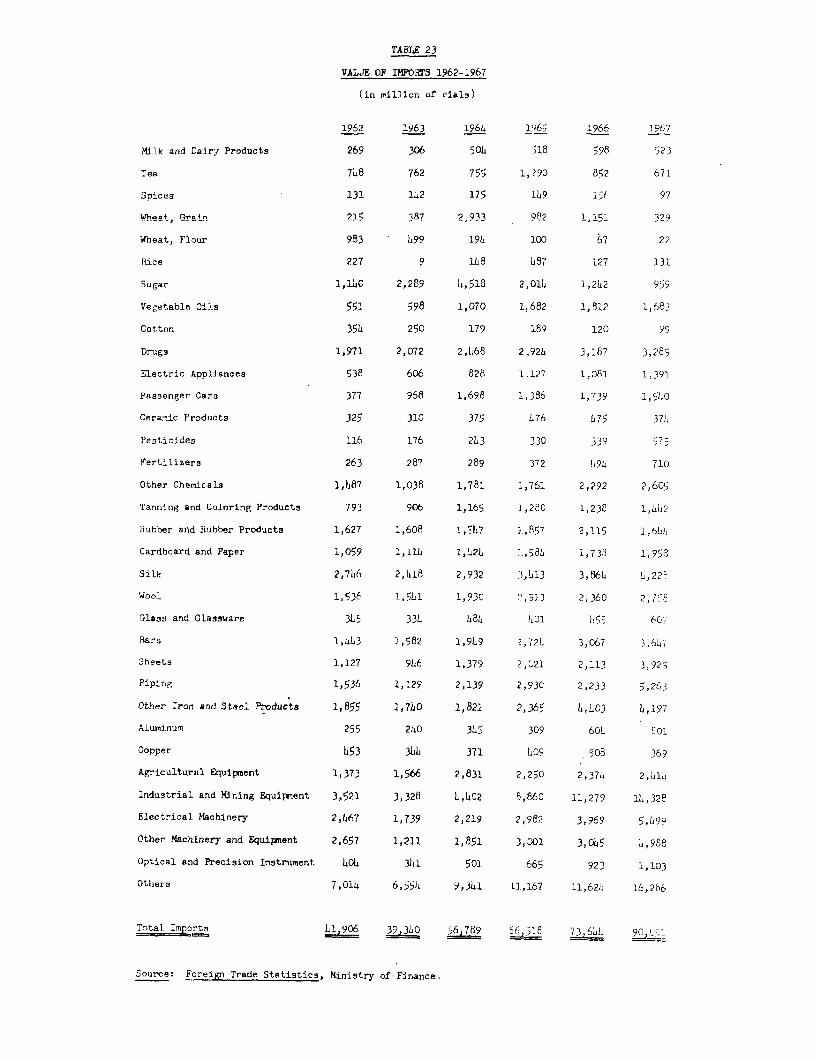
TABLE 23
VALtJE OF IPORTS 1962-1967
(in miliotn of riaimj
1962 1963 i96&, l,65 1966 1967
Mil.k and Dairy Products 269 306 504 18 598 523
Tea 7L8 762 755 1,790 852 671
Spices 131 162 175 109 ,,i 97
bfheat, Orain 215 387 2933 . 982 1,151 329
Wheat, Flour 983 499 19L 100 67 22
Rice 227 9 It- 487 127 131
Sugar i,l6O 2,289 6,518 2,016 1,262 959
Vegetable Oils 551 598 1,070 11682 1,812 1,683
Cotton 356 250 179 189 120 99
Drugs 1,971 2,072 2,L68 2,926 3,187 3,285
Electric Appliances 538 606 828 1.127 1,081 1,391.
Passenger Cars 377 968 1,698 1,336 1,739 1,540
Ceraric Products 325 310 375 676 751 378
P116 1 1-3 30 339
Fertilizers 263 287 289 372 6196 710
Other Chemicals 1,687 1,038 1,781 2,761 2,292 2,605
Tanning and Coloring Products 793 906 1,165 3,2PC 1,238 1,LL2
Rubber and ltubber Products 1,627 1,608 1,57 3,8537 2,115 1,66L
Cardboard and Paper :,059 1,116 1,L26 :.,5aL 1,73.5 1,958
Silk 2,766 2,418 2,932 3,613 3,866 L,22%
Wnnl 1,536 1,561 1,930 3,513 2,3n 2 t,
Glass and Glassware 3L5 33L 686 !,01 155 6C,
Bars 3,643 1,582 1,969 2,726 3,067 3,6I6
Sheets 1,127 966 1,379 2,021 2,113 3,92;
Piping 1,536 1,129 2,139 2,93C 2,233 5,263
Other Iron and Steel Products 1,855 1,7h0 12,821 2,365 6,6C3 6,297
Aluminum 255 260 32,5 309 60L Cci
Copper 653 31 371 609 508 36Q
Agricultural Equipment 1,373 1,566 2,831 2,250 2,376 2,016L
Industrial and Mining Equiprment 3,521 3,328 6,602 8,860 11,279 1I,328
Electrical Mhinr 2,L67 1,739 - 2,9B,. j,969 5,u
Other Machinery and Equipment 2,657 1,211 1,85i 3,001 3,065 6,988
Optical and Precision Instrument 606 341 501 665 923 1,103
Others 7,016 6,554 9,341 11,167 11,626 16,286
Total Imcrts 1906 39,36 56,78 6518 73,6 9,02
Source: Foreilr Trade Rtsttiqt.ir. Ministry of Finance.
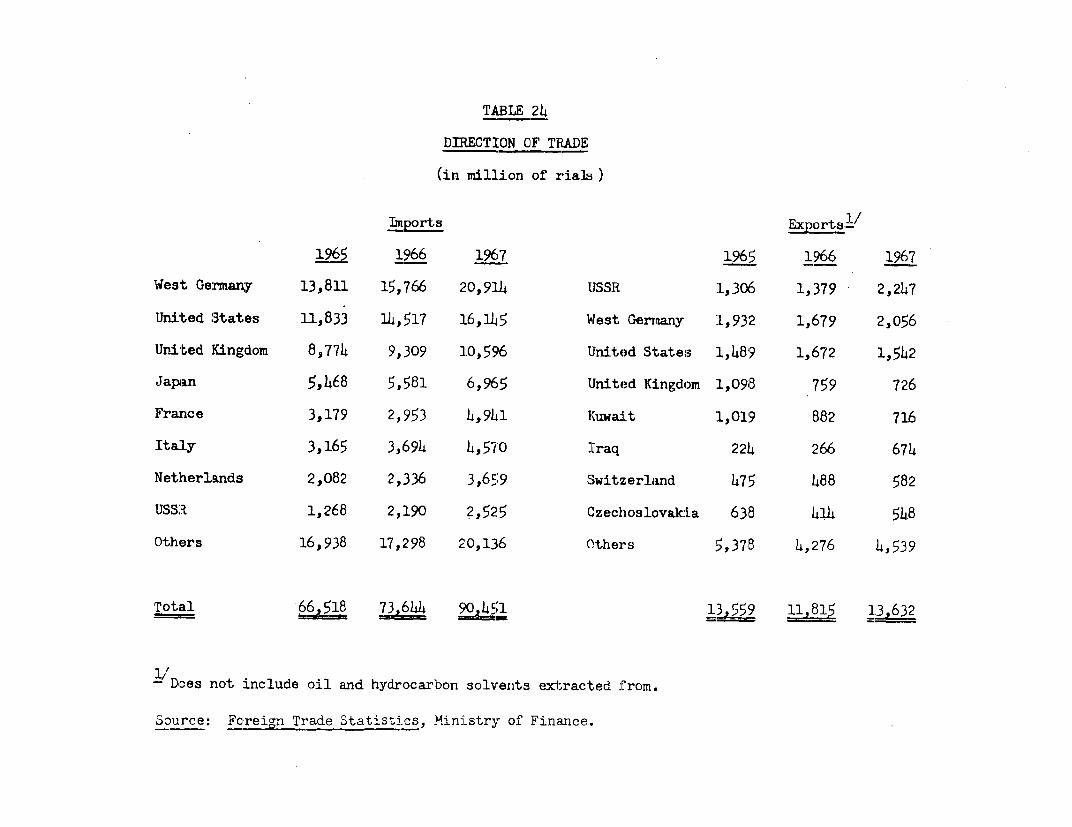
TABLE 24
DIRECTION OF TFADE
(in million of riala)
T1T1port5 9ExpDrts./
1965 1966 1967 1965 1966 1967
West Ge:rmany 13,811 15,766 20,91.4 IJSSR 1L,305 1,379 2,247
Unilted States 11,833 1L,517 1.6,h115 West Germany 1,93:2 1,1679 2,056
Uni-ted Kingdom 8,774 9,309 1.0,5596 IJnited States Il489 1,672 1,542
Japan 5.,468 5,581 6,96,5 United K-Lngdom 1L,098 759 726
France 3,179 2,953 4,94,1 KuwaiLt :l,019 882 716
Italy 3,165 3,694 4,,570 Iraq 221h 266 674
Nethnerlands 2,082 2,336 3,6';9 S;witzer1and t475 1h88 582
USSIR 1,268 2,190 2,525 Czechoslovakia 63B 4h]4 548
Others 16,938 17,298 20,136 Others 50,378 4,276 4,539
Total 66,51.8 73 644 5)011 13,559 11815 13,62
.=~ ~ . , - -,,, - -g _
l/Does not include oil and hydrocarbon solvents extracted from.
Source: Foreivii Trade Statisti.cs, Ministrl of' Finance.
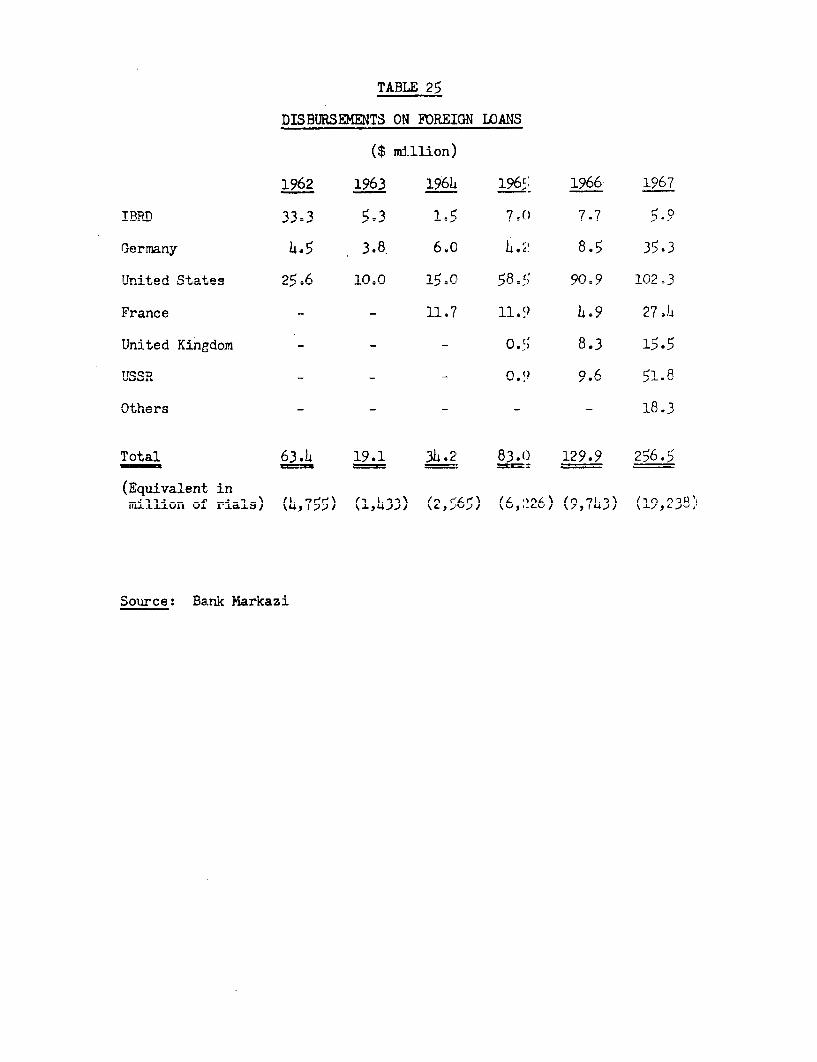
TABLE 25
DIS URSEMENTS ON FOREIGN lWANS
($ million)
1962 1963 196L 196' 1966 1967
ITRn 33-3 5 3 1. 7.0 7.7 5-°
Urnited States 25.6 10.0 15O 0 8'; g= 102-3w~~~~~~ e -A in-n I _ ~ _1 1M 7 1 , 1n1,9 97 1,
Fr11-7 11-9 - _Q 97 A
TTed +.oA = = = 0 15 .
USSR s _ = Q*() 9.6 51 8
Total 63.4 19.1 34.2 83.() 129.9 256.5
(Equivalent inSrIe: oaf ar ris i' ,755 1,' 33) (', if '26) (9,7L3) (19,238
So-urce: Baric Markazi
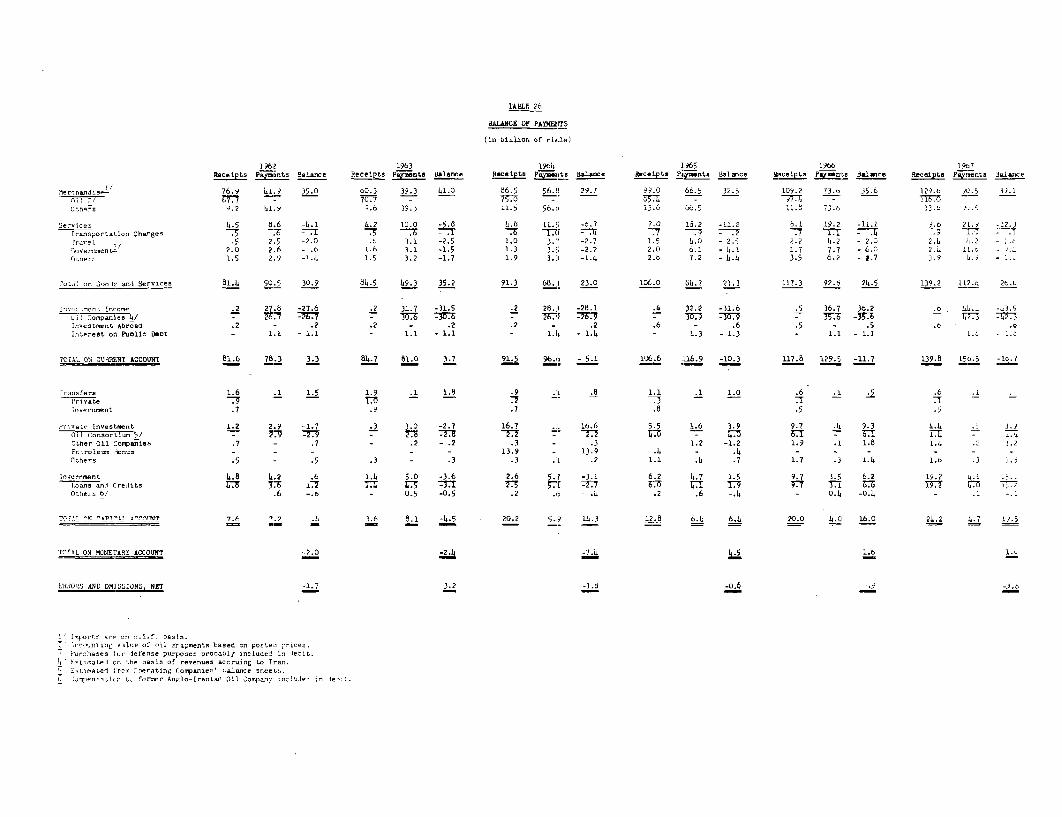
TABiLE 26
BALANCE OF PAYMENITS
(is bic~ior. off rils.)
1 962? 19b3 1964 1965 1966 15c(7Race ipt Pay-etz Balance Receipte rEnits Balance W I55 pf~ irts Balancea FeeIt ntafl5 Balancee RcIt !RiL Baane. Rcit-f 2 et 3..
Mcrccaodcoe- ~~~~~~~~~~ ~~~76.9 Li.9 35.0 0C.3 39. 3 41l.0 8665 56.8 29. 7 99.0 66. 5 32. 5 1.09.2 73.o 35.6 129.0 AJ.5 39).1-7 - 7C.7 M -0 --- - 7rt
loorc 9.~~~~~~ ~ ~~~~~~~~~2 41. y '.0 79. 3 11. 56. 6 13.6 11273.I - -
Bero ices 1~~ ~~~~~ ~~~~~ ~~~.5 8.6 -1.1I 4.2 Ili.o -5.8 14.8 II.!; -6.?7 7.0 18.2 -11. 2 6.1 19.2 -11.1 90 21., -12.3fr,ptaioCharges-7 7 ~ . -7-Zr -_.1 7 = .rz =-rn - -7. _77 -7 = --. ITI ; TZ
Crc - 5 2 .5 -2.0 . 3. 1 -2.5 1.0 3.7 -2. 7 1. 5 1.0 - 2.5 2. 2 4.2 - 2.0 2.1 .lccercmectz' ~~~~ ~~~~ ~~ ~~2.0 2.6 - .6 .6 3.1I -1. 5 1. 3 3.5 -7.2~ 2.0 6,1i -. i1 1.7 7.7 -6.0 2.1, 1. L.finer, 1~~ ~~~~~ ~~~~ ~ ~~~.5 2. 9 -.14 1.5 3. 2 -1.7 1.9 3.37 -1.4 2.6 7. 2 - .4. 3.5 6.2 - 27 3. 9 1.9 I I.,
[01.4 cc lock, ant
ServiceS ~~~~~~81.1. 50. -5 30.9 81.5 49.3 35. 2 91.3 68.3l 23.0 106.0 81. 7 71.3 117.-3 92.6 24.5 139.-2 113.6 2t.
v-icr; Income .~~~~~~~~~~~2 27.8 -2 7.6 .2 31. 7 -31.5 .2 28.3 -28. 1 .6 32. 2 -31.6 .5 36.7 36. 2 L" ... -a3.5Companies_I.! - ~~~~~~~~~~~~~~~7 ~~~fl - C ~~~~~~~flY C jo.p zr~~~~~~~~~~~~ - 35.6 4fl n3~~~- -7 ~ _7
Ic.cse.Abrcd .2 - .2 .2 - .2 .2 - .2 .6 - .6 .5 - .5 .1 .
Icr-st, ori Puaolic Dent - 1.1. - 1.1 - 1.1 - 1.1 - 1.4I - i.4 - 1.3 - 1.3 - 1.1- 1.] 1 - -
10011. 0 291-mINT ACCOUNt 81.6 78.3 3.3 81.,7 1-.0 .7 9. 9.6 -51106.6 1L16. 9 -10.3 117.8 129.5 -11.7- 139.8 Fo. -Ic. 7
in confers ~~~~ ~~~~~~~ ~~~i.6 .1 1.5 1.9 .1 1. 9 . .8 1. 1 10.6 .1 . .6 -
cc-rcssect .~~~~~~~~~~~~~7 .9 .7 . 5
cc cacr_Invectmeot ~~~~ ~~~~ ~~1.2 2. 9 -1.7 .3 3.0 -2.7 16.7 .1 16.6 5.-5 1.6 3.9 9.7 .4 9.. -'I- 4 34
010cr, 011 (se.aniso .7 - .- .2 -. 2 .3 - .3 1.2 -1.2 1. 9 I1 1.8 1.1 .2 .?c.rsieam toas - - - - ~~~~~ ~ ~~~~~ ~ ~~ ~ ~ ~ ~~~~ ~ ~ ~~ ~ ~ ~ ~ ~ ~~~~~~~13.9 - 13.9 .4 .4-- ----
OLh-r .5 - .5 .3 - .3 .3 .1 .2 1.1 .1 .7 1.7 .3 i.1 1.0 .3 .5
22,vornmnen 4.8 1.2 .6 1,1 5.0 -3.6 2.6 5.7 -3.1 6.2 4.7 1.5 9.7 3.5 6.2i 19. 2 I. 16..ma-o alCredits 77 3 T l 3 a fl a a n7 5 a. M; IT. 2 a T7Orth-nb/.6 -.6 - 0.5 -0.5 .2 .65 - .4 2 .6 -.1 - 0.1 -0.1, 1 .
vsrae.,,rAThe . 7.c .3.6 8.i -4.5 20.2 5.9 11.3 12.8 6.1; 6.1 20. 0 14.0 16.01 21. 1. 7 19. 5
.OTAL 09N 43NE'A.RI ACCODUNT -. . ..
-1-v0c of cc: C t,csento, baced c otlm!'u,-chasec ict., es pur,,ses prs..aoly Jiscacdt i.e m~Oit.F Yt,ate c c -oais of renses, accrung t. Tran
ltntdircn Cprtc-pleqaies' a-.lae cometsCc,pmcslicc ;- orrrer ~Ani:io-Irania Oi1 Company incilcLi Ic Ie,:;.
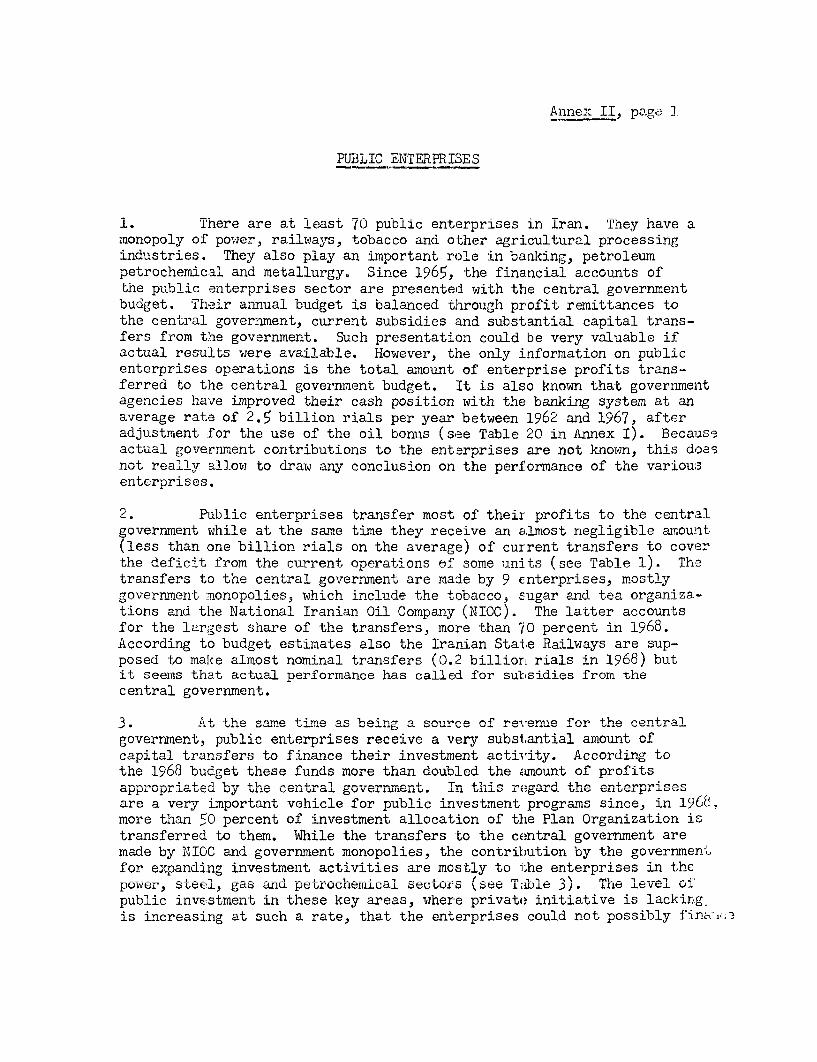
Annex II, page 1
FUBLIC ENTERRISE'S
1. There are at least 70 public enterprises in Iran. They have amonopoly of power, railways, tobacco and other agricultural processingindustries. They also play an important role in banking, petroleumpetrochemical and metallurgy. Since 1965, the financial accounts ofthe public enterprises sector are presented with the central governmentbudget. Their annual budget is balanced through profit remittances tothe central government, current subsidies and substantial capital trans-fers from the government. Such presentation could be very valuable ifactual results were available. However, the only information on publicenterprises operations is the total amount of enterprise profits trans-ferred to the central government budget. it is also known that governmentagencies have improved their cash position with the banking system at anaverage rate of 2.5 billion rials per year between 1962 and 1967, afteradjustment for the use of the oil bonLs (see Table 20 in Annex I). Becauseactual government contributions to the enterprises are not known, this doesnot really allow to draw any conclusion on the performance of the variousenterprises.
2. Public enterprises transfer most of their profits to the centraleovernment while at the same time thev receive an almost negligible amount(less than one billion rials on the average) of current transfers to coverthe deficit from the rmirrent onerations ef some units (see Tablhe 1). Thetransfers to the central government are made by 9 enterprises, rostlygovernment monopolies, which include the tobacco, sugar and tea organiza-tions and the National Iranian Oil Company (NIOC). The latter accountsfor the largest share of the transfers, more than 70 percent in 1968-According to budget estimates also the Iranian State Railways are sup-posed to makle alriost nominJal t-rJ.n.sfers (0.- bdillior. rials i.n out
it seems that actual performance has called for subsidies from thecentral coverLm.ent,
3. At the same tm.e as beingasource of reeneuefor the centralgovernment, public enterprises receive a very substantial amount of
capital Ci.UIL i Utransfersi.I ±A. tL. .LJ.0 C 4UIV.UtJa t.L - tJ -4Ut%'. 4--L6
4-'.
the 1968 budget these funds more than doubled the amount of profitsappropriated buy thile centlra'l governm,ent. Tr. tli eadth nepieare a very important vehicle for public investment programs since, in 196e.m,ore thIan c'O percent 0of 4-VeS4s.en aloaln ft-4Pa rnia ni£II.Ji~ UJ.C.L±~. J KJ,.L 4.Ii LtJ _L.L±V1 UMIiIUIL O.±LtJ_LW1O ULV11ti± LJ.L UAL4- I±~1 .L .1± SieUL6V 4.L I.-4AJJWL 4L
transferred to them. While the transfers to the central government arer ,Ladey NI'JGJC ariu VUveUi1L[iU 1I1UloUnopL±e, UZJ'tbUe contribution by uii th verrzmen-
for expanding investment activities are mostly to t1he enterprises in thepower, steel, gas and petroc-Ielical sectors (see Tu le 3). The level Gt'public investment in these key areas, where private initiative is lackingis increasing at such a rate, that the enterprises could not possibly fi-nal.
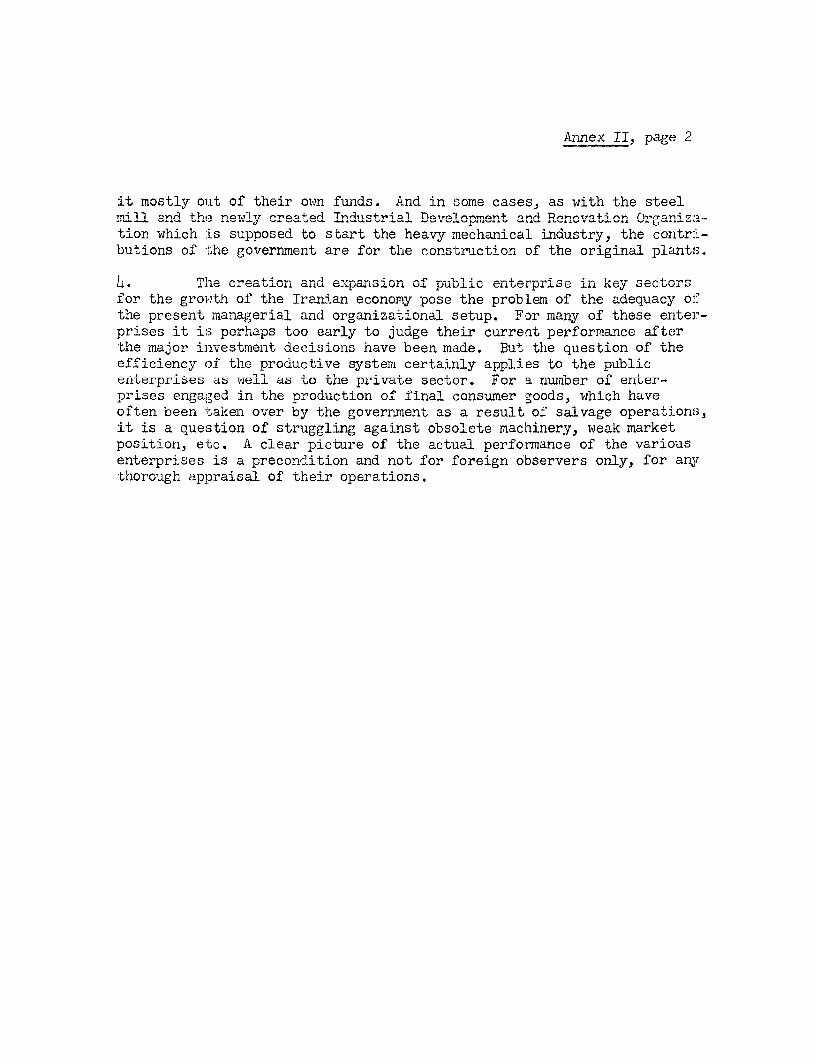
Annex II, page 2
it mostly out of their own funds. And in some cases, as with the steelmill and the newly e-aed T--it+a-- Dv:opment a Renvaion- rganiza-tion which is supposed to start the heavy mechanical industry, the contrf -butions of -the government are for the const-ruction of the original plant<,*
4. ±1~~I. I U ',L UL. U J±.I1 Cd±ikA t5U. CI)- VI ± I . JU LLL tiU L iLt J..L J1 t .I- t-J1 -Y 0U'. LA.i.
for the growth of the Iranian economy pose the problem of the adequacy oftLe JACl present MLMLaV-agerl±tLal ctlU set-up. For J anIyI of these en ter-
prises it is perhaps too early to judge their current performance afterthe Mncjuor liSveStmenLt decisions have been m-ide. But the question of theefficiency of the productive system certainly applies to the publicernterpribes ab well as to the private sector. For a number oI enter-prises engaged in the production of' final consumer goods, which haveoften been -taken over by the government as a result of salvage operations,it is a question of struggling against obsolete machinery, weak marketposition, e-tc. A clear picture of the actual performance of the variousenterprises is a precondition and not for foreign observers only, for anythorough appraisal of their operations.
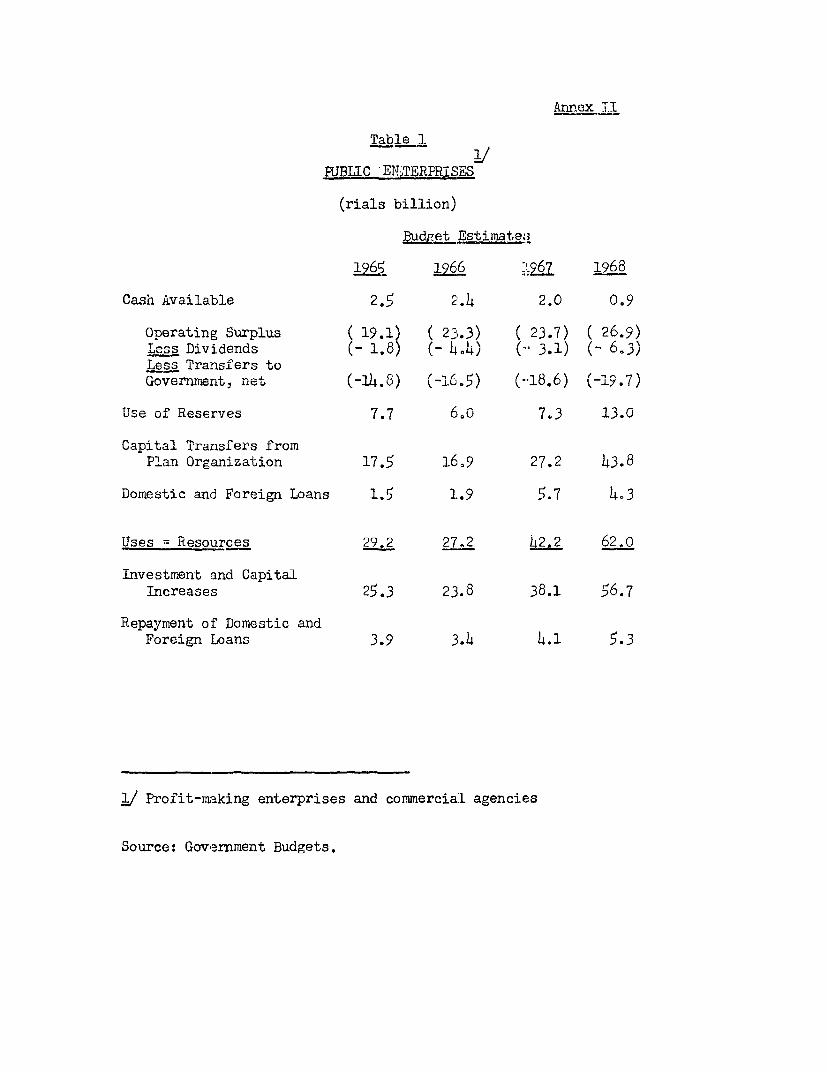
Ann.ex TI
Table 1
PUBIIC_ EN2TERPRI;ES
(rials billion)
kLdZet Estimate.3
19656 1968
Cash Available 2.5 2.4 2.0 0.9
Operating Surplus ( 19.1) (23.3) 23.7) 269)ni!Tess Dividen(Ads ( (23.7) (2 6.9)Less Transfers toGovernment, net (='J.U/ (-16-5) (-18.6) (-19.7)
Use of Reserves 7.7 600 7X3 13.0
Capltal Transfers fromPlan Organization 17.5 16X9 27.2 43.8
Domestic and Foreign Loans 1.5 1.9 5.7 4o3
Uses = Resources 29.2 27.2 h2.2 62.0
Investment and CapitalIncreases 25.3 23.8 38.1 56.7
Repayment of Domestic andForeign Loans 3.9 3.4 4.1 5.3
I/ Profit-making enterprises and commercial agencies
Source: Government Budgets.
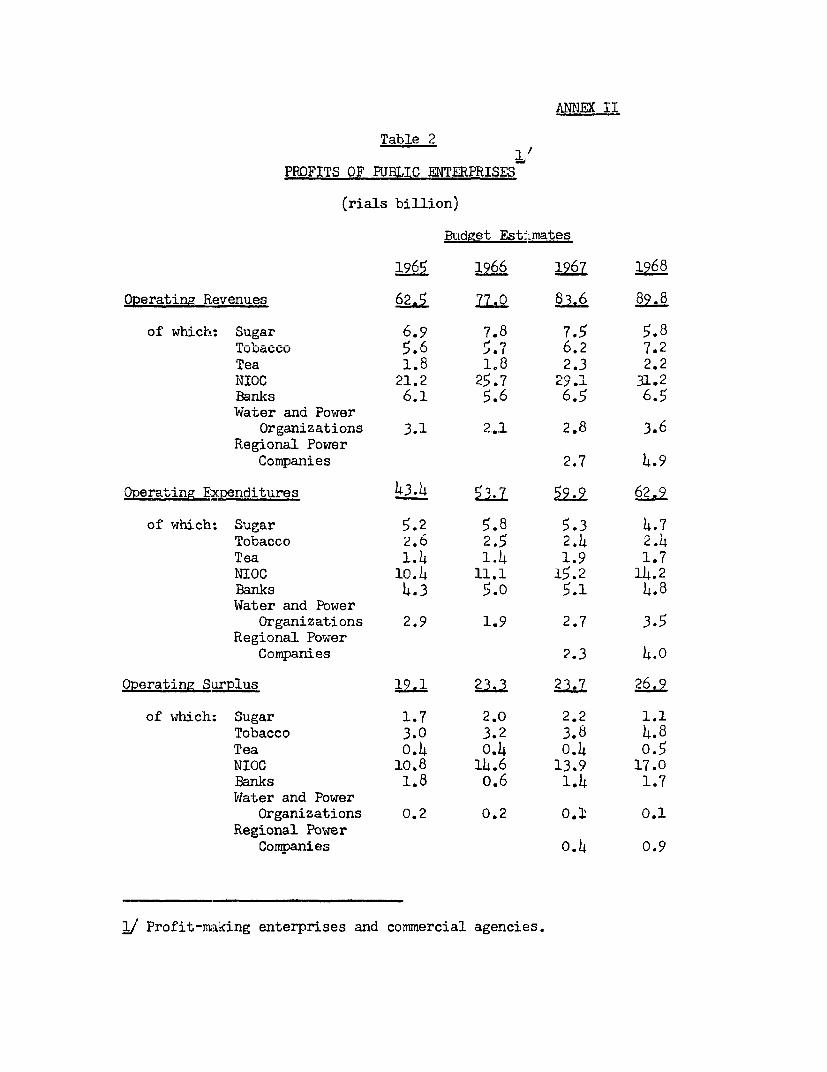
ANN(E II
Table 2
PROFITS OF PURLIC ENTIERPRISES
(rials billion',
Budget EstLmates
1965 1966 1967 1268
Operating Revenues 62.§ 77.0 83,6 89.8
of which: Sugar 6.9 7.8 7.5 5.8Tobuacco . . . .Tea 1.8 1.8 2.3 2.2NIOC 21.2 25.7 29.1 31.2Banks 6.1 5.6 6.5 6.5Water and Power
Organizations 3.1 2.1 2.8 3.6Regional Power
Companies 2.7 4.9
Operating Expenditures 43.4 62.9
of which: Sugar 5.2 5.8 5.3 4.7Tobacco 2.6 2.5 2.4 2.4Tea 1.4 1.4 1.9 1.7NIOC 10.4 11.1 15.2 14.2Banks 4.3 5.0 5.1 4.8Water and Power
Organizations 2.9 1.9 2.7 3.5Regional Power
Companies 2.3 4.0
Operating Surplus 9.1 226.9
of which: Sugar 1.7 2.0 2.2 1.1Tobacco 3.0 3.2 3.8 4.8Tea o.4 o.4 0.4 o.5NIOC 10.8 14.6 13.9 17.0Banks 1.8 o.6 1.4 1.7Water and Power
Organizations 0.2 0.2 0.12 0.1Regional Power
ComDanies 0.4 0.9
I/ Profit-making enterprises and commercia:l agencies.
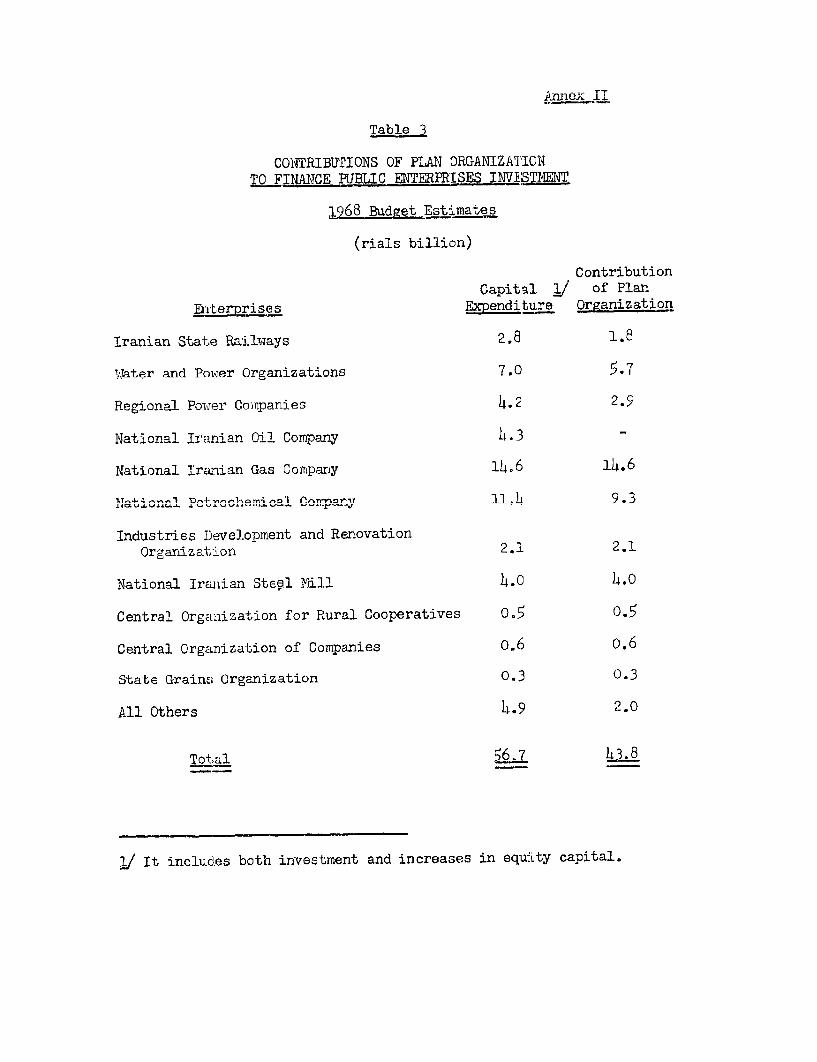
Anne- !I
Table 3
CONTRIBUTIONS OF PLAN ORGANIZAT'IONTO FINAMCE PUBLIC ENTERPRISES INVMQM_f
1968 Budget EstiLmates
(rials billion)
ContributionCapital oI of Plan
Enterprises Expenditure Organization
Tranian State Railways 2.8 1.8
Wuater and Power Organizations 7.0 5.7
RPei nnal PntIre1 C.n;imanieS 4.2 2.9
National Tranian CHIl CompnV h.3 -
Nation.al Trnian Gas con-ran 1i.6 14.6
Vat Jonal Pe4-rchev l Pvmpnan 11 9.3
.LnIUU tr-ie .0v'.p,ln and -^n-vtionw
Organization 2.1 2.1
National Iraunian Stee.l Mill h.0 4.0
Central Orgalization for Rural Cooperatives, o.5 0.5
Central Organization of Companies o.6 o.6
State Grains Organization 0.3 0.3
All Others 4.9 2.0
ffA 7 ,RTotal bi.
~/It includes both investment and increaSE~s in equ:1ty capital.


