Embed Size (px)
Citation preview

Evaluating HTTP/1.1 and HTTP/2 Performancewith Dependency Graph Properties
by
Eeway Erika Hsu
Submitted to the Department of Electrical Engineering and ComputerScience
in partial fulfillment of the requirements for the degree of
Master of Engineering in Electrical Engineering and Computer Science
at the
MASSACHUSETTS INSTITUTE OF TECHNOLOGY
September 2017
c○ Massachusetts Institute of Technology 2017. All rights reserved.
Author . . . . . . . . . . . . . . . . . . . . . . . . . . . . . . . . . . . . . . . . . . . . . . . . . . . . . . . . . . . . . . . .Department of Electrical Engineering and Computer Science
July 21, 2017
Certified by. . . . . . . . . . . . . . . . . . . . . . . . . . . . . . . . . . . . . . . . . . . . . . . . . . . . . . . . . . . .Hari Balakrishnan
Professor, Electrical Engineering and Computer ScienceThesis Supervisor
Accepted by . . . . . . . . . . . . . . . . . . . . . . . . . . . . . . . . . . . . . . . . . . . . . . . . . . . . . . . . . . .Christopher J. Terman
Chairman, Masters of Engineering Thesis Committee

2
Evaluating HTTP/1.1 and HTTP/2 Performance with
Dependency Graph Properties
by
Eeway Erika Hsu
Submitted to the Department of Electrical Engineering and Computer Scienceon July 21, 2017, in partial fulfillment of the
requirements for the degree ofMaster of Engineering in Electrical Engineering and Computer Science
Abstract
This thesis presents an evaluation of web performance under HTTP/1.1 and HTTP/2.It takes a novel approach to compare the two protocols and understand the perfor-mance differences between them. It analyzes each protocol’s web performance withrespect to its web page dependency graph, identifying key graph properties and therelationships between those properties and the resultant performance changes.
To do this, we present Pagescope, a tool that visualizes the relationship betweenweb page properties and the improvement provided. It first records a corpus of webpages by emulating a web client. It then retrieves data from the resulting networkrequests and responses. It processes the data to create a dependency graph and ex-tracts properties used in classifying these web pages. We identify the number, sizeand cacheability of resources, the number of distinct origins, the number of redirects,the distribution of resource priorities, the depth and breadth of the page dependencygraph, the number of connections per origin, and the number of HTTPS clusters, asclassification properties. These pages are then loaded under various network configu-rations, and the load times recorded. The page properties and load times are storedin a database. We find trends between the classifications and page load times.
As with some previous studies, we find that HTTP/2 without server push doesnot consistently outperform HTTP/1.1 [35, 9, 7]. Instead of explaining the resultsthrough network condition variations, we control that aspect and explain performancedifferences through variations in web page dependency graph properties. We see thatthere are optimal per property ranges with which a page best renders the benefits ofHTTP/2. Contradictory to the naive hypothesis, HTTP/2 performance deteriorateswith above average numbers of resources. Related properties – the number of re-sources, the number of origins, and the maximum breadth follow the same trends. Asthe number of HTTPS clusters on a page increases, HTTP/2 performance is overtakenby HTTP/1.1. Web pages with an above average number of resources and HTTPSclusters tend to be unnecessarily complex. These results suggest that HTTP/2 hasan overhead which is only negated by well-designed pages that can utilize the newfeatures. Guidelines for such pages can be found on PageSpeed Insights [24].
3

Thesis Supervisor: Hari BalakrishnanTitle: Professor, Electrical Engineering and Computer Science
4

Acknowledgments
I first thank my advisor, Professor Hari Balakrishnan, for his guidance and support
during my time with the Networks and Mobile Systems Group. I have learned and
benefited immensely from the flexibility he’s offered in defining my research problems.
His vision and creativity have been truly inspirational throughout the journey.
I would also like to thank Ravi Netravali and Tiffany Yu-han Chen. I am grateful
for their willingness to teach and advise me through the ins and outs of academia.
Working together on projects has given me invaluable experience. To my labmates,
Anirudh Sivaraman, Amy Ousterhout, and Vikram Nathan, I thank you for the wel-
coming work environment and open discussions, both academic and personal. I’m
grateful to the Sheila Marian, the CSAIL Networks and Mobile Systems Group, and
members of the ninth floor for shaping my graduate experience.
To my friends, thank you for the continued love and support.
To Ming Yang Ong, thank you for your help, understanding, and perspective.
To Scott Rabin, thank you for your encouragement and unwavering trust.
To Professor Patrick Winston and Professor Junot Diaz, thank you for teaching
me to value communication and creativity, first and forefront.
Finally, to my parents, thank you for everything you have done to help me reach
where I am today. My mother, Shihwin Ma, for her rational approach and commen-
tary. My father, SheauYu Hsu, for his ability to shape interesting problems and give
well-timed advice. I am forever grateful.
5

6
Contents
1 Introduction 11
1.1 HTTP/1.1 versus HTTP/2 . . . . . . . . . . . . . . . . . . . . . . . . 12
1.2 Pagescope . . . . . . . . . . . . . . . . . . . . . . . . . . . . . . . . . 13
2 Related Work 15
2.1 HTTP/1.1 and HTTP/2 Evaluations . . . . . . . . . . . . . . . . . . 15
2.2 Web Performance . . . . . . . . . . . . . . . . . . . . . . . . . . . . . 17
3 Characterization of Web Pages 21
3.1 Selecting a Representative Corpus . . . . . . . . . . . . . . . . . . . . 21
3.2 Identifying Key Properties . . . . . . . . . . . . . . . . . . . . . . . . 23
3.2.1 Number of Resources . . . . . . . . . . . . . . . . . . . . . . . 23
3.2.2 Size of Resources . . . . . . . . . . . . . . . . . . . . . . . . . 24
3.2.3 Cacheability of Resources . . . . . . . . . . . . . . . . . . . . 25
3.2.4 Number of Origins . . . . . . . . . . . . . . . . . . . . . . . . 26
3.2.5 Number of Redirects . . . . . . . . . . . . . . . . . . . . . . . 26
3.2.6 Resource Priority . . . . . . . . . . . . . . . . . . . . . . . . . 26
3.2.7 Dependency Graph . . . . . . . . . . . . . . . . . . . . . . . . 27
4 Design of Pagescope 29
4.1 System Architecture . . . . . . . . . . . . . . . . . . . . . . . . . . . 30
4.1.1 Pagescope Configurations . . . . . . . . . . . . . . . . . . . . 31
4.1.2 Pagescope Pipeline . . . . . . . . . . . . . . . . . . . . . . . . 31
7
4.2 Supporting a Flexible Corpus and Properties . . . . . . . . . . . . . . 32
4.3 Record-and-Replay . . . . . . . . . . . . . . . . . . . . . . . . . . . . 33
4.4 Extracting Key Properties . . . . . . . . . . . . . . . . . . . . . . . . 34
4.4.1 Building a Dependency Graph . . . . . . . . . . . . . . . . . . 35
4.5 Storing Key Properties . . . . . . . . . . . . . . . . . . . . . . . . . . 39
4.6 Visualizations . . . . . . . . . . . . . . . . . . . . . . . . . . . . . . . 40
5 Evaluation of HTTP/x 41
5.1 Page Load Time . . . . . . . . . . . . . . . . . . . . . . . . . . . . . . 41
5.1.1 Definition . . . . . . . . . . . . . . . . . . . . . . . . . . . . . 41
5.1.2 Measuring Page Load Time . . . . . . . . . . . . . . . . . . . 42
5.2 Emulating Network Conditions . . . . . . . . . . . . . . . . . . . . . 43
5.3 Experimental Setup . . . . . . . . . . . . . . . . . . . . . . . . . . . . 44
5.3.1 HTTP/1.1 . . . . . . . . . . . . . . . . . . . . . . . . . . . . . 44
5.3.2 HTTP/2 . . . . . . . . . . . . . . . . . . . . . . . . . . . . . . 44
5.4 Results . . . . . . . . . . . . . . . . . . . . . . . . . . . . . . . . . . . 46
5.4.1 Number of Resources . . . . . . . . . . . . . . . . . . . . . . . 48
5.4.2 Number of Origins . . . . . . . . . . . . . . . . . . . . . . . . 51
5.4.3 Number of High Priority Resources . . . . . . . . . . . . . . . 52
5.4.4 Maximum Breadth . . . . . . . . . . . . . . . . . . . . . . . . 54
5.4.5 Maximum Depth . . . . . . . . . . . . . . . . . . . . . . . . . 57
5.4.6 Number of HTTPS Clusters . . . . . . . . . . . . . . . . . . . 57
5.4.7 HTTP/1.1 vs HTTP/2 . . . . . . . . . . . . . . . . . . . . . . 59
5.4.8 Multicollinearity . . . . . . . . . . . . . . . . . . . . . . . . . 60
6 Conclusion 61
6.1 Contributions . . . . . . . . . . . . . . . . . . . . . . . . . . . . . . . 61
6.2 Future Work . . . . . . . . . . . . . . . . . . . . . . . . . . . . . . . . 62
8
List of Figures
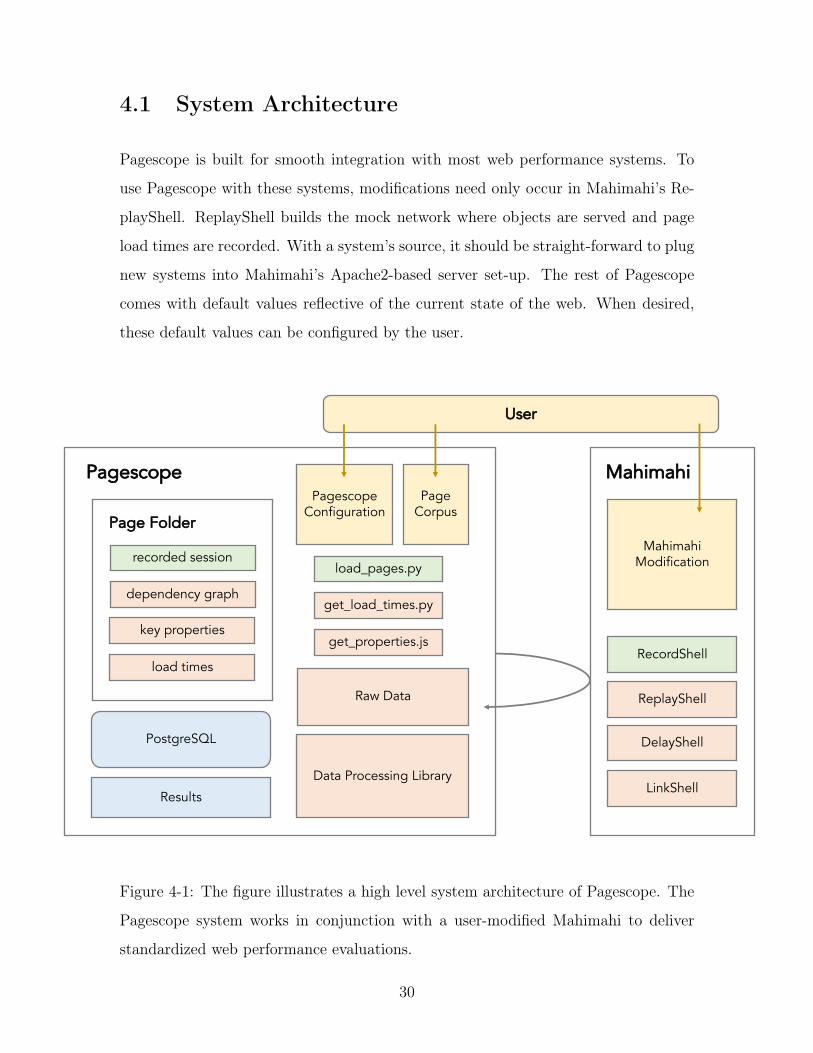
4-1 The figure illustrates a high level system architecture of Pagescope.
The Pagescope system works in conjunction with a user-modified Mahimahi
to deliver standardized web performance evaluations. . . . . . . . . . 30
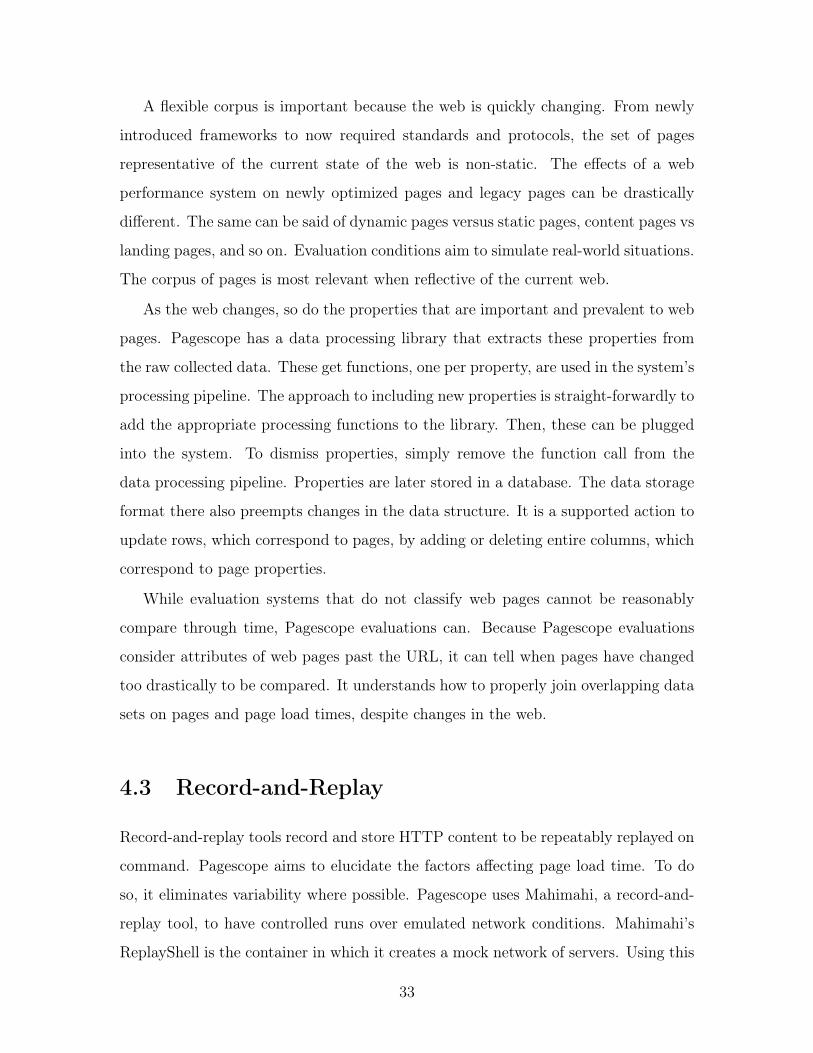
4-2 The source code describes a simple web page. This page displays an
image, image.pgn with a background image, background.png. . . . . 36
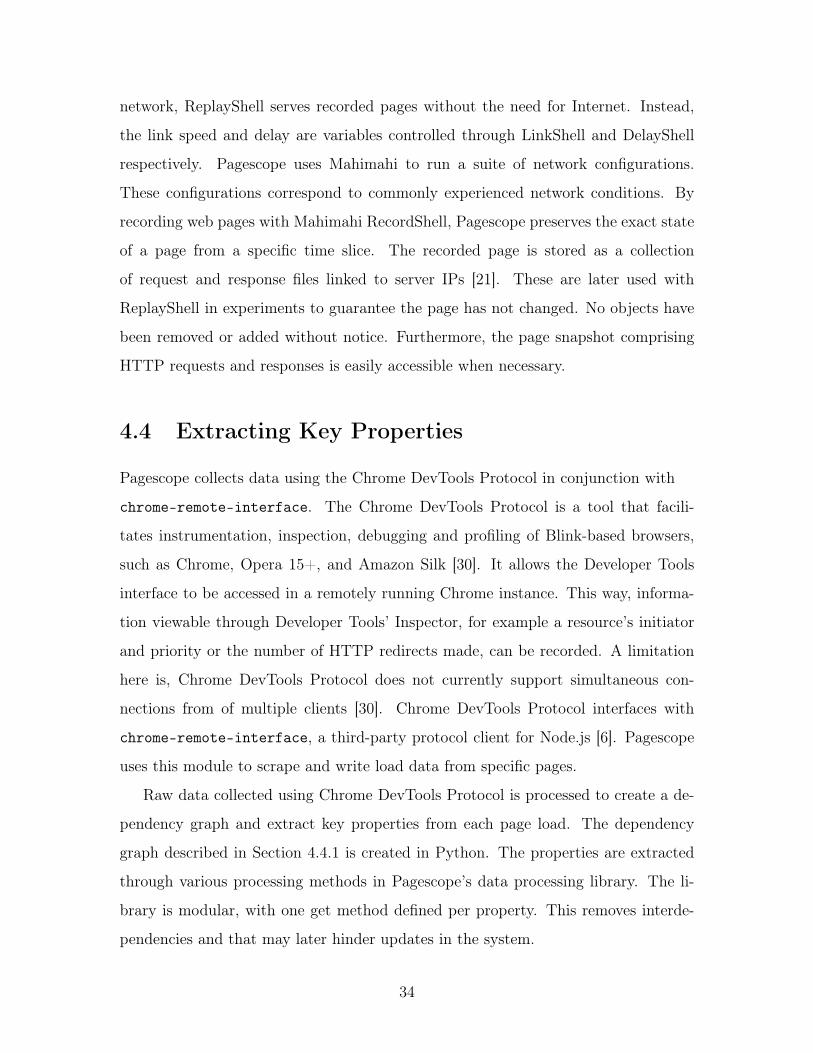
4-3 The figure depicts the dependency graph representation of the page
from Figure 4-2. The root element index.html initiates requests for
two resources, style.css and image.png. style.css requests with a
background image, background.png . . . . . . . . . . . . . . . . . . . 37
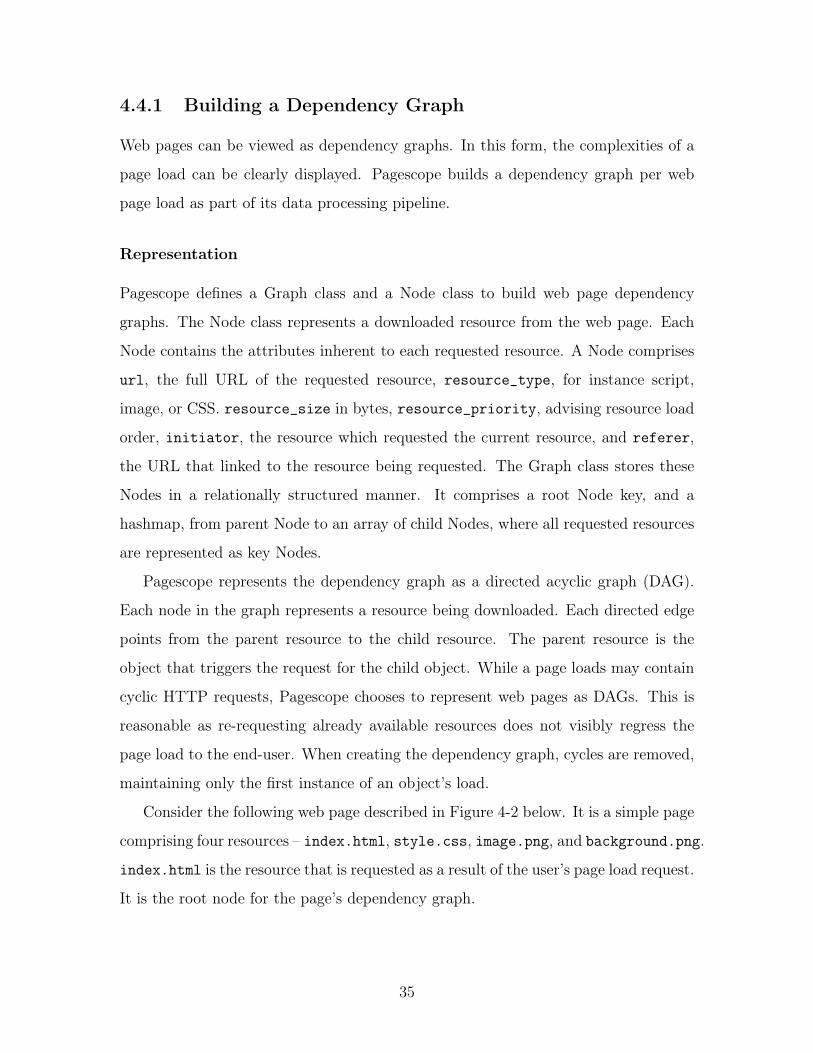
4-4 The pseudocode is used to determines the parent of each requested
resource in the page load. These resources are added as children of the
parent resource in the dependency graph. . . . . . . . . . . . . . . . . 38
5-1 The figure illustrates attributes defined by the PerformanceNavigation-
Timing interface. Attributes in parenthesis may not be available for
navigations involving documents from different origins. [36] . . . . . . 42
5-2 The number of resources graphed against load time for HTTP/1.1 and
HTTP/2. Traversing right increases link speed; traversing down in-
creases delay, excepting the bottom left. . . . . . . . . . . . . . . . . 47
5-3 The number of origins graphed against load time for HTTP/1.1 and
HTTP/2. Traversing right increases link speed; traversing down in-
creases delay, excepting the bottom left . . . . . . . . . . . . . . . . . 50
9
5-4 The number of high priority resources graphed against load time for
HTTP/1.1 and HTTP/2. Traversing right increases link speed; travers-
ing down increases delay, excepting the bottom left . . . . . . . . . . 53
5-5 The maximum breadth graphed against load time for HTTP/1.1 and
HTTP/2. Traversing right increases link speed; traversing down in-
creases delay, excepting the bottom left . . . . . . . . . . . . . . . . . 55
5-6 The maximum depth graphed against load time for HTTP/1.1 and
HTTP/2. Traversing right increases link speed; traversing down in-
creases delay, excepting the bottom left . . . . . . . . . . . . . . . . . 56
5-7 The number of HTTPS clusters graphed against load time for HTTP/1.1
and HTTP/2. Traversing right increases link speed; traversing down
increases delay, excepting the bottom left . . . . . . . . . . . . . . . . 58
10
Chapter 1
Introduction
Page load time is a web performance metric that indicates how long it takes for a
web page to fully load in the browser after a user makes a request. While imperfect,
it is a standard metric in assessing the usability of a web page. It directly impacts
user engagement and a business’ bottom line. Consequently, various performance
improvement schemes have been created to improve web performance by reducing
the page load time.
A variety of factors affect the page load time. As follows, varying approaches
to reduce the page load time exist. Performance improvement schemes based in
different approaches affect the web and its performance differently. Examples of such
schemes range from compression proxies to network layer optimizations. PARCEL,
a proxy assisted browsing system, was developed to reduce energy usage and latency
on cellular networks [33]. Hypertext Transfer Protocol, HTTP, is an application
protocol for data communication on the web. For a long time, HTTP/1.1 was the
most common variant. In 2015, its successor, HTTP/2 was standardized. HTTP/2
introduces stream multiplexing, server push, and header compression to reduce round-
trip times (RTTs) and decrease the page load time. Cumulus, a cloud browser,
was created to reduce page load time when the user is at a significant delay from
the server [19]. Cumulus contains a transparent proxy and a headless browser on
a well-connected public cloud to load and cache pages for quick fetches. Polaris, a
dependency graph optimizer that enables aggressive object fetching, was introduced
11
to provide browser agnostic speed-ups [20]. These systems and others, are used to
decrease page load time and improve the user perceived web performance. We discuss
such schemes further in Section 2.2.
Web performance improvement schemes do not perform equally on most web
pages. Web pages are diverse; they do not have the same size or structure. Within a
site, most content pages contain more and more frequently changing resources than
the corresponding landing page. Evaluation of performance improvement systems of-
ten uses a subset of the Alexa Top Sites. Alexa Top Sites is an updating list of most
trafficked sites, sorted by region or category [3]. However, this list stores only the
base domain, or the landing page, for each visited web site. As such, this list cannot
be a representative page corpus. It does not contain the inner pages where users
spend most time. Furthermore, the web itself changes, adopting new frameworks and
standards. To ensure continued validity and comparability of measurements, web
performance evaluations must be able to differentiate and classify web pages. We
utilize web page dependency graph properties to characterize individual web pages.
Prior work investigates the performance of web transport protocols as a function of
network parameters and conditions, such as the data rate (bandwidth) between server
and client and the RTT. By contrast, we seek to understand the extent to which a
page’s structure matters to the comparative performance of different protocols. We
find that it is an important factor. Our research opens up future work into finding
valuable classifications for web pages that ease the understanding of web performance
system and their effects on page load times and usability.
1.1 HTTP/1.1 versus HTTP/2
This thesis evaluates and compares HTTP/1.1 and HTTP/2. HTTP/2, published in
2015, is a major revision of the HTTP network protocol. Built off of Google’s experi-
mental SPDY protocol, HTTP/2 aims to improve web performance. While HTTP/2
leaves most of HTTP/1.1 syntax intact, it changes the underlying methodology for
how data is framed and transported between client and server. Key HTTP/2 features
12
include HPACK header compression, HTTP server push, stream multiplexing, and
the introduction of resource priorities. While encryption with TLS is not required,
most browsers only support HTTP/2 over TLS. As such, HTTP/2 encourages the
use of HTTPS.
Two years since its introduction, HTTP/2 has largely taken over as the web proto-
col standard in browsers. Our research takes a closer look at the effects of HTTP/1.1
and HTTP/2. We consider how pages with different dependency graph properties
are affected by the change. We look into how web pages can be best optimized to
support HTTP/2.
1.2 Pagescope
Pagescope evaluates the performance of systems with respect to web page properties.
It uses Mahimahi, a record-and-replay tool to simulate page loads with the inclusion
of various systems [21]. In our experiment, we extend Mahimahi’s ability to include
serving resources over the HTTP/2 protocol, in addition to the default HTTP/1.1.
We find that while none of the properties we examined directly explained page load
time, the number of resources, the number of origins, and the number of HTTPS
clusters were the most influential. Pages with an above average number of resources,
origins, or HTTPS clusters performed worse using HTTP/2. The overhead incurred
with HTTP/2 was only negated by well-designed pages able to benefit from the
specific upgrades of HTTP/2. In HTTP/2, there was an optimal range per property,
generally within the first quartile of pages. In HTTP/1.1, there were two distinct
clusters of pages. In the grouping of pages with an on average slower page load
time, there was a lower bound of 5,000 ms. This bound persisted regardless of the
property observed and network configuration used, indicating a bottleneck existing
in the protocol itself.
While this thesis considers only HTTP/1.1 and HTTP/2, Pagescope is extensible.
It can be use to evaluate other web improvement schemes in addition to network
protocols. It integrates with the desired test scheme, and runs an analysis of it over a
13
corpus of web pages. The results are then visualized, showing how the scheme affects
pages characterized by different key properties.
Evaluating improvement schemes is useful from various angles. For a web per-
formance researcher or system developer, Pagescope helps illuminate how and why
a scheme impacts the end-user’s experience. Different schemes can be analyzed and
compared, mapping their relative performance against subsets of the web. For a web
developer, Pagescope helps predict the effectiveness of web performance improvement
schemes, and determines those that should be enabled on the site. For an end-user,
Pagescope enables a better web browsing experience by illustrating the relationship
between performance improvement schemes and the web, forming guidelines to de-
veloping a page that releases the full potential of an enabled scheme.
14
Chapter 2
Related Work
2.1 HTTP/1.1 and HTTP/2 Evaluations
The bulk of this thesis focuses on studying the web performance of HTTP/1.1 and
HTTP/2. While previous experiments analyzed each protocol’s performance with
respect to network conditions, we examine the performance of these protocols with
respect to the type of page loaded. We classify each page with properties found in
the page dependency graph.
We review works evaluating HTTP/1.1, HTTP/2 and SPDY. SPDY is relevant to
our research because it is the foundation from which HTTP/2 is built. Both protocols
integrate stream multiplexing, header compression, server push, and resource priori-
tization. There are differences between the features for each protocol. For instance
in SPDY, stream multiplexing is single-host instead of multi-host; compression uses
DEFLATE instead of HPACK; prioritization is stricter, and less friendly to proxies.
In "How Speedy is SPDY", the authors found SPDY to provide significant im-
provements in performance over HTTP/1.1 when ignoring dependencies in the page
load process and the effects of browser computations [39]. However, when these
factors were reconsidered, the improvements decreased significantly. In this paper,
the authors also found SPDY’s inclusion of server push to produce great improve-
ments when utilized properly, while request prioritization provided minimal benefit
[39]. "Evaluating Performance of SPDY-enabled Web Servers" tests one web page
15
with one HTML document and fifty 32x32 PNG icons. The authors found SPDY to
consume less memory and improve the response time on both the client and server
side [34]. In "SPDY vs HTTP/1.1: An Empirical Evaluation of Network Protocol
Performance", the author found SPDY to improve web page loads under high latency
with zero packet loss and near zero latency with high packet loss [9]. In conditions
with high packet loss and high latency, such as mobile networks, HTTP/1.1 outper-
formed SPDY [9]. Comparisons of HTTP/1.1 and SPDY found SPDY to frequently,
but not always, improve web performance. Because differences in page load process
can significantly reduce the benefits of SPDY, we hypothesized that characterizing a
page by its dependency graph could uncover additional intricacies for improving web
performance.
In "http2 explained", Sternberg suggests that HTTP/2 will become more benefi-
cial as more and larger resources become the norm in web pages, especially under high
latency connections [11]. Our findings do not support this hypothesis. As the num-
ber of resources grew abnormally large, the performance of HTTP/2 degraded. These
large pages were often unnecessarily complex. For example, http://nypost.com/, a
page with hundreds of resources, contained over 300 images and a surprising number
of origins. Additionally, it had many HTTP request errors, including 503 Site over
allowed capacity. But because pages like these exist, our results may include con-
founding properties found only in such overloaded web pages. In "Is the Web HTTP/2
Yet", the performance across the Alexa Top 1 Million sites over an 11-month period
beginning in 2014 was recorded. The authors found that while many sites claimed
HTTP/2 support, only approximately 10,000 pages actually served content with it
[35]. Of those sites, 80% experienced improved page load times in comparison to
HTTP/1.1, with strong benefits found in mobile networks. This is in contrast to
Chamber’s work in "SPDY vs HTTP/1.1", where SPDY performed worst in mobile
networks. Since experiments are run on different subsets of pages during different
times, evaluations are often hard to compare.
16
2.2 Web Performance
Pagescope aims to be a tool capable of evaluating all web performance improvment
schemes. As such, the design of Pagescope is informed by existing improvement
schemes today. These systems range from application protocols, cloud browsers, and
page optimizers, to network layer changes.
Application protocols used to improve web performance include SPDY, HTTP/2,
and QUIC. SPDY and HTTP/2 introduce stream multiplexing, header compression,
single connections, and server push. Stream multiplexing parallelizes requests and
responses, reducing the impact of having a large number of resources. Header com-
pression reduces the size of data packets transferred, decreasing the latency. Using
one connection per origin decreases the number of connections and RTTs necessary
for establishing those connections. Server push predicts requests and minimizes the
number needed by pushing objects preemptively. Due to these features, storing re-
sources at fewer origins is beneficial. Between SPDY and HTTP/2, the treatment of
HTTP and HTTPS origins changes. In HTTP/2, HTTP connections are upgraded,
taking additional RTTs. Thus, the scheme for each origin also affects performance.
QUIC reduces RTTs when establishing a connection, and better supports SPDY-like
multiplexing [28].
Cloud browsers used in improving web performance include Cumulus, Opera
Turbo, Chrome Proxy, PARCEL, Opera Mini and Shandian. Cumulus is a combina-
tion of a content-distribution network and a cloud browser. It contains a "Mini-CDN"
– a transparent proxy running on the user’s machine – and a "Puppet": a headless
browser run by the user on a well-connected public cloud. It improves page load times
by pushing requests to the Puppet and caching the resulting resources locally to the
Mini-CDN [19]. Popular pages are thus stored and become quick to be retrieved
through the Mini-CDN. Opera Turbo and Chrome Proxy likewise process page loads
between the user’s web browser and a remote component. Instead of a user-run proxy,
these systems use centrally operated proxy servers [22, 27]. PARCEL, a system de-
signed for mobile systems splits functionality between the mobile device and proxy,
17
optimizing for their respective strengths [33]. By fetching and storing resources in
better locations, the distance and RTTs necessary is reduced. Again, the impact from
the number of resources, and potentially the size of resources is diminished. Opera
Mini, a browser designed for smartphones, passes web requests through a compression
proxy [23]. Shandian prioritizes resources needed in an initial page, adds a reverse
proxy that loads a page up to the load event, computes the resulting state, and sends
just that to a modified browser [40]. By sending less data through compression or
modification, resource size decreases in importance.
Page optimizers used in improving web performance include Klotski and Polaris.
Klotski prioritizes resources to serve the content most relevant to a user’s preferences.
While doing so, it addresses resource dependencies and creates a method for fast eval-
uation and selection [4]. Polaris creates a fine-grained dependency graph that allows
aggressive fetching otherwise not assumable [20]. The depth of a dependency graph
can be a bottleneck for systems reliant on page optimization. If certain resources
must be fetched and run first, prioritizing the correct resources can only provide so
much improvement for well-designed pages.
Network Layer Changes include systems such as Fast Start, Loss Recovery, and
TCP Fast Open [8, 10, 29]. These systems add novel mechanisms to TCP to minimize
issues such as slow start, time-out recovery, and overheads in connection initiation.
Depending on the network protocols used, each resource may open an individual
connection, or reuse connections over the same origin. When connections are opened,
the protocol headers, data packet size, and a variety of settings can alter performance.
Other systems include Silo, and Flywheel. Silo is a system that leverages DOM
storage to serve Javascript and CSS chunks at a time, reducing the RTTs induced by
separate HTTP requests [16]. Flywheel is a data compression proxy for the mobile
web. Using Flywheel, data use is reduced by 58% on average, but page load time
is increased by 6%. Small pages are typically slower to load though Flywheel while
large pages load faster [1].
Attempts at evaluating web performance include PageSpeed Insights and WProf.
Google’s PageSpeed Insights analyze web pages and suggest avenues of improvement
18

[24]. While PageSpeed Insights focuses on web page improvement, WProf can be
related back to web performance systems in play and their effects on web pages. This
is similar to the flexibility demanded of Pagescope. WProf extracts dependencies
during a page load and identifies bottlenecks [38]. It can then be used in conjunction
with various performance systems to compare their beneficial or harmful effects.
19

20
Chapter 3
Characterization of Web Pages
3.1 Selecting a Representative Corpus
The web consists of pages of highly variable build, content, and structure. Depend-
ing on the year the web page was written or last modified, the frameworks it uses
and standards it follows can be drastically different. As web standards and proto-
cols evolve, the methodology used in optimizing web pages changes. Some pages are
well-designed and well-engineered, while others lack pre-planning and execution. De-
pending on a page’s geographic origins and target, the common structure can also
vary. Web pages may be static or dynamic. Depending on the use case of the web
page, the resources it contains may include many complex scripts, large videos, and
more, or nearly no objects at all. For content heavy pages, if objects are easily cache-
able, the page performance may improve dramatically when frequently visited. For
pages with content served from poorly distributed Content Distribution Networks
(CDN), performance may suffer or excel for different end-users. It is obvious to see
that many factors affect the web performance observed by the average end-user.
That said, web performance must still be evaluated and quantified to promote
overall understanding and improvement. Improvements need not be for the entire
web, but rather an up-to-date and representative web for specific groups of users.
Because Internet usage patterns vary most drastically from geographical region to
region, it is the separation chosen for grouping users. Oftentimes, this is because In-
21
ternet culture is influentially molded by governmental regulations and socio-economic
policies. Pagescope defaults to finding a representative corpus of web pages for the
user group embodied by the United States region. However, the methodology it takes
and the scripts it provides are often applicable to other user groups as well.
To select a representative corpus, Pagescope begins with the present-day standard,
Alexa Top Sites. Alexa Top Sites is a list of web pages, filterable by Country or
Category, that is ranked to intend the ‘top-ness’ of a site. The ranking heuristic is
based on a combination of a site’s daily unique visitors, and the number of pageviews
over continuous three-month periods [3]. Alexa Top Sites are beneficial in explaining
the high-level story behind web usage. It enumerates averages for daily time on site,
daily pageviews per visitor, percent of traffic from search, and the total sites linking in
for each listed page. However, it’s shortcomings lie in the fact that it consists of only
landing pages. Overall traffic is calculated for only the top-level domain; sub-domains
and sub-pages are aggregated underneath.
A corpus of pages consisting of only landing pages is not representative of normal
web usage. For example, despite the quirky fun of Google Doodles, the purpose of
using Google and the majority of time spent within the domain is not for browsing
google.com, the landing page. Looking at Alexa Top five sites today, the same
could be said for youtube.com, baidu.com, and wikipedia.org. Only facebook.com
contains anything remotely representative of it’s normal use, with the News Feed being
the landing page post sign-in.
Landing pages are usually stable, with the exception of simple content modifica-
tions. For instance, pages such as youtube.com or news sites update cover content
daily, while maintaining the same basic page structure. Furthermore, landing pages
are generally simple. Because they are not usually the substance of the product,
there is limited interactivity. For example, google.com’s landing page contains the
daily Doodle, a search bar and button for textual and voice search, and a ‘I’m Feeling
Lucky’ button. Additionally, there is the persistent Google Toolbar. One click in
from the landing page, there is suddenly a flurry of links, images, and advertisements
in addition to the search bar and toolbar. Inner content pages are distinct from the
22
landing page. While landing pages are commonly optimized and light-weight, content
pages are often beefy. Using only landing pages for evaluation would mistake the web
browsing experience for only its initial period.
From the set of landing pages, Pagescope expands into inner content pages. It
creates a page corpus using Selenium, a browser automation tool, and Chrome Driver.
On each landing page, Pagescope explores a number of navigable objects. This pro-
cess is repeated on the resultant pages. The breadth, the number of links explored
per page, and the depth, the number of clicks in from the landing page, are user
determined variables. In the experiments these variables are set to a breadth of 2 and
a depth of 3. The set of landing pages used is the United States Alexa Top 500.
The process Pagescope uses to find a representative page corpus is automated.
Currently, the methodology used to explore inner pages is to randomly select a viable
actions from the page. For a more refined and accurate corpus, a system can appro-
priately evaluate pages and interact in the most likely manner. The selection process
can also be hired out to human users. However, this would detract from the ability
to effortlessly update the corpus at all times.
3.2 Identifying Key Properties
Pagescope is the first step into creating better web performance evaluation schemes
with better web page categorization. Since finding the correct set of key properties
is experimental, Pagescope’s current set of key properties are informed by existing
systems and the factors relevant to their performance.
3.2.1 Number of Resources
Over the HTTP protocol, a client sends a request to the server with request method,
URI, and protocol version, followed by a message containing request modifiers, client
information and possible content. The server responds with a status line, the pro-
tocol version, a success or error code, and a message containing server information,
metadata, and possible content [26]. On GET requests, the information identified by
23
the Request-URI is retrieved as a resource. In characterizing web pages, the number
of resources is the first attribute that comes to mind.
The number of requests and responses correlates to the minimum RTT, the time
taken to send a packet from one connection to another and back. RTT consists of
transmission delay and propagation delay, in addition to the processing delay. On
HTTP/1.x, it is impossible to fetch multiple objects with a single request. Thus,
under HTTP/1.x, the number of resources lower bounds the number of requests and
responses. In HTTP/1.0, requests are sequential, meaning the number of requests
and responses lower bounds the minimum RTTs. Under HTTP/1.1, request pipelin-
ing allows parallel processing of requests. In HTTP/2, requests and responses are
multiplexed, meaning multiple requests and responses can be in flight simultaneously.
Additionally, HTTP/2 introduces a mechanism called Server Push. Server Push al-
lows servers to preemptively push objects to the client without being requested. For
example, if a client requests a web page, index.html from Server Foo, and Server
Foo contains a resource, style.css, that it knows is used on index.html, it can send
both objects as a result of the single request. This minimizes the number of RTTs.
3.2.2 Size of Resources
Despite improvements in modern networks, network bandwidth is often limited. Trans-
mission time, the amount of time from beginning until end of a message transmission
is affected by the network bandwidth. As such, the necessary time it takes to retrieve
a resource correlates to the resource size and amount of bandwidth available.
For large resources, the majority of object retrieval time is spent in data trans-
mission. Without enough bandwidth, congestion creates queuing delay and results
in increased latency. In poorly designed web sites, unnecessary resources can be re-
trieved and bandwidth wasted. In HTTP/1.0, the entirety of a resource must be
retrieved. To reduce wastage, HTTP/1.1 accepts range requests, which instead al-
low the partial retrievals of resources. HTTP/2 further decreases the size of data
transfered by using HTTP Header compression.
For small resources, the majority of object retrieval time is frequently spent on
24
opening a TCP connection. This is because TCP permits data exchange only after the
TCP handshake has established a connection. This introduces one RTT of delay. On
short transfers, this is significant. HTTP/1.0 held no persistent connections, meaning
there would always be this delay on data transfer. HTTP/1.1 introduced persistent
connections and pipelining to better use the TCP protocol. In spite of these changes,
research from TCP Fast Open suggested persistent connections and pipelining had
limited utility, with only an average of 2.4 HTTP requests made per TCP connection
[29]. TCP Fast Open, a web performance system, introduced a method enabling data
transfer during TCP’s initial handshake to avoid the initial induced latency.
3.2.3 Cacheability of Resources
In all HTTP protocols, caching of resources has always been possible. Caching im-
proves performance by eliminating the need to send HTTP requests, and full HTTP
responses. However, not all resources are equally cacheable. A resource’s cacheability
is determined by its propensity to change, and the necessary propagation time. The
lower the likelihood of change, the greater the benefit of caching the object. For each
request made, the browser first checks the browser cache for valid cached response to
fulfill the request. When a match is found, it returns the response instead of fetching
it from across the network. The higher the necessary propagation time for a resource,
the greater the benefit of caching the object. When the necessary propagation time
is low, the freshness requirement becomes high. High freshness requirements mean
the max-age directive of the cached response must be low; the allowed reuse time is
limited, and the resource must be re-fetched frequently. The caching policy of each
resource is set via the Cache-Control policy in the HTTP Header.
The two previous properties, number of resources and size of resources, work in
conjunction with the cacheability of resources. When many objects, large or small,
become cacheable, the number of RTTs required to render a page after the initial
visit is greatly reduced. The RTTs required to download these objects are saved. The
network bandwidth usage of complex pages can look similar to those of simple pages.
25
3.2.4 Number of Origins
Under HTTP/2, there no longer needs to be multiple TCP connections to multiplex
streams in parallel. Instead, only one TCP connection is required per origin. These
connections are persistent, allowing many requests and responses to be sent over
them. When a page’s resources reside within a small pool of origins, many RTTs can
be saved from skipping frequent and unnecessary initiation of new TCP connections.
3.2.5 Number of Redirects
HTTP redirects come in two flavors, server-side and client-side. Server-side redirect
is URL redirection conducted by the web server using an HTTP status code. Some
HTTP redirect codes include 301 Moved Permanently, 302 Found, and 303 See Other.
301 is permanent and cacheable; 302 is temporary and not cacheable by default;
303 is temporary and never cacheable. These redirects ensure requests are properly
load balanced and are not hitting discontinued servers. Client-side redirect is URL
redirection conducted by the web browser using techniques such as meta refresh,
JavaScript redirection, and Flash redirection. While server-side redirects are often
fast, client-side redirects can be hairy and slow. With more and more URL redirects,
there can be redirect chains and loops.
Landing page redirects are often used for mobile sites. From the original site, a
mobile version of the page is requested. These redirects require additional HTTP
request-response cycles and delay page rendering [24]. They add at least one RTT to
the page load time.
3.2.6 Resource Priority
Resources used in page loads are fetched through a request-response cycle. The order
in which they are downloaded can affect the end-user’s perceived web performance.
Resource Priorities is a specification that allows developers to give the User-Agent
hints on the download priority of a resource. Without these specifications, resources
are typically downloaded in document order.
26
HTTP/2 is multiplexed. Multiple requests and responses are in flight simultane-
ously on the same connection. These resources, as such, are downloaded simultane-
ously, interleaved and prioritized as desirable. To mask the latency of a given page
load with the latency of the slowest resources, the slowest resources should be fetched
first. When the slowest resources are fully downloaded, many smaller, faster resources
that were fetched afterwards will be also.
Dependency optimizers such as Klotski and Polaris take advantage of the fact
that resources are often fetched in a non-optimal manner. Klotski reprioritizes web
content to improve user experience on mobile devices. It first creates a web page
fingerprint, built with multiple loads of a page as input. It then uses the fingerprint
to select resources to prioritize when the client loads the page using the Klotski
front-end. Similarly, Polaris first creates a fine-grained dependency graph per web
page. The fine grained dependency graph illuminates dependencies otherwise missed
in basic web dependency graphs. This allows aggressive fetching because conservative
assumptions do not need to be made to ascertain accuracy.
When a page is programmatically written to achieve optimal resource prioritizing,
these systems will not provide additional benefit. How drastically a page can improve
then also depends on the size and shape of the dependency graph.
3.2.7 Dependency Graph
A web page dependency graph visualizes the makeup of the page. It contains all
resources downloaded, and the parent-child relationship between objects. It informs
the basic order resources must be fetched to retain the accuracy of a web page.
Maximum Depth
The maximum depth of a dependency graph highlights the critical path existing in
a page load. This is often the bottleneck for the page load time with protocols that
enable parallelism. Dependency graph optimizers frequently try to shorten this path.
When the path is negligible, such systems cannot be as effective.
27
Maximum Breadth
The maximum breadth of a dependency graph highlights the extent certain resources
are critical. If a resource can block processing of a large percent of the page, getting
it fetched earlier becomes more critical.
Maximum Connections Per Origin
The maximum connections per origin highlights the size of resource clusters from the
same origin. HTTP/2 Server Push improves performance by pushing resources that
have yet to be requested, but are predicted to be necessary. For security purposes, it
enforces the same-origin policy. Looking at connection clusters by origin may inform
how best to utilize the technique.
Number of HTTPS Clusters
The number of HTTPS clusters highlights whether pages are mixed content websites.
HTTP and HTTPS have different performance affects due to the protocols they uti-
lize, HTTP/1.1 versus HTTP/2. There are also differences in setting up HTTPS
versus HTTP connections.
28
Chapter 4
Design of Pagescope
In this thesis, Pagescope is used to evaluate HTTP/1.1 and HTTP/2. However,
Pagescope is designed with general support of various performance improvement
schemes in mind. With current methods, measurements such as page load time
are taken on non-representative and non-standardized sets of pages. Evaluations are
often limited to one-dimensional page load measurements. The naive method results
in data that cannot facilitate in understanding how and why a system behaves as
it does. When evaluations are detailed, they are still not standardized. Without
standardization, comparisons between systems cannot be easily drawn.
Pagescope evaluates web performance systems by automating page loads on vari-
ous emulated networks and correlating the resultant page load times to the type of web
page visited. To be an effective evaluation system, it must provide standardization.
The measurements it takes and resultant information it gleans must be meaningful.
Pagescope should be designed with ease of use, consistency, and future flexibility in
mind. Out of the box, it should be scalable. In large experiments, it should maintain
costs and speed. For Pagescope to be practical, it must gain adoption. Without a
growing user base, the standardization of evaluations loses meaning. Even the best of
systems dull when left untouched. To ensure continued usability, Pagescope should
keep up-to-date despite the fast-paced growth of the web.
29
4.1 System Architecture
Pagescope is built for smooth integration with most web performance systems. To
use Pagescope with these systems, modifications need only occur in Mahimahi’s Re-
playShell. ReplayShell builds the mock network where objects are served and page
load times are recorded. With a system’s source, it should be straight-forward to plug
new systems into Mahimahi’s Apache2-based server set-up. The rest of Pagescope
comes with default values reflective of the current state of the web. When desired,
these default values can be configured by the user.
Data Processing Library
MahimahiModification
Page Corpus
load_pages.py
RecordShell
ReplayShell
get_load_times.py
get_properties.js
dependency graph
key properties
recorded session
load times
PostgreSQL
PagescopeConfiguration
Page Folder
Mahimahi
Raw Data
DelayShell
LinkShell
Pagescope
Results
User
Figure 4-1: The figure illustrates a high level system architecture of Pagescope. The
Pagescope system works in conjunction with a user-modified Mahimahi to deliver
standardized web performance evaluations.
30
4.1.1 Pagescope Configurations
The user controls three aspects of the Pagescope evaluation system. These are de-
picted in yellow in Figure 4-1. First, the user can modify Mahimahi, the record-
and-replay tool to incorporate the specific web performance system into ReplayShell.
ReplayShell is where the page load is emulated with recorded HTTP responses and
HTTP requests served from a mock network of servers. Next, the user can input a
new page corpus as a text file. This changes the web pages with which the system
is evaluated on. Finally, the user can modify the Pagescope configuration to dic-
tate the suite of network configurations used and the number of loads processed. In
ReplayShell, Pagescope uses DelayShell and LinkShell to emulate different network
conditions. DelayShell adds specified delay to each packet entering and leaving the
Mahimahi container. LinkShell emulates links using packet delivery trace files [21].
Without setting configurations, Pagescope defaults to a page corpus consisting of
2015’s United States Alexa Top 500 pages, and an additional two reachable pages per
level, for thee click depths deep. This page corpus incorporates both popular landing
pages and inner pages. The default network configuration suite is stated in Section
5.2.
4.1.2 Pagescope Pipeline
For each evaluation, Pagescope first begins by recording all pages in the page corpus
with Mahimahi’s RecordShell. This process is depicted in green in Figure 4-1. First,
a batch process calls a subprocess that opens a RecordShell container. Inside the
container, it runs a Python script that automates page loads using Selenium, a browser
automation tool, and the Chrome Driver. For each web page in the corpus, a folder is
created to store the resulting recorded files. Folders are named after the web page’s
resource name, containing the sub-domain, domain, and top-level domain. This is
then appended with a index number to ensure uniqueness of folders between web
pages with the same resource name. Pagescope writes a file recording the mapping
of folder name to full domain for use in replay.
31
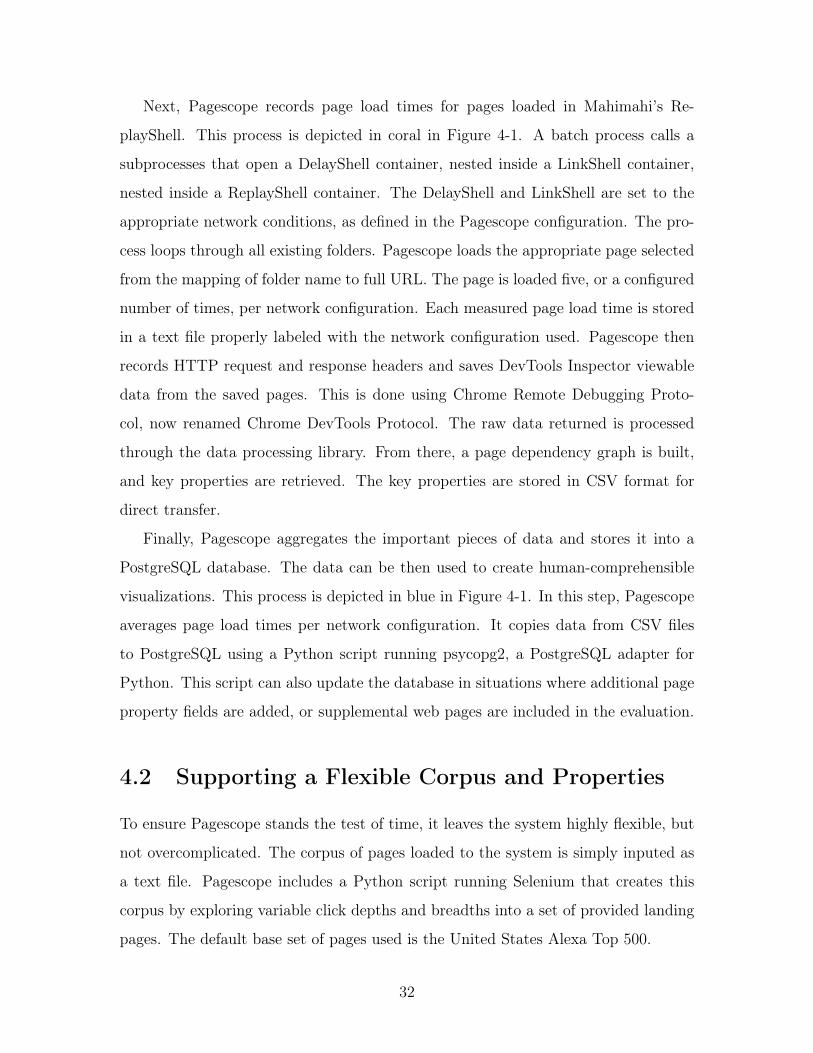
Next, Pagescope records page load times for pages loaded in Mahimahi’s Re-
playShell. This process is depicted in coral in Figure 4-1. A batch process calls a
subprocesses that open a DelayShell container, nested inside a LinkShell container,
nested inside a ReplayShell container. The DelayShell and LinkShell are set to the
appropriate network conditions, as defined in the Pagescope configuration. The pro-
cess loops through all existing folders. Pagescope loads the appropriate page selected
from the mapping of folder name to full URL. The page is loaded five, or a configured
number of times, per network configuration. Each measured page load time is stored
in a text file properly labeled with the network configuration used. Pagescope then
records HTTP request and response headers and saves DevTools Inspector viewable
data from the saved pages. This is done using Chrome Remote Debugging Proto-
col, now renamed Chrome DevTools Protocol. The raw data returned is processed
through the data processing library. From there, a page dependency graph is built,
and key properties are retrieved. The key properties are stored in CSV format for
direct transfer.
Finally, Pagescope aggregates the important pieces of data and stores it into a
PostgreSQL database. The data can be then used to create human-comprehensible
visualizations. This process is depicted in blue in Figure 4-1. In this step, Pagescope
averages page load times per network configuration. It copies data from CSV files
to PostgreSQL using a Python script running psycopg2, a PostgreSQL adapter for
Python. This script can also update the database in situations where additional page
property fields are added, or supplemental web pages are included in the evaluation.
4.2 Supporting a Flexible Corpus and Properties
To ensure Pagescope stands the test of time, it leaves the system highly flexible, but
not overcomplicated. The corpus of pages loaded to the system is simply inputed as
a text file. Pagescope includes a Python script running Selenium that creates this
corpus by exploring variable click depths and breadths into a set of provided landing
pages. The default base set of pages used is the United States Alexa Top 500.
32
A flexible corpus is important because the web is quickly changing. From newly
introduced frameworks to now required standards and protocols, the set of pages
representative of the current state of the web is non-static. The effects of a web
performance system on newly optimized pages and legacy pages can be drastically
different. The same can be said of dynamic pages versus static pages, content pages vs
landing pages, and so on. Evaluation conditions aim to simulate real-world situations.
The corpus of pages is most relevant when reflective of the current web.
As the web changes, so do the properties that are important and prevalent to web
pages. Pagescope has a data processing library that extracts these properties from
the raw collected data. These get functions, one per property, are used in the system’s
processing pipeline. The approach to including new properties is straight-forwardly to
add the appropriate processing functions to the library. Then, these can be plugged
into the system. To dismiss properties, simply remove the function call from the
data processing pipeline. Properties are later stored in a database. The data storage
format there also preempts changes in the data structure. It is a supported action to
update rows, which correspond to pages, by adding or deleting entire columns, which
correspond to page properties.
While evaluation systems that do not classify web pages cannot be reasonably
compare through time, Pagescope evaluations can. Because Pagescope evaluations
consider attributes of web pages past the URL, it can tell when pages have changed
too drastically to be compared. It understands how to properly join overlapping data
sets on pages and page load times, despite changes in the web.
4.3 Record-and-Replay
Record-and-replay tools record and store HTTP content to be repeatably replayed on
command. Pagescope aims to elucidate the factors affecting page load time. To do
so, it eliminates variability where possible. Pagescope uses Mahimahi, a record-and-
replay tool, to have controlled runs over emulated network conditions. Mahimahi’s
ReplayShell is the container in which it creates a mock network of servers. Using this
33
network, ReplayShell serves recorded pages without the need for Internet. Instead,
the link speed and delay are variables controlled through LinkShell and DelayShell
respectively. Pagescope uses Mahimahi to run a suite of network configurations.
These configurations correspond to commonly experienced network conditions. By
recording web pages with Mahimahi RecordShell, Pagescope preserves the exact state
of a page from a specific time slice. The recorded page is stored as a collection
of request and response files linked to server IPs [21]. These are later used with
ReplayShell in experiments to guarantee the page has not changed. No objects have
been removed or added without notice. Furthermore, the page snapshot comprising
HTTP requests and responses is easily accessible when necessary.
4.4 Extracting Key Properties
Pagescope collects data using the Chrome DevTools Protocol in conjunction with
chrome-remote-interface. The Chrome DevTools Protocol is a tool that facili-
tates instrumentation, inspection, debugging and profiling of Blink-based browsers,
such as Chrome, Opera 15+, and Amazon Silk [30]. It allows the Developer Tools
interface to be accessed in a remotely running Chrome instance. This way, informa-
tion viewable through Developer Tools’ Inspector, for example a resource’s initiator
and priority or the number of HTTP redirects made, can be recorded. A limitation
here is, Chrome DevTools Protocol does not currently support simultaneous con-
nections from of multiple clients [30]. Chrome DevTools Protocol interfaces with
chrome-remote-interface, a third-party protocol client for Node.js [6]. Pagescope
uses this module to scrape and write load data from specific pages.
Raw data collected using Chrome DevTools Protocol is processed to create a de-
pendency graph and extract key properties from each page load. The dependency
graph described in Section 4.4.1 is created in Python. The properties are extracted
through various processing methods in Pagescope’s data processing library. The li-
brary is modular, with one get method defined per property. This removes interde-
pendencies and that may later hinder updates in the system.
34
4.4.1 Building a Dependency Graph
Web pages can be viewed as dependency graphs. In this form, the complexities of a
page load can be clearly displayed. Pagescope builds a dependency graph per web
page load as part of its data processing pipeline.
Representation
Pagescope defines a Graph class and a Node class to build web page dependency
graphs. The Node class represents a downloaded resource from the web page. Each
Node contains the attributes inherent to each requested resource. A Node comprises
url, the full URL of the requested resource, resource_type, for instance script,
image, or CSS. resource_size in bytes, resource_priority, advising resource load
order, initiator, the resource which requested the current resource, and referer,
the URL that linked to the resource being requested. The Graph class stores these
Nodes in a relationally structured manner. It comprises a root Node key, and a
hashmap, from parent Node to an array of child Nodes, where all requested resources
are represented as key Nodes.
Pagescope represents the dependency graph as a directed acyclic graph (DAG).
Each node in the graph represents a resource being downloaded. Each directed edge
points from the parent resource to the child resource. The parent resource is the
object that triggers the request for the child object. While a page loads may contain
cyclic HTTP requests, Pagescope chooses to represent web pages as DAGs. This is
reasonable as re-requesting already available resources does not visibly regress the
page load to the end-user. When creating the dependency graph, cycles are removed,
maintaining only the first instance of an object’s load.
Consider the following web page described in Figure 4-2 below. It is a simple page
comprising four resources – index.html, style.css, image.png, and background.png.
index.html is the resource that is requested as a result of the user’s page load request.
It is the root node for the page’s dependency graph.
35
index.html
1 <html>
2 <head>
3 <link rel = "stylesheet"
4 type="text/css" href="style.css">
5 </head>
6 <body>
7 <img src="image.png">
8 </body>
9 </html>
style.css
1 body {
2 background-image: url("background.png");
3 }
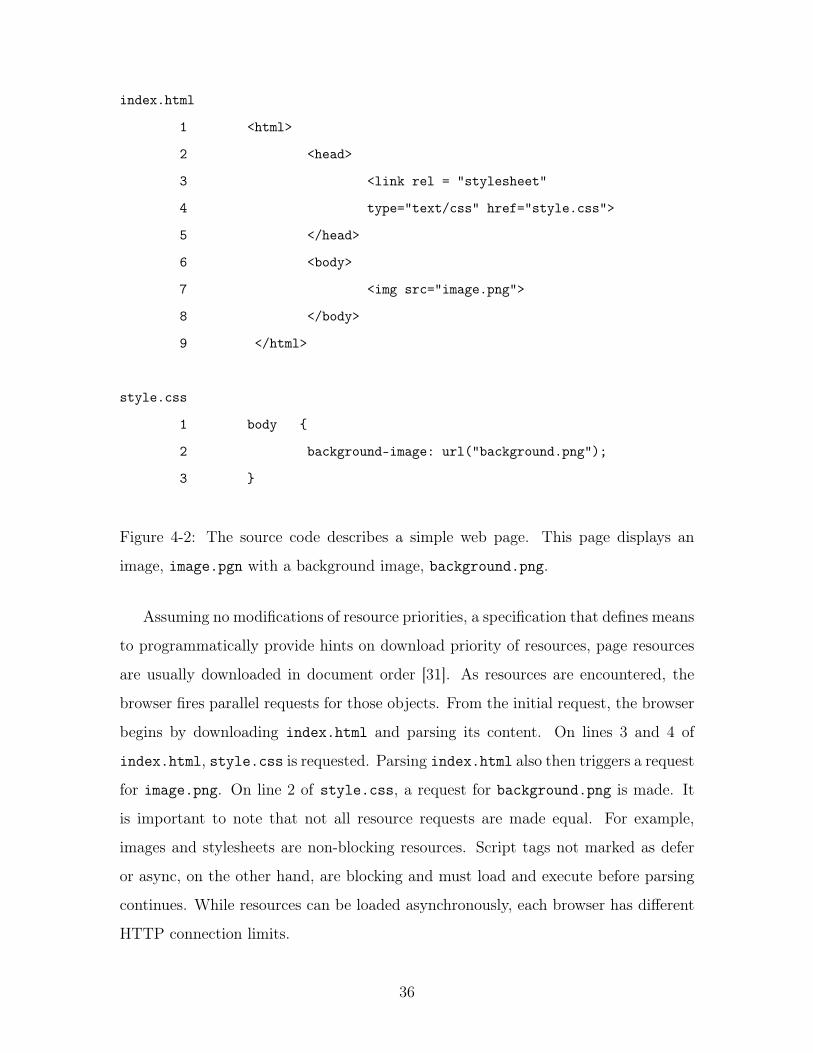
Figure 4-2: The source code describes a simple web page. This page displays an
image, image.pgn with a background image, background.png.
Assuming no modifications of resource priorities, a specification that defines means
to programmatically provide hints on download priority of resources, page resources
are usually downloaded in document order [31]. As resources are encountered, the
browser fires parallel requests for those objects. From the initial request, the browser
begins by downloading index.html and parsing its content. On lines 3 and 4 of
index.html, style.css is requested. Parsing index.html also then triggers a request
for image.png. On line 2 of style.css, a request for background.png is made. It
is important to note that not all resource requests are made equal. For example,
images and stylesheets are non-blocking resources. Script tags not marked as defer
or async, on the other hand, are blocking and must load and execute before parsing
continues. While resources can be loaded asynchronously, each browser has different
HTTP connection limits.
36
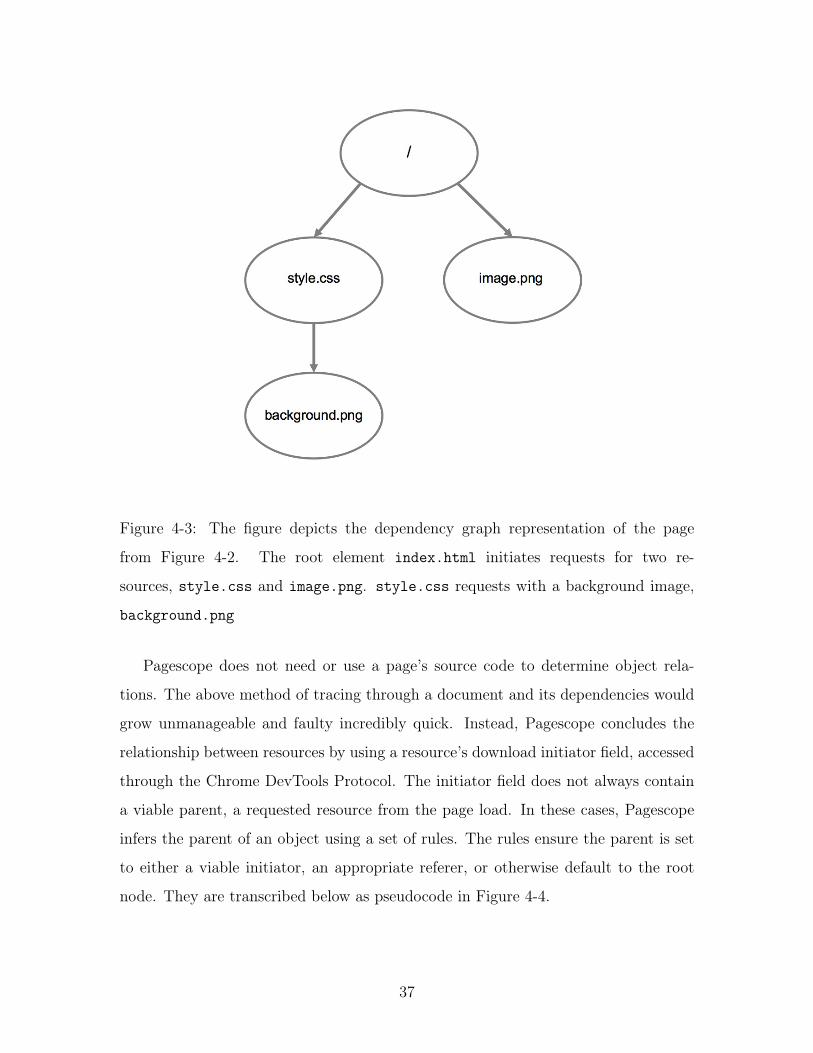
Figure 4-3: The figure depicts the dependency graph representation of the page
from Figure 4-2. The root element index.html initiates requests for two re-
sources, style.css and image.png. style.css requests with a background image,
background.png
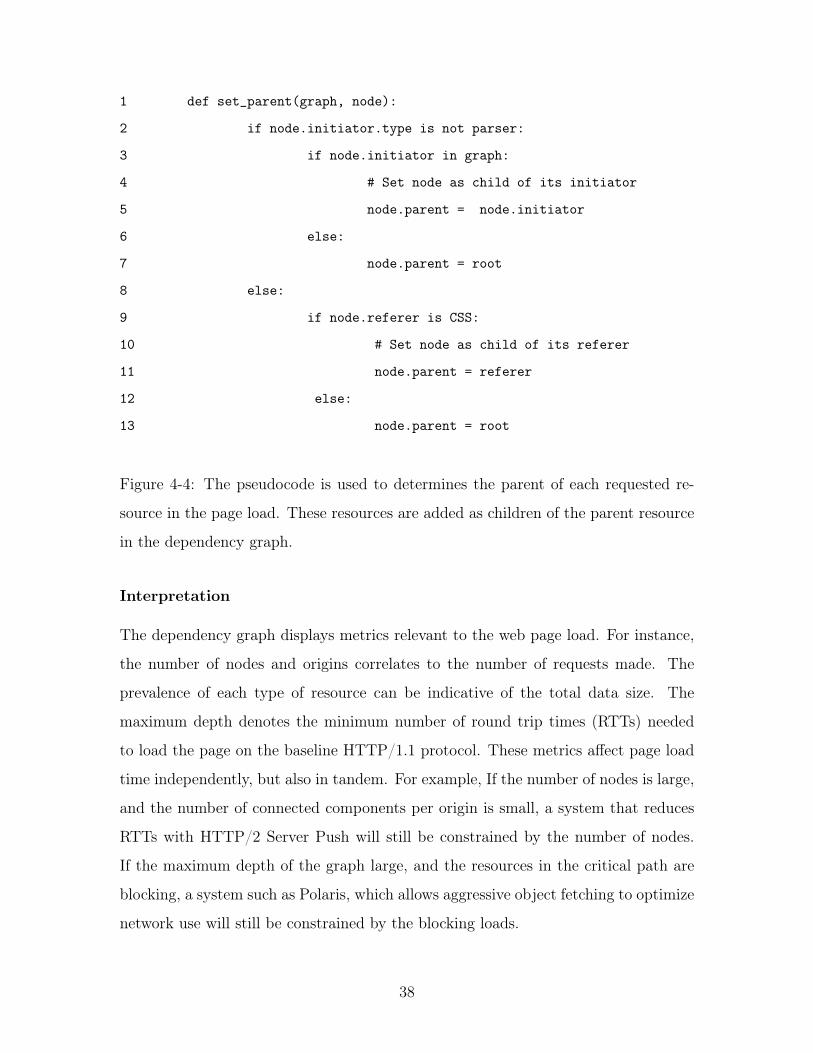
Pagescope does not need or use a page’s source code to determine object rela-
tions. The above method of tracing through a document and its dependencies would
grow unmanageable and faulty incredibly quick. Instead, Pagescope concludes the
relationship between resources by using a resource’s download initiator field, accessed
through the Chrome DevTools Protocol. The initiator field does not always contain
a viable parent, a requested resource from the page load. In these cases, Pagescope
infers the parent of an object using a set of rules. The rules ensure the parent is set
to either a viable initiator, an appropriate referer, or otherwise default to the root
node. They are transcribed below as pseudocode in Figure 4-4.
37
1 def set_parent(graph, node):
2 if node.initiator.type is not parser:
3 if node.initiator in graph:
4 # Set node as child of its initiator
5 node.parent = node.initiator
6 else:
7 node.parent = root
8 else:
9 if node.referer is CSS:
10 # Set node as child of its referer
11 node.parent = referer
12 else:
13 node.parent = root
Figure 4-4: The pseudocode is used to determines the parent of each requested re-
source in the page load. These resources are added as children of the parent resource
in the dependency graph.
Interpretation
The dependency graph displays metrics relevant to the web page load. For instance,
the number of nodes and origins correlates to the number of requests made. The
prevalence of each type of resource can be indicative of the total data size. The
maximum depth denotes the minimum number of round trip times (RTTs) needed
to load the page on the baseline HTTP/1.1 protocol. These metrics affect page load
time independently, but also in tandem. For example, If the number of nodes is large,
and the number of connected components per origin is small, a system that reduces
RTTs with HTTP/2 Server Push will still be constrained by the number of nodes.
If the maximum depth of the graph large, and the resources in the critical path are
blocking, a system such as Polaris, which allows aggressive object fetching to optimize
network use will still be constrained by the blocking loads.
38
Pagescope interprets the resultant graph by picking out key properties with its
library of data processing methods. Information not stored in graph, such as the
number of redirects per page load, is also processed. The output consists of numeric
values for each property. Having properties be quantitative makes sorting simple.
4.5 Storing Key Properties
Pagescope stores the key properties and page load times of each page in a PostgreSQL
database. In the experiments, the PostgreSQL database is hosted on Amazon AWS.
PostgreSQL is an object-relational database. Using a relational database versus a
non-relational database allows for straight-forward sorting and complex querying.
From the number of connected components per origin to the maximum depth of the
dependency graph, the page properties are numerical. Sorting by property provides
a view of the resultant performance measurements in relation to specific factors.
Relational databases contain structured data. The current structure is as follows.
UID | folder_name | max_depth | max_breadth | num_origins |
count_per_priority [VeryLow, Low, Medium, High, VeryHigh] |
max_connected_components_per_origin | num_HTTPS_cluster |
num_redirects | page_load_times
PostgreSQL exposes an ALTER TABLE command which supports adding and drop-
ping columns. This simplifies the task of adding and removing web properties. As
mentioned in Section 4.2, this is important in maintaining Pagescope’s relevance.
PostgreSQL is ACID (Atomicity, Consistency, Isolation, Durability) compliant
[25]. Atomicity requires each transaction to be all or nothing. Consistency requires
that all transactions bring the database to a valid state. Isolation requires that concur-
rent execution of transactions result in the same state as if executed sequentially. This
enables the Pagescope system to scale by safely supporting parallel inserts from var-
ious connections. Durability ensures that once a transaction has been committed, it
will remain. This guarantees that Pagescope is persistent, and need not be frequently
39
backed and restored. These characteristics are beneficial in ensuring Pagescope has
consistent and accessible data that facilitates comprehension and future processing
and visualization.
4.6 Visualizations
Pagescope aims to be a one-stop-shop for web performance system evaluation. As
such, it should include tools to visualize the resulting numbers into human-comprehensible
visualizations. This aspiration is explored further as future work in Section 6.2. In
the experimental setup for HTTP/1.1 and HTTP/2, results are graphed property to
page load time. This is a limitation in the visualizations Pagescope provides. By
graphing each factor separately, it is not possible to see the effects of properties when
combined properly. But because the considered properties seem correlated, we cannot
easily calculate a multivariate regression where individual coefficients are representa-
tive.
40
Chapter 5
Evaluation of HTTP/x
5.1 Page Load Time
5.1.1 Definition
In W3C Navigation Timing Level 1, page load time is defined as the time elapsed
between two timing events, navigationStart and loadEventEnd [37]. As of May 2017,
W3C Navigation Timing Level 1 has been deprecated in favor of W3C Navigation
Timing Level 2. With Navigation Timing Level 2, a similar definition for page load
time, otherwise known as duration, can be made with the time elapsed between
startTime and loadEventEnd. startTime is the user’s initial page request, defined as
zero. loadEventEnd is the time at which the load event of the current document is
completed, defaulting to zero if a load event never fires [36]. The difference between
startTime and loadEventEnd represents the time from a user’s initial request to the
end of a page load. Even after loadEventEnd has fired, it is important to note that
bytes can continue to be transferred for a page load [32]. Navigation Timing Level
2’s PerformanceNavigationTiming interface facilitates obtaining accurate timing data
related to the navigation of the document, in addition to the naive page load time
defined above. It aims to allow fine-grained measurements, such as unload, redirect,
app cache, DNS, TCP, request, response, processing and onload time. The processing
model issued by Navigation Timing Level 2 is as follows.
41
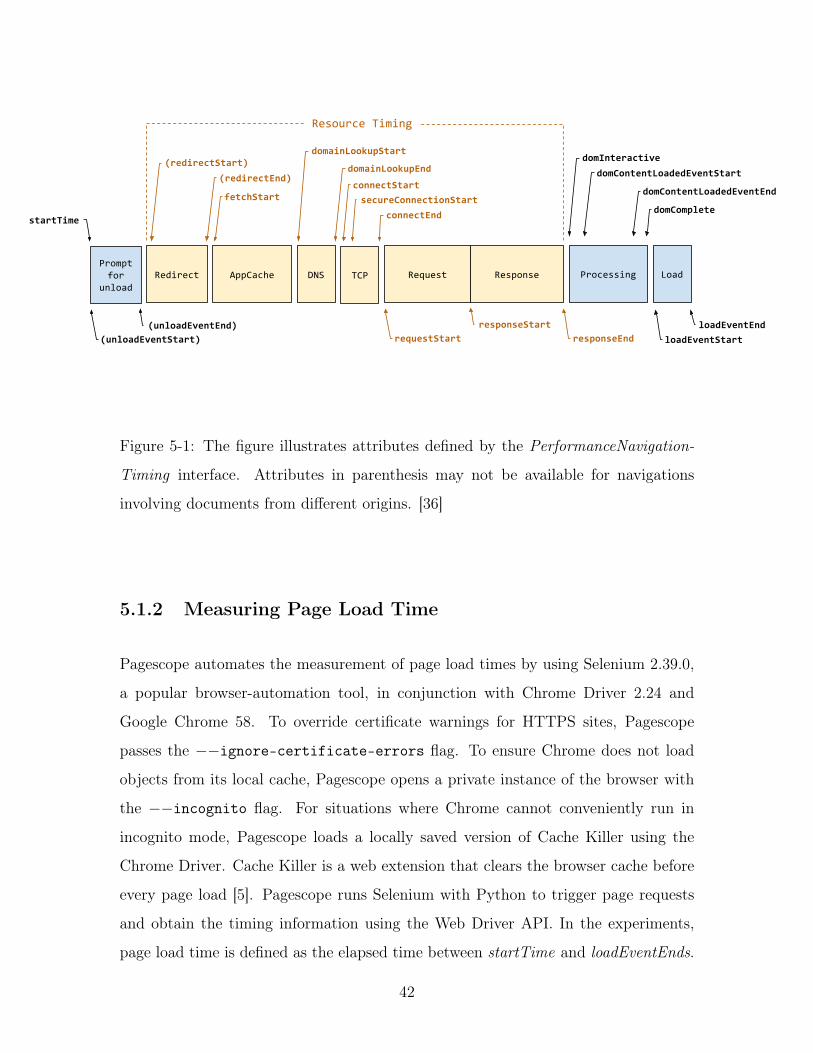
Figure 5-1: The figure illustrates attributes defined by the PerformanceNavigation-
Timing interface. Attributes in parenthesis may not be available for navigations
involving documents from different origins. [36]
5.1.2 Measuring Page Load Time
Pagescope automates the measurement of page load times by using Selenium 2.39.0,
a popular browser-automation tool, in conjunction with Chrome Driver 2.24 and
Google Chrome 58. To override certificate warnings for HTTPS sites, Pagescope
passes the −−ignore-certificate-errors flag. To ensure Chrome does not load
objects from its local cache, Pagescope opens a private instance of the browser with
the −−incognito flag. For situations where Chrome cannot conveniently run in
incognito mode, Pagescope loads a locally saved version of Cache Killer using the
Chrome Driver. Cache Killer is a web extension that clears the browser cache before
every page load [5]. Pagescope runs Selenium with Python to trigger page requests
and obtain the timing information using the Web Driver API. In the experiments,
page load time is defined as the elapsed time between startTime and loadEventEnds.
42
5.2 Emulating Network Conditions
Pagescope aims to standardize web performance evaluation. To do so, it must elimi-
nate network fluctuations during measurements. Pagescope uses Mahimahi, a record-
and-replay tool to create a controlled environment where repeatability is retained.
Pagescope uses Mahimahi’s ReplayShell, alongside LinkShell and DelayShell to em-
ulate page loads over specific network conditions. For example, to emulate a page
load over a 4 Mbit/s link with 100 ms minimum RTT, first run ReplayShell on a
recorded website. Then, within ReplayShell, run DelayShell with a 50 ms one-way de-
lay. Within DelayShell, run LinkShell with a 4 Mbit/s packet-delivery trace. Within
LinkShell, run the browser and load the recorded website.
For each web performance system, Pagescope measures page load time for web
pages in the corpus using a suite of network configurations. Each configuration is run
eight times. The average page load time is then taken. Common broadband markers
include 4, 10, and 25 Mbit/s. According to Akamai State of the Internet report,
as of Q4 2016, the broadband adoption of Internet speeds over 4 Mbit/s is 88% in
the United States [2]. The evaluation presented in this thesis is limited to the web
as perceived in the United States. As such, Pagescope uses a suite containing the
following network configurations.
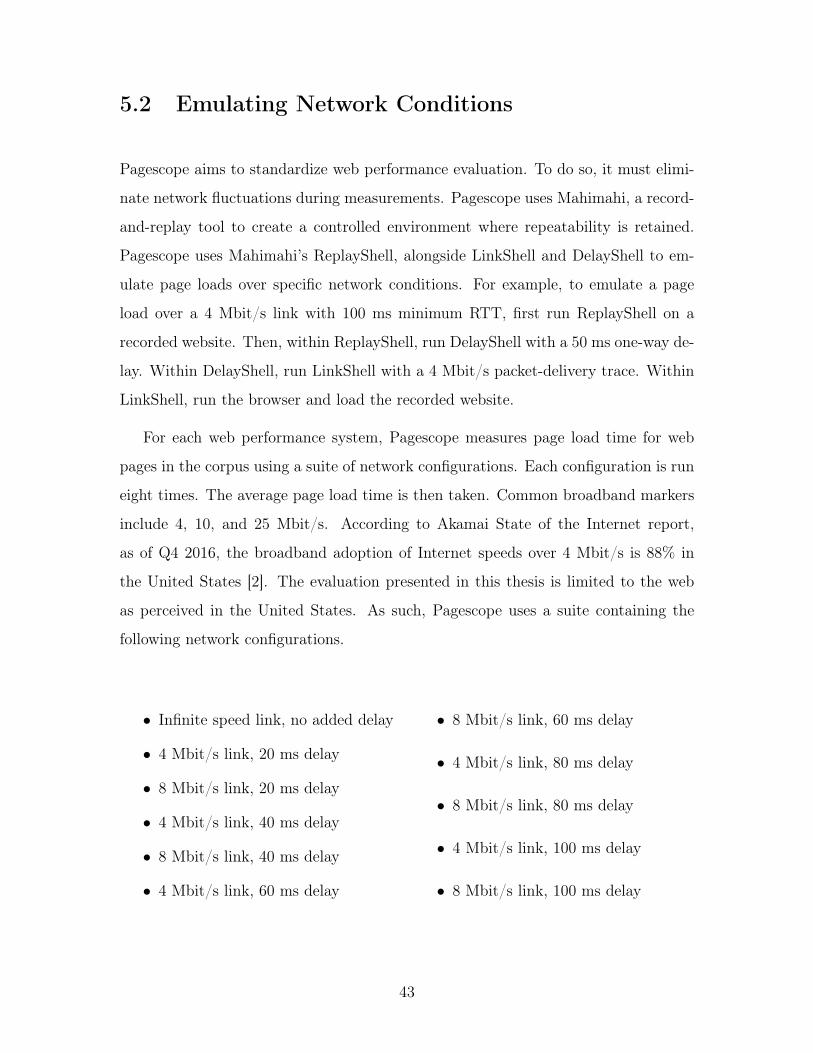
∙ Infinite speed link, no added delay
∙ 4 Mbit/s link, 20 ms delay
∙ 8 Mbit/s link, 20 ms delay
∙ 4 Mbit/s link, 40 ms delay
∙ 8 Mbit/s link, 40 ms delay
∙ 4 Mbit/s link, 60 ms delay
∙ 8 Mbit/s link, 60 ms delay
∙ 4 Mbit/s link, 80 ms delay
∙ 8 Mbit/s link, 80 ms delay
∙ 4 Mbit/s link, 100 ms delay
∙ 8 Mbit/s link, 100 ms delay
43
5.3 Experimental Setup
5.3.1 HTTP/1.1
Pagescope uses HTTP/1.1 with no additional web performance improvement schemes
to represent the baseline setup. To evaluate HTTP/1.1, Pagescope uses Mahimahi
without modification. Each page of the corpus is recorded through Mahimahi’s
RecordShell. Using these recorded requests and responses, Pagescope replays the page
through Mahimahi’s ReplayShell. During the replay, Pagescope uses the Chrome De-
vTools Protocol to pull inspector-viewable data to create the dependency graph and
extracts key properties. These properties, alongside the averaged page load time for
each of the above network configurations are stored into the PostgreSQL database.
5.3.2 HTTP/2
According to the creators of HTTP/2, key differences between it and HTTP/1.1
include that, "HTTP/2 is binary instead of textual, fully multiplexed instead of
ordered and blocking, can use one connection for parallelism, uses header compression,
and allows servers to push responses proactively into client caches" [13]. Many of
the changes focus on the protocol’s end-user perceived performance and reducing
network and server resource usage [13]. HTTP/2 is based off SPDY. Both protocols
allow concurrency and reduce the number of TCP connections and TLS handshakes
through multiplexing. Whereas SPDY uses a general purpose DEFLATE algorithm,
HTTP/2 uses HPACK, an algorithm designed to compress headers [12].
To evaluate HTTP/2, Pagescope uses a modified Mahimahi and Google Chrome.
In ReplayShell, Mahimahi creates a dummy network of interfaces bound to each
IP address where a web server had answered in the recorded session [21]. In our
experiments, ReplayShell uses Apache 2.4.25 to run the web servers and emulate the
corresponding server from the saved session. Because Mahimahi preserves the sharded
structure of a website, binds to actual IP addresses used, and serves requests from
real web servers, it is possible to run protocols, such as SPDY, HTTP/2, and QUIC
44
[21]. For Mahimahi to use HTTP/2, Pagescope configures Apache2 with mod_http2,
an experimental module providing HTTP/2 support for the Apache HTTP Server
[18].
HTTP/2 requires modification to properly handle encodings when recording in
Mahimahi. Pagescope loads ModHeader, a Chrome extension which allows modifi-
cation of the request headers before requests are sent [17]. To modify the Accept-
Encoding field, the Chrome Driver navigates to the extension page. This gives ac-
cess to the extension’s localStorage. The desired HTTP header field and value are
set in localStorage using a Javascript execution script. Pagescope does not use the
−−incognito flag when recording with HTTP/2. In this situation, it loads Cache
Killer to ensure objects are not loaded from local cache.
The results included in this paper consider HTTP/2 without utilizing the server
push functionality. While Apache2’s mod_http2 module supports server push, cor-
rectly setting push patterns requires modifying the Link headers of responses. When
the attribute rel=preload is specified, the resource is pushed. These modifications
to preempt and push beneficial resources are saved as later work. In the experiments
illustrated in Section 5.4, what enabling the HTTP/2 protocol does is allow the
server processes to start additional threads. All requests received are given to Worker
threads for processing, and then collected and streamed out to the client [18]. Streams
are HTTP request and responses pairs. These streams contain messages, made up of
frames containing data, such as HTTP headers, or the message payload. HTTP/2’s
multiplexing allows multiple streams to be in flight within the same connection at the
same time. Additionally, HTTP/2 introduces the concept of priority. Through the
request headers, clients can assign priority for a stream. The root stream gets all the
bandwidth available but then distributes bandwidth by priority amongst its children
[18]. While the priority system does not guarantee processing or transmission order,
it suggests an order to optimize the use of available resources.
As with HTTP/1.1, an average page load time for each of the network configura-
tions listed in Section 5.2 is taken. These are stored into the PostgreSQL database
alongside the properties and load times already gathered.
45
5.4 Results
To guarantee that high quality data is collected and retained, experiments are run in
replicated machines on Amazon EC2. They are loaded from a base AMI containing
the recordings of all pages from the given corpus, the batch scripts used in analyz-
ing pages and collecting load times, and all software dependencies necessary for the
simulation. Page load time is the dependent variable measured in the experiments.
To obtain accuracy of results, each page is loaded eight times. To ensure validity of
results, checks are run to detect improperly measured data. Page load times under
network configurations with smaller delays are verified to be strictly faster than those
with larger delays. Impossible outliers are removed and the loads re-run. For each
page, the interquartile range of load times is taken to assure precision. As the exper-
iments are run in simulation with Mahimahi, the results should be precise in nature.
The resultant load times are then averaged and recorded.
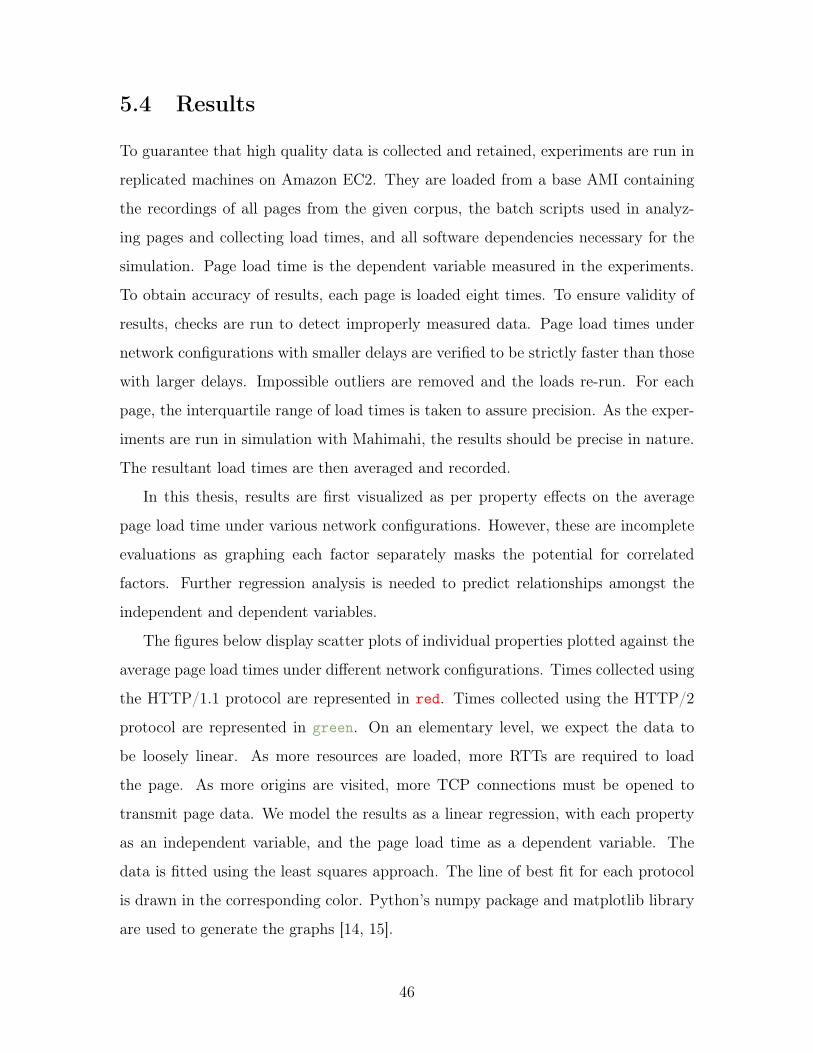
In this thesis, results are first visualized as per property effects on the average
page load time under various network configurations. However, these are incomplete
evaluations as graphing each factor separately masks the potential for correlated
factors. Further regression analysis is needed to predict relationships amongst the
independent and dependent variables.
The figures below display scatter plots of individual properties plotted against the
average page load times under different network configurations. Times collected using
the HTTP/1.1 protocol are represented in red. Times collected using the HTTP/2
protocol are represented in green. On an elementary level, we expect the data to
be loosely linear. As more resources are loaded, more RTTs are required to load
the page. As more origins are visited, more TCP connections must be opened to
transmit page data. We model the results as a linear regression, with each property
as an independent variable, and the page load time as a dependent variable. The
data is fitted using the least squares approach. The line of best fit for each protocol
is drawn in the corresponding color. Python’s numpy package and matplotlib library
are used to generate the graphs [14, 15].
46
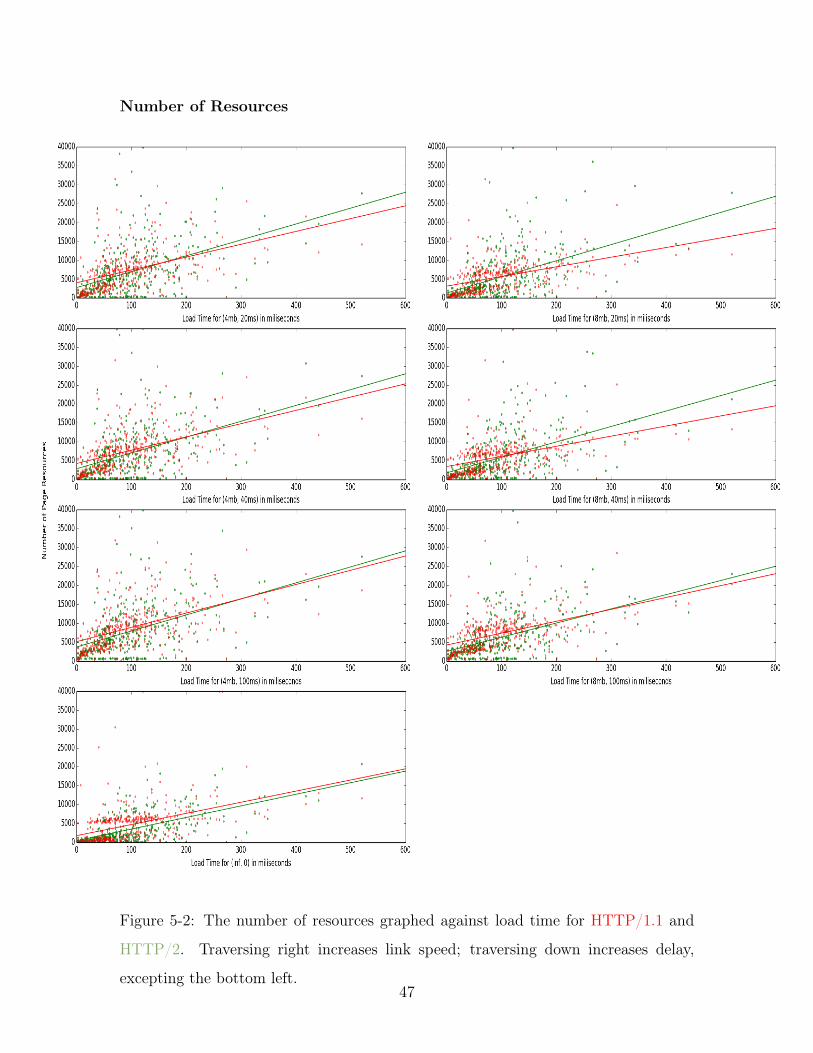
Number of Resources
Figure 5-2: The number of resources graphed against load time for HTTP/1.1 and
HTTP/2. Traversing right increases link speed; traversing down increases delay,
excepting the bottom left.47
5.4.1 Number of Resources
The page load time with respect to the number of resources can be fitted linearly
for both HTTP/1.1 and HTTP/2. In HTTP/1.1, the results gather in two clusters
about the line of best fit. In HTTP/2, the results are either dispersed evenly about
the line of best fit, or along a threshold page load time near the bottom of the graph.
The slope of the linear model for the number of resources to the page load time
for HTTP/1.1 is steeper than that for HTTP/2. HTTP/2 is initially faster than
HTTP/1.1. However, as the number of resources increases, HTTP/1.1 grows faster
per resource, eventually overtaking HTTP/2. This occurs at an intersection point
ranging between 100 and 300 resources across the different network configurations.
HTTP/2 amasses overhead from the additional handshake needed to setup an HTTPS
connection when opening server connections, or the additional request needed to up-
grade HTTP. These overheads are negated by the speedup from multiplexing, as well
as minimizing the number of connections needed through connection reuse. HTTP/2
is single connection, meaning only one connection is needed per domain. When the
number of resources increases, frequently the number of origins increases too. Each
additional connection required takes longer to set up on HTTP/2 than HTTP/1.1.
For both protocols, when the link speed increases, the intersection point is reached
earlier. The slopes of the line of best fit under both protocols are decreased. When
the delay is larger, the intersection point is reached later. The slope under HTTP/2
remains relatively stable, while the slope under HTTP/1.1 increases as the delay
grows. While large RTTs can drastically slow down page loads in HTTP/1.1, HTTP/2
mitigates these delays by reducing the number of trips necessary through multiplexing.
Going against trend, infinite link speed and zero delay increases the link speed and
decreases the delay, but does not reach the intersection point earliest. Instead, the
lines of best fit in our graphs never crosses. We expected the points on the graph to
shift downwards to reflect the decrease load time. Here, while the cluster of pages
along the line of best fit for HTTP/2 shifts accordingly, the cluster of pages above
the line of best fit for HTTP/1.1 does not. Instead of following the line of best fit’s
48
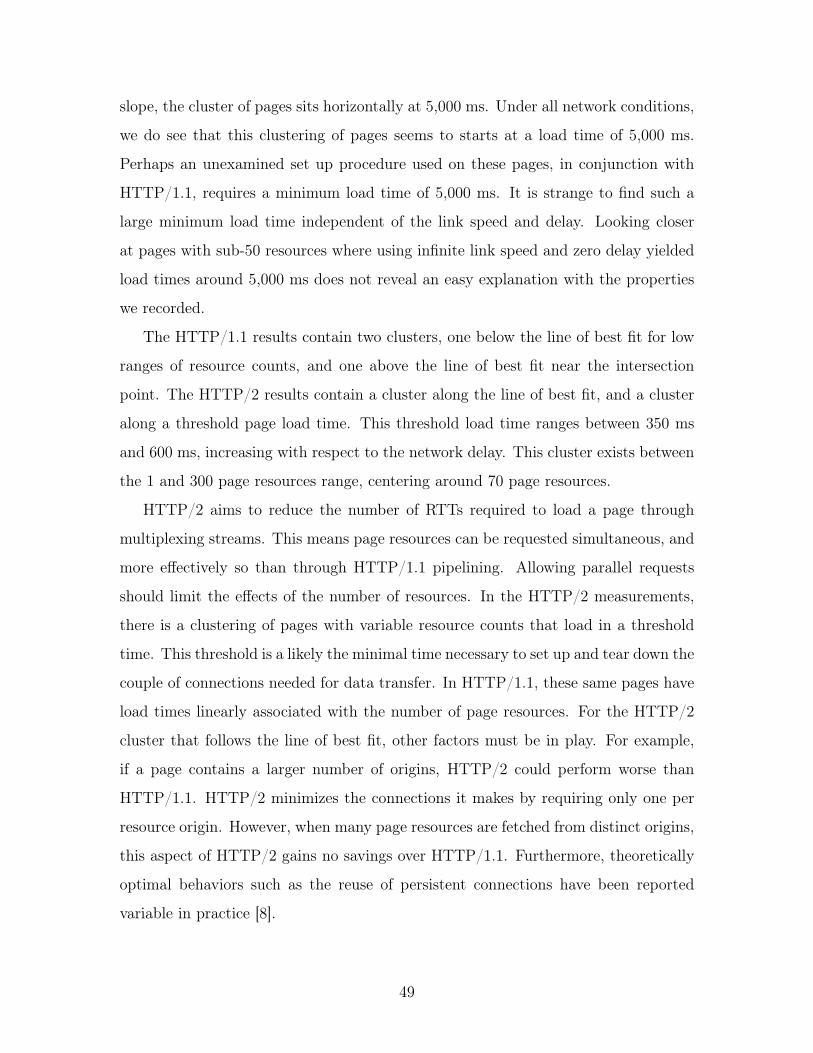
slope, the cluster of pages sits horizontally at 5,000 ms. Under all network conditions,
we do see that this clustering of pages seems to starts at a load time of 5,000 ms.
Perhaps an unexamined set up procedure used on these pages, in conjunction with
HTTP/1.1, requires a minimum load time of 5,000 ms. It is strange to find such a
large minimum load time independent of the link speed and delay. Looking closer
at pages with sub-50 resources where using infinite link speed and zero delay yielded
load times around 5,000 ms does not reveal an easy explanation with the properties
we recorded.
The HTTP/1.1 results contain two clusters, one below the line of best fit for low
ranges of resource counts, and one above the line of best fit near the intersection
point. The HTTP/2 results contain a cluster along the line of best fit, and a cluster
along a threshold page load time. This threshold load time ranges between 350 ms
and 600 ms, increasing with respect to the network delay. This cluster exists between
the 1 and 300 page resources range, centering around 70 page resources.
HTTP/2 aims to reduce the number of RTTs required to load a page through
multiplexing streams. This means page resources can be requested simultaneous, and
more effectively so than through HTTP/1.1 pipelining. Allowing parallel requests
should limit the effects of the number of resources. In the HTTP/2 measurements,
there is a clustering of pages with variable resource counts that load in a threshold
time. This threshold is a likely the minimal time necessary to set up and tear down the
couple of connections needed for data transfer. In HTTP/1.1, these same pages have
load times linearly associated with the number of page resources. For the HTTP/2
cluster that follows the line of best fit, other factors must be in play. For example,
if a page contains a larger number of origins, HTTP/2 could perform worse than
HTTP/1.1. HTTP/2 minimizes the connections it makes by requiring only one per
resource origin. However, when many page resources are fetched from distinct origins,
this aspect of HTTP/2 gains no savings over HTTP/1.1. Furthermore, theoretically
optimal behaviors such as the reuse of persistent connections have been reported
variable in practice [8].
49
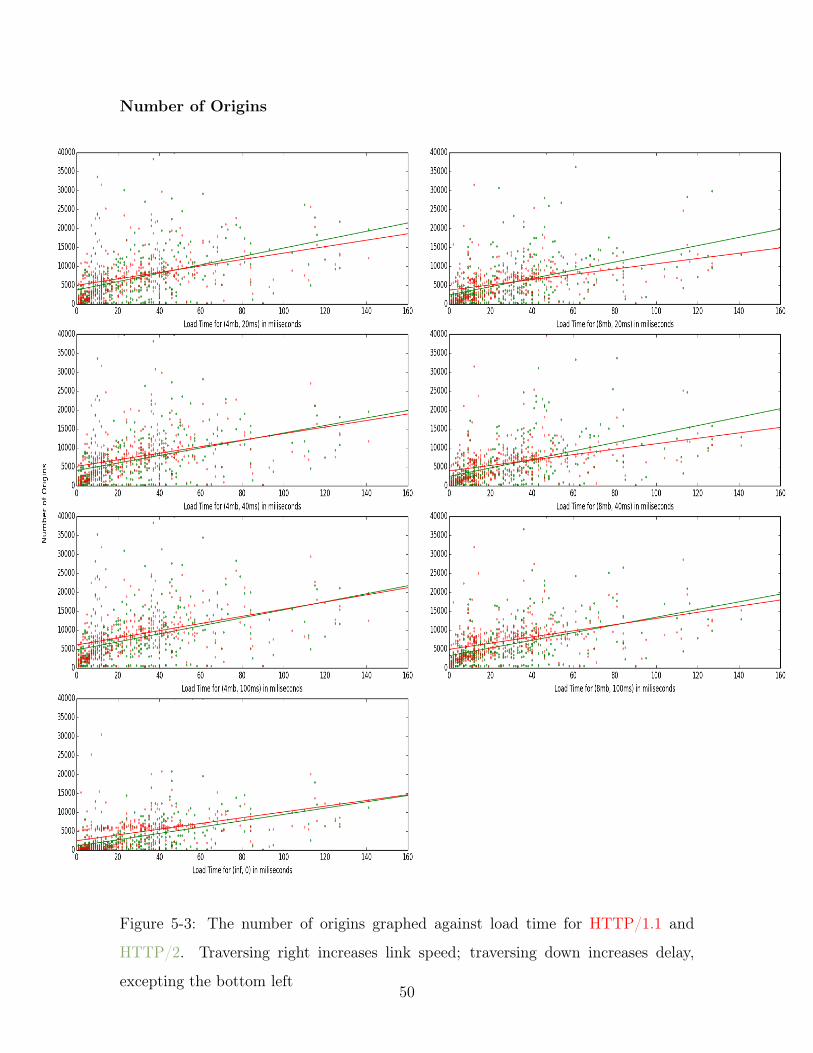
Number of Origins
Figure 5-3: The number of origins graphed against load time for HTTP/1.1 and
HTTP/2. Traversing right increases link speed; traversing down increases delay,
excepting the bottom left50
5.4.2 Number of Origins
The page load time with respect to the number of origins is again fitted linearly. As
the number of origins increases, the number of minimum connections, and thus set
up time, must increase. For HTTP/1.1, the results gather in two clusters about the
line of best fit. In HTTP/2, the results again are either dispersed evenly about the
line of best fit, or along a threshold page load time near the bottom of the graph.
Figure 5-3, the results for the number of origins, exhibits traits similar to those
discussed for Figure 5-2, the results for number of resources. HTTP/1.1 does not
optimize on the number of origins. To improve performance, it frequently opened
6-8 TCP connections per origin. As such, the HTTP/1.1 slope again decreases with
increased link speed, and increases with increased network delay. The HTTP/2 slope
remains relatively unchanged under the various network configurations. Under infinite
link speed and zero delay, the trend flips. The intersection point is reached latest,
instead of earliest. For HTTP/1.1, the grouping above the line of best fit again
clusters; instead of following the line of best fit’s slope, the results cluster horizontally
at the 5,000 ms mark. This finding suggests that some part of the HTTP/1.1 protocol,
unrelated to the speed and latency of actual data transfer bottlenecks performance.
While the clusters are not as distinct, the HTTP/1.1 results again gather in two
groups – one above the line of best fit, and one below. The HTTP/2 results again
display a grouping of pages with varied origin counts that cluster about a threshold
page load time between 350 ms and 600 ms. These pages range between 1 and 65
origins. Within this group, pages with higher origin counts only slightly increase in
page load time. The time needed to set up each additional connection per origin
does not directly and substantially add to the page load time. This observation
invalidates the hypothesis from Section 5.4 suggesting the number of origins as a
directly influential factor causing page load times to trend towards the line of best
fit. The low page load time still exists with higher origin counts. It cannot be the
only cause for the higher page load times in Figure 5-2.
51
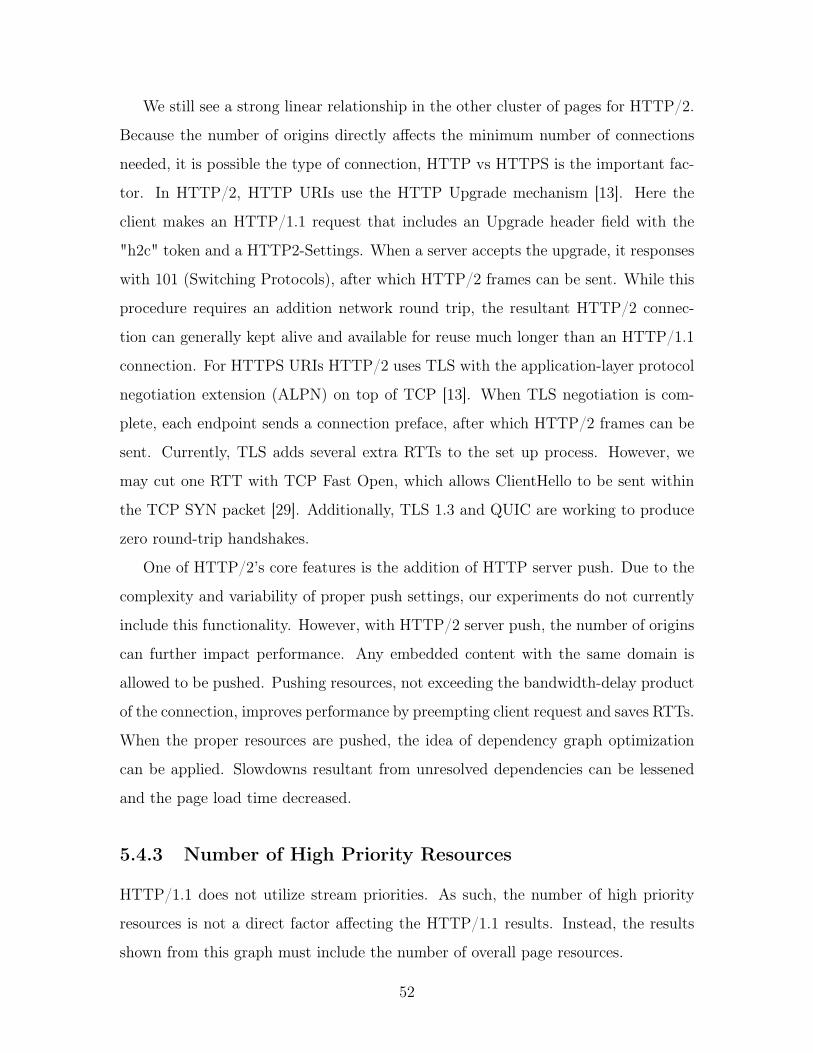
We still see a strong linear relationship in the other cluster of pages for HTTP/2.
Because the number of origins directly affects the minimum number of connections
needed, it is possible the type of connection, HTTP vs HTTPS is the important fac-
tor. In HTTP/2, HTTP URIs use the HTTP Upgrade mechanism [13]. Here the
client makes an HTTP/1.1 request that includes an Upgrade header field with the
"h2c" token and a HTTP2-Settings. When a server accepts the upgrade, it responses
with 101 (Switching Protocols), after which HTTP/2 frames can be sent. While this
procedure requires an addition network round trip, the resultant HTTP/2 connec-
tion can generally kept alive and available for reuse much longer than an HTTP/1.1
connection. For HTTPS URIs HTTP/2 uses TLS with the application-layer protocol
negotiation extension (ALPN) on top of TCP [13]. When TLS negotiation is com-
plete, each endpoint sends a connection preface, after which HTTP/2 frames can be
sent. Currently, TLS adds several extra RTTs to the set up process. However, we
may cut one RTT with TCP Fast Open, which allows ClientHello to be sent within
the TCP SYN packet [29]. Additionally, TLS 1.3 and QUIC are working to produce
zero round-trip handshakes.
One of HTTP/2’s core features is the addition of HTTP server push. Due to the
complexity and variability of proper push settings, our experiments do not currently
include this functionality. However, with HTTP/2 server push, the number of origins
can further impact performance. Any embedded content with the same domain is
allowed to be pushed. Pushing resources, not exceeding the bandwidth-delay product
of the connection, improves performance by preempting client request and saves RTTs.
When the proper resources are pushed, the idea of dependency graph optimization
can be applied. Slowdowns resultant from unresolved dependencies can be lessened
and the page load time decreased.
5.4.3 Number of High Priority Resources
HTTP/1.1 does not utilize stream priorities. As such, the number of high priority
resources is not a direct factor affecting the HTTP/1.1 results. Instead, the results
shown from this graph must include the number of overall page resources.
52
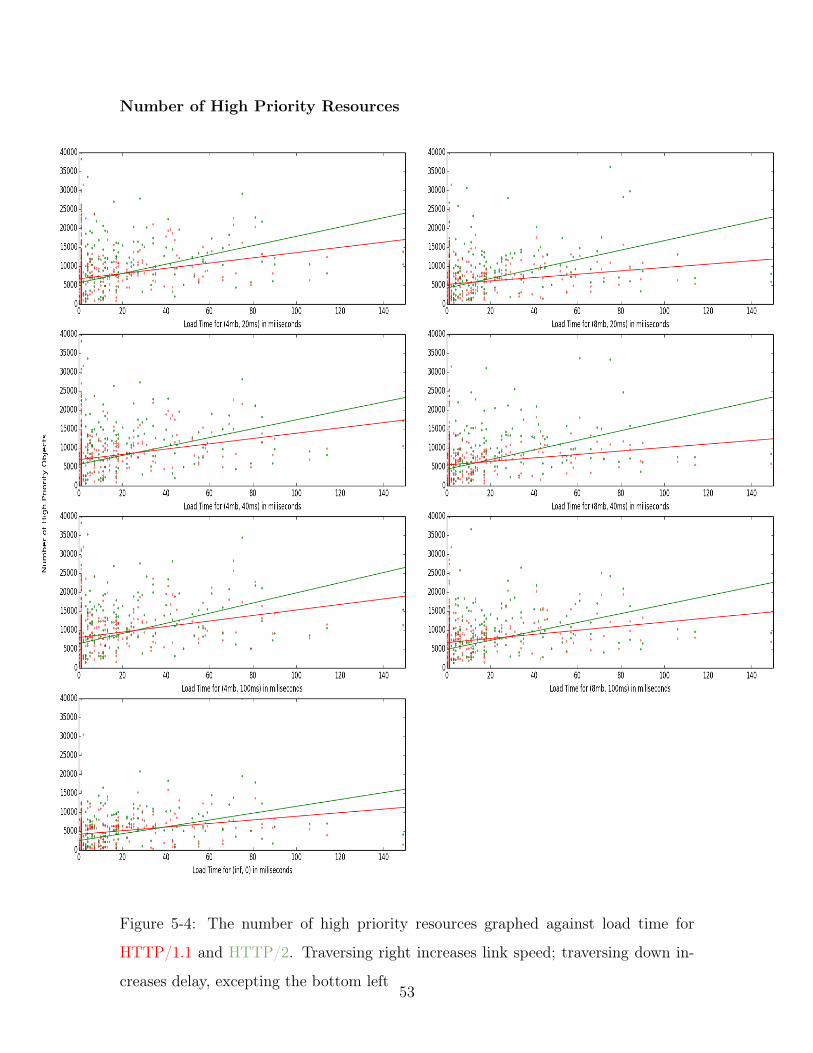
Number of High Priority Resources
Figure 5-4: The number of high priority resources graphed against load time for
HTTP/1.1 and HTTP/2. Traversing right increases link speed; traversing down in-
creases delay, excepting the bottom left53
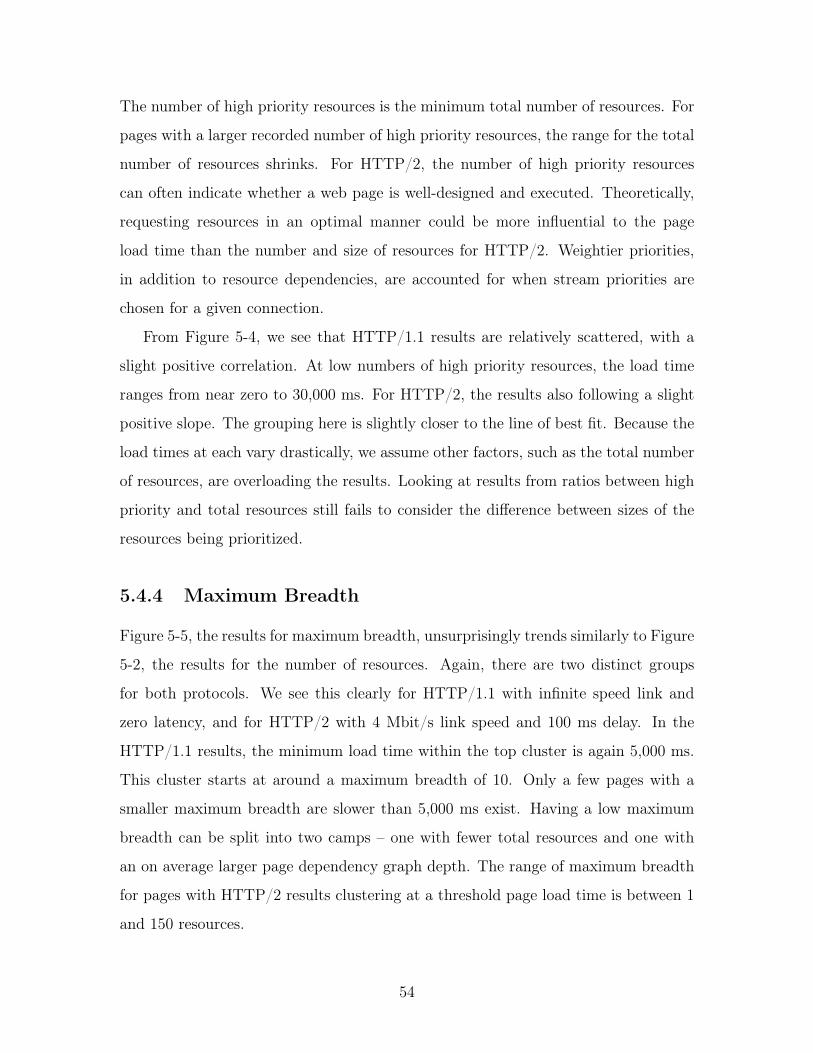
The number of high priority resources is the minimum total number of resources. For
pages with a larger recorded number of high priority resources, the range for the total
number of resources shrinks. For HTTP/2, the number of high priority resources
can often indicate whether a web page is well-designed and executed. Theoretically,
requesting resources in an optimal manner could be more influential to the page
load time than the number and size of resources for HTTP/2. Weightier priorities,
in addition to resource dependencies, are accounted for when stream priorities are
chosen for a given connection.
From Figure 5-4, we see that HTTP/1.1 results are relatively scattered, with a
slight positive correlation. At low numbers of high priority resources, the load time
ranges from near zero to 30,000 ms. For HTTP/2, the results also following a slight
positive slope. The grouping here is slightly closer to the line of best fit. Because the
load times at each vary drastically, we assume other factors, such as the total number
of resources, are overloading the results. Looking at results from ratios between high
priority and total resources still fails to consider the difference between sizes of the
resources being prioritized.
5.4.4 Maximum Breadth
Figure 5-5, the results for maximum breadth, unsurprisingly trends similarly to Figure
5-2, the results for the number of resources. Again, there are two distinct groups
for both protocols. We see this clearly for HTTP/1.1 with infinite speed link and
zero latency, and for HTTP/2 with 4 Mbit/s link speed and 100 ms delay. In the
HTTP/1.1 results, the minimum load time within the top cluster is again 5,000 ms.
This cluster starts at around a maximum breadth of 10. Only a few pages with a
smaller maximum breadth are slower than 5,000 ms exist. Having a low maximum
breadth can be split into two camps – one with fewer total resources and one with
an on average larger page dependency graph depth. The range of maximum breadth
for pages with HTTP/2 results clustering at a threshold page load time is between 1
and 150 resources.
54
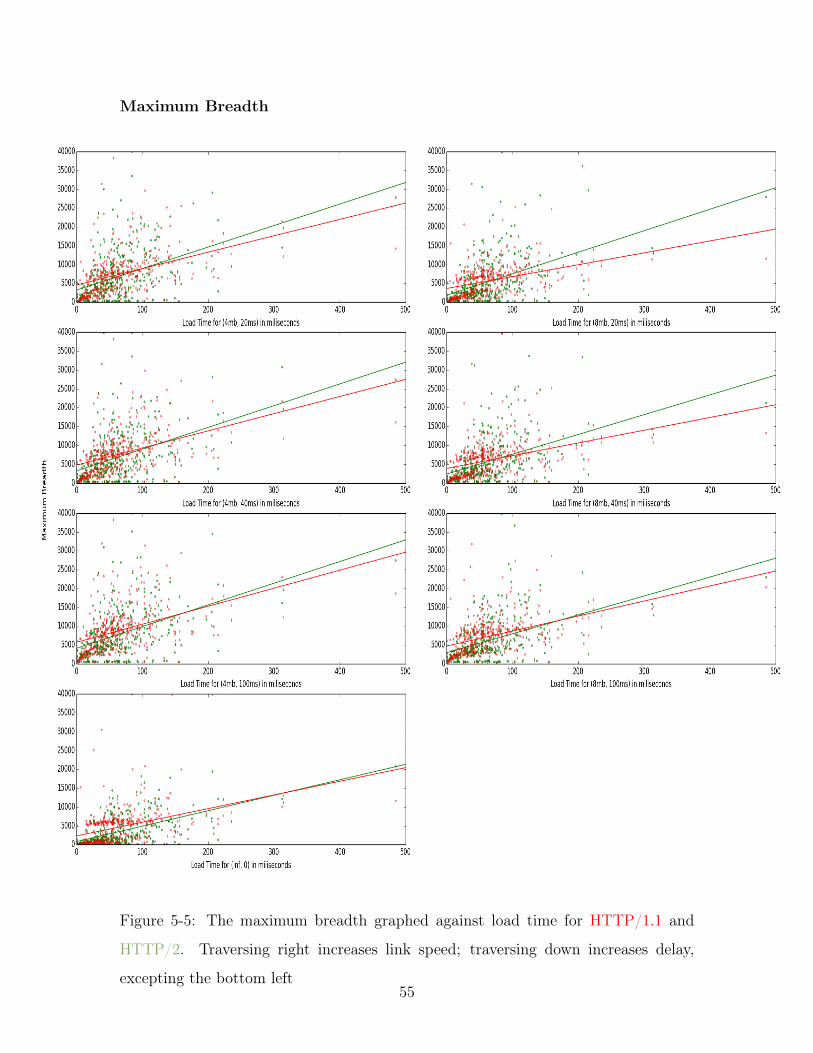
Maximum Breadth
Figure 5-5: The maximum breadth graphed against load time for HTTP/1.1 and
HTTP/2. Traversing right increases link speed; traversing down increases delay,
excepting the bottom left55
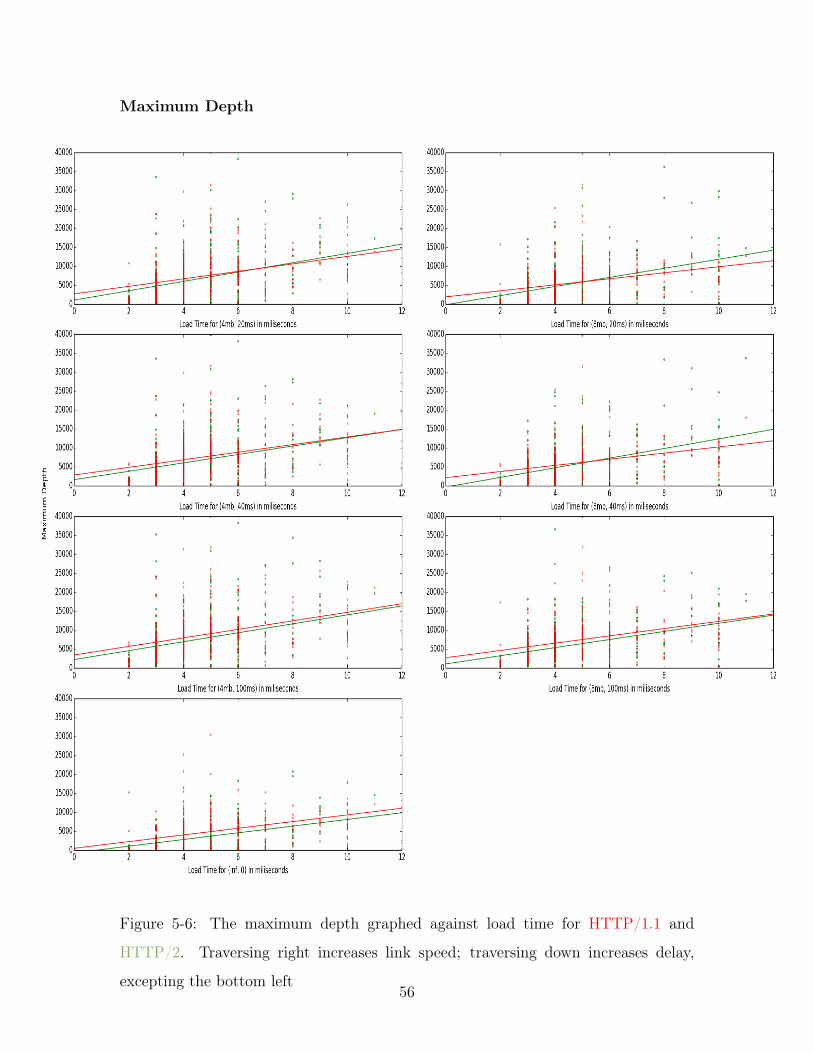
Maximum Depth
Figure 5-6: The maximum depth graphed against load time for HTTP/1.1 and
HTTP/2. Traversing right increases link speed; traversing down increases delay,
excepting the bottom left56
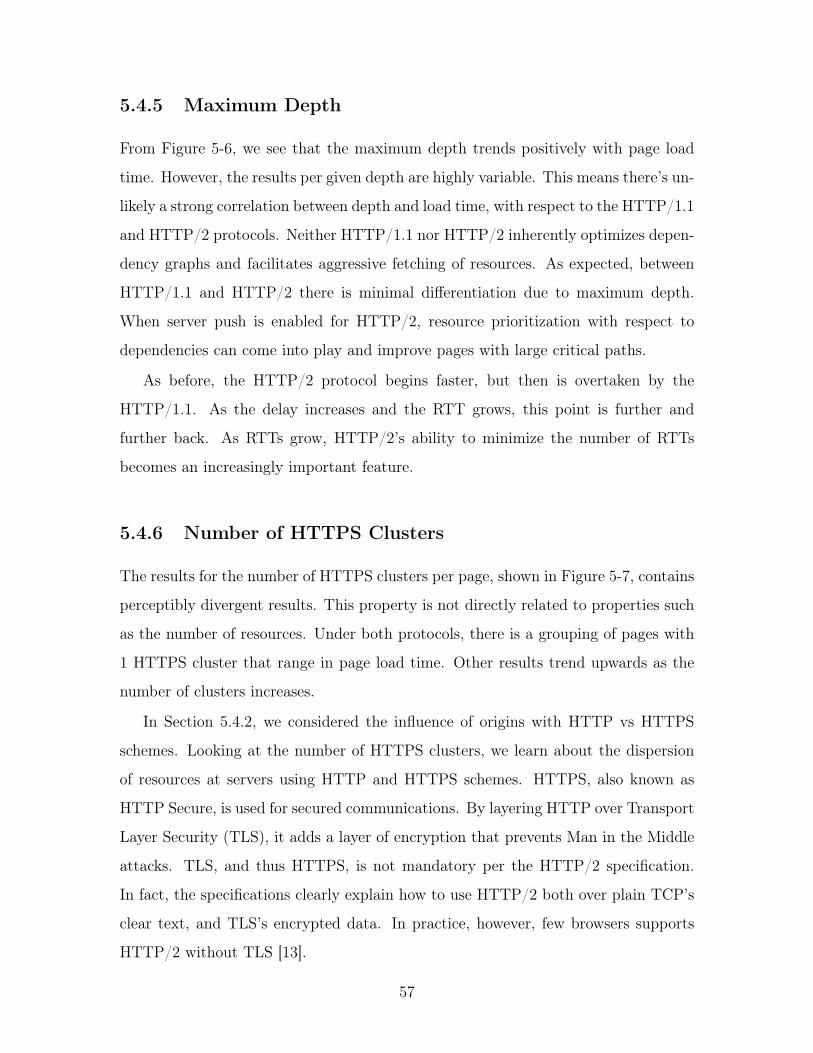
5.4.5 Maximum Depth
From Figure 5-6, we see that the maximum depth trends positively with page load
time. However, the results per given depth are highly variable. This means there’s un-
likely a strong correlation between depth and load time, with respect to the HTTP/1.1
and HTTP/2 protocols. Neither HTTP/1.1 nor HTTP/2 inherently optimizes depen-
dency graphs and facilitates aggressive fetching of resources. As expected, between
HTTP/1.1 and HTTP/2 there is minimal differentiation due to maximum depth.
When server push is enabled for HTTP/2, resource prioritization with respect to
dependencies can come into play and improve pages with large critical paths.
As before, the HTTP/2 protocol begins faster, but then is overtaken by the
HTTP/1.1. As the delay increases and the RTT grows, this point is further and
further back. As RTTs grow, HTTP/2’s ability to minimize the number of RTTs
becomes an increasingly important feature.
5.4.6 Number of HTTPS Clusters
The results for the number of HTTPS clusters per page, shown in Figure 5-7, contains
perceptibly divergent results. This property is not directly related to properties such
as the number of resources. Under both protocols, there is a grouping of pages with
1 HTTPS cluster that range in page load time. Other results trend upwards as the
number of clusters increases.
In Section 5.4.2, we considered the influence of origins with HTTP vs HTTPS
schemes. Looking at the number of HTTPS clusters, we learn about the dispersion
of resources at servers using HTTP and HTTPS schemes. HTTPS, also known as
HTTP Secure, is used for secured communications. By layering HTTP over Transport
Layer Security (TLS), it adds a layer of encryption that prevents Man in the Middle
attacks. TLS, and thus HTTPS, is not mandatory per the HTTP/2 specification.
In fact, the specifications clearly explain how to use HTTP/2 both over plain TCP’s
clear text, and TLS’s encrypted data. In practice, however, few browsers supports
HTTP/2 without TLS [13].
57
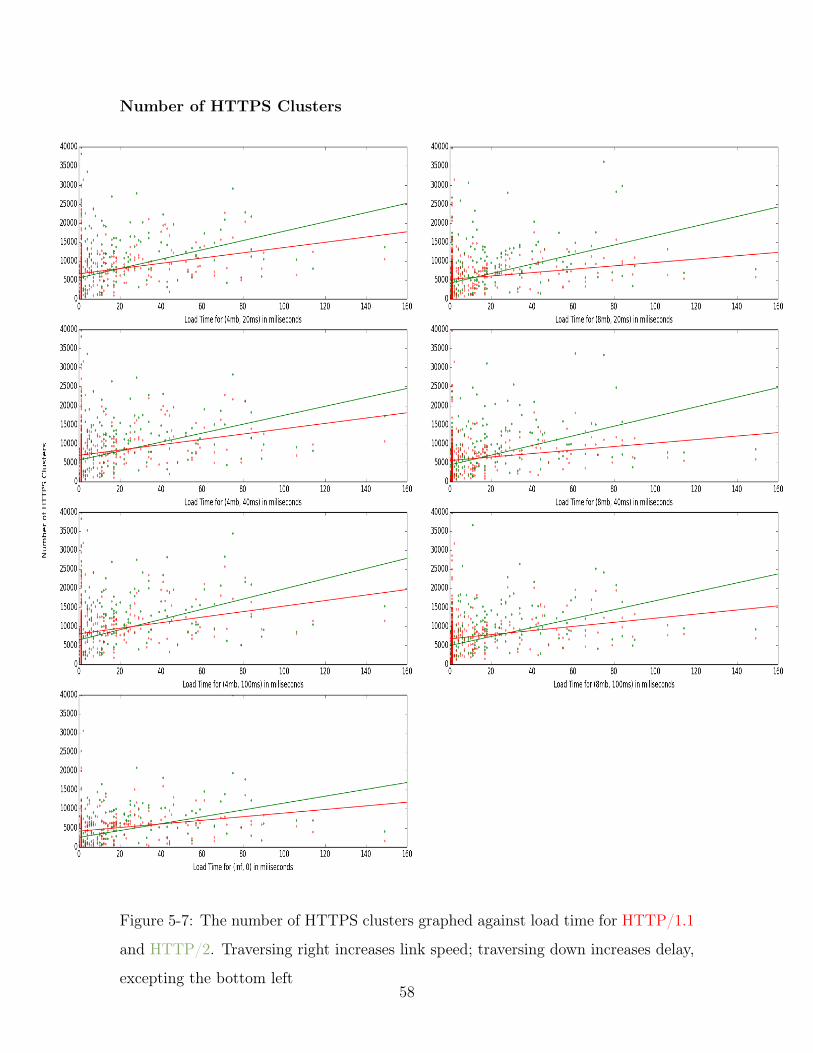
Number of HTTPS Clusters
Figure 5-7: The number of HTTPS clusters graphed against load time for HTTP/1.1
and HTTP/2. Traversing right increases link speed; traversing down increases delay,
excepting the bottom left58
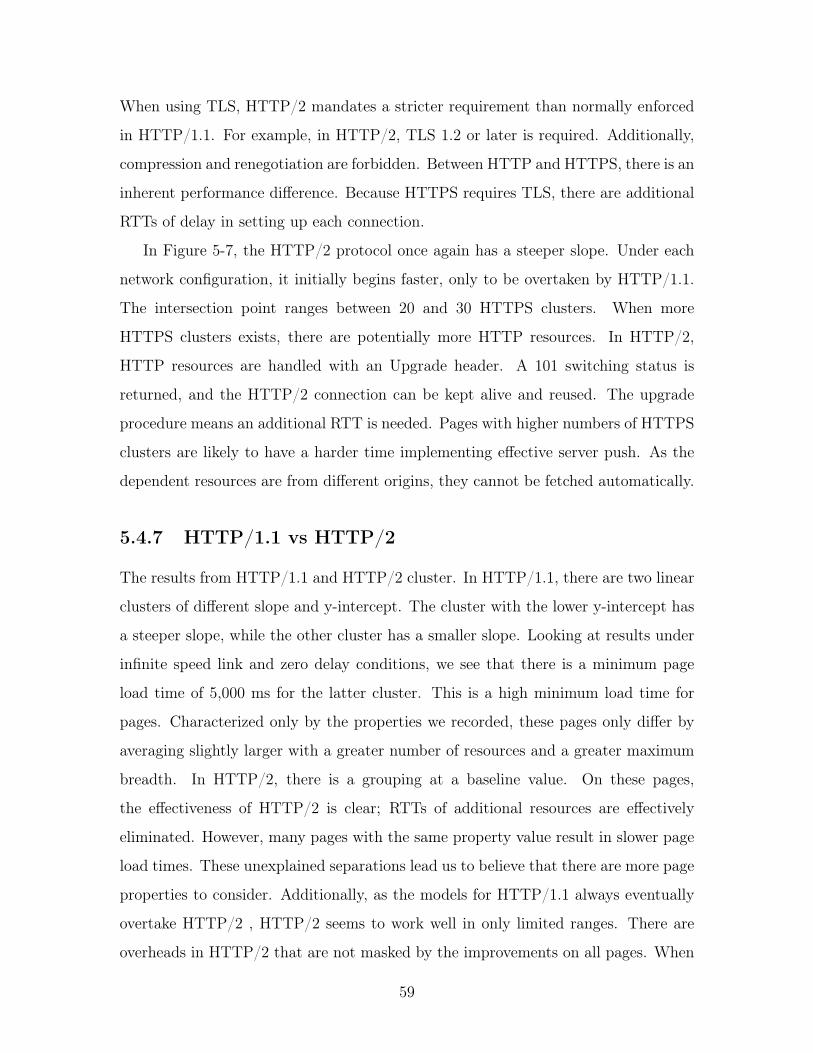
When using TLS, HTTP/2 mandates a stricter requirement than normally enforced
in HTTP/1.1. For example, in HTTP/2, TLS 1.2 or later is required. Additionally,
compression and renegotiation are forbidden. Between HTTP and HTTPS, there is an
inherent performance difference. Because HTTPS requires TLS, there are additional
RTTs of delay in setting up each connection.
In Figure 5-7, the HTTP/2 protocol once again has a steeper slope. Under each
network configuration, it initially begins faster, only to be overtaken by HTTP/1.1.
The intersection point ranges between 20 and 30 HTTPS clusters. When more
HTTPS clusters exists, there are potentially more HTTP resources. In HTTP/2,
HTTP resources are handled with an Upgrade header. A 101 switching status is
returned, and the HTTP/2 connection can be kept alive and reused. The upgrade
procedure means an additional RTT is needed. Pages with higher numbers of HTTPS
clusters are likely to have a harder time implementing effective server push. As the
dependent resources are from different origins, they cannot be fetched automatically.
5.4.7 HTTP/1.1 vs HTTP/2
The results from HTTP/1.1 and HTTP/2 cluster. In HTTP/1.1, there are two linear
clusters of different slope and y-intercept. The cluster with the lower y-intercept has
a steeper slope, while the other cluster has a smaller slope. Looking at results under
infinite speed link and zero delay conditions, we see that there is a minimum page
load time of 5,000 ms for the latter cluster. This is a high minimum load time for
pages. Characterized only by the properties we recorded, these pages only differ by
averaging slightly larger with a greater number of resources and a greater maximum
breadth. In HTTP/2, there is a grouping at a baseline value. On these pages,
the effectiveness of HTTP/2 is clear; RTTs of additional resources are effectively
eliminated. However, many pages with the same property value result in slower page
load times. These unexplained separations lead us to believe that there are more page
properties to consider. Additionally, as the models for HTTP/1.1 always eventually
overtake HTTP/2 , HTTP/2 seems to work well in only limited ranges. There are
overheads in HTTP/2 that are not masked by the improvements on all pages. When
59
pages contain fewer resources from fewer origins, a shallower critical path, and few
HTTPS clusters, HTTP/2 performs well.
5.4.8 Multicollinearity
There are many independent variables affecting the dependent variable, page load
time. Normally in such cases, multiple regression analysis is used to predict the rele-
vance of each independent variable. However, many of the independent variables are
logically correlated. For example, the number of resources and the number of origins
is related. There must be at least as many resources as origins, though usually not
one-to-one in well-structured pages. This results in multicollinearity. Multicollinear-
ity is where two or more independent variables in the multiple regression model are
highly correlated. The coefficient estimates of the multiple regression may change
erratically in response to small changes. Ridge regression analysis is a technique that
removes the effects of correlations from regression analysis by adding a small constant
to the diagonal elements of the standardized covariance matrix.
60
Chapter 6
Conclusion
6.1 Contributions
In this thesis we evaluate the web performance of HTTP/1.1 and HTTP/2 with re-
spect to web page dependency graph properties. Differing from previous approaches
that evaluate systems with respect to network conditions, we attempt to under-
stand how systems perform when loading different types of web pages. We find that
HTTP/2 does not consistently surpass HTTP/1.1 in performance. Instead, there is
an optimal range per property type. These ranges suggest that HTTP/2 performs
worse on larger than average pages. This is counterintuitive, given that multiplexing
HTTP/2 allows parallelization of resource fetches. Within the lower ranges of each
property, we see results more in line with intuition. Under HTTP/2, a cluster of
pages load at the same minimal page load time despite differences in property value.
To evaluate HTTP/1.1 and HTTP/2, we created Pagescope. The goal of Pagescope
is to improve the approach used in evaluating web performance systems. There are
many factors that affect web performance, but often the used metric is boiled down
to an average page load time over oft frequented landing pages. As the content stored
within a web page changes, and the list of popular pages change, the current standard
of evaluation becomes incomprehensible without a copy of the previous page state.
Effective evaluation should be lasting, comparable, and meaningful. It should pro-
vide additional insight into how and why a system behaves. The status quo method
61
cannot.
Pagescope proposes a new approach to evaluating web performance. It begins by
developing a vocabulary to describe web pages, the basis of the web. It identifies
the number and size of resources, the number of distinct origins, the distribution of
resource priorities, the graph depth and breadth, the connected components per ori-
gin, and the number of HTTPS clusters HTTP redirects as key page properties. It
looks at network and CPU utilization, considering bandwidth constraints of different
devices and usage styles. It finds these properties existing on a web page, and then
categorizes its type. To quote Professor Patrick Winston, "Having a name for some-
thing gives us power over it." The basic vocabulary Pagescope eases classification of
web pages. These words allow a more fine-grained understanding of web performance
systems affect the general web.
Pagescope is a starting point for further research into web performance evaluation.
It presents data gathered from experiments with the HTTP/1.1 and the HTTP/2
protocol under various network conditions. Work in progress includes incorporating
experiments using the QUIC protocol and the Polaris system.
6.2 Future Work
In future work, researchers can modify Mahimahi, the open-source record-and-replay
tool, to integrate with new web performance systems and protocols. These systems
can then use Pagescope to obtain a standardized web performance evaluation. As
the web changes, the corpus of representative web pages will change. Eventually
the list of integral properties will grow and change. Pagescope is extensible and
easily updated. A new corpus of representative web pages can be created with our
web crawler and inputted to Pagescope. Newly identified integral properties can be
retrieved and stored by modifying included data processing functions. These features
ensure that Pagescope is adaptable and will grow with the web.
Visualization is a technique beneficial in communicating complex information.
Integrating a visualization tool into Pagescope is the next step. Because many factors
62
affect web performance, the data it stores is overwhelming when directly viewed.
In our evaluations, we graph the experimental findings. To enhance Pagescope’s
usability, it should have a fully developed visualization tool included. This allows
users to run Pagescope, then quickly receive results that help realize what factors
are most relevant to the evaluated system and how those compare to other web
performance systems. This achieves the ultimate goal of Pagescope – to improve,
simplify, and standardize web performance evaluation.
63

64
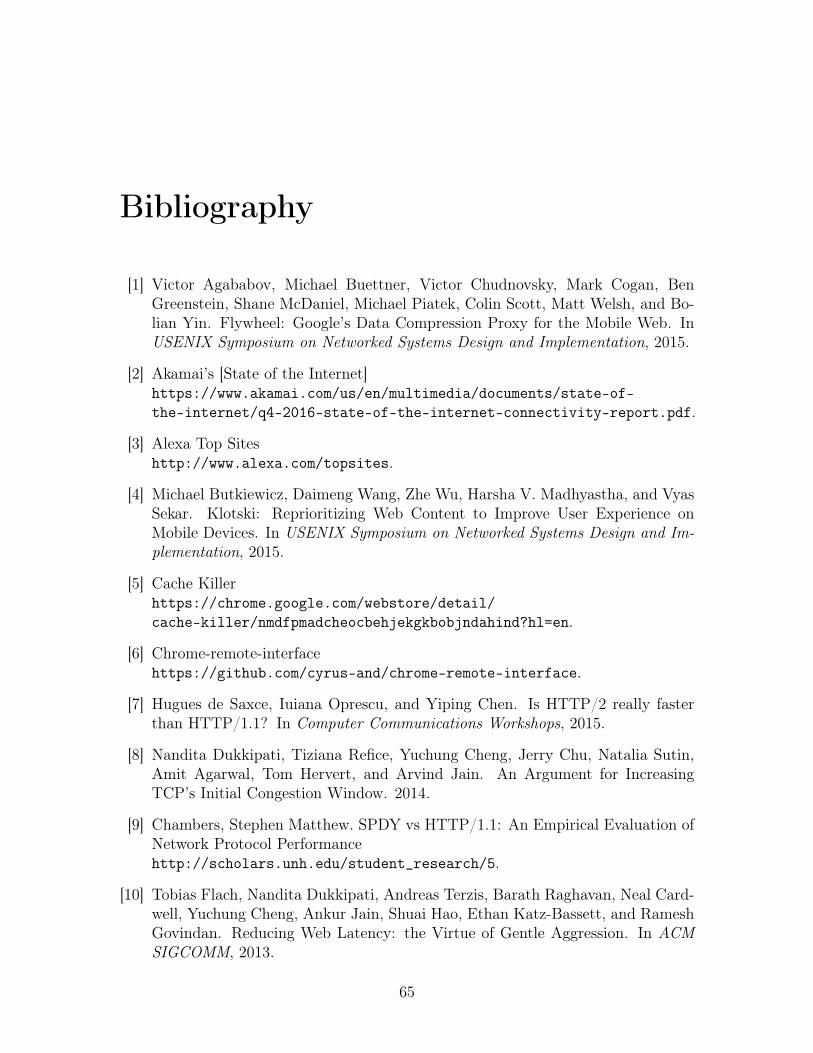
Bibliography
[1] Victor Agababov, Michael Buettner, Victor Chudnovsky, Mark Cogan, BenGreenstein, Shane McDaniel, Michael Piatek, Colin Scott, Matt Welsh, and Bo-lian Yin. Flywheel: Google’s Data Compression Proxy for the Mobile Web. InUSENIX Symposium on Networked Systems Design and Implementation, 2015.
[2] Akamai’s [State of the Internet]https://www.akamai.com/us/en/multimedia/documents/state-of-the-internet/q4-2016-state-of-the-internet-connectivity-report.pdf.
[3] Alexa Top Siteshttp://www.alexa.com/topsites.
[4] Michael Butkiewicz, Daimeng Wang, Zhe Wu, Harsha V. Madhyastha, and VyasSekar. Klotski: Reprioritizing Web Content to Improve User Experience onMobile Devices. In USENIX Symposium on Networked Systems Design and Im-plementation, 2015.
[5] Cache Killerhttps://chrome.google.com/webstore/detail/cache-killer/nmdfpmadcheocbehjekgkbobjndahind?hl=en.
[6] Chrome-remote-interfacehttps://github.com/cyrus-and/chrome-remote-interface.
[7] Hugues de Saxce, Iuiana Oprescu, and Yiping Chen. Is HTTP/2 really fasterthan HTTP/1.1? In Computer Communications Workshops, 2015.
[8] Nandita Dukkipati, Tiziana Refice, Yuchung Cheng, Jerry Chu, Natalia Sutin,Amit Agarwal, Tom Hervert, and Arvind Jain. An Argument for IncreasingTCP’s Initial Congestion Window. 2014.
[9] Chambers, Stephen Matthew. SPDY vs HTTP/1.1: An Empirical Evaluation ofNetwork Protocol Performancehttp://scholars.unh.edu/student_research/5.
[10] Tobias Flach, Nandita Dukkipati, Andreas Terzis, Barath Raghavan, Neal Card-well, Yuchung Cheng, Ankur Jain, Shuai Hao, Ethan Katz-Bassett, and RameshGovindan. Reducing Web Latency: the Virtue of Gentle Aggression. In ACMSIGCOMM, 2013.
65
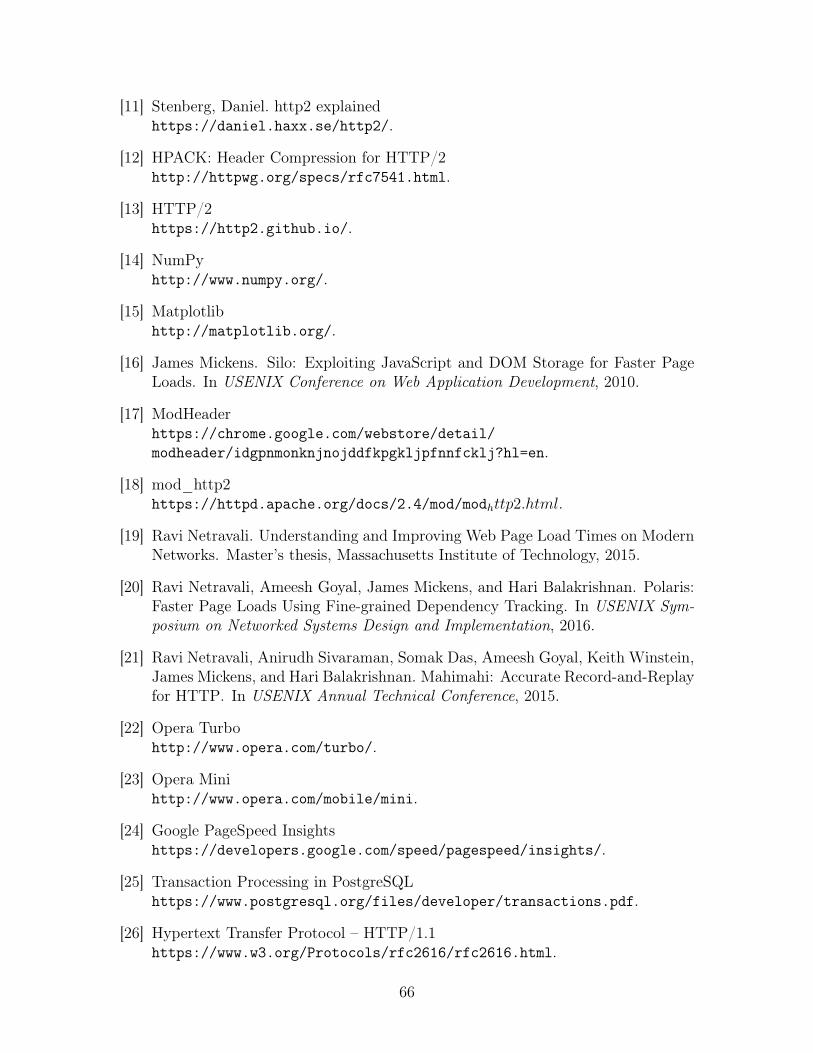
[11] Stenberg, Daniel. http2 explainedhttps://daniel.haxx.se/http2/.
[12] HPACK: Header Compression for HTTP/2http://httpwg.org/specs/rfc7541.html.
[13] HTTP/2https://http2.github.io/.
[14] NumPyhttp://www.numpy.org/.
[15] Matplotlibhttp://matplotlib.org/.
[16] James Mickens. Silo: Exploiting JavaScript and DOM Storage for Faster PageLoads. In USENIX Conference on Web Application Development, 2010.
[17] ModHeaderhttps://chrome.google.com/webstore/detail/modheader/idgpnmonknjnojddfkpgkljpfnnfcklj?hl=en.
[18] mod_http2https://httpd.apache.org/docs/2.4/mod/modℎ𝑡𝑡𝑝2.ℎ𝑡𝑚𝑙.
[19] Ravi Netravali. Understanding and Improving Web Page Load Times on ModernNetworks. Master’s thesis, Massachusetts Institute of Technology, 2015.
[20] Ravi Netravali, Ameesh Goyal, James Mickens, and Hari Balakrishnan. Polaris:Faster Page Loads Using Fine-grained Dependency Tracking. In USENIX Sym-posium on Networked Systems Design and Implementation, 2016.
[21] Ravi Netravali, Anirudh Sivaraman, Somak Das, Ameesh Goyal, Keith Winstein,James Mickens, and Hari Balakrishnan. Mahimahi: Accurate Record-and-Replayfor HTTP. In USENIX Annual Technical Conference, 2015.
[22] Opera Turbohttp://www.opera.com/turbo/.
[23] Opera Minihttp://www.opera.com/mobile/mini.
[24] Google PageSpeed Insightshttps://developers.google.com/speed/pagespeed/insights/.
[25] Transaction Processing in PostgreSQLhttps://www.postgresql.org/files/developer/transactions.pdf.
[26] Hypertext Transfer Protocol – HTTP/1.1https://www.w3.org/Protocols/rfc2616/rfc2616.html.
66
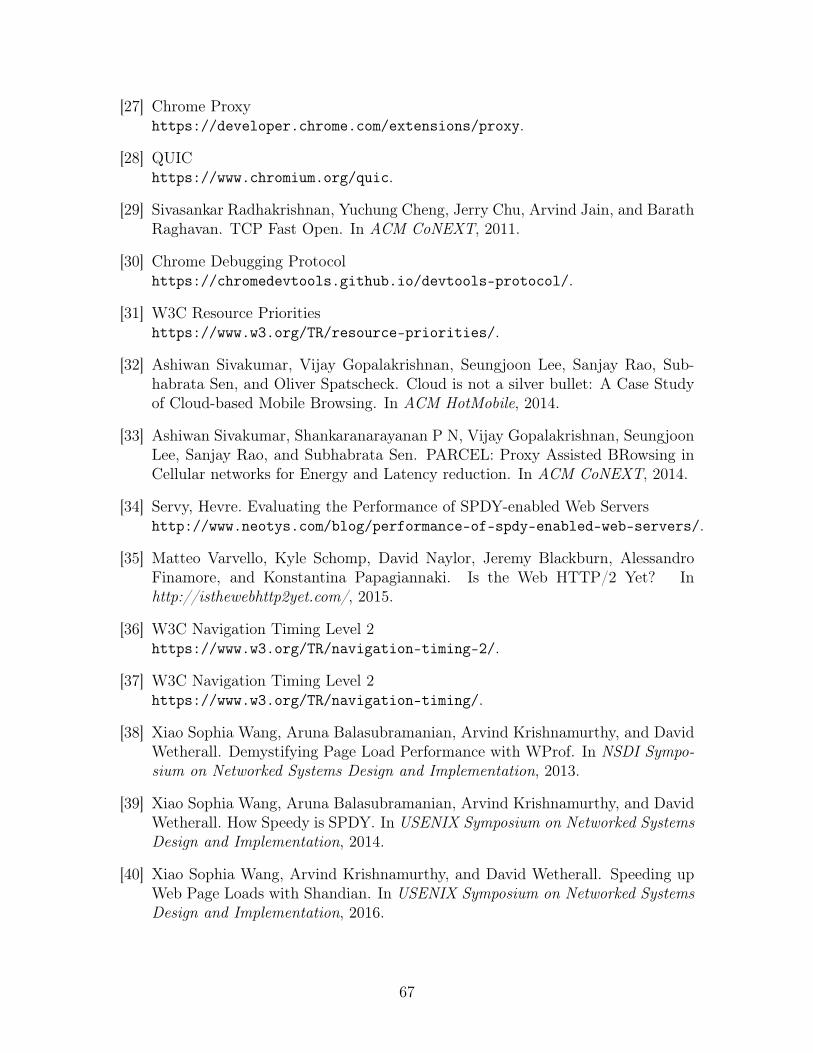
[27] Chrome Proxyhttps://developer.chrome.com/extensions/proxy.
[28] QUIChttps://www.chromium.org/quic.
[29] Sivasankar Radhakrishnan, Yuchung Cheng, Jerry Chu, Arvind Jain, and BarathRaghavan. TCP Fast Open. In ACM CoNEXT, 2011.
[30] Chrome Debugging Protocolhttps://chromedevtools.github.io/devtools-protocol/.
[31] W3C Resource Prioritieshttps://www.w3.org/TR/resource-priorities/.
[32] Ashiwan Sivakumar, Vijay Gopalakrishnan, Seungjoon Lee, Sanjay Rao, Sub-habrata Sen, and Oliver Spatscheck. Cloud is not a silver bullet: A Case Studyof Cloud-based Mobile Browsing. In ACM HotMobile, 2014.
[33] Ashiwan Sivakumar, Shankaranarayanan P N, Vijay Gopalakrishnan, SeungjoonLee, Sanjay Rao, and Subhabrata Sen. PARCEL: Proxy Assisted BRowsing inCellular networks for Energy and Latency reduction. In ACM CoNEXT, 2014.
[34] Servy, Hevre. Evaluating the Performance of SPDY-enabled Web Servershttp://www.neotys.com/blog/performance-of-spdy-enabled-web-servers/.
[35] Matteo Varvello, Kyle Schomp, David Naylor, Jeremy Blackburn, AlessandroFinamore, and Konstantina Papagiannaki. Is the Web HTTP/2 Yet? Inhttp://isthewebhttp2yet.com/, 2015.
[36] W3C Navigation Timing Level 2https://www.w3.org/TR/navigation-timing-2/.
[37] W3C Navigation Timing Level 2https://www.w3.org/TR/navigation-timing/.
[38] Xiao Sophia Wang, Aruna Balasubramanian, Arvind Krishnamurthy, and DavidWetherall. Demystifying Page Load Performance with WProf. In NSDI Sympo-sium on Networked Systems Design and Implementation, 2013.
[39] Xiao Sophia Wang, Aruna Balasubramanian, Arvind Krishnamurthy, and DavidWetherall. How Speedy is SPDY. In USENIX Symposium on Networked SystemsDesign and Implementation, 2014.
[40] Xiao Sophia Wang, Arvind Krishnamurthy, and David Wetherall. Speeding upWeb Page Loads with Shandian. In USENIX Symposium on Networked SystemsDesign and Implementation, 2016.
67


