Embed Size (px)
Citation preview

The Syndication of Angel Investors
Master Thesis Finance
Tilburg University
M.E.G. Verdiesen MSc. Publication date: August 2013
Supervisor: Dr. M. Da Rin
2
‘Does the syndication of Angel Investors have a significant positive correlation to the probability of
successful investment outcomes of Angel Investors?’
Master thesis of the department of Finance, Tilburg School of Economics and Management,
Tilburg University
University supervisor: Dr. M. Da Rin
Second reader: Dr. F. Braggion
Author: Maikel Verdiesen MSc.
ANR: 148982
Program: Master Finance, Tilburg University
Publication date: August 2013

3
Executive summary Angel Investors serve as the primary source for investing in start-up companies. The main goal of almost
all investors is to maximize their investment outcome. One factor that is likely to contribute to an
increase in the probability of a successful outcome by Angel Investors is syndication. However, research
on syndication among Angel Investors is very limited. In this research I have tried to answer whether the
syndication of Angel Investors have a significant positive correlation to the probability of successful
investment outcomes of Angel Investors. In addition, I have measured the influence of deal structure
characteristics and firm specific characteristics on the probability of a successful investment.
Using a unique hand-collected dataset of 62 Angel Investors and their 98 portfolio companies I found
evidence that syndicated Angel Investors have on average a higher probability of a positive investment
outcome than individual Angel Investors. Moreover, the findings indicate that several deal structure and
firm specific characteristics significantly influence the investment outcome of Angel Investors.

4
Table of Contents
Executive summary ....................................................................................................................................... 3
Introduction .................................................................................................................................................. 6
Contribution .............................................................................................................................................. 6
Chapter 1: Current state of the literature .............................................................................................. 8
1.1 Angel Investors .............................................................................................................................. 8
1.2 Syndication .................................................................................................................................... 9
1.3 Syndicated Angel Investors ......................................................................................................... 10
Chapter 2: Research approach .............................................................................................................. 12
2.1 Data collection ............................................................................................................................ 12
2.2 Research questions ..................................................................................................................... 12
Chapter 3: Empirical Analysis ................................................................................................................ 14
3.1 Data analysis ............................................................................................................................... 14
3.1.1 Dependent variables ........................................................................................................... 14
3.1.2 Independent and control variables ..................................................................................... 14
3.1.3 Descriptive statistics ........................................................................................................... 16
3.2 Regression analysis ..................................................................................................................... 19
3.2.1 Multinomial Logistic Model ................................................................................................ 19
3.2.2 Binary Choice model ........................................................................................................... 23
3.2.3 Multinomial Logistic Model versus Binary Choice model ................................................... 25
3.3 Results hypotheses tests ............................................................................................................. 26
Chapter 4: Conclusions ............................................................................................................................... 28
4.1 Summary ..................................................................................................................................... 28
4.2 Limitations and future research .................................................................................................. 29
Reference list .............................................................................................................................................. 30
Appendix A .................................................................................................................................................. 32

5
Table of Figures
Table 1: Independent and dependent variables ......................................................................................... 16
Table 2: Descriptive statistics ...................................................................................................................... 17
Table 3: Pairwise correlation matrix ........................................................................................................... 18
Table 4: Multinomial Logistic model 1 ........................................................................................................ 21
Table 5: Multinomial Logistic model 2 ........................................................................................................ 22
Table 6: Binary Choice model ..................................................................................................................... 24
Table 7: Signs and significance of parameter estimates in Multinomial and Binary models ..................... 26
Table 8: Overview of Hypotheses ............................................................................................................... 27
6
Introduction
Angel Investors are seen as one of the most important investors for entrepreneurial companies. They
serve as the primary source for investing in start-up companies. In addition, in 2000 in the United States
the total market of Angel Investors was already estimated at $100 billion. Angel Investors are wealthy
individuals who typically invest on their own account in small, private, startup companies. These
companies are typically high-risk startups with potential for high growth.
The main goal of almost every investor is to maximize the probability of a successful investment. Many
factors may significantly increase the probability of a successful investment. According to literature, one
of these factors is the syndication of investors. There are several reasons why investors may syndicate.
Nevertheless, it is assumed that the main goal for investors to syndicate is to maximize current and
future investments outcomes. However, other factors that are likely to influence the outcome of the
investment are deal flow and firm specific characteristics.
Contribution
Research on Angel Investors is relatively new. Until 1998, very little was known about the market’s size,
scope, type of firms that raise angel capital, and the types of individuals that provide it (Prowse, 1998;
Mason & Harrison, 1999, in Brush et. al., 2002). One reason could be that data is only limited available,
because transactions are not required to provide rigorous disclosure, due to the fact that it concerns
private equity. Even though research on this topic is increasing, this problem still remains. In addition,
existing studies are often based on small, unrepresentative samples and are limited to descriptive
analysis, instead of on analytical methodologies (Da Rin & Penas, 2011). In the past decade, more
(descriptive) research has been done in the field of Angel Investors. Nevertheless, research devoted to
syndication in angel investing is still relatively small. Therefore, this research is devoted to measure the
influence of syndication of Angel Investors on their investment outcome.
Several expectations are drawn as a result of the theoretical discussion. First of all, based on the
literature it is likely that syndication has a positive influence on the probability of successful investment
outcomes of Angel Investors. Secondly, deal flow characteristics are likely to influence the probability of
a successful outcome. The complexity of the contract is likely to decrease the investment outcome,
while engaging in due diligence is likely to increase the investment outcome. Thirdly, firm specific
characteristics are expected to positively influence the investment outcome of Angel Investors. These
characteristics include the total amount invested in the company, whether the company has realized

7
sales, and the interaction time between Angel Investors and portfolio companies. These expectations
will be tested in an empirical method in this thesis.
The main goal of this thesis is to prove that syndication has a beneficial effect on the probability of a
successful investment. In order to quantify this relation, two models are used. First, several regressions
are run with the Multinomial Logistic model. Secondly, as an alternative, these regressions are run with
the Binary Choice model. In these models many different variables are tested in order to analyze their
influence on the outcome of the investment, and their influence on the relation between syndication
and the outcome of the investment. For this research, the most important variables are related to either
deal structure characteristics or firm specific characteristics. These variables are included in the models.
8
Chapter 1: Current state of the literature
The purpose of this chapter is to provide an understanding of Angel Investors and syndication, on which
I build my analysis in the upcoming chapters. A number of issues are required to be theoretically
elaborated upon before this research can be properly executed. Therefore, this section starts with a
theoretical analysis of Angel Investors. Secondly, an analysis regarding syndication in general is provided.
Lastly, the issues and consequences regarding syndicated Angel Investors are discussed.
1.1 Angel Investors
Angel Investors are seen as one of the most important investors for entrepreneurial companies
(Osnabrugge & Robinson, 2000). It is difficult to exactly quantify the size of the angel market (Wong et.
al., 2009). Nevertheless, in 2000, the size of the total angel market was estimated at $100 billion in the
United States, while the venture capital market is less than half this size at approximately $48 billion
(National Venture Capital Association, 2000; in Wong et. al., 2009). Two years later, the Global
Entrepreneurship Monitor estimated the size of the angel market to be five times as large as the market
for institutional venture capitalists. In addition, Angel Investors are often the first outside investors that
an entrepreneur tries to find (Wiltbank & Boeker, 2007). Compared to Venture Capitalists in the United
States, Angel Investors invest in approximately 20 times the number of new companies (Wiltbank et. al.,
2009).
The definition of Angel Investors used in this thesis is the definition by Wong et. al. (2009), which state
that Angel Investors refer to high-net worth individuals who typically invest in small, private companies
on their own account. These companies are typically high-risk, high-growth startups in an early stage
(Freear et. al., 1994; Ibrahim, 2008). Mason & Harrison (2002) show that there is a high probability of
failure, but also a high probability of a significant return on the investment. The market of Angel
Investors consists of individuals who provide risk capital to small, private companies (Prowse, 1998).
Angel Investors typically go for seed and start-up companies, in which they invest more than 47 percent
of their total amount invested (Smith et. al., 2011). Angel Investors are generally freelancers who are
interested in investing relatively small amounts of money, typically $25,000 - $500,000 (Wiltbank et. al.,
2009). Angel Investors typically invest over horizons of 5 to 10 years. Smith et. al. (2011) argue that
many Angel Investors work alone, while other Angel Investors are affiliated with Angel networks.
Compared to institutional investors such as Venture Capitalists, the investment amount is on average
lower and the horizon is longer.

9
Other differences can be seen in the deal structure of Angel Investors with their portfolio companies.
Venture Capitalists usually have an extensive contract and term sheet usually with all sorts of rights that
flow to the investor in case the investment turns out to be disappointing. On the other hand, Angel
Investors normally enter into an investment agreement that is less complex (Smith et. al., 2011). Smith
et. al. (2011) discuss that normally Angel Investment agreements do not involve formal staging
commitments, preferential forms of investment, ratchets or other antidilution protection, or provisions
designed to force a liquidity event. Ibrahim (2008) proposes three reasons why Angel Investors may
prefer to use less complex deal structures. First, future investments may be discouraged because the
first investment agreement would need to be unwound. Secondly, Angel Investors rely on an informal
method of screening and monitoring. Lastly, it is too costly and time ineffective. The motivation of Angel
Investors to maintain such a less complex investment agreement is to achieve financial and nonfinancial
objectives (Ibrahim, 2008). Therefore, including a more complex deal structure may not be beneficial to
the outcome of the deal. Nevertheless, Ibrahim (2008) argues that there is a trend towards a more
complex and professional deal structure, such as the deal structure of Venture Capitalists. However,
according to Ibrahim (2008) there is not enough information available to analyze the consequences of
this trend.
1.2 Syndication
A syndicated investment is an investment in which a group of investors or funds work together to
provide funds for a portfolio company (Kaiser & Lauterbach, 2007; Brander et. al., 2002). Syndication
among financial institutions is a well-known phenomenon and commonly used by Venture Capitalists
(Nielsen, 2008). Syndication is a reciprocal, ongoing, informal relationship, in which investors tend to
collaborate by taking turns serving as lead investors or co-investors (Smith et. al., 2011). There are
several motives why Venture Capitalists want to syndicate their deals. Manigart et. al. (2006) have
classified these motivations into dealing either with issues at the level of the management of the overall
fund or with issues related to the management of a specific investment.
The first class concerns the additional performance of the overall fund. Manigart et. al. (2006) discuss
five main reasons why syndication leads to a better performance of the overall firm. First of all,
syndication is used to diversify the portfolio, in order to reduce the unsystematic risk (Wilson, 1968, in
Nielsen, 2008; Lockett & Wright, 2001). Secondly, it enables them to limit underperformance with their
peers, by reducing “window dressing” (Clercq & Dimov, 2010). Thirdly, these Venture Capitalists try to
be associated with other successful Venture Capitalists to increase the probability of raising new funds

10
successfully. This leads to the fourth point: the syndicated partner is expected to reciprocate this
gesture in the future, which may lead to improved access and better quality deals. Finally, syndication
reduces the incentive to behave opportunistically which creates trust between the syndicated partners.
The second class concerns the performance of the specific investment (Manigart et. al., 2006).
Syndication is likely to lead to a better investment due to enhanced screening process. Secondly,
syndicated partners are able to add their experience and skills to the investment, which may increase
the performance of the portfolio company. Thirdly, cooperation between investors may lead to an
increase in negotiating power towards the entrepreneur, which may increase the financing terms.
Finally, in case of an IPO, syndication may lead to enhanced certification and lower underpricing of the
portfolio company.
Two results of syndicated investments are described by Brander et. al. (2002), who discuss two results of
syndication by Venture Capitalists. By using Canadian data, syndicated investments turn out to have
higher returns than investments that are not syndicated. Secondly, syndication is likely to add value to
ventures when Venture Capitalists are actively involved in management (Brander et. al., 2002).
1.3 Syndicated Angel Investors
According to Wong et. al. (2009), Angel Investors use syndication to remain in control and to mitigate
risk of investing in early staged companies. In addition, two other methods to remain in control and to
mitigate risk are covered by the amount of funding and by the geographical proximity between Angel
Investors and their investments. A larger syndicate is an indication that the investment passed the
evaluation of more Angel Investors. However, this provides the opportunity for some Angel Investors to
free-ride on the due diligence of others. Wiltbank and Boeker (2007) have evaluated the impact of the
factors due diligence and active involvement in the portfolio company to Angel Investors’ outcomes.
They conclude about that returns increase when Angel Investors spend (more) time on due diligence. In
addition, they conclude that if an investor interacts a couple times a month with the portfolio company,
the angel’s return increases by a factor of 3 as when the investor interacts only a couple times a year
with the company. These reasons of syndication of Angel Investors are comparable with the syndication
of Venture Capitalists. Both Venture Capitalists and Angel Investors syndicate in order to strive for a
maximization of the investment success both in the specific investment as in their overall portfolio.
However, due to the lack of research based on analytical methodology, it remains unclear what the
actual impact of syndication is.

11
To summarize, the main motivation of syndication among investors is to increase the probability of
current and future positive investments. Nevertheless, several factors are also likely to influence the
outcome of the investment. Ibrahim (2008) describes that the trend towards a more extensive deal
structure is likely to negatively influence the outcome. Secondly, Wiltbank and Boeker (2007) indicate
that the time spent on due diligence may positively influence the outcome of the investment. Further,
they describe that interaction between the investor and the portfolio company is also likely to positively
influence the outcome.
12
Chapter 2: Research approach
The second chapter of this thesis first discusses the nature and origin of the data used. Secondly, the
research question and sub questions are formulated. Finally, the hypotheses for this study are presented.
2.1 Data collection
This thesis is based on an ongoing research project of Dr. Da Rin and Dr. Penas (Tilburg University). The
main topic of their research concerns Angel Investors investing in the United Kingdom. The aim of their
study is twofold. First, an understanding regarding the syndication process will be set up. Secondly,
insights are gained into the relationship between Angel Investors and other investors, such as corporate
investors and Venture Capitalists. The aim of this thesis is to focus on the first part. Therefore, a
comprehensive study of Angel Investors with the focus on their syndication process is conducted.
The nature of this study will be descriptive and causal-explanatory. The data selection is carried out once,
over a relative small period of time. Hence, this study uses panel data. The main data is provided by Dr.
Da Rin, with additions collected through Orbis. Orbis is an electronic source which contains
comprehensive information of companies worldwide, and contains all data which used to be available in
AMADEUS and REACH databases (orbis.bvdinfo.com). The primary data is gathered through the
distribution of an extensive questionnaire to Angel Investors investing in the United Kingdom (Appendix
A). Three angel networks have contributed and provided useful answers from 62 Angel Investors and
their 98 portfolio companies. The survey consists of three main parts: the profile of the Angel Investor,
the investment process, and the characteristics and outcome of their portfolio companies. The outcome
of several portfolio companies was unknown when the survey was distributed. However, almost all
investors included the name of their portfolio companies. This made it possible to do extensive research
to the outcome of their portfolio companies by using Orbis. Due to the survey and the acquired
information of Orbis the outcome of 57 out of 98 companies was obtained, whereas the other 41
portfolio companies still need to prove their potential.
2.2 Research questions
Representative, analytical research in the field of syndication and Angel Investors is missing. However,
based on existing literature regarding syndication, the conjecture exists that syndication leads overall to
more successful investment outcomes. Therefore, based on the theory discussed in previous chapters,
the following research question is established:

13
‘Does the syndication of Angel Investors have a significant positive correlation to the probability of
successful investment outcomes of Angel Investors?’
In order to answer the research question, sub questions are conducted and hypotheses based on the
literature and the data of the survey are created. The first hurdle in this thesis is to gather data on the
investment process and investment outcome of Angel Investors. The main information source to gather
data regarding the investment process is the survey conduct among Angel Investors. Next to the survey,
data is obtained through ORBIS. Hence, in the first section of chapter three descriptive statistics will be
presented regarding the investment process and outcome, which answers the following sub question:
‘What are the most important components of the investment process that may influence the outcome of
investments made by Angel Investors?’
By answering the first sub question a distinction is made between relevant and less relevant variables.
The relevant variables are divided into two categories: deal structure characteristics and firm specific
characteristics. Based on this outcome, the second sub question can be formulated by which the main
research question can be answered.
‘What is the influence of Syndication on the investment outcome of Angel Investors, controlling for deal
structure variables and firm specific variables?’
To test the research question in an empirical matter, the following hypothesis is formulated.
Hypothesis I: Syndication among Angel Investors increases the probability of a successful outcome of
the investment of the Angel Investor.
In addition, it is of importance to test whether the relevant, controlling variables also have an influence
on the probability of successful outcomes of Angel Investors. Therefore, the following two hypotheses
are formulated:
Hypothesis 2: Deal structure characteristics influence the probability of a successful investment
outcome of Angel Investors.
Hypothesis 3: Firm specific characteristics influence the probability of a successful investment outcome
of Angel Investors.

14
Chapter 3: Empirical Analysis
In this chapter the hypotheses are tested in an empirical matter. This chapter is structured as follows: in
the first section, the variables used in the regressions are explained and discussed. In section 3.2 an
explanation and discussion of the Multinomial Logistic model and the Binary Choice model is provided.
In section 3.3, the results are discussed and a conclusion to the hypotheses is given.
3.1 Data analysis
The analysis is started with setting up a model with which the hypotheses can be tested. The first step in
setting up the model includes identifying the variables. The variables are derived from the survey
(Appendix A). Hence, this section starts with a specification of the dependent variables. Secondly, the
independent variables and control variables are discussed. Lastly, in 3.1.3., descriptive statistics
regarding these variables are provided.
3.1.1 Dependent variables
The dependent variables used in this thesis are variables based on the nature of the outcome of
investments by Angel Investors (Table 1). The outcome of the investments are divided into three
categories; either negative, still to prove (neutral), or positive. The variable Endscore categorizes the
outcome of the investment as follows: if the portfolio company was liquidated or if the performance
was disappointing, then the investment outcome is classified as negative (1). If the company is still
active and the revenue and/or total assets did not increase significantly compared to the investments,
then the outcome is classified as still to prove (2). The outcome is classified as positive (3) if the
company was exited through an IPO, acquisition, when it is bought back by the entrepreneur, or when
the company realized revenue and/or total assets of more than £3 million. The latter restriction applies
only if the revenue and/or total assets outweigh the total equity invested in the portfolio company by all
investors. It was chosen to categorize the outcome of the investment into these three possibilities,
instead of asking about the financial returns. It is difficult to obtain information on financial returns and,
if provided, may not always be reliable.
3.1.2 Independent and control variables
To construct the base model several factors are considered to influence the relationship between the
syndicated Angel Investors and the outcome of the portfolio companies. In the survey Angel Investors
are asked numerous questions on factors that may influence these activities. Factors that may be
relevant are introduced into the model. The factors are selected based on their addition to the model in
general or based on their own interaction with the dependent variable, with the focus on the

15
significance level of the model and the significance level of the independent variable. These factors are
divided into two categories, deal structure characteristics and firm specific characteristics. Based on
these criteria, the deal structure characteristics that were included are related to: engaging in due
diligence, having the right to preferential liquidation in case of bankruptcy, and having the right to fire
the entrepreneur, liquidate the company, or obtain a board seat in case of disappointing company
performance. The latter two variables belong to a total of four variables which can measure the
complexity of the deal structure. The other two variables are related to retaining the share of ownership
of the portfolio company in case of additional financing rounds, and to obtaining the same terms as
other major shareholders who sell their share. However, the last two variables show no effect on the
outcome of the investment or on the total model.
Firm specific characteristics that were included are related to: whether the company had realized sales
at the time of the investment, and the total amount of equity that the company raised in total of all the
investors including the entrepreneur and his family.
All independent and control variables are dummy variables with a score of either one or zero, except for
the variable regarding the firm’s total equity amount. This variable is a categorical variable based on
seven outcomes. The complete list of variables including the explanation of the variables is presented in
Table 1.
The discussed criteria have implications for the factors that are left out in this research, but may have
showed results in other scientific literature. For example, Wiltbank and Boeker (2007) argued that if an
investor interacts a couple of times a month with the portfolio company, the probability of a successful
outcome significantly increases. However, including this variable into the regressions showed no
significant effect on the dependent variable, and it did not increase the significance level of the model.
Hence, this variable is left out.
Moreover, Wiltbank and Boeker (2007) discussed that returns increase when Angel Investors spend
more time on due diligence. From the survey the amount of time that the investor spent on due
diligence cannot be determined. However, the variable whether the investor engaged in due diligence is
included.

16
Table 1: Independent and dependent variables In the table below the dependent and independent variables used in the regressions are presented. Additionally, the variables Neutral and Negative are added for informational purposes.
Variable name Explanation
Dependent variables
Endscore Independent variable on the score of the outcome of the investment. Classified into 3 categories: negative (1), neutral (2), and positive (3)
Negative Independent dummy variable whether the investment outcome is negative (1/0)
Neutral Independent dummy variable whether the portfolio company still has to prove its potential (1/0)
Positive Independent dummy variable whether the investment outcome is positive (1/0)
Independent variables
Syndication Dummy variable whether the Angel Investor was syndicated when the investment was made (1/0)
Engaged in DD Dummy variable whether the investor engaged in due diligence (1/0)
Right to liquidation Dummy variable whether the investor has included the right to preferential liquidation in the contract (1/0)
Decision rights Dummy variable whether the investor has included having the right to fire the entrepreneur, liquidate the company, or obtain a board seat in case of disappointing company performance (1/0)
Realized sales Dummy variable whether the investor has included the right to preferential liquidation in the contract in case of bankruptcy (1/0)
Firm's equity amount Categorical variable with scores of the amount of equity of the firm at the time of investment, 0-25.000 (1), 25.000-50.000 (2), 50.000-100.000 (3), 100.000-500.000 (4), 500.000-1 million (5), 1 million - 5 million (6), and over 5 million (7)
3.1.3 Descriptive statistics
This section provides and discusses a descriptive overview of the dataset of 98 portfolio companies. First,
descriptive statistics of the variables used in the analysis are presented. In addition, a pairwise
correlation matrix is presented to measure the correlation between the variables used. These tables are
used to obtain insight into the variables of the definite sample.
In Table 2 descriptive statistics of the variables used are visualized. This table shows that there are a few
more negative investment outcomes than positive investment outcomes, because the variable Endscore
has a mean slightly below 2. To specify this number the variables positive, neutral, and negative are
added. These variables show that out of the 98 portfolio companies, 31 companies had a negative
outcome, 41 companies are still running and still need to prove their potential, and 26 companies had a
positive outcome. The outcome is classified as a negative investment when the company is liquidated or
when the company has proved disappointing in its progress, as neutral when the company still needs to
prove its potential, and it is classified as a positive investment when the company was exited through an
IPO, acquisition, when it is bought back by the entrepreneur, or when the company realized revenue
17
and/or total assets of more than £3 million. The latter restriction applies only if the revenue and/or total
assets outweigh the total equity invested in the portfolio company by all investors.
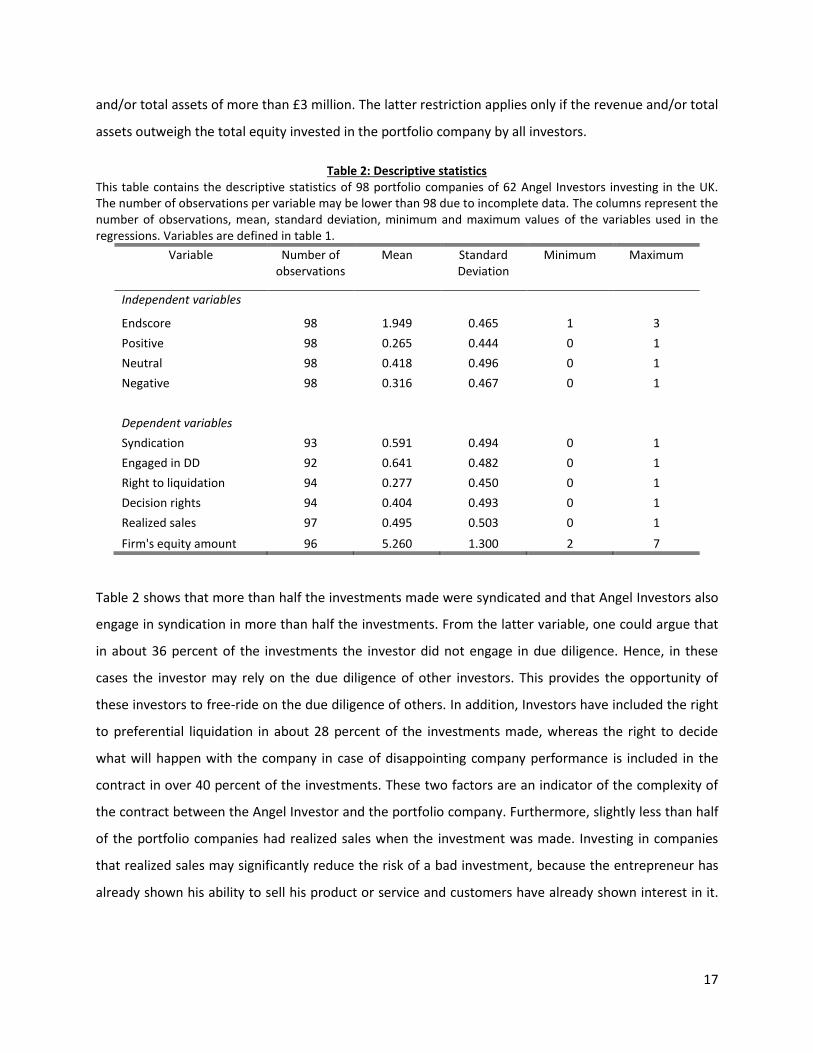
Table 2: Descriptive statistics This table contains the descriptive statistics of 98 portfolio companies of 62 Angel Investors investing in the UK. The number of observations per variable may be lower than 98 due to incomplete data. The columns represent the number of observations, mean, standard deviation, minimum and maximum values of the variables used in the regressions. Variables are defined in table 1.
Variable Number of observations
Mean Standard Deviation
Minimum Maximum
Independent variables
Endscore 98 1.949 0.465 1 3
Positive 98 0.265 0.444 0 1
Neutral 98 0.418 0.496 0 1
Negative 98 0.316 0.467 0 1
Dependent variables Syndication 93 0.591 0.494 0 1
Engaged in DD 92 0.641 0.482 0 1
Right to liquidation 94 0.277 0.450 0 1
Decision rights 94 0.404 0.493 0 1
Realized sales 97 0.495 0.503 0 1
Firm's equity amount 96 5.260 1.300 2 7
Table 2 shows that more than half the investments made were syndicated and that Angel Investors also
engage in syndication in more than half the investments. From the latter variable, one could argue that
in about 36 percent of the investments the investor did not engage in due diligence. Hence, in these
cases the investor may rely on the due diligence of other investors. This provides the opportunity of
these investors to free-ride on the due diligence of others. In addition, Investors have included the right
to preferential liquidation in about 28 percent of the investments made, whereas the right to decide
what will happen with the company in case of disappointing company performance is included in the
contract in over 40 percent of the investments. These two factors are an indicator of the complexity of
the contract between the Angel Investor and the portfolio company. Furthermore, slightly less than half
of the portfolio companies had realized sales when the investment was made. Investing in companies
that realized sales may significantly reduce the risk of a bad investment, because the entrepreneur has
already shown his ability to sell his product or service and customers have already shown interest in it.
18
Lastly, the total amount of equity invested in a portfolio company in which the Angel Investor invests has a mean slightly over 5, meaning that
the total amount of equity invested lies between 500,000 and 1 million.
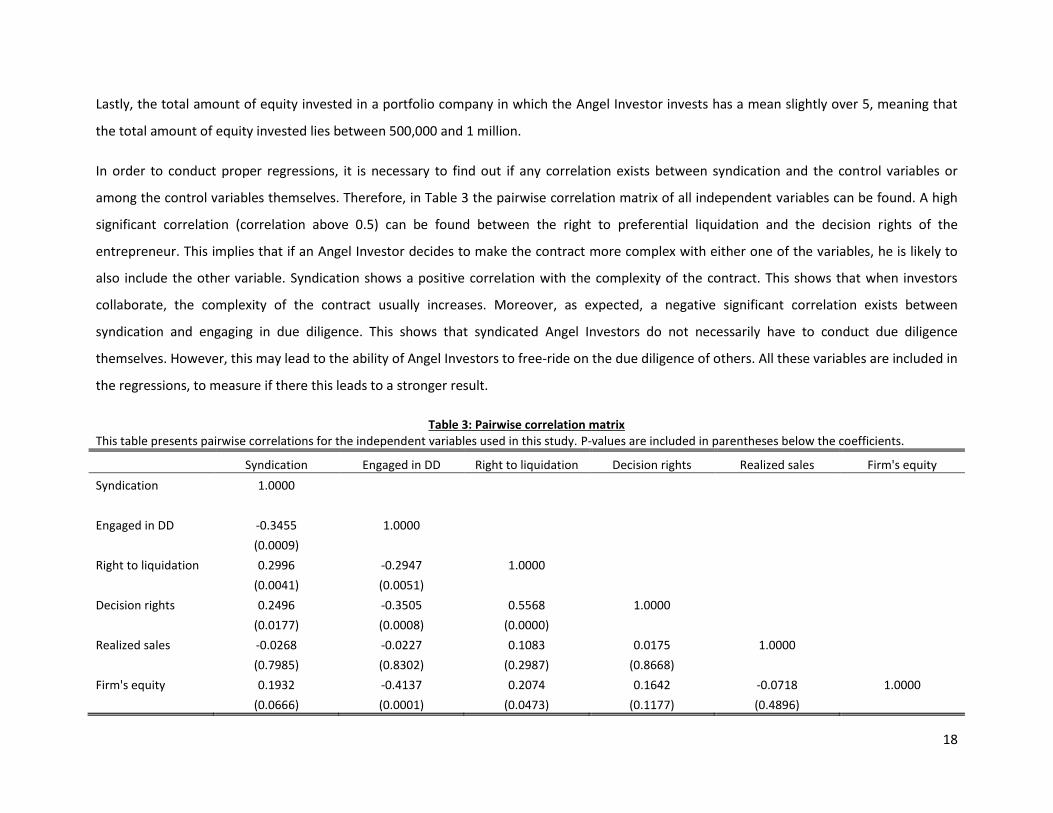
In order to conduct proper regressions, it is necessary to find out if any correlation exists between syndication and the control variables or
among the control variables themselves. Therefore, in Table 3 the pairwise correlation matrix of all independent variables can be found. A high
significant correlation (correlation above 0.5) can be found between the right to preferential liquidation and the decision rights of the
entrepreneur. This implies that if an Angel Investor decides to make the contract more complex with either one of the variables, he is likely to
also include the other variable. Syndication shows a positive correlation with the complexity of the contract. This shows that when investors
collaborate, the complexity of the contract usually increases. Moreover, as expected, a negative significant correlation exists between
syndication and engaging in due diligence. This shows that syndicated Angel Investors do not necessarily have to conduct due diligence
themselves. However, this may lead to the ability of Angel Investors to free-ride on the due diligence of others. All these variables are included in
the regressions, to measure if there this leads to a stronger result.
Table 3: Pairwise correlation matrix This table presents pairwise correlations for the independent variables used in this study. P-values are included in parentheses below the coefficients.
Syndication Engaged in DD Right to liquidation Decision rights Realized sales Firm's equity
Syndication 1.0000
Engaged in DD -0.3455 1.0000
(0.0009)
Right to liquidation 0.2996 -0.2947 1.0000
(0.0041) (0.0051)
Decision rights 0.2496 -0.3505 0.5568 1.0000
(0.0177) (0.0008) (0.0000)
Realized sales -0.0268 -0.0227 0.1083 0.0175 1.0000
(0.7985) (0.8302) (0.2987) (0.8668)
Firm's equity 0.1932 -0.4137 0.2074 0.1642 -0.0718 1.0000
(0.0666) (0.0001) (0.0473) (0.1177) (0.4896)

19
3.2 Regression analysis
In order to test the magnitude of syndication of Angel Investors on the outcome of their investment in a
portfolio company two different models are used. These two models are the Multinomial Logistic Model
and the Binary Choice Model. The first model is used to deal with estimating problems with a nominal
categorical variable as dependent variable. The first model includes three unordered categories. Hence,
the dependent variable is the outcome of the portfolio companies of the Angel Investors (Endscore). The
Binary Choice model is used as an alternative, to further increase the reliability of the research and
consistency of the results. The goal of this thesis is to find out whether syndication leads to a higher
probability of positive investment outcomes. Hence, the dependent variable of interest is the dummy
variable whether the investor realized a positive investment outcome (Positive). Therefore, the Binary
Choice model is chosen. The difference between these two models is that in the Binary Choice model
the neutral observations are dropped such that the dependent variable becomes binomially distributed,
with either an outcome of positive (1) or negative (0).
In order to correct for heteroskedasticity in these models the STATA robustness command (rob) is used.
Implementing robustness ensures that the model performs well, even if the assumptions underlying the
models are slightly violated.
3.2.1 Multinomial Logistic Model
In Table 4 and 5 the outcomes of the Multinomial Logistic Model are presented. In STATA the option to
visualize the coefficients as relative risk ratio (RRR) is chosen, in order to see the relative change in the
investment outcome between the categories still to prove to negative and positive to negative. In the
category positive to negative, for example, the coefficient estimate of an explanatory variable in a logit
regression is the difference of the coefficients of the variable in explaining the probability of a positive
outcome and the probability of a negative outcome. Further, the coefficient estimates of the baseline
category are treated as zero. In the regressions in this thesis the negative investment outcome is chosen
as the baseline category. Similarly, the coefficient estimates of the interactive dummies are the
difference in the effect of variables in a particular category (e.g. positive investment outcome) from the
baseline category (Negative investment outcome).
The coefficient estimates can be interpreted as follows; if the coefficient of an explanatory variable is
significant and greater than 1 in the Still to prove/Negative logit of the Multinomial Logistic model, then
in comparison to an investment outcome that still needs to be proved, there is a positive probability
that this explanatory variable does not lead to a negative outcome of the investment, given the other

20
variables remain constant. In addition, if the coefficient of an explanatory variable is significant and
greater than 1 in the Positive/Negative logit of this model, then there is a positive probability that this
explanatory variable leads to a positive outcome of the investment, given the other variables remain
constant. In both ways, if the coefficient is smaller than 1, then the explanatory variable leads on
average to a greater probability of a negative outcome of the investment.
Starting point in Table 4 is the base model with dependent variable Endscore and independent variable
Syndication. In models 2 to 5 control variables regarding the deal structure characteristics are included
as independent variables, to analyze the impact of Syndication in combination with these control
variables. The number of observations varies between 86 and 93 due to missing values. For each
regression, the table shows the coefficients of the independent variables and the accompanying
standard errors. Significance levels are denoted by ***, **, and * for respectively 1%, 5%, and 10%
significance level. The chi-square statistics for the models indicate that model 1 and 2 are not significant,
that model 3 is significant at a 5% level, and that models 4 and 5 are significant at a 1% level.
In Table 5 the control variables differ from Table 4. Models 6 and 7 include the control variables
regarding the firm characteristics. In model 9 the models that control for deal characteristics and firm
characteristics are combined. The chi-square statistics for these models indicate that model 6 is
significant at a 10% level, model 7 is not significant, and that model 9 is significant at a 1% level.

21
Table 4: Multinomial Logistic model 1 Table 4 presents the first results of the multinomial logistic regression with Endscore as dependent variable. In the first five regressions the deal structure characteristics are included. The option to visualize the coefficients as relative risk ratio (RRR) is chosen, in order to see the relative change in the investment outcome between the categories still to prove to negative and positive to negative. Under RRR the heteroskedasticity-robust standard error (S.E.) is visualized. The base category in this model is the negative outcome of the investment. Significant levels are ***, **, and * for respectively at 1% level of significance, at 5% level of significance, and at 10% level of significance.
Dependent variable =
Endscore of the
investment
Model 1 Syndication Model 2 Engaged Model 3 Liquidation Model 4 Bankruptcy Model 5 Deal
Still to prove Positive Still to prove Positive Still to prove Positive Still to prove Positive Still to prove Positive
RRR S.E.
RRR S.E.
RRR S.E.
RRR S.E.
RRR S.E.
RRR S.E.
RRR S.E.
RRR S.E.
RRR S.E.
RRR S.E.
Syndication 2.082 2.949* 2.352 3.708** 2.328 6.049*** 2.114 6.499*** 2.076 6.642***
1.027 1.699 1.275 2.368 1.335 4.204 1.243 4.579 1.156 4.513 Engaged in DD 0.715 0.775 0.625 0.558 0.636 0.621 0.664 0.571
0.423 0.508 0.417 0.420 0.423 0.467 0.441 0.368 Right to Liquidation
2.173 0.210* 1.196 0.270
1.426 0.1988 1.308 0.240 Decision rights 1.709 0.370
1.276 0.626
0.998 0.273 0.816 0.409
Number of obs 93 89 86 86 86
Wald Chi2(x) 3.98 6.12
17.46 20.67 21.36 Prob>Chi2 0.1370 0.1904
0.0077 0.0021 0.0063
Pseudo R2 0.0205 0.035 0.0874 0.1114 0.1165

22
Table 5: Multinomial Logistic model 2 Table 5 presents the second results of the multinomial logistic regression. In regression 6 and 7 the firm specific characteristics are included. In model 8 both deal structure and firm specific variables are included. The option to visualize the coefficients as relative risk ratio (RRR) is used. Under RRR the heteroskedasticity-robust standard errors (S.E.) are visualized. The base category in this model is the negative outcome of the investment. Significant levels are ***, **, and * for respectively at 1% level of significance, at 5% level of significance, and at 10% level of significance.
Dependent variable =
Endscore of the investment
Model 6 Sales Model 7 Firm Model 8 Combined
Still to prove Positive Still to prove Positive Still to prove Positive
RRR S.E.
RRR S.E.
RRR S.E.
RRR S.E.
RRR S.E.
RRR S.E.
Syndication 2.040 3,058* 2,418* 2,930* 2.404 11,148***
1.016 1.788 1.241 1.790 1.390 9.151 Engaged in DD 0.531 0.627
0.379 0.547 Right to Liquidation
2.910 0,074**
2.050 0.085 Decision rights
1.198 0.578
0.785 0.402
Realized sales 0.643 2.241 0.660 2.147 0.464 4,334**
0.321 1.294 0.332 1.269 0.280 3.229 Firm's equity amount
0.838 0.995 0.674* 0.986
0.157 0.225 0.139 0.310
Number of obs 93 91 84
Wald Chi2(x) 9.21 10.02
32.72 Prob>Chi2 0.0560 0.1239
0.0011
Pseudo R2 0.0475 0.0482 0.2095
According to the Still to prove/Negative logit of the Multinomial Logistic model, there is no explanatory
variable significant in any of the models, except for Syndication in model 7. We can therefore conclude
that, in comparison to outcomes that still need to be proved, there is no significant relation that
syndication would lead to a greater probability of a negative outcome.
In the Positive/Negative logit of the Multinomial Logistic model, it immediately stands out that in all
models the coefficient of syndication is significant. In addition, when more variables are added to the
models the coefficient of syndication becomes not only statistically more significant, but also
economically more significant. For example, the relative risk ratio in model 8 can be interpreted as
follows. For syndication relative to no syndication, the relative risk for a positive outcome compared to a
negative outcome would be expected to increase by a factor of 11.148 given that the other variables in
the model are held constant. This outcome means that at a 1% level of significance it can be concluded
that when Angel Investors syndicate, it significantly increases their odds of a successful investment.

23
However, it should be taken into account that the magnitude of the effect of syndication on the
outcome of the investment differs among the different regressions. In addition, the standard error is
relatively large compared to the coefficient.
Secondly, model 8 shows that two controlling variables in the Positive/Negative logit have a significant
influence on the outcome of the investment. The variables the right to preferential liquidation in case of
bankruptcy and the variable whether the company had realized sales are both significant at a 5% level.
This implies that, next to the influence of syndication, both these variables have a significant influence
on the investment outcomes. The coefficient of the variable right to preferential liquidation shows a
highly negative effect on the probability of a successful outcome of the investment. The coefficient of
the variable realized sales shows that the probability of a successful outcome of the investment
increases when the company has already realized sales. However, it should be noted that both variables
are not significant in some models.
Lastly, the variable Firm’s equity amount in the Neutral/Negative logit shows a negative effect on the
outcome of the investment, at a 10% level of significance. This result argues that the probability of a
negative investment outcome of an Angel Investor increases if the entrepreneur has raised more capital.
Nevertheless, the coefficient of this variable in the Positive/Negative logit shows a small insignificant
negative effect on the investment outcome. Therefore, this result does not prove that investing in a
portfolio company in which the investor has raised less equity, leads to an increase in probability of a
positive investment outcome of Angel Investors.
3.2.2 Binary Choice model
In Table 6 the outcome of the Binary Choice model is visualized. Starting point is the base model with
dependent variable Positive outcome and independent variable Syndication. The command dprobit is
used in STATA, which produces results as marginal effects for an average Angel Investor (Stafford, 2004).
Models 2 to 8 include the same control variables as the Multinomial Logistic model. The number of
observations varies between 48 and 55 due to missing values. The chi-square statistics for the models
indicate that models 1, 2, and 6 are statistically significant at a 10% level, that models 3 to 5, and model
8 are significant at a 1% level, and that model 7 is not significant.

24
Table 6: Binary Choice model Table 6 presents the outcome of the Binary Choice model with Positive as dependent variable. Models 1 to 5 include deal structure characteristics, models 6 and 7 include firm specific characteristics, and in model 8 all variables are included. Coef. is the marginal effect for each coefficient calculated in Stata by using dprobit. For each independent variable, the marginal effect and the heteroskedasticity-robust standard errors (S.E.) are visualized. Significant levels are ***, **, and * for respectively at 1% level of significance, at 5% level of significance, and at 10% level of significance.
Dependent variable = Positive
outcome
Model 1 Syndication
Model 2 Engaged
Model 3 Bankruptcy
Model 4 Liquidation
Model 5 Deal
Model 6 Sales
Model 7 Firm
Model 8 Combined
Coef. S.E.
Coef. S.E.
Coef. S.E.
Coef. S.E.
Coef. S.E.
Coef. S.E.
Coef. S.E.
Coef. S.E.
Syndication 0.257* 0.314** 0.466*** 0.473*** 0.484*** 0,271** 0,260* 0,550***
0.129 0.140 0.142 0.144 0.143 0.131 0.136 0.148 Engaged in DD -0.033 -0.395** -0.244 -0.415* -0.339
0.166 0.234 0.219 0.230 0.226 Right to Liquidation
-0.533*** -0.480** -0,530***
0.128 0.174 0.100 Decision rights -0.407** -0.190 -0.125
0.169 0.257 0.211 Realized sales 0.203 0.190 0,316*
0.135 0.137 0.165 Firm's equity amount
-0.010 0.013
0.064 0.081
Number of obs 55 52 49 49 49 55 54 48
Wald Chi2(x) 3.56 5.44 20.03 13.78 19.68 5.42 4.77 19.65
Prob>Chi2 0.0594 0.0659 0.0002 0.0032 0.0006 0.0667 0.1896 0.0032
Pseudo R2 0.049 0.0798 0.2305 0.1886 0.2381 0.0781 0.0699 0.3112
The main outcome of the Binary Choice model is similar to the Multinomial Logistic model. The
coefficient of Syndication becomes increasingly statistically and economically significant when more
variables are added to the model. This is in congruence with the Multinomial Logistic model, which also
states that there is a significant relationship between syndication and the outcome of an investment.
Nevertheless, the economic significance differs between these two models. This might be due to the
fact that the Binary Choice model includes fewer observations than the Multinomial Logistic model and
due to a different visualization of the result. According to model 8, an Angel Investor who syndicates has
an increases probability on a positive investment outcome of about 55%.
In the Binary Choice model, two control variables have a significant negative influence on the outcome
of the investment. These variables are the right to preferential liquidation in case of bankruptcy and
whether the company had realized sales. They are statistically significant at respectively a 1% and 10%
level of significance. This outcome argues that including the right to preferential liquidation in case of

25
bankruptcy in the contract significantly negatively influences the probability of a positive outcome of the
investment. In addition, this outcome also argues that investing in a company who has already realized
sales significantly increases the probability of a successful outcome. These results are comparable with
the results of the Multinomial Logistic model. A comparison of the results of the two models is discussed
in the next section.
3.2.3 Multinomial Logistic Model versus Binary Choice model
In Table 7 the comparison of the signs and p-value of the Multinomial Logistic Model versus the Binary
Choice model is presented. The sign and p-value of the independent variable Syndication is similar in
both models. These models conclude that, while controlling for deal structure and firm specific
characteristics, syndication of Angel Investors has a significant positive effect of the probability of a
successful investment outcome. In addition, the signs of the significant controlling variables in
Positive/Negative logit of the Multinomial Logistic model are the same as in Positive/Negative probit of
the Binary Choice model. This table shows that including the right to preferential liquidation in the
contract significantly decreases the probability of a positive investment outcome. Further, this table also
shows that investing in a firm that has already realized sales significantly increases the probability of a
successful investment outcome.
Differences between these two models may occur either due to a different testing method, or due to
the difference in dataset, because the Binary Choice model uses 41 observations less. Table 7 shows
only 1 difference in sign between Positive/Negative logit of the Multinomial Logistic model and the
Binary Choice model. The Multinomial Logistic model shows a negative relation between the total
amount of equity invested and the investment outcome, while the Binary Choice model shows a positive.
However, the p-value in Table 7 shows that the effect of this variable in both models is insignificant.
Nevertheless, the Still to prove/Negative logit of the Multinomial Logistic model shows a significant
negative effect on the probability of a positive investment outcome. From this result it can be argued
that total amount of equity raised by the entrepreneur negatively influences the probability of the
investment outcome by the Angel Investor.
Other differences can be seen between the signs of some of the variables in Neutral/Negative logit of
the Multinomial Logistic model and the Positive/Negative probit of the Binary Choice model. However,
none of the coefficients of the variables in the first model are significant.

26
Table 7: Signs and significance of parameter estimates in Multinomial and Binary models In this table the signs and p-values of the independent variables are presented. For Multinomial Logistics this is the RRR sign, while for Binary Choice this is the coefficient sign. Between parentheses are the p-values for the parameter estimates in models 8 of the Multinomial Logistic model and of the Binary Choice model. Sig. means significant and N.S. means not significant at a 10% level of significance. The Multinomial Logistics model uses 86 observations, while the Binary Choice model uses 49 observations.
Variable Multinomial Logistic Binary Choice
Neutral/Negative Positive/Negative Positive/Negative
Syndication +N.S. (0.129) +Sig (0.003) +Sig (0.002)
Engaged in DD -N.S. (0.376) -N.S. (0.592) -N.S. (0.163)
Right to pref. liquidation +N.S. (0.130) -Sig. (0.023) -Sig (0.006)
Decision rights in case of bankruptcy +N.S. (0.783) -N.S. (0.430) -N.S. (0.566)
Realized sales -N.S. (0.202) +Sig (0.049) +Sig (0.073)
Firm's equity amount -Sig (0.056) -N.S. (0.965) +N.S. (0.873)
3.3 Results hypotheses tests
Tables 4 to 7 show detailed results for the models testing the hypotheses which were set up in chapter
2.2. Tables 4 to 6 show that almost all models as a whole are statistically significant. Table 8 provides the
overview of the outcome of the hypotheses. The hypotheses are confirmed when the models indicate
that all relevant coefficients have the expected effect stated in the hypotheses. The hypotheses are
partially confirmed when the models indicate that some relevant coefficients have the expected effect
stated in the hypotheses. The hypotheses are not confirmed when the models indicate that no relevant
coefficients have the expected effect stated in the hypotheses
The first hypothesis is confirmed. Tables 4 to 7 show that syndication has a significant positive influence
on the probability of a successful investment, while controlling for firm and deal structure characteristics.
The coefficient of Syndication is in all models significant. Therefore, by making use of both the
Multinomial Logistic model and the Binary Choice model it is concluded that the first hypothesis is
confirmed.
Secondly, hypothesis two is partially confirmed. As explained in 3.1.2, the deal structure characteristics
that are included in this research are related to engaging in due diligence and to the complexity of the
contract. Results from the Multinomial and Binary models show that engaging in due diligence does not
influence the probability of a successful investment outcome by Angel Investors. However, the
complexity of the contract may influence the probability of a successful investment. The coefficient of
the variable Right to preferential liquidation in the Multinomial Positive/Negative logit and in the Binary
Choice model confirms that this variable has a significant, negative influence on the probability of a
successful investment outcome by Angel Investors. Therefore, hypothesis two is partially confirmed.

27
Lastly, the third hypothesis is also partially confirmed. As explained in 3.1.2, the firm specific
characteristics that are included in this research are related to whether the company had realized sales
at the time of the investment, and the amount of equity that the portfolio company raised in total of all
the investors. Results from the Multinomial and Binary models show that realized sales has a significant
influence on the probability of a successful investment outcome. The coefficient of Firm’s equity amount
in the Positive/Negative logit of the Multinomial Logistic model and in the Binary Choice model indicate
that this variable does not significantly increase the probability of a more successful outcome. However,
the coefficient in the Neutral/Negative logit of the Multinomial Logistic model indicates that this
variable increases the probability of a negative outcome.
Table 8: Overview of Hypotheses In this table the outcome of the three hypotheses is provided. Confirmed means that the models significantly confirm the hypotheses. Partially confirmed means that the models confirm parts of the hypotheses. Not confirmed means that the models do not confirm any part of the hypotheses.
Hypotheses Result
1 Syndication among Angel Investors increases the probability of a successful outcome of the investment of the Angel Investor.
Confirmed
2 Deal structure characteristics influence the probability of a successful investment outcome of Angel Investors.
Partially confirmed
3 Firm specific characteristics influence the probability of a successful investment outcome of Angel Investors.
Partially confirmed

28
Chapter 4: Conclusions
This final chapter will provide a summary of this research. Secondly, limitations to this research and
suggestions for future research are presented.
4.1 Summary
The main goal of this research was to determine whether the syndication of Angel Investors would on
average increase the probability of a successful investment outcome. Syndication among Venture
Capitalists is already proved to lead to better performance of Venture Capital funds (Wilson, 1968, in
Nielsen, 2008; Smith et. al., 2011). There is reason to belief that syndication among Angel Investors also
leads to better performance of investments made by Angel Investors. Syndication enables Angel
Investors to remain in control and to mitigate risk (Wong et. al., 2009), and syndication leads to the fact
that the investment is evaluated by more Angel Investors. However, up until now there is no existing
study based on representative samples and analytical methodologies (Da Rin & Penas, 2011). Therefore,
this study analyzes the impact of syndication on the investment outcome of Angel Investors.
In order to conduct an empirical research to the relation between syndication and a positive investment
outcome, one must control for several variables that may influence the investment outcome. Due to the
survey it was possible to include factors related to the profile of the Angel Investor, the investment
process, and the characteristics and outcome of their portfolio companies in the analysis. Therefore, all
available information regarding these three factors was analyzed. The variables that were an addition to
the model were included in the final regressions. These variables are classified into deal structure
characteristics and firm specific characteristics.
The included deal structure characteristics were related to engaging in due diligence and to the
complexity of the contract. The results indicate that engaging in due diligence does not per definition
lead to a higher probability of successful outcomes. One reason for this could be that it is irrelevant who
performs due diligence, as long as it is performed by at least one investor. Another reason could be that
the time spent on due diligence is more important, as Wiltbank and Boeker (2007) argue. On the other
hand, the complexity of the contract does negatively influence the probability of a successful outcome.
This is in line with the research of Ibrahim (2008). Moreover, the correlation matrix (Table 3) indicates
that syndication is positively correlated with the complexity of the contract, meaning that syndicated
investments use on average more complex contracts.

29
Firm specific characteristics that were included are related to whether the company had already realized
sales, and the total amount of equity raised by the portfolio company. My results show that Angel
Investors who invest in companies that have already realized sales, have on average a higher probability
of a successful outcome. This effect is likely to occur, because customers already showed interest in the
product and the entrepreneur showed that he is capable of selling his product.
By making use of the Multinomial Logistic model and the Binary Choice model I tested the effect of the
independent and control variables on the outcomes of the investments made by Angel Investors. The
coefficients in both models show that syndication among Angel Investors has a significant positive
correlation to the probability of a successful investment outcome of Angel Investors. Therefore, it is
concluded that syndication among Angel Investors leads on average to a significant positive correlation
to the probability of successful investment outcomes of Angel Investors.
4.2 Limitations and future research
In this section, some of the most important limitations of this research are discussed. This study is based
on a relatively small dataset covering 62 Angel Investors and 98 portfolio companies. A reason for this is
that information on Angel Investors is generally private, which creates difficulty in assembling a large
dataset. However, since the study of Dr. Da Rin and Dr. Penas is still running, it is likely that the sample
will extend. Secondly, the variables used in this theses are binominal and categorical. A study based on
this sort of data may cause imprecise test estimations. Using different indicators as variables, such as
numerical variables, may improve preciseness of the study.
The results of this study lead to a number of suggestions for future work. First, it would be very
interesting to see what the exact outcome of syndication is. However, gathering this kind of information
may be very difficult, because it is normally not disclosed due to the fact that it concerns private equity.
Secondly, syndicated Angel Investors usually have a more complex contract than individual Angel
Investors. Future research could elaborate upon this relation and on the consequences of the
complexity of the contract on the investment outcome. Finally, theory describes that the time spent on
due diligence is likely to increase the outcome of the investment. It could be interesting for future
research to study this effect among syndicated Angel Investors.

30
Reference list
Brander, J.A., Amit, R, & Antweiler, W. (2002). Venture-Capital Syndication: Improved Venture Selection
vs. the Value-Added Hypothesis. Journal of Economics & Management Strategy, Vol. 11, N. 3, P. 423-452.
Brush, C.G., Carter, N.M., Greene, P.G., Hart, M., & Gatewood, E. (2002). The role of social capital and
gender in linking financial suppliers and entrepreneurial firms: A framework for future research. Venture
Capital: An International Journal of Entrepreneurial Finance, Vol. 4, N. 4, P. 305-323.
Clercq, de, D., & Dimov, D. (2004). Explaining venture capital firms' syndication behaviour: A longitudinal
study. Venture Capital: An International Journal of Entrepreneurial Finance, Vol. 6, N. 4. P. 243-256.
Da Rin, M. & Penas, M.F. (2011). UK Angel Investors Survey: First Results. Provided by Dr. Da Rin.
Freear, J., Sohl, J.E., & Wetzel Jr., W.E.(1994). Angels and non-angels: Are there differences? Journal of
Business Venturing. Vol. 9, N. 2, P. 109-123.
Ibrahim, D.M. (2008). The (not so) puzzling behavior of Angel Investors. Vanderbilt Law Review, Vol. 61,
P. 1405-1452.
Kaiser, D.G., & Lauterbach, R. (2007). The Need for Diversification and its Impact on the Syndication
Probability of Venture Capital Investments. The Journal of Alternative Investments, Vol. 10, N. 3, P. 62-79.
Lockett, A., & Wright, M. (2001). The syndication of venture capital investments. Omega. Vol. 29, P. 375-
390.
Mahapatra, K., & Kant, S. (2005). Tropical deforestation: a multinomial logistic model and some country-
specific policy prescriptions. Forest Policy and Economics, Vol. 7, P. 1-24.
Manigart, S., Lockett, A., Meuleman, M., Wright, M., Landstöm, H., Bruining, H., Desbrières, P., &
Hommel, U. (2006). Venture Capitalists’ Decision to Syndicate. Entrepreneurial Theory and Practice. Vol.
30, N. 2, P. 131-153.
Mason, C.M., & Harrison, R.T. (2002). Is it worth it? The rates of return from informal venture capital
investments. Journal of Business Venturing, Vol. 17, P. 211-236.
Nielsen, K.M. (2008). Institutional Investors and Private Equity. Review of Finance, Vol. 12, 185-219.
Orbis database. Retrieved from: https://orbis.bvdinfo.com/.
Osnabrugge, M.V., & Robinson, R.J. (2000). Angel investing: matching start-up funds with start-up
companies. Jossey-Bass Inc. California.
Prowse, S. (1998). Angel Investors and the market for angel investments. Journal of Banking & Finance,
Vol. 22, N. 6-8. P. 785 – 792.

31
Smith, J.K., Smith, R.L., Bliss, R.T. (2011). Entrepreneurial Finance: Strategy, Valuation & Deal Structure.
Stanford University Press. Stanford, California.
Stafford, S.L. (2004). Assessing the Effect of Formal and Informal Enforcement on Progress Towards Title
IX Compliance. Social Science Quarterly, vol. 85, N. 5. P. 1469-1486.
Wiltbank, R., & Boeker, w. (2007). Returns to Angel Investors in Groups. Retrieved from:
http://ssrn.com/abstract=1028592, on 14-03-2013.
Wiltbank, R., Read, S., Dew, N., & Sarasvathy, S.D. (2009). Prediction and control under uncertainty:
Outcomes in angel investing. Journal of Business Venturing, Vol. 24, P. 116-133.
Wong, A., Bhatia, M., & Freeman, Z. (2009). Angel finance: the other venture capital. Strategic Change,
Vol. 18, N. 7-8, P. 221-230.

32
Appendix A
This appendix includes the survey conducted among Angel Investors. If the question is a multiple choice
question the possible answers are added between parentheses after the question.
Investment profile
1. When were you born?
2. In which town do you live?
3. Do you have a bachelor degree?
4. Do you have a master degree?
5. Do you have a PhD/MPhil degree?
6. Do you have a MBA degree?
7. Do you have other professional degrees?
8. At what level have you accumulated experience so far? (Managerial, Executive, Directorship)
9. In which areas have you developed substantial expertise? (Finance, HR, Marketing,
Operations/Logistics, Technology, Others)
10. In which sector(s) have you worked in the past or work at present? (Telecommunications, Media
& Entertainment, Electronics, Software, Health/Pharma/Biotech, Consumer products and
services, industrial products and services, financial services, professional services, consulting,
other)
11. Have you started your own company?
12. When did you start making Angel investments?
13. Do you belong to one or more Angel networks?
14. How many?
15. Since when?
16. Do you make use (or plan to make use) of tax incentives when making angel investments?
17. Is angel investing part of an overall financial investment strategy or is it a separate activity?
The investment process
18. Consider your sources of potential deals. Have you ever used this source? (BBAA recognized
Angel Networks, Other angel networks, personal business contacts, other Angel Investors, local
associations or communities, professional service providers, venture capital firms, universities,
own research, others)
19. Which is your main source?
20. Do you typically engage in due diligence or do you delegate it to others?
21. Do you typically do due diligence alone or in cooperation with other investors?
22. Do you consult industry experts?
23. How many companies have you financed (approximately) from January 2008 to December 2011?
(count only once companies to which you provided multiple investment rounds)
24. What is the typical amount that you invested in a company during this period?
25. What is the maximum amount that you invested in a company during this period?

33
26. What is the minimum amount that you invested in a company during this period?
27. Have you ever been deterred from investing in a company because you anticipated a conflict of
interest with other investors (like venture capital firms or corporate investors) that would later
provide funding?
28. Do you typically syndicate?
29. Do you typically syndicate on a deal-by-deal basis or through a stable investment club or Special
Purpose Vehicle?
30. What are your reasons for syndicating investments? (Sharing risk with co-investors, sharing costs
with co-investors, exploit co-investors’ skills for due diligence, exploit co-investors’ skills for
monitoring the investment, provide the company with the necessary financing, gain access to
additional sources of deals, others
31. What is your main reason for syndicating investments?
32. Do you sometime take the role of 'lead investor', coordinating the actions of your co-investors?
33. How do you choose your syndicating partners? (Among business associates, among other angel
network investors, among entrepreneurs you financed in the past, among people who can help
you select promising companies/entrepreneurs, among people who can contribute expertise in
financing each individual company, among wealthy people who remain passive investors, other)
34. Do you typically use a contract template for all investments or draw specific contract for each
investment?
The portfolio company
35. In which sector does (did) the company operate?
36. City where the company is/was headquartered
37. When did you make your first investment in this company:
38. When was the company created?
39. Sources used BEFORE your first investment in the company? (Entrepreneur’s own wealth, Family
and friends, other business angels, bank loans, venture capital firms, corporate investors, public
grants, self-financing, other, not known/other investor)
40. Sources used at SAME TIME as your first investment in the company? (Entrepreneur’s own
wealth, Family and friends, other business angels, bank loans, venture capital firms, corporate
investors, public grants, self-financing, other, not known/other investor)
41. Sources used AFTER your first investment in the company? (Entrepreneur’s own wealth, Family
and friends, other business angels, bank loans, venture capital firms, corporate investors, public
grants, self-financing, other, not known/other investor)
42. Have you provided additional investment rounds in this company?
43. At the time of your first investment, had the company Incorporated?
44. At the time of your first investment, had the company realized any sales?
45. At the time of your first investment, had the company realized any profits?
46. What (approximate) amount have you invested in this company in total (including all investment
rounds to date)? (0-25.000, 25.000-50.000, 50.000-100.000, 100.000-500.000, over 500.000)

34
47. What (approximate) amount of equity has this company raised in total so far from all its
investors (including the entrepreneur and his family)? (0-25.000, 25.000-50.000, 50.000-100.000,
100.000-500.000, 500.000-1 million, 1 million – 5 million, over 5 million)
48. Have you syndicated your investments in this company (i.e., made a coordinated investment with
others)?
49. With whom? (Occasional individual co-investors, individual co-investors on a repeated basis,
corporate investors, venture capitalists, others)
50. Have you provided any of the following services to this company? (mentoring and sounding
board for the entrepreneur, help with additional fund-raising from other business angels, help
with additional fund-raising from venture capitalists, help with additional fund-raising from
other investors, help as board member with steering the company, help with finding suppliers or
customers, help in solving strategic/management issues, help with hiring key employees, help by
providing management time, other services provided to the company)
51. How often do you interact with the entrepreneur? (Weekly, monthly, quarterly, less than
quarterly, substantially passive)
Did the financing contracts you used for this company specify any of the following?
52. Your right to preferential liquidation treatment in case of bankruptcy of the company
53. Your right to retain your share of ownership of the company in case of additional financing
rounds (‘pre-emption’ or ‘right of first refusal’)
54. Your right to join other major shareholders who sell their share and obtain the same terms from
the buyer (‘tag-along’ right)
55. The right to fire the entrepreneur, liquidate the company, or obtain a board set in case of
disappointing company performance
56. Other main rights you obtained in the contract, please specify:
57. If you had pre-emption rights, have you given them up before the company received funding
from other investors?
58. Which investors were they? (Other Angel Investors, venture capital firms, corporate investors,
others?
59. Did you receive pressure from the entrepreneur(s) or from other investors to give them up?
60. Which of the following securities was the main one you used for financing this company?
(common equity, preferred equity, convertible debt, pure debt, warrants, others)
61. What is this company’s name?
62. What happened with the company? (Has been liquidated, has proved disappointing in its
progress, still has to prove its potential, has been exited via buyback by the entrepreneur, has
been exited in an acquisition, has been exited via an IPO)
63. When did this happen?


