Embed Size (px)
Citation preview
93
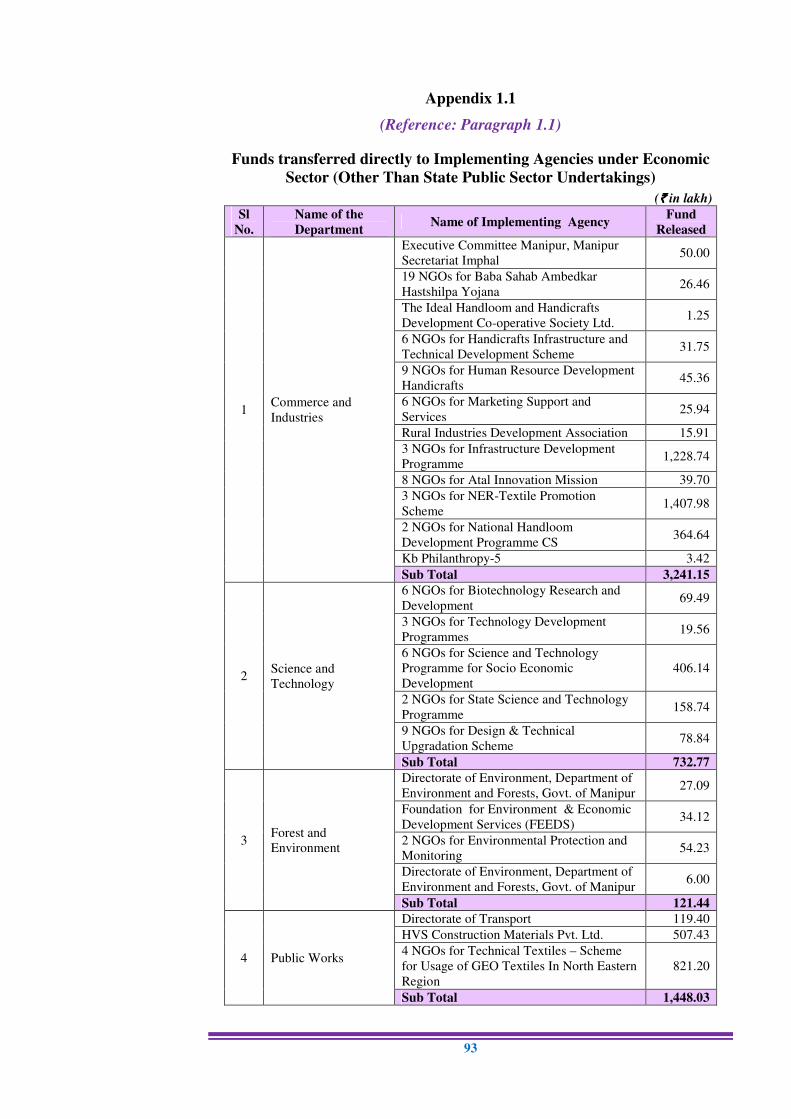
Appendix 1.1
(Reference: Paragraph 1.1)
Funds transferred directly to Implementing Agencies under Economic
Sector (Other Than State Public Sector Undertakings)
(`̀̀̀ in lakh)
Sl
No.
Name of the
Department Name of Implementing Agency
Fund
Released
1 Commerce and
Industries
Executive Committee Manipur, Manipur
Secretariat Imphal 50.00
19 NGOs for Baba Sahab Ambedkar
Hastshilpa Yojana 26.46
The Ideal Handloom and Handicrafts
Development Co-operative Society Ltd. 1.25
6 NGOs for Handicrafts Infrastructure and
Technical Development Scheme 31.75
9 NGOs for Human Resource Development
Handicrafts 45.36
6 NGOs for Marketing Support and
Services 25.94
Rural Industries Development Association 15.91
3 NGOs for Infrastructure Development
Programme 1,228.74
8 NGOs for Atal Innovation Mission 39.70
3 NGOs for NER-Textile Promotion
Scheme 1,407.98
2 NGOs for National Handloom
Development Programme CS 364.64
Kb Philanthropy-5 3.42
Sub Total 3,241.15
2 Science and
Technology
6 NGOs for Biotechnology Research and
Development 69.49
3 NGOs for Technology Development
Programmes 19.56
6 NGOs for Science and Technology
Programme for Socio Economic
Development
406.14
2 NGOs for State Science and Technology
Programme 158.74
9 NGOs for Design & Technical
Upgradation Scheme 78.84
Sub Total 732.77
3 Forest and
Environment
Directorate of Environment, Department of
Environment and Forests, Govt. of Manipur 27.09
Foundation for Environment & Economic
Development Services (FEEDS) 34.12
2 NGOs for Environmental Protection and
Monitoring 54.23
Directorate of Environment, Department of
Environment and Forests, Govt. of Manipur 6.00
Sub Total 121.44
4 Public Works
Directorate of Transport 119.40
HVS Construction Materials Pvt. Ltd. 507.43
4 NGOs for Technical Textiles – Scheme
for Usage of GEO Textiles In North Eastern
Region
821.20
Sub Total 1,448.03
Audit Report on Economic and Revenue Sectors for the year ended 31 March 2017
94
(`̀̀̀ in lakh)
Sl
No.
Name of the
Department Name of Implementing Agency
Fund
Released
5 Veterinary and
Animal Husbandry
Manipur Livestock Development Board
Ltd. 100.00
Manipur Livestock Development Board
Ltd. 220.82
Sub Total 320.82
6 Power Manipur Renewable Energy Development
Agency (MANIREDA) 1,253.41
7 Economics and
Statistics
Department of Economics and Statistics
Manipur 43.32
8 Water Resources
Water Resources Department,
Government. Of Manipur 32.50
9 Tourism
Domestic Promotion and Publicity
including Hospitality 50.00
Tourism Corporation of Manipur Limited 3,765.80
Sub Total 3,815.80
10 Agriculture
Office of the Agriculture Officer (Market
Intelligence),
Manipur
0.20
Manipur Organic Mission Agency
(MOMA) 736.79
Programme Coordinator, KVK
Churachandpur 4.23
Sub Total 741.22
11 Planning 2 NGOs for MPs Local Area
Development Scheme (MPLADS) 2,000.00
12
Horticulture
and Soil
Conservation
Department,
Manipur
Manipur Remote Sensing Application
Centre 25.00
Grand Total 13,775.46
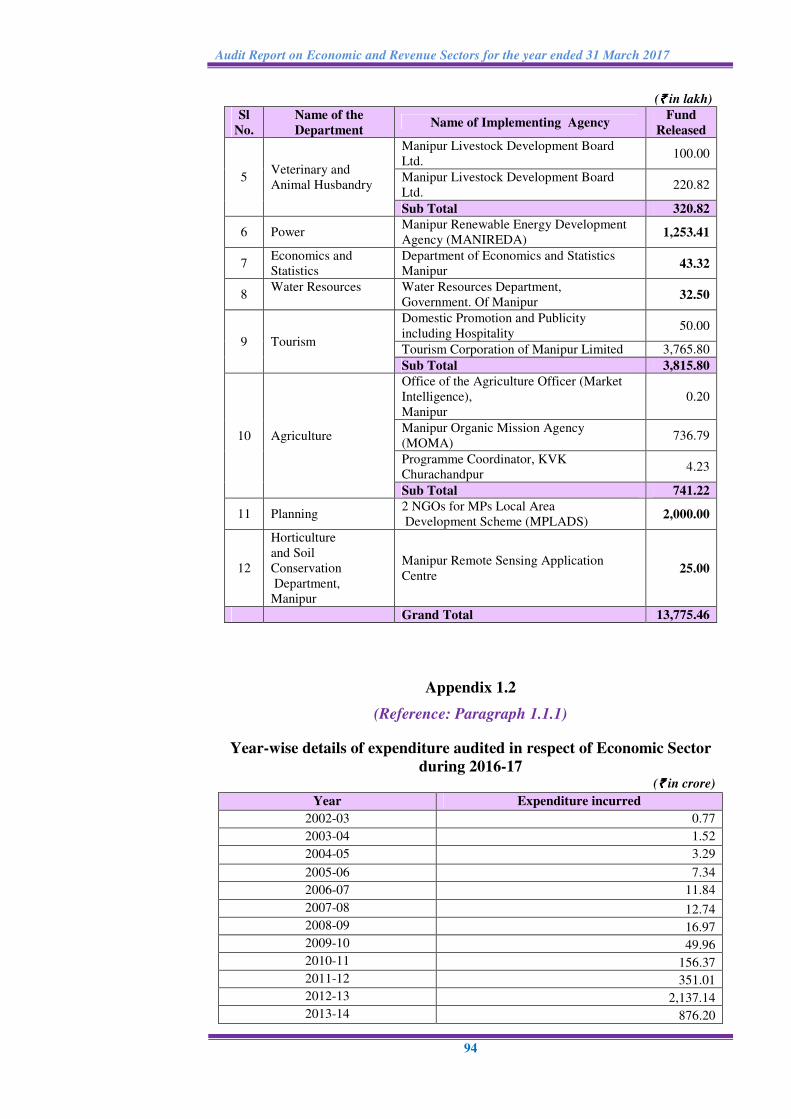
Appendix 1.2
(Reference: Paragraph 1.1.1)
Year-wise details of expenditure audited in respect of Economic Sector
during 2016-17 (`̀̀̀ in crore)
Year Expenditure incurred
2002-03 0.77
2003-04 1.52
2004-05 3.29
2005-06 7.34
2006-07 11.84
2007-08 12.74
2008-09 16.97
2009-10 49.96
2010-11 156.37
2011-12 351.01
2012-13 2,137.14
2013-14 876.20
Appendices
95
(`̀̀̀ in crore)
Year Expenditure incurred
2014-15 305.51
2015-16 1,212.22
2016-17 234.39
Total 5,377.27
Source: Records of the Accountant General (Audit), Manipur
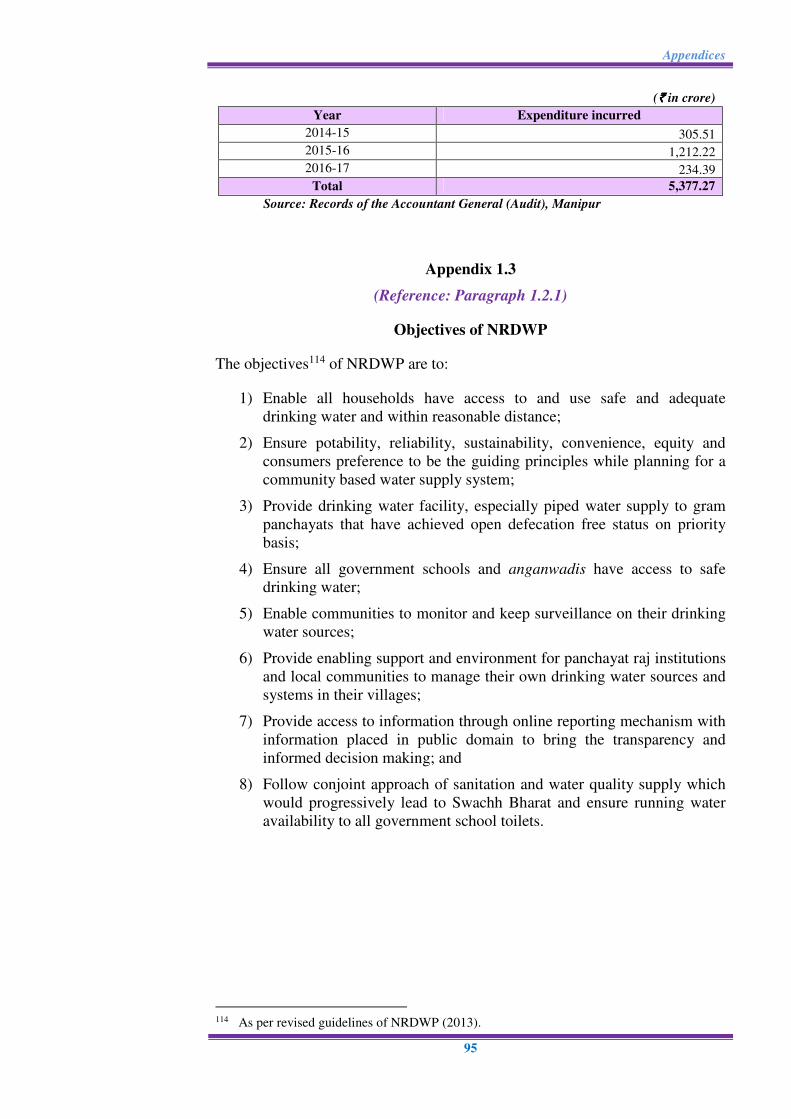
Appendix 1.3
(Reference: Paragraph 1.2.1)
Objectives of NRDWP
The objectives114 of NRDWP are to:
1) Enable all households have access to and use safe and adequate
drinking water and within reasonable distance;
2) Ensure potability, reliability, sustainability, convenience, equity and
consumers preference to be the guiding principles while planning for a
community based water supply system;
3) Provide drinking water facility, especially piped water supply to gram
panchayats that have achieved open defecation free status on priority
basis;
4) Ensure all government schools and anganwadis have access to safe
drinking water;
5) Enable communities to monitor and keep surveillance on their drinking
water sources;
6) Provide enabling support and environment for panchayat raj institutions
and local communities to manage their own drinking water sources and
systems in their villages;
7) Provide access to information through online reporting mechanism with
information placed in public domain to bring the transparency and
informed decision making; and
8) Follow conjoint approach of sanitation and water quality supply which
would progressively lead to Swachh Bharat and ensure running water
availability to all government school toilets.
114 As per revised guidelines of NRDWP (2013).
Audit Report on Economic and Revenue Sectors for the year ended 31 March 2017
96
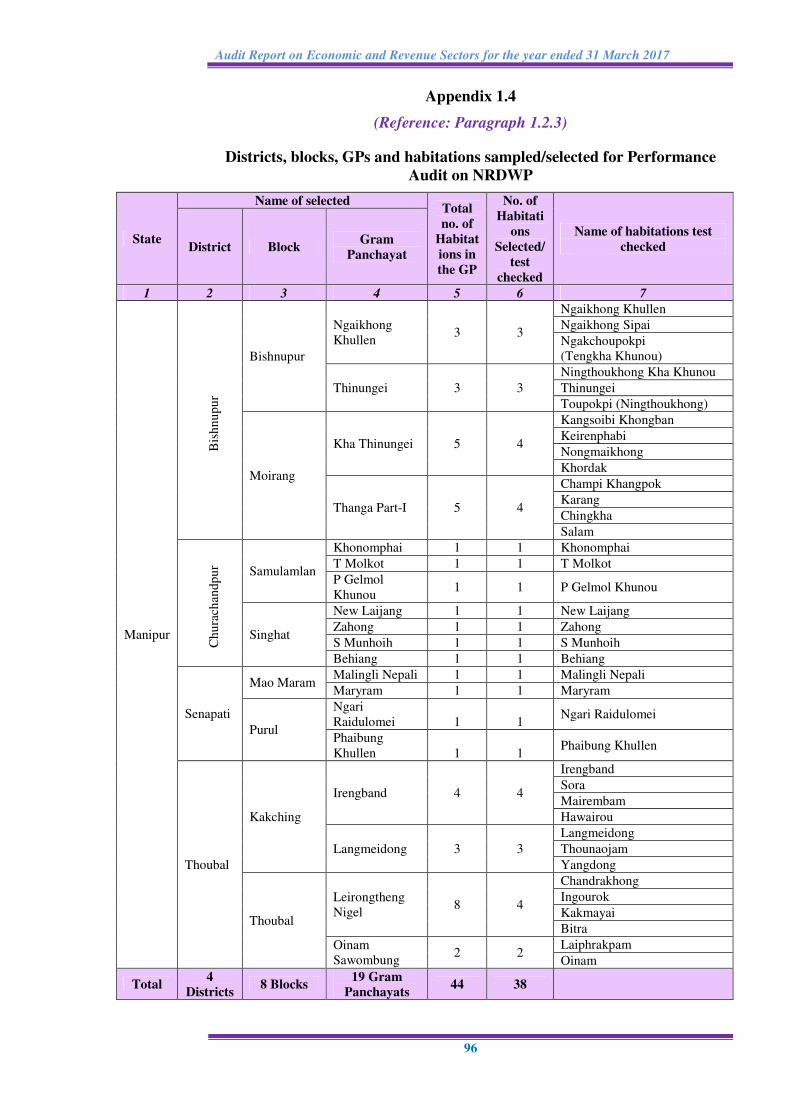
Appendix 1.4
(Reference: Paragraph 1.2.3)
Districts, blocks, GPs and habitations sampled/selected for Performance
Audit on NRDWP
State
Name of selected Total
no. of
Habitat
ions in
the GP
No. of
Habitati
ons
Selected/
test
checked
Name of habitations test
checked District Block Gram
Panchayat
1 2 3 4 5 6 7
Manipur
Bis
hn
up
ur
Bishnupur
Ngaikhong
Khullen 3 3
Ngaikhong Khullen
Ngaikhong Sipai
Ngakchoupokpi
(Tengkha Khunou)
Thinungei 3 3
Ningthoukhong Kha Khunou
Thinungei
Toupokpi (Ningthoukhong)
Moirang
Kha Thinungei 5 4
Kangsoibi Khongban
Keirenphabi
Nongmaikhong
Khordak
Thanga Part-I 5 4
Champi Khangpok
Karang
Chingkha
Salam
Ch
ura
chan
dp
ur Samulamlan
Khonomphai 1 1 Khonomphai
T Molkot 1 1 T Molkot
P Gelmol
Khunou 1 1 P Gelmol Khunou
Singhat
New Laijang 1 1 New Laijang
Zahong 1 1 Zahong
S Munhoih 1 1 S Munhoih
Behiang 1 1 Behiang
Senapati
Mao Maram Malingli Nepali 1 1 Malingli Nepali
Maryram 1 1 Maryram
Purul
Ngari
Raidulomei 1 1 Ngari Raidulomei
Phaibung
Khullen 1 1 Phaibung Khullen
Thoubal
Kakching
Irengband 4 4
Irengband
Sora
Mairembam
Hawairou
Langmeidong 3 3
Langmeidong
Thounaojam
Yangdong
Thoubal
Leirongtheng
Nigel 8 4
Chandrakhong
Ingourok
Kakmayai
Bitra
Oinam
Sawombung 2 2
Laiphrakpam
Oinam
Total 4
Districts 8 Blocks
19 Gram
Panchayats 44 38
Appendices
97
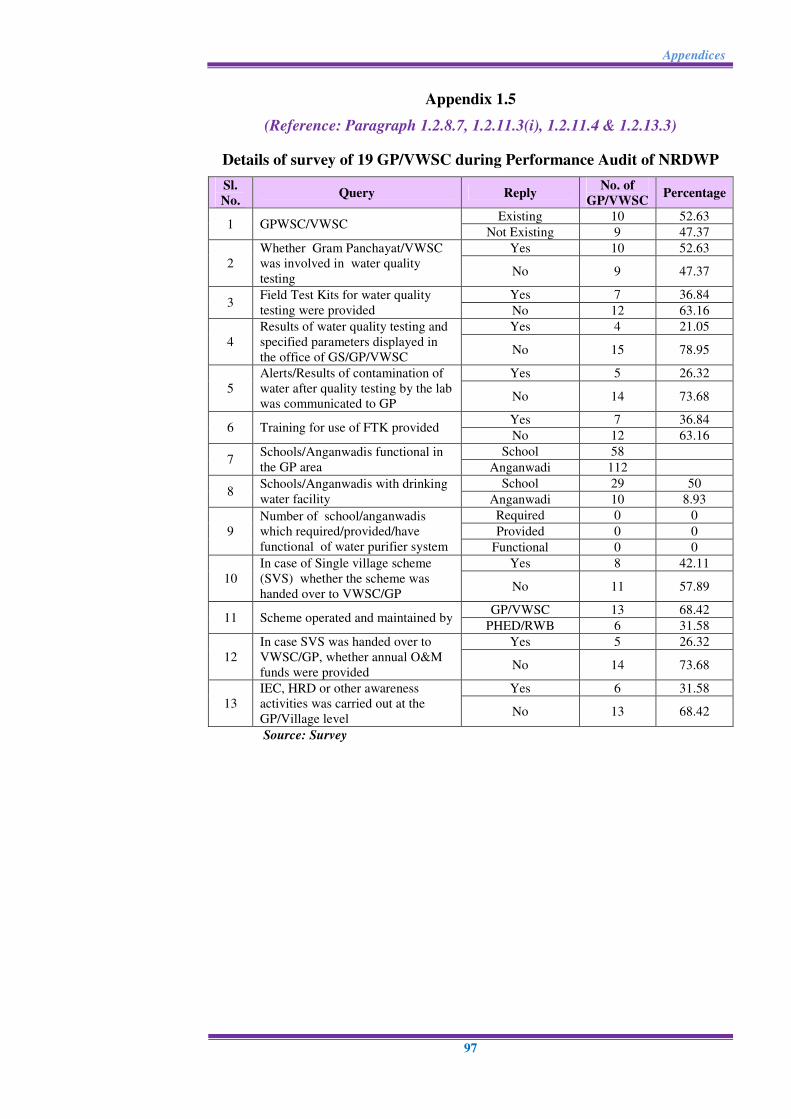
Appendix 1.5
(Reference: Paragraph 1.2.8.7, 1.2.11.3(i), 1.2.11.4 & 1.2.13.3)
Details of survey of 19 GP/VWSC during Performance Audit of NRDWP
Sl.
No. Query Reply
No. of
GP/VWSC Percentage
1 GPWSC/VWSC Existing 10 52.63
Not Existing 9 47.37
2
Whether Gram Panchayat/VWSC
was involved in water quality
testing
Yes 10 52.63
No 9 47.37
3 Field Test Kits for water quality
testing were provided
Yes 7 36.84
No 12 63.16
4
Results of water quality testing and
specified parameters displayed in
the office of GS/GP/VWSC
Yes 4 21.05
No 15 78.95
5
Alerts/Results of contamination of
water after quality testing by the lab
was communicated to GP
Yes 5 26.32
No 14 73.68
6 Training for use of FTK provided Yes 7 36.84
No 12 63.16
7 Schools/Anganwadis functional in
the GP area
School 58
Anganwadi 112
8 Schools/Anganwadis with drinking
water facility
School 29 50
Anganwadi 10 8.93
9
Number of school/anganwadis
which required/provided/have
functional of water purifier system
Required 0 0
Provided 0 0
Functional 0 0
10
In case of Single village scheme
(SVS) whether the scheme was
handed over to VWSC/GP
Yes 8 42.11
No 11 57.89
11 Scheme operated and maintained by GP/VWSC 13 68.42
PHED/RWB 6 31.58
12
In case SVS was handed over to
VWSC/GP, whether annual O&M
funds were provided
Yes 5 26.32
No 14 73.68
13
IEC, HRD or other awareness
activities was carried out at the
GP/Village level
Yes 6 31.58
No 13 68.42
Source: Survey
Audit Report on Economic and Revenue Sectors for the year ended 31 March 2017
98
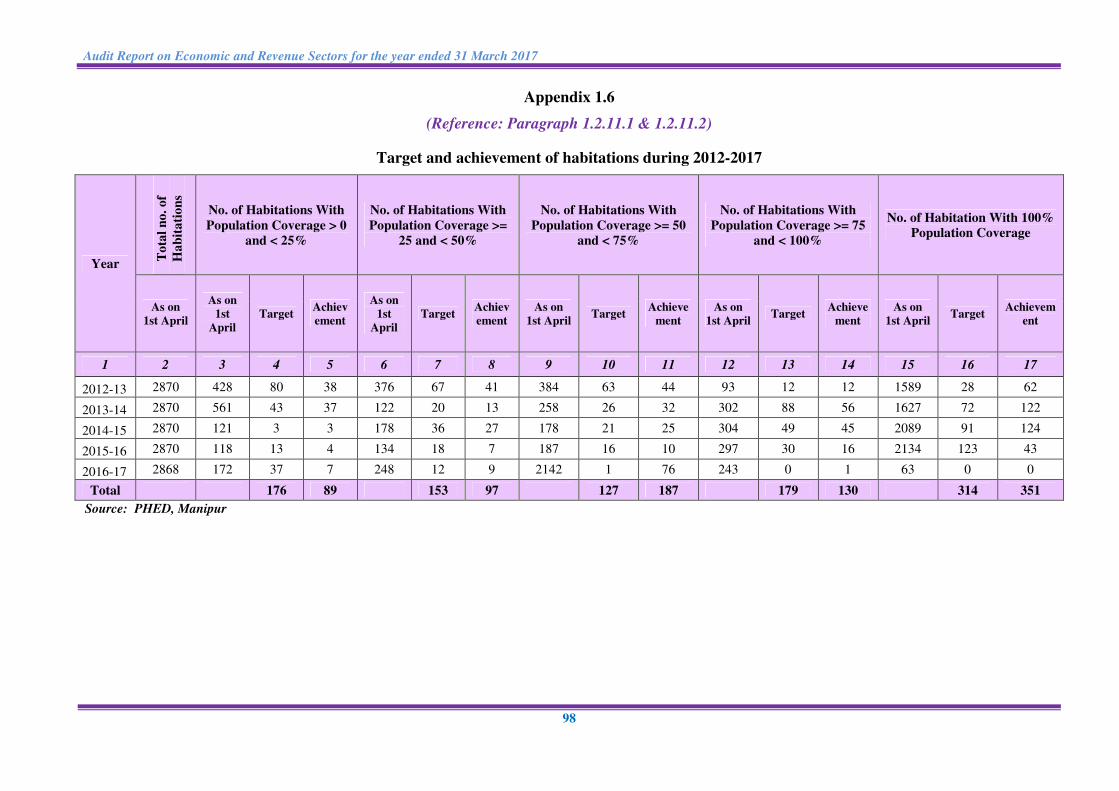
Appendix 1.6
(Reference: Paragraph 1.2.11.1 & 1.2.11.2)
Target and achievement of habitations during 2012-2017
Year
To
tal
no
. o
f
Ha
bit
ati
on
s
No. of Habitations With
Population Coverage > 0
and < 25%
No. of Habitations With
Population Coverage >=
25 and < 50%
No. of Habitations With
Population Coverage >= 50
and < 75%
No. of Habitations With
Population Coverage >= 75
and < 100%
No. of Habitation With 100%
Population Coverage
As on
1st April
As on
1st
April
Target Achiev
ement
As on
1st
April
Target Achiev
ement
As on
1st April Target
Achieve
ment
As on
1st April Target
Achieve
ment
As on
1st April Target
Achievem
ent
1 2 3 4 5 6 7 8 9 10 11 12 13 14 15 16 17
2012-13 2870 428 80 38 376 67 41 384 63 44 93 12 12 1589 28 62
2013-14 2870 561 43 37 122 20 13 258 26 32 302 88 56 1627 72 122
2014-15 2870 121 3 3 178 36 27 178 21 25 304 49 45 2089 91 124
2015-16 2870 118 13 4 134 18 7 187 16 10 297 30 16 2134 123 43
2016-17 2868 172 37 7 248 12 9 2142 1 76 243 0 1 63 0 0
Total 176 89 153 97 127 187 179 130 314 351
Source: PHED, Manipur
Appendices
99
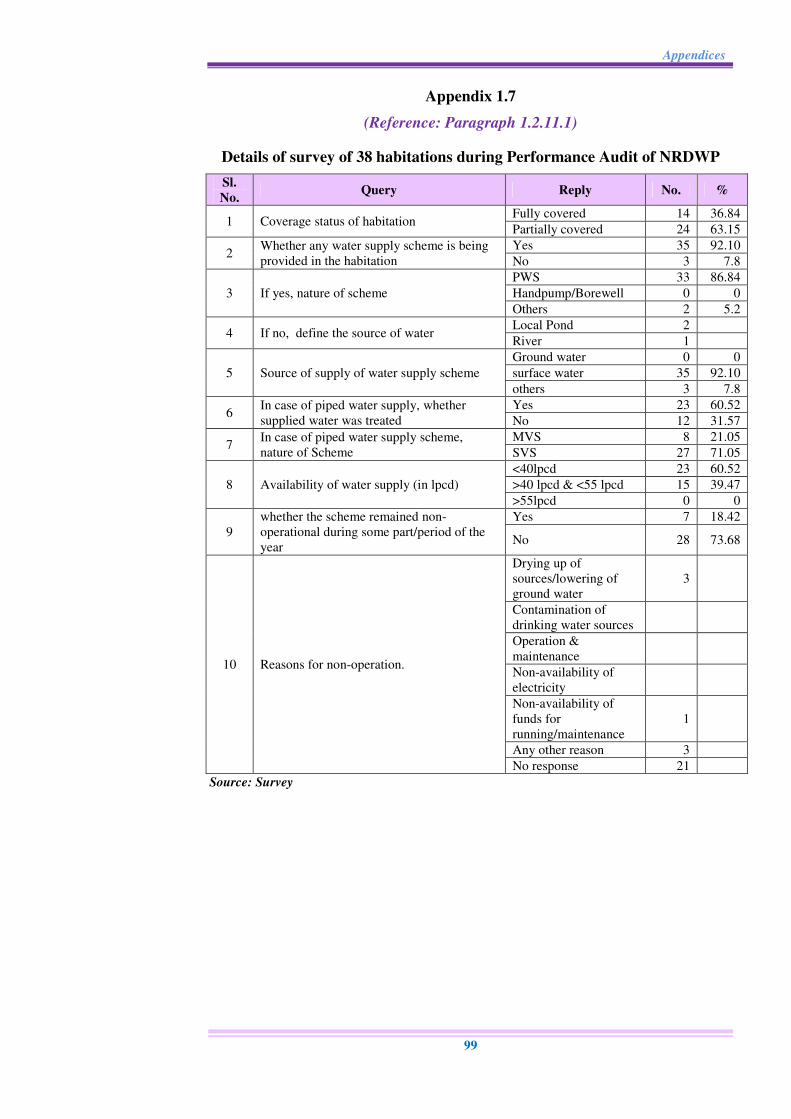
Appendix 1.7
(Reference: Paragraph 1.2.11.1)
Details of survey of 38 habitations during Performance Audit of NRDWP
Sl.
No. Query Reply No. %
1 Coverage status of habitation Fully covered 14 36.84
Partially covered 24 63.15
2 Whether any water supply scheme is being
provided in the habitation
Yes 35 92.10
No 3 7.8
3 If yes, nature of scheme
PWS 33 86.84
Handpump/Borewell 0 0
Others 2 5.2
4 If no, define the source of water Local Pond 2
River 1
5 Source of supply of water supply scheme
Ground water 0 0
surface water 35 92.10
others 3 7.8
6 In case of piped water supply, whether
supplied water was treated
Yes 23 60.52
No 12 31.57
7 In case of piped water supply scheme,
nature of Scheme
MVS 8 21.05
SVS 27 71.05
8 Availability of water supply (in lpcd)
<40lpcd 23 60.52
>40 lpcd & <55 lpcd 15 39.47
>55lpcd 0 0
9
whether the scheme remained non-
operational during some part/period of the
year
Yes 7 18.42
No 28 73.68
10 Reasons for non-operation.
Drying up of
sources/lowering of
ground water
3
Contamination of
drinking water sources
Operation &
maintenance
Non-availability of
electricity
Non-availability of
funds for
running/maintenance
1
Any other reason 3
No response 21
Source: Survey

Audit Report on Economic and Revenue Sectors for the year ended 31 March 2017
100
Appendix 1.8
(Reference: Paragraph 1.2.11.1)
Details of survey of 640 households during Performance Audit of NRDWP
Sl.
No. Query Response
No. of
households Percentage
1 Source Type
Piped water supply 333 52.03
Handpumps/ Tubewell 1 0.15
Others 306 47.81
2 Whether the source of supply of water was
functional
Functional 360 56.25
Non-functional 280 43.75
3
Whether the water supply was through
household individual connection or
common community connection
Household 40 6.25
Community 600 93.75
4 Whether the Beneficiary was aware that
supplied drinking water was safe/potable
Yes 369 57.66
No 271 42.34
5 Whether the Supply was sufficient for
drinking, cooking and other domestic needs
Yes 361 56.40
No 269 42.03
6 Whether the drinking water supply was
available round the year
Yes 255 39.84
No 385 60.15
7 Whether the drinking water supply through
PWS was at regular hours
Yes 219 34.21
No 421 65.78
8 Distance from water supply position/point
Less than 100 mtrs 376 58.75
Between 100-200 mtr 114 17.81
Between 200-500 mtr 71 11.09
More than 500 mtr 79 12.34
9 Average daily time taken in fetching water
Less than 10 min 376 58.75
Between 10-30 min 170 26.56
Between 30-60 min 52 8.13
More than 1hr 42 6.56
10
Whether the household representative faces
any discrimination in access to water from
the community drinking water facility
Yes 0 0
No 640 100
11 Whether access to drinking water from
multiple/alternative sources available to the
beneficiary
Yes 93 14.53
No 547 85.47
12 Whether the beneficiary was satisfied with
the water quality
Yes 337 52.66
No 303 47.34
13 In case answer is No, Water quality
problem faced
Colored supply 136
Smelly water 0
Dirty supply 78
No response 89
14
Status of response given by the agencies on
water quality complaints reported by the
beneficiary
Satisfactory 234 36.56
Not satisfactory 227 35.46
Can’t say 179 27.96
15 Whether samples were being collected
from water source/supply point for testing
Yes 207 32.34
No 433 67.65
16
Whether training and awareness generating
IEC activities on drinking water were ever
provided to the beneficiary
Yes 138 21.56
No 502 78.43
17 Whether the water supply scheme remained
non-operation due to O&M
Yes 314 49.06
No 326 50.93
18 Whether user charges were being collected
and used for operation and maintenance
Yes 59 9.21
No 581 90.78
Source: Survey
Appendices
101
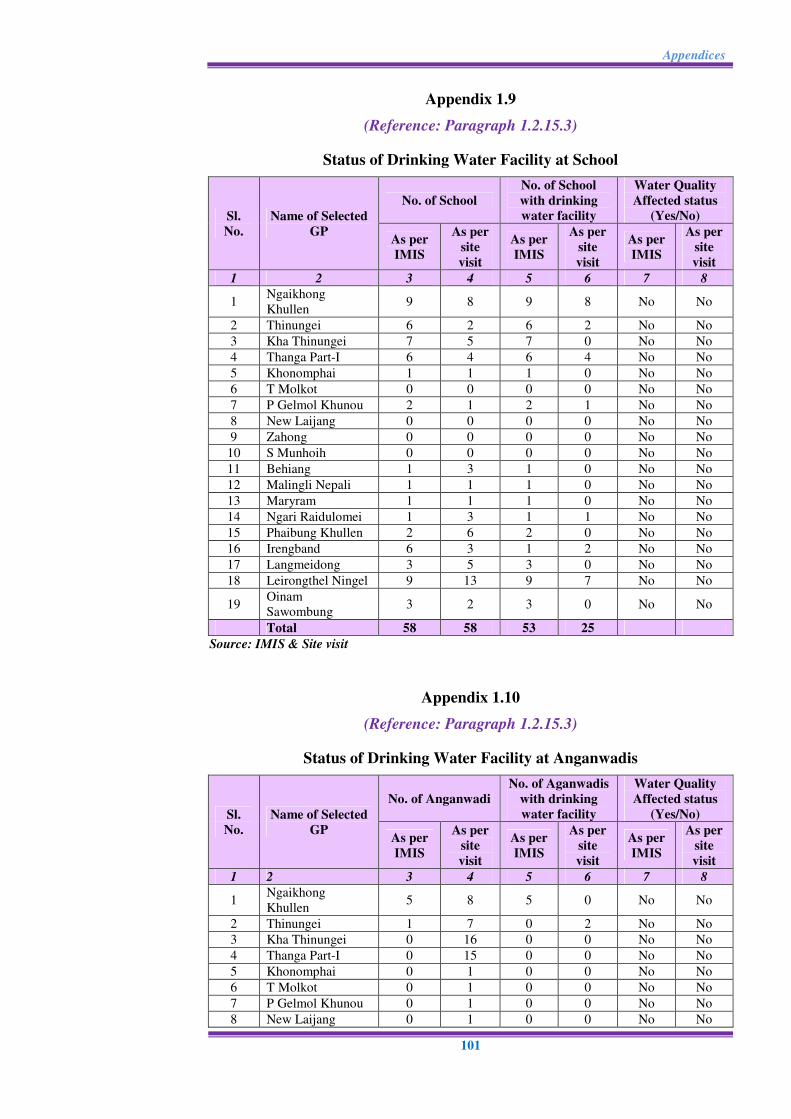
Appendix 1.9
(Reference: Paragraph 1.2.15.3)
Status of Drinking Water Facility at School
Sl.
No.
Name of Selected
GP
No. of School
No. of School
with drinking
water facility
Water Quality
Affected status
(Yes/No)
As per
IMIS
As per
site
visit
As per
IMIS
As per
site
visit
As per
IMIS
As per
site
visit
1 2 3 4 5 6 7 8
1 Ngaikhong
Khullen 9 8 9 8 No No
2 Thinungei 6 2 6 2 No No
3 Kha Thinungei 7 5 7 0 No No
4 Thanga Part-I 6 4 6 4 No No
5 Khonomphai 1 1 1 0 No No
6 T Molkot 0 0 0 0 No No
7 P Gelmol Khunou 2 1 2 1 No No
8 New Laijang 0 0 0 0 No No
9 Zahong 0 0 0 0 No No
10 S Munhoih 0 0 0 0 No No
11 Behiang 1 3 1 0 No No
12 Malingli Nepali 1 1 1 0 No No
13 Maryram 1 1 1 0 No No
14 Ngari Raidulomei 1 3 1 1 No No
15 Phaibung Khullen 2 6 2 0 No No
16 Irengband 6 3 1 2 No No
17 Langmeidong 3 5 3 0 No No
18 Leirongthel Ningel 9 13 9 7 No No
19 Oinam
Sawombung 3 2 3 0 No No
Total 58 58 53 25
Source: IMIS & Site visit
Appendix 1.10
(Reference: Paragraph 1.2.15.3)
Status of Drinking Water Facility at Anganwadis
Sl.
No.
Name of Selected
GP
No. of Anganwadi
No. of Aganwadis
with drinking
water facility
Water Quality
Affected status
(Yes/No)
As per
IMIS
As per
site
visit
As per
IMIS
As per
site
visit
As per
IMIS
As per
site
visit
1 2 3 4 5 6 7 8
1 Ngaikhong
Khullen 5 8 5 0 No No
2 Thinungei 1 7 0 2 No No
3 Kha Thinungei 0 16 0 0 No No
4 Thanga Part-I 0 15 0 0 No No
5 Khonomphai 0 1 0 0 No No
6 T Molkot 0 1 0 0 No No
7 P Gelmol Khunou 0 1 0 0 No No
8 New Laijang 0 1 0 0 No No
Audit Report on Economic and Revenue Sectors for the year ended 31 March 2017
102
Sl.
No.
Name of Selected
GP
No. of Anganwadi
No. of Aganwadis
with drinking
water facility
Water Quality
Affected status
(Yes/No)
As per
IMIS
As per
site
visit
As per
IMIS
As per
site
visit
As per
IMIS
As per
site
visit
1 2 3 4 5 6 7 8
9 Zahong 0 1 0 0 No No
10 S Munhoih 0 1 0 0 No No
11 Behiang 0 2 0 0 No No
12 Malingli Nepali 0 1 0 0 No No
13 Maryram 0 2 0 0 No No
14 Ngari Raidulomei 0 7 0 0 No No
15 Phaibung Khullen 0 3 0 0 No No
16 Irengband 0 8 0 2 No No
17 Langmeidong 0 20 0 0 No No
18 Leirongthel Ningel 6 12 6 6 No No
19 Oinam
Sawombung 3 6 3 0 No No
Total 15 113 14 10
Source: IMIS & Site visit
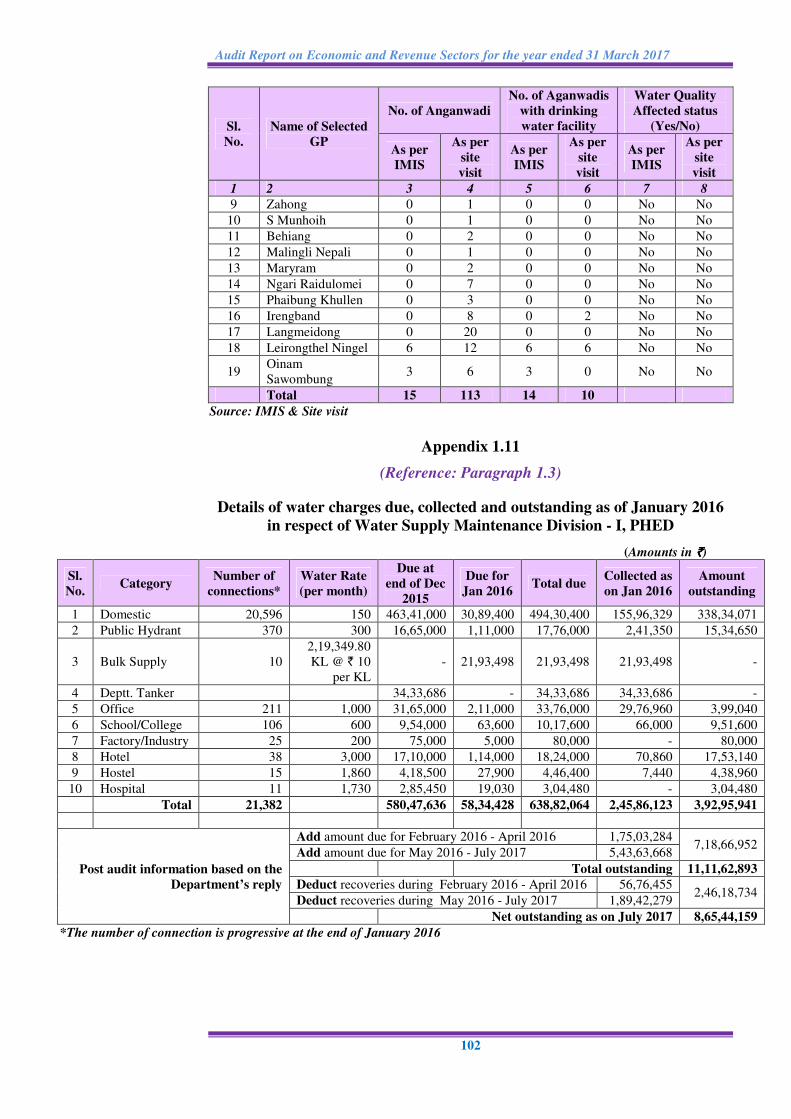
Appendix 1.11
(Reference: Paragraph 1.3)
Details of water charges due, collected and outstanding as of January 2016
in respect of Water Supply Maintenance Division - I, PHED
*The number of connection is progressive at the end of January 2016
(Amounts in `̀̀̀)
Sl.
No. Category
Number of
connections*
Water Rate
(per month)
Due at
end of Dec
2015
Due for
Jan 2016 Total due
Collected as
on Jan 2016
Amount
outstanding
1 Domestic 20,596 150 463,41,000 30,89,400 494,30,400 155,96,329 338,34,071
2 Public Hydrant 370 300 16,65,000 1,11,000 17,76,000 2,41,350 15,34,650
3 Bulk Supply 10
2,19,349.80
KL @ ` 10
per KL
- 21,93,498 21,93,498 21,93,498 -
4 Deptt. Tanker
34,33,686 - 34,33,686 34,33,686 -
5 Office 211 1,000 31,65,000 2,11,000 33,76,000 29,76,960 3,99,040
6 School/College 106 600 9,54,000 63,600 10,17,600 66,000 9,51,600
7 Factory/Industry 25 200 75,000 5,000 80,000 - 80,000
8 Hotel 38 3,000 17,10,000 1,14,000 18,24,000 70,860 17,53,140
9 Hostel 15 1,860 4,18,500 27,900 4,46,400 7,440 4,38,960
10 Hospital 11 1,730 2,85,450 19,030 3,04,480 - 3,04,480
Total 21,382
580,47,636 58,34,428 638,82,064 2,45,86,123 3,92,95,941
Post audit information based on the
Department’s reply
Add amount due for February 2016 - April 2016 1,75,03,284 7,18,66,952
Add amount due for May 2016 - July 2017 5,43,63,668
Total outstanding 11,11,62,893
Deduct recoveries during February 2016 - April 2016 56,76,455 2,46,18,734
Deduct recoveries during May 2016 - July 2017 1,89,42,279
Net outstanding as on July 2017 8,65,44,159
Appendices
103
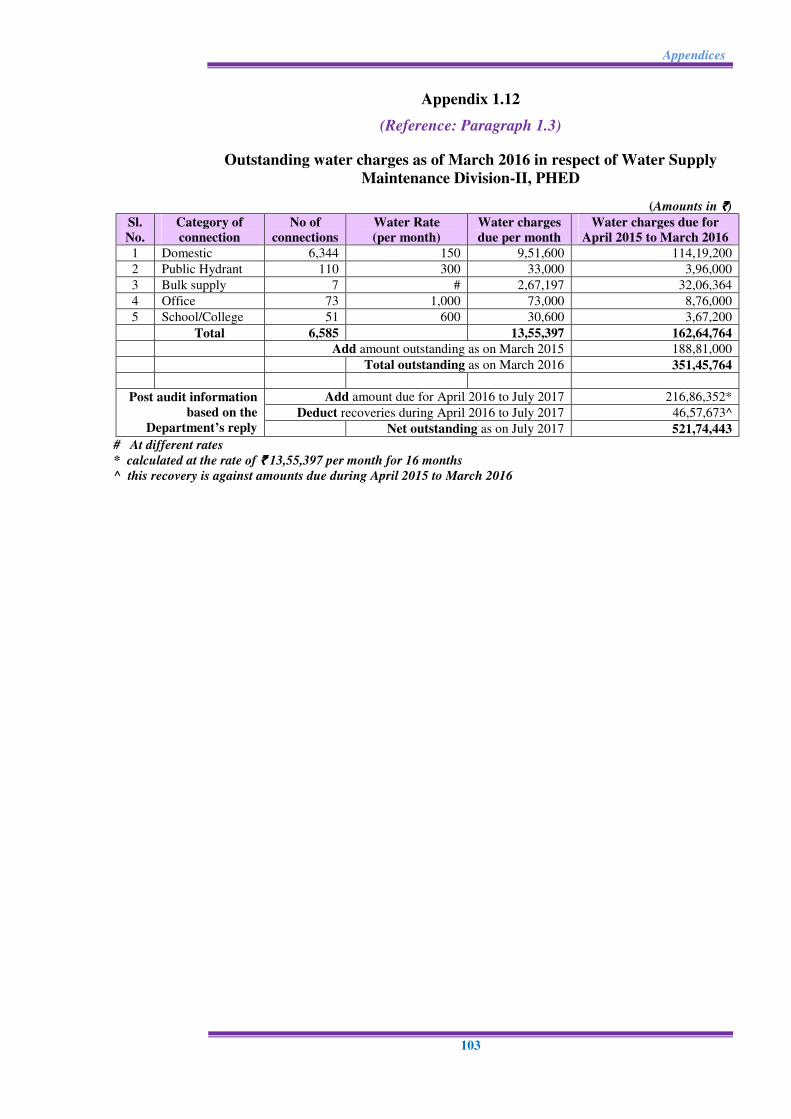
Appendix 1.12
(Reference: Paragraph 1.3)
Outstanding water charges as of March 2016 in respect of Water Supply
Maintenance Division-II, PHED
# At different rates
* calculated at the rate of `̀̀̀ 13,55,397 per month for 16 months
^ this recovery is against amounts due during April 2015 to March 2016
(Amounts in `̀̀̀)
Sl.
No.
Category of
connection
No of
connections
Water Rate
(per month)
Water charges
due per month
Water charges due for
April 2015 to March 2016
1 Domestic 6,344 150 9,51,600 114,19,200
2 Public Hydrant 110 300 33,000 3,96,000
3 Bulk supply 7 # 2,67,197 32,06,364
4 Office 73 1,000 73,000 8,76,000
5 School/College 51 600 30,600 3,67,200
Total 6,585 13,55,397 162,64,764
Add amount outstanding as on March 2015 188,81,000
Total outstanding as on March 2016 351,45,764
Post audit information
based on the
Department’s reply
Add amount due for April 2016 to July 2017 216,86,352*
Deduct recoveries during April 2016 to July 2017 46,57,673^
Net outstanding as on July 2017 521,74,443
Audit Report on Economic and Revenue Sectors for the year ended 31 March 2017
104
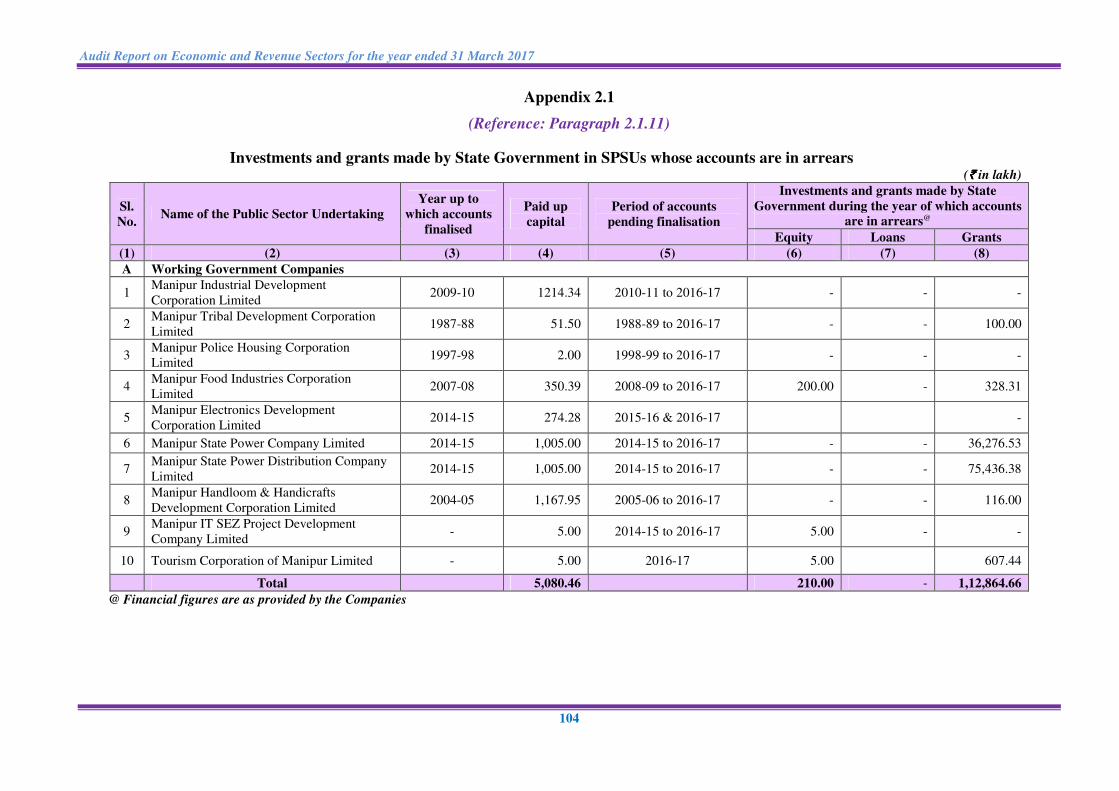
Appendix 2.1
(Reference: Paragraph 2.1.11)
Investments and grants made by State Government in SPSUs whose accounts are in arrears (`̀̀̀ in lakh)
Sl.
No. Name of the Public Sector Undertaking
Year up to
which accounts
finalised
Paid up
capital
Period of accounts
pending finalisation
Investments and grants made by State
Government during the year of which accounts
are in arrears@
Equity Loans Grants
(1) (2) (3) (4) (5) (6) (7) (8)
A Working Government Companies
1 Manipur Industrial Development
Corporation Limited 2009-10 1214.34 2010-11 to 2016-17 - - -
2 Manipur Tribal Development Corporation
Limited 1987-88 51.50 1988-89 to 2016-17 - - 100.00
3 Manipur Police Housing Corporation
Limited 1997-98 2.00 1998-99 to 2016-17 - - -
4 Manipur Food Industries Corporation
Limited 2007-08 350.39 2008-09 to 2016-17 200.00 - 328.31
5 Manipur Electronics Development
Corporation Limited 2014-15 274.28 2015-16 & 2016-17
-
6 Manipur State Power Company Limited 2014-15 1,005.00 2014-15 to 2016-17 - - 36,276.53
7 Manipur State Power Distribution Company
Limited 2014-15 1,005.00 2014-15 to 2016-17 - - 75,436.38
8 Manipur Handloom & Handicrafts
Development Corporation Limited 2004-05 1,167.95 2005-06 to 2016-17 - - 116.00
9 Manipur IT SEZ Project Development
Company Limited - 5.00 2014-15 to 2016-17 5.00 - -
10 Tourism Corporation of Manipur Limited - 5.00 2016-17 5.00
607.44
Total
5,080.46
210.00 - 1,12,864.66
@ Financial figures are as provided by the Companies
Appendices
105
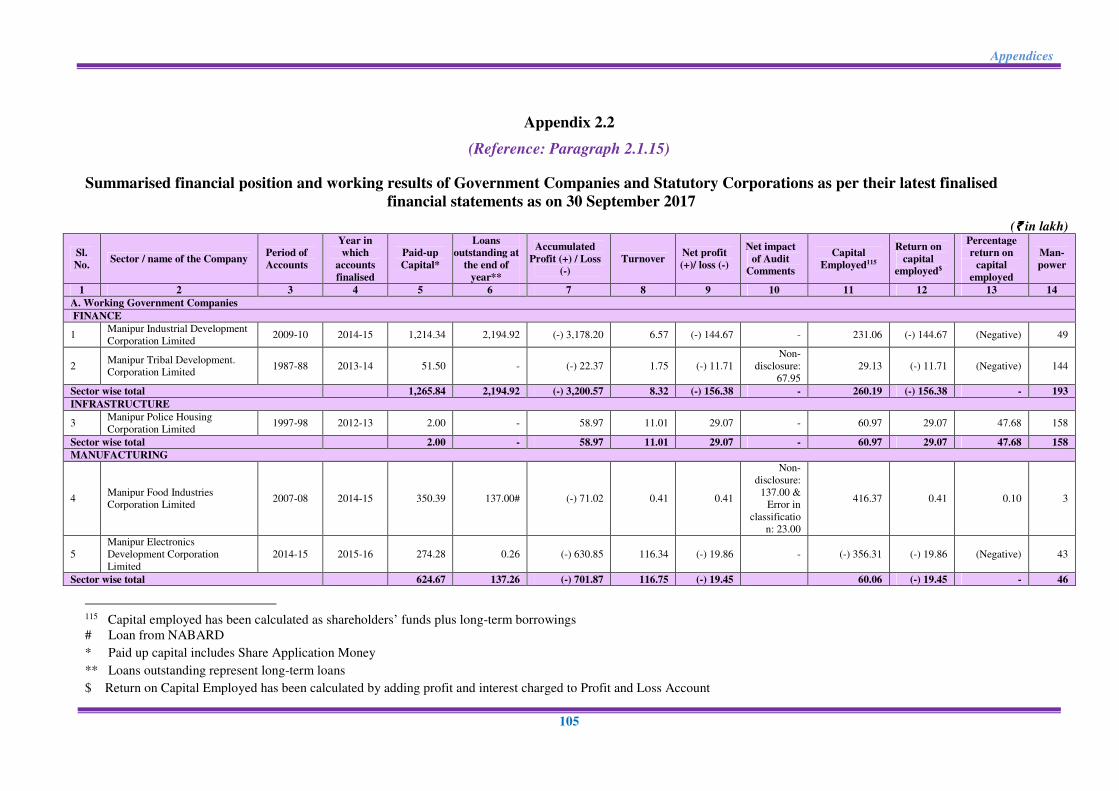
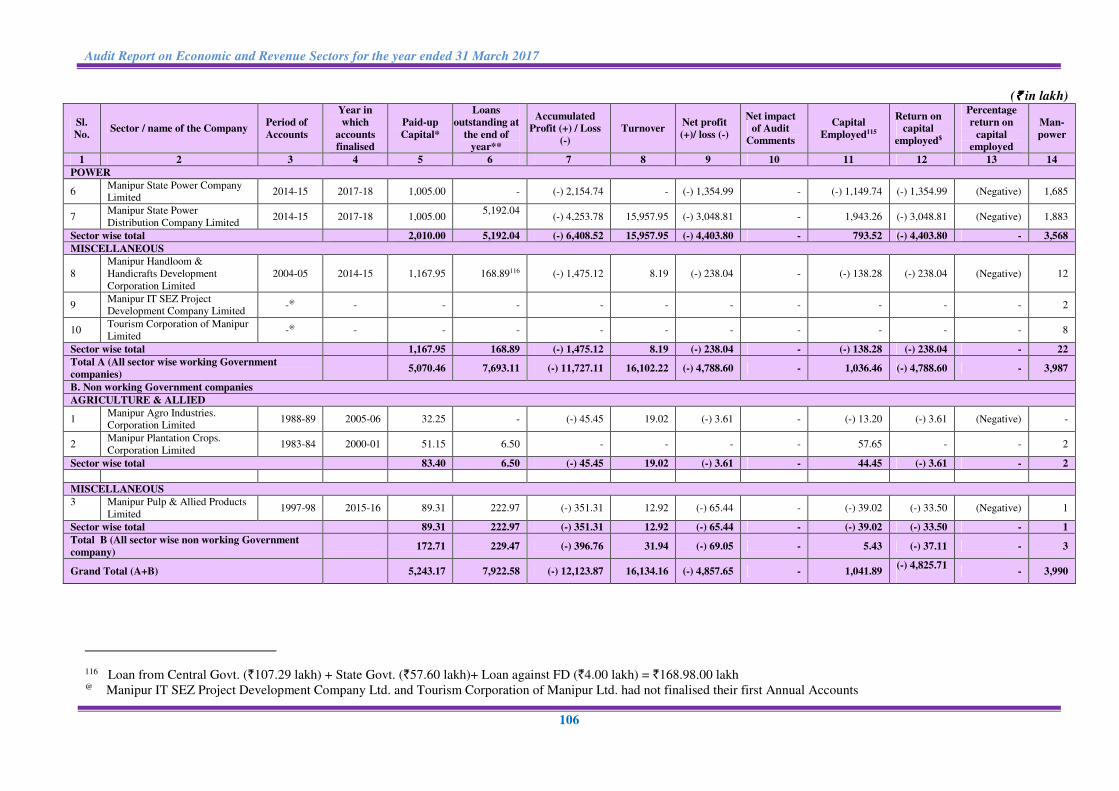
Appendix 2.2
(Reference: Paragraph 2.1.15)
Summarised financial position and working results of Government Companies and Statutory Corporations as per their latest finalised
financial statements as on 30 September 2017
(`̀̀̀ in lakh)
Sl.
No. Sector / name of the Company
Period of
Accounts
Year in
which
accounts
finalised
Paid-up
Capital*
Loans
outstanding at
the end of
year**
Accumulated
Profit (+) / Loss
(-)
Turnover Net profit
(+)/ loss (-)
Net impact
of Audit
Comments
Capital
Employed115
Return on
capital
employed$
Percentage
return on
capital
employed
Man-
power
1 2 3 4 5 6 7 8 9 10 11 12 13 14
A. Working Government Companies
FINANCE
1 Manipur Industrial Development
Corporation Limited 2009-10 2014-15 1,214.34 2,194.92 (-) 3,178.20 6.57 (-) 144.67 - 231.06 (-) 144.67 (Negative) 49
2 Manipur Tribal Development.
Corporation Limited 1987-88 2013-14 51.50 - (-) 22.37 1.75 (-) 11.71
Non-
disclosure:
67.95
29.13 (-) 11.71 (Negative) 144
Sector wise total
1,265.84 2,194.92 (-) 3,200.57 8.32 (-) 156.38 - 260.19 (-) 156.38 - 193
INFRASTRUCTURE
3 Manipur Police Housing
Corporation Limited 1997-98 2012-13 2.00 - 58.97 11.01 29.07 - 60.97 29.07 47.68 158
Sector wise total
2.00 - 58.97 11.01 29.07 - 60.97 29.07 47.68 158
MANUFACTURING
4 Manipur Food Industries
Corporation Limited 2007-08 2014-15 350.39 137.00# (-) 71.02 0.41 0.41
Non-
disclosure:
137.00 &
Error in
classificatio
n: 23.00
416.37 0.41 0.10 3
5
Manipur Electronics
Development Corporation
Limited
2014-15 2015-16 274.28 0.26 (-) 630.85 116.34 (-) 19.86 - (-) 356.31 (-) 19.86 (Negative) 43
Sector wise total
624.67 137.26 (-) 701.87 116.75 (-) 19.45
60.06 (-) 19.45 - 46
115 Capital employed has been calculated as shareholders’ funds plus long-term borrowings
# Loan from NABARD
* Paid up capital includes Share Application Money
** Loans outstanding represent long-term loans
$ Return on Capital Employed has been calculated by adding profit and interest charged to Profit and Loss Account
Audit Report on Economic and Revenue Sectors for the year ended 31 March 2017
106
(`̀̀̀ in lakh)
Sl.
No. Sector / name of the Company
Period of
Accounts
Year in
which
accounts
finalised
Paid-up
Capital*
Loans
outstanding at
the end of
year**
Accumulated
Profit (+) / Loss
(-)
Turnover Net profit
(+)/ loss (-)
Net impact
of Audit
Comments
Capital
Employed115
Return on
capital
employed$
Percentage
return on
capital
employed
Man-
power
1 2 3 4 5 6 7 8 9 10 11 12 13 14
POWER
6 Manipur State Power Company
Limited 2014-15 2017-18 1,005.00 - (-) 2,154.74 - (-) 1,354.99 - (-) 1,149.74 (-) 1,354.99 (Negative) 1,685
7 Manipur State Power
Distribution Company Limited 2014-15 2017-18 1,005.00
5,192.04
(-) 4,253.78 15,957.95 (-) 3,048.81 - 1,943.26 (-) 3,048.81 (Negative) 1,883
Sector wise total 2,010.00 5,192.04 (-) 6,408.52 15,957.95 (-) 4,403.80 - 793.52 (-) 4,403.80 - 3,568
MISCELLANEOUS
8
Manipur Handloom &
Handicrafts Development
Corporation Limited
2004-05 2014-15 1,167.95 168.89116 (-) 1,475.12 8.19 (-) 238.04 - (-) 138.28 (-) 238.04 (Negative) 12
9 Manipur IT SEZ Project
Development Company Limited -@ - - - - - - - - - - 2
10 Tourism Corporation of Manipur
Limited -@ - - - - - - - - - - 8
Sector wise total 1,167.95 168.89 (-) 1,475.12 8.19 (-) 238.04 - (-) 138.28 (-) 238.04 - 22
Total A (All sector wise working Government
companies) 5,070.46 7,693.11 (-) 11,727.11 16,102.22 (-) 4,788.60 - 1,036.46 (-) 4,788.60 - 3,987
B. Non working Government companies
AGRICULTURE & ALLIED
1 Manipur Agro Industries.
Corporation Limited 1988-89 2005-06 32.25 - (-) 45.45 19.02 (-) 3.61 - (-) 13.20 (-) 3.61 (Negative) -
2 Manipur Plantation Crops.
Corporation Limited 1983-84 2000-01 51.15 6.50 - - - - 57.65 - - 2
Sector wise total 83.40 6.50 (-) 45.45 19.02 (-) 3.61 - 44.45 (-) 3.61 - 2
MISCELLANEOUS
3 Manipur Pulp & Allied Products
Limited 1997-98 2015-16 89.31 222.97 (-) 351.31 12.92 (-) 65.44 - (-) 39.02 (-) 33.50 (Negative) 1
Sector wise total 89.31 222.97 (-) 351.31 12.92 (-) 65.44 - (-) 39.02 (-) 33.50 - 1
Total B (All sector wise non working Government
company) 172.71 229.47 (-) 396.76 31.94 (-) 69.05 - 5.43 (-) 37.11 - 3
Grand Total (A+B) 5,243.17 7,922.58 (-) 12,123.87 16,134.16 (-) 4,857.65 - 1,041.89 (-) 4,825.71
- 3,990
116 Loan from Central Govt. (`107.29 lakh) + State Govt. (`57.60 lakh)+ Loan against FD (`4.00 lakh) = `168.98.00 lakh @ Manipur IT SEZ Project Development Company Ltd. and Tourism Corporation of Manipur Ltd. had not finalised their first Annual Accounts
Appendices
107
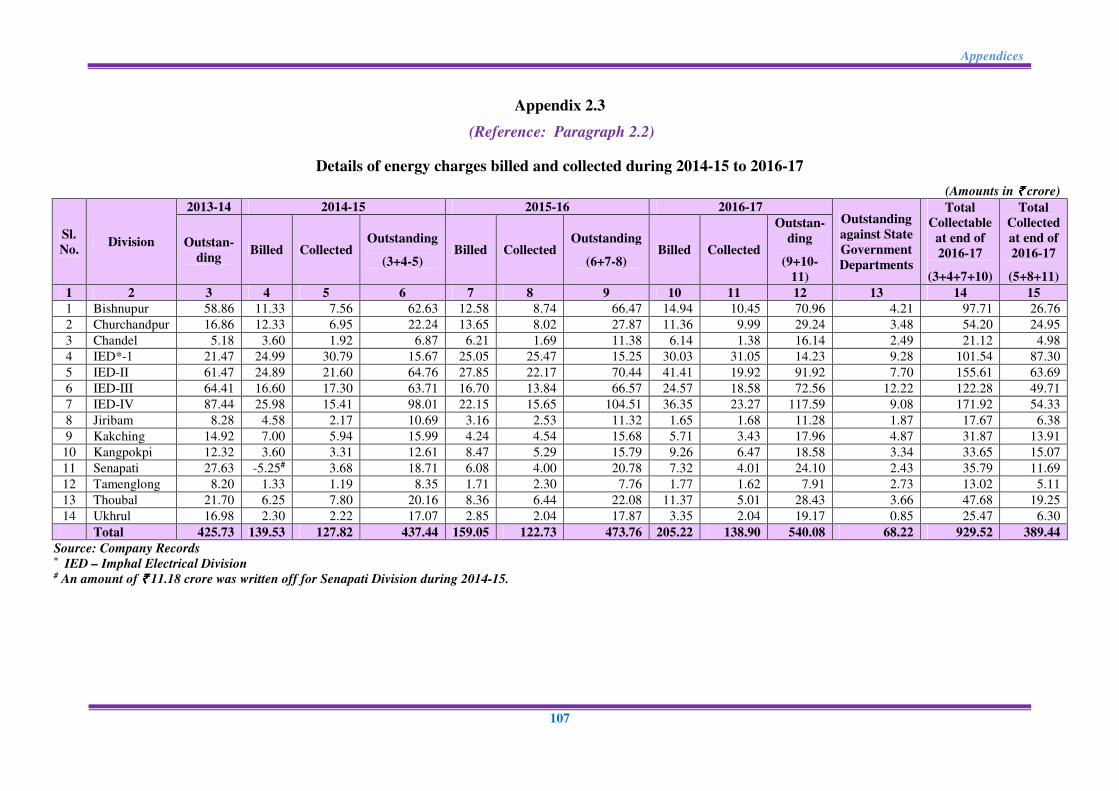
Appendix 2.3
(Reference: Paragraph 2.2)
Details of energy charges billed and collected during 2014-15 to 2016-17
Source: Company Records * IED – Imphal Electrical Division # An amount of `̀̀̀ 11.18 crore was written off for Senapati Division during 2014-15.
(Amounts in `̀̀̀ crore)
Sl.
No. Division
2013-14 2014-15 2015-16 2016-17 Outstanding
against State
Government
Departments
Total
Collectable
at end of
2016-17
(3+4+7+10)
Total
Collected
at end of
2016-17
(5+8+11)
Outstan-
ding Billed Collected
Outstanding
(3+4-5) Billed Collected
Outstanding
(6+7-8) Billed Collected
Outstan-
ding
(9+10-
11)
1 2 3 4 5 6 7 8 9 10 11 12 13 14 15
1 Bishnupur 58.86 11.33 7.56 62.63 12.58 8.74 66.47 14.94 10.45 70.96 4.21 97.71 26.76
2 Churchandpur 16.86 12.33 6.95 22.24 13.65 8.02 27.87 11.36 9.99 29.24 3.48 54.20 24.95
3 Chandel 5.18 3.60 1.92 6.87 6.21 1.69 11.38 6.14 1.38 16.14 2.49 21.12 4.98
4 IED*-1 21.47 24.99 30.79 15.67 25.05 25.47 15.25 30.03 31.05 14.23 9.28 101.54 87.30
5 IED-II 61.47 24.89 21.60 64.76 27.85 22.17 70.44 41.41 19.92 91.92 7.70 155.61 63.69
6 IED-III 64.41 16.60 17.30 63.71 16.70 13.84 66.57 24.57 18.58 72.56 12.22 122.28 49.71
7 IED-IV 87.44 25.98 15.41 98.01 22.15 15.65 104.51 36.35 23.27 117.59 9.08 171.92 54.33
8 Jiribam 8.28 4.58 2.17 10.69 3.16 2.53 11.32 1.65 1.68 11.28 1.87 17.67 6.38
9 Kakching 14.92 7.00 5.94 15.99 4.24 4.54 15.68 5.71 3.43 17.96 4.87 31.87 13.91
10 Kangpokpi 12.32 3.60 3.31 12.61 8.47 5.29 15.79 9.26 6.47 18.58 3.34 33.65 15.07
11 Senapati 27.63 -5.25# 3.68 18.71 6.08 4.00 20.78 7.32 4.01 24.10 2.43 35.79 11.69
12 Tamenglong 8.20 1.33 1.19 8.35 1.71 2.30 7.76 1.77 1.62 7.91 2.73 13.02 5.11
13 Thoubal 21.70 6.25 7.80 20.16 8.36 6.44 22.08 11.37 5.01 28.43 3.66 47.68 19.25
14 Ukhrul 16.98 2.30 2.22 17.07 2.85 2.04 17.87 3.35 2.04 19.17 0.85 25.47 6.30
Total 425.73 139.53 127.82 437.44 159.05 122.73 473.76 205.22 138.90 540.08 68.22 929.52 389.44
Audit Report on Economic and Revenue Sectors for the year ended 31 March 2017
108
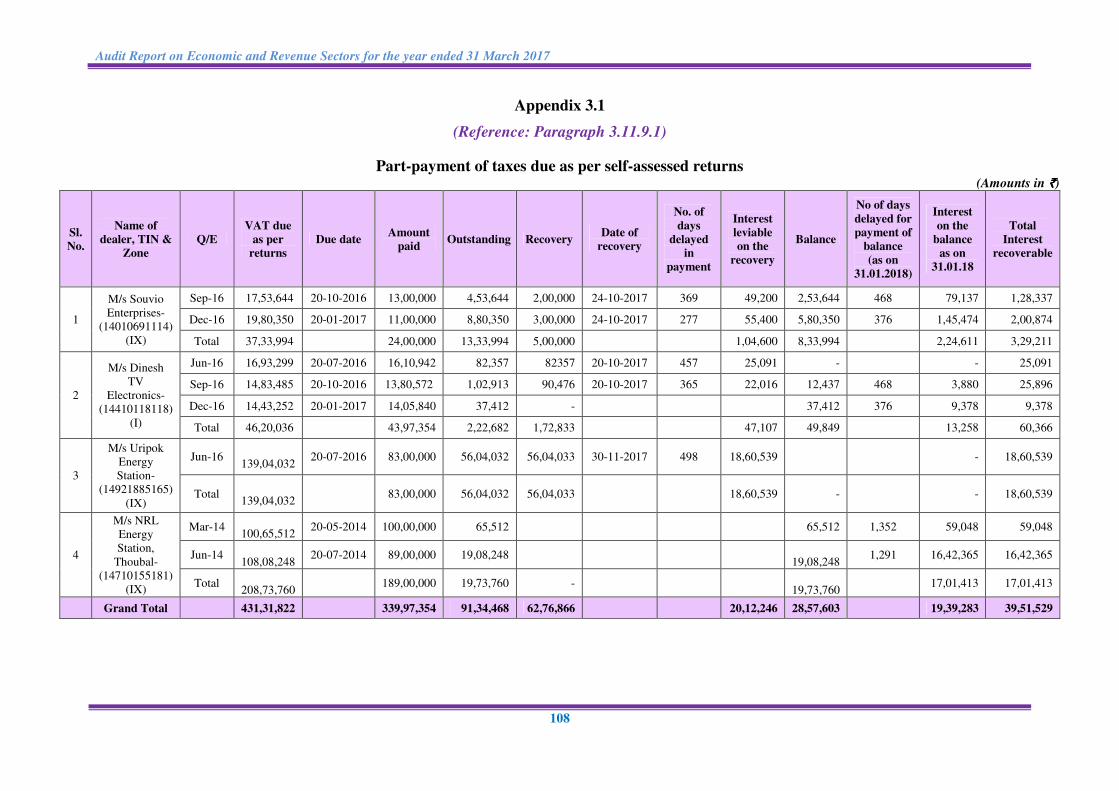
Appendix 3.1
(Reference: Paragraph 3.11.9.1)
Part-payment of taxes due as per self-assessed returns (Amounts in `̀̀̀)
Sl.
No.
Name of
dealer, TIN &
Zone
Q/E
VAT due
as per
returns
Due date Amount
paid Outstanding Recovery
Date of
recovery
No. of
days
delayed
in
payment
Interest
leviable
on the
recovery
Balance
No of days
delayed for
payment of
balance
(as on
31.01.2018)
Interest
on the
balance
as on
31.01.18
Total
Interest
recoverable
1
M/s Souvio
Enterprises-
(14010691114)
(IX)
Sep-16 17,53,644 20-10-2016 13,00,000 4,53,644 2,00,000 24-10-2017 369 49,200 2,53,644 468 79,137 1,28,337
Dec-16 19,80,350 20-01-2017 11,00,000 8,80,350 3,00,000 24-10-2017 277 55,400 5,80,350 376 1,45,474 2,00,874
Total 37,33,994 24,00,000 13,33,994 5,00,000 1,04,600 8,33,994
2,24,611 3,29,211
2
M/s Dinesh
TV
Electronics-
(14410118118)
(I)
Jun-16 16,93,299 20-07-2016 16,10,942 82,357 82357 20-10-2017 457 25,091 -
- 25,091
Sep-16 14,83,485 20-10-2016 13,80,572 1,02,913 90,476 20-10-2017 365 22,016 12,437 468 3,880 25,896
Dec-16 14,43,252 20-01-2017 14,05,840 37,412 -
37,412 376 9,378 9,378
Total 46,20,036 43,97,354 2,22,682 1,72,833 47,107 49,849
13,258 60,366
3
M/s Uripok
Energy
Station-
(14921885165)
(IX)
Jun-16
139,04,032 20-07-2016 83,00,000 56,04,032 56,04,033 30-11-2017 498 18,60,539
- 18,60,539
Total
139,04,032 83,00,000 56,04,032 56,04,033 18,60,539 -
- 18,60,539
4
M/s NRL
Energy
Station,
Thoubal-
(14710155181)
(IX)
Mar-14
100,65,512 20-05-2014 100,00,000 65,512
65,512 1,352 59,048 59,048
Jun-14
108,08,248 20-07-2014 89,00,000 19,08,248
19,08,248 1,291 16,42,365 16,42,365
Total
208,73,760 189,00,000 19,73,760 -
19,73,760 17,01,413 17,01,413
Grand Total
431,31,822
339,97,354 91,34,468 62,76,866
20,12,246 28,57,603
19,39,283 39,51,529

Appendices
109
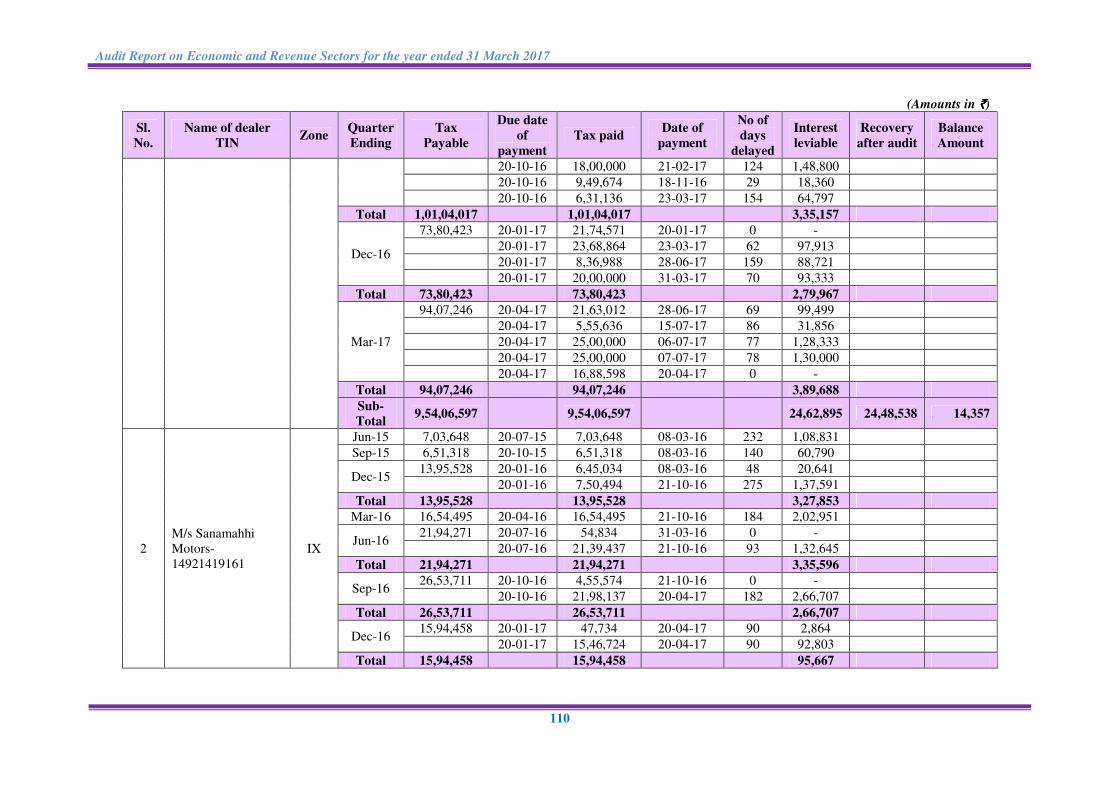
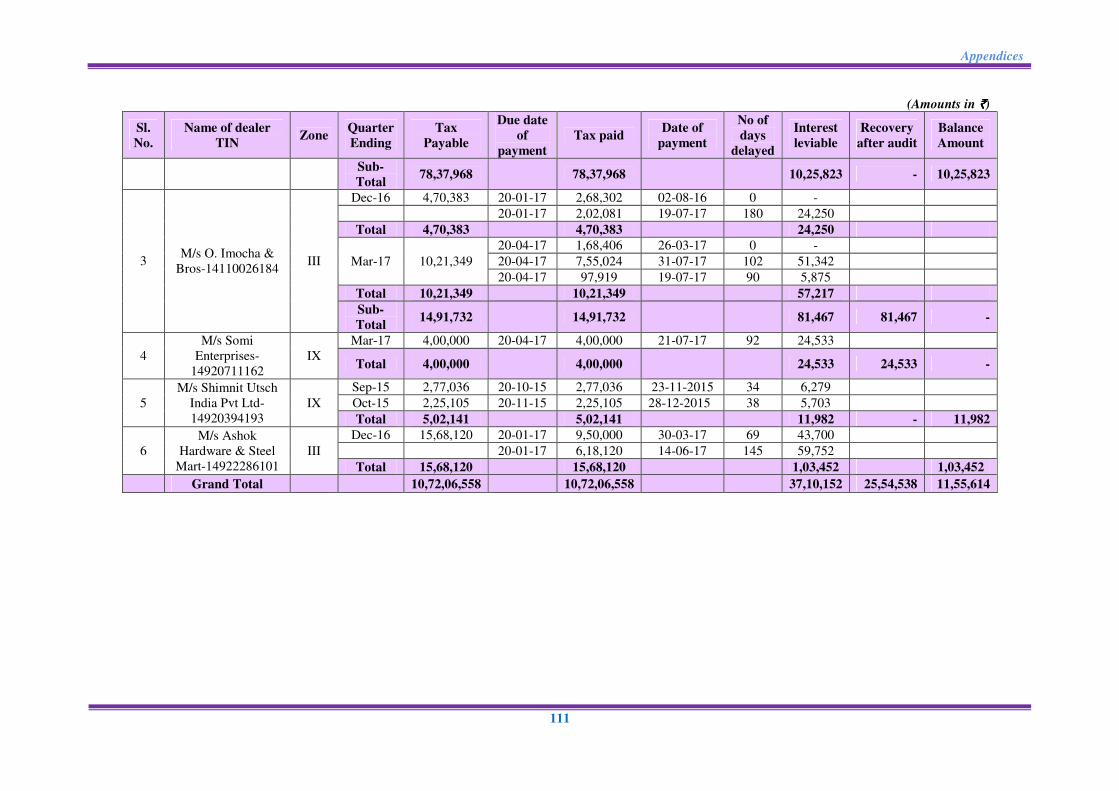
Appendix 3.2
(Reference: Paragraph 3.11.9.1)
Interest leviable for delay in payment of taxes as per self-assessed returns
(Amounts in `̀̀̀)
Sl.
No.
Name of dealer
TIN Zone
Quarter
Ending
Tax
Payable
Due date
of
payment
Tax paid Date of
payment
No of
days
delayed
Interest
leviable
Recovery
after audit
Balance
Amount
1
M/S Manipur
Trading
Corporation-
14920634168
III
Jun-15 1,64,15,001 20-07-15 1,49,64,841 26-06-15 0 0
14,50,160 08-09-15 50 48,339
Total 1,64,15,001
1,64,15,001
48,339 48,339
Sep-15
1,75,24,841 20-10-15 30,00,000 10-11-15 21 42,000
20-10-15 20,00,000 18-11-15 29 38,667
20-10-15 30,00,000 30-11-15 41 82,000
20-10-15 20,00,000 05-11-15 16 21,333
20-10-15 24,45,938 20-01-16 92 1,84,000
20-10-15 20,00,000 29-12-15 70 93,333
20-10-15 30,78,903 20-10-15 0 -
Total 1,75,24,841
1,75,24,841
4,61,333
Mar-16
1,87,39,177 20-04-16 37,39,177 20-04-16 0 -
20-04-16 25,00,000 28-06-16 69 1,15,000
20-04-16 25,00,000 21-06-16 62 1,03,333
20-04-16 20,00,000 01-07-16 72 96,000
20-04-16 40,00,000 30-03-16 0 -
20-04-16 40,00,000 24-03-16 0 -
Total 1,87,39,177
1,87,39,177
3,14,333
Jun-16
1,58,35,892 20-07-16 17,85,566 20-07-16 0 -
20-07-16 20,00,000 09-08-16 20 26,667
20-07-16 30,00,000 03-09-16 45 90,000
20-07-16 20,00,000 14-09-16 56 74,667
20-07-16 30,00,000 03-10-16 75 1,50,000
20-07-16 40,50,326 18-11-16 121 3,26,726
Total 1,58,35,892
1,58,35,892
6,68,060
Sep-16
1,01,04,017 20-10-16 15,23,207 20-10-16 0 -
20-10-16 50,00,000 15-11-16 26 86,667
20-10-16 2,00,000 21-02-17 124 16,533
Audit Report on Economic and Revenue Sectors for the year ended 31 March 2017
110
(Amounts in `̀̀̀)
Sl.
No.
Name of dealer
TIN Zone
Quarter
Ending
Tax
Payable
Due date
of
payment
Tax paid Date of
payment
No of
days
delayed
Interest
leviable
Recovery
after audit
Balance
Amount
20-10-16 18,00,000 21-02-17 124 1,48,800
20-10-16 9,49,674 18-11-16 29 18,360
20-10-16 6,31,136 23-03-17 154 64,797
Total 1,01,04,017
1,01,04,017
3,35,157
Dec-16
73,80,423 20-01-17 21,74,571 20-01-17 0 -
20-01-17 23,68,864 23-03-17 62 97,913
20-01-17 8,36,988 28-06-17 159 88,721
20-01-17 20,00,000 31-03-17 70 93,333
Total 73,80,423
73,80,423
2,79,967
Mar-17
94,07,246 20-04-17 21,63,012 28-06-17 69 99,499
20-04-17 5,55,636 15-07-17 86 31,856
20-04-17 25,00,000 06-07-17 77 1,28,333
20-04-17 25,00,000 07-07-17 78 1,30,000
20-04-17 16,88,598 20-04-17 0 -
Total 94,07,246
94,07,246
3,89,688
Sub-
Total 9,54,06,597
9,54,06,597
24,62,895 24,48,538 14,357
2
M/s Sanamahhi
Motors-
14921419161
IX
Jun-15 7,03,648 20-07-15 7,03,648 08-03-16 232 1,08,831
Sep-15 6,51,318 20-10-15 6,51,318 08-03-16 140 60,790
Dec-15 13,95,528 20-01-16 6,45,034 08-03-16 48 20,641
20-01-16 7,50,494 21-10-16 275 1,37,591
Total 13,95,528
13,95,528
3,27,853
Mar-16 16,54,495 20-04-16 16,54,495 21-10-16 184 2,02,951
Jun-16 21,94,271 20-07-16 54,834 31-03-16 0 -
20-07-16 21,39,437 21-10-16 93 1,32,645
Total 21,94,271
21,94,271
3,35,596
Sep-16 26,53,711 20-10-16 4,55,574 21-10-16 0 -
20-10-16 21,98,137 20-04-17 182 2,66,707
Total 26,53,711
26,53,711
2,66,707
Dec-16 15,94,458 20-01-17 47,734 20-04-17 90 2,864
20-01-17 15,46,724 20-04-17 90 92,803
Total 15,94,458
15,94,458
95,667
Appendices
111
(Amounts in `̀̀̀)
Sl.
No.
Name of dealer
TIN Zone
Quarter
Ending
Tax
Payable
Due date
of
payment
Tax paid Date of
payment
No of
days
delayed
Interest
leviable
Recovery
after audit
Balance
Amount
Sub-
Total 78,37,968
78,37,968
10,25,823 - 10,25,823
3 M/s O. Imocha &
Bros-14110026184 III
Dec-16 4,70,383 20-01-17 2,68,302 02-08-16 0 -
20-01-17 2,02,081 19-07-17 180 24,250
Total 4,70,383
4,70,383
24,250
Mar-17 10,21,349
20-04-17 1,68,406 26-03-17 0 -
20-04-17 7,55,024 31-07-17 102 51,342
20-04-17 97,919 19-07-17 90 5,875
Total 10,21,349
10,21,349
57,217
Sub-
Total 14,91,732
14,91,732
81,467 81,467 -
4
M/s Somi
Enterprises-
14920711162
IX
Mar-17 4,00,000 20-04-17 4,00,000 21-07-17 92 24,533
Total 4,00,000
4,00,000
24,533 24,533 -
5
M/s Shimnit Utsch
India Pvt Ltd-
14920394193
IX
Sep-15 2,77,036 20-10-15 2,77,036 23-11-2015 34 6,279
Oct-15 2,25,105 20-11-15 2,25,105 28-12-2015 38 5,703
Total 5,02,141
5,02,141
11,982 - 11,982
6
M/s Ashok
Hardware & Steel
Mart-14922286101
III
Dec-16 15,68,120 20-01-17 9,50,000 30-03-17 69 43,700
20-01-17 6,18,120 14-06-17 145 59,752
Total 15,68,120
15,68,120
1,03,452 1,03,452
Grand Total
10,72,06,558
10,72,06,558
37,10,152 25,54,538 11,55,614

Audit Report on Economic and Revenue Sectors for the year ended 31 March 2017
112
Appendix 3.3
(Reference: Paragraph 3.11.9.1)
Suppression of purchase turnover in the self-assessed returns
(Amounts in `̀̀̀)
Sl.
No.
Trade Name &
TIN Zone
Quarter
Ending
Purchase as
shown in
the return
Purchase as
per e-ways
bill/’C’ form
database
Suppression Tax
rate Tax
Recovered
amount
Balance
Amount
1
M/s Metro Cycle
Store &
14922341166
VII
Mar-16 - 53,97,287 53,97,287 5% 2,69,864
Jun-16 34,56,655 43,66,252 9,09,597 5% 45,480
Sep-16 - 43,87,663 43,87,663 5% 2,19,383
Dec-16 - 27,59,714 27,59,714 5% 1,37,986
Mar-17 - 1,29,64,001 1,29,64,001 5% 6,48,200
Total 34,56,655 2,98,74,917 2,64,18,262
13,20,913 1,30,540 11,90,373
2
M/s Raj
Electronics &
14921741180
VIII
Mar-17 - 1,55,35,688 1,55,35,688 13.50% 20,97,318
Total - 1,55,35,688 1,55,35,688
20,97,318 - 20,97,318
3
M/S Mayasheel
Retail LLP
14923744131
VIII
Dec-16 1,37,84,455 3,62,30,623 2,24,46,168 5% 11,22,308
Total 1,37,84,455 3,62,30,623 2,24,46,168
11,22,308 - 11,22,308
Grand total
1,72,41,110 8,16,41,228 6,44,00,118
45,40,539 1,30,540 44,09,999
Appendices
113
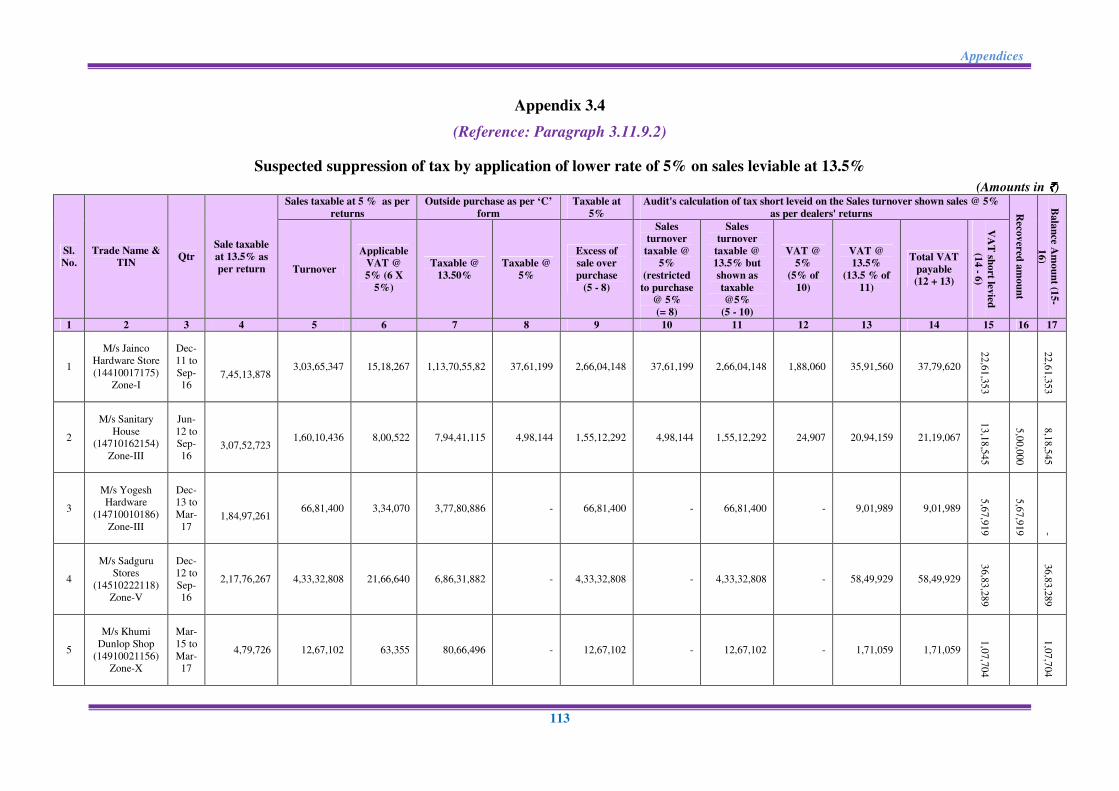
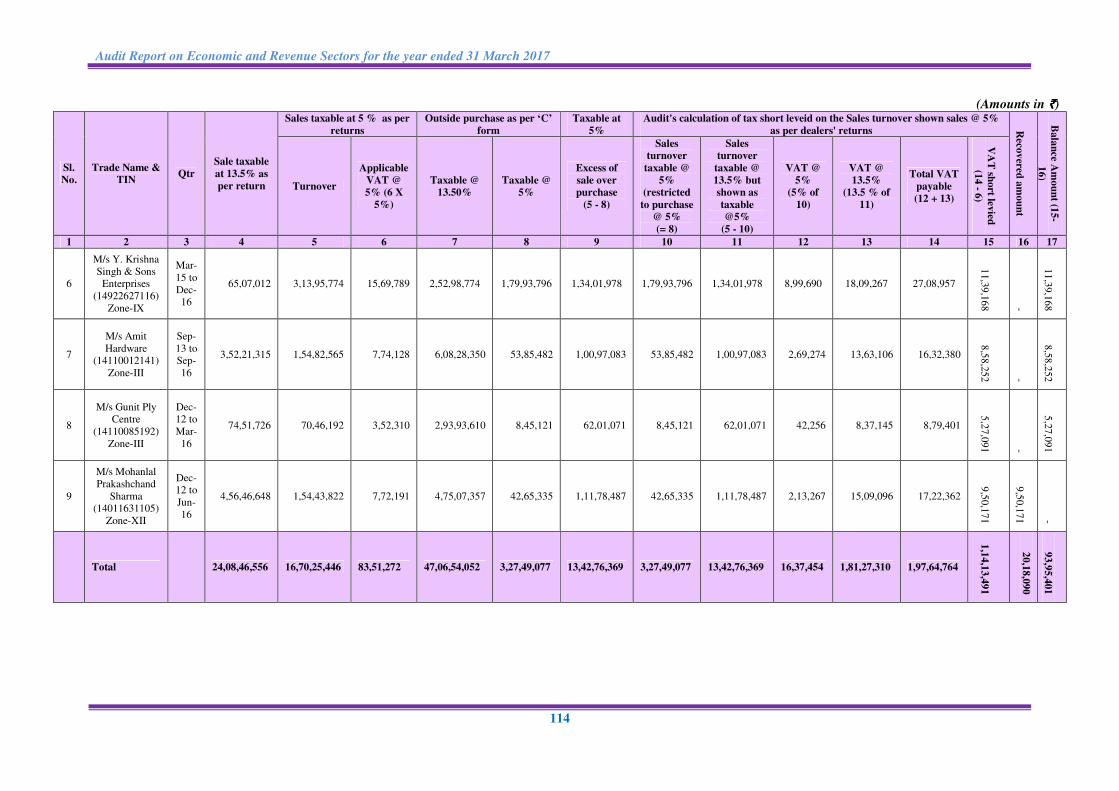
Appendix 3.4
(Reference: Paragraph 3.11.9.2)
Suspected suppression of tax by application of lower rate of 5% on sales leviable at 13.5%
(Amounts in `̀̀̀)
Sl.
No.
Trade Name &
TIN Qtr
Sale taxable
at 13.5% as
per return
Sales taxable at 5 % as per
returns
Outside purchase as per ‘C’
form
Taxable at
5%
Audit's calculation of tax short leveid on the Sales turnover shown sales @ 5%
as per dealers' returns Reco
vered
am
ou
nt
Bala
nce A
mo
un
t (15
-
16
)
Turnover
Applicable
VAT @
5% (6 X
5%)
Taxable @
13.50%
Taxable @
5%
Excess of
sale over
purchase
(5 - 8)
Sales
turnover
taxable @
5%
(restricted
to purchase
@ 5%
(= 8)
Sales
turnover
taxable @
13.5% but
shown as
taxable
@5%
(5 - 10)
VAT @
5%
(5% of
10)
VAT @
13.5%
(13.5 % of
11)
Total VAT
payable
(12 + 13)
VA
T sh
ort lev
ied
(14
- 6)
1 2 3 4 5 6 7 8 9 10 11 12 13 14 15 16 17
1
M/s Jainco
Hardware Store
(14410017175)
Zone-I
Dec-
11 to
Sep-
16
7,45,13,878 3,03,65,347 15,18,267 1,13,70,55,82 37,61,199 2,66,04,148 37,61,199 2,66,04,148 1,88,060 35,91,560 37,79,620
22,6
1,3
53
22
,61,3
53
2
M/s Sanitary
House
(14710162154)
Zone-III
Jun-
12 to
Sep-
16
3,07,52,723 1,60,10,436 8,00,522 7,94,41,115 4,98,144 1,55,12,292 4,98,144 1,55,12,292 24,907 20,94,159 21,19,067
13,1
8,5
45
5,0
0,0
00
8,1
8,5
45
3
M/s Yogesh
Hardware
(14710010186)
Zone-III
Dec-
13 to
Mar-
17
1,84,97,261 66,81,400 3,34,070 3,77,80,886 - 66,81,400 - 66,81,400 - 9,01,989 9,01,989
5,6
7,9
19
5,6
7,9
19
-
4
M/s Sadguru
Stores
(14510222118)
Zone-V
Dec-
12 to
Sep-
16
2,17,76,267 4,33,32,808 21,66,640 6,86,31,882 - 4,33,32,808 - 4,33,32,808 - 58,49,929 58,49,929
36,8
3,2
89
36
,83,2
89
5
M/s Khumi
Dunlop Shop
(14910021156)
Zone-X
Mar-
15 to
Mar-
17
4,79,726 12,67,102 63,355 80,66,496 - 12,67,102 - 12,67,102 - 1,71,059 1,71,059
1,0
7,7
04
1,0
7,7
04
Audit Report on Economic and Revenue Sectors for the year ended 31 March 2017
114
(Amounts in `̀̀̀)
Sl.
No.
Trade Name &
TIN Qtr
Sale taxable
at 13.5% as
per return
Sales taxable at 5 % as per
returns
Outside purchase as per ‘C’
form
Taxable at
5%
Audit's calculation of tax short leveid on the Sales turnover shown sales @ 5%
as per dealers' returns Reco
vered
am
ou
nt
Bala
nce A
mo
un
t (15
-
16
)
Turnover
Applicable
VAT @
5% (6 X
5%)
Taxable @
13.50%
Taxable @
5%
Excess of
sale over
purchase
(5 - 8)
Sales
turnover
taxable @
5%
(restricted
to purchase
@ 5%
(= 8)
Sales
turnover
taxable @
13.5% but
shown as
taxable
@5%
(5 - 10)
VAT @
5%
(5% of
10)
VAT @
13.5%
(13.5 % of
11)
Total VAT
payable
(12 + 13)
VA
T sh
ort lev
ied
(14
- 6)
1 2 3 4 5 6 7 8 9 10 11 12 13 14 15 16 17
6
M/s Y. Krishna
Singh & Sons
Enterprises
(14922627116)
Zone-IX
Mar-
15 to
Dec-
16
65,07,012 3,13,95,774 15,69,789 2,52,98,774 1,79,93,796 1,34,01,978 1,79,93,796 1,34,01,978 8,99,690 18,09,267 27,08,957
11,3
9,1
68 -
11
,39,1
68
7
M/s Amit
Hardware
(14110012141)
Zone-III
Sep-
13 to
Sep-
16
3,52,21,315 1,54,82,565 7,74,128 6,08,28,350 53,85,482 1,00,97,083 53,85,482 1,00,97,083 2,69,274 13,63,106 16,32,380
8,5
8,2
52 -
8,5
8,2
52
8
M/s Gunit Ply
Centre
(14110085192)
Zone-III
Dec-
12 to
Mar-
16
74,51,726 70,46,192 3,52,310 2,93,93,610 8,45,121 62,01,071 8,45,121 62,01,071 42,256 8,37,145 8,79,401
5,2
7,0
91 -
5,2
7,0
91
9
M/s Mohanlal
Prakashchand
Sharma
(14011631105)
Zone-XII
Dec-
12 to
Jun-
16
4,56,46,648 1,54,43,822 7,72,191 4,75,07,357 42,65,335 1,11,78,487 42,65,335 1,11,78,487 2,13,267 15,09,096 17,22,362
9,5
0,1
71
9,5
0,1
71 -
Total
24,08,46,556 16,70,25,446 83,51,272 47,06,54,052 3,27,49,077 13,42,76,369 3,27,49,077 13,42,76,369 16,37,454 1,81,27,310 1,97,64,764
1,1
4,1
3,4
91
20,1
8,0
90
93
,95,4
01
Appendices
115
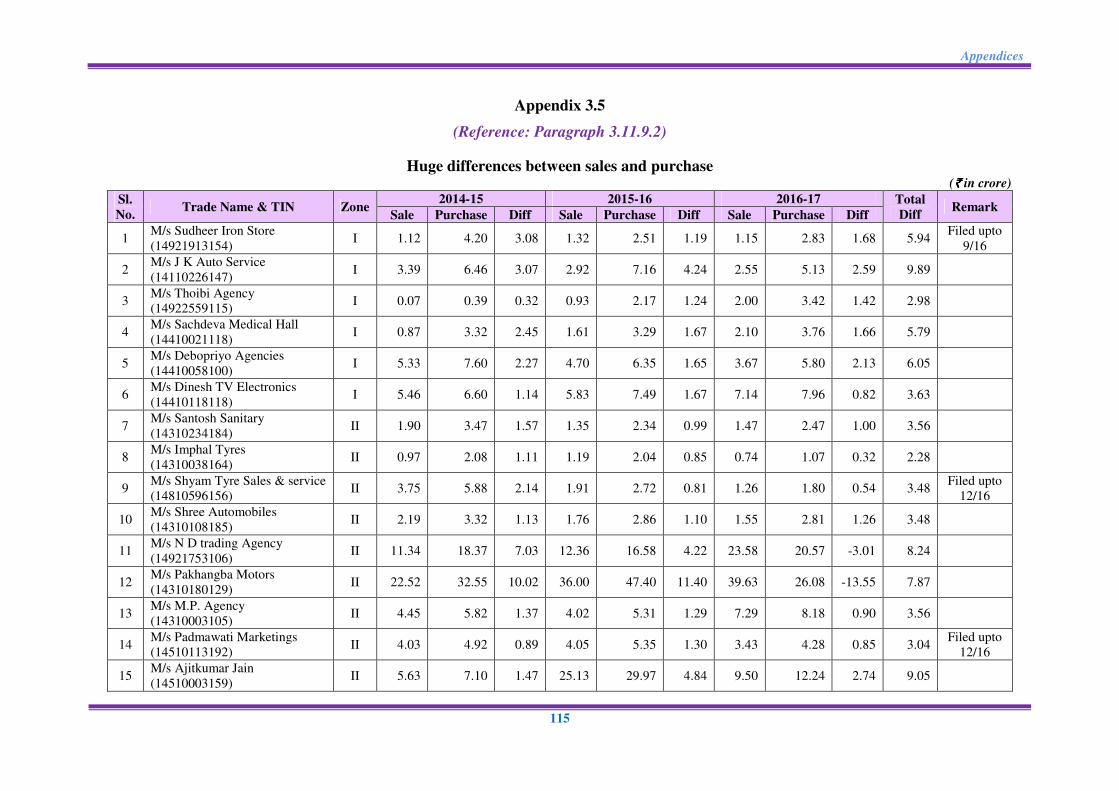
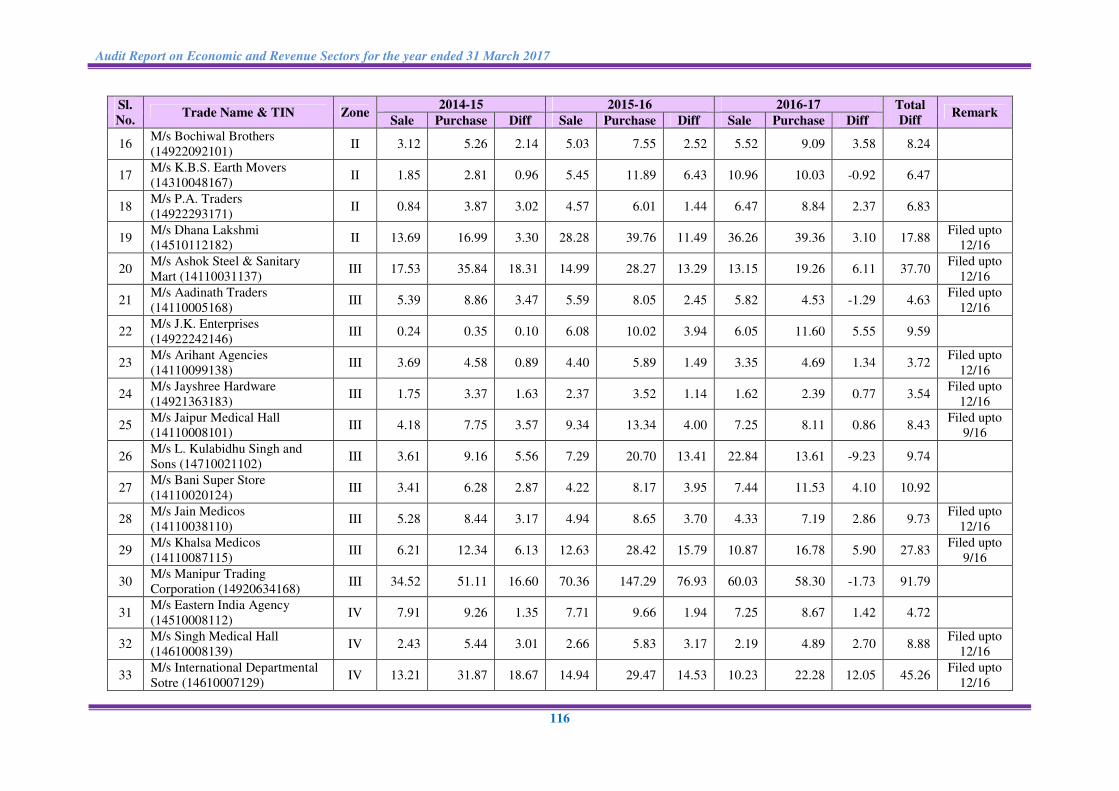
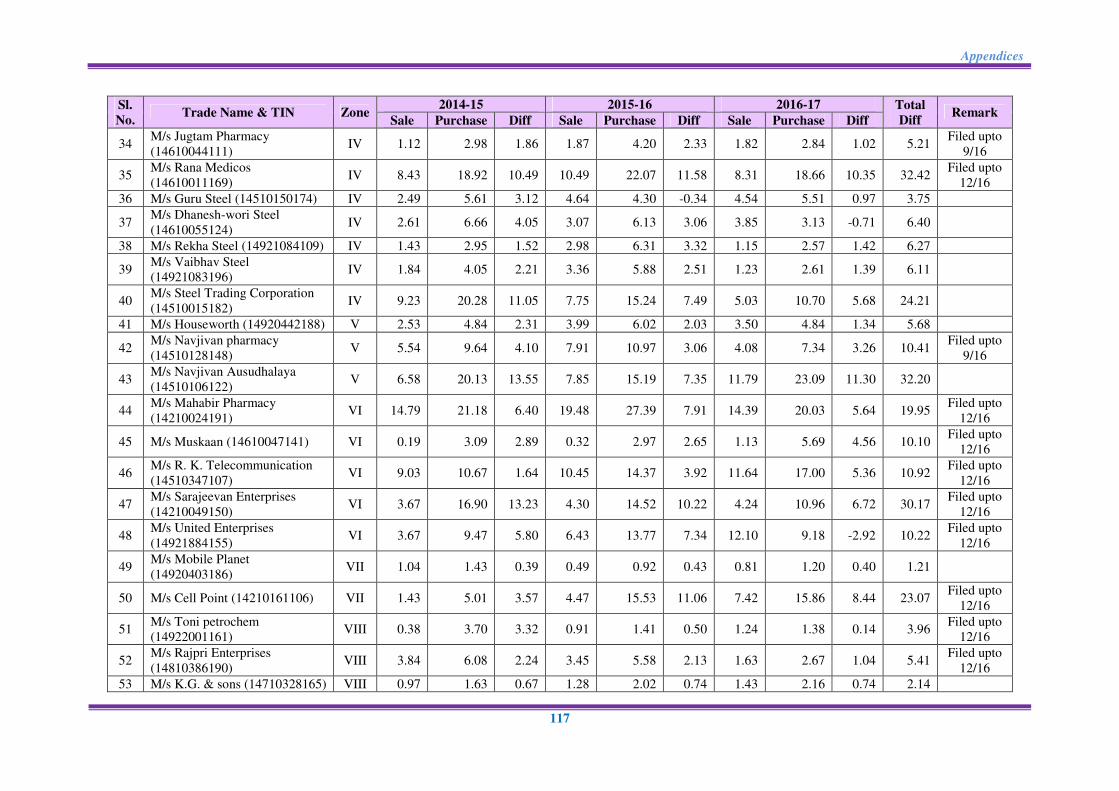
Appendix 3.5
(Reference: Paragraph 3.11.9.2)
Huge differences between sales and purchase (`̀̀̀ in crore)
Sl.
No. Trade Name & TIN Zone
2014-15 2015-16 2016-17 Total
Diff Remark
Sale Purchase Diff Sale Purchase Diff Sale Purchase Diff
1 M/s Sudheer Iron Store
(14921913154) I 1.12 4.20 3.08 1.32 2.51 1.19 1.15 2.83 1.68 5.94
Filed upto
9/16
2 M/s J K Auto Service
(14110226147) I 3.39 6.46 3.07 2.92 7.16 4.24 2.55 5.13 2.59 9.89
3 M/s Thoibi Agency
(14922559115) I 0.07 0.39 0.32 0.93 2.17 1.24 2.00 3.42 1.42 2.98
4 M/s Sachdeva Medical Hall
(14410021118) I 0.87 3.32 2.45 1.61 3.29 1.67 2.10 3.76 1.66 5.79
5 M/s Debopriyo Agencies
(14410058100) I 5.33 7.60 2.27 4.70 6.35 1.65 3.67 5.80 2.13 6.05
6 M/s Dinesh TV Electronics
(14410118118) I 5.46 6.60 1.14 5.83 7.49 1.67 7.14 7.96 0.82 3.63
7 M/s Santosh Sanitary
(14310234184) II 1.90 3.47 1.57 1.35 2.34 0.99 1.47 2.47 1.00 3.56
8 M/s Imphal Tyres
(14310038164) II 0.97 2.08 1.11 1.19 2.04 0.85 0.74 1.07 0.32 2.28
9 M/s Shyam Tyre Sales & service
(14810596156) II 3.75 5.88 2.14 1.91 2.72 0.81 1.26 1.80 0.54 3.48
Filed upto
12/16
10 M/s Shree Automobiles
(14310108185) II 2.19 3.32 1.13 1.76 2.86 1.10 1.55 2.81 1.26 3.48
11 M/s N D trading Agency
(14921753106) II 11.34 18.37 7.03 12.36 16.58 4.22 23.58 20.57 -3.01 8.24
12 M/s Pakhangba Motors
(14310180129) II 22.52 32.55 10.02 36.00 47.40 11.40 39.63 26.08 -13.55 7.87
13 M/s M.P. Agency
(14310003105) II 4.45 5.82 1.37 4.02 5.31 1.29 7.29 8.18 0.90 3.56
14 M/s Padmawati Marketings
(14510113192) II 4.03 4.92 0.89 4.05 5.35 1.30 3.43 4.28 0.85 3.04
Filed upto
12/16
15 M/s Ajitkumar Jain
(14510003159) II 5.63 7.10 1.47 25.13 29.97 4.84 9.50 12.24 2.74 9.05
Audit Report on Economic and Revenue Sectors for the year ended 31 March 2017
116
Sl.
No. Trade Name & TIN Zone
2014-15 2015-16 2016-17 Total
Diff Remark
Sale Purchase Diff Sale Purchase Diff Sale Purchase Diff
16 M/s Bochiwal Brothers
(14922092101) II 3.12 5.26 2.14 5.03 7.55 2.52 5.52 9.09 3.58 8.24
17 M/s K.B.S. Earth Movers
(14310048167) II 1.85 2.81 0.96 5.45 11.89 6.43 10.96 10.03 -0.92 6.47
18 M/s P.A. Traders
(14922293171) II 0.84 3.87 3.02 4.57 6.01 1.44 6.47 8.84 2.37 6.83
19 M/s Dhana Lakshmi
(14510112182) II 13.69 16.99 3.30 28.28 39.76 11.49 36.26 39.36 3.10 17.88
Filed upto
12/16
20 M/s Ashok Steel & Sanitary
Mart (14110031137) III 17.53 35.84 18.31 14.99 28.27 13.29 13.15 19.26 6.11 37.70
Filed upto
12/16
21 M/s Aadinath Traders
(14110005168) III 5.39 8.86 3.47 5.59 8.05 2.45 5.82 4.53 -1.29 4.63
Filed upto
12/16
22 M/s J.K. Enterprises
(14922242146) III 0.24 0.35 0.10 6.08 10.02 3.94 6.05 11.60 5.55 9.59
23 M/s Arihant Agencies
(14110099138) III 3.69 4.58 0.89 4.40 5.89 1.49 3.35 4.69 1.34 3.72
Filed upto
12/16
24 M/s Jayshree Hardware
(14921363183) III 1.75 3.37 1.63 2.37 3.52 1.14 1.62 2.39 0.77 3.54
Filed upto
12/16
25 M/s Jaipur Medical Hall
(14110008101) III 4.18 7.75 3.57 9.34 13.34 4.00 7.25 8.11 0.86 8.43
Filed upto
9/16
26 M/s L. Kulabidhu Singh and
Sons (14710021102) III 3.61 9.16 5.56 7.29 20.70 13.41 22.84 13.61 -9.23 9.74
27 M/s Bani Super Store
(14110020124) III 3.41 6.28 2.87 4.22 8.17 3.95 7.44 11.53 4.10 10.92
28 M/s Jain Medicos
(14110038110) III 5.28 8.44 3.17 4.94 8.65 3.70 4.33 7.19 2.86 9.73
Filed upto
12/16
29 M/s Khalsa Medicos
(14110087115) III 6.21 12.34 6.13 12.63 28.42 15.79 10.87 16.78 5.90 27.83
Filed upto
9/16
30 M/s Manipur Trading
Corporation (14920634168) III 34.52 51.11 16.60 70.36 147.29 76.93 60.03 58.30 -1.73 91.79
31 M/s Eastern India Agency
(14510008112) IV 7.91 9.26 1.35 7.71 9.66 1.94 7.25 8.67 1.42 4.72
32 M/s Singh Medical Hall
(14610008139) IV 2.43 5.44 3.01 2.66 5.83 3.17 2.19 4.89 2.70 8.88
Filed upto
12/16
33 M/s International Departmental
Sotre (14610007129) IV 13.21 31.87 18.67 14.94 29.47 14.53 10.23 22.28 12.05 45.26
Filed upto
12/16
Appendices
117
Sl.
No. Trade Name & TIN Zone
2014-15 2015-16 2016-17 Total
Diff Remark
Sale Purchase Diff Sale Purchase Diff Sale Purchase Diff
34 M/s Jugtam Pharmacy
(14610044111) IV 1.12 2.98 1.86 1.87 4.20 2.33 1.82 2.84 1.02 5.21
Filed upto
9/16
35 M/s Rana Medicos
(14610011169) IV 8.43 18.92 10.49 10.49 22.07 11.58 8.31 18.66 10.35 32.42
Filed upto
12/16
36 M/s Guru Steel (14510150174) IV 2.49 5.61 3.12 4.64 4.30 -0.34 4.54 5.51 0.97 3.75
37 M/s Dhanesh-wori Steel
(14610055124) IV 2.61 6.66 4.05 3.07 6.13 3.06 3.85 3.13 -0.71 6.40
38 M/s Rekha Steel (14921084109) IV 1.43 2.95 1.52 2.98 6.31 3.32 1.15 2.57 1.42 6.27
39 M/s Vaibhav Steel
(14921083196) IV 1.84 4.05 2.21 3.36 5.88 2.51 1.23 2.61 1.39 6.11
40 M/s Steel Trading Corporation
(14510015182) IV 9.23 20.28 11.05 7.75 15.24 7.49 5.03 10.70 5.68 24.21
41 M/s Houseworth (14920442188) V 2.53 4.84 2.31 3.99 6.02 2.03 3.50 4.84 1.34 5.68
42 M/s Navjivan pharmacy
(14510128148) V 5.54 9.64 4.10 7.91 10.97 3.06 4.08 7.34 3.26 10.41
Filed upto
9/16
43 M/s Navjivan Ausudhalaya
(14510106122) V 6.58 20.13 13.55 7.85 15.19 7.35 11.79 23.09 11.30 32.20
44 M/s Mahabir Pharmacy
(14210024191) VI 14.79 21.18 6.40 19.48 27.39 7.91 14.39 20.03 5.64 19.95
Filed upto
12/16
45 M/s Muskaan (14610047141) VI 0.19 3.09 2.89 0.32 2.97 2.65 1.13 5.69 4.56 10.10 Filed upto
12/16
46 M/s R. K. Telecommunication
(14510347107) VI 9.03 10.67 1.64 10.45 14.37 3.92 11.64 17.00 5.36 10.92
Filed upto
12/16
47 M/s Sarajeevan Enterprises
(14210049150) VI 3.67 16.90 13.23 4.30 14.52 10.22 4.24 10.96 6.72 30.17
Filed upto
12/16
48 M/s United Enterprises
(14921884155) VI 3.67 9.47 5.80 6.43 13.77 7.34 12.10 9.18 -2.92 10.22
Filed upto
12/16
49 M/s Mobile Planet
(14920403186) VII 1.04 1.43 0.39 0.49 0.92 0.43 0.81 1.20 0.40 1.21
50 M/s Cell Point (14210161106) VII 1.43 5.01 3.57 4.47 15.53 11.06 7.42 15.86 8.44 23.07 Filed upto
12/16
51 M/s Toni petrochem
(14922001161) VIII 0.38 3.70 3.32 0.91 1.41 0.50 1.24 1.38 0.14 3.96
Filed upto
12/16
52 M/s Rajpri Enterprises
(14810386190) VIII 3.84 6.08 2.24 3.45 5.58 2.13 1.63 2.67 1.04 5.41
Filed upto
12/16
53 M/s K.G. & sons (14710328165) VIII 0.97 1.63 0.67 1.28 2.02 0.74 1.43 2.16 0.74 2.14
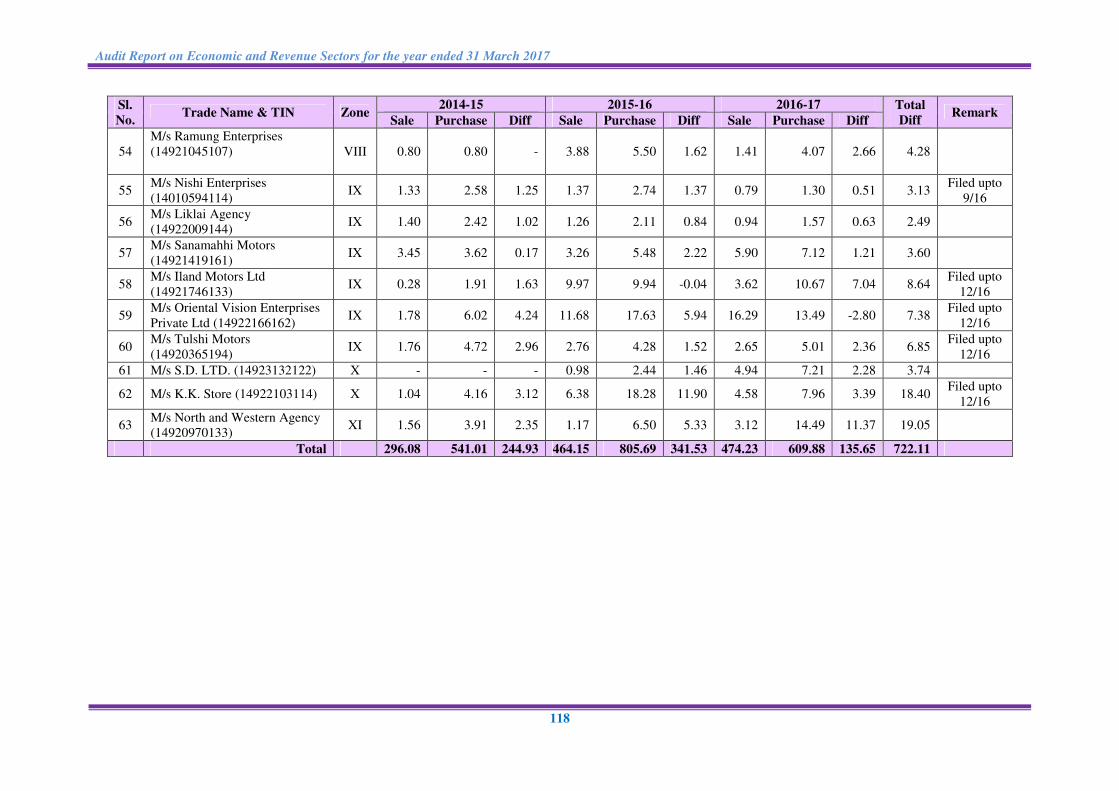
Audit Report on Economic and Revenue Sectors for the year ended 31 March 2017
118
Sl.
No. Trade Name & TIN Zone
2014-15 2015-16 2016-17 Total
Diff Remark
Sale Purchase Diff Sale Purchase Diff Sale Purchase Diff
54
M/s Ramung Enterprises
(14921045107)
VIII 0.80 0.80 - 3.88 5.50 1.62 1.41 4.07 2.66 4.28
55 M/s Nishi Enterprises
(14010594114) IX 1.33 2.58 1.25 1.37 2.74 1.37 0.79 1.30 0.51 3.13
Filed upto
9/16
56 M/s Liklai Agency
(14922009144) IX 1.40 2.42 1.02 1.26 2.11 0.84 0.94 1.57 0.63 2.49
57 M/s Sanamahhi Motors
(14921419161) IX 3.45 3.62 0.17 3.26 5.48 2.22 5.90 7.12 1.21 3.60
58 M/s Iland Motors Ltd
(14921746133) IX 0.28 1.91 1.63 9.97 9.94 -0.04 3.62 10.67 7.04 8.64
Filed upto
12/16
59 M/s Oriental Vision Enterprises
Private Ltd (14922166162) IX 1.78 6.02 4.24 11.68 17.63 5.94 16.29 13.49 -2.80 7.38
Filed upto
12/16
60 M/s Tulshi Motors
(14920365194) IX 1.76 4.72 2.96 2.76 4.28 1.52 2.65 5.01 2.36 6.85
Filed upto
12/16
61 M/s S.D. LTD. (14923132122) X - - - 0.98 2.44 1.46 4.94 7.21 2.28 3.74
62 M/s K.K. Store (14922103114) X 1.04 4.16 3.12 6.38 18.28 11.90 4.58 7.96 3.39 18.40 Filed upto
12/16
63 M/s North and Western Agency
(14920970133) XI 1.56 3.91 2.35 1.17 6.50 5.33 3.12 14.49 11.37 19.05
Total 296.08 541.01 244.93 464.15 805.69 341.53 474.23 609.88 135.65 722.11
Appendices
119
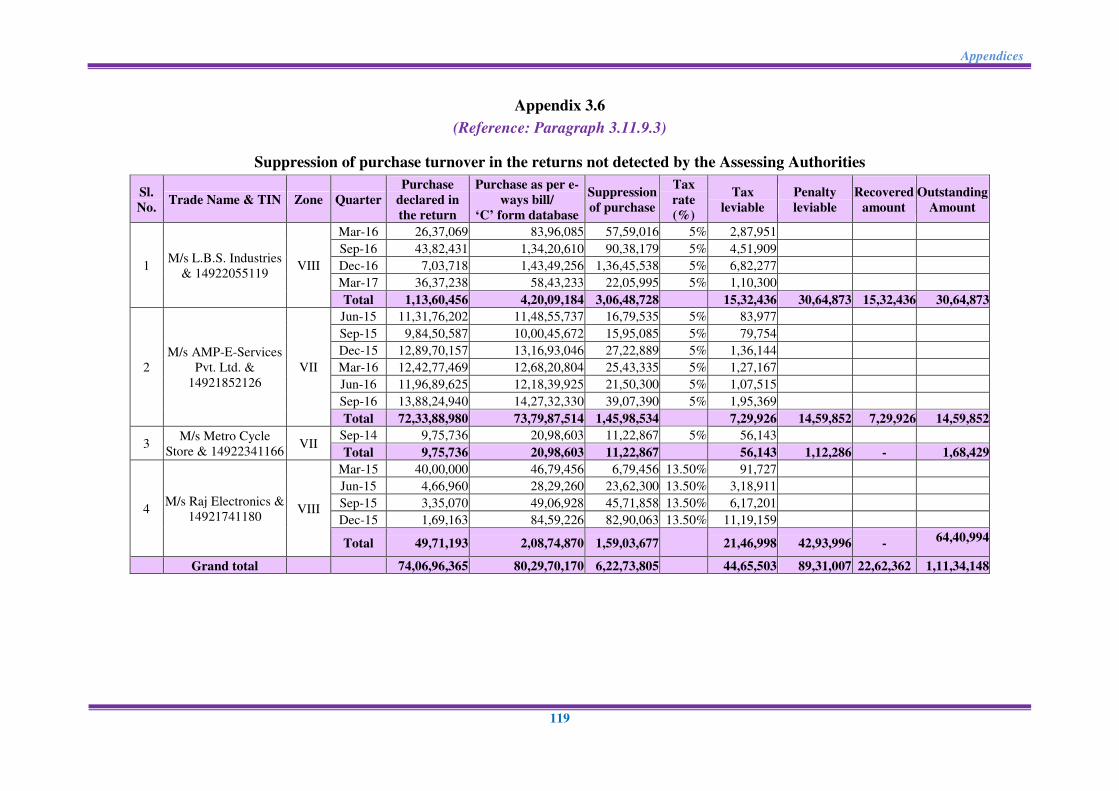
Appendix 3.6
(Reference: Paragraph 3.11.9.3)
Suppression of purchase turnover in the returns not detected by the Assessing Authorities
Sl.
No. Trade Name & TIN Zone Quarter
Purchase
declared in
the return
Purchase as per e-
ways bill/
‘C’ form database
Suppression
of purchase
Tax
rate
(%)
Tax
leviable
Penalty
leviable
Recovered
amount
Outstanding
Amount
1 M/s L.B.S. Industries
& 14922055119 VIII
Mar-16 26,37,069 83,96,085 57,59,016 5% 2,87,951
Sep-16 43,82,431 1,34,20,610 90,38,179 5% 4,51,909
Dec-16 7,03,718 1,43,49,256 1,36,45,538 5% 6,82,277
Mar-17 36,37,238 58,43,233 22,05,995 5% 1,10,300
Total 1,13,60,456 4,20,09,184 3,06,48,728
15,32,436 30,64,873 15,32,436 30,64,873
2
M/s AMP-E-Services
Pvt. Ltd. &
14921852126
VII
Jun-15 11,31,76,202 11,48,55,737 16,79,535 5% 83,977
Sep-15 9,84,50,587 10,00,45,672 15,95,085 5% 79,754
Dec-15 12,89,70,157 13,16,93,046 27,22,889 5% 1,36,144
Mar-16 12,42,77,469 12,68,20,804 25,43,335 5% 1,27,167
Jun-16 11,96,89,625 12,18,39,925 21,50,300 5% 1,07,515
Sep-16 13,88,24,940 14,27,32,330 39,07,390 5% 1,95,369
Total 72,33,88,980 73,79,87,514 1,45,98,534
7,29,926 14,59,852 7,29,926 14,59,852
3 M/s Metro Cycle
Store & 14922341166 VII
Sep-14 9,75,736 20,98,603 11,22,867 5% 56,143
Total 9,75,736 20,98,603 11,22,867
56,143 1,12,286 - 1,68,429
4 M/s Raj Electronics &
14921741180 VIII
Mar-15 40,00,000 46,79,456 6,79,456 13.50% 91,727
Jun-15 4,66,960 28,29,260 23,62,300 13.50% 3,18,911
Sep-15 3,35,070 49,06,928 45,71,858 13.50% 6,17,201
Dec-15 1,69,163 84,59,226 82,90,063 13.50% 11,19,159
Total 49,71,193 2,08,74,870 1,59,03,677
21,46,998 42,93,996 - 64,40,994
Grand total
74,06,96,365 80,29,70,170 6,22,73,805
44,65,503 89,31,007 22,62,362 1,11,34,148
Audit Report on Economic and Revenue Sectors for the year ended 31 March 2017
120
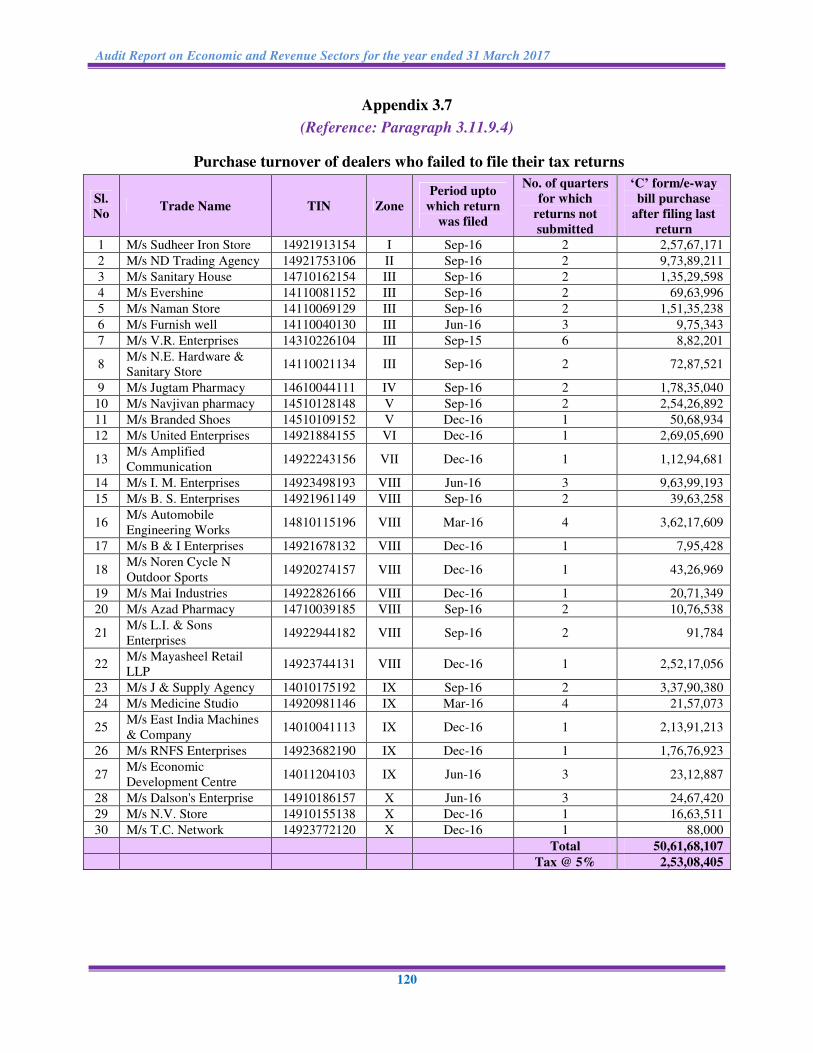
Appendix 3.7
(Reference: Paragraph 3.11.9.4)
Purchase turnover of dealers who failed to file their tax returns
Sl.
No Trade Name TIN Zone
Period upto
which return
was filed
No. of quarters
for which
returns not
submitted
‘C’ form/e-way
bill purchase
after filing last
return
1 M/s Sudheer Iron Store 14921913154 I Sep-16 2 2,57,67,171
2 M/s ND Trading Agency 14921753106 II Sep-16 2 9,73,89,211
3 M/s Sanitary House 14710162154 III Sep-16 2 1,35,29,598
4 M/s Evershine 14110081152 III Sep-16 2 69,63,996
5 M/s Naman Store 14110069129 III Sep-16 2 1,51,35,238
6 M/s Furnish well 14110040130 III Jun-16 3 9,75,343
7 M/s V.R. Enterprises 14310226104 III Sep-15 6 8,82,201
8 M/s N.E. Hardware &
Sanitary Store 14110021134 III Sep-16 2 72,87,521
9 M/s Jugtam Pharmacy 14610044111 IV Sep-16 2 1,78,35,040
10 M/s Navjivan pharmacy 14510128148 V Sep-16 2 2,54,26,892
11 M/s Branded Shoes 14510109152 V Dec-16 1 50,68,934
12 M/s United Enterprises 14921884155 VI Dec-16 1 2,69,05,690
13 M/s Amplified
Communication 14922243156 VII Dec-16 1 1,12,94,681
14 M/s I. M. Enterprises 14923498193 VIII Jun-16 3 9,63,99,193
15 M/s B. S. Enterprises 14921961149 VIII Sep-16 2 39,63,258
16 M/s Automobile
Engineering Works 14810115196 VIII Mar-16 4 3,62,17,609
17 M/s B & I Enterprises 14921678132 VIII Dec-16 1 7,95,428
18 M/s Noren Cycle N
Outdoor Sports 14920274157 VIII Dec-16 1 43,26,969
19 M/s Mai Industries 14922826166 VIII Dec-16 1 20,71,349
20 M/s Azad Pharmacy 14710039185 VIII Sep-16 2 10,76,538
21 M/s L.I. & Sons
Enterprises 14922944182 VIII Sep-16 2 91,784
22 M/s Mayasheel Retail
LLP 14923744131 VIII Dec-16 1 2,52,17,056
23 M/s J & Supply Agency 14010175192 IX Sep-16 2 3,37,90,380
24 M/s Medicine Studio 14920981146 IX Mar-16 4 21,57,073
25 M/s East India Machines
& Company 14010041113 IX Dec-16 1 2,13,91,213
26 M/s RNFS Enterprises 14923682190 IX Dec-16 1 1,76,76,923
27 M/s Economic
Development Centre 14011204103 IX Jun-16 3 23,12,887
28 M/s Dalson's Enterprise 14910186157 X Jun-16 3 24,67,420
29 M/s N.V. Store 14910155138 X Dec-16 1 16,63,511
30 M/s T.C. Network 14923772120 X Dec-16 1 88,000
Total 50,61,68,107
Tax @ 5% 2,53,08,405
Appendices
121
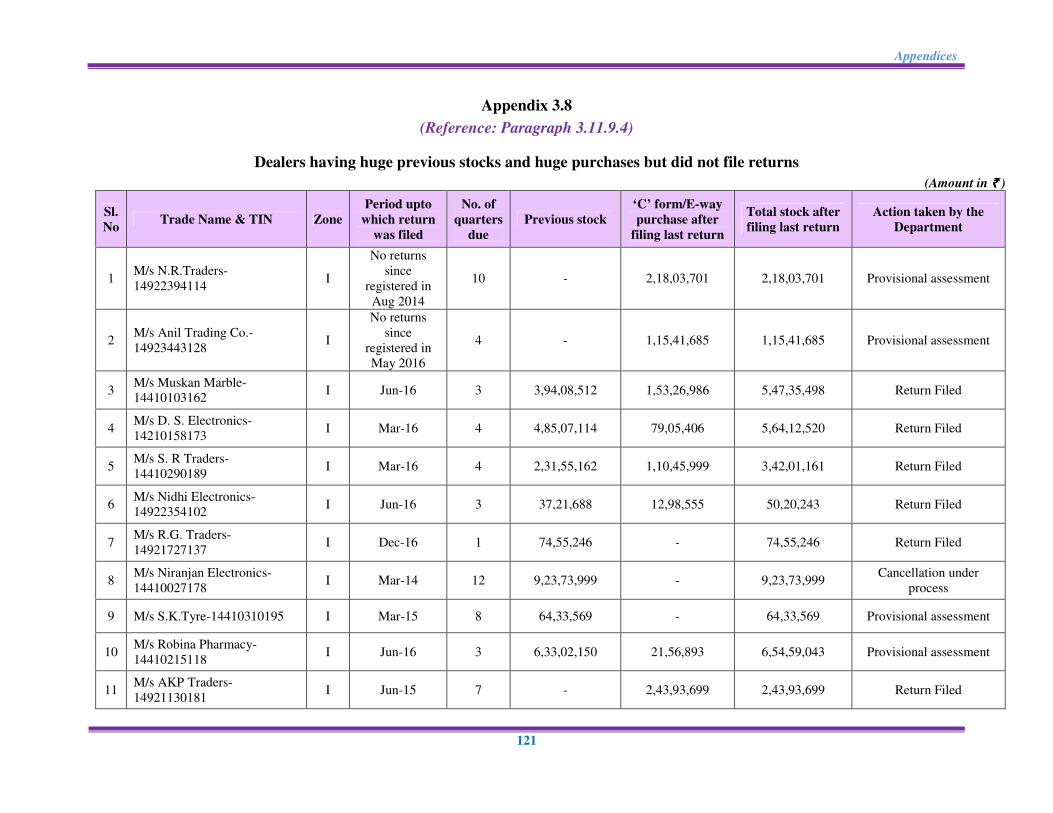
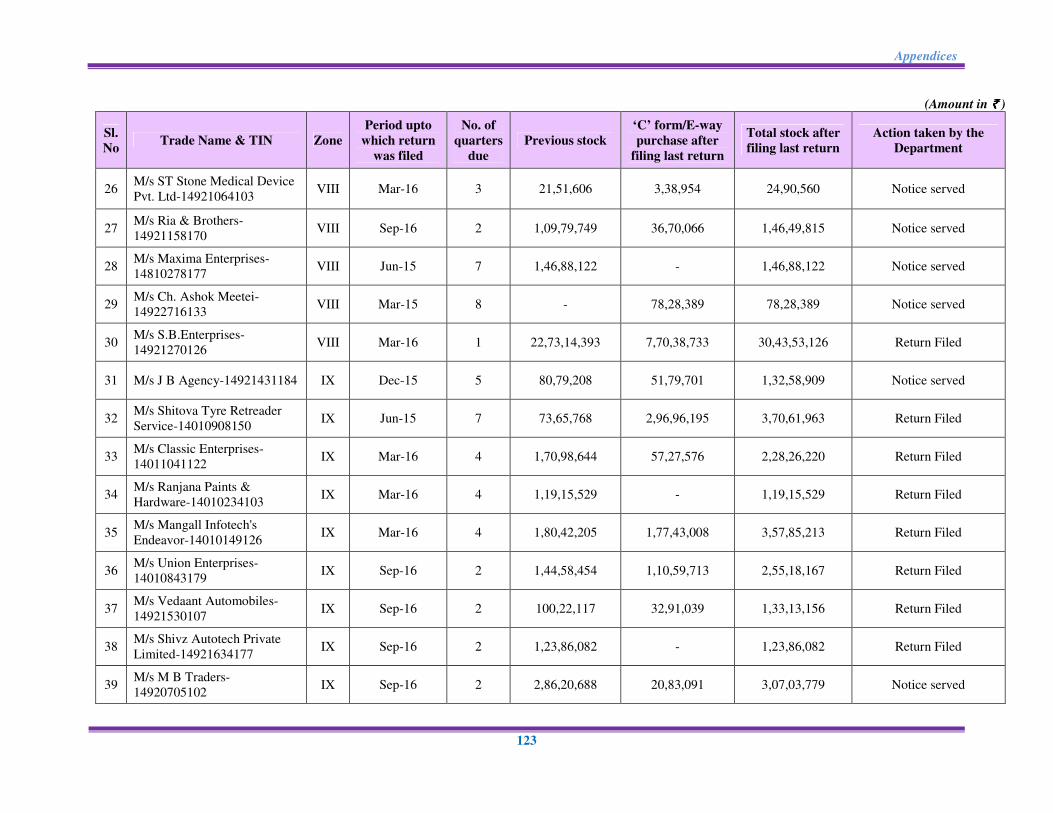
Appendix 3.8
(Reference: Paragraph 3.11.9.4)
Dealers having huge previous stocks and huge purchases but did not file returns
(Amount in `̀̀̀ )
Sl.
No Trade Name & TIN Zone
Period upto
which return
was filed
No. of
quarters
due
Previous stock
‘C’ form/E-way
purchase after
filing last return
Total stock after
filing last return
Action taken by the
Department
1 M/s N.R.Traders-
14922394114 I
No returns
since
registered in
Aug 2014
10 - 2,18,03,701 2,18,03,701 Provisional assessment
2 M/s Anil Trading Co.-
14923443128 I
No returns
since
registered in
May 2016
4 - 1,15,41,685 1,15,41,685 Provisional assessment
3 M/s Muskan Marble-
14410103162 I Jun-16 3 3,94,08,512 1,53,26,986 5,47,35,498 Return Filed
4 M/s D. S. Electronics-
14210158173 I Mar-16 4 4,85,07,114 79,05,406 5,64,12,520 Return Filed
5 M/s S. R Traders-
14410290189 I Mar-16 4 2,31,55,162 1,10,45,999 3,42,01,161 Return Filed
6 M/s Nidhi Electronics-
14922354102 I Jun-16 3 37,21,688 12,98,555 50,20,243 Return Filed
7 M/s R.G. Traders-
14921727137 I Dec-16 1 74,55,246 - 74,55,246 Return Filed
8 M/s Niranjan Electronics-
14410027178 I Mar-14 12 9,23,73,999 - 9,23,73,999
Cancellation under
process
9 M/s S.K.Tyre-14410310195 I Mar-15 8 64,33,569 - 64,33,569 Provisional assessment
10 M/s Robina Pharmacy-
14410215118 I Jun-16 3 6,33,02,150 21,56,893 6,54,59,043 Provisional assessment
11 M/s AKP Traders-
14921130181 I Jun-15 7 - 2,43,93,699 2,43,93,699 Return Filed

Audit Report on Economic and Revenue Sectors for the year ended 31 March 2017
122
(Amount in `̀̀̀ )
Sl.
No Trade Name & TIN Zone
Period upto
which return
was filed
No. of
quarters
due
Previous stock
‘C’ form/E-way
purchase after
filing last return
Total stock after
filing last return
Action taken by the
Department
12 M/s W. Ibohal Singh and
Sons-14310089189 II Dec-15 5 3,80,55,883 2,32,81,814 6,13,37,697 Return Filed
13 M/s Sangai Traders-
14110286165 III Mar-14 12 2,37,29,676 - 2,37,29,676
Recovery certificate
issued
14 M/s Calcutta Trading Co-
14110004158 III Sep-15 6 75,98,756 - 75,98,756 Return Filed
15 M/s J K Agency-14110033157 III Mar-16 4 62,74,51,018 41,56,98,920 1,04,31,49,938 Return Filed
16 M/s Precious Footwear-
14510127138 V Sep-15 5 - 1,49,51,158 1,49,51,158 Notice served
17 M/s Star Mobiles-
14210328127 VI Jun-16 3 8,61,65,579 8,27,57,362 16,89,22,941 Return Filed
18 M/s Jagadamba Glass and
Hardware-14921441187 VI Sep-16 2 54,52,563 36,72,226 91,24,789 Return Filed
19 M/s Glamour-14921871122 VII
No returns
since
registered in
Dec 2013
12 - 1,23,82,930 1,23,82,930 No action
20 M/s D. S. Agency-
14920486143 VIII Jun-16 3 3,88,96,118 - 3,88,96,118 Notice served
21 M/s KNK Associates-
14810467127 VIII Sep-15 6 2,65,06,124 - 2,65,06,124 Return Filed
22 M/s Rebecca's World-
14920939114 VIII Mar-16 4 3,41,62,009 22,71,401 3,64,33,410 Notice served
23 M/s Eastern Ceramics-
14810105193 VIII Jun-14 12 1,28,48,442 27,29,270 1,55,77,712
Recovery certificate
issued
24 M/s Waiagrim-14920683173 VIII Mar-15 8 2,48,09,764 3,50,73,652 5,98,83,416 Notice served
25 M/s Ganesh Mobile-
14923053108 VIII Sep-16 2 63,51,693 1,54,59,676 2,18,11,369 Return Filed
Appendices
123
(Amount in `̀̀̀ )
Sl.
No Trade Name & TIN Zone
Period upto
which return
was filed
No. of
quarters
due
Previous stock
‘C’ form/E-way
purchase after
filing last return
Total stock after
filing last return
Action taken by the
Department
26 M/s ST Stone Medical Device
Pvt. Ltd-14921064103 VIII Mar-16 3 21,51,606 3,38,954 24,90,560 Notice served
27 M/s Ria & Brothers-
14921158170 VIII Sep-16 2 1,09,79,749 36,70,066 1,46,49,815 Notice served
28 M/s Maxima Enterprises-
14810278177 VIII Jun-15 7 1,46,88,122 - 1,46,88,122 Notice served
29 M/s Ch. Ashok Meetei-
14922716133 VIII Mar-15 8 - 78,28,389 78,28,389 Notice served
30 M/s S.B.Enterprises-
14921270126 VIII Mar-16 1 22,73,14,393 7,70,38,733 30,43,53,126 Return Filed
31 M/s J B Agency-14921431184 IX Dec-15 5 80,79,208 51,79,701 1,32,58,909 Notice served
32 M/s Shitova Tyre Retreader
Service-14010908150 IX Jun-15 7 73,65,768 2,96,96,195 3,70,61,963 Return Filed
33 M/s Classic Enterprises-
14011041122 IX Mar-16 4 1,70,98,644 57,27,576 2,28,26,220 Return Filed
34 M/s Ranjana Paints &
Hardware-14010234103 IX Mar-16 4 1,19,15,529 - 1,19,15,529 Return Filed
35 M/s Mangall Infotech's
Endeavor-14010149126 IX Mar-16 4 1,80,42,205 1,77,43,008 3,57,85,213 Return Filed
36 M/s Union Enterprises-
14010843179 IX Sep-16 2 1,44,58,454 1,10,59,713 2,55,18,167 Return Filed
37 M/s Vedaant Automobiles-
14921530107 IX Sep-16 2 100,22,117 32,91,039 1,33,13,156 Return Filed
38 M/s Shivz Autotech Private
Limited-14921634177 IX Sep-16 2 1,23,86,082 - 1,23,86,082 Return Filed
39 M/s M B Traders-
14920705102 IX Sep-16 2 2,86,20,688 20,83,091 3,07,03,779 Notice served

Audit Report on Economic and Revenue Sectors for the year ended 31 March 2017
124
(Amount in `̀̀̀ )
Sl.
No Trade Name & TIN Zone
Period upto
which return
was filed
No. of
quarters
due
Previous stock
‘C’ form/E-way
purchase after
filing last return
Total stock after
filing last return
Action taken by the
Department
40 M/s Khuding Furnisher Pvt
Ltd-14922982174 IX Mar-16 4 14,60,536 96,34,485 1,10,95,021 Return Filed
41 M/s Naorem Enterprises-
14710331195 IX Mar-15 8 1,37,22,299 - 1,37,22,299 Notice served
42 M/s Sharma Electricals &
Hardware Store-14910049145 X Dec-13 13 7,74,21,052 11,05,73,728 18,79,94,780 No action
43 M/s J.K. Store-14910135132 X Sep-13 14 4,40,67,429 9,60,28,636 14,00,96,065 No action
44 M/s 25th Enterprises-
14921171106 XI Mar-16 4 7,07,60,929 3,02,33,204 10,09,94,133 Notice served
Total
1,80,69,39,875 1,11,38,77,851 2,92,08,17,726
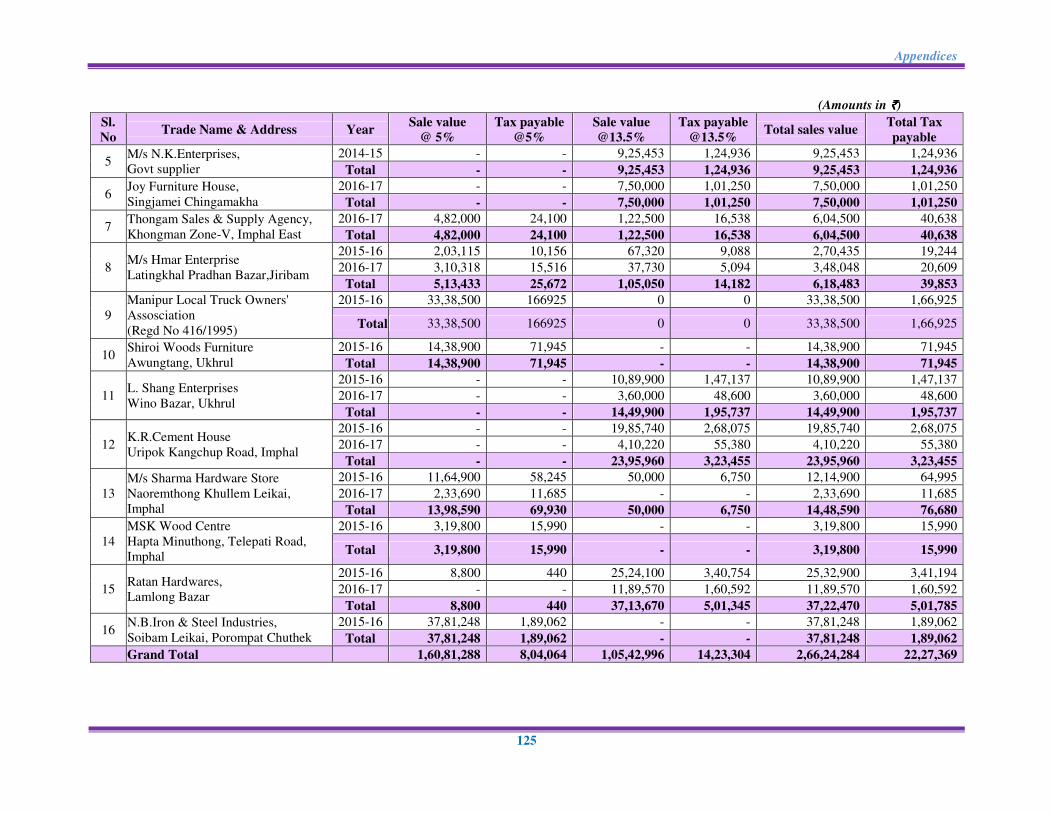
Appendix 3.9
(Reference: Paragraph 3.11.9.5)
Dealers liable to pay tax who remained unregistered and unassessed
(Amounts in `̀̀̀)
Sl.
No Trade Name & Address Year
Sale value
@ 5%
Tax payable
@5%
Sale value
@13.5%
Tax payable
@13.5% Total sales value
Total Tax
payable
1
M/s Ibudhou Stone Crushing Centre,
Khamaran Makha Leikai,Imphal
West
2015-16 2,98,118 14,906 8,000 1,080 3,06,118 15,986
2016-17 18,43,636 92,182 10,22,463 1,38,033 28,66,099 2,30,214
Total 21,41,754 1,07,088 10,30,463 1,39,113 31,72,217 2,46,200
2 Ajay Steels,
Kakching Bazar
2016-17 10,00,000 50,000 - - 10,00,000 50,000
Total 10,00,000 50,000 - - 10,00,000 50,000
3 Nitai Supplier,
Pallel Thongkhong
2016-17 7,00,000 35,000 - - 7,00,000 35,000
Total 7,00,000 35,000 - - 7,00,000 35,000
4 I.J. Cement & Steel Store,
Nambol
2012-13 9,58,263 47,913 - - 9,58,263 47,913
Total 9,58,263 47,913 - - 9,58,263 47,913
Appendices
125
(Amounts in `̀̀̀)
Sl.
No Trade Name & Address Year
Sale value
@ 5%
Tax payable
@5%
Sale value
@13.5%
Tax payable
@13.5% Total sales value
Total Tax
payable
5 M/s N.K.Enterprises,
Govt supplier
2014-15 - - 9,25,453 1,24,936 9,25,453 1,24,936
Total - - 9,25,453 1,24,936 9,25,453 1,24,936
6 Joy Furniture House,
Singjamei Chingamakha
2016-17 - - 7,50,000 1,01,250 7,50,000 1,01,250
Total - - 7,50,000 1,01,250 7,50,000 1,01,250
7 Thongam Sales & Supply Agency,
Khongman Zone-V, Imphal East
2016-17 4,82,000 24,100 1,22,500 16,538 6,04,500 40,638
Total 4,82,000 24,100 1,22,500 16,538 6,04,500 40,638
8 M/s Hmar Enterprise
Latingkhal Pradhan Bazar,Jiribam
2015-16 2,03,115 10,156 67,320 9,088 2,70,435 19,244
2016-17 3,10,318 15,516 37,730 5,094 3,48,048 20,609
Total 5,13,433 25,672 1,05,050 14,182 6,18,483 39,853
9
Manipur Local Truck Owners'
Assosciation
(Regd No 416/1995)
2015-16 33,38,500 166925 0 0 33,38,500 1,66,925
Total 33,38,500 166925 0 0 33,38,500 1,66,925
10 Shiroi Woods Furniture
Awungtang, Ukhrul
2015-16 14,38,900 71,945 - - 14,38,900 71,945
Total 14,38,900 71,945 - - 14,38,900 71,945
11 L. Shang Enterprises
Wino Bazar, Ukhrul
2015-16 - - 10,89,900 1,47,137 10,89,900 1,47,137
2016-17 - - 3,60,000 48,600 3,60,000 48,600
Total - - 14,49,900 1,95,737 14,49,900 1,95,737
12 K.R.Cement House
Uripok Kangchup Road, Imphal
2015-16 - - 19,85,740 2,68,075 19,85,740 2,68,075
2016-17 - - 4,10,220 55,380 4,10,220 55,380
Total - - 23,95,960 3,23,455 23,95,960 3,23,455
13
M/s Sharma Hardware Store
Naoremthong Khullem Leikai,
Imphal
2015-16 11,64,900 58,245 50,000 6,750 12,14,900 64,995
2016-17 2,33,690 11,685 - - 2,33,690 11,685
Total 13,98,590 69,930 50,000 6,750 14,48,590 76,680
14
MSK Wood Centre
Hapta Minuthong, Telepati Road,
Imphal
2015-16 3,19,800 15,990 - - 3,19,800 15,990
Total 3,19,800 15,990 - - 3,19,800 15,990
15 Ratan Hardwares,
Lamlong Bazar
2015-16 8,800 440 25,24,100 3,40,754 25,32,900 3,41,194
2016-17 - - 11,89,570 1,60,592 11,89,570 1,60,592
Total 8,800 440 37,13,670 5,01,345 37,22,470 5,01,785
16 N.B.Iron & Steel Industries,
Soibam Leikai, Porompat Chuthek
2015-16 37,81,248 1,89,062 - - 37,81,248 1,89,062
Total 37,81,248 1,89,062 - - 37,81,248 1,89,062
Grand Total
1,60,81,288 8,04,064 1,05,42,996 14,23,304 2,66,24,284 22,27,369
Audit Report on Economic and Revenue Sectors for the year ended 31 March 2017
126
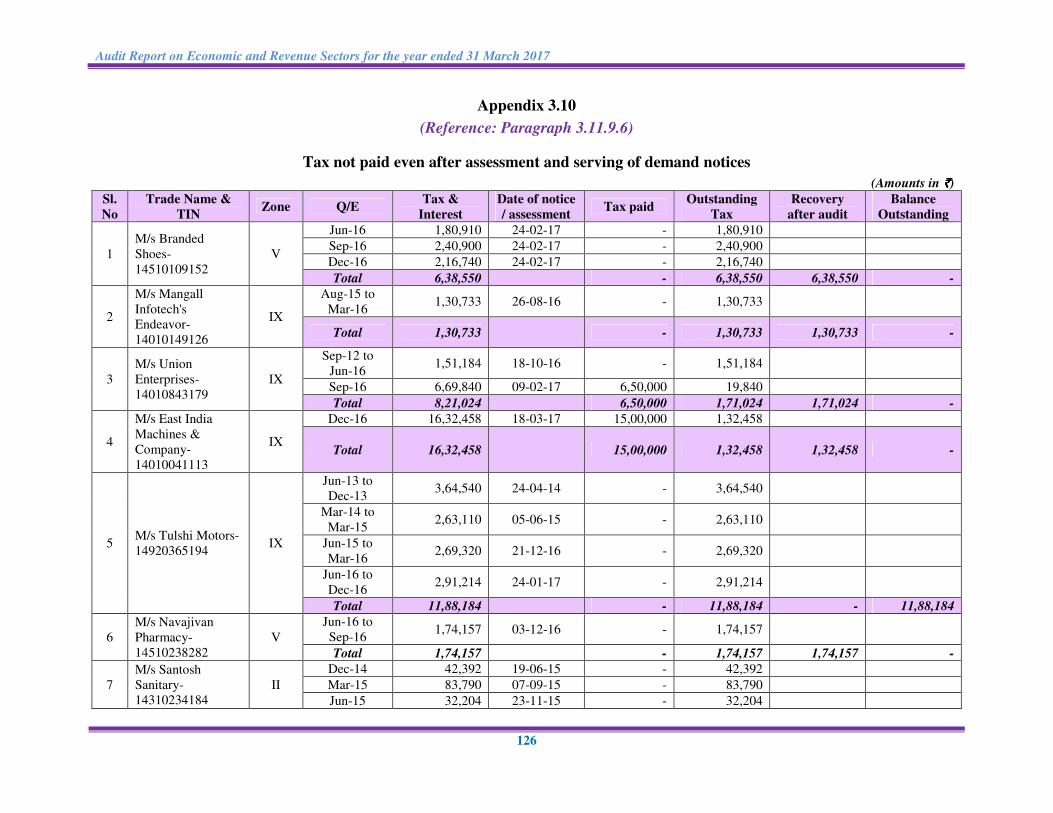
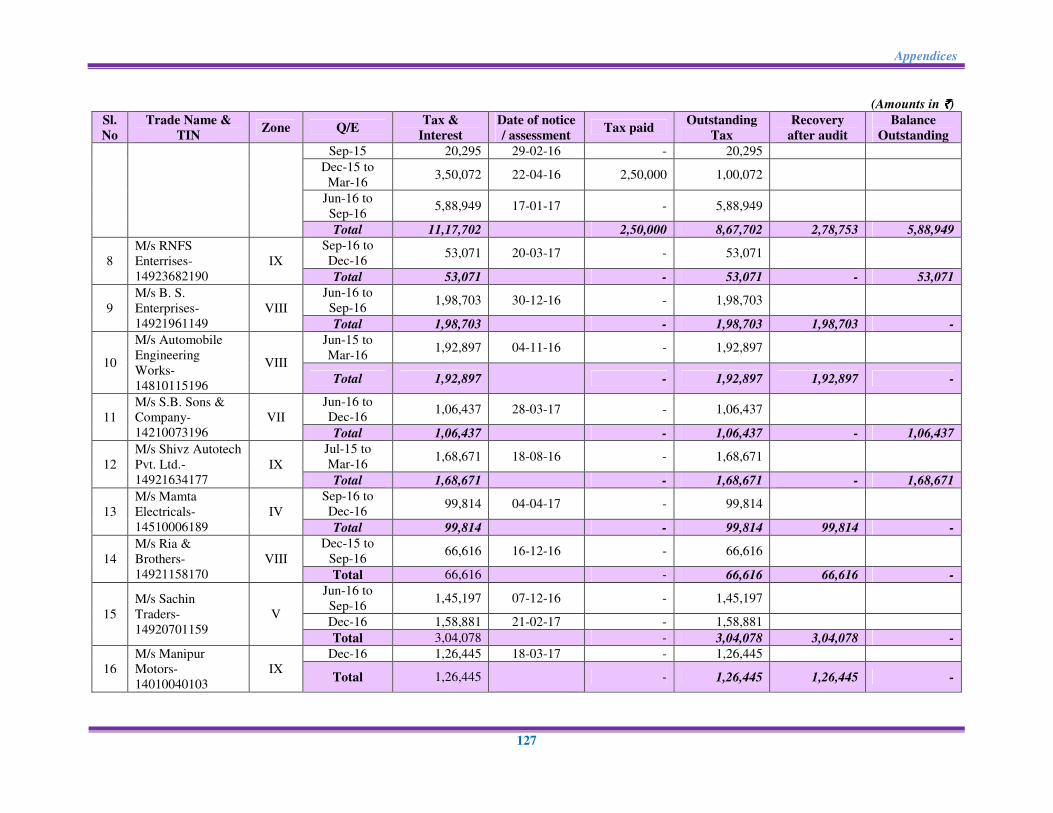
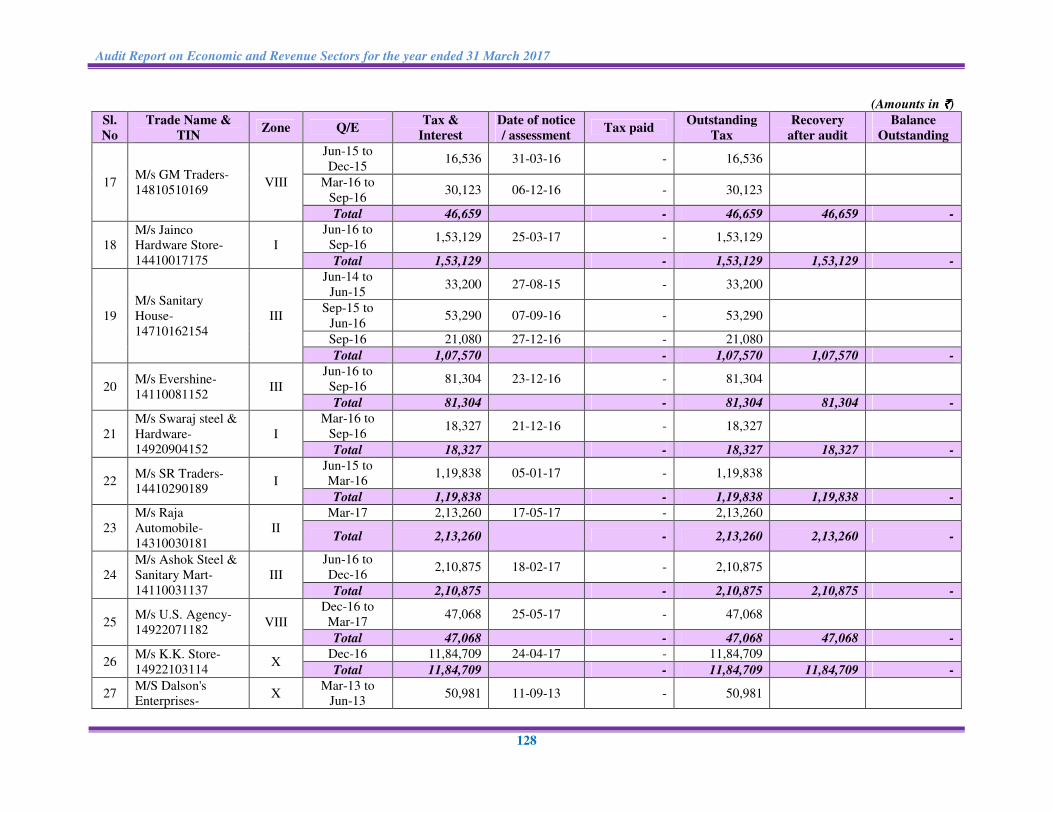
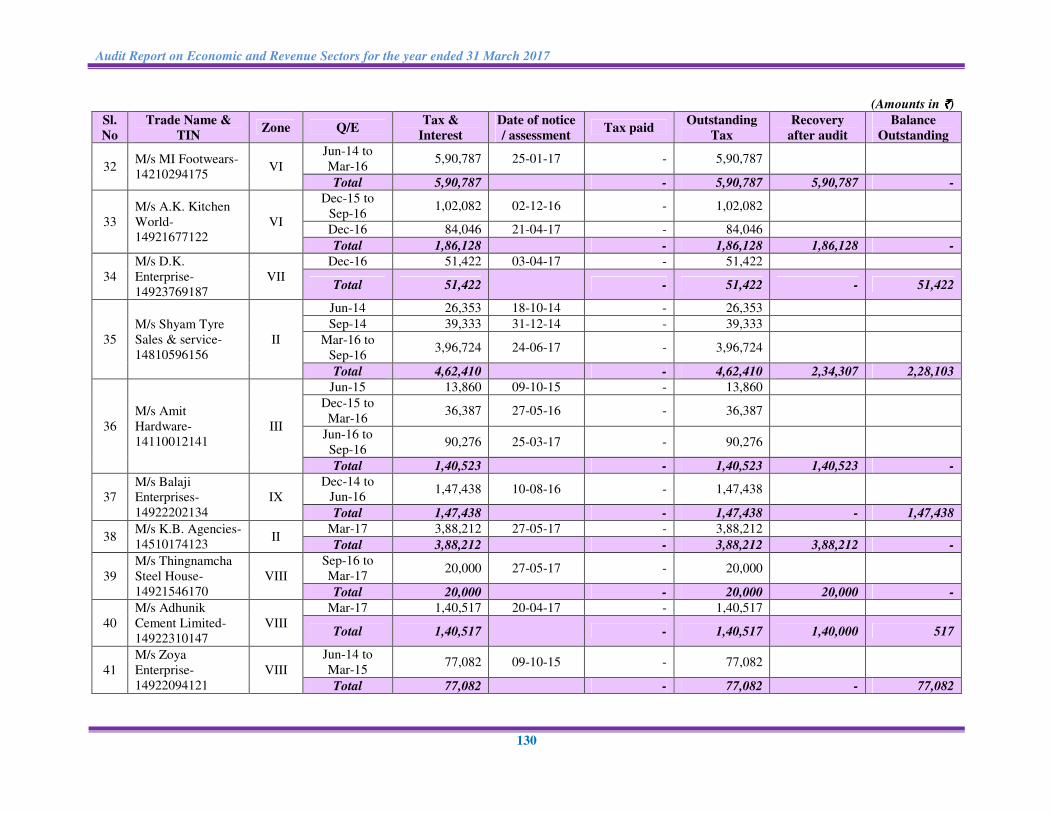
Appendix 3.10
(Reference: Paragraph 3.11.9.6)
Tax not paid even after assessment and serving of demand notices
(Amounts in `̀̀̀)
Sl.
No
Trade Name &
TIN Zone Q/E
Tax &
Interest
Date of notice
/ assessment Tax paid
Outstanding
Tax
Recovery
after audit
Balance
Outstanding
1
M/s Branded
Shoes-
14510109152
V
Jun-16 1,80,910 24-02-17 - 1,80,910
Sep-16 2,40,900 24-02-17 - 2,40,900
Dec-16 2,16,740 24-02-17 - 2,16,740
Total 6,38,550
- 6,38,550 6,38,550 -
2
M/s Mangall
Infotech's
Endeavor-
14010149126
IX
Aug-15 to
Mar-16 1,30,733 26-08-16 - 1,30,733
Total 1,30,733
- 1,30,733 1,30,733 -
3
M/s Union
Enterprises-
14010843179
IX
Sep-12 to
Jun-16 1,51,184 18-10-16 - 1,51,184
Sep-16 6,69,840 09-02-17 6,50,000 19,840
Total 8,21,024
6,50,000 1,71,024 1,71,024 -
4
M/s East India
Machines &
Company-
14010041113
IX
Dec-16 16,32,458 18-03-17 15,00,000 1,32,458
Total 16,32,458
15,00,000 1,32,458 1,32,458 -
5 M/s Tulshi Motors-
14920365194 IX
Jun-13 to
Dec-13 3,64,540 24-04-14 - 3,64,540
Mar-14 to
Mar-15 2,63,110 05-06-15 - 2,63,110
Jun-15 to
Mar-16 2,69,320 21-12-16 - 2,69,320
Jun-16 to
Dec-16 2,91,214 24-01-17 - 2,91,214
Total 11,88,184
- 11,88,184 - 11,88,184
6
M/s Navajivan
Pharmacy-
14510238282
V
Jun-16 to
Sep-16 1,74,157 03-12-16 - 1,74,157
Total 1,74,157
- 1,74,157 1,74,157 -
7
M/s Santosh
Sanitary-
14310234184
II
Dec-14 42,392 19-06-15 - 42,392
Mar-15 83,790 07-09-15 - 83,790
Jun-15 32,204 23-11-15 - 32,204
Appendices
127
(Amounts in `̀̀̀)
Sl.
No
Trade Name &
TIN Zone Q/E
Tax &
Interest
Date of notice
/ assessment Tax paid
Outstanding
Tax
Recovery
after audit
Balance
Outstanding
Sep-15 20,295 29-02-16 - 20,295
Dec-15 to
Mar-16 3,50,072 22-04-16 2,50,000 1,00,072
Jun-16 to
Sep-16 5,88,949 17-01-17 - 5,88,949
Total 11,17,702
2,50,000 8,67,702 2,78,753 5,88,949
8
M/s RNFS
Enterrises-
14923682190
IX
Sep-16 to
Dec-16 53,071 20-03-17 - 53,071
Total 53,071
- 53,071 - 53,071
9
M/s B. S.
Enterprises-
14921961149
VIII
Jun-16 to
Sep-16 1,98,703 30-12-16 - 1,98,703
Total 1,98,703
- 1,98,703 1,98,703 -
10
M/s Automobile
Engineering
Works-
14810115196
VIII
Jun-15 to
Mar-16 1,92,897 04-11-16 - 1,92,897
Total 1,92,897
- 1,92,897 1,92,897 -
11
M/s S.B. Sons &
Company-
14210073196
VII
Jun-16 to
Dec-16 1,06,437 28-03-17 - 1,06,437
Total 1,06,437
- 1,06,437 - 1,06,437
12
M/s Shivz Autotech
Pvt. Ltd.-
14921634177
IX
Jul-15 to
Mar-16 1,68,671 18-08-16 - 1,68,671
Total 1,68,671
- 1,68,671 - 1,68,671
13
M/s Mamta
Electricals-
14510006189
IV
Sep-16 to
Dec-16 99,814 04-04-17 - 99,814
Total 99,814
- 99,814 99,814 -
14
M/s Ria &
Brothers-
14921158170
VIII
Dec-15 to
Sep-16 66,616 16-12-16 - 66,616
Total 66,616
- 66,616 66,616 -
15
M/s Sachin
Traders-
14920701159
V
Jun-16 to
Sep-16 1,45,197 07-12-16 - 1,45,197
Dec-16 1,58,881 21-02-17 - 1,58,881
Total 3,04,078
- 3,04,078 3,04,078 -
16
M/s Manipur
Motors-
14010040103
IX
Dec-16 1,26,445 18-03-17 - 1,26,445
Total 1,26,445
- 1,26,445 1,26,445 -
Audit Report on Economic and Revenue Sectors for the year ended 31 March 2017
128
(Amounts in `̀̀̀)
Sl.
No
Trade Name &
TIN Zone Q/E
Tax &
Interest
Date of notice
/ assessment Tax paid
Outstanding
Tax
Recovery
after audit
Balance
Outstanding
17 M/s GM Traders-
14810510169 VIII
Jun-15 to
Dec-15 16,536 31-03-16 - 16,536
Mar-16 to
Sep-16 30,123 06-12-16 - 30,123
Total 46,659
- 46,659 46,659 -
18
M/s Jainco
Hardware Store-
14410017175
I
Jun-16 to
Sep-16 1,53,129 25-03-17 - 1,53,129
Total 1,53,129
- 1,53,129 1,53,129 -
19
M/s Sanitary
House-
14710162154
III
Jun-14 to
Jun-15 33,200 27-08-15 - 33,200
Sep-15 to
Jun-16 53,290 07-09-16 - 53,290
Sep-16 21,080 27-12-16 - 21,080
Total 1,07,570
- 1,07,570 1,07,570 -
20 M/s Evershine-
14110081152 III
Jun-16 to
Sep-16 81,304 23-12-16 - 81,304
Total 81,304
- 81,304 81,304 -
21
M/s Swaraj steel &
Hardware-
14920904152
I
Mar-16 to
Sep-16 18,327 21-12-16 - 18,327
Total 18,327
- 18,327 18,327 -
22 M/s SR Traders-
14410290189 I
Jun-15 to
Mar-16 1,19,838 05-01-17 - 1,19,838
Total 1,19,838
- 1,19,838 1,19,838 -
23
M/s Raja
Automobile-
14310030181
II
Mar-17 2,13,260 17-05-17 - 2,13,260
Total 2,13,260
- 2,13,260 2,13,260 -
24
M/s Ashok Steel &
Sanitary Mart-
14110031137
III
Jun-16 to
Dec-16 2,10,875 18-02-17 - 2,10,875
Total 2,10,875
- 2,10,875 2,10,875 -
25 M/s U.S. Agency-
14922071182 VIII
Dec-16 to
Mar-17 47,068 25-05-17 - 47,068
Total 47,068
- 47,068 47,068 -
26 M/s K.K. Store-
14922103114 X
Dec-16 11,84,709 24-04-17 - 11,84,709
Total 11,84,709
- 11,84,709 11,84,709 -
27 M/S Dalson's
Enterprises-X
Mar-13 to
Jun-13 50,981 11-09-13 - 50,981

Appendices
129
(Amounts in `̀̀̀)
Sl.
No
Trade Name &
TIN Zone Q/E
Tax &
Interest
Date of notice
/ assessment Tax paid
Outstanding
Tax
Recovery
after audit
Balance
Outstanding
14910186157 Sep-13 to
Dec-13 52,597 04-03-14 - 52,597
Mar-14 to
Jun-14 81,618 06-08-14 - 81,618
Sep-14 to
Dec-14 23,303 07-03-15 - 23,303
Mar-15 to
Jun-15 13,366 05-12-15 - 13,366
Mar-16 to
Jun-16 9,392 22-03-17 - 9,392
Total 2,31,257
- 2,31,257 2,21,865 9,392
28 M/s S.D. LTD-
14923132122 X
Dec-16 9,36,793 24-04-17 - 9,36,793
Total 9,36,793
- 9,36,793 9,36,793 -
29
M/s Manipur
Diesels Spare-
14010748102
IX
Mar-14 1,12,377 30-06-14 - 1,12,377
Jun-14 15,993 16-09-14 - 15,993
Sep-14 55,097 30-12-14 - 55,097
Dec-14 25,228 26-02-15 - 25,228
Mar-15 4,538 02-05-15 - 4,538
Jun-15 12,911 19-08-15 - 12,911
Sep-15 9,881 30-10-15 - 9,881
Dec-15 7,22,527 16-02-16 - 7,22,527
Mar-16 4,59,129 28-05-16 - 4,59,129
Jun-16 22,785 27-09-16 - 22,785
Sep-16 2,63,838 28-12-16 - 2,63,838
Dec-16 2,14,560 06-03-17 - 2,14,560
Mar-17 3,92,152 20-04-17 - 3,92,152
Total 23,11,016
- 23,11,016 22,95,887 15,129
30
M/s W.R.S
Enterprises-
14922986117
IX
Dec-15 to
Mar-16 11,117 17-06-16 - 11,117
Jun-16 to
Mar-17 27,039 24-05-17 - 27,039
Total 38,156
- 38,156 - 38,156
31
M/s ASM
Enterprises-
14923303183
VI
Jun-16 9,583 26-08-16 - 9,583
Sep-16 27,791 24-12-16 - 27,791
Total 37,374
- 37,374 37,374 -
Audit Report on Economic and Revenue Sectors for the year ended 31 March 2017
130
(Amounts in `̀̀̀)
Sl.
No
Trade Name &
TIN Zone Q/E
Tax &
Interest
Date of notice
/ assessment Tax paid
Outstanding
Tax
Recovery
after audit
Balance
Outstanding
32 M/s MI Footwears-
14210294175 VI
Jun-14 to
Mar-16 5,90,787 25-01-17 - 5,90,787
Total 5,90,787
- 5,90,787 5,90,787 -
33
M/s A.K. Kitchen
World-
14921677122
VI
Dec-15 to
Sep-16 1,02,082 02-12-16 - 1,02,082
Dec-16 84,046 21-04-17 - 84,046
Total 1,86,128
- 1,86,128 1,86,128 -
34
M/s D.K.
Enterprise-
14923769187
VII
Dec-16 51,422 03-04-17 - 51,422
Total 51,422
- 51,422 - 51,422
35
M/s Shyam Tyre
Sales & service-
14810596156
II
Jun-14 26,353 18-10-14 - 26,353
Sep-14 39,333 31-12-14 - 39,333
Mar-16 to
Sep-16 3,96,724 24-06-17 - 3,96,724
Total 4,62,410
- 4,62,410 2,34,307 2,28,103
36
M/s Amit
Hardware-
14110012141
III
Jun-15 13,860 09-10-15 - 13,860
Dec-15 to
Mar-16 36,387 27-05-16 - 36,387
Jun-16 to
Sep-16 90,276 25-03-17 - 90,276
Total 1,40,523
- 1,40,523 1,40,523 -
37
M/s Balaji
Enterprises-
14922202134
IX
Dec-14 to
Jun-16 1,47,438 10-08-16 - 1,47,438
Total 1,47,438
- 1,47,438 - 1,47,438
38 M/s K.B. Agencies-
14510174123 II
Mar-17 3,88,212 27-05-17 - 3,88,212
Total 3,88,212
- 3,88,212 3,88,212 -
39
M/s Thingnamcha
Steel House-
14921546170
VIII
Sep-16 to
Mar-17 20,000 27-05-17 - 20,000
Total 20,000
- 20,000 20,000 -
40
M/s Adhunik
Cement Limited-
14922310147
VIII
Mar-17 1,40,517 20-04-17 - 1,40,517
Total 1,40,517
- 1,40,517 1,40,000 517
41
M/s Zoya
Enterprise-
14922094121
VIII
Jun-14 to
Mar-15 77,082 09-10-15 - 77,082
Total 77,082
- 77,082 - 77,082
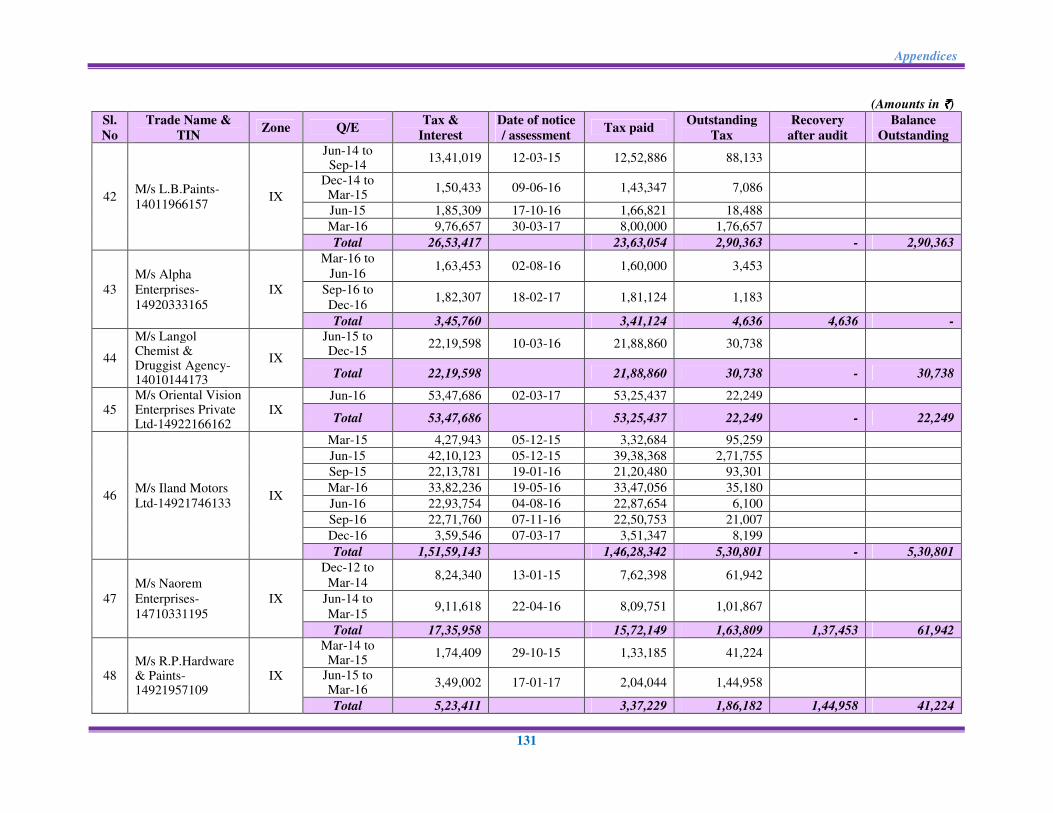
Appendices
131
(Amounts in `̀̀̀)
Sl.
No
Trade Name &
TIN Zone Q/E
Tax &
Interest
Date of notice
/ assessment Tax paid
Outstanding
Tax
Recovery
after audit
Balance
Outstanding
42 M/s L.B.Paints-
14011966157 IX
Jun-14 to Sep-14
13,41,019 12-03-15 12,52,886 88,133
Dec-14 to Mar-15
1,50,433 09-06-16 1,43,347 7,086
Jun-15 1,85,309 17-10-16 1,66,821 18,488
Mar-16 9,76,657 30-03-17 8,00,000 1,76,657
Total 26,53,417
23,63,054 2,90,363 - 2,90,363
43
M/s Alpha
Enterprises-
14920333165
IX
Mar-16 to
Jun-16 1,63,453 02-08-16 1,60,000 3,453
Sep-16 to
Dec-16 1,82,307 18-02-17 1,81,124 1,183
Total 3,45,760
3,41,124 4,636 4,636 -
44
M/s Langol Chemist & Druggist Agency-14010144173
IX
Jun-15 to Dec-15
22,19,598 10-03-16 21,88,860 30,738
Total 22,19,598
21,88,860 30,738 - 30,738
45 M/s Oriental Vision Enterprises Private Ltd-14922166162
IX Jun-16 53,47,686 02-03-17 53,25,437 22,249
Total 53,47,686
53,25,437 22,249 - 22,249
46 M/s Iland Motors
Ltd-14921746133 IX
Mar-15 4,27,943 05-12-15 3,32,684 95,259
Jun-15 42,10,123 05-12-15 39,38,368 2,71,755
Sep-15 22,13,781 19-01-16 21,20,480 93,301
Mar-16 33,82,236 19-05-16 33,47,056 35,180
Jun-16 22,93,754 04-08-16 22,87,654 6,100
Sep-16 22,71,760 07-11-16 22,50,753 21,007
Dec-16 3,59,546 07-03-17 3,51,347 8,199
Total 1,51,59,143
1,46,28,342 5,30,801 - 5,30,801
47
M/s Naorem
Enterprises-
14710331195
IX
Dec-12 to
Mar-14 8,24,340 13-01-15 7,62,398 61,942
Jun-14 to
Mar-15 9,11,618 22-04-16 8,09,751 1,01,867
Total 17,35,958
15,72,149 1,63,809 1,37,453 61,942
48 M/s R.P.Hardware & Paints-14921957109
IX
Mar-14 to Mar-15
1,74,409 29-10-15 1,33,185 41,224
Jun-15 to Mar-16
3,49,002 17-01-17 2,04,044 1,44,958
Total 5,23,411
3,37,229 1,86,182 1,44,958 41,224
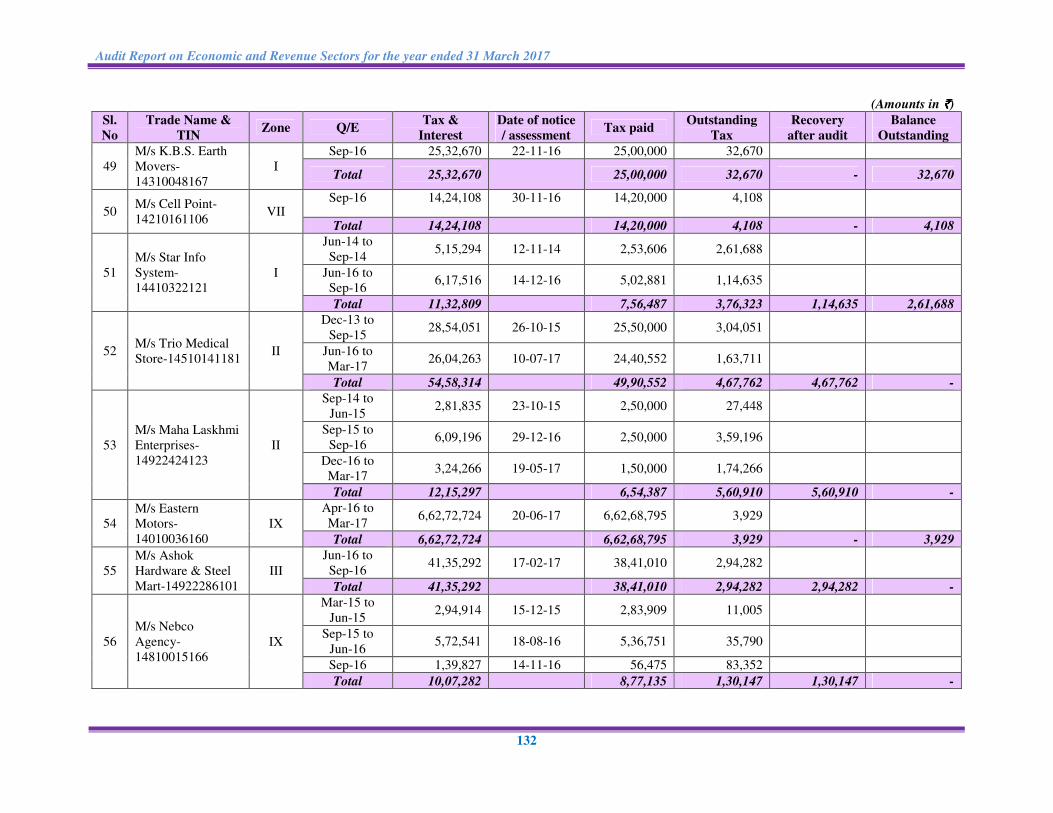
Audit Report on Economic and Revenue Sectors for the year ended 31 March 2017
132
(Amounts in `̀̀̀)
Sl.
No
Trade Name &
TIN Zone Q/E
Tax &
Interest
Date of notice
/ assessment Tax paid
Outstanding
Tax
Recovery
after audit
Balance
Outstanding
49
M/s K.B.S. Earth
Movers-
14310048167
I
Sep-16 25,32,670 22-11-16 25,00,000 32,670
Total 25,32,670
25,00,000 32,670 - 32,670
50 M/s Cell Point-
14210161106 VII
Sep-16 14,24,108 30-11-16 14,20,000 4,108
Total 14,24,108
14,20,000 4,108 - 4,108
51
M/s Star Info
System-
14410322121
I
Jun-14 to
Sep-14 5,15,294 12-11-14 2,53,606 2,61,688
Jun-16 to
Sep-16 6,17,516 14-12-16 5,02,881 1,14,635
Total 11,32,809
7,56,487 3,76,323 1,14,635 2,61,688
52 M/s Trio Medical
Store-14510141181 II
Dec-13 to
Sep-15 28,54,051 26-10-15 25,50,000 3,04,051
Jun-16 to
Mar-17 26,04,263 10-07-17 24,40,552 1,63,711
Total 54,58,314
49,90,552 4,67,762 4,67,762 -
53
M/s Maha Laskhmi
Enterprises-
14922424123
II
Sep-14 to
Jun-15 2,81,835 23-10-15 2,50,000 27,448
Sep-15 to
Sep-16 6,09,196 29-12-16 2,50,000 3,59,196
Dec-16 to
Mar-17 3,24,266 19-05-17 1,50,000 1,74,266
Total 12,15,297
6,54,387 5,60,910 5,60,910 -
54
M/s Eastern
Motors-
14010036160
IX
Apr-16 to
Mar-17 6,62,72,724 20-06-17 6,62,68,795 3,929
Total 6,62,72,724
6,62,68,795 3,929 - 3,929
55
M/s Ashok
Hardware & Steel
Mart-14922286101
III
Jun-16 to
Sep-16 41,35,292 17-02-17 38,41,010 2,94,282
Total 41,35,292
38,41,010 2,94,282 2,94,282 -
56
M/s Nebco
Agency-
14810015166
IX
Mar-15 to
Jun-15 2,94,914 15-12-15 2,83,909 11,005
Sep-15 to
Jun-16 5,72,541 18-08-16 5,36,751 35,790
Sep-16 1,39,827 14-11-16 56,475 83,352
Total 10,07,282
8,77,135 1,30,147 1,30,147 -
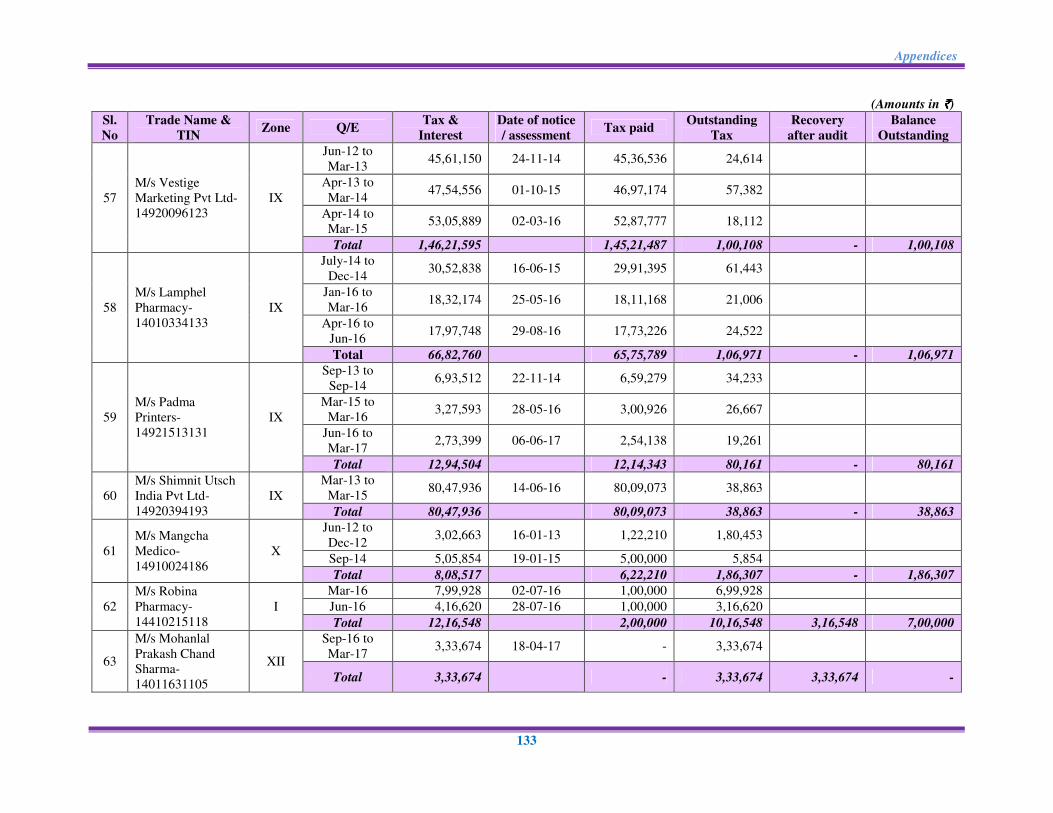
Appendices
133
(Amounts in `̀̀̀)
Sl.
No
Trade Name &
TIN Zone Q/E
Tax &
Interest
Date of notice
/ assessment Tax paid
Outstanding
Tax
Recovery
after audit
Balance
Outstanding
57
M/s Vestige
Marketing Pvt Ltd-
14920096123
IX
Jun-12 to
Mar-13 45,61,150 24-11-14 45,36,536 24,614
Apr-13 to
Mar-14 47,54,556 01-10-15 46,97,174 57,382
Apr-14 to
Mar-15 53,05,889 02-03-16 52,87,777 18,112
Total 1,46,21,595
1,45,21,487 1,00,108 - 1,00,108
58
M/s Lamphel
Pharmacy-
14010334133
IX
July-14 to
Dec-14 30,52,838 16-06-15 29,91,395 61,443
Jan-16 to
Mar-16 18,32,174 25-05-16 18,11,168 21,006
Apr-16 to
Jun-16 17,97,748 29-08-16 17,73,226 24,522
Total 66,82,760
65,75,789 1,06,971 - 1,06,971
59
M/s Padma
Printers-
14921513131
IX
Sep-13 to
Sep-14 6,93,512 22-11-14 6,59,279 34,233
Mar-15 to
Mar-16 3,27,593 28-05-16 3,00,926 26,667
Jun-16 to
Mar-17 2,73,399 06-06-17 2,54,138 19,261
Total 12,94,504
12,14,343 80,161 - 80,161
60
M/s Shimnit Utsch
India Pvt Ltd-
14920394193
IX
Mar-13 to
Mar-15 80,47,936 14-06-16 80,09,073 38,863
Total 80,47,936
80,09,073 38,863 - 38,863
61
M/s Mangcha
Medico-
14910024186
X
Jun-12 to
Dec-12 3,02,663 16-01-13 1,22,210 1,80,453
Sep-14 5,05,854 19-01-15 5,00,000 5,854
Total 8,08,517
6,22,210 1,86,307 - 1,86,307
62
M/s Robina
Pharmacy-
14410215118
I
Mar-16 7,99,928 02-07-16 1,00,000 6,99,928
Jun-16 4,16,620 28-07-16 1,00,000 3,16,620
Total 12,16,548
2,00,000 10,16,548 3,16,548 7,00,000
63
M/s Mohanlal
Prakash Chand
Sharma-
14011631105
XII
Sep-16 to
Mar-17 3,33,674 18-04-17 - 3,33,674
Total 3,33,674
- 3,33,674 3,33,674 -
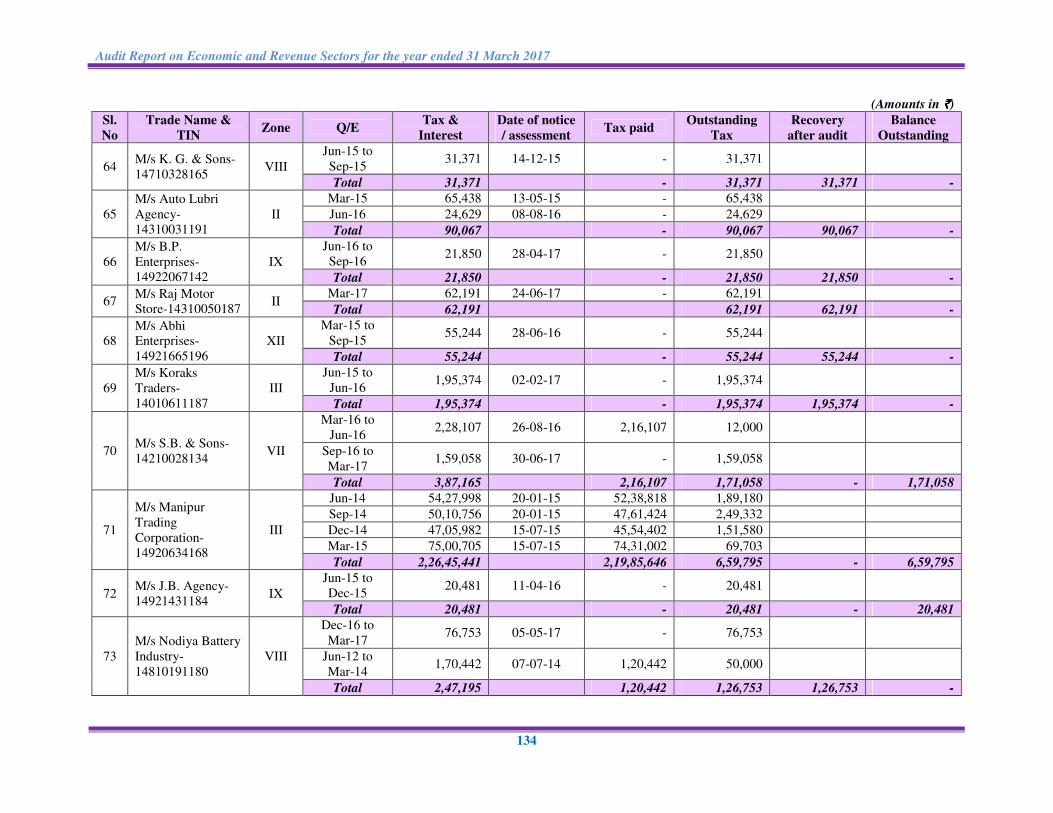
Audit Report on Economic and Revenue Sectors for the year ended 31 March 2017
134
(Amounts in `̀̀̀)
Sl.
No
Trade Name &
TIN Zone Q/E
Tax &
Interest
Date of notice
/ assessment Tax paid
Outstanding
Tax
Recovery
after audit
Balance
Outstanding
64 M/s K. G. & Sons-
14710328165 VIII
Jun-15 to
Sep-15 31,371 14-12-15 - 31,371
Total 31,371
- 31,371 31,371 -
65
M/s Auto Lubri
Agency-
14310031191
II
Mar-15 65,438 13-05-15 - 65,438
Jun-16 24,629 08-08-16 - 24,629
Total 90,067
- 90,067 90,067 -
66
M/s B.P.
Enterprises-
14922067142
IX
Jun-16 to
Sep-16 21,850 28-04-17 - 21,850
Total 21,850
- 21,850 21,850 -
67 M/s Raj Motor
Store-14310050187 II
Mar-17 62,191 24-06-17 - 62,191
Total 62,191
62,191 62,191 -
68
M/s Abhi
Enterprises-
14921665196
XII
Mar-15 to
Sep-15 55,244 28-06-16 - 55,244
Total 55,244
- 55,244 55,244 -
69
M/s Koraks
Traders-
14010611187
III
Jun-15 to
Jun-16 1,95,374 02-02-17 - 1,95,374
Total 1,95,374
- 1,95,374 1,95,374 -
70 M/s S.B. & Sons-
14210028134 VII
Mar-16 to
Jun-16 2,28,107 26-08-16 2,16,107 12,000
Sep-16 to
Mar-17 1,59,058 30-06-17 - 1,59,058
Total 3,87,165
2,16,107 1,71,058 - 1,71,058
71
M/s Manipur
Trading
Corporation-
14920634168
III
Jun-14 54,27,998 20-01-15 52,38,818 1,89,180
Sep-14 50,10,756 20-01-15 47,61,424 2,49,332
Dec-14 47,05,982 15-07-15 45,54,402 1,51,580
Mar-15 75,00,705 15-07-15 74,31,002 69,703
Total 2,26,45,441
2,19,85,646 6,59,795 - 6,59,795
72 M/s J.B. Agency-
14921431184 IX
Jun-15 to
Dec-15 20,481 11-04-16 - 20,481
Total 20,481
- 20,481 - 20,481
73
M/s Nodiya Battery
Industry-
14810191180
VIII
Dec-16 to
Mar-17 76,753 05-05-17 - 76,753
Jun-12 to
Mar-14 1,70,442 07-07-14 1,20,442 50,000
Total 2,47,195
1,20,442 1,26,753 1,26,753 -
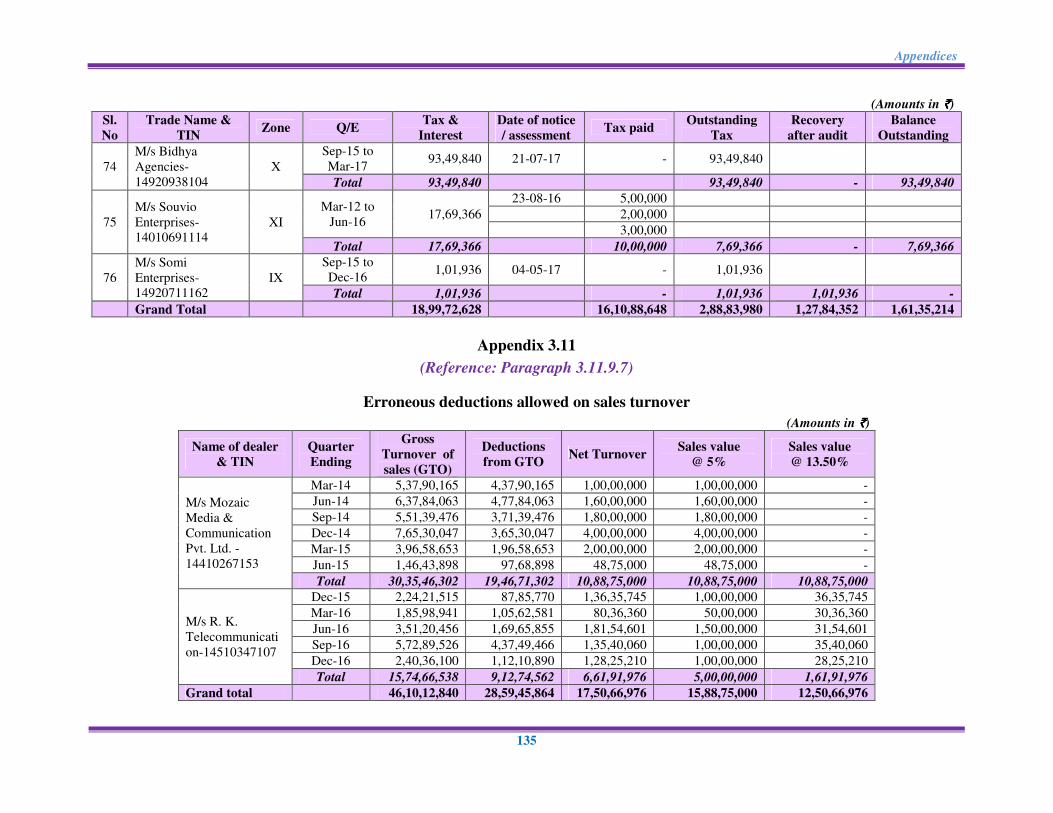
Appendices
135
(Amounts in `̀̀̀)
Sl.
No
Trade Name &
TIN Zone Q/E
Tax &
Interest
Date of notice
/ assessment Tax paid
Outstanding
Tax
Recovery
after audit
Balance
Outstanding
74
M/s Bidhya
Agencies-
14920938104
X
Sep-15 to
Mar-17 93,49,840 21-07-17 - 93,49,840
Total 93,49,840
93,49,840 - 93,49,840
75
M/s Souvio
Enterprises-
14010691114
XI
Mar-12 to
Jun-16 17,69,366
23-08-16 5,00,000
2,00,000
3,00,000
Total 17,69,366
10,00,000 7,69,366 - 7,69,366
76
M/s Somi
Enterprises-
14920711162
IX
Sep-15 to
Dec-16 1,01,936 04-05-17 - 1,01,936
Total 1,01,936
- 1,01,936 1,01,936 -
Grand Total
18,99,72,628
16,10,88,648 2,88,83,980 1,27,84,352 1,61,35,214
Appendix 3.11
(Reference: Paragraph 3.11.9.7)
Erroneous deductions allowed on sales turnover
(Amounts in `̀̀̀)
Name of dealer
& TIN
Quarter
Ending
Gross
Turnover of
sales (GTO)
Deductions
from GTO Net Turnover
Sales value
@ 5%
Sales value
@ 13.50%
M/s Mozaic
Media &
Communication
Pvt. Ltd. -
14410267153
Mar-14 5,37,90,165 4,37,90,165 1,00,00,000 1,00,00,000 -
Jun-14 6,37,84,063 4,77,84,063 1,60,00,000 1,60,00,000 -
Sep-14 5,51,39,476 3,71,39,476 1,80,00,000 1,80,00,000 -
Dec-14 7,65,30,047 3,65,30,047 4,00,00,000 4,00,00,000 -
Mar-15 3,96,58,653 1,96,58,653 2,00,00,000 2,00,00,000 -
Jun-15 1,46,43,898 97,68,898 48,75,000 48,75,000 -
Total 30,35,46,302 19,46,71,302 10,88,75,000 10,88,75,000 10,88,75,000
M/s R. K.
Telecommunicati
on-14510347107
Dec-15 2,24,21,515 87,85,770 1,36,35,745 1,00,00,000 36,35,745
Mar-16 1,85,98,941 1,05,62,581 80,36,360 50,00,000 30,36,360
Jun-16 3,51,20,456 1,69,65,855 1,81,54,601 1,50,00,000 31,54,601
Sep-16 5,72,89,526 4,37,49,466 1,35,40,060 1,00,00,000 35,40,060
Dec-16 2,40,36,100 1,12,10,890 1,28,25,210 1,00,00,000 28,25,210
Total 15,74,66,538 9,12,74,562 6,61,91,976 5,00,00,000 1,61,91,976
Grand total
46,10,12,840 28,59,45,864 17,50,66,976 15,88,75,000 12,50,66,976
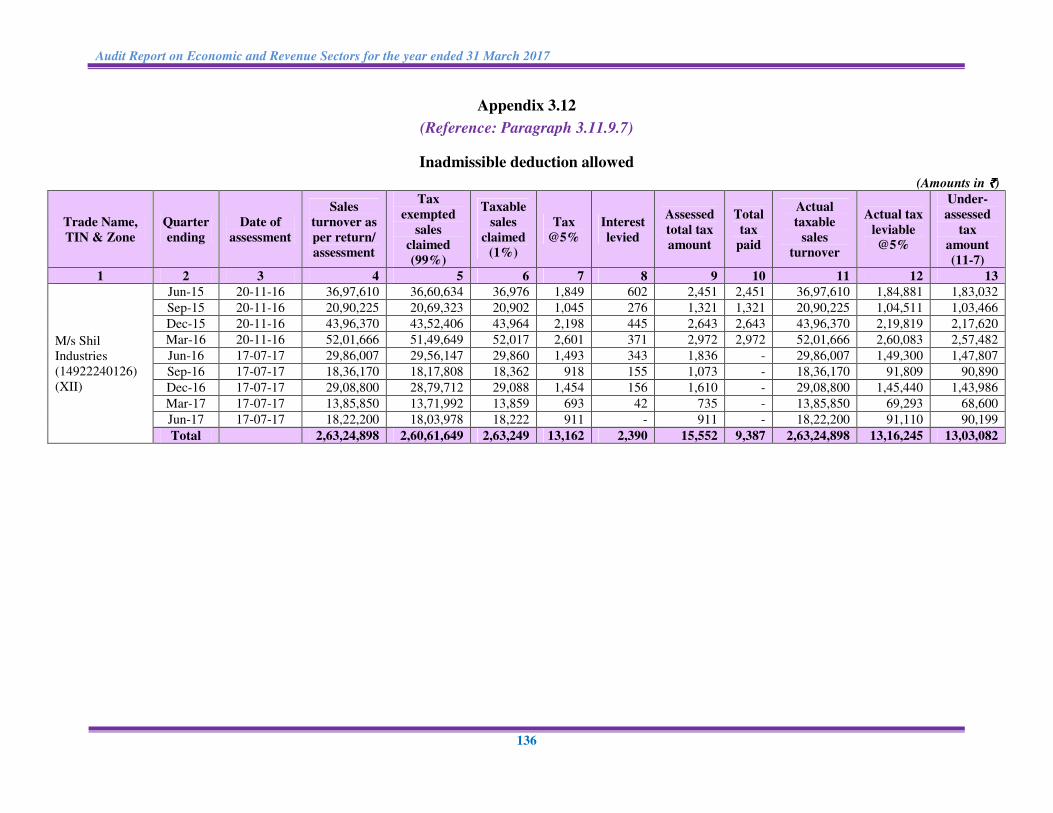
Audit Report on Economic and Revenue Sectors for the year ended 31 March 2017
136
Appendix 3.12
(Reference: Paragraph 3.11.9.7)
Inadmissible deduction allowed
(Amounts in `̀̀̀)
Trade Name,
TIN & Zone
Quarter
ending
Date of
assessment
Sales
turnover as
per return/
assessment
Tax
exempted
sales
claimed
(99%)
Taxable
sales
claimed
(1%)
Tax
@5%
Interest
levied
Assessed
total tax
amount
Total
tax
paid
Actual
taxable
sales
turnover
Actual tax
leviable
@5%
Under-
assessed
tax
amount
(11-7)
1 2 3 4 5 6 7 8 9 10 11 12 13
M/s Shil
Industries
(14922240126)
(XII)
Jun-15 20-11-16 36,97,610 36,60,634 36,976 1,849 602 2,451 2,451 36,97,610 1,84,881 1,83,032
Sep-15 20-11-16 20,90,225 20,69,323 20,902 1,045 276 1,321 1,321 20,90,225 1,04,511 1,03,466
Dec-15 20-11-16 43,96,370 43,52,406 43,964 2,198 445 2,643 2,643 43,96,370 2,19,819 2,17,620
Mar-16 20-11-16 52,01,666 51,49,649 52,017 2,601 371 2,972 2,972 52,01,666 2,60,083 2,57,482
Jun-16 17-07-17 29,86,007 29,56,147 29,860 1,493 343 1,836 - 29,86,007 1,49,300 1,47,807
Sep-16 17-07-17 18,36,170 18,17,808 18,362 918 155 1,073 - 18,36,170 91,809 90,890
Dec-16 17-07-17 29,08,800 28,79,712 29,088 1,454 156 1,610 - 29,08,800 1,45,440 1,43,986
Mar-17 17-07-17 13,85,850 13,71,992 13,859 693 42 735 - 13,85,850 69,293 68,600
Jun-17 17-07-17 18,22,200 18,03,978 18,222 911 - 911 - 18,22,200 91,110 90,199
Total
2,63,24,898 2,60,61,649 2,63,249 13,162 2,390 15,552 9,387 2,63,24,898 13,16,245 13,03,082
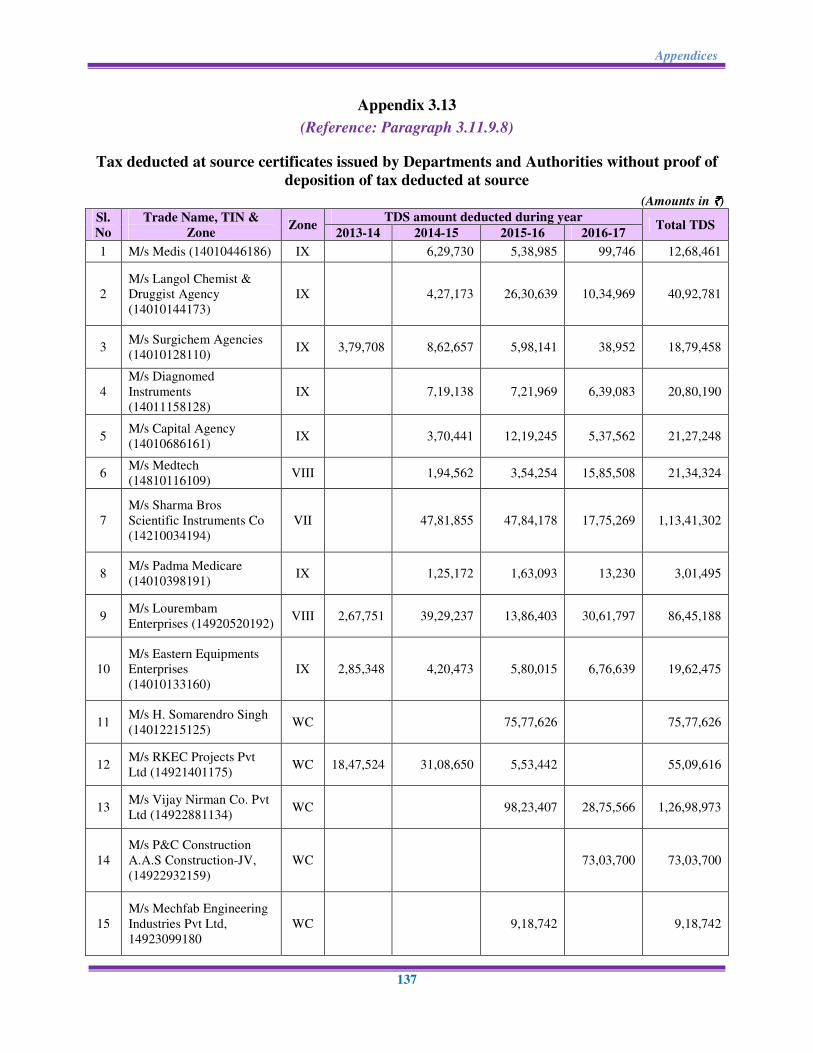
Appendices
137
Appendix 3.13
(Reference: Paragraph 3.11.9.8)
Tax deducted at source certificates issued by Departments and Authorities without proof of
deposition of tax deducted at source
(Amounts in `̀̀̀)
Sl.
No
Trade Name, TIN &
Zone Zone
TDS amount deducted during year Total TDS
2013-14 2014-15 2015-16 2016-17
1 M/s Medis (14010446186) IX
6,29,730 5,38,985 99,746 12,68,461
2
M/s Langol Chemist &
Druggist Agency
(14010144173)
IX
4,27,173 26,30,639 10,34,969 40,92,781
3 M/s Surgichem Agencies
(14010128110) IX 3,79,708 8,62,657 5,98,141 38,952 18,79,458
4
M/s Diagnomed
Instruments
(14011158128)
IX
7,19,138 7,21,969 6,39,083 20,80,190
5 M/s Capital Agency
(14010686161) IX
3,70,441 12,19,245 5,37,562 21,27,248
6 M/s Medtech
(14810116109) VIII
1,94,562 3,54,254 15,85,508 21,34,324
7
M/s Sharma Bros
Scientific Instruments Co
(14210034194)
VII
47,81,855 47,84,178 17,75,269 1,13,41,302
8 M/s Padma Medicare
(14010398191) IX
1,25,172 1,63,093 13,230 3,01,495
9 M/s Lourembam
Enterprises (14920520192) VIII 2,67,751 39,29,237 13,86,403 30,61,797 86,45,188
10
M/s Eastern Equipments
Enterprises
(14010133160)
IX 2,85,348 4,20,473 5,80,015 6,76,639 19,62,475
11 M/s H. Somarendro Singh
(14012215125) WC
75,77,626
75,77,626
12 M/s RKEC Projects Pvt
Ltd (14921401175) WC 18,47,524 31,08,650 5,53,442
55,09,616
13 M/s Vijay Nirman Co. Pvt
Ltd (14922881134) WC
98,23,407 28,75,566 1,26,98,973
14
M/s P&C Construction
A.A.S Construction-JV,
(14922932159)
WC
73,03,700 73,03,700
15
M/s Mechfab Engineering
Industries Pvt Ltd,
14923099180
WC
9,18,742
9,18,742

Audit Report on Economic and Revenue Sectors for the year ended 31 March 2017
138
(Amounts in `̀̀̀)
Sl.
No
Trade Name, TIN &
Zone Zone
TDS amount deducted during year Total TDS
2013-14 2014-15 2015-16 2016-17
16 M/s Navsheen Associates
(14011443165) WC 5,35,767
5,35,767
17
M/s East India
Construction & Supply
Co. (14010491151)
WC 19,29,589
43,61,414
62,91,003
18
M/s Meghalaya
Construction & Supply
Co. (14010579158)
WC
4,42,996
4,42,996
19
M/s Shree Meghalaya
Construction & Supply
Co. (14010489131)
WC 13,88,191
48,54,396
62,42,587
Total
66,33,878 1,60,12,084 4,10,65,949 1,96,42,021 8,33,53,932
Appendix 3.14
(Reference: Paragraph 3.11.9.8)
Tax deducted at source claimed to have been adjusted through Accountant General (A&E),
Manipur but not supported with documents or references of adjustments
(Amounts in `̀̀̀)
Sl.
No.
Trade Name & TIN No. of
firm/dealer from whom TDS
deducted
Year TDS amount TDS
Certificate No
TDS
Certificate
date
1 M/s Crystal works
(14012012132)
2013-14
3,38,660 0057/01422 16-09-14
2,32,876 0057/01421 16-09-14
12,34,664 0057/01420 16-09-14
1,77,569 0057/01419 16-09-14
Total 19,83,769
2014-15
2,48,483 0268/06677 22-06-15
6,64,512 0268/06678 22-06-15
7,14,076 0268/06690 22-06-15
Total 16,27,071
2015-16
5,23,599 0269-06721 23-06-16
12,89,882 0269-06722 23-06-16
4,71,679 0269-06723 23-06-16
5,52,186 0269-06719 21-06-16
7,45,387 0269-06718 21-06-16
Total 35,82,733
2 M/s Navsheen Associates
(14011443165) 2013-14
1,72,652 0084-02086 05-06-14
5,56,660 0084-02084 05-06-14
69,090 0084-02083 05-06-14
5,20,576 0084-02082 05-06-14
4,22,321 0084-02081 05-06-14
6,70,829 0084-02080 05-06-14
5,68,740 0084-02079 05-06-14
1,66,406 0057-01425 16-09-14
6,11,828 0057-01424 16-09-14
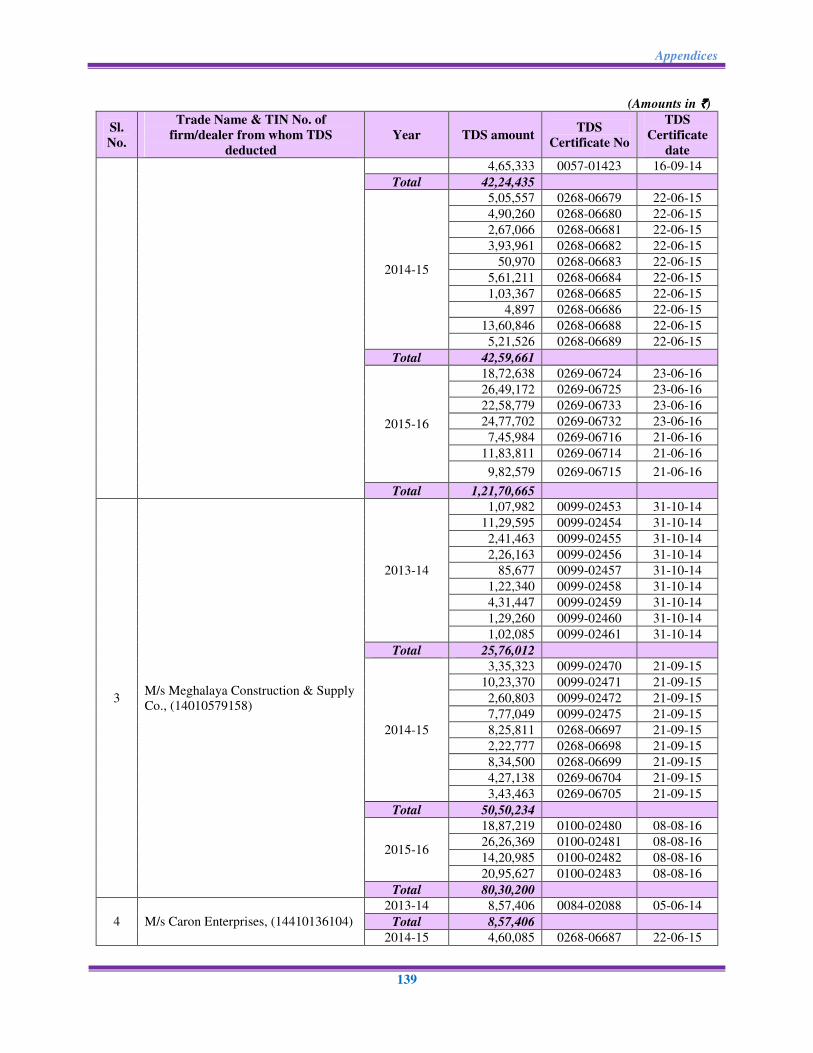
Appendices
139
(Amounts in `̀̀̀)
Sl.
No.
Trade Name & TIN No. of
firm/dealer from whom TDS
deducted
Year TDS amount TDS
Certificate No
TDS
Certificate
date
4,65,333 0057-01423 16-09-14
Total 42,24,435
2014-15
5,05,557 0268-06679 22-06-15
4,90,260 0268-06680 22-06-15
2,67,066 0268-06681 22-06-15
3,93,961 0268-06682 22-06-15
50,970 0268-06683 22-06-15
5,61,211 0268-06684 22-06-15
1,03,367 0268-06685 22-06-15
4,897 0268-06686 22-06-15
13,60,846 0268-06688 22-06-15
5,21,526 0268-06689 22-06-15
Total 42,59,661
2015-16
18,72,638 0269-06724 23-06-16
26,49,172 0269-06725 23-06-16
22,58,779 0269-06733 23-06-16
24,77,702 0269-06732 23-06-16
7,45,984 0269-06716 21-06-16
11,83,811 0269-06714 21-06-16
9,82,579 0269-06715 21-06-16
Total 1,21,70,665
3 M/s Meghalaya Construction & Supply
Co., (14010579158)
2013-14
1,07,982 0099-02453 31-10-14
11,29,595 0099-02454 31-10-14
2,41,463 0099-02455 31-10-14
2,26,163 0099-02456 31-10-14
85,677 0099-02457 31-10-14
1,22,340 0099-02458 31-10-14
4,31,447 0099-02459 31-10-14
1,29,260 0099-02460 31-10-14
1,02,085 0099-02461 31-10-14
Total 25,76,012
2014-15
3,35,323 0099-02470 21-09-15
10,23,370 0099-02471 21-09-15
2,60,803 0099-02472 21-09-15
7,77,049 0099-02475 21-09-15
8,25,811 0268-06697 21-09-15
2,22,777 0268-06698 21-09-15
8,34,500 0268-06699 21-09-15
4,27,138 0269-06704 21-09-15
3,43,463 0269-06705 21-09-15
Total 50,50,234
2015-16
18,87,219 0100-02480 08-08-16
26,26,369 0100-02481 08-08-16
14,20,985 0100-02482 08-08-16
20,95,627 0100-02483 08-08-16
Total 80,30,200
4 M/s Caron Enterprises, (14410136104)
2013-14 8,57,406 0084-02088 05-06-14
Total 8,57,406
2014-15 4,60,085 0268-06687 22-06-15

Audit Report on Economic and Revenue Sectors for the year ended 31 March 2017
140
(Amounts in `̀̀̀)
Sl.
No.
Trade Name & TIN No. of
firm/dealer from whom TDS
deducted
Year TDS amount TDS
Certificate No
TDS
Certificate
date
Total 4,60,085
2015-16 3,24,742 0269-06720 23-06-16
4,51,327 0269-06717 21-06-16
Total 7,76,069
5 M/s East India Construction & Supply
Co, (14010491151)
2014-15 50,18,895 nil nil
Total 50,18,895
6 M/s Shree Meghalaya Construction &
Supply Co., (14010489131)
2014-15 35,95,256 nil nil
Total 35,95,256
Grand Total 5,42,12,491
Appendix 3.15
(Reference: Paragraph 3.11.9.8)
Tax deducted at source not remitted into Government accounts
(Amounts in `̀̀̀)
Sl.
No
Deducting
organisation
Supplier/
Dealer Particulars
VAT
amount
Cheque No. & date
of passing
bill/cheque
Remark
1
Manipur Food
Industries
Corporation Ltd
MANIDCO
Execution of various
electrical and civil
works at Food Park,
Nilakuthi
9,52,879
716564
dt 11.01.2016
for
` 12931675
2
Manipur Tribal
Development
Corporation Ltd
K. Lamchou
Pao
Construction of
prefabricated
structure at CAU
1,86,142 151966
dt 29.07.2016
2,47,557 152122 dt 12.10.2016
3
Kakching
Municipal
Council
M.
Sanatomba
and
Y.Brojen
Construction of office
building complex for
north and south block
2,69,710
(i) 363833
dt 11.11.12
(ii) 363821
dt 16.7.12
(iii) 895005
dt 11-10-13
(iv) 363829
dt 31-8-12
(v) 363835
dt 02-2-13
Total 16,56,288
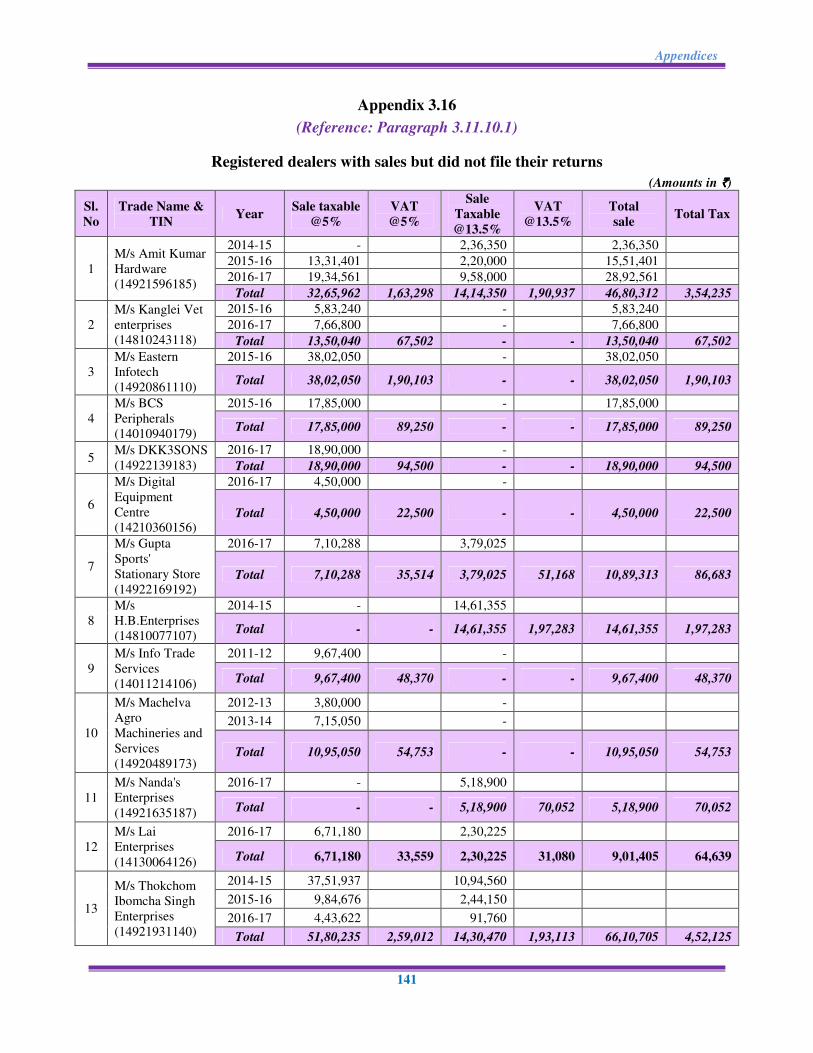
Appendices
141
Appendix 3.16
(Reference: Paragraph 3.11.10.1)
Registered dealers with sales but did not file their returns
(Amounts in `̀̀̀)
Sl.
No
Trade Name &
TIN Year
Sale taxable
@5%
VAT
@5%
Sale
Taxable
@13.5%
VAT
@13.5%
Total
sale Total Tax
1
M/s Amit Kumar
Hardware
(14921596185)
2014-15 - 2,36,350 2,36,350
2015-16 13,31,401 2,20,000 15,51,401
2016-17 19,34,561 9,58,000 28,92,561
Total 32,65,962 1,63,298 14,14,350 1,90,937 46,80,312 3,54,235
2
M/s Kanglei Vet
enterprises
(14810243118)
2015-16 5,83,240 - 5,83,240
2016-17 7,66,800 - 7,66,800
Total 13,50,040 67,502 - - 13,50,040 67,502
3
M/s Eastern
Infotech
(14920861110)
2015-16 38,02,050 - 38,02,050
Total 38,02,050 1,90,103 - - 38,02,050 1,90,103
4
M/s BCS
Peripherals
(14010940179)
2015-16 17,85,000 - 17,85,000
Total 17,85,000 89,250 - - 17,85,000 89,250
5 M/s DKK3SONS
(14922139183)
2016-17 18,90,000 -
Total 18,90,000 94,500 - - 18,90,000 94,500
6
M/s Digital
Equipment
Centre
(14210360156)
2016-17 4,50,000 -
Total 4,50,000 22,500 - - 4,50,000 22,500
7
M/s Gupta
Sports'
Stationary Store
(14922169192)
2016-17 7,10,288 3,79,025
Total 7,10,288 35,514 3,79,025 51,168 10,89,313 86,683
8
M/s
H.B.Enterprises
(14810077107)
2014-15 - 14,61,355
Total - - 14,61,355 1,97,283 14,61,355 1,97,283
9
M/s Info Trade
Services
(14011214106)
2011-12 9,67,400 -
Total 9,67,400 48,370 - - 9,67,400 48,370
10
M/s Machelva
Agro
Machineries and
Services
(14920489173)
2012-13 3,80,000 -
2013-14 7,15,050 -
Total 10,95,050 54,753 - - 10,95,050 54,753
11
M/s Nanda's
Enterprises
(14921635187)
2016-17 - 5,18,900
Total - - 5,18,900 70,052 5,18,900 70,052
12
M/s Lai
Enterprises
(14130064126)
2016-17 6,71,180 2,30,225
Total 6,71,180 33,559 2,30,225 31,080 9,01,405 64,639
13
M/s Thokchom
Ibomcha Singh
Enterprises
(14921931140)
2014-15 37,51,937 10,94,560
2015-16 9,84,676 2,44,150
2016-17 4,43,622 91,760
Total 51,80,235 2,59,012 14,30,470 1,93,113 66,10,705 4,52,125
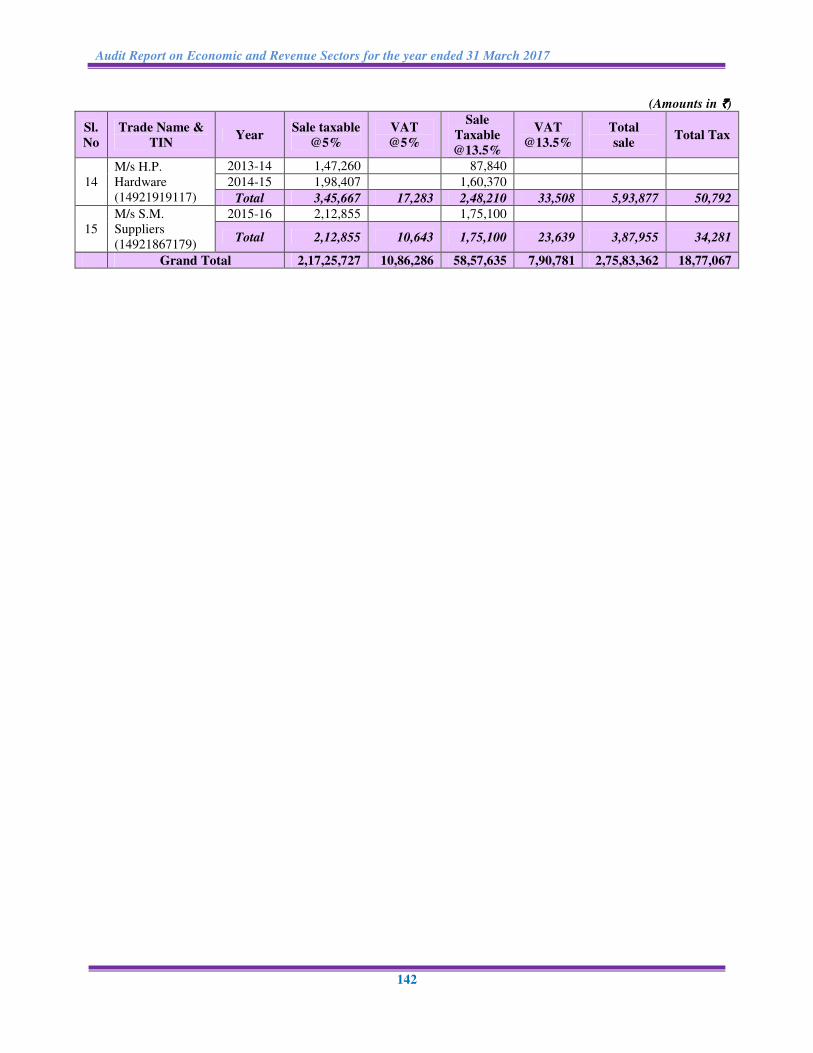
Audit Report on Economic and Revenue Sectors for the year ended 31 March 2017
142
(Amounts in `̀̀̀)
Sl.
No
Trade Name &
TIN Year
Sale taxable
@5%
VAT
@5%
Sale
Taxable
@13.5%
VAT
@13.5%
Total
sale Total Tax
14
M/s H.P.
Hardware
(14921919117)
2013-14 1,47,260 87,840
2014-15 1,98,407 1,60,370
Total 3,45,667 17,283 2,48,210 33,508 5,93,877 50,792
15
M/s S.M.
Suppliers
(14921867179)
2015-16 2,12,855 1,75,100
Total 2,12,855 10,643 1,75,100 23,639 3,87,955 34,281
Grand Total 2,17,25,727 10,86,286 58,57,635 7,90,781 2,75,83,362 18,77,067
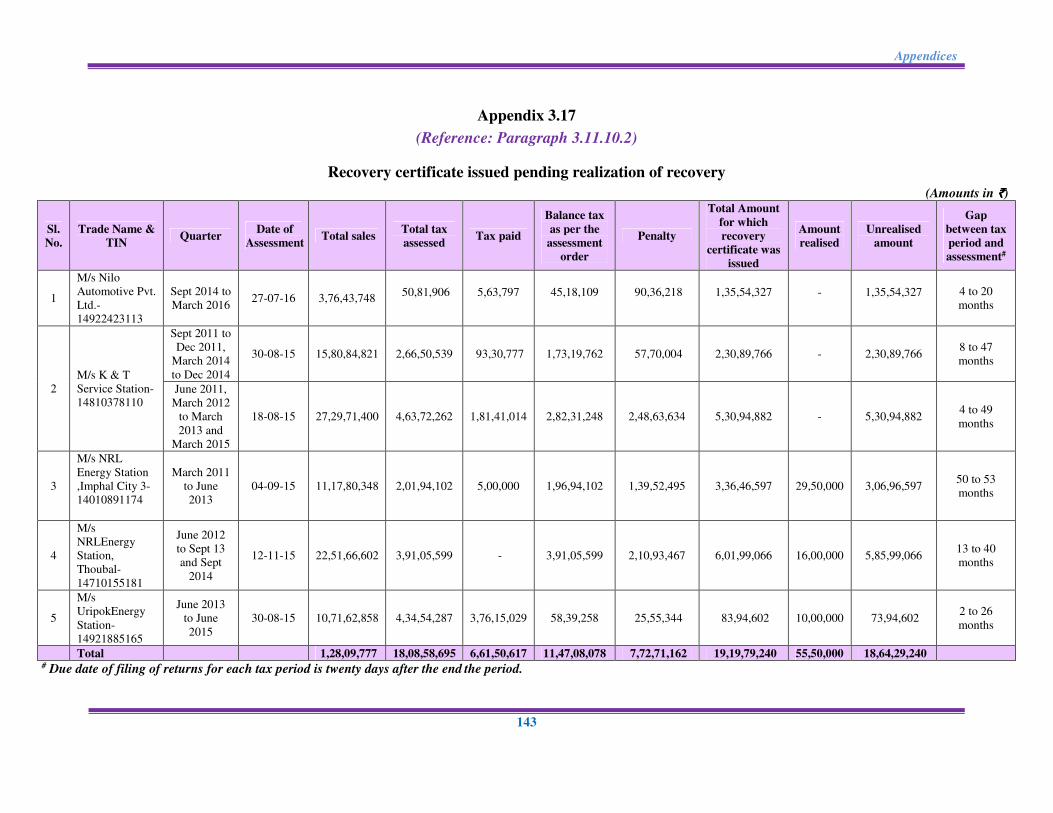
Appendices
143
Appendix 3.17
(Reference: Paragraph 3.11.10.2)
Recovery certificate issued pending realization of recovery
(Amounts in `̀̀̀)
Sl.
No.
Trade Name &
TIN Quarter
Date of
Assessment Total sales
Total tax
assessed Tax paid
Balance tax
as per the
assessment
order
Penalty
Total Amount
for which
recovery
certificate was
issued
Amount
realised
Unrealised
amount
Gap
between tax
period and
assessment#
1
M/s Nilo
Automotive Pvt.
Ltd.-
14922423113
Sept 2014 to
March 2016 27-07-16 3,76,43,748
50,81,906 5,63,797 45,18,109 90,36,218 1,35,54,327 - 1,35,54,327 4 to 20
months
2
M/s K & T
Service Station-
14810378110
Sept 2011 to
Dec 2011,
March 2014
to Dec 2014
30-08-15 15,80,84,821 2,66,50,539 93,30,777 1,73,19,762 57,70,004 2,30,89,766 - 2,30,89,766 8 to 47
months
June 2011,
March 2012
to March
2013 and
March 2015
18-08-15 27,29,71,400 4,63,72,262 1,81,41,014 2,82,31,248 2,48,63,634 5,30,94,882 - 5,30,94,882 4 to 49
months
3
M/s NRL
Energy Station
,Imphal City 3-
14010891174
March 2011
to June
2013
04-09-15 11,17,80,348 2,01,94,102 5,00,000 1,96,94,102 1,39,52,495 3,36,46,597 29,50,000 3,06,96,597 50 to 53
months
4
M/s
NRLEnergy
Station,
Thoubal-
14710155181
June 2012
to Sept 13
and Sept
2014
12-11-15 22,51,66,602 3,91,05,599 - 3,91,05,599 2,10,93,467 6,01,99,066 16,00,000 5,85,99,066 13 to 40
months
5
M/s
UripokEnergy
Station-
14921885165
June 2013
to June
2015
30-08-15 10,71,62,858 4,34,54,287 3,76,15,029 58,39,258 25,55,344 83,94,602 10,00,000 73,94,602 2 to 26
months
Total
1,28,09,777 18,08,58,695 6,61,50,617 11,47,08,078 7,72,71,162 19,19,79,240 55,50,000 18,64,29,240
# Due date of filing of returns for each tax period is twenty days after the end the period.
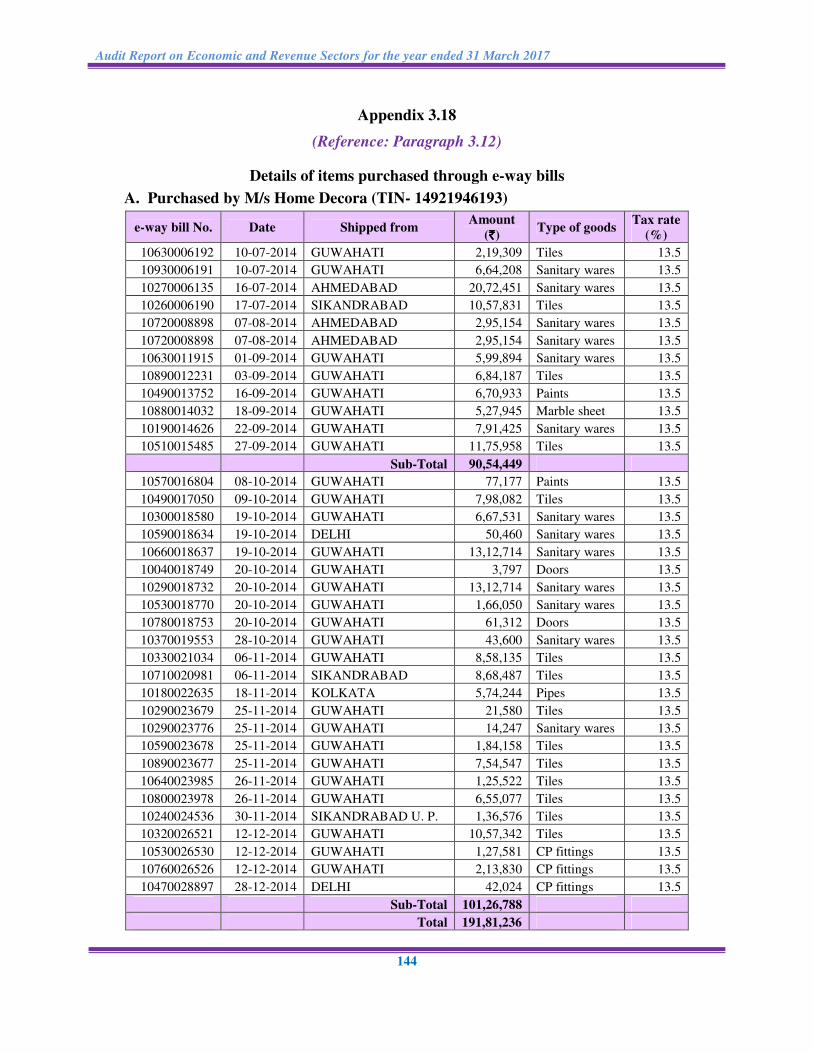
Audit Report on Economic and Revenue Sectors for the year ended 31 March 2017
144
Appendix 3.18
(Reference: Paragraph 3.12)
Details of items purchased through e-way bills
A. Purchased by M/s Home Decora (TIN- 14921946193)
e-way bill No. Date Shipped from Amount
(`̀̀̀) Type of goods
Tax rate
(%)
10630006192 10-07-2014 GUWAHATI 2,19,309 Tiles 13.5
10930006191 10-07-2014 GUWAHATI 6,64,208 Sanitary wares 13.5
10270006135 16-07-2014 AHMEDABAD 20,72,451 Sanitary wares 13.5
10260006190 17-07-2014 SIKANDRABAD 10,57,831 Tiles 13.5
10720008898 07-08-2014 AHMEDABAD 2,95,154 Sanitary wares 13.5
10720008898 07-08-2014 AHMEDABAD 2,95,154 Sanitary wares 13.5
10630011915 01-09-2014 GUWAHATI 5,99,894 Sanitary wares 13.5
10890012231 03-09-2014 GUWAHATI 6,84,187 Tiles 13.5
10490013752 16-09-2014 GUWAHATI 6,70,933 Paints 13.5
10880014032 18-09-2014 GUWAHATI 5,27,945 Marble sheet 13.5
10190014626 22-09-2014 GUWAHATI 7,91,425 Sanitary wares 13.5
10510015485 27-09-2014 GUWAHATI 11,75,958 Tiles 13.5
Sub-Total 90,54,449
10570016804 08-10-2014 GUWAHATI 77,177 Paints 13.5
10490017050 09-10-2014 GUWAHATI 7,98,082 Tiles 13.5
10300018580 19-10-2014 GUWAHATI 6,67,531 Sanitary wares 13.5
10590018634 19-10-2014 DELHI 50,460 Sanitary wares 13.5
10660018637 19-10-2014 GUWAHATI 13,12,714 Sanitary wares 13.5
10040018749 20-10-2014 GUWAHATI 3,797 Doors 13.5
10290018732 20-10-2014 GUWAHATI 13,12,714 Sanitary wares 13.5
10530018770 20-10-2014 GUWAHATI 1,66,050 Sanitary wares 13.5
10780018753 20-10-2014 GUWAHATI 61,312 Doors 13.5
10370019553 28-10-2014 GUWAHATI 43,600 Sanitary wares 13.5
10330021034 06-11-2014 GUWAHATI 8,58,135 Tiles 13.5
10710020981 06-11-2014 SIKANDRABAD 8,68,487 Tiles 13.5
10180022635 18-11-2014 KOLKATA 5,74,244 Pipes 13.5
10290023679 25-11-2014 GUWAHATI 21,580 Tiles 13.5
10290023776 25-11-2014 GUWAHATI 14,247 Sanitary wares 13.5
10590023678 25-11-2014 GUWAHATI 1,84,158 Tiles 13.5
10890023677 25-11-2014 GUWAHATI 7,54,547 Tiles 13.5
10640023985 26-11-2014 GUWAHATI 1,25,522 Tiles 13.5
10800023978 26-11-2014 GUWAHATI 6,55,077 Tiles 13.5
10240024536 30-11-2014 SIKANDRABAD U. P. 1,36,576 Tiles 13.5
10320026521 12-12-2014 GUWAHATI 10,57,342 Tiles 13.5
10530026530 12-12-2014 GUWAHATI 1,27,581 CP fittings 13.5
10760026526 12-12-2014 GUWAHATI 2,13,830 CP fittings 13.5
10470028897 28-12-2014 DELHI 42,024 CP fittings 13.5
Sub-Total 101,26,788
Total 191,81,236
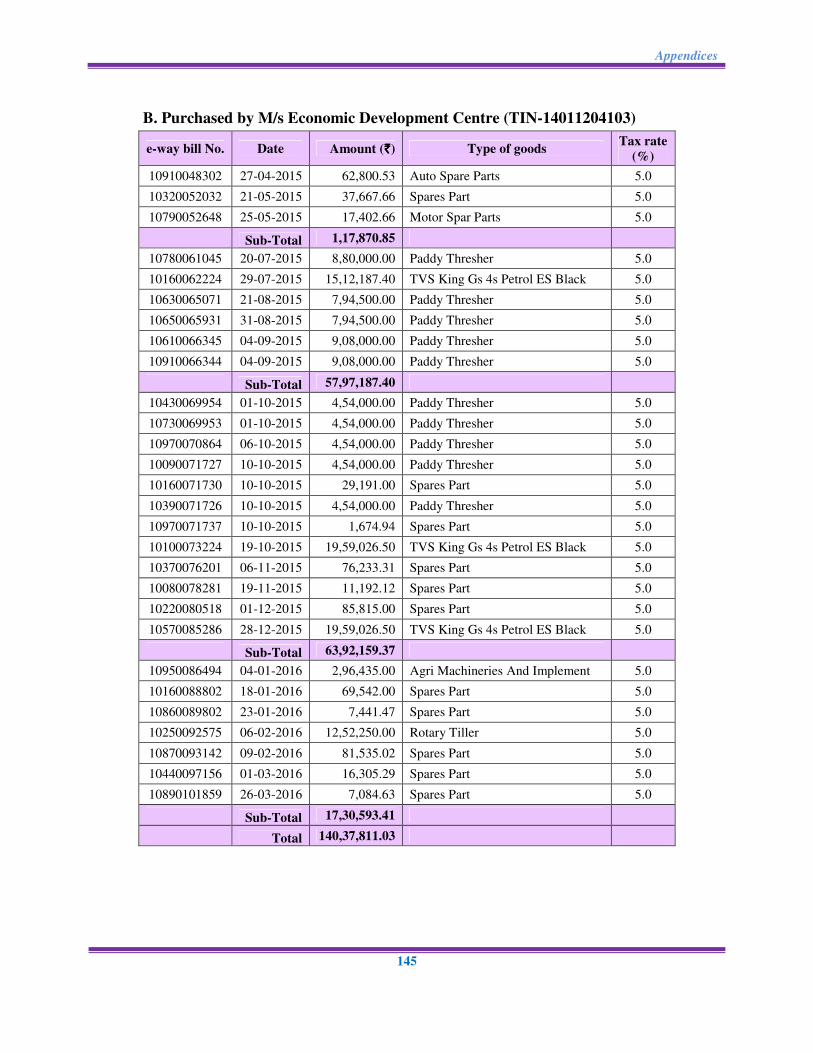
Appendices
145
B. Purchased by M/s Economic Development Centre (TIN-14011204103)
e-way bill No. Date Amount (`̀̀̀) Type of goods Tax rate
(%)
10910048302 27-04-2015 62,800.53 Auto Spare Parts 5.0
10320052032 21-05-2015 37,667.66 Spares Part 5.0
10790052648 25-05-2015 17,402.66 Motor Spar Parts 5.0
Sub-Total 1,17,870.85
10780061045 20-07-2015 8,80,000.00 Paddy Thresher 5.0
10160062224 29-07-2015 15,12,187.40 TVS King Gs 4s Petrol ES Black 5.0
10630065071 21-08-2015 7,94,500.00 Paddy Thresher 5.0
10650065931 31-08-2015 7,94,500.00 Paddy Thresher 5.0
10610066345 04-09-2015 9,08,000.00 Paddy Thresher 5.0
10910066344 04-09-2015 9,08,000.00 Paddy Thresher 5.0
Sub-Total 57,97,187.40
10430069954 01-10-2015 4,54,000.00 Paddy Thresher 5.0
10730069953 01-10-2015 4,54,000.00 Paddy Thresher 5.0
10970070864 06-10-2015 4,54,000.00 Paddy Thresher 5.0
10090071727 10-10-2015 4,54,000.00 Paddy Thresher 5.0
10160071730 10-10-2015 29,191.00 Spares Part 5.0
10390071726 10-10-2015 4,54,000.00 Paddy Thresher 5.0
10970071737 10-10-2015 1,674.94 Spares Part 5.0
10100073224 19-10-2015 19,59,026.50 TVS King Gs 4s Petrol ES Black 5.0
10370076201 06-11-2015 76,233.31 Spares Part 5.0
10080078281 19-11-2015 11,192.12 Spares Part 5.0
10220080518 01-12-2015 85,815.00 Spares Part 5.0
10570085286 28-12-2015 19,59,026.50 TVS King Gs 4s Petrol ES Black 5.0
Sub-Total 63,92,159.37
10950086494 04-01-2016 2,96,435.00 Agri Machineries And Implement 5.0
10160088802 18-01-2016 69,542.00 Spares Part 5.0
10860089802 23-01-2016 7,441.47 Spares Part 5.0
10250092575 06-02-2016 12,52,250.00 Rotary Tiller 5.0
10870093142 09-02-2016 81,535.02 Spares Part 5.0
10440097156 01-03-2016 16,305.29 Spares Part 5.0
10890101859 26-03-2016 7,084.63 Spares Part 5.0
Sub-Total 17,30,593.41
Total 140,37,811.03

Audit Report on Economic and Revenue Sectors for the year ended 31 March 2017
146
Appendix 3.19
(Reference: Paragraph 3.13)
Details of outstanding tax and penalty
(Amounts in `̀̀̀)
Name of dealer Item Quarter Sales as
per Return
Sale as per
records
Suppressed
Sale (incl. of
VAT)
Rate
(%) VAT
Penalty
(8) x 2
Amount
recovered
Outstanding
Amount
(1) (2) (3) (4) (5) (6) (7) (8) (9) (10) (11)
M/s Capital Steel
(TIN-14920286180)
Steel Mar-16 0 24,98,948 26,23,895 5 1,24,947 2,49,894 0 3,74,841
Sub-total 24,98,948 26,23,895
1,24,947 2,49,894 0 3,74,841
M/s Mahen Hardware
(TIN-14921733100)
Cement Sep-15 0 9,93,833 11,28,000 13.5 1,34,167 2,68,334 0
4,02,501
Mar-16 0 5,49,639 6,23,840 13.5 74,201 1,48,402 2,22,603
Sub-total 15,43,472 17,51,840
2,08,368 4,16,736 0 6,25,104
M/s Thokchom Ibomcha
Singh Enterprises
(TIN-14921931140)
Cement Sep-15 0 2,39,753 2,72,120 13.5 32,367 64,734 0 97,101
Sub-total
2,39,753 2,72,120
32,367 64,734 0 97,101
M/s L. Sanjit
Enterprises
(TIN-14920789166)
Cement Dec-14 0 1,52,423 1,73,000 13.5 20,577 41,154
51,145 1,02,290 Mar-15 0 1,51,542 1,72,000 13.5 20,458 40,916
Mar-16 0 74,890 85,000 13.5 10,110 20,220
Sub-total 3,78,855 4,30,000 51,145 1,02,290 51,145 1,02,290
M/s A.U. Brothers
(TIN-14810412159)
Steel Sep-14 1,66,320 5,31,693 3,83,642 5 18,269 36,538
1,87,185 3,68,478
Cement 3,65,48 2,07,753 1,94,318 13.5 23,113 46,226
Steel Dec-14 16,24,60 4,27,192 2,77,969 5 13,237 26,474
Cement 43,163 1,44,493 1,15,010 13.5 13,680 27,360
Steel Jun-15 1,78,860 3,36,102 1,65,104 5 7,862 15,724
Steel Sep-15 1,22,400 1,70,369 50,367 5 2,398 4,796
Cement 19,630 1,62,819 1,62,520 13.5 19,331 38,662
Cement Dec-15 70,533 89,076 21,046 13.5 2,503 5,006
Steel Mar-16 1,00,860 2,55,888 1,62,779 5 7,751 15,502
Cement 30,030 6,00,970 6,48,017 13.5 77,077 1,54,154
Sub-total 9,30,804 29,26,355 21,80,772 1,85,221 3,70,442 1,87,185 3,68,478
M/s E.K. Enterprises
(14920230105)
Cement Dec-14 0 19,77,498 22,44,460 13.5 2,66,962 5,33,924
*7,90,709 10,29,511
Cement Mar-15 0 8,41,561 9,55,172 13.5 1,13,611 2,27,222
Cement Sep-15 0 4,44,405 5,04,400 13.5 59,995 1,19,990
Cement Dec-15 0 12,25,074 13,70,788 13.5 1,45,714 2,91,428
Cement Mar-16 0 1,72,000 1,92,458 13.5 20,458 40,916
Sub-total 46,60,538 52,67,278 6,06,740 12,13,480 7,907,09 10,29,511
Grand Total 9,30,804 1,22,47,921 1,25,25,905 12,08,788 24,17,576 10,29,039 25,97,325
*Input Tax Credit (`̀̀̀ 6,24,537) + Tax paid `̀̀̀ (1,66,172)
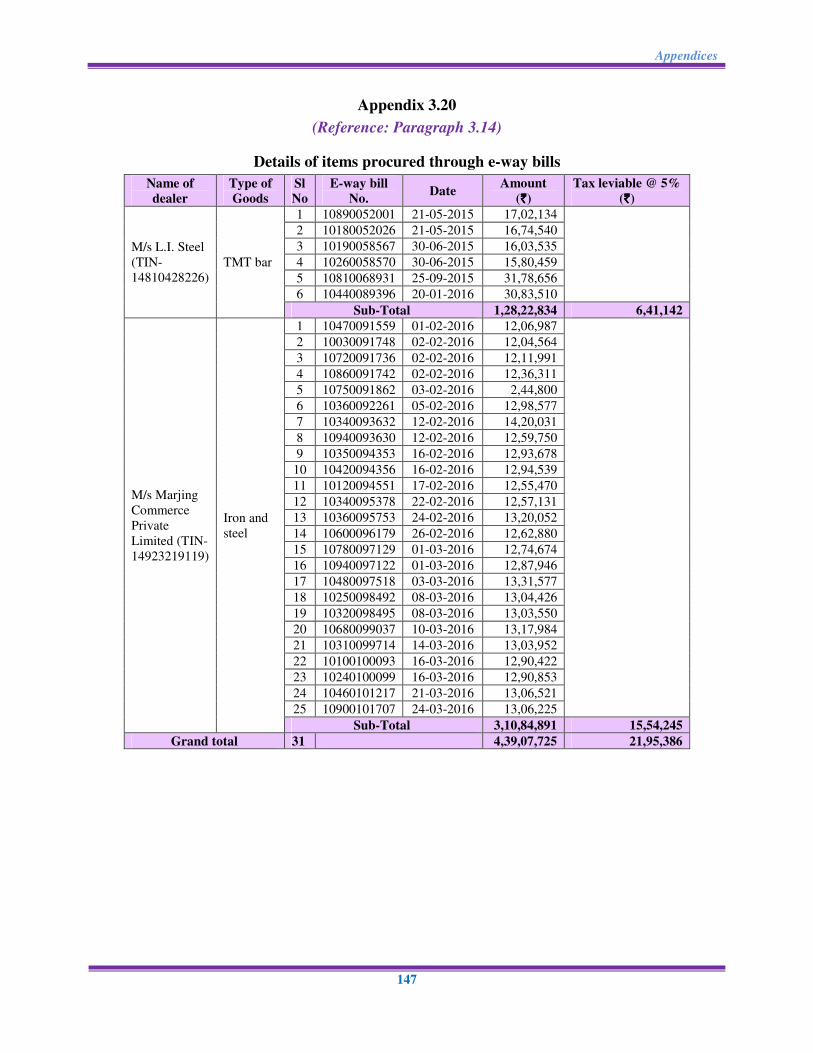
Appendices
147
Appendix 3.20
(Reference: Paragraph 3.14)
Details of items procured through e-way bills
Name of
dealer
Type of
Goods
Sl
No
E-way bill
No. Date
Amount
(`̀̀̀)
Tax leviable @ 5%
(`̀̀̀)
M/s L.I. Steel
(TIN-
14810428226)
TMT bar
1 10890052001 21-05-2015 17,02,134
2 10180052026 21-05-2015 16,74,540
3 10190058567 30-06-2015 16,03,535
4 10260058570 30-06-2015 15,80,459
5 10810068931 25-09-2015 31,78,656
6 10440089396 20-01-2016 30,83,510
Sub-Total 1,28,22,834 6,41,142
M/s Marjing
Commerce
Private
Limited (TIN-
14923219119)
Iron and
steel
1 10470091559 01-02-2016 12,06,987
2 10030091748 02-02-2016 12,04,564
3 10720091736 02-02-2016 12,11,991
4 10860091742 02-02-2016 12,36,311
5 10750091862 03-02-2016 2,44,800
6 10360092261 05-02-2016 12,98,577
7 10340093632 12-02-2016 14,20,031
8 10940093630 12-02-2016 12,59,750
9 10350094353 16-02-2016 12,93,678
10 10420094356 16-02-2016 12,94,539
11 10120094551 17-02-2016 12,55,470
12 10340095378 22-02-2016 12,57,131
13 10360095753 24-02-2016 13,20,052
14 10600096179 26-02-2016 12,62,880
15 10780097129 01-03-2016 12,74,674
16 10940097122 01-03-2016 12,87,946
17 10480097518 03-03-2016 13,31,577
18 10250098492 08-03-2016 13,04,426
19 10320098495 08-03-2016 13,03,550
20 10680099037 10-03-2016 13,17,984
21 10310099714 14-03-2016 13,03,952
22 10100100093 16-03-2016 12,90,422
23 10240100099 16-03-2016 12,90,853
24 10460101217 21-03-2016 13,06,521
25 10900101707 24-03-2016 13,06,225
Sub-Total 3,10,84,891 15,54,245
Grand total 31
4,39,07,725 21,95,386

Audit Report on Economic and Revenue Sectors for the year ended 31 March 2017
148
Appendix 3.21
(Reference: Paragraph 3.16)
Details of demand noticed served and outstanding tax and interest along with amount paid and outstanding amount
(Amounts in `̀̀̀)
Sl.
No. Name of Dealer & TIN No.
Quarter(s)
Ending
Tax
Assessed
Interest
Levied Total due
Demand
notice
served
on
Due
date for
payment
Tax Paid Date of
payment
Outstanding
Tax
Date up
to which
interest
was
calculated
No.
of
days
due
Penalty
Leviable
Total
amount
payable
Tax paid Outstanding
Amount
1 2 3 4 5 6 7 8 9 10 11 12 13 14 15 16 17
1
M/S W. Ibohal Singh &
Sons
(TIN-14310089189)
Mar-15 to Jun-15 11,01,052 2,23,031 13,24,083 20-08-16 19-09-16 11,00,657 Paid on
time 2,23,426 31-10-16 42 6,256
2,29,682
2,23,426
6,256
2
M/S Ashok Steel & Sanitary
Mart
(TIN-14110031137)
Jun-14 to Sep-14 38,95,485 1,72,592 40,68,077 27-06-15 27-07-15 38,95,485 Paid on
time 1,72,592 31-10-16 462 53,158
2,25,750
3,74,784 90,468
Dec-14 to Mar-15 51,95,852 1,14,103 53,09,955 22-08-15 21-09-15 51,95,852
Paid on
time 1,14,103 31-10-16 406 30,884
1,44,987
Jun-15 18,17,295 79,158 18,96,453 15-12-15 14-01-16 18,17,295 Paid on
time 79,158 31-10-16 291 15,357
94,515
Sub- Total 4,65,252
3 M/S Koraks Traders
(TIN-14010611187)
Mar-15 2,00,014 24,268 2,24,282 26-10-15 25-11-15 2,00,000 Paid on
time 24,282 31-10-16 341 5,520
29,802
- 29,802
Sep-12 to Dec-14 8,86,697 1,85,883 10,72,580 06-04-15 06-05-15 8,86,697 Paid on
time 1,85,883 31-10-16 544 67,414 2,53,297 - 2,53,297
Sub- Total 2,83,099
4 M/S S.B. Sons & Co.
(TIN-14210073196)
Mar-16 2,47,402 26,554 2,73,956 06-10-16 05-11-16 2,47,402 Paid on
time 26,554 31-10-16 -5 0 26,554
1,61,575 22,965
Dec-15 2,85,031 - 2,85,031 20-01-16 19-02-16 1,50,000 Paid on
time 1,35,031 31-10-16 255 22,955 1,57,986
Sub- Total 1,84,540
5
M/S Dinesh T.V.
Electronics (TIN-
14410118118)
Sep-15 to Mar-16 45,14,119 33,258 45,47,377 27-07-16 26-08-16 44,56,824 Paid on
time 90,553 31-10-16 66 3,984 94,537 90,553 3,984
6 M/S Banni Super Store
(TIN-14110020124) Jun-15 to Sep-15 16,63,964 59,330 17,23,294 09-02-16 10-03-16 16,63,963
Paid on
time 59,331 31-10-16 235 9,295 68,626 9,925 58,701
7 M/S Thokchom Iboyaima &
Sons (TIN-14410252100) Dec-14 to Sep-15 47,20,456 2,88,844 50,09,300 31-10-15 30-11-15 15,00,000
Paid on
time 35,09,300 03-02-16 65 1,52,070 29,29,116 23,10,000 6,19,116

Appendices
149
(Amounts in `̀̀̀)
Sl.
No. Name of Dealer & TIN No.
Quarter(s)
Ending
Tax
Assessed
Interest
Levied Total due
Demand
notice
served
on
Due
date for
payment
Tax Paid Date of
payment
Outstanding
Tax
Date up
to which
interest
was
calculated
No.
of
days
due
Penalty
Leviable
Total
amount
payable
Tax paid Outstanding
Amount
1 2 3 4 5 6 7 8 9 10 11 12 13 14 15 16 17
2,00,000 03-02-16 33,09,300 20-02-16 17 37,505
3,00,000 20-02-16 30,09,300 07-03-16 16 32,099
3,00,000 07-03-16 27,09,300 04-07-16 119 2,14,938
4,00,000 04-07-16 23,09,300 31-10-16 119 1,83,204
Sub Total 23,09,300 6,19,816
Total 2,45,27,367 12,07,021 2,57,34,388 2,23,14,175 34,20,213 8,34,639 42,54,852 31,70,263 10,84,589
Appendix 3.22
(Reference: Paragraph 3.17)
Details of penalty recovered at the instance of Audit and outstanding penalty for default in audit of accounts
(Amounts in `̀̀̀)
Sl
No
Name of Dealer &
TIN No.
Gross
Turnover for
2011-12, 2014-
15 and 2015-16
Penalty
leviable
Recovered
amount
Accepted
by audit
Amount
accepted by
audit
Excess
recovery
Reasons
for non-
acceptance,
If any
Remarks Outstanding
penalty
1
M/s Manipur Steel
Mart
(14310037154)
4,99,44,427 49,944 49,945 Yes 49,945 -
2
M/s Eastern India
Agency
(14510008112)
15,62,10,126 1,56,210 1,56,210 Yes 1,56,210 -
3
M/s Manipur Gun
House
(14110110151)
4,06,59,824 40,660 47,026 Yes 40,660 6,366
Excess
recovery -
4
M/s Vinod
Hardware Store
(14110013151)
2,72,21,076 27,221 27,221 Yes 27,221 -

Audit Report on Economic and Revenue Sectors for the year ended 31 March 2017
150
(Amounts in `̀̀̀)
Sl
No
Name of Dealer &
TIN No.
Gross
Turnover for
2011-12, 2014-
15 and 2015-16
Penalty
leviable
Recovered
amount
Accepted
by audit
Amount
accepted by
audit
Excess
recovery
Reasons
for non-
acceptance,
If any
Remarks Outstanding
penalty
5
M/s Manjushree
Sales Agency
(14410355160)
6,50,59,521 65,060 65,092 Yes 65,060 32
Excess
recovery -
6
M/s Singh Medical
Hall
(14410355160)
5,09,12,935 50,913 50,913 Yes 50,913 -
7 M/s Tiddim Motors
(14011712139) 30,19,74,663 3,01,975 -
- -
Notice
issued
(Nov
2016)
3,01,975
8
M/s Ranjit
Enterprises
(14310105155)
15,27,47,618 1,52,748 1,52,748 Yes 1,52,748 -
9 M/s S.K. Stores
(14510021145) 1,74,15,502 17,416 17,415 Yes 17,415 -
1
10
M/s Pritam Sales
Agency
(14510067120)
3,14,03,029 31,403 -
- -
Audited
statement
submitted,
however
date of
submission
was not
provided
31,403
11
M/s Panthoibi
Seeds House
(14011156108)
8,40,65,945 84,066 1,11,400 Yes 84,066 27,334
Excess
recovery -
12 M/s Raj Electronics
(14921741180) 2,04,56,652 20,457 -
- -
Notice
issued
(Aug
2017)
20,457
13
M/s Marble &
Sanitary House
(14510101169)
14,82,83,986 1,48,284 -
- -
Notice
issued
(Aug
2017)
1,48,284
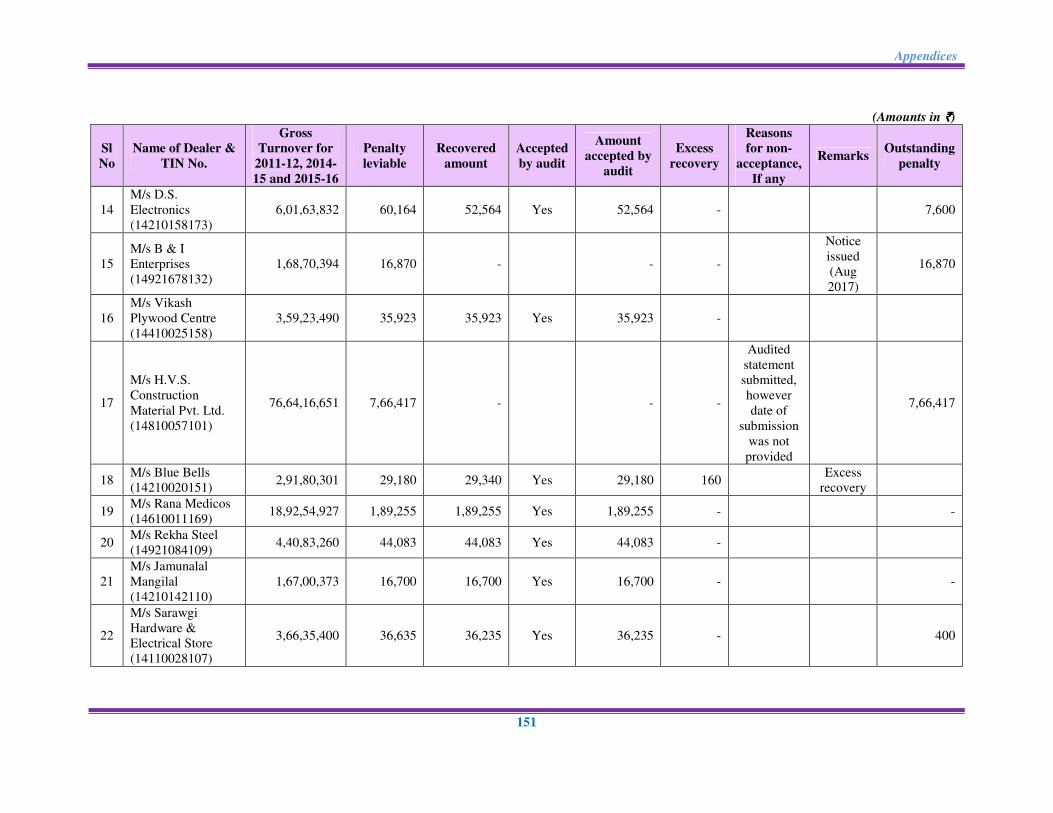
Appendices
151
(Amounts in `̀̀̀)
Sl
No
Name of Dealer &
TIN No.
Gross
Turnover for
2011-12, 2014-
15 and 2015-16
Penalty
leviable
Recovered
amount
Accepted
by audit
Amount
accepted by
audit
Excess
recovery
Reasons
for non-
acceptance,
If any
Remarks Outstanding
penalty
14
M/s D.S.
Electronics
(14210158173)
6,01,63,832 60,164 52,564 Yes 52,564 -
7,600
15
M/s B & I
Enterprises
(14921678132)
1,68,70,394 16,870 -
- -
Notice
issued
(Aug
2017)
16,870
16
M/s Vikash
Plywood Centre
(14410025158)
3,59,23,490 35,923 35,923 Yes 35,923 -
17
M/s H.V.S.
Construction
Material Pvt. Ltd.
(14810057101)
76,64,16,651 7,66,417 -
- -
Audited
statement
submitted,
however
date of
submission
was not
provided
7,66,417
18 M/s Blue Bells
(14210020151) 2,91,80,301 29,180 29,340 Yes 29,180 160
Excess
recovery
19 M/s Rana Medicos
(14610011169) 18,92,54,927 1,89,255 1,89,255 Yes 1,89,255 -
-
20 M/s Rekha Steel
(14921084109) 4,40,83,260 44,083 44,083 Yes 44,083 -
21
M/s Jamunalal
Mangilal
(14210142110)
1,67,00,373 16,700 16,700 Yes 16,700 -
-
22
M/s Sarawgi
Hardware &
Electrical Store
(14110028107)
3,66,35,400 36,635 36,235 Yes 36,235 -
400
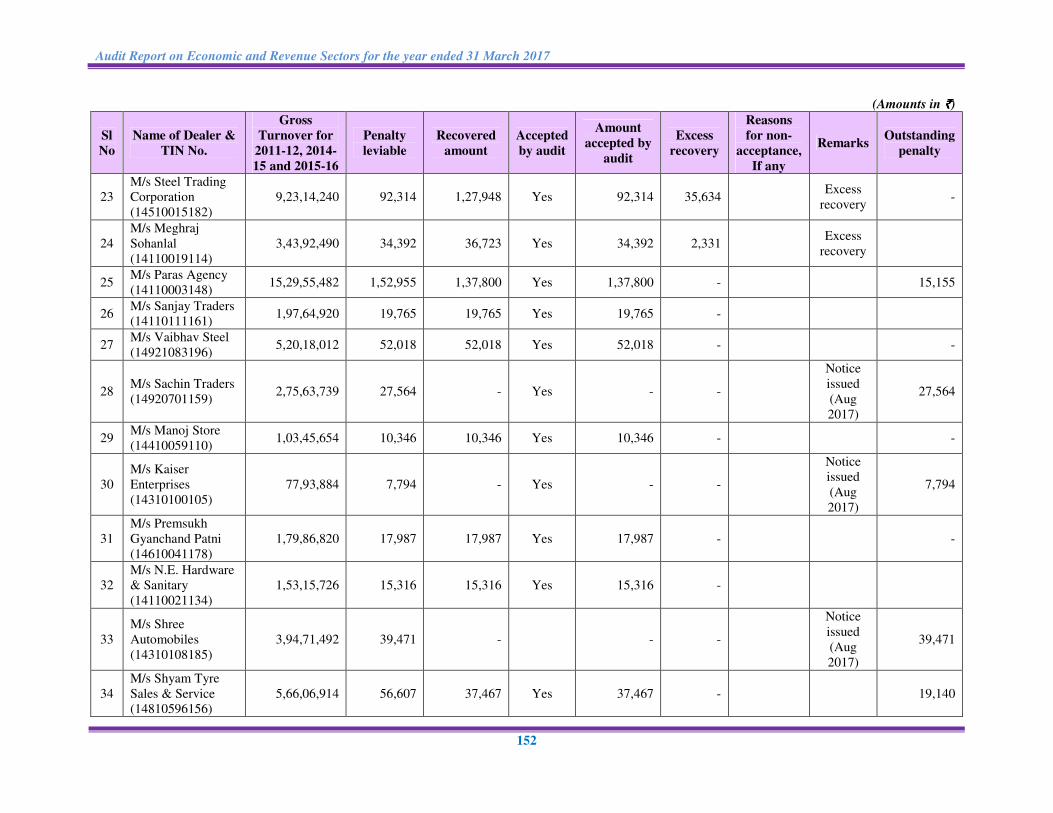
Audit Report on Economic and Revenue Sectors for the year ended 31 March 2017
152
(Amounts in `̀̀̀)
Sl
No
Name of Dealer &
TIN No.
Gross
Turnover for
2011-12, 2014-
15 and 2015-16
Penalty
leviable
Recovered
amount
Accepted
by audit
Amount
accepted by
audit
Excess
recovery
Reasons
for non-
acceptance,
If any
Remarks Outstanding
penalty
23
M/s Steel Trading
Corporation
(14510015182)
9,23,14,240 92,314 1,27,948 Yes 92,314 35,634
Excess
recovery -
24
M/s Meghraj
Sohanlal
(14110019114)
3,43,92,490 34,392 36,723 Yes 34,392 2,331
Excess
recovery
25 M/s Paras Agency
(14110003148) 15,29,55,482 1,52,955 1,37,800 Yes 1,37,800 -
15,155
26 M/s Sanjay Traders
(14110111161) 1,97,64,920 19,765 19,765 Yes 19,765 -
27 M/s Vaibhav Steel
(14921083196) 5,20,18,012 52,018 52,018 Yes 52,018 -
-
28 M/s Sachin Traders
(14920701159) 2,75,63,739 27,564 - Yes - -
Notice
issued
(Aug
2017)
27,564
29 M/s Manoj Store
(14410059110) 1,03,45,654 10,346 10,346 Yes 10,346 -
-
30
M/s Kaiser
Enterprises
(14310100105)
77,93,884 7,794 - Yes - -
Notice
issued
(Aug
2017)
7,794
31
M/s Premsukh
Gyanchand Patni
(14610041178)
1,79,86,820 17,987 17,987 Yes 17,987 -
-
32
M/s N.E. Hardware
& Sanitary
(14110021134)
1,53,15,726 15,316 15,316 Yes 15,316 -
33
M/s Shree
Automobiles
(14310108185)
3,94,71,492 39,471 -
- -
Notice
issued
(Aug
2017)
39,471
34
M/s Shyam Tyre
Sales & Service
(14810596156)
5,66,06,914 56,607 37,467 Yes 37,467 -
19,140
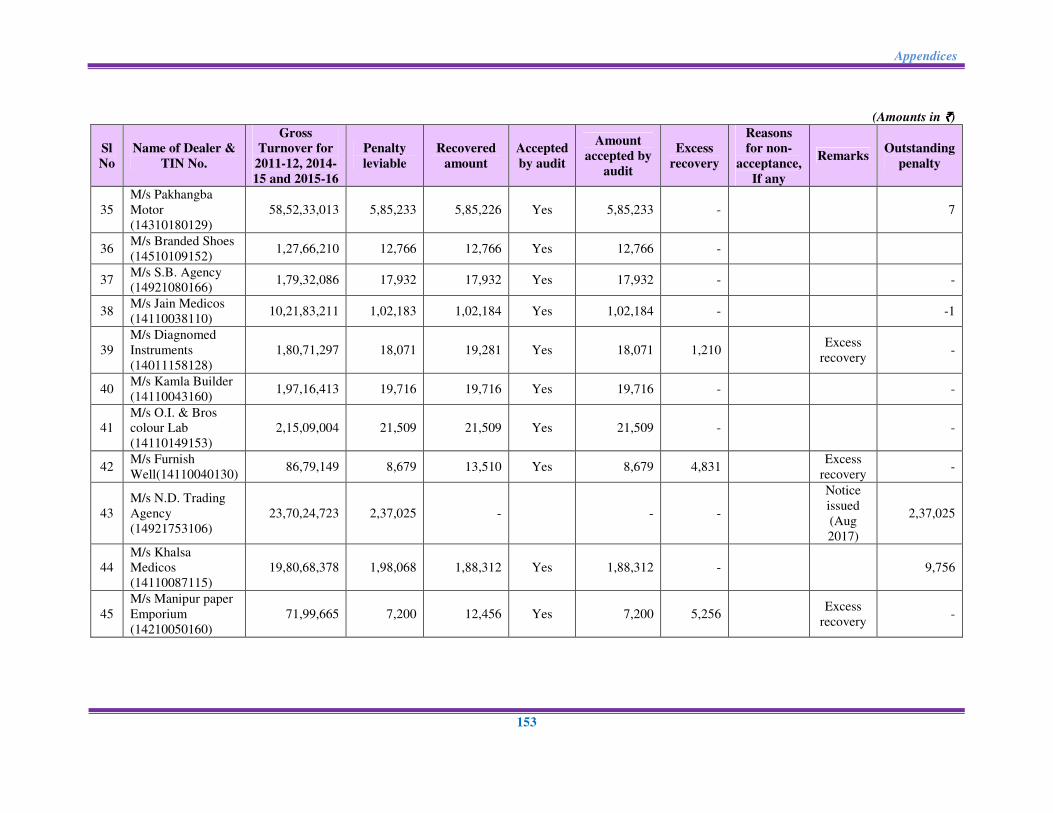
Appendices
153
(Amounts in `̀̀̀)
Sl
No
Name of Dealer &
TIN No.
Gross
Turnover for
2011-12, 2014-
15 and 2015-16
Penalty
leviable
Recovered
amount
Accepted
by audit
Amount
accepted by
audit
Excess
recovery
Reasons
for non-
acceptance,
If any
Remarks Outstanding
penalty
35
M/s Pakhangba
Motor
(14310180129)
58,52,33,013 5,85,233 5,85,226 Yes 5,85,233 -
7
36 M/s Branded Shoes
(14510109152) 1,27,66,210 12,766 12,766 Yes 12,766 -
37 M/s S.B. Agency
(14921080166) 1,79,32,086 17,932 17,932 Yes 17,932 -
-
38 M/s Jain Medicos
(14110038110) 10,21,83,211 1,02,183 1,02,184 Yes 1,02,184 -
-1
39
M/s Diagnomed
Instruments
(14011158128)
1,80,71,297 18,071 19,281 Yes 18,071 1,210
Excess
recovery -
40 M/s Kamla Builder
(14110043160) 1,97,16,413 19,716 19,716 Yes 19,716 -
-
41
M/s O.I. & Bros
colour Lab
(14110149153)
2,15,09,004 21,509 21,509 Yes 21,509 -
-
42 M/s Furnish
Well(14110040130) 86,79,149 8,679 13,510 Yes 8,679 4,831
Excess
recovery -
43
M/s N.D. Trading
Agency
(14921753106)
23,70,24,723 2,37,025 -
- -
Notice
issued
(Aug
2017)
2,37,025
44
M/s Khalsa
Medicos
(14110087115)
19,80,68,378 1,98,068 1,88,312 Yes 1,88,312 -
9,756
45
M/s Manipur paper
Emporium
(14210050160)
71,99,665 7,200 12,456 Yes 7,200 5,256
Excess
recovery -
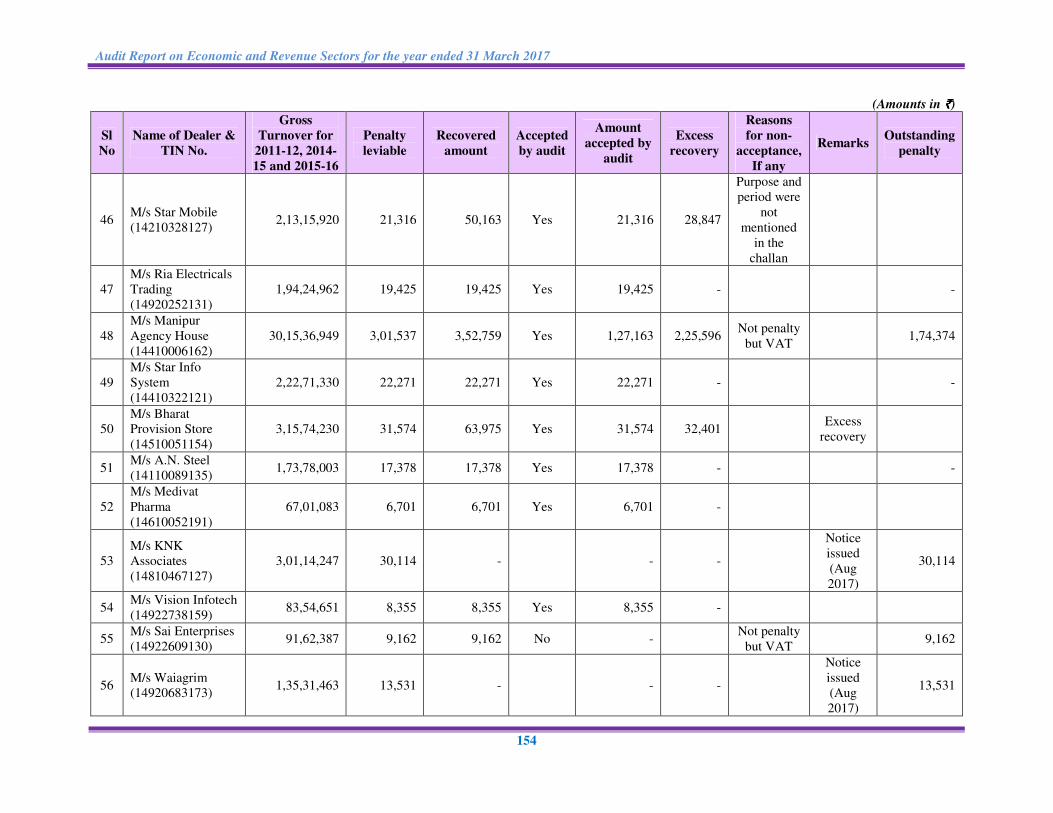
Audit Report on Economic and Revenue Sectors for the year ended 31 March 2017
154
(Amounts in `̀̀̀)
Sl
No
Name of Dealer &
TIN No.
Gross
Turnover for
2011-12, 2014-
15 and 2015-16
Penalty
leviable
Recovered
amount
Accepted
by audit
Amount
accepted by
audit
Excess
recovery
Reasons
for non-
acceptance,
If any
Remarks Outstanding
penalty
46 M/s Star Mobile
(14210328127) 2,13,15,920 21,316 50,163 Yes 21,316 28,847
Purpose and
period were
not
mentioned
in the
challan
47
M/s Ria Electricals
Trading
(14920252131)
1,94,24,962 19,425 19,425 Yes 19,425 -
-
48
M/s Manipur
Agency House
(14410006162)
30,15,36,949 3,01,537 3,52,759 Yes 1,27,163 2,25,596 Not penalty
but VAT 1,74,374
49
M/s Star Info
System
(14410322121)
2,22,71,330 22,271 22,271 Yes 22,271 -
-
50
M/s Bharat
Provision Store
(14510051154)
3,15,74,230 31,574 63,975 Yes 31,574 32,401
Excess
recovery
51 M/s A.N. Steel
(14110089135) 1,73,78,003 17,378 17,378 Yes 17,378 -
-
52
M/s Medivat
Pharma
(14610052191)
67,01,083 6,701 6,701 Yes 6,701 -
53
M/s KNK
Associates
(14810467127)
3,01,14,247 30,114 -
- -
Notice
issued
(Aug
2017)
30,114
54 M/s Vision Infotech
(14922738159) 83,54,651 8,355 8,355 Yes 8,355 -
55 M/s Sai Enterprises
(14922609130) 91,62,387 9,162 9,162 No -
Not penalty
but VAT 9,162
56 M/s Waiagrim
(14920683173) 1,35,31,463 13,531 -
- -
Notice
issued
(Aug
2017)
13,531

Appendices
155
(Amounts in `̀̀̀)
Sl
No
Name of Dealer &
TIN No.
Gross
Turnover for
2011-12, 2014-
15 and 2015-16
Penalty
leviable
Recovered
amount
Accepted
by audit
Amount
accepted by
audit
Excess
recovery
Reasons
for non-
acceptance,
If any
Remarks Outstanding
penalty
57
M/s Manipur
Trading Co.
(14920634168)
34,51,58,179 3,45,158 10,18,742 Yes 3,45,158 6,73,584
Excess
recovery -
58 M/s Sudheer Iron
Store (1492913154) 2,43,60,364 24,360 24,360 Yes 24,360 -
59
M/s S.B.
Enterprises
(14921270126)
4,37,38,091 43,738 - - - -
Notice
issued
(Aug
2017)
43,738
60
M/s Krishna
Traders
(14010765175)
11,19,00,510 1,11,901 1,11,801 Yes 1,11,801 -
100
61
M/s Samayak Retail
Service Pvt. Ltd.
(14922211127)
11,21,20,997 1,12,121 - - - -
1,12,121
62
M/s N. Noyon
Singh & Sons
(14210001155)
1,85,85,767 18,586 - - - -
Audited
statement
submitted,
however
date of
submission
was not
provided
18,586
63 M/s Guru Steel
(14510150174) 7,13,11,345 71,311 71,311 Yes 71,311 -
-
64 M/s Eastern Motors
(14010036160) 1,16,85,73,974 11,68,574 11,68,574 No
Not penalty
but VAT
and period
not
mentioned
11,68,574
65
M/s M.G.T. Motors
Private Limited
(14010083129)
1,08,54,46,756 10,85,447 10,85,447 Yes 10,85,447 -
-
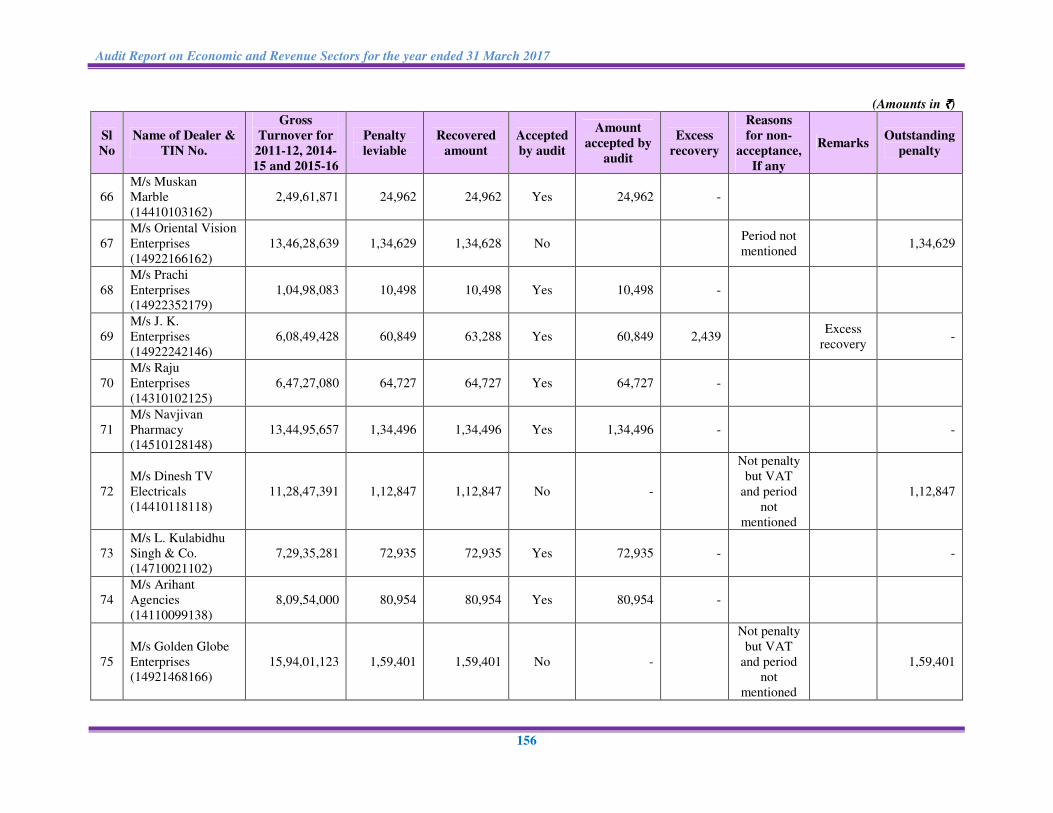
Audit Report on Economic and Revenue Sectors for the year ended 31 March 2017
156
(Amounts in `̀̀̀)
Sl
No
Name of Dealer &
TIN No.
Gross
Turnover for
2011-12, 2014-
15 and 2015-16
Penalty
leviable
Recovered
amount
Accepted
by audit
Amount
accepted by
audit
Excess
recovery
Reasons
for non-
acceptance,
If any
Remarks Outstanding
penalty
66
M/s Muskan
Marble
(14410103162)
2,49,61,871 24,962 24,962 Yes 24,962 -
67
M/s Oriental Vision
Enterprises
(14922166162)
13,46,28,639 1,34,629 1,34,628 No
Period not
mentioned 1,34,629
68
M/s Prachi
Enterprises
(14922352179)
1,04,98,083 10,498 10,498 Yes 10,498 -
69
M/s J. K.
Enterprises
(14922242146)
6,08,49,428 60,849 63,288 Yes 60,849 2,439
Excess
recovery -
70
M/s Raju
Enterprises
(14310102125)
6,47,27,080 64,727 64,727 Yes 64,727 -
71
M/s Navjivan
Pharmacy
(14510128148)
13,44,95,657 1,34,496 1,34,496 Yes 1,34,496 -
-
72
M/s Dinesh TV
Electricals
(14410118118)
11,28,47,391 1,12,847 1,12,847 No -
Not penalty
but VAT
and period
not
mentioned
1,12,847
73
M/s L. Kulabidhu
Singh & Co.
(14710021102)
7,29,35,281 72,935 72,935 Yes 72,935 -
-
74
M/s Arihant
Agencies
(14110099138)
8,09,54,000 80,954 80,954 Yes 80,954 -
75
M/s Golden Globe
Enterprises
(14921468166)
15,94,01,123 1,59,401 1,59,401 No -
Not penalty
but VAT
and period
not
mentioned
1,59,401
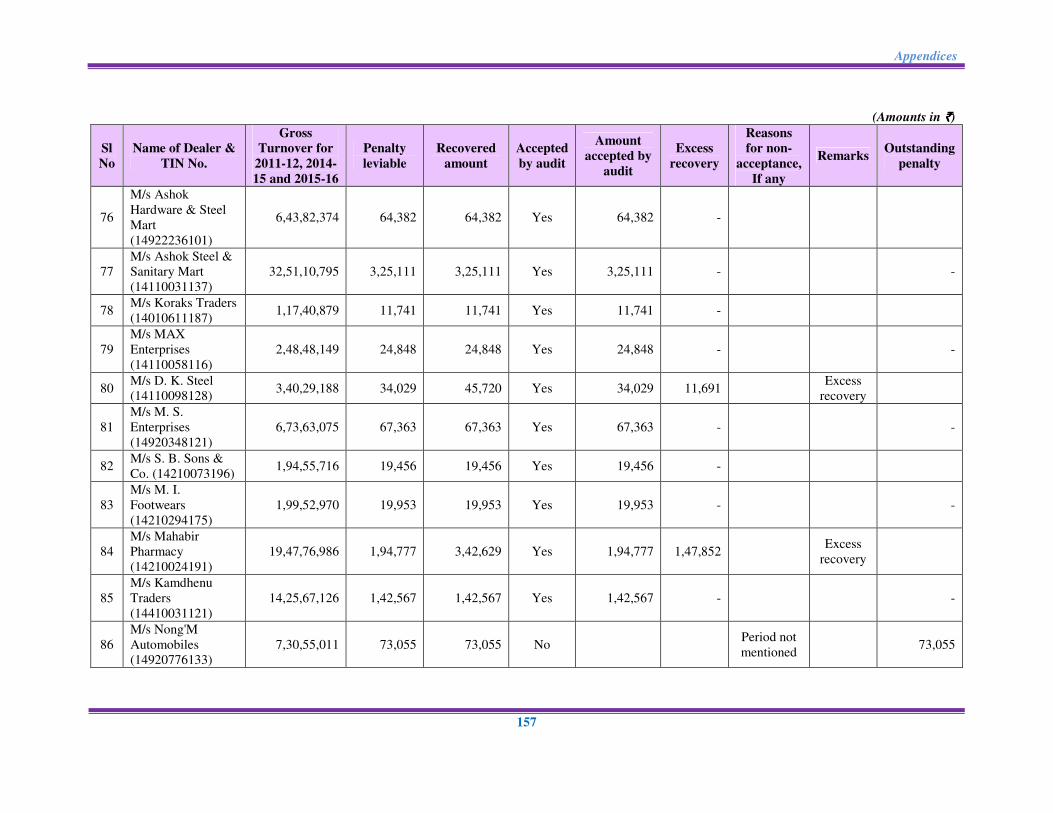
Appendices
157
(Amounts in `̀̀̀)
Sl
No
Name of Dealer &
TIN No.
Gross
Turnover for
2011-12, 2014-
15 and 2015-16
Penalty
leviable
Recovered
amount
Accepted
by audit
Amount
accepted by
audit
Excess
recovery
Reasons
for non-
acceptance,
If any
Remarks Outstanding
penalty
76
M/s Ashok
Hardware & Steel
Mart
(14922236101)
6,43,82,374 64,382 64,382 Yes 64,382 -
77
M/s Ashok Steel &
Sanitary Mart
(14110031137)
32,51,10,795 3,25,111 3,25,111 Yes 3,25,111 -
-
78 M/s Koraks Traders
(14010611187) 1,17,40,879 11,741 11,741 Yes 11,741 -
79
M/s MAX
Enterprises
(14110058116)
2,48,48,149 24,848 24,848 Yes 24,848 -
-
80 M/s D. K. Steel
(14110098128) 3,40,29,188 34,029 45,720 Yes 34,029 11,691
Excess
recovery
81
M/s M. S.
Enterprises
(14920348121)
6,73,63,075 67,363 67,363 Yes 67,363 -
-
82 M/s S. B. Sons &
Co. (14210073196) 1,94,55,716 19,456 19,456 Yes 19,456 -
83
M/s M. I.
Footwears
(14210294175)
1,99,52,970 19,953 19,953 Yes 19,953 -
-
84
M/s Mahabir
Pharmacy
(14210024191)
19,47,76,986 1,94,777 3,42,629 Yes 1,94,777 1,47,852
Excess
recovery
85
M/s Kamdhenu
Traders
(14410031121)
14,25,67,126 1,42,567 1,42,567 Yes 1,42,567 -
-
86
M/s Nong'M
Automobiles
(14920776133)
7,30,55,011 73,055 73,055 No
Period not
mentioned 73,055
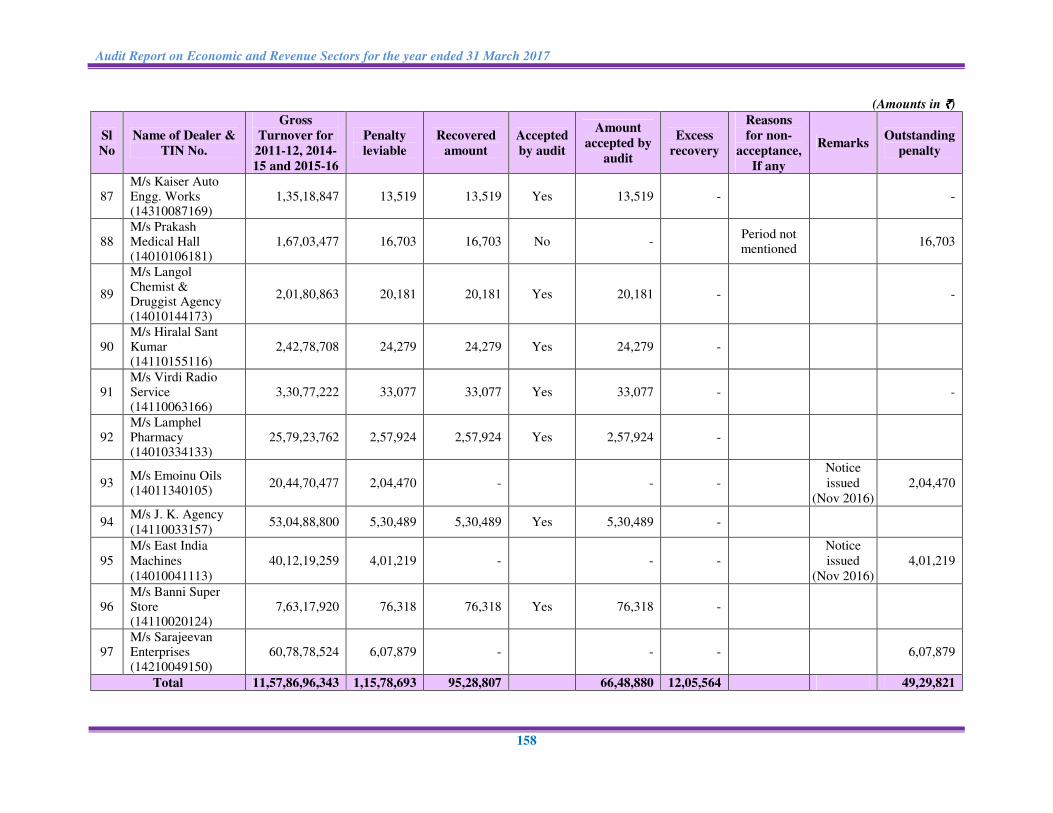
Audit Report on Economic and Revenue Sectors for the year ended 31 March 2017
158
(Amounts in `̀̀̀)
Sl
No
Name of Dealer &
TIN No.
Gross
Turnover for
2011-12, 2014-
15 and 2015-16
Penalty
leviable
Recovered
amount
Accepted
by audit
Amount
accepted by
audit
Excess
recovery
Reasons
for non-
acceptance,
If any
Remarks Outstanding
penalty
87 M/s Kaiser Auto Engg. Works (14310087169)
1,35,18,847 13,519 13,519 Yes 13,519 -
-
88 M/s Prakash Medical Hall (14010106181)
1,67,03,477 16,703 16,703 No -
Period not mentioned
16,703
89
M/s Langol Chemist & Druggist Agency (14010144173)
2,01,80,863 20,181 20,181 Yes 20,181 -
-
90 M/s Hiralal Sant Kumar (14110155116)
2,42,78,708 24,279 24,279 Yes 24,279 -
91 M/s Virdi Radio Service (14110063166)
3,30,77,222 33,077 33,077 Yes 33,077 -
-
92 M/s Lamphel Pharmacy (14010334133)
25,79,23,762 2,57,924 2,57,924 Yes 2,57,924 -
93 M/s Emoinu Oils (14011340105)
20,44,70,477 2,04,470 -
- -
Notice
issued
(Nov 2016)
2,04,470
94 M/s J. K. Agency
(14110033157) 53,04,88,800 5,30,489 5,30,489 Yes 5,30,489 -
95
M/s East India
Machines
(14010041113)
40,12,19,259 4,01,219 -
- -
Notice
issued
(Nov 2016)
4,01,219
96 M/s Banni Super Store (14110020124)
7,63,17,920 76,318 76,318 Yes 76,318 -
97 M/s Sarajeevan Enterprises (14210049150)
60,78,78,524 6,07,879 -
- -
6,07,879
Total 11,57,86,96,343 1,15,78,693 95,28,807
66,48,880 12,05,564
49,29,821
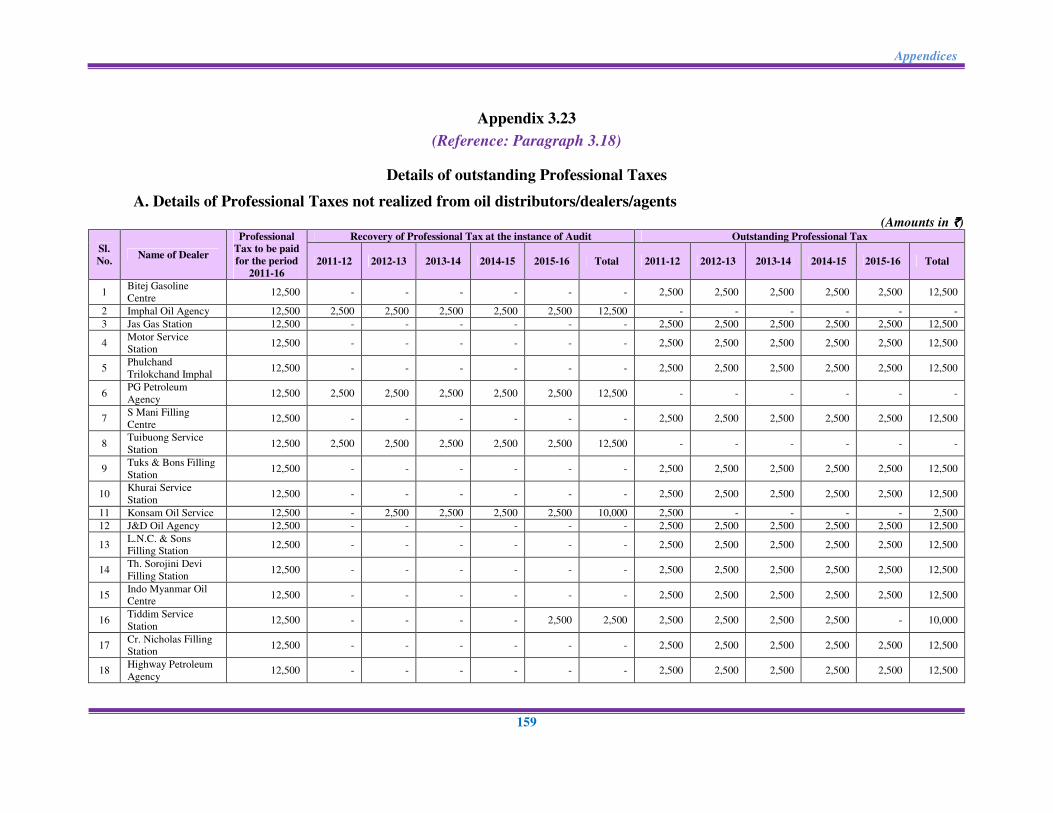
Appendices
159
Appendix 3.23
(Reference: Paragraph 3.18)
Details of outstanding Professional Taxes
A. Details of Professional Taxes not realized from oil distributors/dealers/agents
(Amounts in `̀̀̀)
Sl.
No. Name of Dealer
Professional
Tax to be paid
for the period
2011-16
Recovery of Professional Tax at the instance of Audit Outstanding Professional Tax
2011-12 2012-13 2013-14 2014-15 2015-16 Total 2011-12 2012-13 2013-14 2014-15 2015-16 Total
1 Bitej Gasoline
Centre 12,500 - - - - - - 2,500 2,500 2,500 2,500 2,500 12,500
2 Imphal Oil Agency 12,500 2,500 2,500 2,500 2,500 2,500 12,500 - - - - - -
3 Jas Gas Station 12,500 - - - - - - 2,500 2,500 2,500 2,500 2,500 12,500
4 Motor Service
Station 12,500 - - - - - - 2,500 2,500 2,500 2,500 2,500 12,500
5 Phulchand
Trilokchand Imphal 12,500 - - - - - - 2,500 2,500 2,500 2,500 2,500 12,500
6 PG Petroleum
Agency 12,500 2,500 2,500 2,500 2,500 2,500 12,500 - - - - - -
7 S Mani Filling
Centre 12,500 - - - - - - 2,500 2,500 2,500 2,500 2,500 12,500
8 Tuibuong Service
Station 12,500 2,500 2,500 2,500 2,500 2,500 12,500 - - - - - -
9 Tuks & Bons Filling
Station 12,500 - - - - - - 2,500 2,500 2,500 2,500 2,500 12,500
10 Khurai Service
Station 12,500 - - - - - - 2,500 2,500 2,500 2,500 2,500 12,500
11 Konsam Oil Service 12,500 - 2,500 2,500 2,500 2,500 10,000 2,500 - - - - 2,500
12 J&D Oil Agency 12,500 - - - - - - 2,500 2,500 2,500 2,500 2,500 12,500
13 L.N.C. & Sons
Filling Station 12,500 - - - - - - 2,500 2,500 2,500 2,500 2,500 12,500
14 Th. Sorojini Devi
Filling Station 12,500 - - - - - - 2,500 2,500 2,500 2,500 2,500 12,500
15 Indo Myanmar Oil
Centre 12,500 - - - - - - 2,500 2,500 2,500 2,500 2,500 12,500
16 Tiddim Service
Station 12,500 - - - - 2,500 2,500 2,500 2,500 2,500 2,500 - 10,000
17 Cr. Nicholas Filling
Station 12,500 - - - - - - 2,500 2,500 2,500 2,500 2,500 12,500
18 Highway Petroleum
Agency 12,500 - - - - - - 2,500 2,500 2,500 2,500 2,500 12,500
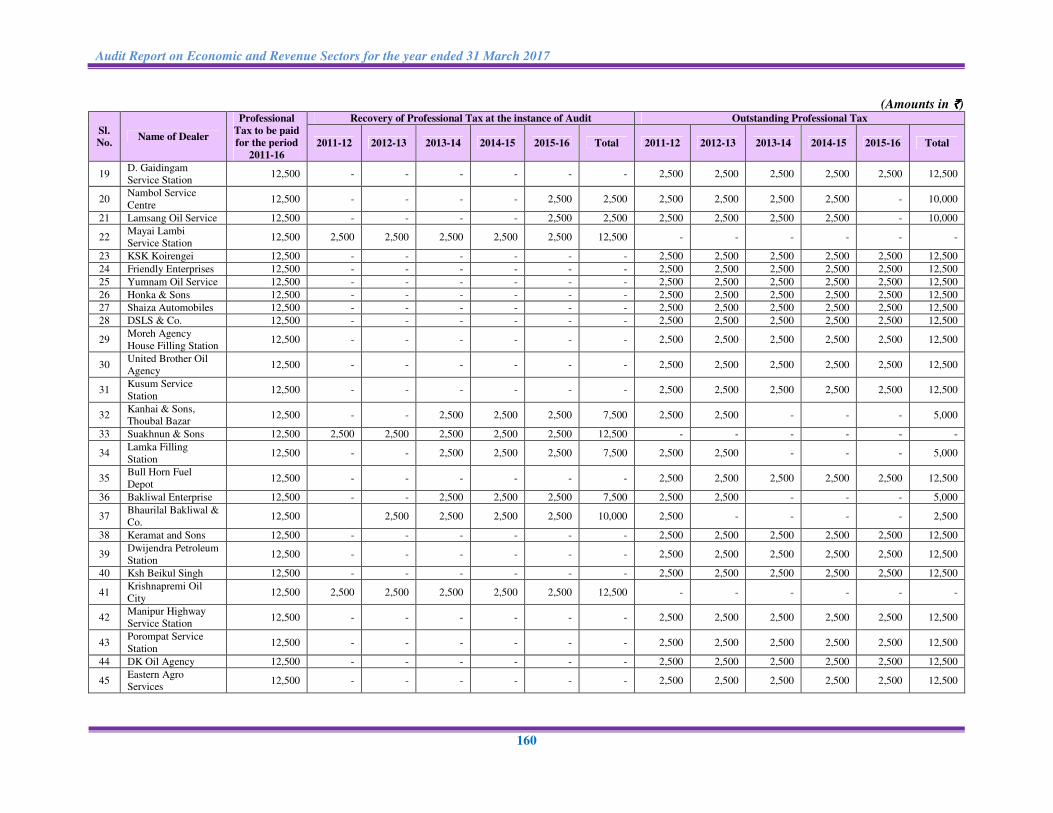
Audit Report on Economic and Revenue Sectors for the year ended 31 March 2017
160
(Amounts in `̀̀̀)
Sl.
No. Name of Dealer
Professional
Tax to be paid
for the period
2011-16
Recovery of Professional Tax at the instance of Audit Outstanding Professional Tax
2011-12 2012-13 2013-14 2014-15 2015-16 Total 2011-12 2012-13 2013-14 2014-15 2015-16 Total
19 D. Gaidingam
Service Station 12,500 - - - - - - 2,500 2,500 2,500 2,500 2,500 12,500
20 Nambol Service
Centre 12,500 - - - - 2,500 2,500 2,500 2,500 2,500 2,500 - 10,000
21 Lamsang Oil Service 12,500 - - - - 2,500 2,500 2,500 2,500 2,500 2,500 - 10,000
22 Mayai Lambi
Service Station 12,500 2,500 2,500 2,500 2,500 2,500 12,500 - - - - - -
23 KSK Koirengei 12,500 - - - - - - 2,500 2,500 2,500 2,500 2,500 12,500
24 Friendly Enterprises 12,500 - - - - - - 2,500 2,500 2,500 2,500 2,500 12,500
25 Yumnam Oil Service 12,500 - - - - - - 2,500 2,500 2,500 2,500 2,500 12,500
26 Honka & Sons 12,500 - - - - - - 2,500 2,500 2,500 2,500 2,500 12,500
27 Shaiza Automobiles 12,500 - - - - - - 2,500 2,500 2,500 2,500 2,500 12,500
28 DSLS & Co. 12,500 - - - - - - 2,500 2,500 2,500 2,500 2,500 12,500
29 Moreh Agency
House Filling Station 12,500 - - - - - - 2,500 2,500 2,500 2,500 2,500 12,500
30 United Brother Oil
Agency 12,500 - - - - - - 2,500 2,500 2,500 2,500 2,500 12,500
31 Kusum Service
Station 12,500 - - - - - - 2,500 2,500 2,500 2,500 2,500 12,500
32 Kanhai & Sons,
Thoubal Bazar 12,500 - - 2,500 2,500 2,500 7,500 2,500 2,500 - - - 5,000
33 Suakhnun & Sons 12,500 2,500 2,500 2,500 2,500 2,500 12,500 - - - - - -
34 Lamka Filling
Station 12,500 - - 2,500 2,500 2,500 7,500 2,500 2,500 - - - 5,000
35 Bull Horn Fuel
Depot 12,500 - - - - - - 2,500 2,500 2,500 2,500 2,500 12,500
36 Bakliwal Enterprise 12,500 - - 2,500 2,500 2,500 7,500 2,500 2,500 - - - 5,000
37 Bhaurilal Bakliwal &
Co. 12,500
2,500 2,500 2,500 2,500 10,000 2,500 - - - - 2,500
38 Keramat and Sons 12,500 - - - - - - 2,500 2,500 2,500 2,500 2,500 12,500
39 Dwijendra Petroleum
Station 12,500 - - - - - - 2,500 2,500 2,500 2,500 2,500 12,500
40 Ksh Beikul Singh 12,500 - - - - - - 2,500 2,500 2,500 2,500 2,500 12,500
41 Krishnapremi Oil
City 12,500 2,500 2,500 2,500 2,500 2,500 12,500 - - - - - -
42 Manipur Highway
Service Station 12,500 - - - - - - 2,500 2,500 2,500 2,500 2,500 12,500
43 Porompat Service
Station 12,500 - - - - - - 2,500 2,500 2,500 2,500 2,500 12,500
44 DK Oil Agency 12,500 - - - - - - 2,500 2,500 2,500 2,500 2,500 12,500
45 Eastern Agro
Services 12,500 - - - - - - 2,500 2,500 2,500 2,500 2,500 12,500
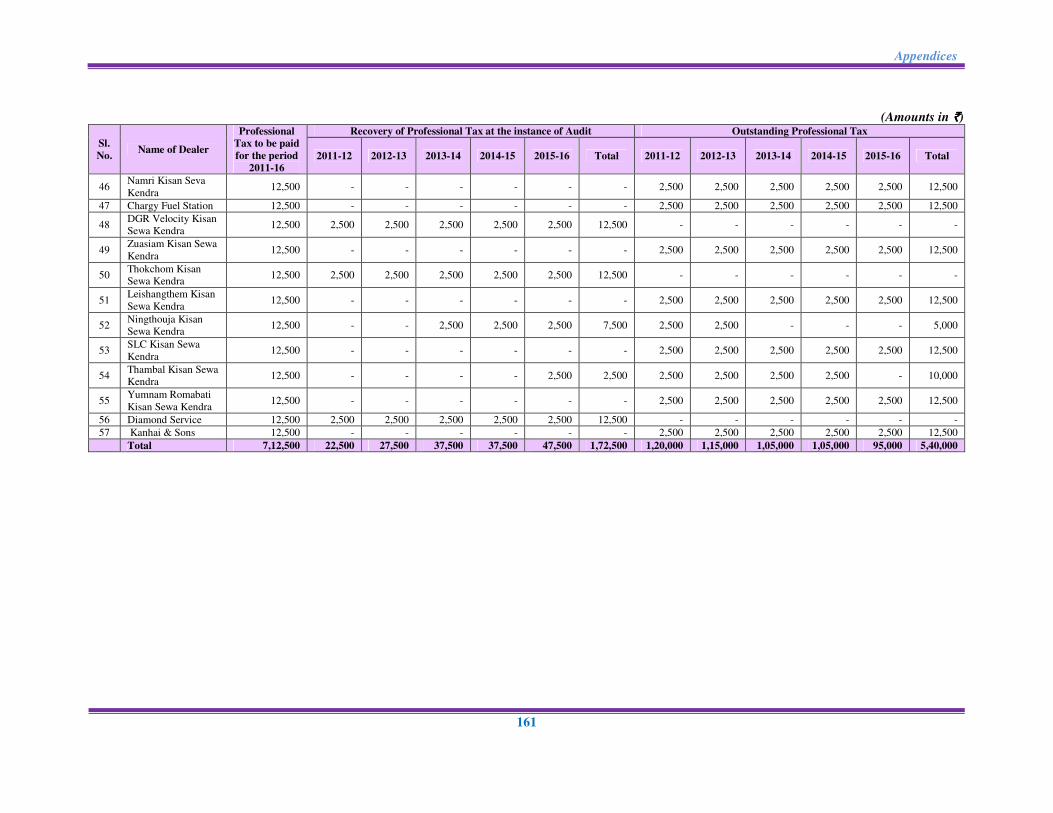
Appendices
161
(Amounts in `̀̀̀)
Sl.
No. Name of Dealer
Professional
Tax to be paid
for the period
2011-16
Recovery of Professional Tax at the instance of Audit Outstanding Professional Tax
2011-12 2012-13 2013-14 2014-15 2015-16 Total 2011-12 2012-13 2013-14 2014-15 2015-16 Total
46 Namri Kisan Seva
Kendra 12,500 - - - - - - 2,500 2,500 2,500 2,500 2,500 12,500
47 Chargy Fuel Station 12,500 - - - - - - 2,500 2,500 2,500 2,500 2,500 12,500
48 DGR Velocity Kisan
Sewa Kendra 12,500 2,500 2,500 2,500 2,500 2,500 12,500 - - - - - -
49 Zuasiam Kisan Sewa
Kendra 12,500 - - - - - - 2,500 2,500 2,500 2,500 2,500 12,500
50 Thokchom Kisan
Sewa Kendra 12,500 2,500 2,500 2,500 2,500 2,500 12,500 - - - - - -
51 Leishangthem Kisan
Sewa Kendra 12,500 - - - - - - 2,500 2,500 2,500 2,500 2,500 12,500
52 Ningthouja Kisan
Sewa Kendra 12,500 - - 2,500 2,500 2,500 7,500 2,500 2,500 - - - 5,000
53 SLC Kisan Sewa
Kendra 12,500 - - - - - - 2,500 2,500 2,500 2,500 2,500 12,500
54 Thambal Kisan Sewa
Kendra 12,500 - - - - 2,500 2,500 2,500 2,500 2,500 2,500 - 10,000
55 Yumnam Romabati
Kisan Sewa Kendra 12,500 - - - - - - 2,500 2,500 2,500 2,500 2,500 12,500
56 Diamond Service 12,500 2,500 2,500 2,500 2,500 2,500 12,500 - - - - - -
57 Kanhai & Sons 12,500 - - - - - - 2,500 2,500 2,500 2,500 2,500 12,500
Total 7,12,500 22,500 27,500 37,500 37,500 47,500 1,72,500 1,20,000 1,15,000 1,05,000 1,05,000 95,000 5,40,000
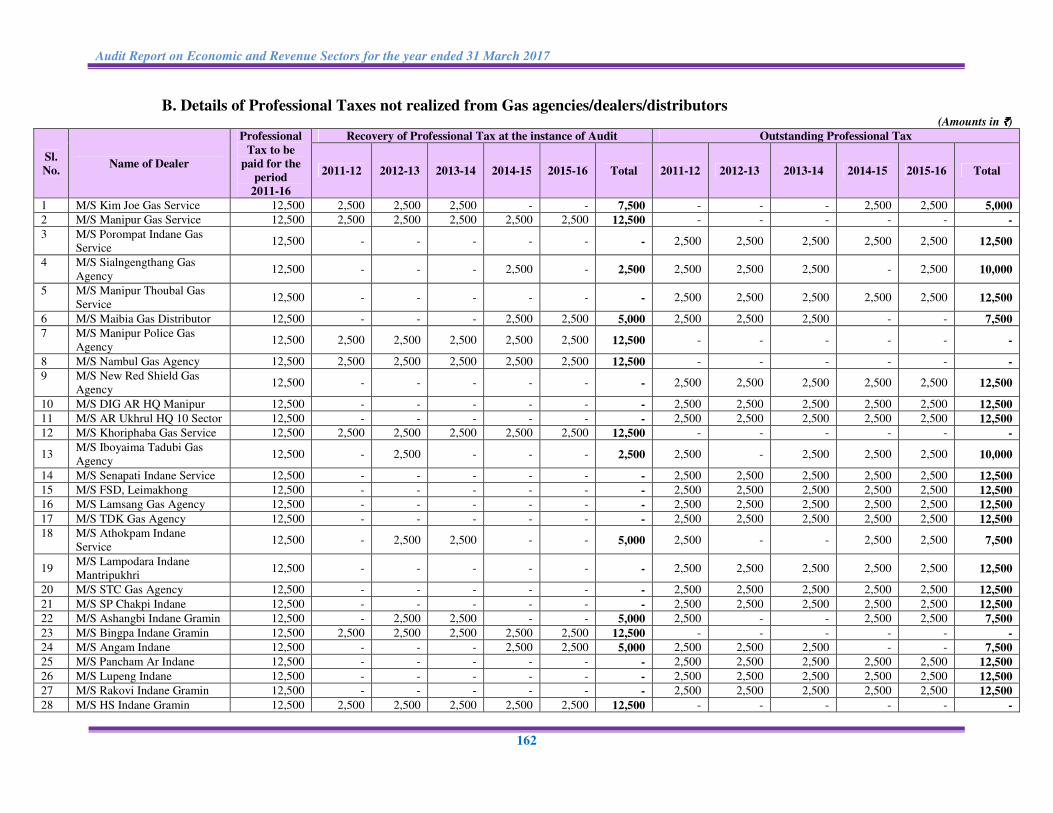
Audit Report on Economic and Revenue Sectors for the year ended 31 March 2017
162
B. Details of Professional Taxes not realized from Gas agencies/dealers/distributors (Amounts in `̀̀̀)
Sl.
No. Name of Dealer
Professional
Tax to be
paid for the
period
2011-16
Recovery of Professional Tax at the instance of Audit Outstanding Professional Tax
2011-12 2012-13 2013-14 2014-15 2015-16 Total 2011-12 2012-13 2013-14 2014-15 2015-16 Total
1 M/S Kim Joe Gas Service 12,500 2,500 2,500 2,500 - - 7,500 - - - 2,500 2,500 5,000
2 M/S Manipur Gas Service 12,500 2,500 2,500 2,500 2,500 2,500 12,500 - - - - - -
3 M/S Porompat Indane Gas
Service 12,500 - - - - - - 2,500 2,500 2,500 2,500 2,500 12,500
4 M/S Sialngengthang Gas
Agency 12,500 - - - 2,500 - 2,500 2,500 2,500 2,500 - 2,500 10,000
5 M/S Manipur Thoubal Gas
Service 12,500 - - - - - - 2,500 2,500 2,500 2,500 2,500 12,500
6 M/S Maibia Gas Distributor 12,500 - - - 2,500 2,500 5,000 2,500 2,500 2,500 - - 7,500
7 M/S Manipur Police Gas
Agency 12,500 2,500 2,500 2,500 2,500 2,500 12,500 - - - - - -
8 M/S Nambul Gas Agency 12,500 2,500 2,500 2,500 2,500 2,500 12,500 - - - - - -
9 M/S New Red Shield Gas
Agency 12,500 - - - - - - 2,500 2,500 2,500 2,500 2,500 12,500
10 M/S DIG AR HQ Manipur 12,500 - - - - - - 2,500 2,500 2,500 2,500 2,500 12,500
11 M/S AR Ukhrul HQ 10 Sector 12,500 - - - - - - 2,500 2,500 2,500 2,500 2,500 12,500
12 M/S Khoriphaba Gas Service 12,500 2,500 2,500 2,500 2,500 2,500 12,500 - - - - - -
13 M/S Iboyaima Tadubi Gas
Agency 12,500 - 2,500 - - - 2,500 2,500 - 2,500 2,500 2,500 10,000
14 M/S Senapati Indane Service 12,500 - - - - - - 2,500 2,500 2,500 2,500 2,500 12,500
15 M/S FSD, Leimakhong 12,500 - - - - - - 2,500 2,500 2,500 2,500 2,500 12,500
16 M/S Lamsang Gas Agency 12,500 - - - - - - 2,500 2,500 2,500 2,500 2,500 12,500
17 M/S TDK Gas Agency 12,500 - - - - - - 2,500 2,500 2,500 2,500 2,500 12,500
18 M/S Athokpam Indane
Service 12,500 - 2,500 2,500 - - 5,000 2,500 - - 2,500 2,500 7,500
19 M/S Lampodara Indane
Mantripukhri 12,500 - - - - - - 2,500 2,500 2,500 2,500 2,500 12,500
20 M/S STC Gas Agency 12,500 - - - - - - 2,500 2,500 2,500 2,500 2,500 12,500
21 M/S SP Chakpi Indane 12,500 - - - - - - 2,500 2,500 2,500 2,500 2,500 12,500
22 M/S Ashangbi Indane Gramin 12,500 - 2,500 2,500 - - 5,000 2,500 - - 2,500 2,500 7,500
23 M/S Bingpa Indane Gramin 12,500 2,500 2,500 2,500 2,500 2,500 12,500 - - - - - -
24 M/S Angam Indane 12,500 - - - 2,500 2,500 5,000 2,500 2,500 2,500 - - 7,500
25 M/S Pancham Ar Indane 12,500 - - - - - - 2,500 2,500 2,500 2,500 2,500 12,500
26 M/S Lupeng Indane 12,500 - - - - - - 2,500 2,500 2,500 2,500 2,500 12,500
27 M/S Rakovi Indane Gramin 12,500 - - - - - - 2,500 2,500 2,500 2,500 2,500 12,500
28 M/S HS Indane Gramin 12,500 2,500 2,500 2,500 2,500 2,500 12,500 - - - - - -
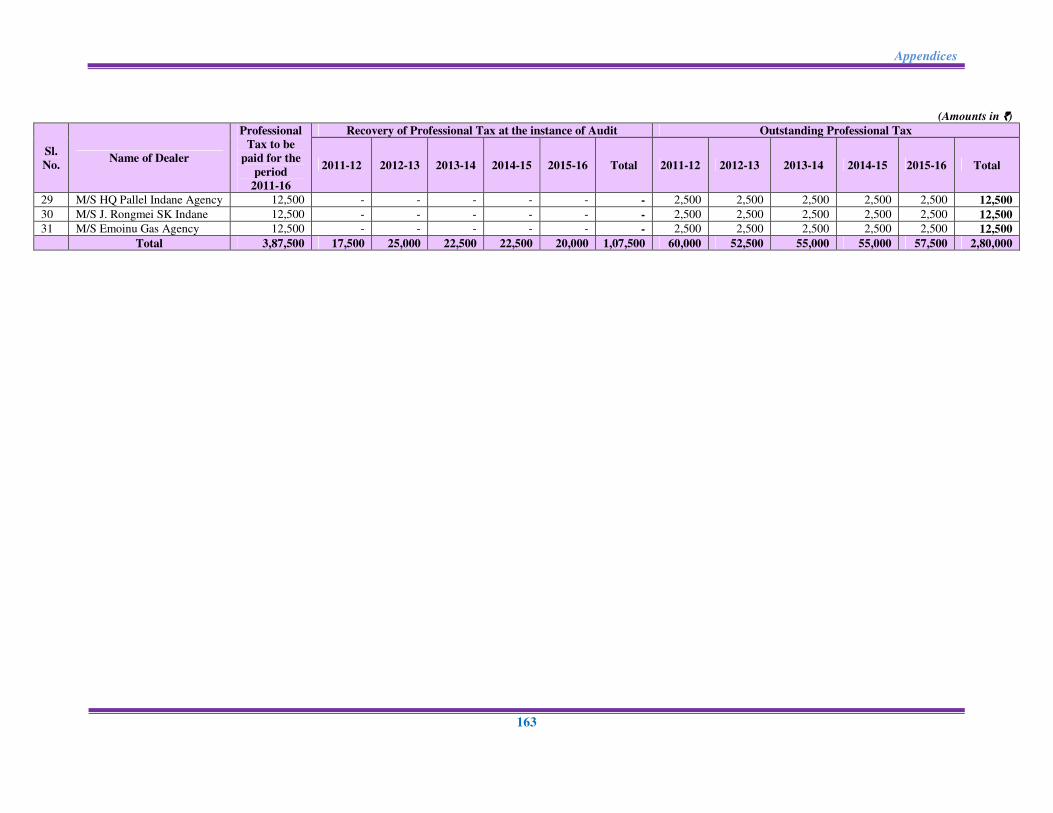
Appendices
163
(Amounts in `̀̀̀)
Sl.
No. Name of Dealer
Professional
Tax to be
paid for the
period
2011-16
Recovery of Professional Tax at the instance of Audit Outstanding Professional Tax
2011-12 2012-13 2013-14 2014-15 2015-16 Total 2011-12 2012-13 2013-14 2014-15 2015-16 Total
29 M/S HQ Pallel Indane Agency 12,500 - - - - - - 2,500 2,500 2,500 2,500 2,500 12,500
30 M/S J. Rongmei SK Indane 12,500 - - - - - - 2,500 2,500 2,500 2,500 2,500 12,500
31 M/S Emoinu Gas Agency 12,500 - - - - - - 2,500 2,500 2,500 2,500 2,500 12,500
Total 3,87,500 17,500 25,000 22,500 22,500 20,000 1,07,500 60,000 52,500 55,000 55,000 57,500 2,80,000
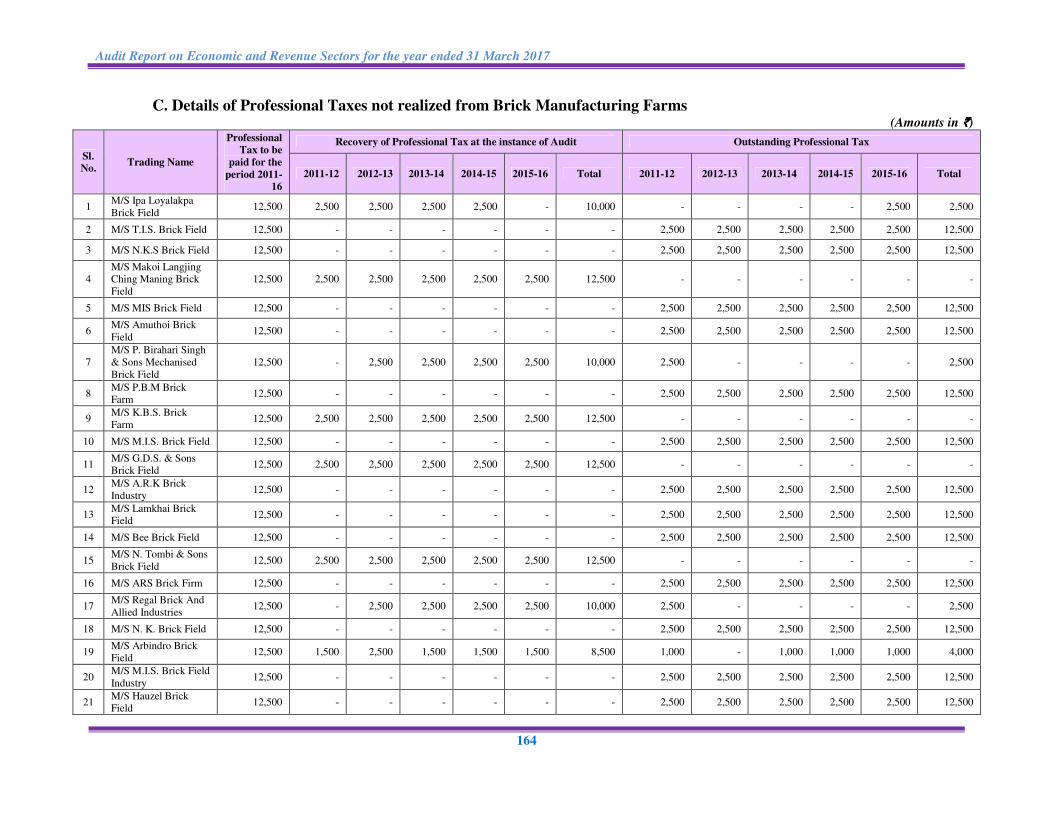
Audit Report on Economic and Revenue Sectors for the year ended 31 March 2017
164
C. Details of Professional Taxes not realized from Brick Manufacturing Farms (Amounts in `̀̀̀)
Sl.
No. Trading Name
Professional
Tax to be
paid for the
period 2011-
16
Recovery of Professional Tax at the instance of Audit Outstanding Professional Tax
2011-12 2012-13 2013-14 2014-15 2015-16 Total 2011-12 2012-13 2013-14 2014-15 2015-16 Total
1 M/S Ipa Loyalakpa
Brick Field 12,500 2,500 2,500 2,500 2,500 - 10,000 - - - - 2,500 2,500
2 M/S T.I.S. Brick Field 12,500 - - - - - - 2,500 2,500 2,500 2,500 2,500 12,500
3 M/S N.K.S Brick Field 12,500 - - - - - - 2,500 2,500 2,500 2,500 2,500 12,500
4
M/S Makoi Langjing
Ching Maning Brick
Field
12,500 2,500 2,500 2,500 2,500 2,500 12,500 - - - - - -
5 M/S MIS Brick Field 12,500 - - - - - - 2,500 2,500 2,500 2,500 2,500 12,500
6 M/S Amuthoi Brick
Field 12,500 - - - - - - 2,500 2,500 2,500 2,500 2,500 12,500
7
M/S P. Birahari Singh
& Sons Mechanised
Brick Field
12,500 - 2,500 2,500 2,500 2,500 10,000 2,500 - - - - 2,500
8 M/S P.B.M Brick
Farm 12,500 - - - - - - 2,500 2,500 2,500 2,500 2,500 12,500
9 M/S K.B.S. Brick
Farm 12,500 2,500 2,500 2,500 2,500 2,500 12,500 - - - - - -
10 M/S M.I.S. Brick Field 12,500 - - - - - - 2,500 2,500 2,500 2,500 2,500 12,500
11 M/S G.D.S. & Sons
Brick Field 12,500 2,500 2,500 2,500 2,500 2,500 12,500 - - - - - -
12 M/S A.R.K Brick
Industry 12,500 - - - - - - 2,500 2,500 2,500 2,500 2,500 12,500
13 M/S Lamkhai Brick
Field 12,500 - - - - - - 2,500 2,500 2,500 2,500 2,500 12,500
14 M/S Bee Brick Field 12,500 - - - - - - 2,500 2,500 2,500 2,500 2,500 12,500
15 M/S N. Tombi & Sons
Brick Field 12,500 2,500 2,500 2,500 2,500 2,500 12,500 - - - - - -
16 M/S ARS Brick Firm 12,500 - - - - - - 2,500 2,500 2,500 2,500 2,500 12,500
17 M/S Regal Brick And
Allied Industries 12,500 - 2,500 2,500 2,500 2,500 10,000 2,500 - - - - 2,500
18 M/S N. K. Brick Field 12,500 - - - - - - 2,500 2,500 2,500 2,500 2,500 12,500
19 M/S Arbindro Brick
Field 12,500 1,500 2,500 1,500 1,500 1,500 8,500 1,000 - 1,000 1,000 1,000 4,000
20 M/S M.I.S. Brick Field
Industry 12,500 - - - - - - 2,500 2,500 2,500 2,500 2,500 12,500
21 M/S Hauzel Brick
Field 12,500 - - - - - - 2,500 2,500 2,500 2,500 2,500 12,500

Appendices
165
(Amounts in `̀̀̀)
Sl.
No. Trading Name
Professional
Tax to be
paid for the
period 2011-
16
Recovery of Professional Tax at the instance of Audit Outstanding Professional Tax
2011-12 2012-13 2013-14 2014-15 2015-16 Total 2011-12 2012-13 2013-14 2014-15 2015-16 Total
22 M/S Toy Tom Tha
Bricks Industry 12,500 - - - - - - 2,500 2,500 2,500 2,500 2,500 12,500
23 M/S Diamond Brick
Farm 12,500 - - - - - - 2,500 2,500 2,500 2,500 2,500 12,500
24 M/S P.I.S. Brick Field 12,500 - - - - - - 2,500 2,500 2,500 2,500 2,500 12,500
25 M/S N.S.M. Brick
Field 12,500 - - - - - - 2,500 2,500 2,500 2,500 2,500 12,500
26 M/S K.N.S Brick Field 12,500 - - - - - - 2,500 2,500 2,500 2,500 2,500 12,500
27 M/S D.I.S. Piyainu
Brick Field 12,500 - 2,500 2,500 2,500 2,500 10,000 2,500 - - - - 2,500
28 M/S Pourabi Brick
Field 12,500 - - - - - - 2,500 2,500 2,500 2,500 2,500 12,500
29 M/S K.K.S. Brick
Field 12,500 - - - - - - 2,500 2,500 2,500 2,500 2,500 12,500
30 M/S K.S.A. Brick
Field 12,500 - - - - - - 2,500 2,500 2,500 2,500 2,500 12,500
31 M/S MRS Brick Field 12,500 - - - - - - 2,500 2,500 2,500 2,500 2,500 12,500
32 M/S Suba Bricks &
Construction 12,500 2,500 2,500 2,500 2,500 2,500 12,500 - - - - - -
33
M/S Epa
Chingkhulakpa Brick
Field
12,500 - - - - - - 2,500 2,500 2,500 2,500 2,500 12,500
34 M/S K.D.S. Brick
Field 12,500 - - - - - - 2,500 2,500 2,500 2,500 2,500 12,500
35 M/S Kairang Brick
Factory 12,500 - - - - - - 2,500 2,500 2,500 2,500 2,500 12,500
36 M/S M.I. Brick Field 12,500 - - - - - - 2,500 2,500 2,500 2,500 2,500 12,500
37 M/S Binoy & Sons
Brick Field 12,500 - - - - - - 2,500 2,500 2,500 2,500 2,500 12,500
Total 4,62,500 16,500 25,000 24,000 24,000 21,500 1,11,000 76,000 67,500 68,500 68,500 71,000 3,51,500

Audit Report on Economic and Revenue Sectors for the year ended 31 March 2017
166
Appendix 3.24
(Reference: Paragraph 3.20)
Details of tax due, tax paid and tax outstanding in respect of goods vehicles (Amounts in `̀̀̀)
Sl.
No. Vehicle No.
Unladen
weight
in tone
Period
upto which
tax was
paid
No. of
Qtrs
due
upto
3/2016
Details of tax due Details of tax paid
Total
outstanding
Token Tax Goods Tax
Penalty
leviable
Total
due
Goods
Tax
Token
Tax Total
Rate/qtr Amount Rate/qtr Amount
1 MN04A/7018 7.5 31-03-2012 16 1,580 25,280 750 12,000 200 37,480 3,000 6,320 9,320 28,160
2 MN04A/7025 5.0 31-03-2012 16 940 15,040 450 7,200 200 22,440 4,500 9,480 13,980 8,460
3 MN04A/7046 7.5 31-12-2013 9 1,580 14,220 750 6,750 200 21,170 180 376 556 20,614
4 MN04A/7047 7.5 31-12-2013 9 1,580 14,220 750 6,750 200 21,170 180 376 556 20,614
5 MN04A/7048 7.5 31-12-2013 9 1,580 14,220 750 6,750 200 21,170 180 376 556 20,614
6 MN04A/7049 7.5 31-12-2013 9 1,580 14,220 750 6,750 200 21,170 3,180 7,896 11,076 10,094
7 MN04A/7050 7.5 31-12-2013 9 1,580 14,220 750 6,750 200 21,170 3,180 7,896 11,076 10,094
8 MN04A/7111 7.5 31-12-2013 9 1,580 14,220 750 6,750 200 21,170 3,000 7,656 10,656 10,514
9 MN04A/7148 15.0 30-06-2014 7 2,540 17,780 1,200 8,400 1,000 27,180 1,275 2,794 4,069 23,111
10 MN04A/7153 7.5 31-03-2013 12 1,580 18,960 750 9,000 200 28,160 900 1,740 2,640 25,520
11 MN04A/7619 5.0 30-09-2012 14 940 13,160 450 6,300 200 19,660 750 1,580 2,330 17,330
12 MN04A/7627 10.0 30-06-2012 15 1,740 26,100 900 13,500 400 40,000 11,250 8,300 19,550 20,450
13 MN04A/7629 7.5 30-06-2012 15 1,580 23,700 750 11,250 200 35,150 1,500 3,160 4,660 30,490
14 MN04A/7633 7.5 31-03-2013 12 1,580 18,960 750 9,000 200 28,160 3,000 6,320 9,320 18,840
15 MN04A/7643 10.0 30-06-2014 7 1,740 12,180 900 6,300 400 18,880 900 1,740 2,640 16,240
16 MN04A/7673 7.5 30-09-2012 14 1,580 22,120 750 10,500 200 32,820 2,330 2,330 4,660 28,160
17 MN04A/7683 7.5 31-12-2012 13 1,580 20,540 750 9,750 200 30,490 1,500 3,160 4,660 25,830
18 MN04A/7718 10.0 30-06-2012 15 1,740 26,100 900 13,500 400 40,000 1,800 3,760 5,560 34,440
19 MN04A/7729 5.0 31-03-2013 12 940 11,280 450 5,400 200 16,880 1,200 2,400 3,600 13,280
20 MN04A/8093 15.0 31-12-2012 13 2,540 33,020 1,200 15,600 1,000 49,620 8,615 14,111 22,726 26,894
21 MN04A/8094 5.0 30-09-2012 14 940 13,160 450 6,300 200 19,660 450 940 1,390 18,270
22 MN04A/8108 7.5 30-09-2012 14 1,580 22,120 750 10,500 200 32,820 750 1,580 2,330 30,490
23 MN04A/8114 10.0 31-12-2012 13 1,740 22,620 900 11,700 400 34,720 1,950 3,828 5,778 28,942
24 MN04A/8188 15.0 31-12-2012 13 2,540 33,020 1,200 15,600 1,000 49,620 975 2,480 3,455 46,165
25 MN04A/8197 5.0 30-09-2012 14 940 13,160 450 6,300 200 19,660 450 940 1,390 18,270
26 MN04A/8224 7.5 30-09-2012 14 1,580 22,120 750 10,500 200 32,820 2,250 4,620 6,870 25,950
27 MN04A/7708 5.0 30-06-2012 15 940 14,100 450 6,750 200 21,050 - - - 21,050
28 MN04A/7022 5.0 31-03-2012 16 940 15,040 450 7,200 200 22,440 - - - 22,440

Appendices
167
(Amounts in `̀̀̀)
Sl.
No. Vehicle No.
Unladen
weight
in tone
Period
upto which
tax was
paid
No. of
Qtrs
due
upto
3/2016
Details of tax due Details of tax paid
Total
outstanding
Token Tax Goods Tax Penalty
leviable
Total
due
Goods
Tax
Token
Tax Total
Rate/qtr Amount Rate/qtr Amount
29 MN04A/7023 5.0 31-03-2012 16 940 15,040 450 7,200 200 22,440 - - - 22,440
30 MN04A/7040 10.0 30-06-2012 15 1,740 26,100 900 13,500 400 40,000 - - - 40,000
31 MN04A/7041 7.5 31-12-2013 9 1,580 14,220 750 6,750 200 21,170 - - - 21,170
32 MN04A/7042 7.5 31-12-2013 9 1,580 14,220 750 6,750 200 21,170 - - - 21,170
33 MN04A/7043 7.5 31-12-2013 9 1,580 14,220 750 6,750 200 21,170 - - - 21,170
34 MN04A/7044 7.5 31-12-2013 9 1,580 14,220 750 6,750 200 21,170 - - - 21,170
35 MN04A/7045 7.5 31-12-2013 9 1,580 14,220 750 6,750 200 21,170 - - - 21,170
36 MN04A/7063 10.0 30-06-2015 3 1,740 5,220 900 2,700 400 8,320 - - - 8,320
37 MN04A/7074 7.5 30-06-2012 15 1,580 23,700 750 11,250 200 35,150 - - - 35,150
38 MN04A/7084 7.5 30-09-2012 14 1,580 22,120 750 10,500 200 32,820 - - - 32,820
39 MN04A/7095 7.5 30-06-2012 15 1,580 23,700 750 11,250 200 35,150 - - - 35,150
40 MN04A/7105 7.5 31-03-2012 16 1,580 25,280 750 12,000 200 37,480 - - - 37,480
41 MN04A/7106 5.0 30-06-2012 15 940 14,100 450 6,750 200 21,050 - - - 21,050
42 MN04A/7107 5.0 31-03-2014 8 940 7,520 450 3,600 200 11,320 - - - 11,320
43 MN04A/7116 7.5 31-03-2012 16 1,580 25,280 750 12,000 200 37,480 1,580 750 2,330 35,150
44 MN04A/7131 7.5 31-03-2012 16 1,580 25,280 750 12,000 200 37,480 - - - 37,480
45 MN04A/7134 10.0 30-06-2013 11 1,740 19,140 900 9,900 400 29,440 - - - 29,440
46 MN04A/7144 10.0 30-09-2012 14 1,740 24,360 900 12,600 400 37,360 - - - 37,360
47 MN04A/7621 7.5 31-12-2013 9 1,580 14,220 750 6,750 200 21,170 - - - 21,170
48 MN04A/7628 7.5 30-06-2012 15 1,580 23,700 750 11,250 200 35,150 3,160 1,500 4,660 30,490
49 MN04A/7644 5.0 30-06-2013 11 940 10,340 450 4,950 200 15,490 - - - 15,490
50 MN04A/7653 5.0 31-03-2013 12 940 11,280 450 5,400 200 16,880 - - - 16,880
51 MN04A/7658 7.5 30-06-2012 15 1,580 23,700 750 11,250 200 35,150 - - - 35,150
52 MN04A/7664 10.0 30-06-2013 11 1,740 19,140 900 9,900 400 29,440 - - - 29,440
53 MN04A/7669 5.0 30-09-2012 14 940 13,160 450 6,300 200 19,660 - - - 19,660
54 MN04A/7674 15.0 30-06-2012 15 2,540 38,100 1,200 18,000 1,000 57,100 - - - 57,100
55 MN04A/7679 15.0 30-09-2012 14 2,540 35,560 1,200 16,800 1,000 53,360 - - - 53,360
56 MN04A/7688 7.5 31-03-2013 12 1,580 18,960 750 9,000 200 28,160 - - - 28,160
57 MN04A/7693 5.0 30-06-2012 15 940 14,100 450 6,750 200 21,050 1,880 900 2,780 18,270
58 MN04A/7696 7.5 30-06-2012 15 1,580 23,700 750 11,250 200 35,150 - - - 35,150
59 MN04A/7697 5.0 31-03-2013 12 940 11,280 450 5,400 200 16,880 - - - 16,880

Audit Report on Economic and Revenue Sectors for the year ended 31 March 2017
168
(Amounts in `̀̀̀)
Sl.
No. Vehicle No.
Unladen
weight
in tone
Period
upto which
tax was
paid
No. of
Qtrs
due
upto
3/2016
Details of tax due Details of tax paid
Total
outstanding
Token Tax Goods Tax
Penalty
leviable
Total
due
Goods
Tax
Token
Tax Total
Rate/qtr Amount Rate/qtr Amount
60 MN04A/7702 10.0 30-09-2015 2 1,740 3,480 900 1,800 400 5,680 - - - 5,680
61 MN04A/7707 10.0 30-06-2013 11 1,740 19,140 900 9,900 400 29,440 - - - 29,440
62 MN04A/7709 5.0 30-06-2012 15 940 14,100 450 6,750 200 21,050 - - - 21,050
63 MN04A/7711 7.5 30-06-2012 15 1,580 23,700 750 11,250 200 35,150 1,580 750 2,330 32,820
64 MN04A/7719 5.0 30-06-2012 15 940 14,100 450 6,750 200 21,050 - - - 21,050
65 MN04A/7722 7.5 30-06-2012 15 1,580 23,700 750 11,250 200 35,150 6,320 3,000 9,320 25,830
66 MN04A/7728 10.0 30-06-2013 11 1,740 19,140 900 9,900 400 29,440 - - - 29,440
67 MN04A/7736 5.0 30-09-2012 14 940 13,160 450 6,300 200 19,660 - - - 19,660
68 MN04A/8089 7.5 30-09-2012 14 1,580 22,120 750 10,500 200 32,820 - - - 32,820
69 MN04A/8091 7.5 30-09-2012 14 1,580 22,120 750 10,500 200 32,820 - - - 32,820
70 MN04A/8096 7.5 31-03-2013 12 1,580 18,960 750 9,000 200 28,160 - - - 28,160
71 MN04A/8099 5.0 30-09-2012 14 940 13,160 450 6,300 200 19,660 - - - 19,660
72 MN04A/8109 7.5 30-09-2012 14 1,580 22,120 750 10,500 200 32,820 1,580 750 2,330 30,490
73 MN04A/8115 7.5 30-09-2012 14 1,580 22,120 750 10,500 200 32,820 - - - 32,820
74 MN04A/8119 20.0 31-12-2012 13 3,340 43,420 1,500 19,500 1,000 63,920 - - - 63,920
75 MN04A/8149 15.0 30-09-2012 14 2,540 35,560 1,200 16,800 1,000 53,360 - - - 53,360
76 MN04A/8153 5.0 30-09-2012 14 940 13,160 450 6,300 200 19,660 - - - 19,660
77 MN04A/8155 5.0 30-09-2012 14 940 13,160 450 6,300 200 19,660 - - - 19,660
78 MN04A/8159 7.5 30-09-2012 14 1,580 22,120 750 10,500 200 32,820 - - - 32,820
79 MN04A/8163 5.0 31-12-2012 13 940 12,220 450 5,850 200 18,270 - - - 18,270
80 MN04A/8164 5.0 31-12-2012 13 940 12,220 450 5,850 200 18,270 - - - 18,270
81 MN04A/8168 5.0 30-09-2012 14 940 13,160 450 6,300 200 19,660 - - - 19,660
82 MN04A/8176 5.0 30-09-2012 14 940 13,160 450 6,300 200 19,660 940 450 1,390 18,270
83 MN04A/8178 7.5 30-09-2013 10 1,580 15,800 750 7,500 200 23,500 - - - 23,500
84 MN04A/8179 7.5 31-12-2012 13 1,580 20,540 750 9,750 200 30,490 - - - 30,490
85 MN04A/8181 7.5 30-09-2012 14 1,580 22,120 750 10,500 200 32,820 - - - 32,820
86 MN04A/8182 7.5 30-09-2012 14 1,580 22,120 750 10,500 200 32,820 - - - 32,820
87 MN04A/8195 7.5 30-09-2012 14 1,580 22,120 750 10,500 200 32,820 - - - 32,820
88 MN04A/8208 5.0 30-09-2012 14 940 13,160 450 6,300 200 19,660 - - - 19,660
89 MN04A/8211 5.0 31-12-2015 1 940 940 450 450 200 1,590 - - - 1,590
90 MN04A/8214 5.0 30-06-2013 11 940 10,340 450 4,950 200 15,490 - - - 15,490
91 MN04A/8215 5.0 30-09-2012 14 940 13,160 450 6,300 200 19,660 - - - 19,660
92 MN04A/8221 5.0 30-09-2013 10 940 9,400 450 4,500 200 14,100 - - - 14,100
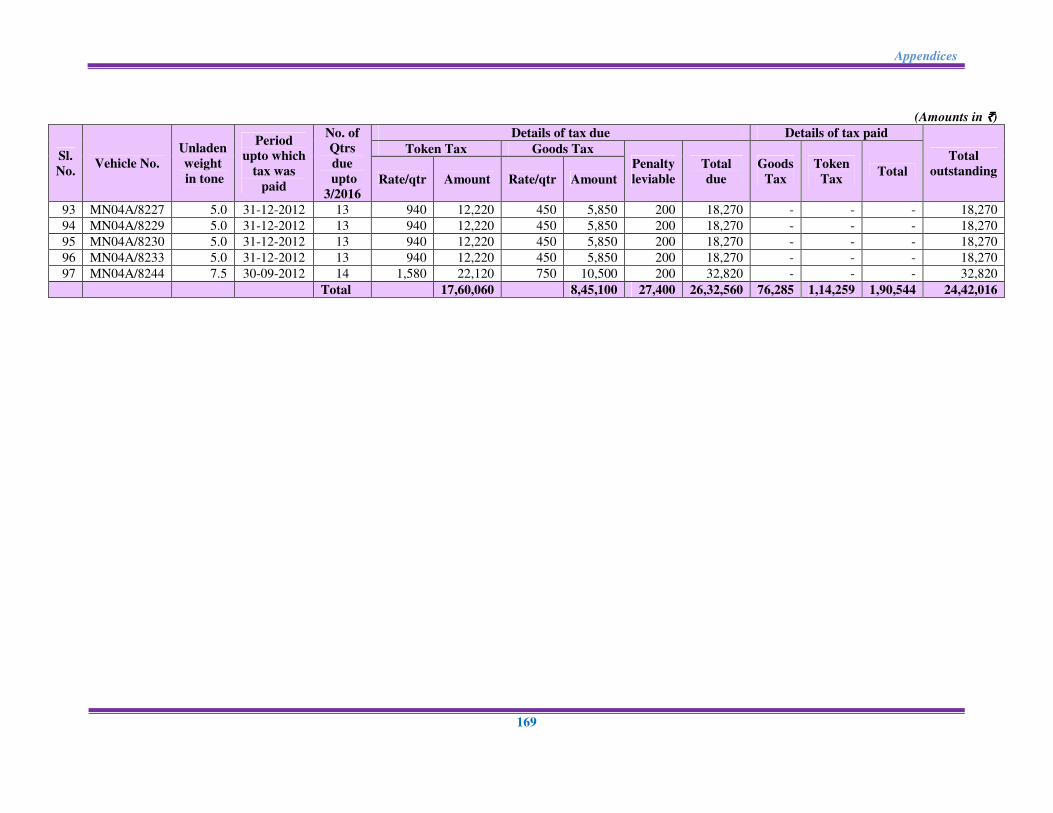
Appendices
169
(Amounts in `̀̀̀)
Sl.
No. Vehicle No.
Unladen
weight
in tone
Period
upto which
tax was
paid
No. of
Qtrs
due
upto
3/2016
Details of tax due Details of tax paid
Total
outstanding
Token Tax Goods Tax Penalty
leviable
Total
due
Goods
Tax
Token
Tax Total
Rate/qtr Amount Rate/qtr Amount
93 MN04A/8227 5.0 31-12-2012 13 940 12,220 450 5,850 200 18,270 - - - 18,270
94 MN04A/8229 5.0 31-12-2012 13 940 12,220 450 5,850 200 18,270 - - - 18,270
95 MN04A/8230 5.0 31-12-2012 13 940 12,220 450 5,850 200 18,270 - - - 18,270
96 MN04A/8233 5.0 31-12-2012 13 940 12,220 450 5,850 200 18,270 - - - 18,270
97 MN04A/8244 7.5 30-09-2012 14 1,580 22,120 750 10,500 200 32,820 - - - 32,820
Total 17,60,060 8,45,100 27,400 26,32,560 76,285 1,14,259 1,90,544 24,42,016


