Embed Size (px)
Citation preview

This article appeared in a journal published by Elsevier. The attachedcopy is furnished to the author for internal non-commercial researchand education use, including for instruction at the authors institution
and sharing with colleagues.
Other uses, including reproduction and distribution, or selling orlicensing copies, or posting to personal, institutional or third party
websites are prohibited.
In most cases authors are permitted to post their version of thearticle (e.g. in Word or Tex form) to their personal website orinstitutional repository. Authors requiring further information
regarding Elsevier’s archiving and manuscript policies areencouraged to visit:
http://www.elsevier.com/authorsrights

Author's personal copy
Grain-structure development in heavily cold-rolled alpha-titanium
G.S. Dyakonov a, S. Mironov b,n, S.V. Zherebtsov c, S.P. Malysheva d, G.A. Salishchev c,A.A. Salem e,f, S.L. Semiatin f
a Institute of Physics of Advanced Materials, Ufa State Aviation Technical University, 12 K. Marx Street, 450000 Ufa, Russiab Department of Materials Processing, Graduate School of Engineering, Tohoku University, 6-6-02 Aramaki-aza-Aoba, Sendai 980-8579, Japanc Laboratory of Bulk Nanostructured Materials, Belgorod State University, Pobeda 85, Belgorod 308015, Russiad Institute for Metals Superplasticity Problems, Russian Academy of Science, 39 Khalturin Str., Ufa 450001, Russiae Materials Resources LLC, Dayton, OH 45402, USAf Air Force Research Laboratory, Materials and Manufacturing Directorate, AFRL/RXCM, Wright-Patterson AFB, OH 45433-7817, USA
a r t i c l e i n f o
Article history:Received 4 February 2014Received in revised form27 March 2014Accepted 27 March 2014Available online 5 April 2014
Keywords:EBSDNanostructured materialsTitanium alloysBulk deformationGrain refinement
a b s t r a c t
High-resolution electron back-scatter diffraction (EBSD) analysis was employed to establish mircos-tructure evolution in heavily cold-rolled alpha-titanium. After thickness reductions of 75% to 96%,significant microstructure and texture changes were documented. The surface area of high-angle grainboundaries was almost tripled, thus giving rise to an ultra-fine microstructure with a mean grain size of0.6 μm. Moreover, orientation spread around typical ‘split-basal’ rolling texture substantially increased.These effects were suggested to be related to the enhancement of pyramidal ⟨cþa⟩ slip.
& 2014 Elsevier B.V. All rights reserved.
1. Introduction
The mechanical properties of metallic materials may beimproved considerably by microstructure refinement. To attain avery fine structure with a grain size less than one micrometer, avariety of techniques based on severe deformation at low tem-peratures, such as high-pressure torsion, equal-channel angularextrusion, and ‘abc’ forging, are commonly used [1]. Forcommercial-purity titanium, it has been found, however, that therefinement imparted by these techniques is comparable to thatproduced by conventional cold rolling [2]. Such a finding hasspurred a renewed interest in microstructure evolution duringcold rolling of this material.
Microstructure evolution during rolling to relatively low thicknessreductions (r40%) has been shown to be markedly influenced bymechanical twinning [3–8]. Extensive development of both com-pressive f1122g⟨112 3⟩ and tensile f1012g⟨101 1⟩ twins during roll-ing leads to rapid grain refinement [3–7]. On the other hand, grainsfavorably oriented for prism slip tend to remain untwinned [4,6]. Thisbehavior gives rise to a bimodal grain structure consisting of fine-grained (twinned) and coarse-grained (untwinned) areas [6].
At relatively large thickness reductions (Z40%), grain refine-ment suppresses twinning activity, and slip becomes the dominantdeformation mode [9,10]. Microstructure formation at these largestrains has been hypothesized to be largely controlled by thedevelopment of deformation-induced dislocation boundaries [5,8],but the details of this process are not clear. The objective of thepresent investigation, therefore, was to develop an understandingof microstructure evolution during cold-rolling of alpha titaniumto large strains.
2. Material and procedures
The material used in the present investigation was commercial-purity titanium whose nominal chemical composition is given inTable 1. The as-received material was pre-conditioned by severe‘abc’ forging at temperatures in the range of 600–400 1C followedby annealing at 800 1C for 1 h. This produced a fully recrystallizedstructure with a mean grain size of �35 μm, a large fraction (85%)of high-angle boundaries, and a moderate crystallographic texturewith (0002) basal planes inclined by �451 to a rolling plane(supplementary data, Fig. S1).
Rolling samples measuring 30 (length)�10 (width)�3 (thick-ness) mm3 were machined from the recrystallized material. Theywere rolled at ambient temperature using a thickness reduction
Contents lists available at ScienceDirect
journal homepage: www.elsevier.com/locate/msea
Materials Science & Engineering A
http://dx.doi.org/10.1016/j.msea.2014.03.1410921-5093/& 2014 Elsevier B.V. All rights reserved.
n Corresponding author. Tel.: þ81 22 795 7353; fax: þ81 22 795 7352.E-mail address: [email protected] (S. Mironov).
Materials Science & Engineering A 607 (2014) 145–154

Author's personal copy
per pass of 10%. to an overall total reduction of 25%, 50%, 75%, or96%. using a rolling speed of 30 mm/s in a cluster mill with 65-mmdiameter work rolls. To maintain consistency with the scientificliterature, the typical flat-rolling convention was adopted in thiswork; i.e., the rolling, long-transverse, and thickness/normaldirections were denoted as RD, TD, and ND, respectively.
Microstructure characterization was performed primarily viaelectron backscatter diffraction (EBSD) examination of the mid-thickness rolling plane (containing the RD and TD). For thispurpose, samples were prepared using conventional metallo-graphic techniques followed by long-term (24 h) vibratory polish-ing with a colloidal-silica suspension. EBSD analysis wasconducted with a JSM-7800F field-emission gun, scanning electronmicroscope (FEG-SEM) equipped with a TSL OIM™ EBSD system.To examine microstructure and texture evolution at differentscales, several EBSD maps were acquired for each material condi-tion (Table 2). For each diffraction pattern, nine Kikuchi bandswere used to index the orientation thus minimizing the possibilityof errors. The average confidence index (CI) for EBSD maps rangedfrom 0.2 to 0.64 (Table 2). By comparison, experiments on face-
centered cubic materials have shown that the fraction of correctlyindexed patterns with CIs greater than 0.1 is 95% [11]. Non-indexed data points as well as points with low CI (r0.1) wereusually associated with grain-boundary regions. Grains comprising3 or fewer pixels were automatically cleaned in the EBSD mapsusing the grain-dilation option in the TSL software. In addition, toeliminate spurious boundaries caused by software limitations, alower-limit boundary misorientation cut-off of 21 was used.
A 151 criterion was used to differentiate low-angle boundaries(LABs) and high-angle boundaries (HABs). Because the microstruc-tures developed at large strains are frequently characterized by acomplex mixture of HABs and LABs, there is often confusion in thedefinition of grains. To clarify this issue, the term ‘grain’ in thepresent work was applied to denote a crystallite bordered by acontinuous HAB perimeter. In all cases, the grain size wasquantified by the determination of the area of each grain andthe calculation of its circle-equivalent diameter, i.e., the so-calledgrain-reconstruction method [12].
To obtain an additional insight into microstructure evolutionand material flow, the Vicker's microhardness was measured usinga load of 500 g for 10 s. At least 25 measurements were made ineach case to obtain an average value.
3. Results
3.1. Microhardness
The influence of rolling strain on microhardness is illustrated inFig. 1a. It is seen that the hardness doubled after rolling to 96%thickness reduction. On the other hand, the approximate hard-ening rate δHv/δε (where Hv is microhardness and ε is true strain)was found to drop rapidly after a true strain of 50% (Fig. 1b). Thiseffect may be related to the suppression of twinning at largestrains [13] as well as with texture changes, discussed below.Furthermore, the strain hardening rate approached almost zero atthe maximum level of deformation (Fig. 1b). This behavior maypromote instability of material flow and the formation of deforma-tion/shear bands.
3.2. Structure morphology and grain size
Selected portions of low- and high-resolution EBSD mapsillustrating the grain structures which developed during rollingto different thickness reductions are summarized in Figs. 2–4. Inthe orientation maps shown in Figs. 2 and 3b, grains are coloredaccording to the orientation of the local sample normal directionrelative to the crystal coordinate system. In the grain-boundary
Table 1Nominal chemical composition (wt%) of program material.
Al Fe O Si C N H other Ti
0.30 0.30 0.20 0.10 0.07 0.04 0.01 0.30 Bal.
Table 2EBSD measurements.
Materialcondition
Scan stepsize (μm)
Map area(mm2)
Averageconfidence index
Number ofgrains
Unrolled material 5.0 64.40 0.55 52,6890.1 0.08 0.64 243
25% reduction 1.0 6.00 0.56 29,0600.1 0.09 0.56 7970
50% reduction 0.5 1.00 0.41 65,3040.1 0.09 0.45 16,052
75% reduction 0.5 1.03 0.18 130,9400.1 0.02 0.32 7299
96% reduction 0.2 0.15 0.20 145,8390.1 0.01 0.23 17,317
Fig. 1. Effect of rolling strain on microhardness (a) and hardening rate (b). In (a), error bars show standard deviation.
G.S. Dyakonov et al. / Materials Science & Engineering A 607 (2014) 145–154146
Author's personal copy
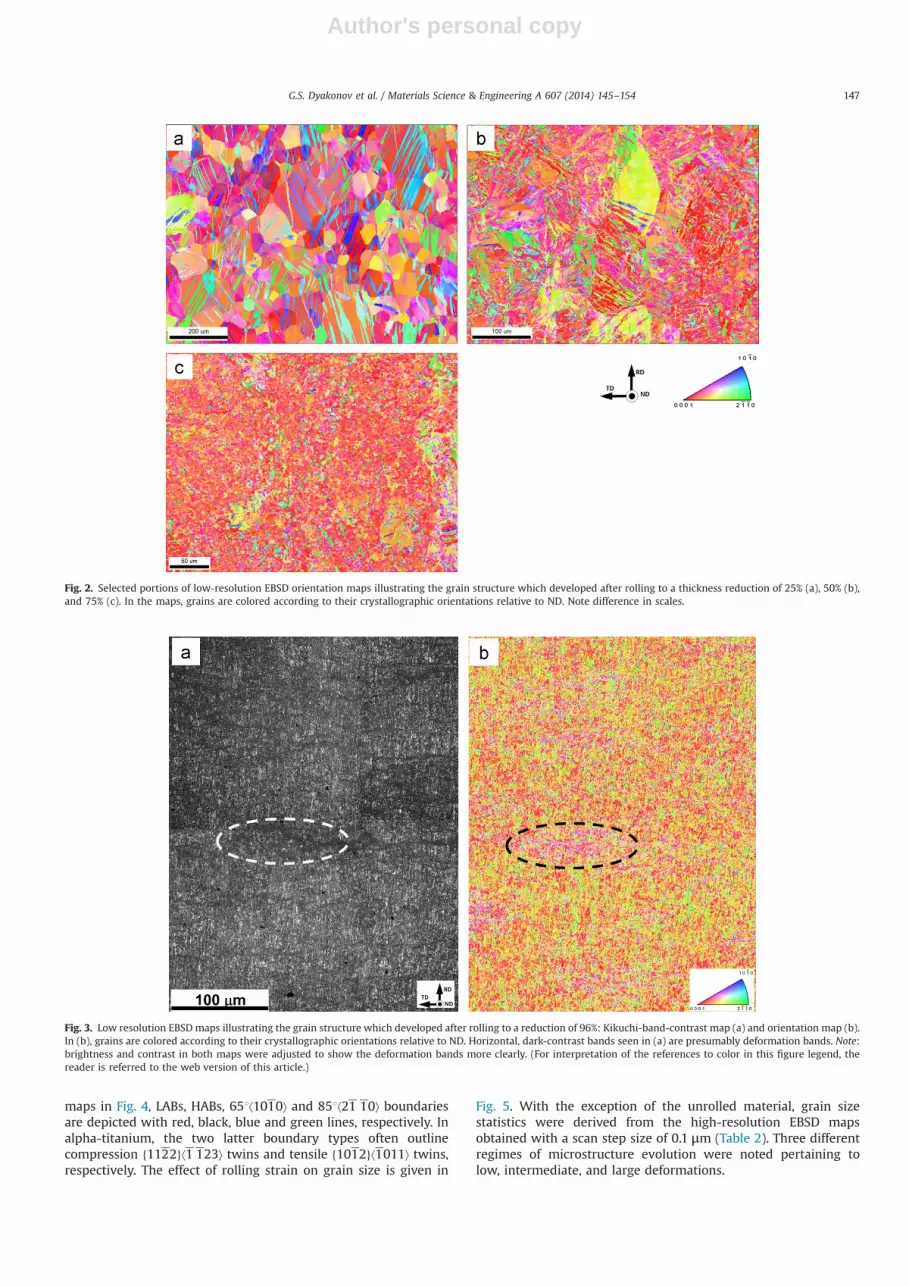
maps in Fig. 4, LABs, HABs, 651⟨1010⟩ and 851⟨21 10⟩ boundariesare depicted with red, black, blue and green lines, respectively. Inalpha-titanium, the two latter boundary types often outlinecompression f1122g⟨1 123⟩ twins and tensile f1012g⟨1011⟩ twins,respectively. The effect of rolling strain on grain size is given in
Fig. 5. With the exception of the unrolled material, grain sizestatistics were derived from the high-resolution EBSD mapsobtained with a scan step size of 0.1 μm (Table 2). Three differentregimes of microstructure evolution were noted pertaining tolow, intermediate, and large deformations.
Fig. 2. Selected portions of low-resolution EBSD orientation maps illustrating the grain structure which developed after rolling to a thickness reduction of 25% (a), 50% (b),and 75% (c). In the maps, grains are colored according to their crystallographic orientations relative to ND. Note difference in scales.
Fig. 3. Low resolution EBSD maps illustrating the grain structure which developed after rolling to a reduction of 96%: Kikuchi-band-contrast map (a) and orientation map (b).In (b), grains are colored according to their crystallographic orientations relative to ND. Horizontal, dark-contrast bands seen in (a) are presumably deformation bands. Note:brightness and contrast in both maps were adjusted to show the deformation bands more clearly. (For interpretation of the references to color in this figure legend, thereader is referred to the web version of this article.)
G.S. Dyakonov et al. / Materials Science & Engineering A 607 (2014) 145–154 147

Author's personal copy
3.2.1. Low strainsAs expected, the microstructures in samples rolled to 25% and
50% thickness reduction were dominated by mechanical twinning(Figs. 2a, b and 4a, b). In agreement with prior work [e.g., 4,6],some of the grains were untwinned (or only slightly twinned) thuscreating a characteristic microstructural inhomogeneity (Fig. 2aand b). The misorientation across the twin boundaries wastypically close to 651⟨1010⟩ or 851⟨21 10⟩ (Fig. 4a and b), thusindicating the activation of f1122g⟨112 3⟩ compressive andf1012g⟨101 1⟩ tensile twins, respectively. Surprisingly, the tensiletwins were often observed within compression twins (Fig. 4a) thuspresumably originating from secondary twinning [14,15]. More-over, the misorientation of the twin boundaries was found todeviate frequently from the exact twin-matrix relationship withsome of the boundary segments transforming into random (non-twin) HABs; an example of an almost completely transformed
twin is circled in Fig. 4a. As described in the literature, thisphenomenon is typically attributed to strain-induced crystallo-graphic rotation of the twin and matrix from their initial orienta-tions [8,16].
LABs were typically found to cluster in (or near) the twinnedregions (Fig. 4a and b). This effect was presumably associated withrelatively easy slip within twinned regions [13,17,18]. The LABswere usually short, curved, and irregular in appearance. Thespecific LAB morphology suggested relatively complex slip char-acter in the vicinity of the twins, and may be surmised to bemandated primarily by the maintenance of strain compatibility attwin/matrix interfaces.
The mean grain size was greatly reduced to �2 μm (Fig. 5a)due to twinning. The grain-size distributions were relatively broad(Fig. 5b), thus reflecting the inhomogeneous character of themicrostructure.
Fig. 4. Selected portions of high-resolution EBSD grain-boundary maps illustrating grain structure which developed after rolling to a reduction of 25% (a), 50% (b), 75% (c),and 96% (d). In the maps, LABs, HABs, 651⟨1010⟩ (compressive twin) and 851⟨2110⟩ (tensile twin) boundaries are depicted as red, black, blue and green lines, respectively.Note difference in scales. The reference frame for all maps is shown in the bottom right corner of (a). (For interpretation of the references to color in this figure legend, thereader is referred to the web version of this article.)
Fig. 5. Effect of rolling reduction on mean grain size (a) and grain-size distribution (b). Error bars in (a) indicate the standard deviation.
G.S. Dyakonov et al. / Materials Science & Engineering A 607 (2014) 145–154148

Author's personal copy
3.2.2. Intermediate strainsAfter rolling to a 75% thickness reduction, remnants of the
original grains disappeared almost completely from the micro-structure (Fig. 2c). In agreement with findings in the literature [3–10,17,18], twinning seemed to be suppressed at this level ofreduction. In addition, the twin boundaries were almost comple-tely transformed into HABs with misorientations different fromthose associated with twinning (Fig. 4c). In the relatively coarse,untwinned regions, LABs with relatively low misorientations werearranged as less-highly developed subgrain structures (Fig. 4c). Incontrast, boundaries in the twinned areas often acquired misor-ientations over 151 thus transforming them into clusters of finegrains (e.g., area circled in Fig. 4c). This shifted the peak of thegrain-size distribution toward smaller sizes (Fig. 5b). Nevertheless,the overall global grain refinement was rather small (Fig. 5a) dueto the heterogeneity of the microstructure.
3.2.3. Large strainsThe distinctive feature of the macroscale structure of material
rolled to a 96% thickness reduction was the formation of deformationbands. In Kikuchi-band-contrast maps, these features appeared asdark bands oriented nearly perpendicular to the RD (Fig. 3a). Thedeformation bands had a somewhat specific crystallographic orien-tation (Fig. 3a and b); this behavior is discussed in more detail inSection 4.2.1. The thickness of individual bands was found to becomparable to the grain size. However, several bands often clusteredtogether thereby producing coarser-scale features (selected areas inFig. 3a and b). The deformation bands were also noted by opticalmicroscopy (supplementary materials, Fig. S2). Deformation bandingin heavily rolled titanium is often reported in the literature [3,19]. Ithas been suggested that this process facilitates strain accommodationat large rolling strains (thus replacing twinning) [4] and maysignificantly refine grain structure [3].
The microstructure after 96% thickness reduction was alsosignificantly changed. Most of the coarse remnants of the originalgrains seen at lower strains had disappeared at this level ofdeformation (Fig. 3b). This behavior narrowed the grain-sizedistribution somewhat (Fig. 5b), and the microstructure thusbecame more homogeneous. The evolved microstructure consistedof irregularly shaped, coarser (�5 μm) grains elongated in the RD
intermixed with fine (o0.5 μm) equiaxed grains (Fig. 4d). Further-more, the circle-equivalent mean grain size was reduced twofoldto �0.6 μm (Fig. 5a) relative to the structure after 75% reduction;the mean grain size measured by the intercept method was evensmaller, i.e., �0.3 μm in the RD and 0.25 μm in the TD.
The grains contained some LAB substructure but almost notwins (Fig. 4d). The sub-boundaries often included HAB segments;several examples are shown by arrows in Fig. 4d. These observa-tions suggested that microstructure development at high strainswas influenced by a LAB-to-HAB-transformation process.
3.3. Texture
Texture formation was quantified with (0002) and (1010) polefigures (Fig. 6) derived from low-resolution EBSD maps.
After 25% reduction, the texture was dominated by whatappeared to be a ‘transient’ f0002g⟨1010⟩ component (Fig. 6a).The formation of this component is described in the literature asbeing due to the activation of multiple twins [6,20]. For rollingreductions of 50% and 75%, on the other hand, a split-basal texture,f0002g⟨1010⟩7301 toward the TD had evolved (Fig. 6b and c). Thisis also an expected result [6–10]; this texture is believed to bestable during rolling and originates from a balance betweentwinning, prism slip, and ⟨cþa⟩ slip [9]. Formation of this textureis thought to contribute (at least partially) to the rapid drop of thestrain hardening rate observed in this strain range (Fig. 1b).
After the 96% reduction, the split-texture components sharpenedsubstantially (Fig. 6d) and shifted slightly to produce f0002g⟨1010⟩7401 toward the TD. In addition, the orientation spread around themajor split component increased toward the TD (Fig. 6d). This effectin heavily rolled titanium has also been reported previously [5,6,21].Although its origin is not completely clear, it is believed it may berelated with prism and pyramidal slip [22].
3.4. Misorientation distribution
Misorientation data derived from the high-resolution EBSDmaps were quantified in terms of the misorientation-angle andmisorientation-axis distributions (Figs. 7a and 8, respectively). Themisorientation angle data were characterized in terms of specific
Fig. 6. (0002) and (1010) pole figures showing the texture developed after rolling reductions of 25% (a), 50% (b), 75% (c), and 95% (d).
G.S. Dyakonov et al. / Materials Science & Engineering A 607 (2014) 145–154 149

Author's personal copy
grain-boundary area, i.e., the total grain-boundary length for agiven misorientation angle (or small range of misorientationangles) divided by the area of the EBSD map. This metrics providesa direct comparison of grain-boundary characteristics for differentrolling reductions, thus enabling more reliable determination ofthe key physical mechanisms governing microstructure evolution.The effect of rolling strain on specific area of different types ofgrain boundaries is shown in Fig. 7b.
3.4.1. Dislocation boundaries originating from prism slipThe rotation axes of (low-angle) dislocation boundaries impose
a constraint upon the slip modes which are potentially activeduring deformation and thus may convey useful information aboutslip activity per se. It is generally accepted that the slip activity ofthe p slip system rotates the crystalline lattice around the axiswpjjðb� nÞp, where b is Burger’s vector and n is the slip planenormal. To maintain strain compatibility requirements, however,several slip systems (or even different deformation modes) usuallyoperate within a grain and thus contribute to the formation of adislocation boundary. Therefore, the misorientation axis of theboundary depends on the contribution of each slip system (mode)and thus is difficult to predict.
Considering the significance of prism slip in titanium, however,it can be instructive to examine those dislocation boundariespossibly originating from this slip mode. Of particular interest isthe fact that all prism slip systems provide a rotation around thesame [0001] axis. In hexagonal close-packed crystals, the [0001]direction is a six-fold rotation axis. On the other hand, the (0002)basal plane is a plane of mirror symmetry. Thus the maximumrotation angle about [0001] is 301. This simple idea agrees well
with the measured misorientation-axis distributions shown inFig. 8; i.e., it is apparent that the region near the [0001] pole‘empties’ as the misorientation angle approaches and exceeds 301.Thus, it is important to note that the maximum misorientationacross the dislocation boundaries originating from purely prismslip cannot exceed 301.
It seems useful therefore to broadly categorize the deformation-induced HABs in titanium into two groups: (i) those with misor-ientations below 301, (which appear to originate mainly from prismslip) and (ii) those with misorientations above 301 which tend to berelated to deformation twinning as well as possibly other slip modes.The effect of rolling reduction on the specific area of the two types ofHABs is shown in Fig. 7c.
3.4.2. Low strainsRolling to 25% and 50% thickness reductions gave rise to a
significant increase of LAB area relative to the undeformed condi-tion (Fig. 7a and b). The misorientation axes of the LABs were notrandomly oriented but tended to align with the [0001] axis (Fig. 8aand b). In material rolled to a 25% reduction, a slight clustering ofLAB misorientation axes near the ½21 10� direction was also found(Fig. 8a). After 50% reduction, however, the LAB cluster near the½21 10� seemed to disappear (Fig. 8b).
In addition to the pronounced development of LABs, the rolledmaterial was characterized by a significant increase in the specificarea of 651⟨1010⟩, 851⟨21 10⟩, and �451⟨51 43⟩ boundaries (Figs. 7aand 8a, b). The crystallographic preference of the first two misor-ientations can be ascribed to f1122g and f1012g twins, whereas thelatter boundaries could be attributable to ‘double’ twinning (i.e., theformation of tensile twins inside the compressive twins) [23].
Fig. 7. Effect of rolling reduction on misorientation-angle distribution (a), specific area of different types of grain boundaries (b), and specific area of different types of HABs(c). In (a), the insert shows the high-angle region of the distribution in more detail.
G.S. Dyakonov et al. / Materials Science & Engineering A 607 (2014) 145–154150

Author's personal copy
A slightly increased proportion of 351⟨1010⟩ boundaries (associatedwith f1121g⟨1 126⟩ tension twins) was also found.
The twin-induced peaks in misorientation-angle (Fig. 7a) andmisorientation-axis (Fig. 8a, b) distributions were characterized bya substantial spread exceeding normal EBSD errors (�21). Thiseffect was likely related to the strain-induced transformation oftwin boundaries, as discussed in Section 3.2.1.
The significant increase of the HAB area during this level ofreduction was almost solely related to boundaries having misor-ientations above 301 (Fig. 7c). This confirms that considerablegrain refinement observed in this strain range (Fig. 5a) wasattributable to deformation twinning.
3.4.3. Intermediate strainsAfter rolling to a 75% thickness reduction, the LAB area was
significantly increased (Fig. 7a and b). This agrees with Ref. [5]reporting extensive formation of deformation-induced boundariesat the rolling strains exceeding 50–60% The LAB cluster near[0001] was strengthened substantially (Fig. 8c).
The low-angle peak in the misorientation-angle distributionshifted toward high-angle misorientations (Fig. 7a). This presum-ably reflected a gradual accumulation of misorientations by LABsand subsequent LAB-to-HAB transformation.
Twin-induced peaks were significantly reduced in size (Figs. 7aand 8c). This effect can be explained by the progressive strain-induced transformation of twins. On the other hand, the specificarea of HABs with misorientation above 301 did not changenotably (Fig. 7c). This perhaps evidences suppression of twinningat large rolling strains and agrees well with findings in theliterature [3–6,9,10].
The specific area of HABs with misorientation below 301increased considerably during rolling to 75% reduction (Fig. 7c).A subtle peak near 301 appeared in the misorientation-angledistribution (Fig. 7a); misorientation axes of the respective bound-aries were clustered near the [0001] pole (Fig. 8c).
3.4.4. Large strainsIn material rolled to the 96% thickness reduction, the LAB area
increased further (Fig. 7b). Specifically, the area of 5–151 bound-aries increased at the expense of 2–31 boundaries (Fig. 7a), thusimplying a pronounced accumulation of misorientation by theLABs. The misorientation-axis distribution for LABs was notnoticeably altered in comparison to the observations for thesample rolled to a 75% reduction (Fig. 8c versus d).
The misorientation-angle distribution showed no clear twin-induced peaks (Fig. 7a) at the highest level of reduction. The totaltwin boundary fraction was found to be only �1.6% It wastherefore concluded that twinning was negligible, and the bound-aries of the former twins were almost completely transformed intonon-special HABs.
One of the most striking results for 96% reduced material wasthe large increase in the HAB area (Fig. 7b). Although the degree ofgrain refinement in this strain range appeared to be relativelysmall (Fig. 5a), the HAB area was almost tripled (Fig. 7b). Ofparticular interest was the observation that the HAB area enlarge-ment was significantly contributed by HABs with a misorientationabove 301 (Fig. 7c). As suggested in Section 3.4.1, these boundariescould not have originated from purely prism slip.
4. Discussion
4.1. Low and intermediate strains
Microstructure evolution at relatively low and intermediatestrains (r75%) was found to be in good agreement with priorobservations [3–10]. At low strains, microstructure evolution wasdominated by the development of f1122g⟨112 3⟩ compressive andf1012g⟨101 1⟩ tensile twins which rapidly refined the grain size. Theextensive twinning produced a transient basal-texture component.
As the rolling reduction increased, the misorientation across thetwin boundaries gradually deviated from the precise twin-matrix
Fig. 8. Misorientation-axis distributions measured in the material rolled to reductions of 25% (a), 50% (b), 75% (c), and 95% (d).
G.S. Dyakonov et al. / Materials Science & Engineering A 607 (2014) 145–154 151

Author's personal copy
orientation relationship and the twinned regions were transformedinto ordinary grains. Subsequent substructure development within thetwinned regions converted them into small equiaxed grains. Theprogressive grain refinement suppressed twinning and the resultantslip-dominated deformation led to the formation of a split-basalf0002g⟨1010⟩7301 TD texture.
It is worth noting as well that LABs tended to preferentially localizein (or near) twinned regions, which resulted in an irregular morphol-ogy with their misorientation axes close to [0001].
4.2. Large strains
For rolling reductions in the range of 75–96%, significant grainrefinement took place, which resulted in the formation of an ultra-fine grain structure. Possible explanations for this effect areexamined below.
4.2.1. Deformation bandingOne possible source of the observed grain refinement in heavily
rolled material was deformation banding [3,19]. The typical appear-ance of deformation bands in a Kikuchi-band-contrast EBSD map andan orientation EBSD map is shown in Fig. 9a and b, respectively; inboth cases, the deformation band is indicated by arrows. The crystal-lographic orientations within the deformation band as well as the
surrounding matrix are given in Fig. 9c and d, respectively. Pole figuresrevealed that the orientations of the band and the matrix wererelatively close. The misorientation between them was estimated ascomprising a �5–101 rotation around an axis nearly parallel to the TD(Fig. 9c and d). The proximity of the orientations also followed fromthe EBSD orientation map in Fig. 9b; here, it is seen that thedeformation band is difficult to distinguish from the matrix. Becausethe grain tolerance angle was taken to be 151, it seems unlikely thatdeformation banding per se contributed significantly to grain refine-ment. Moreover, direct grain size measurements showed only a smalldifference between the bands and the matrix (supplementary materi-als, Fig. S3.).
Fig. 9c and d also indicated that the deformation bands werenot responsible for the large orientation spread around typicalsplit-basal texture seen in (0002) pole figure for 96% rolledmaterial (Fig. 6d).
4.2.2. Correlation between texture and HAB developmentThe grain refinement in the heavily rolled titanium obviously
resulted from the very large increase in the HAB area (Fig. 7b). Inthis regard, it is of interest to examine a possible relationshipbetween HAB development and texture evolution at large strains(Fig. 6d).
Fig. 9. Evaluation of crystallographic orientation of deformation bands: Kikuchi-band-contrast EBSD map (a) and orientation EBSD map (b) with deformation band indicatedby arrows and (0002) and (1010) pole figures showing crystallographic orientation of the matrix (c) and the deformation band (d).
G.S. Dyakonov et al. / Materials Science & Engineering A 607 (2014) 145–154152
Author's personal copy
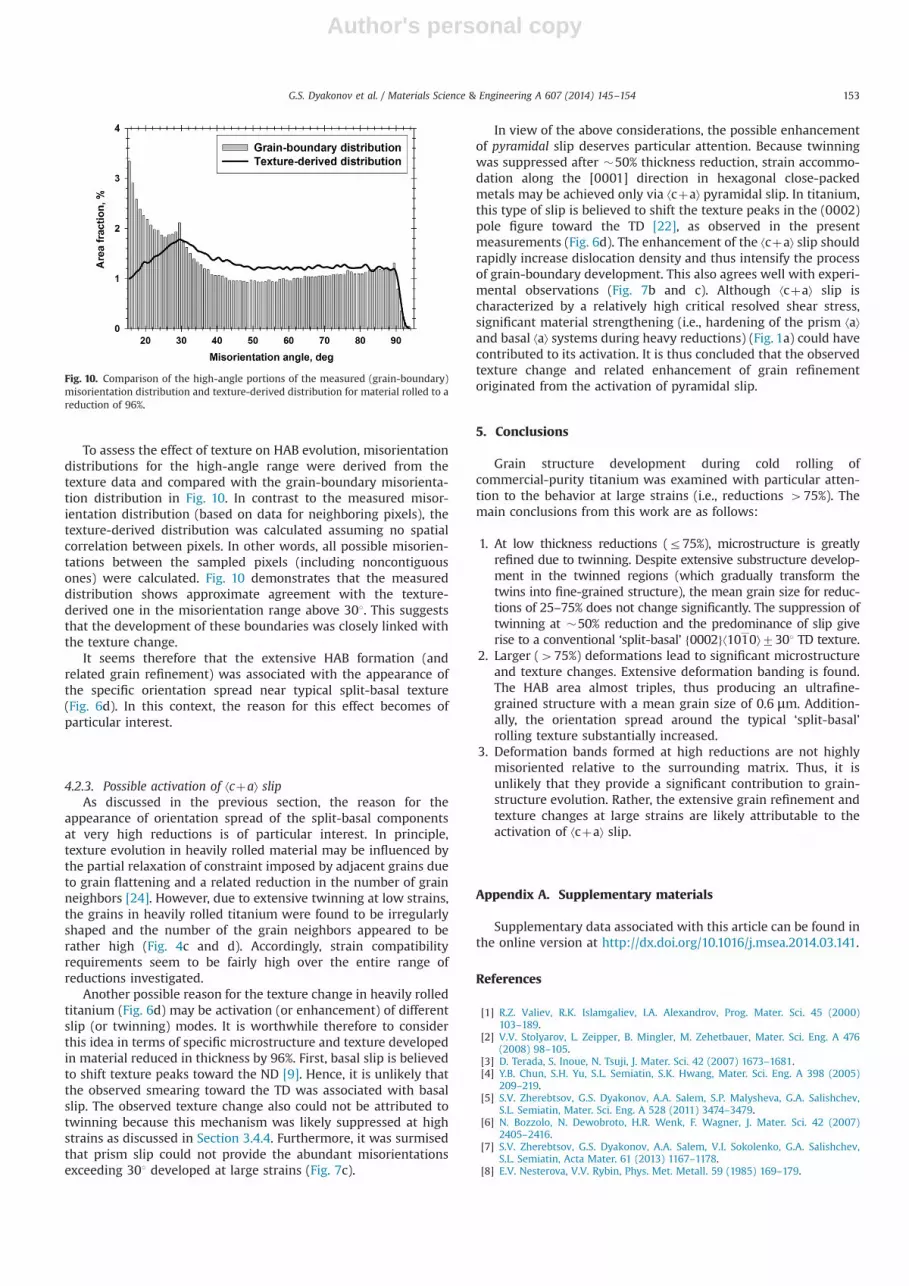
To assess the effect of texture on HAB evolution, misorientationdistributions for the high-angle range were derived from thetexture data and compared with the grain-boundary misorienta-tion distribution in Fig. 10. In contrast to the measured misor-ientation distribution (based on data for neighboring pixels), thetexture-derived distribution was calculated assuming no spatialcorrelation between pixels. In other words, all possible misorien-tations between the sampled pixels (including noncontiguousones) were calculated. Fig. 10 demonstrates that the measureddistribution shows approximate agreement with the texture-derived one in the misorientation range above 301. This suggeststhat the development of these boundaries was closely linked withthe texture change.
It seems therefore that the extensive HAB formation (andrelated grain refinement) was associated with the appearance ofthe specific orientation spread near typical split-basal texture(Fig. 6d). In this context, the reason for this effect becomes ofparticular interest.
4.2.3. Possible activation of ⟨cþa⟩ slipAs discussed in the previous section, the reason for the
appearance of orientation spread of the split-basal componentsat very high reductions is of particular interest. In principle,texture evolution in heavily rolled material may be influenced bythe partial relaxation of constraint imposed by adjacent grains dueto grain flattening and a related reduction in the number of grainneighbors [24]. However, due to extensive twinning at low strains,the grains in heavily rolled titanium were found to be irregularlyshaped and the number of the grain neighbors appeared to berather high (Fig. 4c and d). Accordingly, strain compatibilityrequirements seem to be fairly high over the entire range ofreductions investigated.
Another possible reason for the texture change in heavily rolledtitanium (Fig. 6d) may be activation (or enhancement) of differentslip (or twinning) modes. It is worthwhile therefore to considerthis idea in terms of specific microstructure and texture developedin material reduced in thickness by 96%. First, basal slip is believedto shift texture peaks toward the ND [9]. Hence, it is unlikely thatthe observed smearing toward the TD was associated with basalslip. The observed texture change also could not be attributed totwinning because this mechanism was likely suppressed at highstrains as discussed in Section 3.4.4. Furthermore, it was surmisedthat prism slip could not provide the abundant misorientationsexceeding 301 developed at large strains (Fig. 7c).
In view of the above considerations, the possible enhancementof pyramidal slip deserves particular attention. Because twinningwas suppressed after �50% thickness reduction, strain accommo-dation along the [0001] direction in hexagonal close-packedmetals may be achieved only via ⟨cþa⟩ pyramidal slip. In titanium,this type of slip is believed to shift the texture peaks in the (0002)pole figure toward the TD [22], as observed in the presentmeasurements (Fig. 6d). The enhancement of the ⟨cþa⟩ slip shouldrapidly increase dislocation density and thus intensify the processof grain-boundary development. This also agrees well with experi-mental observations (Fig. 7b and c). Although ⟨cþa⟩ slip ischaracterized by a relatively high critical resolved shear stress,significant material strengthening (i.e., hardening of the prism ⟨a⟩and basal ⟨a⟩ systems during heavy reductions) (Fig. 1a) could havecontributed to its activation. It is thus concluded that the observedtexture change and related enhancement of grain refinementoriginated from the activation of pyramidal slip.
5. Conclusions
Grain structure development during cold rolling ofcommercial-purity titanium was examined with particular atten-tion to the behavior at large strains (i.e., reductions 475%). Themain conclusions from this work are as follows:
1. At low thickness reductions (r75%), microstructure is greatlyrefined due to twinning. Despite extensive substructure develop-ment in the twinned regions (which gradually transform thetwins into fine-grained structure), the mean grain size for reduc-tions of 25–75% does not change significantly. The suppression oftwinning at �50% reduction and the predominance of slip giverise to a conventional ‘split-basal’ f0002g⟨1010⟩7301 TD texture.
2. Larger (475%) deformations lead to significant microstructureand texture changes. Extensive deformation banding is found.The HAB area almost triples, thus producing an ultrafine-grained structure with a mean grain size of 0.6 μm. Addition-ally, the orientation spread around the typical ‘split-basal’rolling texture substantially increased.
3. Deformation bands formed at high reductions are not highlymisoriented relative to the surrounding matrix. Thus, it isunlikely that they provide a significant contribution to grain-structure evolution. Rather, the extensive grain refinement andtexture changes at large strains are likely attributable to theactivation of ⟨cþa⟩ slip.
Appendix A. Supplementary materials
Supplementary data associated with this article can be found inthe online version at http://dx.doi.org/10.1016/j.msea.2014.03.141.
References
[1] R.Z. Valiev, R.K. Islamgaliev, I.A. Alexandrov, Prog. Mater. Sci. 45 (2000)103–189.
[2] V.V. Stolyarov, L. Zeipper, B. Mingler, M. Zehetbauer, Mater. Sci. Eng. A 476(2008) 98–105.
[3] D. Terada, S. Inoue, N. Tsuji, J. Mater. Sci. 42 (2007) 1673–1681.[4] Y.B. Chun, S.H. Yu, S.L. Semiatin, S.K. Hwang, Mater. Sci. Eng. A 398 (2005)
209–219.[5] S.V. Zherebtsov, G.S. Dyakonov, A.A. Salem, S.P. Malysheva, G.A. Salishchev,
S.L. Semiatin, Mater. Sci. Eng. A 528 (2011) 3474–3479.[6] N. Bozzolo, N. Dewobroto, H.R. Wenk, F. Wagner, J. Mater. Sci. 42 (2007)
2405–2416.[7] S.V. Zherebtsov, G.S. Dyakonov, A.A. Salem, V.I. Sokolenko, G.A. Salishchev,
S.L. Semiatin, Acta Mater. 61 (2013) 1167–1178.[8] E.V. Nesterova, V.V. Rybin, Phys. Met. Metall. 59 (1985) 169–179.
Fig. 10. Comparison of the high-angle portions of the measured (grain-boundary)misorientation distribution and texture-derived distribution for material rolled to areduction of 96%.
G.S. Dyakonov et al. / Materials Science & Engineering A 607 (2014) 145–154 153

Author's personal copy
[9] H.P. Lee, C. Esling, H.J. Bunge, Textures Microstruct. 7 (1988) 317–337.[10] S. Nourbakhsh, T.D. O'Brien, Mater. Sci. Eng. 100 (1988) 109–114.[11] D.P. Field, Ultramicroscopy 67 (1997) 1–9.[12] F.J. Humphreys, J. Microscopy 195 (1999) 170–185.[13] A.A. Salem, S.R. Kalidindi, R.D. Doherty, Acta Mater. 51 (2003) 4225–4237.[14] I.J. Beyerlein, J. Wang, M.R. Barnett, C.N. Tome, Proc. R. Soc. A 468 (2012)
1496–1520.[15] H.E. Kadiri, J. Kapil, A.L. Oppedal, L.G. Hector Jr., S.R. Agnew, M. Cherkaoui,
S.C. Vogel, Acta Mater. 61 (2013) 3549–3563.[16] G. Salishchev, S. Mironov, S. Zherebtsov, A. Belyakov, Mater. Character. 61
(2010) 732–739.[17] A.A. Salem, S.R. Kalidindi, R.D. Doherty, S.L. Semiatin, Metall. Mater. Trans. 37A
(2006) 259–268.
[18] A.A. Salem, S.R. Kalidindi, S.L. Semiatin, Acta Mater. 51 (2005) 3495–3502.[19] D.K. Yang, P. Cizek, P.D. Hodgson, C.E. Wen, Acta Mater. 58 (2010) 4536–4548.[20] Y. Zhong, F. Yin, K. Nagai, J. Mater. Res. 23 (2008) 2954–2966.[21] M.J. Philippe, M. Serghat, P. Van Houtte, C. Esling, Acta Metall. Mater. 43 (1995)
1619–1630.[22] S. Zaefferer, Mater. Sci. Eng. A 344 (2003) 20–30.[23] N. Bozzolo, L. Chan, A.D. Rollett, J. Appl. Cryst. 43 (2010) 596–602.[24] U.F. Kocks, G.R. Canova, Deformation of Polycrystals: Mechanisms and Micro-
structures, in: N. Hansen, A. Horsewell, T. Leffers, H. Lilholt (Eds.), RisoNational Laboratory, Roskilde, 1981, pp. 35–44.
G.S. Dyakonov et al. / Materials Science & Engineering A 607 (2014) 145–154154