Embed Size (px)
Citation preview

metals
Article
The Effect of Ultrafast Heating in Cold-Rolled LowCarbon Steel: Recrystallization and Texture Evolution
Felipe M. Castro Cerda 1,2,*, Leo A. I. Kestens 1,3, Alberto Monsalve 2 and Roumen H. Petrov 1,3
1 Department of Materials Science and Engineering, Ghent University, Technologiepark 903, 9052 Gent,Belgium; [email protected] (L.A.I.K.); [email protected] (R.H.P.)
2 Department of Metallurgical Engineering, Universidad de Santiago de Chile, Av. Lib. Bdo. O´Higgins 3363,Estación Central, 9170022 Santiago de Chile, Chile; [email protected]
3 Department of Materials Science and Engineering, Delft University of Technology, Mekelweg 2,2628CD Delft, The Netherlands
* Correspondence: [email protected]; Tel.: +32-9-331-04-64
Academic Editor: Hugo F. LopezReceived: 4 October 2016; Accepted: 17 November 2016; Published: 21 November 2016
Abstract: The microstructure and texture evolution of cold-rolled low carbon steel after ultrafastheating and quenching is investigated. Experiments were carried out at heating rates of 150 ◦C/sand 1500 ◦C/s. The recrystallization of ferrite is studied by scanning electron microscopy andelectron backscattered diffraction techniques. The texture evolution of cold rolled steel duringultrafast heating was studied, making it possible to estimate the precise effect of heating rate on theorientations of newly formed grains. The experimental results showed that the recrystallization offerrite was not completed before the full transformation of austenite. The noticeable increase in thefraction of recrystallized grains of diameter less than 1 µm, when the heating rate is increased from150 ◦C/s to 1500 ◦C/s suggests that the increase of the heating rate enhances the nucleation of ferrite.The crystallographic orientations in recrystallized ferrite are strongly influenced by the heating rates.The effect of heating rate in the releasing of stored energy, carbon diffusion and spheroidization ofcementite might explain some differences in textures observed in recrystallized ferrite.
Keywords: ultrafast heating; microstructure; texture; recrystallization; low-carbon steel
1. Introduction
New processing routes for the production of third generation advanced high strength steels(AHSS) are currently under development [1–5]. The application of ultrafast heating (UFH) tocold-rolled low carbon steel is a growing research field which has recently gained considerableattention from both academic and industry communities. Recent studies [3–8] have revealed thepotential of UFH for enhancing the mechanical properties of the standard low alloy steel grades.The advantage of applying UFH rates to cold-rolled low carbon steel stems from the great variety ofmicrostructures and the properties that can be derived from them. However, the adaptability of UFHrates to conventional steel processing lines still remains an issue [9].
In the present study, the heating rates have been classified in the following ranges: conventional,(lower than 10 ◦C/s), fast (from 10 to 100 ◦C/s) and ultrafast (higher than 100 ◦C/s). The effect ofUFH rates on the recrystallization of cold-rolled ultra-low carbon (ULC) steel during continuousheating (anisothermal conditions) was the subject of a number of studies in recent years [10–15].Ferry et al. [11] and Muljono et al. [12] reported faster recrystallization kinetics when UFH rates areapplied in comparison to conventional heating rates. However, increasing the heating rate decreasesthe recrystallized fraction of ferrite for a given temperature. The pinning effect of carbon atoms on thedislocation structure is claimed to play a significant role in slowing the recrystallization and decreasing
Metals 2016, 6, 288; doi:10.3390/met6110288 www.mdpi.com/journal/metals
Metals 2016, 6, 288 2 of 14
the ferrite recrystallized fraction at the same heating temperatures. Similar findings are reported byStockemer and Vanden Brande [14] and Senuma et al. [15]. It is also reported that the recrystallizationis completed before the onset of austenite formation in low and very low carbon steels, as well as ininterstitial free (IF) steel [16]. Results on the texture evolution during fast and ultrafast heating of ULCsteel and low carbon steel heating have been published elsewhere [4–7,14,15,17,18]. The orientationmeasurements do not show significant deviations from {111}<uvw> ND fiber [19,20], suggesting thatthe recrystallization textures in ferrite are practically independent of the heating rate. In cold-rolledlow carbon steel of ferrite-pearlite initial microstructure, the recrystallization is completely suppressedat heating rates above ~3000 ◦C/s [6]. Petrov et al. [6,7] explained the influence of UFH in the finaltextures as an effect of the stabilization of the recovered structure of the deformed ferrite due to veryhigh heating rate and absence of isothermal soaking.
The microstructure of the carbon steels after ultrafast heating is strongly influenced by thechemical composition, the initial microstructure, and the heating rate. In the present study, the goalis to investigate the recrystallization and evolution of a 70% cold rolled steel with a ferrite-pearlitemicrostructure under two reheating conditions: (i) a heating rate of 150 ◦C/s and (ii) a heatingrate of 1500 ◦C/s. In both cases, the steels were subsequently quenched practically without anyisothermal soaking. The current analysis is mainly focused on the recrystallization of ferrite, whereasthe formation of austenite is studied in a separate paper (Castro Cerda et al., The effect of ultrafastheating on cold-rolled low carbon steel: Formation and decomposition of austenite, submitted toMetals, 2016) The selected heating rates represent achievable intermediate and upper limit valuesunder industrial conditions [9]. The obtained results are expected to be of significance for the potentialapplication of fast heating cycles in newly designed production lines.
2. Materials and Methods
2.1. Steel and Heat Treatment
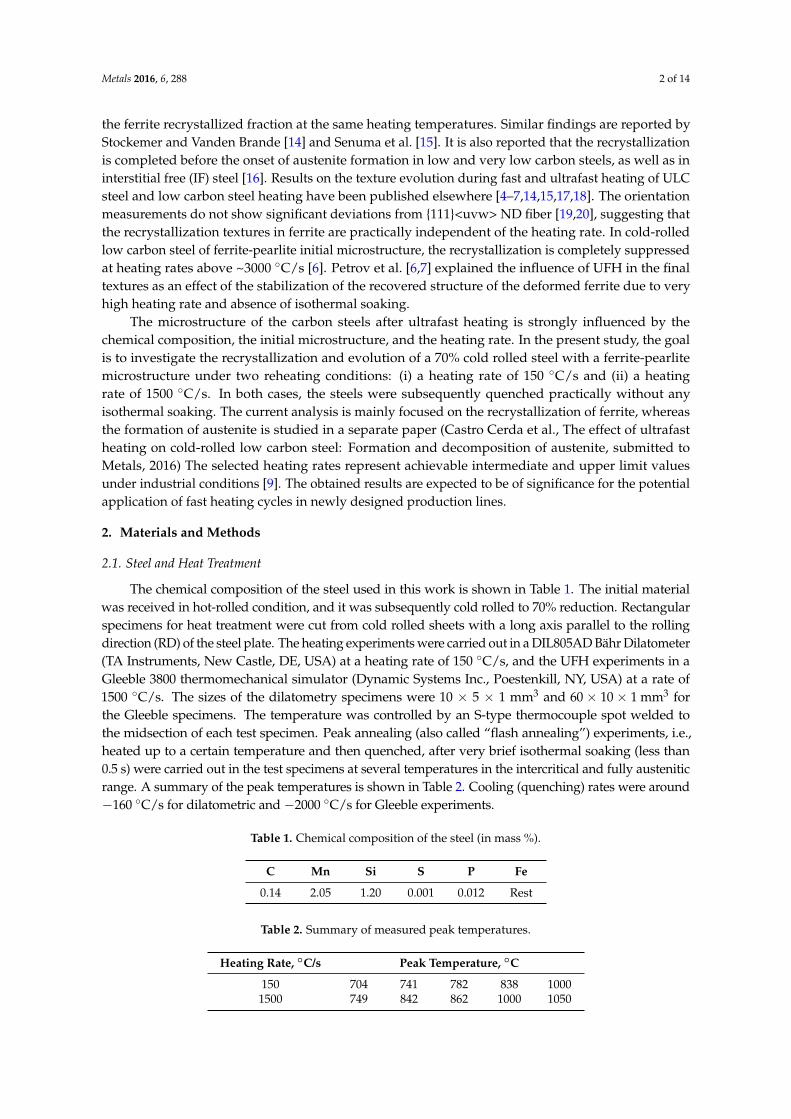
The chemical composition of the steel used in this work is shown in Table 1. The initial materialwas received in hot-rolled condition, and it was subsequently cold rolled to 70% reduction. Rectangularspecimens for heat treatment were cut from cold rolled sheets with a long axis parallel to the rollingdirection (RD) of the steel plate. The heating experiments were carried out in a DIL805AD Bähr Dilatometer(TA Instruments, New Castle, DE, USA) at a heating rate of 150 ◦C/s, and the UFH experiments in aGleeble 3800 thermomechanical simulator (Dynamic Systems Inc., Poestenkill, NY, USA) at a rate of1500 ◦C/s. The sizes of the dilatometry specimens were 10 × 5 × 1 mm3 and 60 × 10 × 1 mm3 forthe Gleeble specimens. The temperature was controlled by an S-type thermocouple spot welded tothe midsection of each test specimen. Peak annealing (also called “flash annealing”) experiments, i.e.,heated up to a certain temperature and then quenched, after very brief isothermal soaking (less than0.5 s) were carried out in the test specimens at several temperatures in the intercritical and fully austeniticrange. A summary of the peak temperatures is shown in Table 2. Cooling (quenching) rates were around−160 ◦C/s for dilatometric and −2000 ◦C/s for Gleeble experiments.
Table 1. Chemical composition of the steel (in mass %).
C Mn Si S P Fe
0.14 2.05 1.20 0.001 0.012 Rest
Table 2. Summary of measured peak temperatures.
Heating Rate, ◦C/s Peak Temperature, ◦C
150 704 741 782 838 10001500 749 842 862 1000 1050

Metals 2016, 6, 288 3 of 14
2.2. Characterization
The calculated equilibrium temperatures for the studied steel were A1 = 674 ◦C and A3 = 834 ◦C.The microstructure evolution was analyzed by dilatometry experiments, optical microscopy (OM,Carl Zeiss Microscopy, Thornwood, NY, USA), scanning electron microscopy (SEM, FEI, Hillsboro,OR, USA) and electron backscatter diffraction (EBSD, EDAX Inc., Mahwah, NJ, USA). Specimens werecut from the middle of each test sample to avoid any effect of temperature gradients along the length(RD). The characterization was thus performed on the RD plane (the plane which is perpendicularto the sample rolling direction) at the center of the heat treated zone, where the thermocouple wasplaced. Metallographic samples were prepared according to the standard procedures by grinding andpolishing to 1 µm diamond paste. The microstructure was revealed by etching with a solution of 4%HNO3 in ethanol (Nital 4%) for ~10 s at room temperature. EBSD measurements were performed afteran additional 40 min mechanical polishing of the samples with colloidal silica with a particle size of35 nm and 10 N force. The SEM images and the EBSD data collection were acquired in the transverseplane of the rolled samples i.e., in the plane perpendicular to the sample transverse direction (TD).
The EBSD data acquisition was carried out with a Hikari detector operated with theEDAX-TSL-OIM-Data Collection version 6 software. The measuring set-up was installed on a FEIQuanta™ 450-FEG-SEM (FEI, Hillsboro, OR, USA), which operated at 20 kV, beam current of ~2.4 nAcorresponding to FEI spot size number 5 for an aperture of 30 µm and a working distance of 16 mm.The samples were 70◦ tilted towards the EBSD detector, and the EBSD patterns were acquired in ahexagonal scan grid with a step size of 60 nm. The textures are represented as orientation distributionfunctions (ODFs) using Bunge notation. They were calculated with series rank (L = 16), Gaussianhalf-width of 5◦ and orthotropic sample symmetry. Each texture calculation is based on a minimumarea of ~6.400 µm2 and contains more than 5000 grains.
2.3. Data Post-Processing and Analysis
Phase quantification was performed on EBSD data with TSL-OIM Analysis V6.3 (EDAX Inc.,Mahwah, NJ, USA). The raw EBSD data were post-processed (cleaned) to re-assign the dubiouslyindexed points using the grain confidence index standardization procedure. To distinguish betweenmartensite and ferrite (both indexed as BCC phases), a plot of the grain area fraction was consideredvs. the grain average image quality (GAIQ), following the procedure described in [21,22]. The grainswere defined as the arrangement of at least 4 points with a misorientation angle higher than 5◦ andconfidence index higher than 0.1. Grain diameter is estimated as the diameter of the circle with areaequal to the area of the detected grain in the EBSD map under the above grain definition. The martensitefraction was associated with the low IQ part of the histogram, whereas the ferrite fraction correspondsto the part with high IQ values. The ferrite fraction is composed of recrystallized and non-recrystallizedgrains. However, the fraction of the recrystallized ferrite was difficult to obtain accurately from theIQ values. One reason for this is the high IQ of some unrecrystallized but recovered ferritic grains,which makes it difficult to separate them from completely recrystallized ones. To better distinguishbetween the recrystallized and recovered grains, the grain average misorientation (GAM) histogramwas considered. In the present study, the approach of [23] was applied where the recrystallized grainswere regarded as having a grain average misorientation less than 0.4◦, while grains with a grainaverage misorientation larger than 0.4◦ were considered non-recrystallized.
3. Results
3.1. Microstructure after Cold-Rolling and Ultrafast Heating
The microstructures after different heating cycles are shown in Figure 1. All microstructuresconsist of a mixture of ferrite and martensite and, in some cases (Figure 1a,d), small fractions ofspheroidized cementite are also resolved. The latter are products of partial spheroidization of pearlite.The martensite in SEM images is identified by its morphology and location in the microstructure.
Metals 2016, 6, 288 4 of 14
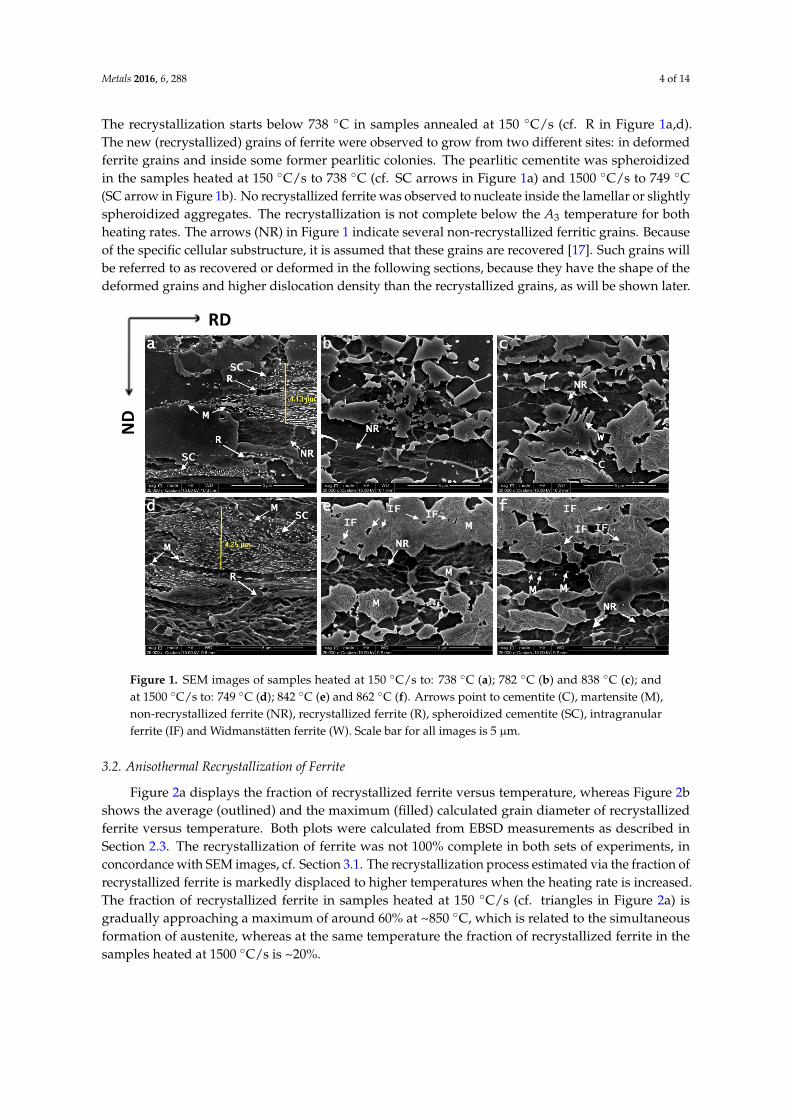
The recrystallization starts below 738 ◦C in samples annealed at 150 ◦C/s (cf. R in Figure 1a,d).The new (recrystallized) grains of ferrite were observed to grow from two different sites: in deformedferrite grains and inside some former pearlitic colonies. The pearlitic cementite was spheroidizedin the samples heated at 150 ◦C/s to 738 ◦C (cf. SC arrows in Figure 1a) and 1500 ◦C/s to 749 ◦C(SC arrow in Figure 1b). No recrystallized ferrite was observed to nucleate inside the lamellar or slightlyspheroidized aggregates. The recrystallization is not complete below the A3 temperature for bothheating rates. The arrows (NR) in Figure 1 indicate several non-recrystallized ferritic grains. Becauseof the specific cellular substructure, it is assumed that these grains are recovered [17]. Such grains willbe referred to as recovered or deformed in the following sections, because they have the shape of thedeformed grains and higher dislocation density than the recrystallized grains, as will be shown later.
Metals 2016, 6, 288 4 of 14
pearlite. The martensite in SEM images is identified by its morphology and location in the
microstructure. The recrystallization starts below 738 °C in samples annealed at 150 °C/s (cf. R in
Figure 1a,d). The new (recrystallized) grains of ferrite were observed to grow from two different
sites: in deformed ferrite grains and inside some former pearlitic colonies. The pearlitic cementite
was spheroidized in the samples heated at 150 °C/s to 738 °C (cf. SC arrows in Figure 1a) and 1500
°C/s to 749 °C (SC arrow in Figure 1b). No recrystallized ferrite was observed to nucleate inside the
lamellar or slightly spheroidized aggregates. The recrystallization is not complete below the A3
temperature for both heating rates. The arrows (NR) in Figure 1 indicate several non-recrystallized
ferritic grains. Because of the specific cellular substructure, it is assumed that these grains are
recovered [17]. Such grains will be referred to as recovered or deformed in the following sections,
because they have the shape of the deformed grains and higher dislocation density than the
recrystallized grains, as will be shown later.
Figure 1. SEM images of samples heated at 150 °C/s to: 738 °C (a); 782 °C (b) and 838 °C (c); and at
1500 °C/s to: 749 °C (d); 842 °C (e) and 862 °C (f). Arrows point to cementite (C), martensite (M),
non-recrystallized ferrite (NR), recrystallized ferrite (R), spheroidized cementite (SC), intragranular
ferrite (IF) and Widmanstätten ferrite (W). Scale bar for all images is 5 µm.
3.2. Anisothermal Recrystallization of Ferrite
Figure 2a displays the fraction of recrystallized ferrite versus temperature, whereas Figure 2b
shows the average (outlined) and the maximum (filled) calculated grain diameter of recrystallized
ferrite versus temperature. Both plots were calculated from EBSD measurements as described in
Section 2.3. The recrystallization of ferrite was not 100% complete in both sets of experiments, in
concordance with SEM images, cf. Section 3.1. The recrystallization process estimated via the
fraction of recrystallized ferrite is markedly displaced to higher temperatures when the heating rate
is increased. The fraction of recrystallized ferrite in samples heated at 150 °C/s (cf. triangles in Figure
2a) is gradually approaching a maximum of around 60% at ~850 °C, which is related to the
simultaneous formation of austenite, whereas at the same temperature the fraction of recrystallized
ferrite in the samples heated at 1500 °C/s is ~20%.
RD
ND
IF
IF IFIF
Figure 1. SEM images of samples heated at 150 ◦C/s to: 738 ◦C (a); 782 ◦C (b) and 838 ◦C (c); andat 1500 ◦C/s to: 749 ◦C (d); 842 ◦C (e) and 862 ◦C (f). Arrows point to cementite (C), martensite (M),non-recrystallized ferrite (NR), recrystallized ferrite (R), spheroidized cementite (SC), intragranularferrite (IF) and Widmanstätten ferrite (W). Scale bar for all images is 5 µm.
3.2. Anisothermal Recrystallization of Ferrite
Figure 2a displays the fraction of recrystallized ferrite versus temperature, whereas Figure 2bshows the average (outlined) and the maximum (filled) calculated grain diameter of recrystallizedferrite versus temperature. Both plots were calculated from EBSD measurements as described inSection 2.3. The recrystallization of ferrite was not 100% complete in both sets of experiments, inconcordance with SEM images, cf. Section 3.1. The recrystallization process estimated via the fraction ofrecrystallized ferrite is markedly displaced to higher temperatures when the heating rate is increased.The fraction of recrystallized ferrite in samples heated at 150 ◦C/s (cf. triangles in Figure 2a) isgradually approaching a maximum of around 60% at ~850 ◦C, which is related to the simultaneousformation of austenite, whereas at the same temperature the fraction of recrystallized ferrite in thesamples heated at 1500 ◦C/s is ~20%.
Metals 2016, 6, 288 5 of 14Metals 2016, 6, 288 5 of 14
Figure 2. (a) Fraction of recrystallized ferrite and (b) average ferritic grain size (outlined) and
maximum ferritic grain size (filled) versus annealing temperature. In both plots, triangles and circles
represent samples annealed with 150 °C/s and 1500 °C/s respectively.
The average grain diameter of recrystallized ferrite in samples heated at 150 °C/s (cf. outlined
triangles in Figure 2b) displays a growing tendency up to ~741 °C and then it stabilizes around the
value of ~3 µm. In samples heated at 1500 °C/s (cf. outlined circles in Figure 2b) the average grain
diameter of recrystallized ferrite gradually approaches the value of ~1 µm. The marked difference
between recrystallized grain sizes as a result of both heating rates is a consequence of the reduced
time for grain growth as the heating rate is increased.
3.3. Textures
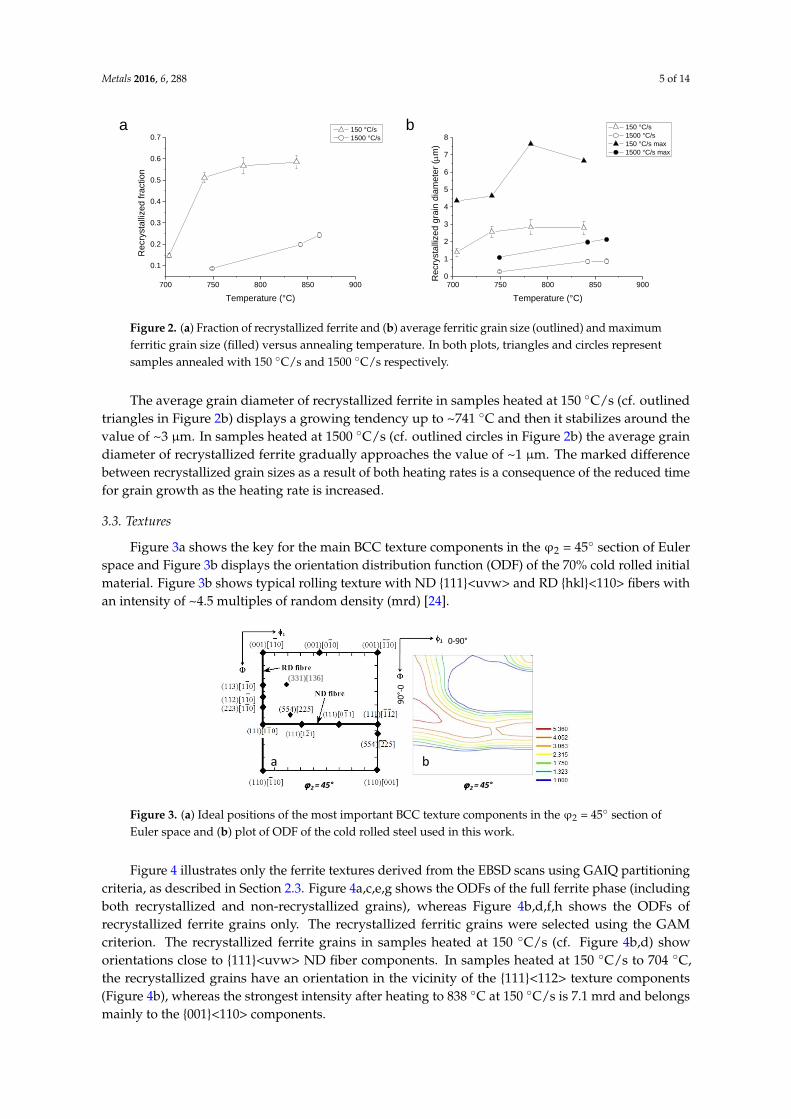
Figure 3a shows the key for the main BCC texture components in the ϕ2 = 45° section of Euler
space and Figure 3b displays the orientation distribution function (ODF) of the 70% cold rolled
initial material. Figure 3b shows typical rolling texture with ND {111}<uvw> and RD {hkl}<110>
fibers with an intensity of ~4.5 multiples of random density (mrd) [24].
Figure 3. (a) Ideal positions of the most important BCC texture components in the ϕ2 = 45° section of
Euler space and (b) plot of ODF of the cold rolled steel used in this work.
Figure 4 illustrates only the ferrite textures derived from the EBSD scans using GAIQ
partitioning criteria, as described in Section 2.3. Figure 4a,c,e,g shows the ODFs of the full ferrite
phase (including both recrystallized and non-recrystallized grains), whereas Figure 4b,d,f,h shows
the ODFs of recrystallized ferrite grains only. The recrystallized ferritic grains were selected using
the GAM criterion. The recrystallized ferrite grains in samples heated at 150 °C/s (cf. Figure 4b,d)
show orientations close to {111}<uvw> ND fiber components. In samples heated at 150 °C/s to 704 °C,
the recrystallized grains have an orientation in the vicinity of the {111}<112> texture components
(Figure 4b), whereas the strongest intensity after heating to 838 °C at 150 °C/s is 7.1 mrd and belongs
mainly to the {001}<110> components.
700 750 800 850 900
0.1
0.2
0.3
0.4
0.5
0.6
0.7 150 °C/s
1500 °C/sR
ecry
sta
llize
d f
ractio
n
Temperature (°C)
a
700 750 800 850 9000
1
2
3
4
5
6
7
8
150 °C/s
1500 °C/s
150 °C/s max
1500 °C/s max
Re
cry
sta
llize
d g
rain
dia
me
ter
(m
)
Temperature (°C)
b
2 = 45°2 = 45°
0-90°
90°-
0
b
(331)[136]
a
Figure 2. (a) Fraction of recrystallized ferrite and (b) average ferritic grain size (outlined) and maximumferritic grain size (filled) versus annealing temperature. In both plots, triangles and circles representsamples annealed with 150 ◦C/s and 1500 ◦C/s respectively.
The average grain diameter of recrystallized ferrite in samples heated at 150 ◦C/s (cf. outlinedtriangles in Figure 2b) displays a growing tendency up to ~741 ◦C and then it stabilizes around thevalue of ~3 µm. In samples heated at 1500 ◦C/s (cf. outlined circles in Figure 2b) the average graindiameter of recrystallized ferrite gradually approaches the value of ~1 µm. The marked differencebetween recrystallized grain sizes as a result of both heating rates is a consequence of the reduced timefor grain growth as the heating rate is increased.
3.3. Textures
Figure 3a shows the key for the main BCC texture components in the ϕ2 = 45◦ section of Eulerspace and Figure 3b displays the orientation distribution function (ODF) of the 70% cold rolled initialmaterial. Figure 3b shows typical rolling texture with ND {111}<uvw> and RD {hkl}<110> fibers withan intensity of ~4.5 multiples of random density (mrd) [24].
Metals 2016, 6, 288 5 of 14
Figure 2. (a) Fraction of recrystallized ferrite and (b) average ferritic grain size (outlined) and
maximum ferritic grain size (filled) versus annealing temperature. In both plots, triangles and circles
represent samples annealed with 150 °C/s and 1500 °C/s respectively.
The average grain diameter of recrystallized ferrite in samples heated at 150 °C/s (cf. outlined
triangles in Figure 2b) displays a growing tendency up to ~741 °C and then it stabilizes around the
value of ~3 µm. In samples heated at 1500 °C/s (cf. outlined circles in Figure 2b) the average grain
diameter of recrystallized ferrite gradually approaches the value of ~1 µm. The marked difference
between recrystallized grain sizes as a result of both heating rates is a consequence of the reduced
time for grain growth as the heating rate is increased.
3.3. Textures
Figure 3a shows the key for the main BCC texture components in the ϕ2 = 45° section of Euler
space and Figure 3b displays the orientation distribution function (ODF) of the 70% cold rolled
initial material. Figure 3b shows typical rolling texture with ND {111}<uvw> and RD {hkl}<110>
fibers with an intensity of ~4.5 multiples of random density (mrd) [24].
Figure 3. (a) Ideal positions of the most important BCC texture components in the ϕ2 = 45° section of
Euler space and (b) plot of ODF of the cold rolled steel used in this work.
Figure 4 illustrates only the ferrite textures derived from the EBSD scans using GAIQ
partitioning criteria, as described in Section 2.3. Figure 4a,c,e,g shows the ODFs of the full ferrite
phase (including both recrystallized and non-recrystallized grains), whereas Figure 4b,d,f,h shows
the ODFs of recrystallized ferrite grains only. The recrystallized ferritic grains were selected using
the GAM criterion. The recrystallized ferrite grains in samples heated at 150 °C/s (cf. Figure 4b,d)
show orientations close to {111}<uvw> ND fiber components. In samples heated at 150 °C/s to 704 °C,
the recrystallized grains have an orientation in the vicinity of the {111}<112> texture components
(Figure 4b), whereas the strongest intensity after heating to 838 °C at 150 °C/s is 7.1 mrd and belongs
mainly to the {001}<110> components.
700 750 800 850 900
0.1
0.2
0.3
0.4
0.5
0.6
0.7 150 °C/s
1500 °C/s
Re
cry
sta
llize
d fra
ction
Temperature (°C)
a
700 750 800 850 9000
1
2
3
4
5
6
7
8
150 °C/s
1500 °C/s
150 °C/s max
1500 °C/s max
Re
cry
sta
llize
d g
rain
dia
me
ter
(m
)
Temperature (°C)
b
2 = 45°2 = 45°
0-90°
90°-
0
b
(331)[136]
a
Figure 3. (a) Ideal positions of the most important BCC texture components in the ϕ2 = 45◦ section ofEuler space and (b) plot of ODF of the cold rolled steel used in this work.
Figure 4 illustrates only the ferrite textures derived from the EBSD scans using GAIQ partitioningcriteria, as described in Section 2.3. Figure 4a,c,e,g shows the ODFs of the full ferrite phase (includingboth recrystallized and non-recrystallized grains), whereas Figure 4b,d,f,h shows the ODFs ofrecrystallized ferrite grains only. The recrystallized ferritic grains were selected using the GAMcriterion. The recrystallized ferrite grains in samples heated at 150 ◦C/s (cf. Figure 4b,d) showorientations close to {111}<uvw> ND fiber components. In samples heated at 150 ◦C/s to 704 ◦C,the recrystallized grains have an orientation in the vicinity of the {111}<112> texture components(Figure 4b), whereas the strongest intensity after heating to 838 ◦C at 150 ◦C/s is 7.1 mrd and belongsmainly to the {001}<110> components.

Metals 2016, 6, 288 6 of 14Metals 2016, 6, 288 6 of 14
Figure 4. ODF of ferrite at ϕ2 = 45° from samples heated at 150 °C/s (a–d) and 1500 °C/s (e–h). (a) and
(b) correspond to peak temperature of 704 °C; (c,d) to 838 °C; (e) and (f) to 749 °C and (g) and (h) to
862 °C. (a,c,e,g) correspond to recrystallized and non-recrystallized ferrite, whereas (b,d,f,h)
correspond to recrystallized ferrite. Numbers in (b,d,f,h) indicate the recrystallized ferrite fraction.
Dashed line indicates the ideal position of {111}<uvw> ND fiber. For color images please see the
online version of the paper.
The ODF of ferrite in samples heated at 1500 °C/s to 749 °C (Figure 4e) is very similar to the
ODF of the cold-rolled initial material (Figure 3b). Figure 4f shows the ODF of ferrite at a very early
stage of recrystallization in a sample heated at 1500 °C/s. The maximum intensities of 3.1 mrd are
close to {112}<110> texture component. The ODF of samples heated at 1500 °C/s to 862 °C (cf. Figure
4g) shows that the ferrite texture intensities are similar to the cold-rolled texture in the main
components of ND {111}<uvw> and RD {hkl}<110> fibers. Recrystallized grains in the same sample
show strong intensities on {112}<110> and {111}<112> components (cf. Figure 4h).
The appearance of the Goss {110}<001> texture component with intensity of ~1.7 mrd is
observed after heat treatments at both heating rates (cf. Figure 4b,d,h). The Goss component is
associated with oriented nucleation at shear bands in deformed ferrite [19]. The rotated Goss
{110}<110> component appears in the recrystallized ferrite after UFH at 1500 °C/s (cf. Figure 4f,h).
These components are claimed to originate along shear bands in deformed ferrite [19,25,26]. The
{331}<136> components shown in recrystallized ferrite (cf. Figure 4b,d,f,h) have been proposed [27]
to originate from specific deformation features, like intra-grain deformation bands in deformed
ferrite of RD {hkl}<110> fiber.
4. Discussion
Recrystallization of Ferrite
Recrystallization begins in cold-rolled ferrite. No recrystallized grains were observed within
lamellar pearlitic aggregates. One explanation for this is related to the energy stored in the different
0-90°1
b c
f g h
150°
C/s
d
1500
°C/s
704°C 838°C
Ferrite Rex. Ferrite only Ferrite Rex. Ferrite only
749°C 862°C
Ferrite Rex. Ferrite only Ferrite Rex. Ferrite only
9 %
90°
-0
3.1x
3.3x
15 % 58 %
7.1x
24 %
2.9x
a
e
Figure 4. ODF of ferrite at ϕ2 = 45◦ from samples heated at 150 ◦C/s (a–d) and 1500 ◦C/s (e–h).(a,b) correspond to peak temperature of 704 ◦C; (c,d) to 838 ◦C; (e,f) to 749 ◦C and (g,h) to 862 ◦C.(a,c,e,g) correspond to recrystallized and non-recrystallized ferrite, whereas (b,d,f,h) correspond torecrystallized ferrite. Numbers in (b,d,f,h) indicate the recrystallized ferrite fraction. Dashed lineindicates the ideal position of {111}<uvw> ND fiber. For color images please see the online version ofthe paper.
The ODF of ferrite in samples heated at 1500 ◦C/s to 749 ◦C (Figure 4e) is very similar to the ODFof the cold-rolled initial material (Figure 3b). Figure 4f shows the ODF of ferrite at a very early stageof recrystallization in a sample heated at 1500 ◦C/s. The maximum intensities of 3.1 mrd are closeto {112}<110> texture component. The ODF of samples heated at 1500 ◦C/s to 862 ◦C (cf. Figure 4g)shows that the ferrite texture intensities are similar to the cold-rolled texture in the main componentsof ND {111}<uvw> and RD {hkl}<110> fibers. Recrystallized grains in the same sample show strongintensities on {112}<110> and {111}<112> components (cf. Figure 4h).
The appearance of the Goss {110}<001> texture component with intensity of ~1.7 mrd is observedafter heat treatments at both heating rates (cf. Figure 4b,d,h). The Goss component is associated withoriented nucleation at shear bands in deformed ferrite [19]. The rotated Goss {110}<110> componentappears in the recrystallized ferrite after UFH at 1500 ◦C/s (cf. Figure 4f,h). These components areclaimed to originate along shear bands in deformed ferrite [19,25,26]. The {331}<136> componentsshown in recrystallized ferrite (cf. Figure 4b,d,f,h) have been proposed [27] to originate from specificdeformation features, like intra-grain deformation bands in deformed ferrite of RD {hkl}<110> fiber.
4. Discussion
Recrystallization of Ferrite
Recrystallization begins in cold-rolled ferrite. No recrystallized grains were observed withinlamellar pearlitic aggregates. One explanation for this is related to the energy stored in the differentphases and constituents of the initial microstructure after cold-rolling. Homogeneous macroscopicdeformation (as introduced in cold-rolling) distributes heterogeneously among the phases with very

Metals 2016, 6, 288 7 of 14
different properties on a microscopic level. The lower strength and higher ductility of proeutectoidferrite, compared to pearlite, suggests that proeutectoid ferrite will accumulate more strain thanthe pearlitic structure during cold rolling. Pearlitic ferrite will bear the strain accommodationin pearlite, whereas cementite remains practically non-deformed (rotated and/or fractured) [28].Experimental evidence of the strain accommodation in the different microconstituents was obtainedfrom a representative deformed area shown in Figure 5. Figure 5a shows a SEM image corresponding tothe same area of the EBSD scan (IQ map) in Figure 5b. In the upper right corner of Figure 5a, a pearlitecolony (P) can be readily identified. Elongated ferrite grains (DF) are situated just below or above thepearlitic colony. The distribution of elongated ferrite below and above deformed pearlitic coloniesshown in Figure 5a is commonly observed through the cold-rolled microstructure. Both constituentsare highlighted in Figure 5b, pearlite in yellow and ferrite in green. Figure 5c illustrates the KernelAverage Misorientation (KAM) distribution of ferrite and pearlite, respectively. It can observed thatthe ferrite KAM distribution has slightly shifted to higher KAM values. The displacement of the curveis a clear indication that the BCC lattice of the proeutectoid ferrite is more distorted than the BCClattice of the pearlitic ferrite.
Metals 2016, 6, 288 7 of 14
phases and constituents of the initial microstructure after cold-rolling. Homogeneous macroscopic
deformation (as introduced in cold-rolling) distributes heterogeneously among the phases with very
different properties on a microscopic level. The lower strength and higher ductility of proeutectoid
ferrite, compared to pearlite, suggests that proeutectoid ferrite will accumulate more strain than the
pearlitic structure during cold rolling. Pearlitic ferrite will bear the strain accommodation in pearlite,
whereas cementite remains practically non-deformed (rotated and/or fractured) [28]. Experimental
evidence of the strain accommodation in the different microconstituents was obtained from a
representative deformed area shown in Figure 5. Figure 5a shows a SEM image corresponding to the
same area of the EBSD scan (IQ map) in Figure 5b. In the upper right corner of Figure 5a, a pearlite
colony (P) can be readily identified. Elongated ferrite grains (DF) are situated just below or above the
pearlitic colony. The distribution of elongated ferrite below and above deformed pearlitic colonies
shown in Figure 5a is commonly observed through the cold-rolled microstructure. Both constituents
are highlighted in Figure 5b, pearlite in yellow and ferrite in green. Figure 5c illustrates the Kernel
Average Misorientation (KAM) distribution of ferrite and pearlite, respectively. It can observed that
the ferrite KAM distribution has slightly shifted to higher KAM values. The displacement of the
curve is a clear indication that the BCC lattice of the proeutectoid ferrite is more distorted than the
BCC lattice of the pearlitic ferrite.
Figure 5. (a) SEM image; (b) IQ map and (c) KAM versus number fraction for 70% cold-rolled
material. Letters in arrows are P for pearlite; and DF for deformed ferrite. Step size 50 nm.
Another possible explanation for the absence of recrystallization inside pearlite is due to the
interlamellar spacing. A critical nucleus larger than the width of the pearlitic ferrite will not be able
to form, in spite of the fact that highly strained regions of pearlitic ferrite may form between
cementite plates. Local increases in carbon content of pearlitic ferrite [29] might also hinder
recrystallization due to the dislocation-pinning effect of carbon.
The growth of the recrystallized ferrite nuclei is thermodynamically more favorable in the
heavily deformed zones, due to the larger amount of defects and hence higher driving force. The
metallographic observations of the recrystallized ferrite in cold-rolled ferrite described in Section 3.1
are consistent with the previous statement. Figure 6 illustrates the recovery and recrystallization of
deformed ferrite (arrows) in a region adjacent to a pearlitic colony in material heated at 150 °C/s to
704 °C. The GAM map (Figure 6b) shows higher average misorientation values for pearlite (cf. P in
Figure 6), compared to the ferrite just above (cf. arrows in Figure 6b) in the recovered and partially
recrystallized structures. The EBSD data indicate that at this stage of recrystallization the
proeutectoid ferrite is already recrystallized and hence its lattice is less distorted than the one of the
pearlitic ferrite. The KAM map in Figure 6c shows large misorientation angles between points in
ferrite above the pearlitic colony, which is also consistent with a highly deformed structure.
P
DF DF
P
DF DF
a b c
RD
ND
0 1 2 3 4 5
0.00
0.05
0.10
0.15
0.20
0.25
Nu
mb
er
fra
ctio
n
KAM (Degrees)
Pearlite
Ferrite
Figure 5. (a) SEM image; (b) IQ map and (c) KAM versus number fraction for 70% cold-rolled material.Letters in arrows are P for pearlite; and DF for deformed ferrite. Step size 50 nm.
Another possible explanation for the absence of recrystallization inside pearlite is due to theinterlamellar spacing. A critical nucleus larger than the width of the pearlitic ferrite will not be able toform, in spite of the fact that highly strained regions of pearlitic ferrite may form between cementiteplates. Local increases in carbon content of pearlitic ferrite [29] might also hinder recrystallization dueto the dislocation-pinning effect of carbon.
The growth of the recrystallized ferrite nuclei is thermodynamically more favorable in theheavily deformed zones, due to the larger amount of defects and hence higher driving force.The metallographic observations of the recrystallized ferrite in cold-rolled ferrite described inSection 3.1 are consistent with the previous statement. Figure 6 illustrates the recovery andrecrystallization of deformed ferrite (arrows) in a region adjacent to a pearlitic colony in material heatedat 150 ◦C/s to 704 ◦C. The GAM map (Figure 6b) shows higher average misorientation values forpearlite (cf. P in Figure 6), compared to the ferrite just above (cf. arrows in Figure 6b) in the recoveredand partially recrystallized structures. The EBSD data indicate that at this stage of recrystallizationthe proeutectoid ferrite is already recrystallized and hence its lattice is less distorted than the one ofthe pearlitic ferrite. The KAM map in Figure 6c shows large misorientation angles between points inferrite above the pearlitic colony, which is also consistent with a highly deformed structure.
Metals 2016, 6, 288 8 of 14Metals 2016, 6, 288 8 of 14
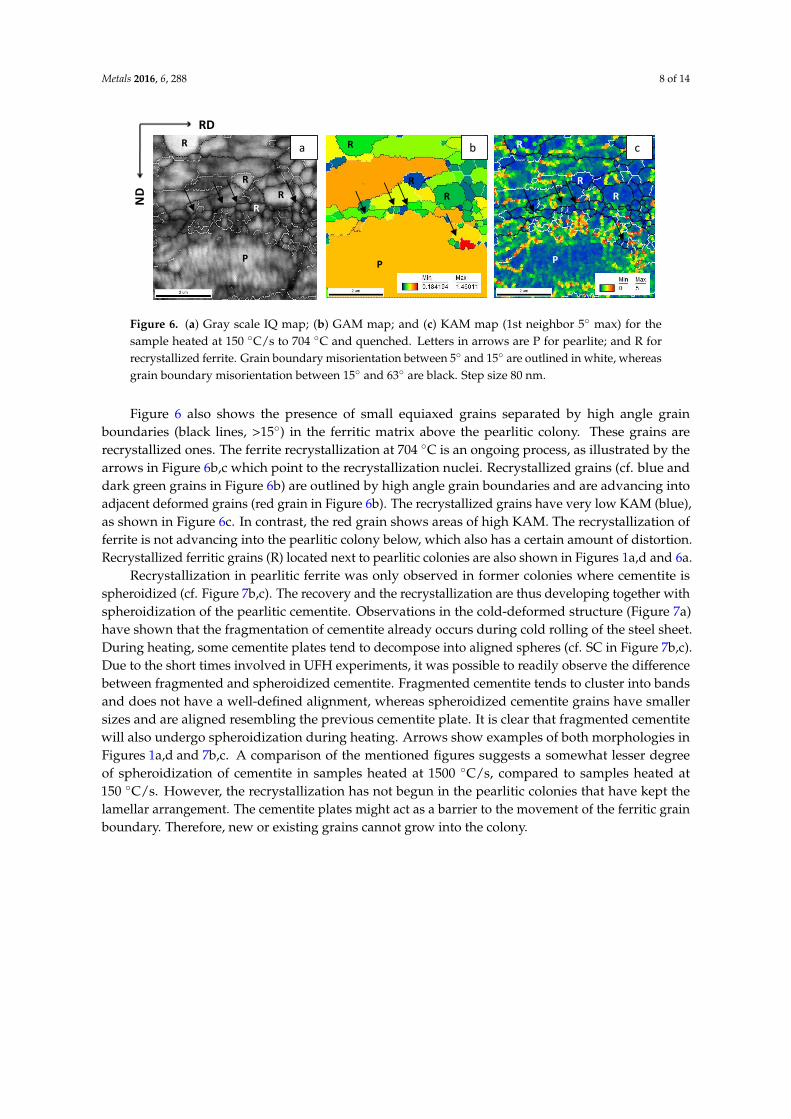
Figure 6. (a) Gray scale IQ map; (b) GAM map; and (c) KAM map (1st neighbor 5° max) for the
sample heated at 150 °C/s to 704 °C and quenched. Letters in arrows are P for pearlite; and R for
recrystallized ferrite. Grain boundary misorientation between 5° and 15° are outlined in white,
whereas grain boundary misorientation between 15° and 63° are black. Step size 80 nm.
Figure 6 also shows the presence of small equiaxed grains separated by high angle grain
boundaries (black lines, >15°) in the ferritic matrix above the pearlitic colony. These grains are
recrystallized ones. The ferrite recrystallization at 704 °C is an ongoing process, as illustrated by the
arrows in Figure 6b,c which point to the recrystallization nuclei. Recrystallized grains (cf. blue and
dark green grains in Figure 6b) are outlined by high angle grain boundaries and are advancing into
adjacent deformed grains (red grain in Figure 6b). The recrystallized grains have very low KAM
(blue), as shown in Figure 6c. In contrast, the red grain shows areas of high KAM. The
recrystallization of ferrite is not advancing into the pearlitic colony below, which also has a certain
amount of distortion. Recrystallized ferritic grains (R) located next to pearlitic colonies are also
shown in Figures 1a,d and 6a.
Recrystallization in pearlitic ferrite was only observed in former colonies where cementite is
spheroidized (cf. Figure 7b,c). The recovery and the recrystallization are thus developing together
with spheroidization of the pearlitic cementite. Observations in the cold-deformed structure (Figure
7a) have shown that the fragmentation of cementite already occurs during cold rolling of the steel
sheet. During heating, some cementite plates tend to decompose into aligned spheres (cf. SC in
Figure 7b,c). Due to the short times involved in UFH experiments, it was possible to readily observe
the difference between fragmented and spheroidized cementite. Fragmented cementite tends to
cluster into bands and does not have a well-defined alignment, whereas spheroidized cementite
grains have smaller sizes and are aligned resembling the previous cementite plate. It is clear that
fragmented cementite will also undergo spheroidization during heating. Arrows show examples of
both morphologies in Figures 1a,d and 7b,c. A comparison of the mentioned figures suggests a
somewhat lesser degree of spheroidization of cementite in samples heated at 1500 °C/s, compared to
samples heated at 150 °C/s. However, the recrystallization has not begun in the pearlitic colonies that
have kept the lamellar arrangement. The cementite plates might act as a barrier to the movement of
the ferritic grain boundary. Therefore, new or existing grains cannot grow into the colony.
RDN
D
P
R
R
R
R
P
R
R
R
R
R
P
R
a b c
Figure 6. (a) Gray scale IQ map; (b) GAM map; and (c) KAM map (1st neighbor 5◦ max) for thesample heated at 150 ◦C/s to 704 ◦C and quenched. Letters in arrows are P for pearlite; and R forrecrystallized ferrite. Grain boundary misorientation between 5◦ and 15◦ are outlined in white, whereasgrain boundary misorientation between 15◦ and 63◦ are black. Step size 80 nm.
Figure 6 also shows the presence of small equiaxed grains separated by high angle grainboundaries (black lines, >15◦) in the ferritic matrix above the pearlitic colony. These grains arerecrystallized ones. The ferrite recrystallization at 704 ◦C is an ongoing process, as illustrated by thearrows in Figure 6b,c which point to the recrystallization nuclei. Recrystallized grains (cf. blue anddark green grains in Figure 6b) are outlined by high angle grain boundaries and are advancing intoadjacent deformed grains (red grain in Figure 6b). The recrystallized grains have very low KAM (blue),as shown in Figure 6c. In contrast, the red grain shows areas of high KAM. The recrystallization offerrite is not advancing into the pearlitic colony below, which also has a certain amount of distortion.Recrystallized ferritic grains (R) located next to pearlitic colonies are also shown in Figures 1a,d and 6a.
Recrystallization in pearlitic ferrite was only observed in former colonies where cementite isspheroidized (cf. Figure 7b,c). The recovery and the recrystallization are thus developing together withspheroidization of the pearlitic cementite. Observations in the cold-deformed structure (Figure 7a)have shown that the fragmentation of cementite already occurs during cold rolling of the steel sheet.During heating, some cementite plates tend to decompose into aligned spheres (cf. SC in Figure 7b,c).Due to the short times involved in UFH experiments, it was possible to readily observe the differencebetween fragmented and spheroidized cementite. Fragmented cementite tends to cluster into bandsand does not have a well-defined alignment, whereas spheroidized cementite grains have smallersizes and are aligned resembling the previous cementite plate. It is clear that fragmented cementitewill also undergo spheroidization during heating. Arrows show examples of both morphologies inFigures 1a,d and 7b,c. A comparison of the mentioned figures suggests a somewhat lesser degreeof spheroidization of cementite in samples heated at 1500 ◦C/s, compared to samples heated at150 ◦C/s. However, the recrystallization has not begun in the pearlitic colonies that have kept thelamellar arrangement. The cementite plates might act as a barrier to the movement of the ferritic grainboundary. Therefore, new or existing grains cannot grow into the colony.

Metals 2016, 6, 288 9 of 14Metals 2016, 6, 288 9 of 14
Figure 7. (a) SEM image of 70% cold-rolled material; (b) SEM of the sample heated at 150 °C/s to 704
°C and quenched and (c) SEM sample heated at 1500 °C/s to 749 °C and quenched (etched with 4%
Nital). Letters in arrows are FC for fragmented cementite, M for martensite SC for spheroidized
cementite, and R for recrystallized ferrite. The scale bar in three micrographs is 3 µm.
The advancing of the α/α interface is also hindered by spheroidized cementite particles, as long
as the distance between them is small enough to interact effectively with the interface movement
[30,31]. Similar pinning effect can be produced by austenite grains (cf. M in Figure 7b,c). Evidence of
this is clearly shown in Figures 1a,d and 7b,c. Small particles of cementite are blocking the advance
of the recrystallized ferrite into pearlite, thus hindering the process at one side of the recrystallized
grains. Otherwise, the recrystallization would progress into both deformed ferrite and pearlite as
expected in the absence of growth barriers, such as low-angle grain boundaries with reduced
mobility [31]. Instead, it has grown along ferrite bands and has stopped at cementite and pearlite
areas. Note in Figure 6 that the boundary between recrystallized ferrite and pearlite has a
misorientation angle between 15° and 63°, which predicts a higher mobility than in the case of
low-angle grain boundaries [31]. The high-angle grain boundary between recrystallized ferrite and
pearlite supports the effect of cementite particles as a barrier for the interface movement.
A mixture of recrystallized and non-recrystallized ferritic grains are observed at all
temperatures above ~700 °C in samples treated at both heating rates until the formation of 100%
austenite. Figure 8 shows the distributions of grain diameters in the recrystallized ferrite for
different temperatures at both heating rates. At the beginning of recrystallization, the fraction of
grains of diameter less than 1 µm is 53% in samples heated at 150 °C/s, and 99% in samples heated at
1500 °C/s. At later stages, the fraction of grains of diameter less than 1 µm is 14% in samples heated
at 150 °C/s, and 66% in samples heated at 1500 °C/s. It can thus be concluded that the nucleation is a
continuous process during heating at both heating rates.
Figure 8. Grain diameter versus area fraction of recrystallized ferritic grains from samples heated at
150 °C/s (a) and 1500 °C/s (b). Outlined and filled triangles show data of samples heated at 704 °C
and 838 °C, whereas outlined and filled circles show data from samples heated at 749 °C and 862 °C,
respectively. The data were obtained from EBSD measurements as described in Section 2.3.
FC
SC
FC
FC
M
R R
SC
M
a b c
RDN
D
R
Figure 7. (a) SEM image of 70% cold-rolled material; (b) SEM of the sample heated at 150 ◦C/s to704 ◦C and quenched and (c) SEM sample heated at 1500 ◦C/s to 749 ◦C and quenched (etched with4% Nital). Letters in arrows are FC for fragmented cementite, M for martensite SC for spheroidizedcementite, and R for recrystallized ferrite. The scale bar in three micrographs is 3 µm.
The advancing of the α/α interface is also hindered by spheroidized cementite particles, as long asthe distance between them is small enough to interact effectively with the interface movement [30,31].Similar pinning effect can be produced by austenite grains (cf. M in Figure 7b,c). Evidence of this isclearly shown in Figures 1a,d and 7b,c. Small particles of cementite are blocking the advance of therecrystallized ferrite into pearlite, thus hindering the process at one side of the recrystallized grains.Otherwise, the recrystallization would progress into both deformed ferrite and pearlite as expected inthe absence of growth barriers, such as low-angle grain boundaries with reduced mobility [31]. Instead,it has grown along ferrite bands and has stopped at cementite and pearlite areas. Note in Figure 6that the boundary between recrystallized ferrite and pearlite has a misorientation angle between15◦ and 63◦, which predicts a higher mobility than in the case of low-angle grain boundaries [31].The high-angle grain boundary between recrystallized ferrite and pearlite supports the effect ofcementite particles as a barrier for the interface movement.
A mixture of recrystallized and non-recrystallized ferritic grains are observed at all temperaturesabove ~700 ◦C in samples treated at both heating rates until the formation of 100% austenite. Figure 8shows the distributions of grain diameters in the recrystallized ferrite for different temperatures atboth heating rates. At the beginning of recrystallization, the fraction of grains of diameter less than1 µm is 53% in samples heated at 150 ◦C/s, and 99% in samples heated at 1500 ◦C/s. At later stages,the fraction of grains of diameter less than 1 µm is 14% in samples heated at 150 ◦C/s, and 66% insamples heated at 1500 ◦C/s. It can thus be concluded that the nucleation is a continuous processduring heating at both heating rates.
Metals 2016, 6, 288 9 of 14
Figure 7. (a) SEM image of 70% cold-rolled material; (b) SEM of the sample heated at 150 °C/s to 704
°C and quenched and (c) SEM sample heated at 1500 °C/s to 749 °C and quenched (etched with 4%
Nital). Letters in arrows are FC for fragmented cementite, M for martensite SC for spheroidized
cementite, and R for recrystallized ferrite. The scale bar in three micrographs is 3 µm.
The advancing of the α/α interface is also hindered by spheroidized cementite particles, as long
as the distance between them is small enough to interact effectively with the interface movement
[30,31]. Similar pinning effect can be produced by austenite grains (cf. M in Figure 7b,c). Evidence of
this is clearly shown in Figures 1a,d and 7b,c. Small particles of cementite are blocking the advance
of the recrystallized ferrite into pearlite, thus hindering the process at one side of the recrystallized
grains. Otherwise, the recrystallization would progress into both deformed ferrite and pearlite as
expected in the absence of growth barriers, such as low-angle grain boundaries with reduced
mobility [31]. Instead, it has grown along ferrite bands and has stopped at cementite and pearlite
areas. Note in Figure 6 that the boundary between recrystallized ferrite and pearlite has a
misorientation angle between 15° and 63°, which predicts a higher mobility than in the case of
low-angle grain boundaries [31]. The high-angle grain boundary between recrystallized ferrite and
pearlite supports the effect of cementite particles as a barrier for the interface movement.
A mixture of recrystallized and non-recrystallized ferritic grains are observed at all
temperatures above ~700 °C in samples treated at both heating rates until the formation of 100%
austenite. Figure 8 shows the distributions of grain diameters in the recrystallized ferrite for
different temperatures at both heating rates. At the beginning of recrystallization, the fraction of
grains of diameter less than 1 µm is 53% in samples heated at 150 °C/s, and 99% in samples heated at
1500 °C/s. At later stages, the fraction of grains of diameter less than 1 µm is 14% in samples heated
at 150 °C/s, and 66% in samples heated at 1500 °C/s. It can thus be concluded that the nucleation is a
continuous process during heating at both heating rates.
Figure 8. Grain diameter versus area fraction of recrystallized ferritic grains from samples heated at
150 °C/s (a) and 1500 °C/s (b). Outlined and filled triangles show data of samples heated at 704 °C
and 838 °C, whereas outlined and filled circles show data from samples heated at 749 °C and 862 °C,
respectively. The data were obtained from EBSD measurements as described in Section 2.3.
FC
SC
FC
FC
M
R R
SC
M
a b c
RDN
D
R
Figure 8. Grain diameter versus area fraction of recrystallized ferritic grains from samples heated at150 ◦C/s (a) and 1500 ◦C/s (b). Outlined and filled triangles show data of samples heated at 704 ◦Cand 838 ◦C, whereas outlined and filled circles show data from samples heated at 749 ◦C and 862 ◦C,respectively. The data were obtained from EBSD measurements as described in Section 2.3.

Metals 2016, 6, 288 10 of 14
The ferritic grain size grows until it reaches a maximum value, around the same order ofmagnitude of the deformed maximum pearlite band spacing (~3.4 µm). Evidence of this was obtainedfrom measurements of average recrystallized ferrite grain sizes (Figure 2b), which supports theprevious statement. However, the validity of this description is restricted to the early stages ofaustenite transformation. At some point during heating, the fraction of austenite becomes largerthan the initial fraction of pearlite, and the austenite further grows into ferrite, which is a reasonableexplanation for the decreasing of the maximum ferritic grain size measured at 838 ◦C in samples heatedat 150 ◦C/s (Figure 2b). In samples heated at 1500 ◦C/s, the average ferritic grain size is lower than1 µm in the temperature range below 862 ◦C. At the same temperature, the fraction of recrystallizedgrains is not larger than 24%. Such low fraction indicates that the recrystallization at 1500 ◦C/s is stillin an early stage.
Although the complete recrystallization of ferrite under UFH experiments in the current materialwas not possible due to the unavoidable formation of austenite, it is clear that very fast heating ratesaffect both the starting and the finishing of recrystallization processes. The pearlite is interacting withthe deformed ferritic structure during recrystallization and thereby hindering the movement of theα/α interface. The nucleation and growth of austenite can take place either towards deformed orrecrystallized ferrite. Thus, the austenite growth will have an impact on the experimentally observedfractions and size of recrystallized ferrite, as shown indirectly in Figure 2.
Textures in Recrystallized Ferrite
Texture measurements have shown that the first recrystallized grains of ferrite in samples treatedat 150 ◦C/s to 704 ◦C are mainly oriented around the {111}<112> components (cf. Figure 4b). It iswell known that such orientations are the most frequently occurring recrystallization components incold-rolled low carbon steel [25,32]. Grains oriented close to {001}<110> are also present, which mightbe due to nucleation at low stored energy grains [33] at the beginning of recrystallization. Grainswith Goss {110}<001> texture component have nucleated and grown in samples heated at 150 ◦C/s(cf. Figure 4b).
Figures 9 and 10 display EBSD maps of the samples heated at 150 ◦C/s and 1500 ◦C/s,respectively, to different temperatures. RD-Inverse Pole Figure (IPF) maps are plotted on top ofIQ maps in Figures 9a,c and 10a,c. In these maps only the grains oriented close to the Goss {110}[001](Figures 9a,c and 10c) and rotated Goss {110}[110] (Figure 10a) components with a tolerance of 10◦ fromthe ideal orientations are highlighted on the IQ maps. Figures 9b,d and 10b,d show the correspondingND-IPF maps for each IQ map on the left-hand side. With the aim of the color coded RD-IPF maps,grains oriented close to the Goss texture component can be identified in the microstructure as thereddish grains in Figures 9a,c and 10c and greenish in Figures 9b,d and 10d. Grains oriented close tothe rotated Goss component can be identified in the microstructure as greenish grains in Figure 10a,cand light blue in Figure 10b,d. Arrows indicate grains with Goss orientation and dashed circles thegrains with Rotated Goss orientation in Figures 9 and 10.
Figure 9a,b shows the recrystallized ferritic grains oriented close to the Goss {110}<001>component in a sample heated at 150 ◦C/s to 704 ◦C. The grains are aligned with other recrystallizedgrains at an angle of ~45◦ with RD (arrows). One could thus infer that grains oriented close to theGoss {110}<001> in samples heated at 150 ◦C/s are likely to originate from shear bands. Recrystallizedferritic grains oriented close to the Goss {110}<001> component are not observed in samples heated at1500 ◦C/s to 749 ◦C. However, Figure 10c,d display grains oriented close to the Goss {110}<001> withsimilar alignments as in Figure 9a,b. It can, therefore, be suggested that nucleation of ferrite at shearbands is delayed to higher temperatures in samples heated to 1500 ◦C/s, compared to samples heatedat 150 ◦C/s.

Metals 2016, 6, 288 11 of 14Metals 2016, 6, 288 11 of 14
Figure 9. Microstructure of samples heated at 150 °C/s to 704 °C (a,b); and to 838 °C (c,d). The
microstructure consists of a mixture of ferrite and martensite. Arrows indicate grains oriented close
to the Goss {110}<001> (with a tolerance of 10°). (c,d). (a,c) correspond to IQ maps in which the
recrystallized grains of ferrite are highlighted by a [100] RD Inverse Pole Figure (IPF) map. (b,d) are
[001] ND IPF maps.
Figure 9. Microstructure of samples heated at 150 ◦C/s to 704 ◦C (a,b); and to 838 ◦C (c,d).The microstructure consists of a mixture of ferrite and martensite. Arrows indicate grains orientedclose to the Goss {110}<001> (with a tolerance of 10◦). (c,d). (a,c) correspond to IQ maps in which therecrystallized grains of ferrite are highlighted by a [100] RD Inverse Pole Figure (IPF) map. (b,d) are[001] ND IPF maps.
Metals 2016, 6, 288 11 of 14
Figure 9. Microstructure of samples heated at 150 °C/s to 704 °C (a,b); and to 838 °C (c,d). The
microstructure consists of a mixture of ferrite and martensite. Arrows indicate grains oriented close
to the Goss {110}<001> (with a tolerance of 10°). (c,d). (a,c) correspond to IQ maps in which the
recrystallized grains of ferrite are highlighted by a [100] RD Inverse Pole Figure (IPF) map. (b,d) are
[001] ND IPF maps.
Figure 10. Microstructure of samples heated at 1500 ◦C/s to 749 ◦C (a,b), and to 862 ◦C (c,d).The microstructure consists of a mixture of ferrite and martensite. Arrows indicate grains oriented closeto the Goss {110}<001> (c,d), and circles the rotated Goss {110}<011> (a,b) components. (a,c) correspondto IQ maps in which the recrystallized grains of ferrite are highlighted by a [100] RD Inverse PoleFigure (IPF) map. (b,d) are [001] ND IPF maps.

Metals 2016, 6, 288 12 of 14
The diffusion of carbon might be playing a role in the nucleation of grains oriented in the vicinityof the Goss {110}<001> component in samples heated at 150 ◦C/s (cf. Figure 4b) and at highertemperatures in samples heated at 1500 ◦C/s (cf. Figure 4h). It has been claimed [34] that carbondissolved in the cold-rolled ferrite strengthens the Goss {110}<001> component in recrystallized ferrite.The longer annealing times involved in samples heated at 150 ◦C/s, compared to samples heated at1500 ◦C/s, can produce significant diffusion of carbon in ferrite and thus enhance the early appearanceof Goss orientation in samples heated at 150 ◦C/s. Consequently, grains with Goss orientation nucleateat higher temperatures in samples heated at 1500 ◦C/s, possibly influenced by the carbon diffusioninto ferrite.
In the sample heated at 1500 ◦C/s to 749 ◦C (cf. Figure 4f), the highest intensity in the ODF islocated in the vicinity of the {112}<110> component. However, considerable intensities are presentat Φ in the range from 0◦ to 90◦ for ϕ1 = 0, and for the {111}<uvw> ND fiber components. It issuggested that the nucleation of the previously mentioned components is related to the stored energyin cold-rolled ferrite. Under ultrafast heating, the time for the recovery in the cold-rolled materialis drastically reduced. The release of energy during the recovery is also reduced, and thus highstored energy components can nucleate. In cold-rolled ferrite, the amount of energy that a componentcan store increases as Φ increases from 0◦ to 90◦ for ϕ1 = 0 [34]. The maximum strain energy isaccommodated by the rotated Goss {110}<110> component, which is present in the recrystallizationtextures of samples heated at 1500 ◦C/s (cf. Figure 4f). The recrystallized ferrite from the sampleheated at 150 ◦C/s to 704 ◦C (cf. Figure 4b) does not exhibit high stored energy components (Φ→ 90◦
for ϕ1 = 0). It is believed to be a consequence of the larger time for recovery, compared to samplesheated at 1500 ◦C/s. The texture changes at 1500 ◦C/s are consistent with data on ULC steel underultrafast heating rates [23].
Figure 4h shows that grains oriented close to the rotated Goss component are still present insamples heated at 1500 ◦C/s to 704 ◦C and 862 ◦C. The circles in Figure 10a,c indicate that such grainsnucleated at grain boundaries. In contrast, moderated intensities are also observed in the sampleheated at 1500 ◦C/s to 862 ◦C (cf. Figure 4f) in components close to {001}<110> and {113}<110>.These components were very weak at 749 ◦C, which indicates that nucleation in some low storedenergy {hkl}<001> RD fiber components is taking place at high temperatures. The appearance ofsimilar low stored energy {hkl}<001> RD fiber components of recrystallized ferrite are observed insamples heated at 150 ◦C/s to 838 ◦C (cf. Figure 4d). These observations are consistent with the datain Figure 8, which show that nucleation accounts for a considerable fraction of the recrystallized ferritein samples heated at 150 ◦C/s and 1500 ◦C/s.
5. Conclusions
Ultrafast heating experiments at 150 ◦C/s and 1500 ◦C/s to different peak temperatures havebeen conducted on a cold-rolled low carbon steel. The ferrite recrystallization and the texture evolutionwere studied via detailed microstructural characterization. The main conclusions of the present studycan be summarized as follows:
• The recrystallization was not 100% complete before the complete formation of austenite for bothheating rates.
• The shear band nucleation of ferrite took place at higher temperatures in samples heated at1500 ◦C/s, compared to samples heated at 150 ◦C/s. The effect of heating rate in carbon diffusioncan justify the observed nucleation of recrystallized ferritic grains and thus the appearance ofrecrystallized grains in the vicinity of the rotated Goss {110}<110> component.
• The continuous nucleation of recrystallized ferrite is enhanced by applying ultrafast heating rates.• The texture of ferrite in early stages of recrystallization in samples heated at 1500 ◦C/s is taking
place close to ND {111}<uvw> fiber components as well as in the vicinity of {110}<110> highstored energy components. When the time for the release of stored energy is comparatively longer

Metals 2016, 6, 288 13 of 14
(as in the case of samples heated at 150 ◦C/s), the orientations in recrystallized ferrite are mainlyclose to ND {111}<uvw> and RD {hkl}<011> fiber components.
• Cementite plates and spheres might act as a barrier for the advance of the α/α interfaceduring recrystallization.
Acknowledgments: The authors are thankful for the experimental facilities for Gleeble tests kindly provided byW. J. Kaluba from University of Littoral, France. F. Castro Cerda gratefully acknowledges the support of CONICYTin the form of the CONICYT-PCHA/Doctorado Nacional/2013 Ph.D. grant.
Author Contributions: R. H. Petrov. and A. Monsalve conceived and designed the experiments; F. M. Castro Cerda,R. H. Petrov, and W. J. Kaluba performed the experiments; F. M. Castro Cerda and L. A. I. Kestens post-processedand analyzed the data; F. M. Castro Cerda wrote the paper.
Conflicts of Interest: The authors declare no conflict of interest.
References
1. Lolla, T.; Cola, G.; Narayanan, B.; Alexandrov, B.; Babu, S.S. Development of rapid heating and cooling(flash processing) process to produce advanced high strength steel microstructures. Mater. Sci. Technol. 2011,27, 863–875. [CrossRef]
2. Meng, Q.; Li, J.; Zheng, H. High-efficiency fast-heating annealing of a cold-rolled dual-phase steel. Mater. Des.2014, 58, 194–197. [CrossRef]
3. De Knijf, D.; Puype, A.; Föjer, C.; Petrov, R. The influence of ultra-fast annealing prior to quenching andpartitioning on the microstructure and mechanical properties. Mater. Sci. Eng. A 2015, 627, 182–190.[CrossRef]
4. Puype, A. Developing of Advanced High Strength Steel via Ultrafast Annealing. Master’s Thesis,Ghent University, Gent, Belgium, July 2013.
5. Kestens, L.; Reis, A.C.C.; Kaluba, W.J.; Houbaert, Y. Grain Refinement and Texture Change in Interstitial FreeSteels after Severe Rolling and Ultra-Short Annealing. Mater. Sci. Forum 2004, 467–470, 287–292. [CrossRef]
6. Petrov, R.; Sidor, J.; Kaluba, W.J.; Kestens, L. Grain Refinement of a Cold Rolled TRIP Assisted Steel afterUltra Short Annealing. Mater. Sci. Forum 2012, 715–716, 661–666. [CrossRef]
7. Petrov, R.H.; Puype, A.; De Knijf, D.; Kestens, L. Ultrafast Heating of Advanced High Strength Steels.In Proceedings of the International Conference on Solid-Solid Phase Transformations in Inorganic Materials2015, Whistler, BC, Canada, 2015; pp. 1157–1158.
8. Castro Cerda, F.M.; Goulas, C.; Sabirov, I.; Papaefthymiou, S.; Monsalve, A.; Petrov, R.H. Microstructure,texture and mechanical properties in a low carbon steel after ultrafast heating. Mater. Sci. Eng. A 2016, 672,108–120. [CrossRef]
9. Griffay, G.; Anderhuber, M.; Klinkenberg, P.; Tusset, V. New Continuous Annealing Technology with High-SpeedInduction Heating Followed by Ultra-Fast Cooling; ECSC steel publications: Brussels, Belgium, 2002.
10. Atkinson, M. Bifurcation of thermal restoration processes in deformed iron and steel. Mater. Sci. Eng. A 1999,262, 33–38. [CrossRef]
11. Ferry, M.; Muljono, D.; Dunne, D.P. Recrystallization Kinetics of Low and Ultra Low Carbon Steels duringHigh-rate Annealing. ISIJ Int. 2001, 41, 1053–1060. [CrossRef]
12. Muljono, D.; Ferry, M.; Dunne, D.P. Influence of heating rate on anisothermal recrystallization in low andultra-low carbon steels. Mater. Sci. Eng. A 2001, 303, 90–99. [CrossRef]
13. Atkinson, M. On the credibility of ultra rapid annealing. Mater. Sci. Eng. A 2003, 354, 40–47. [CrossRef]14. Stockemer, J.; Brande, P. Vanden Recrystallization of a cold-rolled low-carbon steel by cold-plasma-discharge
rapid annealing. Metall. Mater. Trans. A 2003, 34, 1341–1348. [CrossRef]15. Senuma, T.; Kawasaki, K.; Takemoto, Y. Recrystallization Behavior and Texture Formation of Rapidly
Annealed Cold-Rolled Extralow Carbon Steel Sheets. Mater. Trans. 2006, 47, 1769–1775. [CrossRef]16. Yoshinaga, N.; Kestens, L.; De Cooman, B.C. α→ γ→ α Transformation Texture Formation at Cold-Rolled
Ultra Low Carbon Steel Surfaces. Mater. Sci. Forum 2005, 495–497, 1267–1272. [CrossRef]17. Petrov, R.; Kestens, L.; Houbaert, Y. Recrystallization of a Cold Rolled Trip-assisted Steel during Reheating
for Intercritical Annealling. ISIJ Int. 2001, 41, 883–890. [CrossRef]18. Petrov, R.; Kestens, L.; Kaluba, W.J.; Houbaert, Y. Recrystallization and austenite formation in a cold rolled
TRIP steel during ultra fast heating. Steel Grips 2003, 1, 289–293.

Metals 2016, 6, 288 14 of 14
19. Ray, R.K.; Jonas, J.J.; Hook, R.E. Cold rolling and annealing textures in low carbon and extra low carbonsteels. Int. Mater. Rev. 1994, 39, 129–172. [CrossRef]
20. Ray, R.K.; Jonas, J.J. Transformation Textures in Steels. Int. Mater. Rev. 1990, 35, 1–36. [CrossRef]21. Petrov, R.H.; Kestens, L.A.I. Advanced High-Strength Steels: Electron Backscatter Diffraction (EBSD).
In Encyclopedia of Iron, Steel, and Their Alloys; CRC Press: Boca Ratón, FL, USA, 2016; pp. 46–69.22. Pinard, P.T.; Schwedt, A.; Ramazani, A.; Prahl, U.; Richter, S. Characterization of Dual-Phase Steel
Microstructure by Combined Submicrometer EBSD and EPMA Carbon Measurements. Microsc. Microanal.2013, 19, 996–1006. [CrossRef] [PubMed]
23. Cerda, F.M.C.; Vercruysse, F.; Minh, T.N.; Kestens, L.A.I.; Petrov, R.H. The Effect of Heating Rate on theRecrystallization Behavior in Cold Rolled Ultra Low Carbon Steel. Steel Res. Int. 2016. [CrossRef]
24. Kang, J.Y.; Bacroix, B.; Réglé, H.; Oh, K.H.; Lee, H.C. Effect of deformation mode and grain orientation onmisorientation development in a body-centered cubic steel. Acta Mater. 2007, 55, 4935–4946. [CrossRef]
25. Hutchinson, W.B. Development and control of annealing textures in low-carbon steels. Int. Met. Rev. 1984,29, 25–42. [CrossRef]
26. Minh, T.N.; Sidor, J.J.; Petrov, R.H.; Kestens, L.A.I. Occurrence of shear bands in rotated Goss ({110}<110>)orientations of metals with bcc crystal structure. Scr. Mater. 2012, 67, 935–938. [CrossRef]
27. Gobernado, P.; Petrov, R.H.; Kestens, L.A.I. Recrystallized {311}<136> orientation in ferrite steels. Scr. Mater.2012, 66, 623–626. [CrossRef]
28. Wang, X.; Zurob, H.S.; Xu, G.; Ye, Q.; Bouaziz, O.; Embury, D. Influence of Microstructural Length Scale onthe Strength and Annealing Behavior of Pearlite, Bainite, and Martensite. Metall. Mater. Trans. A 2013, 44,1454–1461. [CrossRef]
29. Hono, K.; Ohnuma, M.; Murayama, M.; Nishida, S.; Yoshie, A.; Takahashi, T. Cementite decomposition inheavily drawn pearlite steel wire. Scr. Mater. 2001, 44, 977–983. [CrossRef]
30. Humphreys, F.J.; Hatherly, M. Recrystallization and Related Annealing Phenomena; Elsevier: Oxford, UK, 2004.31. Smith, C.S. Grains, Phases, and Interfaces—An Interpretation of Microstructure. Trans. AIME 1948, 175,
15–51.32. Kang, J.Y.; Kim, D.I.; Lee, H.C. Texture development in low carbon sheet steels for automotive application.
In Microstructure and Texture in Steels: And Other Materials; Springer: London, UK, 2009; pp. 85–101.33. Dillamore, I.L.; Morris, P.L.; Smith, C.J.E.; Hutchinson, W.B. Transition Bands and Recrystallization in Metals.
Proc. R. Soc. Lond. Ser. A 1972, 329, 405–420. [CrossRef]34. Ushioda, K.; Hutchinson, W.B.; Ågren, J.; von Schlippenbach, U. Investigation of structure and texture
development during annealing of low-carbon steel. Mater. Sci. Technol. 1986, 2, 807–815. [CrossRef]
© 2016 by the authors; licensee MDPI, Basel, Switzerland. This article is an open accessarticle distributed under the terms and conditions of the Creative Commons Attribution(CC-BY) license (http://creativecommons.org/licenses/by/4.0/).