Embed Size (px)
Citation preview
A Study of Through-Thickness Texture Gradients in RolledSheets
O ENGLER M-Y HUH and CN TOME
A method to simulate shear effects and through-thickness texture gradients in rolled sheet materialsis introduced The strain history during a rolling pass is idealized by superimposing a sine-shapedevolution of the laquo13 shear component to a plane-strain state These generic strain histories are enforcedin a visco-plastic self-consistent (VPSC) polycrystal deformation model to simulate texture evolutionas a function of through-thickness position The VPSC scheme is deemed superior to a full constraints(FC) or relaxed constraints (RC) approach because it allows one to fully prescribe diagonal andshear-strain-rate components while still accounting for grain-shape effects The idealized strain statesare validated by comparison with deformation histories obtained through finite-element method (FEM)calculations The through-thickness texture gradients are accounted for by introducing a relativevariation of the sine-shaped laquo13 shear with respect to the plane-strain component The simulationresults are validated in turn by comparison with typical examples of through-thickness texturegradients observed experimentally in rolled plates and in sheets of fcc and bcc materials
I INTRODUCTION strongly affect the plastic properties of the rolled products(eg References 5 through 7) Severe through-thicknessIN the literature there are many attempts to model the texture gradients have been reported in cases where the ratio
evolution of the crystallographic texture accompanying roll- of the contact length between the roll and sample (lC) to theing deformation with the help of Taylor-type deformation
sheet thickness (t) is smaller than 1 (with lC RDt wheremodels extensive reviews have been given eg by HirschR is the roll radius and Dt is the thickness reduction perand Lucke[1] and Aernoudt et al[2] In such models thepass)[8ndash13] However also in cases characterized by lC t individual crystallites are assumed to deform by slip on a1 shear textures have been observed which have been attrib-number of crystallographic slip systems so as to accommo-uted to the friction between the rolls and sheet[14ndash17] Suchdate the prescribed macroscopic strain rate (laquoij )[34] The termconditions viz large rolling draughts combined with highlaquoij is the symmetric part of the velocity gradient eij [ uij Thefriction are typically encountered in practical materials pro-antisymmetric part denoted vij represents the plastic spincessing during breakdown rolling and multistand hot roll-In most simulations of rolling textures the deformationing operationsin every grain is either approximated by a plane-strain state
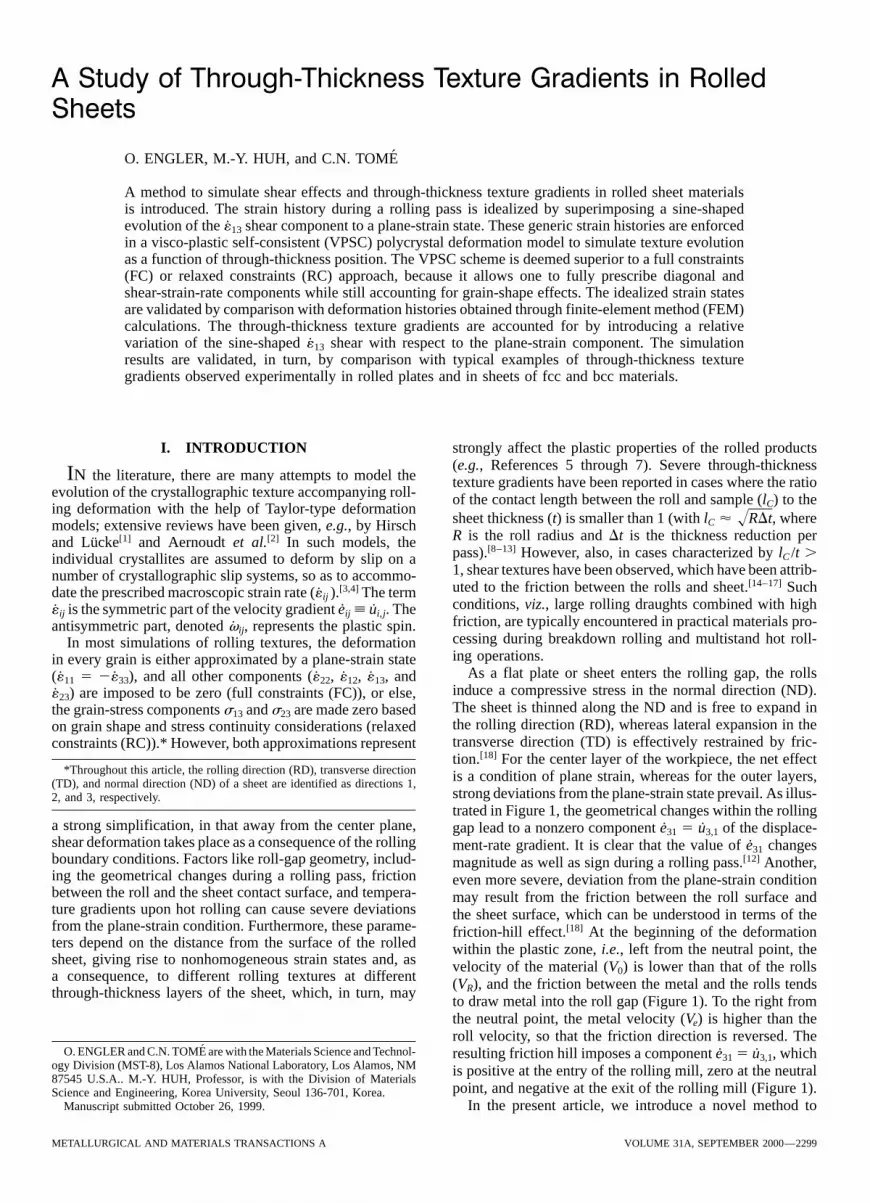
As a flat plate or sheet enters the rolling gap the rolls(laquo11 5 2laquo33) and all other components (laquo22 laquo12 laquo13 andinduce a compressive stress in the normal direction (ND)laquo23) are imposed to be zero (full constraints (FC)) or elseThe sheet is thinned along the ND and is free to expand inthe grain-stress components s13 and s23 are made zero basedthe rolling direction (RD) whereas lateral expansion in theon grain shape and stress continuity considerations (relaxedtransverse direction (TD) is effectively restrained by fric-constraints (RC)) However both approximations representtion[18] For the center layer of the workpiece the net effect
Throughout this article the rolling direction (RD) transverse direction is a condition of plane strain whereas for the outer layers(TD) and normal direction (ND) of a sheet are identified as directions 1strong deviations from the plane-strain state prevail As illus-2 and 3 respectivelytrated in Figure 1 the geometrical changes within the rolling
a strong simplification in that away from the center plane gap lead to a nonzero component e31 5 u31 of the displace-shear deformation takes place as a consequence of the rolling ment-rate gradient It is clear that the value of e31 changesboundary conditions Factors like roll-gap geometry includ- magnitude as well as sign during a rolling pass[12] Anothering the geometrical changes during a rolling pass friction even more severe deviation from the plane-strain conditionbetween the roll and the sheet contact surface and tempera- may result from the friction between the roll surface andture gradients upon hot rolling can cause severe deviations the sheet surface which can be understood in terms of thefrom the plane-strain condition Furthermore these parame- friction-hill effect[18] At the beginning of the deformationters depend on the distance from the surface of the rolled within the plastic zone ie left from the neutral point thesheet giving rise to nonhomogeneous strain states and as velocity of the material (V0) is lower than that of the rollsa consequence to different rolling textures at different (VR) and the friction between the metal and the rolls tendsthrough-thickness layers of the sheet which in turn may
to draw metal into the roll gap (Figure 1) To the right fromthe neutral point the metal velocity (Ve) is higher than theroll velocity so that the friction direction is reversed The
O ENGLER and CN TOME are with the Materials Science and Technol- resulting friction hill imposes a component e31 5 u31 whichogy Division (MST-8) Los Alamos National Laboratory Los Alamos NM is positive at the entry of the rolling mill zero at the neutral87545 USA M-Y HUH Professor is with the Division of Materials
point and negative at the exit of the rolling mill (Figure 1)Science and Engineering Korea University Seoul 136-701 KoreaManuscript submitted October 26 1999 In the present article we introduce a novel method to
METALLURGICAL AND MATERIALS TRANSACTIONS A VOLUME 31A SEPTEMBER 2000mdash2299
FE mesh and texture hardening and anisotropy are updatedas deformation proceeds[21ndash24] However for the case ofrolling the overall constraints are such that local deformationis not likely to be sensitive to details in the local hardeningand anisotropy evolution (constitutive law) In additionFEM computations have the major disadvantage of beingextremely time consuming especially if they are coupled toa polycrystal constitutive law
As an alternative the evolution of strain can be deducedusing certain simplifying assumptions The resulting strainstates are eventually fed into a deformation model so as toderive the texture variations as a function of the strain stateand thus the through-thickness texture gradient Lee andDuggan[12] described the strain field in the rolling gap by
Fig 1mdashSchematic representation showing the formation of the shear com- means of a highly simplified analytical model This modelponents e13 and e31 in a roll gap considers both the shear component e31 introduced by the
geometrical changes during a rolling pass and the compo-nent e13 caused by the friction between the rolls and sheetsurface Based on these analytical expressions Huh etal[1719] used a Taylor approach to estimate shear texturessimulate shear textures and through-thickness texture gradi-by an idealized strain history during a rolling pass Fedosseevents in rolled sheet materials Based on the ideas put forwardet al derived the strain distribution for various rollingby Huh et al[19] the strain history during a rolling pass is
idealized by a plane strain superimposed on a simple sine- sequences based on the concepts of fluid dynamics (methodshaped profile of the e13 and e31 shear-rate components The of superposition of harmonic currents) to model through-resulting strain history is rationalized by comparing it with thickness texture gradients[2526]
results obtained by the finite-element method (FEM) To In all these approaches the strain distribution derived withsimulate the texture evolution and in particular the through- the various assumptions was eventually fed into a Taylorthickness texture gradients the strain history at different FC deformation model to simulate the resulting textureslayers is input in a visco-plastic self consistent (VPSC) However it is nowadays acknowledged that the Taylor FCdeformation model The simulation results obtained for fcc model is not well suited for simulating the texture changesand bcc structures are compared with typical examples of accompanying rolling deformation With increasing reduc-through-thickness texture gradients observed experimentally tion the grain thickness decreases and the prescription ofin rolled plates and sheets of various aluminum alloys and the laquo13 and laquo23 shear components in the Taylor FC modelsteels becomes increasingly less meaningful for infinitely flat
It has erroneously been stated in the literature that the grains only the remaining components are defined This ledtextures observed at the sheet surface are caused by an to the development of the so-called RC models[2728] whichaccumulated shear induced by the friction between the roll since have proven to be superior in simulating the evolutionand sheet surface However the required strong shear would
of rolling textures particularly at high strains (eg Refer-lead to an unrealistic shape change of the sheets Further-ences 1 and 2) In the present application however the laquo13more this view cannot account for the shear textures in theshear has to be prescribed such as to account for the shearsurface of reversibly rolled sheets In this article we willsuperimposed on the plane-strain state This means that theshow that even for a final strain distribution where thelaquo13 shear cannot be relaxed preventing the application ofaccumulated shear strain is completely reversed pronouncedan RC modelthrough-thickness variations in texture may take place in
Alternatively deformation textures can be modeled bythe sheetmeans of a VPSC scheme[2930] Each orientation or ldquograinrdquoof a polycrystalline aggregate is regarded as an inclusion that
II SIMULATION OF SHEAR TEXTURES AND is embedded in and interacts with a homogeneous equivalentTHROUGH-THICKNESS TEXTURE medium (HEM) with the average properties of the aggregate
GRADIENTS The properties of the matrix (the HEM) are not knowna priori however but are adjusted ldquoself-consistentlyrdquo toThe conventional way to determine the local strain evolu-coincide with the average of all inclusions forming the aggre-tion in inhomogeneously deforming specimens is to employgate In contrast to the Taylor-type models in the VPSCthe FEM In what concerns rolling operations the strainmodel each grain deforms differently depending on its rela-states in the sheet layers follow from enforcing an appro-tive stiffness with respect to the HEM In addition a relax-priate set of boundary conditions The information aboutation of the shear components takes place in individual grainsthe resulting strain history can then be input in polycrystalas a consequence of evolving grain shape while all compo-plasticity codes to model the corresponding crystallographicnents of the overall strain rate may still be prescribed Thustexture and hence to simulate texture gradients[1520] Thisa fully prescribed strain-rate tensor can be used which favorsmethod can be further refined by a coupling of the FE codethis approach for the simulation of through-thickness tex-with a polycrystal constitutive law Within this approach a
polycrystal texture is associated with each element of the ture gradients
2300mdashVOLUME 31A SEPTEMBER 2000 METALLURGICAL AND MATERIALS TRANSACTIONS A
Table I Miller Indices and Euler Angles of the Orientations Characteristic of fcc and bcc Plane Strain and Shear Textures
Miller Indices Euler Angleshkl^uvwamp (ldquoDesignationrdquo) w1 F w2 Remarks
112^111amp (ldquoCrdquo) 90 deg 35 deg 45 deg fcc plane strainbcc shear123^634amp (ldquoSrdquo) 59 deg 34 deg 65 deg fcc plane strain011^211amp (ldquoBrdquo) 35 deg 45 deg 0 deg90 deg fcc plane strainbcc shear011^100amp (ldquoGossrdquo) 0 deg 45 deg 0 deg90 deg (fcc plane strain)bcc shear111^112amp 30 deg90 deg 547 deg 45 deg bcc plane strainfcc shear111^110amp 0 deg60 deg 547 deg 45 deg bcc plane strainfcc shear112^110amp 0 deg 35 deg 45 deg bcc plane strainfcc shear001^110amp (ldquorotated cuberdquo) 0 deg 0 deg 45 deg45 deg 0 deg 0 deg90 deg (bcc plane strain)fcc shear
III THROUGH-THICKNESS TEXTURE symmetry is not generally justified in the case of pronouncedshear deformationGRADIENTS IN ROLLED SHEETS
A Analysis and Representation of CrystallographicTextures B Examples of Through-Thickness Texture Gradients in
fcc MetalsThe experimental results of texture gradients reproduced
in this section were determined by conventional X-ray mac- Gradients of strain and strain rate manifest themselves inthe pronounced through-thickness texture gradients that haverotexture analysis (eg Reference 31) Pole figures were
measured from the sheets in back-reflection using a standard been described for various inhomogeneously deformed fccmetals and alloys (eg References 9 through 11 15 33X-ray texture goniometer In order to analyze through-thick-
ness texture gradients various layers of the sheets have to and 34) The example shown here to illustrate the texturegradients in fcc materials pertains to a laboratory cold-rolledbe prepared sequentially by careful grinding polishing or
etching or by an appropriate combination thereof In the sample of a direct chillndashcast commercial-purity aluminumAA1145 A specimen was machined from 13 mm hot gagefollowing text the layer within the sheet is indicated by the
parameter s with s 5 11 and s 5 21 denoting the upper to 6 mm so as to achieve an initially uniform through-thickness structure Then the specimen was cold rolledand lower surface of the sheet respectively such that s 5
0 identifies the center layer Note that with an average reversibly to a 06 mm final thickness corresponding toa total thickness reduction of 90 pct In order to enforcepenetration depth or X-rays of the order of 100 mm X-ray
diffraction is well suited for analysis of texture gradients in inhomogeneous deformation the rolling was performed dryie without using a lubricant which resulted in pronouncedsheets with a thickness in excess of for example 1 mm
Comparison of X-ray results with data obtained by means of through-thickness texture gradients[35]
The texture in the center layer of the hot band mainlythe more tedious and time-consuming local-texture analysisdone by electron back-scattering diffraction showed very comprised orientations that are typical of plane-strain defor-
mation of fcc metals and alloys In such textures mostgood agreement between both techniques (eg References13 and 16) orientations are assembled along the so-called b fiber which
runs through the Euler-angle space from the C orientationAfter correction of the pole-figure data for backgroundirradiation and defocusing error complete orientation distri- 112^111amp through the S orientation 123^634amp to the B
orientation 011^211amp (Figure 2(a) and Table I) Close tobution functions (ODFs) f(g) were computed according tothe method of series expansion with spherical harmonic the surface in contrast typical shear textures were found
(Figure 2(b)) The maximum texture intensity was obtainedfunctions[32] In texture analysis crystal orientations arecommonly denoted by the Miller indices hkl^uvwamp where in the 45 deg ND-rotated cube orientation 001^110amp Fur-
thermore a pronounced scatter of 001^110amp towardthe first set of Miller indices indicates the direction of thecrystal that is parallel to the ND and the second refers to 112^110amp and minor intensities of 111^uvwamp orientations
were also observedthe crystal direction parallel to the RD For quantitativetexture analysis the orientations (g) are expressed as a set Figure 3 shows another example of an fcc shear texture
obtained in a hot-rolled specimen of the aluminum alloy Al-of three Euler angles w1 F and w2 Table I lists the Millerindices and Euler angles of the most commonly observed 58 pct Cu-04 pct Zr This material with a composition
equivalent to the superplastic alloy SUPRAL 100 but withorientations of rolled fcc and bcc metals The textures arerepresented by plotting isodensity lines in sections of con- a coarser grain size of the order of 20 mm was laboratory
hot rolled at 310 8C to a thickness of 6 mm The texturestant w1 or w2 through the three-dimensional Euler spaceAll experimental pole figures discussed in this article irre- obtained for the layer s 5 067 may be regarded as a transi-
tion between the two cases shown in Figure 2 The typicalspective of the sheet layer analyzed revealed orthotropicsample symmetry within experimental accuracy Therefore plane-strain-texture b fiber is still present although weak
but it shows strong scatter toward the rotated cube orientationthe ODF representation was confined to the familiar sub-space of Euler space with 0 deg (w1 F w2) 90 deg It 001^110amp This is obvious from the smear of the individual
texture maxima in the various w2 sections ldquoupwardrdquo ieis noted however that the assumption of orthotropic sample
METALLURGICAL AND MATERIALS TRANSACTIONS A VOLUME 31A SEPTEMBER 2000mdash2301
(b)
(a)
Fig 2mdashHot band texture of commercial purity aluminum serving as an example of the through-thickness texture variations in fcc materials (a) centerlayer s 5 00 and (b) surface layer s 5 10 (by courtesy of S Benum)
toward F 5 0 deg The rotated cube orientation again shows with a and g fiber orientations prevail the surfaces showshear textures consisting of the Goss orientation 011^100ampscatter toward the 112^110amp shear component whereas
111^uvwamp orientations were not observed Similar textures and orientations close to 112^111amp[81740] In contrast inhot-rolled low-carbon steels usually weak rather uniformhave been observed in a variety of nonrecrystallizing high-
strength Al alloys textures were observed which can be attributed to the ran-domizing effect of the g-a phase transformation during sub-It should be noted that in addition to the friction and
geometry effects the evolution of through-thickness texture sequent cooling[41] Lowering the finishing temperature hasthe effect that more deformation takes place in the ferritegradients also depends on the material investigated[101136]
While most Al alloys develop pronounced through-thickness range which strengthens the hot-band texture and in particu-lar enhances through-thickness texture gradients[42]texture gradients other fcc materials in particular materials
with a low stacking-fault energy like brass silver and aus- The typical texture gradients of bcc sheet materials areillustrated in Figure 4 for an interstitial-free (IF) steel sheettenitic steels tend to show more-uniform textures throughout
the sheet thickness In high-purity copper even under very A specimen of a Ti-alloyed IF steel with 00026 pct C waswarm rolled at 650 8C (ie in the ferritic range) from 5 toinhomogeneous deformation conditions no through-thick-
ness texture gradients but rather strongly enhanced shear 3 mm in one pass[43] Similarly as described for the commer-cial-purity aluminum (Figure 2) the rolling was performedband formation were observed[37] This material dependence
is not the subject of this article however and will not without lubricant in order to enforce nonuniform deforma-tion throughout the sheet thicknesstherefore be discussed here any further
The center layer of the specimen (s 5 00) shows a texturethat is characteristic of a plane-strain deformation state (Fig-
C Examples of Through-Thickness Texture Gradients in ure 4(a)) under plane-strain conditions bcc metals andbcc Metals alloys tend to form fiber textures where most orientations
are assembled along two characteristic fibers (marked inVery pronounced through-thickness texture gradientsform in alloyed steel grades that undergo none or only partial Figure 4(a)) as follows (1) The (mostly incomplete) a
fiber comprises orientations with a common ^110amp directionphase transformation during hot rolling[143839] Whereas inthe center layers of such inhomogeneously rolled sheets parallel to the RD ie the orientations hkl^110amp including
the orientations 001^110amp 112^110amp and 111^110amptypically the well-known plane-strain deformation textures
2302mdashVOLUME 31A SEPTEMBER 2000 METALLURGICAL AND MATERIALS TRANSACTIONS A
Fig 3mdashHot band texture of Al-58 pct Cu-04 pct Zr (regular grain sized SUPRAL 100) at the layer s 5 07 showing a characteristic mixture of planestrain and shear texture components (a) Complete ODF in w2 sections (b) representation in the w2 5 45 deg section that contains the most importantrolling and shear texture components and (c) schematic representation of the orientations in the w2 5 45 deg section
(2) The g fiber comprises orientations with 111 parallel 112^111amp appear The maximum intensity of these shear-texture components is obtained at s 5 08 whereas in theto the ND ie the orientations 111^uvwamp including
111^110amp and 111^112amp immediate surface texture the sharpness decreasesslightly[43] Raabe and Lucke[39] reported very similar resultsThe surface texture of the specimen mainly consisted of
a strong 011^100amp Goss orientation plus minor intensities in the hot bands of Cr-containing ferritic stainless steelsMicrostructural investigations of the microband arrange-close to 011^211amp and 112^111amp (Figure 4(b)) From
Figure 4 and Table I it may be seen that most of the relevant ment through the thickness of a rolled steel sheet with pro-nounced through-thickness texture gradients have shownbcc orientations and fibers can be found in the w2 5 45 deg
section of the Euler space Therefore the representation of that in the center layers where plane-strain conditions pre-vail the microbands formed at angles of approximately 35ODFs can be highly condensed by focusing merely on this
section rather than showing the entire ODF Figure 5 shows deg to the RD which is indicative of the arrangement ofthe activated slip planes[17] Close to the surface where well-the w2 5 45 deg sections of the textures in the IF steel as
obtained at the various layers Again at the center layer the defined shear textures were observed the microbands werearranged approximately parallel to the RD This highlytypical plane-strain texture with the characteristic a and g
fibers prevails With increasing the parameter s the rolling unusual arrangement of slip planes can only be achieved ifthe local-stress tensor is strongly rotated by the superpositiontexture degrades at s 5 04 a minimum in texture sharpness
is observed This minimum is due to the transition from the of friction on the plane-stress state imposed by the rollsNote that fcc plane-strain and bcc shear textures (andplane strain to the shear texture that dominates closer to the
sheet surface Accordingly with further increasing s the vice versa the bcc plane-strain and fcc shear textures) showsome characteristic similarities (Figures 2 through 5 andshear components 011^100amp (Goss) 011^211amp and
METALLURGICAL AND MATERIALS TRANSACTIONS A VOLUME 31A SEPTEMBER 2000mdash2303
(b)(a)
Fig 4mdashHot band texture of an IF steel serving as an example of the through-thickness texture variations in bcc materials (a) center layer s 5 00 and(b) surface layer s 5 10 (by courtesy of B Beckers)
Fig 5mdash(a) through (h) w2 5 45 deg sections of the ODFs determined at various through-thickness layers s of the IF hot band steel shown in Fig 4 (bycourtesy of B Beckers)
2304mdashVOLUME 31A SEPTEMBER 2000 METALLURGICAL AND MATERIALS TRANSACTIONS A
the sine-shaped profiles of e13 and e31 and the resultingcomponents laquoij of the symmetric and vij of the antisymmet-ric part of the velocity gradient (Eq [2]) are characterizedby a single parameter viz the value of its first maximum(step 4 in Figure 6) For example the curve of e13 in Figure6 will be denoted emax
13 5 3 and the one of e31 as emax31 5
21In the case of plane-strain deformation e31 and e13 are
expected to be so small that the resulting shear componentlaquo13 becomes negligible Conversely for pronounced sheardeformation to take place ie a large laquo13 component eitherthe friction-induced shear component e13 or the geometry-induced shear component e31 must be large Howeverbecause of the sine-shaped shear profiles after a completerolling pass the integrated values e13 and e31 are zero inde-pendent of the respective amounts of e13 and e31 As a conse-quence a volume element would experience zero net shearFig 6mdashIdealized evolution of the geometry-induced component e31 the(laquo13) as well as zero net rotation (v13) such that the shapefriction-induced component e13 and the resulting shear laquo13 5 laquo31 during
a rolling pass This sine-shaped strain rate history is subdivided into 13 of an originally orthogonal element would still be orthogonalsteps and used as a generic input for the present rolling texture simulations after deformation Thus the deformation of the overall roll-
ing bite is plane strain although the instantaneous localvalues may strongly deviate from the plane-strain conditionWe will show here that although the accumulated shearTable I) This resemblance is addressed in detail else-adds up to zero the final texture depends strongly on thewhere[4445]
deformation history
IV MODELING OF THROUGH-THICKNESSTEXTURE GRADIENTS IN ROLLED SHEETS B Texture Simulations
A Determination of the Strain Distribution To simulate the rolling textures the strain history wassimulated by means of a VPSC deformation model brieflyAs already mentioned in the introduction the strain statedescribed in Section II The calculations were performedduring practical rolling operations may exhibit severe devia-with a fully prescribed velocity gradient eij of the form giventions from the idealized plane-strain condition that is definedby Eq [1] and adopting various values of the shear strainsas eij 5 0 for i THORN j Considering rolling as a two-dimensionale13 and e31problem ie e22 5 e12 5 e21 5 e23 5 e32 5 0 and e33 5
2e11 these deviations from the plane-strain state manifestthemselves as nonzero contributions of the geometry- eij 5 1
1 0 e13
0 0 0e31 0 212 [3]
induced shear component e31 and the friction-induced shearcomponent e13 (Figure 1) Thus the displacement gradienttensor eij becomes To simulate the texture evolution an aggregate composed
of 500 initially random orientations was deformed in 78steps (6 rolling passes of 13 steps each) In each step a
eij 5 1e11 0 e13
0 0 0e31 0 2e11
2 [1] different displacement-rate tensor is imposed and the incre-mental deformation is controlled by enforcing De11 5 00175up to a total accumulated strain of e11 5 1365 whichThe components laquo13 laquo31 v13 and v31 of the symmetric andapproximately corresponds to a 75 pct thickness reductionantisymmetric parts of the velocity gradient eij areSimulations of fcc textures were performed with the usualtwelve 111^110amp slip systems ie four 111 slip planeslaquo13 5 laquo31 5
12
(e13 1 e31) and v13 5 2v31 512
(e13 2 e31) each containing three ^110amp slip directions In the simulationsof bcc textures two slip-system families 110^111amp and[2] 112^111amp were considered (with equal critical resolvedshear stress (tcrss)) which is commonly assumed to give aIt has already been pointed out that the friction-induced
shear component e13 is positive at the entry of the rolling reasonable description of the slip characteristics in manybcc structures (eg Reference 2) Since for this highlymill zero at the neutral plane and negative at the exit of
the rolling mill for the geometry-induced shear component constrained forming problem local deformation is mostlycontrolled by the boundary conditions all simulations weree31 the opposite behavior is anticipated (Figure 1) Accord-
ingly in the present model the evolution of e31 and e13 and performed without hardeningAs outlined previously the shear rates e13 and e31 wereof the resulting shear rates (laquo13 5 laquo31) and rotations (v13 5
2v31) is assumed to follow a simple sine-shaped profile varied according to a sine-shaped profile so as to accountfor the changes in strain evolution from the entry to theduring a rolling pass as indicated in Figure 6 The numerical
values of eij laquoij and vij are referred to the principal strain exit of the rolling mill during one rolling pass For thedeformation texture simulations the sine profiles were sub-rate e11 5 laquo11 which is assumed to remain constant during
a rolling pass and to be the same for all layers Hereinafter divided into 13 steps (Figure 6) which are regarded as
METALLURGICAL AND MATERIALS TRANSACTIONS A VOLUME 31A SEPTEMBER 2000mdash2305
Fig 7mdash(a) through (i) 111 pole figures with the results of the VPSC deformation texture simulations for fcc materials as a function of laquomax13 and vmax
13
making up one distinct rolling pass after these 13 steps the 111 poles in a stereographic projection The two parame-ters e13 and e31 were chosen so as to yield three differentcycle is repeated The thickness reduction during each rolling
pass equals 13 3 00175 5 02275 (20 pct) and the total shear rates (laquomax13 5 0 0875 and 15) and three rotation rates
(vmax13 5 0 15 and as much as 25) For laquomax
13 5 0 all simu-deformation of e11 5 1365 consists of six individual passesChanges in the number of steps per rolling pass such as lated textures consisted mainly of the typical rolling-texture
b fiber and the pole figures (Figures 7(a) through (c)) resem-nine or 17 rather than 13 had no significant effect on thesimulation results Changes in the total number of rolling ble the well-documented pole figures of sheets rolled under
plane-strain conditions For a large value of laquomax13 5 15 apasses or in the amount of strain per pass did to some extent
affect the simulated texture sharpness However the overall pronounced shear texture was observed consisting of001^110amp with some intensities of 111^ uvwamp orienta-texture characteristics ie plane-strain vs shear texture
remained virtually unaffected tions (Figures 7(g) through (i)) The results presented inFigures 7(d) through (f) were derived for an intermediateFigure 7 shows modeling results as a function of the two
parameters e13 and e31 plotted in the form of individual value of the shear namely laquomax13 5 0875 Accordingly the
2306mdashVOLUME 31A SEPTEMBER 2000 METALLURGICAL AND MATERIALS TRANSACTIONS A
pole figure exhibits a mixture of plane-strain and shear tex- laquomax13 increasing to 10 the plane-strain texture rapidly
degrades and instead the shear-texture componentsture components The rotation rate vmax13 has a negligible
impact on the simulation results the only visible effect 111^112amp 112^110amp and in particular the rotated cubeorientation 001^110amp form (Figures 8(d) through (f))caused by a very large vmax
13 is a slight asymmetry in thepole figures (eg Figures 7(b) (c) and (i)) which appear With laquomax
13 further increasing to 15 the simulated shear tex-tures sharpen while their main features remain constantslightly tilted around the TD
The results depicted in Figure 7 are important because (Figures 8(f) through (h)) In comparison with the experi-mental data the simulation results obtained with values ofthey indicate that it is not necessary to characterize the
deformation of each layer by the two independent compo- laquomax13 1 to 15 resemble the pronounced shear textures
found at or typically shortly below the sheet surface (egnents e13 and e31 Rather it is sufficient to consider onlyone parameter the symmetric component laquo13 Accordingly Figure 2(b))
Figures 8(d) through (f) indicate that the transition fromin the following two sections the evolution of through-thickness texture gradients of fcc and bcc materials will plane-strain to shear texture takes place over the relatively
small interval of 07 laquomax13 10 At laquomax
13 5 0825 thebe addressed by a systematic variation of the shear ratelaquomax
13 This was accomplished by variations only in e13 position of the b fiber is rotated to smaller angles of Fwhich essentially corresponds to a TD rotation of the mainwhereas e31 was set to zero in all simulations that follow
For a quantitative evaluation of the modeled textures and rolling-texture components This mainly affects the C orien-tation which in Figure 8(e) is situated at F 5 25 deg anin particular for enabling a direct comparison with the
experimental texture results the three-dimensional ODFs intermediate state between the plane-strain C orientation atF 5 30 to 35 deg (Figures 8(a) through (c)) and the mainf(g) were computed from the resulting sets of modeled
orientations Each orientation was associated with a Gauss- shear-texture component 001^110amp at F 5 0 deg (Figures8(f) through (h)) This TD rotation of the b fiber has indeedshaped peak in Euler-angle space with a (half) scatter
width of c0 5 7 deg according to the series-expansion been observed experimentally in subsurface layers of inho-mogeneously deformed specimens[2646] For the case ofmethod[31] For a texture consisting of N individual orienta-
tions the ODF can then be determined by the superposition laquomax13 5 08 a complete ODF is shown in Figure 9 The
texture strongly resembles the transition case shown in Fig-of the corresponding N Gauss peaks In order to increaseprecision 2000 initially randomly distributed orientations ure 3 which is composed of both the plane-strain-texture b
fiber orientations as well as the main shear componentwere considered As can be seen in Figure 7 for the rangeof e13 and e31 values used in the present simulations the 001^110ampassumption of orthotropic sample symmetry is a reasonableapproximation Thus like the ODFs of the experimental D Application to bcc Metalstextures the simulated ODFs could be calculated and rep-
Figure 10 shows a sequence of modeling results obtainedresented under the assumption of orthotropic samplefor a generic bcc material The results again plotted in w2symmetry5 45 deg sections (Figure 5) clearly show the effect of thelaquo13 shear on the texture evolution For values of laquomax
13 belowC Application to fcc Metals 075 the textures basically consist of a and g fiber compo-
nents with a maximum close to 111^011amp (Figures 10(a)Figure 8 shows a series of modeling results obtainedfor an fcc crystal structure and different values of laquomax
13 through (c)) At such relatively low values of laquo13 the strainstate is akin to the plane-strain state and accordingly theplotted in the w2 5 45 deg section of the reduced Euler
space with 0 deg (w1 F w2) 90 deg (Figure 3) The simulation results strongly resemble the plane-strain texturestypically observed in the center layers (00 s 02) ofcomponent e31 of the displacement rate was kept equal to
zero throughout the simulation For laquomax13 5 0 the simu- rolled sheets eg Figures 4(a) and 5(a) and (b) As described
for the fcc simulations the main texture features are nicelylated texture consisted of the b fiber orientations C Sand B with some intensities along the a fiber between the reproduced yet the overall sharpness in the simulated tex-
tures is significantly higherB and the Goss orientation the maximum texture intensityf(g)max 17 is found in the C orientation (Figure 8(a)) With increasing laquomax
13 the plane-strain rolling texturedegrades and is replaced by the shear-texture componentsAt laquomax
13 5 0 the strain tensor corresponds to the plane-strain condition and accordingly the simulation results 011^211amp 112^111amp and in particular by the Goss ori-
entation 011^100amp (Figures 10(f) through (h)) This texturestrongly resemble the plane-strain textures typicallyobserved in the center layers (00 s 02) of rolled fcc is characteristic of a pronounced shear deformation as
observed in the outer layers of inhomogeneously rolledsheets eg Figure 2(a) The main texture features withthe characteristic a and b fibers as well as the minor sheets as eg in Figures 4(b) and 5(e) through (g) Note
that the texture transition from plane-strain to shear typeorientation scatter are nicely reproduced even the inten-sity ratio between the a and b fibers is simulated with again takes place at values of laquomax
13 between 07 and 10(Figures 10(d) through (f))reasonable accuracy The overall texture sharpness in the
modeled textures is significantly higher however which All simulations so far have been performed with thesymmetrical sine-shaped profile of the shear componentis commonly observed in rolling-texture simulations
For values of laquomax13 5 05 and 0625 very similar simula- laquo13 shown in Figure 6 After 13 steps ie after one rolling
pass the deformation history was repeated Transmittedtion results were obtained (Figures 8(b) and (c)) The overalltexture sharpness is slightly reduced however indicating to practical operations this procedure corresponds to uni-
directional rolling eg sheet rolling on a multistand roll-the upcoming transition from the pure plane-strain state toa prevailing shear component at higher laquomax
13 values With ing mill In other applications like breakdown rolling and
METALLURGICAL AND MATERIALS TRANSACTIONS A VOLUME 31A SEPTEMBER 2000mdash2307
Fig 8mdash(a) through (i) Results of the VPSC deformation texture simulations for fcc materials as a function of laquomax13 (w2 5 45 deg sections compare with
Fig 2)
in many laboratory-scale rolling experiments the rolling the shear laquo13 after each rolling pass Compared to thesimulation results obtained for ldquounidirectional rollingrdquo theis performed reversibly ie the RD is reversed after each
rolling pass In the framework of the present model revers- results representing ldquoreversible rollingrdquo showed no notabledifferences at allible rolling can be simulated by swapping the sign of
2308mdashVOLUME 31A SEPTEMBER 2000 METALLURGICAL AND MATERIALS TRANSACTIONS A
nents e11 e33 e13 and e31 along the streamline for threedifferent layers viz s 5 01 05 and 08 As expected theprincipal strains e11 and e33 behave similarly with oppositesign The shear component e13 shows a strong positive maxi-mum near the entry of the roll gap turns zero about halfwayin between and becomes negative close to the exit of theroll gap For the component e31 a similar evolution althoughwith reversed sign was obtained Approaching the sheetsurface ie with increasing parameter s the amount of bothshear components e13 and e31 increased significantly Withregard to the idealized strain distribution shown in Figure6 we wish to emphasize that for all layers analyzed theevolution of e13 and e31 is fairly symmetrical with respectto the neutral point although not necessarily sine-shaped
Figure 11(e) shows the profile of the resulting shear ratelaquo13 as derived from the evolution of e13 and e31 in fourdifferent layers s 5 01 05 08 and 10 (Eq [2]) Evidentlylaquo13 also shows sign reversal but not necessarily a sine-shaped evolution Again with increasing the parameter sthe amount of laquo13 increased notably In what follows wewill show that the assumption of a sine-shaped profile oflaquo13 with a strong dependency of its maximum on the layeranalyzed appears to be consistent with the FEM results forthe simulation of texture gradients
For a validation of the present model the strain historyderived by the FEM simulations was used as an input forthe VPSC program the resulting texture simulations were
Fig 9mdashResults of the VPSC deformation texture simulations for fcc materi- then compared with predictions based on the simplified sine-als and laquomax
13 5 08 showing the transition between plane strain and shear shaped evolution of laquo13 The strain rates eij given by thetexture components (compare with Fig 3) FEM simulations (eg Figures 11(b) through (d)) averaged
over two steps in each case were fed into the VPSC codeThus the rolling pass was run in 33 steps using constanttime increments of Dt 5 05 s33 5 0015 s The simulation
V VALIDATION OF THE STRAIN results are shown in Figures 12 (a) through (d) in the formDISTRIBUTION BY COMPARISON WITH of the w2 5 45 deg sections of the corresponding ODFs In
FEM SIMULATIONS the sheet center (s 5 01) deformation conditions close toplane strain resulted in a typical bcc rolling texture (FigureResults obtained by the FEM have been used to validate12(a)) whereas at the sheet surface (s 5 10) a shear texturethe simplified strain distribution shown in Figure 6 and inprevailed (Figure 12(d)) The intermediate layers (s 5 05particular to get quantitative data on the maximum amountsand 08) were characterized by weak mixed textures withof e31 and e13 The variation of the strain state throughoutfeatures of both plane-strain and shear textures (Figures 12the sheet thickness during a single rolling pass was simulated(b) and (c)) Note that all textures are quite weak becauseby means of the rigid-plastic FEM code DEFORM[2047] Theof the low level of deformation (16 pct thickness reduction)FEM simulations were performed on a mesh of 150 3 15
A direct quantitative comparison of these textures withinitially square-shaped elements using the material parame-results obtained with the present model (eg Figure 10) isters of low-carbon steel The material was deformed in onenot straightforward because of the different ways the VPSCbite from 207 to 174 mm (half thickness) resulting in asimulations were performed First of all the present modelthickness reduction of 16 pct The roll diameter was 127had to be run in one deformation pass of 13 steps whichmm so that the lC t parameter was close to 1 the circumfer-resulted in the same total strain of e11 5 0174 (16 pct) usedential roll speed was 20 mms Texture gradients werein the FEM simulations Second the free variable of theenforced by applying high friction with a friction parametermodel that is the ratio of the maximum of the sine-curveof m 5 1 where m is defined as the ratio of the frictionallaquomax
13 to the strain increment laquo11 5 e11 had to be determinedstress to the critical shear stress The shape change of theAs discussed in Section IVndashA our model assumes a constantelements during the rolling pass is displayed in Figure 11(a)strain increment laquo11 and a sine-shaped shear profile laquo13It appears that the deformation in the rolling gap is not(Figure 6) The simulations based on the FEM data in con-homogeneous but as sketched in Figure 1 varies continu-trast were run with constant time increments and simulatedously from the entry to the exit of the roll gap The initiallystrain histories like the ones shown in Figure 11 Here laquo11square-shaped elements were first tilted into an advancedis not constant but varies strongly along the rolling passposition and then tilted back in the reverse direction Thisthe evolution of e13 and e31 has some resemblance to aforwardbackward rotation also depends on the through-sine curve yet shows significant deviations Thus to derivethickness parameter s in that its maximum amount decreasednumerical values for the ratios laquomax
13 laquo11 from the FEM simu-from the surface to the center layer Figures 11(b) through(d) show the resulting evolution of the shear-tensor compo- lation results it appeared reasonable to use a criterion based
METALLURGICAL AND MATERIALS TRANSACTIONS A VOLUME 31A SEPTEMBER 2000mdash2309
Fig 10mdash(a) through (i) Results of the VPSC deformation textures simulations for bcc materials as a function of laquomax13 (w2 5 45 deg sections compare with
Fig 4 and 5)
on the accumulated deformation laquo13 5 t
laquo13dt [ I13 andlaquo13 and laquo11 Note that for the integral I13 the absolute valuesof laquo13 were used so as to yield the total amount of shearlaquo11 5
tlaquo11 dt [ I11 rather than the instantaneous values of
2310mdashVOLUME 31A SEPTEMBER 2000 METALLURGICAL AND MATERIALS TRANSACTIONS A
Fig 11mdash(a) through (e) Evolution of the displacement rate tensor components during one rolling pass of 16 pct reduction predicted with FEM calculations
METALLURGICAL AND MATERIALS TRANSACTIONS A VOLUME 31A SEPTEMBER 2000mdash2311
Fig 12mdashComparison of the VPSC deformation texture simulations based on (a) through (d ) FEM data depicted in Fig 11 and (e) through (h) the sine-shaped laquo13-shear profile (Fig 6) (bcc material w2 5 45 deg sections ODF regions with f(g) 1 are marked)
Table II Comparison of VPSC Texture Predictions of the to reproduce the textures simulated with the much morePresent Model with FEM Data complex strain distribution of the FEM results This seems
to indicate that the final texture is determined by the ratios 5 01 s 5 05 s 5 08 s 5 10
between the accumulated shear and plane strain rather thanI13 (FEM) 0030 0084 0103 0182 by the specific evolution of these components during a roll-I11 (FEM) 0179 0177 0177 0157 ing passI13I11 0168 0475 0582 1159 From Table II it may be seen that the ratio I13I11 approxi-laquomax
13 0264 0746 0914 1821mately scales with the sheet-layer parameter s so that thefollowing simple linear relation between the maximum shearrate laquomax
13 and the parameter s can be established
independent of its direction For the FEM simulations the laquomax13 5 p2 3 I13 I11 p2 3 s [4]
values of I13 and I11 were derived by trapezoidal integrationIn Sections IVndashC and D it has been shown that the modelover the respective FEM data the results are summarizedsimulates the transition from a plane-strain to a shear defor-in Table II Note that the values of I11 deviate somewhatmation texture in the range from 07 laquomax
13 10 Trans-from the overall strain laquo11 5 0174 (16 pct) in particular atmitted to the texture gradient in the IF steel sheet displayedthe sheet surface For the sine curve the integration givesin Figure 5 this means that the texture transition shouldI13 5 laquomax
13 3 4 3 0174(2p) and I11 5 0174 Thus if thetake place between layers s 5 04 (laquomax
13 5 07) and s 5ratio laquo13laquo11 has to be the same laquomax13 is related to the FEM
06 (laquomax13 5 1) which is in very good agreement with thestrain data through laquomax
13 5 p2 3 I13 I11 the resulting valuesexperimental texture results Thus the present model mayfor the four layers analyzed are given in Table II as wellactually be used to predict the textures evolving at differentWith these values of laquomax
13 the rolling textures were simu-layers and thus texture gradientslated as described in Section IVndashB The results are repre-
sented in Figures 12(e) through (h) and the similarity tothe respective simulations based on the ldquorealrdquo FEM strain VI IMPACT OF THROUGH-THICKNESSdistribution (Figures 12(a) through (d)) is striking Not only TEXTURE GRADIENTS ON SHEETare the main texture featuresmdashplane-strain texture vs shear FORMABILITYtexturemdashidentical but even minor texture features are nicelyreproduced by the simplified model the texture intensities There is a strong correlation between crystallographic
texture and formability of the rolled sheet (eg Referenceare also very similar Thus despite the strong simplificationsin the strain distribution assumed in the present model (con- 48) Thus it is evident that when the texture gradients are
important through the thickness of the sheet their effect onstant laquo11 and sine-shaped laquo13) the model proved to be able
2312mdashVOLUME 31A SEPTEMBER 2000 METALLURGICAL AND MATERIALS TRANSACTIONS A
coefficient is systematically lower than 1 indicating astronger tendency of the sheet to contract in-plane ratherthan at the through-thickness while being stretched In thecase of the bcc textures R is larger than 1 at the center butexhibits an anomalous effect at the surface
It is logical to expect that the overall qualitative propertiesof the rolled sheet will be a weighted average of these twoextreme responses The influence of the surface texture willdepend on how rapidly the texture evolves toward the plane-strain one As a consequence it is foreseeable that the surfacetexture may play a non-negligible role during sheet form-ing operations
VII DISCUSSION AND CONCLUSIONS
This article describes an approach to simulate and studyshear textures and through-thickness texture gradients inrolled sheet materials The strain evolution during a rollingpass is idealized by a plane-strain state plus a superimposedsine-shaped evolution of the laquo13 shear which is then inputinto a VPSC deformation model The FEM results obtainedfor rolling deformation under high-friction conditions indeedshowed a sign reversal and a zero net amount of both the
Fig 13mdash(a) and (b) Yield locus and (c) and (d ) Lankford coefficient R geometry-induced shear component e31 and the friction-derived from the texture simulations for plane strain deformation (laquomax13 5
induced shear component e13 ie there is some similarity0 solid lines) and plane strain superimposed to shear deformation (laquomax13
5 125 dotted lines) to a sine-shaped evolution However it is not critical tocapture the exact evolution of these components as far asthey are reversible and their relative strength with respectto the plane-strain component is accounted forthe forming properties cannot be dismissed Formability is
usually characterized by the yield locus or polycrystal yield An important conclusion of this study is that the combinedvalues of e31 and e13 influence the final texture rather thansurface and by the Lankford coefficient (R parameter) The
latter defines the ratio between the in-plane and the through- their individual values (Figure 7) Furthermore the antisym-metric component of the displacement gradient rate thethickness strains associated with a tensile test performed at
an angle a with respect to the RD of the sheet rotation rate v13 does not affect the final texture providedthe accumulated rotation rate in each rolling pass is nullIn order to assess the impact of the through-thickness
texture gradients on the resulting sheet formability the yield As a consequence the through-thickness texture gradientscan be realistically tackled using a parametric characteriza-locus and the Lankford coefficient are calculated for the
simulated center and surface textures of the fcc and the bcc tion of the maximum of a sine-shaped laquo13 shear The simula-tion results are validated by comparison with typicalsheets Calculations have been performed for plane-strain
conditions (laquomax13 5 0) and for a case with a strong shear examples of through-thickness texture gradients observed
experimentally in rolled plates and sheets of various fcc andcomponent (laquomax13 5 125) The yield surface is obtained by
probing the aggregate with equispaced strain rates contained bcc materialsAnalysis of the FEM data suggests a linear relationin the plane of deviatoric normal stresses the so-called p
plane The stress states associated with the probes are nor- between the maximum shear laquomax13 and the sheet-layer param-
eter s Hence the model may be usedmdashto some extentmdashtomalized to a reference rate of plastic work and plotted inthe p plane As for the Lankford coefficient tensile deforma- actually predict textures at different layers and thus texture
gradients However it is noted that this monotonic increasetion is imposed to the textured material at an angle a withrespect to the RD while enforcing zero in-plane and through- of laquomax
13 with s is only valid for rolling geometries with fairlylarge rolls and a high friction Such deformation conditionsthickness stress components The ratio of the in-plane
through-thickness strain rates defines the Lankford coeffi- which typically prevail in break-down rolling or multistandhot rolling are characterized by a value of the ratio of contactcient The VPSC formulation was used for all the calcula-
tions and a grain aspect ratio of 38810025 was assumed length lC to sheet thickness t larger than 1 Under othercircumstances especially with a rolling geometry with lC which is consistent with the deformation history used in the
previous sections t 1 the strain distribution through the sheet thickness ismore complicated so that the simple assumptions of theThe results are shown in Figures 13(a) and (b) where it
can be seen that the shape and tilt of the yield surface are present approach no longer holdIt has repeatedly been stated that the shear textures thatgreatly affected by the difference in texture between the
surface and the center of the sheet both for the fcc and the are observed at the sheet surfaces are caused by the strongshear applied by the friction between the roll and sheetbcc cases The effect on the Lankford coefficient is even
more dramatic (Figures 13(c) and (d)) at the center the surface However such unidirectional shear would lead toa very unrealistic shape change of the sheets Only underfcc sheet exhibits the well-documented anomalous response
with R varying from less than 1 along the RD to greater special circumstances can this assumption of unidirectionalshear account for the evolution of shear textures Thesethan 1 along the TD At the surface in contrast the Lankford
METALLURGICAL AND MATERIALS TRANSACTIONS A VOLUME 31A SEPTEMBER 2000mdash2313
5 SI Wright GT Gray III and AD Rollett Metall Mater Trans Asituations are characterized by very asymmetrical deforma-1994 vol 25A pp 1025-31tion conditions including unequal roll sizes[49] and idling
6 DJ Chakrabarti H Weiland BA Cheney and JT Staley Materof one of the rolls[50] Furthermore the development of a Sci Forum 1996 vols 217ndash222 pp 1085-90unidirectional shear would not account for the shear textures 7 A Van Bael E Hoferlin L Kestens and P Van Houtte Mater Sci
Forum 1998 vols 273ndash275 pp 417-22observed in the surface of reversibly rolled sheets The pres-8 PS Mathur and WA Backofen Metall Trans 1973 vol 4 ppent calculations convincingly show that even for a fully
643-51symmetrical strain distribution with complete shear reversal9 HO Asbeck and H Mecking Mater Sci Eng 1978 vol 34 pp
pronounced shear textures may form This is in agreement 111-19with results from forwardreverse torsion experiments 10 W Truszkowski J Krol and B Major Metall Trans A 1980 vol
11A pp 749-58where likewise the texture evolution is irreversible even if11 W Truszkowski J Krol and B Major Metall Trans A 1982 volthe strain path is reversed[4551]
13A pp 665-69The present simulation results obtained using a VPSC12 CS Lee and BJ Duggan Metall Trans A 1991 vol 22A pp
deformation approach are in much better agreement with 2637-43experimental results than similar simulations performed with 13 OV Mishin B Bay and D Juul Jensen Metall Mater Trans A
2000 vol 31A pp 1653-62a Taylor deformation model As stated previously this is14 T Sakai Y Saito M Matsuo and K Kawasaki Iron Steel Inst Jpnpartially caused by the necessity to employ the FC version
1991 vol 31 pp 86-94of the Taylor model when all strain-rate components includ- 15 CH Choi JW Kwon KH Oh and DN Lee Acta Mater 1997ing laquo13 in this particular case are prescribed In the VPSC vol 45 pp 5119-28model in contrast even with a fully prescribed overall strain- 16 S Matsuoka M Morita O Furukimi and T Obara Iron Steel Inst
Jpn Int 1998 vol 38 pp 633-39rate tensor individual orientations can deviate from the aver-17 MY Huh YS Cho JS Kim and O Engler Z Metallkd 1999age and develop local shears yielding a more realistic defor-
vol 90 pp 124-31mation behavior In order to quantify this point the actual 18 WF Hosford and RM Caddell Metal Forming Mechanics anddeviations of the strain-rate components laquoij from the pre- Metallurgy Prentice-Hall Englewood Cliffs NJ 1993
19 MY Huh JC Park and S Lee Met Mater Korea 1996 vol 2scribed overall values have been tracked In the presentpp 141-49simulations the average shear rates laquoij coincide with the
20 JJ Park J Mater Proc Technol 1999 vol 87 pp 146-53overall ones while the distribution of orientations show21 KK Mathur and PR Dawson Int J Plast 1989 vol 5 pp 67-94
standard deviations of up to 045 in the rate-tensor norm 22 SR Kalidindi and L Anand J Mech Phys Solids 1994 vol 42which obviously cannot develop in a Taylor FC scheme pp 459-90
23 SE Schoenfeld and RJ Asaro Int J Mech Sci 1996 vol 38 ppAnother qualitative difference between a fully constrained661-83and a self-consistent polycrystal formulation is that the for-
24 B Beckers R Sebald G Pomana D Gade and G Gottstein Procmer tends to reverse the texture evolution when the shear19th Risoslash Int Symp on Materials Science JV Carstensen T Leffers
is reversed while the latter does not T Lorentzen OB Pedersen BF Soslashrensen and G Winther edsRisoslash National Laboratory Roskilde Denmark 1998 pp 219-27
25 AI Fedosseev and D Raabe Scripta Metall Mater 1994 vol 30NOTE ADDED IN PROOFpp 1-6
26 P Wagner A Fedosseev and G Gottstein Proc 13th Risoslash Int SympAfter acceptance of this article the authors became awareon Materials Science SI Andersen JB Bilde-Soslashrensen N Hansenof a recent publication by F Perocheau and JH Drive (IntD Juul Jensen T Leffers H Lilholt T Lorentzen OB PedersenJ Plast 2000 vol 16 pp 73-89) This paper addresses the and B Ralph eds Risoslash National Laboratory Roskilde Denmark
issue of texture gradients associated with hot forming of 1992 pp 497-50227 H Honneff and H Mecking Textures of Materials Proc ICOTOMaluminum using similar methods as the ones presented in
5 G Gottstein and K Lucke eds Springer-Verlag Berlin 1978 volour articleI pp 265-69
28 UF Kocks and H Chandra Acta Metall 1982 vol 30 pp 695-709ACKNOWLEDGMENTS 29 A Molinari GR Canova and S Ahzi Acta Metall 1987 vol 35
pp 2983-94This work was supported by the United States Department 30 RA Lebensohn and CN Tome Mater Sci Eng A 1994 vol A175
of Energy MYH is grateful to the Korean Research Founda- pp 71-8231 V Randle and O Engler Introduction to Texture Analysis Macrotex-tion for financial support through a research fund (1998-
ture Microtexture and Orientation Mapping Gordon amp Breach New017-E00098) The results of the commercial purity alumi-York NY 2000num shown in Figure 2 have been provided by S Benum 32 M Dahms and HJ Bunge J Appl Cryst 1989 vol 22 pp
and those of the IF steel (Figures 4 and 5) by B Beckers 439-47We are grateful to Professors A Beaudoin and SR Kalidindi 33 D Raabe J Mater Sci 1995 vol 30 pp 47-52
34 W Mao Mater Sci Eng A 1998 vol A257 pp 171-77for valuable discussions Professor JJ Park helped with the35 S Benum O Engler and E Nes Mater Sci Forum 1994 volsFEM calculations
157ndash162 pp 913-1836 O Engler and MY Huh Constitutive and Damage Modeling of Inelas-
tic Deformation and Phase Transformation Proc Plasticity rsquo99 ASREFERENCESKhan ed Neat Press Fulton MD 1998 pp 333-36
37 MY Huh YS Cho and O Engler Mater Sci Eng A 1998 vol1 J Hirsch and K Lucke Acta Metall 1988 vol 36 pp 2883-2904A247 pp 152-642 E Aernoudt P Van Houtte and T Leffers Plastic Deformation and
38 L Seidel M Holscher and K Lucke Textures and MicrostructuresFracture of Materials Ch 3 H Mughrabi vol ed in Materials1989 vol 11 pp 171-85Science and TechnologymdashA Comprehensive Treatment Vol 6 RW
39 D Raabe and K Lucke Mater Sci Technol 1993 vol 9 ppCahn P Haasen and EJ Kramer Ser eds VCH Weinheim Ger-302-12many 1980
40 C Darmann-Nowak and B Engl Steel Res 1991 vol 62 pp 576-793 UF Kocks Metall Trans 1970 vol 1 pp 1121-434 J Gil Sevillano P Van Houtte and E Aernoudt Progr Mater Sci 41 RK Ray JJ Jonas and RE Hook Int Mater Rev 1994 vol 39
pp 129-721980 vol 25 pp 69-412
2314mdashVOLUME 31A SEPTEMBER 2000 METALLURGICAL AND MATERIALS TRANSACTIONS A
47 MY Huh HC Kim JJ Park and O Engler Met Mater Kor 199942 YB Park DN Lee and G Gottstein Acta Mater 1996 vol 44pp 3421-27 vol 5 pp 437-43
48 UF Kocks CN Tome and HR Wenk Texture and Anisotropy43 R Sebald B Beckers G Gottstein GS Kim OJ Kwon and WChoi Proc Int Symp on Modern LC and ULC Sheet Steels for Cold Preferred Orientations and Their Effect on Materials Properties Cam-
bridge University Press Cambridge United Kingdom 1998Forming Processing and Properties W Bleck ed RWTH Aachen1998 pp 363-70 49 CH Choi KH Kim and DN Lee Mater Sci Forum 1998 vols
273ndash275 pp 391-9644 M Holscher D Raabe and K Lucke Acta Metall Mater 1994 vol42 pp 879-86 50 T Sakai S Hamada and Y Saito Aluminum Alloys Their Physical
and Mechanical Properties (Proc ICAA6) T Sato S Kumai T45 AD Rollett and SI Wright Texture and Anisotropy Preferred Orien-tations and Their Effect on Materials Properties UF Kocks CN Kobayashi and Y Murakami eds The Japan Institute of Light Metals
Japan 1998 pp 1161-66Tome and HR Wenk eds Cambridge University Press CambridgeUnited Kingdom 1998 pp 178-239 51 AD Rollett T Lowe UF Kocks and MG Stout Proc ICOTOM
8 JS Kallend and G Gottstein eds TMS Warrendale PA 198846 O Engler J Hirsch K Karhausen and G Gottstein Mater SciForum 1994 vols 157ndash162 pp 673-78 pp 473-78
METALLURGICAL AND MATERIALS TRANSACTIONS A VOLUME 31A SEPTEMBER 2000mdash2315
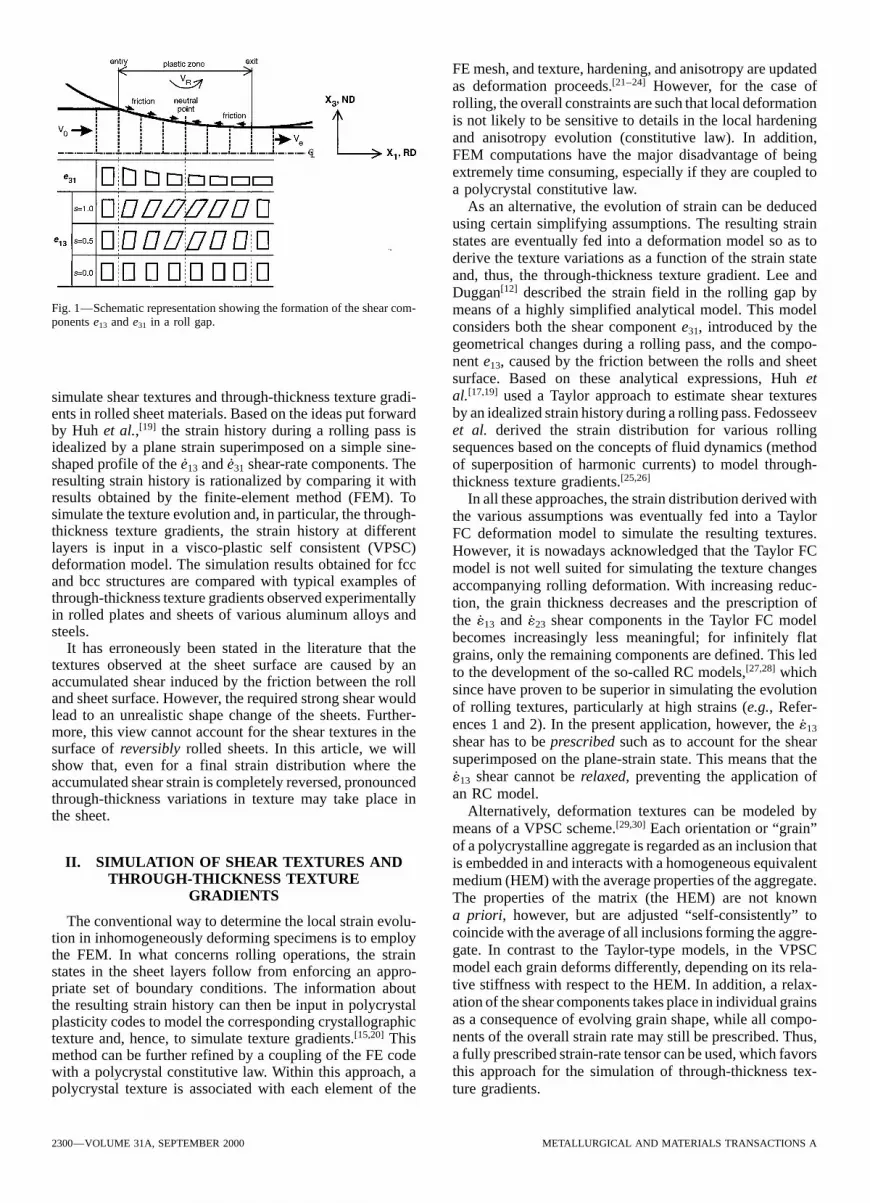
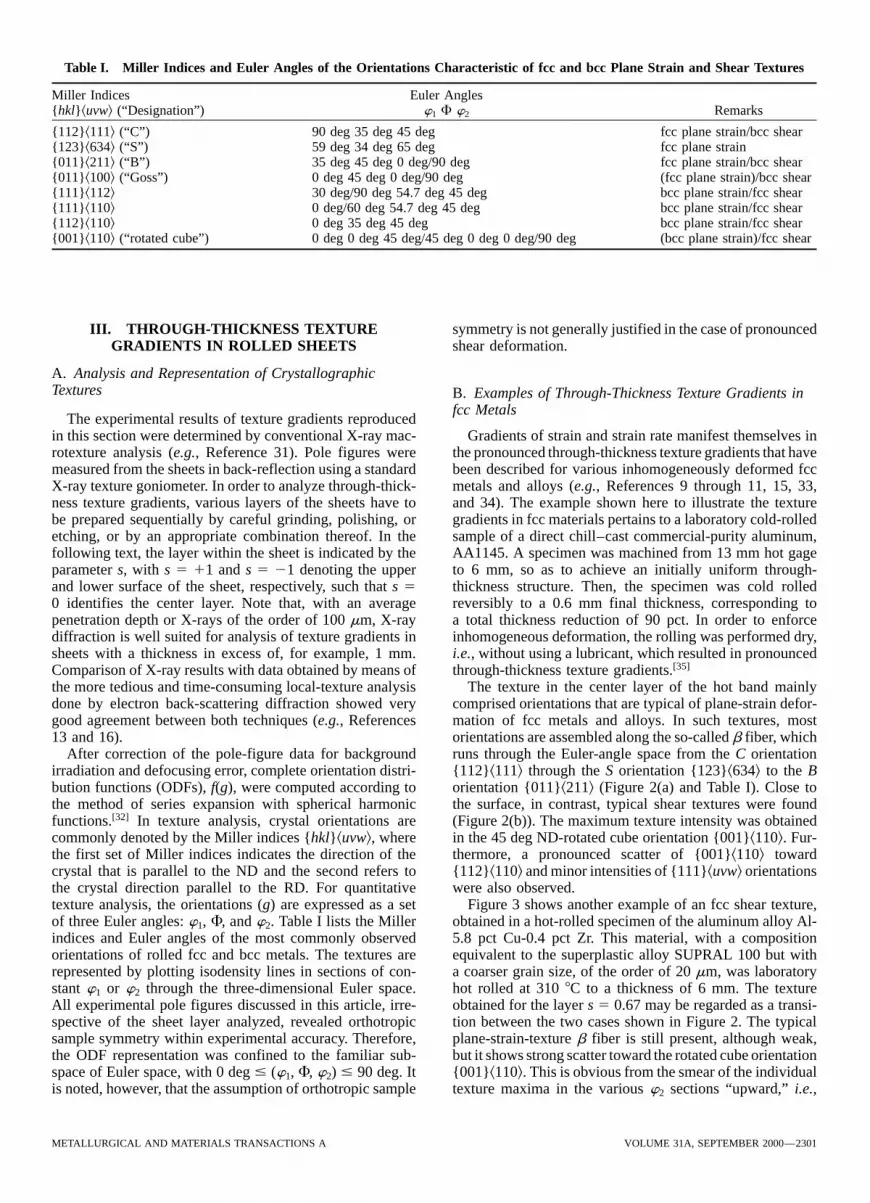
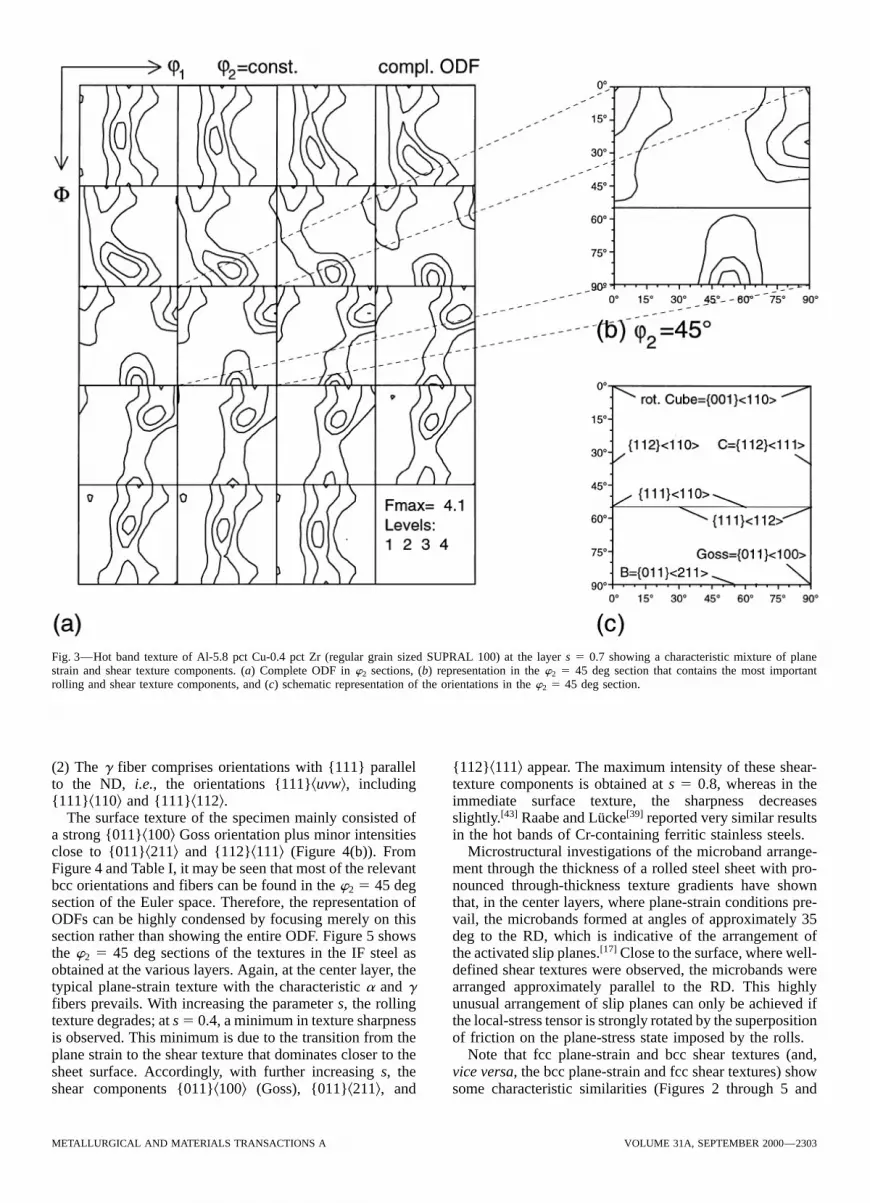
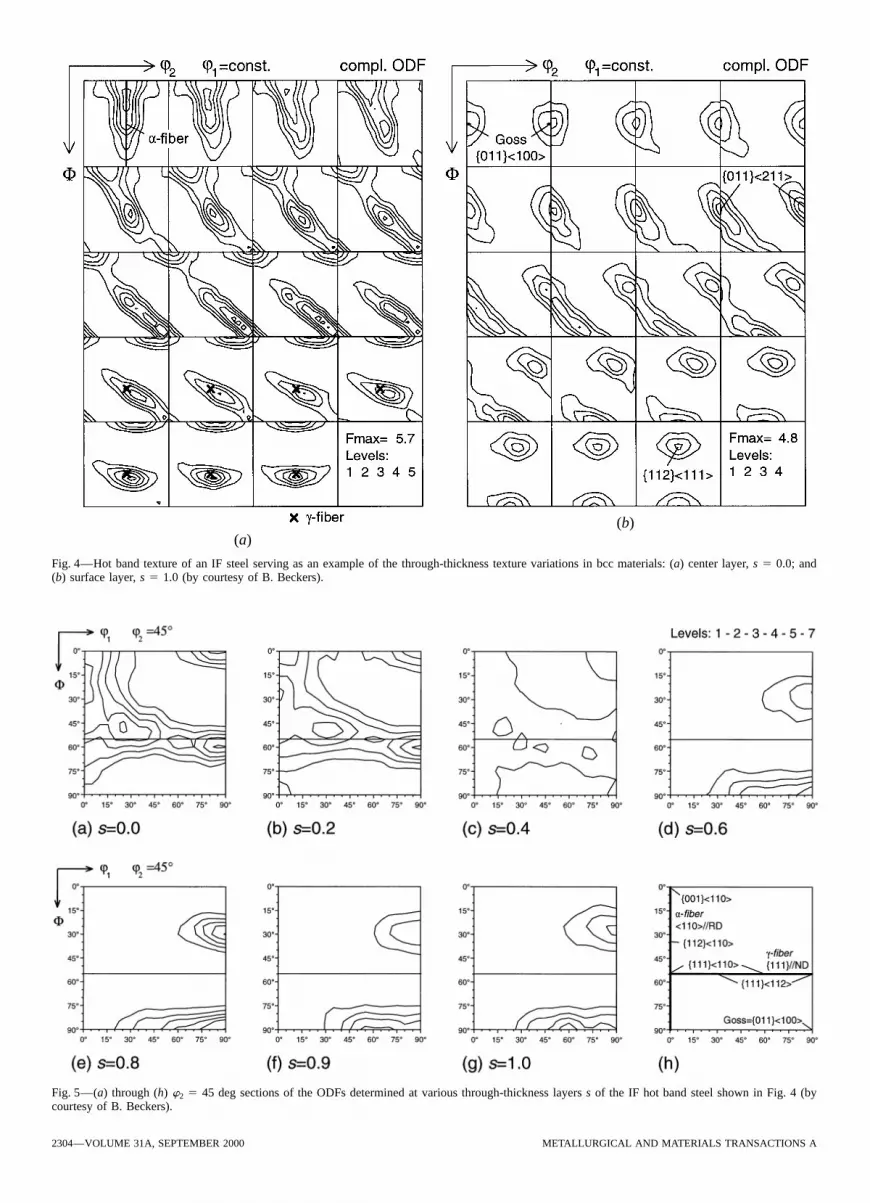
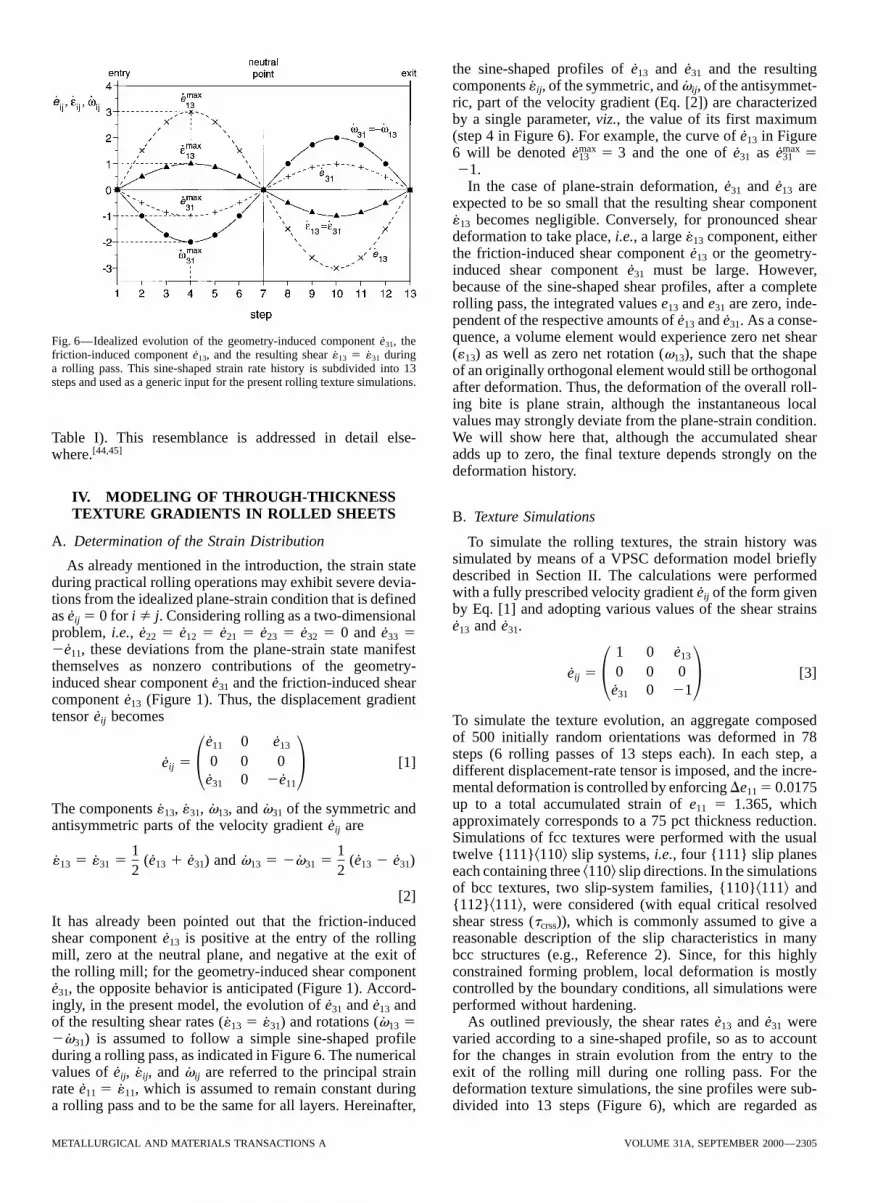
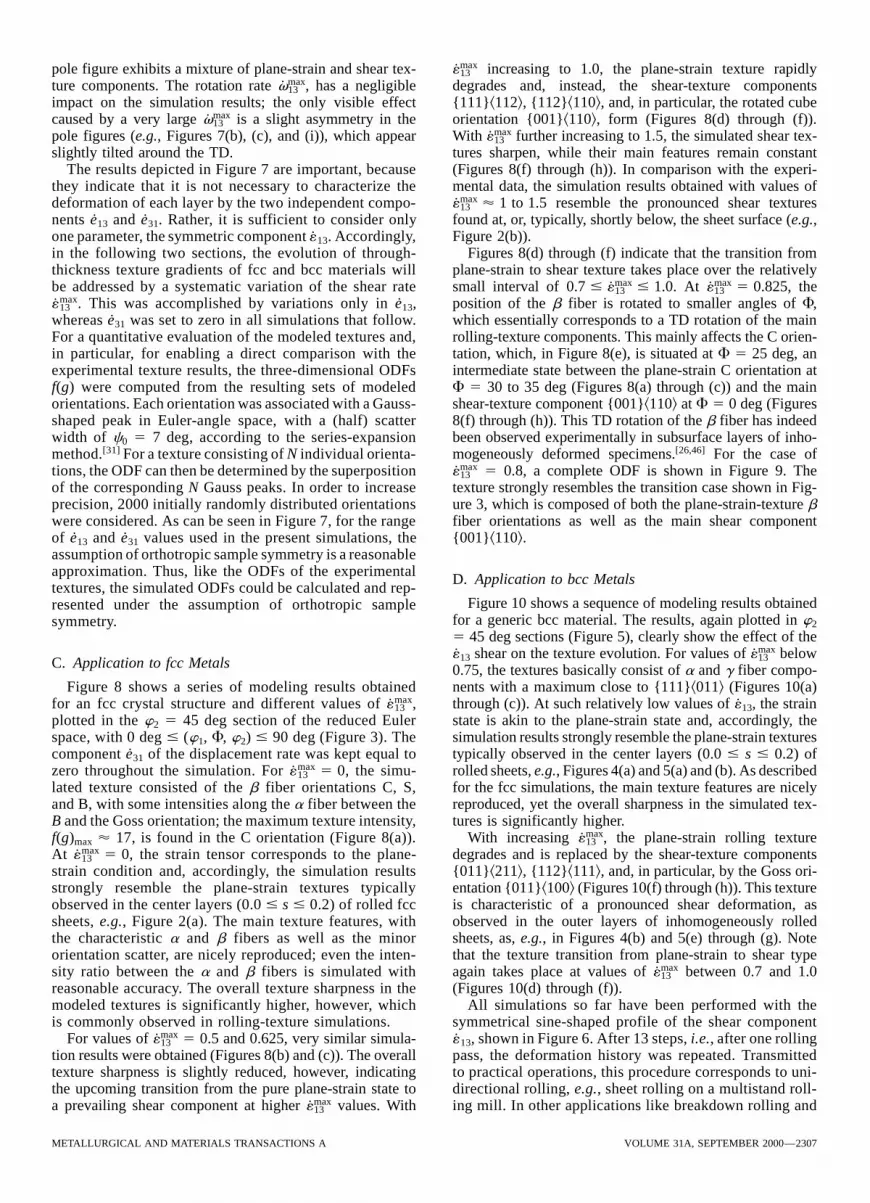