Embed Size (px)
Citation preview

J. Fluid Mech. (2007), vol. 585, pp. 421–456. c! 2007 Cambridge University Press
doi:10.1017/S0022112007006775 Printed in the United Kingdom
421
Atomization of undulating liquid sheets
N. BREMOND, C. CLANET AND E. VILLERMAUX†IRPHE, Universite de Provence, Aix–Marseille 1, Technopole de Chateau-Gombert, 49, rue Frederic
Joliot-Curie, 13384 Marseille Cedex 13, France
(Received 13 June 2006 and in revised form 27 March 2007)
The fragmentation of a laminar undulating liquid sheet flowing in quiescent airis investigated. Combining various observations and measurements we propose asequential atomization scenario describing the overall sheet–drop transition in thisconfiguration. The undulation results from a controlled primary Kelvin–Helmholtzinstability. As the liquid travels through the undulating pattern, it experiences transientaccelerations perpendicular to the sheet. These accelerations trigger a secondaryinstability responsible for the amplification of spanwise thickness modulations of thesheet. This mechanism, called the ‘wavy corridor’, is responsible for the sheet freeedge indentations from which liquid ligaments emerge and break, forming drops. Thefinal drop size distribution is of a Gamma type characterized by a unique parameterindependent of the operating conditions once drop sizes are normalized by theirmean.
1. IntroductionThe transition from a compact liquid volume to a set of dispersed smaller drops –
in the broad sense, the process of atomization – often involves as a transient stage thechange of the liquid topology into a sheet shape. This transition is sometimes enforcedby specific man-made devices, and also occurs spontaneously as a result of variousimpacts and blow-ups (Lefebvre 1989; Bayvel & Orzechowski 1993; Mason 1971).Then, the sheet is destabilized in some way to induce another transition towards theformation of threads or ligaments, the ultimate objects whose breakup (Savart 1833a;Plateau 1873; Rayleigh 1879; Eggers 1997) sets the size distribution of the final dropsin the spray, depending on their state of corrugation while they fragment (Villermaux,Marmottant & Duplat 2004).
The purpose of this paper is to address the sheet–ligament–drop transition in theparticular case when the sheet is undulated. This occurs naturally when its flowingvelocity relative to the ambient medium is large enough (we will explain belowhow large this is) to amplify unstable waves via a shear, Kelvin–Helmholtz type ofinstability (Taylor 1960; Huang 1970; Lin 2003). Let us visualize how the atomizationprocess is altered in that case: consider for instance the oblique impact of twoidentical liquid jets in quiescent air (Heidmann, Priem & Humphrey 1957; Bremond& Villermaux 2006). For low injection velocities, the resulting sheet takes a bay leafshape bounded by a thicker rim. Ligaments are centrifuged from the rim and stretchedas they break because of a longitudinal velocity gradient in the rim itself, which is afunction of the impact angle and jet velocities. The final drop size distribution is thusfound to be a function of the injection conditions. If now the jet speed is increased,
† Also at: Institut Universitaire de France.

422 N. Bremond, C. Clanet and E. Villermaux
(a)
(b)
Figure 1. Front view (a) and side view (b) of the destabilization of a liquid sheet movingin air initially at rest.
the sheet starts to flap like a flag (figure 1). Large drops are still produced by thethick rim as described above, but now a finer spray appears at the centre of the endof the sheet where the unstable wave amplitude has developed. These smaller dropsare produced through the destabilization of thinner ligaments normal to the sheetfree edge. While the bigger drops formed through the destabilization of the thickrim around the sheet have a typical size set by the initial jet diameters, the averagesize of these smaller drops is now a strongly decreasing function of the jet velocities(Villermaux & Clanet 2002).
On the analytical side, a linear analysis of the shear instability of a fast movingsheet sandwiched between two infinite quiescent phases has been done by Squire(1953), York, Stubbs & Tek (1953) and Hagerty & Shea (1955). A review and anaccount of more recent developments can be found in Lin (2003). The instabilitysustains two discrete modes, varicose and sinuous, the growth rate of the latter beingfar larger than that of the former. Good agreement with experiments, both on theselected wavelength and associated growth rate, has been found by Asare, Takahashi& Ho!man (1981) for a sheet with a constant thickness and by Villermaux & Clanet(2002) for a radially expanding sheet.
The influence of the resulting wavy pattern on the sheet fragmentation processremains, on the contrary, conjectural. For instance, York et al. (1953) have proposeda rupture mechanism consisting of a series of lamellae parallel to the free rim andspaced by half the most unstable wavelength of the primary wavy pattern. The reasonwhy the lamellae separate from each other is not given in this nevertheless commonlyinvoked scenario (Fraser et al. 1962; Dombrowski & Johns 1963). It is, however,incompatible with the experimental observation by the same authors showing thatthe sheet breaks via the formation of longitudinal ligaments, perpendicular to itsmean free rim, similarly to what can be seen on figure 1. A mechanism producingfingers perpendicular to the free rim periodically accelerated by the incoming wavesvia a Rayleigh–Taylor-like instability (Rayleigh 1883; Taylor 1950) has been proposed

Atomization of undulating liquid sheets 423
by Villermaux & Clanet (2002). This scenario is encountered in di!erent atomizationconfigurations involving acceleration of the liquid/gas interface (Einsenklam 1964;James et al. 2003) and has been proved in some cases (Marmottant & Villermaux2004b) to be the key e!ect responsible for the initiation of digitations at the interface,the precursor of the formation of ligaments.
These ligaments are common in various atomization processes and have beenobserved by Mansour & Chigier (1990) and Park et al. (2004) in the context ofair-blasted liquid sheets. They were visible on the early drawings made by Savart(1833c) from sheets expanding radially from a jet. They also appear in the numericalsimulations by Lozano, Garcia-Olivares & Dopazo (1998) and Kim & Sirignano(2000) when a spanwise perturbation is initially added to the flow.
However, and despite its widespread and natural occurrence, a global picture ofthe fragmentation of an undulating sheet o!ering a clear description of the relationsbetween the consecutive instabilities is still lacking. As mentioned above, the sourceof the undulations is a shear, broadband instability. The experiments reported herewere first conceived to control the amplitude, wavelength and frequency of the wavepattern, allowing a clear discussion of its impact on the fragmentation process andresulting atomization quality. The especially designed experimental set-up is depictedin § 2 as well as an overview of the experimental observations. Section 3 is devotedto the primary destabilization where the linear theory is compared to experiments. Adiscussion of the secondary instability is provided in § 4 and its consequences for theatomization scenario are examined in § 5. There, we propose a simple analysis whichcaptures the essential physical processes involved in the sheet fragmentation, beforewe conclude. An Appendix analyses the fragmentation mechanism of a jet resultingfrom the merging of two jets.
2. Experiments and overview2.1. Formation of the liquid sheet
Figure 2 depicts the formation of the liquid sheet and introduces the coordinatesand parameters used. The sheet results from the normal impact of a round jet on asolid cylinder fitted with a thin jacket, a configuration inspired by Savart (1833c) andpreviously studied in various limits by Taylor (1959a, b, 1960), Huang (1970), Clanet& Villermaux (2002) and Villermaux & Clanet (2002). The jacket allows the ejectionangle of the sheet with respect to the solid cylinder axis to be controlled at will, andwas kept at a right angle in this study.
A gravity-driven stream of water provides a constant flow rate free of perturbations.The flow is directed through a flow meter, calibrated using a high-precision balanceand a stopwatch, towards a cylindrical injector with a 21 mm inner diameter whosecore contains a 30 mm long grid. The grid has a honeycomb shape containing about15 hexagonal cells which break large perturbation structures. A round jet with adiameter dj equal to 2.9 mm finally emerges from a 35 mm long converging nozzle forstabilizing the boundary layer. The injection protocol is such that the jet is as laminaras possible and with a thin boundary layer at the exit, i.e. with a close-to-uniformvelocity profile. The mean jet velocity uj deduced from the flow rate and jet diameterlies between 2.5 and 5m s"1, leading to jet Weber numbers We = !dju
2j /" smaller
than 1000. Water surface tension and density are " = 0.073 kg s"2 and ! = 1000 kg m"3,respectively. The error in the mean jet velocity, incorporating flow fluctuations andaccuracy of the measurements, is about 0.05 m s"1.

424 N. Bremond, C. Clanet and E. Villermaux
dj
uj
di
z
ui
hi
ru
h
(a0, !0)
Figure 2. Formation of the axisymmetric liquid sheet.
(b)
(c)
(a)
Figure 3. Axisymmetric liquid sheet states: (a) Smooth regime. (b) Flapping regime forlarger Weber number (higher than 1000). (c) Perturbation of the smooth regime by verticallyoscillating the impact cylinder.
After the impact on a solid cylinder with a diameter di = 6 mm and fitted with athin jacket of the appropriate height, the liquid expands radially forming a flat disk.Without this thin jacket the liquid sheet takes a bell-like shape as discussed in Clanet& Villermaux (2002). An example is shown on figure 3(a) for a jet Weber numbersmaller than 1000. This situation is referred to as the smooth regime. If the jet velocity

Atomization of undulating liquid sheets 425
is increased, a shear instability develops at the liquid/air interface and the sheet flapsin a sinuous fashion like a flag, with a preferred wavelength superimposed on a noisybackground as illustrated on figure 3(b).
Since our goal is to investigate the role played by such surface waves in thefragmentation process occurring at the edge of the sheet, the experiment has beendesigned to control the primary destabilization. The control is realized by oscillatingthe impact cylinder vertically with a vibrator (LDS-V406). It was possible in this wayto independently tune the amplitude a0 and the frequency f (pulsation #0 = 2!f ) ofthe oscillating motion of the impact point. This thus sets the oscillating motion of thetrain of fluid particles injected into the sheet from the impact location. A snapshot ofthe vibrated sheet is shown in figure 3(c) for a low Weber number corresponding tothe smooth regime presented in figure 3(a). Amplitudes a0, pulsations #0 and injectionvelocities uj are always such that
a0#0
uj
# 1. (2.1)
If a0#0/uj is close to 1, then the vertical oscillations of the impact cylinder willinduce liquid velocity fluctuations in the sheet which will lead to kinematic packing ofliquid since liquid particles flow at di!erent speeds. This kind of behaviour is observedin liquid jets with a pulsating injection condition as reported by Meier, Klopper &Grabitz (1992), but it is unwanted here.
Let us recall the radial dependence of the sheet thickness h(r) and flow velocityu. The mean velocity ui on leaving the impact cylinder is reduced to $uj due toviscous losses in the development of a boundary layer at the solid surface, and to thesingular losses on crossing the jacket hump. The overall loss of momentum leads toa reduction of velocity by a factor $ $ 0.97 with an impact cylinder diameter di of6 mm (Clanet & Villermaux 2002). If one assumes that the velocity profile has relaxedto a uniform profile as soon as the liquid is ejected from the impactor, mass andmomentum conservation of the radial flow in the sheet imply that the velocity u isconstant and equal to that of the fluid particles just after they have left the impactor,that is $uj . Conservation of mass between the jet and a location r on the sheet gives
!
4!d2
j uj = 2!!rh(r)u (2.2)
yielding finally
u = $uj , (2.3)
h(r) =1
$
d2j
8r. (2.4)
The sheet thins with distance from the impactor, and the process is interrupted whencapillary forces, proportional to "/h(r), become of the order of the incoming liquidinertia !u2. As measured by Bond (1935), Huang (1970) and many others, the radiusR0 of a radially expanding liquid sheet from the impact point to the location wherethe sheet breaks is, in the smooth regime,
R0
dj
=We
16. (2.5)

426 N. Bremond, C. Clanet and E. Villermaux
Figure 4. Vibrating liquid sheet as seen with the naked eye.
The Bond number Bo =!
gR0/u2j = dj/ lc, where lc =
%"/!g is the capillary length
and g is the acceleration due to gravity, is of the order of 0.2 so that gravity can beneglected.
2.2. Experimental observations
2.2.1. Waves
The first feature to be seen on the sheet when the impact cylinder is vibrating isshown in figure 4, taken with a long exposure time (20 ms) compared to the period ofoscillations (6.7 ms). We note a circular, stationary (because of the long exposure time)interference pattern with wavelength decreasing towards the edge. If we now use ahigh-speed camera (Phantom V5.1) recording 4500 frames per second, correspondingto an exposure time of 0.22 ms, we observe the periodic formation of circular wavespropagating towards the free edge of the sheet. A snapshot of the undulating sheetis shown on figure 5(a) showing the wavelength decreases as the waves reach the freeedge. Interesting features are deduced from the spatio-temporal diagram constructedat the horizontal line marked on figure 5(a) shown on figure 5(b). We first note thatthe oscillation of the impact cylinder induces a periodic wavetrain with a constantfrequency equal to the forcing frequency of the impactor f . The trajectory of thewaves is measured from this space–time map by following the shadow at the wavescrest. The velocity of the waves decreases as they approach the free edge. The liquidvelocity being constant, the velocity di!erence between the flowing liquid and thewaves is thus an increasing function of r . This behaviour is crucial for the sheetfragmentation process and will be discussed in § 4.
These observations allow a characterization of the propagating waves from akinematic point of view, but information about their amplitude is lacking. We thusvisualized the cross-section of the undulating sheet using a laser-induced fluorescencetechnique. Fluorescein is mixed with the water before it enters the injector. A lasersheet expanded from an Argon-ion laser working in mono-mode at 488 nm is orientedalong a radius of the liquid sheet and perpendicular to its surface when it is flat.

Atomization of undulating liquid sheets 427
ro
t
(a) (b)
o
0.01 ms
R
R
50 mm
Figure 5. (a) Snapshot of an undulating liquid sheet. (b) Spatiotemporal diagramconstructed at the horizontal line marked on (a).
(a)
(b)
(c)
Figure 6. Radial cross-section of a water sheet with fluorescein revealed by a laser sheet, atrest (a), during oscillations of the impact rod for a short time exposure of the camera (b), anda longer one (c). uj = 3.5 m s"1, f = 120Hz, a0 = 80 µm.
Examples of such visualizations are displayed on figure 6. The first picture, (a),presents the initial state of the liquid sheet before it is perturbed by the vibration.The second snapshot, (b), reveals the forcing of sinusoidal waves with a decreasingwavelength as the wavetrain propagates to the sheet edge. Successive nodes andantinodes are observed if the exposure time of the camera is increased. The beatpattern is the sign of the interference of at least two wavetrains propagating withdi!erent velocities. This phenomenon is discussed in § 3.3.
Close-up views of the flapping sheet envelope are shown in figure 7 for severalinjection velocities uj , the forcing {a0, #0} being constant. The envelope contour ismeasured from binary pictures after applying an intensity threshold and subtractingthe sheet thickness at each location obtained from figure 6(a). The correspondingamplitudes Am of the first antinode normalized by the initial amplitude of the impactcylinder vibration a0 are reported in figure 8 as a function of the jet velocity. We notethat the ratio Am/a0 lies between 3 and 4 for jet velocities lower than 4 m s"1 and

428 N. Bremond, C. Clanet and E. Villermaux
5 mm
Figure 7. Envelopes of an undulating liquid sheet (a0 = 145 µm, f = 120Hz) for several jetvelocities, from top to bottom: 2.8, 3.5, 4.3, 5.0 and 5.6m s"1. The horizontal white line oneach picture represents 5 mm, showing an amplification of the perturbation as the velocityincreases.
0
10
20
30
2 3 4 5
uj (m s–1)
Am—a0
Figure 8. Amplitude of the first antinode Am normalized by the forcing amplitude a0 as afunction of the jet velocity uj for a frequency equal to 120 Hz.
then increases. This indicates an amplification of the initial perturbation and will bediscussed in the analysis of the sheet destabilization in § 3.4.
2.2.2. Fragmentation
Starting with a smooth, steady sheet, and turning the impact cylinder oscillation on,the first moments of the sheet destabilization are shown on figure 9. The sheet is lit byan expanded laser beam and observed from the top. The interference pattern shownon the first picture before the forcing gives information on the sheet thickness field;each bright or dark fringe corresponds to a constant value of the thickness. For an

Atomization of undulating liquid sheets 429
(a) (b) (c) (d )
Figure 9. Initial instants of the sheet destabilization when the impact cylinder starts tooscillate. The sheet is lit by a laser revealing the initial thickness field on snapshot (a), somethickness modulations on (b) when waves propagate on the sheet, then longitudinal folds (c)and finally the retraction of the free edge (d). (a) t = 0, (b) 38 ms, (c) 55 ms, (d) 65 ms.
ideal case, the interference pattern would exhibit concentric circular fringes with anincreasing distance between the fringes since the thickness decreases like 1/r . A smalldeviation from this regular pattern is observed in figure 9(a) where the fringes presentsmall oscillations indicating a weak, but visible, azimuthal modulation of the sheetthickness. The impact cylinder is then set into motion, triggering the formation ofsurface waves as shown in figure 9(b). The surface undulations make the visualizationof the interference pattern di"cult, but an enhancement of the azimuthal thicknessmodulation in front of the waves at a shorter length scale is nevertheless visible. Thewavelength decreases as the wavetrain propagates and a catastrophic event occurswhen it reaches a critical location: radial folds of the sheet appear in front of thewavetrain and the free rim moves rapidly backwards to its new equilibrium position(figure 9c). Since the location of the free rim depends on the local sheet thickness,this event is a sign of a thinning process induced by the surface undulations. Thisimportant, and in fact key phenomenon will be discussed in § 4.1.
The maximum radial extent of the liquid sheet is measured from an average of 20snapshots taken from above and shown in figure 10. Without forcing (figure 10a), thesheet has a disk-like shape where drops are ejected, on average, uniformly around therim. When undulations of the surface are imposed, the sheet shrinks (figure 10b), andthis shrinkage is enhanced for higher frequencies of perturbation f (figure 10c) aswell as for larger amplitude a0 (figure 10d). When the sheet is vibrated, we note thepresence of preferential sites of drop ejections on the rim. The number of these sitesdoes not vary much with the forcing parameters and may be due to imperfectionsof the impact area since they move radially when the thin jacket around the impactcylinder is twisted.
The last step of the sheet fragmentation process is the formation of the drops. Twoclose-up views of the free rim without and with forcing are shown in figure 11. Inboth cases, the rim has cusps at the end of which ligaments emerge and break intodrops via a capillary instability. This scenario is characteristic of sheet atomizationwhen the liquid flow is initially perpendicular to the free rim, such as for the crownformed during splashes (Worthington 1908) or during the rupture of a soap film(Pandit & Davidson 1990). Despite this analogy, the cusp features di!er from onecase to another. First, the cusp signs of curvature are di!erent. Second, as mentionedpreviously, the location of the cusps is nearly stationary when the sheet is vibratedwhile they move around the rim in a random fashion when the sheet is free ofvibration. It will seen in § 4.1 that the surface undulations are responsible for the

430 N. Bremond, C. Clanet and E. Villermaux
(a) (b)
(c) (d)
10 cm
Figure 10. Global top views of a radially expanding liquid sheet (We = 604) for several forcingconditions: (a) free case, (b) f = 120Hz, a0 = 0.10mm, (c) f = 180Hz, a0 = 0.10 mm and(d) f = 180Hz, a0 = 0.16 mm. The common length scale is indicated in (c).
(a) (b)
10 mm
Figure 11. Close-up top views of the free rim without perturbations (a) and with a forcingat 120 Hz (b). The scale indicated in (a) is the same for both images.
amplification of azimuthal modulations of the sheet thickness, and therefore of therim shape.
The drop size measurements have been taken from a collection of frozen imagesof the spray obtained by a back-lightning 5 µs flash lamp triggered by a HamamatsuORCA 1280 & 1024 pixels CCD array. An example is shown in figure 12(a). Theimage processing technique was originally described in Marmottant & Villermaux(2004b). The diameter d of the in-focus drops is determined from their projected areaA by d = (4A/!)1/2. Blurred, overlapping drops and those smaller than 40 pixels onthe original images are rejected. Of the order of 1500 to 5000 drops were processed

Atomization of undulating liquid sheets 431
0
0.2
0.4
0.6
0.8
1.0
1.2
1.4
d (mm)
(a) (b)
5 mm
1 2 3 4 5
Figure 12. (a) Snapshot of the spray used for the drop size characterization. (b) Probabilitydensity functions of the drop diameter d for We = 620 : !, free case; ", a0 = 0.05 mm andf = 200Hz; !, a0 = 0.05 mm and f = 120Hz; ", a0 = 0.01 mm and f = 200Hz.
z
r
h/2
–h/2
"+
u
"–
#
$a
$
$a
Figure 13. Sketch of the destabilization of a plane liquid sheet of thickness h in air at rest.
for each forcing condition. The resulting probability density function (p.d.f.) of thedrop diameter d is reported in figure 12(b). The diameter distribution exhibits a peakaround a millimetric size corresponding to the order of magnitude of the jet diameterdj . The mean drop diameter is a decreasing function of the forcing parameters {a0, f }.
3. Flapping instability3.1. Linear stability
A thin liquid sheet of density ! and thickness h moving with a uniform velocityu in air of density !a initially at rest (figure 13) develops a Kelvin–Helmholtz-typeinstability (Helmholtz 1868; Kelvin 1871). A linear stability analysis of this peculiarconfiguration, namely two free surfaces, was originally done by Squire (1953), Yorket al. (1953) and Hagerty & Shea (1955) using normal modes (Chandrasekhar 1961;Drazin & Reid 1981) in the inviscid limit. The position of both free surfaces isperturbed by small amounts, such as %+ = %0 exp(ikr " i#t) for the upper interfaceand %" = %0 exp(ikr " i#t +&) for the lower one. This parallel flow (i.e. h independentof r) description is justified as long as
!
h
dh
dr# 1 (3.1)

432 N. Bremond, C. Clanet and E. Villermaux
where ! = 2!/k is the undulation wavelength, a condition always fulfilled here:(dh/dr)/h is indeed equal to 1/r since h(r) is a power law of r , and ! quicklybecomes much larger than r .
Two possible destabilization modes are found to coexist depending on the phase& between the interfaces, a varicose mode (& = !/2) and a sinuous mode (& = 0).The dispersion relation for the sinuous mode which here is excited by the verticaloscillation of the impactor, is (e.g. Squire 1953)
# =uk tanh(kh/2)
tanh(kh/2) + '± ("k3(tanh(kh/2) + ')/! " 'u2k2 tanh(kh/2))1/2
tanh(kh/2) + '(3.2)
where the density ratio !a/! is denoted by '. We choose the jet diameter dj and thejet velocity uj , and hence the time dj/uj as characteristic scales. The dimensionlessvariables are marked with a tilde. For clarity, the friction factor $ $ 0.97 is set toone. From equations (2.3) and (2.4), the following transformation has thus to be donefor all the subsequent equations when comparing with experiments:
"r =
r
dj
, # = #dj
uj
, We
#'
$$ r , #/$, $2We
%. (3.3)
The sinuous mode is the one naturally amplified (figure 1), and is also the one excitedby the vibrating technique (figure 3c). The undulation wavelength is much larger thanthe sheet thickness. Using the definition of the sheet thickness h given by equation(2.4), the dimensionless dispersion relation of the sinuous mode in equation (3.2) iswritten, in the long-wave approximation kh # 1 as
# =k
1 + 16'r/k
&1 ±
'16r
We
'1 +
16'r
k
(" 16'r
k
(1/2)
(3.4)
where We = !dju2j /" is the jet Weber number. Here we assume that the parallel flow
description leading to equation (3.2) is locally valid: since the sheet thickness decreasesas 1/r , its tangent slope behaves as 1/r2 and becomes vanishingly small a few jetdiameters away from the jet. The correction to the plane to the radial geometry (Weihs1978) is a second-order e!ect (see Lin 2003 for instance). The system is unstable forwavenumbers such that the sign of the term under the square root of equation (3.4)is negative. Depending on the sign before this term, a perturbation will grow ordecay exponentially with time. For a given radial location r on the sheet, the criticalwavenumber kc below which the sheet becomes unstable is
kc(r) = 'We
'1 " 16r
We
(. (3.5)
The temporal growth rate, i.e. the imaginary part #i of #, is
#i(r , k) =
*16'kr
+1/2
1 + 16'r/k
'1 " 16r
We
'1 +
k
16'r
((1/2
. (3.6)
Since the growth rate is a function of the radial location r , the overall history of theamplification has to be integrated when the waves propagate towards the sheet edge.The perturbation analysis being made by a Fourier decomposition, the amplificationhas an exponential behaviour and a net gain G(r) can be thus defined by
G(r) = ln
'a(#0, r)
a0
(=
, t
t i
#idt =
, r
ri
#i
dr
cg
, (3.7)

Atomization of undulating liquid sheets 433
where cg is the unstable-wave group velocity given by
cg =(#r
( k=
1 + 32'r/k*1 + 16'r/k
+2, (3.8)
#r being the real part of #. As shown by Villermaux & Clanet (2002), the mostamplified wavenumber km selected by the system is
km ='We
5, (3.9)
with a corresponding amplification factor, or gain, given by
Gm(r) = C'We1/2r3/2, (3.10)
where C is a constant of order unity, which will have to be adjusted using themeasurements of the amplification.
This analysis can be used to anticipate how a most-amplified mode emerges fromthe ambient noise in the natural case. Let us now examine the case, like that in thepresent experimental situation, where the initial amplitude of a particular frequencyis forced well above the noise.
3.2. Onset of the instability
We have shown in § 2.2 that the frequency f of the sinuous mode is the frequencyof the impact cylinder oscillations, corrresponding to the dimensionless pulsation#0 = 2!f dj/uj . This pulsation is equal to the real part of equation (3.4). Theassociated wavenumber is then
k(r) =#0
2
&1 +
'1 +
64'r
#0
(1/2)
. (3.11)
Using equation (3.5) together with (3.11), the critical frequency #c below which thesystem is unstable is
wc(r) = 'We
'1 " 16r
We
(2
. (3.12)
The sheet is then unstable until it reaches a critical radius rc given by
rc =We
16
&1 "
'#0
'We
(1/2)
(3.13)
The impact cylinder oscillations impose the frequency of the sinuous modes: anamplified one and a damped one. Those modes become stable beyond rc and thewaves should oscillate with a constant amplitude. Therefore, the sheet is completelystable for perturbation frequencies larger than a cuto! frequency #co for which thecritical radius rc is equal to the impact cylinder radius ri . According to equation (3.12)the dimensionless cuto! frequency is
wco = 'We
'1 " 16ri
We
(2
. (3.14)
Examples of the envelope of the vibrating liquid sheet for frequencies larger thanthe cuto! frequency (3.14) are displayed in figure 14(a) for a Weber number equalto 850. The amplitude of the envelope is normalized by the forced amplitude a0.We note that the size of the first antinode is constant as expected for this range of

434 N. Bremond, C. Clanet and E. Villermaux
0
2
4
6
8
10
12
10 15 20 25r/dj
(a) (b)
A—a0
5 0
2
4
6
8
10
12
10 15 20 25r/dj
5
Figure 14. (a) Envelopes of a vibrating sheet for stable forcing frequencies (!, 220Hz; ",240Hz; #, 260 Hz) and We = 850. The curve corresponds to the exponential of the maximumgain Gmax of the naturally most amplified mode (3.10) with C = 0.51. (b) Envelope ofa vibrating sheet for unstable forcing frequencies (#, 140Hz; ", 180Hz; !, 220 Hz) andWe = 850.
frequencies, but the overall amplitude continues to increase as the waves propagatetowards the free edge. The exponential increase of the naturally most-amplified modekm (3.9) with a corresponding gain Gm given by (3.10) for the same Weber number isalso plotted on figure 14(a) with the constant C in equation (3.10) adjusted to
C = 0.5. (3.15)
From this comparison, we conclude that even if the forcing falls on the stable branchof the instability, the most-amplified mode is still excited and leads to an amplificationwith r of the initial disturbance, as expected from a supercritical instability.
The envelopes for the same Weber number and lower frequencies are shownin figure 14(b). In this case, the amplification of the forced mode becomes morepronounced as the frequency decreases. The onset of the amplification of the forcedmode is defined as when the amplitude of the first antinode starts to rise, as previouslyobserved in figure 8. The frequencies corresponding to this onset are reported infigure 15 together with the predicted cuto! frequency given by equation (3.14). Theexcellent agreement shows the success of the linear theory in predicting the stabilitylimits of this instability and its amplification properties even when the aspect ratio ofthe waves kA is of order unity.
3.3. Stable forcing
We now describe the wave dynamics in the regime for which the forcing frequency islarger than the cuto! frequency. In the long-wave approximation, kh # 1, with theapproximation ' = 0 (i.e. neglecting the influence of the surrounding medium), thedispersion relation (3.2) becomes
#0 = k
&u ±
-2"
!h
)= k(u ± c). (3.16)
For this regime, the waves correspond to the non-dispersive waves studied by Taylor(1959a) where c is the intrinsic velocity of the stable sinuous wave. This velocity alsocorresponds to the retraction speed of the free edge of a liquid sheet with a thickness

Atomization of undulating liquid sheets 435
0
0.5
1.0
1.5
300 600 900 1200We
Stableforcing
Unstableforcing
!~co
Figure 15. Experimental cuto! frequency (!) and that predicted by equation (3.14) (") as afunction of the jet Weber number We.
h due to capillary forces, as shown by Taylor (1959b) and Culick (1960). Because c is adecreasing function of h, which decreases with r , and the flow velocity u in the sheet isconstant, there is a radial position R0 where the liquid and the free-edge velocities areequal. The size of the expanding liquid sheet corresponds to R0. Using the expressionfor the thickness, h = d2
j /8r , the sheet radius R0 is (Bond 1935) R0/dj = We/16.The size of a liquid sheet is an increasing function of the jet velocity and diameter
as first noticed by Savart (1833b). The intrinsic wave velocity c is therefore smallerthan the liquid velocity u up to the free edge. From (3.16), two waves are generated,one denoted k+ with a velocity u + c, and a second one denoted k" with a velocityu " c. Because of their velocity di!erence, k+ and k" will interfere. This interferenceresults in modulations of the mean envelope of the sheet surface, forming nodes andantinodes as shown on figure 6(b). The dimensionless velocity of the non-dispersivewaves is
V± =#0
k±= 1 ± c. (3.17)
Using the definitions of h and c, equation (3.17) becomes
dr
dt= 1 ±
.r
R0. (3.18)
The relationship between the radial position r of a wave, located by its crest forexample, and its lifetime t is deduced from the integration of (3.18) from the impactcylinder edge ri to the radial location r . The relationships for the two waves are then
t+ " t i = 2R0
'.r+
R0" ln
'1 +
.r+
R0
("
'.ri
R0" ln
'1 +
.ri
R0
(((, (3.19)
t" " t i = 2R0
'"
.r"
R0" ln
'1 "
.r"
R0
("
'"
.ri
R0" ln
'1 "
.ri
R0
(((, (3.20)
where t i is the initial time of the wave formation at r = ri . The experimentaltrajectory of a wave is measured from spatiotemporal diagrams such as the one

436 N. Bremond, C. Clanet and E. Villermaux
0
0.5
1.0
1.5
2.0
2.5
3.0
0.2 0.4 0.6 0.8
1
2
3
4
5
r/R0
0 0.2 0.4 0.6 0.8r/R0
(a) (b)
A—a0
uj—R0t
Figure 16. (a) Trajectory of a wave crest generated by a harmonic oscillation of the impactcylinder (") (uj = 2.5 m s"1, f = 100Hz). The curve represents the lifetime of the mode k"given by equation (3.20). (b) Comparison of the experimental envelope of the oscillating sheet(") (uj = 2.8, f = 150 Hz) and that predicted by equation (3.22).
shown in figure 5(b). The wave slows down when it reaches the free edge, a directresult of the liquid sheet thinning; according to equation (3.17) the intrinsic wavevelocity c is an increasing function of the position r . Therefore, this wave correspondsto the wave k". Figure 16(a) shows experimental trajectory of a wavetrain generatedby oscillating the impact cylinder. The trajectory of the wave k" predicted by equation(3.20) is also plotted and reproduces the experimental one well. The good agreementbetween experiment and theory is also a confirmation of the sheet velocity andthickness r-dependence given by equations (2.3) and (2.4).
The total deformation a(r , t) of the interface, which corresponds to the distancebetween the sheet centreline and its initial position at y = 0, is the sum of theamplitudes of the two waves
a*r , t
+= a1 sin
*#0(t"(r) " t)
++ a2 sin
*#0(t+(r) " t) + &
+(3.21)
where & is a phase shift between k" and k+ with respective amplitude a1 and a2. Thetwo wavetrains will interfere because of their velocity di!erence. This interferenceresults in a modulation of the average amplitude as observed on figure 6(c). Thesurface envelope A, deduced from the norm of a, is
A(r) = (a21 + a2
2 + 2a1a2 cos(#0(t+(r) " t"(r)) + &))1/2. (3.22)
The average amplitude described by equation (3.22) is plotted on figure 16(b) aswell as the experimental one. Both envelopes are normalized by the initial amplitudea0 of the impact cylinder. Two remarks arise from this comparison. First, in orderto match the locations of the nodes and the antinodes, the phase shift & is set to !.The waves are therefore out of phase. Second, the size of the antinodes is about threetimes the initial amplitude a0, Am ( 3a0. The initial displacement at r = ri of the freesurface follows the motion of the impact rod, i.e. a1 " a2 = a0. Therefore, from thesurface envelope given by equation (3.22), a1 ( 2a0 and a2 ( a0 (and vice versa).
As discussed in § 3.2, the naturally most-amplified mode is still excited and issuperimposed on the forced mode (figure 14a). The envelope given by equation (3.22)is thus valid for low jet Weber numbers for which the amplification factor (3.10) of

Atomization of undulating liquid sheets 437
the natural mode is weak, which is the case of the example reported on figure 14(b),corresponding to We = 310. It should consequently be noted that the kinematicsof the waves described in this section for this type of forcing is relevant once theamplification of the wave height induced by the natural unstable mode for higher jetWeber numbers has been accounted for.
3.4. Unstable forcing
Let us now examine the regime for which the forcing is at a frequency falling inthe unstable range. By oscillating the impact cylinder at a frequency #0, we excitespatially developing modes with the same frequency #0. The wavenumber k is here acomplex number whose imaginary part corresponds to the spatial growth rate of theinstability. In the long-wave approximation, k is the solution of the equation (Squire1953)
'1 " 16r
We
(k3 " 2#0k
2 + #20k + 16'r#2
0 = 0. (3.23)
A discussion of solutions of equation (3.23) is given in Lin (2003). The amplifiedmode is a complex wavenumber with a negative imaginary part ki . The system is aspatially, convectively unstable developing flow and it has been shown by Villermaux& Clanet (2002) to be characterized well by adopting a translated temporal approach.
The convective nature of the instability is not a priori evident. Convectiveinstabilities are those for which the disturbance sweep rate exceeds their instabilitygrowth rate #i . That rate scales as
#i ( u
!
.!a
!
.!
h(3.24)
for a wavelength ! (see Villermaux & Clanet 2002). The sweeping rate is of the orderof u/! so that
#i!/u = O*We
"1/2h
+where Weh =
!u2h
". (3.25)
But Weh is always larger than unity, up to the free sheet edge, so that convection isalways dominant. We appreciate that this qualitative argument is not rigorous, butall the consequences that we draw from the convective hypothesis are consistent. Thisis why we have described the sheet destabilization by using the analysis presented in§ 3.1, with a view to o!ering analytical solutions.
In the temporal description, the imposed frequency sets the real part of # given byequation (3.4), and the corresponding wavenumber (3.11) associated with the gain Gin equation (3.7). The gain increases with r and reaches a constant beyond the criticalradius rc where the forcing mode becomes stable. A maximal gain Gm is thus definedas
Gm =
, rc
ri
#i
dr
cg
. (3.26)
We describe the deflection amplitude of the sheet for a forcing such that theamplification is larger than that of the natural unstable mode. We therefore considerthe two excited modes only, an amplified one corresponding to the positive solutionof equation (3.4) and a damped one corresponding to the second solution. For r < rc,the total deflection a of the sheet surface is the sum of the two:
a*r , t
+=
*a1e
G(r) + a2e"G(r)
+sin #0 t , (3.27)
438 N. Bremond, C. Clanet and E. Villermaux
0
5
10
15
20
25
30
35
40
10 15 20 25 30
A—a0
r/dj
5
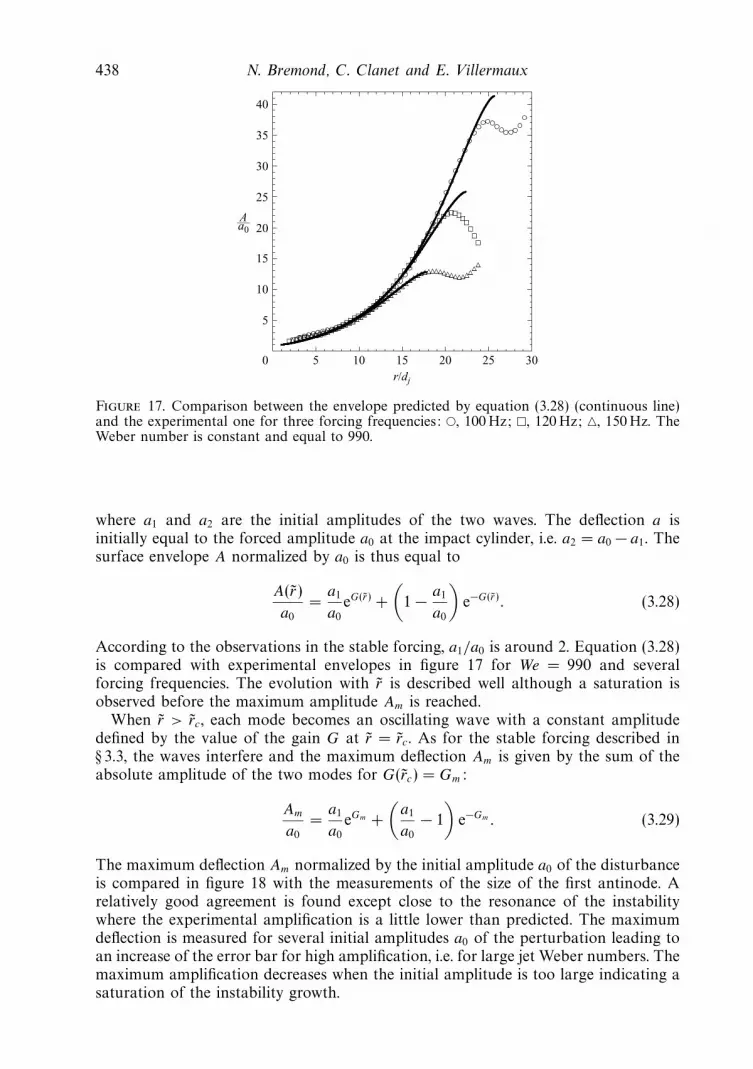
Figure 17. Comparison between the envelope predicted by equation (3.28) (continuous line)and the experimental one for three forcing frequencies: ", 100Hz; $, 120Hz; %, 150Hz. TheWeber number is constant and equal to 990.
where a1 and a2 are the initial amplitudes of the two waves. The deflection a isinitially equal to the forced amplitude a0 at the impact cylinder, i.e. a2 = a0 " a1. Thesurface envelope A normalized by a0 is thus equal to
A(r)
a0=
a1
a0eG(r) +
'1 " a1
a0
(e"G(r). (3.28)
According to the observations in the stable forcing, a1/a0 is around 2. Equation (3.28)is compared with experimental envelopes in figure 17 for We = 990 and severalforcing frequencies. The evolution with r is described well although a saturation isobserved before the maximum amplitude Am is reached.
When r > rc, each mode becomes an oscillating wave with a constant amplitudedefined by the value of the gain G at r = rc. As for the stable forcing described in§ 3.3, the waves interfere and the maximum deflection Am is given by the sum of theabsolute amplitude of the two modes for G(rc) = Gm:
Am
a0=
a1
a0eGm +
'a1
a0" 1
(e"Gm. (3.29)
The maximum deflection Am normalized by the initial amplitude a0 of the disturbanceis compared in figure 18 with the measurements of the size of the first antinode. Arelatively good agreement is found except close to the resonance of the instabilitywhere the experimental amplification is a little lower than predicted. The maximumdeflection is measured for several initial amplitudes a0 of the perturbation leading toan increase of the error bar for high amplification, i.e. for large jet Weber numbers. Themaximum amplification decreases when the initial amplitude is too large indicating asaturation of the instability growth.

Atomization of undulating liquid sheets 439
0
5
10
15
20
25
30
200 400 600 800 1000 0
10
20
30
40
50
0.2 0.4 0.6 0.8 1.0 1.2 1.4
(a) (b)
We !~0
Am—a0
Figure 18. (a) Maximum amplification as a function of the Weber number for a forcingfrequency set to 120Hz. (b) Maximum amplification Am measured at the first antinode as afunction of the dimensionless pulsation #0 for several Weber numbers: !, 990; ", 850; #, 490.In both figures, the continuous line is given by equation (3.26).
4. Transverse indentationsThe fragmentation of the sheet proceeds via a two-stage mechanism, the first of
which has been analysed in the previous section. A secondary instability of a di!erentnature then comes into play which is responsible for the sheet indentations, theformation of ligaments, and drops.
4.1. Mechanism
A peculiar feature of this flapping instability is that the surface waves it sustainspropagate with a di!erent speed than the liquid flow itself. This velocity di!erencebecomes more pronounced as the waves approach the sheet edge. In its referenceframe, a liquid particle propagates in a kind of ‘wavy corridor’ in which it isperiodically accelerated upwards, and downwards. Therefore, and because of thisdi!erence, the sheet is subjected to an acceleration ) perpendicular to its plane whoseintensity and direction depends on its curvature. The density interface between thewater and the air is thus potentially unstable as has been known since Rayleigh(1883) and Taylor (1950). A complication arises from the fact that the two interfacesat the top and bottom of the sheet are close to each other: in addition to the standardcapillary length constructed from the inertia of the liquid and capillary restoringforces i.e. * (
%"/!) , a new length scale, namely the sheet thickness h comes into
play. This situation has been investigated by Bremond & Villermaux (2005) whoshowed that the proximity of the interfaces (when h/* < 1) induces a considerableslowing down of the standard Rayleigh–Taylor instability. Its growth rate goes tozero as h/* ' 0. Using a strong, impulsive acceleration, the system can neverthelessbe destabilized, and does so via growing thickness modulations. These modulationsgrow until their amplitude becomes of the order of the liquid film thickness, and thefilm perforates. Both the sheet perforation time and distance between the perforationlocations are represented well by linear theory.
The sheet thickness and undulation-induced accelerations are such in the presentproblem that perforations are not observed (see figure 19). However, the thicknessfield modulations induced by this instability play a decisive role in the sheet breakup.

440 N. Bremond, C. Clanet and E. Villermaux
(a)
(b)
Figure 19. Thickness field revealed through laser interference of (a) a smooth and freeliquid sheet exhibiting smooth azimuthal thickness modulations, and (b) with forced surfaceundulations where the transverse modulations of the thickness are amplified. Both picturescover the same field.
Consider a two-dimensional liquid sheet of thickness h subjected to an acceleration) initially normal to its surface, lying along the x-axis. The density of the gas phasesurrounding the sheet is neglected as well as the viscosity of the liquid. Perturbationsof the interface position are expanded in Fourier modes exp(ikx " i#t) and thedispersion relation is written, following Keller & Kolodner (1954),
#2 ="k3
!coth(kh)
/0
11 ±21 "
&1 "
'kc
k
(4)
tanh2(kh)
31/245
6 , (4.1)
where kc =%
!) /" ( *"1 is the capillary wavenumber based on the acceleration) . Equation (4.1) with the minus sign has an unstable range of wavenumbers for0 < k < kc. The dispersion curve is reproduced in figure 20 for kch ) 1 and forkch # 1. On the unstable branch and for kch # 1, a condition always satisfied inthe present case, the most-amplified wavenumber kt of the secondary instability is(Bremond & Villermaux 2005)
kt =1
61/6k4/3
c h1/3, (4.2)
lying between 0 and kc on a broad plateau of wavenumbers whose associated growthrate is close to the maximal growth rate
#t =
'!h) 2
2"
(1/2
. (4.3)

Atomization of undulating liquid sheets 441
0 0.2 0.4 0.6 0.8 1.00
0.01
0.02
0.03
0.04
0 0.2 0.4 0.6 0.8 1.0
0.2
0.4
0.6
0.8
1.0
!(%)
%
Figure 20. Imaginary part of the dispersion relation (4.1) where # has been made dimension-
less by!
2/3%
37
!) 3/" , the maximal growth rate of the infinite-thickness limit obtained whenkch ) 1, as a function of + = k/kc with kc =
%!) /" the capillary wavenumber. The curve has
been drawn for kch = 0.001 and the inset shows the corresponding curve for kch ) 1. Note theinvariance of kc with h, and the strong dependence of both the shape and amplitude of #(+)as h decreases. In particular, #(+) presents a plateau with uniform amplification irrespectiveof + .
The acceleration experienced by a fluid particle travelling through the undulationsis itself periodic in direction and intensity. Its maximal value is reached when theparticle reaches an extremum of the primary wavy pattern, where the curvature ismaximum. A rapid estimate is as follows: let ,u be the velocity contrast between thecelerity c = uj " ,u of the propagating wave crests and the velocity of the radialflow uj . The order of magnitude of the centrifugal acceleration is ) ( (,u)2/R whereR is the maximal wave curvature. If ! is the wavelength and a its amplitude, thenR"1 ( a/!2. The transit time of a fluid particle over one wavelength is T ( !/,u sothat ) ( a/T 2. Since the frequency #0 at which the waves are released on the sheet isconserved along their path towards the free edge, #0 = (uj " ,u)/! is constant andtherefore ) = a#2
0/(uj/,u " 1)2. This acceleration depends on the radial location rbecause of a possible dependence of a on r , and most important, because of the radialdependence of ,u =
%2"/!h(r) with h(r) ( d2
i /r . In particular, it is expected todiverge at the smooth sheet edge where ,u = uj . But the centrifugal Rayleigh–Taylorinstability does not allow the waves to travel that far. The ingredients of the sheetatomization mechanism are depicted in figure 21.
The Rayleigh–Taylor instability of a thin sheet, such as the one seen on figure 19,thus does not select a particular wavenumber. There is a broad plateau of wavenum-bers all with the same growth rate, so that the instability time scale is well-definedand allows us to predict correctly the sheet size in § 4.2, but with no intrinsicallyselected wavenumber. That instability is therefore sensitive to the spatial structure ofthe injected noize, which is ultimately amplified, thus revealing the initial imperfectionof the injection devices (injector + impact cylinder + jacket). The mode selection isthus intrinsic to the roughness of the injecting device, and does not come from adimensional combination of physical parameters.
4.2. Sheet radius
A precise expression for ) can be derived from the discussion of the wave kinematicsin the case #0 > #co in § 3.3. As just recalled, from the dispersion relation (3.16) and

442 N. Bremond, C. Clanet and E. Villermaux
&
r
z
a
u-c
y
u
h
(a) (b)
h&
z
y
Figure 21. (a) Sketch of the ‘wavy corridor’ scenario: Since surface waves propagate witha di!erent velocity (u " c) than the liquid (u), fluid particles are subjected to a centrifugalacceleration ) perpendicular to the sheet surface. That acceleration triggers a centrifugalinstability responsible for the amplification of transverse thickness modulations which lead tothe formation of ligaments perpendicular to the sheet edge. (b) Transverse cross-section of theliquid sheet showing the amplification of thickness modulations. The ligaments emerge fromthicker regions.
according to sheet thinning (2.4), the wavenumber of k" diverges to infinity as thewaves approach the free edge since the wave intrinsic velocity c there is equal to thesheet velocity u (figure 5a). Therefore, the maximal acceleration ) induced by the modek" is
) =(2a
(t2= u2 (2a
(r2= a1#
20
r
R0
&1 "
'r
R0
(1/2)"2
(4.4)
where R0 is the size of the undisturbed liquid sheet and a1 is the absolute amplitude ofthe wave k". Using the acceleration given by equation (4.4) and the sheet thickness inequation (2.4) with $ = 1, the maximal growth rate in equation (4.3) of this secondary,centrifugal destabilization is finally
#t =a1#
20
uj
(r/R0)1/2
*1 " (r/R0)
1/2+2
. (4.5)
The development of this instability will induce thickness modulations of thesheet. They will occur everywhere on its surface, and in particular in the azimuthaldirection (figure 21). It is believed that they are responsible for the fast retractionand indentations of the free edge as observed in figure 9. But these azimuthalthickness modulations are likely to be amplified if the instability development hastime to take place. In particular, the residence time T of the fluid particles in thevicinity of a wave crest, where the rate of amplification of the centrifugal instability#t is given, has to be large enough for an appreciable amplification to occur. Wepostulate (as in Villermaux & Clanet (2002) who were, however, working with adi!erent component of the acceleration) that the transverse modulations will growsubstantially when T is of the order of the characteristic instability time scale #"1
t ,that is
T = #"1t , (4.6)
which thus defines the radial location at which the sheet will fragment.

Atomization of undulating liquid sheets 443
0
0.02
0.04
0.06
0.08
0.10
0.4 0.5 0.6 0.7 0.8 0.9 1.0R/R0
a0!0——uj
Figure 22. Correlation between the forcing and the sheet size for three Weber numbers: !,400; ", 600; #, 850. The continuous lines represent equation (4.9) by adjusting the constant Kto 1 (consistently with equation (4.7)), in all cases.
The residence time T is defined from the wave frequency plus a Doppler shift inthe particle reference frame as #*
0 = k"u " #0 and is written
T =K
#*0
=K
#0
1 " (r/R0)1/2
(r/R0)1/2, (4.7)
where K is a constant of order unity to be determined from comparison with theexperiments.
The acceleration ) is proportional to the total wave amplitude a1. That amplitudeis the imposed amplitude a0, superimposed on the amplitude of the unstable noisybackground, amplified according to the maximal gain obtained in § 3.3. We thus addthe two contribution to give
a1 = a0 exp*C'We1/2r3/2
+. (4.8)
The size R of the liquid sheet can now be computed from the fundamental criterionin equation (4.6). Using equations (4.5), (4.7) and (4.8), a relationship between theforcing {a0, #0} and the normalized sheet size R/R0 follows as
a0#0
uj
=1 " (R/R0)1/2
K exp*C16"3/2'We2(R/R0)3/2
+ . (4.9)
The dimensionless ratio a0#0/uj of the forcing is plotted versus the measuredcorresponding sheet size R normalized by R0 in figure 22 for three jet Weber numbersand di!erent amplitudes a0 and frequencies #0. For each case, all the data collapseonto one master curve. The influence of the forcing {a0, #0} on the sheet size becomesmore important as We increases. This is a result of a larger amplification of theinitial amplitude a0 through the naturally most unstable mode at higher injectionvelocities. This amplification leads to stronger accelerations ) imposed on the sheet
444 N. Bremond, C. Clanet and E. Villermaux
and therefore to larger growth rates #t of the secondary instability. This e!ect isincluded in equation (4.9) which, as shown in figure 22, predicts fairly well theexperimental behaviour if the constant K is adjusted to the value 1.
The radial extent of an undulated liquid sheet thus results from the combination oftwo intricate instabilities whose linear analysis provides the relevant time and lengthscales to predict the overall behaviour.
5. Drop size distributionDrops come from the breakup of roughly columnar objects, ligaments, whose
topology is the only one to be made unstable by capillarity. Ligaments emerge, in themean, normal to the free rim of the sheet (figures 11 and 21). They are formed at thetip of cusps bordering the sheet indentations through the merging of the corrugatedcylinders constituting of the sheet rim. This scenario is general and holds for bothcases, i.e. with and without forcing.
Villermaux et al. (2004) have discussed the general rules of the ligaments dynamicsand have shown their decisive importance in understanding the size polydispersity ofthe resulting spray. The drop size distribution P (d) associated with ligament breakupis a Gamma distribution
p(X) =nn
- (n)Xn"1e"nX where X =
d
+d, (5.1)
and +d, denotes the average drop size. The parameter n reflects the regularity of theinitial shape of the ligament, i.e. its relative roughness which is the amplitude of itscorrugations relative to its average diameter. A smooth thread has a very large ngiving rise to a close to uniform distribution of drop sizes since P (X)
n'-"' .(X " 1),whereas a corrugated ligament with n finite induces a skewed, broader distributionof sizes with an exponential tail. Marmottant & Villermaux (2004b) and Bremond &Villermaux (2006) have shown how the value of n can be manipulated in an givenexperimental set-up by varying the parameters influencing the way the ligaments areproduced.
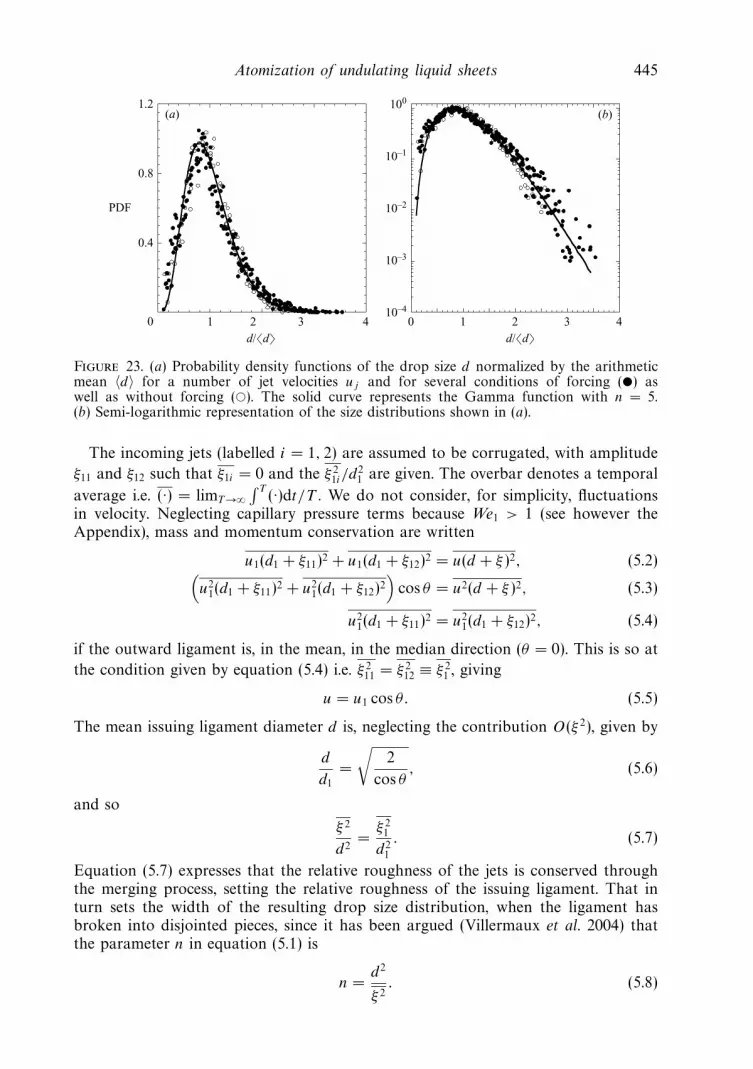
The experimental probability density functions (p.d.f.) of the drop size d aredisplayed in figure 23 for a wide range of forcing and injection conditions: a0 variesfrom 0 (no forcing) to 0.34 mm, f is between 80 Hz and 340 Hz and uj ranges from2.5m s"1 to 5 m s"1. When normalized by their mean +d,, drops sizes are distributedin a unique way, a phenomenon already observed by Simmons (1977a, b) in a di!erentset-up. The master curve is a Gamma distribution of order n around 4 to 5.
We now consider the value of n and why it is insensitive to the external parameterson one hand, and on the other hand determine the value of the average drop sizewhich, by contrast, varies by a factor 3 across the parameter space (figure 12).
5.1. Ligaments corrugations
We consider the inelastic collision of two identical jets with diameter d1, velocity u1
merging at an angle 2/ (see the Appendix). These jets are intended to model the sheetrim and 2/ is the angle of an indentation cusp (figure 11). The associated Webernumber We1 = !u2
1d1/" is de facto of order unity, in fact somewhat larger, and inany case smaller than 4(1 + cos /)/(sin /)2, the value above which the jets form asheet (Bremond & Villermaux 2006). The collision thus forms a free ligament of meandiameter d and velocity u.
Atomization of undulating liquid sheets 445
100
10–1
10–2
10–3
10–4
0 1 2 3 40
0.4
0.8
1.2
1
d/!d" d/!d"
(a) (b)
2 3 4
Figure 23. (a) Probability density functions of the drop size d normalized by the arithmeticmean +d, for a number of jet velocities uj and for several conditions of forcing (!) aswell as without forcing ("). The solid curve represents the Gamma function with n = 5.(b) Semi-logarithmic representation of the size distributions shown in (a).
The incoming jets (labelled i = 1, 2) are assumed to be corrugated, with amplitude
011 and 012 such that 01i = 0 and the 0 21i/d
21 are given. The overbar denotes a temporal
average i.e. (·) = limT '-8 T
(·)dt/T . We do not consider, for simplicity, fluctuationsin velocity. Neglecting capillary pressure terms because We1 > 1 (see however theAppendix), mass and momentum conservation are written
u1(d1 + 011)2 + u1(d1 + 012)2 = u(d + 0 )2, (5.2)9u2
1(d1 + 011)2 + u21(d1 + 012)2
:cos / = u2(d + 0 )2, (5.3)
u21(d1 + 011)2 = u2
1(d1 + 012)2, (5.4)
if the outward ligament is, in the mean, in the median direction (/ = 0). This is so at
the condition given by equation (5.4) i.e. 0 211 = 0 2
12 . 0 21 , giving
u = u1 cos / . (5.5)
The mean issuing ligament diameter d is, neglecting the contribution O(0 2), given by
d
d1=
.2
cos /, (5.6)
and so
0 2
d2=
0 21
d21
. (5.7)
Equation (5.7) expresses that the relative roughness of the jets is conserved throughthe merging process, setting the relative roughness of the issuing ligament. That inturn sets the width of the resulting drop size distribution, when the ligament hasbroken into disjointed pieces, since it has been argued (Villermaux et al. 2004) thatthe parameter n in equation (5.1) is
n =d2
0 2. (5.8)
446 N. Bremond, C. Clanet and E. Villermaux
l
h'
uj
h'
uj
u
d(a) (b)
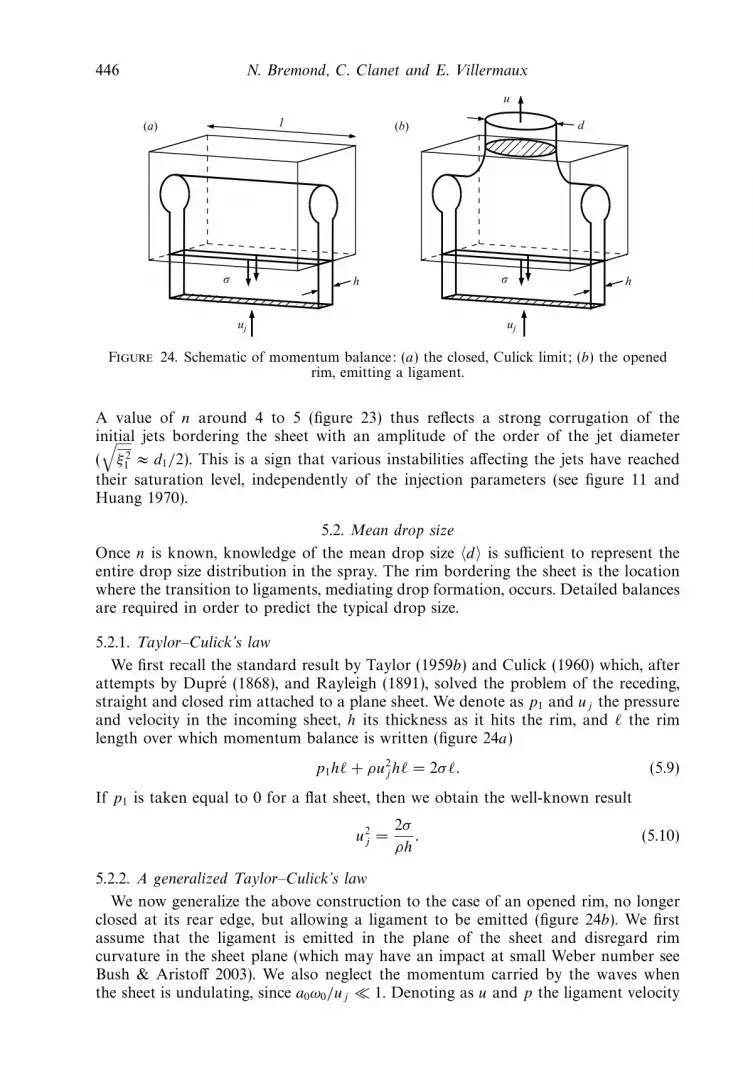
Figure 24. Schematic of momentum balance: (a) the closed, Culick limit; (b) the openedrim, emitting a ligament.
A value of n around 4 to 5 (figure 23) thus reflects a strong corrugation of theinitial jets bordering the sheet with an amplitude of the order of the jet diameter
(!
0 21 $ d1/2). This is a sign that various instabilities a!ecting the jets have reached
their saturation level, independently of the injection parameters (see figure 11 andHuang 1970).
5.2. Mean drop size
Once n is known, knowledge of the mean drop size +d, is su"cient to represent theentire drop size distribution in the spray. The rim bordering the sheet is the locationwhere the transition to ligaments, mediating drop formation, occurs. Detailed balancesare required in order to predict the typical drop size.
5.2.1. Taylor–Culick’s law
We first recall the standard result by Taylor (1959b) and Culick (1960) which, afterattempts by Dupre (1868), and Rayleigh (1891), solved the problem of the receding,straight and closed rim attached to a plane sheet. We denote as p1 and uj the pressureand velocity in the incoming sheet, h its thickness as it hits the rim, and * the rimlength over which momentum balance is written (figure 24a)
p1h* + !u2jh* = 2"*. (5.9)
If p1 is taken equal to 0 for a flat sheet, then we obtain the well-known result
u2j =
2"
!h. (5.10)
5.2.2. A generalized Taylor–Culick’s law
We now generalize the above construction to the case of an opened rim, no longerclosed at its rear edge, but allowing a ligament to be emitted (figure 24b). We firstassume that the ligament is emitted in the plane of the sheet and disregard rimcurvature in the sheet plane (which may have an impact at small Weber number seeBush & Aristo! 2003). We also neglect the momentum carried by the waves whenthe sheet is undulating, since a0#0/uj # 1. Denoting as u and p the ligament velocity

Atomization of undulating liquid sheets 447
and internal pressure and d its diameter, we have
p1h* + !uj ujh* " 2"* = !u u!d2
4" !d" + p
!d2
4, (5.11)
ujh* = u!d2
4, (5.12)
for momentum and mass conservation. We check that the standard Culick’s law isrecovered when the rim is made impermeable, i.e. when u = d = 0. Setting p1 = 0as before for a flat sheet, and p = 2"/d according to Laplace’s law for an elongatedthread, we have
!uj (uj " u) =2"
h" !d"
2h*(5.13)
or equivalently
1 " u
uj
=2"
!u2jh
'1 " !d
4*
((5.14)
which generalizes Culick’s law to the open case. Adapting this result to Savart’sradially expanding sheet for which h = d2
j /8R and where we have set R0 = djWe/16(§ 2), we have
1 " u
uj
=R
R0
'1 " !d
4*
(. (5.15)
Now * is, according to the balance in equation (5.11), the portion of rim length fromwhich a single ligament is emitted. It is at this stage unknown, and can be fixedby any external e!ect. We have mentioned that the number of cusps bordering thesheet is apparently constant as can be seen from the top views of the sheet shownin figures 10(b), 10(c) and 10(d). From the analysis of the secondary instability in§ 4.1, this fact is consistent with the property of the Rayleigh–Taylor instability inthe small thickness limit: there is, in the limit kch # 1, essentially no mode selectionin the range of unstable modes, because the dispersion equation there is flat, with aplateau for 0 < k < kc; all transverse wavelengths are amplified at the same rate #t ,and those setting the indentation width at the rim are likely to be caused by minuteimperfections of the injector and/or the impact cylinder. Let nc be the number ofcusps, then obviously * = 2!R/nc so that
1 " u
uj
=R
R0" nc
8
d
R0. (5.16)
Experiments indicate that d/dj = O(1) and since R0/dj ( We ) 1, approximately
u
uj
$ 1 " R
R0. (5.17)
Global mass conservation expressing that all the nc ligaments carry the injected flowrate gives
'dj
d
(2
= nc
u
uj
. (5.18)
Using equations (5.17) and (5.18), one finally anticipates that the ligament diameterwill be
dj
d=
-
nc
'1 " R
R0
(. (5.19)

448 N. Bremond, C. Clanet and E. Villermaux
0
0.2
0.4
0.6
0.8
1.0
0.2 0.4 0.6 0.8
!d"—–dj
R/R0
1.0
Figure 25. Mean drops size +d, normalized by the jet diameter dj as a function of the relativesheet radius R/R0; the solid curve is the estimate given by equation (5.19) for a fixed numberof cusps nc adjusted to 44.
By analogy with the breakup of a smooth liquid thread, we further assume that themean drop diameter +d, is proportional to the liquid thread diameter d given above(there might, however, be deviations from this rule for strongly corrugated ligamentsof finite volume, see Villermaux et al. (2004) and an illustration in Marmottant &Villermaux (2004b)). The mean drop size, measured when the sheet is forced, is plottedin figure 25 versus the experimental value of R/R0 superimposed with relationship(5.19) with +d, . d for a fixed number of cusps adjusted to nc = 44 which, despitethe spreading and the narrow range, correlates the data well.
5.2.3. The issue of dissipation
We have written the balances in § 5.2.2 assuming that mass and momentum areejected the ligament both in the same direction, aligned with the incoming flow inthe sheet. That situation implies that some energy is dissipated during the passagethrough the rim. Disregarding surface energy contributions (weak as long as We ) 1),the loss of mechanical energy q is
q =1
2!(u2
j " u2) =1
2!u2
j
R
R0
'2 " R
R0
((5.20)
if use is made of equation (5.17) for the link between u and uj , a result somewhatanalogous to that of Carnot for energy loss in pipes of varying section.
One may imagine an alternative scenario, where the Culick equilibrium is stillsatisfied (or its generalized version in equation (5.14)), but where no dissipation occurs.De Gennes (1996) has suggested, in the context of soap films, that the drops couldbe ejected at an angle with respect to the sheet plane. Translated into our situation,the ligaments would leave the rim with a velocity component u/ perpendicularto the sheet plane (in a symmetrical fashion), and a longitudinal component u0satisfying the generalized Culick equilibrium such that u0/uj = 1"R/R0 according to

Atomization of undulating liquid sheets 449
equation (5.17). No dissipation occurs when u20 + u2
/ = u2j , that is for
u/ = uj
-R
R0
'2 " R
R0
(. (5.21)
According to this view, when R/R0 ' 1 (in the smooth regime for instance), whenu0 ' 0, that is all the incident momentum is absorbed in the sheet plane, theligaments should leave the rim with a perpendicular velocity u/ of the order of theinjection velocity uj , in the same manner as the initial jet was redistributed radiallywhen impacting the solid cylinder. This is clearly not what occurs, as can be seenfor instance on figure 3 where the drops, once formed, essentially fall by their ownweight, and leave the rim with no appreciable velocity. The rim does dissipate alarge amount of mechanical energy, as already noted by Taylor (1959b), and laterquantified in Clanet & Villermaux (2002): about 90 % of the incident kinetic energy isdissipated in the rearrangements accompanying the sheet–ligament–drops transitionin the smooth regime. This fraction decays as R/R0 diminishes, but the ligaments andissuing drops are still essentially released in the sheet plane.
This discussion underlines that we have no ab initio principle to decide whatfraction of the initially available energy is dissipated, or converted into anotherform – surface energy for instance – in any given particular situation (see also theAppendix). The energy budget is a consequence of the conservation principles formass and momentum. But when those cannot be expressed unambiguously, as in thepresent case, a degree of freedom is left for heuristic speculations.
5.3. Natural flapping
We finally translate the results obtained in § 4.1 to the ‘natural’ situation when thesheet is no longer artificially vibrated, but when the undulations come from the Squire,shear instability (§ 3). In that case, the most amplified wavenumber has been shown tobe given by km = 'We/5 corresponding to a wavelength !m ( "/!au
2j . The pulsation
#0 in equation (4.9) giving the sheet radius is then #0 $ kmuj (1 " (R/R0)1/2) as shownin § 3 so that a direct application of equation (4.9) provides, mutatis mutandis, thesheet radius R in the form
C16"3/2'We2
'R
R0
(3/2
= ln
'dj
a0'We
((5.22)
or, written as a function of the initial jet diameter dj ,
R
dj
( '"2/3We"1/3 ln
'dj
a0'We
(2/3
, (5.23)
where the logarithm is approximately constant for large dj/a0, a result alreadyfound by Huang (1970) from other arguments. The scaling R ( '"2/3We"1/3 inequation (5.23) reflects the weight of the di!erent quantities in the gain of theprimary instability given by equation (3.10). It is expected to hold as soon as at leastone unstable primary shear wavelength !m fits into the unperturbed radius R0, acondition which occurs for
We #40%'
(5.24)
as anticipated in Villermaux & Clanet (2002), giving We # 1000 for the couplewater/air at normal pressure. This condition equivalently expresses that the transit

450 N. Bremond, C. Clanet and E. Villermaux
0.1
1
1 10 100X
!d"—–dj
0.1
1
0.1 1 10
RR0
X
Figure 26. Mean drop size in the naturally flapping regime versus reduced WeberX = ('We2/402)2/3: !, data from Villermaux & Clanet (2002); ", value expected fromequation (5.19) making use of equation (5.25). Inset: Corresponding sheet radius: !, data fromVillermaux & Clanet (2002); ", expected value from equation (5.25) with % = 3.
time over a primary undulation wavelength T ( !m/,u $ !m/uj is shorter than theglobal transit time R/uj with R given by equation (5.23). The second, Rayleigh–Taylor instability time scale should also be equal to T according to the criterion ofequation (4.6) for breakup of the sheet to occur. However, the growth of the primaryundulations is the slowest process, and its development therefore governs the globalextent of the sheet.
An overall parameterization of the sheet radius (figure 26) is for instance as follows:
R
R0=
1
(1 + X% )1/%with X =
''We2
402
(2/3
, (5.25)
bridging the smooth (for which R/R0 $ 1) and flapping (for which R/R0 ( '"2/3We"4/3)regimes. The sti!ness exponent in the fit of equation (5.25) is % = 3 (see figure 26).
The mean drop size in this flapping regime is now evaluated along the same linesas those of § 5.2.2: we assume a constant number of cusps, and use equation (5.19).From figure 26, it is seen that +d,/dj varies, from the onset of flapping at X = 1to the utimate saturation for X ) 1, by a factor 10 approximately. This indicates,from equation (5.19), that the e!ective number of cusps in that case (the data arefrom Villermaux & Clanet (2002), for a di!erent set-up) is 10 =
%nc, from nc = 100.
Inserting the value of R/R0 from equation (5.25) into the anticipated value for themean drop diameter in equation (5.19), figure 26 shows that both the rapid decreaseof +d, with X (or We), and its saturation are accounted for well.
6. ConclusionThis paper has attempted to give a comprehensive description of the atomization of
undulating, radially expanding liquid sheets formed by the impact of a liquid jet with

Atomization of undulating liquid sheets 451
a solid obstacle. The undulation was either artificially triggered by the oscillation ofthe impact point, or the result of a natural shear instability with the ambient medium.
From the observations made in this study, several lessons can be drawn:The propagation of the undulation waves along the sheet, may they be marginally
stable or unstable, is described well by linear theory. The stability limits, the dynamicsof the wave amplitude and group velocity are satisfactorily predicted by the standardSquire dispersion relation.
A subtle secondary instability, again completely understood on a linear basis,is responsible for thickness modulations of the sheet. The mechanism, ‘the wavycorridor’, relies on transient accelerations imparted to the sheet involving a centrifugalinstability of a Rayleigh–Taylor type, modified by the finiteness of the sheet thickness.It explains the emergence of azimuthal thickness modulations, and may be a precursorof the longitudinal folds close to the sheet edge, terminated by ligaments. Thisinstability, coupled with the undulation dynamics, provides the relevant time scale forunderstanding the radial location at which the sheet disintegrates.
The sheet–drop transition is mediated by the formation of ligaments, whoseformation conditions characterize completely the drop size distribution in the resultingspray. This transition is highly dissipative, although the amount of dissipated energyis not solely responsible for the broadness of the size distribution, which is mainlycaused by the corrugated nature of the rim bordering the sheet as a result of variousinstabilities.
Of critical importance to understanding the mean drop size is the number of cusps,the locations of ligament emission at the sheet edge. It has been argued that thisnumber is roughly constant, independent of the sheet size, and essentially the resultof imperfections of the injection conditions, amplified by the secondary, broadbandcentrifugal instability. This is consistent with the experimental observations, butthough the origin of these cusps seems to be related to the thickness modulationsof the sheet, their shape and dynamics remain obscure. They are very likely to bethe saturated state of the straight receding rim instability, a yet unsolved – butfundamental – issue of free liquid sheet physics.
This work was supported by CNES under contract 02-0485-00.
Appendix. Roughness creation from jet mergingConsider the inelastic collision of two identical jets with diameter d1, velocity u1
merging at an angle 2/ . As explained in § 5.1, these jets are intended to model the sheetrim and 2/ is the angle of an indentation cusp. The jet Weber number We1 = !u2
1d1/"is larger than unity, albeit moderate, say typically 5 to 10 (figure 27). We provide herea slightly more general discussion of the conservation laws in this system, and weshow how, starting with initially smooth jets, the rate of surface energy destructionin the merging process explains the corrugation amplitude of the resulting jet, andconsequently the width of the drop size distribution thus formed.
We take the jets as initially smooth, and denote as u and p the resulting ligamentvelocity and internal pressure, and d its diameter (figure 27). Momentum and massconservation are written
!u1 cos / 2u1d21 " !u ud2 = (p " p1)d
2, (A 1)
2u1d21 = ud2. (A 2)

452 N. Bremond, C. Clanet and E. Villermaux
d1
2( u1
d
)
Figure 27. Impact at an angle and merging of two liquid jets with small Weber number(We = 5).
Surface tension does not enter explicitly in this balance, only through the internalpressures p1 = 2d1/" and p = 2d/" . The pressure di!erence before and after mergingis given according to the above system by
p1 " p = !u(u " u0) with u0 = u1 cos / . (A 3)
On a pressure scale given by the incident kinetic pressure !u21, the pressure di!erence
p1 " p = 2/" (1/d1 " 1/d) is of order We"11 . The velocity of the resulting jet u is thus
u $ u0 = u1 cos / (A 4)
at the precision We"11 = O(1/10), typically so that d/d1 $
%2/ cos / . However, the
loss of energy q during the collision
q =1
2!u2
1(1 " cos2 /) +2"
d1
'1 " d1
d
((A 5)
is finite, and dominated by the surface energy term, corresponding to a destructionof surface area in the collision,
q =2"
d1
'1 " 1%
2
(+ O(/2). (A 6)
It is immediately clear that when two cylinders of diameter d1 and height *1 = u1,tmerge to give a unique cylinder of diameter d = d1
%2/ cos / and height * = u,t of
identical volume, the net mean surface destruction per unit volume is given by q/"(figure 28).
As mentioned in § 5.2.3, we have no ab initio principle to decide how this energywill be dissipated. Irregular motions in the bulk of the resulting jet will ultimately

Atomization of undulating liquid sheets 453
)
d1
l1
d1
l
d
1
2
3
4
5
6
7
0 30 60( (deg.)
90
(a)
(b)
!d"
Figure 28. (a) Schematic of jet merging, and surface roughness generation. Corrugationsexpanded in Fourier modes: 0 =
;k 1k cos(kx). (b) Dependence of the average drop size from
the destabilization of the resulting jet on the impact angle. Solid line is +d,/d1 =%
2/ cos / .
decay by viscous friction, briefly exciting capillary waves at its surface. We may,without precise proof, invoke a kind of equipartition between agitation and surfaceenergy by analogy with the thermal equilibrium limit (Safran 2003), the situationhere being further complicated by the fact that the cylindrical jet geometry isnot in equilibrium since it sustains a capillary-driven instability. The change ofsurface area ,S, at constant volume, of a cylinder whose radius d/2 is corrugatedby an axisymmetric harmonic perturbation of wavenumber k and amplitude 1k is(Plateau 1873)
,S
!d*=
12k
d2
<'kd
2
(2
" 1
=. (A 7)
We attribute the amount of energy ultimately dissipated to the (transient) excess ofsurface energy (implying de facto that k > 2/d)
",S ( q!d2
4* (A 8)
with an unknown pre-factor, presumably of order unity. This provides the relativeamplitude of the corrugations thus formed:
12k
d2=
1
2
%2 " 1
*12kd
+2 " 1. (A 9)
In the confluence region, the resulting jet is obviously essentially excited at a scalegiven by the size of the incoming jets d1. Setting therefore k = 2!/d1, and rememberingthat the width of the (Gamma) drop size distribution coming from the breakup ofthe resulting jet will be set by the corresponding order n = d2/12
k , one anticipatesthat
n =4!2 " 2%
2 " 1$ 90. (A 10)
Figure 29 indeed shows that when two nearly (but not strictly) smooth jets merge,they give rise to drop distributions essentially independent of the merging angle, fittedwell by Gamma distributions with an order (n = 70) somewhat smaller than theexpected one, this latter di!erence being a sign of the residual fluctuations in theincoming jets (see figure 29a, b and § 5.1). This merging process generates, however,

454 N. Bremond, C. Clanet and E. Villermaux
0
1
2
3
4
5
6
7
0.4 0.6 0.8 1.0 1.2 1.4 1.6
0.84 (1 jet)1.070.840.41
(a) (b)
101
100
10–1
10–2
10–3
52°70°90°120°140°160°
d/!d" d/!d"
0
1
2
3
4
0.4 0.8 1.2 1.6
(c) (d)
0.4 0.6 0.8 1.0 1.2 1.4 1.6
101
100
10–1
10–2
10–3
0.4 0.6 0.8 1.0 1.2 1.4 1.6
101
100
10–1
10–2
10–3
0.4 0.6 0.8 1.0 1.2 1.4 1.6
Figure 29. Probability density functions (p.d.f.) of the drop size d normalized by the arithmeticmean +d,. (a) Two jets at an angle of 901 and three di!erent diameters dj . For comparison,the pdf for a single jet is also shown. (b) Same as (a) in log–lin units. (c) An impact angle 2/varying from 521 to 1601 with two identical jets of 1.07mm. (d) Two jets with dj = 1.07mm,' = 901 superimposed with a Gamma fit with n = 70.
weak fluctuation levels, having no correspondence with those attained by the sheetrim destabilization (§ 5.1), those which are responsible for the broadness of the dropsize distribution of the sheet breakup.
REFERENCES
Asare, H. R., Takahashi, R. K. & Hoffman, M. A. 1981 Liquid sheet jet experiments: comparisonwith linear theory. Trans. ASME: J. Fluids Engng 103, 395–604.
Bayvel, L. & Orzechowski, Z. 1993 Liquid atomization . Taylor & Francis.Bond, W. N. 1935 The surface tension of a moving water sheet. Proc. Phys. Soc. 47, 549–558.Bremond, N. & Villermaux, E. 2005 Bursting thin liquid films. J. Fluid Mech. 524, 121–130.Bremond, N. & Villermaux, E. 2006 Atomization by jet impact. J. Fluid Mech. 549, 273–306.Bush, J. W. M. & Aristoff, J. M. 2003 The influence of surface tension on the circular hydraulic
jump. J. Fluid Mech. 489, 229–238.Chandrasekhar, S. 1961 Hydrodynamic and Hydromagnetic Stability . Dover.Clanet, C. & Villermaux, E. 2002 Life of a smooth liquid sheet. J. Fluid Mech. 462, 307–340.Culick, F. E. C. 1960 Comments on a ruptured soap film. J. Appl. Phys. 31, 1128–1129.Dombrowski, N. & Johns, W. R. 1963 The aerodynamics instability and disintegration of viscous
liquid sheets. Chem. Engng Sci. 18, 203–214.

Atomization of undulating liquid sheets 455
Drazin, P. G. & Reid, W. H. 1981 Hydrodynamic Stability . Cambridge University Press.Dupre, A. 1868 Theorie mecanique de la chaleur. Ann. Chim. Phys. 11, 194.Eggers, J. 1997 Nonlinear dynamics and breakup of free-surface flows. Rev. Mod. Phys. 69 (3),
865–929.Einsenklam, P. 1964 On ligament formation from spinning disks and cups. Chem. Engng Sci. 19,
693–694.Fraser, R. P., Eisenklam, P., Dombrowski, N. & Hasson, D. 1962 Drop formation from rapidly
moving liquid sheet. AIChE J. 8, 672–680.de Gennes, P. G. 1996 Mechanics of soft interfaces. Faraday Disc. 104, 1–8.Hagerty, W. W. & Shea, J. F. 1955 A study of the stability of plane fluid sheets. J. Appl. Mech. 22,
509–514.Heidmann, M. F., Priem, R. J. & Humphrey, J. C. 1957 A study of sprays formed by two impacting
jets. NACA Tech. Note 3835.von Helmholtz, H. 1868 On discontinuous movements of fluids. Phil. Mag. 36, 337–346.Huang, J. C. P. 1970 The break-up of axisymmetric liquid sheets. J. Fluid Mech. 43, 305–319.James, A. J., Vukasinovic, B., Smith, M. K. & Glezer, A. 2003 Vibration-induced drop atomization
and bursting. J. Fluid Mech. 476, 1–28.Keller, J. B. & Kolodner, I. 1954 Instability of liquid surfaces and the formation of drops. J.
Appl. Phys. 25, 918–921.Kelvin, Lord 1871 Hydrokinetic solutions and observations. Philo. Mag. 42, 362–377.Kim, I. & Sirignano, W. A. 2000 Three-dimensional wave distortion and disintegration of thin
planar liquid sheets. J. Fluid Mech. 410, 147–183.Lefebvre, A. H. 1989 Atomization and Sprays . Hemisphere.Lin, S. P. 2003 Breakup of Liquid Sheets and Jets. Cambridge University Press.Lozano, A., Garcia-Olivares, A. & Dopazo, C. 1998 The instability growth leading to a liquid
sheet break up. Phys. Fluids 10, 2188–2197.Mansour, A. & Chigier, N. 1990 Disintegration of liquid sheets. Phys. Fluids A 2, 706–719.Marmottant, P. & Villermaux, E. 2004a Fragmentation of stretched liquid ligaments. Phys. Fluids
16, 2732–2741.Marmottant, P. & Villermaux, E. 2004b On spray formation. J. Fluid Mech. 498, 73–112.Mason, B. J. 1971 The Physics of Clouds . Clarendon.Meier, G. E. A., Klopper, A. & Grabitz, G. 1992 The influence of kinematic waves on jet break
down. Exps. Fluids 12, 173–180.Pandit, A. B. & Davidson, J. F. 1990 Hydrodynamics of the rupture of thin liquid films. J. Fluid
Mech. 212, 11–24.Park, J., Huh, K. Y., Li, X. & Renksizbulut, M. 2004 Experimental investigation on cellular
breakup of a planar liquid sheet from an air-blast nozzle. Phys. Fluids 16, 625–632.Plateau, J. 1873 Statique Experimentale et Theorique des Liquides Soumis aux Seules Forces
Moleculaires . Paris, Gauthiers Villars.Rayleigh, Lord 1879 On the instability of jets. Proc. Lond. Math. Soc. 4, 10.Rayleigh, Lord 1883 Investigation of the character of the equilibrium of an incompressible heavy
fluid of variable density. Proc. R. Soc. Lond. 14, 170–177.Rayleigh, Lord 1891 Some applications of photography. Nature XLIV, 249–254.Safran, S. A. 2003 Statistical Thermodynamics of Surfaces, Interfaces, and Membranes . Westview
Press.Savart, F. 1833a Memoire sur la constitution des veines liquides lancees par des orifices circulaires
en mince paroi. Ann. de chim. 53, 337–398.Savart, F. 1833b Memoire sur le choc de deux veines liquides animees de mouvements directement
opposes. Ann. de chim. 55, 257–310.Savart, F. 1833c Memoire sur le choc d’une veine liquide lancee sur un plan circulaire. Ann. de
chim. 54, 56–87.Simmons, H. C. 1977a The correlation of drop-size distributions in fuel nozzle sprays. part i : the
drop-size/volume-fraction distribution. J. Engng Power 7, 309–314.Simmons, H. C. 1977b The correlation of drop-size distributions in fuel nozzle sprays. part ii : the
drop-size/number distribution. J. Engng Power 7, 315–319.

456 N. Bremond, C. Clanet and E. Villermaux
Squire, H. B. 1953 Investigation of the stability of a moving liquid film. Brit. J. Appl. Phys. 4,167–169.
Taylor, G. I. 1950 The instability of liquid surfaces when accelerated in a direction perpendicularto their plane.i. Proc. R. Soc. Lond. A 201, 192–196.
Taylor, G. I. 1959a The dynamics of thin sheets of fluid ii. waves on fluid sheets. Proc. R. Soc.Lond. A 253, 296–312.
Taylor, G. I. 1959b The dynamics of thin sheets of fluid iii. disintegration of fluid sheets. Proc. R.Soc. Lond. A 253, 313–321.
Taylor, G. I. 1960 Formation of thin flat sheets of water. Proc. R. Soc. Lond. A 259, 1–17.Villermaux, E. & Clanet, C. 2002 Life of a flapping liquid sheet. J. Fluid Mech. 462, 341–363.Villermaux, E., Marmottant, P. & Duplat, J. 2004 Ligament-mediated spray formation. Phys.
Rev. Let. 92, 074501.Weihs, D. 1978 Stability of thin, radially moving liquid sheets. J. Fluid Mech. 87, 289–298.Worthington, A. M. 1908 A Study of Splashes . Longmans, Green & Co.York, J. L., Stubbs, H. E. & Tek, M. R. 1953 The mechanism of disintegration of liquid sheets.
Trans. ASME , pp. 1279–1286.


