Embed Size (px)
Citation preview
803
*Author to whom all correspondence should be addressed. E-mail: [email protected].
Sulphated Oxides of Titanium Prepared from Titanium Ethoxide: Surfaceand Related Properties
Adham R. Ramadan1,2, Nahed Yacoub1, Haguer Amin1 and Jehane Ragai1,2* (1) Youssef Jameel
Science and Technology Research Center, The American University in Cairo, P.O. Box 74, New Cairo 11835, Egypt.
(2) Department of Chemistry, American University in Cairo, P.O. Box 74, New Cairo 11835, Egypt.
(Received 24 December 2008; revised form accepted 26 February 2009)
ABSTRACT: Titanium oxides, with moderately high surface areas exhibiting amixed mesoporous/microporous texture, were prepared from titanium ethoxide.The porosity seemed to stem from the loss of volatile components from the innercoordination sphere of the titanium ions. After impregnation with sulphategroups, a general decrease in surface area was observed. This decrease was moredrastic at higher temperatures when the sulphate ions are in a bidentate state ofligation. A high sulphate concentration led to a distinctive decrease in the totalpore volume and to the loss of the microporous texture. Micropore blockingappeared to be due to the presence of the bidentate sulphate groups. The latterare responsible for the higher surface acidities displayed by the sulphatedoxides.
INTRODUCTION
Previous studies have shown that TiO2 oxides converted to the corresponding sulphates using variouspreparative routes can act as superacids (Hadjivanov et al. 1989; Samantaray et al. 2000; Segunan andSeena 1999). Hitherto, these oxides have generally been prepared either by heating the correspondingtitanium hydroxide impregnated with sulphuric acid or ammonium sulphate (Yamaguchi et al. 1987;Tanabe et al. 1984; Tanabe 1987) or by using titanium oxysulphate as the starting material andammonium hydroxide or urea as the precipitating agents (Azer et al. 1997, 1998).
The present work was aimed at complementing such studies by dealing with the study of theacidic and textural properties of sulphated TiO2 obtained using titanium ethoxide as the startingmaterial, hydrolyzing it to TiO2 and subsequently impregnating it with ammonium sulphate.
EXPERIMENTAL
Sample preparation
Titanium ethoxide (in excess ethanol, Aldrich) was used to prepare titanium dioxide. The ethoxidewas dispersed in ethanol (95%), then hydrolyzed through the addition of excess de-ionized waterdropwise with continuous stirring (Yoldas 1986). The precipitated white titanium dioxide obtainedwas filtered off and the pH of the filtrate determined as 4.46. The precipitate was washed free ofalcohol and then dried at 52oC to constant weight.
The sulphated samples were prepared by impregnating the titanium dioxide with differentamounts of ammonium sulphate (99.999% pure, Aldrich) through incipient wetting, followed bydrying at 52oC to constant weight, thereby obtaining samples TS1 and TS2 containing 5 wt% and10 wt% sulphur, respectively. A blank sample, TW, was also prepared by the incipient wetting oftitanium dioxide with de-ionized water. Samples TW, TS1 and TS2 were heat-treated in air for 2 hat temperatures of 80ºC, 200ºC, 300ºC, 400ºC, 600ºC or 700ºC, respectively, to yield three sampleseries. The original titanium dioxide sample, TO, was heat-treated at 80ºC, 200ºC, 400ºC or700ºC, resulting in a fourth sample series. The heat-treatment temperatures were chosen on thebasis of the thermal behaviour of the samples.
Techniques
The specific surface areas of the samples were determined using a Micromeritics ASAP 2020instrument. Similarly, a Thermolyne 48000 furnace was used for sample heating and a ShimadzuDTG-60 instrument for thermal analysis. Infrared studies were carried out using a 337 Perkin-Elmer double-beam grating spectrophotometer, with the solid samples being prepared in the formof KBr pellets. For such pellet preparation, 2 mg of the compound were mixed with ca. 200 mgof KBr (spectroscopic grade) and the mixture subjected to a pressure of ca 1400 kPa in a hydraulicpress. Sample images were obtained using a Leo Supra 55 field emission scanning electronmicroscope.
The surface acidities of the samples were determined volumetrically by the adsorption ofsodium hydroxide (Aldrich 99.99% purity) from solutions of different concentrations. Thus,ca. 0.2 g of the solid oxide was shaken in 10 m� of the base for 6 h and then left overnight. A blankrun employing only the base was carried for each sample, with the difference between the blankrun and that with the sample giving the amount adsorbed (Boehm 1971).
RESULTS AND DISCUSSION
Infrared studies
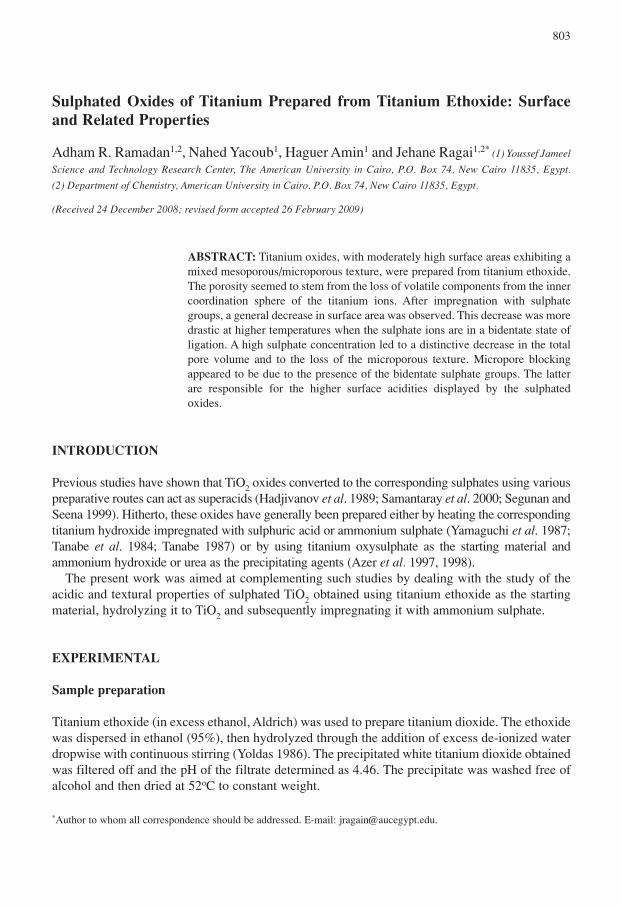
Infrared studies carried out on the original titanium dioxide sample, TO, and on the samplesubsequently heated to 80oC, 200oC or 400oC revealed bands at ca. 3430 cm–1, 1630 cm–1 and ca.590 cm–1 in all cases. The band at 1630 cm–1 was related to molecular water (Parkyns 1970),whereas those at 3430 cm–1 and 590 cm–1 were associated with the hydroxo and Ti–O stretchingmodes, respectively (Nakamoto 1986). Additional bands at ca. 1700 cm–1, ca. 1365 cm–1, ca. 1280cm–1 and ca. 1100 cm–1 appeared to arise from some incompletely hydrolyzed residual ethoxide(Nakamoto 1986), while those at ca. 2926 cm–1 and ca. 2853 cm–1 seemed to arise from EtOHadsorbed onto the hydroxylated titania surface (Suda et al. 1987). All the bands except that at590 cm–1 virtually disappeared on heating the sample to 700oC.
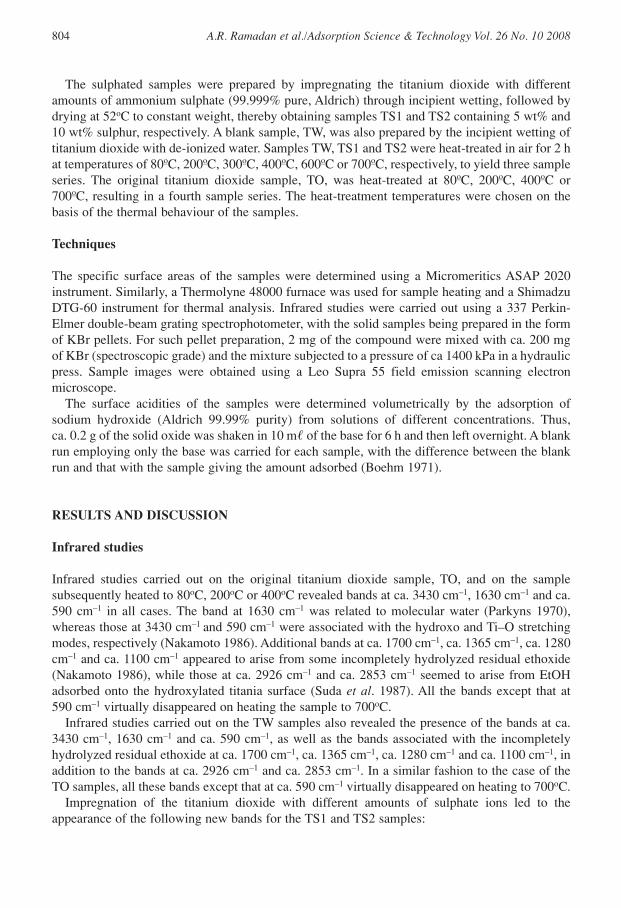
Infrared studies carried out on the TW samples also revealed the presence of the bands at ca.3430 cm–1, 1630 cm–1 and ca. 590 cm–1, as well as the bands associated with the incompletelyhydrolyzed residual ethoxide at ca. 1700 cm–1, ca. 1365 cm–1, ca. 1280 cm–1 and ca. 1100 cm–1, inaddition to the bands at ca. 2926 cm–1 and ca. 2853 cm–1. In a similar fashion to the case of theTO samples, all these bands except that at ca. 590 cm–1 virtually disappeared on heating to 700oC.
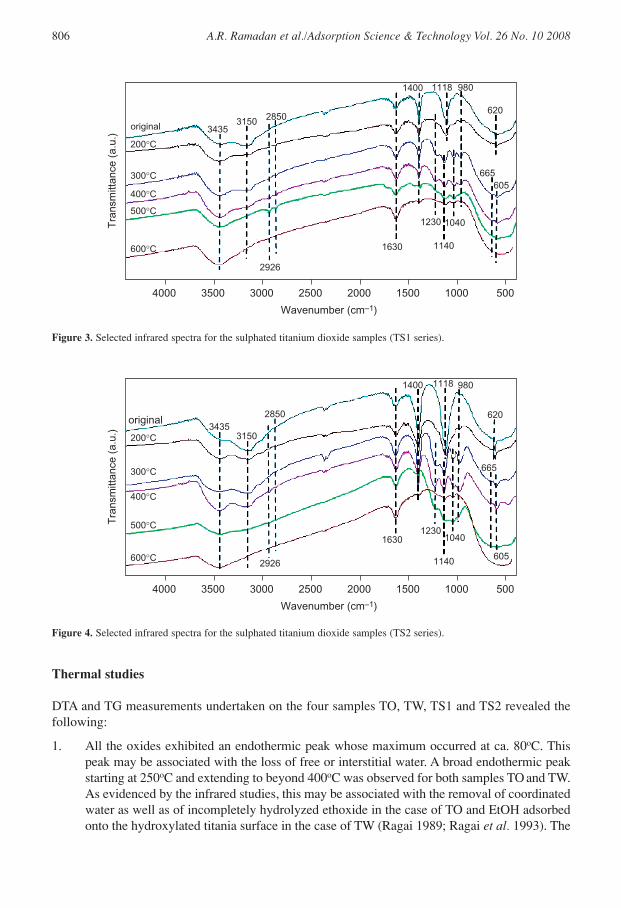
Impregnation of the titanium dioxide with different amounts of sulphate ions led to theappearance of the following new bands for the TS1 and TS2 samples:
804 A.R. Ramadan et al./Adsorption Science & Technology Vol. 26 No. 10 2008
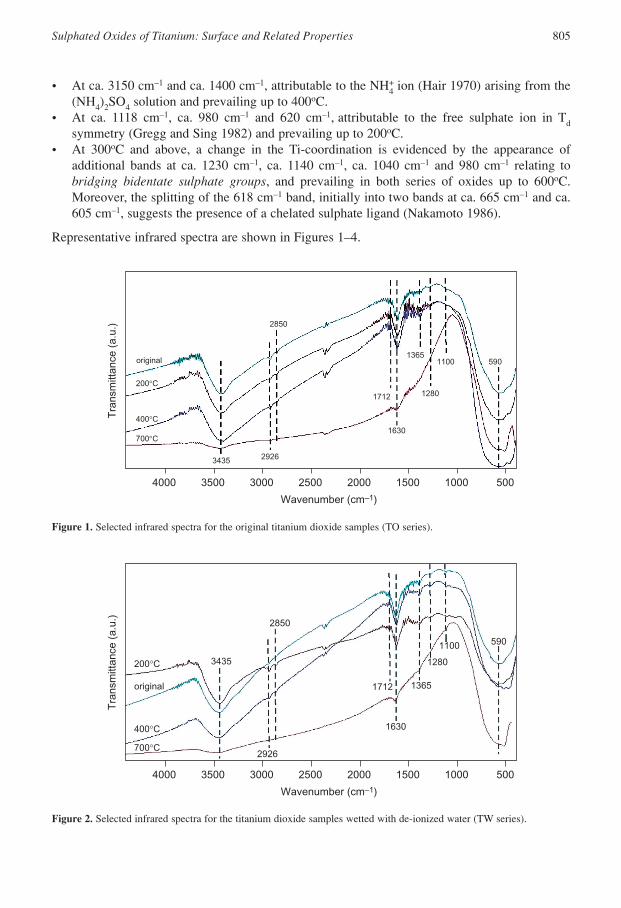
• At ca. 3150 cm–1 and ca. 1400 cm–1, attributable to the NH+4 ion (Hair 1970) arising from the
(NH4)2SO4 solution and prevailing up to 400oC.• At ca. 1118 cm–1, ca. 980 cm–1 and 620 cm–1, attributable to the free sulphate ion in Td
symmetry (Gregg and Sing 1982) and prevailing up to 200oC. • At 300oC and above, a change in the Ti-coordination is evidenced by the appearance of
additional bands at ca. 1230 cm–1, ca. 1140 cm–1, ca. 1040 cm–1 and 980 cm–1 relating tobridging bidentate sulphate groups, and prevailing in both series of oxides up to 600oC.Moreover, the splitting of the 618 cm–1 band, initially into two bands at ca. 665 cm–1 and ca.605 cm–1, suggests the presence of a chelated sulphate ligand (Nakamoto 1986).
Representative infrared spectra are shown in Figures 1–4.
Sulphated Oxides of Titanium: Surface and Related Properties 805
4000
Tra
nsm
ittan
ce (
a.u.
)
700°C
400°C
200°C
original
3435 2926
1630
1712
1365
1280
1100 590
2850
3500
Wavenumber (cm–1)
3000 2500 2000 1500 1000 500
Figure 1. Selected infrared spectra for the original titanium dioxide samples (TO series).
4000
Tra
nsm
ittan
ce (
a.u.
)
700°C
400°C
200°C
original
3435
2926
1630
1712 1365
1280
1100 590
2850
3500
Wavenumber (cm–1)
3000 2500 2000 1500 1000 500
Figure 2. Selected infrared spectra for the titanium dioxide samples wetted with de-ionized water (TW series).
Thermal studies
DTA and TG measurements undertaken on the four samples TO, TW, TS1 and TS2 revealed thefollowing:
1. All the oxides exhibited an endothermic peak whose maximum occurred at ca. 80oC. Thispeak may be associated with the loss of free or interstitial water. A broad endothermic peakstarting at 250oC and extending to beyond 400oC was observed for both samples TO and TW.As evidenced by the infrared studies, this may be associated with the removal of coordinatedwater as well as of incompletely hydrolyzed ethoxide in the case of TO and EtOH adsorbedonto the hydroxylated titania surface in the case of TW (Ragai 1989; Ragai et al. 1993). The
806 A.R. Ramadan et al./Adsorption Science & Technology Vol. 26 No. 10 2008
600°C
500°C
400°C
300°C
200°C
original 34353150
2926
1630
1230 1040
1140
605665
980
620
11181400
2850
4000
Tra
nsm
ittan
ce (
a.u.
)
3500
Wavenumber (cm–1)
3000 2500 2000 1500 1000 500
Figure 3. Selected infrared spectra for the sulphated titanium dioxide samples (TS1 series).
600°C
500°C
400°C
300°C
200°C
original3435
3150
2926
16301230
1040
1140 605
665
980
620
11181400
2850
4000
Tra
nsm
ittan
ce (
a.u.
)
3500
Wavenumber (cm–1)
3000 2500 2000 1500 1000 500
Figure 4. Selected infrared spectra for the sulphated titanium dioxide samples (TS2 series).
corresponding total weight losses, as indicated by the thermogravimetric curves, were ca.11% and 18% for TO and TW, respectively.
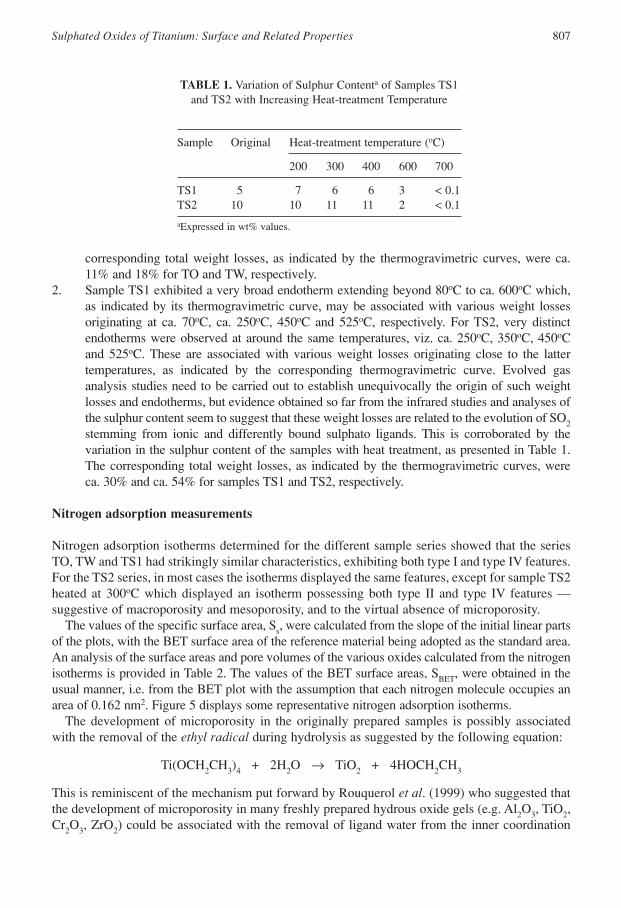
2. Sample TS1 exhibited a very broad endotherm extending beyond 80oC to ca. 600oC which,as indicated by its thermogravimetric curve, may be associated with various weight lossesoriginating at ca. 70oC, ca. 250oC, 450oC and 525oC, respectively. For TS2, very distinctendotherms were observed at around the same temperatures, viz. ca. 250oC, 350oC, 450oCand 525oC. These are associated with various weight losses originating close to the lattertemperatures, as indicated by the corresponding thermogravimetric curve. Evolved gasanalysis studies need to be carried out to establish unequivocally the origin of such weightlosses and endotherms, but evidence obtained so far from the infrared studies and analyses ofthe sulphur content seem to suggest that these weight losses are related to the evolution of SO2stemming from ionic and differently bound sulphato ligands. This is corroborated by thevariation in the sulphur content of the samples with heat treatment, as presented in Table 1.The corresponding total weight losses, as indicated by the thermogravimetric curves, wereca. 30% and ca. 54% for samples TS1 and TS2, respectively.
Nitrogen adsorption measurements
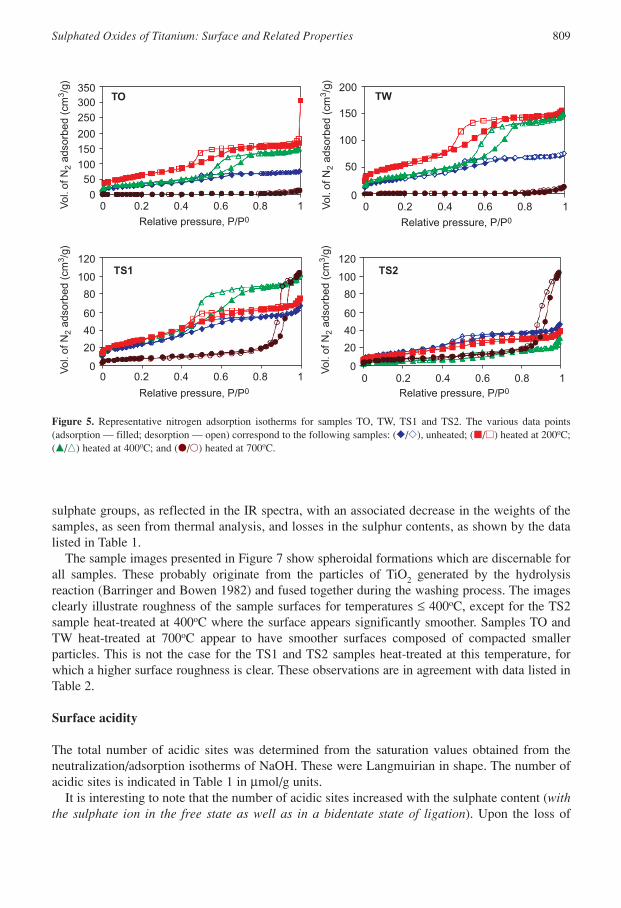
Nitrogen adsorption isotherms determined for the different sample series showed that the seriesTO, TW and TS1 had strikingly similar characteristics, exhibiting both type I and type IV features.For the TS2 series, in most cases the isotherms displayed the same features, except for sample TS2heated at 300oC which displayed an isotherm possessing both type II and type IV features —suggestive of macroporosity and mesoporosity, and to the virtual absence of microporosity.
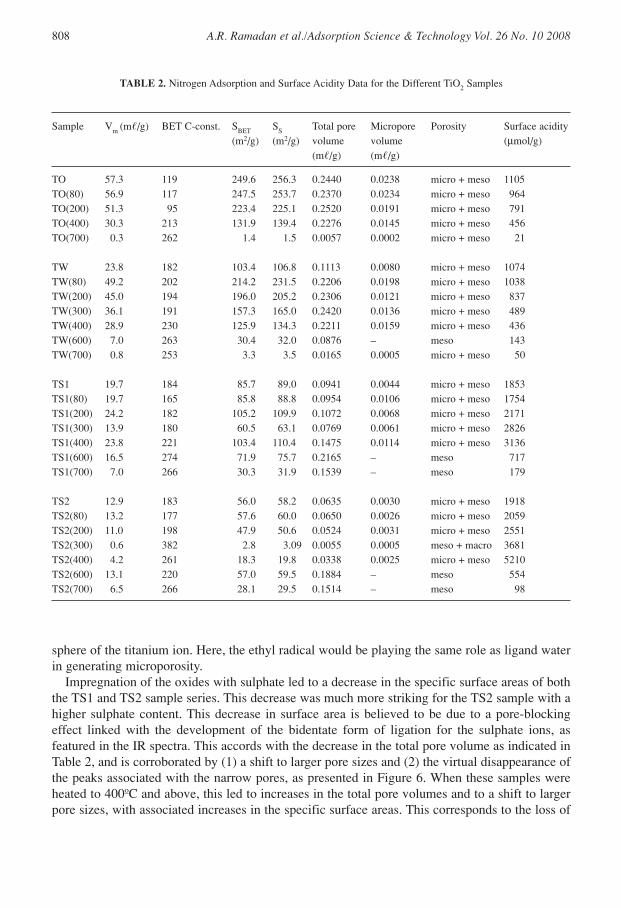
The values of the specific surface area, Ss, were calculated from the slope of the initial linear partsof the plots, with the BET surface area of the reference material being adopted as the standard area.An analysis of the surface areas and pore volumes of the various oxides calculated from the nitrogenisotherms is provided in Table 2. The values of the BET surface areas, SBET, were obtained in theusual manner, i.e. from the BET plot with the assumption that each nitrogen molecule occupies anarea of 0.162 nm2. Figure 5 displays some representative nitrogen adsorption isotherms.
The development of microporosity in the originally prepared samples is possibly associatedwith the removal of the ethyl radical during hydrolysis as suggested by the following equation:
Ti(OCH2CH3)4 + 2H2O → TiO2 + 4HOCH2CH3
This is reminiscent of the mechanism put forward by Rouquerol et al. (1999) who suggested thatthe development of microporosity in many freshly prepared hydrous oxide gels (e.g. Al2O3, TiO2,Cr2O3, ZrO2) could be associated with the removal of ligand water from the inner coordination
Sulphated Oxides of Titanium: Surface and Related Properties 807
TABLE 1. Variation of Sulphur Contenta of Samples TS1and TS2 with Increasing Heat-treatment Temperature
Sample Original Heat-treatment temperature (oC)
200 300 400 600 700
TS1 5 7 6 6 3 < 0.1TS2 10 10 11 11 2 < 0.1
aExpressed in wt% values.
sphere of the titanium ion. Here, the ethyl radical would be playing the same role as ligand waterin generating microporosity.
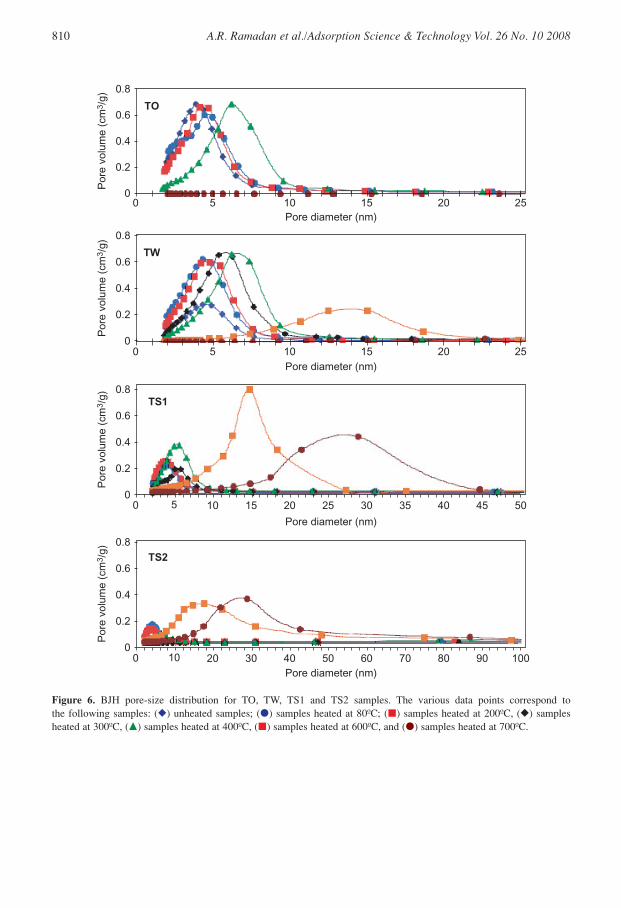
Impregnation of the oxides with sulphate led to a decrease in the specific surface areas of boththe TS1 and TS2 sample series. This decrease was much more striking for the TS2 sample with ahigher sulphate content. This decrease in surface area is believed to be due to a pore-blockingeffect linked with the development of the bidentate form of ligation for the sulphate ions, asfeatured in the IR spectra. This accords with the decrease in the total pore volume as indicated inTable 2, and is corroborated by (1) a shift to larger pore sizes and (2) the virtual disappearance ofthe peaks associated with the narrow pores, as presented in Figure 6. When these samples wereheated to 400ºC and above, this led to increases in the total pore volumes and to a shift to largerpore sizes, with associated increases in the specific surface areas. This corresponds to the loss of
808 A.R. Ramadan et al./Adsorption Science & Technology Vol. 26 No. 10 2008
TABLE 2. Nitrogen Adsorption and Surface Acidity Data for the Different TiO2 Samples
Sample Vm (m�/g) BET C-const. SBET SS Total pore Micropore Porosity Surface acidity(m2/g) (m2/g) volume volume (µmol/g)
(m�/g) (m�/g)
TO 57.3 119 249.6 256.3 0.2440 0.0238 micro + meso 1105TO(80) 56.9 117 247.5 253.7 0.2370 0.0234 micro + meso 964TO(200) 51.3 95 223.4 225.1 0.2520 0.0191 micro + meso 791TO(400) 30.3 213 131.9 139.4 0.2276 0.0145 micro + meso 456TO(700) 0.3 262 1.4 1.5 0.0057 0.0002 micro + meso 21
TW 23.8 182 103.4 106.8 0.1113 0.0080 micro + meso 1074TW(80) 49.2 202 214.2 231.5 0.2206 0.0198 micro + meso 1038TW(200) 45.0 194 196.0 205.2 0.2306 0.0121 micro + meso 837TW(300) 36.1 191 157.3 165.0 0.2420 0.0136 micro + meso 489TW(400) 28.9 230 125.9 134.3 0.2211 0.0159 micro + meso 436TW(600) 7.0 263 30.4 32.0 0.0876 – meso 143TW(700) 0.8 253 3.3 3.5 0.0165 0.0005 micro + meso 50
TS1 19.7 184 85.7 89.0 0.0941 0.0044 micro + meso 1853TS1(80) 19.7 165 85.8 88.8 0.0954 0.0106 micro + meso 1754TS1(200) 24.2 182 105.2 109.9 0.1072 0.0068 micro + meso 2171TS1(300) 13.9 180 60.5 63.1 0.0769 0.0061 micro + meso 2826TS1(400) 23.8 221 103.4 110.4 0.1475 0.0114 micro + meso 3136TS1(600) 16.5 274 71.9 75.7 0.2165 – meso 717TS1(700) 7.0 266 30.3 31.9 0.1539 – meso 179
TS2 12.9 183 56.0 58.2 0.0635 0.0030 micro + meso 1918TS2(80) 13.2 177 57.6 60.0 0.0650 0.0026 micro + meso 2059TS2(200) 11.0 198 47.9 50.6 0.0524 0.0031 micro + meso 2551TS2(300) 0.6 382 2.8 3.09 0.0055 0.0005 meso + macro 3681TS2(400) 4.2 261 18.3 19.8 0.0338 0.0025 micro + meso 5210TS2(600) 13.1 220 57.0 59.5 0.1884 – meso 554TS2(700) 6.5 266 28.1 29.5 0.1514 – meso 98
Sulphated Oxides of Titanium: Surface and Related Properties 809
350TO
TS1
TW300250
200150100
500
0
20
40
60
80
100
120
200
150
100
50
00 0.2
Relative pressure, P/P0 Relative pressure, P/P0
Relative pressure, P/P0 Relative pressure, P/P0
Vol
. of N
2 ad
sorb
ed (
cm3 /
g)V
ol. o
f N2
adso
rbed
(cm
3 /g)
Vol
. of N
2 ad
sorb
ed (
cm3 /
g)V
ol. o
f N2
adso
rbed
(cm
3 /g)
0.4 0.6 0.8 1
0 0.2 0.4 0.6 0.8 1
0 0.2 0.4 0.6 0.8 1
0 0.2 0.4 0.6 0.8 1
TS2
0
20
40
60
80
100
120
Figure 5. Representative nitrogen adsorption isotherms for samples TO, TW, TS1 and TS2. The various data points(adsorption — filled; desorption — open) correspond to the following samples: (�/�), unheated; (�/�) heated at 200ºC;(�/�) heated at 400ºC; and (�/�) heated at 700ºC.
sulphate groups, as reflected in the IR spectra, with an associated decrease in the weights of thesamples, as seen from thermal analysis, and losses in the sulphur contents, as shown by the datalisted in Table 1.
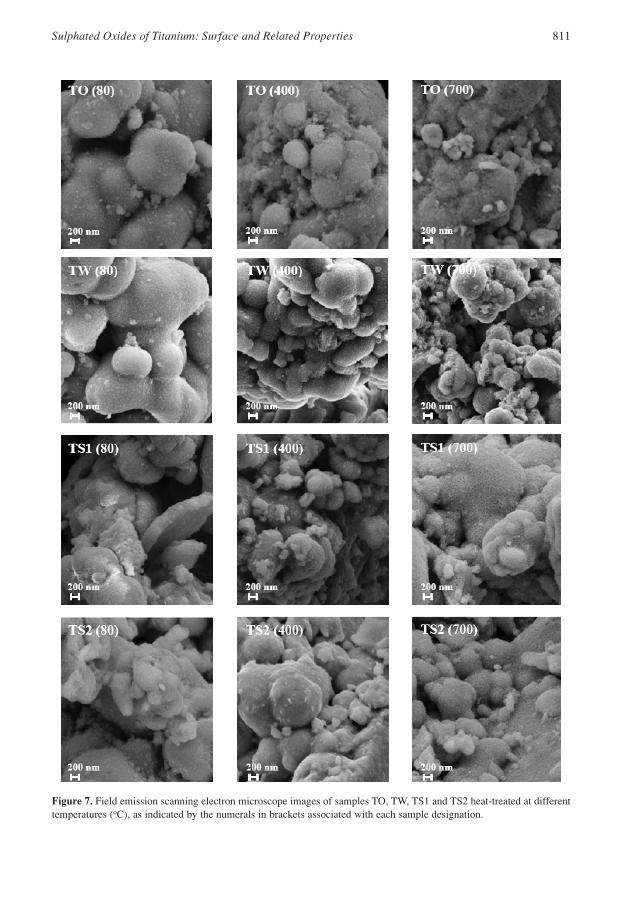
The sample images presented in Figure 7 show spheroidal formations which are discernable forall samples. These probably originate from the particles of TiO2 generated by the hydrolysisreaction (Barringer and Bowen 1982) and fused together during the washing process. The imagesclearly illustrate roughness of the sample surfaces for temperatures ≤ 400oC, except for the TS2sample heat-treated at 400oC where the surface appears significantly smoother. Samples TO andTW heat-treated at 700oC appear to have smoother surfaces composed of compacted smallerparticles. This is not the case for the TS1 and TS2 samples heat-treated at this temperature, forwhich a higher surface roughness is clear. These observations are in agreement with data listed inTable 2.
Surface acidity
The total number of acidic sites was determined from the saturation values obtained from theneutralization/adsorption isotherms of NaOH. These were Langmuirian in shape. The number ofacidic sites is indicated in Table 1 in µmol/g units.
It is interesting to note that the number of acidic sites increased with the sulphate content (withthe sulphate ion in the free state as well as in a bidentate state of ligation). Upon the loss of
810 A.R. Ramadan et al./Adsorption Science & Technology Vol. 26 No. 10 2008
0
0.2
0.4
0.6
0.8
0 5 504540353025201510
TS1
Pore diameter (nm)
Por
e vo
lum
e (c
m3 /
g)
0
0.2
0.4
0.6
0.8
0 5 10 15 20 25
TW
Pore diameter (nm)
Por
e vo
lum
e (c
m3 /
g)
0
0.2
0.4
0.6
0.8
0 5 10 15 20 25
TO
Pore diameter (nm)
Por
e vo
lum
e (c
m3 /
g)
0
0.2
0.4
0.6
0.8
0 10 1009080706050403020
TS2
Pore diameter (nm)
Por
e vo
lum
e (c
m3 /
g)
Figure 6. BJH pore-size distribution for TO, TW, TS1 and TS2 samples. The various data points correspond to the following samples: (�) unheated samples; (�) samples heated at 80ºC; (�) samples heated at 200ºC, (�) samplesheated at 300ºC, (�) samples heated at 400ºC, (�) samples heated at 600ºC, and (�) samples heated at 700ºC.
Sulphated Oxides of Titanium: Surface and Related Properties 811
Figure 7. Field emission scanning electron microscope images of samples TO, TW, TS1 and TS2 heat-treated at differenttemperatures (oC), as indicated by the numerals in brackets associated with each sample designation.
sulphate commencing at 400oC, the acidity notably decreased. Saur et al. (1986) have suggestedthat sulphated TiO2 has the structure (Ti3O3)S=O which upon the addition of water would yield:
812 A.R. Ramadan et al./Adsorption Science & Technology Vol. 26 No. 10 2008
Such a mechanism would account for the increase in acidity with increasing sulphate contenteither in a bidentate state of ligation or in a free state. The latter would also probably eventuallybecome ligated to the surface when present in solution and would lead to the observed increase inacidity.
CONCLUSIONS
• The most important feature exhibited by infrared spectra (FT-IR) of the original oxide (TO) aswell as of the oxide aged in water (TW) was the presence of molecular water. The spectra alsoindicated that impregnation with different amounts of sulphate ions followed by heat treatmentled to the oxide samples exhibiting free sulphate ions up to 200oC, followed by the presenceof sulphate ions in bidentate and chelate states of ligation at higher temperatures (up to 600oC).The thermal studies corroborated the results obtained by FT-IR spectroscopy.
• Adsorption studies indicated that the original titanium oxide (TO) and that aged in water (TW)possessed moderately high surface areas, with textural characteristics exhibiting mixedmesoporous and microporous features. The porosity appeared to stem from the loss of volatilecomponents from the inner coordination sphere of the titanium ions in these cases.
• Impregnation with sulphate ions resulted in a general decrease of surface area. This decreasewas more drastic at higher temperatures when the sulphate ions were in a bidentate state ofligation. The sulphated oxide with the higher sulphate content (TS2) exhibited a loss of themicroporous texture as well as a significant decrease in total pore volume. This is believed tobe due to the micropores being blocked by the sulphate groups.
• High surface acidity was observed in the case of the sulphated oxides and was morepronounced for those oxides containing the sulphate ion in a bidentate state of ligation.
REFERENCES
Azer, C., Selim, S., Yacoub, N. and Ragai, J. (1997) Proc. 4th Int. Symp. “Characterization of Porous Solids(COPS IV)”, Sept. 15–18, 1996, Bath, U.K., p. 306.
Azer, C., Selim, S., Yacoub, N. and Ragai, J. (1998) Proc. 6th Int. Conf. “Fundamentals of Adsorption”, May24–28, 1998, Paris, France, Meunier, F., Ed, Elsevier, Amsterdam, The Netherlands, p. 306
Barringer, E.A. and Bowen, H.K. (1982) Am. Ceram. Soc. Commun. 65, C-199.Boehm, H.P. (1971) Discuss. Faraday Soc. 52, 264.Gregg, S.J. and Sing, K.S.W. (1982) Adsorption, Surface Area and Porosity, 2nd Edn, Academic Press,
New York/London.
= SM O
M O
M OHOH
O
SM O
M O
O
O
M OM OM O
S O + HH2O
Hadjivanov, K., Davydov, A. and Klissurki, D. (1988) Commun. Dept. Chem., Inst. Gen. Inorg. Chem.,Bulgarian Acad. Sci. 21, 498.
Hair, M.L. (1970) J. Phys. Chem. 74, 1290. Nakamoto, K. (1986) Infrared and Raman Spectra of Inorganic and Coordination Compounds, 4th Edn, John
Wiley & Sons, New York.Parkyns, N.D. (1970) Chemisorption and Catalysis, Hepple Publications, London, U.K.Ragai, J. (1989) J. Chem. Technol. Biotechnol. 44, 237.Ragai, J., Selim, S., Sing, K.S.W. and Theocharis, C. (1993) Proc. 3rd Int. Symp. “Characterization of
Porous Solids (COPS III)’’, May 9–12, 1993, Marseille, France, Rouquerol, J., Rodriguez-Reinoso, F.,Sing, K.S.W., Unger, K.K., Eds, Elsevier, Amsterdam, The Netherlands, 1994, p. 496.
Rouquerol, F., Rouquerol, J. and Sing, K.S.W. (1999) Adsorption by Powder and Porous Solids, AcademicPress, New York/London.
Samantaray, S.K., Mishra, T. and Parida, K.M. (2000) J. Mol. Catal. 156, 267.Saur, O., Bensitel, M., Saad, A.B.M., Lavalley, J.C., Tripp, C.P. and Morrow, B.A. (1986) J. Catal. 99, 104.Segunan, S. and Seena, C.R.K. (1999) Indian J. Chem. 38A, 947.Suda, Y., Morimotom, T. and Nagao, M. (1987) Langmuir 3, 99.Tanabe, K. (1987) Mater. Chem. Phys. 7, 31.Tanabe, K., Yamaguchi, T., Akiyama, K., Milton, A., Iwaguchi, K. and Isogai, K. (1984) Proc. VIIIth Int..
Conf. Catal., 2–6 July 1984, Berlin, West Germany, Imelik, B., Naccache, C., Eds, Verlag Chemie,Weinheim, Germany.
Yamaguchi, T., Jin, T., Ishida, T. and Tanabe, K. (1987) Mater. Chem. Phys. 7, 3.Yoldas, B.E. (1986) J. Mater. Sci. 21, 1087.
Sulphated Oxides of Titanium: Surface and Related Properties 813