Embed Size (px)
Citation preview

1
Fourth-Quarter Fiscal 2021 EarningsNovember 4, 2021Sam Mitchell, CEO Mary Meixelsperger, CFOSean Cornett, Investor Relations
2
Forward-Looking StatementsCertain statements in this presentation, other than statements of historical fact, including estimates, projections and statements related to Valvoline’s business plans and operating results, are forward-looking statements within the meaning of the Private Securities Litigation Reform Act of 1995. Valvoline has identified some of these forward-looking statements with words such as “anticipates,” “believes,” “expects,” “estimates,” “is likely,” “predicts,” “projects,” “forecasts,” “may,” “will,” “should” and “intends” and the negative of these words or other comparable terminology. These forward-looking statements are based on Valvoline’s current expectations, estimates, projections and assumptions as of the date such statements are made and are subject to risksand uncertainties that may cause results to differ materially from those expressed or implied in the forward-looking statements.Additional information regarding these risks and uncertainties are described in the company’s filings with the Securities andExchange Commission (the “SEC”), including in the “Risk Factors,” “Management’s Discussion and Analysis of Financial Condition and Results of Operations” and "Quantitative and Qualitative Disclosures about Market Risk" sections of Valvoline’smost recently filed periodic reports on Form 10-K and 10-Q, which are available on Valvoline’s website at http://investors.valvoline.com/sec-filings or on the SEC’s website at http://www.sec.gov. Valvoline assumes no obligation to update or revise these forward-looking statements for any reason, even if new information becomes available in the future, unless required by law.
Regulation G: Adjusted ResultsInformation regarding Valvoline’s definitions, calculations and reconciliation of non-GAAP measures can be found in the Appendix.
SAFE HARBOR
3
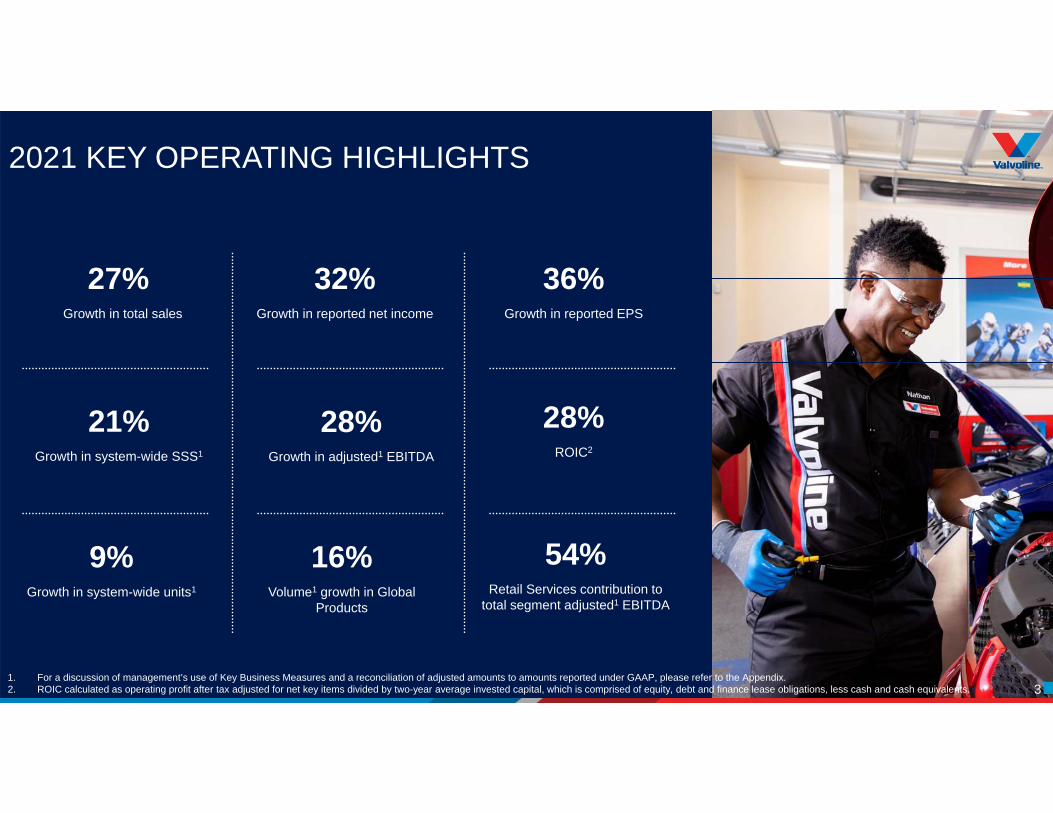
2021 KEY OPERATING HIGHLIGHTS
27%Growth in total sales
28%Growth in adjusted1 EBITDA
9% Growth in system-wide units1
21%Growth in system-wide SSS1
54% Retail Services contribution to
total segment adjusted1 EBITDA
32%Growth in reported net income
28%ROIC2
16%Volume1 growth in Global
Products
3
36%Growth in reported EPS
1. For a discussion of management’s use of Key Business Measures and a reconciliation of adjusted amounts to amounts reported under GAAP, please refer to the Appendix.2. ROIC calculated as operating profit after tax adjusted for net key items divided by two-year average invested capital, which is comprised of equity, debt and finance lease obligations, less cash and cash equivalents.

4
GROWTH IS ACCELERATING
$2,285 $2,390 $2,353
$2,981
2018 2019 2020 2021
Revenue (Millions)
$473 $478 $495
$634
2018 2019 2020 2021
Adjusted1 EBITDA (Millions)
1. For reconciliation of adjusted amounts to amounts reported under GAAP, please refer to the Appendix.
Transformation to a service-driven business has accelerated growth

5

6
RETAIL SERVICES IS DRIVING SIGNIFICANT GROWTH
$660 $822 $883
$1,221
2018 2019 2020 2021
Revenue (Millions)
$202 $239 $247
$382
2018 2019 2020 2021
Adjusted1 EBITDA(Millions)
Expect 6 – 8% SSS growth and 5 – 7% unit growth annually through FY24
1. For a discussion of management’s use of Key Business Measures and a reconciliation of adjusted amounts to amounts reported under GAAP, please refer to the Appendix.
7
1,2421,385 1,462
1,594
2018 2019 2020 2021
$1,161 $1,419 $1,520
$1,970
2018 2019 2020 2021
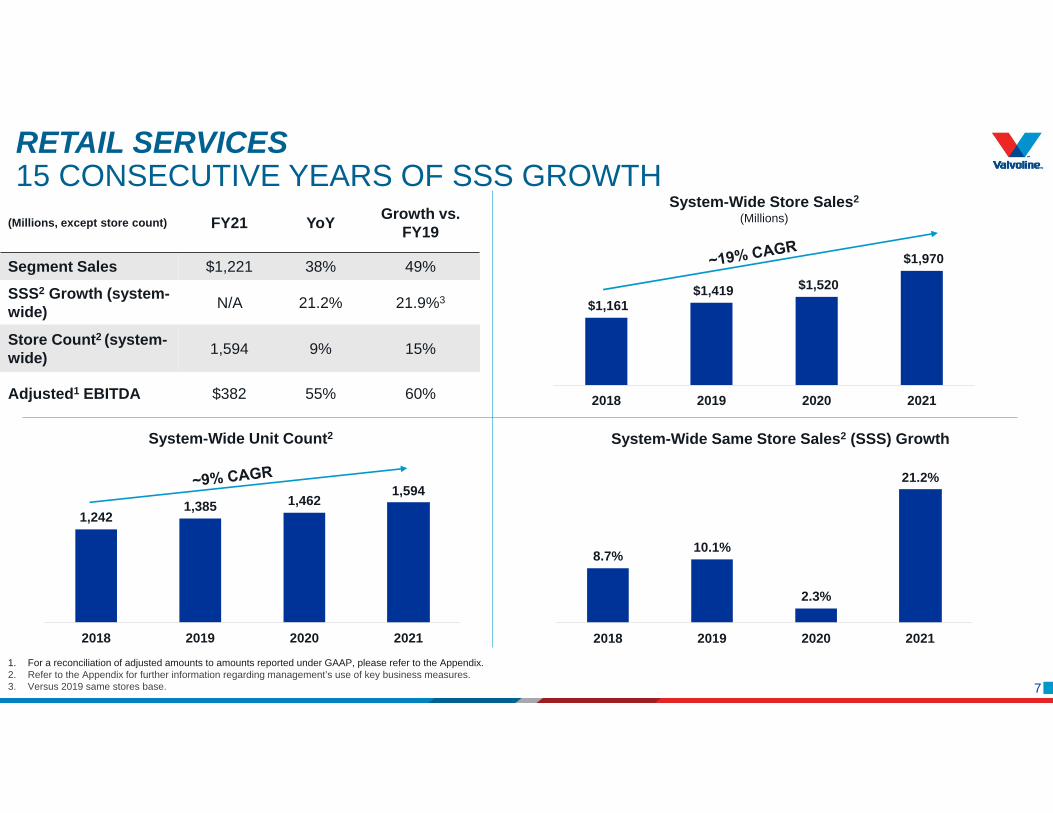
RETAIL SERVICES15 CONSECUTIVE YEARS OF SSS GROWTH
1. For a reconciliation of adjusted amounts to amounts reported under GAAP, please refer to the Appendix.2. Refer to the Appendix for further information regarding management’s use of key business measures.3. Versus 2019 same stores base.
System-Wide Store Sales2
(Millions)(Millions, except store count) FY21 YoY Growth vs. FY19
Segment Sales $1,221 38% 49%
SSS2 Growth (system-wide) N/A 21.2% 21.9%3
Store Count2 (system-wide) 1,594 9% 15%
Adjusted1 EBITDA $382 55% 60%
System-Wide Unit Count2
8.7% 10.1%
2.3%
21.2%
2018 2019 2020 2021
System-Wide Same Store Sales2 (SSS) Growth

8
$330 $296 $309 $327
2018 2019 2020 2021
Adjusted1 EBITDA(Millions)
GLOBAL PRODUCTS DELIVERING PROFITABLE SHARE GROWTH
$1,625 $1,568 $1,470 $1,760
2018 2019 2020 2021
Revenue (Millions)
Expect ~$200+ million in discretionary free cash flow annually through 2024
1. For a reconciliation of adjusted amounts to amounts reported under GAAP, please refer to the Appendix.
~flat CAGR
9
Volume1,2(Gallons, Millions)
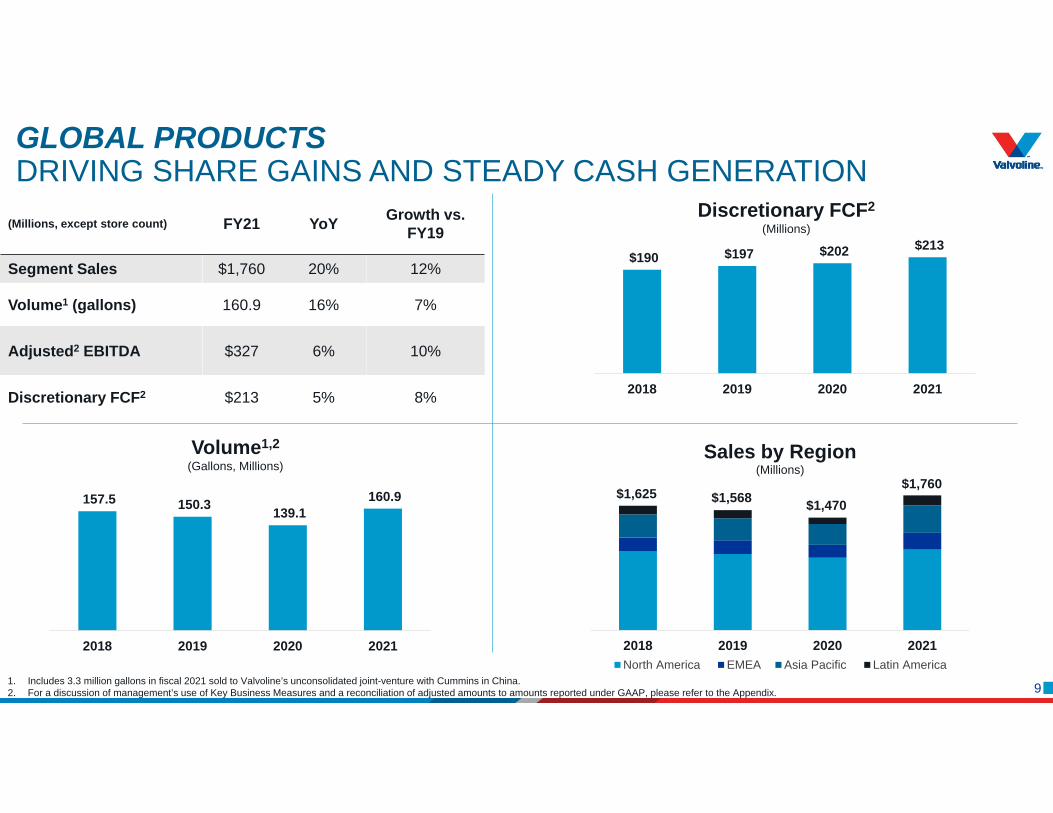
GLOBAL PRODUCTSDRIVING SHARE GAINS AND STEADY CASH GENERATION
$190 $197 $202 $213
2018 2019 2020 2021
Discretionary FCF2(Millions)
1. Includes 3.3 million gallons in fiscal 2021 sold to Valvoline’s unconsolidated joint-venture with Cummins in China.2. For a discussion of management’s use of Key Business Measures and a reconciliation of adjusted amounts to amounts reported under GAAP, please refer to the Appendix.
(Millions, except store count) FY21 YoY Growth vs. FY19
Segment Sales $1,760 20% 12%
Volume1 (gallons) 160.9 16% 7%
Adjusted2 EBITDA $327 6% 10%
Discretionary FCF2 $213 5% 8%
157.5 150.3 139.1 160.9
2018 2019 2020 2021 2018 2019 2020 2021
Sales by Region(Millions)
North America EMEA Asia Pacific Latin America
$1,625 $1,568 $1,470$1,760
10

11
(Millions, except per-share data) 4Q21 YoY
Growth vs.
4Q19
Sales $835 28% 33%
Gross Profit $246 (5)% 13%
Adjusted1 Gross Profit $261 4% 20%
Operating Income $142 (19)% 26%
Adjusted1 Operating Income $131 2% 18%
Net Income $168 38% 522%
Adjusted1 EBITDA $155 5% 20%
Earnings per Diluted Share (EPS)
$0.92 39% 557%
Adjusted1 EPS $0.50 11% 25%
FOURTH QUARTER RESULTS
111. For reconciliation of adjusted amounts to amounts reported under GAAP, please refer to the Appendix.
YoY Changes in Adjusted1 EBITDA(Millions)

12
FOURTH QUARTER RESULTS – ADJUSTED EBITDA MARGINS
Key Takeaways• Incremental labor investment, raw material cost
pressures impact short-term margins• Adjusted EBITDA up 36% YoY and 59% vs
4Q19
Key Takeaways• Peak price-cost lag impacting margins in Q4• Executing incremental pricing actions to drive
recovery in FY22• Adjusted EBITDA margins down 800 bps YoY
and 450 bps vs 4Q19
1. For reconciliation of adjusted amounts to amounts reported under GAAP, please refer to the Appendix.2. Adjusted EBITDA margin is determined as Adjusted EBITDA divided by sales.
Retail Services
(Millions) 4Q21 YoYGrowth
(Decline) vs. 4Q19
Segment Sales $483 21% 19%
Adjusted1 EBITDA $72 (21)% (9)%
Adjusted2 EBITDA Margin
14.9% (800) bps (450) bps
Global Products
(Millions) 4Q21 YoYGrowth
(Decline) vs. 4Q19
Segment Sales $352 39% 59%
Adjusted1 EBITDA $105 36% 59%
Adjusted2 EBITDA Margin
29.8% (50) bps 10 bps
13
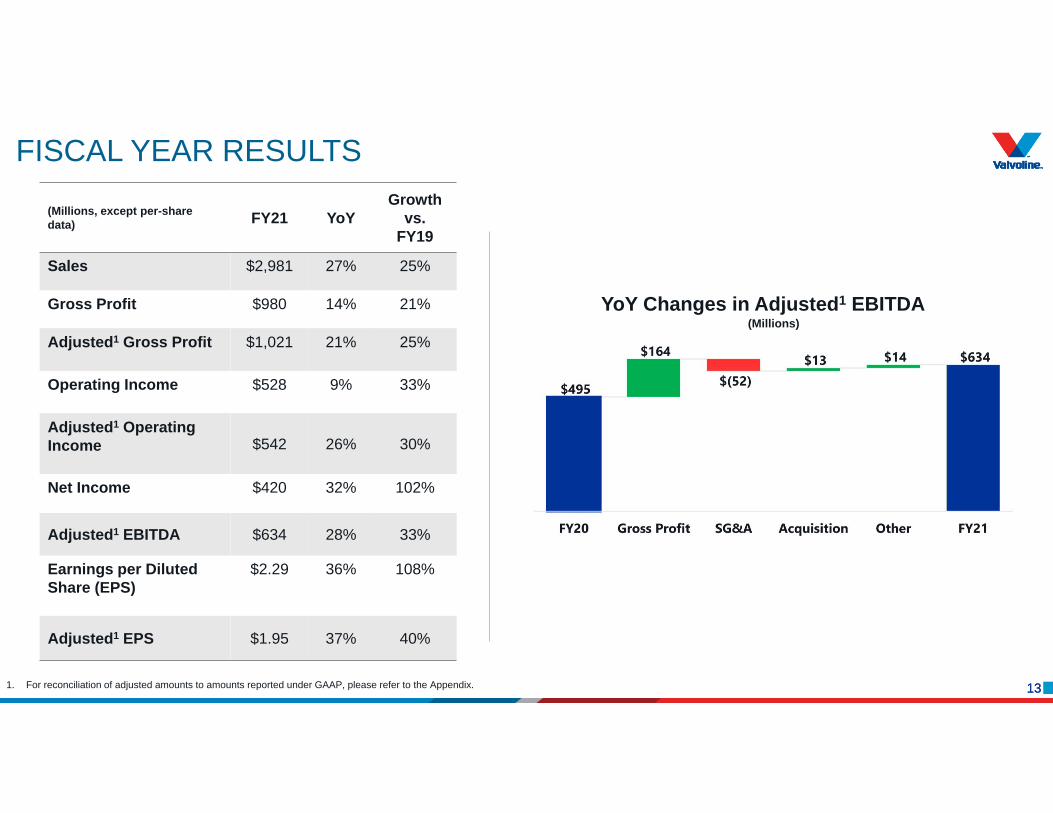
(Millions, except per-share data) FY21 YoY
Growth vs.
FY19
Sales $2,981 27% 25%
Gross Profit $980 14% 21%
Adjusted1 Gross Profit $1,021 21% 25%
Operating Income $528 9% 33%
Adjusted1 Operating Income $542 26% 30%
Net Income $420 32% 102%
Adjusted1 EBITDA $634 28% 33%
Earnings per Diluted Share (EPS)
$2.29 36% 108%
Adjusted1 EPS $1.95 37% 40%
FISCAL YEAR RESULTS
131. For reconciliation of adjusted amounts to amounts reported under GAAP, please refer to the Appendix.
YoY Changes in Adjusted1 EBITDA(Millions)

14
CAPITAL LIGHT MODEL DRIVES SIGNIFICANT FREE CASH FLOW
(Millions) FY21Cash Flow from Operating Activities $404
Less: Maintenance Capital Expenditures $36
Discretionary Free Cash Flow $368
Less: Growth Capital Expenditures $108
Free Cash Flow $260
Maintenance Capital Expenditures % of Sales 1.2%
Free Cash Flow % of Sales 8.7%
Note: Discretionary Free Cash Flow and Free Cash Flow are non-GAAP measures that have been reconciled to GAAP as presented above; for further information, please refer to Use of Non-GAAP Measures in the Appendix.
15
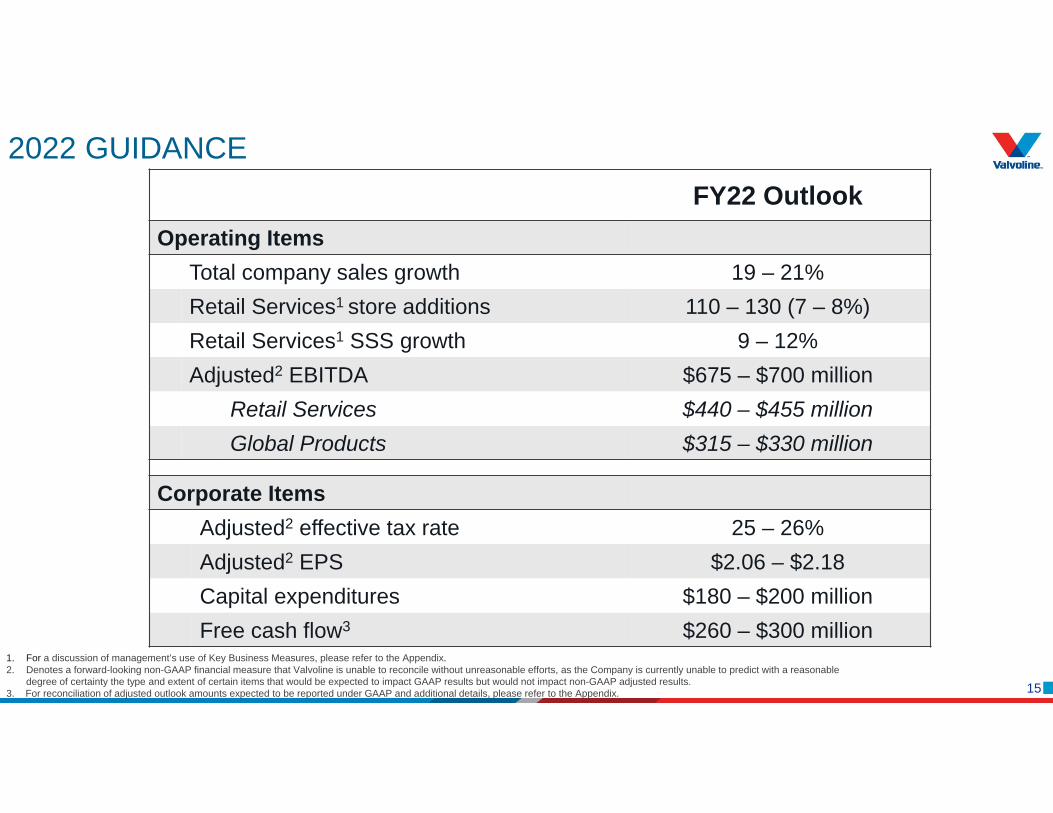
2022 GUIDANCEFY22 Outlook
Operating ItemsTotal company sales growth 19 – 21%Retail Services1 store additions 110 – 130 (7 – 8%)Retail Services1 SSS growth 9 – 12%Adjusted2 EBITDA $675 – $700 million
Retail Services $440 – $455 millionGlobal Products $315 – $330 million
Corporate ItemsAdjusted2 effective tax rate 25 – 26%Adjusted2 EPS $2.06 – $2.18Capital expenditures $180 – $200 millionFree cash flow3 $260 – $300 million
1. For a discussion of management’s use of Key Business Measures, please refer to the Appendix.2. Denotes a forward-looking non-GAAP financial measure that Valvoline is unable to reconcile without unreasonable efforts, as the Company is currently unable to predict with a reasonable
degree of certainty the type and extent of certain items that would be expected to impact GAAP results but would not impact non-GAAP adjusted results. 3. For reconciliation of adjusted outlook amounts expected to be reported under GAAP and additional details, please refer to the Appendix.

16
17
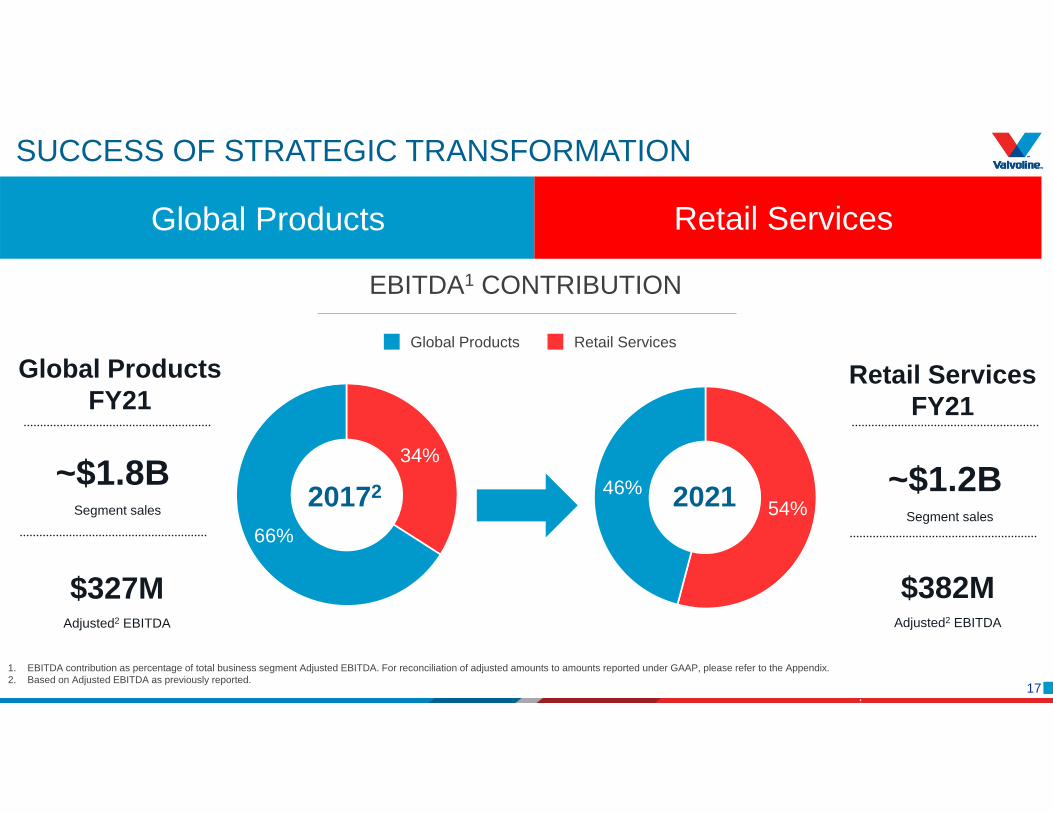
SUCCESS OF STRATEGIC TRANSFORMATION
54%46%
34%
66%
20172 2021
Global Products Retail Services
EBITDA1 CONTRIBUTION
Retail ServicesGlobal Products
1. EBITDA contribution as percentage of total business segment Adjusted EBITDA. For reconciliation of adjusted amounts to amounts reported under GAAP, please refer to the Appendix.2. Based on Adjusted EBITDA as previously reported.
~$1.8BSegment sales
$327MAdjusted2 EBITDA
Global ProductsFY21
~$1.2BSegment sales
$382MAdjusted2 EBITDA
Retail ServicesFY21
18
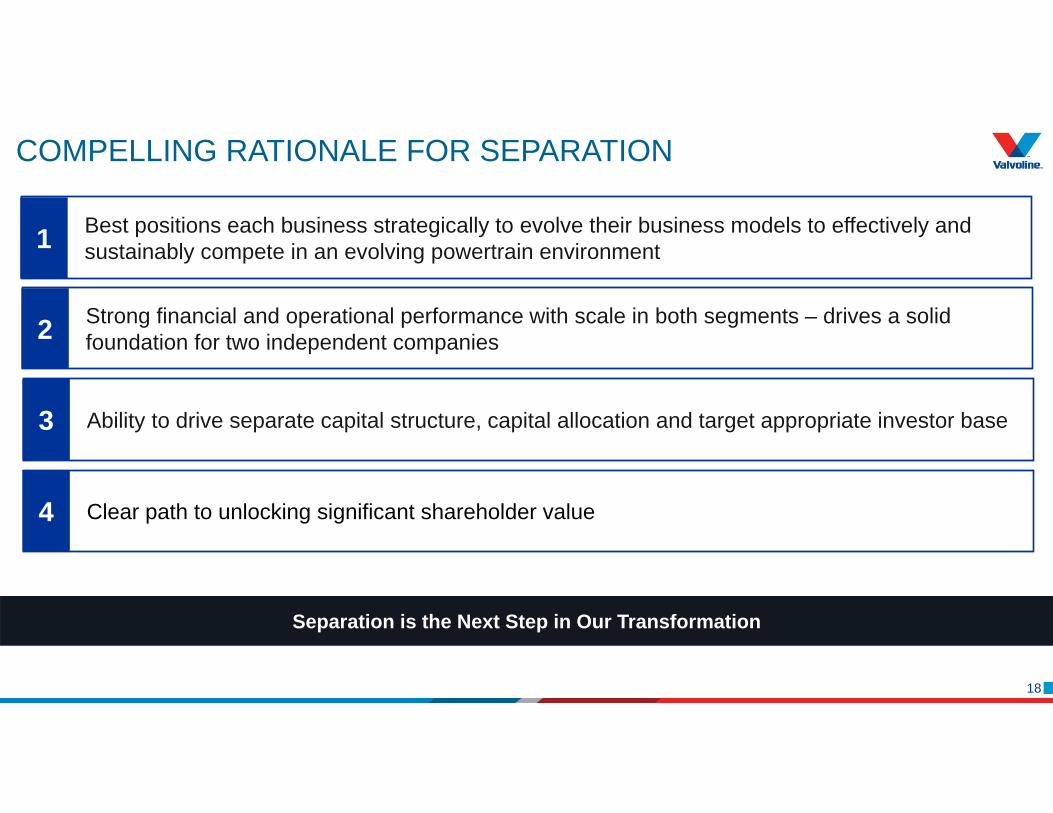
Ability to drive separate capital structure, capital allocation and target appropriate investor base
Clear path to unlocking significant shareholder value
Strong financial and operational performance with scale in both segments – drives a solid foundation for two independent companies
Best positions each business strategically to evolve their business models to effectively and sustainably compete in an evolving powertrain environment
3
4
2
1
Separation is the Next Step in Our Transformation
COMPELLING RATIONALE FOR SEPARATION

19
RETAIL SERVICES: AN AUTO-AFTERMARKET POWERHOUSE
Industry Dynamics
• Auto aftermarket services is a $300 billion, fragmented, and growing total addressable market
• Non-discretionary, economically resilient business model
• Levered to a growing car parc, increasing miles driven and vehicle complexity
• Data analytics are increasingly important to capture customers and optimize marketing
• Opportunity exists for a national, branded services provider with scale
Retail Services Strategy
• Utilize best in class operating model to continue taking market share
• Execute three-pronged growth strategy of company new builds, franchise developments and acquisitions
• Leverage proprietary data analytics from ~22M transactions to create distinct customer loyalty experience
• Service model evolution across passenger car including expansion into fleet service

20
2021E EV / EBITDA Multiple
Auto Aftermarket Service Peers (median)1,2
19.0 x
2018– 2021ERevenue CAGR 22.8% 9.2 %
2018 – 2021E EBITDA CAGR 23.7% 23.8 %
Valvoline Retail Services
2021EEBITDA Margin 31.3% 19.9 %
2022E EV / EBITDA Multiple 15.7 x
RETAIL SERVICES: A COMPELLING VALUE PROPOSITION
Source: Capital IQ, Eikon, Wall Street Research, Company FilingsNote: All peers calendarized to calendar year end, VVV metrics based on period ended 30-Sep-2021. EBITDA represents adjusted EBITDA for peers and VVV. 1. Market data as of October 21, 2021.2. Represents median of auto aftermarket companies including The Boyd Group, Driven Brands, Mister Carwash, Monro.
2020 – 2021E Same Store Sales Stack 23.5% 2.8%

21
GLOBAL PRODUCTS: A LEADING AUTOMOTIVE SOLUTIONS PROVIDER
Industry Dynamics
• Growing international car parc and miles driven creates lubricant demand
• International lubricant market is 3.5x U.S.
• Non-discretionary demand drives resilience
• Shift towards synthetic, premium lubricants drive margin expansion
• Slow growth, high FCF generation drives potential for consolidation
Global Products Strategy
• Drive market share gains in key international markets by leveraging VVV brand
• Leverage proprietary distribution footprint across all customer channels and segments to drive broader product portfolio penetration
• Utilize digital infrastructure, data analytics and proprietary distribution to drive pricing power
• Leverage R&D as the leading fluids provider for electric vehicles

22
2021E EV / EBITDA Multiple
Global Products Peers (median)1,2
12.1 x
2018 – 2021ERevenue CAGR 2.7% 2.8 %
2018 – 2021E EBITDA CAGR Flat 0.7 %
Valvoline Global Products
2021EEBITDA Margin 18.6% 15.6 %
2022E EV / EBITDA Multiple 11.0 x
Source: Capital IQ, Eikon, Wall Street Research, Company FilingsNote: No figures available for SSS growth. All peers calendarized to calendar year end, VVV metrics based on period ended 30-Sep-2021. EBITDA represents adjusted EBITDA for peers and VVV. 1. Market data as of October 21, 2021.2. Represents median of global products companies including Castrol (India), Fuchs, Innospec, NewMarket.
GLOBAL PRODUCTS: A COMPELLING VALUE PROPOSITION

23
KEY DECISIONS AND NEXT STEPS
Product Supply and Brand Agreements
Commercially beneficial arrangements for both Global Products and Retail Services
Transaction Structure
Multiple transaction structures under consideration
Tax basis1:Retail Services $0.7 - $0.8B
Global Products $0.6 - $1.3B
Pro Forma Capital Structures
Analysis to include debt, credit ratings and other considerations
1. Tax basis provided is unaudited and estimated through 9/30/2021. These management tax basis estimates are based on nonpublic pro-forma segment balance sheets, excluding cash and long-term debt, through 9/30/2020 and estimated adjustments for FY 2021 activity. Actual tax basis may be materially different depending on transaction structure, changes in segment or transferred assets and liabilities, and adjustments for FY 2021 actual results.

24
SUMMARY
• Record results in FY21
• Solid FY22 Plan
• Continue strong SSS performance and unit additions for Retail Services
• Topline growth in Global Products, building cost recovery
• Investments in organic growth, acquisitions and share buybacks
• Continue to focus on execution
• Working to set up each segment for long-term success via a separation

25
26
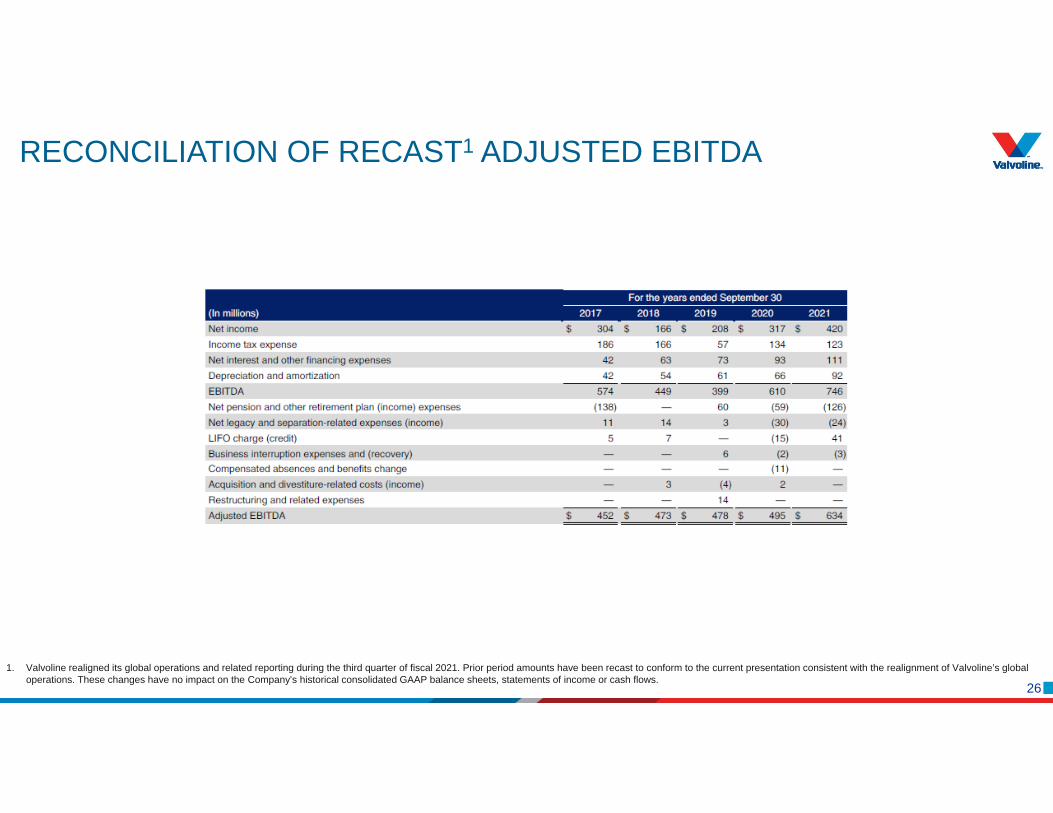
RECONCILIATION OF RECAST1 ADJUSTED EBITDA
1. Valvoline realigned its global operations and related reporting during the third quarter of fiscal 2021. Prior period amounts have been recast to conform to the current presentation consistent with the realignment of Valvoline’s global operations. These changes have no impact on the Company’s historical consolidated GAAP balance sheets, statements of income or cash flows.

27
PRE- AND POST REALIGNMENT1 ADJUSTED EBITDA
1. Valvoline realigned its global operations and related reporting during the third quarter of fiscal 2021. Prior period amounts have been recast to conform to the current presentation consistent with the realignment of Valvoline’s global operations. These changes have no impact on the Company’s historical consolidated GAAP balance sheets, statements of income or cash flows.

28
a) Measure includes Valvoline franchisees, which are independent legal entities. Valvoline does not consolidate the results of operations of its franchisees.b) Beginning in fiscal 2021, Valvoline determines SSS growth as sales by U.S. Retail Services stores, with new stores, including franchised conversions, excluded from the metric until the completion of their first full fiscal year in
operation. Previously, SSS growth was determined as sales by U.S. Retail Services stores, with stores new to the U.S. Retail Services system excluded from the metric until completion of their first full year in operation. Prior period measures have been revised to conform to the current basis of presentation.
c) Segment adjusted operating income is segment operating income adjusted for key items impacting comparability. Segment adjusted operating income is further adjusted for depreciation and amortization to determine segment adjusted EBITDA. Valvoline does not generally allocate activity below operating income to its operating segments; therefore, the table above reconciles operating income to Adjusted EBITDA.
d) Adjusted EBITDA margin is calculated as Adjusted EBITDA divided by segment sales.e) Income tax expense estimated using the adjusted effective tax rate for the period multiplied by operating segment adjusted operating income.f) Segment discretionary free cash flow is defined as operating segment adjusted operating income after-tax less maintenance capital expenditures.
RETAIL SERVICES – Q4 AND FISCAL YEAR RESULTS

29a) System-wide store count includes franchised service center stores. Valvoline franchises are independent legal entities, and Valvoline does not consolidate the results of operations of its franchisees.b) As of September 30, 2020, one franchised service center store included in the store count was temporarily closed at the discretion of the respective independent operator due to the impacts of COVID-19.
RETAIL SERVICES – STORE INFORMATION

30
a) Valvoline includes the United States and Canada in its North America region. Mexico is included within the Latin America region.b) Segment adjusted operating income is segment operating income adjusted for key items impacting comparability. Segment adjusted operating income is further adjusted for depreciation and amortization to
determine segment adjusted EBITDA. Valvoline does not generally allocate activity below operating income to its operating segments; therefore, the table above reconciles operating income to Adjusted EBITDA.c) Adjusted EBITDA margin is calculated as Adjusted EBITDA divided by segment sales.
GLOBAL PRODUCTS – Q4 AND FISCAL YEAR RESULTS

31
NON-GAAP OPERATING SEGMENT FINANCIAL RESULTS RECONCILIATION
a) Segment adjusted operating income is segment operating income adjusted for key items impacting comparability. Segment adjusted operating income is further adjusted for depreciation and amortization to determine segment adjusted EBITDA. Valvoline does not generally allocate activity below operating income to its operating segments; therefore, the table above reconciles operating income to Adjusted EBITDA.
b) Income tax expense estimated using the adjusted effective tax rate for the period multiplied by operating segment adjusted operating income. Segment discretionary free cash flow is defined as operating segment adjusted operating income after-tax less maintenance capital expenditures.

32
KEY ITEMS AFFECTING INCOME

33
RECONCILIATION OF NON-GAAP DATA – GROSS PROFIT AND OPERATING INCOME

34
(a) EBITDA is defined as net income, plus income tax expense, net interest and other financing expenses, and depreciation and amortization. Adjusted EBITDA is EBITDA adjusted for key items, as described in "Use of Non-GAAP Measures" within this appendix.
(b) Segment adjusted EBITDA represents the operations of the Company's two operating segments, including expenses associated with each segment's utilization of indirect resources. The costs of corporate functions, in addition to corporate and non-operational matters, or key items, are not included in segment adjusted EBITDA. The table above reconciles segment adjusted EBITDA to consolidated pre-tax income
RECONCILIATION OF NON-GAAP DATA – ADJUSTED EBITDA
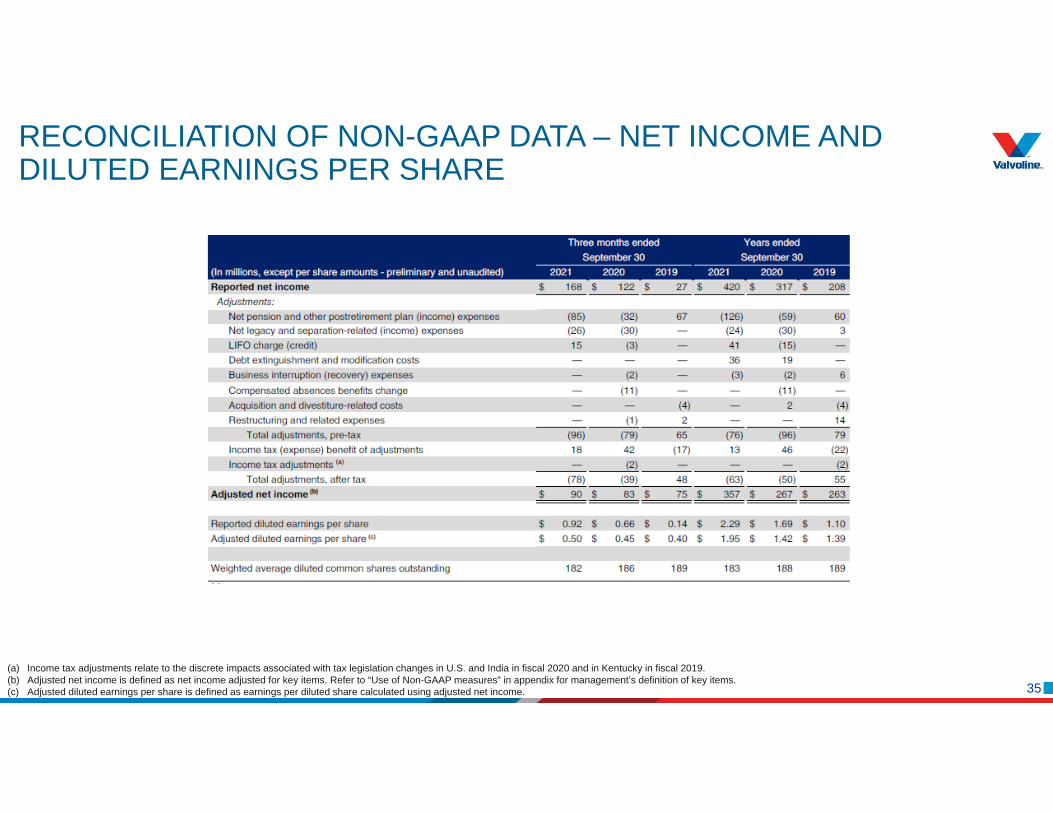
35(a) Income tax adjustments relate to the discrete impacts associated with tax legislation changes in U.S. and India in fiscal 2020 and in Kentucky in fiscal 2019.(b) Adjusted net income is defined as net income adjusted for key items. Refer to “Use of Non-GAAP measures” in appendix for management’s definition of key items.(c) Adjusted diluted earnings per share is defined as earnings per diluted share calculated using adjusted net income.
RECONCILIATION OF NON-GAAP DATA – NET INCOME AND DILUTED EARNINGS PER SHARE
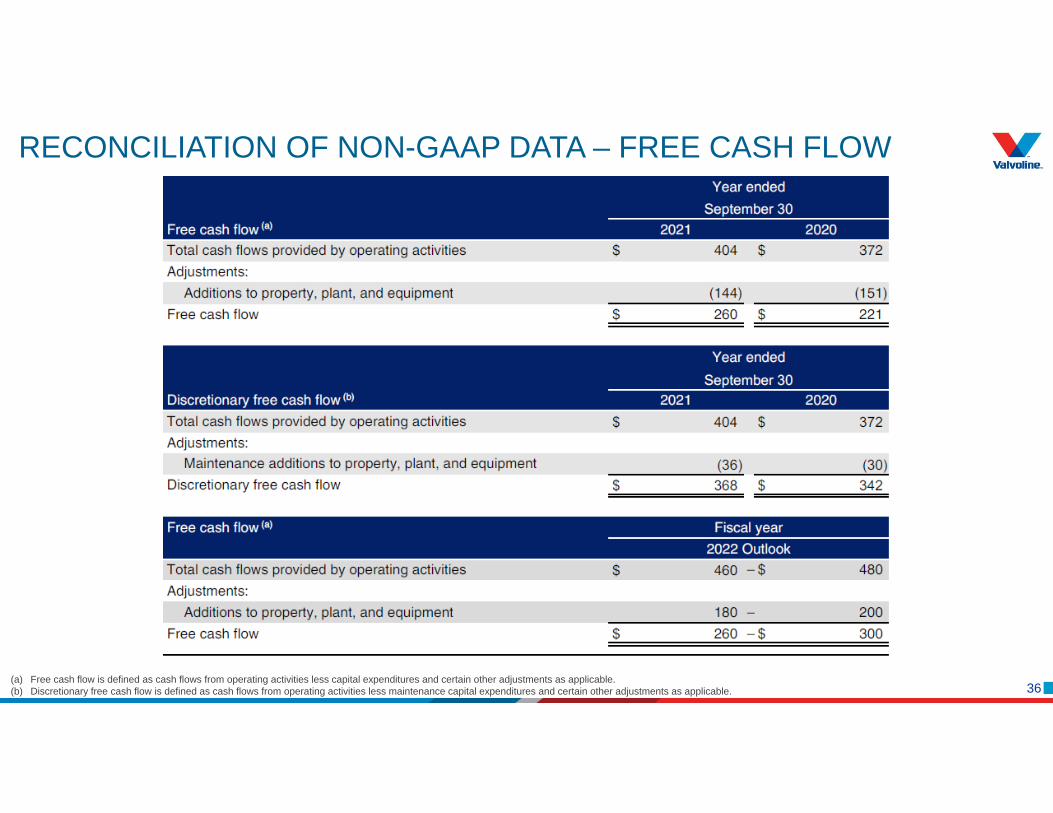
36(a) Free cash flow is defined as cash flows from operating activities less capital expenditures and certain other adjustments as applicable.(b) Discretionary free cash flow is defined as cash flows from operating activities less maintenance capital expenditures and certain other adjustments as applicable.
RECONCILIATION OF NON-GAAP DATA – FREE CASH FLOW

37
To supplement the financial measures prepared in accordance with U.S. GAAP, certain items within this presentation are presented on an adjusted basis. These non-GAAP measures, presented on both a consolidated and operating segment basis, have limitations as analytical tools and should not be considered in isolation from, or as an alternative to, or more meaningful than, the financial results presented in accordance with U.S. GAAP. The financial results presented in accordance with U.S. GAAP and the reconciliations of non-GAAP measures should be carefully evaluated. The non-GAAP information used by management may not be comparable to similar measures disclosed by other companies, because of differing methods used in calculating such measures.
This presentation includes the following non-GAAP measures: segment adjusted operating income, consolidated EBITDA, consolidated and segment adjusted EBITDA, consolidated adjusted net income and earnings per share, consolidated free cash flow, and consolidated and segment discretionary free cash flow. Refer to this appendix for management's definition of each non-GAAP measure and reconciliation to the most comparable U.S. GAAP measure.
Management believes the use of non-GAAP measures on a consolidated and operating segment basis provides a useful supplemental presentation of Valvoline's operating performance and allows for transparency with respect to key metrics used by management in operating the business and measuring performance. Management believes EBITDA measures provide a meaningful supplemental presentation of Valvoline’s operating performance between periods on a comparable basis due to the depreciable assets associated with the nature of the Company’s operations, income tax and interest costs related to Valvoline’s tax and capital structures, respectively.
Adjusted profitability measures enable comparison of financial trends and results between periods where certain items may vary independent of business performance. These adjusted measures exclude the impact of certain unusual, infrequent or non-operational activity not directly attributable to the underlying business, which management believes impacts the comparability of operational results between periods ("key items"). Key items are often related to legacy matters or market-driven events considered by management to not be reflective of the ongoing operating performance. Key items may consist of adjustments related to: legacy businesses, including the separation from Valvoline's former parent company and associated impacts of related indemnities; significant acquisitions or divestitures; restructuring-related matters; tax reform legislation; debt extinguishment and modification costs; and other matters that are non-operational or unusual in nature, including the following:
• Net pension and other postretirement plan expense/income - includes several elements impacted by changes in plan assets and obligations that are primarily driven by changes in the debt and equity markets, as well as those that are predominantly legacy in nature and related to prior service to the Company from employees (e.g., retirees, former employees and current employees with frozen benefits). These elements include (i)interest cost, (ii) expected return on plan assets, (iii) actuarial gains/losses, and (iv) amortization of prior service cost/credit. Significant factors that can contribute to changes in these elements include changes in discount rates used to remeasure pension and other postretirement obligations on an annual basis or upon a qualifying remeasurement, differences between actual and expected returns on plan assets, and other changes in actuarial assumptions, such as the life expectancy of plan participants. Accordingly, management considers that these elements may be more reflective of changes in current conditions in global financial markets (in particular, interest rates), outside the operational performance of the business, and are also primarily legacy amounts that are not directly related to the underlying business and do not have an immediate, corresponding impact on the compensation and benefits provided to eligible employees for current service. Adjusted profitability measures include the costs of benefits provided to employees for current service, including pension and other postretirement service costs.
• Changes in the last-in, first out (LIFO) inventory reserve - charges or credits recognized in Cost of sales to value certain lubricant inventories at the lower of cost or market using the LIFO method. During inflationary or deflationary pricing environments, the application of LIFO can result in variability of the cost of sales recognized each period as the most recent costs are matched against current sales, while preceding costs are retained in inventories. LIFO adjustments are determined based on published prices, which are difficult to predict and largely dependent on future events. The application of LIFO can impact comparability and enhance the lag period effects between changes in inventory costs and related pricing adjustments.
Management uses free cash flow and discretionary free cash flow as additional non-GAAP metrics of cash flow generation. By including capital expenditures and certain other adjustments, as applicable, management is able to provide an indication of the ongoing cash being generated that is ultimately available for both debt and equity holders as well as other investment opportunities. Free cash flow includes the impact of capital expenditures, providing a supplemental view of cash generation. Discretionary free cash flow includes maintenance capital expenditures, which are routine uses of cash that are necessary to maintain the Company's operations and provides a supplemental view of cash flow generation to maintain operations before discretionary investments in growth. Free cash flow and discretionary free cash flow have certain limitations, including that they do not reflect adjustments for certain nondiscretionary cash flows, such as mandatory debt repayments..
USE OF NON-GAAP MEASURES

38
Valvoline tracks its operating performance and manages its business using certain key measures, including system-wide, company-operated and franchised store counts and SSS; system-wide store sales; and lubricant volumes sold. Management believes these measures are useful to evaluating and understanding Valvoline’s operating performance and should be considered as supplements to, not substitutes for, Valvoline's sales and operating income, as determined in accordance with U.S. GAAP.
Sales in the Retail Services reportable segment are influenced by the number of service center stores and the business performance of those stores. Stores are considered open upon acquisition or opening for business. Temporary store closings remain in the respective store counts with only permanent store closures reflected in the activity and end of period store counts. SSS is defined as sales by U.S. Retail Services stores (company-operated, franchised and the combination of these for system-wide SSS), with new stores, including franchised conversions, excluded from the metric until the completion of their first full fiscal year in operation as this period is generally required for new store sales levels to begin to normalize.
Retail Services sales are limited to sales at company-operated stores, sales of lubricants and other products to independent franchisees and Express Care operators and royalties and other fees from franchised stores. Although Valvoline does not recognize store-level sales from franchised stores as sales in its Statements of Consolidated Income, management believes system-wide and franchised SSS comparisons, store counts, and total system-wide store sales are useful to assess market position relative to competitors and overall store and segment operating performance.
Management believes lubricant volumes sold in gallons by its consolidated subsidiaries is a useful measure in evaluating and understanding the operating performance of the Global Products segment. Volumes sold in other units of measure, including liters, are converted to gallons utilizing standard conversions.
KEY BUSINESS MEASURES