Embed Size (px)
Citation preview

Fourth Quarter and Full Year 2021 ResultsMarch 2022
1
DisclaimerThis presentation by Sea Limited (“Sea”) contains forward-looking statements. These statements are made under the “safe harbor” provisions of the U.S. PrivateSecurities Litigation Reform Act of 1995. These forward-looking statements can be identified by terminology such as “may,” “could,” “will,” “expect,” “anticipate,”“aim,” “future,” “intend,” “plan,” “believe,” “estimate,” “likely to,” “potential,” “confident,” “guidance,” and similar statements. Among other things, statements that arenot historical facts, including statements about Sea’s beliefs and expectations, the business, financial and market outlook, projections, and Sea’s strategic andoperational plans, contain forward-looking statements. Sea may also make written or oral forward-looking statements in its periodic reports to the U.S. Securities andExchange Commission (the “SEC”), in its annual report to shareholders, in press releases and other written materials and in oral statements made by its officers,directors or employees to third parties. Forward-looking statements involve inherent risks and uncertainties. A number of factors could cause actual results to differmaterially from those contained in any forward-looking statement, including but not limited to the following: Sea’s goals and strategies; its future businessdevelopment, financial condition, financial results, and results of operations; the growth in, and market size of, the digital entertainment, e-commerce and digitalfinancial services industries in the markets where it operates, including segments within those industries; expected changes in its revenue, costs or expenditures; itsability to continue to source, develop and offer new and attractive online games and to offer other engaging digital entertainment content; the growth of its digitalentertainment, e-commerce and digital financial services businesses; its expectations regarding growth in its user base, level of engagement, and monetization; itsability to continue to develop new technologies and/or upgrade its existing technologies; its expectations regarding the use of proceeds from its financing activities,including its follow-on offerings and convertible notes offerings; growth and trends of its markets and competition in its industries; government policies andregulations relating to its industries, including the effects of any government orders or actions on its businesses; general economic and business conditions in itsmarkets; and the impact of widespread health developments, including the COVID-19 pandemic, and the responses thereto (such as voluntary and in some cases,mandatory quarantines as well as shut downs and other restrictions on travel and commercial, social and other activities, and the availability of effective vaccines andtreatments) which could, among other things, impact the business and manufacturing activities of its ecosystem participants, disrupt the global supply chainincluding those of its sellers on its platforms and merchant partners, and negatively affect consumer discretionary spending. Further information regarding these andother risks is included in Sea’s filings with the SEC. All information provided in this presentation is as of the date hereof, and Sea undertakes no obligation to updateany forward-looking statement, except as required under applicable law.
This presentation contains certain financial measures that are not recognized under generally accepted accounting principles in the U.S. (“GAAP”), including“adjusted EBITDA,” “total adjusted EBITDA,” and “net loss excluding share-based compensation.” The reconciliation of those measures to the most comparable GAAPmeasures is contained within this presentation. The non-GAAP measures have limitations as an analytical tool and you should not consider them in isolation or as asubstitute for an analysis of the Company’s results under GAAP.
This presentation does not contain all relevant information relating to Sea or its securities, particularly with respect to the risks and special considerations involvedwith an investment in the securities of Sea. Nothing contained in this presentation shall be relied upon as a promise or representation as to the past or futureperformance of Sea.
Sea 4Q2021 & FY2021 Results |
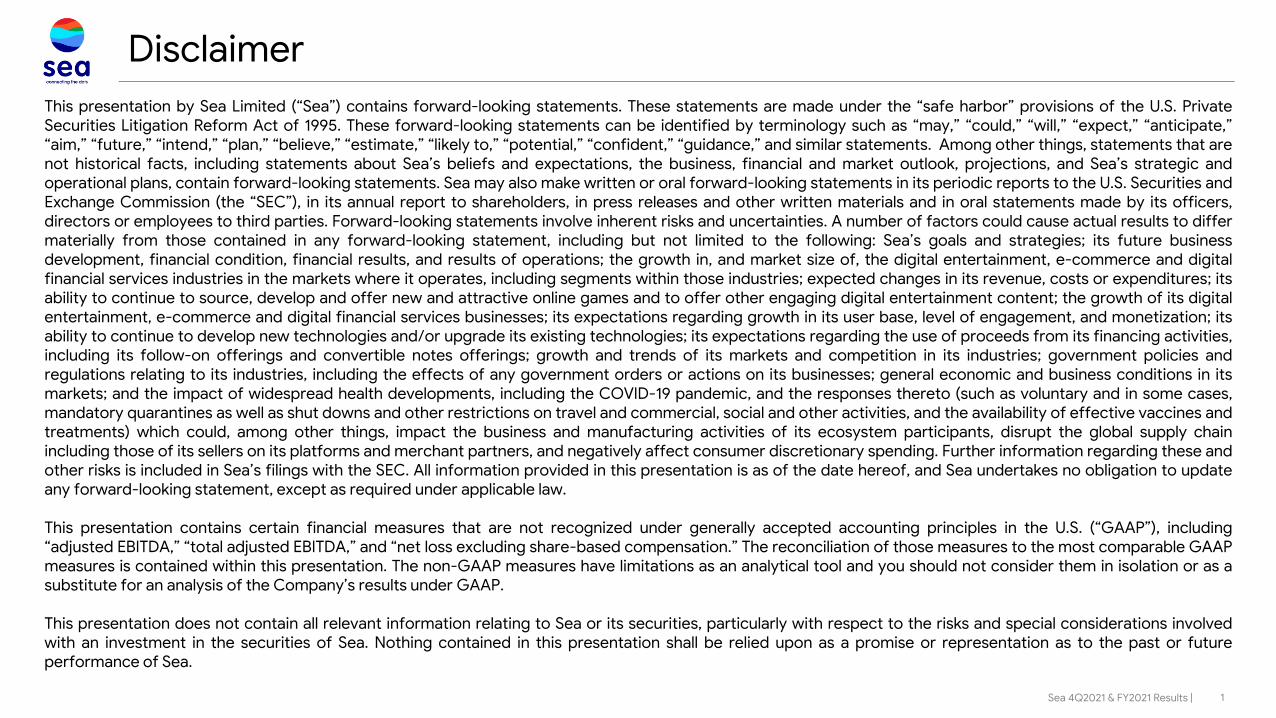
693.4
1,415.0
842.2
1,595.1
24.4
197.5
6.6
14.5
1,566.6
4Q 2020 4Q 2021
2
Group: Triple Digit Growth in GAAP Revenue
US$ Millions
Note: Financial figures are unaudited.1. A combination of multiple business activities that does not meet the quantitative thresholds to qualify as reportable segments are grouped together as “Other Services”.
DE GAAP Revenue
DFS GAAP Revenue
Other Services GAAP Revenue1
Sea 4Q2021 & FY2021 Results |
Total GAAP Revenue
EC GAAP Revenue
2,016.0
4,320.0
2,167.1
5,123.0
60.8
469.8
131.8
42.4
4,375.7
9,955.2
FY 2020 FY 2021
3,222.1
3
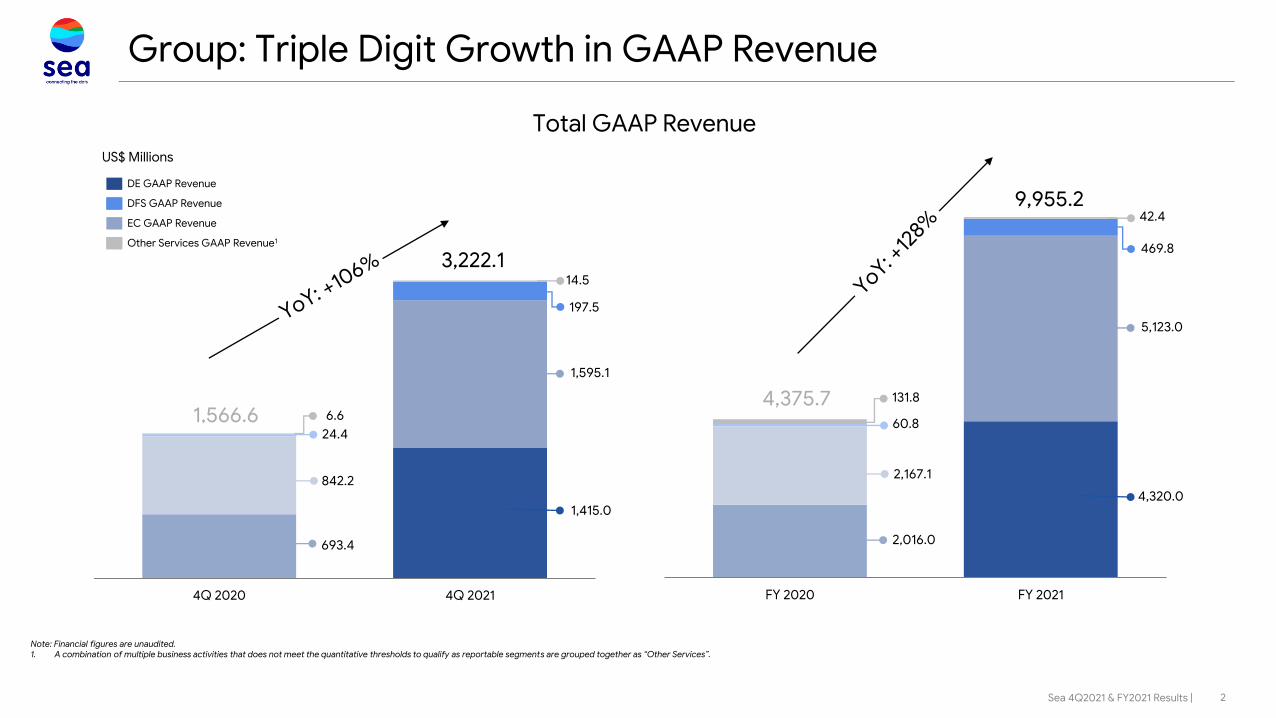
Group: Revenue Driven By Growth Across 3 Segments
Note: Financial figures are unaudited.1. GAAP revenue for the digital entertainment segment plus change in digital entertainment deferred revenue. This operating metric is used as an approximation of cash spent by our users in the applicable period that is attributable to our digital entertainment segment.
Sea 4Q2021 & FY2021 Results |
1.1
4Q 2020 1Q 2021 2Q 2021 3Q 2021 4Q 2021
1.6
4Q 2020 1Q 2021 2Q 2021 3Q 2021 4Q 2021
197.5
4Q 2020 1Q 2021 2Q 2021 3Q 2021 4Q 2021
US$ Billions US$ MillionsUS$ Billions
DE Bookings1 EC GAAP Revenue DFS GAAP Revenue

Digital Entertainment: Large Global User Base
4
Millions
Quarterly Active Users
654.0
4Q 2020 1Q 2021 2Q 2021 3Q 2021 4Q 2021
Millions
Quarterly Paying Users
77.2
4Q 2020 1Q 2021 2Q 2021 3Q 2021 4Q 2021
Sea 4Q2021 & FY2021 Results |
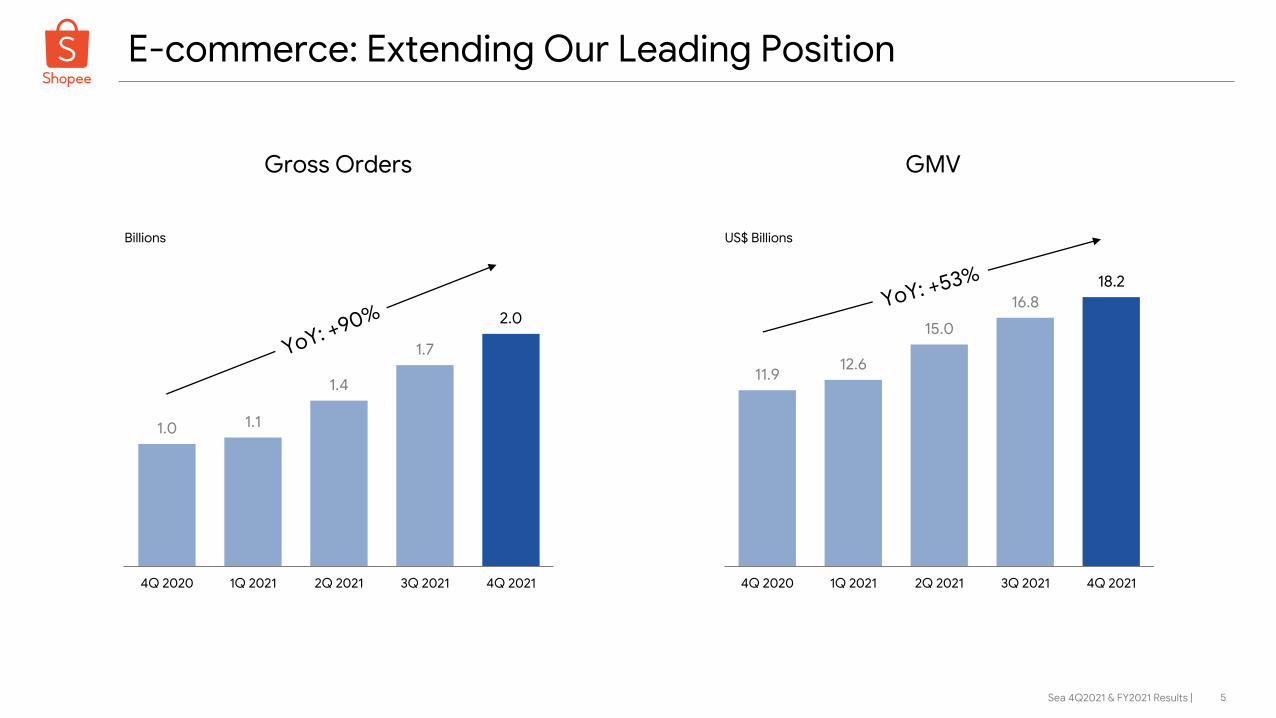
5
E-commerce: Extending Our Leading Position
Billions
2.0
4Q 2020 1Q 2021 2Q 2021 3Q 2021 4Q 2021
US$ Billions
GMV
18.2
4Q 2020 1Q 2021 2Q 2021 3Q 2021 4Q 2021
Gross Orders
Sea 4Q2021 & FY2021 Results |
6
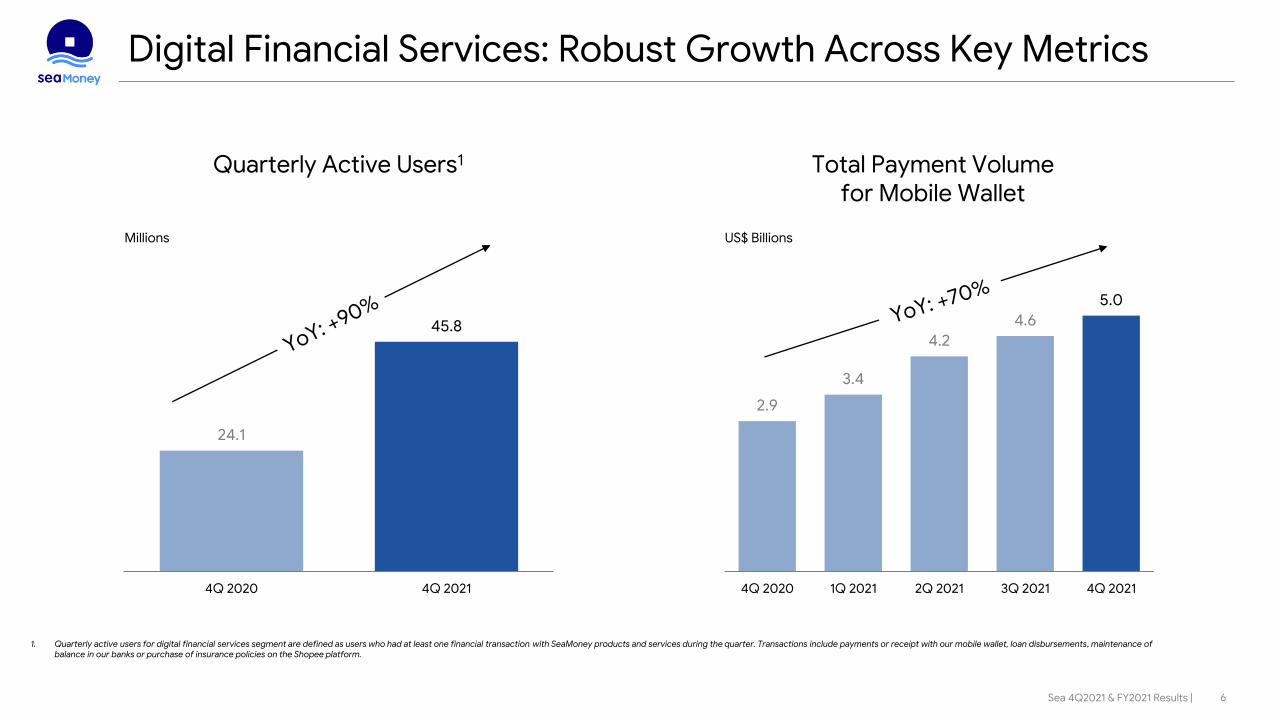
Digital Financial Services: Robust Growth Across Key Metrics
Sea 4Q2021 & FY2021 Results |
US$ Billions
Total Payment Volume for Mobile Wallet
5.0
4Q 2020 1Q 2021 2Q 2021 3Q 2021 4Q 2021
1. Quarterly active users for digital financial services segment are defined as users who had at least one financial transaction with SeaMoney products and services during the quarter. Transactions include payments or receipt with our mobile wallet, loan disbursements, maintenance of balance in our banks or purchase of insurance policies on the Shopee platform.
Millions
45.8
4Q 2020 4Q 2021
Quarterly Active Users1
7
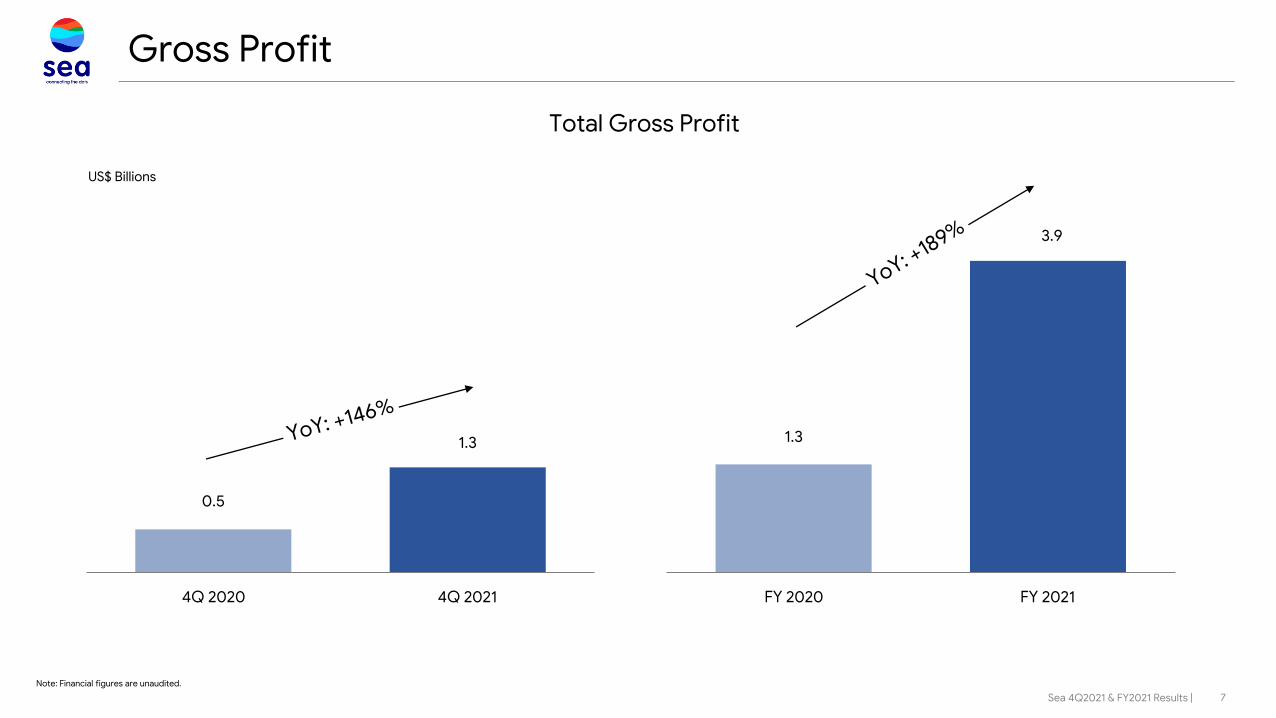
Gross Profit
Total Gross Profit
Note: Financial figures are unaudited.
US$ Billions
0.5
1.3
4Q 2020 4Q 2021
Sea 4Q2021 & FY2021 Results |
1.3
3.9
FY 2020 FY 2021
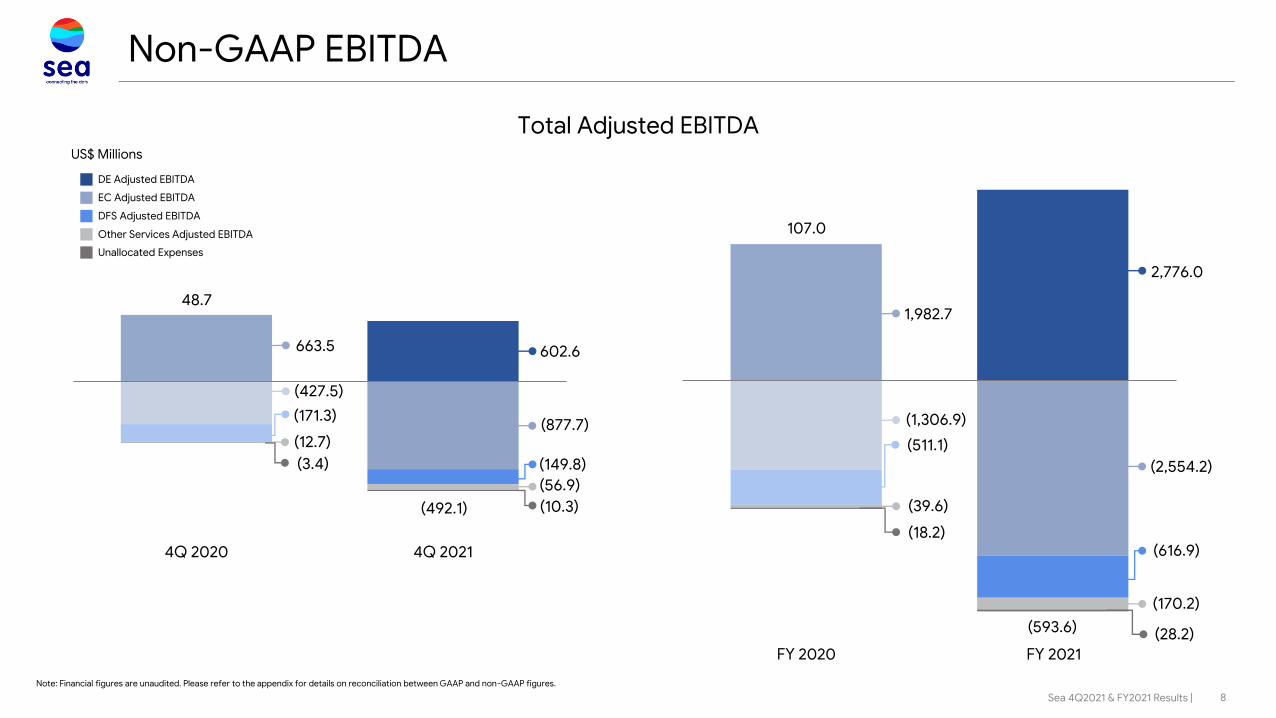
Other Services Adjusted EBITDA
Unallocated Expenses
DE Adjusted EBITDA
EC Adjusted EBITDA
DFS Adjusted EBITDA
8
Non-GAAP EBITDA
Total Adjusted EBITDA
Note: Financial figures are unaudited. Please refer to the appendix for details on reconciliation between GAAP and non-GAAP figures.
Sea 4Q2021 & FY2021 Results |
US$ Millions
1,982.7
2,776.0
(1,306.9)
(2,554.2)(511.1)
(616.9)
(39.6)
(170.2)
(18.2)
(28.2)(593.6)
FY 2020 FY 2021
663.5 602.6
(427.5)
(877.7)(171.3)
(149.8) (12.7)
(56.9)(3.4)
(10.3)
4Q 2020 4Q 2021
107.0
48.7
(492.1)

9
Cost and Expense Trends
1,032.8
1,911.4
4Q 2020 4Q 2021
US$ Millions
Cost of Revenue
189.0
318.6
4Q 2020 4Q 2021
US$ Millions
General & Administrative Expenses
665.2
1,219.9
4Q 2020 4Q 2021
US$ Millions
Sales & Marketing Expenses
109.5
286.6
4Q 2020 4Q 2021
US$ Millions
Research & Development Expenses
Note: Financial figures are unaudited.
Sea 4Q2021 & FY2021 Results |
10
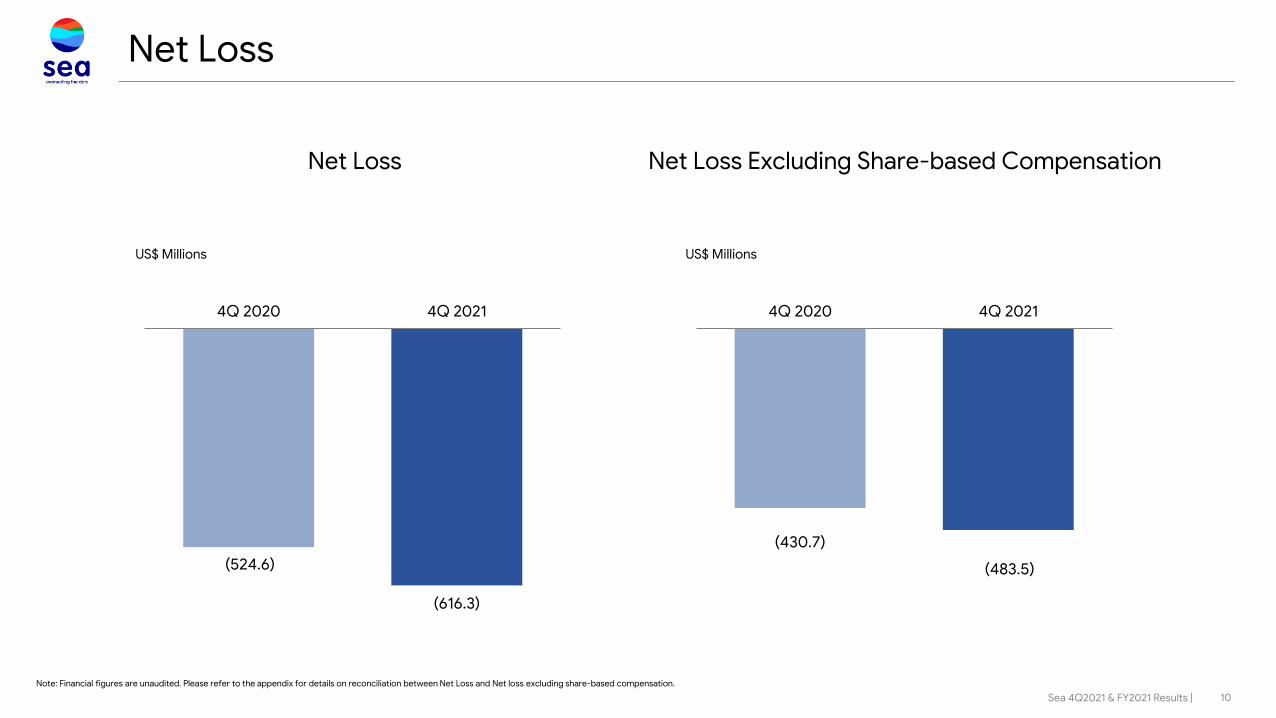
Net Loss
(524.6)
(616.3)
4Q 2020 4Q 2021
US$ Millions
Net Loss
(430.7)
(483.5)
4Q 2020 4Q 2021
Net Loss Excluding Share-based Compensation
US$ Millions
Note: Financial figures are unaudited. Please refer to the appendix for details on reconciliation between Net Loss and Net loss excluding share-based compensation.
Sea 4Q2021 & FY2021 Results |

Cash and Cash Equivalents and Short-term Investments
US$ Billions
1.0
3.2
6.3
10.2
FY 2018 FY 2019 FY 2020 FY 2021
Note: Financial figures are unaudited.
11Sea 4Q2021 & FY2021 Results |

Full Year 2022 Guidance
12
FY 2022 Guidance
Digital Entertainment Bookings US$2.9 Billion - US$3.1 Billion
E-commerce GAAP Revenue US$8.9 Billion - US$9.1 Billion75.7% YoY growth at midpoint
Digital Financial Services GAAP Revenue US$1.1 Billion - US$1.3 Billion155.4% YoY growth at midpoint
Sea 4Q2021 & FY2021 Results |
13
Appendix
Sea 4Q2021 & FY2021 Results |
14
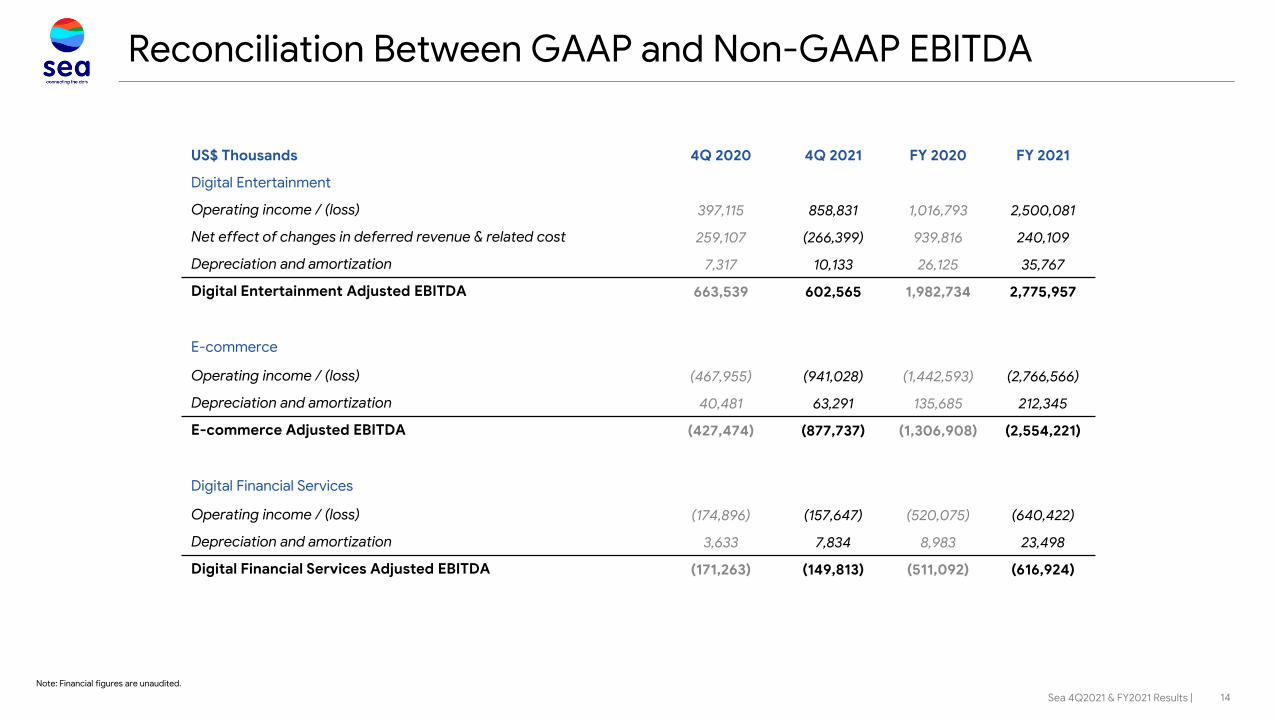
Reconciliation Between GAAP and Non-GAAP EBITDA
US$ Thousands 4Q 2020 4Q 2021 FY 2020 FY 2021
Digital Entertainment
Operating income / (loss) 397,115 858,831 1,016,793 2,500,081
Net effect of changes in deferred revenue & related cost 259,107 (266,399) 939,816 240,109
Depreciation and amortization 7,317 10,133 26,125 35,767
Digital Entertainment Adjusted EBITDA 663,539 602,565 1,982,734 2,775,957
E-commerce
Operating income / (loss) (467,955) (941,028) (1,442,593) (2,766,566)
Depreciation and amortization 40,481 63,291 135,685 212,345
E-commerce Adjusted EBITDA (427,474) (877,737) (1,306,908) (2,554,221)
Digital Financial Services
Operating income / (loss) (174,896) (157,647) (520,075) (640,422)
Depreciation and amortization 3,633 7,834 8,983 23,498
Digital Financial Services Adjusted EBITDA (171,263) (149,813) (511,092) (616,924)
Note: Financial figures are unaudited.
Sea 4Q2021 & FY2021 Results |

15
Reconciliation Between GAAP and Non-GAAP EBITDA
US$ Thousands 4Q 2020 4Q 2021 FY 2020 FY 2021
Other Services
Operating income / (loss) (14,335) (59,138) (49,006) (177,633)
Depreciation and amortization 1,667 2,279 9,455 7,422
Other Services Adjusted EBITDA (12,668) (56,859) (39,551) (170,211)
Group
Operating income / (loss) (357,325) (442,075) (1,303,325) (1,583,060)
Net effect of changes in deferred revenue & related cost 259,107 (266,399) 939,816 240,109
Depreciation and amortization 53,098 83,537 180,248 279,032
Share-based compensation 93,847 132,797 290,246 470,324
Total Adjusted EBITDA 48,727 (492,140) 106,985 (593,595)
Note: Financial figures are unaudited.
Sea 4Q2021 & FY2021 Results |
16
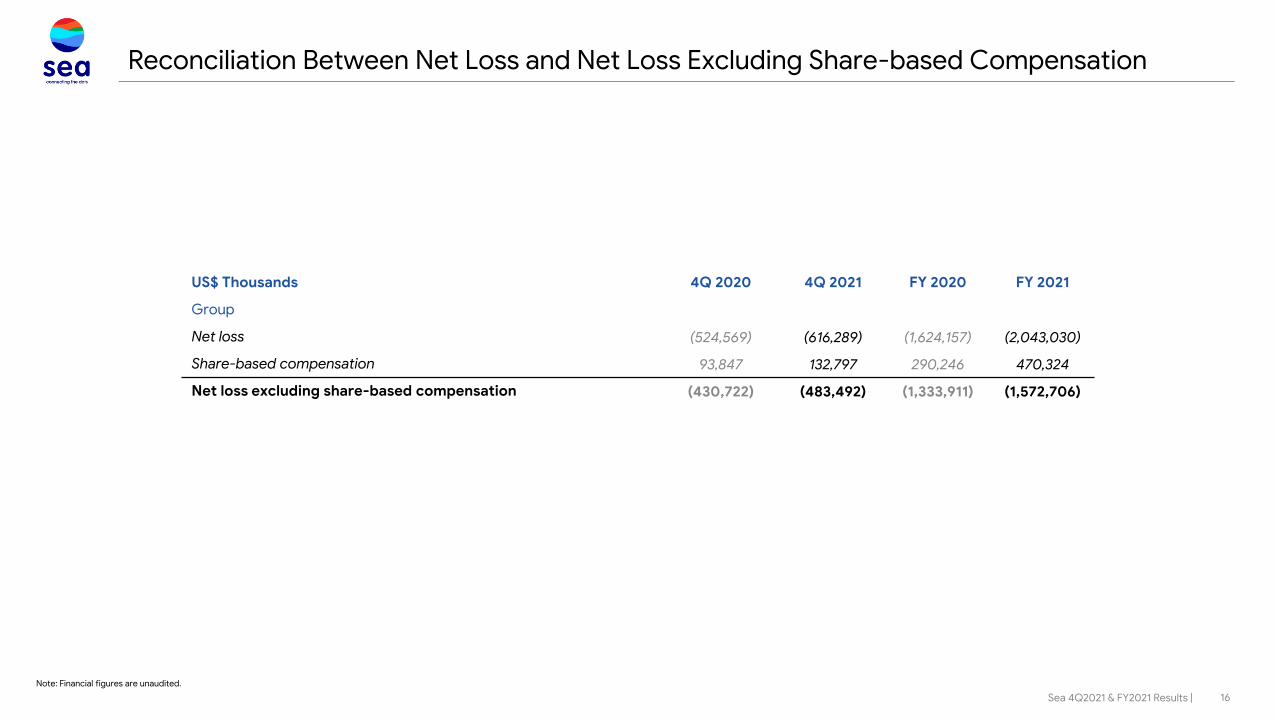
US$ Thousands 4Q 2020 4Q 2021 FY 2020 FY 2021
Group
Net loss (524,569) (616,289) (1,624,157) (2,043,030)
Share-based compensation 93,847 132,797 290,246 470,324
Net loss excluding share-based compensation (430,722) (483,492) (1,333,911) (1,572,706)
Note: Financial figures are unaudited.
Reconciliation Between Net Loss and Net Loss Excluding Share-based Compensation
Sea 4Q2021 & FY2021 Results |