Embed Size (px)
Citation preview

Press release
Information Quarterly statements are unaudited and not subject to any review.
Unless otherwise specified, indicated variations are expressed in comparison with the same period of the previous year. p.1/14
Meudon (France), May 18, 2022
Vallourec first quarter 2022 results
New initiatives launched to be cycle-proof
Q1 2022 results in line with expectations
• €916 million revenue, a 30% year-over-year increase led by North America
• €45 million reported EBITDA negatively impacted by the iron ore mine shutdown; normalized level of ~€130 million1
• €(230) million Free Cash Flow impacted by €(217) million working capital build-up reflecting higher forward volume expectations and raw material price increases
FY 2022 EBITDA now expected to be significantly above 2021, despite Q1 impacted by mine shutdown
€230 million of recurring EBITDA and €250 million ongoing cash up-lift (+€100 million compared to November 2021 announcement)
• Launching the closure process of German sites and refocusing European plants
• Streamline corporate structure to better manage a reshaped industrial footprint and a leaner organization
Philippe Guillemot, Chairman of the Board of Directors and Chief Executive Officer, declared:
“Stepping up the execution of our strategy with a stronger focus on value and performance will enable the
group to benefit further from its leading positions, with a resized industrial footprint and a more agile
organization. In the context of stronger E&P drilling fundamentals, Vallourec is ideally positioned to seize
attractive growth opportunities ahead. The group benefits from its unique assets, solid engineering culture,
strong customer relationships and global reach with market leading products. I am confident that the group
will deliver this year stronger profitability, significantly above last year’s. The group’s transformation will
also be driven by an increased focus on energy transition opportunities, preparing for a future low-carbon
economy. With this agile and entrepreneurial approach, we will build a new Vallourec that is stronger, more
efficient and innovative for the years to come.”
1 Normalized predominantly for operation of iron ore mine

Information Quarterly statements are unaudited and not subject to any review.
Unless otherwise specified, indicated variations are expressed in comparison with the same period of the previous year. p.2/14
Key figures
In € million Q1 2022 Q1 2021 Change Q4 2021
Production shipped (k tons) 395 358 10.3% 510
Revenue 916 702 30.5% 1,064
EBITDA 45 80 €(35)m 136
(as a % of revenue) 4.9% 11.4% (6.5)p.p. 12.8%
Operating income (loss) (17) 27 €(44)m 75
Net income, Group share (35) (93) €58m 89
Free cash-flow (230) (62) €(168)m 17
Net debt 1,213 2,364 €(1,151)m 958
I CONSOLIDATED REVENUE BY MARKET
In € million Q1 2022 Q1 2021 Change At constant
FX rates Q4 2021
Oil & Gas, Petrochemicals 623 410 51.7% 41.7% 709
Industry & Other 261 255 2.7% (3.0)% 306
Power Generation 32 37 (12.7)% (21.1)% 48
Total 916 702 30.5% 22.2% 1,064
In the first quarter of 2022, Vallourec recorded revenues of €916 million, up 30.5% compared with the first quarter of 2021 (+22.2% at constant exchange rates) reflecting:
• 8% currency conversion effect mainly related to EUR/USD and EUR/BRL
• 9% volume increase mainly driven by Oil & Gas in North America
• 22% price/mix effect
• (9)% mine and other impacts
Oil & Gas, Petrochemicals (68% of Q1 2022 consolidated revenue)
In Q1 2022, Oil & Gas revenue reached €552 million, a 52% increase year-on-year (+41.7% at constant exchange rates).
• In North America, Oil & Gas revenue almost tripled thanks to higher prices and volumes.
• In EA-MEA, Oil & Gas revenue decreased slightly, with comparable volumes but unfavorable mix
• In South America, revenue increased, mainly driven by higher volumes in project line pipes.
In Q1 2022, Petrochemicals revenue was €70 million, up 53% year-on-year (+41.8% at constant exchange rates) notably due to higher volumes and better prices in North America.
In Q1 2022, revenue for Oil & Gas and Petrochemicals amounted to €623 million, up 52% compared with Q1
2021 (+41.7% at constant exchange rates).

Information Quarterly statements are unaudited and not subject to any review.
Unless otherwise specified, indicated variations are expressed in comparison with the same period of the previous year. p.3/14
Industry & Other (28.5% of Q1 2022 consolidated revenue)
In Q1 2022, Industry & Other revenue amounted to €261 million, increasing by 3% year-on-year (-3% at constant exchange rates):
• In Europe, Industry revenue was up, reflecting price increase in particular in Mechanical Engineering
• In South America, Industry & Other revenue decreased reflecting the mine shutdown.
Power Generation (3.5% of Q1 2022 consolidated revenue)
In Q1 2022, Power Generation revenue amounted to €32 million, decreasing by 13% year-on-year (-21% at constant exchange rates).
II CONSOLIDATED RESULTS ANALYSIS
Q1 2022 consolidated results analysis
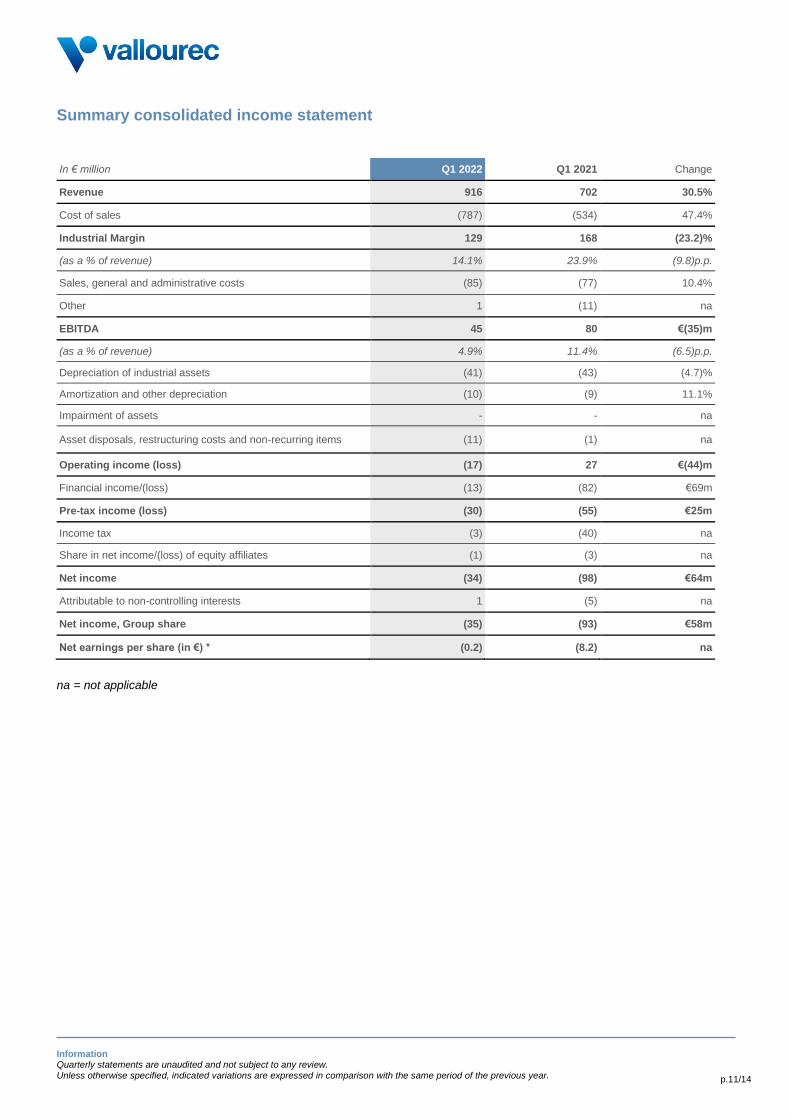
In Q1 2022, EBITDA amounted to €45 million (compared with €80 million in Q1 2021), and the EBITDA margin
stood at 4.9% of revenue (versus 11.4% in Q1 2021), as a result of:
• An industrial margin of €129 million, or 14.1% of revenue, versus €168 million and 23.9% of revenue in Q1
2021. The positive contribution of the Oil & Gas market in North America, both in volumes and prices, was
more than offset by the negative impact of the temporary suspension of the mine operations and by a less
favorable mix on Oil & Gas International markets.
• Sales, general and administrative costs (SG&A) at €85 million or 9.3% of revenue (versus 11.0% in Q1
2021) increasing by 10.4%.
The normalized level of EBITDA is approximately €130 million. The adjustment refers predominantly to the operations
of the iron ore mine.
Operating income was negative at €(17) million, compared to €27 million in Q1 2021, resulting mainly from lower
EBITDA.
Financial income was negative at €(13) million, compared with €(82) million in Q1 2021, reflecting the new balance
sheet structure and non-recurring financial expenses in Q1 2021.
Income tax expense was €(3) million compared to €(40) million in Q1 2021 reflecting the temporary curtailment of
the iron ore mine operations.
This resulted in a negative net income, Group share, of €(35) million, compared to €(93) million in Q1 2021.
Information Quarterly statements are unaudited and not subject to any review.
Unless otherwise specified, indicated variations are expressed in comparison with the same period of the previous year. p.4/14
III CASH FLOW & FINANCIAL POSITION
Cash flow from operating activities
In Q1 2022, cash flow from operating activities was positive at €21 million, compared to €13 million in Q1 2021;
the improvement reflected mainly financial expenses, as well as income tax paid.
Operating working capital requirement
In Q1 2022, operating working capital requirement increased by €(217) million, versus an increase of €(47)
million in Q1 2021, reflecting higher forward volume expectations and raw-material price increases. The net working
capital requirement, excluding the impact of IFRS 5, stood at 125 days of sales, compared to 104 days in Q1 2021.
Capex
Capital expenditure was €(34) million in Q1 2022, compared with €(28) million in Q1 2021.
Free cash flow
As a result, in Q1 2022, free cash flow was negative at €(230) million versus €(62) million in Q1 2021.
Asset disposals & other items
In Q1 2022, asset disposals & other items amounted to €(25) million, compared with €(89) million in Q1 2021.
Net debt and liquidity
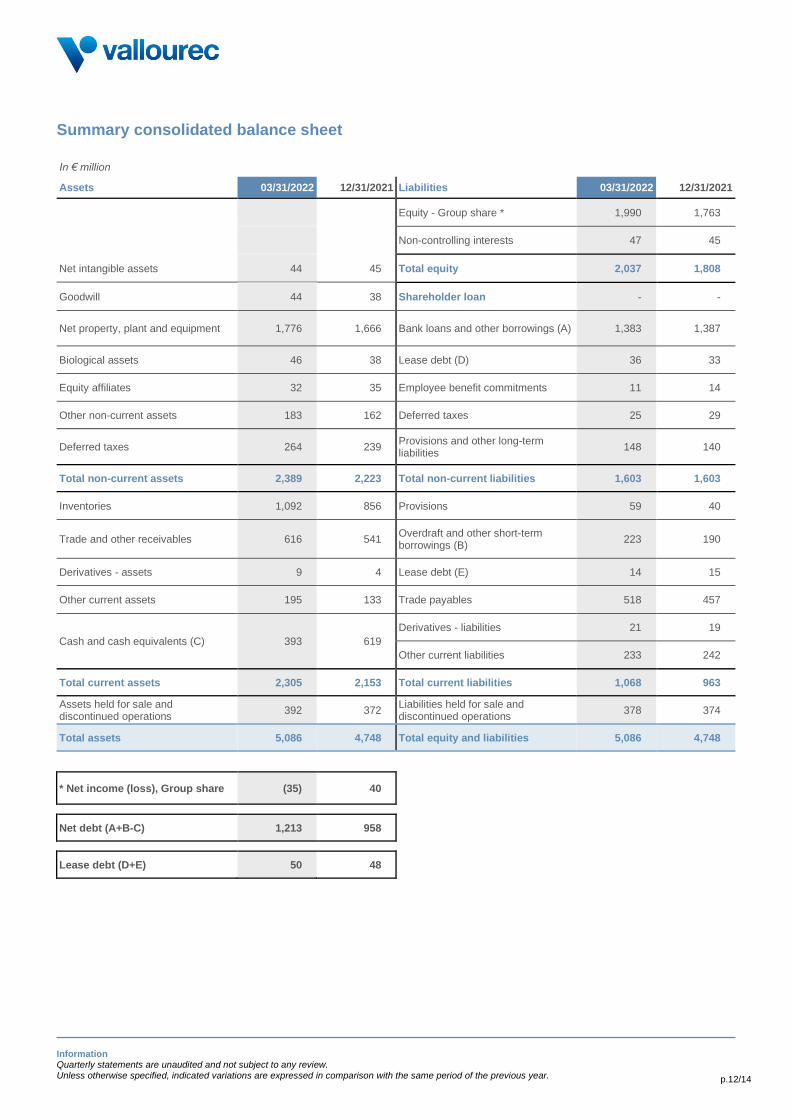
As of March 31, 2022, net debt stood at €1,213 million, compared with €958 million on December 31, 2021. As of
March 31, 2022, gross debt amounted to €1,606 million including €86 million of fair value adjustment under IFRS 9
(which will be reversed over the life of the debt). Long-term debt amounted to €1,383 million and short-term debt
totaled €223 million.
As of March 31, 2022, lease debt stood at €50 million following the application of IFRS 5 standards, compared with
€48 million on December 31, 2021.
The liquidity position was strong at €855 million, with cash amounting to €393 million and an undrawn committed
Revolving Credit Facility of €462 million.
IV UPDATE ON MINE
On January 8, 2022, following the exceptionally heavy rainfall in Minas Gerais State (Brazil), some material from the
waste pile associated with the operations of Vallourec’s Pau Branco mine slid into a rainwater dam (“the Lisa Dam”)
causing it to overflow, and resulting in the interruption of traffic on the nearby highway. The structure of the dam was
not affected, and there were no casualties. As a result of this incident, the operations of the mine have been
temporarily suspended.
On May 4, 2022, Vallourec partially restarted operations, after having obtained the approval of the mining authorities
to resume activities for a period of three months without using the waste pile. Under these temporary conditions,
Vallourec is targeting a progressive ramp-up from 70% to full capacity.
In parallel, Vallourec is continuing to prepare for a return to normal operations, subject to the validation of the stability
of the waste pile by the mining and state environmental authorities.

Information Quarterly statements are unaudited and not subject to any review.
Unless otherwise specified, indicated variations are expressed in comparison with the same period of the previous year. p.5/14
V SUPPORTIVE MARKET ENVIRONMENT
After several years of underinvestment, a global increase in Exploration and Production (E&P) capital spending is forecasted, driven notably by the tight OCTG market environment in North America. According to IHS Markit data, E&P drilling capex forecasts have been revised upwards by $173 billion in aggregate between the projections made in March 2021 and those issued a year later for the 2022-2025 period. Drilling activity is increasing again globally, with the current rig count up 63% from its Covid-19 trough. This situation reflects a tight OCTG market, particularly in North America, which benefits from a strong price environment. The Middle East region is also seeing high activity, particularly in the UAE and Iraq. North Africa is showing strong growth in its region while market conditions are remaining solid in South America. There nevertheless remains substantially more potential for further volume growth, with current rig count at only 78% of pre-Covid levels. OCTG prices are also recovering on the back of the restart of global demand and the increase of raw-material and energy prices.
VI LOOKING AHEAD FOR A NEW VALLOUREC
1. Pursue footprint reshaping
Launch closure process of German sites
In November 2021, Vallourec decided to launch the disposal process of all its German manufacturing assets in order
to find a new operator, better positioned to profitably serve the European Industry markets. The disposal process has
been carried out and no credible buyer has been identified. As a result, Vallourec is launching the closure process
of its German assets which will result in a 685kt reduction in less competitive rolling capacity.
The closure process will take place over the next two years and will include the sale of the land and buildings.
German rolling activity for Oil & Gas relocated to Brazil
This transfer will require €110 million of capex in our Brazilian operations to support the transition of premium tubular
volumes from Europe by end 2023.
Impact of the closure of German assets on the other European assets
The closure of the German assets implies a further rationalization of the other European assets which were finishing
tubes rolled in Germany.
This rationalization will entail the consolidation of all European threading activities in a single location in Aulnoye in
France. The Group will launch the closure process of the heat treatment line of Saint-Saulve in France and of the
threading line in Bellshill in Scotland. In addition, Vallourec will complete the divestiture of Vallourec Bearing Tubes.
Research & Development
Aulnoye Competence Center will lead ‘one R&D’ organization.
The completion of this footprint reshape will allow Vallourec to benefit from a lower-cost manufacturing base capable
of serving worldwide O&G markets. This reorganization is targeted to generate €130 million of run-rate EBITDA
and a €20 million capex reduction. The associated headcount reduction2 should be approximatively 2,400
The implementation of these measures is subject to consultation of the employee representatives.
2 Refers to permanent employees

Information Quarterly statements are unaudited and not subject to any review.
Unless otherwise specified, indicated variations are expressed in comparison with the same period of the previous year. p.6/14
2. Streamline corporate structure to better manage a reshaped industrial footprint and a leaner
organization
In addition to the reshape of Vallourec’s footprint, the Group has launched a comprehensive program aiming to
streamline global overheads in-line with its new manufacturing footprint, representing a major step to lower the break-
even point and create a cycle-proof company that is free cash flow-positive at the bottom of the cycle.
These measures encompass the following:
• A leaner organization in all regions (North America, South America and Eastern Hemisphere): the Group
will move its main manufacturing base to Americas.
• Lower overheads and central costs: the Group will further downsize the headquarter functions which will be
primarily focused on strategy and expertise.
• Higher productivity: the Group will implement process automation for all transactional processes and will
consolidate support functions in larger Shared Services Centers to leverage the Company’s scale.
• Focus on value-creating projects: selective approach to R&D and IT projects with careful return on
investment parameters and interface with a broader strategic vision. The Group will create one global R&D
organization securing consistency and focusing resources on key strategic developments.
• Support functions close to production sites: the Group targets to locate more than 50% of its support functions
in the Americas. The Industrial support will be located in production sites.
With this initiative, the Group aims to generate €100 million of additional run-rate EBITDA. The associated
headcount reduction3 should be approximatively 550
The implementation of these measures is subject to consultation of the employee representatives.
Combined, these initiatives will reduce CO2 emissions (the CO2 content of a tube produced in Brazil is 30%
lower than of a tube produced in Germany) and lead to €230 million of recurring EBITDA and €250 million
ongoing cash up-lift. The execution is expected to be finalized in Q1 2024
Preparing the future low-carbon economy
Appointment of Ulrika Wising
On May 2, 2022, Vallourec announced the appointment of Ulrika Wising as Senior Vice President Energy Transition.
Ulrika has a solid energy transition and corporate development background. She reports to Philippe Guillemot and
will play a key role in Vallourec's ongoing transformation. She will strengthen the focus and commitments to energy
transition and will be responsible for accelerating and developing new profitable business opportunities for the Group.
A committed player with a clear roadmap
In 2020, Vallourec announced its ambition to reduce its direct and indirect carbon emissions by 2025, taking 2017 as
baseline year. These objectives were approved by the Science Based Targets initiative (SBTi), and Vallourec became
the first company in the Oil & Gas sector to obtain this recognition4. The Group, which is already a low emitter of
greenhouse gases, is committed to:
• reducing its direct emissions by 20% (Scopes 1 & 2);
• reducing both direct and indirect emissions by 25% (Scopes 1, 2 & 3).
In December 2021, Vallourec announced that it was again part of the "A List" compiled by the CDP. This
accomplishment serves as a recognition for the Company's transparency and leadership on climate issues.
3 Refers to permanent employees 4 It should be noted that SBTi classifies Vallourec in the “Mining – Iron, Aluminum, Other Metals” sector when assessing its targets. However, given that
Vallourec derives the bulk of its revenue from the Oil & Gas sector, the Company compared itself to SBTi’s “Oil & Gas” category, and no company in
this sector has had its roadmap validated by SBTi.

Information Quarterly statements are unaudited and not subject to any review.
Unless otherwise specified, indicated variations are expressed in comparison with the same period of the previous year. p.7/14
Concretely, in terms of ton of CO2 emitted to produce a tube, Vallourec is clearly a best-in-class actor. The Group
consumes 1.796 ton of CO2 per ton of tube produced versus 2 tons on average for peers5.
Investment in Closed Loop Geothermal Company GreenFire Energy
On May 3, 2022, Vallourec announced an investment in GreenFire Energy Inc., an American start-up developing
Advanced Geothermal Systems based on its innovative technology called GreenFire’s GreenLoop™. This
transaction was carried out alongside other major investors, Baker Hughes and Helmerich & Payne.
Vallourec and GreenFire Energy have been working together since 2019 on several successful Closed- Loop
Geothermal demonstrators in various fields. Vallourec THERMOCASE® Vacuum Insulated Tubing (VIT) is a key
enabler of closed loop geothermal systems: these thermally insulated pipes allow the harvesting of underground heat
and bring it to the surface (as hot water or steam) with minimal losses. Thanks to its leading edge in VIT with its
THERMOCASE® product range, Vallourec will be able to support GFE by designing and manufacturing bespoke
solutions for their downhole heat exchanger. While conventional geothermal systems rely on the exploitation of
geothermal resources in very specific areas, Advanced Geothermal Systems – such as the one developed by
GreenFire Energy - could unlock the possibility of producing energy virtually anywhere.
New steps in the Carbon Capture and Storage (CCS) and Hydrogen fields
For the injection of super critical CO2 into carbon storage wells, VAM Top® connections have been tested for specific
conditions requiring low temperature (-80°C) and a very sudden temperature drop under severe loading conditions,
with full-scale samples. This has been validated by customers including Oil & Gas technology leaders.
Due to the small size and low viscosity of the molecule, hydrogen is known to be a difficult gas to contain. Vallourec
is the first company to have tested and validated full leak-tightness of the VAM® 21 connection with 100% hydrogen
content up to 560 bar that are even more stringent than those required for future storage wells.
VII 2022 OUTLOOK
Oil & Gas
In North America, the very favorable market conditions should continue and even improve in H2 2022, in both price
and volume terms.
In EA-MEA, volumes are expected to significantly recover from Q2 onward; cost increases to be passed on to
customers.
In South America, volumes are expected to increase leading to margin increase throughout the year.
Industry & Other
In Europe, prices are expected to increase to fully offset cost inflation.
In Brazil, volumes are expected to increase slightly, with price increases fully offsetting cost inflation. Vallourec has
partially restarted mining operations, while H2 activity depends on validation of waste pile stability by the authorities.
FY 2022 consensus estimates for iron ore average prices c.$130/MT6.
Based on these market trends and assumptions, particularly related to the operations of the iron ore mine,
EBITDA is now expected to increase significantly for FY 2022 compared to prior year.
Other
Capex is expected to be slightly above €200 million, including approximately €50 million for the preparation of the
transfer of operations from Germany to Brazil.
5 The carbon footprint of our products is based on EPD International PCR 2012:01 standard and certified ISO 14025 & EN 15804+A1 6 Capital IQ: ~$130/MT
Information Quarterly statements are unaudited and not subject to any review.
Unless otherwise specified, indicated variations are expressed in comparison with the same period of the previous year. p.8/14
Information and Forward-Looking Statements
This press release may include forward-looking statements. These forward-looking statements can be identified by the use of
forward-looking terminology, including the terms as “believe”, “expect”, “anticipate”, “may”, “assume”, “plan”, “intend”, “will”,
“should”, “estimate”, “risk” and or, in each case, their negative, or other variations or comparable terminology. These forward-
looking statements include all matters that are not historical facts and include statements regarding the Company’s intentions,
beliefs or current expectations concerning, among other things, Vallourec’s results of operations, financial condition, liquidity,
prospects, growth, strategies and the industries in which they operate. By their nature, forward-looking statements involve risks
and uncertainties because they relate to events and depend on circumstances that may or may not occur in the future. These
risks include those developed or identified in the public documents filed by Vallourec with the French Financial Markets Authority
(Autorité des marches financiers, or “AMF”), including those listed in the “Risk Factors” section of the Registration Document filed
with the AMF on April 19, 2022, under filing number n° D.22-0305. Readers are cautioned that forward-looking statements are not
guarantees of future performance and that Vallourec’s or any of its affiliates’ actual results of operations, financial condition and
liquidity, and the development of the industries in which they operate may differ materially from those made in or suggested by
the forward-looking statements contained in this press release. In addition, even if Vallourec’s or any of its affiliates’ results of
operations, financial condition and liquidity, and the development of the industries in which they operate are consistent with the
forward-looking statements contained in this press release, those results or developments may not be indicative of results or
developments in subsequent periods.
Presentation of Q1 2022 results
Analyst conference call / audio webcast on Thursday, May 19th at 10:00 am (Paris time) to be held in English.
• To listen to the audio webcast:
https://channel.royalcast.com/landingpage/vallourec-en/20220519_2/
• To participate in the conference call, please dial (password to use is “Vallourec”):
o +44 (0) 33 0551 0200 (UK) o +33 (0) 1 70 37 71 66 (France) o +1 212 999 6659 (USA)
• Audio webcast replay and slides will be available on the website at: https://www.vallourec.com/en/investors
About Vallourec
Vallourec is a world leader in premium tubular solutions for the energy markets and for demanding industrial applications such as oil & gas wells in harsh environments, new generation power plants, challenging architectural projects, and high-performance mechanical equipment. Vallourec’s pioneering spirit and cutting edge R&D open new technological frontiers. With close to 17,000 dedicated and passionate employees in more than 20 countries, Vallourec works hand-in-hand with its customers to offer more than just tubes: Vallourec delivers innovative, safe, competitive and smart tubular solutions, to make every project possible.
Listed on Euronext in Paris (ISIN code: FR0013506730, Ticker VK), Vallourec is part of the CAC Mid 60, SBF 120 and Next 150 indices and is eligible for Deferred Settlement Service. In the United States, Vallourec has established a sponsored Level 1 American Depositary Receipt (ADR) program (ISIN code: US92023R4074, Ticker: VLOWY). Parity between ADR and a Vallourec ordinary share has been set at 5:1.

Information Quarterly statements are unaudited and not subject to any review.
Unless otherwise specified, indicated variations are expressed in comparison with the same period of the previous year. p.9/14
Calendar
May 24th 2022
July 27th 2022
Shareholders’ Annual Meeting
Release of second quarter and first half 2022 results
For further information, please contact:
Investor relations Jérôme Friboulet Tel : +33 (0)1 49 09 39 77 [email protected]
Press relations Héloïse Rothenbühler Tel: +33 (0)1 41 03 77 50 [email protected]
Individual shareholders Toll Free Number (from France): 0 800 505 110
Appendices Due to rounding, numbers presented throughout this and other documents may not add up precisely to the totals provided and percentages may not precisely reflect the absolute figures. Documents accompanying this release:
• Sales volume
• Forex
• Revenue by geographic region
• Revenue by market
• Summary consolidated income statement
• Summary consolidated balance sheet
• Free cash flow
• Cash flow statement
• Definitions of non-GAAP financial data

Information Quarterly statements are unaudited and not subject to any review.
Unless otherwise specified, indicated variations are expressed in comparison with the same period of the previous year. p.10/14
Sales volume
In thousands of tons 2022 2021 Change
Q1 395 358 10.3%
Q2 381 -
Q3 391 -
Q4 510 -
Total 1,640 -
Forex
Average exchange rate Q1 2022 Q1 2021
EUR / USD 1.12 1.20
EUR / BRL 5.87 6.60
USD / BRL 5.23 5.48
Revenue by geographic region
In € million Q1 2022 As % of revenue
Q1 2021 As % of revenue
Change
Europe 142 15.6% 113 16.1% 25.9%
North America (Nafta) 346 37.8% 115 16.4% 200%
South America 207 22.5% 226 32.2% (8.6)%
Asia and Middle East 178 19.4% 198 28.2% (10.1)%
Rest of the world 43 4.7% 49 7.0% (13.4)%
Total 916 100% 702 100% 30.5%
Revenue by market
In € million Q1 2022 As % of revenue
Q1 2021 As % of revenue
Change
Oil & Gas 552 60.3% 364 51.9% 51.6%
Petrochemicals 70 7.7% 46 6.6% 52.5%
Oil & Gas, Petrochemicals 623 68.0% 410 58.4% 51.7%
Mechanicals 142 15.5% 94 13.4% 51.2%
Automotive 23 2.5% 19 2.7% 22.2%
Construction & Other 96 10.5% 142 20.2% (32.1)%
Industry & Other 261 28.5% 255 36.3% 2.7%
Power Generation 32 3.5% 37 5.2% (12.7)%
Total 916 100% 702 100% 30.5%
Information Quarterly statements are unaudited and not subject to any review.
Unless otherwise specified, indicated variations are expressed in comparison with the same period of the previous year. p.11/14
Summary consolidated income statement
In € million Q1 2022 Q1 2021 Change
Revenue 916 702 30.5%
Cost of sales (787) (534) 47.4%
Industrial Margin 129 168 (23.2)%
(as a % of revenue) 14.1% 23.9% (9.8)p.p.
Sales, general and administrative costs (85) (77) 10.4%
Other 1 (11) na
EBITDA 45 80 €(35)m
(as a % of revenue) 4.9% 11.4% (6.5)p.p.
Depreciation of industrial assets (41) (43) (4.7)%
Amortization and other depreciation (10) (9) 11.1%
Impairment of assets - - na
Asset disposals, restructuring costs and non-recurring items (11) (1) na
Operating income (loss) (17) 27 €(44)m
Financial income/(loss) (13) (82) €69m
Pre-tax income (loss) (30) (55) €25m
Income tax (3) (40) na
Share in net income/(loss) of equity affiliates (1) (3) na
Net income (34) (98) €64m
Attributable to non-controlling interests 1 (5) na
Net income, Group share (35) (93) €58m
Net earnings per share (in €) * (0.2) (8.2) na
na = not applicable
Information Quarterly statements are unaudited and not subject to any review.
Unless otherwise specified, indicated variations are expressed in comparison with the same period of the previous year. p.12/14
Summary consolidated balance sheet In € million
Assets 03/31/2022 12/31/2021 Liabilities 03/31/2022 12/31/2021
Equity - Group share * 1,990 1,763
Non-controlling interests 47 45
Net intangible assets 44 45 Total equity 2,037 1,808
Goodwill 44 38 Shareholder loan - -
Net property, plant and equipment 1,776 1,666 Bank loans and other borrowings (A) 1,383 1,387
Biological assets 46 38 Lease debt (D) 36 33
Equity affiliates 32 35 Employee benefit commitments 11 14
Other non-current assets 183 162 Deferred taxes 25 29
Deferred taxes 264 239 Provisions and other long-term liabilities
148 140
Total non-current assets 2,389 2,223 Total non-current liabilities 1,603 1,603
Inventories 1,092 856 Provisions 59 40
Trade and other receivables 616 541 Overdraft and other short-term borrowings (B)
223 190
Derivatives - assets 9 4 Lease debt (E) 14 15
Other current assets 195 133 Trade payables 518 457
Cash and cash equivalents (C) 393 619
Derivatives - liabilities 21 19
Other current liabilities 233 242
Total current assets 2,305 2,153 Total current liabilities 1,068 963
Assets held for sale and discontinued operations
392 372 Liabilities held for sale and discontinued operations
378 374
Total assets 5,086 4,748 Total equity and liabilities 5,086 4,748
* Net income (loss), Group share (35) 40
Net debt (A+B-C) 1,213 958
Lease debt (D+E) 50 48
Information Quarterly statements are unaudited and not subject to any review.
Unless otherwise specified, indicated variations are expressed in comparison with the same period of the previous year. p.13/14
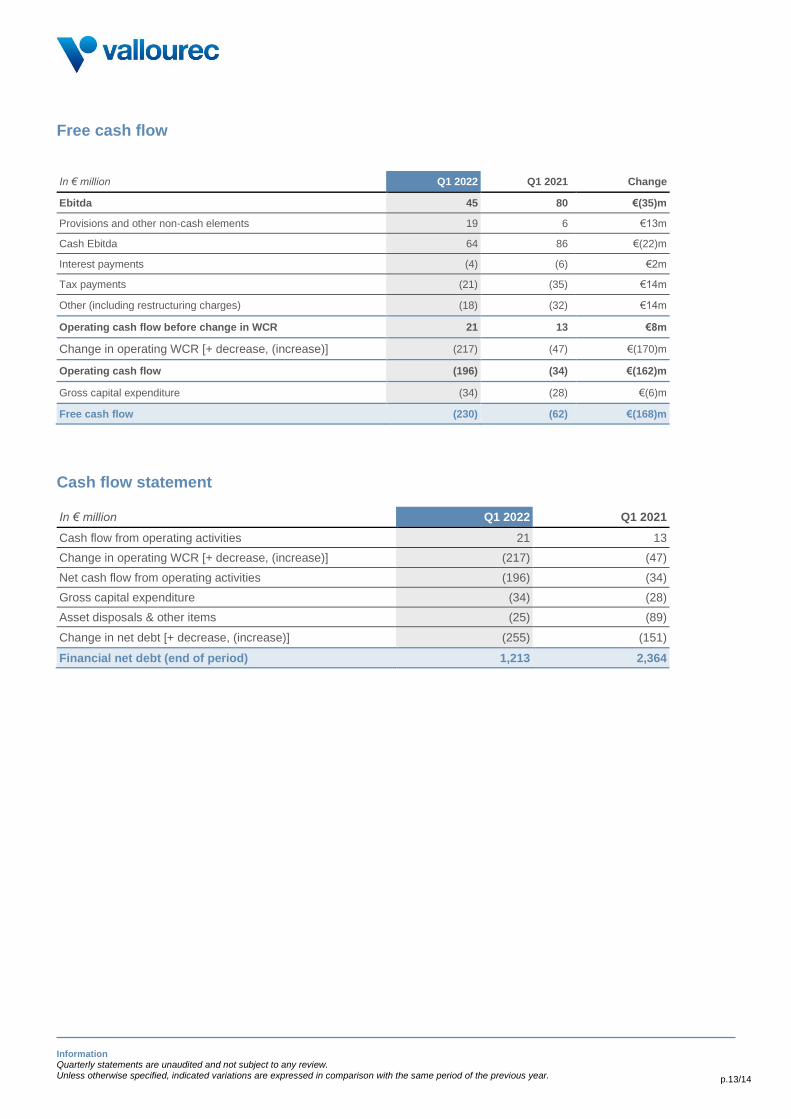
Free cash flow
In € million Q1 2022 Q1 2021 Change
Ebitda 45 80 €(35)m
Provisions and other non-cash elements 19 6 €13m
Cash Ebitda 64 86 €(22)m
Interest payments (4) (6) €2m
Tax payments (21) (35) €14m
Other (including restructuring charges) (18) (32) €14m
Operating cash flow before change in WCR 21 13 €8m
Change in operating WCR [+ decrease, (increase)] (217) (47) €(170)m
Operating cash flow (196) (34) €(162)m
Gross capital expenditure (34) (28) €(6)m
Free cash flow (230) (62) €(168)m
Cash flow statement
In € million Q1 2022 Q1 2021
Cash flow from operating activities 21 13
Change in operating WCR [+ decrease, (increase)] (217) (47)
Net cash flow from operating activities (196) (34)
Gross capital expenditure (34) (28)
Asset disposals & other items (25) (89)
Change in net debt [+ decrease, (increase)] (255) (151)
Financial net debt (end of period) 1,213 2,364
Information Quarterly statements are unaudited and not subject to any review.
Unless otherwise specified, indicated variations are expressed in comparison with the same period of the previous year. p.14/14
Definitions of non-GAAP financial data
Data at constant exchange rates: the data presented « at constant exchange rates » is calculated by eliminating
the translation effect into euros for the revenue of the Group’s entities whose functional currency is not the euro. The
translation effect is eliminated by applying Year N-1 exchange rates to Year N revenue of the contemplated entities. Free cash flow: Free cash-flow (FCF) is defined as cash flow from operating activities minus gross capital expenditure and plus/minus change in operating working capital requirement.
Gross capital expenditure: gross capital expenditure is defined as the sum of cash outflows for acquisitions of
property, plant and equipment and intangible assets and cash outflows for acquisitions of biological assets. Industrial margin: the industrial margin is defined as the difference between revenue and cost of sales (i.e. after allocation of industrial variable costs and industrial fixed costs), before depreciation. Lease debt: defined as the present value of unavoidable future lease payments
Net debt: consolidated net debt is defined as Bank loans and other borrowings plus Overdrafts and other short-term
borrowings minus Cash and cash equivalents. Net debt excludes lease debt.
Net working capital requirement: defined as working capital requirement net of provisions for inventories and trade
receivables; net working capital requirement days are computed on an annualized quarterly sales basis.
Operating working capital requirement: includes working capital requirement as well as other receivables and
payables.
Working capital requirement: defined as trade receivables plus inventories minus trade payables (excluding
provisions).


