Embed Size (px)
Citation preview

Durham E-Theses
Earnings persistence, value relevance, and earnings
timeliness: The Case of Thailand
BENYASRISAWAT, PRAWAT
How to cite:
BENYASRISAWAT, PRAWAT (2011) Earnings persistence, value relevance, and earnings timeliness: The
Case of Thailand, Durham theses, Durham University. Available at Durham E-Theses Online:http://etheses.dur.ac.uk/1378/
Use policy
The full-text may be used and/or reproduced, and given to third parties in any format or medium, without prior permission orcharge, for personal research or study, educational, or not-for-pro�t purposes provided that:
• a full bibliographic reference is made to the original source
• a link is made to the metadata record in Durham E-Theses
• the full-text is not changed in any way
The full-text must not be sold in any format or medium without the formal permission of the copyright holders.
Please consult the full Durham E-Theses policy for further details.

Academic Support O�ce, Durham University, University O�ce, Old Elvet, Durham DH1 3HPe-mail: [email protected] Tel: +44 0191 334 6107
http://etheses.dur.ac.uk
2

Earnings persistence, value relevance, and earnings
timeliness: The Case of Thailand
Prawat Benyasrisawat Thesis submitted to the University of Durham in part fulfilment for the requirements of the degree of Doctor of Philosophy in Accounting and Finance
Department of Accounting and Finance Durham Business School
University of Durham 2011
ii
Earnings persistence, value relevance, and
earnings timeliness: The Case of Thailand
ABSTRACT This research aims to investigate the enhancement of accounting quality in
Thailand after adopting International Financial Reporting Standards (IFRS) in its
domestic accounting system. The accounting quality consists of three properties
of earnings– earnings persistence, value relevance and earnings timeliness. This
research examines the improvement of accounting quality after the IFRS adoption
in Thailand by expanding the conditioning institutional factor to include the
magnitude of book-tax differences. In addition, the relationship between the Thai
accounting quality and firm governance systems is investigated.
The results reveal that the accounting quality, including earnings persistence and
value relevance, has been improved after the IFRS adoption in Thailand. The
earnings timeliness is observed in Thai firms, but it has been declined after the
IFRS adoption. The results also indicate that the improvement of accounting
quality after the IFRS adoption in Thailand is varied according to the magnitude
of book-tax differences. This research finds that the firm governance system is
related to the improvement of accounting quality in Thai settings. This research
concludes that the adoption of IFRS has generally improved accounting quality in
Thailand. The book-tax difference contains significant information about
accounting quality in Thai settings. And, the firm governance system plays an
important role in accounting quality after the IFRS adoption in Thailand.
STATEMENT OF COPYRIGHT The copyright of this thesis rests with the author. No quotation from it should be published without the prior written consent and information derived from it should be acknowledged.

iii
TABLE OF CONTENTS
TITLE PAGE i ABSTRACT ii TABLE OF CONTENTS iii LIST OF FIGURES vi LIST OF TABLES vii ACKNOWLEDGEMENTS x DEDICATIONS xi 1 CHAPTER ONE INTRODUCTION 1 1.1 INTRODUCTION 2 1.2 STATEMENT OF THE PROBLEM 6 1.2.1 ACCOUNTING QUALITY 9 1.2.2 ACCOUNTING QUALITY AND NEW ACCOUNTING
STANDARDS 10 1.2.3 ACCOUNTING QUALITY AND FIRM GOVERNANCE 14 1.2.4 THE USE OF BOOK-TAX DIFFERENCES 17 1.3 STATEMENT OF THE GENERAL HYPOTHESIS 19 1.4 MOTIVATION OF THE STUDY 26 1.5 CONTRIBUTIONS TO THE KNOWLEDGE 28 1.6 STRUCTURE OF THE STUDY 30 2 CHAPTER TWO THAI ACCOUNTING ENVIRONMENTS 32 2.1 INTRODUCTION 33 2.2 THAI ACCOUNTING LAWS 33 2.3 THAI ACCOUNTING BODY 35 2.4 STOCK EXCHANGE OF THAILAND (SET) 36 2.5 THAI ACCOUNTING STANDARD (TAS) 38 2.6 DISCUSSION OF THAI ACCOUNTING SYSTEM 40 2.7 CHAPTER SUMMARY 42

iv
3 CHAPTER THREE THEORETICAL FRAMEWORK AND LITERATURE REVIEW 43 3.1 INTRODUCTION 45 3.2 THEORETICAL FRAMEWORK 45 3.2.1 THEORY OF EARNINGS PERSISTENCE: THE PREDICTIVE APPROACH 46 3.2.1.1 A TIME SERIES ANALYSIS 47 3.2.1.2 FUNDAMENTAL ANALYSIS 47 3.2.1.3 ECONOMIC DETERMINANTS 48 3.2.2 THEORY OF ACCOUNTING VALUATION 49 3.2.2.1 DIRECT VALUATION THEORY 51 3.2.2.2 INPUT-TO-VALUATION THEORY 52 3.2.2.3 VALUATION AND CONTEXTUAL ACCOUNTING ARGUMENT 52 3.2.2.4 VALUATION MODELS 52 3.2.3 THEORY OF EARNINGS TIMELINESS 62 3.2.3.1 CONTRACTING THEORY 64 3.2.3.2 EARNINGS TIMELINESS MODELS 65 3.2.3.3 FIRM-SPECIFIC MEASUREMENT OF ACCOUNTING
CONSERVATISM 68 3.2.4 BOOK-TAX DIFFERENCES 68 3.2.5 FIRM GOVERNANCE SYSTEM 73 3.2.5.1 AGENCY THEORY 73 3.2.5.2 AGENCY PROBLEMS AND ACCOUNTING QUALITY 76 3.3 LITERATURE REVIEW 80 3.3.1 PRIOR STUDY OF EARNINGS PERSISTENCE 80 3.3.2 PRIOR STUDY OF THE VALUE RELEVANCE ANALYSIS 87 3.3.3 EARNINGS TIMELINESS 111 3.3.4 BOOK-TAX DIFFERENCES AND ACCOUNTING QUALITY 121 3.3.5 FIRM GOVERNANCE AND ACCOUNTING QUALITY 126 3.4 CHAPTER SUMMARY 134 4 CHAPTER FOUR EARNINGS PERSISTENCE 136 4.1 INTRODUCTION 137 4.2 HYPOTHESIS DEVELOPMENT 137 4.3 RESEARCH METHODOLOGY 143 4.4 DATA 150 4.5 RESULTS 151 4.6 CHAPTER SUMMARY 184

v
5 CHAPTER FIVE THE VALUE RELEVANCE OF EARNINGS AND BOOK VALUE 186 5.1 INTRODUCTION 187 5.2 HYPOTHESIS DEVELOPMENT 189 5.3 RESEARCH METHODOLOGY 192 5.4 DATA 195 5.5 RESULTS 196 5.6 CHAPTER SUMMARY 217 6 CHAPTER SIX EARNINGS TIMELINESS 219 6.1 INTRODUCTION 220 6.2 HYPOTHESIS DEVELOPMENT 221 6.3 RESEARCH METHODOLOGY 226 6.4 DATA 231 6.5 RESULTS 231 6.6 CHAPTER SUMMARY 250 7 CONCLUSIONS AND DISCUSSIONS 253 7.1 INTRODUCTION 254 7.2 SUMMARY OF THE THESIS AND IMPLEMENTATION 256 7.3 RESEARCH LIMITATIONS 261 7.4 CONCLUDING REMARKS, CONTRIBUTIONS AND FUTURE RESEARCH 263 8 APPENDICES 265 APPENDIX 1 266 APPENDIX 2 269 APPENDIX 3 273 APPENDIX 4 275 APPENDIX 5 277 APPENDIX 6 282 APPENDIX 7 288 APPENDIX 8 292 APPENDIX 9 294 APPENDIX 10 298 9 BIBLIOGRAPHY 302
vi
LIST OF FIGURES
Figure 1.1 Factors Influencing Accounting Information Quality 5
Figure 1.2 Accounting regime and corporate governance 8
Figure 1.3 Research focus (Part I): Accounting quality and
accounting regime 14
Figure 1.4 Research focus (Part II): Accounting quality and
firm governance 17
Figure 4.1 Book-Tax Differences (BT): All firm-years 153
Figure 4.2 Book-Tax Differences (BT): Firm-years under
rehabilitation programme are excluded 153
Figure 4.3 Book-Tax Differences (BT): Non-financial
firm-years with December year-ended 154

vii
LIST OF TABLES Table 2.1 Accounting Laws and Accounting Body
Development in Thailand 35
Table 2.2 Thai Capital Market Development 38
Table 4.1 A distribution of sample firms during the period
1995–2004 based on model (1) 154
Table 4.2 Descriptive statistics 156
Table 4.3 The mean comparisons of firm’s characteristics
between two groups 158
Table 4.4 Earnings smoothing measures 159
Table 4.5 Correlations: Pearson (Spearman) correlation
coefficient on the lower (upper) diagonal 160
Table 4.6 Univariate analysis 162
Table 4.7 OLS estimator with bootstrap standard error
is employed for the estimation. z-statistics are
reported in parentheses 165
Table 4.8 Firm governance and earnings persistence 168
Table 4.9 OLS estimator with bootstrap standard error is
employed for the estimation. z-statistics
are reported in parentheses 171
Table 4.10 Robustness checks of the regression of 2-year-future
earnings on current earnings 173
Table 4.11 The regression of future earnings on current earnings
for all firm-years 175
Table 4.12 The regression of future earnings on earnings
performance attributable to cash and accrual
components for all firm-year 177
Table 4.13 All firm-year analysis partitioning by industry 179
Table 4.14 Robustness checks: Firm governance and
earnings persistence 182
viii
Table 5.1 A distribution of sample firms in each industry 196
Table 5.2 Descriptive statistics 197
Table 5.3 Mean comparisons based on 120 firms
(1,200 observations) 198
Table 5.4 Pearson (Spearman) correlation coefficient
on the lower (upper) diagonal 200
Table 5.5 Earnings response coefficients (ERC):
OLS estimation with firm-fixed effect and
heteroskedasticity-robust standard errors 202
Table 5.6 Price model: OLS estimation with firm fixed
effect and heteroskedasticity-robust standard errors 205
Table 5.7 Value relevance and firm governance 207
Table 5.8 Robustness checks: The value relevance
of accounting summary measures when
partitioning firms by industry 211
Table 5.9 Robustness checks: Panel data analysis
by using Fama-MacBeth regressions 212
Table 5.10 Robustness checks: Pooled-cross section
regression with firm fixed effect and robust
standard error for all firm-years (1993–2007)
and partitioning the dataset by using positive
book-tax differences 214
Table 5.11 Robustness checks: The value relevance and
firm governance 218
Table 6.1 Distribution of samples across years classified
by industry 231
Table 6.2 Summary of Variables 233
Table 6.3 Correlations: Pearson (Spearman) correlation
coefficients on the lower (upper) diagonal 234
Table 6.4 Asymmetric timeliness in earnings: Earnings-returns
regressions (j = 0) and cumulative earnings-returns
regressions (j = 2) 236

ix
Table 6.5 Asymmetric timeliness in earnings (1992–2007)
– Positive book-tax differences 238
Table 6.6 Firm-specific conservatism (BTM): OLS
regressions with firm fixed-effect (1993–2007) 241
Table 6.7 Firm-specific conservatism (ACC): OLS
regressions with firm fixed-effect (1994–2006) 242
Table 6.8 Robustness checks: Partitioning data by
good news and bad news 243
Table 6.9 Robustness checks: The persistence of negative
earnings changes (1993–2007) 245
Table 6.10 Robustness checks: Accrual-based timeliness
(1993–2007) 247
Table 6.11 Robustness checks: 2000–2007 249
Table 6.12 Firm-specific conservatism (BTM): OLS
regressions with firm fixed-effect and
heteroskedasticity-robust standard errors 252
Table 7.1 Missing value of taxable income across years 261

x
AKNOWLEGEMENTS A PhD study is truly a journey. I would not have been able to complete this thesis
without support from people over the past few years. I must first express my
indebtedness towards my supervisors, Professor Rob Dixon: Dean of Durham
Business School and Dr.Aly Salama: Deputy Director of PhD Programme at
Durham Business School. Professor Rob provides me with advice and guidance
from the initial to the final level. He gives me extraordinary experiences by
encouraging me to present research paper at accounting conferences in Finland
and USA. Dr.Aly has made available his support in a number of ways. He
inspires me to produce research paper and he is always there when he is needed.
I am heartily thankful to Bangkok University, Dr.Thanu Kulachol: President
Emeritus, Dr.Mattana Santiwat: President, and the executive board members of
Bangkok University for providing me a grant during my several years in the UK.
I owe my deepest gratitude to Dr.Sutha Jiaranaikulvanich: Dean of School of
Accounting at Bangkok University whose support and encouragement from the
first to the last stage enabled me to walk through this PhD journey. The informal
support and blessings of the faculty from School of Accounting at Bangkok
University in which I have been worked for many years have been indispensable.
It is an honour for me to acknowledge Professor Mars (J.S) Cramer: Honorary
Research Fellows at Tinburgen Institute for his crucial contribution. He gives me
his time for answering my questions about statistics issues. I wish particularly to
thank Karuntarat Boonyawat: my fellow PhD student for her invaluable support
about data collection. The aid of the staff of Durham Business School and
particularly the Doctoral Office has been most helpful. I also thank my college
tutors: Dr.Frankie Chau and Dr.Rataporn Deesomsak and all friends in Durham.
They each helped make my time at Durham University lots of fun and interesting.
Finally, my special thanks go to my parents and my siblings for instilling in me
confidence to pursue my PhD.

xi
TO MY PARENTS

Chapter 1
Introduction
1.1 Introduction
1.2 Statement of the Problem
1.2.1 Accounting Quality
1.2.2 Accounting Quality and New Accounting Standards
1.2.3 Accounting Quality and Firm Governance
1.2.4 The Use of Book-Tax Differences
1.3 Statement of the General Hypothesis
1.4 Motivation of the Study
1.5 Contribution to the Knowledge
1.6 Structure of the Study
Chapter I Introduction
2
Chapter 1
Introduction
1.1 Introduction Without question, financial reporting plays a multiple role in the business world.
For instance, it not only represents corporate financial and/or non-financial
information required by any legislative regulators which firms have to deal with,
but also can be used as a medium to communicate between the firm and related
parties, i.e. creditors, investors and analysts. Financial information shown on the
corporate report is thus of interest to stakeholders and can affect the user who
relies on that information. Back in 1968, Ball and Brown (1968) attempted to
discover the association between accounting numbers and share returns; the
essential role of financial reporting has occupied a great deal of researchers’
attention to investigate whether financial reporting provides useful information for
stakeholders in terms of decision making and predictability. Specifically, as
reported by a growing amount of accounting literature in the area of financial
reporting, recent research studies around the world have focused on and been
aware of the quality of accounting information disclosed on the corporate
financial report.1 Generally speaking, financial information users have expected
to receive a certain level quality of information to achieve their objectives that
vary according to the group of users. In the meantime, business competition is a
major constraint for the firm to disclose all their information to the public. This
ambivalence between information generators (business entities) and users can
distort the information quality in general, as suggested by the economic theory
that information asymmetry between firms – as insiders, and users – as outsiders,
exists in the real world (Spence 1973). Nevertheless, there is a structural
mechanism initiated to mitigate the information gap between a firm’s insiders and
outsiders, i.e. corporate governance systems (Dechow and Schrand 2004, pg.102). 1 Among others, for example, Ding, Hope, Jeanjean and Stolowy (2007) employed cross-country data to compare the use of domestic accounting standards and international accounting standards in 30 countries. Prather-Kinsey (2006) investigated accounting information for firms in South Africa and Mexico. Ball and Shivakumar (2005) examined the quality of financial reporting in UK firms. Habib (2004) studied accounting information quality in Japanese firms.

Chapter I Introduction
3
Thai Accounting Framework defines fundamental qualitative characteristics in
four categories, including understandability, relevance, reliability, and
comparability. From the accounting empirical and anecdotal evidence, accounting
information providing such benefits as the ability to incorporate economic
consequences, relevancy or predictability to information users is considered as
useful or good quality. Consistent with the fundamental qualitative characteristics
in the Thai accounting framework and growing literature, this thesis aims at
investigating accounting information quality by interpreting ‘quality’ of
accounting information in three well-known forms, including the persistence of
accounting summary numbers (to estimate the reliability), relevancy (to estimate
the relevance) and timeliness. More details about these forms of quality will be
explained later.
This thesis depicts that the accounting regime is an important parameter affecting
the quality of accounting information. In a particular accounting environment, i.e.
Thailand, accounting information quality can be affected by significant factors –
accounting rules and other influencing factors. Accounting rules are viewed as
the direct descriptor on accounting information quality whilst such necessary
factors, other than accounting rules, as laws, the market regulator and structure,
politics, information quality monitoring mechanism and errors, are considered as
indirect parameters. To prepare financial reporting, firms are required to follow
procedures stated by accounting rules. Broadly speaking, accounting rules consist
of two main components: on the one hand, mandatory rules specifying accounting
procedures the firm must follow, i.e. firms must identify depreciable vs. non-
depreciable assets, and on the other leaving the choice to the firm, otherwise
termed the voluntary aspect, i.e. the appropriate depreciation method is subject to
the firm’s discretion. Accounting rules formally indicated in accounting standards
eventually play an important role for corporate financial reporting preparations.
Since financial information quality can be analysed by examining corporate
reported information presented on the firm’s financial reporting which is prepared
according to accounting rules in each country, changes in accounting standards
ultimately affect the result of reported accounting numbers, leading to the direct

Chapter I Introduction
4
alteration of the quality of accounting information. This argument is supported by
Ding et al. (2007), who suggest that financial reporting quality is determined by
accounting standards. Additionally, firms can employ the voluntary component in
the accounting standard in either a pessimistic sense – to garble their financial
information – or an optimistic sense – to incorporate their true economic
consequences.
As well-documented by previous research studies, accounting standards as
compulsory requirements of financial reporting can immensely influence the
corporate accounting information when accounting standards have substantially
been changed.2 And, indirect parameters, such as laws (i.e. common vs. civil
laws), politics (i.e. politic-connected vs. non-politic- connected firms), monitoring
mechanisms (i.e. independence audit committee or audit committee components),
market rules (i.e. regulations of the Stock Exchange), the market economic
structure (i.e. well-developed market vs. emerging market) and errors (fraud vs.
management/human errors) can cause difference of accounting information
quality across firms and countries.3 Accordingly, this thesis chooses to explore
accounting information quality in Thailand because Thailand has developed
accounting-related policies to improve Thai accounting information quality.
This thesis examines the improvement of accounting information quality in
general characteristics. However, to be more specific, accounting information
quality is investigated after the reform of accounting standards in Thailand. As
aforementioned, indirect parameters substantially influence the accounting
2 Several prior works have examined the value-relevance of accounting reforms in various countries, i.e. Czech Republic (Hellstrom 2006), South Africa and Mexico (Prather-Kinsey 2006), Poland (Gornik-Tomaszewski 2001) and Spain (Giner and Rees 1999). Other than the accounting reform, Ashbaugh and Pincus (2001) found that the change in accounting policies is positively associated with the reduction in analyst prediction errors. 3 i.e. Ball, Kothari and Robin (2000). Ding et al. (2007) suggested that accounting systems in countries could be improved not only by accounting standards but also the development of economic functions, i.e. the financial market. Nevertheless, Leuz (2003) added the empirical evidence about different accounting policies applied in the identical economic functions by concluding from German new market evidence that International Accounting Standards (IASs) and US GAAP provide no different quality that information asymmetry and market liquidity across firms were not significantly affected by using different accounting policies.
Chapter I Introduction
5
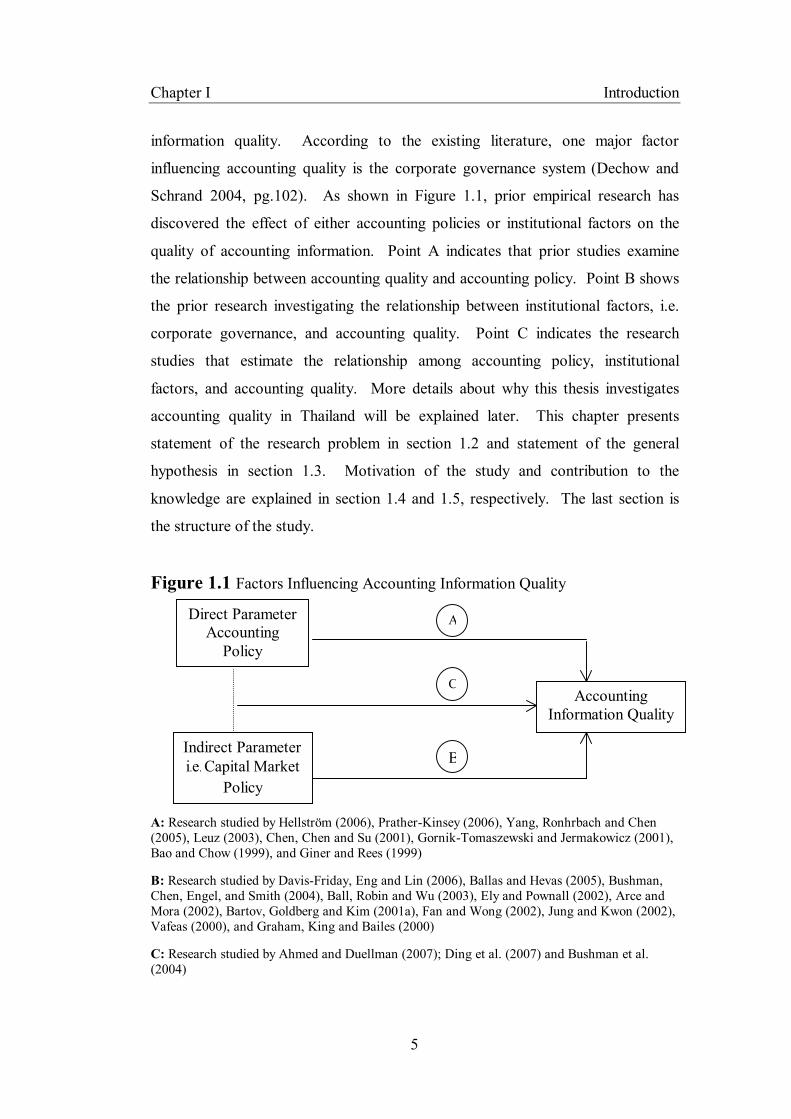
information quality. According to the existing literature, one major factor
influencing accounting quality is the corporate governance system (Dechow and
Schrand 2004, pg.102). As shown in Figure 1.1, prior empirical research has
discovered the effect of either accounting policies or institutional factors on the
quality of accounting information. Point A indicates that prior studies examine
the relationship between accounting quality and accounting policy. Point B shows
the prior research investigating the relationship between institutional factors, i.e.
corporate governance, and accounting quality. Point C indicates the research
studies that estimate the relationship among accounting policy, institutional
factors, and accounting quality. More details about why this thesis investigates
accounting quality in Thailand will be explained later. This chapter presents
statement of the research problem in section 1.2 and statement of the general
hypothesis in section 1.3. Motivation of the study and contribution to the
knowledge are explained in section 1.4 and 1.5, respectively. The last section is
the structure of the study.
Figure 1.1 Factors Influencing Accounting Information Quality
A: Research studied by Hellström (2006), Prather-Kinsey (2006), Yang, Ronhrbach and Chen (2005), Leuz (2003), Chen, Chen and Su (2001), Gornik-Tomaszewski and Jermakowicz (2001), Bao and Chow (1999), and Giner and Rees (1999) B: Research studied by Davis-Friday, Eng and Lin (2006), Ballas and Hevas (2005), Bushman, Chen, Engel, and Smith (2004), Ball, Robin and Wu (2003), Ely and Pownall (2002), Arce and Mora (2002), Bartov, Goldberg and Kim (2001a), Fan and Wong (2002), Jung and Kwon (2002), Vafeas (2000), and Graham, King and Bailes (2000) C: Research studied by Ahmed and Duellman (2007); Ding et al. (2007) and Bushman et al. (2004)
Indirect Parameter i.e. Capital Market
Policy
Accounting Information Quality
Direct Parameter Accounting
Policy
A
C
B
Chapter I Introduction
6
1.2 Statement of the Problem It is clear that Thailand was devastated by the 1997 financial economic crisis after
the floatation of the Thai Baht on 2nd July 1997. Massive economic shocks had
severely attacked private firms. The main reason for the collapse of the Thai
economy was the scale of foreign debt (Graham et al., 2000). Thailand, thus, had
to join the financial rehabilitation programme of the International Monetary Fund
(IMF). One essential part of the financial rehabilitation was to improve Thai
accounting standards. Before the 1997 financial crisis, Thai firms had been using
the Thai Accounting Standard (TAS) published by The Institute of Certified
Accountants and Auditors of Thailand (ICAAT). On 4th May 2000, the Thai
government enacted a new accounting law, the Accounting Act 2000, to regulate
all firms in the country. According to the Accounting Act, on 28th December
2000, 21 out of 31 accounting standards were abolished and superseded by 19
new accounting standards. For the fiscal year ended 2000, there were 29
accounting standards in use and in 2005 three accounting standards were in force
for the fiscal year ended 2005. As a result, the total of 32 accounting standards
are currently in effect at the fiscal year ended 2006. Thai Accounting Standards
had been substantially amended by the accounting body and legitimately used by
the firm to increase the international quality of accounting information and
practice in Thai business. Most new Thai accounting standards converge with the
International Financial Reporting Standards (IFRS) published by the International
Accounting Standards Committee (IASC) into Thai accounting system. Thai
accounting reform started from the fiscal year ended 2000 as from that point Thai
firms had to employ new accounting standards. It should be noted that the use of
new accounting standards is compulsory for all listed firms in Thailand.
For listed firms’ accounting procedures, the Stock Exchange of Thailand (SET)
has regulated listed firms to follow TAS. Since currently the business transaction
is more complicated and share trading has been exposed to foreign investors
leading to the increasing need for accounting information, especially in terms of
quality, TAS did not cover those complicated business transactions. SET
Chapter I Introduction
7
therefore enacts the regulation that when no Thai accounting guidelines can be
applied for any issues, the listed firm must employ accounting guidelines
published by the International Accounting Standards Committee (IASC) and the
American Institute of Certified Public Accountants (AICPA), respectively. In
consequence, the listed firm employs TAS as a minimum requirement for its
accounting procedures. SET later enforced high penalties for firms not preparing
their accounts in line with accounting guidelines, starting from the financial year
ended 1997. As a result, before 1997 Thai firms had employed TAS for their
accounting system. Thai fundamental accounting principles have been reformed
due to IFRS-harmonised new accounting standards since 2000. Nevertheless, the
regulation of using IFRS or US GAAP for some transactions which are not
covered by the new TAS has still been in force. From 1997 until now, IFRS or
US general accepted accounting principles have been applied for corporate
financial reporting when the new TAS does not cover any particular transactions.
Other than accounting reform, another progressive development encouraging
business information quality in Thailand is that SET has required all listed firms
to constitute an audit committee to improve corporate governance in Thailand
since 2nd July 1999. However, corporate governance in Thailand was firstly
introduced in 1993 by requiring listed firms to establish at least two independent
directors on the board (Connelly and Limpaphayom, 2004). Thus, from 1999,
listed firms have been required to organise both an audit committee and
independent directors. This crucial responsibility of Thai firms should principally
stimulate the quality of financial reporting in Thailand as one binding duty of the
audit committee is to provide quality financial reporting.
In conclusion, financial reporting in Thailand, presently, should be ameliorated by
two ingredients: accounting standards and corporate governance through the audit
committee. This analysis, hence, has been attracted by at least two reasons: 1) the
first constituent brings this research to focus on the quality of accounting
information as predominantly investigated by prior research studies for the case of

Chapter I Introduction
8
accounting reform and 2) the other element of interest is the effect of corporate
governance system that attempts to reinforce the improvement of accounting
information usefulness. Figure 1.2 presents the events of accounting reform and
new corporate governance policy.
Figure 1.2 Accounting regime and corporate governance
Y1993 Y1997 Y1999 Y2000 Y2005 Y2007
TAS – Thai Accounting Standards IFRS – International Financial Reporting Standards ICAAT – Institute of Certified Accountants and Auditors of Thailand FAP – Federation of Accounting Professions
As Thailand has reformed its accounting standards, accounting information,
therefore, should be of higher quality compared to the past. This thesis attempts to
study the quality of accounting information in Thailand because there were
significant changes in the accounting system. The principal research problem of
this thesis is to investigate:
Principal research problem “whether the quality of accounting information is altered in the Thai accounting regime and capital market environments between pre- and post-adoption of accounting standards.”
As described earlier, indirect parameters are essential factors affecting the quality
of accounting information. From the principal research question, whether or not
the alteration of accounting information after changes in accounting standards is
observed, the change in accounting standards probably will not be the only factor
TAS New TAS + IFRS or US GAAP
Audit committees + Independent Directors Independent DirectorsCapital Market Policy: Corporate governance
Accounting Regime
FAP Accounting body: ICAAT
Chapter I Introduction
9
inducing the alteration. It is of interest to determine whether the indirect
parameter induces the change in accounting quality in Thailand. Following prior
research, this thesis considers that among other factors, firm governance
mechanism is a major candidate in terms of encouraging the quality of
accounting information. Therefore, this thesis proposes another research question
to support the investigation of the principal research question:
Supporting research question “whether the firm governance system affects the quality of accounting information in Thailand.”
The link between the principal research problem and supporting research question
is due to the fact that the improvement of accounting quality during IFRS post-
adoptions can be varied among firms. Thus, this thesis proposes that the variation
of the enhancement of accounting quality among firms is potentially induced by
the variation of firms’ governance systems.
To respond the principal research problem, this thesis divides the analysis into
two parts for each attribute of accounting quality. The first part relates to the
investigation of the alteration of accounting quality during accounting reforms.
The second part of this study is to examine the effect of firm governance on the
quality of accounting information. As suggested by Ding et al. (2007), not only
accounting standards but also economic functions are significant for the
development of accounting systems; the combination of both parts provides
additional evidence to the accounting literature in emerging market countries.
The next four sections (1.2.1–1.2.4) introduce the main areas of analysis to
respond to the research problem and its supporting question.
1.2.1 Accounting Quality Prior studies focus on the analysis of earnings, as a summary accounting measure,
when determining accounting quality (among others, Sloan 1996; Dechow and
Chapter I Introduction
10
Dichev 2002; Barth, Landsman and Lang 2008). In general, earnings are of high
quality if they can represent current firm economic performance or can be used by
analysts to predict future performance of the firm (Dechow and Schrand 2004).
Following prior literature, the study of earnings quality can be found in three main
areas, including earnings persistence, value relevance and earnings timeliness.
Earnings persistence is a form of accounting quality. Earnings are of high quality
when they are persistent. This is due to the fact that when earnings are of high
persistence, they can be used as a predictor for the future performance of the firm.
A downside of earnings persistence is the possibility that earnings can be
manipulated by the firm. The value relevance analysis is the study of the
relationship between the market value and accounting numbers, indicating that the
higher the relationship, the higher the value relevance of accounting numbers. In
consequence, higher value relevance represents higher earnings quality. One
problem for the value relevance analysis relates to the empirical model used for
the analysis because the model/method is open-ended. Earnings timeliness
investigates whether accounting numbers can capture economic consequences in a
timely fashion. Earnings are of higher quality if they can capture economic events
in a timelier fashion. A major problem for earnings timeliness is that it is difficult
to find a measure for economic consequences.4 Furthermore, the three types of
earnings quality can be viewed in terms of accounting-based or market-based
analyses. Earnings persistence is categorised as accounting-based analysis whilst
value relevance is classified as market-based analysis. For earnings timeliness, it
can be viewed in terms of either market-based or accounting-based (through
accrual information) analysis. Hence, this thesis attempts to investigate those
three perspectives of earnings quality.
1.2.2 Accounting Quality and New Accounting Standards For decades, Thailand has developed its own accounting standards to proxy
underlying economic events. Before coming into force, new accounting standards 4 It should be noted that earnings timeliness is divided into conditional and unconditional timeliness of earnings. More details will be explained in relating chapters.
Chapter I Introduction
11
established by the accounting standards setter (ICAAT) must receive the approval
of the Board of Supervision of Auditing Practices (BSAP) under the Ministry of
Commerce. Accounting standards setting in Thailand is therefore under public
(government supervision) rather than private enforcement (accountants and
auditing professions oversee themselves). Due to the financial crisis in Thailand,
an outcome of the massive shock is the government’s decision to not only reform
the accounting standards formulated on IFRS and US GAAP to meet higher
quality of accounting information but also reorganise the accounting standard
establisher.5
In terms of accounting quality, the principal research problem has been built upon
three key previous works. Graham et al. (2000), Ball et al. (2003) and Davis-
Friday et al. (2006) attempted to explain the quality of accounting information in
Thailand. They investigate earnings quality for Thai firms in terms of value
relevance and timeliness. Despite establishing its own accounting standards, Ball
et al. (2003) commented that reported earnings in Thailand had conformed closely
to tax-based accounting income because of being under a government mandate
even though there were substantial forces from the IASC and moderate influences
from UK accounting (Ball et al. 2003, pg.240). Ball et al. (2003) argued further
that tax-based accounting information (precisely, income) in Thailand causes Thai
accounting information to be less sensitive to changes of economic consequences
(i.e. market value changes). They concluded that among emerging markets,
including Hong Kong, Malaysia and Singapore, Thailand had the lowest
information transparency, representing the lowest quality of accounting
information during the testing period between 1984 and 1996. Because Ball et al.
(2003) did not include in their samples when Thailand experienced the financial
crisis of 1997, Davis-Friday et al. (2006) documented that during the period of the
1997 economy downturn; the value-relevance of earnings information in Thailand
5 On 29th January 2005, the Federation of Accounting Professions (FAP) was officially formed and took over both the duty and authority of ICAAT and BSAP, transferring from public to private enforcement of accounting standards settings. Consequently, new accounting standards generally should bring higher quality of accounting information in Thailand.
Chapter I Introduction
12
from 1996 to 1997 had decreased and there was significant association between
book value and market value of the firm as this finding was also observed in the
well-developed market (i.e. US). Furthermore, Davis-Friday et al. (2006)
categorised the Thailand accounting system as an IFRS-based accounting, not a
tax-based accounting income system. In addition to the study by Davis-Friday et
al. (2006), Graham et al. (2000) indicated the Thai accounting information was
value-relevant during the period 1992 – 1998.
Ball et al. (2003) summarised that earnings in Thai firms cannot capture economic
events in a timely fashion. Three explanations account for these counterintuitive
results:
1) Even though Thai accounting rules are closely based on tax code, the
market is able to value this information, especially when economic
circumstances has considerably altered6,
2) As postulated by the prior empirical work that lower sensitive
accounting information based on tax-based accounting income does
not timely reflect underlying economic performances during normal
economic circumstances7, if Thai dormant accounting information is
able to incorporate economic consequences8, the accounting number
will probably be obscured and it draws further investigation (for
example, the Thai accounting system is not based on tax purposes but
on well-structured accounting systems – i.e. the IFRS-based system),
or
3) The Thai market perceives the torpid accounting information and
interprets it differently from what has been done by the investor in
well-developed markets.
6 Davis-Friday et al. (2006) and Graham et al. (2000) evidenced the value-relevant book value and
earnings in Thailand during the economy distress. 7 Ball et al. (2003) argued that the Thai accounting system before the Thai economic crisis (during
the period 1984 to 1996) was less sensitive in capturing economic change. 8 In their conclusions, Graham et al. (2000) argued that Thai accounting information had value
relevance during their testing period between 1992 and 1998. Davis-Friday et al. (2006) supported their findings.

Chapter I Introduction
13
This thesis investigates the improvement of accounting quality in Thailand in two
aspects. First, the persistence of earnings is analysed. The persistence of earnings
is a study of earnings predictability. Previously, Thailand had been used the rule-
based accounting system, that Thai firms were not required to perform forecasting
measurements, i.e. expected future cash flows. The Thai accounting standard
setter claims that the new accounting standard as the principle-based accounting
system provides more reliable accounting information relative to the old
accounting standard. Second, this thesis analyses the value relevance of
accounting information. The accounting information is considered to be useful
when users (i.e. investors) can use it for decision making. In terms of the capital
market investment, share prices reflect the market’s expection on firm’s net cash
flows. When implementing the new accounting standard in Thailand, accounting
information should be more useful because it reflects more firms’ true
performance that is expected by the market. In addition to the earnings
persistence and value relevance, this thesis investigates the existence of earnings
timeliness in financial statements that is an additional quality that the new
accounting standard prefers the firm to employ. More details are explained in
related chapters.
This thesis expands the investigation of the earnings persistence in Thailand by
including an institutional factor in the analysis.9 In addition to the persistence of
earnings, Graham et al. (2000) and Davis-Friday et al. (2006) investigated the
variation of the left-hand side whether reported earnings were capitalised by share
prices; accounting information quality is a function of market value as dependent
variable and accounting numbers – book value and earnings as independent
variables. However, this thesis basically assumes that the economy remains
unchanged but the accounting system has been altered. The analysis of
accounting quality in this study, in turn, deals with the change in accounting
standards for book value and earnings calculations rather than the effect of
9 Pincus, Rajgopal and Venkatachal (2007) investigate accrual anomaly in 21 countries, including Thailand during 1994–2002. The published research about earnings persistence as a part of accrual anomaly analysis in Thailand can be found in their work.
Chapter I Introduction
14
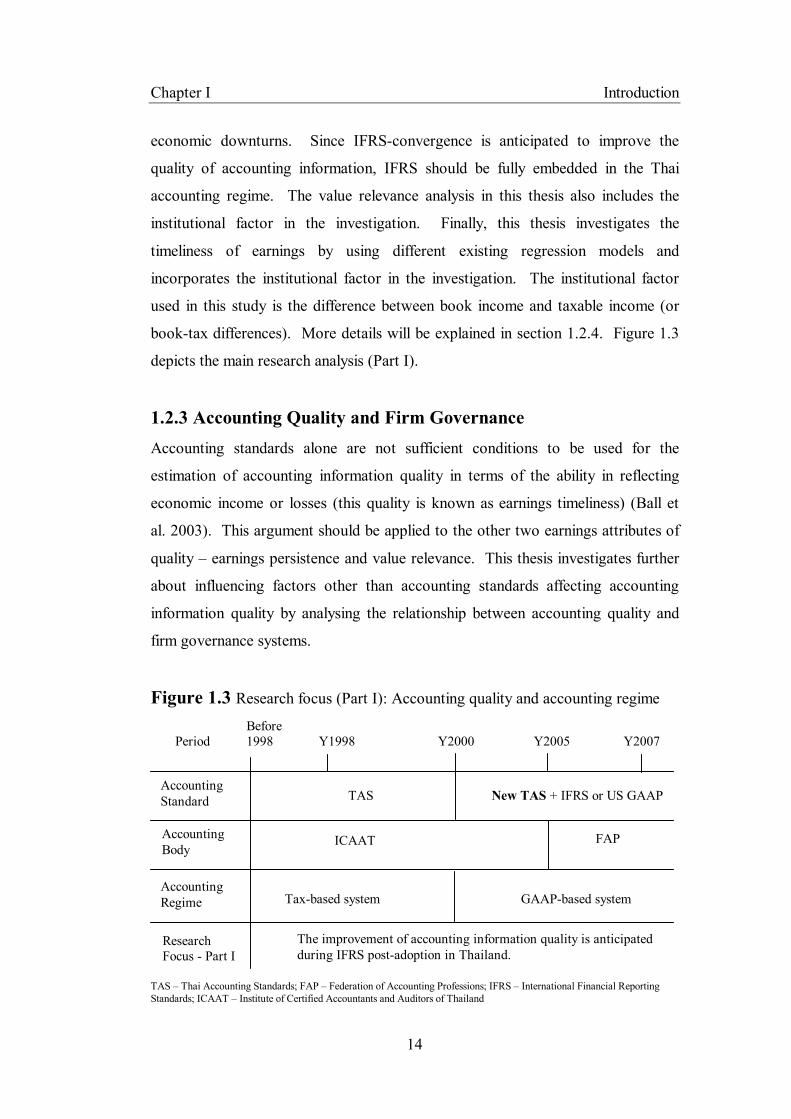
economic downturns. Since IFRS-convergence is anticipated to improve the
quality of accounting information, IFRS should be fully embedded in the Thai
accounting regime. The value relevance analysis in this thesis also includes the
institutional factor in the investigation. Finally, this thesis investigates the
timeliness of earnings by using different existing regression models and
incorporates the institutional factor in the investigation. The institutional factor
used in this study is the difference between book income and taxable income (or
book-tax differences). More details will be explained in section 1.2.4. Figure 1.3
depicts the main research analysis (Part I).
1.2.3 Accounting Quality and Firm Governance Accounting standards alone are not sufficient conditions to be used for the
estimation of accounting information quality in terms of the ability in reflecting
economic income or losses (this quality is known as earnings timeliness) (Ball et
al. 2003). This argument should be applied to the other two earnings attributes of
quality – earnings persistence and value relevance. This thesis investigates further
about influencing factors other than accounting standards affecting accounting
information quality by analysing the relationship between accounting quality and
firm governance systems.
Figure 1.3 Research focus (Part I): Accounting quality and accounting regime
Before Period 1998 Y1998 Y2000 Y2005 Y2007
TAS – Thai Accounting Standards; FAP – Federation of Accounting Professions; IFRS – International Financial Reporting Standards; ICAAT – Institute of Certified Accountants and Auditors of Thailand
TAS New TAS + IFRS or US GAAP Accounting Standard
FAP ICAAT Accounting Body
Research Focus - Part I
The improvement of accounting information quality is anticipated during IFRS post-adoption in Thailand.
Accounting Regime Tax-based system GAAP-based system
Chapter I Introduction
15
A considerable amount of empirical research studies have explored the role of
corporate governance on accounting information quality in terms of accounting
information value-relevance and earnings timeliness.10 Because the corporate
governance in itself does not directly affect accounting numbers which are proxies
of underlying economic contents, this study views ‘corporate governance’ as an
indirect parameter fostering financial information quality overall. Nevertheless,
one distinctive duty of the audit committee in Thai firms is for the accuracy and
sufficiency of information presented on financial reporting.11
One example of the relationship between corporate governance systems and
accounting quality is the connection between corporate governance and firm
valuation process (the value relevance). The connection between corporate
governance and firm valuation process can be found through accounting
reliability.12 As one of three committees is the financial reporting expert, this
audit committee’s expertise and responsibility discourage the firm’s manager to
manipulate accounting information, i.e. reported earnings.13 Thus, if corporate
governance through audit committees can reduce the degree of accounting
information manipulation, the accounting number should be more reliable.14
10 For example, Goncharov, Werner and Zimmermann (2006) examined the value relevance of corporate governance on firm valuation process. Fan and Wong (2002) and Jung and Kwon (2002) studied the role of ownership structure affecting earnings. Vafeas (2000) examined the effect of board structure on earnings. Ahmed and Duellman (2007) study the relationship between earnings timeliness and corporate governance systems. 11 Qualifications and Duties of Audit Committees, Notification of Stock Exchange of Thailand No. 1, 1999. 12 This thesis views reliability in a general sense as unconditional accounting conservatism, i.e. income/expense recognition or increase/decrease of asset values are to be performed according to the condition indicated in the accounting principles. Whelan and McNamara (2004) documented that when earnings are unreliable, the value relevance will shift from earnings to book value information; when book values are unreliable, the value relevance will shift from book value to earnings information. 13 For example, the corporate governance system enforces firms to write-off assets if all conditions indicated in the accounting principles are met. 14 It is unavoidable to question whether or not the reliability of accounting information is problematic and should be determined before estimating the effect of audit committee on accounting information quality (specifically the value relevance). It is due to the fact that the audit committee and the information quality is not directly connected. Bao and Bao (2004, pg. 1526) quoted the argument of Dechow and Skinner (2000) that earnings management causes management incentive which finally is linked to the firm’s share price. A significant effect of earnings management on financial reporting has not been found in prior literature (Bao and Bao 2004) because with reference to the efficient market hypothesis earnings management is not
Chapter I Introduction
16
Incidentally, as with the notion that Thai accounting information is sluggish due
to the close link to income tax laws, the injection of corporate governance policy
may not fully impact on accounting numbers unless the accounting measurement
method has served for the demand of users, i.e. investors, creditors or analysts.
On the other hand, if the Thai accounting system is an IFRS-based system, the
corporate governance policy will be one fostering mechanism for accounting
information quality prepared for public purposes, i.e. investment in the capital
market. Even though Thai financial reporting is more likely to be based on tax
rules, the second part of this study is to investigate whether the firm governance
system, i.e. audit committee, impacts on accounting information quality in Thai
settings. This is motivated by Dechow and Schrand (2004, pg.102) who argue
that the corporate governance system encourages the value relevance of
accounting information. In addition to the value relevance analysis, this thesis
applies this notion to the analysis of earnings persistence and earnings timeliness.
In sum, this thesis attempts to find a relationship between accounting quality and
firm governance systems. If the relationship is observed, the firm governance
system will be one factor inducing the variation in accounting quality in Thai
settings. In other words, the analysis in part I attempt to investigate the
enhancement of accounting information quality during IFRS post-adoption
periods relative to pre-adoption periods. If findings report variations in the
improvement of accounting information quality among firms, this thesis considers
that such variations are potentially induced by the firm governance system.
important when there is full disclosure and small cost/effort to access the information of management incentive (Dechow and Skinner 2000 quoted in Bao and Bao 2004, footnote 4, pg.1526). It infers that the market will be able to fully capture accounting information reliability. Particularly, in the long run, this thesis considers that the market will be able to price differently between firms with and without earnings manipulation. For these reasons, the existing empirical research with regard to the value relevance investigation (among others, i.e. Goncharov et al. 2006 and Vafeas 2000) has directly incorporated corporate governance components into the value-relevance fundamental analysis in a long-window period by estimating the interaction-effect of earnings and corporate governance factors on the firm’s share price or return. Such existing research did not investigate the reliability before examining the value relevance of accounting information. Therefore, based on the existing study this thesis directly investigates the relationship between accounting quality (earnings persistence, value relevance and earnings timeliness) and corporate governance systems.
Chapter I Introduction
17
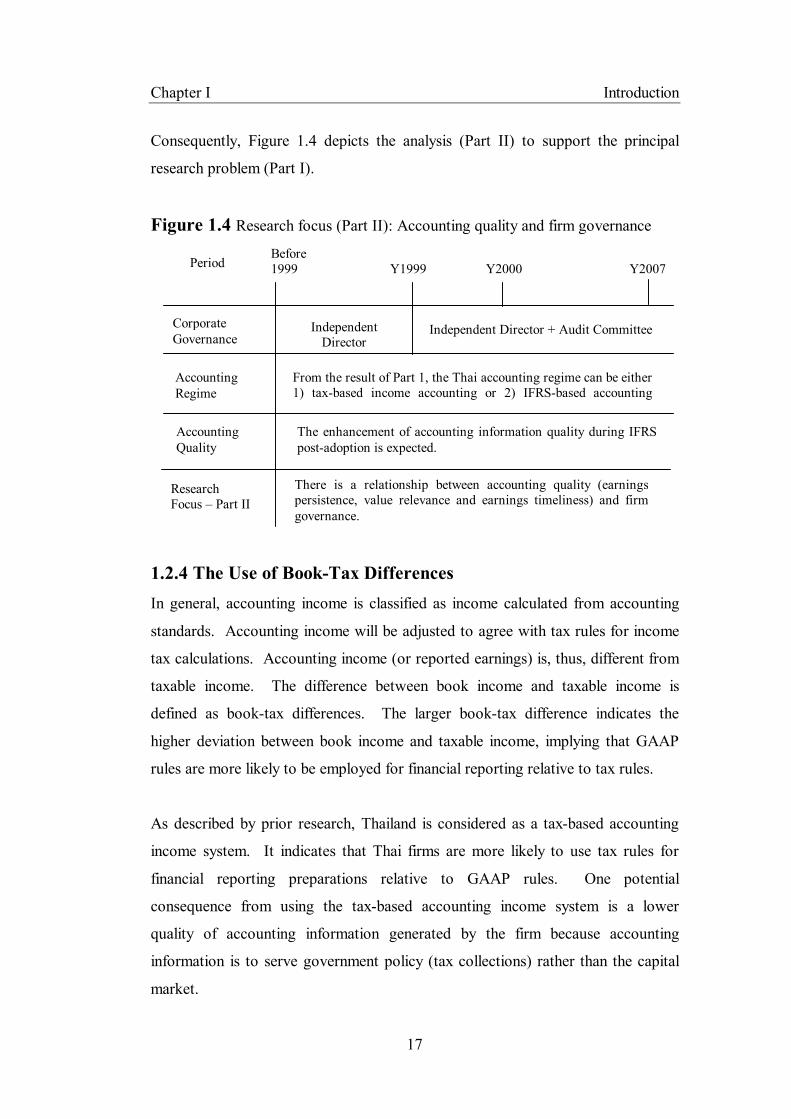
Consequently, Figure 1.4 depicts the analysis (Part II) to support the principal
research problem (Part I).
Figure 1.4 Research focus (Part II): Accounting quality and firm governance
Before 1999 Y1999 Y2000 Y2007
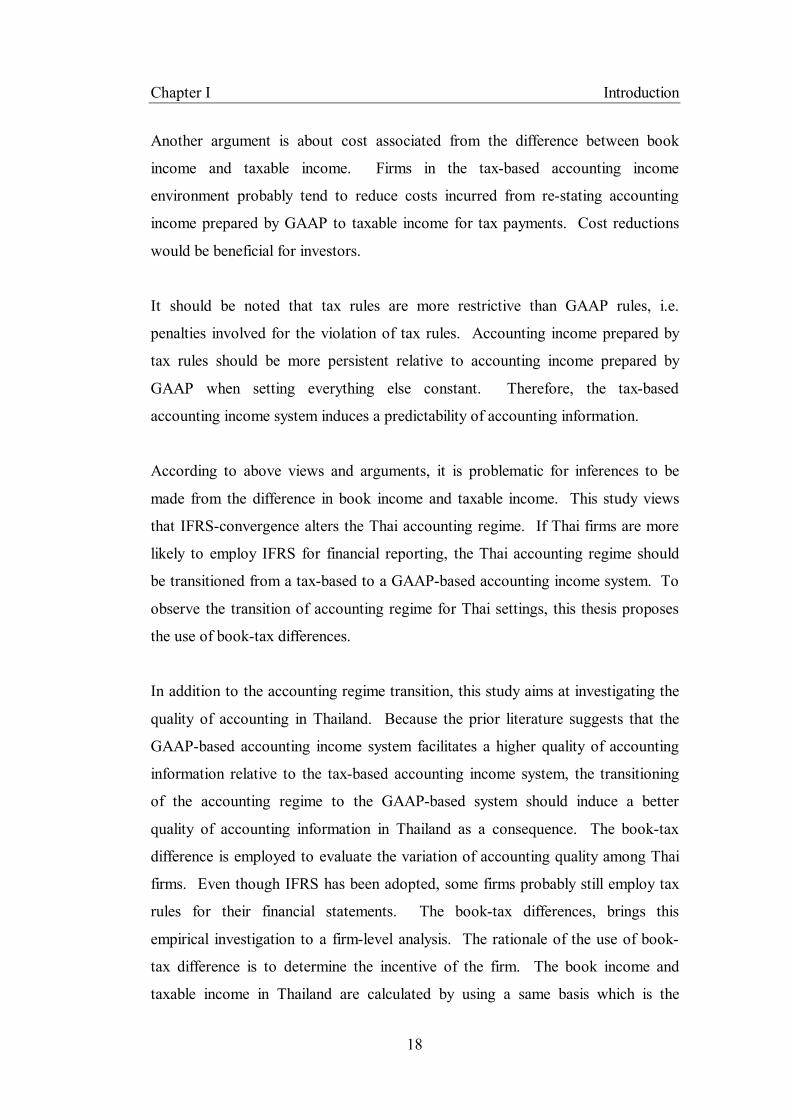
1.2.4 The Use of Book-Tax Differences In general, accounting income is classified as income calculated from accounting
standards. Accounting income will be adjusted to agree with tax rules for income
tax calculations. Accounting income (or reported earnings) is, thus, different from
taxable income. The difference between book income and taxable income is
defined as book-tax differences. The larger book-tax difference indicates the
higher deviation between book income and taxable income, implying that GAAP
rules are more likely to be employed for financial reporting relative to tax rules.
As described by prior research, Thailand is considered as a tax-based accounting
income system. It indicates that Thai firms are more likely to use tax rules for
financial reporting preparations relative to GAAP rules. One potential
consequence from using the tax-based accounting income system is a lower
quality of accounting information generated by the firm because accounting
information is to serve government policy (tax collections) rather than the capital
market.
Accounting Regime
Research Focus – Part II
There is a relationship between accounting quality (earnings persistence, value relevance and earnings timeliness) and firm governance.
Corporate Governance
Independent Director
Independent Director + Audit Committee
From the result of Part 1, the Thai accounting regime can be either 1) tax-based income accounting or 2) IFRS-based accounting income
Period
Accounting Quality
The enhancement of accounting information quality during IFRS post-adoption is expected.
Chapter I Introduction
18
Another argument is about cost associated from the difference between book
income and taxable income. Firms in the tax-based accounting income
environment probably tend to reduce costs incurred from re-stating accounting
income prepared by GAAP to taxable income for tax payments. Cost reductions
would be beneficial for investors.
It should be noted that tax rules are more restrictive than GAAP rules, i.e.
penalties involved for the violation of tax rules. Accounting income prepared by
tax rules should be more persistent relative to accounting income prepared by
GAAP when setting everything else constant. Therefore, the tax-based
accounting income system induces a predictability of accounting information.
According to above views and arguments, it is problematic for inferences to be
made from the difference in book income and taxable income. This study views
that IFRS-convergence alters the Thai accounting regime. If Thai firms are more
likely to employ IFRS for financial reporting, the Thai accounting regime should
be transitioned from a tax-based to a GAAP-based accounting income system. To
observe the transition of accounting regime for Thai settings, this thesis proposes
the use of book-tax differences.
In addition to the accounting regime transition, this study aims at investigating the
quality of accounting in Thailand. Because the prior literature suggests that the
GAAP-based accounting income system facilitates a higher quality of accounting
information relative to the tax-based accounting income system, the transitioning
of the accounting regime to the GAAP-based system should induce a better
quality of accounting information in Thailand as a consequence. The book-tax
difference is employed to evaluate the variation of accounting quality among Thai
firms. Even though IFRS has been adopted, some firms probably still employ tax
rules for their financial statements. The book-tax differences, brings this
empirical investigation to a firm-level analysis. The rationale of the use of book-
tax difference is to determine the incentive of the firm. The book income and
taxable income in Thailand are calculated by using a same basis which is the
Chapter I Introduction
19
accrual basis. Thus, the book income and taxable income should be moved in the
same direction. The gap between the book-tax difference has been driven by the
temporary difference and/or permanent difference. Although the book and taxable
income are caluculated by the accrual basis, the rule for taxable income
calculation is more restricted than accounting standards. New accounting
standards based on the principle-based accounting system allow firms to have
more opportunities to do accounting dicretions. Thus, if holding the taxable
income constant, firms who intend to manage book income by increasing the book
income, the gap between book income and taxable income will be larger. On the
other hand, the gap between book income and taxable income will be smaller if
firms intend to decrease their book income. However, this thesis argues that it is
less likely for firms to decrease their book income. It is due to the fact that book
income is likely to be low because of the accounting conservatism. At the other
point of view, if holding book income constant, firms who have aggressive tax
activities are more likely to have low taxable income. Then, the book-tax
difference for this case will be larger. By these reasons, this thesis employs the
book-tax difference to proxy firms’ incentives. This thesis will incorporate book-
tax differences into the analysis of all three perspectives of accounting quality
(earnings persistence, value relevance and earnings timeliness). Because the
relationship between book-tax differences and each attribute of accounting quality
is different, more explanations will be presented in related chapters.
1.3 Statement of the General Hypothesis This section explains the development of three general hypotheses to respond to
the principal research problem. More specific hypotheses for each perspective of
accounting quality will be elaborated in particular chapters. This thesis defines
accounting quality as earnings persistence, value relevance and earnings
timeliness; this is consistent with a large number of prior studies. Accounting
information is a proxy to represent unobservable underlying economic constructs.
Information users demand useful economic constructs for their decision making or
relevancy before considering what and how a proxy of economic constructs is
Chapter I Introduction
20
determined (Maines and Wahlen 2006). Maines and Wahlen (2006) suggest that
accounting information relevance stimulates measurement and reporting
reliability. However, they further argue that information reliability is an essential
but not adequate characteristic for the efficient use of applicative information.
Because of the different perspectives of reliability and relevancy, it is
controversial to differentiate as to whether reliability or relevancy is more
important.
According to the statement of the Chairman of the International Accounting
Standards Committee of Foundation Trustees (IASC Foundation Annual report
2006, pg.4), IFRS convergence brings high quality standards to countries that
adopt them. This statement implies that the adoption of IFRS should provide
better quality accounting information. Although more than 100 countries around
the world have adopted IFRS in their accounting systems,15 there are only a few
research studies which examine the transition of accounting standards. As a
principles-based accounting system, IFRS allows firms to use their discretion.
However, Dechow and Schrand (2004, pg.102) suggest that IFRS encourages
value relevance. Most prior studies investigate the improvement of accounting
quality after IFRS-adoption through analysis of value relevance. The results of
these studies, however, are mixed and inconclusive (i.e. Prather-Kinsey 2006;
Barth et al. 2008).
In this study, I address whether accounting quality is enhanced when converging
the domestic accounting system to international accounting standards. I employ
Thai data for the analysis as it has adopted IFRS for several years and now these
new accounting standards should be fully implemented. Analysing a single
country minimises the variation of market environment (Leuz 2003). In addition,
although they use the same set of accounting standards, accounting quality can be
varied across countries due to the dispersion of domestic investors (Alford et al.
1993). Graham et al. (2000) find that the value relevance of Thai book values and
15 Report of the Chairman of the IASC Foundation Trustees, International Accounting Standards Committee Foundation Annual Report 2006, pg.2.

Chapter I Introduction
21
earnings declined during the financial crisis. However, Davis-Friday et al. (2006)
report that the value relevance of earnings declined but the value relevance of
book values increased during the financial crisis. Prior studies suggest that Thai
accounting information is value-relevant and the value relevance of the Thai
accounting summary measures reflects economic consequences. It is
controversial whether IFRS brings a higher quality of earnings than domestic
accounting standards due to country-specific factors (Barth et al. 2008).
Nevertheless, based on Barth et al. (2008), I have an ex ante prediction that
earnings quality is enhanced after the accounting system change. As a result, the
first general hypothesis in an alternative form is as follows:
General hypothesis 1
Accounting quality is enhanced after IFRS adoption.
Prior research provides evidence of accounting quality in different accounting
regimes (Alford et al. 1993; Ali and Hwang 2000). Existing studies suggest that
accounting information in code law countries is less sensitive to economic income
and loss, implying a lower accounting quality (Ball, Kothari and Robin 2000; Ball
et al. 2003; Ball and Shivakumar 2008). For example, Ball et al. (2003) argue that
code law system countries are more likely to employ tax-based accounting
systems that have a low ability to capture economic outcomes. Burgstahler, Hail
and Leuz (2006) show that the number of firms in countries using tax rules for
financial reporting purposes engaged in earnings management is greater than that
in countries which use GAAP-based income. As a result, earnings
informativeness is lower for countries where firms have large book-tax
conformity.
In terms of the relationship between book income and taxable income, Guenther,
Maydew and Nutter (1997) argue that it is difficult for firms to employ different
accounting methods to increase taxable income or tax deductions, without
increasing revenues or expenses in financial statements. For example, the
estimated expense of warranty claims can be expenses in financial reporting, but it
Chapter I Introduction
22
cannot be a tax deduction unless economic performance has occurred. The
condition in references to economic performance is sufficient, but not necessary
for financial statement purposes (Guenther et al. 1997). In addition, high book-
tax conformity violates stock exchange rules and increases potential costs, i.e.
high tax payment and information loss (Hanlon, Laplante and Shelvin 2005;
Hanlon, Maydew and Shevlin 2008). Guenther et al. (1997) argue that the book-
tax difference occurs because of the underlying different incentives between
financial and tax accounting. Accounting conservatism attempts to detect firms
which understate expenses or overstate revenues; on the other hand, tax rules
detect understated revenue and overstated expense. Mills (1998) reports that
Internal Revenue Service audit adjustments increase as book-tax differences
increase. This implies that book income information reflects tax activity.
Due to the different law and tax policies, firms in the tax-based accounting system
may employ accounting standards in different ways from firms in the GAAP-
based accounting system. The adoption of IFRS in tax-based accounting
environments versus a GAAP-based accounting system possibly affects
accounting quality differently (Ali and Hwang 2000). In GAAP-based accounting
income systems, at the level of a given firm’s performance, reported earnings can
be varied through different accounting treatments used. The book-tax difference
in GAAP-based accounting income system has twofold: i) assuming that all firms
had used the same tax strategy, at the level of a given firm’s performance, book-
tax differences in GAAP-based accounting income systems reflect the
management’s intention of using accounting standards and ii) on the other hand,
assuming that all firms had used the same accounting treatment, at the level of a
given firm’s performance, the difference of book income and taxable income
reflects the level of aggressiveness in tax activities. In tax-based accounting
income system, at the level of a given firm’s performance and tax strategy, firms
are more likely to use tax rules for reported earnings. However, it is possible that
tax rules do not cover all accounting transactions; book-tax differences still exist.

Chapter I Introduction
23
In this thesis, I investigate accounting quality in Thai firms by partitioning firms
according to the magnitude of book-tax differences between the pre- and post-
adoption period. I use book-tax differences to distinguish firms’ incentives in two
areas; the use of accruals and tax activity. All else being constant, the argument is
that new accounting standards implemented in the Thai tax-based accounting
system will enlarge the difference between book income and taxable income due
to the increasing opportunity to use discretionary accruals (Dechow and Schrand
2004, pg.113-114). However, the larger book-tax difference during post-adoption
periods may be generated by aggressive tax planning. When comparing between
earnings manipulation and tax activity in Thai settings, there is a higher variation
in engagement in managing accruals among firms because aggressive tax planning
is limited by law enforcement and tax audit and adjustment (Mills 1998).
In addition, I employ book-tax differences to construct firm portfolios because: i)
the study of accounting quality and accounting system transition has not
investigated the change in patterns of book-tax differences when the accounting
system has been changed, and ii) in a tax-based accounting income system, IFRS
adoption results in larger book-tax differences, at an unchanged level of tax
activity. The larger book-tax difference reflects either the implication of
principles-based accounting or management’s incentives in the area of accruals, if
tax activity is held constant. However, it should be noted that smaller book-tax
differences in the post-adoption period are not free from management discretions.
New principles-based accounting standards allow firms to have more opportunity
to perform more accruals. It will be problematic if the management is likely to
perform opportunistic or informative earnings management to increase, decrease
or smooth reported earnings. For example, Tucker and Zarowin (2006) suggest
that informative earnings management is observed through income smoothing.
Based all above arguments, the second general hypothesis in an alternative form is
as follows:
Chapter I Introduction
24
General hypothesis 2
Accounting quality is varied according to the magnitude of book-
tax differences.
Accounting quality is also influenced by the indirect parameter as
aforementioned. Based on the general hypothesis 2, if the variation in accounting
quality among firms is observed, this thesis proposes that a firm’s governance
system is a potential factor inducing the variation in accounting quality.
Therefore, this leads to the third general hypothesis stating in an alternative form.
General hypothesis 3
There is an association between accounting quality and firm
governance systems, influencing the variation in accounting quality
among firms.
It should be noted that the analysis is divided into three perspectives of accounting
quality. More detailed explanations about the development of hypotheses for each
perspective, including earnings persistence, value relevance and earnings
timeliness, are introduced in chapter 4 (H.4.1 – 4.3), 5 (H.5.1 – 5.3) and 6 (H.6.1 –
6.2), respectively. It also should be noted that general hypotheses 1 and 2 are to
respond to the principal research problem whereas general hypothesis 3 is to
respond to the supporting research question.
A summary of all research questions and alternative hypotheses is presented as
follows:
Principal research problem
“whether the quality of accounting information is altered in Thai accounting regime and capital market environments between pre- and post-adoption accounting standards.”
Chapter I Introduction
25
General hypothesis 1
Accounting quality is enhanced after IFRS adoption.16
Hypothesis 4.1 (H.4.1):
Earnings are of higher persistence after the adoption of IFRS in
Thailand.
Hypothesis 5.1 (H.5.1):
The value relevance of accounting summary measures is enhanced
after the adoption of IFRS in Thailand.
General hypothesis 2
Accounting quality is varied according to the magnitude of book-tax differences.
Hypothesis 4.2 (H.4.2):
When comparing between pre- and post-adoption periods, earnings
persistence is related to book-tax differences
Hypothesis 5.2 (H.5.2):
When comparing between pre- and post-adoption periods, the
value relevance is related to book-tax differences.
Hypothesis 6.1 (H.6.1):
Earnings timeliness is more pronounced when Thai listed firms
exhibit larger book-tax differences.
Supporting research question
“whether the firm governance system affects the accounting information quality in Thailand.”
16 It should be noted that general hypothesis 1 is applied to the analysis of earnings persistence and value relevance but not the timeliness of earnings. It is due to the fact that the earnings persistence and the earnings timeliness have an opposite perspective. In particular, the earnings timeliness will be less likely for firms with higher persistence of earnings relative to firms with lower persistence of earnings. Therefore, if the alternative hypothesis 4.1 is not rejected, the earnings timeliness will be less likely after the adoption of IFRS in Thailand.
Chapter I Introduction
26
General hypothesis 3
There is an association between accounting quality and firm governance systems,
influencing the variation in accounting quality among firms.
Hypothesis 4.3 (H.4.3):
Earnings persistence varies according to the firm governance
system in Thailand.
Hypothesis 5.3 (H.5.3):
The value relevance varies according to the firm governance
system in Thailand.
Hypothesis 6.2 (H.6.2):
There is a positive association between firm-specific conservatism
measures and book-tax differences in Thai settings.
1.4 Motivation of the Study First of all, the motivation for this study is to investigate whether accounting
quality is generally improved by new accounting standards in Thailand by
expanding it to include an institutional factor – the magnitude of book-tax
differences. Thailand, as a rule-based accounting income country, has changed its
accounting system by adopting International Financial Reporting Standards
(IFRS) since 2000. These accounting standards should now be fully embedded.
In the Accounting Act. (2000), it clearly states in the footnote of the Act that
accounting principles and practices in Thailand were out of date and did not
support the change in economic circumstances. Therefore, Thai accounting
system must be updated. By these reasons, this thesis attempts to examine
whether accounting quality has been enhanced after IFRS adoption in Thailand by
focusing on a long-window period. This thesis investigates the improvement of
accounting quality in two main aspects – the persistence of earnings and the value
relevance of accounting information. In addition to the analysis of improvement
of accounting quality, this thesis investigates the existence of earnings timeliness
in Thai settings.
Chapter I Introduction
27
Next, it should be noted that prior studies had explored accounting quality in a
single market (Ball and Shivakumar 2005; Leuz 2003). This research focuses on
the improvement of accounting quality in the Thai accounting system due to at
least four reasons. Firstly, as IFRS are expected to be applied for all countries,
firm specific and institutional factors, i.e. business culture and system, economic
circumstances and the tax system vary and can influence the effectiveness of IFRS
implementation in the country. In addition, the effects of these factors are not
easily identified on the implementation of IFRS in domestic countries. Focusing
on accounting quality in one market can minimise the variations of market
incentive and economic environment. Secondly, it is of interest to investigate the
IFRS adoption in the country where their financial reporting is greatly influenced
by the domestic tax system. This allows me to explore the pattern of the
accounting income system when it has been moved from the tax-based to GAAP-
based accounting income system. Thirdly, firms must absorb costs incurred by
the adjustment process in terms of tax payments calculated from GAAP-based
financial statements. If Thai firms are likely to avoid high costs incurred from the
adjustment for tax payments, they will be more likely to keep employing the tax-
based accounting income system. If Thai firms are to keep using their tax-based
accounting income system, the significant enhancement of accounting quality
after IFRS adoption should be less likely. The change in pattern of accounting
income system provides an overview picture of the use of IFRS in Thailand.
Lastly, because Thai firms’ financial reporting is largely based on income tax
rules, the investigation of Thai firms’ accounting quality allows this thesis to
estimate the deviation between book income and taxable income (or book-tax
differences) and use the alteration in book-tax differences as proxy to obtain more
insightful information about the discretion of firms’ insiders. This is due to the
fact that new accounting standards still allow for firms’ discretion, and a prior
study suggests that the magnitude of book-tax differences reflects accounting
quality (Hanlon 2005).
In addition to applying the use of book-tax differences in the study of accounting
quality in Thai settings, this thesis proposes that the firm governance system plays
Chapter I Introduction
28
an important role in terms of inducing the quality of accounting information in
Thailand. This is motivated by the prior study (Dechow and Schrand 2004) as
aforementioned.
Lastly, to the best of my knowledge, this is the first study investigating the
enhancement of accounting quality after IFRS adoptions in Thailand by
expanding the conditioning institutional factor to include the magnitude of book-
tax differences. This thesis considers that the magnitude of book-tax differences
is a useful proxy when estimating the development of accounting systems in Thai
settings because: i) this thesis uses the magnitude of book-tax differences to
observe the Thai accounting system whether it has been transitioned from the tax-
based to GAAP-based accounting income system; and ii) new Thai accounting
standards as principles-based systems are likely to provide room for more
accounting discretion relative to old accounting standards as rule-based systems.
The scale of book-tax differences should reflect such discretion.
1.5 Contributions to the Knowledge This research investigates accounting quality in the Thai accounting regime.
Accounting quality is defined by three long-window perspectives, including the
persistence of earnings, the value relevance of accounting information and the
timeliness of earnings information. Exiting studies evidence the change in
accounting quality after IFRS adoptions in different countries. The main
contribution of this study is to add existing published literature that has been silent
on the analysis of accounting quality in Thailand. In particular, this thesis
contributes to the knowledge in different aspects as follows.
Firstly, this research adds to the literature in terms of accounting quality in
Thailand, on which prior research has been silent. A number of research studies
have examined accounting quality in developed countries (i.e. Barth et al. 2008).
However, existing published research has been silent on investigating earnings
persistence and timeliness in Thai capital market.
Chapter I Introduction
29
Secondly, this research analyses accounting quality after the accounting change in
Thailand. Prior research studies investigate the value relevance of Thai
accounting information during financial crisis in Thailand. Theoretically, those
research studies conjecture that accounting information reflects the change in
economic circumstances. In particular, the left-hand side of the value relevance
analysis (market value of the firm) is assumed to be substantially altered.
However, this thesis focuses on the change in the Thai accounting system
(earnings and book value information has been changed) and attempts to examine
whether Thai accounting information prepared by new accounting standards are
useful to the market. Specifically, in terms of the value relevance analysis, this
thesis examines whether the market responds to the change in Thai accounting
information prepared by new accounting standards.
Thirdly, this thesis observes the change in Thai accounting regime during IFRS
post-adoption. This observation is essential for accounting standard setters in
Thailand. Even though IFRS has been adopted in a tax-based accounting income
system, a firm’s incentive to employ tax rules for financial reporting may exist.
Any attempts performed by accounting standard setters to adopt IFRS in Thailand
are meaningless if it appears that Thai firms still employ tax rules for financial
statements.
Next, this thesis employs the book-tax difference to determine the transition of the
Thai accounting regime and the change in Thai accounting quality during IFRS
adoptions. The book-tax difference has been employed to examine accounting
quality in only US firms, but this thesis employs the book-tax difference to
investigate accounting quality in non-US firms. Additionally, the published
literature has been silent on incorporating book-tax differences to the analysis of
earnings timeliness in Thai settings.
In addition to examination of the improvement of accounting quality in Thai
firms, this research investigates whether firm governance systems induce the
variation in accounting quality among Thai firms. This investigation adds to

Chapter I Introduction
30
existing literature and suggests that indirect parameters are not futile but rather
that they are necessary tools to encourage the use of accounting standards, then
leading to the enhancement of accounting quality in Thailand.
Lastly, balanced-panel data are employed for the analysis of earnings persistence
and value relevance for Thai settings. A number of prior studies have employed
firm-year observations. It should provide more powerful inference for the study
of accounting quality when using a longitudinal dataset.
1.6 Structure of the Study The remainder of the thesis is divided into six chapters:
Chapter 2
The background of the Thai accounting regime and capital market is introduced in
chapter 2. It describes IFRS adoption in Thailand and the accounting-related
policy of the Thai capital market.
Chapter 3
The theoretical framework for each perspective of accounting quality is explained
in chapter 3. In addition to the theoretical framework, this chapter discusses the
existing literature. The review of literature relates to the persistence of earnings,
the value relevance of accounting information, the timeliness of earnings, the use
of book-tax difference and the study of accounting quality in different settings of
firm governance systems.
Chapters 4
Chapter 4 presents an investigation of earnings persistence. Specific hypotheses
are explained and developed. The panel dataset has been used for the main
investigation. However, all firm-year observations are applied to support the
main analysis. In addition, the association between earnings persistence and firm
governance factors are examined.

Chapter I Introduction
31
Chapters 5
Chapter 5 presents an investigation of the value relevance of earnings and book
value. Like Chapter 4, detailed hypotheses are elaborated. The main analysis
employs the longitudinal dataset during 1995 – 2004. All firm-year observations
are applied for the robust check. This chapter also presents the association
between the value relevance and firm governance factors.
Chapters 6
The study of earnings timeliness is presented in Chapter 6. More detailed
hypotheses are identified. Firm-year observations are examined in different
models. The investigation of unconditional earnings conservatism and firm
governance factors is presented in this chapter.
Chapter 7
The last chapter is the conclusion of the study. It discusses findings from the
study, recommendations and suggestions for future research.

Chapter II Thai Accounting Environments
Chapter 2
Thai Accounting Environments
2.1 Introduction
2.2 Thai Accounting Laws
2.3 Thai Accounting Body
2.4 Stock Exchange of Thailand (SET)
2.5 Thai Accounting Standard (TAS)
2.6 Discussion of the Thai Accounting System
2.7 Chapter Summary

Chapter II Thai Accounting Environments
33
Chapter 2
Thai Accounting Environments
2.1 Introduction This study aims at understanding accounting information quality and the
accounting regime when there are changes in the Thai accounting system and the
association between corporate governance and accounting information in
Thailand. This chapter elaborates the development of the accounting system in
Thailand to provide the background information about the Thai accounting
system. Thailand has been using accounting laws since 1962. The change in
accounting laws causes several impacts on accounting environments in Thailand,
i.e. accounting standard reforms, accounting body reorganisations, and accounting
professions and education. This chapter focuses only on the discussion about the
impact of accounting laws on changes in accounting information quality in
Thailand. In addition to the Thai accounting system, this chapter covers the Thai
capital market and its accounting-related regulations. In particular, the Stock
Exchange of Thailand (SET) is the other regulator whose rules, i.e. corporate
governance policy, also affect accounting quality. This chapter is organised by an
exploration about accounting laws presented in section 2.2. It moves on to the
Thai accounting body (section 2.3), Stock Exchange of Thailand (section 2.4), and
Thai accounting standards (section 2.5). A discussion of the Thai accounting
system is presented in section 2.6 and the last section, 2.7, is the chapter
summary.
2.2 Thai Accounting Laws The history of Thai accounting laws in Thai language is provided by Federation of
Accounting Professions (FAP).17 In 1937 (2480 B.E), the first Thai accounting
law was drafted by a pioneer, Luang Dhamri-isranuwat, to promote Thai
accounting professions to be legally acknowledged and supported by the Thai
Government as with other professional bodies in the country. However, the 17 http://www.fap.or.th/fap/?q=node/21 [accessed 18th October 2007]
Chapter II Thai Accounting Environments
34
number of Thai accountants who were members of the Thai accounting body at
that time was rather small. The first necessary mission thus was to increase the
number of Thai accountants; therefore, the accounting education had been
provoked rather than attempting to establish the accounting law during that time.
This led to the suspension of the first draft until 1962 (2505 B.E). During the
period without an accounting law to regulate the Thai accounting profession, in
1948 (2491 B.E) Thai accountants had gathered and formed themselves as the
Institute of Certified Accountants and Auditors of Thailand (ICAAT), a self-
regulated organisation. The ICAAT was mainly regulating accounting practices
and issuing Thai Accounting Standards (TAS) after the Auditor Act 1962 was
promulgated.
In 1962 (2505 B.E), the Thai Congress sanctioned the first accounting profession
law which was officially known as the “Auditor Act – 1962 (2505 B.E).”
Regarding the Auditor Act, the new government entity known as the Board of
Supervision of Auditing Practices (BSAP) was established to formally regulate
accounting practices in Thailand. Several main duties of BSAP were auditor
license authorisation and accounting practice promotion as well as ICAAT
supervision. ICAAT was consequently under the mandate of BSAP. Publishing
the Thai Accounting Standards (TAS) under the authorisation of BSAP was the
major responsibility of ICAAT. After the long term use of the Auditor Act, there
were several attempts to revise the 1962 Act to update complex business
transactions, since the economic and business situation had significantly changed
over time. Until 2004 (2547 B.E), the long-term effort, primarily because of many
changes in new Thai government, was ultimately successful by authorising the
Accounting Professions Act 2004 (2547 B.E) promulgated officially on 23rd
October 2004, leading to the withdrawal of the Auditor Act 1962. An additional
result, according to the Accounting Professions Act 2004, was the discontinuation
of ICAAT.
Nevertheless, the foremost purpose of the Accounting Professions Act (previously
the Auditor Act) has been to promote and regulate auditors, i.e. certifying

Chapter II Thai Accounting Environments
35
financial statements rather than accounting practitioners, i.e. book-keeping. In
1972 (2515 B.E) the Revolution council released the Notification of the
Revolutionary Council No. 285 (1972, 2515 B.E) to regulate book-keeping for
companies in Thailand, for instance, which transactions must be journalised and
what details must be shown in accounting records. Thus, since 1972, there were
two accounting Acts in effect: one was responsible for auditing professions and
the other regulated accounting services. In 1997, Thailand had deteriorated after
the financial bubble burst, resulting later in the collapse of the Thai economy.
The Thai Government decided to improve the accounting system by authorising a
new accounting Act, namely the Accounting Act 2000 (2543 B.E), and finally
terminated the Notification of the Revolutionary Council No. 285. In sum, there
are now two accounting laws in effect, which are the Accounting Act 2000 and
the Accounting Professions Act 2004. Table 2.1 presents the summary of the
development of accounting laws and accounting bodies in Thailand.
Table 2.1 Accounting Laws and Accounting Body Development in Thailand
Year 1937 Year 1948 Year 1962 Year 1972 Year 2000 Year 2004
Provocation of Accounting Education
Establishment of ICAAT
Auditor Act and Establishment of BSAP
Notification of the Revolutionary Council No. 285
Accounting Act (In Force)
Accounting Professions Act (In Force)
1997 Financial Crisis
Withdrawal of Notification of the Revolutionary Council No.285
Discontinuation of ICAAT and withdrawal of Auditor Act
Note: ICAAT = Institute of Certified Accountants and Auditors of Thailand
BSAP = Board of Supervision of Auditing Practices
2.3 Thai Accounting Body In 1948, the Institute of Certified Accountants and Auditors of Thailand (ICAAT)
was officially established, principally to encourage accounting practices and issue
as well as revise accounting standards. After ICAAT had been run for more than
fifty years, it was discontinued and, in 2005, the Federation of Accounting
Professions (FAP), a new juristic body, assumed the responsibilities from its
Chapter II Thai Accounting Environments
36
former body (ICAAT) under the authority of the Accounting Professions Act
2004. FAP is committed to18
Maintaining the international level of accounting profession standards,
qualities and ethics
Regulating auditors and accountants to perform accounting services in
accordance with accounting profession standards and laws
Promoting education and training and provide consultation for accounting
practitioners and issue accounting practical guidelines
Coordinating with international organisations for the exchange of
accounting knowledge and experience, and promote the role of FAP to
regional and international recognition
Encouraging the development and use of financial reporting to improve
reliability and transparency and promote good governance
Participating in the prescription of laws and regulations relating to the
accounting professions
Improving harmonisation and cooperation to maintain the accounting
professions, and
Promoting good governance in the Federation of Accounting Professions
In addition, the Act constitutes the independent accounting standard board which
has responsibilities for setting exposure draft and Thai Accounting Standards.
Those standards must be authorised by the BSAP before coming into force,
however.19 Further information about FAP can be found on the website
http://www.fap.or.th.
2.4 Stock Exchange of Thailand (SET) Details in English about the establishment of the Stock Exchange of Thailand
(SET) can be found on the website http://www.set.or.th. This thesis focuses only
18 Federation of Accounting Professions, Missions. [online] Available from: http://www.fap.or.th/about/index.php?id=2 [accessed 18th October 2007] 19 Securities and Exchange Commission, Thailand (2007), Implementation of the IOSCO Objectives and Principles of Securities Regulation: Principle 16. [online] Available from: http://www.sec.or.th/sec/iosco/Content_0000000755.jsp?categoryID=CAT0000014&lang=th [accessed 18th October 2007]
Chapter II Thai Accounting Environments
37
on the important SET rules affecting Thai accounting renders of the firm where
their shares are publicly traded in the capital market.
First of all, the Second National Economic and Social Development Plan (1967-
1971, 2510 B.E – 2514 B.E) instituted for the first time a systematic security
market in order to mobilise additional funds to support industry and national
economic development. SET, established in 1974 by the Securities Exchange of
Thailand Act 1974 (2517 B.E), set out official securities trade in Thailand since
30th April 1975. Becoming a dynamic stock exchange in 1992, a supervisory
authority, the Securities and Exchange Commission (SEC) was organised in
conformity with the new law – the Securities and Exchange Act (SEA) 1992
(2535 B.E). This movement has encouraged the Thai capital market into a further
step by separating the capital market supervised by SEC from the money market
which had until then been under the responsibilities of Bank of Thailand (BOT).
With respect to SEA-1992, the Thai capital market has been developed by
partitioning the market into a primary market for the initial public offering (IPO)
securities and a secondary market where both are under the oversight of SEC.
SET has divided the securities trading board into a main board and a foreign board
since 1987. The foreign board is primarily for foreign investors who would like
to have their names registered on company’s shares that they hold. Foreign
investors can hold shares traded on the foreign board only. Trading on the foreign
board provides privileges for foreign investors who are limited by Thai
commercial laws to hold only a certain percentage of shares in Thai firms, i.e.
right to buy new shares offerings and receive dividends. Above all, foreign
investors are able to trade securities on the main board but only through their
brokers who will hold shares on their behalf; and, as regards trading on the main
board, they are not entitled to receive those privileges. On 21st June 1999, SEC
initially operated a new securities market – the Market for Alternative Investment
(MAI) to support and strengthen as well as mobilise additional capital for small
and medium-sized enterprises (SMEs) in Thailand. The website of MAI for more
details is http://www.mai.or.th. MAI also has both main and foreign boards.

Chapter II Thai Accounting Environments
38
Consequently, Thailand has run two securities markets – SET and MAI since
1999.
In 1993, corporate governance was formally instigated to listed firms by requiring
the appointment of two independent directors. The corporate governance was
reformed in 1999, that SEC has required all listed companies on both trading
markets constituting at least three members on the audit committee in accordance
with the Code of Best Practice for Directors of Listed Companies, which was
initially enacted in the same year. Therefore, since 1999 firms with shares trading
on the Thai stock market have organised corporate governance including at least
three members of the audit committee and two independent directors. Table 2.2
shows summary information about Thai capital market development.
Table 2.2 Thai Capital Market Development
Thai Capital Market
Supervisory Entity: Securities and Exchange Commissions (SEC)
Stock Exchange of Thailand (SET)
Market for Alternative Investment (MAI)
Securities trade commencing year 1975 1999
Trading boards Main board and Foreign board Foreign board commencing in 1987
Good governance enacting year 1993 and 1999 1993 and 1999
Requirements for the listed company
Shareholder equity fully paid at least Thai Baht (THB) 300 Million (~£4.3 Million) - At least 1,000 minor shareholders - At least three audit committees - Accounting Standards required
- Shareholder equity fully paid at least Thai Baht (THB) 20 Million (~£290,000) - At least 300 minor shareholders - At least three audit committees - Accounting Standards required
2.5 Thai Accounting Standard (TAS) After establishing ICAAT in 1948, Thailand published accounting standards for
business entities performing in the country. Before 2004, Thai Accounting
Standards (TAS) were published by ICAAT under BSAP mandates. Although
FAP has undertaken the duties of ICAAT since 2004, the accounting standards
Chapter II Thai Accounting Environments
39
must still be authorised by BSAP as a government entity before officially being in
force. However, BSAP does not have duty about the content in Thai accounting
standards.
Thailand modified TAS many times to meet the change in economic and business
events. Nevertheless, those changes did not considerably reform the Thai
accounting system until Thailand had been massively shocked by the burst of the
Thai economic bubble in 1997. The collapse of the economy in 1997 accelerated
to ameliorate TAS a few years later. Following the financial crisis, the
Accounting Act 2000 was promulgated, and by the authorisation of the Act, on
26th December 2000 the Notification of BSAP No. 42/2000 was announced, to
declare what TAS must be applied for Thai firms. Before 1997, there were 31
accounting standards being used. The Notification indicated the withdrawal of 21
accounting standards with the remaining ten accounting standards being retained,
including TAS No. 7, 11, 14, 24, 25, 26, 27, 29, 30, and 31. With reference to its
announcement, BSAP announced 19 new accounting standards from 1st January
2000, including TAS No. 32–49 and the Accounting Framework. In 2005,
another three new accounting standards were in enforcement. By the fiscal year
ended 2006, there were 32 accounting standards in use. This considerable
amendment of accounting standards has been reckoned as the first substantial
accounting reform in Thailand since 1948. As clearly expressed in the
Accounting Act 2000, this accounting reform is to initiate the quality of
accounting information in Thai businesses. Since the new TAS mostly complied
with selective International Financial Reporting Standards (IFRS)20 published by
IASC to suit Thai business, this implies that the reform has submitted accounting
information quality for international recognition.
Although TAS is applied for all firms in Thailand, in its Notification No. 10/1998
(2541 B.E) and Policy Statement on Code of Best Practices of Directors of Listed
Companies, SEC has regulated and specified accounting standards especially for
20 IFRS, during that period, was formerly named International Accounting Standards (IAS).
Chapter II Thai Accounting Environments
40
firms listed on the stock exchange by stating that in the event of no Thai
accounting guidelines covering the existing issue, IFRS or US GAAP can be
employed, respectively. This is due to the fact that TAS does not cover some
other complicated transactions, i.e. accounting for income tax. Listed firms in
Thailand must employ accounting guidelines published by the International
Accounting Standards Committee (IASC) and the American Institute of Certified
Public Accountants (AICPA), respectively. This regulation, with penalties, has
been strictly in effect since the company financial year ended 1997. In
consequence, the publicly traded firm in Thailand utilises TAS as a minimum
requirement for its accounting procedures and SEC rules have also been
compulsory. A tabular summary presenting a comparison of TAS and IFRS is
presented in Appendix 1.
In conclusion, FAP is currently recognised as an authority organisation for
accounting practices in Thailand. However, SET also regulates the accounting
rule for publicly share trading firms. Therefore, listed firms have to perform
accounting procedures in conformity with both organisations. It should be noted
that TAS is considered as a basis standard for all firms doing business in
Thailand.
2.6 Discussion of the Thai Accounting System Most empirical studies in international accounting policy (i.e. among others, Ball,
Kothari and Robin 2000; Bartov et al. 2001a; Arce and Mora 2002) have argued
about the difference between code law and common law regime and their effect
on accounting information. For example, Ball et al. (2000) reported that in more
than 40,000 firm-year samples for the period 1985–1995, on average, timely and
conservative accounting incomes in code law countries, including France,
Germany and Japan, were significantly less than those in common law countries,
including Australia, Canada, the US and the UK. They argue that political group,
payout policy through dividends, manager’s discretion and tax system are factors
Chapter II Thai Accounting Environments
41
leading to the less timely and less conservative accounting income in code law
countries.
However, recently IFRS has been harmonised in many countries around the
world, including Thailand as a code law and tax-based accounting income
country. This adoption should provide and encourage better quality accounting
information. However, even though IFRS has been harmonised in domestic
accounting systems, this thesis considers that IFRS adoption is a part of many
influencing factors stimulating accounting information quality in IFRS-adopted
countries, i.e. ownership structure (i.e. Fan and Wong 2002; Jung and Kwon
2002; Hovey, Li and Naughton 2003 and Wang 2006) and corporate governance
mechanism (i.e. Beekes et al. 2004; Bushman et al. 2004; and Goncharov et al.
2006). It is essentially of interest to investigate whether their empirical inference
(i.e. Barth et al. 2008) can be applied to Thai settings.
One major point considered by this thesis is the institutional problem in Thai
settings. As Thailand has long been a tax-based accounting income system, Thai
firms have used tax rules for reporting their financial statements (Ball et al. 2000).
A priori conjecture views the Thai accounting regime as a tax-based accounting
income system because of the structure of its accounting standard settings. If
accounting income is based on tax purposes, accounting income is likely to be less
sensitive to economic reality. Nevertheless, IFRS adoption in Thailand is to
promote accounting information quality. Thus, the IFRS adoption should help to
bring about a better quality of accounting income in Thai firms. If this is the case,
Thailand’s accounting regime should move to a well-developed accounting
system after the IFRS adoption.
Regardless of presenting true economic outcomes on their financial statements,
firms are unlikely to change their accounting policies as long as those policies are
allowed by accounting standards because of the potential cost incurred from the
change. On the other hand, firms are likely to employ GAAP rules rather than tax
rules probably because of the demand from market, i.e. creditors or domestic and
Chapter II Thai Accounting Environments
42
foreign investors, or the intention to present the true value of the firm. Thus, it is
of interest to explore whether the Thai accounting system has actually been
reformed. Much of prior research (i.e. Ball et al. 2000 and Barth et al. 2008)
investigates the improvement of accounting quality by comparing pre- and post-
IFRS adoption or studying in international contexts. Even though this thesis
examines the general enhancement of accounting quality in a single emerging
market, namely Thailand, it is not only to examine the change in accounting
quality during IFRS post-adoption in Thailand but attempts to investigate whether
the change in accounting quality during IFRS post-adoption is varied according to
firms’ incentives as well. This thesis employs the book-tax difference as a proxy
of firm’s incentives. This attempt should provide better understanding about
IFRS adoption and the use of IFRS in Thailand.
2.7 Chapter Summary This chapter explains the Thai accounting system and its capital market
environment. Thailand has recently adopted the international accounting standard
for its business. This adoption attempts to promote a quality of accounting
information in Thailand. Not only has the accounting system been reformed but
also Thai security markets have reinforced the attempt to improve accounting
information quality in Thailand by regulating the use of accounting standards and
the constitution of audit committees in publicly held firms. This thesis is
interested in exploring whether accounting information quality in Thailand has
been improved after these several endeavours or whether Thailand only uses these
activities as labels. On the contrary, if an improvement in accounting information
quality in Thailand has not been observed, one can argue that IFRS adoption may
not be suitable for some particular countries, especially countries that have been
using tax rules for financial reporting purposes for a long time, i.e. Thailand.

Chapter 3
Theoretical Framework and Literature Review
3.1 Introduction
3.2 Theoretical Framework
3.2.1 Theory of Earnings Persistence: The Predictive
Approach
3.2.1.1 A Time Series Analysis
3.2.1.2 Fundamental Analysis
3.2.1.3 Economic Determinants
3.2.2 Theory of Accounting Valuation
3.2.2.1 Direct Valuation Theory
3.2.2.2 Input-To-Valuation Theory
3.2.2.3 Valuation and Contextual Accounting Argument
3.2.2.4 Valuation Models
3.2.3 Theory of Earnings Timeliness
3.2.3.1 Contracting Theory
3.2.3.2 Earnings Timeliness Models
3.2.3.3 Firm-Specific Measurement of Accounting
Conservatism
3.2.4 Book-Tax Differences
3.2.5 Firm Governance System
3.2.5.1 Agency Theory
3.2.5.2 Agency Problems and Accounting Quality
3.3 Literature Review
3.3.1 Prior Study of Earnings Persistence
3.3.2 Prior Study of the Value Relevance Analysis

3.3.3 Earnings Timeliness
3.3.4 Book-Tax Differences and Accounting Quality
3.3.5 Firm Governance and Accounting Quality
3.4 Chapter Summary
Chapter III Theoretical framework and literature review
45
Chapter 3
Theoretical Framework and Literature Review
3.1 Introduction This chapter comprises two main parts: the theoretical framework and the review
of existing literature. In part I (section 3.2), the theoretical framework is divided
into five sections. The first three sections (section 3.2.1 – 3.2.3) describe related
approaches of three earnings properties, consisting of earnings persistence, the
value relevance (or accounting valuation) and the timeliness of earnings. In
addition to earnings properties, the explanation of book-tax differences (section
3.3.4) and firm governance system (section 3.3.5) are presented. The first part of
this chapter provides background about earnings quality, the book-tax difference
and corporate governance. The second part of this chapter presents the review of
related literature (section 3.3). Consistent with part I, the related research for
earnings persistence, the value relevance and earnings timeliness is presented in
sections 3.3.1 – 3.3.3, respectively. Sections 3.3.4 – 3.3.5 present prior study of
book-tax differences and firm governance system, respectively. The last section
(section 3.4) is a chapter summary.
3.2 Theoretical Framework
The first part of this chapter explains existing theoretical approaches used in prior
literature. This thesis divides accounting quality in three categories: earnings
persistence, value relevance and earnings timeliness. Among three aspects of
accounting quality, much prior research performs analysis of value relevance and
earnings timeliness. Even though earnings persistence has been explored in
accounting research for decades, the theoretical explanation of earning persistence
is still debated in various aspects, i.e. the determinant of earnings persistence.
Among three earnings qualities, the value relevance analysis has been widely used
by prior research when investigating the change in accounting systems. The most
influential approach for value relevance analysis has been explained and presented
by Ohlson (1997). However, the debate on the usefulness of accounting
Chapter III Theoretical framework and literature review
46
information to explain firm values has been an ongoing process. The third
property of earnings quality, earnings timeliness or accounting conservatism, has
been extensively explored in the literature. A number of accounting research
studies about earnings timeliness were published after Basu (1997) defined
conditional accounting conservatism as the different recognition of bad news and
good news and used stock returns to proxy economic consequences. Much of
following research has employed his approach for the study of conditional
accounting conservatism. In addition to those three accounting qualities, this
section explains the use of book-tax differences and the theoretical approach of
the firm governance system.
3.2.1 Theory of Earnings Persistence: The Predictive Approach One property of earnings that is widely debated among accounting research
studies is the persistence of earnings. Generally speaking, the persistence of
earnings (summary measures) reflects the quality of accounting. In terms of
analysts’ forecast ability, higher persistence of earnings induces higher
predictability of earnings because forecasting errors should be reduced according
to the persistence of earnings. A recent study (Dichev and Tang 2009) suggests
that knowledge about the predictability of earnings is still debated.
The earnings persistence estimation performed in this thesis is to measure the
predictability of current earnings information on future earnings; the theory
applied to this analysis is known as the predictive approach (Riahi-Belkaoui 2000,
pg.332).21 For financial statement preparations, there are alternative accounting
methods that firms are allowed to employ. To reduce the difficulty of evaluating
those alternative accounting methods, the predictive approach is utilised to
differentiate accounting choice by investigating the predictability of particular
accounting methods. The predictive approach is to measure the prediction ability
of accounting methods due to the fact that accounting information must facilitate
21 The predictive approach described throughout this section is based on Riahi-Belkaoui (2000, pg.332-333) and italics are from the original.
Chapter III Theoretical framework and literature review
47
the decision-making of the user. Riahi-Belkaoui (2000, pg.332) suggests that two
criteria should be considered. First, the model employed by the user is descriptive
rather than normative. Therefore, it is difficult to identify and define all the
decision models. The second is about the absence of a criterion for the choice of
relevant information.
With regard to the predictive approach, prior accounting studies have attempted to
measure whether earnings are persistent by using several methods, including a
time-series analysis, fundamental analysis and economic determinants.
3.2.1.1 A Time-Series Analysis A time-series analysis is a method of prediction of economic events and examines
temporal statistical dependencies in a data set (Riahi-Belkaoui 2000, pg.333).
Freeman, Ohlson and Penman (1982) suggest that changes in earnings cannot be
predicted, meaning that future earnings can either decline or increase. Accounting
researchers attempt to predict future earnings by using a time-series model. A
time-series analysis suggests that “an estimate of the expected earnings of firms is
based on the past earnings series” (Foster 1977). The specified model used to
estimate future earnings is (Sloan 1996):
Earningst = β0 + β1Earningst – 1 + εt (3.1)
3.2.1.2 Fundamental Analysis The knowledge about fundamental analysis in this section is based on the view
expressed by Penman (1992). Valuation has been extensively explored in the
literature. The classical approach to value a firm is that the present value is a
function of future expected dividends. Firms’ payoffs must be predicted to
determine the present value. Thus, price relies on future dividends but observed
dividends do not inform as to price (Penman 1992). In addition, dividend policy
is independent from firm value according to the Miller and Modigliani dividend
irrelevancy proposition. Penman (1992) considers that dividend payout is the

Chapter III Theoretical framework and literature review
48
event which occurs after closing accounting summary measures, earnings and
book value. Therefore, earnings and book value must be summarised before the
payout policy comes into action. Therefore, the prediction of future earnings
(book value) is essential for the present value estimation. There are two
approaches to price the firms, consisting of pricing current earnings and pricing
book value. First, pricing current earnings suggests that accounting earnings are
not value attributes but information about value attributes (future dividends)
(Penman 1992). Pricing current earnings is derived as:
Pt + dt = фXt (3.2)
where ф is a price/earnings (PE) ratio; P is share price; d is dividend and X
is earnings. Second, pricing book value is derived as:
Pt = Bt (3.3)
where B is book value.
Thus, fundamental analysis suggests that we must know what future earnings and
book value will be next year/in the future. Empirical evidence shows a significant
relationship between future earnings and fundamental signals, including
inventory, gross margin, effective tax rate, earnings quality, and labour force
(Abarbanell and Bushee 1997).
3.2.1.3 Economic Determinants According to economic theory, a set of relatively constant, i.e. firm-specific
characteristics, induces firms’ earnings generating process in a persistent basis
(Baginski, Lorek, Willinger and Branson 1999). Lev (1983) argues that a random
walk hypothesis reports the persistence of earnings ‘on average’. When the
persistence of earnings in an individual firm is identified, the behaviour of such
earnings persistence differs from the on average random walk process. He further

Chapter III Theoretical framework and literature review
49
argues that stability of earnings was found when employing cross-sectional
rankings of book rate of return (ROE). This considerable stability of earnings
process is due to economic determinants (Lev 1983). If accounting techniques
affect firms’ earnings generating process, the effect will be examined by the
parameter estimated in a time series model (Watts 1972 quoted in Lev 1983). In a
similar vein, if the impact of economic factors is found in firms’ earnings
generating process, the explicit relationship between economic factors and
earnings generating process must be identified.22 At least four observable
economic factors are commonly used and identified (Baginski et al. 1999), that
these economic traits induce the persistence of earnings, including firm size,
product-type, barriers-to-entry and capital intensity.
In conclusion, the persistence of earnings is to predict future earnings, facilitating
decision-making to the user. A time-series analysis is to measure the property of
earnings at an average level whilst the economic determinants approach attempts
to identify the property of earnings at an individual firm level.
3.2.2 Theory of Accounting Valuation
The website of The International Accounting Standards Board (IASB),23 an
independent, privately-funded accounting standard-setter, states that the principal
objectives of IASB are “to develop a single set of high quality, understandable,
enforceable and globally accepted international financial reporting standards
(IFRSs) through its standard-setting body, the IASB; to promote the use and
rigorous application of those standards; to take account of the financial reporting
needs of emerging economies and small and medium-sized entities (SMEs); and
to bring about convergence of national accounting standards and IFRSs to high
quality solutions.” During the past decade, many countries have adopted their 22“for example, that a change in depreciation method is generally associated with a change in capital intensity (e.g., a large investment in fixed assets leads managers to a switch from straight-line to the accelerated depreciation method). If the degree of capital intensity affects the time-series properties of earnings, it would be erroneous to attribute an observed change in the earnings time-series model to the switch in depreciation method.” (Quoted from the original, Lev 1983). 23 http://www.iasb.org/The+organisation/IASCF+and+IASB.htm. [online access 2 January 2010].
Chapter III Theoretical framework and literature review
50
accounting system in alignment with IFRS. This convergence have essentially
attracted global academic researchers’ attention to explore whether the IFRS-
harmonisation brings better quality of accounting measures to explain underlying
economic constructs in their countries. The IFRS adoption has been growing all
around the world, i.e. Europe (Spain, Czech Republic, Poland and UK), North
America (Mexico), Africa (South Africa), and Asia (Thailand).
In case of accounting reforms or accounting changes, one competent theory
widely used in academic empirical research is the fundamental analysis. In
accounting-based analysis, the fundamental analysis refers to the study of firm
valuation process. According to Kothari (2001, pg.109), “it (fundamental
analysis) aids our understanding of the determinants of value, which facilitates
investment decisions and valuation of non-publicly traded securities”
(parentheses not in original). A branch of fundamental analysis in accounting-
based research is valuation analysis. Broadly speaking, valuation theory holds to
the determination of intrinsic value of share prices compared to current share
price. The valuation analysis is mainly the study of whether information is useful
or value-relevant. In particular, value-relevance research investigates the relation
between market value as dependent variable and a set of accounting measures
(Holthausen and Watts 2001). An accounting measure is identified as “value
relevant” if it is significantly associated with the dependent variable (Beaver
2002). Kothari (2001, pg.173) proposes that the theory is required to support the
value relevance analysis. Consistent with Kothari’s argument, Holthausen and
Watts (2001) argue that the value-relevance analysis lacks descriptive theory to
draw inferences for accounting standard settings but they conclude that two
theories are inferred from the value-relevance study: direct valuation theory and
inputs-to-valuation theory. The next two sections (3.2.2.1 and 3.2.2.2) are
devoted to the explanation of these theories based on the work of Holthausen and
Watts (2001).

Chapter III Theoretical framework and literature review
51
As criticised in prior theoretical literature, the value relevance study is considered
as descriptive statistics without a reasonable conceptual explanation. For
example, Verrecchia (1998, quoted in Lee, 1999) argued that a valuation study is
“a very simple idea…with no economic context.” Nevertheless, like other
research areas, value-relevance study, a long-history investigation, is controversial
(Beaver 2002). In his presidential lecture, given at the 2001 American
Accounting Association Annual Meeting, Beaver (2002) contributed to the value-
relevance literature about the conceptual explanation of value-relevance research.
In this speech, Beaver said that the theoretical description about value-relevance
research consists of the combination of valuation model and contextual
accounting arguments. The valuation and contextual accounting argument is
described in section 3.2.2.3.
In sum, the accounting valuation theory includes three theories: direct valuation
theory, input-to-valuation theory and the valuation and contextual accounting
argument. The valuation model is elaborated in section 3.2.2.4.
3.2.2.1 Direct Valuation Theory Direct valuation theory refers to either the investigation of the association
between share market value changes or levels and earnings or book values of
equity or measurement of share market value changes or levels by using
accounting earnings and book values of equity. The theory contains two features:
i) the association approach and ii) the measurement approach (Holthausen and
Watts, 2001 footnote 4). These approaches have absolutely different concerns.
The association approach refers to the usefulness of accounting measures and the
relevant statistics of this approach is the R2. The measurement approach focuses
on the accuracy of accounting numbers and the relevant statistics is the coefficient
of accounting information relative to its predicted value.
Chapter III Theoretical framework and literature review
52
3.2.2.2 Input-to-Valuation Theory Input-to-valuation theory suggests that accounting plays as an information
provider, supporting input-information to investors in the firm valuation process.
In other words, input-to-valuation theory is a selection process to facilitate a
decision of what accounting measure or potential accounting number among
existing alternatives provides better results in valuing firms. An incremental
association study is an example which is based on an input-to-valuation theory.
3.2.2.3 The Valuation and Contextual Accounting Argument Beaver (2002) suggests that although lacking a general theory of accounting to
explain accounting-based valuation research, valuation models plus contextual
accounting arguments can be used for the explanation of the conceptual
foundation of value-relevance study, i.e. the contextual accounting argument of
the economic substance (asset vs. obligation) of pension contracts between
employers and employees that its interpretation depends on the benefit plan, or the
contextual accounting argument of the use of fair value vs. historical costs in the
prediction process. The valuation model performs by discriminating price when a
different argument is used.
3.2.2.4 Valuation Models This section summarises valuation models normally employed by researchers to
provide background knowledge in terms of value relevance analyses. This
attempts to provide theoretical background in the form of econometric rather than
descriptive explanations.
The formula of valuation models being presented in this section is based on prior
literature, including Beaver (2002), Dechow, Hutton and Sloan (1999), Kothari
(2001), Lee (1999), Lippitt and Mastracchio (1993) and Penman (2006). The
most pervasively known and understandable valuation model is the dividend-
discounted model (DDM). Another valuation model with a similar concept of

Chapter III Theoretical framework and literature review
53
DDM is a discounted cash flow valuation model (DCF). Several transformations
have been made to DDM. Products of DDM include the earnings capitalisation
model (Fama and Miller 1972, quoted in Kothari 2001) and the residual income
valuation model (Ohlson 1995, quoted in Lee 1999). Most valuation models are
based on DDM because of their essentially identical assumptions, basically
consisting of: i) growth rate and ii) long time horizon. These qualities require the
“best guess” for implementing the models.
Discounted Dividend Model (DDM)
Discounted dividend model is rather straightforward in calculating the value of
companies. It estimates the value of firms by discounting the firm’s dividend in
perpetuity. Two features must be determined to calculate the value of companies:
forecast of dividend and discount rate. The descriptive formula is:
Firm value = Expected future dividend discounted by the discount rate
The descriptive formula is presented in mathematical form:
P0 = + + + … (3.4)
where P0 is share price at time 0,
d* is expected future dividend at time 1,2,3,…, and
r is a discount rate at time 1,2,3,…
Gordon (1962, quoted in Kothari 2001) simplified DDM by adding a growth rate.
Assuming the discount rate (r) is fixed over time and the dividend growth (g) is at
the constant rate g < r, then
Pt = (3.5)
where Pt is share price at time t,
d*1
r1 r2
d*2 d*
3 r3
(d*t+1)
(r – g)

Chapter III Theoretical framework and literature review
54
d*t
is expected future dividend at time t,
r is a discount rate (the required rate of returns), and
g is a growth rate.
Discounted Cash Flow Valuation Model (DCF)
Similar notions of DDM are applied to derive a discounted cash flow valuation
model. However, rather than using expected future dividend to determine firm
value, accounting cash flow is used instead. This model, therefore, embeds
accounting policy through cash flow calculation. The present value of cash flow
in perpetuity is used to determine firm value and calculated by:
Pt = (3.6)
CF* = Cash flow from operations – Cash investment
where Pt is share price at time t,
CF*t is expected cash flow at time t,
r is a discount rate (weight average cost of capital)24, and
g is a growth rate.
Earnings Capitalisation Model (ECM)
Earnings capitalization model (ECM) determines firm values by dividing the
adjusted accounting earnings by a capitalisation factor. Like DDM and DCF that
dividend and cash flow continue indefinitely, ECM assumes that the earnings are
continuing value, relating to long time horizon. A difficult task for this model is
the estimation of a capitalisation factor (Pratt, 1989 quoted in Lippitt and
Mastracchio 1993) and this becomes problematic. Nevertheless, a capitalisation
factor can be obtained from the market or built up from a computation of risk free
rate and risk premium to derive an appropriate rate (Lippitt and Mastracchio
24 The weighted average cost of capital (WACC) should be employed as the discount rate for this case. It is due to the fact that cash flows include both debt and equity; cost of debt and cost of equity are appropreate factors. In terms of discounted dividend model (DDM), the discount rate is the rate required by investors because intvertors expect to receive dividend paid by the firm.
(r – g) (CF*
t+1)
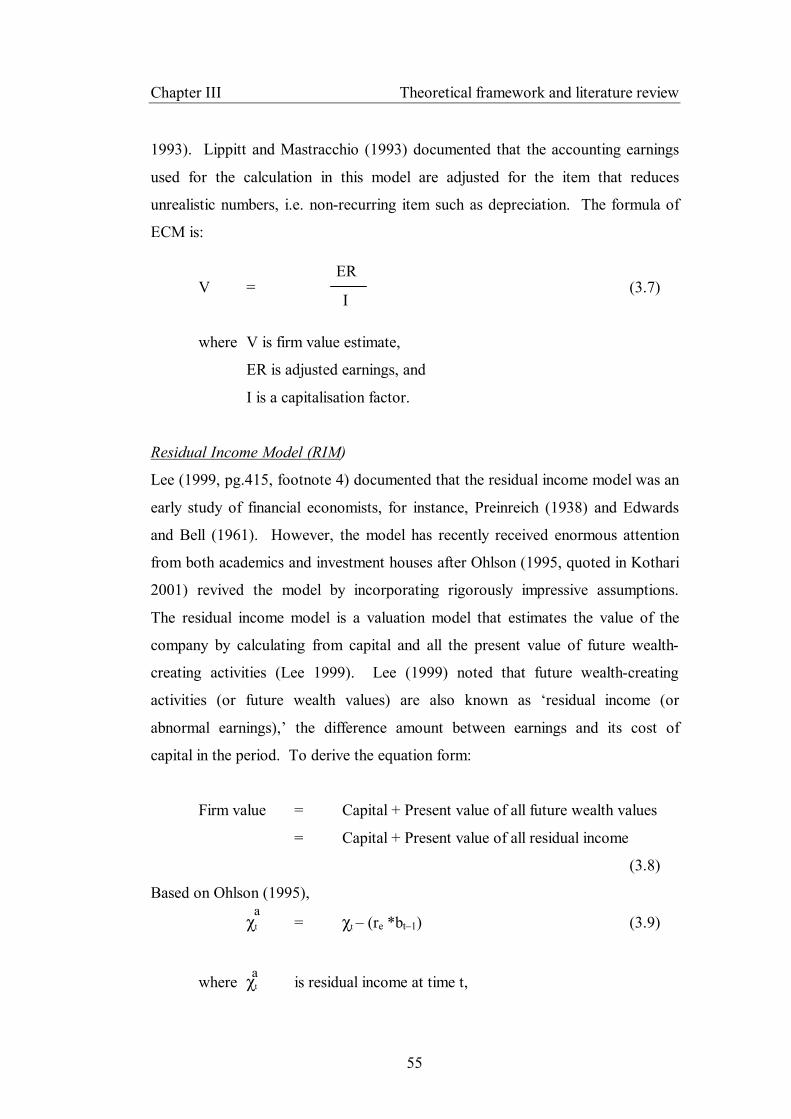
Chapter III Theoretical framework and literature review
55
a
a
1993). Lippitt and Mastracchio (1993) documented that the accounting earnings
used for the calculation in this model are adjusted for the item that reduces
unrealistic numbers, i.e. non-recurring item such as depreciation. The formula of
ECM is:
V = (3.7)
where V is firm value estimate,
ER is adjusted earnings, and
I is a capitalisation factor.
Residual Income Model (RIM)
Lee (1999, pg.415, footnote 4) documented that the residual income model was an
early study of financial economists, for instance, Preinreich (1938) and Edwards
and Bell (1961). However, the model has recently received enormous attention
from both academics and investment houses after Ohlson (1995, quoted in Kothari
2001) revived the model by incorporating rigorously impressive assumptions.
The residual income model is a valuation model that estimates the value of the
company by calculating from capital and all the present value of future wealth-
creating activities (Lee 1999). Lee (1999) noted that future wealth-creating
activities (or future wealth values) are also known as ‘residual income (or
abnormal earnings),’ the difference amount between earnings and its cost of
capital in the period. To derive the equation form:
Firm value = Capital + Present value of all future wealth values
= Capital + Present value of all residual income
(3.8)
Based on Ohlson (1995),
χt = χt – (re *bt–1) (3.9)
where χt is residual income at time t,
ER
I
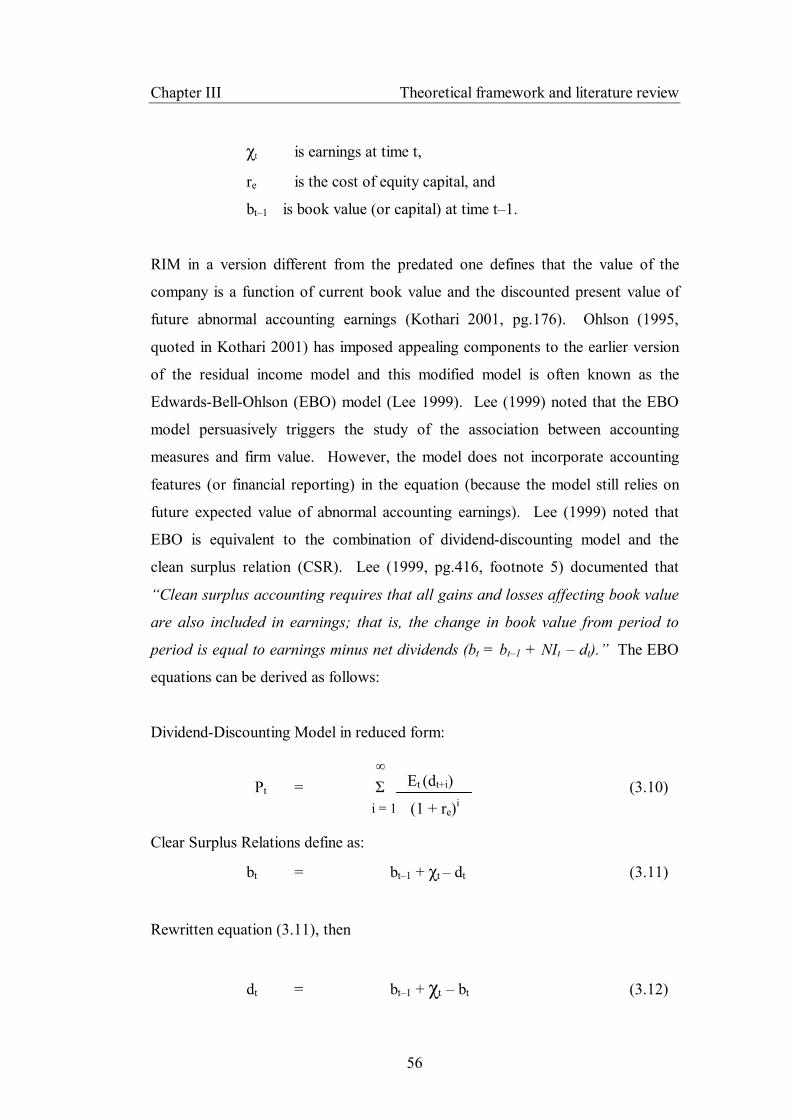
Chapter III Theoretical framework and literature review
56
χt is earnings at time t,
re is the cost of equity capital, and
bt–1 is book value (or capital) at time t–1.
RIM in a version different from the predated one defines that the value of the
company is a function of current book value and the discounted present value of
future abnormal accounting earnings (Kothari 2001, pg.176). Ohlson (1995,
quoted in Kothari 2001) has imposed appealing components to the earlier version
of the residual income model and this modified model is often known as the
Edwards-Bell-Ohlson (EBO) model (Lee 1999). Lee (1999) noted that the EBO
model persuasively triggers the study of the association between accounting
measures and firm value. However, the model does not incorporate accounting
features (or financial reporting) in the equation (because the model still relies on
future expected value of abnormal accounting earnings). Lee (1999) noted that
EBO is equivalent to the combination of dividend-discounting model and the
clean surplus relation (CSR). Lee (1999, pg.416, footnote 5) documented that
“Clean surplus accounting requires that all gains and losses affecting book value
are also included in earnings; that is, the change in book value from period to
period is equal to earnings minus net dividends (bt = bt–1 + NIt – dt).” The EBO
equations can be derived as follows:
Dividend-Discounting Model in reduced form:
Pt = Σ (3.10)
Clear Surplus Relations define as:
bt = bt–1 + χt – dt (3.11)
Rewritten equation (3.11), then
dt = bt–1 + χt – bt (3.12)
Et (dt+i)
(1 + re)i i = 1
∞
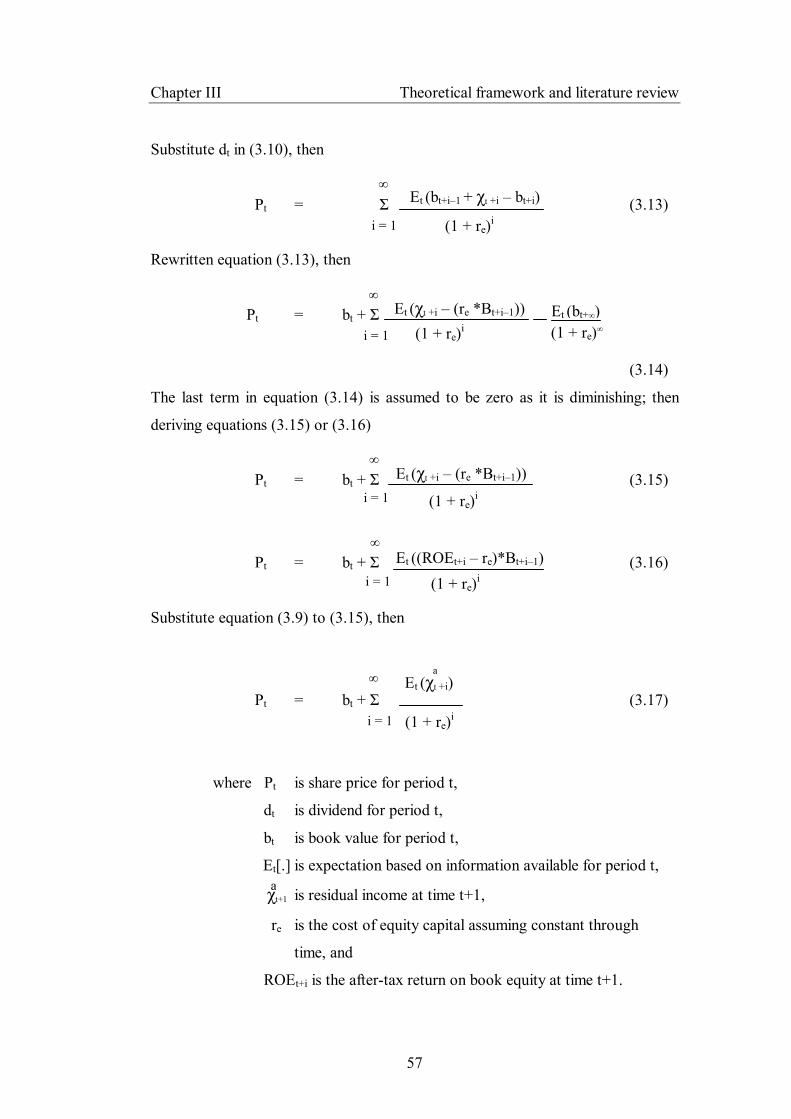
Chapter III Theoretical framework and literature review
57
a
Et (χt +i)
Substitute dt in (3.10), then
Pt = Σ (3.13)
Rewritten equation (3.13), then
Pt = bt + Σ
(3.14)
The last term in equation (3.14) is assumed to be zero as it is diminishing; then
deriving equations (3.15) or (3.16)
Pt = bt + Σ (3.15)
Pt = bt + Σ (3.16)
Substitute equation (3.9) to (3.15), then
Pt = bt + Σ (3.17)
where Pt is share price for period t,
dt is dividend for period t,
bt is book value for period t,
Et[.] is expectation based on information available for period t,
χt+1 is residual income at time t+1,
re is the cost of equity capital assuming constant through
time, and
ROEt+i is the after-tax return on book equity at time t+1.
Et (χt +i – (re *Bt+i–1))
(1 + re)i i = 1
∞
Et ((ROEt+i – re)*Bt+i–1) (1 + re)i i = 1
∞
Et (bt+i–1 + χt +i – bt+i)
(1 + re)i i = 1
∞
∞ Et (bt+∞) (1 + re)∞
Et (χt +i – (re *Bt+i–1)) (1 + re)i i = 1
(1 + re)i i = 1
∞ a
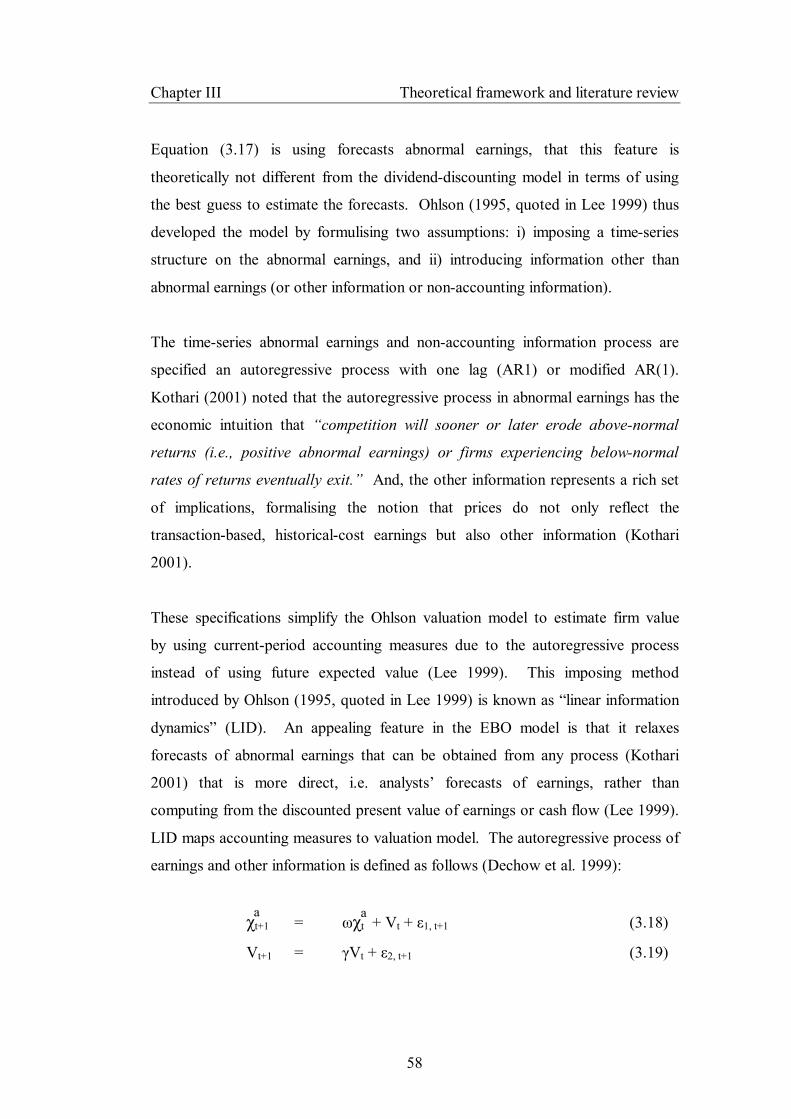
Chapter III Theoretical framework and literature review
58
a a
Equation (3.17) is using forecasts abnormal earnings, that this feature is
theoretically not different from the dividend-discounting model in terms of using
the best guess to estimate the forecasts. Ohlson (1995, quoted in Lee 1999) thus
developed the model by formulising two assumptions: i) imposing a time-series
structure on the abnormal earnings, and ii) introducing information other than
abnormal earnings (or other information or non-accounting information).
The time-series abnormal earnings and non-accounting information process are
specified an autoregressive process with one lag (AR1) or modified AR(1).
Kothari (2001) noted that the autoregressive process in abnormal earnings has the
economic intuition that “competition will sooner or later erode above-normal
returns (i.e., positive abnormal earnings) or firms experiencing below-normal
rates of returns eventually exit.” And, the other information represents a rich set
of implications, formalising the notion that prices do not only reflect the
transaction-based, historical-cost earnings but also other information (Kothari
2001).
These specifications simplify the Ohlson valuation model to estimate firm value
by using current-period accounting measures due to the autoregressive process
instead of using future expected value (Lee 1999). This imposing method
introduced by Ohlson (1995, quoted in Lee 1999) is known as “linear information
dynamics” (LID). An appealing feature in the EBO model is that it relaxes
forecasts of abnormal earnings that can be obtained from any process (Kothari
2001) that is more direct, i.e. analysts’ forecasts of earnings, rather than
computing from the discounted present value of earnings or cash flow (Lee 1999).
LID maps accounting measures to valuation model. The autoregressive process of
earnings and other information is defined as follows (Dechow et al. 1999):
χt+1 = ωχt + Vt + ε1, t+1 (3.18)
Vt+1 = γVt + ε2, t+1 (3.19)
Chapter III Theoretical framework and literature review
59
a where χt is the abnormal earnings (or residual income) at time t,
Vt is other information,
ε is unpredictable mean zero error term, and
γ and ω are persistence parameters.
According to Lee (1999), equations (3.18) and (3.19) are model’s assumptions,
not propositions. Testing the assumptions of linear information dynamics may be
fruitless because one does not obtain much benefit from rejecting the assumptions
(Kothari 2001). In addition, these assumptions logically follow the basics of
economic definitions (Lee 1999). The variables in equations (3.12) and (3.13) are
specified as an autoregressive process with one lag (AR1) or modified AR(1). γ
and ω are both imposed to be non-negative and less than 1. Lee (1999) noted that
with this process, we can determine the firm value by using current period
accounting measures rather than forecasts of the value.
According to the model, LID assumes that accounting methods are unbiased,
meaning that there is no effect of accounting choice on firm value estimation.
Kothari (2001) elaborated that different accounting method will be reflected in
accounting current book value and earnings and future expected earnings. Kothari
(2001) explained this limitation issue as: i) the model, like DDM, is not useful for
the purpose of financial reporting, ii) analysts’ forecasts also use accounting
choice for their abnormal earnings estimation,25 and iii) if future abnormal
earnings are viewed as economic rents,26 accounting choice will become
important.
25 This thesis considers that accounting choice has already been embedded in analysts’ forecasts that result in forecasted earnings, therefore accounting choice affects the valuation process in the form of forecasted earnings. 26 Schoemaker (1990, pg.1179) documented that “To Pareto and Marshall (economic) rents referred to the difference between a resource’s payments in its best and second best use (see Alchian 1988; Rumelt 1987).” (italics not in original) According to the accounting perspective, economic rents refer to the use of different accounting treatments to provide different consequences, i.e. the pooling of interest method vs. the purchase method for a merger (Kothari 2001).
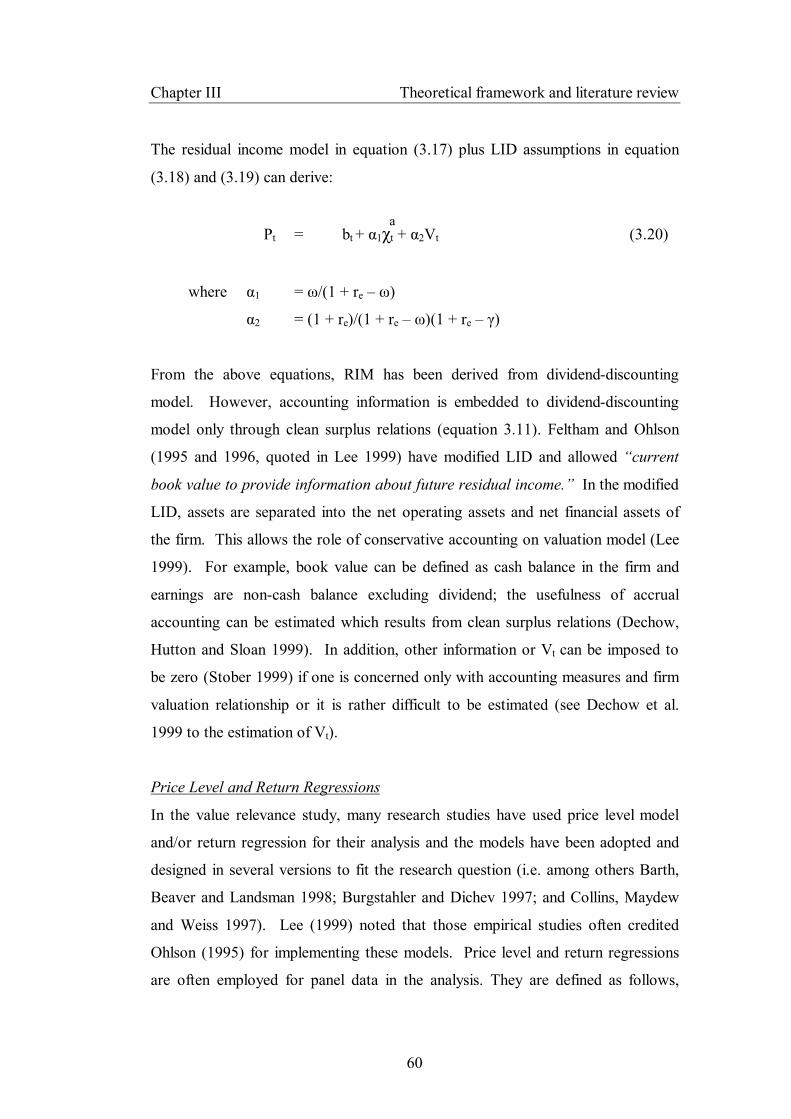
Chapter III Theoretical framework and literature review
60
a
The residual income model in equation (3.17) plus LID assumptions in equation
(3.18) and (3.19) can derive:
Pt = bt + α1χt + α2Vt (3.20)
where α1 = ω/(1 + re – ω)
α2 = (1 + re)/(1 + re – ω)(1 + re – γ)
From the above equations, RIM has been derived from dividend-discounting
model. However, accounting information is embedded to dividend-discounting
model only through clean surplus relations (equation 3.11). Feltham and Ohlson
(1995 and 1996, quoted in Lee 1999) have modified LID and allowed “current
book value to provide information about future residual income.” In the modified
LID, assets are separated into the net operating assets and net financial assets of
the firm. This allows the role of conservative accounting on valuation model (Lee
1999). For example, book value can be defined as cash balance in the firm and
earnings are non-cash balance excluding dividend; the usefulness of accrual
accounting can be estimated which results from clean surplus relations (Dechow,
Hutton and Sloan 1999). In addition, other information or Vt can be imposed to
be zero (Stober 1999) if one is concerned only with accounting measures and firm
valuation relationship or it is rather difficult to be estimated (see Dechow et al.
1999 to the estimation of Vt).
Price Level and Return Regressions
In the value relevance study, many research studies have used price level model
and/or return regression for their analysis and the models have been adopted and
designed in several versions to fit the research question (i.e. among others Barth,
Beaver and Landsman 1998; Burgstahler and Dichev 1997; and Collins, Maydew
and Weiss 1997). Lee (1999) noted that those empirical studies often credited
Ohlson (1995) for implementing these models. Price level and return regressions
are often employed for panel data in the analysis. They are defined as follows,
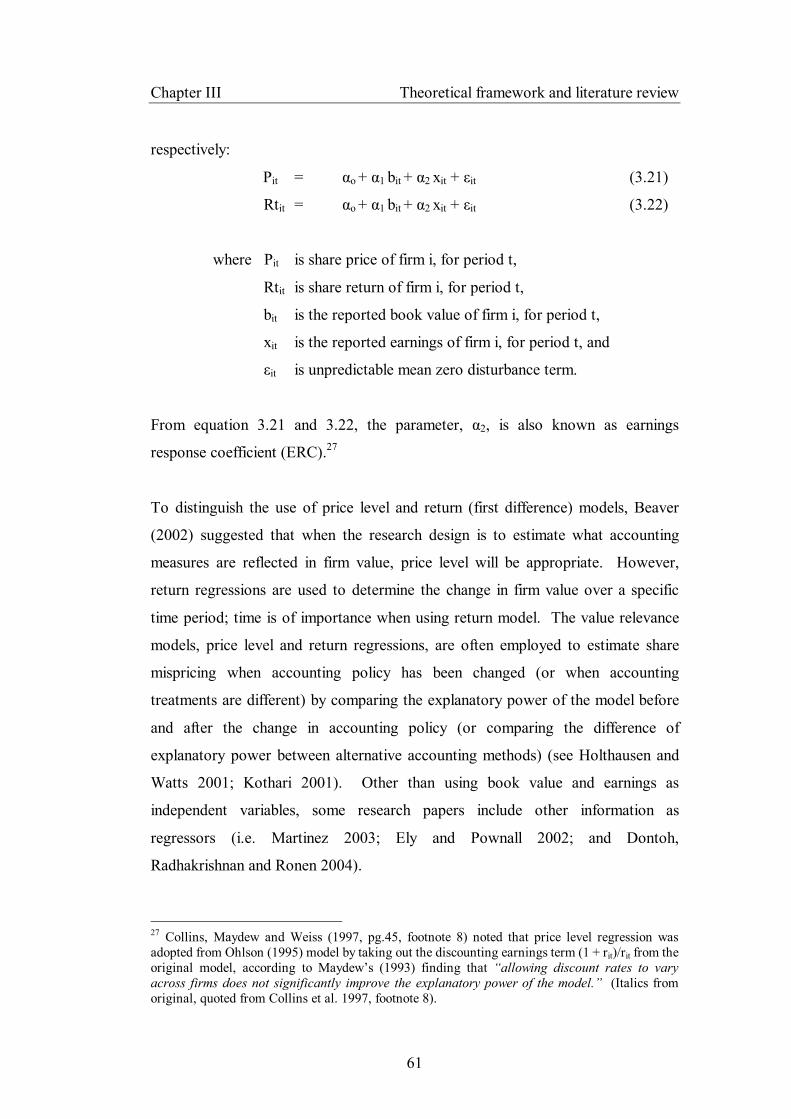
Chapter III Theoretical framework and literature review
61
respectively:
Pit = αo + α1 bit + α2 xit + εit (3.21)
Rtit = αo + α1 bit + α2 xit + εit (3.22)
where Pit is share price of firm i, for period t,
Rtit is share return of firm i, for period t,
bit is the reported book value of firm i, for period t, xit is the reported earnings of firm i, for period t, and
εit is unpredictable mean zero disturbance term.
From equation 3.21 and 3.22, the parameter, α2, is also known as earnings
response coefficient (ERC).27
To distinguish the use of price level and return (first difference) models, Beaver
(2002) suggested that when the research design is to estimate what accounting
measures are reflected in firm value, price level will be appropriate. However,
return regressions are used to determine the change in firm value over a specific
time period; time is of importance when using return model. The value relevance
models, price level and return regressions, are often employed to estimate share
mispricing when accounting policy has been changed (or when accounting
treatments are different) by comparing the explanatory power of the model before
and after the change in accounting policy (or comparing the difference of
explanatory power between alternative accounting methods) (see Holthausen and
Watts 2001; Kothari 2001). Other than using book value and earnings as
independent variables, some research papers include other information as
regressors (i.e. Martinez 2003; Ely and Pownall 2002; and Dontoh,
Radhakrishnan and Ronen 2004).
27 Collins, Maydew and Weiss (1997, pg.45, footnote 8) noted that price level regression was adopted from Ohlson (1995) model by taking out the discounting earnings term (1 + rit)/rit from the original model, according to Maydew’s (1993) finding that “allowing discount rates to vary across firms does not significantly improve the explanatory power of the model.” (Italics from original, quoted from Collins et al. 1997, footnote 8).
Chapter III Theoretical framework and literature review
62
Kothari (2001) documents that accounting-based valuation model is derived from
dividend-discounting model which is attributed to Williams (1938, quoted in
Kothari 2001). The basic theory of dividend-discounting model applies to the
market value of the firm to equal the present value of expected future dividend-
discounted at risk-adjusted expected rate of return (Kothari 2001). As financial
statements principally serve investment purposes (Barth et al. 2001, quoted in
Holthausen and Watts 2001),28 researchers have long been searching if accounting
data are relevant for equity investment. Penman (1992, quoted in Lee 1999)
triggered market-based research to consider the fundamental analysis while most
empirical research papers focused on information flows in the capital market, i.e.
empirical testing in the area of efficient market hypothesis. Mounting of value
relevance analyses can be observed after a parsimonious model, Ohlson (1995)
and Feltham-Ohlson (1995) residual income model (Kothari 2001, pg.175). Lee
(1991) documents that RIM is already determined as a standard technique in many
investment firms after four years of RIM being presented (see also O’Hanlon and
Peasnell 2002). This thesis considers that the valuation analysis has recently
caught stakeholders’ attention because of: i) easily to implement model and ii)
understandable models with rigorous assumptions.
In conclusion, the value relevance analysis attempts to investigate the relevancy of
accounting information. Even though there is no accounting theory supporting the
valuation process, the valuation method is useful for the investigation of
accounting changes. One issue about the valuation process is that the valuation
model is open-ended, i.e. other information being incorporated into the equation
3.20 is subject to information users.
3.2.3 Theory of Earnings Timeliness The relevance and reliability are limited by timeliness. If firms have waited to
gather all information before presenting to the public, such information is
28 Holthausen and Watts (2001) argue that there are several users of financial statements other than equity investors that accounting standard setting has to be concerned with.

Chapter III Theoretical framework and literature review
63
probably very reliable but not relevant. On the other hand, if firms present
information to the public without sufficient information, the reliability of such
information may be reduced. Timeliness is one attribute of accounting measures
(Watts 2003a). Ball et al. (2000) define timeliness of accounting income as the
ability of earnings to incorporate returns which occurred in the same period.
Timely financial reporting can be thought of as timely accounting recognition
presented on financial statements. Accounting recognition of firms’ future
changes has two general ideas: deferred and timely recognition (Ball and
Shivakumar 2005a). Accounting recognition is viewed as ‘conservative’ when
firms recognise losses in more timely manner than gains. A prominent work of
Basu (1997) views accounting conservatism as “capturing accountant’s tendency
to require a higher degree of verification for recognising good news than bad
news in financial statements”. A consequence of accounting conservatism is “the
systematic undervaluation of the entity’s net assets (equity) relative to their
economic value” (Givoly, Hayn and Natarajan. 2007).29
Conservatism can be defined as: conditional or unconditional (Beaver and Ryan
2004). Beaver and Ryan (2004) detail the definition of conditional and
unconditional conservatism as follows:
Unconditional conservatism
Unconditional conservatism (or ex ante or news independent) refers to aspects of
the accounting process that are determined at the inception of assets and
liabilities yield expected unrecorded goodwill, i.e. accelerated depreciation. A
primary motivation for unconditional conservatism is the difficulty of valuing
certain economic assets and liabilities.30
Conditional conservatism
Conditional conservatism (or ex post or news dependent) means that book values
are written down under sufficiently adverse circumstances but not written up 29 Italics in original. 30 Italics in original.

Chapter III Theoretical framework and literature review
64
under favourable circumstances, with the latter being the conservative behaviour,
i.e. lower cost or market value of accounting for inventory and impairment
accounting for long-lived tangible and intangible assets. A primary motivation
for conditional conservatism is to counterbalance managers’ perceived incentives
to report upward-biased accounting numbers when adverse events have
occurred.31
3.2.3.1 Contracting Theory Roychowdhury and Watts (2007) argue that no theory has been derived to explain
asymmetric timeliness. However, Watts (2003a) has attempted to explain
accounting conservatism in a formal way by proposing ‘contracting theory’.
Contracting theory argues that a number of economic reasons generate
conservatism. Conservatism is caused by following reasons (Holthausen and
Watts 2004; Roychowdhury and Watts 2007):
1. Debt and management contract purposes: conservatism defers income
recognition to ensure that firms’ resources are allotted appropriately to
parties according to the precedence of claims. For instance, the
recognition of income could induce a higher dividend payment, generating
the wealth transfer from lenders to shareholders. Earnings-based
compensation to management is deferred to be recognised until the
management performance is captured by earnings. Conservatism reduces
the incentive of management to overstate earnings for their own benefit.
2. Litigation costs and regulator pressures: earnings or assets overstatement
can cause a lawsuit compared to understatement of those components.
However, greater costs for the overstatement of earnings and net assets are
borne by accounting regulators (Roychowdhury and Watts 2007), i.e. the
lack of revaluation method of fixed assets in accounting standards (Watts
2003).
3. Book income and corporate income taxes: higher reported income could
cause higher income tax. Thus, conservatism through deferred income
31 Italics in original.
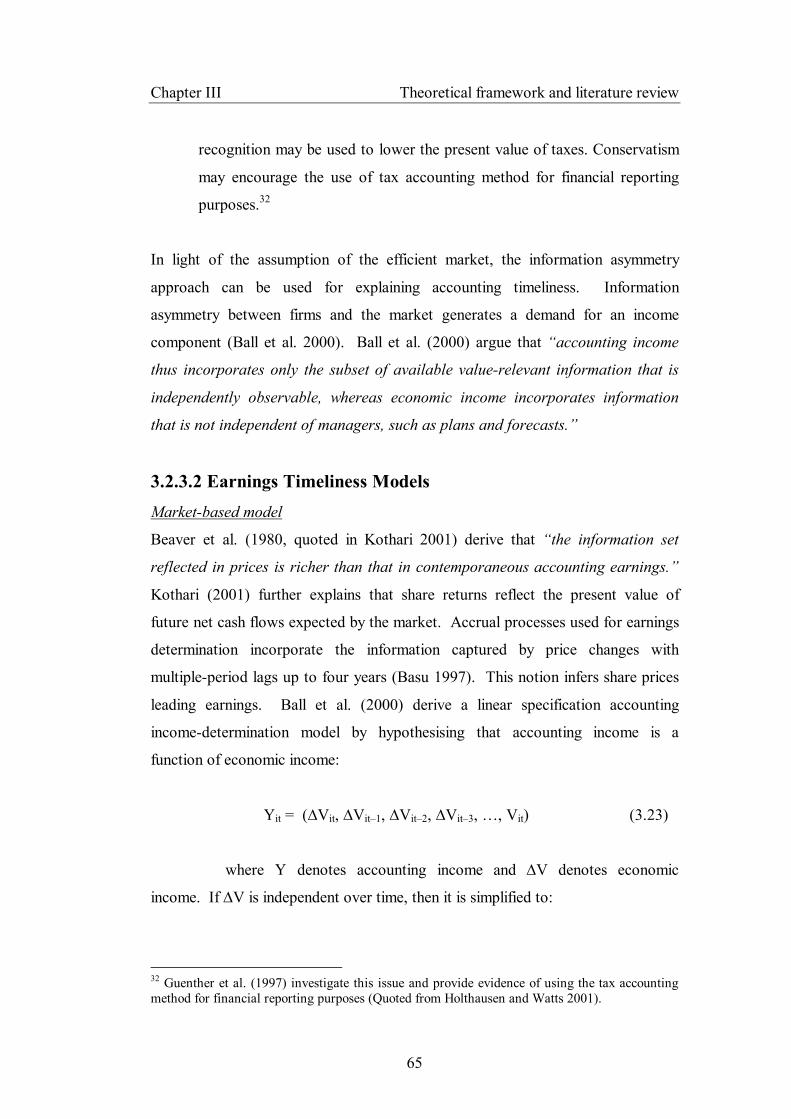
Chapter III Theoretical framework and literature review
65
recognition may be used to lower the present value of taxes. Conservatism
may encourage the use of tax accounting method for financial reporting
purposes.32
In light of the assumption of the efficient market, the information asymmetry
approach can be used for explaining accounting timeliness. Information
asymmetry between firms and the market generates a demand for an income
component (Ball et al. 2000). Ball et al. (2000) argue that “accounting income
thus incorporates only the subset of available value-relevant information that is
independently observable, whereas economic income incorporates information
that is not independent of managers, such as plans and forecasts.”
3.2.3.2 Earnings Timeliness Models Market-based model
Beaver et al. (1980, quoted in Kothari 2001) derive that “the information set
reflected in prices is richer than that in contemporaneous accounting earnings.”
Kothari (2001) further explains that share returns reflect the present value of
future net cash flows expected by the market. Accrual processes used for earnings
determination incorporate the information captured by price changes with
multiple-period lags up to four years (Basu 1997). This notion infers share prices
leading earnings. Ball et al. (2000) derive a linear specification accounting
income-determination model by hypothesising that accounting income is a
function of economic income:
Yit = (∆Vit, ∆Vit–1, ∆Vit–2, ∆Vit–3, …, Vit) (3.23)
where Y denotes accounting income and ∆V denotes economic
income. If ∆V is independent over time, then it is simplified to:
32 Guenther et al. (1997) investigate this issue and provide evidence of using the tax accounting method for financial reporting purposes (Quoted from Holthausen and Watts 2001).
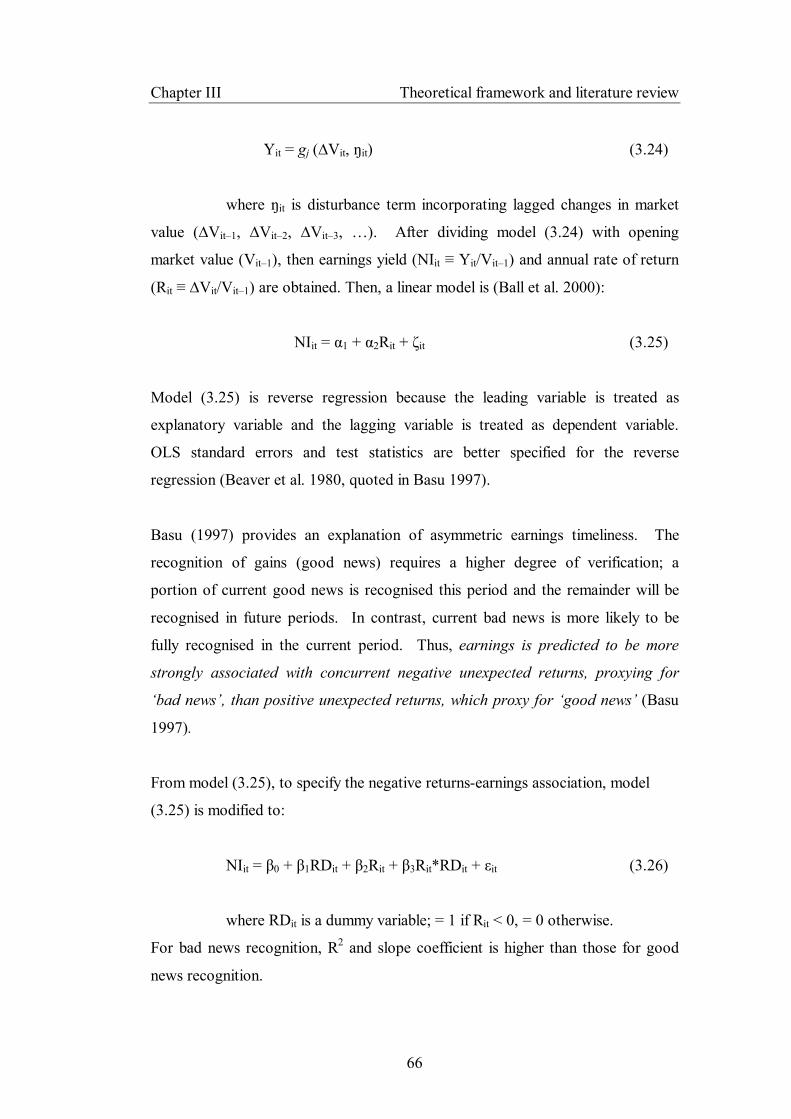
Chapter III Theoretical framework and literature review
66
Yit = gj (∆Vit, ŋit) (3.24)
where ŋit is disturbance term incorporating lagged changes in market
value (∆Vit–1, ∆Vit–2, ∆Vit–3, …). After dividing model (3.24) with opening
market value (Vit–1), then earnings yield (NIit ≡ Yit/Vit–1) and annual rate of return
(Rit ≡ ∆Vit/Vit–1) are obtained. Then, a linear model is (Ball et al. 2000):
NIit = α1 + α2Rit + ζit (3.25)
Model (3.25) is reverse regression because the leading variable is treated as
explanatory variable and the lagging variable is treated as dependent variable.
OLS standard errors and test statistics are better specified for the reverse
regression (Beaver et al. 1980, quoted in Basu 1997).
Basu (1997) provides an explanation of asymmetric earnings timeliness. The
recognition of gains (good news) requires a higher degree of verification; a
portion of current good news is recognised this period and the remainder will be
recognised in future periods. In contrast, current bad news is more likely to be
fully recognised in the current period. Thus, earnings is predicted to be more
strongly associated with concurrent negative unexpected returns, proxying for
‘bad news’, than positive unexpected returns, which proxy for ‘good news’ (Basu
1997).
From model (3.25), to specify the negative returns-earnings association, model
(3.25) is modified to:
NIit = β0 + β1RDit + β2Rit + β3Rit*RDit + εit (3.26)
where RDit is a dummy variable; = 1 if Rit < 0, = 0 otherwise.
For bad news recognition, R2 and slope coefficient is higher than those for good
news recognition.
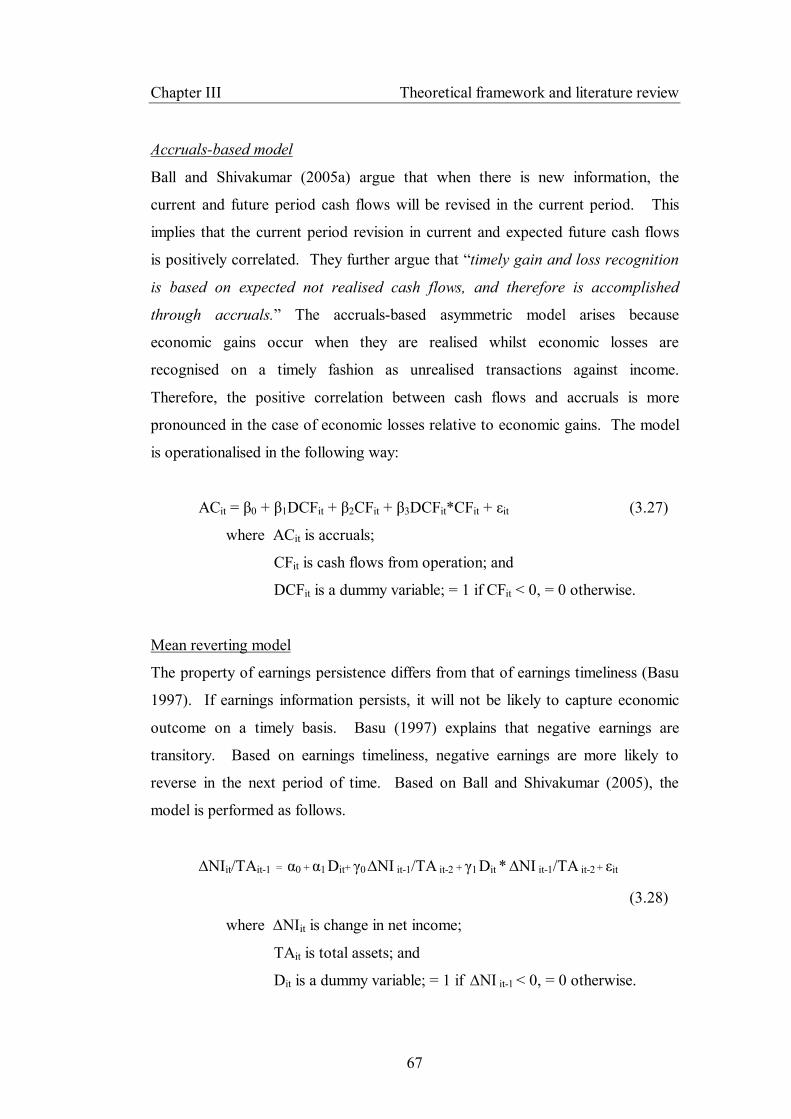
Chapter III Theoretical framework and literature review
67
Accruals-based model
Ball and Shivakumar (2005a) argue that when there is new information, the
current and future period cash flows will be revised in the current period. This
implies that the current period revision in current and expected future cash flows
is positively correlated. They further argue that “timely gain and loss recognition
is based on expected not realised cash flows, and therefore is accomplished
through accruals.” The accruals-based asymmetric model arises because
economic gains occur when they are realised whilst economic losses are
recognised on a timely fashion as unrealised transactions against income.
Therefore, the positive correlation between cash flows and accruals is more
pronounced in the case of economic losses relative to economic gains. The model
is operationalised in the following way:
ACit = β0 + β1DCFit + β2CFit + β3DCFit*CFit + εit (3.27)
where ACit is accruals;
CFit is cash flows from operation; and
DCFit is a dummy variable; = 1 if CFit < 0, = 0 otherwise.
Mean reverting model
The property of earnings persistence differs from that of earnings timeliness (Basu
1997). If earnings information persists, it will not be likely to capture economic
outcome on a timely basis. Basu (1997) explains that negative earnings are
transitory. Based on earnings timeliness, negative earnings are more likely to
reverse in the next period of time. Based on Ball and Shivakumar (2005), the
model is performed as follows.
∆NIit/TAit-1 = α0 + α1 Dit+ γ0 ∆NI it-1/TA it-2 + γ1 Dit * ∆NI it-1/TA it-2 + εit
(3.28)
where ∆NIit is change in net income;
TAit is total assets; and
Dit is a dummy variable; = 1 if ∆NI it-1 < 0, = 0 otherwise.
Chapter III Theoretical framework and literature review
68
3.2.3.3 Firm-Specific Measurement of Accounting Conservatism Base on Givoly and Hayn (2002), there are several measures for firm-specific
accounting conservatism. Firm-specific measurement of accounting conservatism
is also known as unconditional accounting conservatism. First, the accumulation
of net negative accruals over time is an indication of conservatism. Because
accruals tend to reverse in future periods, the consistence of negative accruals
over several periods indicates firms’ conservatism. Second, earnings asymmetric
timeliness suggests that economic losses are recognised timelier than economic
gains. Therefore, the measure of unconditional conservatism can be identified by
a negatively skewed earnings distribution. Third, the recognition of anticipated
losses induces an increase in variability of the earnings series. Thus, the
variability of the earnings distribution is an indication of conservatism. A final
measurement of unconditional accounting conservatism is the ratio of markets
value divided by book values (market-to-book ratio). The ratio indicates that
relative under- or overstatement of assets (and liabilities) captured by the market
compared to book. The higher ratio indicates more conservatism, understating
assets and overstating liabilities.33
In conclusion, earnings timeliness is one property of accounting quality. It is still
arguable that the existing literature has attempted to search for a proxy to measure
the earnings timeliness. Givoly et al. (2007) suggest that information
environment is an influencing factor for the timeliness of earnings.
3.2.4 Book-Tax Differences Book-tax differences (BT) are defined as the deviation between book-income
(earnings) and taxable income. Book income is calculated according to GAAP
whilst taxable income is computed based on tax codes. For Thailand, both book
33 It should be noted that in terms of finance, the market-to-book ratio can be interpreted as growth of the firm. When the market expectation of the company value is greater than the company’s book value (i.e. if the ratio is greater than 1), this means that the maket anticipates the good future of such company. In terms of accounting reserch, however, the market-to-book ratio for this case is used as proxy for unconditional conservatism rather than growth and the larger ratio indicates the higher conservatism.

Chapter III Theoretical framework and literature review
69
and taxable income are prepared by using an accrual basis. Nonetheless, there are
tax exemptions inducing the book-tax difference in Thailand, i.e. depreciation
methods or allowance account for bad debt. The book-tax difference can be
divided into two categories, permanent and temporary difference.
Permanent differences are reflected in current differences between book and
taxable income and the difference will not be deferred to or recovered in future
periods. For example, Thai tax rules allow firms to depreciate the value of
executive cars as taxable expenses (through depreciation expenses) when the cost
of each car is not greater than one million Thai baths (~£18,200). The greater
amount of £18,200 is non-tax deductible expenses. Therefore, this transaction
generates permanent book-tax differences, that book income is lower than taxable
income, all else being constant. Another example of permanent difference is the
reserve account, e.g. an allowance account for bad debt. For Thailand, the
allowance account for bad debt is realised as expenses against book income in the
current period but it is a non-taxable expense.
Temporary differences are incurred according to the timing difference, that book
income and taxable income recognise an accounting transaction in different
periods of time. The temporary difference can be divided as a deferred tax asset
or deferred tax liability. The deferred tax asset will be used as taxable expenses
whilst the deferred tax liability will be realised as taxable income in future
periods. For example, in Thailand, bad debt expense is realised as expenses
against book income in current profit and loss statements. Nonetheless, the
amount of bad debt is used to consider whether the bad debt will be used as
taxable expenses in the current period. For the low amount of bad debt,34 bad
debt will be realised as taxable expenses when the dispute of bad debt is filed
before the court as a prima facie case. For the high amount of bad debt, there
must be a verdict from the court against debtors; this event is known as a deferred
34 It should be noted that for Thailand, the rule for bad debt for financial firms differs from that for non-financial firms (see Thai Tax Code: Ministerial Regulations No. 186 (1991 (2534 B.E)).
Chapter III Theoretical framework and literature review
70
tax asset. Deferred tax assets also include the event that firms realise revenue as
taxable income in the current period but defer the recognition of revenue as book
income to future periods. Thus, deferred tax assets induce the lower book income
relative to taxable income in the current period.
For a deferred tax liability, firms defer the expense recognition in their book
accounts to future periods but capitalise expenses as taxable expenses in the
current period. For example, in Thailand, tax rules allow firms to depreciate fixed
assets, e.g. machine and equipment, over at least five accounting periods.
However, firms depreciate those fixed assets over ten accounting periods in their
book accounts but five accounting periods for tax calculations. In addition to
expenses recognitions, firms defer the recognition of taxable income but realise
revenue in their current book income. With all else being constant, the deferred
tax liability, thus, induces the lower taxable income relative to book income.
The connection between book-tax differences and accounting quality
In terms of the relationship between accounting quality and book-tax differences,
temporary differences play a more important role relative to permanent
differences. Accounting discretions rendered by firms’ insiders against restrictive
tax rules induce more timing (temporary) differences in book income and taxable
income relative to permanent differences. In terms of the relation between book
income and taxable income, Guenther et al. (1997) argue that it is unlikely for
firms to use different accounting methods to increase revenues or tax deductions
for tax purposes without increasing revenues or expenses in financial statements.
For example, the estimated expense of warranty claims can be expenses in
financial reporting but cannot be tax deductible unless economic performance has
occurred. The condition in reference to economic performance is sufficient but
not necessary for financial statement purposes (Guenther et al. 1997). Guenther et
al. (1997) further argue that the book-tax difference incurs because of the
underlying different incentive between financial and tax accounting.
Chapter III Theoretical framework and literature review
71
Accounting conservatism discourages firms to understate expenses or overstate
revenues whilst for the government income, the tax rules detect understating
revenue and overstating expense. Mills (1998) supports empirical evidence on this
argument by reporting that Internal Revenue Service audit adjustments increase as
book-tax differences increase. This implies that book income reflects tax activity.
This thesis considers that the book-tax difference can be employed to differentiate
incentives of a firm’s insiders.
However, the use of GAAP can be subject to management discretion and tax
rules, i.e. measurement methods, are more concrete than GAAP. The stringent
condition of tax rules creates timing book-tax differences (Hanlon 2005).
Regardless of the ability to capture economic consequences, the use of more
restrictive/less subjective rules, or tax rules, should report small changes in
earnings from this period to the next period. Because of this small alteration,
using tax rules for financial reporting purposes facilitates the accounting numbers
predictability, i.e. higher earnings persistence improves predictability. Hanlon
(2005) summarises that firms with large book-tax differences have lower
accounting quality in terms of earnings persistence than firms with small book-tax
differences. However, it is a trade-off when conforming between book and
taxable income. When using tax rules for financial statement purposes, Hanlon et
al. (2005) report a 50 per cent loss in the explanatory power of reported earnings.
Book-tax conformity incurs tax costs, i.e. audit adjustment and tax examination,
and non-tax (financial reporting) costs, i.e. debt covenant violation (Mills and
Newberry 2001). Mills and Newberry (2001) report the evidence that between
public and private firms, public firms have generally higher non-tax costs that
result in larger book-tax gap.
Nevertheless, the use of book-tax differences as proxy of firm’ incentives is
problematic because book-tax differences can either exemplify discretion in
reported income or tax activities (Ayers, Jiang and Laplante 2009; Desai and
Dharmapala 2007). Guenther et al. (1997) find that firms defer income
Chapter III Theoretical framework and literature review
72
recognition in their financial statements when they are required to use the accrual
method for tax purposes. That finding suggests the impact of management
intention on financial reporting. Desai and Dharmapala (2007) suggest that the
magnitude of book-tax differences is a signal of overall tax planning ability.
Ayers et al. (2009) find that the information content of book income is not
different between high tax planning firms and other firms but the information
content of tax income is lower in high tax planning firms than in other firms. In
addition, they report that compared to book income information, tax income
information in low earnings quality firms has higher ability to explain firm
performance than that in high earnings quality firms.
Those studies suggest that large book-tax differences can be derived from either
over-reported earnings or aggressive tax planning activity. In addition, Calegari
(2000) finds that firms with relatively high book-tax conformity increase debt
ratios and minimise income-increasing accruals to achieve tax management and
firms with relatively low book-tax conformity employ discretionary accruals by
increasing income to accomplish financial reporting purposes (i.e. to avoid debt
covenant violation). Mills and Newberry (2001) argue that small book-tax
difference may be derived from the incentive to report higher book income
resulting in increasing tax income because firms are perhaps willing to forfeit tax
dollars. The use of income-increasing accounting practice results in both higher
book and taxable income. If this is the case, Mills and Newberry (2001) suggest
that it is difficult to find predicted results.
Based on the above discussion, the market is able to use book-tax differences to
determine incentives of a firm’s insiders. However, the information contained in
book-tax differences must be interpreted with caution. The larger (or smaller)
magnitude of book-tax differences does not necessarily imply that earnings are of
low (high) quality because those scales of book-tax differences are sensitive to a
firm’s discretions.
Chapter III Theoretical framework and literature review
73
3.2.5 Firm Governance System For the firm governance mechanism, agency theory is a prominent theory that a
large number of research studies have utilised. The firm governance system is a
monitoring mechanism organised by the firm to mitigate potential problems, i.e.
conflict of interests. This section presents descriptive explanations about agency
theory and discussion of agency problems and accounting quality.
3.2.5.1 Agency Theory In a well-known work of theory of the firm and agency costs by Jensen and
Meckling (1976), they propose that agency problems occur in a relationship
between two parties. One party is defined as an agent and the other is a principal.
Agency problems occur when a principal delegates some decision making
authority to an agent. Agency theory suggests that decisions made by an agent
may not maximise both agents’ and principals’ interests; instead of that managers
are likely to act in their self-interest. To secure the principals’ interests, principals
may have to bear some costs to be certain that an agent will not be likely to take
more benefits from the company or harm the principals’ welfare.
The agency theory is formed because the authors view a company as a
culmination of complex contractual relationships. Stakeholders in a company,
e.g. managers, shareholders, or creditors, have their own objectives that may not
be the same. For instance, with all being equal, company’s managers in a highly
profitable company are more likely to maximise their own benefits by taking
company resources whilst shareholders expect managers to pay more dividends.
If managers have tended to pay more dividends, creditors are not likely to agree
with this policy because creditors would like to be certain that managers and
shareholders do not consume all company’s assets and leave nothing for claims at
the end. To balance all objectives in a company is also complicated. Due to the
conflict of interests, the authors suggest that a possible means of balancing
objectives of all parties is contracts. In a company, there are varieties of conflict
domains (Quiry, Dallocchio, Le Fur and Salvi 2005, pg.647), such as managers
Chapter III Theoretical framework and literature review
74
and shareholders, the management and employees, or creditors and shareholders.
Each domain uses contracts to mitigate conflicts and risk, leading to contractual
relationships between parties. Consequently, a company is a nexus of contracts.
For example, the relationship between managers – as agents and shareholders – as
principals can be under employment contracts while the relationship between
managers – as agents and creditors or bondholders – as principals can be bound by
debt contracts. However, contracting incurs costs known as agency costs.
Agency costs
Agency costs are incurred from the attempt to alleviate agency problems. These
costs are higher in a company with severe agency problems. More severe agency
problems can be found in a company with large free cash flow (Jensen 1986).
This is because managers may use large free cash flow and waste it in various
activities rather than paying it to shareholders. Jensen and Meckling (1976)
indicate that agency costs consist of monitoring costs, bonding costs, and residual
loss.
Monitoring costs
Monitoring costs include an agent’s compensation, any legal fees which relate to
the employment contract, audit fees, budgeting, or even operating rules, etc.
Monitoring costs paid to agents aim to respond to agents’ interests, to improve
agents’ performances, or to reduce agents’ decisions which would harm the
principals’ interests. Monitoring costs are usually set up in the first instance by
principals and principals bear the costs. However, the costs can be adjusted later
in some cases depending on the contract. For example, if managers as agents
have low performance, this will lead to the decrease in their remunerations. In
this circumstance, agents bear the costs instead. Thus, monitoring costs are borne
by either agents or principals depending on situations. Monitoring costs should
have negative relation with agents’ remunerations. For example, if principals
have to pay more monitoring costs to control agents’ behaviour, compensation
paid to agents may be reduced. In addition, agents with different reputations will

Chapter III Theoretical framework and literature review
75
not be rewarded at the same levels. Principals may have to pay high monitoring
costs for agents with less or bad reputation because they are not certain that the
agents will be able to make high profits; or such agents may utilise large resources
from the firm. As a result, rewards are decreased when monitoring costs increase.
Another example is a relationship between managers as agents and bondholders as
principals. In this case, managers act on behalf of shareholders. Managers and
bondholders are bound by a debt contract. In general, risk incurs immediately
after lending. To protect risk, bondholders can increase the interest rate or adjust
the term of loans. Risk occurs when bondholders feel that managers try to
transfer wealth to shareholders, e.g. paying high dividends, or try to exploit assets
in place and leave nothing to bondholders, e.g. selling property.
Bonding costs
One duty of managers as agents is that they should balance both shareholders’ and
bondholders’ interests. To do so, managers must set up schemes to show that they
are acting for both interests. Costs incurred from setting up this system are called
bonding costs. Bonding costs can be pecuniary or non-pecuniary, e.g. time and
effort. Bonding costs relate to costs of any actions set by agents to guarantee
principals that they act in principals’ best interests. The cost incurred from
accounting information disclosure is an example of bonding costs. Bonding costs
are borne by agents. Agents disclose financial information to show that decisions
are made on behalf of principals’ interests. If accounting information shows that
managers maximise shareholders’ interests, shareholders are expected to reward
managers. Thus, agents not only bear bonding costs but also can receive benefits
from the costs. Agents incur bonding costs only when they find that these costs
reduce the monitoring costs they bear. They will stop incurring bonding costs
when the net increment wealth which they generate equals the perquisites given
up, or in other words when the marginal increase in the bonding costs equals the
marginal reduction in the monitoring costs (Godfrey, Hodgson and Holmes 2000,
pg.320).
Chapter III Theoretical framework and literature review
76
Residual loss
Although monitoring and bonding costs aim to mitigate agency problems, they
cannot reduce agency costs to zero. Residual loss occurs because the agency
problems cannot be completely managed by the contract in every detail. The left-
over costs from the attempt to diminish agency problems are the residual loss.
For example, managers waste company’s resources in a way that shareholders
may not agree with, e.g. lavishing electric power or other utilities; the contract
probably does not include these concerns.
3.2.5.2 Agency Problems and Accounting Quality
The agency theory provides several ways to lessen agency costs. First, Jensen and
Meckling (1976) suggest that if managers hold shares in a company, conflict of
interests between managers and shareholders will decline. For an exaggerated
example, if managers hold 100 per cent of shares in a company, this should reduce
agency costs to zero, all else being constant. To obtain a high percentage
shareholding, managers may have to use all personal properties or borrow debt to
acquire all shares. Accordingly, even though managers can own all shares in a
company, doing so is not costless, especially in a large company. In terms of
accounting quality, higher managerial ownership could reduce the quality of
accounting information probably because of less demand from the market (Lafond
and Roychowdhury 2008). Rather than deterring the quality of accounting
information, an alternative explanation is that accounting information of the firm
with high managerial ownership should reflect the true value of the firm because
of less pressure from the market and less conflict of interest.35 According to
portfolio theory, risk or managers’ wealth is not diversified due to investing in
only one company. Crutchely and Hansen (1989) suggest that managers will
require an increase in remunerations to compensate for poor diversification.
Shareholders may want to hold a certain number of shares for economies of scale
or reducing agency costs. If shareholders want to hold a large number of shares to
reduce agency costs, they would be confronted with poor diversification and high
35 See Wang (2006) about the discussion of market demand and ownership structure.
Chapter III Theoretical framework and literature review
77
costs. Therefore, they may reduce shareholding size and accept some agency
costs. In some cases, managers do not hold shares in a company but they have a
good relationship with shareholders. Agency problems in this case may not be
rigorous. As a result, it is difficult to determine whether accounting quality varies
positively or negatively with these agency problems.
Second, Jensen and Meckling (1976) and Jensen (1986) suggest that debt
financing can reduce over-investment. Instead of wasting cash in non-profitable
ways, a company with high free cash flow can finance more debt and use free
cash flow to pay interest. Therefore, rather than paying cash back to shareholders,
managers are bound to pay creditors interest from debt financing. One obvious
benefit from debt financing is that interest expenses are a taxable deduction whilst
dividends are not tax deductible. An important function of shareholders is to
monitor managers issuing more debt. If managers issue more debt, agency
problems between managers and shareholders can be reduced. However, debt
financing will probably raise agency problems between shareholders and
bondholders instead. In the case of debt borrowing, managers as agents act on
behalf of shareholders. The conflict of interests between shareholders and
bondholders will also generate agency costs. Shareholders may be more likely to
invest in high risk projects or to dilute properties that will harm bondholders’
asset securities. Shareholders can take any high risk projects because they have
limited liabilities equal to the unpaid amount of shares held. To manage the risk,
bondholders may adjust contracts by increasing interest or making the term of
loans shorter. Another problem about the use of debt financing is that debt
financing is associated with bankruptcy costs. If a company generates high debt,
there is potential for a company to go bankrupt. For all these reasons, using debt
financing to reduce agency costs is not costless. In addition, it can be viewed that
an agency cost of equity (managers and shareholders) is shifted to an agency cost
of debt (shareholders and bondholders). In terms of accounting quality, debt
financing may require firms to disclose sufficient information. In addition,
bondholders may be able to access inside information better than outside
Chapter III Theoretical framework and literature review
78
shareholders. The demand from debt financing, thus, induces higher accounting
quality. On the other hand, firms may retain to disclose sufficient information
requested by debt financing, i.e. in case of firms going bankrupt.
To alleviate agency costs, Easterbrook (1984) suggests that paying higher cash
dividend will reduce agency costs. If a company has high profits and sufficient
funds from operations, it can pay high cash dividends. The opposite is also true in
a company with low profits and insufficient funds. If a company is not able to
generate high profits but intends to pay high dividends, it must obtain funds from
other sources, e.g. selling assets, borrowing or issuing new equities. Crutchely
and Hansen (1989) suggest an interesting view that paying high dividends can
reduce agency costs because of the chance that a company will have to raise funds
from external sources, by issuing more shares, increases. When the number of
shares increases, a company will be overseen by external organisations, e.g. stock
exchange, banks, or large investors. This watchdog would bring managers to act
in line with shareholders. Moh’d, Perry and Rimbey (1995) document that
according to Rozeff’s work, a company will try to reduce agency costs by a new
set of costs, binding managers to act in the outside investors’ interests. Dividend
payment is considered as bonding cost. This means that if managers are forced to
employ external funds for the dividend payment, agency costs must be reduced
and new information must be revealed to secure the new funding. Easterbrook
(1984) argues that dividend payment leads to third-party audit, e.g. the market or
leverage buyout (Brealy, Myers and Allen 2005, pg.871), which motivates
managers to reveal information and reduce agency costs. One reason is that if
companies have had dividend payment lower than the level expected from the
market, other investors may force out managers by taking some action, e.g. taking
over. In addition, shareholders may bear the cost of external funds in relation to
benefits they receive from dividend payment. For instance, a company with 100
per cent of equity in its capital structure should have a severe agency problem
between managers and shareholders. If the company changes the proportion of its
capital structure by adding some debt, bondholders will take a role as principals

Chapter III Theoretical framework and literature review
79
who could help shareholders. However, shareholders bear the cost of issuing debt
since the company must use some cash flow for interest payment rather than using
it all in dividends.
The “third party watchdog” plays an important role to mitigate agency costs.
Firms’ insiders are forced by the market to provide useful information.
Accounting disclosure is one means for firms’ insiders to communicate with the
third party. The requirement of accounting disclosure is based on the degree of
agency costs. The requirement of high quality of accounting disclosure is not
costless. For instance, if managers’ remunerations are tied up with firm
performances, managers are more likely to report information to increase their
benefits; high compensation to managers must be paid to obtain good quality of
accounting disclosure.
For above discussions, there are several factors influencing firms’ insiders to
reveal useful information. One of those factors is a corporate governance system.
Even though a corporate governance system is not a direct tool used for financial
statement preparation, the corporate governance system requires firms’ insiders to
reveal a certain type of information to the public. Therefore, a strong corporate
governance system is more likely to induce firms providing a good quality of
accounting disclosure relative to a weak corporate governance system. Existing
evidence suggests that firm governance systems relate to accounting quality,
among others Bushman et al. (2004), Beekes et al. (2004) and Lara, Osma and
Penalva (2007).
In conclusion, agency theory suggests that conflict of interest is a major factor,
leading to agency problems or moral hazards. Agency problems can be reduced
by bearing some agency costs. Agency costs are borne by agents or principals
depending on the situation. Several ways to reduce agency problems are costly,
especially in large companies. Accounting disclosure is another channel to
alleviate agency costs. Firm governance systems are essential to induce firms

Chapter III Theoretical framework and literature review
80
providing a good quality of accounting information. However, it is difficult to
predict whether accounting quality through accounting information disclosure
positively or negatively varies with the monitoring mechanism.
All the above discussions have explained accounting theories and approaches
relating to three perspectives of accounting quality, including earnings
persistence, the value relevance of accounting information and the timeliness of
earnings. In addition, it explains the importance of book-tax differences and firm
governance mechanism and its agency problems. In addition to the descriptive
explanations, the previous sections have explicated the model employed by the
existing literature to examine accounting quality. The next section will discuss
the review from existing accounting research.
3.3 Literature Review This part of the chapter presents reviews from existing literature. The literature
review is divided into five sections. The first three sections present a summary of
three earnings properties and discussion gathered from the literature review. The
next two sections summarise the literature about book-tax differences and firm
governance relating to those three properties of earnings. It should be noted that
the conventional statistic level, if any, through the literature review, is
acknowledged unless specified.
3.3.1 Prior Study of Earnings Persistence A time series property of earnings
Dichev and Tang (2009) investigate the association between earnings volatility
and earnings predictability. Earnings predictability is estimated through a time
series property of earnings, indicating that more earnings persistence, the higher
earnings predictability. They hypothesise that earnings volatility is negatively
associated with earnings predictability. They construct deciles rank of firms
according to the volatility of earnings, accruals, earnings, and the volatility of
cash flows. Then, deciles 1 and 10 form quintile 5 (extreme volatility), deciles 2

Chapter III Theoretical framework and literature review
81
and 9 form quintile 4, and so on. By using a random walk model, findings report
that the earnings persistence is lower for quintile 5 and higher for quintile 1,
supporting the hypothesis. They also estimate the earnings persistence and
earnings volatility over a long horizon period of time. Findings suggest that the
persistence coefficient of earnings is deteriorated over the 5-year prediction
horizon. In addition, the quicker deterioration of earnings persistence is observed
over the 5-year prediction horizon for the highest earnings volatility firms relative
to the lowest earnings volatility firms.
Sloan (1996) argues that a random walk model that regresses current earnings on
past earnings weights cash flows and accruals component in earnings attributes
equally. Thus, earnings are decomposed to cash flows and accruals in a random
walk model to investigate the predictability of cash flows and accruals on future
earnings. By regressing future earnings on current cash flows and accruals,
findings suggest that the persistence of earnings attributable to the accrual is
smaller than the persistence of earnings performance attributable to the cash flow.
In his research, further investigation is to determine whether the different
properties of the accruals and cash flows components of earnings are captured in
the stock price. By using Mishkin method, the market prices the accrual higher
than the cash flow whilst the persistence of earnings performance attributable to
the accrual is lower than the persistence of earnings performance attributable to
the cash flow. The author concludes that the market fails to anticipate the higher
(lower) persistence of earnings performance attributable to the cash flow (accrual)
until that information affects future earnings.
Fairfield, Whisenant and Yohn (2003) extend Sloan’s work by investigating
whether the lower persistence of accruals is driven from the profitability or
growth in accruals. They propose that ‘growth’ is a factor inducing the lower
persistence in accruals. They argue that “diminishing marginal returns on
investments arise when firms exploit their most profitable investment
opportunities before undertaking less profitable investments. Alternatively,
Chapter III Theoretical framework and literature review
82
increasing marginal returns on divestment arise when firms divest their least
profitable investments.” Both scenarios refer to diminishing marginal returns.
They suggest that based on diminishing marginal returns and conservative
accounting, firms investing more in net operating assets during year t will
experience lower one-year-ahead ROA relative to other firms, ceteris paribus
(Fairfield et al. 2003). They regress one-year-ahead ROA on the one-year growth
in net operating assets (GrNOA) and current ROA. By using the dataset 30-year
period, they find that the relationship between one-year-ahead ROA and GrNOA
is significantly negative, suggesting that accounting conservatism and diminishing
marginal returns deteriorate the one-year-ahead ROA on the new investment.
However, comparing between current and long-term net operating asset growth,
they predict that accruals and growth in long-term net operating assets have
equivalent incremental relations with one-year future ROA after controlling for
current ROA. They regress the one-year-ahead ROA on the one-year long-term
net operating asset growth (GrLTNOA), accruals and current ROA. Their
findings support theirs prediction that the negative relationship between
GrLTNOA and the one-year-ahead ROA and the negative relationship between
accruals and the one-year-ahead ROA are found and they are not statistically
different.
Richardson, Sloan, Soliman and Tuna (2006) argue that other than growth
component as proposed by Fairfield et al. (2003), accrual estimation error
(accounting distortion) is an important factor inducing the lower persistence of
accruals. They decompose accruals into ‘growth’ and other (or so-called
efficiency distortions). They regress the one-year-ahead ROA on accruals and
current ROA. Consistent with Sloan (1996) and Fairfield et al. (2003), the
relationship between the one-year-ahead ROA and accruals is significantly
negative. They decompose accruals to sales growth, changes in efficiency
(changes in net operating asset turnover ratio divided by net operating asset
turnover ratio) and the interaction between sales growth and changes in efficiency
(sales growth multiplied by change in efficiency). They find that the relationship

Chapter III Theoretical framework and literature review
83
between growth and the one-year-ahead ROA is negative. Also, the relationship
between efficiency and the one-year-ahead ROA is negative. However, the
negative coefficient of efficiency component is larger than the negative coefficient
of growth component. Another work by Richardson, Sloan, Soliman and Tuna
(2005) suggests that less reliable of accruals leads to low persistence of accruals.
They decompose accruals into different categories, including total accruals,
change in working capital, change in current operating assets, change in current
operating liabilities, change in non-current operating assets, change in non-current
operating liabilities, change in financial assets, change in financial liabilities,
change in short term investments, and change in long term investments. They
regress the one-year-ahead ROA on accruals and accrual components and suggest
that the low reliability of accruals induces the low persistence of accruals.
Dechow, Richardson and Sloan (2008) examine the persistence of earnings
performance attributable to cash flows, extending the work of Sloan (1996). The
cash component of earnings is decomposed to changes in the annual cash and
short-term investment balance, net cash distributions to equity holders (dividends
and repurchases less equity issuances), net non-interest cash distributions to debt
holders (debt repayments less debt issuances) and the sum of net cash
distributions to shareholders and net non-interest cash distributions to debt
holders. Their findings are consistent with the results reported by Sloan (1996)
that the persistence of earnings performance attributable to accruals is smaller
than the persistence of earnings performance attributable to free cash flows. In
addition, the persistence of the sum of net cash distributions to shareholders and
net non-interest cash distributions to debt holders is larger than the persistence of
changes in annual cash and short-term investment balance. As predicted by the
authors, the persistence of net cash distributions to equity holders is larger than
the persistence of net non-interest cash distributions to debt holders. This is
consistent with a priori expectation that firms are more likely to maintain cash
distributions to equity holders unless there is a persistence in future cash flows,
then cash distributions to equity holders will be increased.

Chapter III Theoretical framework and literature review
84
Earnings persistence and fundamental analysis
Abarbanell and Bushee (1997) investigate whether changes in fundamental
information induce subsequent changes in earnings information. They regress
future earnings changes on current earnings changes and fundamental signals.
They employ fundamental signals based on the work of Lev and Thiagarajan
(1993). Fundamental signals are based on change information, including
inventory, accounts receivable, capital expenditure, gross margin, selling and
administrative expenses, provision for doubtful receivables, effective tax rate,
earnings quality (measured by LIFO or FIFO), audit qualification (measured by
qualified and unqualified audit) and labour force (measured by the ratio of sales
divided by a number of employees). The increase in inventory and accounts
receivable is realised as ‘bad news’ because of difficulties in generating sales,
inducing the negative relationship between firm values and inventory and
accounts receivable changes. A negative relation with returns is expected for
changes in capital expenditures. Firm values are negatively related to the decrease
in the gross margin, the effective tax rate, labour force and the increase in
administrative costs. LIFO inventory method is viewed as a positive signal
because the authors state that relative to FIFO earnings, LIFO earnings are more
sustainable or closer to economic earnings. Their findings support a priori
expectations, suggesting that fundamental information affects earnings property.
Earnings persistence and economic determinants
An earlier research about the association between economic determinants and
earnings persistence was performed by Lev (1983). Lev (1983) investigates a
time series property of earnings conditional on economic determinants. The
research regresses earnings persistence on economic factors as driving forces for
change. Economic determinants include product type, competition, firm size, and
capital intensity. Product type is divided to durables vs. non-durables and
services, measured by different industries. Since the consumption pattern of non-
durables and services is relatively stable compared to durables. Earnings
persistence, therefore, is more pronounced for non-durables and services relative
Chapter III Theoretical framework and literature review
85
to durables. Barriers-to-entry is used to determine the competition. Barriers-to-
entry are defined as ‘a cost of producing.’ As noted by the author, existing firms
are likely to charge prices close to marginal costs to deter further entry. For
example, high barriers-to-entry industries consist of crude petroleum, brewers,
distillers, etc. Low barriers-to-entry industries consist of mining, construction,
meat packers, dairy products, etc. Earnings persistence is more pronounced for
monopolist firms relative to competitive firms because of the instability of the
industrial structure and price wars in competitive firms. Firm size is employed to
determine firm growth. Large firms tend to have low growth rate relative to small
firms, inducing more stability in profitability through time. Therefore, earnings
persistence is more pronounced for large firms relative to small firms. Capital
intensity is the ratio of depreciation divided by fixed capital charges (i.e. interest
expenses) to sales. Smoother earnings series of low capital intensive firms is
expected relative to high capital intensive firms. This study uses three different
earnings for earning persistence estimation, including change in earnings, change
in return on equity, and change in sales. Findings reveal that earnings persistence
is associated with the economic determinant as expected.
Baginski et al. (1999) investigate the relationship between earnings persistence
and economic determinants for 162 firms with complete data during the period
1967–1990. They use five different orders of autoregressive and moving-average
model to measure persistence coefficients by regressing future earnings on current
earnings. Then the obtained coefficient is regressed on economic determinants.
They propose that earnings persistence is positively related to firm size and
barriers-to-entry but negatively related to product type and capital intensity.
Findings support their hypothesis except for firm size.
Freeman et al. (1982) investigate the predictability of book rate of return (the ratio
of net earnings divided by shareholders’ equity) in future earnings. They
hypothesise that book rate of return is a mean reverting process and changes in
book rate of return correlate with changes in earnings. The low (high) book rate

Chapter III Theoretical framework and literature review
86
of return implies that earnings are temporarily depressed (unusually good). They
estimate 30 individual firms (time-series) and pooled data during the period 1946–
1977. Findings support their hypothesis.
Discussion of earnings persistence
From prior studies, it appears that the persistence of earnings is an important
property. Researchers have attempted to identify the determinant of earnings
persistence by using fundamental analysis, a time-series approach or economic
determinants. Although the persistence of earnings induces a predictability of
earnings, the persistence of earnings is sensitive to earnings manipulation, i.e.
smoothing earnings. It is rather difficult to identify whether firms tend to smooth
theirs earnings or earnings are persistent. One important point about the study of
earnings persistence is researchers have attempted to search for the determinant of
earnings persistence. Earnings information is not only investigated at the
integrated level, i.e. annual earnings, but also decomposed to earnings
components, i.e. cash flow and accruals. These attempts are to identify factors
inducing the persistence of earnings information. It should be noted that even
though accruals mitigate noise in cash flows (Ball and Shivakumar 2005b), prior
research finds that the persistence of earnings performance attributable to accruals
is lower than the persistence of earnings performance attributable to cash flows.
In summary, at least two criterions can be raised from the study of earnings
persistence. The first is about the method used to identify the persistence of
earnings, i.e. by using the statistical approach or by searching for the determinant
inducing earnings persistence. The second is about the subject of the study, i.e.
aggregated earnings information (annual/quarterly earnings), deflated earnings
information (book rate of return) or the earnings component (cash flow and
accruals).
Chapter III Theoretical framework and literature review
87
3.3.2 Prior Study of the Value Relevance Analysis The value relevance analysis uses financial data to determine the market value of
the firm. There is a question as to whether or not the information set provided by
financial statements is useful, as it is generally known that forecast data are far
more complex beyond the ability of current GAAP to hold. In general, share price
reflects a richer data set than accounting numbers. For example, share price
reflects future profit of the firm while earnings account for only historical data in
accordance with accrual basis. Thus, there is delay reflecting on earnings.
Kothari (2001, pg.172) suggests that “unless current accounting rules are
changed dramatically, it is unlikely that financial statements in themselves will be
particularly useful or accurate indicators of market value.” “Change” in this
statement might be the change in financial reporting concepts. For instance,
financial reporting guidelines had changed revenue recognition from matching
concept to the other concept that could have captured any effect as much as the
market value does. In another interpretation, it might be the change in accounting
guidelines as a whole. For example, the adoption of new accounting standards
can change several existing accounting treatments to reflect and capture more
information than the past. A growing empirical research papers when accounting
policy has been reformed should support this Kothari’s statement. Generally
speaking, new accounting standards should provide more useful information
and/or more accuracy than previous standards. Most empirical papers have
employed the fundamental analysis through price and/or return model in their
analysis to explore this conjecture. This section summarises empirical papers
about the value relevance of accounting information in terms of accounting policy
or financial environment changes in many countries and other related empirical
studies that implement the firm valuation process in their studies.
Accounting Changes Across Countries
China
Chinese stock markets, Shanghai Stock Exchange and Shenzhen Stock Exchange,
have traded both A-share and B-share; A-share is traded by domestic investors
Chapter III Theoretical framework and literature review
88
while B-share is opened for foreign investors to hold Chinese shares. Chinese
firms with B-share issues are required to present their financial reporting
according to IAS guidelines, while this regulation is not applied to A-share-only
firms. Chen, Chen and Su (2001) studied the value relevance of accounting
information in Chinese firms where both IAS- and Chinese GAAP-based vs.
Chinese GAAP-only financial reporting was mandated. By including all
companies from both stock exchanges during the period 1991–1998, there were
428 firms representing 2,976 firm-year observations. They employed both price
and return regressions to estimate the association between share prices and
accounting measures, book value and earnings. The study subdivided the data set
according to positive/negative earnings, size, earnings persistence (through
changes in and high vs. low earnings) and liquidity of shares and included
interaction effects with dummy variable in the regressions rather than running the
regressions twice in each subgroup. Overall, their results reported that book value
and earnings were value-relevant with the explanatory power ranging from 10 to
61 per cent from before-1995 to 1998. The market weighted higher value to A-
share financial reporting than A- and B-share financial reporting. In addition, the
usefulness of accounting numbers in each subgroup was obtained as expected.
For instance, the value relevance of earnings was found in positive earnings firms;
the opposite was also true for loss-making firms. This thesis considers that an
additional examination could be performed in their study, i.e. stock exchange
effect as to the difference in general characteristic of stock exchanges (as stated by
the authors that different currency is used in two stock exchanges).
Bao and Chow (1999) also estimated the usefulness of book value and earnings in
B-share firms by regressing B-share price on book value and earnings prepared
according to Chinese GAAP and IAS separately. Their results reported that book
value and earnings prepared according to IAS were value relevant greater than
those prepared according to Chinese GAAP. The study of Bao and Chow (1999)
and Chen et al. (2001) is identical. However, the later work used A-share price
data while Bao and Chow (1999) employed B-share price data as dependent
Chapter III Theoretical framework and literature review
89
variable. Bao and Chow (1999) reported stronger relation between B-share price
and IAS-based accounting measures while Chen et al.’s (2001) results of the
relation between A-share price and IAS-based accounting measures were not
strongly pronounced.
This thesis considers that the inconsistent findings between two are not surprising
because foreign investors in B-share price have used IAS-based information,
therefore higher association should be found comparing the association between
A-share price and IAS-based information, that domestic investors have not used
IAS-based information. This thesis also interprets from these two papers that it is
crucial that financial reporting users select what information fits their purposes.
Thus, one essential inference from the papers is that standard settings have to
think about the group of financial reporting users who are directly affected by
financial reporting before developing accounting standards.
Rather than using the price model, Haw, Qi and Wu (1999) defined that annual
share return is a function of changes in annual earnings. Based on their 1,158 A-
share Chinese firms from both stock exchanges for the period 1994–1997,
findings showed that earnings were value-relevant for domestic investors. They
also estimated a short window period by defining that three-day market-adjusted
returns around earnings announcements are a function of changes in annual
earnings. The result also reported that earnings were value-relevant. This study,
however, estimated stock exchange and industry effects and found that the results
remained unchanged.
In 1998, China had used historical cost method (HCM) for all assets and lower
cost or market value method (LCM) for a specific class of assets, but A-share
firms could voluntarily use LCM. However, since 2000, LCM has been applied
for all firms and assets. Yang, Rohrbach and Chen (2005) thus estimated the
value relevance and reliability of accounting information in terms of LCM
adoption in China. The study included all Chinese firms in their data set, making
Chapter III Theoretical framework and literature review
90
a total of 320 (balanced panel) firms during the period 1998 to 2001. The study
applied both a balance sheet approach and an income statement approach in the
examination. The balance sheet approach uses book value as independent
variable regressing on market value of the firm and the income statement
approach is firm earnings regressing on share returns.
This study not only estimated the value relevance after the adoption of LCM but
also examined the reliability of accounting measures. The reliability was
performed by assuming that reliable accounting measures led to smaller errors in
the valuation model; the smaller residuals resulted in a more appropriated model
that was evidenced by the better explanatory power of the model. This study
finally compared the explanatory power by applying J test and Cox test. Both the
balance sheet and income statement approach evidenced that LCM was not high
value-relevant in 2001 (10.5 and 11.5 per cent, respectively) compared to that in
1998 (15.1 per cent and 14.9 per cent, respectively). In addition, the coefficient
estimates of the proxy of LCM/HCM differences reported the strongest impact on
firm values, in 1998, of the voluntary use of LCM, meaning that LCM was more
value-relevant when firms selected this method. The results also reported the
decrease in reliability of using LCM.
In sum, contrary to the authors’ view, the results did not show strong
improvement of quality in using LCM for Chinese firms. The confounding results
could be noise in data as claimed by the authors. This thesis considers that the
study does not argue when LCM was coming into force for all firms; the decrease
in value relevance could come from a reason that no comparison (between LCM
and HCM firms) can be made by financial reporting users. In other words, when
all firms are using the similar accounting method, information users cannot
distinguish the quality of accounting information between one firm and another.

Chapter III Theoretical framework and literature review
91
Czech Republic
Hellström (2006) examined the validity of the value relevance methodology by
investigating economic transition in the Czech Republic during the period 1994 to
2001 when the Accounting Act in Czech Republic was amended in January 1998.
The study designed its research method by comparing results with the value-
relevance benchmark. The author selected Swedish firms as a value-relevance
benchmark because of a relatively similar in general characteristics, i.e.
population and German- and French-influenced accounting system, between two
countries. Balanced panel data consisting of 72 non-financial Czech firms were
grouped by two periods before (1994–1997) and after (1998–2001) the year of the
Accounting Act amendment, i.e. 1998. Each group was compared to the
benchmark that was also separated according to those periods.
To examine the validation of value relevance models, the study employed four
different such models, including price model, return model, log regression model,
and hedge portfolio model.36 Results were obtained by R2 comparison in each
period and revealed that the value relevance of accounting information was
increased after the Accounting Act amendment. R2 increased by ranging from 2–
12 per cent after the use of the new Accounting Act in 1998. However, in price
model, earnings had lost their value relevance by decreasing from 3.36 to 2.43
while book value had increased its value relevance from 0.19 to 0.32. This study
rather differs from other accounting reform studies because the benchmark is
added, leading to the question of whether or not the benchmark is essential, and
choosing a benchmark is crucial. In addition, the sample size is rather small so
that the study does not report if the sample size can be generalised for the Prague
Stock Exchange.
Germany
Jermakowicz, Prather-Kinsey and Wulf (2007) investigate the value relevance of
accounting information in German firms when adopting IFRS or US GAAP for 36 Log regression model is a logarithm price model and hedge portfolio model is earnings return in short and long-term periods.
Chapter III Theoretical framework and literature review
92
the financial reporting process. They employ DAX-30 companies for this
investigation. Based on their questionnaire survey, even though IFRS will be
fully implemented for consolidated financial statement for German firms in 2005,
many DAX-30 companies converge to IFRS or US GAAP before 2005, i.e. 10 per
cent of these firms employ German GAAP in 1997 but the percentage of using
IFRS or US GAAP increases to 63 per cent in 2004. This suggests that DAX-30
companies converge to IFRS or US GAAP in different periods of time before
IFRS will be in force for all firms. They employ the firm valuation model to
determine the value relevance of accounting information by comparing before and
after IFRS or US GAAP adoption. Their findings suggest that during the period
1995–2004, the value relevance of earnings and book value information
substantially improves from 1.2% to 66.5% after IFRS or US GAAP adoption in
DAX-30 companies. They further examine the determinant of IFRS or US GAAP
adoption in the firm. They set that the adoption is a function of firm performance,
size, leverage, ADR listing and an increase in share value during the year. Their
results suggest that the adoption is related to leverage, firm size and ADR listing.
Poland
In Poland, the Accounting Act has been amended in 1990, 1994 and 2000. The
study, performed by Gornik-Tomaszewski and Jermakowicz (2001), investigated
a relation between accounting information and market value during the period
1996–1998 in Polish firms. By using balanced panel data, 77 firms taken from all
industries were included and examined. The study partitioned the data according
to industry sector, performance (reported profit) and size (trading board). Results
showed adjusted R2 ranging from 60 to 70 per cent, leading to the conclusion that
there was a relation between share price and accounting information, earnings and
lagged book values. In addition, book value provided higher incremental value
relevance than did earnings, 20 and 11 per cent respectively.

Chapter III Theoretical framework and literature review
93
South Africa and Mexico
Prather-Kinsey (2006) proposed good motivation in its research whether or not
developed-country accounting standards are appropriated for developing
countries. This study investigated the value relevance of accounting information
for South Africa and Mexico. In South Africa, its accounting policy has adopted
eleven IAS during the period 1998 to 2000. The study used 262 firm-year
observations of all industry sectors in 1998 and 2000 and developed regression
model that market capitalisation is a function of book value and earnings, that all
variables were weighted by book value. The explanatory power in 1998 (93 per
cent) was higher than in 2000 (79 per cent), meaning that IAS convergence in
South Africa did not increase but decreased value relevance in IAS-converged
accounting information.
For Mexico, IAS and US GAAP were adopted during the period 1998–2000. By
using the above regression, results revealed that the explanatory power increased
by 14 per cent from 1998 (71 per cent) and 2000 (85 per cent) in 164 firm-year
observations. However, the study applied an additional test to compare adjusted
R2 by using the Vuong test. The obtained result showed no statistically significant
difference in the adjusted R2 between 1998 and 2000.
These findings should encourage accounting standard setters to understand the
characteristics of countries who are likely to adopt IAS for financial reporting in
their own country. In addition, as argued by Holthausen and Watts (2001),
valuation analysis is unlikely to be useful for standard settings. This thesis
considers that the study of accounting information value-relevance in South
Africa and Mexico can respond to their opinion in this regard.
Spain
Giner and Rees (1999) examined the effect of the Spanish accounting reform to
investigate whether the quality of accounting information increased. In 1990,
“true and fair view” was added to the Spanish accounting system. They examined

Chapter III Theoretical framework and literature review
94
735 non-financial Spanish firm-year observations during the period 1986–1995 by
using price model. They enhanced the model by incorporating dummy variable
and dividend policy to examine the interaction-effect during the reform. Their
results showed the slight improvement of explanatory power following accounting
reforms. In addition, earnings suffered from the decrease in their value relevance
after the reform (i.e. from 6.33 to 3.72 and incremental value decreased from 15.8
per cent during the period 1986–1989 to 10 per cent during the period 1990–1995)
while book value gained higher value relevance (i.e. from 0.18 to 0.72 and
incremental value increased from 0.9 per cent during the period 1986–1989 to
11.2 per cent during the period 1990–1995). This study added other information,
dividend policy, in the price model and found that dividend policy had higher
value relevance compared to book values and earnings with the slope coefficient
ranging from 10 to 14. Naceur and Goaied (2004) also found more pronounced of
dividend policy in the valuation process in Tunisia.
Tunisia
Tunisia is another country that has reformed its accounting and financial market.
Naceur and Goaied (2004) documented that there have been several accounting
and financial market reforms in Tunisia since 1989. Although there were many
changes in accounting and financial markets, the study examined whether value
relevance of earnings, book values, dividend policy, debt and capital expenditure
was improved in general rather than investigating the effect of those changes. By
using unbalanced panel data of 30 firms (239 firm-year observations) from all
industry sectors during the period 1984–1997, they estimated the value relevance
by hypothesising that share price is a function of book values and earnings. In
their enhanced model, they incorporated dividend policy, debt and investment
(proxy by capital expenditure) as regressors in the model. The data were also
subgrouped by market capitalisation and return on equity. Their findings reported
that accounting information through book values, earnings and dividends was
value-relevant. The slope coefficient of earnings (1.37) was more highly
pronounced than that of book values (0.157) but dividend policy provided
Chapter III Theoretical framework and literature review
95
strongest impact on the market value with its slope coefficient 17.55. This
dividend policy mispricing found by this study is consistent with Rees’ findings
that a statistically significant mispricing on dividend policy can be observed in the
UK market (Rees, 1997).
Barth et al. (2008) estimate whether accounting quality has been improved in 21
countries that adopt IFRS. They compare accounting quality between firms
employ IFRS and firms do not employ IFRS (matched firms) in the same country
and year during 1994 – 2003, comprising 1,895 firm-year observations for 327
firms. A priori prediction is that the accounting quality for IFRS firms is better
than the accounting quality for non-IFRS firms. For the value relevance, at first
stage, they regress share price on industry and country fixed-effect indicator
variables. This stage should mitigate the potential problem about the variation in
industry– and country–specific effects. Then, they use the residual from the first
stage as dependent variable. They regress the residual on book value and net
income per share. As expected, the explanatory power (R2) of IFRS firms
(0.4010) is greater than R2 of non-IFRS firms (0.3016) during IFRS post-adoption
periods. The explanatory power of IFRS and non-IFRS firms is not statistically
different during IFRS pre-adoption periods. For only IFRS firms, the value
relevance during IFRS post-adoption periods (0.4010) is greater than IFRS pre-
adoption periods (0.2820).
Impact of Market Environments on the Value Relevance of Accounting
Information
Bartov et al. (2001a) investigated the information content of earnings and cash
flow and estimated whether the usefulness of earnings and cash flow is universal.
The problem was built on the different characteristics of economic and financial
markets between Anglo-Saxon countries, including in their study the US, the UK
and Canada, and non-Anglo-Saxon countries, including Germany and Japan that
were used in their samples. The financial market in Anglo-Saxon countries
weights heavily on the capital market investment or market-oriented countries
Chapter III Theoretical framework and literature review
96
while creditors, i.e. banks, play a major role in driving the economy for non-
Anglo-Saxon countries. In addition, taxation systems and stakeholders in those
countries are also varied. These various characteristics could result in different
accounting measures, i.e. the opportunistic use of earnings. The study selected
manufacturing and distribution industry firms during the period 1987–1996 from
those countries, consisting of 710 firms (3,950 firm-year observations) in total.
By using return regression and comparing the explanatory power by the Vuong
test, they reported a superior value relevance of earnings over cash flow for the
US, the UK and Canada but not for Germany and Japan. However, incremental
value relevance of earnings was obtained in all countries; cash flow incremental
value-relevance was observed in all countries except Canada. These results
concluded that earnings had no superior value relevance compared to cash flow
although many empirical research papers found higher importance of accrual
earnings than cash flow.
Relatively similar to the work of Bartov et al. (2001a), Arce and Mora (2002)
estimated the value relevance of earnings and book value across European
countries, including UK, the Netherlands, Belgium, France, Germany, Italy,
Switzerland and Spain. Other than investigating the difference of value relevance
of accounting information across countries, this study tended to examine whether
the value relevance of underlying accounting numbers was different between
market-oriented (UK and the Netherlands) and creditor-oriented countries
(Belgium, France, Germany, Italy, Switzerland and Spain). With their price level
valuation model, they estimated the incremental value relevance and compared the
explanatory power examined by the Vuong test. The result from their data set,
including 22,436 non-financial firm-year observations of those countries
altogether during the period 1990–1998, did not support the hypothesis that there
was difference in value relevance of accounting information between common
law and code law countries. The value relevance of book value and earnings
could be observed in Belgium, France and the Netherlands with about 10 to 14 per
cent of explanatory power. The value relevance of those accounting numbers was

Chapter III Theoretical framework and literature review
97
very low, in particular Germany, at 0.5 per cent. In addition, overall book value
and earnings provided incremental value-relevant, giving additional information
to the market.
However, the usefulness of accounting measures, in particular accounting income,
in Arce and Mora (2002) was very low for the UK (0.8 per cent) and Germany
(zero per cent) compared to the results (12-16 per cent and 3-4 per cent for the UK
and Germany, respectively) reported by Bartov et al. (2001a). These studies
derived a similar conclusion about lower value relevance in non-Anglo-Saxon
countries compared to Anglo-Saxon countries. Nevertheless, this thesis considers
different findings possibly resulting from: i) price vs. return model may yield
different results due to larger noise in price data; and ii) there might be industry
specific effect as shown in the work of Ballas and Hevas (2005) because Bartov et
al. (2001a) estimated only two sectors while the other study investigated all
industry sectors.
The above research papers have investigated the value relevance of accounting
information in cross-country or cross-industry effects. The following two papers
that will be discussed next are examining the accounting information value-
relevant when dramatic changes in the economy. The research papers include
Graham et al. (2000) and Davis-Friday (2006).
Graham et al. (2000) and Davis-Friday et al. (2006) have studied accounting
information quality in terms of the value relevance in Asian countries, including
Thailand. The first research paper by Graham et al. (2000), to the best of my
knowledge, is the first paper that straightforwardly tests accounting numbers in
Thailand. Graham et al. (2000) estimated whether Thai accounting information
was value relevant during the 1997 financial crisis, forcing the Thai government
to devalue its currency. By examining a Thai quarterly data set from 1992 to the
first quarter of 1998, they reported both relative and incremental value relevance.
The study employed quarterly data of accounting earnings and book value which
Chapter III Theoretical framework and literature review
98
the authors claimed were more volatile than fiscal year-ended data because of
non-audited vs. audited data. With reference to price regression, their findings
reported that share prices can be explained by both book value and accounting
earnings, although investors put a slightly higher weight to book value (9 per cent)
than accounting earnings (5 per cent).
The study also focused its investigation on four quarters before and after July
1997, the period of economic turmoil in Thailand. Results reported significant
changes in accounting earnings’ value-relevance in general; the explanatory
power of earnings decreased from 39 to 16 per cent after the 1997 financial crisis.
Earning value-relevance was relatively volatile (decreasing 23 per cent) compared
to book value value-relevance (decreasing 5 per cent). The authors argued that
the market expected negative earnings were not continued due to the sign of
earnings coefficient estimated shift from positive (i.e. 7.02) to negative (i.e. -0.16)
after the crisis.37 The study also separated the test according to profit- and loss-
firms before and after the crisis.
However, the study by Graham et al. (2001) did not explain about the intercept
terms. Both book value and earnings had less explanatory power to capture share
price in accordance with the larger intercept term. The intercept term coefficient
was -5.68 (p-value = 0.2915) before and 10.76 after the crisis while the coefficient
estimates of book value were 0.93 and 0.84, and those of earnings were 7.02 and –
0.16 before and after the crisis, respectively. This implies that before the crisis,
the market relied heavily on individual accounting numbers but after the crisis
accounting numbers had very much less important roles, as shown on a very
larger intercept term compared to the past, especially in profit-firms. But, for
loss-firms the intercept term was changed from 9.36 to -0.25 (p-value = 0.9628),
37 According to Graham et al. (2001), Ohlson model suggests that earnings have value relevance according to abnormal return. For the case of negative earnings, positive signs of the coefficient estimate of earning should be obtained before and after the crisis, meaning that the market expects that negative earnings are persistence. Therefore, the sign of valuation coefficient was changed from positive to negative before and after the crisis, respectively, implying that negative earnings should reverse back to positive earnings after the financial crisis.
Chapter III Theoretical framework and literature review
99
implying that accounting numbers play an important role after the crisis, i.e.
investors probably pay attention to liquidity values in negative-earnings firms
(Graham et al. 2000).
A recent study of Thailand accounting information value-relevance by Davis-
Friday et al. (2006) revealed that the value relevance of book value increased
while that of earnings decreased between 1996 and 1997. Their findings are
consistent with those of Graham et al. (2000). Barth et al. (1998, quoted in Davis-
Friday et al. 2006) suggested that during the economic downturn, the value
relevance of book value increases while that of earnings decreases. These
findings imply that Thai accounting measures reflect economic consequences,
especially during the economic deterioration and are supported by the suggestion
of prior research. In their study, Davis-Friday et al. (2006) categorised Thailand
as an IAS-based accounting system and Korea is only one from the other three
Asian countries in the analysis, including Indonesia, Malaysia and Thailand,
where its accounting system is based on tax law. On the other hand, Ball et al.
(2003) argued that Thailand is one of the countries where the accounting system
relies on tax laws. This disagreement raises an issue of whether the accounting
regime in Thailand is based on IAS or tax laws. The review of related literature
with regard to accounting regime in Thailand will be discussed in the next section
as this thesis takes the transition of accounting regime to another account that it is
conceptually different from the value relevance study of accounting information.
The Importance of Other Information in Firm Valuations: Other Implications of
the Value Relevance Analysis
As aforementioned, not only accounting measures but also other information is
reflected on firm values according to the assumption proposed by Ohlson (1995).
In the earlier sections, accounting changes and market environment effects are
explored. This section documents the importance of other information observed
by empirical studies in terms of the valuation analysis.

Chapter III Theoretical framework and literature review
100
Firm specific attributes
Martinez (2003) investigated whether firm-specific attributes, including size, debt
and life cycle (measured by market-to-book value), were reflected on firm share
prices by testing the French data set of 918 firm-years observations during the
period 1994–2001. The study used share returns as dependent variables and
accounting numbers as independent variables, including earnings and cash flow.
In addition, the study adopted the quadratic model by incorporating non-linear
information as independent variables. It partitioned the data according to the
degree of total assets, leverage and market-to-book. Findings revealed that size,
debt and maturity/growth significantly affected the firm valuation process, and
cash flow did not provide additional information beyond earnings. Additionally,
non-linear specifications increased the explanatory power of accounting measures.
Rather similar to Martinez (2003) in terms of estimating specific-effects, Ballas
and Hevas (2005) use in-depth knowledge of economic environment (other than
accounting information) concerning the reported numbers. Contributing to prior
research papers that examined national difference effects on accounting
information, they investigated micro feature attributes to provide a better
understanding of specific features affecting the firm valuation process. The tested
attributes were regulation and industry effects on the usefulness of earnings and
book value across European countries, including France, Germany, the
Netherlands and the UK during the period 1995–2003, including the total of 5,957
firm-year observations with seven different industries. They employed price
regression to determine the association between market value of the firm and
accounting measures, abnormal income and book value. By partitioning the data
set in accordance with specific characteristics, including cross-country and cross-
industry differences, their findings reported the importance of industry differences
that impacted on earnings and book value. By constituting the current abnormal
return as a function of previous abnormal return, they found statistically
significant earnings persistence in all countries and industries. In addition, they
revealed that lagged book value was significantly associated with the current book
Chapter III Theoretical framework and literature review
101
value. In their study, they predicted market valued by estimating forecasting
errors in accordance with industry and country effects. They included accrual
effect (net income less operating cash flow) to the price model as other
information and the result showed an improvement of the explanatory power from
66 to 70 per cent and 70 to 72 per cent for cross-country and cross-industry data
sets, respectively. In addition, the prediction errors were smaller with reference to
industry. This implies that industry effect is essential for the value relevance
analysis in terms of prediction process.
Other research which uses knowledge of economic surroundings (other than
accounting information) concerning the reported number is the work of Ely and
Pownall (2002). Ely and Pownall (2002) studied accounting information quality
in terms of value-relevance for Japanese firms who are and who are not cross-
listed in the US to determine the effect of stakeholder-related incentive. The
Japanese financial market, like other markets in code law countries, depends
heavily on the bank and creditor system rather than the shareholder system. The
authors expected a stronger relation between share price and accounting numbers,
book value and earnings, in cross-listed firms than non-cross-listed firms because
the shareholder- or market-oriented environment focuses primarily on firms’
performance more than the creditor-oriented system.
The authors matched cross-listed firms and non-cross-listed firms by using
industry and revenue. They analysed and provided insightful descriptive
characteristics of two different types of these firms, i.e. ownership concentration,
bank’s roles and the role of foreign institute. By selecting 23 cross-listed firms
coupled with 23 matched firms from 1988 to 1996, they reported from price and
deflated price regressions that the value relevance of earnings and book value was
higher in cross-listed firms. In addition, their findings revealed a smaller intercept
term of non-cross-listed firms, interpreting that earnings and book value in non-
cross-listed firms did not play an important role in explaining share price when
compared to those in cross-listed firms.

Chapter III Theoretical framework and literature review
102
This study applies the use of industry and macroeconomic data to determine firm
value as indicated by Kothari (2001). These considerations are essential for
fundamental analysis; Beaver (2002) also suggests that in-depth knowledge of
accounting institutions and the specific characteristics of accounting measures is
demanded for value relevance research. However, this thesis considers that some
other points may be concerned. First, matching selection process is crucial when
it is used to search for a benchmark. Barber and Lyon (1996) suggested that
matching firms with industry and pre-event performance (i.e. return on assets or
many years pre-performance of return on sales) is well-specified rather than using
industry alone. And, second, 14 firms were listed on the NASDAQ and another
nine were listed on the NYSE. Stock exchange effects might impact the result
due to differences in stock exchange rules.
Non-financial information
Dontoh et al. (2004) proposed that the decline of value relevance in US firms
from 1983 to 2000 could be derived from non-financial information, namely
trading activity effects. The study fitted several variables, i.e. analysts’ forecast
revision, trading and outstanding common shares, trading volume, and cross-
section mean trading volume in many equations. First, they regressed share prices
on book value and earnings to obtain the explanatory power. Then the
explanatory power was used as dependent variable and regressed on the cross-
section mean trading volume. The study predicted that if the association between
share price and accounting numbers were perfect, the declining value relevance
should be due to non-financial information. If this is the case, the increasing noise
in non-financial information raises noise in share prices, leading to declining
explanatory power. Therefore, non-financial information should be associated
with the explanatory power and share price. Their results supported their
theoretical predictions that the declining value relevance of book value and
earnings was associated with non-financial information. They suggested that
future value relevance studies should detect this information to make a proper
inference.

Chapter III Theoretical framework and literature review
103
Predictability
Ali, Hwang and Trombley (2003) noted that one major concern about
fundamental analysis is whether residual income model, in particular value-to-
price ratio (hereafter V/P) is sensitive to risk proxies in the process of abnormal
return prediction because prior research found the ability of V/P to predict
abnormal return but argued that this effect may be due to risk factor omissions.
They investigated this concern and whether there is temporary market mispricing
effect in V/P strategy or omitted risk factors drive the predictability of V/P. Value
(V) is calculated by book value and the present value of forecasted return on
equity relying on two periods and V/P is dividing V by share price (P). By the
estimated V/P, US data were formed to five quintile portfolios at the end of June
each year over the 1976–1997 period.
First, the study estimated the mispricing effect of V/P. The authors postulated
that “because asset pricing models do not predict forecasted return over short
window period, if abnormal returns to the V/P strategy are due to omitted risk
factors, then future abnormal returns should not be concentrated around the
earnings announcement periods.” They expected that market mispricing effect is
observed when abnormal returns that were significantly larger than zero around
earnings announcement date. The study estimated the relation between ranking
quintile of V/P and future return with controlled size effect and compared the
degree of abnormal return between earnings announcement (3-day abnormal
returns) and non-announcement (63-day abnormal returns) periods. Findings
revealed that V/P strategy was due to mispricing effect.
Second, because prior analyses suggested that the ability of V/P to predict
abnormal returns was due to omitted risk factor, the study investigated whether
incorrect measurement or risk factor omission related to the abnormal returns
predictability of V/P. The study regressed V/P on several risk factors, including
systematic (beta) and non-systematic risks (share price variability), market price
risk, leverage firm risk, financial distress risk, and information environment risks

Chapter III Theoretical framework and literature review
104
which were proxied by size, number of analysts, variation of analysts’ earnings
forecasts, stability of past return on assets and industry cost of capital. Another
three risks were also included: book-to-price ratio, I/B/E/S long-term growth
predictions and estimated anticipated return. Next, the study regressed future
returns on V/P and those risk factors. If the association is significant after
controlling the risk factors, then it suggests that omitted risk factors do not drive
V/P effect. The study reported significant positive association between V/P and
future returns although controlling for risks. This implies that V/P prediction
ability is not due to omitted risk factors. Additional calculations for V/P were
also performed by using another two different formulas according to Dechow et
al. (1999) and Gode and Mohanram (2001) (quoted in Ali et al. 2003).
Ashbaugh and Pincus (2001) examined whether the adoption of IAS provides
better earnings predictability in cross-country data, including Australia, Canada,
Denmark, Finland, France, Hong Kong, Japan, Malaysia, Norway, Singapore,
Spain, Sweden, and Switzerland, for the period of 1993 (before and after 1
January 1993). They expected that analysts’ earnings forecasts would change
after the IAS adoption; the predictability of earnings could be either increased or
decreased after the adoption. By indexing disclosure requirements and
measurement methods for each country, they defined forecast errors (the absolute
value of the difference between analysts’ earnings forecasts and reported
earnings) are a function of those factors and added number of analysts and market
value of equity as control variables. They estimated both in level and change
models. Overall, findings reported that earnings forecast errors decreased after
the adoption, implying less variation in disclosure and measurement methods.
Test of accounting differences
Zhao (2002) employed a fundamental analysis to estimate the value relevance of
different accounting methods for research and development (R&D) information
across four countries, including France, Germany, the UK and the US. There are
two alternative accounting methods for R&D – the full cost and the successful

Chapter III Theoretical framework and literature review
105
cost. Germany and the US (exclusive of the software company) have used the full
cost by expensing all R&D costs; this method is considered as conservative
method. The other two countries, France and the UK, allow firms to defer and
amortise successful R&D costs. The study was concerned with the public report
of R&D costs and amortisation because this information could be confidential.
Thus, the study was interested in the incremental value relevance for disclosing
R&D costs and allocation costs. By testing the data of four countries for the
period 1990–1999, the study used the price model and added other information,
including estimated R&D costs and allocation costs, R&D accounting methods
and different law systems to the model. The explanatory power of the association
between share price and accounting measures, including book value and earnings,
was increased when R&D cost information was added. In addition, the allocation
R&D costs were incremental value-relevant for France and UK samples, not for
full-cost countries.
Zhao (2002) investigated the value relevance of R&D information across
countries and industries, meaning that reporting environments, i.e. legal
regulations, and industry could affect their analysis. On the other hand, another
study about successful and full cost methods is the work of Bryant (2003) that
focuses on only the US oil and gas industry. This reduces the potential problem of
the market difference and industry effect. By using price and return regressions,
Bryant (2003) added the present value of future net cash flows of oil and gas
reserves as another explanatory variable to the models. The sample of 112 firms
for the period 1994–1996 was examined, separated into 64 successful-cost firms
and 48 full-cost firms. The study calculated as-if book value and income for each
sample group. In particular, for successful-cost (full-cost) firms, their actual book
value and income is re-constructed to obtain full-costs (successful-costs) as if
these firms had been using full-cost (successful-cost) method. This method
allows the comparison of different accounting methods within the same firm by
comparing the explanatory power of the regression from actual numbers and from
as-if numbers. This approach reduces self-selection bias but share price is
Chapter III Theoretical framework and literature review
106
assumed to remain unchanged during the testing period. This assumption can
reduce the power of the test as well. The study found that full-cost method has
superior value relevance to successful method; this finding was inconsistent with
the past finding where the cross-firm approach was used. In addition, the study
found that the higher value relevance of full-cost method was derived from
earnings rather than book value.
Test of alternative book value and earnings and cash flow information
Brown and Sivakumar (2003) attempted to investigate whether earnings prepared
by analysts and firm’s manager had similar properties to reported earnings
according to GAAP. They hypothesised that the higher the value relevance, the
more useful the information. They defined the value relevance in terms of
predictive ability of earnings, relative valuation and the information content.
Based on US data for the period 1989–1997, first, the study obtained earnings
prepared by analysts and managers and compared them to earnings reported in
financial statements by evaluating which number provided more accurate
prediction from the last fourth quarter earnings to the first next quarter earnings.
By using mean and binomial tests, they reported that reported earnings were less
value-relevant in terms of predictive ability of next quarter earnings than earnings
adjusted by managers and analysts. Second, according to the price model, they
separated out earnings, independent variables into two figures according to
analysts and manager’s earnings and reported earnings. The relative valuation
analysis supported the first result that reported earnings were lower value-relevant
compared to the others. Third, they regressed 3-day and 63-day cumulative
abnormal returns on changes in alternative earnings. The result from the third
method also supported the first one that reported earnings did not play an
important role in value-relevance compared to the other two earnings.
Abad, Laffarga, Garcia-Borboolla, Larrán, Piãero and Garrod (2000) studied
whether the value relevance of book value and earnings reported in consolidated
or parent company reporting were different in Spanish firms. From 1991, Spain’s
Chapter III Theoretical framework and literature review
107
accounting system has required publicly held firms to render consolidated
financial statements under the parent company approach by disclosing relevant
information in the parent company accounts.38 The study attempted to report
whether the value relevance was altered when alternative book value and earnings
were used to estimate firm valuation. Based on 474 Spanish firm-year
observations for the period 1991–1997, the study defined annual share price as a
function of a set of annual book value and earnings information. Because Spanish
firms report only minority interests, to compare alternative book value and
earnings, the study estimated as-if book value and earnings by including self-
constructed goodwill based on available information. Their results revealed that
the disclosed information in the parent company accounting was value relevant
while other information was not value relevant.
Two major drawbacks of this analysis: i) the authors have not cautioned about
unchanged share price. Because the study assumed the full entity approach being
used and performed self-calculated goodwill, then share price could reflect this
information if this approach had been actually used, resulting in the alteration of
the existing share price that the authors employed for the whole analysis and ii)
different from other value relevance studies, this study uses year-end share price.
In other words, the study did not allow time for share price to capture information.
It is not clear in the study that using year-end share price can reflect the
consolidated financial reporting that should be released at least after the fiscal
year-end date.
Charitou, Clubb and Andreou (2000) investigated the relative value relevance of
accounting earnings and cash flow in Japanese firms for the period 1985–1993.
The analysis also estimated the incremental value relevance of cash flow and
earnings during the period of earnings transition. Their motivation is derived
38 The authors defined three different consolidated financial statements as: “a) the parent company approach, which excludes minority interest from the book value of equity of the group, b) the entity approach, which includes currently reported minority interest into the book value of equity of the group, and c) the full entity approach, which includes the book value of equity of the group the minority interest reported plus the estimated minority interest share of purchased goodwill.”
Chapter III Theoretical framework and literature review
108
from the fact that Japanese business is heavily based on creditor orientation rather
than the stock market. In addition, earnings and financial information are not
important for economic decisions. Based on 6,662 firm-year observations, they
found that earnings and cash flow were value-relevant at much the same level as
found in the US market. The finding was revealed by different return regressions
that used annual share returns as dependent variable while the level of and change
in earnings and cash flow were used as independent variables. They estimated
earnings persistence by calculating the degree of absolute changes in earnings
divided by price and ranked the earnings persistence. Their findings supported
that during the earnings transition, cash flow had higher incremental value-
relevance than earnings.
Disclosure quality
Kang and Pang (2005) estimated the quality of disclosure level through its value
relevance. High value relevance is high quality of disclosure. Based on non-US
firms in 41 countries whose shares were traded on the US stock exchange for the
period 1993–1999, they employed price model by estimating the association
between share price in the US and home-country reported accounting numbers,
including book value and earnings. The disclosure level was proxied by
economic development: emerging vs. developed countries. Findings revealed that
emerging market countries required more disclosure to obtain more transparency
and quality of accounting information.
Discussion of Value-Relevance Studies
It appears that value relevance analysis has been widely used by researchers when
investigating the change in accounting system. After exploring empirical studies
with regard to the value relevance analysis, some conclusions can be made. First,
the fundamental analysis can be separated into relative information value-
relevance and incremental information value-relevance. Mainly, the explanatory
power or R2 is compared to determine whether or not accounting numbers
estimated by alternative accounting treatments provide different usefulness levels

Chapter III Theoretical framework and literature review
109
to the market. In accounting-based research, the alternative accounting number
estimation can be derived from accounting treatment differences or accounting
policy changes. Value-relevance analysis can be used to determine whether the
different determination method is useful. In addition, value-relevance analysis
can be used to compare the usefulness of accounting information, which is known
as incremental value analysis. Although researchers view that the value analysis
is just a joint test between relevance and reliability (Barth et al. 2001), it is a
useful tool to distinguish accounting numbers in some magnitude or the impact of
accounting system changes as a whole in terms of accounting information quality.
Because the valuation model has been silent on accounting choice, it is a practical
means for estimating how better different accounting methods can explain
economic consequences by comparing the explanatory power of each data set.
Second, price and return models have often been utilised in the study of value
relevance. These models are understandable and rather practical in terms of
proxies implemented for the models’ estimation. For example, rather than using
forecasted abnormal returns, users can replace reported earnings for the forecasted
data. However, each model has drawbacks because the model has a different
quality and they are interpreted differently, as suggested by Beaver (2002),
depending on ‘time.’ Return model is suitable for a specific time period.
Furthermore, Martinez (2003) points to the non-linear relationship when using
return model. Future research should take these points into account.
Third, to compare the explanatory power, prior research uses the Voung test for
the comparison. Some studies use J-test and Cox-test. Other than these methods,
some studies compare the association between the market value and accounting
information by revising the calculation of the explanatory power with the Cramer
methodology (Barth et al. 2008; Harris, Lang and Moller 1994). These tools are
added and provide a stronger support for the inference.
Chapter III Theoretical framework and literature review
110
Fourth, price and return models are practical and easily to be modified. As
performed by many empirical studies, modified regressions provide more
insightful about the analysis, i.e. adding dividend policy or non-financial
information. This helps future research to think about the choice of variables to
be included. Since most value relevance studies have investigated the different
explanatory power between alternative accounting treatments, two or more
treatments will be compared. Therefore, the models are straightforward allowing
the research design to add dummy variables or run the regression twice. In
addition, the residual income model can be augmented and applied for
practitioners. For instance, O’Hanlon and Peasnell (2002) derive the theoretical
link between the residual income model and the economic value added (EVA)
used by the consulting firm Stern Stewart & Co.39
Finally, it is rather interesting that empirical studies have included financial sector
in their sample data set, i.e. Naceur and Goaied (2004), when using price
valuation model. This might be an exception for the valuation model because
accounting choice does not affect the model. Thus, although financial sector has
different or more complicated accounting method, the valuation model, according
to its assumption, is not affected by the difference. Moreover, the special
characteristics of financial-sector firms can be captured by other information in
the valuation model assumed to be zero. Therefore, it is possible to include
financial-sector firms in the analysis. However, this thesis considers that although
the assumption is intuitive, the empirical inference should be interpreted with
care.
In summary, the study of value relevance of accounting information has
extensively caught accounting researchers’ attention. Although there is no
39 O’Hanlon and Peasnell (2002) began with the residual income-based valuation relationship (RIVR see pg. 231 which is similar to equation 3.17 presented in this study). And, they derived the residual income book value relationship (RIBR, see Proposition 1 pg. 233). Then, they derived the excess value created (EVC) over multi-period interval from incorporation to time t (Proposition 2 for the beginning at time 0 and Proposition 3 for the beginning at some date) by combining RIVR and RIBR.
Chapter III Theoretical framework and literature review
111
theoretical explanation to back up this area of study, it is widely accepted by
accounting researchers that the study of value relevance facilitates users’ decision
making. For example, the user perceives information differently when firms
employ different accounting methods.
3.3.3 Earnings Timeliness The remaining type of accounting quality to be discussed is earnings timeliness.
This section reviews the existing literature relating to the asymmetric timeliness
of earnings and the study of firm-specific accounting conservatism. For the first
research paper, Ball and Shivakumar (2005a) compare accounting conservatism
between public and private firms in the UK. The a priori expectation is that there
is less demand for financial reporting quality required in private firms relative to
public firms. Thus, accounting conservatism is more likely for public firms
relative to private firms. In this study, the authors examine accounting
conservatism by employing market-based model and introducing the use of
accrual-based model to determine accounting conservatism. They employ the
dataset during the period 1990–2000, resulting in 141,649 private and 6,208
public firm-years. They determine accounting conservatism by estimating the
differential mean reversion in earnings changes, suggesting that negative earnings
changes tend to reverse in the next period whilst positive earnings changes tend to
persist. Their findings report that public firms have more accounting
conservatism relative to private firms. They use the accrual-based earnings
timeliness to measure accounting conservatism and their findings are consistent
with results obtained from the market-based earnings timeliness model. The
result is robust when controlling for size, industry and leverage. This is the first
study proposing the time-series measurement of earnings timeliness by not
interpreting bad news as negative stock returns.
Roychowdhury and Watts (2007) investigate the relation between market-to-book
and the earnings timeliness measure estimated by Basu’s model. The motivation
of this study is driven by a negative relation between the two measures as this

Chapter III Theoretical framework and literature review
112
association is predominantly documented in the literature Givoly et al. (2007)
evidence the negative relationship between Basu’s earnings asymmetric timeliness
and firm-specific accounting conservatism measures). However, the authors
argue that at the starting point when equity is issued to the market, the book and
market value is equal. Book value records partial gains and delays some gains to
be accounted in the next period. However, losses will be fully recognised in the
current period. This induces the difference between market value and book value.
They argue that the positive relation between Basu’s earnings timeliness measure
and market-to-book should be observed in a long horizon period of time rather
than in a short or single time period. Based on 45,664 firm-years during the
period 1972–1999, they incorporate market-to-book into Basu’s earnings
timeliness model. They employ forward and backward accumulated earnings and
stock returns instead of single-year earnings and stock returns. The coefficient of
the integrated variable between backward accumulated returns and the year-end
market-to-book ratio is positive, suggesting that market-to-book is positively
correlated to Basu’s earnings timeliness measure. The result suggests that Basu’s
earnings asymmetric timeliness model is more powerful when employing
accumulated earnings and returns for an analysis.
Barth et al. (2008) estimate the good/bad news recognition in 21 countries that
adopt IFRS. They compare the good/bad news recognition between firms employ
IFRS and firms do not employ IFRS (matched firms) in the same country and year
during 1994 – 2003, comprising 1,895 firm-year observations for 327 firms. A
priori prediction is that IFRS-Firms should recognise good/bad news more
freguently than non-IFRS firms. They find that during IFRS pre- and post-
adoption periods the good/bad news recognition is not statistically different in
both IFRS and non-IFRS firms. In addition, the good/bad news recognition
during IFRS pre-adoption periods is not statistically different from the good/bad
news recognition during IFRS post-adoption periods for IFRS firms.
Chapter III Theoretical framework and literature review
113
Conservatism and auditors
Krishnan (2007) examines whether earnings conservatism has been improved for
former clients of Arthur Andersen. The author hypothesises that earnings
conservatism should be improved for former clients of Arthur Andersen because
such firms are more likely to protect their reputation and reduce potential
litigation risk. The dataset includes 865 former clients of Arthur Andersen; 91
clients switched to a non-big-four auditor in 2002. Based on the market-based
earnings asymmetric timeliness model, findings suggest that earnings
conservatism has been improved for former clients of Andersen from 2001 to
2002. Particularly, earnings conservatism for former Houston-Based Andersen
clients has been significantly increased following switching to a big-four auditor
in 2002. However, earnings timeliness has not been improved during these two
periods for former Andersen clients switching to non-big four auditors. Further
findings in this paper also suggest that negative earnings changes have been
generally reversed between those two periods for former Andersen clients; the
reversal of negative earnings indicates the timeliness of earnings to capture
economic consequences. In addition, the author employs accrual-based earnings
timeliness model to support the main finding.
Conservatism and debt
Beatty, Weber and Yu (2008) investigate the relationship between accounting
conservatism and debt. This study is motivated by the question of whether the
agency costs of debt affect the modification of conservatism in the firm’s financial
reports. For example, income escalators are more likely at the high agency costs
of debt. Five different firm-specific accounting conservatism measures are
employed in this study, including market-to-book, the coefficient of the
interaction of negative returns with returns, the difference between the skewness
in cash flows and earnings, accumulated non-operating accruals and the sum of
firm’s rank for each of these five measures. They regress the lending contract
modification which is equal to 1 if this contract modification is made, zero
otherwise, on accounting conservatism measures and other variables, i.e. the
Chapter III Theoretical framework and literature review
114
maturity of loan, the interest rate spread, loan type, debt rating, ROA, size and
growth. The contract modification is required only when a percentage of positive
net income is added to net worth thresholds. They also regress the conservatism
measure on income escalator with other control variables. Based on the dataset
during the period 1994–2004 with 2,164 observations, their findings report that
income escalators positively vary with accounting conservatism, suggesting that
lenders’ demands for conservatism are satisfied by reporting conservatism and
conservative contract modifications.
Whilst Beatty et al. (2008) estimate unconditional conservatism and debt, Hsu,
O’Hanlon and Peasnell (2010) examine conditional conservatism and financial
distress during the period 1989 – 2005 with 21,513 US firm-year observations.
They determine financial distress by using two measures – Black-Scholes-Merton
(BSM) score and the Altman (1968) Z Score. They employ three piecewise
regression models, including the market-based model, the negative earnings
change model and the accrual-based model. They interact financial distress
measures through explanatory variables. They find a positive association between
conditional conservatism and both of their measures of financial distress. They
also note that this positive relationship arises mainly from the accruals component
of earnings rather than the cash flow component.
Institutional factors and earnings timeliness
Ball et al. (2003) examine accounting income property in terms of the ability of
earnings to capture economic consequences in East Asian countries, including
Hong Kong, Singapore, Malaysia and Thailand during the period 1984–1996.
Based on Basu’s earnings asymmetric timeliness model, their findings suggest
that earnings asymmetric timeliness in four Asian countries is lower than that for
common law countries, including Australia, Canada, the UK and the USA. They
also examine accounting income property by evaluating through the persistence of
earnings changes. According to Basu (1997), the negative change in earnings is
viewed as transitory and will be reversed in the next period. The positive change
Chapter III Theoretical framework and literature review
115
in earnings is viewed as more permanent relative to the negative change in
earnings. The reversion of negative changes in earnings implies asymmetric
income-conservatism. The coefficient estimated when regressing changes in
earnings on negative changes in earnings is, thus, negative. Their findings
suggest that among four Asian countries, negative earnings changes in Singapore
are more transitory than positive earnings changes. Negative earnings changes for
four Asian countries relative to common law and code law (Germany, France, and
Japan) countries are less transitory than positive earnings changes.
Ball et al. (2000) investigate accounting conservatism among 18 countries during
the period 1985 – 1995. They compare conditional accounting conservatism
between common and code law countries in different aspects, including
accounting regulations, securities law, dividend, cash flows and debt. Based on
the market-based earnings asymmetric timeliness model, findings suggest that
accounting conservatism is higher in common law countries relative to code law
countries due to greater sensitivity to economic losses. They suggest that the
timelier economic loss recognition brings quicker analysts’ attentions and
facilitates the monitoring mechanism of managers as well as induce necessary
actions, i.e. binding leverage and dividend restrictions more quickly or monitoring
bonuses for employees and managers.
Beuselinck and Manigart (2007) investigate earnings timeliness in Belgian
unquoted companies during the period 1985–1999. They incorporate an
institutional factor to determine earnings timeliness by using private equity
ownership concentration. They argue that the incentive of private equity investors
to monitor financial reporting closely is high when those investors hold a small
proportion of equity in the unquoted company. Nonetheless, the relationship can
be positive since private equity investors who hold a large percentage of equity
influence the company to produce high quality of financial reporting due to the
reputation of the investors. Thus, they conjecture that the earnings timeliness for
private equity backed companies is negatively or positively related to the
Chapter III Theoretical framework and literature review
116
proportion of equity held by private equity investors. They incorporate the
percentage of equity held by the investor in the market-based and accrual-based
earnings asymmetric timeliness models. Their findings suggest that earnings
timeliness is lower when the private investor holds a large percentage of equity
but higher when the private investor holds a small percentage of equity in the
unquoted company.
Bushman and Piotroski (2006) investigate whether economic institutional factors
induce differential accounting conservatism among countries. The economy
institutional factor used in their study includes legal regime, judicial system,
securities law, political economy and tax regimes. They separate legal regimes
according to civil and common law. The judicial system is obtained from the
rating of judicial impartiality reported in the Economic Freedom of the World’s
2002 annual report. Basically, a strong judicial system induces more accounting
conservatism. They use the securities law based on the study of La Porta et al.
(2003). They use risk of expropriation assets by the state and state-owned
enterprises to measure the political economy. The marginal tax rate is used to
measure tax regimes. Based on 38 countries during the period 1992–2001, they
employ market-based earnings asymmetric timeliness model with incorporating
the economy institutional factor for main analyses and accrual-based model for
robustness tests. Their findings suggest that high quality judicial systems and
strong securities law induce more ability of earnings to capture bad news. Low
risk of expropriation of assets by the state and low state ownership of enterprises
encourage earnings to recognise bad news in a more timely manner than good
news. The speed to recognise bad news is higher for the civil law country with
high state involvement in the economy relative to low state involvement whilst the
speed to recognise bad news is lower for common law countries with high state
involvement in the economy.
Gassen, Fulbier and Sellhorn (2006) incorporate unconditional conservatism and
income smoothing to investigate earnings conservatism in 23 countries during the
Chapter III Theoretical framework and literature review
117
period 1990–2003. They employ market-to-book ratio and 5-year backward
accumulated accruals to measure unconditional conservatism and the ratio of 5-
year standard deviation of earnings divided by 5-year standard deviation of cash
flows to measure income smoothing. They predict that unconditional
conservatism and income smoothing reduce earnings asymmetric timeliness.
They find that market-to-book ratio and income smoothing are negatively
correlated with earnings asymmetric timeliness based on Basu’s model. However,
a positive relation between the accumulated accrual and earnings asymmetric
timeliness is found. Their analysis investigates accounting conservatism across
countries, but they do not detect the difference in institutional factors among
countries, i.e. economic environment. They only separate the analysis according
to common law and code law countries.
Jindrichovska and Mcleay (2005) investigate earnings asymmetric timeliness in
317 Czech Republic firm-years during the period 1993–1999. Based on Basu’s
earnings timeliness model, they find that earnings timeliness is less likely for the
sample firm. Although they repeat the regression analysis by separating the
sample firm into bad news and good news, no significant result is observed during
the sampling period.
Lara and Mora (2004) investigate accounting conservatism in common law and
code law European countries. They compare accounting conservatism in the UK
using common law with that in other countries using code law, including
Belgium, France, Germany, Italy, the Netherlands, Spain, and Switzerland. They
employ two accounting conservatism measures: book value and earnings
asymmetry. They hypothesise that book value or balance sheet conservatism is
greater for code law countries relative to the UK whilst earnings asymmetric
timeliness is higher in the UK relative to code law countries. These opposite
hypotheses are driven by the different attribute of the market demand, that the UK
is a market-oriented country whilst the other countries are creditor-oriented
countries. They employ the dataset during the period 1987–2000. Based on
Chapter III Theoretical framework and literature review
118
valuation model and earnings asymmetric timeliness model incorporating an
indicator variable to capture the difference in conservatism between UK and the
code law countries, their findings support the hypotheses. They suggest that the
lower balance sheet conservatism in the code law countries is induced by more
pronounced earnings persistence. However, they did not compare the persistence
of earnings between the UK and code law countries. The higher earnings
asymmetric timeliness in the UK is induced by the demand from the dispersion of
shareholders.
Lin and Chen (1999) conduct a survey analysis to investigate accounting
conservatism in China after the conservatism approach has been introduced in
China after 1993. Since China has long been historically a socialist economy,
accounting practices were mostly controlled by the government. The rejection of
implementing accounting conservatism may rise. 800 survey questionnaires were
sent out in 1998 to 150 Chinese firms. The survey questionnaire was sent to
general managers or heads of finance and accounting sections and financial
statement users, including government agencies, bank credit and loan officers,
security analysts, and audit firms, as well as university professors. The response
rate was 26.1%. Findings suggest that most related parties in using financial
statements support the development of accounting conservatism in China except
for the government which tends to support the existing accounting system.
Pope and Walker (1999) examine earnings asymmetric timeliness in the US and
the UK. Based on Basu’s earnings asymmetric timeliness model, they derive five
different measures of conservatism, including the ratio of bad/good news
regression model slope parameters, the ratio of adjusted R2 statistics for bad/good
news regression models, sensitivity to bad news less sensitivity to good news,
sensitivity to bad news, and average earnings/(lagged price) bias. They compare
the earnings timeliness between US and UK firms during the period 1976–1992.
They employ two different earnings in their estimation of conservatism, including
ordinary earnings and earnings after extraordinary items. They expect that

Chapter III Theoretical framework and literature review
119
earnings after extraordinary items are more sensitive to bad news if extraordinary
items are employed to eliminate bad news from ordinary earnings. Their findings
suggest that UK firms are more likely to categorise bad news earnings
components as extraordinary items relative to US firms. These findings suggest
that earnings measures are essential for the analysis of relative conservatism in
different accounting regimes. Thus, inferences are sensitive to the earnings
measure.
Raonic, Stuart and Ioannis (2004) investigate earnings timeliness for 492
European firms during the period 1987–1999, including Belgium, Denmark,
Finland, France, Germany, Ireland, Italy, the Netherlands, Norway, Spain,
Sweden, Switzerland and the UK. The data must be available for each firm for at
least two consecutive years. To investigate earnings timeliness, they include three
pieces of information: index of disclosure items in annual report, stock market
attribute, and legal (enforcement) system. They employ Basu’s earnings
asymmetric timeliness model by including the three pieces of information as
additional independent variables and integrating the three pieces of information in
the model. Their findings suggest that earnings timeliness is observed in their
samples except for France, Norway, Sweden and Switzerland. They find that
disclosure and legal system are positively correlated with earnings information.
When incorporating stock market attribute and legal system in the model, findings
report that the ability of earnings to capture bad news varies with the stock market
or legal system. This research computes a score for the three pieces of
institutional information, however they do not clearly explain whether the higher
score reflects more accounting conservatism. For example, the authors explain
only that the market index for Germany (score = 5) is least important relative to
Switzerland (score = 24.8), which is most important.
Van der Meulen, Gaeremynck and Willekens (2007) study earnings timeliness in
German firms when the German firm can employ either US GAAP or IFRS for
their financial statements. They use the sample firm from 2000–2002, including
Chapter III Theoretical framework and literature review
120
313 observations. They divide the sample firm into two groups then perform the
regression analysis. Based on Basu’s earnings timeliness model, they find
insignificant results for the model’s coefficient representing earnings timeliness.
In addition, they use the explanatory power to determine earnings timeliness that
the higher explanatory power indicates that earnings capture bad news on a timely
fashion. They find that IFRS and US GAAP used by the German firms are
indifferent in terms of the ability of earnings information prepared by those two
accounting standards to capture economic consequences on a timely basis.
Discussion of earnings timeliness
From prior studies, the earnings asymmetric timeliness has been widely used in
existing accounting research. It appears that the notion of earnings asymmetric
timeliness differs from the notion of earnings persistence. Earnings asymmetric
timeliness delays the recognition of good news; good news will be allocated to
future periods of time. It indicates that positive earnings tend to be persistent. On
the other hand, earnings asymmetric timeliness recognises bad news in the current
period but not future periods. The negative earnings changes tend to reverse in
future periods of time (Basu 1997). The market-based earnings asymmetric
timeliness model based on Basu (1997) is a predominant method widely used by
researchers. However, prior studies find that Basu’s earnings asymmetric
timeliness has a negative relation with firm-specific (unconditional) conservatism,
i.e. book-to-market ratio. There is no complete empirical explanation to measure
accounting conservatism. Two criteria should be made from the review of the
literature. Firstly, it is still problematic about the proxy being used to measure
accounting conservatism, i.e. the proxy for economic consequences. Second,
institutional factors play important roles in the timeliness of earnings, i.e. country
specific factors. In addition to those criteria, earnings components are significant
information sources for the analysis of earnings timeliness. For example, Hsu,
O’Hanlon and Peasnell (2010B) report that the asymmetric timeliness of earnings
varies when different earnings components are employed. The explanatory power
from their estimations (adjusted R2) is ranging from 8.51% to 14.74% when

Chapter III Theoretical framework and literature review
121
earnings are measured by clean surplus earnings and operating profit,
respectively.
3.3.4 Book-Tax Differences and Accounting Quality This section summarises existing research studies that employ book-tax
differences to determine accounting information quality of the firm. Even though
prior research incorporates firm-specific and institutional factors, i.e. market-to-
book ratio and legal system, to estimate earnings timeliness, it appears that book-
tax differences have not yet been employed by the existing study. A review of
literature is presented as follows.
Earnings informativeness and book-tax differences
Hanlon et al. (2005) estimate about the information loss if financial accounting
income is conformed to taxable income. The expectation is that accounting
income prepared by GAAP (or book income) should have information content
relative to taxable income because of the different objectives between book
income and taxable income. However, the authors suggest that if investors use
taxable income as a benchmark to evaluate book income, then taxable income will
have incremental information content. Based on the data during the period 1983 –
2001, they compare market returns from the change in book income and taxable
income. They separate the comparison by using the sign from the change in book
income and taxable income and the sign and magnitude from the change in book
and taxable income. Findings suggest that book income is more useful for
investors relative to taxable income because book income provides an average
annual return greater than taxable income. Next, they compare the relative
information content by using the explanatory power. They regress stock returns
on changes in book income and taxable income separately. Their findings report
that book income has higher information content than taxable income. Last, they
estimate the incremental information content. They regress stock returns on book
income and taxable income. They find that the coefficient estimate for book
income and taxable income is .55 and .28, respectively. This suggests that the
Chapter III Theoretical framework and literature review
122
market appears to rely more on book income relative to taxable income. In
addition, they suggest from the findings that if the same accounting rule is used
for calculating both book income and taxable income, the information content
would be loss.
Hanlon et al. (2008) examine a decrease in earnings informativeness if book-tax
conformity increases. They use firms that are forced to convert from cash method
to accrual method for tax calculation and control firms that use accrual method for
tax calculation during the entire period of the study. By using the ERC model,
they set an indicator variable for the converting firm and control firm. And, an
indicator variable is introduced to capture the difference in the time period
between pre- and post-cash and accrual method conversion. They integrate all
indicator variables with changes in earnings. Stock returns are used as a
dependent variable. A priori expectation is that information loss should be
observed at an increase in book-tax conformity. Their findings suggest that the
earnings informativeness declines after firms are forced to use accrual method for
tax purposes, implying that book-tax conformity reduces the value relevance of
earnings information. They also match converting firms and control firms by
using sales growth. The findings remain consistent.
Ayers et al. (2009) estimate the informativeness of taxable income. They
conjecture that taxable income is less informative for high tax-planning firms
relative to other firms, and taxable income is more informative for firms with
lower earnings quality relative to book income. They compare the information
content of book income and taxable income. They regress returns on change in
taxable income and on change in pre-tax book income separately. They obtain the
explanatory power from the return-taxable income regression divided by the
explanatory power from the return-book income regression. The higher ratio
suggests that taxable income is more informative than book income. They define
high tax-planning firms when those firms have low effective tax rate calculated
over five-year periods, t – 4 through t. They define low earnings quality firms by
Chapter III Theoretical framework and literature review
123
using abnormal accruals – the difference between total accruals and modified
Jones model normal accruals. The highest 20 percent of absolute abnormal
accruals in each year is classified as low earnings quality. Based on 50,760 firm-
years during 1983–2002, their findings are consistent with their hypotheses.
Taxable income is more informative for high-tax planning firms relative to other
firms, and taxable is more informative than book income for low earnings quality
firms. They also estimate the incremental explanatory power of taxable income.
They regress returns on change in pre-tax book income and change in taxable
income. The explanatory power from return-book-taxable income regression and
the explanatory power from return-book regression are compared to determine the
incremental explanatory power of taxable income. They find the incremental
information content of taxble income.
Financial reporting and book-tax differences
Guenther et al. (1997) investigate a shift of financial reporting preparation when
firms change from cash method to accrual method according to the change in tax
rules in 1986. Before 1986, firms were allowed to use cash method for tax
purposes. However, accrual method was enacted for all firms after 1986. In their
study, they compare the sample firm that previously used cash method pre-1986
and accrual method post-1986 and the control firm that has been used accrual
method since 1986. Pre-1986, relative to the control firm, the sample firm was
more likely to accelerate (defer) revenues (expenses) around the fiscal year end
because taxes were paid when cash was received. However, during post-1986, the
incentive of revenue (expenses) acceleration (deferral) should decline when
accrual method was enacted for tax purposes for the sample firm relative to the
control firm. The sample and control firm include 66 firms for each group. The
control firm is matched by SIC code. According to univariate test, the higher ratio
of accounts receivable divided by accounts payable and the higher ratio of sales
divided by expenses suggest that the sample firm accelerates revenue recognition
greater than the control firm. They employ three ratios as dependent variables,
including those two ratios and the ratio of cash receipts divided by cash

Chapter III Theoretical framework and literature review
124
disbursements. They regress those ratios on the inventory-incentive ratio – the
ratio of inventory divided by total assets. Their findings are consistent with the
result from the univariate test, suggesting that firms are more likely to defer
income when accrual method is used for tax purposes.
Mills and Newberry (2001) examine tax cost and non-tax cost influencing book-
tax differences between public and private firms. Tax costs refer to costs
associated with tax examinations. Firms that report large book income but low
taxable income are more likely to have high tax costs, i.e. audit adjustments.
Non-tax costs refer to costs associated with financial reporting. Firms that
conform book income and taxable income to reduce tax costs incurred are more
likely to confront with non-tax costs, i.e. decreasing in firm value, debt covenant
violation or managers’ compensation when the compensation is tied with book
income. The book-tax conformity occurs due to firms’ tendency to reduce book
income to conform taxable income. They investigate the relationship between
book-tax differences and some factors including profit and loss, debt constraints
and bonus plan thresholds by using public and private firms. They conjecture
that: 1) public firms report higher book income relative to taxable income than
private firms during profit periods, 2) public firms report higher book losses
relative to tax losses than private firms, and 3) in the period of profit, the
relationship between book-tax differences and debt ratio is weaker for public
firms relative to private firms because public firms are more likely to meet the
requirement of debt obligations. Also, they investigate the relationship between
book-tax differences and bonus plan among public firms only. Based on 9,187
firm-years during the period 1981–1996, they regress book-tax differences on
several variables, i.e. debt, tax credit, industry, bonus threshold and size. They
use an indicator variable to separate public and private firms. Their findings
suggest that among income (loss) firms, public firms report larger positive
(negative) book-tax differences than do private firms. They find a stronger
relation between book-tax differences and debt in private firms relative to public
firms. They expect that managers tend to use income-decreasing procedures when
Chapter III Theoretical framework and literature review
125
their bonus plans upper or lower bounds are binding, and income-increasing
procedures when there is no binding for these bonus plans. Their findings support
this expectation. However, the finding is sensitive to the threshold level.
Earnings persistence and book-tax differences
Hanlon (2005) investigates whether earnings persistence varies according to the
scale of book-tax differences. The dataset during the period 1994–2000 is
partitioned to three groups, including small, large positive and large negative
book-tax differences. A priori expectation is that small book-tax difference firm-
years is of higher persistence than large positive and large negative book-tax
difference firm-years. By using a random walk model, indicator variables are
included to estimate the difference between sample groups. Findings suggest that
firm-years with large negative and positive book-tax differences have
considerably less persistent earnings than firm-years with small book-tax
differences. The study also decomposes earnings information to cash flows and
accruals. Results from the regression of earnings on cash flows and accruals
support the prior finding that earnings are of lower persistence for firm-years with
large book-tax differences relative to small book-tax differences. The study
further estimates the market expectation on book-tax difference information. By
using Mishkin methodology, findings suggest that book-tax differences are used
by investors to infer lower persistence in accruals for firm-years with large
positive book-tax differences. The market overestimates the persistence of
accruals attributable to earnings performance for firm-years with large negative
book-tax differences. The study also examines the relationship between abnormal
returns and pre-tax accruals. The relationship between large negative (positive)
book-tax differences and stock returns is significant (insignificant). This finding
supports the result obtained from the Mishkin test that the market perceives
rationally about large positive book-tax differences but irrationally for relative to
large negative book-tax differences.
Chapter III Theoretical framework and literature review
126
Schmidt (2006) investigates the earnings persistence when earnings are
decomposed into earnings excluding tax changes and tax change component.
Earnings excluding tax (ATE) changes refer to pre-tax earnings multiplied by (1 –
effective tax rate). Tax change component (TCC) refers to pre-tax earnings
multiplied by change in effective tax rate. He regresses the one-year-ahead
earnings on ATE and TCC. He finds the positive relation between the future
earnings and TCC, suggesting that tax changes are not transitory. He extends
TCC component by decomposing TCC into the initial tax change (quarter 1)
component of earnings and the revised tax change (quarter 2, 3 and 4) component
of earnings. He finds that the relationship between the one-year-ahead earnings
and the initial tax change is significantly positive. The persistence between the
one-year-ahead earnings and the revised tax change component of earnings
declines as the year progresses. He concludes that tax change information is not
transitory, and the initial and revised tax change has differential persistence and
forecasting implication.
In conclusion, the book-tax difference is a useful means to differentiate the
incentive of the firm. However, the book-tax difference must be interpreted with
caution. Many research studies in the well-developed market employ book-tax
differences to identify accounting quality. However, research studies conducted
in the emerging market have rarely used book-tax differences as the institutional
factor.
3.3.5 Firm Governance and Accounting Quality This section presents a summary from the existing research in terms of firm
governance and accounting quality. It appears that prior research has widely
explored the effect of firm governance systems on accounting quality. Prior
studies have employed various firm governance factors in their analyses, i.e.
ownership structure or audit committee. Most studies find that firm governance
systems play an important role in accounting quality and they cause variation in
accounting quality among firms. The review of literature is presented as follows:
Chapter III Theoretical framework and literature review
127
Value relevance
Corporate governance system
Goncharov et al. (2006) investigate whether the value relevance of accounting
information has improved after changes in corporate governance code in
Germany. The first version of corporate governance code in Germany was
introduced in 2002. It was amended during the period 2002–2006. They measure
the deviation of the recommendations given by the code and the actual
compliance with the code and use the absolute deviation number as a proxy for
the compliance with corporate governance code. Based on 122 observations (61
firms) in 2002 and 2003, they employ the firm valuation model and ERC model
by including the proxy of the corporate governance code to determine the value
relevance. In their study, they correct an endogeneity problem by identifying
factors deriving the compliance with the code. Then they calculate Inverse Mills
ratio and include it in the valuation models. After controlling for the endogeneity
problem, their findings suggest that the market positively values firms according
to the degree of compliance with the corporate governance code.
Board structure
Vafeas (2000) investigates the quality of boards and the quality of firms’ financial
reports. The relation between board structure and the informativeness of earnings
has been debated extensively in the literature. The author predicts that the
relationship between stock returns and earnings positively varies according to a
number of outside directors serving on a firm’s board. However, the decrease in
this relationship is observed when the proportion of outside directors on a firm’s
board increases. In addition, this study expects a negative relation between the
value relevance of information and board size for a firm’s board with a moderate
to large number of members. The study defines that stock returns are a function
of earnings information and different board compositions and structures. Based
on the dataset during the period 1990–1994 of 307 large firms listed on the Forbes
compensation survey, findings report no relation between the value relevance of
earnings information and board compositions. However, the higher value
Chapter III Theoretical framework and literature review
128
relevance of earnings information is observed for firms with smaller size of firms’
board (five members on a board).
Ownership structure
Fan and Wong (2002) investigate whether earnings informativeness varies
according to the ownership structure in East Asia, including Hong Kong,
Indonesia, Malaysia, Singapore, South Korea, Taiwan and Thailand during the
period 1991–1995. For the ownership structure, they employ ultimate owners and
cash flow right associated with the ultimate owner (voting and cash flow right is
set at 50%.). They predict that earnings informativeness declines with an increase
in the degree of divergence between the controlling owner’s voting and cash flow
rights. They regress the cumulative stock return on the earnings information and
the integrated variable between earnings and ownership structure. Their findings
report a negative relation between stock returns and voting rights but a positive
relation between stock returns and cash flow rights, suggesting that the higher
proportion of voting (cash flow) rights deters (improves) earnings
informativeness. The finding supports their prediction.
Jung and Kwon (2002) estimate earnings informativeness and the ownership
structure in Korea. They define the ownership structure as the largest shareholder
(managing ownership), institutional shareholding and block-shareholding. They
employ return-earnings regressions by regressing stock returns on earnings and
the integrated variable between earnings and the ownership variables. Their
findings report a positive relation between stock returns and those three ownership
proxies. The result is robust when including control variables, suggesting that
agency costs decline when managing ownership increases. The institutional
ownership and blockholders induce earnings informativeness.
Timeliness
Ahmed and Duellman (2007) investigate accounting conservatism and board of
director characteristics. For accounting conservatism, they employ firm-specific

Chapter III Theoretical framework and literature review
129
accounting conservatism measures – accumulative book-to-market and
accumulative accruals and earnings asymmetric timeliness. They use five
different board characteristics, including percentage of insiders, the separation of
CEO and chairman on the board, board size, number of additional directorships
held by board members, and outside director ownership. They expect that a
strong board induces accounting conservatism. Thus, the relationship between
insiders in a board and accounting conservatism is predicted to be negative. The
separation of CEO and chairman induces accounting conservatism. The higher
outside director ownership induces more accounting conservatism. However, the
relationship between accounting conservatism and board size is unclear. In
addition, no a priori expectation is set for the relationship between accounting
conservatism and number of directorships. After controlling firm characteristics,
i.e. size, growth and risk, their findings suggest that accounting conservatism
measured by accumulated book-to-market and accumulated accruals is negatively
related with the percentage of inside directors on the board but positively related
with the percentage of a firm’s shares owned by outside directors. Based on
Roychowdhury and Watts (2006) and Basu (1997), they employ 3-year backward
accumulated earnings for the market-based earnings asymmetric timeliness
analysis. Findings support that the higher percentage of insiders on the board
induces lower accounting conservatism whilst the higher percentage of outside
director ownership induces more accounting conservatism.
Beekes et al. (2004) incorporate corporate governance system to determine the
timeliness of earnings in 501 UK firm-years from 1993 to 1995. Based on Basu’s
asymmetric timeliness of earnings information to capture news, they find that
earnings for firms with a large number of outside directors in firms’ board tend to
capture bad news (through negative stock returns) in a more timely manner than
earnings for firms with a small number of outside directors on the board. Their
findings are consistent when replacing a number of outside directors by the
proportion of non-executive directors and including control variables. They
further partition sample firms according to block ownership, managerial
Chapter III Theoretical framework and literature review
130
ownership, duality of Chief Executive Officer (CEO) and auditor type. They find
that non-executive directors induce accounting conservatism with respect to bad
news recognition although there is a presence of large external block-holder.
Accounting conservatism is less likely when managers own a large percentage of
shareholding probably because the conflict of interests between managers and
shareholders is less pronounced. Accounting conservatism is more pronounced
for firms without CEO duality relative to firms with CEO duality. Since big-five
auditors dominate their sample size, by excluding big-five auditees, results remain
unchanged, i.e. that accounting conservatism is more likely for firms with
outsiders on firms’ boards.
Bushman et al. (2004) construct earnings timeliness from an average of three
percentile rank earnings attributes. The three attributes are measured from the
speed of bad news recognition by earnings information (estimated from Basu’s
asymmetric timeliness model), the R2 from Basu’s asymmetric timeliness model,
and the R2 from earning response coefficient model. They regress governance
structures on earnings timeliness and firm characteristics. The governance
structure consists of board structure, equity-based incentives of outside
shareholders, equity-based incentives of inside or outside directors or the
composition of executive compensation plans. They have no a priori prediction
for the relationship between earnings timeliness and board structure because of
the multiple roles the board performs. They expect that at the higher complexity
of firms, earnings timeliness is negatively correlated with equity-based incentives
of outside shareholders, equity-based incentives of inside and outside directors
and executive compensation. Findings support their expectations. They find no
relationship between earnings timeliness and board size and the percentage of
inside directors.
Lara et al. (2007) investigate the effect of board of directors’ characteristics and
earnings timeliness. They construct an aggregate index for board of directors by
using 6-8 different measures, including the proportion of non-executive directors,
Chapter III Theoretical framework and literature review
131
the proportion of independent directors, CEO duality, number of board meetings,
audit committee, a nomination/remuneration committee, executive committee and
board size. A lower value of index reflects a weak governance system, that CEO
has a high influence over firms’ board. Based on 193 Spanish firm-years during
the period 1997–2002, findings suggest that relative to a weak governance system,
a strong governance system induces the ability of earnings to capture bad news on
a timely basis for Spanish firms. They also incorporate a proxy of growth
opportunity measured by the market to book ratio in the regression. Findings
report that earnings timeliness is less likely for high-growth firms with a strong
corporate governance system. They explain that high-growth firms are less likely
to have more stringent governance systems but more likely to have insider-
dominated boards. They also find that earnings timeliness is more likely when
using accrual-based earnings timeliness model, supporting their main analysis.
Others
Byard, Li and Weintrop (2006) examine the association between the quality of
financial information and corporate governance systems. They define the quality
of financial information as the accuracy of analyst’s forecast. The accuracy of
analyst’s forecast is the difference between the actual and forecasted earnings per
share. They hypothesise that the accuracy of analyst’s forecast is more likely in
better-governed firms since analysts can access better quality firm information.
They employ four proxies for the corporate governance system, including the
duality of CEO and the chair of the board, board size, the proportion of
independent directors on a board, and the proportion of independent directors on
the audit committee. They expect that the CEO duality and board size are
negatively related to the analyst’s accuracy but the proportion of independent
directors on the board and the audit committee has a positive relation with
forecast accuracy. They employ 3, 6, 9 and 12 months consensus analyst forecast
of earnings before the earnings announcement date. Based on 3-year data from
2000–2002, their findings support their predictions, suggesting that the quality of
corporate governance system induces the accuracy of earnings forecast by the
Chapter III Theoretical framework and literature review
132
analyst. This implies that corporate governance system influences accounting
information quality.
Other than focusing on the analyst’s forecast, Karamanou and Vafeas (2005)
examine the effect of corporate governance on different aspects of management
earnings forecasts, including the likelihood of a management earnings forecast,
the precision of a management earnings forecast, the accuracy of a management
earnings forecast, a conservatism of a management earnings forecast, and the
market reaction to a management earnings forecast. They employ several
attributes of corporate governance systems for the analysis, including the
proportion of outside directors on a board, board size, board meeting, insider
ownership, institutional ownership, the proportion of audit committee outsiders,
the proportion of audit committee with financial expertise, audit committee size,
audit committee meeting, bad (good) news that the actual earnings for the period
are less (higher) than the consensus forecast, a number of analysts making a
forecast in the year within 30 days before the management earnings forecast, the
standard deviation of all earnings forecasts made in the 90 days before the
management earnings forecast, firm size, industry dummy, and the number of
days from the management earnings forecast date to the end of period for which
the forecast is made. They examine 275 firms in the Fortune 500 survey that
made 1,621 forecasts in 1,274 firm-years during the period 1995–2000. For the
likelihood of a management earnings forecast, they compare corporate governance
systems between firms who issue at least one earnings forecast in the year and
firms who do not. Findings suggest that firms with strong governance systems are
more likely to disclose information to outside parties. For the precision of a
management earnings forecast, they compare between firms who make point
forecast and who give range, open-ended or qualitative forecasts. Findings
suggest that well-governed firms conveying negative news to outside parties are
more likely to make less precision forecasts. For the accuracy of a management
earnings forecast, they employ: 1) the absolute value of the difference between
actual earnings and the management forecast and 2) the sign difference between
Chapter III Theoretical framework and literature review
133
actual earnings and the management forecast. The use of sign difference is to
measure forecast bias. Findings suggest that strong corporate governance systems
are related to forecast accuracy but not forecast bias. The finding also reports
more accuracy when conveying bad news regarding annual earnings, implying
more conservatism. For the market reaction to a management earnings forecast,
they use the 3-day market adjusted return centered around the forecast
announcement date and the change in the consensus analysts forecast from 90
days before and after the management earnings forecast date as dependent
variables. Findings suggest that the market positively reacts to the forecast for
firms with effective corporate governance systems.
Defond, Hann and Hu (2005) investigate the market reaction on the appointment
of financial expertise on audit committees. After the Sarbanes-Oxley Act requires
financial expertise on audit committee, it is of interest to determine whether the
market values this information. Based on the dataset during the period 1993–
2002, they find that the 3-day cumulative abnormal return is 1.3% around the
appointment of financial expertise on audit committee and is 2% around the
appointment of non-financial expertise on audit committee. They further estimate
whether the market reaction on the financial expertise on audit committee depends
on an expert on the committee before the appointment of the new director. They
regress the 3-day cumulative abnormal return on the expert on the committee
before the appointment of the new director. Their findings suggest that before the
appointment of the new director, the market reaction on the expert on audit
committee is not insignificant, suggesting that the positive market reaction on the
appointment of new audit committee with financial expertise does not depend on
the expert on the committee before the appointment of the new director. They
also find that the 3-day cumulative abnormal return significantly relates to strong
corporate governance. Thus, they conclude that this positive market reaction is
more likely to be observed in firms with strong rather than weak corporate
governance systems.
Chapter III Theoretical framework and literature review
134
Lobo and Zhou (2006) also investigate accounting conservatism post-Sarbanes-
Oxley Act. They estimate the conservatism by using discretionary accruals and
earnings asymmetric timeliness. A priori expectation is that more conservatism is
observed post-Sarbanes-Oxley Act. They regress discretionary accruals on
several variables, i.e. size, auditor, cash flows, leverage, changes in income,
outstanding shares and an indicator variable for pre- and post-Act. Based on 4-
year and 2-year balanced panel data before and after the Act, they find that
discretionary accruals decline post-Act. Based on an unbalanced panel dataset,
they incorporate an indicator variable for pre- and post-Act into Basu’s earnings
asymmetric timeliness model, they find that the coefficient estimate for integrated
variable between bad news and the post-Act is positive, suggesting that
conservatism increases post-Act. This study suggests that the corporate
governance system induces earnings timeliness.
Hovey, Li and Naughton (2003) investigate the ownership structure and firm’s
valuation for Chinese firms during the period 1997–1999. They define firm’s
valuation as firm’s performance by using Tobin’s Q. They classify the ownership
structure according to the top five percentage of shareholding, the percentage of
shareholding by the government and the percentage of shareholding by the legal
person. They attempt to discover whether there is an association between firm
performance and ownership structure. Their findings suggest that firm
performance cannot be explained by the ownership structure for Chinese firms.
However, the institution ownership plays an important role in terms of monitoring
regarding to firm performance.
3.4 Chapter Summary This chapter presents the theoretical framework and a review of prior studies.
Several issues are derived from the review of literature. First, it appears that the
literature has been searching for a theory to explain accounting quality. Second,
there is no concrete approach to explain the behaviour of accounting quality.
Next, since the persistence of earnings is unobservable, a random walk model is
Chapter III Theoretical framework and literature review
135
the most common method to search for the persistence. In addition, the value
relevance is widely employed in the literature to investigate the change in
accounting quality after the change in accounting standards. Fifth, it appears that
accounting standards are not the only parameter influencing accounting quality
but that there are other factors, i.e. the firm governance mechanism and the book-
tax difference impact on the quality of accounting information. Sixth, other than
the value relevance analysis, it is rare to find the existing research investigating
earnings persistence and timeliness in the emerging market. Seventh, the research
study conducted in the emerging market has been silent on employing book-tax
difference in investigating accounting quality, especially the timeliness of
earnings. Last, accounting quality is an important topic largely attracting
researchers’ attentions around the world.

Chapter 4
Earnings Persistence
4.1 Introduction
4.2 Hypothesis Development
4.3 Research Methodology
4.4 Data
4.5 Results
4.6 Chapter Summary
Chapter IV Earnings Persistence
137
Chapter 4
Earnings Persistence
4.1 Introduction In this chapter, the first property of earnings to be investigated is the persistence
of earnings. As aforementioned, the persistence of earnings induces a
predictability of earnings. The higher persistence of earnings indicates the higher
quality of earnings, encouraging the ability of current earnings information to
predict future earnings information. Because this analysis is to examine whether
accounting quality has been enhanced after the adoption of IFRS, a priori
expectation is that earnings are more persistent during IFRS post-adoption. The
improvement of earnings persistence during IFRS post-adoption indicates that
earnings are of higher quality. A time-series approach is used for the research
methodology. In addition, this analysis employs longitudinal data. Even though
the longitudinal data suffers from survivorship bias, the obtained result should be
more powerful in terms of the persistence analysis. This chapter is organised as
follows. First, this chapter begins with the development of hypotheses in section
4.2. Research methodology and dataset are presented in section 4.3 and 4.4,
respectively. The main results and robustness checks are presented in section 4.5
the chapter summary is presented in section 4.6.
4.2 Hypothesis Development In this chapter, I define accounting quality as earnings persistence. This is
consistent with a large number of prior studies (i.e. Sloan 1996; Francis et al.
2004; Hanlon 2005). Earnings persistence in this study is a predictability test of
earnings information. Accounting information is a proxy to represent
unobservable underlying economic constructs. Information users demand
economic constructs for their decision making. Maines and Wahlen (2006)
suggest that accounting information relevance stimulates measurement and
reporting reliability. However, they further argue that information reliability is an
essential but not adequate characteristic for the efficient use of applicative
Chapter IV Earnings Persistence
138
information. Because of the different perspective of reliability and relevancy, it is
controversial to differentiate as to whether reliability or relevancy is more
important. Prior studies have extensively evidenced accounting quality in these
two areas (among others, Sloan 1996; Francis and Schipper 1999; Lev and
Zarowin 1999; Francis et al. 2004; Richardson et al. 2005; Schmidt 2006). For
earnings persistence, prior studies find current earnings can explain future
earnings and accruals information is more persistent than cash flow information
(i.e. Sloan 1996; Hanlon 2005). Richardson, Sloan, Soliman and Tuna (2005)
highlight that less reliable accrual estimates result in lower earnings’ persistence.
Schmidt (2006) finds that current pre-tax earnings can explain future earnings.
Barth et al. (2008) argue whether IFRS brings a higher quality of earnings than
domestic accounting standards due to country-specific factors.
This thesis employs earnings persistence to compare accounting quality between
pre- and post-adoption periods based on three reasons. Firstly, the persistence of
earnings is a statistical property of earnings (Dechow, Ge and Schrand 2009).
The persistence of earnings is the study of the prediction ability of earnings
information. The predictability of earnings is an important input for the
estimation of usefulness of accounting information (value relevance), suggesting
that the higher persistence of earnings induces the higher earnings
informativeness. A consequence of earnings persistence is expected to reflect on
firms’ share prices. Earnings can be decomposed to accrual and cash flows.
According to the principle-based accounting system, firms are required to provide
their forecasting information, i.e. growth and future of their business. In addition,
future cash flows must be predicted and performed (i.e. through asset valuations).
The earnings persistence is one method that allows outsiders (i.e. analysts) to
determine this classified forecasting information. For example, Li (2008) finds
that firms with readable financial statements have more persistence in earnings. It
implies that firms with more volatile in accounting information are less likely to
provide useful guidance to users (Dechow et al. 2009). In terms of the Thai
accounting system, the old Thai accounting standard does not require firms to
predict future cash flows. When Thai firms are now required to predict future
Chapter IV Earnings Persistence
139
cash flows according to new accounting starndards, it is more likely to observe the
persistence of earnings reflected on financial statements. The earnings persistence
facilitates the usefulness of accounting incormaiton (value relevance). The
usefulness of accounting information is reflected on share prices, representing
firm economic values. Because the share price is the market’s expectation on
firms’ net cash flows, relative to the accounting information prepared by the old
accounting standard, the accounting information prepared by the new accounting
standards should correspond to more true firm performance that is more useful for
decision making. Secondly, Dechow and Schrand (2004) suggest that the
corporate governance system plays a significant role when the principle-based
accounting system is employed. In terms of the Thai accounting system, when the
new accounting standard is in effective, it will force the corporate governance
mechanism to have more role and involvement in financial statements
preparation. This mechanism, hence, should induce more predictability of
accounting information. Thirdly, ones could contend that the earnings in Thai
firms based on old accounting standards are more persistent because the firms are
not required to forecast future information and they employ historical cost
method. This thesis argues that although Thai firms are not required to provide
expected future cash flows or they employ historical cost method, accounting
information can be less persistent. It is due to the fact that Thai firms can employ
different accounting methods based only on their discretions. For example, they
can use different valuation methods for the same assets without concerning about
the asset’s ability to generate cash flows that represents firm performances or use
different accounting methods to smooth earnings the the smoothed earnings have
low quality (Dechow et al. 2009).
In addition to the above reasons, the persistence of earnings permits researchers to
calculate the long run equilibrium earnings of the firm or the permanent earnings
(Mueller 1990). The persistence estimate signifies the adjustment of excess
earnings to the equilibrium value of earnings. The lower persistence indicates the
faster adjustment whiles the higher persistence indicates the gradually adjustment.
The calculation of earnings is related to the measurement method specified by
Chapter IV Earnings Persistence
140
accounting standards (Dechow et al 2009). Relative to the old accounting
standard, the earnings calculated by the new accounting standard, the IFRS-based
system, are more reliable as claimed by the Thai accounting standard setter.
Therefore, the current earnings calculated by the new accounting standard are
expected to be close to the long run equilibrium earnings comparing with the
current earnings calculated by the old accounting standard. As a result, the
earnings calculated by the new accounting standard relative to the old accounting
standard are of higher persistence, slow adjustment to the equilibrium value.40 I
have a prediction that earnings quality is enhanced after the IFRS adoption in
Thailand. As a result, I propose the first hypothesis, stated in alternative forms:
H.4.1: Earnings are of higher persistence after the adoption of IFRS in
Thailand.
Following Guenther et al. (1997), Mills (1998) and Hanlon (2005), book-tax
differences (BT) reflect the management’s incentive but it is difficult for firms to
increase book income without increasing taxable income or increase tax
deductions without increasing book expenses. This thesis considers that the cross-
section variation in using a tax strategy is lower than the cross-section variation in
managing accruals because tax rules are more restrictive than accounting
standards. Based on Hanlon (2005), earnings are of lower persistence for firms
with large book-tax differences relative to firms with small book-tax differences.
In this study, I trace book-tax differences over 5-years before and 5-years after
adopting the new accounting standards and partition firms to two groups. Group 1
includes firms whose book-tax differences during post-adoption periods are larger
than those during pre-adoption periods (BT – Pre-adoption < BT – Post-adoption).
Group 2 includes firms whose book-tax differences during post-adoption periods
are smaller than those during pre-adoption periods (BT – Pre-adoption > BT –
Post-adoption). I use the two groupings of firms to track overall enhancement of
earnings quality. In addition, the book-tax difference in this analysis is used as a
40 It should be noted that the reliability of earnings information is unobservable and it is considered as a latent variable (Mueller 1990).
Chapter IV Earnings Persistence
141
proxy to differentiate firms’ incentives of using accruals and tax activities. If we
hold tax activity constant, the larger book-tax difference reflects over-reported
earnings, resulting in lower accounting quality. If we hold earnings management
unchanged, the larger book-tax difference reflects high tax planning, resulting in
lower accounting quality (Ayers et al. 2009). On the other hand, if we hold tax
activities constant, the large book-tax difference reflects high earnings
manipulation, resulting in low accounting quality.
Generally speaking, although the sample firms are partitioned according to book-
tax differences, the enhancement of earnings persistence should be observed for
all firms after IFRS adoptions in Thailand. However, there are two potential
explanations about the larger book-tax difference. Firstly, the firm might engage
in aggressive tax activities and use accruals for earnings manipulations.
Secondly, Dechow and Schrand (2004) suggest that corporate governance is
essential when using IFRS, principles-based accounting system. Thus, the
corporate governance for firms in group 1 might be weak and probably unable to
detect the use of accruals for earnings manipulations, especially after IFRS
adoptions. It is possible to anticipate the improvement of earnings persistence for
firms in group 2 because the smaller book-tax difference reflects lower
manipulation in accounting numbers (Hanlon 2005). Therefore, following the
prior study (Hanlon 2005), the expectation is that earnings during pre-adoption
periods are of higher persistence than earnings during post-adoption periods for
firms with larger book-tax differences (group 1), whereas earnings during pre-
adoption periods are of lower persistence than earnings during post-adoption
periods for firms with smaller book-tax differences (group 2). However, this
anticipation must be interpreted with caution because firms could manage their
figures to obtain small book-tax differences. In addition, Hanlon (2005) suggests
that it is not clear that a large book-tax difference indicates low earnings
persistence. I propose the second hypothesis as follows, stated in the alternative
form:
Chapter IV Earnings Persistence
142
H.4.2: When comparing between pre- and post-adoption periods, the
earnings persistence is related to the book-tax difference.
A number of research studies have investigated the association between corporate
governance structure and earnings informativeness. For example, Vafeas (2000)
concludes that earnings-return relation is found in firms with 5-9 board members.
Bushman et al. (2004) conclude that the relationship between earnings timeliness
and ownership concentration, equity benefits to executives and reputation of
outside directors varies inversely. Fan and Wong (2002) examine ownership
structure and earnings informativeness in East Asia and find that low earnings
information value-relevance is found in concentrated ownership. Defond et al.
(2005) investigate the market reaction after appointing new financial experts as
audit committee members and find that the market reacts positively to accounting
financial experts but not to general financial experts. Xie et al. (2003) report that
the characteristics of audit committee and audit committee activity discourage the
management to be involved in earnings management. Chhaochharia and
Grinstein (2007) find a significant impact of new corporate governance rules,
Sarbanes-Oxley Act, on firm values. Gompers, Ishii and Metrick (2003) report
that higher firm value is observed in firms with stronger shareholder rights. Those
studies suggest that corporate governance plays an important role in accounting
information quality. As stated by Dechow and Schrand (2004, pg.114), “Clearly,
the quality of corporate governance and monitoring of financial reporting will
have a significant impact on whether principles-based standards result in higher-
quality earnings.” Building from prior studies, I perform the analysis to determine
whether there is a relationship between accounting quality and the firm
governance system in Thailand. If accounting quality relates to firm governance,
I expect that accounting quality should be varied with the firm governance
system. I, thus, hypothesise in an alternative form as follows:
H.4.3: Earnings persistence varies according to the firm governance
system in Thailand.
Chapter IV Earnings Persistence
143
4.3 Research Methodology Consistent with a large body of prior research,41 a time series analysis is employed
to estimate the persistence of earnings by regressing future period earnings on
current period earnings. The higher magnitude of coefficient estimates represents
higher earnings persistence. Based on prior research, book-tax differences
indicate firms’ earnings persistence variation probably because of discretion in
accruals (Hanlon 2005). The persistence of cash flows and accruals provides
more direct test of earnings persistence in firms with different book-tax gaps.
Following Sloan (1996) and Hanlon (2005), I decompose earnings to cash flow
from operation and accruals. I operationalise the earnings persistence analysis in
the following way:
EBITit+1 = β0 + β1EBITit + εit (4.1)
EBITit+1 = β0 + β2CFit + β3ACCit + εit (4.2)
where EBITit+1 (EBITit) is earnings before interest and tax in year t+1 (year t).
CFit is cash flow from operation in year t and ACCit is accruals in year t.42 All
variables are deflated by the beginning of total assets to improve cross-section
comparabilities. Coefficients of interest include β1, β2 and β3. Higher coefficient
estimates reflect more persistence in earnings. Equation (4.1) restricts the
persistence coefficients on the accrual and cash components of earnings to be
equal whilst equation (4.2) compares earnings persistence when earnings
performance is attributable to the accrual and cash components of earnings (Sloan
1996).43 Following prior studies (Sloan 1996; Hanlon 2005; Schmidt 2006), the
41 Francis et al. (2004) investigate earnings attributes and cost of equity. Freeman et al. (1982) and Kormendi and Lipe (1987) investigate the persistence of earnings by using changes in earnings this year as a function of changes in earnings last year. Foster (1977) estimates a time series of quarterly earnings by defining that current year earnings are a function of previous year earnings in the same quarter. Brown and Han (2000) investigate whether investors appreciate the current and future earnings by using a first order autoregressive process to determine earnings information. 42 ACC = Annual changes in current assets – Annual changes in cash – Annual changes in current
liabilities – Depreciation, and CF = Earnings before interest and tax – ACC 43 This thesis uses the current earnings to estimate one-year future earnings. It is possible to include higher order lags in the eqations. However, those variables have sufficiently small effects

Chapter IV Earnings Persistence
144
regressions are estimated by using OLS regressions. However, bootstrap standard
errors are applied for the statistics inference of coefficients (Athanasakou et al.
2007).44 More details about the variables used in this analysis are explained in
variable definitions.
Firm governance
Firm governance, i.e. company board structure or audit committee,45 may play a
significant role in accounting quality. Generally, agency theory suggests that the
firm’s agent can affect accounting quality. For example, when an agent’s
remunerations and benefits are tied up with accounting numbers, the firm’s agent
is more likely to manage financial reporting. Firm governance should improve
accounting quality and minimise agency costs. The thesis examines the firm
governance system by mainly focusing on executive board structure. First, this
thesis considers that board size (NBO) is one function that is important for firm
governance and firm valuation (e.g. Yermack 1996). I measure board size by a
number of boards of directors. Based on prior studies,46 I do not have a priori
expectation about the relationship between the earnings quality and board size.
Next, I investigate the relationship between board quality (NBB) and audit
committee quality (NB). For board quality, I determine board quality by a
number of boards that directors serve as board of director or audit committee in
other firms. The higher the number of boards that they serve reflects higher board
quality (i.e. reputation). For audit quality, I employ a number of boards that the
audit committee serves as board of directors or audit committee in other firms.
on the estimation process (Mueller 1990 pg.106-107). 44 Some prior studies report the result obtained from OLS pooled-cross section estimation with robust standard error (Sloan 1996; Hanlon 2005). 45 Audit committee (or independent director is used interchangeably) refers to audit committee and independent director throughout this thesis, and non-audit committee (or non-independent director is used interchangeably) refers to board directors except audit committee and independent director. 46 It is problematic to predict the relationship between board size and earnings quality. For example, Ahmed and Duellman (2007) argue that the relationship between accounting conservatism and board size is unclear. Byard et al. (2006) expect board size are negatively related to the analyst’s accuracy. Bushman et al. (2004) find no relationship between earnings timeliness and board size. Vafeas (2000) expects a negative relation between the value relevance of information and board size for a firm’s board with a moderate to large number of members.
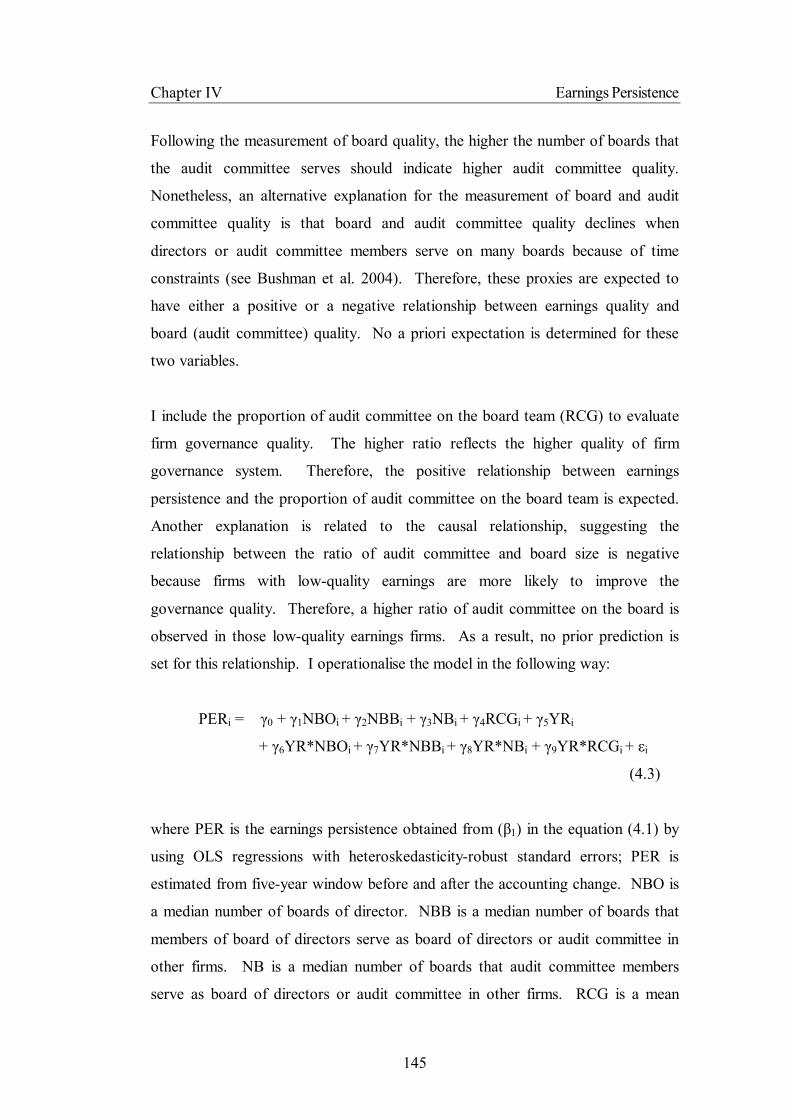
Chapter IV Earnings Persistence
145
Following the measurement of board quality, the higher the number of boards that
the audit committee serves should indicate higher audit committee quality.
Nonetheless, an alternative explanation for the measurement of board and audit
committee quality is that board and audit committee quality declines when
directors or audit committee members serve on many boards because of time
constraints (see Bushman et al. 2004). Therefore, these proxies are expected to
have either a positive or a negative relationship between earnings quality and
board (audit committee) quality. No a priori expectation is determined for these
two variables.
I include the proportion of audit committee on the board team (RCG) to evaluate
firm governance quality. The higher ratio reflects the higher quality of firm
governance system. Therefore, the positive relationship between earnings
persistence and the proportion of audit committee on the board team is expected.
Another explanation is related to the causal relationship, suggesting the
relationship between the ratio of audit committee and board size is negative
because firms with low-quality earnings are more likely to improve the
governance quality. Therefore, a higher ratio of audit committee on the board is
observed in those low-quality earnings firms. As a result, no prior prediction is
set for this relationship. I operationalise the model in the following way:
PERi = γ0 + γ1NBOi + γ2NBBi + γ3NBi + γ4RCGi + γ5YRi
+ γ6YR*NBOi + γ7YR*NBBi + γ8YR*NBi + γ9YR*RCGi + εi
(4.3)
where PER is the earnings persistence obtained from (β1) in the equation (4.1) by
using OLS regressions with heteroskedasticity-robust standard errors; PER is
estimated from five-year window before and after the accounting change. NBO is
a median number of boards of director. NBB is a median number of boards that
members of board of directors serve as board of directors or audit committee in
other firms. NB is a median number of boards that audit committee members
serve as board of directors or audit committee in other firms. RCG is a mean
Chapter IV Earnings Persistence
146
proportion of audit committee members on firms’ boards. YR is an indicator
variable equal to 1 for post-adoption periods (2000–2004), 0 otherwise (1995–
1999). OLS estimators with heteroskedasticity-robust standard errors are applied
to estimate this model.
Variable definitions
Book-tax differences (BT)
This section provides explanations of book-tax differences. In addition, earnings
smoothing measures are calculated to explain descriptive characteristics of the
sample firm. I construct firm portfolios by using the pattern of book-tax
differences. The book-tax difference is defined as the difference between book
income and taxable income. To calculate taxable income, I gross up annual
income tax expenses47 with the actual income tax rate. Annual tax expenses
presented on financial statements are affected by temporary and permanent
differences between accounting principles and tax rules. These may cause
measurement error in tax expenses unless the differences are adjusted to
determine accurate tax expenses in each year (Lev and Nissim 2004). In this
thesis, I do not separate the timing difference in firms’ portfolios because of
limitations of tax data reported in Thai financial statements.48 In addition, I use
annual income tax expenses rather than actual income tax paid by cash. However,
prior studies find that actual income tax expenses do not change the results
obtained from annual income tax expenses (Lev and Nissim 2004). Book-tax
differences I use in this thesis are, therefore, not exhaustive. In this study, book-
tax differences are not exhaustive proxy to determine firms’ incentives whether
they have used new accounting standards for preparing financial statements in
Thai settings. Book income and taxable income are subject to the management’s
discretion and tax management, resulting in the magnitude of book-tax
differences. Whether book-tax differences are large or small, book-tax
47 Lev and Nissim (2004) set missing values of investment tax credit as zero. Hanlon (2005) uses total deferred taxes to replace the missing values of federal and foreign deferred tax expenses. In this thesis, to construct the balanced panel dataset, missing values of annual income tax expenses were set to zero. 48 In addition, IAS12 Accounting for Income Tax is not currently adopted in Thailand.
Chapter IV Earnings Persistence
147
differences of the two groups of firms can be driven by discrete reporting earnings
or aggressive tax management. In addition, IFRS, the principles-based accounting
standard, has a twofold purpose; the management uses accruals to increase or
decrease earnings quality (Dechow and Schrand 2004, pg.114). Hanlon (2005)
suggests that the negative (especially large negative) book-tax difference contains
information about earnings persistence. This study uses the average book-tax
difference that this method should mitigate the potential problem arisen from
negative book-tax differences.
In this study, book-tax differences are calculated by the difference between
earnings before interest and tax (EBIT) and taxable income.49 Taxable income is
calculated by dividing income tax expense by the percent of tax rate (the gross-up
method) (Lev and Nissim 2004). For the company tax rate in Thailand, all firms
doing business in Thailand are subject to pay tax at a flat rate – 30 per cent of
taxable income. Special income tax rates are established for listed firms in the
stock exchange to attract firms to raise business funds from the capital market in
Thailand. New firms entering the stock exchange during the period 2001–2005
are subject to pay company income tax at 25 per cent of taxable income for five
consecutive years, beginning from the year of its being listed on the stock
exchange. For example, the firms that entered to the stock exchange in 2001
(2005) are subject to pay tax at 25 per cent of taxable income from 2001–2005
(2005–2009) and a 30 per cent tax rate will be applied from 2006 (2010). For the
existing firms which have traded their shares on the stock exchange before 2001,
taxable income is separated into two parts. The first part of taxable income – 200
million Thai Baht (~ USD 6.30 million) – is subject to 25 per cent tax rate and the
amount greater than 200 million Thai Baht is subject to 30 per cent tax rate. This
rule is applied for the period 2001–2005. The firm that has branches in foreign
countries must include income generated from those countries for income tax
49 The calculation of book-tax difference is based on company financial statements because taxable income for Thai firms is calculated from company financial statements. This calculation method should obtain more precise book-tax differences and, in turn, reduce some measurement error.
Chapter IV Earnings Persistence
148
t=1
5
calculation in Thailand whether or not the firm has to pay tax to those foreign
countries.
I calculate book-tax differences for the firm portfolios in the main analysis as
follows:
Annual taxable income = Annual income tax expenses/Tax rate (4.4)
(Earnings before interest and tax – Annual taxable income)
5 (4.5)
where BTi is book-tax differences for firm i and t is 1995–1999 and 2000–2004.
This thesis uses the difference between book income and taxable income as a
proxy for firm incentives. In terms of earnings persistence, the large difference
between book income and taxable income suggests that the earnings persistence
tends to be low whilst the small difference between book income and taxable
income suggests that the earnings persistence tends to be high. It is due to the fact
that if firms are more likely to use tax rules to calculate earnings, the difference
between book income and taxable income is likely to be small. The tax rules are
more restricted than GAAP, leading to the small variation in earnings calculation
methods. Therefore, the high persistence of earnings is expected for firms with
small book-tax differences. Nevertheless, the difference between book income
and taxable income can be either positive or negative differences. The large
positive and large negative book-tax difference should indicate the low
persistence. Hence, ones could argue that the absolute value of book-tax
difference should be applied. Nonetheless, this thesis argues that the negative
book-tax difference firm includes firms with negative earnings. Li (2008) reports
that the earnings persistence of firms with negative earnings tends to be lower
than the earnings persistence of firms with positive earnings. Thus, if the absolute
value of book-tax differences is applied, it probably causes a potential problem
about information loss. In addition to the information loss, the book income and
Σ BTi =

Chapter IV Earnings Persistence
149
taxable income in Thailand are calculated by the accrual basis. The value of
accrual tends to be reversed in the next period of time. This thesis uses a balanced
panel dataset. For example, for firm A, this thesis calculates the average book
income and taxable income over five years time. This should reflect the
reversion of accrual values. If the absolute value of book-tax differences is
applied, it probably cause a potential problem about the book income and taxable
income are overvalued. The other reason is that based on accounting
conservatism, equity value distribution is likely to be going downward or decline.
If a firm has tried to manage to increase equity value, resulting in the increasing
earnings each year. By using the average book income over many years should
help to deal with this issue. For taxable income, the prior literature suggests that
tax strategies will be effective when firms exercise tax strategies over several
years. Thus, if firms have very aggressive tax activities, taxable income is more
likely to be decline over time. By using the average taxable income over many
years should help to deal with this issue. If using the absolute value of book-tax
difference, the sign is lost and the book-tax difference may be overvalued.
Earnings smoothing measures (EM)
Earnings smoothing measures are to determine whether insiders manage (smooth)
their report earnings. The smoothing of reported earnings does not represent the
firms’ underlying economic performance. On the other hand, it is argued that the
lower variation of earnings does improve the predictability of earnings. I
calculate earnings smoothing measures to obtain more insightful descriptive
information about firms’ characteristics. Following Leuz, Nanda and Wysocki
(2003), I calculate two earnings smoothing measures of the firm. EM1 is a
median ratio of the firm-level standard deviation of earnings divided by the firm-
level standard deviation of cash flows. The lower standard deviation of earnings
indicates the higher degree to which insiders smooth reported earnings by
reducing the variability of reported earnings by accounting methods. Leuz et al.
(2003) suggest that the ratio is divided by cash flows from operations to mitigate
the difference in the variability of economic performance across firms. EM2 is
the Spearman correlation between changes in accruals and changes in operating
Chapter IV Earnings Persistence
150
cash flows. Firms are able to either delay to report current performance or
accelerate the reporting of future revenues because of the accrual accounting
mechanism. The large magnitude of the correlation indicates the smoothing of
reported earnings.
4.4 Data The initial sample population chosen is based on all non-financial firms with a
31st December financial year-end. They are listed on SET from 1995 to 2004.
According to SET, I categorise sample firms into seven industries: agro-business,
consumer products, industrial, property and construction, natural resources,
services and technology. I use two databases provided by SET to construct
datasets. Share prices and financial data from 1994 to 1996 are obtained from
Integrated-SET Information Management System (I-SIMS) CD-ROMs while the
data from 1997 to 2005 are collected from SETSMART (SET Market Analysis
and Reporting Tool).
I use longitudinal data, over a 10-year period from 1995 to 2004. I gather a
constant sample of firms that have financial data available from 1994 to 2005.
Those sample firms have to govern themselves to respond to accounting changes;
this raises a survivorship problem. Even though the analysis of constant sample
firms suffers a survivorship bias, reasons for using the constant sample of firms
over a ten-year period are that: i) this allows the control of a firm’s characteristics
in a similar range, i.e. operating cycle, reputation, performance (i.e. they should
reach economies of scale) or firm size, ii) some firms entered the capital market
after the accounting reform period, especially IPOs. These firms are more likely
to meet the market demands of reporting high quality financial data (Ball and
Shivakumar 2008). This attrition may induce biased results, iii) the change in
firms’ incentives can influence accounting quality (Barth et al. 2008). The use of
constant samples possibly reduces the level of firms’ incentives problems to the
same range. For example, the constant sample firm has to maintain its
performances to meet the stock listing rules, iv) survivorship problem may induce
Chapter IV Earnings Persistence
151
upward bias. Specifically, survival firms organise themselves to catch up with
new accounting rules, i.e. generating transactions to meet the requirement of
accounting principles and v) the use of constant sample firm is representing the
dynamic change in accounting quality during the sampling period. In this study, I
focus on Thailand’s accounting system rather than comparing with firms in other
countries. This tends to minimise the variation of economic environment and
accounting regime that may influence the result (Ball and Shivakumar 2008).
To compare the accounting information quality before and after the adoption of
IFRS, I partition the data set according to time scales, 1995–1999 (pre-adoption)
and 2000–2004 (post-adoption). In subsamples, I divide the dataset by the
magnitude of accumulated book-tax differences. I split and compare accumulated
book-tax differences by their mean of 5-years before and 5-years after the
accounting change. Dyreng et al. (2008) suggest that tax avoidance is observed in
firms that have a low effective tax rate over many years. The average of multiple-
year book-tax differences should reflect tax activity. In firm portfolios, group 1
includes firms with larger magnitude of book-tax differences during post-adoption
periods (BT-Pre < BT-Post). Group 2 includes firms with a smaller magnitude of
book-tax differences during post-adoption periods (BT-Pre > BT-Post).
4.5 Results The pattern of book-tax differences
Figures 4.1–4.3 illustrate the pattern of book-tax differences during the period
1992–2007. According to SET, listed firms are grouped into seven industries,
including agro-business, consumer products, industrial, natural resources,
services, technology and financial sector. After the 1997-financial crisis in
Thailand, listed firms with very weak performances are transferred and supervised
under the rehabilitation programme. Thus, during the financial crisis, there is
another group: rehabilitation. Firms’ shares in the rehabilitation programme are
not traded until they are removed from the programme. Figure 4.1 shows the
book-tax difference for all firm-years whilst Figure 4.2 depicts the book-tax
Chapter IV Earnings Persistence
152
difference when the firms in the rehabilitation programme are excluded; the
number of firms each year are shown in parentheses.50 These graphs have rather
identical trends. During the financial crisis, book income is much lower than
taxable income as the book-tax difference becomes negative. After 2000, the
book-tax difference bounces back to positive and has an increasing trend until
2007. Kruskal-Wallis test is used to compare the book-tax difference over 16
years. It suggests that the book-tax difference in each year is statistically
significantly different. When partitioning the book-tax difference to pre- (1992–
1999) and post-IFRS adoption (2000–2007), Wilcoxon rank-sum test suggests that
the book-tax difference between the two periods is statistically significantly
different.
Because of the special and complex characteristics of firms in the financial sector,
Figure 4.3 depicts the pattern of book-tax differences for non-financial firms with
December year-ended (and excluding the firm in the rehabilitation programme).
The graph informs that the book-tax difference is positive on average and has an
increasing trend from 1993 to 2007. The book-tax difference in each year is
statistically significantly different over 16 years according to Kruskal-Wallis test.
In addition, Wilcoxon rank-sum test suggests that the book-tax difference between
pre- (1992–1999) and post-adoption periods (2000–2007) is not significantly
different. However, the graph shows an increasing trend of book-tax differences
during the 16-year period.
Based on Figure 4.3, one potential explanation about the increasing trend of book-
tax differences is that new accounting standards as direct tools for book income
calculations play an important role in inducing larger book-tax differences. If this
is the case, Thailand is likely to transfer from a tax-based accounting income to a
GAAP-based accounting income system.51
50 It should be noted that firms with missing values of taxable income are dropped for the calculation of book-tax differences presented on these graphs. For the graphs, a number of observations are quite small during 1997–2004. 51 Appendix 2 presents the graph of book-tax differences for each industry.
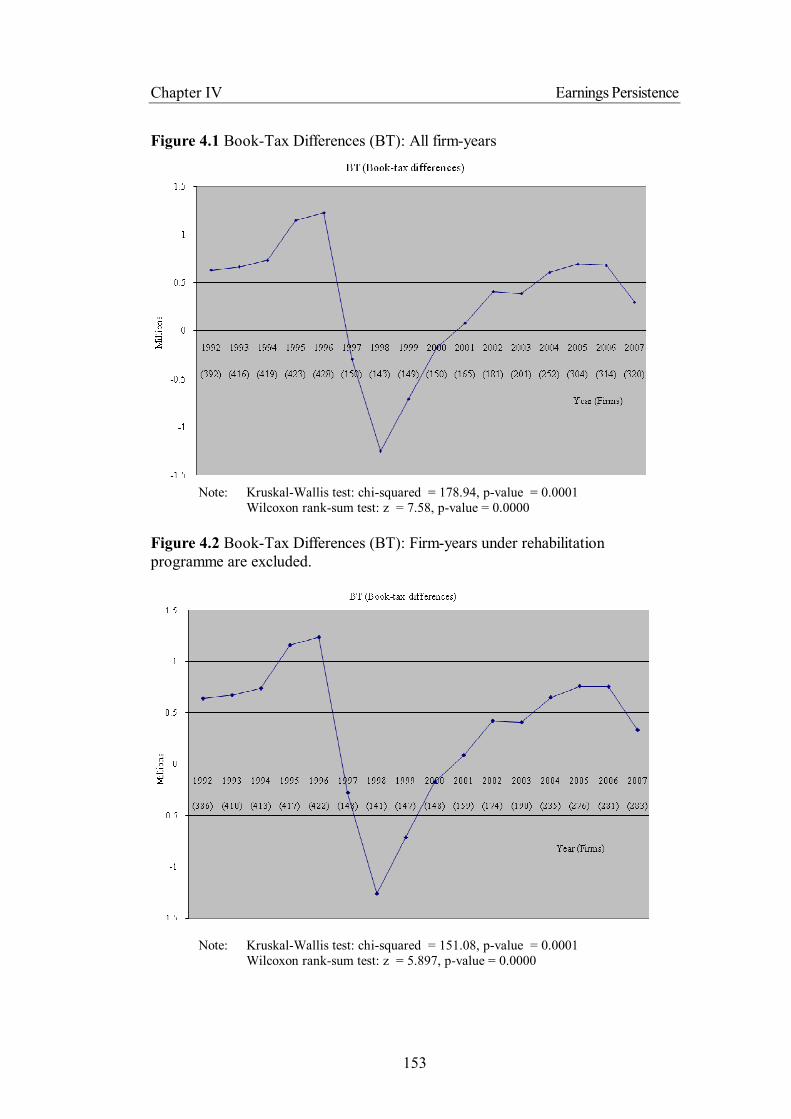
Chapter IV Earnings Persistence
153
Figure 4.1 Book-Tax Differences (BT): All firm-years
Note: Kruskal-Wallis test: chi-squared = 178.94, p-value = 0.0001 Wilcoxon rank-sum test: z = 7.58, p-value = 0.0000
Figure 4.2 Book-Tax Differences (BT): Firm-years under rehabilitation programme are excluded.
Note: Kruskal-Wallis test: chi-squared = 151.08, p-value = 0.0001
Wilcoxon rank-sum test: z = 5.897, p-value = 0.0000
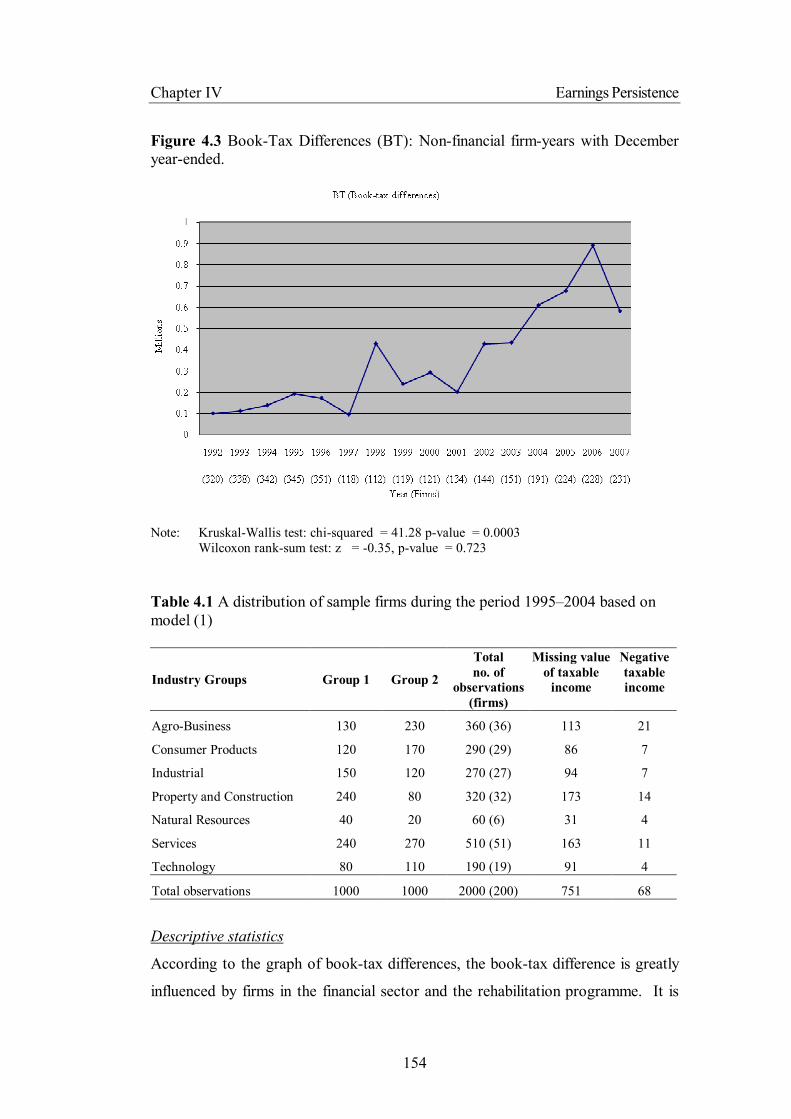
Chapter IV Earnings Persistence
154
Figure 4.3 Book-Tax Differences (BT): Non-financial firm-years with December year-ended.
Note: Kruskal-Wallis test: chi-squared = 41.28 p-value = 0.0003
Wilcoxon rank-sum test: z = -0.35, p-value = 0.723 Table 4.1 A distribution of sample firms during the period 1995–2004 based on model (1)
Industry Groups Group 1 Group 2
Total no. of
observations (firms)
Missing value of taxable
income
Negative taxable income
Agro-Business 130 230 360 (36) 113 21
Consumer Products 120 170 290 (29) 86 7
Industrial 150 120 270 (27) 94 7
Property and Construction 240 80 320 (32) 173 14
Natural Resources 40 20 60 (6) 31 4
Services 240 270 510 (51) 163 11
Technology 80 110 190 (19) 91 4
Total observations 1000 1000 2000 (200) 751 68
Descriptive statistics
According to the graph of book-tax differences, the book-tax difference is greatly
influenced by firms in the financial sector and the rehabilitation programme. It is
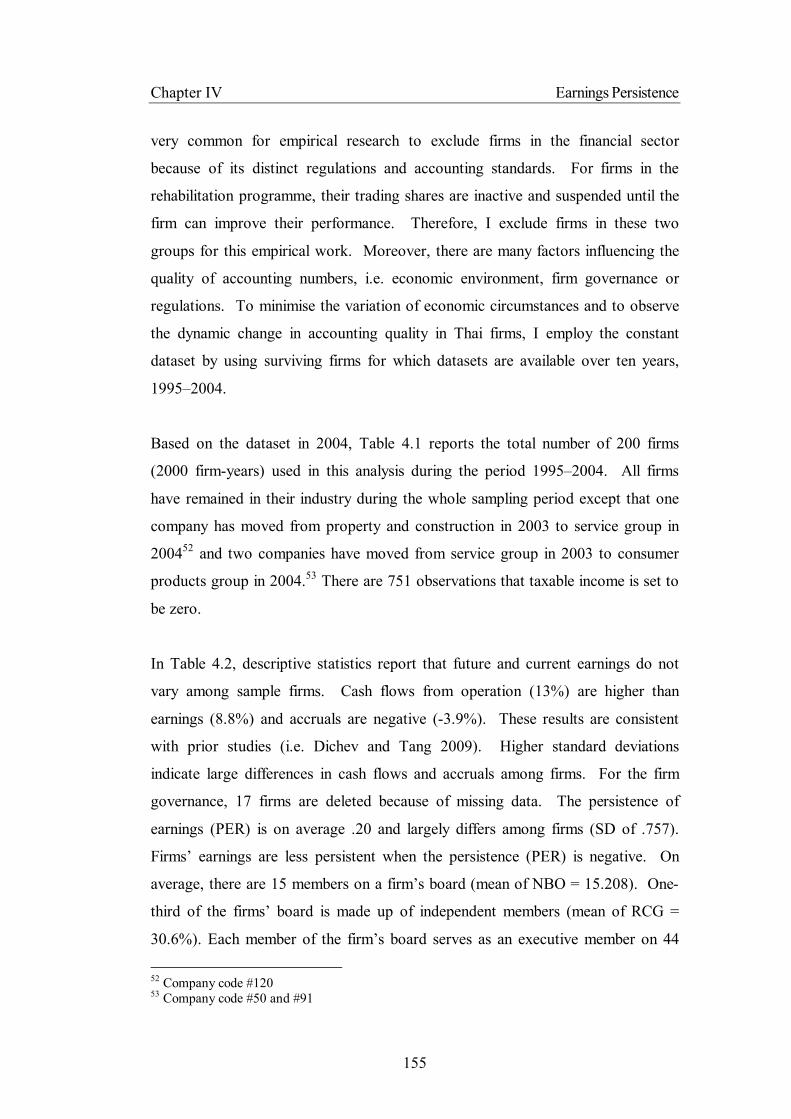
Chapter IV Earnings Persistence
155
very common for empirical research to exclude firms in the financial sector
because of its distinct regulations and accounting standards. For firms in the
rehabilitation programme, their trading shares are inactive and suspended until the
firm can improve their performance. Therefore, I exclude firms in these two
groups for this empirical work. Moreover, there are many factors influencing the
quality of accounting numbers, i.e. economic environment, firm governance or
regulations. To minimise the variation of economic circumstances and to observe
the dynamic change in accounting quality in Thai firms, I employ the constant
dataset by using surviving firms for which datasets are available over ten years,
1995–2004.
Based on the dataset in 2004, Table 4.1 reports the total number of 200 firms
(2000 firm-years) used in this analysis during the period 1995–2004. All firms
have remained in their industry during the whole sampling period except that one
company has moved from property and construction in 2003 to service group in
200452 and two companies have moved from service group in 2003 to consumer
products group in 2004.53 There are 751 observations that taxable income is set to
be zero.
In Table 4.2, descriptive statistics report that future and current earnings do not
vary among sample firms. Cash flows from operation (13%) are higher than
earnings (8.8%) and accruals are negative (-3.9%). These results are consistent
with prior studies (i.e. Dichev and Tang 2009). Higher standard deviations
indicate large differences in cash flows and accruals among firms. For the firm
governance, 17 firms are deleted because of missing data. The persistence of
earnings (PER) is on average .20 and largely differs among firms (SD of .757).
Firms’ earnings are less persistent when the persistence (PER) is negative. On
average, there are 15 members on a firm’s board (mean of NBO = 15.208). One-
third of the firms’ board is made up of independent members (mean of RCG =
30.6%). Each member of the firm’s board serves as an executive member on 44
52 Company code #120 53 Company code #50 and #91

Chapter IV Earnings Persistence
156
boards in the same year (mean of NBB = 44.39). In addition, each independent
member serves as an executive director on 16 boards in the same year (mean of
NB = 16.82%).
Table 4.2 Descriptive statistics Mean Median SD 25th Percentile 75th Percentile N
EBITit+1 0.072 0.079 0.117 0.029 0.125 2000
EBITit 0.088 0.088 0.107 0.033 0.141 2000
CFit 0.130 0.128 0.185 0.050 0.212 1050
ACCit -0.039 -0.045 0.169 -0.113 0.027 1050
PER 0.204 0.167 0.757 -0.215 0.678 360
NBO 15.208 14 4.870 12 18 360
NBB 44.393 39 26.659 24 59 360
NB 16.817 13 14.349 6 22 360
RCG 0.306 0.296 0.116 0.214 0.379 360
ROA 0.031 0.037 0.075 -0.007 0.078 360
MKT1 52.2 88.8 171 35 303 360 EBITit+1 (EBITit) is earnings before interest and tax year t+1 (t) scaled by the beginning of total assets; CFit is cash flow from operation in year t deflated by the beginning of total asset; ACCit is the accrual in year t deflated by the beginning of total asset; PER is persistence coefficient (β1) obtained from the equation: EBITit = β0 + β1EBITit-1 + εit by rolling five–year window estimations; NBO is number of boards of director; NBB is number of boards that members of board of directors serve as board of directors or audit committee in other firms; NB is number of boards that audit committee members serve as board of directors or audit committee in other firms; MKT1 (00’000’000) is market capitalization. RCG is proportion of audit committee members in board of directors and ROA is return on assets. SD is standard deviation. N is number of observations.
I further perform comparison tests between the two groups of firms to obtain
overall characteristics of the sample firms. As presented in Table 4.3, when
considering the standard t-test together with Wilcoxon rank-sum test, in Panel A,
at the conventional significant level (<5%), t-statistics report that the firms in both
groups are not substantially different on average in terms of earnings (EBIT),
performance (measured by ROA and ROE) and leverage. But, firm size
(measured by TA) for group 1 is larger than firm size for group 2. The rank-sum
test suggests that both groups are not different in accruals and ROE.
In Panel B of Table 4.3, the persistence variable (PER) is significantly different
between two groups; on average firms in group 1 have higher persistence
coefficients than firms in group 2. These two groups are also different in terms of
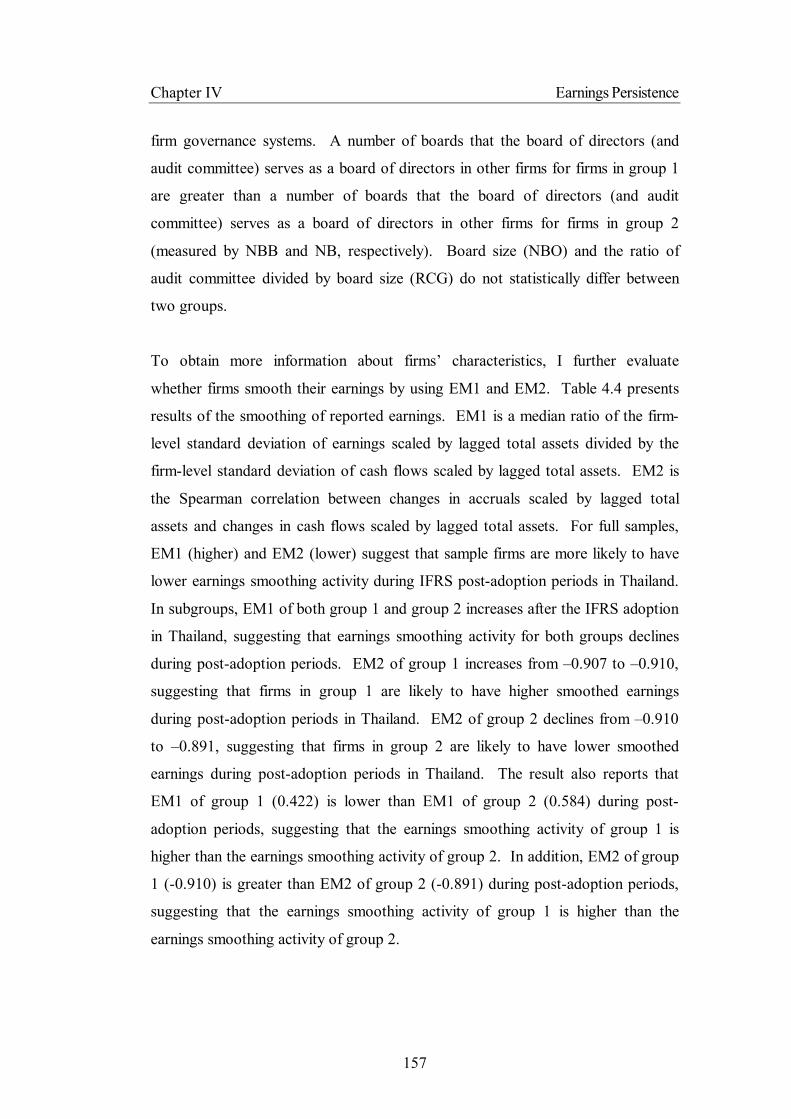
Chapter IV Earnings Persistence
157
firm governance systems. A number of boards that the board of directors (and
audit committee) serves as a board of directors in other firms for firms in group 1
are greater than a number of boards that the board of directors (and audit
committee) serves as a board of directors in other firms for firms in group 2
(measured by NBB and NB, respectively). Board size (NBO) and the ratio of
audit committee divided by board size (RCG) do not statistically differ between
two groups.
To obtain more information about firms’ characteristics, I further evaluate
whether firms smooth their earnings by using EM1 and EM2. Table 4.4 presents
results of the smoothing of reported earnings. EM1 is a median ratio of the firm-
level standard deviation of earnings scaled by lagged total assets divided by the
firm-level standard deviation of cash flows scaled by lagged total assets. EM2 is
the Spearman correlation between changes in accruals scaled by lagged total
assets and changes in cash flows scaled by lagged total assets. For full samples,
EM1 (higher) and EM2 (lower) suggest that sample firms are more likely to have
lower earnings smoothing activity during IFRS post-adoption periods in Thailand.
In subgroups, EM1 of both group 1 and group 2 increases after the IFRS adoption
in Thailand, suggesting that earnings smoothing activity for both groups declines
during post-adoption periods. EM2 of group 1 increases from –0.907 to –0.910,
suggesting that firms in group 1 are likely to have higher smoothed earnings
during post-adoption periods in Thailand. EM2 of group 2 declines from –0.910
to –0.891, suggesting that firms in group 2 are likely to have lower smoothed
earnings during post-adoption periods in Thailand. The result also reports that
EM1 of group 1 (0.422) is lower than EM1 of group 2 (0.584) during post-
adoption periods, suggesting that the earnings smoothing activity of group 1 is
higher than the earnings smoothing activity of group 2. In addition, EM2 of group
1 (-0.910) is greater than EM2 of group 2 (-0.891) during post-adoption periods,
suggesting that the earnings smoothing activity of group 1 is higher than the
earnings smoothing activity of group 2.
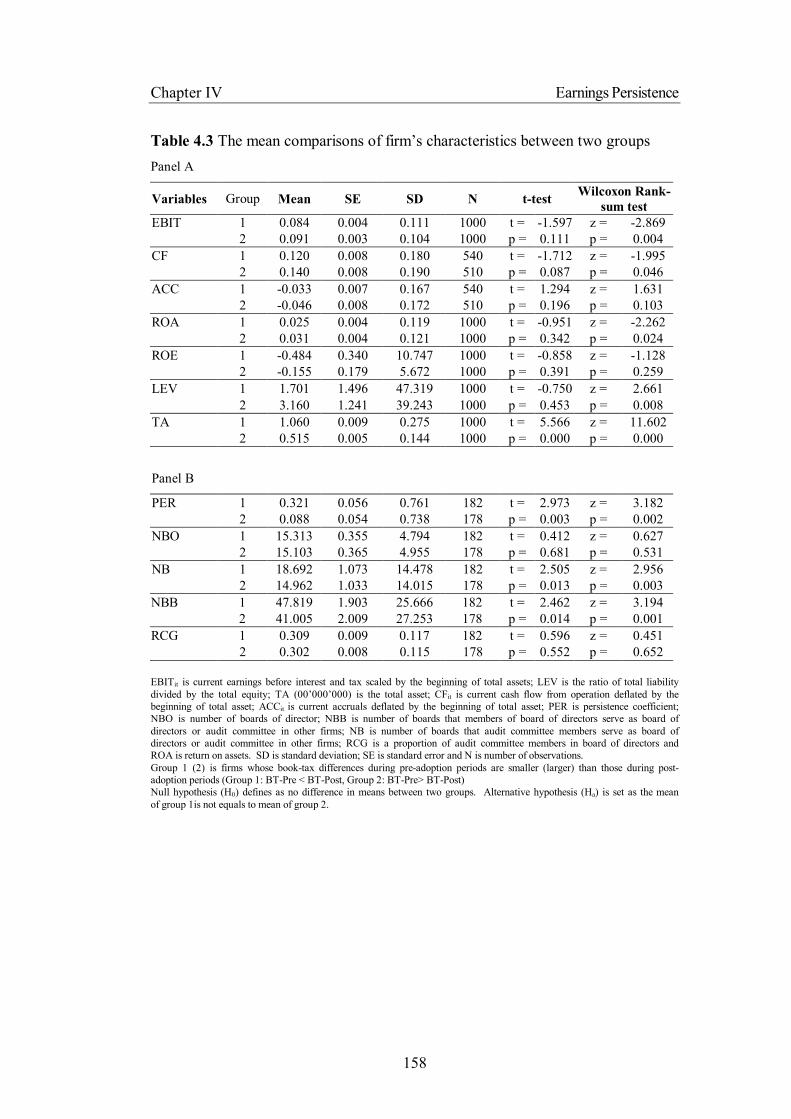
Chapter IV Earnings Persistence
158
Table 4.3 The mean comparisons of firm’s characteristics between two groups Panel A
Variables Group Mean SE SD N t-test Wilcoxon Rank- sum test
EBIT 1 0.084 0.004 0.111 1000 t = -1.597 z = -2.869 2 0.091 0.003 0.104 1000 p = 0.111 p = 0.004 CF 1 0.120 0.008 0.180 540 t = -1.712 z = -1.995 2 0.140 0.008 0.190 510 p = 0.087 p = 0.046 ACC 1 -0.033 0.007 0.167 540 t = 1.294 z = 1.631 2 -0.046 0.008 0.172 510 p = 0.196 p = 0.103 ROA 1 0.025 0.004 0.119 1000 t = -0.951 z = -2.262 2 0.031 0.004 0.121 1000 p = 0.342 p = 0.024 ROE 1 -0.484 0.340 10.747 1000 t = -0.858 z = -1.128 2 -0.155 0.179 5.672 1000 p = 0.391 p = 0.259 LEV 1 1.701 1.496 47.319 1000 t = -0.750 z = 2.661 2 3.160 1.241 39.243 1000 p = 0.453 p = 0.008 TA 1 1.060 0.009 0.275 1000 t = 5.566 z = 11.602 2 0.515 0.005 0.144 1000 p = 0.000 p = 0.000
Panel B
PER 1 0.321 0.056 0.761 182 t = 2.973 z = 3.182 2 0.088 0.054 0.738 178 p = 0.003 p = 0.002 NBO 1 15.313 0.355 4.794 182 t = 0.412 z = 0.627 2 15.103 0.365 4.955 178 p = 0.681 p = 0.531 NB 1 18.692 1.073 14.478 182 t = 2.505 z = 2.956 2 14.962 1.033 14.015 178 p = 0.013 p = 0.003 NBB 1 47.819 1.903 25.666 182 t = 2.462 z = 3.194 2 41.005 2.009 27.253 178 p = 0.014 p = 0.001 RCG 1 0.309 0.009 0.117 182 t = 0.596 z = 0.451 2 0.302 0.008 0.115 178 p = 0.552 p = 0.652 EBITit is current earnings before interest and tax scaled by the beginning of total assets; LEV is the ratio of total liability divided by the total equity; TA (00’000’000) is the total asset; CFit is current cash flow from operation deflated by the beginning of total asset; ACCit is current accruals deflated by the beginning of total asset; PER is persistence coefficient; NBO is number of boards of director; NBB is number of boards that members of board of directors serve as board of directors or audit committee in other firms; NB is number of boards that audit committee members serve as board of directors or audit committee in other firms; RCG is a proportion of audit committee members in board of directors and ROA is return on assets. SD is standard deviation; SE is standard error and N is number of observations. Group 1 (2) is firms whose book-tax differences during pre-adoption periods are smaller (larger) than those during post-adoption periods (Group 1: BT-Pre < BT-Post, Group 2: BT-Pre> BT-Post) Null hypothesis (H0) defines as no difference in means between two groups. Alternative hypothesis (Ha) is set as the mean of group 1is not equals to mean of group 2.
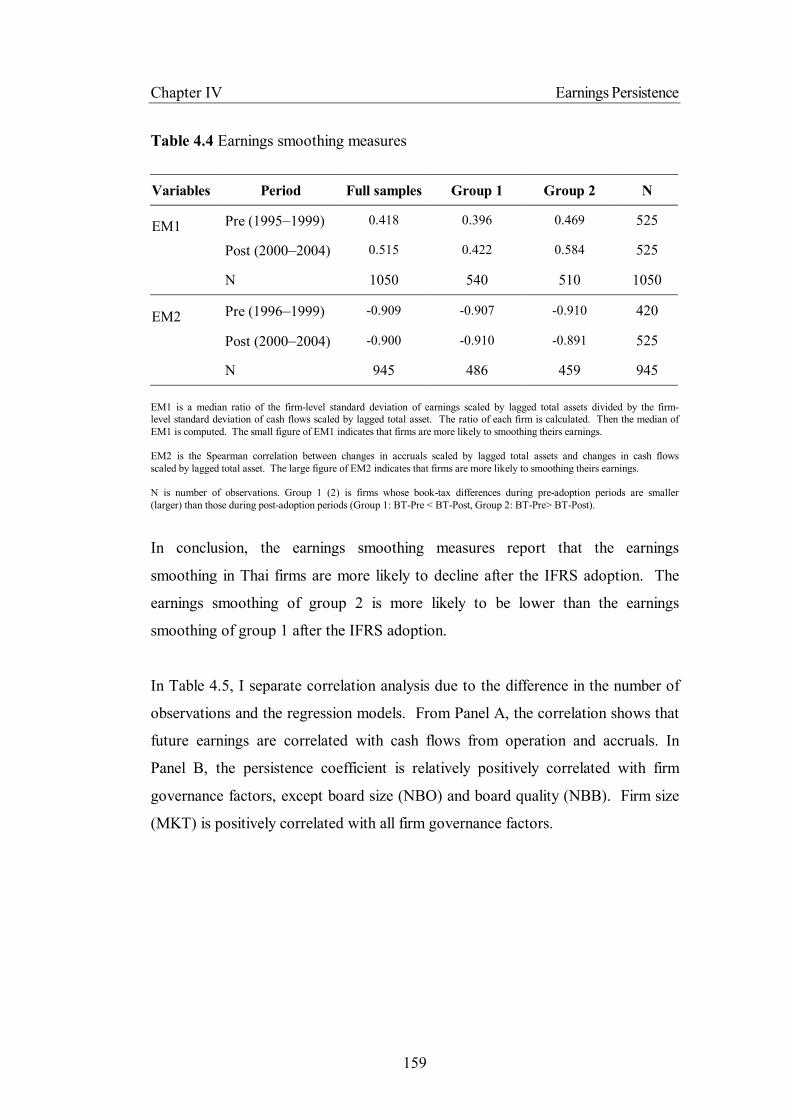
Chapter IV Earnings Persistence
159
Table 4.4 Earnings smoothing measures
Variables Period Full samples Group 1 Group 2 N
EM1 Pre (1995–1999) 0.418 0.396 0.469 525
Post (2000–2004) 0.515 0.422 0.584 525
N 1050 540 510 1050
EM2 Pre (1996–1999) -0.909 -0.907 -0.910 420
Post (2000–2004) -0.900 -0.910 -0.891 525
N 945 486 459 945 EM1 is a median ratio of the firm-level standard deviation of earnings scaled by lagged total assets divided by the firm-level standard deviation of cash flows scaled by lagged total asset. The ratio of each firm is calculated. Then the median of EM1 is computed. The small figure of EM1 indicates that firms are more likely to smoothing theirs earnings. EM2 is the Spearman correlation between changes in accruals scaled by lagged total assets and changes in cash flows scaled by lagged total asset. The large figure of EM2 indicates that firms are more likely to smoothing theirs earnings. N is number of observations. Group 1 (2) is firms whose book-tax differences during pre-adoption periods are smaller (larger) than those during post-adoption periods (Group 1: BT-Pre < BT-Post, Group 2: BT-Pre> BT-Post).
In conclusion, the earnings smoothing measures report that the earnings
smoothing in Thai firms are more likely to decline after the IFRS adoption. The
earnings smoothing of group 2 is more likely to be lower than the earnings
smoothing of group 1 after the IFRS adoption.
In Table 4.5, I separate correlation analysis due to the difference in the number of
observations and the regression models. From Panel A, the correlation shows that
future earnings are correlated with cash flows from operation and accruals. In
Panel B, the persistence coefficient is relatively positively correlated with firm
governance factors, except board size (NBO) and board quality (NBB). Firm size
(MKT) is positively correlated with all firm governance factors.
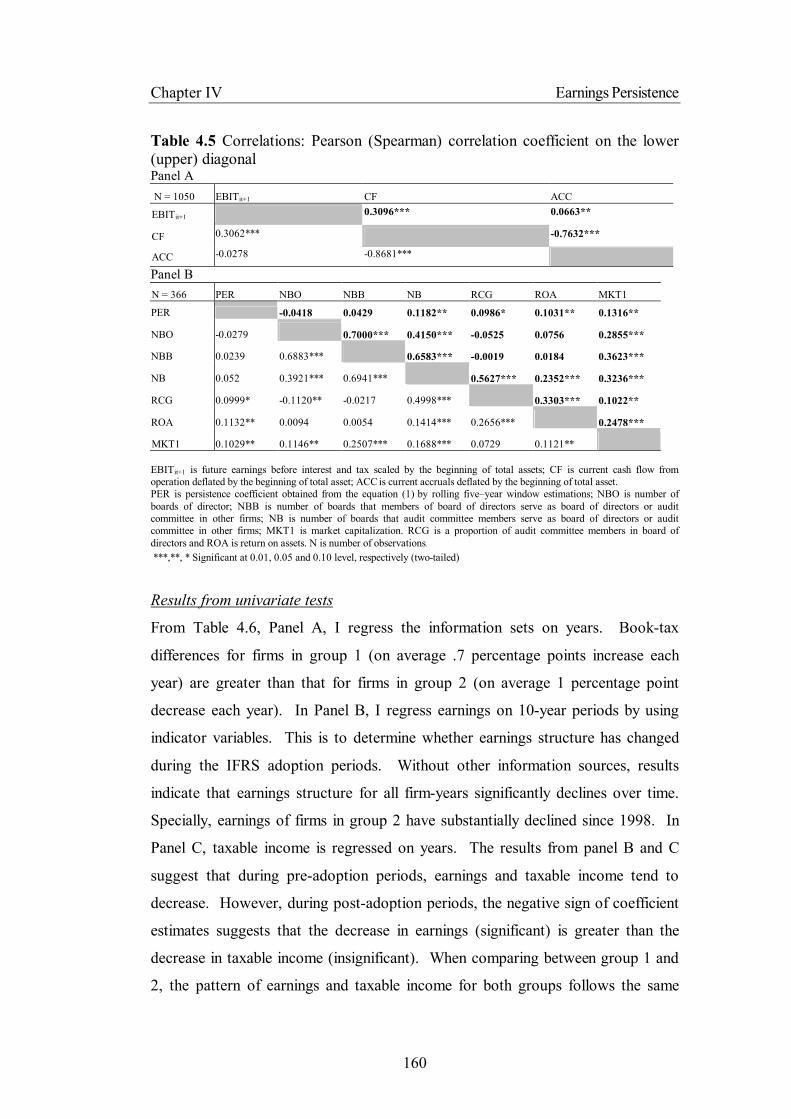
Chapter IV Earnings Persistence
160
Table 4.5 Correlations: Pearson (Spearman) correlation coefficient on the lower (upper) diagonal Panel A N = 1050 EBITit+1 CF ACC
EBITit+1 0.3096*** 0.0663**
CF 0.3062*** -0.7632***
ACC -0.0278 -0.8681***
Panel B N = 366 PER NBO NBB NB RCG ROA MKT1
PER -0.0418 0.0429 0.1182** 0.0986* 0.1031** 0.1316**
NBO -0.0279 0.7000*** 0.4150*** -0.0525 0.0756 0.2855***
NBB 0.0239 0.6883*** 0.6583*** -0.0019 0.0184 0.3623***
NB 0.052 0.3921*** 0.6941*** 0.5627*** 0.2352*** 0.3236***
RCG 0.0999* -0.1120** -0.0217 0.4998*** 0.3303*** 0.1022**
ROA 0.1132** 0.0094 0.0054 0.1414*** 0.2656*** 0.2478***
MKT1 0.1029** 0.1146** 0.2507*** 0.1688*** 0.0729 0.1121** EBITit+1 is future earnings before interest and tax scaled by the beginning of total assets; CF is current cash flow from operation deflated by the beginning of total asset; ACC is current accruals deflated by the beginning of total asset. PER is persistence coefficient obtained from the equation (1) by rolling five–year window estimations; NBO is number of boards of director; NBB is number of boards that members of board of directors serve as board of directors or audit committee in other firms; NB is number of boards that audit committee members serve as board of directors or audit committee in other firms; MKT1 is market capitalization. RCG is a proportion of audit committee members in board of directors and ROA is return on assets. N is number of observations. ***,**, * Significant at 0.01, 0.05 and 0.10 level, respectively (two-tailed)
Results from univariate tests
From Table 4.6, Panel A, I regress the information sets on years. Book-tax
differences for firms in group 1 (on average .7 percentage points increase each
year) are greater than that for firms in group 2 (on average 1 percentage point
decrease each year). In Panel B, I regress earnings on 10-year periods by using
indicator variables. This is to determine whether earnings structure has changed
during the IFRS adoption periods. Without other information sources, results
indicate that earnings structure for all firm-years significantly declines over time.
Specially, earnings of firms in group 2 have substantially declined since 1998. In
Panel C, taxable income is regressed on years. The results from panel B and C
suggest that during pre-adoption periods, earnings and taxable income tend to
decrease. However, during post-adoption periods, the negative sign of coefficient
estimates suggests that the decrease in earnings (significant) is greater than the
decrease in taxable income (insignificant). When comparing between group 1 and
2, the pattern of earnings and taxable income for both groups follows the same
Chapter IV Earnings Persistence
161
direction (decreasing) during pre-adoption periods. However, during post-
adoption periods, the result reports the decrease in earnings but not the decrease in
taxable income for group 2 (that the result in Panel C for group 2 is not
statistically significant from year 2001). On the other hand, the result reports the
decrease in taxable income but not the decrease in earnings for group 1.
In summary, it is rather difficult for firms to reduce taxable income without
lowering earnings. Therefore, it is more likely that earnings and taxable income
follow a similar direction. The result from univariate tests suggests that during
post-adoption periods, on average earnings decline but taxable income does not
significantly decline (group 2), implying that it is more restricting to engage in
high tax activities to lower taxable income. However, taxable income for group 1
declines significantly whilst earnings are not considerably changed. This implies
that firms in group 1 are more likely to engage in earnings manipulation or tax
activity relative to firms in group 2. In addition, the result implies that firms in
group 1 are more likely to use new accounting standards opportunistically or
intentionally to manage earnings relative to firms in group 2.
Results from multivariate regressions
Table 4.7 presents the persistence coefficients of regressions of 1-year future
earnings on current earnings. Panel A of Table 4.7 reveals that the persistence
coefficient (β1) is .616 for full samples.54 Earnings persistence is .560 points
during pre-adoption and increases to .684 points during post-adoption periods.
Panel B presents the results for subgroups formed on the book-tax difference.
Group 1 includes firms whose book-tax differences during pre-adoption periods
are smaller than book-tax differences during post-adoption periods. Group 2
includes firms whose book-tax differences during pre-adoption periods are larger
than book-tax differences during post-adoption periods. An indicator variable for
time (YR) is introduced in the analysis.
54 Pincus et al. (2007) estimate accrual anomaly in 21 countries, including Thailand. As a part of accrual anomaly analysis, they report the persistence of earnings for Thai firms during the period 1994–2002 is .64. The persistence of earnings for US firms ranges from .652 (Dichev and Tang 2009) and .8 (Sloan 1996).

Chapter IV Earnings Persistence
162
Table 4.6 Univariate analysis Panel A: OLS regressions, regressing effective tax rate, discretionary accruals and book-tax differences on time trend. Vit = λ0+ λ1YEARit + εit
Full samples Group 1 Group 2 BT
λ0 2.176 (1.62) -13.039 (-9.19)*** 17.39 (8.03)*** λ1 -0.001 (-1.59) 0.007 (9.22)*** -0.01 (-8.01)***
Adj.R2 0.001 0.045 0.066 N 2000 1000 1000
Panel B: OLS regression, regressing earnings before interest and tax on indicator variables. EBITit = θ0+ θ 1Y96it + θ 2Y97it +…+ θ9Y04it + εit
Full samples Group 1 Group 2 INT 0.130 (23.06)*** 0.113 (14.44)*** 0.147 (18.87)*** Y96 -0.028 (-3.61)*** -0.030 (-2.63)*** -0.026 (-2.63)*** Y97 -0.052 (-5.13)*** -0.066 (-4.41)*** -0.038 (-2.97)*** Y98 -0.040 (-3.43)*** -0.059 (-3.30)*** -0.020 (-1.48) Y99 -0.081 (-8.31)*** -0.082 (-5.74)*** -0.080 (-6.22)*** Y00 -0.060 (-6.11)*** -0.036 (-2.71)*** -0.084 (-5.87)*** Y01 -0.047 (-5.34)*** -0.028 (-2.37)** -0.065 (-5.18)*** Y02 -0.042 (-4.81)*** -0.009 (-0.77) -0.074 (-5.99)*** Y03 -0.035 (-4.00)*** 0.010 (0.91) -0.080 (-6.48)*** Y04 -0.037 (-3.68)*** 0.011 (0.87) -0.086 (-5.88)***
Adj.R2 0.031 0.070 0.075 N 2000 1000 1000
Panel C: OLS regression, regressing taxable income on indicator variables. TAXit = θ0+ θ 1Y96it + θ 2Y97it +…+ θ9Y04it + εit
Full samples Group 1 Group 2 INT 0.055 (13.83)*** 0.044 (8.39)*** 0.066 (11.36)*** Y96 -0.010 (-1.80)* -0.007 (-1.02) -0.012 (-1.55) Y97 -0.030 (-5.55)*** -0.023 (-3.11)*** -0.037 (-4.74)*** Y98 -0.028 (-5.12)*** -0.025 (-3.43)*** -0.031 (-3.89)*** Y99 -0.026 (-4.60)*** -0.021 (-2.89)*** -0.030 (-3.64)*** Y00 -0.022 (-3.96)*** -0.025 (-3.55)*** -0.020 (-2.33)** Y01 -0.012 (-1.95)* -0.020 (-2.67)*** -0.005 (-0.50) Y02 -0.015 (-2.62)*** -0.019 (-2.71)*** -0.012 (-1.30) Y03 -0.013 (-2.17)** -0.015 (-2.10)** -0.011 (-1.16) Y04 -0.008 (-1.36) -0.009 (-1.19) -0.008 (-0.83)
Adj.R2 -0.0004 0.017 0.025 N 2000 1000 1000
EBIT is earnings before interest and tax scaled by the beginning of total assets; TAX is taxable income deflated by total assets; BT is book-tax differences scaled by total assets; Y95 (Y96…Y04) is indicator variable equal to 1 for 1995 (1996…2004) and 0 otherwise; YEAR = 1995, 1996,…, 2004 and N is number of observations. In parentheses, t-statistics are based on OLS firm fixed-effect estimations with heteroskedasticity-robust standard errors. Group 1 (2) include firms with larger (smaller) book-tax-differences during post-adoption periods. ***,**,* Significant at 0.01, 0.05 and 0.10 level, respectively (two-tailed)
Chapter IV Earnings Persistence
163
Panel B of Table 4.7 reports that the persistence coefficient for group 1 (β1) is
.541. The persistence coefficient for group 2 (β1= .553) is slightly higher than for
group 1. The coefficient (β5) for group 1 is negative and insignificant, indicating
that the persistence of earnings for group 1 tends to decrease but not significantly.
On the other hand, the coefficient (β5) for group 2 is positive and significant,
indicating that the persistence of earnings for group 2 increases by .245 point after
the adoption of IFRS in Thailand.
Panels C and D of Table 4.7 present the persistence coefficients of regressions of
1-year future earnings on earnings performance attributable to cash flows from
operation and accruals. Panel C reports that the persistence coefficient of earnings
performance attributable to cash flows from operation and accruals is (β2) .590
and (β3) .543 points, respectively. The Chi2 value (7.18) suggests that the
persistence coefficient for earnings performance attributable to cash flows from
operation is significantly larger that that for earnings performance attributable to
accruals. Prior research suggests that earnings management induces the lower
persistence of earnings performance attributable to the accrual component of
earnings (Sloan 1996). The smaller coefficient on accruals relative to cash flows
reflects the higher discretion in accruals, that these findings are consistent with
US evidence (i.e. Sloan 1996; Hanlon 2005). The finding from full samples in
Panel C suggests that firms are more likely to engage in earnings manipulation.
As compared to pre-adoption periods, the magnitude of coefficient on accruals
and cash flows during post-adoption periods is higher (β2–Pre = .519 vs. β2–Post =
.653 and β3–Pre = .462 vs. β3–Post = .615), reflecting the higher quality of
earnings information prepared by new accounting standards. The Chi2 value
indicates that the persistence coefficient for earnings performance attributable to
cash flows from operation is significantly larger than that for earnings
performance attributable to accruals for both periods. Panel D presents the results
for subgroups. The persistence coefficients of earnings performance attributable
to cash and accrual components for group 1 during pre-adoption are (β2) .520 and
(β3) .494, respectively. The persistence coefficients of earnings performance
Chapter IV Earnings Persistence
164
attributable to cash and accrual components for group 1 tend to improve but not
significant as measured by the positive sign of β7 and β8. On the other hand, the
results suggest that the persistence coefficients of earnings performance
attributable to cash and accrual component for group 2 during pre-adoption are
(β2) .480 and (β3) .390, respectively and they improve by (β7) .207 and (β8) .273,
respectively, during post-adoption periods. The results are consistent with the
regression of 1-year future earnings on current earnings reported in Panel B.
Nevertheless, the persistence coefficients of earnings performance attributable to
cash and accrual component during post-adoption periods are not significantly
different for both subgroups (measured by the Chi2 (β7 = β8) = 0.67 for group 1
and 1.64 for group 2 is not significant).55
In conclusion, earnings are of higher quality in terms of persistence attribute after
the change in accounting standards in Thailand. The results support the
hypothesis (H.4.1). According to these results, earnings persistence is more
pronounced for firms with small book-tax differences relative to firms with large
book-tax differences. This is consistent with the prior study (Hanlon 2005). The
improvement of earnings persistence during post-adoption periods in group 2
supports the hypothesis (H.4.2). Nevertheless, the persistence of earnings for
firms in group 2 must be interpreted with caution because if firms engage in
earnings smoothing, their smoothed earnings will not capture underlying
economic performances. The descriptive analysis suggests that it is less likely for
firms in group 2 to engage in earnings smoothing relative to firms in group 1, and
the earnings smoothing activity for firms in group 2 is declined during post-
adoption periods. Nevertheless, it is essential for future research to explore
whether the persistence of earnings for firms in group 2 involves earnings
smoothing.
55 Pincus et al. (2007) find that the persistence coefficients of earnings performance attributable to accrual component are not significantly different from the persistence of earnings performance attributable to cash component in Denmark, India, Malaysia, the Netherlands, Singapore and Thailand. For Thailand, they report that the persistence coefficients of earnings attributable to cash flow and accrual component are .603 equally.
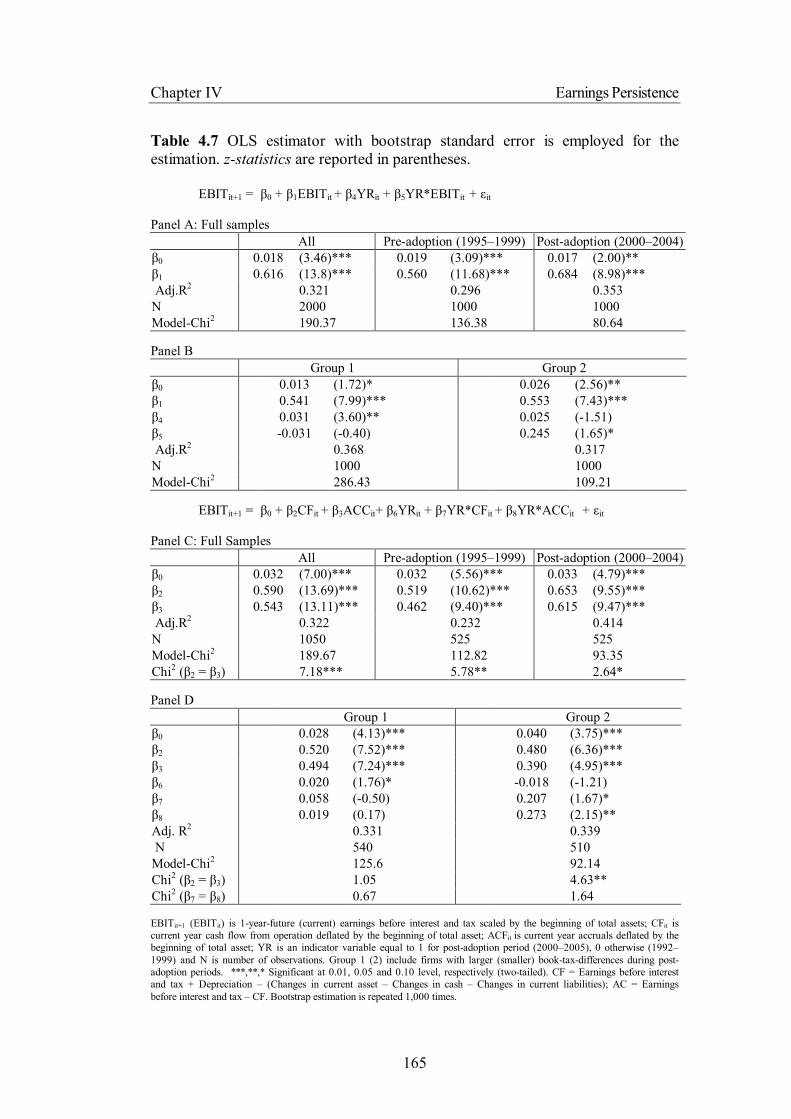
Chapter IV Earnings Persistence
165
Table 4.7 OLS estimator with bootstrap standard error is employed for the estimation. z-statistics are reported in parentheses.
EBITit+1 = β0 + β1EBITit + β4YRit + β5YR*EBITit + εit Panel A: Full samples All Pre-adoption (1995–1999) Post-adoption (2000–2004) β0 0.018 (3.46)*** 0.019 (3.09)*** 0.017 (2.00)** β1 0.616 (13.8)*** 0.560 (11.68)*** 0.684 (8.98)*** Adj.R2 0.321 0.296 0.353 N 2000 1000 1000 Model-Chi2 190.37 136.38 80.64 Panel B Group 1 Group 2 β0 0.013 (1.72)* 0.026 (2.56)** β1 0.541 (7.99)*** 0.553 (7.43)*** β4 0.031 (3.60)** 0.025 (-1.51) β5 -0.031 (-0.40) 0.245 (1.65)* Adj.R2 0.368 0.317 N 1000 1000 Model-Chi2 286.43 109.21
EBITit+1 = β0 + β2CFit + β3ACCit+ β6YRit + β7YR*CFit + β8YR*ACCit + εit Panel C: Full Samples All Pre-adoption (1995–1999) Post-adoption (2000–2004) β0 0.032 (7.00)*** 0.032 (5.56)*** 0.033 (4.79)*** β2 0.590 (13.69)*** 0.519 (10.62)*** 0.653 (9.55)*** β3 0.543 (13.11)*** 0.462 (9.40)*** 0.615 (9.47)*** Adj.R2 0.322 0.232 0.414 N 1050 525 525 Model-Chi2 189.67 112.82 93.35 Chi2 (β2 = β3) 7.18*** 5.78** 2.64* Panel D Group 1 Group 2 β0 0.028 (4.13)*** 0.040 (3.75)*** β2 0.520 (7.52)*** 0.480 (6.36)*** β3 0.494 (7.24)*** 0.390 (4.95)*** β6 0.020 (1.76)* -0.018 (-1.21) β7 0.058 (-0.50) 0.207 (1.67)* β8 0.019 (0.17) 0.273 (2.15)** Adj. R2 0.331 0.339 N 540 510 Model-Chi2 125.6 92.14 Chi2 (β2 = β3) 1.05 4.63** Chi2 (β7 = β8) 0.67 1.64 EBITit+1 (EBITit) is 1-year-future (current) earnings before interest and tax scaled by the beginning of total assets; CFit is current year cash flow from operation deflated by the beginning of total asset; ACFit is current year accruals deflated by the beginning of total asset; YR is an indicator variable equal to 1 for post-adoption period (2000–2005), 0 otherwise (1992–1999) and N is number of observations. Group 1 (2) include firms with larger (smaller) book-tax-differences during post-adoption periods. ***,**,* Significant at 0.01, 0.05 and 0.10 level, respectively (two-tailed). CF = Earnings before interest and tax + Depreciation – (Changes in current asset – Changes in cash – Changes in current liabilities); AC = Earnings before interest and tax – CF. Bootstrap estimation is repeated 1,000 times.
Chapter IV Earnings Persistence
166
It should be noted that the results reported in Table 4.7 are qualitatively similar
when the book-tax difference is calculated from consolidated financial
statements.56 In terms of earnings persistence, this thesis considers that there are
at least two potential explanations why earnings persistence for firms in group 1
has not significantly improved during post-adoption periods. Firstly, firms in
group 1 possibly engage in tax and earnings management to a higher extent than
do firms in group 2. Secondly, because the sample firms do not considerably
differ in earnings, leverage or performance, this thesis proposes that the
differential earnings persistence between two groups should be induced by the
variation in firm governance factors. Therefore, I further explore the relationship
between firm governance factors and earnings persistence.
Earnings persistence and firm governance
I compare the characteristics of firms in two groups and find that they do not
differ in various financial proxies, including earnings, debt-equity ratio or
performance. I therefore analyse whether the earnings persistence is varied
according to firm governance systems. I regress earnings persistence on firm
governance variables. As reported in Table 4.8, YR in the model is year dummy
variable, separating between pre- and post-adoption periods. YR is also interacted
with other firm governance variables. Results show that during pre-adoption
periods, the relationship between earnings persistence and firm governance
variables is not observed for all groups of sample firms. During post-adoption
periods, the full sample analysis reveals that earnings persistence is significantly
associated with firm governance variables, including NBB, NB and RCG, but
there is no relationship between earnings persistence and board size (NBO). The
relationship between earnings persistence and NBB is significantly positive,
suggesting that high board quality induces high earnings persistence.57 The
56 See results in Appendix 3 57 It should be noted that NBB (NB) in this analysis has twofold meanings. One represents the reputation of the board (audit committee). The board (audit committee) reputation should induce positive relationship between earnings quality and board quality. The other meaning can be interpreted as workloads of the board (audit committee) member. If one board (audit committee) member serves on too many boards, the quality of work would be deteriorated, resulting in low earnings quality. By this interpretation, the relationship between board (audit committee) quality

Chapter IV Earnings Persistence
167
relationship between earnings persistence and NB is significantly negative,
suggesting that earnings quality is deteriorated when audit committee members
serve on too many boards. The relationship between earnings persistence and
RCG is significantly positive, suggesting that the higher proportion of audit
committee in a board induces the higher earnings persistence.
For subgroups, their results are rather consistent. The relationship between
earnings persistence and NBB is positive for both groups, but it is statistically
significant for group 1 but not statistically significant for group 2. It implies that
the board reputation increases the persistence of earnings for firms in group 1 but
not for firms in group 2. The relationship between earnings persistence and NB is
negative for both groups, but it is statistically significant for group 2 but not
statistically significant for group 1. It implies that the work quality of audit
committee tends to be low, reducing the persistence of earnings for firms in group
2. The relationship between earnings persistence and RCG is statistically
significantly positive for both groups, suggesting that the firm governance quality
increases the persistence of earnings in the sample firms.
In conclusion, during pre-adoption periods, the relationship between accounting
quality and firm governance systems is not observed, whilst the relationship
between them is more pronounced during post-adoption periods. In addition, the
finding suggests that the firm governance quality (RCG) is statistically
significantly related to the earnings persistence, that the higher proportion of audit
committee on a board induces the higher earnings persistence. Overall, the
obtained results suggest that earnings persistence is varied according to firm
governance systems. This thesis argues that the obtained relationship between the
earnings persistence and firm governance variables probably is a factor
influencing the difference in earnings persistence between firms in group 1 and
firms in group 2. Also, the firm governance plays an important role during IFRS
post-adoption periods.
and earnings persistence should be negative.

Chapter IV Earnings Persistence
168
Table 4.8 Firm governance and earnings persistence I regress persistence (PER) on firm governance proxies. I compare the analysis between firms in group 1 and 2 during pre- and post-adoption periods. Year indicator variables are employed for pre- and post-adoption periods. I use median of NBO, NB and NBB and the mean of RCG and control variables for this analysis. OLS estimators with heteroskedasticity-robust standard errors are employed for the regression analysis. t-statistics are reported in parentheses. PERi = γ0 + γ1NBOi + γ2NBBi + γ3NBi + γ4RCGi + γ5YRi + γ 6YR*NBOi
+ γ7YR*NBBi + γ8YR*NBi + γ9YR*RCGi + εi
All Group 1 Group 2 INT. 0.643 (1.40) 0.839 (1.54) 0.471 (0.59) NBO -0.013 (-0.59) 0.003 (0.10) -0.016 (-0.41) NBB -0.002 (-0.58) -0.004 (-0.86) -0.004 (-0.64) NB 0.019 (1.41) 0.006 (0.42) 0.026 (1.29) RCG -1.701 (-1.49) -1.936 (-1.50) -1.623 (-0.84) YR -1.295 (-2.01)** -1.476 (-1.62) -1.395 (-1.43) YR*NBO 0.001 (0.03) -0.032 (-0.94) 0.027 (0.62) YR*NBB 0.013 (2.28)** 0.019 (2.24)** 0.010 (1.22) YR*NB -0.035 (-2.44)** -0.026 (-1.40) -0.042 (-2.00)** YR*RCG 4.266 (3.06)*** 4.727 (2.55)** 4.286 (2.00)** Adj.R2 0.026 0.019 0.027 N 360 182 178 PER is persistence (β1) obtained from the OLS regression with heteroskedasticity-robust standard errors, rolling five-year window before and after the accounting change: EBITi,t = β0 + β1EBITi,t-1 + εi, where EBITi,t and EBITi.t-1 are earnings before interest and tax in year t and t-1, respectively and ε is the residual. All variables are deflated by the average of total assets. NBO is number of boards of director. NB is number of boards that audit committee members serve as board of directors or audit committee in other firms. RCG is a proportion audit committee members in board of directors. NBB is number of boards that members of board of directors serve as board of directors or audit committee in other firms. YR is an indicator variable equal to 1 for post-adoption periods (2000–2004), 0 otherwise (1995–1999). N are a number of observations. Group 1 (2) is firms with larger (smaller) book-tax-differences in post-adoption period. ***,**,* Significant at 0.01, 0.05 and 0.10 level, respectively (two-tailed).
Robustness checks
Control variables, including revenue growth (GRW), revenue (REV) and firm size
(SIZE) are included in the regression model to mitigate the potential problem of
omitted variables (Kraft et al. 2007).58 In addition to those variables, this study
includes industry-adjusted discretionary accruals (DA) in the analysis to control
58 Kraft et al. (2007) use the growth of sales and sales in their analysis. This study uses the growth of total revenue and total revenue to maintain a number of observations.
Chapter IV Earnings Persistence
169
for the discretionary accrual.59 Nevertheless, the sample size is significantly
reduced when including DA in the regression of future earnings on current
earnings. Therefore, the results are presented separately when DA is included and
excluded. As reported in Panels A and B of Table 4.9, the persistence coefficient
of earnings (β5) enhances from pre- to post-adoption periods for full samples. For
subgroups, the results are consistent with the results obtained from the main
analysis, indicating that the persistence of earnings for group 2 improves during
post-adoption periods (β5 = .256). Panel C and D report the results when earnings
are attributable to cash and accrual components. The results reveal the
improvement of persistence of earnings performance attributable to cash and
accrual components for full samples (measured by β7 and β8). The persistence of
earnings performance attributable to accrual components improves during post-
adoption periods for group 2 (β8 = .286). Overall results are consistent with the
results obtained from the regressions in the main analysis. In addition, the
discretionary accrual is not significantly related with future earnings.
Next, the sample periods are expanded by using the balanced panel data from
1992 to 2005, including 2,240 observations (160 constant firms over the periods).
Table 4.10 presents the results by regressing 2-year future earnings on current
earnings.60 Panel A–C of Table 4.10 reports the results when 2-year future
59 Cross-section modified-Jones model is used for the calculation of discretionary accruals. I calculate accruals by the equation (Jones 1991): (1) Accruals (TA) = Annual changes in current assets – Annual changes in cash – Annual changes in current liabilities – Depreciation (2) Cash flow from operation = Earnings before interest and tax – Accruals The industry cross-section modified-Jones model is calculated as follows: (3) TAi/At-1 = a1(1/At-1) + a2(ΔREVi/At-1) + a3(PPEi/At-1) + εi And, discretionary accruals are obtained from the following equation: (4) ui = TAi/At-1 – [α1(1/At-1) + α2(ΔREVi–ΔRECi/At-1) + α3(PPEi/At-1)] where subscript i refers to six industry groups, including agro & food business, consumer products, industrials, property & construction, services and resources & technology. TA is total accruals; u is the discretionary accruals (DA); ΔREV is revenues in year t less revenues in year t-1; ΔREC is accounts receivable in year t less accounts receivable in year t-1; PPE is gross property plant and equipment; At-1 is total assets at the end of year t-1; ε is the residual and α1, α2, and α3 are cross-section industry-specific parameters obtained from OLS estimates a1, a2 and a3, respectively. a, a2 and a3 are estimated by employing entire firm-years listed on the stock exchange of Thailand. PPE and depreciation are obtained from Datastream. All other variables are obtained from SETSMART. 60 See Table 4.7 for the comparison.
Chapter IV Earnings Persistence
170
earnings are regressed on current earnings. Panel D–F of Table 4.10 reports the
results when current earnings information is decomposed to cash and accrual
components. From Panel A–C, the persistence coefficient during post-adoption
periods is higher than that during pre-adoption periods. The persistence
coefficient for group 1 declines from pre- to post-adoption periods whilst the
persistence coefficient for group 2 increases during those periods of time. The
magnitude of persistence coefficients when using 2-year future earnings is smaller
than that of persistence coefficients when using 1-year future earnings. Also, the
adjusted R2 from 2-year future earnings regressions is smaller than that from 1-
year future earnings regressions.
For the regression of 2-year future earnings on earnings performance attributable
to cash and accrual components, the results reported in Panel D–F are consistent
with the results obtained from 1-year future earnings regressions. The persistence
coefficients for full samples and group 2 increase from pre- to post-adoption
periods whilst the persistence coefficients for group 1 decrease during those
periods of time. The magnitude of persistence coefficient of earnings
performance attributable to cash component is higher than that of earnings
performance attributable to accrual component for full samples and two
subgroups. Nevertheless, the smaller persistence coefficient of earnings
performance attributable to accrual component is not statistically significant as
revealed by the value of Chi2.
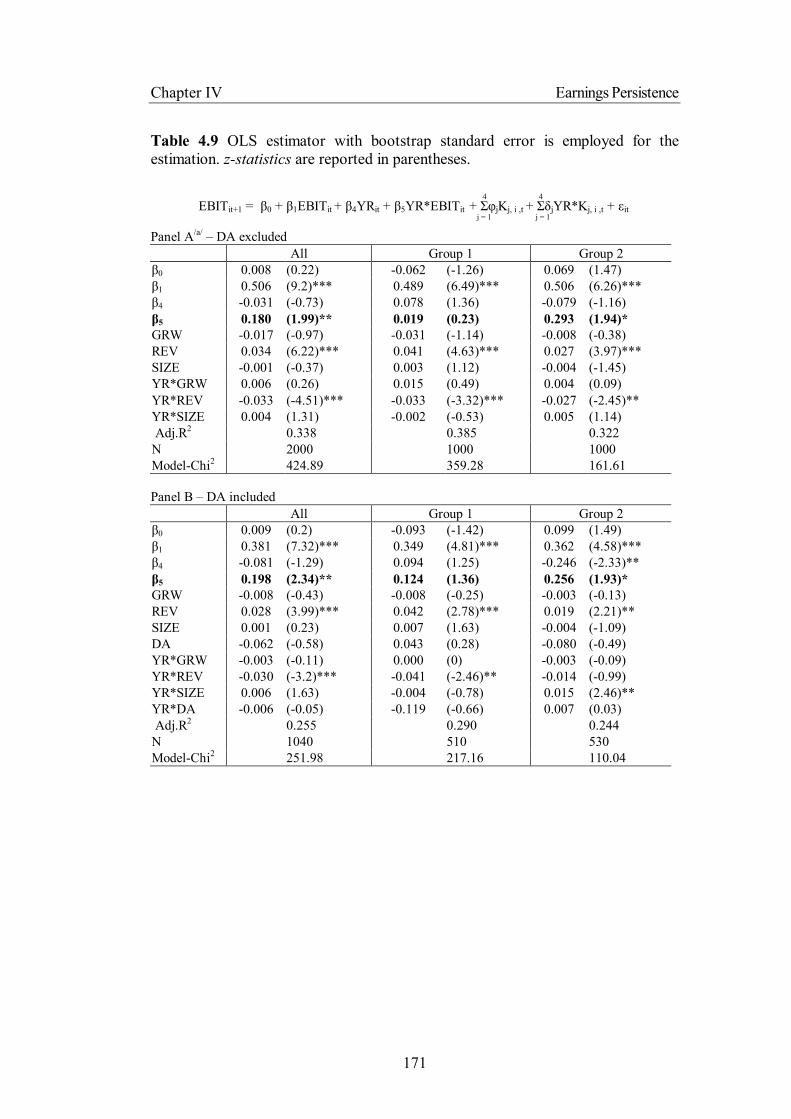
Chapter IV Earnings Persistence
171
j = 1 j = 1
4 4
Table 4.9 OLS estimator with bootstrap standard error is employed for the estimation. z-statistics are reported in parentheses.
EBITit+1 = β0 + β1EBITit + β4YRit + β5YR*EBITit + ΣφjKj, i ,t + ΣδjYR*Kj, i ,t + εit Panel A/a/ – DA excluded All Group 1 Group 2 β0 0.008 (0.22) -0.062 (-1.26) 0.069 (1.47) β1 0.506 (9.2)*** 0.489 (6.49)*** 0.506 (6.26)*** β4 -0.031 (-0.73) 0.078 (1.36) -0.079 (-1.16) β5 0.180 (1.99)** 0.019 (0.23) 0.293 (1.94)* GRW -0.017 (-0.97) -0.031 (-1.14) -0.008 (-0.38) REV 0.034 (6.22)*** 0.041 (4.63)*** 0.027 (3.97)*** SIZE -0.001 (-0.37) 0.003 (1.12) -0.004 (-1.45) YR*GRW 0.006 (0.26) 0.015 (0.49) 0.004 (0.09) YR*REV -0.033 (-4.51)*** -0.033 (-3.32)*** -0.027 (-2.45)** YR*SIZE 0.004 (1.31) -0.002 (-0.53) 0.005 (1.14) Adj.R2 0.338 0.385 0.322 N 2000 1000 1000 Model-Chi2 424.89 359.28 161.61 Panel B – DA included All Group 1 Group 2 β0 0.009 (0.2) -0.093 (-1.42) 0.099 (1.49) β1 0.381 (7.32)*** 0.349 (4.81)*** 0.362 (4.58)*** β4 -0.081 (-1.29) 0.094 (1.25) -0.246 (-2.33)** β5 0.198 (2.34)** 0.124 (1.36) 0.256 (1.93)* GRW -0.008 (-0.43) -0.008 (-0.25) -0.003 (-0.13) REV 0.028 (3.99)*** 0.042 (2.78)*** 0.019 (2.21)** SIZE 0.001 (0.23) 0.007 (1.63) -0.004 (-1.09) DA -0.062 (-0.58) 0.043 (0.28) -0.080 (-0.49) YR*GRW -0.003 (-0.11) 0.000 (0) -0.003 (-0.09) YR*REV -0.030 (-3.2)*** -0.041 (-2.46)** -0.014 (-0.99) YR*SIZE 0.006 (1.63) -0.004 (-0.78) 0.015 (2.46)** YR*DA -0.006 (-0.05) -0.119 (-0.66) 0.007 (0.03) Adj.R2 0.255 0.290 0.244 N 1040 510 530 Model-Chi2 251.98 217.16 110.04

Chapter IV Earnings Persistence
172
j = 1 j = 1
4 4
Table 4.9 (Cont.)
EBITit+1 = β0 + β3CFit + β4ACCit+ β6YRit + β7YR*CFit + β8YR*ACCit
+ ΣφjKj, i ,t + ΣδjYR*Kj, i ,t + εit Panel C/a/– DA excluded All Group 1 Group 2 β0 -0.016 (-0.43) -0.061 (-1.25) 0.027 (0.42) β3 0.453 (7.8)*** 0.417 (5.78)*** 0.442 (4.92)*** β4 0.397 (7.13)*** 0.403 (5.86)*** 0.348 (3.67)*** β6 -0.028 (-0.55) 0.062 (0.96) -0.117 (-1.34) β7 0.190 (2.01)** 0.160 (1.37) 0.217 (1.61) β8 0.208 (2.31)** 0.110 (1.04) 0.286 (2.09)** GRW -0.009 (-0.49) -0.009 (-0.3) -0.005 (-0.19) REV 0.033 (4.79)*** 0.047 (3.76)*** 0.024 (2.59)*** SIZE 0.002 (0.76) 0.004 (1.4) 0.000 (-0.12) YR*GRW 0.005 (0.23) 0.001 (0.03) 0.024 (0.64) YR*REV -0.038 (-4.47)*** -0.046 (-3.24)*** -0.027 (-2.15)** YR*SIZE 0.004 (1.19) -0.001 (-0.29) 0.008 (1.57) Adj.R2 0.348 0.355 0.350 N 1050 540 510 Model-Chi2 273.34 211.62 139.91 Panel D – DA included All Group 1 Group 2 β0 -0.026 (-0.62) -0.111 (-1.76)* 0.032 (0.48) β3 0.438 (7.65)*** 0.374 (4.86)*** 0.442 (4.84)*** β4 0.381 (6.79)*** 0.359 (4.85)*** 0.348 (3.81)*** β6 -0.008 (-0.14) 0.126 (1.61) -0.126 (-1.39) β7 0.198 (2.14)** 0.189 (1.39) 0.208 (1.57) β8 0.223 (2.48)** 0.139 (1.12) 0.286 (2.13)** GRW -0.008 (-0.4) -0.005 (-0.17) -0.006 (-0.22) REV 0.035 (4.82)*** 0.061 (3.74)*** 0.024 (2.61)*** SIZE 0.002 (0.9) 0.007 (1.87)* -0.001 (-0.21) DA -0.079 (-0.66) -0.051 (-0.29) -0.041 (-0.22) YR*GRW 0.003 (0.11) -0.002 (-0.06) 0.020 (0.55) YR*REV -0.041 (-4.29)*** -0.059 (-3.25)*** -0.027 (-2.09)** YR*SIZE 0.002 (0.68) -0.005 (-1.04) 0.009 (1.62) YR*DA -0.010 (-0.07) -0.012 (-0.06) -0.056 (-0.24) Adj.R2 0.343 0.344 0.352 N 1000 500 500 Model-Chi2 262.31 196.63 138.63 EBITit+1 (EBITit) is 1-year future (current) earnings before interest and tax scaled by the beginning of total assets; Kj,i,t is a vector of firm i’s j firm-specific factors, including GRW is the change in total revenue deflated by total asset, SIZE is the natural log of total assets, REV is the ratio of total revenue divided by total assets and DA is industry discretionary accrual; CFit is current cash flow from operation deflated by the beginning of total asset; ACCit is the current accrual deflated by the beginning of total asset; YR is an indicator variable equal to 1 for post-adoption period, 0 otherwise and N is number of observations. Group 1 (2) include firms with larger (smaller) book-tax-differences during post-adoption periods. ***,**,* Significant at 0.01, 0.05 and 0.10 level, respectively (two-tailed). Bootstrap estimation is repeated 1,000 times. /a/ Qualitatively similar results are obtained when the book-tax differences are calculated by using consolidated financial statements (see Appendix 4).

Chapter IV Earnings Persistence
173
Table 4.10 Robustness checks of the regression of 2-year-future earnings on current earnings. EBITit+2 = β0 + β1EBITit + εit Panel A: Full samples All Pre-adoption (1992-1999) Post-adoption (2000-2005) β0 0.048 (10.24)*** 0.047 (6.65)*** 0.048 (8.56)*** β1 0.586 (16.02)*** 0.581 (11.65)*** 0.600 (11.01)*** Adj. R2 0.220 0.195 0.275 N 2240 1280 960 Model-Chi2 256.77 135.61 121.19 Panel B: Group 1 All Pre-adoption (1992-1999) Post-adoption (2000-2005) β0 0.050 (7.48)*** 0.041 (4.1)*** 0.063 (9.55)*** β1 0.568 (10.31)*** 0.587 (7.71)*** 0.526 (7.89)*** Adj. R2 0.181 0.175 0.201 N 1260 720 540 Model-Chi2 106.24 59.5 62.18 Panel C: Group 2 All Pre-adoption (1992-1999) Post-adoption (2000-2005) β0 0.045 (7.86)*** 0.059 (6.54)*** 0.034 (4.03)*** β1 0.609 (13.86)*** 0.549 (9.51)*** 0.658 (8.14)*** Adj. R2 0.287 0.212 0.351 N 980 560 420 Model-Chi2 192.03 90.42 66.25 EBITit+2 = β0 + β3CFit + β4ACCit + εit Panel D: Full samples All Pre-adoption (1993-1999) Post-adoption (2000-2005) β0 0.042 (9.18)*** 0.047 (7.56)*** 0.038 (5.94)*** β2 0.573 (14.52)*** 0.530 (10.72)*** 0.626 (10.98)*** β3 0.540 (12.7)*** 0.523 (9.96)*** 0.553 (8.55)*** Adj. R2 0.248 0.213 0.298 N 1066 574 492 Model-Chi2 211.46 115.92 127.72 Chi2 (β2 = β3) 3.16* 0.08 6.16** Panel E: Group 1 All Pre-adoption (1993-1999) Post-adoption (2000-2005) β0 0.045 (9.26)*** 0.035 (5.3)*** 0.063 (7.52)*** β2 0.545 (13.14)*** 0.612 (10.64)*** 0.424 (6.49)*** β3 0.514 (10.81)*** 0.611 (9.62)*** 0.312 (4.13)*** Adj. R2 0.226 0.288 0.157 N 559 301 258 Model-Chi2 173.95 113.47 52.66 Chi2 (β2 = β3) 1.71 0.00 9.62*** Panel F: Group 2 All Pre-adoption (1993-1999) Post-adoption (2000-2005) β0 0.039 (5.34)*** 0.065 (5.91)*** 0.022 (2.4)** β2 0.594 (9.73)*** 0.432 (5.58)*** 0.750 (8.41)*** β3 0.560 (8.87)*** 0.423 (5.09)*** 0.707 (7.01)*** Adj. R2 0.261 0.130 0.404 N 507 273 234 Model-Chi2 94.69 31.23 73.54 Chi2 (β2 = β3) 1.65 0.06 1.12 EBITit+2 (EBITit) is 2-year-future (current) earnings before interest and tax scaled by the beginning of total assets; CFit is current year cash flow from operation deflated by the beginning of total asset; ACFit is current year accruals deflated by the beginning of total asset; YR is an indicator variable equal to 1 for post-adoption period (2000 – 2005), 0 otherwise and N is a number of observations. Group 1 (2) include firms with larger (smaller) book-tax-differences during post-adoption periods. ***,**,* Significant at 0.01, 0.05 and 0.10 level, respectively (two-tailed). CF = Earnings before interest and tax + Depreciation – (Changes in current asset – Changes in cash – Changes in current liabilities); AC = Earnings before interest and tax – CF. OLS estimator with bootstrap standard error is employed for the estimation repeated 1,000 times. z-statistics are reported in parentheses.

Chapter IV Earnings Persistence
174
Next, the robustness check is performed by analysing the persistence of earnings
for all firm-years. In addition, the samples are sub-grouped by using the book-tax
difference. Each year, the book-tax difference is divided into two groups – small
(BT1) and large (BT2) book-tax differences. Following prior research (Hanlon
2005), the persistence of earnings for firms with small book-tax differences is
expected to be higher than the persistence of earnings for firms with large book-
tax differences. To form the subgroups, outliers, all missing data, the negative
annual income tax and negative book-tax difference are excluded from the
analysis. 2-year and 1-year future earnings are employed for the analysis. Table
4.11 presents the regression of 1-year (Panel A–C) and 2-year (Panel D–F) future
earnings on current earnings. By controlling for industry fixed effects, Panel A of
Table 4.11 reports the regression of 1-year future earnings on current earnings,
indicating that the persistence of earnings increases from pre- to post-adoption
periods for full samples. The enhancement of earnings persistence is also
observed in two subgroups, indicating that the earnings persistence is higher after
IFRS adoption in Thailand. Panel B and C report that during post-adoption
periods the magnitude of earnings persistence for small book-tax differences firms
(BT1: β1 = .701) is higher than that of earnings persistence for large book-tax
differences firms (BT2: β1 = .686). The results are consistent when regressing 2-
year future earnings on current earnings as reported in Panel D – F of Table 4.11.
The results reveal the improvement of earnings persistence and the magnitude of
persistence coefficient for BT1 (β1 = .653) is slightly higher than that of
persistence coefficient for BT2 (β1 = .644). The adjusted R2 is lower for 2-year
future earnings regressions relative to 1-year earnings regressions.
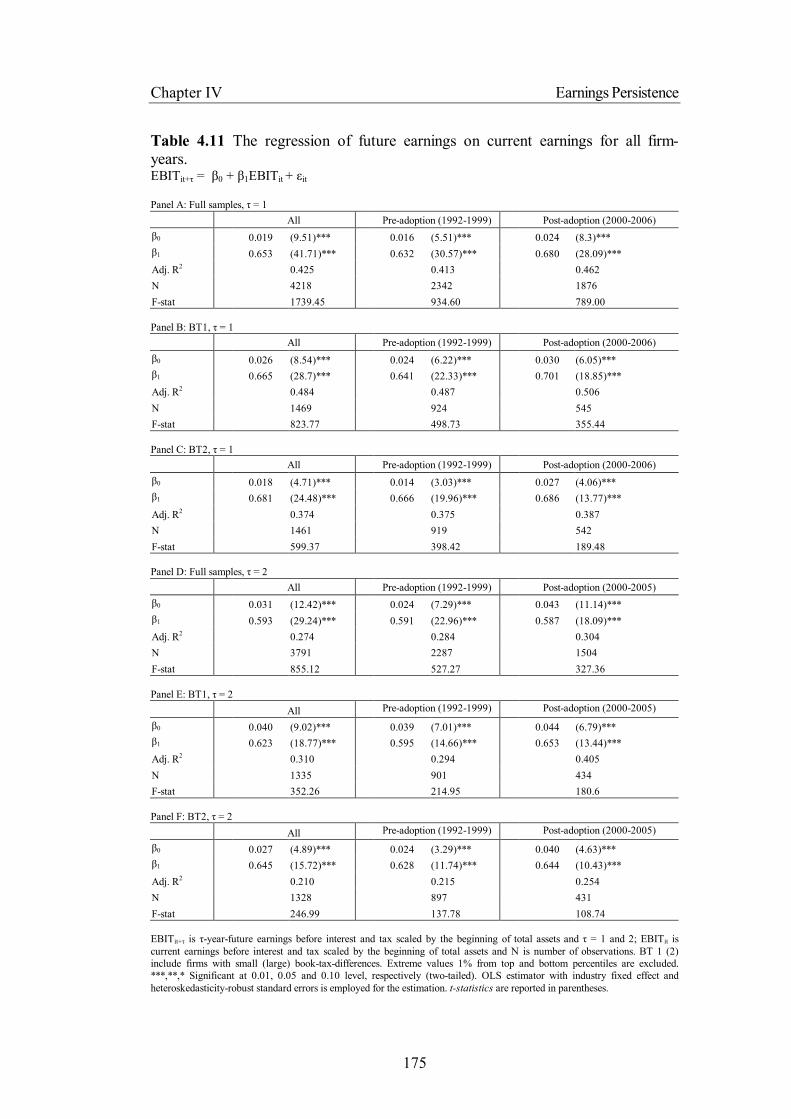
Chapter IV Earnings Persistence
175
Table 4.11 The regression of future earnings on current earnings for all firm-years. EBITit+τ = β0 + β1EBITit + εit Panel A: Full samples, τ = 1
All Pre-adoption (1992-1999) Post-adoption (2000-2006) β0 0.019 (9.51)*** 0.016 (5.51)*** 0.024 (8.3)*** β1 0.653 (41.71)*** 0.632 (30.57)*** 0.680 (28.09)*** Adj. R2 0.425 0.413 0.462 N 4218 2342 1876 F-stat 1739.45 934.60 789.00 Panel B: BT1, τ = 1
All Pre-adoption (1992-1999) Post-adoption (2000-2006) β0 0.026 (8.54)*** 0.024 (6.22)*** 0.030 (6.05)*** β1 0.665 (28.7)*** 0.641 (22.33)*** 0.701 (18.85)*** Adj. R2 0.484 0.487 0.506 N 1469 924 545 F-stat 823.77 498.73 355.44 Panel C: BT2, τ = 1
All Pre-adoption (1992-1999) Post-adoption (2000-2006) β0 0.018 (4.71)*** 0.014 (3.03)*** 0.027 (4.06)*** β1 0.681 (24.48)*** 0.666 (19.96)*** 0.686 (13.77)*** Adj. R2 0.374 0.375 0.387 N 1461 919 542 F-stat 599.37 398.42 189.48 Panel D: Full samples, τ = 2
All Pre-adoption (1992-1999) Post-adoption (2000-2005) β0 0.031 (12.42)*** 0.024 (7.29)*** 0.043 (11.14)*** β1 0.593 (29.24)*** 0.591 (22.96)*** 0.587 (18.09)*** Adj. R2 0.274 0.284 0.304 N 3791 2287 1504 F-stat 855.12 527.27 327.36 Panel E: BT1, τ = 2
All Pre-adoption (1992-1999) Post-adoption (2000-2005)
β0 0.040 (9.02)*** 0.039 (7.01)*** 0.044 (6.79)*** β1 0.623 (18.77)*** 0.595 (14.66)*** 0.653 (13.44)*** Adj. R2 0.310 0.294 0.405 N 1335 901 434 F-stat 352.26 214.95 180.6 Panel F: BT2, τ = 2
All Pre-adoption (1992-1999) Post-adoption (2000-2005)
β0 0.027 (4.89)*** 0.024 (3.29)*** 0.040 (4.63)*** β1 0.645 (15.72)*** 0.628 (11.74)*** 0.644 (10.43)*** Adj. R2 0.210 0.215 0.254 N 1328 897 431 F-stat 246.99 137.78 108.74 EBITit+τ is τ-year-future earnings before interest and tax scaled by the beginning of total assets and τ = 1 and 2; EBITit is current earnings before interest and tax scaled by the beginning of total assets and N is number of observations. BT 1 (2) include firms with small (large) book-tax-differences. Extreme values 1% from top and bottom percentiles are excluded. ***,**,* Significant at 0.01, 0.05 and 0.10 level, respectively (two-tailed). OLS estimator with industry fixed effect and heteroskedasticity-robust standard errors is employed for the estimation. t-statistics are reported in parentheses.
Chapter IV Earnings Persistence
176
Table 4.12 presents the regression of future earnings on earnings performance
attributable to cash and accrual components. For full samples, Panel A reports
that the persistence of earnings performance attributable to cash and accrual
components declines during post-adoption in Thailand. Also, the persistence of
earnings attributable to accrual components is higher than that of earnings
attributable to cash components for all sub-periods. In Panel D, results report the
improvement of the persistence of earnings attributable to cash components
during post-adoption periods (β2 = .498 vs. .560) for full samples. The persistence
of earnings attributable to accrual components slightly declines during post-
adoption periods (β3 = .507 vs. .504) for full samples.
For subgroups, Panel B reports that the persistence of earnings performance
attributable to cash components increases (β2 = .597 vs. .652) but the persistence
of earnings performance attributable to accrual components declines (β2 = .605 vs.
.582) during post-adoption periods for firms with small book-tax differences
(BT1). Panel C reports that the persistence of earnings performance attributable
to cash and accrual components declines during post-adoption periods for firms
with large book-tax differences (BT2). Nevertheless, for 2-year future earnings
regressions presented in Panel E and F, the result reports that the persistence of
earnings performance attributable to cash and accrual components increases for
both subgroups. In addition, the magnitude of coefficient estimates for BT1
(small book-tax difference firms) is higher than the magnitude of coefficient
estimates for BT2 (large book-tax difference firms). In addition, the results report
the deterioration of adjusted R2 when using 2-year future earnings compared with
1-year future earnings.
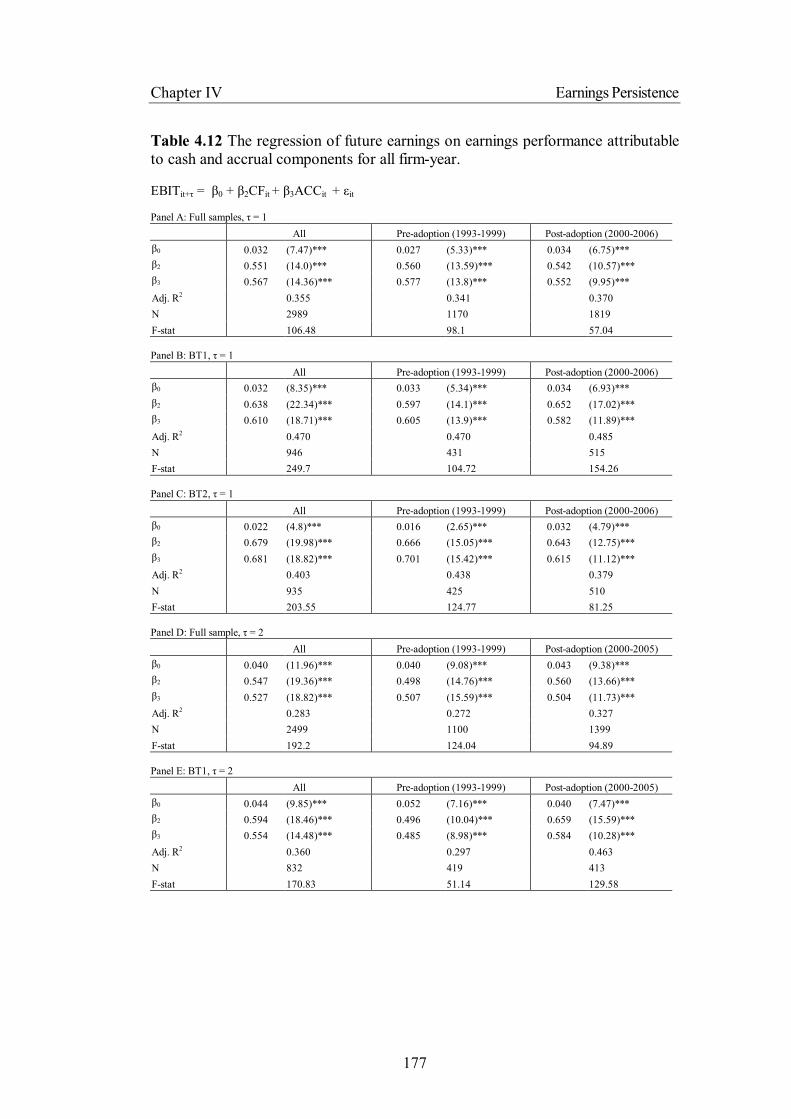
Chapter IV Earnings Persistence
177
Table 4.12 The regression of future earnings on earnings performance attributable to cash and accrual components for all firm-year. EBITit+τ = β0 + β2CFit + β3ACCit + εit Panel A: Full samples, τ = 1
All Pre-adoption (1993-1999) Post-adoption (2000-2006) β0 0.032 (7.47)*** 0.027 (5.33)*** 0.034 (6.75)*** β2 0.551 (14.0)*** 0.560 (13.59)*** 0.542 (10.57)*** β3 0.567 (14.36)*** 0.577 (13.8)*** 0.552 (9.95)*** Adj. R2 0.355 0.341 0.370 N 2989 1170 1819 F-stat 106.48 98.1 57.04 Panel B: BT1, τ = 1
All Pre-adoption (1993-1999) Post-adoption (2000-2006) β0 0.032 (8.35)*** 0.033 (5.34)*** 0.034 (6.93)*** β2 0.638 (22.34)*** 0.597 (14.1)*** 0.652 (17.02)*** β3 0.610 (18.71)*** 0.605 (13.9)*** 0.582 (11.89)*** Adj. R2 0.470 0.470 0.485 N 946 431 515 F-stat 249.7 104.72 154.26 Panel C: BT2, τ = 1
All Pre-adoption (1993-1999) Post-adoption (2000-2006) β0 0.022 (4.8)*** 0.016 (2.65)*** 0.032 (4.79)*** β2 0.679 (19.98)*** 0.666 (15.05)*** 0.643 (12.75)*** β3 0.681 (18.82)*** 0.701 (15.42)*** 0.615 (11.12)*** Adj. R2 0.403 0.438 0.379 N 935 425 510 F-stat 203.55 124.77 81.25 Panel D: Full sample, τ = 2
All Pre-adoption (1993-1999) Post-adoption (2000-2005) β0 0.040 (11.96)*** 0.040 (9.08)*** 0.043 (9.38)*** β2 0.547 (19.36)*** 0.498 (14.76)*** 0.560 (13.66)*** β3 0.527 (18.82)*** 0.507 (15.59)*** 0.504 (11.73)*** Adj. R2 0.283 0.272 0.327 N 2499 1100 1399 F-stat 192.2 124.04 94.89 Panel E: BT1, τ = 2
All Pre-adoption (1993-1999) Post-adoption (2000-2005) β0 0.044 (9.85)*** 0.052 (7.16)*** 0.040 (7.47)*** β2 0.594 (18.46)*** 0.496 (10.04)*** 0.659 (15.59)*** β3 0.554 (14.48)*** 0.485 (8.98)*** 0.584 (10.28)*** Adj. R2 0.360 0.297 0.463 N 832 419 413 F-stat 170.83 51.14 129.58
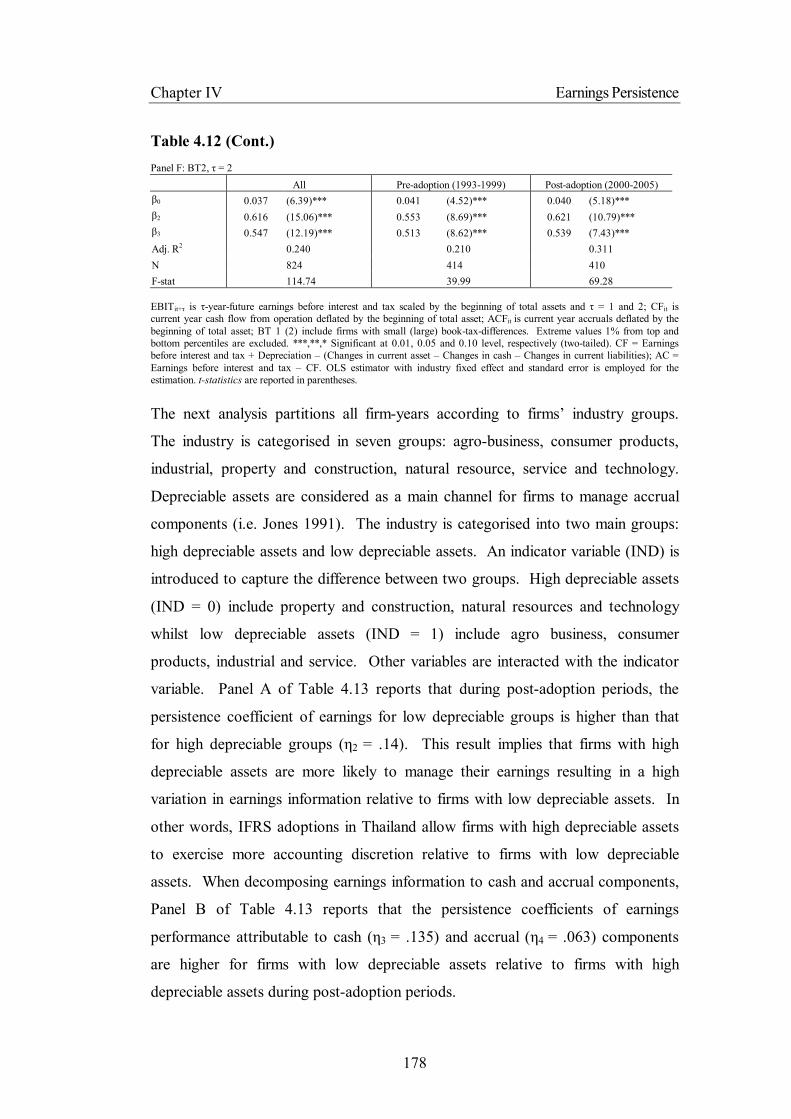
Chapter IV Earnings Persistence
178
Table 4.12 (Cont.) Panel F: BT2, τ = 2
All Pre-adoption (1993-1999) Post-adoption (2000-2005) β0 0.037 (6.39)*** 0.041 (4.52)*** 0.040 (5.18)*** β2 0.616 (15.06)*** 0.553 (8.69)*** 0.621 (10.79)*** β3 0.547 (12.19)*** 0.513 (8.62)*** 0.539 (7.43)*** Adj. R2 0.240 0.210 0.311 N 824 414 410 F-stat 114.74 39.99 69.28 EBITit+τ is τ-year-future earnings before interest and tax scaled by the beginning of total assets and τ = 1 and 2; CFit is current year cash flow from operation deflated by the beginning of total asset; ACFit is current year accruals deflated by the beginning of total asset; BT 1 (2) include firms with small (large) book-tax-differences. Extreme values 1% from top and bottom percentiles are excluded. ***,**,* Significant at 0.01, 0.05 and 0.10 level, respectively (two-tailed). CF = Earnings before interest and tax + Depreciation – (Changes in current asset – Changes in cash – Changes in current liabilities); AC = Earnings before interest and tax – CF. OLS estimator with industry fixed effect and standard error is employed for the estimation. t-statistics are reported in parentheses. The next analysis partitions all firm-years according to firms’ industry groups.
The industry is categorised in seven groups: agro-business, consumer products,
industrial, property and construction, natural resource, service and technology.
Depreciable assets are considered as a main channel for firms to manage accrual
components (i.e. Jones 1991). The industry is categorised into two main groups:
high depreciable assets and low depreciable assets. An indicator variable (IND) is
introduced to capture the difference between two groups. High depreciable assets
(IND = 0) include property and construction, natural resources and technology
whilst low depreciable assets (IND = 1) include agro business, consumer
products, industrial and service. Other variables are interacted with the indicator
variable. Panel A of Table 4.13 reports that during post-adoption periods, the
persistence coefficient of earnings for low depreciable groups is higher than that
for high depreciable groups (η2 = .14). This result implies that firms with high
depreciable assets are more likely to manage their earnings resulting in a high
variation in earnings information relative to firms with low depreciable assets. In
other words, IFRS adoptions in Thailand allow firms with high depreciable assets
to exercise more accounting discretion relative to firms with low depreciable
assets. When decomposing earnings information to cash and accrual components,
Panel B of Table 4.13 reports that the persistence coefficients of earnings
performance attributable to cash (η3 = .135) and accrual (η4 = .063) components
are higher for firms with low depreciable assets relative to firms with high
depreciable assets during post-adoption periods.
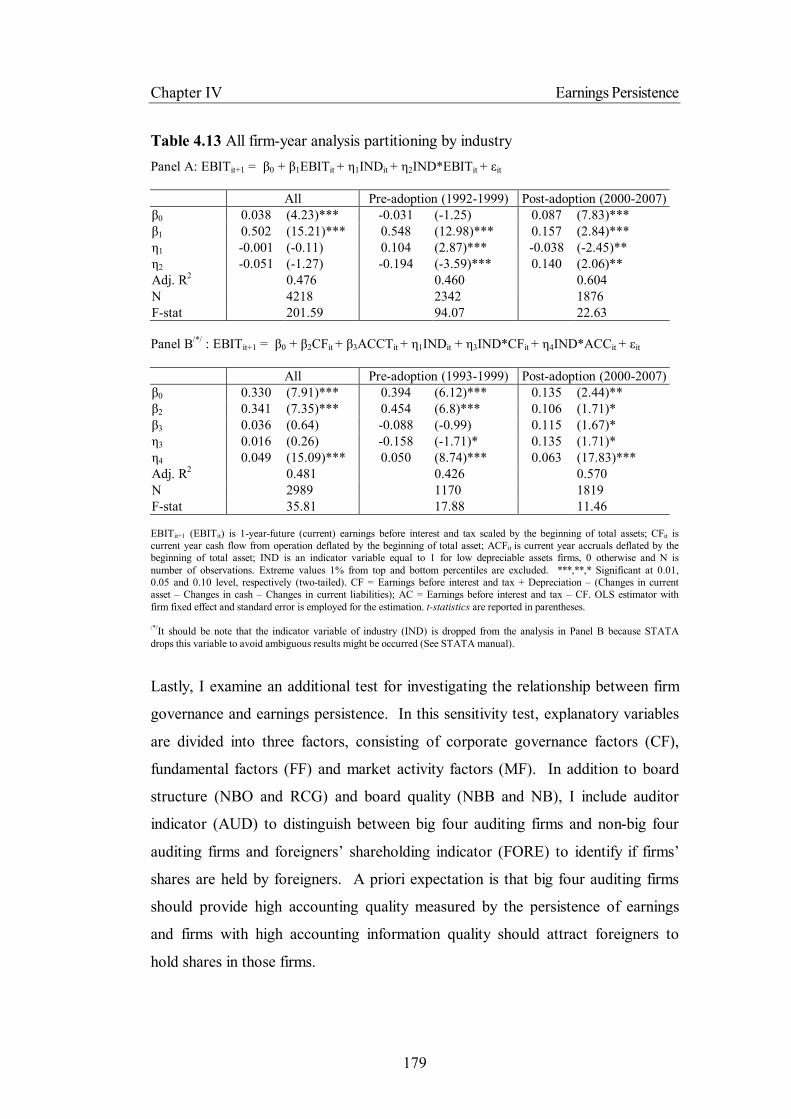
Chapter IV Earnings Persistence
179
Table 4.13 All firm-year analysis partitioning by industry Panel A: EBITit+1 = β0 + β1EBITit + η1INDit + η2IND*EBITit + εit
All Pre-adoption (1992-1999) Post-adoption (2000-2007) β0 0.038 (4.23)*** -0.031 (-1.25) 0.087 (7.83)*** β1 0.502 (15.21)*** 0.548 (12.98)*** 0.157 (2.84)*** η1 -0.001 (-0.11) 0.104 (2.87)*** -0.038 (-2.45)** η2 -0.051 (-1.27) -0.194 (-3.59)*** 0.140 (2.06)** Adj. R2 0.476 0.460 0.604 N 4218 2342 1876 F-stat 201.59 94.07 22.63 Panel B/*/ : EBITit+1 = β0 + β2CFit + β3ACCTit + η1INDit + η3IND*CFit + η4IND*ACCit + εit All Pre-adoption (1993-1999) Post-adoption (2000-2007) β0 0.330 (7.91)*** 0.394 (6.12)*** 0.135 (2.44)** β2 0.341 (7.35)*** 0.454 (6.8)*** 0.106 (1.71)* β3 0.036 (0.64) -0.088 (-0.99) 0.115 (1.67)* η3 0.016 (0.26) -0.158 (-1.71)* 0.135 (1.71)* η4 0.049 (15.09)*** 0.050 (8.74)*** 0.063 (17.83)*** Adj. R2 0.481 0.426 0.570 N 2989 1170 1819 F-stat 35.81 17.88 11.46 EBITit+1 (EBITit) is 1-year-future (current) earnings before interest and tax scaled by the beginning of total assets; CFit is current year cash flow from operation deflated by the beginning of total asset; ACFit is current year accruals deflated by the beginning of total asset; IND is an indicator variable equal to 1 for low depreciable assets firms, 0 otherwise and N is number of observations. Extreme values 1% from top and bottom percentiles are excluded. ***,**,* Significant at 0.01, 0.05 and 0.10 level, respectively (two-tailed). CF = Earnings before interest and tax + Depreciation – (Changes in current asset – Changes in cash – Changes in current liabilities); AC = Earnings before interest and tax – CF. OLS estimator with firm fixed effect and standard error is employed for the estimation. t-statistics are reported in parentheses. /*/It should be note that the indicator variable of industry (IND) is dropped from the analysis in Panel B because STATA drops this variable to avoid ambiguous results might be occurred (See STATA manual).
Lastly, I examine an additional test for investigating the relationship between firm
governance and earnings persistence. In this sensitivity test, explanatory variables
are divided into three factors, consisting of corporate governance factors (CF),
fundamental factors (FF) and market activity factors (MF). In addition to board
structure (NBO and RCG) and board quality (NBB and NB), I include auditor
indicator (AUD) to distinguish between big four auditing firms and non-big four
auditing firms and foreigners’ shareholding indicator (FORE) to identify if firms’
shares are held by foreigners. A priori expectation is that big four auditing firms
should provide high accounting quality measured by the persistence of earnings
and firms with high accounting information quality should attract foreigners to
hold shares in those firms.
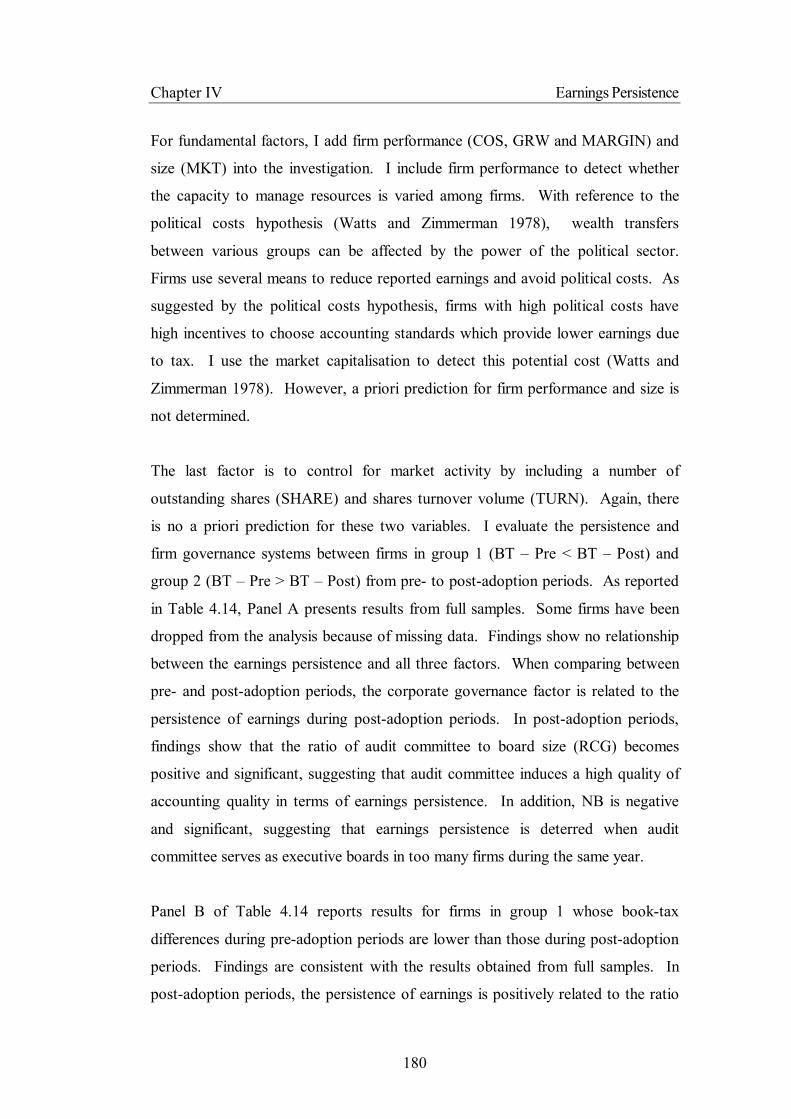
Chapter IV Earnings Persistence
180
For fundamental factors, I add firm performance (COS, GRW and MARGIN) and
size (MKT) into the investigation. I include firm performance to detect whether
the capacity to manage resources is varied among firms. With reference to the
political costs hypothesis (Watts and Zimmerman 1978), wealth transfers
between various groups can be affected by the power of the political sector.
Firms use several means to reduce reported earnings and avoid political costs. As
suggested by the political costs hypothesis, firms with high political costs have
high incentives to choose accounting standards which provide lower earnings due
to tax. I use the market capitalisation to detect this potential cost (Watts and
Zimmerman 1978). However, a priori prediction for firm performance and size is
not determined.
The last factor is to control for market activity by including a number of
outstanding shares (SHARE) and shares turnover volume (TURN). Again, there
is no a priori prediction for these two variables. I evaluate the persistence and
firm governance systems between firms in group 1 (BT – Pre < BT – Post) and
group 2 (BT – Pre > BT – Post) from pre- to post-adoption periods. As reported
in Table 4.14, Panel A presents results from full samples. Some firms have been
dropped from the analysis because of missing data. Findings show no relationship
between the earnings persistence and all three factors. When comparing between
pre- and post-adoption periods, the corporate governance factor is related to the
persistence of earnings during post-adoption periods. In post-adoption periods,
findings show that the ratio of audit committee to board size (RCG) becomes
positive and significant, suggesting that audit committee induces a high quality of
accounting quality in terms of earnings persistence. In addition, NB is negative
and significant, suggesting that earnings persistence is deterred when audit
committee serves as executive boards in too many firms during the same year.
Panel B of Table 4.14 reports results for firms in group 1 whose book-tax
differences during pre-adoption periods are lower than those during post-adoption
periods. Findings are consistent with the results obtained from full samples. In
post-adoption periods, the persistence of earnings is positively related to the ratio
Chapter IV Earnings Persistence
181
of audit committee to board size (RCG) whilst there is no relationship between the
persistence of earnings and corporate governance factors during pre-adoption
periods. Panel C of Table 4.14 reports results for firms in group 2 whose book-
tax differences during pre-adoption periods are higher than those during post-
adoption periods. Again, findings are consistent with the result obtained from full
samples and group 1. The corporate governance factor becomes important during
post-adoption periods, as suggested by the statistically significant results. The
result shows that the persistence of earnings is positively related to the ratio of
audit committee to board size (RCG). Firms employing big-four auditing firms
are more likely to have higher earnings persistence (measured by AUD). In
addition, NB is negative and significant, implying that the persistence of earnings
declines when audit committee serves as executive boards in too many firms.
In conclusion, these findings imply that board (NB) and corporate governance
(RCG) quality play a significant role and impact accounting quality in terms of
earnings persistence during post-adoption periods. The higher numbers of boards
that audit committee serves as board of directors in other firms during post-
adoption periods induce the lack of earnings persistence in the firm whilst the
larger ratio of audit committee to board size induces the higher persistence of
earnings.

Chapter IV Earnings Persistence
182
6
j = 1
5
j = 1 j = 1
2
Table 4.14 Robustness checks: Firm governance and earnings persistence
PERi = γ0 + Σ γjCFj, i + ΣφjFFj, i + ΣδjMFj, i + εi Panel A: Full samples
Pooled Pre-adoption (1995-1999) Post - adoption (2000-2004)
Coef. t value p value Coef. t value p value Coef. t value p value γ0 -0.116 -0.36 0.717 0.443 0.76 0.446 -0.701 -1.42 0.159 Governance factors NBO -0.005 -0.45 0.650 0.009 0.37 0.714 -0.014 -0.92 0.357 NBB 0.002 0.75 0.451 -0.004 -1.02 0.309 0.007 1.52 0.131 NB -0.003 -0.61 0.544 0.022 1.65 0.101 -0.014 -1.87 0.064 RCG 0.852 1.64 0.101 -1.299 -1.04 0.301 2.336 2.88 0.005 AUD 0.101 1.10 0.271 0.011 0.08 0.936 0.158 1.51 0.134 FORE -0.105 -1.15 0.253 -0.149 -1.07 0.285 -0.032 -0.27 0.787 Fundamental factors COS 0.053 0.19 0.853 -0.369 -0.88 0.380 0.402 1.26 0.211 GRW -0.099 -0.29 0.774 0.323 0.63 0.529 -0.010 -0.02 0.981 INV -0.099 -0.39 0.699 -0.426 -0.97 0.333 -0.164 -0.56 0.574 MKT 0.000 1.54 0.125 0.000 -0.08 0.939 0.000 1.15 0.251 MARGIN 0.020 0.12 0.906 0.108 0.47 0.640 0.339 0.81 0.417 Market activity factors SHARE -0.024 -0.97 0.334 0.000 0.02 0.987 -0.128 -2.12 0.035 TURN 0.000 1.23 0.220 0.004 2.29 0.024 0.000 -0.10 0.923 Adj. R2 0.009 -0.003 0.185 N 324 162 162 Panel B: Group 1
Pooled Pre-adoption (1995 - 1999) Post - adoption (2000 - 2004)
Coef. t value p value Coef. t value p value Coef. t value p value γ0 0.683 1.44 0.152 0.797 1.01 0.316 0.094 0.12 0.903 Governance factors NBO -0.010 -0.73 0.468 0.021 0.65 0.519 -0.023 -1.12 0.266 NBB 0.001 0.18 0.861 -0.006 -1.11 0.272 0.009 1.18 0.241 NB -0.002 -0.32 0.753 0.012 0.67 0.503 -0.012 -1.06 0.291 RCG 0.198 0.25 0.799 -1.369 -1.03 0.308 2.231 1.69 0.097 AUD 0.038 0.27 0.787 0.144 0.61 0.547 -0.147 -0.85 0.400 FORE -0.057 -0.48 0.631 -0.124 -0.73 0.470 0.055 0.32 0.751 Fundamental factors COS -0.385 -1.11 0.269 -0.647 -1.21 0.232 -0.161 -0.35 0.727 GRW 0.047 0.09 0.931 0.730 1.77 0.082 -0.475 -0.93 0.355 INV 0.096 0.34 0.738 -0.211 -0.56 0.578 0.298 0.97 0.338 MKT 0.000 2.77 0.006 0.000 -0.11 0.914 0.000 4.98 0.000 MARGIN -0.126 -0.68 0.497 0.019 0.09 0.926 -0.927 -1.53 0.130 Market activity factors SHARE -0.050 -1.41 0.161 -0.011 -0.66 0.509 -0.135 -1.88 0.065 TURN 0.000 1.28 0.201 0.002 1.28 0.206 0.000 -0.03 0.974 Adj. R2 0.027 -0.091 0.282 N 156 78 78
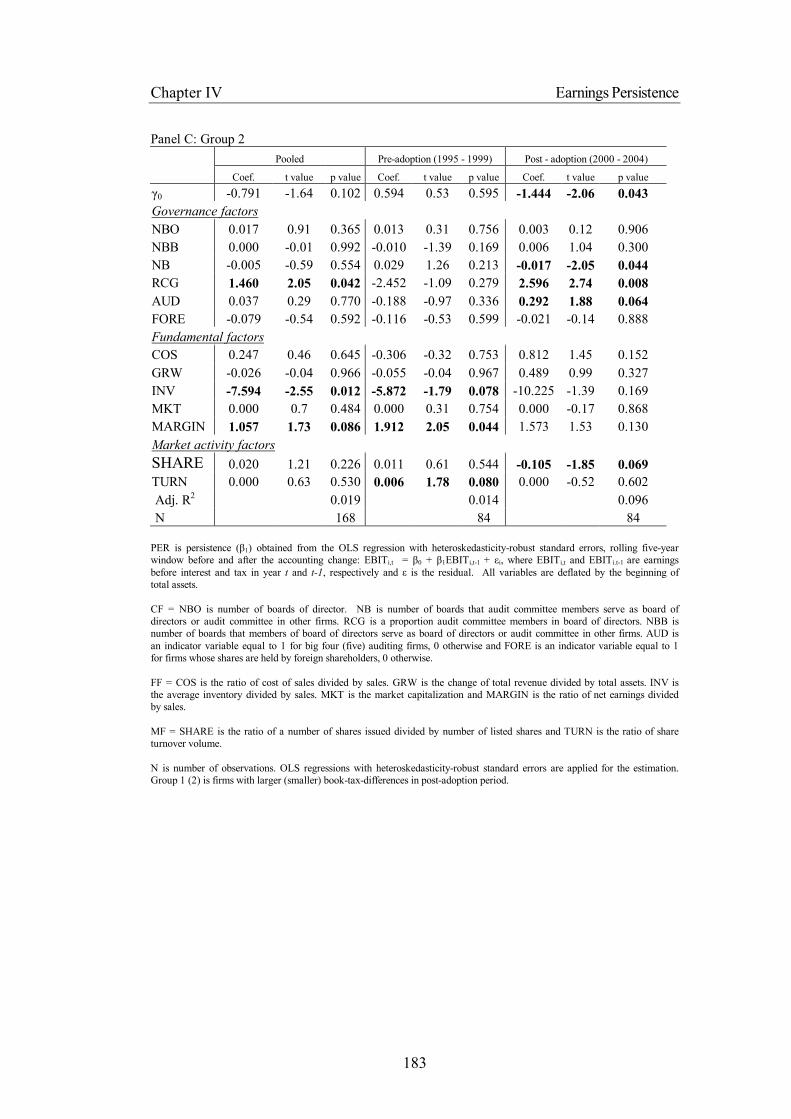
Chapter IV Earnings Persistence
183
Panel C: Group 2 Pooled Pre-adoption (1995 - 1999) Post - adoption (2000 - 2004)
Coef. t value p value Coef. t value p value Coef. t value p value γ0 -0.791 -1.64 0.102 0.594 0.53 0.595 -1.444 -2.06 0.043 Governance factors NBO 0.017 0.91 0.365 0.013 0.31 0.756 0.003 0.12 0.906 NBB 0.000 -0.01 0.992 -0.010 -1.39 0.169 0.006 1.04 0.300 NB -0.005 -0.59 0.554 0.029 1.26 0.213 -0.017 -2.05 0.044 RCG 1.460 2.05 0.042 -2.452 -1.09 0.279 2.596 2.74 0.008 AUD 0.037 0.29 0.770 -0.188 -0.97 0.336 0.292 1.88 0.064 FORE -0.079 -0.54 0.592 -0.116 -0.53 0.599 -0.021 -0.14 0.888 Fundamental factors COS 0.247 0.46 0.645 -0.306 -0.32 0.753 0.812 1.45 0.152 GRW -0.026 -0.04 0.966 -0.055 -0.04 0.967 0.489 0.99 0.327 INV -7.594 -2.55 0.012 -5.872 -1.79 0.078 -10.225 -1.39 0.169 MKT 0.000 0.7 0.484 0.000 0.31 0.754 0.000 -0.17 0.868 MARGIN 1.057 1.73 0.086 1.912 2.05 0.044 1.573 1.53 0.130 Market activity factors SHARE 0.020 1.21 0.226 0.011 0.61 0.544 -0.105 -1.85 0.069 TURN 0.000 0.63 0.530 0.006 1.78 0.080 0.000 -0.52 0.602 Adj. R2 0.019 0.014 0.096 N 168 84 84 PER is persistence (β1) obtained from the OLS regression with heteroskedasticity-robust standard errors, rolling five-year window before and after the accounting change: EBITi,t = β0 + β1EBITi,t-1 + εi, where EBITi,t and EBITi.t-1 are earnings before interest and tax in year t and t-1, respectively and ε is the residual. All variables are deflated by the beginning of total assets. CF = NBO is number of boards of director. NB is number of boards that audit committee members serve as board of directors or audit committee in other firms. RCG is a proportion audit committee members in board of directors. NBB is number of boards that members of board of directors serve as board of directors or audit committee in other firms. AUD is an indicator variable equal to 1 for big four (five) auditing firms, 0 otherwise and FORE is an indicator variable equal to 1 for firms whose shares are held by foreign shareholders, 0 otherwise. FF = COS is the ratio of cost of sales divided by sales. GRW is the change of total revenue divided by total assets. INV is the average inventory divided by sales. MKT is the market capitalization and MARGIN is the ratio of net earnings divided by sales. MF = SHARE is the ratio of a number of shares issued divided by number of listed shares and TURN is the ratio of share turnover volume. N is number of observations. OLS regressions with heteroskedasticity-robust standard errors are applied for the estimation. Group 1 (2) is firms with larger (smaller) book-tax-differences in post-adoption period.

Chapter IV Earnings Persistence
184
4.6 Chapter Summary This chapter presents the analysis of earnings persistence in Thailand. In the
analysis, earnings are also decomposed to cash flow and accrual components. By
using the longitudinal data, the results show that earnings persistence (estimated
by both earnings and earnings performance attributable to cash flows and
accruals) was enhanced after Thailand has adopted IFRS since 2000. These
findings support the hypothesis (H.4.1) that earnings persistence is enhanced after
the IFRS adoption in Thailand.
In addition, this analysis partitions the dataset into two groups according to their
magnitudes of book-tax differences. The data are categorised according to the
change in book-tax difference between pre- and post- IFRS adoption periods in
Thailand. The findings show that earnings persistence for firms whose book-tax
differences become larger during post-adoption periods (Group 1) is reduced
whilst earnings persistence for firms whose book-tax differences become smaller
during post-adoption periods (Group 2) is increased. This finding supports the
hypothesis (H.4.2).
However, the results must be interpreted with caution. Firstly, firms with high
earnings persistence may engage in the earnings smoothing. If firms are
smoothing their earnings, the reported earnings will not reflect firms’ underlying
economic performance. From the descriptive analysis, the earnings smoothing
activity is less likely for group 2 relative to group 1. In addition, the smoothed
earnings for firms in group 2 is more likely to decline from pre- to post-adoption
periods. This descriptive result should support the result that earnings persistence
for firms in group 2 is higher during post-adoption periods. Secondly, the
improvement of earnings persistence can be varied according to industry. The
robustness check reveals that earnings persistence has not been enhanced for
natural resource and high-tech firms. One explanation is that intangible assets and
research and development costs may influence reported earnings. Thirdly, the
persistence of earnings is a statistical property of earnings. It is not a direct link
Chapter IV Earnings Persistence
185
between accounting measurement methods and earnings quality. It is more
important for future research to search for indicators to directly link between
measurement methods and earnings quality to determine more insight about
earnings information.
This thesis argues that firm governance factors may induce the variation in
earnings persistence. Thus, the relationship between earnings persistence and
firm governance factors is examined. The result shows that audit committee and
corporate governance quality are related to the earnings persistence. These
findings support the hypothesis (H4.3) that earnings persistence varies according
to firm governance system, especially during post-adoption periods in Thailand.
However, this thesis does not detect the expertise of audit committee that may
impact on accounting quality. Future research may examine about the
relationship between expertise of audit committee and earnings quality in
Thailand.

Chapter 5
The Value Relevance of Earnings and Book Values
5.1 Introduction
5.2 Hypothesis Development
5.3 Research Methodology
5.4 Data
5.5 Results
5.6 Chapter Summary

Chapter V The Value Relevance of Earnings and Book Value
187
Chapter 5
The Value Relevance of Earnings and Book Value
5.1 Introduction The previous chapter reports the analysis of accounting quality in terms of
earnings persistence. Earnings persistence is to analyse the prediction ability of
earnings information. In particular, the previous chapter examines whether
current earnings are able to predict future earnings at the aggregated level. The
findings from the previous chapter suggest that earnings are more persistent after
the adoption of IFRS in Thailand. This chapter will present another aspect of the
accounting quality, namely the value relevance. It studies the association between
firm value and accounting summary measures, including book value and earnings.
This area of study is to investigate firms’ performance (through contemporaneous
share prices or returns) based on past measures (book value) or current
performances (reported earnings). The value relevance analysis attempts to
explain whether accounting numbers have facilitated users’ decision making. The
consequence of the value-relevant study, hence, refers to the study of whether
corporate financial information is useful.
In accounting-based valuation study, the fundamental analysis and valuation
study61 determines that “in an efficient market, firm value is defined as the present
value of expected future net cash flows, discounted at the appropriate risk-
adjusted rate of return” (Kothari 2001, pg.109). A firm’s current performance
shown in its financial statements has become an important input to the market’s
assessment of the firm’s future net cash flows and the firm’s market valuation.
The fundamental study expects a temporal relation between current financial
performance and future cash flows, as well as a contemporaneous relation
between financial performance and share return or share price. The major concern
of the fundamental analysis and valuation is aimed at identifying share mispricing
61 In the study of information content of the accounting number, the event study, a short-window study, is another widely-used method in empirical work.

Chapter V The Value Relevance of Earnings and Book Value
188
for investment purposes. Since valuation analysis focuses on forecasts of future
revenues, expenses, earnings and cash flows, one contends that financial
statements prepared by current accounting guidelines do not provide adequate
summary statistics for the forecast number. Kothari (2001, pg.172), however,
argued that financial statements in themselves are likely to be useful and accurate
indicators of market value when current accounting guidelines can capture
economic outcome.
In capital market research, Beaver (2002) argued that value-relevant accounting
research is a promising application study. The value relevance of accounting
information ascertains whether the accounting data are useful for valuing the firm
by studying the association between the accounting data and share prices
(Holthausen and Watts 2001). Lee (1999) argued that accounting information in
the firm valuation process is presumed to be superior in a normative sense
because the accounting data, appearing as independent variables, have provided
value relevance to explain contemporaneous share return or share price
determined as the dependent variable. By these notions, a number of prior
empirical studies (i.e. Barth et al. 2008) exploring accounting changes being
occurred in many countries have employed the fundamental analysis. This thesis
also interprets value-relevant information in this sense by investigating whether
value-relevant accounting information used to explain corporate share prices or
returns has been improved after the IFRS adoption in Thailand. The improvement
of value-relevant accounting information should encourage the investment in Thai
capital market.
Thailand, as one of emerging market countries, has long been developing its stock
exchange to support Thai business and economy. However, as is common for
emerging market countries, Thailand’s stock exchange can be considered as a less
efficient stock market. This reduces the ability of the share price to capturing
news exposed to the market, according to the anticipation of efficient market
hypothesis. Even though the assumption of the value relevance analysis requires
Chapter V The Value Relevance of Earnings and Book Value
189
that the market must be efficient, prior empirical studies of value relevance have
been silent on this matter (Aboody, Hughes and Liu 2002). As presented in
Chapter 3, much of prior research examines the value relevance of accounting
information in emerging market countries.
The remainder of this chapter is organised as follows. The development of
hypotheses is presented in section 5.2. Research methodology, data and results are
presented in section 5.3–5.5, respectively. Section 5.6 presents chapter summary.
5.2 Hypothesis Development In this thesis, I address whether value relevance is enhanced when converging the
domestic accounting system to international accounting standards in Thailand.
The hypothesis has been built from prior accounting research studies. Graham et
al. (2000) find that the value relevance of Thai book values and earnings declined
during the financial crisis. However, Davis-Friday et al. (2006) report that the
value relevance of earnings declined but the value relevance of book values
increased during the financial crisis. Prior studies (Graham et al. 2000; Davis-
Friday et al. 2006) suggest that Thai accounting information is value-relevant and
the value relevance of the Thai accounting summary measures reflects economic
consequences. It is controversial whether IFRS brings a higher quality of
earnings than domestic accounting standards due to country-specific factors
(Barth et al. 2008). In terms of the Thai accounting system, previously Thai
accounting standards had employed historical cost methods for preparing financial
statements. After the change in accounting system in Thailand, Thai firms are
required to employ fair value accounting system. For example, the firm is
required to estimate expected future cash flows (i.e. asset valuations). Based on
this requirement, the new accounting system in Thailand should increase the
usefulness of accounting information because it facilitates investors’ decision
making. In terms of the investment in capital market, share prices reflect the
market’s expectation of net cash flows. Thus, accounting information prepared by
the new accounting standard is informative for investors (Dechow and Schrand

Chapter V The Value Relevance of Earnings and Book Value
190
2004) because it contains information about future cash flows required by the
market. As a result, the new accounting standard improves accounting quality in
terms of the value relevance of accounting information. In addition, based on
Barth et al. (2008) and the previous discussion in Chapter 4 about the
improvement of earnings quality after the IFRS adoption in Thailand, I have a
priori prediction that the value relevance of accounting numbers is enhanced after
the accounting system change. I propose the following hypothesis, stated in an
alternative form.
H.5.1: The value relevance of accounting summary measures is enhanced
after the adoption of IFRS in Thailand.
Francis and Schipper (1999) suggest that strong contemporaneous association
between accounting numbers and stock price performance or market value reflects
higher value relevance of accounting information. I measure the association of
those variables by using the explanatory power (R2).62 In addition, following
Francis and Schipper (1999) and Lev and Zarowin (1999), I interpret earnings
response coefficients (ERC) for the firm’s valuation process. Even though the
value relevance of accounting numbers and earnings persistence views accounting
quality in different ways, both are indicators of accounting quality. Prior studies
report the value relevance of accounting information in different countries. For
example, Alford, Jones, Leftwich and Zmijewski (1993) find that the value
relevance of accounting information for Belgium, Canada, Hong Kong, Ireland,
Japan, Norway, South Africa, and Switzerland is inconclusive, as compared to the
value relevance of US accounting information. Arce and Mora (2002) find that
value relevance in the UK, a common law country, is lower than that in Belgium
and France, code law countries. Bartov et al. (2001a) find a superior value
62 Harris et al. (1994) report the R2 to evaluate the value relevance of accounting numbers in German firms vs. US firms. Graham et al. (2000) use the R2 to estimate the Thai value relevance. Dechow (1994) compares the association between returns and earnings and the association between returns and cash flows by using the R2. Francis and Schipper (1999) indicate the use of R2 in the value relevance analysis but the adjusted R2 is reported in their results. In this thesis, I will use the R2 to evaluate the value relevance in Thai firms (Van der Meulen et al. 2007), unless specified.
Chapter V The Value Relevance of Earnings and Book Value
191
relevance of earnings over cash flow for the US, the UK and Canada but not for
Germany and Japan. Ali and Hwang (2000) find that the value relevance of
accounting numbers is lower for bank-oriented countries and for countries when
tax rules influence financial reporting. When using tax rules for financial
statement purposes, Hanlon et al. (2005) report a 50 per cent loss in the
explanatory power of reported earnings. Hanlon et al. (2008) find that the
increase in book-tax conformity reduces earnings informativeness measured by
earnings response coefficients. The implication of these prior studies suggests
that the value relevance of earnings is lower in the tax-based accounting income
system.
Consistent with the analysis of earnings persistence, the sample firms will be
partitioned according to the pattern of book-tax differences (BT). Group 1
includes firms whose book-tax differences during pre-adoption periods are
smaller than those during post-adoption periods (BT – Pre-adoption < BT – Post-
adoption). Group 2 includes firms whose book-tax differences during pre-
adoption periods are larger than those during post-adoption periods (BT – Pre-
adoption > BT – Post-adoption).63 Based on Hanlon et al. (2008), ERC is
influenced by both bias (ƒ) and noise (e). In the absence of noise and bias, ERC is
normalised equal to 1, an unbiased estimate. I apply this structural model to
develop the hypothesis.64
Recall that IFRS adoption improves the value relevance of accounting summary
measures (Barth et al. 2008; Dechow and Schrand 2004, pg.102). Accordingly, in
the absence of noise and bias, accounting changes introduce increasing ERC in
post-adoption periods. In subsamples, if the two groups of firms use new 63 As previously discussed in Chapter 4 equation 4.5, this thesis calculates the book-tax difference by using the average value of book-tax differences over a 5-year period rather than the absolute value of book-tax differences. Furthermore, because the negative book-tax difference firm contains the firm with negative earnings, Hayn (1995) reports that the value relevance for negative earnings firms is significantly lower than the value relevance of positive earnings firms. Thus, if using the absolute value of book-tax differences, the problem of information loss may occur. 64 Hanlon et al. (2008) summarise that
b = ERC, Xt = earnings, e = noise, and ƒ = bias. When e and ƒ = 0, then b = σx
2/σx2 = 1.
Chapter V The Value Relevance of Earnings and Book Value
192
accounting standards to convey firms’ performance (bias = 0), ERC in post-
adoption for both groups of firms increases (at noise = 0). Nevertheless, if bias
and noise in pre-adoption periods of the two groups of firms are held to be equal,
in post-adoption periods at bias = 0 and noise > 0, noise in post-adoption periods
for firms in group 1 (i.e. being of higher tax activity) is higher than noise in post-
adoption periods for firms in group 2 (i.e. being of lower tax activity). As a result,
the increase in earnings informativeness for firms in group 1 is lower than the
increase in earnings informativeness for firms in group 2. In addition, as it is
difficult to reduce taxable income and simultaneously increase book income
(Guenther et al. 1997), in post-adopton periods, noise is still lower for firms in
group 2 even if the two groups of firms engage in earnings manipulation (either
bias < 0 or > 0 results in noise (group 2) < noise (group 1)). I propose the next
hypothesis as follows, stated in the alternative form.
H.5.2: When comparing between pre- and post-adoption periods, the
value relevance is related to the book-tax difference.
As previously discussed about the important role of firm governance systems and
accounting quality in Chapter 4, I attempt to explore the relationship between
value relevance and firm governance system. Based on the hypothesis H.4.3 in
Chapter 4, I hypothesise in the alternative form that:
H.5.3: The value relevance varies according to the firm governance
system.
5.3 Research Methodology In general, the method used to estimate the value relevance of accounting
information is open-ended. This thesis employs a long-window study for value
relevance analysis. Following Francis and Schipper (1999) and Lev and Zarowin
(1999), I define value relevance as the association between accounting numbers
and market values (and returns). I also interpret the earnings response coefficient
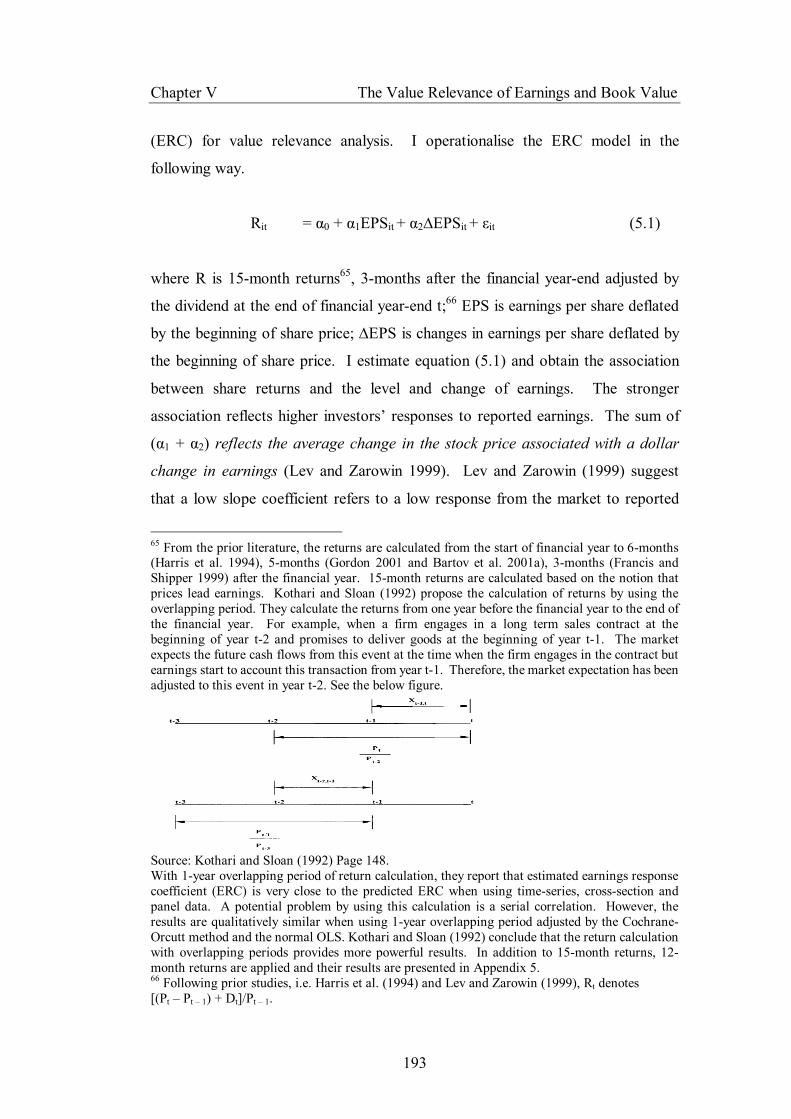
Chapter V The Value Relevance of Earnings and Book Value
193
(ERC) for value relevance analysis. I operationalise the ERC model in the
following way.
Rit = α0 + α1EPSit + α2∆EPSit + εit (5.1)
where R is 15-month returns65, 3-months after the financial year-end adjusted by
the dividend at the end of financial year-end t;66 EPS is earnings per share deflated
by the beginning of share price; ∆EPS is changes in earnings per share deflated by
the beginning of share price. I estimate equation (5.1) and obtain the association
between share returns and the level and change of earnings. The stronger
association reflects higher investors’ responses to reported earnings. The sum of
(α1 + α2) reflects the average change in the stock price associated with a dollar
change in earnings (Lev and Zarowin 1999). Lev and Zarowin (1999) suggest
that a low slope coefficient refers to a low response from the market to reported
65 From the prior literature, the returns are calculated from the start of financial year to 6-months (Harris et al. 1994), 5-months (Gordon 2001 and Bartov et al. 2001a), 3-months (Francis and Shipper 1999) after the financial year. 15-month returns are calculated based on the notion that prices lead earnings. Kothari and Sloan (1992) propose the calculation of returns by using the overlapping period. They calculate the returns from one year before the financial year to the end of the financial year. For example, when a firm engages in a long term sales contract at the beginning of year t-2 and promises to deliver goods at the beginning of year t-1. The market expects the future cash flows from this event at the time when the firm engages in the contract but earnings start to account this transaction from year t-1. Therefore, the market expectation has been adjusted to this event in year t-2. See the below figure.
Source: Kothari and Sloan (1992) Page 148. With 1-year overlapping period of return calculation, they report that estimated earnings response coefficient (ERC) is very close to the predicted ERC when using time-series, cross-section and panel data. A potential problem by using this calculation is a serial correlation. However, the results are qualitatively similar when using 1-year overlapping period adjusted by the Cochrane-Orcutt method and the normal OLS. Kothari and Sloan (1992) conclude that the return calculation with overlapping periods provides more powerful results. In addition to 15-month returns, 12-month returns are applied and their results are presented in Appendix 5. 66 Following prior studies, i.e. Harris et al. (1994) and Lev and Zarowin (1999), Rt denotes [(Pt – Pt – 1) + Dt]/Pt – 1.
Chapter V The Value Relevance of Earnings and Book Value
194
earnings because the investor’s belief is that reported earnings are probably
transitory or manipulated. A large change in share price associated with reported
earnings reflects investors’ belief that reported earnings are permanent.
Accordingly, low (high) slope coefficient reflects low (high) informativeness of
reported earnings.
In addition, I employ a price model for the value relevance analysis. Based on the
prior research previously described in Chapter 3, I employ Ohlson’s price
valuation model. I operationalise the model in the following way:
Pit = γ0 + γ1EPSit + γ2BVPSit + εit (5.2)
where P is stock price 3 months after the financial year-end (Francis and Schipper
1999); EPS is earnings per share and BVPS is book value per share. All three
variables are scaled by the beginning of share price. Consistent with the
estimation in equation (5.1), I run equation (5.2) to obtain the association between
market value and accounting numbers. I also compare the explanatory power by
using the Cramer procedure (Cramer 1987, Lang, Raedy and Wilson 2006 and
Lang, Raedy and Yetman 2003) as derived by Harris et al. (1994).67 OLS firm
fixed effect estimators with heteroskedasticity-robust standard errors are applied
to estimate equation (5.1) and (5.2).
Based on the discussion in Chapter 4, I regress the value relevance on firm
governance variables to determine the relationship between firm governance
systems the informativeness of accounting numbers. The model is operationalised
as follows:
67 z-statistics are computed as (see footnote 38, Harris et al. 1994):
, where σ2 is obtained from the Cramer procedure (Cramer 1987). I am grateful to Professor Mars (J.S) Cramer for providing the GAUSS syntax to run the Cramer procedure.
Chapter V The Value Relevance of Earnings and Book Value
195
VRi = β0 + β1NBOi + β2NBBi + β3NBi + β4RCGi + β5ROAi + β6MKTi + εi
(5.3)
where VR is value relevance obtained from the explanatory power (R2) obtained
from equation (5.1) or earnings response coefficients (ERC); both are calculated
by using 5-year window before and after the IFRS adoption. NBO is a median of
number of boards of directors. NBB is a median of number of boards on which
members of board of directors serve as board of directors or audit committee in
other firms. NB is a median of number of boards on which audit committee
members serve as board of directors or audit committee in other firms. RCG is a
mean of a proportion of audit committee members in board of directors. Control
variables include return on assets (ROA) and market capitalization (MKT). OLS
estimators with heteroskedasticity-robust standard errors are applied to estimate
the equation (5.3). As already discussed in Chapter 4, a priori expectations about
the relationship between value relevance and firm governance factors are not
determined.
5.4 Data I use non-financial firms listed on SET during the period 1995–2004. All sample
firms have December financial year-ended. There are 120 constant firms (1200
firm-years) for the analysis of earnings response coefficient and 97 constant firms
(970 firm-years) for price model analysis. Table 5.1 presents a distribution of
firms classified by their industry. Consistent with the data constructed in Chapter
4, group 1 includes the sample firms whose book-tax differences during pre-
adoption periods are smaller than book-tax differences during post-adoption
periods (BT-Pre-adoption:1995–1999 < BT-Post-adoption: 2000–2004), whilst
group 2 includes the sample firms whose book-tax differences during pre-
adoption periods are larger than book-tax differences during post-adoption periods
(BT-Pre-adoption: 1995–1999 > BT-Post-adoption: 2000–2004). All firms in this
analysis have been in the same industry group for the whole testing period. To
calculate the book-tax difference, the missing value of taxable income will be set
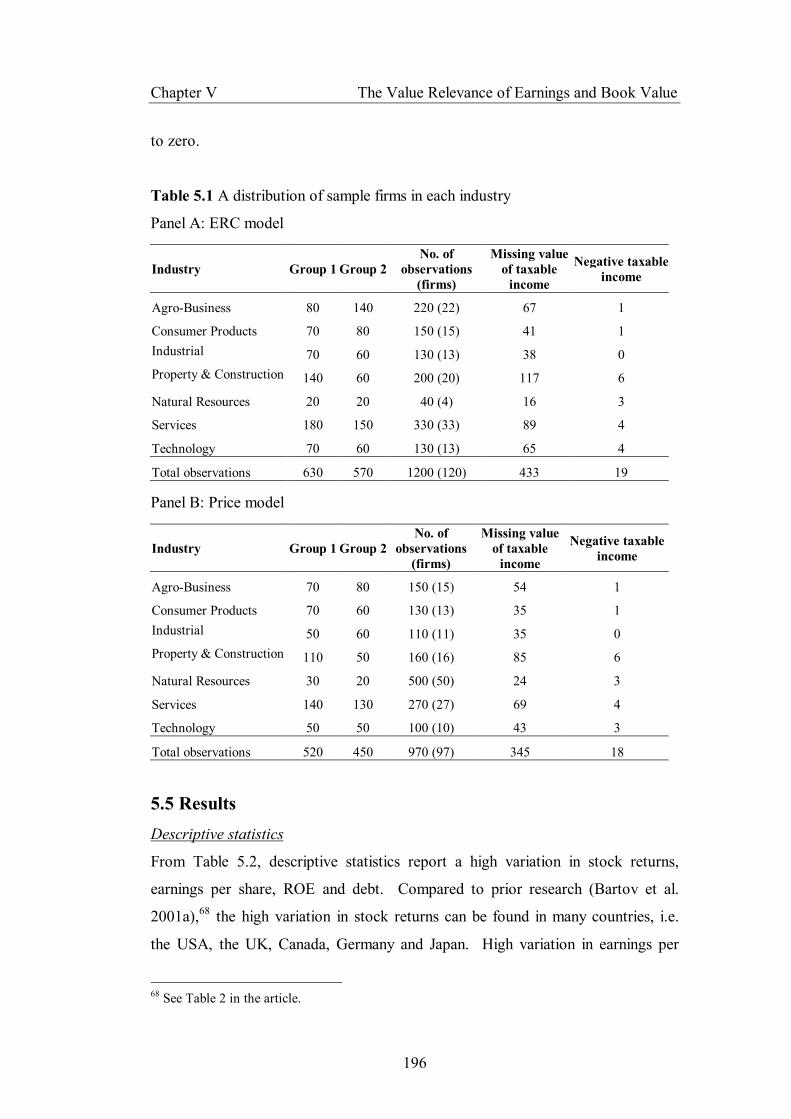
Chapter V The Value Relevance of Earnings and Book Value
196
to zero.
Table 5.1 A distribution of sample firms in each industry
Panel A: ERC model
Industry Group 1 Group 2 No. of
observations (firms)
Missing value of taxable
income
Negative taxable income
Agro-Business 80 140 220 (22) 67 1
Consumer Products 70 80 150 (15) 41 1 Industrial 70 60 130 (13) 38 0 Property & Construction 140 60 200 (20) 117 6
Natural Resources 20 20 40 (4) 16 3
Services 180 150 330 (33) 89 4
Technology 70 60 130 (13) 65 4
Total observations 630 570 1200 (120) 433 19 Panel B: Price model
Industry Group 1 Group 2 No. of
observations (firms)
Missing value of taxable
income
Negative taxable income
Agro-Business 70 80 150 (15) 54 1
Consumer Products 70 60 130 (13) 35 1 Industrial 50 60 110 (11) 35 0 Property & Construction 110 50 160 (16) 85 6
Natural Resources 30 20 500 (50) 24 3
Services 140 130 270 (27) 69 4
Technology 50 50 100 (10) 43 3
Total observations 520 450 970 (97) 345 18
5.5 Results Descriptive statistics
From Table 5.2, descriptive statistics report a high variation in stock returns,
earnings per share, ROE and debt. Compared to prior research (Bartov et al.
2001a),68 the high variation in stock returns can be found in many countries, i.e.
the USA, the UK, Canada, Germany and Japan. High variation in earnings per
68 See Table 2 in the article.

Chapter V The Value Relevance of Earnings and Book Value
197
share and book value can be found in Germany, Belgium and Italy (Barniv and
Myring 2006).69 On average, the sample firms have 15 members on their boards.
On average, one director serves as executive committee on 48 boards during the
testing periods. In particular, one audit committee member serves as executive
committee on 18 boards during the testing period. This high figure represents a
high reputation of board of directors, however the quality of work is more likely
to decline according to time constraints. Because standard deviations are smaller
than means, on average it implies small variations of firm governance systems
among sample firms.
Table 5.2 Descriptive statistics
Mean Median SD 25th Percentile 75th Percentile N Earnings response coefficients (ERC) model R 0.178 -0.006 0.933 -0.384 0.433 1200 EPS 0.020 0.072 0.763 0.003 0.176 1200 ∆EPS 0.182 -0.001 1.847 -0.096 0.080 1200 Price model P 1.140 0.953 0.944 0.586 1.364 970 EPS 0.037 0.072 0.651 0.004 0.172 970 BVPS 1.391 1.012 1.524 0.505 1.790 970 Value relevance and firm governance VR_R2 0.674 0.761 0.286 0.450 0.926 238 VR_ERC 2.666 1.305 4.992 0.024 3.860 238 NBO 15.437 15 4.700 12 18 238 NBB 48.521 45 27.774 27 64 238 NB 18.374 14 14.818 7 25 238 RCG 0.304 0.295 0.114 0.216 0.378 238 ROA 0.034 0.039 0.065 -0.004 0.074 238 MKT 69.3 129 207 43 424 238 R is 15-month dividend adjusted returns, 3-month after the financial year-end deflated by the beginning of share price; EPS is earnings per share scaled by the beginning of share price; ∆EPS is the change in earnings per share scaled by the beginning of share price; P is stock price 3-month after the financial year-end deflated by the beginning of share price; BVPS is book value per share scaled by the beginning of share price. VR is value relevance – VR_ R2 is r-squared and VR_ERC is earnings response coefficient. NBO is number of boards of director. NB is number of boards that audit committee members serve as board of directors or audit committee in other firms. RCG is a proportion audit committee members in board of directors. NBB is number of boards that members of board of directors serve as board of directors or audit committee in other firms. ROA is return on assets; MKT (‘00,000,000) is market capitalization. SD is standard deviation and N is number of observations.
69 See Table 1 in the article.
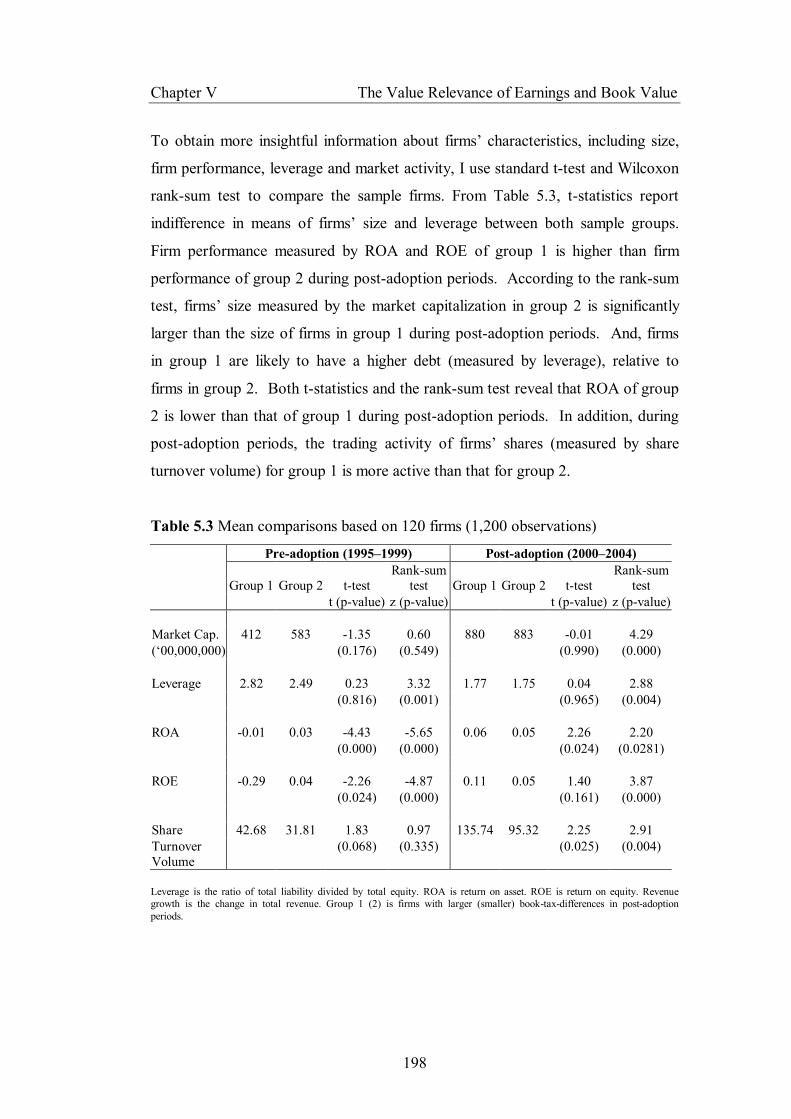
Chapter V The Value Relevance of Earnings and Book Value
198
To obtain more insightful information about firms’ characteristics, including size,
firm performance, leverage and market activity, I use standard t-test and Wilcoxon
rank-sum test to compare the sample firms. From Table 5.3, t-statistics report
indifference in means of firms’ size and leverage between both sample groups.
Firm performance measured by ROA and ROE of group 1 is higher than firm
performance of group 2 during post-adoption periods. According to the rank-sum
test, firms’ size measured by the market capitalization in group 2 is significantly
larger than the size of firms in group 1 during post-adoption periods. And, firms
in group 1 are likely to have a higher debt (measured by leverage), relative to
firms in group 2. Both t-statistics and the rank-sum test reveal that ROA of group
2 is lower than that of group 1 during post-adoption periods. In addition, during
post-adoption periods, the trading activity of firms’ shares (measured by share
turnover volume) for group 1 is more active than that for group 2.
Table 5.3 Mean comparisons based on 120 firms (1,200 observations)
Pre-adoption (1995–1999) Post-adoption (2000–2004)
Group 1 Group 2 t-test Rank-sum
test Group 1 Group 2 t-test Rank-sum
test t (p-value) z (p-value) t (p-value) z (p-value) Market Cap. 412 583 -1.35 0.60 880 883 -0.01 4.29 (‘00,000,000) (0.176) (0.549) (0.990) (0.000) Leverage 2.82 2.49 0.23 3.32 1.77 1.75 0.04 2.88 (0.816) (0.001) (0.965) (0.004) ROA -0.01 0.03 -4.43 -5.65 0.06 0.05 2.26 2.20 (0.000) (0.000) (0.024) (0.0281) ROE -0.29 0.04 -2.26 -4.87 0.11 0.05 1.40 3.87 (0.024) (0.000) (0.161) (0.000) Share 42.68 31.81 1.83 0.97 135.74 95.32 2.25 2.91 Turnover Volume (0.068) (0.335) (0.025) (0.004)
Leverage is the ratio of total liability divided by total equity. ROA is return on asset. ROE is return on equity. Revenue growth is the change in total revenue. Group 1 (2) is firms with larger (smaller) book-tax-differences in post-adoption periods.
Chapter V The Value Relevance of Earnings and Book Value
199
Table 5.4 presents results from Pearson and Spearman correlations. Stock returns
highly correlate with the level and change in earnings. Stock price highly
correlates with net earnings and book value. The value relevance measured by R2
and ERC is positively correlated with firm performance (ROA). ERC is
positively correlated with the quality of audit committee measured by NB and
firm size measured by market capitalization.
Main results
Table 5.5 presents the association between stock returns and earnings measured
by the explanatory power – R2 (Lang, Raedy and Wilson 2006; Van der Meulen et
al. 2007).70 In Panel A, the value relevance for firms in group 1 (17.1%) is higher
than the value relevance for firms in group 2 (13.9%). However, ERC for firms in
group 2 (.512) is greater than ERC for firms in group 1 (.247). As reported in
Panel B, results for full samples reveal that on average the association between
stock returns and earnings information increases from 22.8% in pre-adoption
periods to 30% in post-adoption periods, implying that earnings in post-adoption
periods explain the variation in market returns better than do earnings in pre-
adoption periods, increasing by 31.58% [(.30 –.228)/.228] on average from pre-
adoption periods. Earnings response coefficient (ERC) increases from .006 points
in pre-adoption periods to .841 points in post-adoption periods.71 ERC between
those periods increases by 139.16 times [(.841 – .006)/.006] on average.
70 Qualitatively similar results are obtained when using the adjusted R2. The adjusted R2 is also reported in the parenthesis. However, the magnitude of the adjusted R2 (i.e. Table 5.5, 1.7%) is much smaller than R2 (i.e. Table 5.5, 11.6%). This is consistent with prior studies that the adjusted R2 in returns-earnings model is low. For example, Chen and Wang (2004) report the adjusted R2
about 4% – 12% for returns-earnings model and 8% – 45% for price model in Chinese firms (see Table 4 in the article). 71 ERC in the Thai firm is smaller than ERC in the UK (see Table 2, Donnelly 2002) and USA (see Table 3, Francis and Schipper 1999).
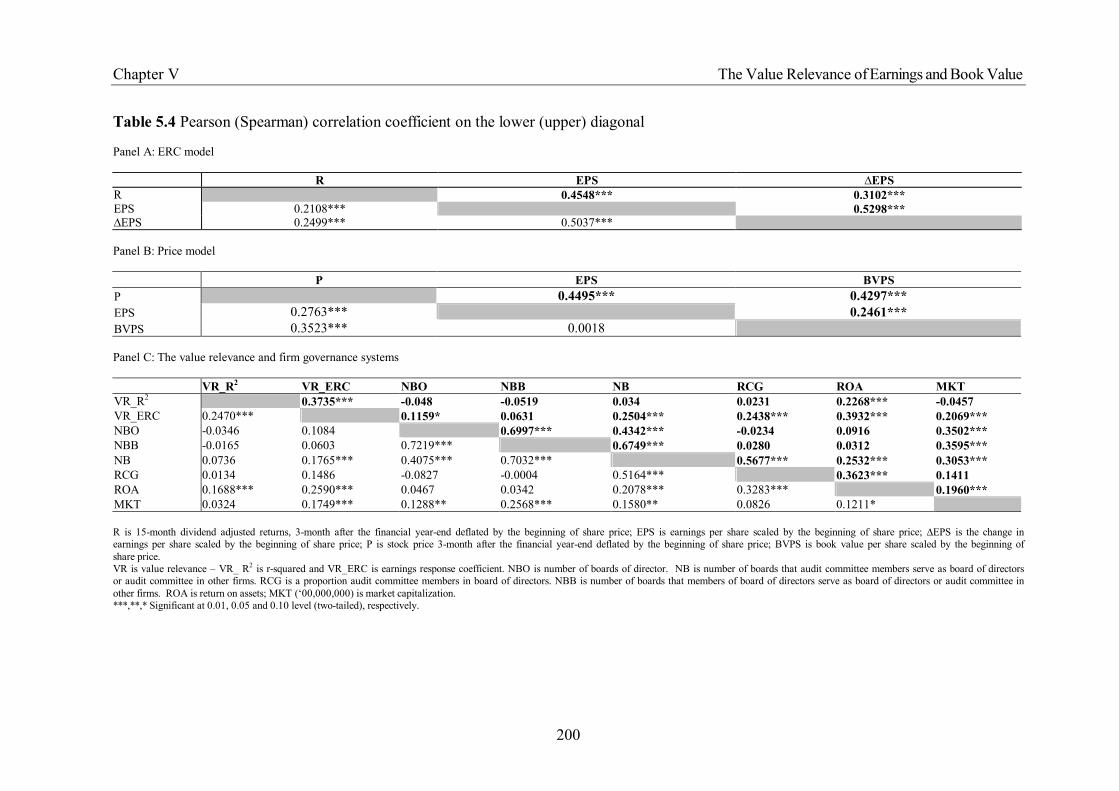
Chapter V The Value Relevance of Earnings and Book Value
200
Table 5.4 Pearson (Spearman) correlation coefficient on the lower (upper) diagonal Panel A: ERC model
R EPS ∆EPS R 0.4548*** 0.3102*** EPS 0.2108*** 0.5298*** ∆EPS 0.2499*** 0.5037*** Panel B: Price model P EPS BVPS P 0.4495*** 0.4297*** EPS 0.2763*** 0.2461*** BVPS 0.3523*** 0.0018 Panel C: The value relevance and firm governance systems VR_R2 VR_ERC NBO NBB NB RCG ROA MKT VR_R2 0.3735*** -0.048 -0.0519 0.034 0.0231 0.2268*** -0.0457 VR_ERC 0.2470*** 0.1159* 0.0631 0.2504*** 0.2438*** 0.3932*** 0.2069*** NBO -0.0346 0.1084 0.6997*** 0.4342*** -0.0234 0.0916 0.3502*** NBB -0.0165 0.0603 0.7219*** 0.6749*** 0.0280 0.0312 0.3595*** NB 0.0736 0.1765*** 0.4075*** 0.7032*** 0.5677*** 0.2532*** 0.3053*** RCG 0.0134 0.1486 -0.0827 -0.0004 0.5164*** 0.3623*** 0.1411 ROA 0.1688*** 0.2590*** 0.0467 0.0342 0.2078*** 0.3283*** 0.1960*** MKT 0.0324 0.1749*** 0.1288** 0.2568*** 0.1580** 0.0826 0.1211* R is 15-month dividend adjusted returns, 3-month after the financial year-end deflated by the beginning of share price; EPS is earnings per share scaled by the beginning of share price; ∆EPS is the change in earnings per share scaled by the beginning of share price; P is stock price 3-month after the financial year-end deflated by the beginning of share price; BVPS is book value per share scaled by the beginning of share price. VR is value relevance – VR_ R2 is r-squared and VR_ERC is earnings response coefficient. NBO is number of boards of director. NB is number of boards that audit committee members serve as board of directors or audit committee in other firms. RCG is a proportion audit committee members in board of directors. NBB is number of boards that members of board of directors serve as board of directors or audit committee in other firms. ROA is return on assets; MKT (‘00,000,000) is market capitalization. ***,**,* Significant at 0.01, 0.05 and 0.10 level (two-tailed), respectively.
Chapter V The Value Relevance of Earnings and Book Value
201
An average association between stock returns and earnings for firms with larger
book-tax differences (group 1) decreases from 34.6% to 30.4%. The value
relevance for firms with larger book-tax differences decreases by 12.14% [(.304 –
.346)/.346] on average. For firms with smaller book-tax differences (group 2),
earnings have a higher ability to explain market returns variation during post-
adoption periods that the coefficient of determination increases from 15.3% to
30.6%. The value relevance for firms with smaller book-tax differences improves
by 1 [(.306 – .153)/.153] time on average. z-statistics report the highly significant
difference in R2 between pre- and post-adoption periods for pooled-data and
group 2, suggesting that the implemented new accounting standard in Thailand
substantially improves the value relevance of accounting information for firms in
group 2. Nevertheless, the value relevance of accounting numbers for firms in
group 1 declines from pre- to post-adoption periods but it is not statistically
significant as measured by z-stat (= -1.299). ERC for firms in group 1 increases
from .037 points72 in pre-adoption periods to 0.976 points in post-adoption
periods. The improvement of ERC increases by on average 25.38 [(0.976 –
.037)/.037] times for firms in group 1. ERC for firms in group 2 improves from
.35 points from pre-adoption periods to .685 points in post-adoption periods. The
enhancement of ERC increases by on average 0.96 [(.685 – .35)/.35] times for
firms in group 2.
Overall results, the ability of earnings to explain market returns has increased
during post-adoption periods. In addition, a higher slope of ERC indicates that
earnings are of higher informativeness to investors, irrespective of the effect of
other information sources (Francis and Schipper 1999). According to Lev and
Zarowin (1999), ERC complements the inferences based on declining (increasing)
the R2. Other information, i.e. news about new accounting standards
implemented, with no change in earnings informativeness may induce the decline
(or increase) of the earnings ability to explain the variation in market returns.
Based on Lev and Zarowin (1999), I interpret the results that the higher ERC is
72 Very low ERC for group 1 during pre-adoption periods is due to the negative coefficient estimate of EPS and low value of coefficient estimate of ∆EPS.

Chapter V The Value Relevance of Earnings and Book Value
202
driven by the investors’ belief that earnings prepared by old accounting standards
are highly transitory compared to earnings prepared by new accounting standards,
resulting in the ERC adjustment being made by the market. The higher
explanation power of earnings information on the variation in market returns is
driven by the investors’ belief that earnings prepared by new accounting standards
reflect performance of the firm more accurately.73
Table 5.5 Earnings response coefficients (ERC): OLS estimation with firm-fixed effect and heteroskedasticity-robust standard errors
Rit = α0 + α1EPSit+ α2∆EPSit + εit
Panel A
Pooled Group 1 Group 2 ERC 0.229 0.247 0.512 R2 0.116 0.171 0.139 Adj. R2 (0.017) (0.077) (0.042) N 1200 630 570 Panel B
Pooled Group 1 Group 2 Pre Post Pre Post Pre Post
ERC 0.006 0.841 0.037 0.976 0.350 0.685 R2 0.228 0.300 0.346 0.304 0.153 0.306 Adj. R2 (0.032) (0.123) (0.179) (0.126) (-0.065) (0.128) N 600 600 315 315 285 285 z stat* 3.462 -1.299 5.487 ERC is earnings response coefficients (α1 + α2); R is 15-month dividend adjusted returns, 3-month after financial year-end; EPS is earnings per share; ∆EPS is changes in earnings per share. All variables are deflated by the beginning of share price. N is a number of observations. Pre = 1995 – 1999 and Post = 2000 – 2004. Group 1 (2) is firms with larger (smaller) book-tax-differences in post-adoption periods. * z-statistics are reported to compare the difference of R2 between pre- and post-adoption periods.
73 Table 5.5, Panel A reports that firms in group 1 have higher R2 but lower ERC compared to firms in group 2. This shows that the increase of R2 does not reflect the increase of ERC or vice versa. (see Lev and Zarowin (1999) Table 1 and Goncharov et al. (2006) Table 4 and 7 for qualitatively similar findings). In addition, qualitatively similar results are obtained when the returns are calculated over 12-months starting from 9-months before and 3-months after the financial year (see appendix 5).
Chapter V The Value Relevance of Earnings and Book Value
203
Table 5.6 presents the result obtained from the price model. Panel A reports that
the value relevance for firms in group 1 (31.9%) is greater than the value
relevance for firms in group 2 (21.5%). This result is consistent with the
explanatory power estimated by the ERC model. For pooled-data, results indicate
that $1 of earnings (book value) corresponds to $0.41 ($0.29) of market value. In
subsamples, $1 of earnings (book value) corresponds to $0.52 ($0.30) of market
value for firms in group 1 and $1 of earnings (book value) corresponds to $0.20
($0.29) of market value for firms in group 2.
When evaluating the improvement of value relevance of accounting summary
measures, the result as presented in Panel B of Table 5.6 reports that value
relevance (R2) is enhanced from pre- to post-adoption periods, 29.5% to 47.6%,
respectively. The value relevance increases by 61.36% on average [(.476 –
.295)/.295]. The coefficient of earnings and book value per share is larger from
pre- to post-adoption periods. z-statistics suggest that the improvement of value
relevance between two periods is statistically significant. Panel C and Panel D
report the value relevance for firms in group 1 and 2, respectively, during pre- and
post-adoption periods. The value relevance of accounting numbers for firms in
group 1 improves from 34.2% to 52.2% between the two periods, increasing by
52.63% [(.522 – .342)/.342] on average. The value relevance of earnings and
book value for firms in group 2 also improves from 22.8% to 43.4% between the
two periods, increasing by 90.35% [(.434 – .228/.228)] on average.
The higher coefficients of earnings and book value per share during IFRS post-
adoption periods suggest that earnings and book value information correspond to
market values higher than that during IFRS pre-adoptions. However, the
coefficient estimate of book value information of group 1 declines during post-
adoption periods. Additionally, z-statistics reveal that the improvement of value
relevance of earnings and book values between the two periods for full samples
and both subgroups is highly significant. It should be noted that qualitatively
similar results as reported in Table 5.5 and 5.6 are also obtained when book-tax
Chapter V The Value Relevance of Earnings and Book Value
204
differences are calculated from consolidated financial statements.74 In conclusion,
the results indicate that value relevance has enhanced after IFRS adoptions,
supporting the hypothesis (H.5.1). The improvement of value relevance for firms
with larger book-tax differences (group 1) is lower than the improvement of value
relevance for firms with smaller book-tax differences (group 2). These findings
support the hypothesis (H.5.2).
The value relevance and firm governance
As reported in Table 5.7, I regress the value relevance on firm governance proxies
to determine whether the alteration of value relevance for firms in both subgroups
is related to firm governance systems. From Panel A, value relevance is estimated
by the explanatory power obtained from the equation (1). For pooled-data,
findings report that the association between the value relevance of accounting
summary measures and firm governance systems is more pronounced during post-
adoption periods, relative to pre-adoption periods. Value relevance is positively
related to NB but negatively related to RCG.
From Panel B, findings report that for firms in group 1, the value relevance is
significantly improved during post-adoption periods (measured by β0) without
other information sources but not varied with firm governance factors both pre-
and post-adoption years. For firms in group 2 presented in Panel C, value
relevance is significantly improved during post-adoption periods (measured by β0)
without other information sources. During post-adoption periods, value relevance
for firms in group 2 relates to the quality of board (measured by NBB) and audit
committee (measured by NB) and firm governance quality (measured by RCG).
Findings report the negative relationship between the value relevance and board
quality (NBB), suggesting that time constraint of board of director may deter the
value relevance. Besides, the negative relationship between the value relevance
and the proportion of audit committee in board of director (RCG) suggests that
higher proportion induces lower value relevance.
74 See Appendix 5.

Chapter V The Value Relevance of Earnings and Book Value
205
Table 5.6 Price model: OLS estimation with firm fixed effect and heteroskedasticity-robust standard errors
Pit = γ0 + γ1EPSit + γ2BVPSit + εit
Panel A Pooled Group 1 Group 2 Estimate t value p value Estimate t value p value Estimate t value p value Intercept 0.722 13.33 0.000 0.713 9.04 0.000 0.724 9.89 0.000 EPS 0.409 2.83 0.005 0.515 2.59 0.010 0.199 1.73 0.085 BVPS 0.289 7.91 0.000 0.303 6.04 0.000 0.287 5.08 0.000 R2 0.273 0.319 0.215 Adj. R2 (0.191) (0.242) (0.126) N 970 520 450 Panel B
Pooled Pre-adoption (1995–1999) Post-adoption (2000–2004) Estimate t value p value Estimate t value p value Intercept 0.711 10.37 0.000 0.577 6.96 0.000 EPS 0.264 1.38 0.167 0.466 2.91 0.004 BVPS 0.248 6.48 0.000 0.537 7.57 0.000 R2 0.295 0.476 Adj. R2 (0.116) (0.343) N 485 485 z-stat* = 6.875 Panel C Group 1 Pre-adoption (1995–1999) Post-adoption (2000–2004) Estimate t value p value Estimate t value p value Intercept 0.360 1.37 0.173 0.884 4.11 0.000 EPS 0.257 4.67 0.000 0.465 7.90 0.000 BVPS 0.680 6.59 0.000 0.532 7.21 0.000 R2 0.342 0.522 Adj. R2 (0.172) (0.399) N 260 260 z-stat = 4.845 Panel D Group 2 Pre-adoption (1995–1999) Post-adoption (2000–2004) Estimate t value p value Estimate t value p value Intercept 0.735 9.87 0.000 0.529 3.33 0.001 EPS 0.053 0.44 0.658 0.359 1.36 0.175 BVPS 0.265 5.38 0.000 0.445 3.42 0.001 R2 0.228 0.434 Adj. R2 (0.028) (0.288) N 225 225 z-stat = 4.581 P is stock price 3-month after the financial year-end; EPS is earnings per share; BVPS is book value per share. All variables are deflated by the beginning of share price. N is number of observations. Pre = 1995–1999 and Post = 2000–2004. Group 1 (2) is firms with larger (smaller) book-tax-differences in post-adoption periods. *z-statistics are reported to compare the difference of R2 between pre- and post-adoption periods.
Chapter V The Value Relevance of Earnings and Book Value
206
Panel D–F present the results when the value relevance is measured by ERC. In
terms of NB, it is measured from the number of boards on which audit committees
and independent directors serve as executive directors in other firms. The higher
number of boards on which they serve can deteriorate the quality of work due to
time constraints. However, an alternative explanation is that a large number of
boards on which they serve reflect the reputation of audit committees and
independent directors. For this analysis, findings report a positive relationship
between value relevance and NB. I argue that this is due to the reputation of audit
committee and independent directors inducing more value relevance in the firm.
On the other hand, the relationship between value relevance and NBB is negative
and significant. It implies that the time constraint deters the value relevance of
accounting numbers. It should be noted that the coefficient sign of NB and NBB
should be in the same direction. However, the result reports different direction of
NB and NBB. Thus, it is difficult to provide an inference for these two variables
relative to the association between value relevance and board (audit committee)
quality.
For RCG, value relevance is negatively related to the proportion of audit
committee to board size (RCG). The larger RCG indicates higher quality of
corporate governance on a board. The obtained negative relationship between
value relevance and RCG suggests that value relevance of accounting information
is less likely when the proportion is large.
From these findings, the relationship between value relevance and firm
governance systems is different from the relationship between earnings
persistence and firm governance systems previously presented in Chapter 4.
However, the obtained result suggests that in Thai settings, firm governance
systems for firms in group 1 are clearly not related to theirs value relevance but
firm governance systems for firms in group 2 are related to theirs value relevance.
These findings, therefore, suggest that the firm governance system is related to the
variation in value relevance of firms in group 1 and group 2. It also implies that
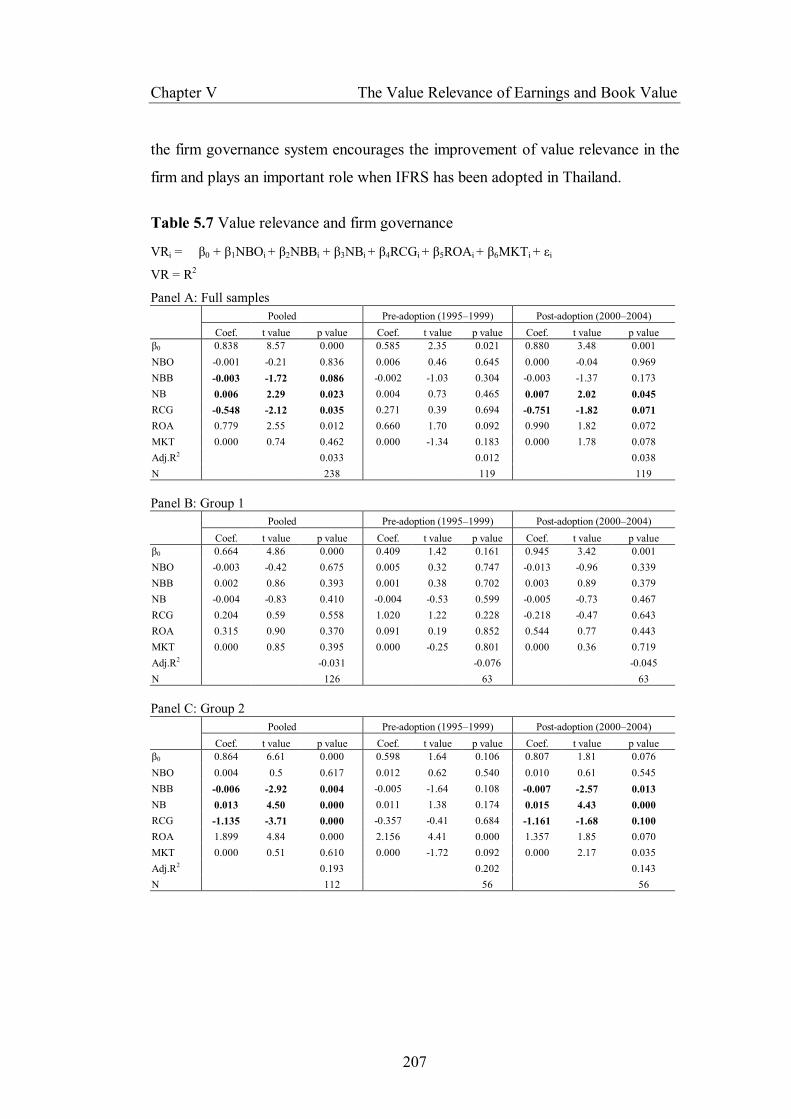
Chapter V The Value Relevance of Earnings and Book Value
207
the firm governance system encourages the improvement of value relevance in the
firm and plays an important role when IFRS has been adopted in Thailand.
Table 5.7 Value relevance and firm governance VRi = β0 + β1NBOi + β2NBBi + β3NBi + β4RCGi + β5ROAi + β6MKTi + εi
VR = R2
Panel A: Full samples Pooled Pre-adoption (1995–1999) Post-adoption (2000–2004) Coef. t value p value Coef. t value p value Coef. t value p value
β0 0.838 8.57 0.000 0.585 2.35 0.021 0.880 3.48 0.001 NBO -0.001 -0.21 0.836 0.006 0.46 0.645 0.000 -0.04 0.969 NBB -0.003 -1.72 0.086 -0.002 -1.03 0.304 -0.003 -1.37 0.173 NB 0.006 2.29 0.023 0.004 0.73 0.465 0.007 2.02 0.045 RCG -0.548 -2.12 0.035 0.271 0.39 0.694 -0.751 -1.82 0.071 ROA 0.779 2.55 0.012 0.660 1.70 0.092 0.990 1.82 0.072 MKT 0.000 0.74 0.462 0.000 -1.34 0.183 0.000 1.78 0.078 Adj.R2 0.033 0.012 0.038 N 238 119 119 Panel B: Group 1
Pooled Pre-adoption (1995–1999) Post-adoption (2000–2004) Coef. t value p value Coef. t value p value Coef. t value p value
β0 0.664 4.86 0.000 0.409 1.42 0.161 0.945 3.42 0.001 NBO -0.003 -0.42 0.675 0.005 0.32 0.747 -0.013 -0.96 0.339 NBB 0.002 0.86 0.393 0.001 0.38 0.702 0.003 0.89 0.379 NB -0.004 -0.83 0.410 -0.004 -0.53 0.599 -0.005 -0.73 0.467 RCG 0.204 0.59 0.558 1.020 1.22 0.228 -0.218 -0.47 0.643 ROA 0.315 0.90 0.370 0.091 0.19 0.852 0.544 0.77 0.443 MKT 0.000 0.85 0.395 0.000 -0.25 0.801 0.000 0.36 0.719 Adj.R2 -0.031 -0.076 -0.045 N 126 63 63 Panel C: Group 2
Pooled Pre-adoption (1995–1999) Post-adoption (2000–2004) Coef. t value p value Coef. t value p value Coef. t value p value
β0 0.864 6.61 0.000 0.598 1.64 0.106 0.807 1.81 0.076 NBO 0.004 0.5 0.617 0.012 0.62 0.540 0.010 0.61 0.545 NBB -0.006 -2.92 0.004 -0.005 -1.64 0.108 -0.007 -2.57 0.013 NB 0.013 4.50 0.000 0.011 1.38 0.174 0.015 4.43 0.000 RCG -1.135 -3.71 0.000 -0.357 -0.41 0.684 -1.161 -1.68 0.100 ROA 1.899 4.84 0.000 2.156 4.41 0.000 1.357 1.85 0.070 MKT 0.000 0.51 0.610 0.000 -1.72 0.092 0.000 2.17 0.035 Adj.R2 0.193 0.202 0.143 N 112 56 56
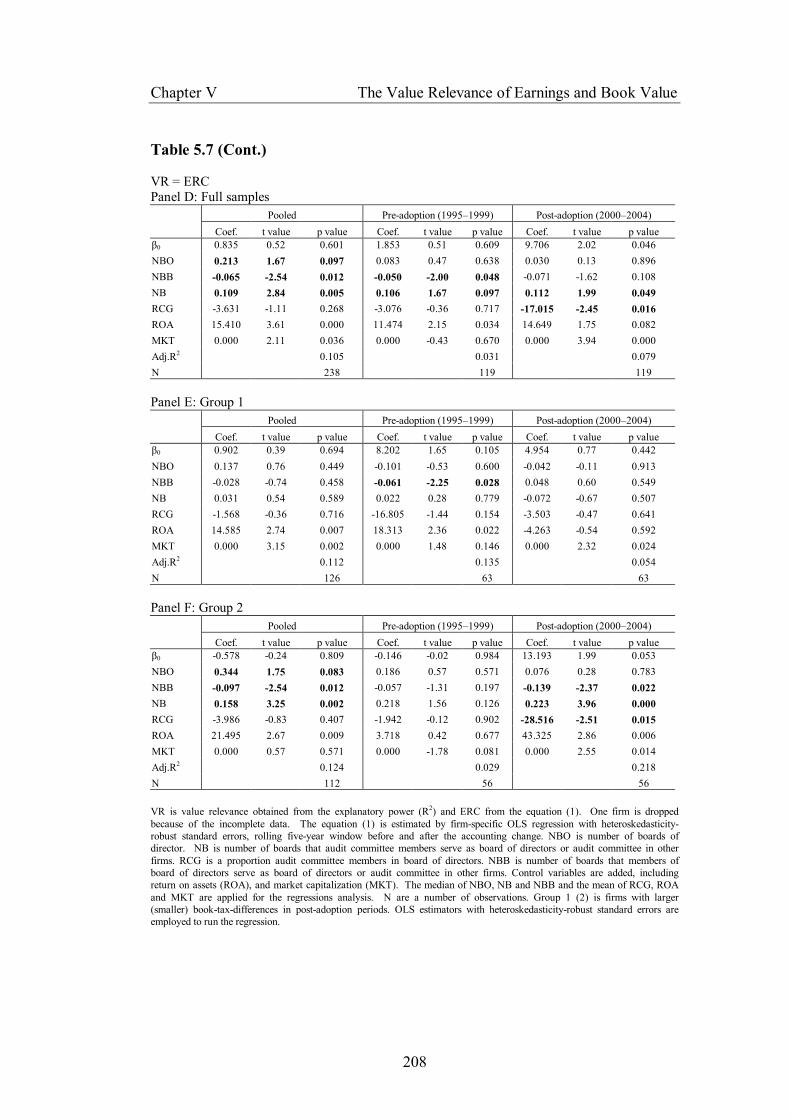
Chapter V The Value Relevance of Earnings and Book Value
208
Table 5.7 (Cont.) VR = ERC Panel D: Full samples
Pooled Pre-adoption (1995–1999) Post-adoption (2000–2004) Coef. t value p value Coef. t value p value Coef. t value p value
β0 0.835 0.52 0.601 1.853 0.51 0.609 9.706 2.02 0.046 NBO 0.213 1.67 0.097 0.083 0.47 0.638 0.030 0.13 0.896 NBB -0.065 -2.54 0.012 -0.050 -2.00 0.048 -0.071 -1.62 0.108 NB 0.109 2.84 0.005 0.106 1.67 0.097 0.112 1.99 0.049 RCG -3.631 -1.11 0.268 -3.076 -0.36 0.717 -17.015 -2.45 0.016 ROA 15.410 3.61 0.000 11.474 2.15 0.034 14.649 1.75 0.082 MKT 0.000 2.11 0.036 0.000 -0.43 0.670 0.000 3.94 0.000 Adj.R2 0.105 0.031 0.079 N 238 119 119 Panel E: Group 1
Pooled Pre-adoption (1995–1999) Post-adoption (2000–2004) Coef. t value p value Coef. t value p value Coef. t value p value
β0 0.902 0.39 0.694 8.202 1.65 0.105 4.954 0.77 0.442 NBO 0.137 0.76 0.449 -0.101 -0.53 0.600 -0.042 -0.11 0.913 NBB -0.028 -0.74 0.458 -0.061 -2.25 0.028 0.048 0.60 0.549 NB 0.031 0.54 0.589 0.022 0.28 0.779 -0.072 -0.67 0.507 RCG -1.568 -0.36 0.716 -16.805 -1.44 0.154 -3.503 -0.47 0.641 ROA 14.585 2.74 0.007 18.313 2.36 0.022 -4.263 -0.54 0.592 MKT 0.000 3.15 0.002 0.000 1.48 0.146 0.000 2.32 0.024 Adj.R2 0.112 0.135 0.054 N 126 63 63 Panel F: Group 2
Pooled Pre-adoption (1995–1999) Post-adoption (2000–2004) Coef. t value p value Coef. t value p value Coef. t value p value
β0 -0.578 -0.24 0.809 -0.146 -0.02 0.984 13.193 1.99 0.053 NBO 0.344 1.75 0.083 0.186 0.57 0.571 0.076 0.28 0.783 NBB -0.097 -2.54 0.012 -0.057 -1.31 0.197 -0.139 -2.37 0.022 NB 0.158 3.25 0.002 0.218 1.56 0.126 0.223 3.96 0.000 RCG -3.986 -0.83 0.407 -1.942 -0.12 0.902 -28.516 -2.51 0.015 ROA 21.495 2.67 0.009 3.718 0.42 0.677 43.325 2.86 0.006 MKT 0.000 0.57 0.571 0.000 -1.78 0.081 0.000 2.55 0.014 Adj.R2 0.124 0.029 0.218 N 112 56 56 VR is value relevance obtained from the explanatory power (R2) and ERC from the equation (1). One firm is dropped because of the incomplete data. The equation (1) is estimated by firm-specific OLS regression with heteroskedasticity-robust standard errors, rolling five-year window before and after the accounting change. NBO is number of boards of director. NB is number of boards that audit committee members serve as board of directors or audit committee in other firms. RCG is a proportion audit committee members in board of directors. NBB is number of boards that members of board of directors serve as board of directors or audit committee in other firms. Control variables are added, including return on assets (ROA), and market capitalization (MKT). The median of NBO, NB and NBB and the mean of RCG, ROA and MKT are applied for the regressions analysis. N are a number of observations. Group 1 (2) is firms with larger (smaller) book-tax-differences in post-adoption periods. OLS estimators with heteroskedasticity-robust standard errors are employed to run the regression.
Chapter V The Value Relevance of Earnings and Book Value
209
Robustness checks First, I exclude the sample firms that have negative annual income tax expenses.
It results in dropping nine firms (90 observations)75 for ERC model and eight
firms (80 observations)76 for price model. I re-estimate both models by using
these sample firms. Results are qualitatively similar to the main findings reported
in Table 5.5. However, the price model reveals that the improvement of value
relevance for group 1 is greater than that for group 2.77
I estimate the value relevance of accounting information and compare it between
pre- and post-adoption periods by each industry as presented in Table 5.8. ERC
model suggests that the value relevance of accounting information (Adj. R2)
increases from pre- to post-adoption periods in 4 out of 7 industries, including
agro-business, consumer products, industrial and services. But ERC increases for
all industries except the firm in the natural resources group. The price model
reveals that the value relevance of earnings and book values (Adj. R2) increases
during the testing period but it declines for firms in the natural resources and
technology groups. Both models report that the value relevance declines for firms
in natural resources and technology after IFRS adoptions. I argue that it is
because these firms have high value of depreciable and intangible assets that are
subject to firms’ accounting discretions. And, IFRS provides more room for
firms’ discretions relative to the old accounting system in Thai settings. The
market, therefore, may interpret accounting information in these two industries as
transitory.
Next, I extend the sample period by using 70 constant firms for ERC model
during the period 1993–2007 and 73 constant firms for price model during the
period 1995–2007.78 The dataset is divided into two groups according to book-tax
differences. Non-deflated variables are employed for the analysis (Goncharov et
75 BCP, BJC, CPF, CPH, CTW, LOXLEY, SCC, SCCC and UCOM 76 BCP, BJC, CPF, CPH, CTW, LOXLEY, SCC and SCCC 77 See details in Appendix 6. 78 The book value per share is available in the database from 1995 onwards.

Chapter V The Value Relevance of Earnings and Book Value
210
al. 2006; Van der Meulen et al. 2007). Consistent with the main analysis, group 1
(2) includes firms whose book-tax differences during post-adoption periods are
larger (smaller) than book-tax differences during pre-adoption periods. Fama-
MacBeth regressions are employed to obtain the average coefficient estimate and
the explanatory power (R2). Table 5.9 presents the result. Findings in panel A are
obtained from ERC model, suggesting that on average, the value relevance of
accounting summary measures increases from pre- (R2 = 16.2%) to post-adoption
periods (R2 = 25.8%). On average, the value relevance for group 1 increases from
25% in pre-adoption years to 32% in post-adoption years, increasing by 26%
[(.315 – .250)/.250]. The value relevance for group 2 increases from 20% in pre-
adoption years to 31% in post-adoption years, increasing by 53.77% [(.306 –
.199)/.199].
In Panel B, the price model reports consistent results that the value relevance of
accounting information measured by the R2 increases from 54.7% in pre-adoption
years to 84.8% in post-adoption years. On average, from pre- to post-adoption
periods, the value relevance for group 1 increases by 12.45% [(.831 – .739)/.739].
The value relevance for group 2 increases from 31% in pre-adoption years to 83%
in post-adoption years, increasing by 1.71 times [(.833 – .307)/.307]. It should be
noted that when excluding firms with negative annual income tax expenses,
qualitatively similar results are obtained.79 These findings suggest that the
enhancement of value relevance from pre- to post-adoption years is higher for
group 2 compared to group 1. The additional tests support the hypotheses (H.5.1
and H.5.2).
79 See results in Appendix 8.
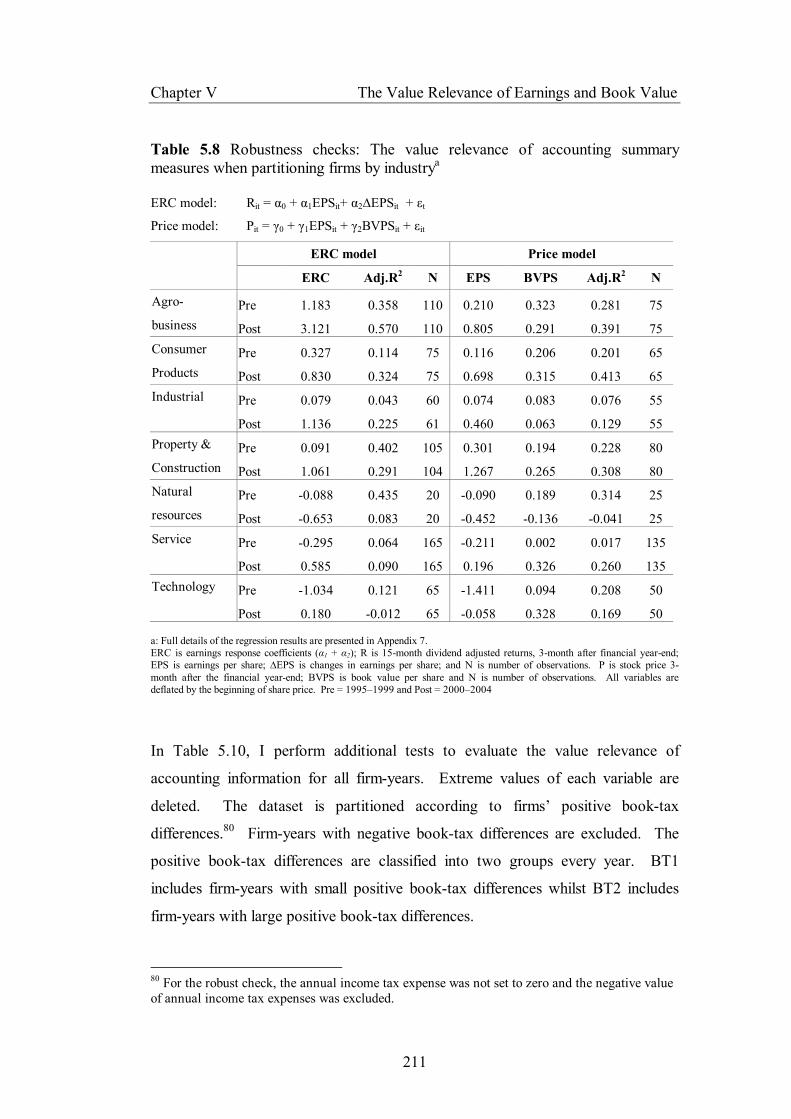
Chapter V The Value Relevance of Earnings and Book Value
211
Table 5.8 Robustness checks: The value relevance of accounting summary measures when partitioning firms by industrya ERC model: Rit = α0 + α1EPSit+ α2∆EPSit + εt
Price model: Pit = γ0 + γ1EPSit + γ2BVPSit + εit
ERC model Price model
ERC Adj.R2 N EPS BVPS Adj.R2 N
Agro- Pre 1.183 0.358 110 0.210 0.323 0.281 75 business Post 3.121 0.570 110 0.805 0.291 0.391 75 Consumer Pre 0.327 0.114 75 0.116 0.206 0.201 65 Products Post 0.830 0.324 75 0.698 0.315 0.413 65 Industrial Pre 0.079 0.043 60 0.074 0.083 0.076 55 Post 1.136 0.225 61 0.460 0.063 0.129 55 Property & Pre 0.091 0.402 105 0.301 0.194 0.228 80 Construction Post 1.061 0.291 104 1.267 0.265 0.308 80 Natural Pre -0.088 0.435 20 -0.090 0.189 0.314 25 resources Post -0.653 0.083 20 -0.452 -0.136 -0.041 25 Service Pre -0.295 0.064 165 -0.211 0.002 0.017 135 Post 0.585 0.090 165 0.196 0.326 0.260 135 Technology Pre -1.034 0.121 65 -1.411 0.094 0.208 50 Post 0.180 -0.012 65 -0.058 0.328 0.169 50 a: Full details of the regression results are presented in Appendix 7. ERC is earnings response coefficients (α1 + α2); R is 15-month dividend adjusted returns, 3-month after financial year-end; EPS is earnings per share; ∆EPS is changes in earnings per share; and N is number of observations. P is stock price 3-month after the financial year-end; BVPS is book value per share and N is number of observations. All variables are deflated by the beginning of share price. Pre = 1995–1999 and Post = 2000–2004
In Table 5.10, I perform additional tests to evaluate the value relevance of
accounting information for all firm-years. Extreme values of each variable are
deleted. The dataset is partitioned according to firms’ positive book-tax
differences.80 Firm-years with negative book-tax differences are excluded. The
positive book-tax differences are classified into two groups every year. BT1
includes firm-years with small positive book-tax differences whilst BT2 includes
firm-years with large positive book-tax differences.
80 For the robust check, the annual income tax expense was not set to zero and the negative value of annual income tax expenses was excluded.
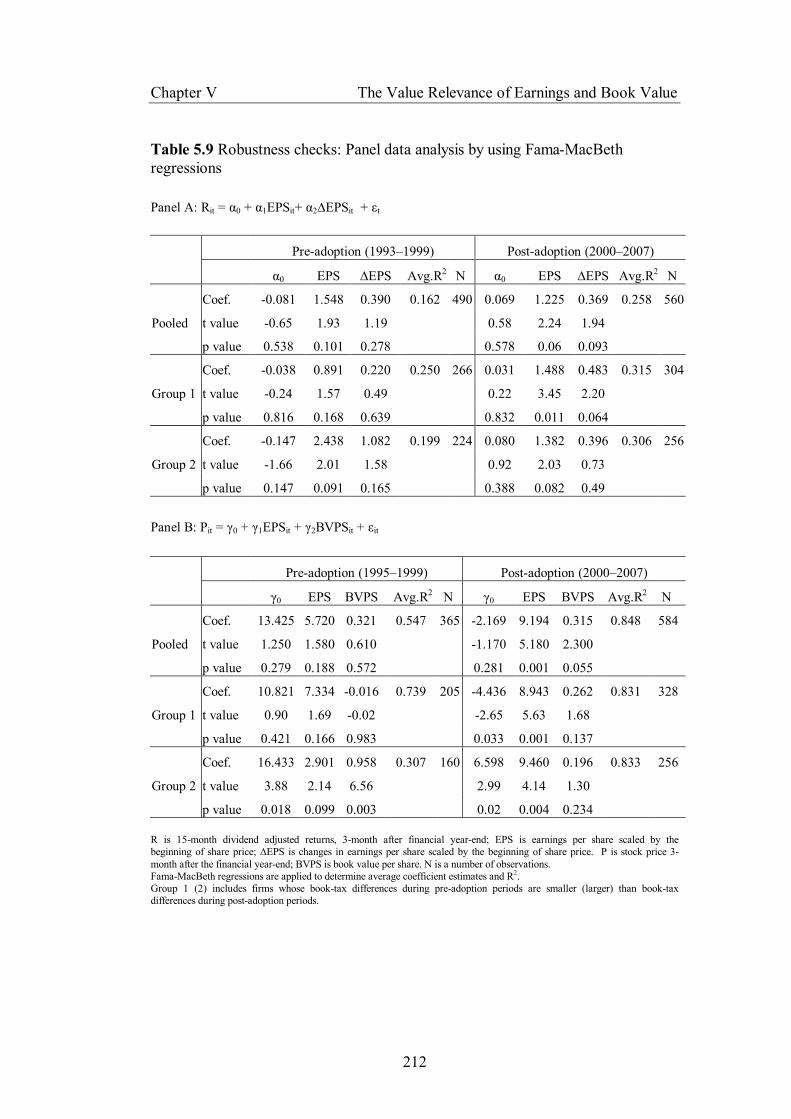
Chapter V The Value Relevance of Earnings and Book Value
212
Table 5.9 Robustness checks: Panel data analysis by using Fama-MacBeth regressions
Panel A: Rit = α0 + α1EPSit+ α2∆EPSit + εt
Pre-adoption (1993–1999) Post-adoption (2000–2007)
α0 EPS ∆EPS Avg.R2 N α0 EPS ∆EPS Avg.R2 N
Coef. -0.081 1.548 0.390 0.162 490 0.069 1.225 0.369 0.258 560
Pooled t value -0.65 1.93 1.19 0.58 2.24 1.94
p value 0.538 0.101 0.278 0.578 0.06 0.093
Coef. -0.038 0.891 0.220 0.250 266 0.031 1.488 0.483 0.315 304
Group 1 t value -0.24 1.57 0.49 0.22 3.45 2.20
p value 0.816 0.168 0.639 0.832 0.011 0.064
Coef. -0.147 2.438 1.082 0.199 224 0.080 1.382 0.396 0.306 256
Group 2 t value -1.66 2.01 1.58 0.92 2.03 0.73
p value 0.147 0.091 0.165 0.388 0.082 0.49
Panel B: Pit = γ0 + γ1EPSit + γ2BVPSit + εit
Pre-adoption (1995–1999) Post-adoption (2000–2007)
γ0 EPS BVPS Avg.R2 N γ0 EPS BVPS Avg.R2 N
Coef. 13.425 5.720 0.321 0.547 365 -2.169 9.194 0.315 0.848 584
Pooled t value 1.250 1.580 0.610 -1.170 5.180 2.300
p value 0.279 0.188 0.572 0.281 0.001 0.055
Coef. 10.821 7.334 -0.016 0.739 205 -4.436 8.943 0.262 0.831 328
Group 1 t value 0.90 1.69 -0.02 -2.65 5.63 1.68
p value 0.421 0.166 0.983 0.033 0.001 0.137
Coef. 16.433 2.901 0.958 0.307 160 6.598 9.460 0.196 0.833 256
Group 2 t value 3.88 2.14 6.56 2.99 4.14 1.30
p value 0.018 0.099 0.003 0.02 0.004 0.234 R is 15-month dividend adjusted returns, 3-month after financial year-end; EPS is earnings per share scaled by the beginning of share price; ∆EPS is changes in earnings per share scaled by the beginning of share price. P is stock price 3-month after the financial year-end; BVPS is book value per share. N is a number of observations. Fama-MacBeth regressions are applied to determine average coefficient estimates and R2. Group 1 (2) includes firms whose book-tax differences during pre-adoption periods are smaller (larger) than book-tax differences during post-adoption periods.
Chapter V The Value Relevance of Earnings and Book Value
213
The expectation is that firms with smaller book-tax differences are of higher-
quality accounting information than firms with large book-tax differences.
Therefore, the higher value relevance of accounting summary measures is
expected in BT1 relative to BT2.
From the ERC model, results show that the value relevance of accounting
summary measures (Adj. R2) improves from pre- (2.8%) to post-adoption periods
(6.4%). When partitioning firms with their book-tax differences (BT1 vs. BT2),
the value relevance for BT1 (Adj. R2 = 47%) is greater than BT2 (Adj. R2 = 35%).
The value relevance increases from pre- to post-adoption periods for firms in both
BT1 and BT2. The value relevance of accounting information for firms in BT1
(Pre = 45.8%, Post = 46.7%) is higher than that for firms in BT2 (Pre = 25.9%,
Post = 40%) in both periods. Moreover, the magnitude of ERC supports the
improvement of value relevance after the IFRS adoption in Thailand. The ERC
increases after the IFRS adoption for pooled-data (ERC – Pre = .183, ERC – Post
= .546) and BT1 (ERC – Pre = 3.22, ERC – Post = 4.26) but slightly declines for
BT2 (ERC – Pre = 3.37, ERC – Post = 2.83). EERC for firms in BT1 is higher
than ERC for firms in BT2 in both pre- and post-adoption periods, supporting the
expectation that the value relevance for BT1 is higher than the value relevance for
BT2.
Consistent with the ERC model, the price model reports that the value relevance
of earnings and book value information increases during post-adoption periods for
pooled-data (Adj. R2 – Pre = 65.6%, Adj. R2 – Post = 82.4%). The magnitude of
earnings coefficients improves from pre- to post-adoption periods, suggesting that
earnings information corresponds to share prices greater than in the past. When
partitioning the dataset according to small (BT1) and large (BT2) positive book-
tax differences, the value relevance of earnings and book value information is
higher quality after IFRS adoptions for both subgroups. The value relevance for
firms in BT1 (Adj. R2 – Pre = 72.1%, Adj. R2 – Post = 84.1%) is greater than the
value relevance for firms in BT2 (Adj. R2 – Pre = 55.6%, Adj. R2 – Post = 81.7%)
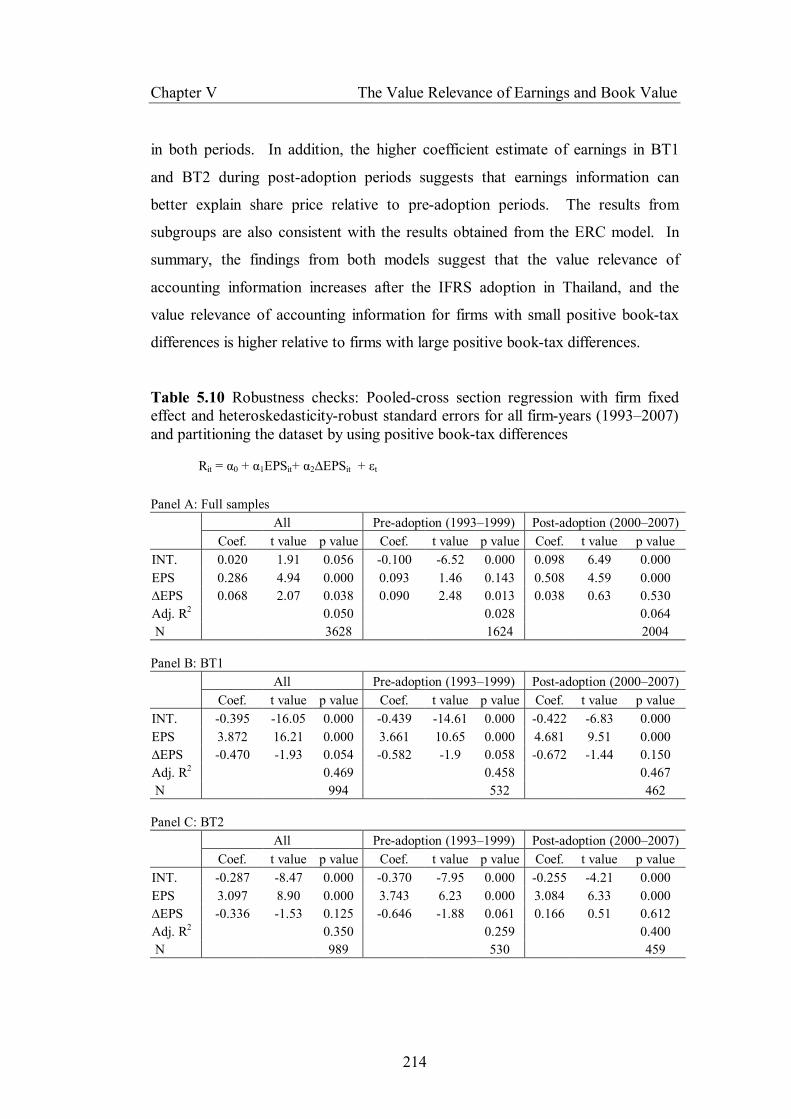
Chapter V The Value Relevance of Earnings and Book Value
214
in both periods. In addition, the higher coefficient estimate of earnings in BT1
and BT2 during post-adoption periods suggests that earnings information can
better explain share price relative to pre-adoption periods. The results from
subgroups are also consistent with the results obtained from the ERC model. In
summary, the findings from both models suggest that the value relevance of
accounting information increases after the IFRS adoption in Thailand, and the
value relevance of accounting information for firms with small positive book-tax
differences is higher relative to firms with large positive book-tax differences.
Table 5.10 Robustness checks: Pooled-cross section regression with firm fixed effect and heteroskedasticity-robust standard errors for all firm-years (1993–2007) and partitioning the dataset by using positive book-tax differences
Rit = α0 + α1EPSit+ α2∆EPSit + εt
Panel A: Full samples All Pre-adoption (1993–1999) Post-adoption (2000–2007) Coef. t value p value Coef. t value p value Coef. t value p value INT. 0.020 1.91 0.056 -0.100 -6.52 0.000 0.098 6.49 0.000 EPS 0.286 4.94 0.000 0.093 1.46 0.143 0.508 4.59 0.000 ∆EPS 0.068 2.07 0.038 0.090 2.48 0.013 0.038 0.63 0.530 Adj. R2 0.050 0.028 0.064 N 3628 1624 2004 Panel B: BT1 All Pre-adoption (1993–1999) Post-adoption (2000–2007) Coef. t value p value Coef. t value p value Coef. t value p value INT. -0.395 -16.05 0.000 -0.439 -14.61 0.000 -0.422 -6.83 0.000 EPS 3.872 16.21 0.000 3.661 10.65 0.000 4.681 9.51 0.000 ∆EPS -0.470 -1.93 0.054 -0.582 -1.9 0.058 -0.672 -1.44 0.150 Adj. R2 0.469 0.458 0.467 N 994 532 462 Panel C: BT2 All Pre-adoption (1993–1999) Post-adoption (2000–2007) Coef. t value p value Coef. t value p value Coef. t value p value INT. -0.287 -8.47 0.000 -0.370 -7.95 0.000 -0.255 -4.21 0.000 EPS 3.097 8.90 0.000 3.743 6.23 0.000 3.084 6.33 0.000 ∆EPS -0.336 -1.53 0.125 -0.646 -1.88 0.061 0.166 0.51 0.612 Adj. R2 0.350 0.259 0.400 N 989 530 459

Chapter V The Value Relevance of Earnings and Book Value
215
Table 5.10 (Cont.)
Pit = γ0 + γ1EPSit + γ2BVPSit + εit
Panel D: Full samples All Pre-adoption (1995–1999) Post-adoption (2000–2007) Coef. t value p value Coef. t value p value Coef. t value p value INT. 3.813 2.99 0.003 9.347 2.12 0.034 5.522 4.61 0.000 EPS 1.014 7.75 0.000 0.663 4.64 0.000 1.806 7.36 0.000 BVPS 0.916 17.58 0.000 0.778 6.24 0.000 0.737 11.28 0.000 Adj. R2 0.675 0.656 0.824 N 3056 1167 1889 Panel E: BT1 All Pre-adoption (1995–1999) Post-adoption (2000–2007) Coef. t value p value Coef. t value p value Coef. t value p value INT. 7.222 2.30 0.022 33.293 1.60 0.112 2.627 0.83 0.407 EPS 4.660 4.29 0.000 4.285 2.13 0.035 5.373 5.92 0.000 BVPS 0.295 1.95 0.052 -0.207 -0.33 0.739 0.281 2.20 0.029 Adj. R2 0.768 0.721 0.841 N 748 320 428 Panel F: BT2 All Pre-adoption (1995–1999) Post-adoption (2000–2007) Coef. t value p value Coef. t value p value Coef. t value p value INT. 6.196 1.24 0.214 27.599 1.62 0.108 14.763 5.41 0.000 EPS 2.986 4.09 0.000 1.965 1.75 0.083 3.876 3.36 0.001 BVPS 0.928 5.46 0.000 0.703 1.78 0.076 0.354 1.71 0.088 Adj. R2 0.623 0.556 0.817 N 740 318 422 ERC is earnings response coefficients (α1 + α2); R is 15-month dividend adjusted returns, 3-month after financial year-end, t; EPS is earnings per share; ∆EPS is changes in earnings per share. P is stock price 3-month after the financial year-end, t; BVPS is book value per share and N is number of observations. Observations of each variable in the top and bottom 1% of both models for full samples are deleted and the top and bottom 0.5% of both models for subgroups (BT1 and BT2) are excluded. N is a number of observations. BT1 and BT2 include firm-years with small and large positive book-tax differences, respectively. Negative annual income tax expenses are excluded. ***,**,* Significant at 0.01, 0.05 and 0.10 level, respectively (two-tailed).
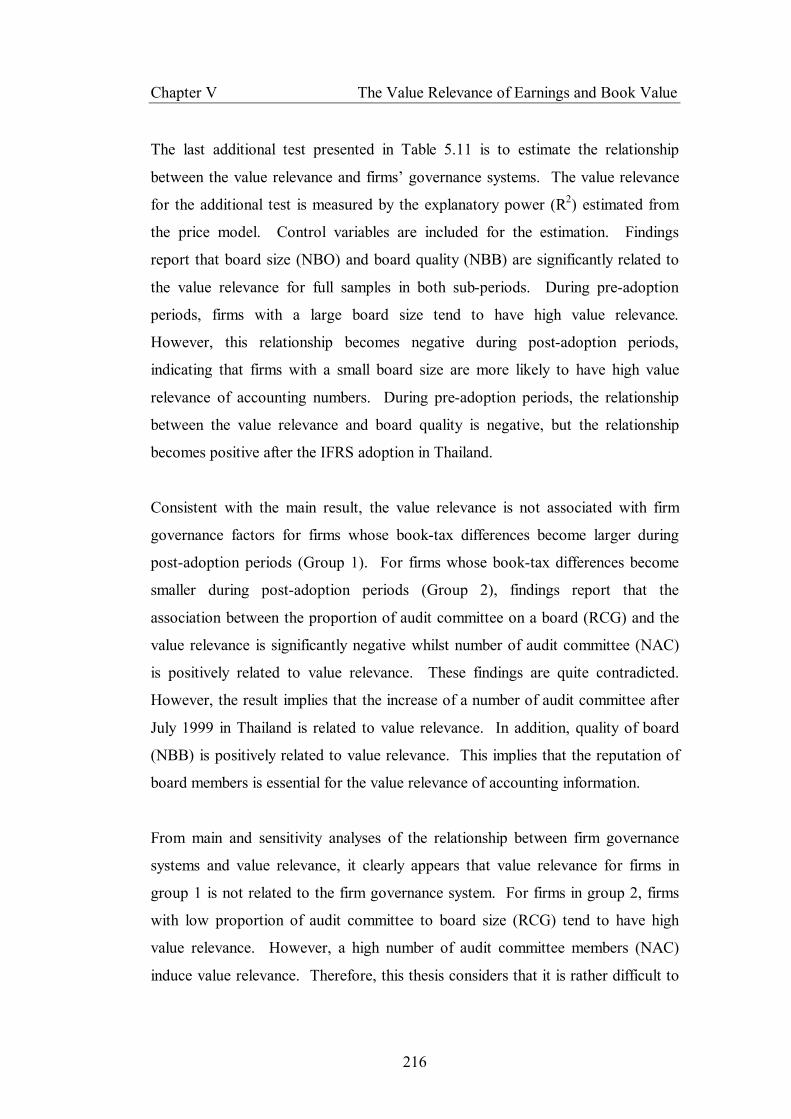
Chapter V The Value Relevance of Earnings and Book Value
216
The last additional test presented in Table 5.11 is to estimate the relationship
between the value relevance and firms’ governance systems. The value relevance
for the additional test is measured by the explanatory power (R2) estimated from
the price model. Control variables are included for the estimation. Findings
report that board size (NBO) and board quality (NBB) are significantly related to
the value relevance for full samples in both sub-periods. During pre-adoption
periods, firms with a large board size tend to have high value relevance.
However, this relationship becomes negative during post-adoption periods,
indicating that firms with a small board size are more likely to have high value
relevance of accounting numbers. During pre-adoption periods, the relationship
between the value relevance and board quality is negative, but the relationship
becomes positive after the IFRS adoption in Thailand.
Consistent with the main result, the value relevance is not associated with firm
governance factors for firms whose book-tax differences become larger during
post-adoption periods (Group 1). For firms whose book-tax differences become
smaller during post-adoption periods (Group 2), findings report that the
association between the proportion of audit committee on a board (RCG) and the
value relevance is significantly negative whilst number of audit committee (NAC)
is positively related to value relevance. These findings are quite contradicted.
However, the result implies that the increase of a number of audit committee after
July 1999 in Thailand is related to value relevance. In addition, quality of board
(NBB) is positively related to value relevance. This implies that the reputation of
board members is essential for the value relevance of accounting information.
From main and sensitivity analyses of the relationship between firm governance
systems and value relevance, it clearly appears that value relevance for firms in
group 1 is not related to the firm governance system. For firms in group 2, firms
with low proportion of audit committee to board size (RCG) tend to have high
value relevance. However, a high number of audit committee members (NAC)
induce value relevance. Therefore, this thesis considers that it is rather difficult to

Chapter V The Value Relevance of Earnings and Book Value
217
make an inference from these opposed results whether or not higher a number of
audit committee on a board encourage higher value relevance for firms in group 2.
In addition, this thesis considers that the relationship between board quality
(NBB) and value relevance cannot be concluded because of their mixed results.
This thesis views that the small sample size employed in the analysis probably is a
potential reason causing inconsistent findings. However, based on the overall
finding, this thesis concludes that the value relevance is varied according to the
firm governance and the corporate governance system becomes very important
when IFRS has been adopted in Thailand.
5.6 Chapter Summary This chapter presents the analysis of value relevance during IFRS pre- (1995–
1999) and post-adoption periods (2000–2004) in Thailand. The study of value
relevance has been widely used by existing research when examining the change
in accounting system. The value relevance is interpreted by using the association
between firm values and accounting summary measures. ERC is also used as a
complement to interpret whether the value relevance has been improved in Thai
firms. Overall findings suggest that the value relevance of earnings and book
values has been enhanced after the IFRS adoption in the Thailand. At the firm
level, the dataset is partitioned according to the book-tax difference. The finding
supports that the enhancement of value relevance is varied according to the
magnitude of book-tax differences. In addition, this thesis evidences that the
variation in the improvement of value relevance among Thai firms is related to the
corporate governance system. These findings support the notion that the IFRS
adoption in Thailand brings better quality of accounting information in terms of
the value relevance conditioning on incentives of a firm’s insiders and the firm
governance system is an essential monitoring mechanism to encourage value
relevance.
Chapter V The Value Relevance of Earnings and Book Value
218
Table 5.11 Robustness checks: The value relevance and firm governance I regress value relevance (VR) on various firm governance proxies. I compare the analysis between firms in group 1 and 2 during pre- and post-adoption periods. Year indicator variables are employed for pre- and post-adoption periods. One firm is dropped due to incomplete data. I use median of NAC, NBO, NB and NBB and the mean of RCG and control variables for this analysis. OLS estimators with heteroskedasticity-robust standard errors are employed to run the regression.
VRi = β0 + β1NACi + β2NBOi + β3NBi + β4RCGi + β5NBBi + β6YRi + β7YR*NACi + β8YR*NBOi
+ β9YR*NBi + β10YR*RCGi + β11YR*NBBi + X + εi
Pooled Group 1 Group 2
Coef. t value p value Coef. t value p value Coef. t value p value
β0 0.336 1.13 0.260 0.568 1.36 0.176 -0.048 -0.11 0.913
NAC -0.044 -0.82 0.411 -0.009 -0.13 0.897 -0.157 -1.56 0.122
NBO 0.029 1.74 0.084 0.010 0.41 0.683 0.057 2.40 0.019
NB 0.005 0.80 0.426 0.005 0.60 0.548 0.004 0.29 0.774
RCG 0.632 0.69 0.492 0.290 0.22 0.824 1.919 1.40 0.166
NBB -0.004 -2.32 0.022 -0.004 -1.42 0.160 -0.005 -1.72 0.090
YR 0.939 1.90 0.059 0.062 0.08 0.935 1.624 2.86 0.006
YR*NAC 0.113 1.44 0.153 -0.012 -0.11 0.914 0.274 2.27 0.026
YR*NBO -0.068 -2.25 0.026 -0.027 -0.59 0.553 -0.109 -3.21 0.002
YR*NB -0.011 -1.35 0.177 -0.012 -0.87 0.385 -0.007 -0.55 0.586
YR*RCG -1.620 -1.23 0.219 0.440 0.23 0.822 -3.753 -2.15 0.035
YR*NBB 0.009 2.54 0.012 0.011 1.58 0.119 0.008 2.19 0.032
Control variables
ROA 0.472 1.15 0.251 0.398 0.70 0.483 1.006 1.56 0.124
GRW -0.078 -1.19 0.234 -0.019 -0.32 0.751 -0.407 -1.67 0.100
LEV -4.523 -0.85 0.398 -2.921 -0.41 0.686 -6.375 -0.77 0.444
MKT 0.000 -0.05 0.957 0.000 -0.84 0.405 0.000 0.80 0.428
Adj.R2 0.066 -0.037 0.173
N 192 104 88 VR is value relevance estimated by the explanatory power (R2). The explanatory variable is obtained from the price model: Pi = a0 + a1EPSi + a2BVPSi + εi, where P is stock price 3-month after the financial year; EPS is earnings per share; BVPS is book value per share (total equity divided by a number of listed outstanding shares) and ε is the residual. The price model is estimated by firm-specific OLS regression with heteroskedasticity-robust standard errors, rolling five-year window before and after the accounting change. NAC is number of audit committee members. NBO is number of boards of director. NB is number of boards that audit committee members serve as board of directors or audit committee in other firms. RCG is a proportion audit committee members in board of directors. NBB is number of boards that members of board of directors serve as board of directors or audit committee in other firms. X is control variable, including return on assets (ROA), total revenues growth rate (GRW), the ratio of total liability divided by market capitalization (LEV), and market capitalization (MKT). YR is year dummy equal to 1 for post-adoption period, 0 otherwise and N is number of observations. Group 1 (2) is firms with larger (smaller) book-tax-differences in post-adoption period.
.

Chapter 6
Earnings Timeliness
6.1 Introduction
6.2 Hypothesis Development
6.3 Research Methodology
6.4 Data
6.5 Results
6.6 Chapter Summary
Chapter VI Earnings Timeliness
220
Chapter 6
Earnings Timeliness
6.1 Introduction The two previous chapters present the analysis of earnings persistence and value
relevance. This chapter presents the other property of earnings information: the
timeliness of earnings. Earnings timeliness is substantially of interest in the
literature. There are at least two main streams of debates relating to earnings
timeliness analysis. First, research studies have attempted to investigate whether
earnings capture economic consequences (Basu 1997; Ball et al. 2000; Ball and
Shivakumar 2008; Barth et al. 2008). Second, there are considerable debates about
measures for conservatism (Givoly et al. 2007; Roychowdhury and Watts 2007;
Givoly and Hayn 2000).
The majority of earnings timeliness studies are conducted in efficient market
countries; the study of earnings timeliness in emerging market countries is scarce
(i.e. Jindrichovska and Kuo 2003). By applying to Thai datasets, this thesis
investigates earnings timeliness in twofold: earnings asymmetric timeliness and
unconditional accounting conservatism. The analysis of earnings asymmetric
timeliness in this study is based on Basu (1997) and unconditional accounting
conservatism or firm-specific conservatism measures is based on Ahmed and
Duellman (2007) and Roychowdhury and Watts (2007). Consistent with the two
properties of accounting numbers – earnings persistence and value relevance as
presented in previous chapters – this study incorporates the book-tax difference in
the analysis of earnings asymmetric timeliness in Thailand. And, based on
Ahmed and Duellman (2007), the relationship between firm-specific conservatism
measures and book-tax differences in Thai settings will be estimated.

Chapter VI Earnings Timeliness
221
The remainder of this chapter is organised as follows. In section 6.2, I discuss the
hypothesis development. The research methodology is presented in Section 6.3.
Sections 6.4 and 6.5 present data and results, respectively. Chapter summary is
presented in Section 6.6.
6.2 Hypothesis Development Timeliness is one attribute of accounting measures (Watts 2003a). Timeliness of
accounting income is defined as the ability of earnings to incorporate return
occurred in the current period (Ball et al. 2000). In the literature (i.e. Basu 1997;
Ball et al. 2000; Givoly and Hayn 2000), conservatism is employed to investigate
the timeliness in earnings information. Accounting recognitions are viewed as
‘conservative’ when firms recognise losses in a more timely fashion than gains.
Givoly et al. (2007) define accounting conservatism as “the systematic
undervaluation of the entity’s net assets (equity) relative to their economic value.”
However, Basu (1997) defines conditional accounting conservatism as “capturing
accountants’ tendency to require a higher degree of verification for recognising
good news than bad news in financial statements.” Measuring accounting
conservatism is controversial (i.e. Givoly et al. 2007). A market-based measure of
earnings asymmetric timeliness proposed by Basu (1997) is an influential
procedure for reporting conservatism (Ahmed and Duellman 2007; Ball et al.
2003; Pope and Walker 1999; Roychowdhury and Watts 2007). In Basu’s work,
reported earnings are a function of good and bad news. Good and bad news is
measured by positive and negative share returns, respectively. A primary
expectation is that earnings recognise bad news (loss) in a more timely manner
than good news (gain). Basu’s results show that earnings sensitivity to bad news
is two to six times larger than to good news. The author concludes that
conservatism in US firms has increased over three decades.
Furthermore, earnings timeliness has been extensively explored in an international
context. Ball et al. (2000) provide evidence about accounting income property in
different international institutions. They evaluate accounting income property in
Chapter VI Earnings Timeliness
222
terms of earnings timeliness in code law countries: France, Germany and Japan
and common law countries, namely Australia, Canada, USA and the UK. They
argue that short-term dividend policy influences accounting income in code law
countries because the government, as one of the stakeholders, shares its income in
the form of firms’ tax payment from firms’ accounting income. They also propose
the investigation of association between cash flow from operation and accounting
income timeliness, hypothesising that accruals reflect economic income in a more
timely manner than cash flow when there is no new information. Based on Basu’s
model, they summarise that common law countries have better accounting income
timeliness in terms of incorporating economic losses than code law countries.
Payout policy influences accounting income property in code law countries
compared to common law countries. Thus, they conclude that the demand for
accounting income influences the way to capture economic income in each
country. Pope and Walker (1999) compare the difference in earnings timeliness
between US and UK financial reporting. They augment Basu’s model by
incorporating prior period shocks (3-year lags) in the model to estimate whether
earnings are sensitive to them. Their findings suggest that bad news is recognised
in a more timely manner in UK firms compared to US firms whilst earnings
timeliness in UK firms responding to good news is lower compared to US firms;
earnings recognise good news with a one-year lag. Barth et al. (2008) suggest that
earnings timeliness has improved in the countries adopting international
accounting standards. Bushman and Piotroski (2006) investigate accounting
conservatism in 38 countries by incorporating various institution factors. They
find many factors shaping accounting conservatism, i.e. legal systems and
political costs.
Some studies investigate the earnings timeliness in single countries probably to
avoid the impact of cross-country variations. For example, Ball and Shivakumar
(2005) find that private company financial reporting is of low timely loss
recognition relative to public company financial reporting in the UK. Ding and
Stolowy (2006) examine earnings timeliness and accounting conservatism in
French firms. As the French accounting system was substantially changed in
Chapter VI Earnings Timeliness
223
1996, they therefore investigate whether reported earnings become more timely
and conservative over the test periods. They also compare earnings timeliness
and conservatism in the French firm according to size and audit quality, as well as
international finance versus domestic finance firms. Their findings estimated by
Basu’s model show that earnings recognise bad news in a more timely manner
than good news and accounting conservatism is likely to increase over time.
Except for firm size, there is no difference in earnings timeliness between firms
with different audit quality or international versus domestic finance firms.
Jindrichovska and Mcleay (2005) report that profits are more persistent than
losses and earnings conservatism is not found in the Czech market.
Since accounting information is shaped by the information environment
(Bushman and Piotroski 2006), prior studies have incorporated corporate
governance information on the level of a company’s reporting conservatism to
estimate their effects on asymmetric timeliness in earnings. This is due to the fact
that corporate governance is a monitoring mechanism to enhance the quality of
financial reporting. For instance, Beekes et al. (2004) find that earnings
asymmetric timeliness for firms with small proportions of outside board directors
are less conservative in capturing news than firms with a higher number of outside
board directors in UK firms. Ahmed and Duellman (2007) find a negative
relationship between the percentage of inside directors and unconditional
conservatism and the positive relationship between the percentage of outside
directors’ shareholdings and unconditional conservatism. Lafond and
Roychowdhury (2008) find that the asymmetric timeliness in earnings declines
with managerial ownership. Lara et al. (2007) document that strong boards
positively correlate with asymmetric timeliness of earnings in Spanish firms.
Bushman et al. (2004) investigate the relationship between earnings quality and
governance variables. They find that high ownership concentrations, strong
incentives to directors and executives and outside directors’ reputation vary
inversely with earnings timeliness while board size and inside director percentage
do not.
Chapter VI Earnings Timeliness
224
The literature also debates about the validity of conservatism measures (see
Givoly et al. 2007). Prior studies (Givoly and Hayn 2000; Givoly et al. 2007)
document that firm-specific conservatism measures include the level and rate of
accumulation over time of negative non-operating accruals, the skewness and
variability of the earnings distributions relative to the cash flows distribution and
changes in the market-to-book ratio. They argue that Basu’s asymmetric
timeliness is negatively correlated with other firm-specific conservatism
measures, i.e. market-to-book. However, Roychowdhury and Watts (2007) find
the positive relationship between the asymmetric timeliness and market-to-book
ratio. They employ cumulative earnings and returns to estimate the asymmetric
timeliness of earnings and incorporate market-to-book in the analysis. They
suggest that the asymmetric timeliness measure is of more power to capture
conservatism when it is estimated over several years (Ahmed and Duellman
2007).
This thesis is motivated by the previous work performed by Ball et al. (2003).
Ball et al. (2003) employ a time-series model to determine the persistence of
transitory loss components in earnings in Asian countries, including Thailand.
According to their samples during the period 1984–1996, Ball et al. (2003)
suggest that Thailand, as a tax-based accounting income system, exhibits low
earnings timeliness in loss recognition due to the influential tax accounting rules
in the country. Tax rules are stringent and do not reflect economic consequences.
If firms’ accounting income is calculated by using tax rules, that accounting
income is of low quality whereas if firms’ accounting income is calculated by
following accounting principles, that accounting income is of high quality.
Among four Asian countries, including Hong Kong, Malaysia, Singapore and
Thailand, they find that Thailand exhibits the lowest earnings timeliness in loss
recognitions. Ball et al. (2003) argue that earnings timeliness is less likely in
Thailand due to the fact that tax accounting influences firms’ financial reporting.
Thus, it is of interest to investigate whether timeliness in earnings is observed
when Thailand has adopted IFRS.
Chapter VI Earnings Timeliness
225
This thesis adds some evidence to the prior study by incorporating book-tax
differences, the deviation between book income and taxable income,81 to examine
the asymmetric timeliness of earnings in Thailand. The interpretation about book-
tax difference is twofold. Prior studies suggest that a large deviation between
book income and taxable income reflects the variation in quality of earnings (i.e.
Lev and Nessim 2004 and Hanlon 2005). Particularly, Hanlon (2005) concludes
that firms with small (positive/negative) book-tax differences have more
persistent earnings than firms with large (positive/negative) book-tax differences
because tax rules are more restricted than GAAP. Thus, financial reporting for
small book-tax differences firms is higher quality relative to that for large book-
tax differences firms. On the other hand, a large book-tax difference indicates the
use of tax shelter (Desai and Dharmapala 2007). This view implies that the large
book-tax difference is caused by tax strategies rather than the management of
financial reporting.
Even though it is rather problematic to employ the book-tax difference as proxy
for determining financial reporting quality, this thesis views that the book-tax
difference is useful information to determine whether Thai listed firms prepare
their financial reporting according to GAAP or tax rules. It is possibility that
under a tax-based accounting system environment, high costs incurred from tax
filing preparations induce firms to use more the tax-based accounting but use less
GAAP. Therefore, one explanation is that large book-tax differences probably
indicate the firm whose financial reporting is being prepared in line with GAAP
when all else is held constant. The large book-tax difference, then, reflects higher
quality of financial reporting relative to the small book-tax difference.
Moreover, earnings timeliness views persistence of earnings in different ways.
Basu (1997) explains that earnings timeliness in loss recognition is less
pronounced when earnings are more persistent. In the literature, Hanlon (2005)
81 As previously described about the absolute value of book-tax differences in Chapter 4, the actual book-tax difference has been employed for this empirical chapter.
Chapter VI Earnings Timeliness
226
finds higher earnings persistence in small book-tax differences firms. Based on
the explanation and finding, this thesis considers that firms with large book-tax
differences have higher earnings timeliness relative to firms with small book-tax
differences. Based on Basu (1997) and Hanlon (2005), a priori prediction is that
the ability of earnings to capture economic losses for firms with large book-tax
differences is higher than that for firms with small book-tax differences.
According to above discussions, I establish a hypothesis as follows, stated in
alternative form:
H.6.1: Earnings asymmetric timeliness is more pronounced when Thai
listed firms exhibit larger book-tax differences.
In addition to the earnings asymmetric timeliness analysis, I perform additional
firm-specific conservatism analysis. Following Ahmed and Duellman (2007), I
employ the market-based and accrual-based conservatism as measured by book-
to-market and deflated accruals, respectively. I estimate the relationship between
the unconditional conservatism measures and book-tax differences. I include
related control variables consisting of firm size and corporate governance factors.
The next hypothesis is as follows, stated in alternative form:
H.6.2: There is a positive association between firm-specific conservatism
measures and book-tax differences in Thai settings.
6.3 Research Methodology Asymmetric timeliness in earnings
Roychowdhury and Watts (2007) suggest that cumulative earnings should be used
in analysing the asymmetric timeliness. Following Roychowdhury and Watts
(2007) and Ahmed and Duellman (2007), other than annual earnings and returns, I
use backward cumulative earnings and returns over the past two years (year -2 to
0). I analyse the effects of book-tax differences on asymmetric timeliness by
using the following model (Basu 1997).

Chapter VI Earnings Timeliness
227
EPSt, t – j/Pt, t – j – 1 = α0 + α1 Dt, t – j + γ0 Rt, t – j + γ1 Dt, t – j *Rt, t – j + ε it
(6.1)
where EPSt, t – j is per share earnings accumulated from year t – j to year t; when t
= 1, earnings are not accumulated and j is equal to 0. Pt, t – j – 1 is the market value
of equity at the end of year t – j – 1. Rt, t – j is equal to buy-and-hold security
returns, beginning the 3rd month of fiscal year t – j and ending 3 months after
fiscal year t (Basu 1997). Dt, t – j is an indicator variable set equal to 1 if Rt, t – j is
less than zero and zero otherwise. The coefficient of primary interests is γ1 and
expected to be positive. Its positive sign indicates the incremental information of
asymmetric timeliness, indicating that earnings are able to capture economic
losses in a timely basis. To observe the variation of asymmetric timeliness in
earnings for sample firms, the dataset is partitioned according to small and large
positive book-tax differences. The positive sign of γ1 is expected in firm-years
with large positive book-tax differences relative to firm-years with small positive
book-tax differences. Following prior studies (Ahmed and Duellman 2007; Basu
1997; Roychowdhury and Watts 2007), pooled cross-section regressions with
heteroskedasticity-robust standard errors are employed to estimate the regression
model.82
Firm-specific conservatism
Following Ahmed and Duellman (2007), I use two measures of firm-specific
conservatism, including book-to-market and 3-year accumulated accruals. I
attempt to estimate the variation of firm-specific conservatism in firms with
82 It should be noted that the equation 5.1 in chapter 5 shows that share returns (R) are a function of earnings (E). However, the equation 6.1 is a regression of earnings on share returns. Beaver, Lambert and Ryan (1987) originally explain these two bivariate linear relations between share returns and earnings. They suggest that “Each characterization is a reverse regression with respect to one another and is equally valid because a random variable can always be linearly projected onto another variable with a resulting disturbance term that is uncorrelated with the explanatory variable and with an unconditional mean of zero. The only difference between the two equations is the direction in which the disturbance terms are measured.” (Italics from originals) The disturbance term in equation 5.1 is measured perpendicular to the E-axis, while the disturbance term in equation 6.1 is measured perpendicular to the R-axis.
Chapter VI Earnings Timeliness
228
difference degrees of positive book-tax differences. A priori prediction is that the
larger positive book-tax difference firm tends to have more accounting
conservatism relative to the smaller positive book-tax difference firm. The first
firm-specific conservatism is the ratio of book-to-market (BTM).83 For BTM, the
lower ratio indicates the higher conservatism. To ease the interpretation, the ratio
is multiplied by negative one. For the second firm-specific conservatism measure,
the accrual-based measure, I use the ratio of accruals divided by average total
asset (ACC).84 Based on Ahmed and Duellman (2007), I add up the ratio over a
3-year period centered on year t and divided by 3 to obtain the accumulated
accruals-based conservatism measure. The 3-year accumulated accruals are used
as a proxy because it is to mitigate the problem of accruals reversion between the
current and previous years. Again, the ratio is multiplied by negative one. The
positive ACC indicates higher conservatism. I include control variables to ensure
that the analysis is well specified. Also, I introduce firm governance factors in the
analysis to investigate whether firms’ governance systems relate firms’
unconditional conservatism.
For control variables, I include leverage, sales growth rate and firm size in the
analysis. Following prior studies, the higher leverage induces the higher
conservatism because of the contractual demand from lenders or creditors. Thus,
the positive relationship between leverage and firm-specific conservatism
measures is expected. Following Ahmed and Duellman (2007), a negative
relationship between the sales growth and ACC is expected because ACC is likely
to be a poor measure when sales are declining. The relationship between sales
growth and BTM is predicted to be positive because firms’ future cash flows are
expected according to the increase of sales growth. The association between
firms’ size and firm-specific conservatism measures is predicted to be positive
because the high political cost in larger firms induces more conservatism. 83 As previously described, the book-to-market ratio employed in this thesis does not represent growth of the firm. 84Accruals are calculated as follows: CFO = Earnings before interest and tax + Depreciation – [(Changes in current assets – Changes in current liabilities)] ACC = Earnings before interest and tax – CFO

Chapter VI Earnings Timeliness
229
For firm governance factors, board quality, corporate governance quality,
institutional ownership and board size are included. Consistent with the previous
chapters, I do not have a priori prediction on the relationship between firm-
specific measures and firm governance systems. I use the number of boards that
board of directors serve as board of directors or audit committee in other firms as
a proxy for board quality. Firms with complexity organization and relatively low
earnings timeliness tend to use highly reputable board committees because of a
demand for costly monitoring (Bushman et al. 2004). However, in this setting,
the constraint of time allocated to their work as board of directors in many firms
can deter the quality of work, finally resulting in a lower quality of accounting
information.
The proportion of audit committee and independent directors in firms’ board is
used to measure the quality of corporate governance systems. The greater
proportion induces higher quality of accounting numbers; therefore, the greater
proportion indicates higher quality of corporate governance systems. As a result,
firms with high proportion should be of higher conservatism compared to firms
with low proportion. According to the monitoring cost approach, however, firms
with low conservatism are likely to be demanded by their shareholders to have
higher proportion of audit committee and independent directors in firms’ board
compared to firms with high conservatism. By this approach, I should find a
negative relationship between firm-specific conservatism measures and the
proportion of audit committee and independent directors on firms’ board.
Institutional ownership induces firms to have more conservatism according to the
monitoring approach. The greater institutional ownership the more power to vote
and secure the firm from private benefits taken by the manager. On the other
hand, the institutional ownership is able to influence firms’ board and obtain
private benefits at the expense of other investors. Thus, no a priori prediction is
set for this issue. I operationalise the model in the following way:
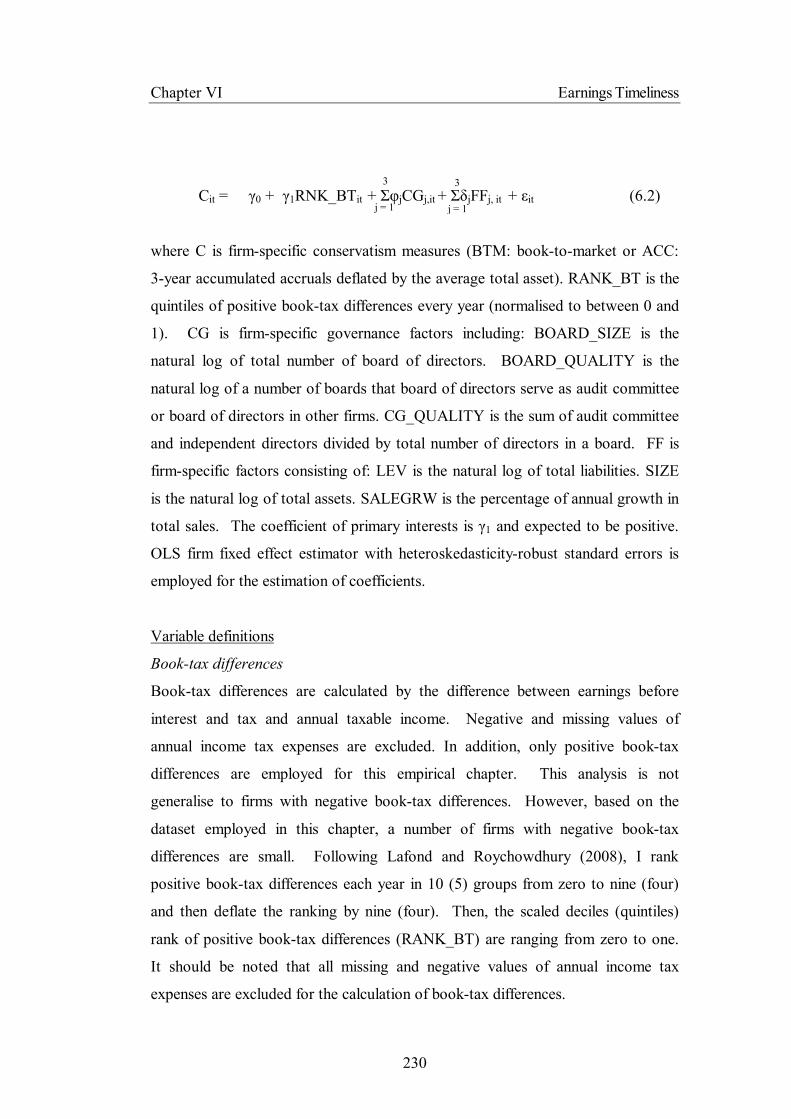
Chapter VI Earnings Timeliness
230
j = 1
3
j = 1
3
Cit = γ0 + γ1RNK_BTit + ΣφjCGj,it + ΣδjFFj, it + εit (6.2)
where C is firm-specific conservatism measures (BTM: book-to-market or ACC:
3-year accumulated accruals deflated by the average total asset). RANK_BT is the
quintiles of positive book-tax differences every year (normalised to between 0 and
1). CG is firm-specific governance factors including: BOARD_SIZE is the
natural log of total number of board of directors. BOARD_QUALITY is the
natural log of a number of boards that board of directors serve as audit committee
or board of directors in other firms. CG_QUALITY is the sum of audit committee
and independent directors divided by total number of directors in a board. FF is
firm-specific factors consisting of: LEV is the natural log of total liabilities. SIZE
is the natural log of total assets. SALEGRW is the percentage of annual growth in
total sales. The coefficient of primary interests is γ1 and expected to be positive.
OLS firm fixed effect estimator with heteroskedasticity-robust standard errors is
employed for the estimation of coefficients.
Variable definitions
Book-tax differences
Book-tax differences are calculated by the difference between earnings before
interest and tax and annual taxable income. Negative and missing values of
annual income tax expenses are excluded. In addition, only positive book-tax
differences are employed for this empirical chapter. This analysis is not
generalise to firms with negative book-tax differences. However, based on the
dataset employed in this chapter, a number of firms with negative book-tax
differences are small. Following Lafond and Roychowdhury (2008), I rank
positive book-tax differences each year in 10 (5) groups from zero to nine (four)
and then deflate the ranking by nine (four). Then, the scaled deciles (quintiles)
rank of positive book-tax differences (RANK_BT) are ranging from zero to one.
It should be noted that all missing and negative values of annual income tax
expenses are excluded for the calculation of book-tax differences.
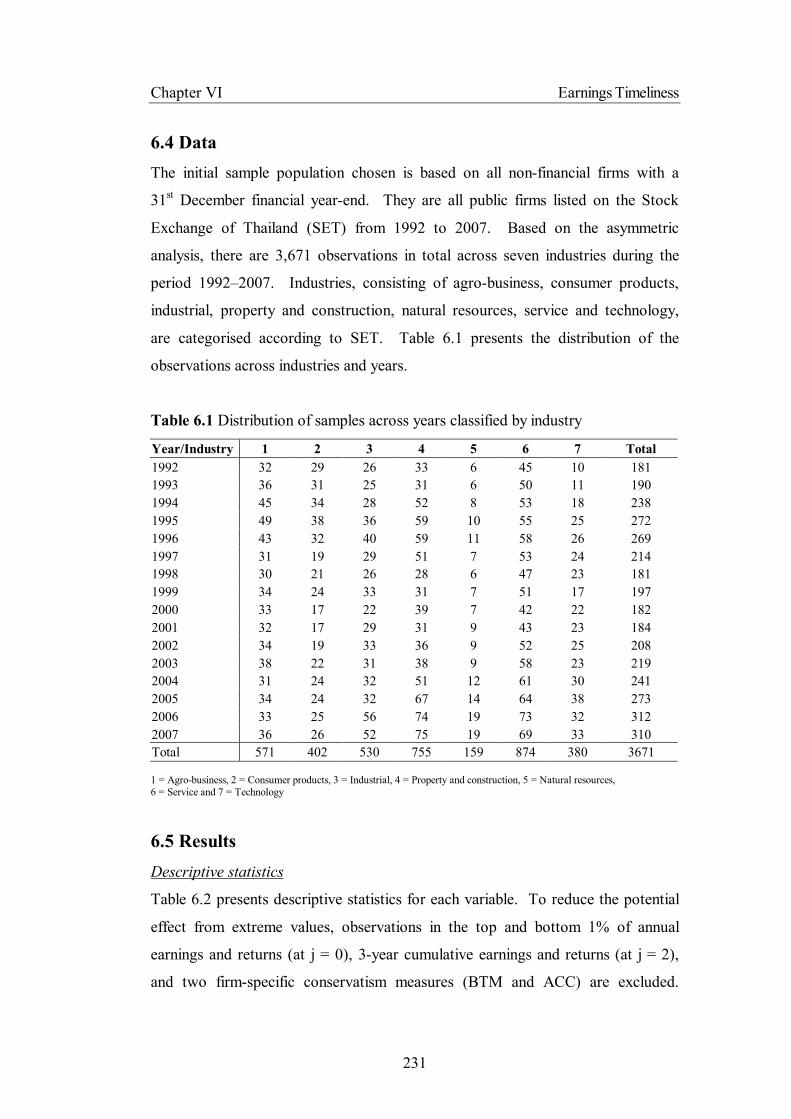
Chapter VI Earnings Timeliness
231
6.4 Data The initial sample population chosen is based on all non-financial firms with a
31st December financial year-end. They are all public firms listed on the Stock
Exchange of Thailand (SET) from 1992 to 2007. Based on the asymmetric
analysis, there are 3,671 observations in total across seven industries during the
period 1992–2007. Industries, consisting of agro-business, consumer products,
industrial, property and construction, natural resources, service and technology,
are categorised according to SET. Table 6.1 presents the distribution of the
observations across industries and years.
Table 6.1 Distribution of samples across years classified by industry
Year/Industry 1 2 3 4 5 6 7 Total 1992 32 29 26 33 6 45 10 181 1993 36 31 25 31 6 50 11 190 1994 45 34 28 52 8 53 18 238 1995 49 38 36 59 10 55 25 272 1996 43 32 40 59 11 58 26 269 1997 31 19 29 51 7 53 24 214 1998 30 21 26 28 6 47 23 181 1999 34 24 33 31 7 51 17 197 2000 33 17 22 39 7 42 22 182 2001 32 17 29 31 9 43 23 184 2002 34 19 33 36 9 52 25 208 2003 38 22 31 38 9 58 23 219 2004 31 24 32 51 12 61 30 241 2005 34 24 32 67 14 64 38 273 2006 33 25 56 74 19 73 32 312 2007 36 26 52 75 19 69 33 310 Total 571 402 530 755 159 874 380 3671 1 = Agro-business, 2 = Consumer products, 3 = Industrial, 4 = Property and construction, 5 = Natural resources, 6 = Service and 7 = Technology
6.5 Results Descriptive statistics
Table 6.2 presents descriptive statistics for each variable. To reduce the potential
effect from extreme values, observations in the top and bottom 1% of annual
earnings and returns (at j = 0), 3-year cumulative earnings and returns (at j = 2),
and two firm-specific conservatism measures (BTM and ACC) are excluded.
Chapter VI Earnings Timeliness
232
Earnings and returns are considerably varied among observations because of large
standard deviations compared to the mean; these seem to be general cases for
emerging markets i.e. Czech Republic (Jindrichovska and McLeay 2005)85 and
Finland (Kankaanpaa, no date).86 SET requires listed firms to constitute at least
three independent directors in a firm. CG_QUALITY indicates that on average
three out of ten directors are independent directors or audit committee in a firm.
Table 6.3 presents the Pearson and Spearman correlations between conservatism
measures and other variables. Pearson and Spearman correlations provide very
similar results. The market-based measure of conservatism (BTM) and accrual–
based measure of conservatism (ACC) are not correlated. At 5% level of
confidence, the market–based measure of conservatism (BTM) is not correlated
with board size but positively correlated with all other variables except firm’s
leverage. The accrual-based measure of conservatism (ACC) is negatively
correlated with board quality at 10% level but not correlated with other variables.
The rank of positive book-tax differences (BT) is correlated with all other variables
except ACC and CG_QUALITY.
85 see Table 1, 2A and 2B in the article. 86 see Table 3 in the article
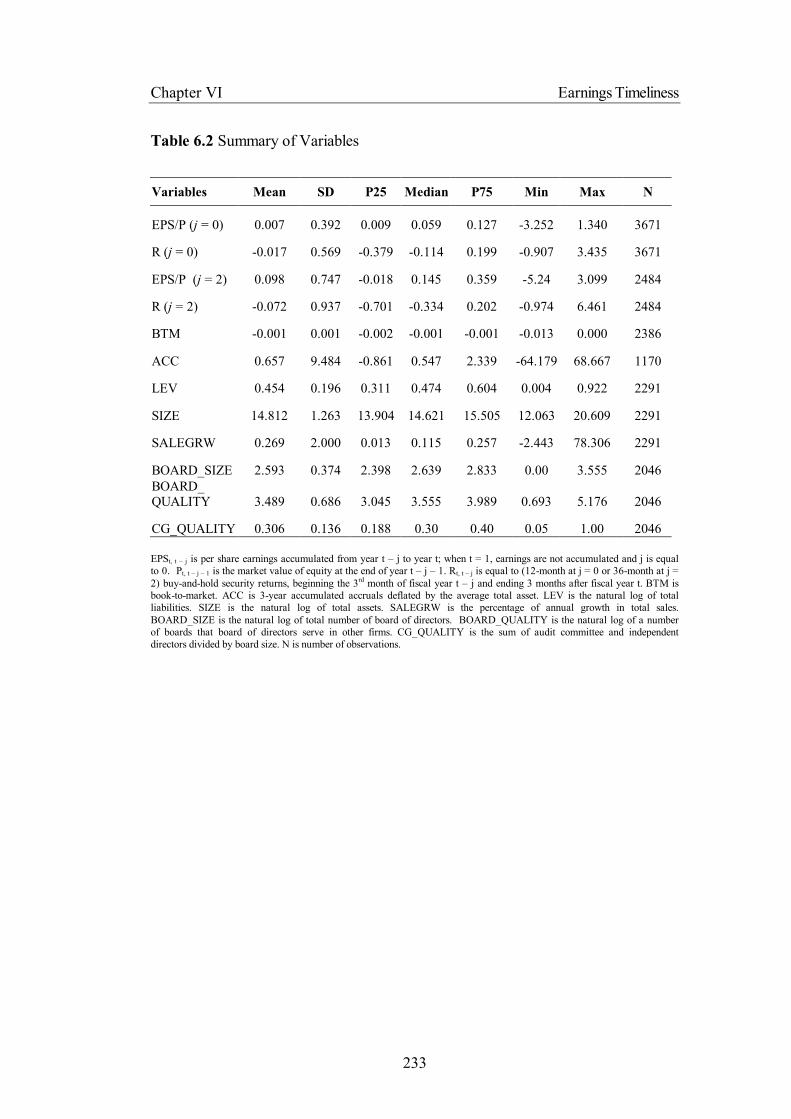
Chapter VI Earnings Timeliness
233
Table 6.2 Summary of Variables
Variables Mean SD P25 Median P75 Min Max N
EPS/P (j = 0) 0.007 0.392 0.009 0.059 0.127 -3.252 1.340 3671
R (j = 0) -0.017 0.569 -0.379 -0.114 0.199 -0.907 3.435 3671
EPS/P (j = 2) 0.098 0.747 -0.018 0.145 0.359 -5.24 3.099 2484
R (j = 2) -0.072 0.937 -0.701 -0.334 0.202 -0.974 6.461 2484
BTM -0.001 0.001 -0.002 -0.001 -0.001 -0.013 0.000 2386
ACC 0.657 9.484 -0.861 0.547 2.339 -64.179 68.667 1170
LEV 0.454 0.196 0.311 0.474 0.604 0.004 0.922 2291
SIZE 14.812 1.263 13.904 14.621 15.505 12.063 20.609 2291
SALEGRW 0.269 2.000 0.013 0.115 0.257 -2.443 78.306 2291
BOARD_SIZE 2.593 0.374 2.398 2.639 2.833 0.00 3.555 2046 BOARD_ QUALITY 3.489 0.686 3.045 3.555 3.989 0.693 5.176 2046
CG_QUALITY 0.306 0.136 0.188 0.30 0.40 0.05 1.00 2046 EPSt, t – j is per share earnings accumulated from year t – j to year t; when t = 1, earnings are not accumulated and j is equal to 0. Pt, t – j – 1 is the market value of equity at the end of year t – j – 1. Rt, t – j is equal to (12-month at j = 0 or 36-month at j = 2) buy-and-hold security returns, beginning the 3rd month of fiscal year t – j and ending 3 months after fiscal year t. BTM is book-to-market. ACC is 3-year accumulated accruals deflated by the average total asset. LEV is the natural log of total liabilities. SIZE is the natural log of total assets. SALEGRW is the percentage of annual growth in total sales. BOARD_SIZE is the natural log of total number of board of directors. BOARD_QUALITY is the natural log of a number of boards that board of directors serve in other firms. CG_QUALITY is the sum of audit committee and independent directors divided by board size. N is number of observations.
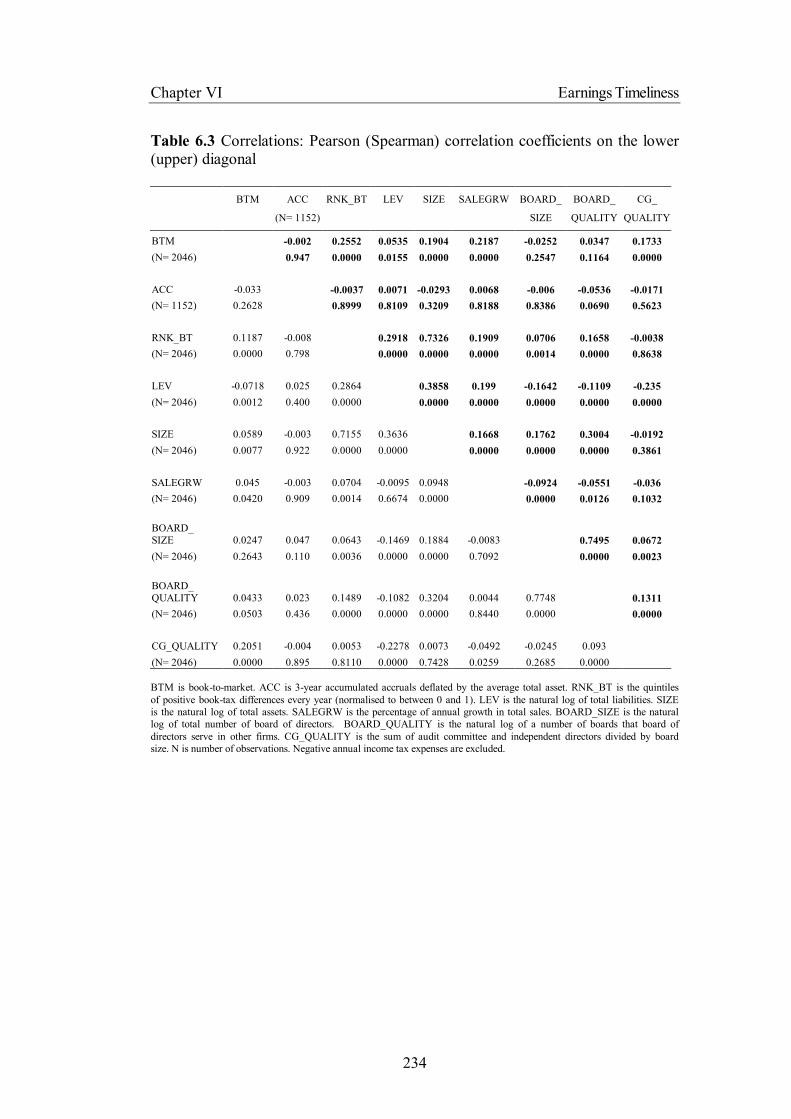
Chapter VI Earnings Timeliness
234
Table 6.3 Correlations: Pearson (Spearman) correlation coefficients on the lower (upper) diagonal
BTM ACC RNK_BT LEV SIZE SALEGRW BOARD_ BOARD_ CG_
(N= 1152) SIZE QUALITY QUALITY
BTM -0.002 0.2552 0.0535 0.1904 0.2187 -0.0252 0.0347 0.1733 (N= 2046) 0.947 0.0000 0.0155 0.0000 0.0000 0.2547 0.1164 0.0000 ACC -0.033 -0.0037 0.0071 -0.0293 0.0068 -0.006 -0.0536 -0.0171 (N= 1152) 0.2628 0.8999 0.8109 0.3209 0.8188 0.8386 0.0690 0.5623 RNK_BT 0.1187 -0.008 0.2918 0.7326 0.1909 0.0706 0.1658 -0.0038 (N= 2046) 0.0000 0.798 0.0000 0.0000 0.0000 0.0014 0.0000 0.8638 LEV -0.0718 0.025 0.2864 0.3858 0.199 -0.1642 -0.1109 -0.235 (N= 2046) 0.0012 0.400 0.0000 0.0000 0.0000 0.0000 0.0000 0.0000 SIZE 0.0589 -0.003 0.7155 0.3636 0.1668 0.1762 0.3004 -0.0192 (N= 2046) 0.0077 0.922 0.0000 0.0000 0.0000 0.0000 0.0000 0.3861 SALEGRW 0.045 -0.003 0.0704 -0.0095 0.0948 -0.0924 -0.0551 -0.036 (N= 2046) 0.0420 0.909 0.0014 0.6674 0.0000 0.0000 0.0126 0.1032 BOARD_ SIZE 0.0247 0.047 0.0643 -0.1469 0.1884 -0.0083 0.7495 0.0672 (N= 2046) 0.2643 0.110 0.0036 0.0000 0.0000 0.7092 0.0000 0.0023 BOARD_ QUALITY 0.0433 0.023 0.1489 -0.1082 0.3204 0.0044 0.7748 0.1311 (N= 2046) 0.0503 0.436 0.0000 0.0000 0.0000 0.8440 0.0000 0.0000 CG_QUALITY 0.2051 -0.004 0.0053 -0.2278 0.0073 -0.0492 -0.0245 0.093 (N= 2046) 0.0000 0.895 0.8110 0.0000 0.7428 0.0259 0.2685 0.0000 BTM is book-to-market. ACC is 3-year accumulated accruals deflated by the average total asset. RNK_BT is the quintiles of positive book-tax differences every year (normalised to between 0 and 1). LEV is the natural log of total liabilities. SIZE is the natural log of total assets. SALEGRW is the percentage of annual growth in total sales. BOARD_SIZE is the natural log of total number of board of directors. BOARD_QUALITY is the natural log of a number of boards that board of directors serve in other firms. CG_QUALITY is the sum of audit committee and independent directors divided by board size. N is number of observations. Negative annual income tax expenses are excluded.

Chapter VI Earnings Timeliness
235
Results from earnings asymmetric timeliness
Table 6.4 presents the asymmetric timeliness of earnings at j = 0 and 2. In Panel
A, annual earnings-return regressions report that asymmetric timeliness in
earnings is observed in Thai firms during the period 1993–2007. The coefficient
estimate, γ1, is positive and significant. The adjusted R2 is 3.9%.87 When using
cumulative earnings and returns, the result is consistent with that using annual
earnings and returns. Earnings in Thai firms are able to capture economic losses
during the period 1994–2007. The adjusted R2 is 6.9% and higher than the result
reported from annual earnings and returns regressions.88
I further compare the asymmetric timeliness in earnings between pre- and post-
adoption periods in Thailand. This is to investigate whether earnings are of higher
quality in terms of timeliness after IFRS adoptions in Thailand. Results from
annual and cumulative earnings and returns indicate that earnings timeliness is
declined or unobserved after IFRS adoptions. It indicates that the ability to
capture economic circumstances is less likely in Thailand after 1999. A potential
explanation that earnings timeliness is less likely during post-adoption periods is
because earnings are more persistent during post-adoption periods. The finding
about earnings persistence is reported in Chapter 4. Thus, this thesis argues that it
is possibility that the persistence of earnings deteriorates the ability to capture
economic consequences in a timely fashion after IFRS adoptions in Thailand.
87 Basu (1997 Table 1) reports the adjusted R2 is 10.09% in US firms. The asymmetric timeliness in earnings is not observed in many countries, i.e. Czech Republic (Jindrichovska and McLeay 2005), Finland (Kankaanpaa, no date, see Tables 5 and 6 in the article) and other European countries (see Grudnitski and Aubert 2008). 88 Based on Basu (1997), an alternative procedure to evaluate the asymmetric timeliness in earnings is by comparing the explanatory power when firms are partitioned according to gains (positive returns) and losses (negative returns). The explanatory power for firms with negative returns is expected to be higher than that for firms with positive returns, indicating that economic losses are captured by earnings in a more timely fashion. Appendix 9 reports more results of asymmetric timeliness in earnings by partitioning the dataset according to positive (economic gains) and negative (economic losses) returns. The adjusted R2 is compared between two groups. Consistent with the result presented in Table 6.4, Panel A, findings suggest that the adjusted R2 for the sample firm with negative returns is greater than that for the sample firm with positive returns.
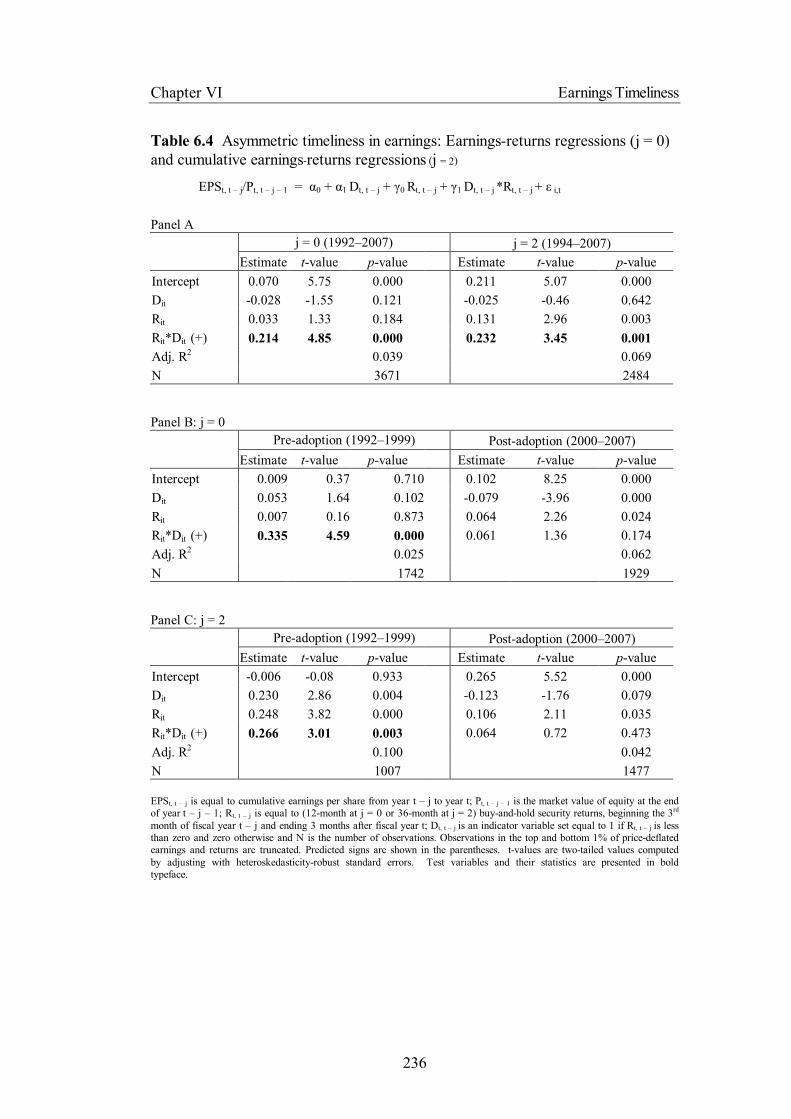
Chapter VI Earnings Timeliness
236
Table 6.4 Asymmetric timeliness in earnings: Earnings-returns regressions (j = 0) and cumulative earnings-returns regressions (j = 2)
EPSt, t – j/Pt, t – j – 1 = α0 + α1 Dt, t – j + γ0 Rt, t – j + γ1 Dt, t – j *Rt, t – j + ε i,t
Panel A j = 0 (1992–2007) j = 2 (1994–2007) Estimate t-value p-value Estimate t-value p-value Intercept 0.070 5.75 0.000 0.211 5.07 0.000 Dit -0.028 -1.55 0.121 -0.025 -0.46 0.642 Rit 0.033 1.33 0.184 0.131 2.96 0.003 Rit*Dit (+) 0.214 4.85 0.000 0.232 3.45 0.001 Adj. R2 0.039 0.069 N 3671 2484 Panel B: j = 0 Pre-adoption (1992–1999) Post-adoption (2000–2007) Estimate t-value p-value Estimate t-value p-value Intercept 0.009 0.37 0.710 0.102 8.25 0.000 Dit 0.053 1.64 0.102 -0.079 -3.96 0.000 Rit 0.007 0.16 0.873 0.064 2.26 0.024 Rit*Dit (+) 0.335 4.59 0.000 0.061 1.36 0.174 Adj. R2 0.025 0.062 N 1742 1929 Panel C: j = 2 Pre-adoption (1992–1999) Post-adoption (2000–2007) Estimate t-value p-value Estimate t-value p-value Intercept -0.006 -0.08 0.933 0.265 5.52 0.000 Dit 0.230 2.86 0.004 -0.123 -1.76 0.079 Rit 0.248 3.82 0.000 0.106 2.11 0.035 Rit*Dit (+) 0.266 3.01 0.003 0.064 0.72 0.473 Adj. R2 0.100 0.042 N 1007 1477
EPSt, t – j is equal to cumulative earnings per share from year t – j to year t; Pt, t – j – 1 is the market value of equity at the end of year t – j – 1; Rt, t – j is equal to (12-month at j = 0 or 36-month at j = 2) buy-and-hold security returns, beginning the 3rd month of fiscal year t – j and ending 3 months after fiscal year t; Dt, t – j is an indicator variable set equal to 1 if Rt, t – j is less than zero and zero otherwise and N is the number of observations. Observations in the top and bottom 1% of price-deflated earnings and returns are truncated. Predicted signs are shown in the parentheses. t-values are two-tailed values computed by adjusting with heteroskedasticity-robust standard errors. Test variables and their statistics are presented in bold typeface.
Chapter VI Earnings Timeliness
237
Table 6.5 reports whether the institutional factor, book-tax differences, plays an
important role to determine the asymmetric timeliness in earnings. The positive
book-tax difference is ranked in ten groups every year from low to high book-tax
differences. Then, the ranking is scaled to zero (least positive) and one (most
positive). The scaled rank of book-tax differences is integrated with all other
variables. A priori prediction is that earnings timeliness is more likely for firms
with large book-tax differences. Therefore, the predicted sign of γ3 is positive.
Results in Panel A suggest that asymmetric timeliness in earnings are more likely
for Thai listed firms with larger positive book-tax differences (γ3 = .091 with
positive sign).
In Panel B of Table 6.5, the data are partitioned according to the level of book-tax
differences. Low (high) threshold includes firms with low (high) scale of book-
tax differences. An indicator variable (YR) for pre- and post-adoption periods is
integrated to bad news and good news variables to estimate whether earnings
timeliness is improved after the IFRS adoption. The α7 with positive sign is
expected for firms in both low and high thresholds.
At j = 0 in Panel B, results show that α7 (.139) is positive and significant for firms
in high threshold, suggesting that conditional conservatism is more likely for
firms with large book-tax differences. It infers that even though new accounting
standards have been adopted in Thailand, earnings quality in terms of conditional
conservatism is still less likely when firms are more likely to use more tax rules
for financial statement preparations. At j = 2, untabulated findings are not
significant. Thus, I perform additional tests to support these main findings in
robustness checks.
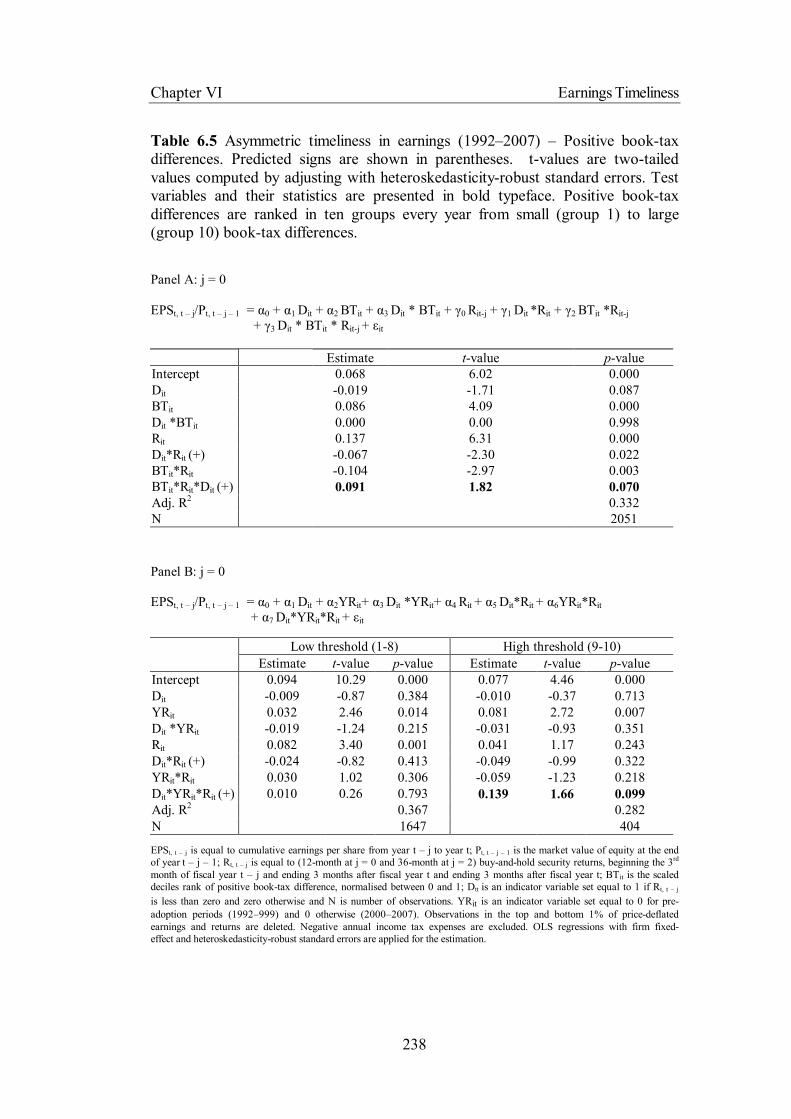
Chapter VI Earnings Timeliness
238
Table 6.5 Asymmetric timeliness in earnings (1992–2007) – Positive book-tax differences. Predicted signs are shown in parentheses. t-values are two-tailed values computed by adjusting with heteroskedasticity-robust standard errors. Test variables and their statistics are presented in bold typeface. Positive book-tax differences are ranked in ten groups every year from small (group 1) to large (group 10) book-tax differences. Panel A: j = 0 EPSt, t – j/Pt, t – j – 1 = α0 + α1 Dit + α2 BTit + α3 Dit * BTit + γ0 Rit-j + γ1 Dit *Rit + γ2 BTit *Rit-j
+ γ3 Dit * BTit * Rit-j + εit Estimate t-value p-value Intercept 0.068 6.02 0.000 Dit -0.019 -1.71 0.087 BTit 0.086 4.09 0.000 Dit *BTit 0.000 0.00 0.998 Rit 0.137 6.31 0.000 Dit*Rit (+) -0.067 -2.30 0.022 BTit*Rit -0.104 -2.97 0.003 BTit*Rit*Dit (+) 0.091 1.82 0.070 Adj. R2 0.332 N 2051 Panel B: j = 0 EPSt, t – j/Pt, t – j – 1 = α0 + α1 Dit + α2YRit+ α3 Dit *YRit+ α4 Rit + α5 Dit*Rit + α6YRit*Rit
+ α7 Dit*YRit*Rit + εit Low threshold (1-8) High threshold (9-10) Estimate t-value p-value Estimate t-value p-value Intercept 0.094 10.29 0.000 0.077 4.46 0.000 Dit -0.009 -0.87 0.384 -0.010 -0.37 0.713 YRit 0.032 2.46 0.014 0.081 2.72 0.007 Dit *YRit -0.019 -1.24 0.215 -0.031 -0.93 0.351 Rit 0.082 3.40 0.001 0.041 1.17 0.243 Dit*Rit (+) -0.024 -0.82 0.413 -0.049 -0.99 0.322 YRit*Rit 0.030 1.02 0.306 -0.059 -1.23 0.218 Dit*YRit*Rit (+) 0.010 0.26 0.793 0.139 1.66 0.099 Adj. R2 0.367 0.282 N 1647 404 EPSt, t – j is equal to cumulative earnings per share from year t – j to year t; Pt, t – j – 1 is the market value of equity at the end of year t – j – 1; Rt, t – j is equal to (12-month at j = 0 and 36-month at j = 2) buy-and-hold security returns, beginning the 3rd month of fiscal year t – j and ending 3 months after fiscal year t and ending 3 months after fiscal year t; BTit is the scaled deciles rank of positive book-tax difference, normalised between 0 and 1; Dtt is an indicator variable set equal to 1 if Rt, t – j
is less than zero and zero otherwise and N is number of observations. YRit is an indicator variable set equal to 0 for pre-adoption periods (1992–999) and 0 otherwise (2000–2007). Observations in the top and bottom 1% of price-deflated earnings and returns are deleted. Negative annual income tax expenses are excluded. OLS regressions with firm fixed-effect and heteroskedasticity-robust standard errors are applied for the estimation.
Chapter VI Earnings Timeliness
239
Results from firm specific conservatism
Table 6.6 reports the result obtained from the market-based firm specific
conservatism measure (BTM). I regress BTM on the quintiles of positive book-
tax difference. Consistent with the scaled deciles rank of positive book-tax
differences, positive book-tax differences are ranked in five groups each year and
normalised between 0 and 1. Without control variables, results highlighted with
bold typeface indicate that the conservatism varies according to the scale of book-
tax differences. The significantly positive relationship between the ratio of book-
to-market (BTM) and the rank of book-tax difference (RNK_BT) indicates that
the larger book-tax difference induces more unconditional accounting
conservatism. This result is consistent when including control variables.
Inconsistent with a priori predictions, results suggest that the market-based
conservatism is negatively associated with leverage and firm size.
When adding firm governance systems into the analysis, the relationship between
BTM and book-tax differences remains positive. Accounting conservatism is
more likely to improve according to larger board size. The higher ratio of
independent directors and audit committee in firms’ board induces more
accounting conservatism, indicating that corporate governance systems in terms of
independence induce accounting conservatism.
Results report negative relationship between BTM and board quality measured by
the number of boards that board of directors serve as executive directors in other
firms. A potential explanation for this negative relationship is that the quality of
work is more likely to decline when one director works on too many boards.89 For
control variables, only the relationship between BTM and sales growth follows
the predicted sign but is insignificant. In addition, the adjusted R2 and F-statistics
are improved when including control and corporate governance factors.
89 It should be noted that the coefficient estimates are relatively small. This is rather consistent with the prior study. Ahmed and Duellman (2007) report the coefficient (quoted in absolute values) of BTM and board size (ranging from 0.028 to 0.129), BTM and sales growth (ranging from 0.003 to 0.007) and ACC and board size (ranging from 0.008 – 0.010), ACC and sales growth (ranging from 0.005 – 0.008).
Chapter VI Earnings Timeliness
240
Table 6.7 reports the relationship between accrual-based conservatism (ACC) and
positive book-tax differences. Findings reports no relationship between ACC and
the scaled quintiles rank of positive book-tax differences. The findings are
consistent when including control variables and firm governance proxies. The
adjusted R2 is not considerably altered when including fundamental and corporate
governance factors. F-statistics are not significant. These results when using
ACC are contradicted with the results reported in Table 6.6. One potential
explanation is that accrual-based conservatism may involve earnings
management. Thus, these two regressions are re-estimated by controlling for
earnings management as presented in the robust test.90
Robustness checks
In terms of earnings timeliness, I compare the explanatory power when
partitioning the dataset according to good news and bad news (Basu 1997). As
reported in Table 6.8, the explanatory power for bad news is higher than that for
good news at j = 0 and j = 2, suggesting that bad news can explain earnings better
than good news. This implies that earnings asymmetric timeliness is more likely
in Thai firms.
90 Appendix 10 presents results when calculating the book-tax difference from consolidated financial statements. It should be noted that the result is consistent when using the mean-reverting model to estimate the asymmetric timeliness of earnings, and estimating the relationship between firm-specific accounting conservatism and the scaled quintiles rank of book-tax differences.
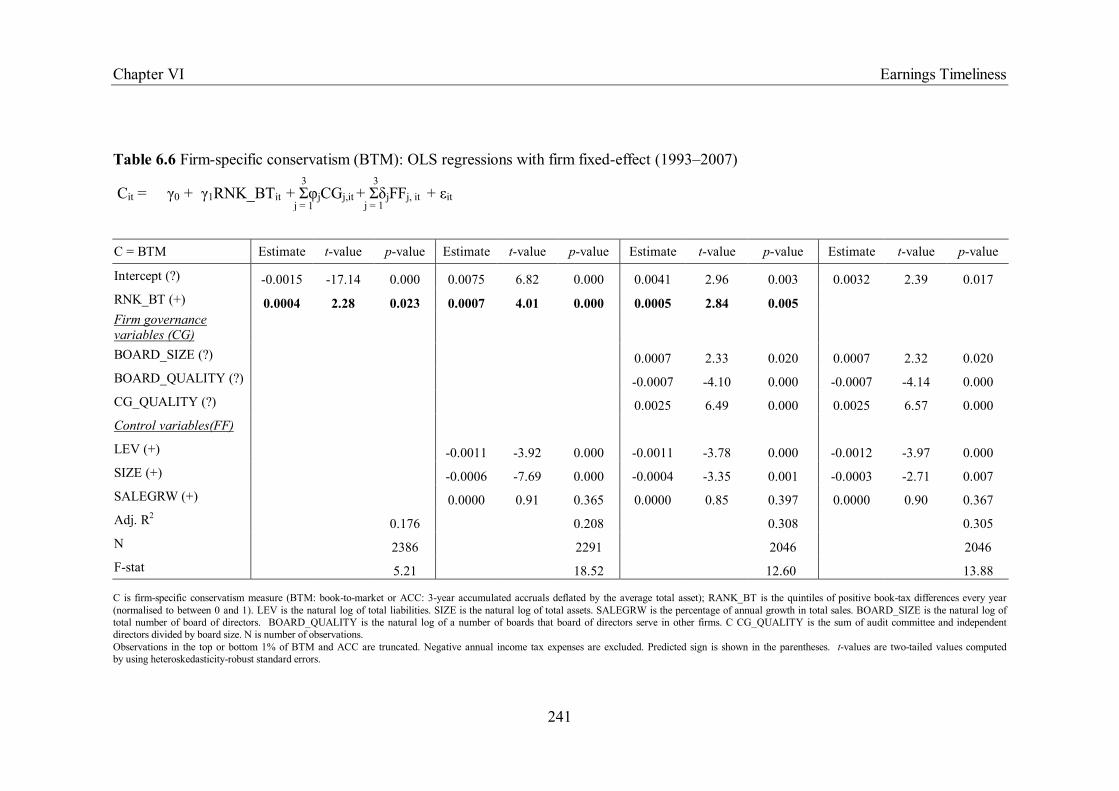
Chapter VI Earnings Timeliness
241
j = 1
3
j = 1
3
Table 6.6 Firm-specific conservatism (BTM): OLS regressions with firm fixed-effect (1993–2007) Cit = γ0 + γ1RNK_BTit + ΣφjCGj,it + ΣδjFFj, it + εit
C = BTM Estimate t-value p-value Estimate t-value p-value Estimate t-value p-value Estimate t-value p-value
Intercept (?) -0.0015 -17.14 0.000 0.0075 6.82 0.000 0.0041 2.96 0.003 0.0032 2.39 0.017 RNK_BT (+) 0.0004 2.28 0.023 0.0007 4.01 0.000 0.0005 2.84 0.005 Firm governance variables (CG) BOARD_SIZE (?) 0.0007 2.33 0.020 0.0007 2.32 0.020 BOARD_QUALITY (?) -0.0007 -4.10 0.000 -0.0007 -4.14 0.000 CG_QUALITY (?) 0.0025 6.49 0.000 0.0025 6.57 0.000 Control variables(FF) LEV (+) -0.0011 -3.92 0.000 -0.0011 -3.78 0.000 -0.0012 -3.97 0.000 SIZE (+) -0.0006 -7.69 0.000 -0.0004 -3.35 0.001 -0.0003 -2.71 0.007 SALEGRW (+) 0.0000 0.91 0.365 0.0000 0.85 0.397 0.0000 0.90 0.367 Adj. R2 0.176 0.208 0.308 0.305 N 2386 2291 2046 2046 F-stat 5.21 18.52 12.60 13.88 C is firm-specific conservatism measure (BTM: book-to-market or ACC: 3-year accumulated accruals deflated by the average total asset); RANK_BT is the quintiles of positive book-tax differences every year (normalised to between 0 and 1). LEV is the natural log of total liabilities. SIZE is the natural log of total assets. SALEGRW is the percentage of annual growth in total sales. BOARD_SIZE is the natural log of total number of board of directors. BOARD_QUALITY is the natural log of a number of boards that board of directors serve in other firms. C CG_QUALITY is the sum of audit committee and independent directors divided by board size. N is number of observations. Observations in the top or bottom 1% of BTM and ACC are truncated. Negative annual income tax expenses are excluded. Predicted sign is shown in the parentheses. t-values are two-tailed values computed by using heteroskedasticity-robust standard errors.
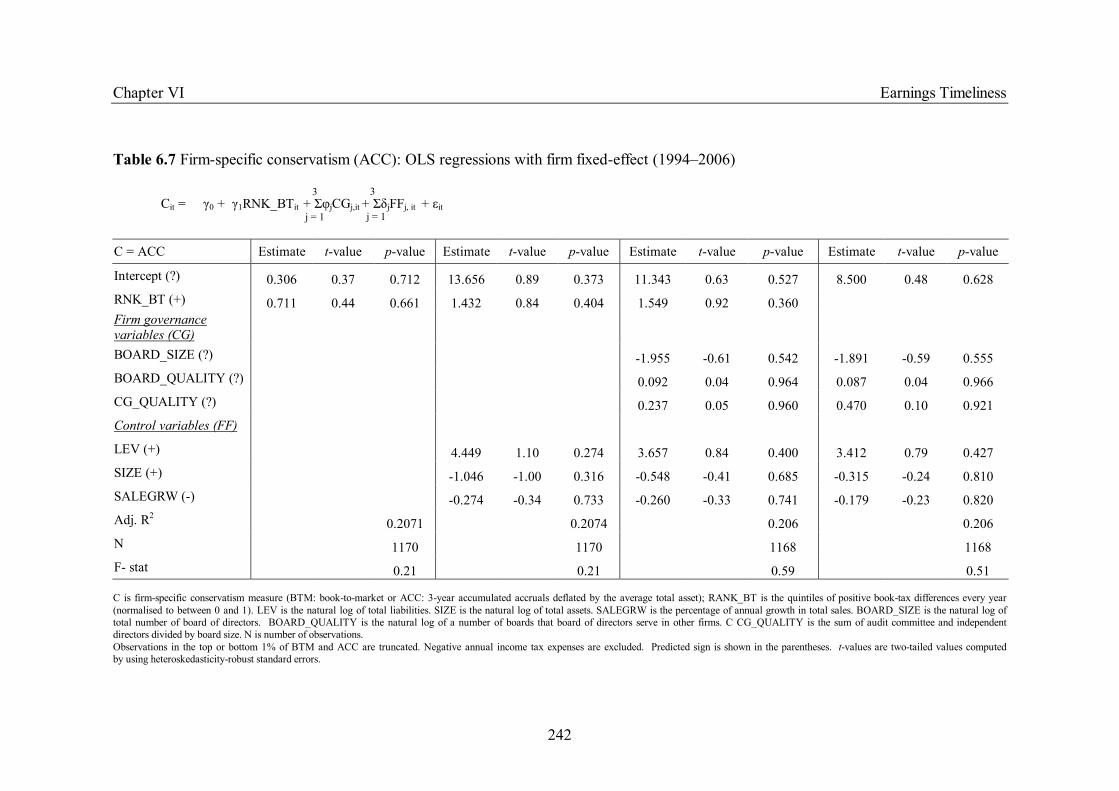
Chapter VI Earnings Timeliness
242
j = 1
3
j = 1
3
Table 6.7 Firm-specific conservatism (ACC): OLS regressions with firm fixed-effect (1994–2006)
Cit = γ0 + γ1RNK_BTit + ΣφjCGj,it + ΣδjFFj, it + εit
C = ACC Estimate t-value p-value Estimate t-value p-value Estimate t-value p-value Estimate t-value p-value
Intercept (?) 0.306 0.37 0.712 13.656 0.89 0.373 11.343 0.63 0.527 8.500 0.48 0.628 RNK_BT (+) 0.711 0.44 0.661 1.432 0.84 0.404 1.549 0.92 0.360 Firm governance variables (CG) BOARD_SIZE (?) -1.955 -0.61 0.542 -1.891 -0.59 0.555 BOARD_QUALITY (?) 0.092 0.04 0.964 0.087 0.04 0.966 CG_QUALITY (?) 0.237 0.05 0.960 0.470 0.10 0.921 Control variables (FF) LEV (+) 4.449 1.10 0.274 3.657 0.84 0.400 3.412 0.79 0.427 SIZE (+) -1.046 -1.00 0.316 -0.548 -0.41 0.685 -0.315 -0.24 0.810 SALEGRW (-) -0.274 -0.34 0.733 -0.260 -0.33 0.741 -0.179 -0.23 0.820 Adj. R2 0.2071 0.2074 0.206 0.206 N 1170 1170 1168 1168 F- stat 0.21 0.21 0.59 0.51 C is firm-specific conservatism measure (BTM: book-to-market or ACC: 3-year accumulated accruals deflated by the average total asset); RANK_BT is the quintiles of positive book-tax differences every year (normalised to between 0 and 1). LEV is the natural log of total liabilities. SIZE is the natural log of total assets. SALEGRW is the percentage of annual growth in total sales. BOARD_SIZE is the natural log of total number of board of directors. BOARD_QUALITY is the natural log of a number of boards that board of directors serve in other firms. C CG_QUALITY is the sum of audit committee and independent directors divided by board size. N is number of observations. Observations in the top or bottom 1% of BTM and ACC are truncated. Negative annual income tax expenses are excluded. Predicted sign is shown in the parentheses. t-values are two-tailed values computed by using heteroskedasticity-robust standard errors.

Chapter VI Earnings Timeliness
243
Table 6.8 Robustness checks: Partitioning data by good news and bad news
EPSt, t – j/Pt, t – j – 1 = α0 + + γ0 Rt, t – j + ε i,t
j = 0 Intercept γ0 Adj. R2 N Good news 0.066 0.040 0.003 1343 (4.92)*** (1.57) Bad news 0.031 0.240 0.017 2114 (2.16)** (6.22)*** j = 2 Intercept γ0 Adj. R2 N Good news 0.211 0.131 0.021 811 (5.07)*** (2.96)*** Bad news 0.186 0.363 0.025 1673 (5.39)*** (7.17)***
EPSt, t – j is equal to cumulative earnings per share from year t – j to year t; Pt, t – j – 1 is the market value of equity at the end of year t – j – 1; Rt, t – j is equal to (12-month at j = 0 or 36-month at j = 2) buy-and-hold security returns, beginning the 3rd month of fiscal year t – j and ending 3 months after fiscal year t and ending 3 months after fiscal year t and N is number of observations. Predicted signs are shown in the parentheses. t-values are two-tailed values computed by adjusting with heteroskedasticity-robust standard errors. ***,** Significant at 0.01 and 0.05 level, respectively (two-tailed).
I further investigate the conditional accounting conservatism by analysing the
persistence of negative earnings changes. Basu (1997) suggests that negative
earnings are transitory and they are mean reverting, suggesting that negative
earnings tend to reverse in next periods of time. Following Ball and Shivakumar
(2005), I regress changes in current year net earnings on changes in previous year
net earnings (∆NI). The negative relation between those two variables is
expected. An indicator variable (Dit) is set to capture the difference between
positive and negative earnings changes. Net earnings changes are scaled by the
total asset at the end of year t – 1. The model is performed as follows:
∆NIit/TAit-1 = α0 + α1 Dit+ γ0 ∆NI it-1/TA it-2 + γ1 Dit * ∆NI it-1/TA it-2 + εit (6.6)
Chapter VI Earnings Timeliness
244
As presented in Table 6.9, Panel A, the coefficient γ1 is negative as expected,
suggesting that earnings timeliness is more likely in Thai firms. The explanatory
power for negative earnings changes is higher than that for positive earnings
changes, as reported in Panel B. This supports the result reported in Panel A.
When comparing between pre- and post-adoption periods reported in Panel C,
findings suggest that earnings timeliness is not observed during post-adoption
periods. These results are consistent with the result obtained from the market-
based regressions91 that earnings timeliness has not been improved during post-
adoption periods. In Panel D, I estimate whether the persistence of negative
earnings changes varies according to positive book-tax differences. The scaled
deciles rank of book-tax differences is integrated with all variables. The predicted
sign of γ3 is negative. As predicted, γ3 is negative and significant. The result is
consistent with the finding obtained from the market-based model at j = 0
presented in Table. 6.5. According to the analysis of negative earnings
persistence, earnings timeliness is more likely in Thai firms and is higher for firms
with large book-tax differences relative to small book-tax differences.
In addition to the market-based earnings asymmetric timeliness, I employ the
accrual-based earnings timeliness as suggested by Ball and Shivakumar (2005).
Although accruals and cash flows have negative relationship according to their
nature, the accrual-based earnings asymmetric timeliness suggests that the
negative cash flows should reflect in negative accruals. Therefore, the positive
relationship between accruals and cash flows should be observed when cash flows
are negative. This positive relationship indicates that earnings are able to capture
economic losses in a timely fashion. Thus, the accrual-based earnings asymmetric
timeliness is derived as follows.
ACit = α0 + α1 Dit +γ0 CFOit + γ1 Dit *CFOit + εit (6.7)
91 See Table 6.4 – Panel B and C.
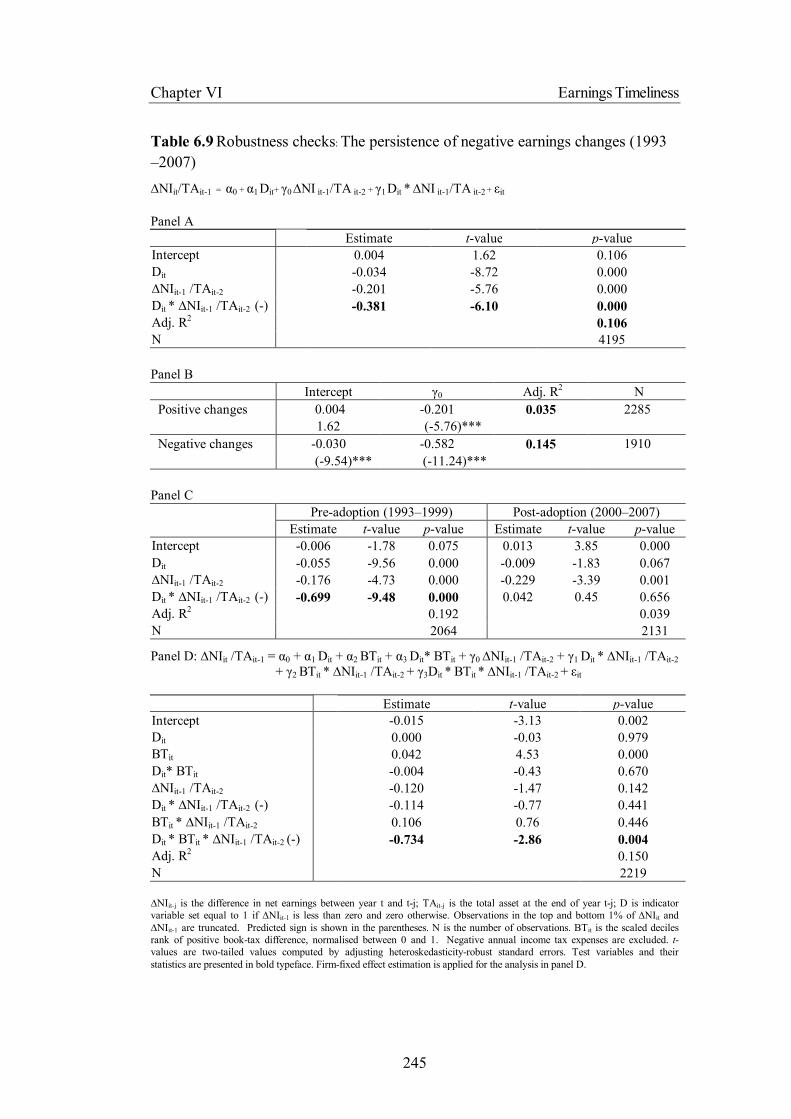
Chapter VI Earnings Timeliness
245
Table 6.9 Robustness checks: The persistence of negative earnings changes (1993 –2007)
∆NIit/TAit-1 = α0 + α1 Dit+ γ0 ∆NI it-1/TA it-2 + γ1 Dit * ∆NI it-1/TA it-2 + εit
Panel A Estimate t-value p-value Intercept 0.004 1.62 0.106 Dit -0.034 -8.72 0.000 ∆NIit-1 /TAit-2 -0.201 -5.76 0.000 Dit * ∆NIit-1 /TAit-2 (-) -0.381 -6.10 0.000 Adj. R2 0.106 N 4195
Panel B Intercept γ0 Adj. R2 N Positive changes 0.004 -0.201 0.035 2285 1.62 (-5.76)*** Negative changes -0.030 -0.582 0.145 1910 (-9.54)*** (-11.24)***
Panel C Pre-adoption (1993–1999) Post-adoption (2000–2007) Estimate t-value p-value Estimate t-value p-value Intercept -0.006 -1.78 0.075 0.013 3.85 0.000 Dit -0.055 -9.56 0.000 -0.009 -1.83 0.067 ∆NIit-1 /TAit-2 -0.176 -4.73 0.000 -0.229 -3.39 0.001 Dit * ∆NIit-1 /TAit-2 (-) -0.699 -9.48 0.000 0.042 0.45 0.656 Adj. R2 0.192 0.039 N 2064 2131
Panel D: ∆NIit /TAit-1 = α0 + α1 Dit + α2 BTit + α3 Dit* BTit + γ0 ∆NIit-1 /TAit-2 + γ1 Dit * ∆NIit-1 /TAit-2
+ γ2 BTit * ∆NIit-1 /TAit-2 + γ3Dit * BTit * ∆NIit-1 /TAit-2 + εit
Estimate t-value p-value Intercept -0.015 -3.13 0.002 Dit 0.000 -0.03 0.979 BTit 0.042 4.53 0.000 Dit* BTit -0.004 -0.43 0.670 ∆NIit-1 /TAit-2 -0.120 -1.47 0.142 Dit * ∆NIit-1 /TAit-2 (-) -0.114 -0.77 0.441 BTit * ∆NIit-1 /TAit-2 0.106 0.76 0.446 Dit * BTit * ∆NIit-1 /TAit-2 (-) -0.734 -2.86 0.004 Adj. R2 0.150 N 2219 ∆NIit-j is the difference in net earnings between year t and t-j; TAit-j is the total asset at the end of year t-j; D is indicator variable set equal to 1 if ∆NIit-1 is less than zero and zero otherwise. Observations in the top and bottom 1% of ∆NIit and ∆NIit-1 are truncated. Predicted sign is shown in the parentheses. N is the number of observations. BTit is the scaled deciles rank of positive book-tax difference, normalised between 0 and 1. Negative annual income tax expenses are excluded. t-values are two-tailed values computed by adjusting heteroskedasticity-robust standard errors. Test variables and their statistics are presented in bold typeface. Firm-fixed effect estimation is applied for the analysis in panel D.
Chapter VI Earnings Timeliness
246
where AC is the accrual deflated by the total asset; D is an indicator variable equal
to 1 when CFO is negative, or 0 otherwise; CFO is cash flows from operation
scaled by the total asset; and ε is error term. γ1 is a primary coefficient of interest
and expected to be positive. Following the prior study, the pooled cross-section
with heteroskedasticity-robust standard errors is applied to obtain coefficient
estimates.
After excluding extreme values of both AC and CFO, results from the accrual-
based earnings asymmetric timeliness are presented in Table 6.10. From Panel A,
the predicted sign of γ1 is positive, but the result reports the negative sign. This
suggests that the earnings timeliness is less likely in terms of accrual-based
analysis. When partitioning the dataset according to pre- and post-adoption
periods as reported in Panel B, the coefficient γ1 remains negative and significant.
Consistent with the market-based earnings timeliness analysis (see Table 6.4), the
ability of earnings in capturing economic consequences is less likely after IFRS
adoptions. Panel C reports the analysis of earnings timeliness when incorporating
the information of positive book-tax differences. I construct the scaled deciles
rank of the positive book-tax difference each year. Then, the scaled rank is
integrated with all variables. Results report that the coefficient γ3 is positive but
insignificant.92
92 When partitioning sample firms with positive and negative cash flow, the adjusted R2 for both groups are not different (equal to 42.14% vs. 42.12%, respectively). The result is not tabulated.
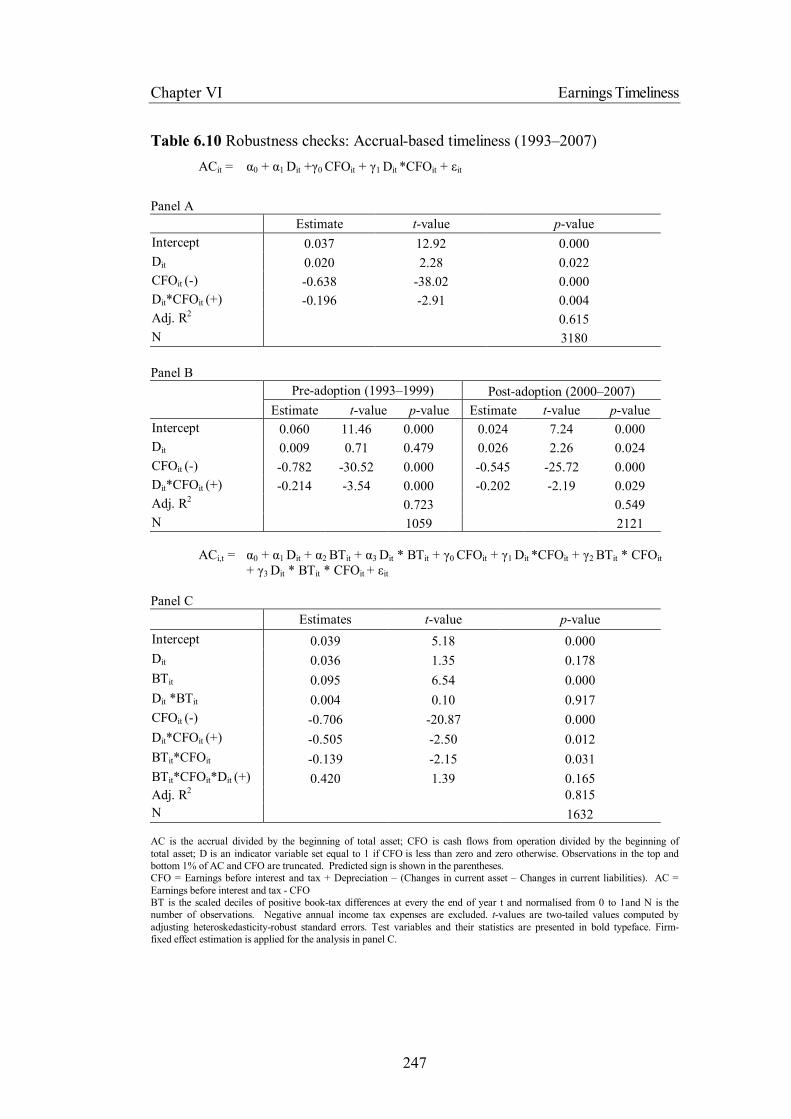
Chapter VI Earnings Timeliness
247
Table 6.10 Robustness checks: Accrual-based timeliness (1993–2007)
ACit = α0 + α1 Dit +γ0 CFOit + γ1 Dit *CFOit + εit
Panel A Estimate t-value p-value Intercept 0.037 12.92 0.000 Dit 0.020 2.28 0.022 CFOit (-) -0.638 -38.02 0.000 Dit*CFOit (+) -0.196 -2.91 0.004 Adj. R2 0.615 N 3180
Panel B Pre-adoption (1993–1999) Post-adoption (2000–2007) Estimate t-value p-value Estimate t-value p-value Intercept 0.060 11.46 0.000 0.024 7.24 0.000 Dit 0.009 0.71 0.479 0.026 2.26 0.024 CFOit (-) -0.782 -30.52 0.000 -0.545 -25.72 0.000 Dit*CFOit (+) -0.214 -3.54 0.000 -0.202 -2.19 0.029 Adj. R2 0.723 0.549 N 1059 2121
ACi,t = α0 + α1 Dit + α2 BTit + α3 Dit * BTit + γ0 CFOit + γ1 Dit *CFOit + γ2 BTit * CFOit + γ3 Dit * BTit * CFOit + εit
Panel C Estimates t-value p-value Intercept 0.039 5.18 0.000 Dit 0.036 1.35 0.178 BTit 0.095 6.54 0.000 Dit *BTit 0.004 0.10 0.917 CFOit (-) -0.706 -20.87 0.000 Dit*CFOit (+) -0.505 -2.50 0.012 BTit*CFOit -0.139 -2.15 0.031 BTit*CFOit*Dit (+) 0.420 1.39 0.165 Adj. R2 0.815 N 1632 AC is the accrual divided by the beginning of total asset; CFO is cash flows from operation divided by the beginning of total asset; D is an indicator variable set equal to 1 if CFO is less than zero and zero otherwise. Observations in the top and bottom 1% of AC and CFO are truncated. Predicted sign is shown in the parentheses. CFO = Earnings before interest and tax + Depreciation – (Changes in current asset – Changes in current liabilities). AC = Earnings before interest and tax - CFO BT is the scaled deciles of positive book-tax differences at every the end of year t and normalised from 0 to 1and N is the number of observations. Negative annual income tax expenses are excluded. t-values are two-tailed values computed by adjusting heteroskedasticity-robust standard errors. Test variables and their statistics are presented in bold typeface. Firm-fixed effect estimation is applied for the analysis in panel C.

Chapter VI Earnings Timeliness
248
Based on the market-based model and the persistence of negative earnings
changes model, these findings suggest that the ability of earnings in capturing
economic losses is varied according to positive book-tax differences in Thai
settings. Relative to firms with small positive book-tax differences, the ability of
earnings in firms with large positive book-tax differences is more likely to capture
economic outcomes in a timely basis.
I further estimate earnings timeliness conditional to the scaled deciles rank of
positive book-tax differences during post-adoption periods in Thailand. As
presented in Table 6.11, I estimate by using all three models during post-adoption
periods. Results shown in the bold typeface suggest that earnings timeliness
varies according to the scale of book-tax differences, that firms with larger book-
tax difference tend to have higher earnings timeliness. However, the market-
based model in Panel A reports positive sign of the coefficient γ3 but insignificant.
As the analysis of firm-specific accounting conservatism measured by
accumulated accruals (ACC) provides insignificant results, this thesis argues that
earnings management is an important candidate to be used as an alternative
explanation. It is due to the fact that accruals are subject to the management’s
discretion. Thus, I partition sample firms according to the degree of discretionary
accruals. By using the industry modified Jones’ discretionary accruals93 and
excluding extreme values, I divide the sample firm each year into three thresholds
from low to high discretionary accruals. The higher discretionary accruals reflect
more activity for earnings management. Therefore, firm-specific conservatism is
more likely to be observed in firms with low discretionary accruals relative to
firms with high discretionary accruals.
93 See footnote 54. However, the constant term is included to estimate the modified Jones model in equation (3) for this sensitivity analysis (see Ayer et al. 2009).
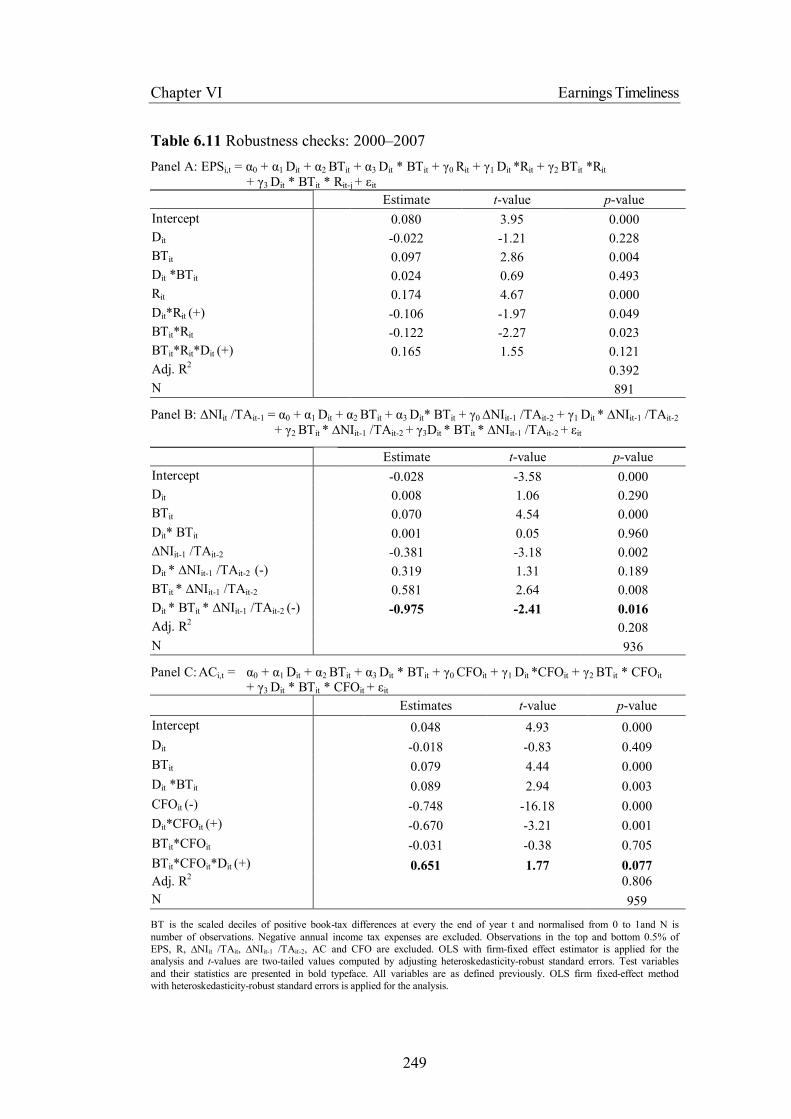
Chapter VI Earnings Timeliness
249
Table 6.11 Robustness checks: 2000–2007
Panel A: EPSi,t = α0 + α1 Dit + α2 BTit + α3 Dit * BTit + γ0 Rit + γ1 Dit *Rit + γ2 BTit *Rit + γ3 Dit * BTit * Rit-j + εit
Estimate t-value p-value Intercept 0.080 3.95 0.000 Dit -0.022 -1.21 0.228 BTit 0.097 2.86 0.004 Dit *BTit 0.024 0.69 0.493 Rit 0.174 4.67 0.000 Dit*Rit (+) -0.106 -1.97 0.049 BTit*Rit -0.122 -2.27 0.023 BTit*Rit*Dit (+) 0.165 1.55 0.121 Adj. R2 0.392 N 891
Panel B: ∆NIit /TAit-1 = α0 + α1 Dit + α2 BTit + α3 Dit* BTit + γ0 ∆NIit-1 /TAit-2 + γ1 Dit * ∆NIit-1 /TAit-2 + γ2 BTit * ∆NIit-1 /TAit-2 + γ3Dit * BTit * ∆NIit-1 /TAit-2 + εit
Estimate t-value p-value Intercept -0.028 -3.58 0.000 Dit 0.008 1.06 0.290 BTit 0.070 4.54 0.000 Dit* BTit 0.001 0.05 0.960 ∆NIit-1 /TAit-2 -0.381 -3.18 0.002 Dit * ∆NIit-1 /TAit-2 (-) 0.319 1.31 0.189 BTit * ∆NIit-1 /TAit-2 0.581 2.64 0.008 Dit * BTit * ∆NIit-1 /TAit-2 (-) -0.975 -2.41 0.016 Adj. R2 0.208 N 936
Panel C: ACi,t = α0 + α1 Dit + α2 BTit + α3 Dit * BTit + γ0 CFOit + γ1 Dit *CFOit + γ2 BTit * CFOit + γ3 Dit * BTit * CFOit + εit
Estimates t-value p-value Intercept 0.048 4.93 0.000 Dit -0.018 -0.83 0.409 BTit 0.079 4.44 0.000 Dit *BTit 0.089 2.94 0.003 CFOit (-) -0.748 -16.18 0.000 Dit*CFOit (+) -0.670 -3.21 0.001 BTit*CFOit -0.031 -0.38 0.705 BTit*CFOit*Dit (+) 0.651 1.77 0.077 Adj. R2 0.806 N 959 BT is the scaled deciles of positive book-tax differences at every the end of year t and normalised from 0 to 1and N is number of observations. Negative annual income tax expenses are excluded. Observations in the top and bottom 0.5% of EPS, R, ∆NIit /TAit, ∆NIit-1 /TAit-2, AC and CFO are excluded. OLS with firm-fixed effect estimator is applied for the analysis and t-values are two-tailed values computed by adjusting heteroskedasticity-robust standard errors. Test variables and their statistics are presented in bold typeface. All variables are as defined previously. OLS firm fixed-effect method with heteroskedasticity-robust standard errors is applied for the analysis.

Chapter VI Earnings Timeliness
250
Table 6.12 presents the relationship between accounting conservatism measures
(BTM and ACC) and book-tax differences (RNK_BT). Findings report that the
coefficient of RNK_BT is positive and significant in threshold 2 for BTM and
threshold 1 for ACC. The significant results indicate that accounting
conservatism measured by the ratio of book-to-market is more pronounced for
firms with large positive book-tax differences and low discretionary accruals
relative to firms with small positive book-tax differences and high discretionary
accruals.
When investigating the relationship between accounting conservatism and firm
governance, CG_QUALITY is positively significantly related to BTM for firms in
threshold 2 (= 0.0019) but to ACC for firms in threshold 1 (= 28.354). This
finding suggests that higher proportion of audit committee on firm’s board
induces more accounting conservatism. The result reports a negative relationship
between BOARD_QUALITY and accounting conservatism (BTM in threshold 2
= -0.0008 and ACC in threshold 1 but insignificant = -8.312). Additionally, f-
statistics become significant for ACC in threshold 1 (f-stat = 2.51). In summary,
overall results are consistent with the main findings, suggesting that more
accounting conservatism in the firm is induced by the larger book-tax difference
and the higher proportion of audit committee and independent directors on the
board.
6.6 Chapter Summary According to all analyses in Thai settings, findings suggest that earnings
asymmetric timeliness is more likely in Thailand for pooled-samples. However,
when comparing between pre- and post-adoption periods, it appears that earnings
asymmetric timeliness declines. It should be noted that the decrease of earnings
asymmetric timeliness during post-adoption periods is consistent with the increase
of earnings persistence during post-adoption periods as reported in Table 4.7. In
addition, accounting conservatism positively varies with the magnitude of positive
book-tax differences. With control variables including firm governance and firm
Chapter VI Earnings Timeliness
251
size, firm-specific conservatism analysis reveals that the unconditional
conservatism measures are more likely for firms with a large scale of positive
book-tax differences. Also, the result suggests that the corporate governance
system relates unconditional accounting conservatism (Ahmed and Duellman
2007). However, earnings management is an important issue when using accruals
to measure firm-specific accounting conservatism. The finding suggests that
accounting conservatism measured by accruals is more likely for firms with large
scale of positive book tax differences when those firms have a low level of
discretionary accruals.
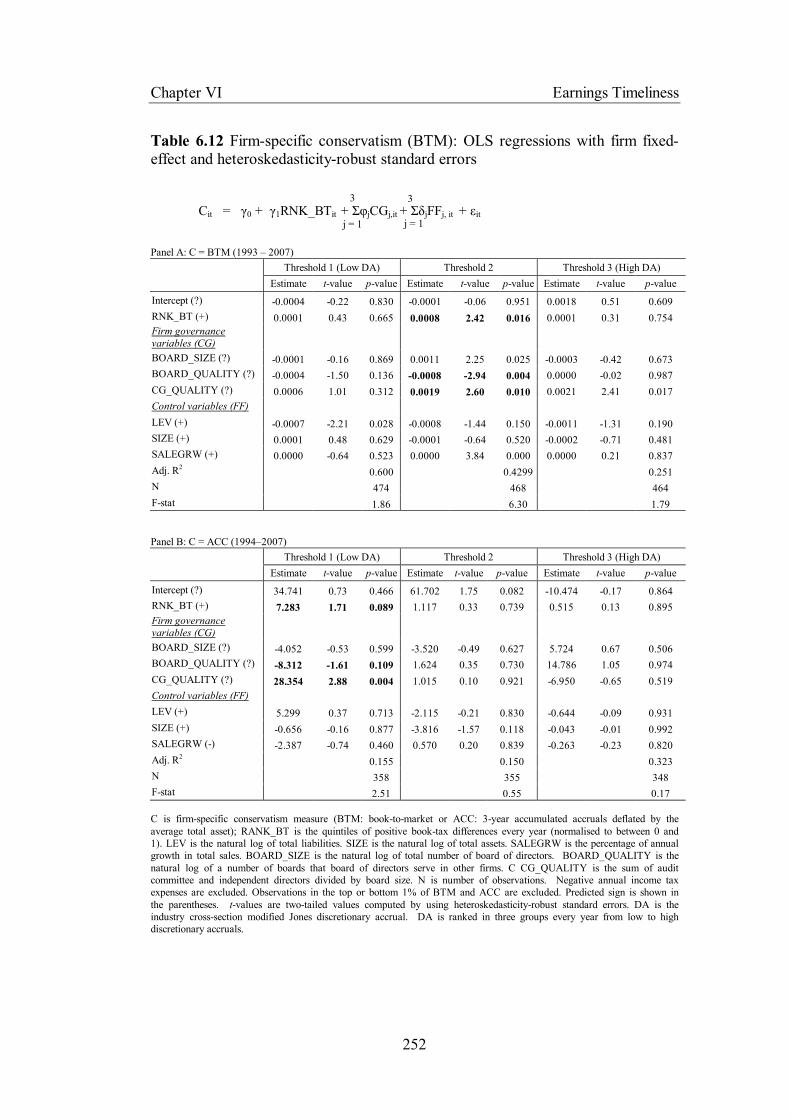
Chapter VI Earnings Timeliness
252
j = 1
3
j = 1
3
Table 6.12 Firm-specific conservatism (BTM): OLS regressions with firm fixed-effect and heteroskedasticity-robust standard errors
Cit = γ0 + γ1RNK_BTit + ΣφjCGj,it + ΣδjFFj, it + εit
Panel A: C = BTM (1993 – 2007) Threshold 1 (Low DA) Threshold 2 Threshold 3 (High DA) Estimate t-value p-value Estimate t-value p-value Estimate t-value p-value Intercept (?) -0.0004 -0.22 0.830 -0.0001 -0.06 0.951 0.0018 0.51 0.609 RNK_BT (+) 0.0001 0.43 0.665 0.0008 2.42 0.016 0.0001 0.31 0.754 Firm governance variables (CG) BOARD_SIZE (?) -0.0001 -0.16 0.869 0.0011 2.25 0.025 -0.0003 -0.42 0.673 BOARD_QUALITY (?) -0.0004 -1.50 0.136 -0.0008 -2.94 0.004 0.0000 -0.02 0.987 CG_QUALITY (?) 0.0006 1.01 0.312 0.0019 2.60 0.010 0.0021 2.41 0.017 Control variables (FF) LEV (+) -0.0007 -2.21 0.028 -0.0008 -1.44 0.150 -0.0011 -1.31 0.190 SIZE (+) 0.0001 0.48 0.629 -0.0001 -0.64 0.520 -0.0002 -0.71 0.481 SALEGRW (+) 0.0000 -0.64 0.523 0.0000 3.84 0.000 0.0000 0.21 0.837 Adj. R2 0.600 0.4299 0.251 N 474 468 464 F-stat 1.86 6.30 1.79 Panel B: C = ACC (1994–2007) Threshold 1 (Low DA) Threshold 2 Threshold 3 (High DA) Estimate t-value p-value Estimate t-value p-value Estimate t-value p-value Intercept (?) 34.741 0.73 0.466 61.702 1.75 0.082 -10.474 -0.17 0.864 RNK_BT (+) 7.283 1.71 0.089 1.117 0.33 0.739 0.515 0.13 0.895 Firm governance variables (CG) BOARD_SIZE (?) -4.052 -0.53 0.599 -3.520 -0.49 0.627 5.724 0.67 0.506 BOARD_QUALITY (?) -8.312 -1.61 0.109 1.624 0.35 0.730 14.786 1.05 0.974 CG_QUALITY (?) 28.354 2.88 0.004 1.015 0.10 0.921 -6.950 -0.65 0.519 Control variables (FF) LEV (+) 5.299 0.37 0.713 -2.115 -0.21 0.830 -0.644 -0.09 0.931 SIZE (+) -0.656 -0.16 0.877 -3.816 -1.57 0.118 -0.043 -0.01 0.992 SALEGRW (-) -2.387 -0.74 0.460 0.570 0.20 0.839 -0.263 -0.23 0.820 Adj. R2 0.155 0.150 0.323 N 358 355 348 F-stat 2.51 0.55 0.17 C is firm-specific conservatism measure (BTM: book-to-market or ACC: 3-year accumulated accruals deflated by the average total asset); RANK_BT is the quintiles of positive book-tax differences every year (normalised to between 0 and 1). LEV is the natural log of total liabilities. SIZE is the natural log of total assets. SALEGRW is the percentage of annual growth in total sales. BOARD_SIZE is the natural log of total number of board of directors. BOARD_QUALITY is the natural log of a number of boards that board of directors serve in other firms. C CG_QUALITY is the sum of audit committee and independent directors divided by board size. N is number of observations. Negative annual income tax expenses are excluded. Observations in the top or bottom 1% of BTM and ACC are excluded. Predicted sign is shown in the parentheses. t-values are two-tailed values computed by using heteroskedasticity-robust standard errors. DA is the industry cross-section modified Jones discretionary accrual. DA is ranked in three groups every year from low to high discretionary accruals.

Chapter 7
Conclusions
7.1 Introduction
7.2 Summary of the Thesis
7.3 Research Limitations
7.4 Concluding Remarks and Future Research
Chapter VII Conclusions and Discussions
254
Chapter 7
Conclusions and Discussions
7.1 Introduction Thailand has officially constituted accounting and auditing organisations for more
than forty years. The accounting and auditing setter was under government
supervision from 1962. In 2005, a self-regulated accounting and auditing
organisation – the Federation of Accounting Professions (FAP) – was established.
The Thai accounting and auditing setter has been independent of government
since then. It is irrefutable that the preparation of Thai financial statements has
been influenced by tax rules because of the government’s supervision on Thai
accounting standards. It is also possible to believe that Thai accounting principles
are more likely to serve the government’s interests rather than public investment.
The Thai accounting system, therefore, has been categorised as a tax-based
accounting income system. However, since 2000, Thailand has adopted and
converged domestic accounting standards to the International Financial Reporting
Standards (IFRS). IFRS harmonisation is obviously aimed to stimulate the quality
of accounting information in Thailand.
Even though IFRS harmonisation aims to bring a better quality of accounting
information for the IFRS-adopted country, many potential factors can influence
the improvement of accounting information quality during IFRS post-adoptions.
The adoption of IFRS in domestic countries has fascinated accounting
researchers, who have explored whether or not the quality of accounting
information has actually been enhanced during IFRS post-adoptions. The existing
research has attempted to compare the variation of accounting quality by either
comparing between pre- and post-adoption in a single country or comparing these
two periods among different countries. By comparing between pre- and post-
adoption periods, researchers can explain the enhancement of accounting
information quality after the change in accounting standards. By comparing
between those two periods in different countries, researchers can explain the
Chapter VII Conclusions and Discussions
255
effect of institutional factors, i.e. legal systems, influencing the improvement of
accounting information quality when IFRS has been adopted. This thesis argues
that it also should be more useful to incorporate institutional factors when
investigating the improvement of accounting information quality after IFRS
adoptions in a single country, raising more understanding about accounting
quality in such country.
Incentives of a firm’s insiders are a major issue and can derive the variation in
accounting quality. This thesis argues that the improvement of accounting
information quality is varied according to a firm’s incentives, especially when the
principles-based accounting system (IFRS) is employed. This thesis employs
book-tax differences (BT) to proxy insiders’ incentives. The use of book-tax
differences provides at least two advantages: i) it can be used to observe the
pattern of the accounting system in Thailand between pre- and post-adoption
periods and ii) it is employed to differentiate the firm’s discretion. However, this
proxy is not exhaustive and must be interpreted with caution because either large
or small scale of book-tax differences is subject to firms’ discretions. This thesis
investigates whether there is an improvement of accounting information quality
between IFRS pre- and post-adoption in Thailand by expanding conditioning to
include the magnitude of book-tax differences.
If the variation in accounting quality among firms is found, this thesis considers
that it is of interest to search for factors influencing such difference. After
examining the variation in the improvement of accounting quality in Thailand,
this thesis investigates whether the accounting quality is varied according to the
firm governance system in Thailand. This thesis views that the firm governance
system is an influential factor driving the difference in accounting information
quality in each firm. To support this conjecture, this thesis further estimates the
relationship between accounting quality and the firm governance system. As a
result, this thesis performs two analyses: i) the investigation of the improvement
of accounting information quality between IFRS pre- and post-adoption periods in
Thailand and ii) the investigation of the relationship between accounting
Chapter VII Conclusions and Discussions
256
information quality and firm governance systems in Thailand. For both
investigations, firms are divided into subgroups according to the scale of book-tax
differences. This chapter summarises important aspects obtained from the
analysis. The remainder of this chapter is divided into three sections. Summary
of the thesis and implementation is presented in section 7.2 and sections 7.3 and
7.4 present research limitations and concluding remarks, contributions and future
research, respectively.
7.2 Summary of the Thesis and Implementation This study divides investigations into two parts. First, the improvement of
accounting information quality between IFRS pre- and post-adoption periods in
Thailand is analysed. Second, the relationship between accounting information
quality and firm governance factors in Thai settings is examined.
This thesis defines accounting information quality according to three properties of
earnings information. First, earnings quality is determined by the persistence of
earnings. Second, accounting information quality is examined by the usefulness
of earnings and book value (the value relevance analysis). And, third, earnings
quality is determined by the ability of earnings to capture economic outcome on a
timely basis (earnings timeliness).
For the analysis of earnings persistence and value relevance, this thesis employs
10-year longitudinal data for both analyses. This study views that these
longitudinal data should provide more powerful inferences although they suffer
from survivorship bias. The dataset for both analyses is also divided into two
subgroups. The first subgroup includes firms whose 5-year accumulated book-tax
differences during pre-adoption periods are smaller than the 5-year accumulated
book-tax differences during post-adoption periods (Group 1: BT-Pre < BT-Post).
The second subgroup includes firms whose 5-year accumulated book-tax
differences during pre-adoption periods are larger than the 5-year accumulated
book-tax differences during post-adoption periods (Group 2: BT-Pre > BT-Post).

Chapter VII Conclusions and Discussions
257
After examining the earnings persistence and value relevance during pre- and
post-adoption peirods, accounting quality is regressed on firm governance
proxies. Accounting quality is measured by two proxies from earnings
persistence–the coefficient estimate of each firm from earnings persistence and
value relevance–the explanatory power and earnings response coefficients of each
firm. The relationship between accounting quality and firm governance factors is
examined by comparing between IFRS pre- and post-adoption periods in
Thailand.
The last property of earnings to be examined is earnings timeliness. As suggested
by prior studies, incorporating additional information into the model facilitates
more powerful to explain the timeliness of earnings. Based on different models of
asymmetric timeliness, the magnitude of book-tax difference is incorporated to
the model. In addition to the asymmetric timeliness model, this thesis employs
firm-specific accounting conservatism for the investigation. Prior studies suggest
that the asymmetric timeliness is negatively related to firm-specific accounting
conservatism. Therefore, it is more powerful if consistent results are observed
when using different methodologies.
Earnings persistence
Consistent with prior research, a random walk model is employed to determine
whether earnings are more persistent during IFRS post-adoptions in Thailand.
Earnings information is also decomposed to cash flows from operation and
accruals information. For analysing balanced-panel data, this thesis employs OLS
estimation and standard errors corrected by bootstrap methodology. The future
earnings are regressed on current earnings (cash flows and accruals component of
earnings). The obtained result is consistent and suggests that earnings are more
persistent during IFRS post-adoptions in Thailand. However, when estimating the
persistence of earnings by industry, the finding reveals that the persistence of
earnings information is sensitive to the industry. The result supports the a priori
prediction that the persistence of earnings declines for firms in group 1 (BT–Pre <
BT–Post) but increases for firms in group 2 (BT–Pre > BT–Post) during post-
Chapter VII Conclusions and Discussions
258
adoption periods. Consistent with prior research, the persistence of earnings is
more persistent for firms with small-scale book-tax differences when using all
firm-years in the analysis. In addition, when including additional explanatory
variables, the robustness check supports the result obtained from the main
analysis.
For the second part of the analysis, the persistence coefficient of each firm is
estimated. Each firm is divided into two periods, pre- and post-adoption, 5-years
each. Then, the persistence coefficient is regressed on firm governance factors.
Overall results suggest that earnings persistence is related to firm governance.
The finding in this setting implies that the decline of earnings persistence for
firms in group 1 is likely to be induced by the governance system.
The value relevance
This study employs the earnings response coefficient model (ERC) and price
model for the analysis of value relevance. This study mainly interprets the value
relevance from the association between the market value (returns) and accounting
summary measures (R2). The earnings response coefficient is also interpreted to
support the main interpretation. Based on balanced-panel data, the result suggests
that value relevance improves during IFRS post-adoption periods in Thailand.
The obtained result also supports the hypothesis that between pre- and post-
adoption periods in Thailand, the improvement of value relevance of accounting
summary measures for firms in group 2 (BT–Pre > BT–Post) is greater than the
improvement of value relevance of accounting summary measures for firms in
group 1 (BT–Pre < BT–Post). The additional test by using all-firm years suggests
that the value relevance for firms with large scale of book-tax differences is lower
than that for firms with small scale of book-tax differences.
For part two, the value relevance of each firm is estimated. Then value relevance
(ERC and the explanatory power – R2) is regressed on the firm governance
factors. Again, the result suggests that value relevance is related to the
Chapter VII Conclusions and Discussions
259
governance factors. Overall results suggest that the variation in value relevance
between firms in two groups is likely to be induced by firm governance factors.
Earnings timeliness
The third property of earnings being investigated in this thesis is earnings
timeliness in Thailand. Three asymmetric piece-wise models are employed for
the analysis of earning asymmetric timeliness, including the market-based
asymmetric model, the accrual-based asymmetric model and the negative earnings
change model. The result suggests that the Thai accounting information exhibits
the timeliness in terms of the ability of earnings to capture negative events in the
same period that they occur. Although it is not the main objective of this thesis,
by using all firm-years, two out of three models suggest that earnings timeliness is
less likely in Thailand during post-adoption periods. This finding does not
deviate from expectations because a prior study (Basu 1997) explains that as
earnings persistence increases, earnings asymmetric timeliness would decline. In
this setting, this thesis finds that the persistence of earnings improves during IFRS
post-adoption, thus it is possibility that the decline in earnings asymmetric
timeliness should be observed.
Earnings persistence predicts that firms with a large scale of book-tax differences
have lower persistence in earnings relative to firms with a small scale of book-tax
differences. However, because the notion of earnings asymmetric timeliness and
earnings persistence is different, earnings asymmetric timeliness should be more
likely for firms with a large scale of book-tax differences relative to firms with a
small scale of book-tax differences. Therefore, this thesis conjectures that
earnings asymmetric timeliness varies positively according to the scale of book-
tax differences: the larger scale the differences, the greater the earnings
asymmetric timeliness. The obtained result supports this conjecture. It should be
noted that this thesis includes only positive book-tax differences in the analysis.
In addition to the earnings asymmetric timeliness, unconditional accounting
conservatism in Thailand is examined. This thesis employs two firm-specific

Chapter VII Conclusions and Discussions
260
earnings conservatism (unconditional conservatism) measures, book-to-market
and 3-year accumulated accruals. Then this thesis investigates the relationship
between unconditional conservatism measures and book-tax differences and firm
governance factors. The finding suggests that book-to-market is positively related
to the scaled rank of book-tax differences. This finding is consistent with the
result obtained from the earnings asymmetric timeliness models. It is due to the
fact that the earnings timeliness obtained from the market-based asymmetric
model (i.e. Basu 1997) is negatively correlated with book-to-market (Givoly et al.
2007). However, the result in this setting reveals that the magnitude of book-tax
differences is positively related to both the earnings asymmetric timeliness and
unconditional conservatism measure (book-to-market). Thus, this consistent
finding suggests that the scale of book-tax differences contains significant
information about accounting conservatism.
Nevertheless, the 3-year accumulated accrual is not related to the scale of book-
tax differences. This study argues that accruals information is potentially caused
by earnings manipulation. Therefore, the sample firm is divided into three
thresholds according to the level of discretionary accruals to control for earnings
management. The finding supports the argument and reports a positive
relationship between 3-year accumulated accruals and the scaled rank of book-tax
differences. Overall results confirm that the scale of book-tax differences
contains information about accounting conservatism.
The study of three properties of accounting information, in particular earnings and
book value, provides accounting policy implication for the Thai standard setter
and accounting standard setters in the country employing a tax-based accounting
income system. This study suggests that IFRS adoption brings higher quality of
accounting information. However, the enhancement of accounting quality is not
only subject to accounting standards but also the environment of accounting, i.e.
the firm governance system. From the overall finding, this thesis argues that
accounting environment as indirect parameter is perhaps more important than
accounting standards as direct parameter. IFRS tends to provide a good quality of
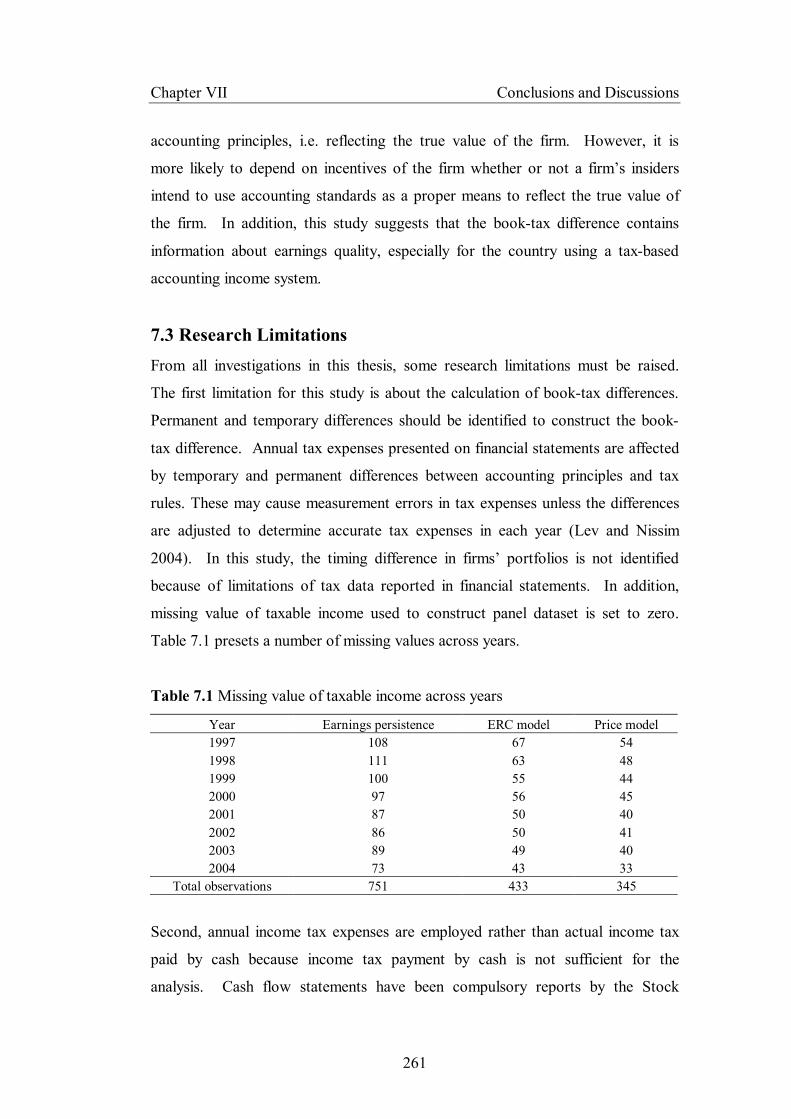
Chapter VII Conclusions and Discussions
261
accounting principles, i.e. reflecting the true value of the firm. However, it is
more likely to depend on incentives of the firm whether or not a firm’s insiders
intend to use accounting standards as a proper means to reflect the true value of
the firm. In addition, this study suggests that the book-tax difference contains
information about earnings quality, especially for the country using a tax-based
accounting income system.
7.3 Research Limitations From all investigations in this thesis, some research limitations must be raised.
The first limitation for this study is about the calculation of book-tax differences.
Permanent and temporary differences should be identified to construct the book-
tax difference. Annual tax expenses presented on financial statements are affected
by temporary and permanent differences between accounting principles and tax
rules. These may cause measurement errors in tax expenses unless the differences
are adjusted to determine accurate tax expenses in each year (Lev and Nissim
2004). In this study, the timing difference in firms’ portfolios is not identified
because of limitations of tax data reported in financial statements. In addition,
missing value of taxable income used to construct panel dataset is set to zero.
Table 7.1 presets a number of missing values across years.
Table 7.1 Missing value of taxable income across years
Year Earnings persistence ERC model Price model 1997 108 67 54 1998 111 63 48 1999 100 55 44 2000 97 56 45 2001 87 50 40 2002 86 50 41 2003 89 49 40 2004 73 43 33
Total observations 751 433 345
Second, annual income tax expenses are employed rather than actual income tax
paid by cash because income tax payment by cash is not sufficient for the
analysis. Cash flow statements have been compulsory reports by the Stock
Chapter VII Conclusions and Discussions
262
Exchange of Thailand since 1999. However, prior studies find that actual income
tax expenses do not change the results obtained from annual income tax expenses
(Lev and Nissim 2004). In addition, it must be noted that for firms operating in
Thailand, tax income must be calculated from individual financial statements
rather than consolidated financial statements. The book-tax difference in this
study, therefore, is mainly calculated from companies’ financial statements to
obtain more accurate figures. Nevertheless, this thesis compares the main
investigation by using the book-tax difference calculated from consolidated
financial statements. The results obtained from the comparison are presented in
appendices and they are reasonably consistent with the result obtained from the
main investigation. As a result, book-tax differences in this study are not
exhaustive. Although the book-tax difference is employed to proxy a firm’s
incentive, the scale of book-tax differences can be influenced by other factors, i.e.
earnings manipulation. Therefore, the interpretation about the use of book-tax
differences must be performed with care.
Next, the industry cross-section modified-Jones’ model is employed for the
calculation of discretionary accruals. The data limitation does not allow this study
to calculate the discretionary accrual by using a time series model. Accruals are
calculated based on prior study rather than obtained from financial statements
because accruals reported in financial statements are not available during pre-
adoption periods.
In addition, accounting quality is unobservable. This study uses the measurement
of accounting quality through earnings persistence and value relevance, and then
regresses accounting quality on the firm governance. These proxies contain
measurement errors.
Last, the proxy for quality of firm governance system, board and audit committee
quality, in this study is measured by a number of sitting boards. This proxy is
twofold: i) a high number of sitting boards indicate the reputation of board
members, inducing a high quality of governance system and ii) a high number of
Chapter VII Conclusions and Discussions
263
sitting boards indicate a large workload, inducing a low quality of governance
system because of time constraints. Therefore, non-linear relationship between
accounting quality and this proxy should be addressed and further performed by
future research.
7.4 Concluding Remarks, Contributions and Future Research This thesis investigates accounting quality in Thailand when IFRS has been
adopted since 2000. Accounting quality in this thesis refers to three properties of
earnings, consisting of the persistence of earnings, the value relevance of earnings
and book value and the timeliness of earnings. This thesis aims to investigate
whether accounting quality in Thailand has been enhanced after the IFRS
adoption. The overall finding suggests that the earnings persistence and value
relevance have been improved after the IFRS adoption in Thailand. The
timeliness of earnings is less likely after the IFRS adoption in Thailand.
This thesis views that a firm’s incentives play important roles in accounting
quality. This thesis employs book-tax differences a proxy for the firm’s incentive
in Thai settings. By incorporating the book-tax difference into the analysis, the
finding suggests that accounting quality in Thai settings is varied according to the
scale of book-tax differences. The result suggests that the earnings persistence
and value relevance has been enhanced for firms with a small scale of book tax
differences relative to firms with a large scale of book-tax differences. In addition
to the firm’s incentive, this thesis views that firm governance systems induce the
variation in accounting quality in firms with different scale of book-tax
differences. And, the finding suggests that the firm governance system is related
to accounting quality, implying that the firm governance system is a significant
factor for the improvement of accounting quality in Thai settings.
This research adds to the literature in many aspects. Firstly, it is an analysis of
accounting quality in emerging market countries that use a tax-based accounting
income system. Secondly, this thesis employs the book-tax difference to control
Chapter VII Conclusions and Discussions
264
for a firm’s incentive in the Thai setting. The published research has been silent
on using the book-tax difference for the investigation of accounting quality in
emerging market countries. Thirdly, this thesis employs panel data for the
analysis. This should provide a relatively strong inference. And, this thesis
should facilitate Thai accounting regulators about accounting policy implications
in Thailand, suggesting that accounting standards are not the only factor to
improve accounting quality but such other factors as incentives and discretions do
affect the improvement of accounting quality in Thailand.
This study suggests that future research should explore accounting quality in other
dimensions. For example, i) future analysis can investigate earnings persistence,
value relevance and earnings timeliness by focusing on a specific industry, i.e.
high technology, or specific accounting standards, i.e. relevant accounting
standards for tangible and intangible assets. This should provide more insightful
information about the property of accounting quality; ii) future research should
search for institutional or firm-specific factors containing richer information that
can be used to identify variation in accounting quality among firms; iii) more
comprehensive variables for firm governance systems should be used for the
analysis, i.e. audit committee expertise – education and background, that
accounting quality is positively varied with expertise or board compensation, that
high compensation may induce high quality of accounting information; iv) the
non-linear relationship and causation issue for firm governance analysis should be
addressed and/or identified in future research; v) the model for value relevance
analysis is open-ended. This thesis employs standard models existed in prior
literature rather than construct models for the analysis. The future research may
develop methodologies to fit the dataset and obtain more powerful results; and vi)
the future research may investigate the association between costs of the firms and
IFRS adoptions.

265
APPENDICES

266
Appendix 1 Thai Accounting Standards and International Accounting Standards Comparison Index TAS Title TAS
No. IAS and AICPA
Effective Date
1 Accounting Basic Assumptions 1 - 1 Feb. 1979 Superseded by Framework
2 Accounting Policy 2 - 1 Sep. 1979 Superseded by TAS 35
3 Extraordinary Items 3 - 1 Sep. 1979 Superseded by TAS 39
4 Accounting Changes 4 - 1 Sep. 1979 Superseded by TAS 39
5 Earnings Per Share 5 - 1 Sep. 1979 Superseded by TAS 38
6 Revenue Recognitions 6 - 1 Sep. 1979 Superseded by TAS 39
7 Leases 7 IAS 17 28 Feb. 1987
8 Construction Contracts 8 - 31 Dec. 1988 Superseded by TAS 49
9 Property, Plant and Equipment 9 - 1 Jan. 1989 Superseded by TAS 32
10 Depreciation Accounting 10 - 1 Jan. 1988 Superseded by TAS 32
11 Doubtful Accounts and Bad Debt
11 - 1 Jul. 1989
12 Accounting for Marketable Securities 12 - 1 Jul. 1989 Superseded by TAS 40
13 Related Party Disclosures 13 - 1 Jul. 1989 Superseded by TAS 47
14 Accounting for Research and Development Activities
14 IAS 9 1 Jan. 1990
15 Borrowing Costs 15 - 1 Jan. 1990 Superseded by TAS 33
16 Current Assets and Current Liabilities 16 - 1 Jan. 1990 Superseded by TAS 35
17 Accounting for Investments 17 - 31 Dec. 1991 Superseded by TAS 40
18 Accounting for Investments in Associates
18 - 31 Dec. 1991 Superseded by TAS 46
19 Consolidated Financial Statements 19 - 31 Dec. 1991 Superseded by TAS 44

267
Thai Accounting Standards and International Accounting Standards Comparison (Cont.) Index TAS Title TAS
No. IAS and AICPA
Effective Date
20 Business Combinations 20 - 31 Dec. 1991 Superseded by TAS 44
21 Events After the Balance Sheet Date 21 - 31 Dec. 1991 Superseded by TAS 52
22 Inventories 22 - 31 Dec. 1991 Superseded by TAS 31
23 Information to be Disclosed in Financial Statements
23 - 1 Jan. 1992 Superseded by TAS 35
24 Segment Reporting 24 IAS 14 1 Jan. 1994
25 Cash flow statements 25 IAS 7 1 Jan. 1994 (Revised in 2007)
26 Revenue Recognition for Real Estate
26 - 1 Jan. 1994
27 Disclosures in the Financial Statements of Banks and Similar Financial Institutions
27 IAS 30 1 Jan. 1995 (Revised in 2006)
28 Accounting for Convertible Debt and Debt Issued with Stock Purchase Warrants
28 - 29 Aug. 1994 Superseded by TAS 48
29 Accounting for Long Term Lease Agreements
29 - 1 Jan. 1996
30 The Effects of Changes in Foreign Exchange Rates
30 IAS 21 1 Jan. 1996
31 Inventories 31 IAS 2 1 Jan. 1997
Amended TAS after 1997
32 Property, Plant and Equipment 32 IAS 16 1 Jan. 1999
33 Borrowing Costs 33 IAS 23 1 Jan. 1999 (Revised in 2007)
34 Accounting by Debtors and Creditors
for Troubled Debt Restructurings
34 SFAS 15, 114
30 Sep.1998
35 Presentation of Financial Statements
35 IAS 1 1 Jan. 1999
36 Impairment of Assets
36 IAS 36 1 Jan. 1999
37 Revenue
37 IAS 18 1 Jan. 1999

268
Thai Accounting Standards and International Accounting Standards Comparison (Cont.)
Index TAS Title TAS No.
IAS and AICPA
Effective Date
38 Earnings Per Share
38 IAS 33 1 Jan. 1999
39 Net Profit or Loss for the Period, Fundamental Errors and Changes in Accounting Policies
39 IAS 8 1 Jan. 1999
40 Accounting for Investments in Debt and Equity Securities
40 IAS 25, IAS 39,
SFAS115
1 Jan. 1999
41 Interim Financial Reporting
41 IAS 34 1 Jan. 2000
42 Accounting Guide for Investment Companies
42 AICPA 1 Jan. 2000
43 Business Combinations
43 IAS 22 1 Jan. 2000
44 Consolidated and Separate Financial Statements
44 IAS 27, IAS 39
1 Jan. 2000 (Revised in 2007)
45 Investments in Associates 45 IAS 28 1 Jan. 2000 (Revised in 2007)
46 Interests in Joint Ventures 46 IAS 31 1 Jan. 2000 (Revised in 2007)
47 Related Party Disclosures
47 IAS 24 1 Jan. 2000
48 Financial Instruments: Disclosure and Presentation
48 IAS 32, IAS 39
1 Jan. 2000
49 Construction Contracts 49 IAS 11 1 Jan. 2000 (Revised in 2007)
50 Events After the Balance Sheet Date
52 IAS 10 1 Jan. 2005
51 Provisions, Contingent Liabilities and Contingent Assets
53 IAS 37 1 Jan. 2005
52 Discontinuing Operations
54 IAS 35 1 Jan. 2005
53 Accounting Framework IAS Framework
1997
Source: The table is amended from the information given by BSAP.94
94 Department of Business Development (2002), Thai Accounting Standards and International Accounting Standards by Institute of Certified Accountants and Auditors of Thailand. [online] Available from: http://www.dbd.go.th/thai/account/standard.phtml?head=061 [accessed 18th October 2007]
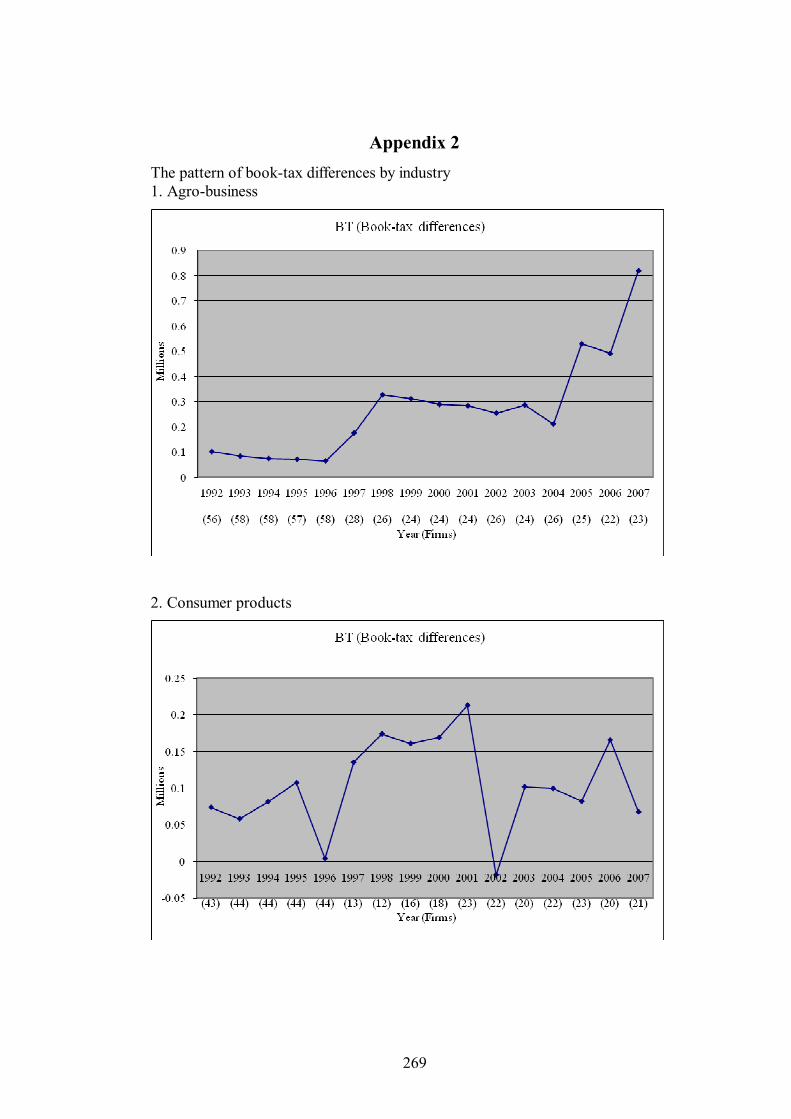
269
Appendix 2 The pattern of book-tax differences by industry 1. Agro-business
2. Consumer products

270
3. Industrial
4. Property and construction
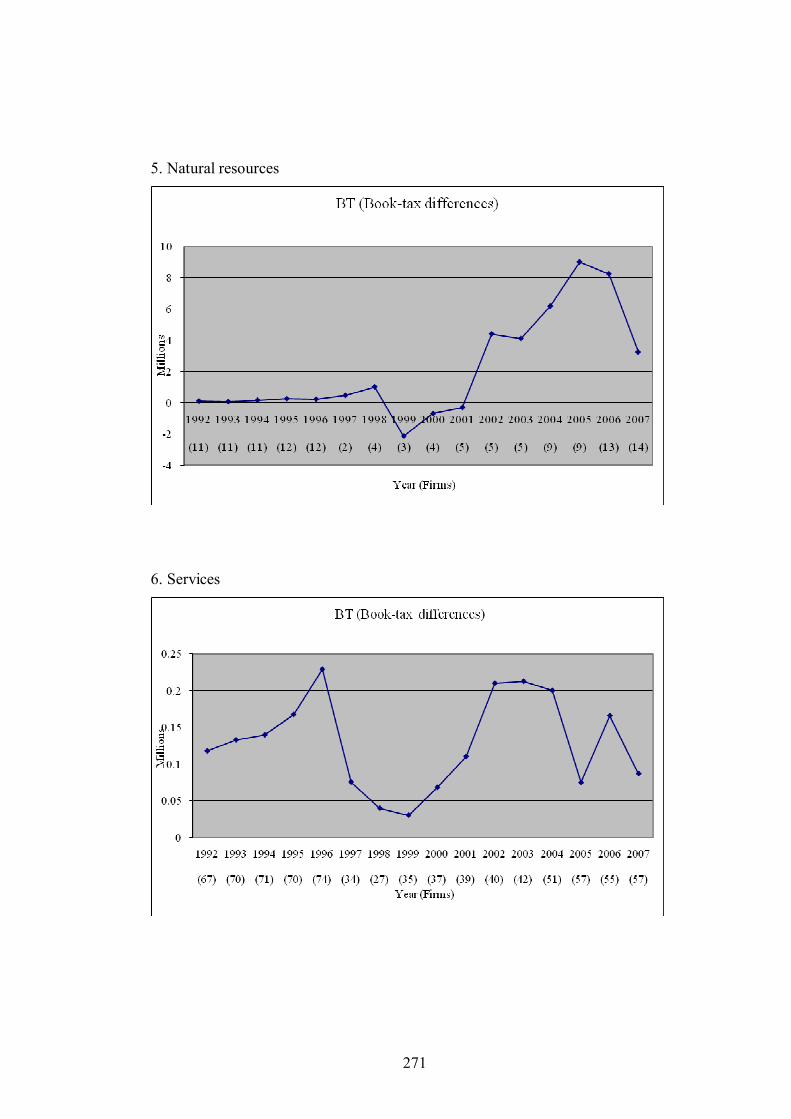
271
5. Natural resources
6. Services

272
7. Technology
8. Financial firms

273
Appendix 3 Supplements for Table 4.7 The book-tax differences are calculated by using consolidated financial statements. Panel B Group 1 . bootstrap, reps (1000): areg lead_ebitast ebitast dy dyebitast if groupcon==1, a(i_industry) r Linear regression, absorbing indicators Number of obs = 850 Replications = 1000 Wald chi2(3) = 229.43 Prob > chi2 = 0.0000 R-squared = 0.3939 Adj R-squared = 0.3874 Root MSE = 0.0852 ------------------------------------------------------------------------------ | Observed Bootstrap Normal-based lead_ebitast | Coef. Std. Err. z P>|z| [95% Conf. Interval] -------------+---------------------------------------------------------------- ebitast | .5157199 .0693966 7.43 0.000 .379705 .6517348 dy | .0341788 .0092613 3.69 0.000 .016027 .0523305 dyebitast | -.0277275 .0779023 -0.36 0.722 -.1804132 .1249582 _cons | .0122919 .0081583 1.51 0.132 -.003698 .0282818 ------------------------------------------------------------------------------ i_industry | absorbed (7 categories) Group 2 . bootstrap, reps (1000): areg lead_ebitast ebitast dy dyebitast if groupcon==2, a(i_industry) r Linear regression, absorbing indicators Number of obs = 1150 Replications = 1000 Wald chi2(3) = 102.82 Prob > chi2 = 0.0000 R-squared = 0.3239 Adj R-squared = 0.3186 Root MSE = 0.1010 ------------------------------------------------------------------------------ | Observed Bootstrap Normal-based lead_ebitast | Coef. Std. Err. z P>|z| [95% Conf. Interval] -------------+---------------------------------------------------------------- ebitast | .5397459 .0668968 8.07 0.000 .4086307 .6708611 dy | -.0220532 .0146925 -1.50 0.133 -.0508501 .0067436 dyebitast | .2228033 .1332309 1.67 0.094 -.0383244 .4839311 _cons | .0275709 .0088927 3.10 0.002 .0101415 .0450003 ------------------------------------------------------------------------------ i_industry | absorbed (7 categories)

274
Panel D Group 1 . bootstrap, reps (1000): reg lead_ebitast cfoast accast dy dycfoast dyaccast if groupcon==1, r Linear regression Number of obs = 450 Replications = 1000 Wald chi2(5) = 95.30 Prob > chi2 = 0.0000 R-squared = 0.3355 Adj R-squared = 0.3280 Root MSE = 0.0774 ------------------------------------------------------------------------------ | Observed Bootstrap Normal-based lead_ebitast | Coef. Std. Err. z P>|z| [95% Conf. Interval] -------------+---------------------------------------------------------------- cfoast | .5152017 .0768261 6.71 0.000 .3646254 .6657781 accast | .4969438 .0764998 6.50 0.000 .347007 .6468806 dy | .0195975 .0126682 1.55 0.122 -.0052316 .0444267 dycfoast | .0616591 .1323295 0.47 0.641 -.1977019 .3210201 dyaccast | .0072589 .1195613 0.06 0.952 -.227077 .2415948 _cons | .0302392 .0078782 3.84 0.000 .0147981 .0456802 ------------------------------------------------------------------------------ . test cfoast=accast ( 1) cfoast - accast = 0 chi2(1) = 0.38 Prob > chi2 = 0.5392 . test dycfoast=dyaccast ( 1) dycfoast - dyaccast = 0 chi2(1) = 0.99 Prob > chi2 = 0.3207 . Group 2 . bootstrap, reps (1000): reg lead_ebitast cfoast accast dy dycfoast dyaccast if groupcon==2, r Linear regression Number of obs = 600 Replications = 1000 Wald chi2(5) = 114.65 Prob > chi2 = 0.0000 R-squared = 0.3435 Adj R-squared = 0.3380 Root MSE = 0.0781 ------------------------------------------------------------------------------ | Observed Bootstrap Normal-based lead_ebitast | Coef. Std. Err. z P>|z| [95% Conf. Interval] -------------+---------------------------------------------------------------- cfoast | .5048576 .0665287 7.59 0.000 .3744638 .6352513 accast | .4133136 .0686272 6.02 0.000 .2788067 .5478206 dy | -.0100195 .0125043 -0.80 0.423 -.0345275 .0144884 dycfoast | .1703924 .1096522 1.55 0.120 -.0445219 .3853067 dyaccast | .2400617 .1105714 2.17 0.030 .0233457 .4567777 _cons | .0344505 .0084636 4.07 0.000 .0178621 .0510389 ------------------------------------------------------------------------------ . test cfoast=accast ( 1) cfoast - accast = 0 chi2(1) = 6.00 Prob > chi2 = 0.0143 . test dycfoast=dyaccast ( 1) dycfoast - dyaccast = 0 chi2(1) = 2.04 Prob > chi2 = 0.1536
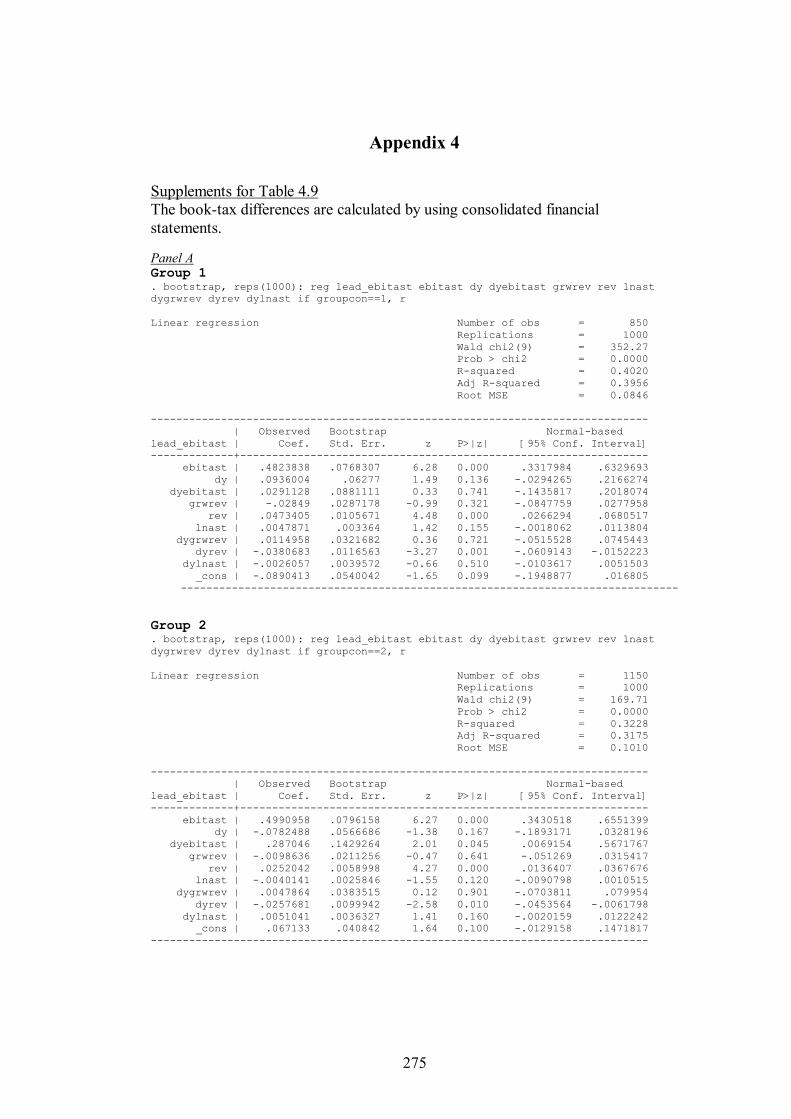
275
Appendix 4 Supplements for Table 4.9 The book-tax differences are calculated by using consolidated financial statements. Panel A Group 1 . bootstrap, reps(1000): reg lead_ebitast ebitast dy dyebitast grwrev rev lnast dygrwrev dyrev dylnast if groupcon==1, r Linear regression Number of obs = 850 Replications = 1000 Wald chi2(9) = 352.27 Prob > chi2 = 0.0000 R-squared = 0.4020 Adj R-squared = 0.3956 Root MSE = 0.0846 ------------------------------------------------------------------------------ | Observed Bootstrap Normal-based lead_ebitast | Coef. Std. Err. z P>|z| [95% Conf. Interval] -------------+---------------------------------------------------------------- ebitast | .4823838 .0768307 6.28 0.000 .3317984 .6329693 dy | .0936004 .06277 1.49 0.136 -.0294265 .2166274 dyebitast | .0291128 .0881111 0.33 0.741 -.1435817 .2018074 grwrev | -.02849 .0287178 -0.99 0.321 -.0847759 .0277958 rev | .0473405 .0105671 4.48 0.000 .0266294 .0680517 lnast | .0047871 .003364 1.42 0.155 -.0018062 .0113804 dygrwrev | .0114958 .0321682 0.36 0.721 -.0515528 .0745443 dyrev | -.0380683 .0116563 -3.27 0.001 -.0609143 -.0152223 dylnast | -.0026057 .0039572 -0.66 0.510 -.0103617 .0051503 _cons | -.0890413 .0540042 -1.65 0.099 -.1948877 .016805
------------------------------------------------------------------------------ Group 2 . bootstrap, reps(1000): reg lead_ebitast ebitast dy dyebitast grwrev rev lnast dygrwrev dyrev dylnast if groupcon==2, r Linear regression Number of obs = 1150 Replications = 1000 Wald chi2(9) = 169.71 Prob > chi2 = 0.0000 R-squared = 0.3228 Adj R-squared = 0.3175 Root MSE = 0.1010 ------------------------------------------------------------------------------ | Observed Bootstrap Normal-based lead_ebitast | Coef. Std. Err. z P>|z| [95% Conf. Interval] -------------+---------------------------------------------------------------- ebitast | .4990958 .0796158 6.27 0.000 .3430518 .6551399 dy | -.0782488 .0566686 -1.38 0.167 -.1893171 .0328196 dyebitast | .287046 .1429264 2.01 0.045 .0069154 .5671767 grwrev | -.0098636 .0211256 -0.47 0.641 -.051269 .0315417 rev | .0252042 .0058998 4.27 0.000 .0136407 .0367676 lnast | -.0040141 .0025846 -1.55 0.120 -.0090798 .0010515 dygrwrev | .0047864 .0383515 0.12 0.901 -.0703811 .079954 dyrev | -.0257681 .0099942 -2.58 0.010 -.0453564 -.0061798 dylnast | .0051041 .0036327 1.41 0.160 -.0020159 .0122242 _cons | .067133 .040842 1.64 0.100 -.0129158 .1471817 ------------------------------------------------------------------------------

276
Panel C Group 1 . bootstrap, reps(1000): reg lead_ebitast cfoast accast dy dycfoast dyaccast grwrev rev lnast dygrwrev dyrev dylnast if groupcon==1, r Linear regression Number of obs = 450 Replications = 1000 Wald chi2(11) = 174.71 Prob > chi2 = 0.0000 R-squared = 0.3755 Adj R-squared = 0.3598 Root MSE = 0.0755 ------------------------------------------------------------------------------ | Observed Bootstrap Normal-based lead_ebitast | Coef. Std. Err. z P>|z| [95% Conf. Interval] -------------+---------------------------------------------------------------- cfoast | .3777486 .0785734 4.81 0.000 .2237475 .5317496 accast | .3723784 .0767963 4.85 0.000 .2218604 .5228963 dy | .0762557 .0709861 1.07 0.283 -.0628744 .2153859 dycfoast | .1964606 .1422659 1.38 0.167 -.0823755 .4752967 dyaccast | .1306296 .1277035 1.02 0.306 -.1196648 .3809239 grwrev | .0042014 .0346064 0.12 0.903 -.063626 .0720287 rev | .0548643 .0146027 3.76 0.000 .0262435 .0834852 lnast | .0056405 .0033045 1.71 0.088 -.0008362 .0121172 dygrwrev | -.0133556 .0394923 -0.34 0.735 -.0907591 .0640479 dyrev | -.0520115 .0165122 -3.15 0.002 -.0843748 -.0196482 dylnast | -.0019768 .0043926 -0.45 0.653 -.0105861 .0066326 _cons | -.0842907 .05464 -1.54 0.123 -.1913831 .0228018 ------------------------------------------------------------------------------ Group 2 . bootstrap, reps(1000): reg lead_ebitast cfoast accast dy dycfoast dyaccast grwrev rev lnast dygrwrev dyrev dylnast if groupcon==2, r Linear regression Number of obs = 600 Replications = 1000 Wald chi2(11) = 171.55 Prob > chi2 = 0.0000 R-squared = 0.3606 Adj R-squared = 0.3486 Root MSE = 0.0775 ------------------------------------------------------------------------------ | Observed Bootstrap Normal-based lead_ebitast | Coef. Std. Err. z P>|z| [95% Conf. Interval] -------------+---------------------------------------------------------------- cfoast | .4761535 .080063 5.95 0.000 .3192328 .6330742 accast | .3815817 .0796432 4.79 0.000 .2254839 .5376795 dy | -.0768992 .0694088 -1.11 0.268 -.2129379 .0591396 dycfoast | .1761865 .1232959 1.43 0.153 -.065469 .417842 dyaccast | .2468741 .1245887 1.98 0.048 .0026848 .4910633 grwrev | -.017446 .0241731 -0.72 0.470 -.0648243 .0299324 rev | .0238322 .0077122 3.09 0.002 .0087166 .0389479 lnast | .0001748 .0033475 0.05 0.958 -.0063861 .0067357 dygrwrev | .0382497 .0364803 1.05 0.294 -.0332503 .1097497 dyrev | -.0305034 .0103275 -2.95 0.003 -.050745 -.0102618 dylnast | .0062482 .004299 1.45 0.146 -.0021778 .0146741 _cons | .0126979 .0531064 0.24 0.811 -.0913888 .1167847 ------------------------------------------------------------------------------
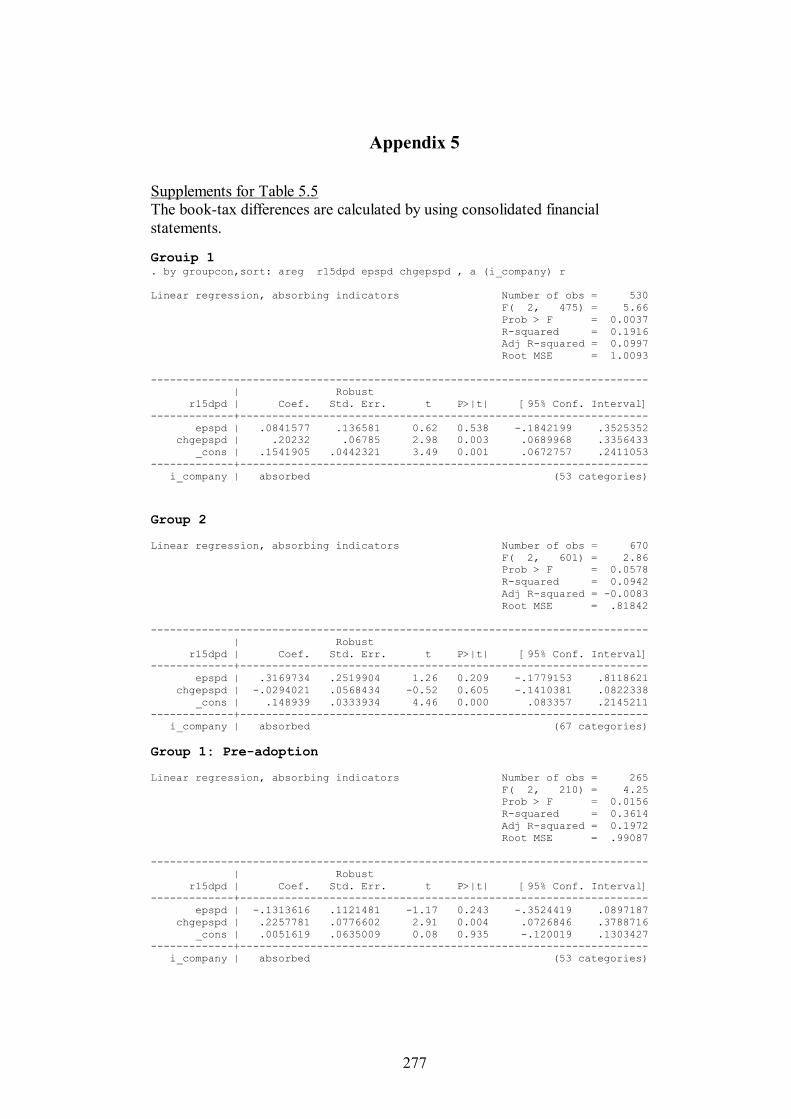
277
Appendix 5 Supplements for Table 5.5 The book-tax differences are calculated by using consolidated financial statements. Grouip 1 . by groupcon,sort: areg r15dpd epspd chgepspd , a (i_company) r Linear regression, absorbing indicators Number of obs = 530 F( 2, 475) = 5.66 Prob > F = 0.0037 R-squared = 0.1916 Adj R-squared = 0.0997 Root MSE = 1.0093 ------------------------------------------------------------------------------ | Robust r15dpd | Coef. Std. Err. t P>|t| [95% Conf. Interval] -------------+---------------------------------------------------------------- epspd | .0841577 .136581 0.62 0.538 -.1842199 .3525352 chgepspd | .20232 .06785 2.98 0.003 .0689968 .3356433 _cons | .1541905 .0442321 3.49 0.001 .0672757 .2411053 -------------+---------------------------------------------------------------- i_company | absorbed (53 categories)
Group 2 Linear regression, absorbing indicators Number of obs = 670 F( 2, 601) = 2.86 Prob > F = 0.0578 R-squared = 0.0942 Adj R-squared = -0.0083 Root MSE = .81842 ------------------------------------------------------------------------------ | Robust r15dpd | Coef. Std. Err. t P>|t| [95% Conf. Interval] -------------+---------------------------------------------------------------- epspd | .3169734 .2519904 1.26 0.209 -.1779153 .8118621 chgepspd | -.0294021 .0568434 -0.52 0.605 -.1410381 .0822338 _cons | .148939 .0333934 4.46 0.000 .083357 .2145211 -------------+---------------------------------------------------------------- i_company | absorbed (67 categories) Group 1: Pre-adoption Linear regression, absorbing indicators Number of obs = 265 F( 2, 210) = 4.25 Prob > F = 0.0156 R-squared = 0.3614 Adj R-squared = 0.1972 Root MSE = .99087 ------------------------------------------------------------------------------ | Robust r15dpd | Coef. Std. Err. t P>|t| [95% Conf. Interval] -------------+---------------------------------------------------------------- epspd | -.1313616 .1121481 -1.17 0.243 -.3524419 .0897187 chgepspd | .2257781 .0776602 2.91 0.004 .0726846 .3788716 _cons | .0051619 .0635009 0.08 0.935 -.120019 .1303427 -------------+---------------------------------------------------------------- i_company | absorbed (53 categories)
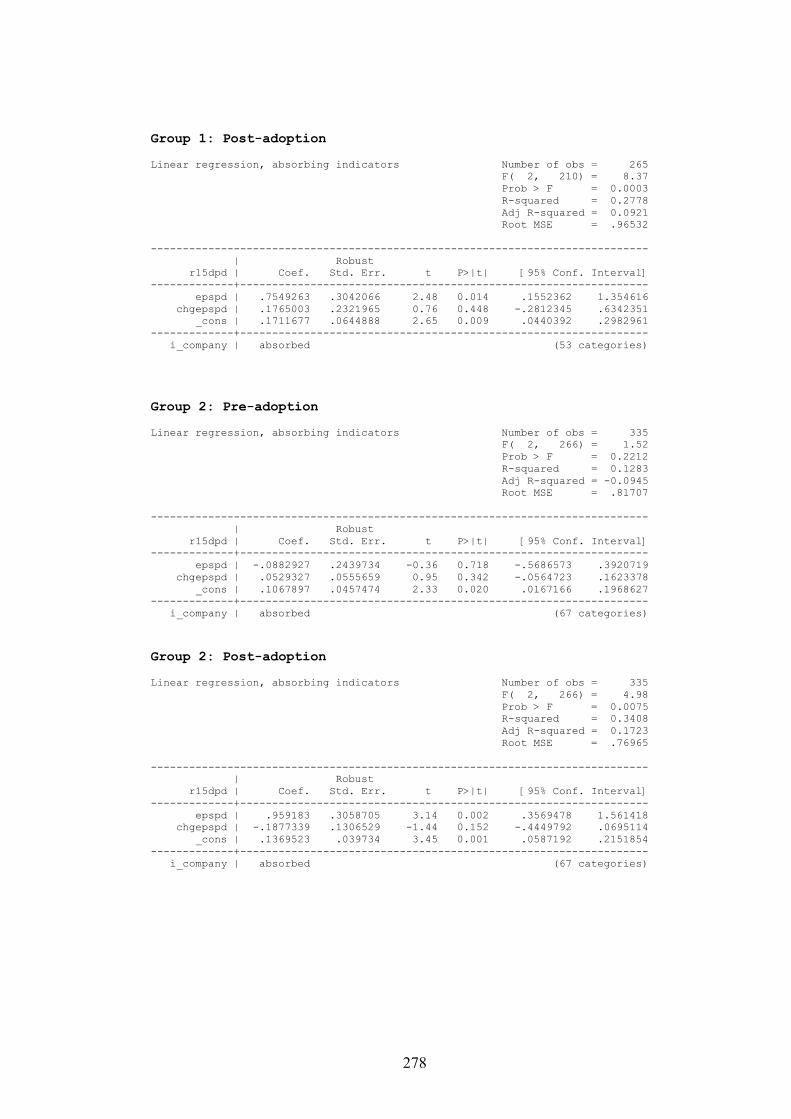
278
Group 1: Post-adoption Linear regression, absorbing indicators Number of obs = 265 F( 2, 210) = 8.37 Prob > F = 0.0003 R-squared = 0.2778 Adj R-squared = 0.0921 Root MSE = .96532 ------------------------------------------------------------------------------ | Robust r15dpd | Coef. Std. Err. t P>|t| [95% Conf. Interval] -------------+---------------------------------------------------------------- epspd | .7549263 .3042066 2.48 0.014 .1552362 1.354616 chgepspd | .1765003 .2321965 0.76 0.448 -.2812345 .6342351 _cons | .1711677 .0644888 2.65 0.009 .0440392 .2982961 -------------+---------------------------------------------------------------- i_company | absorbed (53 categories)
Group 2: Pre-adoption Linear regression, absorbing indicators Number of obs = 335 F( 2, 266) = 1.52 Prob > F = 0.2212 R-squared = 0.1283 Adj R-squared = -0.0945 Root MSE = .81707 ------------------------------------------------------------------------------ | Robust r15dpd | Coef. Std. Err. t P>|t| [95% Conf. Interval] -------------+---------------------------------------------------------------- epspd | -.0882927 .2439734 -0.36 0.718 -.5686573 .3920719 chgepspd | .0529327 .0555659 0.95 0.342 -.0564723 .1623378 _cons | .1067897 .0457474 2.33 0.020 .0167166 .1968627 -------------+---------------------------------------------------------------- i_company | absorbed (67 categories)
Group 2: Post-adoption Linear regression, absorbing indicators Number of obs = 335 F( 2, 266) = 4.98 Prob > F = 0.0075 R-squared = 0.3408 Adj R-squared = 0.1723 Root MSE = .76965 ------------------------------------------------------------------------------ | Robust r15dpd | Coef. Std. Err. t P>|t| [95% Conf. Interval] -------------+---------------------------------------------------------------- epspd | .959183 .3058705 3.14 0.002 .3569478 1.561418 chgepspd | -.1877339 .1306529 -1.44 0.152 -.4449792 .0695114 _cons | .1369523 .039734 3.45 0.001 .0587192 .2151854 -------------+---------------------------------------------------------------- i_company | absorbed (67 categories)

279
Returns are calculated from 9 months before and 3 months after the financial year-end. . by group dum_yr, sort: reg ret12m_9 epspd chgepspd, r -> group = 1, dum_yr = 0 Linear regression Number of obs = 300 F( 2, 297) = 2.55 Prob > F = 0.0801 R-squared = 0.0439
Adj R-squared = 0.0374 Root MSE = .86673 ------------------------------------------------------------------------------ | Robust ret12m_9 | Coef. Std. Err. t P>|t| [95% Conf. Interval] -------------+---------------------------------------------------------------- epspd | .0105885 .0683828 0.15 0.877 -.1239878 .1451647 chgepspd | .071734 .0352862 2.03 0.043 .0022915 .1411766 _cons | .0065023 .0489522 0.13 0.894 -.0898348 .1028394 ------------------------------------------------------------------------------ -> group = 1, dum_yr = 1 Linear regression Number of obs = 300 F( 2, 297) = 13.72 Prob > F = 0.0000 R-squared = 0.2178
Adj R-squared = 0.2125 Root MSE = .81346 ------------------------------------------------------------------------------ | Robust ret12m_9 | Coef. Std. Err. t P>|t| [95% Conf. Interval] -------------+---------------------------------------------------------------- epspd | .4656219 .2564972 1.82 0.070 -.0391605 .9704042 chgepspd | .454327 .1627769 2.79 0.006 .1339847 .7746693 _cons | .0915692 .0511056 1.79 0.074 -.0090058 .1921442 ------------------------------------------------------------------------------ -> group = 2, dum_yr = 0 Linear regression Number of obs = 300 F( 2, 297) = 3.62 Prob > F = 0.0279 R-squared = 0.0197
Adj R-squared = 0.0131 Root MSE = .74027 ------------------------------------------------------------------------------ | Robust ret12m_9 | Coef. Std. Err. t P>|t| [95% Conf. Interval] -------------+---------------------------------------------------------------- epspd | .2258545 .1451733 1.56 0.121 -.0598442 .5115532 chgepspd | -.06759 .0273018 -2.48 0.014 -.1213194 -.0138606 _cons | .0225524 .0450202 0.50 0.617 -.0660467 .1111514 ------------------------------------------------------------------------------ -> group = 2, dum_yr = 1 Linear regression Number of obs = 300 F( 2, 297) = 4.63 Prob > F = 0.0105 R-squared = 0.1021
Adj R-squared = 0.0961 Root MSE = .68264 ------------------------------------------------------------------------------ | Robust ret12m_9 | Coef. Std. Err. t P>|t| [95% Conf. Interval] -------------+---------------------------------------------------------------- epspd | .5493884 .1888145 2.91 0.004 .1778046 .9209722 chgepspd | .0338676 .0907185 0.37 0.709 -.1446648 .2124001 _cons | .0744171 .0359792 2.07 0.039 .0036107 .1452236 ------------------------------------------------------------------------------
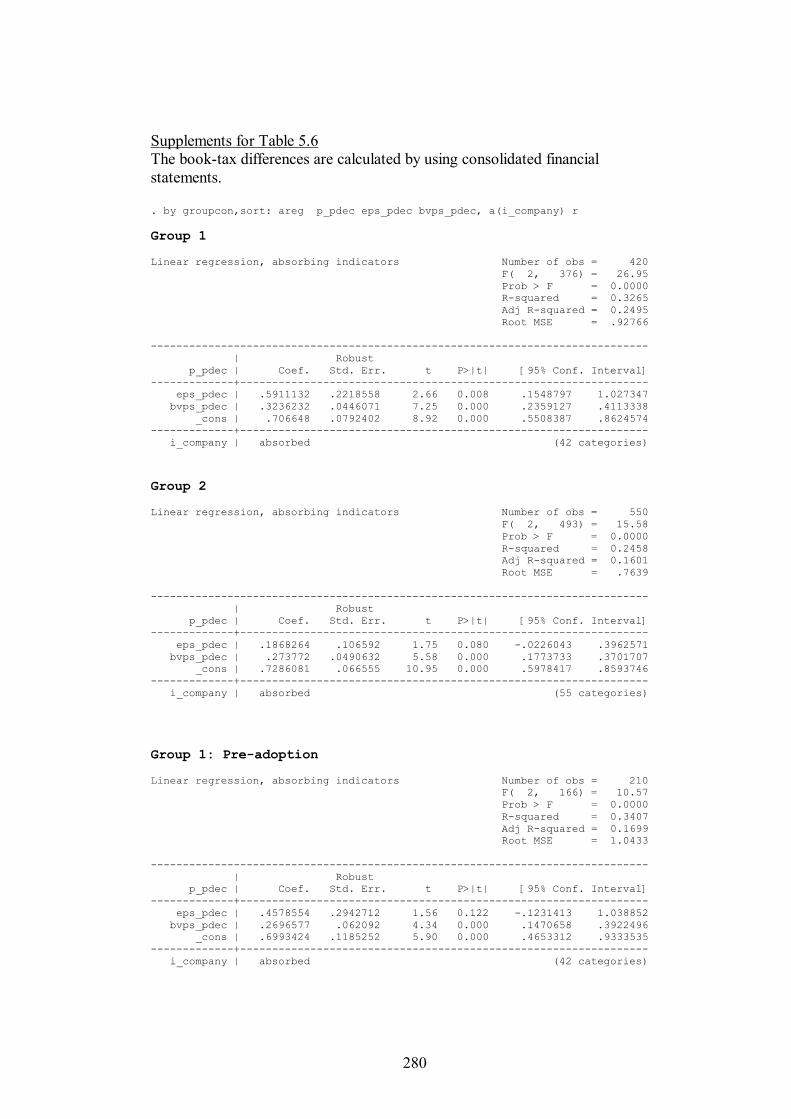
280
Supplements for Table 5.6 The book-tax differences are calculated by using consolidated financial statements. . by groupcon,sort: areg p_pdec eps_pdec bvps_pdec, a(i_company) r Group 1 Linear regression, absorbing indicators Number of obs = 420 F( 2, 376) = 26.95 Prob > F = 0.0000 R-squared = 0.3265 Adj R-squared = 0.2495 Root MSE = .92766 ------------------------------------------------------------------------------ | Robust p_pdec | Coef. Std. Err. t P>|t| [95% Conf. Interval] -------------+---------------------------------------------------------------- eps_pdec | .5911132 .2218558 2.66 0.008 .1548797 1.027347 bvps_pdec | .3236232 .0446071 7.25 0.000 .2359127 .4113338 _cons | .706648 .0792402 8.92 0.000 .5508387 .8624574 -------------+---------------------------------------------------------------- i_company | absorbed (42 categories)
Group 2 Linear regression, absorbing indicators Number of obs = 550 F( 2, 493) = 15.58 Prob > F = 0.0000 R-squared = 0.2458 Adj R-squared = 0.1601 Root MSE = .7639 ------------------------------------------------------------------------------ | Robust p_pdec | Coef. Std. Err. t P>|t| [95% Conf. Interval] -------------+---------------------------------------------------------------- eps_pdec | .1868264 .106592 1.75 0.080 -.0226043 .3962571 bvps_pdec | .273772 .0490632 5.58 0.000 .1773733 .3701707 _cons | .7286081 .066555 10.95 0.000 .5978417 .8593746 -------------+---------------------------------------------------------------- i_company | absorbed (55 categories)
Group 1: Pre-adoption Linear regression, absorbing indicators Number of obs = 210 F( 2, 166) = 10.57 Prob > F = 0.0000 R-squared = 0.3407 Adj R-squared = 0.1699 Root MSE = 1.0433 ------------------------------------------------------------------------------ | Robust p_pdec | Coef. Std. Err. t P>|t| [95% Conf. Interval] -------------+---------------------------------------------------------------- eps_pdec | .4578554 .2942712 1.56 0.122 -.1231413 1.038852 bvps_pdec | .2696577 .062092 4.34 0.000 .1470658 .3922496 _cons | .6993424 .1185252 5.90 0.000 .4653312 .9333535 -------------+---------------------------------------------------------------- i_company | absorbed (42 categories)
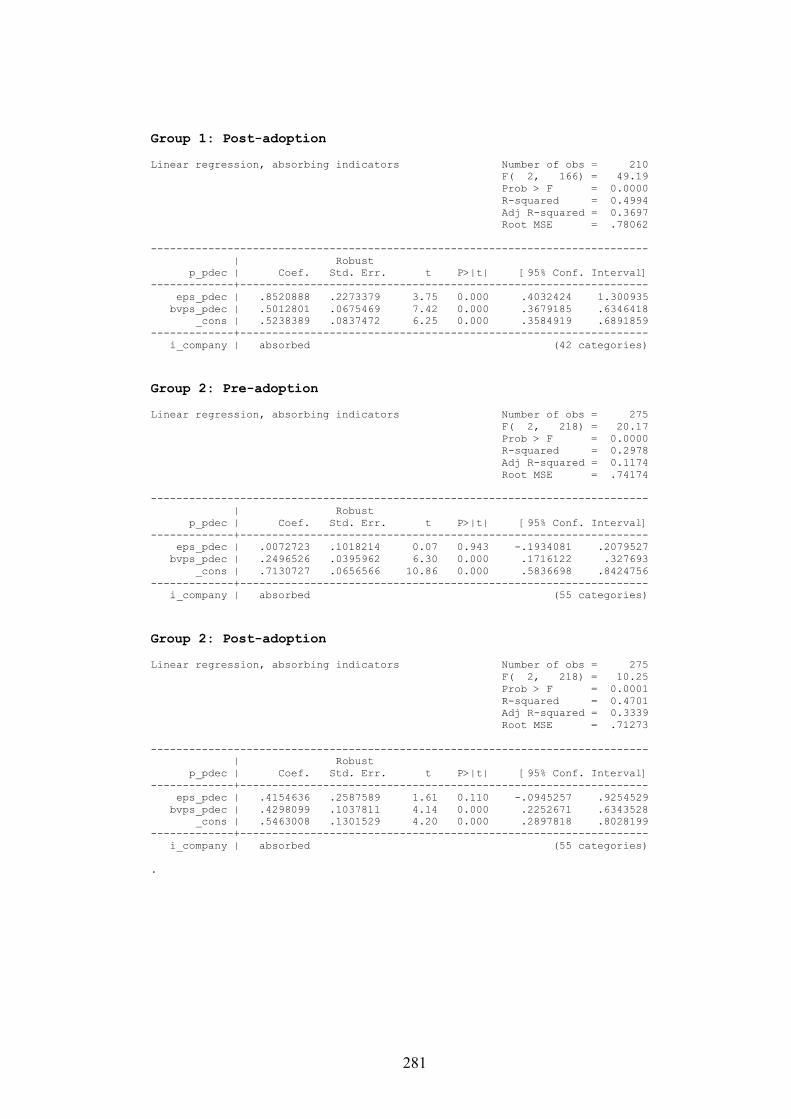
281
Group 1: Post-adoption Linear regression, absorbing indicators Number of obs = 210 F( 2, 166) = 49.19 Prob > F = 0.0000 R-squared = 0.4994 Adj R-squared = 0.3697 Root MSE = .78062 ------------------------------------------------------------------------------ | Robust p_pdec | Coef. Std. Err. t P>|t| [95% Conf. Interval] -------------+---------------------------------------------------------------- eps_pdec | .8520888 .2273379 3.75 0.000 .4032424 1.300935 bvps_pdec | .5012801 .0675469 7.42 0.000 .3679185 .6346418 _cons | .5238389 .0837472 6.25 0.000 .3584919 .6891859 -------------+---------------------------------------------------------------- i_company | absorbed (42 categories)
Group 2: Pre-adoption Linear regression, absorbing indicators Number of obs = 275 F( 2, 218) = 20.17 Prob > F = 0.0000 R-squared = 0.2978 Adj R-squared = 0.1174 Root MSE = .74174 ------------------------------------------------------------------------------ | Robust p_pdec | Coef. Std. Err. t P>|t| [95% Conf. Interval] -------------+---------------------------------------------------------------- eps_pdec | .0072723 .1018214 0.07 0.943 -.1934081 .2079527 bvps_pdec | .2496526 .0395962 6.30 0.000 .1716122 .327693 _cons | .7130727 .0656566 10.86 0.000 .5836698 .8424756 -------------+---------------------------------------------------------------- i_company | absorbed (55 categories)
Group 2: Post-adoption Linear regression, absorbing indicators Number of obs = 275 F( 2, 218) = 10.25 Prob > F = 0.0001 R-squared = 0.4701 Adj R-squared = 0.3339 Root MSE = .71273 ------------------------------------------------------------------------------ | Robust p_pdec | Coef. Std. Err. t P>|t| [95% Conf. Interval] -------------+---------------------------------------------------------------- eps_pdec | .4154636 .2587589 1.61 0.110 -.0945257 .9254529 bvps_pdec | .4298099 .1037811 4.14 0.000 .2252671 .6343528 _cons | .5463008 .1301529 4.20 0.000 .2897818 .8028199 -------------+---------------------------------------------------------------- i_company | absorbed (55 categories) .
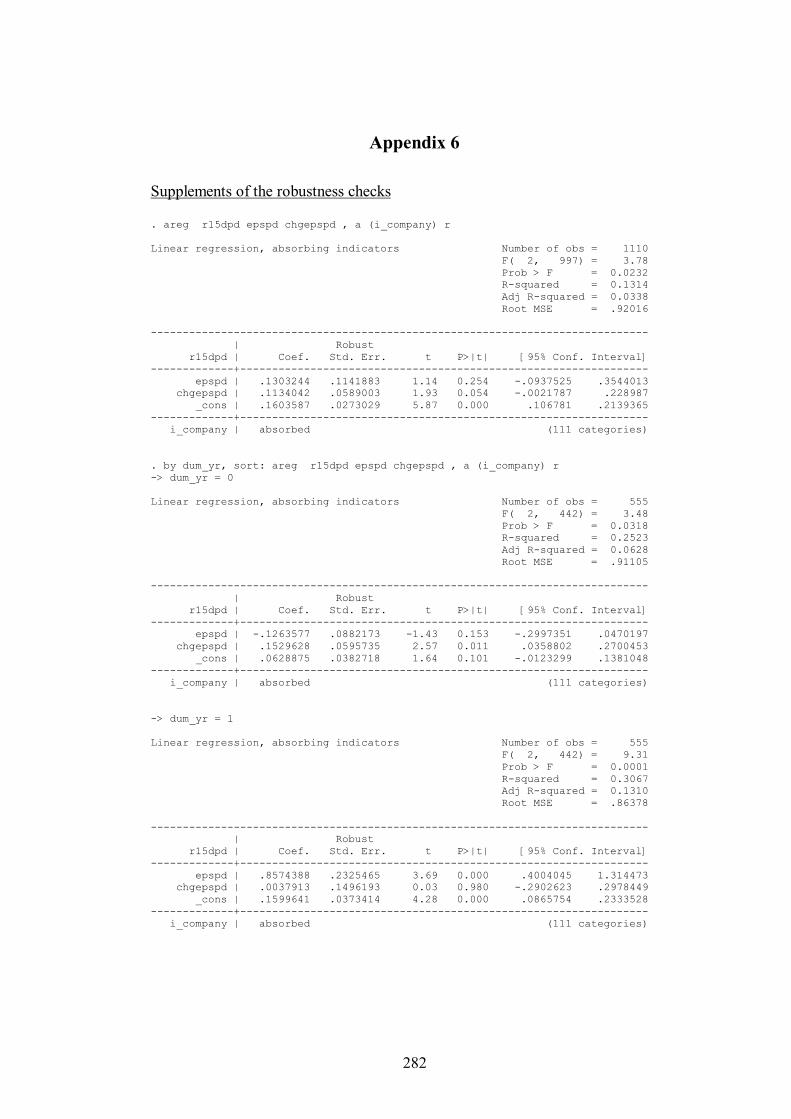
282
Appendix 6 Supplements of the robustness checks . areg r15dpd epspd chgepspd , a (i_company) r Linear regression, absorbing indicators Number of obs = 1110 F( 2, 997) = 3.78 Prob > F = 0.0232 R-squared = 0.1314 Adj R-squared = 0.0338 Root MSE = .92016 ------------------------------------------------------------------------------ | Robust r15dpd | Coef. Std. Err. t P>|t| [95% Conf. Interval] -------------+---------------------------------------------------------------- epspd | .1303244 .1141883 1.14 0.254 -.0937525 .3544013 chgepspd | .1134042 .0589003 1.93 0.054 -.0021787 .228987 _cons | .1603587 .0273029 5.87 0.000 .106781 .2139365 -------------+---------------------------------------------------------------- i_company | absorbed (111 categories) . by dum_yr, sort: areg r15dpd epspd chgepspd , a (i_company) r -> dum_yr = 0 Linear regression, absorbing indicators Number of obs = 555 F( 2, 442) = 3.48 Prob > F = 0.0318 R-squared = 0.2523 Adj R-squared = 0.0628 Root MSE = .91105 ------------------------------------------------------------------------------ | Robust r15dpd | Coef. Std. Err. t P>|t| [95% Conf. Interval] -------------+---------------------------------------------------------------- epspd | -.1263577 .0882173 -1.43 0.153 -.2997351 .0470197 chgepspd | .1529628 .0595735 2.57 0.011 .0358802 .2700453 _cons | .0628875 .0382718 1.64 0.101 -.0123299 .1381048 -------------+---------------------------------------------------------------- i_company | absorbed (111 categories) -> dum_yr = 1 Linear regression, absorbing indicators Number of obs = 555 F( 2, 442) = 9.31 Prob > F = 0.0001 R-squared = 0.3067 Adj R-squared = 0.1310 Root MSE = .86378 ------------------------------------------------------------------------------ | Robust r15dpd | Coef. Std. Err. t P>|t| [95% Conf. Interval] -------------+---------------------------------------------------------------- epspd | .8574388 .2325465 3.69 0.000 .4004045 1.314473 chgepspd | .0037913 .1496193 0.03 0.980 -.2902623 .2978449 _cons | .1599641 .0373414 4.28 0.000 .0865754 .2333528 -------------+---------------------------------------------------------------- i_company | absorbed (111 categories)
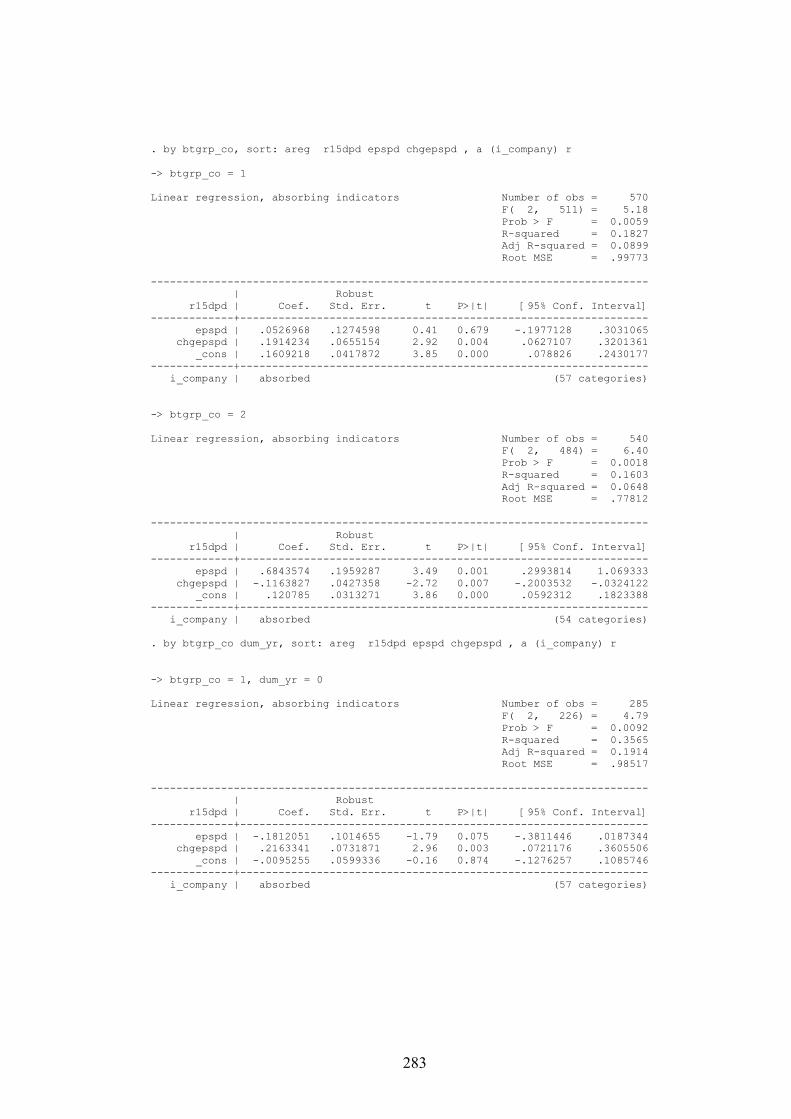
283
. by btgrp_co, sort: areg r15dpd epspd chgepspd , a (i_company) r -> btgrp_co = 1 Linear regression, absorbing indicators Number of obs = 570 F( 2, 511) = 5.18 Prob > F = 0.0059 R-squared = 0.1827 Adj R-squared = 0.0899 Root MSE = .99773 ------------------------------------------------------------------------------ | Robust r15dpd | Coef. Std. Err. t P>|t| [95% Conf. Interval] -------------+---------------------------------------------------------------- epspd | .0526968 .1274598 0.41 0.679 -.1977128 .3031065 chgepspd | .1914234 .0655154 2.92 0.004 .0627107 .3201361 _cons | .1609218 .0417872 3.85 0.000 .078826 .2430177 -------------+---------------------------------------------------------------- i_company | absorbed (57 categories) -> btgrp_co = 2 Linear regression, absorbing indicators Number of obs = 540 F( 2, 484) = 6.40 Prob > F = 0.0018 R-squared = 0.1603 Adj R-squared = 0.0648 Root MSE = .77812 ------------------------------------------------------------------------------ | Robust r15dpd | Coef. Std. Err. t P>|t| [95% Conf. Interval] -------------+---------------------------------------------------------------- epspd | .6843574 .1959287 3.49 0.001 .2993814 1.069333 chgepspd | -.1163827 .0427358 -2.72 0.007 -.2003532 -.0324122 _cons | .120785 .0313271 3.86 0.000 .0592312 .1823388 -------------+---------------------------------------------------------------- i_company | absorbed (54 categories)
. by btgrp_co dum_yr, sort: areg r15dpd epspd chgepspd , a (i_company) r -> btgrp_co = 1, dum_yr = 0 Linear regression, absorbing indicators Number of obs = 285 F( 2, 226) = 4.79 Prob > F = 0.0092 R-squared = 0.3565 Adj R-squared = 0.1914 Root MSE = .98517 ------------------------------------------------------------------------------ | Robust r15dpd | Coef. Std. Err. t P>|t| [95% Conf. Interval] -------------+---------------------------------------------------------------- epspd | -.1812051 .1014655 -1.79 0.075 -.3811446 .0187344 chgepspd | .2163341 .0731871 2.96 0.003 .0721176 .3605506 _cons | -.0095255 .0599336 -0.16 0.874 -.1276257 .1085746 -------------+---------------------------------------------------------------- i_company | absorbed (57 categories)
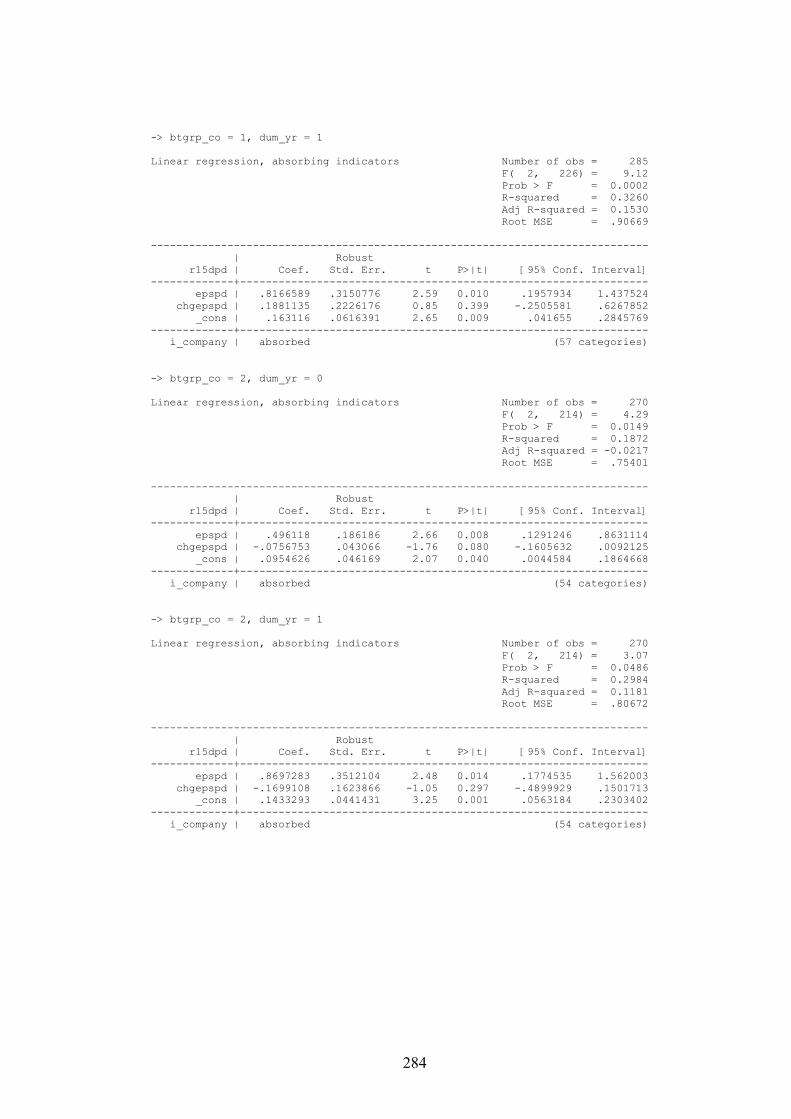
284
-> btgrp_co = 1, dum_yr = 1 Linear regression, absorbing indicators Number of obs = 285 F( 2, 226) = 9.12 Prob > F = 0.0002 R-squared = 0.3260 Adj R-squared = 0.1530 Root MSE = .90669 ------------------------------------------------------------------------------ | Robust r15dpd | Coef. Std. Err. t P>|t| [95% Conf. Interval] -------------+---------------------------------------------------------------- epspd | .8166589 .3150776 2.59 0.010 .1957934 1.437524 chgepspd | .1881135 .2226176 0.85 0.399 -.2505581 .6267852 _cons | .163116 .0616391 2.65 0.009 .041655 .2845769 -------------+---------------------------------------------------------------- i_company | absorbed (57 categories) -> btgrp_co = 2, dum_yr = 0 Linear regression, absorbing indicators Number of obs = 270 F( 2, 214) = 4.29 Prob > F = 0.0149 R-squared = 0.1872 Adj R-squared = -0.0217 Root MSE = .75401 ------------------------------------------------------------------------------ | Robust r15dpd | Coef. Std. Err. t P>|t| [95% Conf. Interval] -------------+---------------------------------------------------------------- epspd | .496118 .186186 2.66 0.008 .1291246 .8631114 chgepspd | -.0756753 .043066 -1.76 0.080 -.1605632 .0092125 _cons | .0954626 .046169 2.07 0.040 .0044584 .1864668 -------------+---------------------------------------------------------------- i_company | absorbed (54 categories) -> btgrp_co = 2, dum_yr = 1 Linear regression, absorbing indicators Number of obs = 270 F( 2, 214) = 3.07 Prob > F = 0.0486 R-squared = 0.2984 Adj R-squared = 0.1181 Root MSE = .80672 ------------------------------------------------------------------------------ | Robust r15dpd | Coef. Std. Err. t P>|t| [95% Conf. Interval] -------------+---------------------------------------------------------------- epspd | .8697283 .3512104 2.48 0.014 .1774535 1.562003 chgepspd | -.1699108 .1623866 -1.05 0.297 -.4899929 .1501713 _cons | .1433293 .0441431 3.25 0.001 .0563184 .2303402 -------------+---------------------------------------------------------------- i_company | absorbed (54 categories)
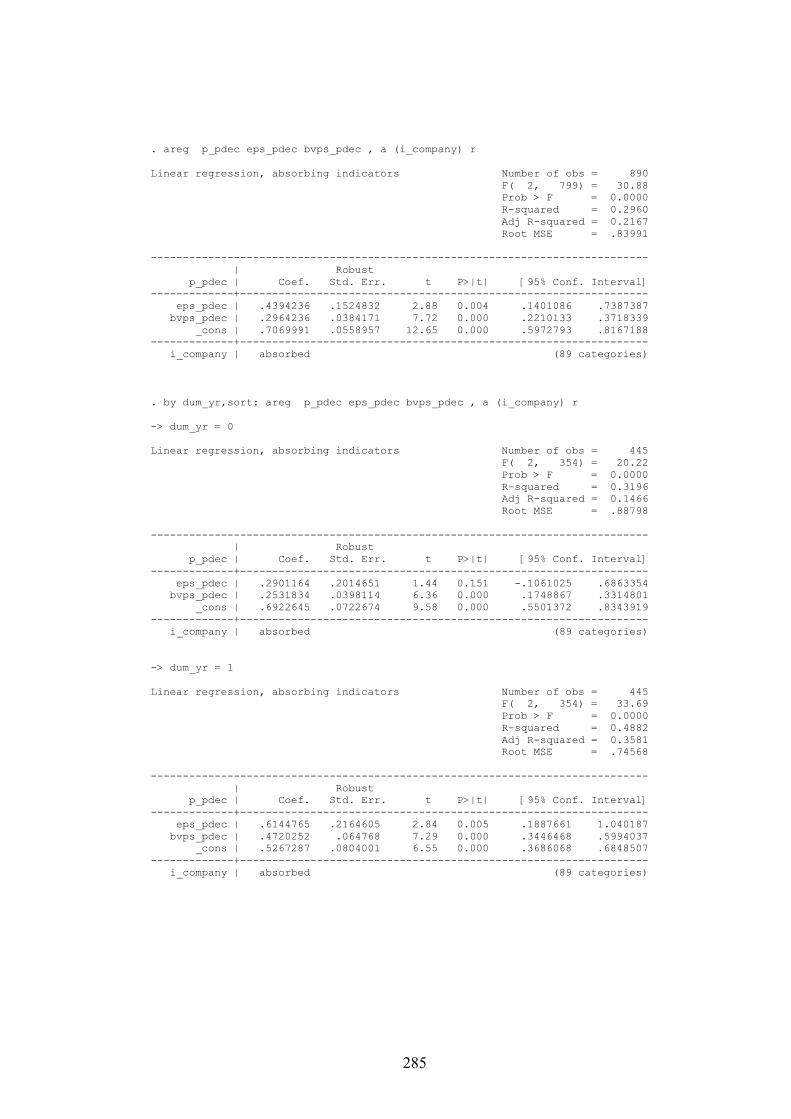
285
. areg p_pdec eps_pdec bvps_pdec , a (i_company) r Linear regression, absorbing indicators Number of obs = 890 F( 2, 799) = 30.88 Prob > F = 0.0000 R-squared = 0.2960 Adj R-squared = 0.2167 Root MSE = .83991 ------------------------------------------------------------------------------ | Robust p_pdec | Coef. Std. Err. t P>|t| [95% Conf. Interval] -------------+---------------------------------------------------------------- eps_pdec | .4394236 .1524832 2.88 0.004 .1401086 .7387387 bvps_pdec | .2964236 .0384171 7.72 0.000 .2210133 .3718339 _cons | .7069991 .0558957 12.65 0.000 .5972793 .8167188 -------------+---------------------------------------------------------------- i_company | absorbed (89 categories) . by dum_yr,sort: areg p_pdec eps_pdec bvps_pdec , a (i_company) r -> dum_yr = 0 Linear regression, absorbing indicators Number of obs = 445 F( 2, 354) = 20.22 Prob > F = 0.0000 R-squared = 0.3196 Adj R-squared = 0.1466 Root MSE = .88798 ------------------------------------------------------------------------------ | Robust p_pdec | Coef. Std. Err. t P>|t| [95% Conf. Interval] -------------+---------------------------------------------------------------- eps_pdec | .2901164 .2014651 1.44 0.151 -.1061025 .6863354 bvps_pdec | .2531834 .0398114 6.36 0.000 .1748867 .3314801 _cons | .6922645 .0722674 9.58 0.000 .5501372 .8343919 -------------+---------------------------------------------------------------- i_company | absorbed (89 categories) -> dum_yr = 1 Linear regression, absorbing indicators Number of obs = 445 F( 2, 354) = 33.69 Prob > F = 0.0000 R-squared = 0.4882 Adj R-squared = 0.3581 Root MSE = .74568 ------------------------------------------------------------------------------ | Robust p_pdec | Coef. Std. Err. t P>|t| [95% Conf. Interval] -------------+---------------------------------------------------------------- eps_pdec | .6144765 .2164605 2.84 0.005 .1887661 1.040187 bvps_pdec | .4720252 .064768 7.29 0.000 .3446468 .5994037 _cons | .5267287 .0804001 6.55 0.000 .3686068 .6848507 -------------+---------------------------------------------------------------- i_company | absorbed (89 categories)

286
. by btgrp_co,sort: areg p_pdec eps_pdec bvps_pdec , a (i_company) r -> btgrp_co = 1 Linear regression, absorbing indicators Number of obs = 470 F( 2, 421) = 16.63 Prob > F = 0.0000 R-squared = 0.3239 Adj R-squared = 0.2468 Root MSE = .90865 ------------------------------------------------------------------------------ | Robust p_pdec | Coef. Std. Err. t P>|t| [95% Conf. Interval] -------------+---------------------------------------------------------------- eps_pdec | .5179383 .2053799 2.52 0.012 .1142405 .921636 bvps_pdec | .3025413 .0528006 5.73 0.000 .1987557 .406327 _cons | .7147797 .0834059 8.57 0.000 .5508359 .8787235 -------------+---------------------------------------------------------------- i_company | absorbed (47 categories) -> btgrp_co = 2 Linear regression, absorbing indicators Number of obs = 420 F( 2, 376) = 15.57 Prob > F = 0.0000 R-squared = 0.2604 Adj R-squared = 0.1758 Root MSE = .74908 ------------------------------------------------------------------------------ | Robust p_pdec | Coef. Std. Err. t P>|t| [95% Conf. Interval] -------------+---------------------------------------------------------------- eps_pdec | .2457477 .1122535 2.19 0.029 .0250244 .4664711 bvps_pdec | .3132999 .0561571 5.58 0.000 .2028786 .4237212 _cons | .6758467 .0687901 9.82 0.000 .5405852 .8111082 -------------+---------------------------------------------------------------- i_company | absorbed (42 categories) . by btgrp_co dum_yr,sort: areg p_pdec eps_pdec bvps_pdec , a (i_company) r -> btgrp_co = 1, dum_yr = 0 Linear regression, absorbing indicators Number of obs = 235 F( 2, 186) = 10.46 Prob > F = 0.0000 R-squared = 0.3396 Adj R-squared = 0.1691 Root MSE = 1.0276 ------------------------------------------------------------------------------ | Robust p_pdec | Coef. Std. Err. t P>|t| [95% Conf. Interval] -------------+---------------------------------------------------------------- eps_pdec | .3509273 .2682813 1.31 0.192 -.178338 .8801927 bvps_pdec | .2561798 .0568905 4.50 0.000 .1439462 .3684134 _cons | .6780099 .1113045 6.09 0.000 .4584284 .8975913 -------------+---------------------------------------------------------------- i_company | absorbed (47 categories)
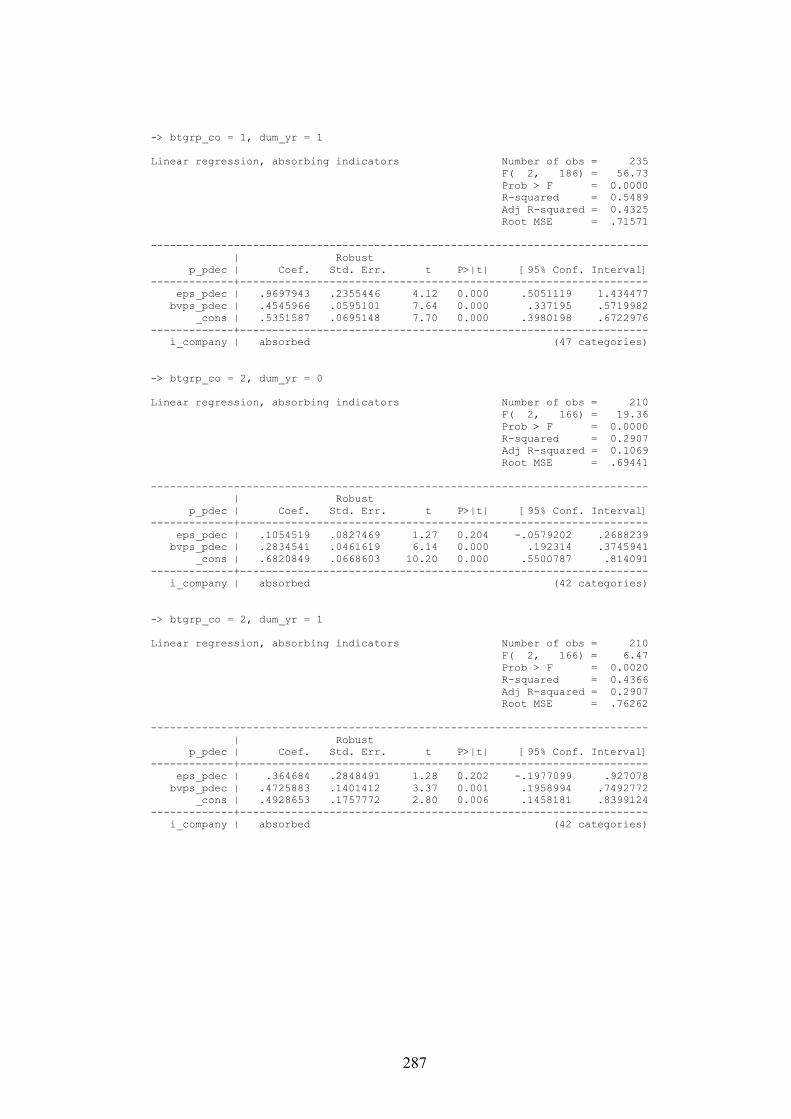
287
-> btgrp_co = 1, dum_yr = 1 Linear regression, absorbing indicators Number of obs = 235 F( 2, 186) = 56.73 Prob > F = 0.0000 R-squared = 0.5489 Adj R-squared = 0.4325 Root MSE = .71571 ------------------------------------------------------------------------------ | Robust p_pdec | Coef. Std. Err. t P>|t| [95% Conf. Interval] -------------+---------------------------------------------------------------- eps_pdec | .9697943 .2355446 4.12 0.000 .5051119 1.434477 bvps_pdec | .4545966 .0595101 7.64 0.000 .337195 .5719982 _cons | .5351587 .0695148 7.70 0.000 .3980198 .6722976 -------------+---------------------------------------------------------------- i_company | absorbed (47 categories) -> btgrp_co = 2, dum_yr = 0 Linear regression, absorbing indicators Number of obs = 210 F( 2, 166) = 19.36 Prob > F = 0.0000 R-squared = 0.2907 Adj R-squared = 0.1069 Root MSE = .69441 ------------------------------------------------------------------------------ | Robust p_pdec | Coef. Std. Err. t P>|t| [95% Conf. Interval] -------------+---------------------------------------------------------------- eps_pdec | .1054519 .0827469 1.27 0.204 -.0579202 .2688239 bvps_pdec | .2834541 .0461619 6.14 0.000 .192314 .3745941 _cons | .6820849 .0668603 10.20 0.000 .5500787 .814091 -------------+---------------------------------------------------------------- i_company | absorbed (42 categories) -> btgrp_co = 2, dum_yr = 1 Linear regression, absorbing indicators Number of obs = 210 F( 2, 166) = 6.47 Prob > F = 0.0020 R-squared = 0.4366 Adj R-squared = 0.2907 Root MSE = .76262 ------------------------------------------------------------------------------ | Robust p_pdec | Coef. Std. Err. t P>|t| [95% Conf. Interval] -------------+---------------------------------------------------------------- eps_pdec | .364684 .2848491 1.28 0.202 -.1977099 .927078 bvps_pdec | .4725883 .1401412 3.37 0.001 .1958994 .7492772 _cons | .4928653 .1757772 2.80 0.006 .1458181 .8399124 -------------+---------------------------------------------------------------- i_company | absorbed (42 categories)
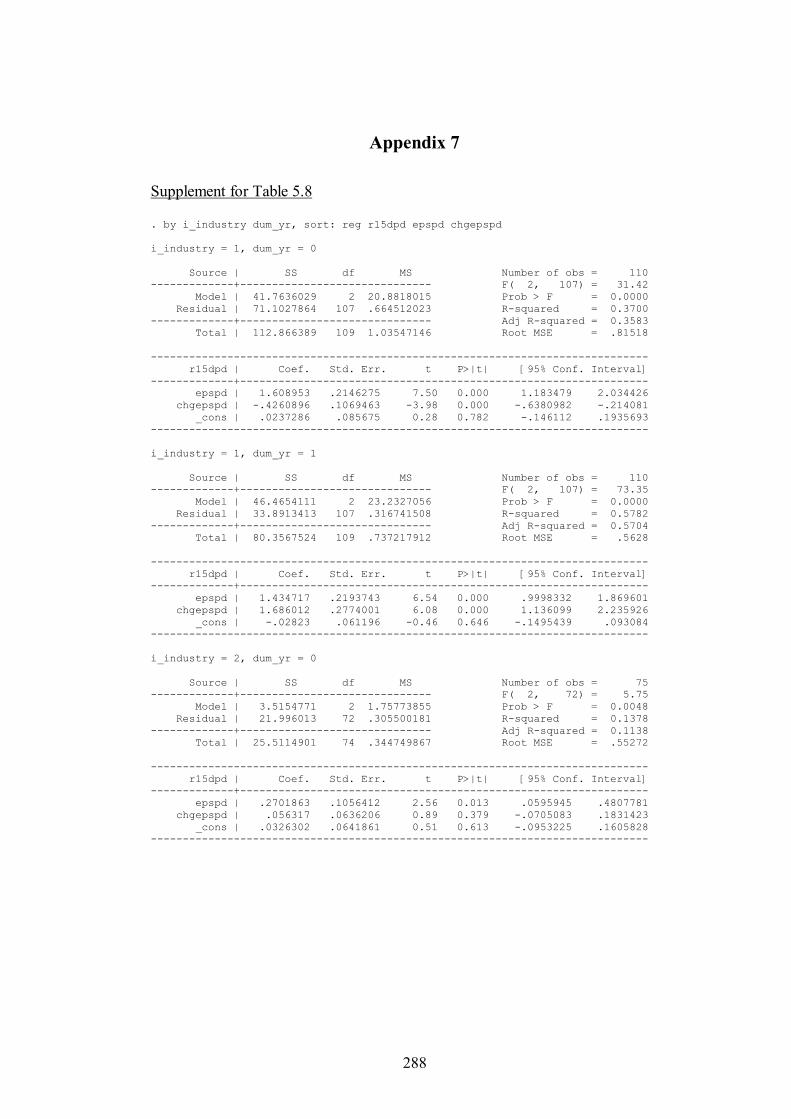
288
Appendix 7 Supplement for Table 5.8 . by i_industry dum_yr, sort: reg r15dpd epspd chgepspd i_industry = 1, dum_yr = 0 Source | SS df MS Number of obs = 110 -------------+------------------------------ F( 2, 107) = 31.42 Model | 41.7636029 2 20.8818015 Prob > F = 0.0000 Residual | 71.1027864 107 .664512023 R-squared = 0.3700 -------------+------------------------------ Adj R-squared = 0.3583 Total | 112.866389 109 1.03547146 Root MSE = .81518 ------------------------------------------------------------------------------ r15dpd | Coef. Std. Err. t P>|t| [95% Conf. Interval] -------------+---------------------------------------------------------------- epspd | 1.608953 .2146275 7.50 0.000 1.183479 2.034426 chgepspd | -.4260896 .1069463 -3.98 0.000 -.6380982 -.214081 _cons | .0237286 .085675 0.28 0.782 -.146112 .1935693 ------------------------------------------------------------------------------ i_industry = 1, dum_yr = 1 Source | SS df MS Number of obs = 110 -------------+------------------------------ F( 2, 107) = 73.35 Model | 46.4654111 2 23.2327056 Prob > F = 0.0000 Residual | 33.8913413 107 .316741508 R-squared = 0.5782 -------------+------------------------------ Adj R-squared = 0.5704 Total | 80.3567524 109 .737217912 Root MSE = .5628 ------------------------------------------------------------------------------ r15dpd | Coef. Std. Err. t P>|t| [95% Conf. Interval] -------------+---------------------------------------------------------------- epspd | 1.434717 .2193743 6.54 0.000 .9998332 1.869601 chgepspd | 1.686012 .2774001 6.08 0.000 1.136099 2.235926 _cons | -.02823 .061196 -0.46 0.646 -.1495439 .093084 ------------------------------------------------------------------------------ i_industry = 2, dum_yr = 0 Source | SS df MS Number of obs = 75 -------------+------------------------------ F( 2, 72) = 5.75 Model | 3.5154771 2 1.75773855 Prob > F = 0.0048 Residual | 21.996013 72 .305500181 R-squared = 0.1378 -------------+------------------------------ Adj R-squared = 0.1138 Total | 25.5114901 74 .344749867 Root MSE = .55272 ------------------------------------------------------------------------------ r15dpd | Coef. Std. Err. t P>|t| [95% Conf. Interval] -------------+---------------------------------------------------------------- epspd | .2701863 .1056412 2.56 0.013 .0595945 .4807781 chgepspd | .056317 .0636206 0.89 0.379 -.0705083 .1831423 _cons | .0326302 .0641861 0.51 0.613 -.0953225 .1605828 ------------------------------------------------------------------------------

289
i_industry = 2, dum_yr = 1 Source | SS df MS Number of obs = 75 -------------+------------------------------ F( 2, 72) = 18.73 Model | 19.2852932 2 9.64264658 Prob > F = 0.0000 Residual | 37.0735799 72 .514910831 R-squared = 0.3422 -------------+------------------------------ Adj R-squared = 0.3239 Total | 56.358873 74 .761606392 Root MSE = .71757 ------------------------------------------------------------------------------ r15dpd | Coef. Std. Err. t P>|t| [95% Conf. Interval] -------------+---------------------------------------------------------------- epspd | 1.132919 .1980402 5.72 0.000 .7381326 1.527704 chgepspd | -.3033679 .2136445 -1.42 0.160 -.7292605 .1225246 _cons | .188567 .0886442 2.13 0.037 .0118581 .3652759 ------------------------------------------------------------------------------ i_industry = 4, dum_yr = 0 Source | SS df MS Number of obs = 60 -------------+------------------------------ F( 2, 57) = 2.33 Model | 1.59673953 2 .798369767 Prob > F = 0.1060 Residual | 19.4924245 57 .34197236 R-squared = 0.0757 -------------+------------------------------ Adj R-squared = 0.0433 Total | 21.089164 59 .357443458 Root MSE = .58478 ------------------------------------------------------------------------------ r15dpd | Coef. Std. Err. t P>|t| [95% Conf. Interval] -------------+---------------------------------------------------------------- epspd | .0351969 .1204689 0.29 0.771 -.2060379 .2764318 chgepspd | .043521 .0342219 1.27 0.209 -.0250072 .1120492 _cons | -.0632379 .0800449 -0.79 0.433 -.223525 .0970493 ------------------------------------------------------------------------------ i_industry = 4, dum_yr = 1 Source | SS df MS Number of obs = 61 -------------+------------------------------ F( 2, 58) = 9.68 Model | 7.40589919 2 3.70294959 Prob > F = 0.0002 Residual | 22.176632 58 .382355724 R-squared = 0.2503 -------------+------------------------------ Adj R-squared = 0.2245 Total | 29.5825312 60 .493042186 Root MSE = .61835 ------------------------------------------------------------------------------ r15dpd | Coef. Std. Err. t P>|t| [95% Conf. Interval] -------------+---------------------------------------------------------------- epspd | 1.149749 .2774793 4.14 0.000 .5943137 1.705184 chgepspd | -.0142182 .1658304 -0.09 0.932 -.3461639 .3177275 _cons | .1101577 .0877017 1.26 0.214 -.0653963 .2857116 ------------------------------------------------------------------------------ i_industry = 5, dum_yr = 0 Source | SS df MS Number of obs = 105 -------------+------------------------------ F( 2, 102) = 35.90 Model | 71.439066 2 35.719533 Prob > F = 0.0000 Residual | 101.492293 102 .995022482 R-squared = 0.4131 -------------+------------------------------ Adj R-squared = 0.4016 Total | 172.931359 104 1.66280153 Root MSE = .99751 ------------------------------------------------------------------------------ r15dpd | Coef. Std. Err. t P>|t| [95% Conf. Interval] -------------+---------------------------------------------------------------- epspd | -.1049312 .0648534 -1.62 0.109 -.2335676 .0237053 chgepspd | .1959053 .0245061 7.99 0.000 .1472976 .2445131 _cons | -.1880015 .1057033 -1.78 0.078 -.3976635 .0216604 ------------------------------------------------------------------------------
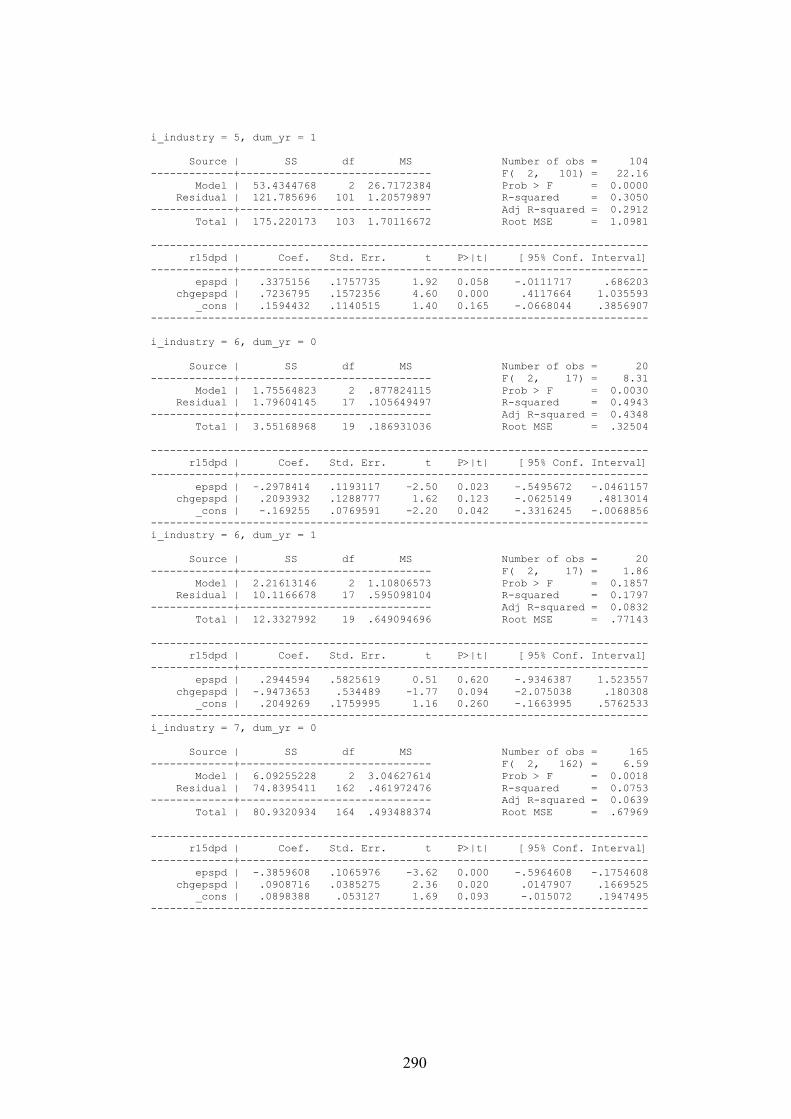
290
i_industry = 5, dum_yr = 1 Source | SS df MS Number of obs = 104 -------------+------------------------------ F( 2, 101) = 22.16 Model | 53.4344768 2 26.7172384 Prob > F = 0.0000 Residual | 121.785696 101 1.20579897 R-squared = 0.3050 -------------+------------------------------ Adj R-squared = 0.2912 Total | 175.220173 103 1.70116672 Root MSE = 1.0981 ------------------------------------------------------------------------------ r15dpd | Coef. Std. Err. t P>|t| [95% Conf. Interval] -------------+---------------------------------------------------------------- epspd | .3375156 .1757735 1.92 0.058 -.0111717 .686203 chgepspd | .7236795 .1572356 4.60 0.000 .4117664 1.035593 _cons | .1594432 .1140515 1.40 0.165 -.0668044 .3856907 ------------------------------------------------------------------------------ i_industry = 6, dum_yr = 0 Source | SS df MS Number of obs = 20 -------------+------------------------------ F( 2, 17) = 8.31 Model | 1.75564823 2 .877824115 Prob > F = 0.0030 Residual | 1.79604145 17 .105649497 R-squared = 0.4943 -------------+------------------------------ Adj R-squared = 0.4348 Total | 3.55168968 19 .186931036 Root MSE = .32504 ------------------------------------------------------------------------------ r15dpd | Coef. Std. Err. t P>|t| [95% Conf. Interval] -------------+---------------------------------------------------------------- epspd | -.2978414 .1193117 -2.50 0.023 -.5495672 -.0461157 chgepspd | .2093932 .1288777 1.62 0.123 -.0625149 .4813014 _cons | -.169255 .0769591 -2.20 0.042 -.3316245 -.0068856 ------------------------------------------------------------------------------ i_industry = 6, dum_yr = 1 Source | SS df MS Number of obs = 20 -------------+------------------------------ F( 2, 17) = 1.86 Model | 2.21613146 2 1.10806573 Prob > F = 0.1857 Residual | 10.1166678 17 .595098104 R-squared = 0.1797 -------------+------------------------------ Adj R-squared = 0.0832 Total | 12.3327992 19 .649094696 Root MSE = .77143 ------------------------------------------------------------------------------ r15dpd | Coef. Std. Err. t P>|t| [95% Conf. Interval] -------------+---------------------------------------------------------------- epspd | .2944594 .5825619 0.51 0.620 -.9346387 1.523557 chgepspd | -.9473653 .534489 -1.77 0.094 -2.075038 .180308 _cons | .2049269 .1759995 1.16 0.260 -.1663995 .5762533 ------------------------------------------------------------------------------ i_industry = 7, dum_yr = 0 Source | SS df MS Number of obs = 165 -------------+------------------------------ F( 2, 162) = 6.59 Model | 6.09255228 2 3.04627614 Prob > F = 0.0018 Residual | 74.8395411 162 .461972476 R-squared = 0.0753 -------------+------------------------------ Adj R-squared = 0.0639 Total | 80.9320934 164 .493488374 Root MSE = .67969 ------------------------------------------------------------------------------ r15dpd | Coef. Std. Err. t P>|t| [95% Conf. Interval] -------------+---------------------------------------------------------------- epspd | -.3859608 .1065976 -3.62 0.000 -.5964608 -.1754608 chgepspd | .0908716 .0385275 2.36 0.020 .0147907 .1669525 _cons | .0898388 .053127 1.69 0.093 -.015072 .1947495 ------------------------------------------------------------------------------
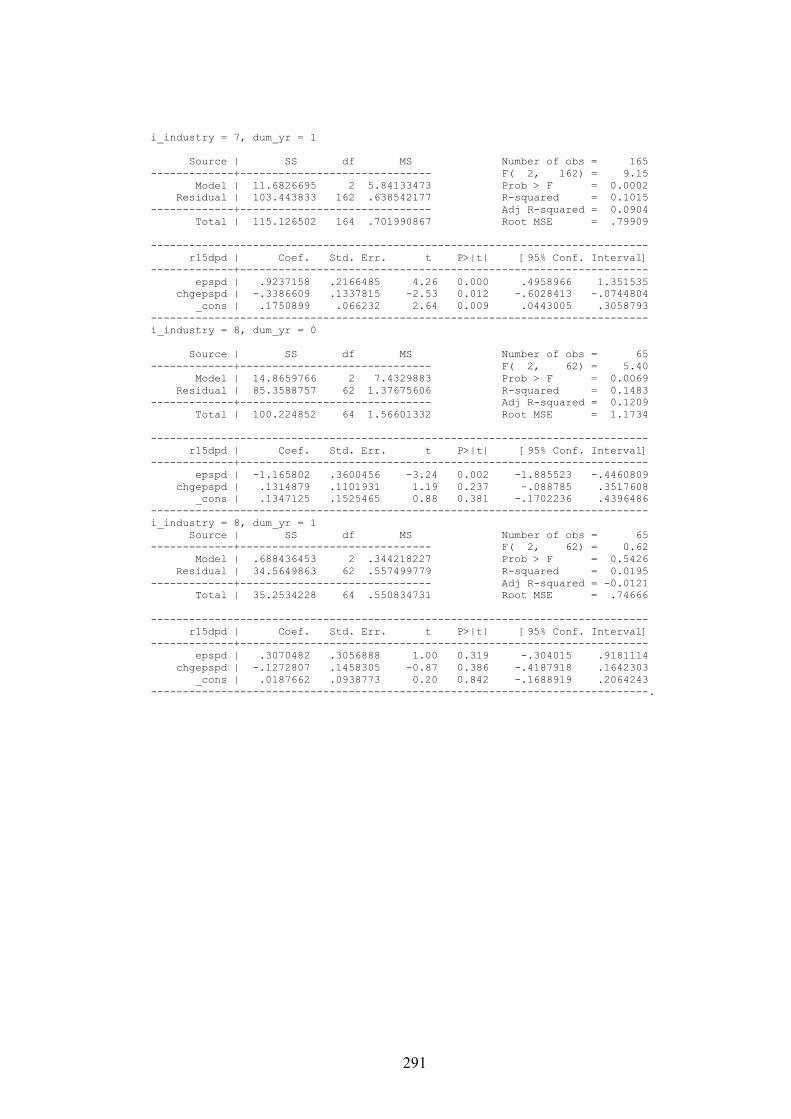
291
i_industry = 7, dum_yr = 1 Source | SS df MS Number of obs = 165 -------------+------------------------------ F( 2, 162) = 9.15 Model | 11.6826695 2 5.84133473 Prob > F = 0.0002 Residual | 103.443833 162 .638542177 R-squared = 0.1015 -------------+------------------------------ Adj R-squared = 0.0904 Total | 115.126502 164 .701990867 Root MSE = .79909 ------------------------------------------------------------------------------ r15dpd | Coef. Std. Err. t P>|t| [95% Conf. Interval] -------------+---------------------------------------------------------------- epspd | .9237158 .2166485 4.26 0.000 .4958966 1.351535 chgepspd | -.3386609 .1337815 -2.53 0.012 -.6028413 -.0744804 _cons | .1750899 .066232 2.64 0.009 .0443005 .3058793 ------------------------------------------------------------------------------ i_industry = 8, dum_yr = 0 Source | SS df MS Number of obs = 65 -------------+------------------------------ F( 2, 62) = 5.40 Model | 14.8659766 2 7.4329883 Prob > F = 0.0069 Residual | 85.3588757 62 1.37675606 R-squared = 0.1483 -------------+------------------------------ Adj R-squared = 0.1209 Total | 100.224852 64 1.56601332 Root MSE = 1.1734 ------------------------------------------------------------------------------ r15dpd | Coef. Std. Err. t P>|t| [95% Conf. Interval] -------------+---------------------------------------------------------------- epspd | -1.165802 .3600456 -3.24 0.002 -1.885523 -.4460809 chgepspd | .1314879 .1101931 1.19 0.237 -.088785 .3517608 _cons | .1347125 .1525465 0.88 0.381 -.1702236 .4396486 ------------------------------------------------------------------------------ i_industry = 8, dum_yr = 1 Source | SS df MS Number of obs = 65 -------------+------------------------------ F( 2, 62) = 0.62 Model | .688436453 2 .344218227 Prob > F = 0.5426 Residual | 34.5649863 62 .557499779 R-squared = 0.0195 -------------+------------------------------ Adj R-squared = -0.0121 Total | 35.2534228 64 .550834731 Root MSE = .74666 ------------------------------------------------------------------------------ r15dpd | Coef. Std. Err. t P>|t| [95% Conf. Interval] -------------+---------------------------------------------------------------- epspd | .3070482 .3056888 1.00 0.319 -.304015 .9181114 chgepspd | -.1272807 .1458305 -0.87 0.386 -.4187918 .1642303 _cons | .0187662 .0938773 0.20 0.842 -.1688919 .2064243 ------------------------------------------------------------------------------.
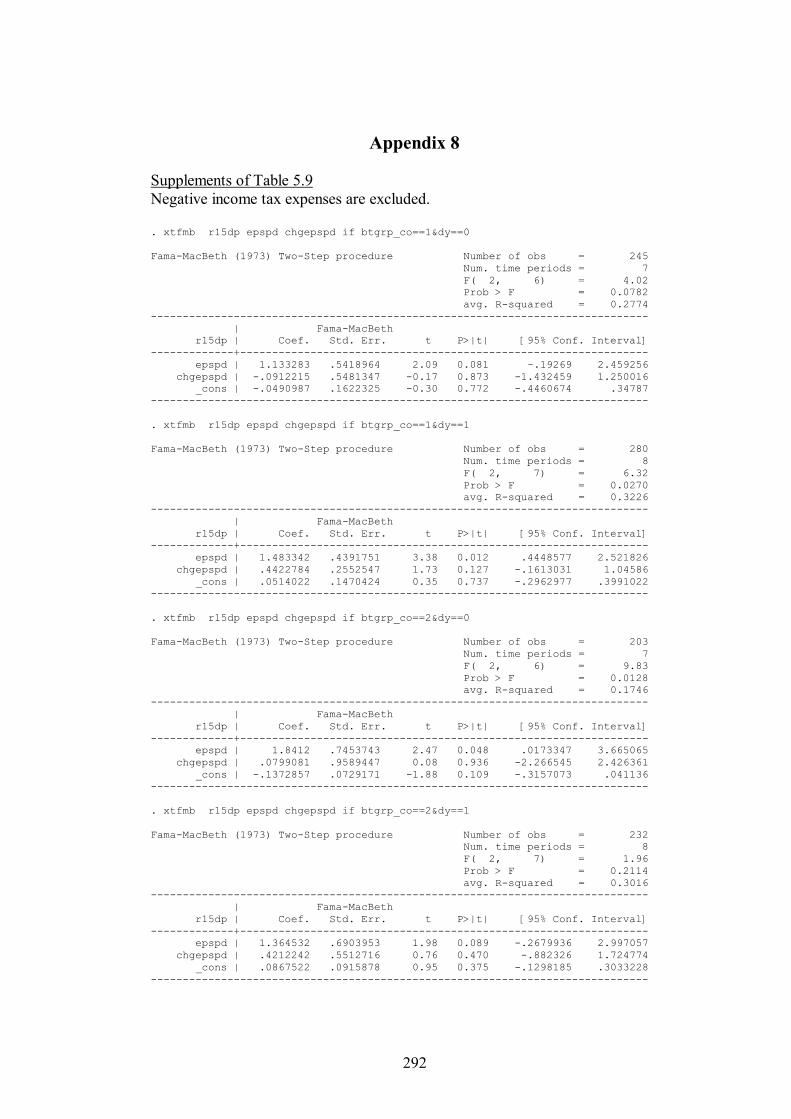
292
Appendix 8
Supplements of Table 5.9 Negative income tax expenses are excluded. . xtfmb r15dp epspd chgepspd if btgrp_co==1&dy==0 Fama-MacBeth (1973) Two-Step procedure Number of obs = 245 Num. time periods = 7 F( 2, 6) = 4.02 Prob > F = 0.0782 avg. R-squared = 0.2774 ------------------------------------------------------------------------------ | Fama-MacBeth r15dp | Coef. Std. Err. t P>|t| [95% Conf. Interval] -------------+---------------------------------------------------------------- epspd | 1.133283 .5418964 2.09 0.081 -.19269 2.459256 chgepspd | -.0912215 .5481347 -0.17 0.873 -1.432459 1.250016 _cons | -.0490987 .1622325 -0.30 0.772 -.4460674 .34787 ------------------------------------------------------------------------------ . xtfmb r15dp epspd chgepspd if btgrp_co==1&dy==1 Fama-MacBeth (1973) Two-Step procedure Number of obs = 280 Num. time periods = 8 F( 2, 7) = 6.32 Prob > F = 0.0270 avg. R-squared = 0.3226 ------------------------------------------------------------------------------ | Fama-MacBeth r15dp | Coef. Std. Err. t P>|t| [95% Conf. Interval] -------------+---------------------------------------------------------------- epspd | 1.483342 .4391751 3.38 0.012 .4448577 2.521826 chgepspd | .4422784 .2552547 1.73 0.127 -.1613031 1.04586 _cons | .0514022 .1470424 0.35 0.737 -.2962977 .3991022 ------------------------------------------------------------------------------ . xtfmb r15dp epspd chgepspd if btgrp_co==2&dy==0 Fama-MacBeth (1973) Two-Step procedure Number of obs = 203 Num. time periods = 7 F( 2, 6) = 9.83 Prob > F = 0.0128 avg. R-squared = 0.1746 ------------------------------------------------------------------------------ | Fama-MacBeth r15dp | Coef. Std. Err. t P>|t| [95% Conf. Interval] -------------+---------------------------------------------------------------- epspd | 1.8412 .7453743 2.47 0.048 .0173347 3.665065 chgepspd | .0799081 .9589447 0.08 0.936 -2.266545 2.426361 _cons | -.1372857 .0729171 -1.88 0.109 -.3157073 .041136 ------------------------------------------------------------------------------ . xtfmb r15dp epspd chgepspd if btgrp_co==2&dy==1 Fama-MacBeth (1973) Two-Step procedure Number of obs = 232 Num. time periods = 8 F( 2, 7) = 1.96 Prob > F = 0.2114 avg. R-squared = 0.3016 ------------------------------------------------------------------------------ | Fama-MacBeth r15dp | Coef. Std. Err. t P>|t| [95% Conf. Interval] -------------+---------------------------------------------------------------- epspd | 1.364532 .6903953 1.98 0.089 -.2679936 2.997057 chgepspd | .4212242 .5512716 0.76 0.470 -.882326 1.724774 _cons | .0867522 .0915878 0.95 0.375 -.1298185 .3033228 ------------------------------------------------------------------------------
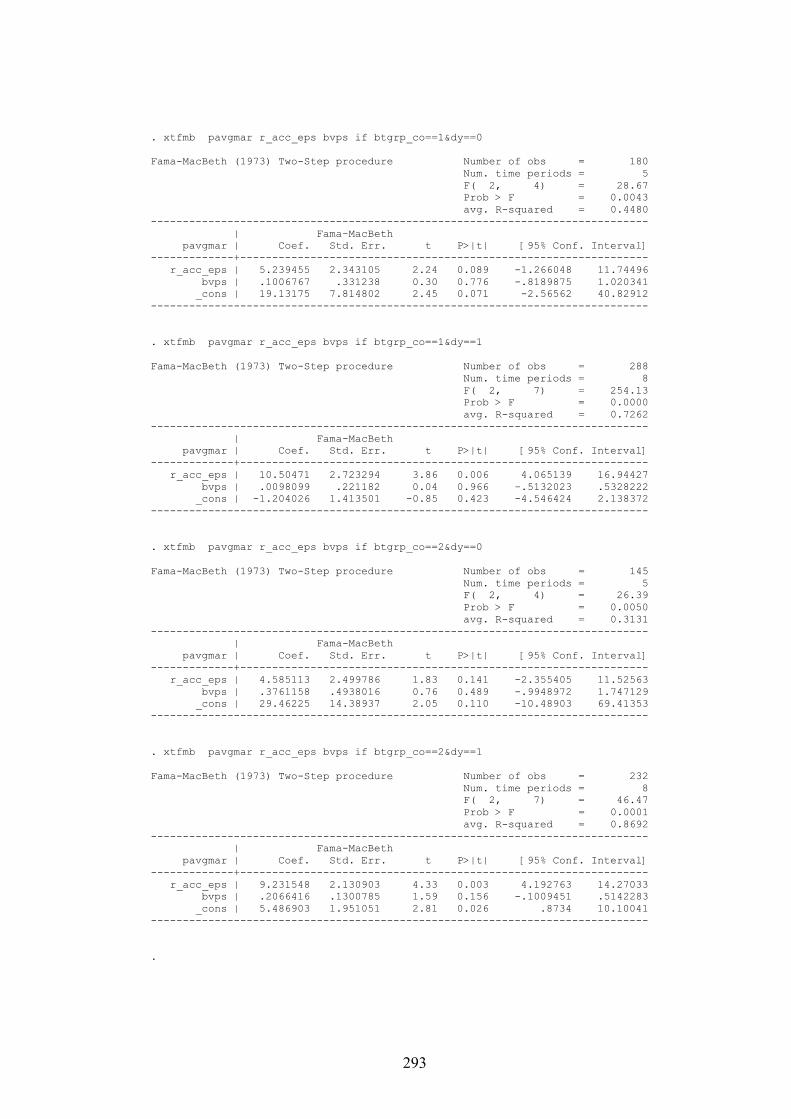
293
. xtfmb pavgmar r_acc_eps bvps if btgrp_co==1&dy==0 Fama-MacBeth (1973) Two-Step procedure Number of obs = 180 Num. time periods = 5 F( 2, 4) = 28.67 Prob > F = 0.0043 avg. R-squared = 0.4480 ------------------------------------------------------------------------------ | Fama-MacBeth pavgmar | Coef. Std. Err. t P>|t| [95% Conf. Interval] -------------+---------------------------------------------------------------- r_acc_eps | 5.239455 2.343105 2.24 0.089 -1.266048 11.74496 bvps | .1006767 .331238 0.30 0.776 -.8189875 1.020341 _cons | 19.13175 7.814802 2.45 0.071 -2.56562 40.82912 ------------------------------------------------------------------------------ . xtfmb pavgmar r_acc_eps bvps if btgrp_co==1&dy==1 Fama-MacBeth (1973) Two-Step procedure Number of obs = 288 Num. time periods = 8 F( 2, 7) = 254.13 Prob > F = 0.0000 avg. R-squared = 0.7262 ------------------------------------------------------------------------------ | Fama-MacBeth pavgmar | Coef. Std. Err. t P>|t| [95% Conf. Interval] -------------+---------------------------------------------------------------- r_acc_eps | 10.50471 2.723294 3.86 0.006 4.065139 16.94427 bvps | .0098099 .221182 0.04 0.966 -.5132023 .5328222 _cons | -1.204026 1.413501 -0.85 0.423 -4.546424 2.138372 ------------------------------------------------------------------------------ . xtfmb pavgmar r_acc_eps bvps if btgrp_co==2&dy==0 Fama-MacBeth (1973) Two-Step procedure Number of obs = 145 Num. time periods = 5 F( 2, 4) = 26.39 Prob > F = 0.0050 avg. R-squared = 0.3131 ------------------------------------------------------------------------------ | Fama-MacBeth pavgmar | Coef. Std. Err. t P>|t| [95% Conf. Interval] -------------+---------------------------------------------------------------- r_acc_eps | 4.585113 2.499786 1.83 0.141 -2.355405 11.52563 bvps | .3761158 .4938016 0.76 0.489 -.9948972 1.747129 _cons | 29.46225 14.38937 2.05 0.110 -10.48903 69.41353 ------------------------------------------------------------------------------ . xtfmb pavgmar r_acc_eps bvps if btgrp_co==2&dy==1 Fama-MacBeth (1973) Two-Step procedure Number of obs = 232 Num. time periods = 8 F( 2, 7) = 46.47 Prob > F = 0.0001 avg. R-squared = 0.8692 ------------------------------------------------------------------------------ | Fama-MacBeth pavgmar | Coef. Std. Err. t P>|t| [95% Conf. Interval] -------------+---------------------------------------------------------------- r_acc_eps | 9.231548 2.130903 4.33 0.003 4.192763 14.27033 bvps | .2066416 .1300785 1.59 0.156 -.1009451 .5142283 _cons | 5.486903 1.951051 2.81 0.026 .8734 10.10041 ------------------------------------------------------------------------------ .
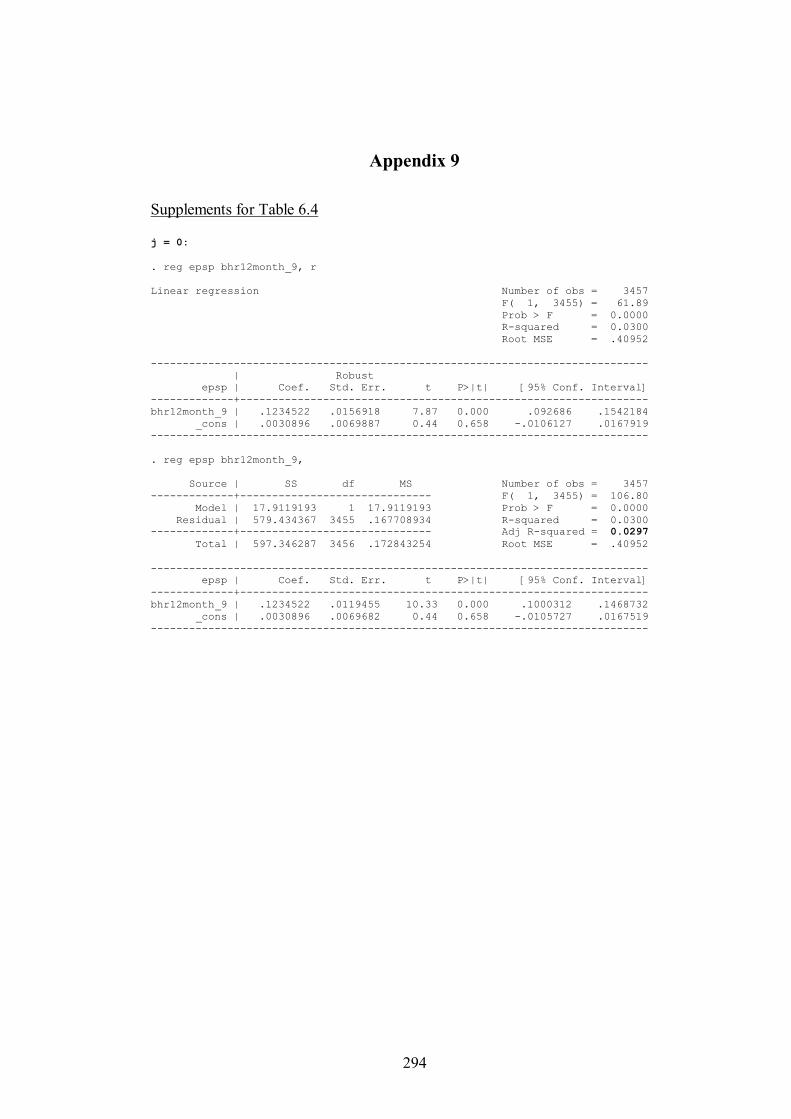
294
Appendix 9
Supplements for Table 6.4 j = 0: . reg epsp bhr12month_9, r Linear regression Number of obs = 3457 F( 1, 3455) = 61.89 Prob > F = 0.0000 R-squared = 0.0300 Root MSE = .40952 ------------------------------------------------------------------------------ | Robust epsp | Coef. Std. Err. t P>|t| [95% Conf. Interval] -------------+---------------------------------------------------------------- bhr12month_9 | .1234522 .0156918 7.87 0.000 .092686 .1542184 _cons | .0030896 .0069887 0.44 0.658 -.0106127 .0167919 ------------------------------------------------------------------------------ . reg epsp bhr12month_9, Source | SS df MS Number of obs = 3457 -------------+------------------------------ F( 1, 3455) = 106.80 Model | 17.9119193 1 17.9119193 Prob > F = 0.0000 Residual | 579.434367 3455 .167708934 R-squared = 0.0300 -------------+------------------------------ Adj R-squared = 0.0297 Total | 597.346287 3456 .172843254 Root MSE = .40952 ------------------------------------------------------------------------------ epsp | Coef. Std. Err. t P>|t| [95% Conf. Interval] -------------+---------------------------------------------------------------- bhr12month_9 | .1234522 .0119455 10.33 0.000 .1000312 .1468732 _cons | .0030896 .0069682 0.44 0.658 -.0105727 .0167519 ------------------------------------------------------------------------------

295
. reg epsp bhr12month_9 if z==0, r Linear regression Number of obs = 1343 F( 1, 1341) = 2.45 Prob > F = 0.1175 R-squared = 0.0035 Root MSE = .39065 ------------------------------------------------------------------------------ | Robust epsp | Coef. Std. Err. t P>|t| [95% Conf. Interval] -------------+---------------------------------------------------------------- bhr12month_9 | .0399635 .0255161 1.57 0.118 -.0100924 .0900193 _cons | .0661171 .0134356 4.92 0.000 .03976 .0924742 ------------------------------------------------------------------------------ . reg epsp bhr12month_9 if z==0, Source | SS df MS Number of obs = 1343 -------------+------------------------------ F( 1, 1341) = 4.67 Model | .713235111 1 .713235111 Prob > F = 0.0308 Residual | 204.643229 1341 .152604944 R-squared = 0.0035 -------------+------------------------------ Adj R-squared = 0.0027 Total | 205.356465 1342 .153022701 Root MSE = .39065 ------------------------------------------------------------------------------ epsp | Coef. Std. Err. t P>|t| [95% Conf. Interval] -------------+---------------------------------------------------------------- bhr12month_9 | .0399635 .0184855 2.16 0.031 .0036998 .0762271 _cons | .0661171 .014237 4.64 0.000 .0381878 .0940464 ------------------------------------------------------------------------------ . reg epsp bhr12month_9 if z==1, r Linear regression Number of obs = 2114 F( 1, 2112) = 38.75 Prob > F = 0.0000 R-squared = 0.0179 Root MSE = .41809 ------------------------------------------------------------------------------ | Robust epsp | Coef. Std. Err. t P>|t| [95% Conf. Interval] -------------+---------------------------------------------------------------- bhr12month_9 | .2403937 .0386184 6.22 0.000 .1646598 .3161277 _cons | .0313897 .0145305 2.16 0.031 .0028941 .0598852 ------------------------------------------------------------------------------ . reg epsp bhr12month_9 if z==1, Source | SS df MS Number of obs = 2114 -------------+------------------------------ F( 1, 2112) = 38.52 Model | 6.73355103 1 6.73355103 Prob > F = 0.0000 Residual | 369.170461 2112 .17479662 R-squared = 0.0179 -------------+------------------------------ Adj R-squared = 0.0174 Total | 375.904012 2113 .177900621 Root MSE = .41809 ------------------------------------------------------------------------------ epsp | Coef. Std. Err. t P>|t| [95% Conf. Interval] -------------+---------------------------------------------------------------- bhr12month_9 | .2403937 .0387318 6.21 0.000 .1644373 .3163502 _cons | .0313897 .0164152 1.91 0.056 -.0008019 .0635812 ------------------------------------------------------------------------------
Positive returns samples Negative returns samples
Adjusted R2 0.0027 < 0.0174 The higher R2 indicates a better performance in capturing economic consequences when returns are negative (Basu 1997).
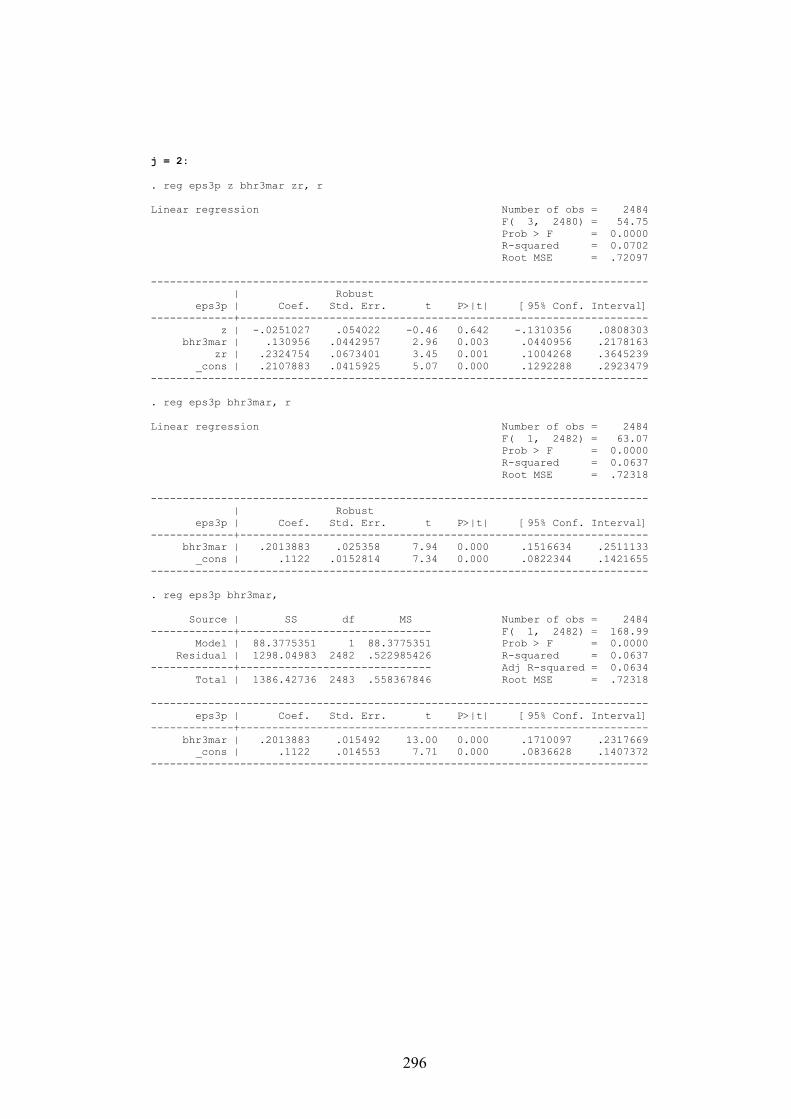
296
j = 2: . reg eps3p z bhr3mar zr, r Linear regression Number of obs = 2484 F( 3, 2480) = 54.75 Prob > F = 0.0000 R-squared = 0.0702 Root MSE = .72097 ------------------------------------------------------------------------------ | Robust eps3p | Coef. Std. Err. t P>|t| [95% Conf. Interval] -------------+---------------------------------------------------------------- z | -.0251027 .054022 -0.46 0.642 -.1310356 .0808303 bhr3mar | .130956 .0442957 2.96 0.003 .0440956 .2178163 zr | .2324754 .0673401 3.45 0.001 .1004268 .3645239 _cons | .2107883 .0415925 5.07 0.000 .1292288 .2923479 ------------------------------------------------------------------------------ . reg eps3p bhr3mar, r Linear regression Number of obs = 2484 F( 1, 2482) = 63.07 Prob > F = 0.0000 R-squared = 0.0637 Root MSE = .72318 ------------------------------------------------------------------------------ | Robust eps3p | Coef. Std. Err. t P>|t| [95% Conf. Interval] -------------+---------------------------------------------------------------- bhr3mar | .2013883 .025358 7.94 0.000 .1516634 .2511133 _cons | .1122 .0152814 7.34 0.000 .0822344 .1421655 ------------------------------------------------------------------------------ . reg eps3p bhr3mar, Source | SS df MS Number of obs = 2484 -------------+------------------------------ F( 1, 2482) = 168.99 Model | 88.3775351 1 88.3775351 Prob > F = 0.0000 Residual | 1298.04983 2482 .522985426 R-squared = 0.0637 -------------+------------------------------ Adj R-squared = 0.0634 Total | 1386.42736 2483 .558367846 Root MSE = .72318 ------------------------------------------------------------------------------ eps3p | Coef. Std. Err. t P>|t| [95% Conf. Interval] -------------+---------------------------------------------------------------- bhr3mar | .2013883 .015492 13.00 0.000 .1710097 .2317669 _cons | .1122 .014553 7.71 0.000 .0836628 .1407372 ------------------------------------------------------------------------------
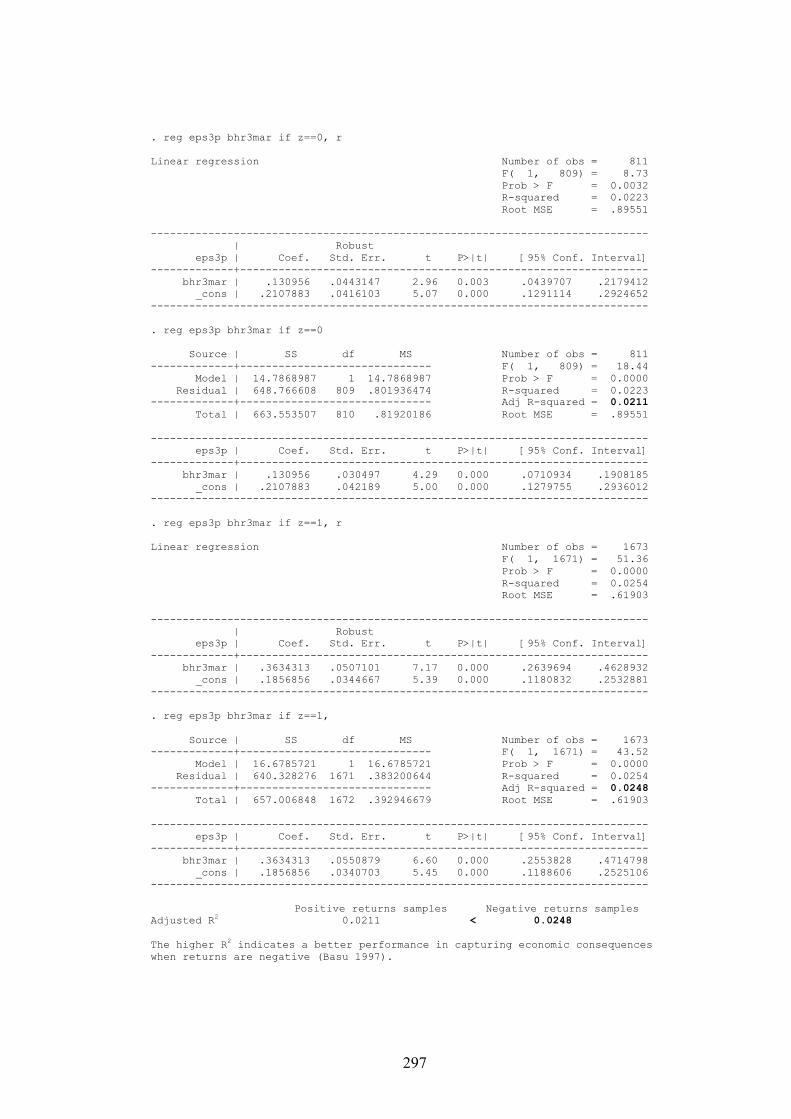
297
. reg eps3p bhr3mar if z==0, r Linear regression Number of obs = 811 F( 1, 809) = 8.73 Prob > F = 0.0032 R-squared = 0.0223 Root MSE = .89551 ------------------------------------------------------------------------------ | Robust eps3p | Coef. Std. Err. t P>|t| [95% Conf. Interval] -------------+---------------------------------------------------------------- bhr3mar | .130956 .0443147 2.96 0.003 .0439707 .2179412 _cons | .2107883 .0416103 5.07 0.000 .1291114 .2924652 ------------------------------------------------------------------------------ . reg eps3p bhr3mar if z==0 Source | SS df MS Number of obs = 811 -------------+------------------------------ F( 1, 809) = 18.44 Model | 14.7868987 1 14.7868987 Prob > F = 0.0000 Residual | 648.766608 809 .801936474 R-squared = 0.0223 -------------+------------------------------ Adj R-squared = 0.0211 Total | 663.553507 810 .81920186 Root MSE = .89551 ------------------------------------------------------------------------------ eps3p | Coef. Std. Err. t P>|t| [95% Conf. Interval] -------------+---------------------------------------------------------------- bhr3mar | .130956 .030497 4.29 0.000 .0710934 .1908185 _cons | .2107883 .042189 5.00 0.000 .1279755 .2936012 ------------------------------------------------------------------------------ . reg eps3p bhr3mar if z==1, r Linear regression Number of obs = 1673 F( 1, 1671) = 51.36 Prob > F = 0.0000 R-squared = 0.0254 Root MSE = .61903 ------------------------------------------------------------------------------ | Robust eps3p | Coef. Std. Err. t P>|t| [95% Conf. Interval] -------------+---------------------------------------------------------------- bhr3mar | .3634313 .0507101 7.17 0.000 .2639694 .4628932 _cons | .1856856 .0344667 5.39 0.000 .1180832 .2532881 ------------------------------------------------------------------------------ . reg eps3p bhr3mar if z==1, Source | SS df MS Number of obs = 1673 -------------+------------------------------ F( 1, 1671) = 43.52 Model | 16.6785721 1 16.6785721 Prob > F = 0.0000 Residual | 640.328276 1671 .383200644 R-squared = 0.0254 -------------+------------------------------ Adj R-squared = 0.0248 Total | 657.006848 1672 .392946679 Root MSE = .61903 ------------------------------------------------------------------------------ eps3p | Coef. Std. Err. t P>|t| [95% Conf. Interval] -------------+---------------------------------------------------------------- bhr3mar | .3634313 .0550879 6.60 0.000 .2553828 .4714798 _cons | .1856856 .0340703 5.45 0.000 .1188606 .2525106 ------------------------------------------------------------------------------
Positive returns samples Negative returns samples Adjusted R2 0.0211 < 0.0248 The higher R2 indicates a better performance in capturing economic consequences when returns are negative (Basu 1997).
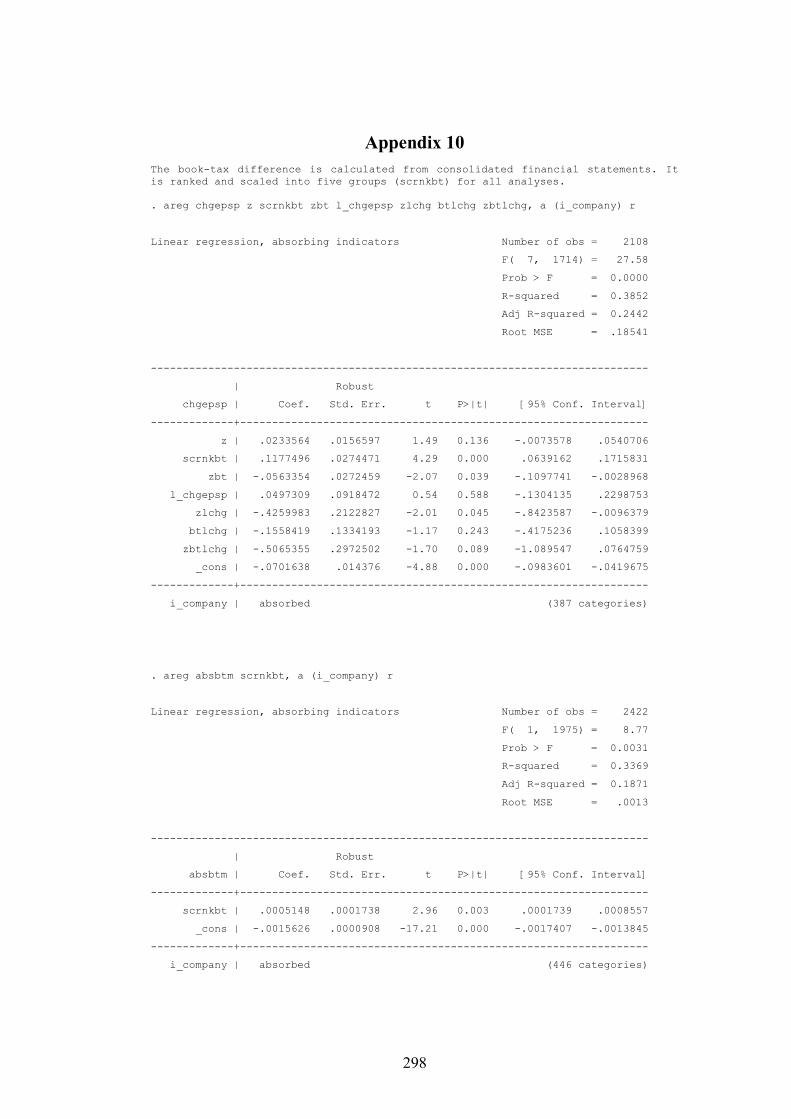
298
Appendix 10 The book-tax difference is calculated from consolidated financial statements. It is ranked and scaled into five groups (scrnkbt) for all analyses. . areg chgepsp z scrnkbt zbt l_chgepsp zlchg btlchg zbtlchg, a (i_company) r
Linear regression, absorbing indicators Number of obs = 2108
F( 7, 1714) = 27.58
Prob > F = 0.0000
R-squared = 0.3852
Adj R-squared = 0.2442
Root MSE = .18541
------------------------------------------------------------------------------
| Robust
chgepsp | Coef. Std. Err. t P>|t| [95% Conf. Interval]
-------------+----------------------------------------------------------------
z | .0233564 .0156597 1.49 0.136 -.0073578 .0540706
scrnkbt | .1177496 .0274471 4.29 0.000 .0639162 .1715831
zbt | -.0563354 .0272459 -2.07 0.039 -.1097741 -.0028968
l_chgepsp | .0497309 .0918472 0.54 0.588 -.1304135 .2298753
zlchg | -.4259983 .2122827 -2.01 0.045 -.8423587 -.0096379
btlchg | -.1558419 .1334193 -1.17 0.243 -.4175236 .1058399
zbtlchg | -.5065355 .2972502 -1.70 0.089 -1.089547 .0764759
_cons | -.0701638 .014376 -4.88 0.000 -.0983601 -.0419675
-------------+----------------------------------------------------------------
i_company | absorbed (387 categories)
. areg absbtm scrnkbt, a (i_company) r
Linear regression, absorbing indicators Number of obs = 2422
F( 1, 1975) = 8.77
Prob > F = 0.0031
R-squared = 0.3369
Adj R-squared = 0.1871
Root MSE = .0013
------------------------------------------------------------------------------
| Robust
absbtm | Coef. Std. Err. t P>|t| [95% Conf. Interval]
-------------+----------------------------------------------------------------
scrnkbt | .0005148 .0001738 2.96 0.003 .0001739 .0008557
_cons | -.0015626 .0000908 -17.21 0.000 -.0017407 -.0013845
-------------+----------------------------------------------------------------
i_company | absorbed (446 categories)
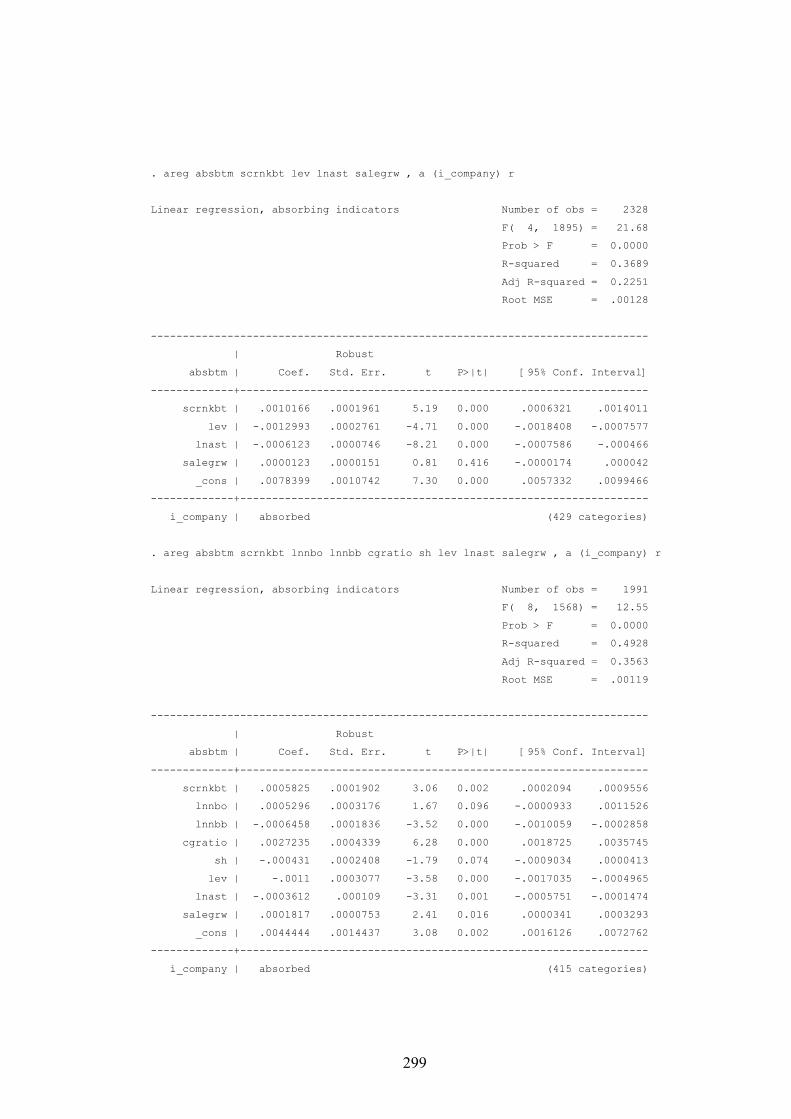
299
. areg absbtm scrnkbt lev lnast salegrw , a (i_company) r
Linear regression, absorbing indicators Number of obs = 2328
F( 4, 1895) = 21.68
Prob > F = 0.0000
R-squared = 0.3689
Adj R-squared = 0.2251
Root MSE = .00128
------------------------------------------------------------------------------
| Robust
absbtm | Coef. Std. Err. t P>|t| [95% Conf. Interval]
-------------+----------------------------------------------------------------
scrnkbt | .0010166 .0001961 5.19 0.000 .0006321 .0014011
lev | -.0012993 .0002761 -4.71 0.000 -.0018408 -.0007577
lnast | -.0006123 .0000746 -8.21 0.000 -.0007586 -.000466
salegrw | .0000123 .0000151 0.81 0.416 -.0000174 .000042
_cons | .0078399 .0010742 7.30 0.000 .0057332 .0099466
-------------+----------------------------------------------------------------
i_company | absorbed (429 categories)
. areg absbtm scrnkbt lnnbo lnnbb cgratio sh lev lnast salegrw , a (i_company) r
Linear regression, absorbing indicators Number of obs = 1991
F( 8, 1568) = 12.55
Prob > F = 0.0000
R-squared = 0.4928
Adj R-squared = 0.3563
Root MSE = .00119
------------------------------------------------------------------------------
| Robust
absbtm | Coef. Std. Err. t P>|t| [95% Conf. Interval]
-------------+----------------------------------------------------------------
scrnkbt | .0005825 .0001902 3.06 0.002 .0002094 .0009556
lnnbo | .0005296 .0003176 1.67 0.096 -.0000933 .0011526
lnnbb | -.0006458 .0001836 -3.52 0.000 -.0010059 -.0002858
cgratio | .0027235 .0004339 6.28 0.000 .0018725 .0035745
sh | -.000431 .0002408 -1.79 0.074 -.0009034 .0000413
lev | -.0011 .0003077 -3.58 0.000 -.0017035 -.0004965
lnast | -.0003612 .000109 -3.31 0.001 -.0005751 -.0001474
salegrw | .0001817 .0000753 2.41 0.016 .0000341 .0003293
_cons | .0044444 .0014437 3.08 0.002 .0016126 .0072762
-------------+----------------------------------------------------------------
i_company | absorbed (415 categories)
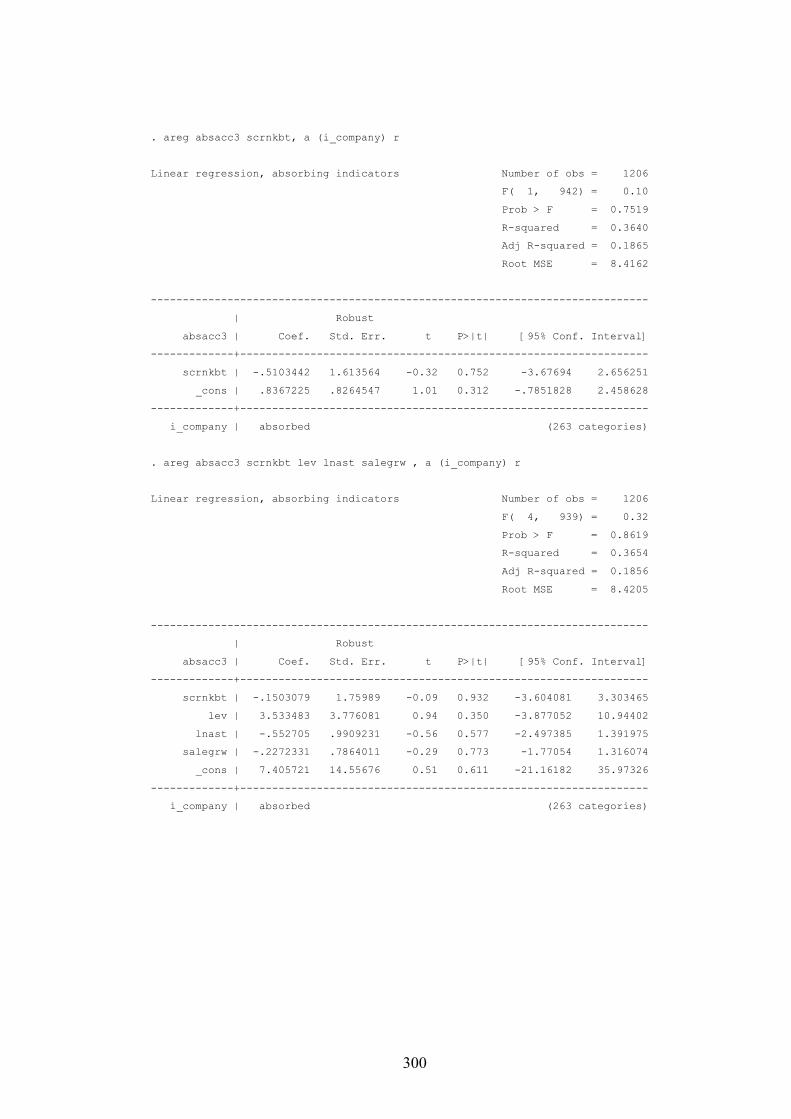
300
. areg absacc3 scrnkbt, a (i_company) r
Linear regression, absorbing indicators Number of obs = 1206
F( 1, 942) = 0.10
Prob > F = 0.7519
R-squared = 0.3640
Adj R-squared = 0.1865
Root MSE = 8.4162
------------------------------------------------------------------------------
| Robust
absacc3 | Coef. Std. Err. t P>|t| [95% Conf. Interval]
-------------+----------------------------------------------------------------
scrnkbt | -.5103442 1.613564 -0.32 0.752 -3.67694 2.656251
_cons | .8367225 .8264547 1.01 0.312 -.7851828 2.458628
-------------+----------------------------------------------------------------
i_company | absorbed (263 categories)
. areg absacc3 scrnkbt lev lnast salegrw , a (i_company) r
Linear regression, absorbing indicators Number of obs = 1206
F( 4, 939) = 0.32
Prob > F = 0.8619
R-squared = 0.3654
Adj R-squared = 0.1856
Root MSE = 8.4205
------------------------------------------------------------------------------
| Robust
absacc3 | Coef. Std. Err. t P>|t| [95% Conf. Interval]
-------------+----------------------------------------------------------------
scrnkbt | -.1503079 1.75989 -0.09 0.932 -3.604081 3.303465
lev | 3.533483 3.776081 0.94 0.350 -3.877052 10.94402
lnast | -.552705 .9909231 -0.56 0.577 -2.497385 1.391975
salegrw | -.2272331 .7864011 -0.29 0.773 -1.77054 1.316074
_cons | 7.405721 14.55676 0.51 0.611 -21.16182 35.97326
-------------+----------------------------------------------------------------
i_company | absorbed (263 categories)
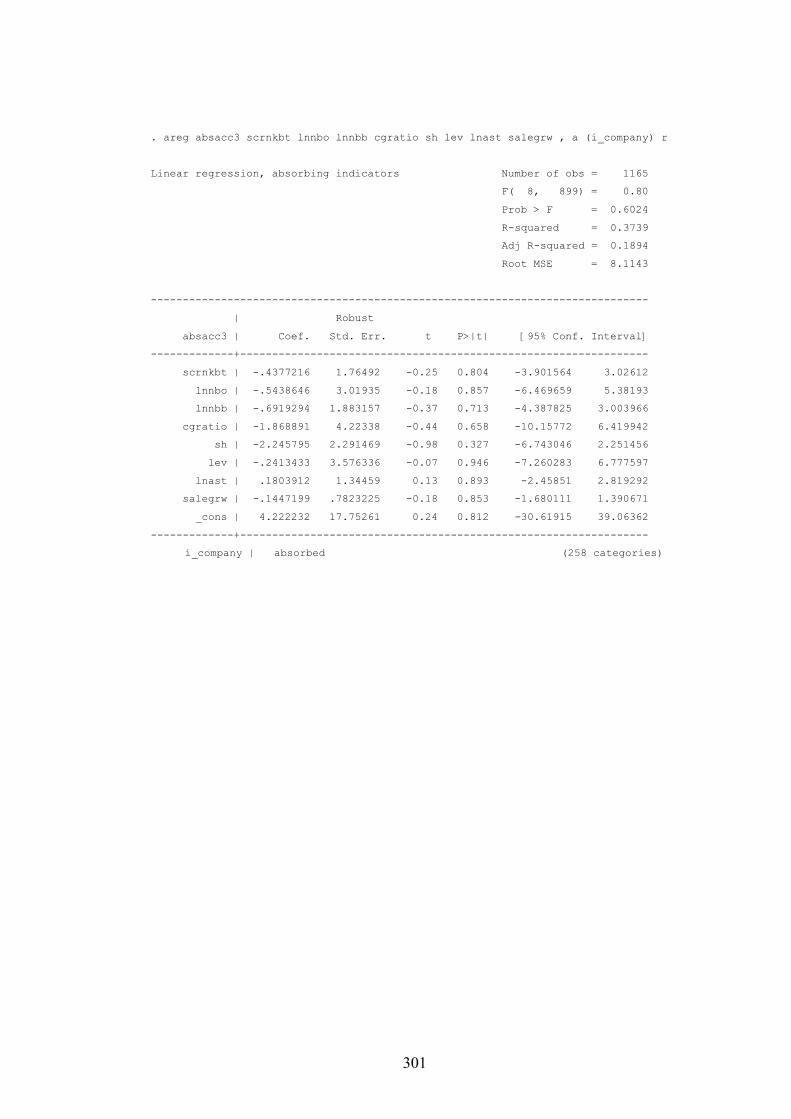
301
. areg absacc3 scrnkbt lnnbo lnnbb cgratio sh lev lnast salegrw , a (i_company) r
Linear regression, absorbing indicators Number of obs = 1165
F( 8, 899) = 0.80
Prob > F = 0.6024
R-squared = 0.3739
Adj R-squared = 0.1894
Root MSE = 8.1143
------------------------------------------------------------------------------
| Robust
absacc3 | Coef. Std. Err. t P>|t| [95% Conf. Interval]
-------------+----------------------------------------------------------------
scrnkbt | -.4377216 1.76492 -0.25 0.804 -3.901564 3.02612
lnnbo | -.5438646 3.01935 -0.18 0.857 -6.469659 5.38193
lnnbb | -.6919294 1.883157 -0.37 0.713 -4.387825 3.003966
cgratio | -1.868891 4.22338 -0.44 0.658 -10.15772 6.419942
sh | -2.245795 2.291469 -0.98 0.327 -6.743046 2.251456
lev | -.2413433 3.576336 -0.07 0.946 -7.260283 6.777597
lnast | .1803912 1.34459 0.13 0.893 -2.45851 2.819292
salegrw | -.1447199 .7823225 -0.18 0.853 -1.680111 1.390671
_cons | 4.222232 17.75261 0.24 0.812 -30.61915 39.06362
-------------+----------------------------------------------------------------
i_company | absorbed (258 categories)
302
Bibliography
Abad, C., J. Laffarga, A. Garcia-Borbolla, M. Larrán, J. M. Piãero, and N. Garrod.
2000. An Evaluation of the Value Relevance of Consolidated versus Unconsolidated Accounting Information: Evidence from Quoted Spanish Firms. Journal of International Financial Management and Accounting 11:156-177.
Abarbanell, J. S., and B. J. Bushee. 1997. Fundamental Analysis, Future Earnings, and Stock Prices. Journal of Accounting Research 35 (1):1-24.
Aboody, D., J. Hughes, and J. Liu. 2002. Measuring Value Relevance in a (Possibly) Inefficient Market. Journal of Accounting Research, 965-986.
Ahmed, A. S., and S. Duellman. 2007. Accounting conservatism and board of director characteristics: An empirical analysis. Journal of Accounting and Economics 43 (2-3):411-437.
Alford, A., J. Jones, R. Leftwich, and M. Zmijewski. 1993. The Relative Informativeness of Accounting Disclosures in Different Countries. Journal of Accounting Research 31:183-223.
Ali, A., and L.-S. Hwang. 2000. Country-Specific Factors Related to Financial Reporting and the Value Relevance of Accounting Data. Journal of Accounting Research 38 (1):1-21.
Ali, A., L.-S. Hwang, and M. A. Trombley. 2003. Residual-Income-Based Valuation Predicts Future Stock Returns: Evidence on Mispricing vs. Risk Explanations. The Accounting Review 78 (2):377-396.
Arce, M., and A. Mora. 2002. Empirical evidence of the effect of European accounting differences on the stock market valuation of earnings and book value. European Accounting Review 11 (3):573-599.
Ashbaugh, H., and M. Pincus. 2001. Domestic Accounting Standards, International Accounting Standards, and the Predictability of Earnings. Journal of Accounting Research 39:417-434.
Athanasakou, V. E., N. C. Strong, and M. Walker. 2007. Classificatory income smoothing: The impact of a change in regime of reporting financial performance. Journal of Accounting and Public Policy 26 (4):387-435.
Ayers, B. C., J. Jiang, and S. K. Laplante. 2009. Taxable Income as a Performance Measure: The Effects of Tax Planning and Earnings Quality. Contemporary Accounting Research 26 (1):15-54.
Baginski, S. P., K. S. Lorek, G. L. Willinger, and B. C. Branson. 1999. The Relationship between Economic Characteristics and Alternative Annual Earnings Persistence Measures. The Accounting Review 74 (1):105-120.
Ball, R and P. Brown. 1968. An Empirical Evaluation of Accounting Income Numbers. Journal of Accounting Research. 6(2):159-178
Ball, R., S. P. Kothari, and A. Robin. 2000. The effect of international institutional factors on properties of accounting earnings. Journal of Accounting and Economics 29 (1):1-51.
Ball, R., A. Robin, and J. S. Wu. 2003. Incentives versus standards: properties of accounting income in four East Asian countries. Journal of Accounting and Economics 36 (1-3):235-270.
303
Ball, R., and L. Shivakumar. 2005a. Earnings quality in UK private firms: comparative loss recognition timeliness. Journal of Accounting and Economics 39 (1):83-128.
Ball, R., and L. Shivakumar. 2005b. The Role of Accruals in Asymmetrically Timely Gain and Loss Recognition: SSRN.
Ballas, A. A., and D. L. Hevas. 2005. Differences in the valuation of earnings and book value: Regulation effects or industry effects? The International Journal of Accounting 40 (4):363-389.
Bao, B.-H., and D.-H. Bao. 2004. Income Smoothing, Earnings Quality and Firm Valuation. Journal of Business Finance & Accounting 31:1525-1557.
Bao, B.-H., and L. Chow. 1999. The Usefulness of Earnings and Book Value for Equity Valuation in Emerging Capital Markets: Evidence From Listed Companies in the People's Republic of China. Journal of International Financial Management and Accounting, 85-104.
Barber, B. M., and J. D. Lyon. 1996. Detecting abnormal operating performance: The empirical power and specification of test statistics. Journal of Financial Economics 41:359-399.
Barniv, R., and M. Myring. 2006. An International Analysis of Historical and Forecast Earnings in Accounting-Based Valuation Models. Journal of Business Finance & Accounting 33 (7-8):1087-1109.
Barth, M. E., W. H. Beaver, and W. R. Landsman. 2001. The relevance of the value relevance literature for financial accounting standard setting: another view. Journal of Accounting and Economics 31 (1-3):77-104.
Barth, M. E., W. R. Landsman, and M. H. Lang. 2008. International Accounting Standards and Accounting Quality. Journal of Accounting Research, 467-498.
Bartov, E., S. R. Goldberg, and M.-S. Kim. 2001a. The Valuation-relevance of Earnings and Cash Flows: an International Perspective. Journal of International Financial Management & Accounting 12 (2):103.
Bartov, E., F. A. Gul, and J. S. L. J. S. L. Tsui. 2001b. Discretionary-accruals models and audit qualifications. Journal of Accounting and Economics 30 (3):421-452.
Basu, S. 1997. The conservatism principle and the asymmetric timeliness of earnings. Journal of Accounting and Economics 24:3-37.
Beatty, A., J. Weber, and J. J. Yu. 2008. Conservatism and Debt. Journal of Accounting and Economics 45 (2-3):154-174.
Beaver, W. H. 2002. Perspectives on Recent Capital Market Research. The Accounting Review 77 (2):453-474.
Beaver, W. H., and S. G. Ryan. 2005. Conditional and Unconditional Conservatism:Concepts and Modeling. Review of Accounting Studies 10 (2):269-309.
Beaver, W.H., R.A. Lambert, and S.G. Ryan. 1987. The Information Content of Security Prices A Second Look. Journal of Accounting and Economics 9:139-157.

304
Beekes, W., P. Pope, and S. Young. 2004. The Link Between Earnings Timeliness, Earnings Conservatism and Board Composition: evidence from the UK. Corporate Governance: An International Review 12 (1):47-59.
Beuselinck, C., and S. Manigart. 2007. Financial Reporting Quality in Private Equity Backed Companies: The Impact of Ownership Concentration. Small Business Economics 29 (3):261-274.
Brealy, R.A., Myers, S. C., Allen, F. 2005. Corporate Finance, 8th edition, McGraw-Hill Irwin, NY, USA
Brown, L. D., and J. C. Y. Han. 2000. Do Stock Prices Fully Reflect the Implications of Current Earnings for Future Earnings for AR1 Firms? Journal of Accounting Research 38 (1):149-164.
Brown, L. D., and K. Sivakumar. 2003. Comparing the Value Relevance of Two Operating Income Measures. Review of Accounting Studies 8:561-572.
Bryant, L. 2003. Relative Value Relevance of the Successful Efforts and Full Cost Accounting Methods in the Oil and Gas Industry. Review of Accounting Studies 8 (1):5-28.
Burghstahler, D. C., L. Hail, and C. Leuz. 2006. The Importance of Reporting Incentives: Earnings Management in European Private and Public Firms. Accounting Review 81 (5):983-1016.
Bushman, R., Q. Chen, E. Engel, and A. Smith. 2004. Financial accounting information, organizational complexity and corporate governance systems. Journal of Accounting and Economics 37 (2):167-201.
Bushman, R. M., and J. D. Piotroski. 2006. Financial reporting incentives for conservative accounting: The influence of legal and political institutions. Journal of Accounting and Economics 42 (1-2):107-148.
Byard, D., Y. Li, and J. Weintrop. 2006. Corporate governance and the quality of financial analysts' information. Journal of Accounting and Public Policy 25 (5):609-625.
Calegari, M. J. 2000. The effect of tax accounting rules on capital structure and discretionary accruals. Journal of Accounting and Economics 30 (1):1-31.
Chan, K. C., and J. Li. 2008. Audit Committee and Firm Value: Evidence on Outside Top Executives as Expert-Independent Directors. Corporate Governance: An International Review 16 (1):16-31.
Charitou, A., C. Clubb, and A. Andreou. 2000. The Value Relevance of Earnings and Cash Flows: Empirical Evidence for Japan. Journal of International Financial Management & Accounting, 1-22.
Chhaochharia, V., and Y. Grinstein. 2007. Corporate Governance and Firm Value: The Impact of the 2002 Governance Rules. The Journal of Finance 62:1789-1825.
Chen, C. J. P., S. Chen, and X. Su. 2001. Is accounting information value-relevant in the emerging Chinese stock market? Journal of International Accounting, Auditing and Taxation 10 (1):1-22.
Collins, D. W., E. L. Maydew, and I. S. Weiss. 1997. Changes in the value- relevance of earnings and book values over the past forty years. Journal of Accounting and Economics 24 (1):39-67.
Cramer, J. S. 1987. Mean and variance of R2 in small and moderate samples.
305
Journal of Econometrics 35:253-266 Crutchely, C.E. and R.S. Hansen. 1989. A test of the agency theory of managerial
ownership, corporate leverage, and corporate dividends, Financial Management 18(4): 36 – 46.
Davis-Friday, P. Y., L. L. Eng, and C.-S. Liu. 2006. The effects of the Asian crisis, corporate governance and accounting system on the valuation of book value and earnings. The International Journal of Accounting 41 (1):22-40.
Dechow, P. M., A. P. Hutton, and R. G. Sloan. 1999. An empirical assessment of the residual income valuation model. Journal of Accounting and Economics 26 (1-3):1-34.
Dechow, P. M., S. A. Richardson, and R. G. Sloan. 2008. The Persistence and Pricing of the Cash Component of Earnings. Journal of Accounting Research 46:537-566.
Dechow, P. M., and C. M. Schrand. 2004. Earnings Quality: Research Foundation of CFA Institute, U.S.A.
Defond, M. L., R. N. Hann, and X. Hu. 2005. Does the Market Value Financial Expertise on Audit Committees of Boards of Directors? Journal of Accounting Research 43:153-193.
Department of Business Development (2002), Thai Accounting Standards and International Accounting Standards by Institute of Certified Accountants and Auditors of Thailand. [online] Available from: http://www.dbd.go.th/thai/account/standard.phtml?head=061 [accessed 18th October 2007]
Desai, M. A., and D. Dharmapala. Corporate Tax Avoidance and Firm Value: SSRN.
Ding, Y., O.-K. Hope, T. Jeanjean, and H. Stolowy. 2007. Differences between domestic accounting standards and IAS: Measurement, determinants and implications. Journal of Accounting and Public Policy 26 (1):1-38.
Dichev, I. D., and V. W. Tang. 2009. Earnings volatility and earnings predictability. Journal of Accounting and Economics 47 (1-2):160-181.
Ding, Y. and H. Stolowy. 2006 Timeliness and Conservatism Changes Over Time in the Properties of Accounting Income in France. Review of Accounting and Finance 5 (2):92-107.
Donnelly, R. 2002. Earnings Persistence, Losses and the Estimation of Earnings Response Coefficients. Abacus 38(1):121-133.
Dontoh, A., S. Radhakrishnan, and J. Ronen. 2004. The Declining Value-relevance of Accounting Information and Non-information-based Trading: An Empirical Analysis. Contemporary Accounting Research 21 (4):795-812.
Dyreng, S. D., M. Hanlon, and E. L. Maydew. 2008. Long-Run Corporate Tax Avoidance. Accounting Review 83 (1):61-82.
Easton, P. D., P. H. Eddey, and T. S. Harris. 1993. An Investigation of Revaluations of Tangible Long-Lived Assets. Journal of Accounting Research 31:1-38.
Easton, P. D., and T. S. Harris. 1991. Earnings As an Explanatory Variable for Returns. Journal of Accounting Research 29 (1):19-36.
306
Easterbrook, F.H. (1984), Two agency-cost explanations of dividends, The American Economic Review 74(4): 650 – 659.
Ely, K. M., and G. Pownall. 2002. Shareholder- Versus Stakeholder-Focused Japanese Companies: Firm Characteristics and Accounting Valuation. Contemporary Accounting Research 19 (4):615-636.
Fah, C.F. 2006. Timeliness of Annual Report Releases in Relation to the Direction and Magnitude of Earnings and Share Price Revaluation: The Case of Malasia. Sunway Academic Journal 3:117-131.
Fairfield, P. M., J. S. Whisenant, and T. L. Yohn. 2003. Accrued Earnings and Growth: Implications for Future Profitability and Market Mispricing. The Accounting Review 78 (1):353-371.
Fan, J. P. H., and T. J. Wong. 2002. Corporate ownership structure and the informativeness of accounting earnings in East Asia. Journal of Accounting and Economics 33 (3):401-425.
Federation of Accounting Professions, Missions. [online] Available from: http://www.fap.or.th/about/index.php?id=2 [accessed 18th October 2007]
Foster, G. 1977. Quarterly Accounting Data: Time-Series Properties and Predictive-Ability Results. The Accounting Review 52 (1):1-21.
Francis, J., R. LaFond, P. Olsson, and K. Schipper. 2005. The market pricing of accruals quality. Journal of Accounting and Economics 39 (2):295-327.
Francis, J., R. LaFond, P. M. Olsson, and K. Schipper. 2004. Costs of Equity and Earnings Attributes. Accounting Review 79 (4):967-1010.
Francis, J., and K. Schipper. 1999. Have Financial Statements Lost Their Relevance? Journal of Accounting Research, 319-352.
Freeman, R. N., J. A. Ohlson, and S. H. Penman. 1982. Book Rate-of-Return and Prediction of Earnings Changes: An Empirical Investigation. Journal of Accounting Research 20 (2):639-653.
Gassen, J., R. U. Fulbier, and T. Sellhorn. 2006. International Differences in Conditional Conservatism - The Role of Unconditional Conservatism and Income Smoothing: Routledge, 527 - 564.
Giner, B., and W. Rees. 1999. A Valuation Based Analysis of the Spanish Accounting Reforms. Journal of Management and Governance 3:31-48.
Givoly, D., C. K. Hayn, and A. Natarajan. 2007. Measuring Reporting Conservatism. Accounting Review 82 (1):65-106.
Godfrey, J., A. Hodgson, and S. Holmes. 2000, Accounting Theory, 5th Edition, Wiley, Australia.
Goncharov, I., J. R. Werner, and J. Zimmermann. 2006. Does Compliance with the German Corporate Governance Code Have an Impact on Stock Valuation? An empirical analysis. Corporate Governance: An International Review, 432-445.
Gompers, P., J. Ishii, and A. Metrick. 2003. Corporate Governance and Equity Prices. Quarterly Journal of Economics, 107-155.
Gordon, E. A. 2001. Accounting for changing prices: The value relevance of historical cost, price level, and replacement cost accounting in Mexico. Journal of Accounting Research 39(1):177-200.
307
Gornik-Tomaszewski, S., and E. K. Jermakowicz. 2001. Accounting-based Valuation of Polish Listed Companies. Journal of International Financial Management and Accounting 12:50-74.
Graham, R., R. King, and J. Bailes. 2000. The Value Relevance of Accounting Information during a Financial Crisis: Thailand and the 1997 Decline in the Value of the Baht. Journal of International Financial Management and Accounting 11:84-107.
Grudnitski, G., and F. Aubert. 2008. The Impact and Importance of Mandatory Adoption of International Financial Reporting Standards in Europe: SSRN.
Guenther, D. A., E. L. Maydew, and S. E. Nutter. 1997. Financial reporting, tax costs, and book-tax conformity. Journal of Accounting and Economics 23 (3):225-248.
Gupta, S., and K. Newberry. 1997. Determinants of the variability in corporate effective tax rates: Evidence from longitudinal data. Journal of Accounting and Public Policy 16 (1):1-34.
Han, J. C. Y., and J. J. Wild. 1997. Timeliness of Reporting and Earnings Information Transfers. Journal of Business Finance & Accounting 24:527-540.
Hanlon, M. 2005. The Persistence and Pricing of Earnings, Accruals, and Cash Flows When Firms Have Large Book-Tax Differences. Accounting Review 80 (1):137-166.
Hanlon, M., S. K. Laplante, and T. Shevlin. 2005. Evidence for the Possible Information Loss of Conforming Book Income and Taxable Income. Journal of Law & Economics, 407-442.
Hanlon, M., E. L. Maydew, and T. Shevlin. 2008. An unintended consequence of book-tax conformity: A loss of earnings informativeness. Journal of Accounting and Economics 46 (2-3):294-311.
Habib, A. 2004. Impact of Earnings Management on Value-Relevance of Accounting Information: Empirical Evidence from Japan. Managerial Finance 30 (11):1-15.
Harris, T. S., M. Lang, and H. P. Moller. 1994. The Value Relevance of German Accounting Measures: An Empirical Analysis. Journal of Accounting Research 32 (2):187-209.
Haw, I.-M., D. Qi, and W. Wu. 1999. Value Relevance of Earnings in an Emerging Capital Market: the Case of A-shares in China. Pacific Economic Review 4:337-348.
Hayn, C. 1995. The Informaiton Content of Loss. Journal of Accounting and Economics 20:125-153.
Hellström, K. 2006. The Value Relevance of Financial Accounting Information in a Transition Economy: The Case of the Czech Republic. European Accounting Review 15:325-349.
Holthausen, R. W., and R. L. Watts. 2001. The relevance of the value-relevance literature for financial accounting standard setting. Journal of Accounting and Economics 31 (1-3):3-75.
308
Hovey, M., L. Li, and T. Naughton. 2003. The Relationship Between Valuation and Ownership of Listed Firms in China. Corporate Governance 11:112-122.
Hsu, A., J. O'Hanlon, and K. Peasnell. 2010A. Financial Distress and the Earnings-Sensitivity-Difference Measure of Conservatism. Working paper 2010/011. Lancaster University.
Hsu, A., J. O'Hanlon, and K. Peasnell. 2010B. The Earnings-Sensitivity Difference as an Indicator of Conditional Conservatism: Evidence from U.K. Earnings Components. Working paper 2010/016. Lancaster University.
Jensen, M. C. 1986. Agency Costs of Free Cash Flow, Corporate Finance, and Takeovers. The American Economic Review 76 (2):323-329.
Jensen, M. C., and W. H. Meckling. 1976. Theory of the firm: Managerial behavior, agency costs and ownership structure. Journal of Financial Economics 3 (4):305-360.
Jermakowicz, E. K., J. Prather-Kinsey, and I. Wulf. 2007. The Value Relevance of Accounting Income Reported by DAX-30 German Companies. Journal of International Financial Management and Accounting 18:151-191.
Jindrichovska, I and D.L. Kuo. 2003. Timeliness of Earnings in the Czech Market. Working paper.
Jindrichovska, I., and S. McLeay. 2005. Accounting for good news and accounting for bad news: Some empirical evidence from the Czech Republic. European Accounting Review 14 (3):635-655.
Jones, J. J. 1991. Earnings Management During Import Relief Investigations. Journal of Accounting Research 29 (2):193-228.
Jung, K., and S. Y. Kwon. 2002. Ownership structure and earnings informativeness - Evidence from Korea. The International Journal of Accounting 37:301-325.
International Accounting Standards Committee Foundation Annual Report. 2006. Report of the Chairman of the IASC Foundation Trustees. pg.2.
Kang, T. and Y.H. Pang. 2005. Economic Development and the Value-Relevance of Accounting Information – A Disclosure Transparency Perspective. Review of Accounting and Finance. 4(1): 5–31.
Kankaanpaa, J. no date. Earnings Timeliness, Earnings Conservatism and Board Independence: Study based on Finnish listed Firms. Working paper. University of Tampere, Finland.
Karamanou, I., and N. Vafeas. 2005. The Association between Corporate Boards, Audit Committees, and Management Earnings Forecasts: An Empirical Analysis. Journal of Accounting Research 43:453-486.
Kothari, S. P. 2001. Capital markets research in accounting. Journal of Accounting and Economics 31:105-231.
Kothari, S.P. and R.G. Sloan. 1992. Information in prices about future earnings. Journal of Accounting and Economics 15:143-171.
Kraft, A., A. J. Leone, and C. E. Wasley. 2007. Regression-Based Tests of the Market Pricing of Accounting Numbers: The Mishkin Test and Ordinary Least Squares. Journal of Accounting Research 45 (5):1081-1114.
309
Krishnan, G. V. 2007. Did Earnings Conservatism Increase for Former Andersen Clients? Journal of Accounting, Auditing & Finance 22 (2):141-163.
Lafond, R., and S. Roychowdhury. 2008. Managerial Ownership and Accounting Conservatism. Journal of Accounting Research 46 (1):101-135.
Lang, L., E. Ofek, and R. Stulz. 1996. Leverage, investment, and firm growth. Journal of Financial Economics 40 (1):3-29.
Lang, M., J. S. Raedy, and M. H. Yetman. 2003. How representative are firms that are cross-listed in the United States? An analysis of accounting quality. Journal of Accounting Research 41 (2):363-386.
Lang, M., J. S. Raedy, and W. Wilson. 2006. Earnings management and cross listing: Are reconciled earnings comparable to US earnings? Journal of Accounting and Economics 42 (1-2):255-283.
Lara, J. M. G., and A. Mora. 2004. Balance sheet versus earnings conservatism in Europe. European Accounting Review 13 (2):261-292.
Lara, J. M. G., B. G. Osma, and F. Penalva. 2007. Board of Directors' Characteristics and Conditional Accounting Conservatism: Spanish Evidence. European Accounting Review 16 (4):727-755.
Lee, C. M. C. 1999. Accounting-Based Valuation: Impact on Business Practices and Research. Accounting Horizons 13 (4):413-425.
Leuz, C. 2003. IAS Versus U.S. GAAP: Information Asymmetry-Based Evidence from Germanys New Market. Journal of Accounting Research 41:445-472.
Leuz, C., D. Nanda, and P. D. Wysocki. 2003. Earnings management and investor protection: an international comparison. Journal of Financial Economics 69 (3):505-527.
Lev, B. 1983. Some economic determinants of time-series properties of earnings. Journal of Accounting and Economics 5:31-48.
Lev, B., and D. Nissim. 2004. Taxable Income, Future Earnings, and Equity Values. Accounting Review 79 (4):1039-1074.
Lev, B., and S. R. Thiagarajan. 1993. Fundamental Information Analysis. Journal of Accounting Research 31 (2):190-215.
Lev, B., and P. Zarowin. 1999. The Boundaries of Financial Reporting and How to Extend Them. Journal of Accounting Research 37 (2):353-385.
Li, F. 2008. Annual Report Readability, Current Earnings, and Earnings Persistence. Journal of Accounting and Economics 45:221-247.
Limpaphayom, P., and J. T. Connelly. 2004. Corporate Governance in Thailand: SSRN.
Lin, Z. J., and F. Chen. 1999. Applicability Of The Conservatism Accounting Convention in China: Empirical Evidence. The International Journal of Accounting 34 (4):517-537.
Lobo, G. J., and J. Zhou. 2006. Did Conservatism in Financial Reporting Increase after the Sarbanes-Oxley Act? Initial Evidence. Accounting Horizons 20 (1):57-73.
Leuz, C., D. Nanda, and P. D. Wysocki. 2003. Earnings management and investor protection: an international comparison. Journal of Financial Economics 69 (3):505-527.
310
Lippitt, J. W., and N. J. Mastracchio Jr. 1993. Valuing Small Businesses: Discounted Cash Flow, Earnings Capitalization, and the Cost of Replacing Capital Assets. Journal of Small Business Management 31 (3):52-61.
Maines, L. A., and J. M. Wahlen. 2006. The Nature of Accounting Information Reliability: Inferences from Archival and Experimental Research. Accounting Horizons 20 (4):399-425.
Martinez, I. 2003. The Impact of Firm-Specific Attributes on the Relevance in Earnings and Cash-flows: A Nonlinear Relationship Between Stock Returns and Accounting Numbers. Review of Accounting and Finance. 2(1):16– 39.
Mills, L. F. 1998. Book-Tax Differences and Internal Revenue Service Adjustments. Journal of Accounting Research 36 (2):343-356.
Mills, L. F., and K. J. Newberry. 2001. The Influence of Tax and Nontax Costs on Book-Tax Reporting Differences: Public and Private Firms. Journal of the American Taxation Association 23 (1):1-19.
Moh’d, M.A., L.G. Perry, and J.N. Rimbey. 1995. An investigation of the dynamic relationship between agency theory and dividend policy. Financial Review 30(2): 367 – 385.
Mueller, D.C. 1990. The Dynamics of Company Profits: An International Comparison. Cambridge University Press, USA.
Naceur, S. B., and M. Goaied. 2004. The value relevance of accounting and financial information: panel data evidence: Routledge, 1219 - 1224.
O'Hanlon, J. and K. Peasnell. 2002. Residual Income and Value-Creation: The Missing Link. Review of Accounting Studies 7:229-245.
Ohlson, J. A. 1995. Earnings, Book Values, and Dividends in Equity Valuation. Contemporary Accounting Research 11 (2):661-687.
Penman, S. H. 1992. Return to Fundamentals. Journal of Accounting, Auditing & Finance 7 (4):465-483.
Penman, S. 2005. Discussion of "On Accounting-Based Valuation Formulae" and "Expected EPS and EPS Growthas Determinants of Value". Review of Accounting Studies 10:367-378.
Penman, S. H. 2006. Valuation, Capital Budgeting, and Value-Based Management. Journal of Applied Corporate Finance 18 (2):48-55.
Pincus, M., S. Rajgopal, and M. Venkatachal. 2007. The Accrual Anomaly: International Evidence. Accounting Review 82 (1):169-203.
Plesko, G. A. 2003. An evaluation of alternative measures of corporate tax rates. Journal of Accounting and Economics 35:201-226.
Pope, P. F., and M. Walker. 1999. International Differences in the Timeliness, Conservatism, and Classification of Earnings. Journal of Accounting Research 37 (3):53-87.
Prather-Kinsey, J. 2006. Developing countries converging with developed-country accounting standards: Evidence from South Africa and Mexico. The International Journal of Accounting 41 (2):141-162.
Quiry, P., M. Dallocchio, Y. Le Fur, and A. Salvi. 2005, Corporate Fianance: Theory and practice, 6th edition, John Wiley & Sons, U.K.
311
Ragab, A. A., and M. M. Omran. 2006. Accounting information, value relevance, and investors? behavior in the Egyptian equity market. Review of Accounting and Finance 5:279-297.
Raonic, I., M. Stuart, and A. Ioannis. 2004. The Timeliness of Income Recognition by European Companies: An Analysis of Institutional and Market Complexity, 115-148.
Rees, W., P. 1997. The Impact of Dividends, Debt and Investment on Valuation Models, 1111-1140.
Riahi-Belkaoui, A. 2000. Accounting Theory 4th Edition. Thomson. UK. Richardson, S. A., R. G. Sloan, M. T. Soliman, and I. Tuna. 2006. The
implications of accounting distortions and growth for accruals and profitability. Accounting Review 81 (3):713-743.
Richardson, S. A., R. G. Sloan, M. T. Soliman, and I. Tuna. 2005. Accrual reliability, earnings persistence and stock prices. Journal of Accounting and Economics 39 (3):437-485.
Roychowdhury, S., and R. L. Watts. 2007. Asymmetric timeliness of earnings, market-to-book and conservatism in financial reporting. Journal of Accounting and Economics 44 (1-2):2-31.
Schmidt, A. P. 2006. The Persistence, Forecasting, and Valuation Implications of the Tax Change Component of Earnings. Accounting Review 81 (3):589-616.
Securities and Exchange Commission, Thailand (2007), Implementation of the IOSCO Objectives and Principles of Securities Regulation: Principle 16. [online] Available from: http://www.sec.or.th/sec/iosco/Content_0000000755.jsp?categoryID=CAT0000014&lang=th [accessed 18th October 2007]
Shaw, K. W. 2003. Corporate disclosure quality, earnings smoothing, and earnings' timeliness. Journal of Business Research 56:1043-1050.
Sloan, R. G. 1996. Do Stock Prices Fully Reflect Information in Accruals and Cash Flows about Future Earnings? The Accounting Review 71 (3):289-315.
Spence, M. 1973. Job Market Signaling. The Quarterly Journal of Economics 87 (3):355-374.
Stober, T.L. 1999. Empirical Applications of the Ohlson [1995] and Feltham and Ohlson [1995, 1996] Valuation Models. Managerial Finance. 25(12):3–16.
Vafeas, N. 2000. Board structure and the informativeness of earnings. Journal of Accounting and Public Policy 19:139-160.
Van der Meulen, S., A. Gaeremynck, and M. Willekens. 2007. Attribute differences between U.S. GAAP and IFRS earnings: An exploratory study. The International Journal of Accounting 42 (2):148-152.
Wang, D. C. 2006. Founding family ownership and earnings quality. Journal of Accounting Research 44 (3):619-656.
Watts, R. L. 2003. Conservatism in Accounting Part I: Explanations and Implications. Accounting Horizons 17 (3):207-221.
312
Watts, R. L., and J. L. Zimmerman. 1978. Towards a Positive Theory of the Determination of Accounting Standards. The Accounting Review 53 (1):112-134.
Whelan, C., and R. McNamara. 2004. The Impact of Earnings Management on the Value-relevance of Financial Statement Information: SSRN.
Yang, Z., K. Rohrbach, and S. Chen. 2005. The Impact of Standard Setting on Relevance and Reliability of Accounting Information: Lower of Cost or Market Accounting Reforms in China. Journal of International Financial Management and Accounting 16:194-228.
Yermack, D. 1996. Higher market valuation of companies with a small board of directors. Journal of Financial Economics 40 (2):185-211.
Zhao, R. 2002. Relative Value Relevance of RD Reporting: An International Comparison. Journal of International Financial Management and Accounting 13:153-174.


