Embed Size (px)
Citation preview
1
1st Quarter 2015
Earnings Call Presentation
April 14, 2015
©Johnson & Johnson Services, Inc. 2015

2
Louise Mehrotra
Vice President
Investor Relations
3
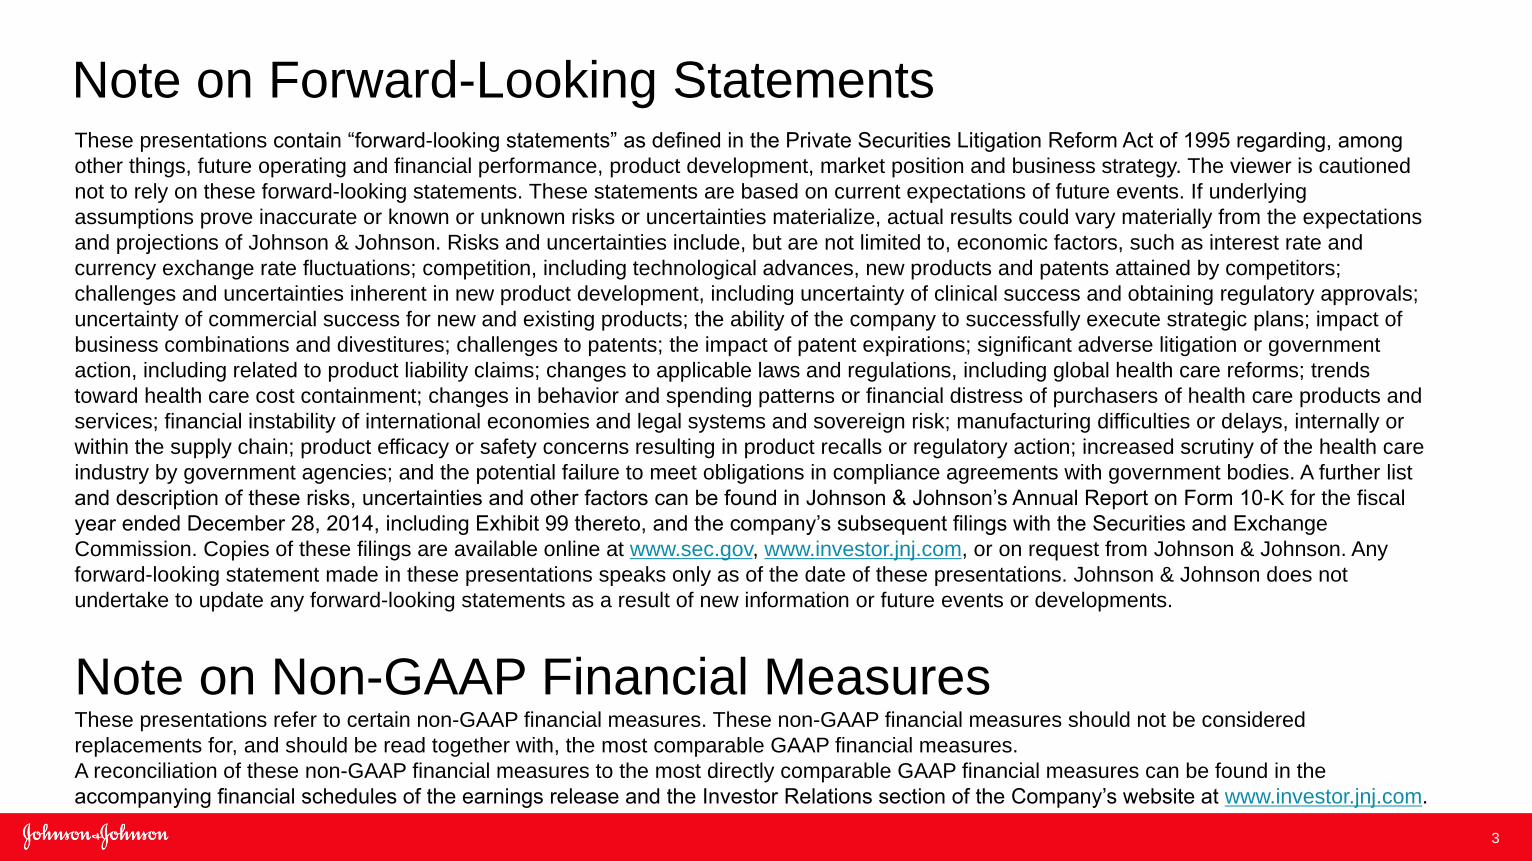
Note on Forward-Looking Statements These presentations contain “forward-looking statements” as defined in the Private Securities Litigation Reform Act of 1995 regarding, among
other things, future operating and financial performance, product development, market position and business strategy. The viewer is cautioned
not to rely on these forward-looking statements. These statements are based on current expectations of future events. If underlying
assumptions prove inaccurate or known or unknown risks or uncertainties materialize, actual results could vary materially from the expectations
and projections of Johnson & Johnson. Risks and uncertainties include, but are not limited to, economic factors, such as interest rate and
currency exchange rate fluctuations; competition, including technological advances, new products and patents attained by competitors;
challenges and uncertainties inherent in new product development, including uncertainty of clinical success and obtaining regulatory approvals;
uncertainty of commercial success for new and existing products; the ability of the company to successfully execute strategic plans; impact of
business combinations and divestitures; challenges to patents; the impact of patent expirations; significant adverse litigation or government
action, including related to product liability claims; changes to applicable laws and regulations, including global health care reforms; trends
toward health care cost containment; changes in behavior and spending patterns or financial distress of purchasers of health care products and
services; financial instability of international economies and legal systems and sovereign risk; manufacturing difficulties or delays, internally or
within the supply chain; product efficacy or safety concerns resulting in product recalls or regulatory action; increased scrutiny of the health care
industry by government agencies; and the potential failure to meet obligations in compliance agreements with government bodies. A further list
and description of these risks, uncertainties and other factors can be found in Johnson & Johnson’s Annual Report on Form 10-K for the fiscal
year ended December 28, 2014, including Exhibit 99 thereto, and the company’s subsequent filings with the Securities and Exchange
Commission. Copies of these filings are available online at www.sec.gov, www.investor.jnj.com, or on request from Johnson & Johnson. Any
forward-looking statement made in these presentations speaks only as of the date of these presentations. Johnson & Johnson does not
undertake to update any forward-looking statements as a result of new information or future events or developments.
Note on Non-GAAP Financial Measures These presentations refer to certain non-GAAP financial measures. These non-GAAP financial measures should not be considered
replacements for, and should be read together with, the most comparable GAAP financial measures.
A reconciliation of these non-GAAP financial measures to the most directly comparable GAAP financial measures can be found in the
accompanying financial schedules of the earnings release and the Investor Relations section of the Company’s website at www.investor.jnj.com.
4
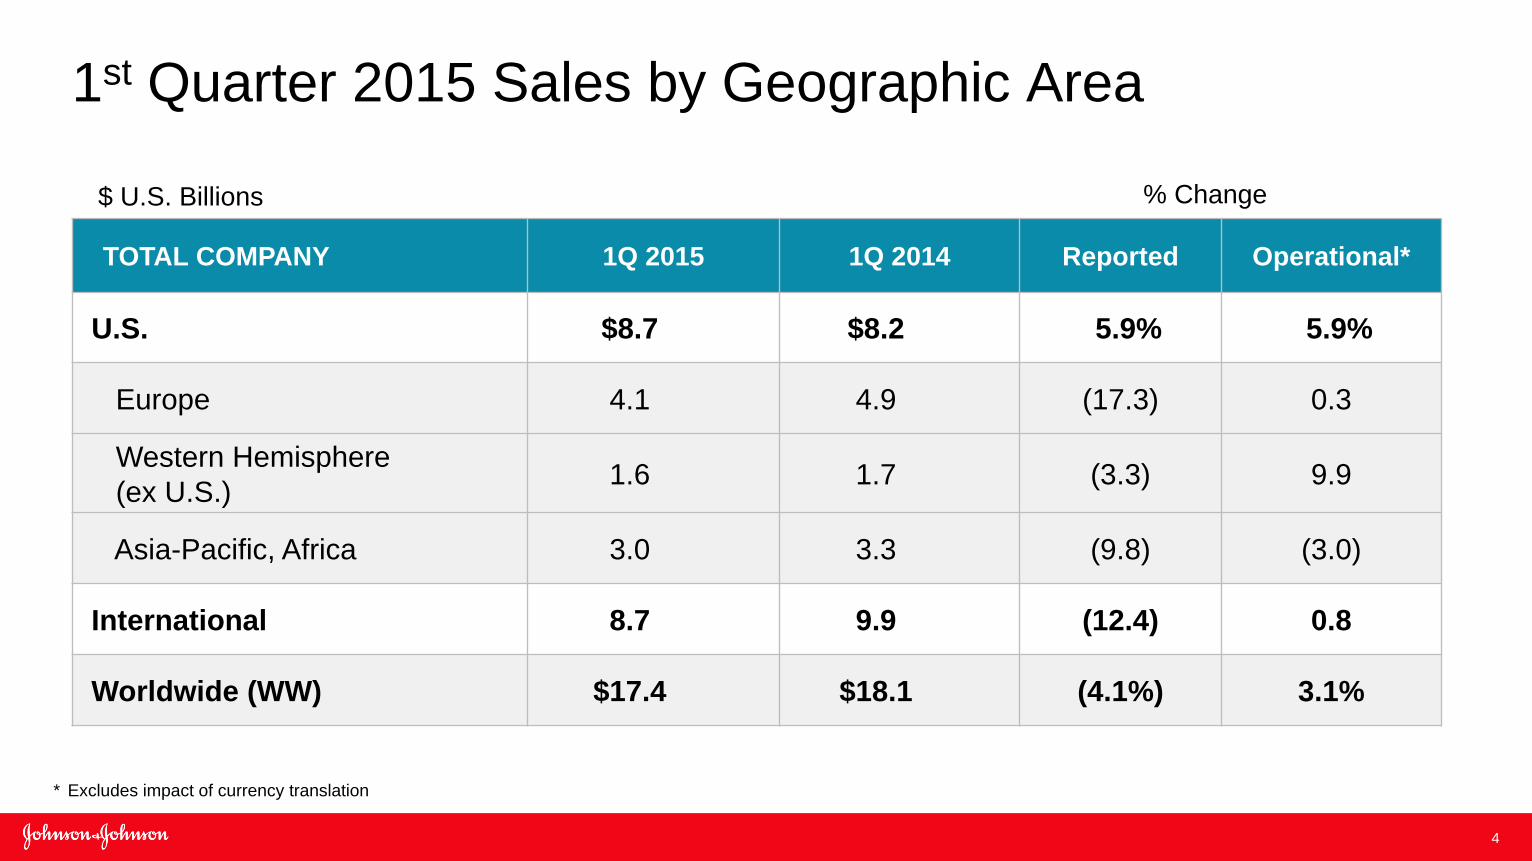
1st Quarter 2015 Sales by Geographic Area
% Change
TOTAL COMPANY 1Q 2015 1Q 2014 Reported Operational*
U.S. $8.7 $8.2 5.9% 5.9%
Europe 4.1 4.9 (17.3) 0.3
Western Hemisphere
(ex U.S.) 1.6 1.7 (3.3) 9.9
Asia-Pacific, Africa 3.0 3.3 (9.8) (3.0)
International 8.7 9.9 (12.4) 0.8
Worldwide (WW) $17.4 $18.1 (4.1%) 3.1%
* Excludes impact of currency translation
$ U.S. Billions
5
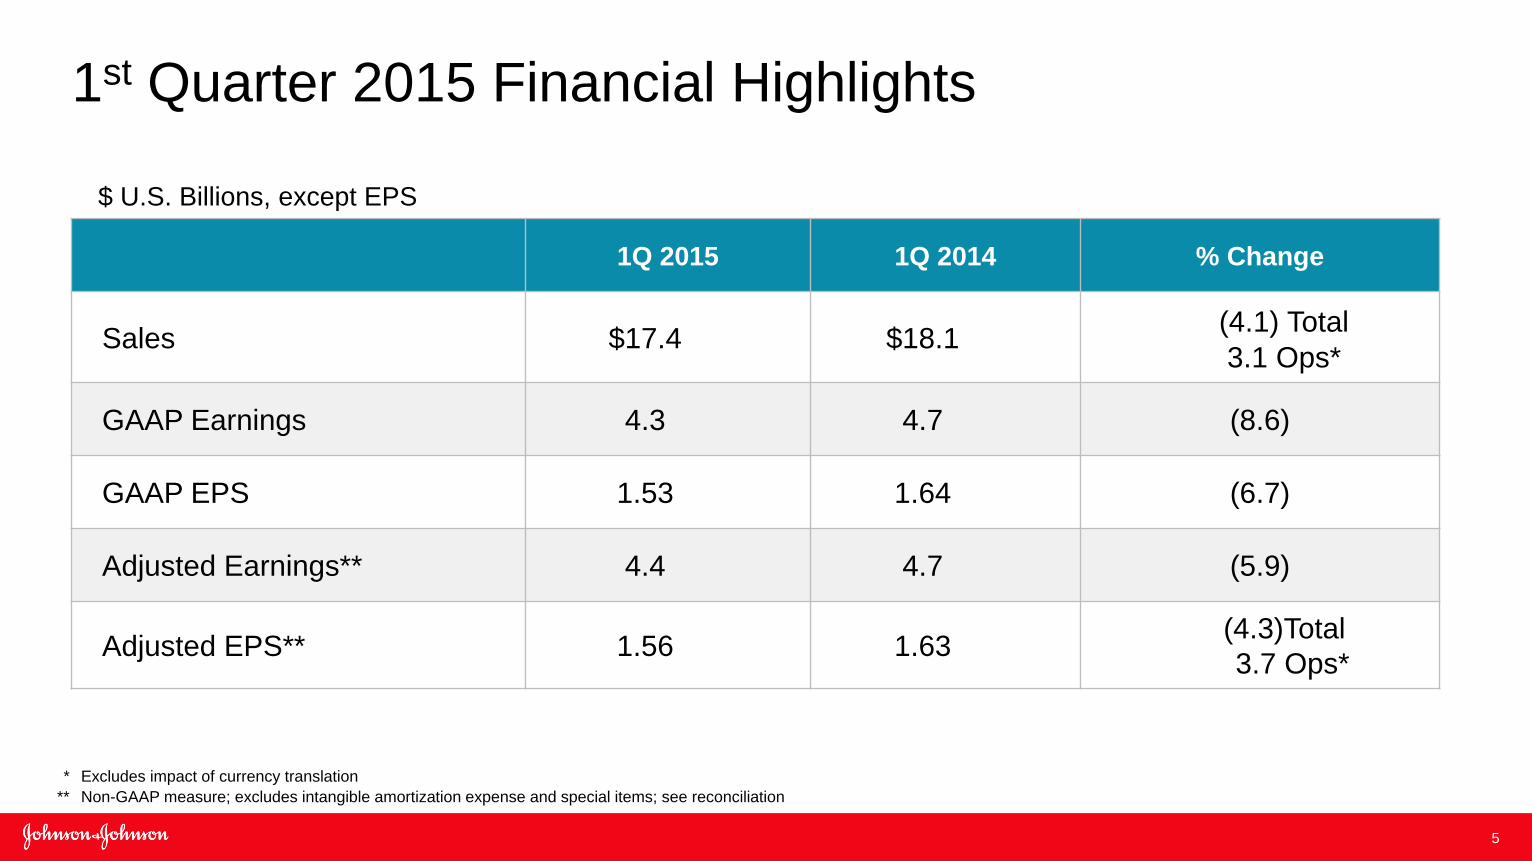
1Q 2015 1Q 2014 % Change
Sales $17.4 $18.1 (4.1) Total 3.1 Ops*
GAAP Earnings 4.3 4.7 (8.6)
GAAP EPS 1.53 1.64 (6.7)
Adjusted Earnings** 4.4 4.7 (5.9)
Adjusted EPS** 1.56 1.63 (4.3)Total
3.7 Ops*
1st Quarter 2015 Financial Highlights
* Excludes impact of currency translation
** Non-GAAP measure; excludes intangible amortization expense and special items; see reconciliation
$ U.S. Billions, except EPS
6
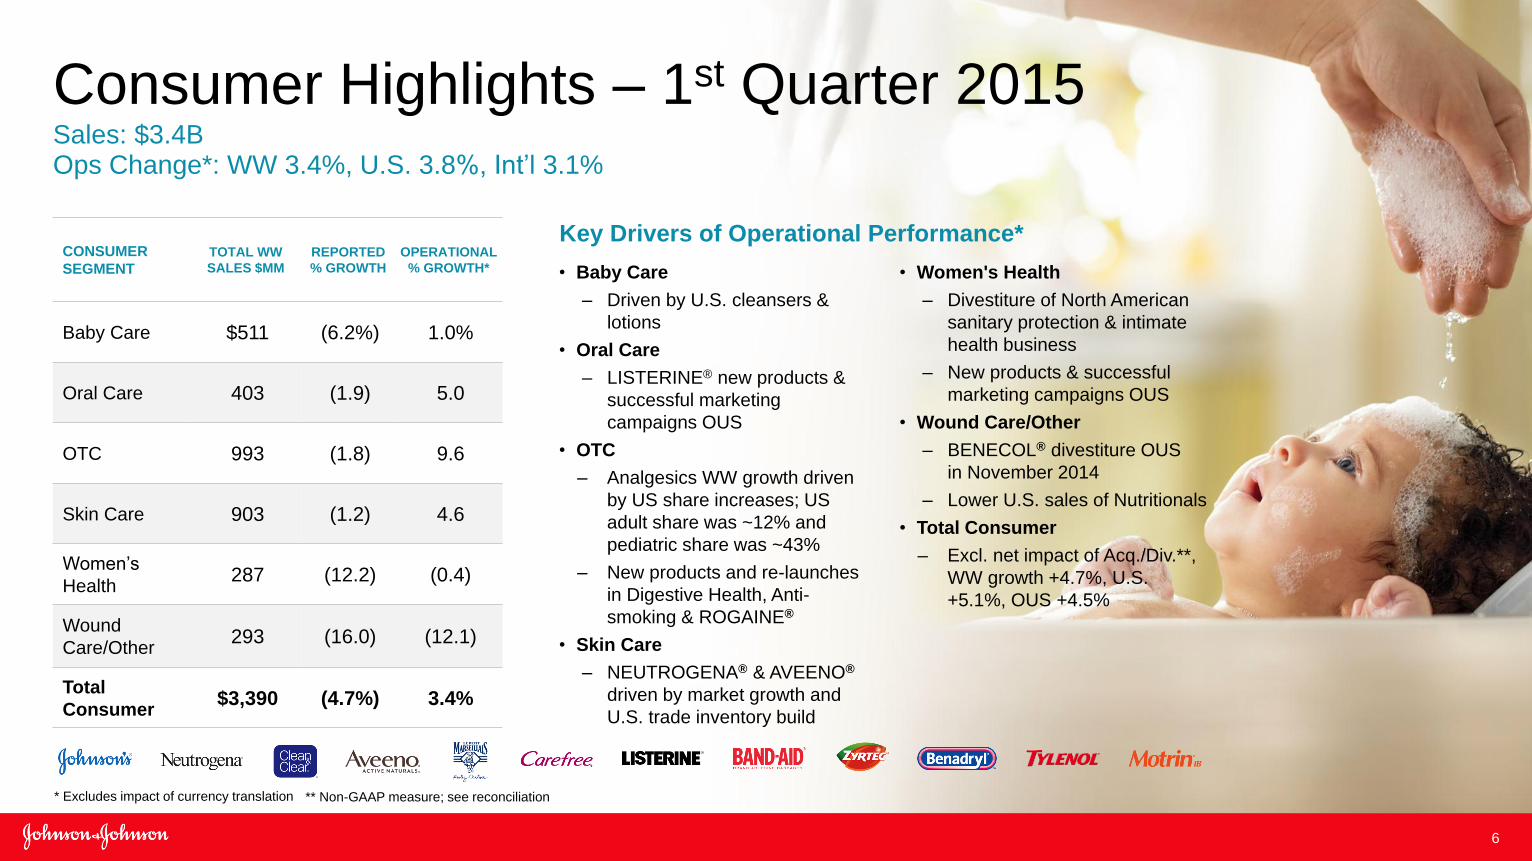
Consumer Highlights – 1st Quarter 2015
Key Drivers of Operational Performance*
• Women's Health
– Divestiture of North American
sanitary protection & intimate
health business
– New products & successful
marketing campaigns OUS
• Wound Care/Other
– BENECOL® divestiture OUS
in November 2014
– Lower U.S. sales of Nutritionals
• Total Consumer
– Excl. net impact of Acq./Div.**,
WW growth +4.7%, U.S.
+5.1%, OUS +4.5%
• Baby Care
– Driven by U.S. cleansers &
lotions
• Oral Care
– LISTERINE® new products &
successful marketing
campaigns OUS
• OTC
– Analgesics WW growth driven
by US share increases; US
adult share was ~12% and
pediatric share was ~43%
– New products and re-launches
in Digestive Health, Anti-
smoking & ROGAINE®
• Skin Care
– NEUTROGENA® & AVEENO®
driven by market growth and
U.S. trade inventory build
Sales: $3.4B Ops Change*: WW 3.4%, U.S. 3.8%, Int’l 3.1%
CONSUMER
SEGMENT
TOTAL WW
SALES $MM
REPORTED
% GROWTH
OPERATIONAL
% GROWTH*
Baby Care $511 (6.2%) 1.0%
Oral Care 403 (1.9) 5.0
OTC 993 (1.8) 9.6
Skin Care 903 (1.2) 4.6
Women’s
Health 287 (12.2) (0.4)
Wound
Care/Other 293 (16.0) (12.1)
Total
Consumer $3,390 (4.7%) 3.4%
* Excludes impact of currency translation ** Non-GAAP measure; see reconciliation
7
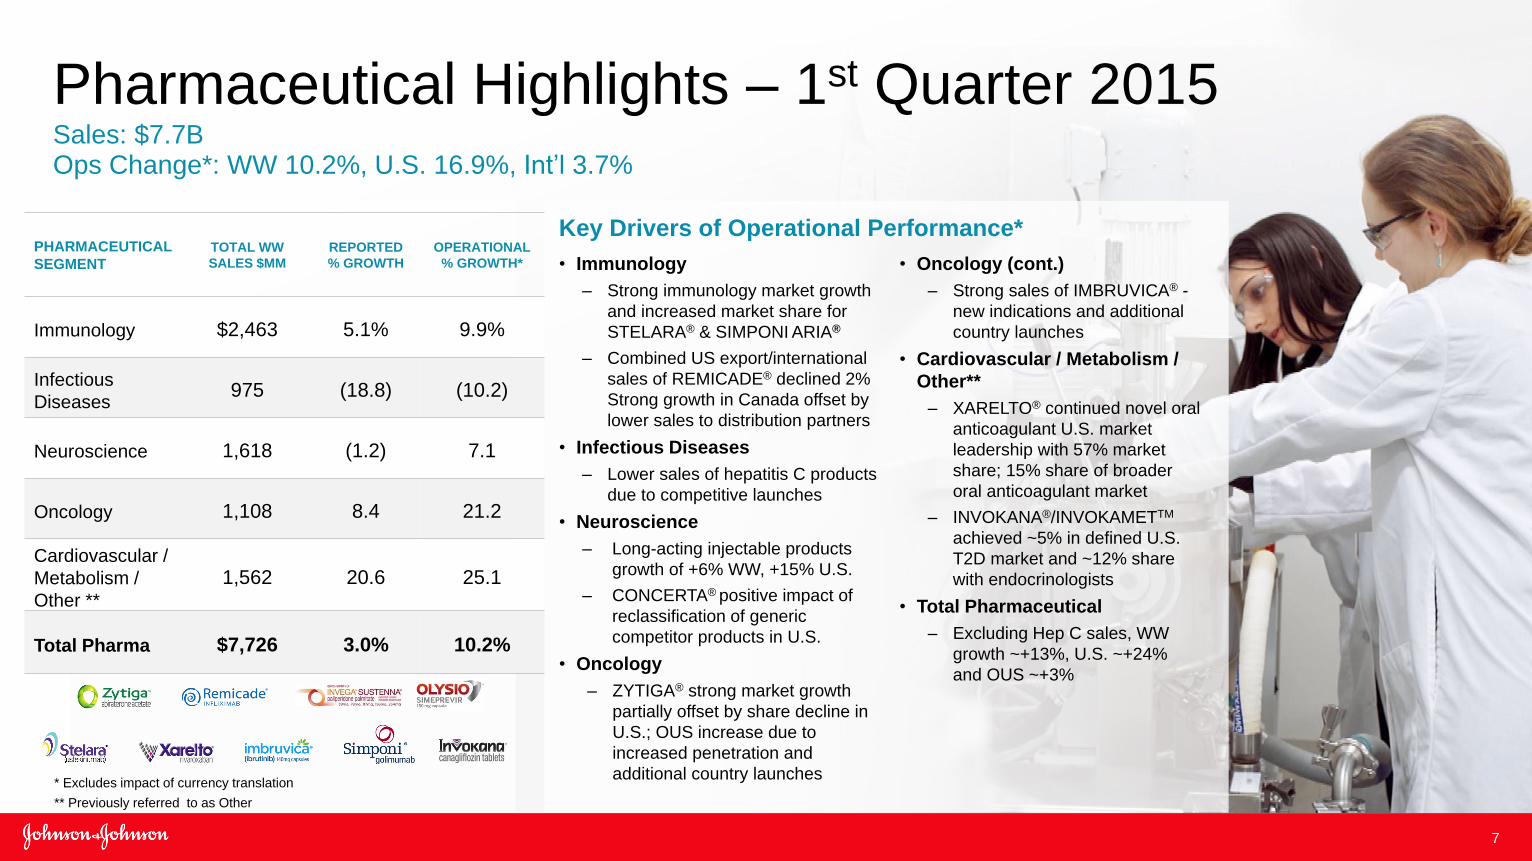
Pharmaceutical Highlights – 1st Quarter 2015
Key Drivers of Operational Performance*
• Oncology (cont.)
– Strong sales of IMBRUVICA® -
new indications and additional
country launches
• Cardiovascular / Metabolism /
Other**
– XARELTO® continued novel oral
anticoagulant U.S. market
leadership with 57% market
share; 15% share of broader
oral anticoagulant market
– INVOKANA®/INVOKAMETTM
achieved ~5% in defined U.S.
T2D market and ~12% share
with endocrinologists
• Total Pharmaceutical
– Excluding Hep C sales, WW
growth ~+13%, U.S. ~+24%
and OUS ~+3%
• Immunology
– Strong immunology market growth
and increased market share for
STELARA® & SIMPONI ARIA®
– Combined US export/international
sales of REMICADE® declined 2%
Strong growth in Canada offset by
lower sales to distribution partners
• Infectious Diseases
– Lower sales of hepatitis C products
due to competitive launches
• Neuroscience
– Long-acting injectable products
growth of +6% WW, +15% U.S.
– CONCERTA® positive impact of
reclassification of generic
competitor products in U.S.
• Oncology
– ZYTIGA® strong market growth
partially offset by share decline in
U.S.; OUS increase due to
increased penetration and
additional country launches
Sales: $7.7B Ops Change*: WW 10.2%, U.S. 16.9%, Int’l 3.7%
PHARMACEUTICAL
SEGMENT
TOTAL WW
SALES $MM
REPORTED
% GROWTH
OPERATIONAL
% GROWTH*
Immunology $2,463 5.1% 9.9%
Infectious
Diseases 975 (18.8) (10.2)
Neuroscience 1,618 (1.2) 7.1
Oncology 1,108 8.4 21.2
Cardiovascular /
Metabolism /
Other **
1,562 20.6 25.1
Total Pharma $7,726 3.0% 10.2%
* Excludes impact of currency translation
** Previously referred to as Other
8
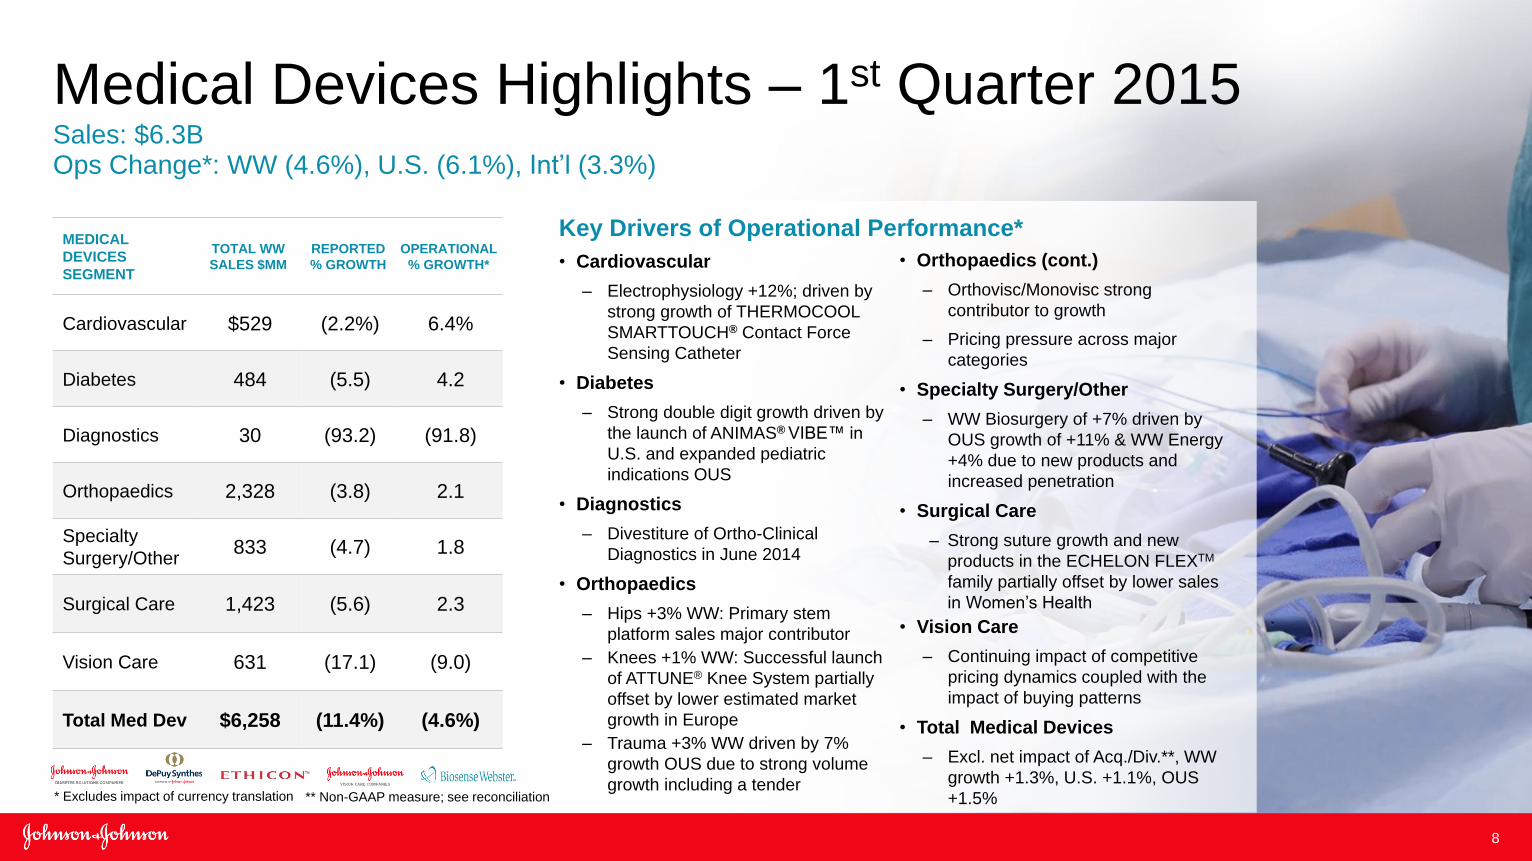
Medical Devices Highlights – 1st Quarter 2015
Key Drivers of Operational Performance*
• Orthopaedics (cont.)
– Orthovisc/Monovisc strong
contributor to growth
– Pricing pressure across major
categories
• Specialty Surgery/Other
– WW Biosurgery of +7% driven by
OUS growth of +11% & WW Energy
+4% due to new products and
increased penetration
• Surgical Care
– Strong suture growth and new
products in the ECHELON FLEXTM
family partially offset by lower sales
in Women’s Health
• Vision Care
– Continuing impact of competitive
pricing dynamics coupled with the
impact of buying patterns
• Total Medical Devices
– Excl. net impact of Acq./Div.**, WW
growth +1.3%, U.S. +1.1%, OUS
+1.5%
• Cardiovascular
– Electrophysiology +12%; driven by
strong growth of THERMOCOOL
SMARTTOUCH® Contact Force
Sensing Catheter
• Diabetes
– Strong double digit growth driven by
the launch of ANIMAS® VIBE™ in
U.S. and expanded pediatric
indications OUS
• Diagnostics
– Divestiture of Ortho-Clinical
Diagnostics in June 2014
• Orthopaedics
– Hips +3% WW: Primary stem
platform sales major contributor
– Knees +1% WW: Successful launch
of ATTUNE® Knee System partially
offset by lower estimated market
growth in Europe
– Trauma +3% WW driven by 7%
growth OUS due to strong volume
growth including a tender
Sales: $6.3B Ops Change*: WW (4.6%), U.S. (6.1%), Int’l (3.3%)
MEDICAL
DEVICES
SEGMENT
TOTAL WW
SALES $MM
REPORTED
% GROWTH
OPERATIONAL
% GROWTH*
Cardiovascular $529 (2.2%) 6.4%
Diabetes 484 (5.5) 4.2
Diagnostics 30 (93.2) (91.8)
Orthopaedics 2,328 (3.8) 2.1
Specialty
Surgery/Other 833 (4.7) 1.8
Surgical Care 1,423 (5.6) 2.3
Vision Care 631 (17.1) (9.0)
Total Med Dev $6,258 (11.4%) (4.6%)
* Excludes impact of currency translation ** Non-GAAP measure; see reconciliation

9
Dominic Caruso
Vice President, Finance
&
Chief Financial Officer
10
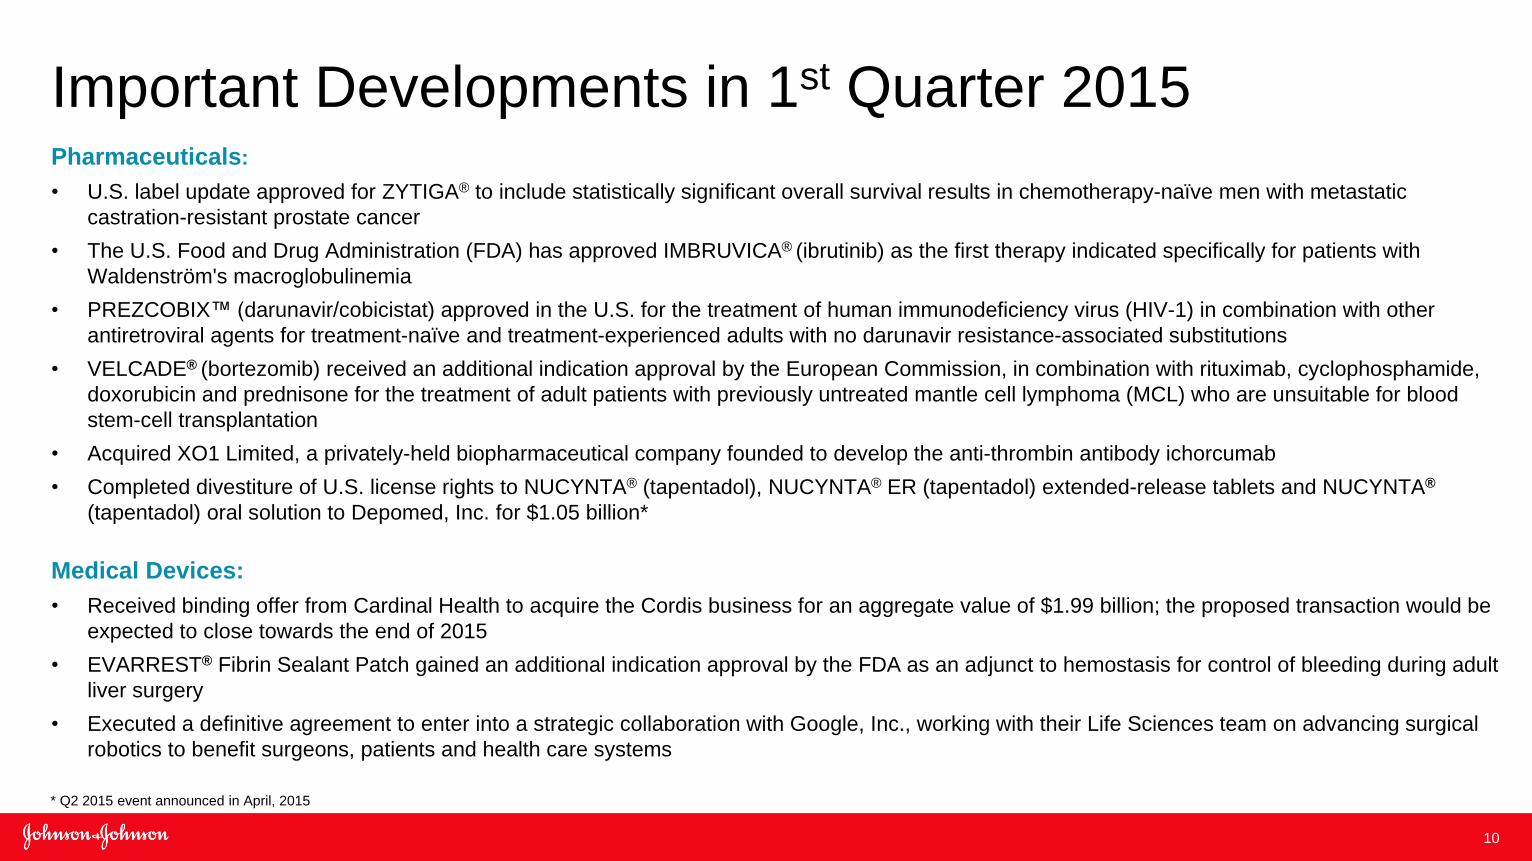
Important Developments in 1st Quarter 2015
Pharmaceuticals:
• U.S. label update approved for ZYTIGA® to include statistically significant overall survival results in chemotherapy-naïve men with metastatic
castration-resistant prostate cancer
• The U.S. Food and Drug Administration (FDA) has approved IMBRUVICA® (ibrutinib) as the first therapy indicated specifically for patients with
Waldenström's macroglobulinemia
• PREZCOBIX™ (darunavir/cobicistat) approved in the U.S. for the treatment of human immunodeficiency virus (HIV-1) in combination with other
antiretroviral agents for treatment-naïve and treatment-experienced adults with no darunavir resistance-associated substitutions
• VELCADE® (bortezomib) received an additional indication approval by the European Commission, in combination with rituximab, cyclophosphamide,
doxorubicin and prednisone for the treatment of adult patients with previously untreated mantle cell lymphoma (MCL) who are unsuitable for blood
stem-cell transplantation
• Acquired XO1 Limited, a privately-held biopharmaceutical company founded to develop the anti-thrombin antibody ichorcumab
• Completed divestiture of U.S. license rights to NUCYNTA® (tapentadol), NUCYNTA® ER (tapentadol) extended-release tablets and NUCYNTA®
(tapentadol) oral solution to Depomed, Inc. for $1.05 billion*
Medical Devices:
• Received binding offer from Cardinal Health to acquire the Cordis business for an aggregate value of $1.99 billion; the proposed transaction would be
expected to close towards the end of 2015
• EVARREST® Fibrin Sealant Patch gained an additional indication approval by the FDA as an adjunct to hemostasis for control of bleeding during adult
liver surgery
• Executed a definitive agreement to enter into a strategic collaboration with Google, Inc., working with their Life Sciences team on advancing surgical
robotics to benefit surgeons, patients and health care systems
* Q2 2015 event announced in April, 2015
11
Percent
Percent Percent Increase
Amount to Sales Amount to Sales (Decrease)
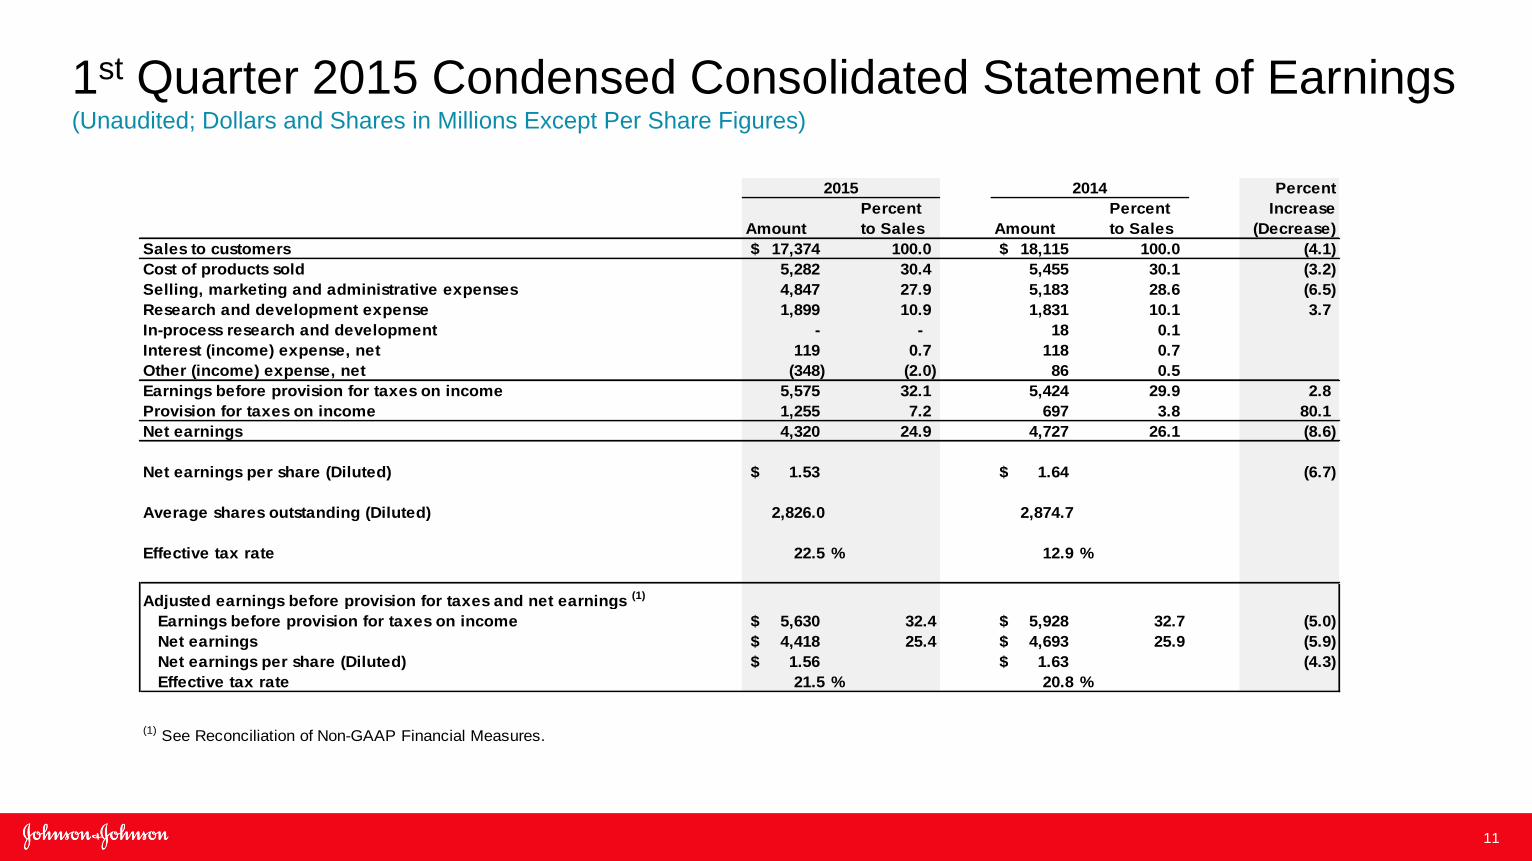
Sales to customers 17,374$ 100.0 18,115$ 100.0 (4.1)
Cost of products sold 5,282 30.4 5,455 30.1 (3.2)
Selling, marketing and administrative expenses 4,847 27.9 5,183 28.6 (6.5)
Research and development expense 1,899 10.9 1,831 10.1 3.7
In-process research and development - - 18 0.1
Interest (income) expense, net 119 0.7 118 0.7
Other (income) expense, net (348) (2.0) 86 0.5
Earnings before provision for taxes on income 5,575 32.1 5,424 29.9 2.8
Provision for taxes on income 1,255 7.2 697 3.8 80.1
Net earnings 4,320 24.9 4,727 26.1 (8.6)
Net earnings per share (Diluted) 1.53$ 1.64$ (6.7)
Average shares outstanding (Diluted) 2,826.0 2,874.7
Effective tax rate 22.5 % 12.9 %
Adjusted earnings before provision for taxes and net earnings (1)
Earnings before provision for taxes on income 5,630$ 32.4 5,928$ 32.7 (5.0)
Net earnings 4,418$ 25.4 4,693$ 25.9 (5.9)
Net earnings per share (Diluted) 1.56$ 1.63$ (4.3)
Effective tax rate 21.5 % 20.8 %
(1) See Reconciliation of Non-GAAP Financial Measures.
2015 2014
1st Quarter 2015 Condensed Consolidated Statement of Earnings (Unaudited; Dollars and Shares in Millions Except Per Share Figures)
12
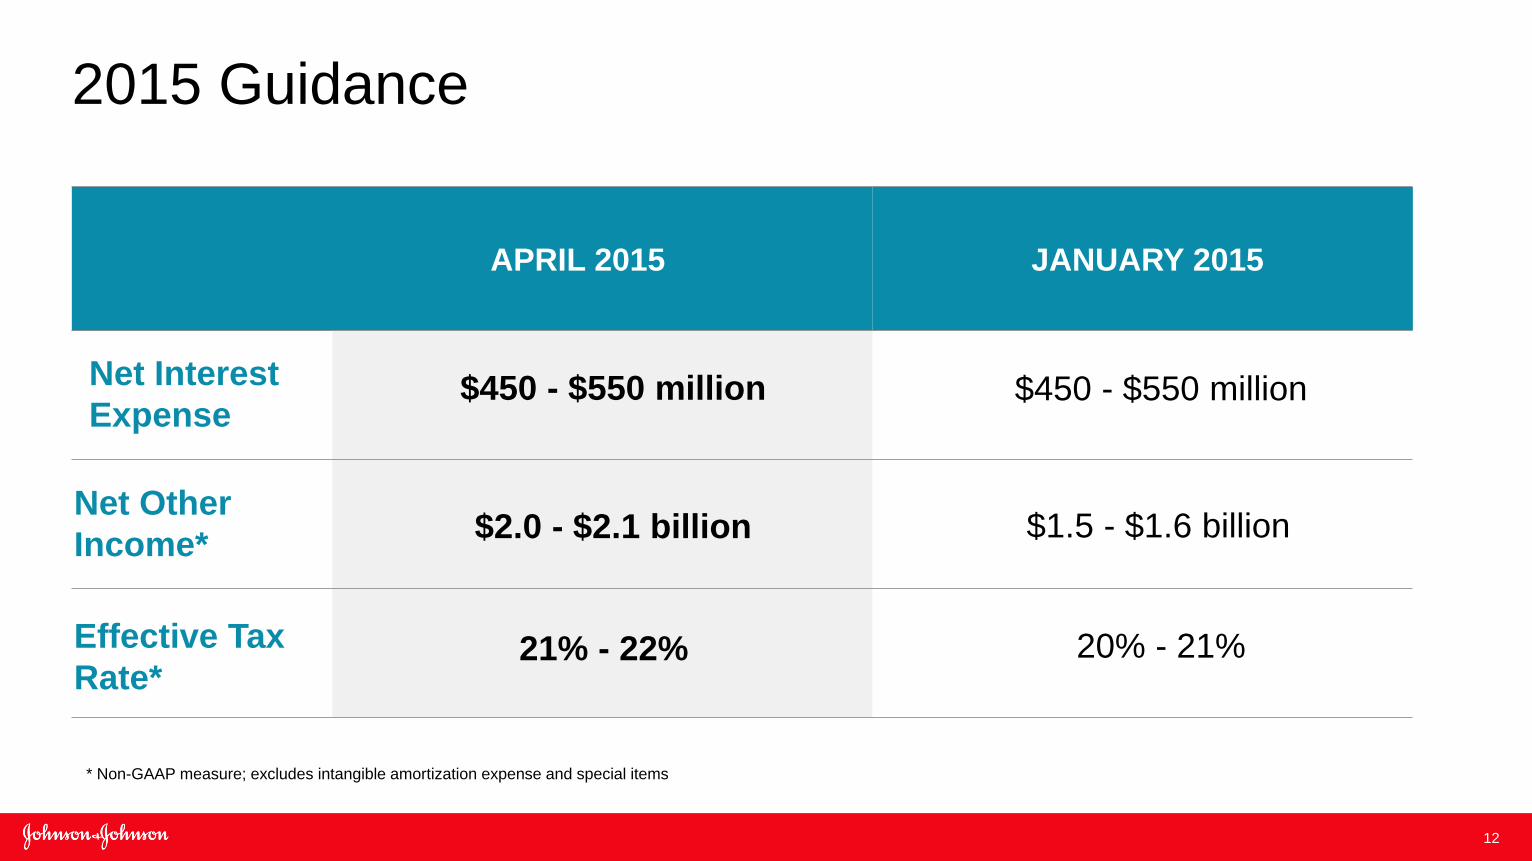
2015 Guidance
APRIL 2015
JANUARY 2015
* Non-GAAP measure; excludes intangible amortization expense and special items
$450 - $550 million $450 - $550 million
$2.0 - $2.1 billion $1.5 - $1.6 billion
21% - 22% 20% - 21%
Net Interest
Expense
Net Other
Income*
Effective Tax
Rate*

14
APRIL 2015
ESTIMATED
OPERATIONAL AT
CONSTANT
CURRENCY
ESTIMATED
CURRENCY
ESTIMATED
REPORTED*
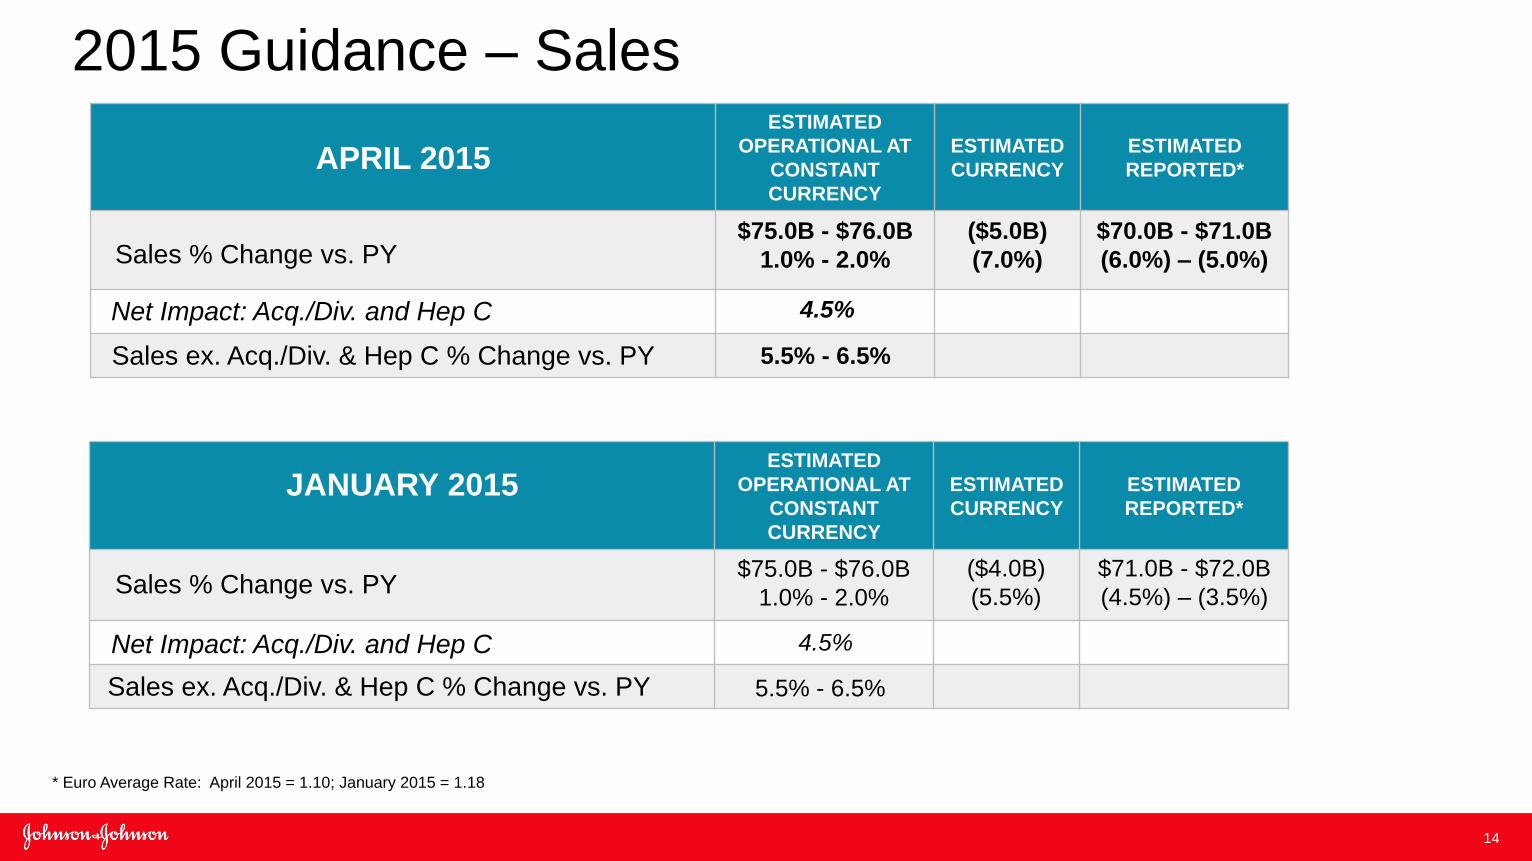
2015 Guidance – Sales
JANUARY 2015
ESTIMATED
OPERATIONAL AT
CONSTANT
CURRENCY
ESTIMATED
CURRENCY
ESTIMATED
REPORTED*
* Euro Average Rate: April 2015 = 1.10; January 2015 = 1.18
$75.0B - $76.0B
1.0% - 2.0%
$70.0B - $71.0B
(6.0%) – (5.0%)
($5.0B)
(7.0%)
$75.0B - $76.0B
1.0% - 2.0%
($4.0B)
(5.5%)
$71.0B - $72.0B
(4.5%) – (3.5%)
4.5%
5.5% - 6.5%
4.5%
5.5% - 6.5%
Sales % Change vs. PY
Sales ex. Acq./Div. & Hep C % Change vs. PY
Net Impact: Acq./Div. and Hep C
Sales % Change vs. PY
Net Impact: Acq./Div. and Hep C
Sales ex. Acq./Div. & Hep C % Change vs. PY
15
APRIL 2015
ESTIMATED
OPERATIONAL AT
CONSTANT
CURRENCY
ESTIMATED
CURRENCY
ESTIMATED
REPORTED**
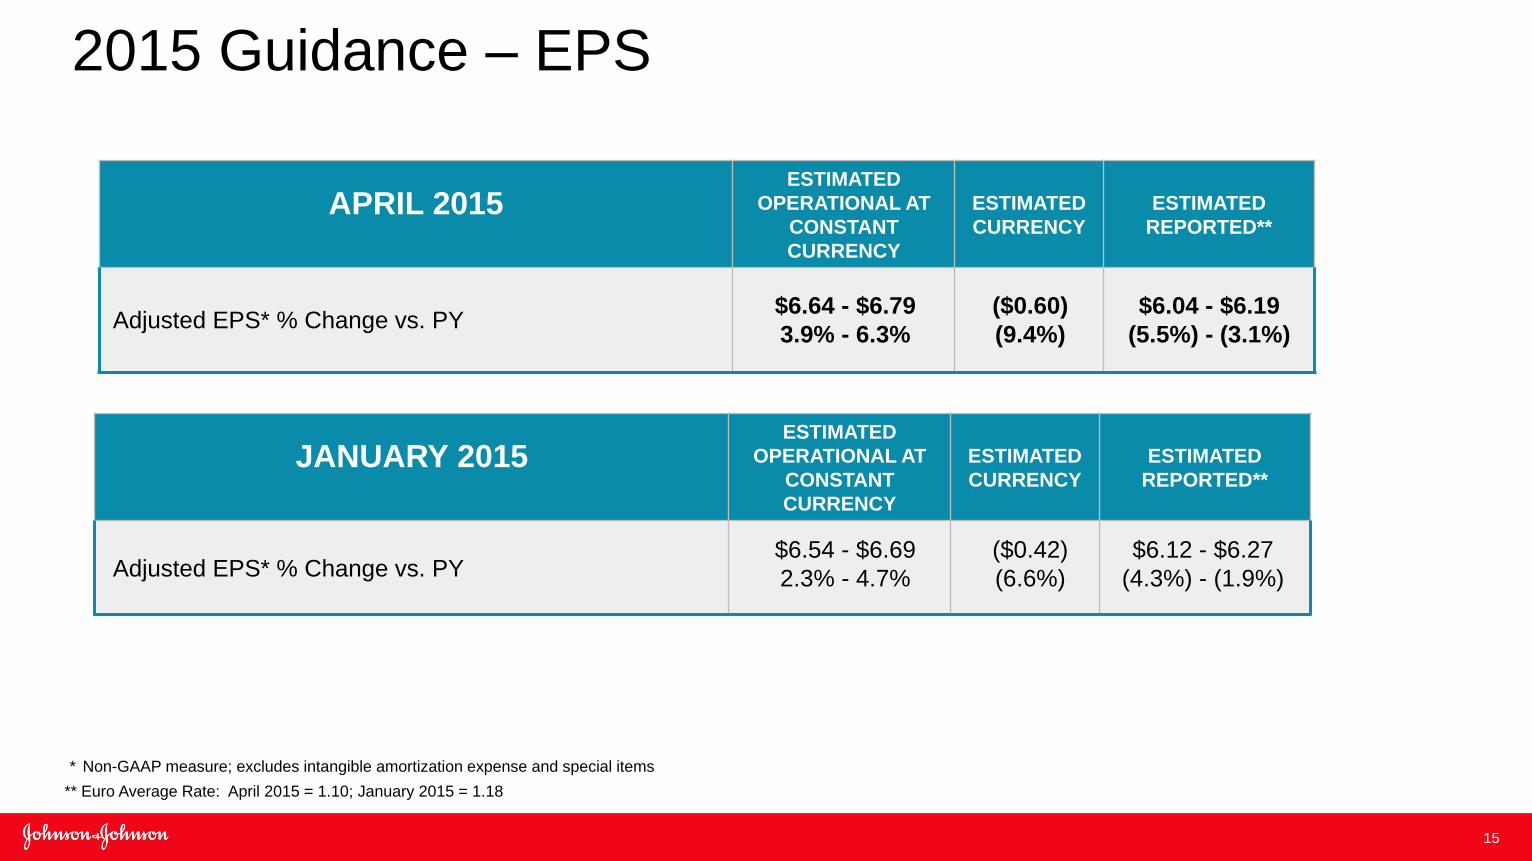
** Euro Average Rate: April 2015 = 1.10; January 2015 = 1.18
JANUARY 2015
ESTIMATED
OPERATIONAL AT
CONSTANT
CURRENCY
ESTIMATED
CURRENCY
ESTIMATED
REPORTED**
2015 Guidance – EPS
$6.64 - $6.79
3.9% - 6.3%
($0.60)
(9.4%)
$6.04 - $6.19
(5.5%) - (3.1%)
($0.42)
(6.6%)
$6.54 - $6.69
2.3% - 4.7%
$6.12 - $6.27
(4.3%) - (1.9%) Adjusted EPS* % Change vs. PY
Adjusted EPS* % Change vs. PY
* Non-GAAP measure; excludes intangible amortization expense and special items
16
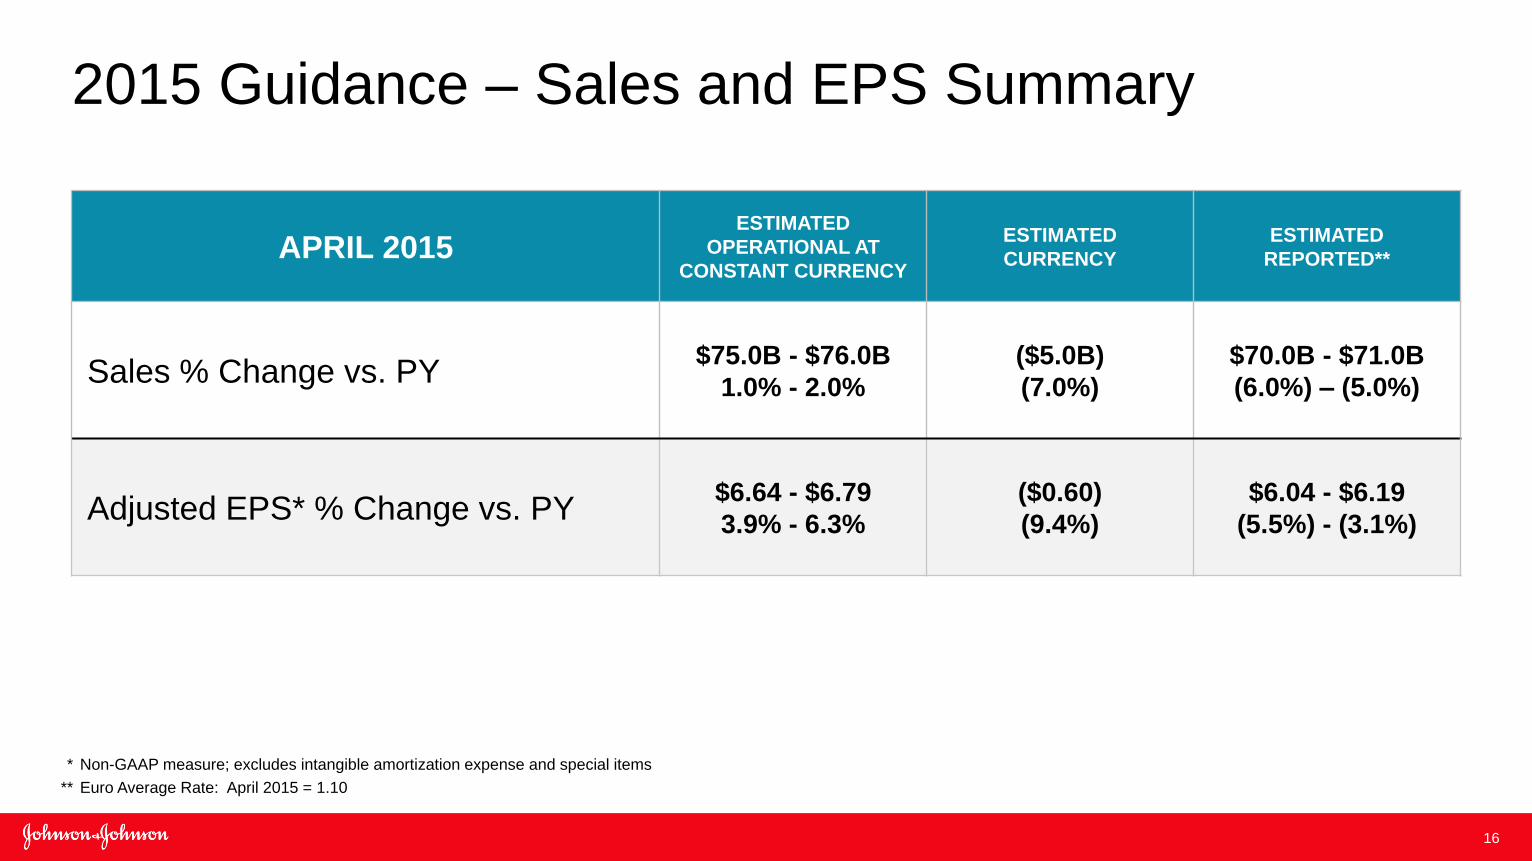
APRIL 2015 ESTIMATED
OPERATIONAL AT
CONSTANT CURRENCY
ESTIMATED
CURRENCY
ESTIMATED
REPORTED**
Sales % Change vs. PY $75.0B - $76.0B
1.0% - 2.0%
($5.0B)
(7.0%)
$70.0B - $71.0B
(6.0%) – (5.0%)
Adjusted EPS* % Change vs. PY $6.64 - $6.79
3.9% - 6.3%
($0.60)
(9.4%)
$6.04 - $6.19
(5.5%) - (3.1%)
* Non-GAAP measure; excludes intangible amortization expense and special items
** Euro Average Rate: April 2015 = 1.10
2015 Guidance – Sales and EPS Summary


18
Save the Date
Pharmaceutical Business Review
Wednesday, May 20, 2015
Hyatt Regency, New Brunswick