Embed Size (px)
Citation preview
Citation: Wang, X.; Jiang, Y.; Xu, S.;
Liu, H.; Li, X. Fiber Bragg
Grating-Based Smart Garment for
Monitoring Human Body
Temperature. Sensors 2022, 22, 4252.
https://doi.org/10.3390/s22114252
Academic Editors: Flavio Esposito,
Stefania Campopiano
and Agostino Iadicicco
Received: 21 April 2022
Accepted: 24 May 2022
Published: 2 June 2022
Publisher’s Note: MDPI stays neutral
with regard to jurisdictional claims in
published maps and institutional affil-
iations.
Copyright: © 2022 by the authors.
Licensee MDPI, Basel, Switzerland.
This article is an open access article
distributed under the terms and
conditions of the Creative Commons
Attribution (CC BY) license (https://
creativecommons.org/licenses/by/
4.0/).
sensors
Article
Fiber Bragg Grating-Based Smart Garment for MonitoringHuman Body TemperatureXiujuan Wang 1,2,3, Yaming Jiang 1, Siyi Xu 1, Hao Liu 1,* and Xiaozhi Li 1,*
1 School of Textile Science and Engineering, Tiangong University, Tianjin 300387, China;[email protected] (X.W.); [email protected] (Y.J.); [email protected] (S.X.)
2 R&D Department of Personal Protective Lifesaving Equipment, Aerospace Life-Supports Industries Ltd.,Xiangyang 441003, China
3 Aviation Key Laboratory of Science and Technology on Life-Support Technology, Xiangyang 441003, China* Correspondence: [email protected] (H.L.); [email protected] (X.L.)
Abstract: Body temperature provides an insight into the physiological state of a person, and bodytemperature changes reflect much information about human health. In this study, a garment formonitoring human body temperature based on fiber Bragg grating (FBG) sensors is reported. TheFBG sensor was encapsulated with a PMMA tube and calibrated in the thermostatic water bath. Theresults showed that FBG sensors had good vibration resistance, and the wavelength changed about0–1 pm at a 0.5–80 Hz vibration frequency. The bending path of the optical fiber after integration withclothing is discussed. When the bending radius is equal to or greater than 20 mm, a lower bendingloss can be achieved even under the bending and stretching of the human body. The FBG sensor, theoptical fiber, and the garment were integrated together using hot melt glue by the electric iron andthe hot press machine. Through experiments of monitoring human body temperature, the sensorcan reach the human armpit temperature in about 10–15 min with the upper arm close to the torso.Because it is immune to electromagnetic interferences, the smart garment can be used in some specialenvironments such as ultrasonography, magnetic resonance (MR), and aerospace.
Keywords: fiber Bragg grating (FBG) sensor; smart garment; sensor calibration; body temperaturemonitoring; optical fiber bending loss
1. Introduction
Body temperature is regarded as the first vital sign [1]. In daily life, it provides aninsight into the physiological condition of a person. Either an elevated body temperatureor a degraded body temperature indicate that the person is suffering from diseases. Inthe medical area, the continuous monitoring of body temperature can offer various kindsof information valuable for clinical diagnosis, and it is a useful guide to take suitableaction [2]. Wearable flexible temperature sensors have been developed for monitoring bodytemperature [3,4]. They measure the temperature by the electrical signal changes of thethermo sensitive materials, which are caused by the temperature change. The electricalsignal is easily affected by electromagnetics, so the sensors cannot be used in some specialenvironments, such as ultrasonography, magnetic resonance (MR), and aerospace.
Fiber Bragg grating (FBG) sensors are sensitive to environmental variables, such astemperature, stress, bending, and pressure. They have been widely applied in the fieldsof civil engineering, the automotive industry, aerospace, the oil and gas industry, andbiomedicine as high-precision sensors [5–8].
Compared with electrical and mechanical sensors, they are immune to electromagneticinterferences. These features make FBG sensors more of an emerging solution for themonitoring of physiological parameters, and they are particularly attractive for applicationin smart textiles. During the last decade, the garment, wearable straps, adhesive tape, or
Sensors 2022, 22, 4252. https://doi.org/10.3390/s22114252 https://www.mdpi.com/journal/sensors
Sensors 2022, 22, 4252 2 of 14
insoles that were embedded with in the FBG sensors were used to monitor body physiolog-ical parameters such as heart rate [9–11], body surface strain [12,13], blood pressure [14,15],respiration [9,10,16,17], Ballistocardiogram (BCG) signal [18], joint postures [19–22], plantarpressure [23–27], and temperature [28,29]. As reported in reviews [29], the garment wasdivided into several blocks, the FBG temperature sensor was woven into the block, andthen the blocks were sewn together. The weaving process was complicated, and when theblocks were sewn together, the sensor may be damaged. In addition, the report did notdiscuss how to design the path of optical fiber, and this is important to transmit the signal.
In this article, an FBG-based smart garment was developed for monitoring bodytemperature. The principle, fabrication, and encapsulation of the FBG temperature sensorare presented in detail, and the sensor was calibrated and its performance tested. Then, anew method of integrating garment, sensor, and the path of optical fiber was designed, andthe integrated garment was worn on the body for a temperature monitoring experiment.
2. Basics of Light Transmission in Optical Fibers and FBG Sensing
The advent of optical fiber with ultralow transmission loss has enabled optical com-munication to develop rapidly. It consists of a core, cladding, and coating, as shown inFigure 1a. While the core and cladding are responsible for light guiding, the coating protectsthe fiber from external influence. Basically, the refractive index of the core by doping withgermanium is slightly higher than that of the cladding, and light transmission obeys theprinciple of total internal reflection at the interface of the core and cladding (Figure 1b).
Sensors 2022, 22, x FOR PEER REVIEW 2 of 13
tape, or insoles that were embedded with in the FBG sensors were used to monitor body physiological parameters such as heart rate [9–11], body surface strain [12,13], blood pres-sure [14,15], respiration [9,10,16,17], Ballistocardiogram (BCG) signal [18], joint postures [19–22], plantar pressure [23–27], and temperature [28,29]. As reported in reviews [29], the garment was divided into several blocks, the FBG temperature sensor was woven into the block, and then the blocks were sewn together. The weaving process was complicated, and when the blocks were sewn together, the sensor may be damaged. In addition, the report did not discuss how to design the path of optical fiber, and this is important to transmit the signal.
In this article, an FBG-based smart garment was developed for monitoring body tem-perature. The principle, fabrication, and encapsulation of the FBG temperature sensor are presented in detail, and the sensor was calibrated and its performance tested. Then, a new method of integrating garment, sensor, and the path of optical fiber was designed, and the integrated garment was worn on the body for a temperature monitoring experiment.
2. Basics of Light Transmission in Optical Fibers and FBG Sensing The advent of optical fiber with ultralow transmission loss has enabled optical com-
munication to develop rapidly. It consists of a core, cladding, and coating, as shown in Figure 1a. While the core and cladding are responsible for light guiding, the coating pro-tects the fiber from external influence. Basically, the refractive index of the core by doping with germanium is slightly higher than that of the cladding, and light transmission obeys the principle of total internal reflection at the interface of the core and cladding (Figure 1b).
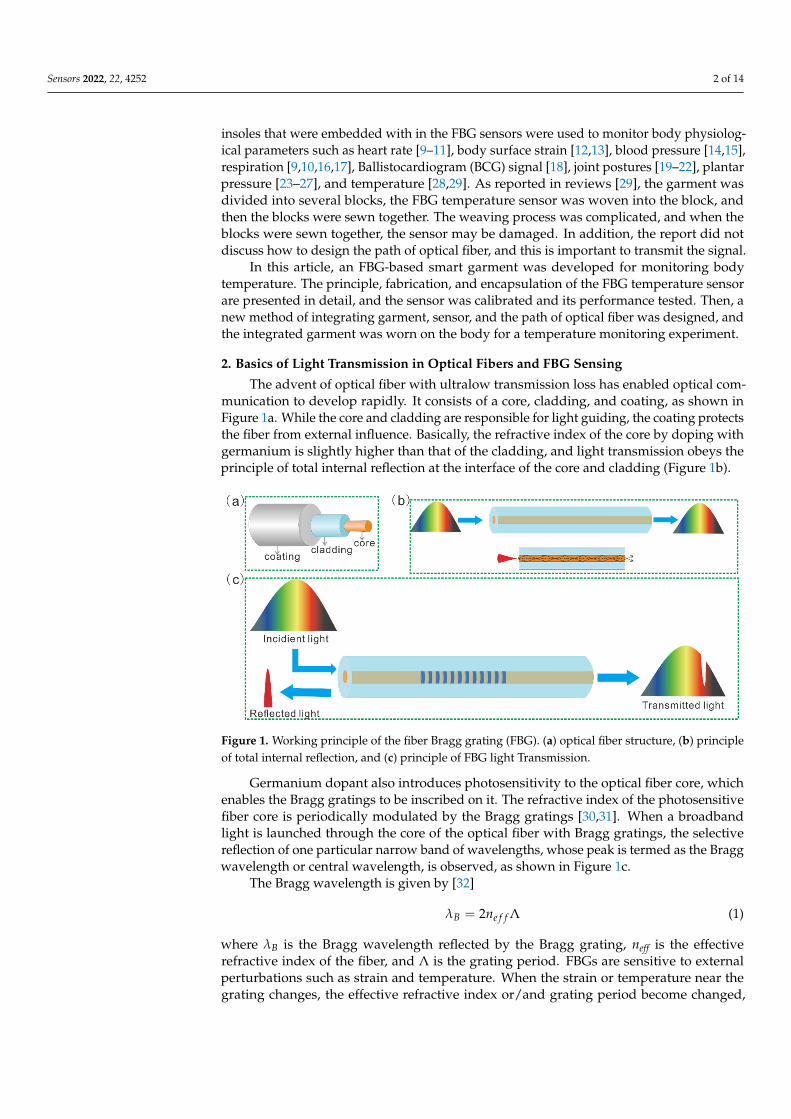
Germanium dopant also introduces photosensitivity to the optical fiber core, which enables the Bragg gratings to be inscribed on it. The refractive index of the photosensitive fiber core is periodically modulated by the Bragg gratings [30,31]. When a broadband light is launched through the core of the optical fiber with Bragg gratings, the selective reflec-tion of one particular narrow band of wavelengths, whose peak is termed as the Bragg wavelength or central wavelength, is observed, as shown in Figure 1c.
Figure 1. Working principle of the fiber Bragg grating (FBG). (a) optical fiber structure, (b) princi-ple of total internal reflection, and (c) principle of FBG light Transmission.
The Bragg wavelength is given by [32]
2B effnλ = Λ (1)
where λB is the Bragg wavelength reflected by the Bragg grating, neff is the effective refrac-tive index of the fiber, and Λ is the grating period. FBGs are sensitive to external pertur-bations such as strain and temperature. When the strain or temperature near the grating changes, the effective refractive index or/and grating period become changed, which leads
Figure 1. Working principle of the fiber Bragg grating (FBG). (a) optical fiber structure, (b) principleof total internal reflection, and (c) principle of FBG light Transmission.
Germanium dopant also introduces photosensitivity to the optical fiber core, whichenables the Bragg gratings to be inscribed on it. The refractive index of the photosensitivefiber core is periodically modulated by the Bragg gratings [30,31]. When a broadbandlight is launched through the core of the optical fiber with Bragg gratings, the selectivereflection of one particular narrow band of wavelengths, whose peak is termed as the Braggwavelength or central wavelength, is observed, as shown in Figure 1c.
The Bragg wavelength is given by [32]
λB = 2ne f f Λ (1)
where λB is the Bragg wavelength reflected by the Bragg grating, neff is the effectiverefractive index of the fiber, and Λ is the grating period. FBGs are sensitive to externalperturbations such as strain and temperature. When the strain or temperature near thegrating changes, the effective refractive index or/and grating period become changed,
Sensors 2022, 22, 4252 3 of 14
which leads to a shift in the reflected Bragg wavelength. The Bragg wavelength shift can beexpressed by [32]:
∆λBλB
=(
1 − pe f f
)∆ε + (α + β)∆T (2)
where λB and ∆λB are the initial Bragg wavelength and its change, and ∆ε and ∆T arethe stain and temperature change. peff, α, and β are the photo-elastic coefficient, thermalexpansion coefficient, and thermal-optic coefficient of fiber, respectively. The property ofthe Bragg wavelength shift with respect to the external strain or temperature is exploitedfor its sensing applications [32,33].
In case the temperature of the external environment is constant, the ∆T = 0, andEquation (2) is as follows:
∆λBλB
=(
1 − pe f f
)∆ε (3)
In case the FBG is not affected by the strain, ∆ε = 0 and Equation (2) is as follows:
∆λBλB
= (α + β)∆T (4)
3. FBG Temperature Sensor Fabrication and Sensing Performance Test3.1. Sensor Design and Encapsulation
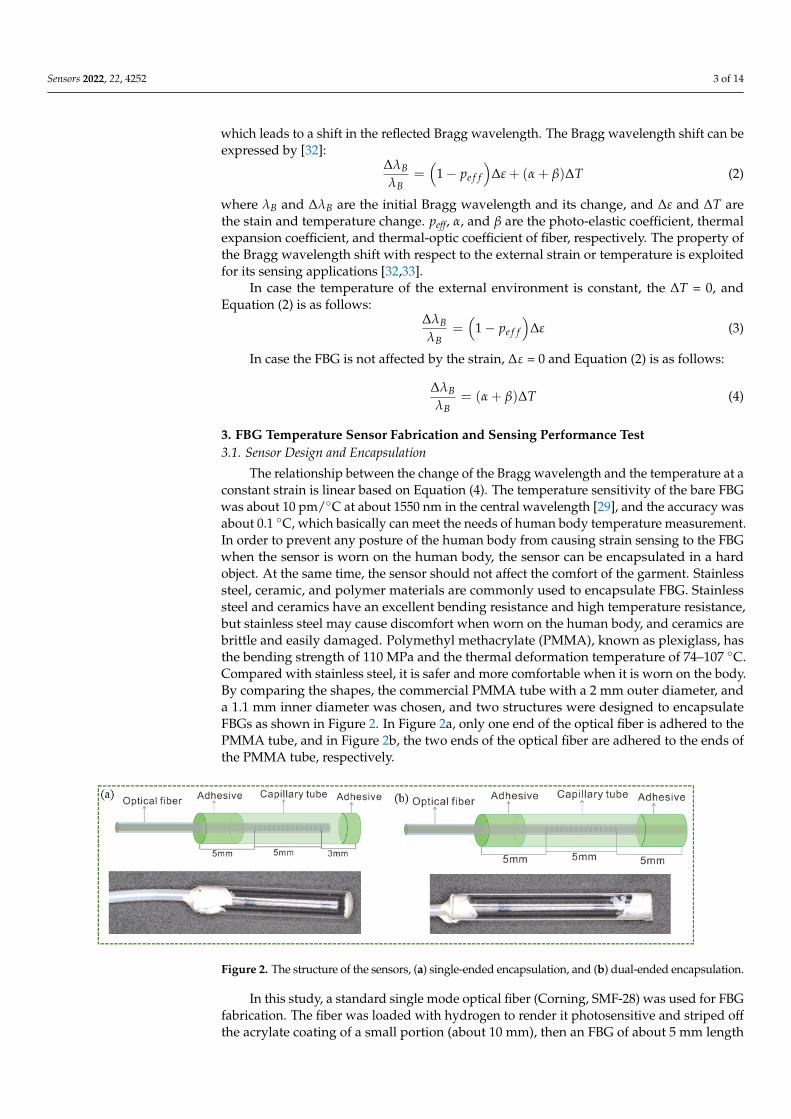
The relationship between the change of the Bragg wavelength and the temperature at aconstant strain is linear based on Equation (4). The temperature sensitivity of the bare FBGwas about 10 pm/◦C at about 1550 nm in the central wavelength [29], and the accuracy wasabout 0.1 ◦C, which basically can meet the needs of human body temperature measurement.In order to prevent any posture of the human body from causing strain sensing to the FBGwhen the sensor is worn on the human body, the sensor can be encapsulated in a hardobject. At the same time, the sensor should not affect the comfort of the garment. Stainlesssteel, ceramic, and polymer materials are commonly used to encapsulate FBG. Stainlesssteel and ceramics have an excellent bending resistance and high temperature resistance,but stainless steel may cause discomfort when worn on the human body, and ceramics arebrittle and easily damaged. Polymethyl methacrylate (PMMA), known as plexiglass, hasthe bending strength of 110 MPa and the thermal deformation temperature of 74–107 ◦C.Compared with stainless steel, it is safer and more comfortable when it is worn on the body.By comparing the shapes, the commercial PMMA tube with a 2 mm outer diameter, anda 1.1 mm inner diameter was chosen, and two structures were designed to encapsulateFBGs as shown in Figure 2. In Figure 2a, only one end of the optical fiber is adhered to thePMMA tube, and in Figure 2b, the two ends of the optical fiber are adhered to the ends ofthe PMMA tube, respectively.
Sensors 2022, 22, x FOR PEER REVIEW 3 of 13
to a shift in the reflected Bragg wavelength. The Bragg wavelength shift can be expressed by [32]:
( ) ( )1Beff
B
p Tλ ε α βλ
Δ= − Δ + + Δ (2)
where λB and ΔλB are the initial Bragg wavelength and its change, and ε and ΔT are the stain and temperature change. peff, α, and β are the photo-elastic coefficient, thermal ex-pansion coefficient, and thermal-optic coefficient of fiber, respectively. The property of the Bragg wavelength shift with respect to the external strain or temperature is exploited for its sensing applications [32,33].
In case the temperature of the external environment is constant, the ΔT = 0, and Equa-tion (2) is as follows:
( )1Beff
B
pλ ελ
Δ= − Δ (3)
In case the FBG is not affected by the strain, Δε = 0 and Equation (2) is as follows:
( )B
B
Tλ α βλ
Δ= + Δ (4)
3. FBG Temperature Sensor Fabrication and Sensing Performance Test 3.1. Sensor Design and Encapsulation
The relationship between the change of the Bragg wavelength and the temperature at a constant strain is linear based on Equation (4). The temperature sensitivity of the bare FBG was about 10 pm/°C at about 1550 nm in the central wavelength [29], and the accuracy was about 0.1 °C, which basically can meet the needs of human body temperature measure-ment. In order to prevent any posture of the human body from causing strain sensing to the FBG when the sensor is worn on the human body, the sensor can be encapsulated in a hard object. At the same time, the sensor should not affect the comfort of the garment. Stainless steel, ceramic, and polymer materials are commonly used to encapsulate FBG. Stainless steel and ceramics have an excellent bending resistance and high temperature resistance, but stainless steel may cause discomfort when worn on the human body, and ceramics are brittle and easily damaged. Polymethyl methacrylate (PMMA), known as plexiglass, has the bending strength of 110 MPa and the thermal deformation temperature of 74–107 °C. Compared with stainless steel, it is safer and more comfortable when it is worn on the body. By comparing the shapes, the commercial PMMA tube with a 2 mm outer diam-eter, and a 1.1 mm inner diameter was chosen, and two structures were designed to encapsu-late FBGs as shown in Figure 2. In Figure 2a, only one end of the optical fiber is adhered to the PMMA tube, and in Figure 2b, the two ends of the optical fiber are adhered to the ends of the PMMA tube, respectively.
Figure 2. The structure of the sensors, (a) single-ended encapsulation, and (b) dual-ended encapsulation. Figure 2. The structure of the sensors, (a) single-ended encapsulation, and (b) dual-ended encapsulation.
In this study, a standard single mode optical fiber (Corning, SMF-28) was used for FBGfabrication. The fiber was loaded with hydrogen to render it photosensitive and striped offthe acrylate coating of a small portion (about 10 mm), then an FBG of about 5 mm length
Sensors 2022, 22, 4252 4 of 14
was imprinted in the fiber core using the standard phase mask technique, and recoatedwith acrylic. The PMMA tube of 13 mm length was used as the single-ended encapsulatedtube, and the one of 15 mm length was used as the duel-ended encapsulated tube. In orderto make the size of the grating area smaller and maintain the stability and accuracy of themeasurement, we designed the fiber Bragg grating measurement area to be 5 mm, the sizeof the fixed end of the FBG and PMMA was designed to be 5 mm to improve stability, andthe only sealing end was designed to be 3 mm. For single-ended encapsulation, first thetail fiber was cut off, one end of the PMMA tube was sealed with glue, the optical fiberwas inserted into the PMMA tube, and the other end of the PMMA tube and the opticalfiber were glued together. For dual-ended encapsulation, the optical fiber was connected tothe FBG interrogator and inserted into the PMMA tube, the grating part was placed in thecenter of the PMMA tube, the front part of the grating and the PMMA tube were sealedwith glue, and the tail fiber was straightened with a clamp, the wavelength change in theFBG interrogator was changed, and when the change was about 0–1 pm, the optical fiberand the PMMA tube were glued together. More glue was added to the bonding end ofthe optical fiber and the PMMA tube to prevent the optical fiber from falling off. Throughexperiments, the length of the single-end encapsulation PMMA tube was set to 13 mm, asshown in Figure 2a, and the length of dual-ended encapsulation PMMA tube was 15 mm, asshown in Figure 2b. The optical fibers were covered with the ethylene-tetrafluoroethylene(ETFE) fluoropolymer as the protective jacket, which could make the optical fiber moreflexible and stronger. The optical fiber, jacket, and the ends of the tubes were fixed withepoxy glue.
3.2. Calibration Experiment of Sensor
Sensors should be calibrated against a certified thermometer before use. Currently,there is no consensus on the best approach for FBG sensors’ calibration [34]. Some literatureshave reported calibrations by immersing FBG sensors into a thermostatic water bath [35]or different temperature liquid (liquid nitrogen (−195.8 ◦C), ice slush (0 ◦C), and boilingwater (100 ◦C)) with a platinum thermoresistance (Pt-100) element [36]. The calibrationerror of the former is related to the temperature accuracy of the water bath. The latter onlycalibrated three fixed points, which directly affected the calibration accuracy.
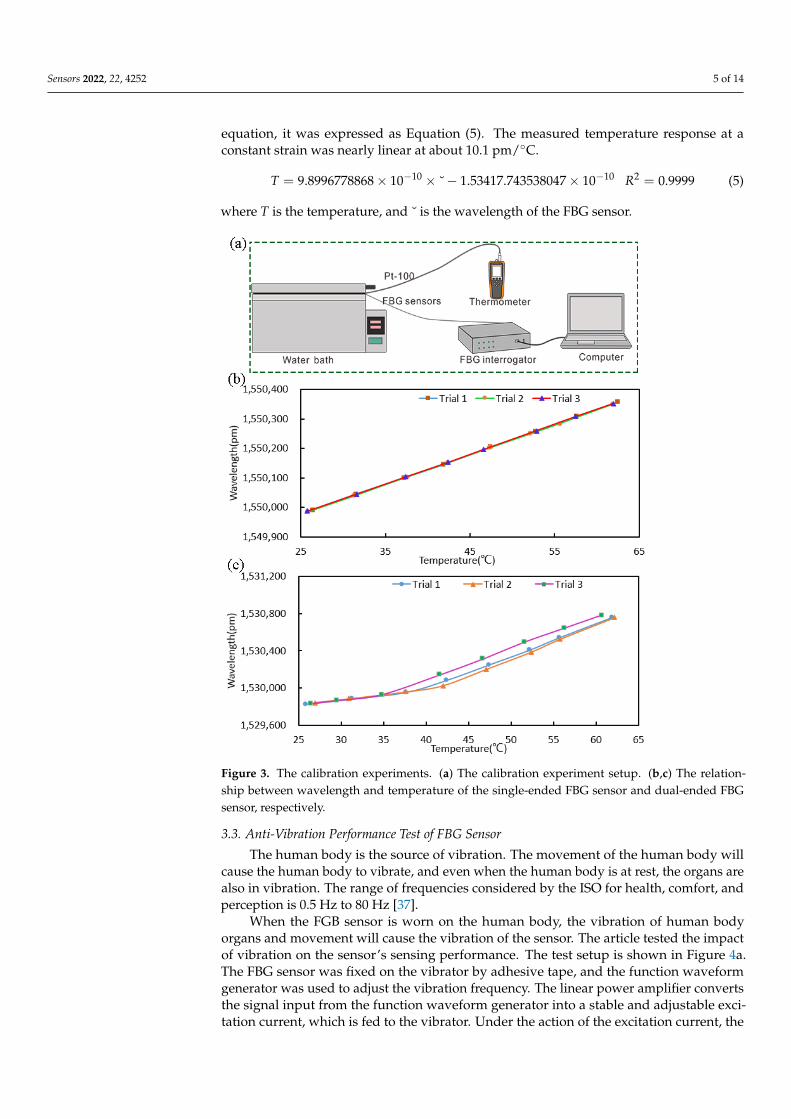
In this work, the block diagram of the experimental setup is depicted in Figure 3a.The thermostatic water bath was heated to different discrete temperatures. A platinumresistance thermometer (YET-720L, Kaipusen) with a reported accuracy of ±0.1 ◦C and aPt-100 platinum resistance temperature sensor were used as the standard measure of thewater bath temperature. The FBG sensor and the Pt-100 sensor were immersed in the sameplace of the water bath. At each discrete temperature, the values of the thermometer andFBG wavelength were recorded when they fluctuated about 30 s slightly around a fixedvalue. Three calibration experiments were carried out three times at different times.
Figure 3b,c shows the relationship between the wavelength and temperature of thesingle-ended FBG sensor and dual-ended FBG sensor, respectively. For the single-endedFBG sensor, it can be observed that the wavelength of the Bragg grating increased withtemperature and the wavelength shifts of all three trial runs agreed well with each other,which shows that the sensors had a good stability and repeatability. However, for thedual-ended FBG sensor, the wavelength of the Bragg grating increased with temperature,but the wavelength shifts of all three experiments were not quite consistent. This may becaused by the change in the length of the PMMA tube (the coefficient of linear expansion isapproximately (5~9) × 10−5/◦C.) due to the change in temperature, which resulted in thestrain applied to the FBG. Thus, further experiments were carried out with single-endedFBG sensors.
The results of the three calibrations were, respectively, fitted with linear equations. Bycombining the data from the three trials and using the mean for determining the calibration
Sensors 2022, 22, 4252 5 of 14
equation, it was expressed as Equation (5). The measured temperature response at aconstant strain was nearly linear at about 10.1 pm/◦C.
T = 9.8996778868 × 10⁻¹⁰ × ˘ − 1.53417.743538047 × 10−10 R2 = 0.9999 (5)
where T is the temperature, and ˘ is the wavelength of the FBG sensor.
Sensors 2022, 22, x FOR PEER REVIEW 5 of 13
Figure 3. The calibration experiments. (a) The calibration experiment setup. (b,c) The relationship be-tween wavelength and temperature of the single-ended FBG sensor and dual-ended FBG sensor, respec-tively.
The results of the three calibrations were, respectively, fitted with linear equations. By combining the data from the three trials and using the mean for determining the cali-bration equation, it was expressed as Equation (5). The measured temperature response at a constant strain was nearly linear at about 10.1 pm/°C.
10 109.8996778868 10 1.53417.743538047 10T λ− −= × × − × 2 0.9999R = (5)
where T is the temperature, and λ is the wavelength of the FBG sensor.
3.3. Anti-Vibration Performance Test of FBG Sensor The human body is the source of vibration. The movement of the human body will
cause the human body to vibrate, and even when the human body is at rest, the organs are also in vibration. The range of frequencies considered by the ISO for health, comfort, and perception is 0.5 Hz to 80 Hz [37].
When the FGB sensor is worn on the human body, the vibration of human body or-gans and movement will cause the vibration of the sensor. The article tested the impact of vibration on the sensor’s sensing performance. The test setup is shown in Figure 4a. The FBG sensor was fixed on the vibrator by adhesive tape, and the function waveform gen-erator was used to adjust the vibration frequency. The linear power amplifier converts the signal input from the function waveform generator into a stable and adjustable excitation current, which is fed to the vibrator. Under the action of the excitation current, the vibrator generates an excitation force to make it vibrate. By setting a different vibration frequency
Figure 3. The calibration experiments. (a) The calibration experiment setup. (b,c) The relation-ship between wavelength and temperature of the single-ended FBG sensor and dual-ended FBGsensor, respectively.
3.3. Anti-Vibration Performance Test of FBG Sensor
The human body is the source of vibration. The movement of the human body willcause the human body to vibrate, and even when the human body is at rest, the organs arealso in vibration. The range of frequencies considered by the ISO for health, comfort, andperception is 0.5 Hz to 80 Hz [37].
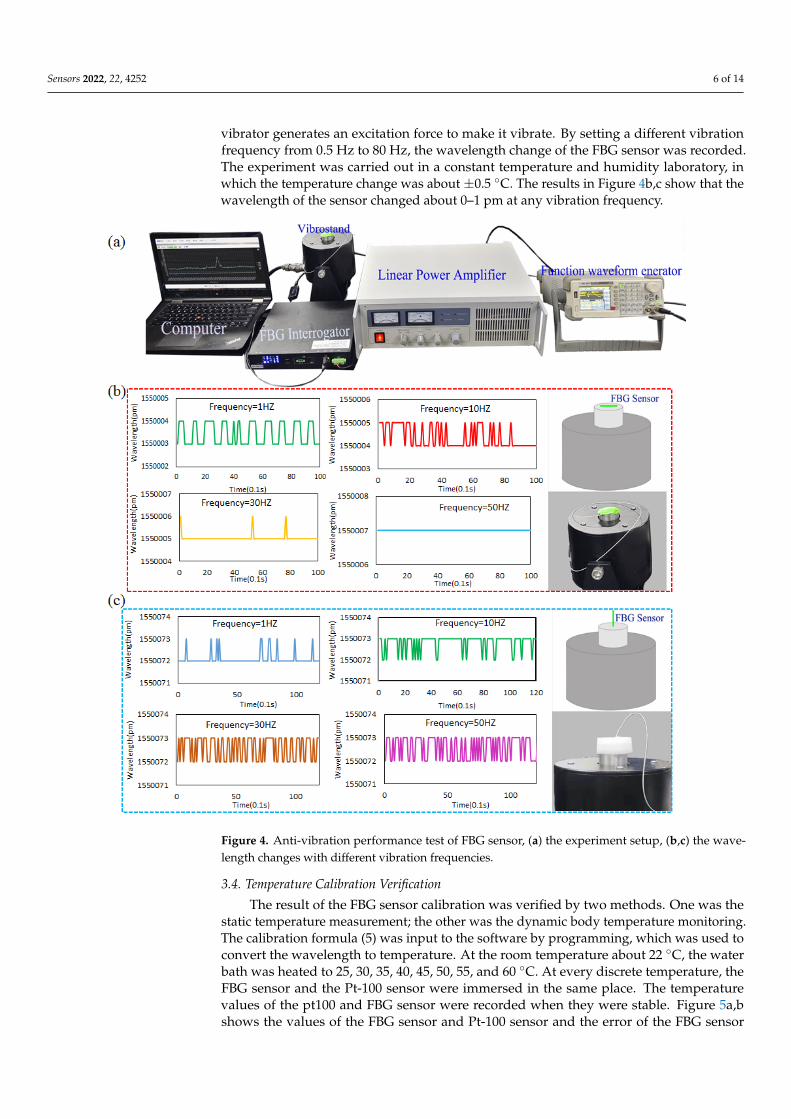
When the FGB sensor is worn on the human body, the vibration of human bodyorgans and movement will cause the vibration of the sensor. The article tested the impactof vibration on the sensor’s sensing performance. The test setup is shown in Figure 4a.The FBG sensor was fixed on the vibrator by adhesive tape, and the function waveformgenerator was used to adjust the vibration frequency. The linear power amplifier convertsthe signal input from the function waveform generator into a stable and adjustable exci-tation current, which is fed to the vibrator. Under the action of the excitation current, the
Sensors 2022, 22, 4252 6 of 14
vibrator generates an excitation force to make it vibrate. By setting a different vibrationfrequency from 0.5 Hz to 80 Hz, the wavelength change of the FBG sensor was recorded.The experiment was carried out in a constant temperature and humidity laboratory, inwhich the temperature change was about ±0.5 ◦C. The results in Figure 4b,c show that thewavelength of the sensor changed about 0–1 pm at any vibration frequency.
Sensors 2022, 22, x FOR PEER REVIEW 6 of 13
from 0.5 Hz to 80 Hz, the wavelength change of the FBG sensor was recorded. The exper-iment was carried out in a constant temperature and humidity laboratory, in which the temperature change was about ±0.5 °C. The results in Figure 4b,c show that the wave-length of the sensor changed about 0–1 pm at any vibration frequency.
Figure 4. Anti-vibration performance test of FBG sensor, (a) the experiment setup, (b,c) the wave-length changes with different vibration frequencies.
3.4. Temperature Calibration Verification The result of the FBG sensor calibration was verified by two methods. One was the
static temperature measurement; the other was the dynamic body temperature monitor-ing. The calibration formula (5) was input to the software by programming, which was used to convert the wavelength to temperature. At the room temperature about 22 °C, the water bath was heated to 25, 30, 35, 40, 45, 50, 55, and 60 °C. At every discrete temperature, the FBG sensor and the Pt-100 sensor were immersed in the same place. The temperature values of the pt100 and FBG sensor were recorded when they were stable. Figure 5a,b shows the values of the FBG sensor and Pt-100 sensor and the error of the FBG sensor relative to the Pt-100 sensor, and the absolute values of the errors are all less than 0.2 °C. Then, at the room temperature about 25 °C, the Pt-100 sensor and FBG sensor were placed in the armpit of the subject at the same time, and the sensors were clamped by the arm. After about 30 min, the sensors were removed from the armpit. The platinum resistance thermometer recorded one data per second, and the FBG interrogator recorded 10 data per second. By calculating the average value of the data recorded by the FBG interrogator
Figure 4. Anti-vibration performance test of FBG sensor, (a) the experiment setup, (b,c) the wave-length changes with different vibration frequencies.
3.4. Temperature Calibration Verification
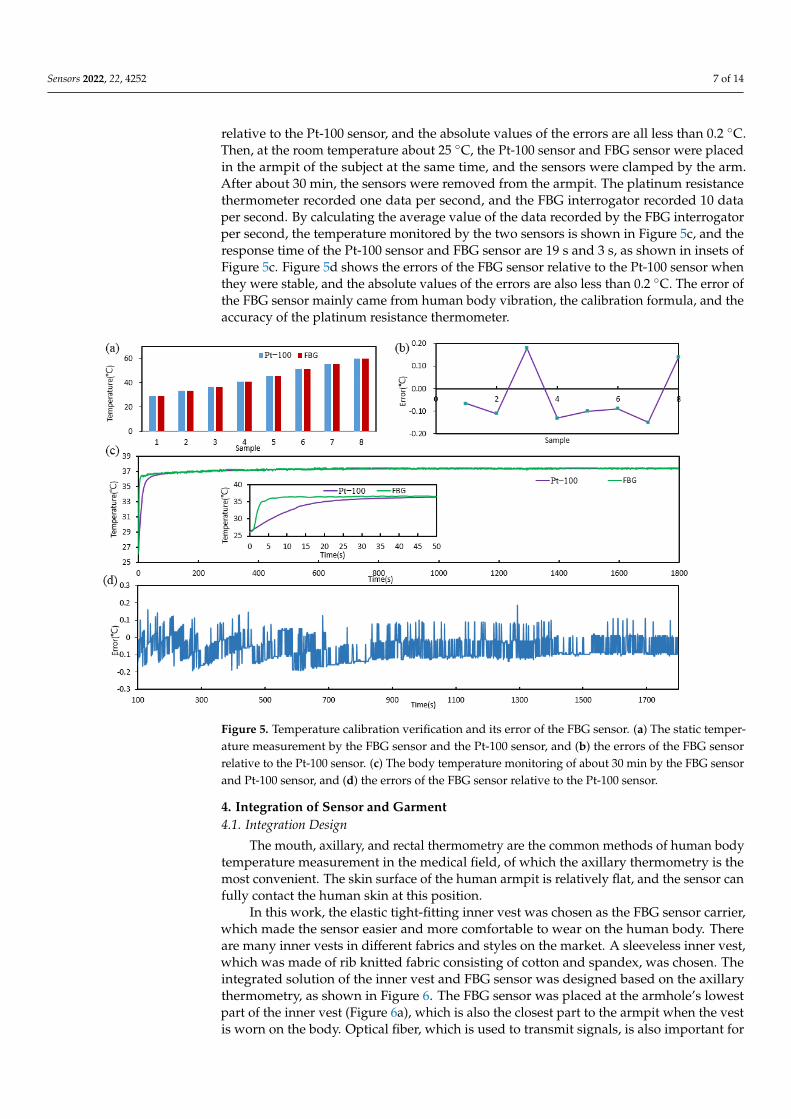
The result of the FBG sensor calibration was verified by two methods. One was thestatic temperature measurement; the other was the dynamic body temperature monitoring.The calibration formula (5) was input to the software by programming, which was used toconvert the wavelength to temperature. At the room temperature about 22 ◦C, the waterbath was heated to 25, 30, 35, 40, 45, 50, 55, and 60 ◦C. At every discrete temperature, theFBG sensor and the Pt-100 sensor were immersed in the same place. The temperaturevalues of the pt100 and FBG sensor were recorded when they were stable. Figure 5a,bshows the values of the FBG sensor and Pt-100 sensor and the error of the FBG sensor
Sensors 2022, 22, 4252 7 of 14
relative to the Pt-100 sensor, and the absolute values of the errors are all less than 0.2 ◦C.Then, at the room temperature about 25 ◦C, the Pt-100 sensor and FBG sensor were placedin the armpit of the subject at the same time, and the sensors were clamped by the arm.After about 30 min, the sensors were removed from the armpit. The platinum resistancethermometer recorded one data per second, and the FBG interrogator recorded 10 dataper second. By calculating the average value of the data recorded by the FBG interrogatorper second, the temperature monitored by the two sensors is shown in Figure 5c, and theresponse time of the Pt-100 sensor and FBG sensor are 19 s and 3 s, as shown in insets ofFigure 5c. Figure 5d shows the errors of the FBG sensor relative to the Pt-100 sensor whenthey were stable, and the absolute values of the errors are also less than 0.2 ◦C. The error ofthe FBG sensor mainly came from human body vibration, the calibration formula, and theaccuracy of the platinum resistance thermometer.
Sensors 2022, 22, x FOR PEER REVIEW 7 of 13
per second, the temperature monitored by the two sensors is shown in Figure 5c, and the response time of the Pt-100 sensor and FBG sensor are 19 s and 3 s, as shown in insets of Figure 5c. Figure 5d shows the errors of the FBG sensor relative to the Pt-100 sensor when they were stable, and the absolute values of the errors are also less than 0.2 °C. The error of the FBG sensor mainly came from human body vibration, the calibration formula, and the accuracy of the platinum resistance thermometer.
Figure 5. Temperature calibration verification and its error of the FBG sensor. (a) The static temper-ature measurement by the FBG sensor and the Pt-100 sensor, and (b) the errors of the FBG sensor relative to the Pt-100 sensor. (c) The body temperature monitoring of about 30 min by the FBG sensor and Pt-100 sensor, and (d) the errors of the FBG sensor relative to the Pt-100 sensor.
4. Integration of Sensor and Garment 4.1. Integration Design
The mouth, axillary, and rectal thermometry are the common methods of human body temperature measurement in the medical field, of which the axillary thermometry is the most convenient. The skin surface of the human armpit is relatively flat, and the sensor can fully contact the human skin at this position.
In this work, the elastic tight-fitting inner vest was chosen as the FBG sensor carrier, which made the sensor easier and more comfortable to wear on the human body. There are many inner vests in different fabrics and styles on the market. A sleeveless inner vest, which was made of rib knitted fabric consisting of cotton and spandex, was chosen. The integrated solution of the inner vest and FBG sensor was designed based on the axillary thermometry, as shown in Figure 6. The FBG sensor was placed at the armhole’s lowest part of the inner vest (Figure 6a), which is also the closest part to the armpit when the vest is worn on the body. Optical fiber, which is used to transmit signals, is also important for the integration of the entire garment. If it is free, it may affect the signal transmission or be pulled off. Because the tight garment is worn on the human body, it may be stretched horizontally or vertically. When the optical fiber is integrated into the garment in a straight line, it is easily damaged as the garment is stretched. Therefore, the path of the optical fiber was designed as a curved line, as shown in Figure 6b. When the garment is stretched, the curvature of the optical fiber path changes, which can protect the optical fiber from being broken. The heat press machine was employed to glue the FBG sensor and optical fiber on the inner vest by the hot melt glue, as Figure 6c shows. Since the
Figure 5. Temperature calibration verification and its error of the FBG sensor. (a) The static temper-ature measurement by the FBG sensor and the Pt-100 sensor, and (b) the errors of the FBG sensorrelative to the Pt-100 sensor. (c) The body temperature monitoring of about 30 min by the FBG sensorand Pt-100 sensor, and (d) the errors of the FBG sensor relative to the Pt-100 sensor.
4. Integration of Sensor and Garment4.1. Integration Design
The mouth, axillary, and rectal thermometry are the common methods of human bodytemperature measurement in the medical field, of which the axillary thermometry is themost convenient. The skin surface of the human armpit is relatively flat, and the sensor canfully contact the human skin at this position.
In this work, the elastic tight-fitting inner vest was chosen as the FBG sensor carrier,which made the sensor easier and more comfortable to wear on the human body. Thereare many inner vests in different fabrics and styles on the market. A sleeveless inner vest,which was made of rib knitted fabric consisting of cotton and spandex, was chosen. Theintegrated solution of the inner vest and FBG sensor was designed based on the axillarythermometry, as shown in Figure 6. The FBG sensor was placed at the armhole’s lowestpart of the inner vest (Figure 6a), which is also the closest part to the armpit when the vestis worn on the body. Optical fiber, which is used to transmit signals, is also important for
Sensors 2022, 22, 4252 8 of 14
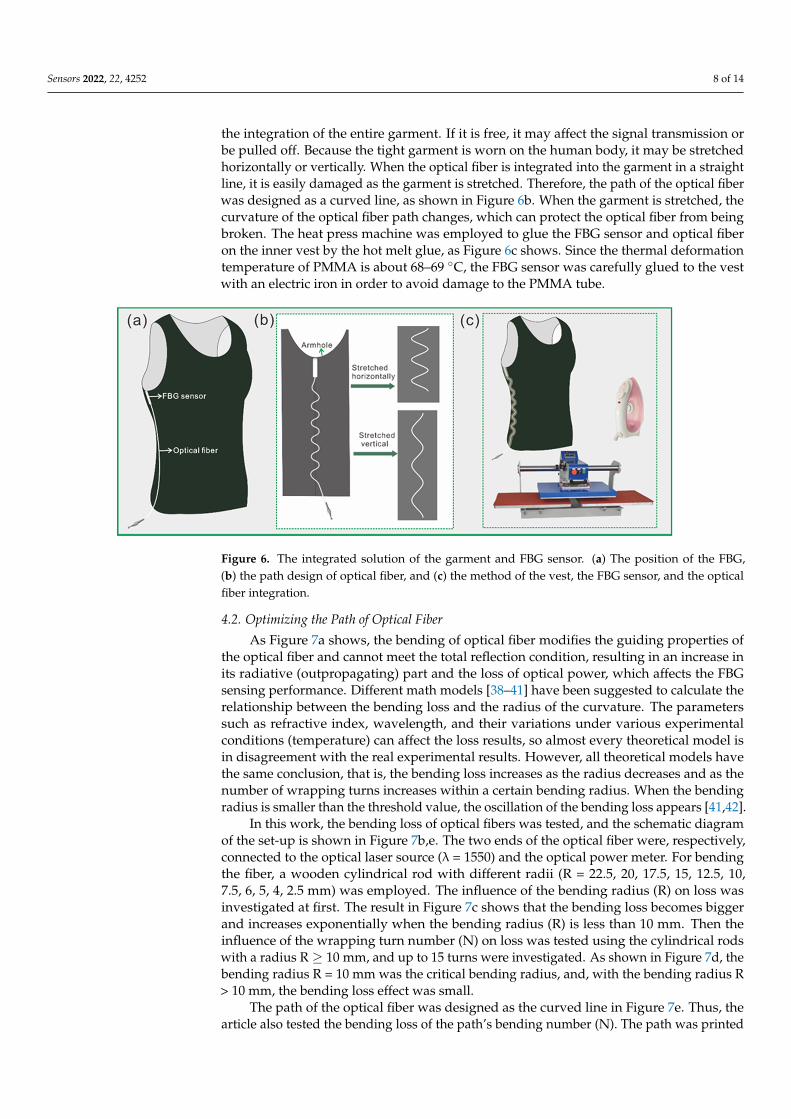
the integration of the entire garment. If it is free, it may affect the signal transmission orbe pulled off. Because the tight garment is worn on the human body, it may be stretchedhorizontally or vertically. When the optical fiber is integrated into the garment in a straightline, it is easily damaged as the garment is stretched. Therefore, the path of the optical fiberwas designed as a curved line, as shown in Figure 6b. When the garment is stretched, thecurvature of the optical fiber path changes, which can protect the optical fiber from beingbroken. The heat press machine was employed to glue the FBG sensor and optical fiberon the inner vest by the hot melt glue, as Figure 6c shows. Since the thermal deformationtemperature of PMMA is about 68–69 ◦C, the FBG sensor was carefully glued to the vestwith an electric iron in order to avoid damage to the PMMA tube.
Sensors 2022, 22, x FOR PEER REVIEW 8 of 13
thermal deformation temperature of PMMA is about 68–69 °C, the FBG sensor was care-fully glued to the vest with an electric iron in order to avoid damage to the PMMA tube.
Figure 6. The integrated solution of the garment and FBG sensor. (a) The position of the FBG, (b) the path design of optical fiber, and (c) the method of the vest, the FBG sensor, and the optical fiber integration.
4.2. Optimizing the Path of Optical Fiber As Figure 7a shows, the bending of optical fiber modifies the guiding properties of
the optical fiber and cannot meet the total reflection condition, resulting in an increase in its radiative (outpropagating) part and the loss of optical power, which affects the FBG sensing performance. Different math models [38–41] have been suggested to calculate the relationship between the bending loss and the radius of the curvature. The parameters such as refractive index, wavelength, and their variations under various experimental conditions (temperature) can affect the loss results, so almost every theoretical model is in disagreement with the real experimental results. However, all theoretical models have the same conclusion, that is, the bending loss increases as the radius decreases and as the number of wrapping turns increases within a certain bending radius. When the bending radius is smaller than the threshold value, the oscillation of the bending loss appears [41,42].
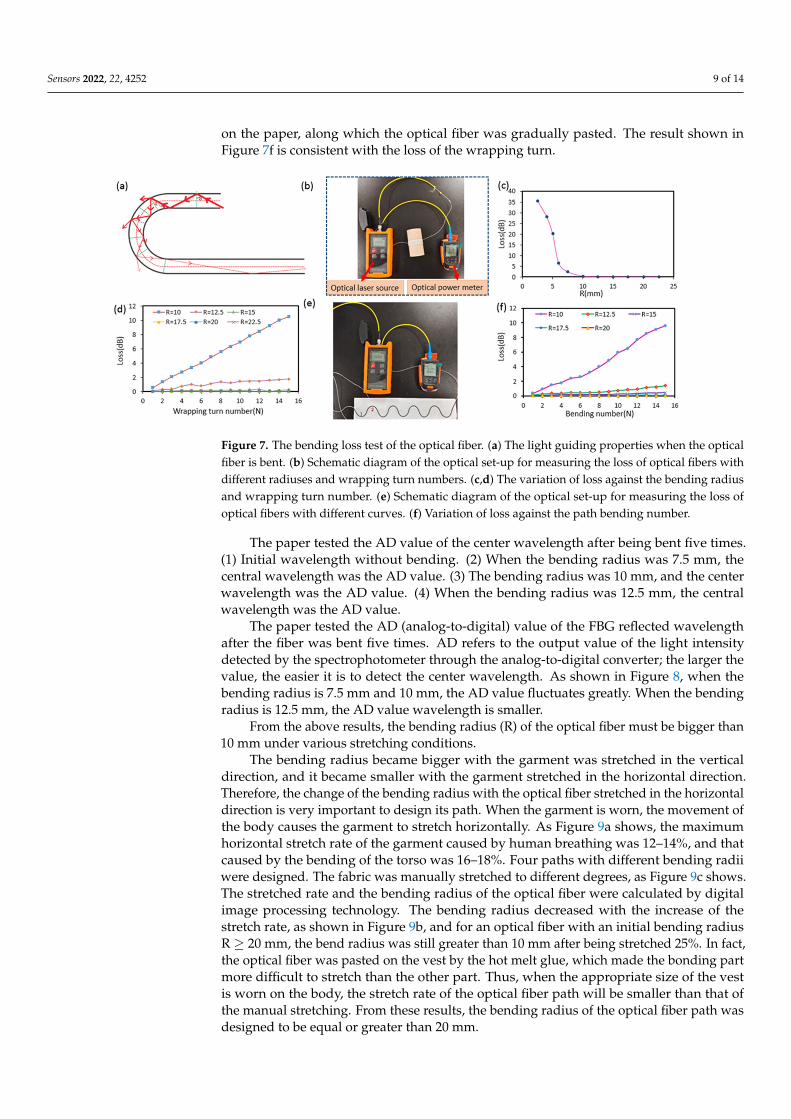
Figure 7. The bending loss test of the optical fiber. (a) The light guiding properties when the optical fiber is bent. (b) Schematic diagram of the optical set-up for measuring the loss of optical fibers with different radiuses and wrapping turn numbers. (c,d) The variation of loss against the bending radius and wrapping turn number. (e) Schematic diagram of the optical set-up for measuring the loss of optical fibers with different curves. (f) Variation of loss against the path bending number.
In this work, the bending loss of optical fibers was tested, and the schematic diagram of the set-up is shown in Figure 7b,e. The two ends of the optical fiber were, respectively,
Figure 6. The integrated solution of the garment and FBG sensor. (a) The position of the FBG,(b) the path design of optical fiber, and (c) the method of the vest, the FBG sensor, and the opticalfiber integration.
4.2. Optimizing the Path of Optical Fiber
As Figure 7a shows, the bending of optical fiber modifies the guiding properties ofthe optical fiber and cannot meet the total reflection condition, resulting in an increase inits radiative (outpropagating) part and the loss of optical power, which affects the FBGsensing performance. Different math models [38–41] have been suggested to calculate therelationship between the bending loss and the radius of the curvature. The parameterssuch as refractive index, wavelength, and their variations under various experimentalconditions (temperature) can affect the loss results, so almost every theoretical model isin disagreement with the real experimental results. However, all theoretical models havethe same conclusion, that is, the bending loss increases as the radius decreases and as thenumber of wrapping turns increases within a certain bending radius. When the bendingradius is smaller than the threshold value, the oscillation of the bending loss appears [41,42].
In this work, the bending loss of optical fibers was tested, and the schematic diagramof the set-up is shown in Figure 7b,e. The two ends of the optical fiber were, respectively,connected to the optical laser source (λ = 1550) and the optical power meter. For bendingthe fiber, a wooden cylindrical rod with different radii (R = 22.5, 20, 17.5, 15, 12.5, 10,7.5, 6, 5, 4, 2.5 mm) was employed. The influence of the bending radius (R) on loss wasinvestigated at first. The result in Figure 7c shows that the bending loss becomes biggerand increases exponentially when the bending radius (R) is less than 10 mm. Then theinfluence of the wrapping turn number (N) on loss was tested using the cylindrical rodswith a radius R ≥ 10 mm, and up to 15 turns were investigated. As shown in Figure 7d, thebending radius R = 10 mm was the critical bending radius, and, with the bending radius R> 10 mm, the bending loss effect was small.
The path of the optical fiber was designed as the curved line in Figure 7e. Thus, thearticle also tested the bending loss of the path’s bending number (N). The path was printed
Sensors 2022, 22, 4252 9 of 14
on the paper, along which the optical fiber was gradually pasted. The result shown inFigure 7f is consistent with the loss of the wrapping turn.
Sensors 2022, 22, x FOR PEER REVIEW 8 of 13
thermal deformation temperature of PMMA is about 68–69 °C, the FBG sensor was care-fully glued to the vest with an electric iron in order to avoid damage to the PMMA tube.
Figure 6. The integrated solution of the garment and FBG sensor. (a) The position of the FBG, (b) the path design of optical fiber, and (c) the method of the vest, the FBG sensor, and the optical fiber integration.
4.2. Optimizing the Path of Optical Fiber As Figure 7a shows, the bending of optical fiber modifies the guiding properties of
the optical fiber and cannot meet the total reflection condition, resulting in an increase in its radiative (outpropagating) part and the loss of optical power, which affects the FBG sensing performance. Different math models [38–41] have been suggested to calculate the relationship between the bending loss and the radius of the curvature. The parameters such as refractive index, wavelength, and their variations under various experimental conditions (temperature) can affect the loss results, so almost every theoretical model is in disagreement with the real experimental results. However, all theoretical models have the same conclusion, that is, the bending loss increases as the radius decreases and as the number of wrapping turns increases within a certain bending radius. When the bending radius is smaller than the threshold value, the oscillation of the bending loss appears [41,42].
Figure 7. The bending loss test of the optical fiber. (a) The light guiding properties when the optical fiber is bent. (b) Schematic diagram of the optical set-up for measuring the loss of optical fibers with different radiuses and wrapping turn numbers. (c,d) The variation of loss against the bending radius and wrapping turn number. (e) Schematic diagram of the optical set-up for measuring the loss of optical fibers with different curves. (f) Variation of loss against the path bending number.
In this work, the bending loss of optical fibers was tested, and the schematic diagram of the set-up is shown in Figure 7b,e. The two ends of the optical fiber were, respectively,
Figure 7. The bending loss test of the optical fiber. (a) The light guiding properties when the opticalfiber is bent. (b) Schematic diagram of the optical set-up for measuring the loss of optical fibers withdifferent radiuses and wrapping turn numbers. (c,d) The variation of loss against the bending radiusand wrapping turn number. (e) Schematic diagram of the optical set-up for measuring the loss ofoptical fibers with different curves. (f) Variation of loss against the path bending number.
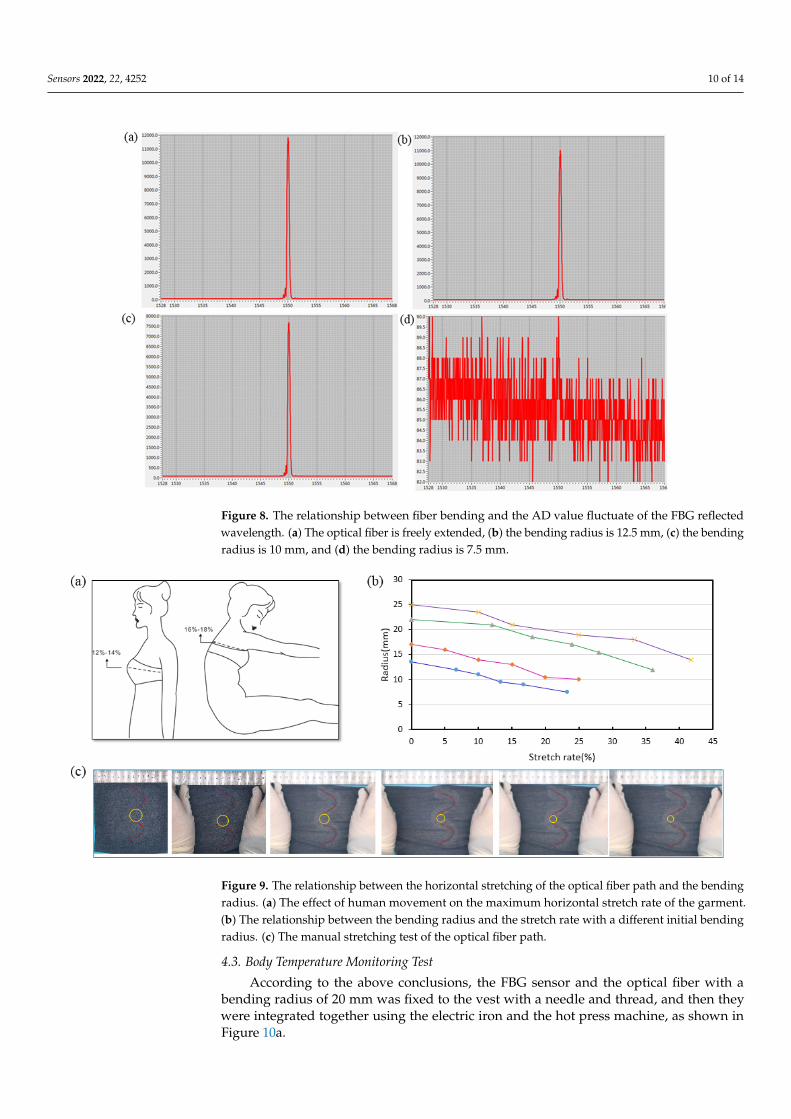
The paper tested the AD value of the center wavelength after being bent five times.(1) Initial wavelength without bending. (2) When the bending radius was 7.5 mm, thecentral wavelength was the AD value. (3) The bending radius was 10 mm, and the centerwavelength was the AD value. (4) When the bending radius was 12.5 mm, the centralwavelength was the AD value.
The paper tested the AD (analog-to-digital) value of the FBG reflected wavelengthafter the fiber was bent five times. AD refers to the output value of the light intensitydetected by the spectrophotometer through the analog-to-digital converter; the larger thevalue, the easier it is to detect the center wavelength. As shown in Figure 8, when thebending radius is 7.5 mm and 10 mm, the AD value fluctuates greatly. When the bendingradius is 12.5 mm, the AD value wavelength is smaller.
From the above results, the bending radius (R) of the optical fiber must be bigger than10 mm under various stretching conditions.
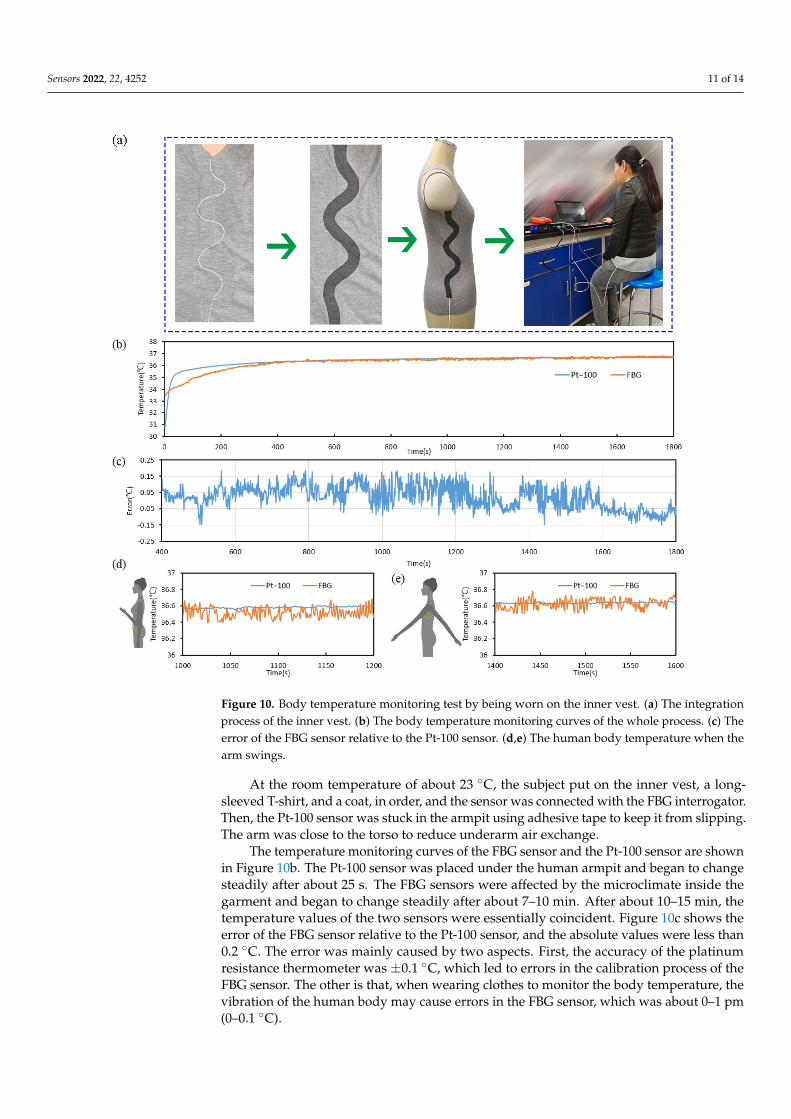
The bending radius became bigger with the garment was stretched in the verticaldirection, and it became smaller with the garment stretched in the horizontal direction.Therefore, the change of the bending radius with the optical fiber stretched in the horizontaldirection is very important to design its path. When the garment is worn, the movement ofthe body causes the garment to stretch horizontally. As Figure 9a shows, the maximumhorizontal stretch rate of the garment caused by human breathing was 12–14%, and thatcaused by the bending of the torso was 16–18%. Four paths with different bending radiiwere designed. The fabric was manually stretched to different degrees, as Figure 9c shows.The stretched rate and the bending radius of the optical fiber were calculated by digitalimage processing technology. The bending radius decreased with the increase of thestretch rate, as shown in Figure 9b, and for an optical fiber with an initial bending radiusR ≥ 20 mm, the bend radius was still greater than 10 mm after being stretched 25%. In fact,the optical fiber was pasted on the vest by the hot melt glue, which made the bonding partmore difficult to stretch than the other part. Thus, when the appropriate size of the vestis worn on the body, the stretch rate of the optical fiber path will be smaller than that ofthe manual stretching. From these results, the bending radius of the optical fiber path wasdesigned to be equal or greater than 20 mm.
Sensors 2022, 22, 4252 10 of 14
Sensors 2022, 22, x FOR PEER REVIEW 9 of 13
connected to the optical laser source (λ = 1550) and the optical power meter. For bending the fiber, a wooden cylindrical rod with different radii (R = 22.5, 20, 17.5, 15, 12.5, 10, 7.5, 6, 5, 4, 2.5 mm) was employed. The influence of the bending radius (R) on loss was inves-tigated at first. The result in Figure 7c shows that the bending loss becomes bigger and increases exponentially when the bending radius (R) is less than 10 mm. Then the influ-ence of the wrapping turn number (N) on loss was tested using the cylindrical rods with a radius R ≥ 10 mm, and up to 15 turns were investigated. As shown in Figure 7d, the bending radius R = 10 mm was the critical bending radius, and, with the bending radius R > 10 mm, the bending loss effect was small.
The path of the optical fiber was designed as the curved line in Figure 7e. Thus, the article also tested the bending loss of the path’s bending number (N). The path was printed on the paper, along which the optical fiber was gradually pasted. The result shown in Figure 7f is consistent with the loss of the wrapping turn.
The paper tested the AD value of the center wavelength after being bent five times. (1) Initial wavelength without bending. (2) When the bending radius was 7.5 mm, the central wavelength was the AD value. (3) The bending radius was 10 mm, and the center wavelength was the AD value. (4) When the bending radius was 12.5 mm, the central wavelength was the AD value.
The paper tested the AD (analog-to-digital) value of the FBG reflected wavelength after the fiber was bent five times. AD refers to the output value of the light intensity detected by the spectrophotometer through the analog-to-digital converter; the larger the value, the easier it is to detect the center wavelength. As shown in Figure 8, when the bending radius is 7.5 mm and 10 mm, the AD value fluctuates greatly. When the bending radius is 12.5 mm, the AD value wavelength is smaller.
Figure 8. The relationship between fiber bending and the AD value fluctuate of the FBG reflected wavelength. (a) The optical fiber is freely extended, (b) the bending radius is 12.5 mm, (c) the bend-ing radius is 10 mm, and (d) the bending radius is 7.5 mm.
From the above results, the bending radius (R) of the optical fiber must be bigger than 10 mm under various stretching conditions.
The bending radius became bigger with the garment was stretched in the vertical direction, and it became smaller with the garment stretched in the horizontal direction. Therefore, the change of the bending radius with the optical fiber stretched in the hori-
Figure 8. The relationship between fiber bending and the AD value fluctuate of the FBG reflectedwavelength. (a) The optical fiber is freely extended, (b) the bending radius is 12.5 mm, (c) the bendingradius is 10 mm, and (d) the bending radius is 7.5 mm.
Sensors 2022, 22, x FOR PEER REVIEW 10 of 13
zontal direction is very important to design its path. When the garment is worn, the move-ment of the body causes the garment to stretch horizontally. As Figure 9a shows, the max-imum horizontal stretch rate of the garment caused by human breathing was 12–14%, and that caused by the bending of the torso was 16–18%. Four paths with different bending radii were designed. The fabric was manually stretched to different degrees, as Figure 9c shows. The stretched rate and the bending radius of the optical fiber were calculated by digital image processing technology. The bending radius decreased with the increase of the stretch rate, as shown in Figure 9b, and for an optical fiber with an initial bending radius R ≥ 20 mm, the bend radius was still greater than 10 mm after being stretched 25%. In fact, the optical fiber was pasted on the vest by the hot melt glue, which made the bonding part more difficult to stretch than the other part. Thus, when the appropriate size of the vest is worn on the body, the stretch rate of the optical fiber path will be smaller than that of the manual stretching. From these results, the bending radius of the optical fiber path was designed to be equal or greater than 20 mm.
Figure 9. The relationship between the horizontal stretching of the optical fiber path and the bend-ing radius. (a) The effect of human movement on the maximum horizontal stretch rate of the gar-ment. (b) The relationship between the bending radius and the stretch rate with a different initial bending radius. (c) The manual stretching test of the optical fiber path.
4.3. Body Temperature Monitoring Test According to the above conclusions, the FBG sensor and the optical fiber with a bend-
ing radius of 20 mm was fixed to the vest with a needle and thread, and then they were inte-grated together using the electric iron and the hot press machine, as shown in Figure 10a.
At the room temperature of about 23 °C, the subject put on the inner vest, a long-sleeved T-shirt, and a coat, in order, and the sensor was connected with the FBG interro-gator. Then, the Pt-100 sensor was stuck in the armpit using adhesive tape to keep it from slipping. The arm was close to the torso to reduce underarm air exchange.
The temperature monitoring curves of the FBG sensor and the Pt-100 sensor are shown in Figure 10b. The Pt-100 sensor was placed under the human armpit and began to change steadily after about 25 s. The FBG sensors were affected by the microclimate inside the garment and began to change steadily after about 7–10 min. After about 10–15 min, the temperature values of the two sensors were essentially coincident. Figure 10c shows the error of the FBG sensor relative to the Pt-100 sensor, and the absolute values were less than 0.2 °C. The error was mainly caused by two aspects. First, the accuracy of the platinum resistance thermometer was ±0.1 °C, which led to errors in the calibration
Figure 9. The relationship between the horizontal stretching of the optical fiber path and the bendingradius. (a) The effect of human movement on the maximum horizontal stretch rate of the garment.(b) The relationship between the bending radius and the stretch rate with a different initial bendingradius. (c) The manual stretching test of the optical fiber path.
4.3. Body Temperature Monitoring Test
According to the above conclusions, the FBG sensor and the optical fiber with abending radius of 20 mm was fixed to the vest with a needle and thread, and then theywere integrated together using the electric iron and the hot press machine, as shown inFigure 10a.
Sensors 2022, 22, 4252 11 of 14
Sensors 2022, 22, x FOR PEER REVIEW 11 of 13
process of the FBG sensor. The other is that, when wearing clothes to monitor the body temperature, the vibration of the human body may cause errors in the FBG sensor, which was about 0–1 pm (0–0.1 °C).
Figure 10d, e shows that the swinging arm did not affect the monitored human body temperature. Therefore, when wearing the vest to monitor body temperature, the arm can perform some movement.
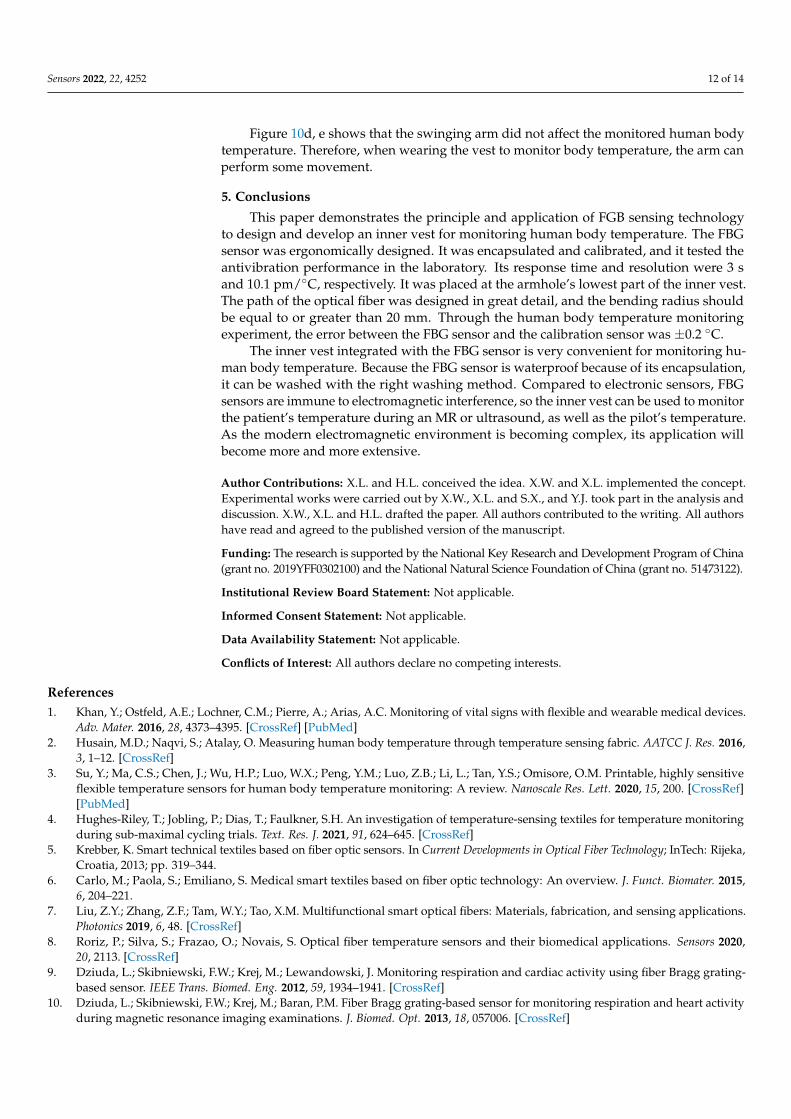
Figure 10. Body temperature monitoring test by being worn on the inner vest. (a) The integration process of the inner vest. (b) The body temperature monitoring curves of the whole process. (c) The error of the FBG sensor relative to the Pt-100 sensor. (d,e) The human body temperature when the arm swings.
5. Conclusions This paper demonstrates the principle and application of FGB sensing technology to
design and develop an inner vest for monitoring human body temperature. The FBG sen-sor was ergonomically designed. It was encapsulated and calibrated, and it tested the an-tivibration performance in the laboratory. Its response time and resolution were 3 s and 10.1 pm/°C, respectively. It was placed at the armhole’s lowest part of the inner vest. The path of the optical fiber was designed in great detail, and the bending radius should be equal to or greater than 20 mm. Through the human body temperature monitoring exper-iment, the error between the FBG sensor and the calibration sensor was ±0.2 °C.
The inner vest integrated with the FBG sensor is very convenient for monitoring hu-man body temperature. Because the FBG sensor is waterproof because of its encapsula-tion, it can be washed with the right washing method. Compared to electronic sensors, FBG sensors are immune to electromagnetic interference, so the inner vest can be used to
Figure 10. Body temperature monitoring test by being worn on the inner vest. (a) The integrationprocess of the inner vest. (b) The body temperature monitoring curves of the whole process. (c) Theerror of the FBG sensor relative to the Pt-100 sensor. (d,e) The human body temperature when thearm swings.
At the room temperature of about 23 ◦C, the subject put on the inner vest, a long-sleeved T-shirt, and a coat, in order, and the sensor was connected with the FBG interrogator.Then, the Pt-100 sensor was stuck in the armpit using adhesive tape to keep it from slipping.The arm was close to the torso to reduce underarm air exchange.
The temperature monitoring curves of the FBG sensor and the Pt-100 sensor are shownin Figure 10b. The Pt-100 sensor was placed under the human armpit and began to changesteadily after about 25 s. The FBG sensors were affected by the microclimate inside thegarment and began to change steadily after about 7–10 min. After about 10–15 min, thetemperature values of the two sensors were essentially coincident. Figure 10c shows theerror of the FBG sensor relative to the Pt-100 sensor, and the absolute values were less than0.2 ◦C. The error was mainly caused by two aspects. First, the accuracy of the platinumresistance thermometer was ±0.1 ◦C, which led to errors in the calibration process of theFBG sensor. The other is that, when wearing clothes to monitor the body temperature, thevibration of the human body may cause errors in the FBG sensor, which was about 0–1 pm(0–0.1 ◦C).
Sensors 2022, 22, 4252 12 of 14
Figure 10d, e shows that the swinging arm did not affect the monitored human bodytemperature. Therefore, when wearing the vest to monitor body temperature, the arm canperform some movement.
5. Conclusions
This paper demonstrates the principle and application of FGB sensing technologyto design and develop an inner vest for monitoring human body temperature. The FBGsensor was ergonomically designed. It was encapsulated and calibrated, and it tested theantivibration performance in the laboratory. Its response time and resolution were 3 sand 10.1 pm/◦C, respectively. It was placed at the armhole’s lowest part of the inner vest.The path of the optical fiber was designed in great detail, and the bending radius shouldbe equal to or greater than 20 mm. Through the human body temperature monitoringexperiment, the error between the FBG sensor and the calibration sensor was ±0.2 ◦C.
The inner vest integrated with the FBG sensor is very convenient for monitoring hu-man body temperature. Because the FBG sensor is waterproof because of its encapsulation,it can be washed with the right washing method. Compared to electronic sensors, FBGsensors are immune to electromagnetic interference, so the inner vest can be used to monitorthe patient’s temperature during an MR or ultrasound, as well as the pilot’s temperature.As the modern electromagnetic environment is becoming complex, its application willbecome more and more extensive.
Author Contributions: X.L. and H.L. conceived the idea. X.W. and X.L. implemented the concept.Experimental works were carried out by X.W., X.L. and S.X., and Y.J. took part in the analysis anddiscussion. X.W., X.L. and H.L. drafted the paper. All authors contributed to the writing. All authorshave read and agreed to the published version of the manuscript.
Funding: The research is supported by the National Key Research and Development Program of China(grant no. 2019YFF0302100) and the National Natural Science Foundation of China (grant no. 51473122).
Institutional Review Board Statement: Not applicable.
Informed Consent Statement: Not applicable.
Data Availability Statement: Not applicable.
Conflicts of Interest: All authors declare no competing interests.
References1. Khan, Y.; Ostfeld, A.E.; Lochner, C.M.; Pierre, A.; Arias, A.C. Monitoring of vital signs with flexible and wearable medical devices.
Adv. Mater. 2016, 28, 4373–4395. [CrossRef] [PubMed]2. Husain, M.D.; Naqvi, S.; Atalay, O. Measuring human body temperature through temperature sensing fabric. AATCC J. Res. 2016,
3, 1–12. [CrossRef]3. Su, Y.; Ma, C.S.; Chen, J.; Wu, H.P.; Luo, W.X.; Peng, Y.M.; Luo, Z.B.; Li, L.; Tan, Y.S.; Omisore, O.M. Printable, highly sensitive
flexible temperature sensors for human body temperature monitoring: A review. Nanoscale Res. Lett. 2020, 15, 200. [CrossRef][PubMed]
4. Hughes-Riley, T.; Jobling, P.; Dias, T.; Faulkner, S.H. An investigation of temperature-sensing textiles for temperature monitoringduring sub-maximal cycling trials. Text. Res. J. 2021, 91, 624–645. [CrossRef]
5. Krebber, K. Smart technical textiles based on fiber optic sensors. In Current Developments in Optical Fiber Technology; InTech: Rijeka,Croatia, 2013; pp. 319–344.
6. Carlo, M.; Paola, S.; Emiliano, S. Medical smart textiles based on fiber optic technology: An overview. J. Funct. Biomater. 2015,6, 204–221.
7. Liu, Z.Y.; Zhang, Z.F.; Tam, W.Y.; Tao, X.M. Multifunctional smart optical fibers: Materials, fabrication, and sensing applications.Photonics 2019, 6, 48. [CrossRef]
8. Roriz, P.; Silva, S.; Frazao, O.; Novais, S. Optical fiber temperature sensors and their biomedical applications. Sensors 2020,20, 2113. [CrossRef]
9. Dziuda, L.; Skibniewski, F.W.; Krej, M.; Lewandowski, J. Monitoring respiration and cardiac activity using fiber Bragg grating-based sensor. IEEE Trans. Biomed. Eng. 2012, 59, 1934–1941. [CrossRef]
10. Dziuda, L.; Skibniewski, F.W.; Krej, M.; Baran, P.M. Fiber Bragg grating-based sensor for monitoring respiration and heart activityduring magnetic resonance imaging examinations. J. Biomed. Opt. 2013, 18, 057006. [CrossRef]

Sensors 2022, 22, 4252 13 of 14
11. Fajkus, M.; Nedoma, J.; Martinek, R.; Novak, M.; Jargus, J.; Vasinek, V. Fiber optic sensor encapsulated in polydimethylsiloxanefor heart rate monitoring. Proc. SPIE 2017, 10208, 102080W.
12. Subbarao, G.P.A.; Narasipur, O.S.; Kalegowda, A.; Asokan, S. A novel fiber Bragg grating based sensing methodology for directmeasurement of surface strain on body muscles during physical exercises. Int. J. Optomechatron. 2012, 6, 189–198. [CrossRef]
13. Lee, S.B.; Jung, Y.J.; Choi, H.K.; Sohn, I.B.; Lee, J.H. Hybrid LPG-FBG based high-resolution micro bending strain sensor. Sensors2020, 21, 22. [CrossRef] [PubMed]
14. Katsuragawa, Y.; Ishizawa, H. Non-invasive blood pressure measurement by pulse wave analysis using FBG sensor.In Proceedings of the IEEE International Instrumentation and Measurement Technology Conference (I2MTC), Pisa, Italy, 11–14May 2015; pp. 511–515.
15. Kumar, N.V.; Pant, S.; Sridhar, S.; Marulasiddappa, V.; Srivatzen, S.; Asokan, S. Fiber Bragg grating-based pulse monitoringdevice for real-time non-invasive blood pressure measurement—A feasibility study. IEEE Sens. J. 2021, 21, 9179–9185. [CrossRef]
16. Witt, J.; Narbonneau, F.; Schukar, M.; Krebber, K.; De Jonckheere, J.; Jeanne, M.; Kinet, D.; Paquet, B.; Depré, A.; D’Angelo, L.T.;et al. Medical textiles with embedded fiber optic sensors for monitoring of respiratory movement. IEEE Sens. J. 2012, 12, 246–254.[CrossRef]
17. Manujlo, A.; Osuch, T. Temperature fiber Bragg grating based sensor for respiration monitoring. Proc. SPIE 2017, 10445, 104451A.18. Dziuda, L.; Skibniewski, F.W. A new approach to ballistocardiographic measurements using fibre Bragg grating-based sensors.
Biocybern. Biomed. Eng. 2014, 34, 101–116. [CrossRef]19. Umesh, S.; Padma, S.; Srinivas, T.; Asokan, S. Fiber Bragg grating goniometer for joint angle measurement. IEEE Sens. J. 2018,
18, 216–222. [CrossRef]20. Abro, Z.A.; Zhang, Y.F.; Chen, N.L.; Hong, C.Y.; Lakho, R.A.; Halepoto, H. A novel flex sensor-based flexible smart garment for
monitoring body postures. J. Ind. Text. 2019, 49, 262–274. [CrossRef]21. Abro, Z.A.; Hong, C.Y.; Chen, N.L.; Zhang, Y.F.; Lakho, R.A.; Yasin, S. A fiber Bragg grating-based smart wearable belt for
monitoring knee joint postures. Text. Res. J. 2019, 90, 386–394. [CrossRef]22. Hong, C.Y.; Abro, Z.A.; Zhang, Y.F.; Lakho, R.A. An FBG-based smart wearable ring fabricated using FDM for monitoring body
joint motion. J. Ind. Text. 2021, 50, 1660–1673.23. Suresh, R.; Bhalla, S.; Hao, J.; Singh, C. Development of a high resolution plantar pressure monitoring pad based on fiber Bragg
grating (FBG) sensors. Technol. Health Care 2015, 23, 785–794. [CrossRef] [PubMed]24. Liang, T.C.; Lin, J.J.; Guo, L.Y. Plantar pressure detection with fiber Bragg gratings sensing system. Sensors 2016, 16, 1766.
[CrossRef] [PubMed]25. Vilarinho, D.; Theodosiou, A.; Leitao, C.; Leal, A.G.; Domingues, M.D.; Kalli, K.; Andre, P.; Antunes, P.; Marques, C. POFBG-
embedded cork insole for plantar pressure monitoring. Sensors 2017, 17, 2924. [CrossRef] [PubMed]26. Leal, A.G.; Domingues, M.F.; Min, R.; Vilarinho, D.; Theodosiou, A.; Tavares, C.; Alberto, N.; Leitao, C.; Grammont, F. Fiber Bragg
based sensors for foot plantar pressure analysis. In Biomedical Engineering Systems and Technologies, Proceedings of the InternationalJoint Conference on Biomedical Engineering Systems and Technologies (BIOSTEC 2018), Madeira, Portugal, 19–21 January 2018; Springer:Cham, Switzerland, 2019; Volume 1024, pp. 3–25.
27. Lakho, R.A.; Zhang, Y.F.; Jiang, J.H.; Hong, C.Y.; Abro, Z.A. A smart insole for monitoring plantar pressure based on the fiberBragg grating sensing technique. Text. Res. J. 2019, 89, 3433–3446. [CrossRef]
28. Ghosh, S.; Amidei, C.; Furrow, K. Development of a sensor-embedded flexible textile structure for apparel or large areaapplications. Indian J. Fibre Text. 2005, 30, 42–48.
29. Li, H.Q.; Yang, H.J.; Li, E.B.; Liu, Z.H.; Wang, K.J. Wearable sensors in intelligent clothing for measuring human body temperaturebased on optical fiber Bragg grating. Opt. Express 2012, 20, 11740. [CrossRef]
30. Hill, K.O.; Fujii, Y.; Johnson, D.C.; Kawasaki, B.S. Photosensitivity in optical fiber waveguides Application to reflection filterfabrication. Appl. Phys. Lett. 1978, 32, 647–649. [CrossRef]
31. Morey, W.W.; Meltz, G.; Glenn, W.H. Fiber optic Bragg grating sensors. Proc. SPIE 1990, 1169, 98–107.32. Othonos, A.; Kalli, K. Fiber Bragg Gratings: Fundamentals and Applications in Telecommunications and Sensing; Artech House
Publishers: Boston, MA, USA, 1999; pp. 1–112.33. Tahir, B.A.; Ali, J.; Rahman, R.A. Fabrication of fiber grating by phase mask and its sensing application. J. Optoelectron. Adv. Mater.
2006, 8, 1604–1609.34. Hunt, A.P.; Stewart, I.B. Calibration of an ingestible temperature sensor. Physiol. Meas. 2008, 29, N71–N78. [CrossRef]35. Ma, B.; Sun, Y.C. Research on real-time monitoring of human body temperature based on fiber Bragg grating sensing technology.
In Proceedings of the International Conference on Cloud Computing and Security, Haikou, China, 8–10 June 2018; Volume 11064,pp. 124–133.
36. Samset, E.; Mala, T.; Ellingsen, R.; Gladhaug, I.; Soreide, O.; Fosse, E. Temperature measurement in soft tissue using a distributedfibre Bragg-grating sensor system. Minim. Invasive Ther. Allied Technol. 2001, 10, 89–93. [CrossRef] [PubMed]
37. ISO 2631-1:1997; Mechanical Vibration and Shock—Evaluation of Human Exposure to Whole-Body Vibration—Part 1: GeneralRequirement. International Organization for Standardization: Beijing, China, 1997; pp. 1–6.
38. Marcuse, D. Curvature loss formula for optical fibers. J. Opt. Soc. Am. 1976, 66, 216–220. [CrossRef]39. Faustini, L.; Martini, G. Bend loss in single-mode fibers. J. Lightwave Technol. 1997, 15, 671–679. [CrossRef]40. Tsao, S.L.; Cheng, W.M. Simplified formula of bending loss for optical fiber sensors. Fiber Integr. Opt. 2002, 21, 333–344. [CrossRef]

Sensors 2022, 22, 4252 14 of 14
41. Zendehnam, A.; Mirzaei, M.; Farashiani, A.; Farahani, L.H. Investigation of bending loss in a single-mode optical fibre. Pramana J.Phys. 2010, 74, 591–603. [CrossRef]
42. Renner, H. Bending losses of coated single-mode fibers: A simple approach. J. Lightwave Technol. 1992, 10, 544–551. [CrossRef]


