Embed Size (px)
Citation preview
The LabVIEW application for fiber Bragg grating sensor system management and data processing
Dariusz Podsiadły, Lech Lewandowski Institute of Electronic Systems, Warsaw University of Technology
15/19 Nowowiejska Street, 00-665 Warsaw, Poland [email protected], [email protected]
ABSTRACT This paper describes design and realization of the fiber sensor system. The metrology system was developed for construction mechanical stress control. The system is based on fiber Bragg gratings as a physical quantity sensors. The major emphasis is placed on sensor system management which is running under the LabView environment. Specific tasks are realized by the programme such as acquiring, processing and visualizing of measurement data from the multiplexed sensor system. Keywords: fiber Bragg grating, optical fiber sensor, strain sensor, LabVIEW
1. INTRODUCTION
Fiber optic telecommunication has made an unprecedented growth in recent years. Such a big progress is caused by constantly increasing data throughput needs, which could be satisfied by high data carrying capacity of an optical fiber. The dynamic growth of the optical telecommunication market was accompanied by the development of innovative technologies for optical sensing and fiber optic devices. During many years large numbers of fiber optic sensors were developed. They are usually used for sensing some physical quantities like temperature, strain, pressure, acceleration and vibration. Unique properties and large number of advantages of fiber optic sensors make them ideal candidates for use in sensing technologies.
2. FIBER BRAGG GRATINGS
Fiber optic sensors are very often based on Bragg gratings. The fiber Bragg grating (FBG) consist of refractive index modulation, created on the core of single mode fiber. When single mode fiber with inscribed Bragg grating is coupled with broadband light source of constant spectral density, some wavelengths in spectrum of transmitted light will be canceled out. It means that light guided along the core of optical fiber is scattered by each grating plane and if Bragg condition is satisfied scattered beams add constructively in the backward direction, what gives reflection. The spectrum of reflected light corresponds to spectrum of transmitted light – fig.1. The center wavelength of reflected beam is defined by grating parameters and it is given by the formula: Λ= effB n2λ , where Λ is a period of the grating and neff is effective refractive index of the fiber core [1].
Photonics Applications in Astronomy, Communications, Industry, and High-Energy PhysicsExperiments 2008, edited by Ryszard S. Romaniuk, Tomasz R. Wolinski, Proceedings of SPIE
Vol. 7124 71240A · © 2008 SPIE · CCC code: 0277-786X/08/$18 · doi: 10.1117/12.817938
Proc. of SPIE Vol. 7124 71240A-12008 SPIE Digital Library -- Subscriber Archive Copy

A
A
Fig.1. Properties of fiber Bragg gratings
According to the Bragg condition the center wavelength of back reflected light depends on effective index of refraction of the core and the periodicity of the grating. The effective index of refraction of the core, as well as periodic spacing between the grating planes will be affected by changes in strain and temperature. Wavelength shift will be given by the formula:
TT
nT
nl
ln
ln
effeff
effeff ∆⎟⎟
⎠
⎞⎜⎜⎝
⎛∂Λ∂
+∂∂
Λ+∆⎟⎟⎠
⎞⎜⎜⎝
⎛∂Λ∂
+∂∂
Λ=∆ 22λ (1)
The first term in the equation (1) represents the strain effect on optical fibers which corresponds to a change in the grating spacing and strain-optic induced change in refractive index. The second term represents the effect of temperature on optical fiber.
3. THE IDEA OF FIBER BRAGG GRATING SENSOR SYSTEM
Information about strain applied to the grating is included in Bragg wavelength changes. The specially designed spectrometer has been built in order to measure each sensor Bragg wavelength variations. The diffracted light from spectrometer is directed onto the linear photodiode array next the output electrical signal is amplified, digitized and processed by computer
An advantage of optical fiber sensors based on Bragg gratings is flexibility in distributed sensors network implementation. Due to very low insertion loss of the fiber, sensors can be serially multiplexed along a single mode optical fiber. The discussed fiber Bragg sensor system is built in this manner. Single sensors set consists of long fiber with six inscribed gratings placed in different regions of the fiber. Every grating has a different center Bragg wavelength what provides strain signals distinguishability. Signal from each grating sensor is detected by single photodiode segment of linear photodiode array. In detection only decreasing slope of spectral reflectivity characteristic of single Bragg grating is used. Strain perturbations induces changes of single photodiode segment illumination corresponding to the applied tension, therefore photocurrent is increasing or decreasing according to Bragg wavelength change – fig.2.
Output signals are dependent on input optical power inserted into fiber sensor. Measurement result must be immune to the level of source power, connector losses and non zero attenuation of every optical device used in the system. To achieve independence of fluctuating light levels reference grating must be used. The reference grating is the Bragg grating with flat top and its shielded from the stretching force applied to other sensors. It’s used only to measure the light source output power. Output voltage level from each fiber sensor is divided by the value measured on reference grating. The division of these two quantities gives the relative values and solves the problem of unpredictable fluctuations of output signals, caused by source instability and losses.
Proc. of SPIE Vol. 7124 71240A-2

photodetector
'I '2 '5 '4
'3 '4 '5 '4
Fig. 2. Spectral characteristic of the Bragg grating sensor with marked working curve.
4. THE FIBER BRAGG GRATING SENSOR SYSTEM REALIZATION 4.1 SENSOR SYSTEM CONSTRUCTION
The presented fiber Bragg grating sensor system is dedicated to smart structure technology for mechanical strain control. It consists of broadband light source which is coupled with 1x4 fiber optic switch The switch connects optical channels by redirecting an incoming optical signal into selected output channel. Output signal is transmitted into optical circulator and next to selected fiber sensor set. [2], [3]. The light reflected from the gratings contains strain information and it is guided through circulator and optical switch to the spectrometer with linear photodiode array. Both optical switches are controlled by the same driver in parallel. Weak output signals from InGaAs detectors are amplified by transimpedance amplifiers block and digitized by KUSB-3108 data acquisition board. The last component in the system is the computer with LabVIEW environment and sensor system controlling application. The primary task of the computer is to read data from the system and to control external devices. Diagram of the system with all its components is presented below (fig.3.)
Fig.3. The fiber Bragg grating sensor system diagram. Components: (1) broadband light source, (2) optical switches, (3) circulators, (4) set of fiber Bragg grating sensors, (5) spectrometer with linear photodiode array, (6) amplifiers block, (7)
data acquisition board, (8) computer with LabVIEW environment
Proc. of SPIE Vol. 7124 71240A-3
4.2. MEASUREMENT ALGORITHM
Due to differences of spectral characteristic of every Bragg grating sensor scaling procedure must be performed. The aim of this procedure is to determine the slope of each grating characteristic.
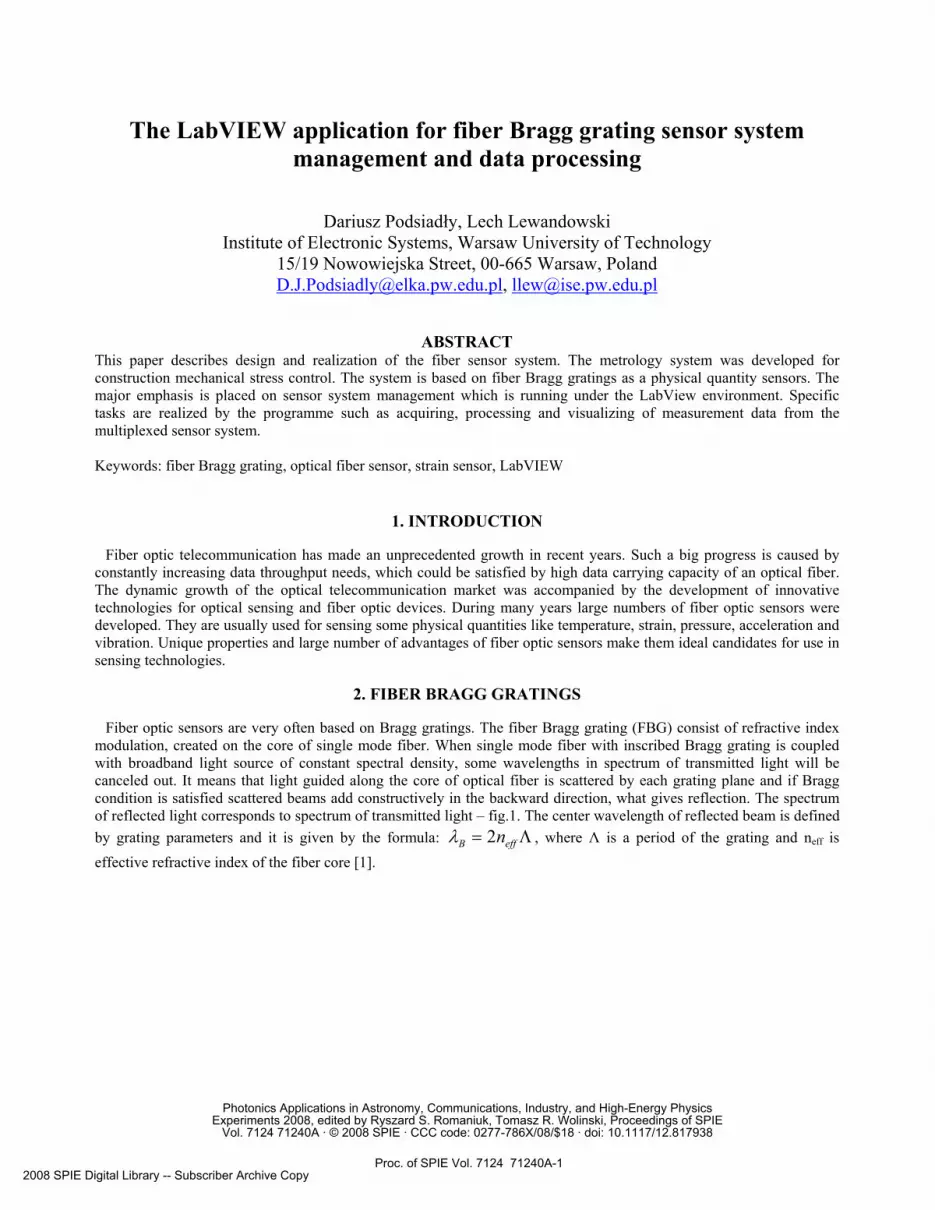
Fig. 4. Reflectivity of sensor grating and reference grating.
The curve segment U’ - U” must be approximated with a linear function. To compute the slope the coordinates of U’ and U” points must be known. The voltage value on first point is measured by a single readout U’ then the spectral characteristic is shifted in wavelength scale by ∆λ1nm=1nm and the second measurement is performed U’’. Every measured signal is divided by voltage value U’’’ from reference grating what gives relative output values.
Knowing the relative voltage difference: '''
'
'''
''
''' UU
UU
UU
−=∆
we are able to compute the slope:
⎥⎦⎤
⎢⎣⎡
∆
∆
=nm
UU
Snm
1
1
'''
λ (2)
The scaling procedure described above have to be done only once and with no strain applied to the fiber sensor. This procedure is realized outside the LabView application and slope values are inserted into programme code.
Before measurement the calibrating procedure ought to done. The aim of calibration is to determine a relative voltage
of static operating point '''
'
opUU
of sensor grating ( '''opU is the voltage from reference grating at the moment of calibration).
Values of operating points are saved and stored in the disk file. When strain is applied to the sensor relative value '''
''
UU
of
the signal is measured. The Bragg wavelength shift can be computed with the formula:
SUrel∆
=∆λ (3)
where: '''
'
'''
''
oprel U
UUUU −=∆
Knowing that strain sensitivity at the range1500-1600 nm for silica fibers grating is 1.2pm/1µε [1], the strain value can be computed using the formula:
[ ] [ ] 3102,1nmx λµε ∆
= (4)
λ λ
∆U
∆λ
U”
U’U’’’
sensor reference
Proc. of SPIE Vol. 7124 71240A-4

Cou!änL91!oUwoqn
COW WflU!C!OUwoqnI6
D9 bLocs22!uä Iijoqnie
A!2fl9I!9POU wolqnie D9 29A!Uä woqrite
5. APPLICATION DESCRIPTION
Above mentioned fiber Bragg grating sensor system diagram with description of measurement algorithm let to determine the operational requirements for the application. The major task of the created programme is to control whole system, acquire and process measurement data from multiplexed sensor system, then present the results. Functional requirements of the programme:
• Application have to determine the value of Bragg wavelength change and the value of strain which is causing wavelength change.
• Application have to manage the KUSB-3108 data acquisition board (DAQ) and optical switch module • Ability to perform calibration procedure on user’s demand. • Possibility of saving measurement results in spreadsheet files
5.1 THE STRUCTURE OF THE APPLICATION.
Computer application was divided into five main blocks which realize different types of functions.
Fig. 5. Application structure
The application configuration module is responsible for performing all procedures which are needed to initialize variables and scaling factors. These variables are used by application to fulfill measurement algorithm. The crucial issue in calibration process is the measurement of signal level from each fiber sensor where no force is applied to the fiber. Electrical signals from photodetectors, including the signal from reference grating, are digitized by acquisition board in parallel. Readouts are saved to a file in application directory. So called static operating points are loaded to the programme when it is launched then are used for wavelength shift computations. Execution of calibration procedure is necessary condition to make all computations. Running application without configuration file will cause limitations in programme functionality and user will be prompted to perform calibration procedure.
The second important block in application structure is communication module which is used to control peripheral devices. External devices such as optical switch and data acquisition board are controlled by user trough different interfaces. The switch board have embedded driver module and connection between computer and driver is realized by RS232 serial port. An application module implements custom controlling procedures using command set provided by Agiltron. The code was based on LabView built in Virtual Instruments and functions that communicate with devices connected to a serial port. Keithley Instrument’s KUSB-3108 acquisition board is more complex device. It uses USB interface. Manufacturer supplies drivers and LabView libraries. The library is set of Virtual Instruments and that enables an access to data acquisition boards. Application communication module is initializing DAQ board, determines which channels will be used, sets channel types (single ended or differential) , sets type of the conversion (in this case analog to digital conversion), executes autoranging procedure to set the most adequate input values range and input gain to minimize measuring error, starts data acquisition and get the results to the LabView application. To provide the best measurement results, the configuration of KUSB-3108 module isn’t fixed; it depends on application working mode which is actually chosen and on level of input signal.
Data processing module is a part of application block diagram which performs mathematical operations on signal samples. Type of arithmetical operations and its sequence depends on measurement algorithm realization. When application is working in continuous measurement mode fast Fourier transform on samples is also performed. Additional signal processing procedure helps in interpretation of measurement data especially when sensors are put on periodical
Proc. of SPIE Vol. 7124 71240A-5

29L
G9 OL CL696 coU!anL !OU J!I6
2Gl1b obpci 2)VCP
cou!anLe 9cdn!2ipc u poq
29L scdni2ipou suq as.ups qs
bLOCG22 qss o cowbnS 2fLS!U
D!2b191\ WG92flLGWGUJ2 9UCI blof dL9bp2
ML!G LG2flI2 o pe !I6
112
bebe9f
Cp9Uaecou!anL9loU
A62
kb0
strain. The results of computations are sent to the visualization module. Final results are displayed on numeric indicators and plotted on graphs. More detailed description of visualization module will be placed in next section where graphics user interface will be presented.
Storing measurements on hard disk drive was one of the application functionality requirements. This ability is granted by last application module - data saving module. This part of application collects all values which were displayed on indicators and build result array. When measurement is finished programme is waiting for user’s action. After switching save button application converts results array into spreadsheet string, opens or creates the result file and writes data into file. In single measure mode new results are appended to existing file. Every saved signal value has its own time stamp. In continuous mode new results are saved in separate file due to large number of samples. Data files have *.xls extension thus can be opened using Microsoft Excel for example. 5.2. APPLICATION BLOCK DIAGRAM
Fig. 6. Simplified application block diagram
The programme diagram presented above is simplified. It focuses only on the most important procedures realized by application. Real operation network is more complex and is a little bit different to each working mode.
5.3 USER INTERFACE DESCRIPTION
Fiber sensor system controlling application is divided into two main parts. The system operator can distinguish two different application working modes. The first is configuration mode where system is set up to perform measurements, and the latter is measurement mode which can be further divided into single and continuous measurement mode. Switching between different application modes is realized by adequate tab selection.
Proc. of SPIE Vol. 7124 71240A-6

gly
Mth1KU18-3118(ll)
%20k1 H
Jh2_h1ALL.
2118-13-26
9-13:23:23
Itbd898855U—581,3 69
25169 ________
604,56259 jijV 11,66611 zp:
-E1:tki Z691 x— r: E p:t
IWm1,54 1.55 1,56 1,52 1,58 1,59 1,6LII. fIi
Configuration mode.
Fig. 7. Configuration mode front panel. (1) Bragg grating set selector, (2) serial port indicator, (3) spectral characteristic of sensor set, (4) data file name indicator, (5) configured sensor selector, (6) measured signal indicators, (7) configuration
file viewer, (8) save button
Front panel of application in configuration mode is presented above. Using the controls placed on the panel user is allowed to perform scaling procedure. One of the most important button is fiber Bragg grating sensor set selector. Changing the value displayed on drop-down list causes channel change in optical switch device, the name of used serial port is indicated next to the button. Apart from that selected value induces operations on configuration files dedicated to chosen sensor set. Spectral characteristic of fiber Bragg grating sensor set is presented on the graph. Every sensor set was analyzed by optical spectrum analyzer on Bragg grating manufacturing stage. Application is reading spectrum analyzer datafiles and plot data points on characteristic. Name of file is also presented on the panel. Displaying sensors spectral characteristic isn’t necessary but it might be useful when system is working with many Bragg grating sensors. The user may select a sensor to configuration from the drop-down list, actually selected Bragg grating is highlighted on spectral characteristic of sensors set. The input channel of data acquisition board corresponding to chosen grating is sampled in every second. The signal level from selected grating and reference grating is displayed on numeric indicators. The third indicator displays relative value of signal level. Previously stored configuration is displayed on the window placed on the left side of front panel. User gets the information about the time and date when calibrating procedure was taken. Displaying saved values of signal gives possibility to compare historical results to actual signal readouts. If selected sensor have not already been configured the window which is displaying saved results is empty. In such case user should press “Save (Zapisz) ” button to complete calibration procedure. User must be aware of the fact that only configured sensors can be used in measurements.
Proc. of SPIE Vol. 7124 71240A-7

Zpi% W!]iki d pIik4
S!tk! Z%th 1 — I H b zt_
PidgIy Utii
H
:iiLIlH_
-00338 pa
HPN p[plt!,,] -zs
— — — CJ!k1C:]j,]ik2 •CJ!k3 •- r ___
—800p
-600p
—400p 3
200 p
--200 p
Npi14:03:59
Single measurement mode
Fig. 8. Single measurement front panel. (1) Bragg grating set selector with serial port indicator, (2) DAQ name indicator, (3) sensor selector, (4) wavelength shift indicator, (5) strain indicator, (6) measurement graph, (7) start/stop button, (8)
time delay, (9) measurement timestamp, (10) save button
Single measurement front panel is presented above. It consists of controls and indicators which allows user to perform measurements. In this mode user also can choose set of sensors to be monitored using sensor set selector. Changing the value displayed on drop-down list causes channel change in optical switch device, the name of used serial port is indicated next to the button. The name of data acquisition board is displayed on the indicator placed on the top of the front panel. If the name is displayed the communication between the device and the computer has been established without any errors. User is able to choose which strain sensor he wants to use in measurements. Each of five sensors marked from S1 to S5 has its own control button. If the button is in “ON” state what is indicated with green colour the sensor will be enabled and used in measurement. Only previously configured sensors can selected, otherwise the button will be disabled and grayed out. Group of indicators is located below sensor selectors. In the first row values of center Bragg wavelength shift is located. The second row of indicators contain the value of computed strain. Numeric indicators show only last sampled value of strain. The 100 previously measured values are presented on the graph. In the range of elastic deformations of optical fiber the relation between center Bragg wavelength shift and strain is linear and described by already known formula (4). This allows to display both quantities on the same graph with two different scales. Therefore the strain values axis is placed on the left side of the graph and wavelength shift scale is located on the other side. Measurement data points are plotted only when sensor is selected. If sensor will be disabled during measurement adequate plot will be cleared. The measurement sequence can be started and stopped by pressing the “Rozpocznij/Przerwij pomiar” button. Measurements are performed continuously with desired time intervals. The repetition rate can be set up using proper numeric control. Timestamp of single readout is displayed on the indicator. When measuring sequence is finished user may press save button to write all results into disc file.
Proc. of SPIE Vol. 7124 71240A-8
— — —C::J,]!k1 ____ -
M:d:} kiyji C::j!]ik 2
KUSB-3106(00) 52 SO SL 55 C::j,]ik 3
C::jHk4 aayjHkS a
P'big::y 111,12— gas)osp
600—
200—
50000'11 -200-
ft 2SkH: -600-
T% ,40: -642,24-
W!d!
0,0025
0,002—
df* 0,0015
0,25 H:0,001 —
0,0005
4 1 1 ib 1214 16 IS 20222426203032343630464244464056C: t:tlft::: [H:]
p:H P:jSy,:: vi iZt 1 v ASRL5:
Continuous measurement mode
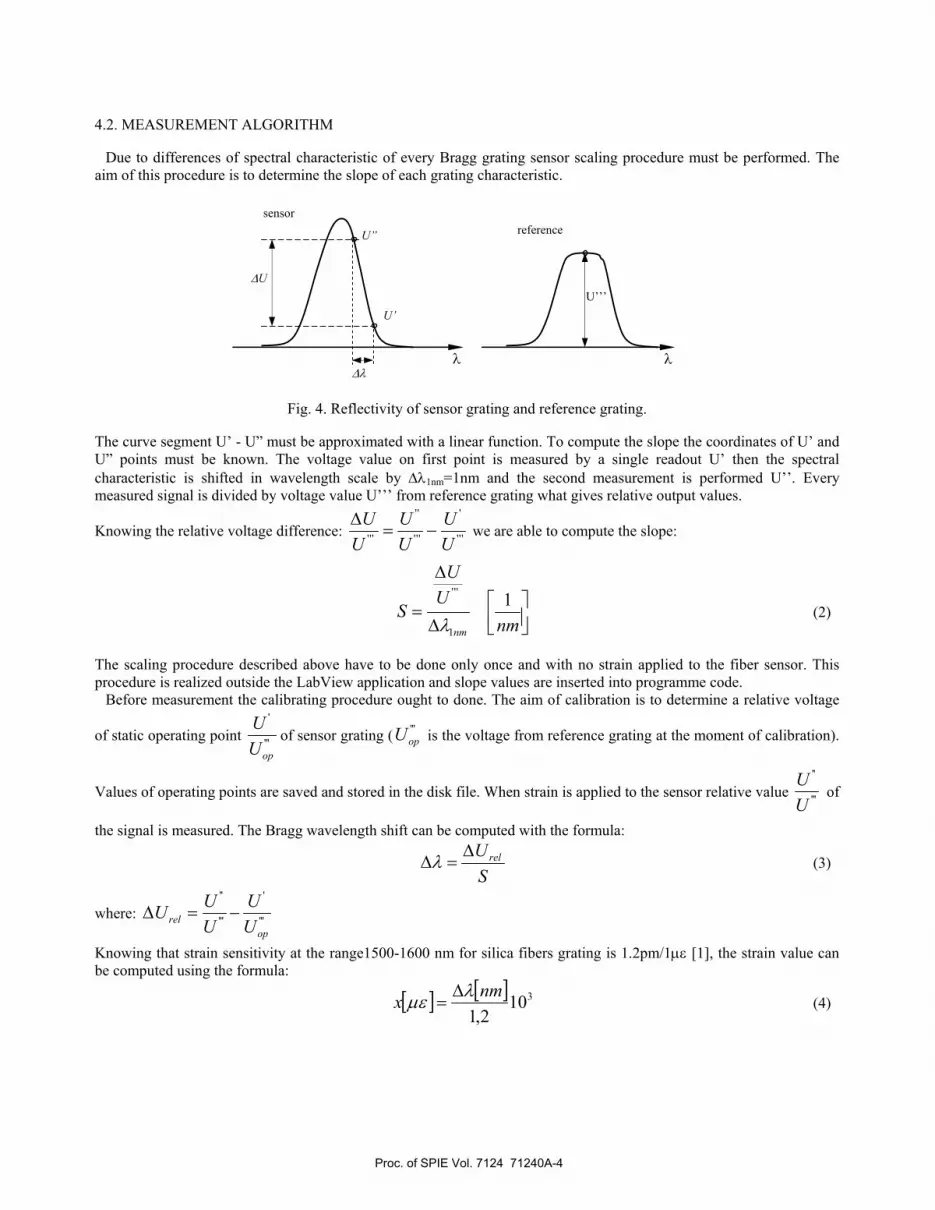
Fig. 9. Continuous measurement front panel. (1) number of samples, (2) samples rate, (3) measurement result graphs, (4) single sampling/continuous sampling selector, (5) write to file button
The last application functionality is ability to perform measurements in continuous mode. In this mode dynamic strain changes can be monitored and the system works as vibrometer. In this mode sampling period of every input channel can be accurately controlled and the results are buffered. Data acquisition device allows to acquire signals at wide frequency range up to 25kHz. Before starting the measurement user should set number of samples to acquire and desired sample rate. These two values are needed to configure data acquisition board by setting up convenient buffer size and sampling frequency. Two indicators are displaying values of sampling period and frequency. Measurement results are presented graphically in time and frequency domain In continuous measurement mode application can work in two different manners. In single series submode application is configuring data acquisition board to get only specified number of samples and stop acquisition. In the second submode sampling is continuous. After getting a pack of samples next measurement is triggered. Results are displayed in a real time and acquisition must be stopped by the user. Type of acquisition scheme may be changed by control button. In continuous measurement mode set of recent measurement results can be saved to the spreadsheet file.
6. SUMMARY This paper presents the project and the realization of fiber Bragg grating sensor system controlling application. Brief
description of the whole system and its all components is also included. Created programme fulfills presented applications requirements. Application is able to process the signals from sensor system. Executed tests proved that the application gives correct results.
Proc. of SPIE Vol. 7124 71240A-9

7. ACKNOWLEGMENTS
The work was supported by the Polish Ministry of Science and Higher Education grant no. 1316/T10/2005/28.
8. REFERENCES
1. A. Othonos, K. Kali: Fiber Bragg Gratings, Artech House 1999 2. J. Helsztyński, L. Lewandowski: Fiber Bragg gratings with very smooth side slopes: Proc. of SPIE Vol. 7120, 71200R,
(2008) · 3. J. Helsztyński, L. Lewandowski, W. Jasiewicz, K. Jędrzejewski: Fiber Bragg grating multiplexing system, Electronics
and Telecommunications Quarterly, vol.3, 2008 (will be published)
Proc. of SPIE Vol. 7124 71240A-10