Embed Size (px)
Citation preview
tthecswabttfi
ro
CDC
1
Demodulation scheme for fiber Bragg grating sensorsbased on active control of the spectral responseof a wavelength division multiplexer
Francisco M. Araujo, Luıs A. Ferreira, Jose L. Santos, and Faramarz Farahi
We present a closed-loop technique for measuring wavelength shifts associated with fiber Bragg gratingsby using a fused biconical wavelength division multiplexer ~WDM!. The spectral response of the WDMis actively tuned by stretching of the coupling region to maintain a fixed coupling ratio at the reflectedBragg wavelength. The closed-loop operation allows sensitivities usually associated with a highlyselective WDM to be obtained without compromising the measurement range. A simple theoreticalmodel is presented together with experimental results for temperature and strain measurements.© 1998 Optical Society of America
OCIS codes: 060.1810, 060.2340, 060.2370.
7
1. IntroductionIn the past few years, fiber Bragg grating ~FBG!emperature and strain sensors and their applica-ion in smart structures and composite materialsave been the subject of considerable researchffort.1–5 The small Bragg wavelength shifts asso-iated with this class of sensor often require expen-ive and complex demodulation schemes. Toiden the range of possible applications, it is desir-ble to develop simple techniques that utilize ro-ust and low-cost components. Several filteringechniques have been demonstrated that fulfillhese requirements, such as those based on bulklters,6 fiber edge filters,7–9 edge optical source
spectra,10 edge fiber grating spectra,11 edge detectoresponse,12 tunable fiber filters,13 tunable acousto-ptic filters,14 and receiving FBG.15 Among these,
one of the most elegant methods is based on using acommercially available wavelength division multi-
F. M. Araujo, L. A. Ferreira, and J. L. Santos [email protected]! are with the Unidade de Tecnologia Optoelectronica,Instituto de Engenharia de Sistemas e Computadores, Porto, Ruado Campo Alegre, 687, 4150 Porto, Portugal. J. L. Santos is alsowith the Departamento de Fısica da Universidade do Porto, Rua do
ampo Alegre, 687, 4150 Porto, Portugal. F. Farahi is with theepartment of Physics, University of North Carolina at Charlotte,harlotte, North Carolina 28223.Received 9 June 1998; revised manuscript received 11 August
998.0003-6935y98y347940-07$15.00y0© 1998 Optical Society of America
7940 APPLIED OPTICS y Vol. 37, No. 34 y 1 December 1998
plexer ~WDM!. Although the measurement rangeobtained is large, the sensitivity is limited by thesmall slope of the WDM transfer function. Forovercoming this problem, dedicated highly over-coupled couplers have been used.8 The increasedslope yields higher sensitivity but reduces the lin-ear measurement range. As in other filtering tech-niques, active tuning would be an obvious solutionto maintain high sensitivities with increased oper-ating range. Mechanically polished couplers arewell recognized by their excellent tunability prop-erties through control of the effective interactionlength.16,17 However, these involve complex fabri-cation processes that result in very sensitive butexpensive devices. The fusion biconical taper tech-nique offers an attractive alternative for losslessand low-cost fabrication.18 Although these devicesare usually packaged to present a high-stabilityspectral response, one can adjust their coupling ra-tio by using techniques such as bend, twist, or axialstrain induced on the tapered region and variationsof the external refractive index.19–24
In this paper we show that it is possible to obtain alarge measurement range by active control of a fusedbiconical WDM and take advantage of its high sen-sitivity. By stretching the coupling region, we dem-onstrate that the spectral characteristic of a WDMcan be effectively tuned over ranges exceeding 15 nmwithout additional loss. These characteristics areuseful for analysis of the optical signal returned froma fiber Bragg grating sensor, as we discuss in thefollowing sections.
ig
sctwctccpa
2. Theory
The power at the output ports of a fused biconicaltapered coupler, P1 and P2, can be written as
P1 5 P0 sin2~CL!, (1)
P2 5 P0 cos2~CL!, (2)
where P0 is the power reaching the WDM, L is thenteraction length, and C, the coupling constant, isiven by25
C 53pl
32n2 a2
1~1 1 1yV!2 , (3)
where l is the operating wavelength, n2 is the silicarefractive index, a is the diameter of the biconicaltaper waist, and V 5 2payl~n2
2 2 1!1y2 is the nor-malized frequency. In this simplified model, the ef-fects of polarization have been neglected, it isassumed that only two modes exist in the couplingregion, and the cross section is considered constantover the entire coupling length. Using the aboveequations, we can derive an expression for the WDMperiod ~Dl!:
Dl 532n2 a2
3L~1 1 1yV!3
~1 2 1yV!. (4)
During the coupler fabrication process a fixedlength LH of fiber is uniformly heated and stretched.In this condition the biconical taper diameter is ex-pected to vary with taper elongation LT as26
a~LT! 5 a0 exp~2LTy2LH!, (5)
where a0 is the initial fiber diameter.The set of Eqs. ~1! and ~2! suggests that it is pos-
ible to modify the spectral response of a WDM byhanging either the length of the coupling region L orhe coupling constant C. For a limited range ofavelengths the coupling constant cannot be easily
hanged to obtain a desired spectral response afterhe fabrication process is completed. However, thishange can be accomplished by proper control of theoupling length. From Eqs. ~1! and ~2!, for equalower to be obtained at both output ports, the oper-ting wavelength l3dB must satisfy
l3dB <8n2 a2
3L~1 1 1yV!2, (6)
where V is approximately constant for a limitedwavelength range. Because the required values ofelongation are always small compared with the totalcoupling length L, a linear relation exists betweenDl3dB and DL:
Dl3dB < 28n2 a2
3L2 ~1 1 1yV!2DL. (7)
In obtaining Eq. ~7! it was assumed that the im-posed elongation is restricted to the coupling region.This in practice is a valid approximation since thecross section of the coupling region is very smallwhen compared with the transition section of the
taper ~a2ya02 , 1023!.26 Also, small strain-induced
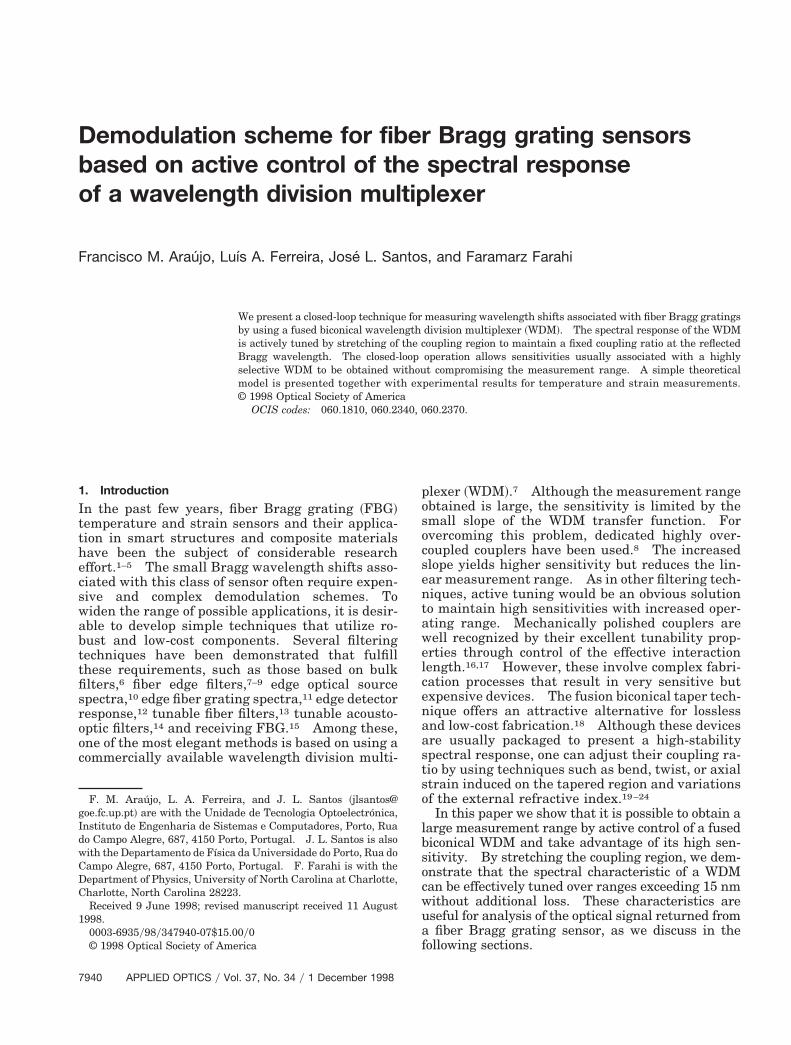
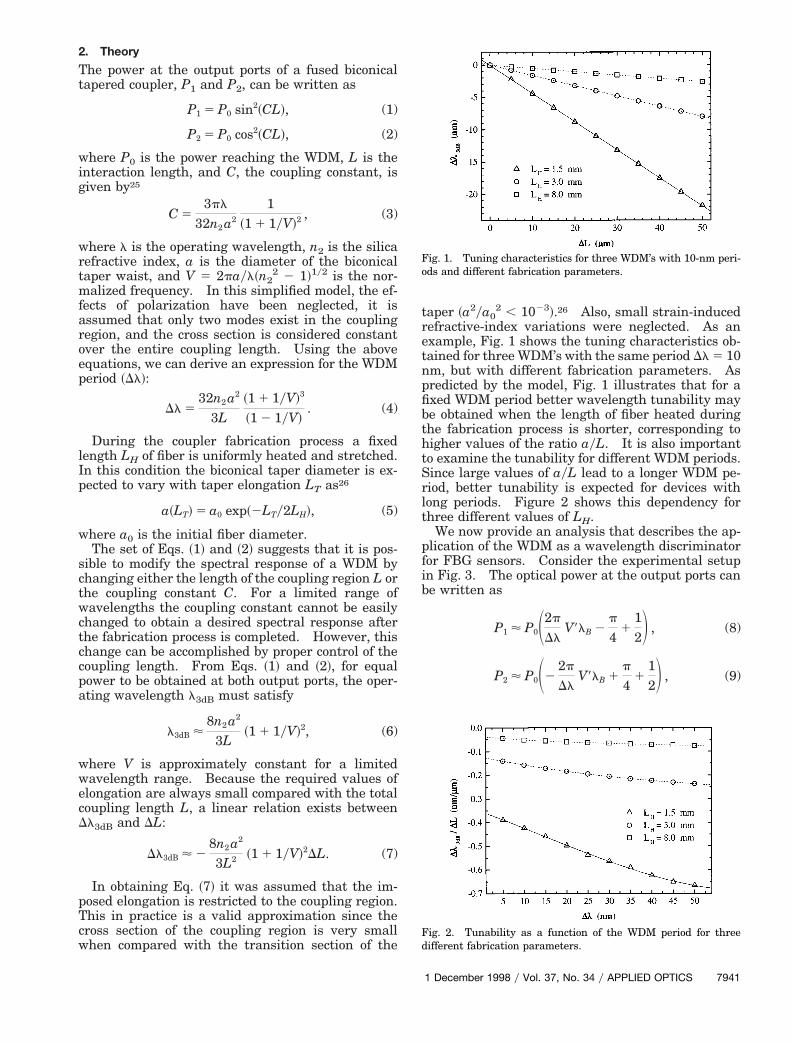
refractive-index variations were neglected. As anexample, Fig. 1 shows the tuning characteristics ob-tained for three WDM’s with the same period Dl 5 10nm, but with different fabrication parameters. Aspredicted by the model, Fig. 1 illustrates that for afixed WDM period better wavelength tunability maybe obtained when the length of fiber heated duringthe fabrication process is shorter, corresponding tohigher values of the ratio ayL. It is also importantto examine the tunability for different WDM periods.Since large values of ayL lead to a longer WDM pe-riod, better tunability is expected for devices withlong periods. Figure 2 shows this dependency forthree different values of LH.
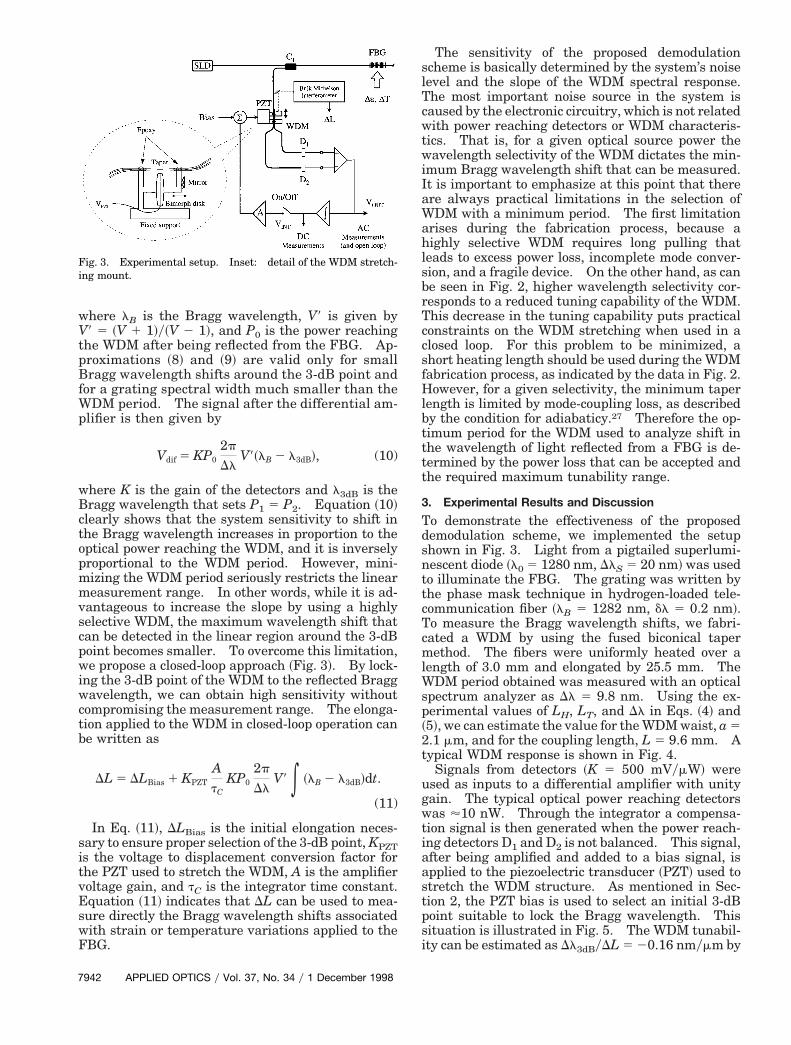
We now provide an analysis that describes the ap-plication of the WDM as a wavelength discriminatorfor FBG sensors. Consider the experimental setupin Fig. 3. The optical power at the output ports canbe written as
P1 < P0S2p
DlV9lB 2
p
41
12D , (8)
P2 < P0S22p
DlV9lB 1
p
41
12D , (9)
Fig. 1. Tuning characteristics for three WDM’s with 10-nm peri-ods and different fabrication parameters.
Fig. 2. Tunability as a function of the WDM period for threedifferent fabrication parameters.
1 December 1998 y Vol. 37, No. 34 y APPLIED OPTICS 7941
BfWp
ttc
~2t
ugwti
7
where lB is the Bragg wavelength, V9 is given byV9 5 ~V 1 1!y~V 2 1!, and P0 is the power reachingthe WDM after being reflected from the FBG. Ap-proximations ~8! and ~9! are valid only for small
ragg wavelength shifts around the 3-dB point andor a grating spectral width much smaller than the
DM period. The signal after the differential am-lifier is then given by
Vdif 5 KP0
2p
DlV9~lB 2 l3dB!, (10)
where K is the gain of the detectors and l3dB is theBragg wavelength that sets P1 5 P2. Equation ~10!clearly shows that the system sensitivity to shift inthe Bragg wavelength increases in proportion to theoptical power reaching the WDM, and it is inverselyproportional to the WDM period. However, mini-mizing the WDM period seriously restricts the linearmeasurement range. In other words, while it is ad-vantageous to increase the slope by using a highlyselective WDM, the maximum wavelength shift thatcan be detected in the linear region around the 3-dBpoint becomes smaller. To overcome this limitation,we propose a closed-loop approach ~Fig. 3!. By lock-ing the 3-dB point of the WDM to the reflected Braggwavelength, we can obtain high sensitivity withoutcompromising the measurement range. The elonga-tion applied to the WDM in closed-loop operation canbe written as
DL 5 DLBias 1 KPZT
AtC
KP0
2p
DlV9 * ~lB 2 l3dB!dt.
(11)
In Eq. ~11!, DLBias is the initial elongation neces-sary to ensure proper selection of the 3-dB point, KPZTis the voltage to displacement conversion factor forthe PZT used to stretch the WDM, A is the amplifiervoltage gain, and tC is the integrator time constant.Equation ~11! indicates that DL can be used to mea-sure directly the Bragg wavelength shifts associatedwith strain or temperature variations applied to theFBG.
Fig. 3. Experimental setup. Inset: detail of the WDM stretch-ing mount.
942 APPLIED OPTICS y Vol. 37, No. 34 y 1 December 1998
The sensitivity of the proposed demodulationscheme is basically determined by the system’s noiselevel and the slope of the WDM spectral response.The most important noise source in the system iscaused by the electronic circuitry, which is not relatedwith power reaching detectors or WDM characteris-tics. That is, for a given optical source power thewavelength selectivity of the WDM dictates the min-imum Bragg wavelength shift that can be measured.It is important to emphasize at this point that thereare always practical limitations in the selection ofWDM with a minimum period. The first limitationarises during the fabrication process, because ahighly selective WDM requires long pulling thatleads to excess power loss, incomplete mode conver-sion, and a fragile device. On the other hand, as canbe seen in Fig. 2, higher wavelength selectivity cor-responds to a reduced tuning capability of the WDM.This decrease in the tuning capability puts practicalconstraints on the WDM stretching when used in aclosed loop. For this problem to be minimized, ashort heating length should be used during the WDMfabrication process, as indicated by the data in Fig. 2.However, for a given selectivity, the minimum taperlength is limited by mode-coupling loss, as describedby the condition for adiabaticy.27 Therefore the op-timum period for the WDM used to analyze shift inthe wavelength of light reflected from a FBG is de-termined by the power loss that can be accepted andthe required maximum tunability range.
3. Experimental Results and Discussion
To demonstrate the effectiveness of the proposeddemodulation scheme, we implemented the setupshown in Fig. 3. Light from a pigtailed superlumi-nescent diode ~l0 5 1280 nm, DlS 5 20 nm! was usedo illuminate the FBG. The grating was written byhe phase mask technique in hydrogen-loaded tele-ommunication fiber ~lB 5 1282 nm, dl 5 0.2 nm!.
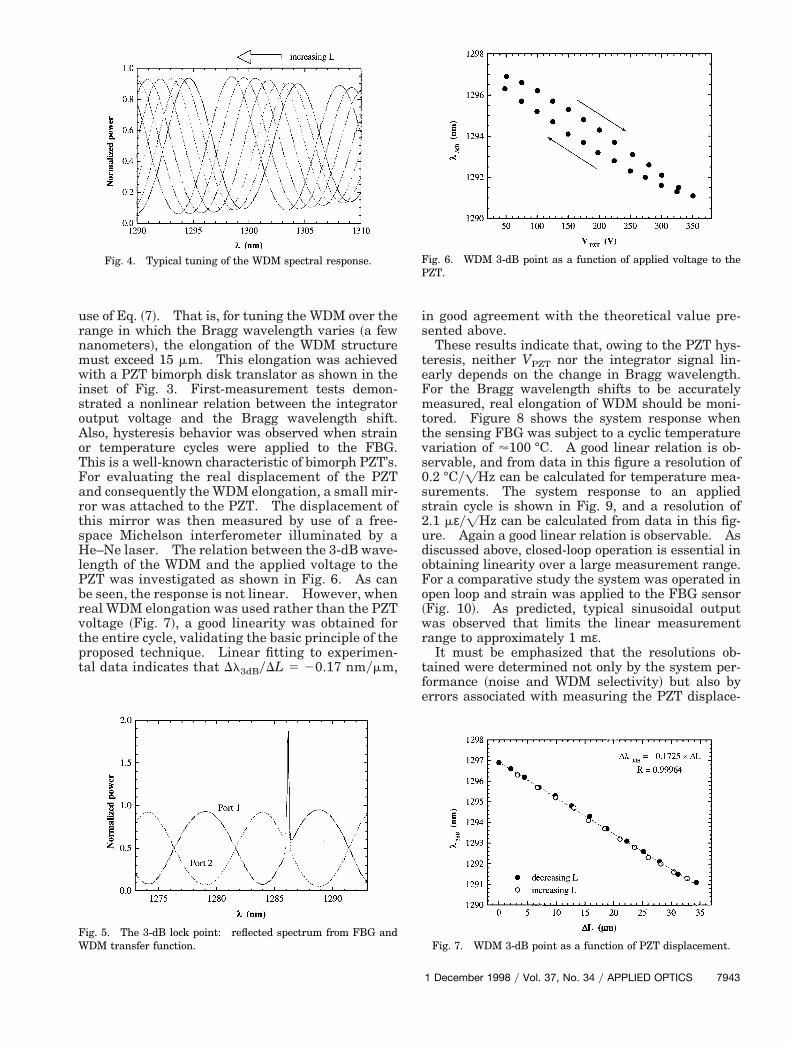
To measure the Bragg wavelength shifts, we fabri-cated a WDM by using the fused biconical tapermethod. The fibers were uniformly heated over alength of 3.0 mm and elongated by 25.5 mm. TheWDM period obtained was measured with an opticalspectrum analyzer as Dl 5 9.8 nm. Using the ex-perimental values of LH, LT, and Dl in Eqs. ~4! and5!, we can estimate the value for the WDM waist, a 5.1 mm, and for the coupling length, L 5 9.6 mm. Aypical WDM response is shown in Fig. 4.
Signals from detectors ~K 5 500 mVymW! weresed as inputs to a differential amplifier with unityain. The typical optical power reaching detectorsas '10 nW. Through the integrator a compensa-
ion signal is then generated when the power reach-ng detectors D1 and D2 is not balanced. This signal,
after being amplified and added to a bias signal, isapplied to the piezoelectric transducer ~PZT! used tostretch the WDM structure. As mentioned in Sec-tion 2, the PZT bias is used to select an initial 3-dBpoint suitable to lock the Bragg wavelength. Thissituation is illustrated in Fig. 5. The WDM tunabil-ity can be estimated as Dl3dByDL 5 20.16 nmymm by
r
wisoAoTFartsHlPbrvtpt
is
t
use of Eq. ~7!. That is, for tuning the WDM over theange in which the Bragg wavelength varies ~a few
nanometers!, the elongation of the WDM structuremust exceed 15 mm. This elongation was achieved
ith a PZT bimorph disk translator as shown in thenset of Fig. 3. First-measurement tests demon-trated a nonlinear relation between the integratorutput voltage and the Bragg wavelength shift.lso, hysteresis behavior was observed when strainr temperature cycles were applied to the FBG.his is a well-known characteristic of bimorph PZT’s.or evaluating the real displacement of the PZTnd consequently the WDM elongation, a small mir-or was attached to the PZT. The displacement ofhis mirror was then measured by use of a free-pace Michelson interferometer illuminated by ae–Ne laser. The relation between the 3-dB wave-
ength of the WDM and the applied voltage to theZT was investigated as shown in Fig. 6. As cane seen, the response is not linear. However, wheneal WDM elongation was used rather than the PZToltage ~Fig. 7!, a good linearity was obtained forhe entire cycle, validating the basic principle of theroposed technique. Linear fitting to experimen-al data indicates that Dl3dByDL 5 20.17 nmymm,
Fig. 5. The 3-dB lock point: reflected spectrum from FBG andWDM transfer function.
n good agreement with the theoretical value pre-ented above.These results indicate that, owing to the PZT hys-
eresis, neither VPZT nor the integrator signal lin-early depends on the change in Bragg wavelength.For the Bragg wavelength shifts to be accuratelymeasured, real elongation of WDM should be moni-tored. Figure 8 shows the system response whenthe sensing FBG was subject to a cyclic temperaturevariation of '100 °C. A good linear relation is ob-servable, and from data in this figure a resolution of0.2 °Cy=Hz can be calculated for temperature mea-surements. The system response to an appliedstrain cycle is shown in Fig. 9, and a resolution of2.1 mεy=Hz can be calculated from data in this fig-ure. Again a good linear relation is observable. Asdiscussed above, closed-loop operation is essential inobtaining linearity over a large measurement range.For a comparative study the system was operated inopen loop and strain was applied to the FBG sensor~Fig. 10!. As predicted, typical sinusoidal outputwas observed that limits the linear measurementrange to approximately 1 mε.
It must be emphasized that the resolutions ob-tained were determined not only by the system per-formance ~noise and WDM selectivity! but also byerrors associated with measuring the PZT displace-
Fig. 7. WDM 3-dB point as a function of PZT displacement.
Fig. 4. Typical tuning of the WDM spectral response.
Fig. 6. WDM 3-dB point as a function of applied voltage to thePZT.1 December 1998 y Vol. 37, No. 34 y APPLIED OPTICS 7943
acwaii
w1cfmpttae
7
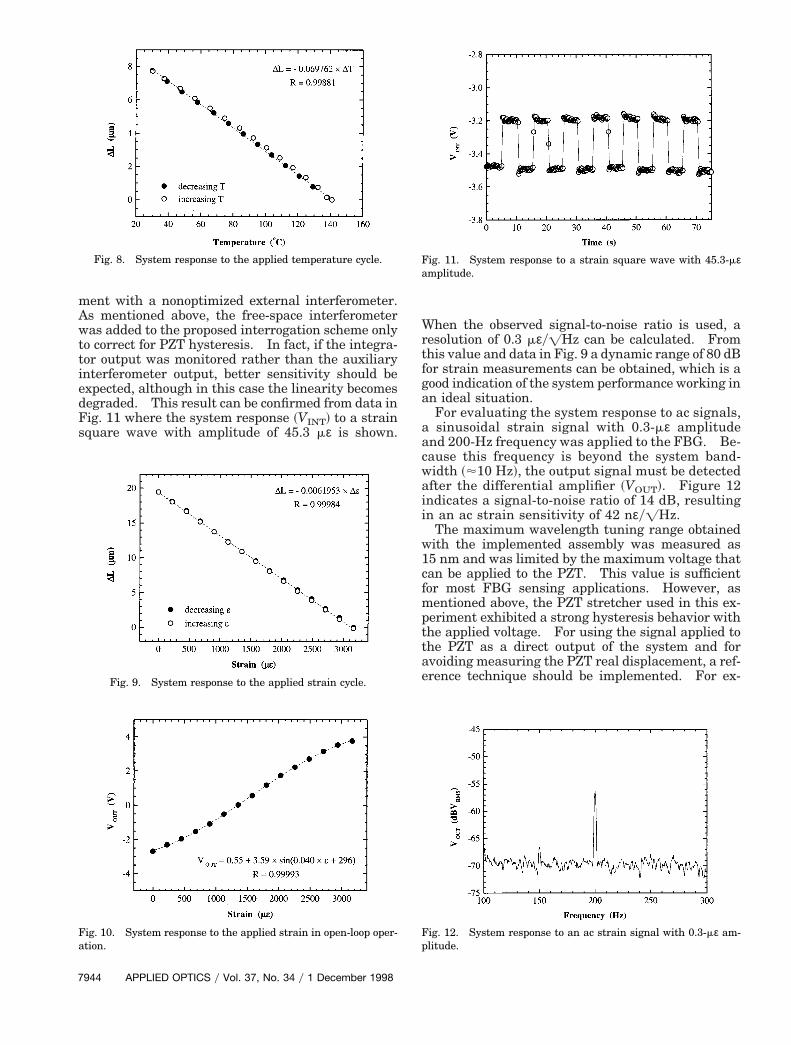
ment with a nonoptimized external interferometer.As mentioned above, the free-space interferometerwas added to the proposed interrogation scheme onlyto correct for PZT hysteresis. In fact, if the integra-tor output was monitored rather than the auxiliaryinterferometer output, better sensitivity should beexpected, although in this case the linearity becomesdegraded. This result can be confirmed from data inFig. 11 where the system response ~VINT! to a strainsquare wave with amplitude of 45.3 mε is shown.
Fig. 8. System response to the applied temperature cycle.
Fig. 9. System response to the applied strain cycle.
Fig. 10. System response to the applied strain in open-loop oper-ation.
944 APPLIED OPTICS y Vol. 37, No. 34 y 1 December 1998
When the observed signal-to-noise ratio is used, aresolution of 0.3 mεy=Hz can be calculated. Fromthis value and data in Fig. 9 a dynamic range of 80 dBfor strain measurements can be obtained, which is agood indication of the system performance working inan ideal situation.
For evaluating the system response to ac signals,a sinusoidal strain signal with 0.3-mε amplitude
nd 200-Hz frequency was applied to the FBG. Be-ause this frequency is beyond the system band-idth ~'10 Hz!, the output signal must be detectedfter the differential amplifier ~VOUT!. Figure 12ndicates a signal-to-noise ratio of 14 dB, resultingn an ac strain sensitivity of 42 nεy=Hz.
The maximum wavelength tuning range obtainedith the implemented assembly was measured as5 nm and was limited by the maximum voltage thatan be applied to the PZT. This value is sufficientor most FBG sensing applications. However, asentioned above, the PZT stretcher used in this ex-
eriment exhibited a strong hysteresis behavior withhe applied voltage. For using the signal applied tohe PZT as a direct output of the system and forvoiding measuring the PZT real displacement, a ref-rence technique should be implemented. For ex-
Fig. 11. System response to a strain square wave with 45.3-mεamplitude.
Fig. 12. System response to an ac strain signal with 0.3-mε am-plitude.
1tTp
2sa
Processing, and Instrumentation, R. O. Claus, ed., Proc. SPIE
ample, if a small ac signal were applied to the PZT inaddition to the compensation signal, an intensity ref-erence would be generated that could be used to lo-cate the operating point on the hysteresis curve andcorrect for the nonlinearity. An alternative solutionwould be the use of less efficient PZT stretchers ex-hibiting low hysteresis. In this case it is possible todesign a feedback circuitry that resets itself when theoutput voltage reaches a certain maximum value.The periodic nature of the WDM device allows a sec-ond 3-dB point to be used when the full range of thefirst operating point has already been utilized.
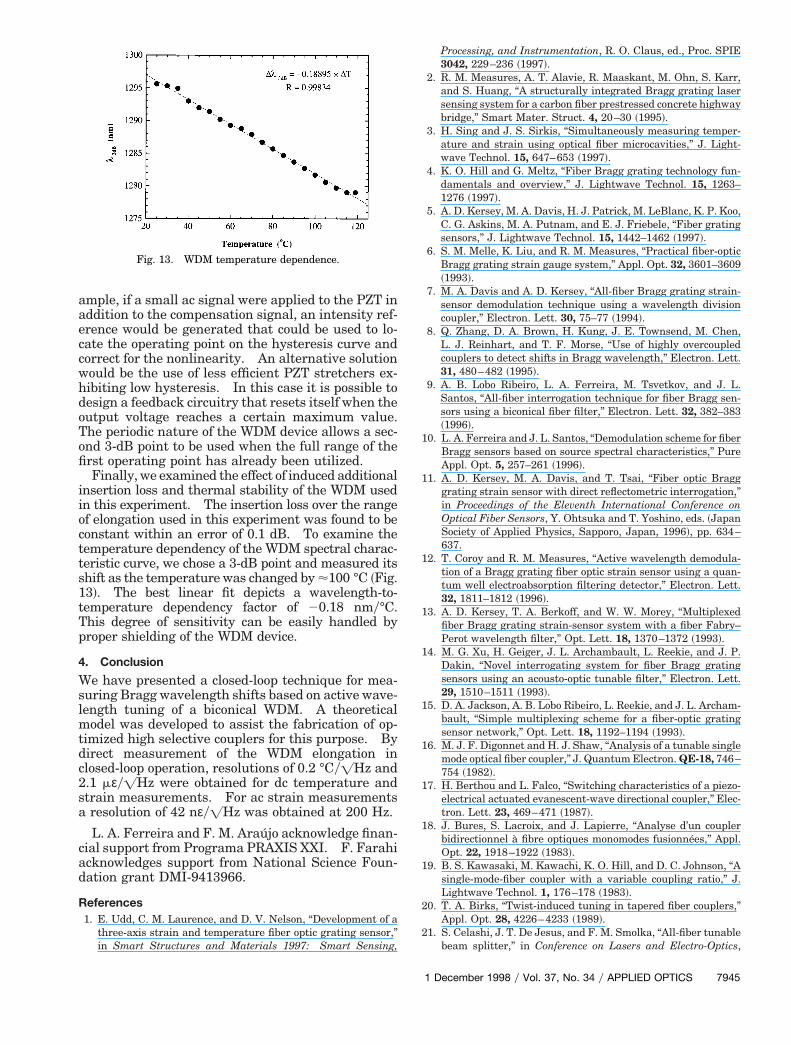
Finally, we examined the effect of induced additionalinsertion loss and thermal stability of the WDM usedin this experiment. The insertion loss over the rangeof elongation used in this experiment was found to beconstant within an error of 0.1 dB. To examine thetemperature dependency of the WDM spectral charac-teristic curve, we chose a 3-dB point and measured itsshift as the temperature was changed by '100 °C ~Fig.3!. The best linear fit depicts a wavelength-to-emperature dependency factor of 20.18 nmy°C.his degree of sensitivity can be easily handled byroper shielding of the WDM device.
4. Conclusion
We have presented a closed-loop technique for mea-suring Bragg wavelength shifts based on active wave-length tuning of a biconical WDM. A theoreticalmodel was developed to assist the fabrication of op-timized high selective couplers for this purpose. Bydirect measurement of the WDM elongation inclosed-loop operation, resolutions of 0.2 °Cy=Hz and.1 mεy=Hz were obtained for dc temperature andtrain measurements. For ac strain measurementsresolution of 42 nεy=Hz was obtained at 200 Hz.
L. A. Ferreira and F. M. Araujo acknowledge finan-cial support from Programa PRAXIS XXI. F. Farahiacknowledges support from National Science Foun-dation grant DMI-9413966.
References1. E. Udd, C. M. Laurence, and D. V. Nelson, “Development of a
three-axis strain and temperature fiber optic grating sensor,”in Smart Structures and Materials 1997: Smart Sensing,
Fig. 13. WDM temperature dependence.
3042, 229–236 ~1997!.2. R. M. Measures, A. T. Alavie, R. Maaskant, M. Ohn, S. Karr,
and S. Huang, “A structurally integrated Bragg grating lasersensing system for a carbon fiber prestressed concrete highwaybridge,” Smart Mater. Struct. 4, 20–30 ~1995!.
3. H. Sing and J. S. Sirkis, “Simultaneously measuring temper-ature and strain using optical fiber microcavities,” J. Light-wave Technol. 15, 647–653 ~1997!.
4. K. O. Hill and G. Meltz, “Fiber Bragg grating technology fun-damentals and overview,” J. Lightwave Technol. 15, 1263–1276 ~1997!.
5. A. D. Kersey, M. A. Davis, H. J. Patrick, M. LeBlanc, K. P. Koo,C. G. Askins, M. A. Putnam, and E. J. Friebele, “Fiber gratingsensors,” J. Lightwave Technol. 15, 1442–1462 ~1997!.
6. S. M. Melle, K. Liu, and R. M. Measures, “Practical fiber-opticBragg grating strain gauge system,” Appl. Opt. 32, 3601–3609~1993!.
7. M. A. Davis and A. D. Kersey, “All-fiber Bragg grating strain-sensor demodulation technique using a wavelength divisioncoupler,” Electron. Lett. 30, 75–77 ~1994!.
8. Q. Zhang, D. A. Brown, H. Kung, J. E. Townsend, M. Chen,L. J. Reinhart, and T. F. Morse, “Use of highly overcoupledcouplers to detect shifts in Bragg wavelength,” Electron. Lett.31, 480–482 ~1995!.
9. A. B. Lobo Ribeiro, L. A. Ferreira, M. Tsvetkov, and J. L.Santos, “All-fiber interrogation technique for fiber Bragg sen-sors using a biconical fiber filter,” Electron. Lett. 32, 382–383~1996!.
10. L. A. Ferreira and J. L. Santos, “Demodulation scheme for fiberBragg sensors based on source spectral characteristics,” PureAppl. Opt. 5, 257–261 ~1996!.
11. A. D. Kersey, M. A. Davis, and T. Tsai, “Fiber optic Bragggrating strain sensor with direct reflectometric interrogation,”in Proceedings of the Eleventh International Conference onOptical Fiber Sensors, Y. Ohtsuka and T. Yoshino, eds. ~JapanSociety of Applied Physics, Sapporo, Japan, 1996!, pp. 634–637.
12. T. Coroy and R. M. Measures, “Active wavelength demodula-tion of a Bragg grating fiber optic strain sensor using a quan-tum well electroabsorption filtering detector,” Electron. Lett.32, 1811–1812 ~1996!.
13. A. D. Kersey, T. A. Berkoff, and W. W. Morey, “Multiplexedfiber Bragg grating strain-sensor system with a fiber Fabry–Perot wavelength filter,” Opt. Lett. 18, 1370–1372 ~1993!.
14. M. G. Xu, H. Geiger, J. L. Archambault, L. Reekie, and J. P.Dakin, “Novel interrogating system for fiber Bragg gratingsensors using an acousto-optic tunable filter,” Electron. Lett.29, 1510–1511 ~1993!.
15. D. A. Jackson, A. B. Lobo Ribeiro, L. Reekie, and J. L. Archam-bault, “Simple multiplexing scheme for a fiber-optic gratingsensor network,” Opt. Lett. 18, 1192–1194 ~1993!.
16. M. J. F. Digonnet and H. J. Shaw, “Analysis of a tunable singlemode optical fiber coupler,” J. Quantum Electron. QE-18, 746–754 ~1982!.
17. H. Berthou and L. Falco, “Switching characteristics of a piezo-electrical actuated evanescent-wave directional coupler,” Elec-tron. Lett. 23, 469–471 ~1987!.
18. J. Bures, S. Lacroix, and J. Lapierre, “Analyse d’un couplerbidirectionnel a fibre optiques monomodes fusionnees,” Appl.Opt. 22, 1918–1922 ~1983!.
19. B. S. Kawasaki, M. Kawachi, K. O. Hill, and D. C. Johnson, “Asingle-mode-fiber coupler with a variable coupling ratio,” J.Lightwave Technol. 1, 176–178 ~1983!.
20. T. A. Birks, “Twist-induced tuning in tapered fiber couplers,”Appl. Opt. 28, 4226–4233 ~1989!.
21. S. Celashi, J. T. De Jesus, and F. M. Smolka, “All-fiber tunablebeam splitter,” in Conference on Lasers and Electro-Optics,
1 December 1998 y Vol. 37, No. 34 y APPLIED OPTICS 7945

Vol. 7 of 1988 Technical Digest Series ~Optical Society of Amer-
2
2
24. M. B. J. Diemeer, W. J. De Vries, and K. W. Benoist, “Fused
7
ica, Washington, D.C., 1988!, pp. 358–359.2. A. Booysen, S. J. Spammer, and P. L. Swart, “Ratiometric fiber
optic sensor utilizing a fused biconically tapered coupler,” inFiber Optic and Laser Sensors IX, R. P. DePaula and E. Udd,eds., Proc. SPIE 1584, 273–279 ~1991!.
3. R. G. Lamont, D. C. Johnson, and K. O. Hill, “Power transferin fused biconical-taper single-mode fiber couplers: depen-dence on external refractive index,” Appl. Opt. 24, 327–332~1995!.
946 APPLIED OPTICS y Vol. 37, No. 34 y 1 December 1998
coupler switch using a thermo-optic cladding,” Electron. Lett.24, 457–458 ~1988!.
25. F. P. Paine, C. D. Hussey, and M. S. Yataki, “Modeling fusedsingle-mode-fiber couplers,” Electron. Lett. 21, 461–462~1985!.
26. R. P. Kenny, T. A. Birks, and K. P. Oakley, “Control of opticalfiber taper shape,” Electron. Lett. 27, 1654–1656 ~1991!.
27. J. D. Love and W. M. Henry, “Quantifying loss minimization insingle-mode fiber tapers,” Electron. Lett. 22, 912–914 ~1986!.


