Embed Size (px)
Citation preview
1
Scientific Journal of Review (2013) 2(1) ISSN 2322-2433
Experimental studies on structural load monitoring using piezoelectric transducer based electromechanical impedance method
M.A. Radhika and V.G.M. Annamdas* Laboratory of Monitoring Science, Nanyang Technological University, 50 Nanyang, Avenue. Singapore 639798.
*Corresponding author; Laboratory of Monitoring Science, Nanyang Technological University, 50 Nanyang, Avenue. Singapore 639798.
A R T I C L E I N F O
Article history: Received 20 January 2013 Accepted 28 January 2013 Available online 31 January 2013
Keywords: Load PZT transducer Monitoring Impedance Boundary effect and buckling effects Civil and mechanical (ACM) structures Fatigue cyclic load Axial and transverse load
A B S T R A C T
In general aerospace, civil and mechanical (ACM) structures are often subjected to some or the other forms of loading during their service life. It has been reported that about 75% of aerospace structures fail due to fatigue cyclic loading. The civil-structural components are subjected to some form of axial and transverse loading which continuously deteriorates the health of the structure. Mechanical components are also subjected to stresses due to contact pressures between several components. Thus for ACM structures, effective monitoring through-out the entire life is required as these often involve public life and huge investments. Owing to such necessity, researchers around the world are continuously working on the development of smart sensor based effective monitoring techniques. Piezo electric (PZT) transducer based electromechanical impedance (EMI) is one such technique which was developed for structural health monitoring (SHM). In this technique, PZT transducers are usually attached to the structure to be monitored and are then subjected to unit sinusoidal electric voltage to generate the electromechanical (EM) admittance signatures when interrogated to the desired frequency range of excitations. These signatures consist of real (conductance) and imaginary (susceptance) parts which serve as indicator to predict the structural health. Any deviations in these signatures during the monitoring period indicate disturbance in the structure. However, the EMI technique was not widely explored for structural load monitoring (such as fatigue cyclic load, monotonous load, axial and transverse load) compared to
Contents lists available at Sjournals
Journal homepage: www.Sjournals.com
Review article
M.A. Radhika and V.G.M. Annamdas / Scientific Journal of Review (2013) 2(1)
2
damage detection. In this paper, systematic experiments were presented on the specimens for axial load variations, transverse load variations, monotonous and fatigue load variation with discussions on boundary effect and buckling effects. For axial, fatigue, monotonic load, the conductance was found to be effective where as for transverse load monitoring susceptance was found to be effective. This paper summarizes different types of loading effects related to EMI.
© 2013 Sjournals. All rights reserved.
1. Introduction
In general aerospace, civil and mechanical (ACM) structures are often subjected to some or the other forms of loading during their service life. It has been reported that about 75% of aerospace structures fail due to fatigue cyclic loading. The civil-structural components such as slabs, beams and columns are constantly subjected to some form of axial and transverse loading which continuously deteriorates the health of the structure. Mechanical components such as gears, shafts and blades are also subjected to stresses due to contact pressures between several components. Thus for ACM structures, effective monitoring through-out the entire life is required as these often involve public life and huge investments. Further it reduces the life-cycle costs and improve reliability. Owing to such necessity, researchers around the world are continuously developing smart sensor based effective monitoring techniques (Elgamal, et al., 2003; Sereci, A.M et al., 2003; Annamdas, et al, 2008; Zhao, et al., 2007) Piezo electric (PZT) sensor based electromechanical impedance (EMI) is one such technique (Annamdas and Soh, 2010) which was developed for structural health monitoring (SHM). The principle employed is that the PZT sensor in the presence of unit sinusoidal electric field actuates harmonically for the desired frequency range to generate electromechanical (EM) admittance (inverse of EMI) signature (Liang et al., 1994). SHM is a broad classification comprising of studies related to damages, cracks, corrosion etc which are aimed to enhance the life cycle of the structure under consideration. One of the most important studies related to load: such as axial, transverse and fatigue are the main sources of structural damage. Thus this article presents the behaviour of EMI technology for structural load monitoring (SLM) which is a part of SHM.
2. Materials and methods
2.1. EMI technology
EM impedance studies related to engineering structures is fast emerging especially in the last decade (Giurgiutiu and Rogers, 1998; Park, et al., 2000; Ritdumrongkul, et al., 2004; Xu, et al., 2004; Yang, et al., 2006). The advantages of EMI method include fast dynamic response, long term durability, negligible ageing, high sensitivity and immunity to ambient noise (Naidu, 2004). Researchers such as Crawley and Luis (1987), Liang et al. (1994), Zhou et al. (1996), Yang et al (2005) and Annamdas and Soh (2006, 2007a, 2007b, 2008) have developed various models to describe the interaction between the PZT transducer and its host structure. The PZT transducers are either surface bonded to or embedded inside the host structure and are subjected to electric actuation, so as to interrogate the structure for the desired frequency range to generate the EM admittance signatures of the PZT transducers. The EM admittance signature is a function of the stiffness, mass, damping (Sun, et al., 1995) and boundary conditions (Park, et al., 2000; Lim and Soh, 2012) of the host structure as well as the length, width, thickness and orientation of the PZT transducer (Wetherhold, et al., 2003). The changes in the EM admittance signature are indicative of the presence of ill health of the structure. The EM admittance consists of real (conductance) and imaginary (susceptance) parts. Annamdas and Soh (2010) reported that if the host structure is smaller than the sensing range of the PZT transducer bonded on it, the boundary conditions can also influence the PZT-based signatures which were verified by Annamdas et al. (2007), Lim and Soh (2012). Park et al. (2000) claimed that the sensing radius of a typical PZT patch might vary from 0.4 m on composite reinforced structures to about 3 m on simple metal beams. The boundary conditions in real-life structures are, however, extremely difficult to
M.A. Radhika and V.G.M. Annamdas / Scientific Journal of Review (2013) 2(1)
3
characterize analytically and tend to exhibit a poor repeatability between structures (Mascarenas, 2006; Annamdas and Yang, 2012).
2.2. Electrical Impedance
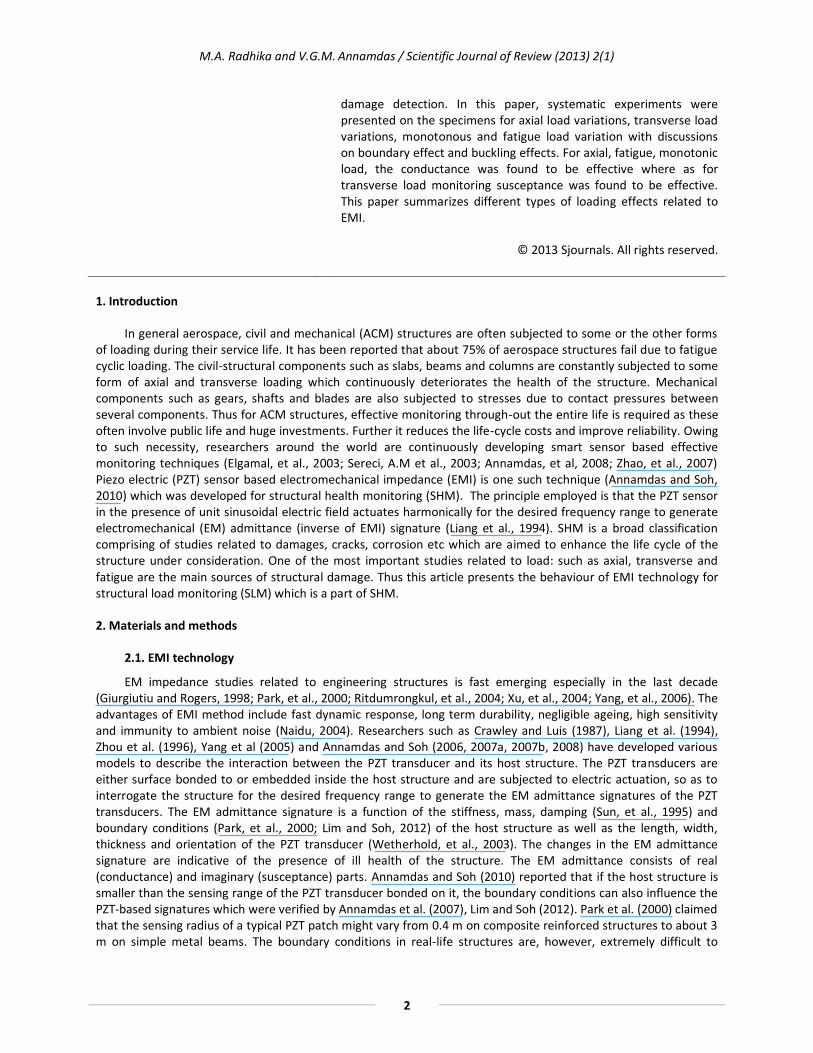
‘Impedance (Z)’ is an important parameter used to characterize electronic circuits, components, and the materials used to make the components. Z is generally defined as the total opposition a device or circuit offers to the flow of an alternating current (AC) at a given frequency, and is represented as a complex quantity which can be graphically shown on a vector plane (Annamdas and Soh, 2010). An impedance vector consists of a real part (resistance, R) and an imaginary part (reactance, X) as shown in Figure 1. Impedance can be expressed using the
rectangular-coordinate form R+jX or in the polar form as a magnitude and phase angle: |Z| θ. Figure 1 also shows the mathematical relationship between R, X, |Z| and θ.
Fig.1. Graphical and mathematical representations of impedance
In some cases, using reciprocal of impedance is mathematically convenient in which case 1/Z = 1/(R + jX) = Y, where Y represents admittance. The unit of impedance is the ohm (Ω), and admittance is the siemen (S). The relation between impedance and admittance is given as
Z
1 = Y = G + jB, (1)
where G is the conductance, and B is the susceptance. The real and the imaginary parts need to be measured for the complete impedance or admittance signatures.
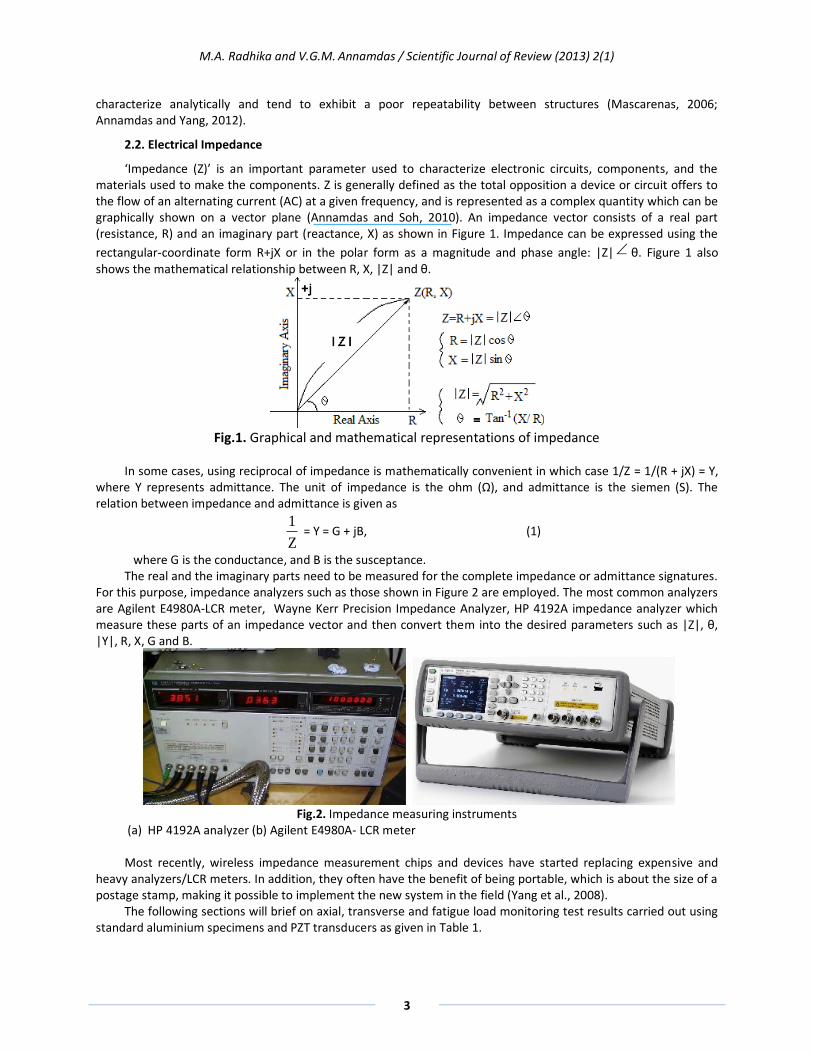
For this purpose, impedance analyzers such as those shown in Figure 2 are employed. The most common analyzers are Agilent E4980A-LCR meter, Wayne Kerr Precision Impedance Analyzer, HP 4192A impedance analyzer which measure these parts of an impedance vector and then convert them into the desired parameters such as |Z|, θ, |Y|, R, X, G and B.
Fig.2. Impedance measuring instruments
(a) HP 4192A analyzer (b) Agilent E4980A- LCR meter Most recently, wireless impedance measurement chips and devices have started replacing expensive and
heavy analyzers/LCR meters. In addition, they often have the benefit of being portable, which is about the size of a postage stamp, making it possible to implement the new system in the field (Yang et al., 2008).
The following sections will brief on axial, transverse and fatigue load monitoring test results carried out using standard aluminium specimens and PZT transducers as given in Table 1.
M.A. Radhika and V.G.M. Annamdas / Scientific Journal of Review (2013) 2(1)
4
Table 1 Key properties of epoxy adhesive (RS 850-940), aluminium and PZT Physical property Value Mechanical
Density (3/ mkg )
Epoxy
1180
Aluminium
2715
PZT 7800
Young’s Modulus (2/ mN ) x
910 2 68.95 66.67
Poisson ratio 0.4 0.33 0.33 loss factor, - - 0.023 Dynamical Mass damping factor
0
Stiffness damping factor x710
1.5923
Electrical
Piezoelectric strain coefficients (m/V) 31d , 32d x 1010
Piezoelectric strain coefficient (m/V) 33d x1010
Dielectric loss factor,
Electric permittivity, 33 (farad/m) x 810
-2.10
4.50 0.015 1.75
3. Recent activities and experimental studies
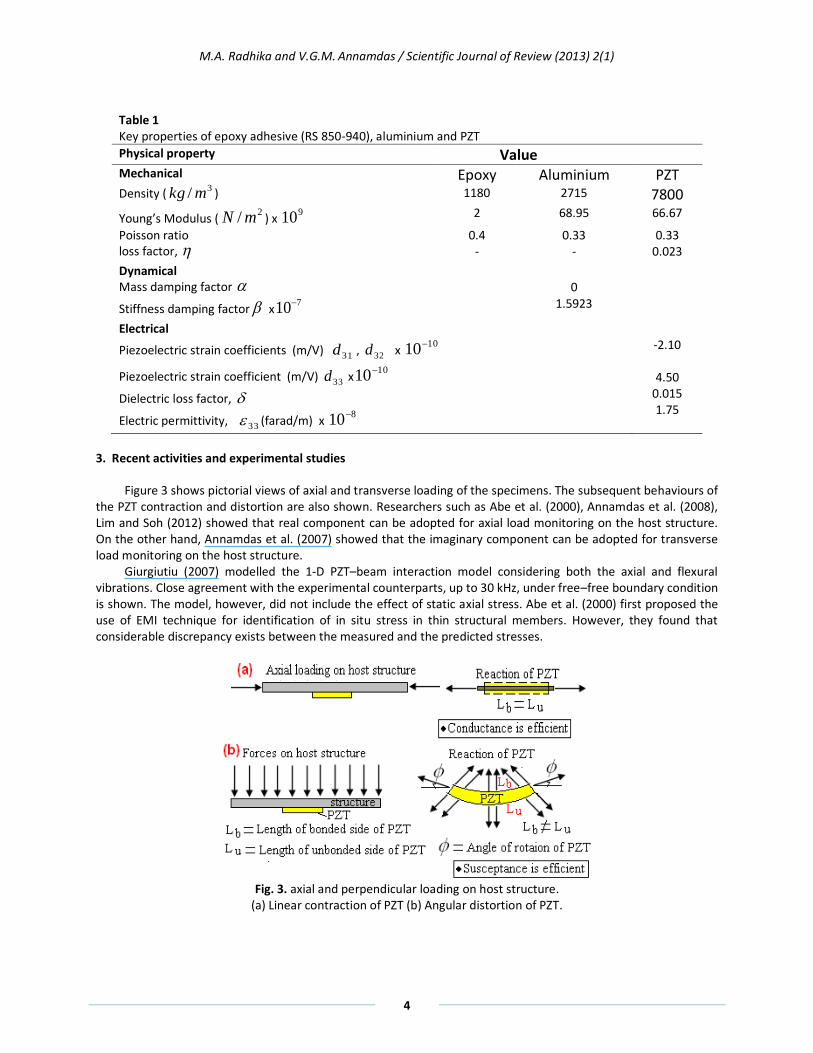
Figure 3 shows pictorial views of axial and transverse loading of the specimens. The subsequent behaviours of the PZT contraction and distortion are also shown. Researchers such as Abe et al. (2000), Annamdas et al. (2008), Lim and Soh (2012) showed that real component can be adopted for axial load monitoring on the host structure. On the other hand, Annamdas et al. (2007) showed that the imaginary component can be adopted for transverse load monitoring on the host structure.
Giurgiutiu (2007) modelled the 1-D PZT–beam interaction model considering both the axial and flexural vibrations. Close agreement with the experimental counterparts, up to 30 kHz, under free–free boundary condition is shown. The model, however, did not include the effect of static axial stress. Abe et al. (2000) first proposed the use of EMI technique for identification of in situ stress in thin structural members. However, they found that considerable discrepancy exists between the measured and the predicted stresses.
Fig. 3. axial and perpendicular loading on host structure.
(a) Linear contraction of PZT (b) Angular distortion of PZT.
M.A. Radhika and V.G.M. Annamdas / Scientific Journal of Review (2013) 2(1)
5
4.1. Axial compression load monitoring
Lim and Soh 2012 presented a series of experimental, analytical, and numerical studies to investigate the effect of axial stress in the presence of fixed boundary condition on natural frequencies and the subsequent admittance signatures. The problem was addressed by first revisiting the 1-D analytical model involved in an axially loaded simple beam with a surface bonded PZT transducer. Both axial and flexural modes of vibrations are considered. Further, their study can be divided into three major parts as
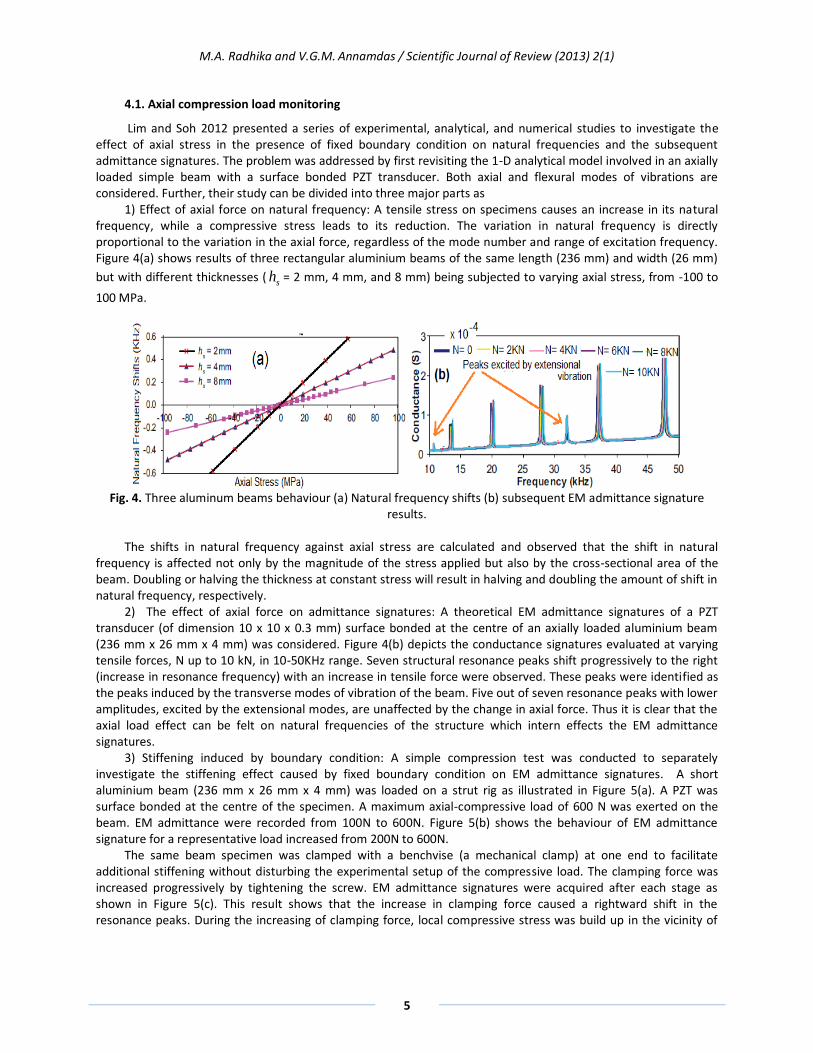
1) Effect of axial force on natural frequency: A tensile stress on specimens causes an increase in its natural frequency, while a compressive stress leads to its reduction. The variation in natural frequency is directly proportional to the variation in the axial force, regardless of the mode number and range of excitation frequency. Figure 4(a) shows results of three rectangular aluminium beams of the same length (236 mm) and width (26 mm)
but with different thicknesses (sh = 2 mm, 4 mm, and 8 mm) being subjected to varying axial stress, from -100 to
100 MPa.
Fig. 4. Three aluminum beams behaviour (a) Natural frequency shifts (b) subsequent EM admittance signature
results.
The shifts in natural frequency against axial stress are calculated and observed that the shift in natural frequency is affected not only by the magnitude of the stress applied but also by the cross-sectional area of the beam. Doubling or halving the thickness at constant stress will result in halving and doubling the amount of shift in natural frequency, respectively.
2) The effect of axial force on admittance signatures: A theoretical EM admittance signatures of a PZT transducer (of dimension 10 x 10 x 0.3 mm) surface bonded at the centre of an axially loaded aluminium beam (236 mm x 26 mm x 4 mm) was considered. Figure 4(b) depicts the conductance signatures evaluated at varying tensile forces, N up to 10 kN, in 10-50KHz range. Seven structural resonance peaks shift progressively to the right (increase in resonance frequency) with an increase in tensile force were observed. These peaks were identified as the peaks induced by the transverse modes of vibration of the beam. Five out of seven resonance peaks with lower amplitudes, excited by the extensional modes, are unaffected by the change in axial force. Thus it is clear that the axial load effect can be felt on natural frequencies of the structure which intern effects the EM admittance signatures.
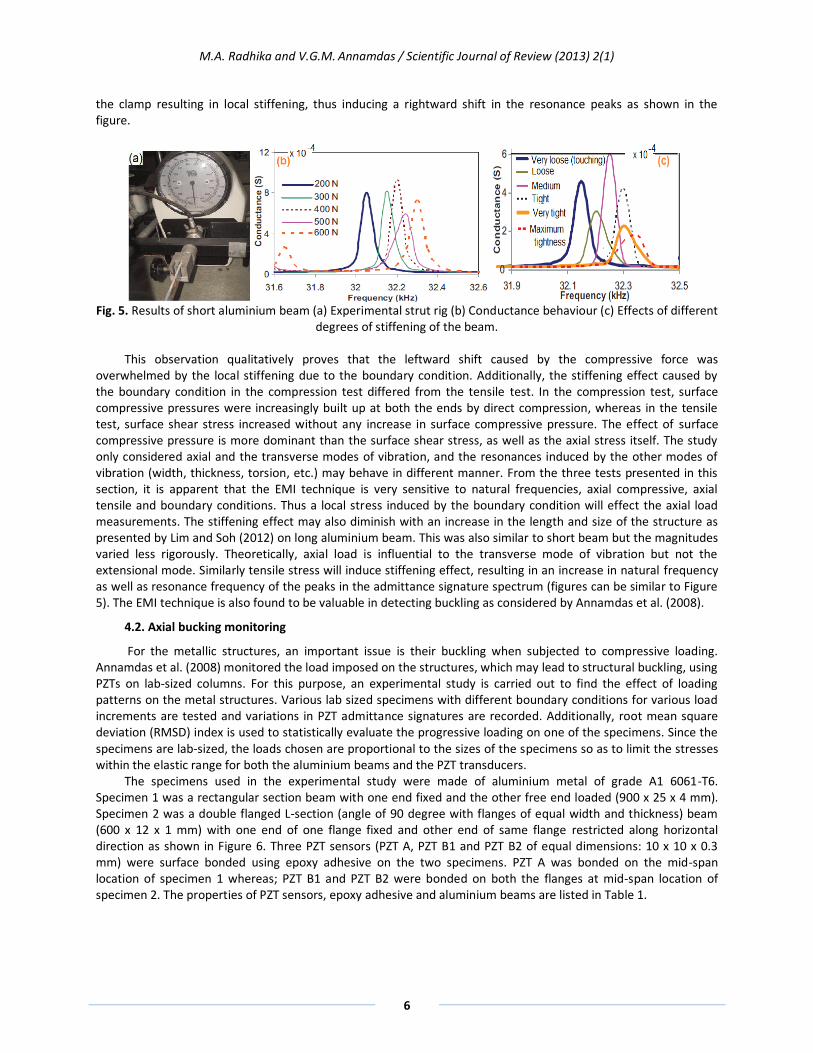
3) Stiffening induced by boundary condition: A simple compression test was conducted to separately investigate the stiffening effect caused by fixed boundary condition on EM admittance signatures. A short aluminium beam (236 mm x 26 mm x 4 mm) was loaded on a strut rig as illustrated in Figure 5(a). A PZT was surface bonded at the centre of the specimen. A maximum axial-compressive load of 600 N was exerted on the beam. EM admittance were recorded from 100N to 600N. Figure 5(b) shows the behaviour of EM admittance signature for a representative load increased from 200N to 600N.
The same beam specimen was clamped with a benchvise (a mechanical clamp) at one end to facilitate additional stiffening without disturbing the experimental setup of the compressive load. The clamping force was increased progressively by tightening the screw. EM admittance signatures were acquired after each stage as shown in Figure 5(c). This result shows that the increase in clamping force caused a rightward shift in the resonance peaks. During the increasing of clamping force, local compressive stress was build up in the vicinity of
M.A. Radhika and V.G.M. Annamdas / Scientific Journal of Review (2013) 2(1)
6
the clamp resulting in local stiffening, thus inducing a rightward shift in the resonance peaks as shown in the figure.
Fig. 5. Results of short aluminium beam (a) Experimental strut rig (b) Conductance behaviour (c) Effects of different
degrees of stiffening of the beam.
This observation qualitatively proves that the leftward shift caused by the compressive force was overwhelmed by the local stiffening due to the boundary condition. Additionally, the stiffening effect caused by the boundary condition in the compression test differed from the tensile test. In the compression test, surface compressive pressures were increasingly built up at both the ends by direct compression, whereas in the tensile test, surface shear stress increased without any increase in surface compressive pressure. The effect of surface compressive pressure is more dominant than the surface shear stress, as well as the axial stress itself. The study only considered axial and the transverse modes of vibration, and the resonances induced by the other modes of vibration (width, thickness, torsion, etc.) may behave in different manner. From the three tests presented in this section, it is apparent that the EMI technique is very sensitive to natural frequencies, axial compressive, axial tensile and boundary conditions. Thus a local stress induced by the boundary condition will effect the axial load measurements. The stiffening effect may also diminish with an increase in the length and size of the structure as presented by Lim and Soh (2012) on long aluminium beam. This was also similar to short beam but the magnitudes varied less rigorously. Theoretically, axial load is influential to the transverse mode of vibration but not the extensional mode. Similarly tensile stress will induce stiffening effect, resulting in an increase in natural frequency as well as resonance frequency of the peaks in the admittance signature spectrum (figures can be similar to Figure 5). The EMI technique is also found to be valuable in detecting buckling as considered by Annamdas et al. (2008).
4.2. Axial bucking monitoring
For the metallic structures, an important issue is their buckling when subjected to compressive loading. Annamdas et al. (2008) monitored the load imposed on the structures, which may lead to structural buckling, using PZTs on lab-sized columns. For this purpose, an experimental study is carried out to find the effect of loading patterns on the metal structures. Various lab sized specimens with different boundary conditions for various load increments are tested and variations in PZT admittance signatures are recorded. Additionally, root mean square deviation (RMSD) index is used to statistically evaluate the progressive loading on one of the specimens. Since the specimens are lab-sized, the loads chosen are proportional to the sizes of the specimens so as to limit the stresses within the elastic range for both the aluminium beams and the PZT transducers.
The specimens used in the experimental study were made of aluminium metal of grade A1 6061-T6. Specimen 1 was a rectangular section beam with one end fixed and the other free end loaded (900 x 25 x 4 mm). Specimen 2 was a double flanged L-section (angle of 90 degree with flanges of equal width and thickness) beam (600 x 12 x 1 mm) with one end of one flange fixed and other end of same flange restricted along horizontal direction as shown in Figure 6. Three PZT sensors (PZT A, PZT B1 and PZT B2 of equal dimensions: 10 x 10 x 0.3 mm) were surface bonded using epoxy adhesive on the two specimens. PZT A was bonded on the mid-span location of specimen 1 whereas; PZT B1 and PZT B2 were bonded on both the flanges at mid-span location of specimen 2. The properties of PZT sensors, epoxy adhesive and aluminium beams are listed in Table 1.
M.A. Radhika and V.G.M. Annamdas / Scientific Journal of Review (2013) 2(1)
7
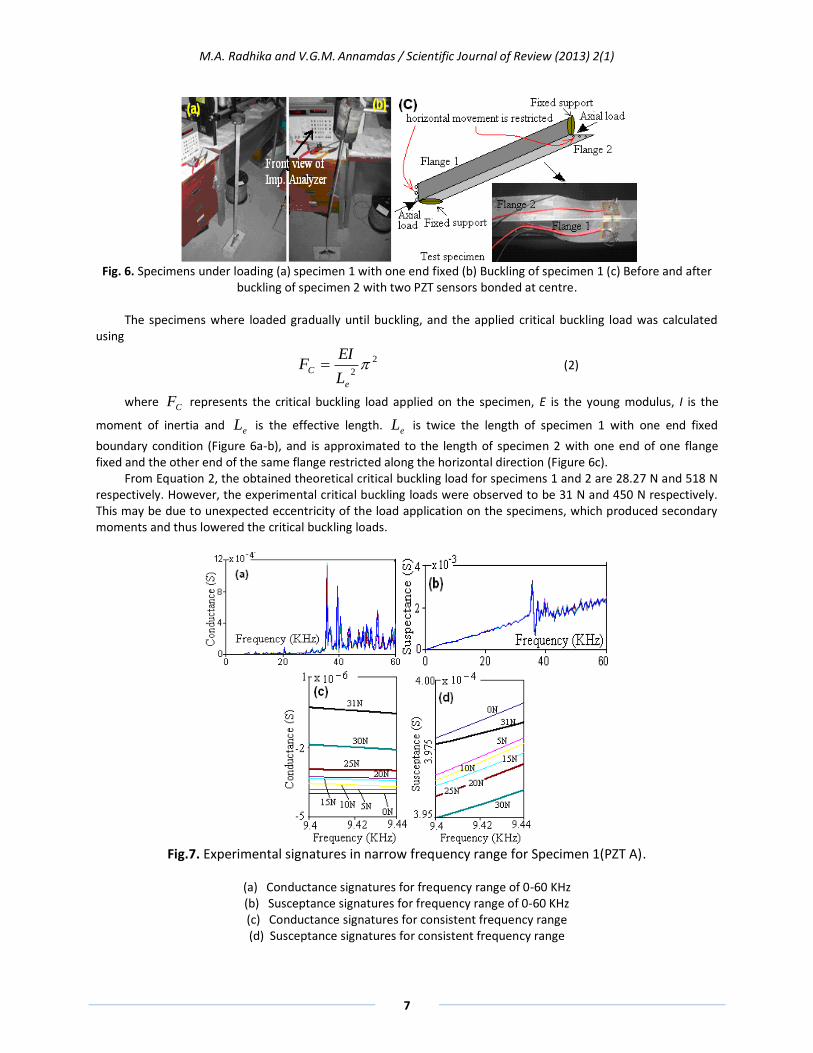
Fig. 6. Specimens under loading (a) specimen 1 with one end fixed (b) Buckling of specimen 1 (c) Before and after
buckling of specimen 2 with two PZT sensors bonded at centre. The specimens where loaded gradually until buckling, and the applied critical buckling load was calculated
using
2
2
e
CL
EIF (2)
where CF represents the critical buckling load applied on the specimen, E is the young modulus, I is the
moment of inertia and eL is the effective length. eL is twice the length of specimen 1 with one end fixed
boundary condition (Figure 6a-b), and is approximated to the length of specimen 2 with one end of one flange fixed and the other end of the same flange restricted along the horizontal direction (Figure 6c).
From Equation 2, the obtained theoretical critical buckling load for specimens 1 and 2 are 28.27 N and 518 N respectively. However, the experimental critical buckling loads were observed to be 31 N and 450 N respectively. This may be due to unexpected eccentricity of the load application on the specimens, which produced secondary moments and thus lowered the critical buckling loads.
Fig.7. Experimental signatures in narrow frequency range for Specimen 1(PZT A).
(a) Conductance signatures for frequency range of 0-60 KHz (b) Susceptance signatures for frequency range of 0-60 KHz (c) Conductance signatures for consistent frequency range (d) Susceptance signatures for consistent frequency range
M.A. Radhika and V.G.M. Annamdas / Scientific Journal of Review (2013) 2(1)
8
Figure 7 shows the conductance and susceptance signatures of specimen 1 for compression loads from 0 N to 31 N with a load step of 5 N for the considered frequency range of 0- 60 KHz. The buckled shape of specimen 1 at a load of 31 N is shown in the Figure 6(b). Further it was reported that, a phenomenon of splitting of few peaks, merging of few other peaks in the signatures were noticed as load magnitude increased. A typical close examination of a narrow frequency range for specimen 1 is shown in the Figure 7(c-d). This examination resulted in a very consistent trend at a frequency range as shown in the figure. However, it can be noted that the only magnitude of the conductance signatures increased with increase in load magnitude but there was no consistency between susceptance and load increments. Thus, Conductance was reported as better indicator than the susceptance for axial load.
Similarly, specimen 2 with two PZT transducers was tested for compression loads from 0 N with a load step of 50 N, till it buckled at 450 N. This specimen buckled at a lower load than the theoretical critical buckling load as estimated by Equation 2, which may be because the axial load did not pass exactly through the centroid of the L-section. Subsequently, secondary moment was produced, which might have reduced the critical buckling load of this specimen. At each load increment, the signatures were recorded and compared. As both PZT B1 and B2 were symmetrically placed at similar location and experienced the same stress during the same magnitude of compression load, hence they were supposed to yield the same type and variations of signatures i.e. identical signatures. In general, the signatures of two different PZT transducers with similar conditions of the PZT-host structure interaction should be similar (or even exactly same). Although theoretically this is expected, in practice it is extremely difficult for two transducers at two different locations (see Figure 6c) to yield exactly the same signatures. The non-repeatability of such signatures could be due to multiple reasons such as (1) non-uniformity in bonding characteristics between the PZT and the host structure, (2) non-homogeneity of the host structure’s material properties, (3) non-similarity of geometrical dimensions of the host structure surrounding the transducer, and (4) variations in the material properties of the transducers. Nonetheless, their experimental study suggested that when the above parameters are controlled, repeatability or replication of signatures of two transducers could be achieved in practice. Thus, PZT B1 and B2 were tested for repeatability of signatures under the same boundary and loading conditions of the host structure to produce almost identical results.
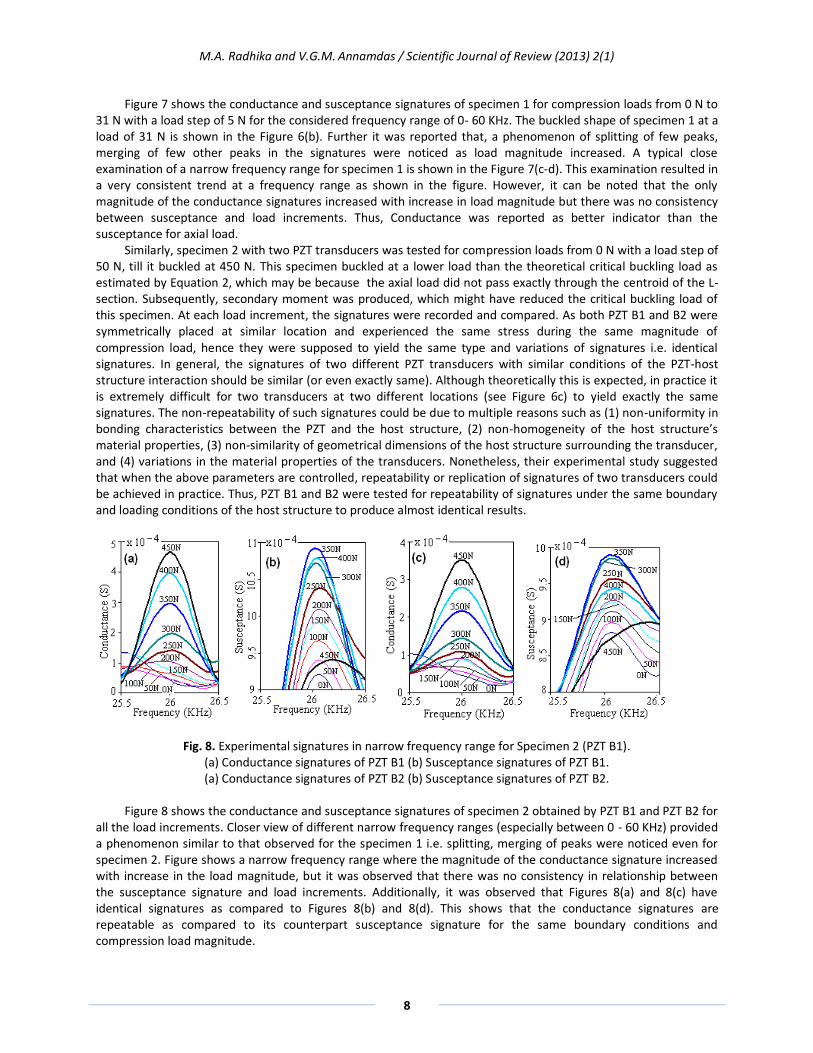
Fig. 8. Experimental signatures in narrow frequency range for Specimen 2 (PZT B1). (a) Conductance signatures of PZT B1 (b) Susceptance signatures of PZT B1. (a) Conductance signatures of PZT B2 (b) Susceptance signatures of PZT B2.
Figure 8 shows the conductance and susceptance signatures of specimen 2 obtained by PZT B1 and PZT B2 for
all the load increments. Closer view of different narrow frequency ranges (especially between 0 - 60 KHz) provided a phenomenon similar to that observed for the specimen 1 i.e. splitting, merging of peaks were noticed even for specimen 2. Figure shows a narrow frequency range where the magnitude of the conductance signature increased with increase in the load magnitude, but it was observed that there was no consistency in relationship between the susceptance signature and load increments. Additionally, it was observed that Figures 8(a) and 8(c) have identical signatures as compared to Figures 8(b) and 8(d). This shows that the conductance signatures are repeatable as compared to its counterpart susceptance signature for the same boundary conditions and compression load magnitude.
M.A. Radhika and V.G.M. Annamdas / Scientific Journal of Review (2013) 2(1)
9
4.3 Fatigue by axially loading specimens and monitoring results
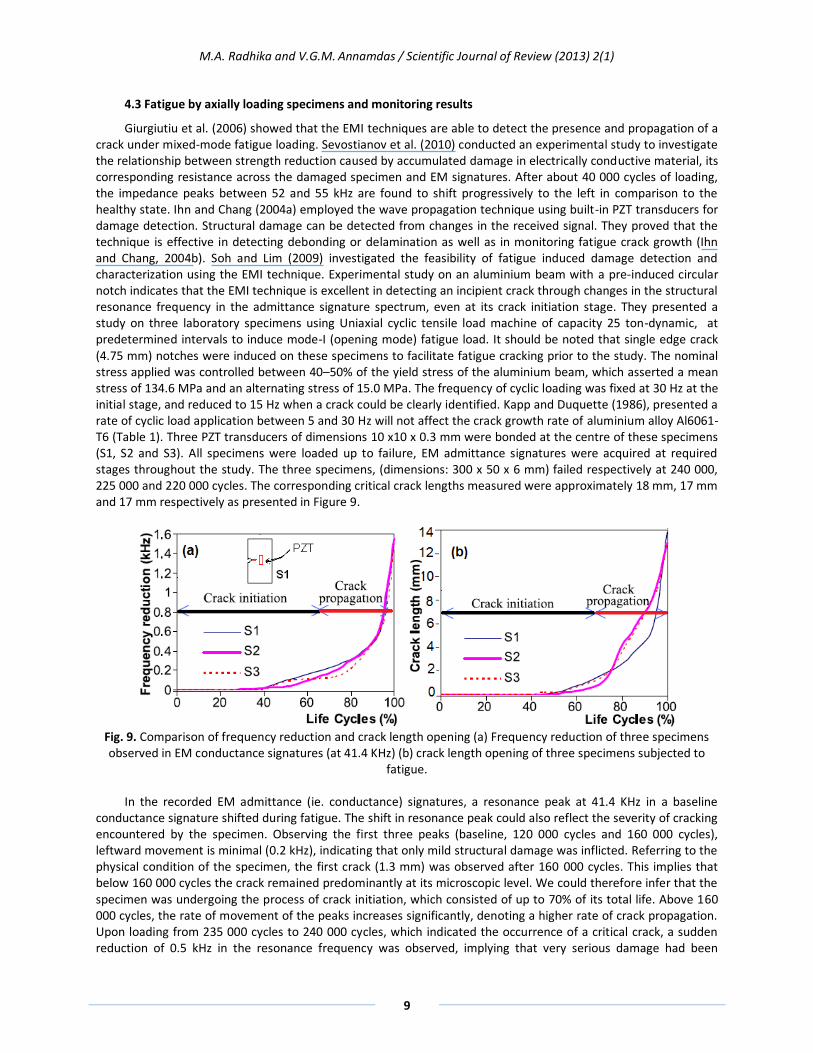
Giurgiutiu et al. (2006) showed that the EMI techniques are able to detect the presence and propagation of a crack under mixed-mode fatigue loading. Sevostianov et al. (2010) conducted an experimental study to investigate the relationship between strength reduction caused by accumulated damage in electrically conductive material, its corresponding resistance across the damaged specimen and EM signatures. After about 40 000 cycles of loading, the impedance peaks between 52 and 55 kHz are found to shift progressively to the left in comparison to the healthy state. Ihn and Chang (2004a) employed the wave propagation technique using built-in PZT transducers for damage detection. Structural damage can be detected from changes in the received signal. They proved that the technique is effective in detecting debonding or delamination as well as in monitoring fatigue crack growth (Ihn and Chang, 2004b). Soh and Lim (2009) investigated the feasibility of fatigue induced damage detection and characterization using the EMI technique. Experimental study on an aluminium beam with a pre-induced circular notch indicates that the EMI technique is excellent in detecting an incipient crack through changes in the structural resonance frequency in the admittance signature spectrum, even at its crack initiation stage. They presented a study on three laboratory specimens using Uniaxial cyclic tensile load machine of capacity 25 ton-dynamic, at predetermined intervals to induce mode-I (opening mode) fatigue load. It should be noted that single edge crack (4.75 mm) notches were induced on these specimens to facilitate fatigue cracking prior to the study. The nominal stress applied was controlled between 40–50% of the yield stress of the aluminium beam, which asserted a mean stress of 134.6 MPa and an alternating stress of 15.0 MPa. The frequency of cyclic loading was fixed at 30 Hz at the initial stage, and reduced to 15 Hz when a crack could be clearly identified. Kapp and Duquette (1986), presented a rate of cyclic load application between 5 and 30 Hz will not affect the crack growth rate of aluminium alloy Al6061-T6 (Table 1). Three PZT transducers of dimensions 10 x10 x 0.3 mm were bonded at the centre of these specimens (S1, S2 and S3). All specimens were loaded up to failure, EM admittance signatures were acquired at required stages throughout the study. The three specimens, (dimensions: 300 x 50 x 6 mm) failed respectively at 240 000, 225 000 and 220 000 cycles. The corresponding critical crack lengths measured were approximately 18 mm, 17 mm and 17 mm respectively as presented in Figure 9.
Fig. 9. Comparison of frequency reduction and crack length opening (a) Frequency reduction of three specimens observed in EM conductance signatures (at 41.4 KHz) (b) crack length opening of three specimens subjected to
fatigue. In the recorded EM admittance (ie. conductance) signatures, a resonance peak at 41.4 KHz in a baseline
conductance signature shifted during fatigue. The shift in resonance peak could also reflect the severity of cracking encountered by the specimen. Observing the first three peaks (baseline, 120 000 cycles and 160 000 cycles), leftward movement is minimal (0.2 kHz), indicating that only mild structural damage was inflicted. Referring to the physical condition of the specimen, the first crack (1.3 mm) was observed after 160 000 cycles. This implies that below 160 000 cycles the crack remained predominantly at its microscopic level. We could therefore infer that the specimen was undergoing the process of crack initiation, which consisted of up to 70% of its total life. Above 160 000 cycles, the rate of movement of the peaks increases significantly, denoting a higher rate of crack propagation. Upon loading from 235 000 cycles to 240 000 cycles, which indicated the occurrence of a critical crack, a sudden reduction of 0.5 kHz in the resonance frequency was observed, implying that very serious damage had been
M.A. Radhika and V.G.M. Annamdas / Scientific Journal of Review (2013) 2(1)
10
inflicted after this 5000 cycles of loading. After the critical crack was reached, the specimen failed shortly in less than a thousand cycles. Therefore the reduction in resonance frequency or peak movement is effective in characterizing fatigue crack and thus its corresponding number of loading cycles.
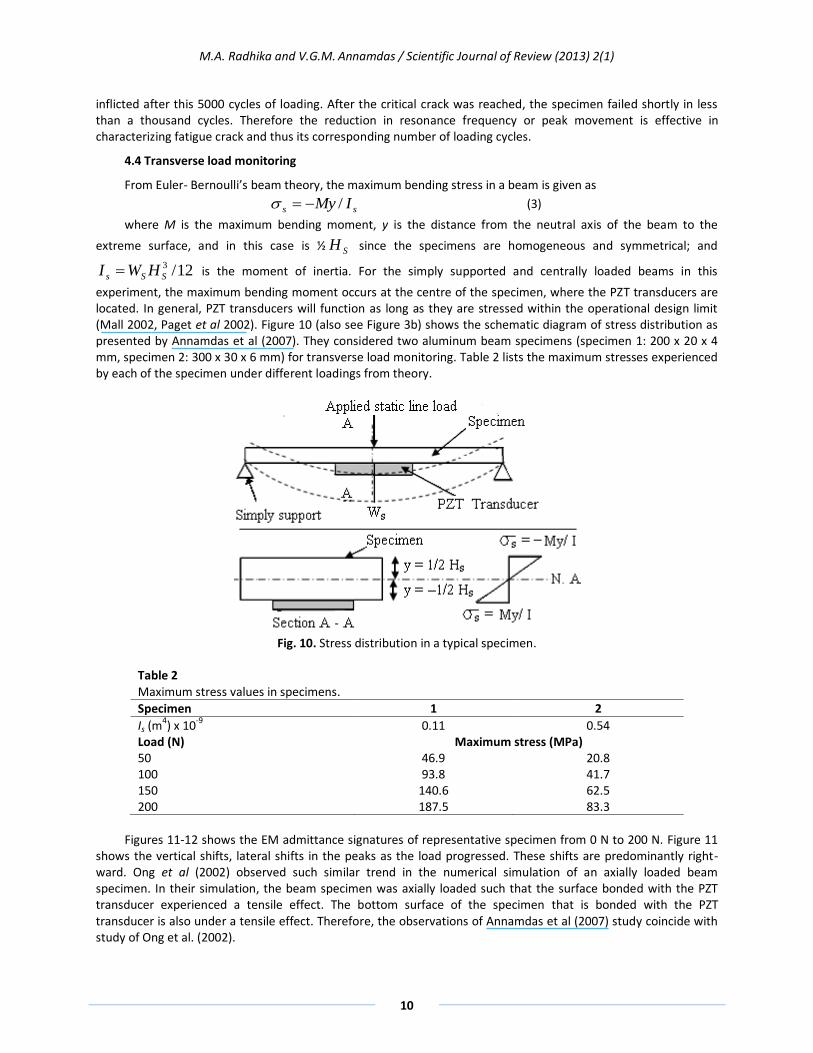
4.4 Transverse load monitoring
From Euler- Bernoulli’s beam theory, the maximum bending stress in a beam is given as
ss IMy / (3)
where M is the maximum bending moment, y is the distance from the neutral axis of the beam to the
extreme surface, and in this case is ½ SH since the specimens are homogeneous and symmetrical; and
12/3
SSs HWI is the moment of inertia. For the simply supported and centrally loaded beams in this
experiment, the maximum bending moment occurs at the centre of the specimen, where the PZT transducers are located. In general, PZT transducers will function as long as they are stressed within the operational design limit (Mall 2002, Paget et al 2002). Figure 10 (also see Figure 3b) shows the schematic diagram of stress distribution as presented by Annamdas et al (2007). They considered two aluminum beam specimens (specimen 1: 200 x 20 x 4 mm, specimen 2: 300 x 30 x 6 mm) for transverse load monitoring. Table 2 lists the maximum stresses experienced by each of the specimen under different loadings from theory.
Fig. 10. Stress distribution in a typical specimen.
Table 2 Maximum stress values in specimens.
Specimen 1 2
Is (m4) x 10
-9 0.11 0.54
Load (N) Maximum stress (MPa) 50 100 150 200
46.9 93.8
140.6 187.5
20.8 41.7 62.5 83.3
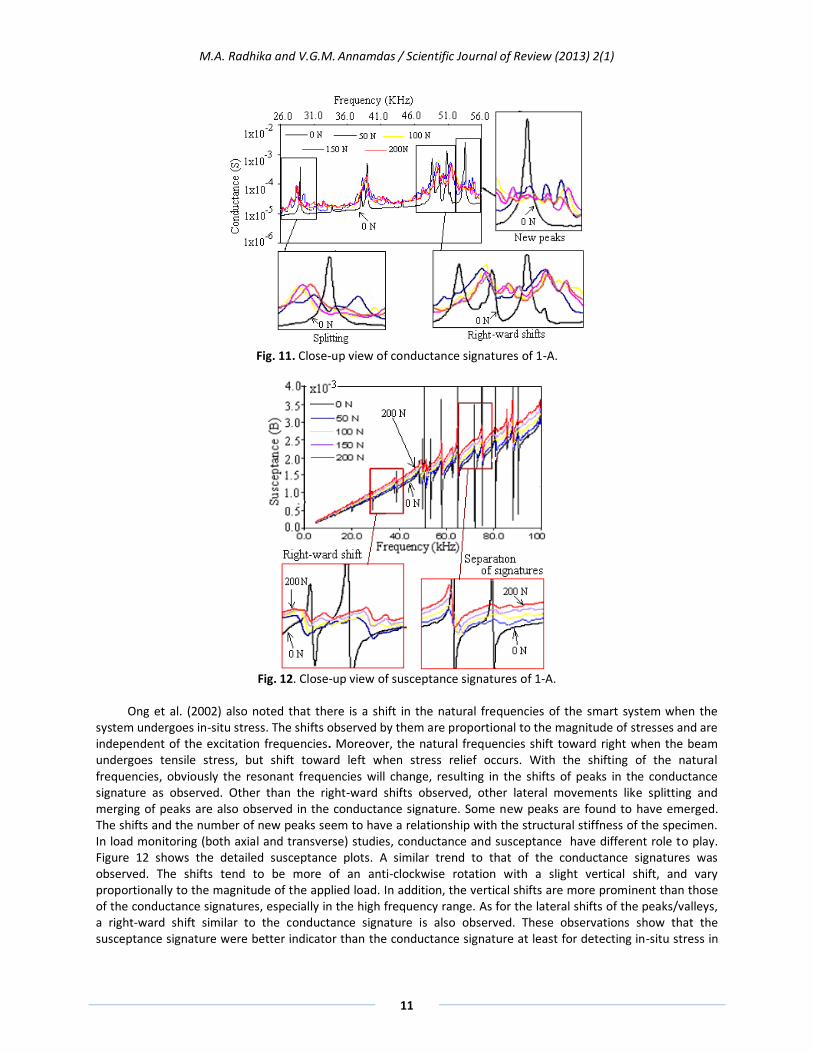
Figures 11-12 shows the EM admittance signatures of representative specimen from 0 N to 200 N. Figure 11
shows the vertical shifts, lateral shifts in the peaks as the load progressed. These shifts are predominantly right-ward. Ong et al (2002) observed such similar trend in the numerical simulation of an axially loaded beam specimen. In their simulation, the beam specimen was axially loaded such that the surface bonded with the PZT transducer experienced a tensile effect. The bottom surface of the specimen that is bonded with the PZT transducer is also under a tensile effect. Therefore, the observations of Annamdas et al (2007) study coincide with study of Ong et al. (2002).
M.A. Radhika and V.G.M. Annamdas / Scientific Journal of Review (2013) 2(1)
11
Fig. 11. Close-up view of conductance signatures of 1-A.
Fig. 12. Close-up view of susceptance signatures of 1-A.
Ong et al. (2002) also noted that there is a shift in the natural frequencies of the smart system when the
system undergoes in-situ stress. The shifts observed by them are proportional to the magnitude of stresses and are independent of the excitation frequencies. Moreover, the natural frequencies shift toward right when the beam undergoes tensile stress, but shift toward left when stress relief occurs. With the shifting of the natural frequencies, obviously the resonant frequencies will change, resulting in the shifts of peaks in the conductance signature as observed. Other than the right-ward shifts observed, other lateral movements like splitting and merging of peaks are also observed in the conductance signature. Some new peaks are found to have emerged. The shifts and the number of new peaks seem to have a relationship with the structural stiffness of the specimen. In load monitoring (both axial and transverse) studies, conductance and susceptance have different role to play. Figure 12 shows the detailed susceptance plots. A similar trend to that of the conductance signatures was observed. The shifts tend to be more of an anti-clockwise rotation with a slight vertical shift, and vary proportionally to the magnitude of the applied load. In addition, the vertical shifts are more prominent than those of the conductance signatures, especially in the high frequency range. As for the lateral shifts of the peaks/valleys, a right-ward shift similar to the conductance signature is also observed. These observations show that the susceptance signature were better indicator than the conductance signature at least for detecting in-situ stress in
M.A. Radhika and V.G.M. Annamdas / Scientific Journal of Review (2013) 2(1)
12
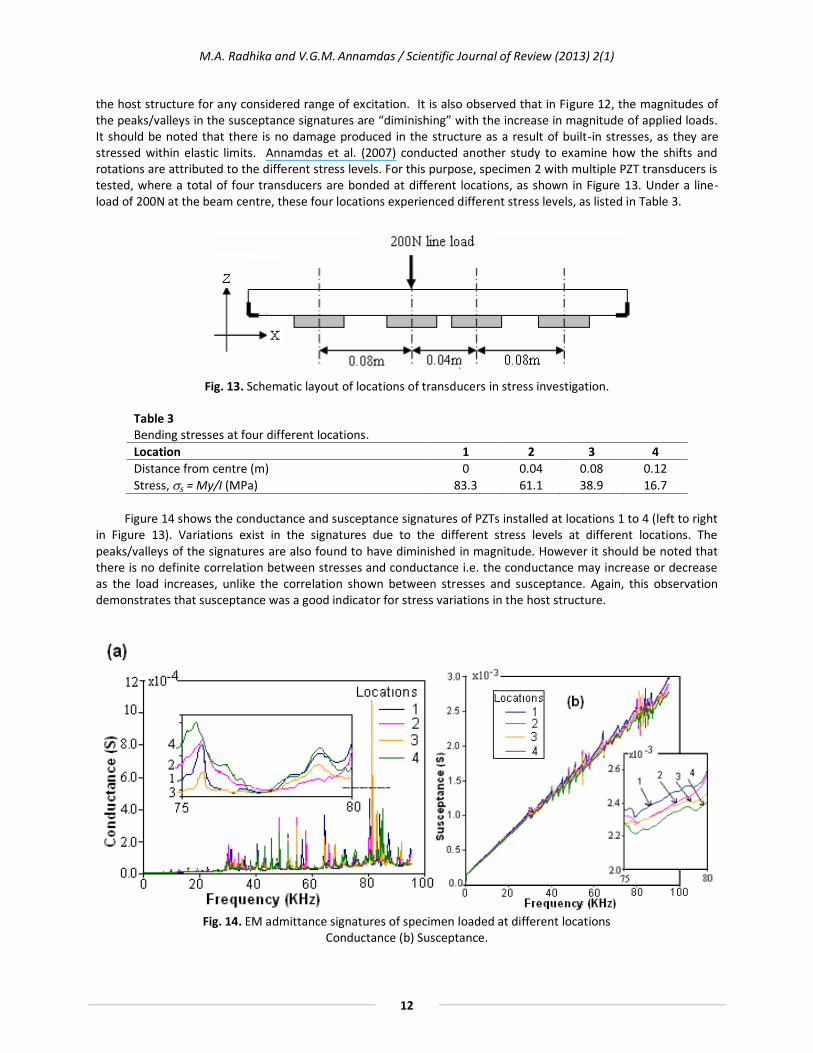
the host structure for any considered range of excitation. It is also observed that in Figure 12, the magnitudes of the peaks/valleys in the susceptance signatures are “diminishing” with the increase in magnitude of applied loads. It should be noted that there is no damage produced in the structure as a result of built-in stresses, as they are stressed within elastic limits. Annamdas et al. (2007) conducted another study to examine how the shifts and rotations are attributed to the different stress levels. For this purpose, specimen 2 with multiple PZT transducers is tested, where a total of four transducers are bonded at different locations, as shown in Figure 13. Under a line-load of 200N at the beam centre, these four locations experienced different stress levels, as listed in Table 3.
Fig. 13. Schematic layout of locations of transducers in stress investigation.
Table 3 Bending stresses at four different locations.
Location 1 2 3 4
Distance from centre (m) 0 0.04 0.08 0.12
Stress, s = My/I (MPa) 83.3 61.1 38.9 16.7
Figure 14 shows the conductance and susceptance signatures of PZTs installed at locations 1 to 4 (left to right
in Figure 13). Variations exist in the signatures due to the different stress levels at different locations. The peaks/valleys of the signatures are also found to have diminished in magnitude. However it should be noted that there is no definite correlation between stresses and conductance i.e. the conductance may increase or decrease as the load increases, unlike the correlation shown between stresses and susceptance. Again, this observation demonstrates that susceptance was a good indicator for stress variations in the host structure.
Fig. 14. EM admittance signatures of specimen loaded at different locations
Conductance (b) Susceptance.
M.A. Radhika and V.G.M. Annamdas / Scientific Journal of Review (2013) 2(1)
13
5. Conclusion
In general for damage analysis using PZT based EMI technique, conductance signature was established as the better indicator as against its counterpart susceptance signature. However, after witnessing axial and transverse monitoring using EMI technique, it can be stated that both conductance and suceptance signatures are equally important. For ‘transversely loaded’ structures, susceptance signature was found to be a better indicator. For 'axially loaded' structures, conductance signatures are better indicators. This paper presented the previous works of researcher in the field of structural load monitoring. Where it was found that conductance signature was more effective indicator for axial (parallel) loading as against susceptance signature for perpendicular loading on the structure. This review paper on load monitoring is thus, expected to be useful for the non-destructive evaluation of engineering structures.
6. Acknowledgements
This article is written in memory of Annamdas Krishna Preetham. Further we would like to acknowledge Professor Soh Chee Kiong (Chair, School of Civil & Environmental Engineering, Nanyang Technological University, Singapore) for being supportive throughout our last 10 years of research.
References
Abe, M., Park, G., Inman, D.J., 2000. Impedance-based monitoring of stress in thin structural members Proc. 11th International Conference on Adaptive Structures and Technologies (Nagoya, Oct.), 285–92.
Agilent Technologies, 2008. A Data sheet of Agilent E4980A Precision LCR Meter, USA. http://cp.literature.agilent.com/litweb/pdf/5989-4435EN.pdf.
Annamdas, V.G.M., Soh, C.K., 2006. Multiple piezoceramic transducers (PZT) -structure interaction model. Proceedings of SPIE, San Diego, California, USA, 6174, pp. 1-12.
Annamdas, V.G.M., Soh, C.K., 2007a. Three-Dimensional Electromechanical Impedance Model. I: Formulation of Directional Sum Impedance, J. Aerospace Eng., 20(1), 53-62.
Annamdas, V.G.M., Soh, C.K., 2007b. Three Dimensional Electromechanical Impedance Model II: Damage analysis and PZT characterization. Journal of Aerospace Engineering. ASCE, 20, 63-71.
Annamdas, V.G.M., Soh, C.K., 2008. Three Dimensional Electromechanical Impedance Model for Multiple Piezoceramic Transducers-Structure Interaction Model, Journal of Aerospace Engineering, ASCE, 21(1),35-44.
Annamdas, V.G.M., Yang, Y., Soh, C.K., 2007. Influence of loading on the electromechanical admittance of piezoceramic transducers, Smart Materials and Structures, 16(5),1888-1897.
Annamdas, V.G.M., Soh, C.K., 2010. Application of electromechanical impedance technique for engineering structures: review and future issues. Journal of Intelligent Material Systems and Structures 21(1), 41–59.
Annamdas, V.G.M., Yang, Y., 2012. " Practical implementation of piezo-impedance sensors in monitoring of excavation support structures " Structural Control Health Monitoring, 19(2), 231 - 245.
Annamdas, V.G.M., Yang, Y., Aiwei, M., 2008. Monitoring buckling of metal structures using PZT transducers" IMAC-XXVI A Conference and Exposition on Structural Dynamics , Orlando, Florida, USA, 4-7 February, 2008 (paper no: 264).
Crawley, E.F., de-Luis, J., 1987. “Use of Piezoelectric Actuators as Elements of Intelligent Structures.” AIAA Journal. 25, 1373-1385.
Mascarenas, D.L., 2006. Development of an impedance method based wireless sensor node for monitoring of bolted joint preload. Master of Science Dissertation, University of California, San Diego, SC.
Elgamal, A., Conte, J.P., Marsim, S., Fraser, M., Fountain, T., Gupta, A., Trivedi, M., Elzarki, M., 2003. Health monitoring frame work for bridges and civil infrastructures, Structural health monitoring 2003: from diagnosis and prognostics to structural health management, Editor Fu-Kuo-Chang, 123-130, DEStech Publications, Inc.
Ihn, J.B., Chang, F.K. 2004a. Detection and monitoring of hidden fatigue crack growth using a built-in piezoelectric sensor/actuator network: I. Diagnostics. Smart Materials and Structures. 13(3), 609
Ihn, J.B., Chang, F.K., 2004b. Detection and monitoring of hidden fatigue crack growth using a built-in piezoelectric sensor/actuator network: II. Validation using riveted joints and repair patches. 13(3), 621
M.A. Radhika and V.G.M. Annamdas / Scientific Journal of Review (2013) 2(1)
14
Giurgiutiu, V., Rogers, C.A., 1998. Recent Advancements in the Electro-Mechanical (E/M) Impedance Method for Structural Health Monitoring and NDE, Proceedings of Smart Structures and Materials Conference, San Diego, California, March, SPIE 3329, 536-547.
Giurgiutiu, V., Xu, B., Chao, Y., Liu, S., Gaddam, R., 2006. Smart Sensors for Monitoring Crack Growth under Fatigue Loading Conditions, Smart Structures and Systems – an International Journal of Mechatronics, Sensors, Monitoring, Control, Diagnosis, and Maintenance, 2(2), pp. 101-113.
Giurgiutiu, V., 2007 Structural Health Monitoring with Piezoelectric Wafer Active Sensors. Oxford: 1st edition, Academic Press.
Hewlett Packard., 1996. HP LF 4192A impedance analyzer Operation manual, Japan. Kapp, J.A., Duquette, D., 1986. Crack growth behavior of aluminium alloys tested in liquid mercury Journal
Engineering Material Technology, 108, 38 Liang, C., Sun, F.P., Rogers, C.A., 1994. Coupled electromechanical analysis of adaptive material systems-
determination of the actuator power consumption and system energy transfer, Journal of Intelligent Material Systems and Structures, 5(1), 12-20.
Lim, Y.Y., Soh, C.K., 2012. Effect of varying axial load under fixed boundary condition on admittance signatures of electromechanical impedance techniqueJournal of Intelligent Material Systems and Structures May 23, 7815-7826.
Mall, S., 2002. “Integrity of graphite/epoxy laminate embedded with piezoelectric sensor/ actuator under monotonic and fatigue loads.” Smart Materials and Structures. 11,527-533.
Naidu, A.S.K., 2004. Structural Damage Identification with Admittance Signatures of Smart PZT Transducers, PhD thesis, Nanyang Technological University, Singapore.
Paget, C.A., Levin, K., Delebarre, C., 2002. “Actuation Performance of Embedded Piezoceramic Transducer in Mechanically Loaded Composites.” Smart Material and Structures. 11, 886-891.
Park, G., Cudney, H.H., Inman, D.J., 2000. Impedance-based health monitoring of civil structural components. Journal of Infrastructure Systems-ASCE 6(4), 153–160.
Ritdumrongkul, S., Abe, M., Fujino, Y., Miyashita, T., 2004, Quantitative health monitoring of Bolted joints using a piezoceramic actuator sensor, Smart Materials and Structures, 13, 20–9.
Sereci, A.M., Radulescu, D., Radulescu, C., 2003. Recent installations of real time structural monitoring systems, Structural health monitoring: from diagnosis and prognostics to structural health management, Editor Fu-Kuo-Chang, 223-230, DEStech Publications, Inc.
Sevostianov, I., Zagrai, A., Kruse, W.A., Hardee, H., 2010. Connection between strength reduction, electric resistance and electro-mechanical impedance in materials with fatigue damage. International Journal of Fracture, 164,pp 159-166.
Soh, C.K., Lim, Y.Y., 2009. Detection and Characterization of Fatigue Induced Damage Using Electromechanical Impedance Technique, Advanced Materials Research, 79-82, pp 2031-2034.
Sun, F.P., Chaudry, Z., Rogers, C.A., Majmundar, M., Liang, C., 1995. Automated real-time structure health monitoring via signature pattern recognition, Proceedings of the Smart Structures Materials Conference, San Diego, California, Feb. 27- Mar. 1, Proc. SPIE, 2443, 236-247
Wetherhold, R., Messer, M., Patra, A., 2003. Optimization of directionally attached piezoelectric actuators, Journal of Engineering Materials and Technology, 125(2), 148-152.
Xu, J.F., Yang, Y.W., Soh, C.K., 2004. “Electromechanical impedance-based structural health monitoring with evolutionary programming.” Journal of Aerospace Engineering. 17, 182-193.
Yang, Y.W., Xu, J.F., Soh, C.K., 2005. Generic impedance-based model for structure-piezoceramic interacting system, Journal of Aerospace Engineering, ASCE, 18(2), 93-101.
Yang, Y., Liu, H., Annamdas, V.G.M., 2009. Wireless sensing using piezo-ceramic transducers for structural health monitoring, SPIE symposium, San Diego California, USA, 8-12 March 09, Proc. of SPIE 7292, 72920D, (Paper 7292-13)
Zhou, S.W., Liang, C., Rogers, C.A., 1996. “An impedance-based system modelling approach for induced strain actuator-driven structures.” Journal of Vibration Acoustic, 118, 323-331.
Zhao, X., Gao, H., Zhang, G., Ayhan, B., Yan, F., Kwan, C., Rose, J. L., 2007. Active health monitoring of an aircraft wing with embedded piezoelectric sensor/actuator network: I. Defect detection, localization and growth monitoring, Smart Materials and Structures, 16(4), 1218-1225.


