Embed Size (px)
Citation preview
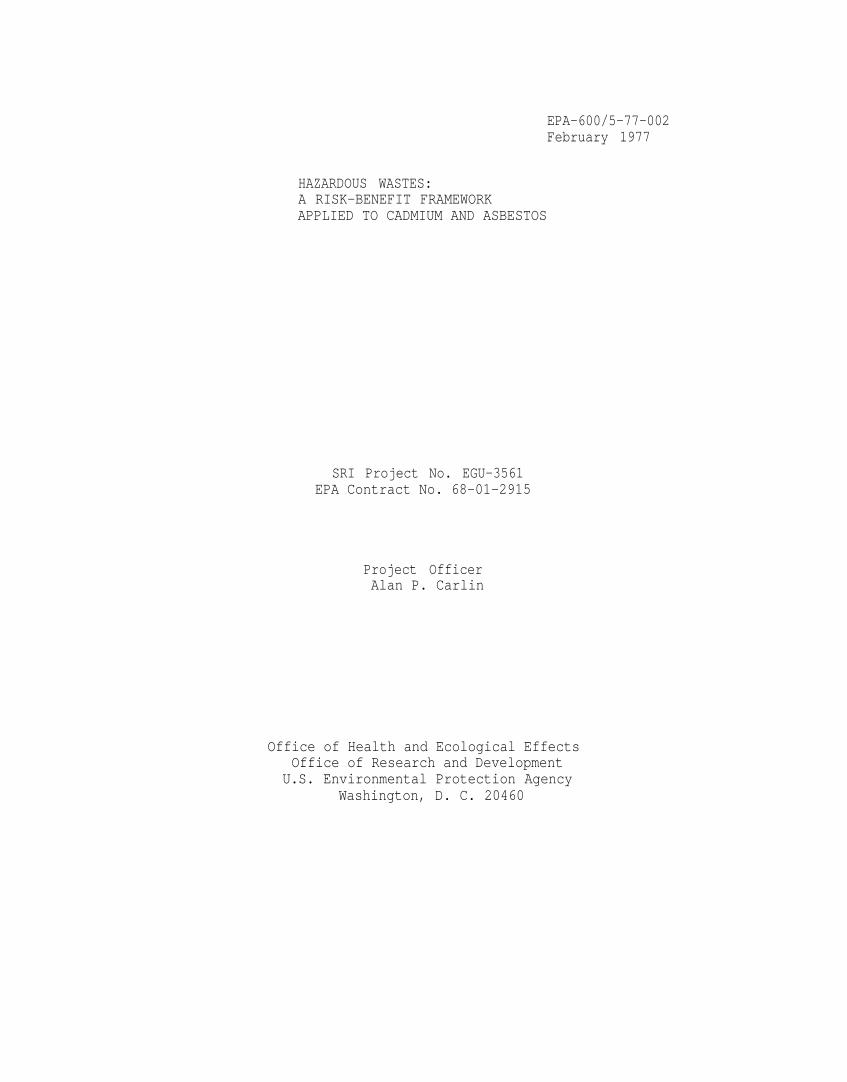
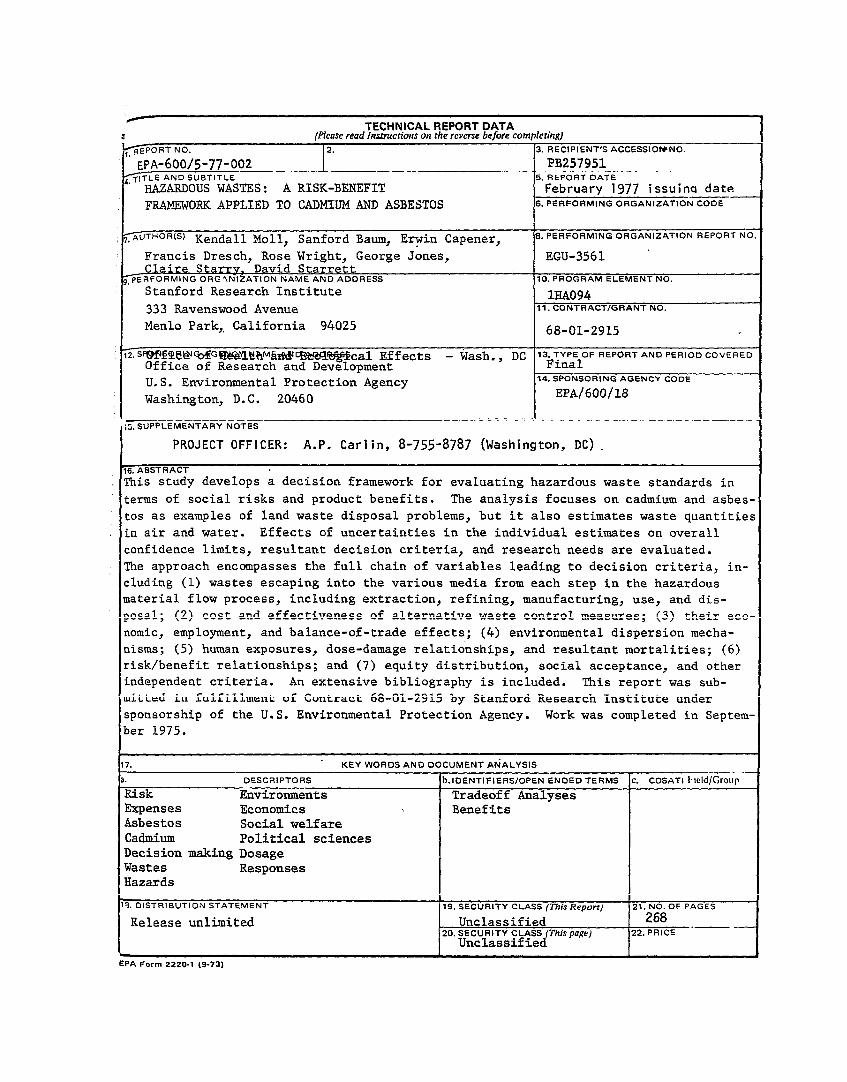
EPA-600/5-77-002February 1977
HAZARDOUS WASTES:A RISK-BENEFIT FRAMEWORKAPPLIED TO CADMIUM AND ASBESTOS
SRI Project No. EGU-3561EPA Contract No. 68-01-2915
Project OfficerAlan P. Carlin
Office of Health and Ecological EffectsOffice of Research and Development
U.S. Environmental Protection AgencyWashington, D. C. 20460
DISCLAIMER
This report has been reviewed by the Office of Health and Ecological
Effects, and approved for publication. Approval does not signify that the
contents necessarily reflect the views and policies of the Environmental
Protection Agency, nor does mention of trade names or commercial products
constitute endorsement or recommendation for use. This report is available
for purchase from the National Technical Information Service, P. O. Box 1553,
Springfield, Virginia 22161. The order number is PB257951.
ii
ABSTRACT
This study develops a decision framework for evaluating hazardous
waste standards in terms of social risks and product benefits. The analy-
sis focuses on cadmium and asbestos as examples of land waste disposal
problems, but it also estimates waste quantities in air and water. Effects
of uncertainties in the individual estimates on overall confidence limits,
resultant decision criteria, and research needs are evaluated. The
approach encompasses the full chain of variables leading to decision
criteria, including (1) wastes escaping into the various media from each
step in the hazardous material flow process, including extraction, refining,
manufacturing, use, and disposal; (2) cost and effectiveness of alternative
waste control measures; (3) their economic, employment, and balance-of-
trade effects; (4) environmental dispersion mechanisms; (5) human expo-
sures, dose-damage relationships, and resultant mortalities; (6) risk/
benefit relationships; and (7) equity distribution, social acceptance, and
other independent criteria. An extensive bibliography is included. This
report was submitted in fulfillment of Contract 68-01-2915 by Stanford
Research Institute under sponsorship of the U.S. Environmental Protection
Agency. Work was completed in September 1975.
iii
CONTENTS
1 INTRODUCTION AND CONCLUSIONS
Background ......................... 1-1
Objectives ................. . ....... 1-2
Approach .......................... 1-3
Conclusions ........................ 1-3
2 PAST, PRESENT, AND PROPOSED STANDARDS
Standards from a Systems Viewpoint ............. 2-1
The Development of Present Standards ............ 2-6
A Proposed Methodology for Future Standards ........ 2-12
3 POLLUTION FROM INDUSTRIAL ACTIVITIES
General Methodology .................... 3-1
Illustrative Application: Cadmium ............. 3-2
Illustrative Application: Asbestos ............ 3-12
4 ALTERNATIVE CONTROL COSTS AND EFFECTIVENESS
Introduction ........................ 4-1
Cadmium Control Alternatives ................ 4-2
Asbestos Control Alternatives ............... 4-12
5 NET ECONOMIC BENEFITS
Introduction ....................... ., 5-1
Cadmium Examples ...................... 5-6
Asbestos Controls ..................... 5-19
6 EXPOSURE TO HAZARDOUS WASTES
Background ......................... 6-1
Method of Analysis ..................... 6-2
Illustrative Application: Cadmium ............. 6-10
Illustrative Application: Asbestos ............ 6-16 I
7 RISKS TO HEALTH
Introduction ........................ 7-1
Cadmium Example ...................... 7-2
Asbestos Example ...................... 7-19
v
8 COMBINING RISK, BENEFIT, AND OTHER CONSIDERATIONS
Introduction .........................
The Recommended Method ...................
Cadmium Examples ......................
Asbestos Examples .....................
9 METHODS FOR DETERMINING ACCEPTABLE RISKS AND
ASSOCIATED RESEARCH NEEDS
Practical Considerations .................. 9-1
Cadmium and Asbestos Examples ............... 9-16
REFERENCES . . . . . . . . . . . . . . . . . . . . . . . . . . . R-1
BIBLIOGRAPHY . . . . . . . . . . . . . . . . . . . . . . . . . . B-1
8-1
8-2
8-14
8-19
vi
ILLUSTRATIONS
1-1 Analytical Steps for Determining Environmental
Standards and Information Needs . . . . . . . . . . . . . . 1-4
2-1 Standards, Monitoring, Controls, and Contaminant Flow
in the Hazardous Waste System . . . . . . . . . . . . . . . 2-2
* 3-1 Cadmium Production, Use, and Disposal Quantities
in the United States . . . . . . . . . . . . . . . . . . . . 3-4
3-2 Incidental Cadmium Disposal Quantities in the
U.S.. . . . . . . . . . . . . . . . . . . . . . . . . . . . 3-9
3-3 Asbestos Production, Fabrication, Consumption, and
Disposal Quantities in the U.S. . . . . l . . . . . . . . . 3-16
4-1 Municipal Incinerator Average Capacities by State . . . . . 4-9
5-1 Schematic of Consumer and Producer Surpluses . . . . . . . . 5-3
5-2 Effects of Pollution Controls on Consumer and
Producer Surpluses . . . . . . . . . . . . . . . . . . . . . 5-4
5-3 Effects of Domestic Protection Controls on Foreign and
Domestic Producers . . . . . . . . . . . . . . . . . . . . . 5-9
6-1 Model of Contaminant Distribution Around an
Emitting Source . . . i . . . . . . . . . . . . . . . . . . 6-4
6-2 Cadmium, Air, and Water Concentrations from U.S. Zinc
Smelter and Municipal Incinerator Emissions (Uncontrolled) . 6-12
6-3 Asbestos Air Concentrations from U.S. Asbestos Industry
and Brake Linings . . . . . . . . . . . . . . . . . . . . . 6-18
7-1 Cadmium Cumulative Lifetime Exposures vs
Increased Mortalities . . . . . . . . . . . . . . . . . . . 7-6
7-2 Cumulative Probability of a Resident Leaving County
Over Time . . . . . . . . . . . . . . . . . . . . . . . . . 7-13
vii
t
Asbestos Inhalation: Cumulative Lifetime Exposures vs
Increased Mortalities . . . . . . . . . . . . . . . . . . .
7-3 7-22
Respiratory System Disease Mortalities Caused by
Asbestos Dosages . . . . . . . . . . . . . . . . . . . . . .
7-4 7-24
7-5 Cancer (Except Mesothelioma) Mortalities Caused by
Asbestos Dosages . . . . . . . . . . . . . . . . . . . . . . 7-25
7-26 Mesothelioma Mortalities Caused by Asbestos Dosages . . . . 7-6
7-7 Asbestosis Symptoms Caused by Chrysotile Asbestos
Dosages . . . . . . . . . . . . . . . . . . . . . . . . . . 7-27
8-3
8-6
8-1 Methods of Displaying Decision Criteria . . . . . . . . . .
8-2 Multiple Criteria Display Sample . . . . . . . . . . . . . .
8-3 Cadmium Risk-Benefit Comparison: Local and National
Smelter Scrubber Criteria . . . . . . . . . . . . . . . . . 8-16
8-4 Cadmium Risk-Benefit Display: Supplementary Criteria
for Smelter Scrubbers . . . . . . . . . . . . . . . . . . . 8-18
Decision Flow Schematic for Selection of Alternative
Controls ..........................
9-1 9-5
Example Estimates of Location of Alternative Control X
Relative to Feasible Domain Border . . . . . . . . . . . . .
9-2 9-7
9-11 9-3 Possible Rules for Ranking Among Alternatives . . . . . . .
viii
TABLES
3-1 The Uses of Asbestos . . . . . . . . . . . . . . . . . . . . . 3-15
3-2 Factors Used to Calculate the Ultimate Disposal
of Asbestos . . . . . . . . . . . . . . . . . . . . . . . .
4-1 Estimated Air Emissions of Cadmium from Zinc Smelter
Operations in 1972 . . . . . . . . . . . . . . . . . . . . .
4-2 Model Zinc Smelter Control Costs and Effectiveness . . . . .
4-3 Municipal Incinerator Control Costs for Effluent Gases . . .
4-4 Model Municipal Incinerator . . . . . . . . . . . . . . . .
4-5 Asbestos Products Industry Air Emissions and
Surrounding Populations . . . . . . . . . . . . . . . . . .
4-6 Asbestos Products Industry Control Costs (1970 Dollars). . .
5-1 Effects of Pollution Control Costs on the U.S. Zinc
Industry....... . . . . . . . . . . . . . . . . . . .
5-2 Changes in Economic Benefits Caused by Adding Zinc
Smelter Controls . . . , . . . . . . . . . . . . . . . . . .
7-1 Quantities Used to Estimate Equivalent Cadmium Intake . . .
7-2 Cadmium Intake and Heart Death Rate Calculations . . . . . .
8-1 Implicit Valuation of Human Life by Reducing Cadmium
Emissions with Stack Scrubbers in Municipal Incinerators . .
9-1 Needs for Information on General Hazardous Waste Risks
and Benefits . . . . . . . . . . . . . . . . . . . . . . . .
9-2 Needs for Information on Cadmium Risks and Benefits . . . . 9-18
9-3 Needs for Information on Asbestos Risks and Benefits . . . . 9-20
3-17
4-4
4-5
4-11
4-11
4-13
4-15
5-12
5-18
7-4
7-10
8-20
9-15
ix
Chapter 1
INTRODUCTION AND CONCLUSIONS
Background
Surveys conducted by EPA indicate that approximately 10 million tons
of nonradioactive hazardous wastes are produced in the United States each
year. This quantity has been increasing at a 5 to 10 percent annual rate,
but federal, state, and local regulations on the control and disposal of
these pollutants are either permissive or entirely lacking. If the trend
continues, the populace will sooner or later be exposed to undesirably
high levels of these pollutants.
Of particular concern is the problem of disposal. Land is being
used more frequently as air and water pollution controls become more
stringent and hence restrict the alternative media that may receive waste
discharges. However, very few standards have yet been established for
land disposal of hazardous wastes; those that have been established are
based upon incomplete risk and cost estimates. The true costs and risks
of land disposal can only be estimated in the larger context of exposures
from all sources, but this context is still highly uncertain.
Widespread, low-level risks to health cannot be clearly assessed by
deterministic methods of relating pollutant exposure levels to resultant
symptoms and illnesses. Probabilistic approaches are needed. Yet, only
1-1
limited data are available on physiological responses to high dose levels
of hazardous materials. Even less data exist on damage to health at low
exposure levels. Similarly, simple assessments of the direct costs of
control measures are clearly inadequate for assessing the full costs of
imposing controls. Indirect costs imposed upon both consumers and pro-
ducers by changes in the public's "willingness to pay" for products
generating the wastes need to be considered. Overall limits to the pub-
lic's willingness to accept social risk may impose independent constraints
on the feasible standards.
For these conditions of information deficiency, a risk-benefit analy-
sis of probable losses and benefits seems most appropriate. Probabilistic
estimates of dose levels that may cause injury need to be defined and
balanced against comprehensive estimates of the economic costs of re-
ducing or controlling hazardous wastes. Furthermore, a decision-theoretic
framework is needed to relate the risk-benefit analysis to the degree of
reliability of the input information. Acceptable risk levels may well
depend upon the reliability as well as the absolute magnitude of the risk
and benefit estimates. Finally, the decision-making process by which
society attaches economic values to risks, benefits, and information re-
liability should be studied so that trade-offs derived by theoretical
methods can serve as realistic guides for the disposal of hazardous wastes.
Objectives
The purpose of this research project, as stated in the contract, is
to develop "an applied decision-making framework to assess the reliability
of environmental standards on hazardous wastes disposal." The scope of
work encompasses a six-step effort:
(1) Review the relevant literature to determine the state ofthe art on economic risk-benefit analysis (see Bibliog-raphy).
1-2
(2)
(3)
(4)
(5)
Develop a decision-making structure to trace the flow ofinformation required to set environmental standards forhazardous waste disposal (see "Approach" in this chapter).
Assess the reliability of decisions about standards interms of the reliability of the input information (seeChapter 8).
Translate the quantitative information on risks andbenefits, wherever possible, into estimates of economicimpacts on social welfare (see Chapter 5).
Apply the methods developed to case studies of alterna-tive control programs for asbestos and cadmium wastedisposal (examples are given in all the chapters below).
(6) Establish a list of research priorities for compiling in-formation that is found to be crucial to the improvementof decision-making standards (see Chapter 9).
Approach
Answers to the questions posed in the above objectives have been de-
rived here by a multidisciplinary analysis to examine (1) the amounts of
emissions and non-health economic benefits from polluting industrial
activities, (2) the risks to human health posed by those emissions, (3)
the changes in risks and benefits caused by alternative control or sub-
stitution measures, (4) the ratios of risks to benefits for the alterna-
tives and the degree of uncertainty in the risk-benefit estimates, and
(5) the effects of these ratios and uncertainties, together with other
constraints on the problem, on the environmental standards and informa-
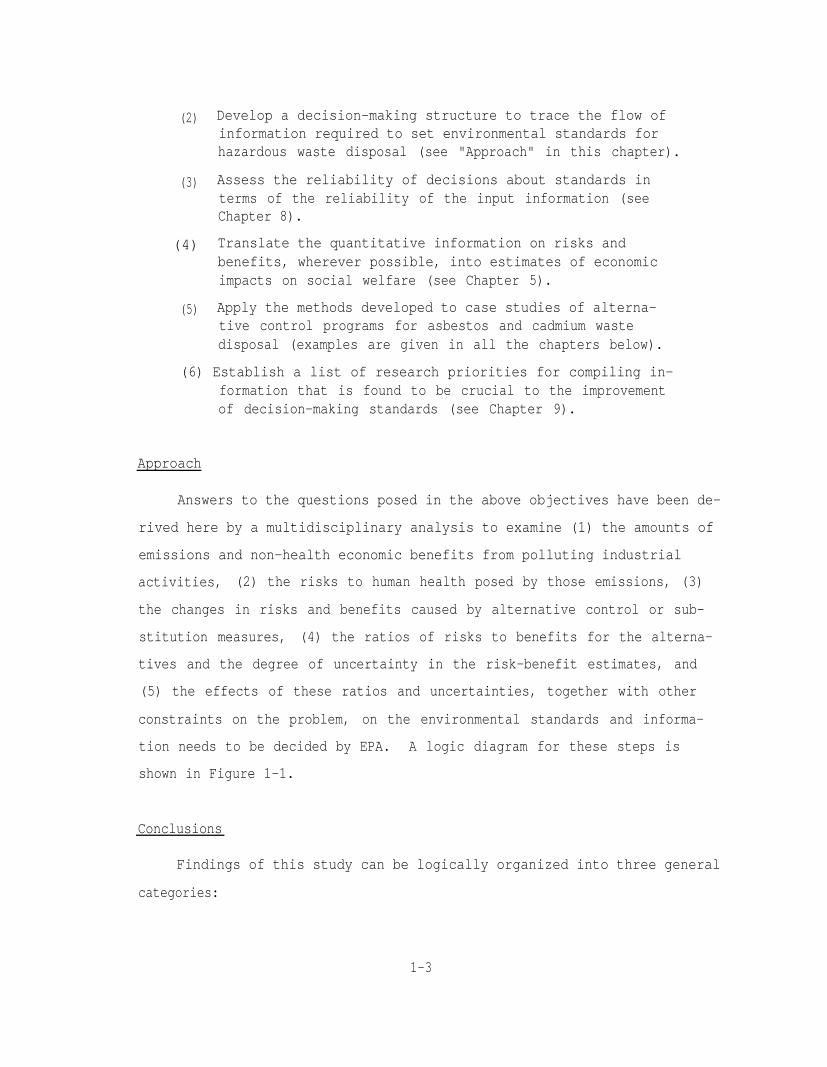
tion needs to be decided by EPA. A logic diagram for these steps is
shown in Figure 1-1.
Conclusions
Findings of this study can be logically organized into three general
categories:
1-3
FIGURE 1-1. ANALYTICAL STEPS FOR DETERMINING ENVIRONMENTALSTANDARDS AND INFORMATION NEEDS
1-4
(1) The methods developed in our work that appear mostsuitable for a framework to assess environmental riskstandards.
(2) Results of applying these methods to example case studiesof alternative control programs for asbestos and cadmiumwaste disposal.
(3) Data from monitoring, research, and other activities thatare needed to serve as inputs to the recommended methods.
Conclusions concerning each of these categories from throughout the re-
port are summarized below, together with references to the chapters con-
taining their analytical derivations.
Methods for Determining Acceptable Risks
A "multiple criteria" methodology is suggested here for the quanti-
tative analysis of acceptable risks to life and health from hazardous
wastes. In this method, multiple criteria are incorporated in a modified
risk-benefit model to generate and display to the decision-maker a feasible
operating domain for environmental controls (see Chapter 8). If alterna-
tive control programs under consideration are found to be feasible ac-
cording to the multiple criteria, they can be ranked and chosen by one
of many quantitative decision procedures (see Chapter 9).
This methodology goes beyond conventional standard setting and
program selection by quantifying and including a wider assortment of the
decision factors involved, by formally considering uncertainties in the
estimates of each factor, and by orienting the analysis toward presenta-
tion for final consideration and choice by the decision-maker rather than
toward derivation of an "optimum" programmed solution. The methodology
is founded on the axioms that there probably is no unequivocally optimum
solution (see Chapter 9) and that, in any event, the responsible decision-
maker must make the final choice (see Chapter 8). Consideration of un-
certainties, however, is one aspect where formal analysis can assist the
1-5
decision-maker in handling interrelated random variables (Chapters 4 and
8). Inclusion of as many relevant criteria as possible in the formal
methodology also can help the decision-maker reach better decisions;
existing standards criteria such as "maximum permissible tolerance,"
"best feasible technology," and "cost/benefit" all suffer in application
from their simplistic assumptions (see Chapter 2).
In outline, the advocated approach starts with an examination of
existing standards (Chapter 2) and contamination sources (Chapter 3).
These serve to describe the status quo situation against which action
alternatives must be measured. The method then examines the costs of
alternative control programs and their effectiveness in reducing hazardous
waste emissions (Chapter 4). These data are applied in an economic analy-
sis (Chapter 5) and in successive calculations of human exposures (Chapter
6) and resultant health effects (Chapter 7). The resultant risk and bene-
fit estimates for each alternative control are compared with each other
and with other decision considerations to determine whether the alterna-
tive appears feasible (Chapter 8). If it does, further analyses are car-
ried out to rank its desirability against other alternatives and to as-
sess information needs that may help to resolve relevant issues (Chapter 9).
Perhaps the most demanding aspect of the method is in obtaining an
estimate of the risk to health, and its uncertainty range. Flow processes
and volumes of the contaminating waste are difficult to obtain; we found
it necessary to carry out detailed material balance studies for the wastes
we studied (see Chapter 3). Also, such relevant processes as wind dis-
persion and resuspension, intermedia exchange, environmental buildup,
and population mobility each require quantitative submodels (see Chapters
6 and 7). Diverse as, these factors are, we found that they could be
linked together to obtain overall risk estimates. Risk to health can be
adequately measured in terms of excess mortality, the value of which is
best expressed by "revealed preference" (Chapter 7).
1-6
Benefit estimation requires sophisticated economic techniques to
evaluate supply and demand curves in deriving changes of such measures
as consumer surplus, profits, employment with and without local multi-
plier effects, gross national product, and balance of trade (Chapter 5).
Our conclusions from these studies were that the most general measure of
national economic effects was that relating to gross national product;
while the best measure of immediate local effects in the producing areas
was one showing employment changes, with appropriate multipliers to re-
flect impacts on the wider local economy. Unavailability of existing
estimates of some benefits unexpectedly forced us to generate new sub-
models; for example, we found it necessary to derive a rough value of
10 percent of annualized control costs as the estimated add-on cost for
government program enforcement and administration (Chapter 4).
In addition to risk and benefit, some of the multiple criteria that
can be quantitatively considered in the analysis are (1) maximum accept-
able economic costs and government budgets for the program--both short
term and long term, (2) maximum acceptable social risks--also both short
and long term, (3) minimum reducible risk, (4) valuation of human life,
(5) risk aversion, and (6) distribution of risks and benefits among dif-
ferent groups (geographic, economic, ethnic, or generational) in the af-
fected population (see Chapter 8).
Preferences among feasible alternatives can be ranked according to
several decision measures, including minimum risk, maximum benefit,
maximum benefit/risk ratio, maximum ratio of change in benefit/change in
risk, maximum monetary value of benefit less risk, and maximum proba-
bility of meeting all constraints. For each measure, various criterion
scales can be used, such as probability density, expected value, optimism,
pessimism, and regret (see Chapter 9). The decision-maker himself may
be expected to use various heuristic procedures in selection that our
presentation method has been designed to accommodate. These procedures
1-7
include pursuit of "satisficing" objectives (satisfying a number of in-
dependent criteria instead of optimizing one), preference for "incremental"
alternatives (small changes from the status quo), and reliance on infor-
mation feedback to perfect the original choice (also in Chapter 9).
Results of Studies of Example Hazards
Four example controls--two for cadmium and two for asbestos--were
examined by the recommended methodology. Although results indicate that
none of the four would be justified, we do not conclude that these controls,
much less controls in general, are necessarily undesirable in a broader
context. Some of the controls will reduce contaminants besides those
analyzed here. Other reasons for this seemingly paradoxical conclusion
are explained in the next section of this chapter. Nevertheless, within
the scope of our model we found all four controls to be severely de-
ficient from a cost-effectiveness standpoint. The best of the four--the
zinc smelter scrubber for control of cadmium emissions--was roughly a
factor of 10 below the effectiveness needed to justify its costs in
terms of a moderate valuation of human life. The other three controls
were 3 or more orders of magnitude (factors of 1,000 or more) below de-
sired efficiencies, (see Chapter 8).
The smelter scrubber would look more justifiable if its calculated
risk reduction included the effects of other contaminants such as arsenic;
but the effects of cadmium alone were minimal except very near the source
of airborne contamination. Observed statistical correlations of cadmium
air concentrations with urban death rates, a major reason for the current
concern over cadmium, appear from our analysis to be at least partly a
spurious artifact of the data, rather than a true cause-effect relation-
ship (see Chapter 7). Also, the full effects of cadmium contamination
are not reached until After 50 years of cumulative body buildup, but
our population mobility model indicates that less than 2 percent of the
local population will stay in a highly contaminated community for that
1-8
length of time (see Chapter 7). Because of these limitations, our model
generated a national annual life saving of 5 years each by only 33 people
in the smelter areas--a total of 166 person-years per year (Chapter 7).
Revealed preference valuations of human life based on risk premiums
charged in the labor market are about $300,000, so this saving would
total in the order of $1.5 million (see Chapter 8). The saving had to
be weighed against a loss of $14 million per year in local industry and
support service wages in smelter areas. Nationally, the loss would be
about $21 million in GNP. Only abou one-fourth of this loss would be
passed on to the consumer if no import restrictions were imposed, because
foreign competition would hold down price increases. (This finding differs
greatly from the 90 percent pass-on percentage of control costs assumed
in another recent study for EPA--see Chapter 5.)
A much more unfavorable risk-benefit ratio could be shown for the
other cadmium control--scrubbers on municipal incinerators. Because
municipal incinerators account for only a small part of incinerated
waste, the number of lives saved are much lower: one-tenth person-year
per year. But the national costs to install scrubbers on the numerous
municipal incinerators would be even higher: $28 million per year.
Finally, the two asbestos alternative controls--filters on asbestos
manufacturing exhausts and substitute materials to replace asbestos in
automobile brakes--showed negligible risk reductions. The original air
concentrations of asbestos from these sources, even around the production
facilities or near busy streets, were too low to be dangerous (Chapter 7).
(Handling of asbestos in the working place or elsewhere was not considered.)
Yet the costs, which would be primarily passed on to consumers, were sub-
stantial because of the widely dispersed sources. Costs for controlling
asbestos production facilities would be only about $3 million per year,
but replacing asbestos brakes with a hypothetical replacement material
could cost $65 million per year (see Chapter 5).
1-9
Uncertainties were large for all of the alternatives, but not large
enough to change the conclusions about any of them (Chapter 8). What
conceivably could change the conclusions are unknown and exogenous factors,
such as undiscovered hazards or substitute materials, that were not con-
sidered in the model.
Monitoring and Research Data Needs
Many data elements were either assumed subjectively or adopted on
the basis of very tentative evidence for this study, which is intended
primarily to demonstrate a methodology rather than to provide authorita-
tive conclusions about technical issues. These data elements can be
greatly improved by successive iterations. In addition to broadening
the model to include the effects of controls on additional hazardous
wastes, as mentioned earlier, several types of feedback and data refine-
ments are needed. As EPA and other agencies have discovered, reviews by
technical experts acting in adversary capacities will quickly elucidate
the range of informed opinion on any subject and will correct initial
errors in analysis. Iterations of the analysis will help to resolve con-
flicting uncertainties, assumptions, and constraints in the formulation.
Eventually they will lead to discovery and inclusion of originally un-
known factors such as long-term and ecological effects, which have been
ignored here.
Any of these prospects could conceivably modify our analysis enough
to change our original conclusions; we expect that a pattern of successive
refinement is characteristic of any dynamic standards development process.
Beyond this evolutionary process of technical knowledge development, how-
ever, more revolutionary improvements can be realized by considering
information for environmental standards as elements in a knowledge system
that must parallel the physical processes involved in contamination (see
1-10
Chapter 2). Data in much of the existing literature are not complete
enough to be useful for the larger analytical purposes of such a system.
For example, emissions may be given in pounds per minute without
indicating how many minutes per day or days per year the emissions con-
tinue, thus precluding any authoritative estimate of the most meaningful
parameter: annual rates. Or, health effects experiments may be reported
in terms of median lethal dose for rats, without (1) providing any clue
of a reasonable transfer function to obtain the relevant variable of human
deaths, or (2) supplying data for other dose levels that might permit
estimation of a complete dose-damage function. Without a complete dose-
damage function, there is no way to estimate the value of a threshold
dose. Without a reasonable threshold dose estimate, there is no logical
basis for promulgating maximum permissible dose standards.
Standard setting as well as information gathering can gain from a
systematic approach. All of the standards in the system, whether of
production rates, usage, emissions, media concentrations, personnel
exposures, or actual ingestion should be related to each other in a
systematic way that reflects the flow processes involved. This kind of
standards integration does not presently exist for either cadmium or
asbestos (see Chapter 2).
If this kind of flow process and its uncertainties can be defined
quantitatively, then it will be possible to determine the ultimate value
(but not necessarily the practical value) of research on any component
or stage of the process. This can be done by calculating the "expected
value of perfect information" and comparing it to the value of other
research efforts or to the expected value of implementing a control
program. In this way, the relative potential payoff of research efforts
can be estimated as an aid to research planning and to deciding whether
program implementation or further study would be most desirable (see
Chapter 9).
1-11
Finally, we have examined a large number of source materials in
the course of this study (see Bibliography) and have made some conclu-
sions about current technical data needs. We found that hazardous waste
research studies generally give inadequate attention to the analysis of
uncertainty, and to generalizing their results for policy applications.
Concerning cadmium, better data are particularly needed on the industrial
processes involved and their wastages, on dispersion patterns into food
and water, and on long-term mechanisms of biological uptake. Asbestos
research is especially needed to find more uniform standards, better
concepts of contamination mechanisms, and more accurate estimates of
cumulative dose histories (see Chapter 9).
1-12
Chapter 2
PAST, PRESENT, AND PROPOSED STANDARDS
To be complete, a study of methods for determining acceptable risks
from hazardous wastes should start with existing premises and precedents.
Accordingly, in this chapter we review the functions of standards and
trace the development of these standards as they have evolved over time.
Finally, a methodology is proposed for setting standards, followed by a
description of how the methodology will be applied in subsequent chapters
of this report.
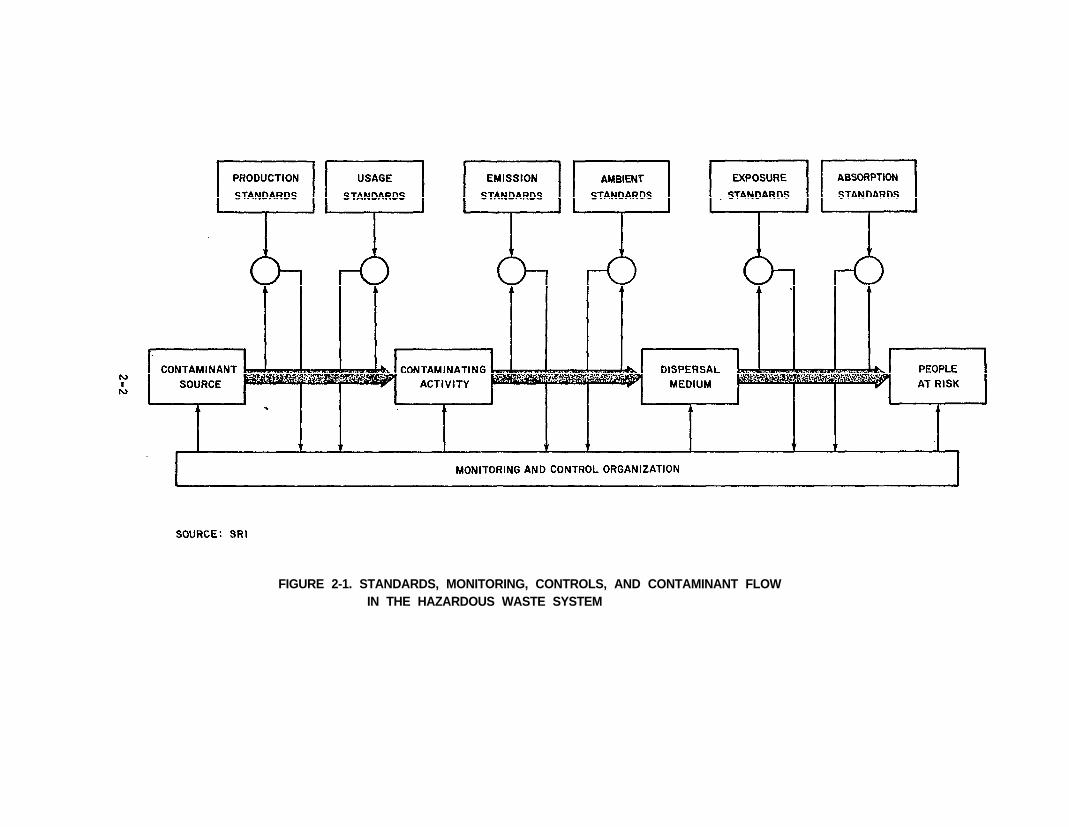
Standards from a Systems Viewpoint
When the process of hazardous waste production and pollution is
viewed as a man-made system, its contaminant levels can be considered
as parameters to be controlled. Standards can then be seen as perfor-
mance goals for controlling the contaminant parameters. Each standard
represents a value that can be compared to a physical measure. These
system concepts are illustrated in Figure 2-1, which shows several types
of physical measures that can be balanced against a comparison standard
to obtain a control signal. It also shows that the control signal serves
as an input to influence either the contaminating activity itself or some
other component of the larger system.
For precision, the best comparison signal is one furthest "downstream"
(for example, absorption levels in Figure 2-1), since that gives the most
accurate measure of the overall contamination problem. However, the down-
stream feedback signal also tends to be the slowest and sometimes the
most erratic, so that error signals from further upstream in the process
also can be helpful.
2-1
2-2
FIGURE 2-1. STANDARDS, MONITORING, CONTROLS, AND CONTAMINANT FLOWIN THE HAZARDOUS WASTE SYSTEM
The complexity of the comparison standard represents another dimen-
sion of control. Standards can vary from crude rules of thumb to highly
sophisticated, dynamically changing values. In roughly increasing order
of complexity, environmental standards can be categorized according to
the following types of criteria:
Zero Tolerance--An absolute ban on any observable amount of con-
tamination. While simple and easily interpreted, this type of standard
is often impractical to enforce if monitoring measurements are sensitive
enough to detect low levels. Otherwise, zero tolerance will usually pre-
clude any significant use of the hazardous materia1.l
Permissible Limits Established on the Basis of Health Effects--If
health effects are used to determine tolerance, they can be categorized
according to the type of evidence on which they are based.2
Indirect evidence--epidemiological evidence from statis-tical experience with a meaningfully large population.
Laboratory evidence--animal (in vivo) and cell culture (invitro) effects.
Chronic effects--clinical evidence that becomes noticeableonly after a cumulative exposure or after a lengthy delayperiod.
Acute effects--quickly noticeable clinical evidence in man.
In all of these cases, the standards are usually established relative to
some "threshold exposure that represents the lowest noticeable level at
which injuries occur. The threshold levels (where they can be observed)
'"Permissible Levels of Occupational Exposure to Airborne Toxic Sub-stances," World Health Organization, Technical Report Series No. 415,Sixth Report of the Joint ILO/WHO Committee on Occupational Health(1969).
2T. F. Hatch, "Criteria for Hazardous Exposure Limits," Arch. Environ.Health, Vol. 27, pp. 231-5 (October 1973).
2-3
are higher for acute than for chronic effects, and higher for chronic than
for indirect effects; so standards set on chronic and indirect effects
usually incorporate safety factors to allow for these differences. But
great variations can exist; even for the same effect, the standard can
vary by a factor of 10 or more, depending upon whether or not homeostatic
adjustments that compensate for effects are considered permissible.
If there is no lower dosage limit to injuries (i.e., if no threshold
is observable), then a standard based only on health effects is not very
logical, since no one can say at what level (except zero) the health ef-
fects become insignificant. Even with a threshold a health standard, like
a zero tolerance standard, gives no consideration to the economic or other
difficulties involved in achieving the specified contamination level.
Process Specifications--Procedural or
contamination controls can form a standard
process conditions imposed on
based on opposite considera-
tions; i.e., one dictated by the economic and other difficulties involved
without explicit consideration of the health hazards involved. This type
is equivalent to a "best technology" standard (sometimes qualified by
words such as "practicable" or "feasible") in which technical considera-
tions dominate. As a temporary start-up standard or where the actual
health hazards are very uncertain or indeterminate, this criterion can be
a logical one; but where reasonable health effects data are available,
some means of balancing health effects against control technology seems a
much more rational approach.
Risk-Benefit--A standard based on the ratio of the health and safety
risks to the economic and other non-health benefits provided by the con-
taminating activity. This ratio does balance the health and economic
effects of any control alternative, and accordingly it has recently been
viewed as a promising method of standard setting. It can be established
2-4
either in common money terms, or in two dimensions (e.g., health and
economic). But either way, it is expressed in quantitative terms repre-
senting some kind of tradeoff between health effects and economic effects
of the standard. It does not reflect possible inequities in who gets
which effects, nor does it consider other potential influences such as
public acceptability.
Multiple Criteria--A combination of criteria to approximate the
complex balance among health, economic, political, and demographic con-
siderations that actually exist in real-life standard-setting situations.
All of these considerations are needed to achieve a durable and accept-
able standard. To date, there have been few, if any, formal attempts to
design and implement a multiple criteria standard, but the present report
outlines a methodology that can be applied to such an effort. Our approach
to the problem is to include conventional risk-benefit criteria modified
by other economic factors such as effects on consumer and producer sur-
pluses, substitution possibilities, joint effects of controls and en-
forcement costs. Other criteria to be introduced include maximum socially
acceptable risk levels, distinctions in risk-benefit trade-offs between
producing and consuming areas, and effects of uncertainties in both costs
and benefits on the overall decision problem.
Whatever standards are developed for a contamination system, feed-
back from the comparisons of standards with measured conditions must be
implemented by means of controls upon one or more of the components of
the system. Figure 2-1 shows schematically how monitored signals might
be used to control the contaminant flow at any point in the system. How-
ever, the exact mechanism by which these controls would operate is not
described. In the case of environmental standards, the controls can
operate through three compliance mechanisms: (1) voluntary cooperation,
(2) regulatory controls, or (3) economic forces. Analyses of the
2-5
effectiveness of these various mechanisms become quite involved. This
compliance component of the waste contamination system is outside the
scope of the present study and will not be addressed here.
The Development of Present Standards
Safety standards in the use of hazardous materials follow a typical
pattern of development. Initially, new materials and new uses of old
materials tend to be discovered and exploited without much regard for
their safety or health hazards. Examples of this phase are the early
uses of lead (which lasted hundreds of years before its health dangers
were recognized) and of radium (which lasted only a few decades before
strict restrictions were imposed). Eventually, even primitive cultures
usually learn by trial and error to deal with the hazards of a given
material. Society develops what are often quite rigid control measures
in the form of regulations, folk wisdom, or taboos to protect itself
against the most obvious hazards of contaminants.
With the rise of the scientific spirit, safety standards have be-
come somewhat more quantitative and cause-effect related. Standards
are set on the basis of explicit, objective criteria for clearly recog-
nized causes. These tendencies became institutionalized by the rise
of public health organizations about a hundred years ago and have led
to a continuous rapid drop in the incidence of such hazards as lead and
zinc poisoning. However, many of the initial standards were merely
advisory or permissive, or if mandatory they were often not fully enforced.
In a third phase, authorities have recently tended to set stricter
standards as they have become more aware of the need for caution due to
chronic and indirect effects. Generally, additional adverse effects have
been discovered by intensive epidemiological studies, both clinical and
experimental, such as those carried out on the hazards of tobacco. These
2-6
studies and the resultant better knowledge of biological effects were
major causes of popular pressures in the United States for stricter en-
vironmental and occupational health standards, leading to such recent
statutes as the Solid Waste Disposal Act of 1965, Resource Recovery Act
of 1970, Clean Air Act of 1970, Water Pollution Control Act of 1972,
National Environmental Policy Act of 1969, and Occupational Safety and
Health Act of 1970.
Example: Cadmium--Cadmium represents an interesting example of the
standards development process because its entire industrial experience
has occurred during relatively recent history. Cadmium was only dis-
covered in 1817 and the first recorded incident of cadmium poisoning
occurred in 1858.3 Its high toxicity provided extensive medical docu-
mentation of the acute effects--encountered from air, water, and food
ingestion--in industrial and other exposure cases and led to the banning
of cadmium in certain applications , such as in cooking and eating utensils.
However, its role in chronic poisoning was not widely recognized until an
epidemic of itai-itai (ouch-ouch) disease, with kidney and bone symptoms
of proteinurea, osteomalacia, and osteoporosis, was documented in Japan.
The cause was eventually traced to mine dumping beginning about 1924 in
a river being used as a supply for drinking water and rice irrigation.
Symptoms among local inhabitants began to be noticed about 1935, and almost
100 deaths attributable to the disease had occurred by 1965. Yet its en-
demic nature was not recognized until 1955, and at least two false leads
(nutritional deficiencies and zinc poisoning) were followed until cadmium
was identified as the probable poison in 1961. Legal responsibility for
the contamination was not determined until 1971. Further investigations
3W. Fulkerson et al., "Cadmium--the Dissipated Element," ORNL NSF-EP-21,supported by the National Science Foundation RANN Program, Oak RidgeNational Laboratory, Oak Ridge, Tennessee.
2-7
near other zinc mines in Japan found at least one additional locality
where deaths and disabilities from itai-itai disease had previously been
unrecognized (Fulkerson, Chapter VI-C).
On the basis of an estimated minimum ingestion of 600 micrograms of
cadmium per day for itai-itai disease sufferers (ten times normal), the
Japanese Ministry of Health established a maximum acceptable ingestion
level of 300 micrograms per day from food and drink. More recently, the
World Health Organization* has recommended a "provisional tolerable weekly
intake" of 400 to 500 micrograms, about 60 micrograms per day. Inhalation
through the air is almost negligible compared to food and water ingestion,
except for heavy smokers and workers in certain industrial installations.
It is interesting to note that these standards apply to the very last
of the types of measurable system outputs that are shown in Figure 2-1
(absorption). To regulate contamination efficiently, additional standards
are needed for other more directly controlled outputs that occur upstream
in the flow process, such as levels of exposure, concentrations, emissions,
usage, or production. For example, absorption might best be controlled by
limiting total amounts eaten in food, the dominant contributor to cadmium
ingestion, or by controlling the maximum concentrations allowed in food
substances. Food at present has no standard either for maximum cadmium
exposures or for maximum cadmium concentrations.
4"Evaluation of Certain Food Additives and the Contaminants Mercury,Lead, and Cadmium," Sixteenth Report of The Joint FAO/WHO Expert Com-mittee on Food Additives, Geneva, 4-12 April 1972, World Health Organ-ization Technical Report Series, No. 505, FAO Nutrition Meetings ReportSeries, No. 51 (1972).
2-8
Water and air also have no media standards that apply to total
exposure by individuals. However, both have concentration standards.
Drinking water has a tentative World Health Organization'.,cadmium con-
centration limit of 0.005 mg/1 and a U.S. limit6 of 0.01 mg/1. Air is
limited under U.S. occupational health regulations to concentrations of
0.1 pg/m3 cadmium fume (0.2 pg/m3 cadmium dust) for an 8-hour work shift.7
Emission standards have been established for water but not yet for air.
Proposed cadmium effluent limits for streams or lakes of hardness less
than 100 mg/1 CaC03 are a maximum concentration of 70 pg/l, a maximum
weight of 0.035 kg/day times the receiving water design flow in m3/sec,
and a maximum cadmium discharge per facility of 9.8 kg/day where more
than one facility is discharging. For freshwater bodies of water hardness
greater than 100 mg/1 CaC03, and for estuary and coastal waters, the
limits progressively rise.s For ocean dumping, waste concentration limits
have been set at not more than one order of magnitude higher than the
local cadmium content of actual seawater.'
No standards have been set to control the usage of cadmium, except
that the FDA bans cadmium-containing materials for use in food prepara-
tion and food packaging (Fulkerson, 1973, p. 351).
5S. Hernberg, "Health Hazards of Persistent Substances in Water," WHOChronicle, Vol. 27, No. 5, World Health Organization, Geneva, pp. 192-3(May 1973).
"'Interim Primary Drinking Water Standards," Environmental ProtectionAgency, Federal Register, Vol. 40, No. 51, Part II, pp. 11990-98(14 March 1975).
7"0ccupational Safety and Health Standards," Occupational Safety andHealth Administration, Federal Register, Vol. 37, No. 202, Part II,pp. 22102-22356 (18 October 1972).
*Toxic Materials News (15 January 1975).
"'Ocean Dumping," U.S. Environmental Protection Agency, Federal Register,Vol. 38, No. 94, pp. 12872-7 (16 May 1973).
2-9
From the control systems standpoint of Figure 2-1, then, present
cadmium standards are seen to be either of the zero-tolerance (food-
touching materials) or permissible-limit (e.g., air and drinking water)
categories. Standards based on cost-benefit or multiple-criteria approaches
are notable by their absence. The relationships between standards, monitor-
ing, and control do not seem to be very systematic or comprehensive. Sev-
era1 potential monitoring points (e.g., cadmium production) have no present
standards, and the means of control for other standards (e.g., food) are
not at all clear.
Example: Asbestos --Asbestos presents a history of standards develop-
ment similar to that of cadmium, even though it has been used as a novelty
in lamp wicks and even tablecloths since antiquity.l' The first recorded
case of a disease related to asbestos fibers was in 1907, but the symptoms
of asbestosis were not determined until 1927, and the hazards of lung
cancer from inhalation of asbestos were not established until 1947. The
first definitive epidemiological study of the effect of asbestos was only
undertaken in the early 1960s by Selikoff and his colleagues.ii
Development of standards for asbestos have been further delayed by
difficulties in counting submicron size fibers. One nanogram may repre-
sent a million fibers. In sprayable insulation formulations, asbestos
fibers can only be reliably counted by electron microscope techniques
costing $300 per sample,i2 Air sampling by this technique costs even more.
"5. S. Horvitz, "Asbestos and Its Environmental Impact," Environ. Affairs,Vol. 3, No. 1, pp. 145-65 (1974).
ilA. K. Ahmed, D. F. MacLeod, and J. Carmody, "Control for Asbestos,"Environment, Vol. 14, No. 10, pp. 16-22 (December 1972).
12"Background Information on the Development of National Emission Stan-dards for Hazardous Air Pollutants: Asbestos, Beryllium, and Mercury,"APTD-1503, Office of Air and Water Programs, U.S. Environmental Protec-tion Agency, p. 34 (March 1973).
2-10
In 1946, the first U.S. standard established a concentration threshold
limit value equivalent to 30 visible particles per milliliter in the air
of working spaces. This occupational standard was reduced to 12 fibers
of greater than 5 micron length per milliliter in 1968, to 5 in 1971, and
to 2 effective in 1976.11 However, the visual methods currently used to
count asbestos concentrations account for less than 5 percent of total
fibers, and no one knows whether the visually identifiable fibers are any
more significant to health effects than the smaller fibers (Ref. 12,
p. 24).
Because of these monitoring difficulties, many responsible agencies
have begun by regulating inputs to the contaminating activity (i.e.,
production and usage of the contaminant) rather than outputs (emissions,
concentrations, and the like). Several local and state jurisdictions,
such as New York, Boston, Philadelphia, and the State of Illinois, have
issued regulations restricting and controlling the usage of asbestos in
specific construction operations. EPA has continued this approach in
its regulations over manufacturing and extraction point sources, as in
the Reserve Mining case. Where appropriate in the case of air pollution,
it has applied a nonquantitative "no visible emissions" requirement.
asbestos. As is the case with cadmium, no current asbestos controls even
attempt to regulate on the basis of cost-benefit or multiple-criteria
models.
Generally, then, we can characterize the emphasis in asbestos con-
trols to be more input-oriented than output-oriented, and more concerned
with qualitative than with quantitative criteria. Many potential observa-
tion points in the "hazardous waste system" shown in Figure 2-1 are not
monitored, and few of those that are monitored seem designed to give very
precise, comprehensive, or reliable assessments of the true hazards from
2-11
A Proposed Methodology for Future Standards
The foregoing examples point directly to ways by which future
standard-setting can be improved. Consideration of the flow of hazardous
wastes as a man-made system can make standards:
(1) More systematic--Individual controls and monitoring points
need to be considered as parts of the entire system shown
in Figure 2-1 rather than as entities unto themselves. If
the balance between controls is not considered, some will
dominate the material flow and form artificial bottlenecks.
(2) More comprehensive--The systems perspective shows how addi-
tional controls can be used to improve the overall response
of the system, and how neglected control points might be
highlighted by careful analysis. At the same time, inter-
active systems effects will permit overall control to be
exerted without having monitors or controls at every
point.
(3) More reliable--Monitoring information can also be used
to verify information from other components in the system,
and controls over one component can reinforce the effects
of controls over another.
(4) More precise--Coordinated use of controls can provide a
precision impossible with individual controls. This
precision can be designed by making use of the feedback
relationships among the system components and controls.
(5) More adaptive--The use of more sophisticated control stan-
dards, such as multiple criteria models, will permit the
system to (1) reach a better balance between social objec-
tives, (2) to remain more consistently in a self-regulated
state without outside policy interference, and (3) to
2-12
address more effectively many of the types of policy
criticisms that have been directed at present and past
environmental standards.
The standard-setting methodology by which hazardous waste systems
can be better controlled must be based on multiple criteria, which are
described in the subsequent parts of this report. Once standards are
set in a systematic manner, monitoring and control procedures can be
designed for effective and equitable control over the entire system.
2-13
Chapter 3
POLLUTION FROM INDUSTRIAL ACTIVITIES
General Methodology
Background
A great deal of literature has been generated over the years describ-
ing production, use, and disposal of hazardous materials. However, the
bulk of this literature concerns micro-scale experiments and specialized
data-gathering efforts. In terms of the larger risk and benefit objec-
tives of this project, not enough past efforts deal with the macro-level
problems associated with disposition of hazardous wastes. For example,
very few previous studies have attempted to quantify the mass balance
characteristics of production, use, and disposal processes, and few have
examined the major large-scale mechanisms of waste dispersion over the
country.
Objectives and Scope
The objectives of this chapter are to describe and quantitatively
assess the emissions of designated hazardous materials into the environ-
ment, and to associate these emissions with specific economic activities.
The magnitudes of these emissions should also be related to the natural
occurrence of hazardous materials in the environment.
The coverage should include emissions of hazardous by-products from
the production or use of other materials, as well as directly from mate-
rials that are themselves produced and used in the economy. The major
focus of interest is the United States and individual regions, states,
3-1
and localities within the United States, but other countries and the
world as a whole will be considered when needed.
Method of Analysis
The approach used in this portion of the analysis consists of the
following steps:
(1) Describe the various uses of the hazardous materialin the U.S. economy.
(2) Outline the quantities and facilities associated withthe flow of the material through its various processingstages, such as extraction and refining, production,use, and eventual disposal.
(3) Assess the nature and amounts of emissions to theenvironment at each stage.
(4) Describe other controllable sources of human exposureto the hazardous material, such as its occurrence asa by-product, impurity, or waste in the productionand use of other materials.
(5) Outline the quantities of economic flow or naturalappearance of these indirect sources of the material.
(6) Assess the nature and amounts of emissions to theenvironment from these secondary sources.
(7) Sum the total of all forms of emissions to the environ-ment by medium (air, land, water) and by location.Variances in the emission estimates are not consideredin this chapter, since the model's mass-balance featurehelps to limit any systematic errors.
Illustrative Application: Cadmium
Cadmium enters our environment directly as a mineral resource used
in industrial activities; indirectly as a by-product of agricultural,
construction, energy production, and transportation activities; and
naturally as an element in food, water, and the earth's crust. EPA
contractors have traced many of its emissions into the atmosphere, but
3-2
they have been much less successful in finding sources of waste cadmium
in surface waters. Likewise, data on the amount of cadmium discarded to
landfill are nonexistent, although strong inferences can be made on the
basis of known dispositions of most cadmium-containing products.
We have used a selected portion of the available data and derived
reasonable estimates where data were not available to calculate a mate-
rial balance of the man-made flow of cadmium into and out of our environ-
ment. We have deferred consideration of its natural concentrations until
Chapter 6.
Pollution from the Extraction and Refining of Zinc,Lead and Copper Ores
Cadmium is purified as a by-product in the extraction of zinc, lead,
and copper from their ores. Consequently, the amount of cadmium produced
is dependent upon the production of these other metals. The Bureau of
Mines13 has developed regression equations which relate cadmium produc-
tion to both cadmium prices and zinc production. High cadmium prices
encourage the importation of zinc ores and flue dusts.
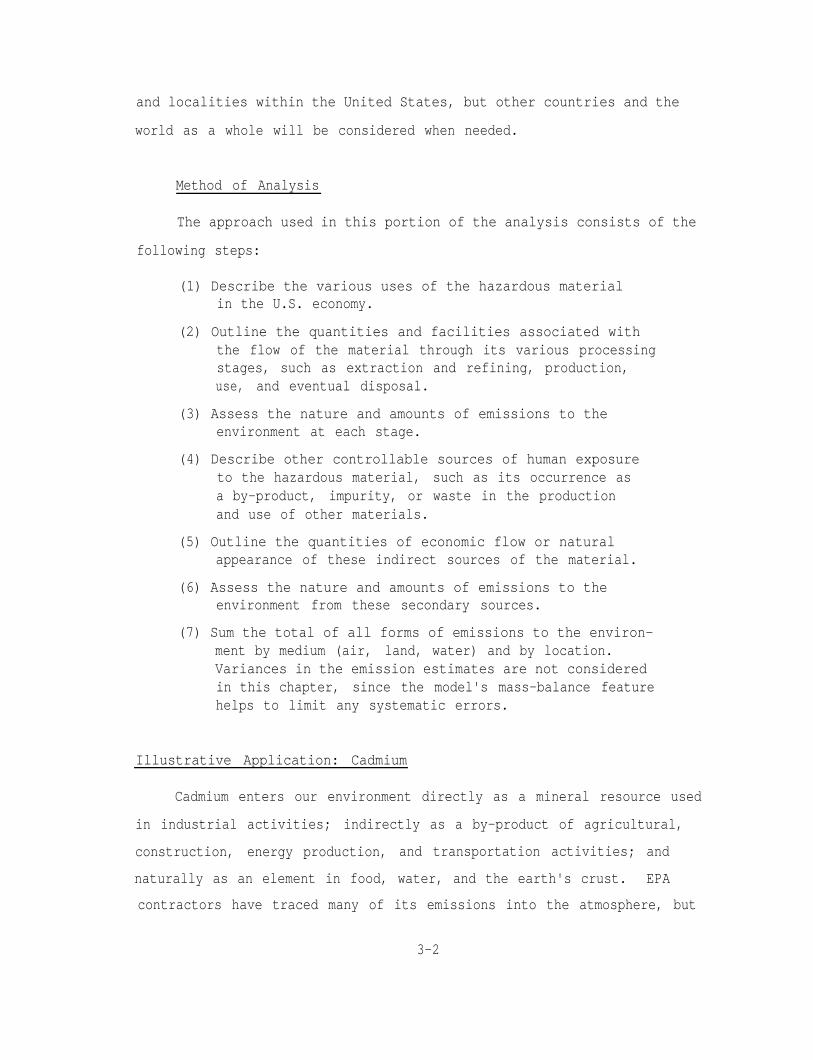
The major flow paths from industrial production and use of cadmium
are given in Figure 3-1. For the most part, the indicated flow reflects
waste quantities generated in 1968, when U.S. consumption was slightly
higher than at present. All of the major flows have been indicated so
that the material balance can be realistically modeled. However, the
scattered evidence available from EPAi4 and other sources on industrial
'=A. Petrick, et al., "The Economics of By-Product Metals," "II. Lead,Zinc, Uranium, Rare Earth, Iron, Aluminum, Titanium, and Lithium Sys-tems," Bureau of Mines Information Circular 8570 (1973).
i4R. S. Ottinger, et al., "Recommended Methods of Reduction, Neutraliza-tion, Recovery, or Disposal of Hazardous Wastes," 16 volumes preparedfor Environmental Protection Agency by TRW Systems Group, PB224579,Set/As, Vol. XIV (February 1973).
3-3
FIGURE 3-1. CADMIUM PRODUCTION, USE, AND DISPOSAL QUANTITIESIN THE U.S. (Metric Tons per Year)
3-4
flows to land and water limited the precision of our estimates of those
quantities. The data on air emissions are from W. E. Davis & Associates?'
Pollution from Cadmium Use
The three major uses of cadmium are (1) electroplating, which
accounts for 49 percent of the total; (2) pigments and phosphors, 21
percent; and (3) plastic stabilizers, 15 percent. In the electroplating
market, the largest use (10 percent of all uses) is for motor vehicle
parts such as nuts, bolts, screws, springs, fasteners, washers, rivets,
and carburetor and alternator parts. About 6 percent of all uses go for
plating small aircraft parts. The remaining electroplating usages were
for radio and television chassis, electrical appliance parts, marine
equipment, hardware, and industrial machinery. (A recent SRI study* shows
the percentages declining for vehicles and rising for aircraft.)
No cadmium air emissions are reported for the electroplating industry
by Davis." Similarly, Fulkerson3 assigns no discharge to sewage from
electroplating. However, numerous other investigators have found large
quantities of cadmium discharges from electroplating. TRti4 estimates
that this industry is the largest cadmium polluter of our sewers, with an
estimated loading of 514 metric tons per year.
Current statistical data for other industrial uses are also uncer-
tain, although we have estimated disposals to achieve the balance shown
in Figure 3-1. Air emissions for all industrial uses total only 16 metric
tons.15 Because of the paucity of water and land pollution data for
cadmium (e.g., the only admitted polluter is the nickel-cadmium battery
""National Inventory of Sources and Emissions: Cadmium, Nickel, andAsbestos--1968," (Cadmium, Section I), PB 192250, prepared by W. E.Davis & Associates, Leawood, Kansas for National Air Pollution ControlAdministration (February 1970).
*Personal communication, Charles Turk, SRI.
3-5
industry,14), we have assumed that 50 percent of the pigments and phosphors
and 100 percent of the plastics containing cadmium stabilizers end up in
waste dumps. The unaccounted cadmium used in pigments (623 metric tons)
is assumed to remain in permanent use as paint. The assumed solid waste
disposals of the remaining uses are as follows: one-third of the cadmium
in alloys, silver braze, and others; two-thirds of the fungicides, nuclear
energy, rubber curatives , photography, and unaccounted uses; and 90 per-
cent of the nickel-cadmium battery output. The rest goes to permanent
uses.
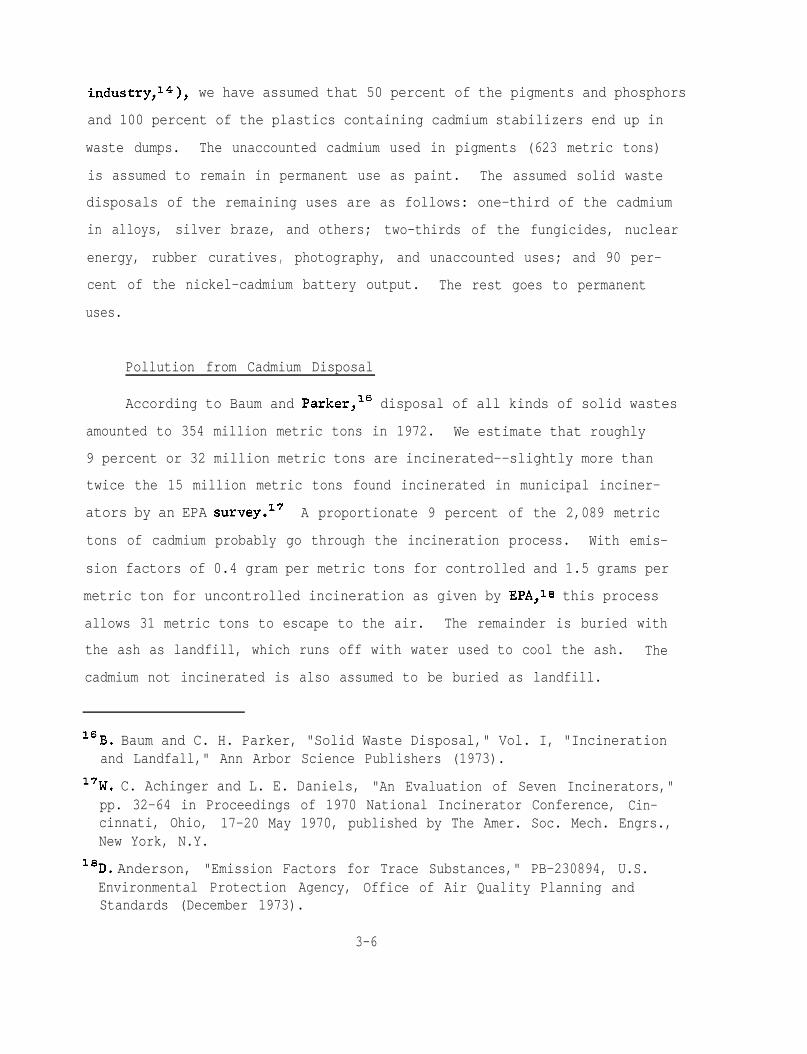
Pollution from Cadmium Disposal
According to Baum and Parker,l' disposal of all kinds of solid wastes
amounted to 354 million metric tons in 1972. We estimate that roughly
9 percent or 32 million metric tons are incinerated--slightly more than
twice the 15 million metric tons found incinerated in municipal inciner-
ators by an EPA survey.17 A proportionate 9 percent of the 2,089 metric
tons of cadmium probably go through the incineration process. With emis-
sion factors of 0.4 gram per metric tons for controlled and 1.5 grams per
metric ton for uncontrolled incineration as given by EPA,ls this process
allows 31 metric tons to escape to the air. The remainder is buried with
the ash as landfill, which runs off with water used to cool the ash. The
cadmium not incinerated is also assumed to be buried as landfill.
"B. Baum and C. H. Parker, "Solid Waste Disposal," Vol. I, "Incinerationand Landfall," Ann Arbor Science Publishers (1973).
17W. C. Achinger and L. E. Daniels, "An Evaluation of Seven Incinerators,"pp. 32-64 in Proceedings of 1970 National Incinerator Conference, Cin-cinnati, Ohio, 17-20 May 1970, published by The Amer. Soc. Mech. Engrs.,New York, N.Y.
I'D. Anderson, "Emission Factors for Trace Substances," PB-230894, U.S.Environmental Protection Agency, Office of Air Quality Planning andStandards (December 1973).
3-6
Recovery of scrap steel accounts for pre-control air emissions of
1,000 metric tons of cadmium per year according to Davis.l' If we accept
the argument that these emissions are well controlled, as implied by
Fulkerson,' then electrostatic precipitation with a 90-percent effective-
ness factor results in 100 metric tons to the air and landfill disposal
of the remaining 900 metric tons.
Of the 11 metric tons of cadmium used in fungicides, only 0.2 are
released as air pollutants; the remainder are applied principally to golf
courses. Much of this probably ends up in ground waters, but in any
event, the magnitudes involved are relatively small so we show this usage
disposed to land.
Our final accounting for pollution from cadmium disposal is a mate-
rial balance around the sewage plant. The water wastes from the electro-
plating, pigment, and battery industries are from TRW.i* We estimate
that 0.5 percent of the amount of cadmium used in the plastic stabilizer
alloy, and "other" industries (nuclear energy, rubber curing, photography,
and unaccounted) is wasted to the sewer. Therefore, cadmium waste pollu-
tion by way of sewage amounts to 527 metric tons per year.
Disposal of these sewage wastes was calculated as follows: Accord-
ing to EPA,l' an estimated 3.8 million liters of sewage is generated
daily by 10,000 people; so for a population of 200 million, some 7.6 x 10¹⁰
liters per day are sent to sewage plants. The sewage plants remove most
of the cadmium with the sewage sludge. If we take EPA's estimates of
sludge generated by primary and secondary treatment plants, and assume
lg"Sewage Sludge Incineration," U.S. Environmental Protection Agency,Task Force for the Office of Research and Monitoring, PB-211323(August 1972).
3-7
that each type treats half of the nation's sewage, the total sludge
generated will be in the range of 14,000 metric tons per day, or 5 mil-
lion metric tons per year. If Page's2' mean cadmium content of 75 ppm
in the sludge is assumed, then the cadmium removed in the sludge will be
367 metric tons per year--about 70 percent of the total cadmium input.
EPA estimates that 3,600 metric tons per day (1.3 million metric
tons per year) of sludge are incinerated. From this, we calculate that
incinerated sludge will contain 98 metric tons per year of cadmium. Since
the EPAi* cadmium emission factor of 4 ppm for sludge incineration im-
plies that 5 metric tons per year will be emitted to the air, the
remaining 93 tons will be dumped as landfill. The cadmium in sludge
that goes directly to landfill without incineration amounts to 269 metric
tons.
The portion of cadmium not collected in sludge amounts to 160 metric
tons. Thus, sewage effluent discharged to surface waters contains an
average 0.006 ppm of cadmium. This estimate compares reasonably with
that of Page,20 who gives a median effluent concentration of 0.005 ppm
from a survey of 57 Michigan sewage plants.
Cadmium Contamination from Other Sources
Cadmium also pollutes the environment indirectly as a result of
man's agricultural, construction, energy production, and transportation
activities. These sources are summarized in the following paragraphs
together with an overall accounting of cadmium pollution in the three
media, and are outlined in Figure 3-2.
"A. L. Page, "Fate and Effects of Trace Elements in Sewage SludgeWhen Applied to Agricultural Lands --A Literature Review Study,"PB 231171, EPA 670/2-74-005, Univ. of Calif., Riverside, Calif.(January 1974).
3-8
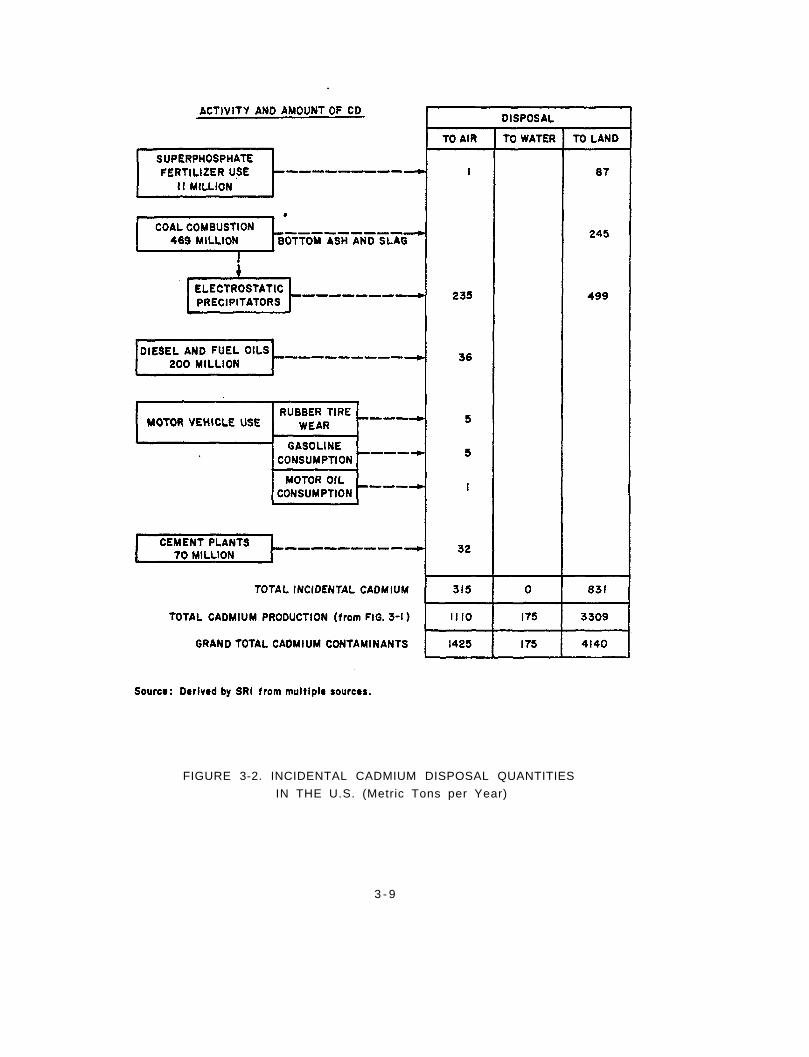
FIGURE 3-2. INCIDENTAL CADMIUM DISPOSAL QUANTITIES
IN THE U.S. (Metric Tons per Year)
3 - 9
Emissions of cadmium to the air resulting from the use of super-
phosphate fertilizers were calculated, assuming 11 million metric tons
per year consumption (Ref. 3, p. 86) and the standard EPA air emission
factor of 0.11 ppm. (Note that we distinguish between the use and the
production of fertilizer. We have not looked into the large-scale water
and land pollution problems rising from mining and beneficiating phos-
phate rock.)
To calculate the cadmium distributed to land by fertilizer applica-
tions, we used an average value of 8 ppm in the fertilizer, the mean of
the analytical values reported by Yost at Purdue.21 This projects to
87 metric tons per year of cadmium deposited on land by fertilizer.
However, Figure 3-2 does not show the complete flow process, because
cadmium does not reside inertly in the land. Its pathway to man con-
tinues by runoff to water sources and by known absorption into food grown
on the land. That problem is discussed in more detail in Chapter 6, Ex-
posures.
Combustion of 469 million metric tons of coal per year3 with an air
emission factor estimated by EPA1* of 0.5 g of cadmium per metric ton of
coal implies that 235 metric tons of cadmium annually passes through the
control equipment and into the air. Cadmium also collects in the flyash
that goes to landfill. To arrive at a reasonable figure for cadmium in
flyash, a material balance was established using statistics from the Bureau
of Mines.22 In 1970, combustion of 469 million metric tons of bituminous
21K. L. Yost, et al., "The Environmental Flow of Cadmium and OtherTrace Metals," Vol. I, Progress Report, July 1, 1972 to June 30,1973, prepared by Purdue Univ., for National Science Foundation(1973).
22C. E. Brackett, "Production and Utilization of Ash in the UnitedStates," pp. 12-18 in "Ash Utilization," Proc. 3rd International AshUtilization Symposium sponsored by National Coal Assoc., Edison Elec-tric Institute, American Public Power Assoc., National Ash Assoc.,and Bureau of Mines, Pittsburgh, Penn., 13-14 March 1973, Bureau ofMines Information Circular 8640 (1973).
3-10
coal resulted in 24 million metric tons of flyash, 9 million metric tons
of bottom ash, and 2.5 million metric tons of boiler slag. However, sub-
tracting the bottom ash and slag from an average of 10 percent total ash2"
leaves about 35 million metric tons of flyash going to electrostatic pre-
cipitators or other collectors. Comparing this residual calculation to
the 24 million metric tons collected by precipitators shows an efficiency
of only 68 percent-- much lower than the 90-percent efficiency usually
estimated for precipitators in controlled tests. The difference could be
due to gradual losses in precipitator efficiency over time and to lower
efficiencies of cyclone-type collectors without precipitators.
If we assume that the industry-wide collection efficiency for cad-
mium as well as total flyash is 68 percent, then 499 metric tons of
cadmium remain in the collected flyash. By adding the amounts in bottom
ash, slag, and gases escaping to the air, we calculate that the input
cadmium concentration in coal totals 977 metric tons: a nationwide
average of 2.08 ppm. This average is at the upper end of the 0.25 to
2 ppm range quoted by Fulkerson.3
Combustion of 1,814 million metric tons of diesel and fuel oil con-
taining an average 0.2 ppm of cadmium adds another 36 metric tons. Esti-
mated air emissions resulting from rubber tire wear and motor oil con-
sumption are those reported by Davis.l' Gasoline emissions are based
on a concentration of 20 ppb, as estimated by SRI from confidential in-
dustrial sources.
Cement plant emissions are based upon the production of 70 million
metric tons (124 million metric tons feed) in 1972 and escape according
to the EPA emission factors, as reported by Anderson." This source con-
tributes another 32 metric tons to cadmium loading of the atmosphere.
23R. F. Abernethy, M. J. Peterson, and F. H. Gibson, "SpectrochemicalAnalyses of Coal Ash for Trace Elements," Bureau of Mines, Report ofInvestigations 7281 (July 1969).
3-11
In summary, the major sources of cadmium pollution can be seen by
reference to Figures 3-1 and 3-2. The major air emissions come from:
(1) the roasting of ores to recover zinc, lead, and copper; (2) the re-
covery of scrap steel; and (3) the combustion of coal, principally in
thermal electric plants. Air emissions from these sources are also im-
portant water and land contaminants from the standpoint of particulate
fallout and washout by rainfall. Where surface waters are used for irriga-
tion, some of the contained cadmium will appear in food, normally the
most important source of cadmium to the human body.
Direct deposition of cadmium onto the land accounts for the largest
amounts of all, but most landfill operations appear able to isolate their
waste materials quite successfully. Dispersed disposal of cadmium wastes
through fertilizers and, as mentioned above, deposition of contaminants
from the air and water seem to present more significant problems to the
land.
Illustrative Application: Asbestos
Tracing of the various paths through which asbestos enters our en-
vironment is complicated by the popularity of this material (3,000 uses
according to the Asbestos Information Association of North America).
Still, it seems strange that after all of the years since asbestos was
found to cause cancer in industrial workers24 and to pervade the urban
environment,26 there is still controversy over the amounts and even the
24R. Doll, "Mortality from Lung Cancer in Asbestos Workers," Brit. J.Ind. Med., Vol. 12, p. 18 (1955).
2sW. J. Nicholson, A. N. Rohl, and E. F. Ferrand, "Asbestos Air Pollutionin New York City," In Proc. 2nd International Clean Air Congress,H. M. Englund and W. T. Berry, editors, Academic Press, New York,pp. 136-9 (1971).
3-12
sources of contamination. As a starting point, we have utilized the
product categories outlined by the U.S. Bureau of Mines26 to attempt to
isolate the major suspected sources.
Several investigators have pinpointed brakes and clutches as a prin-
cipal source of asbestos in air. 27128 Conversely, other micro-studies
have cast doubt upon this hypothesis.2g Spray-on asbestos insulation has
been pinpointed by Selikoff3' as a probable contributor. Obviously, air
emissions from the asbestos industry itself are contributing to the pol-
lution problem.31 A less obvious source may be the growing practice of
incinerating solid wastes containing asbestos.
26B. A. Clifton, "Asbestos," Bureau of Mines, Minerals Yearbook Pre-Print (1972).
27C. F. Harwood, "Asbestos Air Pollution Control," PB 205238 prepared forfor the Illinois Institute for Environmental Quality by the IllinoisInstitute of Technology Research Institute, Chicago, Ill., (Novem-ber 1971).
28L. Bruckman, "Asbestos, an Evaluation of Its Environmental Impact inConnecticut," State of Connecticut, Department of Environmental Protec-tion, Air Compliance-Engineering (12 March 1973).
2sM. G. Jacko, R. T. DuCharme, and J. H. Somers, "How Much AsbestosDo Vehicles Emit?" Automotive Engineering, Vol. 81, No. 6, pp. 38-40(June 1973).
Pollution," Arch. Environ.(July 1972).
Health, Vol. 25, No. 1, pp. 1-133oI. J. Selikoff, W. J. Nicholson, and A. M Langer, "Asbestos Air
31"National Inventory of Sources and Emissions: Cadmium, Nickel, andAsbestos--1968," (Asbestos, Section III), PB 192-252, prepared byW. E Davis & Associates, Leawood, Kansas (February 1970).
3-13
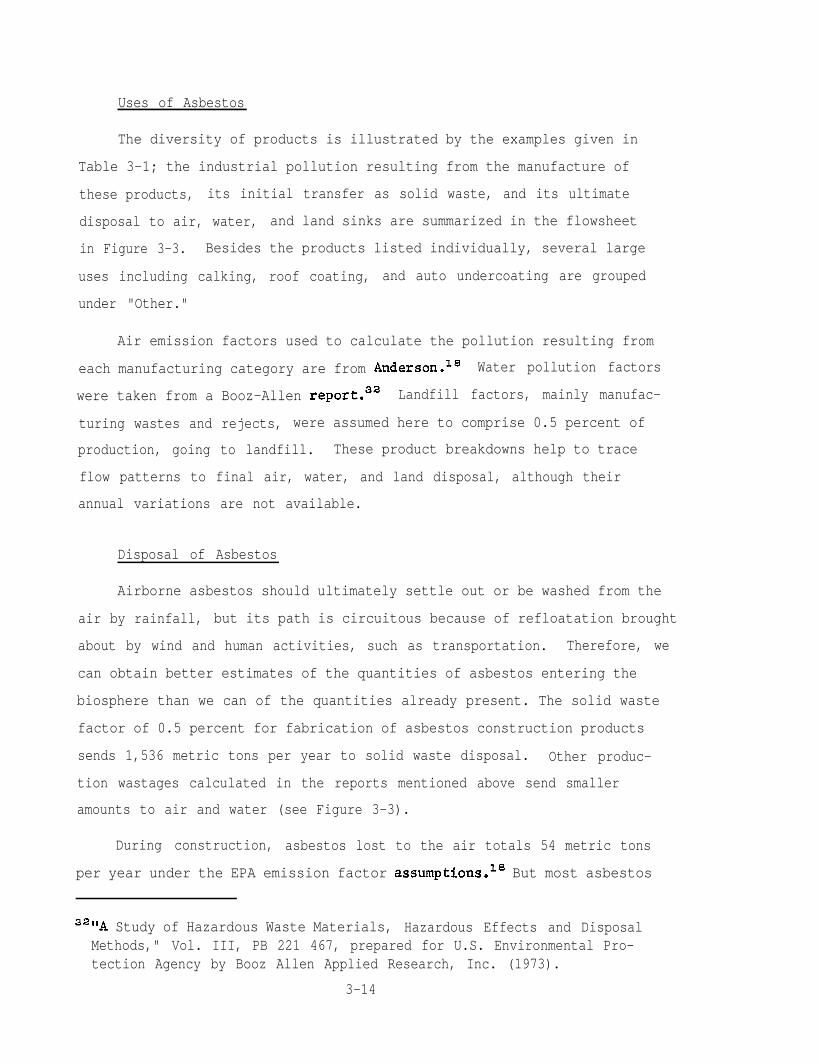
Uses of Asbestos
The diversity of products is illustrated by the examples given in
Table 3-1; the industrial pollution resulting from the manufacture of
these products, its initial transfer as solid waste, and its ultimate
disposal to air, water, and land sinks are summarized in the flowsheet
in Figure 3-3. Besides the products listed individually, several large
uses including calking, roof coating, and auto undercoating are grouped
under "Other."
Air emission factors used to calculate the pollution resulting from
each manufacturing category are from Anders0n.l' Water pollution factors
were taken from a Booz-Allen report.32 Landfill factors, mainly manufac-
turing wastes and rejects, were assumed here to comprise 0.5 percent of
production, going to landfill. These product breakdowns help to trace
flow patterns to final air, water, and land disposal, although their
annual variations are not available.
Disposal of Asbestos
Airborne asbestos should ultimately settle out or be washed from the
air by rainfall, but its path is circuitous because of refloatation brought
about by wind and human activities, such as transportation. Therefore, we
can obtain better estimates of the quantities of asbestos entering the
biosphere than we can of the quantities already present. The solid waste
factor of 0.5 percent for fabrication of asbestos construction products
sends 1,536 metric tons per year to solid waste disposal. Other produc-
tion wastages calculated in the reports mentioned above send smaller
amounts to air and water (see Figure 3-3).
During construction, asbestos lost to the air totals 54 metric tons
per year under the EPA emission factor assumptions." But most asbestos
32"A Study of Hazardous Waste Materials, Hazardous Effects and DisposalMethods," Vol. III, PB 221 467, prepared for U.S. Environmental Pro-tection Agency by Booz Allen Applied Research, Inc. (1973).
3-14
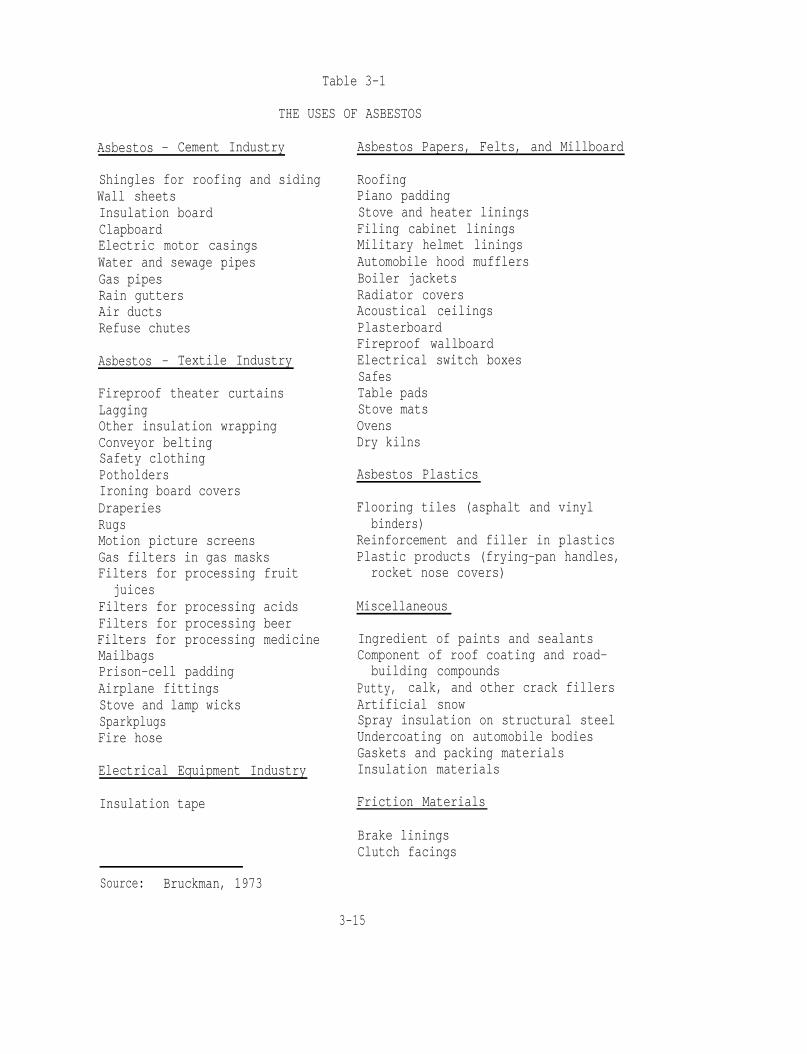
Table 3-1
THE USES OF ASBESTOS
Asbestos - Cement Industry
Shingles for roofing and sidingWall sheetsInsulation boardClapboardElectric motor casingsWater and sewage pipesGas pipesRain guttersAir ductsRefuse chutes
Asbestos - Textile Industry
Fireproof theater curtainsLaggingOther insulation wrappingConveyor beltingSafety clothingPotholdersIroning board coversDraperiesRugsMotion picture screensGas filters in gas masksFilters for processing fruit
juicesFilters for processing acidsFilters for processing beerFilters for processing medicineMailbagsPrison-cell paddingAirplane fittingsStove and lamp wicksSparkplugsFire hose
Electrical Equipment Industry
Insulation tape
Asbestos Papers, Felts, and Millboard
RoofingPiano paddingStove and heater liningsFiling cabinet liningsMilitary helmet liningsAutomobile hood mufflersBoiler jacketsRadiator coversAcoustical ceilingsPlasterboardFireproof wallboardElectrical switch boxesSafesTable padsStove matsOvensDry kilns
Asbestos Plastics
Flooring tiles (asphalt and vinylbinders)
Reinforcement and filler in plasticsPlastic products (frying-pan handles,rocket nose covers)
Miscellaneous
Ingredient of paints and sealantsComponent of roof coating and road-building compounds
Putty, calk, and other crack fillersArtificial snowSpray insulation on structural steelUndercoating on automobile bodiesGaskets and packing materialsInsulation materials
Friction Materials
Brake liningsClutch facings
Source: Bruckman, 1973
3-15
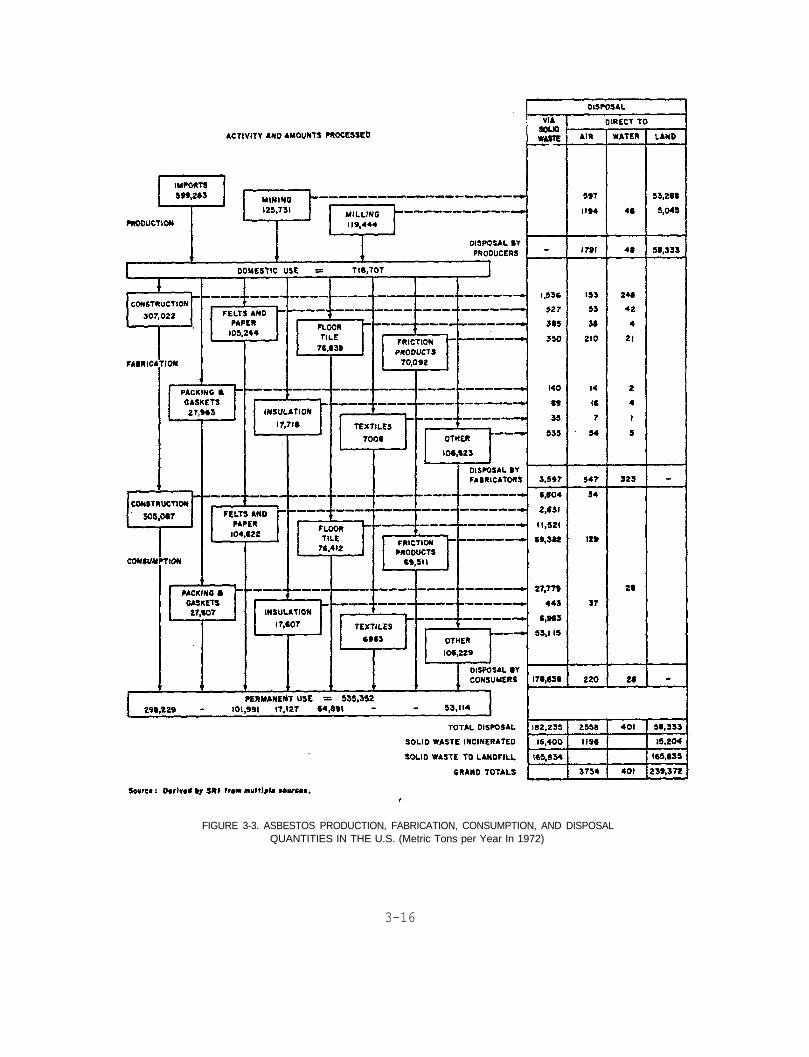
FIGURE 3-3. ASBESTOS PRODUCTION, FABRICATION, CONSUMPTION, AND DISPOSALQUANTITIES IN THE U.S. (Metric Tons per Year In 1972)
3-16
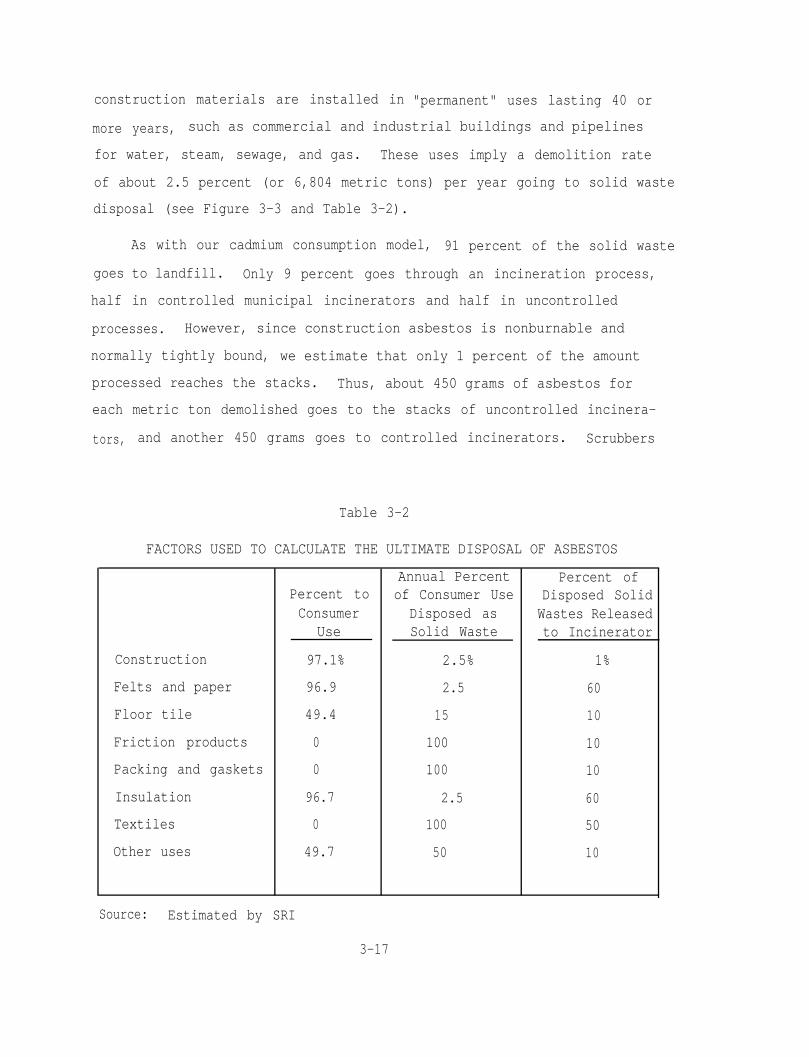
construction materials are installed in "permanent" uses lasting 40 or
more years, such as commercial and industrial buildings and pipelines
for water, steam, sewage, and gas. These uses imply a demolition rate
of about 2.5 percent (or 6,804 metric tons) per year going to solid waste
disposal (see Figure 3-3 and Table 3-2).
normally tightly bound, we estimate that only 1 percent of the amount
processed reaches the stacks. Thus, about 450 grams of asbestos for
each metric ton demolished goes to the stacks of uncontrolled incinera-
tors, and another 450 grams goes to controlled incinerators. Scrubbers
As with our cadmium consumption model, 91 percent of the solid waste
goes to landfill. Only 9 percent goes through an incineration process,
half in controlled municipal incinerators and half in uncontrolled
processes. However, since construction asbestos is nonburnable and
Table 3-2
FACTORS USED TO CALCULATE THE ULTIMATE DISPOSAL OF ASBESTOS
Annual Percent Percent ofPercent to of Consumer Use Disposed SolidConsumer Disposed as Wastes Released
Use Solid Waste to Incinerator
Construction 97.1% 2.5% 1%
Felts and paper 96.9 2.5 60
Floor tile 49.4 15 10
Friction products 0 100 10
Packing and gaskets 0 100 10
Insulation 96.7 2.5 60
Textiles 0 100 50
Other uses 49.7 50 10
Source: Estimated by SRI
3-17
remove 80 percent of even this small amount from most municipal incin-
erators, so the total construction asbestos escaping to the air from
both controlled and uncontrolled incinerators is only about 540 grams
for each metric ton demolished in old construction. A negligible amount
(in the order of 0.5 percent of the amount escaping to the air) is emitted
to cooling water for the ash.
Disposal estimation is similar for most other product lines, as
summarized in Table 3-2. However, several pollution factors fall out-
side the standard methodology. Emissions from brake linings ("Friction
Products" in Figure 3-3) were calculated using an EPA emission factor
given by Anderson).18 Likewise, EPA emission factors provide estimates
of air emissions in the insulation and construction product categories.
We estimate the erosion of pump packings into consumer products to be
0.1 percent per year, mainly through water media.
Asbestos air pollution from municipal incinerators amounts to hardly
5 percent of total emissions from all mining, milling, fabrication, and
disposal operations. The predicted emissions of 200 metric tons from
all municipal incinerators amount to an emission factor of 15 grams of
asbestos per metric ton of solid waste incinerated, based upon an annual
rate of solid waste incineration of 15 million metric tons per year. The
reasonableness of these figures is difficult to establish, since we could
find no reported values for the asbestos content of the stack gases from
municipal incinerators.
We do know that the 15 grams per metric ton asbestos emission esti-
mates are at least 1 to 2 orders of magnitude lower than total incinera-
tor particulate emissions. An asphalt roofing material in an experimental
multiple chamber incinerator without controls gave minimum total particu-
late emissions of 1,300 g/metric ton charged.33 If emission controls to
33R. L. Stenburg, et al., "Effects of High Volatile Fuel on IncineratorEffluents," J. Air Poll. Control, Vol. 11, No. 8, pp. 376-383 (August1961).
3-18
remove 80 percent of the particulates had been used, these experiments
would have emitted at least 260 grams of total particulates per metric
ton of solid waste.
Comparisons may also be made with asbestos air concentration levels
in other environments. If the model incinerator discharges 0.044 gram of
asbestos and 64 standard cubic meters of air per second, the asbestos con-
centration will be 742 micrograms per cubic meter. The proposed OSHA
standard for air in working spaces (2 fibers/cm3 greater than 5 microns)
is roughly equivalent to 24 ug/m3*, or one-thirtieth the estimated in-
cinerator stack concentration.
Visually observed industrial exposures as high as 18 fibers/cm3 are
reported in U.S. mines and mills.34 This converts to 216 pg/m3, a value
about one-third as high as the calculated incinerator air concentration.
All of these comparisons indicate that our estimates of incinerator emis-
sions are at least in the right order of magnitude.
34L. A Schutz, W. Bank, and G. Weems, "Airborne Asbestos Fiber Concen-trations in Asbestos Mines and Mills in the United States," Bureauof Mines Health and Safety Program, Technical Progress Report No. 72(June 1973).
*The OSHA concentration is easily derivable from Bruckman's35 observa-tion that for every fiber longer than 5 microns counted by the standardvisual "phase-contrast illumination" method, there are actually 50fibers countable by the electron microscope method, and from his conver-sion factor of 1,000 fibers observable by the electron microscope methodper nanogram of asbestos. Occupation exposures are based on an 8-hourday and 5-day week, which must be converted to equivalent continuousexposures. The OSHA standard in terms of a full-time air concentrationis thus:
36L. Bruckman and R. A. Rubino, "Rationale Behind a Proposed Asbestos AirQuality Standard," No. 74-222, presented at the 67th Annual Meeting ofthe Air Pollution Control Association, Denver, Colorado, 9-13 June 1974.
3-19
Overall, we may conclude from these estimates that incinerators
could be significant but far from predominant in causing asbestos air
pollution in the United States. Mining, milling, and manufacturing
facilities each produce much larger quantities. Furthermore, the
diverse and widespread presence of asbestos throughout our society, its
consumptive use in such applications as automobile brakes, and its per-
sistence in the biosphere makes it a much more pervasive pollutant than
cadmium. For these reasons, it seems less easy to control by means
short of restricted usage, and it offers only marginal gains for any
particular control strategy.
3-20
Chapter 4
ALTERNATIVE CONTROL COSTS AND EFFECTIVENESS
Introduction
This chapter is devoted to an examination of several alternative
means of reducing pollution in the processes described in Chapter 3, and
the costs of these alternatives.
Background
One of the conveniences of working with the contaminant flow system
defined in Chapter 2 and developed in Chapter 3 is that it helps to
specify various types of pollution control activities and relate them to
each other. Each type of control can be physically described since, as
Figure 2-1 implies, a control is any set of personnel, equipment, and
operational procedures that can act to restrict contaminant flows.
The control can be defined in various ways, depending upon how
broad a part of the contaminant flow system is being covered and how
the control operates. Useful operating distinctions can be made, for
example, among controls that are primarily active (such as limestone
scrubbers), primarily passive (tall stacks), and primarily restrictive
(regulations over the permissible uses of asbestos). Each of these
types of control methods requires a different mix of personnel, equip-
ment, and operating resources, and each will be most feasible in differ-
ent situations, so their indicated costs and effectiveness can vary
widely with the assumed operating conditions. Therefore, it is necessary
to be selective in assessing the appropriate range and application of
control alternatives.
4-1
Specifications
In this study, only a few alternative controls have been chosen to
illustrate how their choice interacts with the process of standard set-
ting. These alternatives have been chosen because they appear poten-
tially significant to the cadmium and asbestos pollution flows described
in Chapter 3, and because they are either now operational or well enough
developed so that sufficient data exist for cost and effectiveness
analyses. In accordance with the research objectives of the project,
they all could cause significant changes in land disposal volumes, al-
though in a larger sense they can better be evaluated in the multimedia
framework of Chapters 2 and 3 than in terms of land (or water or air)
alone.
Inasmuch as the above criteria are somewhat restrictive and the
objective of the procedure is to illustrate a new methodology rather than
to address any particular current policy issue, the alternatives have
not been chosen necessarily to represent the most topical, controversial,
feasible, or effective of possible controls. Neither have they been
chosen to encompass the conceptually similar but analytically much more
difficult problems of controls for multiple contaminants and of multiple
controls for individual contaminants. For these reasons, such important
control issues as stack scrubbers for coal electric plants and asbestos
emission controls for the construction industry are not examined in de-
tail. Instead, we illustrate our methodology with two somewhat simpler
cadmium control alternatives and two asbestos alternatives.
Cadmium Control Alternatives
The material balance analyses of the previous chapter provide a
good basis for developing potential cadmium control alternatives, since
they indicate the largest sources of contamination in air, water, and
land. For example, Figure 3-1 shows that the largest volume of cadmium
4-2
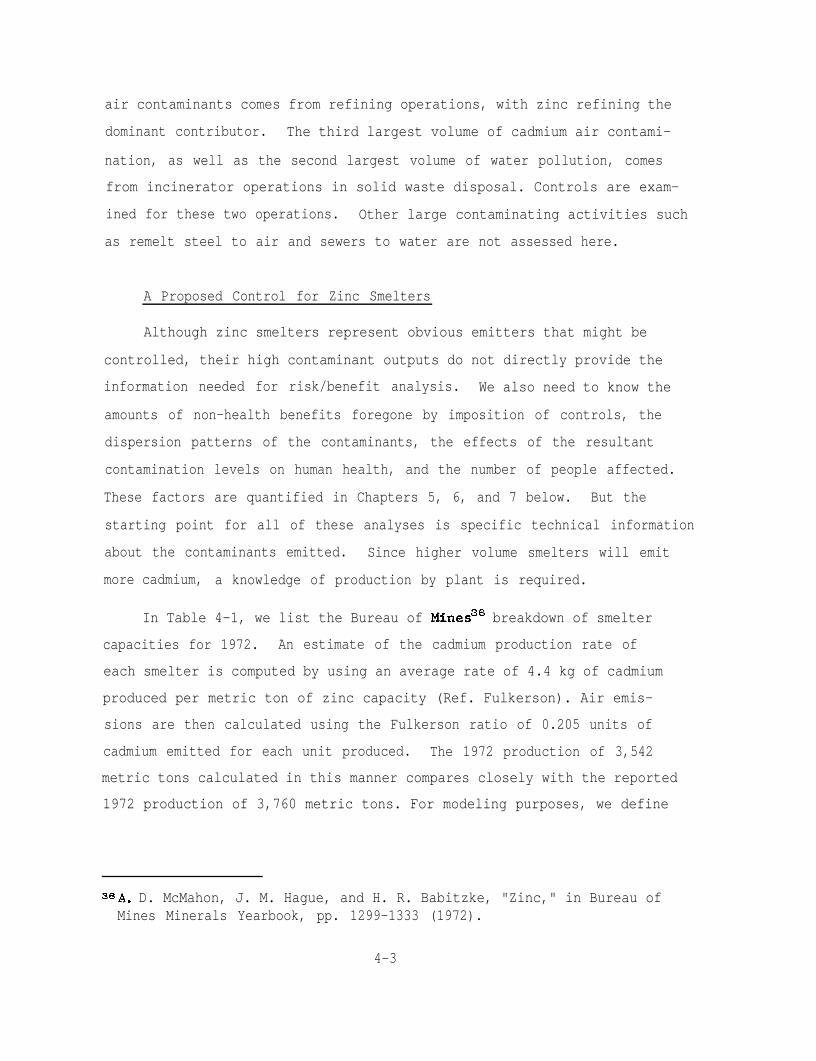
air contaminants comes from refining operations, with zinc refining the
dominant contributor. The third largest volume of cadmium air contami-
nation, as well as the second largest volume of water pollution, comes
from incinerator operations in solid waste disposal. Controls are exam-
ined for these two operations. Other large contaminating activities such
as remelt steel to air and sewers to water are not assessed here.
A Proposed Control for Zinc Smelters
Although zinc smelters represent obvious emitters that might be
controlled, their high contaminant outputs do not directly provide the
information needed for risk/benefit analysis. We also need to know the
amounts of non-health benefits foregone by imposition of controls, the
dispersion patterns of the contaminants, the effects of the resultant
contamination levels on human health, and the number of people affected.
These factors are quantified in Chapters 5, 6, and 7 below. But the
starting point for all of these analyses is specific technical information
about the contaminants emitted. Since higher volume smelters will emit
more cadmium, a knowledge of production by plant is required.
In Table 4-1, we list the Bureau of Mines36 breakdown of smelter
capacities for 1972. An estimate of the cadmium production rate of
each smelter is computed by using an average rate of 4.4 kg of cadmium
produced per metric ton of zinc capacity (Ref. Fulkerson). Air emis-
sions are then calculated using the Fulkerson ratio of 0.205 units of
cadmium emitted for each unit produced. The 1972 production of 3,542
metric tons calculated in this manner compares closely with the reported
1972 production of 3,760 metric tons. For modeling purposes, we define
36A. D. McMahon, J. M. Hague, and H. R. Babitzke, "Zinc," in Bureau ofMines Minerals Yearbook, pp. 1299-1333 (1972).
4-3
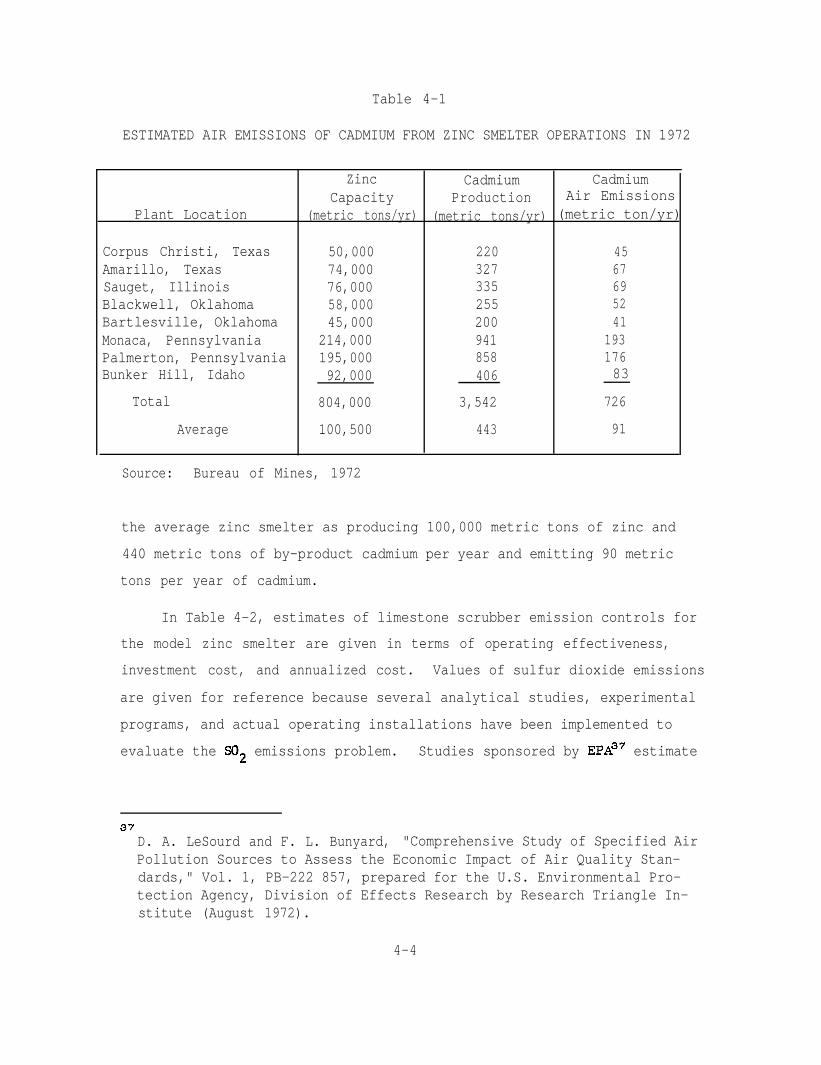
Table 4-1
ESTIMATED AIR EMISSIONS OF CADMIUM FROM ZINC SMELTER OPERATIONS IN 1972
Plant Location
ZincCapacity
(metric tons/yr)
CadmiumProduction
(metric tons/yr)
Corpus Christi, Texas 50,000 220Amarillo, Texas 74,000 327Sauget, Illinois 76,000 335Blackwell, Oklahoma 58,000 255Bartlesville, Oklahoma 45,000 200Monaca, Pennsylvania 214,000 941Palmerton, Pennsylvania 195,000 858Bunker Hill, Idaho 92,000 406
Total
Average
804,000 3,542
100,500 443
CadmiumAir Emissions
(metric ton/yr)
4567695241
19317683
726
91
Source: Bureau of Mines, 1972
the average zinc smelter as producing 100,000 metric tons of zinc and
440 metric tons of by-product cadmium per year and emitting 90 metric
tons per year of cadmium.
In Table 4-2, estimates of limestone scrubber emission controls for
the model zinc smelter are given in terms of operating effectiveness,
investment cost, and annualized cost. Values of sulfur dioxide emissions
are given for reference because several analytical studies, experimental
programs, and actual operating installations have been implemented to
evaluate the SO2 emissions problem. Studies sponsored by EPAa7 estimate
D. A. LeSourd and F. L. Bunyard, "Comprehensive Study of Specified AirPollution Sources to Assess the Economic Impact of Air Quality Stan-dards," Vol. 1, PB-222 857, prepared for the U.S. Environmental Pro-tection Agency, Division of Effects Research by Research Triangle In-stitute (August 1972).
4-4
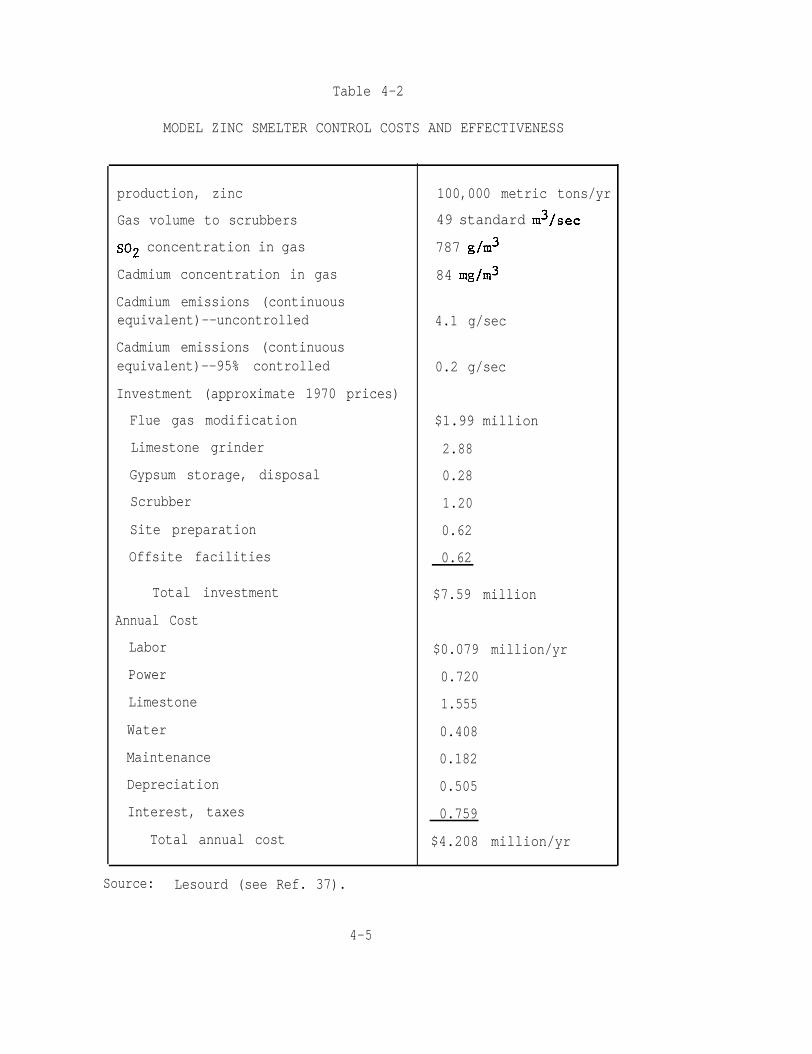
Table 4-2
MODEL ZINC SMELTER CONTROL COSTS AND EFFECTIVENESS
production, zinc
Gas volume to scrubbers
SO2 concentration in gas
Cadmium concentration in gas
Cadmium emissions (continuousequivalent)--uncontrolled
Cadmium emissions (continuousequivalent)--95% controlled
Investment (approximate 1970 prices)
Flue gas modification
Limestone grinder
Gypsum storage, disposal
Scrubber
Site preparation
Offsite facilities
Total investment
Annual Cost
Labor
Power
Limestone
Water
Maintenance
Depreciation
Interest, taxes
Total annual cost
100,000 metric tons/yr
49 standard m3/sec
787 g/m3
84 mg/m3
4.1 g/sec
0.2 g/sec
$1.99 million
2.88
0.28
1.20
0.62
0.62
$7.59 million
$0.079 million/yr
0.720
1.555
0.408
0.182
0.505
0.759
$4.208 million/yr
Source: Lesourd (see Ref. 37).
4-5
that limestone scrubbers can reduce SO2 and particulate emissions by
about 95 percent. We adapt this estimate for cadmium particulate emissions,
The annualized cost for each model smelter is $4.2 million, so the
cost for eight "average" model zinc smelter controls, approximately
$33.6 million, can be taken as the total annual national cost. In addi-
tion, one should estimate the governmental costs for direct monitoring
or at least occasional verification of plant self-monitoring activities,
enforcement of compliance, and administrative overhead. These government
enforcement and administrative costs can be significant, but we could
find no prior control analysis in which they were explicitly added as a
cost consideration. We were therefore forced to resort in this study to
a rough estimate based on generalized expenditure data. Our estimate
uses an average comparison of essentially all operational costs for pol-
lution control in the country with government administrative and over-
head budgets for pollution control.
Outlays for pollution control operational costs in the United States
amounted to $10.4 billion in 1970, excluding monitoring and enforcement,3*
Only about $0.3 billion of these costs were federal, leaving $10.1 bil-
lion nonfederal ($4.6 billion state and local, and $5.5 billion private).
Expansion of operational control costs was projected to expand to 1980
at about 10 percent per year in constant dollars, so that total 1972
operational pollution control costs would be $12 billion.
Enforcement and administrative costs by the federal government
totaled $1 billion in 1972--about half of the $1.975 billion reported
for all federal pollution control and abatement activities (see Reference
38, Table 5-1). This $1 billion went for administrative support of state
3*Environmental Quality, Third Annual Report of the Council on Environ-mental Quality, GPO, Washington, D.C. Table 1 (August 1972).
4-6
and local pollution control organizations, for research and development,
and for federal pollution control activities. (The other half went
mainly for grants to municipal sewage treatment plants and for pollution
control operations at federal facilities.) Add a modest amount of unre-
imbursed enforcement costs by state and local governments to the $1 bil-
lion federal total, and the total could easily reach 10 percent of the
$12 billion direct operational expenditures in 1972. This estimate of
10 percent excludes such overhead expenses as the legal and administra-
tive costs of compliance and reporting that are borne by regulated
facilities, and the court costs of any litigation. Nevertheless, a 10-
percent add-on to operational costs for enforcement does seem consistent
and enforcement of zinc smelters controls will be 110 percent of $33.6
million, or $37.0 million.
with the level of administrative burden that might be expected in govern-
ment regulatory programs, and will be accepted here in the absence of
more precise data. Thus, the annualized national costs for operation
Finally, we must estimate the variability of all these estimates.
The two-sigma confidence limits (encompassing 96 percent of the antici-
pated outcomes) are approximated on the basis of developmental prospects
and rather limited operational experience. They can be represented by
a single factor with which to multiply or divide the mean estimate. Use
of this type of confidence limits permits us to accommodate wide uncer-
tainties and also to combine different components to derive an overall
uncertainty. For the effectiveness estimate, the factor we use is 1.05.
When multiplied by our mean estimate of 0.95, it yields an upper confi-
dence limit of 0.9975, and when divided into the mean, yields a lower
confidence limit of 0.905. For statistical calculations, this is ex-
pressed as a lognormal variable with a mean of log 0.95 and a standard
deviation of ± log 1.025.
4-7
Cost estimates are also expressed with confidence limits. We ignore
uncertainties that may arise strictly from cost inflation because these
costs can be approximately adjusted by applying an appropriate inflation
index or by reestimating. Two-sigma limits due to inherent uncertainties
in cost estimating procedures we evaluate as ± a factor of 1.2 (i.e., a
range from 83 percent to 120 percent of the estimated costs). The log-
normal expression for this variable is: mean = log 1 = 0, sigma =
log 0.1. Variability in enforcement costs can be neglected, since these
are an order of magnitude smaller than the operational costs and very un-
likely to be important.
A Proposed Control for Solid Waste Incinerators
A national incinerator inventory conducted by the Office of Solid
Waste Management showed that only 193 municipal-scale incinerators were
operating in 1972, compared to 251 in 1969. Figure 4-1 gives in ascend-
ing order the average incinerator size for each of the 22 states covered
in that survey. The overall national average size is 0.096 million met-
ric tons per year capacity, near a discontinuity in the curve.
Locations of existing municipal incinerators are also significant
because most are in the heavily populated northeastern quarter. In fact,
153 of the operating incinerators are located in that area, and EPA has
disclosed that 90 are in a narrow Atlantic seaboard area known as the
Incinerator Belt. That belt contains 13 percent of the nation's popula-
tion, as well as almost one-half of the total operating incinerators,
but only 0.06 percent (4,600 'km2) of the land area (see Achinger, Refer-
ence 17).
The material balance of cadmium disposed to solid wastes, summarized
earlier in Figure 3-1, shows that 31 metric tons of cadmium air emis-
sions come from solid waste incinerators. Only a fraction of this total
comes from municipal plants. Based on an EPA emissions factor of 0.4 gram
4-8
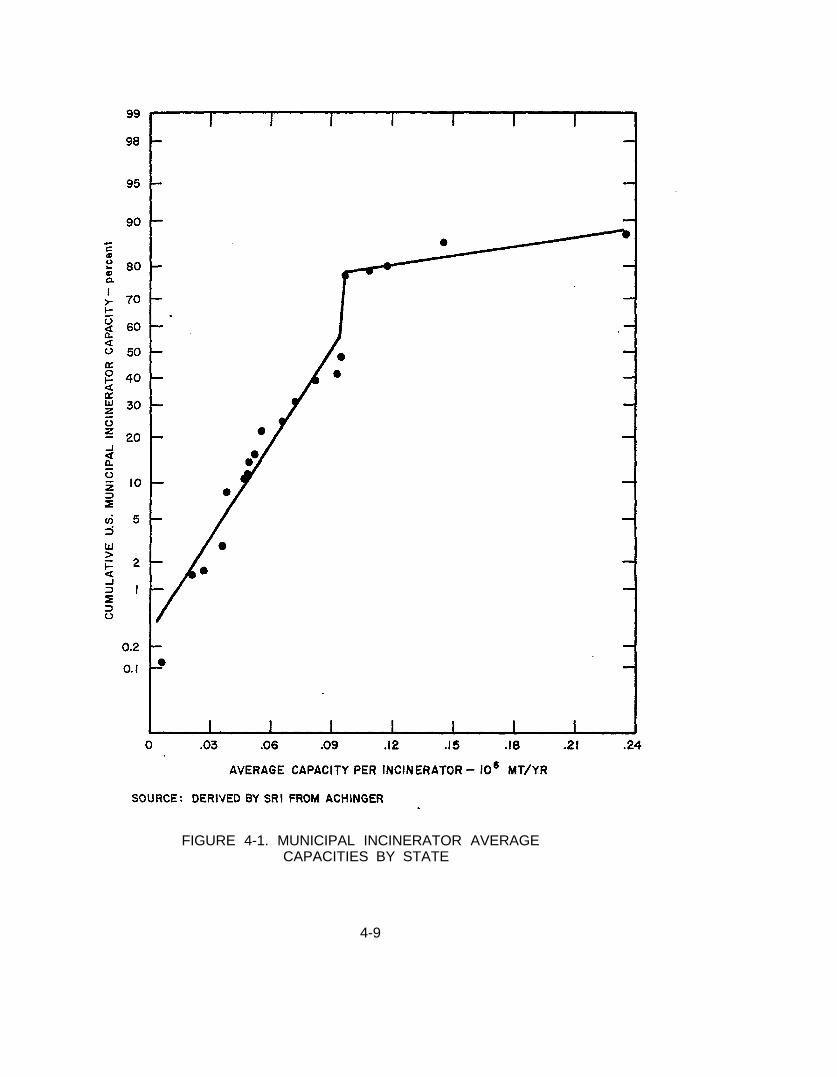
FIGURE 4-1. MUNICIPAL INCINERATOR AVERAGECAPACITIES BY STATE
4-9
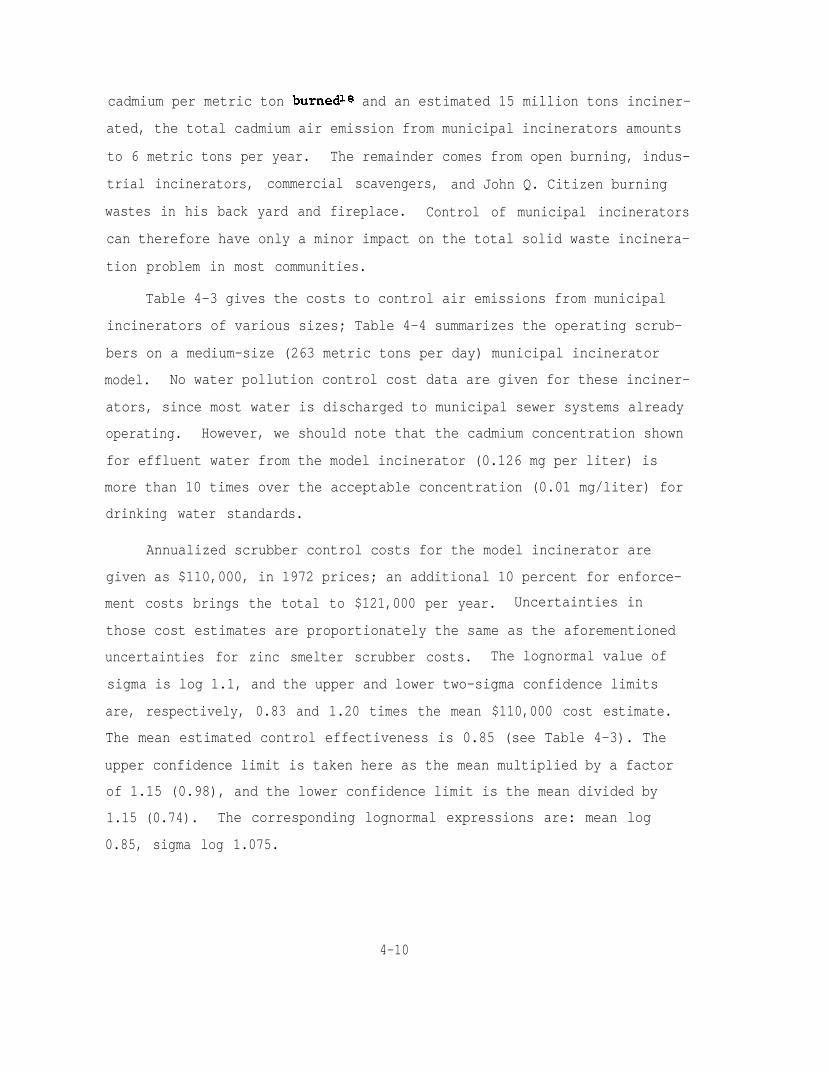
tion problem in most communities.
cadmium per metric ton burned18 and an estimated 15 million tons inciner-
ated, the total cadmium air emission from municipal incinerators amounts
to 6 metric tons per year. The remainder comes from open burning, indus-
trial incinerators, commercial scavengers, and John Q. Citizen burning
wastes in his back yard and fireplace. Control of municipal incinerators
can therefore have only a minor impact on the total solid waste incinera-
Table 4-3 gives the costs to control air emissions from municipal
incinerators of various sizes; Table 4-4 summarizes the operating scrub-
bers on a medium-size (263 metric tons per day) municipal incinerator
model. No water pollution control cost data are given for these inciner-
ators, since most water is discharged to municipal sewer systems already
operating. However, we should note that the cadmium concentration shown
for effluent water from the model incinerator (0.126 mg per liter) is
more than 10 times over the acceptable concentration (0.01 mg/liter) for
drinking water standards.
Annualized scrubber control costs for the model incinerator are
given as $110,000, in 1972 prices; an additional 10 percent for enforce-
ment costs brings the total to $121,000 per year. Uncertainties in
those cost estimates are proportionately the same as the aforementioned
uncertainties for zinc smelter scrubber costs. The lognormal value of
sigma is log 1.1, and the upper and lower two-sigma confidence limits
are, respectively, 0.83 and 1.20 times the mean $110,000 cost estimate.
The mean estimated control effectiveness is 0.85 (see Table 4-3). The
upper confidence limit is taken here as the mean multiplied by a factor
of 1.15 (0.98), and the lower confidence limit is the mean divided by
1.15 (0.74). The corresponding lognormal expressions are: mean log
0.85, sigma log 1.075.
4-10
Table 4-3
MUNICIPAL INCINERATOR CONTROL COSTS FOR EFFLUENT GASES
ParticulateSize Flue Gas Collection Installed Annualized
(metric Volume Efficiency Cost Costtons/day) (m3/sec) (%) ($1000) ($1000)
91 0.022 85% 52 39181 0.044 85 100 77263 0.064 85 145 110454 0.096 90 250 172635 0.116 95 350 213907 0.165 95 480 302
Source: Research Triangle Institute
Table 4-4
MODEL MUNICIPAL INCINERATOR
Operational capacity 263 metric tons/day
Particulate emissions 2.01 metric tons/day
Gas volume to scrubbers 64 m3/sec
Water volume to sewer 2.1 x lo6 liters/day
Ash weight to landfill 105 metric tons/day
Cadmium concentration in effluent gas 18 pg/m3
Cadmium concentration in water effluent 126 pg/liter
Cadmium concentration in ash 11 g/metric ton ash
Cadmium emissions (continuousequivalent) --uncontrolled 11 X low4 g/sec
Cadmium emissions (continuousequivalent)--85% controlled 1.7 X 10⁻⁴ g/sec
Source: Research Triangle Institute
4-11
Asbestos Control Alternatives
Lack of knowledge of the causes of asbestos pollution in the urban
environment makes it difficult to suggest control strategies. Overall,
the asbestos concentrations found in industrialized urban centers such
as Philadelphia do not appear, from the dose/damage relationships devel-
oped in Chapter 7, to be highly deleterious to human health. However,
emissions from point sources, such as factory ventilators, do present a
danger to those living in the vicinity. Other more dispersed sources,
such as automobile traffic, also present a possible hazard to the large
numbers of people who are exposed to them. These two types of emissions
and their associated costs are assessed here.
Table 4-5 shows the major industrial sources of asbestos emissions,
as derived from several references. It also shows figures on numbers of
plant facilities and values of annual product for each industry; these
data are used to help estimate the relative asbestos emissions of each
industry. Also shown is the density of the average surrounding city
populations for each industry; the density data can be used in combina-
tion with the diffusion model in Chapter 6 to derive estimates of the
populations at risk.
Differences in emissions data reported in the literature proved
unusually difficult to reconcile. To aid in establishing reliability,
we compared emissions data from our report (which was derived principally
from Anderson's work for EPAls) with data from RTIss and from ADLaO.
Total annual emissions estimates for the five comparable product groups
39R. E. Paddock et al., "Comprehensive Study off Specified Air PollutionSources to Assess the Economic Impact of Air Quality Standards," Vol.II, "Asbestos, Beryllium, Mercury," PB-222 858, prepared for U.S. En-vironmental Protection Agency by Research Triangle Institute (August1972).
40"Impact of Proposed OSHA Standard for Asbestos," First Report to U.S.Department of Labor, Arthur D. Little, Inc., No. C-74413 (28 April1972), Appendices (5 July 1972).
4-12
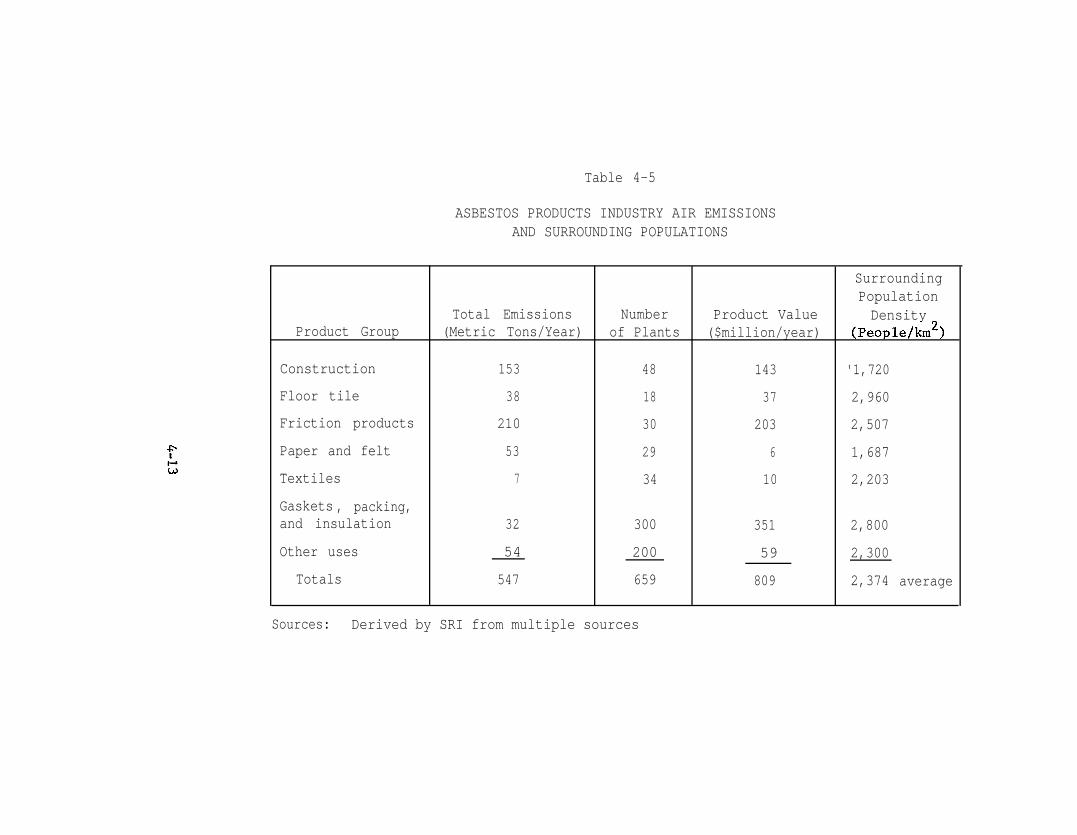
4-13
Table 4-5
ASBESTOS PRODUCTS INDUSTRY AIR EMISSIONSAND SURROUNDING POPULATIONS
Product Group
Construction
Floor tile
Friction products
Paper and felt
Textiles
Gaskets , packing,and insulation
Other uses
Totals
Total Emissions(Metric Tons/Year)
Numberof Plants
153 48
38 18
210 30
53 29
7 34
32 300
54 200
547 659
Sources: Derived by SRI from multiple sources
SurroundingPopulation
Product Value Density($million/year) (People/km2)
143 '1,720
37 2,960
203 2,507
6 1,687
10 2,203
351 2,800
59 2,300
809 2,374 average
amounted to 461.3 metric tons in our report, 595.1 in the RTI report, and
349.2 in the ADL report. We have not resolved the bases of these dis-
agreements but accept the Anderson data partly because its total is in-
termediate between the totals of the other two sources. (The calculated
lognormal mean of the three estimates is 458.)
The multiplying factor corresponding to the lognormal value of sigma
for the three estimates is 1.31, so we estimate that the upper two-sigma
confidence limit for our estimate corresponds to 461.3 x 1.31 x 2 = 746,
and the lower confidence limit corresponds to 461.3 + (1.31. X 2) = 285.
Fabric filters have been found to be the most effective method to
control asbestos emissions from manufacturing processes and are now in
proven use in some segments of the asbestos industry, as reported by
Paddock. This technique has only Limited application to mining processes,
which are not considered here. According to EPA41, filters can limit
asbestos fiber concentrations (counting fibers longer than 5 microns) to
fewer than 0.5/cm3 of exhaust air (equivalent to weight concentrations
of less than 25,000 ng/m3). This standard is at the lower limit of de-
tection by the optical microscope analytical method employed for asbestos
measurements. Therefore, the currently proposed limit of 2 fibers/cm3
(four times higher) appears technically feasible for effluent air streams
from asbestos factories.
sizes. Therefore, we assume that variations of control effectiveness
with size are negligible, but that variations from other causes amount
The effectiveness of control of asbestos milling emissions has been
estimated as 96 percent3' on the basis of a confidential on-site plant
survey. Control levels are proportionately the same for different plant
41"Control Techniques for Asbestos Air Pollutants," U.S. EnvironmentalProtection Agency, Office of Air and Water Programs, AP-117 (February1973).
4-14
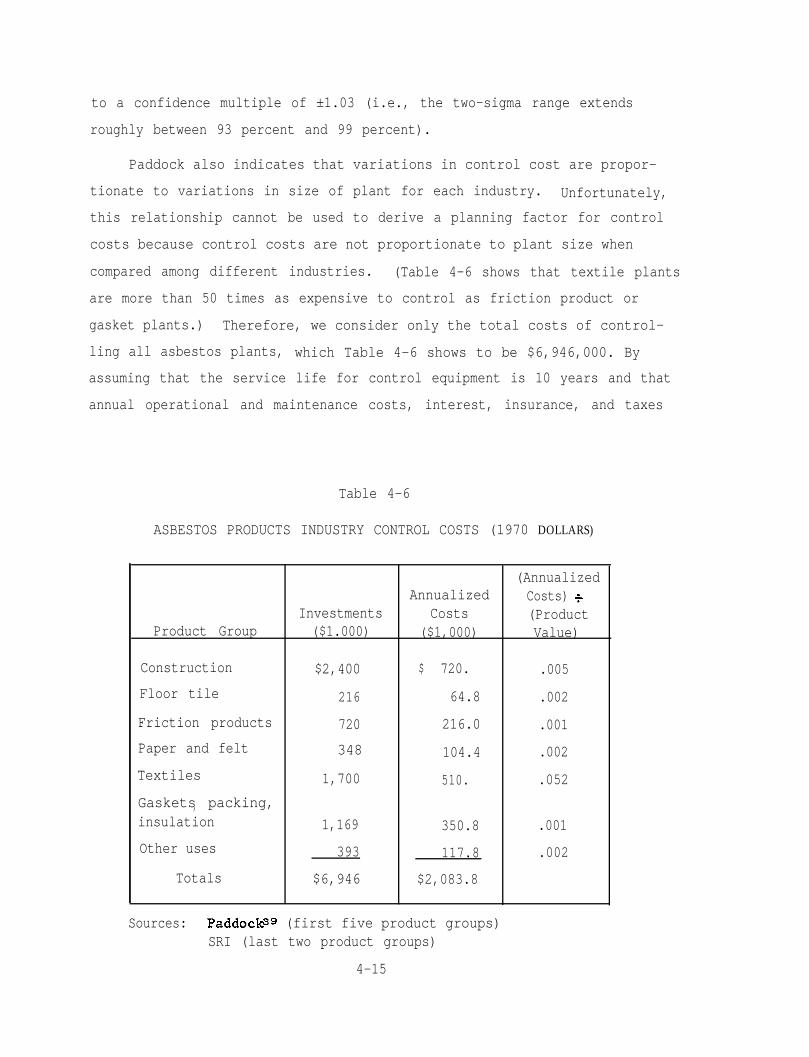
to a confidence multiple of ±1.03 (i.e., the two-sigma range extends
roughly between 93 percent and 99 percent).
Paddock also indicates that variations in control cost are propor-
tionate to variations in size of plant for each industry. Unfortunately,
this relationship cannot be used to derive a planning factor for control
costs because control costs are not proportionate to plant size when
compared among different industries. (Table 4-6 shows that textile plants
are more than 50 times as expensive to control as friction product or
gasket plants.) Therefore, we consider only the total costs of control-
ling all asbestos plants, which Table 4-6 shows to be $6,946,000. By
assuming that the service life for control equipment is 10 years and that
annual operational and maintenance costs, interest, insurance, and taxes
Table 4-6
ASBESTOS PRODUCTS INDUSTRY CONTROL COSTS (1970 DOLLARS)
(AnnualizedAnnualized Costs) f
Investments Costs (ProductProduct Group ($1.000) ($1,000) Value)
Construction $2,400 $ 720. .005
Floor tile 216 64.8 .002
Friction products 720 216.0 .001
Paper and felt 348 104.4 .002
Textiles 1,700 510. .052
Gaskets packing,,insulation 1,169 350.8 .001
Other uses 393 117.8 .002
Totals $6,946 $2,083.8
Sources: Paddocks (first five product groups)SRI (last two product groups)
4-15
together amounted to 20 percent of the original investment, we convert
this to a national annualized cost of $2,084,000 per year in 1970 dollars.
Monitoring of plant asbestos concentrations represents a significant
additional cost. EPA has estimated that the cost of determining the
asbestos content of sprayable insulation material by electron microscope
is in the range of $300 per sample.42 Air sampling and subsequent
analysis is even more expensive. Based upon an instrument cost of
$100,000 and a life of 10 years with 2 or 3 man-days per analysis* the
cost of analyses for air sampling will probably be in the range of $700
per sample. The national cost of surveying 659 plants once a year at
this rate would total about $460,000 per year. (To sample once a month,
the annual cost would be $5.5 million.)
The national control and monitoring costs (one air sampling per
year), then, would add to slightly more than $2,600,000. A 10-percent
supplemental cost for enforcement runs the total national bill to about
$2.9 million per year. We assume for purposes of the study that these
entire costs should be included in the analysis.
To analyze variability, investment cost figures should be broken
down into several segments. The purchase price of fabric filters may
vary by ±20 percent.41 Installation costs have a mean of 180 percent
of purchase cost, with a low of 150 percent and a high of 200 percent;
so the variability in terms of installed cost is lower than ±20 per-
cent. These estimates do not take into account differences in the cost
of capital among firms (smaller firms often have higher charges), which
could add several percentage points to the variability. Similarly, the
42"Background Information on the Development of National Emission Stan-dards for Hazardous Air Pollutants: Asbestos, Beryllium, and Mercury,"APTD-1503, Office of Air and Water Programs, U.S. Environmental Pro-tection Agency (March 1973).
*Personal communication, Dale Coulson, SRI.4-16
estimates do not consider the effects of inflation since 1973, or of
the potentially very large variability in monitoring costs. However,
we assume in our analysis that overall confidence limits for asbestos
controls, monitoring, and enforcement are obtained from multiplying or
dividing by a factor of 1.2.
Automobile Asbestos Emission Controls
A control alternative frequently proposed for asbestos is to sub-
stitute an alternative material for brake linings. Although this sug-
gestion has been around for a long time, no satisfactory substitute has
yet been founde2 As a limiting case, we can ignore feasibility and con-
sider the economic and health implications if such a substitute were
discovered.
To calculate the potential reductions by switching from asbestos
brake linings, we assume that the present urban air concentration of
asbestos is caused by brake linings, asbestos spray insulation, and
asbestos factories, as recapitulated below from Figure 3-3.
Brakes
Asbestos
129 metric tons/yr
Brake product factories 210
Asbestos
Other factories 337
Spray asbestos 37
703 metric tons/yr
If asbestos were eliminated as a brake lining, total emissions would be
reduced by 339 metric tons per year. This hypothetical savings is cal-
culated assuming the same two-sigma uncertainty factor, 1.31, as for
asbestos industry emissions.
4-17
We assume that new brake materials would cost 50 percent more than
asbestos brakes, that they will give equivalent wear, and that no new
tooling costs will be required. The auto manufacturer's cost for asbes-
tos brake pads is in the range of $2.75 per set of four, so a complete
set of brake linings containing new technology materials would cost
$2.75 X 1.5 = $4.13 per vehicle. At sales of 10 million vehicles per
year, the differential cost of new material brake linings would be
10 X lo6 X ($4.13 - $2.75) = $13.8 X 10⁶/yr .
Our estimate for replacement linings is based upon a total U.S. mileage
of 1 X 1o12 vehicle miles per year with linings changed every 27,500
miles, so replacement linings would cost
36.4 X lo6 sets/yr X $1.38/set = $50 X 106/yr .
The total direct cost would thus be $63.8 million per year. For an
assumed 3 pounds of asbestos per brake set, the total loss in new and
replacement asbestos brake linings would be 46.4 x 10⁶
sets per year
X 3 pounds per set, or 140 x lo6 pounds per year. At $211 per short
ton, the lost market would be valued at $14.8 million per year. Ten per-
cent for government enforcement costs adds $1.5 million. A 1.2 cost un-
certainty factor (the same as for industry controls) would apply to both
the lost asbestos and new substitute markets. Uncertainties about the
realism of the hypothetical brake substitute are not considered.
The immediate effects of this substitution are summarized in Chapter
5. Note, however, that the benefits are long deferred behind the cost.
No reasonable substitute material seems feasible at present. If a re-
placement lining material were available now, it would require in the
range of three years to switch from marketing asbestos linings to
4-18
marketing the replacement lining. The health implications of this re-
duction are discussed in Chapter 7.
standard costing techniques, from the more speculative economic costs,
which are estimated on the basis of more ambiguous and theoretically
controversial economic theory.
Cost-benefit specialists will detect a slight difference between
this formulation and the conventional cost-benefit approach. We split
costs into two parts: the direct control costs that are covered in the
present chapter and the indirect costs (or disutilities) that are in-
cluded in Chapter 5. We have divided them to clearly separate the iden-
tifiable engineering and administrative costs, which are calculated by
Both types of costs are summarized in Chapter 5, but the summary is
also different from a standard cost-benefit formulation. It includes
positive benefits as well as costs (e.g., increased employment in the
environmental controls industry) in order to compile all non-health
economic effects in the cost dimension. Since the "benefits" dimension
is reserved for only those benefits that are related to health, we never
attempt to calculate a "cost-benefit ratio" in the conventional framework.
Our approach is to a risk-benefit framework is described in Chapter 8.
4-19
Chapter 5
NET ECONOMIC BENEFITS
Introduction
It is the objective of this chapter to relate technical, cost,
and production data to factors measuring economic benefits. The con-
cern here is with the economic benefits and costs exclusive of effects
on health. Nonhealth costs and benefits can then be compared with the
health benefits achievable by the technically feasible controls.
In general, hazard reduction is achieved either by the introduc-
tion of specific technical controls such as air scrubbers, water
cleaners, or other changes in procedures for production or use of the
product or by partial or total elimination of the product. Insofar as
the cost of controls affect the situation, economic factors to be con-
sidered include:
Increased costs and price of the product.
Reduction in producer revenues and profits.
Possible net reduction in employment.
Reduction of consumer benefits from the use of the prod-uct following either from its total elimination or fromthe reduction in consumption that follows control-induced price rises.
Changes in net imports and the balance of trade.
Possible adverse effects on the economies of particularregions especially affected by such changes.
This chapter, in summary, is concerned with anticipating the effects
of proposed controls on these various economic variables.
5-1
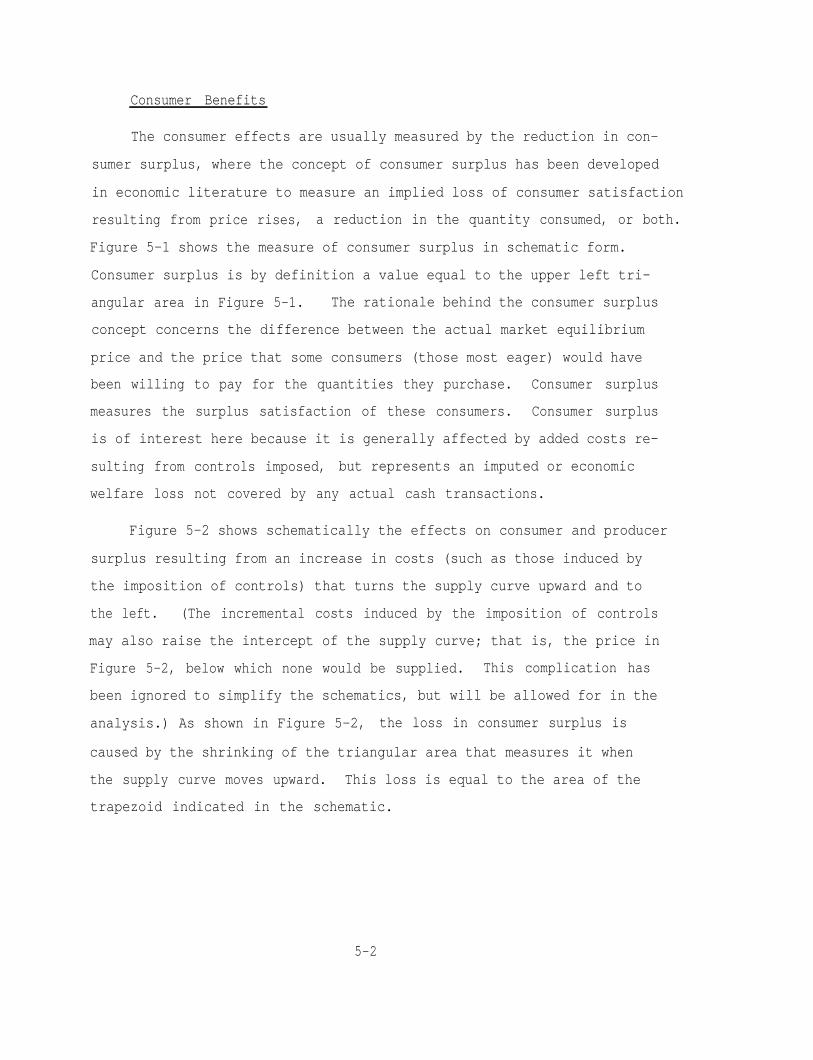
Consumer Benefits
The consumer effects are usually measured by the reduction in con-
sumer surplus, where the concept of consumer surplus has been developed
in economic literature to measure an implied loss of consumer satisfaction
resulting from price rises, a reduction in the quantity consumed, or both.
Figure 5-1 shows the measure of consumer surplus in schematic form.
Consumer surplus is by definition a value equal to the upper left tri-
angular area in Figure 5-1. The rationale behind the consumer surplus
concept concerns the difference between the actual market equilibrium
price and the price that some consumers (those most eager) would have
been willing to pay for the quantities they purchase. Consumer surplus
measures the surplus satisfaction of these consumers. Consumer surplus
is of interest here because it is generally affected by added costs re-
sulting from controls imposed, but represents an imputed or economic
welfare loss not covered by any actual cash transactions.
Figure 5-2 shows schematically the effects on consumer and producer
surplus resulting from an increase in costs (such as those induced by
the imposition of controls) that turns the supply curve upward and to
the left. (The incremental costs induced by the imposition of controls
may also raise the intercept of the supply curve; that is, the price in
Figure 5-2, below which none would be supplied. This complication has
been ignored to simplify the schematics, but will be allowed for in the
analysis.) As shown in Figure 5-2, the loss in consumer surplus is
caused by the shrinking of the triangular area that measures it when
the supply curve moves upward. This loss is equal to the area of the
trapezoid indicated in the schematic.
5-2
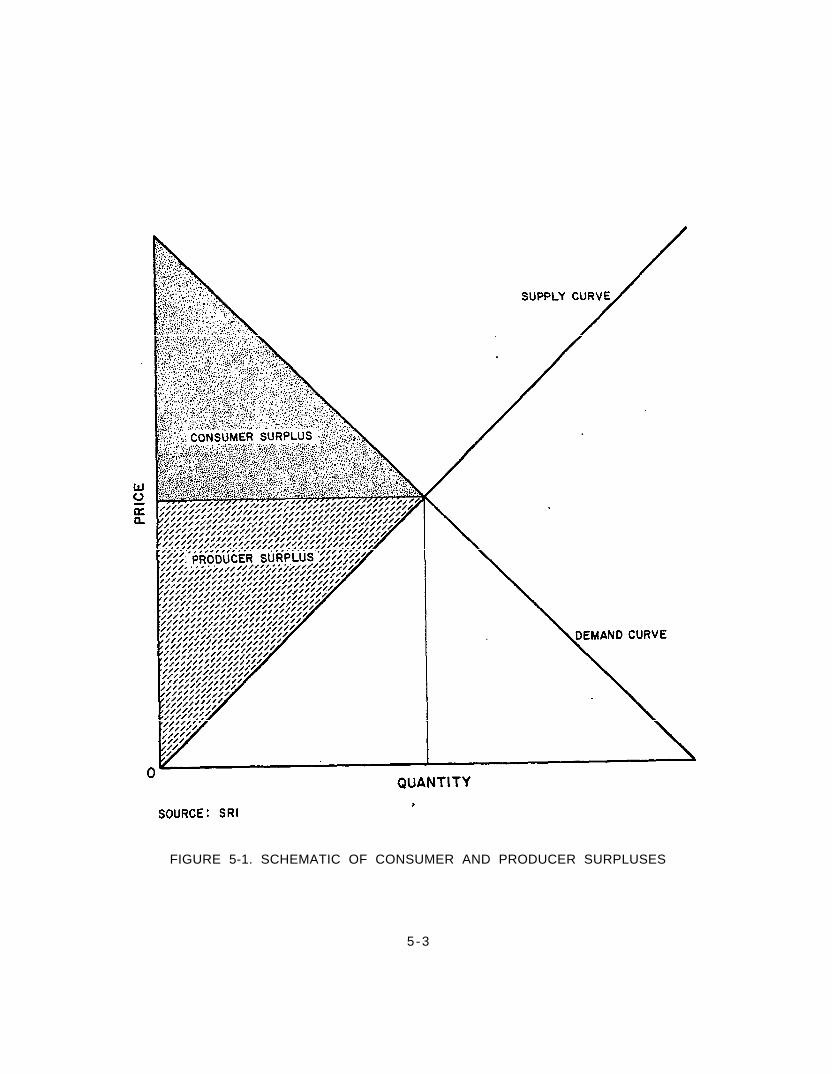
FIGURE 5-1. SCHEMATIC OF CONSUMER AND PRODUCER SURPLUSES
5-3
Trade Benefits
The balance of trade effects of imposing hazard reduction controls
on domestic production depend on: (1) the vigor of foreign competition
for sales of the product both domestically and overseas; (2) whether
similar controls are instituted in countries supplying the competitive
product; and (3) on any changes in tariff protection accorded domestic
producers. For this study, it will be assumed that no added U.S. tariff
is introduced and that foreign countries do not cooperate by imposing
similar environmental control regulations. This results in worst-case
estimates of adverse foreign trade effects. (Best-case estimates would
reflect complete adjustments by tariff policies and competitive forces
so as to show no change in balance of trade.)
Cadmium Examples
Cadmium Emissions and Zinc Smelter Controls
As indicated in Chapter 4, an important source of cadmium pollution
arises from stack emissions from smelter processes involved in the ex-
traction and recovery of zinc, lead, and copper from their ores. The
principal sources of cadmium are by-products of such operations. A
technically feasible method of control is to apply additional limestone
scrubbers to clean up stack effluents. The direct effects of imposing
such controls would be increases in the cost of refining zinc, lead, and
copper less offsetting gains from increased amounts of cadmium recovered.
Demand and supply curves for zinc, lead, and copper cannot be well
established. In the case of zinc (which involves the greatest amount
of associated cadmium), gradual depletion of the high grade veins of
zinc ores has led to a reduction in the number of domestic producers, a
decrease in domestic output, and a consequent increase in imports. Price
controls on domestic zinc were lifted in December 1973 and were followed
by a substantial rise in zinc prices from about 20 cents per pound to
almost 40 cents per pound. In spite of this increase, domestic suppliers5-6
have continued to decrease and have been accompanied (after a lag) by a
drop in domestic consumption. Foreign prices, formerly highly competitive,
have risen even higher than domestic prices. The decline in consumption
has occurred only recently, but can be presumed to be responsive to the
price increase rather than a cause of it. The decrease in domestic pro-
duction, however, cannot be attributed solely to foreign competition or
to increasing costs since costs do not seem to have risen as fast as price.
General inflation and offsetting releases of zinc by GSA from the U.S. Stra-
tegic Stock Pile may have been significant modifying influences. The de-
crease in domestic production appears to be related more to the withdrawal
of high cost producers from the domestic market and to a scarcity of
profitable ores to be worked. The period of uncontrolled prices, however,
is too short for persuasive econometric analysis.
Production Effects of Zinc Smelter Controls
Past studies of the short-run elasticity of the demand for zinc have
shown it to be highly inelastic.43,44,46,46 However the long-run demand,
which is virtually impossible to derive from historical data, cannot be
very inelastic in view of possible substitution of other materials for
zinc in various uses and in view of past import experience. Indirect
43Y. S. Hwang, "A Commodity Consumption and Export Forecasting TechniqueIllustrated by Zinc," Mineral Resources Branch, Dept. of Energy Minesand Resources, Mineral Bulletin MR 119, Ottawa, Canada (1971).
44R. G. Driver, "Econometrics and Zinc Consumption," in "Lead and Zinc,Free World Supply and Demand," 1968-71 Lead Industries Association(April 1968).
46F. E. Banks, "An Econometric Note on the Demand for Refined Zinc,"Zeitochrift fiir National ij konomic, 31, pp. 443-452, Springer-Verlag (1971).
4""Lead and Zinc, Factors Affecting Consumption," International Leadand Zinc Study Group, United Nations, New York.
5-7
while to discuss a schematic representation of these effects from the
point of view of economic theory.
arguments, based on income relationships suggest that the long-run demand
should have an elasticity in the range between one and two. Moreover,
long-run supply should be more responsive to recent price increases than
observed declines in supply would indicate. In the absence of firm
empirical evidence (and some time must lapse before an adequate history
of relatively free price movements can be accumulated) the long-run effects
of controls on consumer surplus, producer surplus, producer profits, em-
ployment, and foreign trade can only be estimated with great uncertainty.
Before attempting to discuss some plausible estimates, it may be worth-
Figure 5-3 shows the market mechanisms for a product such as zinc,
which is imported in substantial fraction. Here we assume that total
domestic demand and both foreign and domestic supply are fairly elastic.
Figure 5-3 then shows the changes in price and quantity sold both from
domestic and foreign production as pollution controls are imposed on
domestic production. Again, possible shifts in the intercepts of the
supply curves have been ignored to simplify the schematic.
In Figure 5-3, it is assumed that no controls are imposed by foreign
authorities and only the domestic supply curve is turned upward. The
turn in the domestic supply curve, however, may be less than that equal
to the full cost of controls because some portion of these costs might
be absorbed by the producers or by government. As long as any portion
of the incremental costs are passed on to the consumers (that is, as long
as the domestic supply curve turns), there will be some reduction in
quantity sold and in producer revenues. To anticipate the effects of
controls, analysis is required of the structure of the zinc industry and
the probable behavior of the domestic producers, assuming that they at-
tempt to minimize their reduction in profits.
5-8
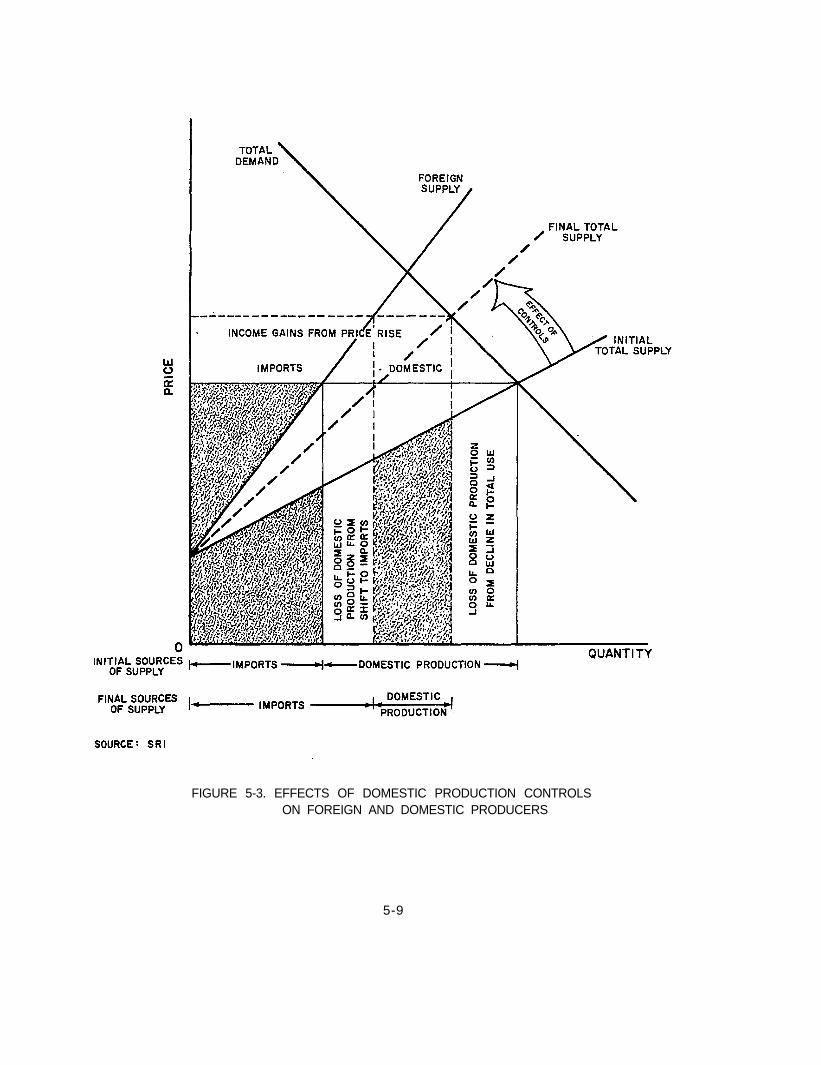
FIGURE 5-3. EFFECTS OF DOMESTIC PRODUCTION CONTROLSON FOREIGN AND DOMESTIC PRODUCERS
5-9
Although some purchases of other ores (including imports) are usual,
most producers depend largely on their own sources and the lowest cost
producers have access to the richer veins. High cost producers who gen-
erally must obtain ores from poorer or depleted veins, have been leaving
the zinc industry. In most cases, any temporary increase in output can
be attained only by increasing costs. An approximation to the situation
can be made by assuming that each producer's total costs are representable
by a quadratic function of output with positive coefficients for all terms.
foreign supply curve may differ from the aggregate domestic supply curve.
Moreover, the individual supply curves will differ among producers within
both the foreign and domestic groups.
Figure 5-3. If no controls are imposed on foreign producers, no change
occurs in the foreign aggregate supply curve. Note that the aggregate
marginal costs equal to the market price. Marginal costs are given by
the slope of the total cost curve; if the total cost curve is quadratic,
the marginal costs are given by a linear function of the quantity supplied.
Under such assumptions, the quantity offered in the market by each producer
is a linear function of the market price. Because control costs are com-
posed primarily of fixed investments and the costs of labor and materials
used for control (costs essentially proportional to output), the effects
of controls are to shift the supply curve for each producer upward and to
turn it counterclockwise. Except for departures from (or entries into)
the market, the aggregate supply curve (obtained by summing over all
producers) is also linear, at least near current operating levels. It
also turns counterclockwise to adjust to additional controls, as shown in
For given market prices, producers can maximize profits by setting
Our analysis shows that under competitive conditions of the type
described, the change in price would be equal to about one-half of the
average cost of controls per unit of output multiplied by the portion of
5-10
consumption met domestically. At current levels of imports, the price
increase would be about one-fourth of the average increase in costs per
metric ton of output. This pass-on percentage implies an elastic demand
function that differs greatly from the assumption by Chase Econometrics
of a 90 percent overall pass-on of the costs of pollution controls.47
Our analysis assumes that only zinc will be controlled whereas their
analysis considers the micro-economic effects of the entire antipollu-
tion package. Table 4-2 gives an estimate of $42 per metric ton for the
annualized cost of zinc controls. A one-fourth pass-on would consequently
be about $11 per metric ton.
Table 5-1 provides some rough estimates of the effects of controls
on economic aggregates of interest based on assumed supply and demand
elasticities, both arbitrarily set at 1.50 for current production and
consumption levels. To indicate the sensitivity of the estimates pre-
sented to variations in the elasticities, error margins are also presented
in Table 5-1, showing the effects of using elasticities of 1.0 or 2.0 in-
stead of 1.5 and allowing for an uncertainty of about 30 percent in the
estimate of control costs.
The data in Table 5-1 are actually based on 1973 market data and an
assumed control cost of $55. per metric ton. 48~4s This value of $55 per
metric ton has been used instead of $42 per metric ton because the lower
estimate was derived from a 1971 report and presumably reflects 1970
or earlier costs structures. The allowance made for inflation over the
47Chase Econometrics Association, Inc., The Economic Impact of Pollu-tion, Bala Cynwynd, PA (March 1975).
4sSurvey of Current Business, March 1975, and prior issues for data onzinc prices, production, consumption; Bureau of Economic Analysis,U.S. Dept. of Commerce.
"Commodity.Yearbook (1973).
5-11
period 1970 to 1973 could be in error because of uncertainties in price
indexes, weights, and the exact date to which the initial estimate
applies. The total uncertainty in the $55 figure for 1973 is believed
to be about 30 percent (i.e., about 10 percent greater than the 20 per-
cent cited in Chapter 4). Projections to later years would require
application of more recent data on inflation and could introduce further
uncertainties.
Although the published data and the quadratic cost model used in
this analysis did not provide estimates of current profit levels, they
did permit estimates of the changes in both foreign and domestic profits
as shown in Table 5-1.
Offsetting the zinc losses to some extent, measures to control
cadmium (and other airborne pollutants) in zinc smelters would yield
an increase of about 20 percent in the amount of by-product cadmium
generated. At the current price for cadmium and the current rate of
production of domestic zinc, this gain would be approximately $4 million
worth of cadmium per year (450 metric tons) or about 20 percent of the
projected loss in value of zinc production.
Employment Effects of Zinc Smelter Controls
Employment effects can be estimated by (1) associating with the
loss of domestic zinc production a proportionate loss of employment,
(2) associating with the costs of using and maintaining control equip-
ment a proportionate gain in employment, and (3) associating with the
increased sales of control equipment, a proportionate gain in employment.
In 1971" the primary zinc industry (SIC Code 3333) was estimated
to have a total employment of 7,100 (5,800 counting production workers
"Annual Survey of Manufactures, Census Bureau, U.S. Dept. ofCommerce (1972).
5-13
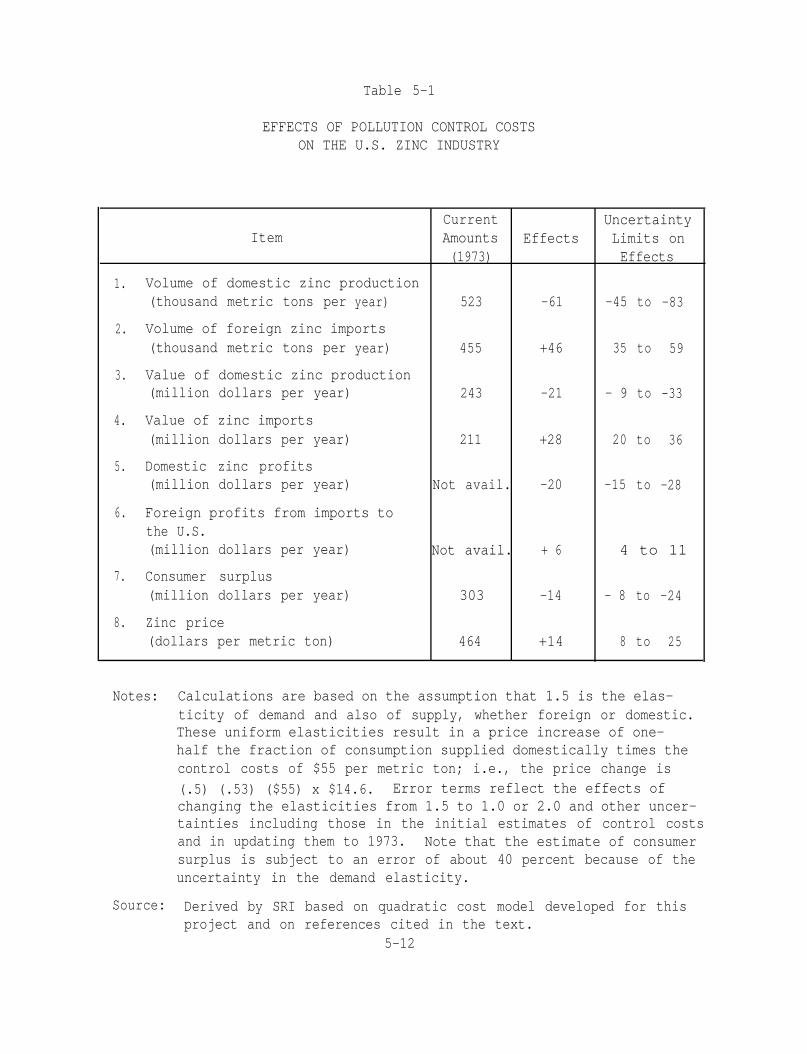
Table 5-1
EFFECTS OF POLLUTION CONTROL COSTSON THE U.S. ZINC INDUSTRY
Current UncertaintyItem Amounts Effects Limits on
(1973) Effects
1. Volume of domestic zinc production(thousand metric tons per year) 523 -61 -45 to -83
2. Volume of foreign zinc imports(thousand metric tons per year) 455 +46 35 to 59
3. Value of domestic zinc production(million dollars per year) 243 -21 - 9 to -33
4. Value of zinc imports(million dollars per year) 211 +28 20 to 36
5. Domestic zinc profits(million dollars per year) Not avail. -20 -15 to -28
6. Foreign profits from imports tothe U.S.(million dollars per year) Not avail. + 6 4 to 11
7. Consumer surplus(million dollars per year) 303 -14 - 8 to -24
8. Zinc price(dollars per metric ton) 464 +14 8 to 25
Notes: Calculations are based on the assumption that 1.5 is the elas-ticity of demand and also of supply, whether foreign or domestic.These uniform elasticities result in a price increase of one-half the fraction of consumption supplied domestically times thecontrol costs of $55 per metric ton; i.e., the price change is
(.5) (.53) ($55) x $14.6. Error terms reflect the effects ofchanging the elasticities from 1.5 to 1.0 or 2.0 and other uncer-tainties including those in the initial estimates of control costsand in updating them to 1973. Note that the estimate of consumersurplus is subject to an error of about 40 percent because of theuncertainty in the demand elasticity.
Source: Derived by SRI based on quadratic cost model developed for thisproject and on references cited in the text.
5-12
only) and a total wage bill of 61.6 million ($47.4 million for production
workers) yielding an average wage of $8,700 ($8,150 for production workers).
From wages and employment reported in the 1972 annual report of the St.
Joe Minerals Corporation,51 average wage rates can be approximated as
$12,000 per year. At this average wage, for the total zinc industry,
wage bills in 1973 would have been $85 million. We have used $10,000
average wage as an intermediate estimate.
If controls had been imposed, we can infer from Table 5-1 that do-
mestic zinc production would have decreased by about 61,000 metric tons,
or about 12 percent, and its value would have decreased by $21 million
or about 9 percent. Using 10 percent as an average to express effects
on employment would amount to decreases of 700 workers and $7 million
in wage bills.
The annual labor costs for control maintenance as given in Table 4-4
for a 100,000 metric ton per year smelter is $79,000, corresponding to
an employment of about 9 persons at smelter wage rates. Annual (1973)
production of 523 thousand metric tons would require about five times
this total employment or perhaps 50 persons. Total investment costs in
obtaining and installing control equipment would amount to $45 million
for the industry and generate about $30 million in one-time wages,
corresponding to employment of the order of 3,000 man-years over the
period during which the new equipment would be produced and installed.
Other elements of annualized scrubber costs include $4.3 million
in extra power consumption, $9.3 million worth of limestone, and $2.4
million worth of water. Depreciation and maintenance account for over
$4 million per year, which could provide some additional employment
'I1971 and 1972 Annual Reports, St. Joe Minerals Corporation, 250 ParkAvenue, New York, N.Y. 10017.
5-14
either at the smelters or more probably at equipment manufacturers. If
these efforts are added to those for original equipment fabrication
(averaged over an assumed 15-year life), possible employment of 300 per-
sons would be involved. In general these sources of increased employ-
ment would be small in comparison with the direct reduction of zinc
industry employment. However, as calculated by Chase Econometrics,47
if controls were introduced rapidly over a three or four year period,
overall employment would increase slightly due to expansion of the pollu-
tion control industry and then decline below previous levels as primary
production declines.
employment that are likely to arise is the net reduction of employment
in the zinc industry in its areas of concentration where the opportunities
for employment in other activities are relatively limited.
The primary long-run regional effect of the various shifts in
Finally, the monitoring and enforcement costs described in Chapter 4
could be estimated to reach from $4.20 to $5.50 per metric ton, or from
$22 to $29 million per year. They would create from 200 to 300 jobs for
monitoring and controlling compliance, presumably including on-site in-
spections and production of appropriate monitoring equipment.
Overall Effects of Zinc Smelter Controls
Table 5-2 collects the economic impact data and provides estimates
of the total dollar impact of controls on zinc smelters. Data are
either taken from Table 5-1 or from estimates of unemployment effects
given above. The $7 million reduction in consumer purchasing power is
caused by the $7 million extra paid for zinc in other products (the net
result of $28 million increase in imports less a $21 million reduction
in domestic production). That $7 million is added to another $7 million
loss of consumer satisfaction from reduced zinc content of consumer
5-15
products to obtain the total $14 million loss of consumer surplus shown
in Table 5-1.
In these rough calculations it has been assumed that wages average
$10,000 per year per full time equivalent employee and that unemployment
is augmented by a multiplier of 2 locally. Because of local multiplier
effects, national wage effects might be geographically distributed as a
loss of $14 million in the vicinity of the smelters and a gain of $4
million near the producers of control equipment. The total loss in value
of production is roughly equal to the change in GNP because it includes
value added from zinc, cadmium, and control equipment as well as value
added from production of materials used in such production.
We assume that control equipment is phased in gradually over the
15-year life of such equipment so that initial installations and re-
placements constitute a stable annual demand for manufacture of control
equipment. There is the tacit assumption that no other environmental
controls are introduced elsewhere to further perturb the economy. Taxes
may be divided approximately as $3 million lost near smelters and $7
million elsewhere in the country, largely as a reduction of federal
corporate profit taxes. The change in investment funds represents gross
profits after taxes and thus includes capital consumption or depreciation
allowances and dividend distributions.
The most significant measure of the overall effect on the national
economy is the $21 million per year net reduction in GNP. The most
significant local effects in smelter areas are the increases in unemploy-
ment. Other employment effects are distributed nationally. A secondary
effect is the reduction of the tax base near the smelters.
The population living in smelter areas with cadmium air concentra-
tions above one nanogram per cubic meter is seen from Figure 6-2 (in
Chapter 6) to be about 2 million (assuming 100 people/km2). Thus, of
the nationally dispersed effects such as changes in federal taxes and
5-16
consumer surpluses, only about one percent will be allocated to the cad-
mium production areas themselves. All such local allocations of nation-
ally dispersed effects shown in Table 5-2 are below a million dollars
per year and can be neglected.
Cadmium Emissions and Municipal Incinerators
As noted in Chapter 4, the controls applicable to municipal in-
cinerators would have other antipollution values but would affect only
a small portion of nationwide cadmium emissions from incineration of
solid wastes. The cost of controls would normally fall on the local
population either as increased charges for refuse collection and dis-
posal or as increased local tax rates (unless, as recently in the case
of municipal water treatment, massive aid were provided by state or
federal governments). Although considerations of equity might suggest
that these costs be recovered by increasing refuse service charges, or
basing such charges on weight or volume of solid wastes collected, the
record-keeping problems of such procedures would be so great that most
municipalities would probably prefer to use tax revenues or increased
service charges. In any case, the total costs would be absorbed by
the total population. The only non-health economic benefits involved
would be the gain to the producers of requisite control equipment or
to those local persons who maintain or monitor it.
The model incinerator cited in Table 4-3 has a capacity for 263
metric tons per day or 0.096 million metric tons per year, and an
annualized cost of $110,000. Total costs for 193 public incinerators
would be about $22 million per year plus another $2 million for mon-
itoring and control. Somewhat more detailed analysis using both the
cumulative distribution of incinerator capacities given in Figure 4-1
and the estimates of annualized costs given in Table 4-3 yields an
estimate of $132,000 of annualized costs or $25.5 million per year for
5-17
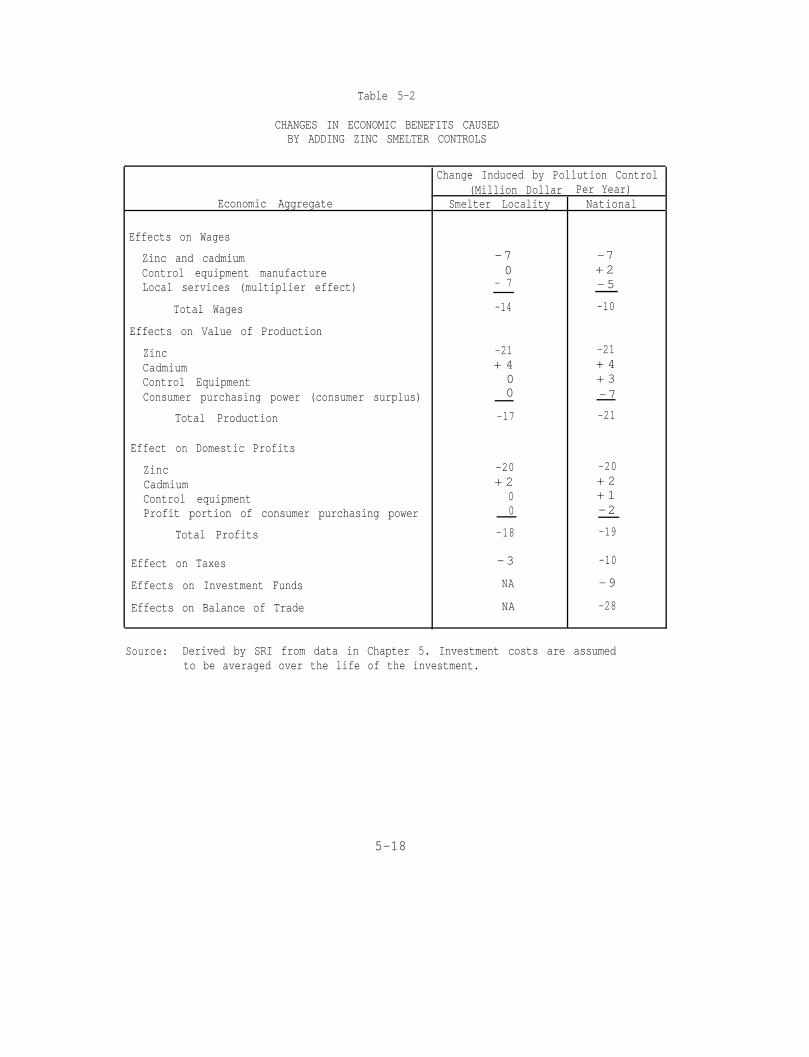
Table 5-2
CHANGES IN ECONOMIC BENEFITS CAUSEDBY ADDING ZINC SMELTER CONTROLS
Economic Aggregate(Million Dollar Per Year)
Smelter Locality National
Change Induced by Pollution Control
Effects on Wages
Zinc and cadmiumControl equipment manufactureLocal services (multiplier effect)
Total Wages -14
-70
- 7
-7+ 2-5
-10
Effects on Value of Production
ZincCadmiumControl EquipmentConsumer purchasing power (consumer surplus)
Total Production
-21+ 400
-17
-21+ 4+ 3-7
-21
Effect on Domestic Profits
ZincCadmiumControl equipmentProfit portion of consumer purchasing power
Total Profits
-20+ 2
00
-18
-20+ 2+ 1-2
-19
Effect on Taxes -3 -10
Effects on Investment Funds NA -9
Effects on Balance of Trade NA -28
Source: Derived by SRI from data in Chapter 5. Investment costs are assumedto be averaged over the life of the investment.
5-18
the whole country plus $2.5 million for monitoring and enforcement.
Using the 20-percent uncertainty limit results in an estimate of annual-
ized costs nationally of from $21 to $31 million plus $2 to $3 million
for monitoring and enforcement. We assume these costs are borne by the
localities involved, except for a portion of the monitoring and enforce-
ment costs.
Asbestos Controls
The impact of asbestos controls can be assumed to be almost en-
tirely on consumer surplus. This impact will be distributed over all
users of asbestos products. In the first place, direct sales of asbestos
products to final demand are small (perhaps one-sixth of the total).
In the second place, asbestos products are largely free of competitive
products. Indirect demands for asbestos in the hundreds of places
where it is fabricated into products of other industries provide an
aggregate demand that should be highly inelastic. Control costs are
thus likely to be passed on fully as minor increases in the costs of
the various consumer products that contain asbestos. Although these
price increases for asbestos products may be somewhat augmented by
application of markups in the consumer products (e.g., there may be a
small multiplier effect), the asbestos content is generally small enough
to preclude any significant reduction in demand for the various products
incorporating some asbestos.
Asbestos Production Controls
Control costs, as summarized in Chapter 4, appear to be very small
as a percentage of the value of the asbestos products themselves, and
an extremely small fraction of the value of the end-items using asbestos.
Effects on the demand for the wide distribution of products can be
assumed to be inconsequential, and the primary impact would be on consumer
5-19
Chapter 6
EXPOSURE TO HAZARDOUS WASTES
Background
Few exposure models of the type needed for this analysis have been
attempted in the past because results that are accurate at the local level
require detailed information on such parameters as the micro-meteorology
of the area, the physical and chemical characteristics of each emission,
the quality of ground water supplies, and the composition of the soil.
Studies that have related the amounts of emitted contaminants to the ex-
tent of the resultant exposures have generally been too complex to be ap-
plied to a general model (e.g., the aerial dispersion models used in the
Purdue Cadmium Project21 and in the AEC manual, "Meteorology and Atomic
Energy,1'52 are dependent on variables for which data are generally not
available).
Because no adequate prior models were discovered in the literature
search for this project, we had to develop our own composite model to
convert emission rates into contaminant concentrations in the air,
water, soil, food, and so forth to which people are exposed. Although
portions of the model are based upon earlier models used for radiological
and other environmental contamination analyses, the overall model repre-
sents a first attempt to define exposure conditions in a manner that can
be conveniently integrated into other portions of the analysis.
52D. H. Slade, editor, "Meteorology and Atomic Energy," U.S. AEC Techni-cal Information Center, Oak Ridge, Tenn. (July 1968).
6-1
The objective of this part of the study is to define a general model
of exposures to contaminant materials that will relate the rates of emis-
sion by a source to the contamination levels that will be created in the
areas around it. The model should be flexible enough to deal with a
single emission source on the one hand and with areawide or even nation-
wide contamination levels on the other. To handle the greatest variety
of input data and analytical results, it should be compatible with a wide
range of detail for such factors as wind patterns, type of contaminants,
source height and heat, population distributions, and surrounding opera-
tional activities. At the same time, its output data must be in a form
that can be applied to the human hazard model in the succeeding part of
the analysis.
The scope of the model need only cover the contaminants that are of
concern (e.g., cadmium or asbestos), but modifications of the basic model
should be applicable to many different contaminants. Media exposed
should include air, water, and land surface, as well as others that may
be significant in the case of individual contaminants, such as food,
tobacco, and clothing.
Method of Analysis
Different methods of analysis are required for each of the media.
In general, the logic of the analysis progresses in the following steps:
(1) Convert the rate of air emissions from the source intolevels of contaminant concentrations at points aroundthe source. This provides a measure of exposure forinhalation.
(2) Convert the air concentrations to rates of depositiononto the earth's surface.
(3) Convert deposition rates to concentrations in biologi-cally active portions of the ground and the water supply.In the case of sources emitting contaminants directly tothe ground or to water, the analysis will start with thisstep.
6-2
(4) Convert the exposures from air, ground, and water con-centrations to an estimate of contamination of foodsgrown in the area.
(5) Sum the exposures from cadmium in air, ground, watersupplies, food, and other media into an equivalenttotal exposure to human beings in the area of interest.
These steps have been followed in building the following simplified models
for air, ground, water, and food exposures.
Air
To estimate air exposures from any emission source, assume that
the source is continuously emitting a flow of contaminants at a rate
of Q' g/sec into the airstream. This flow will become diffused through
the lower layers of the airstream with an "expected concentration C" equal
to its average concentration at some distance r in the downstream air times
the probability that any given point at that distance will be in the air-
stream. For equal frequencies of all wind directions, this expected con-
centration level will be the same for all equidistant points surrounding
the source.
Because the circumference of the concentric circles surrounding the
source is proportional to the distance r, the contaminant will be dis-
persed in propostion to l/r just through the effects of diffusion around
the source. (As explained below, the close-in limit of this model is as-
sumed to be 1 km.) In addition, air diffusion theories indicate that
contaminants will disperse vertically in a "mixing layer" that is propor-
tional in depth to 3& (see Ref. 52, p. 197, Figure 5.2). If we assume
that the mixing layer is 100 m high out to a distance of 1 km from the
source, that it rises in proportion to 3& at further distances, and that
over a long period the contaminant will disperse equally in all directions,
then the layer will appear as illustrated in Figure 6-1(a).
6-3
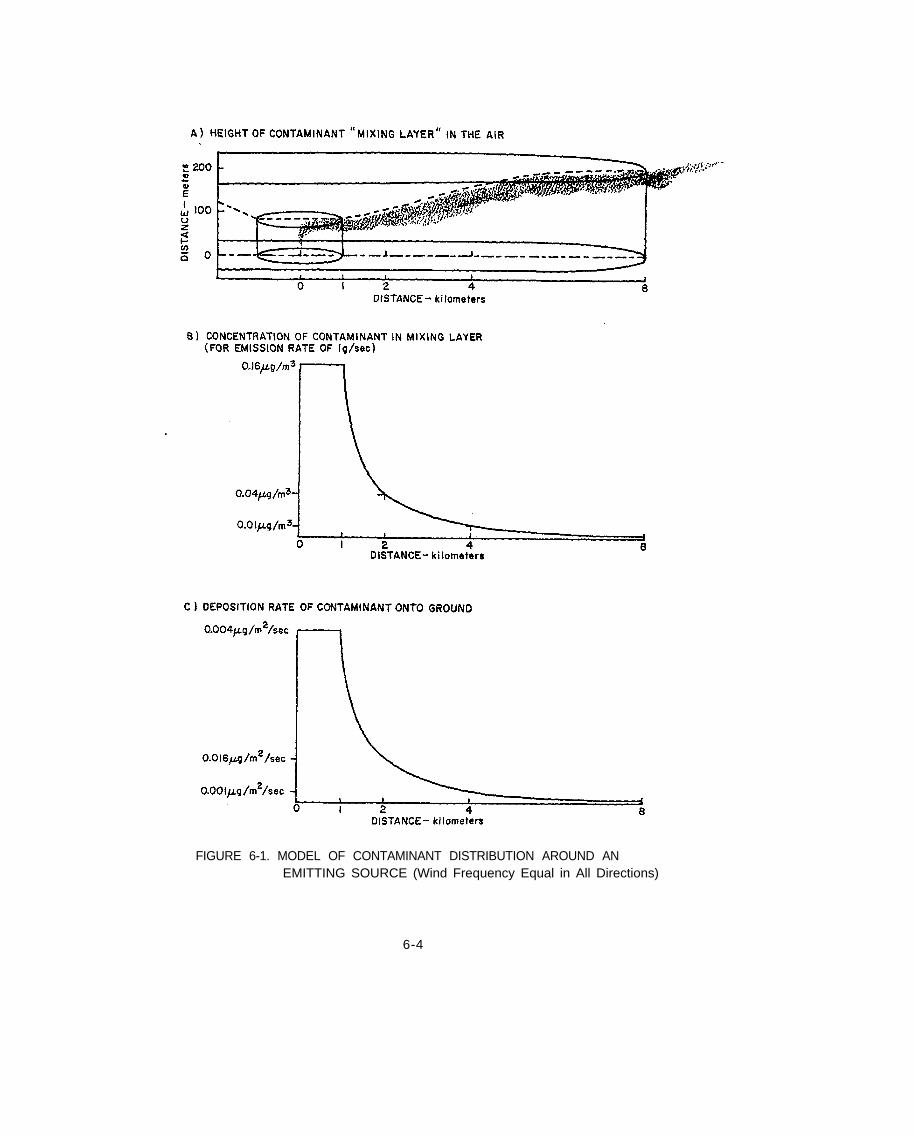
FIGURE 6-1. MODEL OF CONTAMINANT DISTRIBUTION AROUND ANEMITTING SOURCE (Wind Frequency Equal in All Directions)
6-4
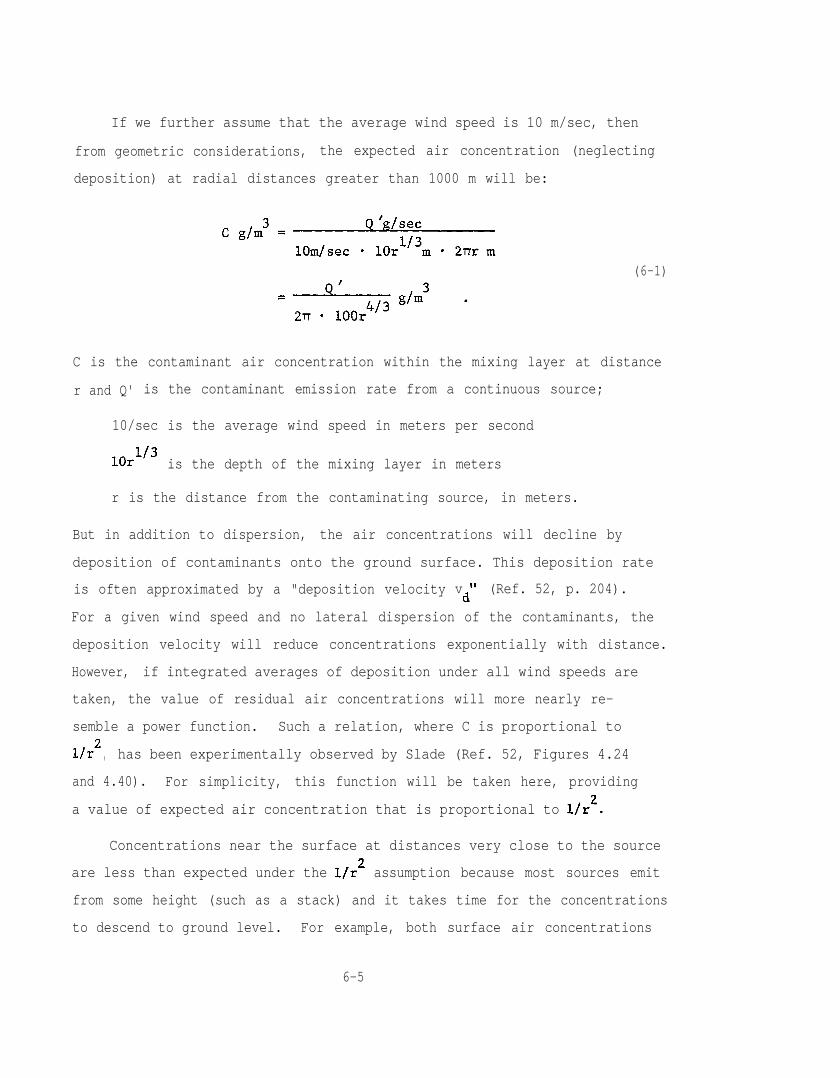
If we further assume that the average wind speed is 10 m/sec, then
from geometric considerations, the expected air concentration (neglecting
deposition) at radial distances greater than 1000 m will be:
(6-1)
C is the contaminant air concentration within the mixing layer at distance
r and Q' is the contaminant emission rate from a continuous source;
10/sec is the average wind speed in meters per second
10rl'3 is the depth of the mixing layer in meters
r is the distance from the contaminating source, in meters.
But in addition to dispersion, the air concentrations will decline by
deposition of contaminants onto the ground surface. This deposition rate
is often approximated by a "deposition velocity vi' (Ref. 52, p. 204).
For a given wind speed and no lateral dispersion of the contaminants, the
deposition velocity will reduce concentrations exponentially with distance.
However, if integrated averages of deposition under all wind speeds are
taken, the value of residual air concentrations will more nearly re-
semble a power function. Such a relation, where C is proportional to
l/r2 , has been experimentally observed by Slade (Ref. 52, Figures 4.24
and 4.40). For simplicity, this function will be taken here, providing
a value of expected air concentration that is proportional to l/r2.
Concentrations near the surface at distances very close to the source
are less than expected under the l/r2 assumption because most sources emit
from some height (such as a stack) and it takes time for the concentrations
to descend to ground level. For example, both surface air concentrations
6-5
and ground deposition rates (which are closely proportional to surface
air concentrations) seem to peak at some distance up to about 1 km from
industrial emitters (see Ref. 52, Figures 4.2 and 4.4).
The model combining deposition and diffusion effects assumes that
the total contaminants suspended in the air remain constant out to a
distance of 1 km, and then decline in proportion to r-2/3
, due to deposi-
tion. This function is shown in Figure 6-1(b). The concentration equa-
tions, as modified to show deposition as well as dispersion (for Q' in
g/sec and r in m), are:
(6-2)
(6-2a)
(6-2b)
These concentrations are additive from each source and from natural back-
ground. Confidence intervals (± 20) are likely to be quite wide for the
model relative to any given contaminant and any downwind location, be-
cause of both micro-meteorological variations and generalizations involved
in the model. By analogy to experience with models for nuclear fallout,
we estimate that the confidence limits for any one source will be of the
order of ± a factor of 10.
Ground
Deposition rates from air concentrations can be related to air con-
centrations through the deposition velocity vd
mentioned above. The
"deposition rate per unit area d'" is:
6-6
(6-3)
The "total deposition rate D'" is the integral of the area deposition
rates over the entire surface of the earth. In simplified form, the earth's
surface can be expressed as a plane circle of radius 8,900 km
if we assume that D' varies as a function of the distance from the emitter.
Therefore, total deposition rate can be approximated by an integral of the
form:
(6-4)
An approximate value for deposition rate per unit area as a function
of air concentration can be derived by combining the above two equations
and introducing the equality D' = Q'. (By the preservation of mass prin-
ciple, the total deposition rate D' will equal the emission rate Q' under
equilibrium conditions.)
(6-5)
Expected values for deposition rates are illustrated in Figure 6-1(c).
Thus, long-term deposition rates in g/m2/sec will average about one-tenth
the long-term expected air concentrations in g/m3. The level of uncer-
tainty of this estimate, however, is even greater than for air concentra-
tions, largely because of micro-meteorological variations in deposition
6-7
rates but also because of particle size variations and approximations in
the model. For these reasons, the estimated uncertainty levels in point-
to-point ground deposition are as much as ± a factor of 30.
Average deposition rates over a large area will also be about 10
times smaller than average air concentrations. Variations of the averages
will be somewhat larger than the variations in average air concentrations:
about ± a factor of 10.
Buildup of contaminants in soils could continue indefinitely except.
as counteracted by natural fixation and depletion processes. Since
these processes are not known from existing data, estimates must be based
on comparison with analogous contaminants. The usual model for turnover
of organic and other foreign matter in the soil is
where x is the amount of matter present initially
A is the annual input
L is the fraction removed each year.
For equilibrium conditions after air depositions to the soil have con-
tinued for many years, the input will be balanced by depletion so that
where x is the amount of matter present in equilibrium conditions.e
Water
Contaminant concentrations in water depend more than air or soil
concentrations on local factors, because water is influenced by upstream
sources, subsurface contaminants, and direct discharges as well as by
6-8
air deposition. Unfortunately, we do not know of any large-scale water
flow model that can be applied to the water concentration problem. How-
ever, as a gross rule of thumb, one may conclude that water concentrations
will be correlated with (1) air concentrations, and (2) soil concentra-
tions of the contaminant of concern. The argument for correlation with air
contaminants is the fact that most municipal water supplies are taken
from surface waters that are susceptible to deposition of airborne con-
taminants. The argument for correlation with soil contaminants is the
obvious propensity of flowing waters to take any contaminants that they
come in contact with into solution or suspension. Furthermore, each argu-
ment can be adduced in partial support of the other because of the close
association between air and soil concentrations that has been described
above. Since we work primarily in the study with air concentrations, the
basis for analyzing water concentrations will be:
water concentration in up;/1 local air concentration in ug/m3=background water concentration background air concentration
Food
Because of discrimination procedures by plants and animals against
excessive levels of any mineral, increases in soil concentrations of con-
taminants are not proportionately reflected in higher food concentrations.
The increases in food concentrations are roughly proportional to the.
square root of the increased soil concentration. 53J54 However, most food
comes from locations that are distant from the consumer. Brown and Pi1z55
s3L. Friberg et al., "Cadmium in the Environment," Table 3.3, CRC Press,Inc., Cleveland, Ohio (1974).
S4A. L. Page and F. T. Bingham, "Cadmium Residues in the Environment,"Residue Review, Vol. 48, p. 26 (1973).
ssS. L. Brown and U. F. Pilz, "U.S. Agriculture: Potential Vulnerabili-ties," Stanford Research Institute, Menlo Park, Calif., p. 63 (January1969).
6-9
have calculated that while food sources vary in proximity to consumers,
the average movement of unprocessed food in the United States is at least
650 miles from producer to processor, and that the movement of processed
food from processor to consumer is another 400 miles or more. The average
area over which soil concentrations should be calculated to determine food
cadmium levels, then, extends to a radius in the order of 1,000 km around
each consumer. The impact of cadmium emissions on food is accordingly
taken to be regional rather than local in nature. (Other evidence de-
rived by Capener for this study shows that concentrations of cadmium in
food are correlated with the sizes of cities sampled, which contradicts
this assumption. Locally procured fresh foods such as milk may explain
the correlation, but development of a plausible cause-effect model must
await future studies.)
Illustrative Application: Cadmium
Although the cadmium flow chart in an earlier chapter shows that
almost three-quarters of the cadmium emitted to the environment ends in
land disposal, the major sources of exposure to humans are ingestion
from food and water and inhalation from the air. The models necessary
to derive these exposures are developed below from the general exposure
models.
Air
Maximum levels of cadmium measured during a year's period in air3
exhibit a mean of approximately 0.003 pg/m and a 2a range of ± a factor
of 10. Maximum urban levels show a mean of 0.01 ug/m3 with the same
proportionate range, and average levels seem to be about one-third of
the maximum ones (Ref. 3, p. 206). This implies that average background
air levels are in the order of 0.001 pg/m3, ± a factor of 10. The maxi-
mum monitored level in recent years at any station was 0.69 pg/m3 in
East Helena, Montana.6-10
Increases over background levels can be calculated from the general
air concentration equations given above. For example, concentrations re-
sulting from the model zinc smelter specified in Table 4-2 can be calcu-
lated from equations (6-2a) and (6-2b). The calculations show that an
uncontrolled cadmium emission rate of 4.1 g/sec will create a maximum air
concentration of 0.65 X 10⁻⁶
g/m3. But the concentration will be higher
than the basic model indicates because some portion of cadmium already
deposited will be resuspended and recirculated. Experiments done by
Purdue University suggest that 20 to 30 percent of measured concentra-
tions are due to resuspended particles. An average of 25 percent would
imply that measured concentrations will be 100% + 75% = 133% of the values
calculated above, or 0.87 X 10B6 g/m3 out to a distance of 1 km from the
smelter. This maximum concentration will encompass a circular area of
3.14 km2 , and concentrations at further distances will be inversely pro-
portional to the area covered.
If we multiply the areas affected by 8 to consider all U.S. smelters,
then we can derive the coverage estimates shown in Figure 6-2. We can
estimate the population covered by assuming an average density of 100
people per km2 (slightly less than the average density in Pennsylvania).
The resultant values incorporate assumptions that concentrations from the
eight model smelters will equal those from the sum of the actual U.S. zinc
smelters listed in Table 4-1, and that overlaps between their contamina-
tion areas are negligible.
Similar calculations can be made for cadmium air concentrations
around municipal incinerators. The model uncontrolled incinerator de-
scribed in Table 4-3(a) emits 1.1 X 10⁻³, g/sec of cadmium and creates a
66K. L. Yost et al., "The Environmental Flow of Cadmium and Other TraceMetals, " Progress Report, prepared by Purdue Univ., p. 95 (1974).
6-11
.
FIGURE 6-2. CADMIUM AIR AND WATER CONCENTRATIONS FROMU.S. ZINC SMELTER AND MUNICIPAL INCINERATOREMISSIONS (UNCONTROLLED)
6-12
concentration of 0.24 X 10⁻⁹
g/m3 within a radius of 1 km. For 193 muni-
cipal incinerators of the same size, the total area covered with this
concentration will be 600 km2. Population densities around municipal
incinerators (mostly in the Northeast) can be taken as 200/km2--about
the same as the average for the Northeast states.
Controls will reduce the air concentrations in proportion to the re-
duction in emissions. Smelter controls are expected to eliminate 0.95 of
the emitted levels, with a two-sigma confidence band lying between 0.905
and 0.998. Incinerator controls will eliminate an expected 0.85 of emis-
sions, with confidence limits of 0.74 and 0.98.
Ground
Total ground levels of cadmium concentration for uncontaminated soils
amount to a mean of 0.06 ppm and a two-sigma range of a factor of ± 10
(Ref. 3, Table IV-1). (This compares with a mean value in the whole
earth's crust of 0.15 ppm.) Assuming that the biologically active soil
zone is the top 10 cm (Ref. 3, p. 279) and that soil weight averages
1 g/cm3, then this concentration of 0.06 ppm is equivalent to:
Deposition rates wi11 of course be additive to this normal ground
concentration. Addition of phosphate fertilizers to the soil can increase
cadmium concentrations by a factor of 10 or more (see Schroeder as re-
ported in Fulkerson, Ref. 3, p. 73). Concentrations of as much as 30 ppm
have been observed in soils around a zinc smelter (Ref. 3, p. 279).
Removal of cadmium from the biosphere in the soil is very difficult
to estimate. Removal rates for mercury from sediments in water are esti-
mated at about 15 percent to 50 percent per year (ref. personal communi-
cation, Buford Holt, SRI). For carbon in soil, the removal rates are
6-13
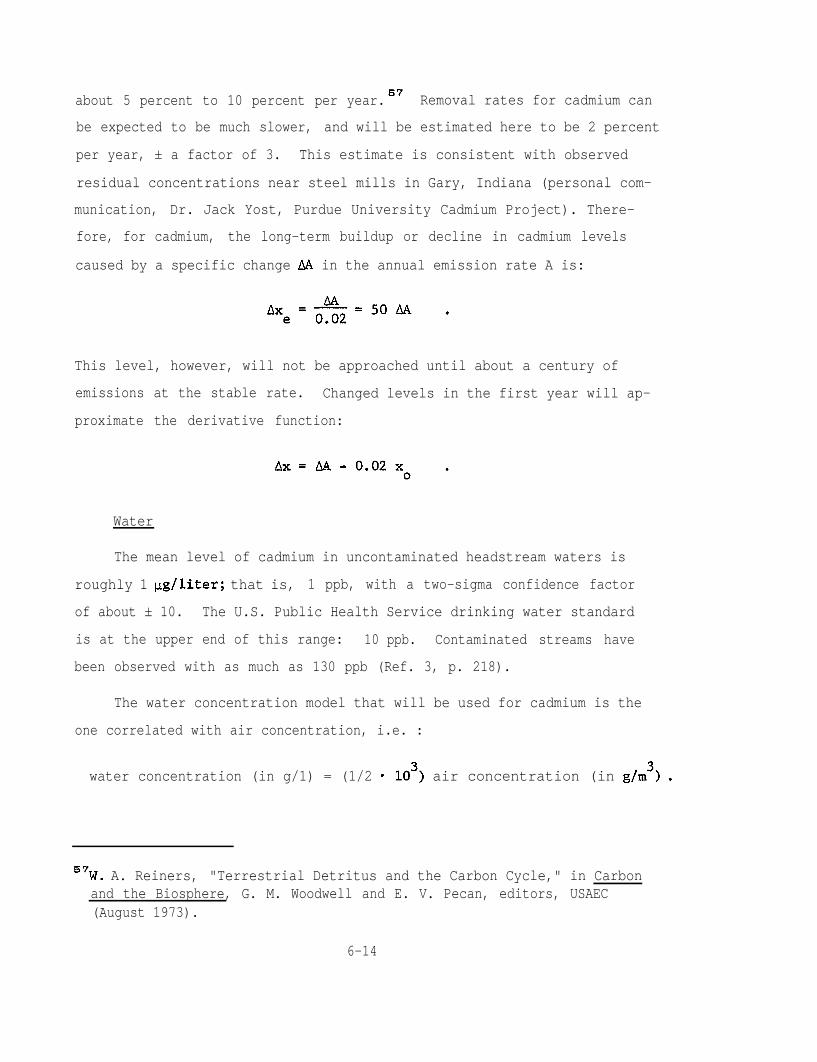
about 5 percent to 10 percent per year. s7 Removal rates for cadmium can
be expected to be much slower, and will be estimated here to be 2 percent
per year, ± a factor of 3. This estimate is consistent with observed
residual concentrations near steel mills in Gary, Indiana (personal com-
munication, Dr. Jack Yost, Purdue University Cadmium Project). There-
fore, for cadmium, the long-term buildup or decline in cadmium levels
caused by a specific change AA in the annual emission rate A is:
This level, however, will not be approached until about a century of
emissions at the stable rate. Changed levels in the first year will ap-
proximate the derivative function:
Water
The mean level of cadmium in uncontaminated headstream waters is
roughly 1 pg/liter; that is, 1 ppb, with a two-sigma confidence factor
of about ± 10. The U.S. Public Health Service drinking water standard
is at the upper end of this range: 10 ppb. Contaminated streams have
been observed with as much as 130 ppb (Ref. 3, p. 218).
The water concentration model that will be used for cadmium is the
one correlated with air concentration, i.e. :
water concentration (in g/1) = (1/2 * 103) air concentration (in g/m') .
"7W. A. Reiners, "Terrestrial Detritus and the Carbon Cycle," in Carbonand the Biosphere, G. M. Woodwell and E. V. Pecan, editors, USAEC(August 1973).
6-14
Supportive evidence for this model can be found from a U.S. Geological
Survey finding that, as in air, "higher concentrations of cadmium in water
generally occur in areas of high population density" (Ref. 3, p. 218).
Also, both the confidence intervals (a factor of 10) and the extreme
values (230 times background for air and 130 times background for water)
are of the same orders of magnitude as the model would indicate.
Effects of emission controls on water concentrations can be calcu-
lated easily from the above formula, since any changes due to controls
will be one-half the magnitude (measured in ng/1) of the changes (mea-3
sured in ug/m ) estimated in air. The comparable curves are illustrated
in Figure 6-2.
Food
"Normal" food concentrations of cadmium are reported by Friberg to
be about 0.05 ppm (Ref. 54, p. 25). Schroeder reports a normal value of
0.35 ppm, but this value is considered too high by other investigators.
Nevertheless, a confidence limit on these estimates of ± a factor of 10
(i.e., lying in a range between 0.005 and 0.5 ppm) seems reasonable.
Other measured concentrations in four foods indicate values ranging
from 0.0015 to 0.07 ppm (Ref. 54, p. 30). This would imply a mean food
level of perhaps 0.01 ppm and two-sigma values of ± a factor of 10. The
estimate relevant to this analysis--integrated total foods eaten by in-
dividuals over a time period of 1 to 50 years--will have much lower vari-
ance. For that figure, an estimate of 0.01 ppm ± factor of 3 can be used.
However, we will not consider variability of food concentrations in this
analysis.
6-15
Illustrative Application: Asbestos
Chapter 7 will document the hazards of asbestos, which are primarily
from inhalation of airborne particles. Therefore, air concentrations are
the major exposure routes of concern for asbestos. Where asbestos is
emitted into the air from man-made sources, we will adopt the same air
transport model that has been used for cadmium.
Available data3 indicate that urban levels, averaging about 29 ng/m3,
are very much higher than nonurban concentrations, which generally appear
to be less than 1 ng/m3. Much of these urban concentrations came either
from the industrial sources or the brake lining residues that are con-
sidered in this analysis, although other major sources include building
construction and demolition activities.
The asbestos industry data tabulated in Table 4-4 show total emis-
sions of 547 metric tons per year, or 17.5 g/sec. Dividing these emis-
sions among the 659 operating asbestos plants yields an average of 0.026 g/
sec from each plant. Air concentrations from Equation (6-2b) will thus
reach a maximum of 4.1 X 10⁻⁹
g/m3 . Additional quantities should be in-
cluded to allow for refloatation of particles deposited on the ground.
Since asbestos particles tend to be smaller than cadmium particles, they
should refloat more easily. We will assume that 33 percent of all as-
bestos particles in the air at any time have been refloated; so the cor-
rected maximum concentrations will be 4.1 X 10⁻⁹
+ (1.00 - 0.33) or 6.2 X
10-9
g/m3. These concentrations will extend 1 km from each plant (covering
a total area of 659 m2, or 2060 km2), and fall off inversely with the
square of further distances from the sources.
Asbestos contamination from brake linings presents an even more
difficult estimating task because the emission sources are so diffuse.
If we consider emissions from each of the 130 U.S. cities of over 100,000
population as a single source and add them to the estimated 30 plants
6-16
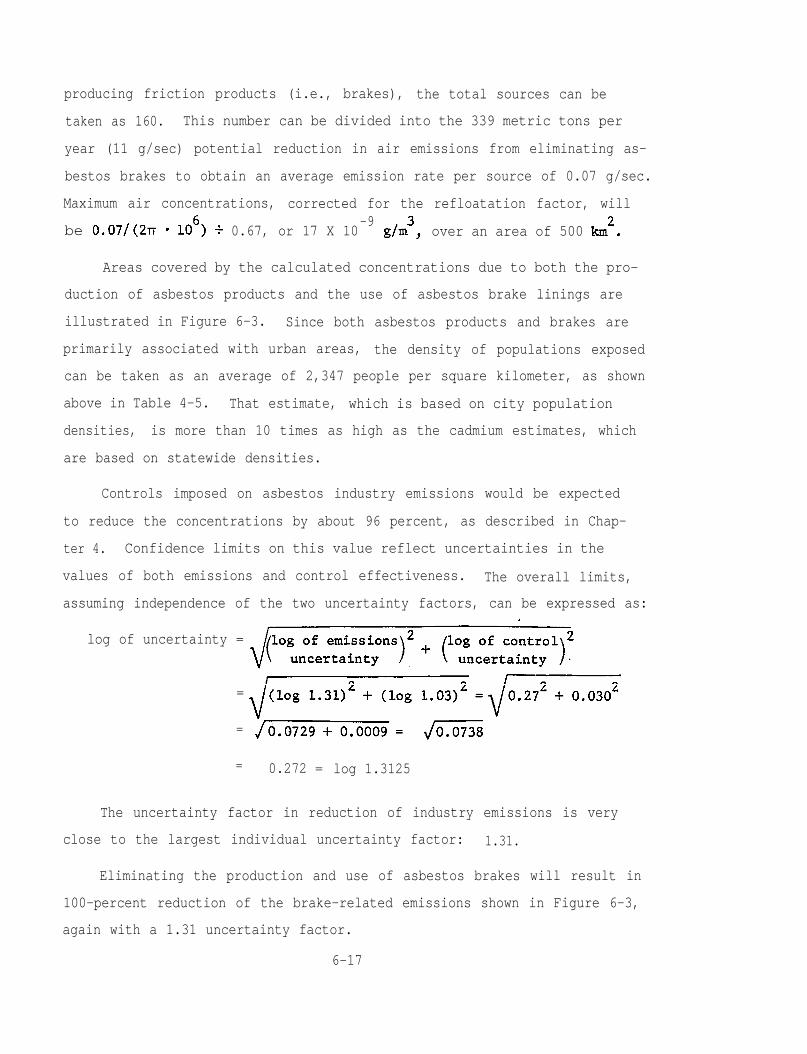
producing friction products (i.e., brakes), the total sources can be
taken as 160. This number can be divided into the 339 metric tons per
year (11 g/sec) potential reduction in air emissions from eliminating as-
bestos brakes to obtain an average emission rate per source of 0.07 g/sec.
Maximum air concentrations, corrected for the refloatation factor, will
be 0.07/(2~ l 106) % 0.67, or 17 X 10-9
dm3, over an area of 500 km2.
Areas covered by the calculated concentrations due to both the pro-
duction of asbestos products and the use of asbestos brake linings are
illustrated in Figure 6-3. Since both asbestos products and brakes are
primarily associated with urban areas, the density of populations exposed
can be taken as an average of 2,347 people per square kilometer, as shown
above in Table 4-5. That estimate, which is based on city population
densities, is more than 10 times as high as the cadmium estimates, which
are based on statewide densities.
Controls imposed on asbestos industry emissions would be expected
to reduce the concentrations by about 96 percent, as described in Chap-
ter 4. Confidence limits on this value reflect uncertainties in the
values of both emissions and control effectiveness. The overall limits,
assuming independence of the two uncertainty factors, can be expressed as:
log of uncertainty =
=
=
= 0.272 = log 1.3125
The uncertainty factor in reduction of industry emissions is very
close to the largest individual uncertainty factor: 1.31.
Eliminating the production and use of asbestos brakes will result in
100-percent reduction of the brake-related emissions shown in Figure 6-3,
again with a 1.31 uncertainty factor.
6-17
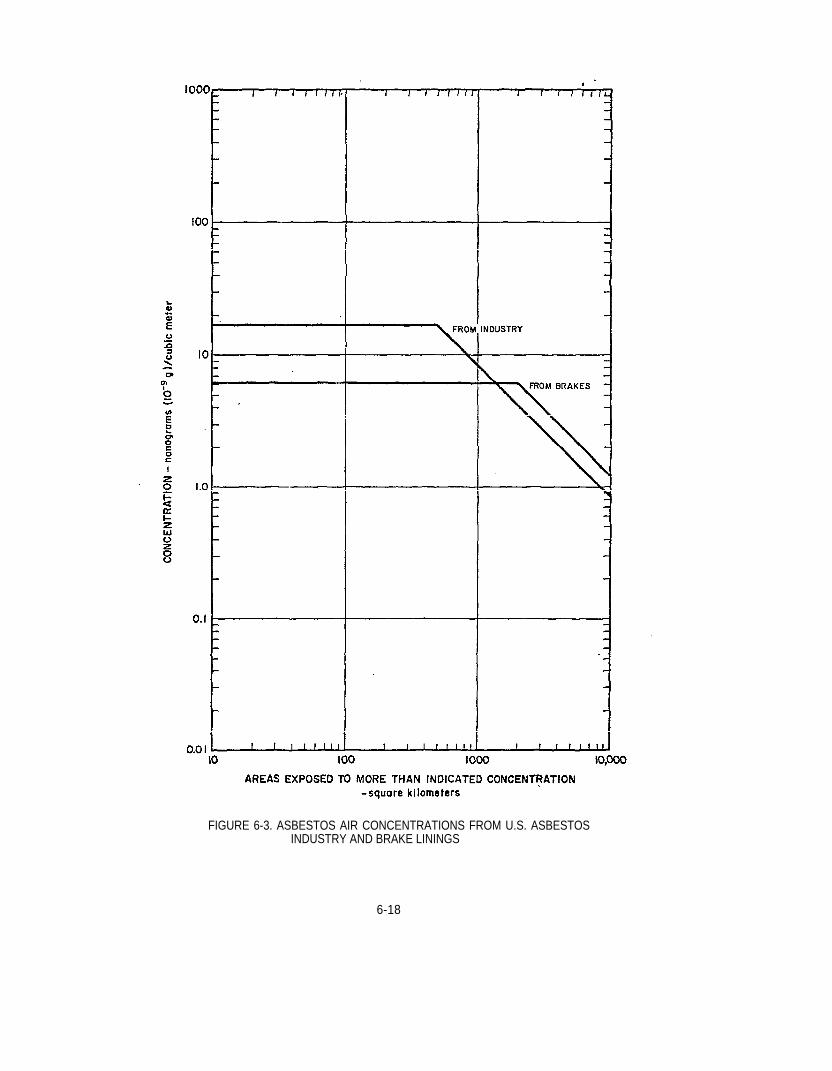
FIGURE 6-3. ASBESTOS AIR CONCENTRATIONS FROM U.S. ASBESTOSINDUSTRY AND BRAKE LININGS
6-18
Chapter 7
RISKS TO HEALTH
Introduction
This chapter describes how estimates of waste exposure levels from
Chapter 6 can be combined with epidemiological data to generate esti-
mates of health effects. One useful way of quantifying such estimates
is through the use of dose-damage curves. Dose is a measure of exposure
to some pollutant in our environment and damage is some health effect
(e.g., mortalities) associated with the dose.
An intermediate phenomenon, absorption of the pollutant from the
environment into the body also occurs. But in many, probably most,
cases of interest to EPA, the processes by which such absorption takes
place are not well understood, and the relationships between observed
levels of pollutants and health effects are subject to considerable un-
certainty. For effective decision making, a dose-damage curve must be
accompanied by an indication of its reliability.
Here we express reliability by drawing confidence limits around the
dose-damage curves. Dose-damage estimates of this type have been de-
veloped to:
Provide an empirical basis for illustrating risk-benefitmethodology.
Identify areas where further data would improve thequality of the results.
The attempt to provide an empirical basis proved available data
were sparse, fragmentary, too narrowly conceived, and in some cases,
contradictory. But it did set forth the considerations needed for a
7-1
comprehensive analysis of environmental health hazards in a manner that
documents the missing as well as the available data elements as clearly
as possible.
Cadmium Example
The concepts described above are first illustrated by applying
them to the case of cadmium. Very little is known about the processes
by which man's body extracts cadmium from his environment. Major un-
certainties exist as to absorption and retention as a function of routes
of intake, chemical forms of the element, and the synergistic or antago-
nistic effects of other components (Reference 3, Fulkerson, Chapter VI).
The best medical evidence (based on analysis of metabolic processes,
systemic effects, and dose response relationships) indicates that the
kidney is the critical organ in chronic cadmium poisoning. However,
statistical correlation studies indicate much higher cadmium-related
mortality rates from cardiovascular diseases and from cancer. For the
chronic exposures that are of interest in this study (chronic exposures
require stricter environmental standards than acute exposures), the sig-
nificant health threats appear to be bracketed on the low side by kidney
effects, and on the high side by cardiovascular and cancer effects.
Body Burden Model
Because of (1) uncertainties in the amounts and pathways of cadmium
in the body, (2) the several physiological systems involved, and (3) the
complicated internal cadmium redistribution that takes place among such
systems, we assume a simplistic view of how cadmium builds up in the body.
A certain fraction of the cadmium brought into the body by ingestion or
inhalation is absorbed into the bloodstream. The fraction absorbed by
ingestion is different from the fraction absorbed by inhalation. A
large fraction of the cadmium in the tissues is slowly excreted at a
7-2
rate that is proportional to the total amount present. There will be a
slow buildup until around age 50 when the amount leached from the total
body burden is the same as the amount deposited. Once this point is
reached the body burden will remain constant. The assumption of no
change in body burden after age 50 provides us with a convenient upper
limit on burden and a cutoff on time of exposure.
estimate that 24 hours exposure to air containing 1 pg/m of cadmium is
equivalent to a daily ingestion of 166 pg via food and water. (This
calculation assumes that cadmium absorption via the gut is as high as
via the lungs--a probable overestimate.) The multiplier for the two-
sigma confidence levels around this value is about 2.0.
To apply the above model it is necessary to know the levels of
cadmium in food, water, and air that will cause equal rates of buildup
in the body. The amount we use as a reference is a daily concentration3
of 1 pg/m of cadmium in air. From the data shown in Table 7-1, we3
equivalent of 0.01 pg/m or less in air. On the other hand; the cadmium
content of food in the daily American diet averages about 50 vg/day. Ex-
pressed in equivalent pg/m3, it ranges from about 0.10 to 0.70 pg/m3 with
an average of about 0.30 ug/m3.
no precautions are taken. According to Friberg,58 the maximum average
value reported at a U.S. nonfactory location was 0.05 pg/m3. The value
for lower Manhattan was 0.02 pg/m3, and values for nonurban sites were
0.003 pg/m3. Ingestion from water averages less than 2 pg/day--the3
than average. Concentrations averaging 1 pg/m3 or more can be found in
factories where cadmium is a major part of the industrial process and
Actually cadmium dust concentrations of 1 pg/m3 are much higher
58L. Fiberg et al., "Cadmium in the Environment: A Toxicological andEpidemiological Appraisal," APTD-0681; PB-199-795, prepared by theKarolinska Institute, Stockholm, Sweden, for the U.S. EnvironmentalProtection Agency, Air Pollution Control Office (April 1971).
7-3
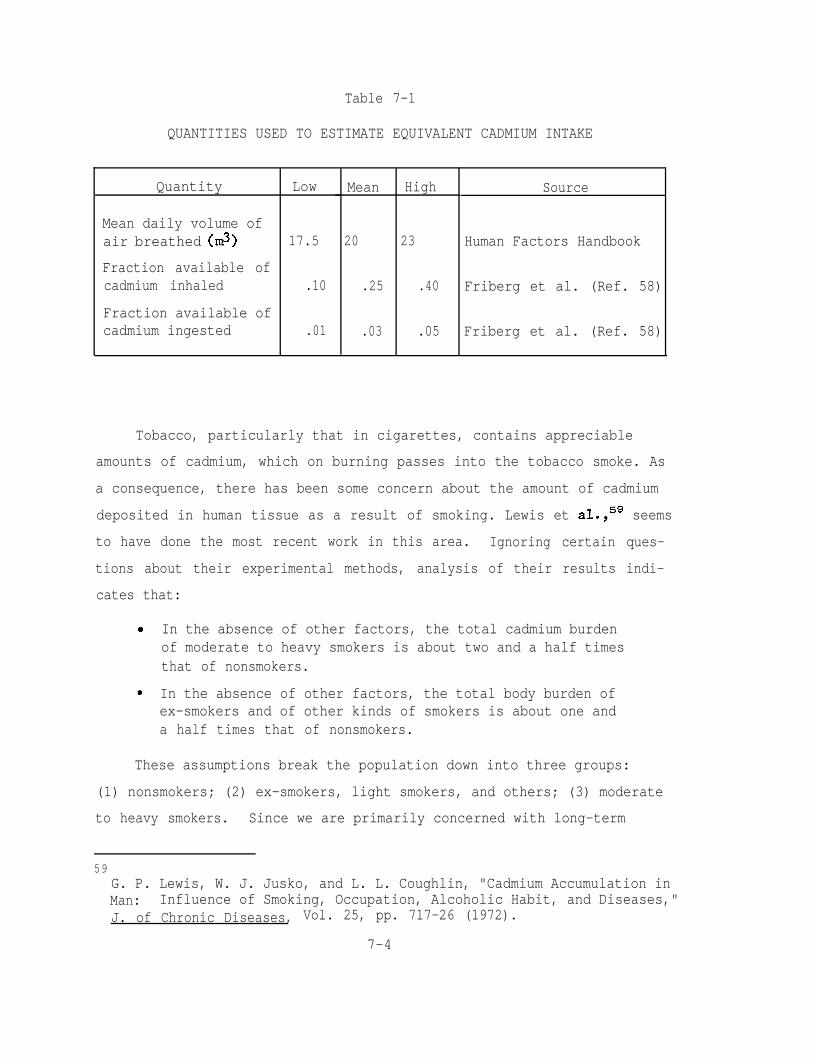
Table 7-1
QUANTITIES USED TO ESTIMATE EQUIVALENT CADMIUM INTAKE
Quantity
Mean daily volume ofair breathed (m3)
Fraction available ofcadmium inhaled
Fraction available ofcadmium ingested
Low
17.5
.10
.01
Mean High
20 23
.25 .40
.03 .05
Source
Human Factors Handbook
Friberg et al. (Ref. 58)
Friberg et al. (Ref. 58)
Tobacco, particularly that in cigarettes, contains appreciable
amounts of cadmium, which on burning passes into the tobacco smoke. As
a consequence, there has been some concern about the amount of cadmium
deposited in human tissue as a result of smoking. Lewis et al.,5s seems
to have done the most recent work in this area. Ignoring certain ques-
tions about their experimental methods, analysis of their results indi-
cates that:
In the absence of other factors, the total cadmium burdenof moderate to heavy smokers is about two and a half timesthat of nonsmokers.
In the absence of other factors, the total body burden ofex-smokers and of other kinds of smokers is about one anda half times that of nonsmokers.
These assumptions break the population down into three groups:
(1) nonsmokers; (2) ex-smokers, light smokers, and others; (3) moderate
to heavy smokers. Since we are primarily concerned with long-term
59G. P. Lewis, W. J. Jusko, and L. L. Coughlin, "Cadmium Accumulation inMan: Influence of Smoking, Occupation, Alcoholic Habit, and Diseases,"J. of Chronic Diseases, Vol. 25, pp. 717-26 (1972).
7-4
exposures, we have defined the distribution of the three classes in terms
of the age 50 population, making a midpoint interpolation between data
on smoking habits for 1959 and 1965, and taking into account gender-
related smoking habits.60 The percentage of nonsmokers is taken to be
65 percent, the percentage of light smokers is taken to be 10 percent,
and the percentage of moderate to heavy smokers is taken to be 25 percent.
Thus most Americans acquire cadmium mainly as a result of ingestion
(and, for smokers, through smoking), rather than through breathing of
cadmium in air. Average total rates are equivalent to 0.3 pg/m3 air3
concentrations for smokers and upwards of 1 pg/m for heavy smokers.
Figure 7-1 presents the basis for relating cadmium-produced mortal-
ities to cadmium exposures. The figure reflects estimates for cadmium
in food, water, tobacco, and air, which were converted to equivalent air3
exposure (expressed in equivalent Kg/m ) and multiplied by the years
of exposure. Units in the abscissa are labeled "equivalent" pg-years/m3
because of the various routes by which cadmium can enter the body, and
because, even with actual cadmium dust in air, the exposure need not be
full time (e.g., as in industrial exposures).
Dose-Damage Lower Limit
The lower dose-damage line was established from clinical studies
of abnormal amounts of protein in the urine (proteinurea) of workers
exposed to high cadmium air concentrations. Worker symptoms were then.
related to actuarial data on death rates from proteinurea. This clinical
function seems reasonably well-based, but it presents only one of the many
potential causes of cadmium mortality. To estimate dose, the mean time
6oE. Hammond and L. Garfinkel, "Changes in Cigarette Smoking 1959-1965,"Am. J. Public Health, Vol. 58, No. 1, pp. 30-45 (January 1968).
7-5
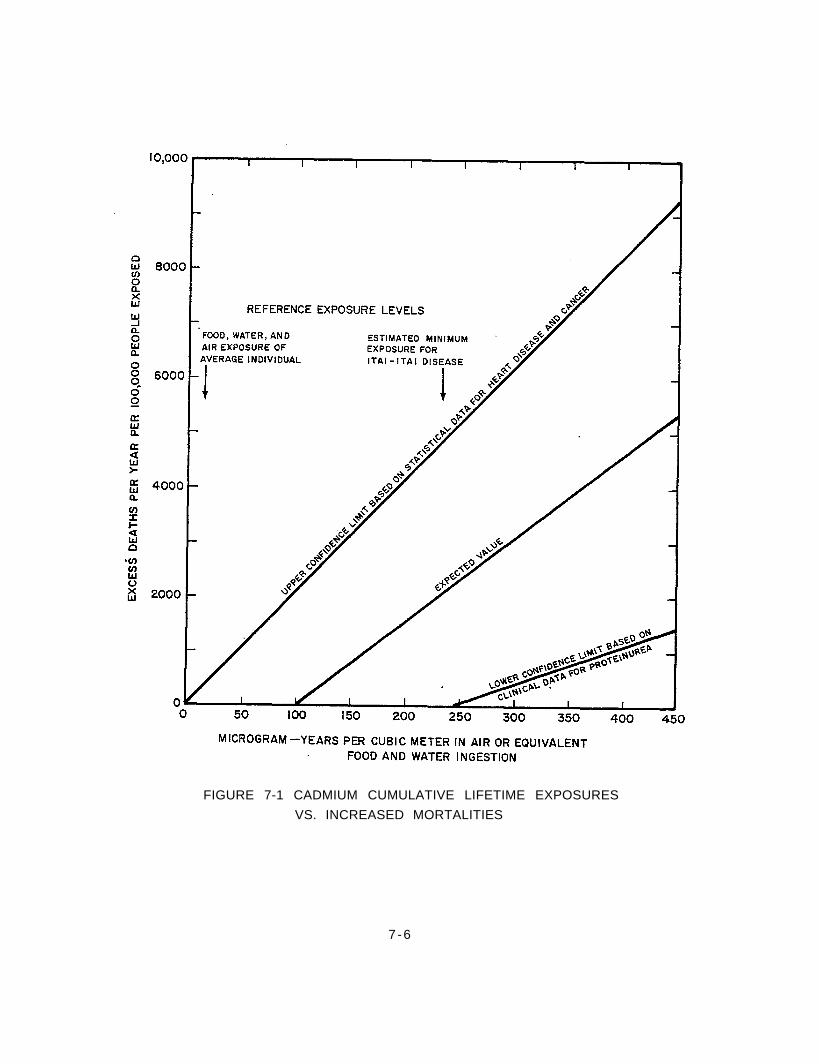
FIGURE 7-1 CADMIUM CUMULATIVE LIFETIME EXPOSURES
VS. INCREASED MORTALITIES
7-6
of employment for the workers was determined by the research team led by
Lauwerys'i from company records, and multiplied by his estimate of average
cadmium dust concentration in the air. The workers were exposed to cad-
mium in the factories roughly one-fourth of the time during their employ-
ment. To generalize on these results, we assume that the Lauwerys sub-
jects were only exposed to normal amounts of cadmium in air, water, and
food when away from the factory.
Mortalities associated with proteinurea are based on data appearing
in a U.S. Public Health Service report.62 That report estimated that if
the entire population were given a scanning test for excess proteinurea
there would be 600,000 positive results, and the expected annual excess
deaths in the group with positive test results would be 14,500: a rate
of 2,417 per 100,000. To obtain the rate for cadmium workers, we must
multiply this excess death rate by the fraction of exposed workers who
have proteinurea. Results of the calculation are shown by the lower
line in Figure 7-1. Its straight line form was considered adequate for
the purpose, considering the variability of exposure times and the un-
known error in the cadmium concentration estimates.
Dose-Damage Upper Limit
The high-risk estimate of Figure 7-1 was obtained from studies by
Hickeys3 and Carroll64 of the relation of the cadmium content of urban
air to disease of the cardiovascular system, and from Berg and Burbank's
61R. R. Lauwerys et al., "Epidemiological Survey of Workers Exposed toCadmium," Arch. Environ. Health, Vol. 28, No. 3, pp. 145-8 (March 1974).
62'tKidney Disease Program Analysis," a report to the Surgeon General,Public Health Service Publication No. 1745 (1967).
63R. J. Hickey, E. P. Schoft, and R. C. Clelland, "Relationship BetweenAir Pollution and Certain Chronic Disease Rates," Arch. Environ. Health,Vol. 15, No. 6, pp. 728-38 (1967).
64R. E. Carroll, "The Relationship of Cadmium in the Air to CardiovascularDisease Death Rates," J. Amer. Med. ASSOC., vol. 198, No. 3, pp. 267-70(17 October 1966).
7-7
study== of the relation of cadmium in water to cancer. The data are com-
bined into a single curve, and the uncertainties associated with this
curve are discussed. As will be seen, both results may only be corre-
lations rather than demonstration of cause and effect.
Using statistical data from the public Health Service, Hickey and
Carrol derived a mathematical relationship that indicated that people
living in urban environments with a high cadmium content suffer a higher
death rate from heart disease than people living in a low cadmium environ-
ment.63, e4,aa Health effects considered included chronic and unspecified
nephritis and other renal sclerosis (International Classification of
Diseases 592-594), diseases of the heart (400-402, 410-443), diseases of
the cardiovascular system (330-334, 400-468), arteriosclerotic heart
disease (420), hypertensive heart disease (440-443), diabetes mellitus
(260), general arteriosclerosis (450) and malignant neoplasms of the
respiratory system (160-164). The more important regression equations
indicated statistically significant correlations between the incidence of
diseases of the heart and the concentrations of cadmium in the urban air
of most major U.S. cities.
Other investigators have disputed these conclusions by claiming (1)
faulty analytical techniques, or (2) stronger statistical correlations
with population density. However, our intensive review indicates that
the evidence based upon statistical inferences is reasonably well-founded
and cannot be ignored. At the same time, the Hickey and Carroll data
ssJ. W. Berg and F. Burbank, "Correlations Between Carcinogenic TraceMetals in Water Supplies and Cancer Mortality," pp. 249-64 in "Geo-Chemical Environment in Relationship to Health and Disease," H. C. Hoppsand H. L. Cannon, editors, Ann. N.Y. Acad. Sci., Vol 199 (28 June 1972).
ss"Vita1 Statistics of the United States 1969, Vol. II-Mortality, PartB," Public Health Service, National Health Center for Health Statistics(1973).
7-8
cannot be accepted literally. If their data were extrapolated to the
maximum exposure found in the Lauwerys data, 463 pg yr/m3 over a 28-
year period, fewer than one percent of the subjects would have survived.
(The principal assumptions used in this extrapolation are that any heart
deaths in excess of 280 per 100,000 per year are due to cadmium in air,
that the currently reported concentrations represent the endpoint of a
linear buildup over 59 years, and that the excess death rates apply to
people 50 years or older.) The observation leads us to believe that in
the urban environment, the observed air concentration correlation with
heart mortalities is a surrogate for some more basic effect such as that
of arsenic, rather than a direct cause.
Under the current view, cadmium normally enters the human system
primarily via food, and secondly through water. Since the food consumed
in most urban environments normally comes from a much wider and primarily
nonurban region, we have assumed that urban air readings are partially
correlated with water concentrations, but not with food concentrations.
To treat the water relationship quantitatively, we have assumed that for
every additional nanogram per m3 in air above the "uncontaminated" level
of 1 nglm3, the local water concentration will increase 0.5 yg/liter
above its "uncontaminated" level of 1 pg/liter.
Table 7-2 shows our derivations from the Hickey-Carroll estimates
of excess heart death rates for people over 50. It incorporates our
assumptions concerning cadmium intakes from all three sources--air,
water, and food--for urban areas, when the air readings are 0.001 and
0.04 pg/m3, respectively.
Another statistical correlation, by Berg and Burbank9 has impli-
cated cadmium in water as a factor in all cancer (International Classifi-
cation of Diseases, pp. 140-205). Since neither regression equations
nor original data were given, the dose-damage correlation was derived by
7-9
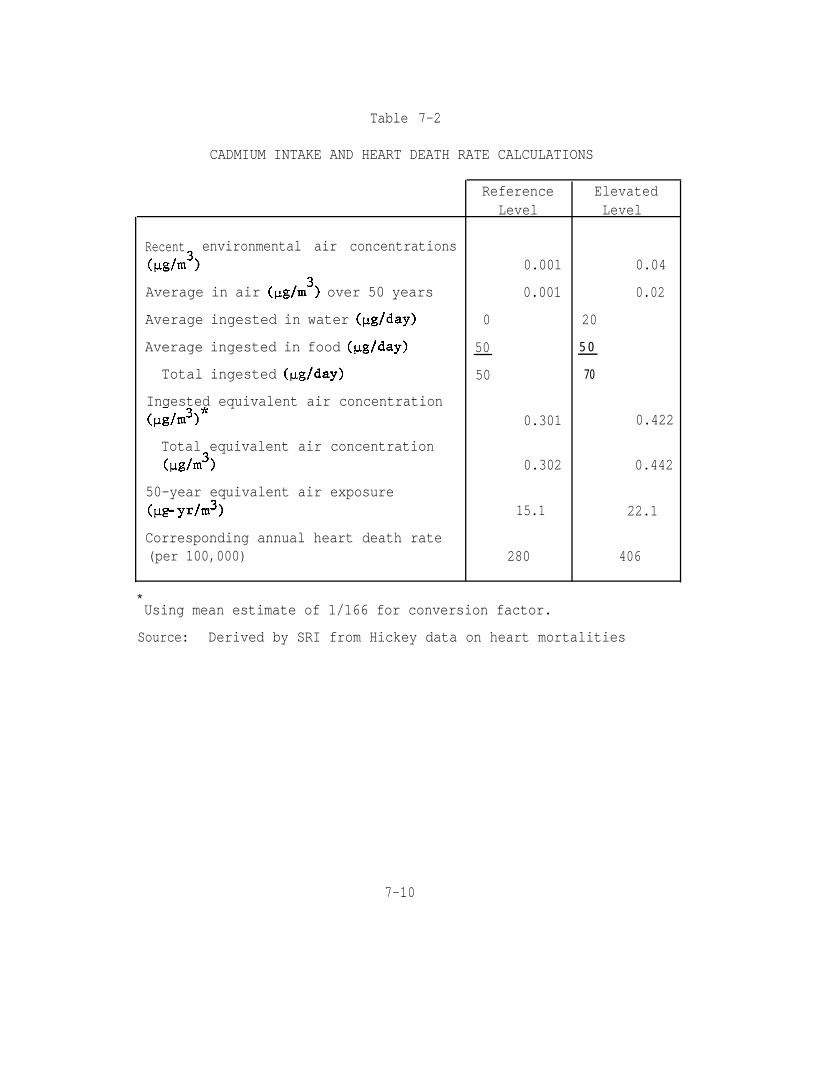
Table 7-2
CADMIUM INTAKE AND HEART DEATH RATE CALCULATIONS
Recent environmental air concentrations
(w/m
Average in air (rJg/m3) over 50 years
Average ingested in water (pg/day)
Average ingested in food (pg/day)
Total ingested (pg/day)
Ingested equivalent air concentration(clgIm3)*
Total equivalent air concentration(pdm3)
50-year equivalent air exposure
(t-w yr/m3>
Corresponding annual heart death rate(per 100,000)
Reference ElevatedLevel Level
0
50
50
0.001
0.001
0.04
0.02
20
5 0
70
0.301 0.422
0.302 0.442
15.1 22.1
280 406
*Using mean estimate of 1/166 for conversion factor.
Source: Derived by SRI from Hickey data on heart mortalities
7-10
regression from Berg's graph showing the colon and rectum mortalities
(153-154) as a function of cadmium in water. The total cancer mortality
rate was derived by multiplying Berg's dose-damage points by the ratio
of total cancer deaths to the colon and rectum cancer deaths, as reported
in the U.S. Vital Statistic@ for 1969.
As was the case for the heart data, there are good reasons why the
Berg data cannot be interpreted literally. In the first place, our
reference level for the normal cadmium content in water, 1 yg/liter is
significantly higher than the values used by Berg and Burbank, which
averaged only 0.11 pg/liter of cadmium. Secondly, if the reported water
values are converted to equivalent rJ,g-yr/m3, a dose-damage slope steeper
even than that from the heart data is obtained. The Lauwerys subjects
would have been less likely to survive cancer than they would have heart
disease. Thus, the best hypothesis for the demonstrated correlation be-
tween basin-wide cadmium concentration in water and excess cancer mortal-
ities is that the concentration values must be a surrogate for some more
basic effect, rather than a direct cause.
The most important analytical condition for cancer mortalities has
to do with how the basin-wide observations are related to the amounts
of cadmium ingested via air and food. The basic assumptions used here
are that the effect of air is negligible and that there is a linear re-
lation between water and food. This set of assumptions is based on (1)
the known quantities of cadmium people inhale or ingest, via air, water,
and food, and (2) the hypothesis that water concentrations affect food
concentrations for local residents.
The dose-damage results for cancer mortalities were combined with
the result for heart mortalities to produce the upper line in Figure 7-1.
Confidence limits were calculated for each source curve, but since the
range of the confidence limits was small relative to the spread between
source curves, these limits are not considered further. The large spread
7-11
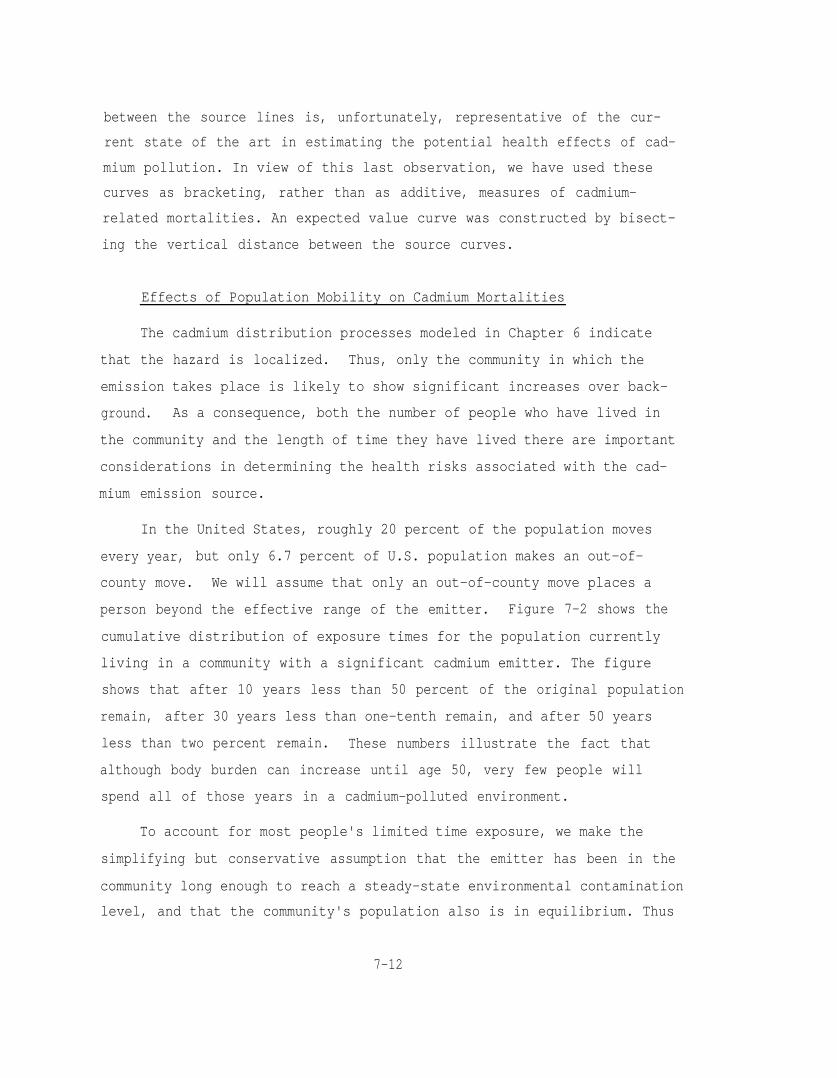
between the source lines is, unfortunately, representative of the cur-
rent state of the art in estimating the potential health effects of cad-
mium pollution. In view of this last observation, we have used these
curves as bracketing, rather than as additive, measures of cadmium-
related mortalities. An expected value curve was constructed by bisect-
ing the vertical distance between the source curves.
Effects of Population Mobility on Cadmium Mortalities
The cadmium distribution processes modeled in Chapter 6 indicate
that the hazard is localized. Thus, only the community in which the
emission takes place is likely to show significant increases over back-
ground. As a consequence, both the number of people who have lived in
the community and the length of time they have lived there are important
considerations in determining the health risks associated with the cad-
mium emission source.
In the United States, roughly 20 percent of the population moves
every year, but only 6.7 percent of U.S. population makes an out-of-
county move. We will assume that only an out-of-county move places a
person beyond the effective range of the emitter. Figure 7-2 shows the
cumulative distribution of exposure times for the population currently
living in a community with a significant cadmium emitter. The figure
shows that after 10 years less than 50 percent of the original population
remain, after 30 years less than one-tenth remain, and after 50 years
less than two percent remain. These numbers illustrate the fact that
although body burden can increase until age 50, very few people will
spend all of those years in a cadmium-polluted environment.
To account for most people's limited time exposure, we make the
simplifying but conservative assumption that the emitter has been in the
community long enough to reach a steady-state environmental contamination
level, and that the community's population also is in equilibrium. Thus
7-12
FIGURE 7-2 CUMULATIVE PROBABILITY OF A RESIDENTLEAVING COUNTY OVER TIME
7-13
each year a group of people who lived in the community no longer acquire
an excess body burden because they move, or because they reach age 50.
Of the community's population 6.7 percent move away and 1.1 percent
reach age 50 each year, so that 7.8 percent cease collecting meaningful
exposures. Under the steady-state assumption, they are replaced by a
new 7.8 percent of whom 6.7 percent move into the community and 1.1 per-
cent are born there.
It will also be conceptually useful to assume that (1) all people
leave or enter the community at the same time, say the beginning of each
year and (2) that, at most, people will only have one significant expo-
sure to cadmium; i.e., if they leave they do not return. In the present
context, both of these assumptions have a negligible effect on the out-
come.
Let n,(J) be the number of people who have been exposed for t years
at time J, and let P be the probability of terminating exposure after
any given year. Since the exposure process has reached equilibrium.
(7-1)
for any t and J. Therefore we can drop the J notation and note that at
the end of each period, ntP will terminate their exposure. The number
of people who will be exposed for t+1 years is given by
(7-2)
and by iteration from time 0
7-14
(7-3)
Now at any given time the number of people in the various year groups
must sum to the total size of the population being exposed, S, i.e.,
(7-4)
Combining Equations (7-3) and (7-4) and converting the series, we obtain
(7-5)
Thus we can define no by
(7-6)
Let f, be the fraction of the population with an exposure of t years
(7-7)
Combining Equations (7-3), (7-6), and (7-7) we obtain
(7-8)
Finally, if we symbolize the fraction of total population with an expo-
sure of t or less years by Ft, we can write
(7-9)
7-15
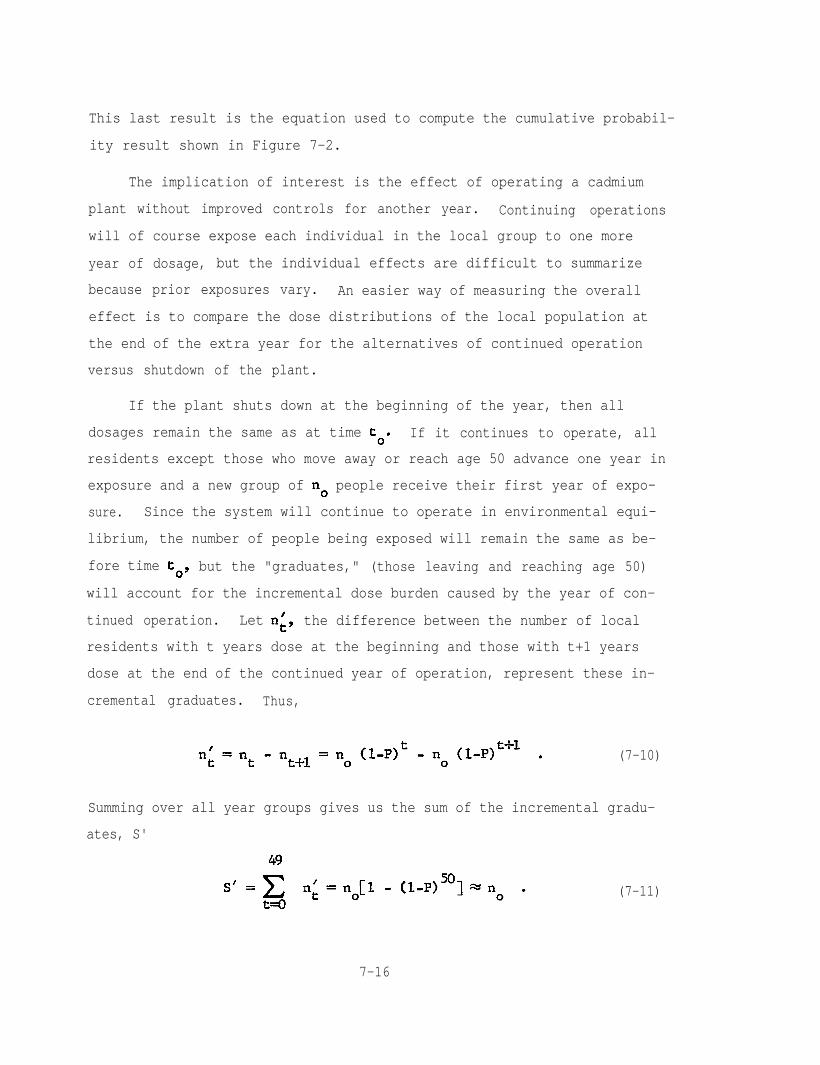
This last result is the equation used to compute the cumulative probabil-
ity result shown in Figure 7-2.
The implication of interest is the effect of operating a cadmium
plant without improved controls for another year. Continuing operations
will of course expose each individual in the local group to one more
year of dosage, but the individual effects are difficult to summarize
because prior exposures vary. An easier way of measuring the overall
effect is to compare the dose distributions of the local population at
the end of the extra year for the alternatives of continued operation
versus shutdown of the plant.
If the plant shuts down at the beginning of the year, then all
dosages remain the same as at time to. If it continues to operate, all
residents except those who move away or reach age 50 advance one year in
exposure and a new group of no people receive their first year of expo-
sure. Since the system will continue to operate in environmental equi-
librium, the number of people being exposed will remain the same as be-
fore time to, but the "graduates," (those leaving and reaching age 50)
will account for the incremental dose burden caused by the year of con-
tinued operation. Let ni, the difference between the number of local
residents with t years dose at the beginning and those with t+1 years
dose at the end of the continued year of operation, represent these in-
cremental graduates. Thus,
(7-10)
Summing over all year groups gives us the sum of the incremental gradu-
ates, S'
(7-11)
7-16
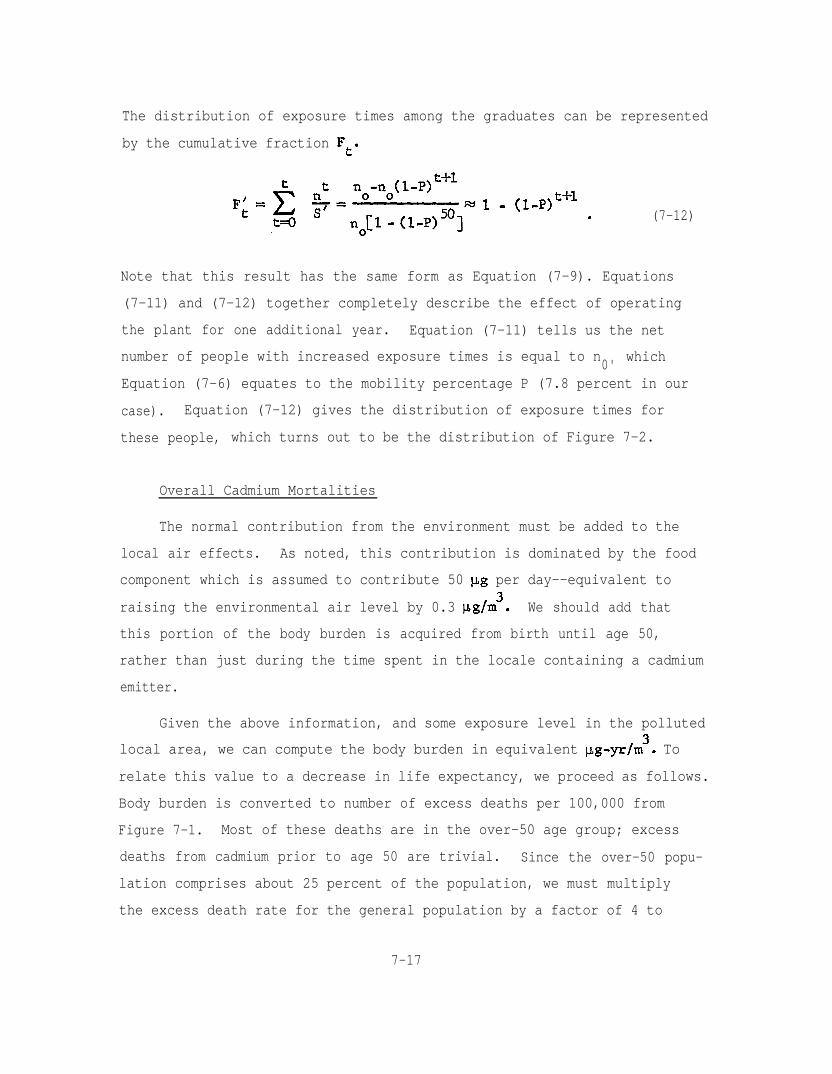
The distribution of exposure times among the graduates can be represented
by the cumulative fraction Ft.
(7-12)
Note that this result has the same form as Equation (7-9). Equations
(7-11) and (7-12) together completely describe the effect of operating
the plant for one additional year. Equation (7-11) tells us the net
number of people with increased exposure times is equal to n0'
which
Equation (7-6) equates to the mobility percentage P (7.8 percent in our
case). Equation (7-12) gives the distribution of exposure times for
these people, which turns out to be the distribution of Figure 7-2.
Overall Cadmium Mortalities
this portion of the body burden is acquired from birth until age 50,
rather than just during the time spent in the locale containing a cadmium
emitter.
The normal contribution from the environment must be added to the
local air effects. As noted, this contribution is dominated by the food
component which is assumed to contribute 50 p,g per day--equivalent to
raising the environmental air level by 0.3 pg/m3. We should add that
lation comprises about 25 percent of the population, we must multiply
the excess death rate for the general population by a factor of 4 to
Body burden is converted to number of excess deaths per 100,000 from
Figure 7-1. Most of these deaths are in the over-50 age group; excess
deaths from cadmium prior to age 50 are trivial. Since the over-50 popu-
Given the above information, and some exposure level in the polluted
local area, we can compute the body burden in equivalent pg-yr/m3. To
relate this value to a decrease in life expectancy, we proceed as follows.
7-17
determine the excess rate in the over-50 group. The reciprocal of the
normal plus excess death rate equals their average life expectancy. Sub-
traction of this life expectancy from 20 years (the average age of dying
for people at 50 was conservatively taken to be 70) then gives the life
shortening due to the extra cadmium exposure.
Risks of Cadmium to the General Population
We have chosen to state the health risks of cadmium in terms of
life loss. The direct and indirect risks of illness might also be con-
sidered, but these other economic effects are generally smaller, particu-
larly for such risks as cancer and circulatory diseases.67 Furthermore,
the "willingness to pay" concept of risk evaluates all subjective safety
risks in terms of mortality cost, so the other risks can be neglected.s%ss
To determine the number of people exposed to cadmium around zinc
smelters we have assumed a constant population density of loo/km2 and
integrated their exposures over (1) distance and (2) time spent in the
area. The mobility model implies that each year 7.8 percent of the popu-
lation of a risk area cease to acquire additional body burden. The total
annual life shortening suffered by the departing 7.8 percent serves as
the measure of annual life shortening effects among all the people exposed.
s7D. P. Rice, "Evaluating the Cost of Illness," HEW, Public Health Service,Table 3.1 (May 1966).
s*E. J. Mishan, "Evaluation of Life and Limb: A Theoretical Approach,"J. Political Economy, Vol. 79, No. 4, pp. 687-706 (July-August 1971).
ssJ. Hirshleifer, et al., Applying Cost-Benefit Concepts to ProjectsWhich Alter Human Mortality, Univ. of Calif., Los Angeles (November1974).
7-18
To carry out the integration process we proceed as follows. The
people at risk are partitioned into groups with similar distance and
duration of exposure, using Figures 6-2 and 7-2. We calculate the number
in each group and their average dose. With the aid of Figure 7-1, the
excess death rate is obtained and added to the normal death rate, 0.05.
The reciprocal of this sum is the average life expectancy (for 50-year-
old people). Subtracting life expectancy from 20 years, the normal life
expectancy, gives us the average life shortening for the group. Summing
the product of number of people times years lost over all groups at risk
produces the total number of person-years of, life shortening. To obtain
the average number of years of life shortening per person, we divide by
the total number of people at risk.
Results of integrating by this method for U.S. smelters indicates
that for each year we continue to operate the smelters, 33 people among
the U.S. population lose 166 person-years from life shortening. The
average years lost per fatality is 5 years.
By using the same methods, we conclude that municipal incinerators
constitute a much less serious cadmium problem. The area of significant
smelter effects was found to be less than 100 km2. In this range the
incinerator generated pollutant levels are less than 1/1000 of the
smelter-generated incinerator levels, so instead of the 166 person-years
quoted above the life shortening is less than one (and probably less
than one-tenth) person-year.
Asbestos Example
In this subsection, the data on asbestos air concentrations are
combined with dose-damage relations to arrive at the risks to health from
asbestos.
Significant data exist on several asbestos-related health effects.
These data have been obtained from studies of various types of asbestos
7-19
workers, and have been used to relate estimates of exposure to the
various health effects. Furthermore, the principal mode of entry into
the human body for asbestos appears to be via the lungs (EPA is currently
supporting work to better define the hazards of other ingestion modes).
Consequently neither a basic body burden model, nor a system for convert-
ing ingested or tobacco-related asbestos to equivalent amounts in the
air is required.
The principal known health effects produced by asbestos are:
Respiratory system diseases, such as pneumocosis, pul-monary fibrosis, and asbestosis.
Respiratory system cancers, such as those of the lung,bronchus, trachea, and pleura.
Mesothelioma: a rare cancer of the chest cavity asso-ciated primarily with asbestos exposure.
For asbestos workers, mesothelioma appears to be the most significant
asbestos-related cause of death. Other cancers, taken as a group, appear
to be roughly comparable, while asbestosis produces about one-third as
many deaths. Asbestosis also produces a significant number of workers
requiring treatment or compensation, but these effects are not included
in the present analysis. Various studies of the ingestion of asbestos,
primarily via water have concluded that in normal circumstances, the
amounts involved are too small to produce cancer.
Prior to the discovery of high concentrations of asbestos in the
drinking water of communities near Duluth on Lake Superior, an asbestos
study was undertaken by the American Water Works Association Research
Foundation to evaluate whether the use of asbestos-cement pipe was a
health hazard.'0 It concluded that although such pipe was a potential
'o"A Study of the Problem of Asbestos in Water," by the American WaterWorks Association Research Foundation, Am. Water Works Assn., Vol. 66,No. 9, Part 2, pp. 1-22 (September 1974).
7-20
source, the highest concentration of water-borne asbestos would result
in 0.07 gram ingested in 60 years. (Amounts inhaled from industrial
exposures over a similar period, according to the Enterline group, could
amount to 336 grams.) The Water Works study concluded that there was
no convincing medical evidence that these small concentrations in water
would produce a risk of cancer. Another group studying the Duluth situ-
ation arrived at a similar conclusion.
The only study implying that ingested asbestos could cause cancer
suggested that the excessive stomach cancers exhibited by a selected
Japanese population was caused by the use of talc containing asbestos
as a polishing compound for rice.71 As a result of the negative findings
of animal feeding70 and the lack of corroborative data from other statis-
tical studies such as that of Masson, it was decided to exclude asbes-
tos ingestion as a variable in this study.
Dose-Damage Relationship
Figure 7-3 is the basis for relating asbestos mortalities to the
pollution conditions estimated by the methods of Chapter 6. The lines
shown represent excess death rates caused by the indicated asbestos doses,
measured in nanogram-years per cubic meter. Death rates are obtained by
summing over the individual causes mentioned above. Since most measure-
ments are related to asbestos fibers with a length greater than 5 microns,
the current industrial standard of five fibers per cubic centimeter has
been converted to the grams per cubic meter dosage measure. The confi-
dence limits indicate the uncertainty in death rate associated with a
71R. R. Merliss, "Talc-Treated Rice and Japanese Stomach Cancer," Science,Vol. 173, pp. 1141-2 (17 September 1971).
72T. J. Masson, F. W. McKay, and R. W. Miller, "Asbestos-Like Fibers inDuluth Water Supply--Relation to Cancer Mortality," J. Amer. Med. Assn.,Vol. 228, No. 8, pp. 1019-20 (20 May 1974).
7-21
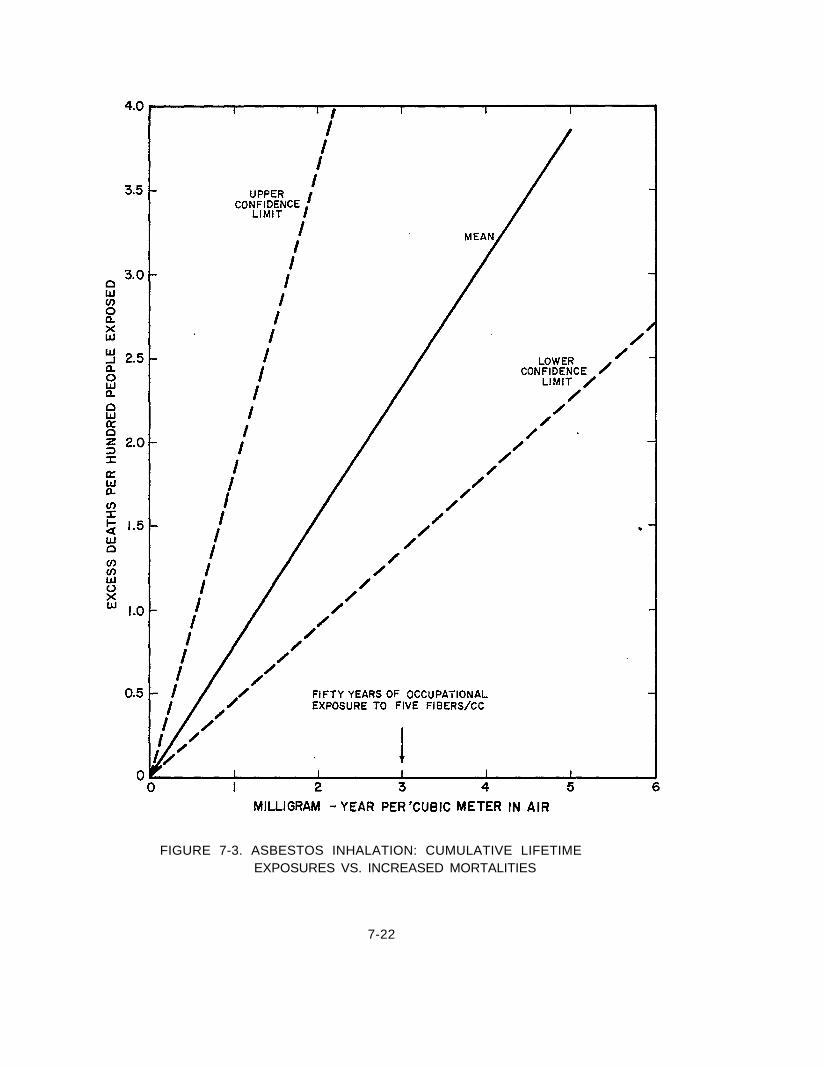
FIGURE 7-3. ASBESTOS INHALATION: CUMULATIVE LIFETIMEEXPOSURES VS. INCREASED MORTALITIES
7-22
given dose estimate. Since the death rate is an excess rate, associated
with some level of asbestos dose, an excess rate of zero must be associ-
ated with a zero dose level. However, we have no idea of what the con-
fidence Limits look like in the low dose region.
Four dose/damage diagrams for respiratory diseases, mesothelioma,
other respiratory cancers, and asbestosis were derived from industrial
data of Enterline, Roach,74 Bruckman,es and Selikoff.7s The diagrams
are shown in Figures 7-4, 7-5, 7-6, and 7-7. Three of them are curvi-
linear rather than straight line approximations to the original data,
but linear estimates have been used to synthesize overall asbestos mor-
talities in Figure 7-3. All show asbestos exposures in fiber-years per
cc (for fibers sizes greater than 5 microns) versus death rates, except
the last which gives rates of asbestos illness.
We encountered several uncertainties in the original data. The
Enterline doses for cancer and respiratory diseases were measured in
millions of particles per cubic foot (MPPCF) by the "impinger" method.
In contrast, the asbestosis dose/damage curve was developed using a mem-
brane filter and counting asbestos fibers greater than 5 microns in
length. NIOSH has recently accepted the latter data as the best avail-
able and has established U.S. working place standards in terms of fibers
per cc (longer than 5 microns).
73P. Enterline, P, DeCoufle, and V. Henderson, "Mortality in Relation toOccupational Exposure in the Asbestos Industry," J. Occup. Med., Vol.14, No. 12, pp. 897-903 (December 1972).
v4S. A. Roach, "Hygiene Standards for Asbestos," Ann. Occup. Hyg., Vol.13, pp. 7-15 (1970).
7sI. J. Selikoff, "Asbestos Criteria Document Highlights," ASSE Journal,pp. 26-33 (March 1975).
7-23
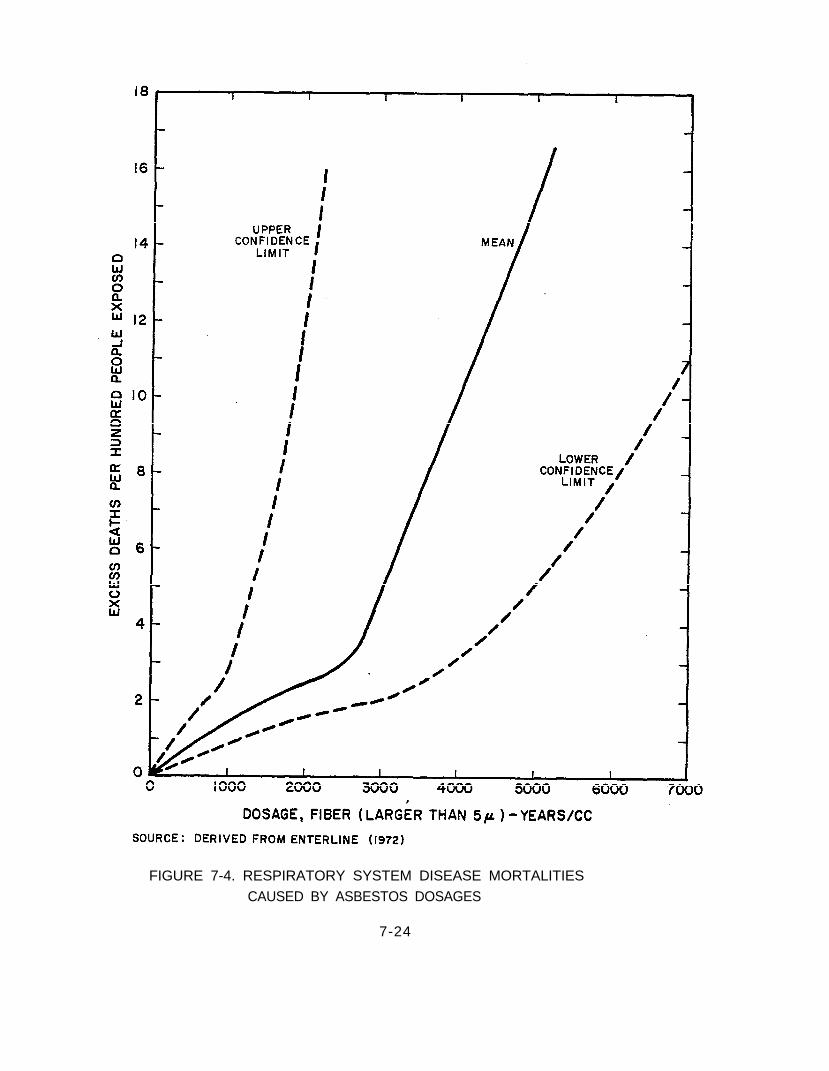
FIGURE 7-4. RESPIRATORY SYSTEM DISEASE MORTALITIESCAUSED BY ASBESTOS DOSAGES
7-24
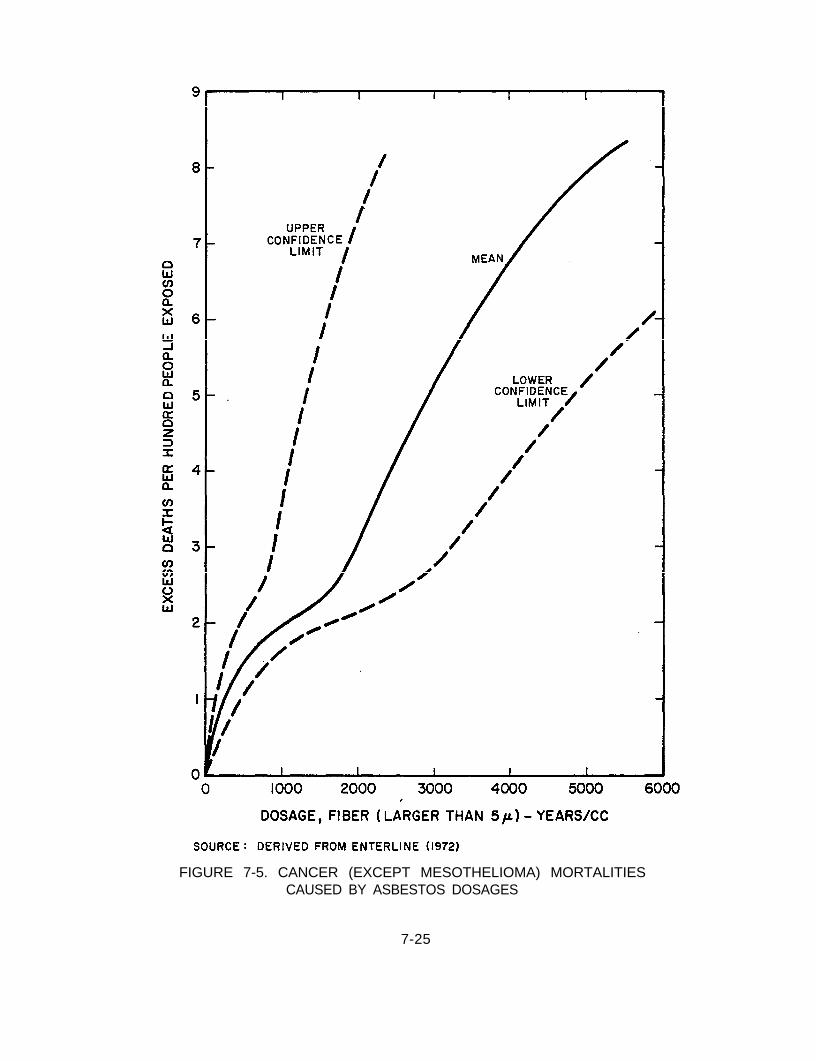
FIGURE 7-5. CANCER (EXCEPT MESOTHELIOMA) MORTALITIESCAUSED BY ASBESTOS DOSAGES
7-25
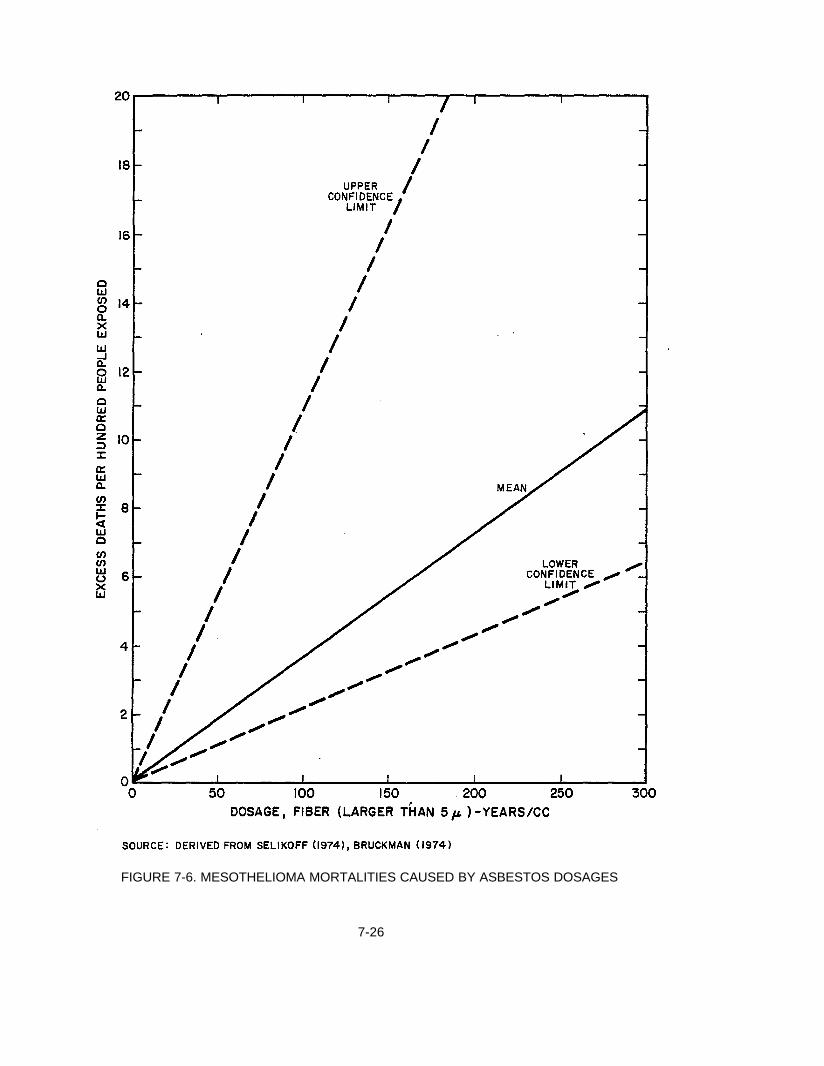
FIGURE 7-6. MESOTHELIOMA MORTALITIES CAUSED BY ASBESTOS DOSAGES
7-26
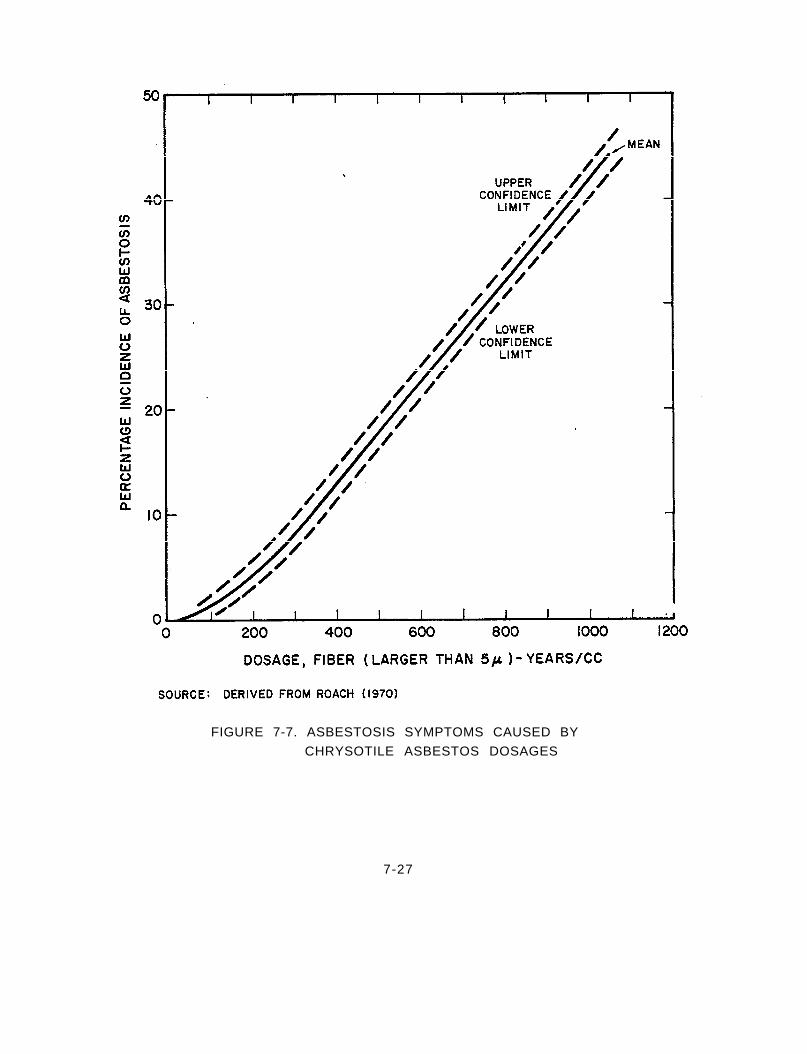
FIGURE 7-7. ASBESTOSIS SYMPTOMS CAUSED BY
CHRYSOTILE ASBESTOS DOSAGES
7-27
To reduce the Enterline dosage data from MPPCF-years to fiber-
years/cc the conversion factors suggested by Ayer% 77 were used. Unfor-
tunately, Ayer presents a grand mean conversion ratio (fibers/MPPCF =
5.4) from measurements covering a range of almost four to one. They were
made at four different plants that employed five different operations to
process asbestos fibers. The range in conversion factors placed wider
limits on the data than the uncertainty in dosages, so the conversion
ratios may be assumed to be measures of reliability of the data. In
Figures 7-4 and 7-5, the grand mean conversion factor fibers/MPPCF =
5.4 was used as the best estimator of the mean, and the extreme conver-
sion factors were used as confidence limits.
There were other data reduction problems. For asbestosis, the
British (Roach,7o Lane78) include a confidence level of one percent risk
of asbestosis in their estimate of the exposure. The values estimated
are a mean = 112 fiber-years/cm3 and lower confidence (two-sigma) limit
of 51 fiber years/cm3 at the 90-percent level, or a confidence multiplier
of about 2. The Enterline data on cancer and respiratory diseases im-
plied a two-sigma confidence limit multiplier of about 1.3.
The mesothelioma diagram presents the largest uncertainty of all
because of conflicting statistics in two references, both attributing
their original data to the same source. Our derivation from data reported
76H. D. Ayer and J. R. Lynch, "Motes and Fibers in the Air of AsbestosProcessing Plants and Hygienic Criteria for Airborne Asbestos,"pp. 511-22 in Inhaled Particles and Vapours II (Pergamom Press, 1965).
77H. E. Ayer et al., "A Comparison of Impinger and Membrane FilterTechniques for Evaluating Air Samples in Asbestos Plants," pp. 274-87in Biological Effects of Asbestos, Ann. N.Y. Acad. Sci., Vol. 132(December 1965).
7sR. E. Lane et al., "Hygiene Standards for Chrysotile Asbestos Dust,"from the Committee on Hygiene Standards of the British OccupationalHygiene Society, Ann. Occup. Hyg., Vol. 11, pp. 47-69 (1968).
7-28
by Bruckman36 yielded a dose-damage curve five times as steep as the
curve from data reported by Selikoff.7s If these are considered as a
sample of two in a log normal distribution, the two-sigma confidence
limits will be multiplying and dividing factors of 10 about the geomet-
ric mean.
Conversion of industrial exposures into units that are consistent
with continuous exposure to ambient air concentrations of asbestos re-
quires a conversion from fibers/cm3 (greater than 5 p) into absolute
weight concentrations. The convention of Bruckman was used. Dose-
damage diagrams constructed by this method provide the basis for the
total fatalities predicted in Figure 7-7.
Another major uncertainty in the above data is the determination
of the dosage, since from 20 to 40 years elapse before detrimental health
effects become apparent. Throughout the development of the dose/damage
diagrams in this report, one of the basic assumptions was that the dosage
occurred year after year, throughout the workers lifetime. However,
Selikoff points out that "years of exposure" are not necessarily synony-
mous with "years from onset of exposure." An important variable is
lacking from our predictive dose-disease response diagram--the residence
time of the asbestos in the lungs. Therefore, such cancers as mesothe-
lioma may be caused by extremely short exposures that trigger the onset
of the disease some 20 to 30 years later.
Another explicit assumption involved in the development of our
dose/response curves is that there is no safe Level of exposure (i.e.,
no threshold Limit) to asbestos dust. We extrapolated the industrial
data linearly to zero dosage at zero damage. Also this extrapolation is
ysI. J. Selikoff, "Asbestos Criteria Document Highlights," ASSE Journal,pp. 26-33 (March 1974).
7-29
made below the lowest industrial exposure data. It is assumed that this
treatment of the data must have some degree of validity as a predictive
model since a survey of 17,800 asbestos insulation workers gave total
fatalities that are in plausible agreement with the curve used here.7s
Risks of Asbestos
As a first approximation we have assumed that population movement
will not affect asbestos dose estimates--since the industrial and other
sources of asbestos pollution are rather widely spread. Also as a first
approximation, the treatment of life shortening should be the same as
that used in the case of cadmium.
Inspection of Figure 6-3 will show that the maximum asbestos expo-
sure Level is about 20 ng/m3. Thus a worst case for a 50-year exposure
by the general public is 1,000 ng/yr/m3. But the dose in Figure 7-3 is
expressed in millions of nanogram years per cubic meter--a thousand
times as severe. Extrapolating the best estimate line into the low dose
region we find that the excess death rate per 100,000 exposures is less
than one. Note this is a result to which we can attach, at best, order
of magnitude confidence. However, if the mean curve is at all repre-
sentative, then our result indicates essentially zero health effects for
the asbestos air exposures to the general population specified in Figure
6-3.
The result shows negligible hazards whether the exposed population
densities are 2,374/ktn2 as estimated in Chapter 4 or 200/km2 as estimated
in Chapter 6. But it does not, of course, indicate that hazardous doses
could not be obtained by a relatively few mine, factory, construction
workers, and others who are in close personal contact with asbestos.
7-30
Chapter 8
COMBINING RISK, BENEFIT, AND OTHER CONSIDERATIONS
Introduction
All of the data collected in the foregoing chapters are of little
use for decision purposes until they can be formulated in some fashion
that will permit comparison of the various considerations involved. The
optimum manner of formulating the problem depends on how and by whom the
choice is to be made, which in turn depends on the environment of the
decision situation.
Because these are largely questions of human beliefs and values,
it should be axiomatic that the choice of alternatives rest with a human
decisionmaker, rather than with a fully programmed machine or procedure.
However, attempts to fully automate social choices have been suggested
in so many decision methodologies that some caution is in order. The
methodology illustrated here is not one that pretends independence of
the human decisionmaker. Too many nonquantifiable, incommensurable, and
incompatible factors are involved to expect that any standard procedure
could be relied on to substitute for human judgment.
Alternative Criteria Formulation Methods
Some efficient protocol for arranging and comparing the data is
obviously needed to help the decisionmaker deal with the complexities
of the problem. Essentially, there are three methods of choosing from
among alternatives. Simplest is the method of choosing on the basis of
one parameter and ignoring all other considerations. As Chapter 2 illus-
trates, this is the method of "zero tolerance" and "permissible limit"
8-1
types of standards that rely only on risk considerations. It is also
the method of "best technology," which relies exclusively on economic
or operational feasibility.
The second method is to attempt to combine all the important de-
cision factors into one overall measure of value, such as money, lives,
or "utility" and then to choose as above on the basis of which alterna-
tive has the most of this measure. An example is the method of conven-
tional cost/benefit procedures, which assumes that all important factors
can be expressed and then compared in dollar terms. As was explained
in Chapter 2, the world is nearly always too complex for such a model.
Even when two incommensurable parameters such as risk and benefit are
combined as the two dimensions of a single diagram, they have only re-
duced the number of unknown parameters from n to n-1.
The third method, multiple criteria decisionmaking, incorporates
the comparison procedures of the cost/benefit method and in addition
uses these criteria as variables and constraints in special ways. Even
this method is not generally able to array decision variables that are
nonquantifiable or incommensurable with each other, but it does incor-
porate a wider and more realistic picture of most decision situations
than the other two methods.
The Recommended Method
This third method is the one advocated in the present study. Ex-
pressed in its simplest logic, the multiple criteria method of formulat-
ing data for decisionmakers involves the following four types of con-
siderations:
(1) The two dominant criteria to be compared and "traded-off"against one another--in this case, risk measured in liveslost and benefits measured in dollars--are quantified asin Chapters 5 and 7. Then their values for alternativeactions of interest are compared as independent dimensionsin a two-dimensional graph (see Figure 8-1A).
8-2
FIGURE 8-1. METHODS OF DISPLAYING DECISION CRITERIA
8-3
(2) Next, other incommensurable criteria, such as maximumlimits in the risk, benefit or combined dimensions, canbe added to enclose the possible decision domain. Allvalues outside of this domain are infeasible (see Figure8-1B).
(3) Several iterations of steps (1) and (2) can be made fordifferent populations or for subgroups of the same pop-ulation, to ensure that all population groups fall with-in the decision domain or meet other common criteria.Distributional aspects of multiple criteria problems,such as comparisons of trade-offs among different geo-graphic areas, can be examined by this means (see Fig-ure 8-1C).
(4) Finally, a catch-all array of criteria that relate tothe decision problem but are not comparable to themultiple quantitative criteria can be constructed sothat the decisionmaker will have recall access to allof the significant considerations that might be expectedto influence his choice (see Figure 8-1D).
Handling Uncertainties
Treatment of uncertainties is of major importance for any of the
criteria because the uncertainties are nearly always significant and are
sometimes dominant. Furthermore, many of the analytical methods advocated
here accentuate the influence of uncertainties, for example: (1) estab-
lishing criteria on the basis of cumulative factors each of which in-
corporates some uncertainty; (2) calculating the ratios of two different
uncertain criteria; and (3) comparing the difference between uncertain
criteria. As will be seen in the next chapter, many decision problems
are more dependent on the resolution of uncertainties than they are on
the comparison of expected values.
For these reasons, uncertainties have been estimated and cumulated
in the preceding chapters according to estimates of confidence limits
that are based (unless otherwise indicated) on assumed two-sigma devia-
tions from the mean of a Log normal distribution. These limits incor-
porate about 95 percent of the expected observations of the assumed
8-4
distributions. Log normal distributions are assumed because they re-
flect proportional (rather than absolute value) uncertainties that are
most characteristic of experimental and observational evidence. Also,
log normal distributions best represent the extremely wide uncertainties
(measured in orders of magnitude) that are sometimes found in the data,
and they are convenient for combining the uncertainties of variables
(such as dose and damage or benefit and risk) that must be multiplied
or divided by each other.
To simplify the presentation of uncertainties for consideration by
the decisionmaker, the two-sigma confidence limits are graphically illus-
trated as the upper and lower bounds of a band of confidence around the
expected value.sO If the criteria are shown in two dimensions, then the
confidence limits in both dimensions can be combined to form an oval
around the point that represents the expected value. Such limits are
shown in Figure 8-2. (Other characteristics of the criteria shown in
Figure 8-2 are discussed in the following sections.)
At the same time, one should not overemphasize the statistical
accuracy of these methods of estimating and combining uncertainties.
Many types of distributions cannot be well represented by the log normal
function; also additive and other types of combinational operations can-
not be easily performed. However, the current state of the art of un-
certainty estimation for environmental policy-making is so primitive that
these limitations seem minor compared to the extent of other unknowns.
Such major unknowns as those buried in the imprecision of existing
methods, the synergistic or inhibitory effects of combining uncertainties,
soD. P. Tihansky, "A Cost-Risk-Benefit Analysis of Toxic Substances,"presented at Early Warning Systems for Toxic Substances, Seattle,Washington, 31 January 1974; published in J. Environ. Sys., Vol. 4,No. 2, pp. 117-34 (Summer 1974).
8-5
FIGURE 8-2. MULTIPLE CRITERIA DISPLAY SAMPLE
8 - 6
and the effects of factors that have not even been considered will in
general create much wider uncertainties than those of the computational
approximations.
The confidence limits described here should not therefore be ac-
cepted as precise statistical evaluations. Rather, they are approximate
estimates that attempt to show the first-order effects of combining the
many uncertainties involved in chains of calculations leading to each
decision criterion. Even this limited role is indispensable to formu-
lating an improved criterion system for risk analysis. It is greatly
superior to leaving uncertainty evaluation to human judgment. Humans
are notoriously deficient in combining uncertainties subjectively, and
they tend unless continually reminded of the presence of uncertainty to
suppress its very existence.
Primary Trade-off Criteria
In the recommended multiple criteria approach, two considerations
must dominate just as they do in the more conventional cost-benefit
approach. In the proposed approach, the two incommensurable considera-
tions are compared so that relationships between them can be shown with-
out requiring that they be reduced to common terms. (Where two consider-
ations can be reduced to common terms, they can be combined into one
dimension.)
The two most significant considerations can vary depending on the
nature of the problem, but at least one will nearly always be some mea-
sure of monetary value. In the cases examined in this study, this con-
sideration is the net non-health economics benefit of an environmental
control action. Since health effects are the major motive for environ-
mental controls, the net non-health effects are most likely to be negative.
(Such negative effects include higher prices and consequent lower pro-
duction of the process being controlled, unemployment, unfavorable balance
8-7
of trade shifts, and others discussed in Chapter 5.) Economic benefits
in this context are therefore best thought of as reductions in benefits,
and their graphical presentation is most conveniently expressed as nega-
tive changes from the existing status quo, which would be located at
the origin as in Figure 8-2.
The second consideration, measuring some aspect of the risk, in
this case is the effect of the control on human health. More precisely,
it is the effect on death rate, which as with benefits would be expressed
as a reduction (see Figure 8-2). Health effects can be expressed in
terms of morbidity, days of disability, or even dollars spent for loss
of work time and cost of medical care. However, these other effects are
not explicitly evaluated here. For completeness in an overall economic
analysis of such morbidity these effects might be considered, but as
explained in Chapter 7, they will not significantly modify the methodology
or conclusions of the type of analysis illustrated here.
Comparison of the alternatives is carried out graphically by pictur-
ing the relative changes in risks and benefits in two dimensions in
Figure 8-2. Their risk/benefit ratios will then be a function of the
slope of the lines connecting them to the origin and to each other. Ad-
ditional criteria can also be considered, as explained below. Other
types of considerations could be used instead of mortalities as measures
of risk; for example, esthetics, comfort, recreational value, and ecolog-
ical quality. However, they are unlikely to be as great a concern as
human health and safety in the evaluation of hazardous wastes and would
generally, if at all, be included in one of the supplementary considera-
tions that are discussed below.
Other Criteria
Several considerations that are important to risk analysis from a
behavioral (i.e., practical decision-making) standpoint can be included
8-8
as constraints to the basic risk-benefit trade-off. These constraints
will tend to limit the domain of feasible or acceptable solutions, so
that certain otherwise desirable alternatives may be eliminated.
Cost Constraint--A practical constraint in many governmental pro-
grams is that of the cost of the program. If the costs are to be borne
by the government, they are subject to rather strict overall budgetary
@tS*'l Even if most of the costs are to be borne by industry or the
public their magnitude will be limited to the reluctance of legislators
to impose sudden onerous new burdens. The tendency of public bodies to
follow "incrementalism" in making policy applies here as in other fields.
An example is the case of auto emission controls, which started modestly
and have gradually grown to increasingly expensive equipment, with pro-
portionately increasing counterpressures against further increases.
"Maximum Acceptable Social Cost" has not previously been applied
formally as a limitation to risk-benefit trade-offs, and its specific
limits are not at this time very well defined. However, its existence
has been well documented in other budgetary fields, and it is likely
to become more explicit in federal programs under the new Congressional
budget limiting procedure. In the case of existing budgeted programs,
short term (one year) incremental changes are likely to be limited to 10
percent or so of existing government environmental budgets in the absence
of new authorizations. Long-term limits on acceptable costs are likely
to be limited by more fundamental relationships such as how much society
is willing to invest in analogous prudently oriented concerns as pre-
ventive medical care, public health, public safety, and defense. Uncer-
tainties will apply to both short-term and long-term limits but they will
810. A. Davis, M.A.H. Dempster, and A. Wildavsky, "A Theory of the Bud-getary Process," The American Political Science Review, p. 542+(September 1966).
8-9
be much greater for the long-term limits. An illustration of the type
of constraint that Maximum Acceptable Social Cost considerations impose
on the system is shown in a vertical Expected Value Line in Figure 8-2,
with a parallel Lower Confidence Limit to its left. In many situations
the line would slope upward to the right to reflect the practical trade-
offs that usually occur between cost and risk.
Maximum Acceptable Social Risk--A comparable and better documented
constraint is that of "Maximum Acceptable Social Risk." This limit is
based on various as-yet poorly understood factors, including the en-
demic disease rate, voluntary or involuntary nature of the risk, ratio
of risks to benefits, and salience and degree of understanding of the
risk. Chauncey Starrs" points out that while volunteer professional
workers and amateur daredevils are willing to engage in activities up to
a thousand times more dangerous than are other people, the general public
seems unwilling to accept fatality rates from common activities that
are significantly greater than those from disease.
Maximum Acceptable Social Risk as a concept can be made more speci-
fic by a Short-Term Maximum Acceptable Social Risk that reflects the cur-
rent standards for any particular social hazard. Starr himself illus-
trates how risk standards tend to become stricter over time as usage and
experience increase, as in the cases of automobile and air transportation.
Chapter 2 of this report describes how particular environmental standards
follow a similar time pattern in an "incremental" fashion. Analysis of
the current pattern, the time-trend from previous standards and analo-
gous trends for comparable hazards should enable one to project likely
future standards.
*aC. Starr, "Benefit-Cost Studies in Sociotechnical Systems," pp. 17-42in "Perspectives on Benefit-Risk Decision Making," National Academyof Engineering (1972).
8-10
Logically, then, one could expect the feasible domain for risk
standards to be limited both in the short-term by proximity to presently
accepted standards and in the long-term by more fundamental relationships
to the general disease level. An example of the short-term type of risk
constraint, together with its lower confidence limit, is shown in Figure
8-2. (Location of the risk constraint above the status-quo level indi-
cates that some reduction in present deaths is demanded. Its horizontal
slope, like the vertical slope of the Maximum Acceptable Social Cost con-
straint, indicates a possible oversimplification because it neglects any
cost/risk trade-offs.)
Minimum Reducible Risk--A "Minimum Reducible Risk" level represents
a residual (i.e., background) absolute risk that remains after all feasible
precautions have been adopted. This constraint can be particularly use-
ful in some analyses because it can be fixed with reasonable precision
and thereby it establishes a ceiling to the decision domain. A Minimum
Reducible Risk limit is shown at the top of Figure 8-2.
Life Valuation--The problem of valuing human life remains an obdu-
rate one in law, welfare economies, and risk-benefit analysis even
though considerable progress has been made in recent years to resolve
the theoretical issues. Mishana3 maintains that such life-valuing meth-
ods as potential future earning power, net future value to society, so-
cial evaluation as reflected in political decisions, and incentives to
purchase life insurance are all inadequate as measures. The most theo-
retically valid measure, according to the Pareto criterion of social
welfare, is the worth to an individual of reducing his own risk of death
as derived from his "revealed preference"68 (see discussion in Chapter 7).
*3E. J. Mishan, "Economics for Social Decisions," Elements of Cost-Benefit Analysis (Praeger Publishers, New York, 1973).
8-11
Thaler and Rosens4 have estimated this worth to American workers as about
$200,000 in 1967 dollars. Melinel@ estimates by similar methods that
valuations by the general population in Britain are slightly lower:
Z50,OOO or $120,000.
Many people object, however, to society itself establishing such a
value, and so explicit valuation in government planning and standard
setting has remained controversial. The methodology advocated here
avoids explicit valuation because risk measurement is separated from mea-
sures of economics benefit. The two can be simply related however, by
the angle of lines drawn between alternatives in Figure 8-2. For example,
the slope of a line drawn from the status-quo point at the origin to any
alternative (which equals the reduction in benefits f the reduction in
deaths) represents the implicit life valuation of that alternative. Such
a line is drawn through Alternative B in the figure. If a decisionmaker
chooses some alternative, he therefore can tell from this formulation
what his implicit valuation of human life is. Conversely, if he values
human life at not less than some particular amount, he can consider only
alternatives that lie above that value line.
Risk Aversion--Almost all people except gamblers have an aversion
toward risk; such aversion accounts for the popularity of the insurance
industry. Several ways can be found to account for various aspects of
risk aversion in the display graphs. Probably the best method (not shown
here but discussed in the next chapter) involves decision procedures
that discriminate against alternatives with the larger confidence rings,
which imply greater uncertainties.
e4R. Thaler and S. Rosen, "The Value of Saving a Life: Evidence fromthe Labor Market," paper presented 30 November 1973; published byUniv. of Rochester.
*ES. J. Melinek, "A Method of Evaluating Human Life for Economic Pur-poses," Fire Research Note No. 950, Herts., England (November 1972).
8-12
Distributional Comparisons
Trade-off comparisons between risks and benefits can only be calcu-
lated for one interest group at a time. The important distributional
question of who within or beyond that one group takes the risks and who
receives the benefits cannot be answered by that one trade-off compari-
son. To answer distributional questions, trade-off calculations would
be made as feasible for each separate interest group of concern to the
decisionmaker, so that comparisons can be made of differences among the
trade-offs of different interest groups as shown in Figure 8-1(C).
Conventionally in studies of national environmental standards,
risk-benefit comparisons are made for the nation as a whole. To allow
for distributional considerations, many other risk-benefit comparisons
might be made for such special groups as:
Local hazardous waste producing areas.
Local areas nearby but not part of the producing areas.
Local or regional areas with consumer rather than pro-ducer interests.
Future populations of producing or consuming areas.
Specialized occupational groups and their families.
Special-interest affiliations such as income classesor ethnic groups.
Supplementary Criteria
Some criteria simply cannot be integrated with others in any formal
way. Nevertheless, they should be arranged together as proposed by Abe1*6
and illustrated in Figure 8-1(D) so that the decisionmaker will be able
to consider all major factors in one group. In a formal procedure such as
e6F. H. Abel and D. P. Tihansky, "Methods and Problems of EstimatingWater-Quality Benefits," Amer. Water Works Assn. J., Vol. 66, No. 5,pp. 276-81 (1974).
8-13
standard-setting, where administrative and judicial review are always
possible if not probable, it is important to make as all-inclusive a
listing of this type as possible, so that interested parties will be
able to see that considerations considered relevant by them have in
fact been included in the evaluation process.
Cadmium Examples
Presentation of results will depend on the hazardous waste, the
decisionmaker, the decision process, the type of situation to be decided,
and other factors. However, the general process can be followed through
for specific emission control alternatives to illustrate the kinds of
information and presentations that can be anticipated. Since in our
present examples, we only have one alternative that meets the control
problem, we will compare the distributional aspects of that alternative
in our presentations. Risk-benefit trade-offs and other considerations
will be compared in each problem for the nation as a whole versus the
local producing areas.
Zinc Smelter Scrubbers
Among the examples studied for this report, the most interesting
and significant is perhaps that of limestone scrubbers as applied to
cadmium emissions by zinc smelters. For the risk variables, Chapter 7
reports that about 166 person-years can be saved by cadmium reductions
in the first year after imposition of scrubber controls on the nation's
zinc smelters. Reference to the confidence limits of Figure 7-3 indicates
that the saving might range between about 100 and about 360 person-years
per year of controls. Lives saved are those of people residing near the
smelters (within 30 kilmeters), so the risk reduction in the local pro-
ducing areas is essentially the same as for the nation as a whole. The
major difference is that population mobility is so great that the local
8-14
area will not have to continue to be responsible for most of the people
now being exposed because they will have moved, but the federal govern-
ment will still in most cases have to be concerned. This difference is
not considered here.
The most significant direct national cost resulting from the new
controls and their effects on zinc prices are a loss of Gross National
Product: $21 million per year (from Table 5-2). Although the local
zinc-producing areas contain only one percent of the U.S. population, the
local economic losses are two-thirds as high as the total national loss,
$14 million, because they include local multiplier effects that cancel
out at the national level. Confidence limits for both national and local
losses are estimated as multiplier and divisor factors of 1.7. A graphic
illustration of these trade-offs is shown in Figure 8-3.
Among the other possible considerations, no Maximum Acceptable Social
Cost was identified because to do anything at all would require initia-
tion of a new national program, but the cost magnitudes envisaged do not
appear to present any overriding difficulties to federal financing. The
Minimum Reducible Risk also cannot be related to this chart because no
simple procedure can be applied to both national and local total lives
saved.
However, the World Health Organization recommended value of Maximum
Acceptable Social Risk of 60'pg/day (mentioned in Chapter 2) could place
a severe constraint on the acceptable domain of cadmium controls. To
simplify calculations for an approximate estimate of this constraint, we
first must subtract the average 50 pg/day average ingestion from food
and water. The margin for contributions, from other sources then averages3
only 10 pg/day, which is equivalent to 60 rig/m continuous exposure in
air. Figure 6-2 shows that 60 ng/m3 is only one-fifteenth the current
maximum exposure from smelters, so not more than about one-fifteenth the
current deaths from smelter emissions should be allowable under this
standard.8-15
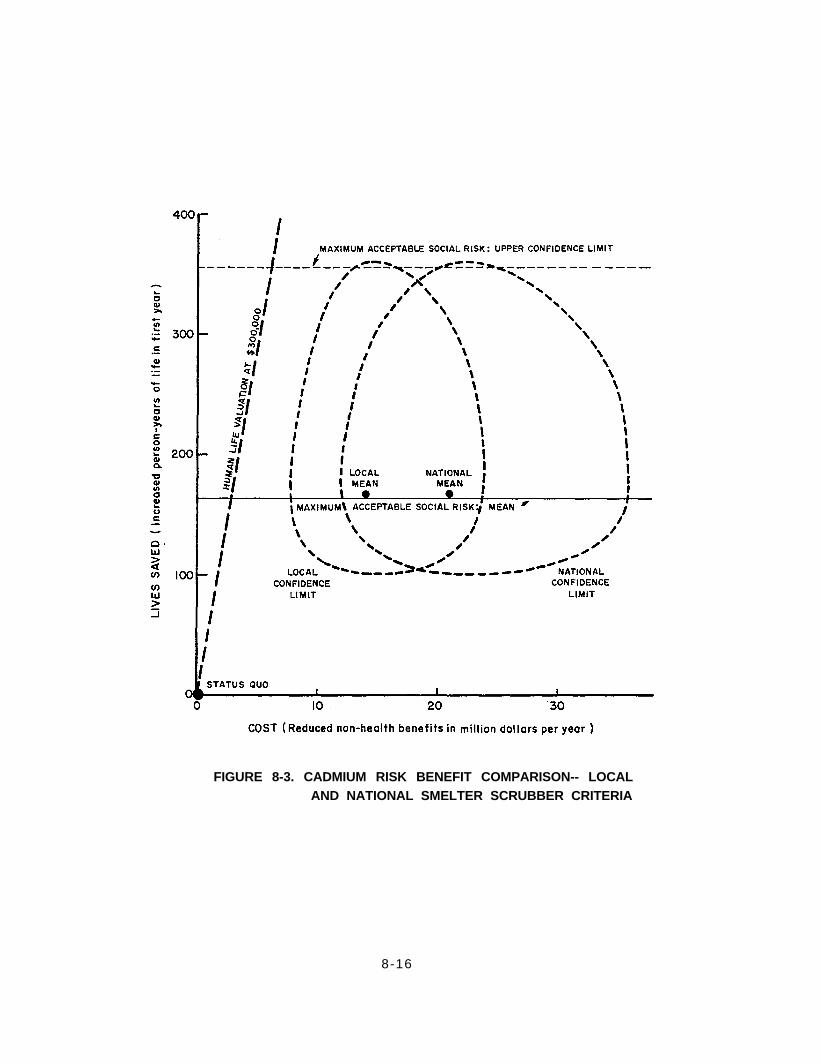
FIGURE 8-3. CADMIUM RISK BENEFIT COMPARISON-- LOCALAND NATIONAL SMELTER SCRUBBER CRITERIA
8-16
Therefore, the mean value of lives saved under the WHO standard
should be about l4/15 of the lives saved by perfect smelter controls.
Since the proposed controls that save 166 persons-years are only 95 per-
cent perfect, the required mean savings under the controls is 166 X 14/15
+ 95% = 163 person-years. The upper confidence limit is applied in the
same way to the maximum expected lives saved by smelter controls to
equal 354 person-years. These limits, shown in Figure 8-3, indicate that
the proposed scrubbers are only minimally effective in meeting the WHO
standards.
Another criterion that can be illustrated in Figure 8-3 implies a
contradictory conclusion. If a Valuation of Human Life analysis is
desired the "Lives Saved" vertical scale must be converted from person-
years to actual lives. For 50-year-olds with a life expectancy of 20
years, the ratio is 20 person-years to one life. But most life valua-
tions are based on an average population, which for calculating we assume
average 35 years old with a life expectancy of 35 years. They expect 35
person-years per life. If we inflate the aforementioned average 1967
life value of $200,000 to $300,000, the value per person-year will then
be $8,700. The value of 166 person-years will only be $1.45 million,
which is barely one-tenth the local cost of the smelter scrubbers and an
even smaller fraction of the national cost. Scrubbers, therefore, do
not appear cost-effective in protecting against cadmium. (Their effec-
tiveness against other contaminants such as heavy metals, SO2, and ar-
senic is not estimated here although it is obviously relevant to overall
scrubber values.)
Finally, the kind of supplementary criteria that cannot be inte-
grated into the chart can be gathered together with the above criteria
in the manner described for Figure 8-1(D). This type of information for
the case of a potential cadmium smelter control is shown in Figure 8-4.
Note that this formulation provides a slightly different perspective to
the type of data shown in Figure 8-3, and in addition relates the
8-17
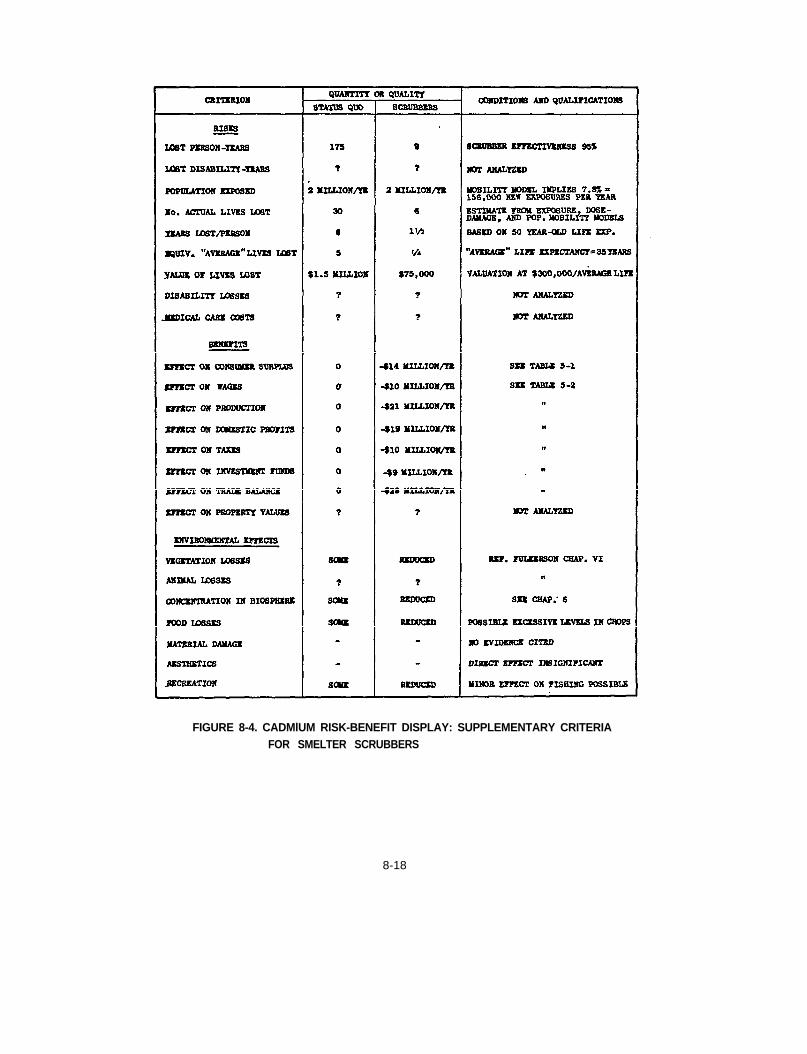
FIGURE 8-4. CADMlUM RISK-BENEFIT DISPLAY: SUPPLEMENTARY CRITERIAFOR SMELTER SCRUBBERS
8-18
quantitative data to additional information of a qualitative or incommen-
surable quantitative nature that otherwise might be lost to the evaluation.
Municipal Incinerators
Cadmium emissions from municipal incinerators are much less hazard-
ous than those from smelters, because the concentrations around indivi-
dual sources are much lower. While the expected life-saving from cad-
mium reductions by scrubbers in zinc smelters has been calculated in
Chapter 7 at 166 person-years, the savings by scrubbers in municipal in-
cinerators are less than one person-year. At the same time, the loss
in non-health benefits from installing scrubbers in municipal incinera-
tors ($28 million nationally) is almost twice the loss from smelter
scrubbers, because the number of units that would have to be installed
is much greater.
Considering the uncertainty ranges in both risks and benefits, the
overall range of the implicit valuation of human life is quite wide, as
shown in Table 8-1. However, the valuation even under the lowest assump-
tions is so high as to be prohibitive if reduction of cadmium emissions
were the only incentive. Because of this constraint to feasibility, and
the analytic similarity to the zinc scrubber alternative, municipal in-
cinerator controls are not examined in further detail here.
Asbestos Examples
Graphical comparisons of asbestos control risks and benefits were
not drawn because the lack of any discernible fatality effects at the dose
rates derived from our emissions model rendered any two-dimensional com-
parison useless. The lack of observable health effects from the model
seems due to the assumption that all exposure would result from contami-
nants dispersed over a wide area, as from a plant stack or from brake
dust. It is certainly interesting to find that these types of exposures
from asbestos seem inconsequential. Their benign levels indicate that
perhaps environmental controls over asbestos eimssions from industrial
8-19
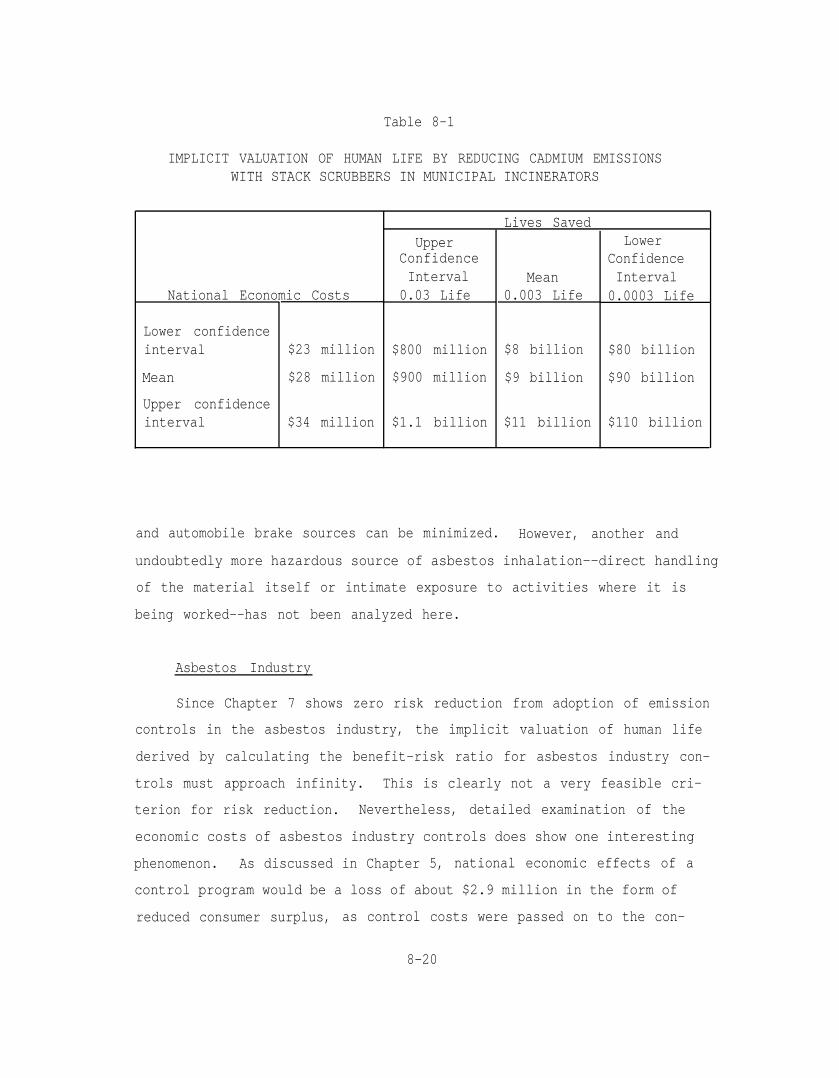
Table 8-1
IMPLICIT VALUATION OF HUMAN LIFE BY REDUCING CADMIUM EMISSIONSWITH STACK SCRUBBERS IN MUNICIPAL INCINERATORS
National Economic Costs
Lower confidenceinterval
Mean
Upper confidenceinterval
$23 million
$28 million
$34 million $1.1 billion $11 billion $110 billion
UpperConfidenceInterval
0.03 Life
$800 million
$900 million
Lives Saved
Mean0.003 Life
$8 billion
$9 billion
LowerConfidenceInterval
0.0003 Life
$80 billion
$90 billion
and automobile brake sources can be minimized. However, another and
undoubtedly more hazardous source of asbestos inhalation--direct handling
of the material itself or intimate exposure to activities where it is
being worked--has not been analyzed here.
Asbestos Industry
Since Chapter 7 shows zero risk reduction from adoption of emission
controls in the asbestos industry, the implicit valuation of human life
derived by calculating the benefit-risk ratio for asbestos industry con-
trols must approach infinity. This is clearly not a very feasible cri-
terion for risk reduction. Nevertheless, detailed examination of the
economic costs of asbestos industry controls does show one interesting
phenomenon. As discussed in Chapter 5, national economic effects of a
control program would be a loss of about $2.9 million in the form of
reduced consumer surplus, as control costs were passed on to the con-
8-20
sumers. But the loss of consumer surplus would only be about $29,000 in
asbestos producer areas (one percent of the national loss), and industry
owners would not lose anything because they could pass their costs along.
The major effect in producer areas would be a gain of perhaps $400,000
from the addition of about 40 workers associated with operation and
maintenance of the control equipment.
In this situation, the most rational motivation in asbestos-producing
areas for an asbestos control program would most likely be from the fi-
nancial and employment (not the health) self-interest of the local labor
force.
Elimination of Asbestos Brake Lining
The hypothetical example of replacing asbestos brake linings with
an undefined material of equal performance but 50 percent more expensive
yields more consistency between costs in the asbestos producer area and
those in the country as a whole. In the case of brakes, national costs
of imposing a 50-percent higher price for linings are dominated by a $65
million loss in consumer surplus. Losses in local asbestos-producing
areas are less than one-twentieth this amount even though significant
local multiplier effects can be assumed. Overall, the non-health economic
effects would be consistently negative everywhere except in locations
where the replacement brake lining material is produced. From an envi-
ronmental standpoint, elimination of asbestos brake linings appears use-
less for the same reason that imposing asbestos emission controls do--
the number of lives to be saved is significant. At the same time, how-
ever, strict exposure control over close contact with asbestos by brake
repairmen, asbestos miners, fabricators, and construction personnel seems
from empirical evidence to be clearly needed. But the exposure model
needed for that analysis must be based on the specific work activities
engaged in rather than on the general emission and dispersion parameters
used in this study.
8-21
Chapter 9
METHODS FOR DETERMINING ACCEPTABLE RISKSAND ASSOCIATED RESEARCH NEEDS
Practical Considerations
Even after decision data have been formulated and compared in the
manner of Chapter 8, several alternatives might remain competitive. In
addition, further alternatives can generally be found by enlarging the
scope of decisions to include future policies, research and development
programs, and other choices that are relevant but not directly tied to
the current alternatives. This chapter provides some clues, but no
final answers, for how such choices can be made from the compiled data.
One major reason why no final answers can be given is the same as
that presented in Chapter 8: no program can reasonably expect to antici-
pate all of the considerations affecting the decision-maker. Actually,
the difficulty is even more fundamental than just attempting to antici-
pate one decision-maker. In the operations of a democratic government,
decisions-makers are ultimately responsible to all of the people. Yet
the work of the economist Kenneth Arrow has proved that, in general,
there is no single optimum democratic social choice.*'
All social choices must be made on the basis of individual values
that represent an imperfect compromise for society at large. When one
accepts the compromises as described in Chapter 8, then the remaining
*7E. T. Haefele, Representative Government and Environmental Management,p. 17 (Johns Hopkins Press for Resources for the Future, Inc., Balti-more, 1973).
9-1
need is to assist the decision-maker in his choice. This can be compli-
cated because, in many cases, the multiple criteria will conflict with
each other.
Any general decision method must be compatible with the decision-
maker's own procedures and his own anticipations of the outcome of his
decision. The method, in other words, must fit with such characteristics
as the "incremental" characteristic of decision-making that was described
in Chapter 8. For example, the types of small moves away from the
existing situation that are followed in incremental decision-making can
be visualized very well in the two-dimensional graph of Figure 8-2,
where the status quo situation is placed at the origin. By that presen-
tation, alternatives located closest to the origin are easily seen to
require the least incremental movement and, therefore, may be preferred
to alternatives farther away.
Related to incrementalism is feedback--another policy-maker's
characteristic in a list compiled by Lindblom.88 Feedback in government
was first described in considerable detail from a cybernetic standpoint
by Karl Deutsch.ss It is the process of constant adjustment and correc-
tion when a policy is put into practice, as reflected in the philosophy
of "Never time to do it right--always time to do it over." In practice,
it is the information process that accompanies and expedites "sequential"
decision-making--another characteristic often mentioned. Short-sighted
feedback and rapid sequential decisions are usually deplored by those
whose orientation is toward planning or standardization, but they are
dominant behavioral characteristics of most operating organizations.
ssC. E. Lindblom, The Policy-Making Process, p. 24+ (Prentice Hall,Englewood Cliffs, N. J., 1968).
ssK. W. Deutsch, The Nerves of Government (The Free Press, N. Y., 1965).
9-2
The graph of Figure 8-2 is designed in two ways to emphasize the impor-
tance of information feedback. First, its cost and risk information is
in annual terms--partly for the reason that new planning information or
economic developments could change the trade-offs significantly. Second,
the confidence limits reflecting uncertainties will change over time as
information is obtained, so the decision conditions as drawn will usually
be valid at only one time.
So many information inputs, in fact, require feedback to refine
their information that almost any first attempt at integrating data,
including this study, can be significantly improved by subsequent analy-
sis. Among the kinds of information feedback needs that have not been
available to this study are:
Resolution of uncertainties by the adversary process ofsearching for better information to support ones' case.This process is achieved in the normal course of EPAstandards hearings.
Estimation of the interactive effects of multiple factorson the environment. For example, no consideration hasbeen given to the potential benefits of smelter controlsin reducing arsenic pollution. (Arsenic has recently beennamed by the National Cancer Institute as the prime sus-pected cause of elevated lung cancer rates around smelters.)
Discovery of unknown factors that more thorough search andfuture research efforts may find.
Resolution of conflicting constraints on the feasibledomain of alternative solutions. As has been noted, con-straints in many cases have to be adjusted to each otheras well as to social and economic influences.
Another typical characteristic of organizational decision-making,
first described by Herbert Simon,go is "satisficing." (He invented the
term "satisfice" as as combination of satisfy and suffice.) According to
this criterion, the decision-maker does not attempt to maximize any
goH. A. Simon, Administrative Behavior: A Study of Decision-MakingProcessed in Administrative Organization, p. xxxv (MacMillan, New York,1957).
9-3
particular criterion but rather seeks minimum satisfactory levels for
all of the criteria important to him. Again, the presentation of Figure
8-2 is well adapted to this characteristic because it provides a decision
domain within which all the pictured criteria are at or above minimum
required levels. Any alternative lying within the decision domain by
definition offers a "satisficing" solution.
Closely related to "satisficing" is the emphasis on "bottlenecks"
in policy-making. The most attention in organizations is given to the
most apparent bottleneck preventing a "satisficing" solution. Figure 8-2
highlights the most obvious bottlenecks by picturing those constraints
that are not satisfied by the solution.
Methods for Choosing Control Alternatives
This focus on "bottlenecks" is an important step in the multiple
criteria decision method discussed in Chapter 8. Any criterion that an
alternative does not fulfill to some "satisficing" level serves as a
bottleneck that prevents the solution of that alternative. Only those
alternatives that have no serious bottlenecks are acceptable for solu-
tion as control policies.
Once the alternatives that meet the constraints have been identified,
the next analytical step is to find the best of the acceptable alterna-
tives. Only when both steps have been accomplished will it be possible
to recommend a choice to the decision-maker.
Selection Procedure
The flow of decision data leading to the choice of a preferred alter-
native is shown in Figure 9-1. Note that the flow requires both the
functions of evaluation and research, operating in an iterative feedback
fashion, to reach the final decision. In this section we are interested
9-4
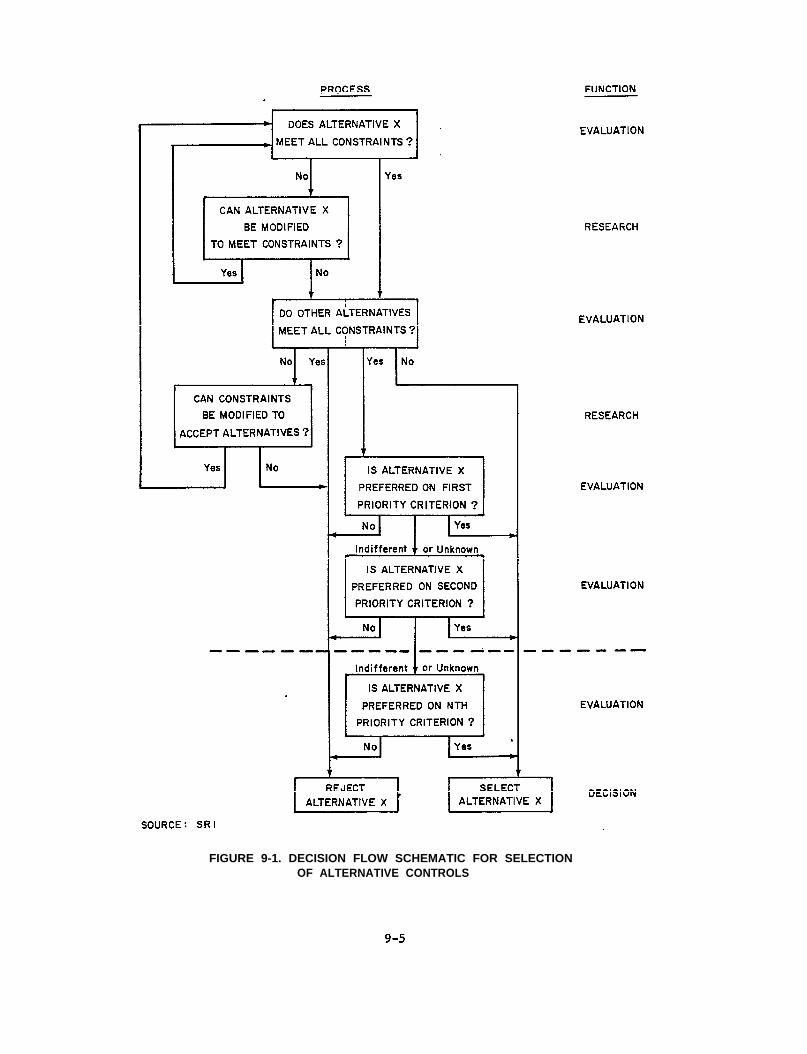
FIGURE 9-1. DECISION FLOW SCHEMATIC FOR SELECTIONOF ALTERNATIVE CONTROLS
9-5
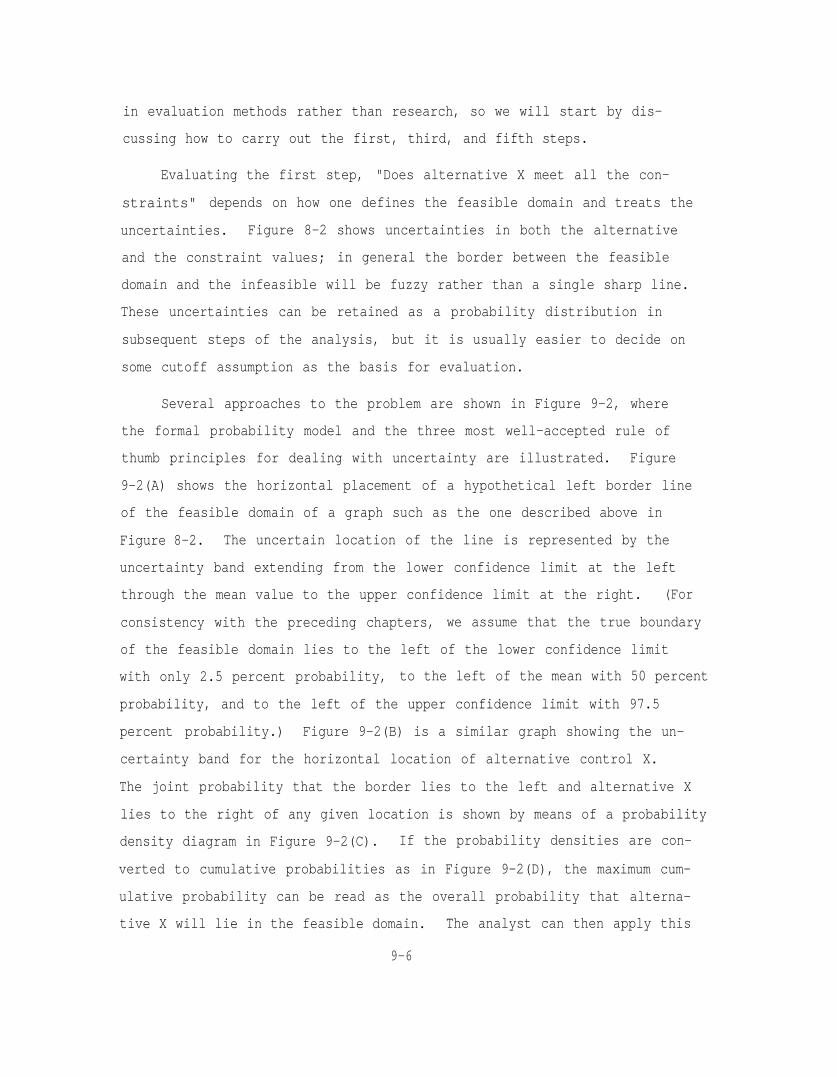
in evaluation methods rather than research, so we will start by dis-
cussing how to carry out the first, third, and fifth steps.
Evaluating the first step, "Does alternative X meet all the con-
straints" depends on how one defines the feasible domain and treats the
uncertainties. Figure 8-2 shows uncertainties in both the alternative
and the constraint values; in general the border between the feasible
domain and the infeasible will be fuzzy rather than a single sharp line.
These uncertainties can be retained as a probability distribution in
subsequent steps of the analysis, but it is usually easier to decide on
some cutoff assumption as the basis for evaluation.
Several approaches to the problem are shown in Figure 9-2, where
the formal probability model and the three most well-accepted rule of
thumb principles for dealing with uncertainty are illustrated. Figure
9-2(A) shows the horizontal placement of a hypothetical left border line
of the feasible domain of a graph such as the one described above in
Figure 8-2. The uncertain location of the line is represented by the
uncertainty band extending from the lower confidence limit at the left
through the mean value to the upper confidence limit at the right. (For
consistency with the preceding chapters, we assume that the true boundary
of the feasible domain lies to the left of the lower confidence limit
with only 2.5 percent probability, to the left of the mean with 50 percent
probability, and to the left of the upper confidence limit with 97.5
percent probability.) Figure 9-2(B) is a similar graph showing the un-
certainty band for the horizontal location of alternative control X.
The joint probability that the border lies to the left and alternative X
lies to the right of any given location is shown by means of a probability
density diagram in Figure 9-2(C). If the probability densities are con-
verted to cumulative probabilities as in Figure 9-2(D), the maximum cum-
ulative probability can be read as the overall probability that alterna-
tive X will lie in the feasible domain. The analyst can then apply this
9-6
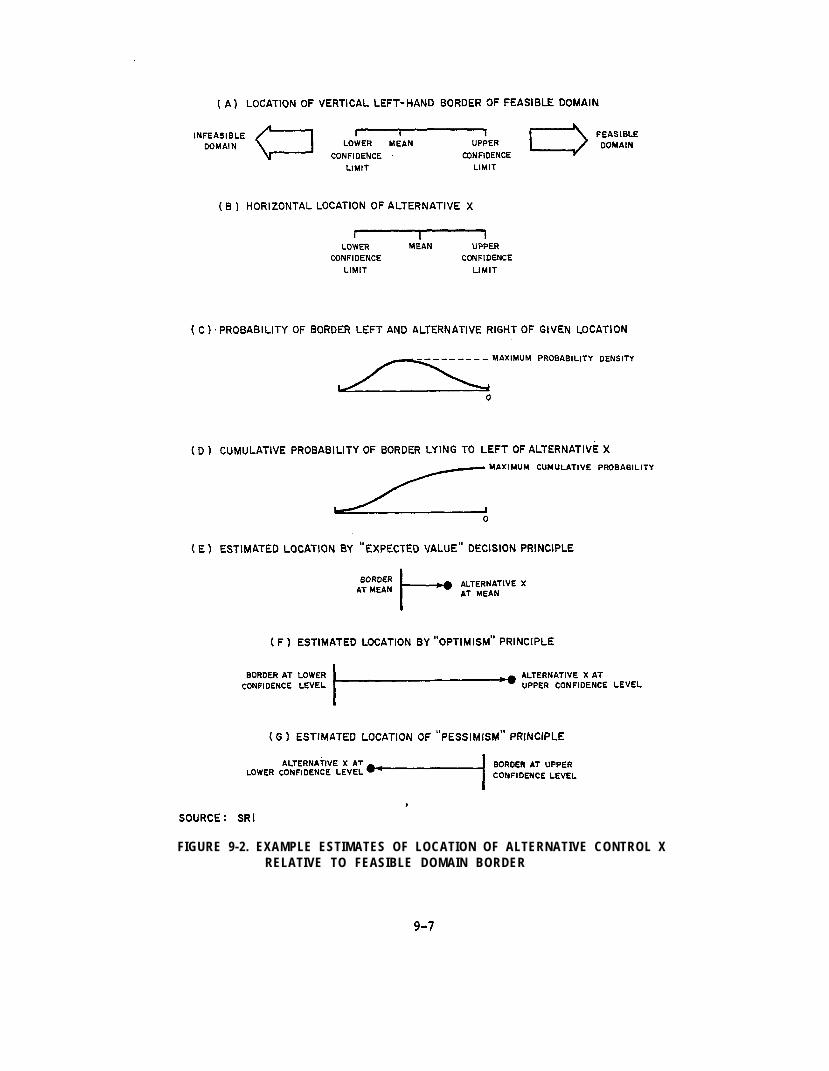
FIGURE 9-2. EXAMPLE ESTIMATES OF LOCATION OF ALTERNATIVE CONTROL XRELATIVE TO FEASIBLE DOMAIN BORDER
9-7
overall probability to further statistical calculations, or he can com-
pare it to some arbitrary criterion (such as 50 percent) to decide
whether the first step in the decision process should be answered Yes or
No.
If the decision problem is neatly specified in terms of probability
distributions, the cumulative probability approach will yield the most
exact and elegant answers. However, if the distributions are poorly
defined, as has been the case in most of the confidence intervals examined
in this study, then more approximate rules of thumb may provide decision
rules that are adequate to the level of accuracy of the data.
Perhaps the simplest principle that could be used directly from
limited data is the "expected value" comparison shown in Figure 9-2(D).
In that figure, alternative X is accepted within the feasible domain by
comparing its mean location with the mean location of the domain border
and observing that alternative X lies to the right of the border. This
method has the advantage of providing answers that will agree with
answers based on acceptance of probabilities over 50 percent that have
been estimated by formal probability calculations.
Other answers that deviate from the 50-percent criterion could be
obtained from the "optimism-pessimism" principle.s1 Under that principle,
decisions can be made on the basis of whether one assumes the best of
all possible outcomes, the worst of all possible outcomes, or some out-
come intermediate in the scale. Figure 9-2(F) is based on the "optimism"
criterion; it compares locations under the most favorable outcomes of the
domain border at its lower confidence limit and alternative X at its
SIR. D. Luce and H. Raiffa, Games and Decisions, p. 282 (Wiley, N.Y.,1957).
9-8
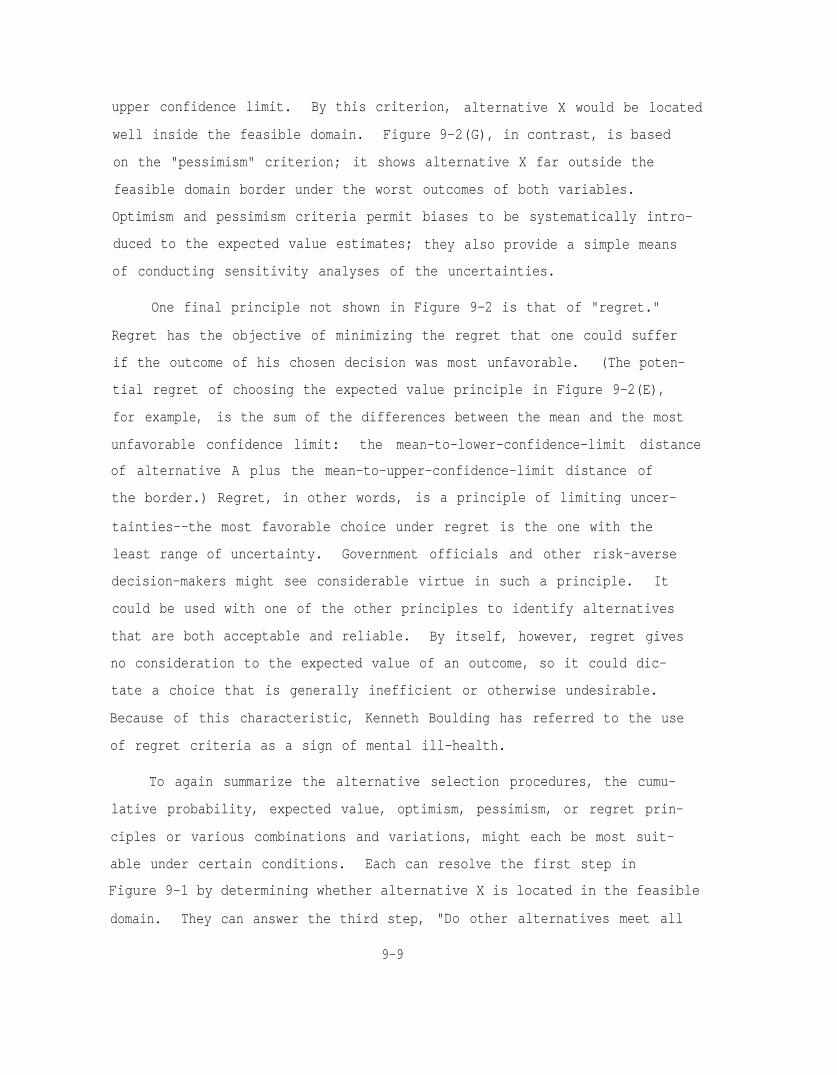
upper confidence limit. By this criterion, alternative X would be located
well inside the feasible domain. Figure 9-2(G), in contrast, is based
on the "pessimism" criterion; it shows alternative X far outside the
feasible domain border under the worst outcomes of both variables.
Optimism and pessimism criteria permit biases to be systematically intro-
duced to the expected value estimates; they also provide a simple means
of conducting sensitivity analyses of the uncertainties.
One final principle not shown in Figure 9-2 is that of "regret."
Regret has the objective of minimizing the regret that one could suffer
if the outcome of his chosen decision was most unfavorable. (The poten-
tial regret of choosing the expected value principle in Figure 9-2(E),
for example, is the sum of the differences between the mean and the most
unfavorable confidence limit: the mean-to-lower-confidence-limit distance
of alternative A plus the mean-to-upper-confidence-limit distance of
the border.) Regret, in other words, is a principle of limiting uncer-
tainties--the most favorable choice under regret is the one with the
least range of uncertainty. Government officials and other risk-averse
decision-makers might see considerable virtue in such a principle. It
could be used with one of the other principles to identify alternatives
that are both acceptable and reliable. By itself, however, regret gives
no consideration to the expected value of an outcome, so it could dic-
tate a choice that is generally inefficient or otherwise undesirable.
Because of this characteristic, Kenneth Boulding has referred to the use
of regret criteria as a sign of mental ill-health.
To again summarize the alternative selection procedures, the cumu-
lative probability, expected value, optimism, pessimism, or regret prin-
ciples or various combinations and variations, might each be most suit-
able under certain conditions. Each can resolve the first step in
Figure 9-1 by determining whether alternative X is located in the feasible
domain. They can answer the third step, "Do other alternatives meet all
9-9
constraints?", in exactly the same way. But because they deal only
with whether the alternatives satisfy all estimates and not with how to
rank the alternatives, they cannot answer the fifth step: "Is alterna-
tive X preferred on the first priority criterion?"
Ranking Procedures
Preferences among the alternatives may be less important to estab-
lish than conventional economic theory would indicate, because the num-
ber and severity of constraints imposed by the multiple criteria are
likely to greatly restrict the number of acceptable alternatives in
practical situations. The pure "satisficing" model of choice is more
realistic than the pure "optimizing" one. Nevertheless, any decision
methodology should be able to establish preferences among alternatives.
Our approach recommends six different possible decision measures
that can establish preferences among the five different decision princi-
ples shown in Figure 9-3. The five principles are the same as those
discussed above, but here they are used for ranking rather than classi-
fication purposes. The six measures are optional criteria that might be
used as ranking measures for alternative controls.
"Risk level," the first decision measure, is the one implicitly
adopted when contaminant concentrations or exposure levels are set at
the lowest possible levels achievable by any control method. Each of
the principles operates on the risk measure in a slightly different way
from the others, but they all attempt to select the alternative with the
lowest overall risk.
"Net benefit" in effect is a negative measure of the overall cost
of the control program. Maximizing the benefit is the same as minimizing
the cost. This would be the measure to base decisions on if cost were
the only measure of merit of a control program. But cost will seldom
9-10
9-11
FIGURE 9-3. POSSIBLE RULES FOR RANKING AMONG ALTERNATIVES
if ever be the only measure, since the very concept of controls introduces
another measure (risk or environmental quality) that overrides cost con-
siderations.
The absolute "benefit-risk" ratio is a more meaningful measure for
the reasons discussed in Chapters 2 and 8. It suffers from being too
comprehensive, however. In many cases it cannot be measured as an abso-
lute value, even where it can be measured it may not serve as the
best indicator of the value of a particular alternative. "Change in
benefit/change in risk" yields a more precise estimate of the effects
of individual alternatives and it is easier to measure. It best fits
the practical needs of incremental decision-making because it orients
the analysis around the controllable effects of the alternative.
"Benefit less risk" difference also gives an incremental measure,
but in general this type is less useful than the ratio. It requires that
benefit and risk be presented in monetary or other commensurate terms,
so it must violate the desirable trait of separating these two dimen-
sions. It also is expressed in absolute terms, so it is insensitive to
differences in the scale of different alternatives. However, in some
circumstances it may be more understandable because it deals with actual
values rather than with ratios.
Finally, the "probability of alternative lying within the feasible
domain" is a different type of measure of merit, based on the fit of the
alternatives within the constraints posed by all of the criteria in the
problem instead of on measurements in only one or two criteria. This
measure is of great value where the feasible domain is small relative to
the scatter and uncertainties of the alternatives on the major dimensions
of the problem. Such conditions seem quite common in the examples exam-
ined in this report, so this measure may prove to be more prominent in
future studies than it has in the past.
9-12
Overall, however, the "change in benefit/change in risk" measure
seems to be the most generally applicable of the six decision measures
for the types of hazardous waste problems examined in this report. The
large uncertainties involved in almost all of the data imply that
expected value is probably the most practical of the decision principles
to apply to this measure. But whichever techniques are used, the meth-
odology suggested here can yield quantitative evaluations that lead,
first, to solution of alternatives to meet the basic constraints of the
environment, and second, to ranking of one preferred alternative from
among all the "satisficing" alternatives. From this final ranking the
final decision can be made as shown in Figure 9-1.
Methods for Analyzing Research Needs
The only steps in Figure 9-1 that have not yet been discussed are
the two relating to research functions. These steps require the gather-
ing of information by research, experimental, and monitoring groups who
normally are not a direct part of the decision process but whose results
are important to it. Since research results and other technical infor-
mation are so essential to the decision process, their own decisions
about the kinds of environmental information that are needed can have
a great influence on the quality of research policy decisions. For these
reasons, research and information-gathering decisions should properly be
considered as part of the larger decision system. We will discuss these
relationships in this section, and present a few hints about how they
can be improved. At the same time, we do not attempt to present a com-
prehensive methodology on how to allocate research and development efforts
or measure their benefits. Reviews of the extensive literature in this
field suggest that such attempts have been, at best, only partially suc-
cessful, and that some fundamental aspects of the R&D process remain
9-13
unknown92 Neither do we intend to resort to the standard complaint
that more research is needed. Perhaps the complaint is even more justi-
fied here than in other branches of knowledge, but from a practical
standpoint, changes in the amount of research may not improve policy
decisions so much as changes in the kinds of results that are being re-
ported.
One clear finding of this study has been that most research results
have given inadequate attention to uncertainties, and to how these uncer-
tainties relate to those of other research studies with similar problems.
Practically no attention has been given to summarizing the results in
terms of the next higher level of generalization, so that the significance
and relevance of the study could be more easily interpreted by readers.
For example, data on animal experiments need to be related to applica-
bility to human effects before the data can be usefully applied by studies
such as the present one.
In attempting to integrate primary source materials, secondary
studies discover the missing links between existing results as well as
the inadequacies of the primary results themselves. In our survey, we
have observed certain general needs for hazardous waste standard setting
that seem typical of the types of information that are available. These
needs and specific recommendations about them are shown in Table 9-1.
They indicate that a whole new category of quantitative models is needed
to use with risk-benefit and other trade-off studies. The models must
be simpler than existing research models with less dependence on immediate
local factors, but sensitive to variations in long-term environmental
parameters.
g2N. Baker and J. Freeland, "Recent Advances in R&D Benefit Measurementand Project Selection Methods," Management Science, Vol. 21, No. 10,pp. 1164-1176 (June 1975).
9-14
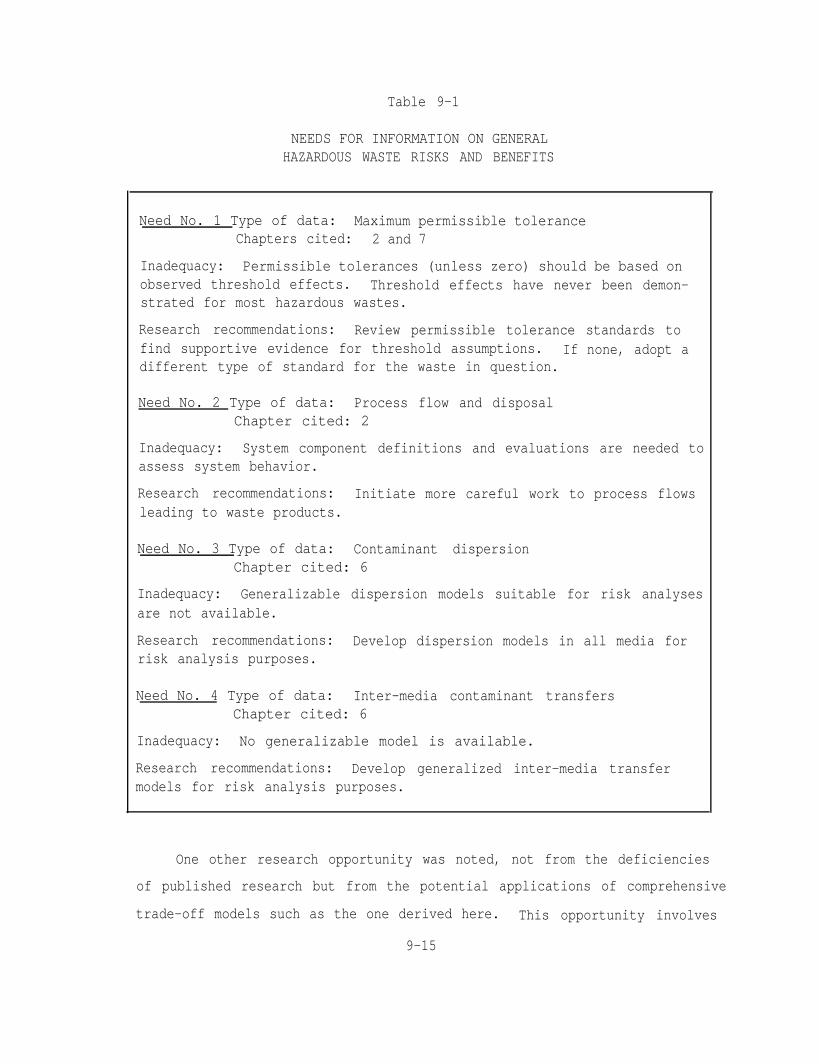
Table 9-1
NEEDS FOR INFORMATION ON GENERALHAZARDOUS WASTE RISKS AND BENEFITS
Need No. 1 Type of data: Maximum permissible toleranceChapters cited: 2 and 7
Inadequacy: Permissible tolerances (unless zero) should be based onobserved threshold effects. Threshold effects have never been demon-strated for most hazardous wastes.
Research recommendations: Review permissible tolerance standards tofind supportive evidence for threshold assumptions. If none, adopt adifferent type of standard for the waste in question.
Need No. 2 Type of data: Process flow and disposalChapter cited: 2
Inadequacy: System component definitions and evaluations are needed toassess system behavior.
Research recommendations: Initiate more careful work to process flowsleading to waste products.
Need No. 3 Type of data: Contaminant dispersionChapter cited: 6
Inadequacy: Generalizable dispersion models suitable for risk analysesare not available.
Research recommendations: Develop dispersion models in all media forrisk analysis purposes.
Need No. 4 Type of data: Inter-media contaminant transfersChapter cited: 6
Inadequacy: No generalizable model is available.
Research recommendations: Develop generalized inter-media transfermodels for risk analysis purposes.
One other research opportunity was noted, not from the deficiencies
of published research but from the potential applications of comprehensive
trade-off models such as the one derived here. This opportunity involves
9-15
the decision analysis concept of "expected value of perfect information."
According to that concept, the value of obtaining perfect information by
resolving all uncertainties (such as by eliminating all of the confidence
limits in Figure 8-2) can be calculated from the probability distribu-
tions of the uncertainties and their relative influences on the final
decision. The value of partial information that might correspond to a
reduced confidence interval of one of the variables can be derived in
the same manner.
These "value of information" analyses might be carried out to
estimate the potential value of research to reduce risk and benefit un-
certainties associated with a particular hazardous waste. Then this
value of research can be compared to the anticipated benefits of
initiating the optimal control alternative. The result (adjusted for
the estimated time, money, and resolving power of the research) will be
a first-order estimate of the relative advantage, given existing uncer-
tainties, of initiating a control program versus conducting more study.
Cadmium and Asbestos Examples
The "value of information" methodology, as well as other techniques
described in this chapter, can best be seen by application to our example
waste cases. Since none of the examples have proved to be very promising
as program alternatives, ranking and research applications may seem
slightly unrealistic, but at least they can be related to actual data.
Cadmium
By referring to Figure 8-3, we can illustrate for one cadmium con-
trol alternative--the zinc smelter scrubber--how to carry out the selec-
tion and ranking procedures that were described above. In the selection
step, we can see that "alternative X" (the smelter scrubber) does not
9-16
meet the constraint representing any reasonable "human life valuation."
However, if it did meet that constraint the next step would be to rank
it with other acceptable alternatives by one of the rules shown in Figure
9-3.
For example, if the smelter scrubber were compared to the "status
quo" alternative according to the "risk level" decision measure, it
would be preferred under all decision principles except "regret" because
it reduces the risk. ("Regret" attempts to minimize uncertainty, and
since the status quo alternative has less uncertainty, it will always be
preferred under the "regret" principle.) Conversely, "status quo" would
win under all decision principles if they were compared according to
"net benefit," because it doesn't cost anything.
The smelter scrubber alternative has a greater "mean lives saved"
value, a smaller mean cost, and a larger uncertainty interval in both
dimensions than the municipal incinerator alternative (not shown in Figure
8-3). It will therefore be preferred to the municipal incinerator pro-
gram under all of the decision principles except "regret."
In examining the two cadmium alternatives, we encountered a number
of specific research and information needs that are formulated in Table
9-2. Many of these needs can be met with quite small efforts, but until
they are resolved they will cast large uncertainties over estimates of
the values of cadmium control measures.
Asbestos
Asbestos studies have also left many unresolved questions, but our
study has not pursued them in detail. Neither of the asbestos alterna-
tives examined here seemed desirable under our decision rules because
neither demonstrates any significant cadmium risk reduction. Therefore,
we have not attempted to apply the selection and ranking procedures to
9-17
Table 9-2
NEEDS FOR INFORMATION ON CADMIUMRISKS AND BENEFITS
Need No. 1 Type of data: StandardsChapter cited: 2
Inadequacy: Standards for different media and environmental conditions are not systematicallyintegrated.
Research recommendations: Develop a cadmium exposure model to make the various types ofcadmium standards more consistent with one another.
Need No. 2 Type of data: PollutionChapter cited: 3
Inadequacy: Statistical data are insufficient for constructing a complete materials balanceanalysis of cadmium flow in the biosphere. Sources of contamination from mining and refiningand to water effluents are particularly deficient.
Research recommendations: Conduct a comprehensive analysis of the cadmium materials balancein the environment.
Need No. 3 Type of data: Precipitator operationsChapter cited: 3
Inadequacy: Precipitator efficiency level estimates are inconsistent.
Research recommendations: Derive more reliable estimates of operating efficiency for precipi-tators and other control devices.
Need No. 4 Type of data: Economic effectsChapter cited: 5
Inadequacy: Cadmium-zinc supply and demand functions are not known.
Research recommendations: Better empirical data should be obtained for these and otherhazardous materials so that more reliable benefit data may be derived.
Need No. 5 Type of data: Food and water concentrationsChapters cited: 6 and 7
Inadequacy: No adequate dispersion theory or model is available to explain variations inobserved cadmium concentrations in food or water.
Research recommendations: Derive a model to explain the sources and dispositions of cadmiumin food.
Need No. 6 Type of data: Biosphere stay timesChapter cited: 6
Inadequacy: No reliable estimates exist of cadmium stay times in or removal rates from thebiosphere. These are needed for general dispersion models.
Research recommendations: Investigate biosphere stay times for cadmium.
Need No. 7 Type of data: Biological absorptionChapter cited: 7
Inadequacy: Little data are available about how the body absorbs and retains cadmium, althoughthere is considerable evidence on ingestion rates.
Research Recommendations: Conduct more specific studies oriented toward biological absorptionand buildup phenomena.
Need No. 8 Type of data: Dose-damage functionsChapter cited: 7
Inadequacy: Large differences develop in deriving dose-damage data from similar sources.These differences create excessive uncertainties.
Research recommendations: Reconcile existing data for use in dose-damage estimates.
9-18
them. However, the research and information needs outlined in Table 9-3
were derived from our studies of asbestos risk-benefit trade-offs. Like
the earlier tables, this one summarizes a list of research tasks that
could serve to resolve some of the most uncertain questions about
hazardous waste risks, benefits, and their interrelationships for
decision-making.
9-19
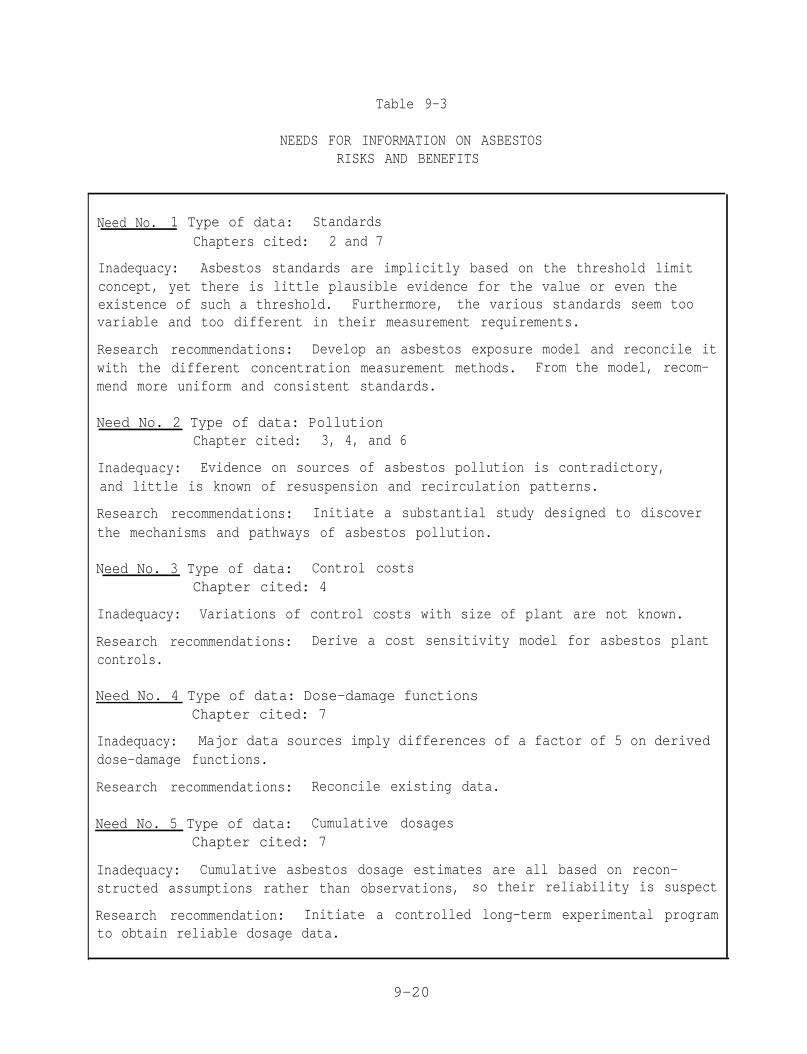
Table 9-3
NEEDS FOR INFORMATION ON ASBESTOSRISKS AND BENEFITS
Need No. 1 Type of data: StandardsChapters cited: 2 and 7
Inadequacy: Asbestos standards are implicitly based on the threshold limitconcept, yet there is little plausible evidence for the value or even theexistence of such a threshold. Furthermore, the various standards seem toovariable and too different in their measurement requirements.
Research recommendations: Develop an asbestos exposure model and reconcile itwith the different concentration measurement methods. From the model, recom-mend more uniform and consistent standards.
Need No. 2 Type of data: PollutionChapter cited: 3, 4, and 6
Inadequacy: Evidence on sources of asbestos pollution is contradictory,and little is known of resuspension and recirculation patterns.
Research recommendations: Initiate a substantial study designed to discoverthe mechanisms and pathways of asbestos pollution.
Need No. 3 Type of data: Control costsChapter cited: 4
Inadequacy: Variations of control costs with size of plant are not known.
Research recommendations: Derive a cost sensitivity model for asbestos plantcontrols.
Need No. 4 Type of data: Dose-damage functionsChapter cited: 7
Inadequacy: Major data sources imply differences of a factor of 5 on deriveddose-damage functions.
Research recommendations: Reconcile existing data.
Need No. 5 Type of data: Cumulative dosagesChapter cited: 7
Inadequacy: Cumulative asbestos dosage estimates are all based on recon-structed assumptions rather than observations, so their reliability is suspect
Research recommendation: Initiate a controlled long-term experimental programto obtain reliable dosage data.
9-20
REFERENCES
1.
2.
3.
4.
5.
6.
7.
8.
9.
10.
"Permissible Levels of Occupational Exposure to Airborne Toxic Sub-stances," World Health Organization Technical Report Series No.415, Sixth Report of the Joint ILO/WHO Committee on OccupationalHealth (1969).
T. F. Hatch, "Criteria for Hazardous Exposure Limits," Arch. Environ.Health, Vol. 27, pp. 231-5 (October 1973).
W. Fulkerson, et al., "Cadmium--the Dissipated Element," ORNL NSF-EP-21, supported by the National Science Foundation RANN Program,Oak Ridge National Laboratory, Oak Ridge, Tennessee (January 1973).
"Evaluation of Certain Food Additives and the Contaminants Mercury,Lead, and Cadmium," Sixteenth Report of the Joint FAO/WHO ExpertCommittee on Food Additives, Geneva, 4-12 April 1972, World HealthOrganization Technical Report, Series No. 505, FAO NutritionMeetings Report, Series No. 51 (1972).
S. Hernberg, "Health Hazards of Persistent Substances in Water,"WHO Chronicle, Vol. 27, No. 5, World Health Organization, Geneva,pp. 192-3 (May 1973).
"Interim Primary Drinking Water Standards," Environmental Protec-tion Agency, Federal Register, Vol. 40, No. 51, Part. II, pp. 11990-98(14 March 1975).
"Occupational Safety and Health Standards," Occupational Safetyand Health Administration, Federal Register, Vol. 37, No. 202,Part II, pp. 22102-22356 (18 October 1972).
Toxic Materials News (15 January 1975).
"Ocean Dumping," U.S. Environmental Protection Agency, Federal Reg-ister, Vol. 38, No. 94, pp. 12872-7 (16 May 1973).
J. S. Horvitz, "Asbestos and Its Environmental Impact," Environ.Affairs, Vol. 3, No. 2, pp. 145-65 (1974).
R-1
11.
12.
13.
14.
15.
16.
17.
18.
19.
20.
A. K. Ahmed, D. F. MacLeod, and J. Carmody, "Control for Asbestos,"Environment, Vol. 14, No. 10, pp. 16-22 (December 1972).
"Background Information on the Development of National EmissionStandards for Hazardous Air Pollutants: Asbestos, Beryllium, andMercury," APTD-1503, Office of Air and Water Programs, U.S. Environ-mental Protection Agency, p. 34 (March 1973).
A. Petrick, et al., "The Economics of By-Product Metals," "II. Lead,Zinc, Uranium, Rare-Earth, Iron, Aluminum, Titanium, and LithiumSystems," Bureau of Mines Information Circular 8570 (1973).
R. S. Ottinger, et al., "Recommended Methods of Reduction, Neutral-ization, Recovery, or Disposal of Hazardous Wastes," 16 volumesprepared for Environmental Protection Agency by TRW Systems Group,PB 224579, Set/As, Vol. XIV (February 1973).
"National Inventory of Sources and Emissions: Cadmium, Nickel, andAsbestos--1968," (Cadmium, Section I), PB 192250, prepared by W. E.Davis & Associates, Leawood, Kansas for National Air Pollution Con-trol Administration (February 1970).
B. Baum and C. H. Parker, "Solid Waste Disposal," Vol. 1, "Incinera-tion and Landfall," Ann Arbor Science Publishers (1973).
W. C. Achinger and L. E. Daniels, "An Evaluation of Seven Incinera-tors," pp. 32-64 in Proceedings of 1970 National Incinerator Con-ference, Cincinnati, Ohio, 17-20 May 1970, published by the Amer.Soc. Mech. Engrs., New York.
D. Anderson,."Emission Factors for Trace Substances," PB-230894,U.S. Environmental Protection Agency, Office of Air Quality Planningand Standards (December 1973).
"Sewage Sludge Incineration," U.S. Environmental Protection Agency,Task Force for the Office of Research and Monitoring, PB-211 323(August 1972).
A. L. Page, "Fate and Effects of Trace Elements in Sewage SludgeWhen Applied to Agricultural Lands--a Literature Review Study,"PB 231171, EPA 670/2-74-005, Univ. of Calif., Riverside, California(January 1974).
R-2
21.
22.
23.
24.
25.
26.
27.
28.
29.
30.
K. L. Yost, et al., "The Environmental Flow of Cadmium and OtherTrace Metals," Vol. I Progress Report, July 1, 1972 to June 30,1973, prepared by Purdue University for National Science Foundation(1973).
C. E. Brackett, "Production and Utilization of Ash in the UnitedStates," pp. 12-18 in "Ash Utilization," Proc. 3rd InternationalAsh Utilization Symposium sponsored by National Coal Assoc., EdisonElectric Institute, American Public Power Assoc., National AshAssoc., and Bureau of Mines, Pittsburgh, Pennsylvania, 13-14 March1973, Bureau of Mines Information Circular 8640 (1973).
R. F. Abernethy, M. J. Peterson, and F. H. Gibson, "SpectrochemicalAnalyses of Coal Ash for Trace Elements," Bureau of Mines, Reportof Investigations 7281 (July 1969).
R. Doll, "Mortality from Lung Cancer in Asbestos Workers," Brit. J.Ind. Med., Vol. 12, p. 18 (1955).
W. J. Nicholson, A. N. Rohl, and E. F. Ferrand, "Asbestos Air Pol-lution in New York City," in Proc. 2nd International Clean Air Con-gress, H. M. Englund and W. T. Berry, editors, Academic Press, NewYork, pp. 136-9 (1971).
R. A. Clifton, "Asbestos," Bureau of Mines, Minerals Yearbook Pre-print (1972).
C. F. Harwood, "Asbestos Air Pollution Control," PB 205238, pre-pared for the Illinois Institute for Environmental Quality by theIllinois Institute of Technology Research Institute, Chicago,Illinois (November 1971).
L. Bruckman, "Asbestos, an Evaluation of Its Environmental Impactin Connecticut," State of Connecticut, Department of EnvironmentalProtection, Air Compliance - Engineering (12 March 1973).
M. G. Jacko, R. T. DuCharme, and J. H. Somers, "How Much AsbestosDo Vehicles Emit?" Automotive Engineering, Vol. 81, No. 6, pp. 38-40(June 1973).
I. J. Selikoff, W. J. Nicholson, and A. M. Langer, "Asbestos AirPollution," Arch. Environ. Health, Vol. 25, No. 1, pp. 1-13 (July1972).
R-3
31.
32.
33.
34.
35.
36.
37.
38.
39.
40.
"National Inventory of Sources and Emissions: Cadmium, Nickel, andAsbestos--1968," (Asbestos, Section III) PB 192-252, prepared byW. E. Davis & Associates, Leawood, Kansas (February 1970).
"A Study of Hazardous Waste Materials, Hazardous Effects and Dis-posal Methods," Vol. III, PB 221 467, prepared for U.S. Environ-mental Protection Agency by Booz Allen Applied Research, Inc. (1973)
R. L. Stenburg, et al., "Effects of High Volatile Fuel on Inciner-ator Effluents," J. Air Poll. Control, Vol. 11, No. 8, pp. 376-383(August 1961).
L. A. Schutz, W. Bank, and G. Weems, "Airborne Asbestos Fiber Con-centrations in Asbestos Mines and Mills in the United States,"Bureau of Mines Health and Safety Program, Technical Progress Re-port No. 72 (June 1973).
L. Bruckman and R. A. Rubino, "Rationale Behind a Proposed AsbestosAir Quality Standard," No. 74-222, presented at the 67th AnnualMeeting of the Air Pollution Control Association, Denver, Colorado,9-13 June 1974.
A. D. McMahon, J. M. Hague, and H. R. Babitzke, "Zinc," in Bureauof Mines Minerals Yearbook, pp. 1299-1333 (1972).
D. A. LeSourd and F. L. Bunyard, "Comprehensive Study of SpecifiedAir Pollution Sources to Assess the Economic Impact of Air QualityStandards," Vol. 1, PB-222 857, prepared for the U.S. EnvironmentalProtection Agency, Div. of Effects Research by Research TriangleInstitute (August 1972).
Environmental Quality, Third Annual Report of the Council on Environ-mental Quality, GPO, Washington, D.C., Table 1 (August 1972).
R. E. Paddock, et al., "Comprehensive Study of Specified Air Pollu-tion Sources to Assess the Economic Impact of Air Quality Standards,"Vol. II, "Asbestos, Beryllium, Mercury," PB-222858, prepared forU.S. Environmental Protection Agency by Research Triangle Institute(August 1972).
"Impact of Proposed OSHA Standard for Asbestos," First Report toU.S. Dept. of Labor, Arthur D. Little, Inc., No. C-74413 (28 April1972), Appendices (5 July 1972).
R-4
41.
42.
43.
44.
45.
46.
47.
48.
49.
50.
51.
52.
"Control Techniques for Asbestos Air Pollutants," U.S. EnvironmentalProtection Agency, Office of Air and Water Programs, AP-117 (Febru-ary 1973).
"Background Information on the Development of National EmissionStandards for Hazardous Air Pollutants: Asbestos, Beryllium, andMercury," APTD-1503, Office of Air and Water Programs, U.S. Environ-mental Protection Agency (March 1973).
Y. S. Hwang, "A Commodity Consumption and Export Forecasting Tech-nique Illustrated by Zinc," Mineral Resources Branch, Dept. ofEnergy Mines and Resources, Mineral Bulletin MR 119, Ottawa, Canada(1971).
R. G. Driver, "Econometrics and Zinc Consumption," in "Lead andZinc, Free World Supply and Demand," 1968-71 Lead Industries Associa-tion (April 1968).
F. E. Banks, "An Econometric Note on the Demand for Refined Zinc,"Zeitochrift fi;r National ij konomic, 31, pp. 443-452, Springer-Verlag (1971).
"Lead and Zinc, Factors Affecting Consumption," International Leadand Zinc Study Group, United Nations, New York.
Chase Econometrics Association, Inc., The Economic Impact of Pollu-tion, Bala Cynwynd, PA (March 1975).
Survey of Current Business, March 1975, and prior issues for dataon zinc prices, production, consumption; Bureau of Economic Analysis,U.S. Dept. of Commerce.
Commodity Yearbook, Commodity Research Center, New York (1973).
Annual Survey of Manufacturers, Census Bureau, U.S. Dept. of Com-merce (1972).
1971 and 1972 Annual Reports, St. Joe Minerals Corporation, 250Park Avenue, New York, New York, 10017.
D. H. Slade, editor, "Meteorology and Atomic Energy," U.S. AECTechnical Information Center, Oak Ridge, Tennessee, p. 197, Fig. 5.2(July 1968).
R-5
53.
54.
55.
56.
57.
58.
59.
60.
61.
62.
63.
64.
L. Friberg, et al., "Cadmium in the Environment," CRC Press, Inc.,Cleveland, Ohio (1974).
A. L. Page and F. T. Bingham, "Cadmium Residues in the Environment,"Residue Review, Vol. 48, pp. 1-44 (1973).
S. L. Brown and U. F. Pilz, "U.S. Agriculture: Potential Vulnera-bilities," Stanford Research Institute, Menlo Park, California,p. 63 (January 1969).
K. L. Yost, et al., "The Environmental Flow of Cadmium and OtherTrace Metals," Progress Report, prepared by Purdue Univ., p. 95(1974).
W. A. Reiners, "Terrestrial Detritus and the Carbon Cycle," inCarbon and the Biosphere, G. M. Woodwell and E. V. Pecan, editors,USAEC (August 1973).
L. Friberg, et al., "Cadmium in the Environment: a Toxicologicaland Epidemiological Appraisal," APTD 0681; PB 199795, prepared bythe Karolinska Institute, Stockholm, Sweden, for the U.S. Environ-mental Protection Agency, Air Pollution Control Office (April 1971).
G. P. Lewis, W. J. Jusko, and L. L. Coughlin, "Cadmium Accumulationin Man: Influence of Smoking, Occupation, Alcoholic Habit, andDisease," J. of Chronic Disease, Vol. 25, pp. 717-26 (1972).
E. Hammond and L. Garfinkel, "Changes in Cigarette Smoking 1959-1965," Am. J. Public Health, Vol. 58, No. 1, pp. 30-45 (January1968).
R. R. Lauwerys, et al., "Epidemiological Survey of Workers Exposedto Cadmium," Arch. Environ. Health, Vol. 28, No. 3, pp. 145-8(March 1974).
"Kidney Disease Program Analysis," a report to the Surgeon General,prepared under direction of Office of Program Planning and Evalua-tion Office of the Surgeon General, Public Health Service Publica-tion No. 1745 (1967).
R. J. Hickey, E. P. Schoft, and R. C. Clelland, "Relationship Be-tween Air Pollution and Certain Chronic Disease Rates," Arch.Environ, Health, Vol. 15, No. 6, pp. 728-38 (1967).
R. E. Carroll, "The Relationship of Cadmium in the Air to Cardio-vascular Disease Death Rates," J. Amer. Med. Assoc., Vol. 198, No. 3,pp. 267-70 (17 October 1966).
R-6
65.
66.
67.
68.
69.
70.
71.
72.
73.
74.
75.
76.
J. W. Berg and F. Burbank, "Correlations Between Carcinogenic TraceMetals in Water Supplies and Cancer Mortality," pp. 249-64 in"Geochemical Environment in Relation to Health and Disease," H. C.Hopps and H. L. Cannon, editors, Ann. N. Y. Acad. Sci., Vol. 199(28 June 1972).
"Vital Statistics of the United States 1969, Vol. II - Mortality,Part B," Public Health Service, National Health Center for HealthStatistics (1973).
D. P. Rice, "Evaluating the Cost of Illness," U.S. Dept. of Health,Education, and Welfare, Public Health Service, Table 3.1 (May 1966).
E. J. Mishan, "Evaluation of Life and Limb: A Theoretical Approach,"J. Political Economy, Vol. 79, No. 4, pp. 687-706 (July-August 1971).
J. Hirshleifer, et al., "Applying Cost-Benefit Concepts to ProjectsWhich Alter Human Mortality," Univ. of California, Los Angeles(November 1974).
"A Study of the Problem of Asbestos in Water," by the AmericanWater Works Association Research Foundation, Am. Water Works Assn.,Vol. 66, No. 9, Part 2, pp. 1-22 (September 1974).
R. R. Merliss, "Talc-Treated Rice and Japanese Stomach Cancer,Science, Vol. 173, pp. 1141-2 (17 September 1971).
T. J. Masson, F. W. McKay, and R. W. Miller, "Asbestos-Like Fibersin Duluth Water Supply--Relation to Cancer Mortality," J. Amer.Med. Assn., Vol. 228, No. 8, pp. 1019-20 (20 May 1974).
P. Enterline, P. Decoufle, and V. Henderson, "Mortality in Relationto Occupational Exposure in the Asbestos Industry," J. Occup. Med.,Vol. 14, No. 12, pp. 897-903 (December 1972).
S. A. Roach, "Hygiene Standards for Asbestos," Ann. Occup. Hyg.,Vol. 13, pp. 7-15 (1970).
I. J. Selikoff, "Asbestos Criteria Document Highlights, ASSEJournal, pp. 26-33 (March 1975).
H. E. Ayer and J. R. Lynch, "Motes and Fibers in the Air ofAsbestos Processing Plants and Hygienic Criteria for Airborne As-bestos," pp. 511-22 in Inhaled Particles and Vapours II, C. N.Davies, editor, Proc. of an International Symposium organized bythe British Occupational Hygiene Society, Cambridge, 28 September-1 October 1965 (Pergamon Press, 1965).
R-7
77.
78.
79.
80.
81.
82.
83.
84.
85.
86.
H. E. Ayer, J. R. Lynch, and J. H. Fanney, "A Comparison of Impingerand Membrane Filter Techniques for Evaluating Air Samples in As-bestos Plants," pp. 274-87 in "Biological Effects of Asbestos,"I. J. Selikoff and J. Chur, editors, Ann. N. Y. Acad. Sci., Vol.132 (31 December 1965).
R. E. Lane, et al., 'Hygiene Standards for Chrysotile AsbestosDust," from the Committee on Hygiene Standards of the British Oc-cupational Hygiene Society, Ann. Occup. Hyg., Vol. 11, pp. 47-69(1968).
I. J. Selikoff, "Asbestos Criteria Document Highlights," ASSEJournal, pp. 26-33 (March 1974).
D. P. Tihansky, "A Cost-Risk-Benefit Analysis of Toxic Substances,"presented at Early Warning Systems for Toxic Substances, Seattle,Wash., 31 January 1974; published in J. Environ. Sys., Vol. 4, No. 2,pp. 117-34 (Summer 1974).
0. A. Davis, M.A.H. Dempster, and A. Wildavsky, "A Theory of theBudgetary Process," The American Political Science Review, p. 542(September 1966).
C. Starr, "Benefit-Cost Studies in Sociotechnical Systems," pp. 17-42in "Perspectives on Benefit-Risk Decision Making," report of a col-loquium conducted by the Committee on Public Engineering Policy,National Academy of Engineering, 26-27 April 1971, published bythe National Academy of Engineering (1972).
E. J. Mishan, "Economics for Social Decisions," Elements of Cost-Benefit Analysis, (Praeger Publishers, New York, 1973).
R. Thaler and S. Rosen, "The Value of Saving a Life: Evidence fromthe Labor Market," paper presented at the National Bureau ofEconomic Research Conference on Income and Wealth, Washington, D.C.,30 November 1973; published by Dept. of Economics, Univ. of Rochester,New York.
S. J. Melinek, "A Method of Evaluating Human Life for Economic Pur-poses," Fire Research Note No. 950, Fire Research Station, BorehamWood, Herts., England (November 1972).
F. H. Abel and D. P. Tihansky, "Methods and Problems of EstimatingWater-Quality Benefits," Amer. Water Works Assn. J., Vol. 66, No. 5,pp. 276-81 (1974).
R-8
87. E. T. Haefele, Representative Government and Environmental Manage-ment, p. 17 (Johns Hopkins Press for Resources for the Future, Inc.,Baltimore, 1973).
88. C. E. Lindblom, The Policy Making Process, p. 24 (Prentice Hall,Englewood Cliffs, New Jersey, 1968).
89. K. W. Deutsch, The Nerves of Government (The Free Press, New York,1965). .
90. H. A. Simon, Administrative Behavior: A Study of Decision-MakingProcesses in Administrative Organization, p. xxxv (MacMillan, NewYork, 1957).
91. R. D. Lute and H. Raiffa, Games and Decisions, p. 282 (Wiley, NewYork, 1957).
92. N. Baker 'and J. Freeland, "Recent Advances in R&D Benefit Measure-ment and Project Selection Methods," Management Science, Vol. 21,No. 10, pp. 1164-76 (June 1975).
R-9

BIBLIOGRAPHY
B-1
BIBLIOGRAPHY
Topic*
R/B ABEL (1973)Abel, F. H., Project-by-Project Analysis vs. ComprehensivePlanning, Symposium held by EPA, September 1973.
R/B ABEL (1974)Abel, F. H. and D. P. Tihansky, "Methods and Problems ofEstimating Water-Quality Benefits," Amer. Water Works Assn.
J., Vol. 66, No. 5, pp. 276-81 (1974).
Asb ABELSONAbelson, P. H., "A Damaging Source of Air Pollution," Science,Vol. 158, No. 3808, p. 1527 (22 December 1967).
Cd ABERNETHYAbernethy, R. F., M. J. Peterson, and F. H. Gibson, "Spectro-Chemical Analyses of Coal Ash for Trace Elements," Bureau ofMines, Report of Investigations 7281 (July 1969).
Asb, Cd ACGIH (1970)"Threshold Limit Values of Airborne Contaminants and In-tended Changes Adopted by ACGIH for 1970," Amer. Conf. ofGovernmental Industrial Hygienists (1973).
Asb, Cd ACGIH (1973)"Threshold Limit Values for Chemical Substances in WorkroomAir Adopted by ACGIH for 1973," Amer. Conf. of GovernmentalIndustrial Hygienists (1973).
*gen GeneralR/B Risk/BenefitAsb AsbestosCd Cadmium
B-3
Topic
Cd
Cd
R/B
Cd
Asb
Asb
Asb
Asb
ACHINGER (1970)Achinger, W. C. and L. E. Daniels, "An Evaluation of SevenIncinerators," pp. 32-64, in Proceedings of 1970 NationalIncinerator Conference, Cincinnati, Ohio, 17-20 May 1970,published by the Amer. Soc. Mech. Engrs., New York.
ACHINGER (1973)Achinger, W. C. and R. L. Baker, "Environmental Assessmentof Municipal-Scale Incinerators," an Open-file ReportSW-111) prepared for the Processing and Disposal DivisionOffice of Solid Waste Management Programs, U. S. EnvironmentalProtection Agency (1973).
ACTONActon, J. P., "Evaluating Public Programs to Save Lives: theCase of Heart Attacks," RAND Corp., Report R-950-RC (January1973).
ADAMSAdams, R. G., J. F. Harrison, and P. Scott, "The Develop-ment of Cadmium-Induced Proteinuria, Impaired Renal Function,and Osteomalacia in Alkaline Battery Workers," Quart. J. Med.,Vol. 38, pp. 425-43 (1969).
ADDINGLEY (1966)Addingley, C. G., "Asbestos Dust and Its Measurements," Ann.Occup. Hyg., Vol. 9, pp. 73-82 (1966).
ADDINGLEY (1965)Addingley, C. G., "Dust Measurement and Monitoring in theAsbestos Industry," pp. 298-305 in I. J. Selikoff, and J.Churg, editors, "Biological Effects of Asbestos," Ann. N.Y.Acad. Sci., Vol. 132 31 (December 1965).
AHERNAhern, L. J., "Occupational Disease Information," Letters tothe Editor, J. Occup. Med., Vol. 16, No. 3, pp. 146-7(March 1974).
AHMEDAhmed, A. K., D. F. MacLeod, and J. Carmody, "Control forAsbestos," Environment, Vol. 14, No. 10, pp. 16-22 (December1972).
B-4
Topic
Gen
Cd
Cd
Gen
AICHE (1974)"Control of Hazardous Material Spills," Proceedings of the 1974National Conference on Control of Hazardous Material Spills,25-28 August 1974, San Francisco, California, sponsored bythe American Institute of Chemical Engineers and the U.S.Environmental Protection Agency.
AIR/WATER POLLUTION RPT. (1973)"Toxic Substances Discharge Limitations Proposed for Industry,Air/Water Pollution Report, pp. 523-4 (31 December 1973).
ALBRECHTAlbrecht, 0. W. and R. G. McDermott, "Economic and TechnologicalImpediments to Recycling Obsolete Ferrous Solid Waste,"National Environmental Research Center, U.S. EnvironmentalProtection Agency, Cincinnati, Ohio (October, 1973),PB-223034.
ALTMANAltman, P. L. and D. S. Dittmer, "Postnatal Vertebrate Develop-ment," pp. 333-49 in: P. L. Altman and D. S. Dittmer, editors,Growth, Including Reproduction and Morphological Development,prepared under the auspices of the Committee on BiologicalHandbooks, Fed. American Societies for Experimental Biology,Washington, D.C. (1962).
Asb, Cd ANDERSONAnderson, D., "Emission Factors for Trace Substances," U.S.Environmental Protection Agency, Office of Air Quality Planningand Standards (December 1973), PB-230894.
Asb
Asb
ANN. OCCUP. HYG."Biological Effects of Asbestos," Report of the AdvisoryCommittee on Asbestos Cancers to the Director of the Inter-national Agency for Research on Cancer, Ann. Occup. Hyg.,Vol. 16, pp. 9-17 (1973).
ARCH. ENVIRON, HEALTH (1965)Working Group on Asbestos and Cancer, Report and Recommendationsof the Working Group Convened Under the Auspices of the Geo-graphical Pathology Committee of the International Union AgainstCancer, Arch. Environ. Health, Vol. 11, No. 8, pp. 221-9(August 1965).
B-5
Topic
Cd ARGOArgo, D. G. and G. L. Culp, "Heavy Metals Removal in Waste-water Treatment Processes, Part 2. Pilot Plant Operation,"Water & Sewage Works, Vol. 119, No. 9, pp. 128-32(September 1972).
Gen ARROW (1961)Arrow, K. J., "The Economic Implications of Learning by Doing,"Review of Economic Studies, Vol. 29, No. 3, pp. 155-73(1961-62).
R/B
R/B
Asb
Cd
Cd
Cd
Asb
ARROW (1951)Arrow, K. J., "Alternative Approaches to the Theory of Choicein Risk-Taking Situations," Econometrica, Vol. 19, No. 4,pp. 404-37 (October 1951).
ARROW (1974)Arrow, K. J., "Limited Knowledge and Economic Analysis,"Amer. Econ. Rev., Vol. 64, No. 1, pp. 1-10 (March 1974).
ASBESTOS INFO. ASSN. (1974)"Asbestos and Health Information File," Asbestos InformationAssociation/North America, Washington, D.C. (1974).
ASHLEYAshley, B. E., "Cadmium," Bureau of Mines Minerals Yearbook,Preprint (1972).
ATHANASSIADIS (1969a)Athanassiadis, Y. C., "Preliminary Air Pollution Survey ofCadmium and Its Compounds: a Literature Review," preparedby Litton Systems, Inc. for the National Air Pollution ControlAdministration (October 1969), APTD 69-32.
ATHANASSIADIS (1969b)Athanassiadis, Y. C., "Preliminary Air Pollution Survey ofZinc and Its Compounds: a Literature Review," prepared byLitton Systems Inc., for the National Air Pollution ControlAdministration (October 1969), APTD 69-49.
AWWAJ (1974)"A Study of the Problem of Asbestos in Water," by The AmericanWater Works Association Research Foundation, Am. Water WorksAssn., Vol. 66, No. 9, Part 2, pp. 1-22 (September 1974).
B-6
Topic
Asb AYER (1965a)Ayer, H. E. and J. R. Lynch, "Motes and Fibers in the Air ofAsbestos Processing Plants and Hygienic Criteria for AirborneAsbestos," pp. 511-22 in: C. N. Davies, editor, InhaledParticles and Vapours II, Proceedings of an InternationalSymposium organized by the British Occupational HygieneSociety, Cambridge, September 28 - October 1, 1965 (PergamonPress, 1965).
Asb AYER (1965b)Ayer, H. E., J. R. Lynch, and J. H. Fanney, "A Comparison ofImpinger and Membrane Filter Techniques for Evaluating AirSamples in Asbestos Plants," pp. 274-87 in: I. J. Selikoffand J. Chur, editors, Biological Effects of Asbestos, Ann.N.Y. Acad. Sci., Vol. 132 (31 December 1965).
R/B AYRESAyres, R. U., "A Materials-Process-Product Model," pp. 35-67in: A. V. Kneese and B. T. Bower, editors, EnvironmentalQuality Analysis - Theory and Method in the Social Sciences(The Johns Hopkins Press, 1972).
Gen BABCOCKBabcock, L. R., Jr., and N. L. Nagda, "Indices of Air Quality,"pp. 183-97 in: W. A. Thomas, editor, Indicators of Environ-mental Quality (Plenum Press, 1972).
Gen BAKERBaker, N. and J. Freeland, "Recent Advances in R&D BenefitMeasurement and Project Selection Methods," Management Science,Vol. 21, No. 10, pp. 1164-76 (June 1975).
Gen BALMFORTH
Cd
Balmforth, D. and C. G. Tewksbury, "EPA's Effluent Guidelines:A Co-operative Program," Text, Chem. Color., Vol. 6, No. 7,pp. 160-3 (July 1974).
BANKSBanks, F. E., "An Econometric Note on the Demand for RefinedZinc," Zeitochrift fur National o konomic 31 (1971) 443-452,Springer-Verlag (1971).
Gen BARLOWBarlow, R. E., F. Proschan, and L. C. Hunter, "Mathematical
Theory of Reliability," (John Wiley and Sons, Inc., 1965).
B-7
Topic
R/B BARRETTBarrett, G. V. and R. H. Franke, "Social, Economic, and MedicalExplanations of Psychogenic Death Rate Differences: a Cross-National Analysis," Technical Report 32, Management ResearchCenter of the College of Business Administration, The Universityof Rochester, Rochester, New York (October 1969), AD 700 286.
Cd
Cd
Cd
Cd
R/B
Gen
Cd
BASKINBaskin, A..M., L. R. Freedman, J. S. Davie, and J. S. Hathaway,"Proteinuria in Yale Students and 30-year Mortality Experience,"J. Urology, Vol. 108, pp. 617-618 (October 1972).
BATTELLE (1968)"State-of-the-Art Review of Metal Finishing Waste Treatment,prepared for Federal Water Quality Administration, and MetalFinishers Foundation by Battelle Memorial Institute, Columbus,Ohio, Water Pollution Control Research Series 12010 EIE 11/68(November 1968).
BATTELLE (1971)"Inorganic Fertilizer and Phosphate Mining Industries - WaterPollution and Control," prepared for U.S. Environmental Pro-tection Agency by Battelle Memorial Institute, Richland,Wash., Water Pollution Control Research Series 12020 FDP 09/71(September 1971).
BAUM, B.Baum, B. and C. H. Parker, "Solid Waste Disposal," Vol. 1,"Incineration and Handfill," Ann Arbor Science Publishers(1973).
BAUM, S.Baum, S. and R. C. Carlson, "Multi-Goal Optimization inManagerial Science," OMEGA, The Int. J. of Management Sci.,Vol. 2, No. 5, pp. 607-24 (October 1974).
BAUMOLBaumol, W. J., Welfare Economics and the Theory of the State(Harvard University Press, 1969).
BENTLEYBentley, J., "Chemical Disposal of Dangerous Wastes," ChemicalEngineer (London), No. 274, pp. 320-305 (1973).
B-8
Topic
Gen
Cd
Asb
R/B
R/B
Asb
Asb
BERENYIBerenyi, J., "Urban-Environmental Indicators in Municipal andNeighborhood Policy Planning and Decision Making," pp. 23-30in: W. A. Thomas, editor, Indicators of EnvironmentalQuality) (Plenum Press, 1972).
BERGBerg, J. W. and F. Burbank, "Correlations Between CarcinogenicTrace Metals in Water Supplies and Cancer Mortality," pp.249-64 in H. C. Hopps and H. L. Cannon, editors, GeochemicalEnvironment in Relation to Health and Disease, Ann N. Y. Acad.Sci., Vol. 199 (28 June 1972).
BERRYBerry, G. and J. C. Wagner, "The Applications of a MathematicalModel Describing the Times of Occurrence of Mesotheliomas inRats Following Inoculation with Asbestos,: Brit. J. Cancer,Vol. 23, 582-6 (1969).
BISHOPBishop, J. and C. Cicchetti, "Some Institutional and ConceptualThoughts on the Measurement of Indirect and Intangible Benefitsand Costs," Symposium held by PA (September 1973).
BLOCKBlock, M. K., and R. C. Lind, "Wealth Equivalents, Risk Aver-sion, and Marginal Benefit from Increased Safety," preparedfor Office of Naval Research, Arlington, Virginia, by NavalPostgraduate School, Monterey, Ca. AD 781375 (May 1974).
BOGOVSKIBogovski, P., et al., "Biological Effects of Asbestos," Proc.of a Working Conf. held at the International Agency for Re-search on Cancer, Lyon, France, 2-6 October 1972, ScientificPublication No. 8, World Health Organization, InternationalAgency for Research on Cancer, Lyon (1973).
BOHLIGBohlig, H., et al. "Epidemiology of Malignant Mesotheliomain Hamburg--a Preliminary Report," Environmental Research,Vol. 3, No. 5-6, pp. 365-72 (December 1970).
B-9
Topic
Asb
Gen
Gen
Asb
Cd
Gen
Asb
BOILLATBoillat, M. A. and M. Lob, "Risk of Asbestosis in WorkersEmployed in Replacing Automobile Brake Linings," Schweiz.Med. Wochenschr., Vol. 103, pp. 1354-9 (29 September 1973)(in French).
BONNENBonnen, J. T., "The Distribution of Benefits from CottonPrice Supports, pp. 223-54 in Problems in Public ExpenditureAnalysis," by S. B. Chase, gr., The Brookings Institution(1968).
BOOZ ALLEN"A Study of Hazardous Waste Materials, Hazardous Effects andDisposal Methods, Vol. III, PB 221467 by Booz Allen AppliedResearch, Inc. prepared for U.S. Environmental ProtectionAgency (1973).
BOROWBorow, M., et al., "Mesothelioma Following Exposure to As-bestos: a Review of 72 Cases, Ches," Vol. 64, No. 5, pp.641-6 (November 1973).
BRACKETTBrackett, C. E., "Production and Utilization of Ash in theUnited States," pp. 12-18 in Ash Utilization, Proc. 3rdInternational Ash Utilization Symposium, sponsored by NationalCoal Assoc., Edison Electric Institute, American Public PowerAssoc., National Ash Assoc., and Bureau of Mines, Pittsburgh,PA, 13-14 March 1973, Bureau of Mines Information Circular8640 (1973).
BRANDTBrandt, C. S., "Plants as Indicators of Air Quality," pp.101-7 in W. A. Thomas, editor, 'Indicators of EnvironmentalQuality," Plenum Press (1972).
BRAUNBraun, D. C. and T. D. Truan, "An Epidemiological Study of LungCancer in Asbestos Miners," Arch. Ind. Health, Vol. 17,pp. 634-53 (1958).
B-10
Topic
Asb
Asb
Cd
Gen
Gen
Asb
Asb
R/B
R/B
BRIT, MED. J. (1968)"Cancer Research in 1967," Brit. Med. J., Vol. 7, pp. 73-4(13 July 1968).
BRIT. MED. J. (1973)"Asbestos Hazard," editorial, Brit. Med. J., Vol. 4, pp.312-3 (10 November 1973).
BROWN, H.Brown, H. G., et al., "Efficiency of Heavy Metals Removal inMunicipal Sewage Treatment Plants," Environ. Letters, Vol. 5,No. 2, pp. 103-14 (1973).
BROWN, R.Brown, R. M., et al., "A Water Quality Index - Crashing thePsychological Barrier," pp. 173-82 in "Indicators of Environ-mental Quality," W. A. Thomas, editor, Plenum Press (1972).
BROWNBrown, S. L. and U. F. Pilz, "U.S. Agriculture: PotentialVulnerabilities," Stanford Research Institute, Menlo Park,Calif., p. 63 (January 1969).
BRUCKMAN (1973)Bruckman, L., "Asbestos, an Evaluation of Its EnvironmentalImpact in Connecticut," State of Connecticut, Department ofEnvironmental Protection, Air Compliance - Engineering (12March 1973).
BRUCKMAN (1974)Bruckman, L. and R. A. Rubino, Rationale Behind a ProposedAsbestos Air Quality Standard, No. 74-222, presented at the67th Annual Meeting of the Air Pollution Control Association,Denver, Colorado (9-13 June 1974).
BURNHAMBurnham, J. B., "Tomorrow's Environmental Benefit/Cost Analysis,BNWL-SA-4722, Battelle Pacific Northwest Labs (May 1973).
BUTZELButzel, A. K., "Legal Mechanisms for Risk-Benefit Analysis:Some Thoughts on the Significance of the Storm King Case,"pp. 63-8 in "Perspectives on Benefit-Risk Decision Making,"Report of a Colloquium Conducted by the Committee on Public
B-11
Topic
Cd
Engineering Policy, National Academy of Engineering, 26-27April 1971, published by The National Academy of Engineering(1972).
BYERRUMByerrum, R. U., "Some Studies on the Chronic Toxicity ofCadmium and Hexavalent Chromium in Drinking Water, pp. 1-8 inProc. 15th International Waste Conf., Purdue Univ., (3-6 May1960).
R/B CAMPBELLCampbell, R. R., "Food Safety Regulation; A Study of theUse and Limitations of Cost-Benefit Analysis," AmericanEnterprise Institute for Public Policy Research (1974).
Cd CANNONCannon, H. L. and H. C. Hopps, editors, EnvironmentalGeochemistry in Health and Disease, American Association forAdvancement of Science Symposium, Dallas, Texas, December1968, published by The Geological Society of America, Inc.,Memoir 123 (1971).
Asb CAPENER (1974a)Capener, E., et al, "'Asbestos, Handbook of Hazardous Wastes,"prepared for the Ministry of the Interior, Federal Republic ofGermany by Stanford Research Institute (1974).
Cd
Cd
CAPENER (1974b)Capener, E., et al., "Cadmium and Cadmium Compounds, Handbookof Hazardous Wastes," prepared for the Ministry of the Interior,Federal Republic of Germany by Stanford Research Institute(1974).
CARROLLCarroll, R. E., "The Relationship of Cadmium in the Air toCardiovascular Disease Death Rates," J. Amer. Med. Assoc.,Vol. 198, No. 3, pp. 267-9 (17 October 1966).
Asb CARTERCarter, R. F., "The Measurement of Asbestos Dust Levels in aWorkshop Environment," United Kingdom Atomic Energy Authority,AWRE Report No. 028/70, Aldermaston, England.
B-12
Topic
Asb
Asb
Asb
Gen
Gen CENSUS (1972a)
CASTLEMANCastleman, B., R. E. Scully, and B. U. McNeely, "Case Recordsof the Massachusetts General Hospital, New England," J. ofMed., Vol. 290, No. 3, pp. 152-7 (17 January 1974).
CENSUS (1967a)"Materials Consumed by Kind," p. 32E-29 in "Abrasive, Asbestos,and Miscellaneous Nonmetallic Mineral Products,' 1967 Censusof Manufactures, Bureau of the Census.
CENSUS (1967b)"Product Classes, Quantity and Value Shipped by All Manufac-turing Establishments," p. 323-30 in Abrasive, Asbestos, andMiscellaneous Nonmetallic Mineral Products," 1967 Census ofManufactures, Bureau of the Census.
CENSUS (1970)"Census of Population, Vol. I, Characteristics of the Popula-tion, Part A, Number of Inhabitants," Bureau of the Census(May 1972).
"1970 Census of Population and Housing, Census Tracts, Gary-Hammond-East Chicago, Ind., Standard Metropolitan StatisticalArea," Bureau of the Census (April 1972).
Cd CENSUS (1972b)Annual Survey of Manufacturers, 1972, Census Bureau, U.S.Department of Commerce
Gen CETRONCetron, M. J. and B. Bartocha, "Technology Assessment in aDynamic Environment," Gordon and Breach Science Publishers,New York (1973).
Cd
Cd
CHALMERSChalmers, R. K., "Treatment of Inorganic Liquid Wastes,"Progress in Water Technology, Vol. 3, pp. 251-64 (1973).
CHANEYChaney, R. L., "Crop and Food Chain Effects of Toxic Elementsin Sludges and Effluents," pp. 129-41 in "Recycling MunicipalSludges and Effluents on Land," Proc. of Joint Conf., 9-13July 1973, Champaign, Illinois, National Assoc. of StateUniversities and Land-Grant Colleges, Washington, D.C. (1973).
B-13
Topic
Cd
Cd
Cd
R/B
Cd
Cd
Asb
Asb
Cd
CHARLES (II)"The Effects of Pollution Control in the Nonferrous MetalsIndustries - Zinc, Part II: Structure of the Industry,"PB 207 159 prepared for the Council on Environmental Qualityby Charles River Associates, Cambridge, Mass. (December 1971).
CHARLES (III)"The Effects of Pollution Control on the Nonferrous MetalsIndustries - Zinc, Part III: The Economic Impact of PollutionAbatement on the Industry, PB 207 160, prepared for theCouncil on Environmental Quality by Charles River Associates,Cambridge, Mass. (December 1971).
CHASE ECONOMETRICSChase Econometrics Associates, "The Economies of PollutionControl," Bala Cynwyd, PA (April 1965).
CHASEChase, S. B., editor, "Problems in Public ExpenditureAnalysis," papers presented at a conference of experts held15-16 September 1966, The Brookings Institution (1968).
CHEM. ENG. NEWS"Trace Metals: Unknown, Unseen Pollution Threat," Chem.Eng. News, pp. 29-33 (19 July 1971).
CHEM. ENG. NEWS"Underground Movement of Wastes Clarified," Chem. Eng. News,p. 15 (15 October 1973).
CHEM. ENG. NEWS."Asbestos Health Question Perplexes Experts," Chem. Eng.News, pp. 18-9 (10 December 1973).
CHEM. ENG. NEWS"Quality of Drinking Water Draws Concern," Chem. Eng. News,pp. 44-8 (18 November 1974).
CHEREMISINOFF (1)Cheremisinoff, P. N. and Y. H. Habib, "Cadmium, Chromium,Lead, Mercury: a Plenary Account for Water Pollution, Part 1,Occurrence, Toxicity and Detection," Water & Sewage Works,Vol. 119, No. 7, pp. 73-86 (July 1972).
B-14
Topic
Cd
Cd
Asb
R/B
R/B
R/B
Cd
Cd
Gen
R/B
CHEREMISINOFF (2)Cheremisinoff, P. N. and Y. H. Habib, "Cadmium, Chromium,Lead, Mercury: Part 2. Removal Techniques," Water andSewage Works, Vol. 119, No. 8, pp. 46-51 (August 1972).
CLARFIELDClarfield, K. W., "Calmer Days Forecast for Cadmium Market,"American Metal Market, pp. 1A, 7A (14 July 1972).
CLIFTONClifton, R. A., "Asbestos, Minerals Yearbook Preprint, Bureauof Mines (1972).
CLYMERClymer, A. B., "Next-Generation Models in Ecology," pp.533-69 in "Systems Analysis and Simulation in Ecology,"Vol. II, B. C. Patten, editor, Academic Press (1972).
COASECoase, R. H., "The Problem of Social Cost," J. of Law andEconomics, Vol. 3, pp. 1-44 (October 1960).
COHENCohen, A. S. and A. P. Hurter, "An Input-Output Analysis ofthe Costs of Air Pollution Control," Management Science,Vol. 21, No. 4, pp. 453-61 (December 1974).
COLUCCIColucci, A. V., et al., "Pollutant Burdens and BiologicalResponse," Arch. Environ. Health, Vol. 27, pp. 151-4(September 1973).
COMMODITY YEARBOOKpublished by the Commodity Research Bureau, New York (1973).
CONFERENCE BOARDThe Conference Board, "Challenge to Leadership - Managingin a Changing World," (The Free Press, New York 1973).
COOKCook, T. J. and Scioli F. P., Jr., "A Research Strategy forAnalyzing the Impacts of Public Policy," Admin. Sci. Quart,pp. 328-39 (September 1972).
B-15
Topic
Cd
Cd
Cd
Cd
Gen
Gen
Cd
Asb
Asb
COPENHAVERCopenhaver, E. D., et al., "Cadmium in the Environment: anAnnotated Bioliography," ORNL-EIS-73-17, Informationsupported by the National Science Foundation, Oak Ridge Na-tional Laboratory (April 1973).
CORNELIUSSEN (1969)Corneliussen, P. E., "Pesticide Residues in Total Diet Samples(IV)," Pesticides Monitoring J., Vol. 2, No, 4, pp. 140-52(March 1969).
CORNELIUSSEN (1970)Corneliussen, P. E., "Pesticide Residues in Total Diet Samples(V)," Pesticides Monitoring J., Vol. 4, No. 3, pp. 89-105(December 1970).
CORNELIUSSEN (1972)Corneliussen, P. E., "Pesticides Residues in Total DietSamples (VI)," Pesticides Monitoring J., Vol. 5, No. 4,pp. 313-30 (March 1972).
COUNCIL ON ENVIRONMENTAL QUALITYEnvironmental Quality, The Third Annual Report of theCouncil on Environmental Quality (August 1972).
COUNCIL ON ENVIRONMENTAL QUALITYEnvironmental Quality, The Fourth Annual Report of theCouncil on Environmental Quality (September 1973).
coxCox, D. B., "Cadmium-a Trace Element of Concern in Miningand Manufacturing," J. Environ. Health, Vol. 36, No. 4,pp. 361-3 (1974).
CRALLEY (1968)Cralley, L. J., R. G. Keeman, and W. S. Lainhart, "Sourceand Identification of Respirable Fibers," Amer. Ind. Hyg.Assoc. J., Vol. 29, pp. 129-35 (March-April 1968).
CRALLEY (1971)Cralley, L. J., "Identification and Control of AsbestosExposures," Amer. Ind. Hyg. Assoc. J., Vol. 32, No. 2,pp. 82-5 (February 1971).
B-16
Topic
R/B CREMEANSCremeans, J. E., "Pollution Abatement and Economic Growth:An Application of the von Neumann Model of an ExpandingEconomy," Naval Research Logistics Quarterly, pp. 526-42(September 1974).
R/B CROCKERCrocker, T. D., "Benefit-Cost Analysis of Benefit-CostAnalysis," Symposium held by EPA (September 1973).
Cd CROSSCross, F. L., R. J. Drago, and H. E. Francis, "Metal andParticulate Emissions from Incinerators Burning Sewage Sludgeand Mixed Refuse," pp. 62-4, 189-95 in "Proc. Natl. IncineratorConference," Cincinnati, Ohio, 17-20 May 1970, published byAmer. Soc. Mech. Eng., New York (1970).
R/B CROWCrow, J. F., "Radiation and Chemical Mutagens: a Problem inRisk Estimation, pp. 56-8 in "Perspectives on Benefit-Risk
Decision Making," Report of a Colloquium Conducted by theCommittee on Public Engineering Policy, National Academy ofEngineering, 26-27 April 1971, published by The NationalAcademy of Engineering (1972).
Asb CROWDERCrowder, J. U. and G. H. Wood, "Control Techniques for AsbestosAir Pollutants," U.S. Environmental Protection Agency,Office of Air and Water Programs (1973) AP-117.
Asb CUNNINGHAM (1971)Cunningham, H. M. and R. Pontefract, "Asbestos Fibers inBeverages and Drinking Water," Nature, Vol. 232, pp. 332-3(30 July 1971).
Asb CUNNINGHAM (1973)Cunningham, H. M. and R. D. Pontefract, "Asbestos Fibers inBeverages, Drinking Water, and Tissues: Their PassageThrough the Intestinal Wall and Movement Through the Body,"J. AOAC, Vol. 56, No. 4, pp. 976-81 (1973).
B-17
Topic
R/B
R/B
Cd
R/B
Asb
Cd
Cd
Gen
D'ARGE (1972)d'Arge, R. C., "Economic Growth and the Natural Environment,"pp. 11-34 in A. V. Kneese, and B. T. Bower, editors, "Environ-mental Quality Analysis - Theory and Method in the SocialSciences," The Johns Hopkins Press (1972).
D'ARGE (1973)d'Arge, R. C., "Environmental Policy Costs: Definitions,Measurement and Conjecture," Symposium held by EPA, September1973.
DAVIESDavies, J. M., "Mortality Among Workers at Two Copper WorksWhere Cadmium Was in Use," British J. Prev. Soc. Med.,Vol. 26, pp. 59 (February 1972).
DAVISDavis, O. A., M.A.H. Dempster, and A. Wildavsky, "A Theory ofthe Budgetary Process," The American Political Science Review,p. 542 (September 1966).
DAVIS"National Inventory of Sources and Emissions: Cadmium, Nickeland Asbestos - 1968, Asbestos, Section III," prepared byW. E. Davis & Associates, Leawood, Kansas, for National AirPollution Control Administration (February 1970), PB192-252.
DAVIS"National Inventory of Sources and Emissions: Cadmium, Nickel,and Asbestos - 1968. Cadmium, Section I." prepared by W. E.Davis & Associates, Leawood, Kansas, for National Air PollutionControl Administration (February 1970), PB 192250.
DAVISONDavison, R. L., F. S. Natusch, and J. R. Wallace, "TraceElements in Fly Ash; Dependence of Concentration on ParticleSize," Environ. Sci. Technol., Vol. 8, No. 13, pp. 1107-13(December 1974).
DDC (1974)"Economic Analysis, Report Bibliography, Jan 1969 - Dec. 1973"Defense Documentation Center (July 1974), AD-782 750/4GA.
B-18
Topic
Cd
Gen
R/B
Gen
Cd
Asb
Cd
Cd
DEANDean, J. G., F. L. Bosqui, and K. H. Lanoutte, "RemovingHeavy Metals from Waste Water," Environ. Sci. Tech.,Vol. 6, No. 6, pp. 518-22 (June 1972).
DEUTSCHDeutsch, K. W., The Nerves of Government The Free Press,N.Y. (1965).
DIAMONDDiamond, P., "Economic Factors in Benefit-Risk Decision
Making, pp. 115-20 in "Perspectives on Benefit-Risk DecisionMaking," Report of a Colloquium Conducted by the Committee onPublic Engineering Policy, National Academy of Engineering,26-27 April 1971, published by The National Academy ofEngineering (1972).
DICKERTDickert, T. G. and K. R. Domeny, editors, "EnvironmentalImpact Assessment: Guidelines and Commentary," Univ. Ex-tension, Univ. of Calif., Berkeley (1974).
DODGENDodgen, D. F., "Some Recent Data on Levels of Cadmium inFoods Consumed in the United States," National Academy ofSciences (March 1972).
DOLLDoll, R., "Mortality from Lung Cancer in Asbestos Workers,"Brit. J. Ind. Med., Vol. 12, p. 81 (1955).
DONARTDonart, G., L. Gaffin, and B. Schmitz,Cadmium," Dept. of Chemistry, Univ. of(1972).
"Task Force ReportChicago, Illinois
on
DRIVERDriver, R. G., "Econometries and Zinc Consumption," in "Leadand Zinc, Free World Supply and Deman," 1968-71 Lead Indus-tries Association (April 1968).
B-19
Topic
R/B DORFMANDorfman, R., editor, "Measuring Benefits of Government In-vestments," The Brookings Institution (1965).
Asb DUBOISDuBois, A. B., "Airborne Asbestos," PB-198 581. Reportprepared by the Committee on Biological Effects of AtmosphericPollutants of the Division of Medical Sciences, NationalResearch Council, National Academy of Sciences and NationalAcademy of Engineering, Washington D. C. (1971).
Cd
Cd
Cd DUGGAN (1967b)Duggan, R. E. and J. R. Weatherwax, "Dietary Intake of Pesti-cide Chemicals," Science, Vol. 157, pp. 1006-10 (September1967).
Cd DUGGAN (1967c)Duggan, R. E. and F. J. McFarland, "Residues in Food andFeed," Pesticides Monitoring J., Vol. I, No, 1, pp. 1-5(June 1967).
Cd DUGGAN (1969)
DUGGAN (1966)Duggan, R. E., H. C. Barry, L. Y. Johnson, "Pesticide residuesin Total Diet Samples," Science, Vol. 151, pp. 101-4 (7January 1966).
DUGGAN (1967a)Duggan, R. E., H. C. Barry, and L. Y. Johnson, "PesticideResidues in Total Diet Samples (II)," Pesticides MonitoringJ., Vol. 1, No. 2, pp. 2-12 (September 1967).
Duggan, R. E. and G. Q. Lipscomb, "Dietary Intake of PesticideChemicals in the United States (II)," June 1966-April 1968,Pesticides Monitoring J., Vol. 2, No. 4, pp. 153-62 (March1969).
Cd DUGGAN (1972)Duggan, R. E. and P. E. Corneliussen, "Dietary Intake ofPesticide Chemicals in the United States (III)," June 1968-April 1970, Pesticides Monitoring J., Vol. 5, No. 4,pp. 331-41 (March 1972).
B-20
Topic
Asb
Asb, Cd
Asb
Asb
Cd
Cd
Cd
Cd
DUMADuma, R. J., "Particulate Matter of Particular Interest,"Ann. Intern. Med., Vol. 78, pp. 146-7 (January 1973).
DUNCANDuncan, L. J., E. L. Keitz, and E. P. Krajeski, "SelectedCharacteristics of Hazardous Pollutant Emissions," Vol. II,MTR-6401, prepared by The MITRE Corp. for U.S. EnvironmentalProtection Agency (May 1973).
DUNN (1965)Dunn, J. E. and J. M. Weir, "Cancer Experience of SeveralOccupational Groups Followed Prospectively," Amer. J. Pub.Health, Vol. 55, pp. 1367-75 (September 1965).
DUNN (1968)Dunn, J. E. and J. M. Weir, "A Prospective Study of Mortalityof Several Occupational Groups," Arch. Environ. Health,Vol. 17, No. 1, pp. 71-6 (July 1968).
DUNPHYDunphy, B., "Acute Occupational Cadmium Poisoning - a CriticalReview of the Literature," J. Occup. Med., Vol. 9, No. 1,pp. 22-6 (January 1967).
DURUMDurum, W. H., J. D. Hem, and S. G. Heidel, "Reconnaissance ofSelected Minor Elements in Surface Waters of the United States,"October 1970, prepared in cooperation with the U. S. Bureauof Sport Fisheries and Wildlife, Geological Survey Circular643 (1971).
EADSEads, E. A. and C. E. Lambdin, "A Survey of Trace Metals inHuman Hair," Environ. Res., Vol. 6, No. 3, pp. 247-52(1973).
EATONEaton, J. G., "Chronic Toxicity of a Copper, Cadmium and ZincMixture to the Fathead Minnow (Pimephales Promelas Rafinesque),"Water Research, Vol. 7, pp. 1723-36 (1973).
B-21
Topic
Cd
R/B
Asb
Cd
Gen
Asb
Asb
Asb
ELIAElia, V. J., E. E. Menden, and H. G. Petering, "Cadmium andNickel--Common Characteristics of Lettuce Leaf and TobaccoCigarette Smoke," Environmental Letters, Vol. 4, No. 4,pp. 317-24 (1973).
ELLSBERGEllsber, D., "Risk, Ambiguity, and Savage Axioms," Quart.J. Econ., Vol. 75, pp. 643-69 (1961).
ELMESElmes, P. C. and M.J.C. Simpson, "Insulation Workers in Belfast,3. Mortality 1940-66," Brit. J. Industr. Med., Vol. 28,pp. 226-36 (1971).
ENCYC. CHEM. TECH."Cadmium and Cadmium Alloys and Cadmium Compounds," pp. 884-911 in Kirk-Othmer Encyclopedia of Chemical Technology, Vol. 3,John Wiley & Sons, Inc. (1964).
ENGENEngen, T., "Use of Sense of Smell in Determining EnvironmentalQuality," pp. 133-46 in Indicators of Environmental Quality,Thomas, W. A., editor, Plenum Press (1972).
ENTERLINE (1965)Enterline, P. E., "Mortality Among Asbestos Products Workersin the United States," pp. 156-65 in Biological Effects ofAsbestos," Selikoff, I. J., and J. Churg, editors, Ann. N.Y.Acad. Sci., Vol. 132 (31 December 1965).
ENTERLINE (1967)Enterline, P. E. and M. A. Kendrich, "Asbestos-Dust Exposuresat Various Levels and Mortality," Arch. Environ. Health,Vol. 15, No. 2., pp. 181-6 (August 1967).
ENTERLINE (1972)Enterline, P., P. DeCoufle, and V. Henderson, "Mortality inRelation to Occupational Exposure in the Asbestos Industry,"J. Occup. Med., Vol. 14, No. 12, pp. 897-903 (December 1972).
B-22
Topic
Asb ENTERLINE (1973)Enterline, P. E. and V. Henderson, "Type of Asbestos and Res-piratory Cancer in the Asbestos Industry," Arch. Environ.Health, Vol. 27, No. 5, pp. 312-7 (November 1973).
Gen ENVIRONMENT (JAPAN)"Pollution Related Diseases and Relief Measures in Japan,"United Nations Conference on the Human Environment, publishedby the Environment Agency (Japan) (May 1972).
Cd EPA (1968)"Air Quality Data from the National Air Sampling Networksand Contributing State and Local Networks," 1966 Edition,Public Health Service (1968) (publication of series takenover by EPA after this edition.)
Asb EPA (1971a)"Asbestos and Air Pollution: an Annotated Bibliography,"U.S. Environmental Protection Agency, Air Pollution ControlOffice, AP-82 (February 1971).
Asb EPA (1971b)"Background Information - Proposed National Emission Standardsfor Hazardous Air Pollutants: Asbestos, Beryllium, Mercury,"APTD-0753 (PB-204 876), Office of Air Programs (December 1971).
Gen EPA (1971c)"1971 Compendium of State Regulatory/Policy Making BodiesCharged with Water Pollution Control Responsibilities,"U.S. Environmental Protection Agency, Office of Intergovern-mental Programs PB-230 194/3WP (1971).
Gen EPA (1972a)"Sewage Sludge Incineration," U.S. Environmental ProtectionAgency, Task Force for the Office of Research and Monitoring,PB-211 323 (August 1972).
Cd EPA (1972b)"Air Quality Data for 1968 from the National Air SurveillanceNetworks and Contributing State and Local Networks," U.S.Environmental Protection Agency, Office of Air Programs,APTD-0978, PB 213-830 (August 1972).
B-23
Topic
Cd
Asb
Asb
R/B
Gen
Cd
Cd
EPA (1972c)"Study of Lead, Copper, Zinc, and Cadmium Contamination ofFood Chains of Man," prepared for U.S. Environmental ProtectionAgency, by the University of Missouri, PB-223 018 (December1972).
EPA (1973a)"Background Information on the Development of NationalEmission Standards for Hazardous Air Pollutants: Asbestos,Beryllium, and Mercury," APTD-1503 Office of Air and WaterPrograms, U.S. Environmental Protection Agency, (March 1973).
EPA (1973b)"Control Techniques for Asbestos Air Pollutants," AP-117,U.S. Environmental Protection Agency, Office of Air andWater Programs (February 1973).
EPA (1973c)"Cost of Air Pollution Damage: a Status Report," AP-117,U.S. Environmental Protection Agnecy, Office of Air andWater Programs (February 1973).
EPA (1973e)"Working Conference on Health Intelligence for Fuels andFuel Additives," Convened by Fuels and Fuel Additive Regis-tration Program, National Environmental Research Center -RTP, U.S. Environmental Protection Agency, Durham, NorthCarolina, (5-7 January 1973).
EPA (1973f)"The National Air Monitoring Program: Air Quality andEmissions Trends Annual Report, Vol. 1," EPA-450/1-73-001-a,U.S. Environmental Protection Agency, Office of Air and WaterPrograms, (August 1973).
EPA (1973g)"The National Air Monitoring Program: Air Quality andEmissions Trends Annual Report, Vol. II," EPA-450/1-73-001-b,U.S. Environmental Protection Agency, Office of Air and WaterPrograms, (August 1973).
B-24
Topic
R/B EPA (1974a)"Assessing the Social Impacts of Oil Spills," BackgroundPapers and Conference Proceedings of an Invitational Symposium,sponsored by U.S. Environmental Protection Agency, and TheInstitute on Man and Science, 25-28 September 1973, Rensselaer-ville, New York, published by The Institute on Man and Science(February 1974).
Cd
R/B EPA (1974c)
EAP (1974b)"Air Pollution Aspects of Emission Sources: Primary ZincProduction - a Bibliography with Abstracts," U.S. Environ-mental Protection Agency, EPA-450/1-74-003 PB 232499,(March 1974).
"Evaluation of Techniques for Cost-Benefit Analysis of WaterPollution Control Programs and Policies," Report of the Ad-ministrator, U.S. Environmental Protection Agency to theCongress in compliance with Public Law 92-500 (January 1974).
Cd, Gen EPA (1974d)"Report to Congress: Disposal of Hazardous Wastes," preparedby the U.S. Environmental Protection Agency, Office of SolidWaste Management Programs (1974).
Cd EPA (1974e)"Air Quality Data - 1972 Annual Statistics," EPA-450/2-74-001,U.S. Environmental Protection Agency, Office of Air and WaterPrograms, (March 1974).
R/B
R/B
EPSTEINEpstein, S. S.,"Information Requirements for Determiningthe Benefit-Risk Spectrum," pp. 50-5 in "Perspectives onBenefit-Risk Decision Making," Report of a Colloquium Con-ducted by the Committee on Public Engineering Policy, NationalAcademy of Engineering, 26-27 April 1971, published byThe National Academy of Engineering (1972).
ETZOLDEtzold, D. J., "Benefit-Cost Analysis: an Integral Part ofEnvironmental Decisioning," J. Environ. Sys., Vol. 3, No. 3,pp. 253-6 (Winter 1973).
B-25
Topic
ASb FACTORY INSPECTORATE"Hygiene Standards for Asbestos Dust Concentration for Usewith the Asbestos Regulations, 1969, Technical Data Note 13Department of Employment and Productivity, Her Majesty'sFactory Inspectorate (1970).
Asb FARRELL (1973)Farrell, E. A., "Asbestos," Mining Engineers, Vol. 25, No. 1,pp. 25-6 (January 1973).
Asb FARRELL (1974)Farrell, E. A., "Asbestos," Mining Engineers, Vol. 26,No. 2, pp. 101-2 (February 1974).
Cd FASSETTFassett, D. W., "Cadmium," pp. 97-124 in D.H.K. Lee, editor,"Metallic Contaminants and Human Health," Fogarty InternationalCenter Proceedings No. 9, Academic Press, New York (1972).
Asb FED. REG. (16 December 1971)"National Emission Standards for Hazardous Air Pollutants,U.S. Environmental Protection Agency, Federal Register, Vol.36, No. 242, p. 23931 (16 December 1971).
Cd, Asb FED. REG. (18 Oct. 1972)"Occupational Safety and Health Standards," OccupationalSafety and Health Administration, Federal Register, Vol. 37,No. 202, Part II, pp. 22102-22356 (18 October 1972).
Asb FED. REG. (6 April 1973)"Asbestos, Beryllium, and Mercury," U.S. Environmental Pro-tection Agency, Federal Register, Vol. 38, No. 66, pp. 8820-50(6 April 1973).
Cd FED. REG. (16 May 1973)"Ocean Dumping," U.S. Environmental Protection Agency, FederalRegister, Vol. 38, No. 94, pp. 12872-7 (16 May 1973).
B-26
Topic
Cd
Asb
Cd
Asb
Gen
Asb
Cd
Asb
FED. REG. (7 Sept. 1973)"List of Toxic Pollutants," U.S. Environmental. ProtectionAgency, Federal Register, Vol. 38, No. 173, pp. 24342-4(7 September 1973).
FED. REG. (28 Sept. 1973)"Asbestos Particles in Food and Drugs, Notice of ProposedRulemaking," Food and Drug Admin., Federal Register, Vol.38, No. 188, pp. 27076-81 (28 September 1973).
FED. REG. (27 Dec. 1973)"Proposed Environmental Protection Agency Regulations on ToxicPollutant Standards," Federal Register, Vol. 38, p. 35388(27 December 1973).
FED. REG. (26 Feb. 1974)"Asbestos Manufacturing Point Source Category," U.S. Environ-mental Protection Agency, Federal Register, Vol. 39, No. 39,pp. 7526-35 (Feb. 26, 1974); amended in Federal Register,Vol. 39, p. 31592 (29 August 1974).
FED. REG. (21 Oct. 1974)"Ferroalloy Production Facilities, U.S. Environmental Protec-tion Agency, Proposed Standards of Performance for NewStationary Sources," Federal Register, Vol. 39, No. 204,Part III, pp. 37470-2 (21 October 1974).
FED. REG. (25 Oct. 1974)"Asbestos and Mercury, Proposed Amendments to National EmissionStandards," U.S. Environmental Protection Agency, FederalRegister, Vol. 39, No. 208, Part II, pp. 38064-73 (25 October1974).
FED. REG. (14 March 1975)"Interim Primary Drinking Water Standards," EnvironmentalProtection Agency, Federal Register, Vol. 40, No. 51, PartII, pp. 11990-98 (14 March 1975).
FED. REGULATION"National Emission Standard for Asbestos," Code of FederalRegulations, Title 61, Subpart B.
B-27
Topic
Cd
R/B
R/B
R/B
Cd
Cd
Cd
R/B
FERGUSONFerguson, B. B., C. Hinkle, and D. J. Wilson, "Foam Separationof Lead (II) and Cadmium (II) from Waste Water," SeparationSci., Vol. 9, No. 2, pp. 125-45 (1974).
FINKLEAFinklea, J. H., et al., "Pollutant Burdens in Humans: aMeasure of Environmental Quality," pp. 83-91 in "Indicatorsof Environmental Quality," W. A. Thomas, editor, PlenumPress (1972).
FISHER (1972)Fisher, A. C., J. V. Krutilla, and C. J. Cicchetti, "TheEconomics of Environmental Preservation: a Theoretical andEmpirical Analysis," Vol. 62, No. 4, pp. 605-19 (September1972).
FISHER (1973)Fisher, A. C. and J. V. Krutilla, "Valuing Long-Run EcologicalConsequences and Irreversibilities," Symposium held by EPA,September 1973.
FLICKFlick, D. F., H. F. Kraybill, and J. M. Dimitroff, "ToxicEffects of Cadmium: a Review," Environ. Research, Vol. 4,No. 2, pp. 71-85 (April 1971).
FLUOR UTAH"The Impact of Air Pollution Abatement on the Copper Industry,"Fluor Utah, San Mateo, Calif., a subsidiary of Fluro Corp.,prepared for Kennecott Copper Corp. (20 April 1971).
FOOD COSMET. TOXICOL (1972)"Itai-Itai Byo and Other Views on Cadmium" Food Cosmet.Toxicol., Vol. 10, pp. 249-55 (April 1972).
FREEMAN (1972a)Freeman, A. M., "Distribution of Environmental Quality," pp.243-78 in "Environmental Quality Analysis - Theory and Methodin the Social Sciences," A. V. Kneese and B. T. Bower, editors,The Johns Hopkins Press (1972).
B-28
Topic
R/B FREEMAN (1972b)Freeman, A. M. and R. H. Haveman, "Residuals Charges forPollution Control: a Policy Evaluation," Science, Vol. 177,pp. 322-29 (28 July 1972).
Cd FRIBERG (1971)Friberg, L., et al., "Cadmium in the Environment: a Toxi-cological and Epidemiological Appraisal," APTD 0681; PB 199795,prepared by the Karolinska Institute, Stockholm, Sweden,for the U.S. Environmental Protection Agency, Air PollutionControl Office (April 1971).
Cd FRIBERG (1974)Friberg, L., et al., "Cadmium in the Environment," CRC Press,Inc., Cleveland, Ohio (1974).
Gen FRITSCHFritsch, A., "Gasoline, Center for Science in the PublicInterest," Washington, D.C. (September 1972).
Cd FULKERSONFulkerson, W., et al., "Cadmium - the Dissipated Element,"ORNL NSF-EP-21, supported by the National Science FoundationRANN Program, Oak Ridge National Laboratory, Oak Ridge,Tenn. (January 1973).
Cd GARDINER, J.Gardiner, J., "The Chemistry of Cadmium in Natural Water - I.A study of Cadmium Complex Formation Using the Cadmium Specific-ion Electrode," Water Res., Vol. 8, No. 1, pp. 23-30(1974).
R/B
Asb
GARDINER, P. C.Gardiner, P. C., "Public Policy Decision Making. The Appli-cation of Decision Technology and Monte Carlo Simulation toMultiple Objective Decisions: a Case Study in CaliforniaCoastal Zone Management," Ph. D. thesis, Univ. SouthernCalifornia (June 1974):
GEEGee, B. and A. Bouhuys, "Action on Asbestos," New England J.Med., Vol. 285, No. 23, pp. 1317-8 (2 December 1971).
B-29
Topic
Gen
R/B
Asb
Asb
Asb
Asb
Asb
Gen
Gen
GERAGHTY"Ground-Water Contamination, an Explanation of Its Causes andEffects," Geraghty & Miller Inc., Consulting Ground WaterGeologists, Port Washington, New York (May 1972).
GERHARDTGerhardt, P. H., "Air Pollution Control: Benefits, Costs,and Inducements," pp. 153-71 in Public Prices for PublicProducts, S. J. Mushkin, editor, The Urban Institute (1972).
GIBBS (1970)Gibbs, G. W., "Qualitative Aspects of Dust Exposure in theQuebec Asbestos Mining and Milling Industry, Inhaled Part.,"Vol. 2, pp. 783-99 (1970).
GIBBS (1974)Gibbs, G. W. and M. LaChance, "Dust-Fiber Relationships inthe Quebec Chrysotile Industry," Arch. Environ. Health,Vol. 28, No. 2, pp. 69-71 (February 1974).
GILSON (1972)Gilson, J. C., "Health Hazards of Asbestos," Composites,Vol. 3, No. 2, pp. 57-9 (March 1972).
GILSON (1973)Gilson, J. C., "Asbestos Cancer: Past and Future Hazards,"Proc. Roy. Soc. Med., Vol. 66, pp. 395-403 (April 1973).
GOLDGold, C. and J. Cuthbert, "Asbestos - a Hazard to theCommunity, Public Health, Vol. 80, No. 6, pp. 261-70 (1971).
GOLDBERGGoldberg, A. J,, "A Survey of Emissions and Controls forHazardous and Other Pollutants," U.S. Environmental ProtectionAgency, Office of Research & Monitoring (February 1973).
GOLDSTEIN, G.Goldstein, G., "Biochemical Indicators of EnvironmentalPollution," pp. 109-31 in "Indicators of Environmental Qual-ity," W. A. Thomas, editor, Plenum Press (1972).
B-30
Topic
Gen
Asb
Cd
R/B
R/B
Cd
Gen
Gen
GOLDSTEIN, I.Goldstein, I. F. and G. Block, "Asthma and Air Pollution inTwo Inner City Areas in New York City," J. Air PollutionControl ASSC., Vol. 24, No. 7, pp. 665-673 (July 1974).
GORSONGorson, R. O. and J. L. Lieberman, "The Prohibition of theUse of Asbestos Spray in Building Construction," J. Occup.Med., Vol. 15, No. 3, pp. 260-1 (March 1973).
GOYERGoyer, R. A., et al., "Aminoaciduria in Japanese Workers inthe Lead and Cadmium Industries," Amer. J. Clin. Pathol.,Vol. 57, pp. 635-42 (May 1972).
GREENGreen, H. P., "Comments on Legal Mechanisms," pp. 69-72 in"Perspectives on Benefit-Risk Decision Making," Report of aColloquium Conducted by the Committee on Public EngineeringPolicy, National Academy of Engineering, 26-27 April 1971,published by The National Academy of Engineering (1972).
GREENFIELDGreenfield, S. M., "Cost-Benefit Research in EPA - Office ofResearch and Development," Symposium held by EPA, September1973.
GRIFFINGriffin, R. M., et al., "The Assessment of Individual Varia-bility to Trace Mental Insult: Low-Molecular-Weight MetalComplexing Agents as Indicators of Trace Metal Insult, Am.Ind. Hyg. Assoc. J., Vol. 33, pp. 373-7 (June 1972).
GRIFFITHGriffith, J., "The Role of Social Scientists in River BasinPlanning: a Critique," J. Environ. Sys., Vol. 3, No. 2,pp. 131-51 (Summer 1973).
GRIGALGrigal, D. F., "Plant Indicators in Ecology," pp. 257-67 in"Indicators of Environmental Quality," W. A. Thomas, editor,Plenum Press (1972).
B-31
Topic
Gen GROSS, G.Gross, G., "Preliminary Analyses of Urban Wastes, New YorkMetropolitan Region," AD 746 959, Marine Sciences ResearchCenter, State University of New York, Stony Brook, New York(February 1970).
Asb GROSS, P. (1967)Gross, P., et al., "Experimental Asbestosis," Arch. Environ.Health, Vol. 15, pp. 343-55 (1967).
Asb GROSS, P. (1970)Gross, P., R.T.P. deTreville, and M. N. Haller, "AsbestosVersus Nonasoestos Fibers," Arch. Environ. Health, Vol. 20,No. 5, pp. 571-8, (May 1970).
Asb GROSS, P. (1974)Gross, P., et al., "Ingested Mineral Fibers: Do They PenetrateTissue or Cause Cancer?," Arch. Environ. Health, Vol. 29,pp. 341-7 (December 1974).
Gen HACKESHackes, P., "The Uncommunicative Scientist: the Obligation ofScientists to Explain Environment to the Public, pp. 31-41 in"Indicators of Environmental Quality," W. A. Thomas, editor,Plenum Press (1972).
R/B HAEFELE (1972)Haefele, E. T., "Environmental Quality as a Problem of SocialChoice," pp. 281-331 in "Environmental Quality Analysis -Theory and Method in the Social Sciences," Kneese, A. V. andBower, B. T.,. The Johns Hopkins Press (1972).
R/B HAEFELE (1973)Haefele, E. T., "Representative Government and EnvironmentalManagement," published for Resources for the Future, Inc.,by the Johns Hopkins Press, Baltimore (1973).
B-32
Topic
Cd HALLOWELLHallowell, J. B., et al., "Water Pollution Control in thePrimary Nonferrous-Metals Industry - Vol. I. Copper, Zinc,and Lead Industries," EPA-R2-73-247a, U.S. EnvironmentalProtection Agency, prepared for Office of Research and Moni-toring, by Edison Water Quality Research Laboratory, EdisonNew Jersey (September 1973).
Gen HAMHam, R. K., "Evaluation of Sanitary Landfill Design andOperating Practices," Waste Age, Vol. 3, pp. 28-31 (1972).
Cd HAMMER (1971)Hammer, D. I., et al., "Hair Trace Metal Levels and Environ-mental Exposure," Am. J. Epidemiology, Vol. 93, No. 2,pp. 84-92 (1971).
Cd
Cd
Cd
Asb
HAMMER (1972a)Hammer, D. I., et al., "Cadmium Exposure and Human HealthEffects," pp. 269-83 in 'Trace Substances in EnvironmentalHealth" - V, Hemphill, D. D., editor, Proc. of Universityof Missouri's 5th Annual Conference on Trace Substances inEnvironmental Health, June 29 - July 1, 1971, sponsored byUniversity of Missouri, Environ. Health Center and ExtensionDivision, Columbia, Missouri (1972).
HAMMER (1972b)Hammer, D. I., "Trace Metals in Human Hair as a Simple Epi-demiologic Monitor of Environmental Exposure," pp. 25-38 inTrace Substances in Environmental Health - V, Hemphill, D. D.,editor, Proc. Univ. of Missouri's 5th Annual Conf. on TraceSubstances in Environmental Health, June 29 - July 1, 1971Columbia, Missouri (1972).
HAMMER (1973)Hammer, D. I., et al., "Cadmium and Lead in Autopsy Tissues,"J. Occup. Med., Vol. 15, pp. 956-63 (December 1973).
HAMMOND (1965)Hammond, E. C., I. J. Selikoff, and J. Churg, "Neoplasia AmongInsulation Workers in the United States with Special Referenceto Intra-Abdominal Neoplasia," pp. 519-25 in BiologicalEffects of Asbestos, I. J. Selikoff, and J. Churg, editors,Ann. N.Y. Acad. Sci., Vol. 132 (31 December 1965).
B-33
Topic
Gen
Asb
R/B
Asb
Cd
Cd
Cd
HAMMOND (1968)Hammond, E. C. and L. Garfinkel, "Changes in Cigarette Smoking1959-1965 ," Am. J. Public Health, Vol. 58, No. 1, pp.30-45 (January 1968).
HAMMOND (1972)Hammond, E., and I. J. Selikoff, "Relation of Cigarette Smokingto Risk of Death of Asbestos-Associated Disease Among InsulationWorkers in the United States," presented at the meeting of theWorking Group to Assess Biological Effects of Asbestos, Inter-national Agency for Research on Cancer, Lyon, France (4 October1972).
HANKEHanke, S. H. and I. Gutmanis, "Estimates of Industrial Water-Borne Residual Control Costs: A Review of Concepts, Method-ology and Empirical Results," Symposium held by EPA, September1973.
HARADAHarada Jr., H. M., et al., "Modified Filtration Method forSuspended Solids Analysis," J. Water Poll. Control Fed.,Vol. 45, No. 9, pp. 1853-8 (1973).
HARDYHardy, E. P., "Health and Safety Laboratory Fallout Program,"HASL-242, Quarterly Summary Report, Atomic Energy Commission,Health and Safety Lab., New York (1 April 1971).
HARRISON, P.Harrison, P. R. and J. W. Winchester, "Area-Wide Distributionof Lead, Copper, and Cadmium in Air Particulates from Chicagoand Northwest Indiana," Atmospheric Environment, Vol. 5,pp. 863-880 (1971).
HARRISON, T.Harrison, T. S., W. W. Foster, and W. D. Cobb, "Applicationsof Atomic Absorption Spectrophotometry in an Iron and Steel-works Laboratory: Ancillary Methods, Waters and Effluents,Pollutants and Lubricants," Metallurgia and Metal Forming,Vol. 41, No. 1, pp. 27-9 (1974).
B-34
Topic
Cd
Cd
Asb
Asb
R/B
R/B
Cd
Asb
HARRISSHarriss, R. C., "Distribution of Pesticides in a SouthFlorida Watershed, PB-231 684/2WP, Florida State Univ.,Tallahassee Marine Lab (March 1973).
HARVEYHarvey, T. C., "Cigarette Smoking and Cadmium Accumulation,"Lancet, pp. 538-9 (4 March 1972).
HARWOODHarwood, C. F., "Asbestos Air Pollution Control," PB 205238,prepared for the Illinois Institute for Environmental Qualityby the Illinois Institute of Technology Research Institute,Chicago, Ill. (November 1971).
HATCH, D.Hatch D., "Possible Alternatives to Asbestos as a FrictionMaterial", Ann. Occup. Hyg., Vol. 13, pp. 25-9 (1970).
HATCH, T.Hatch, T. F., "Criteria for Hazardous Exposure Limits,"Arch. Environ. Health, Vol. 27, pp. 231-5 (October 1973).
HAVEMANHaveman, R. H., and B. A. Weisbrod, "The Concept of Benefitsin Benefit-Cost Analysis with Emphasis on Water PollutionControl Activities," Symposium held by EPA, September 1973.
HECKERHecker, L. H., et al., "Heavy Metal Levels in Acculturated andUnacculturated Populations," Arch. Environ. Health, Vol.29, pp. 181-5 (October 1974).
HEFFELFINGERHeffelfinger, R. E., C. W. Melton, and D. L. Kiefer, "Develop-ment of a Rapid Survey Method of Sampling and Analysis forAsbestos in Ambient Air ," PB 209 477, prepared for U.S.Environmental Protection Agency, Division of Atmospheric Sur-veillance, by Battelle Columbus Laboratories, Columbus, Ohio(29 February 1972).
B-35
Topic
Cd
Cd
Cd
Asb
Cd
Cd
Asb
HEMPHILL (1971)Hemphill, D. D., editor, "Trace Substances in EnvironmentalHealth - V," Proc. of Univ. of Missouri's 5th Annual Con-ference on Trace Substances in Environmental Health, 29 June- 1 July 1971, sponsored by University of Missouri, Environ-mental Health Center and Extension Division, Columbia,Missouri (1971).l
HEMPHILL (1973a)Hemphill, D. D., editor, "Trace substances in EnvironmentalHealth - VI," Proc. of Univ. of Missouri's 6th Annual Con-ference on Trace Substances in Environmental Health, 13-15June 1972, Univ. of Missouri Environmental Trace SubstancesCenter and Extension Division, Columbia, Missouri (1973).
HEMPHILL (1973b)Hemphill, D. D., editor, "Trace Substances in EnvironmentalHealth - VII," Proc. of Univ. of Missouri's 7th Annual Con-ference on Trace Substances in Environmental Health, 12-14June 1973, Univ. of Missouri Environmental Trace SubstancesCenter and Extension Division, Columbia, Missouri (1973).
HENDRYHendry, N. W., "The Outlook for Asbestos in Canada," TheCanadian Mining and Metallurgical Bulletin, Vol. 65, F40-4 (August 1972).
HERNBERGHernberg, S., "Health Hazards of Persistent Substances inWater," WHO Chronicle, Vol. 27, No. 5, World Health Or-ganization Geneva, pp. 192-3 (May 1973).
HICKEYHickey, R. J., E. P. Schoft, and R. C. Clelland, "RelationshipBetween Air Pollution and Certain Chronic Disease Death Rates,"Arch. Environ. Health, Vol. 15, No. 6, pp. 728-38 (1967).
HICKISHHickish, D. E. and K. L. Knight, "Exposure to Asbestos DuringBrake Maintenance," Ann. Occup. Hyg., Vol. 13, pp. 17-21(1970).
B-36
Topic
R/B HIGHWAY RES. BOARD"Toward Environmental Benefit/Cost: Measurement Methodology,"Final report, Vols. I and II, prepared for Highway ResearchBoard, National Cooperative Highway Research Program, andNational Academy of Sciences, by Polytechnic Institute of NewYork, Brooklyn, New York (1 January 1974).
R/B
Asb
HIRSCHLEIFERHirschleifer, J., T. Bergstrom, and E. Rappaport, "ApplyingCost-Benefit Concepts to Projects Which Alter Human Mortality,"UCLA-ENG-7478, prepared for the National Science Foundation,by the University of California, School of Engineering andApplied Science, Los Angeles, Calif. (November 1974).
HOLMESHolmes, S., "Safe Use of Asbestos Plastics," Composites,Vol. 3, No. 2, pp. 60-1 (March 1972).
Asb HOLTHolt, P. F. and D. K. Young, "Asbestos Fibers in the Air ofTowns," Atmos. Environ., Vol. 7, No. 5, pp. 481-3 (May1973).
Cd
Asb
Gen
Gen
HORVICKHorvick, E. W., "Zinc and Zinc Alloys," pp. 1157-72 inMetals Handbook, 8th Ed., Vol. 1, Properties and Selectionof Metals, American Society for Metals, Metals Park, Ohio(1961).
HORVITZHorvitz, J. S,, "Asbestos and Its Environmental Impact,"Environ. Affairs,, Vol. 3, No. 1, pp. 145-65 (1974).
HOUTHAKKERHouthakker, H. S., "Revealed Preference and the UtilityFunction," Economica (new series), Vol. 7, pp. 159-74(May 1950).
HOVEYHovey, H. H., H. C. Jones, and W. N. Stasiuk, "Developmentof Short-Term Air Quality Standards for Suspended ParticulateMatter in New York State," presented at the Air PollutionControl Association meeting, Denver, Colo., June 1974.
B-37
Topic
Gen
Asb
Asb
Cd
Asb
R/B
Asb
Gen
HOWELLHowell, W. C., "Uncertainty from Internal and External Sources:a Clear Case of Overconfidence," J. Exp. Psych., Vol. 89,No. 2, pp. 240-3 (1971).
HUEPER (1955)Hueper, W., "Silicosis, Asbestosis, and Cancer of the Lung,"Am. J. Clin. Pathol., Vol. 25, No. 12, pp. 1388-90 (December1955).
HUEPER (1965)Hueper, W. C., "Occupational and Nonoccupational Exposuresto Asbestos," pp. 184-95 in "Biological Effects of Asbestos,"Selikoff, I. J. and Churg, J., editors, Ann. N.Y. Acad. Sci.,Vol. 132 (31 December 1965).
HUNTHunt, W. F., et al., "A Study in Trace Element Pollution ofAir in 77 Midwestern Cities," pp. 56-68 in: 4th AnnualConference on Trace Substances in Environmental Health, Univ.of Missouri, Columbia, Missouri (23 June 1970).
HUTCHESONHutcheson, J.R.M., "Environmental Control in the AsbestosIndustry of Quebec," Can. Mining. Met. Bull., Vol. 64,No. 712, pp. 83-9 (August 1971).
ISARDIsard, W., et al., "Ecologic-Economic Analysis for RegionalDevelopment," The Free Press, New York (1972).
JACKOJacko, M. G., R. T. DuCharme, and J. H. Somers, "How MuchAsbestos Do Vehicles Emit?," Automotive Engineering, Vol.81, No. 6, pp. 38-40 (June 1973).
JACKSONJackson, S. and V. M. Brown, "Effect of Toxic Wastes on Treat-ment Processes and Watercourses," Conference Paper No. 2C,presented at the Annual Conference of The Institute of WaterPollution Control, Douglas, Isle of Man, 16-19 September 1969.
B-38
Topic
Gen
Asb
Cd
R/B
Cd
R/B
Cd
Asb
J. METALS"Ferrous Scrap, Is It Plentiful or in Short Supply?, "Reclama-tion and Residuals, J. Metals, pp. 33-40 (March 1974).
J. OCCUP. MED. (1973)"Excerpts from the Criteria Document, I. Recommendations foran Asbestos Standard," J. Occup. Med., Vol. 15, No. 4,pp. 375-9 (April 1973).
JOHNSONJohnson, D. E., "Development of Analytic Techniques to MeasureHuman Exposure to Fuel Additives," PB 232702, prepared bySouthwest Research Institute for U.S. Environmental ProtectionAgency (March 1974).
JORDENINGJordening, D. L., and J. K. Allwood, "Research Needs andPriorities: Water Pollution Control Benefits and Costs,Vol. II," U.S. Environmental Protection Agency, Office ofResearch and Monitoring, (October 1973).
JURINAKJurinak, J. J. and J. Santillan-Medrano, "The Chemistry andTransport of Lead and Cadmium in Soils," PB 237497, ResearchReport 18, Utah Agricultural Experiment Station, Utah StateUniv. (June 1974).
KATZKatz, M., "Legal Mechanisms," pp. 59-62 in "Perspectives onBenefit-Risk Decision Making" Report of a Colloquium Conductedby the Committee on Public Engineering, National Academy ofEngineering, 26-27 April 1971, published by The NationalAcademy of Engineering (1972).
KAUFMANKaufman, W. J., "Chemical Pollution of Ground Waters," Amer.Water Works Assn. J., Vol. 66, No. 3, pp. 152-159 (1974).
KAYKay, G. H., "Asbestos in Drinking Water," Amer. Water WorksAssn. J., Vol. 66, No. 9, pp. 513-14 (1974).
B-39
Topic
Gen KENAHAMKenahan, C. B., et al., "Composition and Characteristics ofMunicipal Incinerator Residues," Bureau of Mines, Report ofInvestigations 7204 (December 1968).
Asb KESTINGKesting, A. M., "Dust Measurement in Plants with AsbestosProcessing Machinery," Staub (English Translation), Vol. 26,No. 10, pp. 14-6 (October 1966).
R/B KIMBALLKimball, T. L., "Why Environmental Quality Indices?," pp.7-14 in Indicators of Environmental Quality, W. A. Thomas,editor, Plenum Press (1972).
R/B KLARMAN (1965a)Klarman, H. E., "The Economics of Health," Columbia Univ. Press,New York (1965).
Gen KLARMAN (1965b)Klarman, H. E., "Syphilis Control Programs," pp. 367-414 inMeasuring Benefits in Government Investments, R. Dorfman,editor, The Brookings Institution (1965).
Cd KLEINKlein, D. H. and P. Russell, "Heavy Metals: Fallout Arounda Power Plant," Environ. Sci. Tech., Vol. 7, No. 4, pp.357-8 (April 1973).
Asb KLEINFELD (1967)Kleinfeld, M., "Mortality Among Talc Miners and Millers inNew York State," Arch. Environ. Health, Vol. 14, pp. 663-7 (May 1967).
Asb KLEINFELD (1973a)Kleinfeld, M., "Biologic Response to Kind and Amount ofAsbestos," J. Occup. Med., Vol. 15, No. 3, pp. 296-300 (1973).
Asb KLEINFELD (1973b)Kleinfeld, M., J. Messite, and A. M. Langer, "A Study ofWorkers Exposed to Asbestiform Minerals in Commerical TalcManufacture," Environ. Research, Vol. 6, pp. 132-43 (1973).
B-40
Topic
R/B
R/B
R/B
R/B
Cd
R/B
Asb
Gen
KNEESE (1969)Kneese, A. V. and R. C. d'Arge, "Pervasive External Costsand the Response of Society," pp. 87-115 in U.S. Congress,Joint Economic Committee, Subcommittee on Economy in Govern-ment, "The Analysis and Evaluation of Public Expenditures:the PPB System," 91st Congress, 1st Session (1969).
KNEESE (1970)Kneese, A. V., R. U. Ayres, and R. C. d'Arge, "Economics andthe Environment - a Materials Balance Approach," Resources forthe Future, Inc., Washington, D.C., distributed by The JohnsHopkins Press (1970).
KNEESE (1972)Kneese, A. V. and B. T. Bower, editors, "Environmental QualityAnalysis - Theory and Method in the Social Sciences," TheJohns Hopkins Press (1972).
KNEESE (1973)Kneese, A. V., "Costs of Water Quality Improvement, TransferFunctions and Public Policy," Symposium held by EPA, September1974
KNEIPKneip, T. J., "Airborne Particulates in New York City," J.Air Pollution Control Assoc., Vol. 20, No. 3, pp. 144-9 -(March 1970).
KNETSCHKnetsch, J. L., "Outdoor Recreation Demands and Benefits,"Land Economics, Vol. 39, No. 4, pp. 387-96 (November 1973).
KNOXKnox, J. F., "Mortality from Lung Cancer and Other CausesAmong Workers in an Asbestos Textile Factory," Brit. J.Industr. Med., Vol. 25, pp. 293-303 (1968).
KOHNKohn, R. E., "Optimal Air Quality Standards," Econometrica,Vol. 39, No. 6, pp. 983-95 (November 1971).
B-41
Topic
Cd
R/B
Cd
R/B
Gen
Gen
KOPPKopp, J. F. and R. C. Kroner, "Trace Metals in Waters of theUnited States, A Five-Year Summary of Trace Metals inRivers and Lakes of the United States (October 1, 1962 -September 30, 1967)," Federal Water Control Admin., Divisionof Pollution Surveillance, Cincinnati, Ohio.
KRUTILLAKrutilla, J. V., et al., "Observations on the Economics ofIrreplaceable Assets," pp. 69-112 in Environmental QualityAnalysis - Theory and Method in the Social Sciences, A. V.Kneese, and B. T. Bower, editors, The Johns Hopkins Press(1972).
KUBASIKKubasik, N. P., et al., "Heavy Metal Poisoning: ClinicalAspects and Laboratory Analysis," Am. J. Med..Technol,Vol. 39, pp. 443-50 (November 1973).
KUNREUTHERKunreuther, H., "Values and Costs," pp. 41-62 in BuildingPractices for Disaster Mitigation, Proc. of a Workshop spon-sored by the National Science Foundation, Research Appliedto National Needs Program and the National Bureau of Standards,R. Wright, S. Kramer, and C. Culver, editors, held at theNational Bureau of Standards, Boulder, Colorado, 28 August -1 September 1972, National Bureau of Standards, BuildingScience Series No. 46 (February 1973).
LINDBLOMLindblom, C. E., The Policy Making Process, p. 24 (PrenticeHall, Englewood Cliffs, N. J., 1968).
LUCELute, R. D., and H. Raiffa, Games and Decisions, p. 282(Wiley, N.Y., 1957).
B-42
Topic
Asb
Cd
Asb
Asb
Asb
Asb
Gen
Cd
LAAMANENLaamanen, A., L. Noro, and V. Raunio, "Observations on Atmo-spheric Air Pollution Caused by Asbestos," pp. 240-54 inSelikoff, I. J. and Churg, J., editors, "Biological Effectsof Asbestos," Ann. N. Y. Acad, Sci., Vol. 132 (31 Decem-ber 1965).
LANCET (1973)"Cadmium and the Lung," Lancet, Vol. 2, pp. 1134-5 (17November 1973).
LANELane, R. E., "Hygiene Standards for Chrysotile AsbestosDust," from the Committee on Hygiene Standards of theBritish Occupational Hygiene Society, Ann. Occup. Hyg.,Vol. 11, pp. 47-69 (1968).
LANGER (1970)Langer, A. M., I. Rubin, and I. J. Selikoff, "Electron Mi-croprobe Analysis of Asbestos Bodies," pp. 57-6.9 in "Pneu-moconiosis," Proc. of the International Conference, Johan-nesburg, 1969 (pub. 1970).
LANGER (1971)Langer, A. M., I. J. Selikoff, and A. Sastre, "ChrysotileAsbestos in the Lungs of Persons in New York City," Arch.Environ. Health, Vol. 22, No. 3, 348-61 (March 1971).
LANGER (1972)Langer, A. M., I. B. Rubin, and I. J. Selikoff, "ChemicalCharacterization of Asbestos Body Cores by Electron Mi-croprobe Analysis," J. Histochem. Cytochem., Vol. 20,No. 9, pp. 723-34 (1972).
Gen LANGHAMLangham, M. R., J. C. Headley, and W. F. Edwards, "Agricul-tural Pesticides: Productivity and Externalities," pp.181-212 in "Environmental Quality Analysis - Theory andMethod in the Social Sciences,' A. V. Kneese and B. T.Bower, editors, The Johns Hopkins Press (1972).
LAUGLaug, E. P., et al., "Total Diet Study: A. Strontium-90 andCesium-137 Content. B. Nutrient Content. C. Pesticide Con-tent," J. AOAC, Vol. 46, pp. 749-67 (1963).
LAUWERYSLauwerys, R. R., et al., "Epidemiological Survey of WorkersExposed to Cadmium," Arch. Environ. Health, Vol. 28, No. 3,pp. 145-8 (March 1974).
B-43
Topic
R/B
R/B
R/B
R/B
Cd
Cd
Gen, Cd
Asb
R/B
LAVE (1970)Lave, L. and E. P. Seskin, "Air Pollution and Human Health,"Science, Vol. 169, No. 3947, pp. 723-33 (21 August 1970).
LAVE (1972a)Lave, L. B., "Air Pollution Damage: Some Difficulties inEstimating the Value of Abatement," pp. 213-42 in Environ-mental Quality Analysis - Theory and Method in the SocialSciences, A. V. Kneese and B. T. Bower, editors, The JohnsHopkins Press (1972).
LAVE (1972b)Lave, L. B., "Risk, Safety, and the Role of Government,"pp. 96-108 in "Perspectives on Benefit-Risk Decision Making,"Report of a Colloquium conducted by the Committee on PublicEngineering Policy, National Academy of Engineering, 26-27April 1971, published by The National Academy of Engineer-ing (1972).
LAVE (1973)Lave, L. B. and L. C. Freeburg, "Health Effects of Electric-ity Generation from Coal, Oil, and Nuclear Fuel," NuclearSafety, Vol. 14, No. 5, pp. 408-28 (September-October 1973).
LEAD AND ZINC STUDY GROUP"Lead and Zinc, Factors Affecting Consumption," InternationalLead and Zinc Study Group, United Nations, New York.
LEE (1972)Lee, D.H.K., editor, "Metallic Contaminants and Human Health,"Fogarty International Center Proc. No. 9, Academic Press,New York (1972).
LEE (1973)Lee, D.H.K., "Biologic Effect of Metallic Contaminants - TheNext Step," Environmental Research, Vol. 6, pp. 121-31 (1973).
LEE (1974)Lee, D.H.K., editor, "Biological Effects of Ingested Asbestos,"Proc. of a Joint NIEHS-EPA Conference held in Durham, N.C.,18-20 November 1973, published in Environmental Health Per-spectives, Vol. 9 (December 1974).
LEGATORLegator, M. S., "How Safe are Commercially Used Drugs?"(Abstract), pp. 85-7 in "Perspectives on Benefit-Risk De-cision Making," Report of a Colloquium Conducted by the Com-mittee on Public Engineering Policy, National Academy of En-gineering, 26-27 April 1971, published by The NationalAcademy of Engineering (1972).
B-44
Topic
Cd
R/B
Cd
Cd
Cd
Asb
Cd
R/B
Gen
Gen
LEONARDLeonard, C. D., et al., "Proteinuria Screening and KidneyDisease Questionnaire in an Industrial Population," Ind. Med.,Vol. 42, No. 2, pp. 27-30 (February 1973).
LESOURDLeSourd, D. A. and F. L. Bunyard, "Comprehensive Study ofSpecified Air Pollution Sources to Assess the Economic Im-pact of Air Quality Standards," Vol. 1, PB-222857, preparedfor the U.S. Environmental Protection Agency, Div. of Ef-fects Research by Research Triangle Institute (August 1972).
LEWIS (1972a)Lewis, G. P., "Cigarette Smoking and Cadmium Accumulation inMan," Lancet, pp. 682-3 (25 March 1972).
LEWIS (1972b)Lewis, G. P., W. J. Jusko, and L. L. Coughlin, "Cadmium Accum-ulation in Man: Influence of Smoking, Occupation, AlcoholicHabit and Disease," Journal of Chronic Diseases, Vol. 25, pp.717-26 (1972).
LEWIS (1972c)Lewis, G. P., "Contribution of Cigarette Smoking to CadmiumAccumulation in Man," Lancet, pp. 291-2 (5 February 1972).
LIEBENLieben, J. and H. Pistawka, "Mesothelioma and Asbestos Expo-sure," Arch, Environ. Health, Vol. 14, No. 4, pp. 559-63(April 1967).
LIEBERLieber, M. and W. F. Welsch, "Contamination of Groundwaterby Cadmium," J. Amer. Water Works Assoc., Vol. 46, pp. 541-7(1954).
LINDLind, R. C., "The Analysis of Benefit-Risk Relationships;Unresolved Issues and Areas for Future Research," pp. 109-14in "Perspectives on Benefit-Risk Decision Making," Report ofa Colloquium conducted by the Committee on Public Engineer-ing Policy, National Academy of Engineering, 26-27 April 1971,published by The National Academy of Engineering (1972).
LINDBLOMLindblom, C. E., The Policy Making Process, pg. 24, PrenticeHall, Englewood Cliffs, N.J. (1968).
LIPSCOMBLipscomb, D. M., "Indicators of Environmental Noise," pp.211-41 in "Indicators of Environmental Quality," W. A. Thomaseditor, Plenum Press (1972).
B-45
Topic
Asb LITTLE (1972)"Impact of Proposed OSHA Standard for Asbestos, First Reportto U.S. Dept. of Labor," Arthur D. Little, Inc., No. C-74413(28 April 1972) Appendices (5 July 1972).
Gen LITTLE (1974)"Economic Analysis of Effluent Guidelines for the InorganicChemicals Industry," Arthur D. Little, Inc., PB-234 457/OWP(April 19.74).
Cd LOHLoh, H. S. and C.W.M. Wilson, "Cigarette-Smoking and Cadmium,"Lancet, p. 491 (26 February 1972).
Gen LUCELuce, R. D. and H. Raiffa, Games and Decisions, p. 282, Wiley,N.Y. (1957).
Asb LUMLEYLumley, K.P.S., P. G. Harries, and F. J. O'Kelly, "BuildingsInsulated with Sprayed Asbestos: A Potential Hazard," Ann.Occup. Hyg., Vol. 14, pp. 255-7 (1971).
Asb LYNCH (1966)Lynch, J. R. and H. E. Ayer, "Measurement of Dust Exposuresin the Asbestos Textile Industry," Am. Ind. Hyg. Assoc. J.,pp. 431-7 (September-October 1966).
Asb LYNCH (1968a)Lynch, J. R., "Brake Lining Decomposition Products," Air Pol-lution Control Assoc. Journal, Vol. 18, No. 12, pp. 824-6(December 1968).
Asb LYNCH (1968b)Lynch, J. R. and H. E. Ayer, "Measurement of Asbestos Expo-sure," J. Occup. Med., Vol. 10, No. 1, pp. 21-4 (January1968).
Asb LYNCH (1970)Lynch, J. R., H. E. Ayer, and D. L. Johnson, "The Interrela-tionships of Selected Asbestos Exposure Indices," Amer. Ind.Hyg. Assn. J., Vol. 31, pp. 598-604 (1970).
R/B MAASSMaass, A., "Benefit-Cost Analysis: Its Relevance to PublicInvestment Decisions," Quart. J. Economics, Vol. 80, No. 2,pp. 208-26 (May 1966).
Gen MACDONALDMacDonald, G.J.F., "Uses of Environmental Indices in PolicyFormulation," pp. 15-21 in "Indicators of Environmental Qual-ity," W. A. Thomas, editor, Plenum Press (1972).
B-46
Topic
Cd MACKAYMackay, D. W., W. Halcrow, and I. Thorton, "Sludge Dumpingin the Firth of Clyde," Mar. Pollut. Bull., Vol. 3, pp. 7-10(1972).
Gen MACNAMARAMacNamara, E. E., "Leachate from Landfilling," Compost Science,Vol. 12, pp. 10-14 (1971).
Cd MALCOLMMalcolm, D., "Potential Carcinogenic Effect of Cadmium inAnimals and Man," Ann. Occup. Hyg., Vol. 15, pp. 33-6 (1972).
R/B MALERMaler, K. G., "A Method of Estimating Social Benefits fromPollution Control," Swed. J. of Economics, pp. 121-33 (1971).
Cd MALIKMalik, R. K., "Evaluation of Contaminants - Mercury and Cad-mium - by the Joint FAO/WHO Expert Committee on Food Addi-tives," April 1972, presented at the European ColloquiumProblems of the Contamination of Man and His Environment byMercury and Cadmium, Kirchberg, Luxembourg, 3-5 July 1973.
Gen MANCUSO (196 3)Mancuso, T. F. and E. J. Coultet, "Methodology in IndustrialHealth Studies," Arch. Environ. Health, Vol. 6, No. 2, pp.36-52 (1963).
Asb MANCUSO (1967)Mancuso, T. F. and A. A. El-Attar, "Mortality Pattern in aCohort of Asbestos Workers," J. Occup. Med., Vol. 9, No. 4,pp. 147-62 (April 1967).
Asb MANCUSO (1969)Mancuso T.-F., "Asbestos and Cancer," Arch. Environ. Health,Vol. 18, p. 859 (May 1969).
R/B MARCUSMarcus, M., "The Economic Benefits of Nuclear Power Plants,"Public Utilities Fortnightly, Vol. 93, No. 13, pp. 27-30(20 June 1974).
Cd MARTINMartin, R. J. and R. E. Duggan, "Pesticide Residues in TotalDiet Samples (III)," Pesticides Monitoring J., Vol. 1, No. 4,pp. 11-20 (March 1968).
B-47
B-48
Topic
R/B
Asb
Cd
Cd
Gen
Asb
Asb
Asb
Asb
Gen
MASSEYMassey, H. G., "Cost, Benefit, and Risk--Keys to Evaluationof Policy Alternatives," AD-783 325, RAND Corp. (March 1974).
MASSONMasson, T. J., F. W. McKay, and R. W. Miller, "Asbestos-LikeFibers in Duluth Water Supply - Relation to Cancer Mortality,"J. Amer. Med. Assn., Vol. 228, No. 8, pp. 1019-20 (20 May 1974).
MATHEWSONMathewson, C. H., "Zinc, the Science and Technology of theMetal, Its Alloys and Compounds," Reinhold Publishing Corp.,New York (1959).
MCCABEMcCabe, L. J., et al., "Survey of Community Water Supply Sys-tems," Amer. Water Works Assoc. J., Vol. 62, pp. 670-87(1970).
MCCAULLMcCaull, J., "Building a Shorter Life," Environment, Vol. 13,No. 7, pp. 3-15 (September 1971).
MCDONALD, A. (1970)McDonald, A. D., "Epidemiology of Primary Malignant Meso-thelial Tumors in Canada," Cancer, Vol. 26, No. 4, pp. 914-9(1970).
MCDONALD, A. (1973)McDonald, A. D. and J. C. McDonald, "Epidemiologic Surveil-lance of Mesothelioma in Canada," Canadian Medical Assn. J.,Vol. 109, pp. 359-62 (1 September 1973).
MCDONALD, J. (1971)McDonald, J. C., et al., "Mortality in the Chrysotile AsbestosMines and Mills of Quebec," Arch. Environ. Health, Vol. 22,pp. 677-86 (June 1971).
MCDONALD, J. (1974)McDonald, J. C., et al., "The Health of Chrysotile AsbestosMine and Mill Workers of Quebec," Arch. Environ. Health,Vol. 28, No. 2, pp. 61-8 (February 1974).
MCKEANMcKean, R. N., "The Use of Shadow Prices," pp. 33-77 in "Prob-lems in Public Expenditure Analysis," S. B. Chase, Jr., TheBrookings Institution (1968).
Topic
Cd
Cd
Cd
Asb
Asb
R/B
Cd
Asb
R/B
R/B
MCKEE (1969a)"Systems Study for Control of Emissions, Primary NonferrousSmelting Industry," Vols. I, II and III, McKee Report 993,prepared by Arthur G. McKee & Co. for National Air PollutionControl Administration (June 1969).
MCMAHON (1972)McMahon, A. D., J. M. Hague, and H. R. Babitzke, "Zinc," pp.1299-1333 in Bureau of Mines Minerals Yearbook (1972).
MCMAHON (1974)McMahon, A. D., et al., "The U.S. Zinc Industry: A HistoricalPerspective," Bureau of Mines Information Circular (February1974).
MCVITTIEMcVittie, J. C., "Asbestosis in Great Britain," pp. 128-38 in
'Biological Effects of Asbestos," I. J. Selikoff and J. Churg,editors, Ann. N. Y. Acad. of Sci., Vol. 132 (31 December 1965).
MECH. ENG. (1972)"Asbestosis," Vol. 94, No. 9, p. 38 (September 1972).
MELINEKMelinek, S. J., "A Method of Evaluating Human Life for Eco-nomic Purposes," Fire Research Note No. 950, Fire ResearchStation, Boreham Wood, Herts., England (November 1972).
MENDENMenden, E. E., et al., "Distribution of Cadmium and Nickelof Tobacco During Cigarette Smoking," Environ. Sci. Technol.,Vol. 6, pp. 830-3 (1972).
MERLISSMERLISS R. R., "Talc-Treated Rice and Japanese StomachCancer," Science, Vol. 173, pp. 1141-2 (17 September 1971).
MEREWITZ (1966)Merewitz, L., "Recreational Benefits of Water Resource De-velopment," Water Resources Research, Vol. 2, No. 4, pp.625-40 (Fourth Quarter 1966).
MEREWITZ (1971)Merewitz, L. and S. H. Sosnick, "The Budget's New Clothes,a Critique of Planning-Programming-Budgeting and Benefit-Cost Analysis," Markham Publishing Co., Chicago (1971).
B-49
Topic
Gen
Gen
Cd
R/B
Cd
Gen
R/B
Gen
Cd
R/B
MEYERMeyer, C. F., "Polluted Groundwater: Some Causes, Effects,Controls, and Monitoring," PB-232117, prepared by TEMPO,General Electric Co., Center for Advanced Studies, for U.S.Environmental Protection Agency, Office of Research and De-velopment (July 1973).
MILLERMiller, D. C., "Power Structure Studies and EnvironmentalManagement: the Study of Powerful Urban Problem-OrientedLeaders in Northeastern Megalopolis," pp. 345-95 in "En-vironmental Quality Analysis - Theory and Method in theSocial Sciences," A. V. Kneese and B. T. Bower, editors,The Johns Hopkins Press 61972).
MINES"Control of Sulfur Oxide Emissions in Copper, Lead, and ZincSmelting," Bureau of Mines Information Circular 8527 (1971).
MISHANMishan, E. J., "Economics for Social Decisions," Elements ofCost-Benefit Analysis, Praeger Publishers, New York (1973).
MORGANMorgan, J. M., Normal Lead and Cadmium Content of the HumanKidney," Arch. Environ. Health, Vol. 24, pp. 364-8 (May 1972).
MOSTARDIMostardi, R. A. and D. Leonard, "Air Pollution and Cardio-pulmonary Functions," Arch. Environ. Health, Vol. 29, pp.325-8 (December 1974).
MUELHAUSEMuelhause, C. O., "Costs, Real and Perceived, Examined in aRisk-Benefit Decision Framework," OECD Summer Think Tank,21 August-1 September 1972, Paris.
MURIEMurie, M., "Evaluation of Natural Environments," pp. 43-53in "Indicators of Environmental Quality," W. A. Thomas, ed-itor, Plenum Press (1972).
MURMANNMurmann, R. K., "The Preparation and Oxidative Propertiesof Ferrate Ion Studies Directed Toward Its Use asa Water Purifying Agent," PB-213505, Missouri Water ResourcesResearch Center, Columbia, Missouri (October 1972).
MISHANMishan, E. J., "Evaluation of Life and Limb: A TheoreticalApproach," J. Political Economy, Vol. 79, No. 4, pp. 687-706(July-August 1971).
B-50
Topic
Asb
Cd
R/B
R/B
R/B
Asb
Cd
R/B
Asb
Asb
MURPHYMurphy, R.L.H., "Effects of Low Concentrations of Asbestos,"New England J. Med., Vol. 285, No. 23, pp. 1271-8 (2 Decem-ber 1971).
MURTHYMurthy, G. K., U. Rhea, and J. T. Peeler, "Levels of Antimony,Cadmium, Chromium, Cobalt, Manganese, and Zinc in Institu-tional Total Diets," Environ. Sci. Technol., Vol. 5, No. 5,pp. 436-42 (May 1971).
MUSHKIN (1959)Mushkin, S. J. and F. d'A Collings, "Economic Costs of Dis-ease and Injury," Public Health Reports, Vol. 74, No. 9,pp. 795-809 (September 1959).
MUSHKIN (1963)Mushkin, S. J. and B. A. Weisbrod, "Investment in Health -Lifetime Health Expenditure on the 1960 Work Force," Kyklos,Vol. 16, pp. 583-98 (1963).
MUSHKIN (1972)Mushkin, S. J., editor, "Public Prices for Public Goods,"The Urban Institute, Washington, D.C. (1972).
MYERSMyers, J. L., "Chrysotile Asbestos in Plastics," presentedat the Society of Plastics Engineers, 32nd Annual TechnicalConference, San Francisco, Calif., 13-16 May 1974.
MYTELKAMytelka, A. I. et al., "Heavy Metals in Wastewater and Treat-ment Plant Effluents," J. Water Pollution Control Fed.,Vol. 45, No. 9, pp. 1859-64 (September 1973).
NAT. ACAD. ENG."Perspectives on Benefit-Risk Decision Making," Report of aColloquium conducted by the Committee on Public EngineeringPolicy, National Academy of Engineering, 26-27 April 1971,published by The National Academy of Engineering (1972).
NAT. ACAD. SCI. (1971a)"Asbestos: The Need for and Feasibility of Air PollutionControls," APTD-0770, Committee on Biological Effects of At-mospheric Pollutants, National Academy of Sciences (1971).
NAT. ACAD. SCI. (1971b)"Airborne Asbestos," PB-198581, a report prepared by theCommittee on Biologic Effects of Atmospheric Pollutants,National Academy of Sciences, Washington, D.C. (1971).
B-51
Topic
R/B
Gen
Asb
Asb
Asb
Gen
Asb
Asb
Asb
Asb
NAT. ACAD. SCI. (1973)"Evaluation of the Hazard of Bulk Water Transportation ofIndustrial Chemicals (a Tentative Guide)," AD-775756, Na-tional Academy of Sciences (July 1973).
NAT. ACAD. SCI. (1975)"Principles for Evaluating Chemicals in the Environment,"National Academy of Sciences (1975).
NAT. HEALTH"Asbestos in Consumer Products Presents Growing Health Haz-ard," Nation's Health, Vol. 2, No. 7 (August 1972).
NAT. LIBR. MED."Asbestos Toxicity," January 1970 through July 1973, NationalLibrary of Medicine, prepared by Charlotte Kenton, LiteratureSearch No. 73-31.
NAT. SAFETY NEWS (1973)"Asbestos," National Safety News, Vol. 108, No. 2, p. 54(August 1973).
NELSONNelson, J. R., "The Value of Travel Time," pp. 78-126 in"Problems in Public Expenditure Analysis," S. B. Chase, Jr.,editor, The Brookings Institution (1968).
NEWHOUSE (1965)Newhouse, M. L. and H. Thompson, "Mesothelioma of Pleura andPeritoneum Following Exposure to Asbestos in the London Area,"Brit. J. Ind. Med., vol. 22, pp. 261-9 (1965).
NEWHOUSE (1969)Newhouse, M. L., "A Study of the Mortality of Workers in anAsbestos Factory," Brit. J. Ind.,Med., Vol. 26, pp. 294-301 (1969).
NEWHOUSE (1973)Newhouse, M. L., "Asbestos in the Work Place and the Commu-nity," Ann. Occupational Hyg., Vol. 16, No. 2, pp. 97-107(August 1973).
NICHOLSON (1971)Nicholson, W. J., A. N. Rohl, and E. F. Ferrand, "AsbestosAir Pollution in New York City," Proc. 2nd InternationalClean Air Congress, H. M. Englund and W. T. Berry, editors,Academic Press, New York, pp. 136-9 (1971).
B-52
Topic
Asb
Asb
Gen
Gen
Cd
Asb
Cd
Cd
Asb
Gen
NICHOLSON (1972)Nicholson, W. J., C. J. Maggiore, and I. J. Selikoff, "AsbestosContamination of Parenteral Drugs," Science, Vol. 177, No.4044, pp. 171-3 (14 July 1972).
NICHOLSON (1973)Nicholson, W. J., A. M. Langer, and I. J. Selikoff, "Discus-sion - Asbestos Fibers in the Air of Towns," Atmos. Environ.,Vol. 7, No. 6, pp. 666-8 (June 1973).
NIH (1969)"Hypertension; High Blood Pressure," National Institutes ofHealth, No. 1714, Heart Information Center, National Insti-tutes of Health (1969).
NIESSENNiessen, W. R. and A. F. Sarofim, "Incinerator Air Pollution:Facts and Speculation," pp. 167-81 in Proc. of 1970 NationalIncinerator Conference, Cincinnati, Ohio, 17-20 May 1970,published by the Amer. Soc. of Mech. Eng., New York (1970).
NILSSONNilsson, R.,2, pp. 56-66
"Some Facts About Cadmium," Ambio, Vol. 3, No.(1974).
NIOSH (1972)"Criteria for a Recommended Standard: Occupational Exposureto Asbestos," HSM 72-10267, National Institute for Occupa-tional Safety and Health (1972).
NMAB (1969)"Trends in Usage of Cadmium," Report of the panel on cadmiumof the Committee on Technical Aspects of Critical and Stra-tegic Materials, National Materials Advisory Board, NationalResearch Council, NMAB-255 (November 1969).
NOMIYAMANomiyama, K., "Urinary Low-Molecular-Weight Proteins in Itai-Itai Disease," Environ. Res., Vol. 6, pp. 373-81 (1973).
NORONoro. L., "Occupational and Non-occupational Asbestosis inFinland," Amer. Ind. Hyg. Assoc. J., Vol. 29, No. 3, pp.195-201 (May-June 1968).
NSF (1973)"Chemicals and Health," report of the Panel of Chemicals andHealth, President's Science Advisory Committee, Science andTechnology Policy Office, National Science Foundation, Wash-ington, D.C. (1973).
B-53
Topic
Cd
Gen
Asb
Gen
Asb
R/B
Cd
Asb
Asb, Cd
R/B
NYGAARDNygaard, S. P., G. J. Bonde and J. C. Hansen, "StandardValues of Lead and Cadmium in Human Blood," Nord. Hyg. Tidskr.,Vol. 54, No. 4, pp. 153-62 (1973).
OCCUP. HAZARDS (1973)"The New Dimension in Occupational Health," Occup. Hazards,Vol. 35, No. 10, pp. 89-92 (October 1973).
OETTLEOettle, A. G., "Mortality from Malignant Neoplasms of theAlimentary Canal in Whites, Coloreds, and Asians in SouthAfrica, 1949-1958," National Cancer Institute Monograph, #25(July 1967).
OFF. SCI. TECHNOL. (1969)"Solid Waste Management - a Comprehensive Assessment of SolidWaste Problems, Practices, and Needs," Office of Science andTechnology (May 1969).
OLSON, H.Olson, H. L., "Asbestos in Potable-Water Supplies," Amer.Water Works Assn. J., Vol. 66, No. 9, pp. 515-8 (1974).
OLSON, M.Olson, M., "Ignorance and Uncertainty," Symposium held byEPA (September 1973).
ONDOVOndov, J. M., W. H. Zoller, and G. E. Gordon, "Trace Elementson Aerosols from Motor Vehicles," presented at the Air Pol-lution Control Association annual meeting, Denver, Colo.,9 June 1974.
ORTIZOrtiz, L. W., H. J. Ettinger, and C. L. Fairchild, "Calibra-tion Standards for Counting Asbestos," Amer. Ind. Hyg. Assn.J., Vol. 36, pp. 104-12 (February 1975).
OTTINGEROttinger, R. S., et al., "Recommended Methods of Reduction,Neutralization, Recovery or Disposal of Hazardous Wastes,"PB 224579, 16 volumes, prepared for U.S. Environmental Pro-tection Agency by TRW Systems Group, Set/As, Vol. XIV (Feb-ruary 1973).
OTWAY (1970)Otway, H. J. and R. C. Erdmann, "Reactor Siting and Designfrom a Risk Viewpoint," Nuclear Engineering and Design,Vol. 13, pp. 365-76 (1970).
B-54
Topic
R/B OTWAY (1972)Otway, H. J., editor, "Risk vs. Benefit: Solution or Dream,"a compendium of papers from a symposium sponsored by theWestern Interstate Nuclear Board with the cooperation of theLos Alamos Scientific Laboratory at Los Alamos, New Mexico(February 1972), LA-4860-MS.
Gen OVERLYOverly, D., "Introducing Societal Indicators into TechnologyAssessment," pp. 561-89 in Technology Assessment in a DynamicEnvironment, M. J. Cetron and B. Bartocha, editors, Gordonand Breach, New York (1973).
Asb PADDOCKPaddock, R. E., et al., "Comprehensive Study of Specified AirPollution Sources to Assess the Economic Impact of Air Qual-ity Standards," Vol. II, "Asbestos, Beryllium, Mercury,"PB-222858, prepared for U.S. Environmental Protection Agencyby Research Triangle Institute (August 1972).
Cd PAGE (1973)Page, A. L. and F. T. Bingham, "Cadmium Residues in the En-vironment," Residue Reviews, Vol. 48, pp. 1-44 (1973).
Cd PAGE (1974)Page, A. L., "Fate and Effects of Trace Elements in SewageSludge When Applied to Agricultural Lands - a Literature Re-view Study," PB-231171, EPA-670/2-74-005, prepared for U.S.Environmental Protection Agency by University of California,Riverside, Calif. (January 1974).
Asb PARKESParkes, W. R., "Asbestos-Related Disorders," Brit. J. Dis.Chest., Vol. 67, pp. 261-300 (October 1973).
Gen PATRICKPatrick, R., "Aquatic Communities as Indices of Pollution,"pp. 93-100 in "Indicators of Environmental Quality," W. A.Thomas, editor, Plenum Press (1972).
Cd PATTERSONPatterson, J. W. and R. A. Minear, "Wastewater TreatmentTechnology," prepared for the Illinois Institute for En-vironmental Quality by Illinois Institute of Technology,Chicago, Illinois (February 1973).
Asb PATTNAIKPattnaik, A. and J. D. Meakin, "Development of an Instrumen-tal Monitoring Method for Measurement of Asbestos Concentra-tions in or Near Sources," EPA-650/2-73-016, prepared for
B-55
Topic
Cd
Cd
Cd
Cd
Cd
Cd
Gen
Cd
Cd
U.S. EnvironmentalDevelopment by The(June 1973).
Protection Agency, Office of Research andFranklin Institute Research Laboratories
PERRY (1972a)Perry, H. M., Jr., "Hypertension and the Geochemical Environ-ment," pp. 202-16 in Geochemical Environment in Relation toHealth and Disease," Ann. N. Y. Acad. Sci., Vol. 199, H. C.Hopps and H. L. Cannon, editors (28 June 1972).
PERRY (1972b)Perry, H. M., et al., "Evaluated Pulmonary Cadmium in Emphy-sematous Subjects Without Known Cadmium Exposure," pp. 207-14 in "Trace Substances in Environmental Health - VI," Uni-versity of Missouri, Columbia, Missouri (1972).
PETERINGPetering, H. G., D. W. Yeager, and S. O. Witherup, "TraceMetal Content of Hair, II. Cadmium and Lead of Human Hairin Relation to Age and Sex," Arch. Environ. Health, Vol. 27,No. 5, pp. 327-30 (November 1973).
PETERSONPeterson, M. J. and J. B. Zink, "A Semiquantitative Spectro-chemical Method for Analysis of Coal Ash," Bureau of MinesReport of Investigations 6496 (1964).
PETERSONPeterson, N. S., et al., Material Substitution Study: GeneralMethodology and Review of U.S. Zinc Die-Casting Markets, Bu-reau of Mines Information Circular, 8505 (1971).
PETRICKPetrick, A., et al., "The Economics of By-Product Metals,""II. Lead, Zinc, Uranium, Rare-Earth, Iron, Aluminum, Tita-nium, and Lithium Systems," Bureau of Mines Information Cir-cular 8570 (1973).
PHS (1965a)"Economic Costs of Cardiovascular Diseases and Cancer, 1962,"Health Economics Series No. 5, Public Health Service (Feb-ruary 1965).
PHS (1965b)"Interaction of Heavy Metals and Biological Sewage TreatmentProcesses," Public Health Service No. 999-WP-22 (May 1965).
PHS (1967)"Kidney Disease Program Analysis," a report to the SurgeonGeneral, prepared under direction of Office of Program Plan-ning and Evaluation Office of the Surgeon General, PublicHealth Service Publication No. 1745 (1967).
B-56
Topic
Cd PHS (1968)"Nationwide Inventory of Air Pollutant Emissions 1968," AP-73,National Air Pollution Control Administration (1970).
Cd PHS (1969)"Air Quality Criteria for Particulate Matter," AP-49, Na-tional Air Pollution Control Administration (January 1969).
Cd PHS (1970)"Community Water Supply Study Analysis of National SurveyFindings," Public Health Service (July 1970).
Gen PHS (1973)"Vital Statistics of the United States 1969, Vol. II -Mortality, Part B.," Public Health Service, National Centerfor Health Statistics (1973).
Gen PHS (1974)"Vital Statistics of the United States 1970, Vol. II -Mortality, Part B," Public Health Service, National Centerfor Health Statistics (1974).
R/B PIKULPikul, R. P., C. A. Bisselle, and M. Lilienthal, "Develop-ment of Environmental Indices: Outdoor Recreational Re-sources and Land Use Shift," pp. 147-72 in "Indicators ofEnvironmental Quality, W. A. Thomas, editor, Plenum Press(1972).
Cd PISCATORPiscator, M. and B. Lind, "Cadmium, Zinc, Copper, and Leadin Human Renal Cortex," Arch. Environ. Health, Vol. 24,pp. 426-31 (June 1972).
Gen POLTAPolta, H. J., "Iron and Steel Scrap," pp. 667-81 in Bureauof Mines Minerals Yearbook (1972).
Asb PONTEFRACTPontefract, R. D. and H. M. Cunningham, "Penetration ofAsbestos Through the Digestive Tract of Rats," Nature,Vol. 243, pp. 352-3 (8 June 1973).
Asb POOLEYPooley, F. D., et al., "The Detection of Asbestos in Tissues,"H. A. Shapiro, editor, pp. 108-16 in "Pneumoconiosis," Proc.International Conf., Johannesburg, 1969, Oxford UniversityPress (1970).
B-57
Topic
R/B
Cd
Cd, Gen
Gen
Asb
Asb
R/B
Cd
Asb
PORTNEYPortney, P. R., "Voting, Cost-Benefit Analysis and WaterPollution Policy," Symposium held by EPA, September 1973.
POTTSPotts, C. L., "Cadmium Proteinuria - the Health of BatteryWorkers Exposed to Cadmium Oxide Dust," Ann. Occup. Hyg.Vol. 8, pp. 55-61 (1965).
PREULPreul, H. C., "Underground Pollution Analysis and Control,"Water Research, Vol. 6, pp. 1141-54 (1972).
RAJRaj, P.P.K. and A. S. Kalelkar, "Assessment Models in Sup-port of the Hazard Assessment Handbook," AD-776617, preparedby Arthur D. Little, Inc., for U. S. Coast Guard (January1974).
RAJHANSRajhans, G. S., "Fibrous Dust - Its Measurement and Control,"Can. Mining and Met. Bull., Vol. 63, No. 70, pp. 900-10 (Aug-ust 1970).
RAJHANSRajhans, G. S, "Talc Dust and Its Toxicity," CIM Bulletin,pp. 117-18 (April 1974).
RAPKINRapkin, C. and R. W. Ponte, "Indicators of EnvironmentalQuality of Urban Life: Economic, Spatial, Social, and Po-litical Factors, W. A. Thomas, editor, pp. 55-69 in "Indica-tors of Environmental Quality," Plenum Press (1972).
RATSCHRatsch, H. C., "Heavy-Metal Accumulation in Soil and Vegeta-tion from Smelter Emissions," prepared for U.S. Environmen-tal Protection Agency, Office of Research and Development,by National Ecological Research Laboratory, Corvallis, Ore.(August 1974), EPA-660/3-74-012.
REEVESReeves, A. L., H. E. Puro, and R. G. Smith, "Inhalation Car-cinogenesis from Various Forms of Asbestos," Environ. Research,Vol. 8; pp. 178-202 (1974).
B-58
Topic
Gen
R/B
Asb
R/B
Asb
Asb
R/B
Gen
Asb
Asb
REINERSReiners, W. A., "Terrestrial Detritus and the Carbon Cycle,"in Carbon and the Biosphere, G. M. Woodwell and E. V. Pecan,editors, USAEC (August 1973).
REIQUAMReiquam, H., "Establishing Priorities Among EnvironmentalStresses," pp. 71-82 in "Indicators of Environmental Qual-ity," W. A. Thomas, editor, Plenum Press (1972).
REITZEReitze, W. B., et al., "Application of Sprayed Inorganic FiberContaining Asbestos: Occupational Health Hazards," Amer.Ind. Hyg. Assn. J., Vol. 33, No. 3, pp. 178-91 (March 1972).
RICERice, D. P., "Estimating the Cost of Illness," U.S. HealthEconomics Series No. 6, Public Health Service (1966).
RICKARDS (1971)Rickards, A. L. and D. V. Badami, "Chrysotile Asbestos inUrban Air," Nature, Vol. 234, pp. 93-4 (12 November 1971).
RICKARDS (1973)Rickards, A. L., "Estimation of Submicrogram Quantities ofChrysotile Asbestos by Electron Microscopy," Anal. Chem.,Vol. 45, No, 4, pp. 809-11 (April 1973).
RIDKER (1967a)Ridker, R. G., Economic Costs of Air Pollution - Studiesin Measurement, Frederick A. Praeger, Inc., New York (1967).
RIDKER (1967b)Ridker, R. G., "Soiling and Materials-Damage Studies: Evi-dence from Households," pp. 73-88 in Economic Costs of AirPollution--Studies in Measurement, Frederick A. Praeger,Inc., New York (1967).
ROACH (1965)Roach, S. A., "Measurement of Airborne Asbestos Dust by In-struments Measuring Different Parameters," pp. 306-15 in"Biological Effects of Asbestos," I. J. Selikoff and J. Churg,editors, Ann. N. Y. Acad. Sci., Vol. 132 (31 December 1965).
ROACH (1970)Roach, S. A., "Hygiene Standards for Asbestos," Ann. Occup.Hyg., Vol. 13, pp. 7-15 (1970).
B-59
Topic
R/B
R/B
ROBACKRoback, H., "Politics and Expertise in Policy Making," pp.121-33 in "Perspectives on Benefit-Risk Decision Making,"report of a colloquium conducted by the Committee on PublicEngineering Policy, National Academy of Engineering, 26-27April 1971, published by The National Academy of Engineering(1972).
ROBERTSRoberts, H. V., "Risk, Ambiguity , and the Savage Axioms:Comment," Quart. J. Econ., Vol. 77, pp. 327-36 (1963) andreply by D. Ellsberg, pp. 336-42.
Gen ROBERTSONRobertson, J. M., C. R. Toussaint, and M. A. Jorque, "OrganicCompounds Entering Ground Water from a Landfill," EPA-660/2-74-077, prepared for U.S. Environmental Protection Agency,Office of Research and Development by Univ. of Oklahoma,School of Civil Engineering and Environmental Science (Sep-tember 1974).
Gen
Asb
Cd ROWE, D.
Gen
R/B
ROHWERRohwer, P. S. and E. G. Struxness, "Environmental Indicesfor Radioactivity Releases," pp. 249-55 in "Indicators ofEnvironmental Quality," W. A. Thomas, editor, Plenum Press(1972).
ROSENRosen, P., A. Savino, and M. Melamed, "Ferruginous (Asbestos)Bodies and Primary Carcinoma of the Colon," Amer. J. Clin.Pathol., Vol. 61, pp. 135-8 (January 1974).
Rowe, D. W. and E. J. Massaro, "Cadmium Uptake and Time De-pendent Alterations in Tissue Levels in the White CatfishIctalurus Catus (Pisces: Ictaluridae)," Bull. Environ.Contamination and Toxicology, Vol. 11, No. 3, pp. 244-9(March 1974).
ROWE, W.Rowe, W. D., "The Environment: a Systems Approach with Em-phasis on Monitoring," pp. 371-99 in Technology Assessmentin a Dynamic Environment, M. J. Cetron and B. Bartocha,editors, Gordon and Breach, New York (1973).
ROWENRowen, H. "The Role of Cost-Benefit Analysis in Policy-Making," Symposium held by EPA, September 1973.
B-60
Topic
R/B RUFFRuff, L. E., "The Economic Common Senselic Interest, No. 19, pp. 69-85 (Spring
R/B RUSSELL
of Pollution," Pub-1970).
Russell, C. S. and W. O. Spofford Jr., "A Quantitative Frame-work for Residuals Management Decisions," pp. 115-79 inEnvironmental Quality Analysis - Theory and Method in theSocial Sciences, A. V. Kneese and B. T. Bower, editors,The Johns Hopkins Press (1972).
Gen RUSTRust, R. H., R. S. Adams, Jr. and W. P. Martin, "Developinga Soil Quality Index," pp. 243-7 in "Indicators of Environ-mental Quality," W. A. Thomas, editor, Plenum Press (1972).
R/B SAGAN (1972)Sagan, L. A., "Human Costs of Nuclear Power," Science, Vol.177, pp. 487-93 (11 August 1972).
R/B SAGAN (1974)Sagan, L. A., "Health Costs Associated with the Mining, Trans-port, and Combustion of Coal in the Steam-Electric Industry,"Nature, Vol. 250, p. 107 (12 July 1974).
R/B SAILASaila, S. B., "Systems Analysis Applied to Some FisheriesProblems," pp. 331-72 in Systems Analysis and Simulationin Ecology, Vol. II, B. C. Patten, Academic Press (1972).
Cd ST. JOE1971 and 1972 Annual Reports, St. Joe Minerals Corporation,250 Park Avenue, New York, N.Y. 10017.
Gen SAMUELSONSamuelson, P. A., "Constancy of the Marginal Utility of In-come," pp. 37-53 in The Collected Scientific Papers of PaulA. Samuelson, Vol. I, J. E. Stiglitz, editor, MIT Press, Cam-bridge, Mass.
Asb
R/B
SARGENTSargent, H. E., "Asbestos in Drinking Water," J. New EnglandWater Works Assoc., Vol. 88, No. 1, pp. 44-57 (1974).
SATHERSather, H. N., "Biostatistical Aspects of Risk-Benefit: TheUse of Competing Risks Analysis," UCLA-ENG7477, preparedfar the National Science Foundation by Univ. of Calif.,School of Engineering and Applied Science, Los Angeles, Calif.(September 1974).
B-61
Topic
R/B
Asb
Gen
Gen
R/B
R/B
Cd
Gen
Cd
SAXSax, J. L., "Legal Strategies Applicable to EnvironmentalQuality Management Decisions," pp. 333-43 in EnvironmentalQuality Analysis - Theory and Method in the Social Sciences,A. V. Kneese and B. T. Bower, editors, The Johns HopkinsPress (1972).
SCHALLSchall, E. L., "Present Threshold Limit Value in the U.S.A.for Asbestos Dust: A Critique," pp. 316-21 in "BiologicalEffects of Asbestos," Ann. N. Y. Acad. Sci., I. J. Selikoffand J. Churg, editors, Vol. 132, (31 December 1965).
SCHELLING .Schelling, T. C., "The Life You Save May Be Your Own," pp.127-76 in "Problems in Public Expenditure Analysis," S. B.Chase, Jr;, editor, The Brookings Institution (1968).
SCHLAIFERSchlaifer, R., Analysis of Decisions Under Uncertainty,McGraw-Hill (1969).
SCHMALENSEE (1972)Schmalensee, R., "Option Demand and Consumer's Surplus:Valuing Price Changes Under Uncertainty," Amer. Econ. Rev.,Vol. 62, No. 5, pp. 813-24 (December 1972).
SCHMALENSEE (1974)Schmalensee, R. S., "Estimating the Costs and Benefits ofUtility Regulation," Quart. Rev. Economics and Business,Vol. 14, No. 2, pp. 51-64 (Summer 1974).
SCHOENBERGERSchoenberger, R. J., et al., "A Study of Incinerator ResidueAnalysis of Water Soluble Components," PB-222458, preparedby Drexel Univ. for U.S. Environmental Protection Agency(August 1973).
SCHRENKSchrenk, H. H., et al., "Air Pollution in Donora, Pa.: Epi-demiology of the Unusual Smog Episode of October 1948," Pre-liminary Report, Public Health Bulletin 306, Public HealthService (1949).
SCHROEDER (1960)Schroeder, H. A., "Relation Between Mortality and Cardio-vascular Disease and Treated Water Supplies," J. Amer. Med.Assoc., Vol. 172, No. 17, pp. 1902-8 (23 April 1960).
B-62
Topic
Cd
Cd
Cd
Cd
Cd
Cd
Cd
Cd
Cd
Cd
Cd
SCHROEDER (1961)Schroeder, H. A., J. J. Balassa, and J. C. Hogencamp, "Patho-biology - Abnormal Trace Metals in Man: Cadmium," J. ChronicDiseases, Vol. 14, No. 2, pp. 236-58 (August 1961).
SCHROEDER (1963)Schroeder, H. A. and J. H. Balassa, "Cadmium: Uptake byVegetables from Superphosphate in Soil," Science, Vol. 140,pp. 819-20 (17 May 1963).
SCHROEDER (1964)Schroeder, H. A., "Cadmium Hypertension in Rats," Am. J.Physical, Vol. 207, pp. 62-6 (1964).
SCHROEDER (1965)Schroeder, H. A., "Cadmium as a Factor in Hypertension,"J. Chron. Dis., Vol. 18, pp. 647-56 (1965).
SCHROEDER (1966)Schroeder, H. A., "Municipal Drinking Water and Cardiovascu-lar Death Rates," J. Amer. Med. Assoc., Vol. 195, No. 2,pp. 81-5 (10 January 1966).
SCHROEDER (1967)Schroeder, H. A., "Cadmium,Disease," Circulation, Vol.
Chromium, and Cardiovascular35, pp. 570-82 (March 1967).
SCHROEDER (1968)Schroeder, H. A., "Airbornepp. 83-8 (April 1968).
Metals, Scientist and Citizen,"
SCHROEDER (1970)Schroeder, H. A., "A Sensible Look at Air Pollution by Metals,"Arch. Environ. Health, Vol. 21, No. 6, pp. 798-806 (December1970).
SCHROEDER (1971)Schroeder, H. A., "Trace Elements in the Human Environment,"The Ecologist, Vol. 1, No. 11, pp. 15-9 (May 1971).
SCHROEDER (1972)Schroeder, H. A. and D. K. Darrow, "Relation of Trace Metalsto Human Health," J. Environ. Affairs, Vol. 2, No. 1, pp.222-36 (1972).
SCHROEDER (1974)Schroeder, H. A., "The Role of Trace Elements in Cardiovas-cular Diseases," Medical Clinics of North America, Vol. 58,No. 2, pp. 381-96 (March 1974).
B-63
Topic
R/B
Asb
Asb
Asb
Asb
Asb
Asb
Asb
Asb
SCHULTZESchultze, C. L., "The Politics and Economics of Public Spend-ing," The Brookings Institution (1968).
SCHUTZ, A.Schutz, A., "Mineralogy and the Use of Asbestos, Dust Con-trol and Dust Limits," Staub, Vol. 28, No. 8, pp. 37-9(August 1968).
SCHUTZ, L. A.Schutz, L. A., W. Bank, and G. Weems, "Airborne AsbestosFiber Concentrations in Asbestos Mines and Mills in theUnited States," Bureau of Mines Health, and Safety Program,Technical Progress Report No. 72 (June 1973).
SELIKOFF (1965a)Selikoff, I. J. and J. Churg, "Biological Effects of Asbes-tos," Ann. N. Y. Acad. Sci., Vol. 132 (31 December 1965).
SELIKOFF (1965b)Selikoff, I. J., J. Churg, and E. C. Hammond, "The Occurrenceof Asbestos Among Insulation Workerspp. 139-55 in "Biological Effects of
in the United States,"Asbestos," Ann. N. Y.
Acad. Sci., I. J. Selikoff and J. Churg, editors, Vol. 132,(31 December 1965).
Selikoff, I. J. and E. C. Hammond, "Community Effects ofNonoccupational Environmental Asbestos Exposure," Am. J. Public
No. 9, pp. 1658-66 (September 1968).Health, Vol. 58,
SELIKOFF (1968b)Selikoff, I. J.,posure, Smoking,Vol. 204, No. 2,
E. C. Hammond, and J. Churg, "Asbestos Ex-and Neoplasia," J. Amer. Med. Assoc.,pp. 106-12 (8 April 1968).
SELIKOFF (1970a)Selikoff, I. J., "Partnership for Prevention - The Insulation
SELIKOFF (1968a)
Industry Hygiene Research Program," Industrial Medicine, Vol.39, No. 4, pp. 162-6 (April 1970).
SELIKOFF (1970b)Selikoff, I. J. and E. C. Hammond, "Asbestos Bodies in theNew York City Population in Two Periods of Time," pp. 99-105in "Pneumoconiosis," Proc. of the Third Intl. Conf., H. A.Shapiro, editor, Johannesburg, 1969, Oxford Univ. Press(1970).
B-64
Topic
Asb
Asb
Asb
Asb
Asb
Asb
R/B
Gen
R/B
SELIKOFF (1970c)Selikoff, I. J., E. C. Hammond, and H. Heimann, "CriticalEvaluation of Disease Hazards Associated with CommunityAsbestos Air Pollution," pp. 165-71 in Proc. of the 2ndInternational Clean Air Congress, International Union ofAir Pollution Prevention Associations, Washington, D.C.(1970).
the 3rd Intl. Conf., Johannesburg, 1969, Oxford Univ. Press(1970).
SELIKOFF (1970d)Selikoff, I. J., E. C. Hammond, and J. Churg, "Mortality Ex-periences of Asbestos Insulation Workers 1943-1968," pp.180-6 in "Pneumoconiosis," H. A. Shapiro, editor, Proc. of
SELIKOFF (1972a)Selikoff, I. J., E. C. Hammond, and J. Churg, "Carcinogenicityof Amosite Asbestos," Arch. Environ. Health, Vol. 25, No. 3,pp. 183-6 (September 1972).
SELIKOFF (1972b)Selikoff, I. J., W. J. Nicholson, and A. M. Langer, "AsbestosAir Pollution," Arch. Environ. Health, Vol. 25, No. 1, pp.1-13 (July 1972).
SELIKOFF (1974)Selikoff, I. J., "Asbestos Criteria Document Highlights,"ASSE Journal, pp. 26-33 (March 1974).
SERASera, Y., K. Kang, and K. Yokoyama, "Asbestos and Lung Cancerin Osaka Sennan District," Gann, Vol. 64, No. 3, pp. 313-6(1973).
SHAPPERTShappert, L. B., et al., "Probability and Consequences ofTransportation Accidents Involving Radioactive-MaterialShipments in the Nuclear Fuel Cycle," Nuclear Safety,Vol. 14, No. 6, pp. 597-604 (November-December 1973).
SHULTSShults, W. D. and J. J. Beauchamp, "Statistically Based Air-Quality Indices," pp. 199-209 in Indicators of EnvironmentalQuality, W. A. Thomas, editor, Plenum Press (1972).
SIMMONSSimmons, J. A., R. C. Erdmann, and B. N. Naft, "Risk Assess-ment of Large Spills of Toxic Materials," Proceedings, 1974Conference on Control of Hazardous Material Spills, cospon-sored by American Institute of Chemical Engineers and EPA,San Francisco, August 1974.
B-65
Topic
R/B
Gen
R/B
Cd
R/B
Ash
Asb
R/B
R/B
Gen
SIMONSimon, H. A., Administrative Behavior: A Study of Decision-Making Processes in Administrative Organization, p. xxxv(MacMillan, New York, 1957).
SINCLAIRSinclair, C., "Technology Assessment in Great Britain," pp.35-73 in Technology Assessment in a Dynamic Environment,M. J. Cetron and B. Bartocha, editors, Gordon and Breach,New York (1973).
SINDENSinden, J. A., "Utility Analysis in the Valuation of Extra-Market Benefits with Particular Reference to Water-BasedRecreation," WRRI-17, PB-231701, Dept. of Agricultural Eco-nomics, Oregon State Univ., Corvallis, Oregon (March 1973).
SINGHALSinghal, R. L., et al., "Persistance of Cadmium-InducedMetabolic Changes in Liver and Kidney," Science, Vol. 183,pp. 1094-6 (15 March 1974).
SLADESlade, D. H., editor, Meteorology and Atomic Energy, U.S.AEC Tech. Info. Center, Oak Ridge, TN, p. 197 and Fig. 5.2(July 1968).
SMITH (1965)Smith, W. E., et al., "Tests for Carcinogenicity of Asbestos,"pp. 456-88 in "Biological EffectsAcad. Sci., I. J. Selikoff and J.(31 December 1965).
SMITH (1973)Smith, W. E., "Asbestos, Talc and
of Asbestos," Ann. N. Y.Churg, editors, Vol. 132,
Nitrites in Relation toGastric Cancer," Am. Ind. Hyg. Assoc. J., Vol. 34, No. 5,pp. 227-8 (May 1973).
SOLOWSolow, R. M., "The Economist's Approach to Pollution andIts Control," Science, Vol. 173, No. 3996, pp. 498-503(6 August 1971).
SPANGLERSpangler, M. B., "Environmental and Social Issues of SiteChoice for Nuclear Power Plants," Energy Policy, pp. 18-32(March 1974).
SPECTORSpector, W. S., editor, "Handbook of Biological Data," pre-pared under the Direction of the Committee on the Handbook
B-66
Topic
Gen of Biological Data, National Academy of Sciences, W. B.(Concl.) Saunders Company (1956).
Asb SPEILSpeil, S. and J. P. Leinweber, "Asbestos Minerals in ModernTechnology," Environ. Research, Vol. 2, pp. 166-208 (1969).
Cd SPRAGUESprague, J. B., "Measurement of Pollutant Toxicity to FishIII: Sublethal Effects and 'Safe' Concentrations," WaterResearch, Vol. 5, No. 6, pp. 245-66 (June 1971).
Asb STANTON (1972)Stanton, M. F. and C. Wrench, "Mechanisms of MesotheliomaInduction with Asbestos and Fibrous Glass," Nat. CancerInst. J., Vol. 48, pp, 797-821 (1972).
Asb
R/B
R/B
Gen
Gen
STANTON (1974)Stanton, M. F., "Fiber Carcinogenesis: Is Asbestos the OnlyHazard?," J. of the Nat. Cancer Inst., p. 633 (March 1974).
STARR (1972a)Starr, C., "Benefit-Cost Studies in Sociotechnical Systems,"pp. 17-42 in "Perspectives on Benefit-Risk Decision Making,"report of a colloquium conducted by the Committee on PublicEngineering Policy, 26-27 April 1971, published by The Na-tional Academy of Engineering (1972).
STARR (1972b)Starr, C., M. A. Greenfield, and D. F. Hausknecht, "A Compar-ison of Public Health Risks: Nuclear Versus Oil-Fired PowerPlants," Nuclear News, p. 37 (October 1972).
STENBURGStenburg, R. L., et al., "Effects of High Volatile Fuel onIncinerator Effluents," Air Poll. Control Assn., Vol. 11,No. 8, pp. 376-383 (August 1961).
STEPHENSStephens, G. R., L. Hankin, and W. D. Glover, Jr., "Lead Emis-sions from Incinerated Sewage Sludge Detected on Tree Foliage,"J. Air Poll. Control Assn., Vol. 22, No. 10, pp. 799-800(October 1972).
R/B STEVENSStevens, J. B., "Recreation Benefits from Water PollutionControl," Water Resources Research, Vol. 2, No. 2, pp.167-82 (Second Quarter 1966).
R/B STOCKFISCHStockfisch, J. A., "Cost-Benefit Analysis, Property-RightSpecification and Distribution," Symposium held by EPA,September 1973.
B-67
Topic
Gen STOKINGERStokinger, H. E., "The Spectre of Today's Environmental Pol-lution USA Brand, New Perspectives from an Old Scout," Am.Ind. Hyg. Assoc. J., Vol. 30, pp. 195-217 (May-June 196%
Gen SULLIVAN, P.Sullivan, P. M., M. H. Stanczyk, and M. J. Spendlove, "Re-source Recovery from Raw Urban Refuse," Bureau of Mines,Report of Investigations 7760 (1973).
Asb SULLIVAN, R.Sullivan, R. J. and Y. C. Athanassiadis, "Preliminary AirPollution Survey of Asbestos - A Literature Review," APTD69-27, prepared by Litton Systems, Inc., for National AirPollution Control Administration (October 1969).
Cd
Asb SVERDRUP & PARCEL (1973)
Asb
Asb
SURVEY OF CURRENT BUSINESSSurvey of Current Business, March 1975 and prior issues fordata on zinc prices, production, consumption, Bureau of Eco-nomic Analysis, U.S. Department of Commerce.
"Development Document for Effluent Limitations Guidelinesand Standards of Performance; Asbestos Manufacturing," draftreport prepared by Sverdrup & Parcel and Associates, Inc.,for U.S. Environmental Protection Agency, Contract 68-01-1505 (June 1973).
SVERDRUP & PARCEL (1974)"Development Document for Proposed Effluent Limitations Guide-lines and New Source Performance Standards for the Textile,Friction Materials and Sealing Devices Segment of the Asbes-tos Manufacturing Point Source Category," draft report pre-pared by Sverdrup & Parcel and Associates, Inc., for U.S.Environmental Protection Agency, Contract 68-01-1505 (May1974).
TABERSHAWTabershaw, I. R., "Asbestos as an Environmental Hazard," J.Occup. Med., Vol. 10, No. 1, pp. 32-7 (January 1968).
R/B TAMERINTamerin, J. S. and H.L.P. Resnik, "Risk Taking by IndividualOption-Case Study," pp. 73-84 in "Perspectives on Benefit-Risk Decision Making," report on a colloquium conducted bythe Committee on Public Engineering Policy, National Academyof Engineering, 26-27 April 1971, published by The NationalAcademy of Engineering (1972).
B-68
Topic
R/B THALERThaler, R. and S. Rosen, "The Value of Saving a Life: Evi-dence from the Labor Market," paper presented at the NationalBureau of Economic Research Conference on Income and Wealth,Washington, D.C., 30 November 1973, published by Dept. of Eco-nomics, Univ. of Rochester, N.Y.
Cd THINDThind, G. S., "Role of Cadmium in Human and Experimental Hy-pertension," J. Air Poll. Control Assn., Vol. 22, No. 4,pp. 267-70 (April 1972).
Gen THOMAS (1972a)Thomas, W. A., editor, Indicators of Environmental Quality,Plenum Press (1972).
Gen THOMAS (1972b)Thomas, W. A., "Indicators of Environmental Quality: AnOverview," pp. 1-5 in Indicators of Environmental Quality,W. A. Thomas, editor, Plenum Press (1972).
Asb THOMPSONThompson, R. J. and G. B. Morgan, "Determination of Asbestosin Ambient Air," presented at the International Symposiumon Identification and Measurement of Environmental Pollutants,Ottawa, Ontario, Canada, 14-17 June, 1971.
Asb THOMSONThomson, J. G. and W. M. Graves, Jr., "Asbestos as an UrbanAir Contaminant," Arch. Pathol., Vol. 81, pp. 458-65 (May1966).
R/B TIHANSKY (1971)Tihansky, D. P., "Effects of Pollution Control on the Firm,"AD-737681, RAND Corp. (October 1971).
R/B TIHANSKY (1972).Tihansky, D. P., "Models of Industrial Pollution Control inUrban Planning," AD-742401, RAND Corp. (January 1972).
R/B TIHANSKY (1973a)Tihansky, D. P., "Cost Analysis of Water Pollution Control:An Annotated Bibliography," EPA-R5-73-017, U.S. EnvironmentalProtection Agency, Office of Research and Monitoring (April1973).
R/B TIHANSKY (1973b)Tihansky, D. P., "A Survey of Empirical Benefit Studies,"Symposium held by EPA, September 1973.
B-69
Topic
R/B
R/B
TIHANSKY (1973c)Tihansky, D. P., "Economic Damages to Household Items fromWater Supply Use," EPA-600-S-73-001, U.S. EnvironmentalProtection Agency, Office of Research and Development (July1973).
TIHANSKY (1974a)Tihansky, D. P., "Economic Damages from Oil Spills: Measure-ment Techniques and Empirical Results," pp. 57-65 in "Assess-ing the Social Impacts of Oil Spills," an invitational sym-posium, sponsored by EPA and The Institute on Man and Science,25-28 September 1973, Rensselaerville, New York, publishedby The Institute on Man and Science (February 1974).
R/B TIHANSKY (1974b)Tihansky, D. P., "Economic Damages from Residential Use ofMineralized Water Supply," Water Resources Research, Vol. 10,No. 2, pp. 145-54 (April 1974).
R/B TIHANSKY (1974c)Tihansky, D. P., "A Cost-Risk-Benefit Analysis of Toxic Sub-stances," presented at Early Warning Systems for Toxic Sub-stances, Seattle, Washington, 31 January 1974, published inJ. Environ. Sys., Vol. 4, No. 2, pp. 117-34 (Summer 1974).
R/B
Cd
Cd
Asb
R/B
TIHANSKY (1974d)Tihansky, D. P., "Historical Development of Water PollutionControl Cost Functions," J. Water Poll. Control Fed., Vol.46, No. 4, pp. 813-33 (May 1974).
TOXIC MATERIAL NEWSToxic Material News (15 January 1975).
TUWINERTuwiner, S. B., "Investigation of Treating ElectroplatersCyanide Waste by Electrodialysis," EPA-R2-73-287, preparedfor U.S. Environmental Protection Agency, Office of Researchand Monitoring, by Edison Water Quality Research Laboratory,Edison, New Jersey (December 1973).
UMUrn, C. H., "Study of the Secular Trend in Asbestos Bodies inLungs in London 1936-66," Brit. Med. J., Vol. 2, pp. 248-51(1 May 1971).
UNGERUnger, S. G., M. J. Emerson , and D. L. Jordening, "State-of-Art Review: Water Pollution Control Benefits and Costs,"U.S. Environmental Protection Agency, Office of Research andMonitoring (October 1973).
B-70
Topic
Cd VALLEE
Gen
Cd
Cd
Cd
Asb
Asb
Asb
Vallee, B. L. and D. D. Ulmer, "Biochemical Effects of Mer-cury, Cadmium, and Lead," Annual Rev. of Biochem., Vol. 41,pp. 91-128 (1972).
VAN DER LEEDENvan der Leeden, F., "Groundwater Pollution Features of Fed-eral and State Statutes and Regulations," PB-232116, preparedby TEMPO, General Electric Co., Center for Advanced Studies,for U.S. Environmental Protection Agency, Office of Researchand Development (July 1973).
VESTERBERGVesterberg, O. and G. Nise, "Urinary Proteins Studied by Useof Isoelectric Focusing; I. Tubular Malfunction in Associa-tion with Exposure to Cadmium," Clinical Chemistry, Vol. 19,No. 10, pp. 1179-83 (1973).
VOLCHOKVolchok, H. L. and D. Bogen, "Trace Metals - Fallout in NewYork City," pp. I-91-10,7 in "Health and Safety LaboratoryFallout Program Quarterly Summary Report," E. P. Hardy, HASL-242, Atomic Energy Commission, Health and Safety LaboratoryNew York (1 April 1971).
VOORSVoors, A. W., M. S. Shuman, and P. N. Gallagher, "Zinc andCadmium Autopsy Levels for Cardiovascular Disease in Geo-graphical Context," pp. 215-22 in "Trace Substances in En-vironmental Health - VI," D. D. Hemphill, editor, Universityof Missouri's 6th Annual Conf. on Trace Substances in En-vironmental Health, 13-15 June 1972, Columbia, Missouri (1973).
WAGNER, C.Wagner, C., "Disputes on the Safety of Asbestos," New Scien-tist, pp. 606-9 (7 March 1974).
WAGNER, J. C.Wagner, J. C., G. Berry and V. Timbrell, "Mesotheliomata inRats after Innoculation with Asbestos and Other Materials,"Brit. J. Cancer, Vol. 28, No. 2, pp. 173-85 (1973).
WAGNER, J. M.Wagner, J. M., C. A. Sleggs, and P. Marchand, "Diffuse PleuralMesothelioma and Asbestos Exposure in the North Western CapeProvince," Brit. J. Industr. Med., Vol. 17, pp. 260-71(1960).
B-71
Topic
Cd
Cd
Asb
R/B
Asb
Cd
Cd
Asb
Asb
R/B
WAGONERWagoner, R. D., "Clinical Significance of Proteinuria,"Postgraduate Med., Vol. 52, pp. 155-9 (September 1972).
WALKERWalker, R., "The Use and Production ofposits," Metal Finishing, Vol. 72, No.1974).
WALTERWalter, E., "Evaluation and Assessment
Cadmium Electrode-1, pp. 59-64 (January
of Dust Measurementsin Asbestos Plants of the Textile Industry," Staub (EnglishTranslation), Vol. 26, No. 10, pp. 16-9 (October 1966).
WATSONWatson, W. D., Jr., "Costs of Air Pollution Control in theCoal-Fired Electric Power Industry," Quart. Rev. Econ. andBusiness, Vol. 12, No. 3, pp. 63-85 (Autumn 1972).
WEBSTERWebster, I., "Asbestos and Maligancy," South African Med. J.,Vol. 47, pp. 165-69 (1973).
WEDOW (1973a)Wedow, H., "Cadmium," pp. 105-9 in United States Mineral Re-sources, Geological Survey Professional Paper 820, D. A.Brobst and W. P. Pratt, editors, U.S. Geol. Survey (1973).
WEDOW (1973b)Wedow, H., et al., "Zinc," pp. 697-711 in United States Min-eral Resources, Geological Survey Professional Paper 820,D. A. Brobst and W. P. Pratt, editors, U.S. Geol. Survey(1973).
WEGMANWegman, D. H., G. P. Theriault, and J. M. Peters, "Worker-Sponsored Survey for Asbestosis," Arch. Environ. Health,Vol. 27, No. 2, pp. 105-9 (August 1973).
WEHMANWehman, H. J. and B. A. Plantholt, "Asbestos Fibrils in Bev-erages, I. Gin," Bull, Environ. Contam. Toxicol., Vol. 11,No. 3, pp. 267-72 (March 1974).
WEISBRODWeisbrod, B. A., "Income Redistribution Effects and Benefit-Cost Analysis," pp. 176-222 in "Problems in Public Expendi-ture Analysis," S. B. Chase, Jr., The Brookings Institution(1968).
B-72
Topic
Cd
Asb
Asb
R/B
Gen
Cd
Asb
Cd
WEISSWeiss, H. V. and K. K. Bertine, "Simultaneous Determinationof Manganese, Copper, Arsenic, Cadmium, Antimony and Mercury,in Glacial Ice by Radioactivation," Anal. Chim, Acta, Vol.65, pp. 253-9 (1973).
WESOLOWSKI (1974a)Wesolowski, J. J., "Asbestos in the California Environment,"Calif. State Dept. of Health, Air and Industrial HygieneLaboratory, Berkeley, Calif. AIHL Report No. 164 (May 1974).
WESOLOWSKI (1974b)Wesolowski, J. J., et al., "Asbestos Measurements in theCalifornia Environment," prepared for publication in theProc. of the International Symposium on Recent Advances inthe Assessment of the Health Effects of Environmental Pol-lution, World Health Organization Conf., Paris, June 1974.
WHITEWhite, G. F., "Human Response to Natural Hazard," pp. 43-9in "Perspectives on Benefit-Risk Decision Making," reportof a colloquium conducted by the Committee on Public Engi-neering Policy, National Academy of Engineering, 26-27 April1971, published by The National Academy of Engineering (1972).
WHO (1969)"Permissible Levels of Occupational Exposure to Airborne ToxicSubstances, " World Health Organization Technical Report SeriesNo. 415, Sixth report of the Joint ILO/WHO Committee on Oc-cupational Health (1969).
WHO (1971)"International Standards for Drinking Water," World HealthOrganization, Geneva (1971).
WHO (1972a)"Report of the Advisory Committee on Asbestos Cancers to theDirector of the International Agency for Research on Cancer,a division of the World Health Organization, Lyons, France,5-6 October 1972, published in Brit. J. Industr. Med., Vol.30, No. 4, pp. 180-6 (April 1973).
WHO (1972b)"Evaluation of Certain Food Additives and the ContaminantsMercury, Lead, and Cadmium," Sixteenth Report of the JointFAO/WHO Expert Committee on Food Additives, Geneva, 4-12April 1972, World Health Organization Technical Report SeriesNo. 505, FAO Nutrition Meetings Report Series, No. 51, (1972).
B-73
Topic
Cd WHO (1973)"IARC Monographs on the Evaluation of Carcinogenic Risk ofChemicals to Man: Some Inorganic and Organometallic Com-pounds," Vol. 2, World Health Organization, InternationalAgency for Research on Cancer, Lyons (1973).
R/B WIGGINSWiggins, J. H., "Earthquake Safety in the City of Long BeachBased on the Concept of Balanced Risk," pp. 87-95 in "Per-spectives on Benefit-Risk Decision Making," report of a col-1oquium conducted by the Committee on Public EngineeringPolicy, National Academy of Engineering, 26-27 April 1971,published by The National Academy of Engineering (1972).
R/B WILLIAMSWilliams, J. R. and C. G. Justus, "Evaluation of NationwideHealth Costs of Air Pollution and Cigarette Smoking," AirPoll. Control Assn., Vol. 24, No. 11, pp. 1063-66 (Novem-ber 1974).
R/B WILLIGWillig, R., "Consumer's Surplus: A Rigorous Cookbook," Tech-nical Report No. 98, prepared by Institute for MathematicalStudies in the Social Sciences, Stanford University, forNational Science Foundation (May 1973).
Asb WINTERWinter, R. E., "Furor Over a Plant on Lake Superior is Warn-ing to Industry - Challenge to the Dumping of Iron-Ore WasteShows How Rules Can Change - A Shadow Over Silver Bay,"Wall Street J., p. 1 (26 August 1974).
Asb WRIGHTWright, G. W., "Asbestos and Health in 1969," Amer. Rev. Res-pirat. Disease, Vol. 100, No. 4, pp. 467-79 (October 1969).
Cd WRSIC (1973)"Cadmium in Water - A Bibliography," WRSIC 73-209, WaterResources Scientific Information Center, Office of Water Re-sources Research, U.S. Dept. of the Interior (March 1973).
Asb WYATTWyatt, J. P., "Occupational Lung Diseases and InferentialRelationships to General Population Hazards," Am. J. Pathol.,Vol. 64, No. 1, pp. 197-216 (July 1971).
Cd YOST (1973)Yost, K. J., et al., "The Environmental Flow of Cadmium andOther Trace Metals, Vol. I," Progress Report July 1, 1972to June 30, 1973, prepared by Purdue Univ., for NationalScience Foundation (1973).
B-74
Topic
Cd YOST (1974)Yost, K. J., et al., "The Environmental Flow of Cadmium andOther Trace Metals," Environmental Studies, Progress ReportJuly 1, 1974 to June 30, 1974, prepared by Purdue Univ., forNational Science Foundation (1974).
Cd YUNICEYunice, A. and H. M. Perry, "The Accute Pressor Effect ofParenteral Cadmium and Mercury Ions," J. Lab. Clin. Med.,Vol. 58, No. 6, p. 975 (1961).
Cd YAMAGATAYamagata, N. and I. Shigematsu, "Cadmium Pollution in Per-spective," Bull. Inst. Public Health, Vol. 19, No. 1, pp.1-27 (1970).
Gen ZANONIZanoni, A. E., "Potential for Ground Water Pollution fromthe Land Disposal of Solid Wastes," Critical Rev. in Environ.Control, Vol. 3, pp. 225-60 (1973).
Cd ZHIGALOVSKAYAZhigalovskaya, T. N., et al., "Certain Characteristics of theGlobal Concentration Distributions of Microelements in theLower Troposphere," Acad. Sci. U.S.S.R., Bull. Atmos. OceanPhys., Vol. 9, No. 7, pp. 439-42 (1973).
B-75