Embed Size (px)
Citation preview
COMPARATIVE RISKS OF HAZARDOUS MATERIALS AND NON-HAZARDOUS MATERIALS TRUCK SHIPMENT ACCIDENTS/INCIDENTS Final Report Prepared for Federal Motor Carrier Safety Administration March 2001
505 King Avenue, Columbus, OH 43201
Final Report — March 2001 i
Table of Contents Page Executive Summary ................................................................................................................. ES-1 1.0 Introduction .................................................................................................................. 1-1 1.1 Purpose and Organization ................................................................................... 1-1 1.2 Hazardous Materials Transportation ................................................................... 1-2 1.3 Hazardous Material Flow .................................................................................... 1-3 2.0 Study Methodology........................................................................................................ 2-1 2.1 Accident and Incident Data Sources ................................................................... 2-1 2.2 Methodology for Estimating Accidents/Incidents............................................... 2-5 2.3 Impact Methodology ........................................................................................... 2-10 2.4 Impact Summary Discussion............................................................................... 2-25 3.0 High Consequence Low Probability Accidents ............................................................. 3-1 3.1 Introduction ......................................................................................................... 3-1 3.2 Event Tree Application ....................................................................................... 3-1 4.0 Accident and Incident Numbers and Impacts ................................................................ 4-1 4.1 Accident and Incident Likelihood ....................................................................... 4-1 4.2 Shipment Impact Summary................................................................................. 4-2 5.0 Impact Summary by HM Category................................................................................ 5-1 5.1 Introduction ......................................................................................................... 5-1 5.2 HM Category 1.1, 1.2, 1.3................................................................................... 5-1 5.3 HM Category 1.4, 1.5, 1.6................................................................................... 5-1 5.4 HM Category 2.1................................................................................................. 5-1 5.5 HM Category 2.2................................................................................................. 5-9 5.6 HM Category 2.3................................................................................................. 5-9 5.7 HM Category 3.................................................................................................... 5-9 5.8 HM Category 4.1, 4.2, 4.3................................................................................... 5-10 5.9 HM Category 5.1, 5.2.......................................................................................... 5-10 5.10 HM Category 6.1, 6.2.......................................................................................... 5-10 5.11 HM Category 7.................................................................................................... 5-10 5.12 HM Category 8.................................................................................................... 5-10 5.13 HM Category 9.................................................................................................... 5-11 5.14 All HM Categories .............................................................................................. 5-11
Table of Contents (Continued)
Final Report — March 2001 ii
Page 6.0 Non-Hazardous Materials Accident Totals and Impacts ............................................... 6-1 6.1 Introduction ......................................................................................................... 6-1 6.2 Accident and Incident Totals............................................................................... 6-1 6.3 Non-HM Accident Impacts ................................................................................. 6-1 6.4 Non-HM Accident Risk and Cost per Mile......................................................... 6-2 7.0 Comparative Impacts and Risk of HM and Non-HM Shipments.................................. 7-1 7.1 Introduction ......................................................................................................... 7-1 7.2 Comparative Costs .............................................................................................. 7-1 7.3 Comparative Risk and Cost per Mile .................................................................. 7-1 7.4 Discussion ........................................................................................................... 7-4 8.0 SafeStat Applications..................................................................................................... 8-1 8.1 Introduction to SafeStat....................................................................................... 8-1 8.2 Current Role of HM in the SafeStat Algorithm .................................................. 8-1 8.3 SafeStat HM Analysis ......................................................................................... 8-2 8.4 Changes in SafeStat Applications ....................................................................... 8-4 9.0 HM Database Assessments and Recommendations ...................................................... 9-1 9.1 Purpose and Organization ................................................................................... 9-1 9.2 Opportunities for Database Improvement ........................................................... 9-2 9.3 Recommendations and Conclusions.................................................................... 9-5 10.0 Conclusion .................................................................................................................. 10-1 10.1 Project Significance............................................................................................. 10-1 10.2 Project Results..................................................................................................... 10-2 10.3 Recommendations for Future Projects ................................................................ 10-3
List of Appendices Appendix A. State Hazardous Material Flows ...................................................................... A-1 Appendix B Database Search Criteria .................................................................................. B-1 Appendix C. Accident Information for Class 3, Class 2.1, and Class 8 ................................ C-1 Appendix D Natural Resource Damages Settlements .......................................................... D-1 Appendix E Class 2.1 Releases ............................................................................................ E-1 Appendix F Impact Case Examples ..................................................................................... F-1 Appendix G References ........................................................................................................ G-1
Table of Contents (Continued)
Final Report — March 2001 iii
List of Tables Page Table 1. Class 3 Truck Shipments — Estimated Unique Accidents for 1996 .................. 2-9 Table 2. Class 2.1 Truck Shipments — Estimated Unique Accidents for 1995–1997 ..... 2-9 Table 3. Class 8 Truck Shipments — Estimated Unique Accidents for 1995–1997 ........ 2-10 Table 4. Distribution of VMT by Functional Class and Vehicle Type ............................. 2-18 Table 5. Summary of Steps ............................................................................................... 2-22 Table 6. Initiating Event Frequency and Event Tree Branch Probabilities for Various Classes/Divisions of HM Being Transported by Truck ................... 3-9 Table 7. Initiating Event Frequency and Event Tree Branch Probabilities for Division 2.3 (Poison Gases) by Truck........................................................... 3-10 Table 8. Initiating Event Frequency and Event Tree Branch Probabilities for Class 7 (Radioactive) by Truck ..................................................................... 3-10 Table 9. HM Accident and Incident Likelihood................................................................ 4-1 Table 10. Enroute Release Accident Types......................................................................... 4-2 Table 11. Estimated Annual Accident and Incident Impacts (Costs).................................. 4-3 Table 12. Estimated Annual Release Accident Impact Costs ............................................. 4-3 Table 13. Average Accident/Incident Costs for the Portrait Year....................................... 4-5 Table 14. Average Accident Costs for the Portrait Year..................................................... 4-5 Table 15. Average Impacts per Accident as if the High Consequence/Infrequent Accident
had Occurred in the Portrait Year Compared to Average Costs for that Year.... 4-6 Table 16. Enroute Accidents: Total HM (Release/Non-Release) Impact Components ...... 4-7 Table 17. Enroute Accident: Total Releases, Impact Components ..................................... 4-9 Table 18. Enroute Accident: Release Only, Impacts Components ..................................... 4-9 Table 19. Enroute Accident: Fire, Impact Components ...................................................... 4-10 Table 20. Enroute Accident: Explosion Impact Components ............................................. 4-10 Table 21. Enroute Accidents Non-Release Accidents Impact Components ....................... 4-11 Table 22. Leak Enroute Impact Components ...................................................................... 4-11 Table 23. Loading/Unloading Incidents .............................................................................. 4-12 Table 24. HM Accident Rate Per Mile................................................................................ 4-13 Table 25. HM Accident/Incident Risk Per Mile (Includes Leak Enroute Incidents) .......... 4-13 Table 26. HM Accident Cost Per Mile................................................................................ 4-14 Table 27. HM Accident/Incident Cost Per Mile (Includes Leak Enroute).......................... 4-14 Table 28. Category 1.1, 1.2, 1.3 .......................................................................................... 5-2 Table 29. Category 1.4, 1.5, 1.6 .......................................................................................... 5-2 Table 30. Category 2.1 ........................................................................................................ 5-3 Table 31. Category 2.2 ........................................................................................................ 5-3 Table 32. Category 2.3 ........................................................................................................ 5-4 Table 33. Category 3.0 ........................................................................................................ 5-4 Table 34. Category 4.1, 4.2, 4.3 .......................................................................................... 5-5 Table 35. Category 5.1, 5.2 ................................................................................................. 5-5 Table 36. Category 6.1, 6.2 ................................................................................................. 5-6 Table 37. Category 7 ........................................................................................................... 5-6 Table 38. Category 8 ........................................................................................................... 5-7 Table 39. Category 9 ........................................................................................................... 5-7 Table 40. All HM Categories .............................................................................................. 5-8
Table of Contents (Continued)
Final Report — March 2001 iv
List of Tables (Continued)
Page Table 41. Estimated Non-HM Accidents in 1996 ............................................................... 6-1 Table 42. Estimated Annual Non-HM Accident Impacts ................................................... 6-2 Table 43. HM and Non-HM Accident Rate per Mile.......................................................... 7-2 Table 44. HM Accident and Non-HM Accident Cost per Mile .......................................... 7-4 Table 45. Effect of Removing All HM Weightings from the SafeStat Scoring Algorithm.................................................................. 8-7 Table 46. Effect of Adding Non-Spill Accidents to the Accident SEA Algorithm ............ 8-8 Table 47. Effect of Doubling Weight of Spill and Non-Spill Accidents to the Accident SEA Algorithm .......................................................................... 8-8 Table 48. Effect of Scoring all Bulk HM with Accident SEA >70..................................... 8-10 Table 49. Effect of Including Bulk Carriers with ACSEA Scores >70 and Adding Non-Spill to the Spill Accidents and Doubling the Weighting.............. 8-10
List of Figures Figure 1. Demand and Bottleneck Traffic Flows ............................................................... 2-16 Figure 2. Level of Service Versus Delay Traffic Volume.................................................. 2-19 Figure 3. Level of Service Versus Delay Traffic Volume.................................................. 2-20 Figure 4. Event Tree Used to Model Division 1.1, 1.4, 2.1, Class 3 and Class 9 Accidents............................................................................. 3-2 Figure 5. Event Tree Used to Model Division 2.2, Classes 5, 6, and 8 Accidents ............. 3-3 Figure 6. Event Tree Used to Model Class 4 Accidents..................................................... 3-4 Figure 7. Event Tree Used to Model Division 2.3 Accidents............................................. 3-5 Figure 8. Event Tree Used to Model Class 7 Accidents..................................................... 3-6
Final Report — March 2001 ES-1
COMPARATIVE RISKS OF HAZARDOUS MATERIALS AND NON-HAZARDOUS MATERIALS TRUCK SHIPMENT
ACCIDENTS/INCIDENTS
Executive Summary
his project was designed to assist the U.S. Department of Transportation (USDOT) in achieving their strategic goal of reducing the rate and severity of transportation fatalities and injuries in hazardous materials (HM) transportation and of reducing the dollar loss from
high-consequence, transportation accidents. The purpose of this project is to assess the additional risks posed by HM transportation when compared to non-hazardous shipments. The results will also be used to assist the Federal Motor Carrier Safety Administration (FMCSA) in identifying high risk motor carriers. The project has been divided in three phases. • The initial portion of the first phase characterized for one year the shipment impacts of Class 3
shipments and assessed the feasibility of conducting a comprehensive risk assessment of HM and non-HM shipments. The feasibility study results were published in the Plan for Assessing the Feasibility for Conducting a Comparative Risk Assessment on Hazardous Materials and Non-hazardous Materials Movements, June 1999.
• The second part of the first phase characterized the one-year shipment impacts of Class 2.1 and
Class 8 and provided a preliminary estimate of the impacts of non-HM shipments. Two white papers, Potential for Integrating Hazmat Transportation Risk Assessment into Safestat and Incorporating Severe Class 3 and Class 2.1 Accidents into the Truck Transportation Risk Assessment were produced by the project in 1999.
• The project’s second phase was the actual comparative risk assessment between HM and non-
HM truck shipments. To obtain the overall HM risk, the study calculated the risk associated with each class/division of hazardous material. With the completion of the second phase of the project, the risk associated with the shipment of any class/division of HM can be compared to the risk associated with other classes/divisions as well as to the shipment of non-HM materials.
• The third phase of the project focused on a possible application of the HM risk results.
Specifically, the study assessed how HM risk information is currently being used in the SafeStat program to identify potentially unsafe HM carriers. With these results in hand, the assessment then focused on how the HM risk information obtained during the first two phases of the study could be applied to the SafeStat algorithm to better identify “high risk” HM carriers.
• For comparative purposes, the risk assigned was applied to 12 HM categories, consisting of
classes and divisions or groups of divisions as follows:
T
Final Report — March 2001 ES-2
• Class 1: Divisions 1.1, 1.2, 1.3 — all have the potential for mass detonation • Class 1: Divisions 1.4, 1.5, 1.6 — characteristics make mass detonation unlikely • Class 2: Division 2.1 — Flammable gases • Class 2: Division 2.2 — Non-flammable gases • Class 2: Division 2.3 — Poisonous gases • Class 3: Flammable liquids (and combustible liquids) • Class 4: Division 4.1, 4.2, 4.3— Flammable solids; spontaneously combustible materials and dangerous when wet materials • Class 5: Division 5.1, 5.2 — Oxidizers and organic peroxides • Class 6: Division 6.1, 6.2— Toxic (poison) materials and infectious substances • Class 7: Radioactive materials • Class 8: Corrosive materials • Class 9: Miscellaneous dangerous goods.
Adding non-HM transport brought the total number of categories of materials being assessed to 13. This report analyzes events involving the transportation of hazardous material that may or may not result in the release of hazardous material to the environment. These events are defined as accidents and incidents. An accident is defined here as an event that occurs when the vehicle transporting the goods is involved in a collision. Any accident involving the shipment of HM would be considered as a HM accident regardless of whether any of the material was spilled or was exposed to the atmosphere. Similarly, a non-HM shipment accident would be considered as a non-HM shipment accident even if fuel from the tractor spilled during an accident. An event that occurs when the vehicle transporting the goods spills some of the HM cargo but is not involved in a collision is termed an enroute incident. An event resulting in the spill or release of HM material during loading or unloading is defined as a loading/unloading incident. An initial step in developing a risk assessment is to estimate reliably the number of accidents and incidents across a defined period of time. For the first phase, estimates were developed for Class 3, Division 2.1, and Class 8 truck shipment incidents and accidents for a representative year. The Hazardous Materials Information System (HMIS) database served as the baseline database. The HMIS represents the only national database of hazardous materials, highway transportation incidents with details of the material, packaging and consequences involved. To be more complete, the data found in the HMIS were supplemented with data from other federal and state databases. The most important of these was the Motor Carrier Management Information System (MCMIS) accident database that provides accident information for both spill and no-spill accidents. The study determined underreporting rates for Class 3, Division 2.1, and Class 8 accidents and incidents by examining the same accident in several databases. These underreporting factors were then applied to the other HM categories to develop accident and incident likelihoods for an annual portrait. A key portion of this assessment was the consideration of the impacts of high consequence/low frequency accidents. First, these severe accidents were identified through an examination of the historical record during the past fifty years. Next, the study obtained the likelihood of occurrence by estimating the fraction of the accidents represented by the accident sequence that would, based on the historical record, likely to be severe. Thus, a total likelihood of accidents for the portrait year was developed for all of the HM categories.
Final Report — March 2001 ES-3
The average annual enroute HM accident frequency was estimated to be 2,484 accidents. The release accidents are estimated at 768. Average annual enroute leak incidents totaled 1,455 and loading/unloading incidents totaled 10,746. Class 3 shipments account for about 64 percent of the enroute accidents with releases and about 52 percent of the non-release accidents. Class 3 shipments along with categories 2.1, 2.2, 5.1, 5.2, 8, and 9, represent about 94 percent of all enroute accidents with releases and about 93 percent of all enroute non-release accidents. Classes 3 and 8 alone are involved in about 77 percent of all of the enroute leaks in the year. For loading and unloading incidents, these two classes were involved in about 84 percent of all incidents. To derive an estimate of the economic impact of incidents/accidents for the annual portrait, the following impact categories were considered:
• Injuries and Deaths • Cleanup Costs • Property Damage • Evacuation • Product Loss • Traffic Incident Delay • Environmental Damage.
The study reviewed several sources of information to establish reasonable estimates of the economic impacts of each consequence. A literature review was conducted, as was an evaluation of the utility of the federal and state databases. Impact estimates not readily available from the above sources, such as incident delay, were modeled. Finally, all impacts were converted to dollars to permit comparison and to compile total impact cost. The HMIS proved to be an important source of impact costs for product loss, cleanup costs, and property damage. Injuries and deaths were valued to be the amount the USDOT would be willing to spend to avoid an injury or death. This averaged out to be $200,000 to avoid an injury and $2,800,000 to avoid a fatality. Traffic incident delay was established as the total number of people delayed at an incident or accident multiplied by $15 per hour. The size of an average spill and the value placed on environmental contamination as determined by an average of 30 legal settlements constituted an estimate of environmental damage. Total HM annual impacts for the portrait year are estimated at about $1.2 billion. Enroute accidents with total impacts of just over $1 billion account for about 89 percent of the total impacts. Accidents with a release of HM with impacts of $416 million account for a total of about 40 percent of the enroute accident impacts. Within the release accident category, accidents with a fire and accidents with an explosion have total impacts of $139 million or about 34 percent of the total cost of enroute release accidents. The consequences of these accidents are important because they make up only about 12 percent of the total number of enroute release accidents. Non-release accidents make up about 60 percent of the total enroute accident impacts in the annual portrait.
Final Report — March 2001 ES-4
Leaks enroute at $72 million account for an additional six percent and loading/unloading incidents at $53.5 million accounts for about five percent of the impacts. Class 3 represents 56 percent of all of the impacts, while categories 8, 2.1, 2.2, and 9 represent 13 percent, 9 percent, 6 percent, and 7 percent respectively. These five categories alone account for approximately 91 percent of the estimated annual impacts for HM shipments. No other category accounts for more than three percent of the total impacts. Injuries and fatalities dominated the impact costs. For both release and non-release accidents combined, injuries represent about 40 percent of the impact costs. Fatalities represent about 40 percent of all impact costs for enroute accidents. Thus, injuries and fatalities together account for about 80 percent of the impact cost. Incident delay for both release and non-release enroute accidents add up to about nine percent of the total cost. Carrier, property damage, and product loss together represent about eight percent of the total. Clean up, environmental damage, and evacuations account for the remaining three percent of impacts. Non-HM shipments experienced an estimated 126,880 accidents in the portrait year. After compensating for underreporting, there were an estimated 5,009 fatalities and 109,779 injuries. These injuries and fatalities result in impact costs of about $43 billion. All but $7 billion of that cost results from injuries and fatalities. All release and non-release enroute accidents for all of the HM categories for the annual portrait year have an average value of about $414,000 per accident, while non-HM accidents averaged about $340,000 per accident. This difference is magnified when non-HM accident impacts are compared with HM release impacts. In the annual portrait year, the average cost per HM accident release is about $536,000. The average impact cost of a release accident with a fire or one with an explosion compared to the average cost of a non-HM accident shows an even greater contrast. The non-HM accident rate of 0.73 per million vehicle miles is more than double the average HM accident rate of 0.32 per million vehicle miles. This comparison is based on estimated mileage figures from the 1997 Commodity Flow Survey (CFS). As stated above, the annual economic impact of non-HM truck accidents is over $43 billion, considerably higher than for HM truck incidents. Although due primarily to a much larger volume of transport activity, the estimated non-HM truck accident rate is also reflected in the impact cost per vehicle-mile. Hazardous material shipments make up between four and eight percent of all shipments. Given this small percentage, the cost of non-HM accidents clearly dominates the cost of HM accidents. Although the average cost of an accident is higher for HM, these higher costs are not nearly enough to overcome the large disparity in shipment volume between HM and non-HM shipments by truck. Taking these observations into consideration, one should view the results of this risk assessment in the context of establishing a general estimate or bound on the financial impact of this problem rather than a precise valuation. This project represents a systematic attempt to benchmark the financial implications of the problem based on the best available data. We anticipate that meaningful research and policy inferences can be derived for risk management purposes. The SafeStat algorithm was evaluated to determine the appropriate inclusion of the risk of hazardous materials shipments in the FMCSA carrier selection process. Potential changes in how
Final Report — March 2001 ES-5
HM is used in the algorithm were the focus of this effort. At the present time, about 1.6 percent of the bulk HM carriers are identified as potentially unsafe carriers and are therefore subjected to a compliance review. However, the risk assessment results show that the cost associated with the transport of bulk HM by truck represents over two percent of the total truck accident risk. Thus, the current SafeStat algorithm under represents bulk HM carriers. Several alternative scenarios for increasing this percentage were subsequently defined and evaluated. Based on these results, the recommendations formulated state that all bulk HM carriers with a D score should undergo a compliance review. In addition, the scoring algorithm should be changed for bulk HM carriers to include all ACSEA scores greater than 70. Finally, the accident weighting for HM accidents should be expanded to include both spill and non-spill accidents. Currently, SafeStat uses only HM spill accidents in the accident weighting. The HM risk assessment results presented in this study made extensive use of DOT, Census Bureau and State supported databases. While these results would not be possible without the availability of these databases, limitations of the study can in part be linked to their deficiencies. The study concludes with recommendations, such as investigating ways to cross-reference the TIFA, MCMIS, and HMIS databases and determining the causes of HM accidents. These would enable FMSCA to improve its safety performance monitoring capabilities. The benefit of such improvements would be a reduction in the expense associated with maintaining the databases and in the availability of additional information, such as causal factors, that could be used to develop programs to improve the safety of both HM and non-HM truck transport.
Final Report — March 2001 1-1
1.0 Introduction
1.1 Purpose and Organization
he United States Department of Transportation’s (U.S. DOT) 1997 Draft Strategic Plan recognizes safety as its most important strategic goal and commits to promoting the public health and safety by working towards the elimination of transportation related deaths,
injuries, and property damage. This project was designed to assist DOT in achieving this strategic goal by reducing the rate and severity of transportation fatalities and injuries in hazardous materials transportation and the dollar loss from high-consequence transportation accidents. Additionally, the FMCSA 2000-2001 Hazardous Materials Program Plan stresses the identification of high risk carriers for compliance reviews as a primary strategy for the reduction of hazardous materials incidents. The information developed in this project will be directed toward that strategy. The long-term purpose of this project is to assess the additional risks posed by hazardous materials (HM) highway truck shipments when compared to non-hazardous materials (non-HM) highway truck shipments. Specifically, the project focuses on benchmarking the risk associated with HM highway transportation as compared to the transportation of non-HM. A second purpose of the project is to develop a transportation risk assessment model that will enable the Federal Motor Carrier Safety Administration (FMCSA) to identify programs that can result in the greatest improvement in safety. Additionally, the FMSCA must be able to break down the HM risk assessment into hazard classes so that experts can compare the costs associated with accidents/ incidents for each class. The distinction among hazard classes is based on the regulatory hazard classification system that includes nine classes with divisions contained in the Code of Federal Regulations (CFR) part 172.101 (49CFR Part 172). The project was divided into three phases. • The initial portion of Phase I characterized the shipment impacts for one year of Class 3 HM
shipments and assessed the feasibility of conducting a comprehensive risk assessment of HM and non-HM shipments. Class 3 materials were selected because of their relative importance among HM shipments in volume and their potential for injury and damage during an accident. The characterization of the one-year of impacts of Class 3 HM shipments is contained in this report. The assessment of the feasibility of conducting a comprehensive risk assessment of HM and non-HM shipments is contained in the Plan for Assessing the Feasibility for Conducting a Comparative Risk Assessment on Hazardous Materials and Nonhazardous Materials Movements, April 1999.
The second portion of Phase I characterized the shipment impacts for one year of Class 2.1 and Class 8 shipments as well as a preliminary annual portrait of non-HM shipments. These characterizations are also contained in this report.
The project’s first phase also produced the two white papers: Potential for Integrating Hazmat Transportation Risk Assessment into SafeStat and The Identification of High Consequence Low Frequency Class 3 Hazmat Transportation Accidents. The papers were produced in late 1999.
T
Final Report — March 2001 1-2
• Phase II of the project produced the actual comparative risk assessment between HM and non-HM truck shipments. The overall HM risk depends on the risk associated with each class/ division of hazardous material. They are calculated for this report. Thus, with the completion of Phase II of the project, the risk associated with the shipment of any class/division of HM can be compared to the risk associated with other classes/divisions as well as to the shipment of non-HM materials.
• Phase III of this project uses the information developed for the first two phases and analyzes the
SafeStat algorithm to determine the appropriate inclusion of the risk of hazardous materials in the FMCSA carrier selection process.
1.2 Hazardous Materials Transportation
A hazardous material shipment is cargo that is part or all hazardous material according to the Code of Federal Regulations (49CFR). An incident involving the shipment of HM is defined in 49 CFR parts 171.15 and 171.16 and includes criteria for non-spill accidents. In the CFR, hazardous materials are separated into the following classes (49CFR Part 171): • Class 1 — Explosives • Class 2 — Gases • Class 3 — Flammable liquids (and combustible liquids) • Class 4 — Flammable solids; spontaneously combustible materials and dangerous when wet
materials • Class 5 — Oxidizers and organic peroxides • Class 6 — Toxic (poison) materials and infectious substances • Class 7 — Radioactive materials • Class 8 — Corrosive materials • Class 9 — Miscellaneous dangerous goods. The majority of classes are segmented into divisions. For purposes of comparing risks, this analysis employed a finer categorization of hazardous materials. Specifically, risks were developed for the following classes and divisions or groups of divisions of HM. These are called categories in the report. • Class 1: Divisions 1.1, 1.2, 1.3 - all have the potential for mass detonating • Class 1: Divisions 1.4, 1.5, 1.6 - characteristics make mass detonation extremely unlikely • Class 2: Division 2.1 - Flammable Gases • Class 2: Division 2.2 - Non-flammable Gases • Class 2: Division 2.3 - Poisonous Gases • Class 3 • Class 4: Division 4.1, 4.2, 4.3 • Class 5: Division 5.1, 5.2 • Class 6: Division 6.1, 6.2 • Class 7 • Class 8 • Class 9
Final Report — March 2001 1-3
This risk assessment considered a total of 12 different categories of hazardous materials. Adding non-HM transport brings the total number of categories of materials assessed to 13.
1.3 Hazardous Material Flow
An essential element of the annual characterization of HM shipments is a description of traffic flows. An estimate of transportation flows for all truck traffic and for all hazardous materials can be derived from several sources. One source is the 1993 Commodity Flow Survey (CFS) (U.S. Department of Commerce, 1996). The (CFS) is a component of the quinquennial Census of Transportation that is designed to sample the economic activity of the transportation of goods by mode of transportation. The 1993 Commodity Flow Survey provides an estimate of ton-miles for all commodities shipped and an approximate estimate of the percentage of HM shipments of this total volume. The report shows that all commodities were shipped an estimated 869,536,000,000 ton-miles in 1993 with hazardous materials comprising about 74,410,000,000 ton miles of this total. Hazardous materials represent about 8.5 percent of the total ton-miles. Unfortunately, the data for calculating the percentage of the HM allocated to the various HM classes is limited, so the 1993 Commodity Flow study does not provide a reasonable number in this regard. In addition, average shipment tonnages are not available for calculating the mileage. The 1997 CFS (U.S. Department of Commerce, 2000) is a more recent source of data. The report shows that all commodities shipped by truck comprised an estimated 1,023,506,000,000 ton miles in 1997, with hazardous materials comprising about 74,939,000,000 ton miles of this total. This represents about 7 percent of the total truck ton mileage. Utilizing average tonnage values per shipment supplied by the Census Bureau and assuming an average of about two shipments per truckload, the ton mileage for all truck shipments in 1997 can be converted into an estimated 182,132,216,586 vehicle miles. HM shipments constitute approximately 7,763,282,762 vehicle miles, or approximately 5 percent of the total mileage. The data clearly indicate that HM shipments, although on average heavier than non-HM shipments, tend to travel shorter distances. This is especially true for Class 3 shipments that involve gasoline and fuel oil. Another source for vehicle miles traveled is the Federal Highway Administration’s (FHWA) Highway Statistics for 1996, which provides annual vehicle miles for 1996. The total for all combination and single unit trucks is 182,756,000,000 miles (U.S. DOT, 1997b). During the first phase of the project, the study utilized the National Fleet Safety Survey for 1996 to estimate the percentage of HM (Star Mountain Inc., 1997). For 1996, using a weighted average, 7.2 percent of all trucks surveyed carried HM. To calculate the percentage of Class 3 materials carried by truck for 1996, five regional HM commodity flow surveys were used. Based on the five surveys, the project team estimated that 52 percent of HM vehicles carried flammable liquids. Appendix A provides additional information from these flow studies. The Research and Special Program Administration’s (RSPA) Office of Hazardous Materials Safety in their 1998 study “Hazardous Materials Shipments” (US DOT, 1998) provided an estimate for the number of daily shipments of hazardous materials and the number of tons shipped. This study, based on a number of sources, estimates that all hazardous material truck shipments accounted for about 769,000 shipments per day and about 1.4 billion tons shipped annually. Petroleum products, which comprise the major part of the Class 3 shipments, accounted for an estimated 314,000
Final Report — March 2001 1-4
of these daily shipments and about 1.04 billion annual tons shipped. Chemical and allied products accounted for about 445,000 daily shipments and “other” for about 10,000 daily shipments. The RSPA study found that although only 43 percent of all HM tonnage is transported by truck, this accounts for approximately 94 percent of all the individual shipments transported by truck.
Final Report — March 2001 2-1
2.0 Study Methodology
his section describes the methodology used for this report. Crucial portions of the methodology include the • review, selection and analysis of available data sources;
• estimation of the number of hazardous material and non hazardous material accidents and incidents for the annual portrait; and
• measurement of impacts from these accidents and incidents.
2.1 Accident and Incident Data Sources
In this report, an incident is defined as an event involving the transportation of hazardous material that results in an unanticipated cost to the shipper, carrier or any other party. An accident is an incident that occurs when the vehicle transporting the goods is involved in a collision. The study included HM accidents with a release, HM accidents with no release, loading/unloading with release, and enroute leaks not caused by a vehicular accident. Non-spill accidents warranted consideration in this study because severe consequences (e.g., injuries and fatalities) can still occur. In addition, law enforcement and fire protection officials often treat any HM accident as a potential spill even if no release of material is apparent. An initial step in developing a risk assessment is estimating the number of accidents and incidents reliably for a defined period of time. In the initial part of Phase I, an estimate of accidents and incidents was developed for Class 3 truck shipments for the annual portrait. The estimate focused on the Hazardous Materials Information System (HMIS) database and utilized several sources of data to adjust the incidents and accidents reported in the HMIS. The adjustment was made in an effort to reflect the actual number of incidents and accidents in a one-year period. During the second part of Phase I, the methodology developed for Class 3 was applied to two additional classes/divisions of HM: Division 2.1 - Flammable Gases and Class 8 - Corrosives. Findings during Phase I affected the Phase II risk assessment work. Data analysis revealed that the impacts from fires and explosions represented a series of impacts that should be separately assessed whenever the data could support such a breakout. Another finding was the necessity of using more than one year of accident data for the other 11 classes/divisions of HM, if similar accident statistics were to be realized. For the analyses of Division 2.1 and Class 8 transport, initially three years of data were used. Eventually, over nine years of data were used to obtain the statistics for all 12 categories of HM. As the studies began to focus on the categories with less shipping exposure, some techniques adjusting for underreporting had to change as well. Rather than look at several databases and determine the amount of underreporting directly, the underreporting was estimated using factors obtained from the detailed look at the first three categories of hazardous material, Classes 3 and 8 and Division 2.1. Even if time and money permitted using the accident reporting comparisons for the other categories of hazardous material, it would have not been possible because only the HMIS data covered the entire nine-year study period. For most of the other databases, only one or two years of data were obtainable. The following sections describe the databases used in this effort.
T
Final Report — March 2001 2-2
Data identified and reviewed during initial research efforts associated with FMCSA’s hazardous materials risk assessment study were from multiple sources and categories with varying detail. Sources of data reviewed consisted of federal and state databases as well as research studies and analytical reports. The categories reviewed were numerator data, characterized as hazardous materials accidents/incidents or general commodity highway crashes, and denominator data, consisting of the flow or movement of hazardous materials and general commodities. The data assembled and reviewed may be categorized as generally being from a federal or state database with input in some instances by local authorities or private companies. The federal databases are collected and maintained by multiple administrations within the U.S. DOT as well as the Commerce Department’s Census Bureau. These data are collected under different regulations, utilizing disparate definitions under programs that have varying missions. The state databases have issues of incompleteness and inconsistency primarily due to jurisdictional reporting variances among the states as well as diversity in data processing capability. A review of the various pertinent databases initially assembled for this project follows.
2.1.1 Federal Databases
Hazardous Materials Information System (HMIS). The HMIS is a system of databases main-tained and managed by the Office of Hazardous Materials Safety (OHMS) within the RSPA. The major database in the HMIS and the most pertinent for the FMCSA risk assessment study is the incident/accident database. This database dates back to 1971, contains more than 300,000 records, and currently adds approximately 14,000 reports annually. Although the HMIS is a multi-modal database, about 85 percent of the records are in the highway mode. The HMIS consists of incidents where an unintentional release of a hazardous material in commerce occurs during the course of transportation or is possibly imminent and results in the closure of a major artery or an evacuation of the general public. Although the HMIS annually adds more than 10,000 truck transport-related reports, an average of 250 reports represent highway accidents with the great majority (approximately 200) involving cargo tanks. Until recently, the intrastate carriers, those operating in only one state, were not required to file HM incident reports. Thus, for most of the recording period, the HMIS reports encompassed motor carriers that operate interstate and those that transport certain highly hazardous materials interstate. This reporting requirement was extended to intrastate motor carriers on October 1, 1998. In 49CFR, Parts 171.15 and 171.16 provide the specific reporting requirements. As a result of the distribution practices of some hazardous materials, such as gasoline, fuel oil, propane, and fertilizers that are transported in large volumes by intrastate motor carriers, a substantial increase in HMIS reports was predicted but has not been immediately realized. The HMIS is specifically designed to capture information concerning the unintentional release of a hazardous material. Although an accident checkbox is available on the HMIS report form, the only detailed information involving the causation of an accident is found in the narrative section or in attachments. For the purposes of FMCSA’s risk assessment study, the HMIS represents the only national database of hazardous materials highway transportation accidents and incidents with details of the material, packaging, and consequences involved. This database is mature, well maintained, and has been extensively examined; as a result, its limitations can be identified. The consequences associated with an incident are not comprehensive and in some instances the report form may not even be complete. This deficiency, together with the lack of accident information, intrastate carrier
Final Report — March 2001 2-3
incidents and non-spill incidents, requires input from additional databases whose strengths will complement the HMIS for conducting the risk assessment. Of all the databases, this database is one of the more thoroughly checked and most inconsistencies have been eliminated. While it is clear that some accidents must be reported, two carriers might experience essentially the same minor incident and one will report it and the other will not. The minor incidents that are reported dominate the truck transport records contained in the HMIS database. Registration Database. The registration database for carriers, shippers, and offerors of certain types or quantities of hazardous materials is contained within RSPA’s HMIS. An annual registra-tion form must be completed and submitted to RSPA that indicates the company’s primary activity and the states in which the company operates. The registration database collects approximately 26,500 records annually and may be sorted by primary activity, whether the registrant is a carrier, offeror or both and whether the registrant operates inter- or intrastate. Recent annual tabulations show that of the 26,500 registrations received by RSPA, 2,820 are intrastate carriers and 731 indicate that they are both carriers and offerors on an intrastate basis. This database may prove useful in estimating the lack of intrastate incidents not recorded in 1999. News Clippings Database. The RSPA contracts with a private clipping service to provide nationwide coverage of newspaper reports of hazardous material incidents. Copies of these incidents are forwarded to RSPA for entry into an electronic database. This database supplements HMIS data by compiling hazardous materials incidents not reported to RSPA. Paper copies of this database were obtained from RSPA, and after review, data elements were entered into a separate database for comparison with the HMIS database. Safetynet MCMIS Database. The Motor Carrier Management Information System (MCMIS) is a system of databases - not unlike RSPA’s HMIS - managed by the FMCSA. The Safetynet database, also known as the accident file, is comprised of police accident reports (PAR) assembled by the states and forwarded to the FMCSA. Each state has adopted the National Governors Association’s (NGA) twenty-two uniform truck accident data elements on their PAR. This database was designed to provide a census of truck accidents nationwide. Among the states, there is a wide variance among the local jurisdictions that provide PARs for a state’s submittal into Safetynet. Because of this wide diversity of reporting jurisdictions within the states, some states have a more comprehen-sive data set in Safetynet than others. This database captures the general details of a crash, as well as information on the vehicle and hazardous material cargo involved. For the purposes of the FMCSA risk assessment study, Safetynet data files were requested for eight selected states (PA, IN, IA, MN, CO, OR, OH, and CA). Six of these states belong to the Performance and Registration Information Systems Management (PRISM) program that links U.S. DOT’s information system to the states’ systems. The PRISM program began as a mandate from Congress in the Intermodal Surface Transportation Efficiency Act (ISTEA) of 1991 to explore the potential of linking the commercial vehicle registration process to motor vehicle safety. The PRISM program includes two major processes: the Commercial Vehicle Registration Process and the Motor Carrier Safety Improvement Process (MCSIP). These two processes work in parallel to identify motor carriers and to hold them responsible for the safety of their operations. The six states participating in the PRISM program are also part of an effort to improve the accuracy and timeliness of data reported to the federal government. The two non-PRISM states selected, OH and CA, were chosen because they produce additional state databases that were expected to be useful for the purposes of the FMCSA risk assessment study. The Safetynet database proved very useful in adjusting the HMIS database by adding intrastate carrier accidents and non-spill accidents.
Final Report — March 2001 2-4
Trucks in Fatal Accidents. The Trucks in Fatal Accidents (TIFA) is a database developed by the University of Michigan Truck Research Institute (UMTRI) from the Fatal Accident Reporting System (FARS) compiled by the U.S. DOT. Under contract to the U.S. DOT, UMTRI identifies truck accidents in FARS and does extensive follow up on details of the fatal truck accident, including the presence of hazardous materials as cargo. TIFA does not however contain any details on the consequences resulting from a hazardous materials spill. This makes it difficult to compare TIFA with other databases containing HM data. Commodity Flow Survey (CFS). The processing of the 1997 CFS hazardous materials report was completed in the spring of 2000. Much needed data regarding the flow of hazardous materials for risk assessment studies is now available from the 1997 CFS. The largest contribution to hazardous materials data comes from the highway data produced from the 1997 CFS. In sharp contrast to a single HM table produced from the 1993 CFS, a total of 26 HM tables were produced from the 1997 CFS. All but four of the 1997 CFS HM tables had some application to hazardous material transportation in the highway mode. The 1997 CFS hazardous materials tables included fourteen tables concerned with HM class or division, six mode specific tables, three state/geographic tables, and three tables on selected materials. The tabulations of the 1997 CFS hazardous materials data was compiled using the standard CFS breakout of tons, ton miles, average shipment distance and weight. These data were tabulated utilizing the data set assembled in the 1997 CFS from responses containing a UN/NA entry. Presentations of the 1997 CFS hazardous materials data were constructed from the UN/NA data set. In addition to the 1997 CFS hazardous materials tables, estimates were derived and employed in this risk assessment study to establish the approximate number of miles hazardous materials were transported by truck to help in the identification of the exposure level of hazardous materials on our nations’ highways. The hazardous material tables from the 1997 CFS can be found in the document 1997 Commodity Flow Survey issued April 2000, EC97TCF-US (HM) RV. Included in this report are twenty-six tables, an overview of the 1997 CFS, a review of the sample design, data collection, and an estimation methodology and sample report forms and instructions. Vehicle Inventory and Use Survey (VIUS). The Vehicle Inventory and Use Survey (VIUS), known as the Truck Inventory Use Survey (TIUS) until 1992, is a component of the quinquennial Census of Transportation and complements the CFS. The name change occurred because other vehicles such as buses and recreational vehicles were intended to be added to the sample frame in 1997. However vehicles other than trucks were not included in the sample so VIUS remains solely a truck survey. The 1997 VIUS was released in early 2000 and is now available for review and analysis. A hard copy report has been published and the micro data is available on a CD ROM. The VIUS provides figures for the number and type of trucks in operation, together with the physical and operating characteristics of the country’s truck population. The format for hazardous materials data collection in the VIUS involves an indication of whether the truck was used to transport placarded hazardous materials, with a hazard class breakout. A broad breakout of the national percentage of trucks that have carried hazardous materials by hazard class and equipment type is available. Limitations associated with this database include definitional issues (e.g., a truck may also include a pickup, and a placard must have been used) and little trailer information, as well as a limited sample of about 131,000 registered private and commercial trucks to draw on.
Final Report — March 2001 2-5
2.1.2 State Databases
State reports and databases were utilized for Ohio, California, and Colorado. They included reports from the Public Utility Commission of Ohio and databases from the California Highway Patrol and Colorado State Patrol. These databases focus on hazardous material incidents and provide an independent source of data. California Highway Patrol (CHP). The CHP maintains a database of all reported hazardous material incidents. A subset of the CHP database was obtained from the CHP for analysis in FMCSA’s risk assessment study. This database includes information on the actual incident, hazardous material, and casualties but lacked carrier information and whether the incident was actually an incident or accident. However, the database was able to provide enough information on 1996 Class 3 accidents to supplement the HMIS database. Colorado State Patrol. The Colorado State Patrol also maintains a database of all reported hazardous material incidents. The 1996 hazardous material incidents database was obtained for analysis for Phase I of FMCSA’s risk assessment study. The database contains information concerning the actual incident, along with detailed information on the hazardous material and carrier information. Thus, the database was able to provide enough information to supplement HMIS. The Public Utilities Commission of Ohio (PUCO) Incident Reports. The PUCO provided copies of HM incident reports from January 1, 1996 to mid 1998. These reports contained information on the incident and carrier along with evacuation and road closure details. The reports were also very valuable in that they typically contained a detailed description of the incident, an item missing in most of the other databases. The PUCO reports were reviewed and data was extracted and entered into a database for comparison to HMIS.
2.1.3 Other Databases
Dialogue (Newspaper Clippings). A search of newspaper clippings from the eight states was completed to identify Classes 3, 2.1, and 8 accidents/incidents for the annual portrait. Those that were identified were included in the adjustment of the HMIS database. Most of the articles also provided additional detailed information about the accident/incident.
2.2 Methodology for Estimating Accidents/Incidents
The following sections describe the methodology used in the effort to estimate accidents/incidents for the one-year period.
2.2.1 Selection of Reference Database
The first step was to select a reference database. For the purposes of OMC’s risk assessment study, the HMIS represents the only national database of hazardous materials highway transportation incidents with details of the material, packaging, and consequences involved, although these consequences may not be comprehensive. The database is well maintained and carrier participation is required. Deficiencies include a lack of accidents or incidents involving intrastate carriers
Final Report — March 2001 2-6
(although this deficiency is being corrected for FY 1999) and lack of coverage for no-spill HM accidents. No-spill HM accidents should be included in an analysis because law enforcement and fire protection officials often treat any HM accident as a potential spill even if no release of material is apparent. Any accident involving a truck transporting HM should receive serious scrutiny from officials and the DOT. DOT has done an excellent job maintaining the integrity of the database as various changes have been made in the definition of the classes/divisions of Hazardous Materials and as additional fields have been added. For example, when the explosive categories were changed from A, B, and C to numerical categories, the 1982 through 1990 records were modified to show the A through C class accidents as 1.7 through 1.9. This enables a database search to go back as far as 1982 and get meaningful accident data on the classes of HM. When the project was started, 1996 was chosen as the base year for the analysis. At that time it happened to be the last year for which complete data were available from all data sources. The first analysis was for Class 3, flammable and combustible liquid transport. Because this single class represents more than 50 percent of all HM truck transport, good statistics could be obtained by looking at just one year. The first study during the second part of Phase I added two additional classes/divisions of HM to the analysis, Division 2.1 (flammable gases) and Class 8 (corrosives). Because these materials are involved in fewer accidents, the analysis base was expanded to 3 years of records, 1995 - 1997. During Phase II, this analysis was subsequently extended to all classes/ divisions of HM truck transport. In the expanded categories of HM, some categories have few incidents occurring in a given year. Thus, for the final analysis, data from 1990 through March 1999 were used to create an annual portrait of HM impacts. This provided the greatest quantity of HM incident data from which consequence and likelihood values could be obtained. While data from 1982 on could have been used, prior to 1990, only total impact costs were provided. Since breaking the total cost out into multiple cost categories is crucial for the risk assessment, and pre-1990 data did not have this information, it was not used. While more than nine years of data were used to evaluate consequences and likelihoods, the risk portrait continued to describe one year. Whenever the approach is to collect data that covers several years in order to consider the results to be representative of a year portrait, there is always a concern about trends. Accident rate changes and cost escalation trends might be expected to be major concerns. However, the data for the period 1982 to 1998 shows that the average total cost of an accident remained constant. Furthermore, the total number of accidents reported each year did not seem to change significantly over the 17-year period. While this result was somewhat surprising given the significant cost increases in parameters such as the vehicle cost, the HMIS data provided no basis for the selection of an escalation factor, so none was used. Although the costs were checked with other sources to determine reasonableness, subsequent research and analyses should be conducted to confirm whether increased accident costs occurred during these years.
2.2.2 Selection of Additional Databases
Additional databases with strengths complementing the HMIS for conducting the risk assessment were consulted to supplement HMIS data with data on other spill accidents (especially intrastate accidents) and non-spill accidents. In all cases, the additional databases covered fewer years. However, because it was always possible to reduce the statistics to cover a single year, this limitation was not significant. The greatest limitation was in the time period covered by the
Final Report — March 2001 2-7
databases. Where the databases covered the same time period, it was feasible to look at data from a single year in a wide variety of databases and, in so doing, evaluate the underreporting that was present in the databases. However, it was not feasible to continue to compare databases over many years of data and for all HM classes. First of all, most databases, particularly the state databases, are generated for a specific purpose and the information may only have been collected for a year or two. Secondly, if accidents are very infrequent, which is the case for some of the classes/divisions of HM, when one database misses one accident, the correction factor for underreporting of that class/division of HM would be large and making such corrections would not be an accurate representation of reality. Thus in the second part of Phase I, two additional classes/divisions — Division 2.1, flammable gases and Class 8, corrosives — were used to compare multiple databases for estimating the number of accidents/incidents occurring in a year. When added to the data from Class 3, the comparison represents more than 75 percent of all the HM shipped by truck in a given year. Given the large fraction of HM shipments represented by these categories of HM, it was felt to be appropriate to apply the underreporting factors developed for these three HM categories to all the remaining HM categories. The search criteria used to identify the 1996 Class 3 and 8 and Division 2.1 truck shipments for each database is located in Appendix B. Because each database has its own field characteristic, individual queries were generated to identify the truck shipments. Criteria used across each database included the following:
• Year • Accident (vs. Incident) • Class • Placarded vehicle • Enroute (traveling from origin to destination).
2.2.3 Approach for Estimating Accidents
As stated in the previous section, two distinct approaches were used to estimate the frequency of accidents for a given hazard class. Using the data for Classes 3 and 8 and Division 2.1 in each database, underreporting factors were developed for accidents and incidents in HMIS and non-spill accidents in MCMIS. These underreporting factors were developed by using the HMIS database and comparing additional spill accidents that were present in the other databases. Accidents that appeared in the other databases but not in HMIS were assumed to represent underreporting. These underreporting factors were then applied to the other classes/division of HM. The following paragraphs describe this process in more detail. The specific approach to supplementing the HMIS data involved focusing on the eight-state sample and more intensively on California, Colorado, and Ohio because of additional state database availability. The HMIS data for the eight states were systematically compared with respect to specific accidents, which were found in one or more of the additional databases. By identifying accidents, which appeared in other databases and probably should have also appeared in the HMIS, a portion of those underreported accidents were identified. The Safetynet data proved to be the most useful of the other databases because it included both intrastate and no-spill accidents involving HM. After analyzing the data in the various databases described above, the accident count for the eight states was used as a measure to calculate the number of accidents for the nation. This process required four steps:
Final Report — March 2001 2-8
1. The number of accidents for the eight states was estimated by supplementing the HMIS data with data from the other databases.
Tables C-1 through C-24 provide the tables for each of the eight states which summarize the accident information used to estimate the number of accidents for the annual portrait. (Note that for the analysis, the three states where state databases and dialogue information was used were weighted more heavily.)
2. A proportion of the national accidents represented by the eight states was calculated.
Commodity flow and truck registration data for the eight states were both used to estimate the portion of the total HM traffic represented by the eight states. The 1993 Commodity Flow Study tabulation of ton-miles provides an estimation of the total commodity ton-miles allocated to HM for each of the eight case-study states. The total ton-miles within the eight states represent about 30 percent of the total ton-miles for the United States. California, Ohio and Pennsylvania alone represent about 19 percent of the total US ton-mileage.
3. The accident estimates for each of the eight states were totaled. 4. The total estimated national accident number was calculated by assuming the additional
70 percent of the national accidents occurred at the same rates and types and then by adding the estimate for the remaining 42 states to the eight-state estimate.
Tables 1, 2, and 3 show the estimated unique accidents for 1996 for both release (spill) and non-release (no-spill) accidents for Classes 3, 2.1, and 8. The tables also show how these numbers were converted into national numbers.
2.2.4 Approach for Estimating Incidents
Incidents were estimated in a more direct manner. Because the HMIS is the best source for enroute and loading/unloading incidents, these numbers were used for the fifty states. They were augmented by the percentage represented by the number of intrastate incidents that were not covered in the HMIS for the 1996 data. Utilizing the Safetynet data for the eight states, the percentage of accidents represented by intrastate carriers was about 22 percent. Thus the incidents for the fifty states were supplemented by 22 percent.
Final Report — March 2001 2-9
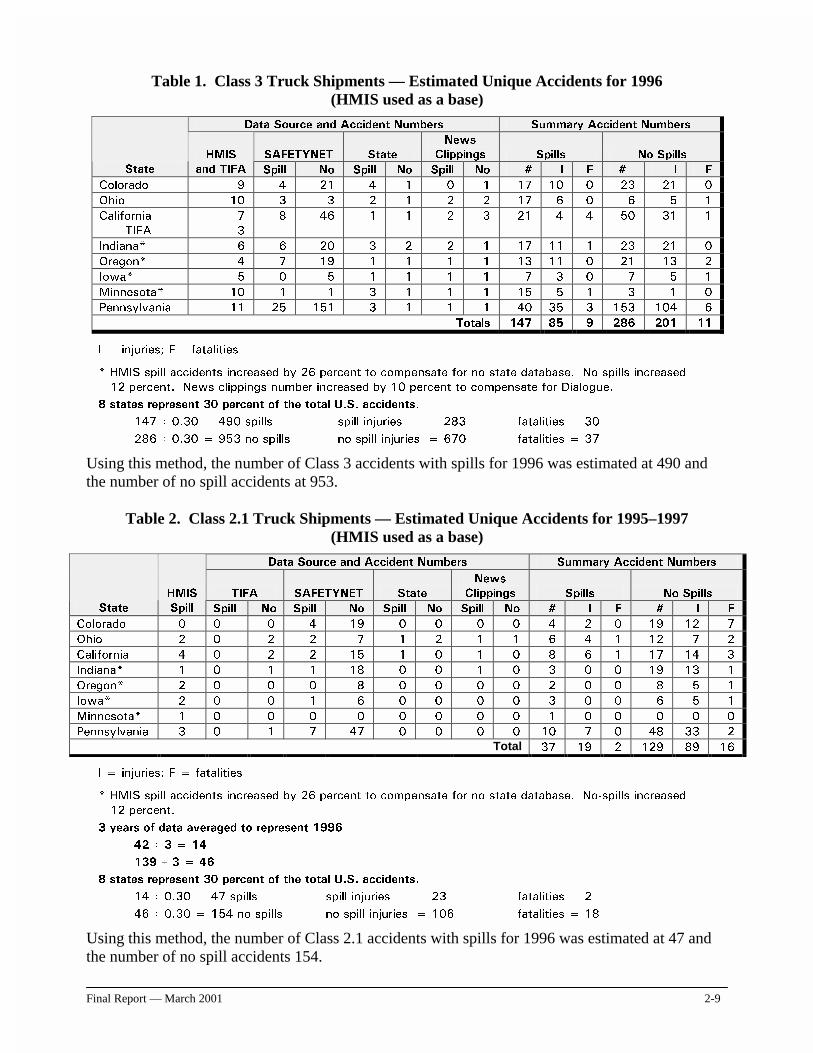
Table 1. Class 3 Truck Shipments — Estimated Unique Accidents for 1996 (HMIS used as a base)
'DWD 6RXUFH DQG $FFLGHQW 1XPEHUV 6XPPDU\ $FFLGHQW 1XPEHUV
6$)(7<1(7 6WDWH
1HZV
&OLSSLQJV 6SLOOV 1R 6SLOOV
6WDWH
+0,6
DQG 7,)$ 6SLOO 1R 6SLOO 1R 6SLOO 1R � , ) � , )
&RORUDGR � � �� � � � � �� �� � �� �� �
2KLR �� � � � � � � �� � � � � �
&DOLIRUQLD
7,)$
�
�
� �� � � � � �� � � �� �� �
,QGLDQD � � �� � � � � �� �� � �� �� �
2UHJRQ � � �� � � � � �� �� � �� �� �
,RZD � � � � � � � � � � � � �
0LQQHVRWD �� � � � � � � �� � � � � �
3HQQV\OYDQLD �� �� ��� � � � � �� �� � ��� ��� �
7RWDOV ��� �� � ��� ��� ��
, LQMXULHV� ) IDWDOLWLHV
+0,6 VSLOO DFFLGHQWV LQFUHDVHG E\ �� SHUFHQW WR FRPSHQVDWH IRU QR VWDWH GDWDEDVH� 1R�VSLOOV LQFUHDVHG
�� SHUFHQW� 1HZV FOLSSLQJV QXPEHU LQFUHDVHG E\ �� SHUFHQW WR FRPSHQVDWH IRU 'LDORJXH�
� VWDWHV UHSUHVHQW �� SHUFHQW RI WKH WRWDO 8�6� DFFLGHQWV�
��� � ���� ��� VSLOOV VSLOO LQMXULHV ��� IDWDOLWLHV ��
��� � ���� ��� QR VSLOOV QR VSLOO LQMXULHV ��� IDWDOLWLHV ���
Using this method, the number of Class 3 accidents with spills for 1996 was estimated at 490 and the number of no spill accidents at 953.
Table 2. Class 2.1 Truck Shipments — Estimated Unique Accidents for 1995–1997 (HMIS used as a base)
'DWD 6RXUFH DQG $FFLGHQW 1XPEHUV 6XPPDU\ $FFLGHQW 1XPEHUV
7,)$ 6$)(7<1(7 6WDWH
1HZV
&OLSSLQJV 6SLOOV 1R 6SLOOV
6WDWH
+0,6
6SLOO 6SLOO 1R 6SLOO 1R 6SLOO 1R 6SLOO 1R � , ) � , )
&RORUDGR � � � � �� � � � � � � � �� �� �
2KLR � � � � � � � � � � � � �� � �
&DOLIRUQLD � � � � �� � � � � � � � �� �� �
,QGLDQD � � � � �� � � � � � � � �� �� �
2UHJRQ � � � � � � � � � � � � � � �
,RZD � � � � � � � � � � � � � � �
0LQQHVRWD � � � � � � � � � � � � � � �
3HQQV\OYDQLD � � � � �� � � � � �� � � �� �� �
Total �� �� � ��� �� ��
, LQMXULHV� ) IDWDOLWLHV
+0,6 VSLOO DFFLGHQWV LQFUHDVHG E\ �� SHUFHQW WR FRPSHQVDWH IRU QR VWDWH GDWDEDVH� 1R�VSLOOV LQFUHDVHG
�� SHUFHQW�
� \HDUV RI GDWD DYHUDJHG WR UHSUHVHQW ����
�� � � ��
��� � � ��
� VWDWHV UHSUHVHQW �� SHUFHQW RI WKH WRWDO 8�6� DFFLGHQWV�
�� � ���� �� VSLOOV VSLOO LQMXULHV �� IDWDOLWLHV �
�� � ���� ��� QR VSLOOV QR VSLOO LQMXULHV ��� IDWDOLWLHV ���
Using this method, the number of Class 2.1 accidents with spills for 1996 was estimated at 47 and the number of no spill accidents 154.
Final Report — March 2001 2-10
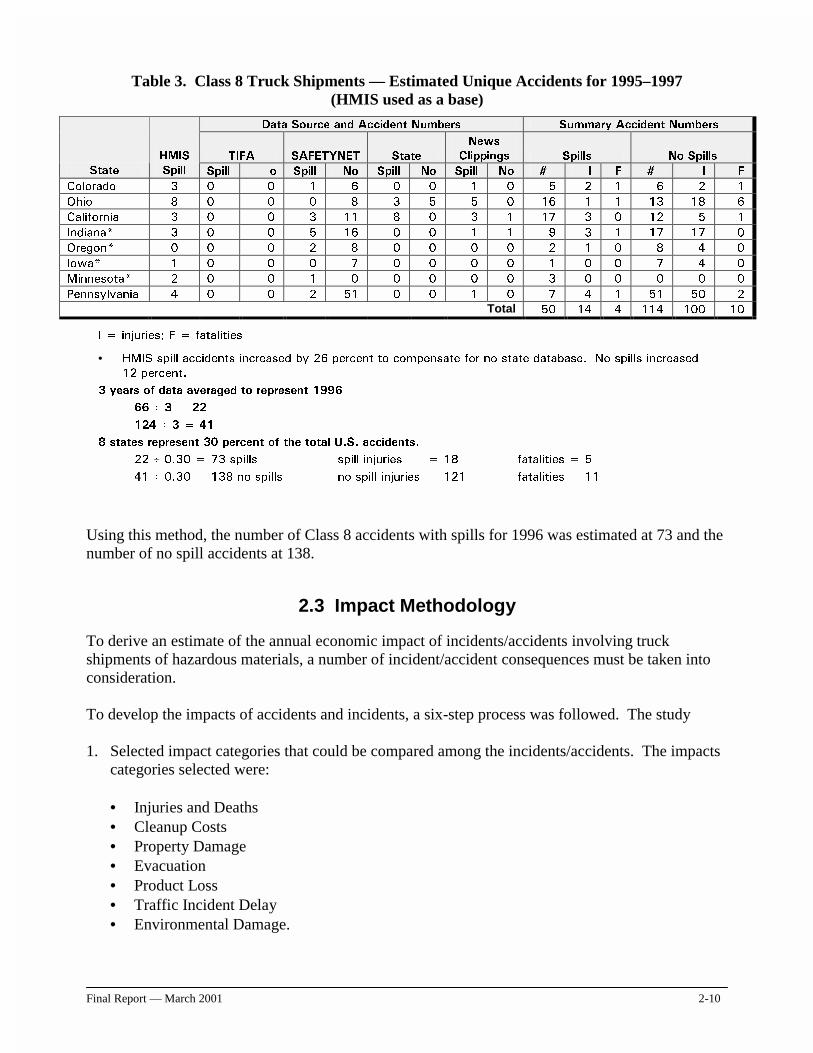
Table 3. Class 8 Truck Shipments — Estimated Unique Accidents for 1995–1997 (HMIS used as a base)
'DWD 6RXUFH DQG $FFLGHQW 1XPEHUV 6XPPDU\ $FFLGHQW 1XPEHUV
7,)$ 6$)(7<1(7 6WDWH
1HZV
&OLSSLQJV 6SLOOV 1R 6SLOOV
6WDWH
+0,6
6SLOO 6SLOO R 6SLOO 1R 6SLOO 1R 6SLOO 1R � , ) � , )
&RORUDGR � � � � � � � � � � � � � � �
2KLR � � � � � � � � � �� � � �� �� �
&DOLIRUQLD � � � � �� � � � � �� � � �� � �
,QGLDQD � � � � �� � � � � � � � �� �� �
2UHJRQ � � � � � � � � � � � � � � �
,RZD � � � � � � � � � � � � � � �
0LQQHVRWD � � � � � � � � � � � � � � �
3HQQV\OYDQLD � � � � �� � � � � � � � �� �� �
Total �� �� � ��� ��� ��
, LQMXULHV� ) IDWDOLWLHV
• +0,6 VSLOO DFFLGHQWV LQFUHDVHG E\ �� SHUFHQW WR FRPSHQVDWH IRU QR VWDWH GDWDEDVH� 1R�VSLOOV LQFUHDVHG
�� SHUFHQW�
� \HDUV RI GDWD DYHUDJHG WR UHSUHVHQW ����
�� � � ��
��� � � ��
� VWDWHV UHSUHVHQW �� SHUFHQW RI WKH WRWDO 8�6� DFFLGHQWV�
�� � ���� �� VSLOOV VSLOO LQMXULHV �� IDWDOLWLHV �
�� � ���� ��� QR VSLOOV QR VSLOO LQMXULHV ��� IDWDOLWLHV ���
Using this method, the number of Class 8 accidents with spills for 1996 was estimated at 73 and the number of no spill accidents at 138.
2.3 Impact Methodology
To derive an estimate of the annual economic impact of incidents/accidents involving truck shipments of hazardous materials, a number of incident/accident consequences must be taken into consideration. To develop the impacts of accidents and incidents, a six-step process was followed. The study 1. Selected impact categories that could be compared among the incidents/accidents. The impacts
categories selected were:
• Injuries and Deaths • Cleanup Costs • Property Damage • Evacuation • Product Loss • Traffic Incident Delay • Environmental Damage.
Final Report — March 2001 2-11
2. Reviewed several sources of information to establish reasonable estimates of the economic
impacts of each consequence. It also conducted a comprehensive literature review to identify unit costs that have been used in prior economic evaluation studies related to transportation, environmental health, and safety. In addition, the study analyzed the HMIS and several state databases to the extent that economic consequences were been reported.
3. Tallied impacts reported in federal and state databases. 4. Supplemented impacts found in the databases with impacts derived from literature sources and
interviews with knowledgeable sources. 5. Modeled impacts not readily available from the above sources to develop impact estimates. For
example, incident delay was modeled because HMIS and the other databases do not report this parameter.
6. Converted all impacts into dollar values to enable comparison among the impacts and the
preparation of a total impact figure for the annual portrait year. Where feasible, an attempt was made to compensate for accidents whose impacts are unlikely to be representative when a single year’s data is used. For example, several years of HMIS data were used to estimate average property loss costs. The following sections present the parameters and background used to calculate impacts for the annual portrait year. Based on this review and analysis, “ball park” unit costs of hazardous materials transportation events can be established.
2.3.1 Injuries and Deaths
Injuries and fatalities associated with HM shipments can be attributed to the effects of the hazardous cargo or to other non-hazardous material related causes. This differentiation is sometimes clear-cut. For example, in 1978 in Spain as a result of a traffic accident, a LPG tank rocketed into a trailer park and exploded. The ensuing fire injured and killed more than two hundred people. They would not have been injured or killed if the material involved in the accident were not hazardous. Differentiation becomes especially difficult when the traffic accident involves flammable material. For example, if a truck carrying Class 3 material collides with a car, trapping a person, and a fire ensues and burns and kills that individual, can we attribute this death directly to the hazardous cargo? Because gasoline is associated with the car, the individual might have died in a non-HM accident as well. Or perhaps it was the leaking cargo from the truck that caused the car fuel to burn. Although the HMIS tabulates only those fatalities attributable to HM, other databases such as MCMIS include fatalities regardless of the direct cause. For the purpose of this evaluation, injuries and fatalities associated with all accidents were tabulated whether or not they were known to have been caused by HM. Injuries and deaths were tabulated from the major federal and state databases and estimated through analysis of the data for the eight states. To accomplish this, the HMIS data for the eight selected
Final Report — March 2001 2-12
states were used as the reference case and data from the other databases were used to estimate the total fatalities and injuries for those states. As was the case for the accident numbers, the numbers of fatalities and injuries were extrapolated for the entire country. Injuries and deaths were estimated in detail for Classes 3, 2.1, and 8. Preparation of impact estimates for all 12 groups of HM classes/divisions employed a two-tiered approach. This approach involved tabulating injuries and fatalities for accidents in HMIS, developing a rate per accident and using these as representative of injuries and fatalities caused by HM. For these, accidents, an injury and fatality rate per accident was calculated from MCMIS for non-HM and used to represent all injuries and fatalities that could be expected to develop as a result of the truck crash itself. Both rates were added to give the total injury and fatality rate for HM shipments. The value placed on an injury or fatality suffered in an accident varies considerably. Part of this discrepancy can be attributable to different approaches to calculating the value. One approach is to see an injury or fatality in terms of lost income and economic productivity to society. Another more comprehensive approach collects data not only on lost productivity, but also quality of life. This estimate might more closely approximate compensation awarded by the courts for fatalities and injuries in accidents. Finally, a third approach considers the cost of a fatality or injury as the amount of money required to prevent it from happening. The National Highway Transportation Safety Administration (NHTSA) estimated the cost of fatalities and injuries in 1994 and presented these estimates in terms of lost productivity. In 1996 dollars, a fatality would be worth about $913,000 and a critical injury about $780,000 (NHTSA, 1996). An earlier report, the Cost of Highway Crashes, (FHWA, 1991), utilizes a comprehensive approach. In 1996 dollars, this report estimates that a fatality would be worth about $3,170,000 and an incapacitating injury about $225,000. The National Safety Council is considered another primary source for obtaining estimates of the impacts of deaths and injuries in economic terms (National Safety Council, 1996). One approach presented is based on comprehensive costs, which indicate what people are actually willing to pay to reduce their safety and health risks. The cost estimates include wage and productivity losses (i.e., wages and fringe benefits, replacement cost and travel delays caused by the accident), medical expenses (i.e., doctor fees, hospital charges, cost of medicines, future medical costs and other emergency medical services), administrative expenses (i.e., insurance premiums and paid claims, police and legal costs), motor vehicle damage (i.e., property damage to vehicles), and employer costs (i.e., time lost by uninjured workers, investigation and reporting time, production slowdowns, training of replacement workers and extra costs of overtime for uninsured workers). Comprehen-sive costs tend to be three to four times higher than historical costs for each human health consequence category because of a societal desire to avoid these consequences in the future. The 1996 estimates of comprehensive costs are:
• $2,790,000 per death • $138,000 per incapacitating injury • $35,700 per non-incapacitating injury
Final Report — March 2001 2-13
• $17,000 per possible injury • $1,700 per non-injury.
It is important to recognize that these estimates are based on motor-vehicle accidents as a whole. The impact of a truck accident is likely to be more severe across several of the components that comprise these unit costs. Moreover, a truck accident involving the transport of hazardous materials would add to the economic considerations because of the inherent danger of a cargo spill. Therefore, for this portrait, these numbers should be considered low-end estimates of the economic consequences. Finally, a third approach, developed by NHTSA, that estimates the cost of avoiding the fatality or injury, resulted in an estimate of $2,800,000 for a fatality and $400,000 for an injury requiring hospitalization. This estimate is used by some portions of the USDOT to estimate the cost of avoiding a fatality or serious injury (NHTSA, 1996). For the purposes to this report, the latter estimate of the cost for avoiding the fatality or serious injury is used as a means to estimate the overall cost for the accidents during the annual portrait year. For minor injuries, an estimated value of $4,000 is used. The distribution of major and minor injuries in the HMIS for 1995, 1996, and 1997 was used to determine the ratio of major to minor injuries. During those three years, the two types of injuries are evenly distributed. Thus, an estimated cost of $200,000 is used as the cost of avoiding an accident/incident injury.
2.3.2 Cleanup Costs
Cleanup costs are assumed to encompass the costs of both stopping the spread of a spill and removing spilled materials. Cleanup costs vary widely depending on the size, type of materials, and location of the spill. Different approaches exist to placing financial value on these considerations. Clean-up can include initial response costs, soil and groundwater remediation, incineration, and restoration. Our literature review identified the following relevant statistics: • A New York State Department of Environmental Conservation Study placed clean-up costs for
small trucks at $6,717 per vehicle and large trucks at $13,437 per vehicle (U.S. EPA, 1996). These costs were reported in 1987 dollars and converted to 1996 dollars for this report. They apply only to the removal of the vehicle from the scene.
• The same study reports clean-up costs as $40.38, $57.26, and $78.40 per square meter of impact
area if the incident/accident occurs in an urban, suburban or farmland setting, respectively. Furthermore, clean-up costs associated with environmental impairment are estimated to be $131.01, $61.83, and $429.47 per square meter of affected woodland, park, or river/lake respectively. These figures were also reported in 1987 dollars and converted to 1996 dollars.
Private environmental contractors provide yet another source for cleanup estimates. For example, PRO TERRA, a Columbus based environmental contracting company, estimates the average cost of a cleanup at about $14,000. However, their record cost was $102,000 to clean up a jet fuel spill at
Final Report — March 2001 2-14
the Rickenbacker AFB that required 10 men at the site (Hogue, J., 1998). The average HM cleanup costs about $1,000 per hour. The HMIS database includes a field for cleanup costs. This data is submitted by the carrier and it should be accurate since the carrier is responsible for paying the cleanup costs. For 1990 to1999, cleanup costs averaged about $24,000 per enroute accident cleanup, $1,300 per cleanup for an enroute incident spill, and $260 for an unloading/loading accident and incident spill cleanup. To create a conservative estimate, these figures were applied as the average cleanup cost for all spills.
2.3.3 Evacuation
A small percentage of HM accidents causes the evacuation of people and business operations. This is one important impact of HM transportation. The HMIS database and the Ohio PUCO are among the few databases which provide evacuation data. Of the two, the HMIS provides a comprehensive picture. For example, three years of HMIS data (1995, 1996, 1997), 498 records of Class 3 shipment accidents showed that about eight percent resulted in an evacuation. These evacuations involved 1,974 people, an average of 51 per evacuation. For the 1320 incidents recorded, about one percent resulted in evacuations. Thus, a total of 431 people were evacuated with an average of 25 people per evacuation. The cost of evacuations is very difficult to estimate since there are numerous variables. These costs include the expense for temporary lodging and food, losses due to lost wages and business disrup-tions, inconvenience to the public and the cost of agencies assisting with the operation. The U.S. Nuclear Regulatory Commission, for example, uses a range of $600 to $1,800 per person evacuated. A reasonable estimate would be $1,000 per person evacuated (Transportation Research Board, 1993). This $1,000 estimate is also used by the Federal Railroad Administration (FRA) to estimate impacts from railroad evacuations. For this report, evacuations were also assumed to be possible for all HM classes whether or not a release occurred. Evacuations for non-release accidents were assumed to occur at the same rate as evacuations for release accidents.
2.3.4 Product Loss
Product loss refers to the quantity and value of the HM material lost during a spill. The HMIS provides estimates for product loss in its cost estimates. For example, for Class 3 enroute accident related spills, the average cost of product lost per spill 1990 to 1999 was $3,208. For enroute incident spills, the average cost of product lost during the same three-year period was $117. Incidents and accidents during loading and unloading accounted for average product loss of about $61 over the more than nine years. Similarly, for Class 2.1 accidents, the average cost of product lost per enroute accident related to a spill accident during the same period was $1,140. For enroute Class 2.1, incident spills, the average cost of product lost during the same three-year period was $1,656; for incidents and accidents during loading and unloading, it was $171. During the same period, Class 8 spill accidents averaged $4,910 in product loss while product lost during enroute incidents averaged $124; for loading and unloading incidents, it averaged $62.
Final Report — March 2001 2-15
2.3.5 Public Property Damage
Property damage encompasses damage to other vehicles, which may have been involved in the accident, and damage to both public and private property in addition to the vehicles involved in the accident. For example, this could include damage to a private building, public utilities, or a public roadway and related structures. Environmental damage to property that results in economic losses is another category of damage that will be addressed in Section 2.3.9. The HMIS provides estimates of property damage in one of its fields. This estimate appears to be reliable for damage to vehicles involved in the accident but perhaps less reliable when estimating public property damage. However, these estimates have been used as the basis for calculating the impacts to property and the amount of damage. For the over nine-year period for which the HMIS was analyzed, the average property damage for Class 3 enroute accidents was $16,041, while the average property damage for enroute incident spills was $274. Property damage for leaks occurring during loading and unloading incidents and accidents was $68. Average property damage for Class 2.1 enroute accidents, enroute spills, and loading and unloading incidents were $3,147, $173, and $2,315, respectively. For Class 8, the average values for enroute accidents, enroute spill incidents, and loading and unloading incidents were $3,104, $67, and $17, respectively.
2.3.6 Carrier Damage
Carrier damage includes damage to the truck and associated equipment transporting the Class 3, Class 2.1, and Class 8 materials. A New York State Department of Environmental Conservation study reported the economic loss from damaged vehicle downtime as $7,887 per large truck, expressed in 1996-dollar terms, converted for this report from the original 1987 dollars of the study (U.S. EPA, 1996). The estimate provided by the HMIS database is probably a more reliable estimate. For the 1990 to 1999, the more than 9-year period for which the HMIS was analyzed, the average carrier damage for Class 3 enroute accidents was $33,013; the average carrier damage for enroute incident spills was $174; and the damages for spills associated with unloading and loading accidents/incidents was $37. Class 2.1 carrier damage for enroute accidents, enroute spills, and for loading and unloading incidents averaged $25,582, $1,407, and $815 respectively. Class 8 carrier damage averaged $25,541 for enroute accidents. Class 8 carrier damage for enroute spills and for loading and unloading incidents averaged $165 and $17.
2.3.7 Traffic Incident Delay
Although an aspect of these costs is embedded in the National Safety Council estimates, it is important to isolate this effect because HM spills (or suspected spills) typically require a different type of emergency response that tends to lengthen traffic delays considerably. To aid in this effort, HM incident delay was extracted from data collected by the states of California and Ohio. This was supplemented by several studies reported in the literature (Agent, K.R, 1995; Grenzeback, L.R., 1990).
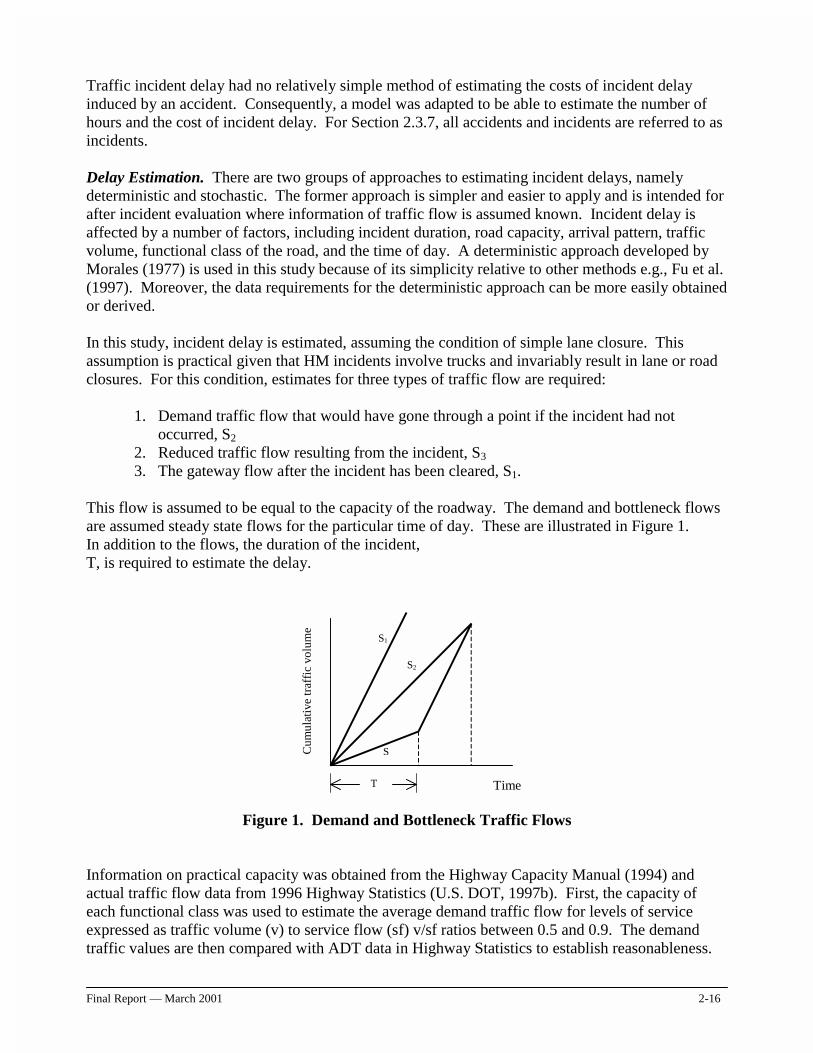
Final Report — March 2001 2-16
S1
S2
S
Traffic incident delay had no relatively simple method of estimating the costs of incident delay induced by an accident. Consequently, a model was adapted to be able to estimate the number of hours and the cost of incident delay. For Section 2.3.7, all accidents and incidents are referred to as incidents. Delay Estimation. There are two groups of approaches to estimating incident delays, namely deterministic and stochastic. The former approach is simpler and easier to apply and is intended for after incident evaluation where information of traffic flow is assumed known. Incident delay is affected by a number of factors, including incident duration, road capacity, arrival pattern, traffic volume, functional class of the road, and the time of day. A deterministic approach developed by Morales (1977) is used in this study because of its simplicity relative to other methods e.g., Fu et al. (1997). Moreover, the data requirements for the deterministic approach can be more easily obtained or derived. In this study, incident delay is estimated, assuming the condition of simple lane closure. This assumption is practical given that HM incidents involve trucks and invariably result in lane or road closures. For this condition, estimates for three types of traffic flow are required:
1. Demand traffic flow that would have gone through a point if the incident had not occurred, S2
2. Reduced traffic flow resulting from the incident, S3 3. The gateway flow after the incident has been cleared, S1.
This flow is assumed to be equal to the capacity of the roadway. The demand and bottleneck flows are assumed steady state flows for the particular time of day. These are illustrated in Figure 1. In addition to the flows, the duration of the incident, T, is required to estimate the delay.
Figure 1. Demand and Bottleneck Traffic Flows Information on practical capacity was obtained from the Highway Capacity Manual (1994) and actual traffic flow data from 1996 Highway Statistics (U.S. DOT, 1997b). First, the capacity of each functional class was used to estimate the average demand traffic flow for levels of service expressed as traffic volume (v) to service flow (sf) v/sf ratios between 0.5 and 0.9. The demand traffic values are then compared with ADT data in Highway Statistics to establish reasonableness.
C
umul
ativ
e tr
affi
c vo
lum
e
Time T
Final Report — March 2001 2-17
The v/sf ratio range is chosen to include the threshold value above which congestion occurs i.e., v/sf = 0.80 and free-flow conditions reflecting non-peak flows which occur at v/sf less than 0.80. Bottleneck traffic flow is assumed to be about 60 percent of the actual (demand) flow. This assumption is consistent with earlier observations (Jacobson, 1992) that about 80 percent of incidents reduce capacity by at least one-third, regardless of whether a lane was blocked. Incident delay is estimated as a function of the level of service offered for four functional highway classes: (1) urban interstate, freeways and expressways; (2) other urban roads; (3) rural interstate; and (4) other rural roads. It is important that incident delay be considered within the context of highway functional class because of differences in the level of service, the volume of traffic, and the average annual vehicle miles traveled (VMT). VMT is a utilization measure of the highway facility, therefore an indication of the level of exposure or the risk of being involved in an incident. Incident delay can be estimated from the following equations for simple lane closure condition (Morales, 1977).
Figure 2 shows the variation of � with v/sf ratio for the four functional highway classes. For a given demand traffic flow, the v/sf ratio on a particular highway class and the � can be determined from the graphs in Figure 2. This value can be multiplied by the incident duration, T, to obtain an estimate of the incident delay in veh-hr on the particular highway class. Figure 3 shows the variation of incident delay in vehicle-hours with incident duration for the congestion threshold v/sf value of 0.80. This v/sf ratio represents a typical operating condition on the interstate system. Data from the 1966 Highway Statistics indicate that 95 percent of the rural interstate, 66 percent of the urban interstate and 75 percent of other freeways and expressways operate at v/sf ratios less than 0.80. As noted in the equation and depicted in the figure, incident delay is a linear function of the duration of the incident. Figures 2 and 3 are developed based on service flows (or capacity) that are considered typical minimum values for each functional highway class as derived from the Highway Capacity Manual (1994). The curves may be considered conservative given the differences in traffic flows, HM types, and type of incident and incident response management. To obtain the user costs resulting from incident delays, information on the occurrence or probability of an occurrence of an incident or the split between trucks and other vehicles on the various highway systems may be required. Data on VMT for trucks and other vehicles for the various functional highway classes may be used to obtain the distribution of incident delay costs between trucks and other vehicles. Table 4 summarizes the percent of VMT by trucks and other vehicles on the four groups of functional highway classes and the distribution of VMT among on the functional classes, using both truck VMT data only and total VMT.
)2
))(
21
3231
S - S(
S - S( S - S =κ
κ T. D =
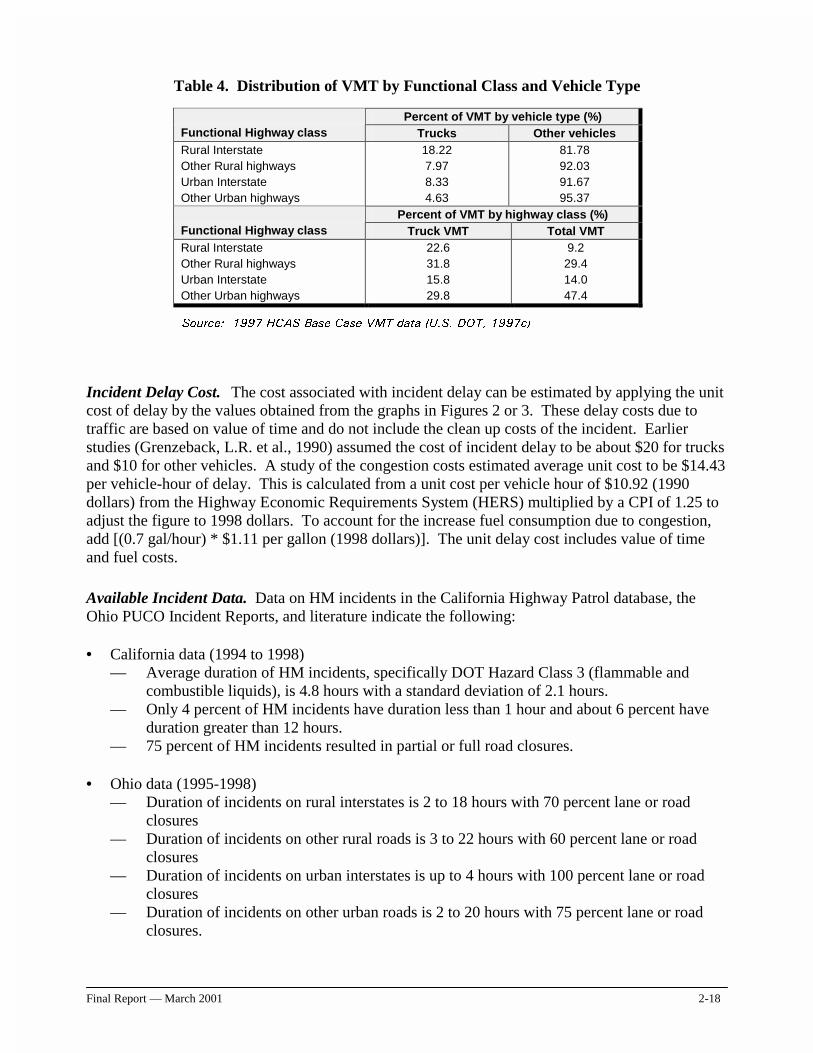
Final Report — March 2001 2-18
Table 4. Distribution of VMT by Functional Class and Vehicle Type
Percent of VMT by vehicle type (%) Functional Highway class Trucks Other vehicles Rural Interstate Other Rural highways Urban Interstate Other Urban highways
18.22 7.97 8.33 4.63
81.78 92.03 91.67 95.37
Percent of VMT by highway class (%) Functional Highway class Truck VMT Total VMT Rural Interstate Other Rural highways Urban Interstate Other Urban highways
22.6 31.8 15.8 29.8
9.2 29.4 14.0 47.4
6RXUFH� ���� +&$6 %DVH &DVH 907 GDWD �8�6� '27� ����F�
Incident Delay Cost. The cost associated with incident delay can be estimated by applying the unit cost of delay by the values obtained from the graphs in Figures 2 or 3. These delay costs due to traffic are based on value of time and do not include the clean up costs of the incident. Earlier studies (Grenzeback, L.R. et al., 1990) assumed the cost of incident delay to be about $20 for trucks and $10 for other vehicles. A study of the congestion costs estimated average unit cost to be $14.43 per vehicle-hour of delay. This is calculated from a unit cost per vehicle hour of $10.92 (1990 dollars) from the Highway Economic Requirements System (HERS) multiplied by a CPI of 1.25 to adjust the figure to 1998 dollars. To account for the increase fuel consumption due to congestion, add [(0.7 gal/hour) * $1.11 per gallon (1998 dollars)]. The unit delay cost includes value of time and fuel costs.
Available Incident Data. Data on HM incidents in the California Highway Patrol database, the Ohio PUCO Incident Reports, and literature indicate the following: • California data (1994 to 1998)
— Average duration of HM incidents, specifically DOT Hazard Class 3 (flammable and combustible liquids), is 4.8 hours with a standard deviation of 2.1 hours.
— Only 4 percent of HM incidents have duration less than 1 hour and about 6 percent have duration greater than 12 hours.
— 75 percent of HM incidents resulted in partial or full road closures. • Ohio data (1995-1998)
— Duration of incidents on rural interstates is 2 to 18 hours with 70 percent lane or road closures
— Duration of incidents on other rural roads is 3 to 22 hours with 60 percent lane or road closures
— Duration of incidents on urban interstates is up to 4 hours with 100 percent lane or road closures
— Duration of incidents on other urban roads is 2 to 20 hours with 75 percent lane or road closures.
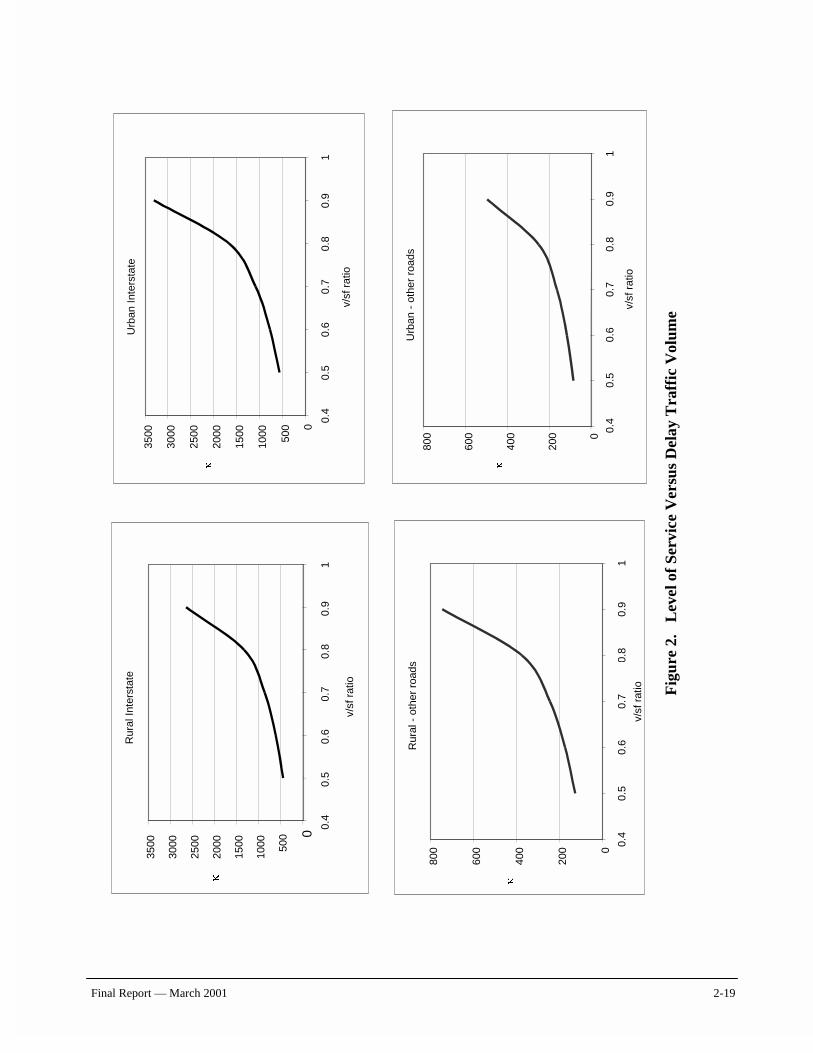
Final Report — March 2001 2-19
Fig
ure
2.
Lev
el o
f Se
rvic
e V
ersu
s D
elay
Tra
ffic
Vol
ume
Rur
al In
ters
tate
0
500
1000
1500
2000
2500
3000
3500
0.4
0.5
0.6
0.7
0.8
0.9
1
v/sf
rat
io
�
Urb
an In
ters
tate
0
500
1000
1500
2000
2500
3000
3500
0.4
0.5
0.6
0.7
0.8
0.9
1
v/sf
rat
io
�
Rur
al -
oth
er r
oads
0
200
400
600
800
0.4
0.5
0.6
0.7
0.8
0.9
1
v/sf
rat
io
�
Urb
an -
oth
er r
oads
0
200
400
600
800 0.
40.
50.
60.
70.
80.
91
v/sf
rat
io
�
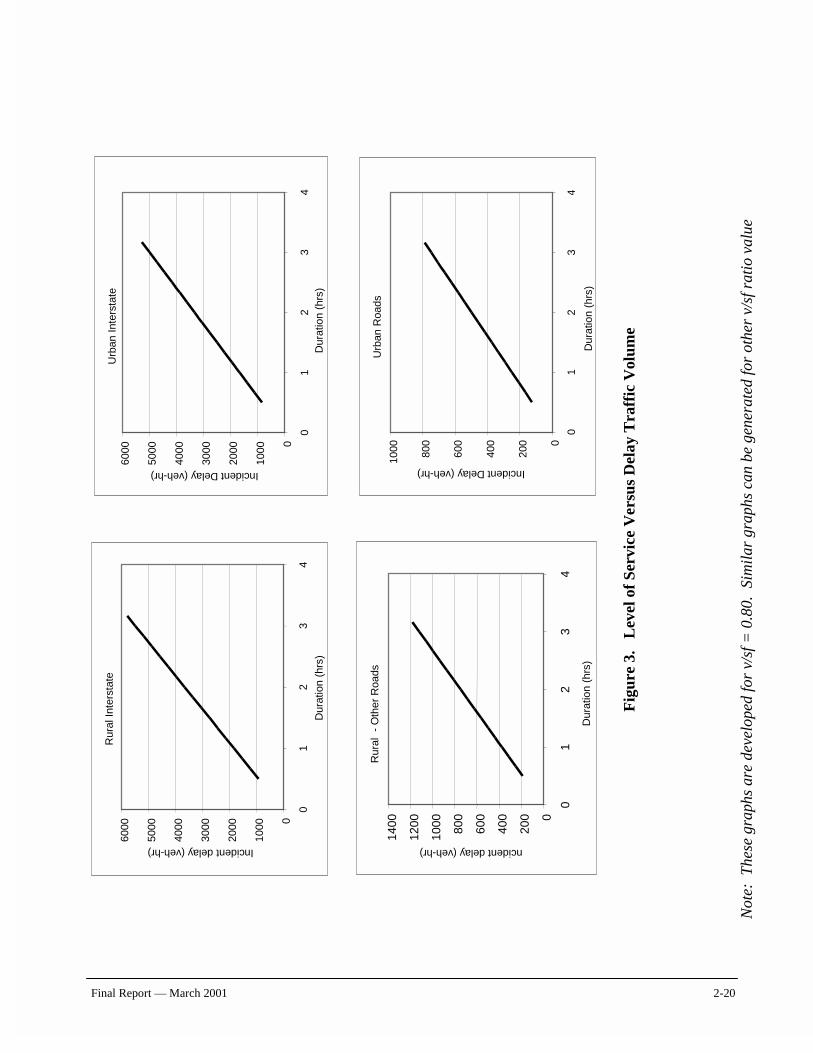
Final Report — March 2001 2-20
N
ote:
The
se g
raph
s ar
e de
velo
ped
for
v/sf
= 0
.80.
Sim
ilar
gra
phs
can
be g
ener
ated
for
othe
r v/
sf r
atio
val
ue
Fig
ure
3.
Lev
el o
f Se
rvic
e V
ersu
s D
elay
Tra
ffic
Vol
ume
Rur
al In
ters
tate
0
1000
2000
3000
4000
5000
6000
01
23
4
Dur
atio
n (h
rs)
Incident delay (veh-hr)
Rur
al -
Oth
er R
oads
0
200
400
600
800
1000
1200
1400
01
23
4
Dur
atio
n (h
rs)
ncident delay (veh-hr)
Urb
an In
ters
tate
0
1000
2000
3000
4000
5000
6000
01
23
4D
urat
ion
(hrs
)
Incident Delay (veh-hr)
Urb
an R
oads
0
200
400
600
800
1000
01
23
4
Dur
atio
n (h
rs)
Incident Delay (veh-hr)
Final Report — March 2001 2-21
• Literature — Major incidents constitute 5 to 10 percent of all truck incidents (Grenzeback, L.R. et al.,
1990). A major incident is one that blocks two or more lanes of the freeway for 2 hours or longer.
— Average duration of major incidents is 3 hours 39 minutes, and it triggers an average of 2,800 veh-hr of delay on freeways around it. Major incidents lasting 10 to 12 hours triggered 30,000 to 40,000 veh-hr delay (Recker et al., 1988).
— Average duration of a common incident is 1 hour with an average 1,200 veh-hr delay (Recker et al., 1988).
— About two thirds of major incidents are the result of overturns, spills, or shifted loads.
Input Data Summary. The following is a summary of inputs for estimating incident delays based on the limited data discussed above. These are for the purposes of obtaining rough estimates of incident delays and associated costs, using the process described in Delay Estimation.
• Average duration of all incidents – 5 hours. • Average duration of major incidents (those requiring closure of all lanes) – 12 hours. • Average duration of common incidents - 2 hours. • About 5 percent of all incidents can be classified as major incidents. • Average unit cost of delay is $15 per vehicle-hour. • Minimum service flows (or capacities) expressed in vehicles per hour (vph) per direction used
in developing the curves are: — Rural interstate – 3,200 vph — Rural other highways – 900 vph — Urban interstate – 4,000 vph — Urban other highways – 600 vph These values are used to calculate the v/sf ratio and determine � from Figure 2.
Illustration. The following illustration describes the sequential steps followed to calculate incident delay. Assume that average traffic volumes shown above are representative of the respective groups of functional highway classes. Assume average duration of 5 hours per incident regardless of the functional class of highway. The steps in estimating the incident delays are summarized in Table 5 and described below. Step 1 — Determine the design service flow (vph in each direction of travel) for the functional
highway class in question. Step 2 — Determine the average actual traffic flow (vph) per direction for that highway. Step 3 — Calculate the v/sf ratio by dividing the value of Step 2 by that of Step 1. Step 4 — With the v/sf ratio read off the corresponding �-value from Figure 2. Step 5 — Obtain the average duration of incidents for the type of incident and/or highway from
historical data.
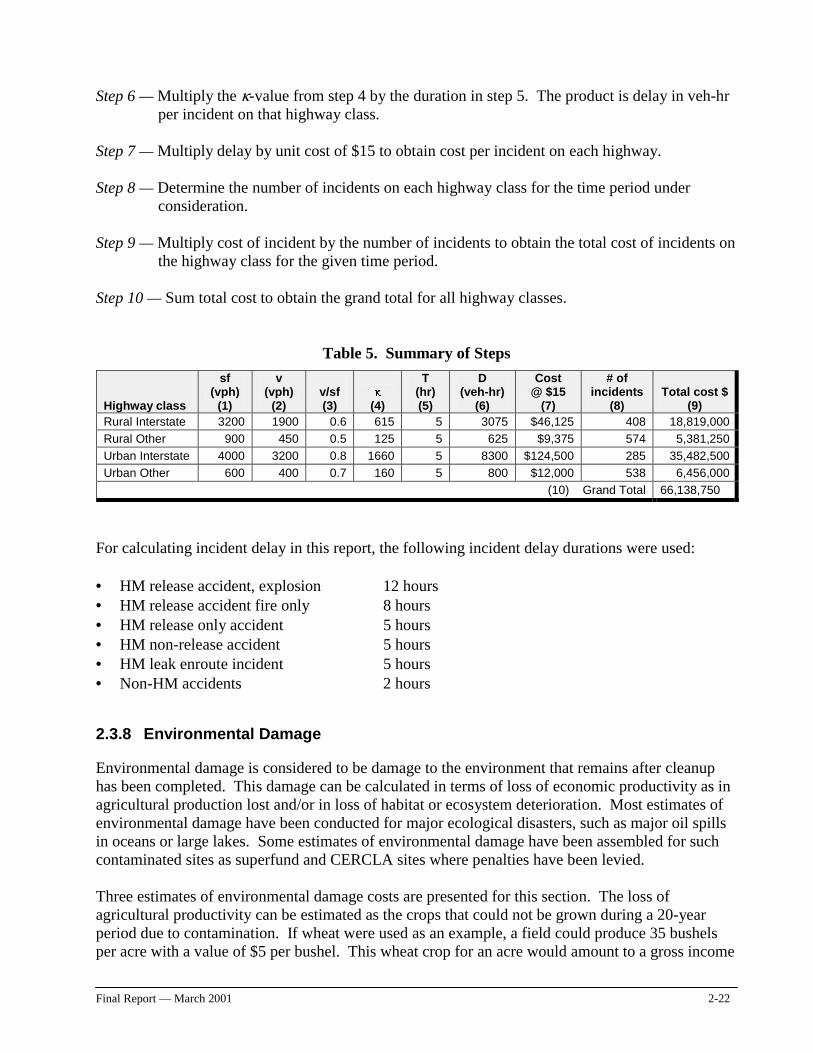
Final Report — March 2001 2-22
Step 6 — Multiply the �-value from step 4 by the duration in step 5. The product is delay in veh-hr per incident on that highway class.
Step 7 — Multiply delay by unit cost of $15 to obtain cost per incident on each highway. Step 8 — Determine the number of incidents on each highway class for the time period under
consideration. Step 9 — Multiply cost of incident by the number of incidents to obtain the total cost of incidents on
the highway class for the given time period. Step 10 — Sum total cost to obtain the grand total for all highway classes.
Table 5. Summary of Steps
Highway class
sf (vph)
(1)
v (vph)
(2)
v/sf (3)
��
(4)
T (hr) (5)
D (veh-hr)
(6)
Cost @ $15
(7)
# of incidents
(8) Total cost $
(9) Rural Interstate 3200 1900 0.6 615 5 3075 $46,125 408 18,819,000 Rural Other 900 450 0.5 125 5 625 $9,375 574 5,381,250 Urban Interstate 4000 3200 0.8 1660 5 8300 $124,500 285 35,482,500 Urban Other 600 400 0.7 160 5 800 $12,000 538 6,456,000
(10) Grand Total 66,138,750
For calculating incident delay in this report, the following incident delay durations were used: • HM release accident, explosion 12 hours • HM release accident fire only 8 hours • HM release only accident 5 hours • HM non-release accident 5 hours • HM leak enroute incident 5 hours • Non-HM accidents 2 hours
2.3.8 Environmental Damage
Environmental damage is considered to be damage to the environment that remains after cleanup has been completed. This damage can be calculated in terms of loss of economic productivity as in agricultural production lost and/or in loss of habitat or ecosystem deterioration. Most estimates of environmental damage have been conducted for major ecological disasters, such as major oil spills in oceans or large lakes. Some estimates of environmental damage have been assembled for such contaminated sites as superfund and CERCLA sites where penalties have been levied. Three estimates of environmental damage costs are presented for this section. The loss of agricultural productivity can be estimated as the crops that could not be grown during a 20-year period due to contamination. If wheat were used as an example, a field could produce 35 bushels per acre with a value of $5 per bushel. This wheat crop for an acre would amount to a gross income
Final Report — March 2001 2-23
of $3,500 over a 20-year period. For corn, a field could produce 128 bushels per acre with a value of $2.50 per bushel that would be worth $320 for one year and $6,400 of gross income for a twenty-year period. Of course, the net income would be considerably less. A New York State Department of Environmental Conservation study reported property damage to the incident/accident site as subsequent economic loss of 8.3 percent of the annual net revenue generated per square meter of property impacted, with a corresponding property devaluation of 5 percent of the resale value of property per square meter (EPA, 1996). The same study reported that economic loss due to environmental impairment was estimated as $7.37 per square meter of impacted area in woodland, park and river/lake settings. This would mean an additional loss of approximately $469 per acre. These figures were reported in 1987 dollars and converted to 1996 dollars for this report. Natural resource damage settlements were selected as presenting a more conservative estimate of environmental damage. Damages were collected for 18 cases where environmental damage settlements were completed (Battelle Compilation of Environmental Settlements, 1998). These settlements were primarily against companies that had damaged the environment and were now paying a fine. The average per acre settlement price was $3,792. This average per acre settlement price could be for more serious pollution cases than that represented by a spill of Class 3, Class 2.1, or Class 8 materials. However, the average figure represents one conservative estimate of environ-mental damage. This figure was selected as a simple estimate of environmental damage that could be used as a representative number. A table listing all of the settlements is shown in Appendix D. To calculate the natural resource environmental damage from a truck release of Class 3, Class 2.1, or Class 8 materials, its necessary to know how much material was spilled, where the spill occurred, and what sort of surface it covered. An assumption was made that all of the spills would occur on land and on a dirt surface. In reality, a certain proportion of the spills would occur in water or a paved surface. Furthermore, at least one barrel, or 55 gallons, had to escape in order for the spill to be considered. Below this threshold no damage was considered to occur. HMIS data was consulted to determine spill size and distribution. For 1996 and for Class 3 enroute accidents resulting in a spill, the average spill greater than 55 gallons was 3,031 gallons, although the largest spill was 9,200 gallons. The data shows that 170 spills took place during an enroute accident and that 69 percent of the spills are represented by the 3,031 figure. For the material covered and the spill size, a formula was used which assumed that the surface would be dirt and that the spill would spread to about one centimeter in thickness. The area covered by the average spill size of 3,031 gallons would be about .21 acres. To be conservative, this estimated area of coverage was increased to .7 acres. Thus, for an average spill exceeding 55 gallons, $2,654 dollars of environmental damage would occur, calculating this spill as a percentage of the $3,792 figure cited earlier. However, since this estimate was applied to only 69 percent of the enroute spills, all spills over 55 gallons would average about $1,800 of environmental damage where only a release occurred. For the typical full tanker spill of 8,000 gallons, an estimated $7,000 of environmental damage would be incurred. The area suffering environmental damage from Class 2.1 materials would be expected to be smaller than for Class 3 materials. Appendix E provides a discussion of the likely behavior of Class 2.1
Final Report — March 2001 2-24
materials in an accident. Class 2.1 represents liquefied petroleum gases. The most common materials are Liquefied Petroleum Gas (LPG) and Liquefied Natural Gas (LNG). LPG is predominately propane and LNG is predominately methane. For this report, we assume the spill area is 60 percent of the area we used for Class 3 flammable liquids, such as gasoline. The LNG calculation indicates that 70 percent is a reasonable estimate but when the LNG is released from the tank, there will be some mixing with air that decreases the spill percentage. This will result in additional vaporization for the colder LNG and will bring the two estimates closer together. Class 2.1 accidents enroute spills averaged about 2144 gallons per spill. The 2144 gallon spill would cover about 0.09 acres (assuming 60 percent coverage of a Class 3 spill). The 0.09 acres are increased to 0.30 acres to be conservative. This represents a cost of about $1,138 per spill. However, only about 35 percent of the spills exceeded 55 gallons and the average spill size distributed among all of the accidents was estimated to be 750 gallons per spill. Consequently, the average cost of environmental damage per spill for an enroute Class 2.1 accident spill is $398. Unlike Class 2.1 spills, Class 8 (corrosives) spills are assumed to cover about the same area as Class 3 spills. For Class 8 incidents enroute, an average spill totaled about 496 gallons. Thus, each spill would affect about 0.12 acres. This area was increased to 0.4 acres to ensure a conservative estimate. This amounts to about $1,517 of environmental damage per spill. In 1996, only 66 accidents had spills greater than 55 gallons (about 13 percent). Thus, the average environmental damage for each of the 522 enroute incident spills would be $191. Class 8 accidents enroute registered 60 spills over the 1995 to 1997 period. These spills averaged 911 gallons. Sixty-seven percent of all spill accidents had spills greater than 55 gallons. Each 911-gallon spill would cover about 0.06 acres, which was then increased by 3.33 times to 0.21 acres to be conservative. This amounts to $796 per average spill. However, since only 67 percent of all spill accidents would have an average spill greater than 55 gallons, the value of environmental damage for an average spill accident for 1996 would be $533. The analysis of environmental damage assumed that release-only accidents (no fire or explosion) for the other nine HM classes/divisions would be similar to either Class 3, Class 2.1, or Class 8 in environmental damage. For Class 7 radioactive materials, environmental damages are estimated to be about the same as for a spill-only accident for Class 3.0, while damages for a Class 2.2 spill-only accident averages about the same as Class 2.1, $398 in environmental damage. All of the other HM groups except for Class 2.3 have an average environmental damage for a spill-only accident of about $533, the same as for Class 8. HM release accidents with a fire and those with an explosion, result in greater environmental damage, due to thermal damage from fire and blast damage from explosions. Accidents with a fire result in an average environmental damage of about $7,584, while damages from explosions average an estimated $30,336. Class 2.3 (poison gas) releases constitute the greatest environmental damage. Dispersion models for chlorine gas indicates that an average of $53,336 of environmental damage will result.
Final Report — March 2001 2-25
2.4 Impact Summary Discussion
The primary objective of this effort is to estimate the annual economic impact of transportation safety involving truck transport of Class 3, Class 2.1, and Class 8 hazardous materials. While the goal is to establish a high degree of confidence in these estimates, the reality is that the quality of available data limits the ability to do so. Among the reasons for this are: • Concerns about the non-reporting of incidents/accidents to HMIS, as well as the accuracy of the
reports that have been filed. • The impacts of catastrophic events on these estimates; the absence or existence of a single
catastrophic event can significantly alter the reported estimates. • The vintage of the literature being used and its implications in terms of safety investments
which may have been made since then, as well as the net present economic value of the reported costs.
• The study sample and its relevance to truck transport of Class 3, Class 2.1, and Class 8 hazardous materials on a national level.
Taking these observations into consideration, one should view the results in the context of establishing a general estimate or bound on the financial impact of this problem rather than a precise valuation. As such, it represents a valid attempt to benchmark the financial implications of the problem based on best available data.
Final Report — March 2001 3-1
3.0 High Consequence Low Probability Accidents
3.1 Introduction
he consideration of high consequence/low probability accidents is essential for completing a comprehensive risk assessment. To determine the likelihoods and sequencing of these accidents, the first step was to develop event trees for each of the HM class/division groups used
for this analysis. Next, a historical record of severe accidents was compiled. These severe events are logical appendages to the event trees. Then the likelihood of severe accidents occurring was calculated by looking at the record of severe accidents and the likelihood of an accident sequence. Then the study staff estimated the fraction of the accidents represented by accident sequences of the severity documented by the historical record. For many of the classes/divisions of hazardous materials, the historical record identified no severe accidents. In these cases, no appending was performed. The special analysis section describes the approach that was used in the few cases where the above process failed to produce the needed results. The appending of the severe accidents to the event trees is considered to be an important step in the risk assessment since these severe accidents get extensive media coverage. As a result, the public is more aware of these accidents than the less severe accidents that occur much more frequently. As will be shown, these tragic and sensational events are not the events that control the risk level. However, the general public would consider any assessment that did not explicitly include severe accidents to be incomplete. Most of the probabilities shown on the event trees were obtained from the databases maintained by the Department of Transportation. The primary source of information on non-release accidents was the MCMIS Accident File. The primary source of information on release accidents was the HMIS database. Both databases were corrected for underreporting, using additional secondary sources that also should have captured the same accidents recorded by DOT. Numerous queries were run to identify any relationships that might enable the model to better represent the accident risk. Evaluations of accident likelihood as a function of time identified no significant trends. Similar evaluations of accident cost over time also showed no significant trend. While this was somewhat surprising given the known increases in the costs of vehicles, property, and materials, no trend was observed. So no corrections were made. In actuality, the absence of time-related trends simplified the analysis because no time weighting was needed. This enabled the queries to use an extended time period without correction.
3.2 Event Tree Application
Although there seemed to be no overall cost or accident frequency trends, queries showed that the severity of an accident was a function of whether or not a fire or explosion occurred as part of the accident sequence. Thus, where the data supported breaking out explosions and fire as separate accident sequences, the breakout was made. One way to show accident sequences is by event trees. An analysis of the data for all the classes/divisions of HM material being shipped, revealed that all the classes/divisions could be presented using four event trees. These event trees are shown in Figures 4 though 8. All begin with “accident occurs.” Figure 4 is representative of the event tree structure for five of the 12 HM categories being considered in this analysis. These classes or divisions represented
T
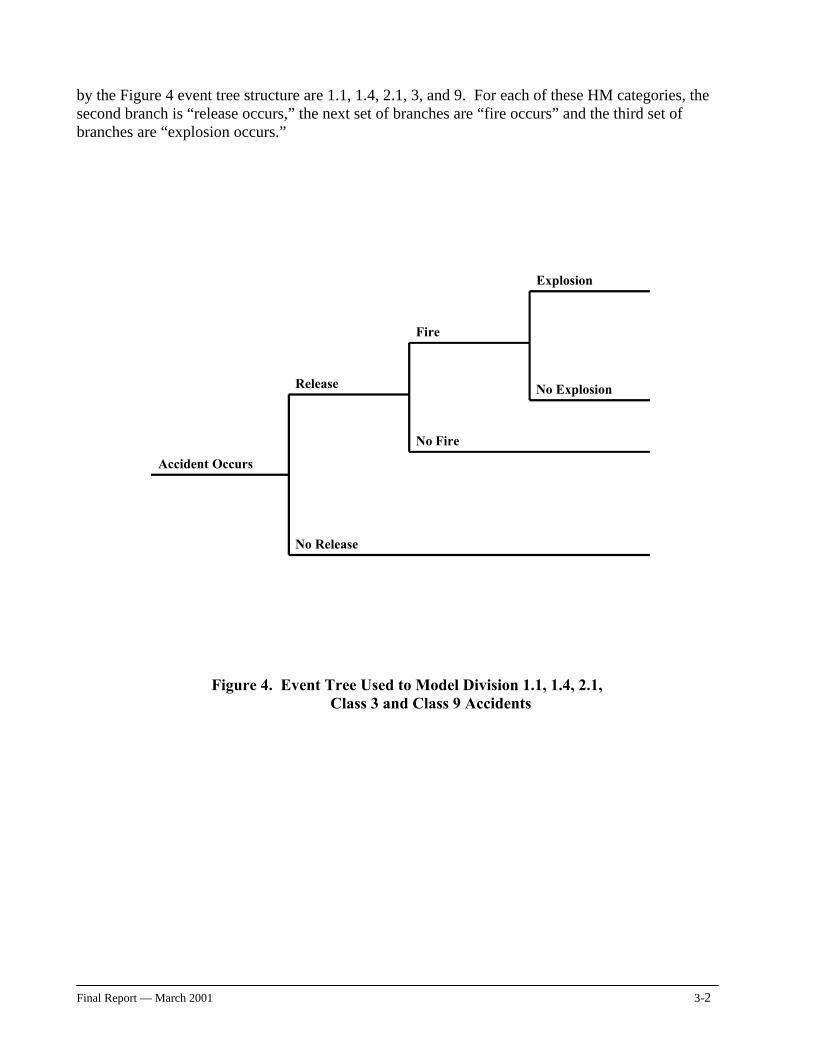
Final Report — March 2001 3-2
by the Figure 4 event tree structure are 1.1, 1.4, 2.1, 3, and 9. For each of these HM categories, the second branch is “release occurs,” the next set of branches are “fire occurs” and the third set of branches are “explosion occurs.”
Accident Occurs
Release
No Release
Fire
No Fire
Explosion
No Explosion
Figure 4. Event Tree Used to Model Division 1.1, 1.4, 2.1, Class 3 and Class 9 Accidents
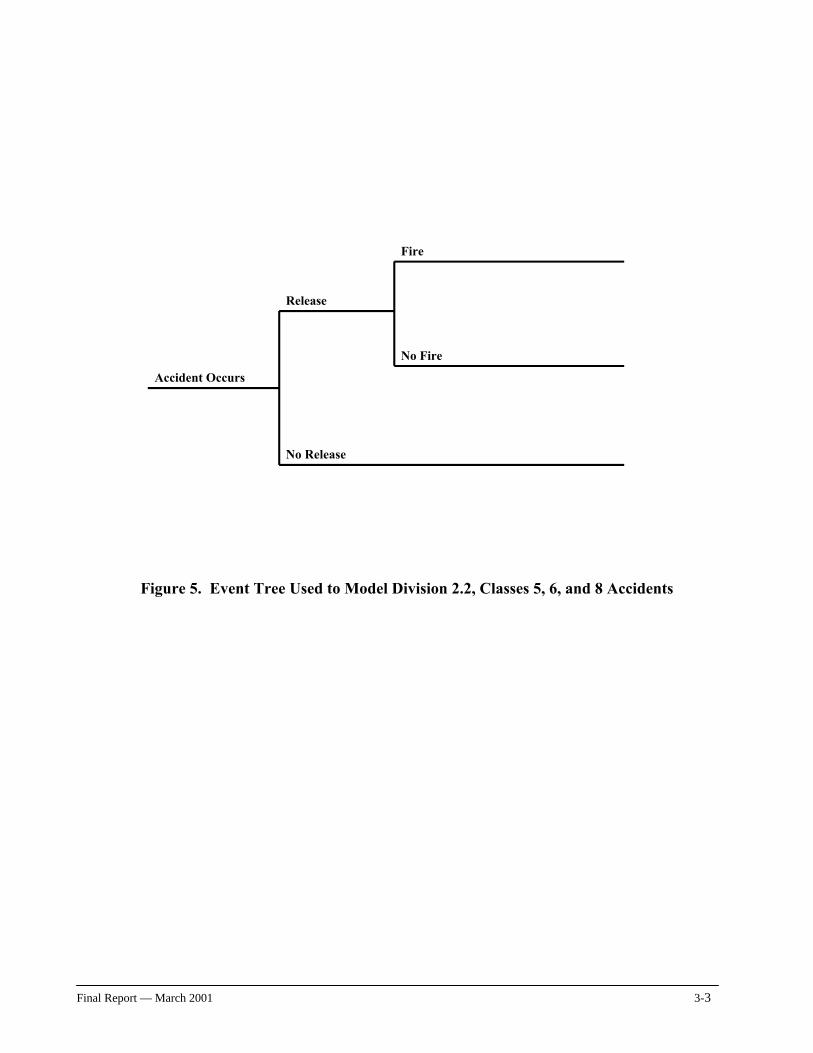
Final Report — March 2001 3-3
Accident Occurs
Release
No Release
Fire
No Fire
Figure 5. Event Tree Used to Model Division 2.2, Classes 5, 6, and 8 Accidents
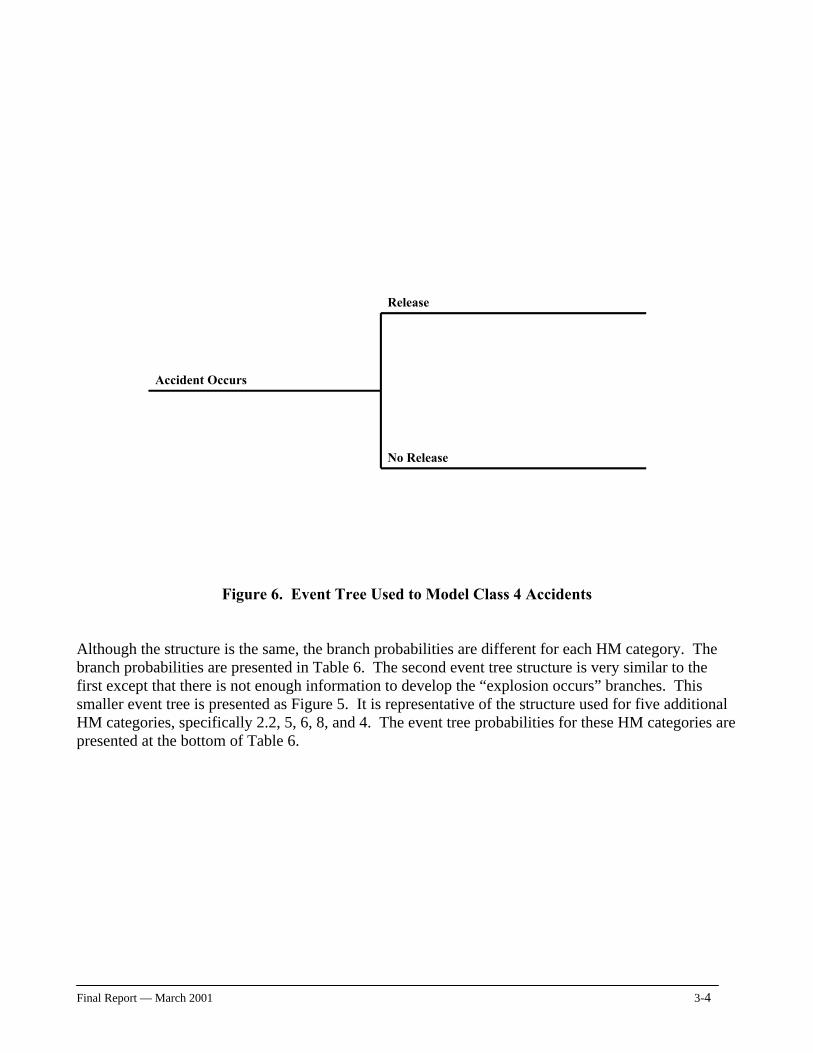
Final Report — March 2001 3-4
Accident Occurs
Release
No Release
Figure 6. Event Tree Used to Model Class 4 Accidents Although the structure is the same, the branch probabilities are different for each HM category. The branch probabilities are presented in Table 6. The second event tree structure is very similar to the first except that there is not enough information to develop the “explosion occurs” branches. This smaller event tree is presented as Figure 5. It is representative of the structure used for five additional HM categories, specifically 2.2, 5, 6, 8, and 4. The event tree probabilities for these HM categories are presented at the bottom of Table 6.
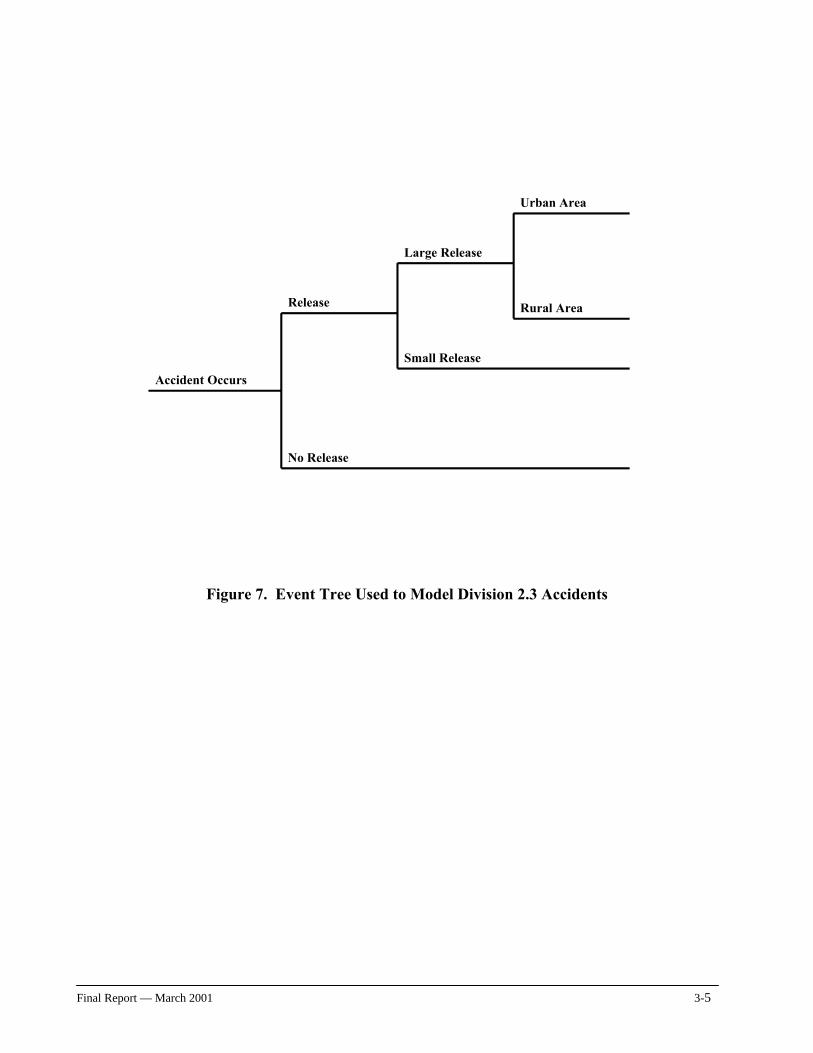
Final Report — March 2001 3-5
Accident Occurs
Release
No Release
Large Release
Small Release
Urban Area
Rural Area
Figure 7. Event Tree Used to Model Division 2.3 Accidents
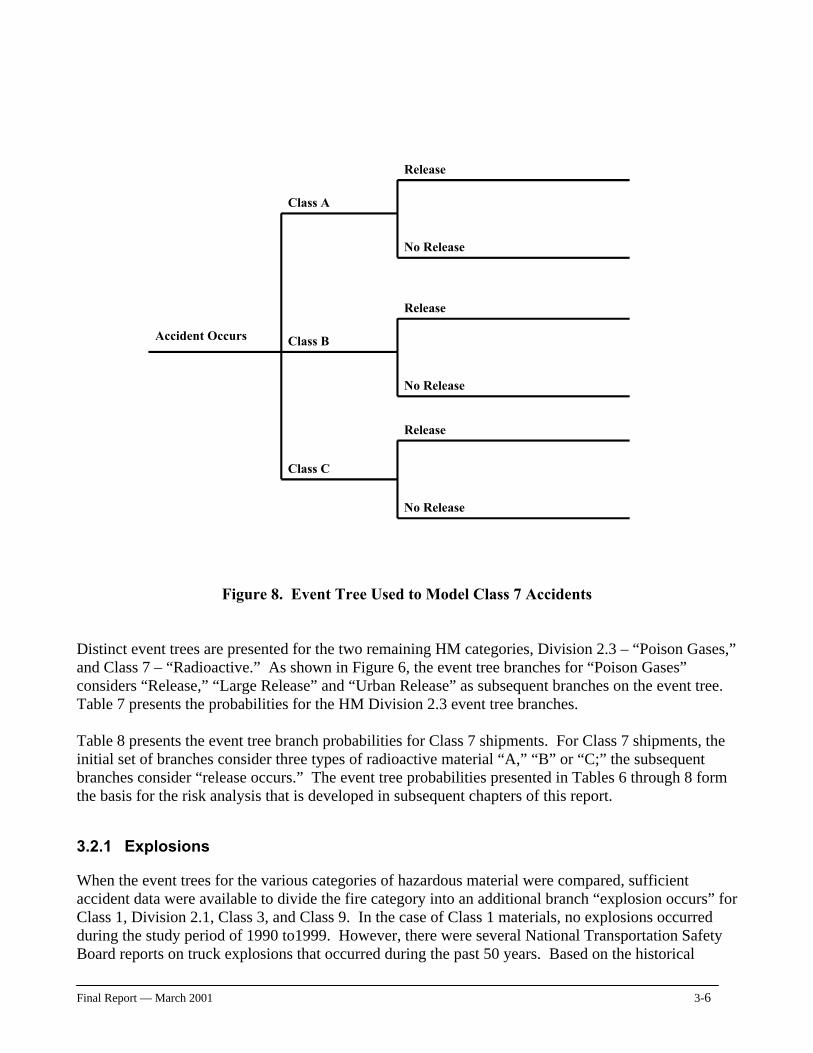
Final Report — March 2001 3-6
Accident Occurs
Release
No Release
Release
No Release
Release
No Release
Class A
Class B
Class C
Figure 8. Event Tree Used to Model Class 7 Accidents Distinct event trees are presented for the two remaining HM categories, Division 2.3 – “Poison Gases,” and Class 7 – “Radioactive.” As shown in Figure 6, the event tree branches for “Poison Gases” considers “Release,” “Large Release” and “Urban Release” as subsequent branches on the event tree. Table 7 presents the probabilities for the HM Division 2.3 event tree branches. Table 8 presents the event tree branch probabilities for Class 7 shipments. For Class 7 shipments, the initial set of branches consider three types of radioactive material “A,” “B” or “C;” the subsequent branches consider “release occurs.” The event tree probabilities presented in Tables 6 through 8 form the basis for the risk analysis that is developed in subsequent chapters of this report.
3.2.1 Explosions
When the event trees for the various categories of hazardous material were compared, sufficient accident data were available to divide the fire category into an additional branch “explosion occurs” for Class 1, Division 2.1, Class 3, and Class 9. In the case of Class 1 materials, no explosions occurred during the study period of 1990 to1999. However, there were several National Transportation Safety Board reports on truck explosions that occurred during the past 50 years. Based on the historical
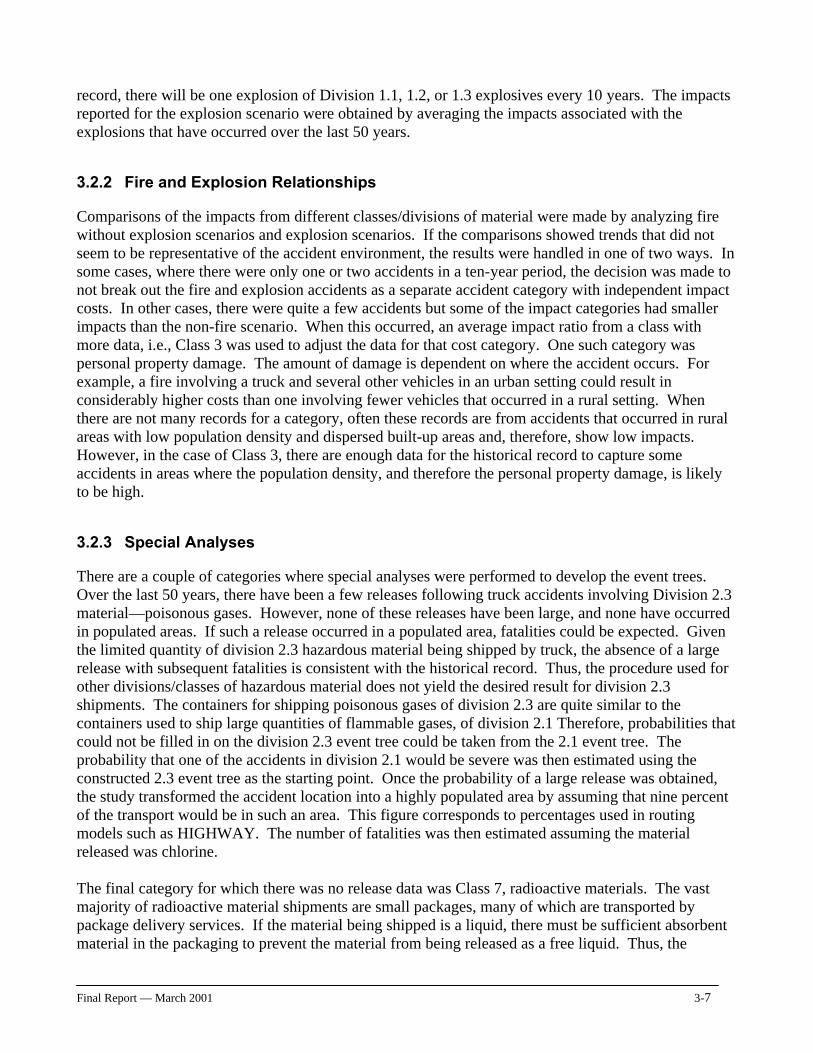
Final Report — March 2001 3-7
record, there will be one explosion of Division 1.1, 1.2, or 1.3 explosives every 10 years. The impacts reported for the explosion scenario were obtained by averaging the impacts associated with the explosions that have occurred over the last 50 years.
3.2.2 Fire and Explosion Relationships
Comparisons of the impacts from different classes/divisions of material were made by analyzing fire without explosion scenarios and explosion scenarios. If the comparisons showed trends that did not seem to be representative of the accident environment, the results were handled in one of two ways. In some cases, where there were only one or two accidents in a ten-year period, the decision was made to not break out the fire and explosion accidents as a separate accident category with independent impact costs. In other cases, there were quite a few accidents but some of the impact categories had smaller impacts than the non-fire scenario. When this occurred, an average impact ratio from a class with more data, i.e., Class 3 was used to adjust the data for that cost category. One such category was personal property damage. The amount of damage is dependent on where the accident occurs. For example, a fire involving a truck and several other vehicles in an urban setting could result in considerably higher costs than one involving fewer vehicles that occurred in a rural setting. When there are not many records for a category, often these records are from accidents that occurred in rural areas with low population density and dispersed built-up areas and, therefore, show low impacts. However, in the case of Class 3, there are enough data for the historical record to capture some accidents in areas where the population density, and therefore the personal property damage, is likely to be high.
3.2.3 Special Analyses
There are a couple of categories where special analyses were performed to develop the event trees. Over the last 50 years, there have been a few releases following truck accidents involving Division 2.3 material—poisonous gases. However, none of these releases have been large, and none have occurred in populated areas. If such a release occurred in a populated area, fatalities could be expected. Given the limited quantity of division 2.3 hazardous material being shipped by truck, the absence of a large release with subsequent fatalities is consistent with the historical record. Thus, the procedure used for other divisions/classes of hazardous material does not yield the desired result for division 2.3 shipments. The containers for shipping poisonous gases of division 2.3 are quite similar to the containers used to ship large quantities of flammable gases, of division 2.1 Therefore, probabilities that could not be filled in on the division 2.3 event tree could be taken from the 2.1 event tree. The probability that one of the accidents in division 2.1 would be severe was then estimated using the constructed 2.3 event tree as the starting point. Once the probability of a large release was obtained, the study transformed the accident location into a highly populated area by assuming that nine percent of the transport would be in such an area. This figure corresponds to percentages used in routing models such as HIGHWAY. The number of fatalities was then estimated assuming the material released was chlorine. The final category for which there was no release data was Class 7, radioactive materials. The vast majority of radioactive material shipments are small packages, many of which are transported by package delivery services. If the material being shipped is a liquid, there must be sufficient absorbent material in the packaging to prevent the material from being released as a free liquid. Thus, the
Final Report — March 2001 3-8
impacts are very small. There are very infrequent accidents that have larger impacts. What was done was to model one of each, neither of which, it turns out, adds significantly to the overall risk of shipping hazardous materials.
3.2.4 Incorporation of High Consequence Accidents
While the event trees enable the modeling of accidents with varying severity within the same hazard class or division, the approach is to use average impact numbers and not extremes. Furthermore, because it was recognized that some very severe accidents might not be present in the database records, an effort was made to look at accidents around the world that have been recorded during the last 50 years to see if any significant accidents have been missed. As a result, several severe, less frequent events were added. As each was added, a check was made to see if the addition presented a type of significant accident that had not been previously considered. As more and more accidents were added, fewer accidents could be considered distinct. Therefore, additional scenarios contributed less to the overall risk of transporting hazardous material. For example, a bus-gasoline truck accident in which many of the bus passengers were trapped in the ensuing fire was added because a similar accident killed more than 50 people in Brazil in 1998. Once that accident scenario was added, a similar accident scenario could be added to consider the situation where the truck was carrying other types of flammable material, for example, flammable gas, division 2.1. That scenario presented a risk similar to that of the bus--flammable gasoline truck fire scenario Therefore, that accident scenario was not added. Once professional judgement indicated that all of the various types of accident scenarios had been evaluated, the process of identifying additional accidents for inclusion ended, based on the assumption that no significant risks (ones that would significantly increase the overall risk) of shipping hazardous materials had been neglected.
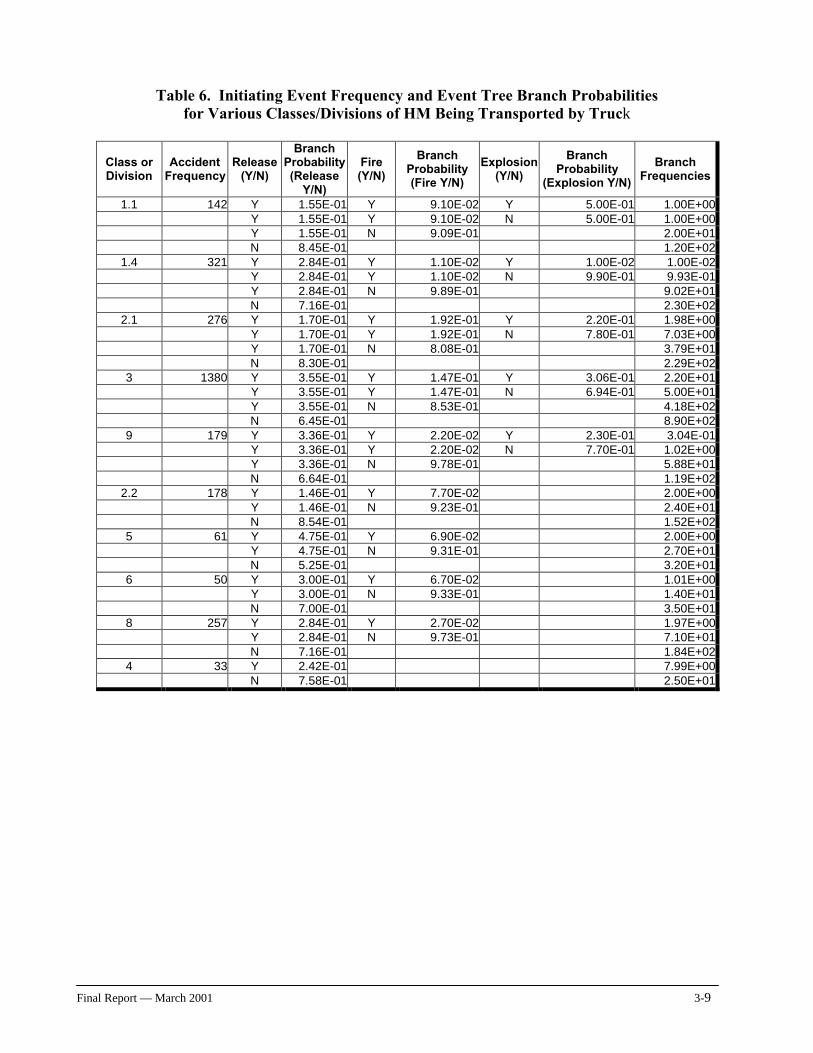
Final Report — March 2001 3-9
Table 6. Initiating Event Frequency and Event Tree Branch Probabilities for Various Classes/Divisions of HM Being Transported by Truck
Class or Division
Accident Frequency
Release (Y/N)
Branch Probability (Release
Y/N)
Fire (Y/N)
Branch Probability (Fire Y/N)
Explosion (Y/N)
Branch Probability
(Explosion Y/N)
Branch Frequencies
1.1 142 Y 1.55E-01 Y 9.10E-02 Y 5.00E-01 1.00E+00 Y 1.55E-01 Y 9.10E-02 N 5.00E-01 1.00E+00 Y 1.55E-01 N 9.09E-01 2.00E+01 N 8.45E-01 1.20E+02
1.4 321 Y 2.84E-01 Y 1.10E-02 Y 1.00E-02 1.00E-02 Y 2.84E-01 Y 1.10E-02 N 9.90E-01 9.93E-01 Y 2.84E-01 N 9.89E-01 9.02E+01 N 7.16E-01 2.30E+02
2.1 276 Y 1.70E-01 Y 1.92E-01 Y 2.20E-01 1.98E+00 Y 1.70E-01 Y 1.92E-01 N 7.80E-01 7.03E+00 Y 1.70E-01 N 8.08E-01 3.79E+01 N 8.30E-01 2.29E+023 1380 Y 3.55E-01 Y 1.47E-01 Y 3.06E-01 2.20E+01 Y 3.55E-01 Y 1.47E-01 N 6.94E-01 5.00E+01 Y 3.55E-01 N 8.53E-01 4.18E+02 N 6.45E-01 8.90E+029 179 Y 3.36E-01 Y 2.20E-02 Y 2.30E-01 3.04E-01 Y 3.36E-01 Y 2.20E-02 N 7.70E-01 1.02E+00 Y 3.36E-01 N 9.78E-01 5.88E+01 N 6.64E-01 1.19E+02
2.2 178 Y 1.46E-01 Y 7.70E-02 2.00E+00 Y 1.46E-01 N 9.23E-01 2.40E+01 N 8.54E-01 1.52E+025 61 Y 4.75E-01 Y 6.90E-02 2.00E+00 Y 4.75E-01 N 9.31E-01 2.70E+01 N 5.25E-01 3.20E+016 50 Y 3.00E-01 Y 6.70E-02 1.01E+00 Y 3.00E-01 N 9.33E-01 1.40E+01 N 7.00E-01 3.50E+018 257 Y 2.84E-01 Y 2.70E-02 1.97E+00 Y 2.84E-01 N 9.73E-01 7.10E+01 N 7.16E-01 1.84E+024 33 Y 2.42E-01 7.99E+00 N 7.58E-01 2.50E+01
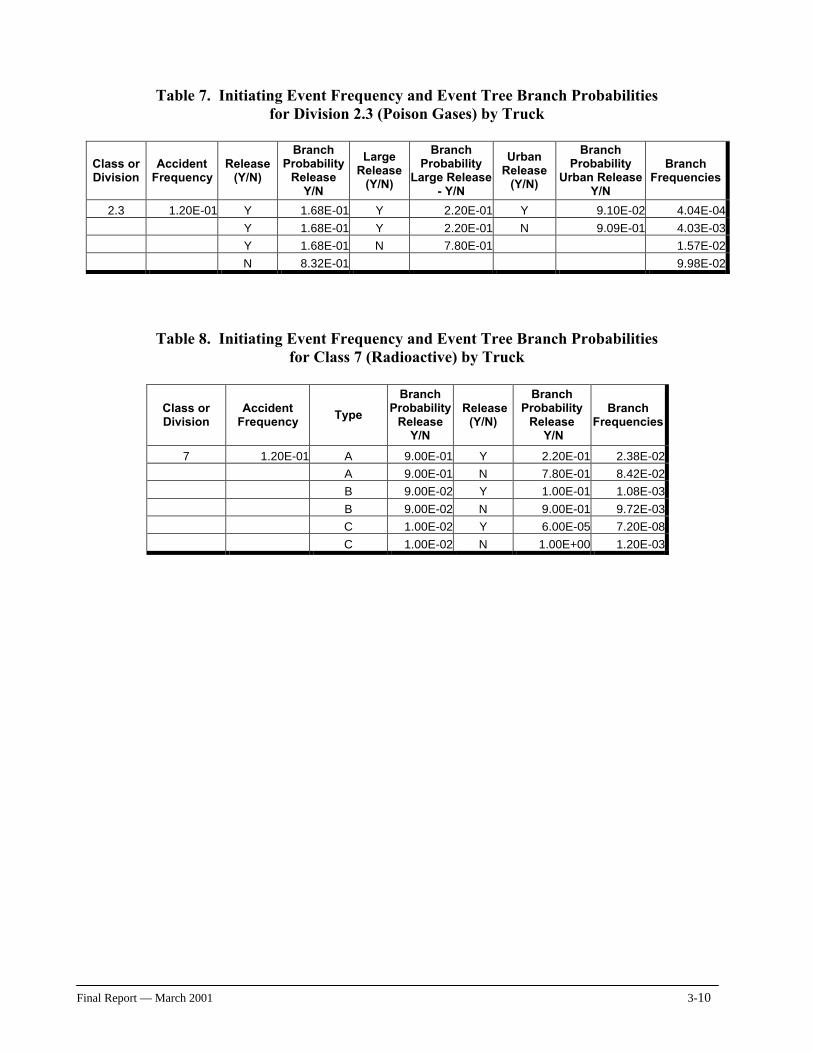
Final Report — March 2001 3-10
Table 7. Initiating Event Frequency and Event Tree Branch Probabilities for Division 2.3 (Poison Gases) by Truck
Class or Division
Accident Frequency
Release (Y/N)
Branch Probability
Release Y/N
Large Release
(Y/N)
Branch Probability
Large Release - Y/N
Urban Release
(Y/N)
Branch Probability
Urban Release Y/N
Branch Frequencies
2.3 1.20E-01 Y 1.68E-01 Y 2.20E-01 Y 9.10E-02 4.04E-04
Y 1.68E-01 Y 2.20E-01 N 9.09E-01 4.03E-03
Y 1.68E-01 N 7.80E-01 1.57E-02
N 8.32E-01 9.98E-02
Table 8. Initiating Event Frequency and Event Tree Branch Probabilities for Class 7 (Radioactive) by Truck
Class or Division
Accident Frequency Type
Branch Probability
Release Y/N
Release (Y/N)
Branch Probability
Release Y/N
Branch Frequencies
7 1.20E-01 A 9.00E-01 Y 2.20E-01 2.38E-02
A 9.00E-01 N 7.80E-01 8.42E-02
B 9.00E-02 Y 1.00E-01 1.08E-03
B 9.00E-02 N 9.00E-01 9.72E-03
C 1.00E-02 Y 6.00E-05 7.20E-08
C 1.00E-02 N 1.00E+00 1.20E-03
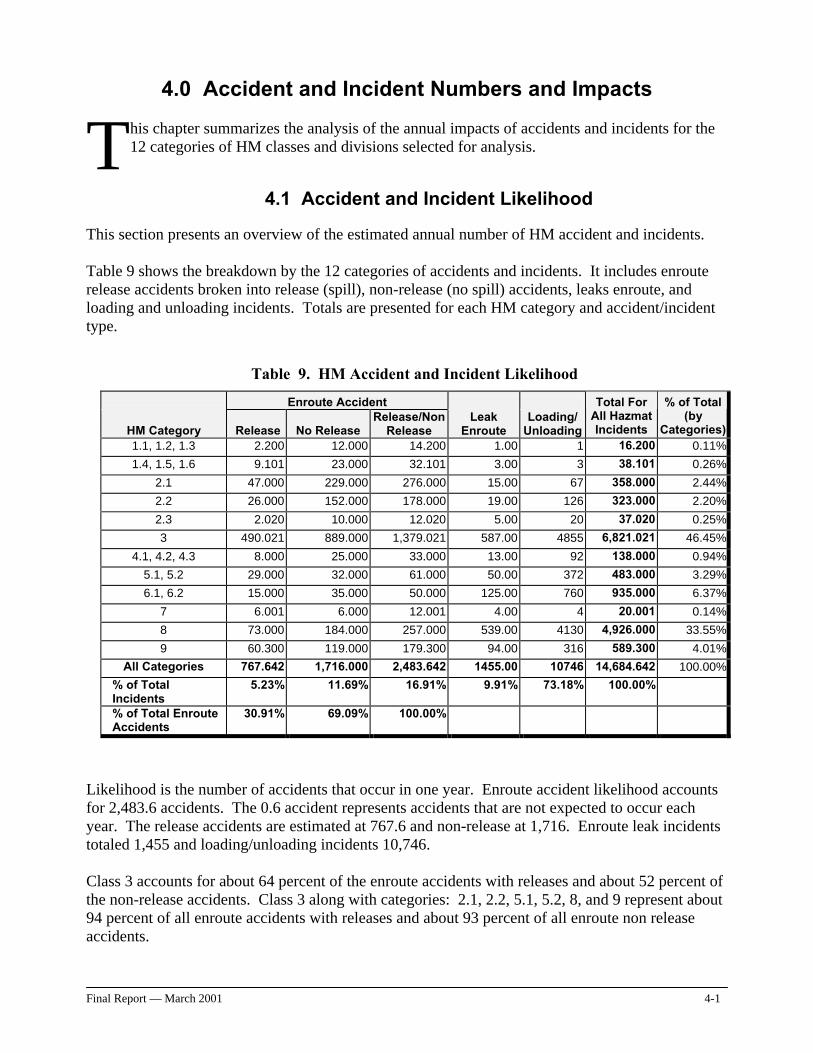
Final Report — March 2001 4-1
4.0 Accident and Incident Numbers and Impacts
his chapter summarizes the analysis of the annual impacts of accidents and incidents for the 12 categories of HM classes and divisions selected for analysis.
4.1 Accident and Incident Likelihood
This section presents an overview of the estimated annual number of HM accident and incidents. Table 9 shows the breakdown by the 12 categories of accidents and incidents. It includes enroute release accidents broken into release (spill), non-release (no spill) accidents, leaks enroute, and loading and unloading incidents. Totals are presented for each HM category and accident/incident type.
Likelihood is the number of accidents that occur in one year. Enroute accident likelihood accounts for 2,483.6 accidents. The 0.6 accident represents accidents that are not expected to occur each year. The release accidents are estimated at 767.6 and non-release at 1,716. Enroute leak incidents totaled 1,455 and loading/unloading incidents 10,746. Class 3 accounts for about 64 percent of the enroute accidents with releases and about 52 percent of the non-release accidents. Class 3 along with categories: 2.1, 2.2, 5.1, 5.2, 8, and 9 represent about 94 percent of all enroute accidents with releases and about 93 percent of all enroute non release accidents.
T
Table 9. HM Accident and Incident Likelihood
Enroute Accident
HM Category Release No Release Release/Non
Release Leak
Enroute Loading/
Unloading
Total For All Hazmat Incidents
% of Total (by
Categories) 1.1, 1.2, 1.3 2.200 12.000 14.200 1.00 1 16.200 0.11%
1.4, 1.5, 1.6 9.101 23.000 32.101 3.00 3 38.101 0.26%
2.1 47.000 229.000 276.000 15.00 67 358.000 2.44%
2.2 26.000 152.000 178.000 19.00 126 323.000 2.20%
2.3 2.020 10.000 12.020 5.00 20 37.020 0.25%
3 490.021 889.000 1,379.021 587.00 4855 6,821.021 46.45%
4.1, 4.2, 4.3 8.000 25.000 33.000 13.00 92 138.000 0.94%
5.1, 5.2 29.000 32.000 61.000 50.00 372 483.000 3.29%
6.1, 6.2 15.000 35.000 50.000 125.00 760 935.000 6.37%
7 6.001 6.000 12.001 4.00 4 20.001 0.14%
8 73.000 184.000 257.000 539.00 4130 4,926.000 33.55%
9 60.300 119.000 179.300 94.00 316 589.300 4.01%
All Categories 767.642 1,716.000 2,483.642 1455.00 10746 14,684.642 100.00%
% of Total Incidents
5.23% 11.69% 16.91% 9.91% 73.18% 100.00%
% of Total Enroute Accidents
30.91% 69.09% 100.00%
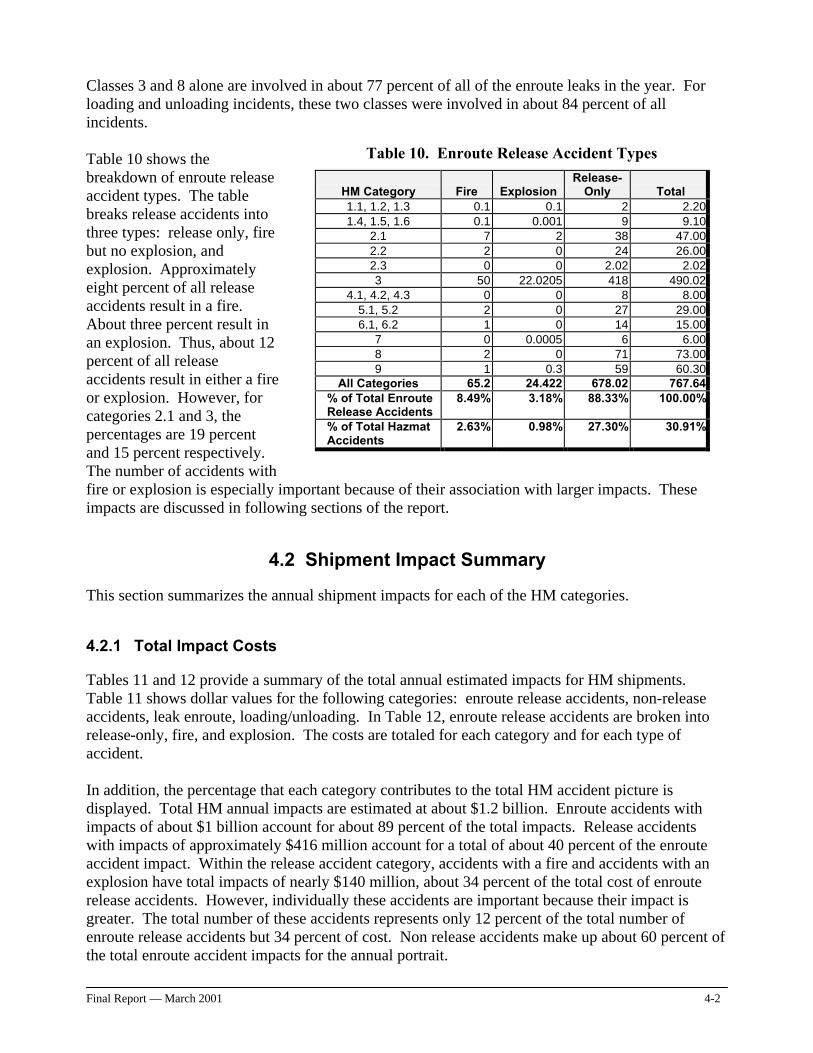
Final Report — March 2001 4-2
Table 10. Enroute Release Accident Types
HM Category Fire Explosion Release-
Only Total 1.1, 1.2, 1.3 0.1 0.1 2 2.201.4, 1.5, 1.6 0.1 0.001 9 9.10
2.1 7 2 38 47.002.2 2 0 24 26.002.3 0 0 2.02 2.023 50 22.0205 418 490.02
4.1, 4.2, 4.3 0 0 8 8.005.1, 5.2 2 0 27 29.006.1, 6.2 1 0 14 15.00
7 0 0.0005 6 6.008 2 0 71 73.009 1 0.3 59 60.30
All Categories 65.2 24.422 678.02 767.64% of Total Enroute Release Accidents
8.49% 3.18% 88.33% 100.00%
% of Total Hazmat Accidents
2.63% 0.98% 27.30% 30.91%
Classes 3 and 8 alone are involved in about 77 percent of all of the enroute leaks in the year. For loading and unloading incidents, these two classes were involved in about 84 percent of all incidents. Table 10 shows the breakdown of enroute release accident types. The table breaks release accidents into three types: release only, fire but no explosion, and explosion. Approximately eight percent of all release accidents result in a fire. About three percent result in an explosion. Thus, about 12 percent of all release accidents result in either a fire or explosion. However, for categories 2.1 and 3, the percentages are 19 percent and 15 percent respectively. The number of accidents with fire or explosion is especially important because of their association with larger impacts. These impacts are discussed in following sections of the report.
4.2 Shipment Impact Summary
This section summarizes the annual shipment impacts for each of the HM categories.
4.2.1 Total Impact Costs
Tables 11 and 12 provide a summary of the total annual estimated impacts for HM shipments. Table 11 shows dollar values for the following categories: enroute release accidents, non-release accidents, leak enroute, loading/unloading. In Table 12, enroute release accidents are broken into release-only, fire, and explosion. The costs are totaled for each category and for each type of accident. In addition, the percentage that each category contributes to the total HM accident picture is displayed. Total HM annual impacts are estimated at about $1.2 billion. Enroute accidents with impacts of about $1 billion account for about 89 percent of the total impacts. Release accidents with impacts of approximately $416 million account for a total of about 40 percent of the enroute accident impact. Within the release accident category, accidents with a fire and accidents with an explosion have total impacts of nearly $140 million, about 34 percent of the total cost of enroute release accidents. However, individually these accidents are important because their impact is greater. The total number of these accidents represents only 12 percent of the total number of enroute release accidents but 34 percent of cost. Non release accidents make up about 60 percent of the total enroute accident impacts for the annual portrait.
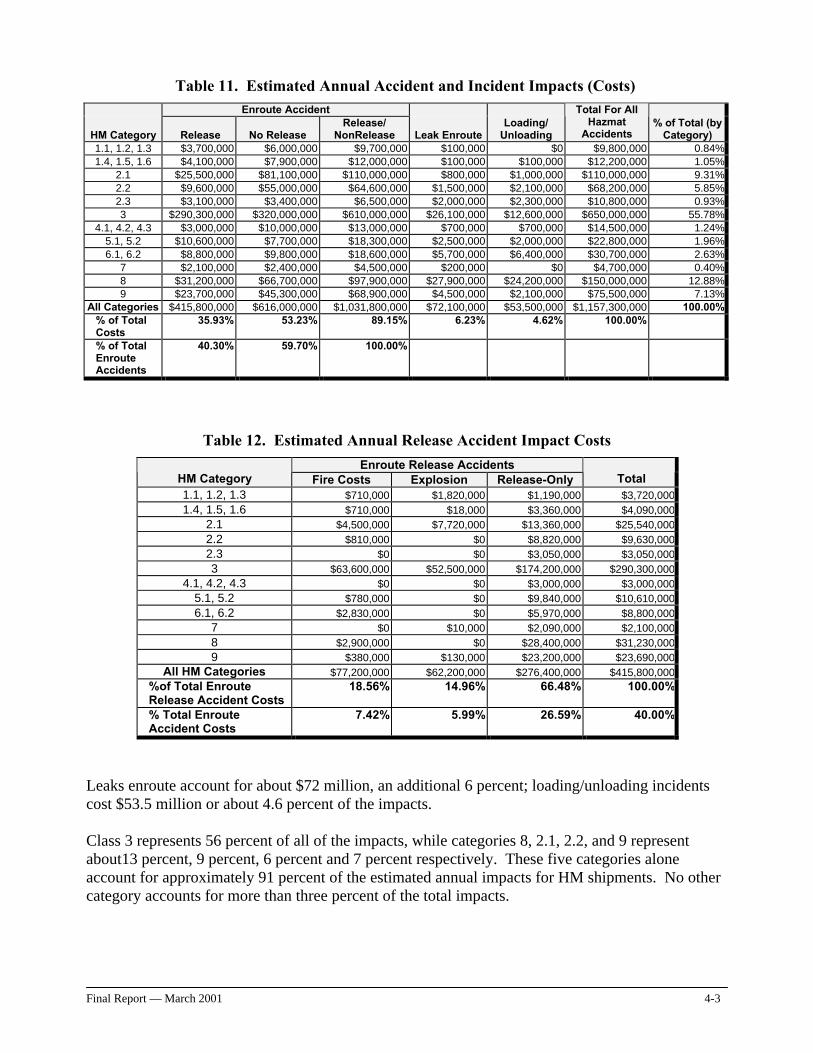
Final Report — March 2001 4-3
Table 11. Estimated Annual Accident and Incident Impacts (Costs) Enroute Accident
HM Category Release No Release Release/
NonRelease Leak Enroute Loading/
Unloading
Total For All Hazmat
Accidents % of Total (by
Category) 1.1, 1.2, 1.3 $3,700,000 $6,000,000 $9,700,000 $100,000 $0 $9,800,000 0.84%1.4, 1.5, 1.6 $4,100,000 $7,900,000 $12,000,000 $100,000 $100,000 $12,200,000 1.05%
2.1 $25,500,000 $81,100,000 $110,000,000 $800,000 $1,000,000 $110,000,000 9.31%2.2 $9,600,000 $55,000,000 $64,600,000 $1,500,000 $2,100,000 $68,200,000 5.85%2.3 $3,100,000 $3,400,000 $6,500,000 $2,000,000 $2,300,000 $10,800,000 0.93%3 $290,300,000 $320,000,000 $610,000,000 $26,100,000 $12,600,000 $650,000,000 55.78%
4.1, 4.2, 4.3 $3,000,000 $10,000,000 $13,000,000 $700,000 $700,000 $14,500,000 1.24%5.1, 5.2 $10,600,000 $7,700,000 $18,300,000 $2,500,000 $2,000,000 $22,800,000 1.96%6.1, 6.2 $8,800,000 $9,800,000 $18,600,000 $5,700,000 $6,400,000 $30,700,000 2.63%
7 $2,100,000 $2,400,000 $4,500,000 $200,000 $0 $4,700,000 0.40%8 $31,200,000 $66,700,000 $97,900,000 $27,900,000 $24,200,000 $150,000,000 12.88%9 $23,700,000 $45,300,000 $68,900,000 $4,500,000 $2,100,000 $75,500,000 7.13%
All Categories $415,800,000 $616,000,000 $1,031,800,000 $72,100,000 $53,500,000 $1,157,300,000 100.00%% of Total Costs
35.93% 53.23% 89.15% 6.23% 4.62% 100.00%
% of Total Enroute Accidents
40.30% 59.70% 100.00%
Table 12. Estimated Annual Release Accident Impact Costs
Enroute Release Accidents HM Category Fire Costs Explosion Release-Only Total 1.1, 1.2, 1.3 $710,000 $1,820,000 $1,190,000 $3,720,000 1.4, 1.5, 1.6 $710,000 $18,000 $3,360,000 $4,090,000
2.1 $4,500,000 $7,720,000 $13,360,000 $25,540,000 2.2 $810,000 $0 $8,820,000 $9,630,000 2.3 $0 $0 $3,050,000 $3,050,000 3 $63,600,000 $52,500,000 $174,200,000 $290,300,000
4.1, 4.2, 4.3 $0 $0 $3,000,000 $3,000,000 5.1, 5.2 $780,000 $0 $9,840,000 $10,610,000 6.1, 6.2 $2,830,000 $0 $5,970,000 $8,800,000
7 $0 $10,000 $2,090,000 $2,100,000 8 $2,900,000 $0 $28,400,000 $31,230,000 9 $380,000 $130,000 $23,200,000 $23,690,000
All HM Categories $77,200,000 $62,200,000 $276,400,000 $415,800,000 %of Total Enroute Release Accident Costs
18.56% 14.96% 66.48% 100.00%
% Total Enroute Accident Costs
7.42% 5.99% 26.59% 40.00%
Leaks enroute account for about $72 million, an additional 6 percent; loading/unloading incidents cost $53.5 million or about 4.6 percent of the impacts. Class 3 represents 56 percent of all of the impacts, while categories 8, 2.1, 2.2, and 9 represent about13 percent, 9 percent, 6 percent and 7 percent respectively. These five categories alone account for approximately 91 percent of the estimated annual impacts for HM shipments. No other category accounts for more than three percent of the total impacts.
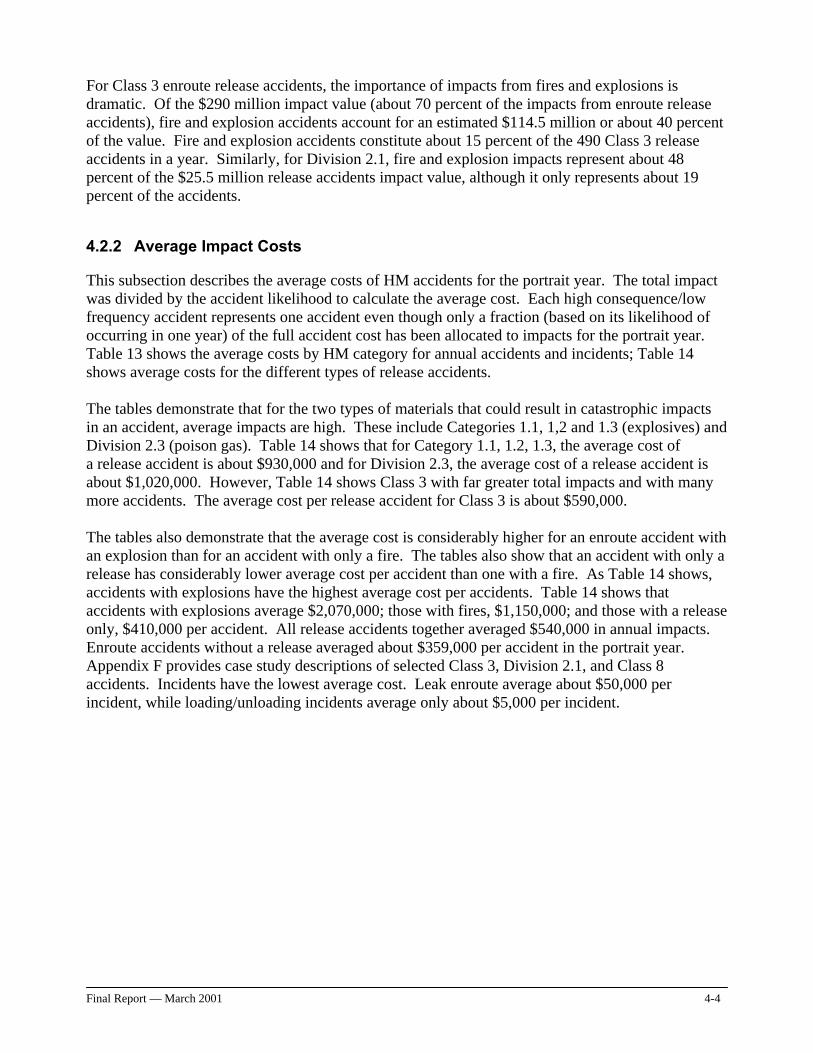
Final Report — March 2001 4-4
For Class 3 enroute release accidents, the importance of impacts from fires and explosions is dramatic. Of the $290 million impact value (about 70 percent of the impacts from enroute release accidents), fire and explosion accidents account for an estimated $114.5 million or about 40 percent of the value. Fire and explosion accidents constitute about 15 percent of the 490 Class 3 release accidents in a year. Similarly, for Division 2.1, fire and explosion impacts represent about 48 percent of the $25.5 million release accidents impact value, although it only represents about 19 percent of the accidents.
4.2.2 Average Impact Costs
This subsection describes the average costs of HM accidents for the portrait year. The total impact was divided by the accident likelihood to calculate the average cost. Each high consequence/low frequency accident represents one accident even though only a fraction (based on its likelihood of occurring in one year) of the full accident cost has been allocated to impacts for the portrait year. Table 13 shows the average costs by HM category for annual accidents and incidents; Table 14 shows average costs for the different types of release accidents. The tables demonstrate that for the two types of materials that could result in catastrophic impacts in an accident, average impacts are high. These include Categories 1.1, 1,2 and 1.3 (explosives) and Division 2.3 (poison gas). Table 14 shows that for Category 1.1, 1.2, 1.3, the average cost of a release accident is about $930,000 and for Division 2.3, the average cost of a release accident is about $1,020,000. However, Table 14 shows Class 3 with far greater total impacts and with many more accidents. The average cost per release accident for Class 3 is about $590,000. The tables also demonstrate that the average cost is considerably higher for an enroute accident with an explosion than for an accident with only a fire. The tables also show that an accident with only a release has considerably lower average cost per accident than one with a fire. As Table 14 shows, accidents with explosions have the highest average cost per accidents. Table 14 shows that accidents with explosions average $2,070,000; those with fires, $1,150,000; and those with a release only, $410,000 per accident. All release accidents together averaged $540,000 in annual impacts. Enroute accidents without a release averaged about $359,000 per accident in the portrait year. Appendix F provides case study descriptions of selected Class 3, Division 2.1, and Class 8 accidents. Incidents have the lowest average cost. Leak enroute average about $50,000 per incident, while loading/unloading incidents average only about $5,000 per incident.
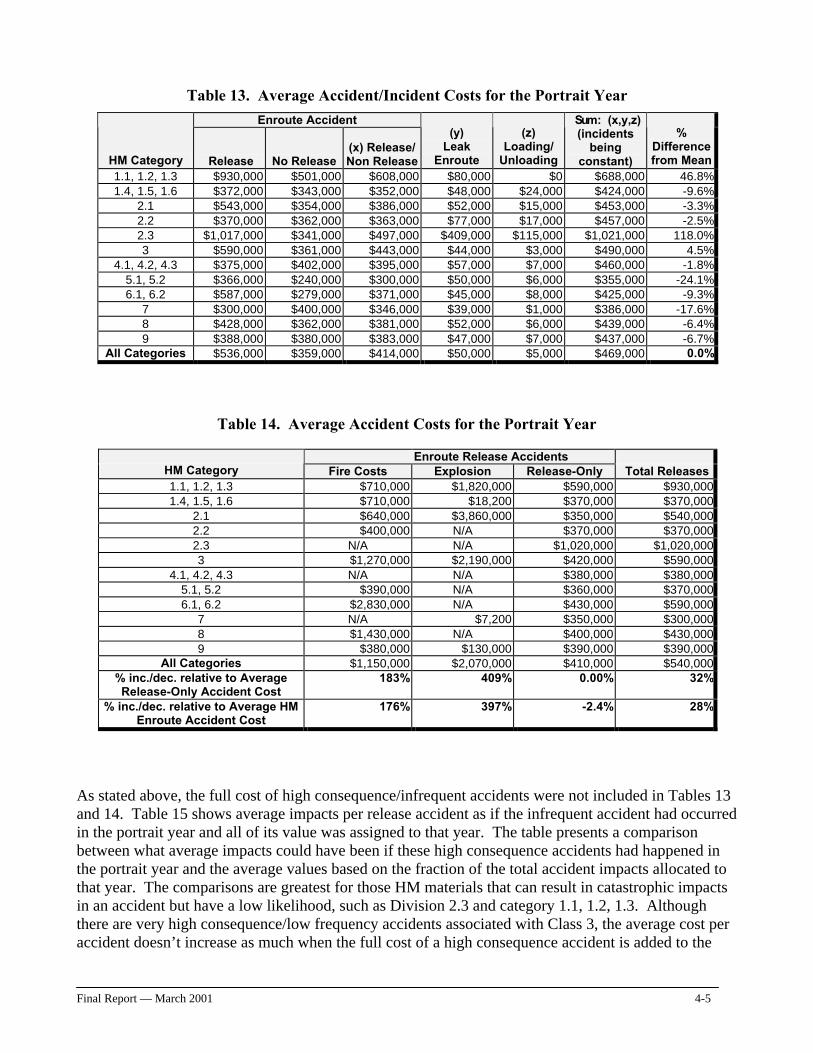
Final Report — March 2001 4-5
Table 13. Average Accident/Incident Costs for the Portrait Year
Enroute Accident
HM Category Release No Release (x) Release/ Non Release
(y) Leak
Enroute
(z) Loading/
Unloading
�Sum: (x,y,z) (incidents
being constant)
% Difference from Mean
1.1, 1.2, 1.3 $930,000 $501,000 $608,000 $80,000 $0 $688,000 46.8%1.4, 1.5, 1.6 $372,000 $343,000 $352,000 $48,000 $24,000 $424,000 -9.6%
2.1 $543,000 $354,000 $386,000 $52,000 $15,000 $453,000 -3.3%2.2 $370,000 $362,000 $363,000 $77,000 $17,000 $457,000 -2.5%2.3 $1,017,000 $341,000 $497,000 $409,000 $115,000 $1,021,000 118.0%3 $590,000 $361,000 $443,000 $44,000 $3,000 $490,000 4.5%
4.1, 4.2, 4.3 $375,000 $402,000 $395,000 $57,000 $7,000 $460,000 -1.8%5.1, 5.2 $366,000 $240,000 $300,000 $50,000 $6,000 $355,000 -24.1%6.1, 6.2 $587,000 $279,000 $371,000 $45,000 $8,000 $425,000 -9.3%
7 $300,000 $400,000 $346,000 $39,000 $1,000 $386,000 -17.6%8 $428,000 $362,000 $381,000 $52,000 $6,000 $439,000 -6.4%9 $388,000 $380,000 $383,000 $47,000 $7,000 $437,000 -6.7%
All Categories $536,000 $359,000 $414,000 $50,000 $5,000 $469,000 0.0%
Table 14. Average Accident Costs for the Portrait Year
Enroute Release Accidents HM Category Fire Costs Explosion Release-Only Total Releases 1.1, 1.2, 1.3 $710,000 $1,820,000 $590,000 $930,000 1.4, 1.5, 1.6 $710,000 $18,200 $370,000 $370,000
2.1 $640,000 $3,860,000 $350,000 $540,000 2.2 $400,000 N/A $370,000 $370,000 2.3 N/A N/A $1,020,000 $1,020,000 3 $1,270,000 $2,190,000 $420,000 $590,000
4.1, 4.2, 4.3 N/A N/A $380,000 $380,000 5.1, 5.2 $390,000 N/A $360,000 $370,000 6.1, 6.2 $2,830,000 N/A $430,000 $590,000
7 N/A $7,200 $350,000 $300,000 8 $1,430,000 N/A $400,000 $430,000 9 $380,000 $130,000 $390,000 $390,000
All Categories $1,150,000 $2,070,000 $410,000 $540,000 % inc./dec. relative to Average Release-Only Accident Cost
183% 409% 0.00% 32%
% inc./dec. relative to Average HM Enroute Accident Cost
176% 397% -2.4% 28%
As stated above, the full cost of high consequence/infrequent accidents were not included in Tables 13 and 14. Table 15 shows average impacts per release accident as if the infrequent accident had occurred in the portrait year and all of its value was assigned to that year. The table presents a comparison between what average impacts could have been if these high consequence accidents had happened in the portrait year and the average values based on the fraction of the total accident impacts allocated to that year. The comparisons are greatest for those HM materials that can result in catastrophic impacts in an accident but have a low likelihood, such as Division 2.3 and category 1.1, 1.2, 1.3. Although there are very high consequence/low frequency accidents associated with Class 3, the average cost per accident doesn’t increase as much when the full cost of a high consequence accident is added to the
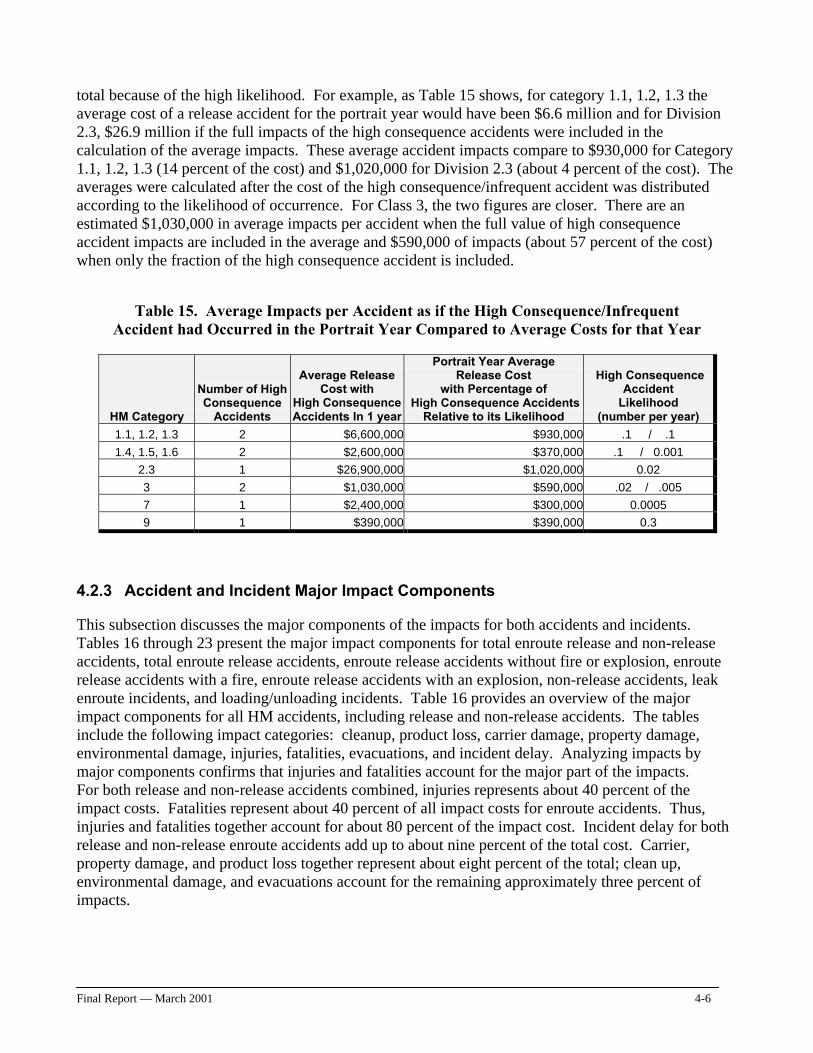
Final Report — March 2001 4-6
total because of the high likelihood. For example, as Table 15 shows, for category 1.1, 1.2, 1.3 the average cost of a release accident for the portrait year would have been $6.6 million and for Division 2.3, $26.9 million if the full impacts of the high consequence accidents were included in the calculation of the average impacts. These average accident impacts compare to $930,000 for Category 1.1, 1.2, 1.3 (14 percent of the cost) and $1,020,000 for Division 2.3 (about 4 percent of the cost). The averages were calculated after the cost of the high consequence/infrequent accident was distributed according to the likelihood of occurrence. For Class 3, the two figures are closer. There are an estimated $1,030,000 in average impacts per accident when the full value of high consequence accident impacts are included in the average and $590,000 of impacts (about 57 percent of the cost) when only the fraction of the high consequence accident is included.
Table 15. Average Impacts per Accident as if the High Consequence/Infrequent Accident had Occurred in the Portrait Year Compared to Average Costs for that Year
HM Category
Number of High Consequence
Accidents
Average Release Cost with
High Consequence Accidents In 1 year
Portrait Year Average Release Cost
with Percentage of High Consequence Accidents
Relative to its Likelihood
High Consequence Accident
Likelihood (number per year)
1.1, 1.2, 1.3 2 $6,600,000 $930,000 .1 / .1
1.4, 1.5, 1.6 2 $2,600,000 $370,000 .1 / 0.001
2.3 1 $26,900,000 $1,020,000 0.02
3 2 $1,030,000 $590,000 .02 / .005
7 1 $2,400,000 $300,000 0.0005
9 1 $390,000 $390,000 0.3
4.2.3 Accident and Incident Major Impact Components
This subsection discusses the major components of the impacts for both accidents and incidents. Tables 16 through 23 present the major impact components for total enroute release and non-release accidents, total enroute release accidents, enroute release accidents without fire or explosion, enroute release accidents with a fire, enroute release accidents with an explosion, non-release accidents, leak enroute incidents, and loading/unloading incidents. Table 16 provides an overview of the major impact components for all HM accidents, including release and non-release accidents. The tables include the following impact categories: cleanup, product loss, carrier damage, property damage, environmental damage, injuries, fatalities, evacuations, and incident delay. Analyzing impacts by major components confirms that injuries and fatalities account for the major part of the impacts. For both release and non-release accidents combined, injuries represents about 40 percent of the impact costs. Fatalities represent about 40 percent of all impact costs for enroute accidents. Thus, injuries and fatalities together account for about 80 percent of the impact cost. Incident delay for both release and non-release enroute accidents add up to about nine percent of the total cost. Carrier, property damage, and product loss together represent about eight percent of the total; clean up, environmental damage, and evacuations account for the remaining approximately three percent of impacts.
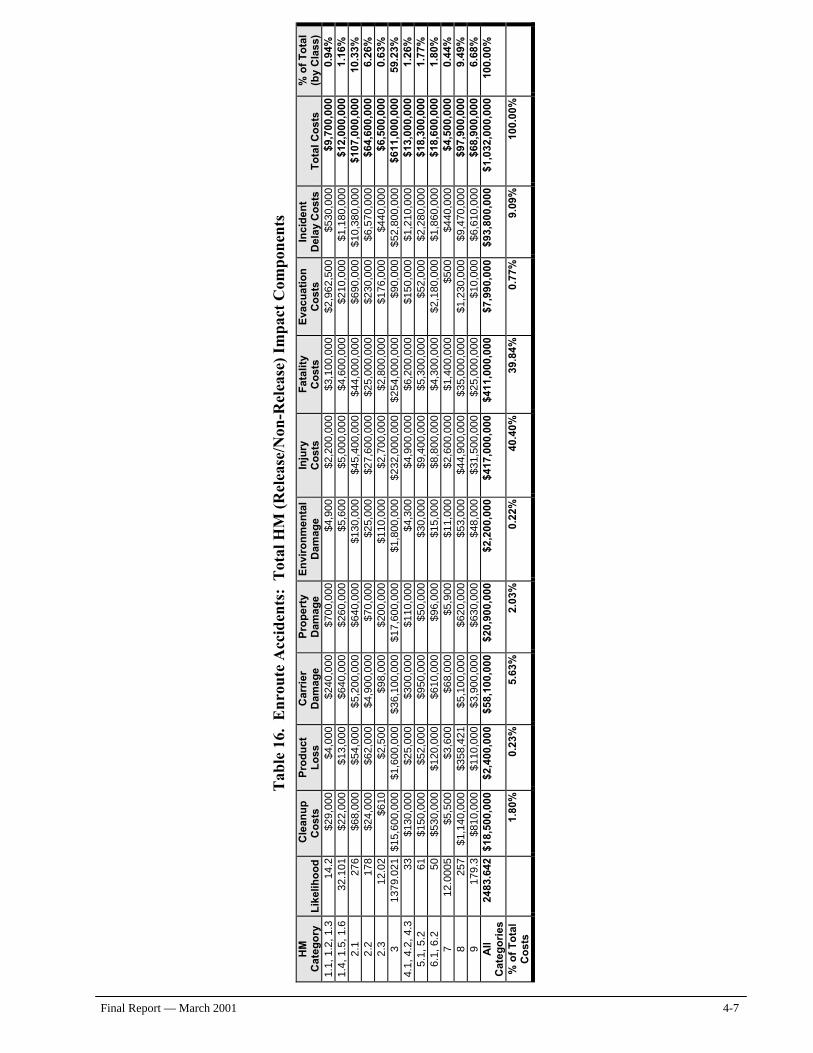
Final Report — March 2001 4-7
Tab
le 1
6. E
nrou
te A
ccid
ents
: T
otal
HM
(R
elea
se/N
on-R
elea
se)
Impa
ct C
ompo
nent
s H
M
Cat
ego
ry
Lik
elih
oo
d
Cle
anu
p
Co
sts
Pro
du
ct
Lo
ss
Car
rier
D
amag
e P
rop
erty
D
amag
e E
nvi
ron
men
tal
Dam
age
Inju
ry
Co
sts
Fat
alit
y C
ost
s E
vacu
atio
n
Co
sts
Inci
den
t D
elay
Co
sts
To
tal C
ost
s %
of
To
tal
(by
Cla
ss)
1.1,
1.2
, 1.
3 1
4.2
$2
9,00
0 $4
,000
$2
40,0
00
$700
,000
$4
,900
$2
,200
,000
$3
,100
,000
$2
,962
,500
$5
30,0
00
$9,7
00,0
00
0.94
%
1.4,
1.5
, 1.
6 32
.101
$2
2,00
0 $1
3,00
0 $6
40,0
00
$260
,000
$5
,600
$5
,000
,000
$4
,600
,000
$2
10,0
00
$1,1
80,0
00
$12,
000,
000
1.16
%
2.1
27
6 $6
8,00
0 $5
4,00
0 $5
,200
,000
$6
40,0
00
$130
,000
$4
5,40
0,00
0 $4
4,00
0,00
0 $6
90,0
00
$10,
380,
000
$107
,000
,000
10
.33%
2
.2
178
$24,
000
$62,
000
$4,9
00,0
00
$70,
000
$25,
000
$27,
600,
000
$25,
000,
000
$230
,000
$6
,570
,000
$6
4,60
0,00
0 6.
26%
2
.3
12.0
2 $6
10
$2,5
00
$98,
000
$200
,000
$1
10,0
00
$2,7
00,0
00
$2,8
00,0
00
$176
,000
$4
40,0
00
$6,5
00,0
00
0.63
%
3 13
79.0
21
$15,
600,
000
$1,6
00,0
00
$36,
100,
000
$17,
600,
000
$1,8
00,0
00
$232
,000
,000
$2
54,0
00,0
00
$90,
000
$52,
800,
000
$611
,000
,000
59
.23%
4.
1, 4
.2,
4.3
33
$130
,000
$2
5,00
0 $3
00,0
00
$110
,000
$4
,300
$4
,900
,000
$6
,200
,000
$1
50,0
00
$1,2
10,0
00
$13,
000,
000
1.26
%
5.1,
5.2
61
$1
50,0
00
$52,
000
$950
,000
$5
0,00
0 $3
0,00
0 $9
,400
,000
$5
,300
,000
$5
2,00
0 $2
,280
,000
$1
8,30
0,00
0 1.
77%
6.
1, 6
.2
50
$530
,000
$1
20,0
00
$610
,000
$9
6,00
0 $1
5,00
0 $8
,800
,000
$4
,300
,000
$2
,180
,000
$1
,860
,000
$1
8,60
0,00
0 1.
80%
7
12.0
005
$5,5
00
$3,6
00
$68,
000
$5,9
00
$11,
000
$2,6
00,0
00
$1,4
00,0
00
$500
$4
40,0
00
$4,5
00,0
00
0.44
%
8 25
7 $1
,140
,000
$3
58,4
21
$5,1
00,0
00
$620
,000
$5
3,00
0 $4
4,90
0,00
0 $3
5,00
0,00
0 $1
,230
,000
$9
,470
,000
$9
7,90
0,00
0 9.
49%
9
179.
3 $8
10,0
00
$110
,000
$3
,900
,000
$6
30,0
00
$48,
000
$31,
500,
000
$25,
000,
000
$10,
000
$6,6
10,0
00
$68,
900,
000
6.68
%
All
Cat
ego
ries
24
83.6
42
$18,
500,
000
$2,4
00,0
00
$58,
100,
000
$20,
900,
000
$2,2
00,0
00
$417
,000
,000
$4
11,0
00,0
00
$7,9
90,0
00
$93,
800,
000
$1,0
32,0
00,0
00
100.
00%
% o
f T
ota
l C
ost
s
1.80
%
0.23
%
5.63
%
2.03
%
0.22
%
40.4
0%
39.8
4%
0.77
%
9.09
%
100.
00%
Final Report — March 2001 4-8
Examining release accidents by themselves reveals differences with all HM enroute accidents. Table 17 shows that clean-up costs alone account for about 4.5 percent of the impacts. Although environmental damage only accounts for about 0.5 percent of all impacts, it is more then twice the relative importance compared with environmental damage for all HM accidents. Table 18 shows that the distribution of impacts for enroute accidents, release-only, is similar to that shown for total releases except that the percentage of impacts related to fatalities and injuries differ. Injury impacts for enroute accident release-only account for more that 46 percent and fatality account for about 30 percent of the impacts, compared to about 37 percent for injuries and 41 percent of the fatalities for total release-only. Enroute release accident with a fire and no explosion indicates the relative importance of fatalities in this accident type. Table 19 shows that fatalities account for more than 61 percent of impacts and injuries only about 19 percent. Incident delay accounts for only about five percent of the impacts for this category. Enroute release accidents with explosions are characterized by a similar impact relationship between fatalities and injuries, as occurs with fire only accidents. Table 20 shows that fatalities in explosion accidents account for more than 67 percent while injuries only about 16.5 percent. As might be expected, carrier and property damage and product loss are higher and accounts for about 10.5 percent compared to about eight percent for release accidents with fire-only. Incident delay represents less that four percent of the impact total for explosions compared to about five percent of the total for accidents with fires. Table 21shows the impacts for enroute accidents without a release. For these accidents, fatalities and injuries still account for most of the impacts and together total about 82 percent of the impacts. Incident delay represents about 10 percent of the total. Unlike the release accidents, there are no impacts attributed to clean-up costs, product loss, and environmental damage. The distribution of the costs differs for leak enroute incidents when compared to enroute accidents. Table 22 shows that about 74 percent of the cost for leak incidents enroute is composed of incident delay cost. About 22 percent of the cost relates to injuries, 2.6 percent to cleanup costs, and about 1.25 to the cost of product loss, carrier damage, and property damage combined. Table 23 shows that for loading and unloading incidents, there are no incident delay costs but the cost to avoid injuries accounts for about 91 percent of the costs. Cleanup accounts for about five percent of the impact costs and product loss; carrier and property damage add up to about three percent of the total.
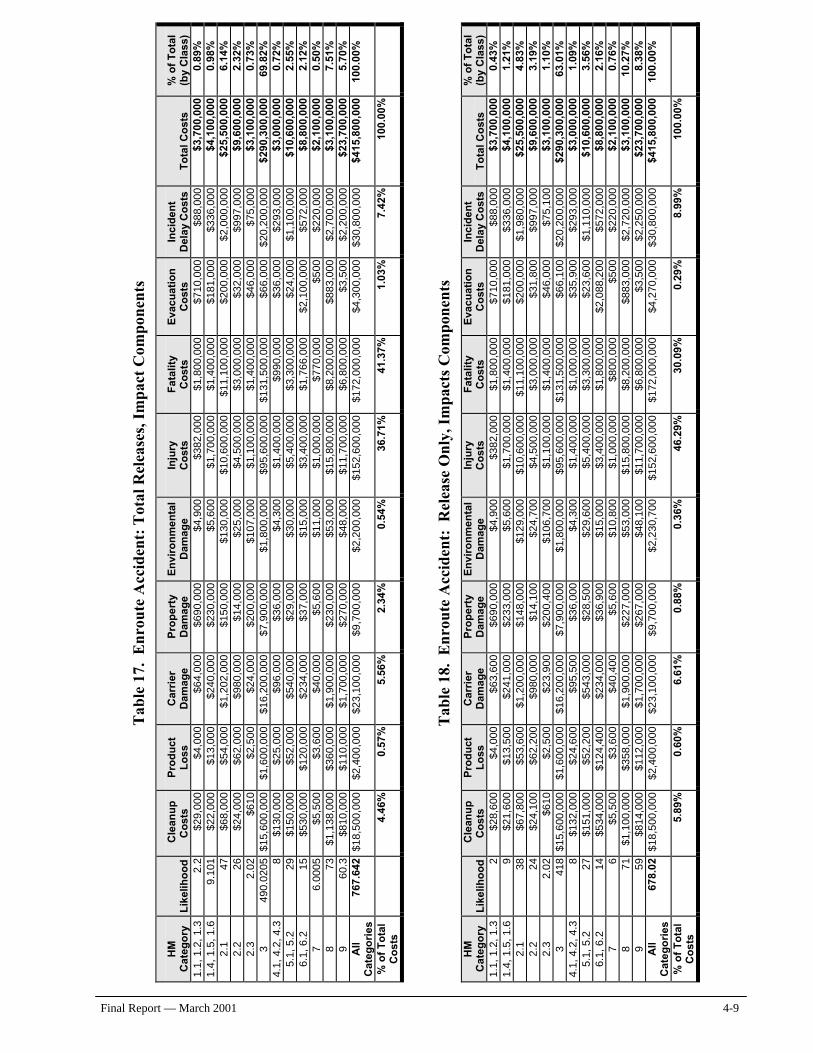
Final Report — March 2001 4-9
T
able
17.
Enr
oute
Acc
iden
t: T
otal
Rel
ease
s, I
mpa
ct C
ompo
nent
s
HM
C
ateg
ory
L
ikel
iho
od
C
lean
up
C
ost
s P
rod
uct
L
oss
C
arri
er
Dam
age
Pro
per
ty
Dam
age
En
viro
nm
enta
l D
amag
e In
jury
C
ost
s F
atal
ity
Co
sts
Eva
cuat
ion
C
ost
s In
cid
ent
Del
ay C
ost
s T
ota
l Co
sts
% o
f T
ota
l (b
y C
lass
) 1.
1, 1
.2,
1.3
2.2
$2
9,00
0 $4
,000
$6
4,00
0 $6
90,0
00
$4,9
00
$382
,000
$1
,800
,000
$7
10,0
00
$88,
000
$3,7
00,0
00
0.89
%
1.4,
1.5
, 1.
6 9.
101
$22,
000
$13,
000
$240
,000
$2
30,0
00
$5,6
00
$1,7
00,0
00
$1,4
00,0
00
$181
,000
$3
36,0
00
$4,1
00,0
00
0.98
%
2.1
47
$6
8,00
0 $5
4,00
0 $1
,202
,000
$1
50,0
00
$130
,000
$1
0,60
0,00
0 $1
1,10
0,00
0 $2
00,0
00
$2,0
00,0
00
$25,
500,
000
6.14
%
2.2
26
$2
4,00
0 $6
2,00
0 $9
80,0
00
$14,
000
$25,
000
$4,5
00,0
00
$3,0
00,0
00
$32,
000
$997
,000
$9
,600
,000
2.
32%
2
.3
2.02
$6
10
$2,5
00
$24,
000
$200
,000
$1
07,0
00
$1,1
00,0
00
$1,4
00,0
00
$46,
000
$75,
000
$3,1
00,0
00
0.73
%
3 49
0.02
05
$15,
600,
000
$1,6
00,0
00
$16,
200,
000
$7,9
00,0
00
$1,8
00,0
00
$95,
600,
000
$131
,500
,000
$6
6,00
0 $2
0,20
0,00
0 $2
90,3
00,0
00
69.8
2%
4.1,
4.2
, 4.
3 8
$130
,000
$2
5,00
0 $9
6,00
0 $3
6,00
0 $4
,300
$1
,400
,000
$9
90,0
00
$36,
000
$293
,000
$3
,000
,000
0.
72%
5.
1, 5
.2
29
$150
,000
$5
2,00
0 $5
40,0
00
$29,
000
$30,
000
$5,4
00,0
00
$3,3
00,0
00
$24,
000
$1,1
00,0
00
$10,
600,
000
2.55
%
6.1,
6.2
15
$5
30,0
00
$120
,000
$2
34,0
00
$37,
000
$15,
000
$3,4
00,0
00
$1,7
66,0
00
$2,1
00,0
00
$572
,000
$8
,800
,000
2.
12%
7
6.00
05
$5,5
00
$3,6
00
$40,
000
$5,6
00
$11,
000
$1,0
00,0
00
$770
,000
$5
00
$220
,000
$2
,100
,000
0.
50%
8
73
$1,1
38,0
00
$360
,000
$1
,900
,000
$2
30,0
00
$53,
000
$15,
800,
000
$8,2
00,0
00
$883
,000
$2
,700
,000
$3
,100
,000
7.
51%
9
60
.3
$810
,000
$1
10,0
00
$1,7
00,0
00
$270
,000
$4
8,00
0 $1
1,70
0,00
0 $6
,800
,000
$3
,500
$2
,200
,000
$2
3,70
0,00
0 5.
70%
A
ll C
ateg
ori
es
767.
642
$18,
500,
000
$2,4
00,0
00
$23,
100,
000
$9,7
00,0
00
$2,2
00,0
00
$152
,600
,000
$1
72,0
00,0
00
$4,3
00,0
00
$30,
800,
000
$415
,800
,000
10
0.00
%
% o
f T
ota
l C
ost
s
4.46
%
0.57
%
5.56
%
2.34
%
0.54
%
36.7
1%
41.3
7%
1.03
%
7.42
%
100.
00%
T
able
18.
Enr
oute
Acc
iden
t: R
elea
se O
nly,
Im
pact
s C
ompo
nent
s H
M
Cat
ego
ry
Lik
elih
oo
d
Cle
anu
p
Co
sts
Pro
du
ct
Lo
ss
Car
rier
D
amag
e P
rop
erty
D
amag
e E
nvi
ron
men
tal
Dam
age
Inju
ry
Co
sts
Fat
alit
y C
ost
s E
vacu
atio
n
Co
sts
Inci
den
t D
elay
Co
sts
To
tal C
ost
s %
of
To
tal
(by
Cla
ss)
1.1,
1.2
, 1.
3 2
$28,
600
$4,0
00
$63,
600
$690
,000
$4
,900
$3
82,0
00
$1,8
00,0
00
$710
,000
$8
8,00
0 $3
,700
,000
0.
43%
1.
4, 1
.5,
1.6
9 $2
1,60
0 $1
3,50
0 $2
41,0
00
$233
,000
$5
,600
$1
,700
,000
$1
,400
,000
$1
81,0
00
$336
,000
$4
,100
,000
1.
21%
2
.1
38
$67,
800
$53,
600
$1,2
00,0
00
$148
,000
$1
29,0
00
$10,
600,
000
$11,
100,
000
$200
,000
$1
,980
,000
$2
5,50
0,00
0 4.
83%
2
.2
24
$24,
100
$62,
200
$980
,000
$1
4,10
0 $2
4,70
0 $4
,500
,000
$3
,000
,000
$3
1,80
0 $9
97,0
00
$9,6
00,0
00
3.19
%
2.3
2.
02
$610
$2
,500
$2
3,90
0 $2
00,4
00
$106
,700
$1
,100
,000
$1
,400
,000
$4
6,00
0 $7
5,10
0 $3
,100
,000
1.
10%
3
418
$15,
600,
000
$1,6
00,0
00
$16,
200,
000
$7,9
00,0
00
$1,8
00,0
00
$95,
600,
000
$131
,500
,000
$6
6,10
0 $2
0,20
0,00
0 $2
90,3
00,0
00
63.0
1%
4.1,
4.2
, 4.
3 8
$132
,000
$2
4,60
0 $9
5,50
0 $3
6,00
0 $4
,300
$1
,400
,000
$1
,000
,000
$3
5,90
0 $2
93,0
00
$3,0
00,0
00
1.09
%
5.1,
5.2
27
$1
51,0
00
$52,
200
$543
,000
$2
8,50
0 $2
9,60
0 $5
,400
,000
$3
,300
,000
$2
3,60
0 $1
,110
,000
$1
0,60
0,00
0 3.
56%
6.
1, 6
.2
14
$534
,000
$1
24,4
00
$234
,000
$3
6,90
0 $1
5,00
0 $3
,400
,000
$1
,800
,000
$2
,088
,200
$5
72,0
00
$8,8
00,0
00
2.16
%
7 6
$5,5
00
$3,6
00
$40,
400
$5,6
00
$10,
800
$1,0
00,0
00
$800
,000
$5
00
$220
,000
$2
,100
,000
0.
76%
8
71
$1,1
00,0
00
$358
,000
$1
,900
,000
$2
27,0
00
$53,
000
$15,
800,
000
$8,2
00,0
00
$883
,000
$2
,720
,000
$3
,100
,000
10
.27%
9
59
$814
,000
$1
12,0
00
$1,7
00,0
00
$267
,000
$4
8,10
0 $1
1,70
0,00
0 $6
,800
,000
$3
,500
$2
,250
,000
$2
3,70
0,00
0 8.
38%
A
ll C
ateg
ori
es
678.
02
$18,
500,
000
$2,4
00,0
00
$23,
100,
000
$9,7
00,0
00
$2,2
30,7
00
$152
,600
,000
$1
72,0
00,0
00
$4,2
70,0
00
$30,
800,
000
$415
,800
,000
10
0.00
%
% o
f T
ota
l C
ost
s
5.89
%
0.60
%
6.61
%
0.88
%
0.36
%
46.2
9%
30.0
9%
0.29
%
8.99
%
100.
00%
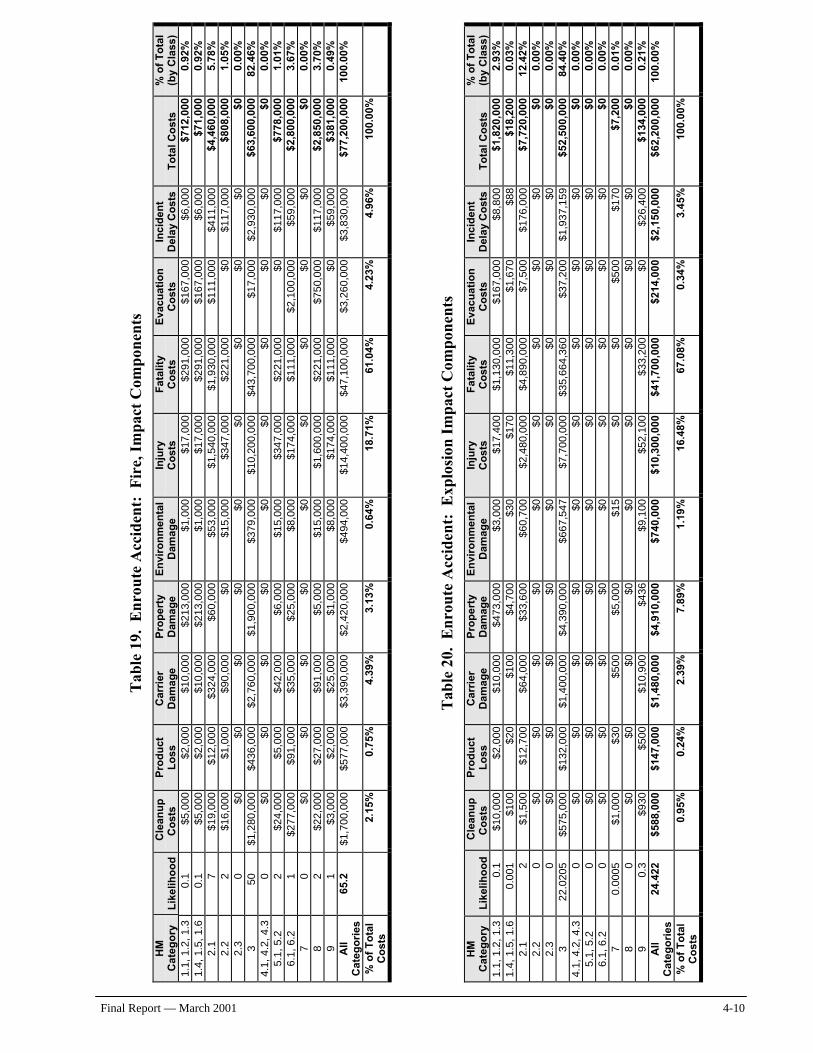
Final Report — March 2001 4-10
T
able
19.
Enr
oute
Acc
iden
t: F
ire,
Im
pact
Com
pone
nts
HM
C
ateg
ory
L
ikel
iho
od
C
lean
up
C
ost
s P
rod
uct
L
oss
C
arri
er
Dam
age
Pro
per
ty
Dam
age
En
viro
nm
enta
l D
amag
e In
jury
C
ost
s F
atal
ity
Co
sts
Eva
cuat
ion
C
ost
s In
cid
ent
Del
ay C
ost
s T
ota
l Co
sts
% o
f T
ota
l (b
y C
lass
) 1.
1, 1
.2,
1.3
0.1
$5
,000
$2
,000
$1
0,00
0 $2
13,0
00
$1,0
00
$17,
000
$291
,000
$1
67,0
00
$6,0
00
$712
,000
0.
92%
1.
4, 1
.5,
1.6
0
.1
$5,0
00
$2,0
00
$10,
000
$213
,000
$1
,000
$1
7,00
0 $2
91,0
00
$167
,000
$6
,000
$7
1,00
0 0.
92%
2
.1
7 $1
9,00
0 $1
2,00
0 $3
24,0
00
$60,
000
$53,
000
$1,5
40,0
00
$1,9
30,0
00
$111
,000
$4
11,0
00
$4,4
60,0
00
5.78
%
2.2
2
$16,
000
$1,0
00
$90,
000
$0
$15,
000
$347
,000
$2
21,0
00
$0
$117
,000
$8
08,0
00
1.05
%
2.3
0
$0
$0
$0
$0
$0
$0
$0
$0
$0
$0
0.00
%
3 50
$1
,280
,000
$4
36,0
00
$2,7
60,0
00
$1,9
00,0
00
$379
,000
$1
0,20
0,00
0 $4
3,70
0,00
0 $1
7,00
0 $2
,930
,000
$6
3,60
0,00
0 82
.46%
4.
1, 4
.2,
4.3
0 $0
$0
$0
$0
$0
$0
$0
$0
$0
$0
0.
00%
5.
1, 5
.2
2 $2
4,00
0 $5
,000
$4
2,00
0 $6
,000
$1
5,00
0 $3
47,0
00
$221
,000
$0
$1
17,0
00
$778
,000
1.
01%
6.
1, 6
.2
1 $2
77,0
00
$91,
000
$35,
000
$25,
000
$8,0
00
$174
,000
$1
11,0
00
$2,1
00,0
00
$59,
000
$2,8
00,0
00
3.67
%
7 0
$0
$0
$0
$0
$0
$0
$0
$0
$0
$0
0.00
%
8 2
$22,
000
$27,
000
$91,
000
$5,0
00
$15,
000
$1,6
00,0
00
$221
,000
$7
50,0
00
$117
,000
$2
,850
,000
3.
70%
9
1 $3
,000
$2
,000
$2
5,00
0 $1
,000
$8
,000
$1
74,0
00
$111
,000
$0
$5
9,00
0 $3
81,0
00
0.49
%
All
Cat
ego
ries
65
.2
$1,7
00,0
00
$577
,000
$3
,390
,000
$2
,420
,000
$4
94,0
00
$14,
400,
000
$47,
100,
000
$3,2
60,0
00
$3,8
30,0
00
$77,
200,
000
100.
00%
% o
f T
ota
l C
ost
s
2.15
%
0.75
%
4.39
%
3.13
%
0.64
%
18.7
1%
61.0
4%
4.23
%
4.96
%
100.
00%
T
able
20.
Enr
oute
Acc
iden
t: E
xplo
sion
Im
pact
Com
pone
nts
HM
C
ateg
ory
L
ikel
iho
od
C
lean
up
C
ost
s P
rod
uct
L
oss
C
arri
er
Dam
age
Pro
per
ty
Dam
age
En
viro
nm
enta
l D
amag
e In
jury
C
ost
s F
atal
ity
Co
sts
Eva
cuat
ion
C
ost
s In
cid
ent
Del
ay C
ost
s T
ota
l Co
sts
% o
f T
ota
l (b
y C
lass
) 1.
1, 1
.2,
1.3
0.1
$1
0,00
0 $2
,000
$1
0,00
0 $4
73,0
00
$3,0
00
$17,
400
$1,1
30,0
00
$167
,000
$8
,800
$1
,820
,000
2.
93%
1.
4, 1
.5,
1.6
0.00
1 $1
00
$20
$100
$4
,700
$3
0 $1
70
$11,
300
$1,6
70
$88
$18,
200
0.03
%
2.1
2
$1,5
00
$12,
700
$64,
000
$33,
600
$60,
700
$2,4
80,0
00
$4,8
90,0
00
$7,5
00
$176
,000
$7
,720
,000
12
.42%
2
.2
0 $0
$0
$0
$0
$0
$0
$0
$0
$0
$0
0.
00%
2
.3
0 $0
$0
$0
$0
$0
$0
$0
$0
$0
$0
0.
00%
3
22.0
205
$575
,000
$1
32,0
00
$1,4
00,0
00
$4,3
90,0
00
$667
,547
$7
,700
,000
$3
5,66
4,36
0 $3
7,20
0 $1
,937
,159
$5
2,50
0,00
0 84
.40%
4.
1, 4
.2,
4.3
0 $0
$0
$0
$0
$0
$0
$0
$0
$0
$0
0.
00%
5.
1, 5
.2
0 $0
$0
$0
$0
$0
$0
$0
$0
$0
$0
0.
00%
6.
1, 6
.2
0 $0
$0
$0
$0
$0
$0
$0
$0
$0
$0
0.
00%
7
0.00
05
$1,0
00
$30
$500
$5
,000
$1
5 $0
$0
$5
00
$170
$7
,200
0.
01%
8
0 $0
$0
$0
$0
$0
$0
$0
$0
$0
$0
0.
00%
9
0.3
$9
30
$500
$1
0,90
0 $4
36
$9,1
00
$52,
100
$33,
200
$0
$26,
400
$134
,000
0.
21%
A
ll C
ateg
ori
es
24.4
22
$588
,000
$1
47,0
00
$1,4
80,0
00
$4,9
10,0
00
$740
,000
$1
0,30
0,00
0 $4
1,70
0,00
0 $2
14,0
00
$2,1
50,0
00
$62,
200,
000
100.
00%
% o
f T
ota
l C
ost
s
0.95
%
0.24
%
2.39
%
7.89
%
1.19
%
16.4
8%
67.0
8%
0.34
%
3.45
%
100.
00%
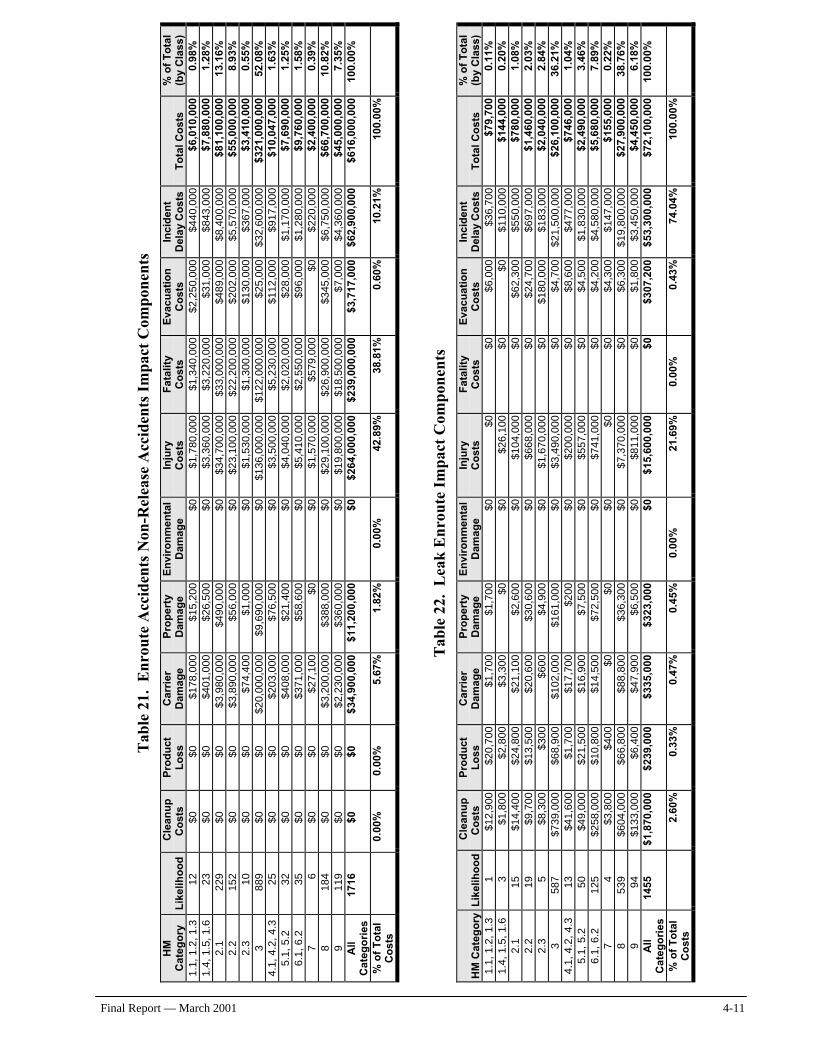
Final Report — March 2001 4-11
T
able
21.
Enr
oute
Acc
iden
ts N
on-R
elea
se A
ccid
ents
Im
pact
Com
pone
nts
HM
C
ateg
ory
L
ikel
iho
od
C
lean
up
C
ost
s P
rod
uct
L
oss
C
arri
er
Dam
age
Pro
per
ty
Dam
age
En
viro
nm
enta
l D
amag
e In
jury
C
ost
s F
atal
ity
Co
sts
Eva
cuat
ion
C
ost
s In
cid
ent
Del
ay C
ost
s T
ota
l Co
sts
% o
f T
ota
l (b
y C
lass
) 1.
1, 1
.2,
1.3
12
$0
$0
$178
,000
$1
5,20
0 $0
$1
,780
,000
$1
,340
,000
$2
,250
,000
$4
40,0
00
$6,0
10,0
00
0.98
%
1.4,
1.5
, 1.
6 23
$0
$0
$4
01,0
00
$26,
500
$0
$3,3
60,0
00
$3,2
20,0
00
$31,
000
$843
,000
$7
,880
,000
1.
28%
2
.1
229
$0
$0
$3,9
80,0
00
$490
,000
$0
$3
4,70
0,00
0 $3
3,00
0,00
0 $4
89,0
00
$8,4
00,0
00
$81,
100,
000
13.1
6%
2.2
15
2 $0
$0
$3
,890
,000
$5
6,00
0 $0
$2
3,10
0,00
0 $2
2,20
0,00
0 $2
02,0
00
$5,5
70,0
00
$55,
000,
000
8.93
%
2.3
10
$0
$0
$7
4,40
0 $1
,000
$0
$1
,530
,000
$1
,300
,000
$1
30,0
00
$367
,000
$3
,410
,000
0.
55%
3
889
$0
$0
$20,
000,
000
$9,6
90,0
00
$0
$136
,000
,000
$1
22,0
00,0
00
$25,
000
$32,
600,
000
$321
,000
,000
52
.08%
4.
1, 4
.2,
4.3
25
$0
$0
$203
,000
$7
6,50
0 $0
$3
,500
,000
$5
,230
,000
$1
12,0
00
$917
,000
$1
0,04
7,00
0 1.
63%
5.
1, 5
.2
32
$0
$0
$408
,000
$2
1,40
0 $0
$4
,040
,000
$2
,020
,000
$2
8,00
0 $1
,170
,000
$7
,690
,000
1.
25%
6.
1, 6
.2
35
$0
$0
$371
,000
$5
8,60
0 $0
$5
,410
,000
$2
,550
,000
$9
6,00
0 $1
,280
,000
$9
,760
,000
1.
58%
7
6 $0
$0
$2
7,10
0 $0
$0
$1
,570
,000
$5
79,0
00
$0
$220
,000
$2
,400
,000
0.
39%
8
184
$0
$0
$3,2
00,0
00
$388
,000
$0
$2
9,10
0,00
0 $2
6,90
0,00
0 $3
45,0
00
$6,7
50,0
00
$66,
700,
000
10.8
2%
9 11
9 $0
$0
$2
,230
,000
$3
60,0
00
$0
$19,
800,
000
$18,
500,
000
$7,0
00
$4,3
60,0
00
$45,
000,
000
7.35
%
All
Cat
ego
ries
17
16
$0
$0
$34,
900,
000
$11,
200,
000
$0
$264
,000
,000
$2
39,0
00,0
00
$3,7
17,0
00
$62,
900,
000
$616
,000
,000
10
0.00
%
% o
f T
ota
l C
ost
s
0.00
%
0.00
%
5.67
%
1.82
%
0.00
%
42.8
9%
38.8
1%
0.60
%
10.2
1%
100.
00%
T
able
22.
Lea
k E
nrou
te I
mpa
ct C
ompo
nent
s
HM
Cat
ego
ry
Lik
elih
oo
d
Cle
anu
p
Co
sts
Pro
du
ct
Lo
ss
Car
rier
D
amag
e P
rop
erty
D
amag
e E
nvi
ron
men
tal
Dam
age
Inju
ry
Co
sts
Fat
alit
y C
ost
s E
vacu
atio
n
Co
sts
Inci
den
t D
elay
Co
sts
To
tal C
ost
s %
of
To
tal
(by
Cla
ss)
1.1,
1.2
, 1.
3 1
$12,
900
$20,
700
$1,7
00
$1,7
00
$0
$0
$0
$6,0
00
$36,
700
$79,
700
0.11
%
1.4,
1.5
, 1.
6 3
$1,8
00
$2,8
00
$3,3
00
$0
$0
$26,
100
$0
$0
$110
,000
$1
44,0
00
0.20
%
2.1
15
$1
4,40
0 $2
4,80
0 $2
1,10
0 $2
,600
$0
$1
04,0
00
$0
$62,
300
$550
,000
$7
80,0
00
1.08
%
2.2
19
$9
,700
$1
3,50
0 $2
0,60
0 $3
0,60
0 $0
$6
68,0
00
$0
$24,
700
$697
,000
$1
,460
,000
2.
03%
2
.3
5 $
8,3
00
$300
$6
00
$4,9
00
$0
$1,6
70,0
00
$0
$180
,000
$1
83,0
00
$2,0
40,0
00
2.84
%
3 58
7 $7
39,0
00
$68,
900
$102
,000
$1
61,0
00
$0
$3,4
90,0
00
$0
$4,7
00
$21,
500,
000
$26,
100,
000
36.2
1%
4.1,
4.2
, 4.
3 13
$4
1,60
0 $1
,700
$1
7,70
0 $2
00
$0
$200
,000
$0
$8
,600
$4
77,0
00
$746
,000
1.
04%
5.
1, 5
.2
50
$49,
000
$21,
500
$16,
900
$7,5
00
$0
$557
,000
$0
$4
,500
$1
,830
,000
$2
,490
,000
3.
46%
6.
1, 6
.2
125
$258
,000
$1
0,80
0 $1
4,50
0 $7
2,50
0 $0
$7
41,0
00
$0
$4,2
00
$4,5
80,0
00
$5,6
80,0
00
7.89
%
7 4
$3,8
00
$400
$0
$0
$0
$0
$0
$4
,300
$1
47,0
00
$155
,000
0.
22%
8
539
$604
,000
$6
6,80
0 $8
8,80
0 $3
6,30
0 $0
$7
,370
,000
$0
$6
,300
$1
9,80
0,00
0 $2
7,90
0,00
0 38
.76%
9
94
$133
,000
$6
,400
$4
7,90
0 $6
,500
$0
$8
11,0
00
$0
$1,8
00
$3,4
50,0
00
$4,4
50,0
00
6.18
%
All
Cat
ego
ries
14
55
$1,8
70,0
00
$239
,000
$3
35,0
00
$323
,000
$0
$1
5,60
0,00
0 $0
$3
07,2
00
$53,
300,
000
$72,
100,
000
100.
00%
% o
f T
ota
l C
ost
s
2.60
%
0.33
%
0.47
%
0.45
%
0.00
%
21.6
9%
0.00
%
0.43
%
74.0
4%
100.
00%
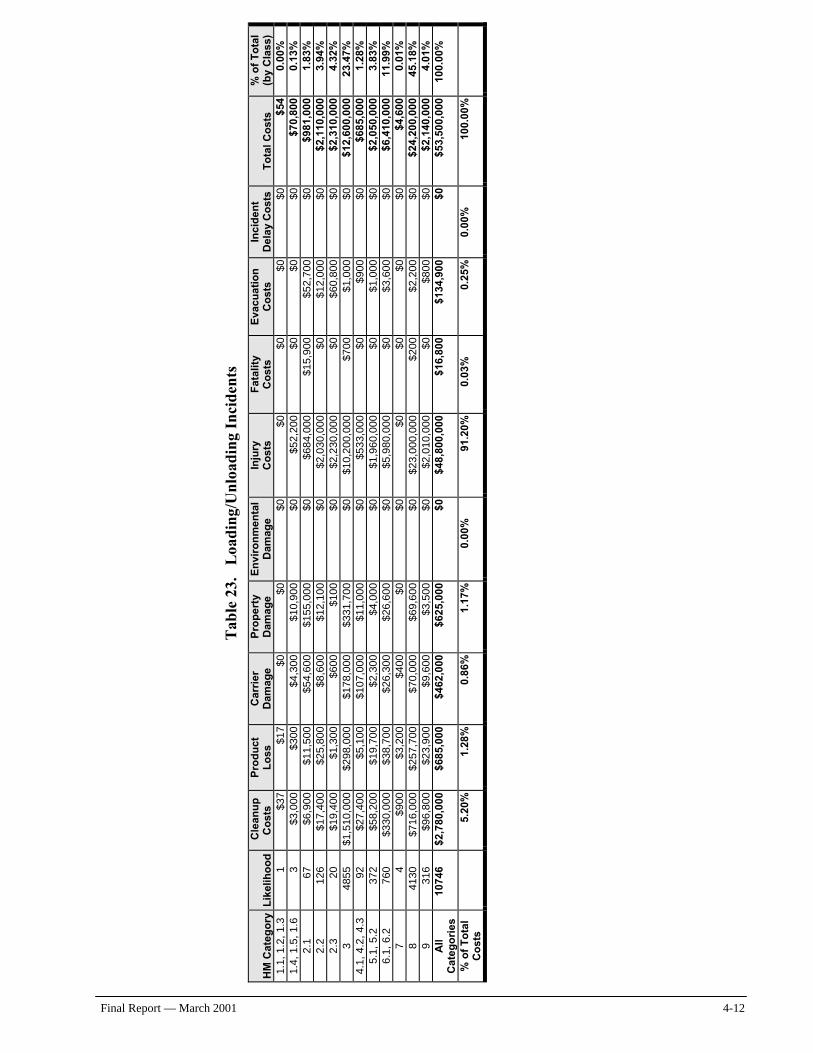
Final Report — March 2001 4-12
T
able
23.
L
oadi
ng/U
nloa
ding
Inc
iden
ts
HM
Cat
ego
ry
Lik
elih
oo
d
Cle
anu
p
Co
sts
Pro
du
ct
Lo
ss
Car
rier
D
amag
e P
rop
erty
D
amag
e E
nvi
ron
men
tal
Dam
age
Inju
ry
Co
sts
Fat
alit
y C
ost
s E
vacu
atio
n
Co
sts
Inci
den
t D
elay
Co
sts
To
tal C
ost
s %
of
To
tal
(by
Cla
ss)
1.1,
1.2
, 1.
3 1
$37
$17
$0
$0
$0
$0
$0
$0
$0
$54
0.00
%
1.4,
1.5
, 1.
6 3
$3,0
00
$300
$4
,300
$1
0,90
0 $0
$5
2,20
0 $0
$0
$0
$7
0,80
0 0.
13%
2
.1
67
$6,9
00
$11,
500
$54,
600
$155
,000
$0
$6
84,0
00
$15,
900
$52,
700
$0
$981
,000
1.
83%
2
.2
126
$17,
400
$25,
800
$8,6
00
$12,
100
$0
$2,0
30,0
00
$0
$12,
000
$0
$2,1
10,0
00
3.94
%
2.3
20
$1
9,40
0 $1
,300
$6
00
$100
$0
$2
,230
,000
$0
$6
0,80
0 $0
$2
,310
,000
4.
32%
3
4855
$1
,510
,000
$2
98,0
00
$178
,000
$3
31,7
00
$0
$10,
200,
000
$700
$1
,000
$0
$1
2,60
0,00
0 23
.47%
4.
1, 4
.2,
4.3
92
$27,
400
$5,1
00
$107
,000
$1
1,00
0 $0
$5
33,0
00
$0
$900
$0
$6
85,0
00
1.28
%
5.1,
5.2
37
2 $5
8,20
0 $1
9,70
0 $2
,300
$4
,000
$0
$1
,960
,000
$0
$1
,000
$0
$2
,050
,000
3.
83%
6.
1, 6
.2
760
$330
,000
$3
8,70
0 $2
6,30
0 $2
6,60
0 $0
$5
,980
,000
$0
$
3,6
00
$0
$6,4
10,0
00
11.9
9%
7 4
$900
$3
,200
$4
00
$0
$0
$0
$0
$0
$0
$4,6
00
0.01
%
8 41
30
$716
,000
$2
57,7
00
$70,
000
$69,
600
$0
$23,
000,
000
$200
$2
,200
$0
$2
4,20
0,00
0 45
.18%
9
316
$96,
800
$23,
900
$9,6
00
$3,5
00
$0
$2,0
10,0
00
$0
$800
$0
$2
,140
,000
4.
01%
A
ll C
ateg
ori
es
1074
6 $2
,780
,000
$6
85,0
00
$462
,000
$6
25,0
00
$0
$48,
800,
000
$16,
800
$134
,900
$0
$5
3,50
0,00
0 10
0.00
%
% o
f T
ota
l C
ost
s
5.20
%
1.28
%
0.86
%
1.17
%
0.00
%
91.2
0%
0.03
%
0.25
%
0.00
%
100.
00%
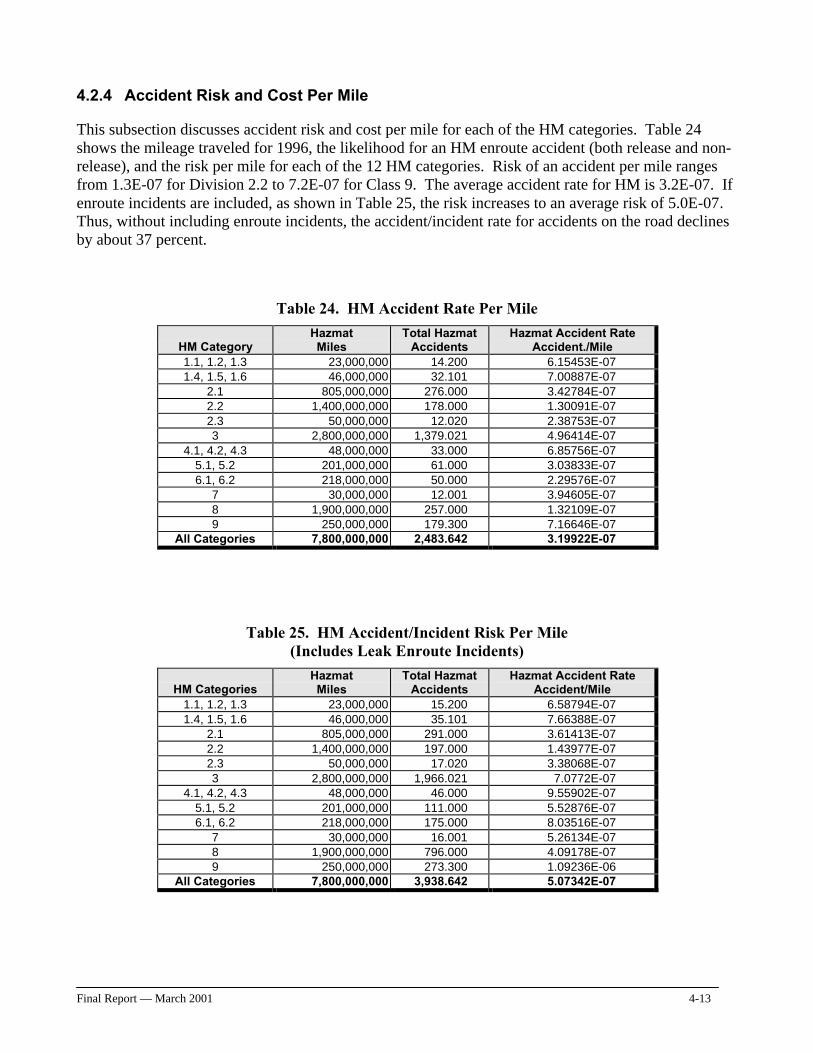
Final Report — March 2001 4-13
4.2.4 Accident Risk and Cost Per Mile
This subsection discusses accident risk and cost per mile for each of the HM categories. Table 24 shows the mileage traveled for 1996, the likelihood for an HM enroute accident (both release and non-release), and the risk per mile for each of the 12 HM categories. Risk of an accident per mile ranges from 1.3E-07 for Division 2.2 to 7.2E-07 for Class 9. The average accident rate for HM is 3.2E-07. If enroute incidents are included, as shown in Table 25, the risk increases to an average risk of 5.0E-07. Thus, without including enroute incidents, the accident/incident rate for accidents on the road declines by about 37 percent.
Table 24. HM Accident Rate Per Mile
HM Category Hazmat Miles
Total Hazmat Accidents
Hazmat Accident Rate Accident./Mile
1.1, 1.2, 1.3 23,000,000 14.200 6.15453E-07 1.4, 1.5, 1.6 46,000,000 32.101 7.00887E-07
2.1 805,000,000 276.000 3.42784E-07 2.2 1,400,000,000 178.000 1.30091E-07 2.3 50,000,000 12.020 2.38753E-07 3 2,800,000,000 1,379.021 4.96414E-07
4.1, 4.2, 4.3 48,000,000 33.000 6.85756E-07 5.1, 5.2 201,000,000 61.000 3.03833E-07 6.1, 6.2 218,000,000 50.000 2.29576E-07
7 30,000,000 12.001 3.94605E-07 8 1,900,000,000 257.000 1.32109E-07 9 250,000,000 179.300 7.16646E-07
All Categories 7,800,000,000 2,483.642 3.19922E-07
Table 25. HM Accident/Incident Risk Per Mile (Includes Leak Enroute Incidents)
HM Categories Hazmat Miles
Total Hazmat Accidents
Hazmat Accident Rate Accident/Mile
1.1, 1.2, 1.3 23,000,000 15.200 6.58794E-07 1.4, 1.5, 1.6 46,000,000 35.101 7.66388E-07
2.1 805,000,000 291.000 3.61413E-07 2.2 1,400,000,000 197.000 1.43977E-07 2.3 50,000,000 17.020 3.38068E-07 3 2,800,000,000 1,966.021 7.0772E-07
4.1, 4.2, 4.3 48,000,000 46.000 9.55902E-07 5.1, 5.2 201,000,000 111.000 5.52876E-07 6.1, 6.2 218,000,000 175.000 8.03516E-07
7 30,000,000 16.001 5.26134E-07 8 1,900,000,000 796.000 4.09178E-07 9 250,000,000 273.300 1.09236E-06
All Categories 7,800,000,000 3,938.642 5.07342E-07
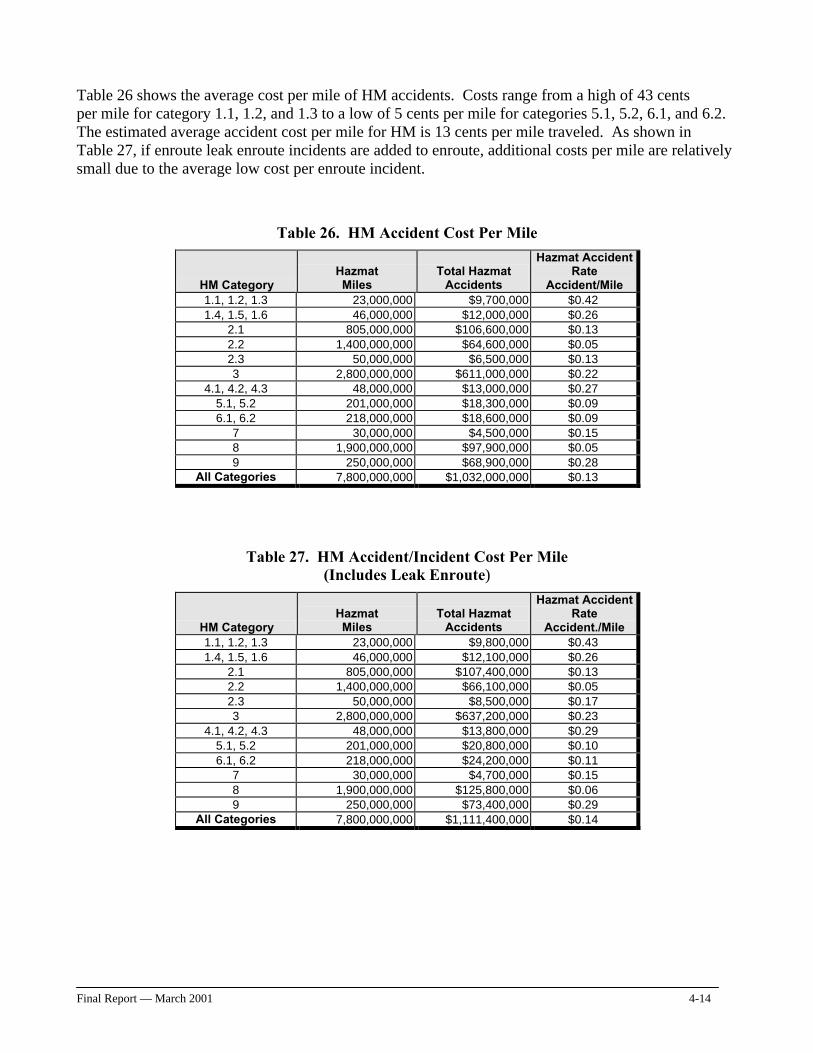
Final Report — March 2001 4-14
Table 26 shows the average cost per mile of HM accidents. Costs range from a high of 43 cents per mile for category 1.1, 1.2, and 1.3 to a low of 5 cents per mile for categories 5.1, 5.2, 6.1, and 6.2. The estimated average accident cost per mile for HM is 13 cents per mile traveled. As shown in Table 27, if enroute leak enroute incidents are added to enroute, additional costs per mile are relatively small due to the average low cost per enroute incident.
Table 26. HM Accident Cost Per Mile
HM Category Hazmat Miles
Total Hazmat Accidents
Hazmat Accident Rate
Accident/Mile 1.1, 1.2, 1.3 23,000,000 $9,700,000 $0.42 1.4, 1.5, 1.6 46,000,000 $12,000,000 $0.26
2.1 805,000,000 $106,600,000 $0.13 2.2 1,400,000,000 $64,600,000 $0.05 2.3 50,000,000 $6,500,000 $0.13 3 2,800,000,000 $611,000,000 $0.22
4.1, 4.2, 4.3 48,000,000 $13,000,000 $0.27 5.1, 5.2 201,000,000 $18,300,000 $0.09 6.1, 6.2 218,000,000 $18,600,000 $0.09
7 30,000,000 $4,500,000 $0.15 8 1,900,000,000 $97,900,000 $0.05 9 250,000,000 $68,900,000 $0.28
All Categories 7,800,000,000 $1,032,000,000 $0.13
Table 27. HM Accident/Incident Cost Per Mile (Includes Leak Enroute)
HM Category Hazmat Miles
Total Hazmat Accidents
Hazmat Accident Rate
Accident./Mile 1.1, 1.2, 1.3 23,000,000 $9,800,000 $0.43 1.4, 1.5, 1.6 46,000,000 $12,100,000 $0.26
2.1 805,000,000 $107,400,000 $0.13 2.2 1,400,000,000 $66,100,000 $0.05 2.3 50,000,000 $8,500,000 $0.17 3 2,800,000,000 $637,200,000 $0.23
4.1, 4.2, 4.3 48,000,000 $13,800,000 $0.29 5.1, 5.2 201,000,000 $20,800,000 $0.10 6.1, 6.2 218,000,000 $24,200,000 $0.11
7 30,000,000 $4,700,000 $0.15 8 1,900,000,000 $125,800,000 $0.06 9 250,000,000 $73,400,000 $0.29
All Categories 7,800,000,000 $1,111,400,000 $0.14
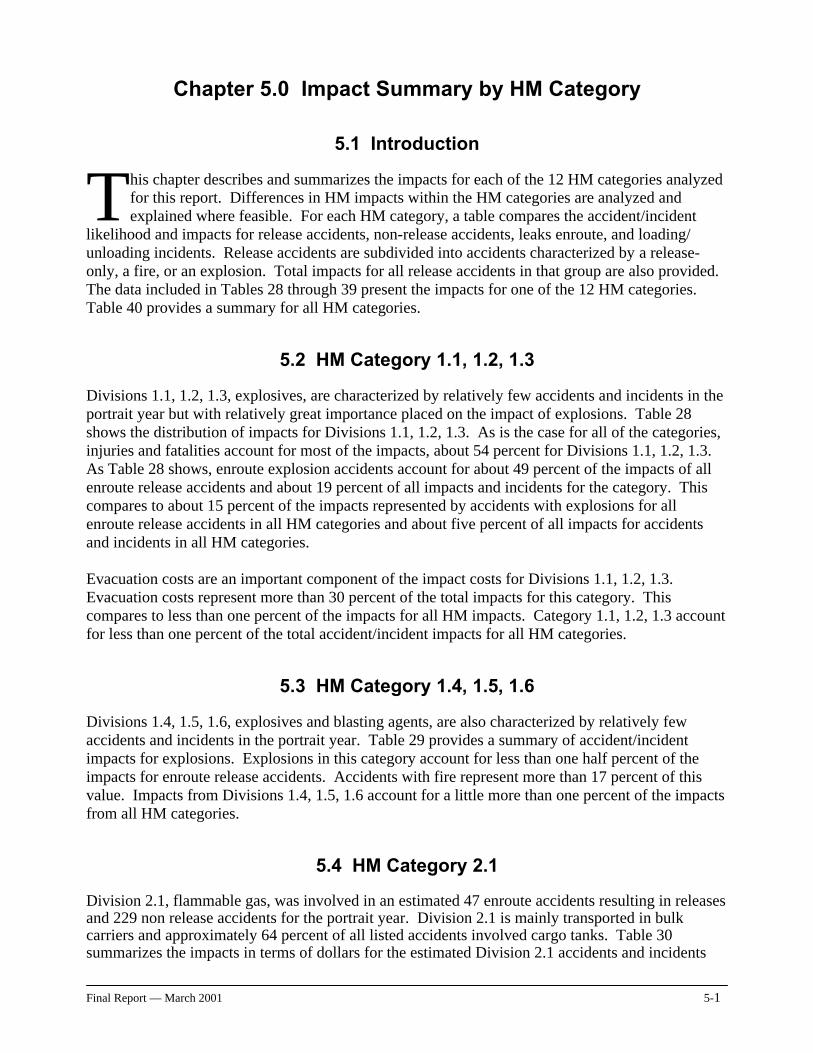
Final Report — March 2001 5-1
Chapter 5.0 Impact Summary by HM Category
5.1 Introduction
his chapter describes and summarizes the impacts for each of the 12 HM categories analyzed for this report. Differences in HM impacts within the HM categories are analyzed and explained where feasible. For each HM category, a table compares the accident/incident
likelihood and impacts for release accidents, non-release accidents, leaks enroute, and loading/ unloading incidents. Release accidents are subdivided into accidents characterized by a release-only, a fire, or an explosion. Total impacts for all release accidents in that group are also provided. The data included in Tables 28 through 39 present the impacts for one of the 12 HM categories. Table 40 provides a summary for all HM categories.
5.2 HM Category 1.1, 1.2, 1.3
Divisions 1.1, 1.2, 1.3, explosives, are characterized by relatively few accidents and incidents in the portrait year but with relatively great importance placed on the impact of explosions. Table 28 shows the distribution of impacts for Divisions 1.1, 1.2, 1.3. As is the case for all of the categories, injuries and fatalities account for most of the impacts, about 54 percent for Divisions 1.1, 1.2, 1.3. As Table 28 shows, enroute explosion accidents account for about 49 percent of the impacts of all enroute release accidents and about 19 percent of all impacts and incidents for the category. This compares to about 15 percent of the impacts represented by accidents with explosions for all enroute release accidents in all HM categories and about five percent of all impacts for accidents and incidents in all HM categories. Evacuation costs are an important component of the impact costs for Divisions 1.1, 1.2, 1.3. Evacuation costs represent more than 30 percent of the total impacts for this category. This compares to less than one percent of the impacts for all HM impacts. Category 1.1, 1.2, 1.3 account for less than one percent of the total accident/incident impacts for all HM categories.
5.3 HM Category 1.4, 1.5, 1.6
Divisions 1.4, 1.5, 1.6, explosives and blasting agents, are also characterized by relatively few accidents and incidents in the portrait year. Table 29 provides a summary of accident/incident impacts for explosions. Explosions in this category account for less than one half percent of the impacts for enroute release accidents. Accidents with fire represent more than 17 percent of this value. Impacts from Divisions 1.4, 1.5, 1.6 account for a little more than one percent of the impacts from all HM categories.
5.4 HM Category 2.1
Division 2.1, flammable gas, was involved in an estimated 47 enroute accidents resulting in releases and 229 non release accidents for the portrait year. Division 2.1 is mainly transported in bulk carriers and approximately 64 percent of all listed accidents involved cargo tanks. Table 30 summarizes the impacts in terms of dollars for the estimated Division 2.1 accidents and incidents
T
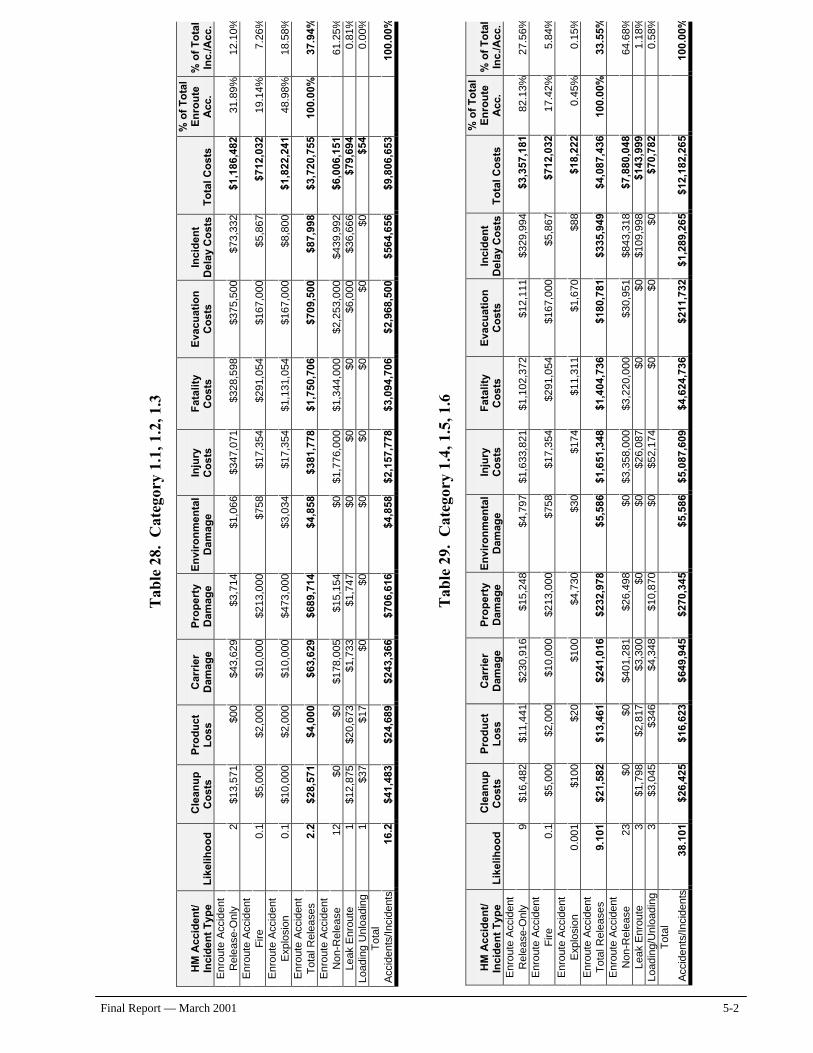
Final Report — March 2001 5-2
Tab
le 2
8. C
ateg
ory
1.1,
1.2
, 1.3
HM
Acc
iden
t/
Inci
den
t T
ype
Lik
elih
oo
d
Cle
anu
p
Co
sts
Pro
du
ct
Lo
ss
Car
rier
D
amag
e P
rop
erty
D
amag
e E
nvi
ron
men
tal
Dam
age
Inju
ry
Co
sts
Fat
alit
y C
ost
s E
vacu
atio
n
Co
sts
Inci
den
t D
elay
Co
sts
To
tal C
ost
s
% o
f T
ota
l E
nro
ute
A
cc.
% o
f T
ota
l In
c./A
cc.
Enr
oute
Acc
iden
t
Rel
ease
-Onl
y 2
$13,
571
$00
$43,
629
$3,7
14
$1,0
66$3
47,0
71
$328
,598
$375
,500
$73,
332
$1,1
86,4
8231
.89%
12.1
0%E
nrou
te A
ccid
ent
F
ire
0.1
$5,0
00
$2,0
00$1
0,00
0$2
13,0
00
$758
$17,
354
$291
,054
$167
,000
$5,8
67
$712
,032
19.1
4%7.
26%
Enr
oute
Acc
iden
t
Exp
losi
on
0.1
$10,
000
$2,0
00$1
0,00
0$4
73,0
00
$3,0
34$1
7,35
4 $1
,131
,054
$167
,000
$8,8
00
$1,8
22,2
4148
.98%
18.5
8%E
nrou
te A
ccid
ent
T
otal
Rel
ease
s 2.
2$2
8,57
1 $4
,000
$63,
629
$689
,714
$4
,858
$381
,778
$1
,750
,706
$709
,500
$87,
998
$3,7
20,7
5510
0.00
%37
.94%
Enr
oute
Acc
iden
t
Non
-Rel
ease
12
$0
$0$1
78,0
05$1
5,15
4 $0
$1,7
76,0
00
$1,3
44,0
00$2
,253
,000
$439
,992
$6
,006
,151
61
.25%
Leak
Enr
oute
1
$12,
875
$20,
673
$1,7
33$1
,747
$0
$0
$0$6
,000
$36,
666
$79,
694
0.
81%
Load
ing
Unl
oadi
ng
1$3
7 $1
7$0
$0
$0$0
$0
$0$0
$5
4
0.00
%T
otal
Acc
iden
ts/In
cide
nts
16.2
$41,
483
$24,
689
$243
,366
$706
,616
$4
,858
$2,1
57,7
78
$3,0
94,7
06$2
,968
,500
$564
,656
$9
,806
,653
10
0.00
%
Tab
le 2
9. C
ateg
ory
1.4,
1.5
, 1.6
HM
Acc
iden
t/
Inci
den
t T
ype
L
ikel
iho
od
C
lean
up
C
ost
s P
rod
uct
L
oss
C
arri
er
Dam
age
Pro
per
ty
Dam
age
En
viro
nm
enta
l D
amag
e In
jury
C
ost
s F
atal
ity
Co
sts
Eva
cuat
ion
C
ost
s In
cid
ent
Del
ay C
ost
s T
ota
l Co
sts
% o
f T
ota
l E
nro
ute
A
cc.
% o
f T
ota
lIn
c./A
cc.
Enr
oute
Acc
iden
t
Rel
ease
-Onl
y 9
$16,
482
$11,
441
$230
,916
$1
5,24
8$4
,797
$1
,633
,821
$1,1
02,3
72$1
2,11
1 $3
29,9
94$3
,357
,181
82
.13%
27.5
6%E
nrou
te A
ccid
ent
F
ire
0.1
$5,0
00$2
,000
$10,
000
$213
,000
$758
$1
7,35
4$2
91,0
54$1
67,0
00
$5,8
67$7
12,0
32
17.4
2%5.
84%
Enr
oute
Acc
iden
t
Exp
losi
on
0.00
1$1
00$2
0$1
00
$4,7
30$3
0 $1
74$1
1,31
1$1
,670
$8
8$1
8,22
2 0.
45%
0.15
%E
nrou
te A
ccid
ent
T
otal
Rel
ease
s 9.
101
$21,
582
$13,
461
$241
,016
$2
32,9
78$5
,586
$1
,651
,348
$1,4
04,7
36$1
80,7
81
$335
,949
$4,0
87,4
36
100.
00%
33.5
5%E
nrou
te A
ccid
ent
N
on-R
elea
se
23$0
$0$4
01,2
81
$26,
498
$0
$3,3
58,0
00$3
,220
,000
$30,
951
$843
,318
$7,8
80,0
48
64.6
8%Le
ak E
nrou
te
3$1
,798
$2,8
17$3
,300
$0
$0
$26,
087
$0$0
$1
09,9
98$1
43,9
99
1.18
%Lo
adin
g/U
nloa
ding
3
$3,0
45$3
46$4
,348
$1
0,87
0$0
$5
2,17
4$0
$0
$0$7
0,78
2
0.58
%T
otal
Acc
iden
ts/In
cide
nts
38.1
01$2
6,42
5$1
6,62
3$6
49,9
45
$270
,345
$5,5
86
$5,0
87,6
09$4
,624
,736
$211
,732
$1
,289
,265
$12,
182,
265
10
0.00
%
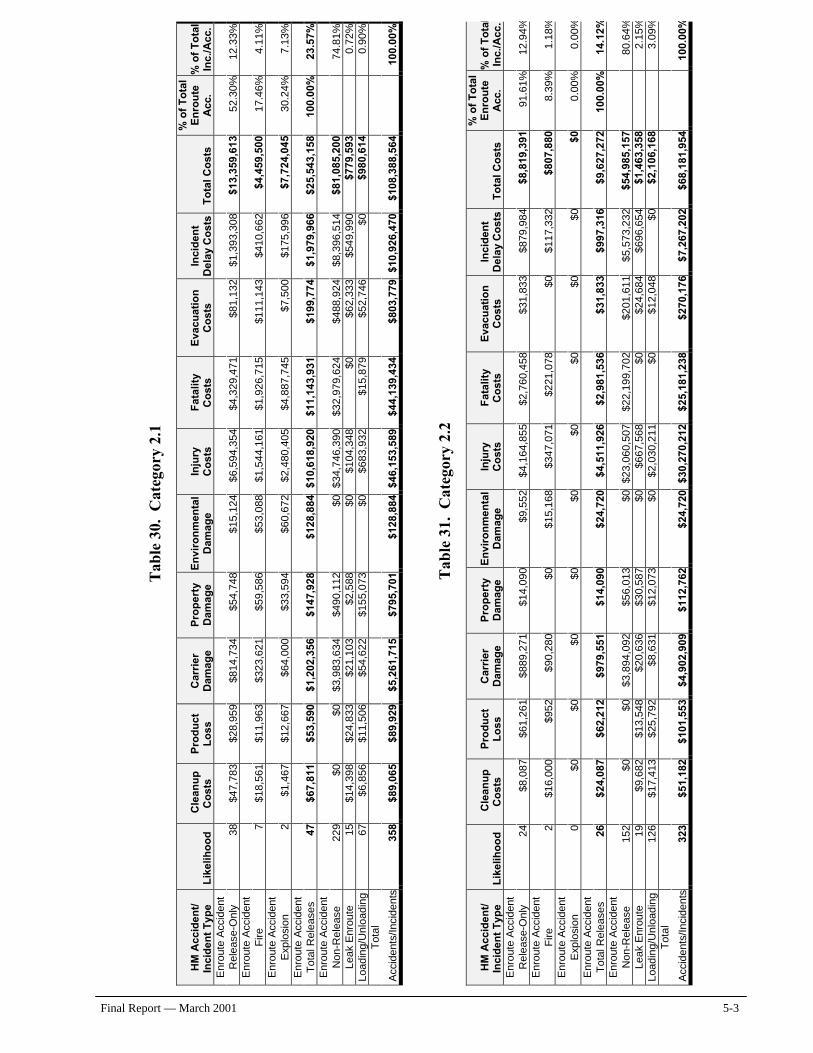
Final Report — March 2001 5-3
Tab
le 3
0. C
ateg
ory
2.1
HM
Acc
iden
t/
Inci
den
t T
ype
L
ikel
iho
od
C
lean
up
C
ost
s P
rod
uct
L
oss
C
arri
er
Dam
age
Pro
per
ty
Dam
age
En
viro
nm
enta
l D
amag
e In
jury
C
ost
s F
atal
ity
Co
sts
Eva
cuat
ion
C
ost
s In
cid
ent
Del
ay C
ost
s T
ota
l Co
sts
% o
f T
ota
l E
nro
ute
A
cc.
% o
f T
ota
l In
c./A
cc.
Enr
oute
Acc
iden
t
Rel
ease
-Onl
y 38
$47,
783
$28,
959
$814
,734
$5
4,74
8$1
5,12
4 $6
,594
,354
$4,3
29,4
71$8
1,13
2 $1
,393
,308
$13,
359,
613
52.3
0%12
.33%
Enr
oute
Acc
iden
t
Fire
7
$18,
561
$11,
963
$323
,621
$5
9,58
6$5
3,08
8 $1
,544
,161
$1,9
26,7
15$1
11,1
43
$410
,662
$4,4
59,5
00
17.4
6%4.
11%
Enr
oute
Acc
iden
t
Exp
losi
on
2$1
,467
$12,
667
$64,
000
$33,
594
$60,
672
$2,4
80,4
05$4
,887
,745
$7,5
00
$175
,996
$7,7
24,0
45
30.2
4%7.
13%
Enr
oute
Acc
iden
t
Tot
al R
elea
ses
47$6
7,81
1$5
3,59
0$1
,202
,356
$1
47,9
28$1
28,8
84
$10,
618,
920
$11,
143,
931
$199
,774
$1
,979
,966
$25,
543,
158
100.
00%
23.5
7%E
nrou
te A
ccid
ent
N
on-R
elea
se
229
$0$0
$3,9
83,6
34
$490
,112
$0
$34,
746,
390
$32,
979,
624
$488
,924
$8
,396
,514
$81,
085,
200
74
.81%
Leak
Enr
oute
15
$14,
398
$24,
833
$21,
103
$2,5
88$0
$1
04,3
48$0
$62,
333
$549
,990
$779
,593
0.
72%
Load
ing/
Unl
oadi
ng
67$6
,856
$11,
506
$54,
622
$155
,073
$0
$683
,932
$15,
879
$52,
746
$0$9
80,6
14
0.90
%T
otal
Acc
iden
ts/In
cide
nts
358
$89,
065
$89,
929
$5,2
61,7
15
$795
,701
$128
,884
$4
6,15
3,58
9$4
4,13
9,43
4$8
03,7
79
$10,
926,
470
$108
,388
,564
10
0.00
%
Tab
le 3
1. C
ateg
ory
2.2
HM
Acc
iden
t/
Inci
den
t T
ype
L
ikel
iho
od
C
lean
up
C
ost
s P
rod
uct
L
oss
C
arri
er
Dam
age
Pro
per
ty
Dam
age
En
viro
nm
enta
l D
amag
e In
jury
C
ost
s F
atal
ity
Co
sts
Eva
cuat
ion
C
ost
s In
cid
ent
Del
ay C
ost
s T
ota
l Co
sts
% o
f T
ota
l E
nro
ute
A
cc.
% o
f T
ota
lIn
c./A
cc.
Enr
oute
Acc
iden
t
Rel
ease
-Onl
y 24
$8,0
87$6
1,26
1$8
89,2
71
$14,
090
$9,5
52
$4,1
64,8
55$2
,760
,458
$31,
833
$879
,984
$8,8
19,3
91
91.6
1%12
.94%
Enr
oute
Acc
iden
t
Fire
2
$16,
000
$952
$90,
280
$0$1
5,16
8 $3
47,0
71$2
21,0
78$0
$117
,332
$807
,880
8.
39%
1.18
%E
nrou
te A
ccid
ent
E
xplo
sion
0
$0$0
$0
$0$0
$0
$0$0
$0$0
0.
00%
0.00
%E
nrou
te A
ccid
ent
T
otal
Rel
ease
s 26
$24,
087
$62,
212
$979
,551
$1
4,09
0$2
4,72
0 $4
,511
,926
$2,9
81,5
36$3
1,83
3$9
97,3
16$9
,627
,272
10
0.00
%14
.12%
Enr
oute
Acc
iden
t
Non
-Rel
ease
15
2$0
$0$3
,894
,092
$5
6,01
3$0
$2
3,06
0,50
7$2
2,19
9,70
2$2
01,6
11$5
,573
,232
$54,
985,
157
80
.64%
Leak
Enr
oute
19
$9,6
82$1
3,54
8$2
0,63
6 $3
0,58
7$0
$6
67,5
68$0
$24,
684
$696
,654
$1,4
63,3
58
2.15
%Lo
adin
g/U
nloa
ding
12
6$1
7,41
3$2
5,79
2$8
,631
$1
2,07
3$0
$2
,030
,211
$0$1
2,04
8$0
$2,1
06,1
68
3.09
%T
otal
Acc
iden
ts/In
cide
nts
323
$51,
182
$101
,553
$4,9
02,9
09
$112
,762
$24,
720
$30,
270,
212
$25,
181,
238
$270
,176
$7,2
67,2
02$6
8,18
1,95
4
100.
00%
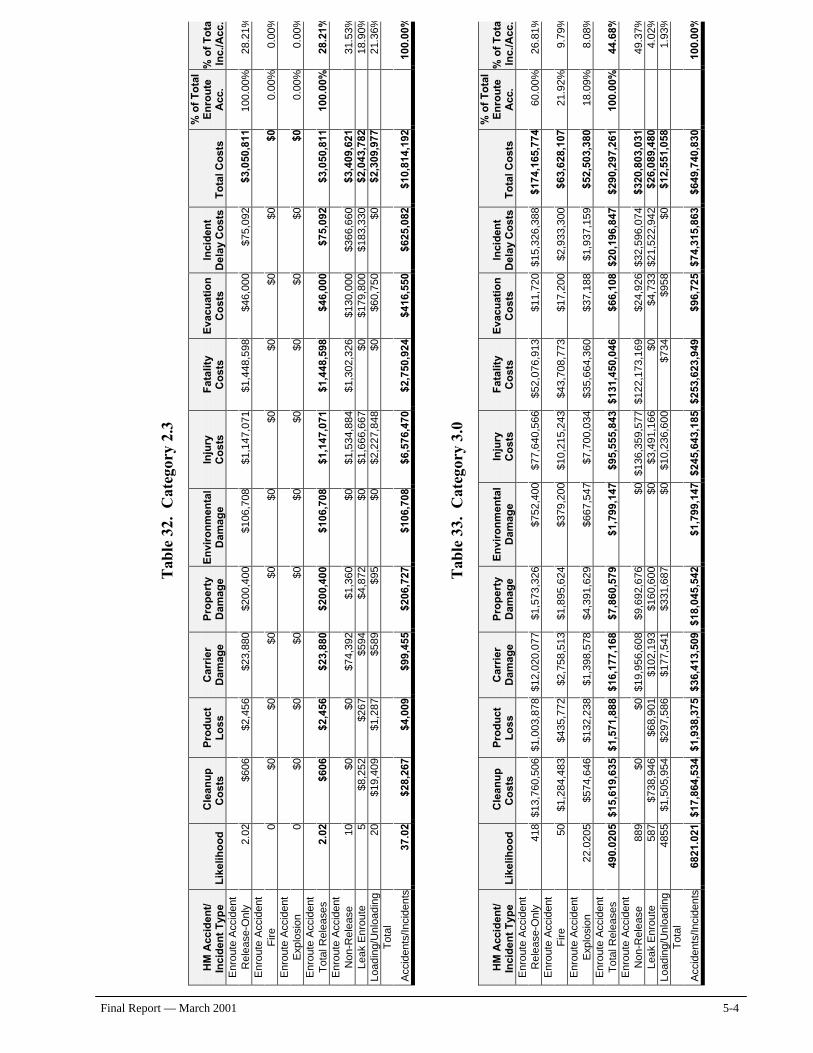
Final Report — March 2001 5-4
Tab
le 3
2. C
ateg
ory
2.3
HM
Acc
iden
t/
Inci
den
t T
ype
L
ikel
iho
od
C
lean
up
C
ost
s P
rod
uct
L
oss
C
arri
er
Dam
age
Pro
per
ty
Dam
age
En
viro
nm
enta
l D
amag
e In
jury
C
ost
s F
atal
ity
Co
sts
Eva
cuat
ion
C
ost
s In
cid
ent
Del
ay C
ost
s T
ota
l Co
sts
% o
f T
ota
l E
nro
ute
A
cc.
% o
f T
ota
lIn
c./A
cc.
Enr
oute
Acc
iden
t
Rel
ease
-Onl
y 2.
02$6
06
$2,4
56$2
3,88
0$2
00,4
00
$106
,708
$1,1
47,0
71
$1,4
48,5
98$4
6,00
0$7
5,09
2 $3
,050
,811
100.
00%
28.2
1%E
nrou
te A
ccid
ent
F
ire
0$0
$0
$0$0
$0
$0
$0$0
$0
$00.
00%
0.00
%E
nrou
te A
ccid
ent
E
xplo
sion
0
$0
$0$0
$0
$0$0
$0
$0$0
$0
0.00
%0.
00%
Enr
oute
Acc
iden
t
Tot
al R
elea
ses
2.02
$606
$2
,456
$23,
880
$200
,400
$1
06,7
08$1
,147
,071
$1
,448
,598
$46,
000
$75,
092
$3,0
50,8
1110
0.00
%28
.21%
Enr
oute
Acc
iden
t
Non
-Rel
ease
10
$0
$0$7
4,39
2$1
,360
$0
$1,5
34,8
84
$1,3
02,3
26$1
30,0
00$3
66,6
60
$3,4
09,6
21
31.5
3%Le
ak E
nrou
te
5$8
,252
$2
67$5
94$4
,872
$0
$1,6
66,6
67
$0$1
79,8
00$1
83,3
30
$2,0
43,7
82
18.9
0%Lo
adin
g/U
nloa
ding
20
$19,
409
$1,2
87$5
89$9
5 $0
$2,2
27,8
48
$0$6
0,75
0$0
$2
,309
,977
21
.36%
Tot
al
Acc
iden
ts/In
cide
nts
37.0
2$2
8,26
7 $4
,009
$99,
455
$206
,727
$1
06,7
08$6
,576
,470
$2
,750
,924
$416
,550
$625
,082
$1
0,81
4,19
2
100.
00%
Tab
le 3
3. C
ateg
ory
3.0
HM
Acc
iden
t/
Inci
den
t T
ype
L
ikel
iho
od
C
lean
up
C
ost
s P
rod
uct
L
oss
C
arri
er
Dam
age
Pro
per
ty
Dam
age
En
viro
nm
enta
l D
amag
e In
jury
C
ost
s F
atal
ity
Co
sts
Eva
cuat
ion
C
ost
s In
cid
ent
Del
ay C
ost
s T
ota
l Co
sts
% o
f T
ota
l E
nro
ute
A
cc.
% o
f T
ota
lIn
c./A
cc.
Enr
oute
Acc
iden
t
Rel
ease
-Onl
y 41
8$1
3,76
0,50
6 $1
,003
,878
$12,
020,
077
$1,5
73,3
26
$752
,400
$77,
640,
566
$52,
076,
913
$11,
720
$15,
326,
388
$174
,165
,774
60.0
0%26
.81%
Enr
oute
Acc
iden
t
Fire
50
$1,2
84,4
83
$435
,772
$2,7
58,5
13$1
,895
,624
$3
79,2
00$1
0,21
5,24
3$4
3,70
8,77
3$1
7,20
0$2
,933
,300
$6
3,62
8,10
721
.92%
9.79
%E
nrou
te A
ccid
ent
E
xplo
sion
22
.020
5$5
74,6
46
$132
,238
$1,3
98,5
78$4
,391
,629
$6
67,5
47$7
,700
,034
$35,
664,
360
$37,
188
$1,9
37,1
59
$52,
503,
380
18.0
9%8.
08%
Enr
oute
Acc
iden
t
Tot
al R
elea
ses
490.
0205
$15,
619,
635
$1,5
71,8
88$1
6,17
7,16
8$7
,860
,579
$1
,799
,147
$95,
555,
843
$131
,450
,046
$66,
108
$20,
196,
847
$290
,297
,261
100.
00%
44.6
8%E
nrou
te A
ccid
ent
N
on-R
elea
se
889
$0
$0$1
9,95
6,60
8$9
,692
,676
$0
$136
,359
,577
$122
,173
,169
$24,
926
$32,
596,
074
$320
,803
,031
49
.37%
Leak
Enr
oute
58
7$7
38,9
46
$68,
901
$102
,193
$160
,600
$0
$3,4
91,1
66$0
$4,7
33$2
1,52
2,94
2 $2
6,08
9,48
0
4.02
%Lo
adin
g/U
nloa
ding
48
55$1
,505
,954
$2
97,5
86$1
77,5
41$3
31,6
87
$0$1
0,23
6,60
0$7
34$9
58$0
$1
2,55
1,05
8
1.93
%T
otal
Acc
iden
ts/In
cide
nts
6821
.021
$17,
864,
534
$1,9
38,3
75$3
6,41
3,50
9$1
8,04
5,54
2 $1
,799
,147
$245
,643
,185
$253
,623
,949
$96,
725
$74,
315,
863
$649
,740
,830
10
0.00
%
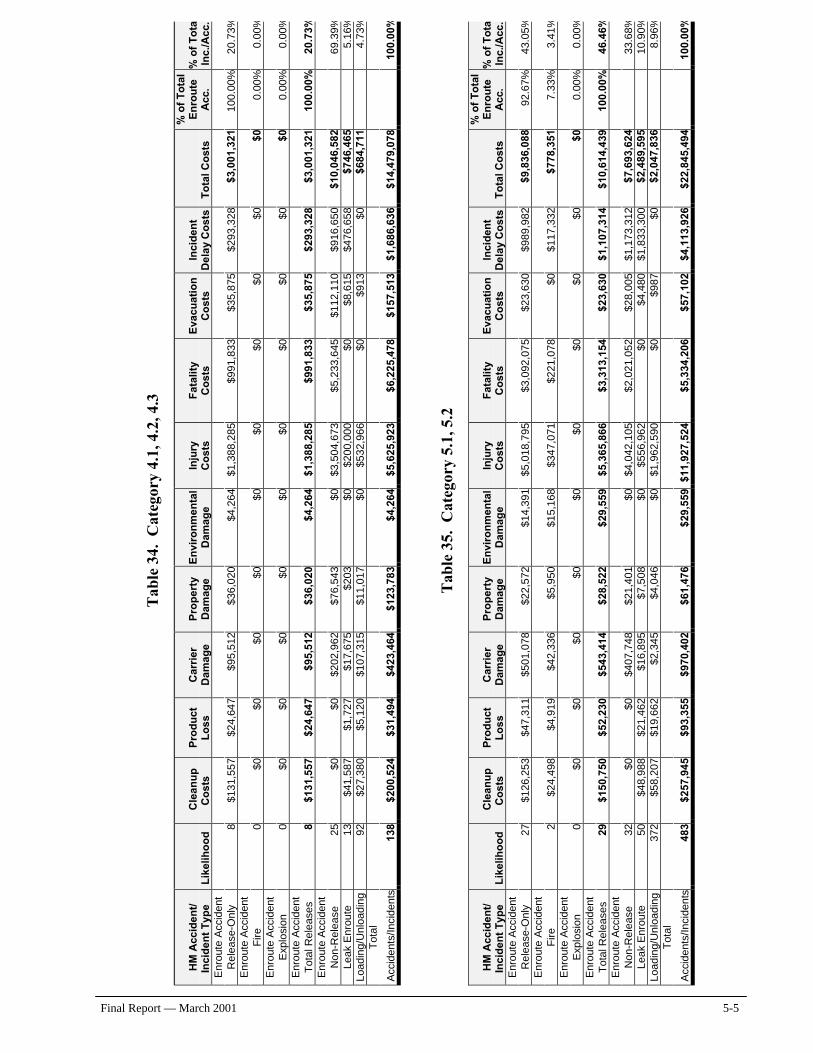
Final Report — March 2001 5-5
Tab
le 3
4. C
ateg
ory
4.1,
4.2
, 4.3
HM
Acc
iden
t/
Inci
den
t T
ype
L
ikel
iho
od
C
lean
up
C
ost
s P
rod
uct
L
oss
C
arri
er
Dam
age
Pro
per
ty
Dam
age
En
viro
nm
enta
l D
amag
e In
jury
C
ost
s F
atal
ity
Co
sts
Eva
cuat
ion
C
ost
s In
cid
ent
Del
ay C
ost
s T
ota
l Co
sts
% o
f T
ota
l E
nro
ute
A
cc.
% o
f T
ota
lIn
c./A
cc.
Enr
oute
Acc
iden
t
Rel
ease
-Onl
y 8
$131
,557
$2
4,64
7$9
5,51
2$3
6,02
0 $4
,264
$1,3
88,2
85
$991
,833
$35,
875
$293
,328
$3
,001
,321
100.
00%
20.7
3%E
nrou
te A
ccid
ent
F
ire
0$0
$0
$0$0
$0
$0
$0$0
$0
$00.
00%
0.00
%E
nrou
te A
ccid
ent
E
xplo
sion
0
$0
$0$0
$0
$0$0
$0
$0$0
$0
0.00
%0.
00%
Enr
oute
Acc
iden
t
Tot
al R
elea
ses
8$1
31,5
57
$24,
647
$95,
512
$36,
020
$4,2
64$1
,388
,285
$9
91,8
33$3
5,87
5$2
93,3
28
$3,0
01,3
2110
0.00
%20
.73%
Enr
oute
Acc
iden
t
Non
-Rel
ease
25
$0
$0$2
02,9
62$7
6,54
3 $0
$3,5
04,6
73
$5,2
33,6
45$1
12,1
10$9
16,6
50
$10,
046,
582
69
.39%
Leak
Enr
oute
13
$41,
587
$1,7
27$1
7,67
5$2
03
$0$2
00,0
00
$0$8
,615
$476
,658
$7
46,4
65
5.16
%Lo
adin
g/U
nloa
ding
92
$27,
380
$5,1
20$1
07,3
15$1
1,01
7 $0
$532
,966
$0
$913
$0
$684
,711
4.
73%
Tot
al
Acc
iden
ts/In
cide
nts
138
$200
,524
$3
1,49
4$4
23,4
64$1
23,7
83
$4,2
64$5
,625
,923
$6
,225
,478
$157
,513
$1,6
86,6
36
$14,
479,
078
10
0.00
%
Tab
le 3
5. C
ateg
ory
5.1,
5.2
HM
Acc
iden
t/
Inci
den
t T
ype
L
ikel
iho
od
C
lean
up
C
ost
s P
rod
uct
L
oss
C
arri
er
Dam
age
Pro
per
ty
Dam
age
En
viro
nm
enta
l D
amag
e In
jury
C
ost
s F
atal
ity
Co
sts
Eva
cuat
ion
C
ost
s In
cid
ent
Del
ay C
ost
s T
ota
l Co
sts
% o
f T
ota
l E
nro
ute
A
cc.
% o
f T
ota
lIn
c./A
cc.
Enr
oute
Acc
iden
t
Rel
ease
-Onl
y 27
$126
,253
$4
7,31
1$5
01,0
78$2
2,57
2 $1
4,39
1$5
,018
,795
$3
,092
,075
$23,
630
$989
,982
$9
,836
,088
92.6
7%43
.05%
Enr
oute
Acc
iden
t
Fire
2
$24,
498
$4,9
19$4
2,33
6$5
,950
$1
5,16
8$3
47,0
71
$221
,078
$0$1
17,3
32
$778
,351
7.33
%3.
41%
Enr
oute
Acc
iden
t
Exp
losi
on
0$0
$0
$0$0
$0
$0
$0$0
$0
$00.
00%
0.00
%E
nrou
te A
ccid
ent
T
otal
Rel
ease
s 29
$150
,750
$5
2,23
0$5
43,4
14$2
8,52
2 $2
9,55
9$5
,365
,866
$3
,313
,154
$23,
630
$1,1
07,3
14
$10,
614,
439
100.
00%
46.4
6%E
nrou
te A
ccid
ent
N
on-R
elea
se
32$0
$0
$407
,748
$21,
401
$0$4
,042
,105
$2
,021
,052
$28,
005
$1,1
73,3
12
$7,6
93,6
24
33.6
8%Le
ak E
nrou
te
50$4
8,98
8 $2
1,46
2$1
6,89
5$7
,508
$0
$556
,962
$0
$4,4
80$1
,833
,300
$2
,489
,595
10
.90%
Load
ing/
Unl
oadi
ng
372
$58,
207
$19,
662
$2,3
45$4
,046
$0
$1,9
62,5
90
$0$9
87$0
$2
,047
,836
8.
96%
Tot
al
Acc
iden
ts/In
cide
nts
483
$257
,945
$9
3,35
5$9
70,4
02$6
1,47
6 $2
9,55
9$1
1,92
7,52
4 $5
,334
,206
$57,
102
$4,1
13,9
26
$22,
845,
494
10
0.00
%
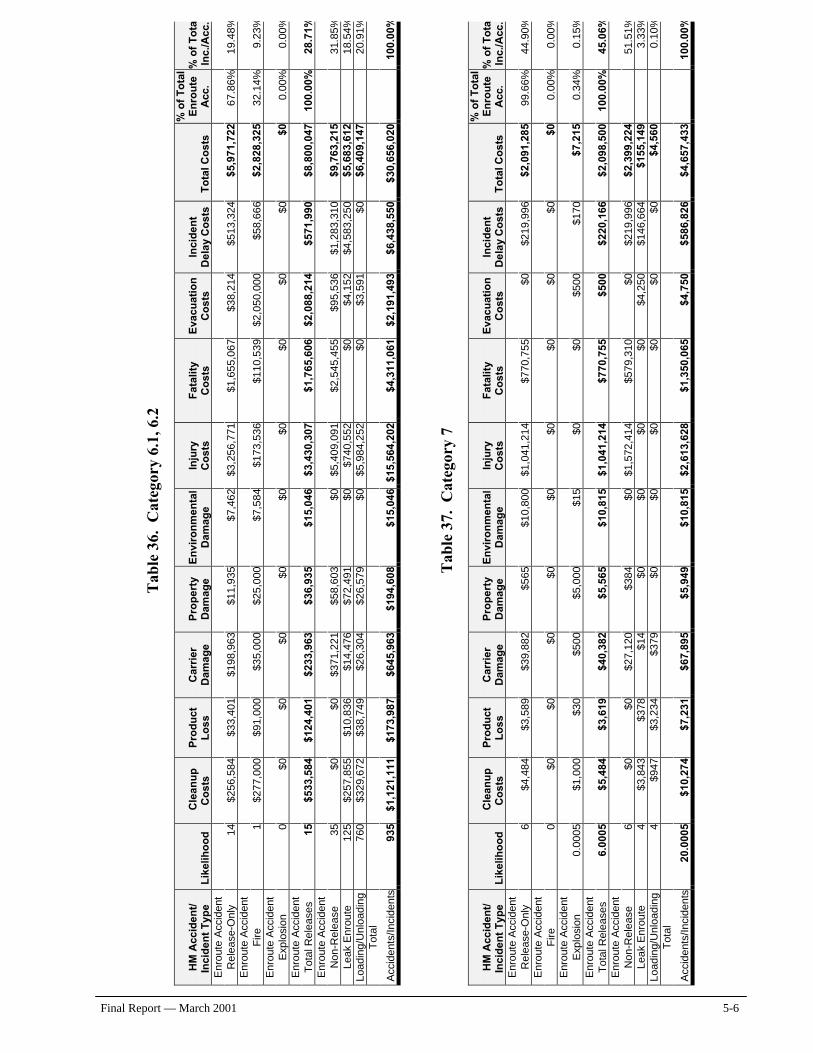
Final Report — March 2001 5-6
Tab
le 3
6. C
ateg
ory
6.1,
6.2
HM
Acc
iden
t/
Inci
den
t T
ype
L
ikel
iho
od
C
lean
up
C
ost
s P
rod
uct
L
oss
C
arri
er
Dam
age
Pro
per
ty
Dam
age
En
viro
nm
enta
l D
amag
e In
jury
C
ost
s F
atal
ity
Co
sts
Eva
cuat
ion
C
ost
s In
cid
ent
Del
ay C
ost
s T
ota
l Co
sts
% o
f T
ota
l E
nro
ute
A
cc.
% o
f T
ota
lIn
c./A
cc.
Enr
oute
Acc
iden
t
Rel
ease
-Onl
y 14
$256
,584
$3
3,40
1$1
98,9
63$1
1,93
5 $7
,462
$3,2
56,7
71
$1,6
55,0
67$3
8,21
4$5
13,3
24$5
,971
,722
67
.86%
19.4
8%E
nrou
te A
ccid
ent
F
ire
1$2
77,0
00
$91,
000
$35,
000
$25,
000
$7,5
84$1
73,5
36
$110
,539
$2,0
50,0
00$5
8,66
6$2
,828
,325
32
.14%
9.23
%E
nrou
te A
ccid
ent
E
xplo
sion
0
$0
$0$0
$0
$0$0
$0
$0$0
$0
0.00
%0.
00%
Enr
oute
Acc
iden
t
Tot
al R
elea
ses
15$5
33,5
84
$124
,401
$233
,963
$36,
935
$15,
046
$3,4
30,3
07
$1,7
65,6
06$2
,088
,214
$571
,990
$8,8
00,0
47
100.
00%
28.7
1%E
nrou
te A
ccid
ent
N
on-R
elea
se
35$0
$0
$371
,221
$58,
603
$0$5
,409
,091
$2
,545
,455
$95,
536
$1,2
83,3
10$9
,763
,215
31
.85%
Leak
Enr
oute
12
5$2
57,8
55
$10,
836
$14,
476
$72,
491
$0$7
40,5
52
$0$4
,152
$4,5
83,2
50$5
,683
,612
18
.54%
Load
ing/
Unl
oadi
ng
760
$329
,672
$3
8,74
9$2
6,30
4$2
6,57
9 $0
$5,9
84,2
52
$0$3
,591
$0$6
,409
,147
20
.91%
Tot
al
Acc
iden
ts/In
cide
nts
935
$1,1
21,1
11
$173
,987
$645
,963
$194
,608
$1
5,04
6$1
5,56
4,20
2 $4
,311
,061
$2,1
91,4
93$6
,438
,550
$30,
656,
020
10
0.00
%
Tab
le 3
7. C
ateg
ory
7
HM
Acc
iden
t/
Inci
den
t T
ype
L
ikel
iho
od
C
lean
up
C
ost
s P
rod
uct
L
oss
C
arri
er
Dam
age
Pro
per
ty
Dam
age
En
viro
nm
enta
l D
amag
e In
jury
C
ost
s F
atal
ity
Co
sts
Eva
cuat
ion
C
ost
s In
cid
ent
Del
ay C
ost
s T
ota
l Co
sts
% o
f T
ota
l E
nro
ute
A
cc.
% o
f T
ota
lIn
c./A
cc.
Enr
oute
Acc
iden
t
Rel
ease
-Onl
y 6
$4,4
84
$3,5
89$3
9,88
2$5
65
$10,
800
$1,0
41,2
14
$770
,755
$0$2
19,9
96$2
,091
,285
99
.66%
44.9
0%E
nrou
te A
ccid
ent
F
ire
0$0
$0
$0$0
$0
$0
$0$0
$0$0
0.
00%
0.00
%E
nrou
te A
ccid
ent
E
xplo
sion
0.
0005
$1,0
00
$30
$500
$5,0
00
$15
$0
$0$5
00$1
70$7
,215
0.
34%
0.15
%E
nrou
te A
ccid
ent
T
otal
Rel
ease
s 6.
0005
$5,4
84
$3,6
19$4
0,38
2$5
,565
$1
0,81
5$1
,041
,214
$7
70,7
55$5
00$2
20,1
66$2
,098
,500
10
0.00
%45
.06%
Enr
oute
Acc
iden
t
Non
-Rel
ease
6
$0
$0$2
7,12
0$3
84
$0$1
,572
,414
$5
79,3
10$0
$219
,996
$2,3
99,2
24
51.5
1%Le
ak E
nrou
te
4$3
,843
$3
78$1
4$0
$0
$0
$0$4
,250
$146
,664
$155
,149
3.
33%
Load
ing/
Unl
oadi
ng
4$9
47
$3,2
34$3
79$0
$0
$0
$0$0
$0$4
,560
0.
10%
Tot
al
Acc
iden
ts/In
cide
nts
20.0
005
$10,
274
$7,2
31$6
7,89
5$5
,949
$1
0,81
5$2
,613
,628
$1
,350
,065
$4,7
50$5
86,8
26$4
,657
,433
10
0.00
%
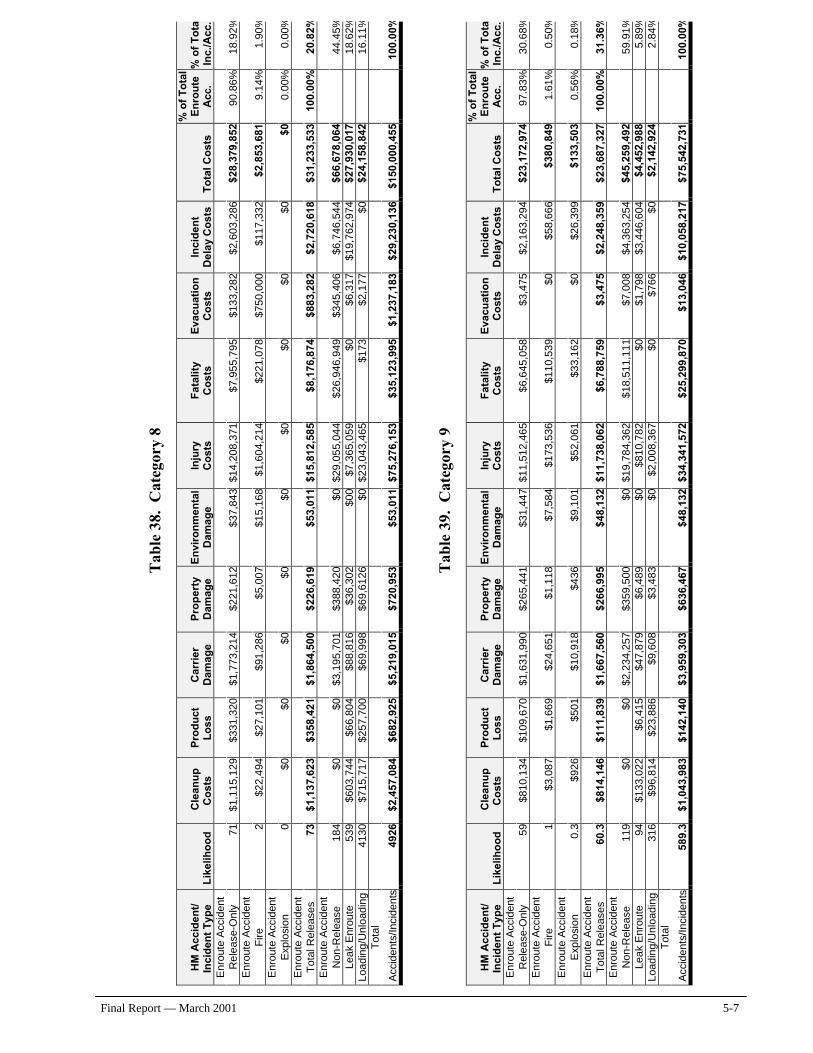
Final Report — March 2001 5-7
Tab
le 3
8. C
ateg
ory
8
HM
Acc
iden
t/
Inci
den
t T
ype
L
ikel
iho
od
C
lean
up
C
ost
s P
rod
uct
L
oss
C
arri
er
Dam
age
Pro
per
ty
Dam
age
En
viro
nm
enta
l D
amag
e In
jury
C
ost
s F
atal
ity
Co
sts
Eva
cuat
ion
C
ost
s In
cid
ent
Del
ay C
ost
s T
ota
l Co
sts
% o
f T
ota
l E
nro
ute
A
cc.
% o
f T
ota
lIn
c./A
cc.
Enr
oute
Acc
iden
t
Rel
ease
-Onl
y 71
$1,1
15,1
29
$331
,320
$1,7
73,2
14$2
21,6
12
$37,
843
$14,
208,
371
$7,9
55,7
95$1
33,2
82$2
,603
,286
$28,
379,
852
90.8
6%18
.92%
Enr
oute
Acc
iden
t
Fire
2
$22,
494
$27,
101
$91,
286
$5,0
07
$15,
168
$1,6
04,2
14
$221
,078
$750
,000
$117
,332
$2,8
53,6
81
9.14
%1.
90%
Enr
oute
Acc
iden
t
Exp
losi
on
0$0
$0
$0$0
$0
$0
$0$0
$0$0
0.
00%
0.00
%E
nrou
te A
ccid
ent
T
otal
Rel
ease
s 73
$1,1
37,6
23
$358
,421
$1,8
64,5
00$2
26,6
19
$53,
011
$15,
812,
585
$8,1
76,8
74$8
83,2
82$2
,720
,618
$31,
233,
533
100.
00%
20.8
2%E
nrou
te A
ccid
ent
N
on-R
elea
se
184
$0
$0$3
,195
,701
$388
,420
$0
$29,
055,
044
$26,
946,
949
$345
,406
$6,7
46,5
44$6
6,67
8,06
4
44.4
5%Le
ak E
nrou
te
539
$603
,744
$6
6,80
4$8
8,81
6$3
6,30
2 $0
0$7
,365
,059
$0
$6,3
17$1
9,76
2,97
4$2
7,93
0,01
7
18.6
2%Lo
adin
g/U
nloa
ding
41
30$7
15,7
17
$257
,700
$69,
998
$69,
6126
$0
$23,
043,
465
$173
$2,1
77$0
$24,
158,
842
16
.11%
Tot
al
Acc
iden
ts/In
cide
nts
4926
$2,4
57,0
84
$682
,925
$5,2
19,0
15$7
20,9
53
$53,
011
$75,
276,
153
$35,
123,
995
$1,2
37,1
83$2
9,23
0,13
6$1
50,0
00,4
55
100.
00%
Tab
le 3
9. C
ateg
ory
9
HM
Acc
iden
t/
Inci
den
t T
ype
L
ikel
iho
od
C
lean
up
C
ost
s P
rod
uct
L
oss
C
arri
er
Dam
age
Pro
per
ty
Dam
age
En
viro
nm
enta
l D
amag
e In
jury
C
ost
s F
atal
ity
Co
sts
Eva
cuat
ion
C
ost
s In
cid
ent
Del
ay C
ost
s T
ota
l Co
sts
% o
f T
ota
l E
nro
ute
A
cc.
% o
f T
ota
lIn
c./A
cc.
Enr
oute
Acc
iden
t
Rel
ease
-Onl
y 59
$810
,134
$1
09,6
70$1
,631
,990
$265
,441
$3
1,44
7$1
1,51
2,46
5 $6
,645
,058
$3,4
75$2
,163
,294
$23,
172,
974
97.8
3%30
.68%
Enr
oute
Acc
iden
t
Fire
1
$3,0
87
$1,6
69$2
4,65
1$1
,118
$7
,584
$173
,536
$1
10,5
39$0
$58,
666
$380
,849
1.
61%
0.50
%E
nrou
te A
ccid
ent
E
xplo
sion
0
.3$9
26
$501
$10,
918
$436
$9
,101
$52,
061
$33,
162
$0$2
6,39
9$1
33,5
03
0.56
%0.
18%
Enr
oute
Acc
iden
t
Tot
al R
elea
ses
60.3
$814
,146
$1
11,8
39$1
,667
,560
$266
,995
$4
8,13
2$1
1,73
8,06
2 $6
,788
,759
$3,4
75$2
,248
,359
$23,
687,
327
100.
00%
31.3
6%E
nrou
te A
ccid
ent
N
on-R
elea
se
119
$0
$0$2
,234
,257
$359
,500
$0
$19,
784,
362
$18,
511,
111
$7,0
08$4
,363
,254
$45,
259,
492
59
.91%
Leak
Enr
oute
94
$133
,022
$6
,415
$47,
879
$6,4
89
$0$8
10,7
82
$0$1
,798
$3,4
46,6
04$4
,452
,988
5.
89%
Load
ing/
Unl
oadi
ng
316
$96,
814
$23,
886
$9,6
08$3
,483
$0
$2,0
08,3
67
$0$7
66$0
$2,1
42,9
24
2.84
%T
otal
Acc
iden
ts/In
cide
nts
589.
3$1
,043
,983
$1
42,1
40$3
,959
,303
$636
,467
$4
8,13
2$3
4,34
1,57
2 $2
5,29
9,87
0$1
3,04
6$1
0,05
8,21
7$7
5,54
2,73
1
100.
00%
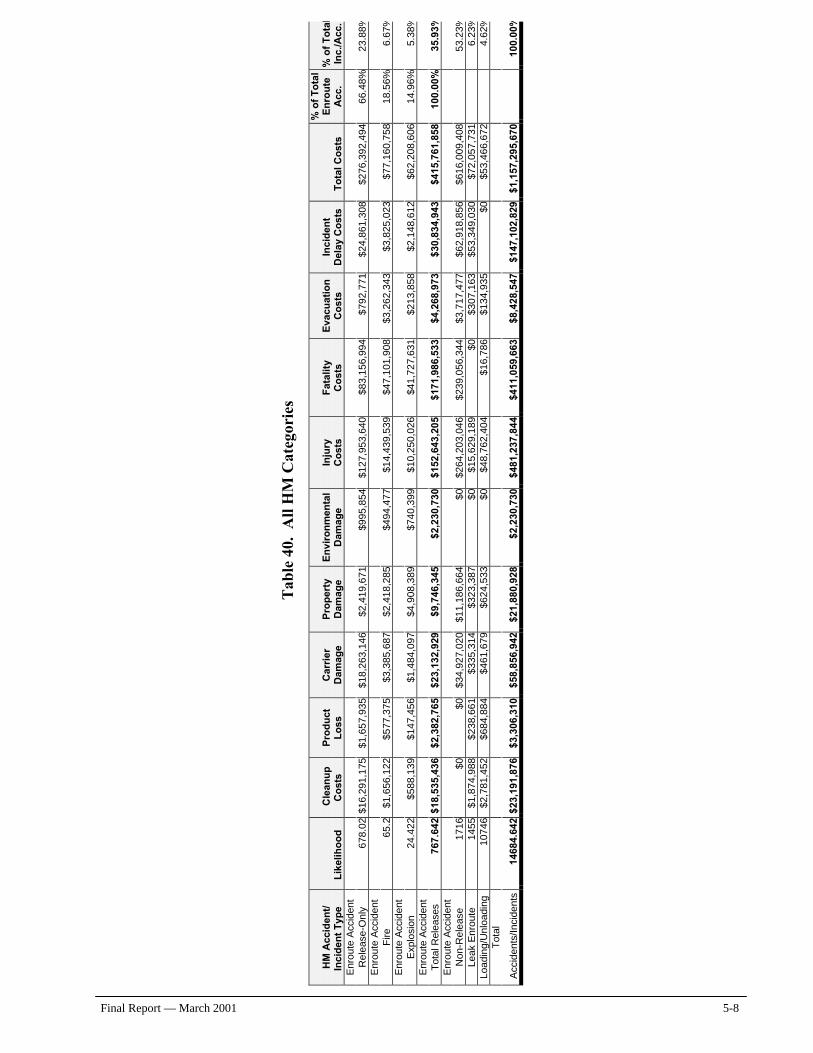
Final Report — March 2001 5-8
Tab
le 4
0. A
ll H
M C
ateg
orie
s
HM
Acc
iden
t/
Inci
den
t T
ype
L
ikel
iho
od
C
lean
up
C
ost
s P
rod
uct
L
oss
C
arri
er
Dam
age
Pro
per
ty
Dam
age
En
viro
nm
enta
l D
amag
e In
jury
C
ost
s F
atal
ity
Co
sts
Eva
cuat
ion
C
ost
s In
cid
ent
Del
ay C
ost
s T
ota
l Co
sts
% o
f T
ota
l E
nro
ute
A
cc.
% o
f T
ota
lIn
c./A
cc.
Enr
oute
Acc
iden
t
Rel
ease
-Onl
y 67
8.02
$16,
291,
175
$1,6
57,9
35$1
8,26
3,14
6$2
,419
,671
$9
95,8
54$1
27,9
53,6
40$8
3,15
6,99
4 $7
92,7
71$2
4,86
1,30
8$2
76,3
92,4
94
66.4
8%23
.88%
Enr
oute
Acc
iden
t
Fire
6
5.2
$1,6
56,1
22$5
77,3
75$3
,385
,687
$2,4
18,2
85
$494
,477
$14,
439,
539
$47,
101,
908
$3,2
62,3
43$3
,825
,023
$77,
160,
758
18.5
6%6.
67%
Enr
oute
Acc
iden
t
Exp
losi
on
24.4
22$5
88,1
39$1
47,4
56$1
,484
,097
$4,9
08,3
89
$740
,399
$10,
250,
026
$41,
727,
631
$213
,858
$2,1
48,6
12$6
2,20
8,60
6 14
.96%
5.38
%E
nrou
te A
ccid
ent
T
otal
Rel
ease
s 76
7.64
2$1
8,53
5,43
6$2
,382
,765
$23,
132,
929
$9,7
46,3
45
$2,2
30,7
30$1
52,6
43,2
05$1
71,9
86,5
33
$4,2
68,9
73$3
0,83
4,94
3$4
15,7
61,8
58
100.
00%
35.9
3%E
nrou
te A
ccid
ent
N
on-R
elea
se
1716
$0$0
$34,
927,
020
$11,
186,
664
$0$2
64,2
03,0
46$2
39,0
56,3
44
$3,7
17,4
77$6
2,91
8,85
6$6
16,0
09,4
08
53.2
3%Le
ak E
nrou
te
1455
$1,8
74,9
88$2
38,6
61$3
35,3
14$3
23,3
87
$0$1
5,62
9,18
9$0
$3
07,1
63$5
3,34
9,03
0$7
2,05
7,73
1
6.23
%Lo
adin
g/U
nloa
ding
10
746
$2,7
81,4
52$6
84,8
84$4
61,6
79$6
24,5
33
$0$4
8,76
2,40
4$1
6,78
6 $1
34,9
35$0
$53,
466,
672
4.
62%
Tot
al
Acc
iden
ts/In
cide
nts
1468
4.64
2$2
3,19
1,87
6$3
,306
,310
$58,
856,
942
$21,
880,
928
$2,2
30,7
30$4
81,2
37,8
44$4
11,0
59,6
63
$8,4
28,5
47$1
47,1
02,8
29$1
,157
,295
,670
10
0.00
%
Final Report — March 2001 5-9
for the portrait year. As shown in the table, the cost for the year was $108,388,564. Injuries and fatalities accounted for approximately 83 percent of the total cost. Carrier damage and incident delay costs together accounted for about 15 percent of the total estimated cost for the year. The cost related to accidents is considerably higher than that for incidents. Both release and non release accidents account for about 98 percent of the estimated costs for the portrait year. Release accidents with explosions or fires total only seven and two respectively but represent about 48 percent of the impacts for all enroute release accidents and about 11 percent of the annual impacts for all Division 2.1 incidents and accidents. Non release accidents alone account for about 75 percent of the costs. This is primarily because the number of non release accidents is more than three times the number of spill accidents and results in more injuries and fatalities. Although there are no cleanup costs for the product or environmental damage costs, the costs are still considerably more than for the spill accidents. Impacts from Division 2.1 represent about nine percent of the impacts from all HM incidents and accident impacts in the portrait year.
5.5 HM Category 2.2
Division 2.2, non-flammable gas, was involved in an estimated 24 enroute release accidents and 152 non-release accidents in the portrait year. As Table 31 shows, none of the release accidents resulted in an explosion and only two in fires. Release accidents represent about 14 percent of the impacts; non-release accidents represent more than 80 percent of the total impacts for the portrait year.
5.6 HM Category 2.3
Trucks shipping Division 2.3, poison gas, experienced an estimated two enroute accidents and 10 non-release accidents in the portrait year. Because of the nature of the hazard, catastrophic impacts are possible. One high consequence accident with an estimated probability of once every 50 years was added to the release accidents. The total enroute release impact for the portrait year, as shown in Table 32, is estimated at about 28 percent of the total impact cost.
5.7 HM Category 3 Class 3, flammable and combustible liquids, accident and incident impacts are the most important single category of the 12 categories examined in this report. Impacts from Class 3 accidents and incidents account for about 56 percent of all of the impacts for HM in the portrait year. Class 3 materials travel predominantly in bulk carriers. For the total number of enroute accidents estimated for the year, an estimated 88 percent of listed accidents involved cargo tanks. This does not include the approximately four percent of accidents for which this information is unavailable. As Table 33 shows, Class 3 accidents include an estimated 490 release accidents and about 889 non-release accidents in the portrait year. Total accidents and incidents totaled more than 6,620. The cost related to accidents is considerably higher than that for incidents. Both release and non release accidents account for about 94 percent of the estimated costs for the portrait year. Enroute release accidents account for about 45 percent of all Class 3 impacts. Impacts from fires and explosions are important. Impacts from enroute release fire and explosion accidents account for
Final Report — March 2001 5-10
an estimated 40 percent of the cost of all Class 3 release accidents, although they only represent 15 percent of these accidents. As shown in table 33, the cost for the portrait year for all Class 3 impacts was about $650 million. The costs of injuries and fatalities accounted for about 77 percent of the total.
5.8 HM Category 4.1, 4.2, 4.3
Divisions 4.1, 4.2, 4.3flammable solids, spontaneously combustible, and dangerous when wet materialsaccounted for only an estimated 33 enroute accidents in portrait year. Eight were release accidents. These eight accidents represented about 21 percent of the total impacts for the year. As Table 34 shows, there were no enroute release accidents associated with either an explosion or a fire. Non-release accidents represented about 70 percent of the impact value.
5.9 HM Category 5.1, 5.2
Divisions 5.1, 5.2, oxidizers and organic peroxides, experienced an estimated 56 accidents in the portrait year. Table 35 shows that 27 of these were release accidents. Of these 27 accidents, two resulted in fires. As shown in Table 35, release accident accounted for about 46 percent of the total impacts, compared to only about 34 percent for the non-release accidents. Total impacts for these divisions amounted to about $23 million in the portrait year
5.10 HM Category 6.1, 6.2
Divisions 6.1, 6.2, toxic materials and infectious substances, had a total of 50 accidents in the portrait year of which only 15 were release accidents. One of the release accidents resulted in a fire. In addition to the enroute accidents, there were 125 leak enroute incidents and 760 loading and unloading incidents. As Table 36 shows, although almost 61 percent of the impacts were associated with the accidents, more than 39 percent were associated with incidents. Impacts for Divisions 6.1, 6.2 in the portrait year totaled about $30,500,000.
5.11 HM Category 7 Class 7, radioactive materials, experienced only about 12 enroute accidents in the portrait year. Half of these resulted in releases. One high consequence accident was added to the release accidents. However, it was judged to occur once in a couple of thousand years. As Table 37 shows, the impact from release accidents totals about 45 percent of the total impacts. Enroute accidents represent almost 97 percent of all the impacts. Impact costs for the portrait year totaled about $4.6 million.
5.12 HM Category 8
Class 8, corrosive materials, represents the HM category with the second greatest proportion of the impacts after Class 3. As shown in Table 38, the cost of the Class 8 category for the portrait year was about $150 million. This constitutes about 13 percent of the total impact cost for all of the HM categories. There were an estimated 257 release accidents in the portrait year of which 73 were
Final Report — March 2001 5-11
release accidents and two were associated with a fire. As Table 38 shows, enroute accidents accounted for more than 65 percent of the total impacts. Enroute leaks and loading/unloading incidents alone accounted for about 35 percent of the total impacts. Costs for avoiding injuries and fatalities accounted for approximately 74 percent of the total costs with injury costs alone representing an estimated half of all impact costs.
5.13 HM Category 9
Class 9, miscellaneous dangerous goods, represents about seven percent of the total HM impacts. For the portrait year, Table 39 shows an estimated 179 accidents of which about 60 were release accidents. One accident was associated with a fire and one explosion with a likelihood of 0.3 was estimated for the year. More than 91 percent of the impacts for the class are associated with enroute accidents. Non-release accidents represented about 60 percent of the total Class 9 impacts and release accidents about 31 percent of the total. Total Class 9 impacts for the portrait year amounted to about $76 million.
5.14 All HM Categories
Table 40 summarizes the impacts for all HM categories. The table follows the same format as Tables 28 through 39 and therefore, facilitates comparisons among the 12 categories. The HM category summaries show clearly that more detail can be developed for some categories of HM because those classes or divisions have more accident exposure. For example, fire and explosion statistics were developed for Division 2.1, Classes 3 and 9, but it was not possible to separate out the accident statistics for many other categories. For these other categories, the impact costs for fire and explosion accidents are included in the class or division impact costs. If the likelihood of occurrence is greater than about 0.2 per year, they have been included. If all accidents were captured by the databases, this number would be about 0.1 since about 10 years of accident history were analyzed. However, because of under reporting, this number should be significantly higher. For fire and explosion to be segmented into separate categories, one should have at least five actual records of fires or explosions reported during the almost 10-year evaluation period. If there were fewer accidents, the only cases where fire and explosion were separated out was for groups of HM divisions in which the severity was sufficient to generate many detailed accident reports over the last 50 years. The 1.1, 1.2, and 1.3 HM category fell into this category. In all other cases, the fire and explosion impacts were not broken out. Thus, when comparing the 12 categories of HM analyzed, comparisons of the average impacts among HM categories might be the only valid comparison that can be made. Where maximum impacts are presented, they are based on the historical record and are made only where data support the results. Thus, categories for which maximum impacts are not presented could have accidents that are of similar severity to those that are captured in the database. The absence of such maximum impact cases does not distract from the results, as long as the limitation that is imbedded in analyses based on historical information is recognized.
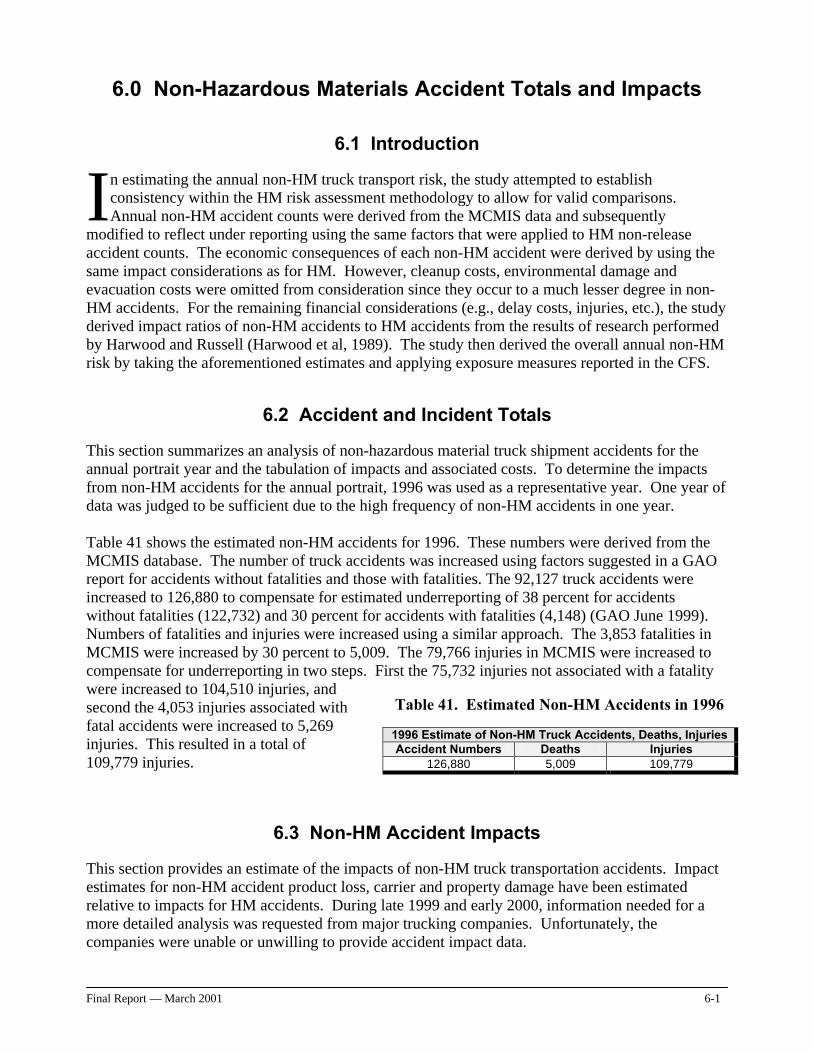
Final Report — March 2001 6-1
6.0 Non-Hazardous Materials Accident Totals and Impacts
6.1 Introduction
n estimating the annual non-HM truck transport risk, the study attempted to establish consistency within the HM risk assessment methodology to allow for valid comparisons. Annual non-HM accident counts were derived from the MCMIS data and subsequently
modified to reflect under reporting using the same factors that were applied to HM non-release accident counts. The economic consequences of each non-HM accident were derived by using the same impact considerations as for HM. However, cleanup costs, environmental damage and evacuation costs were omitted from consideration since they occur to a much lesser degree in non-HM accidents. For the remaining financial considerations (e.g., delay costs, injuries, etc.), the study derived impact ratios of non-HM accidents to HM accidents from the results of research performed by Harwood and Russell (Harwood et al, 1989). The study then derived the overall annual non-HM risk by taking the aforementioned estimates and applying exposure measures reported in the CFS.
6.2 Accident and Incident Totals
This section summarizes an analysis of non-hazardous material truck shipment accidents for the annual portrait year and the tabulation of impacts and associated costs. To determine the impacts from non-HM accidents for the annual portrait, 1996 was used as a representative year. One year of data was judged to be sufficient due to the high frequency of non-HM accidents in one year. Table 41 shows the estimated non-HM accidents for 1996. These numbers were derived from the MCMIS database. The number of truck accidents was increased using factors suggested in a GAO report for accidents without fatalities and those with fatalities. The 92,127 truck accidents were increased to 126,880 to compensate for estimated underreporting of 38 percent for accidents without fatalities (122,732) and 30 percent for accidents with fatalities (4,148) (GAO June 1999). Numbers of fatalities and injuries were increased using a similar approach. The 3,853 fatalities in MCMIS were increased by 30 percent to 5,009. The 79,766 injuries in MCMIS were increased to compensate for underreporting in two steps. First the 75,732 injuries not associated with a fatality were increased to 104,510 injuries, and second the 4,053 injuries associated with fatal accidents were increased to 5,269 injuries. This resulted in a total of 109,779 injuries.
6.3 Non-HM Accident Impacts
This section provides an estimate of the impacts of non-HM truck transportation accidents. Impact estimates for non-HM accident product loss, carrier and property damage have been estimated relative to impacts for HM accidents. During late 1999 and early 2000, information needed for a more detailed analysis was requested from major trucking companies. Unfortunately, the companies were unable or unwilling to provide accident impact data.
I
Table 41. Estimated Non-HM Accidents in 1996
1996 Estimate of Non-HM Truck Accidents, Deaths, Injuries Accident Numbers Deaths Injuries
126,880 5,009 109,779
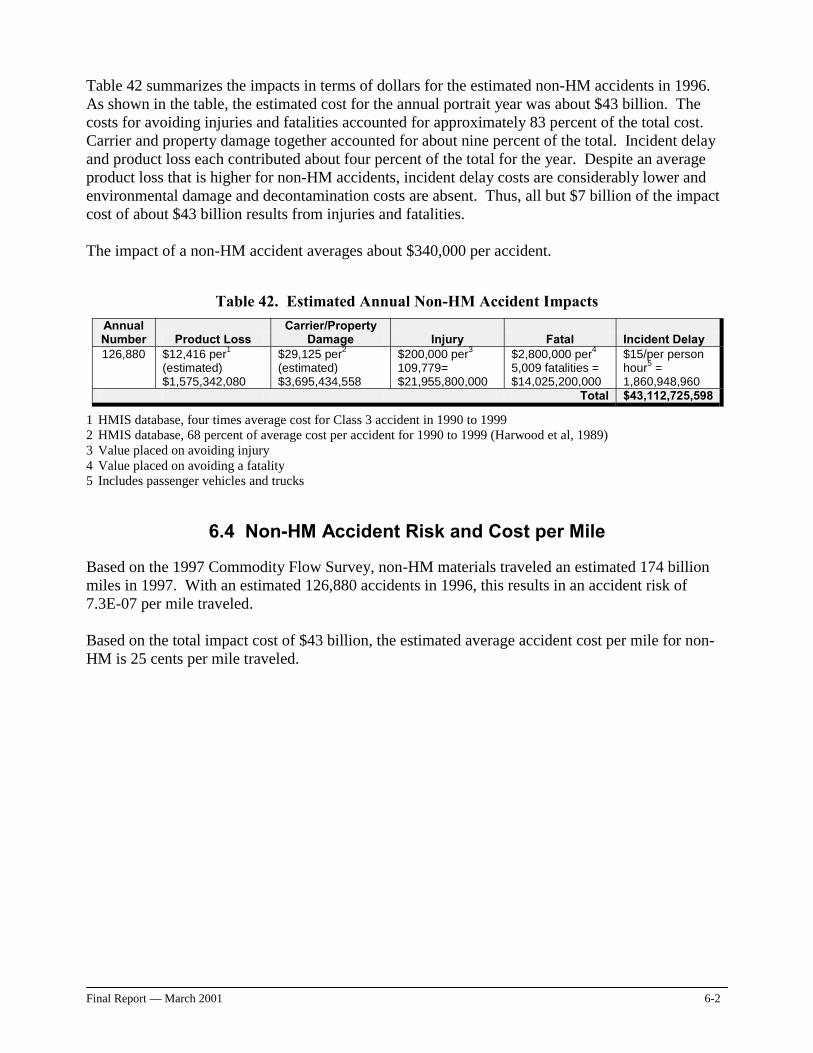
Final Report — March 2001 6-2
Table 42 summarizes the impacts in terms of dollars for the estimated non-HM accidents in 1996. As shown in the table, the estimated cost for the annual portrait year was about $43 billion. The costs for avoiding injuries and fatalities accounted for approximately 83 percent of the total cost. Carrier and property damage together accounted for about nine percent of the total. Incident delay and product loss each contributed about four percent of the total for the year. Despite an average product loss that is higher for non-HM accidents, incident delay costs are considerably lower and environmental damage and decontamination costs are absent. Thus, all but $7 billion of the impact cost of about $43 billion results from injuries and fatalities. The impact of a non-HM accident averages about $340,000 per accident.
Table 42. Estimated Annual Non-HM Accident Impacts
Annual Number Product Loss
Carrier/Property Damage Injury Fatal Incident Delay
126,880 $12,416 per1 (estimated) $1,575,342,080
$29,125 per2 (estimated) $3,695,434,558
$200,000 per3 109,779= $21,955,800,000
$2,800,000 per4
5,009 fatalities = $14,025,200,000
$15/per person hour5 = 1,860,948,960
Total $43,112,725,598
1 HMIS database, four times average cost for Class 3 accident in 1990 to 1999 2 HMIS database, 68 percent of average cost per accident for 1990 to 1999 (Harwood et al, 1989) 3 Value placed on avoiding injury 4 Value placed on avoiding a fatality 5 Includes passenger vehicles and trucks
6.4 Non-HM Accident Risk and Cost per Mile
Based on the 1997 Commodity Flow Survey, non-HM materials traveled an estimated 174 billion miles in 1997. With an estimated 126,880 accidents in 1996, this results in an accident risk of 7.3E-07 per mile traveled. Based on the total impact cost of $43 billion, the estimated average accident cost per mile for non-HM is 25 cents per mile traveled.
Final Report — March 2001 7-1
7.0 Comparative Impacts and Risk of HM and Non-HM Shipments
7.1 Introduction
his section examines the comparative impacts of shipping HM and non-HM cargoes on the nation’s highways. Due to some inherent data uncertainties with respect to material flows, these comparisons are preliminary. Future research will be needed to present more definitive
risk comparisons. Section 9.0 presents data needs and opportunities.
7.2 Comparative Costs
Although non-HM shipments have a far greater cumulative impact than HM shipments, approximately $43.1 billion as compared to $1.1 billion in the portrait year, the cost per individual accident differs considerably. Despite an average product loss that is higher for non-HM accidents, incident delay costs for non-HM accidents are considerably lower and environmental damage and decontamination costs are usually limited. For example in the portrait year,
• all release and non-release enroute accidents for all HM categories have an average value of about $414,000 per accident;
• non-HM accidents averaged about $340,000 per accident; however • the average per HM release accident costs about $536,000
There is a large difference when non-HM accident impacts are compared with HM release accident impacts. An even greater contrast occurs when the average impact costs of a release accident with a fire or one with an explosion are compared to the average cost of a non-HM accident. In the portrait year, the average cost of
• an HM release accident with a fire was about $1,152,000. This average cost is almost three times as much as for the non-HM accident.
• an HM release accident with an explosion is about $2,100,000 or more than five times the average cost of a non-HM accident.
7.3 Comparative Risk and Cost per Mile
The non-HM accident rate of 0.73 per million vehicle miles is more than double the average HM accident rate of 0.32 per million vehicle miles. These accident rates are shown in Table 43. The table also compares accident rates for each of the 12 HM categories with the accident rate for non-HM. The table shows that for all HM classes, the accident rate is lower than for non-HM. However differences vary from about four percent higher for Divisions 1.4, 1.5, 1.6 to almost 80 percent
T
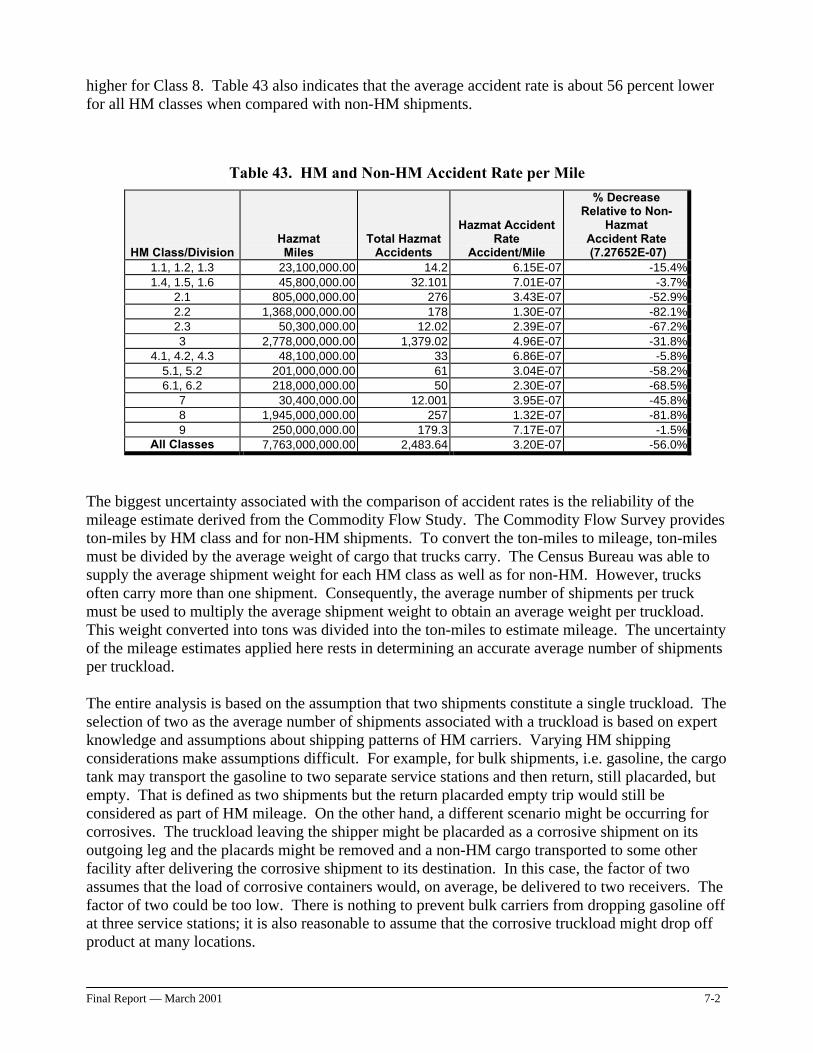
Final Report — March 2001 7-2
higher for Class 8. Table 43 also indicates that the average accident rate is about 56 percent lower for all HM classes when compared with non-HM shipments.
Table 43. HM and Non-HM Accident Rate per Mile
HM Class/Division Hazmat Miles
Total Hazmat Accidents
Hazmat Accident Rate
Accident/Mile
% Decrease Relative to Non-
Hazmat Accident Rate (7.27652E-07)
1.1, 1.2, 1.3 23,100,000.00 14.2 6.15E-07 -15.4%1.4, 1.5, 1.6 45,800,000.00 32.101 7.01E-07 -3.7%
2.1 805,000,000.00 276 3.43E-07 -52.9%2.2 1,368,000,000.00 178 1.30E-07 -82.1%2.3 50,300,000.00 12.02 2.39E-07 -67.2%3 2,778,000,000.00 1,379.02 4.96E-07 -31.8%
4.1, 4.2, 4.3 48,100,000.00 33 6.86E-07 -5.8%5.1, 5.2 201,000,000.00 61 3.04E-07 -58.2%6.1, 6.2 218,000,000.00 50 2.30E-07 -68.5%
7 30,400,000.00 12.001 3.95E-07 -45.8%8 1,945,000,000.00 257 1.32E-07 -81.8%9 250,000,000.00 179.3 7.17E-07 -1.5%
All Classes 7,763,000,000.00 2,483.64 3.20E-07 -56.0%
The biggest uncertainty associated with the comparison of accident rates is the reliability of the mileage estimate derived from the Commodity Flow Study. The Commodity Flow Survey provides ton-miles by HM class and for non-HM shipments. To convert the ton-miles to mileage, ton-miles must be divided by the average weight of cargo that trucks carry. The Census Bureau was able to supply the average shipment weight for each HM class as well as for non-HM. However, trucks often carry more than one shipment. Consequently, the average number of shipments per truck must be used to multiply the average shipment weight to obtain an average weight per truckload. This weight converted into tons was divided into the ton-miles to estimate mileage. The uncertainty of the mileage estimates applied here rests in determining an accurate average number of shipments per truckload. The entire analysis is based on the assumption that two shipments constitute a single truckload. The selection of two as the average number of shipments associated with a truckload is based on expert knowledge and assumptions about shipping patterns of HM carriers. Varying HM shipping considerations make assumptions difficult. For example, for bulk shipments, i.e. gasoline, the cargo tank may transport the gasoline to two separate service stations and then return, still placarded, but empty. That is defined as two shipments but the return placarded empty trip would still be considered as part of HM mileage. On the other hand, a different scenario might be occurring for corrosives. The truckload leaving the shipper might be placarded as a corrosive shipment on its outgoing leg and the placards might be removed and a non-HM cargo transported to some other facility after delivering the corrosive shipment to its destination. In this case, the factor of two assumes that the load of corrosive containers would, on average, be delivered to two receivers. The factor of two could be too low. There is nothing to prevent bulk carriers from dropping gasoline off at three service stations; it is also reasonable to assume that the corrosive truckload might drop off product at many locations.
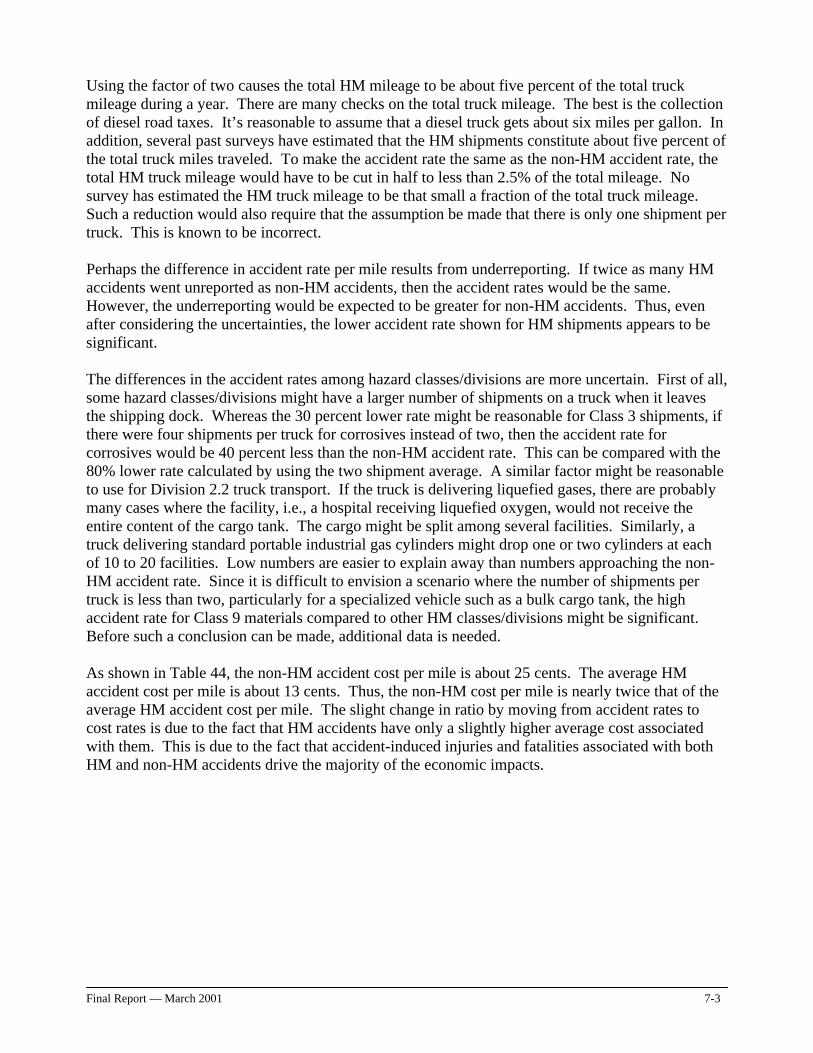
Final Report — March 2001 7-3
Using the factor of two causes the total HM mileage to be about five percent of the total truck mileage during a year. There are many checks on the total truck mileage. The best is the collection of diesel road taxes. It’s reasonable to assume that a diesel truck gets about six miles per gallon. In addition, several past surveys have estimated that the HM shipments constitute about five percent of the total truck miles traveled. To make the accident rate the same as the non-HM accident rate, the total HM truck mileage would have to be cut in half to less than 2.5% of the total mileage. No survey has estimated the HM truck mileage to be that small a fraction of the total truck mileage. Such a reduction would also require that the assumption be made that there is only one shipment per truck. This is known to be incorrect. Perhaps the difference in accident rate per mile results from underreporting. If twice as many HM accidents went unreported as non-HM accidents, then the accident rates would be the same. However, the underreporting would be expected to be greater for non-HM accidents. Thus, even after considering the uncertainties, the lower accident rate shown for HM shipments appears to be significant. The differences in the accident rates among hazard classes/divisions are more uncertain. First of all, some hazard classes/divisions might have a larger number of shipments on a truck when it leaves the shipping dock. Whereas the 30 percent lower rate might be reasonable for Class 3 shipments, if there were four shipments per truck for corrosives instead of two, then the accident rate for corrosives would be 40 percent less than the non-HM accident rate. This can be compared with the 80% lower rate calculated by using the two shipment average. A similar factor might be reasonable to use for Division 2.2 truck transport. If the truck is delivering liquefied gases, there are probably many cases where the facility, i.e., a hospital receiving liquefied oxygen, would not receive the entire content of the cargo tank. The cargo might be split among several facilities. Similarly, a truck delivering standard portable industrial gas cylinders might drop one or two cylinders at each of 10 to 20 facilities. Low numbers are easier to explain away than numbers approaching the non-HM accident rate. Since it is difficult to envision a scenario where the number of shipments per truck is less than two, particularly for a specialized vehicle such as a bulk cargo tank, the high accident rate for Class 9 materials compared to other HM classes/divisions might be significant. Before such a conclusion can be made, additional data is needed. As shown in Table 44, the non-HM accident cost per mile is about 25 cents. The average HM accident cost per mile is about 13 cents. Thus, the non-HM cost per mile is nearly twice that of the average HM accident cost per mile. The slight change in ratio by moving from accident rates to cost rates is due to the fact that HM accidents have only a slightly higher average cost associated with them. This is due to the fact that accident-induced injuries and fatalities associated with both HM and non-HM accidents drive the majority of the economic impacts.
Final Report — March 2001 7-4
Table 44. HM Accident and Non-HM Accident Cost per Mile
HM Class/Division Hazmat Miles
Hazmat Road Costs
Hazmat Costs per
Mile
% Difference Relative to Non-
Hazmat Cost per Mile ($0.25)
1.1, 1.2, 1.3 23,100,000 $9,730,000 $0.42 70.6%1.4, 1.5, 1.6 45,800,000 $12,000,000 $0.26 5.7%
2.1 805,000,000 $107,000,000 $0.13 -46.4%2.2 1,368,000,000 $64,600,000 $0.05 -80.9%2.3 50,300,000 $6,460,000 $0.13 -48.1%3 2,778,000,000 $611,000,000 $0.22 -11.0%
4.1, 4.2, 4.3 48,100,000 $13,000,000 $0.27 9.7%5.1, 5.2 201,000,000 $18,300,000 $0.09 -63.1%6.1, 6.2 218,000,000 $18,600,000 $0.09 -65.5%
7 30,400,000 $4,500,000 $0.15 -40.2%8 1,945,000,000 $97,900,000 $0.05 -79.6%9 250,000,000 $76,500,000 $0.31 23.7%
All Classes 7,763,000,000 $1,039,000,000 $0.13 -45.8%
7.4 Discussion
Comparisons between hazardous and non-hazardous transport must be made by utilizing multiple databases prepared for different purposes by several organizations. For example, the carrier files the HMIS accident/incident report and a police agency completes an accident report that is assembled by a state and submitted to MCMIS. The Commodity Flow Survey was conducted by the Census Department whose focus is primarily economic. In the first phase of this study, an investigation was conducted to determine how many unique accidents were reported in all databases. The results were key for the comparison of HM and non-HM impacts. In most situations, the accident was reported by two sources but seldom by all. These differences make it challenging to compare non-hazardous and hazardous transport risk. Though it is difficult to compare hazardous and non-hazardous transport risk, the differences appear to be significant enough to conclude that the shear magnitude of non-hazardous transport accidents dominates highway transport risk. Furthermore, although data uncertainties are evident, the difference in accident rates for non-hazardous and HM truck shipments appear to be meaningful. Perhaps the specific hazardous material trucking regulations and the additional care provided by carriers and shippers are effectively reducing the accident rate for hazardous material shipments. This may indicate that these improvements in safety could possibly be applied to reduce non-HM shipment accident rates. While an effort was made to collect shipment and accident information for various categories of HM over a ten-year-period, uncertainties remain. The approach taken in this analysis was to base the results on actual data as opposed to theoretical modeling. For HM categories with only a few accidents in a 10-year period, large uncertainties develop. Furthermore, it is easier to model bulk material transport as opposed to shipments containing many packages. This can be seen in the comparison of Class 3 and Class 8. Together they make up over 75 percent of the overall HM truck shipment risk. About 90 percent of the Class 3 shipments are bulk but only 50 percent of the Class 8 shipments are bulk. When a Class 8 shipment gets involved in an accident, many of the releases are from one or two packages. Although this accident enters into the statistics of estimated accident
Final Report — March 2001 7-5
rates, the actual cost of these accidents is relatively small. This is seen in the low cost per mile rates for Class 8 as compared to Class 3. Some of the other categories with low rates are also probably influenced by non-bulk shipment. Most analyses show that hazardous material shipments make up between four and eight percent of all shipments. Consequently, the cost of non-HM accidents dominates that of HM accidents. As shown in other sections of the report, the average cost of an accident is higher for HM, but these higher costs are not nearly large enough to overcome the large disparity in shipment volume between HM and non-HM shipments by truck. This dominance is illustrated by an assumption embedded in the analysis. In the HMIS database, all non-HM related injuries and fatalities are excluded. Therefore, the non-HM related fatalities and injuries were added back into the analysis. This was done by calculating the injury and fatality rate per accident from MCMIS and then adding this rate to the injury and fatality rate for HM, as reported in the HMIS database. The importance of this assumption is realized only after the total cost of injuries and fatalities for non-HM accidents have been obtained. These two costs dominate the impacts. As shown in the analysis, unless the HM costs for other impact categories are much higher, these two impact costs will dominate the HM risk as well.
Final Report — March 2001 8-1
8.0 SafeStat Applications
he economic impact of incidents and accidents associated with the truck transport of HM in the United States is substantial. The magnitude of this impact underscores the importance of effectively managing HM transportation risk. One mechanism for improving safety
performance in HM transportation is making more effective use of existing programs, such as the FMCSA’s Safety Status (SafeStat) Measurement System compliance initiative. The purpose of this chapter is to explore
• how the findings of this study correlate with assumptions about HM carriers contained in the current SafeStat algorithm; and,
• if appropriate, suggest enhancements to the SafeStat algorithm that might improve its effectiveness in identifying high risk HM carriers.
This chapter is intended to serve as a conceptual discussion rather than a prescription for change.
8.1 Introduction to SafeStat
The SafeStat Program was conceived under a research project at the U.S. Department of Transportation, Volpe National Transportation System Center to monitor motor carrier safety fitness. SafeStat is designed to incorporate current on-road safety performance, enforcement history, and on-site compliance review information in an automated, data-driven analysis system for measuring the relative safety fitness of motor carriers. The objective of this initiative is to enable the Federal Motor Carrier Safety Administration (FMCSA) to target inspection resources more effectively by improving identification of those carriers with high risk profiles.
SafeStat ranks the relative performance of motor carriers in four areas: (1) accident history, (2) driver performance, (3) vehicle safety, and (4) safety management. While SafeStat algorithms do contain entries related to hazardous material transport, the impact of the HM entries on the final rankings is unclear. This makes it difficult for regulators to determine if the SafeStat algorithm is targeting sufficient resources at HM carriers, specifically bulk carriers that have been shown in previous analyses to make up about 75 percent of the HM Risk. This study will help determine if the ratio of HM to non-HM carriers being placed in the various ranking categories is commensurate with the relative risk.
8.2 Current Role of HM in the SafeStat Algorithm
As mentioned above, SafeStat evaluates carrier performance across four Safety Evaluation Areas (SEAs): Accident, Driver, Vehicle and Safety Management. Within each SEA, the performance of an individual carrier is compared to its peers. A carrier SEA score in each category is obtained by dividing the carriers into groups with similar experiences (i.e. carriers having a similar number of accidents). Then the rating compares the performance of all carriers in the group, ranking them in ascending order and assigning each a corresponding percentile ranking from 0 to 100. For example, the carrier in the group with the worst performance would be assigned a score of 100.
T
Final Report — March 2001 8-2
Carriers with a SEA score above 75 in at least one of the four safety evaluation areas are placed in an A through G category, based on its score in each of the four areas. Not all the evaluation areas are weighted equally in calculating a carrier’s score. A carrier’s Accident SEA score is doubled and the carrier’s Driver SEA score is multiplied by 1.5 when the total score is calculated. The other two categories have a weighting of one. To be assigned to:
• A Category, a carrier must have a weighted score in excess of 350. (Includes all 4 SEAs or 3 SEAs that result in a weighted score > 350)
• B Category, its score must be less than 350 but greater than 225. (Includes 3 SEAs that result in a weighted score of < 350 or 2 SEAs that result in a weighted score > 225).
• C Category, its score must be less than 225 and greater than 150. (2 SEAs that result in a weighted score < 225)
The remainder of the scored carriers have a score above 75 in only one area. If its score is above 75 in the accident, driver, vehicle or safety management areas, the carrier is assigned to the D, E, F or G Category respectively. Carriers in the A and B Category receive an on site compliance review by FMCSA inspectors. Carriers assigned to a lower category are candidates for a compliance review as resources allow. Occasionally, D Category carriers, those that have an accident and score from 75 to 100 points, are reviewed by FMCSA inspectors. The information used in the SEA calculation is obtained from accident data, compliance reviews, enforcement actions and roadside inspections. The accident data are time weighted so that poor performance during the last six-month period is more important than poor performance earlier. For the other three safety evaluation areas, a carrier’s score is not time weighted. HM is already considered in the SEA calculations to a limited extent. In the Accident SEA, if an accident results in an HM release, then points are added to the severity index component of the scoring algorithm. Similarly, the Safety Management SEA (SMSEA) contains an HM review indicator (HMRI) that is based on the number and severity of hazardous material-related acute/critical violations cited at a carrier’s most recent compliance review.
8.3 SafeStat HM Analysis
To understand these relationships and their implications, an analysis was conducted to: (1) evaluate the current SafeStat algorithm in terms of the percentage of HM carriers that have been scored, (2) examine these carriers and determine if they adequately reflect HM transportation risk as demonstrated in this comparative risk assessment study and, if appropriate, (3) assess how the algorithm could be adjusted to target high risk HM carriers more effectively. In the discussion below, the contribution of HM accidents, HM related enforcement actions, and HM on-site compliance reviews to the scoring and ranking of HM carriers is systematically determined. Sensitivity analyses are subsequently performed on the scoring and ranking algorithms to determine how changes in the algorithms would affect the scores assigned to HM carriers and their respective category ranking.
Final Report — March 2001 8-3
8.3.1 The Contribution of HM to SafeStat
To determine the impact of HM within SafeStat, the contribution of HM was first removed from the algorithm. To accomplish this, new Safety Evaluation Area (SEA) values were calculated without HM. The HM contribution to SafeStat most directly affects ACSEA and SMSEA. The HM contribution to SMSEA is the easiest to remove. Rather than calculate SMSEA based on the maximum of the Enforcement History Indicator (EHI), Hazardous Material Review Indicator (HMRI), and Safety Management Review Indicator (SMRI), the SMSEA value without HM is based on the maximum of EHI and SMRI. In the recent SafeStat run of 09/23/2000, the net effect of adding HMRI to the calculation of SMSEA resulted in 26 additional carriers requiring a compliance review because their scores fell in the A or B Category as a result of the poor HM performance. The analysis also showed that 42 carriers went from unscored to scored because of this factor. When considering that there are about 1,850 known HM carriers included in the 9/23/00 SafeStat run, the effect of HMRI is limited because it only affects the value of SMSEA when it is greater than EHI, the enforcement indicator, plus SMRI, the non-HM compliance review score. It is further limited because the SMSEA has no effect on the carrier’s score if it is less than 75. The contribution of HM to the ACSEA is similar but the logic of when to use the component with the HM factor is more involved. The time weighted number of accidents, Total Consequence/Time Weighted Accidents (TCTWA), is determined by a number of factors. The TCTWA is calculated by first determining the severity of a crash. The severity score is the sum of two different components of the accident. A score of 1 is assigned to the accident if the truck involved in the accident was towed but no injuries or fatalities occurred. A score of 2 is assigned if an injury or fatality occurred. If there was a hazardous material release, a score of 1 is then added to this severity score. The severity score is then “time weighted.” The TCTWA is “increased” by multiplying the severity score by
• 3 if the release occurred in the last six months, • 2 if the release occurred in the period of time between 7 and 18 months, and • 1 for accidents that resulted in an HM release 19 to 30 months prior to the SafeStat run
date. Note, accidents that occurred more than 30 months before the review date are not considered. To remove HM releases from TCTWA, the MCMIS accident file was searched to identify releases that occurred in each of the three time periods. These were weighted and then added together to produce the effect on TCTWA. It was assumed that the HM releases occurred when both the accident fields, HM Placard and HM Cargo were “Y.” The next step was to subtract the HM contribution to TCTWA from every carrier that had an HM release during the 30-month period. The results were placed in the “TCTWANEW” field. This number was then divided by the number of power units operated by the carrier to obtain New Accident Involvement Measure, “AIMNEW.” Since the number of accidents is not changed by the occurrence of an HM spill, the carrier’s accident group is not changed. Thus, the next step is to recalculate the New Accident Involvement Indicator “AIINNEW” for each carrier based on its accident group. ACSEA is calculated from “AIINEW” and “RAI.” Although “RAI” is called the reportable accident indicator, it might more accurately be called the recent accident indicator. It contains no
Final Report — March 2001 8-4
HM component and is calculated based on the number of reported accidents the carrier has experienced since the last compliance review. “RAI” is the percentile ranking of “RAR,” which is calculated by dividing the number of accidents since the review by the annual mileage driven by the carrier in millions. “ACSEANEW” is
• set equal to “AIINEW” if there has been no compliance review in the last 12 months or • set to be the higher of “RAI” and “AIINEW” if a compliance review has occurred in the
last 12 months, but there has been no reported accident since the last compliance review. When this methodology was applied to the 9/23/00 SafeStat run, only 24 ACSEA scores for carriers changed and of those, only 7 required a compliance review because they fell in an A or B Category. Thus, only 7 carriers, about one percent, required a compliance review because of their poor HM performance. When HM contributions to SafeStat were removed from both the SMSEA and ACSEA values, only 29 had their scores elevated into the A, B, C, or D scoring categories.
8.3.2 Expected Influence of HM in the SafeStat Scoring from the Comparative Risk Analysis
Previous sections of this report have compared the risk of hazardous and non-hazardous material truck shipments. The analysis results provided insights into how HM could be weighted in the SafeStat algorithm. The estimated annual accident impact for non-HM shipments is $43.1 billion as compared to $1.1 billion for HM shipments. Thus, HM comprises approximately 2.5% of the total impacts. It logically follows that HM should represent about 2.5% of the Accident SEA in SafeStat. However, a higher inspection fraction might be justifiable. As described in Chapter 7, HM accidents individually represent greater costs than non-HM accidents. Comparing the average $536,000 cost of an HM accident (including only release accidents) with the average $400,000 cost of a non-HM accident, shows that the HM accident has an impact that averages about 34% greater than that for the non-HM accident. The high consequence HM accident poses an increased transportation risk that should also be considered. The average cost of an HM accident with an explosion is about $2.1million. This is more than five times the cost of the average non-HM accident.
8.4 Changes in SafeStat Applications
There are several approaches to making HM more representative in SafeStat. They include the following:
• Selecting appropriate methodologies for identifying HM carriers. • Segmenting bulk and non-bulk HM carriers. • Evaluating the performance of non-bulk carriers that move both HM and non-HM • Deciding on the vintage of “historical” data to use in the algorithms. • Determining inputs into SEA category scoring algorithms. • Weighting of respective SEA category scores. • Standardizing criteria for counting a SEA score towards the overall SafeStat score.
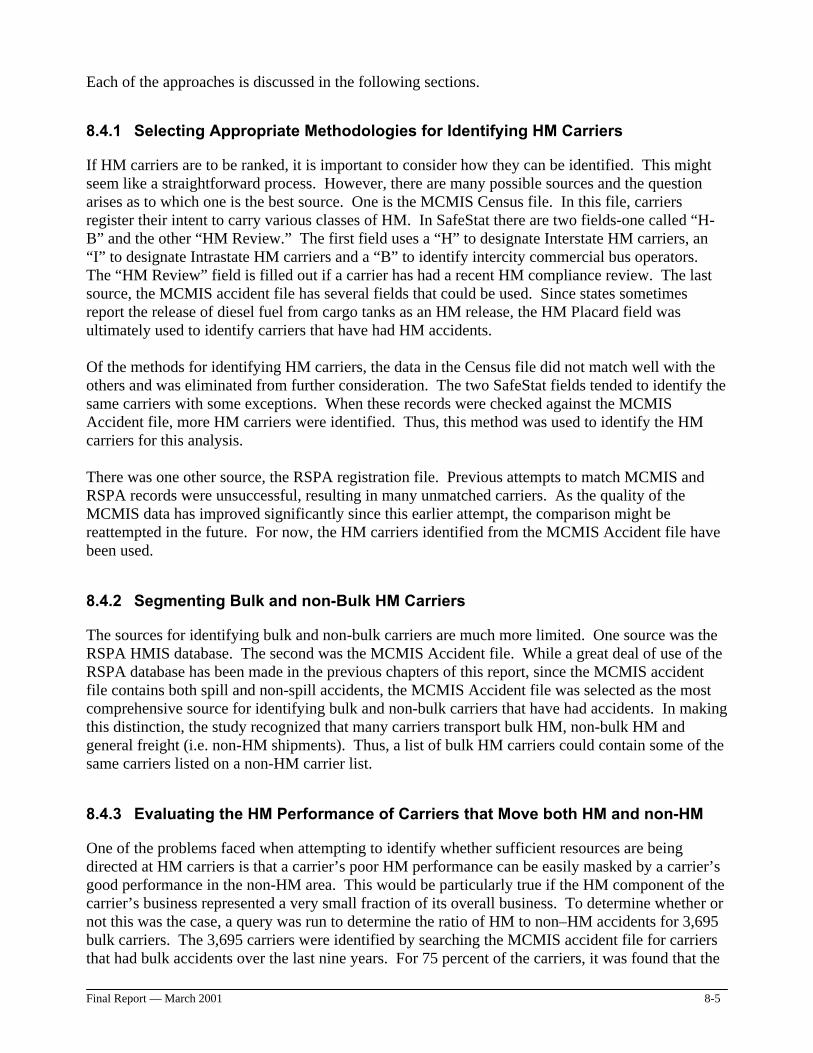
Final Report — March 2001 8-5
Each of the approaches is discussed in the following sections.
8.4.1 Selecting Appropriate Methodologies for Identifying HM Carriers
If HM carriers are to be ranked, it is important to consider how they can be identified. This might seem like a straightforward process. However, there are many possible sources and the question arises as to which one is the best source. One is the MCMIS Census file. In this file, carriers register their intent to carry various classes of HM. In SafeStat there are two fields-one called “H-B” and the other “HM Review.” The first field uses a “H” to designate Interstate HM carriers, an “I” to designate Intrastate HM carriers and a “B” to identify intercity commercial bus operators. The “HM Review” field is filled out if a carrier has had a recent HM compliance review. The last source, the MCMIS accident file has several fields that could be used. Since states sometimes report the release of diesel fuel from cargo tanks as an HM release, the HM Placard field was ultimately used to identify carriers that have had HM accidents. Of the methods for identifying HM carriers, the data in the Census file did not match well with the others and was eliminated from further consideration. The two SafeStat fields tended to identify the same carriers with some exceptions. When these records were checked against the MCMIS Accident file, more HM carriers were identified. Thus, this method was used to identify the HM carriers for this analysis. There was one other source, the RSPA registration file. Previous attempts to match MCMIS and RSPA records were unsuccessful, resulting in many unmatched carriers. As the quality of the MCMIS data has improved significantly since this earlier attempt, the comparison might be reattempted in the future. For now, the HM carriers identified from the MCMIS Accident file have been used.
8.4.2 Segmenting Bulk and non-Bulk HM Carriers
The sources for identifying bulk and non-bulk carriers are much more limited. One source was the RSPA HMIS database. The second was the MCMIS Accident file. While a great deal of use of the RSPA database has been made in the previous chapters of this report, since the MCMIS accident file contains both spill and non-spill accidents, the MCMIS Accident file was selected as the most comprehensive source for identifying bulk and non-bulk carriers that have had accidents. In making this distinction, the study recognized that many carriers transport bulk HM, non-bulk HM and general freight (i.e. non-HM shipments). Thus, a list of bulk HM carriers could contain some of the same carriers listed on a non-HM carrier list.
8.4.3 Evaluating the HM Performance of Carriers that Move both HM and non-HM
One of the problems faced when attempting to identify whether sufficient resources are being directed at HM carriers is that a carrier’s poor HM performance can be easily masked by a carrier’s good performance in the non-HM area. This would be particularly true if the HM component of the carrier’s business represented a very small fraction of its overall business. To determine whether or not this was the case, a query was run to determine the ratio of HM to non–HM accidents for 3,695 bulk carriers. The 3,695 carriers were identified by searching the MCMIS accident file for carriers that had bulk accidents over the last nine years. For 75 percent of the carriers, it was found that the
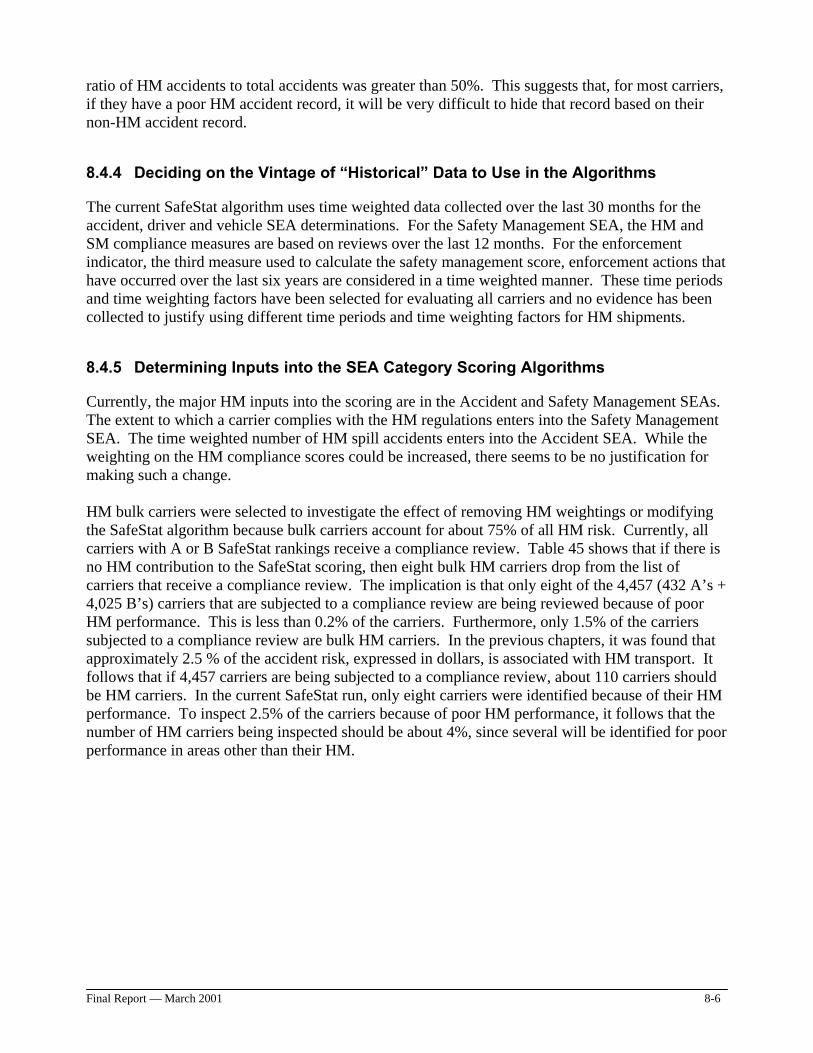
Final Report — March 2001 8-6
ratio of HM accidents to total accidents was greater than 50%. This suggests that, for most carriers, if they have a poor HM accident record, it will be very difficult to hide that record based on their non-HM accident record.
8.4.4 Deciding on the Vintage of “Historical” Data to Use in the Algorithms
The current SafeStat algorithm uses time weighted data collected over the last 30 months for the accident, driver and vehicle SEA determinations. For the Safety Management SEA, the HM and SM compliance measures are based on reviews over the last 12 months. For the enforcement indicator, the third measure used to calculate the safety management score, enforcement actions that have occurred over the last six years are considered in a time weighted manner. These time periods and time weighting factors have been selected for evaluating all carriers and no evidence has been collected to justify using different time periods and time weighting factors for HM shipments.
8.4.5 Determining Inputs into the SEA Category Scoring Algorithms
Currently, the major HM inputs into the scoring are in the Accident and Safety Management SEAs. The extent to which a carrier complies with the HM regulations enters into the Safety Management SEA. The time weighted number of HM spill accidents enters into the Accident SEA. While the weighting on the HM compliance scores could be increased, there seems to be no justification for making such a change. HM bulk carriers were selected to investigate the effect of removing HM weightings or modifying the SafeStat algorithm because bulk carriers account for about 75% of all HM risk. Currently, all carriers with A or B SafeStat rankings receive a compliance review. Table 45 shows that if there is no HM contribution to the SafeStat scoring, then eight bulk HM carriers drop from the list of carriers that receive a compliance review. The implication is that only eight of the 4,457 (432 A’s + 4,025 B’s) carriers that are subjected to a compliance review are being reviewed because of poor HM performance. This is less than 0.2% of the carriers. Furthermore, only 1.5% of the carriers subjected to a compliance review are bulk HM carriers. In the previous chapters, it was found that approximately 2.5 % of the accident risk, expressed in dollars, is associated with HM transport. It follows that if 4,457 carriers are being subjected to a compliance review, about 110 carriers should be HM carriers. In the current SafeStat run, only eight carriers were identified because of their HM performance. To inspect 2.5% of the carriers because of poor HM performance, it follows that the number of HM carriers being inspected should be about 4%, since several will be identified for poor performance in areas other than their HM.
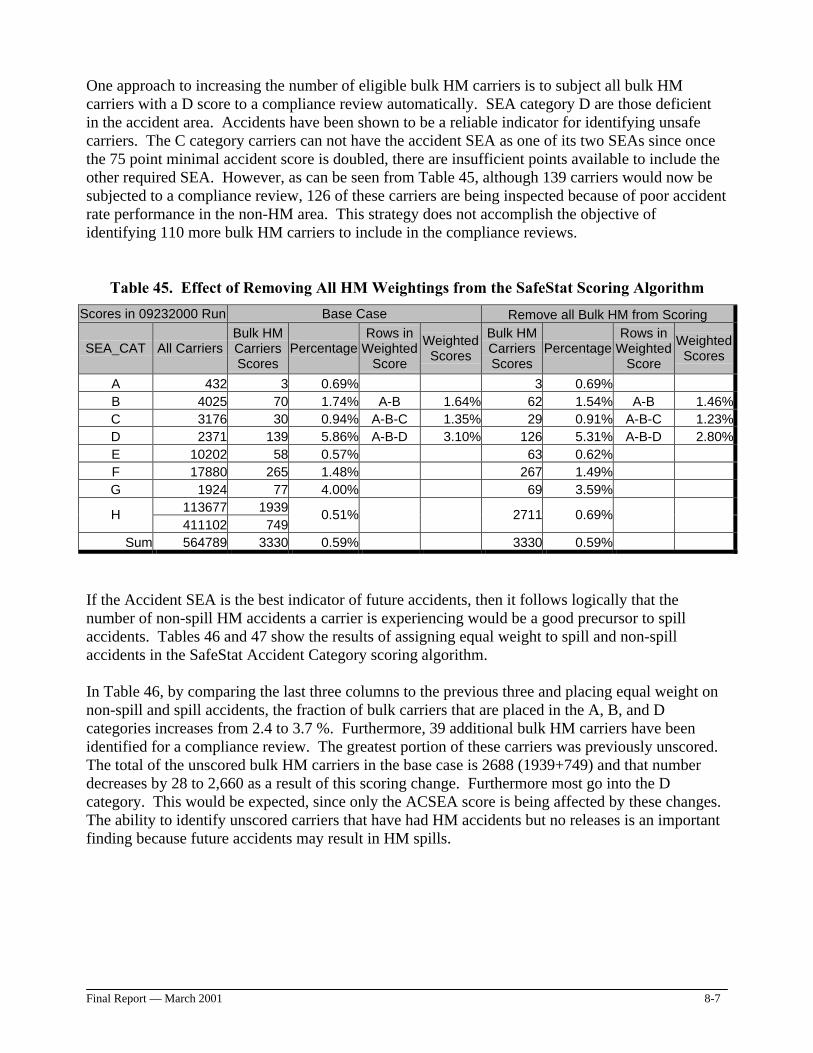
Final Report — March 2001 8-7
One approach to increasing the number of eligible bulk HM carriers is to subject all bulk HM carriers with a D score to a compliance review automatically. SEA category D are those deficient in the accident area. Accidents have been shown to be a reliable indicator for identifying unsafe carriers. The C category carriers can not have the accident SEA as one of its two SEAs since once the 75 point minimal accident score is doubled, there are insufficient points available to include the other required SEA. However, as can be seen from Table 45, although 139 carriers would now be subjected to a compliance review, 126 of these carriers are being inspected because of poor accident rate performance in the non-HM area. This strategy does not accomplish the objective of identifying 110 more bulk HM carriers to include in the compliance reviews.
Table 45. Effect of Removing All HM Weightings from the SafeStat Scoring Algorithm
Scores in 09232000 Run Base Case Remove all Bulk HM from Scoring
SEA_CAT All Carriers Bulk HM Carriers Scores
Percentage Rows in
Weighted Score
Weighted Scores
Bulk HM Carriers Scores
Percentage Rows in
Weighted Score
Weighted Scores
A 432 3 0.69% 3 0.69% B 4025 70 1.74% A-B 1.64% 62 1.54% A-B 1.46%C 3176 30 0.94% A-B-C 1.35% 29 0.91% A-B-C 1.23%D 2371 139 5.86% A-B-D 3.10% 126 5.31% A-B-D 2.80%E 10202 58 0.57% 63 0.62% F 17880 265 1.48% 267 1.49% G 1924 77 4.00% 69 3.59%
113677 1939H
411102 7490.51%
2711 0.69%
Sum 564789 3330 0.59% 3330 0.59%
If the Accident SEA is the best indicator of future accidents, then it follows logically that the number of non-spill HM accidents a carrier is experiencing would be a good precursor to spill accidents. Tables 46 and 47 show the results of assigning equal weight to spill and non-spill accidents in the SafeStat Accident Category scoring algorithm. In Table 46, by comparing the last three columns to the previous three and placing equal weight on non-spill and spill accidents, the fraction of bulk carriers that are placed in the A, B, and D categories increases from 2.4 to 3.7 %. Furthermore, 39 additional bulk HM carriers have been identified for a compliance review. The greatest portion of these carriers was previously unscored. The total of the unscored bulk HM carriers in the base case is 2688 (1939+749) and that number decreases by 28 to 2,660 as a result of this scoring change. Furthermore most go into the D category. This would be expected, since only the ACSEA score is being affected by these changes. The ability to identify unscored carriers that have had HM accidents but no releases is an important finding because future accidents may result in HM spills.
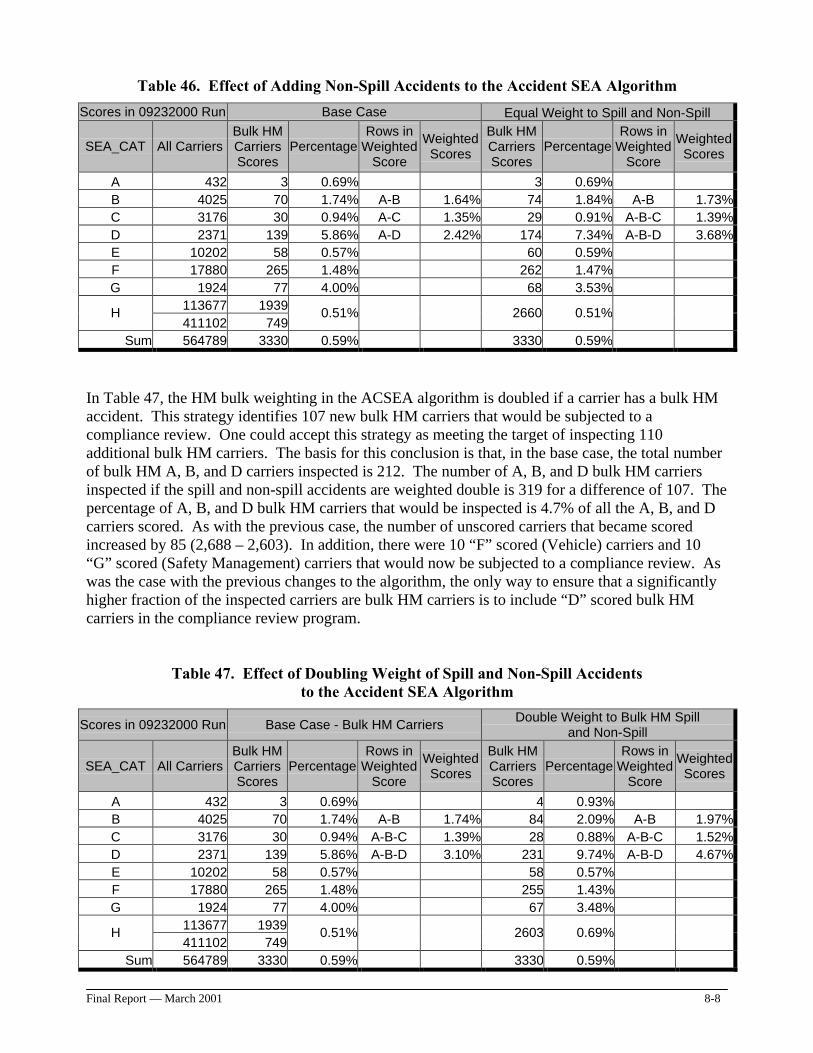
Final Report — March 2001 8-8
Table 46. Effect of Adding Non-Spill Accidents to the Accident SEA Algorithm
Scores in 09232000 Run Base Case Equal Weight to Spill and Non-Spill
SEA_CAT All Carriers Bulk HM Carriers Scores
Percentage Rows in
Weighted Score
Weighted Scores
Bulk HM Carriers Scores
Percentage Rows in
Weighted Score
Weighted Scores
A 432 3 0.69% 3 0.69% B 4025 70 1.74% A-B 1.64% 74 1.84% A-B 1.73%C 3176 30 0.94% A-C 1.35% 29 0.91% A-B-C 1.39%D 2371 139 5.86% A-D 2.42% 174 7.34% A-B-D 3.68%E 10202 58 0.57% 60 0.59% F 17880 265 1.48% 262 1.47% G 1924 77 4.00% 68 3.53%
113677 1939H
411102 7490.51%
2660 0.51%
Sum 564789 3330 0.59% 3330 0.59%
In Table 47, the HM bulk weighting in the ACSEA algorithm is doubled if a carrier has a bulk HM accident. This strategy identifies 107 new bulk HM carriers that would be subjected to a compliance review. One could accept this strategy as meeting the target of inspecting 110 additional bulk HM carriers. The basis for this conclusion is that, in the base case, the total number of bulk HM A, B, and D carriers inspected is 212. The number of A, B, and D bulk HM carriers inspected if the spill and non-spill accidents are weighted double is 319 for a difference of 107. The percentage of A, B, and D bulk HM carriers that would be inspected is 4.7% of all the A, B, and D carriers scored. As with the previous case, the number of unscored carriers that became scored increased by 85 (2,688 – 2,603). In addition, there were 10 “F” scored (Vehicle) carriers and 10 “G” scored (Safety Management) carriers that would now be subjected to a compliance review. As was the case with the previous changes to the algorithm, the only way to ensure that a significantly higher fraction of the inspected carriers are bulk HM carriers is to include “D” scored bulk HM carriers in the compliance review program.
Table 47. Effect of Doubling Weight of Spill and Non-Spill Accidents to the Accident SEA Algorithm
Scores in 09232000 Run Base Case - Bulk HM Carriers Double Weight to Bulk HM Spill
and Non-Spill
SEA_CAT All Carriers Bulk HM Carriers Scores
Percentage Rows in
Weighted Score
Weighted Scores
Bulk HM Carriers Scores
Percentage Rows in
Weighted Score
Weighted Scores
A 432 3 0.69% 4 0.93% B 4025 70 1.74% A-B 1.74% 84 2.09% A-B 1.97%C 3176 30 0.94% A-B-C 1.39% 28 0.88% A-B-C 1.52%D 2371 139 5.86% A-B-D 3.10% 231 9.74% A-B-D 4.67%E 10202 58 0.57% 58 0.57% F 17880 265 1.48% 255 1.43% G 1924 77 4.00% 67 3.48%
113677 1939H
411102 7490.51%
2603 0.69%
Sum 564789 3330 0.59% 3330 0.59%
Final Report — March 2001 8-9
8.4.6 Weighting of Respective SEA Category Scores
The Volpe Transportation Systems Center, the developers of SafeStat, have performed extensive studies of accident precursors and have found that the accident and driver performance measures used in SafeStat are more important than the other two as predictors of future poor carrier performance. Accordingly, the weighting factors have been set at 2 and 1.5 for the Accident and Driver SEA respectively. Without additional study requiring the collection of a great deal more data, there is no justification for moving away from the Volpe SEA SafeStat weighting factors.
8.4.7 Standardizing Criteria for Counting a SEA Score Toward the Overall SafeStat Score
At the present time, only those carriers with a score above 75 are counted. Furthermore, some groups of carriers (e.g. those with only one accident over the past 30 month period) are assigned to accident Group 1; the highest score attainable for this group is 74. If all Accident SEA scores above 70, instead of the current 75, were used for bulk carriers, then there would be an additional 5% of the Group 1 carriers that scored between 70 and 74 as well as the carriers in the other accident groups that scored above 70 that would be counted. The effect of such a scoring algorithm is shown in Table 48 and discussed in the following paragraphs. Table 48 shows that scoring all bulk HM Carriers with ACSEA scores above 70 creates a result similar to that observed when the bulk non-spill accidents were added. The number of bulk HM carriers that would undergo a required compliance review, A and B scored carriers, would increase from 1.6 to 1.8 percent. If the A, B, and D bulk HM carriers were subjected to a compliance review, the number of carriers reviewed would increase from 3.1 to 3.9 percent. More importantly, as a result of this change, the 2,688 bulk HM carriers unscored (H = 1,939 + 749 = 2,688) is reduced by 43. Most of the newly scored carriers are scored as a “D.” However, what is different in this case is the change in the number of A-B scored carriers. There are three more carriers that become “As,”and three more that become “Bs,” and thus are automatically subjected to a compliance review. However, as in the previous cases, the greatest change is in the number of carriers that went from “H,” unscored, to “D.” Thus as in the past cases, the only way to guarantee that a “high risk” HM bulk carrier is subjected to a compliance review is to inspect the “D” scored bulk HM carriers. In terms of the target of identifying 110 new bulk HM carriers subject to a compliance review, this algorithm identifies only 54 new carriers (268 A, B, and Ds in the augmented case minus 212 A, B, and Ds in the base case).
Table 49, shown below, combines two of the cases analyzed above. First, both bulk HM spill and non-spill accidents are included in the ACSEA score and the HM weighting for both spill and non-spill accidents is doubled. Second all ACSEA scores greater than 70 when calculating the overall SafeStat score for bulk HM carriers are added. As can be seen from the table, the number of A and B scored carriers increases from 1.6 to 2.0 percent, about the same as was observed by doubling the weighting on spill and non-spill accidents. By far the biggest change was in the totals for the A, B, and D scores for bulk HM carriers. If all bulk HM carriers with an A through D score were subjected to a compliance review, the number inspected would more than triple, increasing from 1.6 to 5.2 percent. As stated above, 1.6 percent is considered the base case because that is the number of bulk HM carriers that are being inspected using the current SafeStat algorithm.
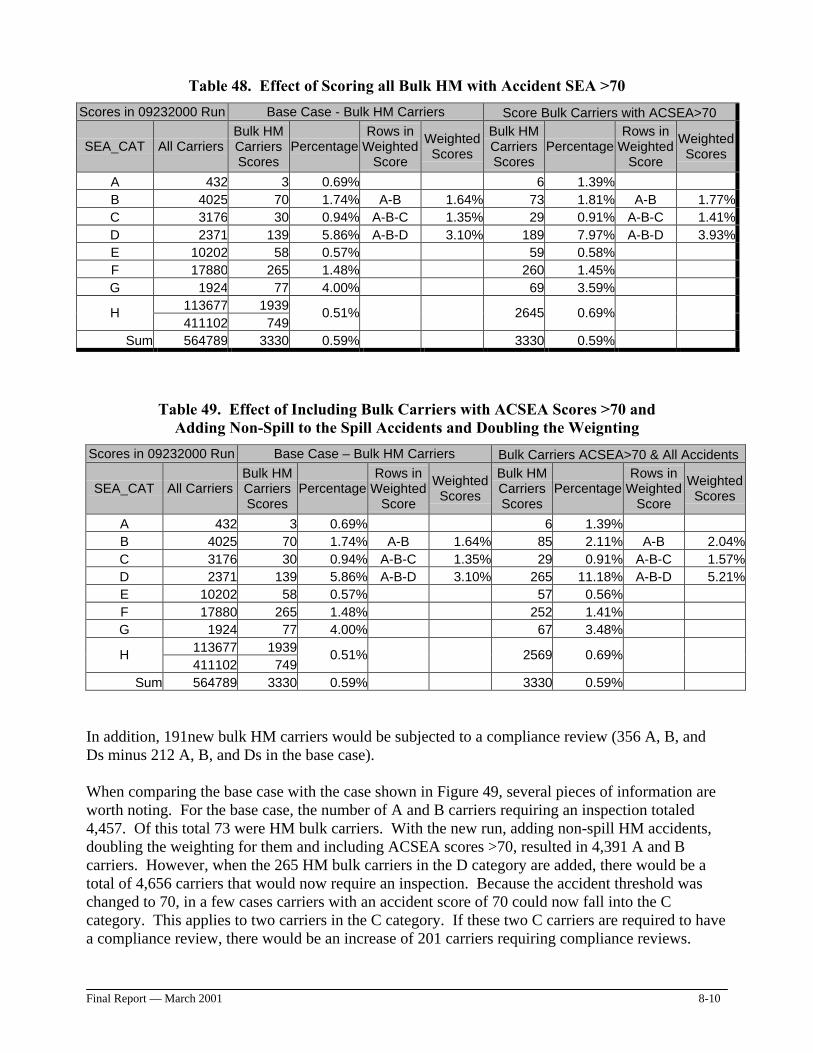
Final Report — March 2001 8-10
Table 48. Effect of Scoring all Bulk HM with Accident SEA >70
Scores in 09232000 Run Base Case - Bulk HM Carriers Score Bulk Carriers with ACSEA>70
SEA_CAT All Carriers Bulk HM Carriers Scores
Percentage Rows in
Weighted Score
Weighted Scores
Bulk HM Carriers Scores
Percentage Rows in
Weighted Score
Weighted Scores
A 432 3 0.69% 6 1.39% B 4025 70 1.74% A-B 1.64% 73 1.81% A-B 1.77%C 3176 30 0.94% A-B-C 1.35% 29 0.91% A-B-C 1.41%D 2371 139 5.86% A-B-D 3.10% 189 7.97% A-B-D 3.93%E 10202 58 0.57% 59 0.58% F 17880 265 1.48% 260 1.45% G 1924 77 4.00% 69 3.59%
113677 1939 H
411102 749 0.51%
2645 0.69%
Sum 564789 3330 0.59% 3330 0.59%
Table 49. Effect of Including Bulk Carriers with ACSEA Scores >70 and Adding Non-Spill to the Spill Accidents and Doubling the Weignting
Scores in 09232000 Run Base Case – Bulk HM Carriers Bulk Carriers ACSEA>70 & All Accidents
SEA_CAT All Carriers Bulk HM Carriers Scores
Percentage Rows in
Weighted Score
Weighted Scores
Bulk HM Carriers Scores
Percentage Rows in
Weighted Score
Weighted Scores
A 432 3 0.69% 6 1.39% B 4025 70 1.74% A-B 1.64% 85 2.11% A-B 2.04%C 3176 30 0.94% A-B-C 1.35% 29 0.91% A-B-C 1.57%D 2371 139 5.86% A-B-D 3.10% 265 11.18% A-B-D 5.21%E 10202 58 0.57% 57 0.56% F 17880 265 1.48% 252 1.41% G 1924 77 4.00% 67 3.48%
113677 1939H
411102 7490.51%
2569 0.69%
Sum 564789 3330 0.59% 3330 0.59%
In addition, 191new bulk HM carriers would be subjected to a compliance review (356 A, B, and Ds minus 212 A, B, and Ds in the base case). When comparing the base case with the case shown in Figure 49, several pieces of information are worth noting. For the base case, the number of A and B carriers requiring an inspection totaled 4,457. Of this total 73 were HM bulk carriers. With the new run, adding non-spill HM accidents, doubling the weighting for them and including ACSEA scores >70, resulted in 4,391 A and B carriers. However, when the 265 HM bulk carriers in the D category are added, there would be a total of 4,656 carriers that would now require an inspection. Because the accident threshold was changed to 70, in a few cases carriers with an accident score of 70 could now fall into the C category. This applies to two carriers in the C category. If these two C carriers are required to have a compliance review, there would be an increase of 201 carriers requiring compliance reviews.
Final Report — March 2001 8-11
With the new run, 358 HM bulk carriers would be inspected because they were in the A, B, C, or D categories. Of these, 138 of the carriers were previously in the D category and 127 were previously unscored and moved into the D category. As stated above, two HM bulk carriers moved into the C category with the new run. One of these went from the F category and the other the G category to the C category. Seventy-two of the HM bulk carriers from the A or B Category in the base case are combined with 19 new HM carriers that rose to A or B resulting in 91 A and B HM bulk carriers subject to a compliance review. (One carrier that was on the base case list dropped off the list). Thus, a total of 283 new bulk carriers would be subject to inspection.
8.4.8 Conclusions and Recommendations
In summary, the SafeStat Algorithm has two major HM entries: (1) compliance review indicator that is part of the Safety Management SEA and (2) a weighting applied to HM spills that have occurred over the last 30 months that is incorporated into the Accident SEA. The analysis showed that using the current SafeStat algorithm resulted in about 3.1 % of the carriers receiving an A, B, or D score being bulk HM carriers. If all these carriers were being reviewed because of their poor HM performance, then simply adding the bulk HM carriers with D scores to the compliance review program would meet the arbitrary target of having the percentage of bulk HM carriers inspected equal the percentage of the total accident cost attributable to HM carriers. However, it was shown in the analysis that most of the carriers are not being identified because of poor HM performance. The analysis also showed that if the target were to be reached, then at least 110 new bulk HM carriers would have to be added to the carriers being subjected to a compliance review. Several sensitivity analyses were performed to identify possible changes in the scoring algorithm that would enable this target to be met. The study found that by adding the non-spill accidents to the HM scoring and having all A, B, and D bulk HM carriers subjected to a compliance review, the number of bulk HM carriers falling into those categories increased to 3.7%. However, this change alone would not meet the target of identifying 110 new bulk HM carriers for a compliance review. Since most of the increase occurs because unscored bulk HM carriers are now scored in the D category due to their high HM non-spill accident rate, the change in the algorithm is clearly identifying carriers that previously went unidentified and are very likely to have an accident that results in a spill in the future. Thus, this change fits very well into SafeStat’s target of identifying those carriers to prevent future accidents, in this case future HM spill accidents. Two additional changes were evaluated that would identify 110 new bulk HM carriers. One was a doubling of the accident spill and non-spill score. The second was to decrease the threshold for bulk HM carriers in the ACSEA area to 70. Of all the possible changes, three changes came closest to attaining the target of identifying 110 new bulk HM carriers to be subjected to a compliance review. First, including non-spill HM accidents and equating them to spill accidents. Second, doubling the weighting for both of these categories of accidents. Third, combining the spill and non-spill accident weighting and the ACSEA > 70. These changes together result in an identification of over 140 new bulk HM carriers that had not been included in the A, B, C, or D categories for the base case. Rather than just increasing the weighting, these changes provide a balanced approach. Based on the analyses that were performed for this study, the following change to the SafeStat algorithm are recommended in order to make the number of bulk HM carriers being inspected more commensurate with the risk of accidents posed by this group of carriers.
Final Report — March 2001 8-12
Thus, the final recommendations are:
• Add non-spill HM accidents as well as spill HM accidents to the Accident SEA scoring algorithm and double weight all of these HM accidents;
• Include all bulk HM ACSEA scores >70; and • Expand those carriers subjected to a compliance review to include all bulk HM carriers
in the A, B and D Categories as well as those in the C Category that include an accident component.
Final Report— March 2001 9-1
9.0 HM Database Assessments and Recommendations
9.1 Purpose and Organization
his chapter summarizes the recommendations formulated as a result of completing this risk assessment of HM and non-HM transport by truck.
9.1.1 Background
Accurate and comprehensive data is the most essential component in the production of a risk assessment. Experiential data is necessary to document the consequences and likelihood of HM accidents. Meaningful assessments of the safety of hazardous materials transportation on the nation’s highways require such data. The ability to make informed decisions and to develop effective safety policies and regulations concerning hazardous material transportation can be seriously compromised if it is not based on reliable information. This risk assessment reviewed numerous databases, managed and maintained in multiple public agencies. These agencies collect data for varying purposes, using disparate definitions under limited jurisdictional authority. As a result, much of the data available for this risk assessment was inconsistent, fragmented, and incomplete. Databases should standardize definitions to reduce the differences in the definition of
• what constitutes an accident, • which accidents must be reported, and • what information must be reported.
Until this standardization occurs, it will not be possible for DOT to realize fully the benefits of a relational database structure. If such a structure were developed, the reporting requirements would be greatly simplified, accuracy would be increased, there would be fewer databases, and the overall size of the databases would be dramatically smaller.
9.1.2 Approach
The review and comparison of the databases assembled and analyzed for this risk assessment could be used to develop a road map to better data collection in the future. The limitations of the databases assembled and reviewed provided the analysts involved in this project with an overview of potential improvements to existing databases. The limitations associated with these databases became readily apparent as they were employed in the risk assessment. Possible improvements to these existing public databases are discussed in the following section. Extensive efforts were also made by the research team to identify and obtain data from private sector sources. Solicitations were made of companies in the trucking and insurance industries for data involving the costs associated with highway accidents of both hazardous materials and non-
T
Final Report— March 2001 9-2
hazardous commodities. In all cases, despite repeated efforts, no data was obtained regarding accident costs from the private sector. The lack of any positive response to attempts to acquire cost figures for highway accidents is in keeping with past results in this area. In the Transportation Research Board’s Special Report #229 “Safety Research for a Changing Highway Environment,” this was succinctly discussed with the statement that from the private sector, “Detailed information is not available....” Although the empirical cost data maintained by the private sector would be invaluable in conducting a risk assessment, concerns about confidentiality and competitiveness ensure that these data are viewed as proprietary information and not releasable. Absent a major and substantial outreach program by a government safety agency to solicit private companies to cooperate and provide data for safety research, it does not appear any useful information will be forthcoming from the private sector. Therefore, as a lesson learned from efforts made in conducting this report, researchers should focus exclusively on public databases to obtain data for future studies.
9.2 Opportunities for Database Improvement
Although public databases containing information useful for conducting risk assessments are deficient in a number of areas, they can be improved. Better coordination among the multiple agencies that collect data would allow for the correction of definitional differences and the coordination of inconsistent reporting requirements. The collection of data, whether it is by a survey or in a census database, should be done with consideration and planning for consistency and coordination with other datasets. Substantive improvements to existing data sources and the implementation of useful new data sources is most effectively derived by addressing data gaps and existing database shortcomings. Opportunities that currently exist for improved hazardous material highway data might include considering the following recommendations. Improvements in the DOT databases should be made now, anticipating the successful completion of a number of on-going initiatives. For example, there is a requirement that all carriers reregister over the next two years. This will enable DOT to update its listing of motor carriers. In anticipation of this event, the MCMIS accident file, HMIS database, and the MCMIS registration database should be restructured so all are linked by the shippers and carriers DOT registration number
9.2.1 The Trucks in Fatal Accidents (TIFA) Database
The Trucks in Fatal Accidents (TIFA) database could modestly expand the number of questions on its questionnaire that concern hazardous materials. The TIFA database currently consists of only one additional hazardous material question, “Was there a release of the material?” This is asked after the Fatal Accident Report yes/no field of “Was hazardous material present in the cargo?” Additional questions that could be asked might include a request for the identification number of the material transported, the DOT specification of the truck or trailer, and a more detailed explanation of the consequences resulting from a spill. This would be a modest effort that could result in greater knowledge of the circumstances and consequences associated with a serious incident. Annually, about four to five percent of the FARS truck accidents followed up on in TIFA involve trucks transporting hazardous materials and only a quarter of these or one percent of all TIFA accidents result in a release of the material. Based on approximately 5,300 TIFA records from the most recent year’s data, additional queries would need to be made of approximately 250 cases.
Final Report— March 2001 9-3
DOT should investigate ways of coupling the TIFA, MCMIS and HMIS databases so information can be shared between the databases. One potential solution might be to request that the MCMIS accident report number filed by the local law enforcement agency be included as a record in the TIFA file. Assuming DOT has already coupled the HMIS and MCMIS accident files, adding the MCMIS accident report number to the TIFA file would effectively couple TIFA with HMIS. Through such coupling, the unique information compiled by each database could be shared without requiring significant additions to any database. This effort would compensate for HMIS not containing all the fatal HM accidents in TIFA due to HMIS’s exclusion of fatalities that were not caused by the hazardous material.
9.2.2 The Vehicle Inventory and Use Survey (VIUS)
The Vehicle Inventory and Use Survey (VIUS) can also with a modest expansion in the hazardous material section contribute new and useful data. A single question is currently asked of the respondent, “...was this vehicle (or combination) used to haul hazardous materials in quantities large enough to require a hazmat placard ...” A rephrasing of the question to request the respondent to provide the percentage of the time the vehicle or combination was used to haul hazardous materials would be helpful. Additional improvements to VIUS hazardous materials data could include finding a way to control for the double counting associated with the placarding responses and to somehow obtain the DOT specification numbers on responses involving cargo tanks.
9.2.3 The Motor Carrier Management Information System (MCMIS)
Under the Motor Safety Improvement Act of 1999, the Federal Motor Carrier Safety Administration (FMCSA) is obligated to require refiling of the motor carrier identification report form MCS-150 starting December 9, 2000. The current registration file in the Motor Carrier Management Information System (MCMIS) is woefully out of date and contains many cases of inaccurate information. Once an update has been completed to the MCMIS registration file, a detailed analysis should be undertaken. This analysis should include comparisons with other existing hazardous material registration databases, such as RSPA’s registration database, which has recently been substantially expanded. The accuracy of the MCMIS database should be improved by using “pick lists” when entering the data. In addition, the record should not be accepted if certain required fields are not filled out. Use of the “pick list” would reduce errors. As the person using a “pick list” starts to type in the data, such as a company name or chemical, the selection of choices narrows until the correct name is displayed among the list of choices showing on the input screen. By using a cursor, the data entry person then selects the correct entry. At the moment that is not how the system works. If you query the current database, it is evident that every field is filled out uniquely. For example,
• If the current database is queried to look for the company name and address of a large carrier associated with a specified DOT registration number, the list of variations will fill pages. Some variations concern only the presence or absence of a period at the end of “Inc.”
• If the current database is queried asking for “Like ‘Carrier Name,’” several DOT registration numbers will be listed for the same carrier.
Final Report— March 2001 9-4
• If UN number 1005 queries the database, “ammonia” will pop up, entered at least in 25 different ways. In many cases, ammonia is misspelled. Data entry personnel should not be expected to know how to spell the names of thousands of chemicals.
The use of “pick lists” will improve the accuracy of the database and also improve the accuracy of the queries because the fields will be filled out accurately. In a case where HM is involved, there should be a requirement that certain fields, such as hazard code and chemical name, be filled out before the record can be entered. Currently, the HM field is often checked in association with blank entries in all the other HM related fields.
When the accident involves HM, one of the required fields entered in the MCMIS accident file should be the HMIS report number. If none has been assigned, then it should be possible to assign one and place the relevant accident data in the HMIS file. Later on, when the HMIS report is submitted, the first step would be to see if the HMIS number had already been assigned. Given this simple coupling, it would be possible to identify carriers that are not reporting their HMIS accidents and formally request that they do so. It should also be possible to identify law enforcement agencies that are not filing MCMIS reports for HM accidents.
9.2.4 The Hazardous Materials Information System (HMIS)
The Hazardous Materials Information System (HMIS), the primary incident database for collecting data on hazardous materials incidents nationwide, is currently undergoing a revision of its form. This revision of the F 5800.1 form will have far reaching consequences for hazardous materials incident data for a decade or more to come. Major efforts need to be exerted to assure that the revisions to the form include critical data fields that will aid in conducting future risk assessments. This is enormously important to the highway mode, since approximately 85 percent of HMIS reports now involve highway transportation. There are a number of important fields that are being considered for inclusion on the DOT F 5800.1 form. Two additional questions that would prove very useful for future research:
1. The addition of a field to capture the police accident report (PAR) number for accidents and
2. A field to record the amount in a container at the time of the release. DOT should make the database more relational in the future. One area in particular exemplifies the need for making this significant improvement. There are many standard DOT specification containers that are used in the shipping of HM. If a standard specification container is involved in an accident, all that should be required is to list the container number. The rest of the information should be in the database. If there is concern about possible variations among containers designed to the same specification, as a minimum, all the generic information should pop up so the person entering the data can edit those fields that are different.
9.2.5 The 1997 Commodity Flow Survey (CFS)
The 1997 Commodity Flow Survey (CFS) was recently released and utilized for the estimation of mileage traveled by both HM and non-HM shipments. Although the CFS represents a major
Final Report— March 2001 9-5
expansion in highway denominator or flow data, the data did not provide a calculated mileage estimate for truckload shipments. The data for tons miles had to be converted into mileage by dividing tons-miles by the average truck load weight of a particular hazard class. Average shipment weight was available for shipments but information regarding the number of shipments per truck was unavailable. In the future, this additional data should be made available to facilitate the assembly of reliable denominator data for future risk investigations. A review of the highway data contained in the CFS with input from data users should help identify other improvements that might be made to future surveys in both the collection and processing of responses. Recommendations for improvements to hazardous material highway data can also be broader than enhancements to specific databases. There is a need for much better data on the costs and consequences associated with incidents involving hazardous material highway incidents. Whether this lack of reliable data is addressed by better reporting on existing forms or achieved through other means, such as greater use of survey methodology, this is a topic that should be addressed. It should be self evident that it is in everyone’s interest for a coordinated effort to be made among the responsible public agencies and the private sector to identify and obtain better data for improving the safety of hazardous materials transportation on our nation’s highways.
9.3 Recommendations and Conclusions
This project demonstrated that to date, no single database is able to provide all of the data required to conduct a risk analysis. For example, to catalogue the total number of accidents, the project team selected the HMIS database as the reference database and supplemented this information with data from the MCMIS and TIFA databases, as well as selected state accident databases. This was done to obtain a more complete portrait of the HM accidents for one year. This exercise demonstrated clearly that it was necessary to use more than one database to obtain the full portrait of annual accidents. This was especially true for HMIS and MCMIS because, although both included spill accidents, only MCMIS include the no-spill accident. Therefore, in order to obtain a portrait of spill and non-spill accidents for a period of time, the researcher would have to use at a minimum the HMIS and MCMIS databases. The databases should be linked through the use of a common field, such as the MCMIS accident number, so queries can be made using unique information. To accomplish this, a small committee could be formed, consisting of FMCSA and RSPA staff, to develop recommendations for an approach to link the databases. Clearly, a key will be to ensure that common fields, such as the DOT Registration Number and a unique accident number, are used so that all records related to those numbers can easily be retrieved. The recommendations identified for the specific databases in this chapter are summarized below. 1. Over time, definitions in accident databases such as HMIS, MCMIS and TIFA should be
standardized so there is a reduction in the differences in the definition of (a) what constitutes an accident, (b) which accidents must be reported, and (c) what information must be reported.
2. Accident databases should have sufficient common fields so that information about the accident
entered in one database can be shared rather than duplicated in the other databases. 3. DOT should determine a viable mechanism for using carrier records for the purpose of verifying
that HMIS and MCMIS reports are complete and accurate.
Final Report— March 2001 9-6
4. Improvements in the DOT databases should be made now, anticipating the successful completion of a number of on-going initiatives, i.e., the reregistering of carriers and shippers that started in December 2000.
5. The accuracy of the MCMIS database should be improved by using “pick lists”or other aids to
improve the accuracy of entered data. 6. Electronic filing should be available for HMIS and MCMIS reports. 7. Databases should be coupled to allow DOT enforcement staff to have instant access to complete
accident information in more than one database.
Final Report — March 2001 10-1
10.0 Conclusion
10.1 Project Significance
his report has presented the results of a project designed to better understand HM truck safety in the context of key risk contributors within the industry. The study approach and corresponding results allow for comparisons to be made across several dimensions: (1) HM
vs. non-HM, (2) by HM category, and (3) by HM incident type. These results are portrayed both as estimates of annual economic impact and on a per vehicle-mile basis. The report also demonstrates the usefulness of a methodology for effectively estimating the number of accidents and incidents for a one-year or a longer period. This methodology focuses on the use of existing national databases and the selection of data from sample states to supplement national databases. The methodology uses the HMIS database and the MCMIS accident file supplemented by state databases and news clippings to assemble an annual number of accidents from an eight-state sample. This eight-state accident count was then assigned a likely proportion of the national accidents and extrapolated to develop a national estimate of accident and incident numbers. The report has estimated the number and type of impacts for accidents and incidents in 12 HM categories of HM classes or divisions. HM impact estimates were made for the following:
• Injuries and deaths • Cleanup costs • Carrier/Property damage • Evacuation • Product loss • Traffic incident delay • Environmental damage
An impact estimate was also made for accidents involving non-HM accidents. For non-HM accidents, impacts were estimated for:
• Injuries and deaths • Cargo loss • Carrier/Property damage • Traffic incident delay
Based on available data, dollar cost estimates were made for each of the impact categories and translated into a per accident or incident cost. Then, the total cost for the impact was calculated based on the number of accidents or incidents. While this study represents a valid attempt to benchmark the financial implications of the problem based on best available data, these observations should be viewed in the context of establishing a general estimate or bound on the financial impact of this problem rather than a precise valuation. Consequently, if the results are within an order of magnitude, meaningful comparisons can be derived for evaluation purposes.
T
Final Report — March 2001 10-2
Impact measures can be refined in the future by supplementing available data with impact estimates obtained from private sector sources, such as insurance companies and trucking companies.
10.2 Project Results
The annual number of non-HM accidents is estimated to be 126,880, in contrast with the approximately 15,000 HM accidents and incidents estimated to occur each year. Of these HM incidents and accidents, about 75% are represented by loading and unloading incidents. Enroute HM accidents total about 2,500 annually with about 700 (28%) of these being spill accidents. The estimated number of annual incidents (and accidents) can be converted into rates by using annual vehicle miles of HM operation. The 1997 Commodity Flow Survey (CFS) was used for this estimate. The mileage numbers provide a general measure of differences but more rigorous comparisons must await further refinements in the accuracy of CFS mileage numbers. The average HM accident rate is 0.32 accidents per million vehicle-miles and the average HM incident rate is 0.51 accidents per million vehicle-miles. When comparing across HM categories, Class 9 has the highest accident and incident rates, and Class 2.2 has the lowest. However, the HM category accident and incident rates are all within the same order of magnitude. Several findings can be reported from reviewing the analysis results, including:
• HM truck incidents cost society nearly $1.2 billion on an annual basis. • Injuries and fatalities comprise the largest components of this cost. • Class 3 contributes the largest economic impact associated with HM incidents. • Bulk shipments account for about 75% of the risk for HM shipments. Class 3 and Class
8 make up over 75% of the overall HM truck shipment risk. About 90% of the Class 3 shipments and 50% of Class 8 shipments are bulk. Class 2.1 gases, representing about 9% of all HM risks, is transported in bulk shipments about 64% of the time.
• Release-causing enroute accidents have the highest average cost, followed by enroute
accidents in which a release does not occur. Leaks enroute are an order of magnitude lower in average cost with the average cost of loading/unloading incidents an order of magnitude lower than that. The greatest economic impact is associated with accidents enroute where a release does not occur, due to the higher frequency of these events.
• Of those enroute accidents resulting in a release, explosions have the highest per incident
cost, followed by fires and then releases where neither a fire or explosion ensue; however, the release-only incidents contribute more to the annual economic impact because of the frequency of such events. Explosions result in the greatest economic impact, with an average cost of over $2.1 million per accident. The average cost of an enroute accident resulting in a fire is nearly $1.2 million, while enroute accidents that have a release without fire or explosion have an average cost of slightly over $400,000.
Final Report — March 2001 10-3
The annual economic impact of non-HM truck accidents is over $43 billion, considerably higher than for HM truck incidents. The annual number of non-HM accidents is 126,880 in contrast with the approximately 15,000 HM incidents. Although due primarily to a much larger volume of transport activity, the estimated non-HM truck accident rate is more than twice the HM truck accident rate, a relationship also reflected in the impact cost per vehicle-mile. Hazardous material shipments make up between four and eight percent of all shipments. Given this small percentage, the overall cost of non-HM accidents clearly dominates the cost of HM accidents. However, although the average cost of an accident is higher for HM, these higher costs are not nearly enough to overcome the large disparity in shipment volume between HM and non-HM shipments by truck.
10.3 Recommendations for Future Projects
This section describes five future initiatives that follow from the HM risk assessment project described in this report. 1. Database Enhancements
This project effort demonstrated the need to improve the data used for HM truck safety evaluations. To promote continuous improvement in HM safety data quality, the study makes the following recommendations:
• Incident/accident databases, such as HMIS and MCMIS, should contain standardized
definitions to provide greater compatibility in
(1) What constitutes an incident/accident, (2) Which incidents/accidents must be reported, and (3) What incident/accident attributes must be reported.
• Different incident/accident databases should have sufficient common fields to expedite
sharing of information. DOT should investigate ways to cross reference the TIFA, MCMIS, and HMIS databases.
• DOT should develop a system to verify the accuracy and completeness of HMIS reports by
comparing the data with the carrier records.
• The quality and completeness of the MCMIS database should be improved. Quality control protocols should be developed for inclusion in MCMIS accident file to ensure that required fields are properly completed.
2. HM Risk Management Policy Development
Results of the HM Risk Assessment Study provide an opportunity to establish this foundation, leading to the development of future HM risk management initiatives within FMCSA. Although the FMCSA has adopted a risk-based approach for enhancing the safety of hazardous materials truck transport, the principal objective of this approach is to assign priorities and allocate resources to policies and programs that are cost-effective in satisfying the agency’s
Final Report — March 2001 10-4
safety mission. A key to success is a thorough understanding of the likelihood and severity of incidents involving the truck transport of HM cargo. By systematically evaluating the focus of its current risk management activities, FMCSA will have an opportunity to validate the significance of ongoing initiatives, while taking corrective actions to improve areas of deficiency. The bottom line will be a more targeted use of resources, directed at problems that cause the greatest threat to the safety of HM truck shipments.
3. HM Risk Management Training
Federal, state and local HM program managers are being asked to implement risk management methods and practices, often with little knowledge or awareness of the concept of risk management. This restricts their ability to lead this effort, which reduces the potential effectiveness of corresponding programs. Education is needed to improve understanding of risk management concepts and methods.
This could be addressed with the development of a ½ to 1-day executive management training course covering HM risk management concepts and methods. The curriculum could include findings and implications from the HM Risk Assessment study as well as best practices in risk management being used in government and industry. As part of the course, the risk assessment model developed in the study could be made available for attendees to use in their own operations.
4. Determination of HM Accident Causation
If the FMCSA is going to reach its goal of reducing the average number of truck related fatalities by 50 percent, then it is necessary to identify and address the causal factors associated with accidents.
As part of the Phase I activities, the remarks file in HMIS was examined to identify the precursor events for serious accidents. Although the precursor cause of an accident, such as a tanker rollover, could be determined, the root cause could not. For example, if the cause of the accident was driver error or some type of equipment failure on the vehicle, we could not identify why there was driver error or equipment failure. Did the driver make a mistake because he had been driving for 10 hours? Was the cause of the equipment failure poor maintenance or just a random failure? FMCSA could use other sources of data, such as police accident reports and personal interviews with drivers involved in selected accidents, to compile root causes for major HM accidents.
5. Augmentation of “HM Model”
A product of this study has been the development of the essential elements of a Hazardous Material Truck Transportation Risk Model. In any model, some elements of the model are more important than others. The most cost-effective way to improve a model is to develop better algorithms in the areas that are most important to consider. In this way, the model becomes a better risk management tool for FMCSA.
Final Report — March 2001 10-5
The proposed project would begin by performing sensitivity studies on the parameters incorporated in the current risk model. For example, currently mean values are being used for all the parameters. However, some parameters can take on a broad range of values, i.e., the delay cost from an HM accident. In some cases, it is just a few hours delay, but there are frequently times when the traffic flow patterns can be disrupted for weeks or longer when a critical structure, damaged by the accident, is replaced. The development of such distributed models must be balanced by the proportion of the overall risk represented by traffic delay. If the dominant risk component is injuries, which is indicated by the current model, then collecting better data on injuries might be the most cost effective way to improved the accuracy of the model. Such an analysis would look at the extent to which the number of injuries is underreported. The anticipated benefit of the project is the development of a more accurate risk model for hazardous material transport by truck that could be used by FMCSA to more precisely develop programs designed to reduce transportation risk and improve truck safety.
�����������
�
����� �������
��������������
Final Report — March 2001
A-1
Appendix A State Hazardous Material Flows
Truck Transportation of Hazardous Materials:
Traffic and Commodity Flow
his appendix summarizes the results of the regional HM flow studies that have been conducted in recent years and some of the data from the national databases.
Summary of State and Local Flow Studies
Colorado
Mesa County Local Emergency Planning Committee. Hazardous Materials in Mesa County. August 1997 A survey was conducted on two major roadways through Mesa County, which is located in western Colorado. Two inspection stations were set up on I-70 and Highway 6 & 50 for two days (12 hours/day) in August, where each truck was classified by hazard class. For both survey locations, HM vehicles comprised 7 percent of observed vehicles. Commodities in Hazard Class 2 (Gases) and Class 3 (Flammable Liquids) accounted for 43 percent and 36 percent of HM vehicles.
Delaware
State Emergency Response Commission. Delaware Hazardous Material Transportation Flow Study. June 1994 The Delaware Hazardous Material Transportation Flow Study consisted of statewide survey of HM trucks on highways in March of 1994. Trucks were classified by placard/hazard class and counted during a 4-day (8 hours/day) survey at eighteen intersections on Interstate or Principal Arterials. For all sites, the results of the highway truck survey showed that HM vehicles accounted for 6 percent of the total truck traffic. Petroleum products, specifically gasoline, fuel oil and propane, consisted of more than 55 percent of all HM vehicles observed. Furthermore, 59 percent of all HM vehicles were carrying flammable liquids.
T
Final Report — March 2001
A-2
Kentucky
Kentucky Emergency Response Commission. Corridor Commodity Flow Analysis Final Reports. I-24, January 1998 I-71, December 1997 I-75, November 1995 I-65, September 1995 I-64, June 1995 Each corridor study consisted of 600 hours of observations at weigh stations along the interstate highway. Each survey recorded placard information for HM vehicles. For all five corridors, HM vehicles consisted of 3.4 percent of total truck traffic. Most frequently observed placards were for gasoline and motor fuel and for flammable materials consisting of approximately 17 and 12 percent of HM trucks respectively. Trucks carrying flammable liquids consisted of 57 percent of all HM vehicles.
Ohio
“Growth Fuels Talk or Route Review.” Columbus Dispatch. July 21, 1996 Observations at I-70 and I-71 interchanges with I-270 through Columbus showed that 47 percent of placarded trucks were carrying flammable liquids. No information regarding date, time and duration of the observation period was specified.
Oregon
Public Utility Commission of Oregon and the Oregon Department of Transportation. Hazardous Material Movements on Oregon Highways. 1987 A statewide survey was conducted at 11 truck weigh scale locations for three days in both March and August. The survey recorded the hazard class, the specific material’s shipping name and identification number of each HM truck. For all sites combined, hazardous materials were being carried by six percent of the trucks observed. Fifty-four percent of placarded trucks carried goods in the flammable or combustible hazard class. Gasoline and fuel oil, followed by paint and hazardous wastes, were the most common materials being transported.
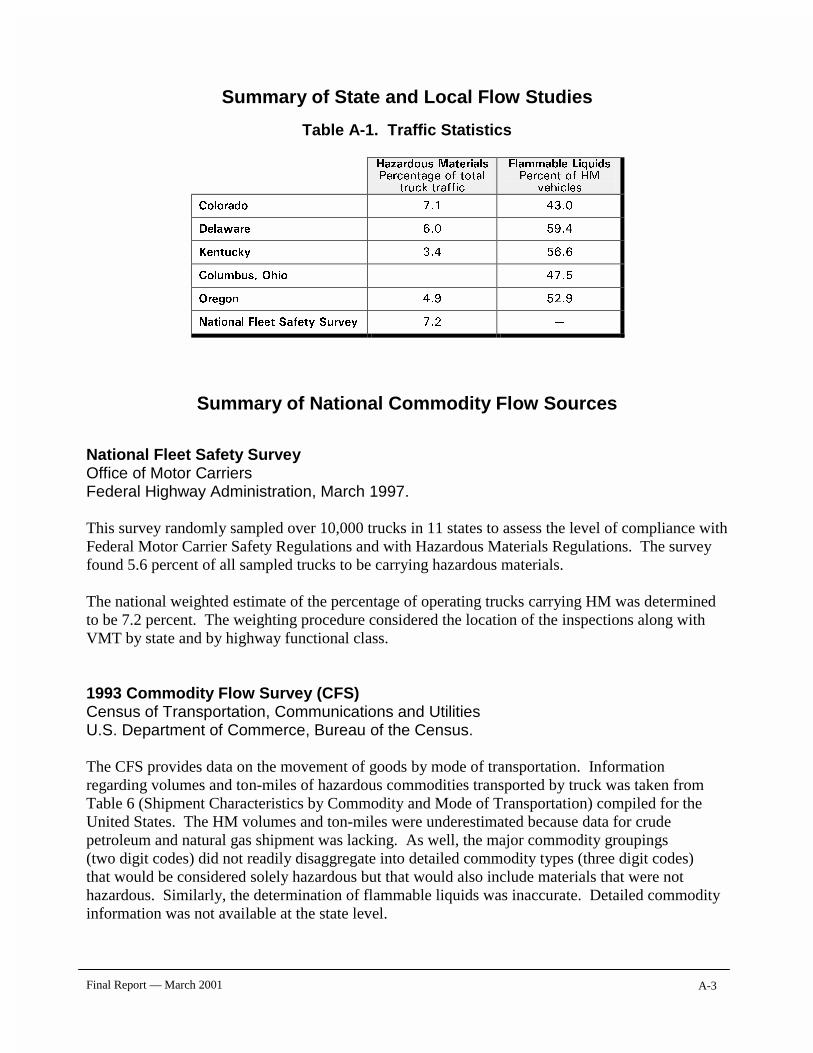
Final Report — March 2001
A-3
Summary of State and Local Flow Studies
Table A-1. Traffic Statistics
+D]DUGRXV 0DWHULDOV3HUFHQWDJH RI WRWDOWUXFN WUDIILF
)ODPPDEOH /LTXLGV3HUFHQW RI +0YHKLFOHV
&RORUDGR ��� ����
'HODZDUH ��� ����
.HQWXFN\ ��� ����
&ROXPEXV� 2KLR � ����
2UHJRQ ��� ����
1DWLRQDO )OHHW 6DIHW\ 6XUYH\ ��� ³
Summary of National Commodity Flow Sources National Fleet Safety Survey Office of Motor Carriers Federal Highway Administration, March 1997. This survey randomly sampled over 10,000 trucks in 11 states to assess the level of compliance with Federal Motor Carrier Safety Regulations and with Hazardous Materials Regulations. The survey found 5.6 percent of all sampled trucks to be carrying hazardous materials. The national weighted estimate of the percentage of operating trucks carrying HM was determined to be 7.2 percent. The weighting procedure considered the location of the inspections along with VMT by state and by highway functional class. 1993 Commodity Flow Survey (CFS) Census of Transportation, Communications and Utilities U.S. Department of Commerce, Bureau of the Census. The CFS provides data on the movement of goods by mode of transportation. Information regarding volumes and ton-miles of hazardous commodities transported by truck was taken from Table 6 (Shipment Characteristics by Commodity and Mode of Transportation) compiled for the United States. The HM volumes and ton-miles were underestimated because data for crude petroleum and natural gas shipment was lacking. As well, the major commodity groupings (two digit codes) did not readily disaggregate into detailed commodity types (three digit codes) that would be considered solely hazardous but that would also include materials that were not hazardous. Similarly, the determination of flammable liquids was inaccurate. Detailed commodity information was not available at the state level.
Final Report — March 2001
A-4
1997 Commodity Flow Survey (CFS) Census of Transportation, Communications and Utilities U.S. Department of Commerce, Bureau of the Census. The 1997 CFS provides the first comprehensive view of hazardous materials flows in the United States. Hazardous materials totaled 1.6 billion tons, or 14.1 percent of all commodities measured in the 1997 CFS, with 80 percent being flammable liquids. These data are identified by mode, hazard class, division, and selected identification numbers to serve as exposure measures for risk assessments. The hazardous materials data represent a major expansion in the availability of safety data, particularly in the air and highway modes. For the 1997 CFS, approximately 100,000 domestic establishments were sampled from a universe of about 800,000 establishments in mining, manufacturing, wholesale, and selected retail industries. Also included were auxiliary locations (warehouses) of multi-establishment companies. The CFS does not cover farms, forestry, fisheries, governments, households, foreign establishments, and most establishments in retail and services. The sampling frame was the Standard Statistical Establishment List (SSEL) of business establishments with paid employees, maintained by the Census Bureau. 1987 and 1992 Truck Inventory and Use Survey (TIUS) Census of Transportation U.S. Department of Commerce, Bureau of the Census. TIUS measures the operational characteristics of the nation's truck fleet. The study consisted of a mail survey of about 154,000 selected trucks including large trucks and small trucks (pickups and vans). Published information is reported as national totals and by state of registration. The unaggregated database is available as a microdata file. The information is a result of the number of trucks and truck-miles reported during 1992. TIUS reports only the number of vehicles used to transport various commodities rather than the amount of commodity moved over a distance (ton-miles for example). As well, the trucks reported may be used to transport more than one hazardous commodity. The 1992 survey showed that two percent of all trucks including small trucks carried HMs. Of the HM carriers, 35 percent carried commodities that could be considered flammable liquids. Analysis showed that 18 percent of large trucks carried HMs and that 20 percent of them were placarded as flammable. 1997 Vehicle Inventory and Use Survey (VIUS) Census of Transportation U.S. Department of Commerce, Bureau of the Census. This is formerly known as the Truck Inventory and Use Survey (TIUS). It contains data about vehicles--physical characteristics, including date of purchase, weight, number of axles, overall length, type of engine, and body type. Operational characteristics data include type of use, lease characteristics, operator classification, base of operation, gas mileage, annual and lifetime miles
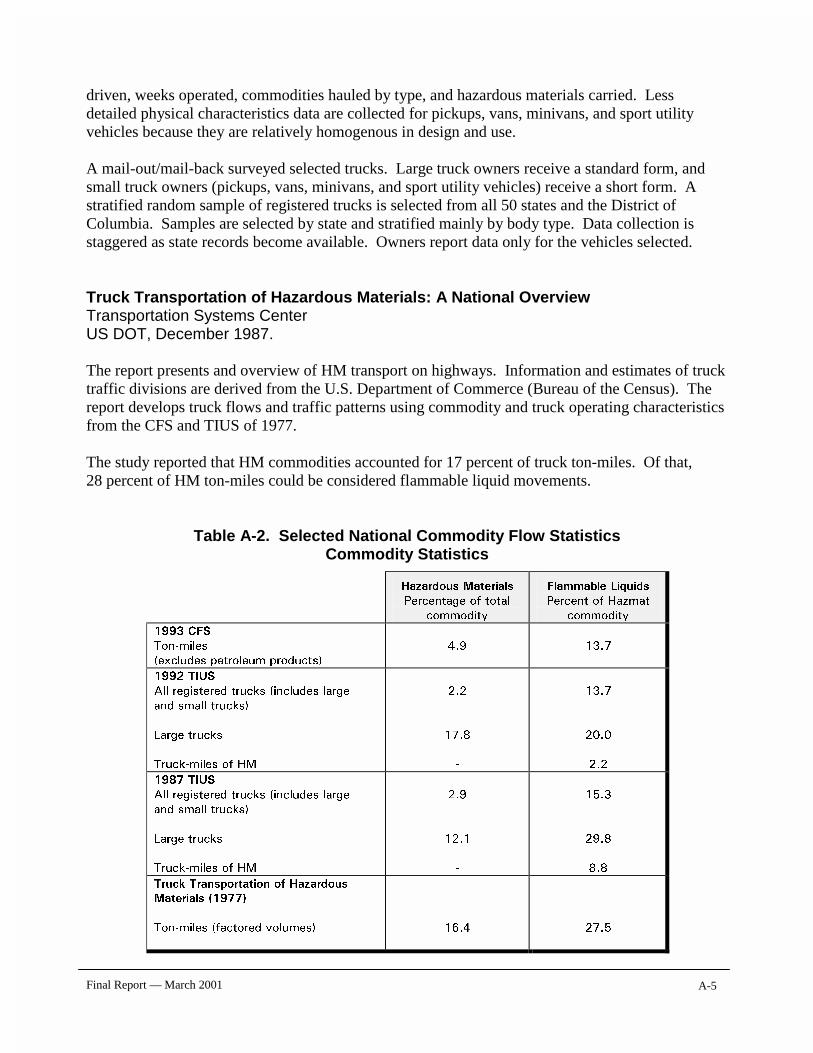
Final Report — March 2001
A-5
driven, weeks operated, commodities hauled by type, and hazardous materials carried. Less detailed physical characteristics data are collected for pickups, vans, minivans, and sport utility vehicles because they are relatively homogenous in design and use. A mail-out/mail-back surveyed selected trucks. Large truck owners receive a standard form, and small truck owners (pickups, vans, minivans, and sport utility vehicles) receive a short form. A stratified random sample of registered trucks is selected from all 50 states and the District of Columbia. Samples are selected by state and stratified mainly by body type. Data collection is staggered as state records become available. Owners report data only for the vehicles selected. Truck Transportation of Hazardous Materials: A National Overview Transportation Systems Center US DOT, December 1987. The report presents and overview of HM transport on highways. Information and estimates of truck traffic divisions are derived from the U.S. Department of Commerce (Bureau of the Census). The report develops truck flows and traffic patterns using commodity and truck operating characteristics from the CFS and TIUS of 1977. The study reported that HM commodities accounted for 17 percent of truck ton-miles. Of that, 28 percent of HM ton-miles could be considered flammable liquid movements.
Table A-2. Selected National Commodity Flow Statistics Commodity Statistics
+D]DUGRXV 0DWHULDOV
3HUFHQWDJH RI WRWDO
FRPPRGLW\
)ODPPDEOH /LTXLGV
3HUFHQW RI +D]PDW
FRPPRGLW\
���� &)6
7RQ�PLOHV
�H[FOXGHV SHWUROHXP SURGXFWV�
��� ����
���� 7,86
$OO UHJLVWHUHG WUXFNV �LQFOXGHV ODUJH
DQG VPDOO WUXFNV�
/DUJH WUXFNV
7UXFN�PLOHV RI +0
���
����
�
����
����
���
���� 7,86
$OO UHJLVWHUHG WUXFNV �LQFOXGHV ODUJH
DQG VPDOO WUXFNV�
/DUJH WUXFNV
7UXFN�PLOHV RI +0
���
����
�
����
����
���
7UXFN 7UDQVSRUWDWLRQ RI +D]DUGRXV
0DWHULDOV ������
7RQ�PLOHV �IDFWRUHG YROXPHV� ���� ����

�����������
�
��������
��������������
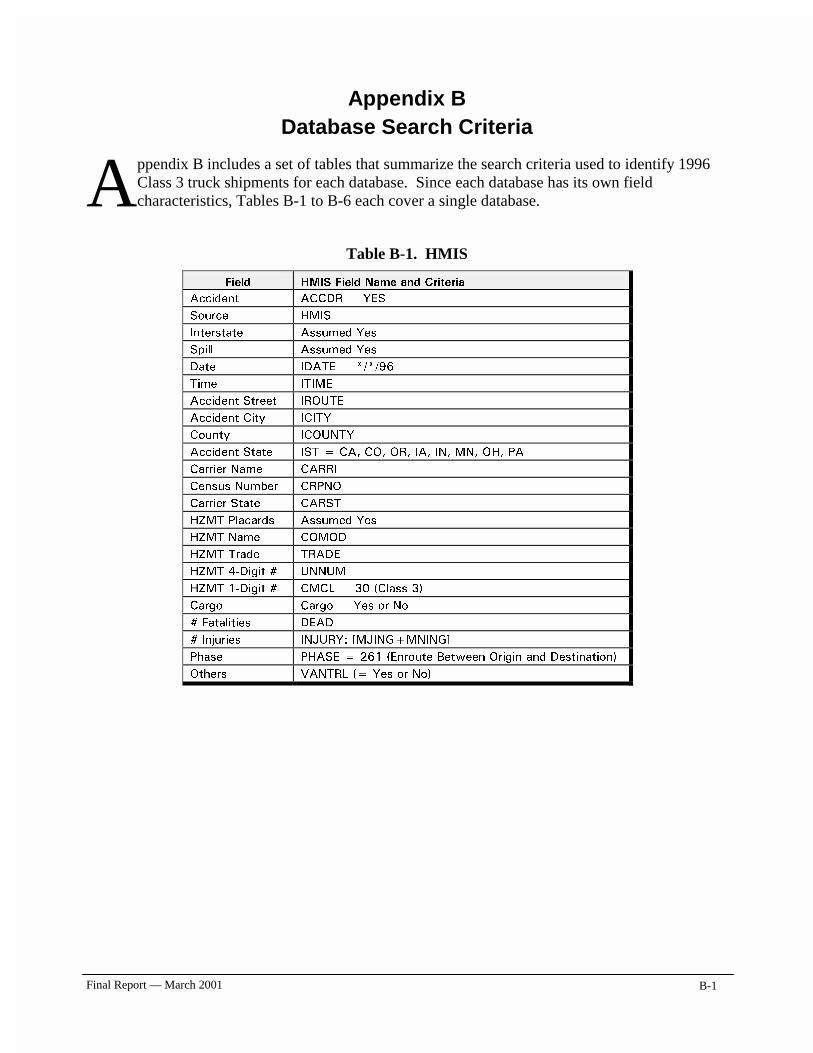
Final Report — March 2001
B-1
Appendix B Database Search Criteria
ppendix B includes a set of tables that summarize the search criteria used to identify 1996 Class 3 truck shipments for each database. Since each database has its own field characteristics, Tables B-1 to B-6 each cover a single database.
Table B-1. HMIS
)LHOG +0,6 )LHOG 1DPH DQG &ULWHULD
$FFLGHQW $&&'5 <(6
6RXUFH +0,6
,QWHUVWDWH $VVXPHG <HV
6SLOO $VVXPHG <HV
'DWH ,'$7( � ���
7LPH ,7,0(
$FFLGHQW 6WUHHW ,5287(
$FFLGHQW &LW\ ,&,7<
&RXQW\ ,&2817<
$FFLGHQW 6WDWH ,67 &$� &2� 25� ,$� ,1� 01� 2+� 3$
&DUULHU 1DPH &$55,
&HQVXV 1XPEHU &5312
&DUULHU 6WDWH &$567
+=07 3ODFDUGV $VVXPHG <HV
+=07 1DPH &202'
+=07 7UDGH 75$'(
+=07 ��'LJLW � 81180
+=07 ��'LJLW � &0&/ �� �&ODVV ��
&DUJR &DUJR <HV RU 1R
� )DWDOLWLHV '($'
� ,QMXULHV ,1-85<� >0-,1*�01,1*@
3KDVH 3+$6( ��� �(QURXWH %HWZHHQ 2ULJLQ DQG 'HVWLQDWLRQ�
2WKHUV 9$175/ � <HV RU 1R�
A
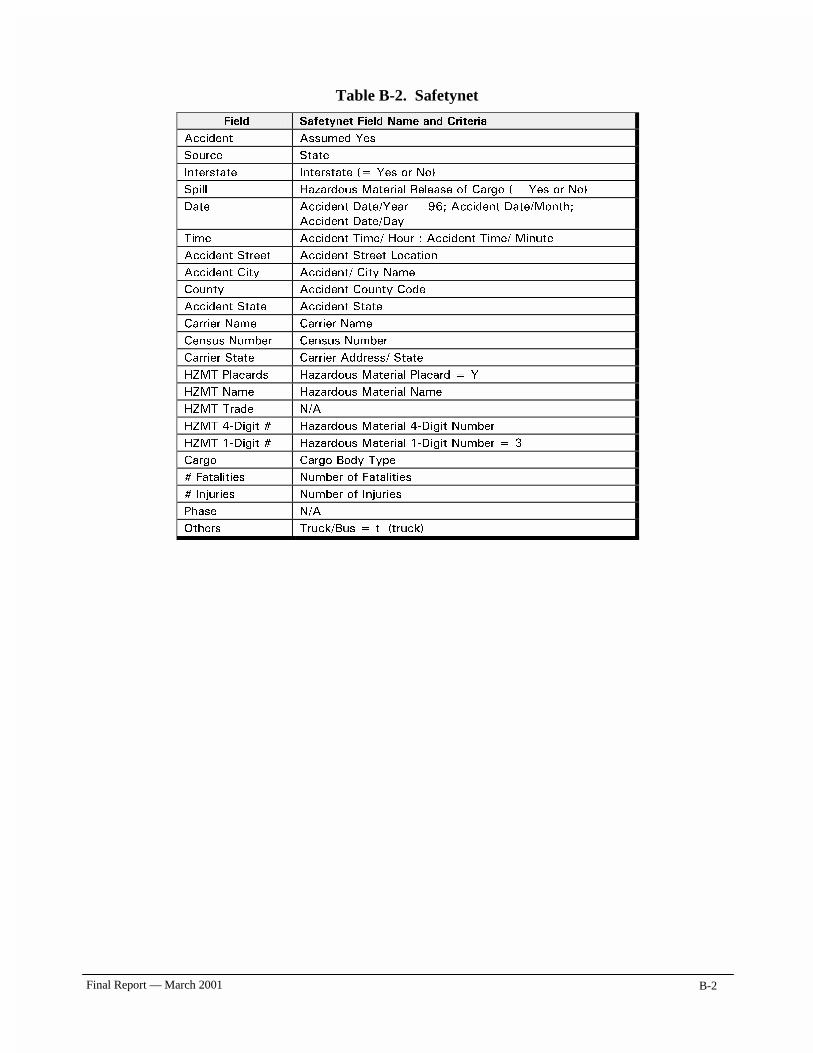
Final Report — March 2001
B-2
Table B-2. Safetynet
)LHOG 6DIHW\QHW )LHOG 1DPH DQG &ULWHULD
$FFLGHQW $VVXPHG <HV
6RXUFH 6WDWH
,QWHUVWDWH ,QWHUVWDWH � <HV RU 1R�
6SLOO +D]DUGRXV 0DWHULDO 5HOHDVH RI &DUJR � <HV RU 1R�
'DWH $FFLGHQW 'DWH�<HDU ��� $FFLGHQW 'DWH�0RQWK�
$FFLGHQW 'DWH�'D\
7LPH $FFLGHQW 7LPH� +RXU � $FFLGHQW 7LPH� 0LQXWH
$FFLGHQW 6WUHHW $FFLGHQW 6WUHHW /RFDWLRQ
$FFLGHQW &LW\ $FFLGHQW� &LW\ 1DPH
&RXQW\ $FFLGHQW &RXQW\ &RGH
$FFLGHQW 6WDWH $FFLGHQW 6WDWH
&DUULHU 1DPH &DUULHU 1DPH
&HQVXV 1XPEHU &HQVXV 1XPEHU
&DUULHU 6WDWH &DUULHU $GGUHVV� 6WDWH
+=07 3ODFDUGV +D]DUGRXV 0DWHULDO 3ODFDUG <
+=07 1DPH +D]DUGRXV 0DWHULDO 1DPH
+=07 7UDGH 1�$
+=07 ��'LJLW � +D]DUGRXV 0DWHULDO ��'LJLW 1XPEHU
+=07 ��'LJLW � +D]DUGRXV 0DWHULDO ��'LJLW 1XPEHU �
&DUJR &DUJR %RG\ 7\SH
� )DWDOLWLHV 1XPEHU RI )DWDOLWLHV
� ,QMXULHV 1XPEHU RI ,QMXULHV
3KDVH 1�$
2WKHUV 7UXFN�%XV W �WUXFN�
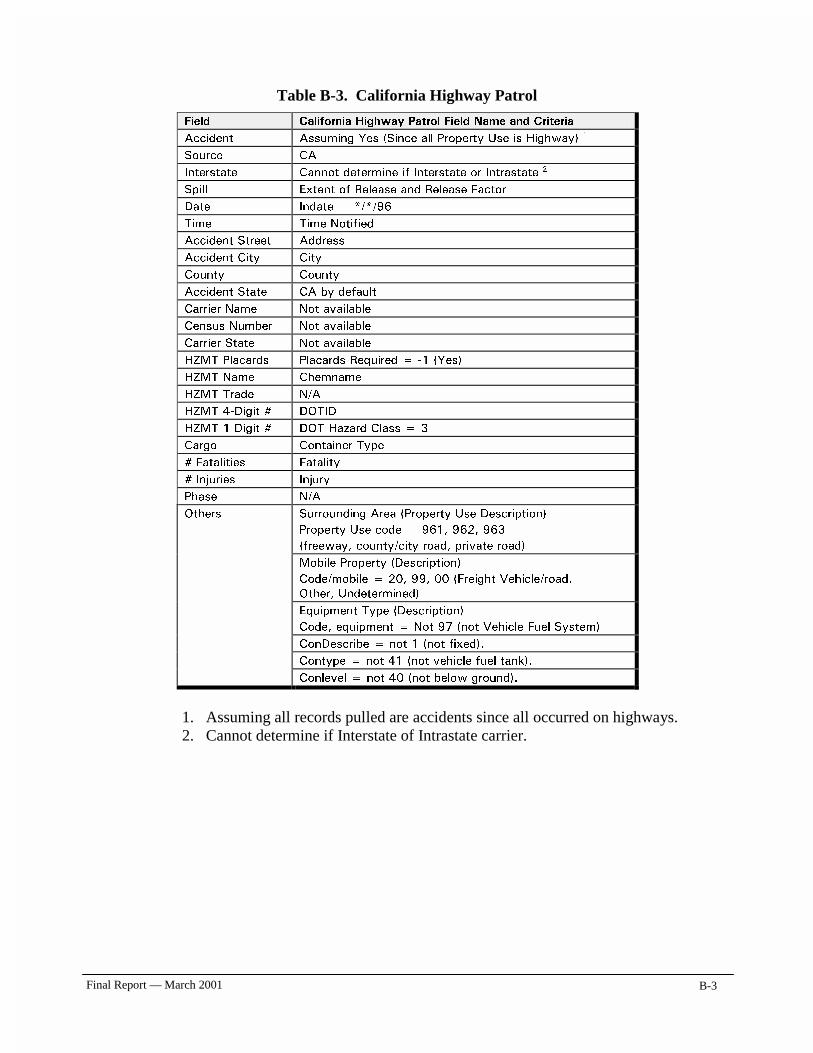
Final Report — March 2001
B-3
Table B-3. California Highway Patrol
)LHOG &DOLIRUQLD +LJKZD\ 3DWURO )LHOG 1DPH DQG &ULWHULD
$FFLGHQW $VVXPLQJ <HV �6LQFH DOO 3URSHUW\ 8VH LV +LJKZD\� �
6RXUFH &$
,QWHUVWDWH &DQQRW GHWHUPLQH LI ,QWHUVWDWH RU ,QWUDVWDWH �
6SLOO ([WHQW RI 5HOHDVH DQG 5HOHDVH )DFWRU
'DWH ,QGDWH � ���
7LPH 7LPH 1RWLILHG
$FFLGHQW 6WUHHW $GGUHVV
$FFLGHQW &LW\ &LW\
&RXQW\ &RXQW\
$FFLGHQW 6WDWH &$ E\ GHIDXOW
&DUULHU 1DPH 1RW DYDLODEOH
&HQVXV 1XPEHU 1RW DYDLODEOH
&DUULHU 6WDWH 1RW DYDLODEOH
+=07 3ODFDUGV 3ODFDUGV 5HTXLUHG �� �<HV�
+=07 1DPH &KHPQDPH
+=07 7UDGH 1�$
+=07 ��'LJLW � '27,'
+=07 ��'LJLW � '27 +D]DUG &ODVV �
&DUJR &RQWDLQHU 7\SH
� )DWDOLWLHV )DWDOLW\
� ,QMXULHV ,QMXU\
3KDVH 1�$
2WKHUV 6XUURXQGLQJ $UHD �3URSHUW\ 8VH 'HVFULSWLRQ�
3URSHUW\ 8VH FRGH ���� ���� ���
�IUHHZD\� FRXQW\�FLW\ URDG� SULYDWH URDG�
0RELOH 3URSHUW\ �'HVFULSWLRQ�
&RGH�PRELOH ��� ��� �� �)UHLJKW 9HKLFOH�URDG�
2WKHU� 8QGHWHUPLQHG�
(TXLSPHQW 7\SH �'HVFULSWLRQ�
&RGH� HTXLSPHQW 1RW �� �QRW 9HKLFOH )XHO 6\VWHP�
&RQ'HVFULEH QRW � �QRW IL[HG��
&RQW\SH QRW �� �QRW YHKLFOH IXHO WDQN��
&RQOHYHO QRW �� �QRW EHORZ JURXQG��
1. Assuming all records pulled are accidents since all occurred on highways. 2. Cannot determine if Interstate of Intrastate carrier.
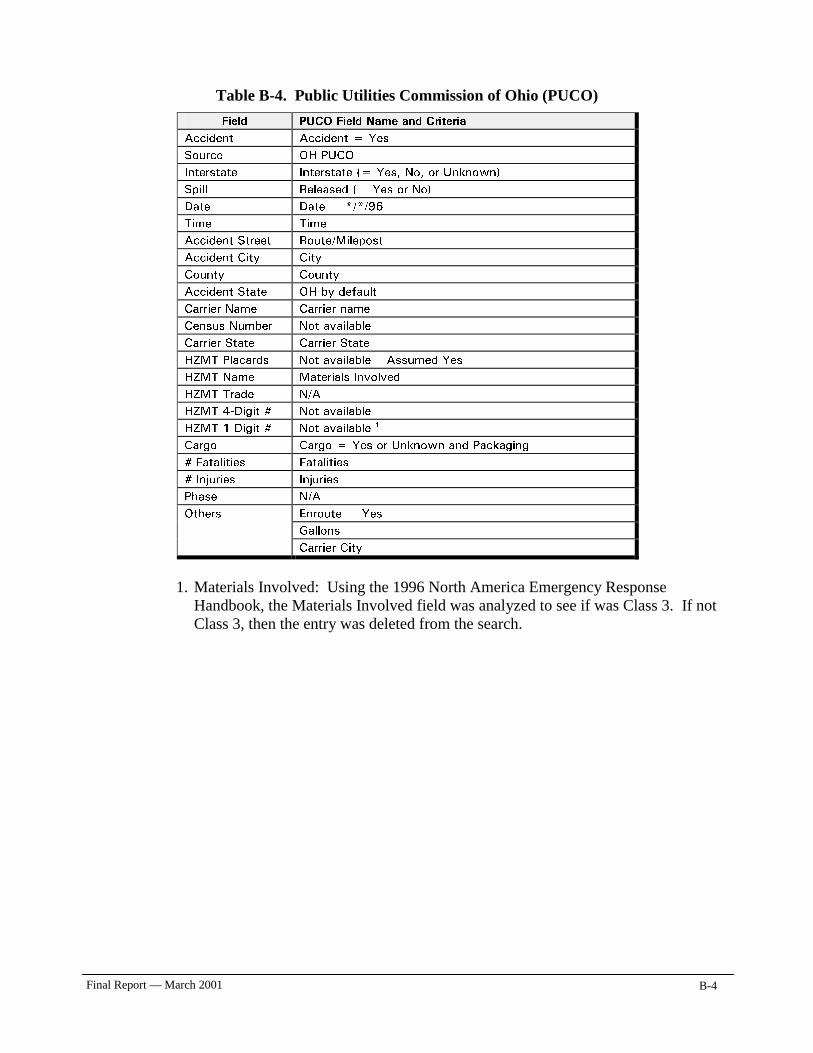
Final Report — March 2001
B-4
Table B-4. Public Utilities Commission of Ohio (PUCO)
)LHOG 38&2 )LHOG 1DPH DQG &ULWHULD
$FFLGHQW $FFLGHQW <HV
6RXUFH 2+ 38&2
,QWHUVWDWH ,QWHUVWDWH � <HV� 1R� RU 8QNQRZQ�
6SLOO 5HOHDVHG � <HV RU 1R�
'DWH 'DWH � ���
7LPH 7LPH
$FFLGHQW 6WUHHW 5RXWH�0LOHSRVW
$FFLGHQW &LW\ &LW\
&RXQW\ &RXQW\
$FFLGHQW 6WDWH 2+ E\ GHIDXOW
&DUULHU 1DPH &DUULHU QDPH
&HQVXV 1XPEHU 1RW DYDLODEOH
&DUULHU 6WDWH &DUULHU 6WDWH
+=07 3ODFDUGV 1RW DYDLODEOH ² $VVXPHG <HV
+=07 1DPH 0DWHULDOV ,QYROYHG
+=07 7UDGH 1�$
+=07 ��'LJLW � 1RW DYDLODEOH
+=07 ��'LJLW � 1RW DYDLODEOH �
&DUJR &DUJR <HV RU 8QNQRZQ DQG 3DFNDJLQJ
� )DWDOLWLHV )DWDOLWLHV
� ,QMXULHV ,QMXULHV
3KDVH 1�$
2WKHUV (QURXWH <HV
*DOORQV
&DUULHU &LW\
1. Materials Involved: Using the 1996 North America Emergency Response
Handbook, the Materials Involved field was analyzed to see if was Class 3. If not Class 3, then the entry was deleted from the search.
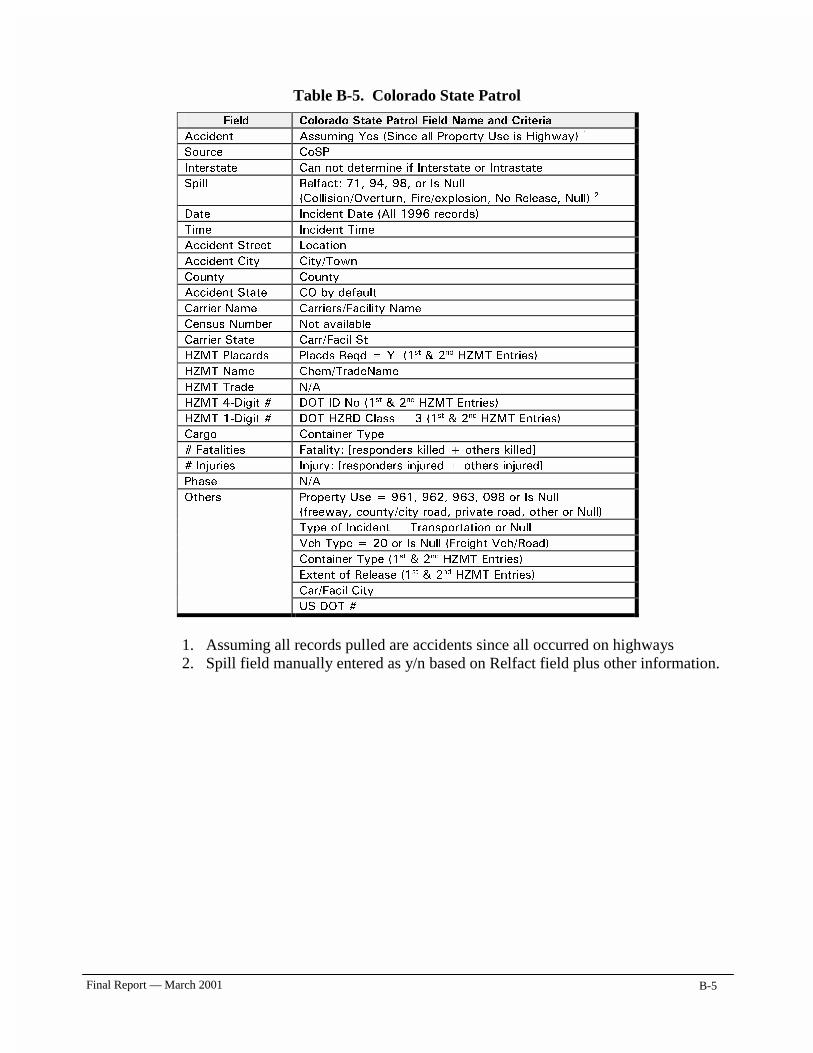
Final Report — March 2001
B-5
Table B-5. Colorado State Patrol
)LHOG &RORUDGR 6WDWH 3DWURO )LHOG 1DPH DQG &ULWHULD
$FFLGHQW $VVXPLQJ <HV �6LQFH DOO 3URSHUW\ 8VH LV +LJKZD\� �
6RXUFH &R63
,QWHUVWDWH &DQ QRW GHWHUPLQH LI ,QWHUVWDWH RU ,QWUDVWDWH
6SLOO 5HOIDFW� ��� ��� ��� RU ,V 1XOO
�&ROOLVLRQ�2YHUWXUQ� )LUH�H[SORVLRQ� 1R 5HOHDVH� 1XOO� �
'DWH ,QFLGHQW 'DWH �$OO ���� UHFRUGV�
7LPH ,QFLGHQW 7LPH
$FFLGHQW 6WUHHW /RFDWLRQ
$FFLGHQW &LW\ &LW\�7RZQ
&RXQW\ &RXQW\
$FFLGHQW 6WDWH &2 E\ GHIDXOW
&DUULHU 1DPH &DUULHUV�)DFLOLW\ 1DPH
&HQVXV 1XPEHU 1RW DYDLODEOH
&DUULHU 6WDWH &DUU�)DFLO 6W
+=07 3ODFDUGV 3ODFGV 5HTG < ��VW �QG +=07 (QWULHV�
+=07 1DPH &KHP�7UDGH1DPH
+=07 7UDGH 1�$
+=07 ��'LJLW � '27 ,' 1R ��VW �QG +=07 (QWULHV�
+=07 ��'LJLW � '27 +=5' &ODVV � ��VW �QG +=07 (QWULHV�
&DUJR &RQWDLQHU 7\SH
� )DWDOLWLHV )DWDOLW\� >UHVSRQGHUV NLOOHG � RWKHUV NLOOHG@
� ,QMXULHV ,QMXU\� >UHVSRQGHUV LQMXUHG � RWKHUV LQMXUHG@
3KDVH 1�$
2WKHUV 3URSHUW\ 8VH ���� ���� ���� ��� RU ,V 1XOO
�IUHHZD\� FRXQW\�FLW\ URDG� SULYDWH URDG� RWKHU RU 1XOO�
7\SH RI ,QFLGHQW 7UDQVSRUWDWLRQ RU 1XOO
9HK 7\SH �� RU ,V 1XOO �)UHLJKW 9HK�5RDG�
&RQWDLQHU 7\SH ��VW �QG +=07 (QWULHV�
([WHQW RI 5HOHDVH ��VW �QG +=07 (QWULHV�
&DU�)DFLO &LW\
86 '27 �
1. Assuming all records pulled are accidents since all occurred on highways 2. Spill field manually entered as y/n based on Relfact field plus other information.
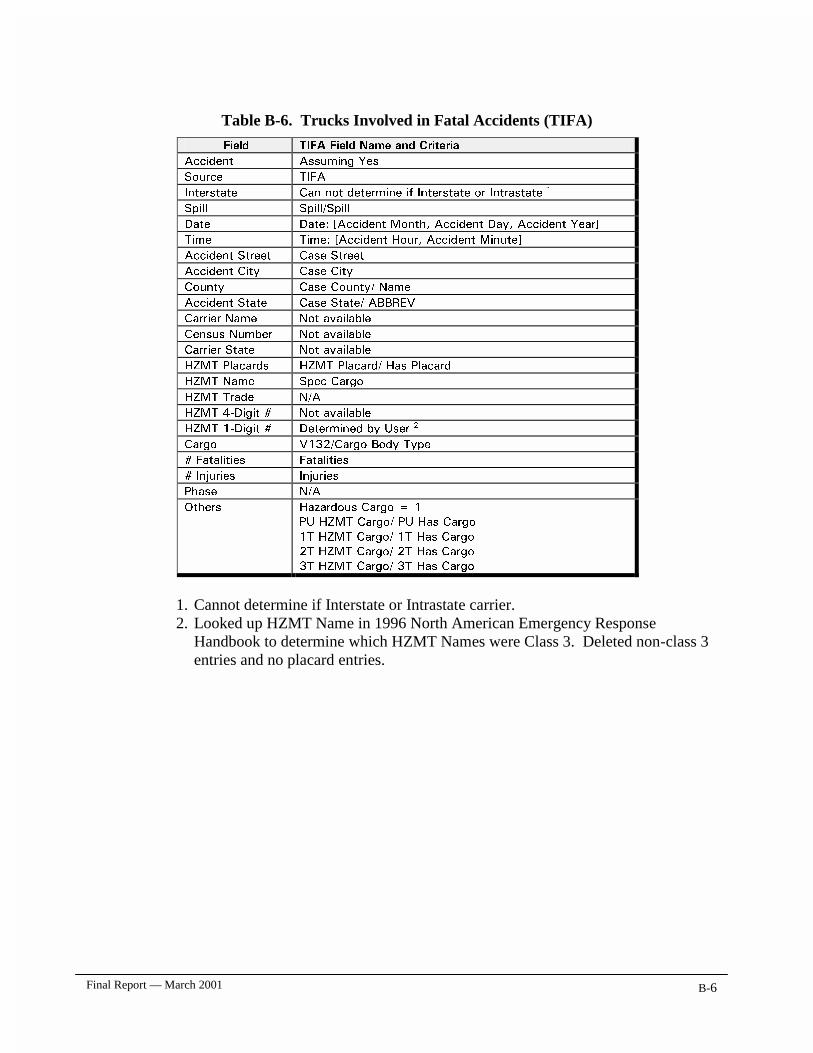
Final Report — March 2001
B-6
Table B-6. Trucks Involved in Fatal Accidents (TIFA)
)LHOG 7,)$ )LHOG 1DPH DQG &ULWHULD
$FFLGHQW $VVXPLQJ <HV
6RXUFH 7,)$
,QWHUVWDWH &DQ QRW GHWHUPLQH LI ,QWHUVWDWH RU ,QWUDVWDWH �
6SLOO 6SLOO�6SLOO
'DWH 'DWH� >$FFLGHQW 0RQWK� $FFLGHQW 'D\� $FFLGHQW <HDU@
7LPH 7LPH� >$FFLGHQW +RXU� $FFLGHQW 0LQXWH@
$FFLGHQW 6WUHHW &DVH 6WUHHW
$FFLGHQW &LW\ &DVH &LW\
&RXQW\ &DVH &RXQW\� 1DPH
$FFLGHQW 6WDWH &DVH 6WDWH� $%%5(9
&DUULHU 1DPH 1RW DYDLODEOH
&HQVXV 1XPEHU 1RW DYDLODEOH
&DUULHU 6WDWH 1RW DYDLODEOH
+=07 3ODFDUGV +=07 3ODFDUG� +DV 3ODFDUG
+=07 1DPH 6SHF &DUJR
+=07 7UDGH 1�$
+=07 ��'LJLW � 1RW DYDLODEOH
+=07 ��'LJLW � 'HWHUPLQHG E\ 8VHU �
&DUJR 9����&DUJR %RG\ 7\SH
� )DWDOLWLHV )DWDOLWLHV
� ,QMXULHV ,QMXULHV
3KDVH 1�$
2WKHUV +D]DUGRXV &DUJR �
38 +=07 &DUJR� 38 +DV &DUJR
�7 +=07 &DUJR� �7 +DV &DUJR
�7 +=07 &DUJR� �7 +DV &DUJR
�7 +=07 &DUJR� �7 +DV &DUJR
1. Cannot determine if Interstate or Intrastate carrier. 2. Looked up HZMT Name in 1996 North American Emergency Response
Handbook to determine which HZMT Names were Class 3. Deleted non-class 3 entries and no placard entries.
Appendix C
Accident Information for
Class 3, Class 2.1,
and Classand Class 88
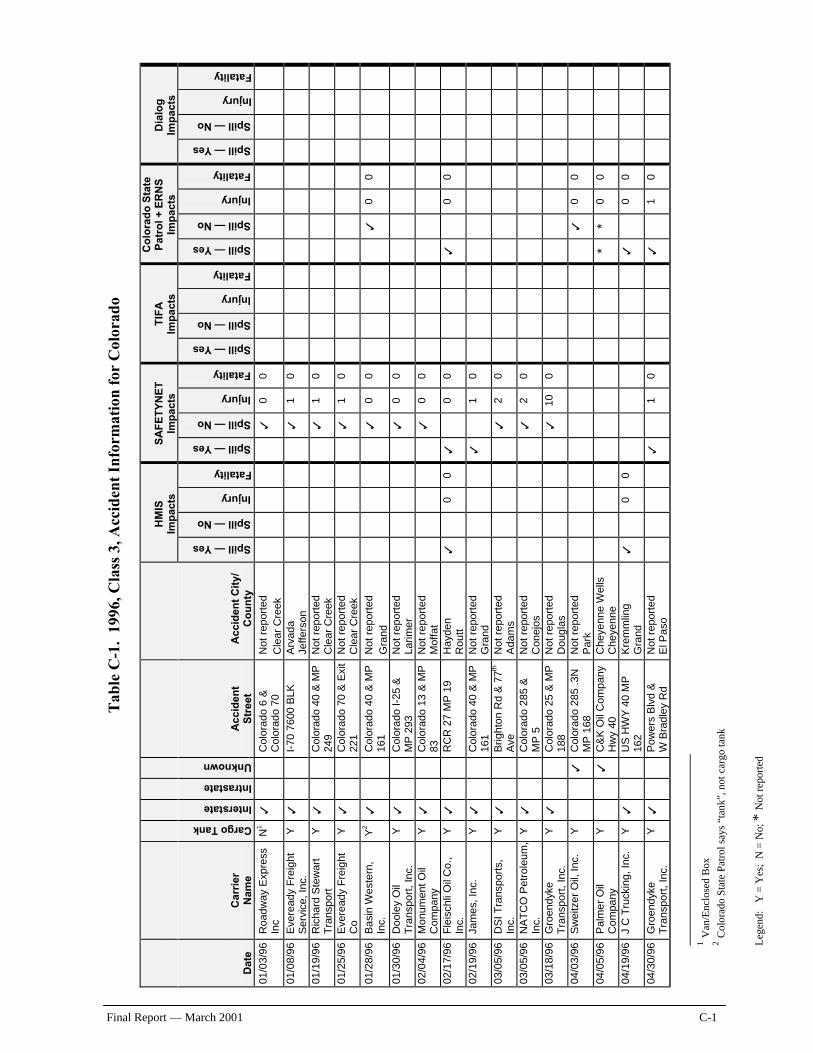
Leg
end:
Y
= Y
es;
N =
No;
* N
ot r
epor
ted
Final Report — March 2001 C-1
T
able
C-1
. 19
96, C
lass
3, A
ccid
ent
Info
rmat
ion
for
Col
orad
o
H
MIS
Im
pac
ts
SA
FE
TY
NE
T
Imp
acts
T
IFA
Im
pac
ts
Co
lora
do
Sta
te
Pat
rol +
ER
NS
Im
pac
ts
Dia
log
Im
pac
ts
Dat
e C
arri
er
Nam
e
Cargo Tank
Interstate
Intrastate
Unknown
Acc
iden
t S
tree
t A
ccid
ent
Cit
y/
Co
un
ty
Spill — Yes Spill — No Injury Fatality Spill — Yes Spill — No Injury Fatality Spill — Yes Spill — No Injury Fatality Spill — Yes Spill — No Injury Fatality Spill — Yes Spill — No Injury Fatality
01/0
3/96
R
oadw
ay E
xpre
ss
Inc
N1
3
Col
orad
o 6
&
Col
orad
o 70
N
ot r
epor
ted
Cle
ar C
reek
3
0 0
01/0
8/96
E
vere
ady
Fre
ight
S
ervi
ce,
Inc.
Y
3
I-
70 7
600
BLK
A
rvad
a Je
ffers
on
3
1
0
01/1
9/96
R
icha
rd S
tew
art
Tra
nspo
rt
Y
3
Col
orad
o 40
& M
P
249
Not
rep
orte
d C
lear
Cre
ek
3
1
0
01/2
5/96
E
vere
ady
Fre
ight
C
o Y
3
C
olor
ado
70 &
Exi
t 22
1 N
ot r
epor
ted
Cle
ar C
reek
3
1 0
01/2
8/96
B
asin
Wes
tern
, In
c.
Y2
3
Col
orad
o 40
& M
P
161
Not
rep
orte
d G
rand
3
0 0
3
0
0
01/3
0/96
D
oole
y O
il T
rans
port
, In
c.
Y
3
Col
orad
o I-
25 &
M
P 2
93
Not
rep
orte
d La
rimer
3
0 0
02/0
4/96
M
onum
ent O
il C
ompa
ny
Y
3
Col
orad
o 13
& M
P
83
Not
rep
orte
d M
offa
t
3
0 0
02/1
7/96
F
leis
chli
Oil
Co.
, In
c.
Y
3
RC
R 2
7 M
P 1
9 H
ayde
n R
outt
3
0
0 3
0 0
3
0
0
02/1
9/96
Ja
mes
, In
c.
Y
3
Col
orad
o 40
& M
P
161
Not
rep
orte
d G
rand
3
1 0
03/0
5/96
D
SI T
rans
port
s,
Inc.
Y
3
B
right
on R
d &
77th
A
ve
Not
rep
orte
d A
da
ms
3
2
0
03/0
5/96
N
AT
CO
Pet
role
um,
Inc.
Y
3
C
olor
ado
285
&
MP
5
Not
rep
orte
d C
onej
os
3
2
0
03/1
8/96
G
roen
dyke
T
rans
port
, In
c.
Y
3
Col
orad
o 25
& M
P
188
Not
rep
orte
d D
ougl
as
3
10
0
04/0
3/96
S
wei
tzer
Oil,
Inc.
Y
3
C
olor
ado
285
.3N
M
P 1
68
Not
rep
orte
d P
ark
3
0
0
04/0
5/96
P
alm
er O
il C
ompa
ny
Y
3
C&
K O
il C
ompa
ny
Hw
y 40
C
heye
nne
Wel
ls
Che
yenn
e
*
* 0
0
04/1
9/96
J
C T
ruck
ing,
Inc.
Y
3
U
S H
WY
40
MP
16
2 K
rem
mlin
g G
rand
3
0 0
3
0
0
04/3
0/96
G
roen
dyke
T
rans
port
, In
c.
Y
3
Pow
ers
Blv
d &
W
Bra
dley
Rd
Not
rep
orte
d E
l Pa
so
3
1
0
3
1 0
1 Van
/Enc
lose
d B
ox
2 Col
orad
o St
ate
Patr
ol s
ays
“tan
k”, n
ot c
argo
tank
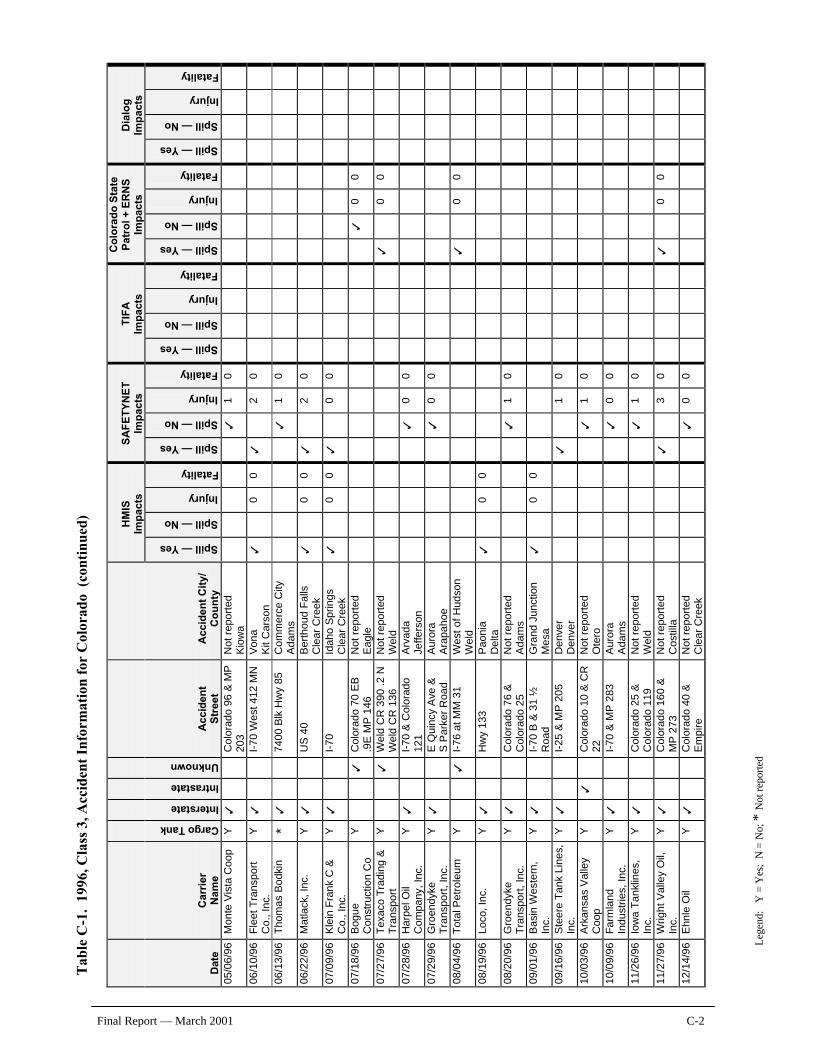
Tab
le C
-1.
1996
, Cla
ss 3
, Acc
iden
t In
form
atio
n fo
r C
olor
ado
(co
ntin
ued)
L
egen
d:
Y =
Yes
; N
= N
o; *
Not
rep
orte
d
Final Report — March 2001 C-2
H
MIS
Im
pac
ts
SA
FE
TY
NE
T
Imp
acts
T
IFA
Im
pac
ts
Co
lora
do
Sta
te
Pat
rol +
ER
NS
Im
pac
ts
Dia
log
Im
pac
ts
Dat
e C
arri
er
Nam
e Cargo Tank
Interstate
Intrastate
Unknown
Acc
iden
t S
tree
t A
ccid
ent
Cit
y/
Co
un
ty
Spill — Yes Spill — No Injury Fatality Spill — Yes Spill — No Injury Fatality Spill — Yes Spill — No Injury Fatality Spill — Yes Spill — No Injury Fatality Spill — Yes Spill — No Injury Fatality
05/0
6/96
M
onte
Vis
ta C
oop
Y
3
Col
orad
o 96
& M
P
203
Not
rep
orte
d K
iow
a
3
1
0
06/1
0/96
F
leet
Tra
nspo
rt
Co.
, Inc
. Y
3
I-
70 W
est 4
12 M
N
Von
a K
it C
arso
n 3
0 0
3
2
0
06/1
3/96
T
hom
as B
odki
n *
3
7400
Blk
Hw
y 85
C
omm
erce
City
A
da
ms
3
1
0
06/2
2/96
M
atla
ck, I
nc.
Y
3
US
40
Ber
thou
d F
alls
C
lear
Cre
ek
3
0
0 3
2 0
07/0
9/96
K
lein
Fra
nk C
&
Co.
, Inc
. Y
3
I-
70
Idah
o S
prin
gs
Cle
ar C
reek
3
0 0
3
0
0
07/1
8/96
B
ogue
C
onst
ruct
ion
Co
Y
3
Col
orad
o 70
EB
.9
E M
P 1
46
Not
rep
orte
d E
agle
3
0 0
07/2
7/96
T
exac
o T
radi
ng &
T
rans
port
Y
3
W
eld
CR
390
.2 N
W
eld
CR
136
N
ot r
epor
ted
Wel
d
3
0 0
07/2
8/96
H
arpe
l Oil
Com
pany
, In
c.
Y
3
I-70
& C
olor
ado
121
Arv
ada
Jeffe
rson
3
0 0
07/2
9/96
G
roen
dyke
T
rans
port
, In
c.
Y
3
E Q
uinc
y A
ve &
S
Par
ker
Roa
d A
uror
a A
rapa
hoe
3
0
0
08/0
4/96
T
otal
Pet
role
um
Y
3
I-76
at M
M 3
1 W
est
of H
udso
n W
eld
3
0
0
08/1
9/96
Lo
co, I
nc.
Y
3
Hw
y 13
3 P
aoni
a D
elta
3
0 0
08/2
0/96
G
roen
dyke
T
rans
port
, In
c.
Y
3
Col
orad
o 76
&
Col
orad
o 25
N
ot r
epor
ted
Ad
am
s
3
1 0
09/0
1/96
B
asin
Wes
tern
, In
c.
Y
3
I-70
B &
31
½
Roa
d G
rand
Jun
ctio
n M
esa
3
0
0
09/1
6/96
S
teer
e T
ank
Line
s,
Inc.
Y
3
I-
25 &
MP
205
D
enve
r D
enve
r
3
1 0
10/0
3/96
A
rkan
sas
Val
ley
Coo
p Y
3
C
olor
ado
10 &
CR
22
N
ot r
epor
ted
Ote
ro
3
1
0
10/0
9/96
F
arm
land
In
dust
ries,
Inc
. Y
3
I-
70 &
MP
283
A
uror
a A
da
ms
3
0
0
11/2
6/96
Io
wa
Tan
klin
es,
Inc.
Y
3
C
olor
ado
25 &
C
olor
ado
119
Not
rep
orte
d W
eld
3
1
0
11/2
7/96
W
right
Val
ley
Oil,
In
c.
Y
3
Col
orad
o 16
0 &
M
P 2
73
Not
rep
orte
d C
ostil
la
3
3
0
3
0 0
12/1
4/96
E
hnle
Oil
Y
3
Col
orad
o 40
&
Em
pire
N
ot r
epor
ted
Cle
ar C
reek
3
0 0
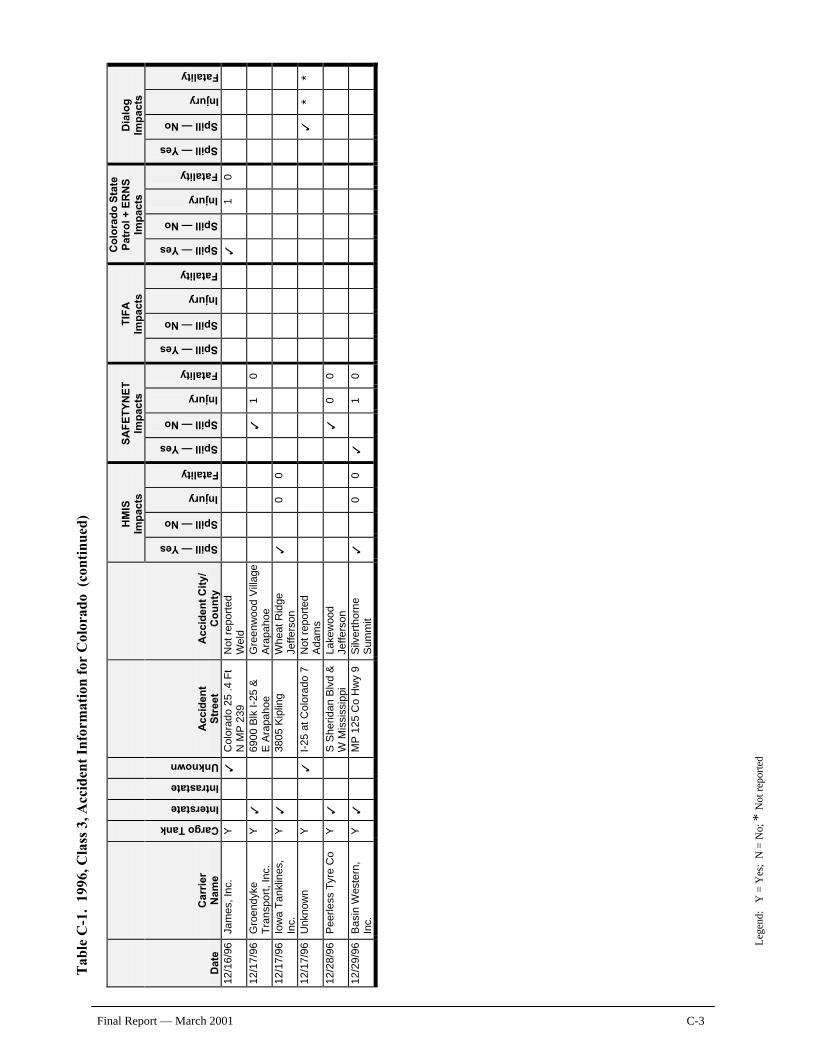
Tab
le C
-1.
1996
, Cla
ss 3
, Acc
iden
t In
form
atio
n fo
r C
olor
ado
(co
ntin
ued)
L
egen
d:
Y =
Yes
; N
= N
o; *
Not
rep
orte
d
Final Report — March 2001 C-3
H
MIS
Im
pac
ts
SA
FE
TY
NE
T
Imp
acts
T
IFA
Im
pac
ts
Co
lora
do
Sta
te
Pat
rol +
ER
NS
Im
pac
ts
Dia
log
Im
pac
ts
Dat
e C
arri
er
Nam
e Cargo Tank
Interstate
Intrastate
Unknown
Acc
iden
t S
tree
t A
ccid
ent
Cit
y/
Co
un
ty
Spill — Yes Spill — No Injury Fatality Spill — Yes Spill — No Injury Fatality Spill — Yes Spill — No Injury Fatality Spill — Yes Spill — No Injury Fatality Spill — Yes Spill — No Injury Fatality
12/1
6/96
Ja
mes
, In
c.
Y
3
Col
orad
o 25
.4
Ft
N M
P 2
39
Not
rep
orte
d W
eld
3
1
0
12/1
7/96
G
roen
dyke
T
rans
port
, In
c.
Y
3
6900
Blk
I-2
5 &
E
Ara
paho
e G
reen
woo
d V
illag
e A
rapa
hoe
3
1
0
12/1
7/96
Io
wa
Tan
klin
es,
Inc.
Y
3
38
05 K
iplin
g W
heat
Rid
ge
Jeffe
rson
3
0 0
12/1
7/96
U
nkno
wn
Y
3
I-
25 a
t C
olor
ado
7 N
ot r
epor
ted
Ad
am
s
3
* *
12/2
8/96
P
eerle
ss T
yre
Co
Y
3
S S
herid
an B
lvd
&
W M
issi
ssip
pi
Lake
woo
d Je
ffers
on
3
0
0
12/2
9/96
B
asi
n W
este
rn,
Inc.
Y
3
M
P 1
25 C
o H
wy
9 S
ilver
thor
ne
Sum
mit
3
0
0 3
1 0
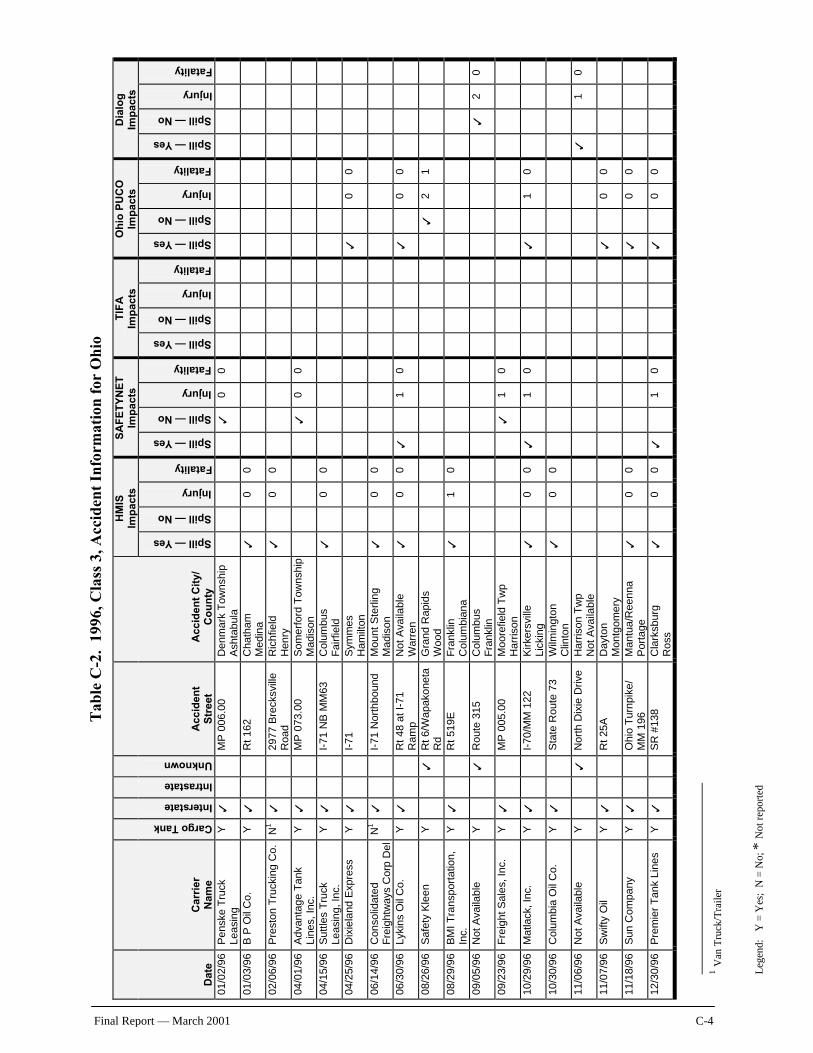
Leg
end:
Y
= Y
es;
N =
No;
* N
ot r
epor
ted
Final Report — March 2001 C-4
Tab
le C
-2.
1996
, Cla
ss 3
, Acc
iden
t In
form
atio
n fo
r O
hio
HM
IS
Imp
acts
S
AF
ET
YN
ET
Im
pac
ts
TIF
A
Imp
acts
O
hio
PU
CO
Im
pac
ts
Dia
log
Im
pac
ts
Dat
e C
arri
er
Nam
e Cargo Tank
Interstate
Intrastate
Unknown
Acc
iden
t S
tree
t A
ccid
ent
Cit
y/
Co
un
ty
Spill — Yes Spill — No Injury Fatality Spill — Yes Spill — No Injury Fatality Spill — Yes Spill — No Injury Fatality Spill — Yes Spill — No Injury Fatality Spill — Yes Spill — No Injury Fatality
01/0
2/96
P
ensk
e T
ruck
Le
asin
g Y
3
M
P 0
06.0
0 D
enm
ark
Tow
nshi
p A
shta
bula
3
0 0
01/0
3/96
B
P O
il C
o.
Y
3
Rt
162
Cha
tham
M
edin
a 3
0 0
02/0
6/96
P
rest
on T
ruck
ing
Co.
N
1 3
29
77 B
reck
svill
e R
oad
Ric
hfie
ld
Hen
ry
3
0
0
04/0
1/96
A
dvan
tage
Tan
k Li
nes,
Inc
. Y
3
M
P 0
73.0
0 S
omer
ford
Tow
nshi
p M
adis
on
3
0
0
04/1
5/96
S
uttle
s T
ruck
Le
asin
g, In
c.
Y
3
I-71
NB
MM
63
Col
umbu
s F
airf
ield
3
0 0
04/2
5/96
D
ixie
land
Exp
ress
Y
3
I-
71
Sym
mes
H
amilt
on
3
0
0
06/1
4/96
C
onso
lidat
ed
Fre
ight
way
s C
orp
Del
N
1 3
I-
71 N
orth
boun
d M
ount
Ste
rling
M
adis
on
3
0
0
06/3
0/96
Ly
kins
Oil
Co.
Y
3
R
t 48
at
I-71
R
am
p N
ot A
vaila
ble
War
ren
3
0
0 3
1 0
3
0
0
08/2
6/96
S
afet
y K
leen
Y
3
R
t 6/W
apak
onet
a R
d G
rand
Rap
ids
Woo
d
3
2 1
08/2
9/96
B
MI
Tra
nspo
rtat
ion,
In
c.
Y
3
Rt
519E
F
rank
lin
Col
umbi
ana
3
1
0
09/0
5/96
N
ot A
vaila
ble
Y
3
Rou
te 3
15
Col
umbu
s F
rank
lin
3
2
0
09/2
3/96
F
reig
ht S
ales
, Inc
. Y
3
M
P 0
05.0
0 M
oore
field
Tw
p
Har
rison
3
1 0
10/2
9/96
M
atla
ck, I
nc.
Y
3
I-70
/MM
122
K
irker
svill
e Li
ckin
g 3
0 0
3
1
0
3
1 0
10/3
0/96
C
olum
bia
Oil
Co.
Y
3
S
tate
Rou
te 7
3 W
ilmin
gton
C
linto
n 3
0 0
11/0
6/96
N
ot A
vaila
ble
Y
3
Nor
th D
ixie
Driv
e H
arris
on T
wp
N
ot A
vaila
ble
3
1
0
11/0
7/96
S
wift
y O
il Y
3
R
t 25
A
Day
ton
Mon
tgom
ery
3
0
0
11/1
8/96
S
un C
ompa
ny
Y
3
Ohi
o T
urnp
ike/
M
M 1
96
Man
tua/
Ree
nna
Por
tage
3
0 0
3
0
0
12/3
0/96
P
rem
ier
Tan
k Li
nes
Y
3
SR
#13
8 C
lark
sbur
g R
oss
3
0
0 3
1 0
3
0
0
1 Van
Tru
ck/T
raile
r
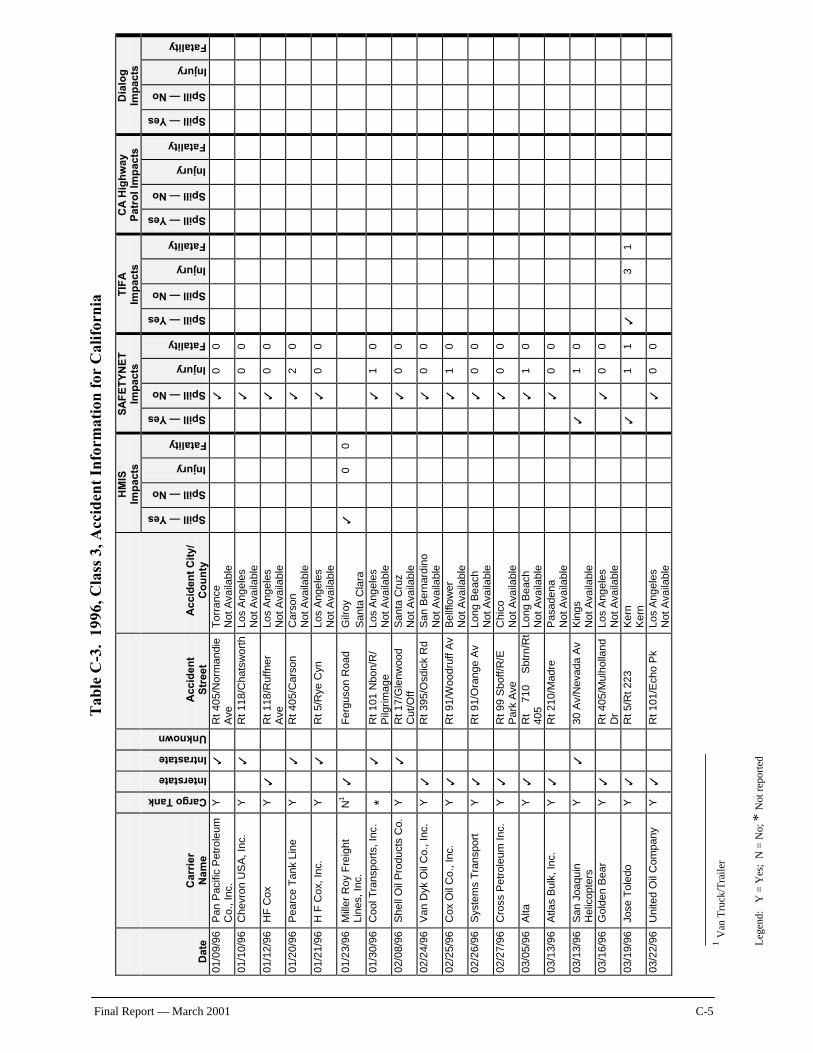
Leg
end:
Y
= Y
es;
N =
No;
* N
ot r
epor
ted
Final Report — March 2001 C-5
Tab
le C
-3.
1996
, Cla
ss 3
, Acc
iden
t In
form
atio
n fo
r C
alif
orni
a
HM
IS
Imp
acts
S
AF
ET
YN
ET
Im
pac
ts
TIF
A
Imp
acts
C
A H
igh
way
P
atro
l Im
pac
ts
Dia
log
Im
pac
ts
Dat
e C
arri
er
Nam
e
Cargo Tank
Interstate
Intrastate
Unknown
Acc
iden
t S
tree
t A
ccid
ent
Cit
y/
Co
un
ty
Spill — Yes Spill — No Injury Fatality Spill — Yes Spill — No Injury Fatality Spill — Yes Spill — No Injury Fatality Spill — Yes Spill — No Injury Fatality Spill — Yes Spill — No Injury Fatality
01/0
9/96
P
an P
acifi
c P
etro
leum
C
o., I
nc.
Y
3
Rt 4
05/N
orm
andi
e A
ve
Tor
ranc
e N
ot A
vaila
ble
3
0
0
01/1
0/96
C
hevr
on U
SA
, Inc
. Y
3
R
t 11
8/C
hats
wor
th
Los
Ang
eles
N
ot A
vaila
ble
3
0
0
01/1
2/96
H
F C
ox
Y
3
Rt 1
18/R
uffn
er
Ave
Lo
s A
ngel
es
Not
Ava
ilabl
e
3
0 0
01/2
0/96
P
earc
e T
ank
Line
Y
3
R
t 40
5/C
arso
n C
arso
n N
ot A
vaila
ble
3
2
0
01/2
1/96
H
F C
ox,
Inc.
Y
3
R
t 5/
Rye
Cyn
Lo
s A
ngel
es
Not
Ava
ilabl
e
3
0 0
01/2
3/96
M
iller
Roy
Fre
ight
Li
nes,
Inc
. N
1 3
F
ergu
son
Roa
d G
ilroy
S
anta
Cla
ra
3
0
0
01/3
0/96
C
ool T
rans
port
s, In
c.
*
3
R
t 101
Nbo
n/R
/ P
ilgrim
age
Los
Ang
eles
N
ot A
vaila
ble
3
1
0
02/0
8/96
S
hell
Oil
Pro
duct
s C
o.
Y
3
Rt 1
7/G
lenw
ood
Cut
/Off
S
anta
Cru
z N
ot A
vaila
ble
3
0
0
02/2
4/96
V
an D
yk O
il C
o.,
Inc.
Y
3
R
t 39
5/O
sdic
k R
d S
an B
erna
rdin
o N
ot A
vaila
ble
3
0
0
02/2
5/96
C
ox O
il C
o., I
nc.
Y
3
Rt 9
1/W
oodr
uff A
v B
ellfl
ower
N
ot A
vaila
ble
3
1
0
02/2
6/96
S
yste
ms
Tra
nspo
rt
Y
3
Rt 9
1/O
rang
e A
v Lo
ng B
each
N
ot A
vaila
ble
3
0
0
02/2
7/96
C
ross
Pet
role
um In
c.
Y
3
Rt 9
9 S
boff/
R/E
P
ark
Ave
C
hic
o N
ot A
vaila
ble
3
0
0
03/0
5/96
A
lta
Y
3
Rt
710
Sbt
rn/R
t 40
5 Lo
ng B
each
N
ot A
vaila
ble
3
1
0
03/1
3/96
A
tlas
Bul
k, In
c.
Y
3
Rt
210/
Mad
re
Pas
aden
a N
ot A
vaila
ble
3
0
0
03/1
3/96
S
an J
oaqu
in
Hel
icop
ters
Y
3
30
Av/
Nev
ada
Av
Kin
gs
Not
Ava
ilabl
e
3
1 0
03/1
6/96
G
olde
n B
ear
Y
3
Rt 4
05/M
ulho
lland
D
r Lo
s A
ngel
es
Not
Ava
ilabl
e
3
0 0
03/1
9/96
Jo
se T
oled
o Y
3
R
t 5/
Rt
223
Ker
n K
ern
3
1
1 3
3 1
03/2
2/96
U
nite
d O
il C
ompa
ny
Y
3
Rt
101/
Ech
o P
k Lo
s A
ngel
es
Not
Ava
ilabl
e
3
0 0
1 Van
Tru
ck/T
raile
r
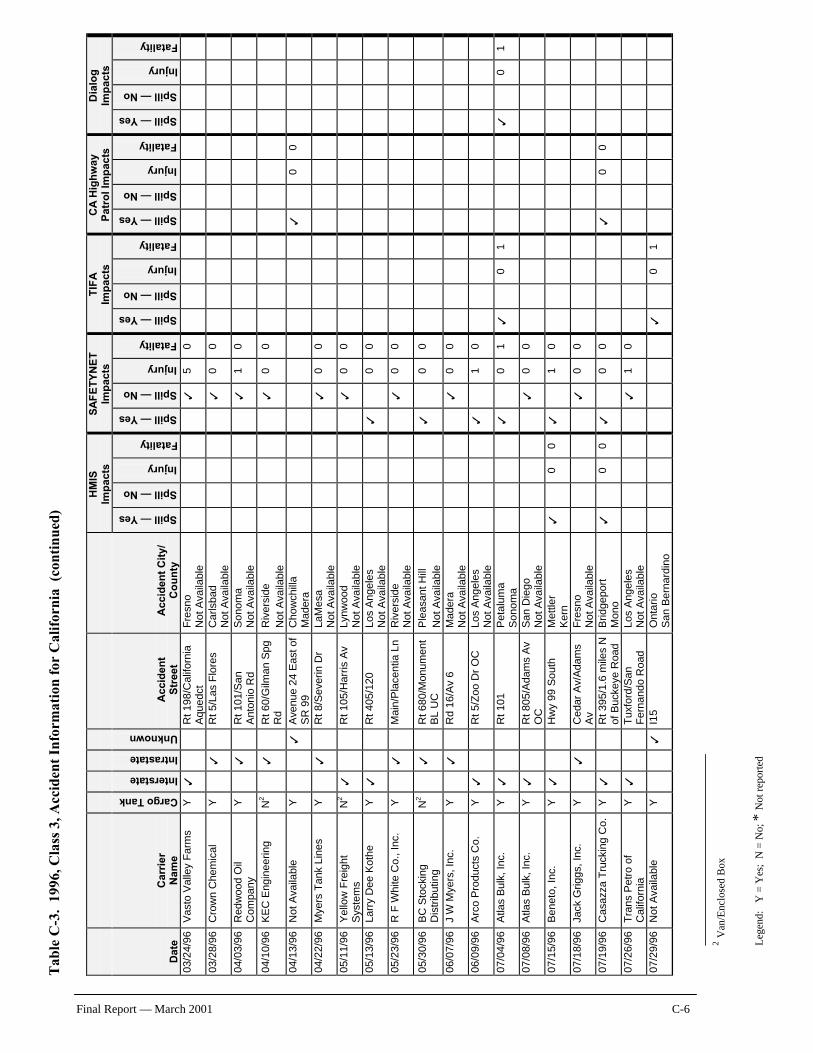
Tab
le C
-3.
1996
, Cla
ss 3
, Acc
iden
t In
form
atio
n fo
r C
alif
orni
a (
cont
inue
d)
Leg
end:
Y
= Y
es;
N =
No;
* N
ot r
epor
ted
Final Report — March 2001 C-6
HM
IS
Imp
acts
S
AF
ET
YN
ET
Im
pac
ts
TIF
A
Imp
acts
C
A H
igh
way
P
atro
l Im
pac
ts
Dia
log
Im
pac
ts
Dat
e C
arri
er
Nam
e
Cargo Tank
Interstate
Intrastate
Unknown
Acc
iden
t S
tree
t A
ccid
ent
Cit
y/
Co
un
ty
Spill — Yes Spill — No Injury Fatality Spill — Yes Spill — No Injury Fatality Spill — Yes Spill — No Injury Fatality Spill — Yes Spill — No Injury Fatality Spill — Yes Spill — No Injury Fatality
03/2
4/96
V
asto
Val
ley
Far
ms
Y
3
Rt 1
98/C
alifo
rnia
A
qued
ct
Fre
sno
Not
Ava
ilabl
e
3
5 0
03/2
8/96
C
row
n C
hem
ica
l Y
3
R
t 5/
Las
Flo
res
Car
lsba
d N
ot A
vaila
ble
3
0
0
04/0
3/96
R
edw
ood
Oil
Com
pany
Y
3
R
t 101
/San
A
nton
io R
d S
onom
a N
ot A
vaila
ble
3
1
0
04/1
0/96
K
EC
Eng
inee
ring
N2
3
Rt 6
0/G
ilman
Spg
R
d R
iver
side
N
ot A
vaila
ble
3
0
0
04/1
3/96
N
ot A
vaila
ble
Y
3
Ave
nue
24 E
ast o
f S
R 9
9 C
how
chill
a M
ader
a
3
0 0
04/2
2/96
M
yers
Tan
k Li
nes
Y
3
Rt
8/S
ever
in D
r La
Mes
a N
ot A
vaila
ble
3
0
0
05/1
1/96
Y
ello
w F
reig
ht
Sys
tem
s N
2 3
R
t 10
5/H
arris
Av
Lynw
ood
Not
Ava
ilabl
e
3
0 0
05/1
3/96
La
rry
Dee
Kot
he
Y
3
Rt
405/
120
Los
Ang
eles
N
ot A
vaila
ble
3
0
0
05/2
3/96
R
F W
hite
Co.
, Inc
. Y
3
M
ain/
Pla
cent
ia L
n R
iver
side
N
ot A
vaila
ble
3
0
0
05/3
0/96
B
C S
tock
ing
Dis
trib
utin
g N
2
3
R
t 680
/Mon
umen
t B
L U
C
Ple
asan
t H
ill
Not
Ava
ilabl
e
3
0 0
06/0
7/96
J
W M
yers
, Inc
. Y
3
R
d 16
/Av
6 M
ader
a N
ot A
vaila
ble
3
0
0
06/0
9/96
A
rco
Pro
duct
s C
o.
Y
3
Rt
5/Z
oo D
r O
C
Los
Ang
eles
N
ot A
vaila
ble
3
1
0
07/0
4/96
A
tlas
Bul
k, In
c.
Y
3
Rt
101
Pe
talu
ma
Son
oma
3
0
1 3
0 1
3
0
1
07/0
8/96
A
tlas
Bul
k, In
c.
Y
3
Rt 8
05/A
dam
s A
v O
C
San
Die
go
Not
Ava
ilabl
e
3
0 0
07/1
5/96
B
enet
o, I
nc.
Y
3
Hw
y 99
So
uth
M
ettle
r K
ern
3
0
0 3
1 0
07/1
8/96
Ja
ck G
riggs
, Inc
. Y
3
C
edar
Av/
Ada
ms
Av
Fre
sno
Not
Ava
ilabl
e
3
0 0
07/1
9/96
C
asaz
za T
ruck
ing
Co.
Y
3
R
t 395
/1.6
mile
s N
of
Buc
keye
Roa
d B
ridge
port
M
ono
3
0
0 3
0 0
3
0
0
07/2
6/96
T
rans
Pet
ro o
f C
alifo
rnia
Y
3
T
uxfo
rd/S
an
Fer
nand
o R
oad
Los
Ang
eles
N
ot A
vaila
ble
3
1
0
07/2
9/96
N
ot A
vaila
ble
Y
3
I15
Ont
ario
S
an B
erna
rdin
o
3
0 1
2 Van
/Enc
lose
d B
ox
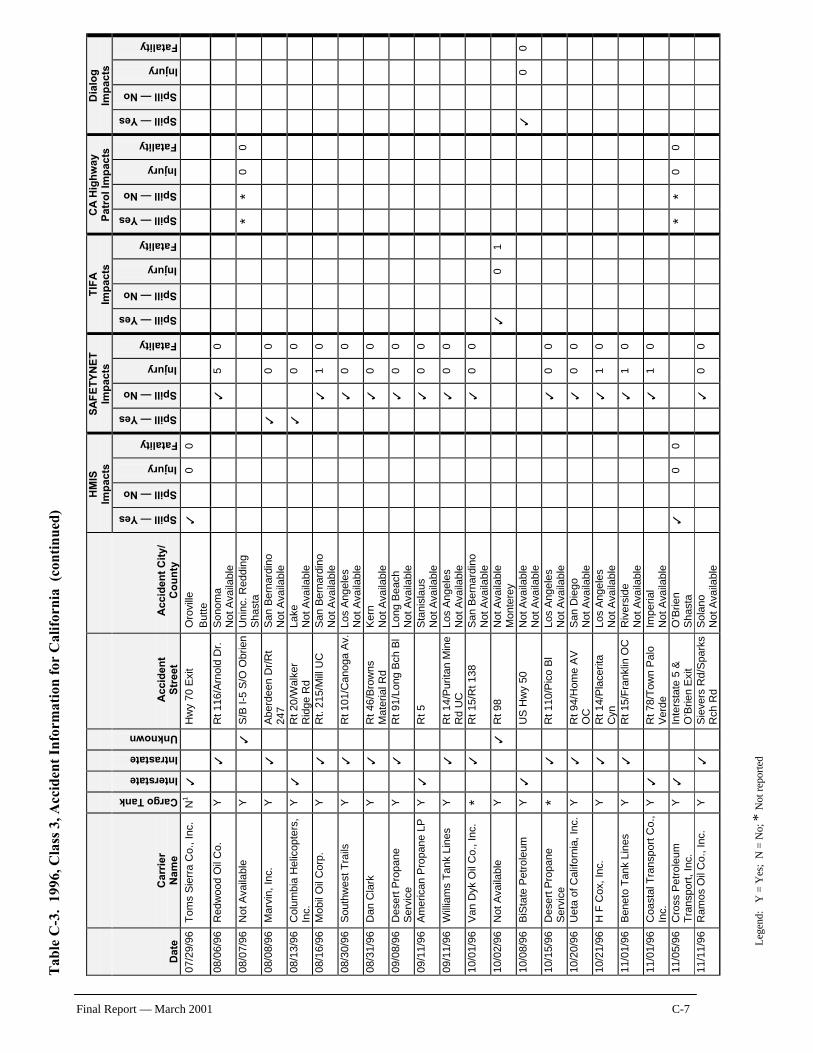
Tab
le C
-3.
1996
, Cla
ss 3
, Acc
iden
t In
form
atio
n fo
r C
alif
orni
a (
cont
inue
d)
Leg
end:
Y
= Y
es;
N =
No;
* N
ot r
epor
ted
Final Report — March 2001 C-7
HM
IS
Imp
acts
S
AF
ET
YN
ET
Im
pac
ts
TIF
A
Imp
acts
C
A H
igh
way
P
atro
l Im
pac
ts
Dia
log
Im
pac
ts
Dat
e C
arri
er
Nam
e
Cargo Tank
Interstate
Intrastate
Unknown
Acc
iden
t S
tree
t A
ccid
ent
Cit
y/
Co
un
ty
Spill — Yes Spill — No Injury Fatality Spill — Yes Spill — No Injury Fatality Spill — Yes Spill — No Injury Fatality Spill — Yes Spill — No Injury Fatality Spill — Yes Spill — No Injury Fatality
07/2
9/96
T
oms
Sie
rra
Co.
, In
c.
N1
3
Hw
y 70
Exi
t O
rovi
lle
Bu
tte
3
0
0
08/0
6/96
R
edw
ood
Oil
Co.
Y
3
R
t 11
6/A
rnol
d D
r.
Son
oma
Not
Ava
ilabl
e
3
5 0
08/0
7/96
N
ot A
vaila
ble
Y
3
S/B
I-5
S/O
Obr
ien
Uni
nc.
Red
ding
S
hast
a
*
* 0
0
08/0
8/96
M
arvi
n, I
nc.
Y
3
Abe
rdee
n D
r/R
t 24
7 S
an B
erna
rdin
o N
ot A
vaila
ble
3
0
0
08/1
3/96
C
olum
bia
Hel
icop
ters
, In
c.
Y
3
Rt 2
0/W
alke
r R
idge
Rd
La
ke
Not
Ava
ilabl
e
3
0 0
08/1
6/96
M
obil
Oil
Cor
p.
Y
3
Rt.
215/
Mill
UC
S
an B
erna
rdin
o N
ot A
vaila
ble
3
1
0
08/3
0/96
S
outh
wes
t T
rails
Y
3
R
t 101
/Can
oga
Av.
Lo
s A
ngel
es
Not
Ava
ilabl
e
3
0 0
08/3
1/96
D
an C
lark
Y
3
R
t 46
/Bro
wns
M
ater
ial R
d K
ern
Not
Ava
ilabl
e
3
0 0
09/0
8/96
D
eser
t Pro
pane
S
ervi
ce
Y
3
Rt
91/L
ong
Bch
Bl
Long
Bea
ch
Not
Ava
ilabl
e
3
0 0
09/1
1/96
A
mer
ican
Pro
pane
LP
Y
3
R
t 5
Sta
nisl
aus
Not
Ava
ilabl
e
3
0 0
09/1
1/96
W
illia
ms
Tan
k Li
nes
Y
3
Rt 1
4/P
urita
n M
ine
Rd
UC
Lo
s A
ngel
es
Not
Ava
ilabl
e
3
0 0
10/0
1/96
V
an D
yk O
il C
o.,
Inc.
*
3
Rt
15/R
t 13
8 S
an B
erna
rdin
o N
ot A
vaila
ble
3
0
0
10/0
2/96
N
ot A
vaila
ble
Y
3
Rt
98
Not
Ava
ilabl
e M
onte
rey
3
0
1
10/0
8/96
B
iSta
te P
etro
leum
Y
3
U
S H
wy
50
Not
Ava
ilabl
e N
ot A
vaila
ble
3
0
0
10/1
5/96
D
eser
t Pro
pane
S
ervi
ce
*
3
R
t 11
0/P
ico
Bl
Los
Ang
eles
N
ot A
vaila
ble
3
0
0
10/2
0/96
U
eta
of C
alifo
rnia
, In
c.
Y
3
Rt
94/H
ome
AV
O
C
San
Die
go
Not
Ava
ilabl
e
3
0 0
10/2
1/96
H
F C
ox,
Inc.
Y
3
R
t 14/
Pla
cerit
a C
yn
Los
Ang
eles
N
ot A
vaila
ble
3
1
0
11/0
1/96
B
enet
o T
ank
Line
s Y
3
R
t 15/
Fra
nklin
OC
R
iver
side
N
ot A
vaila
ble
3
1
0
11/0
1/96
C
oast
al T
rans
port
Co.
, In
c.
Y
3
Rt 7
8/T
own
Pal
o V
erde
Im
peria
l N
ot
Ava
ilabl
e
3
1 0
11/0
5/96
C
ross
Pet
role
um
Tra
nspo
rt,
Inc.
Y
3
In
ters
tate
5 &
O
’Brie
n E
xit
O’B
rien
Sha
sta
3
0
0
*
* 0
0
11/1
1/96
R
amos
Oil
Co.
, Inc
. Y
3
S
ieve
rs R
d/S
park
s R
ch R
d S
olan
o N
ot A
vaila
ble
3
0
0
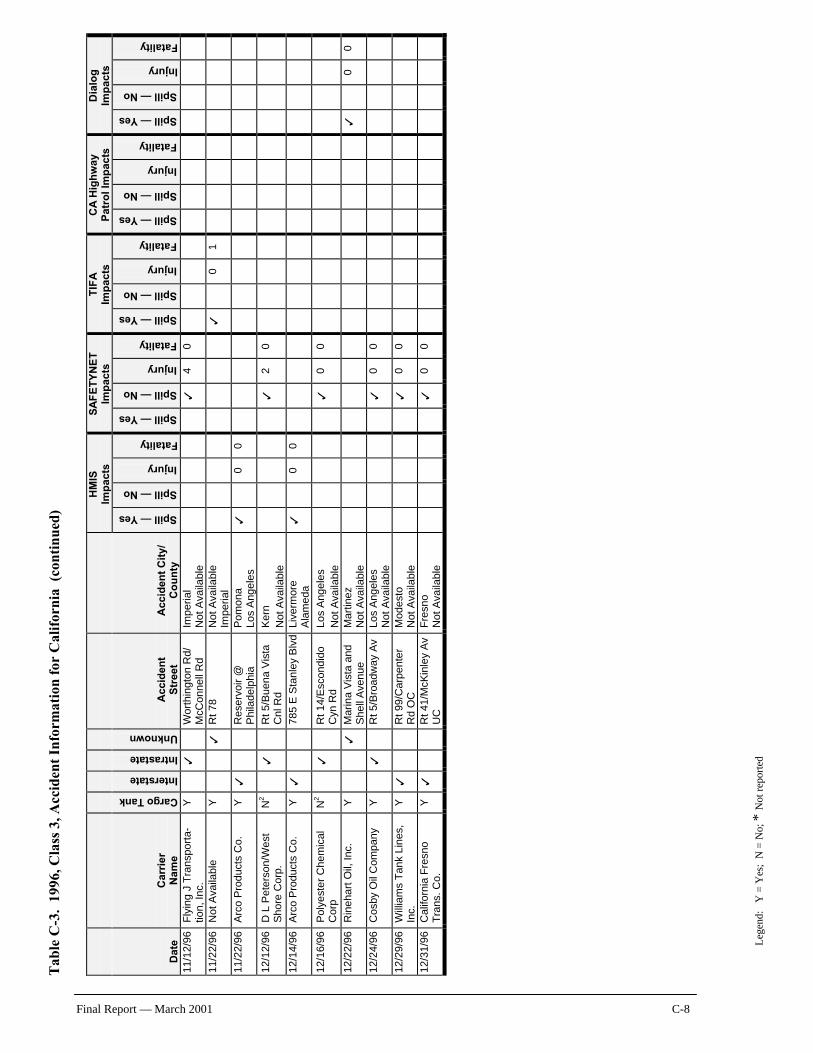
Tab
le C
-3.
1996
, Cla
ss 3
, Acc
iden
t In
form
atio
n fo
r C
alif
orni
a (
cont
inue
d)
Leg
end:
Y
= Y
es;
N =
No;
* N
ot r
epor
ted
Final Report — March 2001 C-8
HM
IS
Imp
acts
S
AF
ET
YN
ET
Im
pac
ts
TIF
A
Imp
acts
C
A H
igh
way
P
atro
l Im
pac
ts
Dia
log
Im
pac
ts
Dat
e C
arri
er
Nam
e
Cargo Tank
Interstate
Intrastate
Unknown
Acc
iden
t S
tree
t A
ccid
ent
Cit
y/
Co
un
ty
Spill — Yes Spill — No Injury Fatality Spill — Yes Spill — No Injury Fatality Spill — Yes Spill — No Injury Fatality Spill — Yes Spill — No Injury Fatality Spill — Yes Spill — No Injury Fatality
11/1
2/96
F
lyin
g J
Tra
nspo
rta-
tion,
Inc.
Y
3
W
orth
ingt
on R
d/
McC
onne
ll R
d Im
peria
l N
ot A
vaila
ble
3
4
0
11/2
2/96
N
ot A
vaila
ble
Y
3
Rt
78
Not
Ava
ilabl
e Im
peria
l
3
0 1
11/2
2/96
A
rco
Pro
duct
s C
o.
Y
3
Res
ervo
ir @
P
hila
delp
hia
Pom
ona
Los
Ang
eles
3
0 0
12/1
2/96
D
L P
eter
son/
Wes
t S
hore
Cor
p.
N2
3
Rt 5
/Bue
na V
ista
C
nl R
d K
ern
Not
Ava
ilabl
e
3
2 0
12/1
4/96
A
rco
Pro
duct
s C
o.
Y
3
785
E S
tanl
ey B
lvd
Live
rmor
e A
lam
eda
3
0
0
12/1
6/96
P
olye
ster
Che
mic
al
Cor
p N
2
3
R
t 14/
Esc
ondi
do
Cyn
Rd
Los
Ang
eles
N
ot A
vaila
ble
3
0
0
12/2
2/96
R
ineh
art
Oil,
Inc
. Y
3
M
arin
a V
ista
and
S
hell
Ave
nue
Mar
tinez
N
ot A
vaila
ble
3
0
0
12/2
4/96
C
osby
Oil
Com
pany
Y
3
R
t 5/
Bro
adw
ay A
v Lo
s A
ngel
es
Not
Ava
ilabl
e
3
0 0
12/2
9/96
W
illia
ms
Tan
k Li
nes,
In
c.
Y
3
Rt 9
9/C
arpe
nter
R
d O
C
Mod
esto
N
ot A
vaila
ble
3
0
0
12/3
1/96
C
alifo
rnia
Fre
sno
Tra
ns.
Co.
Y
3
R
t 41/
McK
inle
y A
v U
C
Fre
sno
Not
Ava
ilabl
e
3
0 0
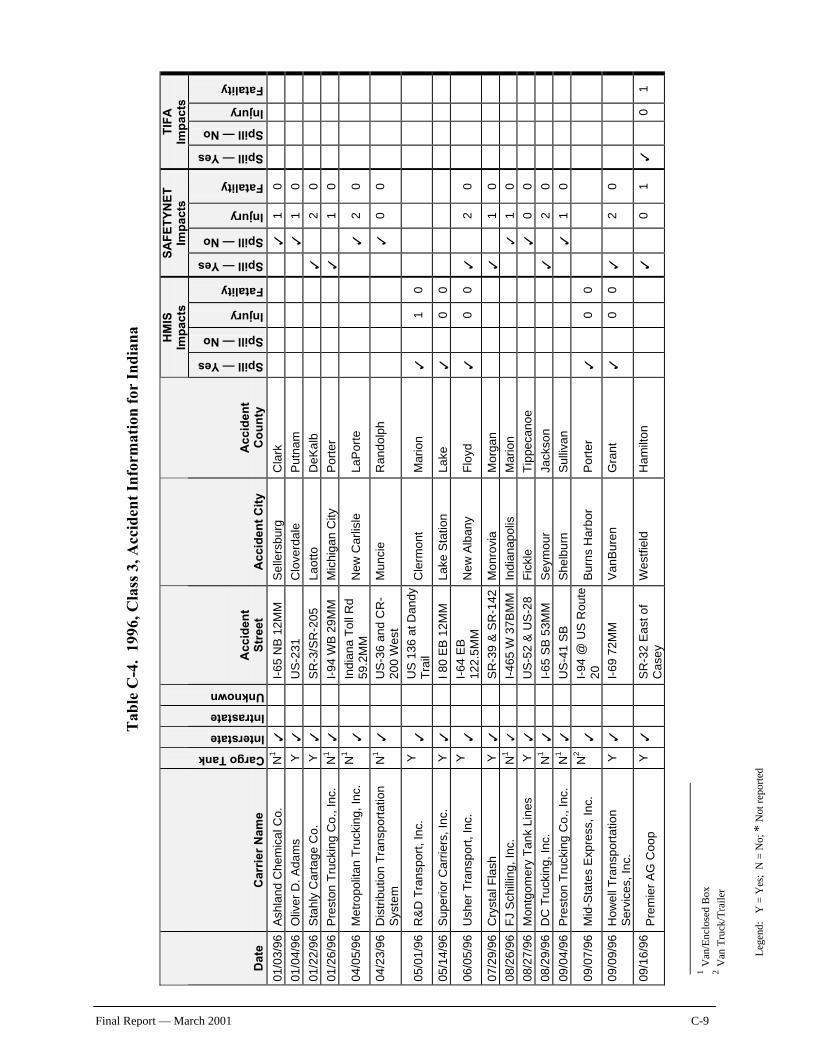
Leg
end:
Y
= Y
es;
N =
No;
* N
ot r
epor
ted
Final Report — March 2001 C-9
T
able
C-4
. 19
96, C
lass
3, A
ccid
ent
Info
rmat
ion
for
Indi
ana
H
MIS
Im
pac
ts
SA
FE
TY
NE
T
Imp
acts
T
IFA
Im
pac
ts
D
ate
C
arri
er N
ame
Cargo Tank Interstate
Intrastate
Unknown
A
ccid
ent
Str
eet
A
ccid
ent
Cit
y A
ccid
ent
Co
un
ty
Spill — Yes
Spill — No
Injury
Fatality
Spill — Yes
Spill — No
Injury
Fatality
Spill — Yes
Spill — No
Injury
Fatality
01
/03
/96 A
shla
nd C
hem
ical
Co.
N
1
3
I-65
NB
12M
M
Sel
lers
burg
C
lark
3
1
0
01
/04
/96 O
liver
D.
Ada
ms
Y
3
US
-23
1
Clo
verd
ale
P
utna
m
3
1
0
01
/22
/96 S
tahl
y C
arta
ge C
o.
Y
3
SR
-3/S
R-2
05
La
ott
o
De
Ka
lb
3
2
0
01
/26
/96
P
rest
on T
ruck
ing
Co.
, In
c.
N1
3
I-9
4 W
B 2
9M
M
Mic
hig
an
City
P
ort
er
3
1
0
04
/05
/96 M
etro
polit
an T
ruck
ing,
Inc
. N
1
3
Indi
ana
Tol
l Rd
59.2
MM
N
ew C
arlis
le
La
Po
rte
3
2
0
04
/23
/96 D
istr
ibut
ion
Tra
nspo
rtat
ion
Sys
tem
N
1
3
US
-36
and
CR
-2
00
We
st
Mun
cie
Ra
nd
olp
h
3
0
0
05
/01
/96 R
&D
Tra
nspo
rt,
Inc.
Y
3
U
S 1
36 a
t Dan
dy
Tra
il C
lerm
ont
Mar
ion
3
1
0
05
/14
/96 S
uper
ior
Car
riers
, In
c.
Y
3
I 80
EB
12M
M
Lake
Sta
tion
La
ke
3
0
0
06
/05
/96 U
sher
Tra
nspo
rt, I
nc.
Y
3
I-6
4 E
B
122.
5MM
N
ew A
lban
y F
loyd
3
0
0
3
2
0
07
/29
/96 C
ryst
al F
lash
Y
3
S
R-3
9 &
SR
-14
2
Mon
rovi
a M
orga
n
3
1
0
08
/26
/96
F
J S
chill
ing,
Inc
. N
1
3
I-4
65
W 3
7B
MM
In
dian
apol
is
Mar
ion
3
1
0
08
/27
/96 M
ontg
omer
y T
ank
Line
s Y
3
U
S-5
2 &
US
-28
Fic
kle
Tip
peca
noe
3
0
0
08
/29
/96
D
C T
ruck
ing,
Inc.
N
1
3
I-65
SB
53M
M
Se
ymo
ur
Jack
son
3
2
0
09
/04
/96
P
rest
on T
ruck
ing
Co.
, In
c.
N1
3
US
-41
SB
S
helb
urn
S
ulli
van
3
1
0
09
/07
/96
M
id-S
tate
s E
xpre
ss,
Inc.
N
2
3
I-94
@ U
S R
oute
2
0
Bur
ns H
arbo
r P
ort
er
3
0
0
09
/09
/96
H
owel
l Tra
nspo
rtat
ion
Ser
vice
s, I
nc.
Y
3
I-69
72M
M
Va
nB
ure
n
Gra
nt
3
0
0
3
2
0
09
/16
/96
P
rem
ier
AG
Coo
p Y
3
S
R-3
2 E
ast
of
Ca
sey
Wes
tfiel
d
Ha
milt
on
3
0
1
3
0
1
1 Van
/Enc
lose
d B
ox
2 Van
Tru
ck/T
raile
r
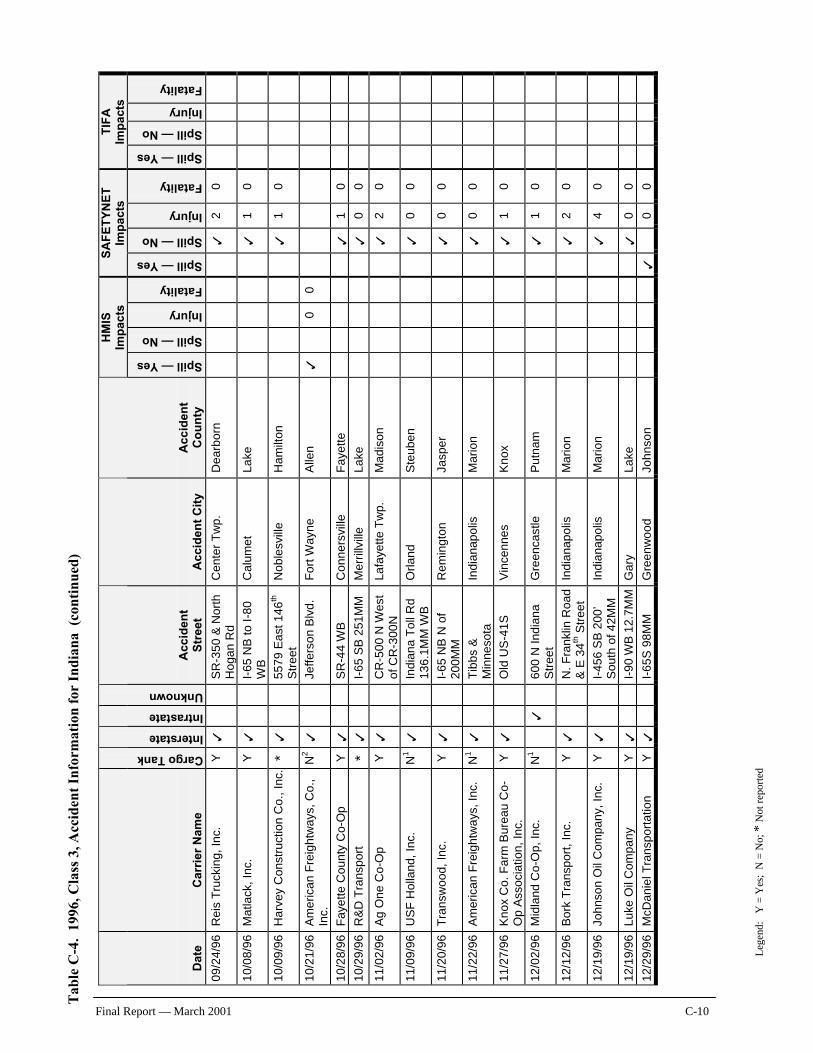
Tab
le C
-4.
1996
, Cla
ss 3
, Acc
iden
t In
form
atio
n fo
r In
dian
a (
cont
inue
d)
Leg
end:
Y
= Y
es;
N =
No;
* N
ot r
epor
ted
Final Report — March 2001 C-10
HM
IS
Imp
acts
S
AF
ET
YN
ET
Im
pac
ts
TIF
A
Imp
acts
D
ate
C
arri
er N
ame
Cargo Tank Interstate
Intrastate
Unknown
A
ccid
ent
Str
eet
A
ccid
ent
Cit
y A
ccid
ent
Co
un
ty
Spill — Yes
Spill — No
Injury
Fatality
Spill — Yes
Spill — No
Injury
Fatality
Spill — Yes
Spill — No
Injury
Fatality
09
/24
/96
R
eis
Tru
ckin
g, I
nc.
Y
3
SR
-350
& N
orth
H
og
an
Rd
C
ente
r T
wp.
D
ea
rbo
rn
3
2
0
10
/08
/96
M
atla
ck,
Inc.
Y
3
I-
65 N
B to
I-8
0
WB
C
alum
et
La
ke
3
1
0
10
/09
/96
H
arve
y C
onst
ruct
ion
Co.
, In
c.
* 3
5
57
9 E
ast
14
6th
Str
ee
t N
ob
lesv
ille
H
am
ilto
n
3
1
0
10
/21
/96
A
mer
ican
Fre
ight
way
s, C
o.,
Inc.
N
2
3
Jeff
erso
n B
lvd.
F
ort
Wa
yne
A
llen
3
0
0
10
/28
/96
F
ayet
te C
ount
y C
o-O
p
Y
3
SR
-44
WB
C
on
ne
rsvi
lle
Fa
yett
e
3
1
0
10
/29
/96
R
&D
Tra
nspo
rt
* 3
I-
65 S
B 2
51M
M
Mer
rillv
ille
La
ke
3
0
0
11
/02
/96
A
g O
ne C
o-O
p
Y
3
CR
-50
0 N
We
st
of C
R-3
00
N
Lafa
yette
Tw
p.
Mad
ison
3
2
0
11
/09
/96
U
SF
Hol
land
, In
c.
N1
3
Ind
iana
Tol
l Rd
13
6.1
MM
WB
O
rla
nd
S
teub
en
3
0
0
11
/20
/96
T
rans
woo
d, I
nc.
Y
3
I-65
NB
N o
f 20
0MM
R
em
ing
ton
Ja
spe
r
3
0
0
11
/22
/96
A
mer
ican
Fre
ight
way
s, In
c.
N1
3
Tib
bs &
M
inn
eso
ta
Indi
anap
olis
M
ario
n
3
0
0
11
/27
/96
K
nox
Co.
Far
m B
urea
u C
o-O
p A
ssoc
iatio
n, I
nc.
Y
3
Old
US
-41
S
Vin
cenn
es
Kn
ox
3
1
0
12
/02
/96
M
idla
nd C
o-O
p, I
nc.
N1
3
600
N I
ndia
na
Str
ee
t G
reen
cast
le
Put
nam
3
1
0
12
/12
/96
B
ork
Tra
nspo
rt,
Inc.
Y
3
N
. F
rank
lin R
oad
& E
34
th S
tree
t In
dian
apol
is
Ma
rio
n
3
2
0
12
/19
/96
Jo
hnso
n O
il C
ompa
ny,
Inc.
Y
3
I-
45
6 S
B 2
00
’ S
outh
of
42M
M
Indi
anap
olis
M
ario
n
3
4
0
12
/19
/96
L
uke
Oil
Co
mp
an
y Y
3
I-
90
WB
12
.7M
M
Ga
ry
La
ke
3
0
0
12
/29
/96
M
cDan
iel T
rans
port
atio
n Y
3
I-
65S
98M
M
Gre
enw
oo
d
Joh
nso
n
3
0
0
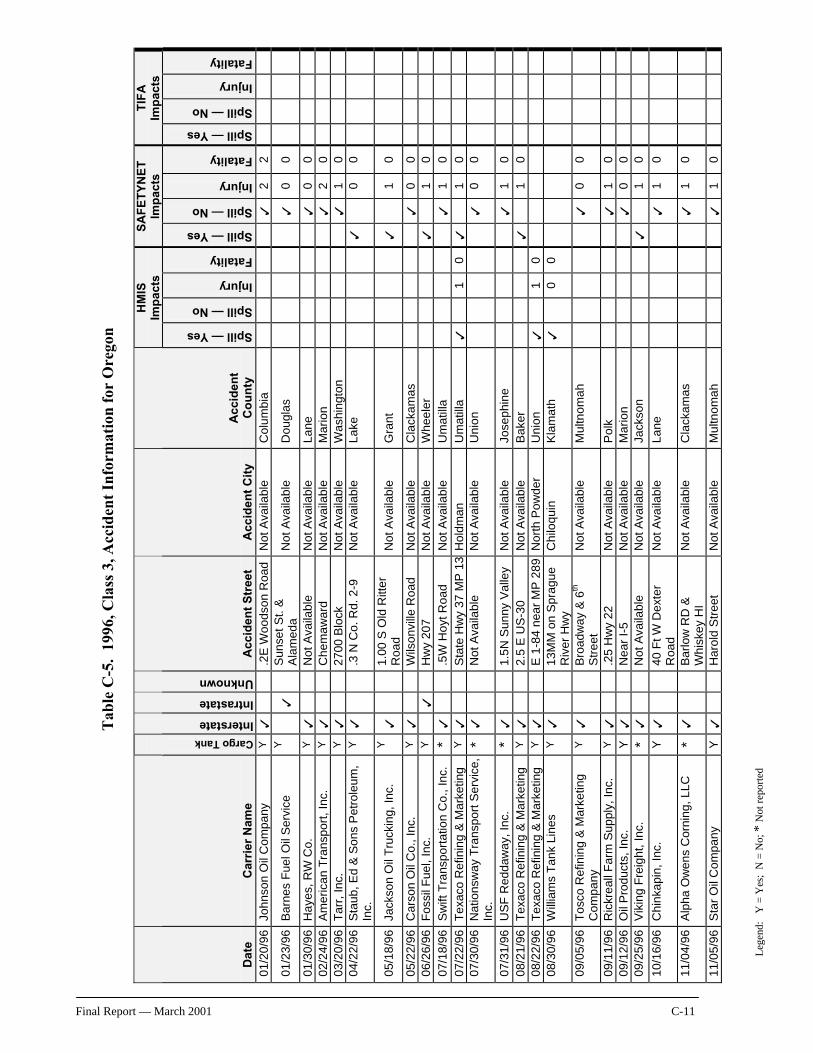
Leg
end:
Y
= Y
es;
N =
No;
* N
ot r
epor
ted
Final Report — March 2001 C-11
Tab
le C
-5.
1996
, Cla
ss 3
, Acc
iden
t In
form
atio
n fo
r O
rego
n
H
MIS
Im
pac
ts
SA
FE
TY
NE
T
Imp
acts
T
IFA
Im
pac
ts
D
ate
C
arri
er N
ame
Cargo Tank
Interstate
Intrastate
Unknown
A
ccid
ent
Str
eet
A
ccid
ent
Cit
y A
ccid
ent
Co
un
ty
Spill — Yes
Spill — No
Injury
Fatality
Spill — Yes
Spill — No
Injury
Fatality
Spill — Yes
Spill — No
Injury
Fatality
01
/20
/96 J
ohns
on O
il C
ompa
ny
Y
3
.2E
Woo
dson
Roa
d
Not
Ava
ilabl
e C
olu
mb
ia
3
2
2
01
/23
/96 B
arne
s F
uel O
il S
ervi
ce
Y
3
Sun
set
St.
&
Ala
me
da
Not
Ava
ilabl
e D
ougl
as
3
0
0
01
/30
/96 H
aye
s, R
W C
o.
Y
3
Not
Ava
ilabl
e N
ot A
vaila
ble
La
ne
3
0
0
0
2/2
4/9
6
Am
eric
an T
rans
port
, In
c.
Y
3
Che
maw
ard
Not
Ava
ilabl
e M
ario
n
3
2
0
03
/20
/96 T
arr,
In
c.
Y
3
2700
Blo
ck
Not
Ava
ilabl
e W
ashi
ngto
n
3
1
0
04
/22
/96 S
taub
, Ed
& S
ons
Pet
role
um,
Inc.
Y
3
.3
N C
o. R
d. 2
-9
Not
Ava
ilabl
e L
ake
3
0
0
05
/18
/96 J
acks
on O
il T
ruck
ing,
Inc
. Y
3
1.
00 S
Old
Ritt
er
Ro
ad
N
ot A
vaila
ble
Gra
nt
3
1
0
05
/22
/96 C
arso
n O
il C
o., I
nc.
Y
3
Wils
onvi
lle R
oad
Not
Ava
ilabl
e C
lack
am
as
3
0
0
0
6/2
6/9
6 F
ossi
l Fue
l, In
c.
Y
3
Hw
y 20
7 N
ot A
vaila
ble
Whe
eler
3
1
0
07
/18
/96 S
wift
Tra
nspo
rtat
ion
Co.
, In
c.
* 3
.5
W H
oyt
Ro
ad
Not
Ava
ilabl
e U
ma
tilla
3
1
0
07
/22
/96 T
exac
o R
efin
ing
& M
arke
ting
Y
3
Sta
te H
wy
37 M
P 1
3 H
old
ma
n
Um
atil
la
3
1
0
3
1
0
07
/30
/96
N
atio
nsw
ay T
rans
port
Ser
vice
, In
c.
* 3
N
ot A
vaila
ble
Not
Ava
ilabl
e U
nio
n
3
0
0
07
/31
/96
U
SF
Red
daw
ay,
Inc.
*
3
1.5
N S
un
ny
Va
lley
Not
Ava
ilabl
e Jo
sep
hin
e
3
1
0
0
8/2
1/9
6
Tex
aco
Ref
inin
g &
Mar
ketin
g Y
3
2.
5 E
US
-30
N
ot A
vaila
ble
Ba
ker
3
1
0
0
8/2
2/9
6
Tex
aco
Ref
inin
g &
Mar
ketin
g Y
3
E
1-8
4 ne
ar M
P 2
89
Nor
th P
owde
r U
nio
n
3
1
0
0
8/3
0/9
6
Will
iam
s T
ank
Line
s Y
3
13
MM
on
Spr
ague
R
iver
Hw
y C
hilo
qu
in
Kla
ma
th
3
0
0
09
/05
/96
T
osco
Ref
inin
g &
Mar
ketin
g C
om
pa
ny
Y
3
Bro
adw
ay &
6th
S
tre
et
Not
Ava
ilabl
e M
ultn
om
ah
3
0
0
09
/11
/96
R
ickr
eall
Far
m S
uppl
y, I
nc.
Y
3
.25
Hw
y 22
N
ot A
vaila
ble
Po
lk
3
1
0
0
9/1
2/9
6
Oil
Pro
duct
s, I
nc.
Y
3
Ne
ar
I-5
N
ot A
vaila
ble
Mar
ion
3
0
0
0
9/2
5/9
6
Vik
ing
Fre
ight
, In
c.
* 3
N
ot A
vaila
ble
Not
Ava
ilabl
e Ja
ckso
n
3
1
0
10
/16
/96
C
hink
apin
, In
c.
Y
3
40
Ft W
De
xte
r R
oa
d
Not
Ava
ilab
le
La
ne
3
1
0
11
/04
/96
A
lpha
Ow
ens
Cor
ning
, LL
C
* 3
B
arlo
w R
D &
W
hisk
ey H
I N
ot A
vaila
ble
Cla
cka
ma
s
3
1
0
11
/05
/96
S
tar
Oil
Com
pany
Y
3
H
arol
d S
tree
t N
ot A
vaila
ble
Mu
ltno
ma
h
3
1
0
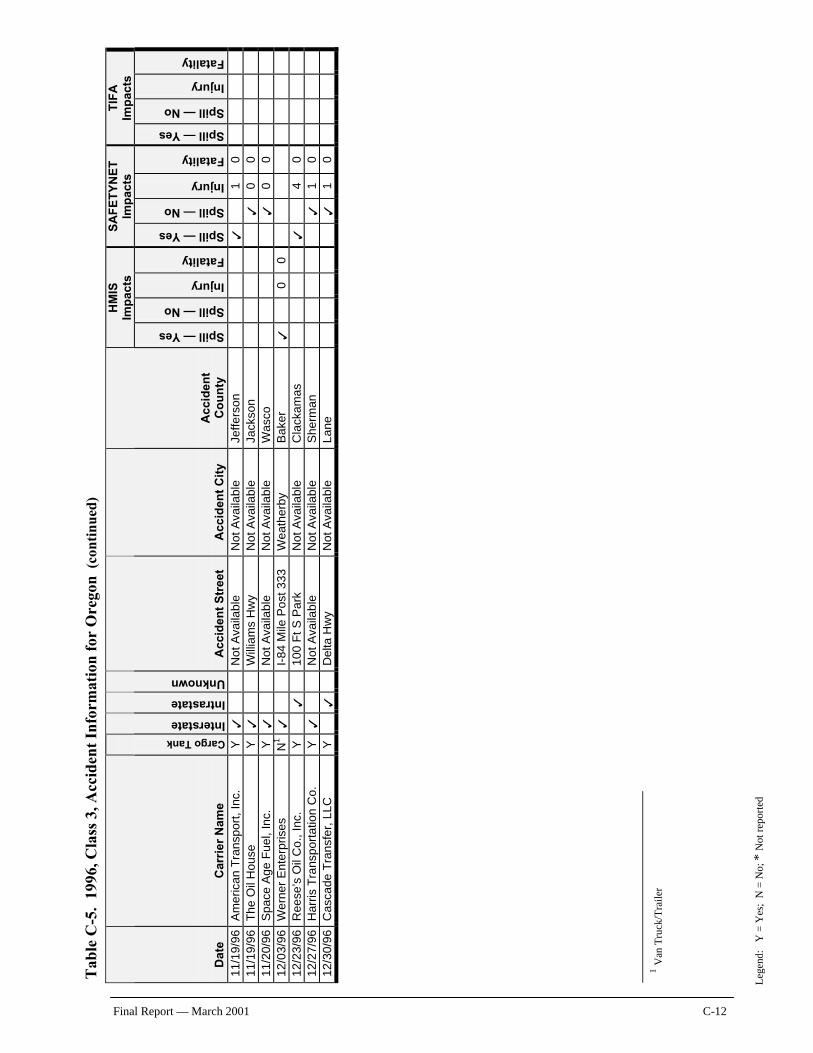
Tab
le C
-5.
1996
, Cla
ss 3
, Acc
iden
t In
form
atio
n fo
r O
rego
n (
cont
inue
d)
Leg
end:
Y
= Y
es;
N =
No;
* N
ot r
epor
ted
Final Report — March 2001 C-12
H
MIS
Im
pac
ts
SA
FE
TY
NE
T
Imp
acts
T
IFA
Im
pac
ts
D
ate
C
arri
er N
ame
Cargo Tank
Interstate
Intrastate
Unknown
A
ccid
ent
Str
eet
A
ccid
ent
Cit
y A
ccid
ent
Co
un
ty
Spill — Yes
Spill — No
Injury
Fatality
Spill — Yes
Spill — No
Injury
Fatality
Spill — Yes
Spill — No
Injury
Fatality
11
/19
/96
A
mer
ican
Tra
nspo
rt,
Inc.
Y
3
N
ot A
vaila
ble
Not
Ava
ilabl
e Je
ffe
rso
n
3
1
0
1
1/1
9/9
6
The
Oil
Hou
se
Y
3
Will
iam
s H
wy
Not
Ava
ilabl
e Ja
ckso
n
3
0
0
1
1/2
0/9
6
Spa
ce A
ge F
uel,
Inc.
Y
3
N
ot A
vaila
ble
Not
Ava
ilabl
e W
asco
3
0
0
12
/03
/96
W
erne
r E
nter
pris
es
N1
3
I-84
Mile
Pos
t 33
3 W
ea
the
rby
Ba
ker
3
0
0
1
2/2
3/9
6
Ree
se’s
Oil
Co.
, In
c.
Y
3
100
Ft
S P
ark
Not
Ava
ilabl
e C
lack
am
as
3
4
0
1
2/2
7/9
6
Har
ris T
rans
port
atio
n C
o.
Y
3
Not
Ava
ilabl
e N
ot A
vaila
ble
She
rman
3
1
0
12
/30
/96
C
asca
de T
rans
fer,
LLC
Y
3
D
elta
Hw
y N
ot A
vaila
ble
La
ne
3
1
0
1 Van
Tru
ck/T
raile
r
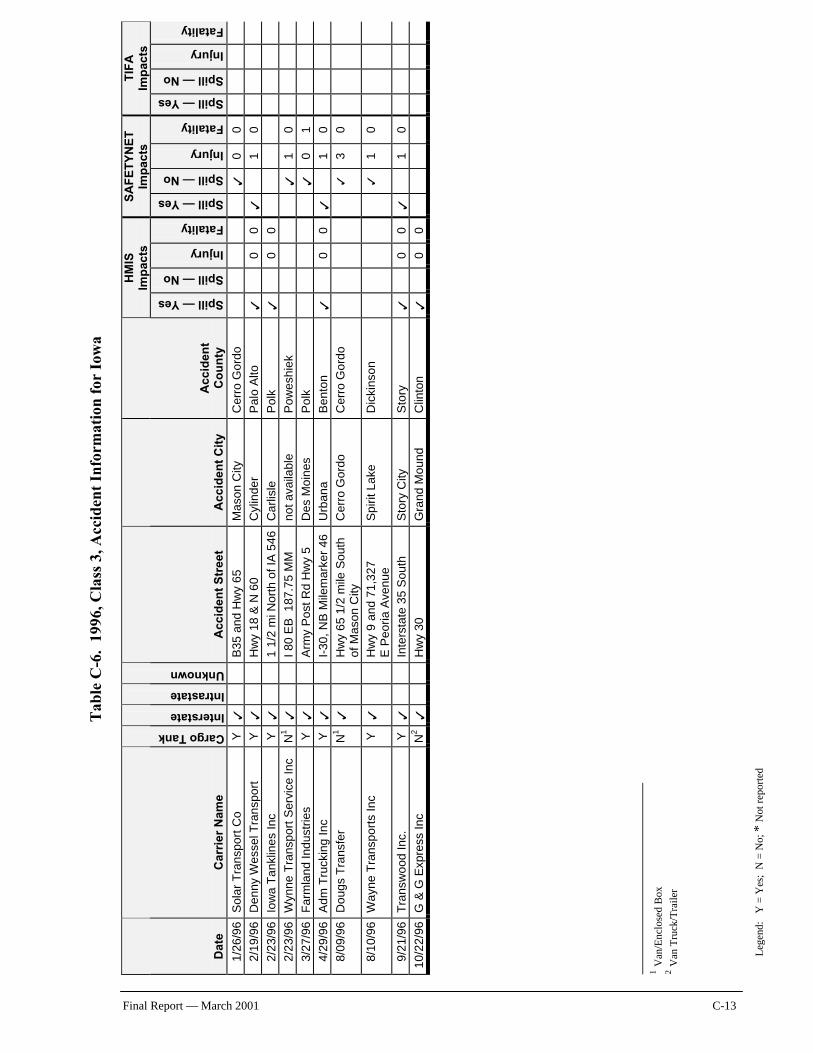
Leg
end:
Y
= Y
es;
N =
No;
* N
ot r
epor
ted
Final Report — March 2001 C-13
Tab
le C
-6.
1996
, Cla
ss 3
, Acc
iden
t In
form
atio
n fo
r Io
wa
H
MIS
Im
pac
ts
SA
FE
TY
NE
T
Imp
acts
T
IFA
Im
pac
ts
D
ate
C
arri
er N
ame
Cargo Tank Interstate Intrastate Unknown
A
ccid
ent
Str
eet
A
ccid
ent
Cit
y A
ccid
ent
Co
un
ty
Spill — Yes Spill — No Injury Fatality Spill — Yes Spill — No Injury Fatality Spill — Yes Spill — No Injury Fatality
1/26
/96
S
olar
Tra
nspo
rt C
o Y
3
B
35 a
nd H
wy
65
Mas
on C
ity
Cer
ro G
ordo
3
0
0
2/19
/96
D
enny
Wes
sel T
rans
port
Y
3
H
wy
18 &
N 6
0 C
ylin
de
r P
alo
Alto
3
0
0
3
1
0
2/23
/96
Io
wa
Tan
klin
es I
nc
Y
3
1 1/
2 m
i Nor
th o
f IA
546
C
arl
isle
P
olk
3
0
0
2/23
/96
W
ynne
Tra
nspo
rt S
ervi
ce I
nc
N1
3
I 80
EB
187
.75
MM
n
ot
avai
labl
e P
ow
esh
iek
3
1
0
3/27
/96
F
arm
lan
d In
du
stri
es
Y
3
Arm
y P
ost R
d H
wy
5 D
es M
oine
s P
olk
3
0
1
4/29
/96
A
dm
Tru
ckin
g In
c Y
3
I-
30, N
B M
ilem
arke
r 46
U
rba
na
B
en
ton
3
0
0
3
1
0
8/09
/96
D
ougs
Tra
nsfe
r N
1
3
Hw
y 65
1/2
mile
Sou
th
of M
ason
City
C
erro
Gor
do
Cer
ro G
ordo
3
3
0
8/10
/96
W
ayn
e T
ran
spo
rts
Inc
Y
3
Hw
y 9
and
71,3
27
E P
eoria
Ave
nue
Spi
rit L
ake
D
icki
nson
3
1
0
9/21
/96
T
rans
woo
d In
c.
Y
3
Inte
rsta
te 3
5 S
ou
th
Sto
ry C
ity
Sto
ry
3
0
0
3
1
0
10
/22
/96
G &
G E
xpre
ss In
c N
2
3
Hw
y 30
G
rand
Mou
nd
Clin
ton
3
0
0
1 Van
/Enc
lose
d B
ox
2 Van
Tru
ck/T
raile
r
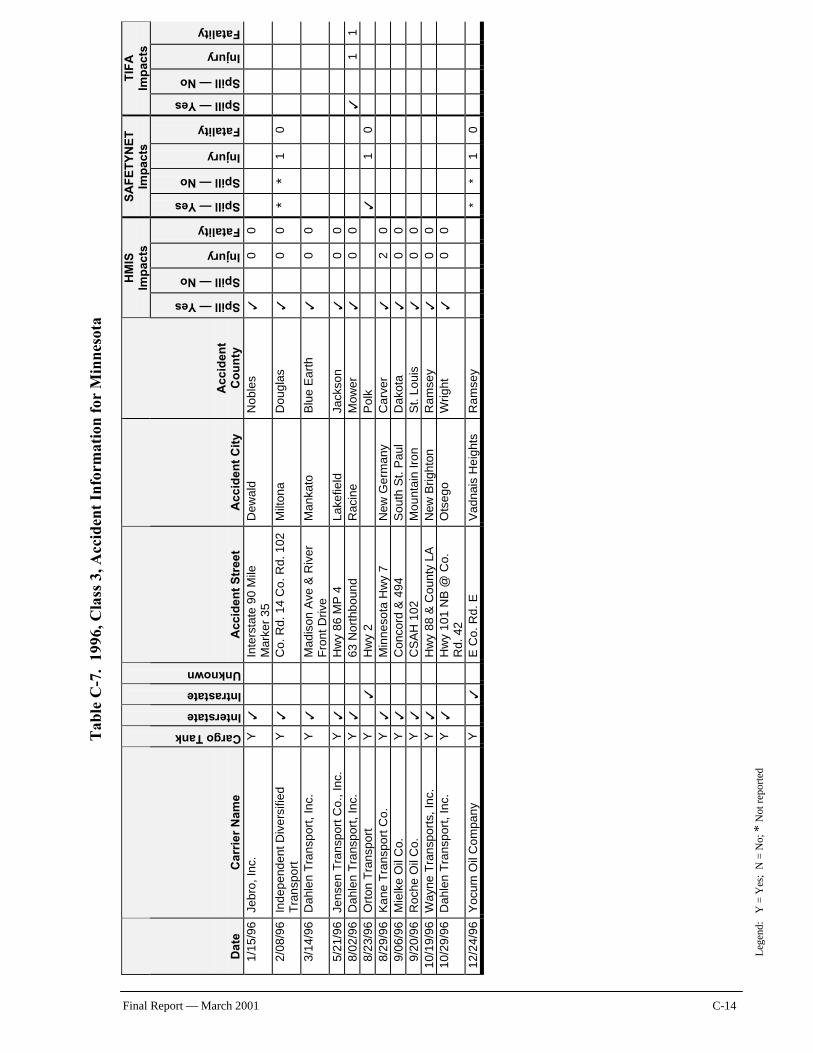
Leg
end:
Y
= Y
es;
N =
No;
* N
ot r
epor
ted
Final Report — March 2001 C-14
Tab
le C
-7.
1996
, Cla
ss 3
, Acc
iden
t In
form
atio
n fo
r M
inne
sota
HM
IS
Imp
acts
S
AF
ET
YN
ET
Im
pac
ts
TIF
A
Imp
acts
D
ate
C
arri
er N
ame
Cargo Tank Interstate
Intrastate
Unknown
A
ccid
ent
Str
eet
A
ccid
ent
Cit
y A
ccid
ent
Co
un
ty
Spill — Yes
Spill — No
Injury
Fatality
Spill — Yes
Spill — No
Injury
Fatality
Spill — Yes
Spill — No
Injury
Fatality
1/15
/96 J
ebro
, In
c.
Y
3
Inte
rsta
te 9
0 M
ile
Mar
ker
35
Dew
ald
Nob
les
3
0
0
2/08
/96 I
ndep
ende
nt D
iver
sifie
d T
ran
spo
rt
Y
3
Co.
Rd.
14
Co.
Rd.
102
M
ilton
a D
ougl
as
3
0
0
*
* 1
0
3/14
/96 D
ahle
n T
rans
port
, In
c.
Y
3
Mad
ison
Ave
& R
iver
F
ront
Driv
e
Man
kato
B
lue
Ear
th
3
0
0
5/21
/96 J
en
sen
Tra
nspo
rt C
o.,
Inc.
Y
3
H
wy
86 M
P 4
La
kefie
ld
Jack
son
3
0
0
8/
02/9
6 D
ahle
n T
rans
port
, In
c.
Y
3
63 N
orth
boun
d
Rac
ine
Mow
er
3
0
0
3
1
1
8/23
/96 O
rton
Tra
nspo
rt
Y
3
Hw
y 2
P
olk
3
1
0
8/29
/96 K
ane
Tra
nspo
rt C
o.
Y
3
Min
neso
ta H
wy
7 N
ew G
erm
any
Car
ver
3
2
0
9/
06/9
6 M
ielk
e O
il C
o.
Y
3
Con
cord
& 4
94
Sou
th S
t. P
aul
Da
kota
3
0
0
9/20
/96 R
oche
Oil
Co.
Y
3
C
SA
H 1
02
Mou
ntai
n Ir
on
St.
Lo
uis
3
0
0
10
/19
/96 W
ayne
Tra
nspo
rts,
Inc
. Y
3
H
wy
88 &
Cou
nty
LA
New
Brig
hton
R
am
sey
3
0
0
1
0/2
9/9
6
Dah
len
Tra
nspo
rt,
Inc.
Y
3
H
wy
101
NB
@ C
o.
Rd.
42
O
tse
go
W
rig
ht
3
0
0
12
/24
/96
Y
ocum
Oil
Com
pany
Y
3
E
Co.
Rd.
E
Vad
nais
Hei
ghts
R
am
sey
* *
1
0
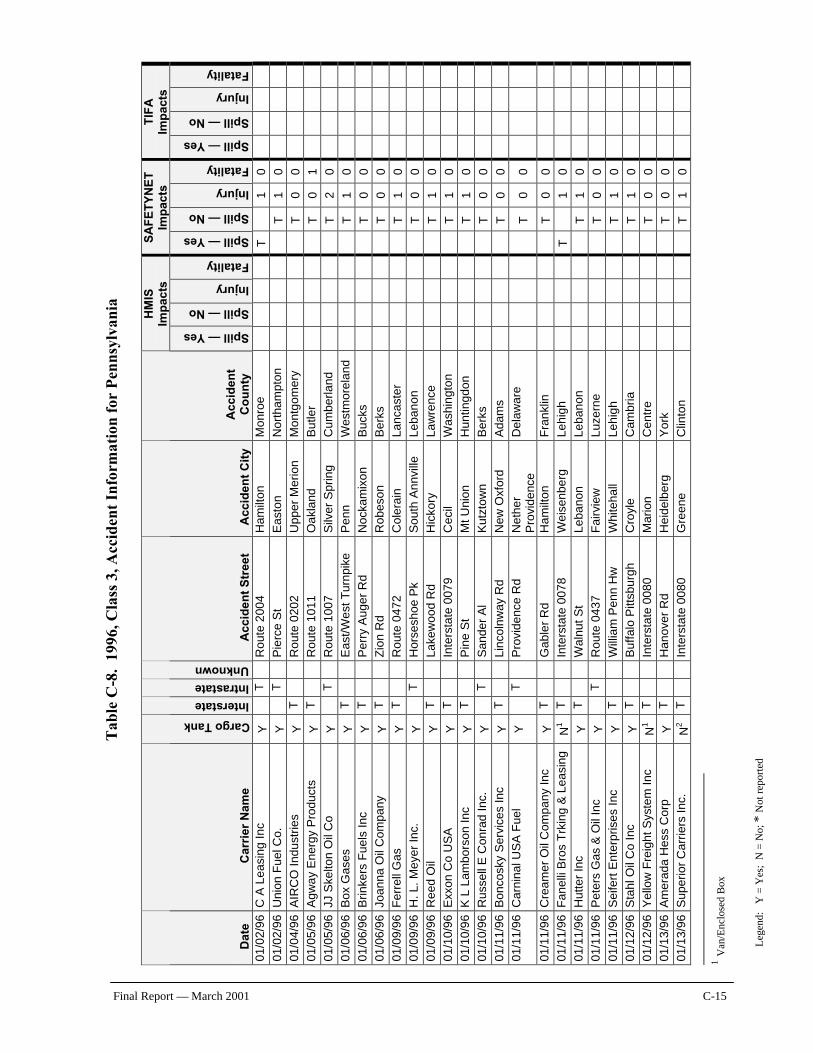
Leg
end:
Y
= Y
es;
N =
No;
* N
ot r
epor
ted
Final Report — March 2001 C-15
Tab
le C
-8.
1996
, Cla
ss 3
, Acc
iden
t In
form
atio
n fo
r P
enns
ylva
nia
H
MIS
Im
pac
ts
SA
FE
TY
NE
T
Imp
acts
T
IFA
Im
pac
ts
D
ate
C
arri
er N
ame
Cargo Tank
Interstate Intrastate Unknown
A
ccid
ent
Str
eet
A
ccid
ent
Cit
y A
ccid
ent
Co
un
ty
Spill — Yes Spill — No Injury Fatality Spill — Yes Spill — No Injury Fatality Spill — Yes Spill — No Injury Fatality
01
/02
/96
C
A L
easi
ng I
nc
Y
T
Ro
ute
20
04
H
am
ilto
n
Mon
roe
T
1
0
01
/02
/96
U
nion
Fue
l Co.
Y
T
P
ierc
e S
t E
ast
on
N
orth
ampt
on
T
1
0
0
1/0
4/9
6
AIR
CO
Ind
ustr
ies
Y
T
Ro
ute
02
02
U
pper
Mer
ion
Mon
tgom
ery
T
0
0
01
/05
/96
A
gway
Ene
rgy
Pro
duct
s Y
T
R
ou
te 1
01
1
Oak
land
B
utle
r
T
0
1
0
1/0
5/9
6
JJ S
kelto
n O
il C
o Y
T
R
ou
te 1
00
7
Silv
er S
prin
g C
umbe
rland
T
2
0
01
/06
/96
B
ox G
ases
Y
T
E
ast
/We
st T
urnp
ike
P
en
n
Wes
tmor
elan
d
T
1
0
0
1/0
6/9
6
Brin
kers
Fue
ls I
nc
Y
T
Per
ry A
uger
Rd
Noc
kam
ixon
B
ucks
T
0
0
01
/06
/96
Jo
anna
Oil
Com
pany
Y
T
Z
ion
Rd
R
obes
on
Be
rks
T
0
0
01
/09
/96
F
erre
ll G
as
Y
T
Ro
ute
04
72
C
oler
ain
La
ncas
ter
T
1
0
01
/09
/96
H
. L.
Mey
er I
nc.
Y
T
Hor
sesh
oe P
k S
outh
Ann
ville
L
eb
an
on
T
0
0
01
/09
/96
R
ee
d O
il Y
T
L
ake
wo
od
Rd
H
icko
ry
Law
renc
e
T
1
0
0
1/1
0/9
6
Exx
on C
o U
SA
Y
T
In
ters
tate
007
9
Ce
cil
Was
hing
ton
T
1
0
01
/10/
96
K
L L
am
bo
rso
n In
c Y
T
P
ine
St
Mt
Uni
on
Hu
ntin
gd
on
T
1
0
01
/10
/96
R
usse
ll E
Con
rad
Inc.
Y
T
S
ande
r A
l K
utzt
own
B
erk
s
T
0
0
0
1/1
1/9
6
Bon
cosk
y S
ervi
ces
Inc
Y
T
Linc
olnw
ay R
d N
ew O
xfor
d A
dam
s
T
0
0
01
/11
/96
C
arni
nal U
SA
Fue
l Y
T
P
rovi
denc
e R
d N
eth
er
Pro
vide
nce
D
elaw
are
T
0
0
01
/11
/96
C
ream
er O
il C
ompa
ny I
nc
Y
T
Ga
ble
r R
d
Ha
milt
on
F
ran
klin
T
0
0
01
/11
/96
F
anel
li B
ros
Trk
ing
& L
easi
ng
N1
T
Inte
rsta
te 0
078
W
eise
nber
g
Le
hig
h
T
1
0
0
1/1
1/9
6
Hut
ter
Inc
Y
T
Wal
nut
St
Le
ba
no
n
Le
ba
no
n
T
1
0
0
1/1
1/9
6
Pet
ers
Gas
& O
il In
c Y
T
R
ou
te 0
43
7
Fai
rvie
w
Lu
zern
e
T
0
0
0
1/1
1/9
6
Sei
fert
Ent
erpr
ises
Inc
Y
T
W
illia
m P
enn
Hw
W
hite
hall
Le
hig
h
T
1
0
0
1/1
2/9
6
Sta
hl O
il C
o In
c Y
T
B
uffa
lo P
ittsb
urgh
C
royl
e C
ambr
ia
T
1
0
0
1/1
2/9
6
Yel
low
Fre
ight
Sys
tem
Inc
N
1
T
Inte
rsta
te 0
080
M
ario
n C
en
tre
T
0
0
01
/13
/96
A
mer
ada
Hes
s C
orp
Y
T
H
anov
er R
d H
eid
elb
erg
Y
ork
T
0
0
01
/13
/96
S
uper
ior
Car
riers
Inc
. N
2
T
Inte
rsta
te 0
080
G
ree
ne
C
linto
n
T
1
0
1 Van
/Enc
lose
d B
ox
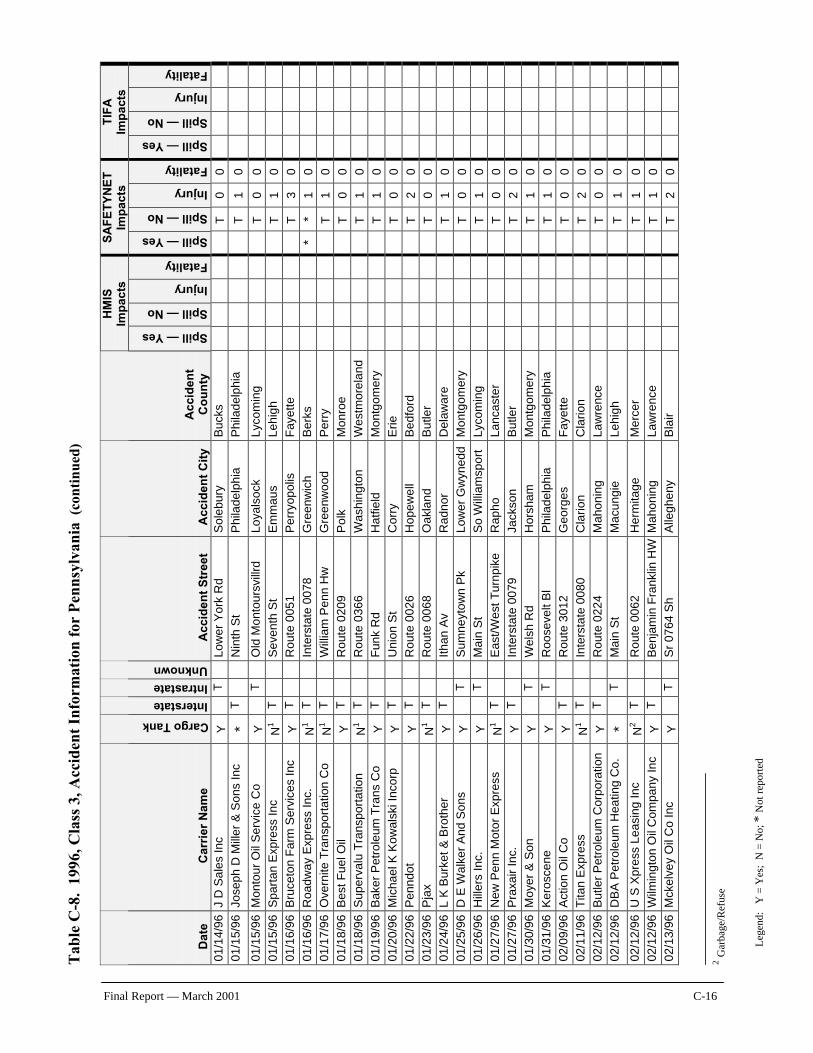
Tab
le C
-8.
1996
, Cla
ss 3
, Acc
iden
t In
form
atio
n fo
r P
enns
ylva
nia
(co
ntin
ued)
Leg
end:
Y
= Y
es;
N =
No;
* N
ot r
epor
ted
Final Report — March 2001 C-16
HM
IS
Imp
acts
S
AF
ET
YN
ET
Im
pac
ts
TIF
A
Imp
acts
D
ate
C
arri
er N
ame
Cargo Tank
Interstate Intrastate Unknown
A
ccid
ent
Str
eet
A
ccid
ent
Cit
y A
ccid
ent
Co
un
ty
Spill — Yes Spill — No Injury Fatality Spill — Yes Spill — No Injury Fatality Spill — Yes Spill — No Injury Fatality
01
/14
/96
J
D S
ales
Inc
Y
T
Lo
wer
Yor
k R
d S
ole
bu
ry
Bu
cks
T
0
0
01
/15
/96
Jo
seph
D M
iller
& S
ons
Inc
* T
N
inth
St
Ph
ilad
elp
hia
P
hila
de
lph
ia
T
1
0
01
/15
/96
M
onto
ur O
il S
ervi
ce C
o
Y
T
Old
Mon
tour
svill
rd
Lo
yals
ock
L
yco
min
g
T
0
0
0
1/1
5/9
6
Spa
rtan
Exp
ress
Inc
N
1
T
Sev
enth
St
Em
ma
us
Le
hig
h
T
1
0
0
1/1
6/9
6
Bru
ceto
n F
arm
Ser
vice
s In
c Y
T
R
ou
te 0
05
1
Per
ryop
olis
F
aye
tte
T
3
0
01
/16
/96
R
oadw
ay E
xpre
ss I
nc.
N1
T
Inte
rsta
te 0
078
G
reen
wic
h B
erk
s
* *
1
0
01
/17
/96
O
vern
ite T
rans
port
atio
n C
o N
1
T
Will
iam
Pen
n H
w
Gre
enw
ood
Per
ry
T
1
0
0
1/1
8/9
6
Bes
t Fue
l Oil
Y
T
Ro
ute
02
09
P
olk
M
onro
e
T
0
0
01
/18
/96
S
uper
valu
Tra
nspo
rtat
ion
N1
T
Ro
ute
03
66
W
ashi
ngto
n W
estm
orel
and
T
1
0
01
/19
/96
B
aker
Pet
role
um T
rans
Co
Y
T
Fun
k R
d
Hat
field
M
ontg
omer
y
T
1
0
0
1/2
0/9
6
Mic
hael
K K
owal
ski I
ncor
p
Y
T
Un
ion
St
Co
rry
Eri
e
T
0
0
0
1/2
2/9
6
Pen
ndot
Y
T
R
ou
te 0
02
6
Hop
ewel
l B
ed
ford
T
2
0
01
/23
/96
P
jax
N1
T
Ro
ute
00
68
O
akla
nd
Bu
tler
T
0
0
01
/24
/96
L
K B
urke
t &
Bro
ther
Y
T
It
han
Av
Ra
dn
or
Del
awar
e
T
1
0
0
1/2
5/9
6
D E
Wal
ker
And
Son
s Y
T
S
umne
ytow
n P
k Lo
wer
Gw
yned
d M
on
tgo
me
ry
T
0
0
0
1/2
6/9
6
Hill
ers
Inc.
Y
T
M
ain
St
So
Will
iam
spo
rt
Lyc
om
ing
T
1
0
01
/27
/96
N
ew P
enn
Mot
or E
xpre
ss
N1
T
Eas
t/Wes
t T
urnp
ike
R
ap
ho
La
ncas
ter
T
0
0
01
/27
/96
P
raxa
ir In
c.
Y
T
Inte
rsta
te 0
079
Ja
ckso
n
Bu
tler
T
2
0
01
/30
/96
M
oyer
& S
on
Y
T
We
lsh
Rd
H
orsh
am
Mon
tgom
ery
T
1
0
01
/31
/96
K
ero
sce
ne
Y
T
R
oose
velt
Bl
Ph
ilad
elp
hia
P
hila
de
lph
ia
T
1
0
0
2/0
9/9
6
Act
ion
Oil
Co
Y
T
Ro
ute
30
12
G
eo
rge
s F
aye
tte
T
0
0
02
/11
/96
T
itan
Exp
ress
N
1
T
Inte
rsta
te 0
080
C
lari
on
C
lario
n
T
2
0
0
2/1
2/9
6
But
ler
Pet
role
um C
orpo
ratio
n
Y
T
Ro
ute
02
24
M
ahon
ing
Law
renc
e
T
0
0
0
2/1
2/9
6
DB
A P
etro
leum
Hea
ting
Co.
*
T
Mai
n S
t M
acun
gie
Le
hig
h
T
1
0
02
/12
/96
U
S X
pres
s Le
asin
g In
c N
2
T
Ro
ute
00
62
H
erm
itag
e
Mer
cer
T
1
0
02
/12
/96
W
ilmin
gton
Oil
Com
pany
Inc
Y
T
B
enja
min
Fra
nklin
HW
Mah
onin
g La
wre
nce
T
1
0
02
/13
/96
M
ckel
vey
Oil
Co
Inc
Y
T
Sr
0764
Sh
A
lleg
he
ny
Bla
ir
T
2
0
2 Gar
bage
/Ref
use
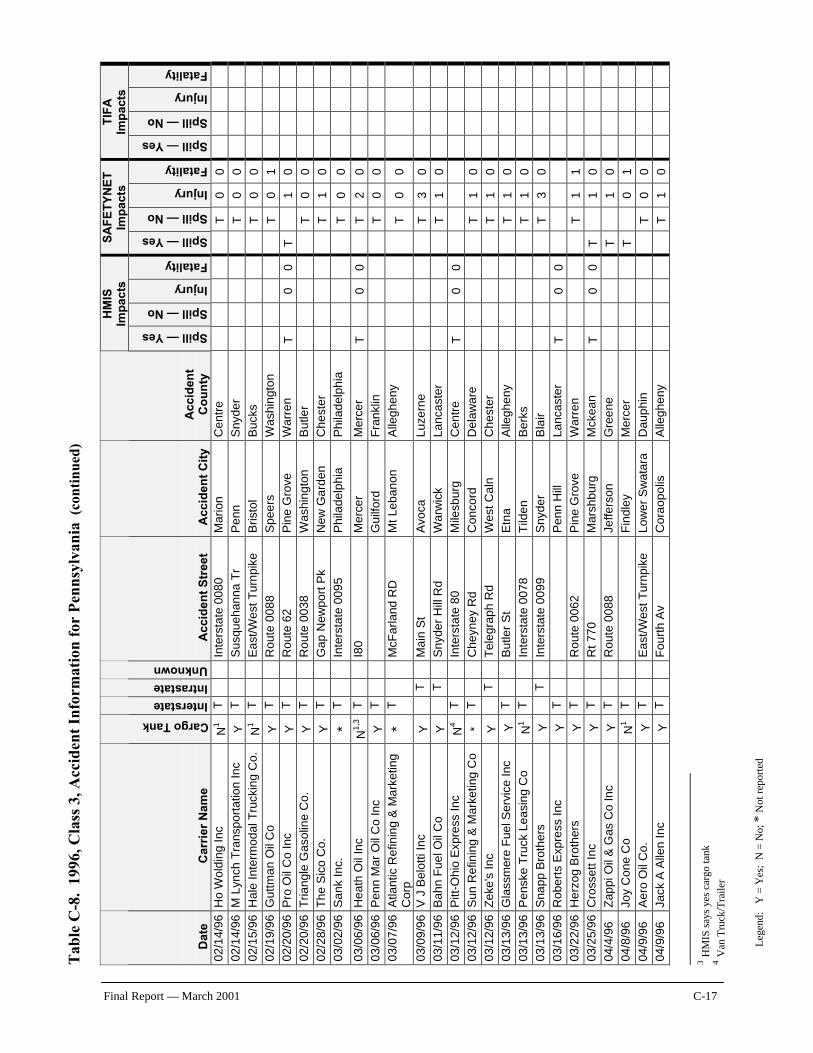
Tab
le C
-8.
1996
, Cla
ss 3
, Acc
iden
t In
form
atio
n fo
r P
enns
ylva
nia
(co
ntin
ued)
Leg
end:
Y
= Y
es;
N =
No;
* N
ot r
epor
ted
Final Report — March 2001 C-17
HM
IS
Imp
acts
S
AF
ET
YN
ET
Im
pac
ts
TIF
A
Imp
acts
D
ate
C
arri
er N
ame
Cargo Tank
Interstate Intrastate Unknown
A
ccid
ent
Str
eet
A
ccid
ent
Cit
y A
ccid
ent
Co
un
ty
Spill — Yes Spill — No Injury Fatality Spill — Yes Spill — No Injury Fatality Spill — Yes Spill — No Injury Fatality
02
/14
/96
H
o W
old
ing
Inc
N1
T
Inte
rsta
te 0
080
M
ario
n C
en
tre
T
0
0
02
/14
/96
M
Lyn
ch T
rans
port
atio
n In
c Y
T
S
usqu
ehan
na T
r P
en
n
Sny
der
T
0
0
02
/15
/96
H
ale
Inte
rmod
al T
ruck
ing
Co.
N
1
T
Eas
t/Wes
t T
urnp
ike
B
risto
l B
uck
s
T
0
0
0
2/1
9/9
6
Gut
tman
Oil
Co
Y
T
Ro
ute
00
88
S
pe
ers
W
ashi
ngto
n
T
0
1
0
2/2
0/9
6
Pro
Oil
Co
Inc
Y
T
Rou
te 6
2
Pin
e G
rove
W
arr
en
T
0
0
T
1
0
0
2/2
0/9
6
Tria
ngle
Gas
olin
e C
o.
Y
T
Ro
ute
00
38
W
ashi
ngto
n B
utle
r
T
0
0
0
2/2
8/9
6
Th
e S
ico
Co
. Y
T
G
ap N
ewpo
rt P
k N
ew G
ard
en
C
hest
er
T
1
0
0
3/0
2/9
6
Sa
nk
Inc.
*
T
Inte
rsta
te 0
095
P
hila
de
lph
ia
Ph
ilad
elp
hia
T
0
0
03
/06
/96
H
eath
Oil
Inc
N1
,3 T
I8
0
Mer
cer
Mer
cer
T
0
0
T
2
0
03
/06
/96
P
enn
Mar
Oil
Co
Inc
Y
T
Gu
ilfo
rd
Fra
nkl
in
T
0
0
0
3/0
7/96
A
tlant
ic R
efin
ing
& M
arke
ting
Co
rp
* T
M
cFar
land
RD
M
t Le
bano
n A
llegh
eny
T
0
0
03
/09
/96
V
J B
elo
tti I
nc
Y
T
Mai
n S
t A
voca
L
uze
rne
T
3
0
03
/11
/96
B
ahn
Fue
l Oil
Co
Y
T
Sny
der
Hill
Rd
War
wic
k La
ncas
ter
T
1
0
03
/12
/96
Pitt
-Ohi
o E
xpre
ss In
c N
4
T
Inte
rsta
te 8
0
Mile
sbur
g C
en
tre
T
0
0
03
/12
/96
S
un R
efin
ing
& M
arke
ting
Co
* T
C
heyn
ey R
d C
on
cord
D
elaw
are
T
1
0
03
/12
/96
Z
eke'
s In
c Y
T
T
eleg
raph
Rd
W
est
Ca
ln
Che
ster
T
1
0
03
/13
/96
G
lass
mer
e F
uel S
ervi
ce In
c Y
T
B
utle
r S
t E
tna
A
llegh
eny
T
1
0
03
/13
/96
P
ensk
e T
ruck
Lea
sing
Co
N1
T
Inte
rsta
te 0
078
T
ilde
n
Be
rks
T
1
0
03
/13
/96
S
napp
Bro
ther
s
Y
T
Inte
rsta
te 0
099
S
nyde
r B
lair
T
3
0
03
/16
/96
R
ober
ts E
xpre
ss In
c Y
T
P
enn
Hill
La
ncas
ter
T
0
0
0
3/2
2/9
6
Her
zog
Bro
ther
s Y
T
R
ou
te 0
06
2
Pin
e G
rove
W
arr
en
T
1
1
03
/25
/96
C
ross
ett
Inc
Y
T
Rt
77
0
Mar
shbu
rg
Mck
ean
T
0
0
T
1
0
04/4
/96
Z
appi
Oil
& G
as C
o In
c Y
T
R
ou
te 0
08
8
Jeff
ers
on
G
ree
ne
T
1
0
04/8
/96
Jo
y C
on
e C
o
N1
T
Fin
dle
y M
erce
r
T
0
1
04
/9/9
6
Ae
ro O
il C
o.
Y
T
Eas
t/Wes
t T
urnp
ike
Lo
wer
Sw
atar
a D
auph
in
T
0
0
04
/9/9
6
Jack
A A
llen
Inc
Y
T
Fou
rth
Av
Co
rao
po
lis
Alle
ghen
y
T
1
0
3 HM
IS s
ays
yes
carg
o ta
nk
4 Van
Tru
ck/T
raile
r
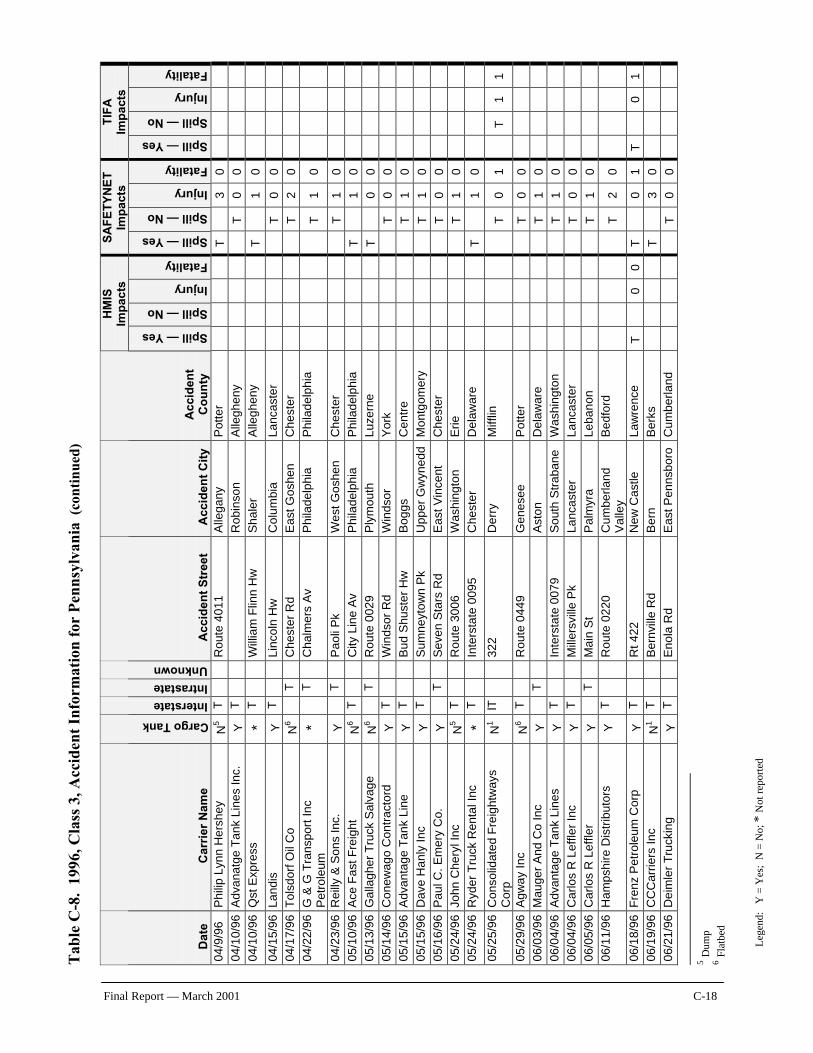
Tab
le C
-8.
1996
, Cla
ss 3
, Acc
iden
t In
form
atio
n fo
r P
enns
ylva
nia
(co
ntin
ued)
Leg
end:
Y
= Y
es;
N =
No;
* N
ot r
epor
ted
Final Report — March 2001 C-18
HM
IS
Imp
acts
S
AF
ET
YN
ET
Im
pac
ts
TIF
A
Imp
acts
D
ate
C
arri
er N
ame
Cargo Tank
Interstate Intrastate Unknown
A
ccid
ent
Str
eet
A
ccid
ent
Cit
y A
ccid
ent
Co
un
ty
Spill — Yes Spill — No Injury Fatality Spill — Yes Spill — No Injury Fatality Spill — Yes Spill — No Injury Fatality
04/9
/96
P
hili
p L
ynn
He
rsh
ey
N5
T
Ro
ute
40
11
A
lleg
an
y P
ott
er
T
3
0
04
/10
/96
A
dvan
atge
Tan
k Li
nes
Inc.
Y
T
R
ob
inso
n
Alle
ghen
y
T
0
0
0
4/1
0/9
6
Qst
Exp
ress
*
T
Will
iam
Flin
n H
w
Sh
ale
r A
llegh
eny
T
1
0
04
/15
/96
La
ndis
Y
T
L
inco
ln H
w
Co
lum
bia
La
ncas
ter
T
0
0
04
/17
/96
T
olsd
orf
Oil
Co
N6
T
Che
ster
Rd
Ea
st G
osh
en
C
hest
er
T
2
0
0
4/2
2/9
6
G &
G T
rans
port
Inc
P
etr
ole
um
*
T
Cha
lmer
s A
v P
hila
de
lph
ia
Ph
ilad
elp
hia
T
1
0
04
/23
/96
R
eilly
& S
ons
Inc.
Y
T
P
ao
li P
k W
est G
oshe
n
Che
ster
T
1
0
05
/10
/96
A
ce F
ast
Fre
ight
N
6
T
City
Lin
e A
v P
hila
de
lph
ia
Ph
ilad
elp
hia
T
1
0
05
/13
/96
G
alla
gher
Tru
ck S
alva
ge
N6
T
Ro
ute
00
29
P
lym
ou
th
Lu
zern
e
T
0
0
0
5/1
4/9
6
Con
ewag
o C
ontr
acto
rd
Y
T
Win
dsor
Rd
Win
dso
r Y
ork
T
0
0
05
/15
/96
A
dvan
tage
Tan
k Li
ne
Y
T
Bud
Shu
ster
Hw
B
og
gs
Ce
ntr
e
T
1
0
0
5/1
5/9
6
Dav
e H
anly
Inc
Y
T
S
umne
ytow
n P
k U
pper
Gw
yned
d M
ontg
omer
y
T
1
0
0
5/1
6/9
6
Pau
l C.
Em
ery
Co.
Y
T
S
even
Sta
rs R
d E
ast
Vin
cent
C
hest
er
T
0
0
0
5/2
4/9
6
John
Che
ryl I
nc
N5
T
Ro
ute
30
06
W
ashi
ngto
n E
rie
T
1
0
05
/24
/96
R
yder
Tru
ck R
enta
l Inc
*
T
Inte
rsta
te 0
095
C
he
ste
r D
elaw
are
T
1
0
05
/25
/96
C
onso
lidat
ed F
reig
htw
ays
Co
rp
N1
lT
32
2
De
rry
Miff
lin
T
0
1
T
1
1
05
/29
/96
A
gway
Inc
N
6
T
Ro
ute
04
49
G
enes
ee
Po
tte
r
T
0
0
0
6/0
3/9
6
Mau
ger
And
Co
Inc
Y
T
Ast
on
D
elaw
are
T
1
0
06
/04
/96
A
dvan
tage
Tan
k Li
nes
Y
T
Inte
rsta
te 0
079
S
outh
Str
aban
e
Was
hing
ton
T
1
0
06
/04
/96
C
arlo
s R
Lef
fler
Inc
Y
T
Mill
ersv
ille
Pk
Lanc
aste
r La
ncas
ter
T
0
0
06
/05
/96
C
arl
os
R L
eff
ler
Y
T
Mai
n S
t P
alm
yra
L
eb
an
on
T
1
0
06
/11
/96
H
amps
hire
Dis
trib
utor
s Y
T
R
ou
te 0
22
0
Cum
berla
nd
Va
lley
Be
dfo
rd
T
2
0
06
/18
/96
F
renz
Pet
role
um C
orp
Y
T
Rt
42
2
New
Cas
tle
Law
renc
e T
0
0
T
0
1
T
0
1
06
/19
/96
C
CC
arrie
rs I
nc
N1
T
Ber
nvill
e R
d B
ern
B
erk
s
T
3
0
0
6/2
1/9
6
Dei
mle
r T
ruck
ing
Y
T
En
ola
Rd
E
ast
Pen
nsbo
ro
Cum
berla
nd
T
0
0
5 Dum
p 6 F
latb
ed
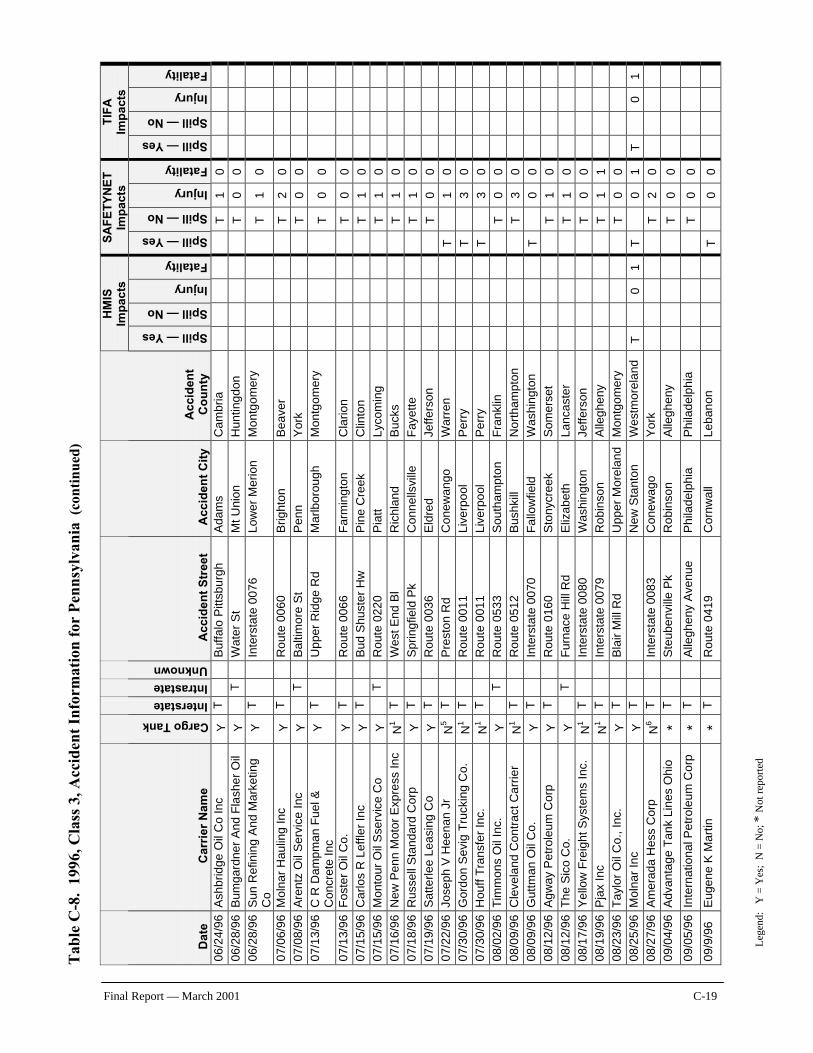
Tab
le C
-8.
1996
, Cla
ss 3
, Acc
iden
t In
form
atio
n fo
r P
enns
ylva
nia
(co
ntin
ued)
Leg
end:
Y
= Y
es;
N =
No;
* N
ot r
epor
ted
Final Report — March 2001 C-19
HM
IS
Imp
acts
S
AF
ET
YN
ET
Im
pac
ts
TIF
A
Imp
acts
D
ate
C
arri
er N
ame
Cargo Tank
Interstate Intrastate Unknown
A
ccid
ent
Str
eet
A
ccid
ent
Cit
y A
ccid
ent
Co
un
ty
Spill — Yes Spill — No Injury Fatality Spill — Yes Spill — No Injury Fatality Spill — Yes Spill — No Injury Fatality
06
/24
/96
A
shb
ridge
Oil
Co
Inc
Y
T
Buf
falo
Pitt
sbur
gh
Ada
ms
Cam
bria
T
1
0
06
/28
/96
B
umga
rdne
r A
nd F
lash
er O
il Y
T
W
ate
r S
t M
t U
nion
H
un
ting
do
n
T
0
0
0
6/2
8/9
6
Sun
Ref
inin
g A
nd M
arke
ting
Co
Y
T
Inte
rsta
te 0
076
Lo
wer
Mer
ion
Mon
tgom
ery
T
1
0
07
/06
/96
M
olna
r H
aulin
g In
c Y
T
R
ou
te 0
06
0
Brig
hton
B
eave
r
T
2
0
0
7/0
8/9
6
Are
ntz
Oil
Ser
vice
Inc
Y
T
B
alti
mo
re S
t P
en
n
Yor
k
T
0
0
0
7/1
3/9
6
C R
Dam
pman
Fue
l &
Con
cret
e In
c Y
T
U
pper
Rid
ge R
d M
arlb
orou
gh
Mon
tgom
ery
T
0
0
07
/13
/96
F
oste
r O
il C
o.
Y
T
Ro
ute
00
66
F
arm
ingt
on
Cla
rion
T
0
0
07
/15
/96
C
arlo
s R
Lef
fler
Inc
Y
T
Bud
Shu
ster
Hw
P
ine
Cre
ek
Clin
ton
T
1
0
07
/15
/96
M
onto
ur O
il S
serv
ice
Co
Y
T
Ro
ute
02
20
P
iatt
L
yco
min
g
T
1
0
0
7/1
6/96
N
ew P
enn
Mot
or E
xpre
ss I
nc
N1
T
We
st E
nd
Bl
Ric
hla
nd
B
uck
s
T
1
0
0
7/1
8/9
6
Rus
sell
Sta
ndar
d C
orp
Y
T
Spr
ingf
ield
Pk
Con
nells
ville
F
aye
tte
T
1
0
07
/19
/96
S
atte
rlee
Leas
ing
Co
Y
T
Ro
ute
00
36
E
ldre
d
Jeff
erso
n
T
0
0
0
7/2
2/9
6
Jose
ph V
Hee
nan
Jr
N5
T
Pre
ston
Rd
Con
ewan
go
Wa
rre
n
T
1
0
0
7/3
0/9
6
Gor
don
Sev
ig T
ruck
ing
Co.
N
1
T
Ro
ute
00
11
Li
verp
ool
Per
ry
T
3
0
0
7/3
0/9
6
Hou
ff T
rans
fer
Inc.
N
1
T
Ro
ute
00
11
Li
verp
ool
Per
ry
T
3
0
0
8/0
2/9
6
Tim
mo
ns
Oil
Inc.
Y
T
R
ou
te 0
53
3
Sou
tham
pton
F
ran
klin
T
0
0
08
/09
/96
C
leve
land
Con
trac
t C
arrie
r N
1
T
Ro
ute
05
12
B
ushk
ill
Nor
tham
pton
T
3
0
08
/09
/96
G
uttm
an O
il C
o.
Y
T
Inte
rsta
te 0
070
F
allo
wfie
ld
Was
hing
ton
T
0
0
08
/12
/96
A
gway
Pet
role
um C
orp
Y
T
R
ou
te 0
16
0
Sto
nycr
eek
So
me
rse
t
T
1
0
0
8/1
2/9
6
Th
e S
ico
Co
. Y
T
F
urna
ce H
ill R
d E
liza
be
th
Lanc
aste
r
T
1
0
0
8/1
7/9
6
Yel
low
Fre
ight
Sys
tem
s In
c.
N1
T
Inte
rsta
te 0
080
W
ashi
ngto
n Je
ffer
son
T
0
0
08
/19
/96
P
jax
Inc
N1
T
Inte
rsta
te 0
079
R
ob
inso
n
Alle
ghen
y
T
1
1
0
8/2
3/9
6
Tay
lor
Oil
Co.
, In
c.
Y
T
Bla
ir M
ill R
d U
pper
Mor
elan
d M
ontg
omer
y
T
0
0
0
8/2
5/9
6
Mol
nar
Inc
Y
T
New
Sta
nton
W
estm
orel
and
T
0
1
T
0
1
T
0
1
08
/27
/96
A
mer
ada
Hes
s C
orp
N
6
T
Inte
rsta
te 0
083
C
onew
ago
Yor
k
T
2
0
0
9/0
4/9
6
Adv
anta
ge T
ank
Line
s O
hio
* T
S
teub
envi
lle P
k R
ob
inso
n
Alle
ghen
y
T
0
0
09
/05
/96
In
tern
atio
nal P
etro
leum
Cor
p *
T
Alle
ghen
y A
venu
e P
hila
de
lph
ia
Ph
ilad
elp
hia
T
0
0
09/9
/96
E
ugen
e K
Mar
tin
* T
R
ou
te 0
41
9
Cor
nwal
l L
eb
an
on
T
0
0
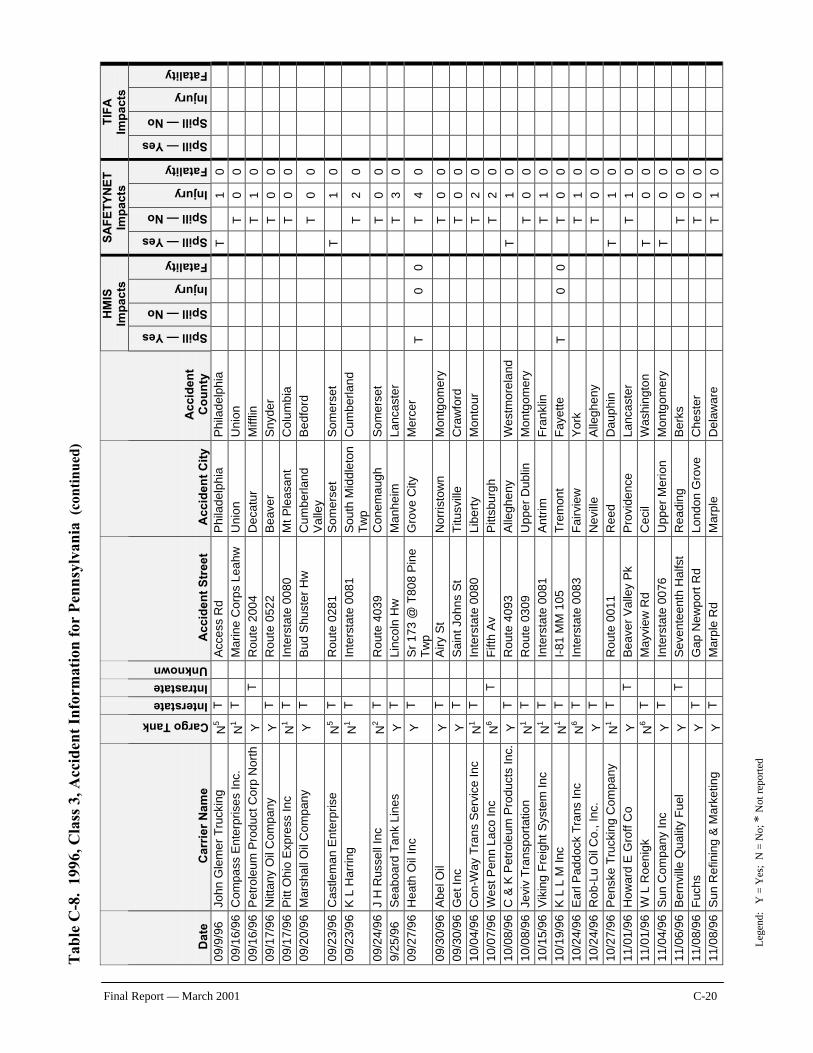
Tab
le C
-8.
1996
, Cla
ss 3
, Acc
iden
t In
form
atio
n fo
r P
enns
ylva
nia
(co
ntin
ued)
Leg
end:
Y
= Y
es;
N =
No;
* N
ot r
epor
ted
Final Report — March 2001 C-20
HM
IS
Imp
acts
S
AF
ET
YN
ET
Im
pac
ts
TIF
A
Imp
acts
D
ate
C
arri
er N
ame
Cargo Tank
Interstate Intrastate Unknown
A
ccid
ent
Str
eet
A
ccid
ent
Cit
y A
ccid
ent
Co
un
ty
Spill — Yes Spill — No Injury Fatality Spill — Yes Spill — No Injury Fatality Spill — Yes Spill — No Injury Fatality
09/9
/96
Jo
hn G
lem
er T
ruck
ing
N5
T
Acc
ess
Rd
P
hila
de
lph
ia
Ph
ilad
elp
hia
T
1
0
09
/16
/96
C
ompa
ss E
nter
pris
es I
nc.
N1
T
Mar
ine
Cor
ps L
eahw
U
nio
n
Un
ion
T
0
0
09
/16
/96
P
etro
leum
Pro
duct
Cor
p N
orth
Y
T
R
ou
te 2
00
4
De
catu
r M
ifflin
T
1
0
09
/17
/96
N
ittan
y O
il C
ompa
ny
Y
T
Ro
ute
05
22
B
eave
r S
nyde
r
T
0
0
0
9/1
7/9
6
Pitt
Ohi
o E
xpre
ss In
c N
1
T
Inte
rsta
te 0
080
M
t P
leas
ant
Co
lum
bia
T
0
0
09
/20
/96
M
arsh
all O
il C
ompa
ny
Y
T
Bud
Shu
ster
Hw
C
umbe
rland
V
alle
y B
ed
ford
T
0
0
09
/23
/96
C
astle
man
Ent
erpr
ise
N5
T
Ro
ute
02
81
S
om
ers
et
So
me
rse
t
T
1
0
0
9/2
3/9
6
K L
Har
ring
N
1
T
Inte
rsta
te 0
081
S
outh
Mid
dlet
on
Tw
p
Cu
mb
erla
nd
T
2
0
09
/24
/96
J
H R
usse
ll In
c N
2
T
Ro
ute
40
39
C
on
em
au
gh
S
om
ers
et
T
0
0
9/25
/96
S
eabo
ard
Tan
k Li
nes
Y
T
Lin
coln
Hw
M
anhe
im
Lanc
aste
r
T
3
0
0
9/2
7/9
6
Hea
th O
il In
c Y
T
S
r 17
3 @
T80
8 P
ine
Tw
p
Gro
ve C
ity
Mer
cer
T
0
0
T
4
0
09
/30
/96
A
be
l Oil
Y
T
Airy
St
Nor
risto
wn
M
ontg
omer
y
T
0
0
0
9/3
0/9
6
Ge
t In
c Y
T
S
ain
t Jo
hn
s S
t T
itusv
ille
C
raw
ford
T
0
0
10
/04
/96
C
on
-Wa
y T
ran
s S
erv
ice
In
c N
1
T
Inte
rsta
te 0
080
L
ibe
rty
Mon
tour
T
2
0
10
/07
/96
Wes
t Pen
n La
co In
c N
6
T
Fift
h A
v P
ittsb
urg
h
T
2
0
10
/08
/96
C
& K
Pet
role
um P
rodu
cts
Inc.
Y
T
R
ou
te 4
09
3
Alle
gh
en
y W
estm
orel
and
T
1
0
10
/08
/96
Je
viv
Tra
nspo
rtat
ion
N
1
T
Ro
ute
03
09
U
pper
Dub
lin
Mon
tgom
ery
T
0
0
10
/15/
96
Vik
ing
Fre
ight
Sys
tem
Inc
N
1
T
Inte
rsta
te 0
081
A
ntr
im
Fra
nkl
in
T
1
0
1
0/1
9/9
6
K L
L M
Inc
N
1
T
I-81
MM
105
T
rem
ont
Fa
yett
e
T
0
0
T
0
0
10
/24
/96
E
arl P
addo
ck T
rans
Inc
N6
T
Inte
rsta
te 0
083
F
airv
iew
Y
ork
T
1
0
10
/24
/96
R
ob
-Lu
Oil
Co.
, In
c.
Y
T
Ne
ville
A
llegh
eny
T
0
0
10
/27
/96
P
ensk
e T
ruck
ing
Com
pany
N
1
T
Ro
ute
00
11
R
ee
d
Dau
phin
T
1
0
11
/01
/96
H
owar
d E
Gro
ff C
o Y
T
B
eave
r V
alle
y P
k P
rovi
denc
e
Lanc
aste
r
T
1
0
1
1/0
1/9
6
W L
Roe
nigk
N
6
T
May
view
Rd
Ce
cil
Was
hing
ton
T
0
0
11
/04
/96
S
un C
ompa
ny I
nc
Y
T
Inte
rsta
te 0
076
U
pper
Mer
ion
Mon
tgom
ery
T
0
0
11
/06
/96
B
ernv
ille
Qua
lity
Fue
l Y
T
S
even
teen
th H
alfs
t R
eadi
ng
Be
rks
T
0
0
11
/08
/96
F
uchs
Y
T
G
ap N
ewpo
rt R
d Lo
ndon
Gro
ve
Che
ster
T
0
0
11
/08
/96
S
un R
efin
ing
& M
arke
ting
Y
T
Mar
ple
Rd
Mar
ple
Del
awar
e
T
1
0
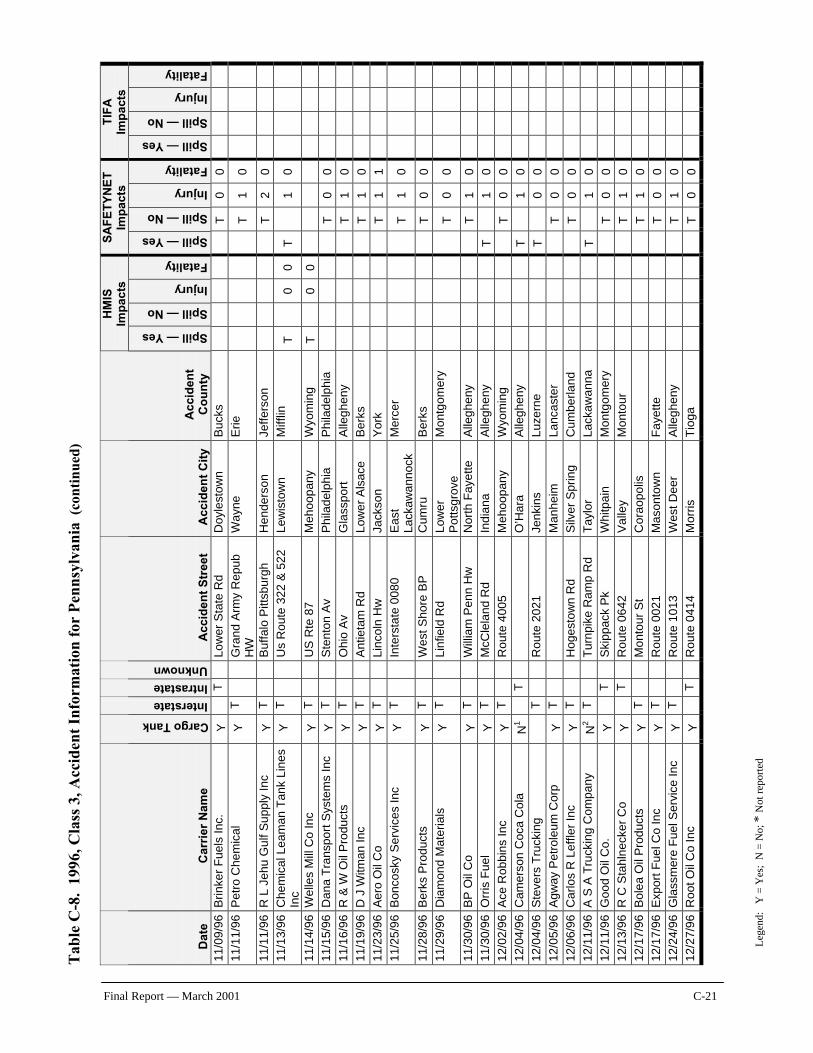
Tab
le C
-8.
1996
, Cla
ss 3
, Acc
iden
t In
form
atio
n fo
r P
enns
ylva
nia
(co
ntin
ued)
Leg
end:
Y
= Y
es;
N =
No;
* N
ot r
epor
ted
Final Report — March 2001 C-21
HM
IS
Imp
acts
S
AF
ET
YN
ET
Im
pac
ts
TIF
A
Imp
acts
D
ate
C
arri
er N
ame
Cargo Tank
Interstate Intrastate Unknown
A
ccid
ent
Str
eet
A
ccid
ent
Cit
y A
ccid
ent
Co
un
ty
Spill — Yes Spill — No Injury Fatality Spill — Yes Spill — No Injury Fatality Spill — Yes Spill — No Injury Fatality
11
/09
/96
B
rinke
r F
uels
Inc
. Y
T
Lo
wer
Sta
te R
d D
oyle
stow
n
Bu
cks
T
0
0
11
/11
/96
P
etro
Che
mic
al
Y
T
Gra
nd A
rmy
Rep
ub
HW
W
ayne
E
rie
T
1
0
11
/11
/96
R
L J
ehu
Gul
f S
uppl
y In
c Y
T
B
uffa
lo P
ittsb
urgh
H
en
de
rso
n
Jeff
erso
n
T
2
0
1
1/1
3/9
6
Che
mic
al L
eam
an T
ank
Line
s In
c Y
T
U
s R
oute
322
& 5
22
Lew
isto
wn
M
ifflin
T
0
0
T
1
0
11
/14
/96
W
elle
s M
ill C
o In
c Y
T
U
S R
te 8
7 M
eh
oo
pa
ny
Wyo
min
g
T
0
0
1
1/1
5/9
6
Dan
a T
rans
port
Sys
tem
s In
c Y
T
S
tent
on A
v P
hila
de
lph
ia
Ph
ilad
elp
hia
T
0
0
11
/16
/96
R
& W
Oil
Pro
duct
s Y
T
O
hio
Av
Gla
ssp
ort
A
llegh
eny
T
1
0
11
/19
/96
D
J W
itman
Inc
Y
T
An
tieta
m R
d
Low
er A
lsac
e
Be
rks
T
1
0
11
/23
/96
A
ero
Oil
Co
Y
T
L
inco
ln H
w
Jack
son
Y
ork
T
1
1
11
/25
/96
B
onco
sky
Ser
vice
s In
c Y
T
In
ters
tate
008
0
Ea
st
Lack
awan
nock
M
erce
r
T
1
0
11
/28
/96
B
erks
Pro
duct
s Y
T
W
est
Sho
re B
P
Cu
mru
B
erk
s
T
0
0
1
1/2
9/9
6
Dia
mon
d M
ater
ials
Y
T
Li
nfie
ld R
d
Low
er
Pot
tsgr
ove
M
ontg
omer
y
T
0
0
11
/30
/96
B
P O
il C
o Y
T
W
illia
m P
enn
Hw
N
orth
Fay
ette
A
llegh
eny
T
1
0
11
/30
/96
O
rris
Fue
l Y
T
M
cCle
land
Rd
Ind
ian
a
Alle
gh
en
y
T
1
0
1
2/0
2/9
6
Ace
Rob
bins
Inc
Y
T
R
ou
te 4
00
5
Me
ho
op
an
y W
yom
ing
T
0
0
12
/04
/96
C
amer
son
Coc
a C
ola
N1
T
O’H
ara
Alle
ghen
y
T
1
0
1
2/0
4/9
6
Ste
vers
Tru
ckin
g
T
Ro
ute
20
21
Je
nkin
s L
uze
rne
T
0
0
12
/05
/96
A
gway
Pet
role
um C
orp
Y
T
M
anhe
im
Lanc
aste
r
T
0
0
1
2/0
6/9
6
Car
los
R L
effle
r In
c Y
T
H
oges
tow
n R
d S
ilver
Spr
ing
Cum
berla
nd
T
0
0
1
2/1
1/9
6
A S
A T
ruck
ing
Com
pany
N
2
T
Tur
npik
e R
amp
Rd
T
aylo
r La
ckaw
anna
T
1
0
12
/11
/96
G
oo
d O
il C
o.
Y
T
Ski
ppac
k P
k W
hitp
ain
M
ontg
omer
y
T
0
0
1
2/1
3/9
6
R C
Sta
hlne
cker
Co
Y
T
Ro
ute
06
42
V
alle
y M
onto
ur
T
1
0
1
2/1
7/9
6
Bol
ea O
il P
rodu
cts
Y
T
Mon
tour
St
Co
rao
po
lis
T
1
0
12
/17
/96
E
xpor
t F
uel C
o In
c Y
T
R
ou
te 0
02
1
Mas
onto
wn
F
aye
tte
T
0
0
12
/24
/96
G
lass
mer
e F
uel S
ervi
ce I
nc
Y
T
Ro
ute
10
13
W
est
Dee
r A
llegh
eny
T
1
0
12
/27
/96
R
oo
t Oil
Co
Inc
Y
T
Ro
ute
04
14
M
orris
T
ioga
T
0
0
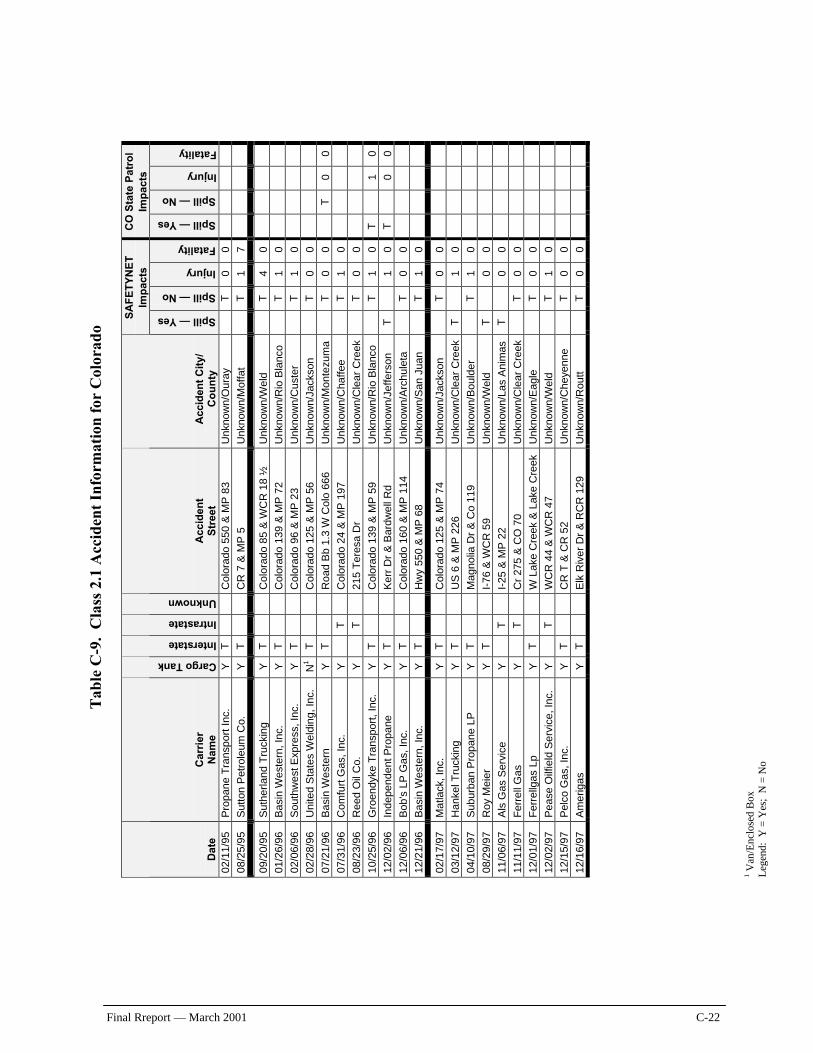
1 Van
/Enc
lose
d B
ox
Leg
end:
Y =
Yes
; N
= N
o
Final Rreport — March 2001 C-22
Tab
le C
-9.
Cla
ss 2
.1 A
ccid
ent
Info
rmat
ion
for
Col
orad
o
SA
FE
TY
NE
T
Imp
acts
C
O S
tate
Pat
rol
Imp
acts
Dat
e C
arri
er
Nam
e
Cargo Tank
Interstate
Intrastate
Unknown
Acc
iden
t S
tree
t A
ccid
ent
Cit
y/
Co
un
ty
Spill — Yes Spill — No Injury Fatality Spill — Yes Spill — No Injury Fatality
02/1
1/95
P
ropa
ne T
rans
port
Inc
. Y
T
C
olor
ado
550
& M
P 8
3 U
nkno
wn/
Our
ay
T
0
0
08/2
5/95
S
utto
n P
etro
leum
Co.
Y
T
C
R 7
& M
P 5
U
nkno
wn/
Mof
fat
T
1
7
09/2
0/95
S
uthe
rland
Tru
ckin
g Y
T
C
olor
ado
85 &
WC
R 1
8 ½
U
nkno
wn/
Wel
d
T
4 0
01/2
6/96
B
asin
Wes
tern
, Inc
. Y
T
C
olor
ado
139
& M
P 7
2 U
nkno
wn/
Rio
Bla
nco
T
1
0
02/0
6/96
S
outh
wes
t Exp
ress
, Inc
. Y
T
C
olor
ado
96 &
MP
23
Unk
now
n/C
uste
r
T
1 0
02/2
8/96
U
nite
d S
tate
s W
eldi
ng, I
nc.
N1
T
Col
orad
o 12
5 &
MP
56
Unk
now
n/Ja
ckso
n
T
0 0
07/2
1/96
B
asi
n W
est
ern
Y
T
Roa
d B
b 1.
3 W
Col
o 66
6 U
nkno
wn/
Mon
tezu
ma
T
0
0
T
0 0
07/3
1/96
C
omfu
rt G
as, I
nc.
Y
T
Col
orad
o 24
& M
P 1
97
Unk
now
n/C
haffe
e
T
1 0
08/2
3/96
R
eed
Oil
Co.
Y
T
21
5 T
eres
a D
r U
nkno
wn/
Cle
ar C
reek
T
0 0
10/2
5/96
G
roen
dyke
Tra
nspo
rt,
Inc.
Y
T
C
olor
ado
139
& M
P 5
9 U
nkno
wn/
Rio
Bla
nco
T
1
0 T
1 0
12/0
2/96
In
depe
nden
t P
ropa
ne
Y
T
Ker
r D
r &
Bar
dwel
l Rd
Unk
now
n/Je
ffers
on
T
1
0 T
0 0
12/0
6/96
B
ob's
LP
Gas
, Inc
. Y
T
C
olor
ado
160
& M
P 1
14
Unk
now
n/A
rchu
leta
T
0 0
12/2
1/96
B
asin
Wes
tern
, Inc
. Y
T
H
wy
550
& M
P 6
8 U
nkno
wn/
San
Jua
n
T
1 0
02/1
7/97
M
atla
ck, I
nc.
Y
T
Col
orad
o 12
5 &
MP
74
Unk
now
n/Ja
ckso
n
T
0 0
03/1
2/97
H
anke
l Tru
ckin
g Y
T
U
S 6
& M
P 2
26
Unk
now
n/C
lear
Cre
ek
T
1
0
04/1
0/97
S
ubur
ban
Pro
pane
LP
Y
T
M
agno
lia D
r &
Co
119
Unk
now
n/B
ould
er
T
1
0
08/2
9/97
R
oy M
eier
Y
T
I-
76 &
WC
R 5
9 U
nkno
wn/
Wel
d T
0 0
11/0
6/97
A
ls G
as S
ervi
ce
Y
T
I-25
& M
P 2
2 U
nkno
wn/
Las
Ani
mas
T
0 0
11/1
1/97
F
erre
ll G
as
Y
T
Cr
275
& C
O 7
0 U
nkno
wn/
Cle
ar C
reek
T
0 0
12/0
1/97
F
erre
llgas
Lp
Y
T
W L
ake
Cre
ek &
Lak
e C
reek
U
nkno
wn/
Eag
le
T
0
0
12/0
2/97
P
ease
Oilf
ield
Ser
vice
, Inc
. Y
T
W
CR
44
& W
CR
47
Unk
now
n/W
eld
T
1
0
12/1
5/97
P
elco
Gas
, Inc
. Y
T
C
R T
& C
R 5
2 U
nkno
wn/
Che
yenn
e
T
0 0
12/1
6/97
A
mer
igas
Y
T
E
lk R
iver
Dr
& R
CR
129
U
nkno
wn/
Rou
tt
T
0 0
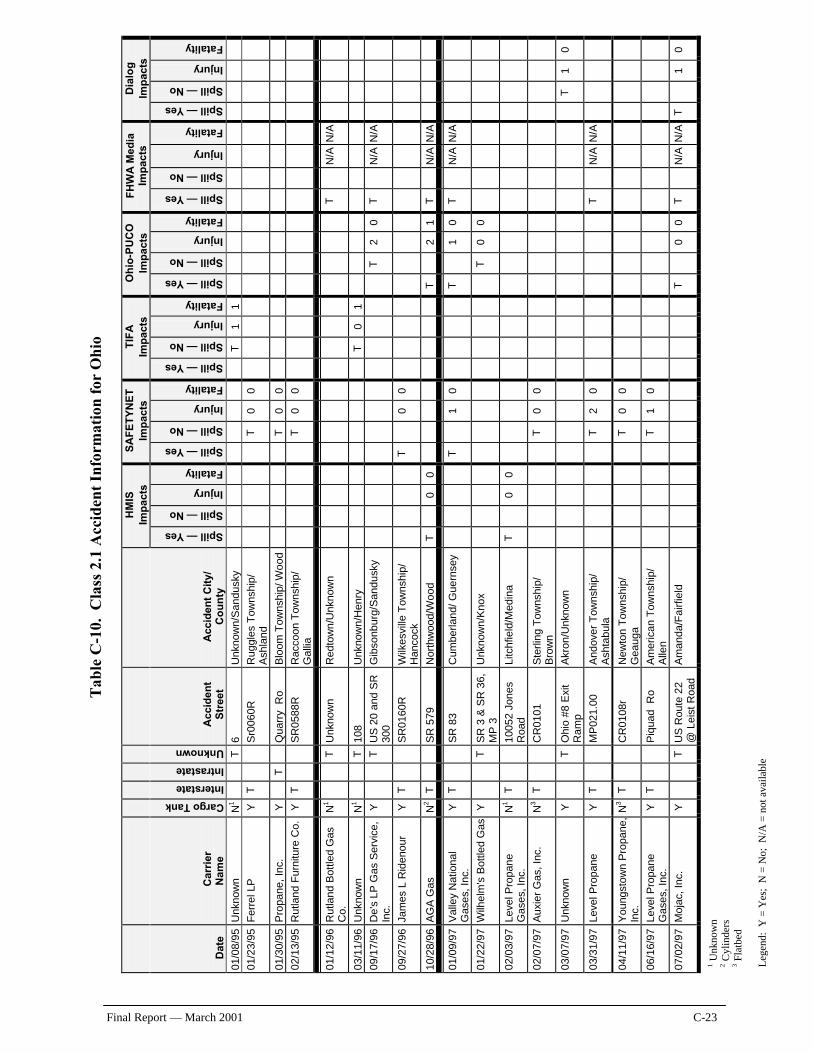
1 Unk
now
n 2 C
ylin
ders
3 F
latb
ed
Leg
end:
Y =
Yes
; N
= N
o; N
/A =
not
ava
ilabl
e
Final Report — March 2001 C-23
Tab
le C
-10.
Cla
ss 2
.1 A
ccid
ent
Info
rmat
ion
for
Ohi
o
HM
IS
Imp
acts
S
AF
ET
YN
ET
Im
pac
ts
TIF
A
Imp
acts
O
hio
-PU
CO
Im
pac
ts
FH
WA
Med
ia
Imp
acts
D
ialo
g
Imp
acts
Dat
e C
arri
er
Nam
e
Cargo Tank
Interstate
Intrastate
Unknown
Acc
iden
t S
tree
t A
ccid
ent
Cit
y/
Co
un
ty
Spill — Yes Spill — No Injury Fatality Spill — Yes Spill — No Injury Fatality Spill — Yes Spill — No Injury Fatality Spill — Yes Spill — No Injury Fatality Spill — Yes Spill — No Injury Fatality Spill — Yes Spill — No Injury Fatality
01/0
8/95
U
nkno
wn
N
1
T
6
Unk
now
n/S
an
du
sky
T
1
1
01/2
3/95
F
erre
l LP
Y
T
S
r006
0R
Rug
gles
Tow
nshi
p/
Ash
land
T
0 0
01/3
0/95
P
ropa
ne,
Inc.
Y
T
Q
uarr
y R
o B
loom
Tow
nshi
p/ W
oo
d
T
0
0
02/1
3/95
R
utla
nd F
urni
ture
Co.
Y
T
S
R05
88R
R
acco
on T
owns
hip/
G
allia
T
0 0
01/1
2/96
R
utla
nd B
ottle
d G
as
Co.
N
1
T
U
nkno
wn
R
edto
wn
/Unk
now
n
T
N
/A N
/A
03/1
1/96
U
nkno
wn
N
1
T
10
8 U
nkno
wn
/Hen
ry
T
0
1
09/1
7/96
D
e's
LP G
as S
ervi
ce,
Inc.
Y
T
U
S 2
0 an
d S
R
300
Gib
sonb
urg/
San
dusk
y
T
2 0
T
N
/A N
/A
09/2
7/96
Ja
mes
L R
iden
our
Y T
S
R01
60R
W
ilkes
ville
Tow
nshi
p/
Han
cock
T
0 0
10/2
8/96
A
GA
Gas
N
2 T
S
R 5
79
Nor
thw
ood/
Wo
od
T
0 0
T
2
1 T
N/A
N/A
01/0
9/97
V
alle
y N
atio
nal
Gas
es, I
nc.
Y T
S
R 8
3 C
umbe
rland
/ G
uern
sey
T
1
0
T
1 0
T
N
/A N
/A
01/2
2/97
W
ilhel
m's
Bot
tled
Gas
Y
T
S
R 3
& S
R 3
6,
MP
3
Unk
now
n/K
nox
T
0
0
02/0
3/97
Le
vel P
ropa
ne
Gas
es, I
nc.
N1
T
1005
2 Jo
nes
Roa
d Li
tchf
ield
/Med
ina
T
0
0
02/0
7/97
A
uxie
r G
as, I
nc.
N3
T
CR
0101
S
terli
ng T
owns
hip/
B
row
n
T
0
0
03/0
7/97
U
nkno
wn
Y
T
O
hio
#8 E
xit
Ra
mp
Akr
on/U
nkno
wn
T
1 0
03/3
1/97
Le
vel P
ropa
ne
Y T
M
P02
1.00
A
ndov
er T
owns
hip/
A
shta
bula
T
2 0
T
N
/A N
/A
04/1
1/97
Y
oung
stow
n P
ropa
ne,
Inc.
N
3 T
C
R01
08r
New
ton
Tow
nshi
p/
Gea
uga
T
0
0
06/1
6/97
Le
vel P
ropa
ne
Gas
es, I
nc.
Y T
P
iqua
d R
o A
mer
ican
Tow
nshi
p/
Alle
n
T
1 0
07/0
2/97
M
ojac
, Inc
. Y
T
U
S R
oute
22
@ L
eist
Roa
d A
man
da/F
airf
ield
T
0 0
T
N
/A N
/A T
1 0
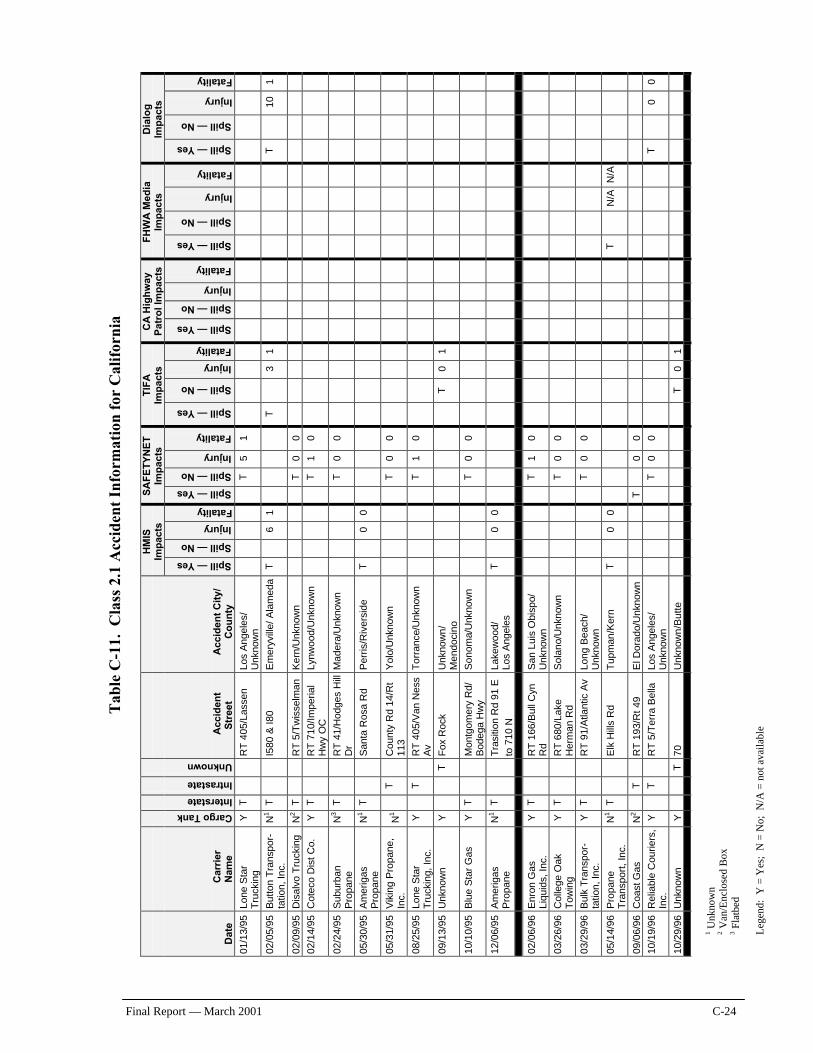
1 Unk
now
n 2 V
an/E
nclo
sed
Box
3 F
latb
ed
Leg
end:
Y =
Yes
; N
= N
o; N
/A =
not
ava
ilabl
e
Final Report — March 2001 C-24
Tab
le C
-11.
Cla
ss 2
.1 A
ccid
ent
Info
rmat
ion
for
Cal
ifor
nia
HM
IS
Imp
acts
S
AF
ET
YN
ET
Im
pac
ts
TIF
A
Imp
acts
C
A H
igh
way
P
atro
l Im
pac
ts
FH
WA
Med
ia
Imp
acts
D
ialo
g
Imp
acts
Dat
e C
arri
er
Nam
e Cargo Tank
Interstate
Intrastate
Unknown
Acc
iden
t S
tree
t A
ccid
ent
Cit
y/
Co
un
ty
Spill — Yes Spill — No Injury Fatality Spill — Yes Spill — No Injury Fatality Spill — Yes Spill — No Injury Fatality Spill — Yes Spill — No Injury Fatality Spill — Yes Spill — No Injury Fatality Spill — Yes Spill — No Injury Fatality
01/1
3/95
Lo
ne S
tar
Tru
ckin
g Y
T
RT
405
/Las
sen
Los
Ang
eles
/ U
nkno
wn
T
5 1
02/0
5/95
B
utto
n T
rans
por-
tatio
n, In
c.
N1
T
I580
& I8
0 E
mer
yvill
e/ A
lam
eda
T
6
1
T
3
1
T
10
1
02/0
9/95
D
isal
vo T
ruck
ing
N2
T
RT
5/T
wis
selm
an
Ker
n/U
nkno
wn
T
0 0
02/1
4/95
C
otec
o D
ist
Co.
Y
T
RT
710
/Impe
rial
Hw
y O
C
Lynw
ood/
Unk
now
n
T
1 0
02/2
4/95
S
ubur
ban
Pro
pane
N
3 T
RT
41/
Hod
ges
Hill
D
r M
ader
a/U
nkno
wn
T
0 0
05/3
0/95
A
mer
igas
P
ropa
ne
N1
T
San
ta R
osa
Rd
Per
ris/R
iver
side
T
0
0
05/3
1/95
V
ikin
g P
ropa
ne,
Inc.
N
1
T
C
ount
y R
d 14
/Rt
113
Yol
o/U
nkno
wn
T
0 0
08/2
5/95
Lo
ne S
tar
Tru
ckin
g, I
nc.
Y
T
R
T 4
05/V
an N
ess
Av
Tor
ranc
e/U
nkno
wn
T
1 0
09/1
3/95
U
nkno
wn
Y
T
Fox
Roc
k U
nkno
wn
/ M
endo
cino
T
0 1
10/1
0/95
B
lue
Sta
r G
as
Y T
Mon
tgom
ery
Rd/
B
odeg
a H
wy
Son
oma/
Unk
now
n
T
0 0
12/0
6/95
A
mer
igas
P
ropa
ne
N1
T
Tra
sitio
n R
d 91
E
to 7
10 N
Lake
woo
d/
Los
Ang
eles
T
0
0
02/0
6/96
E
nron
Gas
Li
quid
s, In
c.
Y T
RT
166
/Bul
l Cyn
R
d S
an L
uis
Obi
spo/
U
nkno
wn
T
1 0
03/2
6/96
C
olle
ge O
ak
Tow
ing
Y T
RT
680
/Lak
e H
erm
an R
d S
olan
o/U
nkno
wn
T
0 0
03/2
9/96
B
ulk
Tra
nspo
r-ta
tion,
Inc.
Y
T
RT
91/
Atla
ntic
Av
Long
Bea
ch/
Unk
now
n
T
0 0
05/1
4/96
P
ropa
ne
Tra
nspo
rt,
Inc.
N
1 T
Elk
Hill
s R
d T
upm
an/K
ern
T
0
0
T
N
/A
N/A
09/0
6/96
C
oast
Gas
N
2
T
R
T 1
93/R
t 49
E
l Dor
ado/
Unk
now
n
T
0
0
10/1
9/96
R
elia
ble
Cou
riers
, In
c.
Y
T
R
T 5
/Ter
ra B
ella
Lo
s A
ngel
es/
Unk
now
n
T
0 0
T
0
0
10/2
9/96
U
nkno
wn
Y
T
70
Unk
now
n/B
utt
e
T
0 1
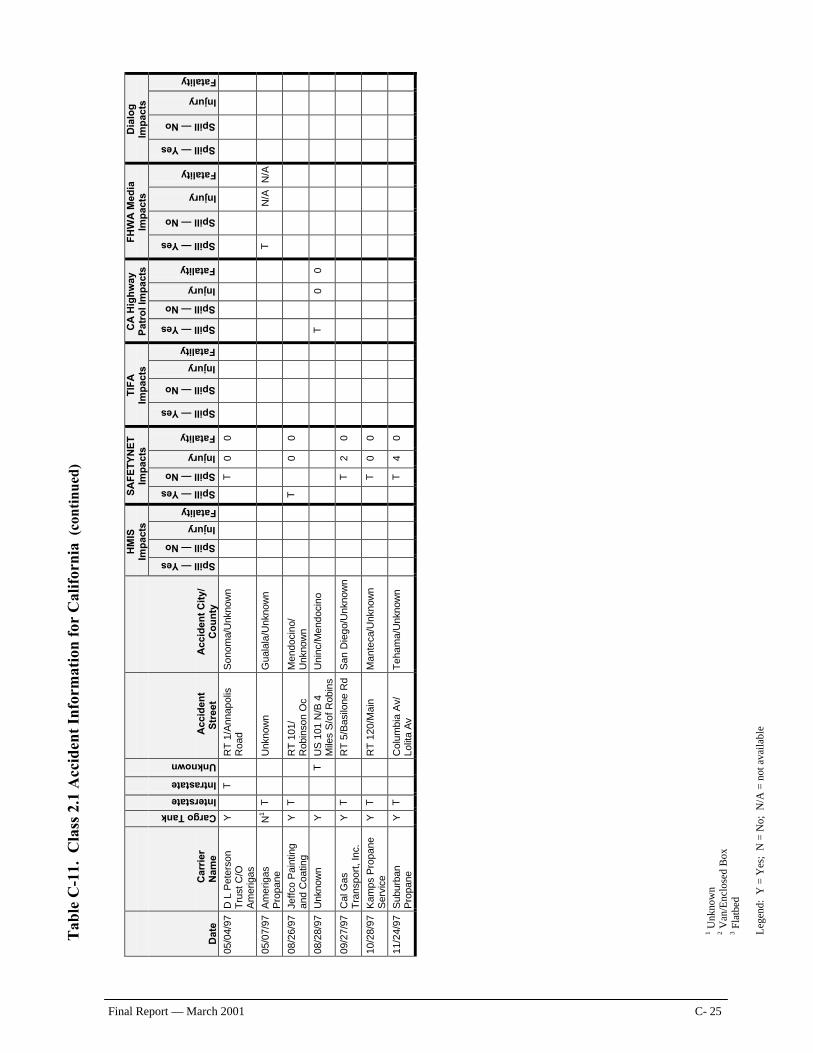
T
able
C-1
1. C
lass
2.1
Acc
iden
t In
form
atio
n fo
r C
alif
orni
a (
cont
inue
d)
1 Unk
now
n 2 V
an/E
nclo
sed
Box
3 F
latb
ed
Leg
end:
Y =
Yes
; N
= N
o; N
/A =
not
ava
ilabl
e
Final Report — March 2001 C- 25
HM
IS
Imp
acts
S
AF
ET
YN
ET
Im
pac
ts
TIF
A
Imp
acts
C
A H
igh
way
P
atro
l Im
pac
ts
FH
WA
Med
ia
Imp
acts
D
ialo
g
Imp
acts
Dat
e C
arri
er
Nam
e
Cargo Tank
Interstate
Intrastate
Unknown
Acc
iden
t S
tree
t A
ccid
ent
Cit
y/
Co
un
ty
Spill — Yes Spill — No Injury Fatality Spill — Yes Spill — No Injury Fatality Spill — Yes Spill — No Injury Fatality Spill — Yes Spill — No Injury Fatality Spill — Yes Spill — No Injury Fatality Spill — Yes Spill — No Injury Fatality
05/0
4/97
D
L P
eter
son
Tru
st C
/O
Am
erig
as
Y
T
R
T 1
/Ann
apol
is
Roa
d S
onom
a/U
nkno
wn
T
0 0
05/0
7/97
A
mer
igas
P
ropa
ne
N1
T
Unk
now
n
Gua
lala
/Unk
now
n
T
N
/A
N/A
08/2
6/97
Je
ffco
Pai
ntin
g an
d C
oatin
g Y
T
RT
101
/ R
obin
son
Oc
Men
doci
no/
Unk
now
n
T
0
0
08/2
8/97
U
nkno
wn
Y
T
US
101
N/B
4
Mile
s S
/of R
obin
s U
ninc
/Men
doci
no
T
0
0
09/2
7/97
C
al G
as
Tra
nspo
rt,
Inc.
Y
T
RT
5/B
asilo
ne R
d S
an D
iego
/Unk
now
n
T
2 0
10/2
8/97
K
amps
Pro
pane
S
ervi
ce
Y T
RT
120
/Mai
n M
ante
ca/U
nkno
wn
T
0 0
11/2
4/97
S
ubur
ban
Pro
pane
Y
T
Col
umbi
a A
v/
Lolit
a A
v T
eham
a/U
nkno
wn
T
4 0
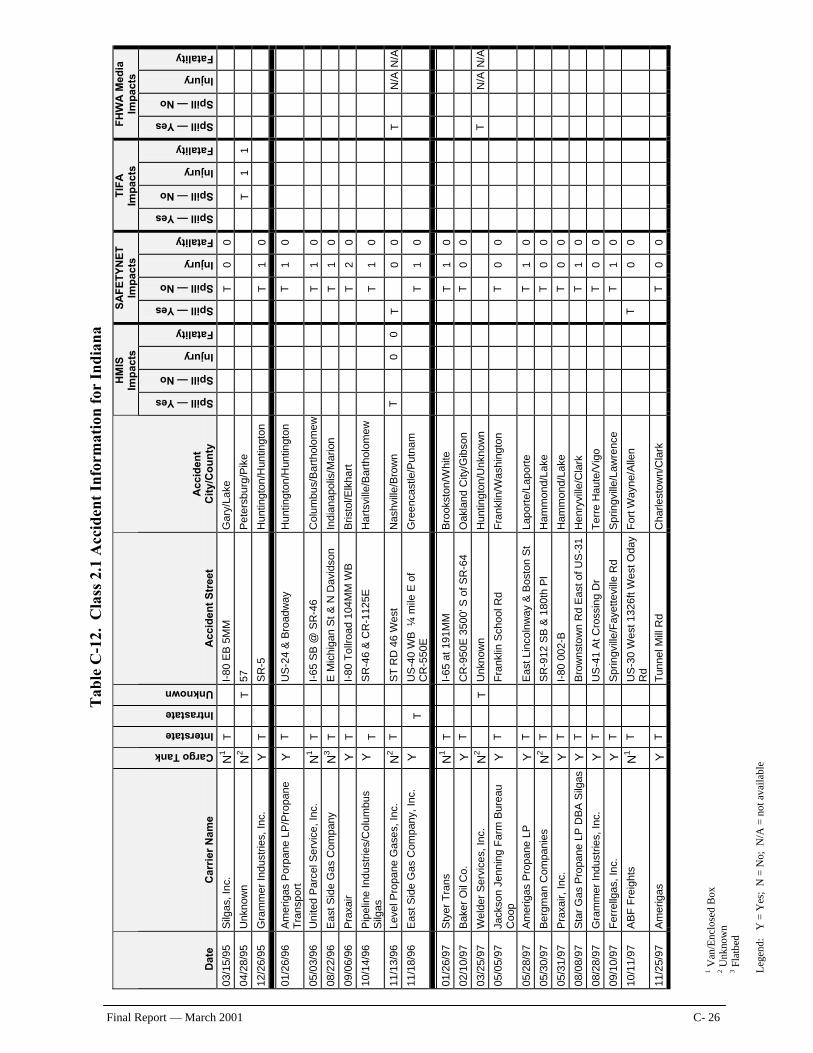
1 Van
/Enc
lose
d B
ox
2 Unk
now
n 3 F
latb
ed
Leg
end:
Y
= Y
es;
N =
No;
N/A
= n
ot a
vaila
ble
Final Report — March 2001 C- 26
Tab
le C
-12.
Cla
ss 2
.1 A
ccid
ent
Info
rmat
ion
for
Indi
ana
H
MIS
Im
pac
ts
SA
FE
TY
NE
T
Imp
acts
T
IFA
Im
pac
ts
FH
WA
Med
ia
Imp
acts
Dat
e C
arri
er N
ame
Cargo Tank
Interstate
Intrastate
Unknown
Acc
iden
t S
tree
t A
ccid
ent
C
ity/
Co
un
ty
Spill — Yes Spill — No Injury Fatality Spill — Yes Spill — No Injury Fatality Spill — Yes Spill — No Injury Fatality Spill — Yes Spill — No Injury Fatality
03/1
5/95
S
ilgas
, Inc
. N
1 T
I-
80 E
B 5
MM
G
ary/
Lake
T
0 0
04/2
8/95
U
nkno
wn
N
2
T
57
Pet
ersb
urg/
Pik
e
T
1 1
12/2
6/95
G
ram
mer
Ind
ustr
ies,
Inc
. Y
T
S
R-5
H
untin
gton
/Hun
tingt
on
T
1
0
01/2
6/96
A
mer
igas
Por
pane
LP
/Pro
pane
T
rans
port
Y
T
US
-24
& B
road
way
H
untin
gton
/Hun
tingt
on
T
1
0
05/0
3/96
U
nite
d P
arce
l Ser
vice
, Inc
. N
1 T
I-
65 S
B @
SR
-46
Col
umbu
s/B
arth
olom
ew
T
1
0
08/2
2/96
E
ast S
ide
Gas
Com
pany
N
3 T
E
Mic
higa
n S
t & N
Dav
idso
n In
dian
apol
is/M
ario
n
T
1 0
09/0
6/96
P
raxa
ir Y
T
I-
80 T
ollro
ad 1
04M
M W
B
Bris
tol/E
lkha
rt
T
2
0
10/1
4/96
P
ipel
ine
Indu
strie
s/C
olum
bus
Silg
as
Y
T
SR
-46
& C
R-1
125E
H
arts
ville
/Bar
thol
omew
T
1 0
11/1
3/96
Le
vel P
ropa
ne G
ases
, In
c.
N2 T
S
T R
D 4
6 W
est
Nas
hvill
e/B
row
n
T
0
0 T
0 0
T
N
/A N
/A
11/1
8/96
E
ast S
ide
Gas
Com
pany
, Inc
. Y
T
U
S-4
0 W
B ¼
mile
E o
f C
R-5
50E
G
reen
cast
le/P
utna
m
T
1
0
01/2
6/97
S
tyer
Tra
ns
N1 T
I-
65 a
t 191
MM
B
rook
ston
/Whi
te
T
1
0
02/1
0/97
B
aker
Oil
Co.
Y
T
C
R-9
50E
350
0' S
of
SR
-64
Oak
land
City
/Gib
son
T
0
0
03/2
5/97
W
elde
r S
ervi
ces,
Inc.
N
2
T
Unk
now
n
Hun
tingt
on/U
nkno
wn
T
N/A
N/A
05/0
5/97
Ja
ckso
n Je
nnin
g F
arm
Bur
eau
Coo
p Y
T
F
rank
lin S
choo
l Rd
Fra
nklin
/Was
hing
ton
T
0
0
05/2
8/97
A
mer
igas
Pro
pane
LP
Y
T
E
ast
Linc
olnw
ay &
Bos
ton
St
Lapo
rte/
Lapo
rte
T
1
0
05/3
0/97
B
ergm
an C
ompa
nies
N
2 T
S
R-9
12 S
B &
180
th P
l H
amm
ond/
Lake
T
0 0
05/3
1/97
P
raxa
ir, I
nc.
Y
T
I-80
002
-B
Ham
mon
d/La
ke
T
0
0
08/0
8/97
S
tar
Gas
Pro
pane
LP
DB
A S
ilgas
Y
T
B
row
nsto
wn
Rd
Eas
t of U
S-3
1 H
enry
ville
/Cla
rk
T
1
0
08/2
8/97
G
ram
mer
Ind
ustr
ies,
Inc
. Y
T
U
S-4
1 A
t C
ross
ing
Dr
Ter
re H
aute
/Vig
o
T
0 0
09/1
0/97
F
erre
llgas
, In
c.
Y
T
Spr
ingv
ille/
Fay
ette
ville
Rd
Spr
ingv
ille/
Law
renc
e
T
1 0
10/1
1/97
A
BF
Fre
ight
s N
1 T
U
S-3
0 W
est 1
326f
t Wes
t Oda
y R
d F
ort W
ayne
/Alle
n
T
0 0
11/2
5/97
A
mer
igas
Y
T
T
unne
l Mill
Rd
Cha
rlest
own/
Cla
rk
T
0
0
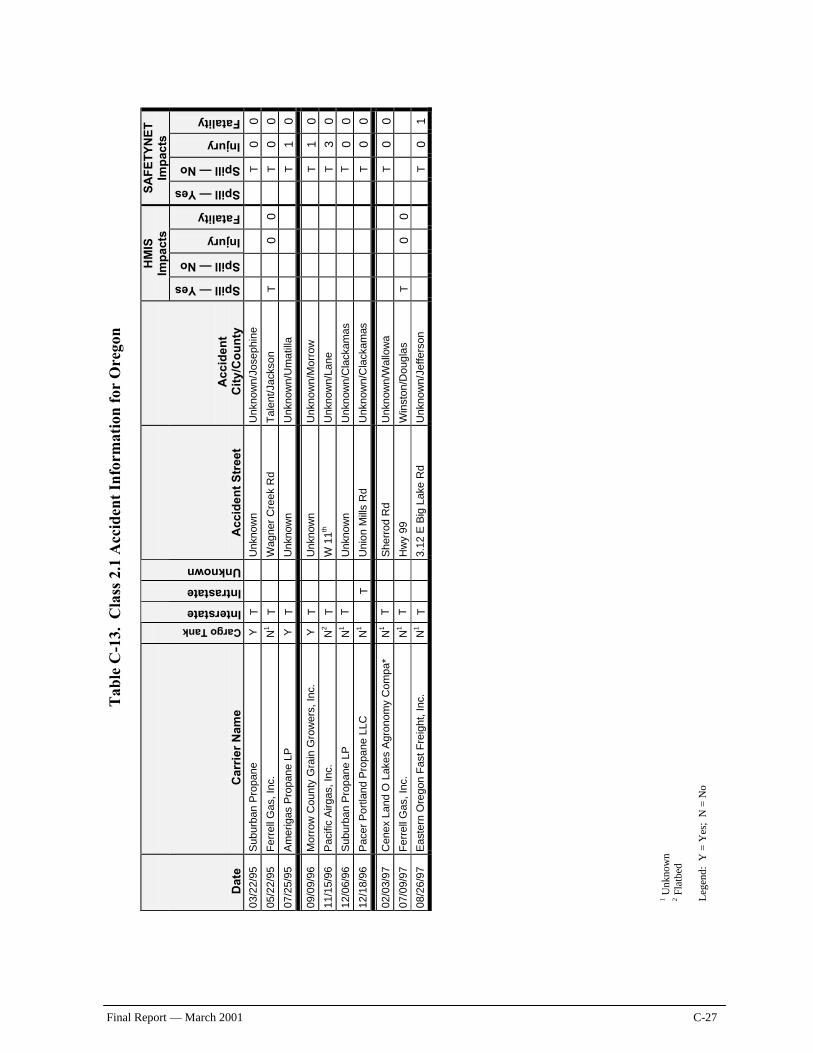
1 Unk
now
n 2 F
latb
ed
Leg
end:
Y =
Yes
; N
= N
o
Final Report — March 2001 C-27
Tab
le C
-13.
Cla
ss 2
.1 A
ccid
ent
Info
rmat
ion
for
Ore
gon
HM
IS
Imp
acts
S
AF
ET
YN
ET
Im
pac
ts
Dat
e C
arri
er N
ame
Cargo Tank
Interstate
Intrastate
Unknown
Acc
iden
t S
tree
t
A
ccid
ent
Cit
y/C
ou
nty
Spill — Yes
Spill — No
Injury
Fatality
Spill — Yes
Spill — No
Injury
Fatality
03/2
2/95
S
ubur
ban
Pro
pane
Y
T
U
nkno
wn
U
nkno
wn/
Jose
phin
e
T
0
0
05/2
2/95
F
erre
ll G
as, I
nc.
N1
T
Wag
ner
Cre
ek R
d T
alen
t/Jac
kson
T
0
0
T
0
0
07
/25/
95
Am
erig
as P
ropa
ne L
P
Y
T
Unk
now
n
Unk
now
n/U
mat
illa
T
1
0
09
/09/
96
Mor
row
Cou
nty
Gra
in G
row
ers,
Inc
. Y
T
U
nkno
wn
U
nkno
wn/
Mor
row
T
1
0
11/1
5/96
P
acifi
c A
irgas
, Inc
. N
2 T
W
11th
U
nkno
wn/
Lane
T
3
0
12/0
6/96
S
ubur
ban
Pro
pane
LP
N
1 T
U
nkno
wn
U
nkno
wn/
Cla
ckam
as
T
0
0
12
/18/
96
Pac
er P
ortla
nd P
ropa
ne L
LC
N1
T
Uni
on M
ills
Rd
Unk
now
n/C
lack
amas
T
0
0
02/0
3/97
C
enex
Lan
d O
Lak
es A
gron
omy
Com
pa*
N1
T
She
rrod
Rd
Unk
now
n/W
allo
wa
T
0
0
07/0
9/97
F
erre
ll G
as, I
nc.
N1
T
Hw
y 99
W
inst
on/D
ougl
as
T
0
0
08
/26/
97
Eas
tern
Ore
gon
Fas
t Fre
ight
, Inc
. N
1 T
3.
12 E
Big
Lak
e R
d U
nkno
wn/
Jeffe
rson
T
0
1
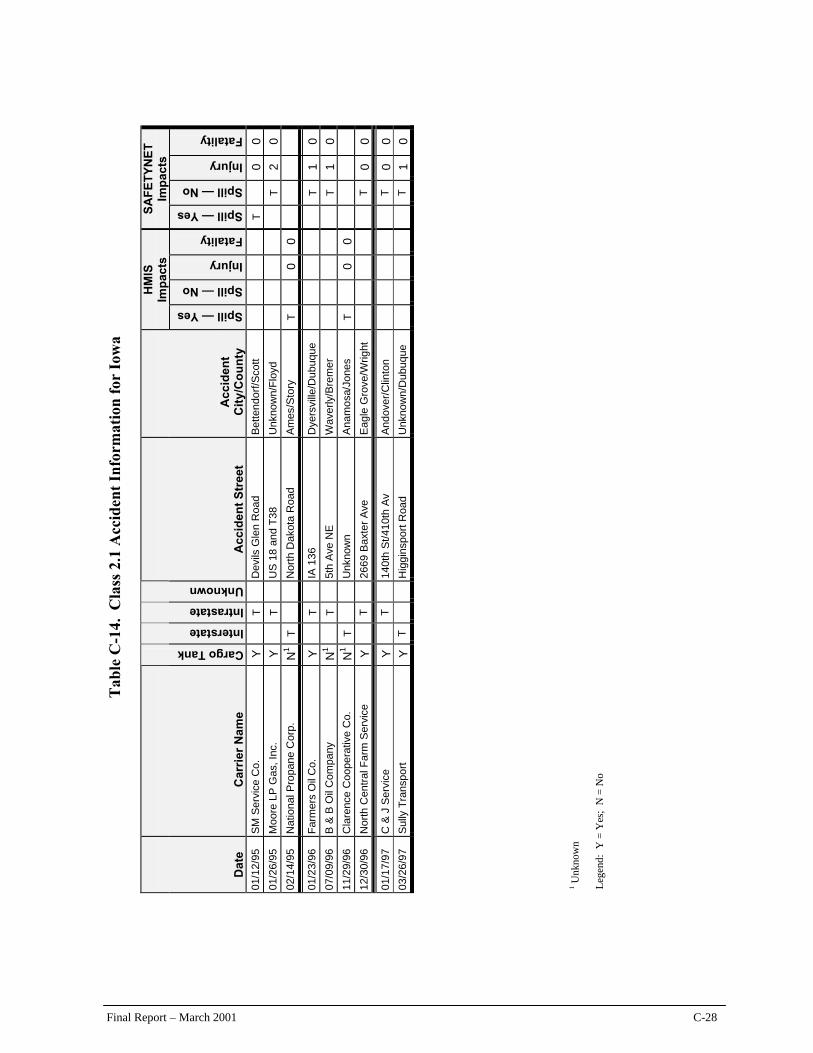
1 Unk
now
n L
egen
d: Y
= Y
es;
N =
No
Final Report – March 2001 C-28
Tab
le C
-14.
Cla
ss 2
.1 A
ccid
ent
Info
rmat
ion
for
Iow
a
HM
IS
Imp
acts
S
AF
ET
YN
ET
Im
pac
ts
Dat
e C
arri
er N
ame
Cargo Tank Interstate Intrastate Unknown
Acc
iden
t S
tree
t A
ccid
ent
Cit
y/C
ou
nty
Spill — Yes Spill — No Injury Fatality Spill — Yes Spill — No Injury Fatality
01/1
2/95
S
M S
ervi
ce C
o.
Y
T
Dev
ils G
len
Roa
d B
ette
ndor
f/Sco
tt
T
0
0
01
/26/
95
Moo
re L
P G
as, I
nc.
Y
T
US
18
and
T38
U
nkno
wn/
Flo
yd
T
2
0
02
/14/
95
Nat
iona
l Pro
pane
Cor
p.
N1 T
N
orth
Dak
ota
Roa
d A
mes
/Sto
ry
T
0
0
01/2
3/96
F
arm
ers
Oil
Co.
Y
T
IA
136
D
yers
ville
/Dub
uque
T
1
0
07/0
9/96
B
& B
Oil
Com
pany
N
1
T
5th
Ave
NE
W
aver
ly/B
rem
er
T
1
0
11
/29/
96
Cla
renc
e C
oope
rativ
e C
o.
N1 T
U
nkno
wn
A
na
mo
sa/J
ones
T
0
0
12/3
0/96
N
orth
Cen
tral
Far
m S
ervi
ce
Y
T
2669
Bax
ter
Ave
E
agle
Gro
ve/W
right
T
0
0
01/1
7/97
C
& J
Se
rvic
e Y
T
14
0th
St/4
10th
Av
And
over
/Clin
ton
T
0
0
03
/26/
97
Sul
ly T
rans
port
Y
T
H
iggi
nspo
rt R
oad
Unk
now
n/D
ubuq
ue
T
1
0
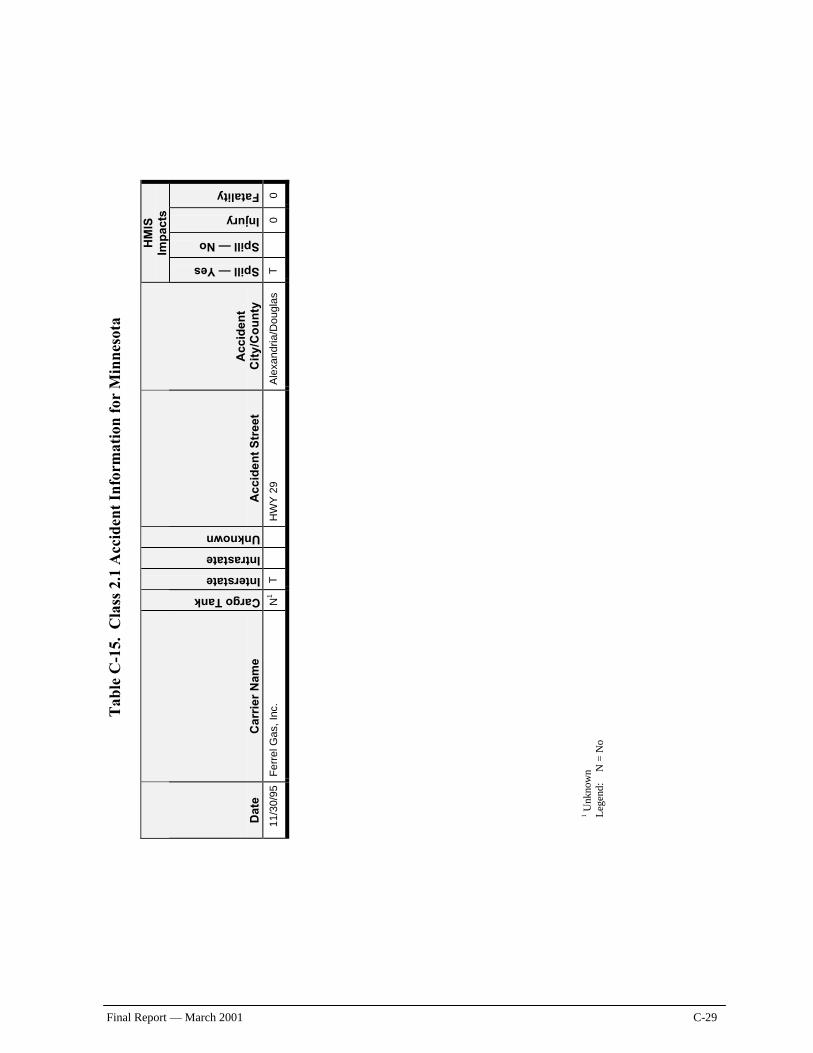
1 Unk
now
n L
egen
d:
N =
No
Final Report — March 2001 C-29
Tab
le C
-15.
Cla
ss 2
.1 A
ccid
ent
Info
rmat
ion
for
Min
neso
ta
H
MIS
Im
pac
ts
D
ate
C
arri
er N
ame
Cargo Tank Interstate
Intrastate
Unknown
A
ccid
ent
Str
eet
A
ccid
ent
Cit
y/C
ou
nty
Spill — Yes
Spill — No
Injury
Fatality
11/3
0/95
F
erre
l Gas
, Inc
. N
1 T
H
WY
29
Ale
xand
ria/D
ougl
as
T
0
0
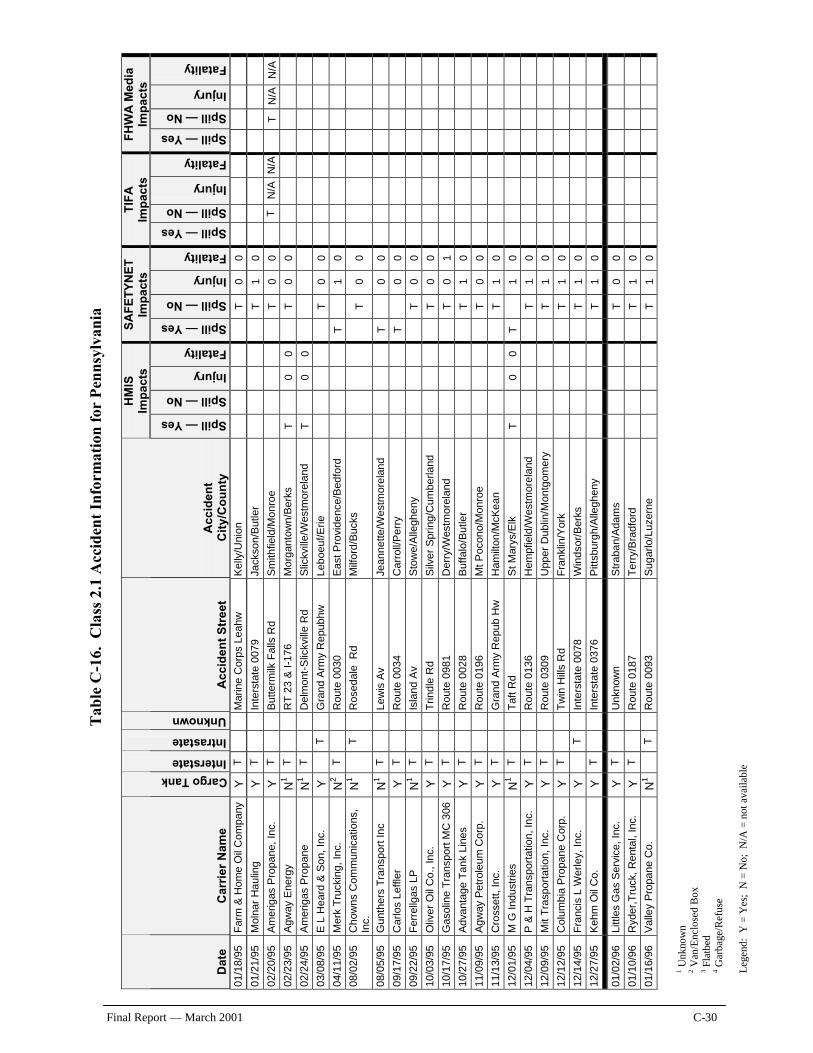
1 Unk
now
n 2 V
an/E
nclo
sed
Box
3 F
latb
ed
4 Gar
bage
/Ref
use
Leg
end:
Y =
Yes
; N
= N
o; N
/A =
not
ava
ilabl
e
Final Report — March 2001 C-30
Tab
le C
-16.
Cla
ss 2
.1 A
ccid
ent
Info
rmat
ion
for
Pen
nsyl
vani
a
HM
IS
Imp
acts
S
AF
ET
YN
ET
Im
pac
ts
TIF
A
Imp
acts
F
HW
A M
edia
Im
pac
ts
Dat
e C
arri
er N
ame
Cargo Tank
Interstate Intrastate Unknown
Acc
iden
t S
tree
t A
ccid
ent
C
ity/
Co
un
ty
Spill — Yes Spill — No Injury Fatality Spill — Yes Spill — No Injury Fatality Spill — Yes Spill — No Injury Fatality Spill — Yes Spill — No Injury Fatality
01/1
8/95
F
arm
& H
ome
Oil
Com
pany
Y
T
M
arin
e C
orps
Lea
hw
Kel
ly/U
nion
T
0 0
01/2
1/95
M
olna
r H
aulin
g Y
T
In
ters
tate
007
9 Ja
ckso
n/B
utle
r
T
1 0
02/2
0/95
A
mer
igas
Pro
pane
, In
c.
Y
T
But
term
ilk F
alls
Rd
Sm
ithfie
ld/M
onro
e
T
0 0
T
N
/A
N/A
T
N/A
N
/A
02/2
3/95
A
gway
Ene
rgy
N1
T
RT
23
& I
-176
M
orga
ntow
n/B
erks
T
0 0
T
0
0
02/2
4/95
A
mer
igas
Pro
pane
N
1
T
Del
mon
t-S
lickv
ille
Rd
Slic
kvill
e/W
estm
orel
and
T
0
0
03/0
8/95
E
L H
eard
& S
on, I
nc.
Y
T
Gra
nd A
rmy
Rep
ubhw
Le
boeu
f/Erie
T
0 0
04/1
1/95
M
erk
Tru
ckin
g, I
nc.
N2
T
Rou
te 0
030
Eas
t Pro
vide
nce/
Bed
ford
T
1 0
08/0
2/95
C
how
ns C
omm
unic
atio
ns,
Inc.
N
1
T
Ros
edal
e R
d M
ilfor
d/B
ucks
T
0 0
08/0
5/95
G
unth
ers
Tra
nspo
rt In
c N
1
T
Lew
is A
v Je
anne
tte/W
estm
orel
and
T
0
0
09/1
7/95
C
arlo
s Le
ffler
Y
T
R
oute
003
4 C
arro
ll/P
erry
T
0 0
09/2
2/95
F
erre
llgas
LP
N
1
T
Isla
nd A
v S
tow
e/A
llegh
eny
T
0
0
10/0
3/95
O
liver
Oil
Co.
, In
c.
Y
T
Trin
dle
Rd
Silv
er S
prin
g/C
umbe
rland
T
0 0
10/1
7/95
G
asol
ine
Tra
nspo
rt M
C 3
06
Y
T
Rou
te 0
981
Der
ry/W
estm
orel
and
T
0
1
10/2
7/95
A
dvan
tage
Tan
k Li
nes
Y
T
Rou
te 0
028
Buf
falo
/But
ler
T
1
0
11/0
9/95
A
gway
Pet
role
um C
orp.
Y
T
R
oute
019
6 M
t P
ocon
o/M
onro
e
T
0 0
11/1
3/95
C
ross
ett,
Inc.
Y
T
G
rand
Arm
y R
epub
Hw
H
amilt
on/M
cKea
n
T
1 0
12/0
1/95
M
G In
dust
ries
N1
T
Taf
t R
d S
t M
arys
/Elk
T
0 0
T
1
0
12/0
4/95
P
& H
Tra
nspo
rtat
ion,
Inc.
Y
T
R
oute
013
6 H
empf
ield
/Wes
tmor
elan
d
T
1 0
12/0
9/95
M
it T
rasp
orta
tion,
Inc
. Y
T
R
oute
030
9 U
pper
Dub
lin/M
ontg
omer
y
T
1 0
12/1
2/95
C
olum
bia
Pro
pane
Cor
p.
Y
T
Tw
in H
ills
Rd
Fra
nklin
/Yor
k
T
1 0
12/1
4/95
F
ranc
is L
Wer
ley,
Inc.
Y
T
In
ters
tate
007
8 W
inds
or/B
erks
T
1 0
12/2
7/95
K
ehm
Oil
Co.
Y
T
In
ters
tate
037
6 P
ittsb
urgh
/Alle
ghen
y
T
1 0
01/0
2/96
Li
ttles
Gas
Ser
vice
, Inc
. Y
T
U
nkno
wn
S
trab
an/A
dam
s
T
0 0
01/1
0/96
R
yder
,Tru
ck, R
enta
l, In
c.
Y
T
Rou
te 0
187
Ter
ry/B
radf
ord
T
1
0
01/1
6/96
V
alle
y P
ropa
ne C
o.
N1
T
Rou
te 0
093
Sug
arlo
/Luz
erne
T
1 0
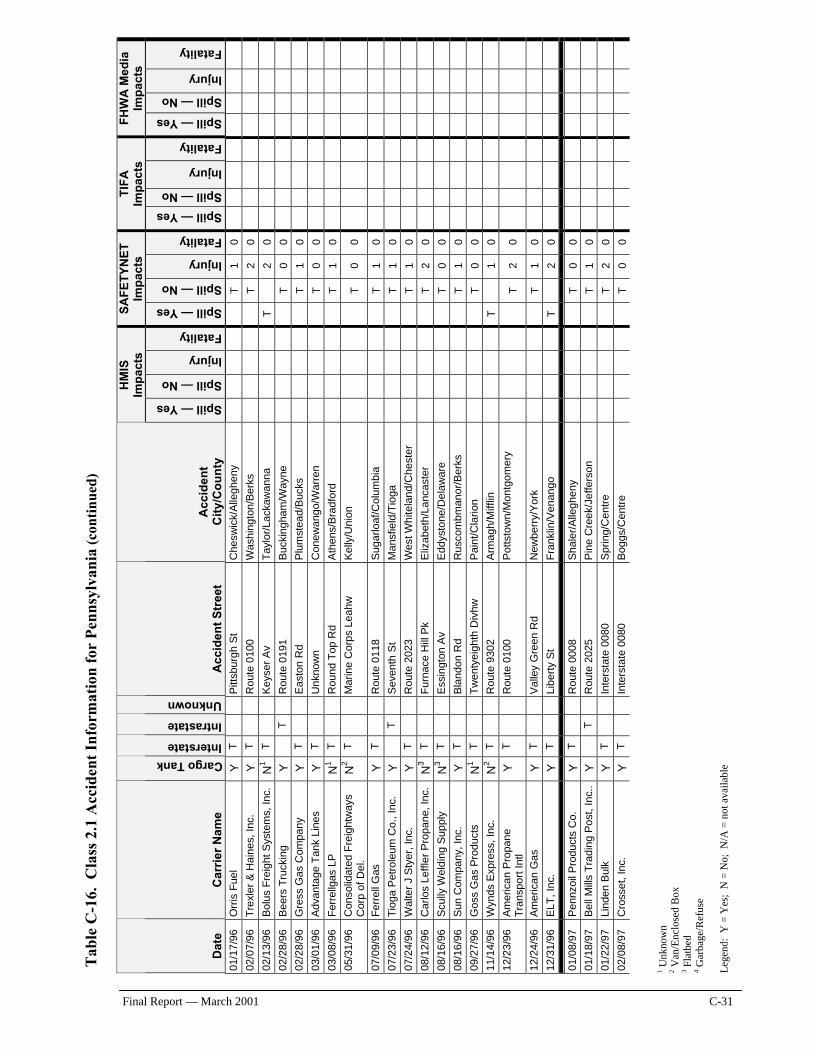
T
able
C-1
6. C
lass
2.1
Acc
iden
t In
form
atio
n fo
r P
enns
ylva
nia
(con
tinu
ed)
1 Unk
now
n 2 V
an/E
nclo
sed
Box
3 F
latb
ed
4 Gar
bage
/Ref
use
Leg
end:
Y =
Yes
; N
= N
o; N
/A =
not
ava
ilabl
e
Final Report — March 2001 C-31
HM
IS
Imp
acts
S
AF
ET
YN
ET
Im
pac
ts
TIF
A
Imp
acts
F
HW
A M
edia
Im
pac
ts
Dat
e C
arri
er N
ame
Cargo Tank
Interstate Intrastate Unknown
Acc
iden
t S
tree
t A
ccid
ent
C
ity/
Co
un
ty
Spill — Yes Spill — No Injury Fatality Spill — Yes Spill — No Injury Fatality Spill — Yes Spill — No Injury Fatality Spill — Yes Spill — No Injury Fatality
01/1
7/96
O
rris
Fue
l Y
T
P
ittsb
urgh
St
Che
swic
k/A
llegh
eny
T
1
0
02/0
7/96
T
rexl
er &
Hai
nes,
Inc.
Y
T
R
oute
010
0 W
ashi
ngto
n/B
erks
T
2 0
02/1
3/96
B
olus
Fre
ight
Sys
tem
s, I
nc.
N1
T
Key
ser
Av
Tay
lor/
Lack
awan
na
T
2
0
02/2
8/96
B
eers
Tru
ckin
g Y
T
R
oute
019
1 B
ucki
ngha
m/W
ayne
T
0 0
02/2
8/96
G
ress
Gas
Com
pany
Y
T
E
asto
n R
d P
lum
stea
d/B
ucks
T
1 0
03/0
1/96
A
dvan
tage
Tan
k Li
nes
Y
T
Unk
now
n
Con
ewan
go/W
arre
n
T
0 0
03/0
8/96
F
erre
llgas
LP
N
1
T
Rou
nd T
op R
d A
then
s/B
radf
ord
T
1
0
05/3
1/96
C
onso
lidat
ed F
reig
htw
ays
Cor
p of
Del
. N
2
T
Mar
ine
Cor
ps L
eahw
K
elly
/Uni
on
T
0
0
07/0
9/96
F
erre
ll G
as
Y
T
Rou
te 0
118
Sug
arlo
af/C
olum
bia
T
1
0
07/2
3/96
T
ioga
Pet
role
um C
o.,
Inc.
Y
T
S
even
th S
t M
ansf
ield
/Tio
ga
T
1
0
07/2
4/96
W
alte
r J
Sty
er, I
nc.
Y
T
Rou
te 2
023
Wes
t Whi
tela
nd/C
hest
er
T
1
0
08/1
2/96
C
arlo
s Le
ffler
Pro
pane
, Inc
. N
3
T
Fur
nace
Hill
Pk
Eliz
abet
h/La
ncas
ter
T
2
0
08/1
6/96
S
cully
Wel
ding
Sup
ply
N3
T
Ess
ingt
on A
v E
ddys
tone
/Del
awar
e
T
0 0
08/1
6/96
S
un C
ompa
ny, I
nc.
Y
T
Bla
ndon
Rd
Rus
com
bman
or/B
erks
T
1 0
09/2
7/96
G
oss
Gas
Pro
duct
s N
1
T
Tw
enty
eigh
th D
ivhw
P
aint
/Cla
rion
T
0
0
11/1
4/96
W
ynds
Exp
ress
, In
c.
N2
T
Rou
te 9
302
Arm
agh/
Miff
lin
T
1
0
12/2
3/96
A
mer
ican
Pro
pane
T
rans
port
Intl
Y
T
Rou
te 0
100
Pot
tsto
wn/
Mon
tgom
ery
T
2
0
12/2
4/96
A
mer
ican
Gas
Y
T
V
alle
y G
reen
Rd
New
berr
y/Y
ork
T
1
0
12/3
1/96
E
LT,
Inc.
Y
T
Li
bert
y S
t F
rank
lin/V
enan
go
T
2
0
01/0
8/97
P
ennz
oil P
rodu
cts
Co.
Y
T
R
oute
000
8 S
hale
r/A
llegh
eny
T
0
0
01/1
8/97
B
ell M
ills
Tra
ding
Pos
t, In
c..
Y
T
Rou
te 2
025
Pin
e C
reek
/Jef
fers
on
T
1
0
01/2
2/97
Li
nden
Bul
k Y
T
In
ters
tate
008
0 S
prin
g/C
entr
e
T
2 0
02/0
8/97
C
ross
et, I
nc.
Y
T
Inte
rsta
te 0
080
Bog
gs/C
entr
e
T
0 0
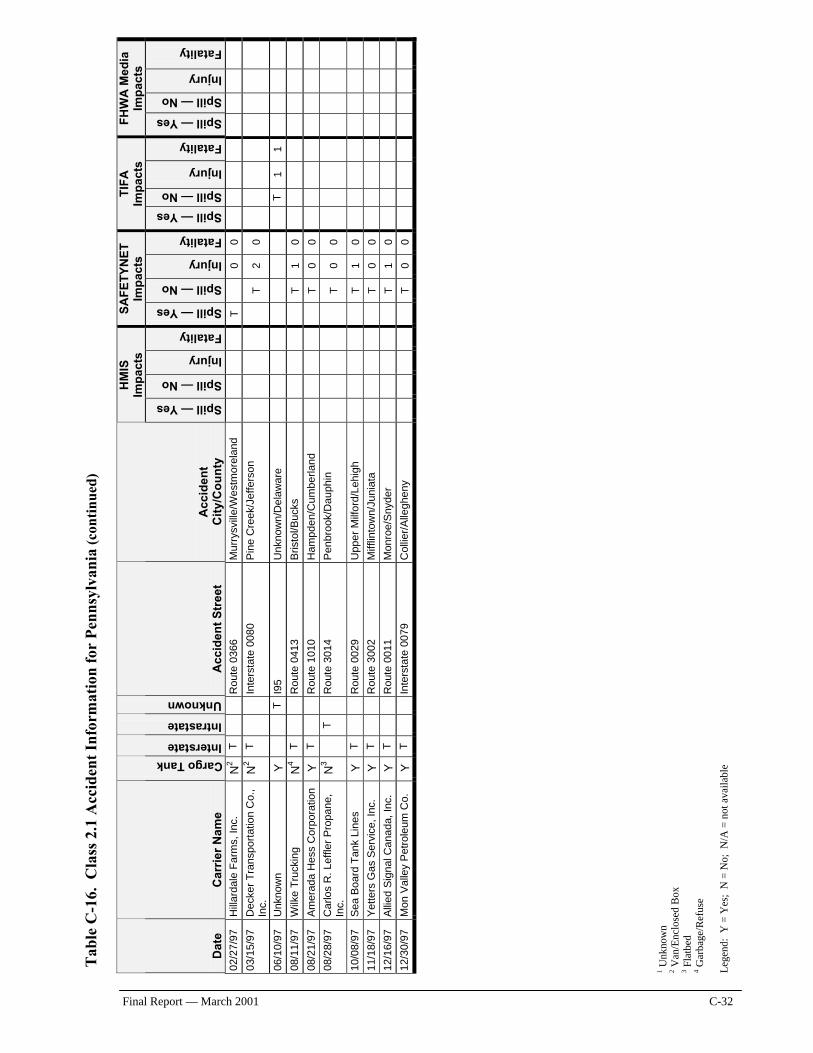
T
able
C-1
6. C
lass
2.1
Acc
iden
t In
form
atio
n fo
r P
enns
ylva
nia
(con
tinu
ed)
1 Unk
now
n 2 V
an/E
nclo
sed
Box
3 F
latb
ed
4 Gar
bage
/Ref
use
Leg
end:
Y =
Yes
; N
= N
o; N
/A =
not
ava
ilabl
e
Final Report — March 2001 C-32
HM
IS
Imp
acts
S
AF
ET
YN
ET
Im
pac
ts
TIF
A
Imp
acts
F
HW
A M
edia
Im
pac
ts
Dat
e C
arri
er N
ame
Cargo Tank
Interstate Intrastate Unknown
Acc
iden
t S
tree
t A
ccid
ent
C
ity/
Co
un
ty
Spill — Yes Spill — No Injury Fatality Spill — Yes Spill — No Injury Fatality Spill — Yes Spill — No Injury Fatality Spill — Yes Spill — No Injury Fatality
02/2
7/97
H
illar
dale
Far
ms,
Inc
. N
2
T
Rou
te 0
366
Mur
rysv
ille/
Wes
tmor
elan
d
T
0 0
03/1
5/97
D
ecke
r T
rans
port
atio
n C
o.,
Inc.
N
2
T
Inte
rsta
te 0
080
Pin
e C
reek
/Jef
fers
on
T
2
0
06/1
0/97
U
nkno
wn
Y
T
I95
U
nkno
wn/
Del
awar
e
T
1 1
08/1
1/97
W
ilke
Tru
ckin
g N
4
T
Rou
te 0
413
Bris
tol/B
ucks
T
1 0
08/2
1/97
A
mer
ada
Hes
s C
orpo
ratio
n Y
T
R
oute
101
0 H
ampd
en/C
umbe
rland
T
0 0
08/2
8/97
C
arlo
s R
. Lef
fler
Pro
pane
, In
c.
N3
T
Rou
te 3
014
Pen
broo
k/D
auph
in
T
0
0
10/0
8/97
S
ea B
oard
Tan
k Li
nes
Y
T
Rou
te 0
029
Upp
er M
ilfor
d/Le
high
T
1 0
11/1
8/97
Y
ette
rs G
as S
ervi
ce, I
nc.
Y
T
Rou
te 3
002
Miff
linto
wn/
Juni
ata
T
0
0
12/1
6/97
A
llied
Sig
nal C
anad
a, In
c.
Y
T
Rou
te 0
011
Mon
roe/
Sny
der
T
1
0
12/3
0/97
M
on V
alle
y P
etro
leum
Co.
Y
T
In
ters
tate
007
9 C
ollie
r/A
llegh
eny
T
0
0
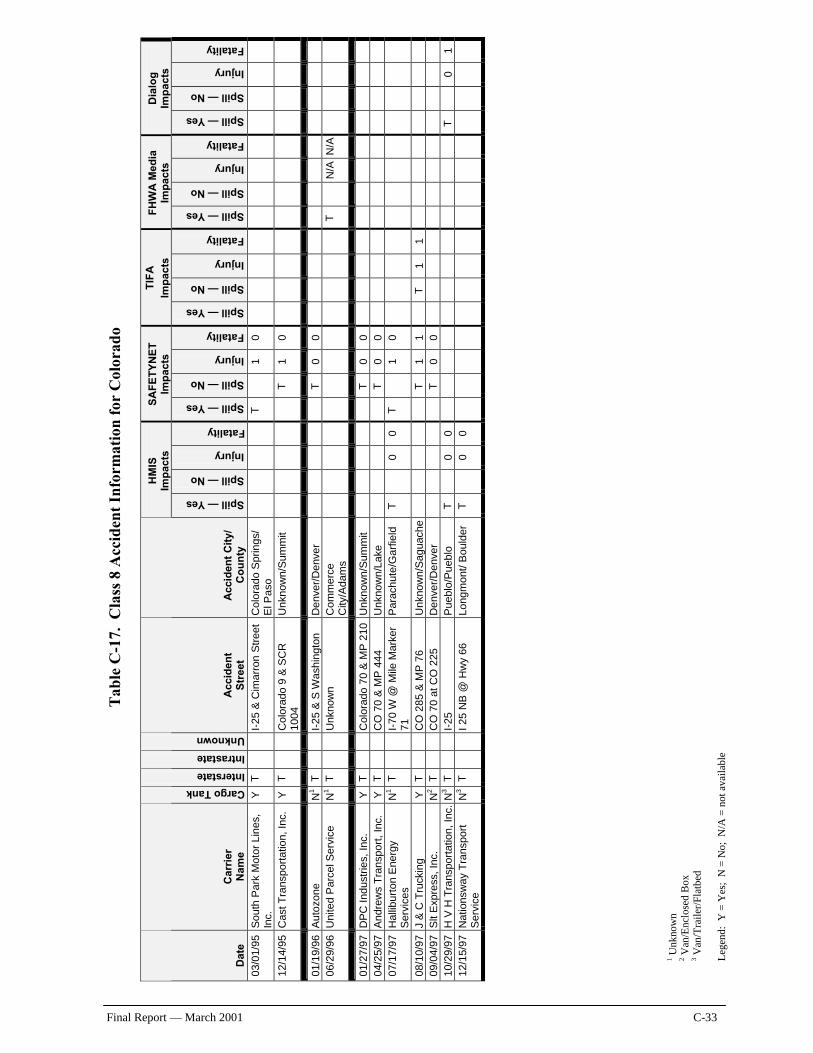
1 Unk
now
n 2 V
an/E
nclo
sed
Box
3 V
an/T
raile
r/Fl
atbe
d L
egen
d: Y
= Y
es;
N =
No;
N/A
= n
ot a
vaila
ble
Final Report — March 2001 C-33
Tab
le C
-17.
Cla
ss 8
Acc
iden
t In
form
atio
n fo
r C
olor
ado
H
MIS
Im
pac
ts
SA
FE
TY
NE
T
Imp
acts
T
IFA
Im
pac
ts
FH
WA
Med
ia
Imp
acts
D
ialo
g
Imp
acts
Dat
e C
arri
er
Nam
e
Cargo Tank
Interstate
Intrastate
Unknown
Acc
iden
t S
tree
t A
ccid
ent
Cit
y/
Co
un
ty
Spill — Yes Spill — No Injury Fatality Spill — Yes Spill — No Injury Fatality Spill — Yes Spill — No Injury Fatality Spill — Yes Spill — No Injury Fatality Spill — Yes Spill — No Injury Fatality
03/0
1/95
S
outh
Par
k M
otor
Lin
es,
Inc.
Y
T
I-
25 &
Cim
arro
n S
tree
t C
olor
ado
Spr
ings
/ E
l Pa
so
T
1
0
12/1
4/95
C
ast T
rans
port
atio
n, In
c.
Y T
C
olor
ado
9 &
SC
R
1004
U
nkno
wn/
Sum
mit
T
1
0
01/1
9/96
A
utoz
one
N1
T
I-25
& S
Was
hing
ton
Den
ver/
Den
ver
T
0
0
06
/29/
96
Uni
ted
Par
cel S
ervi
ce
N1
T
Unk
now
n
Com
mer
ce
City
/Ada
ms
T
N
/A N
/A
01/2
7/97
D
PC
Ind
ustr
ies,
Inc
. Y
T
C
olor
ado
70 &
MP
210
U
nkno
wn/
Sum
mit
T
0
0
04
/25/
97
And
rew
s T
rans
port
, In
c.
Y T
C
O 7
0 &
MP
444
U
nkno
wn/
Lake
T
0 0
07/1
7/97
H
allib
urto
n E
nerg
y S
ervi
ces
N1
T
I-70
W @
Mile
Mar
ker
71
Par
achu
te/G
arfie
ld
T
0
0 T
1 0
08/1
0/97
J
& C
Tru
ckin
g Y
T
C
O 2
85 &
MP
76
Un
know
n/S
agua
che
T
1
1
T
1 1
09/0
4/97
S
lt E
xpre
ss,
Inc.
N
2 T
C
O 7
0 at
CO
225
D
enve
r/D
enve
r
T
0 0
10/2
9/97
H
V H
Tra
nspo
rtat
ion,
Inc
. N
3 T
I-
25
Pue
blo/
Pue
blo
T
0
0
T
0 1
12/1
5/97
N
atio
nsw
ay T
rans
port
S
ervi
ce
N3
T
I 25
NB
@ H
wy
66
Long
mon
t/ B
ould
er
T
0
0
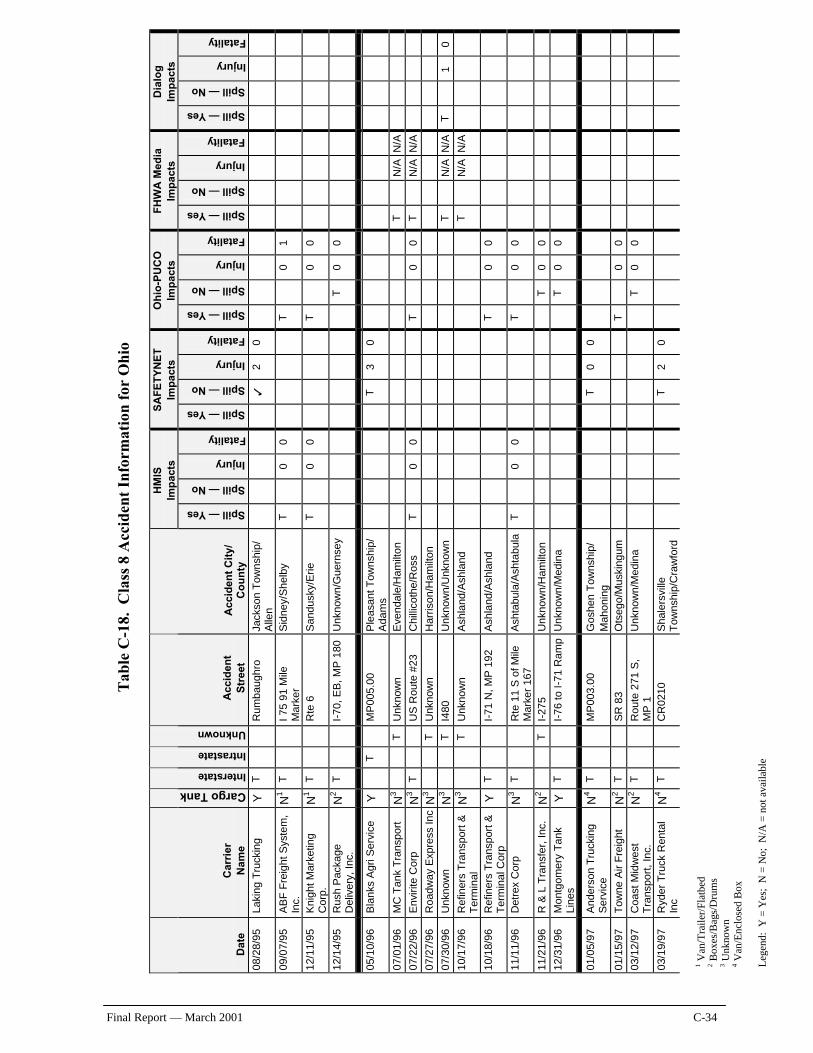
1 Van
/Tra
iler/
Flat
bed
2 Box
es/B
ags/
Dru
ms
3 Unk
now
n 4 V
an/E
nclo
sed
Box
L
egen
d: Y
= Y
es;
N =
No;
N/A
= n
ot a
vaila
ble
Final Report — March 2001 C-34
T
able
C-1
8. C
lass
8 A
ccid
ent
Info
rmat
ion
for
Ohi
o
HM
IS
Imp
acts
S
AF
ET
YN
ET
Im
pac
ts
Oh
io-P
UC
O
Imp
acts
F
HW
A M
edia
Im
pac
ts
Dia
log
Im
pac
ts
Dat
e C
arri
er
Nam
e Cargo Tank
Interstate
Intrastate
Unknown
Acc
iden
t S
tree
t A
ccid
ent
Cit
y/
Co
un
ty
Spill — Yes Spill — No Injury Fatality Spill — Yes Spill — No Injury Fatality Spill — Yes Spill — No Injury Fatality Spill — Yes Spill — No Injury Fatality Spill — Yes Spill — No Injury Fatality
08/2
8/95
La
king
Tru
ckin
g Y
T
R
umba
ughr
o Ja
ckso
n T
owns
hip/
A
llen
3
2
0
09/0
7/95
A
BF
Fre
ight
Sys
tem
, In
c.
N1 T
I 7
5 91
Mile
M
arke
r S
idne
y/S
helb
y T
0 0
T
0
1
12/1
1/95
K
nigh
t Mar
ketin
g C
orp.
N
1 T
R
te 6
S
andu
sky/
Erie
T
0 0
T
0
0
12/1
4/95
R
ush
Pac
kage
D
eliv
ery,
Inc
. N
2 T
I-
70, E
B, M
P 1
80
Unk
now
n/G
uern
sey
T
0
0
05/1
0/96
B
lank
s A
gri S
ervi
ce
Y
T
MP
005.
00
Ple
asan
t Tow
nshi
p/
Ad
am
s
T
3 0
07/0
1/96
M
C T
ank
Tra
nspo
rt
N3
T
Unk
now
n
Eve
ndal
e/H
amilt
on
T
N
/A
N/A
07/2
2/96
E
nviri
te C
orp
N3 T
U
S R
oute
#23
C
hilli
coth
e/R
oss
T
0
0
T
0 0
T
N
/A
N/A
07/2
7/96
R
oadw
ay E
xpre
ss In
c N
3
T
Unk
now
n
Har
rison
/Ham
ilton
07/3
0/96
U
nkno
wn
N
3
T
I480
U
nkno
wn/
Unk
now
n
T
N
/A
N/A
T
1 0
10/1
7/96
R
efin
ers
Tra
nspo
rt &
T
erm
inal
N
3
T
Unk
now
n
Ash
land
/Ash
land
T
N/A
N
/A
10/1
8/96
R
efin
ers
Tra
nspo
rt &
T
erm
inal
Cor
p Y
T
I-
71 N
, MP
192
A
shla
nd/A
shla
nd
T
0
0
11/1
1/96
D
etre
x C
orp
N3 T
R
te 1
1 S
of M
ile
Mar
ker
167
Ash
tabu
la/A
shta
bula
T
0 0
T
0
0
11/2
1/96
R
& L
Tra
nsfe
r, In
c.
N2
T
I-27
5 U
nkno
wn/
Ham
ilton
T
0 0
12/3
1/96
M
ontg
omer
y T
ank
Line
s Y
T
I-
76 to
I-7
1 R
amp
Unk
now
n/M
edin
a
T
0 0
01/0
5/97
A
nder
son
Tru
ckin
g S
ervi
ce
N4 T
M
P00
3.00
G
oshe
n T
owns
hip/
M
ahon
ing
T
0
0
01/1
5/97
T
owne
Air
Fre
ight
N
2 T
S
R 8
3 O
tseg
o/M
uski
ngum
T
0 0
03/1
2/97
C
oast
Mid
wes
t T
rans
port
, In
c.
N2 T
R
oute
271
S,
MP
1
Unk
now
n/M
edin
a
T
0 0
03/1
9/97
R
yder
Tru
ck R
enta
l In
c N
4 T
C
R02
10
Sha
lers
ville
T
owns
hip/
Cra
wfo
rd
T
2
0
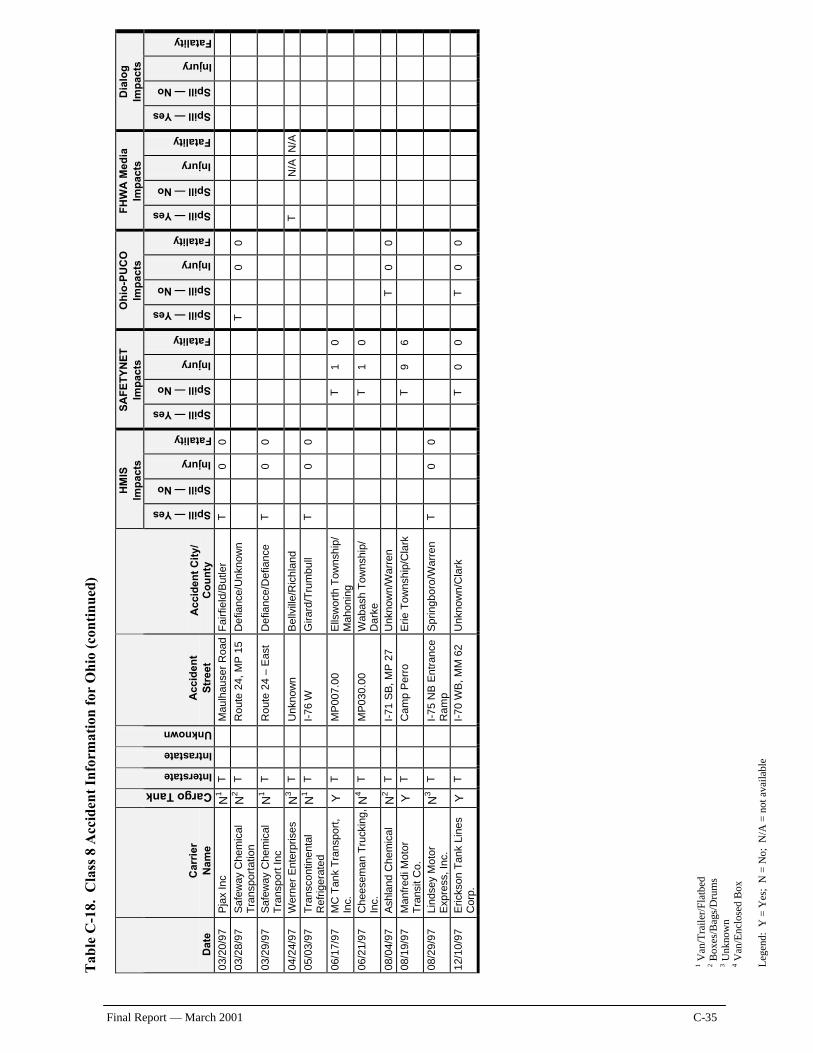
T
able
C-1
8. C
lass
8 A
ccid
ent
Info
rmat
ion
for
Ohi
o (c
onti
nued
)
1 Van
/Tra
iler/
Flat
bed
2 Box
es/B
ags/
Dru
ms
3 Unk
now
n 4 V
an/E
nclo
sed
Box
L
egen
d: Y
= Y
es;
N =
No;
N/A
= n
ot a
vaila
ble
Final Report — March 2001 C-35
HM
IS
Imp
acts
S
AF
ET
YN
ET
Im
pac
ts
Oh
io-P
UC
O
Imp
acts
F
HW
A M
edia
Im
pac
ts
Dia
log
Im
pac
ts
Dat
e C
arri
er
Nam
e
Cargo Tank
Interstate
Intrastate
Unknown
Acc
iden
t S
tree
t A
ccid
ent
Cit
y/
Co
un
ty
Spill — Yes Spill — No Injury Fatality Spill — Yes Spill — No Injury Fatality Spill — Yes Spill — No Injury Fatality Spill — Yes Spill — No Injury Fatality Spill — Yes Spill — No Injury Fatality
03/2
0/97
P
jax
Inc
N1 T
M
aulh
ause
r R
oad
Fai
rfie
ld/B
utle
r T
0 0
03/2
8/97
S
afew
ay C
hem
ical
T
rans
port
atio
n N
2 T
R
oute
24,
MP
15
Def
ianc
e/U
nkno
wn
T
0 0
03/2
9/97
S
afew
ay C
hem
ical
T
rans
port
Inc
N1 T
R
oute
24
– E
ast
Def
ianc
e/D
efia
nce
T
0
0
04/2
4/97
W
erne
r E
nter
pris
es
N3 T
U
nkno
wn
Bel
lvill
e/R
ichl
and
T
N
/A
N/A
05/0
3/97
T
rans
cont
inen
tal
Ref
riger
ated
N
1 T
I-
76 W
G
irard
/Tru
mbu
ll T
0 0
06/1
7/97
M
C T
ank
Tra
nspo
rt,
Inc.
Y
T
M
P00
7.00
E
llsw
orth
Tow
nshi
p/
Mah
onin
g
T
1 0
06/2
1/97
C
hees
eman
Tru
ckin
g,
Inc.
N
4 T
M
P03
0.00
W
abas
h T
owns
hip/
D
arke
T
1 0
08/0
4/97
A
shla
nd C
hem
ical
N
2 T
I-
71 S
B, M
P 2
7 U
nkno
wn/
War
ren
T
0
0
08/1
9/97
M
anfr
edi M
otor
T
rans
it C
o.
Y
T
Cam
p P
erro
E
rie T
owns
hip/
Cla
rk
T
9
6
08/2
9/97
Li
ndse
y M
otor
E
xpre
ss, I
nc.
N3 T
I-
75 N
B E
ntra
nce
Ra
mp
Spr
ingb
oro/
War
ren
T
0
0
12/1
0/97
E
ricks
on T
ank
Line
s C
orp.
Y
T
I-
70 W
B, M
M 6
2 U
nkno
wn/
Cla
rk
T
0
0
T
0 0
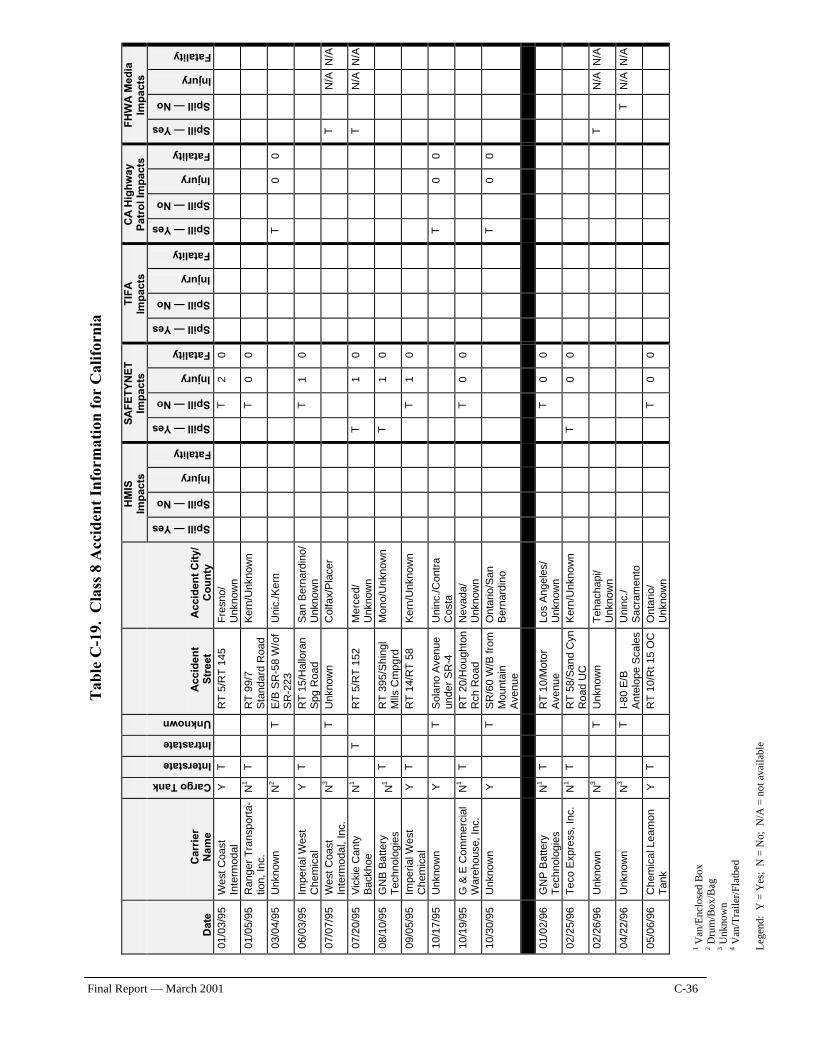
1 Van
/Enc
lose
d B
ox
2 Dru
m/B
ox/B
ag
3 Unk
now
n 4 V
an/T
raile
r/Fl
atbe
d L
egen
d: Y
= Y
es;
N =
No;
N/A
= n
ot a
vaila
ble
Final Report — March 2001 C-36
Tab
le C
-19.
Cla
ss 8
Acc
iden
t In
form
atio
n fo
r C
alif
orni
a
HM
IS
Imp
acts
S
AF
ET
YN
ET
Im
pac
ts
TIF
A
Imp
acts
C
A H
igh
way
P
atro
l Im
pac
ts
FH
WA
Med
ia
Imp
acts
Dat
e C
arri
er
Nam
e
Cargo Tank
Interstate
Intrastate
Unknown
Acc
iden
t S
tree
t A
ccid
ent
Cit
y/
Co
un
ty
Spill — Yes Spill — No Injury Fatality Spill — Yes Spill — No Injury Fatality Spill — Yes Spill — No Injury Fatality Spill — Yes Spill — No Injury Fatality Spill — Yes Spill — No Injury Fatality
01/0
3/95
W
est C
oast
In
term
odal
Y
T
R
T 5
/RT
145
F
resn
o/
Unk
now
n
T
2
0
01/0
5/95
R
ange
r T
rans
port
a-tio
n, In
c.
N1
T
RT
99/
7 S
tand
ard
Roa
d K
ern/
Unk
now
n
T
0
0
03/0
4/95
U
nkno
wn
N
2
T
E
/B S
R-5
8 W
/of
SR
-223
U
nic.
/Ker
n
T
0 0
06/0
3/95
Im
peria
l Wes
t C
hem
ical
Y
T
R
T 1
5/H
allo
ran
Spg
Roa
d S
an B
erna
rdin
o/
Unk
now
n
T
1
0
07/0
7/95
W
est C
oast
In
term
odal
, In
c.
N3
T
Unk
now
n
Col
fax/
Pla
cer
T
N
/A
N/A
07/2
0/95
V
icki
e C
anty
B
ackh
oe
N1
T
RT
5/R
T 1
52
Mer
ced/
U
nkno
wn
T
1 0
T
N
/A
N/A
08/1
0/95
G
NB
Bat
tery
T
echn
olog
ies
N1
T
RT
395
/Shi
ngl
Mlls
Cm
pgrd
M
ono/
Unk
now
n
T
1
0
09/0
5/95
Im
peria
l Wes
t C
hem
ical
Y
T
R
T 1
4/R
T 5
8 K
ern/
Unk
now
n
T
1
0
10/1
7/95
U
nkno
wn
Y
T
S
olan
o A
venu
e un
der
SR
-4
Uni
nc./C
ontr
a C
ost
a
T
0 0
10/1
9/95
G
& E
Com
mer
cial
W
areh
ouse
, In
c.
N1
T
RT
20/
Hou
ghto
n R
ch R
oad
Nev
ada/
U
nkno
wn
T
0 0
10/3
0/95
U
nkno
wn
Y
T
S
R/6
0 W
/B fr
om
Mou
ntai
n A
venu
e
Ont
ario
/San
B
erna
rdin
o
T
0 0
01/0
2/96
G
NP
Bat
tery
T
echn
olog
ies
N1
T
RT
10/
Mot
or
Ave
nue
Los
Ang
eles
/ U
nkno
wn
T
0 0
02/2
5/96
T
eco
Exp
ress
, Inc
. N
1 T
R
T 5
8/S
and
Cyn
R
oad
UC
K
ern/
Unk
now
n
T
0
0
02
/26/
96
Unk
now
n
N3
T
Unk
now
n
Teh
acha
pi/
Unk
now
n
T
N
/A
N/A
04/2
2/96
U
nkno
wn
N
3
T
I-
80 E
/B
Ant
elop
e S
cale
s U
ninc
./ S
acra
men
to
T
N
/A
N/A
05/0
6/96
C
hem
ical
Lea
mon
T
ank
Y
T
RT
10/
Rt
15 O
C
Ont
ario
/ U
nkno
wn
T
0 0
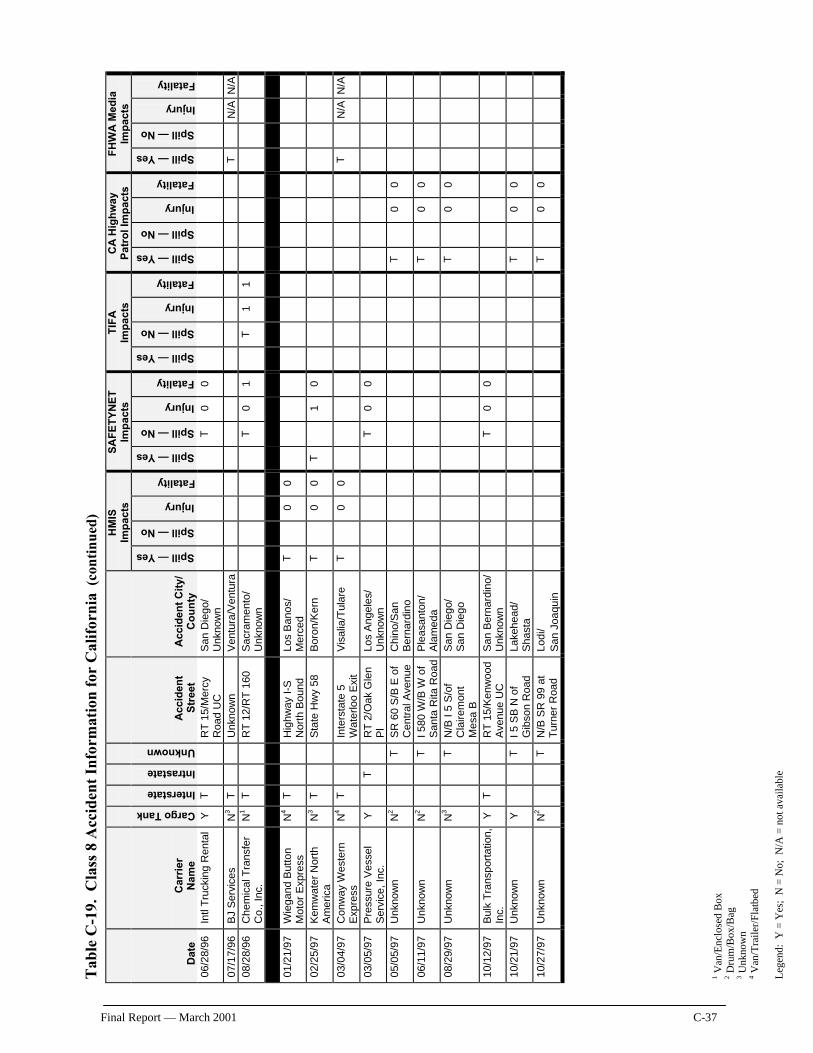
T
able
C-1
9. C
lass
8 A
ccid
ent
Info
rmat
ion
for
Cal
ifor
nia
(co
ntin
ued)
1 Van
/Enc
lose
d B
ox
2 Dru
m/B
ox/B
ag
3 Unk
now
n 4 V
an/T
raile
r/Fl
atbe
d L
egen
d: Y
= Y
es;
N =
No;
N/A
= n
ot a
vaila
ble
Final Report — March 2001 C-37
HM
IS
Imp
acts
S
AF
ET
YN
ET
Im
pac
ts
TIF
A
Imp
acts
C
A H
igh
way
P
atro
l Im
pac
ts
FH
WA
Med
ia
Imp
acts
Dat
e C
arri
er
Nam
e
Cargo Tank
Interstate
Intrastate
Unknown
Acc
iden
t S
tree
t A
ccid
ent
Cit
y/
Co
un
ty
Spill — Yes Spill — No Injury Fatality Spill — Yes Spill — No Injury Fatality Spill — Yes Spill — No Injury Fatality Spill — Yes Spill — No Injury Fatality Spill — Yes Spill — No Injury Fatality
06/2
8/96
In
tl T
ruck
ing
Ren
tal
Y
T
RT
15/
Mer
cy
Roa
d U
C
San
Die
go/
Unk
now
n
T
0
0
07/1
7/96
B
J S
ervi
ces
N3
T
Unk
now
n
Ven
tura
/Ven
tura
T
N
/A
N/A
08
/28/
96
Che
mic
al T
rans
fer
Co.
, Inc
. N
1 T
R
T 1
2/R
T 1
60
Sac
ram
ento
/ U
nkno
wn
T
0 1
T
1
1
01/2
1/97
W
iega
nd B
utto
n M
otor
Exp
ress
N
4 T
H
ighw
ay I
-S
Nor
th B
ound
Lo
s B
anos
/ M
erce
d T
0 0
02/2
5/97
K
emw
ater
Nor
th
Am
eric
a N
3 T
S
tate
Hw
y 58
B
oron
/Ker
n T
0 0
T
1
0
03/0
4/97
C
onw
ay W
este
rn
Exp
ress
N
4 T
In
ters
tate
5
Wat
erlo
o E
xit
Vis
alia
/Tul
are
T
0
0
T
N/A
N
/A
03/0
5/97
P
ress
ure
Ves
sel
Ser
vice
, In
c.
Y
T
RT
2/O
ak G
len
Pl
Los
Ang
eles
/ U
nkno
wn
T
0 0
05/0
5/97
U
nkno
wn
N
2
T
S
R 6
0 S
/B E
of
Cen
tral
Ave
nue
Chi
no/S
an
Ber
nard
ino
T
0
0
06/1
1/97
U
nkno
wn
N
2
T
I 5
80 W
/B W
of
San
ta R
ita R
oad
Ple
asan
ton/
A
lam
eda
T
0
0
08/2
9/97
U
nkno
wn
N
3
T
N
/B I
5 S
/of
Cla
irem
ont
Mes
a B
San
Die
go/
San
Die
go
T
0
0
10/1
2/97
B
ulk
Tra
nspo
rtat
ion,
In
c.
Y
T
RT
15/
Ken
woo
d A
venu
e U
C
San
Ber
nard
ino/
U
nkno
wn
T
0 0
10/2
1/97
U
nkno
wn
Y
T
I 5
SB
N o
f G
ibso
n R
oad
Lake
head
/ S
hast
a
T
0 0
10/2
7/97
U
nkno
wn
N
2
T
N
/B S
R 9
9 at
T
urne
r R
oad
Lodi
/ S
an J
oaqu
in
T
0
0
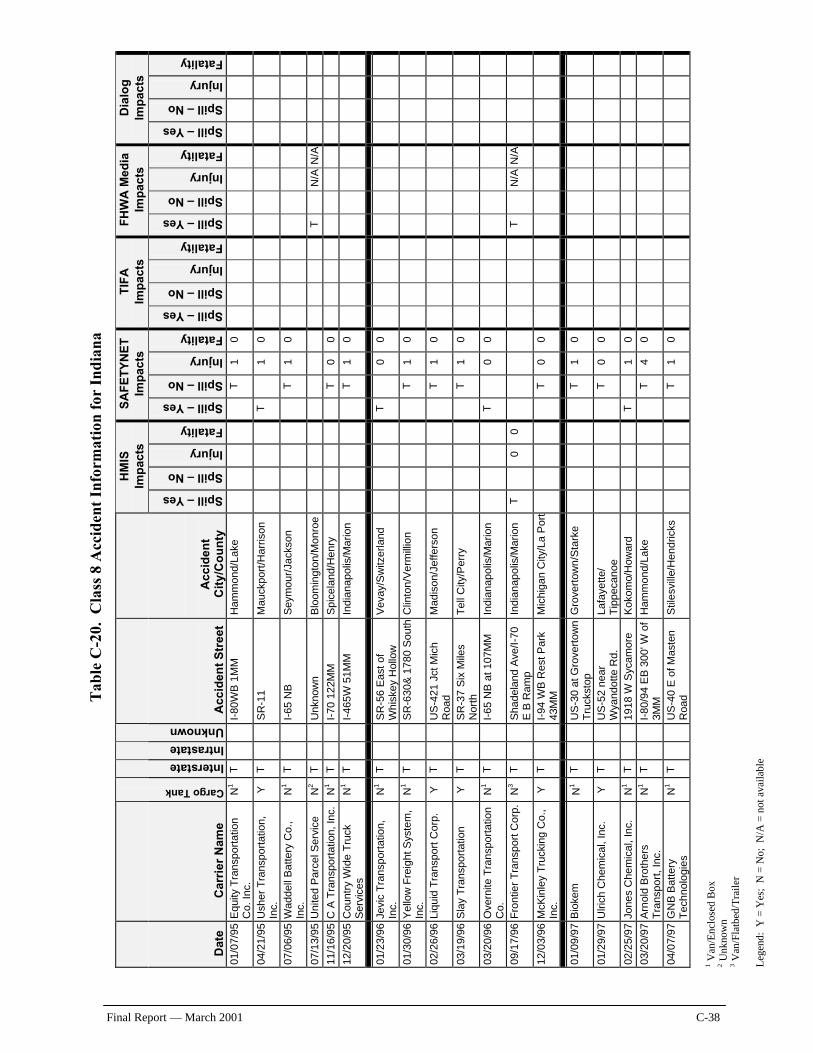
1 Van
/Enc
lose
d B
ox
2 Unk
now
n 3 V
an/F
latb
ed/T
raile
r L
egen
d: Y
= Y
es;
N =
No;
N/A
= n
ot a
vaila
ble
Final Report — March 2001 C-38
Tab
le C
-20.
Cla
ss 8
Acc
iden
t In
form
atio
n fo
r In
dian
a
HM
IS
Imp
acts
S
AF
ET
YN
ET
Im
pac
ts
TIF
A
Imp
acts
F
HW
A M
edia
Im
pac
ts
Dia
log
Im
pac
ts
Dat
e C
arri
er N
ame
Cargo Tank
Interstate
Intrastate
Unknown
A
ccid
ent
Str
eet
A
ccid
ent
Cit
y/C
ou
nty
Spill – Yes
Spill – No
Injury
Fatality
Spill – Yes
Spill – No
Injury
Fatality
Spill – Yes
Spill – No
Injury
Fatality
Spill – Yes
Spill – No
Injury
Fatality
Spill – Yes
Spill – No
Injury
Fatality
01/0
7/95
Equ
ity T
rans
port
atio
n C
o. I
nc.
N1
T
I-80
WB
1M
M
Ham
mon
d/L
ake
T
1 0
04/2
1/95
Ush
er T
rans
port
atio
n,
Inc.
Y
T
S
R-1
1 M
auck
port
/Har
rison
T
1 0
07/0
6/95
Wad
dell
Bat
tery
Co.
, In
c.
N1
T
I-65
NB
S
eym
our/
Jack
son
T
1
0
07/1
3/95
Uni
ted
Par
cel S
ervi
ce
N2
T
Unk
now
n
Blo
omin
gton
/Mon
roe
T
N
/A N
/A
11/1
6/95
C A
Tra
nspo
rtat
ion,
Inc.
N
1 T
I-
70 1
22M
M
Spi
cela
nd/H
enry
T
0 0
12/2
0/95
Cou
ntry
Wid
e T
ruck
S
ervi
ces
N1
T
I-46
5W 5
1MM
In
dian
apol
is/M
ario
n
T
1 0
01/2
3/96
Jev
ic T
rans
port
atio
n,
Inc.
N
1 T
S
R-5
6 E
ast
of
Whi
skey
Hol
low
V
evay
/Sw
itzer
land
T
0 0
01/3
0/96
Yel
low
Fre
ight
Sys
tem
, In
c.
N1
T
SR
-630
& 1
780
Sou
th C
linto
n/V
erm
illio
n
T
1 0
02/2
6/96
Liq
uid
Tra
nspo
rt C
orp.
Y
T
U
S-4
21 J
ct M
ich
Roa
d M
adis
on/J
effe
rson
T
1 0
03/1
9/96
Sla
y T
rans
port
atio
n Y
T
S
R-3
7 S
ix M
iles
Nor
th
Tel
l City
/Per
ry
T
1
0
03/2
0/96
Ove
rnite
Tra
nspo
rtat
ion
Co.
N
1 T
I-
65 N
B a
t 10
7MM
In
dian
apol
is/M
ario
n
T
0 0
09/1
7/96
Fro
ntie
r T
rans
port
Cor
p.
N3
T
Sha
dela
nd A
ve/I
-70
E B
Ra
mp
Indi
anap
olis
/Mar
ion
T
0
0
T
N/A
N/A
12/0
3/96
McK
inle
y T
ruck
ing
Co.
, In
c.
Y
T
I-94
WB
Res
t Par
k 43
MM
M
ichi
gan
City
/La
Por
t
T
0 0
01/0
9/97
Bio
kem
N
1 T
U
S-3
0 at
Gro
vert
own
Tru
ckst
op
Gro
vert
own
/Sta
rke
T
1
0
01/2
9/97
Ulri
ch C
hem
ical
, Inc
. Y
T
U
S-5
2 ne
ar
Wya
ndot
te R
d.
Lafa
yette
/ T
ippe
cano
e
T
0 0
02/2
5/97
Jon
es C
hem
ical
, In
c.
N1
T
1918
W S
ycam
ore
Ko
kom
o/H
owar
d
T
1 0
03/2
0/97
Arn
old
Bro
ther
s T
rans
port
, In
c.
N1
T
I-80
/94
EB
300
' W o
f 3M
M
Ham
mon
d/La
ke
T
4
0
04/0
7/97
GN
B B
atte
ry
Tec
hnol
ogie
s N
1 T
U
S-4
0 E
of
Mas
ten
Roa
d S
tiles
ville
/Hen
dric
ks
T
1
0
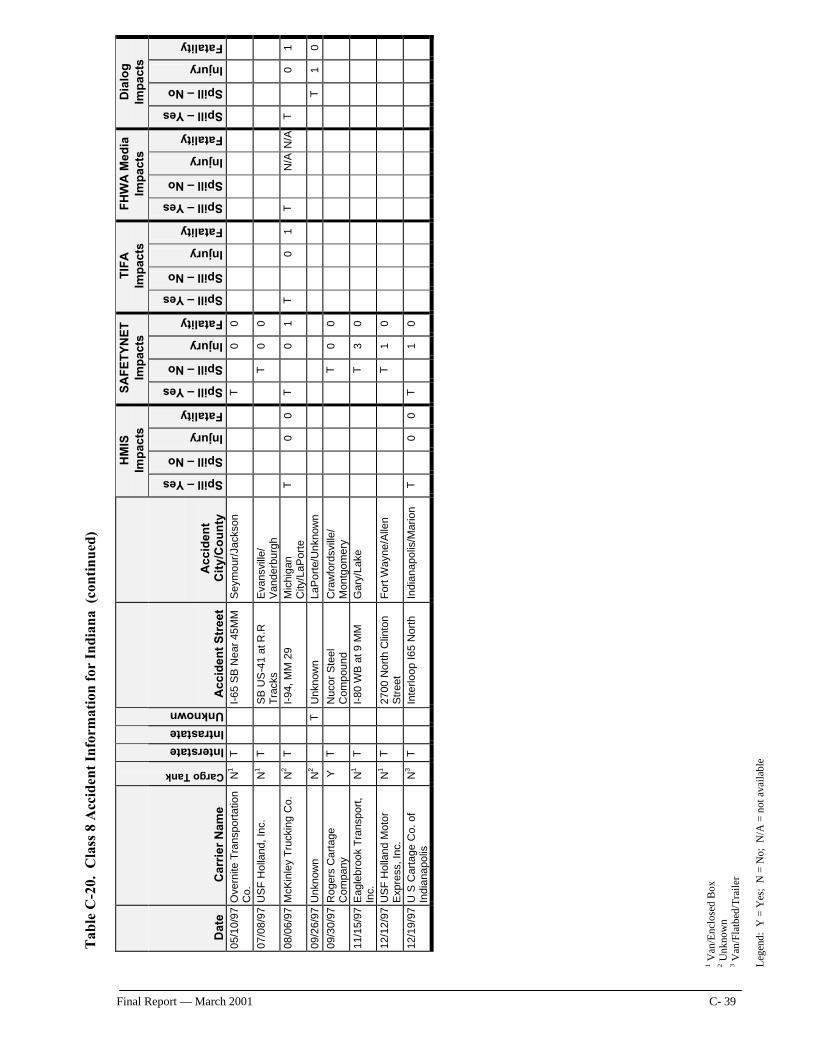
T
able
C-2
0. C
lass
8 A
ccid
ent
Info
rmat
ion
for
Indi
ana
(co
ntin
ued)
1 Van
/Enc
lose
d B
ox
2 Unk
now
n 3 V
an/F
latb
ed/T
raile
r L
egen
d: Y
= Y
es;
N =
No;
N/A
= n
ot a
vaila
ble
Final Report — March 2001 C- 39
HM
IS
Imp
acts
S
AF
ET
YN
ET
Im
pac
ts
TIF
A
Imp
acts
F
HW
A M
edia
Im
pac
ts
Dia
log
Im
pac
ts
Dat
e C
arri
er N
ame
Cargo Tank
Interstate
Intrastate
Unknown
A
ccid
ent
Str
eet
A
ccid
ent
Cit
y/C
ou
nty
Spill – Yes
Spill – No
Injury
Fatality
Spill – Yes
Spill – No
Injury
Fatality
Spill – Yes
Spill – No
Injury
Fatality
Spill – Yes
Spill – No
Injury
Fatality
Spill – Yes
Spill – No
Injury
Fatality
05/1
0/97
Ove
rnite
Tra
nspo
rtat
ion
Co.
N
1 T
I-
65 S
B N
ear
45M
M
Sey
mou
r/Ja
ckso
n
T
0 0
07/0
8/97
US
F H
olla
nd,
Inc.
N
1 T
S
B U
S-4
1 at
R.R
T
rack
s E
vans
ville
/ V
ande
rbur
gh
T
0
0
08/0
6/97
McK
inle
y T
ruck
ing
Co.
N
2 T
I-
94, M
M 2
9 M
ichi
gan
City
/LaP
orte
T
0 0
T
0
1 T
0 1
T
N
/A N
/A
T
0
1
09/2
6/97
Unk
now
n
N2
T
Unk
now
n
LaP
orte
/Unk
now
n
T
1
0
09/3
0/97
Rog
ers
Car
tage
C
ompa
ny
Y
T
Nuc
or S
teel
C
ompo
und
Cra
wfo
rdsv
ille/
M
ontg
omer
y
T
0 0
11/1
5/97
Eag
lebr
ook
Tra
nspo
rt,
Inc.
N
1 T
I-
80 W
B a
t 9 M
M
Gar
y/L
ake
T
3 0
12/1
2/97
US
F H
olla
nd M
otor
E
xpre
ss, I
nc.
N1
T
2700
Nor
th C
linto
n S
tree
t F
ort W
ayne
/Alle
n
T
1 0
12/1
9/97
U S
Car
tage
Co.
of
Indi
anap
olis
N
3 T
In
terlo
op I
65 N
orth
In
dian
apol
is/M
ario
n T
0 0
T
1
0
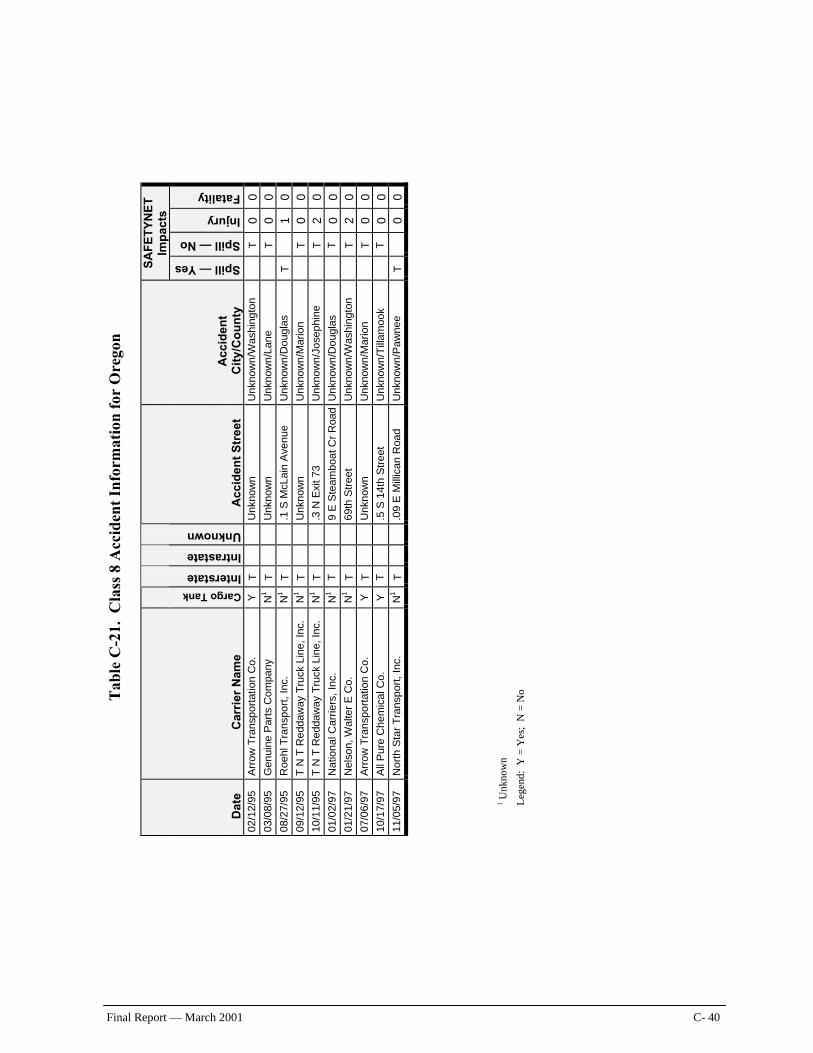
1 Unk
now
n
Leg
end:
Y =
Yes
; N
= N
o
Final Report — March 2001 C- 40
Tab
le C
-21.
Cla
ss 8
Acc
iden
t In
form
atio
n fo
r O
rego
n
S
AF
ET
YN
ET
Im
pac
ts
Dat
e C
arri
er N
ame
Cargo Tank
Interstate
Intrastate
Unknown
Acc
iden
t S
tree
t
A
ccid
ent
Cit
y/C
ou
nty
Spill — Yes
Spill — No
Injury
Fatality
02/1
2/95
A
rrow
Tra
nspo
rtat
ion
Co.
Y
T
U
nkno
wn
U
nkno
wn
/Was
hing
ton
T
0
0
03
/08/
95
Gen
uine
Par
ts C
ompa
ny
N1
T
Unk
now
n
Unk
now
n/L
ane
T
0
0
08
/27/
95
Roe
hl T
rans
port
, In
c.
N1
T
.1 S
McL
ain
Ave
nue
Unk
now
n/D
ougl
as
T
1
0
09
/12/
95
T N
T R
edda
way
Tru
ck L
ine,
Inc.
N
1 T
U
nkno
wn
U
nkno
wn
/Mar
ion
T
0
0
10
/11/
95
T N
T R
edda
way
Tru
ck L
ine,
Inc.
N
1 T
.3
N E
xit 7
3 U
nkno
wn
/Jos
ephi
ne
T
2
0
01
/02/
97
Nat
iona
l Car
riers
, In
c.
N1
T
9 E
Ste
ambo
at C
r R
oad
Unk
now
n/D
ougl
as
T
0
0
01
/21/
97
Nel
son,
Wal
ter
E C
o.
N1
T
69th
Str
eet
Unk
now
n/W
ashi
ngto
n
T
2
0
07/0
6/97
A
rrow
Tra
nspo
rtat
ion
Co.
Y
T
U
nkno
wn
U
nkno
wn
/Mar
ion
T
0
0
10
/17/
97
All
Pur
e C
hem
ical
Co.
Y
T
.5
S 1
4th
Str
eet
Unk
now
n/T
illam
ook
T
0
0
11
/05/
97
Nor
th S
tar
Tra
nspo
rt, I
nc.
N1
T
.09
E M
illic
an R
oad
Unk
now
n/P
awne
e T
0
0
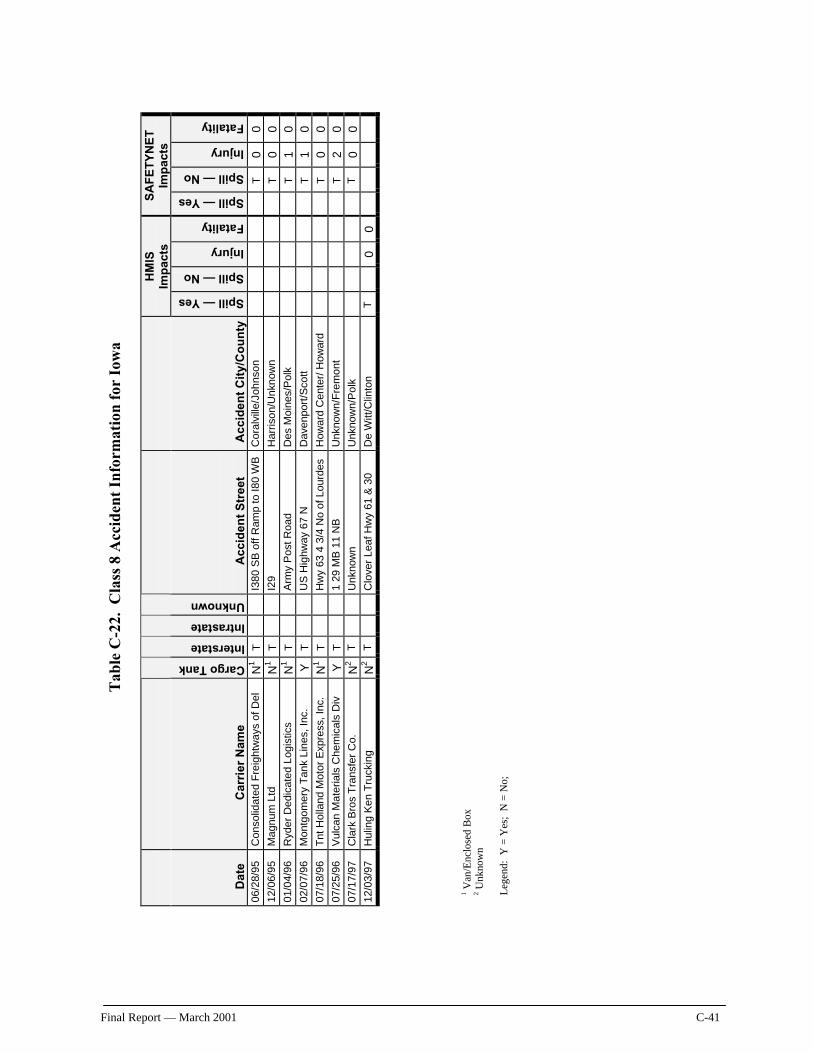
1 Van
/Enc
lose
d B
ox
2 Unk
now
n L
egen
d: Y
= Y
es;
N =
No;
Final Report — March 2001 C-41
Tab
le C
-22.
Cla
ss 8
Acc
iden
t In
form
atio
n fo
r Io
wa
H
MIS
Im
pac
ts
SA
FE
TY
NE
T
Imp
acts
Dat
e C
arri
er N
ame
Cargo Tank Interstate Intrastate Unknown
A
ccid
ent
Str
eet
Acc
iden
t C
ity/
Co
un
ty
Spill — Yes Spill — No Injury Fatality Spill — Yes Spill — No Injury Fatality
06/2
8/95
C
onso
lidat
ed F
reig
htw
ays
of D
el
N1 T
I3
80 S
B o
ff R
amp
to I8
0 W
B
Cor
alvi
lle/J
ohns
on
T
0
0
12
/06/
95
Mag
num
Ltd
N
1 T
I2
9 H
arris
on/U
nkno
wn
T
0
0
01/0
4/96
R
yder
Ded
icat
ed L
ogis
tics
N1 T
A
rmy
Pos
t R
oad
Des
Moi
nes/
Pol
k
T
1
0
02/0
7/96
M
ontg
omer
y T
ank
Line
s, I
nc.
Y
T
US
Hig
hway
67
N
Dav
enpo
rt/S
cott
T
1
0
07/1
8/96
T
nt H
olla
nd M
otor
Exp
ress
, In
c.
N1 T
H
wy
63 4
3/4
No
of L
ourd
es
How
ard
Cen
ter/
How
ard
T
0
0
07
/25/
96
Vul
can
Mat
eria
ls C
hem
ical
s D
iv
Y
T
1 29
MB
11
NB
U
nkno
wn
/Fre
mon
t
T
2
0
07/1
7/97
C
lark
Bro
s T
rans
fer
Co.
N
2 T
U
nkno
wn
U
nkno
wn
/Po
lk
T
0
0
12
/03/
97
Hul
ing
Ken
Tru
ckin
g N
2 T
C
love
r Le
af H
wy
61 &
30
De
Witt
/Clin
ton
T
0
0
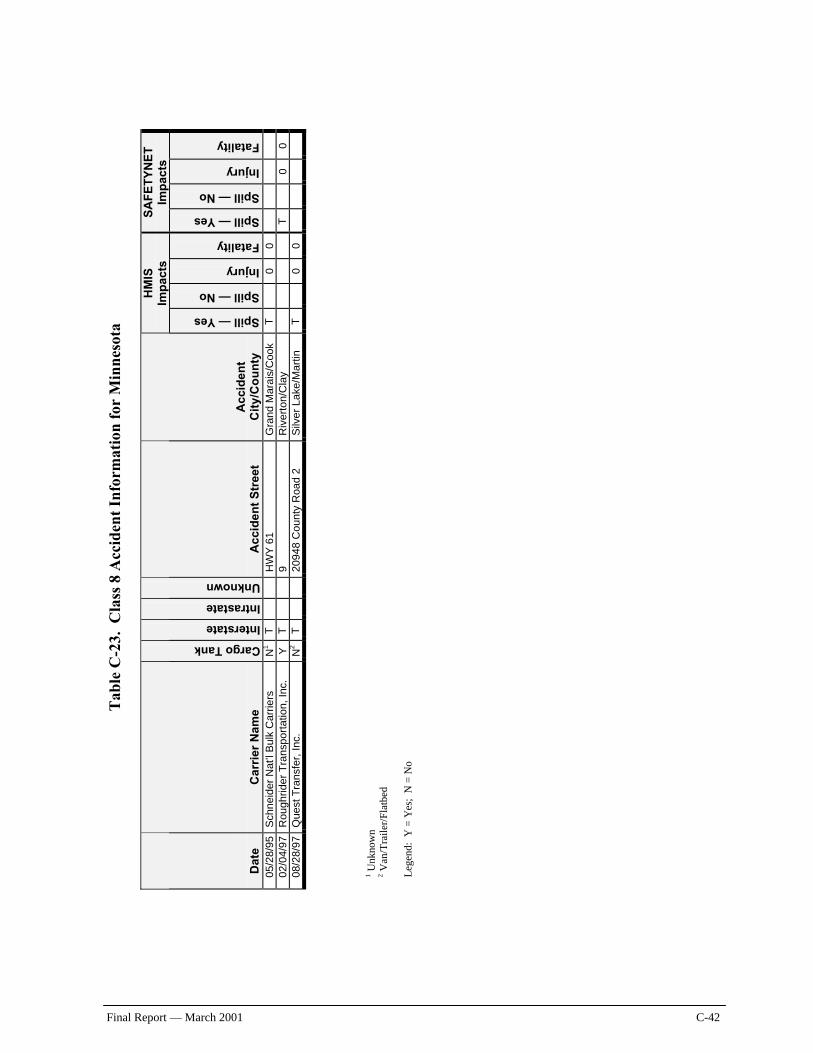
1 Unk
now
n 2 V
an/T
raile
r/Fl
atbe
d L
egen
d: Y
= Y
es;
N =
No
Final Report — March 2001 C-42
Tab
le C
-23.
Cla
ss 8
Acc
iden
t In
form
atio
n fo
r M
inne
sota
HM
IS
Imp
acts
S
AF
ET
YN
ET
Im
pac
ts
D
ate
C
arri
er N
ame
Cargo Tank Interstate
Intrastate
Unknown
A
ccid
ent
Str
eet
A
ccid
ent
Cit
y/C
ou
nty
Spill — Yes
Spill — No
Injury
Fatality
Spill — Yes
Spill — No
Injury
Fatality
05/2
8/95
S
chne
ider
Nat
’l B
ulk
Car
riers
N
1 T
H
WY
61
Gra
nd M
arai
s/C
ook
T
0
0
02
/04/
97
Rou
ghrid
er T
rans
port
atio
n, I
nc.
Y
T
9 R
iver
ton/
Cla
y
T
0 0
08/2
8/97
Q
uest
Tra
nsfe
r, In
c.
N2
T
2094
8 C
ount
y R
oad
2 S
ilver
Lak
e/M
artin
T
0 0
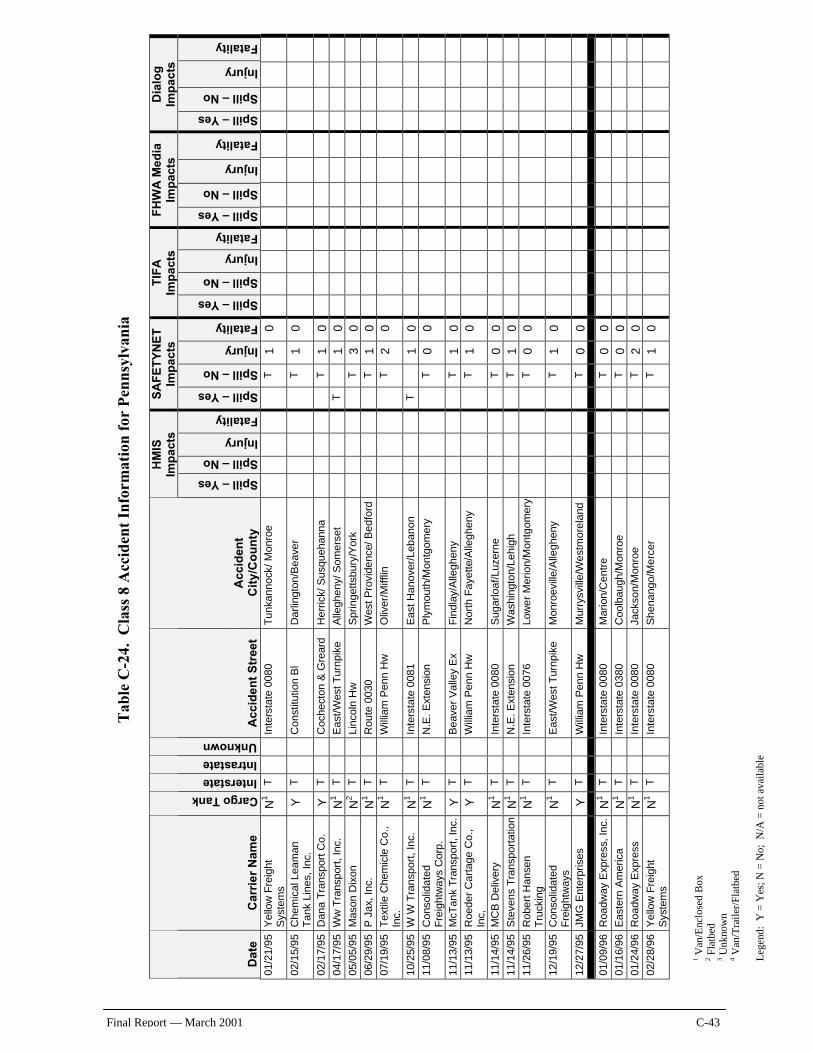
Final Report — March 2001 C-43
1 Van
/Enc
lose
d B
ox
2 Fla
tbed
3 U
nkno
wn
4 Van
/Tra
iler/
Flat
bed
Leg
end:
Y =
Yes
; N =
No;
N/A
= n
ot a
vaila
ble
T
able
C-2
4. C
lass
8 A
ccid
ent
Info
rmat
ion
for
Pen
nsyl
vani
a
HM
IS
Imp
acts
S
AF
ET
YN
ET
Im
pac
ts
TIF
A
Imp
acts
F
HW
A M
edia
Im
pac
ts
Dia
log
Im
pac
ts
Dat
e C
arri
er N
ame
Cargo Tank
Interstate Intrastate Unknown A
ccid
ent
Str
eet
Acc
iden
t
Cit
y/C
ou
nty
Spill – Yes
Spill – No
Injury
Fatality
Spill – Yes
Spill – No
Injury
Fatality
Spill – Yes
Spill – No
Injury
Fatality
Spill – Yes
Spill – No
Injury
Fatality
Spill – Yes
Spill – No
Injury
Fatality
01/2
1/95
Y
ello
w F
reig
ht
Sys
tem
s N
1 T
In
ters
tate
008
0 T
unka
nnoc
k/ M
onro
e
T
1
0
02/1
5/95
C
hem
ical
Lea
man
T
ank
Line
s, I
nc.
Y
T
Con
stitu
tion
Bl
Dar
lingt
on/B
eave
r
T
1
0
02/1
7/95
D
ana
Tra
nspo
rt C
o.
Y
T
Coc
hect
on &
Gre
ard
Her
rick/
Sus
queh
anna
T
1
0
04/1
7/95
W
w T
rans
port
, Inc
. N
1 T
E
ast/W
est
Tur
npik
e A
llegh
eny/
Som
erse
t
T
1
0
05/0
5/95
M
ason
Dix
on
N2 T
Li
ncol
n H
w
Spr
inge
ttsbu
ry/Y
ork
T
3
0
06
/29/
95
P J
ax, I
nc.
N1 T
R
oute
003
0 W
est
Pro
vide
nce/
Bed
ford
T
1
0
07/1
9/95
T
extil
e C
hem
icle
Co.
, In
c.
N1 T
W
illia
m P
enn
Hw
O
liver
/Miff
lin
T
2
0
10/2
5/95
W
W T
rans
port
, Inc
. N
1 T
In
ters
tate
008
1 E
ast
Han
over
/Leb
anon
T
1
0
11/0
8/95
C
onso
lidat
ed
Fre
ight
way
s C
orp.
N
1 T
N
.E.
Ext
ensi
on
Ply
mou
th/M
ontg
omer
y
T
0
0
11/1
3/95
M
cTan
k T
rans
port
, Inc
. Y
T
B
eave
r V
alle
y E
x F
indl
ay/A
llegh
eny
T
1
0
11
/13/
95
Roe
der
Car
tage
Co.
, In
c,
Y
T
Will
iam
Pen
n H
w
Nor
th F
ayet
te/A
llegh
eny
T
1
0
11/1
4/95
M
CB
Del
iver
y N
1 T
In
ters
tate
008
0 S
ugar
loaf
/Luz
erne
T
0
0
11/1
4/95
S
teve
ns T
rans
port
atio
n N
1 T
N
.E.
Ext
ensi
on
Was
hing
ton/
Lehi
gh
T
1
0
11
/26/
95
Rob
ert H
anse
n T
ruck
ing
N1 T
In
ters
tate
007
6 Lo
we
r M
erio
n/M
ontg
omer
y
T
0
0
12/1
9/95
C
onso
lidat
ed
Fre
ight
way
s N
1 T
E
ast/W
est
Tur
npik
e M
onro
evill
e/A
llegh
eny
T
1
0
12/2
7/95
JM
G E
nter
pris
es
Y
T
Will
iam
Pen
n H
w
Mur
rysv
ille/
Wes
tmor
elan
d
T
0
0
01/0
9/96
R
oadw
ay E
xpre
ss,
Inc.
N
1 T
In
ters
tate
008
0 M
ario
n/C
entr
e
T
0
0
01/1
6/96
E
aste
rn A
mer
ica
N1 T
In
ters
tate
038
0 C
oolb
augh
/Mon
roe
T
0
0
01
/24/
96
Roa
dway
Exp
ress
N
1 T
In
ters
tate
008
0 Ja
ckso
n/M
onro
e
T
2
0
02/2
8/96
Y
ello
w F
reig
ht
Sys
tem
s N
1 T
In
ters
tate
008
0 S
hena
ngo/
Mer
cer
T
1
0
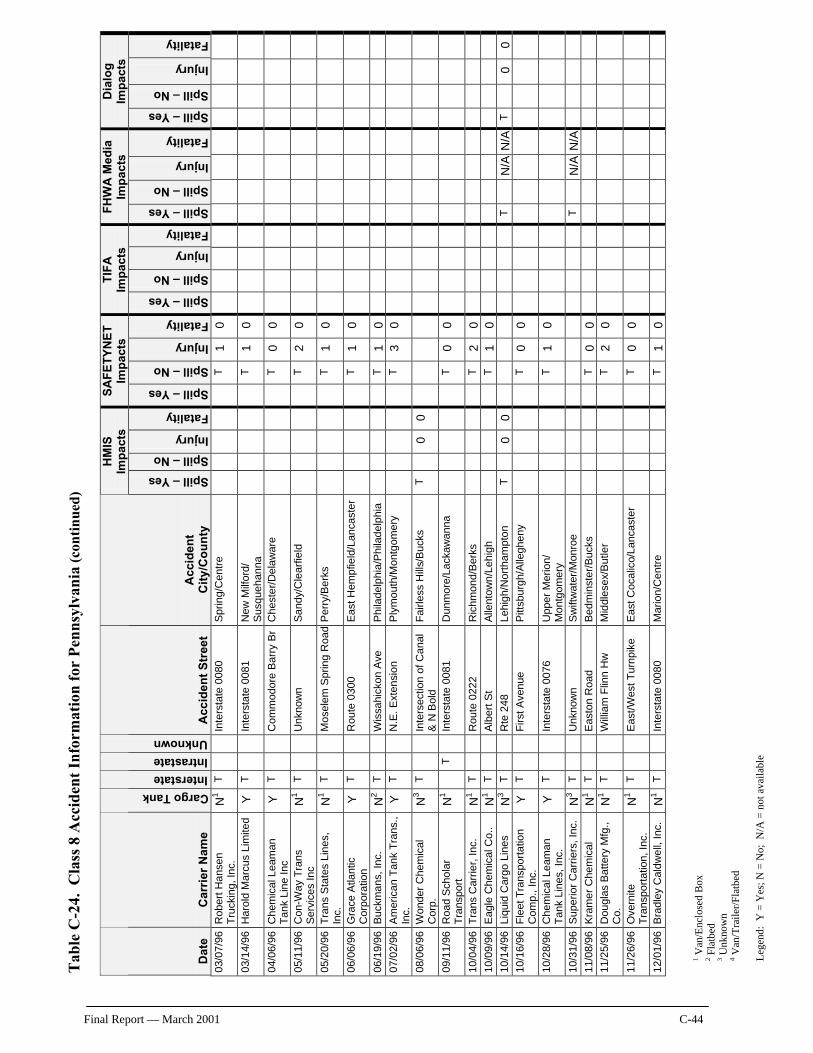
T
able
C-2
4. C
lass
8 A
ccid
ent
Info
rmat
ion
for
Pen
nsyl
vani
a (c
onti
nued
)
1 Van
/Enc
lose
d B
ox
2 Fla
tbed
3 U
nkno
wn
4 Van
/Tra
iler/
Flat
bed
Leg
end:
Y =
Yes
; N =
No;
N/A
= n
ot a
vaila
ble
Final Report — March 2001 C-44
HM
IS
Imp
acts
S
AF
ET
YN
ET
Im
pac
ts
TIF
A
Imp
acts
F
HW
A M
edia
Im
pac
ts
Dia
log
Im
pac
ts
Dat
e C
arri
er N
ame
Cargo Tank
Interstate Intrastate Unknown A
ccid
ent
Str
eet
Acc
iden
t
Cit
y/C
ou
nty
Spill – Yes
Spill – No
Injury
Fatality
Spill – Yes
Spill – No
Injury
Fatality
Spill – Yes
Spill – No
Injury
Fatality
Spill – Yes
Spill – No
Injury
Fatality
Spill – Yes
Spill – No
Injury
Fatality
03/0
7/96
R
ober
t Han
sen
Tru
ckin
g, In
c.
N1 T
In
ters
tate
008
0 S
prin
g/C
entr
e
T
1
0
03/1
4/96
H
arol
d M
arcu
s Li
mite
d Y
T
In
ters
tate
008
1 N
ew M
ilfor
d/
Sus
queh
anna
T
1
0
04/0
6/96
C
hem
ical
Lea
man
T
ank
Line
Inc
Y
T
Com
mod
ore
Bar
ry B
r C
hest
er/D
elaw
are
T
0
0
05/1
1/96
C
on-W
ay T
rans
S
ervi
ces
Inc
N1 T
U
nkno
wn
S
andy
/Cle
arfie
ld
T
2
0
05/2
0/96
T
rans
Sta
tes
Line
s,
Inc.
N
1 T
M
osel
em S
prin
g R
oad
Per
ry/B
erks
T
1
0
06/0
6/96
G
race
Atla
ntic
C
orpo
ratio
n Y
T
R
oute
030
0 E
ast
Hem
pfie
ld/L
anca
ster
T
1
0
06/1
9/96
B
uckm
ans,
Inc
. N
2 T
W
issa
hick
on A
ve
Phi
lade
lphi
a/P
hila
delp
hia
T
1
0
07
/02/
96
Am
eric
an T
ank
Tra
ns.,
Inc.
Y
T
N
.E.
Ext
ensi
on
Ply
mou
th/M
ontg
omer
y
T
3
0
08/0
6/96
W
onde
r C
hem
ical
C
orp.
N
3 T
In
ters
ectio
n of
Can
al
& N
Bol
d F
airle
ss H
ills/
Buc
ks
T
0
0
09/1
1/96
R
oad
Sch
olar
T
rans
port
N
1
T
Inte
rsta
te 0
081
Dun
mor
e/La
ckaw
anna
T
0
0
10/0
4/96
T
rans
Car
rier,
Inc.
N
1 T
R
oute
022
2 R
ichm
ond/
Ber
ks
T
2
0
10
/09/
96
Eag
le C
hem
ical
Co.
. N
1 T
A
lber
t St
Alle
ntow
n/L
ehig
h
T
1
0
10/1
4/96
Li
quid
Car
go L
ines
N
3 T
R
te 2
48
Lehi
gh/N
orth
ampt
on
T
0
0
T
N/A
N/A
T
0
0
10/1
6/96
F
leet
Tra
nspo
rtat
ion
Com
p.,
Inc.
Y
T
F
irst
Ave
nue
Pitt
sbur
gh/A
llegh
eny
T
0
0
10/2
8/96
C
hem
ical
Lea
man
T
ank
Line
s, I
nc.
Y
T
Inte
rsta
te 0
076
Upp
er M
erio
n/
Mon
tgom
ery
T
1
0
10/3
1/96
S
uper
ior
Car
riers
, Inc
. N
3 T
U
nkno
wn
S
wift
wat
er/M
onro
e
T
N/A
N/A
11
/08/
96
Kra
mer
Che
mic
al
N1 T
E
asto
n R
oad
Bed
min
ster
/Buc
ks
T
0
0
11
/25/
96
Dou
glas
Bat
tery
Mfg
., C
o.
N1 T
W
illia
m F
linn
Hw
M
iddl
esex
/But
ler
T
2
0
11/2
6/96
O
vern
ite
Tra
nspo
rtat
ion,
Inc.
N
1 T
E
ast/W
est
Tur
npik
e E
ast
Coc
alic
o/La
ncas
ter
T
0
0
12/0
1/96
B
radl
ey C
aldw
ell,
Inc.
N
1 T
In
ters
tate
008
0 M
ario
n/C
entr
e
T
1
0
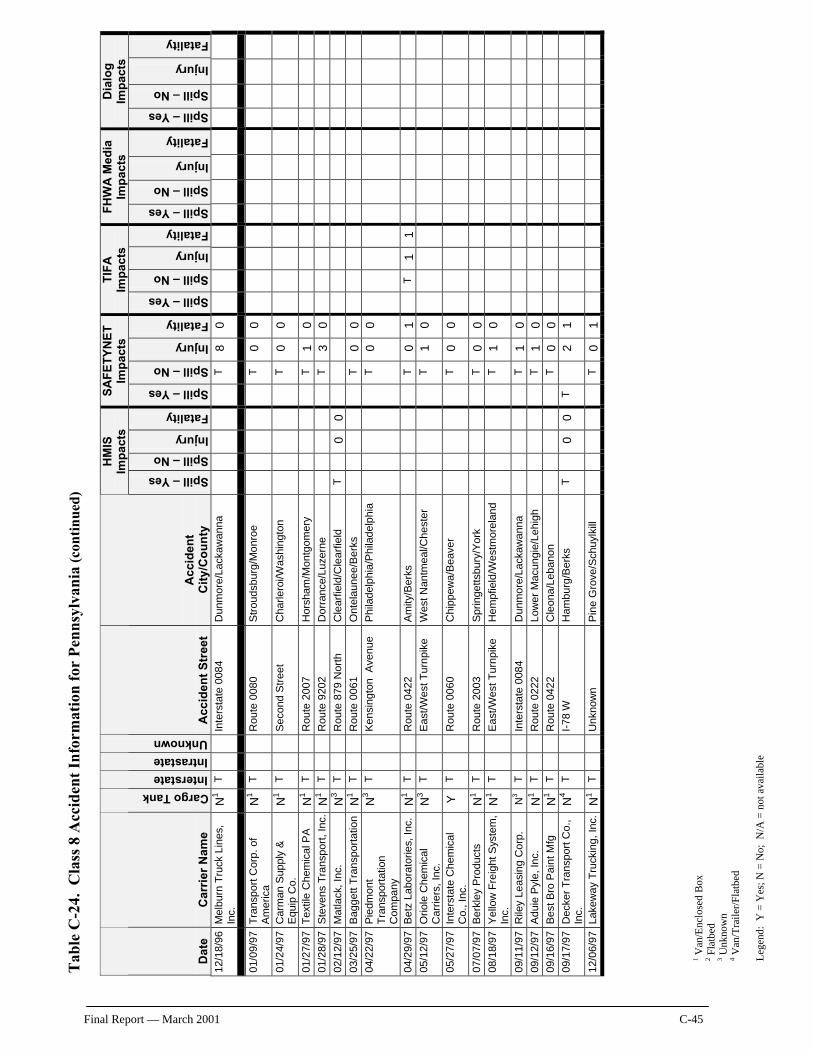
T
able
C-2
4. C
lass
8 A
ccid
ent
Info
rmat
ion
for
Pen
nsyl
vani
a (c
onti
nued
)
1 Van
/Enc
lose
d B
ox
2 Fla
tbed
3 U
nkno
wn
4 Van
/Tra
iler/
Flat
bed
Leg
end:
Y =
Yes
; N =
No;
N/A
= n
ot a
vaila
ble
Final Report — March 2001 C-45
HM
IS
Imp
acts
S
AF
ET
YN
ET
Im
pac
ts
TIF
A
Imp
acts
F
HW
A M
edia
Im
pac
ts
Dia
log
Im
pac
ts
Dat
e C
arri
er N
ame
Cargo Tank
Interstate Intrastate Unknown A
ccid
ent
Str
eet
Acc
iden
t
Cit
y/C
ou
nty
Spill – Yes
Spill – No
Injury
Fatality
Spill – Yes
Spill – No
Injury
Fatality
Spill – Yes
Spill – No
Injury
Fatality
Spill – Yes
Spill – No
Injury
Fatality
Spill – Yes
Spill – No
Injury
Fatality
12/1
8/96
M
elbu
rn T
ruck
Lin
es,
Inc.
N
1 T
In
ters
tate
008
4 D
unm
ore/
Lack
awan
na
T
8
0
01/0
9/97
T
rans
port
Cor
p. o
f A
mer
ica
N1 T
R
oute
008
0 S
trou
dsbu
rg/M
onr
oe
T
0
0
01/2
4/97
C
arm
an S
uppl
y &
E
quip
Co.
N
1 T
S
econ
d S
tree
t C
harle
roi/W
ashi
ngto
n
T
0
0
01/2
7/97
T
extil
e C
hem
ical
PA
N
1 T
R
oute
200
7 H
orsh
am/M
ontg
omer
y
T
1
0
01/2
8/97
S
teve
ns T
rans
port
, Inc
. N
1 T
R
oute
920
2 D
orra
nce/
Luze
rne
T
3
0
02
/12/
97
Mat
lack
, Inc
. N
3 T
R
oute
879
Nor
th
Cle
arfie
ld/C
lear
field
T
0
0
03/2
5/97
B
agge
tt T
rans
port
atio
n N
1 T
R
oute
006
1 O
ntel
aune
e/B
erks
T
0
0
04/2
2/97
P
iedm
ont
Tra
nspo
rtat
ion
Com
pany
N3 T
K
ensi
ngto
n A
venu
e P
hila
delp
hia/
Phi
lade
lphi
a
T
0
0
04/2
9/97
B
etz
Labo
rato
ries,
Inc.
N
1 T
R
oute
042
2 A
mity
/Ber
ks
T
0
1
T
1
1
05/1
2/97
O
riole
Che
mic
al
Car
riers
, In
c.
N3 T
E
ast/W
est
Tur
npik
e W
est
Nan
tmea
l/Che
ster
T
1
0
05/2
7/97
In
ters
tate
Che
mic
al
Co.
, Inc
. Y
T
R
oute
006
0 C
hipp
ewa/
Bea
ver
T
0
0
07/0
7/97
B
erkl
ey P
rodu
cts
N1 T
R
oute
200
3 S
prin
getts
bury
/Yor
k
T
0
0
08/1
8/97
Y
ello
w F
reig
ht S
yste
m,
Inc.
N
1 T
E
ast/W
est
Tur
npik
e H
empf
ield
/Wes
tmor
elan
d
T
1
0
09/1
1/97
R
iley
Leas
ing
Cor
p.
N3
T
Inte
rsta
te 0
084
Dun
mor
e/La
ckaw
anna
T
1
0
09/1
2/97
A
duie
Pyl
e, In
c.
N1 T
R
oute
022
2 Lo
wer
Mac
ungi
e/Le
high
T
1
0
09/1
6/97
B
est B
ro P
aint
Mfg
N
1 T
R
oute
042
2 C
leon
a/Le
bano
n
T
0
0
09/1
7/97
D
ecke
r T
rans
port
Co.
, In
c.
N4 T
I-
78 W
H
ambu
rg/B
erks
T
0
0
T
2
1
12/0
6/97
La
kew
ay T
ruck
ing,
Inc
. N
1 T
U
nkno
wn
P
ine
Gro
ve/S
chuy
lkill
T
0
1
Appendix D
Natural Resource Damages Settlements

Final Report — March 2001
D-1
Appendix D Natural Resource Damages Settlements
able (D-1) presents 30 natural resource settlements from sites around the country. The settlements are representative of the magnitude of settlement characteristic of sites where environmental damage has occurred. The settlements are often the result of
complex environmental damage that would likely be more serious than that anticipated from a HM spill after cleanup has occurred. However the damages provide a useful conservative estimate of damage associated with specified acreage.
T
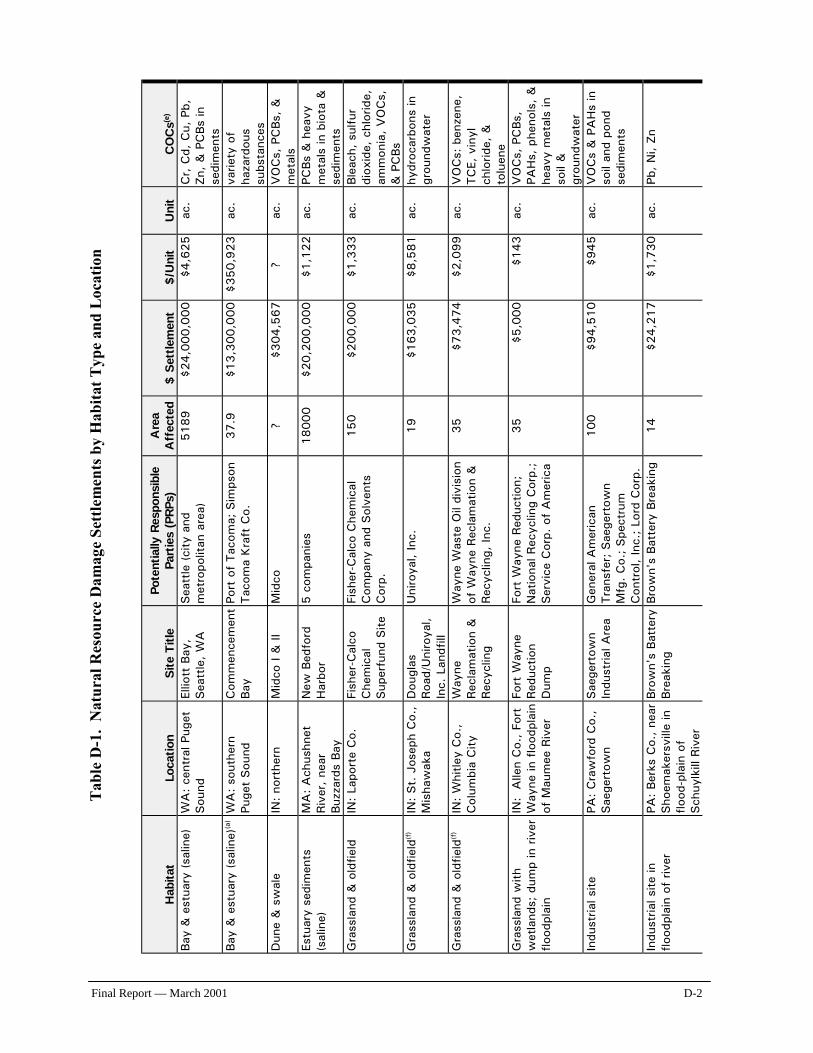
Final Report — March 2001 D-2
Tab
le D
-1.
Nat
ural
Res
ourc
e D
amag
e Se
ttle
men
ts b
y H
abit
at T
ype
and
Loc
atio
n
Hab
itat
Lo
cation
Site
Title
Po
tent
ially
Res
pons
ible
Pa
rtie
s (P
RPs
) A
rea
Aff
ecte
d $ S
ettlem
ent
$/U
nit
Uni
t C
OC
s(e)
Bay
& e
stua
ry (
salin
e)
WA
: ce
ntra
l Pug
et
Sou
nd
Ellio
tt B
ay,
Sea
ttle
, W
A
Sea
ttle
(ci
ty a
nd
met
ropo
litan
are
a)
5189
$24,0
00,0
00
$4,6
25
ac.
Cr,
Cd,
Cu,
Pb,
Zn
, &
PC
Bs
in
sedi
men
ts
Bay
& e
stua
ry (sa
line)
(a)
WA
: so
uthe
rn
Puge
t Sou
nd
Com
men
cem
ent
Bay
Po
rt o
f Tac
oma;
Sim
pson
Tac
oma
Kra
ft C
o.
37.9
$
13,3
00,0
00
$350,9
23
ac.
varie
ty o
f ha
zard
ous
subs
tanc
es
Dun
e &
sw
ale
IN:
nort
hern
M
idco
I &
II
Mid
co
? $
304,5
67
?
ac.
VO
Cs,
PC
Bs,
&
met
als
Estu
ary
sedi
men
ts
(sal
ine)
M
A:
Ach
ushn
et
Riv
er, ne
ar
Buz
zard
s Bay
New
Bed
ford
H
arbo
r 5 c
ompa
nies
18000
$20,2
00,0
00
$1,1
22
ac.
PCBs
& h
eavy
m
etal
s in
bio
ta &
se
dim
ents
G
rass
land
& o
ldfie
ld
IN:
Lapo
rte
Co.
Fi
sher
-Cal
co
Che
mic
al
Sup
erfu
nd S
ite
Fish
er-C
alco
Che
mic
al
Com
pany
and
Sol
vent
s C
orp.
150
$200,0
00
$1,3
33
ac.
Ble
ach,
sul
fur
diox
ide,
chl
orid
e,
amm
onia
, V
OC
s,
& P
CBs
Gra
ssla
nd &
old
field
(f)
IN:
St.
Jos
eph
Co.
, M
isha
wak
a D
ougl
as
Roa
d/U
niro
yal,
Inc.
Lan
dfill
Uni
roya
l, In
c.
19
$163,0
35
$8,5
81
ac.
hydr
ocar
bons
in
grou
ndw
ater
Gra
ssla
nd &
old
field
(f)
IN:
Whi
tley
Co.
, C
olum
bia
City
W
ayne
Rec
lam
atio
n &
Rec
yclin
g
Way
ne W
aste
Oil
divi
sion
of
Way
ne R
ecla
mat
ion
&
Rec
yclin
g, In
c.
35
$73,4
74
$2,0
99
ac.
VO
Cs:
ben
zene
, TC
E, v
inyl
ch
lorid
e, &
to
luen
e G
rass
land
with
w
etla
nds;
dum
p in
riv
er
flood
plai
n
IN:
Alle
n C
o.,
Fort
W
ayne
in f
lood
plai
n of
Mau
mee
Riv
er
Fort
Way
ne
Red
uctio
n D
ump
Fort
Way
ne R
educ
tion;
N
atio
nal R
ecyc
ling
Cor
p.;
Ser
vice
Cor
p. o
f A
mer
ica
35
$5,0
00
$143
ac.
VO
Cs,
PC
Bs,
PA
Hs,
phe
nols
, &
he
avy
met
als
in
soil
&
grou
ndw
ater
In
dust
rial s
ite
PA:
Cra
wfo
rd C
o.,
Sae
gert
own
Sae
gert
own
Indu
stria
l Are
a G
ener
al A
mer
ican
Tra
nsfe
r; S
aege
rtow
n M
fg.
Co.
; Spe
ctru
m
Con
trol
, In
c.;
Lord
Cor
p.
100
$94,5
10
$945
ac.
VO
Cs
& P
AH
s in
so
il an
d po
nd
sedi
men
ts
Indu
stria
l site
in
flood
plai
n of
riv
er
PA:
Ber
ks C
o.,
near
Sho
emak
ersv
ille
in
flood
-pla
in o
f Sch
uylk
ill R
iver
Bro
wn'
s Bat
tery
Bre
akin
g
Bro
wn'
s Bat
tery
Bre
akin
g 14
$24,2
17
$1,7
30
ac.
Pb,
Ni,
Zn
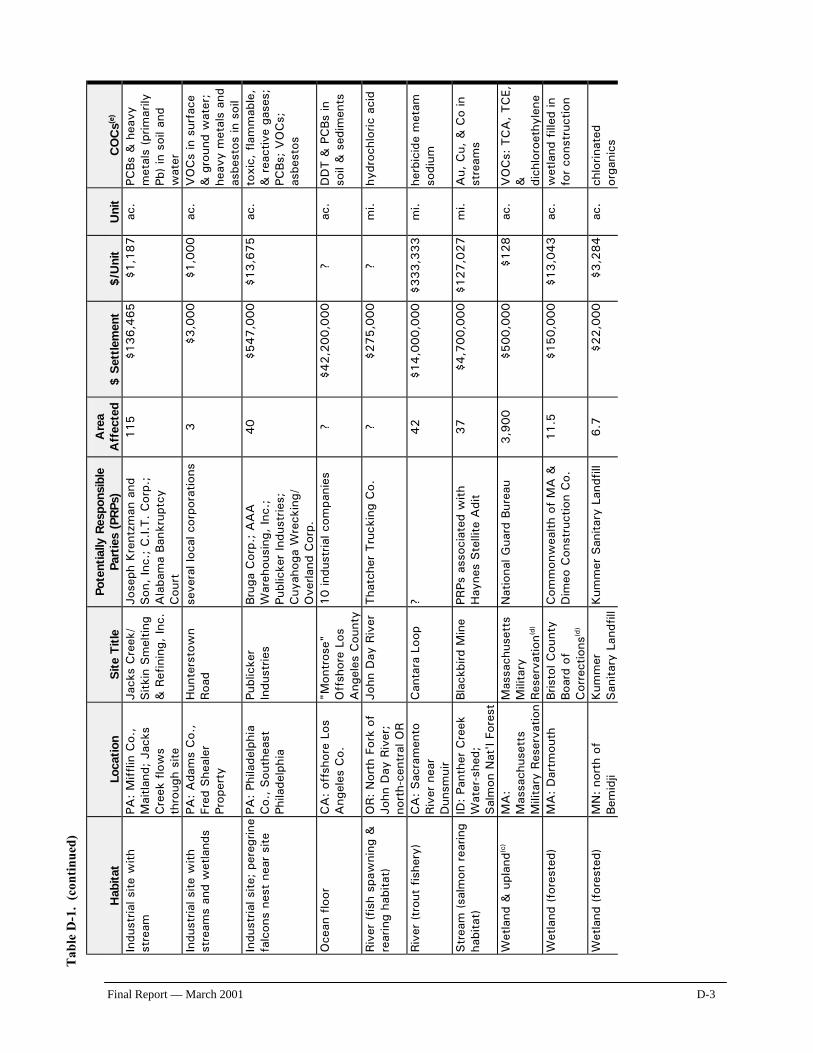
Tab
le D
-1.
(con
tinu
ed)
Final Report — March 2001 D-3
Hab
itat
Lo
cation
Site
Title
Po
tent
ially
Res
pons
ible
Pa
rtie
s (P
RPs
) A
rea
Aff
ecte
d $ S
ettlem
ent
$/U
nit
Uni
t C
OC
s(e)
Indu
stria
l site
with
st
ream
PA
: M
ifflin
Co.
, M
aitla
nd;
Jack
s C
reek
flo
ws
thro
ugh
site
Jack
s C
reek
/ Sitk
in S
mel
ting
& R
efin
ing,
Inc.
Jose
ph K
rent
zman
and
Son
, In
c.;
C.I.
T.
Cor
p.;
Ala
bam
a Ban
krup
tcy
Cou
rt
115
$136,4
65
$1,1
87
ac.
PCBs
& h
eavy
m
etal
s (p
rimar
ily
Pb)
in s
oil a
nd
wat
er
Indu
stria
l site
with
st
ream
s an
d w
etla
nds
PA:
Ada
ms
Co.
, Fr
ed S
heal
er
Prop
erty
Hun
ters
tow
n Roa
d se
vera
l loc
al c
orpo
ratio
ns
3
$3,0
00
$1,0
00
ac.
VO
Cs
in s
urfa
ce
& g
roun
d w
ater
; he
avy
met
als
and
asbe
stos
in s
oil
Indu
stria
l site
; pe
regr
ine
falc
ons
nest
nea
r si
te
PA:
Phila
delp
hia
Co.
, Sou
thea
st
Phila
delp
hia
Publ
icke
r In
dust
ries
Bru
ga C
orp.
; A
AA
W
areh
ousi
ng,
Inc.
; Pu
blic
ker
Indu
strie
s;
Cuy
ahog
a W
reck
ing/
O
verla
nd C
orp.
40
$547,0
00
$13,6
75
ac.
toxi
c, f
lam
mab
le,
& r
eact
ive
gase
s;
PCBs;
VO
Cs;
as
best
os
Oce
an f
loor
C
A:
offs
hore
Los
A
ngel
es C
o.
"Mon
tros
e"
Off
shor
e Lo
s A
ngel
es C
ount
y
10 in
dust
rial c
ompa
nies
?
$42,2
00,0
00
?
ac.
DD
T &
PC
Bs
in
soil
& s
edim
ents
Riv
er (
fish
spaw
ning
&
rear
ing
habi
tat)
O
R:
Nor
th F
ork
of
John
Day
Riv
er;
nort
h-ce
ntra
l OR
John
Day
Riv
er
Tha
tche
r Tru
ckin
g C
o.
? $
275,0
00
?
mi.
hydr
ochl
oric
aci
d
Riv
er (tr
out
fishe
ry)
CA
: Sac
ram
ento
Riv
er n
ear
Dun
smui
r
Can
tara
Loo
p ?
42
$14,0
00,0
00
$333,3
33
mi.
herb
icid
e m
etam
so
dium
Str
eam
(sa
lmon
rea
ring
habi
tat)
ID
: Pa
nthe
r C
reek
W
ater
-she
d;
Sal
mon
Nat
'l Fo
rest
Bla
ckbi
rd M
ine
PRPs
ass
ocia
ted
with
H
ayne
s Ste
llite
Adi
t 37
$4,7
00,0
00
$127,0
27
mi.
Au,
Cu,
& C
o in
st
ream
s
Wet
land
& u
plan
d(c)
MA
: M
assa
chus
etts
M
ilita
ry R
eser
vatio
n
Mas
sach
uset
ts
Mili
tary
Res
erva
tion(d
)
Nat
iona
l Gua
rd B
urea
u 3,9
00
$500,0
00
$128
ac.
VO
Cs:
TC
A,
TC
E,
&
dich
loro
ethy
lene
W
etla
nd (
fore
sted
) M
A:
Dar
tmou
th
Bris
tol C
ount
y Boa
rd o
f C
orre
ctio
ns(d
)
Com
mon
wea
lth o
f M
A &
D
imeo
Con
stru
ctio
n C
o.
11.5
$
150,0
00
$13,0
43
ac.
wet
land
fill
ed in
fo
r co
nstr
uctio
n
Wet
land
(fo
rest
ed)
MN
: no
rth
of
Bem
idji
Kum
mer
San
itary
Lan
dfill
Kum
mer
San
itary
Lan
dfill
6.7
$
22,0
00
$3,2
84
ac.
chlo
rinat
ed
orga
nics
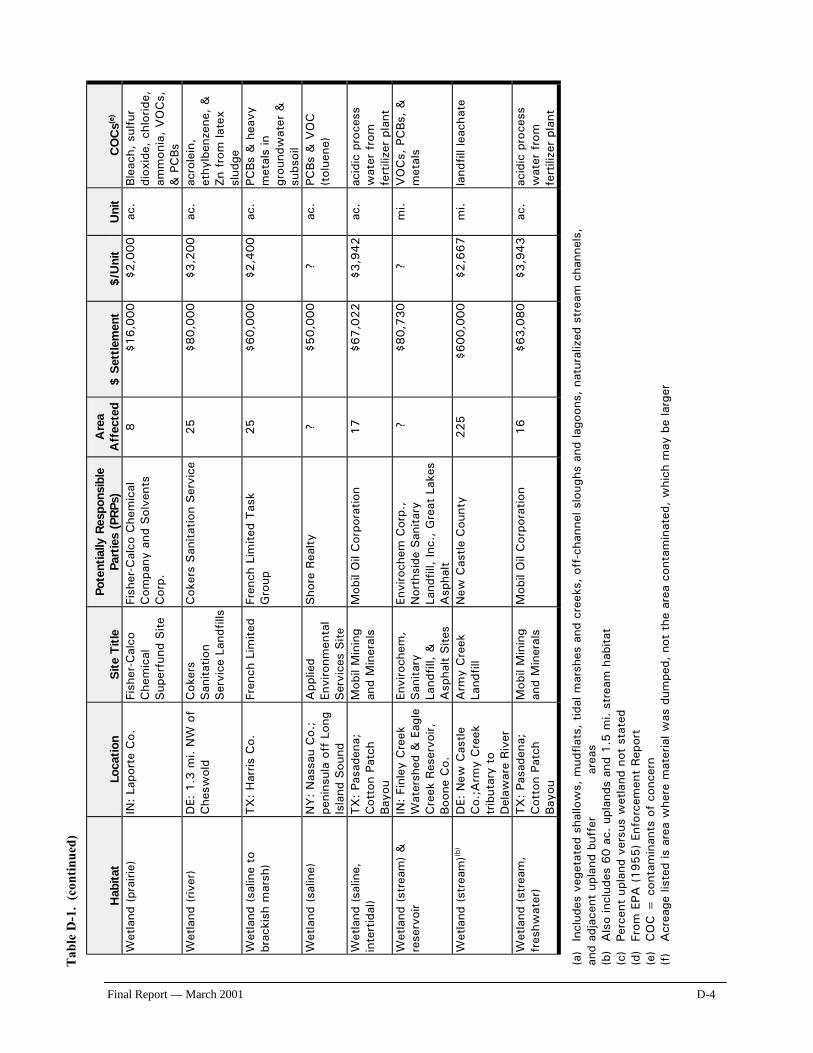
Tab
le D
-1.
(con
tinu
ed)
Final Report — March 2001 D-4
Hab
itat
Lo
cation
Site
Title
Po
tent
ially
Res
pons
ible
Pa
rtie
s (P
RPs
) A
rea
Aff
ecte
d $ S
ettlem
ent
$/U
nit
Uni
t C
OC
s(e)
Wet
land
(pr
airie
) IN
: La
port
e C
o.
Fish
er-C
alco
C
hem
ical
Sup
erfu
nd S
ite
Fish
er-C
alco
Che
mic
al
Com
pany
and
Sol
vent
s C
orp.
8
$16,0
00
$2,0
00
ac.
Ble
ach,
sul
fur
diox
ide,
chl
orid
e,
amm
onia
, V
OC
s,
& P
CBs
Wet
land
(riv
er)
DE:
1.3
mi.
NW
of
Che
swol
d C
oker
s San
itatio
n Ser
vice
Lan
dfill
s
Cok
ers
San
itatio
n Ser
vice
25
$80,0
00
$3,2
00
ac.
acro
lein
, et
hylb
enze
ne,
&
Zn f
rom
late
x sl
udge
W
etla
nd (
salin
e to
br
acki
sh m
arsh
) TX
: H
arris
Co.
Fr
ench
Lim
ited
Fr
ench
Lim
ited
Tas
k G
roup
25
$60,0
00
$2,4
00
ac.
PCBs
& h
eavy
m
etal
s in
gr
ound
wat
er &
su
bsoi
l W
etla
nd (
salin
e)
NY
: N
assa
u C
o.;
peni
nsul
a of
f Lo
ng
Isla
nd S
ound
App
lied
Envi
ronm
enta
l Ser
vice
s Site
Sho
re R
ealty
?
$50,0
00
?
ac.
PCBs
& V
OC
(t
olue
ne)
Wet
land
(sa
line,
in
tert
idal
) TX
: Pa
sade
na;
Cot
ton
Patc
h Bay
ou
Mob
il M
inin
g an
d M
iner
als
Mob
il O
il C
orpo
ratio
n 17
$67,0
22
$3,9
42
ac.
acid
ic p
roce
ss
wat
er f
rom
fe
rtili
zer
plan
t W
etla
nd (
stre
am)
&
rese
rvoi
r IN
: Fi
nley
Cre
ek
Wat
ersh
ed &
Eag
le
Cre
ek R
eser
voir,
Boo
ne C
o.
Envi
roch
em,
San
itary
La
ndfil
l, &
A
spha
lt Site
s
Envi
roch
em C
orp.
, N
orth
side
San
itary
La
ndfil
l, In
c.,
Gre
at L
akes
A
spha
lt
?
$80,7
30
?
mi.
VO
Cs,
PC
Bs,
&
met
als
Wet
land
(st
ream
)(b)
DE:
New
Cas
tle
Co.
;Arm
y C
reek
tr
ibut
ary
to
Del
awar
e Riv
er
Arm
y C
reek
La
ndfil
l N
ew C
astle
Cou
nty
225
$600,0
00
$2,6
67
mi.
land
fill l
each
ate
Wet
land
(st
ream
, fr
eshw
ater
) TX
: Pa
sade
na;
Cot
ton
Patc
h Bay
ou
Mob
il M
inin
g an
d M
iner
als
Mob
il O
il C
orpo
ratio
n 16
$63,0
80
$3,9
43
ac.
acid
ic p
roce
ss
wat
er f
rom
fe
rtili
zer
plan
t (a
) In
clud
es v
eget
ated
sha
llow
s, m
udfla
ts,
tidal
mar
shes
and
cre
eks,
off
-cha
nnel
slo
ughs
and
lago
ons,
nat
ural
ized
str
eam
cha
nnel
s,
and
adja
cent
upl
and
buff
er
area
s (b
) A
lso
incl
udes
60 a
c. u
plan
ds a
nd 1
.5 m
i. st
ream
hab
itat
(c)
Perc
ent
upla
nd v
ersu
s w
etla
nd n
ot s
tate
d (d
) Fr
om E
PA (
1955)
Enfo
rcem
ent
Rep
ort
(e)
CO
C =
con
tam
inan
ts o
f co
ncer
n (f
) A
crea
ge li
sted
is a
rea
whe
re m
ater
ial w
as d
umpe
d, n
ot t
he a
rea
cont
amin
ated
, w
hich
may
be
larg
er


Appendix D
Natural Resource Damages Settlements
Final Report — March 2001
D-1
Appendix D Natural Resource Damages Settlements
able (D-1) presents 30 natural resource settlements from sites around the country. The settlements are representative of the magnitude of settlement characteristic of sites where environmental damage has occurred. The settlements are often the result of
complex environmental damage that would likely be more serious than that anticipated from a HM spill after cleanup has occurred. However the damages provide a useful conservative estimate of damage associated with specified acreage.
T
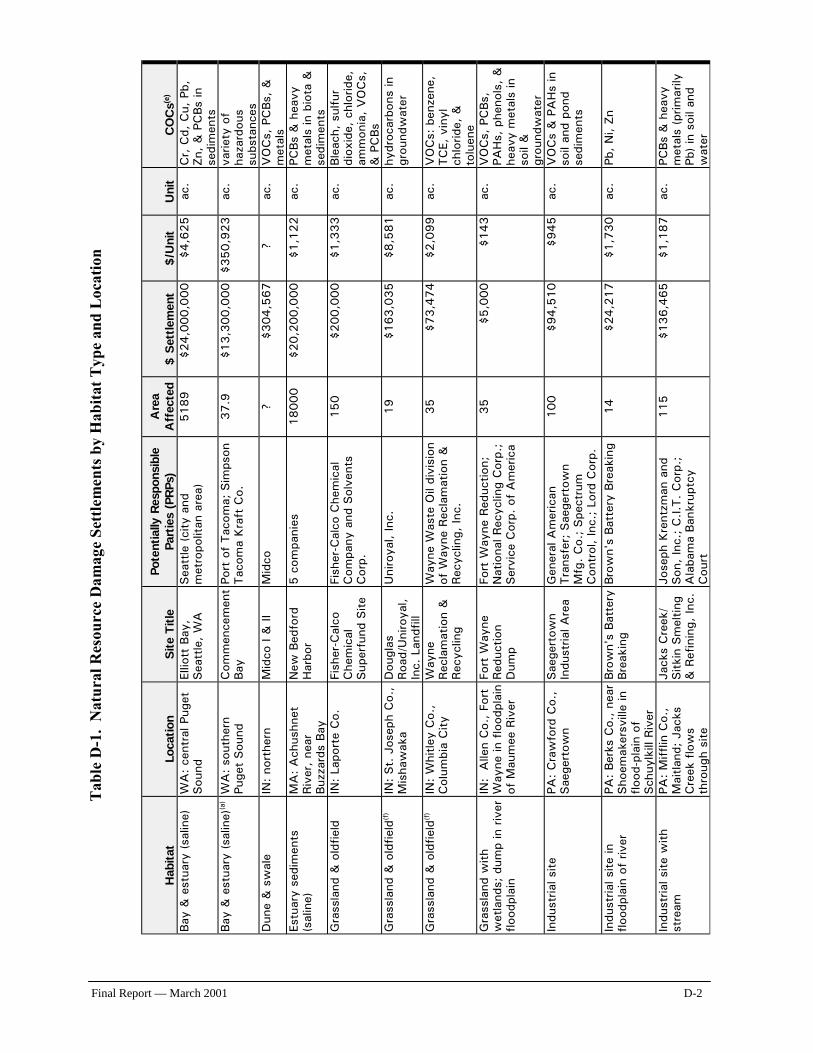
Final Report — March 2001 D-2
Tab
le D
-1.
Nat
ural
Res
ourc
e D
amag
e Se
ttle
men
ts b
y H
abit
at T
ype
and
Loc
atio
n
Hab
itat
Lo
cation
Site
Title
Po
tent
ially
Res
pons
ible
Pa
rtie
s (P
RPs
) A
rea
Aff
ecte
d $ S
ettlem
ent
$/U
nit
Uni
t C
OC
s(e)
Bay
& e
stua
ry (
salin
e)
WA
: ce
ntra
l Pug
et
Sou
nd
Ellio
tt B
ay,
Sea
ttle
, W
A
Sea
ttle
(ci
ty a
nd
met
ropo
litan
are
a)
5189
$24,0
00,0
00
$4,6
25
ac.
Cr,
Cd,
Cu,
Pb,
Zn
, &
PC
Bs
in
sedi
men
ts
Bay
& e
stua
ry (sa
line)
(a)
WA
: so
uthe
rn
Puge
t Sou
nd
Com
men
cem
ent
Bay
Po
rt o
f Tac
oma;
Sim
pson
Tac
oma
Kra
ft C
o.
37.9
$
13,3
00,0
00
$350,9
23
ac.
varie
ty o
f ha
zard
ous
subs
tanc
es
Dun
e &
sw
ale
IN:
nort
hern
M
idco
I &
II
Mid
co
? $
304,5
67
?
ac.
VO
Cs,
PC
Bs,
&
met
als
Estu
ary
sedi
men
ts
(sal
ine)
M
A:
Ach
ushn
et
Riv
er, ne
ar
Buz
zard
s Bay
New
Bed
ford
H
arbo
r 5 c
ompa
nies
18000
$20,2
00,0
00
$1,1
22
ac.
PCBs
& h
eavy
m
etal
s in
bio
ta &
se
dim
ents
G
rass
land
& o
ldfie
ld
IN:
Lapo
rte
Co.
Fi
sher
-Cal
co
Che
mic
al
Sup
erfu
nd S
ite
Fish
er-C
alco
Che
mic
al
Com
pany
and
Sol
vent
s C
orp.
150
$200,0
00
$1,3
33
ac.
Ble
ach,
sul
fur
diox
ide,
chl
orid
e,
amm
onia
, V
OC
s,
& P
CBs
Gra
ssla
nd &
old
field
(f)
IN:
St.
Jos
eph
Co.
, M
isha
wak
a D
ougl
as
Roa
d/U
niro
yal,
Inc.
Lan
dfill
Uni
roya
l, In
c.
19
$163,0
35
$8,5
81
ac.
hydr
ocar
bons
in
grou
ndw
ater
Gra
ssla
nd &
old
field
(f)
IN:
Whi
tley
Co.
, C
olum
bia
City
W
ayne
Rec
lam
atio
n &
Rec
yclin
g
Way
ne W
aste
Oil
divi
sion
of
Way
ne R
ecla
mat
ion
&
Rec
yclin
g, In
c.
35
$73,4
74
$2,0
99
ac.
VO
Cs:
ben
zene
, TC
E, v
inyl
ch
lorid
e, &
to
luen
e G
rass
land
with
w
etla
nds;
dum
p in
riv
er
flood
plai
n
IN:
Alle
n C
o.,
Fort
W
ayne
in f
lood
plai
n of
Mau
mee
Riv
er
Fort
Way
ne
Red
uctio
n D
ump
Fort
Way
ne R
educ
tion;
N
atio
nal R
ecyc
ling
Cor
p.;
Ser
vice
Cor
p. o
f A
mer
ica
35
$5,0
00
$143
ac.
VO
Cs,
PC
Bs,
PA
Hs,
phe
nols
, &
he
avy
met
als
in
soil
&
grou
ndw
ater
In
dust
rial s
ite
PA:
Cra
wfo
rd C
o.,
Sae
gert
own
Sae
gert
own
Indu
stria
l Are
a G
ener
al A
mer
ican
Tra
nsfe
r; S
aege
rtow
n M
fg.
Co.
; Spe
ctru
m
Con
trol
, In
c.;
Lord
Cor
p.
100
$94,5
10
$945
ac.
VO
Cs
& P
AH
s in
so
il an
d po
nd
sedi
men
ts
Indu
stria
l site
in
flood
plai
n of
riv
er
PA:
Ber
ks C
o.,
near
Sho
emak
ersv
ille
in
flood
-pla
in o
f Sch
uylk
ill R
iver
Bro
wn'
s Bat
tery
Bre
akin
g
Bro
wn'
s Bat
tery
Bre
akin
g 14
$24,2
17
$1,7
30
ac.
Pb,
Ni,
Zn
Indu
stria
l site
with
st
ream
PA
: M
ifflin
Co.
, M
aitla
nd;
Jack
s C
reek
flo
ws
thro
ugh
site
Jack
s C
reek
/ Sitk
in S
mel
ting
& R
efin
ing,
Inc.
Jose
ph K
rent
zman
and
Son
, In
c.;
C.I.
T.
Cor
p.;
Ala
bam
a Ban
krup
tcy
Cou
rt
115
$136,4
65
$1,1
87
ac.
PCBs
& h
eavy
m
etal
s (p
rimar
ily
Pb)
in s
oil a
nd
wat
er
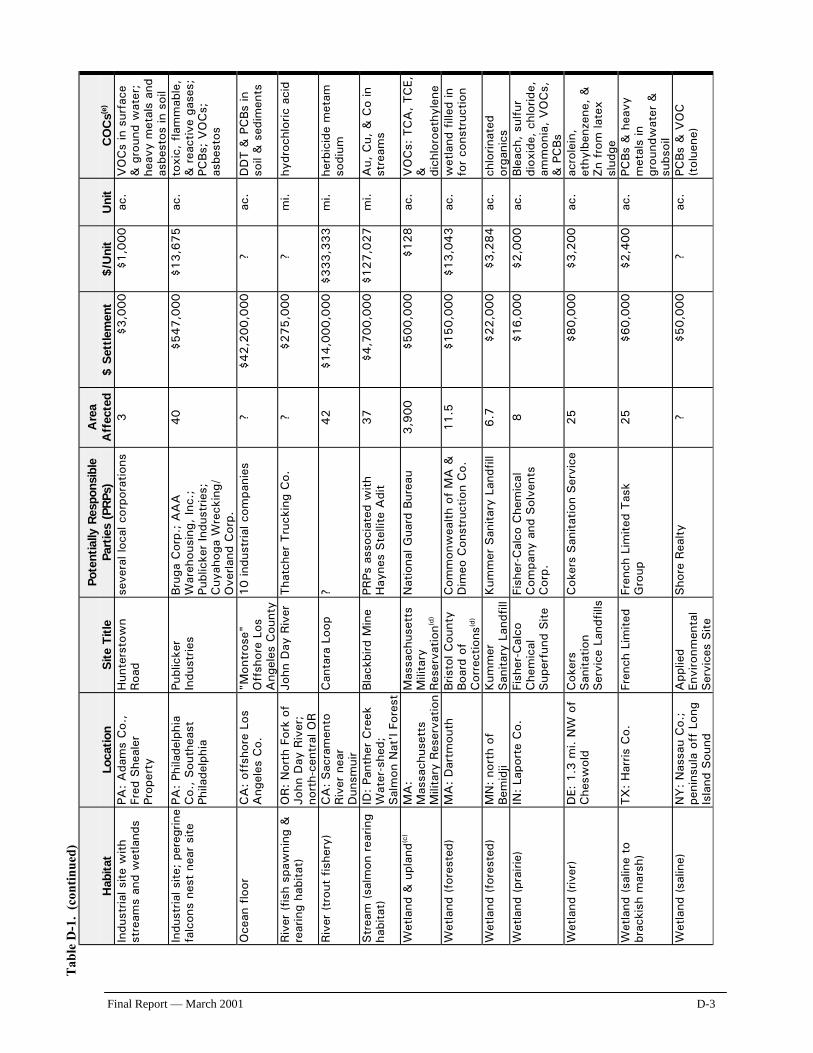
Tab
le D
-1.
(con
tinu
ed)
Final Report — March 2001 D-3
Hab
itat
Lo
cation
Site
Title
Po
tent
ially
Res
pons
ible
Pa
rtie
s (P
RPs
) A
rea
Aff
ecte
d $ S
ettlem
ent
$/U
nit
Uni
t C
OC
s(e)
Indu
stria
l site
with
st
ream
s an
d w
etla
nds
PA:
Ada
ms
Co.
, Fr
ed S
heal
er
Prop
erty
Hun
ters
tow
n Roa
d se
vera
l loc
al c
orpo
ratio
ns
3
$3,0
00
$1,0
00
ac.
VO
Cs
in s
urfa
ce
& g
roun
d w
ater
; he
avy
met
als
and
asbe
stos
in s
oil
Indu
stria
l site
; pe
regr
ine
falc
ons
nest
nea
r si
te
PA:
Phila
delp
hia
Co.
, Sou
thea
st
Phila
delp
hia
Publ
icke
r In
dust
ries
Bru
ga C
orp.
; A
AA
W
areh
ousi
ng,
Inc.
; Pu
blic
ker
Indu
strie
s;
Cuy
ahog
a W
reck
ing/
O
verla
nd C
orp.
40
$547,0
00
$13,6
75
ac.
toxi
c, f
lam
mab
le,
& r
eact
ive
gase
s;
PCBs;
VO
Cs;
as
best
os
Oce
an f
loor
C
A:
offs
hore
Los
A
ngel
es C
o.
"Mon
tros
e"
Off
shor
e Lo
s A
ngel
es C
ount
y
10 in
dust
rial c
ompa
nies
?
$42,2
00,0
00
?
ac.
DD
T &
PC
Bs
in
soil
& s
edim
ents
Riv
er (
fish
spaw
ning
&
rear
ing
habi
tat)
O
R:
Nor
th F
ork
of
John
Day
Riv
er;
nort
h-ce
ntra
l OR
John
Day
Riv
er
Tha
tche
r Tru
ckin
g C
o.
? $
275,0
00
?
mi.
hydr
ochl
oric
aci
d
Riv
er (tr
out
fishe
ry)
CA
: Sac
ram
ento
Riv
er n
ear
Dun
smui
r
Can
tara
Loo
p ?
42
$14,0
00,0
00
$333,3
33
mi.
herb
icid
e m
etam
so
dium
Str
eam
(sa
lmon
rea
ring
habi
tat)
ID
: Pa
nthe
r C
reek
W
ater
-she
d;
Sal
mon
Nat
'l Fo
rest
Bla
ckbi
rd M
ine
PRPs
ass
ocia
ted
with
H
ayne
s Ste
llite
Adi
t 37
$4,7
00,0
00
$127,0
27
mi.
Au,
Cu,
& C
o in
st
ream
s
Wet
land
& u
plan
d(c)
MA
: M
assa
chus
etts
M
ilita
ry R
eser
vatio
n
Mas
sach
uset
ts
Mili
tary
Res
erva
tion(d
)
Nat
iona
l Gua
rd B
urea
u 3,9
00
$500,0
00
$128
ac.
VO
Cs:
TC
A,
TC
E,
&
dich
loro
ethy
lene
W
etla
nd (
fore
sted
) M
A:
Dar
tmou
th
Bris
tol C
ount
y Boa
rd o
f C
orre
ctio
ns(d
)
Com
mon
wea
lth o
f M
A &
D
imeo
Con
stru
ctio
n C
o.
11.5
$
150,0
00
$13,0
43
ac.
wet
land
fill
ed in
fo
r co
nstr
uctio
n
Wet
land
(fo
rest
ed)
MN
: no
rth
of
Bem
idji
Kum
mer
San
itary
Lan
dfill
Kum
mer
San
itary
Lan
dfill
6.7
$
22,0
00
$3,2
84
ac.
chlo
rinat
ed
orga
nics
W
etla
nd (
prai
rie)
IN:
Lapo
rte
Co.
Fi
sher
-Cal
co
Che
mic
al
Sup
erfu
nd S
ite
Fish
er-C
alco
Che
mic
al
Com
pany
and
Sol
vent
s C
orp.
8
$16,0
00
$2,0
00
ac.
Ble
ach,
sul
fur
diox
ide,
chl
orid
e,
amm
onia
, V
OC
s,
& P
CBs
Wet
land
(riv
er)
DE:
1.3
mi.
NW
of
Che
swol
d C
oker
s San
itatio
n Ser
vice
Lan
dfill
s
Cok
ers
San
itatio
n Ser
vice
25
$80,0
00
$3,2
00
ac.
acro
lein
, et
hylb
enze
ne,
&
Zn f
rom
late
x sl
udge
W
etla
nd (
salin
e to
br
acki
sh m
arsh
) TX
: H
arris
Co.
Fr
ench
Lim
ited
Fr
ench
Lim
ited
Tas
k G
roup
25
$60,0
00
$2,4
00
ac.
PCBs
& h
eavy
m
etal
s in
gr
ound
wat
er &
su
bsoi
l W
etla
nd (
salin
e)
NY
: N
assa
u C
o.;
peni
nsul
a of
f Lo
ng
Isla
nd S
ound
App
lied
Envi
ronm
enta
l Ser
vice
s Site
Sho
re R
ealty
?
$50,0
00
?
ac.
PCBs
& V
OC
(t
olue
ne)
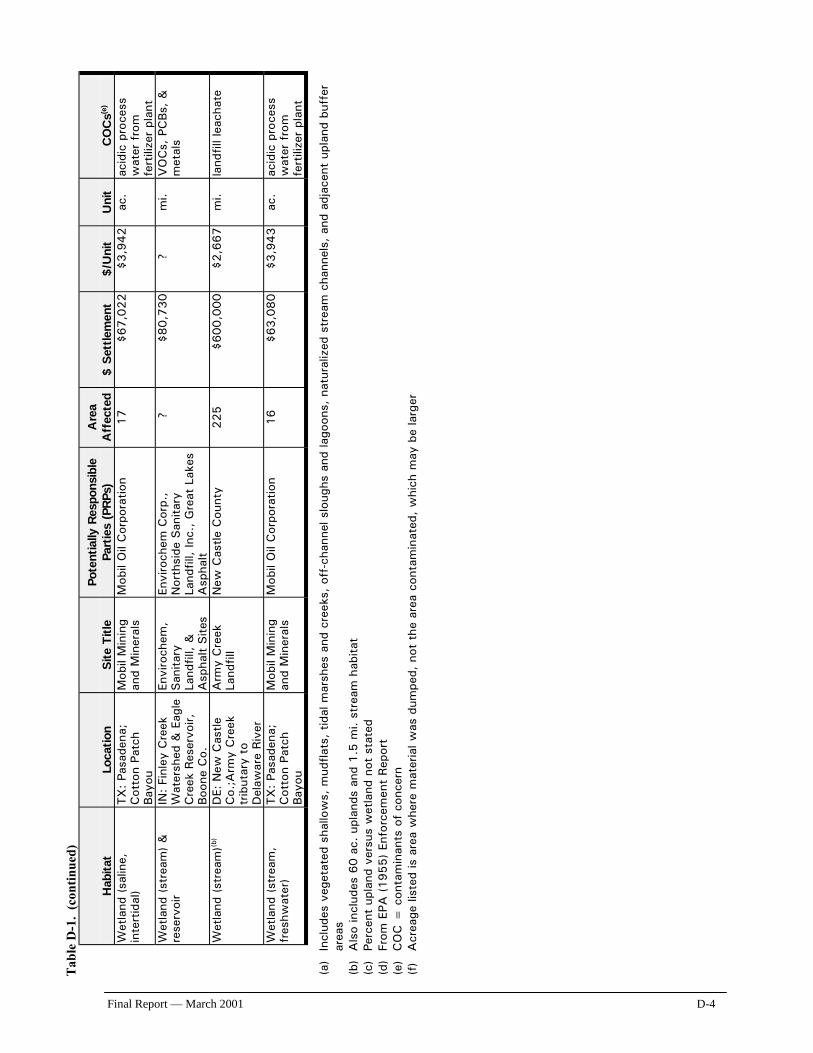
Tab
le D
-1.
(con
tinu
ed)
Final Report — March 2001 D-4
Hab
itat
Lo
cation
Site
Title
Po
tent
ially
Res
pons
ible
Pa
rtie
s (P
RPs
) A
rea
Aff
ecte
d $ S
ettlem
ent
$/U
nit
Uni
t C
OC
s(e)
Wet
land
(sa
line,
in
tert
idal
) TX
: Pa
sade
na;
Cot
ton
Patc
h Bay
ou
Mob
il M
inin
g an
d M
iner
als
Mob
il O
il C
orpo
ratio
n 17
$67,0
22
$3,9
42
ac.
acid
ic p
roce
ss
wat
er f
rom
fe
rtili
zer
plan
t W
etla
nd (
stre
am)
&
rese
rvoi
r IN
: Fi
nley
Cre
ek
Wat
ersh
ed &
Eag
le
Cre
ek R
eser
voir,
Boo
ne C
o.
Envi
roch
em,
San
itary
La
ndfil
l, &
A
spha
lt Site
s
Envi
roch
em C
orp.
, N
orth
side
San
itary
La
ndfil
l, In
c.,
Gre
at L
akes
A
spha
lt
?
$80,7
30
?
mi.
VO
Cs,
PC
Bs,
&
met
als
Wet
land
(st
ream
)(b)
DE:
New
Cas
tle
Co.
;Arm
y C
reek
tr
ibut
ary
to
Del
awar
e Riv
er
Arm
y C
reek
La
ndfil
l N
ew C
astle
Cou
nty
225
$600,0
00
$2,6
67
mi.
land
fill l
each
ate
Wet
land
(st
ream
, fr
eshw
ater
) TX
: Pa
sade
na;
Cot
ton
Patc
h Bay
ou
Mob
il M
inin
g an
d M
iner
als
Mob
il O
il C
orpo
ratio
n 16
$63,0
80
$3,9
43
ac.
acid
ic p
roce
ss
wat
er f
rom
fe
rtili
zer
plan
t (a
) In
clud
es v
eget
ated
sha
llow
s, m
udfla
ts,
tidal
mar
shes
and
cre
eks,
off
-cha
nnel
slo
ughs
and
lago
ons,
nat
ural
ized
str
eam
cha
nnel
s, a
nd a
djac
ent
upla
nd b
uffe
r
area
s (b
) A
lso
incl
udes
60 a
c. u
plan
ds a
nd 1
.5 m
i. st
ream
hab
itat
(c)
Perc
ent
upla
nd v
ersu
s w
etla
nd n
ot s
tate
d (d
) Fr
om E
PA (
1955)
Enfo
rcem
ent
Rep
ort
(e)
CO
C =
con
tam
inan
ts o
f co
ncer
n (f
) A
crea
ge li
sted
is a
rea
whe
re m
ater
ial w
as d
umpe
d, n
ot t
he a
rea
cont
amin
ated
, w
hich
may
be
larg
er
Appendix E
Class 2.1 ReleasesClass 2.1 Releases
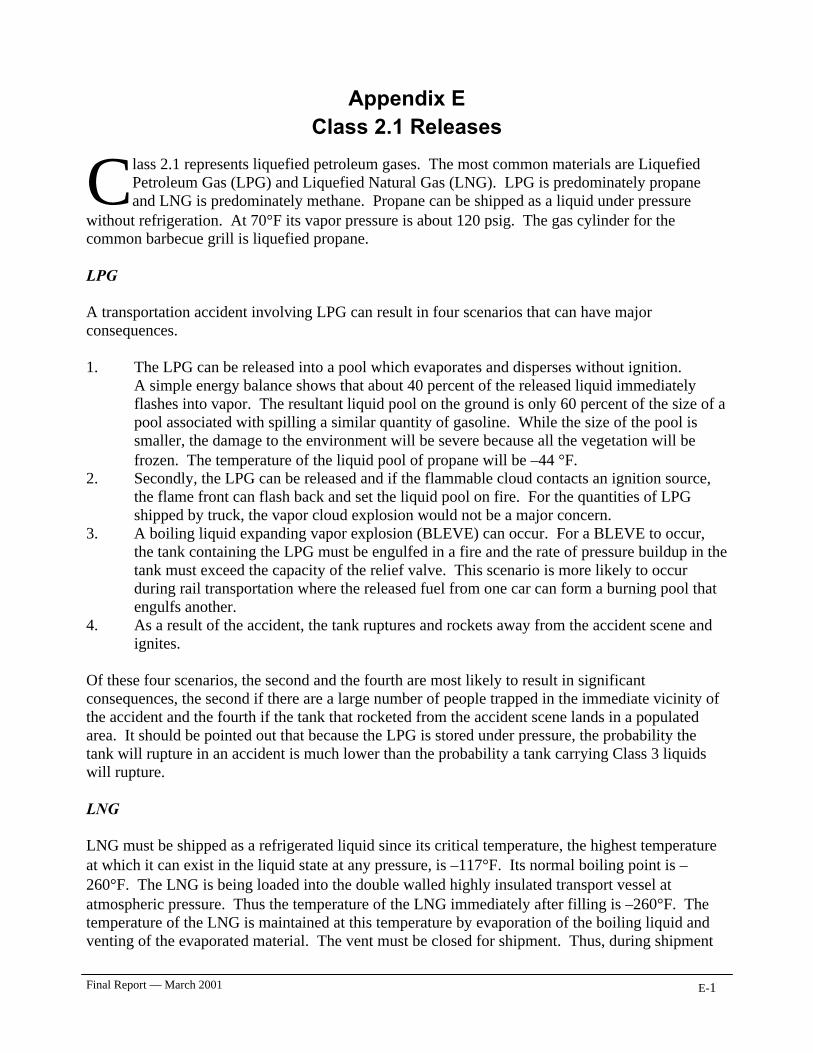
Final Report — March 2001
E-1
Appendix E Class 2.1 Releases
lass 2.1 represents liquefied petroleum gases. The most common materials are Liquefied Petroleum Gas (LPG) and Liquefied Natural Gas (LNG). LPG is predominately propane and LNG is predominately methane. Propane can be shipped as a liquid under pressure
without refrigeration. At 70°F its vapor pressure is about 120 psig. The gas cylinder for the common barbecue grill is liquefied propane. LPG A transportation accident involving LPG can result in four scenarios that can have major consequences. 1. The LPG can be released into a pool which evaporates and disperses without ignition.
A simple energy balance shows that about 40 percent of the released liquid immediately flashes into vapor. The resultant liquid pool on the ground is only 60 percent of the size of a pool associated with spilling a similar quantity of gasoline. While the size of the pool is smaller, the damage to the environment will be severe because all the vegetation will be frozen. The temperature of the liquid pool of propane will be –44 °F.
2. Secondly, the LPG can be released and if the flammable cloud contacts an ignition source, the flame front can flash back and set the liquid pool on fire. For the quantities of LPG shipped by truck, the vapor cloud explosion would not be a major concern.
3. A boiling liquid expanding vapor explosion (BLEVE) can occur. For a BLEVE to occur, the tank containing the LPG must be engulfed in a fire and the rate of pressure buildup in the tank must exceed the capacity of the relief valve. This scenario is more likely to occur during rail transportation where the released fuel from one car can form a burning pool that engulfs another.
4. As a result of the accident, the tank ruptures and rockets away from the accident scene and ignites.
Of these four scenarios, the second and the fourth are most likely to result in significant consequences, the second if there are a large number of people trapped in the immediate vicinity of the accident and the fourth if the tank that rocketed from the accident scene lands in a populated area. It should be pointed out that because the LPG is stored under pressure, the probability the tank will rupture in an accident is much lower than the probability a tank carrying Class 3 liquids will rupture. LNG LNG must be shipped as a refrigerated liquid since its critical temperature, the highest temperature at which it can exist in the liquid state at any pressure, is –117°F. Its normal boiling point is –260°F. The LNG is being loaded into the double walled highly insulated transport vessel at atmospheric pressure. Thus the temperature of the LNG immediately after filling is –260°F. The temperature of the LNG is maintained at this temperature by evaporation of the boiling liquid and venting of the evaporated material. The vent must be closed for shipment. Thus, during shipment
C
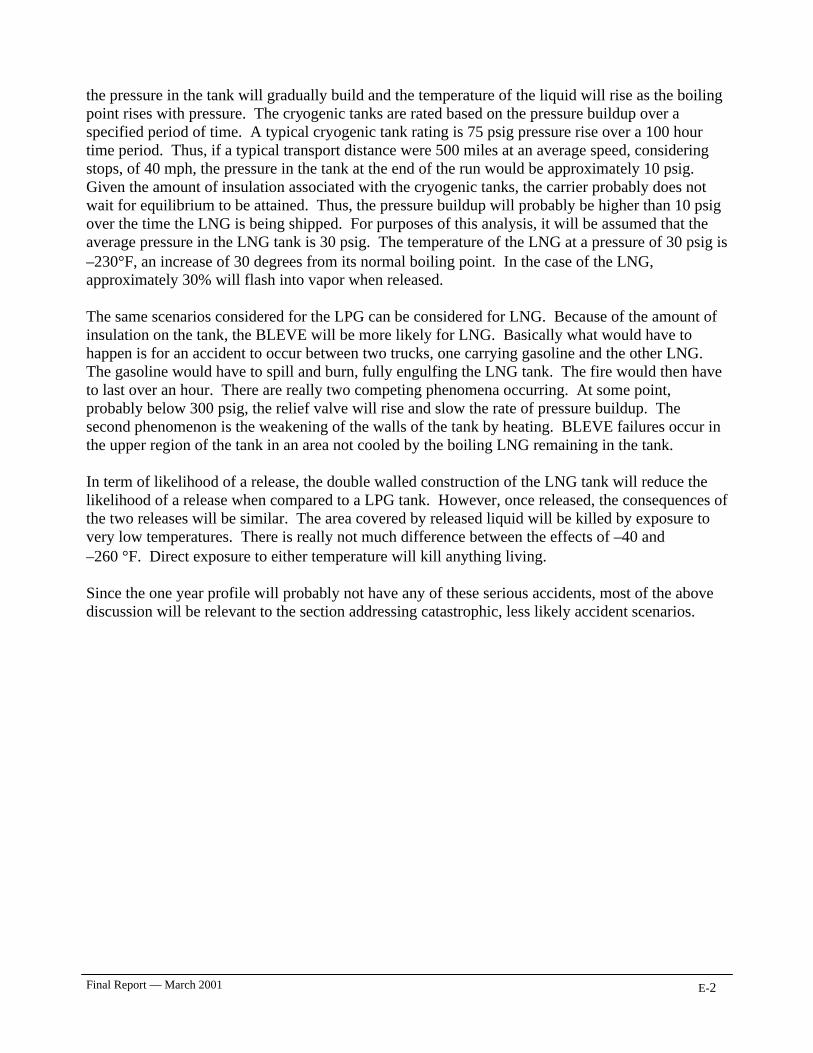
Final Report — March 2001
E-2
the pressure in the tank will gradually build and the temperature of the liquid will rise as the boiling point rises with pressure. The cryogenic tanks are rated based on the pressure buildup over a specified period of time. A typical cryogenic tank rating is 75 psig pressure rise over a 100 hour time period. Thus, if a typical transport distance were 500 miles at an average speed, considering stops, of 40 mph, the pressure in the tank at the end of the run would be approximately 10 psig. Given the amount of insulation associated with the cryogenic tanks, the carrier probably does not wait for equilibrium to be attained. Thus, the pressure buildup will probably be higher than 10 psig over the time the LNG is being shipped. For purposes of this analysis, it will be assumed that the average pressure in the LNG tank is 30 psig. The temperature of the LNG at a pressure of 30 psig is –230°F, an increase of 30 degrees from its normal boiling point. In the case of the LNG, approximately 30% will flash into vapor when released. The same scenarios considered for the LPG can be considered for LNG. Because of the amount of insulation on the tank, the BLEVE will be more likely for LNG. Basically what would have to happen is for an accident to occur between two trucks, one carrying gasoline and the other LNG. The gasoline would have to spill and burn, fully engulfing the LNG tank. The fire would then have to last over an hour. There are really two competing phenomena occurring. At some point, probably below 300 psig, the relief valve will rise and slow the rate of pressure buildup. The second phenomenon is the weakening of the walls of the tank by heating. BLEVE failures occur in the upper region of the tank in an area not cooled by the boiling LNG remaining in the tank. In term of likelihood of a release, the double walled construction of the LNG tank will reduce the likelihood of a release when compared to a LPG tank. However, once released, the consequences of the two releases will be similar. The area covered by released liquid will be killed by exposure to very low temperatures. There is really not much difference between the effects of –40 and –260 °F. Direct exposure to either temperature will kill anything living. Since the one year profile will probably not have any of these serious accidents, most of the above discussion will be relevant to the section addressing catastrophic, less likely accident scenarios.

Appendix F
Impact Case Examples
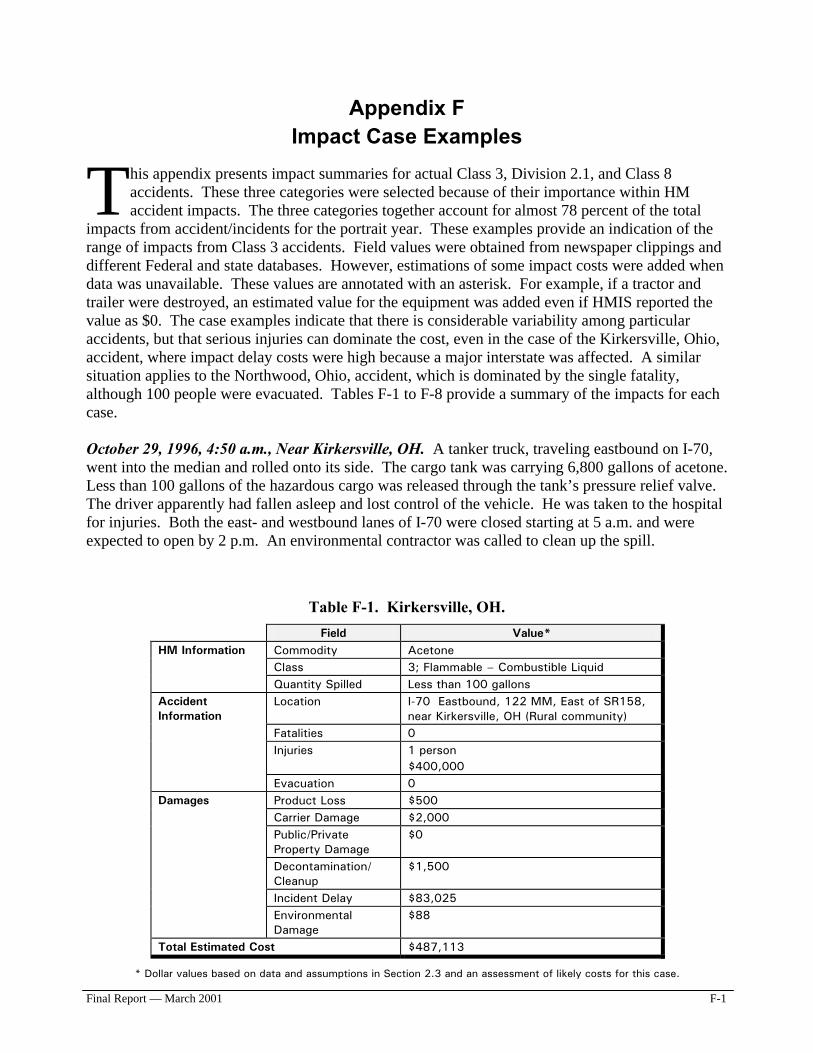
Final Report — March 2001 F-1
Appendix F Impact Case Examples
his appendix presents impact summaries for actual Class 3, Division 2.1, and Class 8 accidents. These three categories were selected because of their importance within HM accident impacts. The three categories together account for almost 78 percent of the total
impacts from accident/incidents for the portrait year. These examples provide an indication of the range of impacts from Class 3 accidents. Field values were obtained from newspaper clippings and different Federal and state databases. However, estimations of some impact costs were added when data was unavailable. These values are annotated with an asterisk. For example, if a tractor and trailer were destroyed, an estimated value for the equipment was added even if HMIS reported the value as $0. The case examples indicate that there is considerable variability among particular accidents, but that serious injuries can dominate the cost, even in the case of the Kirkersville, Ohio, accident, where impact delay costs were high because a major interstate was affected. A similar situation applies to the Northwood, Ohio, accident, which is dominated by the single fatality, although 100 people were evacuated. Tables F-1 to F-8 provide a summary of the impacts for each case. October 29, 1996, 4:50 a.m., Near Kirkersville, OH. A tanker truck, traveling eastbound on I-70, went into the median and rolled onto its side. The cargo tank was carrying 6,800 gallons of acetone. Less than 100 gallons of the hazardous cargo was released through the tank’s pressure relief valve. The driver apparently had fallen asleep and lost control of the vehicle. He was taken to the hospital for injuries. Both the east- and westbound lanes of I-70 were closed starting at 5 a.m. and were expected to open by 2 p.m. An environmental contractor was called to clean up the spill.
Table F-1. Kirkersville, OH.
Field Value* Commodity Acetone Class 3; Flammable – Combustible Liquid
HM Information
Quantity Spilled Less than 100 gallons Location I-70 Eastbound, 122 MM, East of SR158,
near Kirkersville, OH (Rural community) Fatalities 0 Injuries 1 person
$400,000
Accident Information
Evacuation 0 Product Loss $500 Carrier Damage $2,000 Public/Private Property Damage
$0
Decontamination/ Cleanup
$1,500
Incident Delay $83,025
Damages
Environmental Damage
$88
Total Estimated Cost $487,113
* Dollar values based on data and assumptions in Section 2.3 and an assessment of likely costs for this case.
T
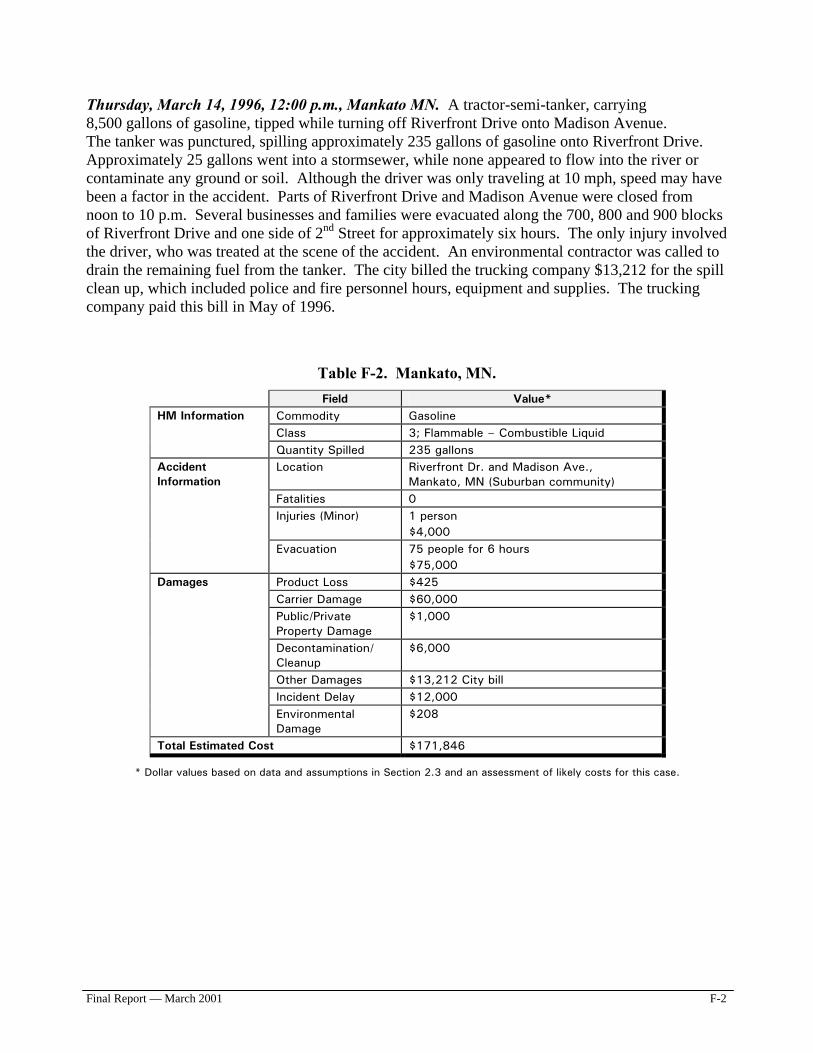
Final Report — March 2001 F-2
Thursday, March 14, 1996, 12:00 p.m., Mankato MN. A tractor-semi-tanker, carrying 8,500 gallons of gasoline, tipped while turning off Riverfront Drive onto Madison Avenue. The tanker was punctured, spilling approximately 235 gallons of gasoline onto Riverfront Drive. Approximately 25 gallons went into a stormsewer, while none appeared to flow into the river or contaminate any ground or soil. Although the driver was only traveling at 10 mph, speed may have been a factor in the accident. Parts of Riverfront Drive and Madison Avenue were closed from noon to 10 p.m. Several businesses and families were evacuated along the 700, 800 and 900 blocks of Riverfront Drive and one side of 2nd Street for approximately six hours. The only injury involved the driver, who was treated at the scene of the accident. An environmental contractor was called to drain the remaining fuel from the tanker. The city billed the trucking company $13,212 for the spill clean up, which included police and fire personnel hours, equipment and supplies. The trucking company paid this bill in May of 1996.
Table F-2. Mankato, MN.
Field Value* Commodity Gasoline Class 3; Flammable – Combustible Liquid
HM Information
Quantity Spilled 235 gallons Location Riverfront Dr. and Madison Ave.,
Mankato, MN (Suburban community) Fatalities 0 Injuries (Minor) 1 person
$4,000
Accident Information
Evacuation 75 people for 6 hours $75,000
Product Loss $425 Carrier Damage $60,000 Public/Private Property Damage
$1,000
Decontamination/ Cleanup
$6,000
Other Damages $13,212 City bill Incident Delay $12,000
Damages
Environmental Damage
$208
Total Estimated Cost $171,846
* Dollar values based on data and assumptions in Section 2.3 and an assessment of likely costs for this case.
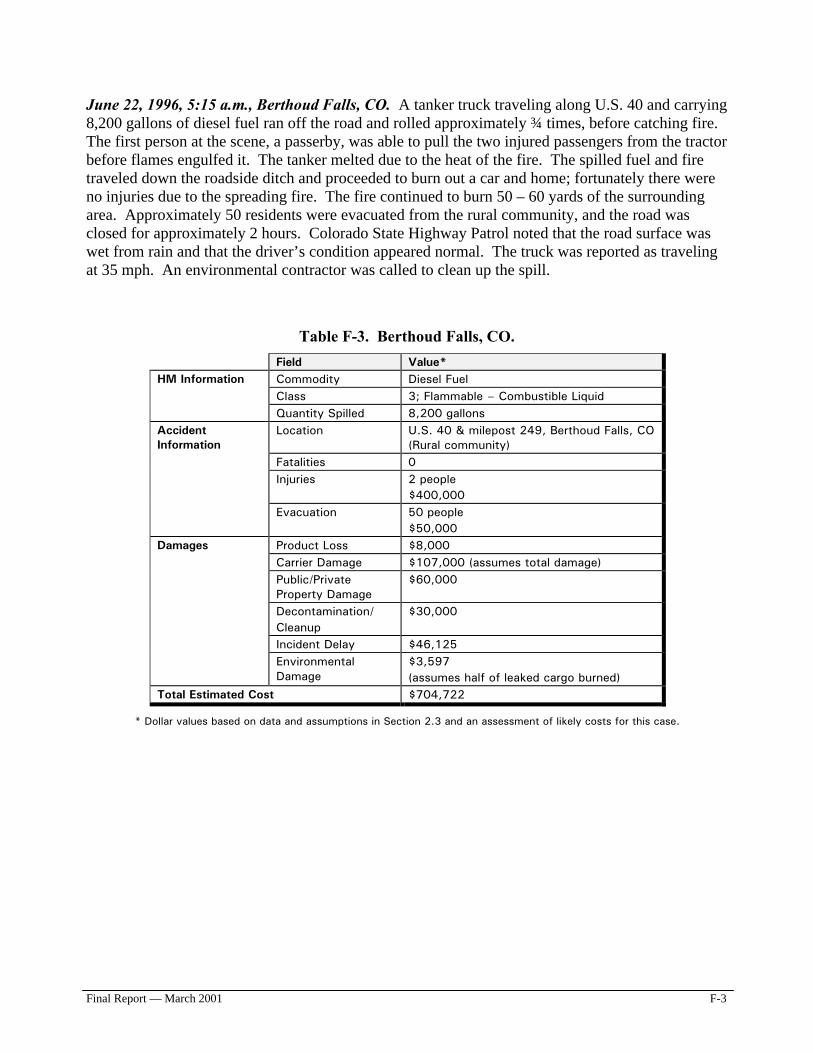
Final Report — March 2001 F-3
June 22, 1996, 5:15 a.m., Berthoud Falls, CO. A tanker truck traveling along U.S. 40 and carrying 8,200 gallons of diesel fuel ran off the road and rolled approximately ¾ times, before catching fire. The first person at the scene, a passerby, was able to pull the two injured passengers from the tractor before flames engulfed it. The tanker melted due to the heat of the fire. The spilled fuel and fire traveled down the roadside ditch and proceeded to burn out a car and home; fortunately there were no injuries due to the spreading fire. The fire continued to burn 50 – 60 yards of the surrounding area. Approximately 50 residents were evacuated from the rural community, and the road was closed for approximately 2 hours. Colorado State Highway Patrol noted that the road surface was wet from rain and that the driver’s condition appeared normal. The truck was reported as traveling at 35 mph. An environmental contractor was called to clean up the spill.
Table F-3. Berthoud Falls, CO.
Field Value* Commodity Diesel Fuel Class 3; Flammable – Combustible Liquid
HM Information
Quantity Spilled 8,200 gallons Location U.S. 40 & milepost 249, Berthoud Falls, CO
(Rural community) Fatalities 0 Injuries 2 people
$400,000
Accident Information
Evacuation 50 people $50,000
Product Loss $8,000 Carrier Damage $107,000 (assumes total damage) Public/Private Property Damage
$60,000
Decontamination/ Cleanup
$30,000
Incident Delay $46,125
Damages
Environmental Damage
$3,597 (assumes half of leaked cargo burned)
Total Estimated Cost $704,722
* Dollar values based on data and assumptions in Section 2.3 and an assessment of likely costs for this case.
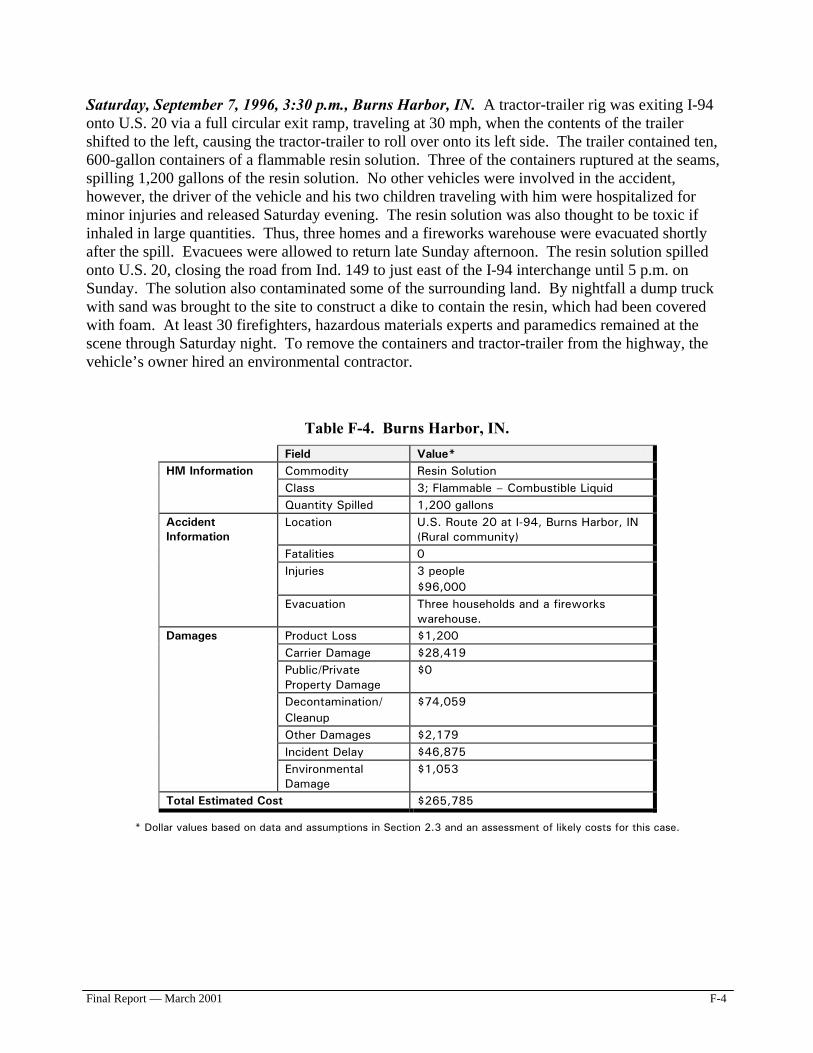
Final Report — March 2001 F-4
Saturday, September 7, 1996, 3:30 p.m., Burns Harbor, IN. A tractor-trailer rig was exiting I-94 onto U.S. 20 via a full circular exit ramp, traveling at 30 mph, when the contents of the trailer shifted to the left, causing the tractor-trailer to roll over onto its left side. The trailer contained ten, 600-gallon containers of a flammable resin solution. Three of the containers ruptured at the seams, spilling 1,200 gallons of the resin solution. No other vehicles were involved in the accident, however, the driver of the vehicle and his two children traveling with him were hospitalized for minor injuries and released Saturday evening. The resin solution was also thought to be toxic if inhaled in large quantities. Thus, three homes and a fireworks warehouse were evacuated shortly after the spill. Evacuees were allowed to return late Sunday afternoon. The resin solution spilled onto U.S. 20, closing the road from Ind. 149 to just east of the I-94 interchange until 5 p.m. on Sunday. The solution also contaminated some of the surrounding land. By nightfall a dump truck with sand was brought to the site to construct a dike to contain the resin, which had been covered with foam. At least 30 firefighters, hazardous materials experts and paramedics remained at the scene through Saturday night. To remove the containers and tractor-trailer from the highway, the vehicle’s owner hired an environmental contractor.
Table F-4. Burns Harbor, IN.
Field Value* Commodity Resin Solution Class 3; Flammable – Combustible Liquid
HM Information
Quantity Spilled 1,200 gallons Location U.S. Route 20 at I-94, Burns Harbor, IN
(Rural community) Fatalities 0 Injuries 3 people
$96,000
Accident Information
Evacuation Three households and a fireworks warehouse.
Product Loss $1,200 Carrier Damage $28,419 Public/Private Property Damage
$0
Decontamination/ Cleanup
$74,059
Other Damages $2,179 Incident Delay $46,875
Damages
Environmental Damage
$1,053
Total Estimated Cost $265,785
* Dollar values based on data and assumptions in Section 2.3 and an assessment of likely costs for this case.
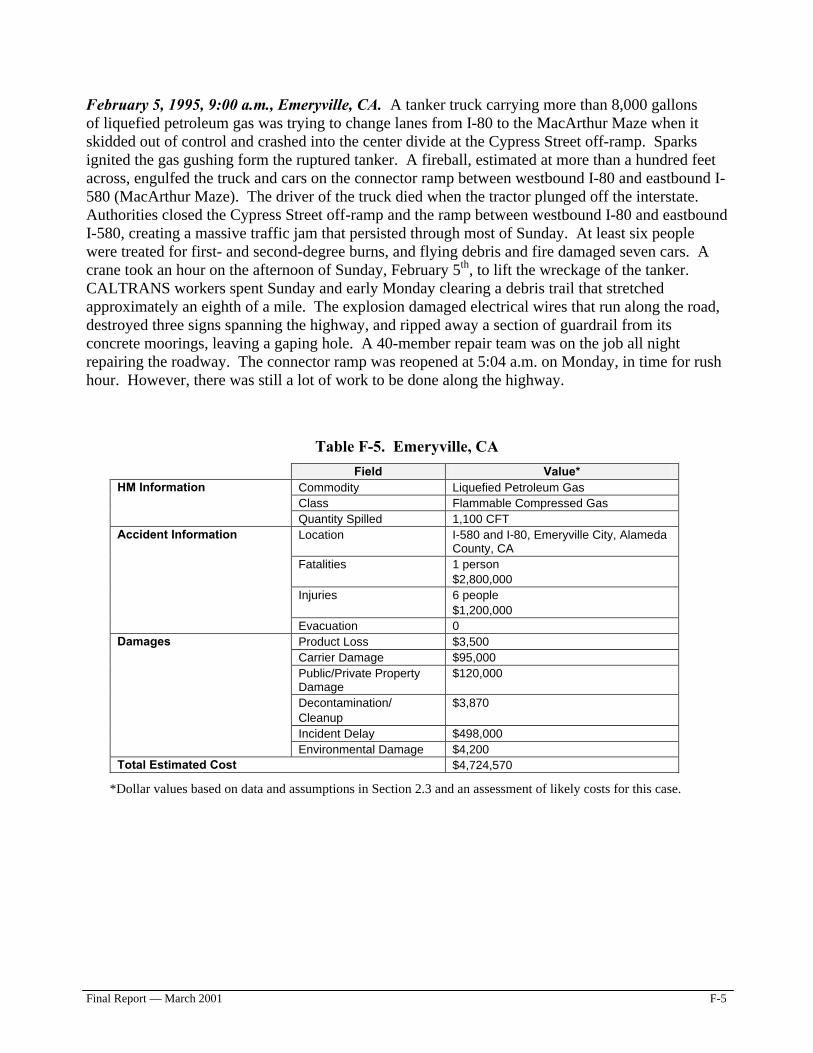
Final Report — March 2001 F-5
February 5, 1995, 9:00 a.m., Emeryville, CA. A tanker truck carrying more than 8,000 gallons of liquefied petroleum gas was trying to change lanes from I-80 to the MacArthur Maze when it skidded out of control and crashed into the center divide at the Cypress Street off-ramp. Sparks ignited the gas gushing form the ruptured tanker. A fireball, estimated at more than a hundred feet across, engulfed the truck and cars on the connector ramp between westbound I-80 and eastbound I-580 (MacArthur Maze). The driver of the truck died when the tractor plunged off the interstate. Authorities closed the Cypress Street off-ramp and the ramp between westbound I-80 and eastbound I-580, creating a massive traffic jam that persisted through most of Sunday. At least six people were treated for first- and second-degree burns, and flying debris and fire damaged seven cars. A crane took an hour on the afternoon of Sunday, February 5th, to lift the wreckage of the tanker. CALTRANS workers spent Sunday and early Monday clearing a debris trail that stretched approximately an eighth of a mile. The explosion damaged electrical wires that run along the road, destroyed three signs spanning the highway, and ripped away a section of guardrail from its concrete moorings, leaving a gaping hole. A 40-member repair team was on the job all night repairing the roadway. The connector ramp was reopened at 5:04 a.m. on Monday, in time for rush hour. However, there was still a lot of work to be done along the highway.
Table F-5. Emeryville, CA
Field Value* Commodity Liquefied Petroleum Gas Class Flammable Compressed Gas
HM Information
Quantity Spilled 1,100 CFT Location I-580 and I-80, Emeryville City, Alameda
County, CA Fatalities 1 person
$2,800,000 Injuries 6 people
$1,200,000
Accident Information
Evacuation 0 Product Loss $3,500 Carrier Damage $95,000 Public/Private Property Damage
$120,000
Decontamination/ Cleanup
$3,870
Incident Delay $498,000
Damages
Environmental Damage $4,200 Total Estimated Cost $4,724,570
*Dollar values based on data and assumptions in Section 2.3 and an assessment of likely costs for this case.
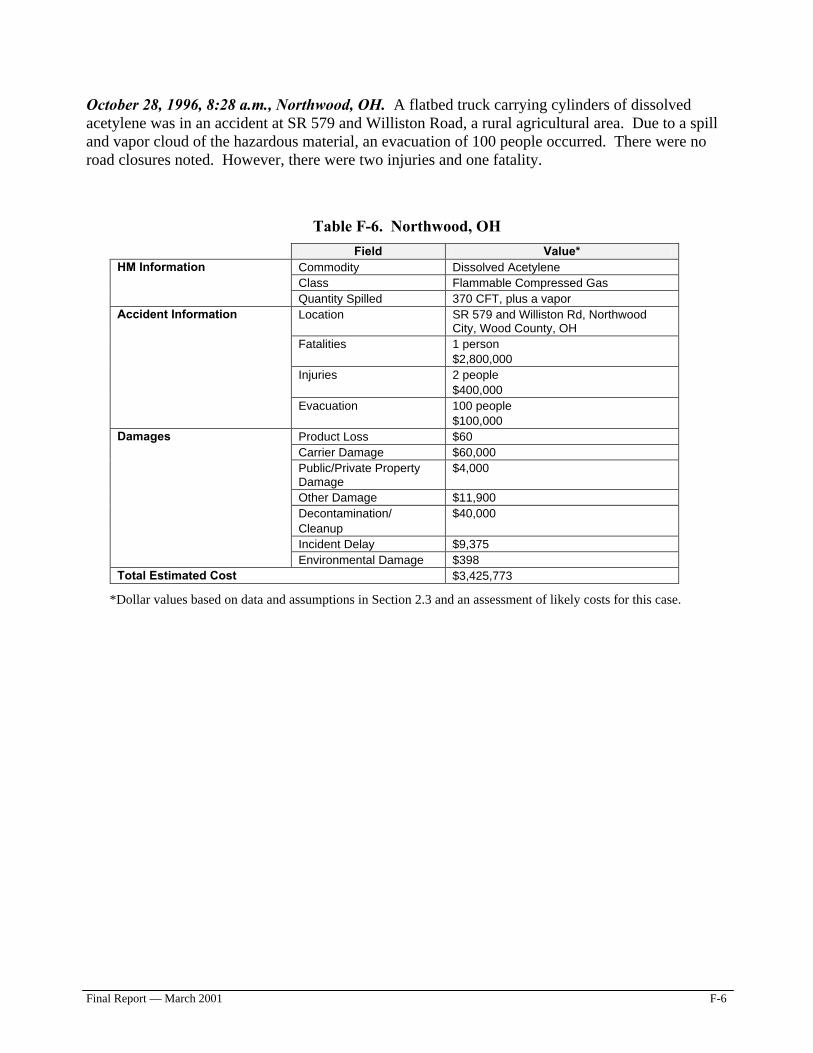
Final Report — March 2001 F-6
October 28, 1996, 8:28 a.m., Northwood, OH. A flatbed truck carrying cylinders of dissolved acetylene was in an accident at SR 579 and Williston Road, a rural agricultural area. Due to a spill and vapor cloud of the hazardous material, an evacuation of 100 people occurred. There were no road closures noted. However, there were two injuries and one fatality.
Table F-6. Northwood, OH
Field Value* Commodity Dissolved Acetylene Class Flammable Compressed Gas
HM Information
Quantity Spilled 370 CFT, plus a vapor Location SR 579 and Williston Rd, Northwood
City, Wood County, OH Fatalities 1 person
$2,800,000 Injuries 2 people
$400,000
Accident Information
Evacuation 100 people $100,000
Product Loss $60 Carrier Damage $60,000 Public/Private Property Damage
$4,000
Other Damage $11,900 Decontamination/ Cleanup
$40,000
Incident Delay $9,375
Damages
Environmental Damage $398 Total Estimated Cost $3,425,773
*Dollar values based on data and assumptions in Section 2.3 and an assessment of likely costs for this case.
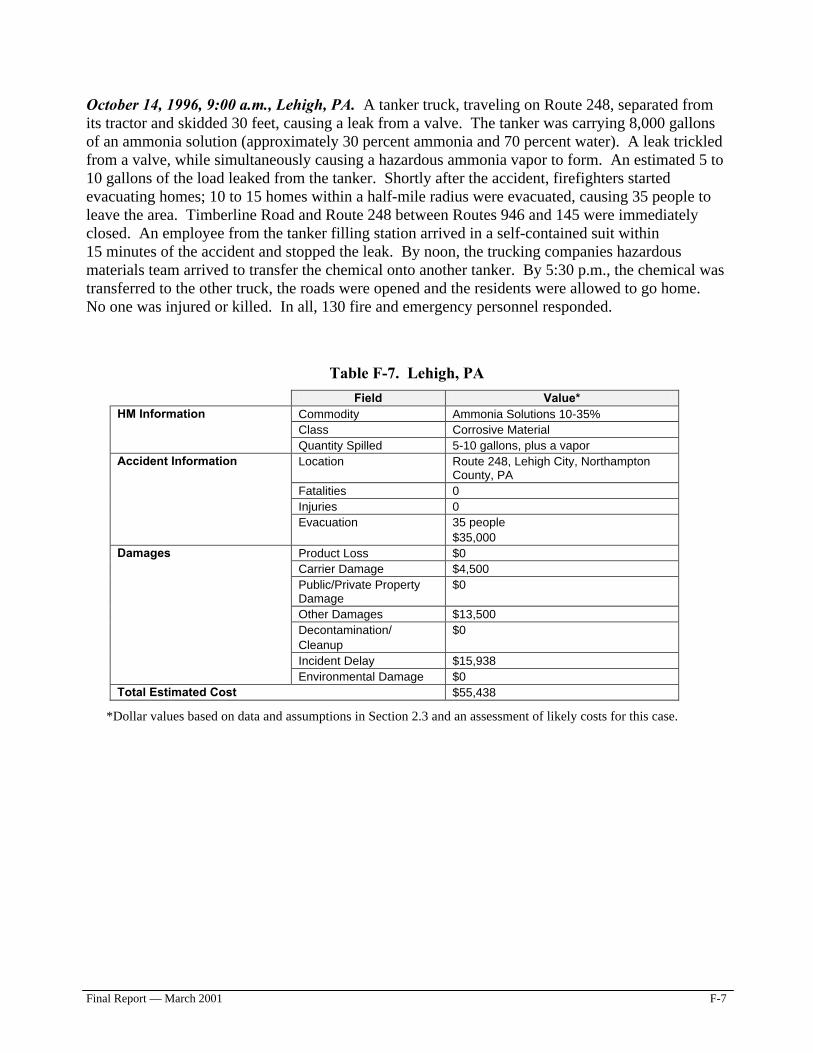
Final Report — March 2001 F-7
October 14, 1996, 9:00 a.m., Lehigh, PA. A tanker truck, traveling on Route 248, separated from its tractor and skidded 30 feet, causing a leak from a valve. The tanker was carrying 8,000 gallons of an ammonia solution (approximately 30 percent ammonia and 70 percent water). A leak trickled from a valve, while simultaneously causing a hazardous ammonia vapor to form. An estimated 5 to 10 gallons of the load leaked from the tanker. Shortly after the accident, firefighters started evacuating homes; 10 to 15 homes within a half-mile radius were evacuated, causing 35 people to leave the area. Timberline Road and Route 248 between Routes 946 and 145 were immediately closed. An employee from the tanker filling station arrived in a self-contained suit within 15 minutes of the accident and stopped the leak. By noon, the trucking companies hazardous materials team arrived to transfer the chemical onto another tanker. By 5:30 p.m., the chemical was transferred to the other truck, the roads were opened and the residents were allowed to go home. No one was injured or killed. In all, 130 fire and emergency personnel responded.
Table F-7. Lehigh, PA
Field Value* Commodity Ammonia Solutions 10-35% Class Corrosive Material
HM Information
Quantity Spilled 5-10 gallons, plus a vapor Location Route 248, Lehigh City, Northampton
County, PA Fatalities 0 Injuries 0
Accident Information
Evacuation 35 people $35,000
Product Loss $0 Carrier Damage $4,500 Public/Private Property Damage
$0
Other Damages $13,500 Decontamination/ Cleanup
$0
Incident Delay $15,938
Damages
Environmental Damage $0 Total Estimated Cost $55,438
*Dollar values based on data and assumptions in Section 2.3 and an assessment of likely costs for this case.
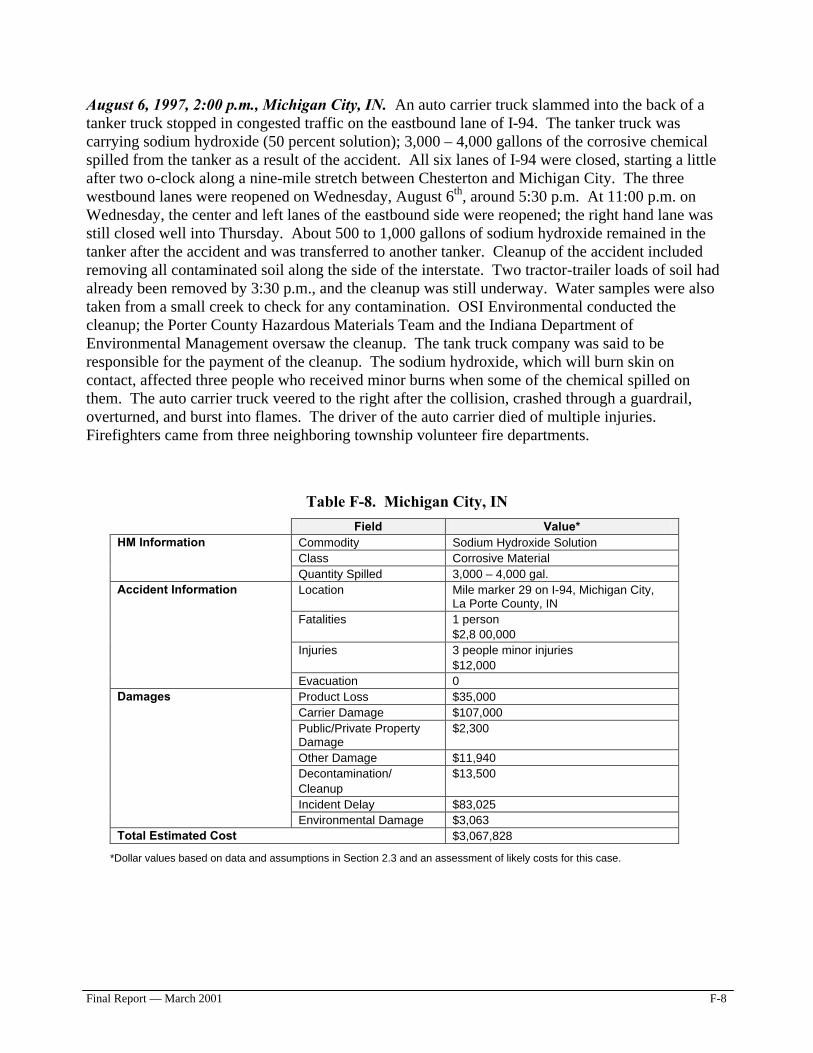
Final Report — March 2001 F-8
August 6, 1997, 2:00 p.m., Michigan City, IN. An auto carrier truck slammed into the back of a tanker truck stopped in congested traffic on the eastbound lane of I-94. The tanker truck was carrying sodium hydroxide (50 percent solution); 3,000 – 4,000 gallons of the corrosive chemical spilled from the tanker as a result of the accident. All six lanes of I-94 were closed, starting a little after two o-clock along a nine-mile stretch between Chesterton and Michigan City. The three westbound lanes were reopened on Wednesday, August 6th, around 5:30 p.m. At 11:00 p.m. on Wednesday, the center and left lanes of the eastbound side were reopened; the right hand lane was still closed well into Thursday. About 500 to 1,000 gallons of sodium hydroxide remained in the tanker after the accident and was transferred to another tanker. Cleanup of the accident included removing all contaminated soil along the side of the interstate. Two tractor-trailer loads of soil had already been removed by 3:30 p.m., and the cleanup was still underway. Water samples were also taken from a small creek to check for any contamination. OSI Environmental conducted the cleanup; the Porter County Hazardous Materials Team and the Indiana Department of Environmental Management oversaw the cleanup. The tank truck company was said to be responsible for the payment of the cleanup. The sodium hydroxide, which will burn skin on contact, affected three people who received minor burns when some of the chemical spilled on them. The auto carrier truck veered to the right after the collision, crashed through a guardrail, overturned, and burst into flames. The driver of the auto carrier died of multiple injuries. Firefighters came from three neighboring township volunteer fire departments.
Table F-8. Michigan City, IN
Field Value* Commodity Sodium Hydroxide Solution Class Corrosive Material
HM Information
Quantity Spilled 3,000 – 4,000 gal. Location Mile marker 29 on I-94, Michigan City,
La Porte County, IN Fatalities 1 person
$2,8 00,000 Injuries 3 people minor injuries
$12,000
Accident Information
Evacuation 0 Product Loss $35,000 Carrier Damage $107,000 Public/Private Property Damage
$2,300
Other Damage $11,940 Decontamination/ Cleanup
$13,500
Incident Delay $83,025
Damages
Environmental Damage $3,063 Total Estimated Cost $3,067,828
*Dollar values based on data and assumptions in Section 2.3 and an assessment of likely costs for this case.

Appendix G
References
Final Report — March 2001
G-1
Appendix G References
49 CFR Parts 170-179, Research and Special Programs Administration, DOT Agent, Kenneth R., et. al. “Evaluation of Advanced Surveying Technology for Accident Investigation,” Transportation Research Record, No. 1485, 1995 Battelle Compilation of Environmental Settlements, 1998 Delaware Hazardous Material Transportation Flow Study. June 1994 Fu, Liping et al. “Real-Time Estimation of Incident Delay in Dynamic and Stochastic Networks.” Transportation Research, No. 1603, 1997 Government Accounting Office (GAO), Truck Safety: Effectiveness of Motor Carriers Office Hampered by Data Problems and Slow Progress on Implementing Safety Initiatives, T-RCED-99-122, March 1999 Grenzeback, Lance R., et. al. “Urban Freeway Gridlock Study: Decreasing the Effects of Large Trucks on Peak-Period Urban Freeway Congestion,” Transportation Research Record, No. 1256, 1990 “Growth Fuels Talk or Route Review.” Columbus Dispatch. July 21, 1996 Harwood, Douglas W., et. al. “Characteristics of Accidents and Incidents in Highway Transportation of Hazardous Materials,” Presentation at the Transportation Research Board Annual Meeting, January 1989. Hazardous Materials in Mesa County, August 1997 Highway Capacity Manual, 1994 Interview with Joel Hogue, PRO TERRA, July 7, 1998 Jacobson, Leslie N., et al. “Incident Management Using total Stations,” Transportation Research Board, No. 1376, 1992 Kentucky Emergency Response Commission. Corridor Commodity Flow Analysis Final Reports. I-24, January 1998; I-71, December 1997; I-75, November 1995; I-65, September 1995; I-64, June 1995 Morales, Juan M. “Analytical Procedures for Estimating Freeway Traffic Congestion,” ITE Journal, Vol. 57, No. 1, January 1987, pp. 45-49
Final Report — March 2001
G-2
National Highway Transportation Safety Administration (NHTSA), The Economic Cost of Motor Vehicle Crashes: http//www.nhtsa.dot.gov, 1996 National Safety Council, Estimating the Cost of Unintentional Injuries, 1996 Public Utility Commission of Oregon and the Oregon Department of Transportation. Hazardous Material Movements on Oregon Highways. 1987 Recker, W.W., et al. “An Analysis of Truck Involved Freeway Accidents.” Institute of Transportation Studies, University of California at Irvine, 1988 Research and Special Programs Administration. Hazardous Materials Shipment, Washington, D.C., 1998 Star Mountain, Inc., for Office of Motor Carriers. National Fleet Safety Survey, 1996, Alexandria, VA 1997 The Cost of Highway Crashes, FHWA-RD-91-055, October 1991 Title 49 Code of Federal Regulations (49CFR), Transportation Title 49 Code of Federal Regulations (49CFR), Transportation, Parts 171 and 172 Transportation Research Board, Hazardous Materials Shipment Information for Emergency Response, Special Report 239, Washington D.C., 1993 U.S. Department of Commerce, Census Bureau, 1993 Commodity Flow Survey, Washington D.C., 1996 U.S. Department of Commerce, Census Bureau, 1997 Commodity Flow Survey, Washington D.C., EC97TCF-US (HM) RV, April 2000 U.S. DOT, 1997 Draft Strategic Plan, Washington, D.C., 1997 U.S. DOT, Transport Canada. 1996 North American Emergency Response Guidebook, 1997(a) U.S. DOT, FHWA, Highway Statistics, 1996, Washington, D.C., 1997(b) U.S. DOT, 1997 Federal Highway Cost Allocation Study, Washington, D.C., 1997(c) US DOT, Transportation Systems Center Truck Transportation of Hazardous Materials: A National Overview, December 1987 U.S. Environmental Protection Agency. Valuing Potential Environmental Liabilities for Managerial Decision-Making: A Review of Available Techniques, Report No. EPA742-R-96-003, December 1996
Final Report — March 2001
G-3
Zebe, Paul, TSC, personal conversation, August 1998