Embed Size (px)
Citation preview

United States Office of Water (4303) EPA-821-R-99-020Environmental Protection Washington, DC 20460 January 2000Agency
Development Document for Final Effluent Limitations Guidelines andStandards for CommercialHazardous Waste Combustors

DEVELOPMENT DOCUMENT FOR
FINAL EFFLUENT LIMITATIONS GUIDELINES AND STANDARDS
FOR THE COMMERCIAL HAZARDOUS WASTE COMBUSTOR SUBCATEGORY
OF THE WASTE COMBUSTORS POINT SOURCE CATEGORY
Carol M. BrownerAdministrator
J. Charles FoxAssistant Administrator, Office of Water
Geoffrey H. GrubbsDirector, Office of Science and Technology
Sheila E. FraceDirector, Engineering and Analysis Division
Elwood H. ForshtChief, Chemicals and Metals Branch
Samantha HopkinsProject Manager
January 2000
U.S. Environmental Protection AgencyOffice of Water
Washington, DC 20460
Additional Support by Contract No. 68-C5-0041

ACKNOWLEDGEMENTS AND DISCLAIMER
This document has been reviewed and approved for publication by the Engineering and Analysis Division,Office of Science and Technology, U.S. Environmental Protection Agency. This document was preparedwith the support of Science Applications International Corporation under Contract 68-C5-0041, underthe direction and review of the Office of Science and Technology. Neither the United States governmentnor any of its employees, contractors, subcontractors, or other employees makes any warranty, expressedor implied, or assumes any legal liability or responsibility for any third party's use of, or the results of suchuse of, any information, apparatus, product or process discussed in this report, or represents that its useby such a third party would not infringe on privately owned rights.
Credit must also be given to the additional members of the CHWC project team (William Anderson,Charles White, Patricia Harrigan, and Richard Witt) for their professional manner, conscientious effort andcontributions.

i
TABLE OF CONTENTS
SECTION 1 LEGAL AUTHORITY . . . . . . . . . . . . . . . . . . . . . . . . . . . . . . . . . . . . . . . . . . . 1-11.1 LEGAL AUTHORITY . . . . . . . . . . . . . . . . . . . . . . . . . . . . . . . . . . . . . . . . . . . 1-11.2 BACKGROUND . . . . . . . . . . . . . . . . . . . . . . . . . . . . . . . . . . . . . . . . . . . . . . . . 1-1
1.2.1 Clean Water Act (CWA) . . . . . . . . . . . . . . . . . . . . . . . . . . . . . . . . . . . . 1-11.2.1.1 Best Practicable Control Technology Currently Available (BPT)
(Section 304(b)(1) of the CWA) . . . . . . . . . . . . . . . . . . . . . . . . 1-11.2.1.2 Best Conventional Pollutant Control Technology (BCT)
(Section 304(a)(4) of the CWA) . . . . . . . . . . . . . . . . . . . . . . . . 1-21.2.1.3 Best Available Technology Economically Achievable (BAT)
(Sections 304(b)(2)(B) of the CWA) . . . . . . . . . . . . . . . . . . . . . 1-21.2.1.4 New Source Performance Standards (NSPS)
(Section 306 of the CWA) . . . . . . . . . . . . . . . . . . . . . . . . . . . . . 1-31.2.1.5 Pretreatment Standards for Existing Sources (PSES)
(Section 307(b) of the CWA) . . . . . . . . . . . . . . . . . . . . . . . . . . . 1-31.2.1.6 Pretreatment Standards for New Sources (PSNS)
(Section 307(b) of the CWA) . . . . . . . . . . . . . . . . . . . . . . . . . . . 1-41.2 SECTION 304(M) REQUIREMENTS . . . . . . . . . . . . . . . . . . . . . . . . . . . . . . . 1-4
SECTION 2 DATA COLLECTION . . . . . . . . . . . . . . . . . . . . . . . . . . . . . . . . . . . . . . . . . . . . 2-12.1 CLEAN WATER ACT SECTION 308 QUESTIONNAIRES AND
SCREENER SURVEYS . . . . . . . . . . . . . . . . . . . . . . . . . . . . . . . . . . . . . . . . . . 2-22.1.1 Development of Questionnaires and Screener Surveys . . . . . . . . . . . . . 2-22.1.2 Distribution of Screener Surveys and Questionnaires . . . . . . . . . . . . . . 2-4
2.2 SAMPLING PROGRAM . . . . . . . . . . . . . . . . . . . . . . . . . . . . . . . . . . . . . . . . . 2-62.2.1 Pre-1989 Sampling Program . . . . . . . . . . . . . . . . . . . . . . . . . . . . . . . . . 2-62.2.2 1993 - 1995 Sampling Program . . . . . . . . . . . . . . . . . . . . . . . . . . . . . . . 2-6
2.2.2.1 Facility Selection . . . . . . . . . . . . . . . . . . . . . . . . . . . . . . . . . . . . 2-62.2.2.2 Five-Day Sampling Episodes . . . . . . . . . . . . . . . . . . . . . . . . . . . 2-8
SECTION 3 DESCRIPTION OF THE INDUSTRY AND SUBCATEGORIZATION . . . . 3-13.1 GENERAL INFORMATION . . . . . . . . . . . . . . . . . . . . . . . . . . . . . . . . . . . . . . 3-13.2 SCOPE OF THIS REGULATION . . . . . . . . . . . . . . . . . . . . . . . . . . . . . . . . . . . 3-3
3.2.1 CHWC Facilities . . . . . . . . . . . . . . . . . . . . . . . . . . . . . . . . . . . . . . . . . . 3-33.2.2 Captive and Intracompany CHWC Facilities . . . . . . . . . . . . . . . . . . . . . 3-3
3.3 SUMMARY INFORMATION ON 55 CHWC FACILITIES . . . . . . . . . . . . . . 3-63.4 SUMMARY INFORMATION ON 22 CHWC FACILITIES WHICH
GENERATE CHWC WASTEWATER . . . . . . . . . . . . . . . . . . . . . . . . . . . . . . 3-93.4.1 RCRA Designation of 22 CHWC Facilities . . . . . . . . . . . . . . . . . . . . 3-103.4.2 Waste Burned at 22 CHWC Facilities . . . . . . . . . . . . . . . . . . . . . . . . . 3-10

ii
3.4.3 Air Pollution Control Systems for 22 CHWC Facilities . . . . . . . . . . . 3-113.5 SUMMARY INFORMATION ON 10 CHWC FACILITIES WHICH
GENERATE AND DISCHARGE CHWC WASTEWATER . . . . . . . . . . . . . 3-133.6 INDUSTRY SUBCATEGORIZATION . . . . . . . . . . . . . . . . . . . . . . . . . . . . . 3-14
SECTION 4 WASTEWATER USE AND WASTEWATER CHARACTERIZATION . . . . 4-14.1 WATER USE AND SOURCES OF WASTEWATER . . . . . . . . . . . . . . . . . . . 4-14.2 WATER USE . . . . . . . . . . . . . . . . . . . . . . . . . . . . . . . . . . . . . . . . . . . . . . . . . . . 4-24.3 WASTEWATER CHARACTERIZATION . . . . . . . . . . . . . . . . . . . . . . . . . . . 4-3
4.3.1 Five-Day Sampling Episodes . . . . . . . . . . . . . . . . . . . . . . . . . . . . . . . . . 4-44.3.1.1 Conventional Pollutants . . . . . . . . . . . . . . . . . . . . . . . . . . . . . . . 4-44.3.1.2 Priority and Non-Conventional Pollutants . . . . . . . . . . . . . . . . . 4-7
4.3.2 Characterization Sampling Episodes . . . . . . . . . . . . . . . . . . . . . . . . . . . 4-74.4 WASTEWATER POLLUTANT DISCHARGES . . . . . . . . . . . . . . . . . . . . . . . 4-8
SECTION 5 SELECTION OF POLLUTANTS AND POLLUTANT PARAMETERS FORREGULATION . . . . . . . . . . . . . . . . . . . . . . . . . . . . . . . . . . . . . . . . . . . . . . . . . 5-1
5.1 INTRODUCTION . . . . . . . . . . . . . . . . . . . . . . . . . . . . . . . . . . . . . . . . . . . . . . . 5-15.2 POLLUTANTS CONSIDERED FOR REGULATION . . . . . . . . . . . . . . . . . . 5-15.3 SELECTION OF POLLUTANTS OF CONCERN . . . . . . . . . . . . . . . . . . . . . . 5-2
5.3.1 Dioxins/Furans in Commercial Hazardous Waste Combustor Industry 5-75.3.1.1 Background . . . . . . . . . . . . . . . . . . . . . . . . . . . . . . . . . . . . . . . . 5-75.3.1.2 Dioxins/Furans in Commercial Hazardous Waste Combustor
Wastewater . . . . . . . . . . . . . . . . . . . . . . . . . . . . . . . . . . . . . . . . . 5-85.4 SELECTION OF POLLUTANTS FOR REGULATION . . . . . . . . . . . . . . . . 5-115.5 SELECTION OF POLLUTANTS TO BE REGULATED FOR PSES AND
PSNS . . . . . . . . . . . . . . . . . . . . . . . . . . . . . . . . . . . . . . . . . . . . . . . . . . . . . . . . 5-145.5.1 Removal Comparison Approach . . . . . . . . . . . . . . . . . . . . . . . . . . . . . 5-145.5.2 50 POTW Study Database . . . . . . . . . . . . . . . . . . . . . . . . . . . . . . . . . . 5-155.5.3 Final POTW Data Editing . . . . . . . . . . . . . . . . . . . . . . . . . . . . . . . . . . 5-165.5.4 Final Removal Comparison Results . . . . . . . . . . . . . . . . . . . . . . . . . . . 5-17
SECTION 6 WASTEWATER TREATMENT TECHNOLOGIES . . . . . . . . . . . . . . . . . . . . 6-16.1 AVAILABLE BAT AND PSES TECHNOLOGIES . . . . . . . . . . . . . . . . . . . . . 6-2
6.1.1 Physical/Chemical Treatment . . . . . . . . . . . . . . . . . . . . . . . . . . . . . . . . 6-26.1.1.1 Equalization . . . . . . . . . . . . . . . . . . . . . . . . . . . . . . . . . . . . . . . . 6-26.1.1.2 Neutralization or pH Control . . . . . . . . . . . . . . . . . . . . . . . . . . . 6-36.1.1.3 Flocculation . . . . . . . . . . . . . . . . . . . . . . . . . . . . . . . . . . . . . . . . 6-66.1.1.4 Gravity-Assisted Separation . . . . . . . . . . . . . . . . . . . . . . . . . . . 6-66.1.1.5 Chemical Precipitation . . . . . . . . . . . . . . . . . . . . . . . . . . . . . . . . 6-76.1.1.6 Stripping . . . . . . . . . . . . . . . . . . . . . . . . . . . . . . . . . . . . . . . . . . 6-13

iii
6.1.1.7 Filtration . . . . . . . . . . . . . . . . . . . . . . . . . . . . . . . . . . . . . . . . . . 6-136.1.1.7.1 Sand/Multi-Media Filtration . . . . . . . . . . . . . . 6-156.1.1.7.2 Fabric Filters . . . . . . . . . . . . . . . . . . . . . . . . . . 6-176.1.1.7.3 Ultrafiltration . . . . . . . . . . . . . . . . . . . . . . . . . . 6-17
6.1.1.8 Carbon Adsorption . . . . . . . . . . . . . . . . . . . . . . . . . . . . . . . . . . 6-196.1.1.9 Chromium Reduction . . . . . . . . . . . . . . . . . . . . . . . . . . . . . . . . 6-21
6.1.2 Sludge Handling . . . . . . . . . . . . . . . . . . . . . . . . . . . . . . . . . . . . . . . . . . 6-216.1.2.1 Sludge Slurrying . . . . . . . . . . . . . . . . . . . . . . . . . . . . . . . . . . . 6-236.1.2.2 Vacuum Filtration . . . . . . . . . . . . . . . . . . . . . . . . . . . . . . . . . . 6-236.1.2.3 Pressure Filtration . . . . . . . . . . . . . . . . . . . . . . . . . . . . . . . . . . 6-236.1.2.4 Centrifuges . . . . . . . . . . . . . . . . . . . . . . . . . . . . . . . . . . . . . . . . 6-266.1.2.5 Dryer . . . . . . . . . . . . . . . . . . . . . . . . . . . . . . . . . . . . . . . . . . . . 6-26
6.1.3 Zero Discharge Options . . . . . . . . . . . . . . . . . . . . . . . . . . . . . . . . . . . . 6-276.1.3.1 Incineration . . . . . . . . . . . . . . . . . . . . . . . . . . . . . . . . . . . . . . . 6-276.1.3.2 Off-Site Disposal . . . . . . . . . . . . . . . . . . . . . . . . . . . . . . . . . . . 6-276.1.3.3 Evaporation/Land Applied . . . . . . . . . . . . . . . . . . . . . . . . . . . . 6-27
6.2 TREATMENT OPTIONS FOR OTHER WASTEWATERS GENERATED BYCHWC OPERATIONS . . . . . . . . . . . . . . . . . . . . . . . . . . . . . . . . . . . . . 6-286.2.1 Chemical Oxidation . . . . . . . . . . . . . . . . . . . . . . . . . . . . . . . . . . . . . . . 6-286.2.2 Zero Discharge Options . . . . . . . . . . . . . . . . . . . . . . . . . . . . . . . . . . . . 6-29
6.2.2.1 Deep Well Disposal . . . . . . . . . . . . . . . . . . . . . . . . . . . . . . . . . 6-316.3 OTHER ON-SITE WASTEWATER TREATMENT TECHNOLOGIES . . . 6-316.4 TREATMENT PERFORMANCE AND DEVELOPMENT OF REGULATORY
OPTION . . . . . . . . . . . . . . . . . . . . . . . . . . . . . . . . . . . . . . . . . . . . . . . . . . . . . . 6-326.4.1 Performance of EPA Sampled Treatment Processes . . . . . . . . . . . . . . 6-32
6.4.1.1 Treatment Performance for Episode #4646 . . . . . . . . . . . . . . . 6-326.4.1.2 Treatment Performance for Episode #4671 . . . . . . . . . . . . . . . 6-396.4.1.3 Treatment Performance for Episode #4733 . . . . . . . . . . . . . . . 6-44
6.4.2 Rationale Used for Selection of BAT Treatment Technologies . . . . . 6-486.4.3 Performance at Facilities Added Post-Proposal . . . . . . . . . . . . . . . . . . 6-53
6.4.3.1 Treatment Performance for Episode # 6181 . . . . . . . . . . . . . . 6-536.4.3.2 Treatment Performance for Episode # 6183 . . . . . . . . . . . . . . 6-576.4.3.3 Performance Comparison with Proposed BAT Facility . . . . . . 6-60
SECTION 7 ENGINEERING COSTS . . . . . . . . . . . . . . . . . . . . . . . . . . . . . . . . . . . . . . . . . . 7-17.1 COSTS DEVELOPMENT . . . . . . . . . . . . . . . . . . . . . . . . . . . . . . . . . . . . . . . . . 7-2
7.1.1 Sources of Cost Data . . . . . . . . . . . . . . . . . . . . . . . . . . . . . . . . . . . . . . . 7-27.1.1.1 Cost Models . . . . . . . . . . . . . . . . . . . . . . . . . . . . . . . . . . . . . . . . 7-27.1.1.2 Vendor Data . . . . . . . . . . . . . . . . . . . . . . . . . . . . . . . . . . . . . . . . 7-47.1.1.3 1992 Waste Treatment Industry Phase II: Incinerators 308
Questionnaire Costing Data . . . . . . . . . . . . . . . . . . . . . . . . . . . . 7-4

iv
7.1.1.4 Other EPA Effluent Guideline Studies . . . . . . . . . . . . . . . . . . . 7-47.1.2 Benchmark Analysis and Evaluation Criteria . . . . . . . . . . . . . . . . . . . . 7-47.1.3 Selection of Final Cost Models . . . . . . . . . . . . . . . . . . . . . . . . . . . . . . . 7-8
7.2 ENGINEERING COSTING METHODOLOGY . . . . . . . . . . . . . . . . . . . . . . . 7-97.2.1 Treatment Costing Methodology . . . . . . . . . . . . . . . . . . . . . . . . . . . . . . 7-97.2.2 Option Costing Methodology . . . . . . . . . . . . . . . . . . . . . . . . . . . . . . . . 7-11
7.3 TREATMENT TECHNOLOGIES COSTING . . . . . . . . . . . . . . . . . . . . . . . . 7-147.3.1 Physical/Chemical Wastewater Treatment Technology Costs . . . . . . . 7-14
7.3.1.1 Chemical Feed Systems . . . . . . . . . . . . . . . . . . . . . . . . . . . . . . 7-157.3.1.2 Pumping . . . . . . . . . . . . . . . . . . . . . . . . . . . . . . . . . . . . . . . . . . 7-337.3.1.3 Rapid Mix Tanks . . . . . . . . . . . . . . . . . . . . . . . . . . . . . . . . . . . 7-337.3.1.4 Flocculation . . . . . . . . . . . . . . . . . . . . . . . . . . . . . . . . . . . . . . . 7-387.3.1.5 Primary Clarification . . . . . . . . . . . . . . . . . . . . . . . . . . . . . . . . 7-417.3.1.6 Secondary Clarification . . . . . . . . . . . . . . . . . . . . . . . . . . . . . . 7-417.3.1.7 Sand Filtration . . . . . . . . . . . . . . . . . . . . . . . . . . . . . . . . . . . . . 7-44
7.3.2 Sludge Treatment and Disposal . . . . . . . . . . . . . . . . . . . . . . . . . . . . . . 7-487.3.2.1 Plate and Frame Pressure Filtration . . . . . . . . . . . . . . . . . . . . . 7-487.3.2.2 Filter Cake Disposal Costs . . . . . . . . . . . . . . . . . . . . . . . . . . . . 7-51
7.4 ADDITIONAL COSTS . . . . . . . . . . . . . . . . . . . . . . . . . . . . . . . . . . . . . . . . . . 7-517.4.1 Retrofit and Upgrade Costs . . . . . . . . . . . . . . . . . . . . . . . . . . . . . . . . . 7-527.4.2 Land Costs . . . . . . . . . . . . . . . . . . . . . . . . . . . . . . . . . . . . . . . . . . . . . . 7-527.4.3 RCRA Permit Modification Costs . . . . . . . . . . . . . . . . . . . . . . . . . . . . 7-537.4.4 Monitoring Costs . . . . . . . . . . . . . . . . . . . . . . . . . . . . . . . . . . . . . . . . . 7-53
7.5 WASTEWATER OFF-SITE DISPOSAL COSTS . . . . . . . . . . . . . . . . . . . . . 7-557.6 COSTS FOR REGULATORY OPTIONS . . . . . . . . . . . . . . . . . . . . . . . . . . . 7-56
7.6.1 BPT/BCT/BAT Costs . . . . . . . . . . . . . . . . . . . . . . . . . . . . . . . . . . . . . 7-567.6.1.1 BPT/BCT/BAT Option: Two-Stage Chemical Precipitation and
Sand Filtration . . . . . . . . . . . . . . . . . . . . . . . . . . . . . . . . . . . . . 7-567.6.2 PSES Costs . . . . . . . . . . . . . . . . . . . . . . . . . . . . . . . . . . . . . . . . . . . . . 7-56
7.6.2.1 PSES Option: Two-Stage Chemical Precipitation and SandFiltration . . . . . . . . . . . . . . . . . . . . . . . . . . . . . . . . . . . . . . . . . . 7-57
7.6.3 New Source Performance Standards Costs . . . . . . . . . . . . . . . . . . . . . 7-577.6.4 Pretreatment Standards for New Sources Costs . . . . . . . . . . . . . . . . . . 7-57
SECTION 8 DEVELOPMENT OF LIMITATIONS AND STANDARDS . . . . . . . . . . . . . . 8-18.1 ESTABLISHMENT OF BPT/BCT/BAT/PSES . . . . . . . . . . . . . . . . . . . . . . . . 8-18.2 NSPS . . . . . . . . . . . . . . . . . . . . . . . . . . . . . . . . . . . . . . . . . . . . . . . . . . . . . . . . . 8-78.3 PSNS . . . . . . . . . . . . . . . . . . . . . . . . . . . . . . . . . . . . . . . . . . . . . . . . . . . . . . . . . 8-88.4 COST OF TECHNOLOGY OPTIONS . . . . . . . . . . . . . . . . . . . . . . . . . . . . . . . 8-9
8.4.1 BPT and PSES Costs . . . . . . . . . . . . . . . . . . . . . . . . . . . . . . . . . . . . . . . 8-98.4.2 BCT and BAT Costs . . . . . . . . . . . . . . . . . . . . . . . . . . . . . . . . . . . . . . 8-10

v
8.5 POLLUTANT REDUCTIONS . . . . . . . . . . . . . . . . . . . . . . . . . . . . . . . . . . . . 8-108.5.1 Conventional Pollutant Reductions . . . . . . . . . . . . . . . . . . . . . . . . . . . 8-108.5.2 Priority and Non-conventional Pollutant Reductions . . . . . . . . . . . . . 8-10
8.5.2.1 Methodology . . . . . . . . . . . . . . . . . . . . . . . . . . . . . . . . . . . . . . 8-108.5.2.2 Direct and Indirect Discharges (BPT/BCT/BAT) and (PSES) 8-11
SECTION 9 NON-WATER QUALITY IMPACTS . . . . . . . . . . . . . . . . . . . . . . . . . . . . . . . 9-19.1 AIR POLLUTION . . . . . . . . . . . . . . . . . . . . . . . . . . . . . . . . . . . . . . . . . . . . . . . 9-19.2 SOLID WASTE . . . . . . . . . . . . . . . . . . . . . . . . . . . . . . . . . . . . . . . . . . . . . . . . . 9-29.3 ENERGY REQUIREMENTS . . . . . . . . . . . . . . . . . . . . . . . . . . . . . . . . . . . . . . 9-3
Appendix A Listing of CHWC Analytes with at Least One Detect
Appendix B Listing of CHWC Analytes with No Detects
Appendix C Range of Pollutant Influent Concentrations of the Pooled Daily Data from the Three 5-Day EPA Sampling Episodes for all Analytes
Appendix D ACRONYMS AND DEFINITIONS

LIST OF TABLES
vi
3-1 Non-Commercial Grab Sample Episode Data . . . . . . . . . . . . . . . . . . . . . . . . . . . . . . . . 3-53-2 Comparison of Non-Commercial and Commercial Data . . . . . . . . . . . . . . . . . . . . . . . . 3-63-3 Number of Thermal Units at Each of the 55 CHWC Facility Locations . . . . . . . . . . . . 3-73-4 Types of Thermal Units at 55 CHWC Facilities . . . . . . . . . . . . . . . . . . . . . . . . . . . . . . 3-73-5 Amount of Waste Treated by 55 Commercial Facilities in Calender Year 1992 (Tons) 3-83-6 Quantity of Process Wastewater Generated by 55 CHWC Facilities in Calender Year
1992 (Thousand Gallons) . . . . . . . . . . . . . . . . . . . . . . . . . . . . . . . . . . . . . . . . . . . . . . . . 3-93-7 1992 RCRA Designation of 22 Commercial Facilities . . . . . . . . . . . . . . . . . . . . . . . . 3-103-8 Number of Customers/Facilities Served in 1992 by 22 Commercial Facilities . . . . . . 3-103-9 Types of Air Pollution Control Systems at 22 Commercial Facilities . . . . . . . . . . . . . 3-113-10 Air Pollutants for Which Add-On Control Systems are in Operation for 22
Commercial Facilities . . . . . . . . . . . . . . . . . . . . . . . . . . . . . . . . . . . . . . . . . . . . . . . . . 3-123-11 Scrubbing Liquor Used in Air Pollution Control Systems of 22 Commercial
Facilities . . . . . . . . . . . . . . . . . . . . . . . . . . . . . . . . . . . . . . . . . . . . . . . . . . . . . . . . . . . . 3-123-12 Type of Water Recirculation System Used in Air Pollution Control Systems of the 22
CHWC Facilities . . . . . . . . . . . . . . . . . . . . . . . . . . . . . . . . . . . . . . . . . . . . . . . . . . . . . 3-134-1 Amount of CHWC Wastewater Discharged . . . . . . . . . . . . . . . . . . . . . . . . . . . . . . . . . 4-34-2 Range of Pollutant Influent Concentrations of the Pooled Daily Data from the Three
Five-Day EPA Sampling Episodes (ug/l) . . . . . . . . . . . . . . . . . . . . . . . . . . . . . . . . . . . 4-54-3 Range of Pollutant Influent Concentrations of the Pooled Daily Data from the
Characterization EPA Sampling Episodes (ug/l) . . . . . . . . . . . . . . . . . . . . . . . . . . . . . . 4-74-4 CHWC Industry 1992 Discharge Concentration . . . . . . . . . . . . . . . . . . . . . . . . . . . . . 4-115-1 Pollutants Detected Only During Wastewater Characterization Sampling . . . . . . . . . . 5-25-2 Pollutants Not Detected Three or More Times Above MDL . . . . . . . . . . . . . . . . . . . . . 5-35-3 Pollutants Only Found During Sampling Episodes 4733 and 4671 . . . . . . . . . . . . . . . . 5-45-4 Pollutants Not Detected Three or More Times at an Average Influent Concentration
Greater Than or Equal To 10 Times the MDL . . . . . . . . . . . . . . . . . . . . . . . . . . . . . . . . 5-55-5 Pollutants Not Treated by the BAT Treatment System . . . . . . . . . . . . . . . . . . . . . . . . . 5-65-6 Pollutants Indirectly Controlled Through Regulation of Other Pollutants . . . . . . . . . . 5-65-7 Dioxins and Furans Eliminated as Pollutants of Concern . . . . . . . . . . . . . . . . . . . . . . . 5-65-8 Breakdown of Detected Dioxins/Furans During CHWC Sampling Program . . . . . . . . 5-85-9 Pollutants Selected for Regulation . . . . . . . . . . . . . . . . . . . . . . . . . . . . . . . . . . . . . . . . 5-105-10 Sampling Episode 6181 Analytical Results . . . . . . . . . . . . . . . . . . . . . . . . . . . . . . . . . 5-125-11 Sampling Episode 6183 Analytical Results . . . . . . . . . . . . . . . . . . . . . . . . . . . . . . . . . 5-135-12 Final POTW Removals for CHWC Industry Pollutants . . . . . . . . . . . . . . . . . . . . . . . 5-165-13 Sampling Episode Percent Removals . . . . . . . . . . . . . . . . . . . . . . . . . . . . . . . . . . . . . 5-175-14 Final Results for CHWC Industry Regulatory Option . . . . . . . . . . . . . . . . . . . . . . . . . 5-186-1 Description of CHWC Sampling Episodes . . . . . . . . . . . . . . . . . . . . . . . . . . . . . . . . . 6-33

LIST OF TABLES
vii
6-2 Treatment Technology Performance for Facility 4646 . . . . . . . . . . . . . . . . . . . . . . . . 6-366-3 Treatment Technology Performance for Facility 4671 . . . . . . . . . . . . . . . . . . . . . . . . 6-416-4 Treatment Technology Performance for Facility 4733 . . . . . . . . . . . . . . . . . . . . . . . . 6-466-5 Primary Chemical Precipitation Treatment Technology Performance Comparison . . 6-506-6 Secondary Chemical Precipitation and Filtration Treatment Technology Performance
Comparison . . . . . . . . . . . . . . . . . . . . . . . . . . . . . . . . . . . . . . . . . . . . . . . . . . . . . . . . . 6-516-7 Description of CHWC Sampling Episodes . . . . . . . . . . . . . . . . . . . . . . . . . . . . . . . . . 6-546-8 Treatment Technology Performance for Episode 6181 . . . . . . . . . . . . . . . . . . . . . . . . 6-586-9 Treatment Technology Performance for Episode 6183 . . . . . . . . . . . . . . . . . . . . . . . . 6-596-10 Treatment Technology Performance Comparison . . . . . . . . . . . . . . . . . . . . . . . . . . . . 6-617-1 Costing Source Comparison . . . . . . . . . . . . . . . . . . . . . . . . . . . . . . . . . . . . . . . . . . . . . 7-67-2 Breakdown of Costing Method by Treatment Technology . . . . . . . . . . . . . . . . . . . . . 7-107-3 Additional Cost Factors . . . . . . . . . . . . . . . . . . . . . . . . . . . . . . . . . . . . . . . . . . . . . . . . 7-117-4 Regulatory Option Wastewater Treatment Technology Breakdown . . . . . . . . . . . . . . 7-137-5 Chemical Addition Design Method . . . . . . . . . . . . . . . . . . . . . . . . . . . . . . . . . . . . . . . 7-167-6 Treatment Chemical Costs . . . . . . . . . . . . . . . . . . . . . . . . . . . . . . . . . . . . . . . . . . . . . . 7-167-7 Sodium Hydroxide Requirements for Chemical Precipitation . . . . . . . . . . . . . . . . . . 7-187-8 State Land Costs . . . . . . . . . . . . . . . . . . . . . . . . . . . . . . . . . . . . . . . . . . . . . . . . . . . . . 7-537-9 Analytical Monitoring Costs . . . . . . . . . . . . . . . . . . . . . . . . . . . . . . . . . . . . . . . . . . . . 7-557-10 Summary of Costs - BPT/BCT/BAT/PSES Final . . . . . . . . . . . . . . . . . . . . . . . . . . . . 7-587-11 Summary of Costs - NSPS/PSNS . . . . . . . . . . . . . . . . . . . . . . . . . . . . . . . . . . . . . . . . 7-588-1 BPT/BCT/BAT Effluent Limitations (ug/l) . . . . . . . . . . . . . . . . . . . . . . . . . . . . . . . . . . 8-58-2 PSES Pretreatment Standards (ug/l) . . . . . . . . . . . . . . . . . . . . . . . . . . . . . . . . . . . . . . . 8-68-3 Direct and Indirect Discharge Loads (in lbs.) . . . . . . . . . . . . . . . . . . . . . . . . . . . . . . . 8-11

LIST OF FIGURES
viii
6-1 Equalization . . . . . . . . . . . . . . . . . . . . . . . . . . . . . . . . . . . . . . . . . . . . . . . . . . . . . . . . . . 6-46-2 Neutralization . . . . . . . . . . . . . . . . . . . . . . . . . . . . . . . . . . . . . . . . . . . . . . . . . . . . . . . . . 6-56-3 Clarification System Incorporating Coagulation and Flocculation . . . . . . . . . . . . . . . . 6-86-4 Calculated Solubilities of Metal Hydroxides . . . . . . . . . . . . . . . . . . . . . . . . . . . . . . . . 6-116-5 Chemical Precipitation System Design . . . . . . . . . . . . . . . . . . . . . . . . . . . . . . . . . . . . 6-126-6 Typical Air Stripping System . . . . . . . . . . . . . . . . . . . . . . . . . . . . . . . . . . . . . . . . . . . . 6-146-7 Multimedia Filtration . . . . . . . . . . . . . . . . . . . . . . . . . . . . . . . . . . . . . . . . . . . . . . . . . . 6-166-8 Ultrafiltration System Diagram . . . . . . . . . . . . . . . . . . . . . . . . . . . . . . . . . . . . . . . . . . 6-186-9 Granular Activated Carbon Adsorption . . . . . . . . . . . . . . . . . . . . . . . . . . . . . . . . . . . . 6-206-10 Chromium Reduction . . . . . . . . . . . . . . . . . . . . . . . . . . . . . . . . . . . . . . . . . . . . . . . . . . 6-226-11 Vacuum Filtration . . . . . . . . . . . . . . . . . . . . . . . . . . . . . . . . . . . . . . . . . . . . . . . . . . . . 6-246-12 Plate and Frame Pressure Filtration System Diagram . . . . . . . . . . . . . . . . . . . . . . . . . 6-256-13 Cyanide Destruction . . . . . . . . . . . . . . . . . . . . . . . . . . . . . . . . . . . . . . . . . . . . . . . . . . . 6-306-14 EPA Sampling Episode 4646 - CHWC Wastewater Treatment System Block Flow
Diagram with Sampling Locations . . . . . . . . . . . . . . . . . . . . . . . . . . . . . . . . . . . . . . . 6-346-15 EPA Sampling Episode 4671 - CHWC Wastewater Treatment System Block Flow
Diagram with Sampling Locations . . . . . . . . . . . . . . . . . . . . . . . . . . . . . . . . . . . . . . . 6-406-16 EPA Sampling Episode 4733 - CHWC Wastewater Treatment System Block Flow
Diagram with Sampling Locations . . . . . . . . . . . . . . . . . . . . . . . . . . . . . . . . . . . . . . . 6-456-17 EPA Sampling Episode 6181 - CHWC Wastewater Treatment System Block Flow
Diagram with Sampling Locations . . . . . . . . . . . . . . . . . . . . . . . . . . . . . . . . . . . . . . . 6-556-18 EPA Sampling Episode 6183 - CHWC Wastewater Treatment System Block Flow
Diagram with Sampling Locations . . . . . . . . . . . . . . . . . . . . . . . . . . . . . . . . . . . . . . . 6-567-1 Option-Specific Costing Logic Flow Diagram . . . . . . . . . . . . . . . . . . . . . . . . . . . . . . 7-127-2 Sodium Hydroxide Capital Cost Curve . . . . . . . . . . . . . . . . . . . . . . . . . . . . . . . . . . . . 7-197-3 Sodium Hydroxide O&M Cost Curve . . . . . . . . . . . . . . . . . . . . . . . . . . . . . . . . . . . . . 7-207-4 Ferric Chloride Capital Cost Curve . . . . . . . . . . . . . . . . . . . . . . . . . . . . . . . . . . . . . . . 7-237-5 Ferric Chloride O&M Cost Curve . . . . . . . . . . . . . . . . . . . . . . . . . . . . . . . . . . . . . . . . 7-247-6 Sodium Bisulfite Capital Cost Curve . . . . . . . . . . . . . . . . . . . . . . . . . . . . . . . . . . . . . . 7-257-7 Sodium Bisulfite O&M Cost Curve . . . . . . . . . . . . . . . . . . . . . . . . . . . . . . . . . . . . . . . 7-267-8 Hydrochloric Acid Capital Cost Curve . . . . . . . . . . . . . . . . . . . . . . . . . . . . . . . . . . . . 7-287-9 Hydrochloric Acid O&M Cost Curve . . . . . . . . . . . . . . . . . . . . . . . . . . . . . . . . . . . . . 7-297-10 Polymer Feed Capital Cost Curve . . . . . . . . . . . . . . . . . . . . . . . . . . . . . . . . . . . . . . . . 7-317-11 Polymer Feed O&M Cost Curve . . . . . . . . . . . . . . . . . . . . . . . . . . . . . . . . . . . . . . . . . 7-327-12 Wastewater Pumping Capital Cost Curve . . . . . . . . . . . . . . . . . . . . . . . . . . . . . . . . . . 7-347-13 Wastewater Pumping O&M Cost Curve . . . . . . . . . . . . . . . . . . . . . . . . . . . . . . . . . . . 7-357-14 Mix Tank Capital Cost Curve . . . . . . . . . . . . . . . . . . . . . . . . . . . . . . . . . . . . . . . . . . . 7-367-15 Mix Tank O&M Cost Curve . . . . . . . . . . . . . . . . . . . . . . . . . . . . . . . . . . . . . . . . . . . . 7-37

LIST OF FIGURES
ix
7-16 Flocculation Capital Cost Curve . . . . . . . . . . . . . . . . . . . . . . . . . . . . . . . . . . . . . . . . . 7-397-17 Flocculation O&M Cost Curve . . . . . . . . . . . . . . . . . . . . . . . . . . . . . . . . . . . . . . . . . . 7-407-18 Primary Clarifier Capital Cost Curve . . . . . . . . . . . . . . . . . . . . . . . . . . . . . . . . . . . . . . 7-427-19 Primary Clarifier O&M Cost Curve . . . . . . . . . . . . . . . . . . . . . . . . . . . . . . . . . . . . . . . 7-437-20 Secondary Clarifier Capital Cost Curve . . . . . . . . . . . . . . . . . . . . . . . . . . . . . . . . . . . . 7-457-21 Secondary Clarifier O&M Cost Curve . . . . . . . . . . . . . . . . . . . . . . . . . . . . . . . . . . . . . 7-467-22 Sand Filtration Capital Cost Curve . . . . . . . . . . . . . . . . . . . . . . . . . . . . . . . . . . . . . . . 7-477-23 Sludge Dewatering Capital Cost Curve . . . . . . . . . . . . . . . . . . . . . . . . . . . . . . . . . . . . 7-497-24 Sludge Dewatering O&M Cost Curve . . . . . . . . . . . . . . . . . . . . . . . . . . . . . . . . . . . . . 7-50

1-1
SECTION 1
LEGAL AUTHORITY
1.1 LEGAL AUTHORITY
Effluent limitations guidelines and standards for the Commercial Hazardous Waste Combustor
Industry (formerly Industrial Waste Combustor Industry) are promulgated under the authority of Sections
301, 304, 306, 307, 308 and 501 of the Clean Water Act, 33 U.S.C. 1311, 1314, 1316, 1317, 1318,
1342, and 1361.
1.2 BACKGROUND
1.2.1 Clean Water Act (CWA)
The Federal Water Pollution Control Act Amendments of 1972 established a comprehensive
program to "restore and maintain the chemical, physical, and biological integrity of the Nation's waters."
(Section 101(a)). To implement the Act, EPA is to issue effluent limitations guidelines, pretreatment
standards and new source performance standards for industrial discharges. These guidelines and standards
are summarized briefly in the following sections.
1.2.1.1 Best Practicable Control Technology Currently Available (BPT) (Section 304(b)(1) of the CWA)
In the guidelines for an industry category, EPA defines BPT effluent limits for conventional, priority,
and non-conventional pollutants. In specifying BPT, EPA looks at a number of factors. EPA first
considers the cost of achieving effluent reductions in relation to the effluent reduction benefits. The Agency
next considers: the age of the equipment and facilities; the processes employed and any required process
changes; engineering aspects of the control technologies; non-water quality environmental impacts (including
energy requirements); and such other factors as the Agency deems appropriate (CWA §304(b)(1)(B)).

1-2
Traditionally, EPA establishes BPT effluent limitations based on the average of the best performances of
facilities within the industry of various ages, sizes, processes or other common characteristics. Where,
however, existing performance within a category or subcategory is uniformly inadequate, EPA may require
higher levels of control than currently in place in an industrial category (or subcategory) if the Agency
determines that the technology can be practically applied.
1.2.1.2 Best Conventional Pollutant Control Technology (BCT)(Section 304(a)(4) of the CWA)
The 1977 amendments to the CWA required EPA to identify effluent reduction levels for
conventional pollutants associated with BCT technology for discharges from existing industrial point
sources. In addition to other factors specified in Section 304(b)(4)(B), the CWA requires that EPA
establish BCT limitations after consideration of a two part "cost-reasonableness" test. EPA explained its
methodology for the development of BCT limitations in the July 1986 Federal Register (51 FR 24974).
Section 304(a)(4) designates the following as conventional pollutants: five day biochemical oxygen
demand (BOD ), total suspended solids (TSS), fecal coliform, pH, and any additional pollutants defined5
by the Administrator as conventional. The Administrator designated oil and grease as an additional
conventional pollutant on July 30, 1979 (44 FR 44501).
1.2.1.3 Best Available Technology Economically Achievable (BAT)(Section 304(b)(2)(B) of the CWA)
In general, BAT effluent limitations guidelines represent the best economically achievable
performance of plants in the industrial subcategory or category. The factors considered in assessing BAT
include the cost of achieving BAT effluent reductions, the age of equipment and facilities involved, the
process employed, potential process changes, and non-water quality environmental impacts, including
energy requirements. The Agency retains considerable discretion in assigning the weight to be accorded
these factors. Unlike BPT limitations, BAT limitations may be based on effluent reductions attainable
through changes in a facility's processes and operations. As with BPT, where existing performance is

1-3
uniformly inadequate, BAT may require a higher level of performance than is currently being achieved
based on technology transferred from a different subcategory or category. BAT may be based upon
process changes or internal controls, even when these technologies are not common industry practice.
1.2.1.4 New Source Performance Standards (NSPS) (Section 306 of the CWA)
NSPS reflect effluent reductions that are achievable based on the best available demonstrated
control technology. New facilities have the opportunity to install the best and most efficient production
processes and wastewater treatment technologies. As a result, NSPS should represent the most stringent
controls attainable through the application of the best available control technology for all pollutants (i.e.,
conventional, non-conventional, and priority pollutants). In establishing NSPS, EPA is directed to take into
consideration the cost of achieving the effluent reduction and any non-water quality environmental impacts
and energy requirements.
1.2.1.5 Pretreatment Standards for Existing Sources (PSES) (Section 307(b) of the CWA)
PSES are designed to prevent the discharge of pollutants that pass through, interfere with, or are
otherwise incompatible with the operation of publicly owned treatment works (POTW). The CWA
authorized EPA to establish pretreatment standards for pollutants that pass through POTWs or interfere
with treatment processes or sludge disposal methods at the POTW. Pretreatment standards are
technology-based and analogous to BAT effluent limitations guidelines.
The general Pretreatment Regulations, which set forth the framework for the implementation of
categorical pretreatment standards, are found in 40 CFR Part 403. Those regulations contain a definition
of pass through that addresses localized rather than national instances of pass through and establish
pretreatment standards that apply to all non-domestic dischargers (see 52 FR 1586, January 14, 1987).

1-4
1.2.1.6 Pretreatment Standards for New Sources (PSNS) (Section 307(b) of the CWA)
Like PSES, PSNS are designed to prevent the discharges of pollutants that pass through, interfere
with, or are otherwise incompatible with the operation of POTWs. PSNS are to be issued at the same time
as NSPS. New indirect dischargers have the opportunity to incorporate into their plants the best available
demonstrated technologies. The Agency considers the same factors in promulgating PSNS as it considers
in promulgating NSPS.
1.2.2 Section 304(m) Requirements
Section 304(m) of the Act (33 U.S.C. 1314(m)), added by the Water Quality Act of 1987,
requires EPA to establish schedules for (1) reviewing and revising existing effluent limitation guidelines and
standards (“effluent guidelines”), and (2) promulgating new effluent guidelines. On January 2, 1990, EPA
published an Effluent Guidelines Plan (55 FR 80), that included schedules for developing new and revised
effluent guidelines for several industry categories. One of the industries for which the Agency established
a schedule was the Hazardous Waste Treatment Industry.
The Natural Resources Defense Council (NRDC) and Public Citizen, Inc. filed suit against the
Agency, alleging violation of Section 304(m) and other statutory authorities requiring promulgation of
effluent guidelines (NRDC et al. v. Reilly, Civ. No. 89-2980 (D.D.C.)). Under the terms of the consent
decree in that case, as amended, EPA agreed, among other things, to propose effluent guidelines for the
ALandfills and Industrial Waste Combusters@ category by November 1997 and final action by November
1999. Although the Consent Decree lists "Landfills and Industrial Waste Combusters" as a single entry,
EPA is publishing separate regulations for Industrial Waste Combusters and for Landfills.
In order to reflect accurately the segment of the combustion industry being regulated today, EPA
has now changed the name for this final regulation from “Industrial Waste Combustor” to “Commercial
Hazardous Waste Combustor” regulations.

2-1
SECTION 2
DATA COLLECTION
In 1986, the Agency initiated a study of waste treatment facilities which receive waste from off site
for treatment, recovery, or disposal. The Agency looked at various segments of the waste management
industry including combustors, centralized waste treatment facilities, landfills, fuel blending operations, and
waste solidification/stabilization processes (Preliminary Data Summary for the Hazardous Waste Treatment
Industry, EPA 440-1-89-100, September 1989).
Development of effluent limitations guidelines and standards for the Commercial Hazardous Waste
Combustor (CHWC) (formerly Industrial Waste Combustor (IWC)) Subcategory began in 1993. EPA
originally looked at RCRA hazardous waste incinerators, RCRA boilers and industrial furnaces (BIFs), and
non-hazardous combustion units that treat industrial waste. Sewage sludge incinerators, municipal waste
incinerators, and medical waste incinerators were not included in the 1989 study or in the initial data
collection effort in 1993. EPA limited the proposed rulemaking to the development of regulations for
industrial waste combustors. Based on comments received on the proposed rulemaking, EPA has limited
the final rulemaking to regulations for Commercial Hazardous Waste Combustors.
EPA has gathered and evaluated technical and economic data from various sources in the course
of developing the final effluent limitations guidelines and standards for the CHWC Industry. These data
sources include:
C Responses to EPA's "1992 Waste Treatment Industry Phase II: Incinerators Screener
Survey,"
C Responses to EPA's "1994 Waste Treatment Industry Phase II: Incinerators
Questionnaire,"
C Responses to EPA's "1994 Detailed Monitoring Questionnaire,"
C EPA's 1993 - 1995 sampling of selected CHWC facilities,
C Literature data, and

2-2
C Facility NPDES and POTW wastewater discharge permit data.
EPA has used data from these sources to profile the industry with respect to: wastes received for
treatment or recovery, treatment/recovery processes, geographical distribution, and wastewater and solid
waste disposal practices. EPA then characterized the wastewater generated by treatment/recovery
operations through an evaluation of water usage, type of discharge or disposal, and the occurrence of
conventional, non-conventional and priority pollutants.
2.1 CLEAN WATER ACT SECTION 308 QUESTIONNAIRES AND SCREENERSURVEYS
2.1.1 Development of Questionnaires and Screener Surveys
A major source of information and data used in developing effluent limitations guidelines and
standards is industry responses to questionnaires and screener surveys distributed by EPA under the
Authority of Section 308 of the Clean Water Act (CWA). The questionnaires typically request information
concerning treatment processes, wastes received for treatment, and disposal practices as well as
wastewater treatment system performance data. Questionnaires also request financial and economic data
for use in assessing economic impacts and the economic achievability of technology options. Screener
surveys generally request less detailed information than the questionnaires regarding treatment processes,
wastes received for treatment and disposal practices.
EPA used its experience with previous questionnaires to develop one screener survey (the 1992
Waste Treatment Industry Phase II: Incinerators Screener Survey) and two questionnaires (the 1994
Waste Treatment Industry Phase II: Incinerators Questionnaire and the Detailed Monitoring Questionnaire)
for this project. The 1992 Waste Treatment Industry Phase II: Incinerators Screener Survey was designed
to obtain general infomation on facility operations from a census of the industry. The 1994 Waste
Treatment Industry Phase II: Incinerators Questionnaire was designed to request 1992 technical,
economic, and financial data to describe industrial operations adequately from a census of facilities in the
industry that were operating commercially and from a sample of facilities in the industry that were not

2-3
operating commercially. The Detailed Monitoring Questionnaire was designed to elicit daily analytical data
from a limited number of facilities which would be selected after receipt and review of the 1994 Waste
Treatment Industry Phase II: Incinerators Questionnaire responses.
For the 1994 Waste Treatment Industry Phase II: Incinerators Questionnaire, EPA wanted to
minimize the burden to industrial waste combustor facilities. Thus, only a statistical sample of the non-
commercial facilities meeting the preliminary scope qualifications received the 1994 Waste Treatment
Industry Phase II: Incinerators Questionnaire. The questionnaire specifically requested information on:
C combustion processes,
C types of waste received for combustion,
C wastewater and solid waste disposal practices,
C ancillary waste management operations,
C summary analytical monitoring data,
C the degree of co-combustion (combustion of waste received from off-site with other on-
site industrial waste),
C cost of waste combustion processes, and
C the extent of wastewater recycling or reuse at facilities.
In the 1994 Waste Treatment Industry Phase II: Incinerators Questionnaire, EPA requested
summary monitoring data from all recipients, but summary information is not sufficient for determining
limitations and industry variability. Therefore, the Detailed Monitoring Questionnaire was designed to
collect daily analytical data from a limited number of facilities. Facilities were chosen to complete the
Detailed Monitoring Questionnaire based on technical information submitted in the 1994 Waste Treatment
Industry Phase II: Incinerators Questionnaire. The burden was minimized in the Detailed Monitoring
Questionnaire by tailoring the questionnaire to the facility operations.
EPA sent draft screener surveys and questionnaires to industry trade associations, incinerator
facilities who had expressed interest, and environmental groups for review and comment. A pre-test for

2-4
both the 1992 Waste Treatment Industry Phase II: Incinerators Screener Survey and the 1994 Waste
Treatment Industry Phase II: Incinerators Questionnaire was conducted at nine industrial waste combustor
facilities to determine if the type of information necessary would be received from the questions posed as
well as to determine if questions were designed to minimize the burden to facilities.
Based on comments from the reviewers, EPA modified the draft questionnaire.
As required by the Paperwork Reduction Act, 44 U.S.C. 3501 et seq., EPA submitted the
Questionnaire package (including the 1992 Waste Treatment Industry Phase II: Incinerators Screener
Survey and the 1994 Waste Treatment Industry Phase II: Incinerators Questionnaire and the Detailed
Monitoring Questionnaire) to the Office of Management and Budget (OMB) for review. EPA also
redistributed the questionnaire package to industry trade associations, industrial waste combustor facilities,
environmental groups, and to any others who requested a copy of the questionnaire package.
2.1.2 Distribution of Screener Surveys and Questionnaires
Under the authority of Section 308 of the Clean Water Act, EPA sent the 1992 Waste Treatment
Industry Phase II: Incinerators Screener Survey (OMB Approval Number: 2040-0162, Expired: 08/31/96)
in September 1993 to 606 facilities that the Agency had identified as possible industrial waste combustor
facilities. EPA identified the 606 facilities as possible industrial waste combustor facilities from various
sources; such as, companies listed in the 1992 Environmental Information (EI) Directory, companies that
were listed as incinerators in the RCRIS National Oversight Database (November, 1992 and February,
1993 versions), companies that were listed as BIF Facilities by EPA (updated December, 1992), and
incinerator facilities identified in the development of the Centralized Waste Treatment (CWT) effluent
guidelines. Since industrial waste combustors were not represented by a SIC code at the time of the
survey, identification of facilities was difficult. The screener survey requested summary information on: (1)
the types of wastes accepted for combustion; (2) the types of combustion units at a facility; (3) the
quantity, treatment, and disposal of wastewater generated from combustion operations; (4) available
analytical monitoring data on wastewater treatment; and (5) the degree of co-treatment (treatment of
CHWC wastewater with wastewater from other industrial operations at the facility). The responses from

2-5
564 facilities indicated that 357 facilities burned industrial waste in 1992. The remaining 207 did not burn
industrial waste in 1992. Of the 357 facilities that burned industrial waste, 142 did not generate any
wastewater from air pollution control systems or water used to quench flue gas or slag generated as a result
of their combustion operations. Of the remaining 215 facilities that generated these types of wastewater,
59 operated commercially, and 156 only burned wastes generated on site, and/or only burned wastes
generated from off-site facilities under the same corporate structure.
Following an analysis of the screener survey results, EPA sent the 1994 Waste Treatment Industry
Phase II: Incinerators Questionnaire (OMB Approval Number: 2040-0167, Expired: 12/31/96) in March,
1994 to selected facilities which burned industrial waste and generated wastewater from air pollution
control systems or water used to quench flue gas or slag generated as a result of their combustion
operations. EPA sent the questionnaire to all 59 of the commercial facilities and all 16 of the non-
commercial facilities that burned non-hazardous industrial waste. Further, EPA sent 32 of the remaining
140 non-commercial facilities a questionnaire. These thirty-two were selected based on a statistical
random sample. The questionnaire specifically requested information on: (1) the type of wastes accepted
for treatment; (2) the types of combustion units at a facility; (3) the types of air pollution control devices
used to control emissions from the combustion units at a facility; (4) the quantity, treatment, and disposal
of wastewater generated from combustion operations; (5) available analytical monitoring data on
wastewater treatment; (6) the degree of co-treatment (treatment of industrial waste combustor wastewater
with wastewater from other industrial operations at the facility); and (7) the extent of wastewater recycling
and/or reuse at the facility. Information was also obtained through follow-up telephone calls and written
requests for clarification of questionnaire responses.
EPA also requested a subset of industrial waste combustor facilities that received a questionnaire
to submit wastewater monitoring data in the form of individual data points rather than monthly or annual
aggregates. Only facilities that had identified a sample point location where the stream was over 50 percent
wastewater from air pollution control systems or water used to quench flue gas or slag generated as a result
of their combustion operations received the Detailed Monitoring Questionnaire. These wastewater
monitoring data included information on pollutant concentrations at various points in the wastewater

2-6
treatment processes. Data were requested from 26 facilities. Sixteen of these facilities operated
commercially and 10 operated non-commercially.
2.2 SAMPLING PROGRAM
2.2.1 Pre-1989 Sampling Program
In the sampling program for the 1989 Hazardous Waste Treatment Industry Study, twelve facilities
were sampled to characterize the wastes received and evaluate the on-site treatment technology
performance at combustors, landfills, and hazardous waste treatment facilities. Since all of the facilities
sampled had more than one on-site operation (e.g., combustion and landfill leachate generation), the data
collected can not be used for this project because data were collected for mixed waste streams and the
waste characteristics and treatment technology performance for the combustor facilities cannot be
differentiated. Information collected in the study is presented in the Preliminary Data Summary for the
Hazardous Waste Treatment Industry (EPA 440/1-89/100, September 1989).
2.2.2 1993 - 1995 Sampling Program
2.2.2.1 Facility Selection
Between 1993 and 1995, EPA visited 14 industrial waste combustor facilities. Eight of the fourteen
industrial waste combustors EPA visited were captive facilities because captive facilities were still being
considered for inclusion in the scope of the CHWC regulation at the time of the site visits. During each
visit, EPA gathered the following information:
C the process for accepting waste for combustion,
C the types of waste accepted for combustion,
C design and operating procedures for combustion technologies,
C general facility management practices,

2-7
C water discharge options,
C solid waste disposal practices, and
C other facility operations.
EPA also took one grab sample of untreated industrial waste combustor scrubber blowdown water at
twelve of the fourteen facilities. EPA analyzed most of these grab samples for over 450 analytes to identify
pollutants at these facilities. The grab samples from the twelve site visits allowed EPA to assess whether
there was a significant difference in raw wastewater characteristics from a wide variety of combustion unit
types. (See Section 3 for a description of the types of combustion units.) EPA determined that the raw
wastewater characteristics were similar for all types of combustion units both in types of pollutants found
and the concentrations of the pollutants found. Specifically, organics, pesticides/herbicides, and
dioxins/furans were generally only found, if at all, in low concentrations in the grab samples. (See Section
5 of this document for a discussion of dioxins/furans found at 7 of the 12 CHWC facilities sampled.)
However, a variety of metal analytes were found in significant concentrations in the grab samples.
Based on these data and the responses to the 1994 Waste Treatment Industry Phase II:
Incinerators Questionnaire, EPA selected three of the industrial waste combustor facilities for the BAT
sampling program in order to collect data to characterize discharges and the performance of selected
treatment systems. Using data supplied by the facilities, EPA applied five criteria in initially selecting which
facilities to sample. The criteria were based on whether the wastewater treatment system: (1) was effective
in removing pollutants, (2) treated wastes received from a variety of sources (solids as well as liquids), (3)
employed either novel treatment technologies or applied traditional treatment technologies in a novel
manner, (4) applied waste management practices that increased the effectiveness of the treatment unit, and
(5) discharged its treated wastewater under a NPDES permit. The other 11 facilities visited were not
sampled because they did not meet these criteria. Eight of these 11 facilities visited did not operate
commercially, and are thus no longer included in the CHWC Industry.

2-8
2.2.2.2 Five-Day Sampling Episodes
After a facility was chosen to participate in the five-day sampling program, a draft sampling plan
was prepared which described the location of sample points and analyses to be performed at specific
sample points as well as the procedures to be followed during the sampling episode. Prior to sampling, a
copy of the draft sampling plan was provided to the facility for review and comment to ensure that EPA
properly described and understood facility operations. All comments were incorporated into the final
sampling plan. During the sampling episode, teams of EPA employees and contractors collected and
preserved samples. Samples were sent to EPA approved laboratories for analysis. Samples were
collected at influent and effluent points. Samples were also taken at intermediate points to assess the
performance of individual treatment units. Facilities were given the option to split all samples with EPA,
but most facilities split only effluent sample points with EPA. Following the sampling episode, a draft
sampling report was prepared that included descriptions of the treatment/recovery processes, sampling
procedures and analytical results. After all information was gathered, the reports were provided to the
facilities for review and comment. Corrections were incorporated into the final report. The facilities also
identified any information in the draft sampling report that were considered to be Confidential Business
Information.
During each sampling episode, wastewater treatment system influent and effluent streams were
sampled. Samples were also taken at intermediate points to assess the performance of individual treatment
units. Selected sampling information is summarized in Section 4 and Appendix A of this document . In all
sampling episodes, samples were analyzed for over 450 analytes to identify the pollutants at these facilities.
Again, organic compounds, pesticides/herbicides, and dioxins/furans were generally only found in low
concentrations in the composite daily samples, if they were found at all. Dioxin/furan analytes were not
detected in the sampling episode used to establish BPT/BAT/PSES. However, dioxin/furan analytes were
found in the two other sampling episodes (see discussion in Section 5 of this document).
EPA completed the three sampling episodes for the Commercial Hazardous Waste Combustor
Subcategory from 1994 to 1995. Selection of facilities to be sampled was limited due to the small number
of facilities in the scope of the project. Only eight of the operating facilities identified discharged their

2-9
treated wastewater under a NPDES permit. Of these eight facilities, only five burned solid as well as liquid
waste. All of the facilities sampled used some form of chemical precipitation for treatment of the metal-
bearing waste streams. All of the facilities were direct dischargers and were therefore designed to
effectively treat the only conventional pollutant found in this industry, total suspended solids (TSS). Data
from one of these facilities could not be used to calculate the proposed limitations and standards because
influent concentrations for many parameters were low and thus performance data for the treatment systems
could not be adequately ascertained. Also, as discussed in Section 6.4.2, EPA determined that only one
of the two remaining facilities employed BPT technology. However, data from all three facilities were used
to characterize the raw waste streams. Thus, for the proposal, only one sampling episode contained data
which were used to characterize the treatment technology performance of Commercial Hazardous Waste
Combustors.
As described in the Notice of Availability on May 17, 1999 (64 FR 26714), EPA received
additional wastewater treatment system performance data from CHWC facilities in early 1999, subsequent
to the close of the comment period for the proposal. Three CHWCs submitted influent and effluent
wastewater treatment system performance data and related information on the operation of their treatment
systems. Each facility submitted daily measurements for chlorides, total dissolved solids (TDS), TSS,
sulfate, pH and 15 metals (aluminum, antimony, arsenic, cadmium, chromium, copper, iron, lead, mercury,
molybdenum, selenium, silver, tin, titanium and zinc.) One facility provided 11 days of sampling data and
the two other facilities provided 30 days of sampling data each.
Following an evaluation of the three facilities, EPA determined that two of these three facilities
employed BPT treatment technology. EPA used data from these two additional facilities, along with the
data used for the proposed regulation, to revise the proposed limitations and standards. The concentrations
of pollutants in the treated effluent from these two additional facilities are higher for some pollutants and
lower for others, as compared to the facility used to develop limitations and standards for the proposal.
On average, the variability of the effluent concentrations at these two additional facilities were lower than
those at the facility used as the basis for the proposed numerical guidelines. EPA did not use data from
these two facilities in determining the variability factors used to calculate the numerical guidelines because

2-10
EPA concluded that the average variability observed in the data used to calculate the limitations and
standards for proposal was greater than the average variability determined from the data for the other two
CHWCs. The variability factors used at proposal better reflect the variability seen in waste receipts
accepted for burning over longer periods of time at CHWCs.
Information on waste stream characteristics is included in Section 4 of this document and
information on system performances is included in Section 6.

3-1
SECTION 3
DESCRIPTION OF THE INDUSTRY AND SUBCATEGORIZATION
3.1 GENERAL INFORMATION
The universe of combustion facilities currently in operation in the United State is broad. These
include municipal waste incinerators that burn household and other municipal trash and incinerators that
burn hazardous wastes. Other types of incinerators include those that burn medical wastes exclusively and
sewage sludge incinerators for incineration of POTWs’ wastewater treatment residual sludge. In addition,
some boilers and industrial furnaces (e.g., aggregate kilns) may burn waste materials for fuel.
While many industries began incinerating some of their wastes as early as the late 1950's, the
current market for waste combustion (particularly combustion of hazardous wastes) is essentially a creature
of the Resource Conservation and Recovery Act (RCRA) and EPA’s resulting regulation of hazardous
waste disposal. Among the major regulatory spurs to combustion of hazardous wastes have been the land-
ban restrictions under the Hazardous and Solid Waste Amendments (HSWA) of 1984 and clean-up
agreements for Superfund sites called “Records of Decision” (RODs).
Prior to the promulgation of EPA’s Land Disposal Restrictions (LDRs)(40 CFR Part 268),
hazardous waste generators were free to send untreated wastes directly to landfills. The LDRs mandated
alternative treatment standards for wastes, known as Best Demonstrated Available Technologies (BDATs).
Quite often, combustion was the stipulated BDAT. Future modifications to the LDRs may either increase
or decrease the quantity of wastes directed to the combustion sector.
The LDRs have also influenced hazardous waste management under the Comprehensive
Environmental Response, Compensation, and Liability Act (CERCLA)(42 U.S.C §§ 9601, et. seq.). The
RODs set out the clean-up plan for contaminated sites under CERCLA. A key attribute of the RODs is
the choice of remediation technology. Incineration is often a technology selected for remediation. While
remediation efforts contribute a minority of the wastes managed by combustion, combustion has been used
frequently on remediation projects. In addition, future Congressional changes to CERCLA may affect
remediation disposal volumes directed to the combustion sector.

3-2
The Agency proposed a draft Waste Minimization and Combustion Strategy in 1993 and 1994 to
promote better combustion of hazardous waste and encourage reduced generation of wastes. The key
projects under the broad umbrella of the strategy are: "Revised Standards for Hazardous Waste
Combustors" 61 FR 17358, April 1996, the Waste Minimization National Plan completed in May 1995,
and the “RCRA Expanded Public Participation Rule” 60 FR 63417, December 1995. Waste minimization
will directly affect waste volumes sent to the combustion and all other waste management sectors.
In recent years, a number of contrary forces have contributed to a reduction in the volume of
wastes being incinerated. Declines in waste volumes and disposal prices have been attributed to: waste
minimization by waste generators, intense price competition driven by overcapacity, and changes in the
competitive balance between cement kilns (and other commercial boilers and industrial furnaces (BIFs))
and commercial incinerators. These trends have been offset by factors such as increased overall waste
generation as part of general economic improvement, industrial waste combustor consolidation, and
reductions in on-site combustion.
The segment of the universe of combustion units for which EPA is regulating includes units which
operate commercially and which use controlled flame combustion in the treatment or recovery of RCRA
hazardous waste. For example, industrial boilers, industrial furnaces, rotary kiln incinerators and liquid-
injection incinerators are all types of units included in the Commercial Hazardous Waste Combustor
(CHWC) Industry.
Combustion or recovery operations at these facilities generate the following types of wastewater,
described more fully in Section 4: air pollution control wastewater, flue gas quench wastewater, slag
quench, truck/equipment wash water, container wash water, laboratory drain wastewater, and floor
washings from the process area. Typical non-wastewater by-products of combustion or recovery
operations may include: slag or ash developed in the combustion unit itself, and emission particles collected
using air pollution control systems. There are many different types of air pollution control systems in use
by combustion units. The types employed by combustion units include, but are not limited to: packed
towers (which use a caustic scrubbing solution for the removal of acid gases), baghouses (which remove
particles and do not use any water), wet electrostatic precipitators (which remove particles using water but

3-3
do not generate a wastewater stream), and venturi scrubbers (which remove particles using water and
generate a wastewater stream). Thus, the amount and types of wastewater generated by a combustion unit
are directly dependent upon the types of air pollution control systems employed by the combustion unit.
3.2 SCOPE OF THE REGULATION
3.2.1 CHWC Facilities
EPA promulgated effluent limitations guidelines and pretreatment standards for new and existing
thermal units, except cement kilns, that are subject to either to 40 CFR Part 264, Subpart O; Part 265,
Subpart O; or Part 266, Subpart H if the thermal unit burns RCRA hazardous wastes received from off-site
for a fee or other remuneration in the following circumstances.
The thermal unit is a commercial hazardous waste combustor if the off-site wastes are generated
at a facility not under the same corporate structure or subject to the same ownership as the thermal unit and
(1) the thermal unit is burning wastes that are not of a similar nature to wastes being burned from
industrial processes on site, or
(2) there are no wastes being burned from industrial processes on site.
3.2.2 Captive and Intracompany CHWC Facilities
As noted above, the rule does not apply to wastewater discharges associated with combustion units
that burn only wastes generated on-site. Furthermore, wastewater discharges from RCRA hazardous
incinerators and RCRA BIFs that burn waste generated off-site (for fee or other remuneration) from
facilities that are under the same corporate ownership (or corporate structure) as the combustor are
similarly not included within the scope of this rule.
EPA has decided not to include facilities which only burn waste from off-site facilities under the
same corporate structure (intracompany facility) and/or only burn waste generated on-site (captive facility)
within the scope of this regulation for the following reasons. First, based on its survey, EPA identified (as

3-4
of 1992) approximately 185 captive facilities and 89 facilities that burn wastes received from other facilities
within the same corporate umbrella. A significant number of these facilities generated no CHWC
wastewater. EPA’s data show that 73 captive facilities (39 percent) and 36 intracompany facilities (42
percent) generated no wastewater as a result of their waste combustor operations. Second, EPA believes
the wastewater generated by waste combustor operations at most of the captive and intracompany facilities
that EPA has identified are already subject to national effluent limitations (or pretreatment standards) based
on the manufacturing operations at the facility. Specifically, 140 of the 156 captive and intracompany
facilities which received a screener survey and generated CHWC wastewater as a result of their
combustion operations: 1) were either previously identified as subject to other effluent guidelines by EPA
or 2) identified themselves as subject to other effluent guidelines. There are 97 facilities subject to the
Organic Chemicals, Plastics and Synthetic Fibers category (40 CFR Part 414), 17 subject to the
Pharmaceuticals category (40 CFR Part 439), 16 subject to the Steam Electric Power Generating category
(40 CFR Part 423), 3 subject to the Pesticide Manufacturing category (40 CFR Part 455), and 7 subject
to other categories. EPA could not identify an effluent guideline category applicable to their discharges for
16 of these 156 facilities (five of these are federal facilities). Moreover, in the case of the small number --
less than 10 percent -- for which EPA could not identify a specific guideline that would apply, the permit
writer has authority to obtain any necessary data to write facility-specific best professional judgement (BPJ)
limitations or standards.
In addition, EPA looked at the pollutant data for commercial and non-commercial hazardous
facilities and concluded that their scrubber water is qualitatively different. EPA evaluated the grab samples
of untreated scrubber water it collected from eight non-commercial facilities to determine if there was a
difference in wastewater characteristics at non-commercial versus commercial facilities. See Table 3-1 for
a presentation of grab sample data from non-commercial facilities. For each regulated pollutant, the
average untreated CHWC wastewater concentration is less for the eight non-commercial facilities than for
the three commercial facilities used to determine the final limitations (see Table 3-2). EPA concluded these
results from the fact that non-commercial facilities do not treat the large variety of different wastes that
commercial facilities treat. Additionally, two of the nine regulated metal pollutants (mercury and silver)

3-5
were not at treatable levels at any of the eight non-commercial facilities. Two more of the nine regulated
metal pollutants (arsenic and cadmium) were at treatable levels at only one of the eight non-commercial
facilities. Further, only one of the nine regulated metal pollutants (zinc) was at treatable levels at more than
half of the eight non-commercial facilities. In contrast, seven of the nine regulated metal pollutants (arsenic,
cadmium copper, lead, mercury, titanium and zinc) were found at treatable levels at all three of the
commercial facilities used to determine the final limitations. Further, the remaining two metal pollutants
(chromium and silver) were found at treatable levels at two of these three commercial facilities. These
circumstances further support EPA’s decision not to subject non-commercial, captive hazardous
incinerators to the limitations and standards developed here.
Table 3-1. Non-Commercial Grab Sample Episode Data
Analyte Non-Commercial Grab Sample Episodes
#9 #1 #2 #11 #6 #10 #A #B
TSS (mg/l) 310 10 ND(4) 44 40 48 46 95
Arsenic 78.4 42.1 ND(1.9) ND(1.1) 1420 ND(20) ND(2) ND(2)
Cadmium 300 ND(5) ND(1.2) 19.05 41.9 ND(4) ND(4) ND(4)
Chromium 250 236 ND(3.6) 24.42 1650 52.7 19.9 ND(9)
Copper 698 101 16.02 75.85 131 59.7 1960 ND(10)
Lead 3300 ND(47) 84.26 319.46 96.6 ND(49) ND(49) ND(49)
Mercury ND(0.2) 0.68 ND(0.1) ND(0.1) 1.04 ND(0.2) 0.63 ND(0.2)
Silver ND(4) ND(5) 4.12 15.74 ND(5) ND(5) ND(5) ND(5)
Titanium 3770 110 ND(2.2) 59.06 98.9 9.2 134 7.5
Zinc 1830 44.7 47.19 1745.6 341 1120 3200 283Values in (ug/l) unless otherwise noted.ND = Non-Detects
Note: Values in parentheses are the detection limits.

3-6
Table 3-2. Comparison of Non-Commercial and Commercial Data
Analyte Number of Treatable Number of Avg. Influent Concentration ofDetects Level Times at Concentration of Three Commercial
(out of 8) (10*QL) Treatable Non-Commercial Facilities Used forLevel Grabs Final Limitations
Avg. Influent
TSS (mg/l) 7 40 6 of 8 74.63 147.40
Arsenic 3 100 1 of 8 195.94 654.33
Cadmium 3 50 1 of 8 47.39 376.57
Chromium 6 100 3 of 8 280.70 835.67
Copper 7 100 4 of 8 381.45 2575.33
Lead 4 100 2 of 8 499.29 2395.33
Mercury 3 2 0 of 8 0.39 93.87
Silver 2 50 0 of 8 6.11 124.27
Titanium 7 100 3 of 8 523.86 2163.67
Zinc 8 200 6 of 8 1076.44 6482.00Values in (ug/l) unless otherwise noted.QL = Quantitation Limit
There may be instances when a combustor is operated in conjunction with on-site industrial
activities and the combustor wastewater is treated and discharged separately from the treatment of
industrial wastewater (or treated separately and mixed before discharge). Permit writers should consider
this guideline as one source of information when developing limitations and standards for these situations.
3.3 SUMMARY INFORMATION ON 55 CHWC FACILITIES
For 1992, EPA identified 55 combustor facilities that accept hazardous or hazardous and non-
hazardous industrial waste from off-site facilities not under the same corporate umbrella for combustion.
The following tables provide summary information from the 1992 Waste Treatment Industry Phase II:
Incinerators Screener Survey on these 55 combustor facilities.

3-7
Many of the 55 CHWC facilities have more than one unit on-site. The majority of facilities with
two or more units on-site operate boilers, industrial furnaces, or aggregate kilns. Table 3-3 presents the
number of thermal units at each of the 55 CHWC facilities that provided data in the survey.
Table 3-3. Number of Thermal Units at Each of the 55 CHWC Facility Locations
Number of Units 1 2 3 4 5 6 7 8 >8
Number of Facilities 26 14 6 4 2 1 0 0 0
There are more industrial furnaces, boilers, and aggregate kilns than any other unit types. However,
more than one of these units often is present at a single facility. Table 3-4 presents the unit types at all 55
CHWC facilities that provided data in the survey.
Table 3-4. Types of Thermal Units at 55 CHWC Facilities
Type of Thermal Unit Number of Each Unit Type
Rotary Kiln Incinerator 22
Liquid Injection Incinerator 16
Fluidized-Bed Incinerator 1
Multiple-Hearth Incinerator 6
Fixed-Hearth Incinerator 3
Pyrolytic Destructor 3
Industrial Boiler 19
Industrial Furnace 25
Other 9
Most of the waste burned by the 55 CHWC facilities is hazardous or non-hazardous industrial
waste containing organic compounds. Only one facility indicated it burned waste containing dioxins/furans
and only four facilities indicated burning waste regulated under the Toxic Substances Control Act (TSCA).
Table 3-5 presents the types and amount of waste treated at all 55 CHWC facilities.

3-8
Table 3-5. Amount of Waste Treated by 55 Commercial Facilities in Calendar Year 1992(Tons)
Tons# of
FacilitiesWaste Type 1-50 51-100 101-500 501- 1,001- 5,001- >10,0001,000 5,000 10,000
Non-RCRA
Sewage Sludge 0 1 0 0 0 0 0 1
ContainingMetals
3 0 3 1 4 1 4 16
ContainingOrganics
5 2 9 0 9 5 6 36
All Others 2 0 2 1 5 0 1 11
RCRA
ContainingMetals
6 0 1 1 7 0 16 31
ContainingOrganics
9 1 6 3 5 1 24 49
ContainingDioxins/Furans
0 0 1 0 0 0 0 1
ContainingPesticides/Herbicides
0 2 0 1 8 0 1 12
All Others 3 0 1 1 1 1 6 13
Special
RadioactiveWastes
1 0 0 0 0 0 0 1
TSCA Wastes(PCBs)
0 0 0 0 1 0 3 4
Medical Wastes 0 0 1 0 0 0 0 1
For the CHWC regulations, only air pollution control water, slag quench and flue gas quench are
considered “CHWC wastewater.” The largest wastewater stream generated by the 55 CHWC facilities,
stormwater runoff, is regulated under other effluent guidelines. The industry also generates large quantities
of boiler blowdown. Boiler blowdown wastewater was not considered for regulation for this industry

3-9
because it does not come into contact with any of the wastes being burned. Table 3-6 presents the quantity
of process wastewater generated by the 55 CHWC facilities that provided data in the survey.
Table 3-6. Quantity of Process Wastewater Generated by 55 CHWC Facilities in CalendarYear 1992 (Thousand Gallons)
Gallons (1,000s) # ofFacilitiesType of Process Water 0-5 5-15 15-50 50-100 100-500 500-750 >750
None 16 0 0 0 0 0 0 16
Air Pollution Control 1 1 2 2 0 0 13 19Water
Slag Quench 1 0 2 0 2 0 0 5
Process Area Washdown 4 2 3 1 4 0 2 16
Truck/Equipment Wash 2 0 1 2 1 0 1 7Water
Container Wash Water 1 0 1 1 1 0 0 4
Stormwater Runoff 0 0 0 2 3 3 11 19
Laboratory Waste 2 0 0 2 2 0 0 6
Flue Gas Quench 1 0 0 0 0 0 7 8
Boiler Blowdown 4 0 2 1 0 2 8 17
Other 2 0 0 0 0 0 3 5
3.4 SUMMARY INFORMATION ON 22 CHWC FACILITIES WHICHGENERATE CHWC WASTEWATER
Following the distribution of the screener survey, EPA sent the 1994 Waste Treatment Industry
Phase II: Incinerators Questionnaire only to those commercial facilities that generated CHWC wastewater.
Thirty-three of the 55 CHWC facilities did not generate any CHWC wastewater; thus, EPA only has
detailed operation information on the 22 CHWC facilities that generated CHWC wastewater. The
following tables provide summary information from the 1994 Waste Treatment Industry Phase II:
Incinerators Questionnaire on these 22 commercial combustor facilities.

3-10
3.4.1 RCRA Designation of 22 CHWC Facilities
Most of the 22 facilities that generate CHWC wastewater are regulated as incinerators under
RCRA. Very few boilers and industrial furnaces regulated under RCRA generate air pollution control
water, flue gas quench, or slag quench. Table 3-7 presents the RCRA designation of the 22 commercial
facilities.
Table 3-7. 1992 RCRA Designation of 22 Commercial Facilities
Total Thermal Units
Hazardous Waste Incinerator 25
Boiler and/or Industrial Furnace 6
3.4.2 Waste Burned at 22 CHWC Facilities
The number of customers served by a facility varies greatly in this industry. Some facilities burn
primarily waste generated on site and only take very few waste shipments from facilities not under their
corporate structure. Other facilities operate a strictly commercial operation, serving hundreds or thousands
of customers on a regular basis. Table 3-8 presents the number of customers served by the 22 commercial
facilities.
Table 3-8. Number of Customers/Facilities Served in 1992 by 22 Commercial Facilities
Number of Customers
Minimum 1
Maximum 4,000
Mean 858
Median 83
Total 27,450

3-11
3.4.3 Air Pollution Control Systems for 22 CHWC Facilities
The type of air pollution control system used by a CHWC facility has a direct effect on the
characteristics and quantity of the CHWC wastewater generated by that facility. Table 3-9 presents the
types of air pollution control systems in use at the 22 commercial facilities. Table 3-10 presents the types
of air pollutants for which add-on control systems are in operation for the 22 CHWC facilities. Some of
these systems do not generate any wastewater (e.g., a fabric filter for particulate removal). Other systems
would generate wastewater (e.g., a packed tower scrubber with lime used for halogenated acid gas
removal).
Table 3-9. Types of Air Pollution Control Systems at 22 Commercial Facilities
Type of Air Pollution Control System Total Thermal Units
Spray Chamber Scrubber 16
Impingement Baffle Scrubber 2
Wet Cyclone (including multiclones) 2
Venturi Scrubber 12
Packed Tower 16
Ionizing Wet Scrubber 4
Wet Electrostatic Precipitator 3
Fabric Filter 11
Dry Scrubber 2
Spray Dryer 1
Other (Includes: Demister; Dry Cyclone; Dry Electrostatic 12Precipitator; Horizontal Packed Absorber; Scrubber Quench Unit;Steam Atomization)

3-12
Table 3-10. Air Pollutants for Which Add-On Control Systems are in Operation for 22Commercial Facilities
Air Pollutant Total Thermal Units
None 2
Halogenated Acid Gases 21
Sulfur Compounds 17
Nitrogen Compounds 5
Particulates 28
Metals 23
Other (Organics) 1
Of the facilities that use water in their air pollution control systems, the chemicals added to the water
and the types of water recirculation systems vary greatly by facility. The addition of chemicals to the water
is dependent upon the purpose of the scrubbing system (e.g., no chemicals would be used to trap
particulates in a cyclonic scrubber and sodium hydroxide would be used to remove halogenated acid gases
in a packed tower scrubber). The chemicals added to the scrubber water would have a direct effect on
the characteristics of the wastewater generated. Table 3-11 presents the types of scrubbing liquors in use
at the 22 commercial facilities.
Table 3-11. Scrubbing Liquor Used in Air Pollution Control Systems of 22 CommercialFacilities
Scrubbing Liquor Total Thermal Units
None 7
Water With No Added Chemicals 13
Sodium Hydroxide 17
Lime Slurry 8
Other (Includes: Lime-Hydrated; Sodium Carbonate Solution; 5Sulfuric Acid)

3-13
The type of water recirculation system used by a facility also has a direct effect on the amount of
wastewater generated. If a facility operated a closed loop air pollution control system with no discharge,
no wastewater would be generated. Alternately, a facility that did not recirculate its air pollution control
system wastewater, would tend to generate a large quantity of wastewater. Table 3-12 presents the types
of water recirculation systems.
Table 3-12. Type of Water Recirculation System Used in Air Pollution Control Systems of the22 CHWC Facilities
Water Recirculation System Total Thermal Units
None (once through) 2
Closed Loop (no discharge) 7
Recirculating with Intermittent Blowdown 1
Recirculating with Continuous Blowdown 12
3.5 SUMMARY INFORMATION ON 10 CHWC FACILITIES WHICHGENERATE AND DISCHARGE CHWC WASTEWATER
Twelve of the twenty-two facilities generate CHWC wastewater but do not discharge the
wastewater to a receiving stream or to a POTW. These facilities are considered “zero or alternative
dischargers” and use a variety of methods to dispose of their wastewater. At these facilities, (1)
wastewater is sent off-site for treatment or disposal (four facilities); (2) wastewater is burned or evaporated
on site (four facilities); (3) wastewater is sent to a surface impoundment on site (three facilities); and (4)
wastewater is injected underground on-site (one facility). Thus, EPA has identified only 10 facilities that
were discharging CHWC wastewater to a receiving stream or to a POTW in 1992. Of these 10 facilities,
2 facilities have either stopped accepting waste from off-site for combustion or have closed their
combustion operations since 1992. These eight facilities are found near the industries generating the wastes
undergoing combustion.
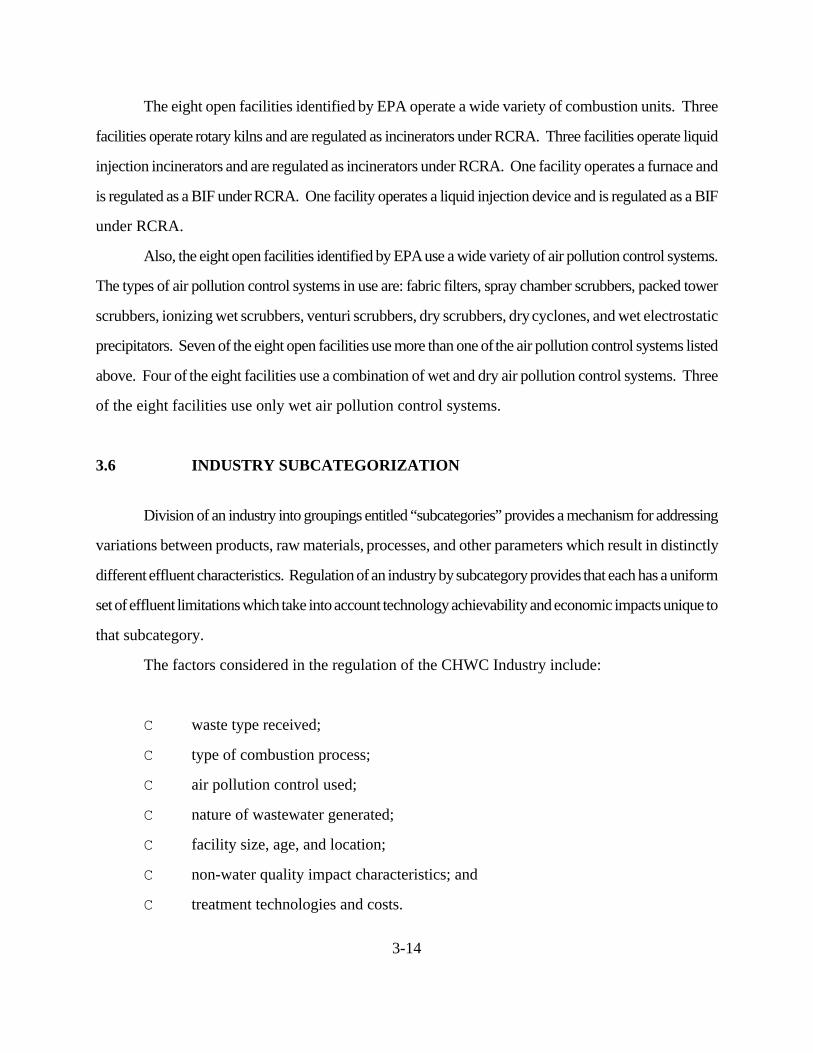
3-14
The eight open facilities identified by EPA operate a wide variety of combustion units. Three
facilities operate rotary kilns and are regulated as incinerators under RCRA. Three facilities operate liquid
injection incinerators and are regulated as incinerators under RCRA. One facility operates a furnace and
is regulated as a BIF under RCRA. One facility operates a liquid injection device and is regulated as a BIF
under RCRA.
Also, the eight open facilities identified by EPA use a wide variety of air pollution control systems.
The types of air pollution control systems in use are: fabric filters, spray chamber scrubbers, packed tower
scrubbers, ionizing wet scrubbers, venturi scrubbers, dry scrubbers, dry cyclones, and wet electrostatic
precipitators. Seven of the eight open facilities use more than one of the air pollution control systems listed
above. Four of the eight facilities use a combination of wet and dry air pollution control systems. Three
of the eight facilities use only wet air pollution control systems.
3.6 INDUSTRY SUBCATEGORIZATION
Division of an industry into groupings entitled “subcategories” provides a mechanism for addressing
variations between products, raw materials, processes, and other parameters which result in distinctly
different effluent characteristics. Regulation of an industry by subcategory provides that each has a uniform
set of effluent limitations which take into account technology achievability and economic impacts unique to
that subcategory.
The factors considered in the regulation of the CHWC Industry include:
C waste type received;
C type of combustion process;
C air pollution control used;
C nature of wastewater generated;
C facility size, age, and location;
C non-water quality impact characteristics; and
C treatment technologies and costs.

3-15
EPA evaluated these factors and determined that subcategorization is not required.
For most facilities in this industry, a wide variety of wastes are combusted. These facilities,
however, employ the same wastewater treatment technologies regardless of the specific type of waste being
combusted in a given day.
EPA concluded that a number of factors did not provide an appropriate basis for subcategorization.
The Agency concluded that the age of a facility should not be a basis for subcategorization because many
older facilities have unilaterally improved or modified their treatment process over time. Facility size is also
not a useful technical basis for subcategorization for the CHWC Industry because wastes can be burned
to the same level regardless of the facility size and has no significant relation to the quality or character of
the wastewaters generated or treatment performance. Likewise, facility location is not a good basis for
subcategorization; no consistent differences in wastewater treatment performance or costs exist because
of geographical location. Non-water quality characteristics (waste treatment residuals and air emission
effects) did not constitute a basis for subcategorization. The environmental effects associated with disposal
of waste treatment residual or the transport of potentially hazardous wastewater are a result of individual
facility practices. The Agency did not identify any consistent basis for these decisions that would support
subcategorization. Treatment costs do not appear to be a basis for subcategorization because costs will
vary and are dependent on the following waste stream variables: flow rates, waste quality, waste energy
content, and pollutant loadings. Therefore, treatment costs were not used as a factor in determining
subcategories.
EPA identified three factors with significance for potentially subcategorizing the CHWC Industry:
the type of waste received for treatment, the type of air pollution control system used by a facility, and the
types of CHWC wastewater sources (e.g., container wash water vs. air pollution control water).
A review of untreated CHWC air pollution control system wastewater showed that there is some
difference in the concentration of pollutants between solid and liquid waste combustion units. In particular,
for nine of the 27 metals analyzed at six CHWC facilities, the average concentration of a particular metal
was higher in the water from facilities that burned solids (as well as liquids) than in facilities that burned
liquids only. EPA believes that this difference is probably the result of two factors: the type of air pollution

3-16
control employed by the facilities and the amount of wastewater generated. Specifically, the data reviewed
by EPA showed that two of the three facilities that burn liquid waste use dry scrubbing devices prior to
using scrubbing devices which generate wastewater. One of these facilities uses a baghouse initially and
the other uses a fabric filter. These dry scrubbers would remove some of the metals which would have
ended up in the wastewater stream. In comparison, only one of the three facilities that burn solids uses a
dry scrubbing device prior to using scrubber devices which generate wastewater. This facility uses an
electrostatic precipitator initially. In addition, all three of the facilities that burn liquid waste do not recycle
any of their wastewater for reuse in the scrubbing system following partial wastewater treatment. In
comparison, two of the three facilities that burn solids recycle some of their partially treated wastewater
for reuse in their scrubbing system. One of these facilities recycles 60 percent and the other recycles 82
percent. The reuse of partially treated wastewater would have the effect of reducing the wastewater
discharge and increasing the concentration of metals in the recycled wastewater. Thus, the Agency could
not conclude that there is in fact any significant difference in the concentrations of pollutants in wastewater
from facilities burning solid versus liquid waste. This situation in general makes subcategorizing on this basis
difficult. See CHWC Record W-97-08, #7.2.0.1 for the presentation of this statistical analysis. Therefore,
EPA has concluded that available data do not support subcategorization either by the type of waste
received for treatment or the type of air pollution control system used by a facility.
Based on analysis of the CHWC Industry, EPA has determined that it should not subcategorize
the Commercial Hazardous Waste Combustors for purposes of determining appropriate limitations and
standards.

4-1
SECTION 4
WASTEWATER USE AND WASTEWATER CHARACTERIZATION
In 1993, under authority of Section 308 of the Clean Water Act (CWA), the EPA distributed the
“1992 Waste Treatment Industry Phase II: Incinerators Screener Survey” and, subsequently, the “1994
Waste Treatment Industry Phase II: Incinerators Questionnaire” to facilities that EPA had identified as
possible CHWC facilities. Responses to the screener survey and questionnaire indicated that, in 1992, 10
CHWC facilities operated commercially and discharged their CHWC wastewater to a receiving stream
or to a POTW. Of these 10 facilities, 2 facilities have either stopped accepting waste from off site for
combustion or have closed their combustion operations since 1992. Thus, this section presents information
on water use at only the remaining 8 facilities. This section also presents information on wastewater
characteristics for the CHWC facilities that were sampled by EPA and for some of those facilities that
provided self-monitoring data.
4.1 WATER USE AND SOURCES OF WASTEWATER
Approximately 820 million gallons of wastewater are generated and discharged annually at the 8
CHWC facilities. EPA has identified the sources described below as contributing to wastewater discharges
at CHWC operations. Only air pollution control wastewater, flue gas quench, and slag quench, however,
would be subject to the CHWC effluent limitations and standards. Most of the wastewater generated by
CHWC operations result from these sources.
a. Air Pollution Control System Wastewater. Particulate matter in the effluent gas stream of a
CHWC is removed by four main physical mechanisms (Handbook of Hazardous Waste
Incineration, Brunner 1989). One mechanism is interception, which is the collision between a water
droplet and a particle. Another method is gravitational force, which causes a particle to fall out of
the direction of the streamline. The third mechanism is impingement, which causes a water particle
to fall out of the streamline due to inertia. Finally, contraction and expansion of a gas stream allow
particulate matter to be removed from the stream. Thus, removal of particulate matter can be

4-2
accomplished with or without the use of water. Depending upon the type of waste being burned,
Commercial Hazardous Waste Combustors may produce acid gases in the air pollution control
system. In order to collect these acid gases, a caustic solution is generally used in a wet scrubbing
system.
b. Flue Gas Quench Wastewater. Water is used to rapidly cool the gas emissions from combustion
units. There are many types of air pollution control systems that are used to quench the gas
emission from Commercial Hazardous Waste Combustors. For example, in packed tower
scrubbing systems, water enters from the top of the tower and gas enters from the bottom. Water
droplets collect on the packing material and are rinsed off by the water stream entering the top of
the tower (Handbook of Hazardous Waste Incineration, Brunner 1989). This rapidly cools the gas
stream along with removing some particulate matter.
c. Slag Quench Wastewater. Water is used to cool molten material generated in slagging-type
combustors.
d. Truck/Equipment Wash Water. Water is used to clean the inside of trucks and the equipment used
for transporting wastes.
e. Container Wash Water. Water is used to clean the insides of waste containers.
f. Laboratory Wastewater. Water is used in on-site laboratories which characterize incoming waste
streams and monitor on-site treatment performance.
g. Floor Washings and Other Wastewater from Process Area. This includes stormwater which
comes in direct contact with the waste or waste handling and treatment areas. (Stormwater which
does not come into contact with the wastes would not be subject to today's promlugated limitations
and standards. However, this stormwater is covered under the NPDES stormwater rule, 40 CFR
122.26).
4.2 WATER USE
As mentioned in Section 4.1, approximately 820 million gallons of wastewater were discharged
from 8 of the 55 commercial industrial combustors identified by EPA based on questionnaire responses.

4-3
Table 4-1 presents the total, average, and range of discharge flow rates for the eight discharging facilities.
There were 45 facilities that either do not generate any CHWC wastewater (33) or do not discharge their
wastewater (12) as discussed previously. In general, the primary types of wastewater discharges from
discharging facilities are: air pollution control system wastewater, flue gas quench, and slag quench. EPA
is using the phrase “CHWC wastewater” to refer to these three types of wastewaters only. Other types
of wastewater generated as a result of combustor operations (e.g., truck washing water) are not
considered “CHWC wastewater”.
This regulation applies to direct and indirect discharges only.
Table 4-1. Amount of CHWC Wastewater Discharged
Number of CHWC Wastewater CHWC Wastewater Amount of CHWCFacilities Discharged Discharged Wastewater Discharged
Total Amount of Average Amount of Range In Average
(Gallons/Day) (Gallons/Day) (Gallons/Day)
8 2,247,580 280,948 47,430 to 1,007,640
4.3 WASTEWATER CHARACTERIZATION
EPA conducted 15 sampling episodes at 13 different facilities in an effort to characterize CHWC
raw influent wastewaters during the formulation of the CHWC rule. These included three five-day sampling
efforts and twelve individual grab samples. A total of 467 pollutants were analyzed in the raw wastewater,
including 232 toxic and non-conventional organic compounds, 69 toxic and non-conventional metals, 4
conventional pollutants, and 162 toxic and non-conventional pollutants including pesticides, herbicides,
dioxins, and furans. Of these 467 pollutants, only 139 were ever detected at any of the CHWC influent
samples; most being metals and other non-organic compounds. Therefore, 328 pollutants analyzed were
never found at detectable levels in any CHWC influent samples. Appendix A presents a list of all analytes
that were detected at least once, along with: the detection limit, number of observations (samples), number
of detects, and minimum, maximum, and mean values of the pollutant. Appendix B lists all of the remaining

4-4
328 pollutants never found in CHWC wastewaters, including the number of observations and detection
levels of the analytes.
4.3.1 Five-Day Sampling Episodes
The Agency's five-day sampling program for this industry detected 21 pollutants (conventional,
priority, and non-conventional) in waste streams at treatable levels at the facility that provides the basis for
the BPT/BAT limits. Two additional pollutants were detected at treatable levels in the two other five-day
sampling episodes: strontium and dichlorprop. The quantity of these pollutants currently being discharged
from all facilities is difficult to assess. Limited monitoring data are available from facilities for the list of
pollutants identified from the Agency's sampling program prior to commingling of these wastewaters with
non-contaminated stormwater and other industrial wastewater before discharge. EPA used monitoring data
supplied in the 1994 Waste Treatment Industry Phase II: Incinerators Questionnaire and data supplied in
the Detailed Monitoring Questionnaire, wastewater permit information, and EPA sampling data to estimate
raw waste and current pollutant discharge levels. EPA used a “non-process wastewater” factor to quantify
the amount of non-contaminated stormwater and other industrial process water in a facility's discharge.
Section 4.4 of this document provides a more detailed description of “non-process wastewater” factors
and their use. A facility's current discharge of treated CHWC wastewater was calculated using the
monitoring data supplied multiplied by the “non-process wastewater” factor.
4.3.1.1 Conventional Pollutants
The most appropriate conventional pollutant parameters for characterizing untreated wastewater
and wastewater discharged by CHWC facilities are:
C Total Suspended Solids, and
C pH

4-5
Total solids in wastewater are defined as the residue remaining upon evaporation at just above the
boiling point. Total suspended solids (TSS) is the portion of the total solids that can be filtered out of the
solution using a 1 micron filter. Untreated wastewater TSS content is a function of the type and form of
waste accepted for treatment (e.g., wastewater that results from the combustion of solid waste receipts
would tend to have higher TSS values than waste received in a liquid form). TSS can also be due to
treatment chemicals added to the wastewater as it is being generated (e.g., a caustic solution may be used
in a CHWC air pollution control system). The total solids are composed of matter which is settleable, in
suspension or in solution, and can be removed in a variety of ways, such as during the metals precipitation
process or by multimedia filtration, depending on a facility’s operation. Untreated wastewater TSS levels
found in the three five-day EPA sampling episodes are presented in Table 4-2.
The pH of a solution is a unitless measurement which represents the acidity or alkalinity of a
wastewater stream, based on the dissociation of the acid or base in the solution into hydrogen (H+) or
hydroxide (OH-) ions, respectively. Untreated wastewater pH is a function of the source of waste receipts
as well as a function of the chemicals used in the air pollution control devices. This parameter can vary
widely from facility to facility. Control of pH is necessary to achieve proper removal of pollutants in the
BPT/BAT treatment system (chemical precipitation).
As shown in Table 4-2, raw waste five-day biochemical oxygen demand and oil and grease are
very low, ranging from 1 mg/l to 53 mg/l and from 5 mg/l (not detected) to 6 mg/l, respectively. Both of
these parameters are indirect measurements of the organic strength of wastewater. The wastewater
sampled by EPA is generated from air pollution control systems and consists primarily of inorganic
pollutants and very low concentrations of organic compounds because they are destroyed during
combustion. (Furthermore, a more direct measure of the organic strength of the raw wastewater, total
organic carbon, also shown in Table 4-2, only ranges from 10 mg/l (not detected) to 16 mg/l).
Table 4-2. Range of Pollutant Influent Concentrations of the Pooled Daily Data from theThree Five-Day EPA Sampling Episodes (ug/l)
Pollutant Mean Minimum Maximum
Aluminum 897.6 13.6 2,538.0

Pollutant Mean Minimum Maximum
4-6
Ammonia as Nitrogen 14,312.4 100.0 75,000.0
Antimony 268.2 7.8 958.8
Arsenic 166.4 4.6 827.2
BOD 9,960 1,000 53,0005
Boron 1,604.6 918.0 3,760.0
Cadmium 312.2 1.8 2,616.0
Calcium 293,146.0 8,140.0 1,270,000.0
Chemical Oxygen Demand 343,140.0 67,000.0 1,036,000.0
Chloride 6,833,746.7 1,010,000.0 17,002,400.0
Chromium 127.2 5.8 529.2
Copper 1,786.7 8.5 10,554.0
Fluoride 82,620.5 16,500.0 360,000.0
Iron 2,904.1 149.0 10,838.0
Lead 1,613.9 2.1 13,248.0
Manganese 114.7 4.0 388.0
Mercury 21.1 0.2 115.4
Molybdenum 336.7 4.6 1024.4
Nitrate/Nitrite 2,650.9 360.0 4,560.0
Oil and Grease 5,067 5,000 6,000
Phosphorus 32,480.0 3,210.0 225,800.0
Potassium 77,743.0 1,310.0 195,400.0
Selenium 102.8 2.3 429.2
Silicon 15,414.0 5,380.0 28,100.0
Silver 98.9 1.0 390.8
Sodium 3,443,333.3 6,400.0 11,250,600.0
Strontium 630.2 100.0 2,280.0
Sulfur 400,788.1 2,145.0 1,078,240.0
Tin 665.9 14.5 6,046.0
Titanium 777.7 5.0 4,474.2
Total Dissolved Solids 12,815,853.3 158,000.0 32,641,200.0
Total Organic Carbon 10,485 10,000 16,000
Total Phosphorus 1,088.6 10.0 4,460.0
Total Sulfide 28,261.3 1,000.0 103,200.0

Pollutant Mean Minimum Maximum
4-7
Total Suspended Solids 122,553.3 4,000.0 522,000.0
Zinc 3,718.8 89.8 12,310.0
Dichlorprop 7.7 1.0 47.0
MCPP 375.7 50.0 2,594.0
4.3.1.2 Priority and Non-Conventional Pollutants
Table 4-2 above presents the range of the pooled daily pollutant influent concentration data from
the three five-day EPA sampling episodes. This table includes treatment chemicals and nutrients found in
CHWC wastewater as well as pollutants to be removed from CHWC wastewater.
4.3.2 Characterization Sampling Episodes
As discussed in Section 2.2.2.1 of this document, EPA obtained a grab sample of untreated
CHWC wastewater at 12 facilities. These samples were used to help characterize the CHWC
wastewaters at a wide range of combustor types, including captive facilities. Data from one facility was
excluded due to the sample solidifying soon after collection, thus provided, in the Agency’s opinion, data
of a poor and misrepresentative nature. Table 4-3 below presents a breakdown of levels of typical
pollutants found in the raw CHWC wastewater at 11 different facilities. The pollutants presented in Table
4-3 were detected at more than one facility with a mean concentration of at least 10 times the pollutant
detection limit.
Table 4-3. Range of Pollutant Influent Concentrations of the Pooled Daily Data from theCharacterization EPA Sampling Episodes (ug/l)
Pollutant Mean Minimum Maximum
Aluminum 5,458.8 21.5 34,800.0
Ammonia as Nitrogen 2,908.8 130.0 13,000.0
Arsenic 323.2 1.1 1,420.0
Benzoic Acid 263,249.8 50.0 3,157,556.0

Pollutant Mean Minimum Maximum
4-8
BOD 1,092,333.3 1,000.0 10,100,000.05
Boron 22,565.2 20.0 182,000.0
Cadmium 225.7 1.2 1,632.8
Chemical Oxygen Demand 2,284,583.3 13,000.0 19,100,000.0
Chloride 10,203,416.7 40,000.0 28,300,000.0
Chromium 342.0 3.6 1,650.0
Copper 894.2 10.0 4,621.8
Fluoride 879,230.0 120.0 7,500,000.0
Iron 10,413.5 239.2 50,600.0
Lead 1,604.5 45.5 12,358.0
Manganese 245.8 10.8 1,534.6
Mercury 32.7 0.1 217.0
Molybdenum 131.3 4.0 508.5
Nitrate/Nitrite 5,166.7 210.0 33,280.0
Potassium 147,574.2 478.6 805,000.0
Selenium 65.8 0.5 288.0
Silicon 42,997.6 28.2 340,000.0
Sodium 12,377,392.9 8,244.3 62,400,000.0
Sulfur 22,998,416.6 12,500.0 174,000,000.0
Titanium 463.9 2.2 3,770.0
Total Dissolved Solids 37,896,083.3 89,000.0 185,000,000.0
Total Organic Carbon 391,041.7 1,700.0 4,540,000.0
Total Phenols 12,316.3 6.0 146,000.0
Total Phosphorus 1,279.2 10.0 4,520.0
Total Sulfide 163,340.8 10.0 1,180,000.0
Total Suspended Solids 100,000.0 1,000.0 416,000.0
Uranium 10,099.6 608.2 67,100.0
Zinc 5,436.6 44.7 28,569.0
4.4 WASTEWATER POLLUTANT DISCHARGES
As previously discussed, most of the effluent monitoring data received from facilities included non-
CHWC wastewater, such as other industrial waste streams and stormwater. Due to the lack of effluent

4-9
data for CHWC wastewater, the EPA had to develop various methods to estimate their current wastewater
pollutant discharge. This section describes the various methodologies used to estimate current
performance.
Most of the data supplied by the CHWC facilities represented data that included non-CHWC
wastewater in the form of non-contaminated stormwater and other industrial stormwater prior to discharge.
Therefore, the amount of a pollutant in the final effluent would be equal to the amount of the pollutant in the
CHWC process in addition to the amount in the non-CHWC process, as shown in Equation 4.1.
C * F = C * F + C * F (4.1)T TOTAL CHWC CHWC NON-CHWC NON-CHWC
where:
C = Concentration of pollutant in the combined wastewater stream -- the concentrationT
reported in the CHWC Questionnaire, the CHWC Detailed Monitoring Questionnaire,
in POTW permits, in NPDES permits, or from EPA sampling program.
F = Flowrate of total wastewater stream.TOTAL
C = Concentration of pollutant in the CHWC (and other similar) wastewater streams.CHWC
F = Flowrate of CHWC (and other similar) wastewater streams.CHWC
C = Concentration of pollutant in stormwater or non-contact wastewater streams.NON-CHWC
F = Flowrate of stormwater or non-contact wastewater streams.NON-CHWC
Stormwater or non-contact wastewater was assumed to be significantly lower in concentration in
comparison to the CHWC wastewater, and thus, the concentration of non-CHWC wastewater streams
was set equal to zero. This assumption simplifies Equation 4.1 as shown in Equation 4.2 below. Also,
other industrial wastewater streams were assumed to have the same concentrations as the CHWC
wastewater streams.

4-10
C * F = C * F (4.2)T TOTAL CHWC CHWC
For each facility, the EPA calculated the portion of CHWC wastewater in the facility discharge and
then calculated the CHWC effluent concentration by solving Equation 4.2. Thus, the non-process
wastewater factor is the flowrate of the total wastewater stream divided by the flowrate of the CHWC (and
other similar) wastewater stream.
The hierarchy of data used to estimate current loading concentrations was as follows:
1.) Detailed Monitoring Questionnaire (DMQ) for the CHWC Industry data from effluent sample
locations for 1992. The facility’s long-term monitoring data was supplied in this questionnaire.
Often, this data had to be corrected for inclusion of non-CHWC wastewater streams using
Equation 4.2 above.
2.) Detailed Monitoring Report (DMR) data from effluent sample locations for 1992. The
facility’s long-term monitoring data was supplied to EPA in this report. Often, this data had to be
corrected for inclusion of non-CHWC wastewater streams using Equation 4.2.
3.) Waste Treatment Industry Phase II: Incinerators Questionnaire data from effluent sample
locations for 1992. The facility’s year-long monitoring data was supplied in this questionnaire.
Often, this data had to be corrected for inclusion of non-CHWC wastewater streams using
Equation 4.2.
4.) POTW or NPDES permit effluent concentrations for 1992. Often, this data had to be
corrected for inclusion of non-CHWC wastewater streams using Equation 4.2.
5.) EPA Five-Day Sampling Data for three CHWC facilities. This data was used either for specific
facilities sampled or averages were obtained to model facilities for which limited data was available.
6.) Averages from similar facilities. Data averages from similar facilities were used to model current
loadings concentrations for facilities for which limited data was available.
The average, flow-weighted, estimated 1992 discharge concentration for facilities in the CHWC
Industry is presented in Table 4-4.

4-11
Table 4-4. CHWC Industry 1992 Discharge Concentration
Pollutant Discharge UnitConcentration
Chemical Oxygen Demand 145.2 mg/l
Total Dissolved Solids 10,430.0 mg/l
Total Suspended Solids 30.6 mg/l
Aluminum 663.7 ug/l
Antimony 559.0 ug/l
Arsenic 217.7 ug/l
Boron 1,614.9 ug/l
Cadmium 118.4 ug/l
Chromium 4,276.9 ug/l
Copper 944.2 ug/l
Iron 306.2 ug/l
Lead 363.4 ug/l
Manganese 156.2 ug/l
Mercury 10.6 ug/l
Molybdenum 239.2 ug/l
Selenium 34.2 ug/l
Silver 31.0 ug/l
Tin 88.4 ug/l
Titanium 79.6 ug/l
Zinc 385.6 ug/l

5-1
SECTION 5
SELECTION OF POLLUTANTS AND POLLUTANT PARAMETERS FOR REGULATION
5.1 INTRODUCTION
As previously discussed, EPA evaluated sampling data that was collected from the industry prior
to the proposal of this regulation as well as data submitted by industry following the proposal of this
regulation. EPA used these data (presented in Section 4) to identify which pollutants present in combustor
wastewaters it should consider for regulation -- the so called “pollutants of concern” for the Commercial
Hazardous Waste Combustor (CHWC) Industry. EPA classifies pollutants into three categories:
conventional, non-conventional, and toxic pollutants. Conventional pollutants include 5-day biolgoical
oxygen demand (BOD ), total suspended solids (TSS), oil and grease, and pH. Toxic pollutants -- EPA5
also refers to them as priority pollutants -- include selected metals, pesticides and herbicides, and over 100
organic parameters that represent a comprehensive list of volatile and semi-volatile compounds. Non-
conventional pollutants are any pollutants that do not fall within the specific conventional and toxic pollutant
lists, for example, total organic carbon (TOC), chemical oxygen demand (COD), chloride, fluoride,
ammonia as nitrogen, nitrate/nitrite, total phenol and total phosphorus.
This section presents the criteria used for the selection of pollutants EPA evaluated for regulation
and the selection of pollutants for which EPA has established effluent limitations and standards.
5.2 POLLUTANTS CONSIDERED FOR REGULATION
To characterize CHWC wastewaters and to determine the pollutants that it should evaluate for
potential limitations and standards, EPA collected wastewater characterization samples at 12 CHWC
facilities, in addition to influent data collected during three five-day sampling episodes. EPA analyzed
wastewater samples for 467 conventional, toxic, and non-conventional pollutants including metals, organics,
pesticides, herbicides, and dioxins and furans. Section 4 presents this wastewater characterization data.

5-2
From the original list of 467 analytes, EPA developed a list of “pollutants of concern” that it would
further evaluate for possible regulation. A total of 328 pollutants were never detected in CHWC
wastewaters during EPA sampling episodes, leaving 139 pollutants to be considered as pollutants of
concern that served as the basis for selecting pollutants for regulation. These 328 pollutants are presented
in Section 4.
5.3 SELECTION OF POLLUTANTS OF CONCERN
EPA determined “pollutants of concern” -- pollutants that EPA evaluates for regulation -- using the
raw wastewater data collected during the EPA sampling program. EPA only considered the three five-day
sampling episodes to determine the pollutants of concern. Therefore, EPA did not include sampling data
from the 12 wastewater characterization sampling episodes. Of these 12 facilities, eight were captive
facilities that did not operate commercially (outside the scope of this regulation) and the samples from one
facility solidified during transport to the analytical laboratory and were not re-sampled. Two of the
remaining three facilities were selected for five-day sampling episodes and therefore, characterization data
is included as part of these events. A total of 25 pollutants were detected during the wastewater
characterization sampling episodes but were not detected during the three five-day sampling episodes and
were eliminated as pollutants of concern. These 25 pollutants are listed in Table 5-1.
Table 5-1. Pollutants Detected Only During Wastewater Characterization Sampling
Pollutants
Amenable Cyanide N-Decane
Atrazine N-Docosane
Benzoic Acid N-Docecane
Beryllium N-Eicosane
Bromodichloromethane N-Tetradecane
Carbon Disulfide P-Cresol
Chloroform Tribromomethane

Pollutants
5-3
Dibenzothiophene Trichlorofluoromethane
Dibromochloromethane Yttrium
Erbium 2-Butanone
Hexanoic Acid 2-Propanone
Isophrone 2-Propenol
Methylene Chloride
EPA further determined a pollutant to be a potential pollutant of concern if it was detected three
or more times in the influent above the method detection limit (MDL) at a five-day sampling episode. This
ensured that pollutants that were detected relatively frequently at CHWC facilities were given consideration
as pollutants of concern. This criterion eliminated the 47 pollutants listed in Table 5-2.
Table 5-2. Pollutants Not Detected Three or More Times Above MDL
Pollutants
Acetophenone Oil and Grease
Cerium Osmium
Cobalt Phenol
Dalapon Platinum
Dicamba Praseodymium
Dinoseb Rhenium
Dysprosium Rhodium
Europium Ruthenium
Gadolinium Samarium
Gallium Scandium
Germanium Tantalum
Hafnium Terbium
Holmium Thallium
Indium Thorium
Iodine Thulium

Pollutants
5-4
Iridium Total Phenols
Lanthanum Tungsten
Lutetium Ytterbium
MCPA Zirconium
Monocrotophos 2,4 - D
Neodymium 2,4 - DB
Niobium 2,4,5 - T
Norflurazon 2,4,5 - TP
OCDF
EPA then further examined the characteristics of the three facilities that were sampled as part of
the five-day episodes. As noted in Section 6, influent concentrations for many parameters were low due
to the liquid injection system employed at the facility sampled during Episode # 4733 and the actual raw
wastewater characteristics as well as treatment system performance could not be adequately determined.
In addition, raw wastewater pollutant concentrations also were lower at the treatment system employed
at the facility sampled during Episode 4671 and treatment system performance was not as good as the
system considered BAT. Therefore, EPA determined that only data collected from five-day sampling
Episode 4646 should be considered further in determining pollutants of concern. This criterion eliminated
the six pollutants listed in Table 5-3, leaving a total of 61 pollutants remaining.
Table 5-3. Pollutants Only Found During Sampling Episodes 4733 and 4671
Pollutants
Bismuth Total Cyanide
Dichloroprop Total Organic Carbon
Strontium Uranium
Next, EPA evaluated which pollutants were present in raw wastewaters at treatable levels by
determining the pollutants that were detected three or more times at an average influent concentration

5-5
greater than or equal to 10 times the MDL ( in the case of aluminium and lead, criteria of five and three
times the MDL was used, respectively, to determine treatable levels because of higher MDLs). EPA
determined that this criterion eliminated the 11 pollutants listed in Table 5-4, leaving a total of 50 pollutants
remaining.
The raw wastewater value for pollutants detected during sampling Episode 4646 was a flow-
weighted average of two sample points. Barium (291 ug/l), bis (2-ethylhexyl) phthalate (37 ug/l), BOD5
(3.7 mg/l), hexavalent chromium (35 ug/l), lithium (497 ug/l), magnesium (5,431 ug/l), nickel (151 ug/l) and
vanadium (315 ug/l) were all detected at an average concentration well below the 10 times the MDL
threshold for treatable levels. For n-hexacosane, n-octacosane and n-tricotane, samples were analyzed
using different analytical methods that yielded values in different units, ug/kg and ug/l. In both cases, the
average concentration also was well below the 10 times the MDL threshold for treatable levels for all three
pollutants.
Table 5-4. Pollutants Not Detected Three or More Times at an Average InfluentConcentration Greater Than or Equal To 10 Times the MDL
Pollutants
Barium N-Hexacosane
Bis (2-Ethylhexyl) Phthalate N-Octacosane
BOD N-Tricotane5
Hexavalent Chromium Nickel
Lithium Vanadium
Magnesium
EPA then excluded pollutants that are used as treatment chemicals in this industry from the
pollutants of concern list. These compounds include ammonia as nitrogen, calcium, chloride, fluoride,
nitrate/nitrite, phosphorus, potassium, silicon, sodium, sulfur, total phosphorus, and total sulfide. Eliminating
these 12 pollutants leaves a total of 38 pollutants remaining.

5-6
EPA eliminated pollutants that received ineffective treatment by the selected BAT treatment
technology. Concentrations of these pollutants increased or decreased insignificantly during sampling
Episode 4646 and could not be considered treated. This criterion eliminated the five pollutants listed in
Table 5-5, leaving a total of 33 pollutants remaining.
Table 5-5. Pollutants Not Treated by the BAT Treatment System
Pollutants
Boron MCPP
Chemical Oxygen Demand Total Dissolved Soilds
Manganese
EPA then eliminated those pollutants indirectly controlled through the regulation of other pollutants
in the final rule. This criterion eliminated the six pollutants shown in Table 5-6, leaving a total of 27
pollutants remaining.
Table 5-6. Pollutants Indirectly Controlled Through Regulation of Other Pollutants
Pollutants
Aluminum Molybdenum
Antimony Selenium
Iron Tin
Finally, EPA eliminated the 16 dioxins and furans presented in Table 5-7, for the reasons presented
below.
Table 5-7. Dioxins and Furans Eliminated as Pollutants of Concern
Pollutants
234678 - HXCDF 123678 - HXCDF
23478 - PECDF 12378 - PECDD

Pollutants
5-7
2378 - TCDD 12378 - PECDF
2378 - TCDF 123789 - HXCDD
123478 - HXCDD 123789 - HXCDF
123478 - HXCDF OCDD
1234789 - HPCDF 1234678 - HPCDD
123678 - HXCDD 1234678 - HPCDF
5.3.1 Dioxins/Furans in Commercial Hazardous Waste Combustor Industry
5.3.1.1 Background
Scientific research has identified 210 isomers of chlorinated dibenzo-p-dioxins (CDD) and
chlorinated dibenzofurans (CDF). EPA’s attention has primarily focused on the 2,3,7,8-substituted
congeners, a priority pollutant under the CWA, of which 2,3,7,8-TCDD and 2,3,7,8-TCDF are
considered the most toxic. Evidence suggests that non-2,3,7,8-substituted congeners may not be as toxic.
Some sources report that these non-2,3,7,8-substituted congeners may either be broken down or quickly
eliminated by biological systems. Dioxins and furans are formed as a by-product during many industrial
and combustion activities, as well as during several other processes. The combustion activities that may
create dioxins under certain conditions may include:
• Combustion of chlorinated compounds, including PCBs;
• Some metals are suspected to serve as catalysts in the formation of dioxin/furans;
• Metal processing and smelting;
• Petroleum refining;
• Chlorinated organic compound manufacturing.

5-8
5.3.1.2 Dioxin/Furans in Commercial Hazardous Waste Combustor Wastewater
EPA identified a number of dioxin/furan compounds as present in the untreated wastewater streams
at seven of the twelve facilities sampled (including grab and composite samples). Two of the facilities with
dioxins detected in their CHWC wastewater are now closed and no longer within the scope of the final
rule, so data from these facilities has not been considered further here. Thus, the following discussion relates
to data from the ten remaining facilities (a total of 32 aqueous samples). Table 5-8 below summarizes the
dioxin/furans detected in CHWC wastewaters during the sampling program. Similar isomers that contain
the 2,3,7,8 base were grouped together for this analysis due to their similar nature and characteristics.
Table 5-8. Breakdown of Detected Dioxin/Furans During CHWC Sampling Program
Dioxin/Furan Equivalent Concentrations Aqueous Toxic Mean Total # of
Value CHWC Industry Samples
(TEQ) (detects only) (out of 32)
Universal # of FacilitiesTreatment Detected Standards Detected
(out of 10)
2,3,7,8- TCDF 0.1 63,000 pg/l 17 pg/l 2 2
2,3,7,8- PeCDF 0.5 35,000 pg/l 93 pg/l 1 1
2,3,7,8- HxCDD 0.1 63,000 pg/l 68 pg/l 1 1
2,3,7,8- HxCDF 0.1 63,000 pg/l 249 pg/l 7 3
2,3,7,8- HpCDD 0.01 none 272 pg/l 5 4
2,3,7,8- HpCDF 0.01 none 939 pg/l 7 4
OCDD 0.001 none 971 pg/l 10 5
OCDF 0.001 none 6165 pg/l 6 4
It is important to note that EPA did not detect 2,3,7,8-TCDD (the most toxic congener) or
2,3,7,8-PeCDD in the raw wastewater samples collected. The dioxin/furans detected in untreated CHWC
wastewaters during EPA sampling at 10 sites show that these dioxin/furans were all detected at levels
significantly (orders of magnitude) below the “Universal Treatment Standard” (40 CFR 268.48) level
established under RCRA for dioxins/furans. In addition, low levels of HpCDD and OCDD (as indicated

5-9
above) are generally considered pervasive in the environment and Universal Treatment Standards have not
been set for these compounds. EPA identified no dioxin/furans in the CHWC wastewater treated effluent.
CDD/CDFs are lipophilic and hydrophobic. As such, they are most often associated, or have an
affinity for, suspended particulates in wastewater matrices. The more highly chlorinated isomers (i.e., the
hepta- and octa- congeners) are the least volatile and more likely to be removed through particulate
adsorption or filtration. While recommended treatment technologies differ according to the wastewater
characteristics, there is some evidence that dioxins generally will bind with suspended solids and some
sources (EPA NRMRL Treatability database) have asserted that these compounds may be removed by
precipitation and filtration technologies.
Of the three five-day sampling episodes conducted by EPA, the episode from which BAT/BPT
limits were developed had no dioxins detected in the influent or effluent. At the other two facilities,
HpCDD, HpCDF, OCDD, and OCDF were detected in the influent but none were detected in the effluent.
Both facilities employed a combination of chemical precipitation and filtration that may have contributed
to these removals.
The most toxic congener, 2,3,7,8-TCDD, was never detected in CHWC wastewater during the
sampling program and the CDD/CDFs detected were neither detected at most facilities sampled nor found
in any significant quantity. The toxic equivalent (TEQ) values found in the CHWC wastewater were low
when compared to other dioxin sources in industry. The detected congeners were of the highly chlorinated
type which may be treated by the methods recommended by this guideline (chemical precipitation, filtration,
see Section 6). Also, since no dioxins were detected in the treated effluents at any of the three facilities
EPA sampled, this may be evidence of dioxin removals.
Based on EPA’s sampling program, no CDD/CDF met the criteria for wastewater regulation in
the final rule.
The Agency has proposed CDD/CDF air emission limits of 0.2 ng/dscm from the stacks of
hazardous waste burning incinerators (see 61 FR 17358 of 4/19/96 and 62 FR 24212 of 5/2/97), and
believes that the incinerators have to operate with good combustion conditions to meet the proposed
emission limits. In the final Land Disposal Restrictions (LDR) rulemaking that set treatment standards for

5-10
CDD/CDF constituents in non-wastewater and wastewater from RCRA code F032 wastes, the Agency
has established (62 FR 26000, 5/12/97) incineration as the BDAT, after which the CDD/CDF constituents
do not have to be analyzed in the effluent.
Based on the data available and the resulting decision not to establish limitations and standards for
dioxins, EPA also cannot justify a monitoring program for dioxins, as suggested by a commenter on the
proposal. While EPA recognizes that the promulgation of the Hazardous Waste Combustor (HWC)
MACT (64 FR 52828, September 30, 1999) dioxin/furan emission standards may result in some changes
in the volume and character of air pollution control wastewater generated, EPA does not believe that the
changes will result in a media transfer for dioxins that would change its decision not to establish dioxin
limitations and standards. The promulgated MACT standards for 85 percent of the hazardous waste
incinerators in the final HWC rule are based on changes in air pollution control device process conditions
to minimize generation of dioxins and furans. Various studies have shown that a significant source of dioxin
in waste incinerators is from the formation of dioxin in the flue gas as it is cooled to around 400 degrees
C. The longer the flue gas is held at this temperature the greater the formation of dioxin. One useful control
measure is the rapid cooling of flue gas to levels below this temperature range to minimize this dioxin
production window. EPA has concluded that the largest portion of the reduction in dioxin emissions will
be through reductions in the amount generated rather than media transfer.
Table 5-9 presents the 11 pollutants selected for regulation for the CHWC Industry.
Table 5-9. Pollutants Selected for Regulation
Pollutants
Arsenic pH
Cadmium Silver
Chromium Titanium
Copper Total Suspended Solids
Lead Zinc
Mercury

5-11
5.4 SELECTION OF POLLUTANTS FOR REGULATION
All of the analytes listed in Table 5-9 were included in data submitted by two facilities (Sampling
Episodes 6181 and 6183) following the proposal of the CHWC regulation, presented in Tables 5-10 and
5-11. EPA received additional sampling data from three facilities. These facilities only tested for
conventional, priority and non-conventional pollutants that they considered treatable and likely to be found
in CHWC wastewater. These pollutants included TSS, total dissolved solids (TDS), chloride, sulfate,
aluminum, antimony, arsenic, cadmium, chromium, copper, iron, lead, mercury, molybdenum, selenium,
silver, tin, titanium, and zinc. TDS, chloride and sulfate were included in the testing to characterize the
wastewater and evaluate the pollutants’ potential effect on the treatability of metals.
Based on several factors, EPA specifically excluded data from the third facility (Episode 6182)
from consideration as BAT technology. The facility treated less than 2 percent of their wastewater through
the filtration unit considered BPT/BCT/BAT. Hence, the data submitted represents single-stage
precipitation with clarification only. Not only does the single-stage treatment sampled during Episode 6183
not represent BPT/BCT/BAT technology, but it does not provide sufficient treatment for the typical profile
of metals detected in CHWC wastewaters. There are a variety of metals at significant and treatable
concentrations in CHWC wastewaters that pose a problem for a single-stage precipitation system. To
properly treat a large number of different metals effectively, several different pH settings and treatment
chemicals are ususally required. Hence, many CHWC facilities currently employ two-stage chemical
precipitation. When a single-stage of precipitation is employed with a narrow pH range (as was the case
for Episode 6182), many of the metals present in the influent are not effectively removed and some are not
removed at all. Removal efficiencies and effluent concentrations for Episode 6182 can be characterized
as poor when compared to EPA-conducted sampling episodes. Based on these factors, the Agency
determined that data from sampling Episode 6182 would not be used in this rulemaking.
After reviewing the data submitted by these two facilities (Sampling Episodes 6181 and 6183),
EPA has decided to promulgate the CHWC regulations for the same analytes as proposed. Review of the
additional TSS and TDS data submitted brought EPA to the same conclusion as at proposal: TDS should
not be regulated because treatment chemicals associated with the technology selected for BPT/BCT/BAT

5-12
increased TDS levels and TSS should be continue to be regulated. In addition, not all of the analytes
proposed for regulation were found in one of the submitted sampling episodes (Episode 6181) in “treatable
levels” at the influent sampling point, as defined above in this section. Also, not all of the analytes proposed
for regulations were effectively treated (as indicated by the percent removal calculated in Section 6) in
Episode 6181.
The following tables illustrate the results of the analyses to determine which pollutant data could
be used from Episode 6181 and 6183 to develop the final regulations. For four of the metal analytes
(arsenic, lead, selenium and silver), EPA received data for Episodes 6181 and 6183 using more than one
analytical method. For arsenic, methods 200.7, 200.8 and 206.3 were used. For lead, methods 200.7
and 200.8 were used. For selenium, methods 200.7, 200.8 and 270.3 were used. For silver, methods
200.7 and 200.8 were used. EPA elected to use the results from method 200.8 for all of these metal
analytes because of the quantitation limit achieved by this method and because of the reliability of this
method. EPA received data using only method 200.7 for aluminum, antimony, cadmium, chromium,
copper, iron, molybdenum, tin, titanium and zinc. EPA received data using only method 245.1 for mercury.
Finally, EPA received data using only method 160.2 for TSS.
Table 5-10. Sampling Episode 6181 Analytical Results 1
Episode 6181 Pollutants usedTreatable Avg. % from Epsiode 6181
Level? Effluent Removal to Develop FinalConc. Regulations
Pollutant Avg. Quanti- 10XInfluent tation QLConc. Limit
(QL)+
TSS (mg/l) 78.8 4 40 Yes 4.77 93.95 TSS
Aluminum 7000 100 500* Yes 102 98.54 Aluminum
Antimony 874 60 600 Yes 806 7.78 Antimony
Arsenic 278 10 100 Yes 87.8 68.42 Arsenic
Cadmium 103 5 50 Yes 7.1 93.11 Cadmium
Chromium 37.0 10 100 No 13.1 64.59 -
Copper 528 10 100 Yes 11.9 97.75 Copper
Iron 3050 20 200 Yes 23.6 99.23 Iron

Episode 6181 Pollutants usedTreatable Avg. % from Epsiode 6181
Level? Effluent Removal to Develop FinalConc. Regulations
Pollutant Avg. Quanti- 10XInfluent tation QLConc. Limit
(QL)+
5-13
Lead 895 10 100 Yes 10.3 98.85 Lead
Mercury 3.40 0.2 2 Yes 0.209 93.85 Mercury
Molybdenum 387 50 500 No 445 -14.99 -
Selenium 136 10 100 Yes 137 -0.74 -
Silver 20.0 5 50 No 5.37 73.15 -
Tin 151 50 500 No 62.6 58.54 -
Titanium 345 10 100 Yes 10 97.10 Titanium
Zinc 1690 20 200 Yes 23.1 98.63 ZincValues in (ug/l) unless otherwise noted.1
+ Quantitation limit development is detailed in Commercial HWC record (W-97-08, Item 16.4.9, Attachment VI.)* For aluminum, the treatable level was set at 5 times the quantitation limit of 100 ug/l because 100 ug/l is a high
quantitation limit.
Table 5-11. Sampling Episode 6183 Analytical Results1
Episode 6183 Pollutants usedTreatable Avg. % from Epsiode
Level? Effluent Removal 6183 to DevelopConc. Final Regulations
Pollutant Avg. Quanti- 10XInfluent tation QLConc. Limit
(QL)+
TSS (mg/l) 350 4 40 yes 84.6 75.83 TSS
Aluminum 61500 100 500* yes 319 99.48 Aluminum
Antimony 1710 60 600 yes 289 83.10 Antimony
Arsenic 1210 10 100 yes 26.1 97.84 Arsenic
Cadmium 97.7 5 50 yes 5 94.88 Cadmium
Chromium 2250 10 100 yes 10 99.56 Chromium
Copper 1970 10 100 yes 10 99.49 Copper
Iron 231000 20 200 yes 434 99.81 Iron
Lead 1600 10 100 yes 10 99.38 Lead
Mercury 219 0.2 2 yes 0.478 99.78 Mercury
Molybdenum 1550 50 500 yes 856 44.77 Molybdenum
Selenium 113 10 100 yes 32.8 70.97 Selenium

Episode 6183 Pollutants usedTreatable Avg. % from Epsiode
Level? Effluent Removal 6183 to DevelopConc. Final Regulations
Pollutant Avg. Quanti- 10XInfluent tation QLConc. Limit
(QL)+
5-14
Silver 69.8 5 50 yes 5.53 92.08 Silver
Tin 1330 50 500 yes 134 89.92 Tin
Titanium 4030 10 100 yes 10 99.75 Titanium
Zinc 8300 20 200 yes 64.3 99.23 Zinc
Values in (ug/l) unless otherwise noted.1
+ Quantitation limit development is detailed in Commercial HWC record (W-97-08, Item 16.4.9, Attachment VI.)* For aluminum, the treatable level was set at 5 times the quantitation limit of 100 ug/l because 100 ug/l is a high
quantitation limit.
5.5 SELECTION OF POLLUTANTS TO BE REGULATED FOR PSES AND PSNS
Indirect dischargers in the CHWC Industry send their wastewater streams to a POTW for further
treatment, unlike direct dischargers, whose wastewater will receive no further treatment once it leaves their
facility. Therefore, the levels of pollutants allowable in the wastewater of an indirect discharger are
dependent upon (1) whether a given pollutant “passes through” the POTW’s treatment system or (2)
whether additional treatment provided by the POTW will result in removal of the pollutant to a level
equivalent to that obtained through treatment by a direct discharger.
5.5.1 Removal Comparison Approach
To establish PSES, EPA must first determine which of the CHWC Industry pollutants of concern
(identified earlier in Section 5.3) may not be susceptible to POTW treatment, interfere with, or are
incompatible with the operation of POTWs (including interferences with sludge disposal practices). EPA
evaluates the susceptibility of a pollutant to POTW treatment by looking at the removal performance of
POTWs for a particular pollutant. EPA’s removal comparison evaluates the percentage removed by
POTWs with the percentage removed by direct dischargers using BPT/BCT/BAT technology. EPA has

5-15
assumed, for the purposes of its removal comparison and based upon the data received, that the untreated
wastewater at indirect discharge facilities is not significantly different from direct discharge facilities.
EPA’s comparison satisfies two competing objectives set by Congress: (1) that standards for
indirect dischargers be equivalent to standards for direct dischargers, and (2) that the treatment capability
and performance of the POTW be recognized and taken into account in regulating the discharge of
pollutants from indirect dischargers. Rather than compare the mass or concentration of pollutants
discharged by the POTW with the mass or concentration of pollutants discharged by a BAT facility, EPA
compares the percentage of the pollutants removed by the facility with the POTW removal. EPA takes
this approach because a comparison of mass or concentration of pollutants in a POTW effluent with
pollutants in a BAT facility’s effluent would not take into account the mass of pollutants discharged to the
POTW from non-industrial sources, nor the dilution of the pollutants in the POTW effluent to lower
concentrations from the addition of large amounts of non-industrial wastewater.
5.5.2 50 POTW Study Database
For past effluent guidelines, a study of 50 well-operated POTWs was used for the pass-through
analysis. This study is referred to as the “The Fate of Priority Pollutants in Publicly Owned Treatment
Works”, September 1982 (EPA 440/1-82/303), also known as the 50 POTW Study. Because the data
collected for evaluating POTW removals included influent levels of pollutants that were close to the
detection limit, the POTW data were edited to eliminate influent levels less than 10 times the minimum level
and the corresponding effluent values, except in the cases where none of the influent concentrations
exceeded 10 times the minimum level. In the latter case, where no influent data exceeded 10 times the
minimum level, the data were edited to eliminate influent values less than 5 times the minimum level.
Further, where no influent data exceeded 5 times the minimum level, the data were edited to eliminate
influent values less than 20 ug/l and the corresponding effluent values. These editing rules were used to
allow for the possibility that low POTW removals simply reflected the low influent levels.
EPA then averaged the remaining influent data and also averaged the remaining effluent data from
the 50 POTW database. The percent removals achieved for each pollutant were determined from these

5-16
averaged influent and effluent levels. This percent removal was then compared to the percent removal for
the BAT option treatment technology.
5.5.3 Final POTW Data Editing
The final percent removal for each pollutant was selected based on a data hierarchy, which was
related to the quality of the data source. This hierarchy was:
1. 50 POTW Study Data (10x NOMDL edit)
2. 50 POTW Study Data (5x NOMDL edit)
3. 50 POTW Study Data (20 ug/l edit)
The final POTW removals for the CHWC regulated pollutants, determined via the data use
hierarchy, are presented in Table 5-12.
Table 5-12. Final POTW Removals for CHWC Industry Pollutants
Pollutant CAS Percent Source of DataNumber Removal
Arsenic 7440382 66 50 POTW - (20 ug/l edit)
Cadmium 7440439 90 50 POTW - (10x NOMDL edit)
Chromium 7440473 91 50 POTW - (10x NOMDL edit)
Copper 7440508 84 50 POTW - (10x NOMDL edit)
Lead 7439921 92 50 POTW - (10x NOMDL edit)
Mercury 7439976 90 50 POTW - (10x NOMDL edit)
Silver 7440224 88 50 POTW - (10x NOMDL edit)
Titanium 7440326 92 50 POTW - (10x NOMDL edit)
Zinc 7440666 78 50 POTW - (10x NOMDL edit)

5-17
5.5.4 Final Removal Comparison Results
For each CHWC regulated pollutant, the daily removals were calculated using the BPT/BCT/BAT
data. Then, the average overall BPT/BCT/BAT removal was calculated for each pollutant from the daily
removals (see Table 5-13). The averaging of daily removals is appropriate for this industry as
BPT/BCT/BAT treatment technologies typically have retention times of less than one day. For the final
assessment, the final POTW removal data determined for each CHWC regulated pollutant was compared
to the percent removal achieved for that pollutant using the BPT/BCT/BAT option treatment technologies.
Of the 9 pollutants regulated under BPT/BCT/BAT, all were found to pass through for the regulatory
wastewater treatment technology option selected (see Section 7 for a description of the selected
BPT/BCT/BAT Regulatory Option) and are proposed for PSES. The final results for the CHWC
Regulatory Option are presented in Table 5-14.
Table 5-13. Sampling Episode Percent Removals
6181 Percent 6183 Percent 4646 Percent Average PercentRemoval Removal Removal Removal
Aluminum 98.54 99.48 85 94
Antimony 7.78 83.10 49 47
Arsenic 68.42 97.84 98 88
Cadmium 93.11 94.88 98 95
Chromium *64.59 99.56 95 97
Copper 97.75 99.49 99 99
Iron 99.23 99.81 98 99
Lead 98.85 99.38 99 99
Mercury 93.85 99.78 97 97
Molybdenum *-14.99 44.77 38 41
Selenium *-0.74 70.97 89 80
Silver *73.15 92.08 98 95
Tin *58.54 89.92 99 94
Titanium 97.10 99.75 99 99

6181 Percent 6183 Percent 4646 Percent Average PercentRemoval Removal Removal Removal
5-18
Zinc 98.63 99.23 99 99
* These pollutants from Episode 6181 could not be used to develop final regulations either because they were notfound at a treatable level or because the percent removal was a negative value.
Table 5-14. Final Results for CHWC Industry Regulatory Option
Pollutant Option Percent Removal POTW Percent Removal
Arsenic 88 66
Cadmium 95 90
Chromium 97 91
Copper 99 84
Lead 99 92
Mercury 97 90
Silver 95 88
Titanium 99 92
Zinc 99 78

6-1
SECTION 6
WASTEWATER TREATMENT TECHNOLOGIES
This section describes the technologies available for the treatment of wastewater generated by the
55 commercial facilities within the Commercial Hazardous Waste Combustor (CHWC) Industry. This
section also presents an evaluation of performance data on treatment systems collected by EPA during field
sampling programs and the rationale used in the development of the regulatory options. Specifically,
Section 6.1 describes the technologies used by CHWC facilities to treat air pollution control, flue gas
quench, and ash/slag quench wastewaters, which are the only types of wastewater covered by this
regulation. Section 6.2 describes technologies used by CHWC facilities for the treatment of wastewater
generated as a result of CHWC operations (e.g., container wash water and truck wash water) for which
EPA is not proposing regulations. Section 6.3 lists technologies used by CHWC facilities for the treatment
of wastewater generated as a result of other operations on-site (e.g., landfill leachate and sanitary water).
Section 6.4 presents the EPA performance data on selected treatment technologies as well as the rationale
used in selecting the treatment technologies for the regulatory options.
Of the 55 CHWC facilities, 16 facilities generate no wastewater. A breakdown of the types of
wastewaters collected at the remaining 39 CHWC facilities which generate wastewater is as follows:
Type of wastewater collected Number of CHWC facilitiesCHWC wastewaters only 8
(air pollution control, ash/slag quench, flue gas quench)Wastewaters generated from CHWC operations only 7
(container, area, and truck wash waters)Other on-site wastewaters only 9
(sanitary wastewater, leachates)CHWC wastewaters and wastewaters generated fromCHWC operations 13CHWC wastewaters, wastewaters generated from CHWCoperations, and other on-site wastewaters 1Wastewaters generated from CHWC operations and other on-sitewastewaters 3
As demonstrated above, only 22 of the 55 CHWC facilities generate CHWC wastewaters and
therefore, were considered to be within the scope of this regulation.

6-2
6.1 AVAILABLE BAT AND PSES TECHNOLOGIES
CHWC facilities use either physical/chemical treatment technology to treat CHWC wastewaters
or treatment and disposal methods that result in no discharge of CHWC wastewaters.
Through its CWA Section 308 Questionnaire, EPA obtained information on nine different
wastewater treatment technologies currently in use by the 22 CHWC facilities for the treatment of air
pollution control, flue gas quench, and ash/slag quench wastewater. In addition, EPA collected other
detailed information on available technologies from engineering plant visits to a number of CHWC facilities.
The data presented in Section 6.4 are based on these data collection activities.
6.1.1 Physical/Chemical Treatment
6.1.1.1 Equalization
Wastewater generation rates at incinerators are sometimes variable due to variations in burn rates
and system down times. To allow for the equalization of pollutant loadings and flow rates, CHWC
wastewaters may be collected in tanks or lined ponds prior to treatment. These are designed with sufficient
capacity to hold the peak flows and thus dampen the variation in hydraulic and pollutant loads.
Minimization of this variability increases the performance and reliability of down stream treatment systems,
and can reduce the size of subsequent treatment by reducing the maximum flow rates and concentrations
of pollutants that they will experience. Equalization also lowers the operating costs of associated treatment
units by reducing instantaneous treatment capacity demand and by optimizing the amount of treatment
chemicals required for a less erratic set of treatment variables. The EPA's Section 308 Questionnaire
database identifies 10 facilities that use equalization technology as part of their treatment of CHWC
wastewaters.
Equalization systems consist of steel or fiberglass holding tanks or lined ponds that provide sufficient
capacity to contain peak flow conditions and wastewater volumes of high pollutant loadings. Detention
times can vary from a few hours to several days, with one day being a typical value. Some equalization

6-3
systems contain mechanical mixing systems that enhance the equalization process. A breakdown of
equalization systems used is as follows:
Equalization Type Number of UnitsUnstirred 7Mechanically stirred 2
A typical equalization system is shown in Figure 6-1.
6.1.1.2 Neutralization or pH Control
In the treatment of CHWC wastewaters, neutralization or pH control systems are used in
conjunction with certain chemical treatment processes, such as chemical precipitation, to adjust the pH of
the wastewater to optimize process control. Acids, such as sulfuric acid or hydrochloric acid, are added
to reduce pH, whereas, alkalis, such as sodium hydroxides, are added to raise pH values. Neutralization
may be performed in a holding tank, rapid mix tank, or an equalization tank. Neutralization systems are
widely used at CHWC facilities for pH control in chemical precipitation systems. Chemicals, such as
sodium hydroxide or lime, are frequently used in order to raise the pH of the wastewater to a range
somewhere between 9 to 12 in order to optimize precipitation of metal compounds. Acids, such as
hydrochloric acid, are also used in conjunction with ferric chloride for chemical precipitation. Neutralization
systems at the end of a treatment system are typically designed to control the pH of the discharge to
between 6 and 9. There are 14 neutralization systems in place among the CHWC facilities that use various
caustic and/or alkalis to treat CHWC wastewaters. A breakdown of these neutralization systems is as
follows:
Type of Neutralization Number of UnitsCaustic 4Acid 2Multiple Chemicals 5Other 1
Figure 6-2 presents a flow diagram for a typical neutralization system.

Equalization Tank
WastewaterInfluent
EqualizedWastewaterEffluent
6-4
Figure 6-1. Equalization

Neutralization Tank
WastewaterInfluent
NeutralizedWastewaterEffluent
pH monitor/control
Acid
Caustic
6-5
Figure 6-2. Neutralization

6-6
6.1.1.3 Flocculation
Flocculation is a treatment technology used to enhance sedimentation or filtration treatment.
Flocculation precedes these processes and consists usually of a rapid mix tank, or in-line mixer and a
flocculation tank. The waste stream is initially mixed while a flocculation chemical is added. Flocculants
adhere readily to suspended solids and each other to facilitate gravity sedimentation or filtration.
Coagulants can be added to reduce the electrostatic surface charges and enhance the formation of complex
hydrous oxides. Coagulation allows for the formation of larger, heavier particles, or flocculants (which are
usually formed in a flocculation chamber), that can settle faster. There are three different types of
flocculants commonly used; inorganic electrolytes, natural organic polymers, and synthetic polyelectrolytes.
The selection of the specific treatment chemical is highly dependent upon the characteristics and chemical
properties of the contaminants. A rapid mix tank is usually designed for a detention time ranging from 15
seconds to several minutes. After mixing, the coagulated wastewater flows to a flocculation basin where
slow mixing of the waste occurs. The slow mixing allows for the particles to agglomerate into heavier, more
settleable solids. Mixing is provided either by mechanical paddle mixers or by diffused air. Flocculation
basins are typically designed for a detention time of 15 to 60 minutes. There are 5 flocculation systems
used among the CHWC facilities used to treat CHWC wastewaters.
6.1.1.4 Gravity-Assisted Separation
Gravity-assisted separation is a simple, economical, and widely used method for the treatment of
CHWC wastewaters. There are 12 such systems in place at the CHWC facilities. Clarification systems
remove suspended matter by allowing the wastewater to become quiescent. As a result, suspended matter,
which is heavier than water, settles to the bottom, forming a sludge which can be removed. This process
may take place in specially designed tanks, or in earthen ponds and basins. Sedimentation units at CHWC
facilities are typically used as either primary treatment options to remove suspended solids or following a
chemical precipitation process.

6-7
Clarifiers may be rectangular, square, or circular in shape. In rectangular tanks, wastewater flows
from one end of the tank to the other with settled sludge collected into a hopper located at one end of the
tank. In circular tanks, flow enters from the center and flows towards the outside edge with sludge
collected in a center hopper. Treated wastewater exits the clarifier by flowing over a weir located at the
top of the clarifier. Sludge which accumulates in the bottom of the clarifiers is periodically removed and
is typically stabilized and/or dewatered prior to disposal.
Flocculation systems are commonly used in conjunction with gravity assisted clarification systems
in order to improve their solids removal efficiency. Some clarifiers are designed with a center well to
introduce flocculants and allow for coagulation in order to improve removal efficiencies. A schematic of a
typical clarification system using coagulation and flocculation is shown in Figure 6-3. The main design
parameters used in designing a clarifier are the overflow rate, detention time and the side water depth. The
overflow rate is the measure of the flow as a function of the surface area of the clarifier. Typical design
parameters used for both primary and secondary clarifiers are presented below:
Design Parameter Primary SecondaryOverflow Rate, gpd/sq ft 600-1,000 500-700Detention Time, min 90-150 90-150Minimum Side Water Depth, ft 8 10
Source: ASCE/WEF, Design of Municipal Wastewater Treatment Plants, 1991.
There are three facilities that use corrugated plate interceptor technology. These systems include
a series of small (approximately 2 inch square) inclined tubes in the clarification settling zone. The
suspended matter must only travel a short distance, when settling or floating, before they reach a surface
of the tube. At the tubes’ surface, the suspended matter further coagulates. Because of the enhanced
removal mechanism, corrugated plate interceptor units can have much smaller settling chambers than
standard clarifiers.
6.1.1.5 Chemical Precipitation
Chemical precipitation is used for the removal of metal compounds from wastewater. In the
chemical precipitation process, soluble metallic ions and certain anions, which are found in CHWC

Rapid MixTank
Coagulant
Influent
FlocculatingTank
Clarifier
Sludge
Effluent
6-8
Figure 6-3. Clarification System Incorporating Coagulation and Flocculation

6-9
wastewaters, are converted to insoluble forms, which precipitate from the solution. Most metals are
relatively insoluble as hydroxides, sulfides, or carbonates. Coagulation processes are used in conjunction
with precipitation in order to facilitate removal by agglomeration of suspended and colloidal materials. The
precipitated metals are subsequently removed from the wastewater stream by liquid filtration or clarification
(or some other form of gravity assisted sedimentation). Other treatment processes such as equalization,
chemical oxidation or reduction (e.g., hexavalent chromium reduction), precede the chemical precipitation
process. The performance of the chemical precipitation process is affected by chemical interactions,
temperature, pH, solubility of waste contaminants, and mixing effects. There are a total of 7 chemical
precipitation systems in use by the CHWC facilities to treat CHWC wastewater.
Common precipitation chemicals used in the CHWC Industry include lime, sodium hydroxide, soda
ash, sodium sulfide, and alum. Other chemicals used in the precipitation process for pH adjustment and/or
coagulation include sulfuric and phosphoric acid, ferric chloride, and polyelectrolytes. Many facilities use,
or have the means to use, a combination of these chemicals. Precipitation using sodium hydroxide or lime
is the conventional method of removing metals from wastewater. However, sulfide precipitation is also
frequently used instead of hydroxide precipitation in order to remove certain metal ions. Hydroxide
precipitation is effective in removing such metals as antimony, arsenic, chromium, copper, lead, mercury,
nickel, and zinc. Sulfide precipitation is more appropriate for removing mercury, lead, and silver.
Carbonate precipitation, while not frequently used in the CHWC Industry, is another method of chemical
precipitation and is used primarily to remove antimony and lead. Alum, another precipitant/coagulant agent
infrequently used, forms aluminum hydroxides in wastewaters containing calcium or magnesium bicarbonate
alkalinity. Aluminum hydroxide is an insoluble gelatinous floc which settles slowly and entraps suspended
materials. For metals such as arsenic and cadmium, coprecipitation with iron or aluminum is an effective
treatment process.
Hydroxide precipitation using lime or sodium hydroxide is the most commonly used means of
chemical precipitation in the CHWC industry, and of these, lime is used more often than sodium hydroxide.
The chief advantage of lime over caustic is its lower cost. However, lime is more difficult to handle and
feed, as it must be slaked, slurried, and mixed, and can plug the feed system lines. Lime precipitation also

6-10
produces a larger volume of sludge. The reaction mechanism for precipitation of a divalent metal using lime
is shown below:
M + Ca(OH) 6 M(OH) + Ca++ ++2 2
The reaction mechanism for precipitation of a divalent metal using sodium hydroxide is as follows:
M + 2NaOH 6 M(OH) + 2Na++ ++2
In addition to the type of treatment chemical chosen, another important design factor in the chemical
precipitation operation is pH. Metal hydroxides are amphoteric, meaning that they can react chemically
as acids or bases. As such, their solubilities increase toward both lower and higher pH levels. Therefore,
there is an optimum pH for precipitation for each metal, which corresponds to its point of minimum
solubility. Figure 6-4 presents calculated solubilities of metal hydroxides. Another key consideration in
a chemical precipitation application is the detention time in the sedimentation phase of the process, which
is specific to the wastewater being treated and the desired effluent quality.
The first step of a chemical precipitation process is pH adjustment and the addition of coagulants.
This process usually takes place in separate mixing and flocculation tanks. After mixing the wastewater
with treatment chemicals, the resultant mixture is allowed to agglomerate in the flocculation tank which is
slowly mixed by either mechanical means, such as mixers, or recirculation pumping. The wastewater then
undergoes a separation/dewatering process such as clarification or filtration, where the precipitated metals
are removed from solution. In a clarification system, a flocculent, such as a polymer, is sometimes added
to aid in the settling process. The resulting sludge from the clarifier or filter must be further treated,
disposed, or recycled. A typical chemical precipitation system is shown in Figure 6-5.

Figure 6-4. Calculated Solubilities of Metal Hydroxides
0.0001
0.001
0.01
0.1
1
10
100
0 2 4 6 8 10 12 14 16
pH
Solu
ble
Met
al C
once
ntra
tion
(m
g/l)
Cr(OH)3
Ni(OH)2
Cu(OH)2
Cd(OH)2
Zn(OH)2
Pb(OH)2
6-11

Clarifier
LiquidEffluent
Chemical Precipitation Tank
WastewaterInfluent
Sludge Handlingand/or Treatment
ChemicalController
TreatmentChemical
Sludge
6-12
Figure 6-5. Chemical Precipitation System Design

6-13
6.1.1.6 Stripping
Stripping refers to the removal of pollutant compounds from a wastewater by the passage of air,
steam, or other gas, through the liquid. The stripped volatile components are generally condensed and
recovered for reuse, disposal, or allowed to be stripped into the atmosphere. If the pollutants are in
sufficiently low concentrations, the gaseous phase can be emitted through a stack without treatment.
Air stripping is a process in which air is brought into contact with the liquid. During this contact,
the volatile compounds move from the liquid to the gas stream. The process usually takes place in a
stripping tower (as shown in Figure 6-6) which consists of a vertical shell filled with packing material to
increase the surface area for gas-liquid contact. Usually, the liquid flows down through the stripping column
and air passes upward in a counter-current fashion. Another orientation is called "crossflow", where the
air is pulled through the sides of the tower along its entire length.
There is only one CHWC facility that uses air stripping as a treatment option for the removal of
excess treatment chemicals contained in its flue gas quench wastewater.
6.1.1.7 Filtration
Filtration is a method for separating solid particles from wastewaters through the use of a porous
medium. The driving force in filtration is a pressure gradient, caused by gravity, centrifugal force, vacuum,
or higher than atmospheric pressure. Filtration treatment processes can be used at CHWC facilities to
remove solids from wastewaters after a chemical precipitation treatment step, or can used as the primary
source of treatment. Filtration processes include a broad range of media and membrane separation
technologies from sand filtration to ultrafiltration. To aid in removal, the filter medium may be precoated
with a filtration aid such as ground cellulose or diatomaceous earth.
CHWC facilities currently have the following types of filtration systems in operation to treat their
CHWC wastewaters:

WastewaterInfluent Distributor
TreatedEffluent
Packing
Off-gas
Air
Blower
6-14
Figure 6-6. Typical Air Stripping System

6-15
Type of Filtration System Number of UnitsSand 2Granular Multimedia 1Fabric 1Ultrafiltration 1
Dissolved compounds in CHWC wastewaters can be pretreated by chemical precipitation
processes to convert the compound to an insoluble solid particle before filtration. Polymers can be injected
into the filter feed piping downstream of feed pumps to enhance flocculation of smaller flocs that may
escape an upstream clarifier.
The following paragraphs describe each type of filtration system.
6.1.1.7.1 Sand/Multimedia Filtration
Granular bed filtration in the CHWC industry is used primarily for achieving supplemental removal
of residual suspended solids from the effluent of chemical treatment processes, or rarely, as the primary
form of wastewater treatment. These filters can be operated either by gravity or in a pressure vessel. In
granular bed filtration, the wastewater stream is sent through a bed containing one or more layers of
different granular materials. The solids are retained in the voids between the media particles while the
wastewater passes through the bed. Typical media used in granular bed filters include anthracite coal, sand,
and garnet. These media can be used alone, such as in sand filtration, or in a multimedia combination.
Multimedia filters are designed such that the individual layers of media remain fairly discrete. This is
accomplished by selecting appropriate filter loading rates, media grain size, and bed density. Hydraulic
loading rates for a multimedia filter are between 4 to 10 gpm/sq ft. A typical multimedia filter vessel is
shown in Figure 6-7.
The complete filtration process involves two phases: filtration and backwashing. As the filter
becomes filled with trapped solids, the efficiency of the filtration process falls off. Head loss is a measure
of solids trapped in the filter. As the head loss across the filter bed increases to a limiting value, the end
of the filter run is reached and the filter must be backwashed to remove the suspended solids in the bed.
During backwashing, the flow through the filter is reversed so that the solids trapped in the media are
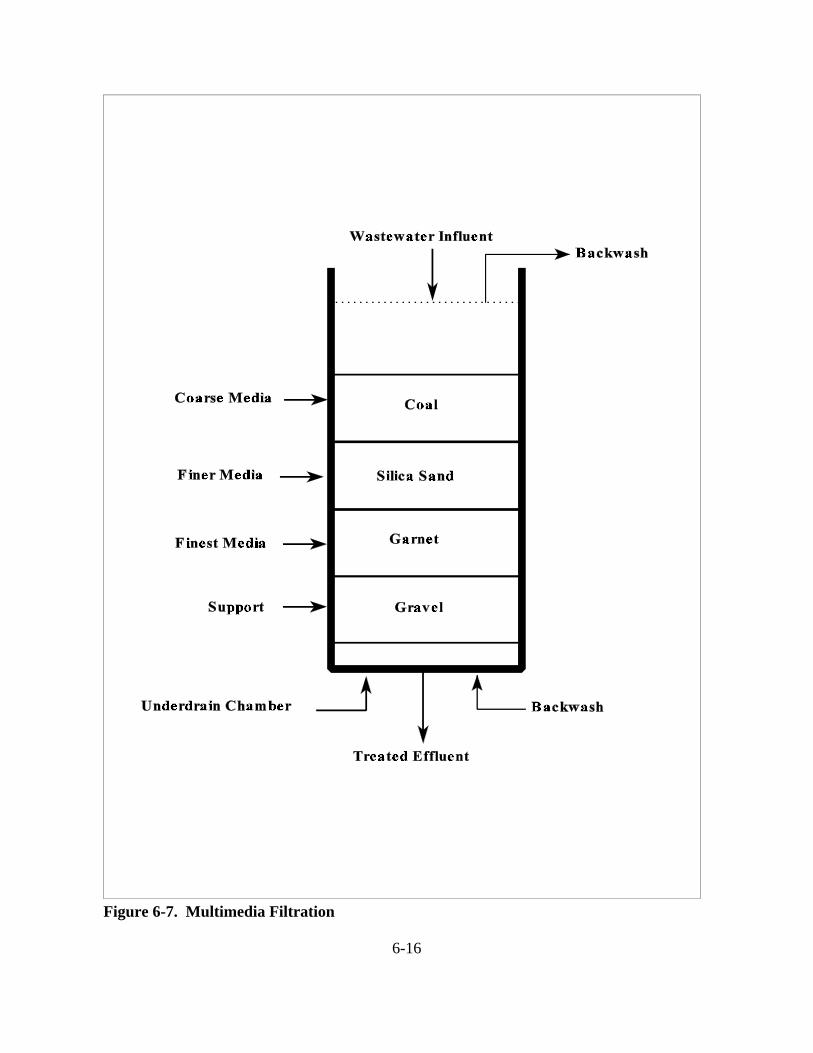
6-16
Figure 6-7. Multimedia Filtration

6-17
dislodged and can exit the filter. The bed may also be agitated with air to aid in solids removal. The
backwash water is then recycled back into the wastewater feed stream.
6.1.1.7.2 Fabric Filters
Fabric filters consist of a vessel that contains a cloth or paper barrier through which the wastewater
must pass. The suspended matter is screened by the fabric, and the effectiveness of the filter depends on
the mesh size of the fabric. Fabric filters may either be backwashed, or built as disposable units.
For waters having less than 10 mg/l suspended solids, cartridge fabric filters may be cost effective.
Cartridge filters have very low capital cost and can remove particles of one micron or larger in size. Using
two-stage cartridge filters (coarse and fine) in series extends the life of the fine cartridge. Disposable or
backwashable bag filters are also available and may be quite cost effective for certain applications.
Typically, these fabric filters act as a pre-filter and are used to remove suspended solids prior to other
filtrations systems in order to protect membranes and equipment and reduce solids fouling.
6.1.1.7.3 Ultrafiltration
Ultrafiltration uses a semi-permeable, microporous membrane, through which the wastewater is
passed under pressure. Water and low molecular weight solutes, such as salts and surfactants, pass
through the membrane and are removed as permeate. Emulsified oils and suspended solids are rejected
by the membrane and removed with some of the wastewater as a concentrated liquid. The concentrate
is recirculated through the membrane unit until the flow of permeate drops, while the permeate can either
be discharged or passed along to another treatment unit. The concentrate is usually stored and held for
further treatment or disposal. Several types of ultrafiltration membranes configurations are available: tubular,
spiral wound, hollow fiber, and plate and frame. A typical ultrafiltration system is presented in Figure 6-8.
Ultrafiltration in the CHWC industry is used for the treatment of metal-bearing wastewaters. It can
remove substances with molecular weights greater than 500, including suspended solids, oil and grease,
and complexed heavy metals. Ultrafiltration is used when the solute molecules are greater than ten times
the size of the solvent molecules, and are less than one-half micron. The primary design consideration in
6-18
Figure 6-8. Ultrafiltration System Diagram

6-19
ultrafiltration is the membrane selection. A membrane pore size is chosen based on the size of the
contaminant particles targeted for removal. Other design parameters to be considered are the solids
concentration, viscosity, and temperature of the feed stream, and the membrane permeability and thickness.
6.1.1.8 Carbon Adsorption
Granular activated carbon (GAC) adsorption is a physical separation process in which organic and
inorganic materials are removed from wastewater by adsorption, attraction, and/or accumulation of the
compounds on the surface of the carbon granules. While the primary removal mechanism is adsorption,
the activated carbon also acts as a filter for additional pollutant removal. Adsorption capacities of 0.5 to
10 percent by weight are typical. Spent carbon can be regenerated thermally on site by processes such
as wet-air oxidation or steam stripping. For smaller operations, spent carbon can be regenerated off site
or sent directly for disposal. Vendors of carbon typically, under contract, exchange spent carbon with fresh
carbon.
Activated carbon systems usually consist of a vessel containing a bed of carbon (typically 4 to 12
feet in depth), whereby the wastewater is either passed upflow or downflow through the filter bed. A
carbon adsorption vessel is shown in Figure 6-9. Carbon vessels are typically operated under pressure,
however, some designs use gravity beds. For smaller applications, GAC systems are also available in
canister systems which can be readily changed-out and sent for either off-site regeneration or disposal. The
key design parameter is the adsorption capacity of the GAC, which is a measure of the mass of contaminant
adsorbed per unit mass of carbon, and is a function of the chemical compounds being removed, type of
carbon used, and process and operating conditions. The volume of carbon required is based upon the
COD of the wastewater to be treated and desired frequency of carbon change-outs. The vessel is typically
designed for an empty bed contact time of 15 to 60 minutes. Non-polar, high molecular weight organics
with low solubility are readily adsorbed using GAC. Certain organic compounds have a competitive
advantage for adsorption onto the GAC, which results in compounds being preferentially adsorbed or
causing other less competitive compounds to be desorbed from the GAC. Most organic compounds and

6-20
Figure 6-9. Granular Activated Carbon Adsorption

6-21
some metals typically found in CHWC wastewaters are effectively removed using GAC. Two CHWC
facilities employ GAC for treatment of CHWC wastewaters.
6.1.1.9 Chromium Reduction
Chemical reduction processes involve a chemical reaction in which electrons are transferred from
one chemical to another in order to reduce the chemical state of a contaminant. The main application of
chemical reduction in CHWC wastewater treatment is the reduction of hexavalent chromium to trivalent
chromium. The reduction enables the trivalent chromium to be precipitated from solution in conjunction
with other metallic salts. Sodium bisulfate is the reducing agent used by one CHWC facility that
incorporates reduction technology for treatment of its CHWC wastewater.
Once the chromium has been reduced to the trivalent state, it can be further treated in a chemical
precipitation process, where it is removed as a metal hydroxide or sulfide. A typical chromium reduction
process is shown in Figure 6-10.
6.1.2 Sludge Handling
Sludges are generated by a number of treatment technologies, including gravity-assisted separation
and filtration. These sludges are further processed at CHWC facilities using various methods. Following
are the number of CHWC facilities which employ each type of sludge handling process.
Type of Sludge Handling Number of UnitsSludge Slurrying 1Vacuum Filtration 1Pressure Filtration 6Centrifuge 1Dryer 1
The following paragraphs describe each type of sludge handling system.

6-22
Figure 6-10. Chromium Reduction

6-23
6.1.2.1 Sludge Slurrying
Sludge slurrying is the process of transporting sludge from one treatment process to another. It can
only be applied to liquid sludges that can be pumped through a pipe under pressure. Only one CHWC
facility utilizes a sludge slurry process.
6.1.2.2 Vacuum Filtration
A typical vacuum filtration unit is shown in Figure 6-11. Vacuum filtration provides more
aggressive sludge drying by placing the sludge on a screen or mesh and drawing a vacuum through the
screen, which draws the liquid out of the sludge. Often the screen is oriented on a cylindrical support,
which rotates. The sludge is distributed over the cylinder as it rotates. As the screen rotates, the dried
sludge is removed with a scraper, and collected in a hopper placed below the filtration unit. These units
can dry sludges to approximately 30 to 50 percent solids. Only one CHWC facility utilizes vacuum
filtration for sludge dewatering.
6.1.2.3 Pressure Filtration
The plate and frame pressure filtration system is the most common process used by the CHWC
industry to dewater sludges from physical/chemical treatment processes. Six CHWC facilities use a plate
and frame pressure filtration system to dewater sludge. Sludges generated by CHWC wastewater
treatment processes are typically 2 to 5 percent solids by weight. These sludges are then dewatered to a
30 to 50 percent solids by weight using a plate and frame filter. Sludges from treatment systems can be
thickened by gravity or stabilized prior to dewatering, or may be processed directly with the plate and
frame pressure filtration unit.
A pressure filter consists of a series of screens (see Figure 6-12) upon which the sludge is applied
under pressure. A precoat material may be applied to the screens to aid in solids removal. The applied
pressure forces the liquid through the screen, leaving the solids to accumulate behind the screen. Filtrate
which passes through the screen media is typically recirculated back to the head of the on-site wastewater

6-24
Figure 6-11. Vacuum Filtration

6-25
Figure 6-12. Plate and Frame Pressure Filtration System Diagram
6-26
treatment plant. Screens (also referred to as plates) are held by frames placed side by side and held
together with a vice-type mechanism. The unit processes sludge until all of the plates are filled with dry
sludge as indicated by a marked rise in the application pressure. Afterwards, the vice holding the plates
is loosened and the frames separated. Dried sludge is manually scraped from the plates and collected in
a hopper for final disposal. The size of the filter and the number of plates utilized depends not only on the
amount of solids produced by treatment processes, but also is highly dependent on the desired operational
requirements for the filter (e.g., shifts per day). A plate and frame pressure filter can produce a sludge with
a higher solids content than most other methods of sludge dewatering. Pressure filters offer operational
flexibility since they are typically operated in a batch mode.
6.1.2.4 Centrifuges
Centrifuges use centripetal force to separate the liquid from the sludge solids. The sludge enters
the top of a rapidly spinning cylinder where the solids are "thrown" to the outer wall of the vessel. The
separated solids are continually removed through an orifice on the outer wall, and the liquid stream is
collected at the bottom.
Because the unit is spinning rapidly, and sludge often contains abrasive materials, centrifuges often
require a high level of maintenance. Centrifuges typically dry sludges to the range of 20 to 30 percent solids
by weight. One CHWC facility utilizes a centrifuge for sludge dewatering.
6.1.2.5 Dryer
One CHWC facility employs a sludge dryer to remove the moisture from its sludge prior to disposal
of the solid waste. The sludge dryer uses thermal energy derived from steam or electricity to evaporate
the moisture from the sludge in a drying bed/tank.

6-27
6.1.3 Zero Discharge Options
Some CHWC facilities use treatment and disposal practices that result in no discharge of CHWC
wastewaters to surface waters. These practices are described below.
6.1.3.1 Incineration
Two CHWC facilities generate annual flow rates of 108,100 gallons and 300,000 gallons and
dispose of their CHWC wastewater exclusively by incinerating them on site. Normally, these wastewater
flows are minimal compared to the amount of fuel and/or waste the thermal unit handles, and as such, these
CHWC facilities find it cheaper to dispose of their wastewaters in this fashion rather than utilizing other
disposal methods.
6.1.3.2 Off-Site Disposal
Three CHWC facilities transport their wastewater off site to either another CHWC facility’s
wastewater treatment system or to a Centralized Wastewater Treatment (CWT) facility for ultimate
disposal. These three facilities generate annual flow rates of 18,250 gallons, 10,000 gallons, and 43 million
gallons. A fourth facility with an annual flow rate of 4.865 million gallons sells their wastewater as oil well
completion fluid.
6.1.3.3 Evaporation/Land Applied
One CHWC facility with an annual flow rate of approximately 100 million gallons discharges its
CHWC wastewater into on-site surface impoundments as a means of ultimate disposal. There is no
discharge to a receiving water from these impoundments. Rather, water is lost by evaporation.

6-28
6.2 TREATMENT OPTIONS FOR OTHER WASTEWATERS GENERATED BYCHWC OPERATIONS
CHWC facilities employ the same two treatment options (physical/chemical treatment or zero
discharge) to treat other wastewaters generated as a result of CHWC operations (see Section 4). Most
of the same treatment technologies are used to treat these secondary wastewaters as are being used to treat
CHWC wastewaters. The EPA's Section 308 Questionnaire obtained information on eight different
technologies currently in use by 37 CHWC facilities for the treatment of various wash down waters, run-off
from CHWC areas, and laboratory wastewater. A breakdown of these treatment systems is shown below:
Treatment Technology Number of CHWC FacilitiesEqualization 7Neutralization 8Flocculation 5Gravity Assisted Separation 7Chemical Precipitation 5Air Stripping 1Carbon Adsorption 5Chemical Oxidation 2Sludge Handling 9
Each of the above treatment technologies, with the exception of chemical oxidation, has been previously
described in Section 6.1. As for CHWC wastewaters, the design and operation of these treatment systems
to treat other wastewaters generated by CHWC operations are the same. Since the amount of wastewater
generated by other CHWC operations is minimal as compared to CHWC wastewater flow rates, these
small flows are typically mixed with CHWC wastewaters for treatment in the physical/chemical treatment
system. Below is a description of the only new treatment technology listed above that was not described
in the previous section: chemical oxidation.
6.2.1 Chemical Oxidation
Chemical oxidation treatment processes may be used to remove ammonia, to reduce the
concentration of residual organics, and to reduce the bacterial and viral content of wastewaters. CHWC

6-29
facilities that use chemical oxidation processes use them for the treatment of other out-of-scope
wastewaters generated at these facilities, such as landfill leachate, storm water, groundwater, or sanitary
wastewater. Both chlorine and ozone can be used to destroy some residual organics in wastewater. When
these chemicals are used for this purpose, disinfection of the wastewater is usually an added benefit. A
further benefit of using ozone is the removal of color. Ozone can also be combined with hydrogen peroxide
for removing organic compounds in contaminated wastewater. Oxidation is also used to convert pollutants
to terminal end products or to intermediate products that are more readily biodegradable or more readily
removed by adsorption. There are two CHWC facilities that use chemical oxidation units as part of their
treatment process to treat secondary CHWC wastewaters.
Chemical oxidation is a chemical reaction process in which one or more electrons are transferred
from the chemical being oxidized to the chemical initiating the transfer (the oxidizing agent). The electron
acceptor may be another element, including an oxygen molecule, or it may be a chemical species containing
oxygen, such as hydrogen peroxide and chlorine dioxide or some other electron acceptor. This process
is also effective in destroying cyanide and toxic organic compounds. Figure 6-13 illustrates one such
chemical oxidation process. According to the Section 308 Questionnaire data, CHWC facilities use
chemical oxidation processes to treat organic pollutants and as a disinfectant. When treating organic
wastes, these processes use oxidizing chemicals, such as hydrogen peroxide, or ozone. As a disinfection
process, an oxidant (usually chlorine) is added to the wastewater in the form of either chlorine dioxide or
sodium hypochlorite. Other disinfectant chemicals include ozone, peroxide, and calcium hypochlorite.
Once the oxidant is mixed with the wastewater, sufficient detention time is allowed (usually 30 minutes) for
the disinfecting reactions to occur.
6.2.2 Zero Discharge Options
Other CHWC facilities use treatment and disposal practices that result in no discharge of their
secondary CHWC wastewaters to surface waters. A breakdown of the zero discharge options for
secondary CHWC wastewaters at CHWC facilities is as follows:

6-30
Figure 6-13. Cyanide Destruction

6-31
Zero Discharge Option Number of CHWC FacilitiesIncineration 2Off-Site Disposal 5Evaporated/Land Applied 1Recycled 2Deep Well Disposal 2
Most of the above zero discharge options, with the exception of deep well disposal, have been
described previously in Section 6.1.3. Below is a description of the only new zero discharge option listed
above that was not described in the previous section; deep well disposal.
6.2.2.1 Deep Well Disposal
Deep well disposal consists of pumping the wastewater into a disposal well which discharges the
liquid into a deep aquifer. These aquifers do not typically contain potable water and commonly are
brackish. These aquifers are thoroughly characterized to insure that they are not hydrogeologically
connected to an aquifer which is or has the potential to be used for potable water. Characterization
confirms the existence of impervious layers of rock above and below the aquifer in order to prevent the
migration of pollutants.
6.3 OTHER ON-SITE WASTEWATER TREATMENT TECHNOLOGIES
There are other treatment technologies used by CHWC facilities to treat other on-site wastewaters
(leachates, sanitary wastewater). Some facilities may use one or more of the technologies described above
for the treatment of these wastewaters. Four CHWC facilities use some form of biological treatment as
the preferred method of treatment of leachates and other organic wastewaters. The biological treatment
technologies used at these CHWC facilities are listed below:
Treatment Technology Number of FacilitiesActivated Sludge 1Trickling Filter 1PAC System (Powdered Activated Carbon) 2

6-32
6.4 TREATMENT PERFORMANCE AND DEVELOPMENT OF REGULATORYOPTION
This section presents an evaluation of performance data on treatment systems collected both by
EPA during field sampling programs and by industry generated data (provided to the Agency post-proposal
and used to revise limitations), as well as the rationale used in the development of the regulatory option.
6.4.1 Performance of EPA Sampled Treatment Processes
To collect data on potential BAT treatment technologies, Questionnaire responses were reviewed
to identify candidate facilities that had well operated and designed wastewater treatment systems. EPA
conducted site visits to 13 CHWC facilities to evaluate treatment systems; based on these site visits, three
facilities were selected for a five consecutive day sampling episode (Episode ID #s 4646, 4671, and 4733).
At these facilities, EPA collected data on a variety of physical and chemical treatment processes.
Technologies evaluated at the selected sampling facilities include hydroxide precipitation, sulfide
precipitation, sedimentation, carbon adsorption, sand filtration and ultrafiltration. Table 6-1 presents a
summary of the treatment technologies sampled during each EPA sampling episode. Summaries of the
treatment system performance data collected by EPA during each of these sampling episodes are presented
below.
6.4.1.1 Treatment Performance for Episode #4646
EPA performed a five-day sampling program, Episode # 4646. This facility was evaluated by EPA
in order to obtain performance data on several treatment technologies installed at this facility including
hydroxide precipitation, ferric chloride precipitation, and sand filtration. A flow diagram of the CHWC
wastewater treatment system sampled during Episode # 4646 is presented in Figure 6-14. The wastewater
treatment system used at this CHWC facility treats wastewater from the air pollution control system
(quench chamber run-down and packed tower wastewater) and the ionizing wet scrubber. The

Table 6-1. Description of CHWC Sampling Episodes
6-33
Episode Sample Point Sample Point DescriptionInfluent Effluent
4646 1+2 4 First-stage chemical precipitation using sodium hydroxide4 5 Second-stage chemical precipitation using ferric chloride5 6 Sand filtration
1+2 6 Overall treatment system- first-stage chemical precipitation, second-stage chemical precipitation, and sand filter4671 1 2 First-stage chemical precipitation using sodium hydroxide
2 3 Second-stage chemical precipitation using sodium hydroxide and ultrafiltration1 3 Overall treatment system- first-stage chemical precipitation,second-stage chemical precipitation, and ultrafiltration
4733 1 2 Sulfide precipitation and Lancy filters2 4 Carbon adsorption system1 4 Overall treatment system- sulfide precipitation, Lancy filters and carbon adsorption system

ChromiumReduction
NeutralizationPrimaryClarifier
Plate and FrameFilter Press
Acidification Precipitation Neutralization ClarifierSand
Filters
SodiumBisulfite
QuenchRun-Down
Packed TowerWastewater
Ionizing WetScrubber
Wastewater
Sludge
Filtrate
Sampling Location
Figure 6-14. EPA Sampling Episode 4646 - CHWC Wastewater Treatment System Block Flow Diagram with Sampling Locations
01
02
04
05
06To Equalizationand Discharge
Sludge
DewateredSludgeto On-SiteLandfill
Sodium Hydroxideor LimePolymer
FerricChloride
WeakHydrochloric Acid
To QuenchChamber
SodiumHydroxide
6-34

6-35
wastewater treatment system is comprised of two separate systems both of which were sampled by EPA.
The primary system is part of the primary water circulation loop that serves the incinerator and consists of
chromium reduction and hydroxide precipitation treatment followed by sedimentation. Only the
precipitation portion of the primary system was sampled by EPA. Blowdown from the primary loop is
treated in the secondary system. Treatment in the secondary loop consists of precipitation using ferric
chloride followed by sedimentation and sand filtration. Table 6-2 presents a summary of percent removal
data collected at Episode #4646 for the performance of the entire treatment system, both the primary and
secondary system, as well as the primary system, secondary system, and sand filter separately. Percent
removal efficiencies for the processes were calculated by first obtaining an average concentration based
upon the daily sampling results for each sample collection location (influent and effluent point to the
treatment process). Next, the percent removal efficiency of the system was calculated using the following
equation:
Percent Removal = [Concentration Influent - Concentration Effluent] x100Concentration Influent
Negative percent removals for a treatment process were reported on the table as “0.0" percent removals.
The treatment efficiency of the primary system was assessed using the data obtained from sampling
points 01, 02, and 04 (see Figure 6-14). Influent concentration data was obtained using a flow-weighted
average for sample points 01 and 02. Effluent from the primary treatment system was represented by
sample point 04. As demonstrated on Table 6-2, the primary treatment system experienced good overall
removals for TSS (90.9 percent). COD was removed at 70.9 percent, whereas, no removal was observed
for TDS. Many of the metals observed in the influent were removed to high levels; these include aluminum,
cadmium, chromium, copper, iron, lead, tin, titanium, and zinc. Other metals also with limited removals
include manganese (66.5 percent), mercury (63.9 percent), silver (40.3 percent), and strontium (19.7
percent). Poor removal efficiencies were observed in the primary system for antimony, arsenic, boron,
molybdenum, and selenium.

Table 6-2. Treatment Technology Performance for Episode 4646
6-36
First-Stage Chemical Precipitation Second-Stage Chemical PrecipitationSample Points 1+2 to 4 Sample Points 4 to 5
CAS Influent Effluent % Influent Effluent %Pollutant of Concern # DL SP Conc. (ug/l) SP Conc. (ug/l) Removal DL SP Conc. SP Conc. (ug/l) Removal
(ug/l)ConventionalTSS C-009 4,000 01+02 122,560 04 11,200 90.9 4,000 04 11,200 05 13,400 0.0Non-ConventionalCOD C-004 5,000 01+02 535,920 04 156,200 70.9 5,000 04 156,200 05 238,800 0.0TDS C-010 01+02 30,694,160 04 50,320,000 0.0 04 50,320,000 05 36,910,000 26.6MetalsAluminum 7429905 200 01+02 1,104 04 170 84.6 200 04 170 05 197 0.0Antimony 7440360 20.0 01+02 672 04 1,026 0.0 20.0 04 1,026 05 381 62.9Arsenic 7440382 10.0 01+02 475 04 494 0.0 10.0 04 494 05 8.8 98.2Boron 7440428 100 01+02 1,280 04 1,744 0.0 100 04 1,744 05 1,705 2.2Cadmium 7440439 5.0 01+02 929 04 174 81.2 5.0 04 174 05 47.2 72.9Chromium 7440473 10.0 01+02 220 04 53.4 75.8 10.0 04 53.4 05 ND 81.3Copper 7440508 25.0 01+02 5,228 04 321 93.9 25.0 04 321 05 18.8 94.2Iron 7439896 100 01+02 7,066 04 254 96.4 100 04 254 05 1,994 0.0Lead 7439921 50.0 01+02 4,691 04 117 97.5 50.0 04 117 05 47.7 59.1Manganese 7439965 15.0 01+02 228 04 76.6 66.5 15.0 04 76.6 05 517 0.0Mercury 7439976 0.2 01+02 59.2 04 21.4 63.9 0.2 04 21.4 05 2.6 87.7Molybdenum 7439987 10.0 01+02 936 04 1,137 0.0 10.0 04 1,137 05 578 49.1Selenium 7782492 5.0 01+02 240 04 263 0.0 5.0 04 263 05 49.6 81.1Silver 7440224 10.0 01+02 283 04 169 40.3 10.0 04 169 05 9.5 94.4Strontium 7440246 100 01+02 408 04 328 19.7 100 04 328 05 689 0.0Tin 7440315 30.0 01+02 1,882 04 45.9 97.6 30.0 04 45.9 05 33.0 28.2Titanium 7440326 5.0 01+02 2,116 04 32.9 98.4 5.0 04 32.9 05 3.9 88.2Zinc 7440666 20.0 01+02 9,456 04 209 97.8 20.0 04 209 05 121 42.2Pesticides/HerbicidesDichloroprop 120365 1.0 01+02 3.1 04 NS NS 1.0 04 NS 05 NS NSMCPP 7085190 50.0 01+02 1,027 04 NS NS 50.0 04 NS 05 NS NS
Negative percent removal are recorded as 0.0NS: Not SampledND: Non-DetectDL: Specific detection limits of sample when there is a non-detect, otherwise it is the method detection limitSP: Sample Point
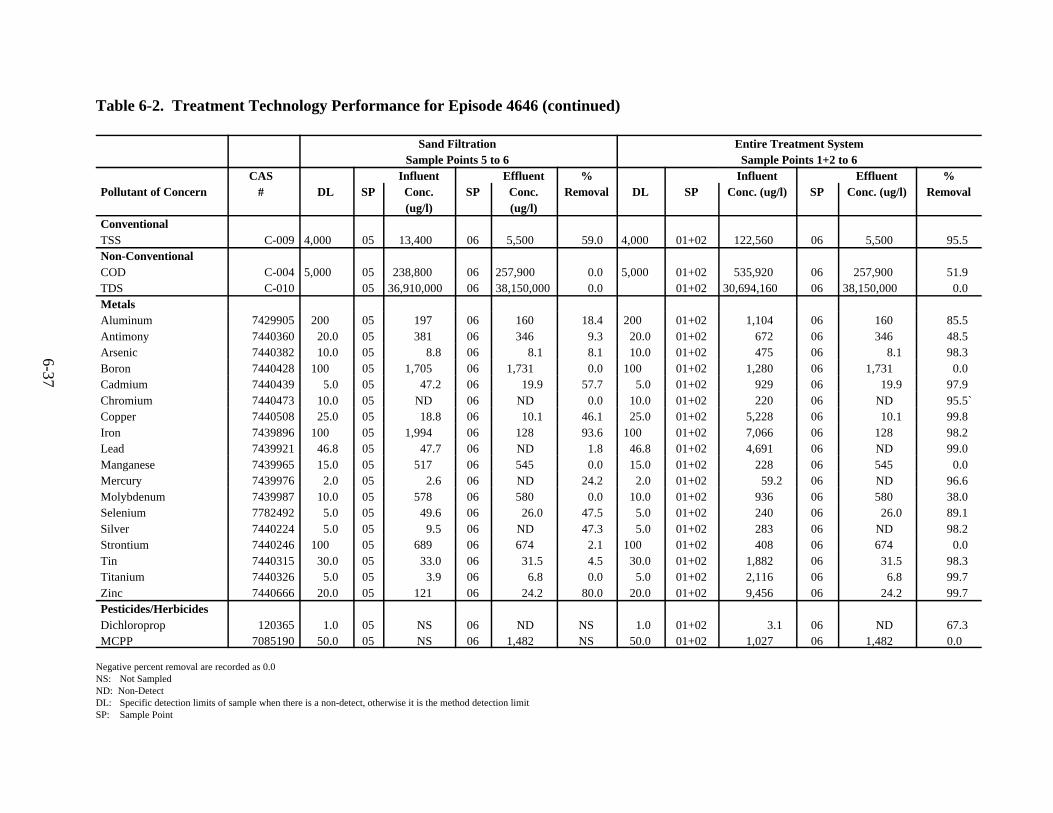
6-37
Table 6-2. Treatment Technology Performance for Episode 4646 (continued)
Sand Filtration Entire Treatment SystemSample Points 5 to 6 Sample Points 1+2 to 6
CAS Influent Effluent % Influent Effluent %Pollutant of Concern # DL SP Conc. SP Conc. Removal DL SP Conc. (ug/l) SP Conc. (ug/l) Removal
(ug/l) (ug/l)ConventionalTSS C-009 4,000 05 13,400 06 5,500 59.0 4,000 01+02 122,560 06 5,500 95.5Non-ConventionalCOD C-004 5,000 05 238,800 06 257,900 0.0 5,000 01+02 535,920 06 257,900 51.9TDS C-010 05 36,910,000 06 38,150,000 0.0 01+02 30,694,160 06 38,150,000 0.0MetalsAluminum 7429905 200 05 197 06 160 18.4 200 01+02 1,104 06 160 85.5Antimony 7440360 20.0 05 381 06 346 9.3 20.0 01+02 672 06 346 48.5Arsenic 7440382 10.0 05 8.8 06 8.1 8.1 10.0 01+02 475 06 8.1 98.3Boron 7440428 100 05 1,705 06 1,731 0.0 100 01+02 1,280 06 1,731 0.0Cadmium 7440439 5.0 05 47.2 06 19.9 57.7 5.0 01+02 929 06 19.9 97.9Chromium 7440473 10.0 05 ND 06 ND 0.0 10.0 01+02 220 06 ND 95.5`Copper 7440508 25.0 05 18.8 06 10.1 46.1 25.0 01+02 5,228 06 10.1 99.8Iron 7439896 100 05 1,994 06 128 93.6 100 01+02 7,066 06 128 98.2Lead 7439921 46.8 05 47.7 06 ND 1.8 46.8 01+02 4,691 06 ND 99.0Manganese 7439965 15.0 05 517 06 545 0.0 15.0 01+02 228 06 545 0.0Mercury 7439976 2.0 05 2.6 06 ND 24.2 2.0 01+02 59.2 06 ND 96.6Molybdenum 7439987 10.0 05 578 06 580 0.0 10.0 01+02 936 06 580 38.0Selenium 7782492 5.0 05 49.6 06 26.0 47.5 5.0 01+02 240 06 26.0 89.1Silver 7440224 5.0 05 9.5 06 ND 47.3 5.0 01+02 283 06 ND 98.2Strontium 7440246 100 05 689 06 674 2.1 100 01+02 408 06 674 0.0Tin 7440315 30.0 05 33.0 06 31.5 4.5 30.0 01+02 1,882 06 31.5 98.3Titanium 7440326 5.0 05 3.9 06 6.8 0.0 5.0 01+02 2,116 06 6.8 99.7Zinc 7440666 20.0 05 121 06 24.2 80.0 20.0 01+02 9,456 06 24.2 99.7Pesticides/HerbicidesDichloroprop 120365 1.0 05 NS 06 ND NS 1.0 01+02 3.1 06 ND 67.3MCPP 7085190 50.0 05 NS 06 1,482 NS 50.0 01+02 1,027 06 1,482 0.0
Negative percent removal are recorded as 0.0NS: Not SampledND: Non-DetectDL: Specific detection limits of sample when there is a non-detect, otherwise it is the method detection limitSP: Sample Point

6-38
The treatment efficiency of the secondary system was assessed using the data obtained from
sampling points 04 and 05 (see Figure 6-14). Influent concentration data to the secondary system was
obtained using sampling point 04 which is also the effluent from the primary system. Effluent from the
secondary treatment system was represented by sample point 05. As demonstrated in Table 6-2, the
secondary treatment system experienced no additional removals for TSS or COD. As in the primary
system, no removal was observed for TDS. For those metals for which there was little or no removal in
the primary system, improved removals were generally observed in the second system. These metals
include antimony (62.9 percent), arsenic (98.2 percent), selenium (81.1 percent), and silver (94.4 percent).
Other metals for which adequate removals were observed in the primary system also experienced
additional removals in the secondary system. The data show the following removals: cadmium (72.9
percent), chromium (81.3 percent), copper (94.2 percent), mercury (87.7 percent), and titanium (88.2
percent).
The treatment efficiency of the sand filter was evaluated using the data obtained from sampling
points 05 and 06 (see Figure 6-14). Influent concentration data was obtained using sample point 05 which
represents the discharge from the secondary treatment system. Effluent from the sand filter as well as the
overall effluent from the treatment process was represented by sample point 06. As demonstrated in Table
6-2, the treatment system achieved a removal rate for TSS of 59.0 percent. No removals were observed
for COD or TDS. Additional metals were removed by the sand filter including cadmium, copper, iron,
selenium, silver, and zinc. Limited additional removals were also observed for aluminum and mercury.
The treatment efficiency of the entire treatment system was evaluated using the data obtained from
sampling points 01, 02, and 06 (see Figure 6-14). Influent concentration data was obtained using a flow-
weighted average for sample points 01 and 02. Effluent from the treatment system was represented by
sample point 06. As demonstrated in Table 6-2, the treatment system achieved good overall removal for
TSS (95.5 percent). COD was removed at 51.9 percent, whereas, no removal was observed for TDS.
Many of the metals observed in the influent were removed to levels exceeding 95 percent. These include
arsenic, cadmium, chromium, copper, iron, lead, mercury, silver, tin, titanium, and zinc. Other metals also
with high removals include aluminum (85.5 percent) and selenium (89.1 percent). Overall poor removal

6-39
efficiencies were observed for antimony (48.5 percent) and molybdenum (38.0 percent). No removals
were observed for the treatment system for boron, manganese, and strontium. Dichloroprop, a pesticide
parameter, was detected in the influent in low levels and was not detected in the effluent. MCPP did not
experience any removal through the treatment system.
6.4.1.2 Treatment Performance for Episode #4671
EPA performed a five-day sampling program, Episode #4671. This facility was evaluated by EPA
in order to obtain performance data on various treatment units which are in operation at this facility,
including a combination sulfide and hydroxide precipitation process, conventional hydroxide precipitation,
and ultrafiltration. A flow diagram of the CHWC wastewater treatment system sampled during Episode
# 4671 is presented in Figure 6-15. The wastewater treatment system used at this CHWC facility treats
wastewater from the air pollution control system. The air pollution control system consists of a quench
tank, packed tower, and a venturi scrubber. The wastewater treatment system is comprised of two
separate systems both of which were sampled by EPA. The primary system is part of the primary water
circulation loop that serves the incinerator. Treatment processes for the primary system consists of sulfide
precipitation using ferrous sulfate followed by hydroxide precipitation using sodium hydroxide and lime and
then followed by sedimentation. The facility treats the discharge from the primary loop in the secondary
system. Treatment in the secondary loop consists of hydroxide precipitation using sodium hydroxide
followed by sedimentation and ultrafiltration. Table 6-3 presents a summary of percent removal data
collected at Episode #4671 for the performance of the entire treatment system, both the primary and
secondary system, and for the primary system only.
The treatment efficiency of the primary treatment system was evaluated using the data obtained
from sampling points 01 and 02 (see Figure 6-15). Influent concentration data for the primary system was
obtained using sample point 01. Effluent from the primary treatment system was represented by sample
point 02. As demonstrated on Table 6-3, the primary treatment system removal rate for TSS was 70.6
percent. COD was removed at 12.3 percent, whereas, TDS was removed at 7.8 percent. Metals with

Sampling Location
Figure 6-15. EPA Sampling Episode 4671 - CHWC Wastewater Treatment System Block Flow Diagram with Sampling Locations
6-40
ChemicalAddition/
EqualizationNeutralization
FilterPress
Pre-FlocMix Tank
Clarifiers
PrecipitationUltrafiltration
UnitNeutralization
FerrousSulfate
Air PollutionControl
Wastewater
SodiumHydroxide
Lime
Sludge
To AirPollutionControlSystem
03
02
01
Filtrate
Dewatered Sludgeto Off-Site Landfill
SodiumHydroxide Sludge
SulfuricAcid
Polymer
To Equalizationand Disposal

Table 6-3. Treatment Technology Performance for Episode 4671
6-41
First-Stage Chemical Precipitation Second-Stage Chemical Precipitation Sample Points 1 to 2 Sample Points 2 to 3
CAS Influent Effluent % Influent Effluent %Pollutant of Concern # DL SP Conc. (ug/l) SP Conc. Removal DL SP Conc. SP Conc. Removal
(ug/l) (ug/l) (ug/l)ConventionalTSS C-009 4,000 01 241,100 02 70,900 70.6 4,000 02 70,900 03 13,800 80.5Non-ConventionalCOD C-004 5,000 01 259,400 02 227,600 12.3 5,000 02 227,600 03 154,800 32.0TDS C-010 01 7,481,000 02 6,896,000 7.8 02 6,896,000 03 6,560,000 4.9MetalsAluminum 7429905 200 01 1,575 02 266 83.1 6.5 02 266 03 ND 97.6Antimony 7440360 20.0 01 110 02 107 2.5 20.0 02 107 03 94.2 12.2Arsenic 7440382 10.0 01 19.2 02 19.9 0.0 10.0 02 19.9 03 25.6 0.0Boron 7440428 100 01 1,723 02 1,219 29.2 100 02 1,219 03 1,069 12.3Cadmium 7440439 5.0 01 4.2 02 2.4 43.1 5.0 02 2.4 03 0.4 83.6Chromium 7440473 10.0 01 124 02 3.2 97.4 10.0 02 3.2 03 1.0 67.7Copper 7440508 25.0 01 121 02 33.8 72.0 25.0 02 33.8 03 18.8 44.4Iron 7439896 100 01 1,217 02 79.8 93.4 100 02 79.8 03 50.1 37.1Lead 7439921 50.0 01 149 02 14.3 90.4 1.5 02 14.3 03 ND 89.5Manganese 7439965 15.0 01 107 02 74.3 30.5 15.0 02 74.3 03 2.3 96.9Mercury 7439976 0.2 01 0.7 02 0.4 33.8 0.2 02 0.4 03 ND 54.5Molybdenum 7439987 10.0 01 69.7 02 66.6 4.5 10.0 02 66.6 03 59.5 10.6Selenium 7782492 9.7 01 ND 02 14.0 0.0 11.5 02 14.0 03 ND 17.6Silver 7440224 10.0 01 5.7 02 9.1 0.0 10.0 02 9.1 03 2.0 77.7Strontium 7440246 100 01 1,382 02 1,582 0.0 100 02 1,582 03 1,315 16.8Tin 7440315 30.0 01 49.5 02 39.0 21.2 28.3 02 39.0 03 ND 27.4Titanium 7440326 10.0 01 206 02 ND 95.1 10.0 02 ND 03 ND 0.0Zinc 7440666 20.0 01 1,598 02 813 49.1 20.0 02 813 03 239 70.7Pesticides/HerbicidesDichloroprop 120365 1.0 01 ND 02 NS NS 1.0 02 NS 03 ND NSMCPP 7085190 50.0 01 ND 02 NS NS 50.0 02 NS 03 ND NS
Negative percent removal are recorded as 0.0NS: Not SampledND: Non-DetectDL: Specific detection limits of sample when there is a non-detect, otherwise it is the method detection limitSP: Sample Point

Table 6-3. Treatment Technology Performance for Episode 4671 (continued)
6-42
Entire Treatment SystemSample Points 1 to 3
CAS Influent Effluent %Pollutant of Interest # DL SP Conc. (ug/l) SP Conc. (ug/l) RemovalConventionalTSS C-009 4,000 01 241,100 03 13,800 94.3Non-ConventionalCOD C-004 5,000 01 259,400 03 154,800 40.3TDS C-010 01 7,481,000 03 6,560,000 12.3MetalsAluminum 7429905 6.5 01 1,575 03 ND 99.6Antimony 7440360 20.0 01 110 03 94.2 14.4Arsenic 7440382 10.0 01 19.2 03 25.6 0.0Boron 7440428 100 01 1,723 03 1,069 37.9Cadmium 7440439 5.0 01 4.2 03 0.4 90.7Chromium 7440473 10.0 01 124 03 1.0 99.2Copper 7440508 25.0 01 121 03 18.8 84.5Iron 7439896 100 01 1,217 03 50.1 95.9Lead 7439921 1.5 01 149 03 ND 99.0Manganese 7439965 15.0 01 107 03 2.3 97.8Mercury 7439976 0.2 01 0.7 03 ND 69.9Molybdenum 7439987 10.0 01 69.7 03 59.5 14.6Selenium 7782492 9.7 01 ND 03 ND 0.0
/11.5Silver 7440224 10.0 01 5.7 03 2.0 64.1Strontium 7440246 100 01 1,382 03 1,315 4.8Tin 7440315 28.3 01 49.5 03 ND 42.8Titanium 7440326 10.0 01 206 03 ND 95.1Zinc 7440666 20.0 01 1,598 03 239 85.1Pesticides/HerbicidesDichloroprop 120365 1.0 01 ND 03 ND 0.0MCPP 7085190 50.0 01 ND 03 ND 0.0
Negative percent removal are recorded as 0.0NS: Not SampledND: Non-DetectDL: Specific detection limits of sample when there is a non-detect, otherwise it is the method detection limitSP: Sample Point

6-43
high removal rates in the primary system include: aluminum (83.1 percent), chromium (97.4 percent),
copper (72.0 percent), iron (93.4 percent), lead (90.4 percent), and titanium (95.1 percent). The system
achieved limited removals for other metals through the primary system. These include boron, cadmium,
manganese, mercury, tin, and zinc.
Poor to no removals were observed for antimony, arsenic, molybdenum, silver, and strontium.
However, influent concentrations to the primary treatment system for some metals, such as arsenic,
cadmium, silver, and zinc, were low or not detected. Therefore, the influent concentrations for these
parameters are close to the treatability levels using chemical precipitation, making it difficult to achieve
additional removals for these pollutants. For example, cadmium was found in the influent and effluent of
the primary treatment system at concentrations of 4.2 ug/l and 2.4 ug/l, respectively. This resulted in a
percent removal of only 43.1 percent. Therefore, the low percent removal efficiency is a function of the
low influent concentration (near treatability levels) and not indicative of poor performance.
The treatment efficiency of the secondary treatment system was evaluated using the data obtained
from sampling points 02 and 03 (see Figure 6-15). Influent concentration data to the secondary system
was obtained using sample point 02, which is the effluent from the primary system. Effluent from the
secondary treatment system was represented by sample point 03. As demonstrated on Table 6-3, the
secondary treatment system removal rate for TSS was 80.5 percent. COD was removed at 32.0 percent,
whereas, TDS was removed at 4.9 percent. Metals with high removal rates or removed to non-detectable
levels in the secondary system include; aluminum, cadmium, chromium, lead, manganese, mercury, silver,
tin, and zinc. Limited additional removals were observed for copper and iron. Poor removals were
observed in the secondary system for antimony, boron, molybdenum, and strontium.
The treatment efficiency of the entire treatment system, both primary and secondary treatment
systems, were evaluated using the data obtained from sampling points 01 and 03 (see Figure 6-15).
Influent concentration data was obtained using sample point 01. Effluent from the entire treatment system
was represented by sample point 03. As demonstrated on Table 6-3, the treatment system achieved good
overall removals for TSS (94.3 percent). COD was removed at 40.3 percent, whereas, TDS was
removed at 12.3 percent. Selenium, dichloroprop, and MCPP were not detected in the influent or effluent.

6-44
Many of the metals observed in the influent were removed to levels exceeding 95 percent removal; these
include aluminum, chromium, iron, lead, manganese, and titanium. Other metals also with high removals
or removed to non-detectable levels include cadmium (90.7 percent), copper (84.5 percent), mercury
(69.9 percent), silver (64.1 percent), and tin (42.8 percent). Poor removal efficiencies were observed for
the entire treatment system for antimony (14.4 percent), boron (37.9 percent), molybdenum (14.6 percent),
and strontium (4.8 percent). Arsenic was observed at below treatable levels throughout the system.
6.4.1.3 Treatment Performance for Episode #4733
EPA performed a five-day sampling program, Episode #4733. This facility was evaluated by EPA
in order to obtain performance data on various treatment units which are in operation at this facility,
including sulfide precipitation, Lancy filtration, and carbon adsorption. A flow diagram of the CHWC
wastewater treatment system sampled during Episode # 4733 is presented in Figure 6-16. The wastewater
treatment system used at this CHWC facility treats wastewater from the air pollution control system. The
air pollution control system consists of a quench tank and a wet scrubber. Table 6-4 presents a summary
of percent removal data collected at Episode #4733 for the performance of the sulfide precipitation and
Lancy filtration process, carbon adsorption system, and the entire treatment system.
The treatment efficiency of the sulfide precipitation and Lancy filtration system was evaluated using
the data obtained from sampling points 01 and 02 (see Figure 6-16). Influent concentration data to the
primary system was obtained using sample point 01. Effluent from the first-stage treatment system was
represented by sample point 02. As demonstrated on Table 6-4, the first-stage treatment system had non-
detectable levels in the influent for TSS, aluminum, cadmium, lead, molybdenum, silver, strontium, and
MCPP. Other parameters were observed in the influent at levels near to or below treatable levels, such
as antimony, arsenic, and copper. COD was removed at 11.8 percent, whereas, no removal was observed
for TDS. Metals with high removal rates in the first-stage system include; chromium (84.4 percent), iron
(85.3 percent), manganese (86.3 percent), mercury (94.0 percent), and zinc (92.2 percent). Titanium was
removed to non-detectable levels in the first-stage system. The treatment system achieved limited removal

Normal Flow Pattern
Figure 6-16. EPA Sampling Episode 4733 - CHWC Wastewater Treatment System Block Flow Diagram with Sampling Locations
6-45
LancySorptionFilters
RetentionTank
SulfideAddition
Tank
1st StagepH Adjust
Tank
2nd StagepH Adjust
Tank
FlowEqualization
Tank
Pre-Filter
Pre-Filter
CarbonAbsorption
Unit
CarbonAbsorption
Unit
FinalpH Adjust
Tank
SludgeThickener
DiversionTank
DiversionTank
Filter Press
CoolingTower
to NPDESDischarge
Ion Exchange UnitsNOT
In Use During Sampling
SupernateReturn
Supernate
SludgeFilter CakeSolids Off-Site
Disposal
Sludge
FilteredWastewater
Combined RawWastewater
Water FromAir PollutionControlSystem
01
02
04
Sampling Location
Diversion/Optional Treatment PatternNOT In Operation During Sampling

Table 6-4. Treatment Technology Performance for Episode 4733
6-46
First-Stage Lancy Filter Carbon Adsorption System Sample Points 1 to 2 Sample Points 2 to 4
CAS Influent Effluent % Influent Effluent %Pollutant of Concern # DL SP Conc. (ug/l) SP Conc. (ug/l) Removal DL SP Conc. (ug/l) SP Conc. (ug/l) RemovalConventionalTSS C-009 4,000 01 ND 02 ND 0.0 4,000 02 ND 04 ND 0.0Non-ConventionalCOD C-004 5,000 01 234,100 02 206,600 11.8 5,000 02 206,600 04 192,300 6.9TDS C-010 01 272,400 02 2,206,000 0.0 02 2,206,000 04 2,899,000 0.0MetalsAluminum 7429905 13.6 01 ND 02 ND 0.0 13.6 02 ND 04 ND 0.0Antimony 7440360 20.0 01 22.8 02 24.6 0.0 20.0 02 24.6 04 26.4 0.0Arsenic 7440382 10.0 01 5.3 02 4.9 8.3 10.0 02 4.9 04 4.1 15.4Boron 7440428 100 01 1,811 02 1,846 0.0 100 02 1,846 04 2,381 0.0Cadmium 7440439 3.5 01 ND 02 ND 0.0 3.5 02 ND 04 ND 0.0Chromium 7440473 5.8 01 37.1 02 ND 84.4 5.8 02 ND 04 ND 0.0Copper 7440508 25.0 01 10.9 02 9.5 12.5 25.0 02 9.5 04 7.4 22.1Iron 7439896 100 01 430 02 63.4 85.3 2.4 02 63.4 04 ND 96.2Lead 7439921 2.1 01 ND 02 ND 0.0 2.1 02 ND 04 ND 0.0
/1.8Manganese 7439965 1.2 01 8.8 02 ND 86.3 1.2 02 ND 04 1.3 0.0Mercury 7439976 0.2 01 3.3 02 ND 94.0 0.2 02 ND 04 0.4 0.0Molybdenum 7439987 4.6 01 ND 02 ND 0.0 4.6 02 ND 04 7.1 0.0Selenium 7782492 5.0 01 59.1 02 43.9 25.6 5.0 02 43.9 04 56.5 0.0Silver 7440224 7.8 01 ND 02 8.1 0.0 7.8 02 8.1 04 8.1 0.0Strontium 7440246 100 01 ND 02 ND 0.0 100 02 ND 04 ND 0.0
/86.7Tin 7440315 30.0 01 65.9 02 145 0.0 30.0 02 145 04 48.6 66.4Titanium 7440326 5.0 01 11.4 02 ND 56.3 5.0 02 ND 04 ND 0.0Zinc 7440666 20.0 01 102 02 7.9 92.2 2.4 02 7.9 04 ND 69.8Pesticides/HerbicidesDichloroprop 120365 1.0 01 18.9 02 NS NS 1.0 02 NS 04 ND NSMCPP 7085190 50.0 01 ND 02 NS NS 50.0 02 NS 04 ND NS
Negative percent removal are recorded as 0.0NS: Not SampledND: Non-DetectDL: Specific detection limits of sample when there is a non-detect, otherwise it is the method detection limitSP: Sample Point

Table 6-4. Treatment Technology Performance for Episode 4733 (continued)
6-47
Entire Treatment SystemSample Points 1 to 4
CAS Influent Effluent %Pollutant of Concern # DL SP Conc. (ug/l) SP Conc. (ug/l) RemovalConventionalTSS C-009 4,000 01 ND 04 ND 0.0Non-ConventionalCOD C-004 5,000 01 234,100 04 192,300 17.9TDS C-010 01 272,400 04 2,899,000 0.0MetalsAluminum 7429905 13.6 01 ND 04 ND 0.0Antimony 7440360 20.0 01 22.8 04 26.4 0.0Arsenic 7440382 10.0 01 5.3 04 4.1 22.5Boron 7440428 100 01 1,811 04 2,381 0.0Cadmium 7440439 3.5 01 ND 04 ND 0.0Chromium 7440473 5.8 01 37.1 04 ND 84.4Copper 7440508 25.0 01 10.9 04 7.4 31.8Iron 7439896 2.4 01 430 04 ND 99.4Lead 7439921 2.1 01 ND 04 ND 0.0
/1.8Manganese 7439965 15.0 01 8.8 04 1.3 85.2Mercury 7439976 0.2 01 3.3 04 0.4 88.6Molybdenum 7439987 4.6 01 ND 04 7.1 0.0Selenium 7782492 5.0 01 59.1 04 56.5 4.4Silver 7440224 7.8 01 ND 04 8.1 0.0Strontium 7440246 100 01 ND 04 ND 0.0
/86.7Tin 7440315 30.0 01 65.9 04 48.6 26.2Titanium 7440326 5.0 01 11.4 04 ND 56.3Zinc 7440666 2.4 01 102 04 ND 97.7Pesticides/HerbicidesDichloroprop 120365 1.0 01 18.9 04 ND 94.7MCPP 7085190 5.0 01 ND 04 ND 0.0
Negative percent removal are recorded as 0.0NS: Not SampledND: Non-DetectDL: Specific detection limits of sample when there is a non-detect, otherwise it is the method detection limitSP: Sample Point

6-48
of selenium through the first-stage primary system (25.6 percent). Poor to no removals were observed for
boron and tin.
The treatment efficiency of the carbon adsorption system was evaluated using the data obtained
from sampling points 02 and 04 (see Figure 6-16). Influent concentration data to the carbon adsorption
system was obtained using sample point 02, which is also the effluent from the first-stage treatment system.
Effluent from the carbon adsorption system was represented by sample point 04 which is also the effluent
point for the entire treatment system. As demonstrated on Table 6-4, the carbon adsorption system had
non-detectable levels in the influent for the same parameters as in the first-stage system, plus the metals
were removed to non-detectable levels in the first-stage system, such as chromium, manganese, mercury,
and titanium. Additional removals were observed for iron (96.2 percent), tin (66.4 percent), and zinc (69.8
percent). No removals in the carbon adsorption system were observed for boron and selenium. As in the
first-stage system, antimony, arsenic, and copper are at concentrations in the influent below treatable levels.
The treatment efficiency of the entire treatment system, including the first-stage sulfide precipitation,
Lancy filtration, and carbon adsorption, were evaluated using the data obtained from sampling points 01
and 04 (see Figure 6-16). Influent concentration data was obtained using sample point 01. Effluent from
the entire treatment system was represented by sample point 04. As demonstrated on Table 6-4, the
treatment system achieved a COD removal of 17.9 percent, whereas, there is no removal for TDS. For
the overall treatment system, the metals with high removal rates include chromium, iron, manganese,
mercury, titanium, and zinc. Poor removals were observed for selenium and tin. Other metals were only
detected at concentrations at or near treatable levels. Dichlorprop was removed to non-detectable levels
at 94.7 percent. MCPP was not detected in the influent or effluent from the treatment system.
6.4.2 Rationale Used for Selection of BAT Treatment Technologies
This section presents the rationale used in selecting the treatment technologies used in the regulatory
option. Treatment technologies used at Episode # 4733 were not considered for further evaluation, since
influent concentrations for many parameters were low and performance data for the treatment systems
could not adequately be ascertained. Therefore, the technologies utilized at Episodes # 4646 and # 4671

6-49
were further evaluated in order to select the most appropriate technologies to be used as the basis for the
BAT options. The basis of this evaluation consists of a comparative analysis of the performance data for
the BAT treatment technologies based upon EPA sampling data.
Table 6-5 presents a summary of the percent removal data collected at EPA sampling Episodes
# 4646 and # 4671 for the primary chemical precipitation systems. As demonstrated on this table, both
chemical precipitation systems achieved similar removals for many of the same metal parameters. Although
the loadings for some metal parameters were lower for Episode # 4671 which resulted in lower percent
removals, the overall concentrations for some of the pollutants were treated to similar concentration levels
as those for Episode # 4646. For instance, the percent removal for manganese at Episode # 4671 was
only 33.8 percent, however the effluent concentration of 74.3 ug/l was comparable to that at Episode #
4646 of 76.6 ug/l during which a 66.5 percent removal was achieved. Metals which experienced good
overall removals in both chemical precipitation treatment systems include aluminum, cadmium, chromium,
copper, iron, lead, manganese, mercury, tin, titanium, and zinc. Neither system was effective in treating
antimony, arsenic, boron, selenium, silver, and strontium. Episode # 4646 had higher removals for TSS
(90.9 percent) and COD (70.9 percent).
Next, an evaluation of the secondary precipitation process plus filtration for both facilities was
performed. Table 6-6 presents a summary of the percent removal data collected at EPA for sampling
Episodes # 4646 and # 4671 for the secondary precipitation process and sand filter or ultrafiltration
process, respectively. As demonstrated on this table, either process resulted in low effluent concentrations
for many of the metal parameters such as cadmium, chromium, copper, iron, lead, mercury, and zinc.
However, the most significant difference between the two systems is the removal of antimony (66.3
percent), arsenic (98.4 percent), and selenium (90.1 percent) in the secondary system for Episode # 4646.
Episode # 4671, which employs a secondary treatment system consisting of hydroxide precipitation and
ultrafiltration, did not achieve significant removals for antimony, arsenic, or selenium.
Overall both facilities achieved similar removals and/or treated to the same degree for many of the
metal parameters which are readily removed by chemical precipitation using sodium hydroxide, including
but not limited to cadmium, chromium, copper, iron, lead, mercury, and zinc. Both facilities utilized a two

Table 6-5. Primary Chemical Precipitation Treatment Technology Performance Comparison
6-50
Episode #4646 First-Stage Chemical Precipitation Episode #4671 First-Stage Chemical PrecipitationSample Points 1+2 to 4 Sample Points 1 to 2
CAS Influent Effluent % Influent Effluent %Pollutant of Concern # DL SP Conc. (ug/l) SP Conc. (ug/l) Removal DL SP Conc. (ug/l) SP Conc. (ug/l) RemovalConventionalTSS C-009 4,000 01+02 122,560 04 11,200 90.9 4,000 01 241,100 02 70,900 70.6Non-ConventionalCOD C-004 5,000 01+02 535,920 04 156,200 70.9 5,000 01 259,400 02 227,600 12.3TDS C-010 01+02 30,694,160 04 50,320,000 0.0 01 7,481,000 02 6,896,000 7.8MetalsAluminum 7429905 200 01+02 1,104 04 170 84.6 200 01 1,575 02 266 83.1Antimony 7440360 20.0 01+02 672 04 1,026 0.0 20.0 01 110 02 107 2.5Arsenic 7440382 10.0 01+02 475 04 494 0.0 10.0 01 19.2 02 19.9 0.0Boron 7440428 100 01+02 1,280 04 1,744 0.0 100 01 1,723 02 1,219 29.2Cadmium 7440439 5.0 01+02 929 04 174 81.2 5.0 01 4.2 02 2.4 43.1Chromium 7440473 10.0 01+02 220 04 53.4 75.8 10.0 01 124 02 3.2 97.4Copper 7440508 25.0 01+02 5,228 04 321 93.9 25.0 01 121 02 33.8 72.0Iron 7439896 100 01+02 7,066 04 254 96.4 100 01 1,217 02 79.8 93.4Lead 7439921 50.0 01+02 4,691 04 117 97.5 50.0 01 149 02 14.3 90.4Manganese 7439965 15.0 01+02 228 04 76.6 66.5 15.0 01 107 02 74.3 30.5Mercury 7439976 0.2 01+02 59.2 04 21.4 63.9 0.2 01 0.7 02 0.4 33.8Molybdenum 7439987 10.0 01+02 936 04 1,137 0.0 10.0 01 69.7 02 66.6 4.5Selenium 7782492 5.0 01+02 240 04 263 0.0 9.7 01 ND 02 14.0 0.0Silver 7440224 10.0 01+02 283 04 169 40.3 10.0 01 5.7 02 9.1 0.0Strontium 7440246 100 01+02 408 04 328 19.7 100 01 1,382 02 1,582 0.0Tin 7440315 30.0 01+02 1,882 04 45.9 97.6 30.0 01 49.5 02 39.0 21.2Titanium 7440326 5.0 01+02 2,116 04 32.9 98.4 10.0 01 206 02 ND 95.1Zinc 7440666 20.0 01+02 9,456 04 209 97.8 20.0 01 1,598 02 813 49.1Pesticides/HerbicidesDichloroprop 120365 1.0 01+02 3.1 04 NS NS 1.0 01 ND 02 NS NSMCPP 7085190 50.0 01+02 1,027 04 NS NS 50.0 01 ND 02 NS NS
Negative percent removal are recorded as 0.0NS: Not SampledND: Non-DetectDL: Specific detection limits of sample when there is a non-detect, otherwise it is the method detection limitSP: Sample Point

Table 6-6. Secondary Chemical Precipitation and Filtration Treatment Technology Performance Comparison
6-51
Episode #4646 Second-Stage Chemical Precipitation & Episode #4671 Second-Stage Chemical Precipitation &Sand Filtration Ultrafiltration
Sample Points 4 to 6 Sample Points 2 to 3CAS Influent Effluent % Influent Effluent %
Pollutant of Concern # DL SP Conc. (ug/l) SP Conc. (ug/l) Removal DL SP Conc. (ug/l) SP Conc. (ug/l) RemovalConventionalTSS C-009 4,000 04 11,200 05 5,500 50.9 4,000 02 70,900 03 13,800 80.5Non-ConventionalCOD C-004 5,000 04 156,200 05 257,900 0.0 5,000 02 227,600 03 154,800 32.0TDS C-010 04 50,320,000 05 38,150,000 24.2 02 6,896,000 03 6,560,000 4.9MetalsAluminum 7429905 200 04 170 05 160 5.9 6.5 02 266 03 ND 97.6Antimony 7440360 20.0 04 1,026 05 346 66.3 20.0 02 107 03 94.2 12.2Arsenic 7440382 10.0 04 494 05 8.1 98.4 10.0 02 19.9 03 25.6 0.0Boron 7440428 100 04 1,744 05 1,731 0.7 100 02 1,219 03 1,069 12.3Cadmium 7440439 5.0 04 174 05 19.9 88.6 5.0 02 2.4 03 0.4 83.6Chromium 7440473 10.0 04 53.4 05 ND 81.3 10.0 02 3.2 03 1.0 67.7Copper 7440508 25.0 04 321 05 10.1 96.9 25.0 02 33.8 03 18.8 44.4Iron 7439896 100 04 254 05 128 49.6 100 02 79.8 03 50.1 37.1Lead 7439921 50.0 04 117 05 ND 57.3 1.5 02 14.3 03 ND 89.5Manganese 7439965 15.0 04 76.6 05 545 0.0 15.0 02 74.3 03 2.3 96.9Mercury 7439976 0.2 04 21.4 05 ND 99.1 0.2 02 0.4 03 ND 54.5Molybdenum 7439987 10.0 04 1,137 05 580 49.0 10.0 02 66.6 03 59.5 10.6Selenium 7782492 5.0 04 263 05 26.0 90.1 11.5 02 14.0 03 ND 17.6Silver 7440224 10.0 04 169 05 ND 94.1 10.0 02 9.1 03 2.0 77.7Strontium 7440246 100 04 328 05 674 0.0 100 02 1,582 03 1,315 16.8Tin 7440315 30.0 04 45.9 05 31.5 31.4 28.3 02 39.0 03 ND 27.4Titanium 7440326 5.0 04 32.9 05 6.8 79.3 10.0 02 ND 03 ND 0.0Zinc 7440666 20.0 04 209 05 24.2 88.4 20.0 02 813 03 239 70.7Pesticides/HerbicidesDichloroprop 120365 1.0 04 NS 05 ND NS 1.0 02 NS 03 ND NSMCPP 7085190 50.0 04 NS 05 1,482 NS 50.0 02 NS 03 ND NS
Negative percent removal are recorded as 0.0NS: Not SampledND: Non-DetectDL: Specific detection limits of sample when there is a non-detect, otherwise it is the method detection limitSP: Sample Point

6-52
tiered approach in the design of their treatment system using some type of a chemical precipitation process
to provide treatment. Primary treatment system designs are comparable at both facilities and are designed
to remove similar pollutants. Both primary treatment systems are designed to remove those metals which
readily precipitate out of solution at a high pH range using a sodium hydroxide precipitation treatment
process. Based upon EPA sampling data, this treatment process was determined not to be very effective
in treating antimony, arsenic, boron, selenium, silver, and strontium. The treatment system at Episode #
4671 uses a secondary treatment system targeted to achieve additional removals for the same parameters
which receive initial removals in the primary system. Chemical precipitation by hydroxide precipitation is
once again utilized with ultrafiltration as a polishing step in the secondary system. The design of this
treatment system is primarily due to the characteristics of the wastewater at this facility, as well as a function
of the discharge limitations in their NPDES permit. During the sampling episode, the facility for Episode
# 4671 was permitted for antimony (2,000 ug/l daily maximum) and for arsenic (100 ug/l daily maximum).
However, neither of these two parameters were observed in the influent at levels above their respective
discharge limitation in EPA’s sampling episode. Therefore, the design and operation of the treatment
system at Episode # 4671 is not driven by the removals of parameters such as antimony or arsenic, but
rather by other metals which are removed by hydroxide precipitation such as aluminum. Conversely, the
facility for Episode # 4646 is designed to remove those metals in the secondary treatment process which
are not readily removed by hydroxide precipitation. At the time of the sampling episode, this facility’s
NPDES permit contained discharge limitations for antimony (600 ug/l daily maximum), arsenic (100 ug/l
daily maximum), selenium (100 ug/l daily maximum), and silver (100 ug/l daily maximum). Each of these
parameters were observed in the influent to the treatment system at concentrations above their respective
discharge limitation. Therefore, the wastewater treatment system used at Episode # 4646 is designed and
operated with a secondary treatment system consisting of chemical precipitation at a low pH range
facilitated by ferric chloride and multimedia filtration aimed at removing these additional metal parameters
which are not removed by hydroxide precipitation in the primary treatment system.
Based upon the results of the above comparative analysis of chemical precipitation and filtration
processes used at CHWC facilities sampled by EPA, the regulatory option utilizes unit treatment processes

6-53
such as those found at Episode # 4646. Performance data from this facility indicates that a primary
chemical precipitation system utilizing a sodium hydroxide precipitation process can readily achieve high
removals for many metal parameters. A secondary system consisting of chemical precipitation using ferric
chloride and sand filtration can effectively remove additional metals not readily removed by hydroxide
precipitation, such as antimony, arsenic, and selenium, as well as achieve high additional removals for other
metals which are removed by hydroxide precipitation. Therefore, the combining of these treatment
processes results in a highly effective treatment operation which can readily accommodate the pollutants
of concern for the CHWC industry.
6.4.3 Performance at Facilities Added Post-Proposal
Following proposal of the CHWC rule, the Agency decided to revise its effluent limitations by
including the data gathered by industry at two new CHWC facilities. Both facilities conducted sampling
events using analytical methods agreed upon by EPA at its five-day sampling episodes, and analyzed
influent and effluent samples for regulated pollutants. Both facilities employed a two-stage chemical
precipitation treatment system. Examples of treatment technologies found include hydroxide precipitation
and ferric chloride precipitation, as illustrated in Table 6-7. Summaries of the treatment system
performance data collected are presented below. Performance data for Episodes # 6181 and # 6183 were
evaluated to determine if the effluent data could be included in the calculation of effluent limitations for the
CHWC industry (See Section 8 for limitations). Flow diagrams of the CHWC wastewater treatment
systems found at Episodes # 6181 and # 6183 are presented in Figure 6-17 and Figure 6-18, respectively.
6.4.3.1 Treatment Performance for Episode #6181
The wastewater treatment system used at this CHWC facility treats water from the air pollution
control system. The wastewater treatment system is comprised of two separate systems: a primary system
that is part of the primary water circulation loop that serves the incinerator and consists of lime/hydroxide

Table 6-7. Description of CHWC Sampling Episodes
6-54
EpisodeInfluent Effluent Description
Sample Point Sample Point
6181 1 2 chemical precipitation, second-stage precipitation,Overall treatment system- equalization, first-stage
neutralization
6183 1 2 chemical precipitation, pressure filtration, second-Overall treatment system- equalization, first-stage
stage precipitation, sand filtration, bag filtration

Sampling Location
Figure 6-17. EPA Sampling Episode 6181 - CHWC Wastewater Treatment System Block Flow Diagram with Sampling Locations
6-55
Equalization
Neutralization
ClarificationNeutral-ization
Precipitation
NeutralizationHolding
Tank
Air PollutionControl
Wastewater
02
01
Polymer
Blowdown
Outfall
Neutral-ization
NaOHLime Slurry
Solids
CoolingTowers
Recycle
NaOH
Acid(if needed)
Clarification
Solids

Sampling Location
Figure 6-18. EPA Sampling Episode 6183 - CHWC Wastewater Treatment System Block Flow Diagram with Sampling Locations
6-56
Equalization ClarificationHeatExchanger
SandFilter
Clarifier
Air PollutionControl
Wastewater
02
01
Caustic
Tank
FilterPress
Tank
Caustic FeCl3
Polymer
Water
FeCl3 Polymer
HoldingTank
BagFilters
FilterPress
Solids
Solids
Outfall

6-57
precipitation treatment followed by sedimentation, and a secondary system that treats the blowdown from
the primary system and is comprised of precipitation using ferric chloride followed by sedimentation. Table
6-8 presents a summary of percent removal data at Episode # 6181, measuring the treatment performance
of the entire system, both the primary and secondary systems.
The treatment efficiency of the entire treatment system, both primary and secondary treatment
systems, was evaluated using the data obtained from sampling points 01 and 02 (see Figure 6-17). Influent
concentration data was obtained using sample point 01. Effluent from the entire treatment system was
represented by sample point 02. As demonstrated on Table 6-8, the treatment system achieved good
overall removals for TSS (94 percent). Many of the metals observed in the influent were removed to levels
exceeding 95 percent, these include aluminum, copper, iron, lead, titanium, and zinc. Other metals also
with high removals include cadmium (94.4 percent), mercury (93.4 percent), silver (63 percent), arsenic
(60 percent), chromium (56.4 percent), and tin (52.3 percent). Poor removal efficiencies were observed
for antimony, molybdenum, and selenium.
6.4.3.2 Treatment Performance for Episode #6183
The wastewater treatment system used at this CHWC facility treats water from the air pollution
control system. The wastewater treatment system is comprised of a two-stage hydroxide and ferric
chloride precipitation treatment followed by sedimentation and sand filtration. Table 6-9 presents a
summary of percent removal data at Episode # 6183, measuring the treatment performance of the entire
system, both the primary and secondary systems.
The treatment efficiency of the entire treatment system, both primary and secondary treatment
systems, was evaluated using the data obtained from sampling points 01 and 02 (see Figure 6-18). Influent
concentration data was obtained using sample point 01. Effluent from the entire treatment system was
represented by sample point 02. As demonstrated on Table 6-9, the treatment system achieved fairly
good overall removals for TSS (84 percent). Many of the metals observed in the influent were removed
to levels at or exceeding 95 percent, these include aluminum, arsenic, cadmium, chromium, copper, iron,

Table 6-8. Treatment Technology Performance for Episode 6181
6-58
Entire Treatment SystemSample Points 1 to 2
CAS Influent Effluent %Pollutant of Concern # unit DL SP Conc. SP Conc. RemovalConventionalTSS C-009 mg/l 4 01 78.8 02 4.77 93.95MetalsAluminum 7429905 ug/l 100 01 5,810 02 100 98.28Antimony 7440360 ug/l 60 01 919 02 1,020 0.0Arsenic 7440382 ug/l 10 01 129 02 51.6 60.00Boron 7440428 ug/l 01 02Cadmium 7440439 ug/l 5 01 99.6 02 5.54 94.44Chromium 7440473 ug/l 10 01 27.5 02 12 56.36Copper 7440508 ug/l 10 01 522 02 12.9 97.53Iron 7439896 ug/l 20 01 2,050 02 25.1 98.78Lead 7439921 ug/l 10 01 1,160 02 10.6 99.09Manganese 7439965 ug/l 01 02Mercury 7439976 ug/l 0.2 01 3.04 02 0.2 93.42Molybdenum 7439987 ug/l 50 01 399 02 488 0.0Selenium 7782492 ug/l 10 01 70.3 02 86.6 0.0Silver 7440224 ug/l 5 01 16.2 02 6 62.96Strontium 7440246 ug/l 01 02 Tin 7440315 ug/l 50 01 135 02 64.4 52.30Titanium 7440326 ug/l 10 01 204 02 10 95.10Zinc 7440666 ug/l 20 01 2,120 02 24.3 98.85Pesticides/HerbicidesDichloroprop 120365 ug/l 01 02 MCPP 7085190 ug/l 01 02
Negative percent removal are recorded as 0.0NS: Not SampledND: Non-DetectDL: Specific detection limits of sample when there is a non-detect, otherwise it is the method detection limitSP: Sample Point
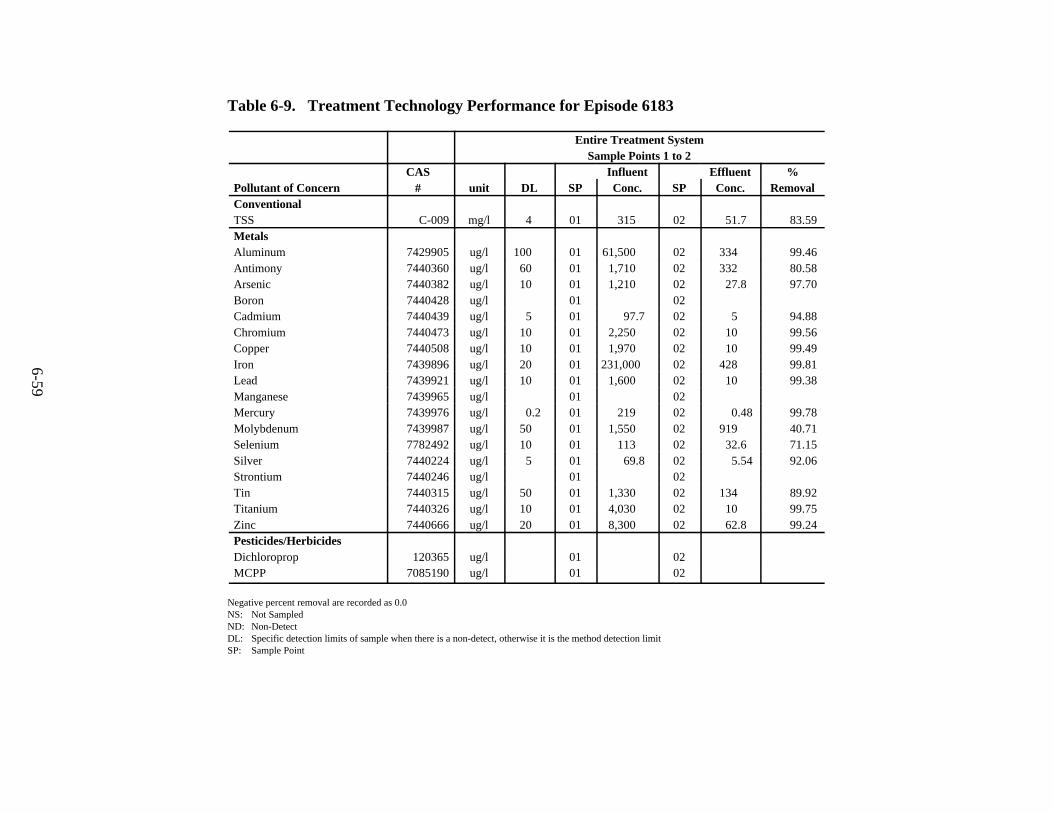
Table 6-9. Treatment Technology Performance for Episode 6183
6-59
Entire Treatment SystemSample Points 1 to 2
CAS Influent Effluent %Pollutant of Concern # unit DL SP Conc. SP Conc. RemovalConventionalTSS C-009 mg/l 4 01 315 02 51.7 83.59MetalsAluminum 7429905 ug/l 100 01 61,500 02 334 99.46Antimony 7440360 ug/l 60 01 1,710 02 332 80.58Arsenic 7440382 ug/l 10 01 1,210 02 27.8 97.70Boron 7440428 ug/l 01 02Cadmium 7440439 ug/l 5 01 97.7 02 5 94.88Chromium 7440473 ug/l 10 01 2,250 02 10 99.56Copper 7440508 ug/l 10 01 1,970 02 10 99.49Iron 7439896 ug/l 20 01 231,000 02 428 99.81Lead 7439921 ug/l 10 01 1,600 02 10 99.38Manganese 7439965 ug/l 01 02Mercury 7439976 ug/l 0.2 01 219 02 0.48 99.78Molybdenum 7439987 ug/l 50 01 1,550 02 919 40.71Selenium 7782492 ug/l 10 01 113 02 32.6 71.15Silver 7440224 ug/l 5 01 69.8 02 5.54 92.06Strontium 7440246 ug/l 01 02 Tin 7440315 ug/l 50 01 1,330 02 134 89.92Titanium 7440326 ug/l 10 01 4,030 02 10 99.75Zinc 7440666 ug/l 20 01 8,300 02 62.8 99.24Pesticides/HerbicidesDichloroprop 120365 ug/l 01 02MCPP 7085190 ug/l 01 02
Negative percent removal are recorded as 0.0NS: Not SampledND: Non-DetectDL: Specific detection limits of sample when there is a non-detect, otherwise it is the method detection limitSP: Sample Point

6-60
lead, mercury, titanium, and zinc. All other metals analyzed had high removals: tin (89.9 percent), antimony
(80.6 percent), selenium (71.2 percent), and molybdenum (40.7 percent).
6.4.3.3 Performance Comparison with Proposed BAT Facility
In order to decide whether it should include the effluent data from Episodes # 6181 and # 6183
in its calculation of the limitations and standards, the Agency compared the treatment performance at these
two facilities with the treatment performance at Episode # 4646, whose performance was the basis for the
proposed BAT limitations, to determine if the data generated at the two facilities was of acceptable quality
for limitation calculations (see Section 8).
Table 6-10 presents a summary of the percent removal data collected at Episodes # 6181, # 6183,
and # 4646 for their entire treatment systems. As the table demonstrates, all three systems achieved
similarly high removals for many of the same metal parameters, especially those metals readily removed
using hydroxide. All three facilities utilize a two-tiered approach in the design of their treatment systems
using some type of two-stage precipitation process to achieve the high levels of removal. Each facility
demonstrates high removals (above 90 percent) for pollutants that appear in high concentrations in the raw
wastewater (often several mg/l).
EPA decided that it should include the effluent data from Episodes # 6181 and # 6183 into its
limitations calculations because both new facilities: 1) employ a two-stage chemical precipitation
wastewater treatment process similar to the proposed BAT facility, and 2) achieve comparable percent
removals of relatively high concentrated raw wastewater to those achieved at the proposed BAT facility.

Table 6-10. Treatment Technology Performance Comparison
6-61
Entire Treatment System Entire Treatment System Entire Treatment System Episode #6181 Episode #6183 Episode #4646
Sample Points 1 to 2 Sample Points 1 to 2 Sample Points 1+2 to 6Pollutant of CAS Inf Eff % Inf Eff % Inf Eff %Concern # unit DL SP Conc. SP Conc. Rem SP Conc. SP Conc. Rem SP Conc. SP Conc. RemConventionalTSS C-009 mg/l 4 01 78.8 02 4.77 93.95 01 315 02 51.7 83.59 01+02 122.56 06 5.5 95.5MetalsAluminum 7429905 ug/l 100 01 5,810 02 100 98.28 01 61,500 02 334 99.46 01+02 1,104 06 160 85.5Antimony 7440360 ug/l 60 01 919 02 1,020 0.0 01 1,710 02 332 80.58 01+02 672 06 346 48.5Arsenic 7440382 ug/l 10 01 129 02 51.6 60.00 01 1,210 02 27.8 97.70 01+02 475 06 8.1 98.3Cadmium 7440439 ug/l 5 01 99.6 02 5.54 94.44 01 97.7 02 5 94.88 01+02 929 06 19.9 97.9Chromium 7440473 ug/l 10 01 27.5 02 12 56.36 01 2,250 02 10 99.56 01+02 220 06 ND 95.5Copper 7440508 ug/l 10 01 522 02 12.9 97.53 01 1,970 02 10 99.49 01+02 5,228 06 10.1 99.8Iron 7439896 ug/l 20 01 2,050 02 25.1 98.78 01 231,000 02 428 99.81 01+02 7,066 06 128 98.2Lead 7439921 ug/l 10 01 1,160 02 10.6 99.09 01 1,600 02 10 99.38 01+02 4,691 06 ND 99.0Mercury 7439976 ug/l 0.2 01 3.04 02 0.2 93.42 01 219 02 0.48 99.78 01+02 59.2 06 ND 96.6Molybdenum 7439987 ug/l 50 01 399 02 488 0.0 01 1,550 02 919 40.71 01+02 936 06 580 38.0Selenium 7782492 ug/l 10 01 70.3 02 86.6 0.0 01 113 02 32.6 71.15 01+02 240 06 26.0 89.1Silver 7440224 ug/l 5 01 16.2 02 6 62.96 01 69.8 02 5.54 92.06 01+02 283 06 ND 98.2Tin 7440315 ug/l 50 01 135 02 64.4 52.30 01 1,330 02 134 89.92 01+02 1,882 06 31.5 98.3Titanium 7440326 ug/l 10 01 204 02 10 95.10 01 4,030 02 10 99.75 01+02 2,116 06 6.8 99.7Zinc 7440666 ug/l 20 01 2,120 02 24.3 98.85 01 8,300 02 62.8 99.24 01+02 9,456 06 24.2 99.7
Negative percent removal are recorded as 0.0NS: Not SampledND: Non-DetectDL: Specific detection limits of sample when there is a non-detect, otherwise it is the method detection limitSP: Sample Point

7-1
SECTION 7
ENGINEERING COSTS
This section of the Commercial Hazardous Waste Combustor (CHWC) Industry Development
Document presents the following information: sources of cost data along with a benchmark analysis of
models; engineering costing methodology and description of each type of additional cost to comply with
options; individual treatment technology costs; and individual compliance costs for each facility in the
database for each option.
This chapter contains the following sections:
C Section 7.1 presents a discussion of the various costing options that were evaluated. The
criteria used to evaluate these costing options are presented, as well as a benchmark
analysis to compare the accuracy of each of these options. The selected costing option is
also presented in this section.
C Section 7.2 presents a discussion of the costing methodology used to develop regulatory
costs. This section discusses the methodology used to cost treatment systems and
components, as well as to develop regulatory option costs.
C Section 7.3 presents the costing method used to cost individual treatment technologies
which comprise the regulatory options. Cost curves and equations developed for each
treatment technology are presented in this section.
C Section 7.4 presents the approach to developing additional regulatory costs associated
with the implementation of the CHWC regulation. Additional costs which were developed
include retrofit, monitoring, RCRA permit modification, and land costs.
C Section 7.5 presents the wastewater off-site disposal costs used for facilities with very low
flow rates of CHWC wastewater.

7-2
C Section 7.6 presents summary tables of the total compliance costs, by facility, for each of
the CHWC Industry regulatory options, including BPT/BCT/BAT and PSES. Also
presented in this section are the compliance costs for NSPS and PSNS.
7.1 COSTS DEVELOPMENT
This section presents a discussion of the various costing options which were evaluated in order to
calculate compliance costs for the CHWC Industry. A discussion of the selection criteria used to evaluate
these costing options are presented in this section, as well as a benchmark analysis to compare the
accuracy of each of these options. The selected costing option is then presented.
7.1.1 Sources of Cost Data
The following sections present the various costing sources considered in developing regulatory costs
for the CHWC Industry, including computer models, vendor quotes, the 1992 Waste Treatment Industry
Phase II: Incinerators 308 Questionnaire, and other effluent guidelines.
7.1.1.1 Cost Models
Cost estimates of wastewater treatment systems are required to be developed in order to evaluate
the economic impact of the regulation. Mathematical cost models were used to assist in developing
estimated costs. In a mathematical cost model, various design and vendor data are combined to develop
cost equations which describe costs as a function of system parameters, such as flow. Using such models
readily allows for iterative costing to be performed to assist in option selection.
For developing costs for the CHWC Industry regulation, two commonly used cost models were
evaluated:

7-3
C Computer-Assisted Procedure for the Design and Evaluation of Wastewater Treatment
Systems (CAPDET), developed by the U.S. Army Corps of Engineers.
C W/W Costs Program (WWC), Version 2.0, developed by CWC Engineering Software.
CAPDET is intended to provide planning level cost estimates to analyze alternate design
technologies for wastewater treatment systems. It was developed to estimate treatment system costs
primarily for high flow, municipal wastewater applications. Modules are used which represent physical,
chemical, and biological treatment unit processes. Equations in each of these modules are based upon
engineering principles historically used for wastewater treatment plant design. Modules can be linked
together to represent entire treatment trains. CAPDET designs and costs various treatment trains and ranks
them with respect to present worth, capital, operating, or energy costs.
WWC is a cost model developed by Culp/Wesner/Culp from a variety of engineering sources,
including vendor supplied data, reported plant construction data, unit takeoffs from empirical and
conceptual designs, and published data. The program allows for the costing of various unit processes. As
with CAPDET, this program allows for these unit processes to be strung together to develop cost for
treatment trains. WWC does not perform the design of the unit process, but rather prompts the user to
provide design input parameters which form the basis for the costing. The WWC program is provided with
a separate spreadsheet program entitled Design Criteria Guidelines to assist in developing the input
parameters to the costing program. The Design Criteria Guidelines is a spreadsheet of treatment
component design equations which is supplied using default parameters to assist in designing particular
treatment units. Default parameters are based upon commonly accepted design criteria used in wastewater
treatment. Flexibility is provided with this spreadsheet, in that particular design parameters can be modified
to best satisfy given situations. Once design inputs are entered into the program, the WWC costing
program yields both construction and operation and maintenance (O&M) costs for the system.

7-4
7.1.1.2 Vendor Data
For certain treatment processes, the cost models do not yield acceptable and valid treatment costs.
In these instances, it was more reliable to obtain equipment and maintenance costs directly from treatment
system or component manufacturers. Information on the wastewater characteristics was provided to the
vendor in order to determine accurately the appropriate treatment unit and sizing. Vendor quotes were
used to determine cost curves for sand filtration and for sludge dewatering using plate and frame
technology. The cost curves used are based on the vendor quotes and information obtained as part of the
Centralize Waste Treatment (CWT) effluent guidelines effort.
7.1.1.3 1992 Waste Treatment Industry Phase II: Incinerators 308 QuestionnaireCosting Data
The 1992 Waste Treatment Industry Phase II: Incinerators 308 Questionnaire costing data was
only utilized in the benchmark analysis to compare the accuracy of the costing models and is discussed
further in Section 7.1.2.
7.1.1.4 Other EPA Effluent Guideline Studies
Other EPA effluent studies, such as the Organic Chemicals and Plastics and Synthetic Fibers
(OCPSF) industry effluent guidelines, were reviewed in order to obtain additional costing background and
supportive information. However, costs developed as part of other industrial effluent guidelines were not
used in costing for this industry, with the exception of the CWT effluent guideline data referenced in Section
7.1.1.2 above.
7.1.2 Benchmark Analysis and Evaluation Criteria
A benchmark analysis was performed to gauge the accuracy of the costing models presented
above. This benchmark analysis used reported costs provided in the Incinerator 308 Questionnaires as

7-5
compared to costs generated using various costing options. Two facilities (Episodes # 4646 and 4671)
were selected to be used in the benchmark analysis. The facilities had installed treatment systems similar
to the BPT/BCT/BAT/PSES options. Treatment technologies which were used in the benchmark analysis
include:
C equalization
C chemical precipitation
C sedimentation
C sand filtration
Table 7-1 presents a cost comparison of capital and O&M costs for the above technologies.
Costs were developed using the average design flow of the selected facilities and average pollutant loadings
(see Section 4). This table presents costs developed using the WWC program, CAPDET, and vendor
quotes, as compared to industry provided treatment system capital and O&M costs provided in the
Incinerator 308 Questionnaires for the facilities.
Capital costs provided in the Incinerator 308 Questionnaire for chemical precipitation systems
installed at facilities 4646 and 4671 were $2,207,000 and $1,215,000, respectively. Questionnaire capital
cost for the second-stage chemical precipitation system and filtration process at facility 4646 was
$2,751,000, whereas, the capital cost for the second-stage chemical precipitation at facility 4671 was
$2,265,000. As demonstrated on Table 7-1, capital costs developed by the WWC program for the
various treatment technologies were typically close to the reported costs as provided in the questionnaire.
For the WWC program, the range of accuracy in predicting treatment component capital costs ranged
from plus 76.6 percent for the chemical precipitation system for facility 4671 to a minus 34.8 percent for
the second-stage chemical precipitation system also for facility 4671. The range of accuracy for the
CAPDET program capital costs was greater than that of the WWC program and ranged from a positive
110.6 percent for the chemical precipitation system for facility 4646 to a minus 46.6 percent for the

4646 Chem Precip 4646 2-stage Chem Precip 4671 Chem Precip 4671 2-stage Chem Precip
and Sand Filtration
Questionnaire 2,206,980 2,751,204 1,214,563 2,265,009
WWC 3,543,264 2,950,035 2,144,446 1,476,821
CAPDET 4,948,779 1,475,480 942,216 3,072,253
Vendor Quotes 399,878 3,314,930 319,206 670,158
4646 Chem Precip 4646 2-stage Chem Precip 4671 Chem Precip 4671 2-stage Chem Precip
and Sand Filtration
Questionnaire 910,000 315,000 1,837,000 363,000
WWC 1,355,505 231,728 1,864,219 686,360
CAPDET 585,855 99,036 515,859 466,848
Vendor Quotes 860,867 222,135 361,623 151,889
0
1
2
3
4
5
Mill
ions
Cap
ital C
ost (
$)Questionnaire
WWC
CAPDET
Vendor Quotes
Capital Costs1992 Dollars
0
500
1000
1500
2000
Tho
usan
ds
O &
M C
ost
($)
Questionnaire
WWC
CAPDET
Vendor Quotes
O&M Costs1992 Dollars
Table 7 -1 . Cos ting S o urce Comparison
7-6

7-7
second-stage chemical precipitation and filtration system at the same facility. Vendor quotes consistently
had a large variability from reported questionnaire costs and were typically much lower.
O&M costs provided in the Incinerator 308 Questionnaire for chemical precipitation systems
installed at facilities 4646 and 4671 were $910,000 and $1,837,000, respectively. Questionnaire O&M
costs for the second-stage chemical precipitation system and filtration process at facility 4646 was
$315,000, whereas, the O&M cost for the second-stage chemical precipitation at facility 4671 was
$363,000. As demonstrated on Table 7-1, O&M costs developed by the WWC program for the various
treatment technologies were typically close to the reported costs as provided in the questionnaire. For
the WWC program, the range of accuracy in predicting treatment component O&M costs ranged from plus
89.1 percent for the second-stage chemical precipitation system for facility 4671 to a minus 26.4 percent
for the second-stage chemical precipitation and filtration system for facility 4646. The ranges of accuracy
for the CAPDET program and vendor quotes in predicting O&M costs were typically greater than the
WWC program costs or were significantly lower than questionnaire provided costs.
Therefore, the benchmark analysis demonstrated that the WWC cost program consistently
developed capital and O&M costs which are considered acceptable estimates of the reported costs from
the questionnaire responses. Whereas, both CAPDET and vendor quotes were determined not to be as
accurate or consistent in estimating capital and O&M costs for these technologies.
The following criteria was used in order to evaluate the costing options and to select the appropriate
option for developing the CHWC Industry costing methodology:
C Does the model contain costing modules representative of the various wastewater
technologies in use or planned for use in the CHWC Industry?
C Can the program produce costs in the expected flow range experienced in this industry?
C Can the model be adapted to cost entire treatment trains used in the CHWC Industry?
C Is sufficient documentation available regarding the assumptions and sources of data so that
costs are credible and defensible?

7-8
C Is the model capable of providing detailed capital and operation and maintenance costs
with unit costing breakdowns?
C Is the program capable of altering the default design criteria in order to accurately
represent actual design criteria indicative of the CHWC Industry?
7.1.3 Selection of Final Cost Models
Based upon the results of the benchmark analysis and an evaluation using the criteria above, the
WWC costing program was selected for costing the majority of the treatment technologies. It was
determined that the WWC produces reliable capital and O&M costs for a wide range of treatment
technologies. As demonstrated on Table 7-1, WWC program costs were consistently accurate in
predicating both capital and O&M costs for those wastewater treatment systems at the selected facilities.
Capital costs predicted by CAPDET for these various treatment systems were typically less consistent and
were either much higher or lower than Questionnaire provided costs. O&M costs developed with
CAPDET were typically low compared to Questionnaire costs. In addition, CAPDET could not cost all
of the technologies needed for the CHWC Industry and was determined not to be as accurate in predicting
costs in the low flow range that characterize the CHWC Industry. Vendor quotes for both capital and
O&M costs in general were much lower than Questionnaire costs. Therefore, CAPDET and vendor
quotes (except as provided for below) were not used for costing.
The WWC computer-based costing program best satisfied the selection criteria presented above.
The program cost a wide range of typical and innovative treatment unit operations and combined these unit
operations to develop system costs. Since the WWC program is a computer based program, it readily
allowed for the repeated development of costs for a number of facilities. The program utilizes cost modules
which accommodated the range of flows and design input parameters needed to cost the CHWC Industry.
Costs developed by this program are based upon a number of sources, including reported construction and
operation costs, as well as published data. Costs are presented in a breakdown summary table which
contains unit costs and totals. Finally, the WWC program is adaptable to costing unit operations based
upon specified design criteria, as well as flow rate. Certain unit operations are costed strictly based upon

7-9
the input of flow rate, whereas other unit operations are costed based upon a combination of flow rate and
design loadings or component size. The Design Criteria Guidelines spreadsheet is used in conjunction with
the program to aid in determining particular treatment component design input parameters. This
spreadsheet is based upon design default values, which can readily be modified in order to develop costs
based upon particular design parameters common in the CHWC Industry.
However, there were particular instances where the WWC program did not produce reliable cost
information, such as for sand filtration and sludge dewatering facilities. WWC program costs for these
technologies were excessively high as compared to industry provided costs in the Questionnaire. For these
technologies, vendor quotes were more accurate in predicating costs and, therefore, were used to provide
costs.
7.2 ENGINEERING COSTING METHODOLOGY
This section presents the costing methodology used to develop treatment technology and
BPT/BCT/BAT and PSES option costs for the CHWC Industry. Additional costs to comply with this
regulation, such as monitoring costs, are presented in Section 7.4 of this chapter.
7.2.1 Treatment Costing Methodology
The following discussion presents a detailed summary of the technical approach used to estimate
treatment technology costs for each in-scope facility in the CHWC database. For each facility in the
database and for each option, EPA developed total capital and annual O & M treatment costs to upgrade
existing wastewater treatment systems, or to install new treatment technologies, in order to comply with the
long term averages (LTAs). Facilities were costed primarily using the WWC costing program. Vendor
cost curves, as developed in the CWT industry study, were used for sand filtration and sludge dewatering
costing. Table 7-2 presents a breakdown of the costing method used for each treatment technology.

7-10
Table 7-2. Breakdown of Costing Method by Treatment Technology
Treatment Cost Using Cost Using Vendor Key DesignTechnology WWC Program Quotes Parameter(s)1
Flocculation, Mixing X Flow rate& Pumping
Chemical Feed System X Flow rate & POCMetals
Primary & Secondary X Flow rateClarification
Sand Filtration X Flow rate
Sludge Filter Press X Flow rate(1) Cost curves developed using vendor quotes in the CWT guideline effort.
In using the WWC computer model to develop treatment technology costs, the first step was to
use the Design Criteria Guidelines spreadsheet to develop input parameters for the computer costing
program. Reported pollutant loadings from the facility were used whenever possible. If pollutant loadings
were not available for a particular parameter, EPA used an estimated concentration developed based on
combined waste stream loadings or loadings from similar facilities. The facility's baseline flow rate and the
regulatory option LTAs were also used in the design of the unit operation. Certain key design parameters,
such as total suspended solids (TSS), are used directly in the WWC program, and accompanying Design
Criteria Guidelines spreadsheet, to design the various treatment unit operations, such as a clarifier. Selected
pollutant of concern (POC) metals were used to assist in the design of BPT/BCT/BAT chemical
precipitation systems. These metals typically impose a large requirement for the various precipitating agents,
thereby governing the chemical feed system design. A more detailed discussion of individual treatment
technology costing and their design parameters is presented in Section 7.3. The design parameters from
the Design Criteria Guidelines spreadsheet were next used as input for the WWC costing program to
develop the installed capital and O&M costs.
Individual treatment component costs were developed by the WWC program by using the
corresponding module provided by the program for that particular technology. Technology-specific design
parameters were input into the WWC program. The WWC program then calculated both installed capital
costs and annual O&M costs. Treatment technology costs developed by the WWC costing program were

7-11
corrected to 1992 costs using the Engineering News Record (ENR) published indexes. After the installed
capital and annual O&M costs were developed for each facility, selected cost factors, as shown in Table
7-3, were applied to the results to develop total capital and O&M costs. Capital costs developed by the
program include the cost of the treatment unit and some ancillary equipment associated with that technology
(see Section 7.3 for further information on particular items costed for each technology). O&M costs for
treatment chemicals, labor, materials, electricity, and fuel are included in the computer program O&M
costs.
Table 7-3. Additional Cost Factors
Type Factor % of Capital Cost
Capital Site Work & Interface Piping 18
General Contractor Overhead 10
Engineering 12
Instrumentation & Controls 13
Buildings 6
Site Improvements 10
Legal, Fiscal, & Administrative 2
Interest During Construction 9
Contingency 8
Retrofit (if necessary) 20
O&M Taxes & Insurance 21
(1) 2 percent of total capital costs, which includes WWC computer costs and capital costs listed above.
7.2.2 Option Costing Methodology
The following discussion presents a detailed summary of the technical approach used to estimate
the BPT/BCT/BAT and PSES option costs for each in-scope facility in the CHWC database. Zero
discharge facilities were not costed for any of the regulatory options. The costing methodology used to
develop facility-specific BPT/BCT/BAT and PSES option compliance costs is presented graphically on
the flow diagram in Figure 7-1.

Does the facility have allof the treatment components for
this BPT/BCT/BAT/PSESoption installed?
No
Upgrade existing processequipment or operation to
ensure compliance with LTAsfor this BPT/BCT/BAT/PSES
option
Cost upgrade to existing treatment systemto achieve LTAs for this BPT/BCT/BAT/PSES
option; including retrofit, land, residual,RCRA permit modifications (if hazardous)
and monitoring costs
Does the facility have some of the treatment
components for this BPT/BCT/BAT/PSES option or
equivalent treatment?
Provide entire treatmentsystem for this BPT/BCT/
BAT/PSES option
Cost facility for entire treatment systemunder this BPT/BCT/BAT/PSES option;including land, residual, RCRA permit
modifications (if hazardous), andmonitoring costs
Yes
Provide additional treatmentcomponents necessary to
achieve LTAs for this BPT/BCT/BAT/PSES option. In
some cases upgrades to existingtreatment components or other
incremental treatment processesmay only be necessary to
achieve LTAs for this BPT/BCT/BAT/PSES option
Cost facility only for additional treatmentprocess(es) and upgrades necessary to
achieve LTAs for this BPT/BCT/BAT/PSESoption; including retrofit, land, residual,
RCRA permit modifications (if hazardous),and monitoring costs
Figure 7-1. Option-Specific Costing Logic Flow Diagram
Yes
No
Start
7-12

7-13
For each BPT/BCT/BAT and PSES regulatory option, it was first determined whether a facility
was complying with the LTAs for each pollutant considered for regulation. None of the facilities were in
compliance with the LTAs, and were therefore assigned additional equipment and/or upgrade costs to
achieve compliance with that option. The next step was to determine whether a facility had already installed
treatment unit operations capable of complying with the LTAs. If a facility already had BPT/BCT/BAT,
PSES or equivalent treatment installed, the facility was only assigned costs for treatment system upgrades.
For facilities that did not have BPT/BCT/BAT or PSES treatment systems or equivalent, costs
were developed for the additional unit operations and/or system upgrades necessary to meet each LTA.
Facilities which were already close to compliance with the LTAs were costed for upgrades in order to
achieve BPT/BCT/BAT levels. Upgrade costs were developed using the WWC costing program
whenever possible, and included either additional equipment to be installed on existing unit processes,
expansion of existing equipment, or operational changes. Examples of upgrade costs include such items
as a new or expanded chemical feed system, or improved or expanded sedimentation capabilities. If a
facility had no treatment system, or one that could not achieve desired levels with upgrades or minor
additions, an entire BPT/BCT/BAT treatment system was costed for that facility.
Once all of the individual treatment technology requirements for each facility were established,
individual capital and O&M treatment technology costs were developed as previously described above
in Section 7.2.1. In order to estimate the total compliance cost for a regulatory option it is necessary to
sum all of the individual component treatment technology costs. Table 7-4 presents the regulatory option
in the CHWC Industry and the corresponding treatment technologies costed.
Table 7-4. Regulatory Option Wastewater Treatment Technology Breakdown
BPT/BCT/BAT/PSES Option Treatment Code Components WWCDescription #
Two-Stage Chemical Precipitation, Sand Pumping 92Filtration & Sludge Dewatering Rapid Mix Tank 104
Sodium Bisulfite Feed System 42
Flocculation 72

BPT/BCT/BAT/PSES Option Treatment Code Components WWCDescription #
7-14
Two-Stage Chemical Precipitation, Sand Sodium Hydroxide Feed System 45Filtration & Sludge Dewatering (cont.) Primary Clarification 118
Pumping 92
Rapid Mix Tank 104
Hydrochloric Acid Feed System 46
Flocculation 72
Ferric Chloride Feed System 40
Polymer Feed 43
Rapid Mix Tank 104
Sodium Hydroxide Feed System 45
Secondary Clarification 118
Sand Filter NA
Sludge Dewatering NANA = Technology costed using vendor cost curves from CWT study.
7.3 TREATMENT TECHNOLOGIES COSTING
The following sections describe how costs were developed for the BPT/BCT/BAT/PSES
treatment technologies. Specific assumptions are discussed for each treatment technology regarding the
equipment used, flow ranges, input and design parameters, and design and cost calculations. Table 7-2,
previously referenced, presented the selected costing method which was used to cost each of the treatment
technologies used in the BPT/BCT/BAT and PSES options. The following subsections present a detailed
discussion on how each of the treatment technologies presented in Table 7-3 were costed. Costs are
presented as physical/chemical wastewater treatment costs, and sludge treatment and disposal costs.
7.3.1 Physical/Chemical Wastewater Treatment Technology Costs
Table 7-4 presents a breakdown of the WWC treatment modules used in costing each treatment
technology for the regulatory option. The following sections present a description of costs for each

7-15
physical/chemical wastewater treatment technology used in the regulation. Capital and O&M cost curves
were developed for specific technologies and system components. These curves, which represent cost as
a function of flow rate or other system design parameters, were developed using a commercial statistical
software package (SlideWrite Plus Version 2.1). First, costs were developed using the WWC program
for each technology or component using as a design basis five different flow rates or other system design
parameters (depending upon the governing design parameter). For instance, a technology costed on the
basis of flow would have costs developed by the WWC program at 0.01 million gallons per day (MGD),
0.05 MGD, 0.1 MGD, 0.5 MGD, and 1.0 MGD. Ranges for the five selected points to cost were based
upon a review of the flow or technology design parameters for all facilities in the database and were
selected in order to bracket the range from low to high. Next, these five data points (flow/design parameter
and associated cost) were entered into the commercial statistical software program . Cost curves to model
the total capital and O&M costs were then developed by the program using curve fitting routines. A
second order natural log equation format was used to develop all curves. All cost curves yielded total
capital and O&M costs, unless otherwise noted.
7.3.1.1 Chemical Feed Systems
The following section presents the methodology used to calculate the chemical addition feed rates
used with each applicable regulatory option. Table 7-5 presents a breakdown of the design process used
for each type of chemical feed. Chemical costs presented in Table 7-6 were taken from the September
1992 Chemical Marketing Reporter.
For facilities with existing chemical precipitation systems, an evaluation was made as to whether
the system was achieving the regulatory option LTAs. If the existing system was achieving LTAs, no
additional chemical costs were necessary. However, if the facility was not achieving the LTAs for an
option, the facility was costed for an upgrade to the chemical precipitation system. First, the stoichiometric
requirements were determined for each metal to be removed to the LTA level. If the current feed rates
were within the calculated feed rates no additional costs were calculated. For facilities currently feeding
less than the calculated amounts, the particular facility was costed for an upgrade to add additional

7-16
precipitation chemicals, such as a coagulant, or expand their existing chemical feed system to accommodate
larger dosage rates.
Table 7-5. Chemical Addition Design Method
Basis for Design
Chemical Stoichiometry Reference (mg/l)1
Hydrochloric Acid X
Sodium Hydroxide X
Polymer 2.0
Sodium Bisulfate X
Ferric Chloride 75(1) Source: Industrial Water Pollution Control, 2nd Edition.
Table 7-6. Treatment Chemical Costs
Treatment Chemical Cost 1
Ferric Chloride $200/ton
Hydrochloric Acid $72/ton
Polymer $2.25/lb
Sodium Bisulfate $230/ton
Sodium Hydroxide $350/ton(1) Source: 1992 Chemical Marketing Reporter.
Facilities without an installed chemical precipitation system were costed for an entire metals
precipitation system. The chemical feed rates used at a particular facility for either an upgrade or a new
system were based upon stoichiometric requirements, pH adjustments, and buffering ability of the raw
influent.
In developing the CWT industry guideline, EPA’s analysis led the agency to conclude that the
stoichiometric requirements for chemical addition far outweighed the pH and buffer requirements. It was
determined that 150 percent of the stoichiometric requirement would sufficiently accommodate for pH

7-17
lbtreatment chemical 'lbM removed
year
valenceM
MWM
MWtreatment chemical
valenceNa/Ca
adjustment and buffering of the solution. An additional 50 percent of the stoichiometric requirement was
included to react with metals not on the POC list. Finally, an additional 10 percent was added as excess.
Therefore, a total of 210 percent of the stoichiometric requirement was used in developing costs.
Sodium Hydroxide Feed Systems
The stoichiometric requirement for sodium hydroxide to remove a particular metal is based upon
the generic equation:
where, M is the target metal and MW is the molecular weight.
The calculated amounts of sodium hydroxide to remove a pound of each of the selected metal
pollutants of concern are presented in Table 7-7. For indirect dischargers, only those metals which were
determined to pass through a POTW were used in determining the stoichiometric requirements. The other
metals present in the wastewater will be accommodated for by the additional 110 percent of the
stoichiometric requirement. Sodium hydroxide chemical feed system costs were developed for many
facilities using the WWC costing program. Reported facility loadings were used to establish the sodium
hydroxide dosage requirement. WWC unit process 45 was used to develop capital and O&M costs for
sodium hydroxide feed systems. The capital and O&M cost curves developed for sodium hydroxide feed
systems, based upon the calculated dosages, are presented as Equations 7-1 and 7-2, respectively.

7-18
Table 7-7. Sodium Hydroxide Requirements for Chemical Precipitation
Dosage Rate
Pollutant Sodium Hydroxide (lb/lb metal removed)
Aluminum 4.45
Antimony 1.64
Arsenic 2.67
Boron 11.10
Cadmium 0.71
Chromium 2.31
Copper 1.26
Iron 2.15
Lead 0.77
Manganese 2.91
Mercury 0.40
Molybdenum 2.50
Selenium 2.03
Silver 0.74
Tin 1.35
Titanium 3.34
ln(Y) = 10.653 - 0.184ln(X) + 0.040ln(X) (7-1)2
ln(Y) = 8.508 - 0.0464ln(X) + 0.014ln(X) (7-2)2
where:
X = Dosage Rate (lb/day), and
Y = Cost (1992 $)
Figures 7-2 and 7-3 graphically present the sodium hydroxide feed system capital and O&M cost
curves, respectively.
Costs for a sodium hydroxide feed system are estimated using the WWC unit process cost number
45. Costs are based on sodium hydroxide dosage rates between 10-10,000 lb/day, with dry sodium

Dosage Rate (lb/day)
Cos
t ($)
Figure 7-2Sodium Hydroxide Capital Cost Curve
WWC Cost
7-1
9

Dosage Rate (lb/day)
Cos
t ($)
Figure 7-3Sodium Hydroxide O&M Cost Curve
WWC Cost
7-20

7-21
hydroxide used at rates less than 200 lb/day, and liquid sodium hydroxide used at higher feed rates. The
costing program assumes that dry sodium hydroxide (98.9 percent pure) is delivered in drums and mixed
to a 10 percent solution on-site. A volumetric feeder is used to feed sodium hydroxide to one of two tanks;
one for mixing the 10 percent solution, and one for feeding. Two tanks are necessary for this process
because of the slow rate of sodium hydroxide addition due to the high heat of solution. Each tank is
equipped with a mixer and a dual-head metering pump, used to convey the 10 percent solution to the point
of application. Pipe and valving is required to convey water to the dry sodium hydroxide mixing tanks and
between the metering pumps and the point of application.
A 50 percent sodium hydroxide solution is purchased, premixed and delivered by bulk transport
for feed rates greater than 200 lb/day. The 50 percent solution contains 6.38 pounds of sodium hydroxide
per gallon, which is stored in fiberglass reinforced polyester tanks designed to a hold 15 day capacity.
Dual-head metering pumps are used to convey the liquid solution to the point of application, and a standby
metering pump is provided in all systems. The storage tanks are located indoors, since 50 percent sodium
hydroxide begins to crystallize at temperatures less than 54EF.
Ferric Chloride Feed Systems
Ferric chloride feed systems were costed using the WWC unit process 40. Costs were based
upon a dosage rate of 75 mg/l of ferric chloride. The capital and O&M cost curves developed for ferric
chloride feed systems are based upon the calculated dosage and are presented as Equations 7-3 and 7-4,
respectively.
ln(Y) = 11.199 - 0.136ln(X) + 0.054ln(X) (7-3)2
ln(Y) = 8.808 - 0.408ln(X) + 0.074ln(X) (7-4)2
where:
X = Dosage Rate (lb/hr), and
Y = Cost (1992 $)

7-22
Figures 7-4 and 7-5 graphically present the ferric chloride feed system capital and O&M cost
curves, respectively. Costs for ferric chloride feed facilities are based on storage and feeding a 43 percent
solution of ferric chloride with a weight of 12 pounds per gallon (5.2 lbs dry ferric chloride/gallon). The
solution is stored in covered fiberglass reinforced polyester tanks designed to hold a 15 day supply. Cost
estimates include dual-head metering pumps (one standby) with materials suitable for ferric chloride and
150 feet of stainless steel pipe and associated valves. Automatic or feed back controls are excluded.
Sodium Bisulfite Feed Systems
Sodium bisulfite feed systems were costed using the WWC unit process 42. Costs were based
upon a stoichiometric requirement of 2.81 mg/l of sodium bisulfite per 1 mg/l of total chromium. The capital
and O&M cost curves developed for sodium bisulfite feed systems are based upon the calculated dosage
and are presented as Equations 7-5 and 7-6, respectively.
ln(Y) = 10.822452 - 0.010997ln(X) + 0.038691ln(X) (7-5)2
ln(Y) = 8.418772 + 0.51824ln(X) + 0.039838ln(X) (7-6)2
where:
X = Dosage Rate (lb/hr), and
Y = Cost (1992 $)
Figures 7-6 and 7-7 graphically present the sodium bisulfite feed system capital and O&M cost
curves, respectively.
A five minute detention period is provided in the dissolving tank. Fifteen days of storage is included
using mild steel storage hoppers which are located indoors. Sodium bisulfite is conveyed pneumatically
from bulk delivery trucks to the hoppers, with the blower located on the delivery truck. Hopper costs
include dust collectors. Bag loaders are used on the feeder in systems too small for bulk systems.
Volumetric feeders are used for all installations. Solution tanks are located directly beneath the storage

Dosage Rate (lb/hr)
Cos
t ($)
Figure 7-4Ferric Chloride Capital Cost Curve
WWC Cost
7-23

Dosage Rate (lb/hr)
Cos
t ($)
Figure 7-5Ferric Chloride O&M Cost Curve
WWC Cost
7-2
4

Dosage Rate (lb/hr)
Cos
t ($)
Figure 7-6Sodium Bisulfite Capital Cost Curve
WWC Cost
7-2
5

Dosage Rate (lb/hr)
Cos
t ($)
Figure 7-7Sodium Bisulfite O&M Cost Curve
WWC Cost
7-26

mg/L H2SO4 ' 10&initial pOH& 10&final pOH mol OH&
1L
1 mol H2SO4
2 mol H%
98,000 mg1 mol H2SO4
hoppers. Conveyance from the solution tanks to the point of application is by dual-head diaphragm
metering pumps.
Hydrochloric Acid Feed Systems
Hydrochloric acid is necessary to neutralize the waste stream or adjust the waste stream for
chemical treatment. The amount necessary was calculated using the following equation.
To allow for solution buffering, 10 percent excess acid was added.
Hydrochloric acid feed systems were costed using the WWC unit process 46. The capital and
O&M cost curves developed for hydrochloric acid feed systems, based upon the calculated feed rate, are
presented as Equations 7-7 and 7-8, respectively.
ln(Y) = 10.431273 - 0.196812ln(X) + 0.044247ln(X)2 (7-7)
ln(Y) = 7.630396 + 0.312305ln(X) - 0.002419ln(X)2 (7-8)
where:
X = Feed Rate (gpd), and
Y = Cost (1992 $)
Figures 7-8 and 7-9 graphically present the hydrochloric acid feed system capital and O&M cost
curves, respectively.
Costs are based on systems capable of metering concentrated acid from a storage tank directly to
the point of application. For feed rates up to 200 gpd, the concentrated acid is delivered in drums and
stored indoors. At higher flow rates, the acid is delivered in bulk and stored outdoors in fiberglass

Dosage Rate (gpd)
Cos
t ($)
Figure 7-8Hydrochloric Acid Capital Cost Curve
WWC Cost
7-28

Dosage Rate (gpd)
Cos
t ($)
Figure 7-9Hydrochloric Acid O&M Cost Curve
WWC Cost
7-29

7-30
reinforced polyester tanks. Acid is stored for 15 days, and a standby metering pump is included for all
installations.
Polymer Feed Systems
WWC unit process 34 was used to cost polymer feed systems. Polymer dosage rate in lb/hr was
calculated based upon a target concentration of 2 mg/l using the facility’s flow rate. Although this module
is designed to cost for a liquid alum feed system, costs generated by this module were determined to be
more reasonable and accurate in developing polymer system costs than the WWC unit process 43 for
polymer feed systems. The capital and O&M unloaded cost curves developed for polymer feed systems
are presented as Equations 7-9 and 7-10, respectively.
ln(Y) = 10.539595 - 0.13771ln(X) + 0.052403ln(X) (7-9)2
ln(Y) = 9.900596 + 0.99703ln(X) + 0.00019ln(X) (7-10)2
where:
X = Dosage Rate (lb/hr), and
Y = Cost (1992 $)
Figures 7-10 and 7-11 graphically present the polymer feed system capital and O&M cost curves,
respectively.
Polymer is stored for 15 days in fiberglass reinforced polyester tanks. For smaller installations, the
tanks are located indoors and left uncovered, and for larger installations the tanks are covered and vented,
with insulation and heating provided. Dual-head metering pumps deliver the polymer from the storage tank
and meter the flow to the point of application. Feed costs include 150 feet of 316 stainless steel pipe, along
with fittings and valves, for each metering pump. A standby metering pump is included for each installation.

Dosage Rate (lb/hr)
Cos
t ($)
Figure 7-10Polymer Feed Capital Cost Curve
WWC Cost
7-31

Dosage Rate (lb/hr)
Cos
t ($)
Figure 7-11Polymer Feed O&M Cost Curve
WWC Cost
7-3
2

7-33
7.3.1.2 Pumping
Wastewater pumping costs were estimated using WWC unit process 92, and are based on flow
rate. The capital and O&M cost curves developed for pumping are presented as Equations 7-11 and 7-
12, respectively.
ln(Y) = 10.048 + 0.167ln(X) - 0.001ln(X) (7-11)2
ln(Y) = 7.499 + 0.024ln(X) + 0.0429ln(X) (7-12)2
where:
X = Flow Rate (gpm), and
Y = Cost (1992 $)
Figures 7-12 and 7-13 graphically present the pumping capital and O&M cost curves, respectively.
7.3.1.3 Rapid Mix Tanks
Capital and O&M costs for rapid mix tanks were estimated using the WWC unit process 104 and
are based on reinforced concrete basins. The capital and O&M cost curves developed for rapid mix tanks
based upon flow rate are presented as Equations 7-13 and 7-14, respectively.
ln(Y) = 12.234467 - 0.677898ln(X) + 0.078143ln(X) (7-13)2
ln(Y) = 10.730231 + 0.614141ln(X) + 0.083221ln(X) (7-14)2
where:
X = Flow Rate (MGD), and
Y = Cost (1992 $)
Figures 7-14 and 7-15 graphically present the rapid mix tank capital and O&M cost curves,
respectively.

Flow (gpm)
Cos
t ($)
Figure 7-12Wastewater Pumping Capital Cost CurveWWC Cost
7-3
4

Flow (gpm)
Cos
t ($)
Figure 7-13Wastewater Pumping O&M Cost CurveWWC Cost
7-35

Flow (MGD)
Cos
t ($)
Figure 7-14Mix Tank Capital Cost Curve
WWC Cost
7-36

Flow (MGD)
Cos
t ($)
Figure 7-15Mix Tank O&M Cost Curve
WWC Cost
7-3
7

7-38
Common wall construction is assumed for multiple basins. Costs include vertical shaft, variable
speed turbine mixers with 304 stainless steel shafts, paddles, and motors. Costs are based on a G value
(G is the mean temporal velocity gradient which describes the degree of mixing; i.e., the greater the value
of G the greater the degree of mixing) of 300 (3 ft-lbs/sec/cu. ft.) and a water temperature of 15EC. The
energy requirements are a function of G value, water temperature, and an overall mechanism efficiency of
70 percent.
7.3.1.4 Flocculation
A cost curve was developed for flocculation using the WWC cost program. WWC unit process
72 was used. Costs for flocculation were based upon a function of flow at a hydraulic detention time of
20 minutes. The capital and O&M cost curves developed for flocculation are presented as Equations 7-15
and 7-16, respectively.
ln(Y) = 11.744579 + 0.633178ln(X) - 0.015585ln(X) (7-15)2
ln(Y) = 8.817304 + 0.533382ln(X) + 0.002427ln(X) (7-16)2
where:
X = Flow Rate (MGD), and
Y = Cost (1992 $)
Figures 7-16 and 7-17 graphically present the flocculation capital and O&M cost curves,
respectively. Cost estimates for flocculation basins are based on rectangular-shaped, reinforced concrete
structures with a depth of 12 feet and length-to-width ratio of 4:1. Horizontal paddle flocculators were
used in costing because they are less expensive and more efficient. Manufactured equipment costs are
based on a G value of 80. Cost estimates for drive units are based on variable speed drives for maximum
flexibility, and although common drives for two or more parallel basins are often utilized, the costs are based
on individual drives for each basin.

Flow (MGD)
Cos
t ($)
Figure 7-16Flocculation Capital Cost Curve
WWC Cost
7-39

Flow (MGD)
Cos
t ($)
Figure 7-17Flocculation O&M Cost Curve
WWC Cost
7-4
0

7-41
Energy requirements are based on a G value 80 and an overall motor/mechanism efficiency of 60
percent. Labor requirements are based on routine operation and maintenance of 15 min/day/basin and a
4 hour oil change every 6 months.
7.3.1.5 Primary Clarification
Cost curves were developed for primary clarification using the WWC cost program. WWC unit
process 118 for a rectangular basin with a 12 foot side wall depth was used. Costs for primary clarification
were based upon a function of flow rate, using an overflow rate of 900 gallons per day per square feet in
calculating tank size. The capital and O&M cost curves developed for primary clarification are presented
as Equations 7-17 and 7-18, respectively.
ln(Y) = 12.517967 + 0.575652ln(X) + 0.009396ln(X) (7-17)2
ln(Y) = 10.011664 + 0.268272ln(X) + 0.00241ln(X) (7-18)2
where:
X = Flow Rate (MGD), and
Y = Cost (1992 $)
Figures 7-18 and 7-19 graphically present the primary clarification capital and O&M cost curves,
respectively.
Estimated costs are based on rectangular basins with a 12 foot side water depth (SWD), and chain
and flight sludge collectors. Costs for the structure assumed common wall construction, and include the
chain and flight collector, collector drive mechanism, weirs, the reinforced concrete structure complete with
inlet and outlet troughs, a sludge sump, and sludge withdrawal piping.
7.3.1.6 Secondary Clarification
Cost curves were developed for secondary clarification using the WWC cost program. WWC unit
process 118 for a rectangular basin with a 12 foot side wall depth, and chain and flight collectors was used.

Flow (MGD)
Cos
t ($)
Figure 7-18Primary Clarifier Capital Cost Curve
WWC Cost
7-4
2

Flow (MGD)
Cos
t ($)
Figure 7-19Primary Clarifier O&M Cost Curve
WWC Cost
7-4
3

7-44
Costs for secondary clarification were based upon a function of flow rate, using an overflow rate of 600
gallons per day per square feet in calculating tank size. The capital and O&M cost curves developed for
secondary clarification are presented as Equations 7-19 and 7-20, respectively.
ln(Y) = 12.834601 + 0.688675ln(X) + 0.035432ln(X) (7-19)2
ln(Y) = 10.197762 + 0.339952ln(X) + 0.015822ln(X) (7-20)2
where:
X = Flow Rate (MGD), and
Y = Cost (1992 $)
Figures 7-20 and 7-21 graphically present the secondary clarification capital and O&M cost
curves, respectively. Costs for the structure assumed common wall construction, and include the chain and
flight collector, collector drive mechanism, weirs, the reinforced concrete structure complete with inlet and
outlet troughs, a sludge sump, and sludge withdrawal piping. Yard piping to and from the clarifier is not
included in the above costs, but accounted for by the engineering cost factors.
7.3.1.7 Sand Filtration
A capital cost curve, as a function of flow rate, was developed for a sand filtration system using
vendor supplied quotes. The cost curve used in this study was developed as part of the CWT effluent
guidelines effort. The capital cost curve developed for sand filtration is presented as Equation 7-21.
ln(Y) = 12.265 + 0.658ln(X) + 0.036ln(X) (7-21)2
where:
X = Flow Rate (MGD), and
Y = Capital Cost (1992 $)
O&M costs for filter operation were estimated as 50 percent of the capital cost. Figure 7-22 graphically
presents the sand filtration capital cost curve.

Flow (MGD)
Cos
t ($)
Figure 7-20Secondary Clarifier Capital Cost CurveWWC Cost
7-45

Flow (MGD)
Cos
t ($)
Figure 7-21Secondary Clarifier O&M Cost Curve
WWC Cost
7-4
6

Flow (MGD)
Cos
t ($)
Figure 7-22Sand Filtration Capital Cost Curve
WWC Cost
7-4
7

7-48
The total capital costs for the sand filtration systems represent equipment and installation costs. The
total construction cost includes the costs of the filter, instrumentation and controls, pumps, piping, and
installation. The operation and maintenance costs include energy usage, maintenance, labor, taxes, and
insurance.
7.3.2 Sludge Treatment and Disposal
The method of developing sludge treatment and disposal costs are presented in the following
sections.
7.3.2.1 Plate and Frame Pressure Filtration
Regulatory costs for sludge dewatering were developed using cost curves from the CWT effluent
guideline effort. Costs are for a sludge dewatering system using a plate and frame pressure filter, and are
based upon flow rate. Only facilities without installed sludge treatment were costed.
The capital and O&M cost curves developed for a plate and frame filter press sludge dewatering
are presented as Equations 7-22 and 7-23, respectively.
ln(Y) = 15.022877 + 1.1199216ln(X) + 0.063001ln(X) (7-22)2
ln(Y) = 12.52046 + 0.713233ln(X) + 0.066701ln(X) (7-23)2
where:
X = Flow (MGD), and
Y = Cost (1992 $)
Figures 7-23 and 7-24 graphically present the plate and frame sludge dewatering capital and O&M
cost curves, respectively. For facilities with a flow rate of less than 1,500 gallons per day, the O&M costs
were estimated as 50 percent of the capital cost.
The components of the plate and frame pressure filtration system include: filter plates, filter cloth,
hydraulic pumps, pneumatic booster pumps, control panel, connector pipes, and support platform.

Flow (MGD)
Cos
t ($)
Figure 7-23Sludge Dewatering Capital Cost Curve
WWC Cost
7-4
9

Flow (MGD)
Cos
t ($)
Figure 7-24Sludge Dewatering O&M Cost Curve
WWC Cost
7-5
0

7-51
Equipment and operational costs were obtained from manufacturers’ recommendations. The capital cost
equation was developed by adding installation, engineering, and contingency costs to the vendors’
equipment costs. The O&M costs were based on estimated electricity usage, maintenance, labor, taxes
and insurance, and filter cake disposal costs. The labor requirement for the plate and frame pressure
filtration system was approximated at 30 minutes per cycle per filter press.
7.3.2.2 Filter Cake Disposal Costs
Filter cake was costed for off-site disposal at a landfill. A facility's filter cake generation was
calculated using the difference between the facility's loadings and allowable effluent concentration. A
facility's total influent loading was calculated by taking the sum of the average metals and TSS
concentrations multiplied by the baseline flow. Effluent concentrations were developed similarly using the
LTAs for each option. Then, the sludge generation in the treatment system was calculated as the influent
loading minus the amount in effluent loading, converted to an annual amount (lbs/yr). The amount of
treatment chemicals added to the system (based upon BPT/PSES option) was also included in the
calculation of sludge generation. The amount of total sludge generated in the treatment system was then
converted to a wet weight basis assuming 35 percent solids filter cake. Off-site disposal costs were
estimated at $0.19/lb and was based upon the median cost reported by CHWC facilities in the
Questionnaire responses. This cost includes transportation, handling, conditioning, and disposal of the
cake. Costs are based upon a filter cake of 35 percent solids.
7.4 ADDITIONAL COSTS
In order to complete the costing for each regulatory option, costs other than treatment component
costs were developed. These additional costs are required in order to accommodate for other costs
associated with the development of the guideline. The following additional costs were included in the total
guideline option costs for each facility, as needed:

7-52
C retrofit
C monitoring
C RCRA permit modifications
C land costs
Each of these additional costs are further discussed and defined in the following sections. Total
facility compliance costs under each BPT/BCT/BAT and PSES option were developed by adding
individual treatment technology costs with these additional costs.
Final capital costs developed for each facility were then amortized using a 7 percent interest rate
over 15 years. This annualized capital cost was then added to the annual O&M cost to develop a total
annual cost for each guideline option.
7.4.1 Retrofit and Upgrade Costs
A retrofit cost factor was applied when additional equipment or processes were needed to be
added to existing systems. Retrofit costs cover the need for system modifications and components, such
as piping, valves, controls, etc., which are necessary in order to connect new treatment units and processes
to an existing treatment facility. An upgrade cost factor was also applied to allow for existing treatment
systems to be enhanced to provide sufficient treatment capability. The combined retrofit and upgrade cost
factor was estimated at 25 percent of the installed capital cost of the equipment.
7.4.2 Land Costs
Land costs provide for the value of the land requirements needed for the installation of the
BPT/BCT/BAT/PSES treatment technology. Land costs were estimated based upon the expected land
requirements for the new treatment units. Land size increments of either 0.5, 1 or 2 acres were used
depending on the expected size of the required treatment system.
Land costs vary greatly across the country depending upon the region and state. Therefore, a
national average would not be appropriate for costing purposes. State-specific unit land costs ($/acre)

7-53
were developed for each state. These state-specific unit land costs were based upon the average land
costs for suburban sites in each state and were obtained from the 1990 Guide to Industrial and Real Estate
Office Markets Survey. Costs were corrected to 1992 dollars using engineering cost factors.
According to the survey, unimproved sites are the most desirable location for development and are
generally zoned for industrial usage. State-specific unit land costs were developed by averaging the
reported unimproved site survey data for the various size ranges (zero to 10 acres, 10 to 100 acres, and
greater than 100 acres). Regional averages were used for states which did not have data provided. Hawaii
was not used in developing regional average costs, due to extremely high costs. Table 7-8 presents the
developed state-specific unit land costs used in costing. Facility land costs for this rule varied from $11,500
to $237,628.
7.4.3 RCRA Permit Modification Costs
No cost associated with the modification of an existing RCRA Part B permit was included for any
hazardous waste facilities requiring an upgrade or additional treatment processes. The wastewater
treatment unit exemption (40 CFR 264.1(g)(6), 40 CFR 265.1(c)(10)) exempts wastewater treatment units
that are subject to NPDES or pretreatment requirements under the Clean Water Act from certain RCRA
requirements, such as permitting modifications. Wastewater treatment units that are exempt from certain
RCRA requirements are defined in 40 CFR 260.10. Since all units costed under this rule fall under this
exemption, no costs were assumed to be associated for the CHWC Industry.
Table 7-8. State Land Costs1
State Land Cost State Land Cost(1992 $/acre) (1992 $/acre)
Alabama 24,595 Nebraska 26,659Alaska 87,593 Nevada 39,2042
Arizona 49,790 New Hampshire 57,238Arkansas 17,170 New Jersey 96,598California 325,000 New Mexico 29,083Colorado 47,045 New York 118,814

State Land Cost State Land Cost(1992 $/acre) (1992 $/acre)
7-54
Connecticut 58,570 North Carolina 36,590Delaware 58,806 North Dakota 22,1272
Florida 68,335 Ohio 15,744Georgia 78,408 Oklahoma 26,267Hawaii 1,176,120 Oregon 54,886Idaho 87,593 Pennsylvania 34,8922
Illinois 39,204 Rhode Island 64,6082
Indiana 22,764 South Carolina 23,000Iowa 9,670 South Dakota 22,1272
Kansas 7,605 Tennessee 22,543Kentucky 31,363 Texas 51,488Louisiana 61,158 Utah 87,5932
Maine 21,170 Vermont 64,6082
Maryland 121,532 Virginia 43,124Massachusetts 64,687 Washington 68,764Michigan 14,740 West Virginia 51,1332
Minnesota 22,738 Wisconsin 18,818Mississippi 14,113 Wyoming 87,5932
Missouri 43,124 Washington, DC 188,179Montana 87,5932
(1) Source: 1990 Guide to Industrial and Real Estate Office Markets Survey.(2) No data available for State, regional average used.
7.4.4 Monitoring Costs
Costs were developed for the monitoring of treatment system effluent. Costs were developed for
both direct and indirect dischargers and were based upon the following assumptions:
C Monitoring costs are based on the number of outfalls through which wastewater is
discharged. The costs associated with a single outfall is multiplied by the total number of
outfalls to arrive at the total cost for a facility. The estimated monitoring costs are
incremental to the costs already incurred by the facility.
C The capital costs for flow monitoring equipment are included in the estimates.

7-55
C Sample collection costs (equipment and labor) and sample shipment costs are not included
in the estimates because it is assumed that the facility is already conducting these activities
as part of its current permit requirements.
Based upon a review of current monitoring practices at CHWC facilities, many conventional and
non-conventional parameters, as well as metals, are already being monitored on a routine basis. Therefore,
monitoring costs were developed based upon daily monitoring of TSS and weekly monitoring of metals.
Current compliance monitoring for existing facilities is generally less than the frequency used for estimating
the monitoring costs of this rule. Table 7-9 presents the monitoring costs per sample type for the CHWC
Industry.
Table 7-9. Analytical Monitoring Costs
Pollutants Cost/Sample ($)1
TSS 6.00
Metals 40.00/metal(1) Cost based on 1998 analytical laboratory costs adjusted to 1992 dollars.
7.5 WASTEWATER OFF-SITE DISPOSAL COSTS
An evaluation was conducted to determine whether it would be more cost effective for low flow
facilities to have their CHWC wastewaters hauled off-site and treated/disposed at a CWT facility, as
opposed to on-site wastewater treatment. Total annual costs for new or upgraded wastewater treatment
facilities were compared to the costs for off-site treatment at a CWT facility. Off-site disposal costs were
estimated at $0.25 per gallon of wastewater treated. Transportation costs were added to the off-site
treatment costs at a rate of $3.00 per loaded mile using an average distance of 250 miles to the treatment
facility. Transportation costs were based upon the use of a 5,000 gallon tanker truck load. Facilities which
treat their wastewaters off-site are considered zero dischargers and hence would not incur ancillary costs
such as residual disposal, monitoring and land, except for permit modification costs. After review and

7-56
comparison of costs, EPA found off-site disposal costs to be cost prohibitive because it was more
expensive than on-site treatment. Therefore none of the eight facilities were costed for off-site disposal.
7.6 COSTS FOR REGULATORY OPTIONS
The following sections present the treatment costs for complying with the CHWC guideline for the
BPT/BCT/BAT, PSES, NSPS, and PSNS options.
7.6.1 BPT/BCT/BAT Costs
One BPT/BCT/BAT option was selected based upon the treatment technology sampled at a
selected facility. Engineering costs for this BPT/BCT/BAT option is presented below.
7.6.1.1 BPT/BCT/BAT Option: Two-Stage Chemical Precipitation and Sand Filtration
The BPT/BCT/BAT option consists of a two-stage chemical precipitation treatment system using
sodium hydroxide in the first precipitation stage with ferric chloride and sodium hydroxide in the second
stage. Sodium bisulfite is used at the head of the treatment system for hexavalent chromium removal. A
sand filter is provided at the end of the treatment system to polish the effluent. Sludge dewatering is also
provided in this option. Table 7-10 presents the total capital and O&M costs for this option. This table
also presents the total amortized annual cost for each facility.
7.6.2 PSES Costs
One PSES option was selected based upon the technology sampled at a selected facility. This
PSES option is equivalent to the BPT/BCT/BAT option presented above. Engineering costs for this PSES
option is presented below.

7-57
7.6.2.1 PSES Option: Two-Stage Chemical Precipitation and Sand Filtration
The PSES option consists of a two-stage chemical precipitation treatment system using sodium
hydroxide in the first precipitation stage with ferric chloride and sodium hydroxide in the second stage.
Sodium bisulfite is used at the head of the treatment system for hexavalent chromium removal. A sand filter
is provided at the end of the treatment system. Sludge dewatering is also provided in this option. This
PSES option is equivalent to the BPT/BCT/BAT option. Table 7-10 (previously referenced) presents the
total capital and O&M costs for this option. This table also presents the total amortized annual cost for
each facility.
7.6.3 New Source Performance Standards Costs
The New Source Performance Standards (NSPS) for the CHWC Industry are equivalent to the
limitations for the BPT/BCT/BAT option. Therefore, NSPS consists of a two-stage chemical precipitation
treatment system using sodium hydroxide in the first precipitation stage with ferric chloride and sodium
hydroxide in the second stage. Sodium bisulfite is used at the head of the treatment system for hexavalent
chromium reduction. A sand filter is provided at the end of the treatment system to polish the effluent.
Sludge dewatering is also provided in this option. NSPS costs were estimated using an industry average
flow rate of approximately 280,948 gpd and loadings similar to the representative BPT/BCT/BAT facility
(see Section 6). The total NSPS amortized annual cost is $550,248 assuming an average facility daily flow
of 280,948 gpd. A breakdown of the NSPS capital and O&M costs are presented on Table 7-11.
7.6.4 Pretreatment Standards for New Sources Costs
The Pretreatment Standards for New Sources (PSNS) for the CHWC Industry is equivalent to
the limitations for the PSES option. This option is also equivalent to the BPT/BCT/BAT option. Therefore,
PSNS consists of a two-stage chemical precipitation treatment system using sodium hydroxide in the first
precipitation stage with ferric chloride and sodium hydroxide in the second stage. Sodium bisulfite is used

Table 7-11. Summary of Costs - NSPS/PSNS
AVERAGE CA P I TA L COSTS ($ ) A M ORTI ZED O & M COSTS ($ /YR) TOTA L
F LOW RA TE RETROFIT & PERMIT TOTA L TOTA L CA P I TA L* SOLIDS TOTA L ANNUA L
TYPE (gpd) EQUIPMENT UPGRADE MODIFICA TION LAND CA P I TA L ($ /YR) EQUIPMENT DISPOSA L MONITORING O & M COST ($ /YR)
NSP S 280,948 1,693,819 0 0 149,176 1,842,995 202,351 298,300 14,128 35,470 347,897 550,248
P SNS 280,948 1,693,819 0 0 149,176 1,842,995 202,351 298,300 14,128 35,470 347,897 550,248
* A ssuming 7% interest over a fifteen year pe riod.
Table 7-10. Summary of Costs - BPT/BCT/BAT/PSES Final
AVERAGE CA P I TA L COSTS ($ ) A M ORTI ZED O & M COSTS ($ /YR) TOTA L
F LOW RA TE RETROFIT & PERMIT TOTA L TOTA L CA P I TA L* SOLIDS TOTA L A N N UA L
ID# (gpd) EQUIPMENT UPGRA D E MODIFICA TION LAND CA P I TA L ($ /YR) EQUIPMENT DISPOSA L MONITORING O & M COST ($ /YR)
5736 144,290 611,635 152,909 0 61,158 825,701 90,658 140,834 6,715 32,454 180,003 270,661
5737 174,360 0 0 0 0 0 0 0 0 31,078 31,078 31,078
5761 510,490 880,521 220,130 0 193,198 1,293,849 142,058 178,681 23,586 30,678 232,945 375,002
5765 47,340 757,143 0 0 237,628 994,771 109,221 184,273 29,186 20,010 233,469 342,690
5782 114,010 496,348 124,087 0 23,000 643,435 70,646 100,143 6,606 20,628 127,377 198,023
5797 135,580 528,301 132,075 0 51,488 711,864 78,159 104,742 6,116 20,910 131,768 209,927
5798 1,007,640 874,679 218,670 0 102,976 1,196,325 131,350 244,830 47,994 30,686 323,510 454,860
5720 113,870 1,183,603 0 0 45,530 1,229,133 134,952 285,533 76,606 35,470 397,610 532,562
TOTA LS 2,247,580 5,332,230 847,871 0 714,978 6,895,079 757,043 1,239,035 196,810 221,914 1,657,759 2,414,802
* A ssuming 7% intere st over a fif teen year pe riod.
NOTE: Due to low flow, costs for 5037 and 5624 we re c a lculated based on off-site d isposal cost
7-58

7-59
at the head of the treatment system for hexavalent chromium reduction. Sludge dewatering is also provided
in this option. PSNS costs were estimated using an industry average flow rate of approximately 280,948
gpd and loadings similar to the representative BPT/BCT/BAT facility (see Section 6.0). The total PSNS
amortized annual cost is $550,248 assuming an average facility flow of 280,948 gpd. A breakdown of
the PSNS capital and O&M costs are presented on Table 7-11, referenced above.

8-1
SECTION 8
DEVELOPMENT OF LIMITATIONS AND STANDARDS
This section describes various waste treatment technologies and their costs, pollutants chosen for
regulation, and pollutant reductions associated with the different treatment technologies evaluated for the
final effluent limitations guidelines and standards for the Commercial Hazadous Waste Combustor (CHWC)
Industry. The limitations and standards discussed in this section are Best Practicable Control Technology
Currently Available (BPT), Best Conventional Pollutant Control Technology (BCT), Best Available
Technology Economically Achievable (BAT), New Source Performance Standards (NSPS), Pretreatment
Standards for Existing Sources (PSES), and Pretreatment Standards for New Sources (PSNS).
For this rule, EPA has combined the presentation of the final regulatory option for direct and
indirect dischargers. EPA has combined these because there are no differences between direct and indirect
discharges with respect to the characteristics of wastewater generated or the model process technologies
considered to develop the final limitations and standards, as well as to prevent the disclosure of confidential
business information.
8.1 ESTABLISHMENT OF BPT/BCT/BAT/PSES
Generally, EPA bases BPT upon the average of the best current performance (in terms of pollutant
removals in treated effluent) by facilities of various sizes, ages, and unit processes within an industry
subcategory. The factors considered in establishing BPT include: (1) the total cost of applying the
technology relative to pollutant reductions, (2) the age of process equipment and facilities, (3) the processes
employed and required process changes, (4) the engineering aspects of the control technology, (5) non-
water quality environmental impacts such as energy requirements, air pollution, and solid waste generation,
and (6) such other factors as the Administrator deems appropriate (Section 304(b)(2)(B) of the Act.) As
noted, BPT technology represents the average of the best existing performances of facilities within the
industry. EPA looks at the performance of the best operated treatment systems and calculates limitations
from some level of average performance of these "best" facilities. For example, in the BPT limitations for

8-2
the Oragnic Chemicals, Plastics, and Synthetic Fibers (OCPSF) Category, EPA identified “best” facilities
on a BOD performance criteria of achieving a 95 percent BOD removal or a BOD effluent level of 40 mg/l
(52 FR 42535, November 5, 1987). When existing performance is uniformly inadequate, EPA may
require a higher level of control than is currently in place in an industrial category if EPA determines that
the technology can be practically applied. BPT may be transferred from a different subcategory or
category. However, BPT normally focuses on end-of-process treatment rather than process changes or
internal controls, except when these technologies are common industry practice.
The cost/effluent reduction inquiry for BPT is a limited balancing one, committed to EPA's
discretion, that does not require the Agency to quantify effluent reduction benefits in monetary terms. (See,
e.g., American Iron and Steel v. EPA, 526 F. 2d 1027 (3rd Cir., 1975.)) In balancing costs against the
effluent reduction benefits, EPA considers the volume and nature of discharges expected after application
of BPT, the general environmental effects of pollutants, and the cost and economic impacts of the required
level of pollution control. In developing guidelines, the Act does not require or permit consideration of
water quality problems attributable to particular point sources, or water quality improvements in particular
bodies of water. Therefore, EPA has not considered these factors in developing the final limitations. (See
Weyerhaeuser Company v. Costle, 590 F. 2d 1011 (D.C. Cir. 1978.))
EPA set BAT effluent limitations for the CHWC Industry based upon the same technologies
evaluated for BPT. The final BAT effluent limitations control identified priority and non-conventional
pollutants discharged from facilities. EPA has not identified any more stringent treatment technology option
which it considered to represent BAT level of control applicable to facilities in this industry.
EPA considered and rejected zero discharge as possible BAT technology for the following reasons.
EPA determined that combustors have two main options for achieving zero discharge -- off-site disposal
or on-site incineration. Facilities will likely choose off-site disposal where the cost of on-site incineration
is greater than the cost of off-site disposal. But off-site disposal ultimately results in some pollutant
discharge to surface waters which will exceed the level achieved by BPT unless the limitations and
standards applicable to the off-site treater are equivalent to this guideline. EPA is concerned that adopting
a BAT zero discharge requirement may, in actuality, result in fewer effluent reductions than expected from

8-3
today’s limitations and standards. The second option for zero discharge is on-site disposal/elimination. In
this case, a facility must either incinerate its scrubber water or replace its wet scrubbing system with a dry
scrubber. EPA has determined that on-site incineration would be more expensive than off-site disposal
and therefore would result in off-site treatment. Similarly, EPA believes, but cannot confirm, that the cost
of changing air pollution control systems is probably so high that a combustor would send its scrubber water
off-site for treatment. Moreover, even if the cost is not greater, EPA found that replacement of wet
scrubbing systems with dry scrubbers may result in an unstable solid (as opposed to the stable solids
generated in wastewater treatment systems) that must be disposed of in a landfill, with potentially adverse,
non-water quality effects. Consequently, EPA determined that zero discharge is not, in fact, the best
available technology. EPA is promulgating BAT limitations equal to the BPT limitations for the non-
conventional and priority pollutants covered under BPT.
Section 307(b) requires EPA to promulgate pretreatment standards to prevent the introduction into
POTWs of pollutants that are not susceptible to treatment or which would interfere with the operation of
POTWs. EPA is establishing PSES for this industry to prevent pass through of the same pollutants
controlled by BAT from POTWs to waters of the U.S.
EPA considered the same regulatory options as in the BPT analysis to reduce the discharge of
pollutants by CHWC facilities. The Agency is proposing to adopt PSES pretreatment standards based
on the same technology as BAT.
As discussed in Sections 2 and 6, EPA concluded that three of the facilities it surveyed are using
best practicable, currently available technology. Thus, the final BPT/BCT/BAT/PSES effluent limitations
are based on the data from three treatment systems.
As pointed out previously, CHWC facilities burn highly variable wastes that, in many cases, are
process residuals and sludges from other point source categories. The wastewater produced in combustion
of these wastes contains a wide variety of metals. Chemical precipitation for these metals at a single pH
is not adequate treatment for metals removal from such a highly variable waste stream. EPA's review of
existing permit limitations for the direct dischargers show that, in most cases, the dischargers are subject

8-4
to "best professional judgment" (BPJ) concentration limitations which were developed from guidelines for
facilities treating and discharging much more specific waste streams (e.g. Metal Finishing limitations).
Specifically, EPA has based the final BPT/BCT/BAT/PSES effluent limitations on data from the
CHWC facility used in the development of the proposed IWC limitations as well as data from two other
CHWC facilities that submitted sampling data to EPA (See 64 FR 26714, May 17, 1999) following
proposal of the IWC rule. Based on a thorough analysis of the sampling data, EPA considered only one
option for the final BPT/BCT/BAT/PSES limitations. EPA concluded that a two-stage precipitation
process with or without a sand filtration polishing step provided the greatest overall pollutant removals at
a cost that is economically achievable at most CHWC facilities. Consequently, EPA has based the final
limitations on this treatment technology.
In determining BPT/BCT/BAT/PSES, EPA evaluated metals precipitation as the principal treatment
practice within the CHWC Industry. Seven of the eight facilities in the CHWC Industry currently use some
type of metals precipitation as a means for waste treatment. The precipitation techniques used by facilities
varied in the treatment chemicals used and in the number of stages of precipitation used.
The currently available treatment system for which the EPA assessed performance for
BPT/BCT/BAT/PSES is:
• Option 1 - Chromium Reduction (as necessary), Primary Precipitation, Solid-Liquid
Separation, Secondary Precipitation, Solid-Liquid Separation, with (or without) Sand
Filtration. Under Option 1, BPT/BCT/BAT/PSES limitations and standards would be based
upon two stages of chemical precipitation, each followed by some form of separation and sludge
dewatering. The pHs used for the two stages of chemical precipitation would be different in order
to promote optimal removal of metals because different metals are preferentially removed at
different pH levels. In addition, the first stage of chemical precipitation is preceded by chromium
reduction, when necessary. Also, sand filtration is used at the end of the treatment train, when
necessary. In some cases, BPT/BCT/BAT/PSES limitations and standards would require the
current treatment technologies in place to be improved by use of increased quantities of treatment
chemicals and additional chemical precipitation/sludge dewatering systems.

8-5
The Agency is promulgating BPT/BCT/BAT effluent limitations for 11 pollutants and PSES for 10
pollutants for the CHWC Industry. These limitations and standards were developed based on an
engineering evaluation of the average level of pollutant reduction achieved through application of the best
practical control technology currently available for the discharges of the regulated pollutants. The daily
maximum and monthly average BPT/BCT/BAT limitations and PSES standards for the CHWC Industry
are presented in Tables 8-1 and 8-2, respectively. Long-term averages, daily variability factors and
monthly variability factors for the selected technology are also presented in Tables 8-1 and 8-2. A
combination of two different methodologies was used in the development of the variability factors (monthly
and daily). Specifically, pollutant-specific variability factors were calculated and used when a metal
pollutant was detected a sufficient number of times in the effluent sampling data. However, when a metal
pollutant could not be calculated using the effluent sampling data due to the fact that too few points were
detected above the minimum level, a group-level variability factor was used. The group-level variability
factor is the mean of the pollutant-level variability factors calculated for the entire group of metals found in
significant concentrations in the facility used to estimate variability for the CHWC Industry. These metals
are: aluminum, antimony, arsenic, boron, cadmium, copper, iron, manganese, molybdenum, selenium,
titanium and zinc. The Statistical Support Document of Proposed Effluent Limitations Guidelines and
Standards for Industrial Waste Combustors (EPA 821-B-99-010) provides more detailed information
on the development of the limitations for this option.
Table 8-1. BPT/BCT/BAT Effluent Limitations (ug/l)
Pollutant or Long-Term Daily Monthly Maximum for MonthlyPollutant Average Variability Variability Any One Day AverageParameter Factor Factor
(ug/l) (Rounded) (Rounded) (ug/l) (ug/l)
Conventional Pollutants
TSS 27,200 4.2 1.3 113,000 34,800
pH (1)
Priority and Non-Conventional Pollutants
Arsenic 41.8 2.0 2.0 84 72
Cadmium 11.4 6.2 2.2 71 26

Pollutant or Long-Term Daily Monthly Maximum for MonthlyPollutant Average Variability Variability Any One Day AverageParameter Factor Factor
(ug/l) (Rounded) (Rounded) (ug/l) (ug/l)
8-6
Chromium 10 2.5 1.5 25 14
Copper 10.7 2.2 1.3 23 14
Lead 22.4 2.5 1.5 57 32
Mercury 0.899 2.5 1.5 2.3 1.3
Silver 5.27 2.5 1.5 13 8
Titanium 10.0 6.0 2.2 60 22
Zinc 37.3 2.2 1.5 82 54
(1)Within the range 6.0 to 9.0 pH units.
Table 8-2. PSES Pretreatment Standards (ug/l)
Pollutant or Long-Term Daily Monthly Maximum for MonthlyPollutant Average Variability Variability Any One Day AverageParameter Factor Factor
(ug/l) (Rounded) (Rounded) (ug/l) (ug/l)
Priority and Non-Conventional Pollutants
Arsenic 41.8 2.0 2.0 84 72
Cadmium 11.4 6.2 2.2 71 26
Chromium 10 2.5 1.5 25 14
Copper 10.7 2.2 1.3 23 14
Lead 22.4 2.5 1.5 57 32
Mercury 0.899 2.5 1.5 2.3 1.3
Silver 5.27 2.5 1.5 13 8
Titanium 10.0 6.0 2.2 60 22
Zinc 37.3 2.2 1.5 82 54
EPA's decision to base BPT limitations on the selected treatment reflects primarily an evaluation
of three factors: the degree of effluent reduction attainable, the total cost of the proposed treatment
technologies in relation to the effluent reductions achieved, and potential non-water quality benefits. No
basis could be found for identifying different BPT limitations based on age, size, process or other
engineering factors. Neither the age nor the size of the CHWC facility will significantly affect either the

8-7
character or treatability of the wastes or the cost of treatment. Further, the treatment process and
engineering aspects of the technologies considered have a relatively insignificant effect because in most
cases they represent fine tuning or add-ons to treatment technology already in use. These factors
consequently did not weigh heavily in the development of these guidelines.
The Agency has concluded that this treatment system represents the best practicable technology
currently available and should be the basis for the BPT limitations for the following reasons. First, the
demonstrated effluent reductions attainable through this control technology represent performance that may
be achieved through the application of demonstrated treatment measures currently in operation in this
industry. Three facilities employing the identified BPT technology were used in the database to calculate
the effluent limitations. This database reflects technology and removals readily applicable to all facilities.
Second, the adoption of this level of control would represent a significant reduction in pollutants discharged
into the environment (approximately 94,000 pounds of TSS and metals). Third, the Agency assessed the
total cost of water pollution controls likely to be incurred, in relation to the effluent reduction benefits and
found those costs were reasonable. The pretax total estimated annualized cost in 1998 dollars is
approximately $2.9 million at the eight direct and indirect discharging facilities. EPA’s assessment shows
that one of the eight CHWC facilities will experience a line closure as a result of the installation of the
necessary technology.
EPA set BCT equivalent to the BPT guidelines for the conventional pollutants covered under BPT.
In developing BCT limits, EPA considered whether there are technologies that achieve greater removals
of conventional pollutants than for BPT, and whether those technologies are cost-reasonable according to
the BCT Cost Test. EPA identified no technologies that can achieve greater removals of conventional
pollutants than for BPT that are also cost-reasonable under the BCT Cost Test, and accordingly, EPA set
BCT effluent limitations equal to the BPT effluent limitations guidelines and pretreatment standards.
8.2 NSPS
As previously noted, under Section 306 of the Act, new industrial direct dischargers must comply
with standards which reflect the greatest degree of effluent reduction achievable through application of the

8-8
best available demonstrated control technologies. Congress envisioned that new treatment systems could
meet tighter controls than existing sources because of the opportunity to incorporate the most efficient
processes and treatment systems into plant design. Therefore, Congress directed EPA to consider the best
demonstrated process changes, in-plant controls, operating methods and end-of-pipe treatment
technologies that reduce pollution to the maximum extent feasible.
EPA proposed to establish NSPS equal to BPT/BCT/BAT for all conventional, non-conventional
and priority pollutants covered under BPT. EPA has decided that it should not promulgate NSPS based
on any more stringent technology. EPA considered basing NSPS on zero discharge but has rejected this
technology. As explained above, EPA has concluded that zero discharge may not ultimately result in any
reduction in effluent discharges relative to BPT/BCT/BAT levels or it may have unacceptable non-water
quality effects.
EPA is promulgating NSPS that would control the same conventional, priority, and non-
conventional pollutants as the BPT effluent limitations. The technologies used to control pollutants at
existing facilities are fully applicable to new facilities. Therefore, EPA is promulgating NSPS limitations that
are identical to BPT/BCT/BAT/PSES.
EPA considered the cost of the NSPS technology for new facilities. EPA concluded that such
costs are not so great as to present a barrier to entry, as demonstrated by the fact that currently operating
facilities are using these technologies. The Agency considered energy requirements and other non-water
quality environmental impacts and found no basis for any different standards than the selected NSPS.
8.3 PSNS
Section 307(c) of the Act requires EPA to promulgate pretreatment standards for new sources
(PSNS) at the same time it promulgates new source performance standards (NSPS). New indirect
discharging facilities, like new direct discharging facilities, have the opportunity to incorporate the best
available demonstrated technologies, process changes, in-facility controls, and end-of-pipe treatment
technologies.

8-9
As set forth in Section 5.3 of this document, EPA determined that all of the pollutants selected for
regulation for the CHWC Industry pass through POTWs. The same technologies discussed previously for
BPT, BCT, BAT, NSPS, and PSES are available as the basis for PSNS.
EPA promulgated pretreatment standards for new sources equal to PSES for priority and non-
conventional pollutants. The Agency is establishing PSNS for the same priority and non-conventional
pollutants as for PSES. EPA considered the cost of the proposed PSNS technology for new facilities.
EPA concluded that such costs are not so great as to present a barrier to entry, as demonstrated by the
fact that currently operating facilities are using these technologies. The Agency considered energy
requirements and other non-water quality environmental impacts and found no basis for any different
standards than the selected PSNS.
8.4 COST OF TECHNOLOGY OPTIONS
The Agency estimated the cost for CHWC facilities to achieve each of the proposed effluent
limitations and standards. All cost estimates in this section are presented in 1998 dollars. The cost
components reported in this section represent estimates of the investment cost of purchasing and installing
equipment, the annual operating and maintenance costs associated with that equipment and additional costs
for discharge monitoring. The following sections present costs for BPT/PSES and BCT/BAT
8.4.1 BPT and PSES Costs
The Agency estimated the cost of implementing the BPT/PSES effluent limitations guidelines and
pretreatment standards by calculating the engineering costs of meeting the required effluent limitations for
each direct and indirect discharging CHWC. This facility-specific engineering cost assessment for BPT
began with a review of present waste treatment technologies. For facilities without a treatment technology
in place equivalent to the BPT technology, the EPA estimated the cost to upgrade its treatment technology,
and to use additional treatment chemicals to achieve the new discharge standards. The only facilities given
no cost for compliance were facilities with the treatment in place prescribed for the option. Details

8-10
pertaining to the development of the technology costs are included in Section 7. The capital expenditures
for the process change component of BPT/PSES are estimated to be approximately $8.2 million with
annual O&M costs of approximately $2.0 million for the eight CHWC facilities under the selected
regulatory technology option.
8.4.2 BCT and BAT Costs
The Agency estimated that there would be no cost of compliance for implementing BCT or BAT,
because the technology is identical to BPT and the costs are included with BPT.
8.5 POLLUTANT REDUCTIONS
8.5.1 Conventional Pollutant Reductions
EPA has calculated how much the total quantity of conventional pollutants that are discharged
would be reduced due to the adoption of the final BPT/BCT/BAT limitations. To do this, the Agency
developed an estimate of the long-term average (LTA) loading of TSS that would be discharged after the
implementation of BPT. Next, the BPT/BCT/BAT LTA for TSS was multiplied by 1992 wastewater flows
for each direct discharging facility in the industry to calculate BPT/BCT/BAT mass discharge loadings for
TSS for each facility. The BPT/BCT/BAT mass discharge loadings were subtracted from the estimated
current loadings to calculate the pollutant reductions for each facility. The Agency estimates that the final
regulations will reduce TSS discharges by approximately 80,000 pounds per year for the CHWC facilities.
The current discharges and BPT/BCT/BAT discharges for TSS are listed in Table 8-3.
8.5.2 Priority and Non-conventional Pollutant Reductions
8.5.2.1 Methodology
The proposed BPT, BCT, BAT and PSES will also reduce discharges of priority and non-
conventional pollutants. Applying the same methodology used to estimate conventional pollutant reductions

8-11
attributable to application of BPT/BCT/BAT control technology, EPA has also estimated priority and non-
conventional pollutant reductions for each facility.
Current loadings were estimated using the questionnaire data supplied by the industry, data
collected by the Agency in the field sampling program, facility POTW permit information and facility
NPDES permit information. For many facilities, data were not available for all pollutants of concern or
without the addition of other non-CHWC wastewater. Therefore, methodologies were developed to
estimate current performance for the industry (see Section 4.4 of this document).
In the construction of the plant-specific pollutant by pollutant loadings, in any case where the
technology option generated an estimated pollutant loading in excess of the current loading, the option
loading was set equal to the current loading. The rationale for the adoption of this methodology is
consistency with and similarity to the “anti-backsliding” provisions. Also, a well designed and operated
treatment system shouldn't increase pollutant loadings above current practice. (It should be noted in the
situation described above, no removal of the specific pollutant at the specific plant is achieved under the
technology option).
8.5.2.2 Direct and Indirect Discharges (BPT/BCT/BAT) and (PSES)
The Agency estimates that proposed BPT/BCT/BAT/PSES regulations will reduce direct and
indirect discharges of priority and non-conventional pollutants by approximately 13,400 pounds per year
for the eight CHWC facilities. The current discharges and BPT/BCT/BAT/PSES discharges for priority
and non-conventional pollutants are listed in Table 8-3.
Table 8-3. Direct and Indirect Discharge Loads (in lbs.)
Pollutant Name CAS NO Current Load BPT/BCT/BAT/PSESOption
Total Suspended Solids C-009 157,364 76,898
Aluminum 7429905 1,479 1,003
Antimony 7440360 3,938 2,126

Pollutant Name CAS NO Current Load BPT/BCT/BAT/PSESOption
8-12
Arsenic 7440382 776 108
Cadmium 7440439 379 63
Chromium 7440473 5,721 65
Copper 7440508 1,276 70
Iron 7439896 964 412
Lead 7439921 837 127
Mercury 7439976 32 5
Molybdenum 7439987 1,600 1,527
Selenium 7782492 197 88
Silver 7440224 195 34
Tin 7440315 484 272
Titanium 7440326 348 62
Zinc 7440666 1,361 236
Total 176,950 83,098
Note: One facility is projected to cease combustion operations while the facility will remain open (a line closure). Thefacility has been assigned 0 lbs. in the option loads.

9-1
SECTION 9
NON-WATER QUALITY IMPACTS
Section 304(b) and 306 of the Clean Water Act require EPA to consider non-water quality
environmental impacts (including energy requirements) associated with effluent limitations and guidelines.
Pursuant to these requirements, EPA has considered the possible effect of the Commercial Hazardous
Waste Combustors (CHWC) BPT, BCT, BAT, NSPS, PSES, and PSNS regulations on air pollution,
solid waste generation, and energy consumption. In evaluating the environmental impacts across all media,
it has been determined that the impacts discussed below are minimal and are justified by the benefits
associated with compliance with the CHWC regulations.
During CHWC wastewater treatment, the pollutants of concern are either removed from the
wastewater stream or concentrated. If the pollutants are removed, they are either transferred from the
wastewater stream to another medium (e.g., VOC emissions to the atmosphere) or end up as a treatment
residual, such as sludge. Subsequent removal of pollutants to another media and the disposition of these
wastewater treatment residuals result in non-water quality impacts. Non-water quality impacts evaluated
for the CHWC Industry regulations include air pollution and solid waste generation.
Wastewater treatment also results in other, non-water, non-residual, impacts. These impacts are
the consumption of energy used to power the wastewater treatment equipment.
9.1 AIR POLLUTION
CHWC facilities treat wastewater streams which contain very low concentrations of volatile organic
compounds (VOCs). These concentrations for most organic pollutants are typically below treatable levels.
This is due to the nearly total destruction of organic pollutants in the original wastes through the combustion
process, which prevents many of these pollutants from being detected in wastewaters and from being
released into the atmosphere and affecting air quality. Losses through fugitive emissions is not expected
to be significant as most of the organics present in the CHWC wastewater typically have a low volatility.
While the wastewater streams usually pass through collection units, cooling towers, and treatment units that

9-2
are open to the atmosphere, this exposure is not expected to result in any significant volatilization of VOCs
from the wastewater.
Since there are no significant air emissions generated by the selected BPT/BCT/BAT treatment
technologies, EPA believes that there are essentially no adverse air quality impacts anticipated as a result
of the CHWC regulations.
9.2 SOLID WASTE
Several of the wastewater treatment technologies used to comply with the CHWC regulations
generate a solid waste. The costs for disposal of these waste residuals were included in the compliance
cost estimates prepared for the regulatory options.
The solid waste treatment residual generated as a result of implementation of these regulations is
filter cake from chemical precipitation processes. In the BPT/PSES wastewater treatment trains of the
CHWC Industry, hydroxide and ferric chloride precipitation of metals generates a sludge residual. For
the BPT/BCT/BAT option, backwash from the sand filter is recirculated back to the treatment system prior
to the chemical precipitation processes, therefore all solids are removed from the treatment process in the
clarifiers. This sludge is dewatered, and the resultant filter cake is typically disposed of off-site into a
landfill. It is expected that the filter cake generated from chemical precipitation will contain high
concentrations of metals. As a result, this filter cake may be a RCRA hazardous waste. Depending upon
the wastewater usage and the resultant characteristics of the sludge, the sludge generated at a particular
facility may be either a listed or characteristic hazardous waste, pursuant to 40 CFR 261
regulations (Identification and Listing of Hazardous Waste). These filter cakes are considered to be a
characteristic hazardous waste based upon toxicity when the waste exceeds allowable standards based
upon the Toxicity Characteristic Leaching Procedure or exhibits other hazardous characteristics as defined
under 40 CFR 261 Subpart C (e.g., ignitability, corrosivity, or reactivity). Filter cake may also be
considered a RCRA listed waste (e.g., wastes which are hazardous based upon definition as per 40 CFR
261 Subpart D) depending upon the types of wastewater produced by the combustion process and
whether it is in contact with the wastes being combusted or residuals from the combustion process. EPA

9-3
evaluated the cost of disposing hazardous and non-hazardous filter cake. In the CHWC economic
evaluation, contract hauling for off-site disposal in a Subtitle C or D landfill was the method costed.
It is estimated that compliance with the BPT/PSES option would result in the disposal of 1.035
million pounds of hazardous and non-hazardous filter cake.
EPA believes that the disposal of this filter cake would not have an adverse effect on the
environment or result in the release of pollutants in the filter cake to other media. The disposal of these
wastes into controlled Subtitle D or C landfills are strictly regulated by the RCRA program. New landfills
are required to meet lining requirements to prevent the release of contaminants and to capture leachate.
Landfill capacity throughout the country can readily accommodate the additional solid waste expected to
be generated by the institution of this regulation. For costing purposes, it was assumed that these solid
wastes would be considered hazardous and will be disposed of into permitted RCRA landfills with
appropriate treatment of these filter cakes prior to disposition to achieve compliance with applicable RCRA
land-ban treatment requirements (e.g., stabilization) pursuant with 40 CFR 268 regulations, if necessary.
9.3 ENERGY REQUIREMENTS
In each of the regulatory options, operation of wastewater treatment equipment results in the
consumption of energy. This energy is used to power pumps, mixers, and other equipment components,
to power lighting and controls, and to generate heat. The CHWC BPT/BCT/BAT option would require
the consumption of 1,672 thousand kilowatt-hours per year of electricity for both direct and indirect
dischargers. This is the equivalent of 937 barrels per year of #2 fuel oil, as compared with the 1992 rate
of consumption in the United States of 40.6 million barrels per year. The BPT/BCT/BAT option represents
an increase in the production or importation of oil of 2.3 x 10 percent annually. Based upon this relatively-5
low increase in oil consumption, EPA believes that the implementation of this regulation would cause no
substantial impact to the oil industry.
In 1992, approximately 2,797.2 billion kilowatt hours of electric power were generated in the
United States. The additional energy consumption requirements for the BPT/BCT/BAT option
corresponds to approximately 5.9 x 10 percent of the national requirements. This increase in energy-7

9-4
requirements to implement the BPT/PSES technologies will result in an air emissions impact from electric
power generating facilities. It is expected that air emissions parameters generated by electric producing
facilities, such as particulates, NO and SO , will be impacted. This increase in air emissions is expectedX 2
to be directly proportional to the increase in energy requirements, or approximately 5.9 x 10 percent.-7
EPA believes this additional increase in air emissions from electric generating facilities to be minimal and
will result in no substantial impact to air emissions or detrimental results to air quality.

APPENDIX A
LISTING OF CHWC ANALYTES WITH AT LEAST ONE DETECT
A-1
Number Number Min. of ofAnalyte CAS_NO Level Obs. Detects Mean Min. Max.
ACETOPHENONE 98862 10 27 1 16.7 10.0 86.0
ALUMINUM 7429905 200 27 21 2924.8 13.6 34800.0
AMENABLE CYANIDE C-025 20 3 1 610.0 10.0 1810.0
AMMONIA AS NITROGEN 7664417 10 27 25 9244.1 100.0 75000.0
ANTIMONY 7440360 20 27 20 203.0 3.3 958.8
ARSENIC 7440382 10 27 15 236.1 1.1 1420.0
ATRAZINE 1912249 10 14 1 13.8 8.9 35.6
BARIUM 7440393 200 27 27 235.1 18.8 1158.8
BENZOIC ACID 65850 50 27 3 117041.1 50.0 3157556.0
BERYLLIUM 7440417 5 27 1 0.9 0.2 1.5
BIS(2-ETHYLHEXYL) PHTHALATE 117817 10 27 5 20.7 10.0 86.0
BISMUTH 7440699 100 25 7 164.1 0.1 887.0
BOD 5-DAY (CARBONACEOUS) C-002 2000 27 17 491014.8 1000.0 10100000.0
BORON 7440428 100 27 26 10920.4 20.0 182000.0
BROMODICHLOROMETHANE 75274 10 27 2 12.4 10.0 58.7
CADMIUM 7440439 5 27 16 273.7 1.2 2616.0
CALCIUM 7440702 5000 27 27 181209.8 5299.0 1270000.0
CARBON DISULFIDE 75150 10 27 1 26.9 10.0 466.6
CERIUM 7440451 1000 25 4 479.6 1.0 1000.0
CHEMICAL OXYGEN DEMAND (COD) C-004 5000 27 27 1206003.7 13000.0 19100000.0
CHLORIDE 16887006 1000 27 27 8331377.8 40000.0 28300000.0
CHLOROFORM 67663 10 27 1 10.2 10.0 15.6

APPENDIX A
LISTING OF CHWC ANALYTES WITH AT LEAST ONE DETECT
A-2
Number Number Min. of ofAnalyte CAS_NO Level Obs. Detects Mean Min. Max.
CHROMIUM 7440473 10 27 22 222.7 3.6 1650.0
COBALT 7440484 50 27 13 21.7 2.3 221.0
COPPER 7440508 25 27 26 1390.0 8.5 10554.0
DALAPON 75990 0 11 3 0.7 0.2 1.8
DIBENZOTHIOPHENE 132650 10 27 1 16.6 10.0 86.0
DIBROMOCHLOROMETHANE 124481 10 27 2 17.1 10.0 115.5
DICAMBA 1918009 0 11 2 0.5 0.2 1.8
DICHLORPROP 120365 1 11 5 7.2 1.0 47.0
DINOSEB 88857 1 11 2 1.2 0.5 4.5
DYSPROSIUM 7429916 100 25 1 74.9 0.1 100.0
ERBIUM 7440520 100 25 1 73.9 0.1 100.0
EUROPIUM 7440531 100 25 4 73.4 0.1 100.0
FLUORIDE 16984488 100 27 27 436669.2 120.0 7500000.0
GADOLINIUM 7440542 500 25 3 209.1 0.5 500.0
GALLIUM 7440553 500 25 2 224.2 0.5 500.0
GERMANIUM 7440564 500 25 1 367.7 0.5 500.0
HAFNIUM 7440586 1000 25 1 468.6 1.0 1000.0
HEXANOIC ACID 142621 10 27 2 23.1 10.0 142.3
HEXAVALENT CHROMIUM 18540299 10 17 4 18.2 10.0 76.0
HOLMIUM 7440600 500 25 3 365.0 0.5 500.0
INDIUM 7440746 1000 25 4 489.4 1.0 1000.0
IODINE 7553562 1000 20 6 4301.3 500.0 20798.1

APPENDIX A
LISTING OF CHWC ANALYTES WITH AT LEAST ONE DETECT
A-3
Number Number Min. of ofAnalyte CAS_NO Level Obs. Detects Mean Min. Max.
IRIDIUM 7439885 1000 25 7 539.7 1.0 1708.0
IRON 7439896 100 27 27 6241.6 149.0 50600.0
ISOPHORONE 78591 10 27 1 16.5 10.0 86.0
LANTHANUM 7439910 100 25 2 74.8 0.1 100.0
LEAD 7439921 50 27 18 1609.7 2.1 13248.0
LITHIUM 7439932 100 25 12 177.5 29.1 532.8
LUTETIUM 7439943 100 25 2 72.3 0.1 100.0
MAGNESIUM 7439954 5000 27 27 18968.0 1080.0 316000.0
MANGANESE 7439965 15 27 27 173.0 4.0 1534.6
MCPA 94746 50 11 4 334.0 50.0 1980.0
MCPP 7085190 50 11 4 383.7 50.0 2594.0
MERCURY 7439976 0 27 19 26.2 0.1 217.0
METHYLENE CHLORIDE 75092 10 27 2 10.1 10.0 12.5
MOLYBDENUM 7439987 10 27 19 245.4 4.0 1024.4
MONOCROTOPHOS 6923224 2 3 1 2.0 2.0 2.0
N-DECANE 124185 10 27 1 44.9 10.0 780.0
N-DOCOSANE 629970 10 27 1 17.0 10.0 86.0
N-DODECANE 112403 10 27 1 18.1 10.0 86.0
N-EICOSANE 112958 10 27 1 18.4 10.0 86.0
N-HEXACOSANE 630013 10 27 2 19.5 10.0 92.9
N-OCTACOSANE 630024 10 27 2 20.3 10.0 95.7
N-TETRADECANE 629594 10 27 1 17.0 10.0 86.0

APPENDIX A
LISTING OF CHWC ANALYTES WITH AT LEAST ONE DETECT
A-4
Number Number Min. of ofAnalyte CAS_NO Level Obs. Detects Mean Min. Max.
N-TRIACONTANE 638686 10 27 2 17.3 10.0 86.0
NEODYMIUM 7440008 500 25 7 214.4 0.5 500.0
NICKEL 7440020 40 27 19 166.6 4.5 872.0
NIOBIUM 7440031 1000 25 7 482.7 29.3 1000.0
NITRATE/NITRITE C-005 50 27 27 3769.0 210.0 33280.0
NORFLURAZON 27314132 1 14 1 1.9 1.0 8.9
OCDD 3268879 0 27 11 0.0 0.0 0.0
OCDF 39001020 0 27 7 0.0 0.0 0.0
OIL AND GREASE C-036 5000 24 3 63875.0 5000.0 1350000.0
OSMIUM 7440042 100 25 1 75.2 0.1 100.0
P-CRESOL 106445 10 27 1 425.5 10.0 11056.8
PHENOL 108952 10 27 3 4936.9 10.0 132818.0
PHOSPHORUS 7723140 1000 20 18 17222.9 204.7 225800.0
PLATINUM 7440064 1000 25 4 488.5 1.0 1000.0
POTASSIUM 7440097 1000 20 19 112658.6 478.6 805000.0
PRASEODYMIUM 7440100 1000 25 3 723.0 1.0 3910.0
RHENIUM 7440155 1000 25 5 530.6 19.4 1000.0
RHODIUM 7440166 1000 25 3 732.1 1.0 1000.0
RUTHENIUM 7440188 1000 25 4 471.5 1.0 1000.0
SAMARIUM 7440199 500 25 4 369.3 0.5 500.0
SCANDIUM 7440202 100 25 4 72.3 0.1 100.0
SELENIUM 7782492 5 27 17 86.4 0.5 429.2

APPENDIX A
LISTING OF CHWC ANALYTES WITH AT LEAST ONE DETECT
A-5
Number Number Min. of ofAnalyte CAS_NO Level Obs. Detects Mean Min. Max.
SILICON 7440213 100 25 24 26447.4 28.2 340000.0
SILVER 7440224 10 27 13 72.3 1.0 390.8
SODIUM 7440235 5000 27 27 7414026.5 6400.0 62400000.0
STRONTIUM 7440246 100 25 19 650.9 32.7 4190.0
SULFUR 7704349 1000 20 20 11699602.3 2145.0 174000000.0
TANTALUM 7440257 500 25 1 364.4 0.5 500.0
TERBIUM 7440279 500 25 4 370.7 0.5 500.0
THALLIUM 7440280 10 27 5 8.3 1.2 20.2
THORIUM 7440291 1000 25 2 477.5 1.0 1000.0
THULIUM 7440304 500 25 3 362.2 0.5 500.0
TIN 7440315 30 27 15 451.3 14.5 6046.0
TITANIUM 7440326 5 27 21 638.2 2.2 4474.2
TOTAL CYANIDE 57125 20 17 5 202.3 10.0 3160.0
TOTAL DISSOLVED SOLIDS C-010 10 27 27 23962622.2 89000.0 185000000.0
TOTAL ORGANIC CARBON (TOC) C-012 1000 27 9 179621.5 1700.0 4540000.0
TOTAL PHENOLS C-020 50 27 7 5525.7 6.0 146000.0
TOTAL PHOSPHORUS 14265442 10 27 24 1173.3 10.0 4520.0
TOTAL SULFIDE (IODOMETRIC) 18496258 1000 27 22 88296.7 10.0 1180000.0
TOTAL SUSPENDED SOLIDS C-009 4000 27 19 112529.6 1000.0 522000.0
TRIBROMOMETHANE 75252 10 27 2 19.2 10.0 162.4
TRICHLOROFLUOROMETHANE 75694 10 27 1 11.1 10.0 39.6
TUNGSTEN 7440337 1000 25 5 559.6 93.2 1000.0

APPENDIX A
LISTING OF CHWC ANALYTES WITH AT LEAST ONE DETECT
A-6
Number Number Min. of ofAnalyte CAS_NO Level Obs. Detects Mean Min. Max.
URANIUM 7440611 1000 25 11 4697.9 10.1 67100.0
VANADIUM 7440622 50 27 16 70.7 1.7 488.2
YTTERBIUM 7440644 100 25 1 73.1 0.1 100.0
YTTRIUM 7440655 5 27 4 3.5 0.4 7.4
ZINC 7440666 20 27 27 4482.3 44.7 28569.0
ZIRCONIUM 7440677 100 25 5 152.0 0.1 1310.0
1234678-HPCDD 35822469 0 27 7 0.0 0.0 0.0
1234678-HPCDF 67562394 0 27 9 0.0 0.0 0.0
123478-HXCDD 39227286 0 27 1 0.0 0.0 0.0
123478-HXCDF 70648269 0 27 4 0.0 0.0 0.0
1234789-HPCDF 55673897 0 27 3 0.0 0.0 0.0
123678-HXCDD 57653857 0 27 1 0.0 0.0 0.0
123678-HXCDF 57117449 0 27 4 0.0 0.0 0.0
12378-PECDD 40321764 0 27 1 0.0 0.0 0.0
12378-PECDF 57117416 0 27 2 0.0 0.0 0.0
123789-HXCDD 19408743 0 27 2 0.0 0.0 0.0
123789-HXCDF 72918219 0 27 1 0.0 0.0 0.0
2-BUTANONE 78933 50 27 1 73.3 49.9 678.2
2-PROPANONE 67641 50 27 4 56.8 49.9 141.5
2-PROPEN-1-OL 107186 10 27 2 15.8 10.0 93.9
2,4-D 94757 1 11 2 2.5 1.0 8.9
2,4-DB 94826 2 11 1 4.6 2.0 17.9

APPENDIX A
LISTING OF CHWC ANALYTES WITH AT LEAST ONE DETECT
A-7
Number Number Min. of ofAnalyte CAS_NO Level Obs. Detects Mean Min. Max.
2,4,5-T 93765 0 11 1 0.5 0.2 1.8
2,4,5-TP 93721 0 11 2 0.5 0.2 1.8
234678-HXCDF 60851345 0 27 5 0.0 0.0 0.0
23478-PECDF 57117314 0 27 3 0.0 0.0 0.0
2378-TCDD 1746016 0 27 1 0.0 0.0 0.0
2378-TCDF 51207319 0 27 4 0.0 0.0 0.0

APPENDIX B
LISTING OF CHWC ANALYTES WITH NO DETECTS
B-1
Number Min. of Analyte CAS_NO Level Obs.
ACENAPHTHENE 83329 10 27
ACENAPHTHYLENE 208968 10 27
ACEPHATE 30560191 20 14
ACIFLUORFEN 50594666 10 14
ACRYLONITRILE 107131 50 27
ALACHLOR 15972608 0 14
ALDRIN 309002 0 14
ALPHA-BHC 319846 0 14
ALPHA-CHLORDANE 5103719 0 14
ALPHA-TERPINEOL 98555 10 27
ANILINE 62533 10 27
ANILINE, 2,4,5-TRIMETHYL- 137177 20 27
ANTHRACENE 120127 10 27
ARAMITE 140578 50 27
AZINPHOS ETHYL 2642719 2 11
AZINPHOS METHYL 86500 1 11
BENFLURALIN 1861401 0 14
BENZANTHRONE 82053 50 27
BENZENE 71432 10 27
BENZENETHIOL 108985 10 27
BENZIDINE 92875 50 27
BENZO(A)ANTHRACENE 56553 10 27

APPENDIX B
LISTING OF CHWC ANALYTES WITH NO DETECTS
B-2
Number Min. of Analyte CAS_NO Level Obs.
BENZO(A)PYRENE 50328 10 27
BENZO(B)FLUORANTHENE 205992 10 27
BENZO(GHI)PERYLENE 191242 20 27
BENZO(K)FLUORANTHENE 207089 10 27
BENZONITRILE, 3,5-DIBROMO-4-HYDROXY- 1689845 50 27
BENZYL ALCOHOL 100516 10 27
BETA-BHC 319857 0 14
BETA-NAPHTHYLAMINE 91598 50 27
BIPHENYL 92524 10 27
BIPHENYL, 4-NITRO 92933 10 27
BIS(2-CHLOROETHOXY)METHANE 111911 10 27
BIS(2-CHLOROETHYL) ETHER 111444 10 27
BIS(2-CHLOROISOPROPYL) ETHER 108601 10 27
BROMACIL 314409 1 14
BROMOMETHANE 74839 50 27
BROMOXYNIL OCTANOATE 1689992 1 14
BUTACHLOR 23184669 1 14
BUTYL BENZYL PHTHALATE 85687 10 27
CAPTAFOL 2425061 2 14
CAPTAN 133062 1 14
CARBAZOLE 86748 20 27
CARBOPHENOTHION 786196 1 14

APPENDIX B
LISTING OF CHWC ANALYTES WITH NO DETECTS
B-3
Number Min. of Analyte CAS_NO Level Obs.
CHLORFENVINPHOS 470906 2 11
CHLOROACETONITRILE 107142 10 27
CHLOROBENZENE 108907 10 27
CHLOROBENZILATE 510156 1 14
CHLOROETHANE 75003 50 27
CHLOROMETHANE 74873 50 27
CHLORONEB 2675776 1 14
CHLOROPROPYLATE 5836102 10 14
CHLOROTHALONIL 1897456 0 14
CHLORPYRIFOS 2921882 2 11
CHRYSENE 218019 10 27
CIS-PERMETHRIN 61949766 2 14
CIS-1,3-DICHLOROPROPENE 10061015 10 27
COUMAPHOS 56724 5 11
CROTONALDEHYDE 4170303 50 27
CROTOXYPHOS 7700176 99 27
DACTHAL (DCPA) 1861321 0 14
DEF 78488 2 11
DELTA-BHC 319868 0 14
DEMETON A 8065483A 2 11
DEMETON B 8065483B 2 11
DI-N-BUTYL PHTHALATE 84742 10 27

APPENDIX B
LISTING OF CHWC ANALYTES WITH NO DETECTS
B-4
Number Min. of Analyte CAS_NO Level Obs.
DI-N-OCTYL PHTHALATE 117840 10 27
DI-N-PROPYLNITROSAMINE 621647 20 27
DIALLATE A 2303164A 2 14
DIALLATE B 2303164B 2 14
DIAZINON 333415 2 11
DIBENZO(A,H)ANTHRACENE 53703 20 27
DIBENZOFURAN 132649 10 27
DIBROMOMETHANE 74953 10 27
DICHLOFENTHION 97176 2 11
DICHLONE 117806 2 14
DICHLORVOS 62737 5 11
DICOFOL 115322 1 14
DICROTOPHOS 141662 5 3
DIELDRIN 60571 0 14
DIETHYL ETHER 60297 50 27
DIETHYL PHTHALATE 84662 10 27
DIMETHOATE 60515 1 11
DIMETHYL PHTHALATE 131113 10 27
DIMETHYL SULFONE 67710 10 27
DIOXATHION 78342 5 3
DIPHENYL ETHER 101848 10 27
DIPHENYLAMINE 122394 10 27

APPENDIX B
LISTING OF CHWC ANALYTES WITH NO DETECTS
B-5
Number Min. of Analyte CAS_NO Level Obs.
DIPHENYLDISULFIDE 882337 20 27
DISULFOTON 298044 2 11
ENDOSULFAN I 959988 0 14
ENDOSULFAN II 33213659 1 14
ENDOSULFAN SULFATE 1031078 0 14
ENDRIN 72208 0 14
ENDRIN ALDEHYDE 7421934 0 14
ENDRIN KETONE 53494705 0 14
EPN 2104645 2 11
ETHALFLURALIN 55283686 0 14
ETHANE, PENTACHLORO- 76017 20 27
ETHION 563122 2 11
ETHOPROP 13194484 2 11
ETHYL CYANIDE 107120 10 27
ETHYL METHACRYLATE 97632 10 27
ETHYL METHANESULFONATE 62500 20 27
ETHYLBENZENE 100414 10 27
ETHYLENETHIOUREA 96457 20 27
ETRIDIAZOLE 2593159 0 6
FAMPHUR 52857 5 11
FENARIMOL 60168889 0 14
FENSULFOTHION 115902 5 11

APPENDIX B
LISTING OF CHWC ANALYTES WITH NO DETECTS
B-6
Number Min. of Analyte CAS_NO Level Obs.
FENTHION 55389 2 11
FLUORANTHENE 206440 10 27
FLUORENE 86737 10 27
GAMMA-BHC 58899 0 14
GAMMA-CHLORDANE 5103742 0 14
GOLD 7440575 1000 25
HEPTACHLOR 76448 0 14
HEPTACHLOR EPOXIDE 1024573 0 14
HEXACHLOROBENZENE 118741 10 27
HEXACHLOROBUTADIENE 87683 10 27
HEXACHLOROCYCLOPENTADIENE 77474 10 27
HEXACHLOROETHANE 67721 10 27
HEXACHLOROPROPENE 1888717 20 27
HEXAMETHYLPHOSPHORAMIDE 680319 2 3
INDENO(1,2,3-CD)PYRENE 193395 20 27
IODOMETHANE 74884 10 27
ISOBUTYL ALCOHOL 78831 10 27
ISODRIN 465736 0 14
ISOPROPALIN 33820530 0 14
ISOSAFROLE 120581 10 27
KEPONE 143500 1 14
LEPTOPHOS 21609905 2 11

APPENDIX B
LISTING OF CHWC ANALYTES WITH NO DETECTS
B-7
Number Min. of Analyte CAS_NO Level Obs.
LONGIFOLENE 475207 50 27
M-XYLENE 108383 10 27
MALACHITE GREEN 569642 10 27
MALATHION 121755 2 11
MERPHOS 150505 2 8
MESTRANOL 72333 20 27
METHAPYRILENE 91805 10 27
METHOXYCHLOR 72435 0 14
METHYL CHLORPYRIFOS 5598130 2 11
METHYL METHACRYLATE 80626 10 27
METHYL METHANESULFONATE 66273 20 27
METHYL PARATHION 298000 2 11
METHYL TRITHION 953173 5 3
METRIBUZIN 21087649 0 14
MEVINPHOS 7786347 5 11
MIREX 2385855 0 14
N-HEXADECANE 544763 10 27
N-NITROSODI-N-BUTYLAMINE 924163 10 27
N-NITROSODIETHYLAMINE 55185 10 27
N-NITROSODIMETHYLAMINE 62759 50 27
N-NITROSODIPHENYLAMINE 86306 20 27
N-NITROSOMETHYLETHYLAMINE 10595956 10 27

APPENDIX B
LISTING OF CHWC ANALYTES WITH NO DETECTS
B-8
Number Min. of Analyte CAS_NO Level Obs.
N-NITROSOMETHYLPHENYLAMINE 614006 99 27
N-NITROSOMORPHOLINE 59892 10 27
N-NITROSOPIPERIDINE 100754 10 27
N-OCTADECANE 593453 10 27
N-TETRACOSANE 646311 10 27
N,N-DIMETHYLFORMAMIDE 68122 10 27
NALED 300765 8 11
NAPHTHALENE 91203 10 27
NITROBENZENE 98953 10 27
NITROFEN 1836755 0 14
O+P XYLENE 136777612 10 27
O-ANISIDINE 90040 10 27
O-CRESOL 95487 10 27
O-TOLUIDINE 95534 10 27
O-TOLUIDINE, 5-CHLORO- 95794 10 27
P-CHLOROANILINE 106478 10 27
P-CYMENE 99876 10 27
P-DIMETHYLAMINOAZOBENZENE 60117 20 27
P-NITROANILINE 100016 50 27
PALLADIUM 7440053 500 25
PARATHION (ETHYL) 56382 2 11
PCB 1016 12674112 1 14

APPENDIX B
LISTING OF CHWC ANALYTES WITH NO DETECTS
B-9
Number Min. of Analyte CAS_NO Level Obs.
PCB 1221 11104282 1 14
PCB 1232 11141165 1 14
PCB 1242 53469219 1 14
PCB 1248 12672296 1 14
PCB 1254 11097691 1 14
PCB 1260 11096825 1 14
PENDAMETHALIN 40487421 1 14
PENTACHLOROBENZENE 608935 20 27
PENTACHLORONITROBENZENE (PCNB) 82688 0 14
PENTACHLOROPHENOL 87865 50 27
PENTAMETHYLBENZENE 700129 10 27
PERTHANE 72560 10 14
PERYLENE 198550 10 27
PHENACETIN 62442 10 27
PHENANTHRENE 85018 10 27
PHENOL, 2-METHYL-4,6-DINITRO- 534521 20 27
PHENOTHIAZINE 92842 50 27
PHORATE 298022 2 11
PHOSMET 732116 5 11
PHOSPHAMIDON E 297994 5 11
PHOSPHAMIDON Z 23783984 5 11
PICLORAM 1918021 1 11

APPENDIX B
LISTING OF CHWC ANALYTES WITH NO DETECTS
B-10
Number Min. of Analyte CAS_NO Level Obs.
PRONAMIDE 23950585 10 27
PROPACHLOR 1918167 0 14
PROPANIL 709988 1 14
PROPAZINE 139402 1 14
PYRENE 129000 10 27
PYRIDINE 110861 10 27
RESORCINOL 108463 50 27
RONNEL 299843 2 11
SAFROLE 94597 10 27
SIMAZINE 122349 8 14
SQUALENE 7683649 99 27
STROBANE 8001501 5 14
STYRENE 100425 10 27
SULFOTEP 3689245 2 11
SULPROFOS 35400432 2 11
TELLURIUM 13494809 1000 25
TEPP 107493 5 3
TERBACIL 5902512 2 14
TERBUFOS 13071799 2 11
TERBUTHYLAZINE 5915413 5 14
TETRACHLOROETHENE 127184 10 27
TETRACHLOROMETHANE 56235 10 27

APPENDIX B
LISTING OF CHWC ANALYTES WITH NO DETECTS
B-11
Number Min. of Analyte CAS_NO Level Obs.
TETRACHLORVINPHOS 22248799 2 11
THIANAPHTHENE 95158 10 27
THIOACETAMIDE 62555 20 27
THIOXANTHE-9-ONE 492228 20 27
TOKUTHION 34643464 4 3
TOLUENE 108883 10 27
TOLUENE, 2,4-DIAMINO- 95807 99 27
TOTAL RECOVERABLE OIL AND GREASE C-007 5000 3
TOXAPHENE 8001352 5 14
TRANS-PERMETHRIN 61949777 2 14
TRANS-1,2-DICHLOROETHENE 156605 10 27
TRANS-1,3-DICHLOROPROPENE 10061026 10 27
TRANS-1,4-DICHLORO-2-BUTENE 110576 50 27
TRIADIMEFON 43121433 1 14
TRICHLORFON 52686 5 11
TRICHLOROETHENE 79016 10 27
TRICHLORONATE 327980 2 11
TRICRESYLPHOSPHATE 78308 10 11
TRIFLURALIN 1582098 0 14
TRIMETHYLPHOSPHATE 512561 2 3
TRIPHENYLENE 217594 10 27
TRIPROPYLENEGLYCOL METHYL ETHER 20324338 99 27

APPENDIX B
LISTING OF CHWC ANALYTES WITH NO DETECTS
B-12
Number Min. of Analyte CAS_NO Level Obs.
VINYL ACETATE 108054 50 27
VINYL CHLORIDE 75014 10 27
1-BROMO-2-CHLOROBENZENE 694804 10 27
1-BROMO-3-CHLOROBENZENE 108372 10 27
1-CHLORO-3-NITROBENZENE 121733 50 27
1-METHYLFLUORENE 1730376 10 27
1-METHYLPHENANTHRENE 832699 10 27
1-NAPHTHYLAMINE 134327 10 27
1-PHENYLNAPHTHALENE 605027 10 27
1,1-DICHLOROETHANE 75343 10 27
1,1-DICHLOROETHENE 75354 10 27
1,1,1-TRICHLOROETHANE 71556 10 27
1,1,1,2-TETRACHLOROETHANE 630206 10 27
1,1,2-TRICHLOROETHANE 79005 10 27
1,1,2,2-TETRACHLOROETHANE 79345 10 27
1,2-DIBROMO-3-CHLOROPROPANE 96128 20 27
1,2-DIBROMOETHANE 106934 10 27
1,2-DICHLOROBENZENE 95501 10 27
1,2-DICHLOROETHANE 107062 10 27
1,2-DICHLOROPROPANE 78875 10 27
1,2-DIPHENYLHYDRAZINE 122667 20 27
1,2,3-TRICHLOROBENZENE 87616 10 27

APPENDIX B
LISTING OF CHWC ANALYTES WITH NO DETECTS
B-13
Number Min. of Analyte CAS_NO Level Obs.
1,2,3-TRICHLOROPROPANE 96184 10 27
1,2,3-TRIMETHOXYBENZENE 634366 10 27
1,2,4-TRICHLOROBENZENE 120821 10 27
1,2,4,5-TETRACHLOROBENZENE 95943 10 27
1,2:3,4-DIEPOXYBUTANE 1464535 20 27
1,3-BUTADIENE, 2-CHLORO 126998 10 27
1,3-DICHLORO-2-PROPANOL 96231 10 27
1,3-DICHLOROBENZENE 541731 10 27
1,3-DICHLOROPROPANE 142289 10 27
1,3,5-TRITHIANE 291214 50 27
1,4-DICHLOROBENZENE 106467 10 27
1,4-DINITROBENZENE 100254 20 27
1,4-DIOXANE 123911 10 27
1,4-NAPHTHOQUINONE 130154 99 27
1,5-NAPHTHALENEDIAMINE 2243621 99 27
2-(METHYLTHIO)BENZOTHIAZOLE 615225 10 27
2-CHLOROETHYLVINYL ETHER 110758 10 27
2-CHLORONAPHTHALENE 91587 10 27
2-CHLOROPHENOL 95578 10 27
2-HEXANONE 591786 50 27
2-ISOPROPYLNAPHTHALENE 2027170 10 27
2-METHYLBENZOTHIOAZOLE 120752 10 27

APPENDIX B
LISTING OF CHWC ANALYTES WITH NO DETECTS
B-14
Number Min. of Analyte CAS_NO Level Obs.
2-METHYLNAPHTHALENE 91576 10 27
2-NITROANILINE 88744 10 27
2-NITROPHENOL 88755 20 27
2-PHENYLNAPHTHALENE 612942 10 27
2-PICOLINE 109068 50 27
2-PROPENAL 107028 50 27
2-PROPENENITRILE, 2-METHYL- 126987 10 27
2,3-BENZOFLUORENE 243174 10 27
2,3-DICHLOROANILINE 608275 10 27
2,3-DICHLORONITROBENZENE 3209221 50 27
2,3,4,6-TETRACHLOROPHENOL 58902 20 27
2,3,6-TRICHLOROPHENOL 933755 10 27
2,4-DICHLOROPHENOL 120832 10 27
2,4-DIMETHYLPHENOL 105679 10 27
2,4-DINITROPHENOL 51285 50 27
2,4-DINITROTOLUENE 121142 10 27
2,4,5-TRICHLOROPHENOL 95954 10 27
2,4,6-TRICHLOROPHENOL 88062 10 27
2,6-DI-TERT-BUTYL-P-BENZOQUINONE 719222 99 27
2,6-DICHLORO-4-NITROANILINE 99309 99 27
2,6-DICHLOROPHENOL 87650 10 27
2,6-DINITROTOLUENE 606202 10 27

APPENDIX B
LISTING OF CHWC ANALYTES WITH NO DETECTS
B-15
Number Min. of Analyte CAS_NO Level Obs.
3-CHLOROPROPENE 107051 10 27
3-METHYLCHOLANTHRENE 56495 10 27
3-NITROANILINE 99092 20 27
3,3'-DICHLOROBENZIDINE 91941 50 27
3,3'-DIMETHOXYBENZIDINE 119904 50 27
3,6-DIMETHYLPHENANTHRENE 1576676 10 27
4-AMINOBIPHENYL 92671 10 27
4-BROMOPHENYL PHENYL ETHER 101553 10 27
4-CHLORO-2-NITROANILINE 89634 20 27
4-CHLORO-3-METHYLPHENOL 59507 10 27
4-CHLOROPHENYLPHENYL ETHER 7005723 10 27
4-METHYL-2-PENTANONE 108101 50 27
4-NITROPHENOL 100027 50 27
4,4'-DDD 72548 0 14
4,4'-DDE 72559 0 14
4,4'-DDT 50293 0 14
4,4'-METHYLENEBIS(2-CHLOROANILINE) 101144 20 27
4,5-METHYLENE PHENANTHRENE 203645 10 27
5-NITRO-O-TOLUIDINE 99558 10 27
7,12-DIMETHYLBENZ(A)ANTHRACENE 57976 10 27

APPENDIX C
Range of Pollutant Influent Concentrations of the Pooled Daily Data from the Three 5-DayEPA Sampling Episodes for all Analytes
Measurement type ND means that the pollutant was not detected at any data point.1
Measurement type NC means that the pollutant was detected for at least one data point.
C-1
Meas. Analyte CAS_NO Type Mean Min Max Unit1
ACENAPHTHENE 83329 ND 14.83 10.00 35.56 UG/L
ACENAPHTHYLENE 208968 ND 14.83 10.00 35.56 UG/L
ACEPHATE 30560191 ND 30.53 20.00 71.00 UG/L
ACETOPHENONE 98862 NC 15.47 10.00 35.56 UG/L
ACIFLUORFEN 50594666 ND 15.27 10.00 35.56 UG/L
ACRYLONITRILE 107131 ND 50.00 49.94 50.00 UG/L
ALACHLOR 15972608 ND 0.31 0.20 0.71 UG/L
ALDRIN 309002 ND 0.31 0.20 0.71 UG/L
ALPHA-BHC 319846 ND 0.08 0.05 0.18 UG/L
ALPHA-CHLORDANE 5103719 ND 0.15 0.10 0.36 UG/L
ALPHA-TERPINEOL 98555 ND 14.83 10.00 35.56 UG/L
ALUMINUM 7429905 NC 897.59 13.60 2538.00 UG/L
AMENABLE CYANIDE C-025 ND 10.00 10.00 10.00 UG/L
AMMONIA AS NITROGEN 7664417 NC 14312.40 100.00 75000.00 UG/L
ANILINE 62533 ND 14.83 10.00 35.56 UG/L
ANILINE,2,4,5-TRIMETHYL- 137177 ND 29.66 20.00 71.12 UG/L
ANTHRACENE 120127 ND 14.83 10.00 35.56 UG/L
ANTIMONY 7440360 NC 268.16 7.80 958.80 UG/L
ARAMITE 140578 ND 74.14 50.00 177.80 UG/L
ARSENIC 7440382 NC 166.41 4.60 827.20 UG/L
ATRAZINE 1912249 ND 15.27 10.00 35.56 UG/L
AZINPHOS ETHYL 2642719 ND 3.05 2.00 7.10 UG/L
AZINPHOS METHYL 86500 ND 3.19 1.00 5.00 UG/L

APPENDIX C
Range of Pollutant Influent Concentrations of the Pooled Daily Data from the Three 5-DayEPA Sampling Episodes for all Analytes
C-2
Meas. Analyte CAS_NO Type Mean Min Max Unit
BARIUM 7440393 NC 237.70 43.10 613.00 UG/L
BENFLURALIN 1861401 ND 0.31 0.20 0.71 UG/L
BENZANTHRONE 82053 ND 74.14 50.00 177.80 UG/L
BENZENE 71432 ND 10.00 9.99 10.00 UG/L
BENZENETHIOL 108985 ND 14.83 10.00 35.56 UG/L
BENZIDINE 92875 ND 74.14 50.00 177.80 UG/L
BENZO(A)ANTHRACENE 56553 ND 14.83 10.00 35.56 UG/L
BENZO(A)PYRENE 50328 ND 14.83 10.00 35.56 UG/L
BENZO(B)FLUORANTHENE 205992 ND 14.83 10.00 35.56 UG/L
BENZO(GHI)PERYLENE 191242 ND 29.66 20.00 71.12 UG/L
BENZO(K)FLUORANTHENE 207089 ND 14.83 10.00 35.56 UG/L
BENZOIC ACID 65850 ND 74.14 50.00 177.80 UG/L
BENZONITRILE, 3,5-DIBROMO-4-HYDROXY- 1689845 ND 74.14 50.00 177.80 UG/L
BENZYL ALCOHOL 100516 ND 14.83 10.00 35.56 UG/L
BERYLLIUM 7440417 ND 0.93 0.30 1.50 UG/L
BETA-BHC 319857 ND 0.15 0.10 0.36 UG/L
BETA-NAPHTHYLAMINE 91598 ND 74.14 50.00 177.80 UG/L
BIPHENYL 92524 ND 14.83 10.00 35.56 UG/L
BIPHENYL, 4-NITRO 92933 ND 14.83 10.00 35.56 UG/L
BIS(2-CHLOROETHOXY)METHANE 111911 ND 14.83 10.00 35.56 UG/L
BIS(2-CHLOROETHYL) ETHER 111444 ND 14.83 10.00 35.56 UG/L
BIS(2-CHLOROISOPROPYL) ETHER 108601 ND 14.83 10.00 35.56 UG/L
BIS(2-ETHYLHEXYL) PHTHALATE 117817 NC 22.57 10.00 53.05 UG/L

APPENDIX C
Range of Pollutant Influent Concentrations of the Pooled Daily Data from the Three 5-DayEPA Sampling Episodes for all Analytes
C-3
Meas. Analyte CAS_NO Type Mean Min Max Unit
BISMUTH 7440699 NC 205.14 0.10 887.00 UG/L
BOD 5-DAY C-002 NC 9960.00 1000.00 53000.00 UG/L
BORON 7440428 NC 1604.60 918.00 3760.00 UG/L
BROMACIL 314409 ND 1.53 1.00 3.56 UG/L
BROMODICHLOROMETHANE 75274 ND 10.00 9.99 10.00 UG/L
BROMOMETHANE 74839 ND 50.00 49.94 50.00 UG/L
BROMOXYNIL OCTANOATE 1689992 ND 0.76 0.50 1.78 UG/L
BUTACHLOR 23184669 ND 0.76 0.50 1.78 UG/L
BUTYL BENZYL PHTHALATE 85687 ND 14.83 10.00 35.56 UG/L
CADMIUM 7440439 NC 312.19 1.80 2616.00 UG/L
CALCIUM 7440702 NC 293146.00 8140.00 1270000.00 UG/L
CAPTAFOL 2425061 ND 3.05 2.00 7.10 UG/L
CAPTAN 133062 ND 1.53 1.00 3.56 UG/L
CARBAZOLE 86748 ND 29.66 20.00 71.12 UG/L
CARBON DISULFIDE 75150 ND 10.00 9.99 10.00 UG/L
CARBOPHENOTHION 786196 ND 1.53 1.00 3.56 UG/L
CERIUM 7440451 NC 507.47 1.00 1000.00 UG/L
CHEMICAL OXYGEN DEMAND (COD) C-004 NC 343140.00 67000.00 1036000.00 UG/L
CHLORFENVINPHOS 470906 ND 3.05 2.00 7.10 UG/L
CHLORIDE 16887006 NC 6833746.67 1010000.00 17002400.00 UG/L
CHLOROACETONITRILE 107142 ND 10.00 9.99 10.00 UG/L
CHLOROBENZENE 108907 ND 10.00 9.99 10.00 UG/L
CHLOROBENZILATE 510156 ND 1.53 1.00 3.56 UG/L

APPENDIX C
Range of Pollutant Influent Concentrations of the Pooled Daily Data from the Three 5-DayEPA Sampling Episodes for all Analytes
C-4
Meas. Analyte CAS_NO Type Mean Min Max Unit
CHLOROETHANE 75003 ND 50.00 49.94 50.00 UG/L
CHLOROFORM 67663 ND 10.00 9.99 10.00 UG/L
CHLOROMETHANE 74873 ND 50.00 49.94 50.00 UG/L
CHLORONEB 2675776 ND 1.53 1.00 3.56 UG/L
CHLOROPROPYLATE 5836102 ND 15.27 10.00 35.56 UG/L
CHLOROTHALONIL 1897456 ND 0.31 0.20 0.71 UG/L
CHLORPYRIFOS 2921882 ND 3.05 2.00 7.10 UG/L
CHROMIUM 7440473 NC 127.17 5.80 529.20 UG/L
CHRYSENE 218019 ND 14.83 10.00 35.56 UG/L
CIS-PERMETHRIN 61949766 ND 3.05 2.00 7.10 UG/L
CIS-1,3-DICHLOROPROPENE 10061015 ND 10.00 9.99 10.00 UG/L
COBALT 7440484 NC 10.50 2.30 35.24 UG/L
COPPER 7440508 NC 1786.69 8.50 10554.00 UG/L
COUMAPHOS 56724 ND 7.64 5.00 17.78 UG/L
CROTONALDEHYDE 4170303 ND 50.00 49.94 50.00 UG/L
CROTOXYPHOS 7700176 ND 146.80 99.00 352.04 UG/L
DACTHAL (DCPA) 1861321 ND 0.08 0.05 0.18 UG/L
DALAPON 75990 NC 0.53 0.20 1.06 UG/L
DEF 78488 ND 3.05 2.00 7.10 UG/L
DELTA-BHC 319868 ND 0.08 0.05 0.18 UG/L
DEMETON A 8065483A ND 3.05 2.00 7.10 UG/L
DEMETON B 8065483B ND 3.05 2.00 7.10 UG/L
DI-N-BUTYL PHTHALATE 84742 ND 14.83 10.00 35.56 UG/L

APPENDIX C
Range of Pollutant Influent Concentrations of the Pooled Daily Data from the Three 5-DayEPA Sampling Episodes for all Analytes
C-5
Meas. Analyte CAS_NO Type Mean Min Max Unit
DI-N-OCTYL PHTHALATE 117840 ND 14.83 10.00 35.56 UG/L
DI-N-PROPYLNITROSAMINE 621647 ND 29.66 20.00 71.12 UG/L
DIALLATE A 2303164A ND 3.05 2.00 7.10 UG/L
DIALLATE B 2303164B ND 3.05 2.00 7.10 UG/L
DIAZINON 333415 ND 3.05 2.00 7.10 UG/L
DIBENZO(A,H)ANTHRACENE 53703 ND 29.66 20.00 71.12 UG/L
DIBENZOFURAN 132649 ND 14.83 10.00 35.56 UG/L
DIBENZOTHIOPHENE 132650 ND 14.83 10.00 35.56 UG/L
DIBROMOCHLOROMETHANE 124481 ND 10.00 9.99 10.00 UG/L
DIBROMOMETHANE 74953 ND 10.00 9.99 10.00 UG/L
DICAMBA 1918009 NC 0.32 0.20 0.71 UG/L
DICHLOFENTHION 97176 ND 3.05 2.00 7.10 UG/L
DICHLONE 117806 ND 3.05 2.00 7.10 UG/L
DICHLORPROP 120365 NC 7.66 1.00 47.00 UG/L
DICHLORVOS 62737 ND 7.64 5.00 17.78 UG/L
DICOFOL 115322 ND 1.53 1.00 3.56 UG/L
DICROTOPHOS 141662 ND 5.00 5.00 5.00 UG/L
DIELDRIN 60571 ND 0.06 0.04 0.14 UG/L
DIETHYL ETHER 60297 ND 50.00 49.94 50.00 UG/L
DIETHYL PHTHALATE 84662 ND 14.83 10.00 35.56 UG/L
DIMETHOATE 60515 ND 1.86 1.00 3.56 UG/L
DIMETHYL PHTHALATE 131113 ND 14.83 10.00 35.56 UG/L
DIMETHYL SULFONE 67710 ND 14.83 10.00 35.56 UG/L

APPENDIX C
Range of Pollutant Influent Concentrations of the Pooled Daily Data from the Three 5-DayEPA Sampling Episodes for all Analytes
C-6
Meas. Analyte CAS_NO Type Mean Min Max Unit
DINOSEB 88857 NC 0.87 0.50 2.63 UG/L
DIOXATHION 78342 ND 5.00 5.00 5.00 UG/L
DIPHENYL ETHER 101848 ND 14.83 10.00 35.56 UG/L
DIPHENYLAMINE 122394 ND 14.83 10.00 35.56 UG/L
DIPHENYLDISULFIDE 882337 ND 29.66 20.00 71.12 UG/L
DISULFOTON 298044 ND 3.05 2.00 7.10 UG/L
DYSPROSIUM 7429916 NC 67.17 0.10 100.00 UG/L
ENDOSULFAN I 959988 ND 0.15 0.10 0.36 UG/L
ENDOSULFAN II 33213659 ND 1.53 1.00 3.56 UG/L
ENDOSULFAN SULFATE 1031078 ND 0.15 0.10 0.36 UG/L
ENDRIN 72208 ND 0.31 0.20 0.71 UG/L
ENDRIN ALDEHYDE 7421934 ND 0.15 0.10 0.36 UG/L
ENDRIN KETONE 53494705 ND 0.15 0.10 0.36 UG/L
EPN 2104645 ND 3.05 2.00 7.10 UG/L
ERBIUM 7440520 ND 66.70 0.10 100.00 UG/L
ETHALFLURALIN 55283686 ND 0.15 0.10 0.36 UG/L
ETHANE, PENTACHLORO- 76017 ND 29.66 20.00 71.12 UG/L
ETHION 563122 ND 3.05 2.00 7.10 UG/L
ETHOPROP 13194484 ND 3.05 2.00 7.10 UG/L
ETHYL CYANIDE 107120 ND 10.00 9.99 10.00 UG/L
ETHYL METHACRYLATE 97632 ND 10.00 9.99 10.00 UG/L
ETHYL METHANESULFONATE 62500 ND 29.66 20.00 71.12 UG/L
ETHYLBENZENE 100414 ND 10.00 9.99 10.00 UG/L

APPENDIX C
Range of Pollutant Influent Concentrations of the Pooled Daily Data from the Three 5-DayEPA Sampling Episodes for all Analytes
C-7
Meas. Analyte CAS_NO Type Mean Min Max Unit
ETHYLENETHIOUREA 96457 ND 29.66 20.00 71.12 UG/L
ETRIDIAZOLE 2593159 ND 0.10 0.10 0.10 UG/L
EUROPIUM 7440531 NC 68.07 0.10 100.00 UG/L
FAMPHUR 52857 ND 7.64 5.00 17.78 UG/L
FENARIMOL 60168889 ND 0.31 0.20 0.71 UG/L
FENSULFOTHION 115902 ND 7.64 5.00 17.78 UG/L
FENTHION 55389 ND 3.05 2.00 7.10 UG/L
FLUORANTHENE 206440 ND 14.83 10.00 35.56 UG/L
FLUORENE 86737 ND 14.83 10.00 35.56 UG/L
FLUORIDE 16984488 NC 82620.53 16500.00 360000.00 UG/L
GADOLINIUM 7440542 NC 236.22 0.50 500.00 UG/L
GALLIUM 7440553 NC 236.12 0.50 500.00 UG/L
GAMMA-BHC 58899 ND 0.08 0.05 0.18 UG/L
GAMMA-CHLORDANE 5103742 ND 0.08 0.05 0.18 UG/L
GERMANIUM 7440564 NC 335.79 0.50 500.00 UG/L
GOLD 7440575 ND 100.33 1.00 200.00 UG/L
HAFNIUM 7440586 NC 500.92 1.00 1000.00 UG/L
HEPTACHLOR 76448 ND 0.15 0.10 0.36 UG/L
HEPTACHLOR EPOXIDE 1024573 ND 0.08 0.05 0.18 UG/L
HEXACHLOROBENZENE 118741 ND 14.83 10.00 35.56 UG/L
HEXACHLOROBUTADIENE 87683 ND 14.83 10.00 35.56 UG/L
HEXACHLOROCYCLOPENTADIENE 77474 ND 14.83 10.00 35.56 UG/L
HEXACHLOROETHANE 67721 ND 14.83 10.00 35.56 UG/L

APPENDIX C
Range of Pollutant Influent Concentrations of the Pooled Daily Data from the Three 5-DayEPA Sampling Episodes for all Analytes
C-8
Meas. Analyte CAS_NO Type Mean Min Max Unit
HEXACHLOROPROPENE 1888717 ND 29.66 20.00 71.12 UG/L
HEXAMETHYLPHOSPHORAMIDE 680319 ND 2.00 2.00 2.00 UG/L
HEXANOIC ACID 142621 ND 14.83 10.00 35.56 UG/L
HEXAVALENT CHROMIUM 18540299 NC 18.67 10.00 76.00 UG/L
HOLMIUM 7440600 NC 336.78 0.50 500.00 UG/L
INDENO(1,2,3-CD)PYRENE 193395 ND 29.66 20.00 71.12 UG/L
INDIUM 7440746 NC 512.02 1.00 1000.00 UG/L
IODINE 7553562 NC 1943.00 500.00 3840.00 UG/L
IODOMETHANE 74884 ND 10.00 9.99 10.00 UG/L
IRIDIUM 7439885 NC 609.97 1.00 1708.00 UG/L
IRON 7439896 NC 2904.13 149.00 10838.00 UG/L
ISOBUTYL ALCOHOL 78831 ND 10.00 9.99 10.00 UG/L
ISODRIN 465736 ND 0.15 0.10 0.36 UG/L
ISOPHORONE 78591 ND 14.83 10.00 35.56 UG/L
ISOPROPALIN 33820530 ND 0.31 0.20 0.71 UG/L
ISOSAFROLE 120581 ND 14.83 10.00 35.56 UG/L
KEPONE 143500 ND 1.53 1.00 3.56 UG/L
LANTHANUM 7439910 NC 68.18 0.10 100.00 UG/L
LEAD 7439921 NC 1613.89 2.10 13248.00 UG/L
LEPTOPHOS 21609905 ND 3.05 2.00 7.10 UG/L
LITHIUM 7439932 NC 231.26 79.00 532.80 UG/L
LONGIFOLENE 475207 ND 74.14 50.00 177.80 UG/L
LUTETIUM 7439943 NC 66.78 0.10 100.00 UG/L

APPENDIX C
Range of Pollutant Influent Concentrations of the Pooled Daily Data from the Three 5-DayEPA Sampling Episodes for all Analytes
C-9
Meas. Analyte CAS_NO Type Mean Min Max Unit
M-XYLENE 108383 ND 10.00 9.99 10.00 UG/L
MAGNESIUM 7439954 NC 7435.80 1140.00 20400.00 UG/L
MALACHITE GREEN 569642 ND 14.83 10.00 35.56 UG/L
MALATHION 121755 ND 3.05 2.00 7.10 UG/L
MANGANESE 7439965 NC 114.72 4.00 388.00 UG/L
MCPA 94746 NC 115.60 50.00 399.20 UG/L
MCPP 7085190 NC 375.68 50.00 2594.00 UG/L
MERCURY 7439976 NC 21.06 0.20 115.36 UG/L
MERPHOS 150505 ND 3.58 2.00 7.10 UG/L
MESTRANOL 72333 ND 29.66 20.00 71.12 UG/L
METHAPYRILENE 91805 ND 14.83 10.00 35.56 UG/L
METHOXYCHLOR 72435 ND 0.31 0.20 0.71 UG/L
METHYL CHLORPYRIFOS 5598130 ND 3.05 2.00 7.10 UG/L
METHYL METHACRYLATE 80626 ND 10.00 9.99 10.00 UG/L
METHYL METHANESULFONATE 66273 ND 29.66 20.00 71.12 UG/L
METHYL PARATHION 298000 ND 3.05 2.00 7.10 UG/L
METHYL TRITHION 953173 ND 5.00 5.00 5.00 UG/L
METHYLENE CHLORIDE 75092 ND 10.00 9.99 10.00 UG/L
METRIBUZIN 21087649 ND 0.15 0.10 0.36 UG/L
MEVINPHOS 7786347 ND 7.64 5.00 17.78 UG/L
MIREX 2385855 ND 0.31 0.20 0.71 UG/L
MOLYBDENUM 7439987 NC 336.68 4.60 1024.40 UG/L
MONOCROTOPHOS 6923224 NC 2.00 2.00 2.00 UG/L
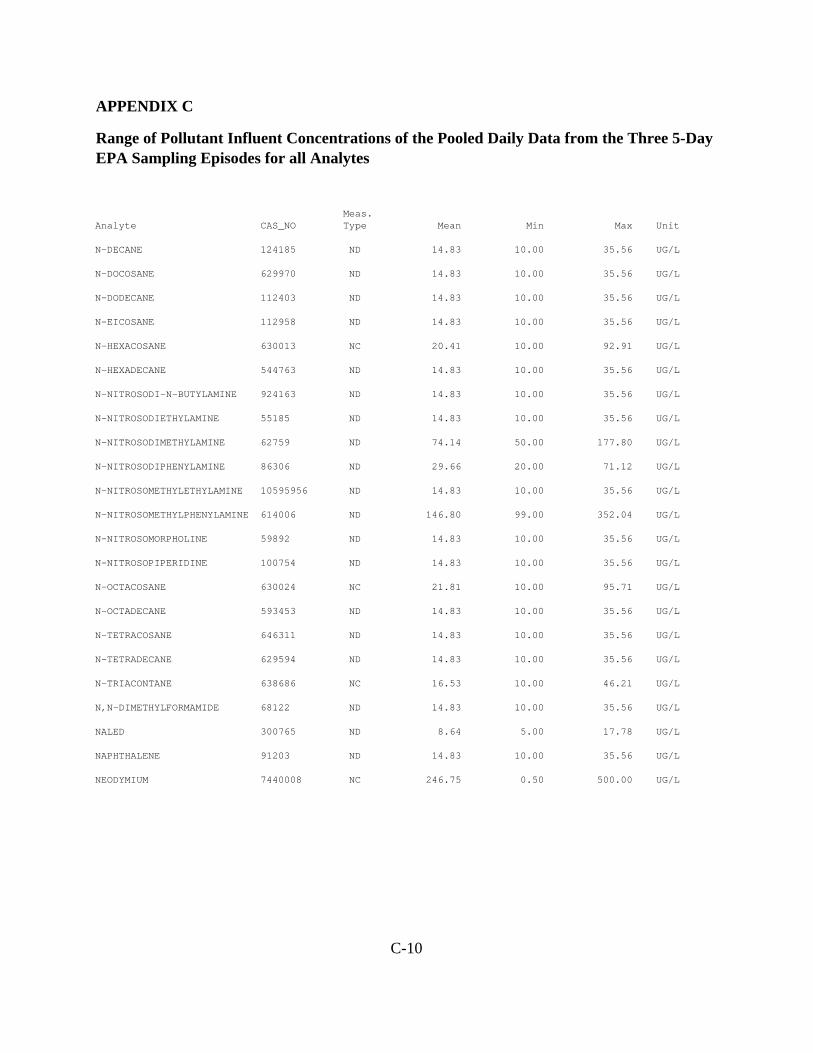
APPENDIX C
Range of Pollutant Influent Concentrations of the Pooled Daily Data from the Three 5-DayEPA Sampling Episodes for all Analytes
C-10
Meas. Analyte CAS_NO Type Mean Min Max Unit
N-DECANE 124185 ND 14.83 10.00 35.56 UG/L
N-DOCOSANE 629970 ND 14.83 10.00 35.56 UG/L
N-DODECANE 112403 ND 14.83 10.00 35.56 UG/L
N-EICOSANE 112958 ND 14.83 10.00 35.56 UG/L
N-HEXACOSANE 630013 NC 20.41 10.00 92.91 UG/L
N-HEXADECANE 544763 ND 14.83 10.00 35.56 UG/L
N-NITROSODI-N-BUTYLAMINE 924163 ND 14.83 10.00 35.56 UG/L
N-NITROSODIETHYLAMINE 55185 ND 14.83 10.00 35.56 UG/L
N-NITROSODIMETHYLAMINE 62759 ND 74.14 50.00 177.80 UG/L
N-NITROSODIPHENYLAMINE 86306 ND 29.66 20.00 71.12 UG/L
N-NITROSOMETHYLETHYLAMINE 10595956 ND 14.83 10.00 35.56 UG/L
N-NITROSOMETHYLPHENYLAMINE 614006 ND 146.80 99.00 352.04 UG/L
N-NITROSOMORPHOLINE 59892 ND 14.83 10.00 35.56 UG/L
N-NITROSOPIPERIDINE 100754 ND 14.83 10.00 35.56 UG/L
N-OCTACOSANE 630024 NC 21.81 10.00 95.71 UG/L
N-OCTADECANE 593453 ND 14.83 10.00 35.56 UG/L
N-TETRACOSANE 646311 ND 14.83 10.00 35.56 UG/L
N-TETRADECANE 629594 ND 14.83 10.00 35.56 UG/L
N-TRIACONTANE 638686 NC 16.53 10.00 46.21 UG/L
N,N-DIMETHYLFORMAMIDE 68122 ND 14.83 10.00 35.56 UG/L
NALED 300765 ND 8.64 5.00 17.78 UG/L
NAPHTHALENE 91203 ND 14.83 10.00 35.56 UG/L
NEODYMIUM 7440008 NC 246.75 0.50 500.00 UG/L

APPENDIX C
Range of Pollutant Influent Concentrations of the Pooled Daily Data from the Three 5-DayEPA Sampling Episodes for all Analytes
C-11
Meas. Analyte CAS_NO Type Mean Min Max Unit
NICKEL 7440020 NC 134.26 4.50 327.00 UG/L
NIOBIUM 7440031 NC 525.87 29.25 1000.00 UG/L
NITRATE/NITRITE C-005 NC 2650.93 360.00 4560.00 UG/L
NITROBENZENE 98953 ND 14.83 10.00 35.56 UG/L
NITROFEN 1836755 ND 0.31 0.20 0.71 UG/L
NORFLURAZON 27314132 NC 1.59 1.00 4.08 UG/L
O+P XYLENE 136777612 ND 10.00 9.99 10.00 UG/L
O-ANISIDINE 90040 ND 14.83 10.00 35.56 UG/L
O-CRESOL 95487 ND 14.83 10.00 35.56 UG/L
O-TOLUIDINE 95534 ND 14.83 10.00 35.56 UG/L
O-TOLUIDINE, 5-CHLORO- 95794 ND 14.83 10.00 35.56 UG/L
OCDD 3268879 NC 0.00 0.00 0.00 UG/L
OCDF 39001020 NC 0.00 0.00 0.00 UG/L
OIL AND GREASE C-036 NC 5066.67 5000.00 6000.00 UG/L
OSMIUM 7440042 NC 67.19 0.10 100.00 UG/L
P-CHLOROANILINE 106478 ND 14.83 10.00 35.56 UG/L
P-CRESOL 106445 ND 14.83 10.00 35.56 UG/L
P-CYMENE 99876 ND 14.83 10.00 35.56 UG/L
P-DIMETHYLAMINOAZOBENZENE 60117 ND 29.66 20.00 71.12 UG/L
P-NITROANILINE 100016 ND 74.14 50.00 177.80 UG/L
PALLADIUM 7440053 ND 333.50 0.50 500.00 UG/L
PARATHION (ETHYL) 56382 ND 3.05 2.00 7.10 UG/L
PCB 1016 12674112 ND 1.53 1.00 3.56 UG/L

APPENDIX C
Range of Pollutant Influent Concentrations of the Pooled Daily Data from the Three 5-DayEPA Sampling Episodes for all Analytes
C-12
Meas. Analyte CAS_NO Type Mean Min Max Unit
PCB 1221 11104282 ND 1.53 1.00 3.56 UG/L
PCB 1232 1141165 ND 1.53 1.00 3.56 UG/L
PCB 1242 53469219 ND 1.53 1.00 3.56 UG/L
PCB 1248 12672296 ND 1.53 1.00 3.56 UG/L
PCB 1254 11097691 ND 1.53 1.00 3.56 UG/L
PCB 1260 11096825 ND 1.53 1.00 3.56 UG/L
PENDAMETHALIN 40487421 ND 0.76 0.50 1.78 UG/L
PENTACHLOROBENZENE 608935 ND 29.66 20.00 71.12 UG/L
PENTACHLORONITROBENZENE (PCNB) 82688 ND 0.08 0.05 0.18 UG/L
PENTACHLOROPHENOL 87865 ND 74.14 50.00 177.80 UG/L
PENTAMETHYLBENZENE 700129 ND 14.83 10.00 35.56 UG/L
PERTHANE 72560 ND 15.27 10.00 35.56 UG/L
PERYLENE 198550 ND 14.83 10.00 35.56 UG/L
PHENACETIN 62442 ND 14.83 10.00 35.56 UG/L
PHENANTHRENE 85018 ND 14.83 10.00 35.56 UG/L
PHENOL 108952 NC 17.11 10.00 44.16 UG/L
PHENOL, 2-METHYL-4,6-DINITRO- 534521 ND 29.66 20.00 71.12 UG/L
PHENOTHIAZINE 92842 ND 74.14 50.00 177.80 UG/L
PHORATE 298022 ND 3.05 2.00 7.10 UG/L
PHOSMET 732116 ND 7.64 5.00 17.78 UG/L
PHOSPHAMIDON E 297994 ND 7.64 5.00 17.78 UG/L
PHOSPHAMIDON Z 23783984 ND 7.64 5.00 17.78 UG/L
PHOSPHORUS 7723140 NC 32480.80 3210.00 225800.00 UG/L

APPENDIX C
Range of Pollutant Influent Concentrations of the Pooled Daily Data from the Three 5-DayEPA Sampling Episodes for all Analytes
C-13
Meas. Analyte CAS_NO Type Mean Min Max Unit
PICLORAM 1918021 ND 0.76 0.50 1.78 UG/L
PLATINUM 7440064 NC 528.11 1.00 1000.00 UG/L
POTASSIUM 7440097 NC 77743.00 1310.00 195400.00 UG/L
PRASEODYMIUM 7440100 NC 927.87 1.00 3910.00 UG/L
PRONAMIDE 23950585 ND 14.83 10.00 35.56 UG/L
PROPACHLOR 1918167 ND 0.15 0.10 0.36 UG/L
PROPANIL 709988 ND 1.53 1.00 3.56 UG/L
PROPAZINE 139402 ND 1.53 1.00 3.56 UG/L
PYRENE 129000 ND 14.83 10.00 35.56 UG/L
PYRIDINE 110861 ND 14.83 10.00 35.56 UG/L
RESORCINOL 108463 ND 74.14 50.00 177.80 UG/L
RHENIUM 7440155 NC 615.13 205.00 1000.00 UG/L
RHODIUM 7440166 NC 670.22 1.00 1000.00 UG/L
RONNEL 299843 ND 3.05 2.00 7.10 UG/L
RUTHENIUM 7440188 NC 504.65 1.00 1000.00 UG/L
SAFROLE 94597 ND 14.83 10.00 35.56 UG/L
SAMARIUM 7440199 NC 336.92 0.50 500.00 UG/L
SCANDIUM 7440202 NC 66.75 0.10 100.00 UG/L
SELENIUM 7782492 NC 102.82 2.30 429.20 UG/L
SILICON 7440213 NC 15414.00 5380.00 28100.00 UG/L
SILVER 7440224 NC 98.92 1.00 390.80 UG/L
SIMAZINE 122349 ND 12.22 8.00 28.46 UG/L
SODIUM 7440235 NC 3443333.33 6400.00 11250600.00 UG/L

APPENDIX C
Range of Pollutant Influent Concentrations of the Pooled Daily Data from the Three 5-DayEPA Sampling Episodes for all Analytes
C-14
Meas. Analyte CAS_NO Type Mean Min Max Unit
SQUALENE 7683649 ND 146.80 99.00 352.04 UG/L
STROBANE 8001501 ND 7.64 5.00 17.78 UG/L
STRONTIUM 7440246 NC 630.23 100.00 2280.00 UG/L
STYRENE 100425 ND 14.83 10.00 35.56 UG/L
SULFOTEP 3689245 ND 4.05 2.00 7.10 UG/L
SULFUR 7704349 NC 400788.06 2145.00 1078240.00 UG/L
SULPROFOS 35400432 ND 3.05 2.00 7.10 UG/L
TANTALUM 7440257 NC 333.89 0.50 500.00 UG/L
TELLURIUM 13494809 ND 667.00 1.00 1000.00 UG/L
TEPP 107493 ND 5.00 5.00 5.00 UG/L
TERBACIL 5902512 ND 3.05 2.00 7.10 UG/L
TERBIUM 7440279 NC 342.22 0.50 500.00 UG/L
TERBUFOS 13071799 ND 3.05 2.00 7.10 UG/L
TERBUTHYLAZINE 5915413 ND 7.64 5.00 17.78 UG/L
TETRACHLOROETHENE 127184 ND 10.00 9.99 10.00 UG/L
TETRACHLOROMETHANE 56235 ND 10.00 9.99 10.00 UG/L
TETRACHLORVINPHOS 22248799 ND 3.05 2.00 7.10 UG/L
THALLIUM 7440280 NC 9.19 1.20 20.00 UG/L
THIANAPHTHENE 95158 ND 14.83 10.00 35.56 UG/L
THIOACETAMIDE 62555 ND 29.66 20.00 71.12 UG/L
THIOXANTHE-9-ONE 492228 ND 29.66 20.00 71.12 UG/L
THORIUM 7440291 NC 512.90 1.00 1000.00 UG/L
THULIUM 7440304 NC 333.98 0.50 500.00 UG/L

APPENDIX C
Range of Pollutant Influent Concentrations of the Pooled Daily Data from the Three 5-DayEPA Sampling Episodes for all Analytes
C-15
Meas. Analyte CAS_NO Type Mean Min Max Unit
TIN 7440315 NC 665.88 14.50 6046.00 UG/L
TITANIUM 7440326 NC 777.71 5.00 4474.20 UG/L
TOKUTHION 34643464 ND 2.00 2.00 2.00 UG/L
TOLUENE 108883 ND 10.00 9.99 10.00 UG/L
TOLUENE, 2,4-DIAMINO- 95807 ND 146.80 99.00 352.04 UG/L
TOTAL CYANIDE 57125 NC 17.93 10.00 105.00 UG/L
TOTAL DISSOLVED SOLIDS C-010 NC 12815853.33 158000.00 32641200.00 UG/L
TOTAL ORGANIC CARBON (TOC) C-012 NC 10485.33 10000.00 16000.00 UG/L
TOTAL PHENOLS C-020 NC 93.20 50.00 681.00 UG/L
TOTAL PHOSPHORUS 14265442 NC 1088.60 10.00 4460.00 UG/L
TOTAL SULFIDE(IODOMETRIC) 18496258 NC 28261.33 1000.00 103200.00 UG/L
TOTAL SUSPENDED SOLIDS C-009 NC 122553.33 4000.00 522000.00 UG/L
TOXAPHENE 8001352 ND 7.64 5.00 17.78 UG/L
TRANS-PERMETHRIN 61949777 ND 3.05 2.00 7.10 UG/L
TRANS-1,2-DICHLOROETHENE 156605 ND 10.00 9.99 10.00 UG/L
TRANS-1,3-DICHLOROPROPENE 10061026 ND 10.00 9.99 10.00 UG/L
TRANS-1,4-DICHLORO-2-BUTENE 110576 ND 50.00 49.94 50.00 UG/L
TRIADIMEFON 43121433 ND 1.53 1.00 3.56 UG/L
TRIBROMOMETHANE 75252 ND 10.00 9.99 10.00 UG/L
TRICHLORFON 52686 ND 7.64 5.00 17.78 UG/L
TRICHLOROETHENE 79016 ND 10.00 9.99 10.00 UG/L
TRICHLOROFLUOROMETHANE 75694 ND 10.00 10.00 10.00 UG/L
TRICHLORONATE 327980 ND 3.05 2.00 7.10 UG/L

APPENDIX C
Range of Pollutant Influent Concentrations of the Pooled Daily Data from the Three 5-DayEPA Sampling Episodes for all Analytes
C-16
Meas. Analyte CAS_NO Type Mean Min Max Unit
TRICRESYLPHOSPHATE 78308 ND 15.27 10.00 35.56 UG/L
TRIFLURALIN 1582098 ND 0.15 0.10 0.36 UG/L
TRIMETHYLPHOSPHATE 512561 ND 2.00 2.00 2.00 UG/L
TRIPHENYLENE 217594 ND 14.83 10.00 35.56 UG/L
TRIPROPYLENEGLYCOL METHYL ETHER 20324338 ND 146.80 99.00 352.04 UG/L
TUNGSTEN 7440337 NC 649.28 93.20 1000.00 UG/L
URANIUM 7440611 NC 1096.71 10.10 2670.00 UG/L
VANADIUM 7440622 NC 107.67 2.60 488.20 UG/L
VINYL ACETATE 108054 ND 50.00 49.94 50.00 UG/L
VINYL CHLORIDE 75014 ND 10.00 9.99 10.00 UG/L
YTTERBIUM 7440644 NC 68.46 0.10 100.00 UG/L
YTTRIUM 7440655 ND 4.33 3.00 5.00 UG/L
ZINC 7440666 NC 3718.81 89.75 12310.00 UG/L
ZIRCONIUM 7440677 NC 67.89 0.10 100.00 UG/L
1-BROMO-2-CHLOROBENZENE 694804 ND 14.83 10.00 35.56 UG/L
1-BROMO-3-CHLOROBENZENE 108372 ND 14.83 10.00 35.56 UG/L
1-CHLORO-3-NITROBENZENE 121733 ND 74.14 50.00 177.80 UG/L
1-METHYLFLUORENE 1730376 ND 14.83 10.00 35.56 UG/L
1-METHYLPHENANTHRENE 832699 ND 14.83 10.00 35.56 UG/L
1-NAPHTHYLAMINE 134327 ND 14.83 10.00 35.56 UG/L
1-PHENYLNAPHTHALENE 605027 ND 14.83 10.00 35.56 UG/L
1,1-DICHLOROETHANE 75343 ND 10.00 9.99 10.00 UG/L
1,1-DICHLOROETHENE 75354 ND 10.00 9.99 10.00 UG/L

APPENDIX C
Range of Pollutant Influent Concentrations of the Pooled Daily Data from the Three 5-DayEPA Sampling Episodes for all Analytes
C-17
Meas. Analyte CAS_NO Type Mean Min Max Unit
1,1,1-TRICHLOROETHANE 71556 ND 10.00 9.99 10.00 UG/L
1,1,1,2-TETRACHLOROETHANE 630206 ND 10.00 9.99 10.00 UG/L
1,1,2-TRICHLOROETHANE 79005 ND 10.00 9.99 10.00 UG/L
1,1,2,2-TETRACHLOROETHANE 79345 ND 10.00 9.99 10.00 UG/L
1,2-DIBROMO-3-CHLOROPROPANE 96128 ND 29.66 20.00 71.12 UG/L
1,2-DIBROMOETHANE 106934 ND 10.00 9.99 10.00 UG/L
1,2-DICHLOROBENZENE 95501 ND 14.83 10.00 35.56 UG/L
1,2-DICHLOROETHANE 107062 ND 10.00 9.99 10.00 UG/L
1,2-DICHLOROPROPANE 78875 ND 10.00 9.99 10.00 UG/L
1,2-DIPHENYLHYDRAZINE 122667 ND 29.66 20.00 71.12 UG/L
1,2,3-TRICHLOROBENZENE 87616 ND 14.83 10.00 35.56 UG/L
1,2,3-TRICHLOROPROPANE 96184 ND 10.00 9.99 10.00 UG/L
1,2,3-TRIMETHOXYBENZENE 634366 ND 14.83 10.00 35.56 UG/L
1,2,4-TRICHLOROBENZENE 120821 ND 14.83 10.00 35.56 UG/L
1,2,4,5-TETRACHLOROBENZENE 95943 ND 14.83 10.00 35.56 UG/L
1,2:3,4-DIEPOXYBUTANE 1464535 ND 29.66 20.00 71.12 UG/L
1,3-BUTADIENE, 2-CHLORO 126998 ND 10.00 9.99 10.00 UG/L
1,3-DICHLORO-2-PROPANOL 96231 ND 14.83 10.00 35.56 UG/L
1,3-DICHLOROBENZENE 541731 ND 14.83 10.00 35.56 UG/L
1,3-DICHLOROPROPANE 142289 ND 10.00 9.99 10.00 UG/L
1,3,5-TRITHIANE 291214 ND 74.14 50.00 177.80 UG/L
1,4-DICHLOROBENZENE 106467 ND 14.83 10.00 35.56 UG/L
1,4-DINITROBENZENE 100254 ND 29.66 20.00 71.12 UG/L

APPENDIX C
Range of Pollutant Influent Concentrations of the Pooled Daily Data from the Three 5-DayEPA Sampling Episodes for all Analytes
C-18
Meas. Analyte CAS_NO Type Mean Min Max Unit
1,4-DIOXANE 123911 ND 10.00 9.99 10.00 UG/L
1,4-NAPHTHOQUINONE 130154 ND 146.80 99.00 352.04 UG/L
1,5-NAPHTHALENEDIAMINE 2243621 ND 146.80 99.00 352.04 UG/L
1234678-HPCDD 35822469 NC 0.00 0.00 0.00 UG/L
1234678-HPCDF 67562394 NC 0.00 0.00 0.00 UG/L
123478-HXCDD 39227286 ND 0.00 0.00 0.00 UG/L
123478-HXCDF 70648269 ND 0.00 0.00 0.00 UG/L
1234789-HPCDF 55673897 ND 0.00 0.00 0.00 UG/L
123678-HXCDD 57653857 ND 0.00 0.00 0.00 UG/L
123678-HXCDF 57117449 ND 0.00 0.00 0.00 UG/L
12378-PECDD 40321764 ND 0.00 0.00 0.00 UG/L
12378-PECDF 57117416 ND 0.00 0.00 0.00 UG/L
123789-HXCDD 19408743 ND 0.00 0.00 0.00 UG/L
123789-HXCDF 72918219 ND 0.00 0.00 0.00 UG/L
2-(METHYLTHIO)BENZOTHIAZOLE 615225 ND 14.83 10.00 35.56 UG/L
2-BUTANONE 78933 ND 50.00 49.94 50.00 UG/L
2-CHLOROETHYLVINYL ETHER 110758 ND 10.00 9.99 10.00 UG/L
2-CHLORONAPHTHALENE 91587 ND 14.83 10.00 35.56 UG/L
2-CHLOROPHENOL 95578 ND 14.83 10.00 35.56 UG/L
2-HEXANONE 591786 ND 50.00 49.94 50.00 UG/L
2-ISOPROPYLNAPHTHALENE 2027170 ND 14.83 10.00 35.56 UG/L
2-METHYLBENZOTHIOAZOLE 120752 ND 14.83 10.00 35.56 UG/L
2-METHYLNAPHTHALENE 91576 ND 14.83 10.00 35.56 UG/L

APPENDIX C
Range of Pollutant Influent Concentrations of the Pooled Daily Data from the Three 5-DayEPA Sampling Episodes for all Analytes
C-19
Meas. Analyte CAS_NO Type Mean Min Max Unit
2-NITROANILINE 88744 ND 14.83 10.00 35.56 UG/L
2-NITROPHENOL 88755 ND 29.66 20.00 71.12 UG/L
2-PHENYLNAPHTHALENE 612942 ND 14.83 10.00 35.56 UG/L
2-PICOLINE 109068 ND 74.14 50.00 177.80 UG/L
2-PROPANONE 67641 ND 50.00 49.94 50.00 UG/L
2-PROPEN-1-OL 107186 ND 10.00 9.99 10.00 UG/L
2-PROPENAL 107028 ND 50.00 49.94 50.00 UG/L
2-PROPENENITRILE, 2-METHYL- 126987 ND 10.00 9.99 10.00 UG/L
2,3-BENZOFLUORENE 243174 ND 14.83 10.00 35.56 UG/L
2,3-DICHLOROANILINE 608275 ND 14.83 10.00 35.56 UG/L
2,3-DICHLORONITROBENZENE 3209221 ND 74.14 50.00 177.80 UG/L
2,3,4,6-TETRACHLOROPHENOL 58902 ND 29.66 20.00 71.12 UG/L
2,3,6-TRICHLOROPHENOL 933755 ND 14.83 10.00 35.56 UG/L
2,4-D 94757 NC 1.80 1.00 3.56 UG/L
2,4-DB 94826 NC 3.43 2.00 10.46 UG/L
2,4-DICHLOROPHENOL 120832 ND 14.83 10.00 35.56 UG/L
2,4-DIMETHYLPHENOL 105679 ND 14.83 10.00 35.56 UG/L
2,4-DINITROPHENOL 51285 ND 74.14 50.00 177.80 UG/L
2,4-DINITROTOLUENE 121142 ND 14.83 10.00 35.56 UG/L
2,4,5-T 93765 NC 0.35 0.20 0.71 UG/L
2,4,5-TP 93721 NC 0.42 0.20 1.25 UG/L
2,4,5-TRICHLOROPHENOL 95954 ND 14.83 10.00 35.56 UG/L
2,4,6-TRICHLOROPHENOL 88062 ND 14.83 10.00 35.56 UG/L

APPENDIX C
Range of Pollutant Influent Concentrations of the Pooled Daily Data from the Three 5-DayEPA Sampling Episodes for all Analytes
C-20
Meas. Analyte CAS_NO Type Mean Min Max Unit
2,6-DI-TERT-BUTYL-P-BENZOQUINONE 719222 ND 146.80 99.00 352.04 UG/L
2,6-DICHLORO-4-NITROANILINE 99309 ND 146.80 99.00 352.04 UG/L
2,6-DICHLOROPHENOL 87650 ND 14.83 10.00 35.56 UG/L
2,6-DINITROTOLUENE 606202 ND 14.83 10.00 35.56 UG/L
234678-HXCDF 60851345 ND 0.00 0.00 0.00 UG/L
23478-PECDF 57117314 ND 0.00 0.00 0.00 UG/L
2378-TCDD 1746016 ND 0.00 0.00 0.00 UG/L
2378-TCDF 51207319 ND 0.00 0.00 0.00 UG/L
3-CHLOROPROPENE 107051 ND 10.00 9.99 10.00 UG/L
3-METHYLCHOLANTHRENE 56495 ND 14.83 10.00 35.56 UG/L
3-NITROANILINE 99092 ND 29.66 20.00 71.12 UG/L
3,3'-DICHLOROBENZIDINE 91941 ND 74.14 50.00 177.80 UG/L
3,3'-DIMETHOXYBENZIDINE 119904 ND 74.14 50.00 177.80 UG/L
3,6-DIMETHYLPHENANTHRENE 1576676 ND 14.83 10.00 35.56 UG/L
4-AMINOBIPHENYL 92671 ND 14.83 10.00 35.56 UG/L
4-BROMOPHENYL PHENYL ETHER 101553 ND 14.83 10.00 35.56 UG/L
4-CHLORO-2-NITROANILINE 89634 ND 29.66 20.00 71.12 UG/L
4-CHLORO-3-METHYLPHENOL 59507 ND 14.83 10.00 35.56 UG/L
4-CHLOROPHENYLPHENYL ETHER 7005723 ND 14.83 10.00 35.56 UG/L
4-METHYL-2-PENTANONE 108101 ND 50.00 49.94 50.00 UG/L
4-NITROPHENOL 100027 ND 74.14 50.00 177.80 UG/L

APPENDIX C
Range of Pollutant Influent Concentrations of the Pooled Daily Data from the Three 5-DayEPA Sampling Episodes for all Analytes
C-21
Meas. Analyte CAS_NO Type Mean Min Max Unit
4,4'-DDD 72548 ND 0.31 0.20 0.71 UG/L
4,4'-DDE 72559 ND 0.15 0.10 0.36 UG/L
4,4'-DDT 50293 ND 0.15 0.10 0.36 UG/L
4,4'-METHYLENEBIS(2-CHLOROANILINE) 101144 ND 29.66 20.00 71.12 UG/L
4,5-METHYLENE PHENANTHRENE 203645 ND 14.83 10.00 35.56 UG/L
5-NITRO-O-TOLUIDINE 99558 ND 14.83 10.00 35.56 UG/L
7,12-DIMETHYLBENZ(A)ANTHRACENE 57976 ND 14.83 10.00 35.56 UG/L

D-1
APPENDIX D
ACRONYMS AND DEFINITIONS
Administrator -- The Administrator of the U.S. Environmental Protection AgencyAgency -- The U.S. Environmental Protection AgencyBAT -- The best available technology economically achievable, as described in Sec. 304(b)(2) of theCWA. BCT -- The best conventional pollutant control technology, as described in Sec. 304(b)(4) of the CWA.BOD -- Biochemical oxygen demand - Five Day. A measure of biochemical decomposition of organic5
matter in a water sample. It is determined by measuring the dissolved oxygen consumed bymicroorganisms to oxidize the organic contaminants in a water sample under standard laboratory conditionsof five days and 70EC. BOD is not related to the oxygen requirements in chemical combustion.5
Boiler -- means an enclosed device using controlled flame combustion and having the followingcharacteristics:(1) (i) The unit must have physical provisions for recovering and exporting thermal energy in the form
of steam, heated fluids, or heated gases; and(ii) The unit’s combustion chamber and primary energy recovery section(s) must be of integral
design. To be of integral design, the combustion chamber and the primary energy recoverysection(s) (such as waterwalls and superheaters) must be physically formed into onemanufactured or assembled unit. A unit in which the combustion chamber and the primaryenergy recovery section(s) are joined only by ducts or connections carrying flue gas is notintegrally designed; however, secondary energy recovery equipment (such as economizers orair preheaters) need not be physically formed into the same unit as the combustion chamber andthe primary energy recovery section. The following units are not precluded from being boilerssolely because they are not of integral design: process heaters (units that transfer energy directlyto a process stream), and fluidized bed combustion units; and
(iii) While in operation, the unit must maintain a thermal energy recovery efficiency of at least 60percent, calculated in terms of the recovered energy compared with the thermal value of the fuel;and
(iv) The unit must export and utilize at least 75 percent of the recovered energy, calculated on anannual basis. In this calculation, no credit shall be given for recovered heat used internally in thesame unit. (Examples of internal use are the preheating of fuel or combustion air, and the drivingof induced or forced draft fans or feedwater pumps); or
(2) The unit is one which the Regional Administrator has determined, on a case-by-case basis, tobe a boiler, after considering the standards in Section 260.32.
BPT -- The best practicable control technology currently available, as described in Sec. 304(b)(1) of theCWA.Captive -- Used to describe a facility that only accepts waste generated on site and/or by the owneroperator at the facility.

D-2
Clarification -- A treatment designed to remove suspended materials from wastewater--typically bysedimentation.Clean Water Act (CWA) -- The Federal Water Pollution Control Act Amendments of 1972 (33 U.S.C.1251 et seq.), as amended, inter alia, by the Clean Water Act of 1977 (Public Law 95-217) and theWater Quality Act of 1987 (Public Law 100-4).Closed -- A facility or portion thereof that is currently not receiving or accepting wastes and has undergonefinal closure.Combustion Unit -- A device for waste treatment which uses elevated temperatures as the primary meansto change the chemical, physical, biological character or composition of the waste. Examples ofcombustion units are incinerators, fuel processors, boilers, industrial furnaces, and kilns.Commercial Hazardous Waste Combustor -- Any thermal unit, except a cement kiln, that is subjectto either to 40 CFR Part 264, Subpart O; Part 265, Subpart O; or Part 266, Subpart H if the thermal unitburns RCRA hazardous wastes received from off-site for a fee or other remuneration in the followingcircumstances. The thermal unit is a commercial hazardous waste combustor if the off-site wastes aregenerated at a facility not under the same corporate structure or subject to the same ownership as thethermal unit and
(1) The thermal unit is burning wastes that are not of a similar nature to wastes being burnedfrom industrial processes on site or
(2) There are no wastes being burned from industrial processes on site. Examples of wastes of a “similar nature” may include the following: wastes generated in industrialoperations whose wastewaters are subject to the same provisions in 40 CFR Subchapter N or wastesburned as part of a product stewardship activity. The term commercial hazardous waste combustorincludes the following facilities: a facility that burns exclusively waste received from off-site; and, a facilitythat burns both wastes generated on-site and wastes received from off-site. Facilities that may becommercial hazardous waste combustors include hazardous waste incinerators, rotary kiln incinerators, limekilns, lightweight aggregate kilns, and boilers. A facility not otherwise a commercial hazardous wastecombustor is not a commercial hazardous waste combustor if it burns RCRA hazardous waste forcharitable organizations, as a community service or as an accommodation to local, state or governmentagencies so long as the waste is burned for no fee or other remuneration.Commercial hazardous waste combustor wastewater -- Wastewater attributable to commercialhazardous waste combustion operations, but includes only wastewater from air pollution control systemsand water used to quench flue gas or slag generated as a result of commercial hazardous waste combustoroperations.Conventional pollutants -- The pollutants identified in Sec. 304(a)(4) of the CWA and the regulationsthereunder (biochemical oxygen demand (BOD ), total suspended solids (TSS), oil and grease, fecal5
coliform, and pH).Direct discharger -- A facility that discharges or may discharge treated or untreated pollutants into watersof the United States.Disposal -- Intentional placement of waste or waste treatment residual into or on any land where thematerial will remain after closure. Waste or residual placed into any water is not defined as disposal, butas discharge.

D-3
Effluent -- Wastewater discharges. Effluent limitation -- Any restriction, including schedules of compliance, established by a State or theAdministrator on quantities, rates, and concentrations of chemical, physical, biological, and otherconstituents which are discharged from point sources into navigable waters, the waters of the contiguouszone, or the ocean. (CWA Sections 301(b) and 304(b).)EA -- Economic AnalysisEPA -- The U.S. Environmental Protection Agency.Facility -- A facility is all contiguous property owned, operated, leased or under the control of the sameperson. The contiguous property may be divided by public or private right-of-way.Hazardous Waste -- Any waste, including wastewaters defined as hazardous under RCRA, ToxicSubstances Control Act (TSCA), or any state law.Incinerator -- means any enclosed device that:(1) Uses controlled flame combustion and neither meets the criteria for classification as a boiler, sludge
dryer, or carbon regeneration unit, nor is listed as an industrial furnace; or(2) Meets the definition of infrared incinerator or plasma arc incinerator. Indirect discharger -- A facility that discharges or may discharge pollutants into a publicly-ownedtreatment works.Industrial Furnace -- means any of the following enclosed devices that are integral components ofmanufacturing processes and that use thermal treatment to accomplish recovery of materials or energy:(1) Cement kilns(2) Lime kilns(3) Aggregate kilns(4) Phosphate kilns(5) Coke ovens(6) Blast furnaces(7) Smelting, melting and refining furnaces (including pyrometallurgical devices such as cupolas,
reverberator furnaces, sintering machine, roasters, and foundry furnaces)(8) Titanium dioxide chloride process oxidation reactors(9) Methane reforming furnaces(10) Pulping liquor recovery furnaces(11) Combustion devices used in the recovery of sulfur values from spent sulfuric acid(12) Halogen acid furnaces (HAFs) for the production of acid from halogenated hazardous waste
generated by chemical production facilities where the furnace is located on the site of a chemicalproduction facility, the acid product has a halogen acid content of at least 3 percent, the acid productis used in a manufacturing process, and except for hazardous waste burned as fuel, hazardous wastefed to the furnace has a minimum halogen content of 20 percent as generated.
(13) Such other devices as the Administrator may, after notice and comment, add to this list on the basisof one or more of the following factors:(i) The design and use of the device primarily to accomplish recovery of material products;(ii) The use of the device to burn or reduce raw materials to make a material product; (iii) The use of the device to burn or reduce secondary materials as effective substitutes for raw

D-4
materials, in processes using raw materials as principal feedstocks;(iv) The use of the device to burn or reduce secondary materials as ingredients in an industrial
process to make a material product;(v) The use of the device in common industrial practice to produce a material product; and,(vi) Other factors, as appropriate.
Intracompany -- A facility that treats, disposes, or recycles/recovers wastes generated by off-site facilitiesunder the same corporate ownership. The facility may also treat on-site generated wastes. If any wastefrom other facilities not under the same corporate ownership is accepted for a fee or other remunerations,the facility is considered commercial.LTA -- Long-term Average. For purposes of the effluent guidelines, LTAs are defined as averagepollutant levels achieved over a period of time by a technology option. LTAs were used in developing thelimitations and standards in today’s proposed regulation.Minimum level -- The level at which an analytical system gives recognizable signals and an acceptablecalibration point.Municipal Facility -- A facility which is owned or operated by a municipal, county, or regionalgovernment.New Source -- “New source” is defined at 40 CFR 122.2 and 122.29.Non-conventional pollutants -- Pollutants that are neither conventional pollutants nor priority pollutantslisted at 40 CFR Section 401.Non-detect value -- A concentration-based measurement reported below the sample specific detectionlimit that can reliably be measured by the analytical method for the pollutant.Non-hazardous waste -- All waste not defined as hazardous under RCRA regulations.Non-water quality environmental impact -- An environmental impact of a control or treatmenttechnology, other than to surface waters. NPDES -- The National Pollutant Discharge Elimination System authorized under Sec. 402 of the CWA.NPDES requires permits for discharge of pollutants from any point source into waters of the United States.NSPS -- New Source Performance StandardsOCPSF -- Organic Chemicals, Plastics, and Synthetic Fibers Manufacturing Effluent Guideline (40 CFRPart 414).Off-site -- “Off-site” means outside the boundaries of a facility.On-site -- “On-site” means within the boundaries of a facility.Outfall -- The mouth of conduit drains and other conduits from which a facility effluent discharges intoreceiving waters or POTWs.Point Source Category -- A category of sources of water pollutants.POTW or POTWs -- Publicly-owned treatment works, as defined at 40 CFR 403.3(o).Pretreatment Standard -- a regulation that establishes industrial wastewater effluent quality as requiredfor discharge to a POTW. (CWA Section 307(b).)Priority Pollutants -- The pollutants designated by EPA as priority in 40 CFR Part 423 Appendix A.Process wastewater -- “Process Wastewater” is defined at 40 CFR 122.2.PSES -- Pretreatment standards for existing sources of indirect discharges, under Sec. 307(b) of theCWA.

D-5
PSNS -- Pretreatment standards for new sources of indirect discharges, under Sec. 307(b) and (c) of theCWA.RCRA -- Resource Conservation and Recovery Act (PL 94-580) of 1976, as amended.Residuals -- The material remaining after a natural or technological process has taken place, e.g., thesludge remaining after initial wastewater treatment.Sewage Sludge -- Sludge generated by a sewage treatment plant or POTW.Sludge -- The accumulated solids separated from liquids during processing.Small business -- Businesses with annual sales revenues less than $6 million. This is the Small BusinessAdministration definition of small business for SIC code 4953, Refuse Systems (13 CFR Ch.1, § 121.601)Solids -- For the purpose of this notice, a waste that has a very low moisture content, is not free-flowing,and does not release free liquids. This definition deals with the physical state of the waste, not the RCRAdefinition.Treatment -- Any activity designed to change the character or composition of any waste so as to prepareit for transportation, storage, or disposal; render it amenable for recycling or recovery; or reduce it involume.TSS -- Total Suspended Solids. A measure of the amount of particulate matter that is suspended in awater sample. The measure is obtained by filtering a water sample of known volume. The particulatematerial retained on the filter is then dried and weighed.Waste Receipt -- Wastes received for combustion.Wastewater treatment system -- A facility, including contiguous land and structures, used to receive andtreat wastewater. The discharge of a pollutant from such a facility is subject to regulation under the CleanWater Act.Waters of the United States -- The same meaning set forth in 40 CFR 122.2Zero discharge -- No discharge of pollutants to waters of the United States or to a POTW. Alsoincluded in this definition are discharge of pollutants by way of evaporation, deep-well injection, off-sitetransfer and land application.