Embed Size (px)
Citation preview
CPT-based seismic stability assessment of a hazardous waste site
Neven Matasovica,*, Edward Kavazanjian Jrb, Anirban Dec, Jeff Dunnd
aGeoSyntec Consultants, Huntington Beach, CA, USAbArizona State University, Tempe, AZ, USA
cManhattan College, Bronx, NY, USAdKleinfelder, Pleasanton, CA, USA
Received 30 June 2004; revised 31 December 2004; accepted 20 February 2005
Abstract
In areas of high seismicity, seismic stability often controls hazardous and solid waste landfill closure design. The undrained shear strength
(Su) of the waste mass is fundamental to seismic slope stability analyses. The value of Su for hazardous waste fill is often difficult to
characterize. The physical and chemical natures of the waste fill typically preclude laboratory testing of the materials. In certain cases, Cone
Penetration Test (CPT) soundings can provide a viable technique for evaluation of Su provided that the cone shear strength factor Nk can be
established. If hazardous waste materials laboratory testing is not an option, Nk may be evaluated based upon results of non-intrusive in situ
testing. This paper presents a case history of the seismic stability assessment of a hazardous waste site in which Nk was established from the
results of non-intrusive Spectral Analysis of Surface Waves (SASW) soundings and empirical correlations to shear strength of soils.
Generalization of the proposed methodology to other sites should be done with caution owing to variability among the parameters used in the
analyses.
q 2005 Elsevier Ltd. All rights reserved.
Keywords: Cone factor; CPT; Methodology; SASW; Seismic; Slope stability
1. Introduction and site background
The subject site is an inactive hazardous waste
treatment, storage and disposal facility that is undergoing
closure under United States Environmental Protection
Agency (EPA) oversight. The entire facility, shown on an
oblique aerial photo in Fig. 1, occupies an area of
approximately 100 ha. The site is underlain by Tertiary-
age bedrock that is mostly (gray) claystone with thin zones
of porcelaneous shale.
The results of the seismic site exposure evaluation [1]
indicate that the maximum earthquake that appears
0267-7261/$ - see front matter q 2005 Elsevier Ltd. All rights reserved.
doi:10.1016/j.soildyn.2005.02.014
Abbreviations ASTM, American Society for Testing and Materials;
EPA, (United States) Environmental Protection Agency; FS, (Static) factor
of safety; CPT, cone penetration test; PHGA, peak horizontal ground
acceleration; RCRA, resource conservation and recovery Act (US
Regulations for Landfills); SASW, spectral analysis of surface waves.* Corresponding author. Tel.: C1 714 969 0800; fax: C1 714 969 0820.
E-mail address: [email protected] (N. Matasovic).
capable of occurring at the site under the presently
known geologic framework (i.e. Maximum Credible
Earthquake, MCE) is a moment magnitude (Mw) 6.6
event on a thrust fault which underlies the site. The
distance from the landfill area to the fault plane is
estimated to be 2.6 km. The MCE was characterized by a
mean peak horizontal ground acceleration (PHGA) in a
hypothetical bedrock outcrop at the geometric center of
the site of 0.86 g and a significant duration of strong
shaking of 10 s.
There are six segregated landfills at the site, along with
43 former waste ponds, 15 evaporation ponds, and several
process treatment units and waste disposal units. The six
landfills include the clean-closed RCRA (Resource
Conservation and Recovery Act) landfill and five existing
hazardous waste landfills: the Pesticides/ Solvents Landfill
(P/S), the PCB Landfill and the Heavy Metals Sludges
(M/S), Caustics/Cyanides (C/C) and Acids (AL)
landfills. The investigations and material characterizations
documented herein focus on five of these landfills: the P/S,
PCB, M/S, C/C, and AL landfills. These five hazardous
waste landfills are shown in plan view on Fig. 2.
Soil Dynamics and Earthquake Engineering 26 (2006) 201–208
www.elsevier.com/locate/soildyn

Notation
ky yield acceleration (g)
Mw moment magnitude (K)
Nk cone shear strength factor (K)
OCR overconsolidation ratio (K)
PI plasticity index
qc (uncorrected) CPT cone tip resistance (kPa)
Su undrained shear strength (kPa)
umax seismically-induced permanent displacement of
waste mass (mm)
Vs shear wave velocity of waste mass (m/s)
svo in situ total vertical stress (kPa)
N. Matasovic et al. / Soil Dynamics and Earthquake Engineering 26 (2006) 201–208202
2. Waste description and waste disposal history
Typical waste disposal practice at the site consisted of
placing bulk and containerized (liquid and solid) hazardous
waste in horizontal layers as shown in Fig. 3. As indicated in
Fig. 3, the horizontal layers were then covered by an
approximately 0.3-m thick layer of daily cover soil infill
prior to placement of the next layer of waste. Waste disposal
at each landfill at the site took place in independent canyons.
The canyon floors were excavated into unweathered
claystone prior to waste disposal. No engineered base and/
or side-slope liners were placed prior to landfilling. Several
of the landfills had toe buttress stability berms in place at the
time of the investigation described herein.
The hazardous waste in containers or as bulk was
segregated among the landfills at the site based upon
chemical compatibility and placed in horizontal lifts.
Occasionally, smaller areas were filled by soil to complete
a lift, thus forming an irregular soil/waste matrix. The daily
cover and soil infill were derived from locally available
decomposed claystone. The soil materials were spread and
compacted by dozers and scrapers. According to estimates
provided by site operators, the ratio (by volume) of waste to
daily cover/infill soil was 2.7 (waste):1 (soil).
The P/S, M/S, C/C, and AL landfills accepted off-site
wastes between the start of landfill operations in 1979 and
their cessation in November 1989. Between November 1989
and November 1990, the P/S, and M/S, C/C, and AL
landfills accepted wastes generated on-site, specifically
excavated pond and pad subgrade material and chemically
solidified pond liquids and sludges generated during closure
of surface impoundments. Materials generated during clean
closure of the former RCRA landfill were also disposed of in
the landfills. The plan areas and maximum waste depths of
the five hazardous waste landfills are provided in Table 1.
Fig. 1. An oblique aerial view of the site.
3. Site-specific investigations
3.1. General
Information on the mechanical properties of contain-
erized liquid and/or solid waste in a soil matrix is not
generally available in the technical literature. To
characterize these and other wastes at the site, a site-specific
investigation program was conducted. This program
included non-intrusive Spectral Analysis of Surface
Waves (SASW) soundings and intrusive Cone Penetration
Tests (CPT) testing. Field and laboratory testing of samples
from potential borrow sources and the landfill covers was
also performed as part of the investigation program.
3.2. Laboratory testing
Bulk soil samples were collected from test pits excavated
in the interim soil cover on top of the landfills and from on-
site borrow sources near the northern part of the property.
According to the information provided by the on-site
personnel, materials from these borrow sources were very
similar to the borrow materials used for daily cover during
landfill operations. The test pits were excavated to a depth of
1.5 m in a grid pattern on top of each of the landfills. In situ
measurements of dry density and moisture content were
made in test pits and bulk soil samples of borrow source and
cover soils were collected for laboratory testing.
The laboratory testing results for the borrow source soil
indicate that tested soil classifies as a high plasticity silt
(MH) in the Unified Soil Classification System (ASTM D
2487). The average Plasticity Index (PI) of tested soils was
50. The results indicate that most of the sampled interim
cover test pit materials also classify as highly plasticity silt
(MH). The average PI of the test pit soils was 39. The
average in situ dry unit weight of the tested soils measured
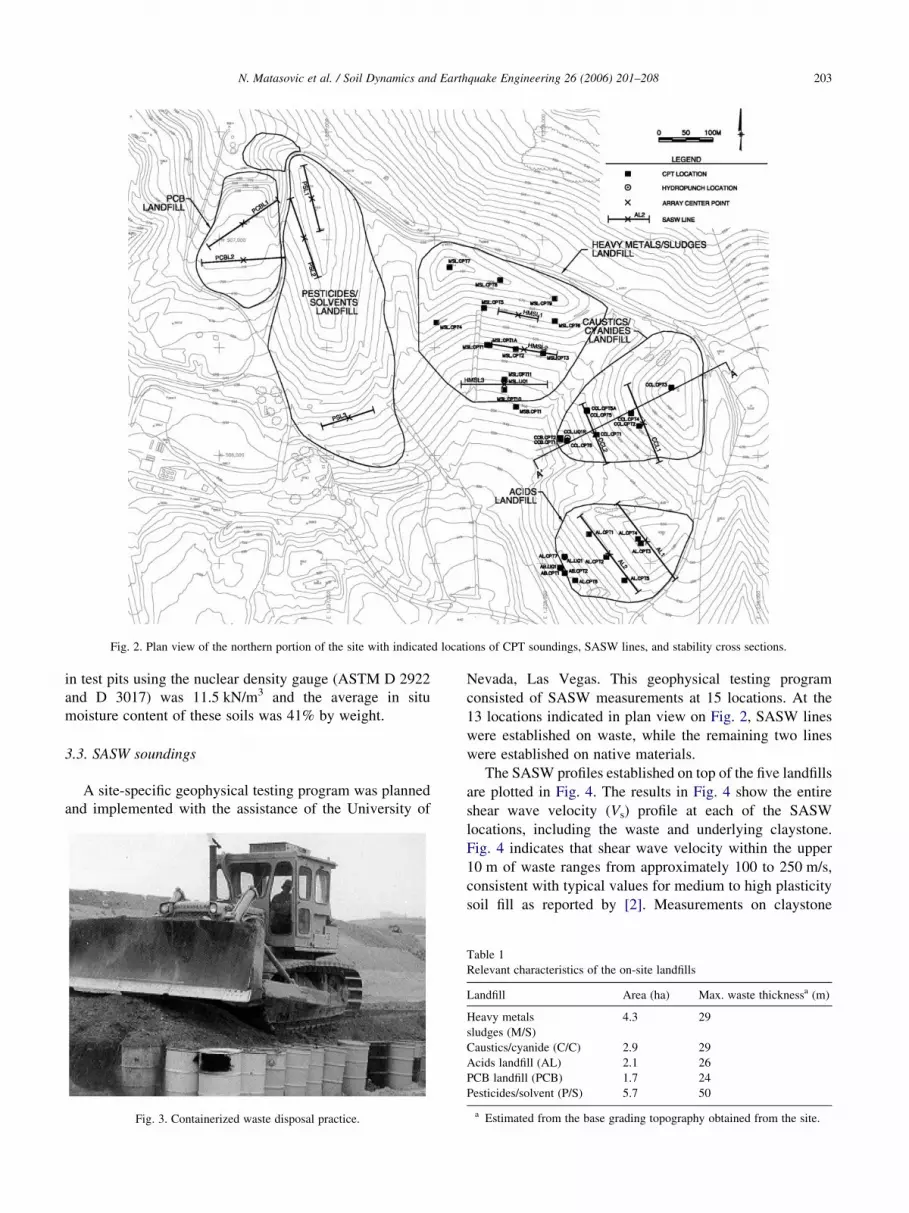
Fig. 2. Plan view of the northern portion of the site with indicated locations of CPT soundings, SASW lines, and stability cross sections.
N. Matasovic et al. / Soil Dynamics and Earthquake Engineering 26 (2006) 201–208 203
in test pits using the nuclear density gauge (ASTM D 2922
and D 3017) was 11.5 kN/m3 and the average in situ
moisture content of these soils was 41% by weight.
3.3. SASW soundings
A site-specific geophysical testing program was planned
and implemented with the assistance of the University of
Fig. 3. Containerized waste disposal practice.
Nevada, Las Vegas. This geophysical testing program
consisted of SASW measurements at 15 locations. At the
13 locations indicated in plan view on Fig. 2, SASW lines
were established on waste, while the remaining two lines
were established on native materials.
The SASW profiles established on top of the five landfills
are plotted in Fig. 4. The results in Fig. 4 show the entire
shear wave velocity (Vs) profile at each of the SASW
locations, including the waste and underlying claystone.
Fig. 4 indicates that shear wave velocity within the upper
10 m of waste ranges from approximately 100 to 250 m/s,
consistent with typical values for medium to high plasticity
soil fill as reported by [2]. Measurements on claystone
Table 1
Relevant characteristics of the on-site landfills
Landfill Area (ha) Max. waste thicknessa (m)
Heavy metals
sludges (M/S)
4.3 29
Caustics/cyanide (C/C) 2.9 29
Acids landfill (AL) 2.1 26
PCB landfill (PCB) 1.7 24
Pesticides/solvent (P/S) 5.7 50
a Estimated from the base grading topography obtained from the site.

Fig. 4. SASW dataset.
Fig. 5. Mean and mean G one standard deviation shear wave velocity in
waste mass.
N. Matasovic et al. / Soil Dynamics and Earthquake Engineering 26 (2006) 201–208204
outcrops indicate that the shear wave velocity of competent
native materials (claystone) is on the order of 680 m/s.
Processing of the SASW data consisted of: (i) separating
the shear wave velocity in waste from the shear wave
velocity measured in underlying claystone; and (ii)
statistical processing of the separated waste data set. The
waste data was separated from the subgrade based upon the
known range of shear wave velocity in claystone and
the observed contrast between shear wave velocities in the
waste and in the claystone. The waste thickness inferred
from the shear wave velocity profiles was compared to
waste thickness estimates based upon base and final grade
topography comparisons at the ‘SASW array center points’
(the approximate ‘representative’ location of SASW
measurement). The array center points are indicated by an
‘x’ in Fig. 2. The two approaches for evaluating waste
thickness showed excellent agreement, indicating the
separated data set accurately represents the shear wave
velocity in the waste.
The separated waste shear wave velocity data was
processed to calculate the mean shear wave velocity profile
and the corresponding standard deviation. The mean, mean
plus one standard deviation and mean minus one standard
deviation shear wave velocity curves developed in this
manner are plotted in Fig. 5. Fig. 5 indicates that the mean
shear wave velocity consistently increases with depth. While
a waste landfill may be somewhat non-homogeneous, the
shear wave velocity profile developed from SASW is
calculated using relatively long period surface waves
(particularly at depth). Therefore, the interpreted shear
wave velocity values in Fig. 5 are considered to give a good
indication of the average small strain stiffness of the waste
mass. Analysis of the data in Fig. 5 indicates that at shallower
depths, the shear wave velocity profile is more characteristic
of an overconsolidated cohesive soil which is expected given
the effects of compaction and desiccation on the near-surface
soils. At depths beyond approximately 15 m, the increase in
shear wave velocity with depth is proportional to the square
root of vertical effective stress, a trend often observed in
normally consolidated cohesive soils. Analysis of the data in
Fig. 5 further indicates that the standard deviation of the data
set is within 20% of the mean value, which is within the range
expected for engineered fills [2].
3.4. CPT sounding program
To assist in characterization of the on-site waste
materials and establish undrained shear strength profiles
for the landfills, a site-specific CPT sounding program was
conducted. The program consisted of advancing 43 CPT
soundings within the landfills and seven CPTs within the toe
buttress areas of the landfills. Most of the CPT sounding
locations are indicated on the plan view in Fig. 2. CPT
sounding locations are also indicated on the representative
cross section through the M/S landfill presented in Fig. 6.
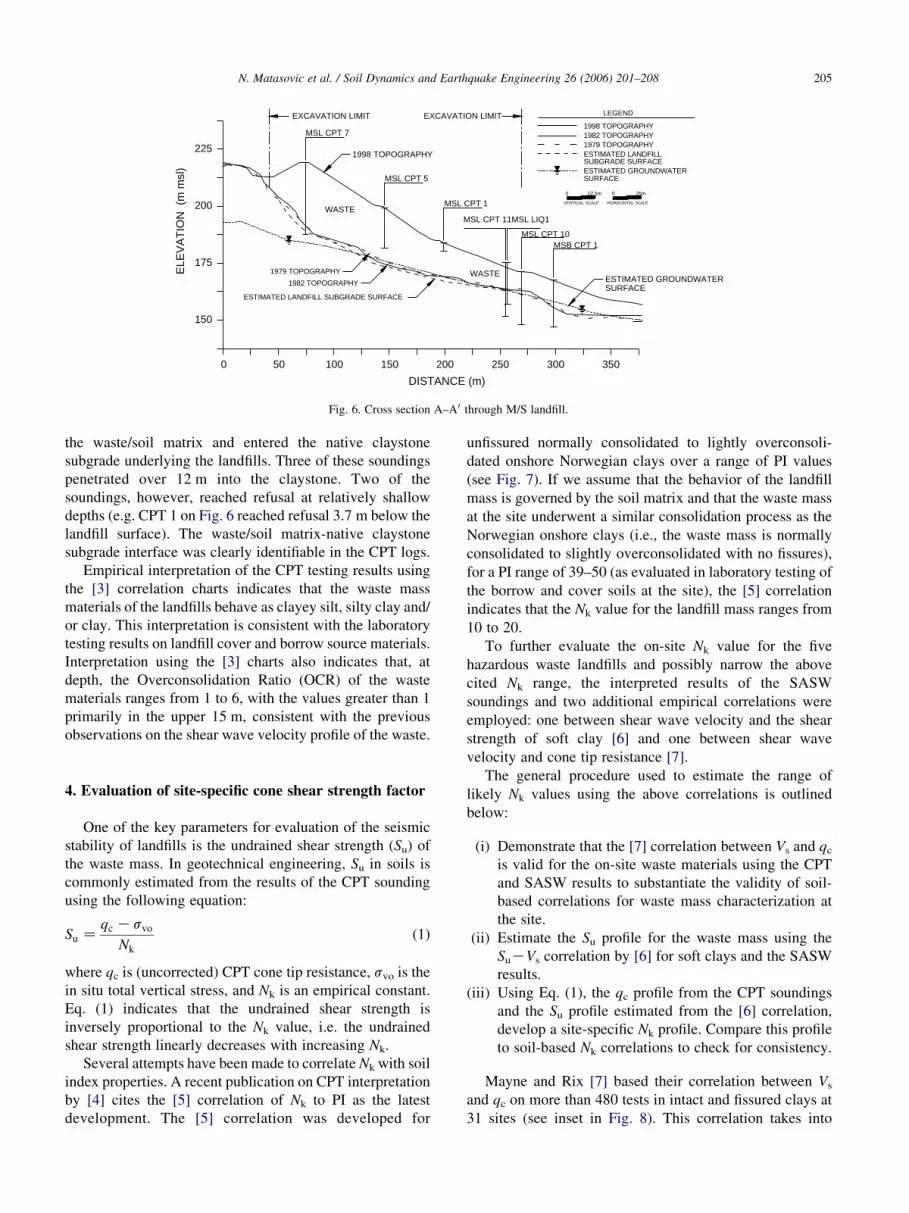
Fig. 6 indicates that five out of a total of seven
CPT soundings at the M/S landfill penetrated through
MSB CPT 1 MSL CPT 10
MSL CPT 11MSL LIQ1
MSL CPT 1
MSL CPT 5
MSL CPT 7
WASTE
WASTE
EXCAVATION LIMIT EXCAVATION LIMIT
1998 TOPOGRAPHY
ESTIMATED LANDFILL SUBGRADE SURFACE
1982 TOPOGRAPHY
1979 TOPOGRAPHY
1998 TOPOGRAPHY1982 TOPOGRAPHY1979 TOPOGRAPHYESTIMATED LANDFILL
ESTIMATED GROUNDWATER
25m0
HORIZONTAL SCALEVERTICAL SCALE
0 12.5m
LEGEND
SUBGRADE SURFACE
SURFACE
DISTANCE (m)
0 50 100 150 200 250 300 350
150
175
200
225
ELE
VA
TIO
N (
m m
sl)
SURFACEESTIMATED GROUNDWATER
Fig. 6. Cross section A–A0 through M/S landfill.
N. Matasovic et al. / Soil Dynamics and Earthquake Engineering 26 (2006) 201–208 205
the waste/soil matrix and entered the native claystone
subgrade underlying the landfills. Three of these soundings
penetrated over 12 m into the claystone. Two of the
soundings, however, reached refusal at relatively shallow
depths (e.g. CPT 1 on Fig. 6 reached refusal 3.7 m below the
landfill surface). The waste/soil matrix-native claystone
subgrade interface was clearly identifiable in the CPT logs.
Empirical interpretation of the CPT testing results using
the [3] correlation charts indicates that the waste mass
materials of the landfills behave as clayey silt, silty clay and/
or clay. This interpretation is consistent with the laboratory
testing results on landfill cover and borrow source materials.
Interpretation using the [3] charts also indicates that, at
depth, the Overconsolidation Ratio (OCR) of the waste
materials ranges from 1 to 6, with the values greater than 1
primarily in the upper 15 m, consistent with the previous
observations on the shear wave velocity profile of the waste.
4. Evaluation of site-specific cone shear strength factor
One of the key parameters for evaluation of the seismic
stability of landfills is the undrained shear strength (Su) of
the waste mass. In geotechnical engineering, Su in soils is
commonly estimated from the results of the CPT sounding
using the following equation:
Su Zqc Ksvo
Nk
(1)
where qc is (uncorrected) CPT cone tip resistance, svo is the
in situ total vertical stress, and Nk is an empirical constant.
Eq. (1) indicates that the undrained shear strength is
inversely proportional to the Nk value, i.e. the undrained
shear strength linearly decreases with increasing Nk.
Several attempts have been made to correlate Nk with soil
index properties. A recent publication on CPT interpretation
by [4] cites the [5] correlation of Nk to PI as the latest
development. The [5] correlation was developed for
unfissured normally consolidated to lightly overconsoli-
dated onshore Norwegian clays over a range of PI values
(see Fig. 7). If we assume that the behavior of the landfill
mass is governed by the soil matrix and that the waste mass
at the site underwent a similar consolidation process as the
Norwegian onshore clays (i.e., the waste mass is normally
consolidated to slightly overconsolidated with no fissures),
for a PI range of 39–50 (as evaluated in laboratory testing of
the borrow and cover soils at the site), the [5] correlation
indicates that the Nk value for the landfill mass ranges from
10 to 20.
To further evaluate the on-site Nk value for the five
hazardous waste landfills and possibly narrow the above
cited Nk range, the interpreted results of the SASW
soundings and two additional empirical correlations were
employed: one between shear wave velocity and the shear
strength of soft clay [6] and one between shear wave
velocity and cone tip resistance [7].
The general procedure used to estimate the range of
likely Nk values using the above correlations is outlined
below:
(i)
Demonstrate that the [7] correlation between Vs and qcis valid for the on-site waste materials using the CPT
and SASW results to substantiate the validity of soil-
based correlations for waste mass characterization at
the site.
(ii)
Estimate the Su profile for the waste mass using theSuKVs correlation by [6] for soft clays and the SASW
results.
(iii)
Using Eq. (1), the qc profile from the CPT soundingsand the Su profile estimated from the [6] correlation,
develop a site-specific Nk profile. Compare this profile
to soil-based Nk correlations to check for consistency.
Mayne and Rix [7] based their correlation between Vs
and qc on more than 480 tests in intact and fissured clays at
31 sites (see inset in Fig. 8). This correlation takes into

Fig. 7. Aas et al. [5] correlation between cone shear strength factor, Nk, and
Plasticity Index, PI.
Fig. 8. Comparison between measured and estimated qc profile.
Fig. 9. Undrained shear strength profile estimated from the Vs profile.
N. Matasovic et al. / Soil Dynamics and Earthquake Engineering 26 (2006) 201–208206
account the normal stress dependency of qc values and has a
coefficient of correlation of approximately 0.7. Comparison
between the measured (uncorrected) qc values at the
landfills and the qc values calculated from the SASW Vs
profile using the [7] correlation is shown in Fig. 8. Fig. 8
indicates that measured and calculated qc values correlate
reasonably well over the depth of the waste at the site.
Using the general procedure discussed above, the range
of Nk values was calculated from the results of SASW
measurements as follows. We first estimated mean, upper
and lower bound Su profiles from the mean Vs data using the
mean, upper and lower bound [6] correlation. This
correlation, developed for relatively shallow deposits of
San Francisco Bay Mud (clay of medium to high plasticity),
is reproduced as an inset in Fig. 9. Fig. 9 indicates, as
expected, that in general the undrained shear strength
increases with depth. Using the Vs-derived qc profile, the
Vs-derived Su profiles from Fig. 9, and Eq. (1), the mean,
lower bound and upper bound Nk profiles for the five
hazardous waste landfills were developed. The Nk profiles
for the landfills derived in this manner are shown in Fig. 10.
Note that Vs is the only measured parameter used to
derive Nk.
Mean, upper bound, and lower bound Nk profiles
evaluated using the mean shear wave velocity from site-
specific SASW measurements and the mean, upper bound
and lower bound of the [6] correlation are compared in
Fig. 10 to the Nk values evaluated using the [5] correlation
for clayey soils (for the PI range of 39–50) between
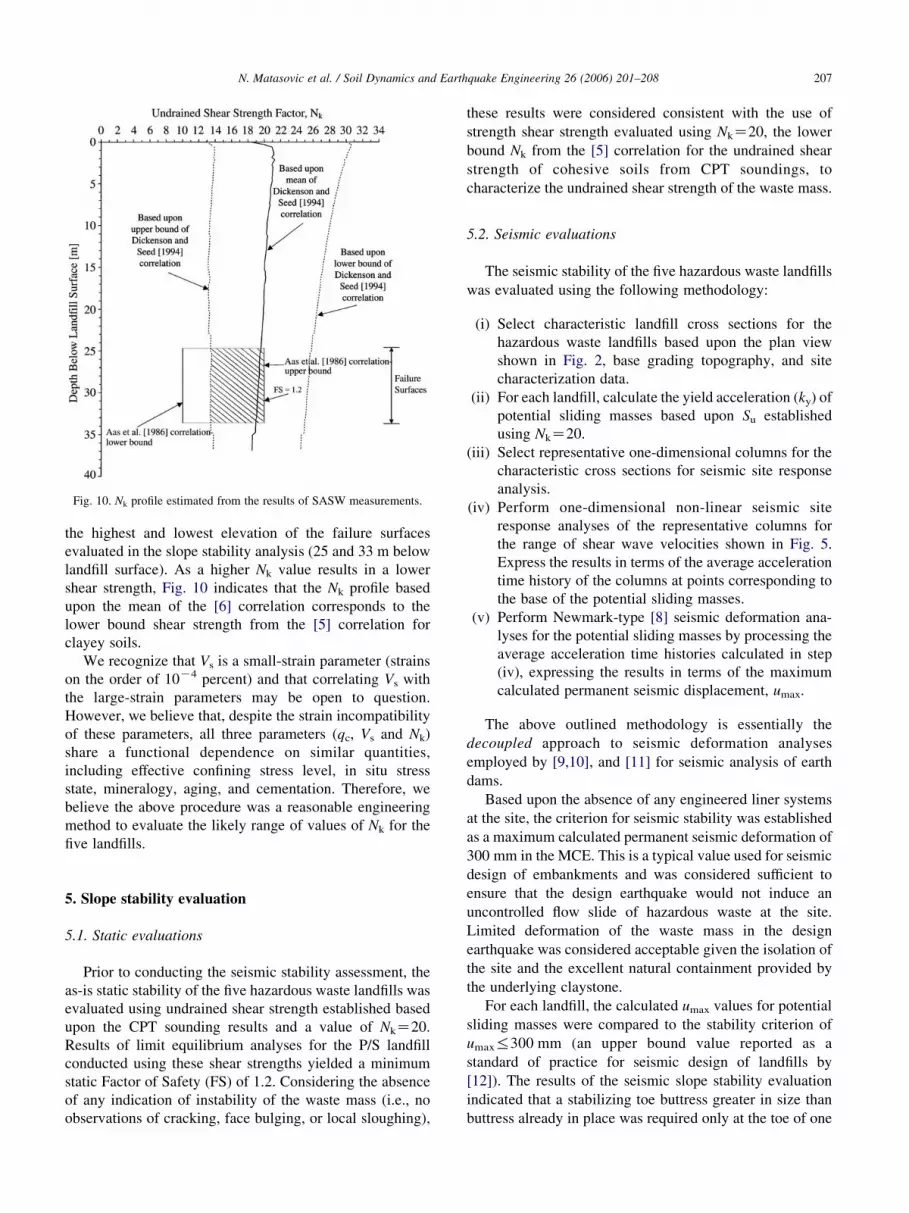
Fig. 10. Nk profile estimated from the results of SASW measurements.
N. Matasovic et al. / Soil Dynamics and Earthquake Engineering 26 (2006) 201–208 207
the highest and lowest elevation of the failure surfaces
evaluated in the slope stability analysis (25 and 33 m below
landfill surface). As a higher Nk value results in a lower
shear strength, Fig. 10 indicates that the Nk profile based
upon the mean of the [6] correlation corresponds to the
lower bound shear strength from the [5] correlation for
clayey soils.
We recognize that Vs is a small-strain parameter (strains
on the order of 10K4 percent) and that correlating Vs with
the large-strain parameters may be open to question.
However, we believe that, despite the strain incompatibility
of these parameters, all three parameters (qc, Vs and Nk)
share a functional dependence on similar quantities,
including effective confining stress level, in situ stress
state, mineralogy, aging, and cementation. Therefore, we
believe the above procedure was a reasonable engineering
method to evaluate the likely range of values of Nk for the
five landfills.
5. Slope stability evaluation
5.1. Static evaluations
Prior to conducting the seismic stability assessment, the
as-is static stability of the five hazardous waste landfills was
evaluated using undrained shear strength established based
upon the CPT sounding results and a value of NkZ20.
Results of limit equilibrium analyses for the P/S landfill
conducted using these shear strengths yielded a minimum
static Factor of Safety (FS) of 1.2. Considering the absence
of any indication of instability of the waste mass (i.e., no
observations of cracking, face bulging, or local sloughing),
these results were considered consistent with the use of
strength shear strength evaluated using NkZ20, the lower
bound Nk from the [5] correlation for the undrained shear
strength of cohesive soils from CPT soundings, to
characterize the undrained shear strength of the waste mass.
5.2. Seismic evaluations
The seismic stability of the five hazardous waste landfills
was evaluated using the following methodology:
(i)
Select characteristic landfill cross sections for thehazardous waste landfills based upon the plan view
shown in Fig. 2, base grading topography, and site
characterization data.
(ii)
For each landfill, calculate the yield acceleration (ky) ofpotential sliding masses based upon Su established
using NkZ20.
(iii)
Select representative one-dimensional columns for thecharacteristic cross sections for seismic site response
analysis.
(iv)
Perform one-dimensional non-linear seismic siteresponse analyses of the representative columns for
the range of shear wave velocities shown in Fig. 5.
Express the results in terms of the average acceleration
time history of the columns at points corresponding to
the base of the potential sliding masses.
(v)
Perform Newmark-type [8] seismic deformation ana-lyses for the potential sliding masses by processing the
average acceleration time histories calculated in step
(iv), expressing the results in terms of the maximum
calculated permanent seismic displacement, umax.
The above outlined methodology is essentially the
decoupled approach to seismic deformation analyses
employed by [9,10], and [11] for seismic analysis of earth
dams.
Based upon the absence of any engineered liner systems
at the site, the criterion for seismic stability was established
as a maximum calculated permanent seismic deformation of
300 mm in the MCE. This is a typical value used for seismic
design of embankments and was considered sufficient to
ensure that the design earthquake would not induce an
uncontrolled flow slide of hazardous waste at the site.
Limited deformation of the waste mass in the design
earthquake was considered acceptable given the isolation of
the site and the excellent natural containment provided by
the underlying claystone.
For each landfill, the calculated umax values for potential
sliding masses were compared to the stability criterion of
umax%300 mm (an upper bound value reported as a
standard of practice for seismic design of landfills by
[12]). The results of the seismic slope stability evaluation
indicated that a stabilizing toe buttress greater in size than
buttress already in place was required only at the toe of one

N. Matasovic et al. / Soil Dynamics and Earthquake Engineering 26 (2006) 201–208208
landfill, the C/C landfill, as the other landfills met the
seismic stability criterion.
6. Summary and conclusions
Information on the mechanical properties of hazardous
waste/soil masses is not readily available in technical
literature. To characterize the hazardous waste/soil mass
mechanical properties at the site, a site-specific waste
characterization program was conducted. This characteri-
zation program consisted of a review of historical data on
waste disposal, laboratory testing of soil samples recovered
from former borrow sources and the landfill interim soil
covers, and interpretation of the results of site-specific CPT
and SASW soundings. The collected data was interpreted to
evaluate a representative value for the CPT shear strength
factor Nk for the landfills.
Review of historical information indicated that all of the
segregated landfills at the site shared similar waste disposal
practices, daily cover soils, and cover materials. The results
of the SASW sounding indicated that the shear wave
velocities measured in the on-site waste materials fell within
a relatively narrow range and were stress-dependant,
following a trend typical of soils. The results of the CPT
soundings also fell within the range of values expected for
engineered fill and indicated that waste/soil matrix exhibited
similar mechanical behavior as that of clayey silt, silty clay
and/or clay, consistent with the results of laboratory testing
conducted on soil recovered from the former borrow sources
and landfill covers.
Based upon the results of the waste/soil mass character-
ization study, including laboratory and in situ testing, the
CPT and SASW data were interpreted to evaluate the
undrained shear strength parameter Nk. The evaluation of Nk
included both direct correlation based upon established CPT
correlations for soils (using the PI of the on-site soils), and
indirect correlation based upon the SASW and CPT test
results. The direct evaluation based upon PI indicated that
site-specific value of Nk ranged from 10 to 20. The indirect
evaluation based upon correlation of the SASW and CPT
data indicated that, at the depth of concern (25–33 m below
landfill surface, see Fig. 10), Nk ranged from 14 to 26.
Results of our stability evaluation indicate that Nk equal
to 20 corresponds to a minimum static Factor of Safety of
1.2 for existing conditions. Given that none of the landfills
shows any signs of instability such as face bulging or
cracking, a static Factor of Safety of 1.2 was considered a
reasonable lower bound and, therefore, Nk equal to 20 was
assumed to represent the upper bound Nk value for the
landfills evaluated. This value is consistent with the upper
bound Nk value evaluated using the [5] correlation for
clayey soil. Seismic stability evaluations were conducted
using this Nk value and a decoupled Newmark-type
permanent seismic deformation analysis. Results of the
seismic deformation analysis indicated the need for an
expanded toe buttress to provide adequate seismic stability
for one of the five hazardous waste landfills at the site.
The extrapolation of the methodology for evaluation of
the waste shear strength presented in this paper to other sites
should be done with caution due to the site-specific nature of
the waste placement process and materials.
Acknowledgements
The authors wish to express their sincere appreciation to
Barbara Luke of University of Nevada, Las Vegas, who
measured shear wave velocities at the site, and Tarik Hadj-
Hamou of GeoSyntec, who reviewed the manuscript and
provided valuable suggestions.
References
[1] Kavazanjian E Jr, Matasovic N. Seismic design of mixed and
hazardous waste landfills. Proceedings of the fourth international
conference on recent advances in geotechnical earthquake engineer-
ing and soil dynamics, State-of-the-Art Paper No. SOAP-11, San
Diego, CA; 2001.
[2] Imai T, Tonouchi K. Correlation of N-value with S-wave velocity and
shear modulus. Proceedings of the second European symposium on
penetration testing, Amsterdam, The Netherlands 1982 pp. 67–72.
[3] Robertson PK. Soil classification using the cone penetration test. Can
Geotechnical J 1990;27(1):151–8.
[4] Lunne T, Robertson PK, Powell JJM. Cone penetration testing in
geotechnical practice. Glasgow: Blackie Academic and Professional;
1997 p. 312.
[5] Aas G, Lacasse S, Lunne T, Hoeg K. Use of in situ tests for foundation
design on clay. Proceedings of the ASCE specialty conference in situ
86: use of in situ tests in geotechnical engineering. Blacksburg:
American Society of Civil Engineers; 1986 pp. 1–30.
[6] Dickenson SE, Seed RB. Preliminary report on correlations of shear
wave velocity and engineering properties for soft soil deposits in the
San Francisco Bay Region, research report, Department of Civil
Engineering, UCB/EERC-94/XX, Berkeley, CA; 1994.
[7] Mayne PW, Rix GJ. Correlations between shear wave velocity and
cone tip resistance in natural clays. Soils and foundations. vol. 35.:
Japanese Society of Soil Mechanics and Foundation Engineering;
1995 pp. 107–110.
[8] Newmark NM. Effects of earthquakes, on dams and embankments.
Geotechnique 1965;15(2):139–60.
[9] Seed HB, Martin GR. The seismic coefficient in earth dam design.
J Geotechnical Eng, ASCE 1966;92(3):25–58.
[10] Ambraseys NN, Sarma AK. The response of earth dams to strong
earthquake. Geotechnique 1967;17:181–213 [London, England].
[11] Makdisi FI, Seed HB. Simplified procedure for estimating dam and
embankment earthquake-induced deformations. J Geotechnical Eng
Div, ASCE 1978;104(GT7):849–67.
[12] Seed RB, Bonaparte R. Seismic analysis and design of lined waste
fills: current practice. Proc. stability and performance of slopes and
embankments-II, vol. 2, ASCE Geotechnical Special Publication
No. 31, Berkeley, California; 1992. pp. 1521–45.