Embed Size (px)
Citation preview
RR-91-49-ONR
AD-A241 600
ITEM CONSTRUCTION AND PSYCHOMETRIC MODELSAPPROPRIATE FOR CONSTRUCTED RESPONSES
Kikumi K.Tatsuoka
DTICS P-LECTEO .17.1991,
This research was sponsored in part by theCognitive Science ProgramCognitive and Neural Sciences DivisionOffice of Naval Research, underContract No. N0001 4-90-J-1 307R&T 4421559
Kikumi K. Tatsuoka, Principal Investigator
Educational Testing ServicePrinceton, New Jersey
August 1991
Reproduction in whole or in part is permittedfor any purpose of the United States Government.
91-13399 Approved for public release; distribution unlimited.
UnclassifiedSECURITY CLASSIFICATION 0; THIS PAGE
REPOR DOCMENTTIONPAGEFor ApprovedREPOT DCUMNTATON AGE0M No 0704-0788
la REPORT SECURIT ' CLASSIFICATION lb RESTRICTIVE MARK %6SUnclassified
2a SECURITY CLASS)FI, 'ION AUTHORITY 3 DiSTRIBJTION/AVAILABLITY OF REPORT
2b DECLASSIFICATION iDOWNGRADING SCHEDULE Approved for public release; distributionunlimited.
4 PER, )RIMING ORGANIZATION REPORT NUMBER(S) S MOXiTOR:NG ORGANIZATION REPORT NJMBE8R(S)
RR-91-49-ONR
6a .~A~E OF PERFORMING ORGANIZATION 6 b OFFICE SYMBOL 7a, NAME OF MVON:TORING ORGANZATION(if applicable) Cognitive Science Frogran, itice of Naval
Educational Testing Service J _______Research (Code 1142CS)
6c. ADDRESS (City, State, and Z.P Code) /0 ADDRESS (City, State, and ZIP Code)
Prineton Ne Jerey 05L1800 N. Quincy StreetPrineton Ne Jerey C5L1Arlington, VA 22217-5000
8a NAME OF FUNDING, SPONSOR:%G J8b OFFICE SYMBOL 9 PROCUREMENT INSTRUMENT IDENTIFICA'10N NUMBERORGANIZATION I(if applicable)
I _______ N00014-90-J-1307
8c. ADDRESS (City, State, and ZIP Code) 10 SOURIE OF FUNDING NUMVBERS
PROGRAM PROJECT ITASK ORK UNITELEMENT NO NO NO ACCESSION NO
.61153 N IRR 04204 1RR04204-01 JR&T442155911 TiTLE (include Security Classification)
Item construction and psyclometric models appropriate for constructed responses(unclassified)
12 PERSONAL AUTHOR(S)
Kkur- i K. T atsuoka13a TYPE OF REPORT 13b TIME COVERED 14 DATE OF REPORT (Year, Mont~i ay 15 PAGE COLIN-
Technical FROM 1989 T0 1 9 9 2 August 191 7 5016 SUPPLEMENTARY NOrATION
17 COSATI CODES 18 SUBJECT TERMS (Continue on reverse if necessary and identify by block number)FIL GOP U-RUP item construction coontv stutr-dl ieracy
05 10 gCraph theory cognitive porocesses3oclean algebra trcinaddition
19 ABSTRACT (Continue on reverse i .f necessary and identify by block number)
ABSTRACT
Constructed-response formats are desired for measuring
complex and dynamic response processes which require the examinee
to understand the structures of problems and micro-level
cognitive tasks. These micro-level tasks and their organized~
structures are usually unobservable. This study shows that
20 DIS-RIBUTION 'AVALABILITY OF ABSTRACT 121 ABTRACT SECURITY CLASS!FICATIONM UNCLASSIFIED'UNLIMITED C SAME AS RPT EC DTIC USERS I Unclassified
22a NAME OF RESPONS BLE INDIVIDUAL 22b TELEP-OXE (include Area Code) 22c OFF;CE SYMBOLDr. Fusan C-hioman 703-c':'--31b ONR 1142CS
DD Form 1473, JUN 86 ,eviu.JS editions are obsolete SECURITY CLASSIFICATION OF THIS PACE
SIN 0102-LF-014-6603Unclassified
Unclassified
SECURITY CLASSIFICATION OF THIS PAGE
elementary graph theory is useful for organizing these micro-
level tasks and for exploring their properties and relations.
Moreover, this approach enables us to better understand macro-
level performances on test items. TL.en, an attempt to develop a
general theory of item construction is described briefly and
illustrated with the domains of fraction addition problems and
adult literacy. Psychometric models appropriate for various
scoring rubrics are discussed.
DO Form 1473, JUN 86 Reverse SECURITY CLASSIFICATION OF THIS PAGE
Unclassified
Item Construction and Psychometric Models Appropriate
for Constructed Responses
Kikumi K. Tatsuoka
August 1991

Copyright ©c 1991. Educational Testing Service. All rights reserved.
ABSTRACT
Constructed-response formats are desired for measuring
complex and dynamic response processes which require the examinee
to understand the structures of problems and Ynicro-level
cognitive Lasks. These micro-level tasks and their organized
structures are usually unobservable. This study shows that
elementary graph theory is useful for organ4 zing these -ic-o-
level tasks and for exploring their properties and relations.
Moreover, this approach enables us to better understand macro-
level performances on test items. Then, an attempt to develop a
general theory of item construction is described briefly and
illustrated with the domains of fraction addition problems and
adult literacy. Psychometric models appropriate for varinlis
scoring rubrics are discussed.
Accession For
NTIS GRA&I
DTIC TAB 5Untnounced 5
By-_ D I. I. r .t t . , / .. .. . .
Dt°,,. r1 t onDistf
' 'L1
1
Introduction
Recent developments in cognitive theory suggest that new
achievement tests must reflect four important aspects of
performance: The first is to assess the principle of performance
on a test that is designed to measure, the second is to measure
dynamic changes in students' strategies, the third is to evaluate
the structure or representation of knowledge and cognitive
skills, and the fourth is to assess the automaticity of
performance skills (Graser, 1985).
These measurement objectives require a new test theory that
is both qualitative and quantitative in nature. Achievement
measures must be both descriptive and interpretable in terms of
the processes that determine performance. Traditional test
theories have shown a long history of contributions to American
-education through supporting norm-referenced and criterion-
referenced testing.
Scaling of test scores has been an important goal in these
types of testing, while individualized information such as
diagnosis of misconceptions has never been a main concern of
testing. In these contexts the information objectives for a test
will depend on the intended use of the test. Standardized test
scores are useful for admission or selection purposes but such
scores cannot provide teachers with useful information for
designing remediation. Formative uses of assessment require new
techniques, and this chapter will try to introduce one of such
techniques.
2
Constructed-response formats are desirable for measuring
complex and dynamic cognitive processes (Bennett, Ward, Rock, &
LaHart, 1990) while multiple-choice items are suitable for
measuring static knowledge. Birenbaum and Tatsuoka (1987)
examined the effect of the response format on the diagnosis of
examinees' misconceptions and concluded that multiple-choice
items may not provide appropriate information for identifying
students' misconceptions. The constructed-response format, on
the other hand, appears to be more appropriate. This finding
also confirms the assertion mentioned above by Bennett et al.
(1990).
As for the second objective, several studies on "bug"
stability suggest that bugs tend to change with "environmental
challenges" (Ginzburg, 1977) or "impasses" (Brown & VanLehn,
1980). Sleeman and his associates (1989) developed an
intelligent tutoring system aimed at the diagnosis of bugs and
their remediation in algebra. However, bug instability made
diag7nosis uncertain and hence remediation could not be directed.
Tatsuoka, Birenbaum and Arnold (1990) conducted an experimental
study to test the stability of bugs and also found that
inconsistent rule application was common among students who had
not mastered signed-number arithmetic operations. By contrast,
mastery-level students showed a stable pattern of rule
application. These studies strongly indicate that the unit of
diagnosis should be neither erroneous rules nor bugs but somewhat
larger components such as sources of misconceptions or
3
instructionally relevant cognitive components.
The primary weakness of attempts to diagnose bugs is that
bugs are tentative solutions for solving the problems when
students don't have the right skills.
However, the two identical subtests (32 items each) used in
the signed-number study, had almost identical true score curves
for the two parameter-logistic model (Tatsuoka & Tatsuoka, 1991).
This means that bugs are unstable but total scores are very
stable. Therefore, searching for the stable components that are
cognitively relevant is an important goal for diagnosis and
remediation.
The third objective, evaluating the structure or
representation of cognitive skills, requires response formats
different from traditional item types. We need items that ask
P-A-i --- - flow chartc in which complex relations among
tasks, subtasks, skills and solution path are expressed
graphically, or that ask examinees to describe such relations
verbally. Questions can be fi-ural respnne: n t in which
examinees are asked to order the causal relationships among
several concepts and connect them by a directed graph.
These demanding measurement objectives apparently require a
new psychometric theory that can accommodate more complicated
forms of scoring than just right or wrong item-level responses.
The correct response to the item is determined by whether or not
all the cognitive tasks involved in the item can be answered
correctly. Therefore, the hypothesis in this regard would be
that if any of the tasks would be wrong, then there would be a
high probability that the final answer would also be wrong.
These item-level responses are called macro-level responses
and those of the task-level are called micro-level responses.
This report will address such issues as follows:
The first section will discuss macro-level analyses versus
micro-level analyses and will focus on the skills and knowledge
that each task requires.
The second section will introduce elementary graph theory as
a tool to organize various micro-level tasks and their directed
relations.
Third, a theory for designing constructed-response items
will be discussed and will be illustrated with real examples.
Further, the connection of this deter-ministic approach to the
probabilistic models, Item Response Theory and Rule space models
(Tatsuoka, 1983, 1990) will also be explained. These models will
be demonstrated as a computation device for drawing inferences
about micro-level performances from the item-level responses.
Finally, possible scoring rubrics suitable for graded,
continuous and nominal response models will be addressed.
Macro- And Micro-Level Analyses
Making Inferences On Unobservable Micro-Level Tasks From
Observable Item-Level Scores
Statistical test theories deal mostly with test scores and
item scores. In this study, these scores are considered to be
macro-level intormation while the underlying cognitive processes

are viewed as micro-level information. Here we shall be using a
much finer level of observable performances than the item level
or the macro-level.
Looking into underlying cognitive processes and speculating
about examinees' solution strategies, which are unobservable, may
be analogous to the situation that modern physics has come
through in the history of its development. Exploring the
properties and relations among micro-level objects such as atoms,
electrons, neutrons and other elementary particles, has led to
many phenomenal successes in theorizing about physical phenorena
at the macro-level such as the relation between the loss and gain
of heat and temperature. Easley and Tatsuoka (1968) state in
their book Scientific Thought that "the heat lost or gained by a
sample of any non-atomic substance not undergoing a change of
state is jointly proportional to the number of atoms in the
sample and to the temperature change. This strongly suggests
that both heat and temperature are intimately related to some
property of atoms." Heat and temperature relate to molecular
motion and the relation can be expressed by mathematical
equations involving molecular velocities.
This finding suggests that, analogously, it might be useful
to explore the properties and relations among micro-level and
invisible tasks, and to predict their outcomes. These are
observable as responses to test items. The approach mentioned
above is not new in scientific research. In this instance, our
aim is to explore a method that can, scientitically, explain
macro-level phenomena -- in our context item-level or test-level
achievement -- derived from micro-level tasks. The met hor ho
be generalizable from specific relations in a specific dom n to
general relations in general domains. in order to acccmplish our
goal, elementary graph theory is used.
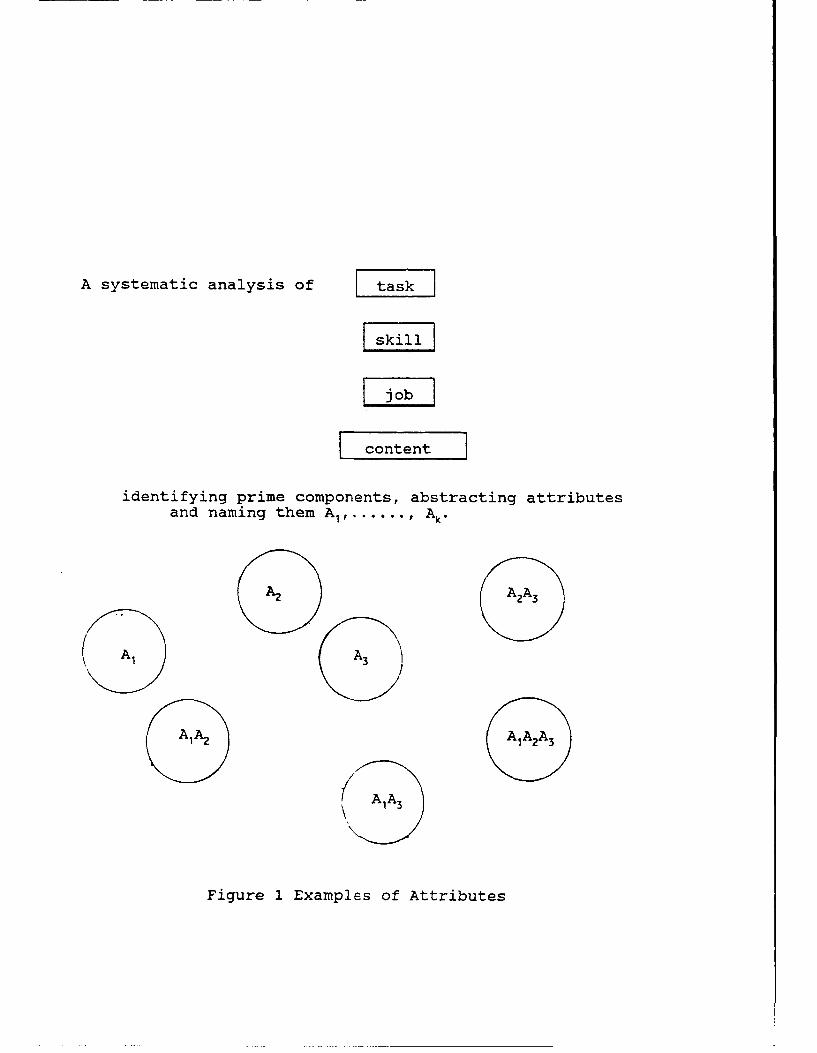
Identification of Prime Subtasks or Attributes
The development of an intelligent tutoring system or
cognitive error diacnostic system, involves a painstaking and
detailed task analysis in which goals, subgoals and various
solution paths are identified in a procedural network (or a flow
chart). This process of uncovering all possible combinations of
subtasks at the micro-level is essential for making a tutoring
system perform the role of the master teachers, although the
current state of research in expert systems only partially
achieves this goal. According to Chipmar, Davis and Shafto
(1986) , many studies have shown the tremendous effectiveness of
individual tutoring by master teachers.
It is very important that analysis of students' performances
on a test be similar to various levels of analyses done by human
teachers while individual tutoring is given. Although the
context of this discussion is task analysis, the methodology to
be introduced can be applied in more general contexts such as
skill analysis, job analysis or content analysis.
Identifying subcomponents of tasks in a given problem-
solving domain and abstracting their attributes is still an art.
It is also necessary that the process be made automatic and
7
objective. However, we here assume that the tasks are already
divided into components (subtasks) and that any task in the
domain can be expressed by a combination of cognitively relevant
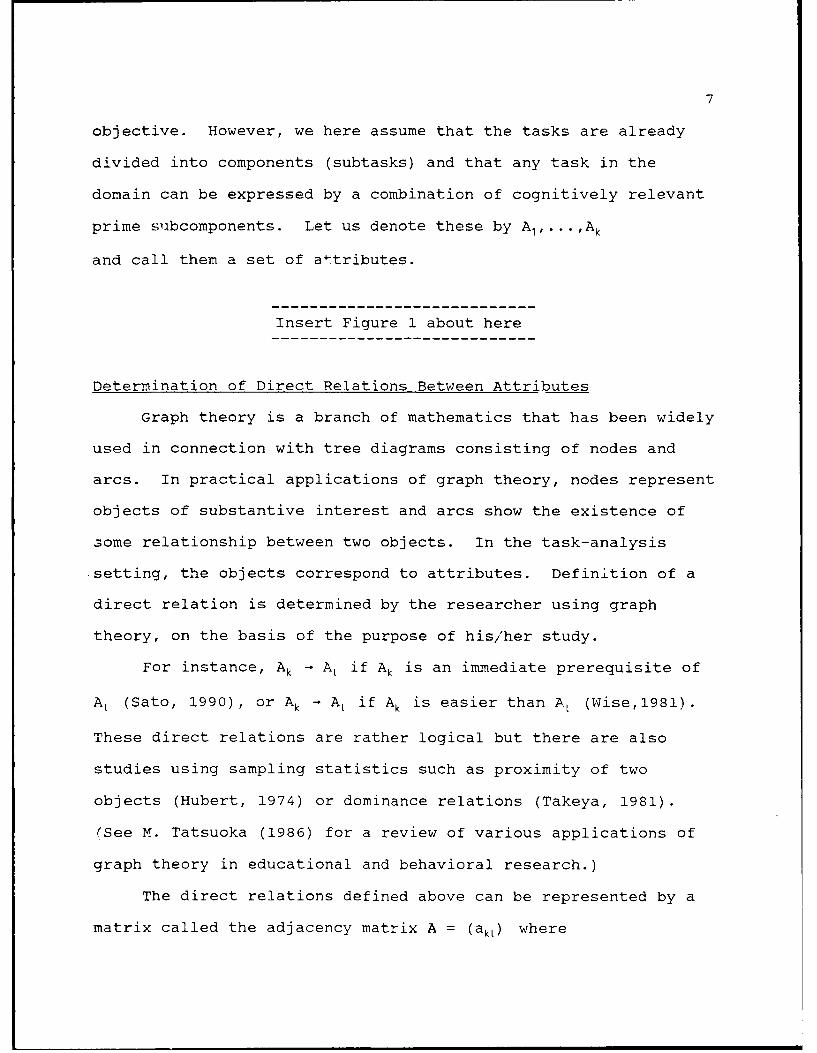
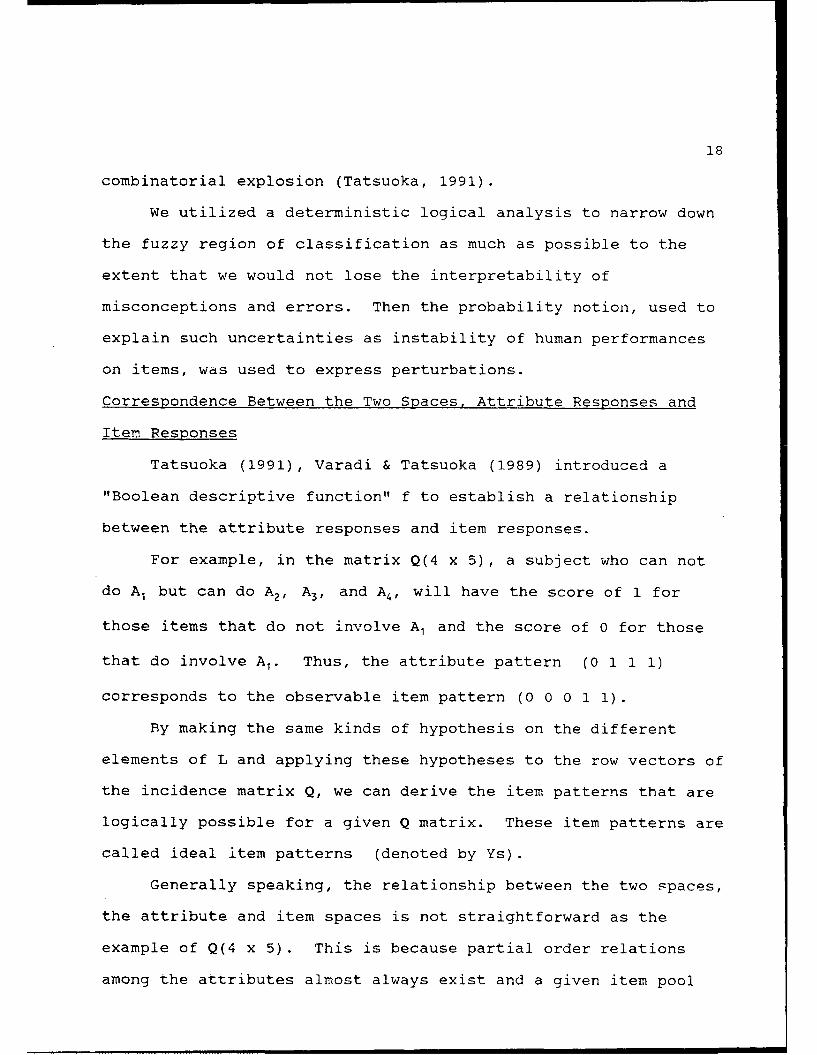
prime slibcomponents. Let us denote these by Al,...,Ak
and call them a set of attributes.
Insert Figure 1 about here
Determination of Direct Relations Between Attributes
Graph theory is a branch of mathematics that has been widely
used in connection with tree diagrams consisting of nodes and
arcs. In practical applications of graph theory, nodes represent
objects of substantive interest and arcs show the existence of
some relationship between two objects. In the task-analysis
setting, the objects correspond to attributes. Definition of a
direct relation is determined by the researcher using graph
theory, on the basis of the purpose of his/her study.
For instance, Ak - AL if Ak is an immediate prerequisite of
AL (Sato, 1990), or Ak - AL if Ak is easier than A, (Wise,1981).
These direct relations are rather logical but there are also
studies using sampling statistics such as proximity of two
objects (Hubert, 1974) or dominance relations (Takeya, 1981).
(See M. Tatsuoka (1986) for a review of various applications of
graph theory in educational and behavioral research.)
The direct relations defined above can be represented by a
matrix called the adjacency matrix A = (akl) where
8
I akl = 1 if a direct relation exists from Ak to A,
[ akt = 0 otherwise
If a direct relation exists from Ak to AL and also from A, to A.,
then Ak and A, are said to be equivalent. In this case, the
elements ak! and aLk of the adjacency matrix are both one.
There are many ways to define a direct relationship between
two attributes, but we will use a "prerequisite" relation in this
paper. One of the open-ended questions shown in Bennett et al.
(1990) will be used as an example to illustrate various new
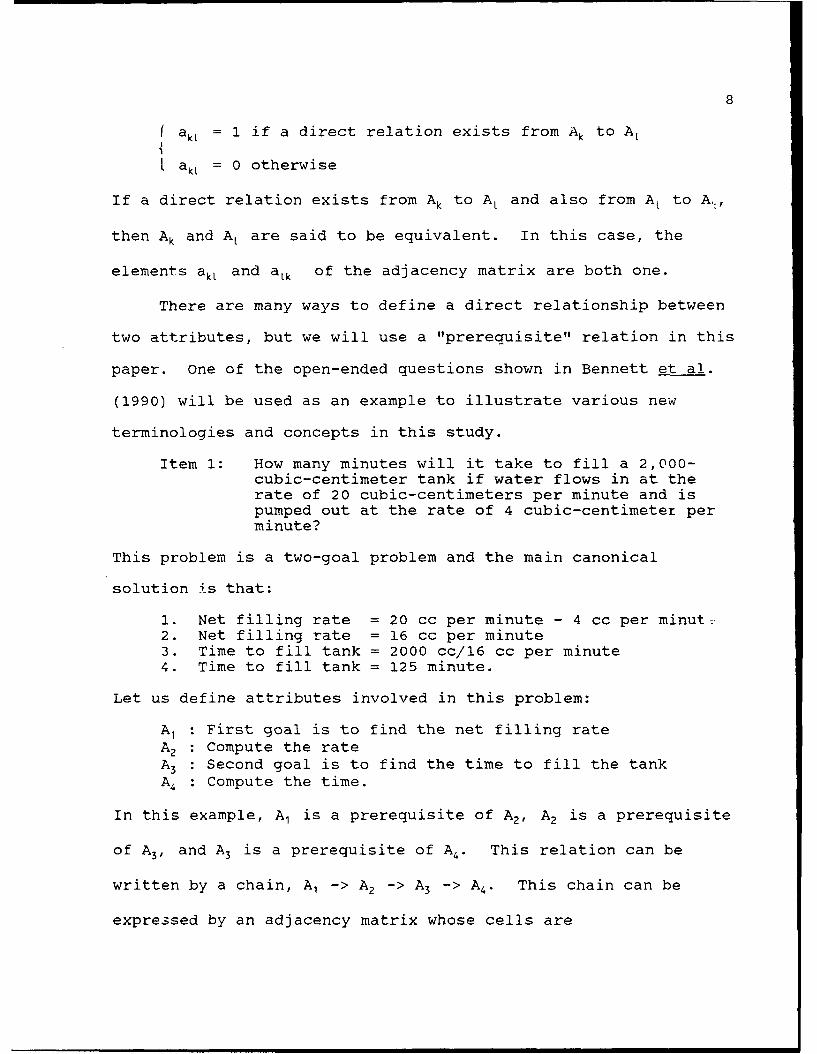
terminologies and concepts in this study.
Item 1: How many minutes will it take to fill a 2,000-cubic-centimeter tank if water flows in at therate of 20 cubic-centimeters per minute and ispumped out at the rate of 4 cubic-centimeter perminute?
This problem is a two-goal problem and the main canonical
solution is that:
1. Net filling rate = 20 cc per minute - 4 cc per minut-2. Net filling rate = 16 cc per minute3. Time to fill tank = 2000 cc/16 cc per minute4. Time to fill tank = 125 minute.
Let us define attributes involved in this problem:
Al : First goal is to find the net filling rateA2 : Compute the rateA3 : Second goal is to find the time to fill the tankA4 : Compute the time.
In this example, Al is a prerequisite of A2 , A2 is a prerequisite
of A3, and A3 is a prerequisite of A4 . This relation can be
written by a chain, Al -> A 2 -> A3 -> A4. This chain can be
expressed by an adjacency matrix whose cells are
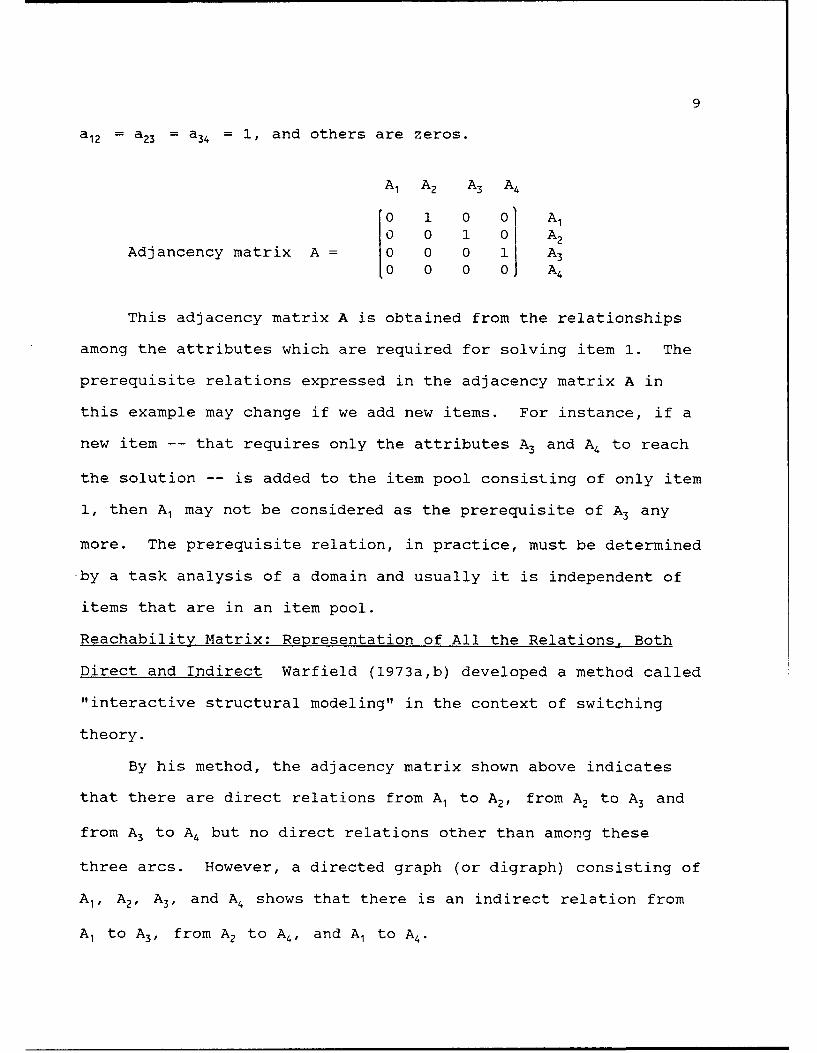
9
a 12 = a23 = a34 = 1, and others are zeros.
Al A2 A3 A4
0 1 0 01 A,0 0 1 01 A 2
Adjancency matrix A = 0 0 0 i A30 0 0 0J A4
This adjacency matrix A is obtained from the relationships
among the attributes which are required for solving item 1. The
prerequisite relations expressed in the adjacency matrix A in
this example may change if we add new items. For instance, if a
new item -- that requires only the attributes A3 and A4 to reach
the solution -- is added to the item pool consisting of only item
1, then Al may not be considered as the prerequisite of A3 any
more. The prerequisite relation, in practice, must be determined
by a task analysis of a domain and usually it is independent of
items that are in an item pool.
Reachability Matrix: Representation of All the Relations, Both
Direct and Indirect Warfield (1973a,b) developed a method called
"interactive structural modeling" in the context of switching
theory.
By his method, the adjacency matrix shown above indicates
that there are direct relations from Al to A2, from A2 to A3 and
from A3 to A4 but no direct relations other than among these
three arcs. However, a directed graph (or digraph) consisting of
Al, A2, A3, and A4 shows that there is an indirect relation from
A1 to A3, from A2 to A4, and Al to A4.
10
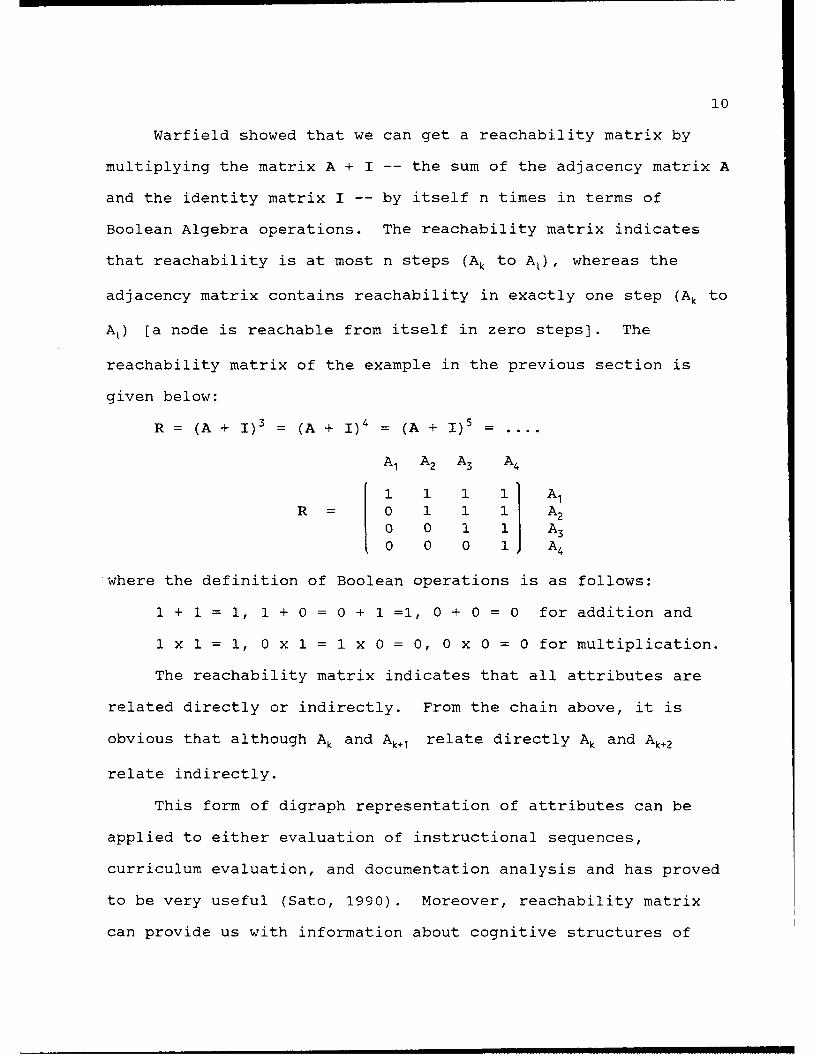
Warfield showed that we can get a reachability matrix by
multiplying the matrix A + I -- the sum of the adjacency matrix A
and the identity matrix I -- by itself n times in terms of
Boolean Algebra operations. The reachability matrix indicates
that reachability is at most n steps (Ak to A,), whereas the
adjacency matrix contains reachability in exactly one step (Ak to
A,) [a node is reachable from itself in zero steps]. The
reachability matrix of the example in the previous section is
given below:
R = (A + I)3 = (A + I)4 = (A + I)' =
Al A2 A3 A4
1 1 1 1 AlR = 0 1 1 1 A 2
0 0 1 1 A3
0 0 0 1J A4
where the definition of Boolean operations is as follows:
1 + 1 = 1, 1 + 0 = 0 + 1 =1, 0 + 0 =0 for addition and
1 x 1 = 1, 0 x 1 = 1 x 0 = 0, 0 x 0 0 for multiplication.
The reachability matrix indicates that all attributes are
related directly or indirectly. From the chain above, it is
obvious that although Ak and Ak+ relate directly Ak and Ak+2
relate indirectly.
This form of digraph representation of attributes can be
applied to either evaluation of instructional sequences,
curriculum evaluation, and documentation analysis and has proved
to be very useful (Sato, 1990). Moreover, reachability matrix
can provide us with information about cognitive structures of
11
attributes. However, application to assessment analysis requires
extension of the original method introduced by Warfield.
A Theory of Item DesiQn Appropriate For
The Constructed-Response Format
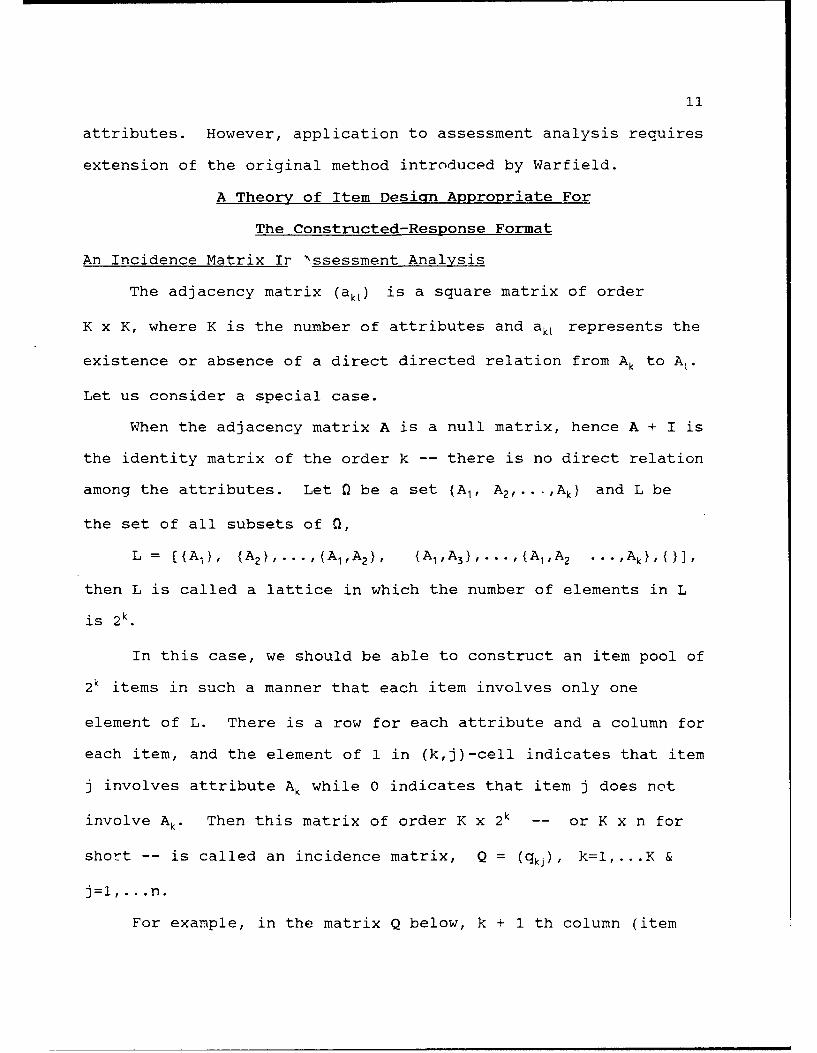
An Incidence Matrix Ir "ssessment Analysis
The adjacency matrix (akt) is a square matrix of order
K x K, where K is the number of attributes and akl represents the
existence or absence of a direct directed relation from Ak to A,.
Let us consider a special case.
When the adjacency matrix A is a null matrix, hence A + I is
the identity matrix of the order k -- there is no direct relation
among the attributes. Let 0 be a set {Al, A2,...,Ak) and L be
the set of all subsets of 0,
L = [{A }, {A 2 }, ... , (A, ,A2), {AlA 3 } ,... (A ,A 2 . . . ,Ak},{
then L is called a lattice in which the number of elements in L
is 2k.
In this case, we should be able to construct an item pool of
2k items in such a manner that each item involves only one
element of L. There is a row for each attribute and a column for
each item, and the element of 1 in (k,j)-cell indicates that item
j involves attribute Ak while 0 indicates that item j does not
involve Ak. Then this matrix of order K x 2 k -- or K x n for
short -- is called an incidence matrix, Q = (qkj), k=l,...K &
j=l,...n.
For example, in the matrix Q below, k + 1 th column (item
12
k + 1) has the vector of (1 1 0 ... 0) which corresponds to the
k + 1 th set, {Al, A2 ) in L.
il i2 . ik i(k+l) i(k+2) . . . i( 2 k-l) i(2k)
1 0 . 0 1 1 . ...... 1 0 AlQ(kxn) 0 1 . 0 1 0 . ...... 1 0 A2
0 0 . .0 0 1 . ...... 1 0 A3
0 0 . 1 0 1. ....... 1 0 Ak
However, if K becomes large, say K=20, then the number of
items in the item pool becomes astronomically large,
220=1,048,576. In practice, it might be very difficult to
develop a pool of constructed response items so that each item
requires only one independent attribute. Constructed response
items are usually designed to measure such functions as cognitive
processes, organization of knowledge and cognitive skills, and
theory changes required in solving a problem. These complex
mental activities require an understanding of all the
relationships which exist in the elements of 0. Some attributes
are connected by a direct relation while others are isolated.
In general, the manner in which the attributes in 0
interrelate, one with another, bear a closer resemblanice to the
arc/node tree configuration than they do to the unidimensional
chain shown in the previous section.
Suppose we modify the original water-filling-a-tank problem
to make four new items (beyond our original item 1 - page 8),
which include the original attributes.
13
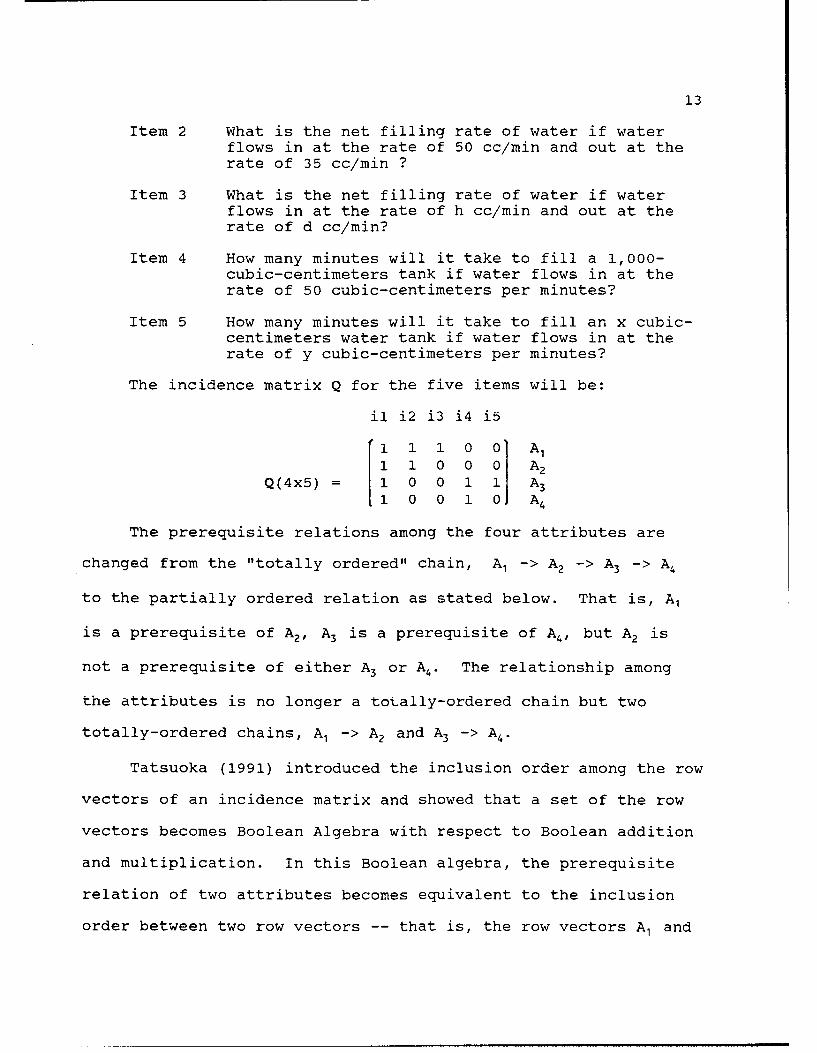
Item 2 What is the net filling rate of water if waterflows in at the rate of 50 cc/min and out at therate of 35 cc/min ?
Item 3 What is the net filling rate of water if waterflows in at the rate of h cc/min and out at therate of d cc/min?
Item 4 How many minutes will it take to fill a 1,000-cubic-centimeters tank if water flows in at therate of 50 cubic-centimeters per minutes?
Item 5 How many minutes will it take to fill an x cubic-centimeters water tank if water flows in at therate of y cubic-centimeters per minutes?
The incidence matrix Q for the five items will be:
il i2 i3 i4 i5
1 1 0 0 Al1 0 0 0 A2
Q(4x5)= 1 0 0 1 1 A 3
1 0 0 1 01 A4
The prerequisite relations among the four attributes are
changed from the "totally ordered" chain, Al -> A2 -> A3 -> A4
to the partially ordered relation as stated below. That is, A,
is a prerequisite of A2, A3 is a prerequisite of A4, but A2 is
not a prerequisite of either A3 or A4. The relationship among
the attributes is no longer a totally-ordered chain but two
totally-ordered chains, A -> A2 and A3 -> A4.
Tatsuoka (1991) introduced the inclusion order among the row
vectors of an incidence matrix and showed that a set of the row
vectors becomes Boolean Algebra with respect to Boolean addition
and multiplication. In this Boolean algebra, the prerequisite
relation of two attributes becomes equivalent to the inclusion
order between two row vectors -- that is, the row vectors A and
14
A3 include the row vectors A2 and A4, respectively, in the
Q(4 x 5) matrix above.
There is an interesting relationship between an incidence
matrix Q(k x n) and the reachability matrix R(k x k). A pairwise
comparison over all the combinations of the row vectors of
Q(k x n) matrix with respect to the inclusion order will yie=1
the reachability matrix R(k x k) in which all the relations
logically existing among the k attributes, both direct or
indirect, are expressed. This property is very useful for
examining the quality and cognitive strucL~res oi an item
pool.
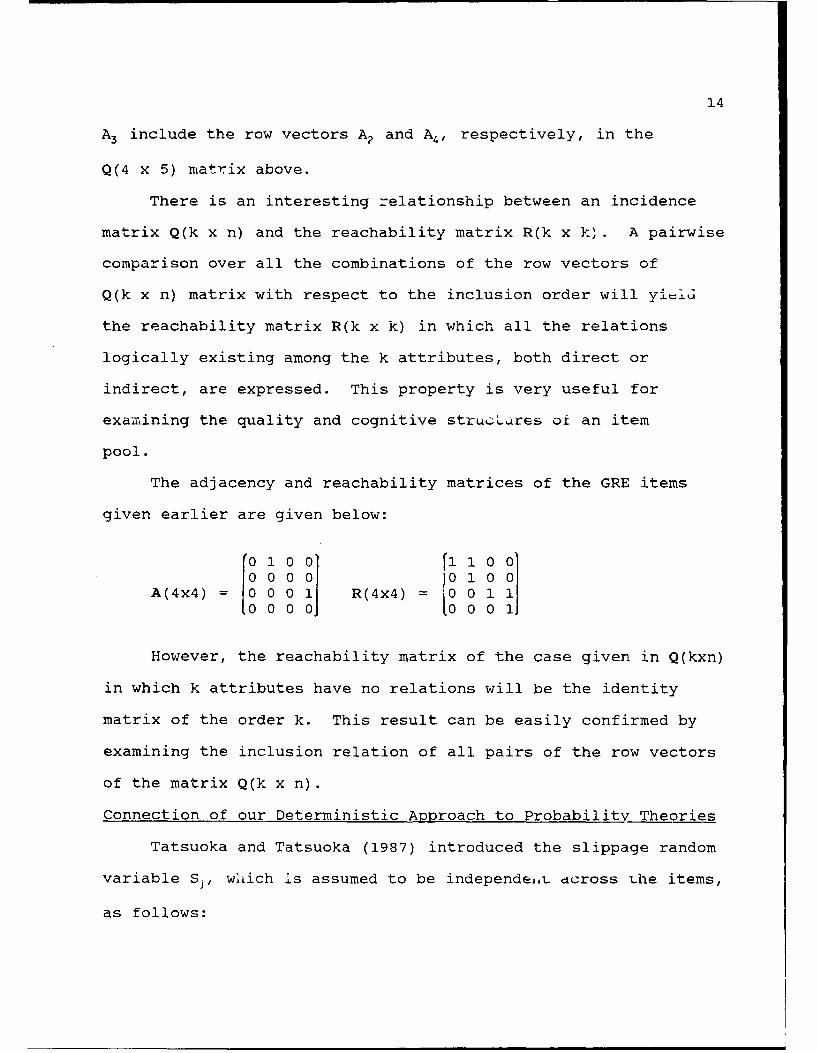
The adjacency and reachability matrices of the GRE items
given earlier are given below:
f o 10 0 1100
A(4x4) = 0 0 1 R(4x4) = 0 1110 000 0 01
However, the reachability matrix of the case given in Q(kxn)
in which k attributes have no relations will be the identity
matrix of the order k. This result can be easily confirmed by
examining the inclusion relation of all pairs of the row vectors
of the matrix Q(k x n).
Connection of our Deterministic Approach to Probability Theories
Tatsuoka and Tatsuoka (1987) introduced the slippage random
variable S, wliich is assumed to be independe1iL dcross the items,
as follows:

15
If Si = 1, then X, = 1 - Ri and if S. = 0, then Xi = R-.
or, equivalently, Sj = l Xj- Rj I .
A set (Xm} forms a cluster around R -- (where X. is an item
response pattern that is generated by adding different numbers of
slips to the ideal item pattern R). The Tatsuokas showed that
the total number of slippage s in these 'Lazzy" item patterns
follows a compound binomial distribution with the slippage
probabilities unique to each item. They called this distribution
the "bug distribution."
However, it is also the conditional distribution of s given
R, where R is a state of knowledge and capabilities. This is
called a state distribution for short. Once a distribution is
determined for each state of knowledge and capabilities, then
Bayes' decision rule for minimum errors can be applied to
classify any student's response patterns into one of these
predetermined states of knowledge and capabilities (Tatsuoka &
Tatsuoka, 1987).
The notion of classification has an important implication
for education. Given a response pattern, we want to determine
the state to which the students' misconception is the closest and
we want to answer the question: "What misconception, leading to
what incorrect rule of operation, did this subject most likely
have?" or "What is the probability that the subject's observed
responses have been drawn from each of the predetermined states?"
This is error dianoiusis.
For Bayes' decision rule for minimum errors, the
16
classification boundary of two groups of "fuzzy" response
patterns becomes the linear discriminant function when the state
distributions are a multivariate normal and their covariance
matrices are approximately equal. Kim (1990) examined the effect
of violation of the normality requirement, and found that the
linear discriminant function is robust against this violation.
Kim further compared the classification results using the linear
discriminant functions and K nearest neighbors method, which is a
non-parametric approach, and found that the linear discriminant
functions are better. However, the classification in the n-
dimensional space with many predetermined groups (as many as 50
or 100 states) is not practical.
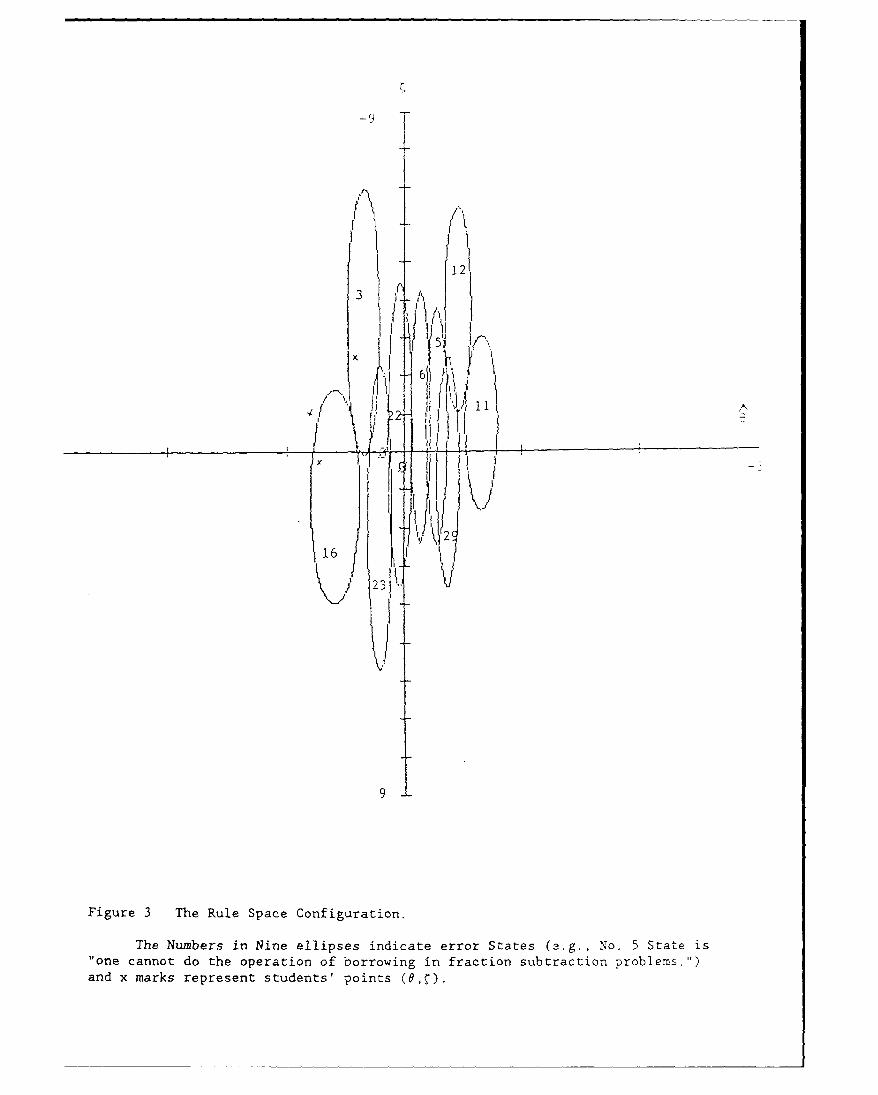
Tatsuoka (1983, 1985, 1990) proposed a model (called 'rule
space') that is capable of diagnosing cognitive errors. Rule
space uses item response functions where the probability of
correct response to item j is modeled as a function of the
student's "proficiency", (which is denoted by 0) as P1 (0), and
that Qj(6)=l-Pj(O). Since the rule space model maps all possible
item response patterns into ordered pairs of (e,C) and where C is
an index measuring atypicality of response patterns (a projection
operator by a mathematical term), all the error groups will also
be mapped into this Cartesian Product space. The mapping is one-
to-one at almost everywhere if IRT functions are monotone
increasing (Tatsuoka, 1985; Dibello & Baillie, 1991).
Figure 3 illustrates the rule space configuration.
17
Insert Figure 3 about here
Rule space can be regarded as a technique for reducing the
dimensionality of the classification space. Furthermore, since
the clusters of "fuzzy" response patterns that are mapped into
the two dimensional space follow approximately bivariate normal
distributions (represented by the ellipses shown in Figure 3),
Bayes' decision rules can be applied to classify a point in the
space into which one of the ellipses shown in Figure 3), (M.
Tatsuoka & K Tatsuoka, 1989; Tatsuoka, 1990).
Kim also compared the classification results using rule
space with Bayes' classifiers -- the discriminant function
approach -- and the non-parametric K-nearest neighbors method.
He found that the rule space approach was efficient in terms of
CPU time, and that the classification errors were as small as
those created by the other two methods.
Moreover, states located in the two extreme regions of the 0
scale, tended to have singular within-groups covariance matrices
in the n-dimensional space; hence, classification using
discriminant functions could not be carried out for such cases.
The rule space classification, on the other hand, was always
obtainable and reasonably reliable.
We assumed the states for classification groups were pre-
determined. However, determination of the universal set of
knowledge states is a complicated task and it requires a
mathematical tool, Boolean algebra, to cope with the problem of
18
combinatorial explosion (Tatsuoka, 1991).
We utilized a deterministic logical analysis to narrow down
the fuzzy region of classification as much as possible to the
extent that we would not lose the interpretability of
misconceptions and errors. Then the probability notion, used to
explain such uncertainties as instability of human performances
on items, was used to express perturbations.
Correspondence Between the Two Spaces, Attribute Responses and
Item Responses
Tatsuoka (1991), Varadi & Tatsuoka (1989) introduced a
"Boolean descriptive function" f to establish a relationship
between the attribute responses and item responses.
For example, in the matrix Q(4 x 5), a subject who can not
do Al but can do A2, A3, and A4, will have the score of 1 for
those items that do not involve Al and the score of 0 for those
that do involve Al. Thus, the attribute pattern (0 1 1 1)
corresponds to the observable item pattern (0 0 0 1 1).
By making the same kinds of hypothesis on the different
elements of L and applying these hypotheses to the row vectors of
the incidence matrix Q, we can derive the item patterns that are
logically possible for a given Q matrix. These item patterns are
called ideal item patterns (denoted by Ys).
Generally speaking, the relationship between the two spaces,
the attribute and item spaces is not straightforward as the
example of Q(4 x 5). This is because partial order relations
among the attributes almost always exist and a given item pool
19
often does not include the universal set of items which involve
all possible combinations of attributes.
A case when there is no relation among the attributes
Suppose there are four attributes in a domain of testing,
and that the universal set of items 24 are constructed, then
incidence matrix of 24 items is given below:
11111111234567890123456
0100011100011101 A10 1 0 0 1 0 0 110 1 1 0 1 A2
Q(4 x 16) = 0 0 0 1 0 0 1 0 1 0 1 1 0 1 1 1 A30 0 0 0 1 0 0 1 0 1 1 0 1 1 1 1 A4
An hypothesis that states "this subject cannot do A, but can
do Al,.. A[ i, AL ,..Ak correctly" corresponds to the attribute
pattern (1 ... 1 0 1... 1). Let us denote this attribute pattern
by Y,, then Y, produces the item pattern X, where xJ = 1 if item
j does not involve A,, and xJ = 0 if item j involves A,. This
operation is defined as a Boolean descriptive function.
Sixteen possible attribute patterns and the images of f (16
ideal item patterns), are summarized in Table 1 below.
Insert tabie i aDout here
For instance, attribute response pattern 1 0 indicates that
a subject cannot do A, and A3 correctly but can do A2 and A4.
Then from the incidence matrix Q(4x16) shown above, we see that
the scores of items 2,4,6,7,8,9 11,12,13,14,16 must become zero
while the scores of 1,3,5,10 must be 1.
20
Table 1 indicates that any responses to the 16 items can be
classified into one of the 16 predetermined groups. They are the
universal set of knowledge and capability states that are derived
from the incidence matrix Q(4 x 16) by applying the properties of
Boolean algebra. In other words, the 16 ideal item patterns
exhaust all the possible patterns logically compatible with the
constraints imposed by the incidence matrix Q(4 x 16). By
examining and comparing a subject's responses with these 16 ideal
item patterns, one can infer the subject's performances on the
unobservable attributes. As long as these attributes represent
the true task analysis, any response patterns of the above 16
items, which differ from the 16 ideal item patterns, are regarded
as fuzzy patterns or perturbations resulting from some lapses or
slips on one or more items, reflecting random errors.
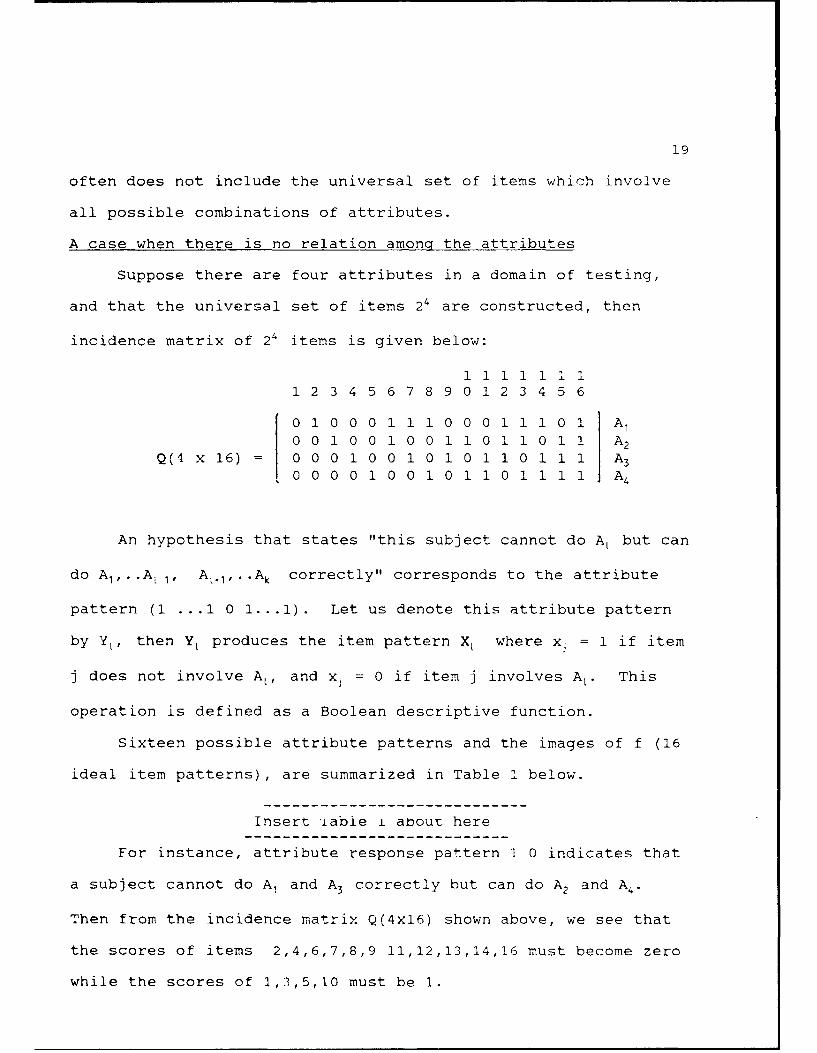
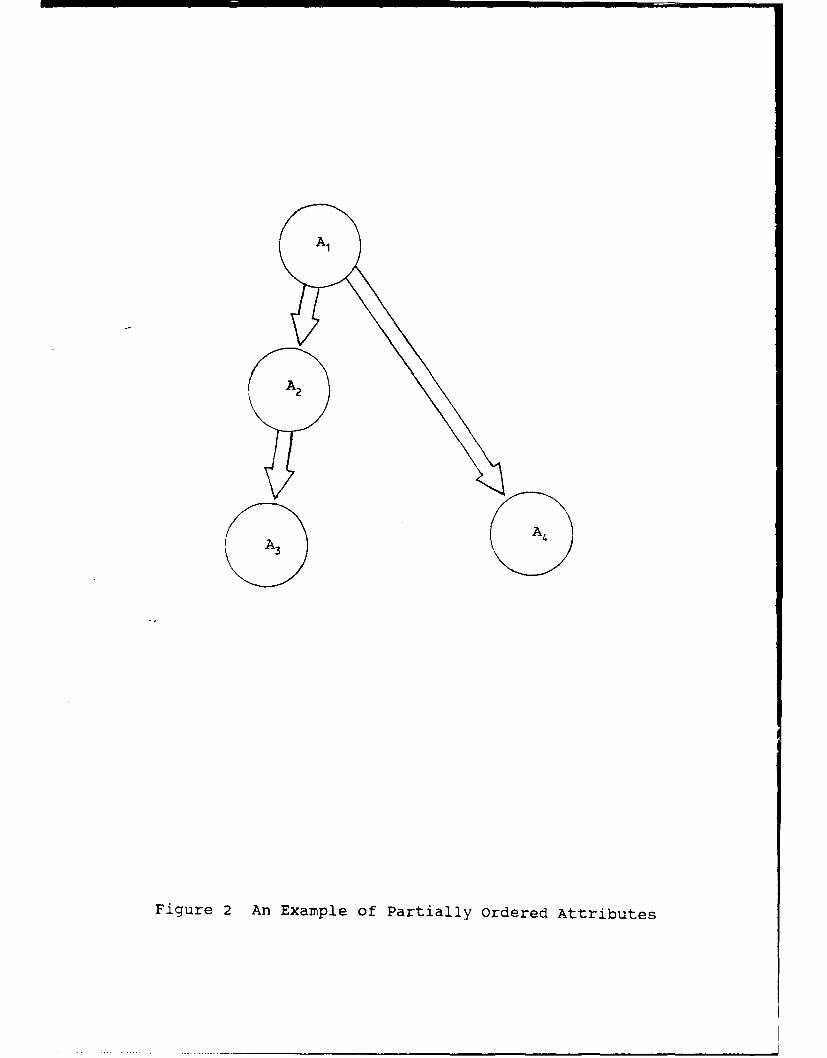
A Case When There Are Prerequisite Relations Among the Attribuces
So far we have not assumed any relations among the four
attributes in Table 1. It is often the case that some attributes
are directly related one to another. Suppose Al is a
prerequisite of A2, A2 is a prerequisite of A3 and A, is also a
prerequisite of A4 .
Insert Figure 2 about here
If we assume that a subject cannot do Al correctly, then A2
and A3 cannot be correct because they require knowledge of Al as
a prerequisite. Therefore, the attribute patterns 3, 4, 5, 9,
10, 11, and 15 in Table 1 become (0 0 0 0) which is pattern 1.
21
By an argument similar to the above paragraph, "cannot do A2 "
implies "cannot do A3t . In this case the attribute patterns 2
and 7, and the patterns 8 and 14 are respectively no longer
distinguishable. Table 2 summarizes the implication of the
relations assumed above among the four attribute set.
Insert Table 2 about here
The number of attribute patterns has been reduced from 16 to
7. The item patterns associated with these seven attribute
patterns are given in the right-hand column, in which each
pattern still has 16 elements. It should be noted that we do not
need 16 items to distinguish seven attribute patterns. Items 2,
3, 4, 5, 10, and 11 are sufficient to provide the different ideal
item patterns, (0 0 0 0 0 0), (1 0 0 0 0 0 0), (1 0 0 1 0 0),
(1 1 0 1 1 0), (1 1 0 0 0 0), (1 1 1 0 0 0), (1 1 1 1 1 1), which
are obtained from the second through fifth columns, and the 10th
and 11th columns of the ideal item patterns in Table 2.
The seven reduced attribute paterns given in Table 2 can be
considered as a matrix of the order 7 x 4. The four column
vectors, which associate with attributes, Al, A2, A3 and A4
satisfy the partial order defined by the inclusion relation.
Expressing the inclusion relationships among the four attributes
-- A, (column 1), A2 (column 2), A3 (column 3) and A4 (column
4) -- in a matrix, results in the following reachability matrix
R:
22
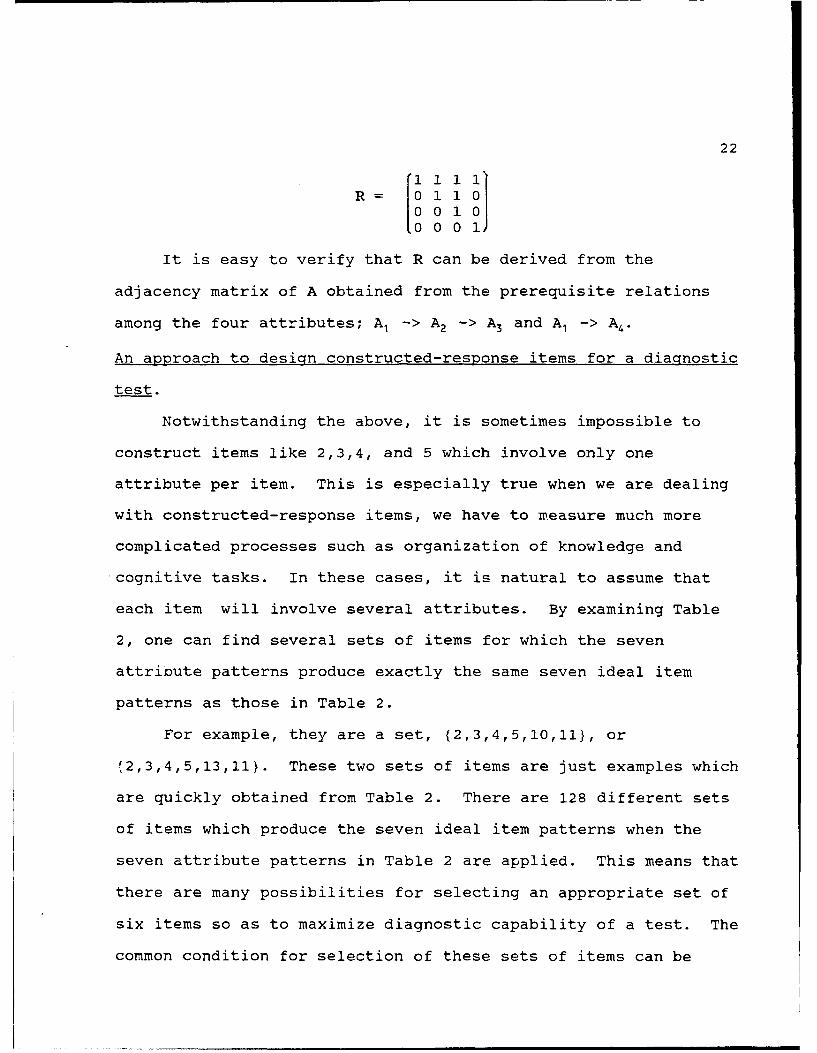
R= ii1 1 1
0 0 10
It is easy to verify that R can be derived from the
adjacency matrix of A obtained from the prerequisite relations
among the four attributes; Al -> A2 -> A3 and Al -> A4.
An approach to design constructed-response items for a diagnostic
test.
Notwithstanding the above, it is sometimes impossible to
construct items like 2,3,4, and 5 which involve only one
attribute per item. This is especially true when we are dealing
with constructed-response items, we have to measure much more
complicated processes such as organization of knowledge and
cognitive tasks. In these cases, it is natural to assume that
each item will involve several attributes. By examining Table
2, one can find several sets of items for which the seven
attribute patterns produce exactly the same seven ideal item
patterns as those in Table 2.
For example, they are a set, (2,3,4,5,10,11}, or
,2,3,4,5,13,11}. These two sets of items are just examples which
are quickly obtained from Table 2. There are 128 different sets
of items which produce the seven ideal item patterns when the
seven attribute patterns in Table 2 are applied. This means that
there are many possibilities for selecting an appropriate set of
six items so as to maximize diagnostic capability of a test. The
common condition for selection of these sets of items can be
23
generalized by the use of Boolean algebra, but detailed
discussion will not be given in this paper.
This simple example implies that this systematic item
construction method enables us to measure unobservable underlying
cognitive processes via observable item response patterns.
However, if the items are constructed without taking these
requirements into account, then instructionally useful feedback
or cognitive error diagnoses may not be always obtainable.
Explanation with GRE math items
The five items associated with GRE water filling problem are
given in the earlier section. The incidence matrix Q(4 x 5)
produces nine ideal item patterns and attribute patterns by using
BUGLIB program (Varadi & Tatsuoka, 1989). Table 3 summarizes
them.
Insert Table 3 about here
The prerequisite relations, Al -> A2 and A3 -> A4 imply some
constraints on attribute patterns: the attribute pattern, (0 1)
for A,, A2 and A3, A4 cannot exist logically. A close
examination of Table 1 reveals that the constraints result in
nine distinguishable attribute patterns. They are: 3,5,10 result
in 1 that is (0000) ; 8 to 2 that is (1000) ; 9 to 4, (0010) ; 13 to
6, (1100); 15 to 11, (0011) and the remaining patterns 7, (1010);
12, (1110); 14, (1011) and 16 (1111). These attribute patterns
are identical to the patterns given in Table 3.
It can be easily verified that the reachability matrix given
24
in earlier section (p. 13) is the same as the matrix which is
obtained by examining the inclusion relationships among all
combinations of the four column vectors of the attribute patterns
in Table 3. This means that all possible knowledge states,
obtainable from the four attributes with the structure
represented by R can be used for diagnosing a student's errors.
The five GRE items are good items as far as a researcher's
interest is to measure and diagnose the nine states of knowledge
and capabilities listed in Table 3.
Illustration With Real Examples
Example I: A Case of Discrete Attributes In Fraction AdditionProblems
Birenbaum & Shaw (1985) used Guttman's facet analysis
technique (Guttman, et.al. 1991) to identify eight task-content
facets for solving fraction addition problems. There were six
operation facets that described the numbers used in the problems
and two facets dealing with the results. Then, a task
specification chart was created based on a design which combined
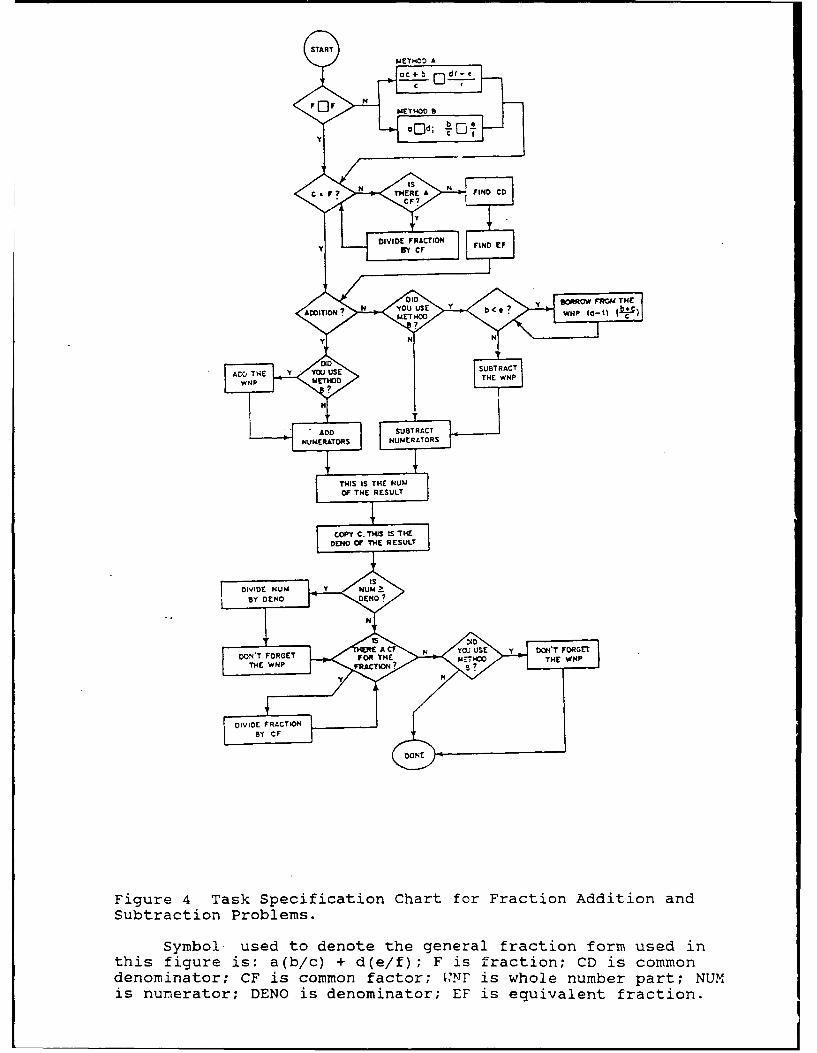
the content facets with the procedural steps. Figure 4 shows the
task specification chart.
Insert Figure 4 about here
The task specification chart describes two strategies to
solve the problems, methods A and B. Those examinees who use
Method A convert a mixed number (a b/c) into a simple fraction,
(ac+b)/c, similarly, the users of method B separate the whole
number part from the fraction part and then add the two parts
25
independently. In these cases, it is clear that when the numbers
become larger in a fraction addition problem, then Method A
obviously requires computational skills to get the correct
answer. Method B, on the other hand, requires a deeper
understanding of the number system.
Sets of attributes for the two methods are selected from the
task specification chart in Figure 4 as follows:
Problem: a b/c + d e/f Method A Method B
Al Convert (a b/c) to (ac+b)/c used Not used
A2 convert (d e/f) to (df+e)/f used Not used
A3 Divide fraction by a common factor used used
A4 Find the common denominator of c & f used used
A5 Make equivalent fractions used used
A6 Add numerators used used
A7 Divide numerator by denominator used used
A8 Don't forget the whole number part used used
BI Separate a & d and b/c & e/f Not used used
B2 Add the whole numbers including 0 Not used used
The two methods share all of the attributes in common,
except for BI and B2 , A, and A2. The incidence matrices for the
ten items in Birenbaum and Shaw (1985), for Methods A and B, are
given in Table 4.
Insert Table 4 about here
A computer program written by Varadi and Tatsuoka (BUGLIB,
1990) produces a list of all the possible "can/cannot"
combinations of attributes, otherwise known as the universal set
of attribute response patterns.
26
For Method A, 13 attribute patterns are obtained. The
attribute patterns and their corresponding ideal item patterns
are given in Table 5 where the attributes are denoted by the
numbers 1 through 8 for Al through A., and 9 and 10 for BI and
B2, respectively. For instance, the second state, 2, has the
attribute pattern 11111110 and the ideal item pattern is
represented by 111100010.
Insert Table 5 about here
It is interesting to note that there is no state including
"cannot do an item that involves both of the attributes, Al and
A2, but can do items that involve either A, or A2 alone" in the
list given in Table 5. If one would like to diagnose such a
compound state, then a new attribute should be added to the list.
Another interesting result is that A5 cannot be separated
from A4 as long as we use only these ten items. In other words,
the rows for A4 and A5 in the incidence matrix for Method A are
identical. Needless to say, Shaw and Tatsuoka (1983) found many
different errors that originated in attribute A5, -- making
equivalent fractions -- and they must be diagnosed for
remediation (Bunderson & Ohlsen, 1983). In order to separate A5
from A4, we must add a new item which involves A4 but not A5 ,
thereby making Row A5 different from Row A4.
Beyond asking the original "equivalent fraction" question,
we now add an item to the existing item pool, which asks, "What
is the common denominator of 2/5 and 1/7?" This is a w/y to test
27
the skill for getting common denominators correctly and also
distinguishes the separate skill required for making equivalent
fractions. However, since the solutions to each of these
questions a are so closely related and inter-dependent, it may
not be possible to separate measure the examinees' skills in
terms of each function.
If an examinee answers this item correctly but gets a wrong
answer for items involving addition, such as 2/5 + 1/7, then it
is more likely that the examinee has the skill for getting
correct common denominators but not the skill for making
equivalent fractions correctly.
Thirteen knowledge and capability states are identified from
the incidence matrix for Method B, and they are also summarized
in Table 5. Some ideal item response patterns can be found in
the lists for both Methods A and B. This means that for some
cases we cannot diagnose a student's underlying strategy for
solving these ten items. Our attribute list cannot distinguish
whether a student converts a mixed number (a b/c) to an improper
fraction, or separates the whole number part from the fraction
part. If we can see the student's scratch paper and can examine
the numerators prior to addition, then we can find which method
the student used. There are two solutions to this problem. One
is to use a computer for testing so that crucial steps during
problem solving activities can be coded. The second is to add
new items sc that these three attributes, Al, A2 and Bi can be
separated in the incidence matrix for Method B.
28
Example 2: The Case of Continuous and Hierarchically RelatedAttributes in The Adult Literacy Domain
Kirsch and Mosenthal (1990) have developed a cognitive model
which underlies the performance of young adults on the so-called
document literacy tasks. They identified three categories of
variables which predict the difficulties of items with a multiple
R of .94.
Three categories of variables are defined:
"* Document" variables (based on the structure and
complexity of the document)
. "Task" variables (based on the structural relation between
the document and the accompanying question or directive)
" "Process" variables (based on strategies used to relate
information in the question or directive to information in
the documents" (Kirsch and Mosenthal, 1990, p.5).
The "Document" variables comprise six specific variables
including the number of organizing categories in the document,
the number of embedded organizing categories in the document and
the number of specifics. These three variables are considered in
our incidence matrix as the attributes for "Document" variables.
The "Task" variables are determined on the basis of the
structural relations between a question and the document that it
refers to. The larger the number of units of information
required to complete a task, the more difficult the task. Four
attributes are picked up from this variable group.
The "Process" variables developed through Kirsch and
Mosenthal's regression analysis showed that variables in the
29
category of "Process" variables influenced the item difficulties
to a large extent. One of the variables in this category is the
degree of correspondence, which is defined as the degree to which
the information given in the question or directive matches the
corresponding information in the document.
The next variable represents the type of information which
has to be developed to locate, identify, generate, or provide the
requested information based on one or more nodes from a document
hiererchy. Five hierarchically related attributes are determined
from this variable group.
The last variables are Plausibility of Distractors, which
measure the ability to identify the extent to which information
in the document matches features in a question's given and
requested information.
A total of 22 attributes are selected to characterize the 61
items. Since the attributes in each variable group are totally
ordered, i.e., Al -> A2 -> A3 -> A4 -> A5, the number of possible
combinations of "can/cannot" attributes is drastically reduced
(Tatsuoka, 1991). One-hundred fifty-seven possible attribute
response patterns were derived by the BUGLIB program and hence
157 ideal item response patterns are produced. As was explained
in the earlier section, these 157 ideal item response patterns
correspond to the 157 state distributions that are multivariate
normal. These states are used for classifying an individual
examinee's response pattern. A sample of ten states with their
corresponding attribute response patterns are shown in
30
Table 6 as examples.
Insert Table 6 about here
As can be seen in Table 6, several subsets of attributes are
totally ordered and the elements of the subset form a chain.
Further 1500 subjects were classified into one of the 157
misconception states by a computer program entitled RULESPACE
(Tatsuoka, Baillie, Sheehan, 1991). The number of subjects who
were classified into one of these ten states are -- 157 subjects
in State No.1, 46 in No. 4, 120 in No. 11, 81 in No. 12, 37 in
No. 14, 68 in No. 50, 12 in No. 32, 27 in No. 102, 11 in No. 138
and 4 in No. 156.
While the interpretation of misconceptions for these results
is described in detail elsewhere (Sheehan, Tatsuoka & Lewis,
1991), State No. 11 (into which the largest number of subjects
were classified) will be described here.
"Cannot attributes A18 and A19" relate directly from A18 to
A19. Therefore, as represented in Table 6, the statement can be
made that, "a subject classified in this state cannot do A18 , and
hence cannot, by default, do A 19 ." Thus, the prescription for
these subjects' errors is likely to be that they make mistakes
when items have the following specific feature:
.... Distractors appear both within an organizing category
and across orgarizing categories, because different
organizing categories list the zar- specifics but with
different attributes" (Kirsch and Mosenthal, 1990, p. 30).
31
Psychometric Theories Appropriate For
A Constructed Response Format
An incidence matrix suggests various scoring formulas for
the items.
First, the binary scores of right or wrong answers can be
obtained from the condition that - if a subject can perform all
the attributes involved in an item correctly, then the subject
will get a score of one on that item; otherwise the subject will
get a score of zero. With this scoring formula, the simple
logistic models (Lord & Novick, 1968) for binary responses can be
uzed for estimating the scaling variable 0.
Second, partial credit scores or graded response scores can
be obtained from the incidence matrix if performance dependent on
the attributes is observable and can be measured directly. This
condition permits applicability of Masters' partial credit models
(Masters, 1982) or Samejima's General Graded response models
(Samejima, 1988) to data.
As far as error diagnoses are concerned, simple binary
response models always work even when performances on the
attributes cannot be measured directly and are not observable.
However, computer scoring (Bennett, Rock, Braun, Frye, Spohrer,
and Soloway, 1990), or scoring by human raters or teachers can
assign graded scores to the items. For example, the number of
correctly processed attributes for each item could be a graded
score.
Muraki (1991) wrote a computer program for his modified
32
version of Samejima's original graded response model (Samejima,
1969). Muraki's program can be used for Samejima's model itself
also.
Third, a teacher may assign different weights to the
attributes and give a student a score corresponding to the
percentage of correct answers achieved, depending on how well the
student performed on the attributes. Thus, the final score for
the item becomes a continuous variable. Then Samejima's (1976,
1988) General Continuous IRT model can be used to estimate the
ability parameter 0. If the response time for each item is
available, then her Multidimensional Continuous model can be
applied to such data sets.
Fourth, if a teacher is interested in particular
combinations of attributes and assigns scores to nominal
categories, say 1 = {can do Al and A3), 2 = {can do A, and A2)
and 3 = (can do A2, A3 and A4},.. so on, then Bock's (1972)
Polychotomous model can be utilized for getting 8.
Discussion
A wide variety of Item Response Theory models accommodating
binary scores, graded, polychotomous, and continuous responses
have been developed in the past two decades. These models are
built upon a hypothetical ability variable 8. We are not against
the use of global item scores and total scores -- e.g., the total
score is a sufficient statistic for 0 in the Rasch Model -- but
it is necessary to investigate micro-level variables such as
cognitive skills and knowledge and their structural relationships
33
in order to develop a pool of "good" constructed- response items.
The systematic item construction method enables us to measure
unobservable underlying cognitive processes via observable item
response patterns.
This study introduces an approach for organizing a couple of
dozen such micro-level variables and for investigating their
systematic interrelationships. The approach utilizes
deterministic theories, graph theory and Boolean algebra. When
most micro-level variables are not easy to measure directly, an
inference must be made from the observable macro-level measures.
An incidence matrix for characterizing the underlying
relationships among micro-level variables is the first step
toward achieving our goal. Then a Boolean algebra that is
formulated on a set of sets of attributes, or a set of all
possible item response patterns obtainable from the incidence
matrix, enables us to establish relationships between two worlds:
attribute space and item space (Tatsuoka, 1991).
A theory of item construction is introduced in this paper
in conjunction with Tatsuoka's Boolean algebra work (1991). If a
subset of attributes has a connected, directed relation and forms
a chain, then the number of combinations of "can/cannot"
attributes will be reduced dramatically. Thus, it will become
easier for us to construct a pool of items by which a particular
group of misconceptions of concern can be diagnosed with a
minimum classification errors.
One of the advantages of rule space model (Tatsuoka, 1983,
34
1990) is that the model relates a scaled ability parameter e to
misconception states. For a given misconception state, which is
error, one can always identify the particular types of errors
which relate to ability level 0. If the centroid of the state is
located in the upper part of the rule space, then one can
conclude that this type of error is rare. If the centroid lies
on the 8 axis, then this error type is observed very frequently.
Although Rule space was developed in the context of binary
IRT models, the concept and mathematics are general enough to be
extended for use in more complicated IRT models. Further work to
extend the rule space concept to accommodate complicated response
models will be left for future research.
35
References
Bennett, R. E., Rock. D. A., Braun, H. I., Frye, D., Spohrer, J.C. & Soloway, E. (1990). The relationship of constrainedfree-response to multiple-choice and open-ended items.Applied Psychological Measurement, 14, 151-162.
Bennett, R. E., Ward, W.C., Rock, D. A., & LaHart, C. (1990).Toward a framework for constructed-response items (RR-90-7).Princeton, NJ: Educational Testing Service.
Birenbaum, M. & Shaw, D. J. (1985). Task Specification Chart: Akey to better understanding of test results. Journal ofEducational Measurement, 22, 219-230.
Birenbaum, M., & Tatsuoka, K. K. (1987). Open-ended versusmultiple-choice response formats--it does make a differencefor diagnostic purposes. Applied Psychological Measurement,11, 329-341.
Bock, R. D. (1972). Estimating item parameters and latent abilitywhen the responses are scored in two or more nominalcategories. Psychometrika. 37, 29-51.
Brown, J. S., & VanLehn, K. (1980). Diagnostic models forprocedural bugs in basic mathematical skills. CognitiveScience, 4, 370-426.
Bunderson, V. C., & Olsen, J. B. (1983). Mental errors inarithmetic: their diagnosis in precollege students. (FinalProject Report, NSF SED 80-12500). WICAT, Provo, UT.
Chipman, S. F., Davis, C., & Shafto, M. G. (1986). Personnel andtraining research program: Cognitive science at ONR. NavalResearch Review. 38, 3-21.
Dibello, L. V. & Baillie, R. J. (1991). Separating points inRule space. (CERL Research Report). University of Illinois,Urbana, IL.
Easley, J. A. & Tatsuoka, M. M. (19680). Scientific thought,cases from classical physics. Allyn and Bacon, Boston.
Ginzburg, H. (1977). Children's arithmetic: The learningprocess. New York: Van Norstrand.
Glaser, R. (1985). The integration of instruction and testing.A paper presented at the ETS invitational Conference on theRedesign of Testing for the 21st Centry, New York, New York.

36
Guttman, R., Epstein, E. E., Amir, M., & Guttman, L. (1990).A structural theory of spacial abilities. AppliedPsychological Measurement, 14, 217-236.
Hubert, L. J. (1974). Some applications of graph theory toclustering. Psychometrika, 39, 283-309.
Kim, S. H. (1990). Classification of item-response patternsinto misconception groups. Unpublished doctoraldissertation. University of Illinois, Champaign.
Kirsch, I. S., & Mosenthal, P. B. (1990). Document literacy.Reading research guarterly, 25, 5-29.
Lord, F. M., & Novick, M. R. (1968). Statistical theories ofmental test scores. Reading, MA: Addison-Wesley.
Masters, G. N. (1982). A Rasch model for partial credit scoringin objective tests. Psychometrika, 47, 149-174.
Muraki, E. (1991). Comparison of the graded and partial credititem response models. Unpublished manuscript. Princeton, NJ:Educational Testing Service, Princeton.
Samejima, F. (1969). Estimation of ability using a responsepattern of graded scores. Psychometrika Monograph, 17.
Samejima, F. (1974). Normal ogive model on the continuousresponse level in the multidimensional latent space.Psychometrika, 39, 111-121.
Samejima, F. (1988). Advancement of latent trait theory. ONRFinal Report. University of Tennessee, Knoxville, Tenn.
Sato, T. (1990). An introduction to educational informationtechnology. In Delwyn L. Harnisch & Michael L. Connell(Eds.), NEC Technical College, Kawasaki, Japan.
Sheehan, K., Tatsuoka, K. K., & C. Lewis (1991). Using the rulespace model to diagnose document processing errors. A paperpresented at the ONR conference, Workshop on Model-basedMeasurement, Educational Testing Service, Princeton, NJ.
Sleeman, D., Kelly, A. E., Martinak, R., Ward, R.,& Moore, J.(1989). Studies of diagnosis and remediation with highschool algebra students. Cognitive Science, 13, 551-568.
Takeya, M. (1981). A study on item relational structure analysisof criterion referenced tests. Unpublished doctoraldissertation, Waseda University, Tokyo.
37
Tatsuoka, K. K. (1983). Rule space: An approach for aealingwith misconceptions based on item response theory. Journalof Educational Measurement, 20, 345-354.
Tatsuoka, K. K. (1985). A probabilistic model for diagnosingmisconceptions in the pattern classification approach.Journal of Educational Statistics, 12, 55-73.
Tatsuoka, K. K. (1990). Toward an integration of item-responsetheory and cognitive error diagnoses. In N. Frederiksen, R.L. Glaser, A. M. Lesgold, & M. G. Shafto (Eds.), Diagnosticmonitoring of skill and knowledge acquisition. Hillsdale,NJ: Erlbaum.
Tatsuoka, K. K. (1991). Boolean algebra applied to determinationof the universal set of knowledge states. Technical Report-ONR-1, (RR-91-4). Princeton, NJ:Educational TestingService.
Tatsuoka, K. K., Baillie, R. & Sheehan, K. (1991). RULESPACE:classifying a subject into one of the predetermined groups.Unpublished computer program.
Tatsuoka, K. K., Birenbaum, M., & Arnold, J. (1989). On thestability of students' rules of operation for solvingarithmetic problems. Journal of Educational Measurement,26, 351-361.
Tatsuoka, K. K., & Tatsuoka, M. M. (1987). Bug distributionand pattern classification. Psychometrika, 52, 193-206.
Tatsuoka, K. K., & Tatsuoka, M. M. (1991). On measures ofMisconception stability. ONR-technical report. Princeton,NJ: Educational Testing Service, Princeton.
Tatsuoka, M. M. (1986). Graph theory and its applications ineducational research: A review and integration. Review ofEducational Research, 56, 291-329.
Tatsuoka, M. M., & Tatsuoka, K. K. (1989). Rule space. In S.Kotz and N. L. Johnson (Eds.), Encyclopedia of statisticalsciences. New York: Wiley.
Varadi, F. & Tatsuoka, K. K. (1989). BUGLIB. Unpublishedcomputer program. Trenton, New Jersey.
Warfield, J. N. (1973). On arranging elements of a binary ingraphic form. IEEE transaction on systems, man andcybanetics, SMC-3, 121-132.

38
Warfield, J. N. (1973). Binary matrices in system modeling. IEEEtransactions on systems, man and cybernetics, SMC-3, 441-449.
Wise, S. L. (1981). A modified order-analysis procedure fordetermininQ unidimensional items sets. Unpublished doctoraldissertation, University of Illinois, Champaign.

Acknowledgement
The author would like to gratefully acknowledge and thank
several people for their help. Randy Bennett, Robert Mislevy,
Kathy Sheehan, Maurice Tatsuoka, Bill Ward for valuable comments
and suggestions, John Cordery for editorial help, Donna Lembeck for
various help.
Table 1 A List of 16 Ideal Item Response Patterns Obtained from16 Attribute Response Patterns by a Boolean DescriptionFunction
Attribute response patterns Ideal item response patterns
1 0000 1000000000000000
2 1000 1100000000000000
3 0100 1010000000000000
4 0010 1001000000000000
5 0001 1000100000000000
6 1100 1110010000000000
7 1010 1101001000000000
8 1001 1100100100000000
9 0110 1011000010000000
10 0101 1010100001000000
11 0011 1001100000100000
12 1110 1111011010010000
13 1101 1110110101001000
14 1011 1101101100100100
15 0111 1011100011100010
16 1111 111111111111l
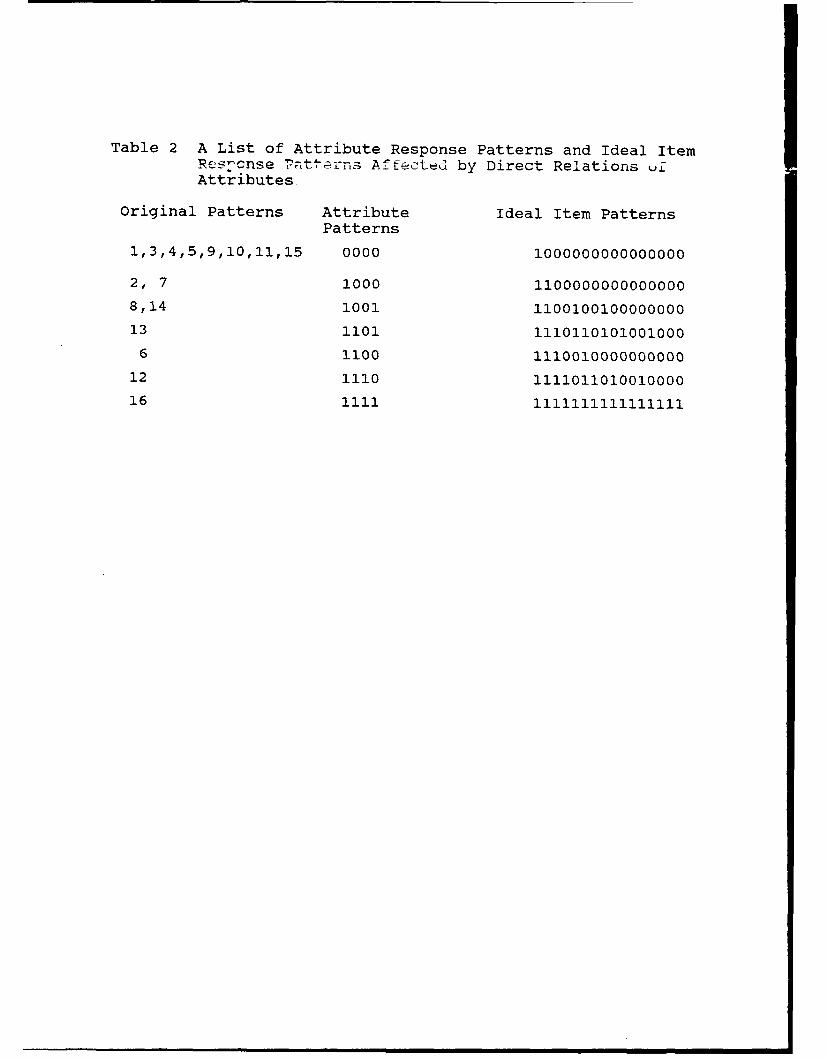
Table 2 A List of Attribute Response Patterns and Ideal ItemRes-cnse ter Affecteu' by Direct Relations QLAttributes
Original Patterns Attribute Ideal Item PatternsPatterns
1,3,4,5,9,10,11,15 0000 1000000000000000
2, 7 1000 1100000000000000
8,14 1001 1100100100000000
13 1101 1110110101001000
6 1100 1110010000000000
12 1110 1111011010010000
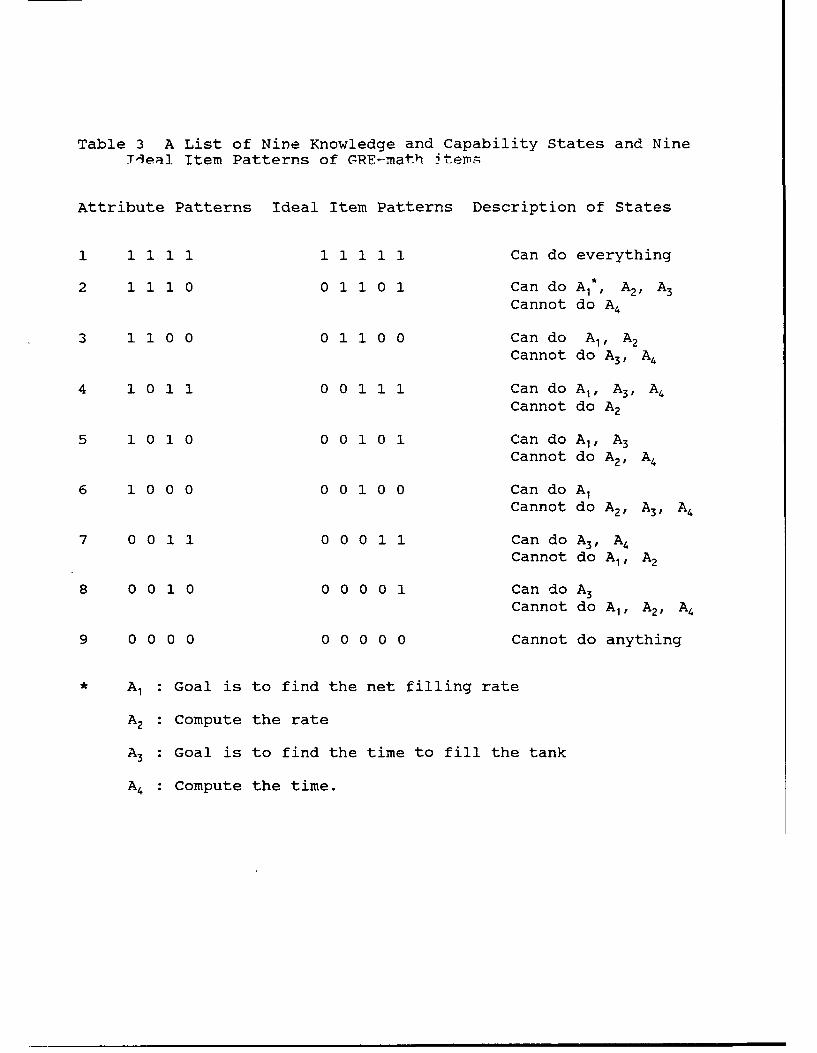
Table 3 A List of Nine Knowledge and Capability States and Nine
Tleal Item Patterns of GRE-math -ters
Attribute Patterns Ideal Item Patterns Description of States
1 1 1 1 1 1 1 1 1 1 Can do everything
2 1 1 1 0 0 1 1 0 1 Can do AI*, A2, A3Cannot do A4
3 1 1 00 0 1 1 0 0 Can do A,, A2Cannot do A3, A4
4 1 0 1 1 0 0 1 1 1 Can do A1 , A3, A4Cannot do A2
5 1 0 1 0 0 0 1 0 1 Can do A,, A3Cannot do A2, A4
6 1 0 0 0 0 0 1 0 0 Can do AlCannot do A2 , A3 , A4
7 0 0 1 1 0 0 0 1 1 Can do A3, A4Cannot do A,, A2
8 0 0 1 0 0 0 0 0 1 Can do A3Cannot do Al, A2 , A4
9 0 0 0 0 0 0 0 0 0 Cannot do anything
* A : Goal is to find the net filling rate
A2 : Compute the rate
A3 : Goal is to find the time to fill the tank
A4 : Compute the time.
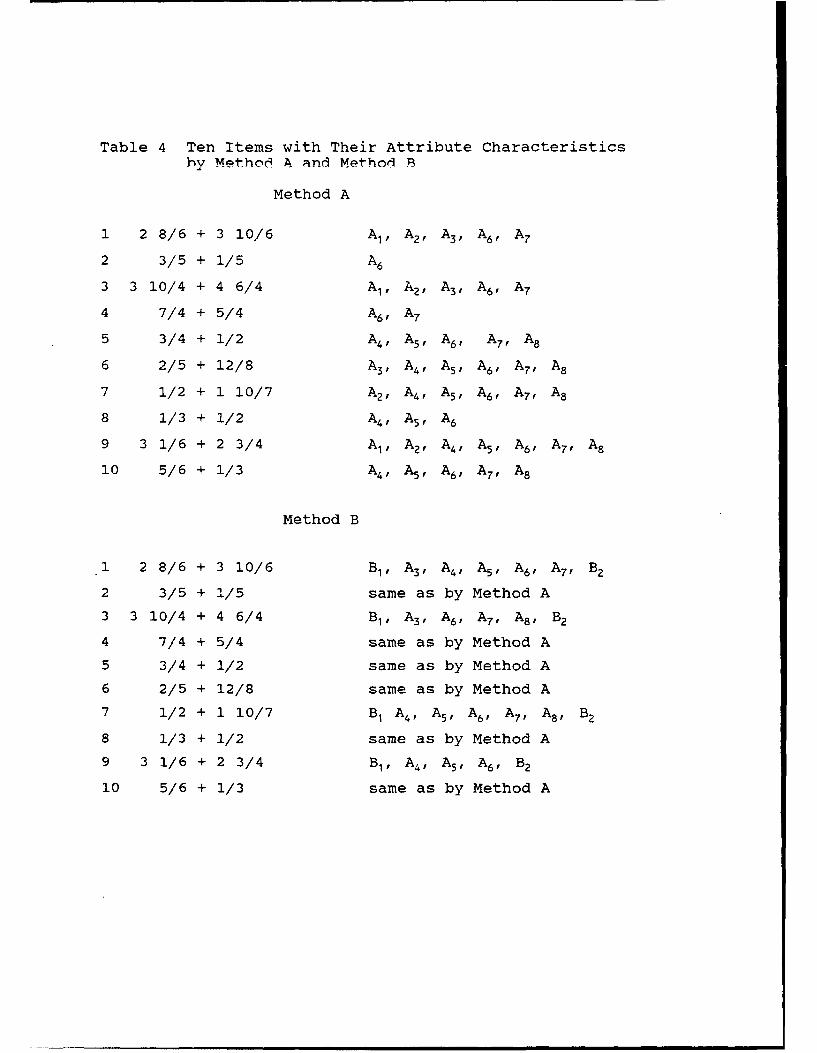
Table 4 Ten Items with Their Attribute Characteristics
by Metho6 A and Method B
Method A
1 2 8/6 + 3 10/6 Al, A2, A3, A6 , A7
2 3/5 + 1/5 A6
3 3 10/4 + 4 6/4 Al, A2, A3, A6 , A7
4 7/4 + 5/4 A6, A7
5 3/4 + 1/2 A4, A5 , A6, A7, A8
6 2/5 + 12/8 A3, A4, A5, A6 , A7, A8
7 1/2 + 1 10/7 A2, A4 , A5, A6 , A7 , A8
8 1/3 + 1/2 A4, A5, A6
9 3 1/6 + 2 3/4 A1, A2, A4, A5 , A6 , A7 , A8
10 5/6 + 1/3 A4, A5, A6, A7 , A8
Method B
1 2 8/6 + 3 10/6 B1, A3 , A4, A5, A6 , A7, B2
2 3/5 + 1/5 same as by Method A
3 3 10/4 + 4 6/4 B1, A3 , A6, A7 , A8 , B2
4 7/4 + 5/4 same as by Method A
5 3/4 + 1/2 same as by Method A
6 2/5 + 12/8 same as by Method A
7 1/2 + 1 10/7 BI A4, A5, A6 , A7, A8, B2
8 1/3 + 1/2 same as by Method A
9 3 1/6 + 2 3/4 B1, A4, A5 , A6, B2
10 5/6 + 1/3 same as by Method A
Table 5 A list of all the possible sets of attribute patternsderived from the incidence matrices given in TablP
Method A
States Cannot Can Ideal Item Response Pattern
1 none 1,2,3,4,5,6,7,8 1111111111
2 8 1,2,3,4,5,6,7 1111000100
3 4,5,8 1,2,3,6,7 1111000000
4 1 2,3 4,5,6,7,8 0101111101
5 2,1 3,4,5,6,7,8 01011101Ci
6 3 1,2,4,5,6,7,8 0101101111
7 3,1 2,4,5,6,7,8 0101101101
8 3,2,1 4,5,6,7,8 0101100101
9 1,2,3,8 4,5,6,7 0101000100
10 1,2,3,4,5,8 6,7 0101000000
11 7,1,2,3,8 4,5,6 0100000100
12 1,2,3,8,7,4,5 6 0100000000
13 1,2,3,4,5,6,7,8 none 0000000000
Method B
States Cannot Can
1 none 3,4,5,6,7,8,9,10 1111111111
2 8 3,4,5,6,7,9,10 1101000110
3 4,5 3,6,7,8,9,10 0111000000
4 9,10 3,4,5,6,7,8 0101110101
5 3 4,5,6,7,8,9,10 0101101111
6 3,9,10 4,5,6,7,8 0101100101
7 3,8 4,5,6,7,9,10 0101000110
8 3,8,9,10 4,5,6,7 0101000100
9 3,4,5,8,9,10 6,7 0101000000
10 7,3 8 4,5,6,9,10 0100000110
11 3,7,8,9,10 4,5,6 0100000100
12 3,4,5,7,8,9,10 6 0100000000
13 3,4,5,6,7,8,9,10 none 0000000000
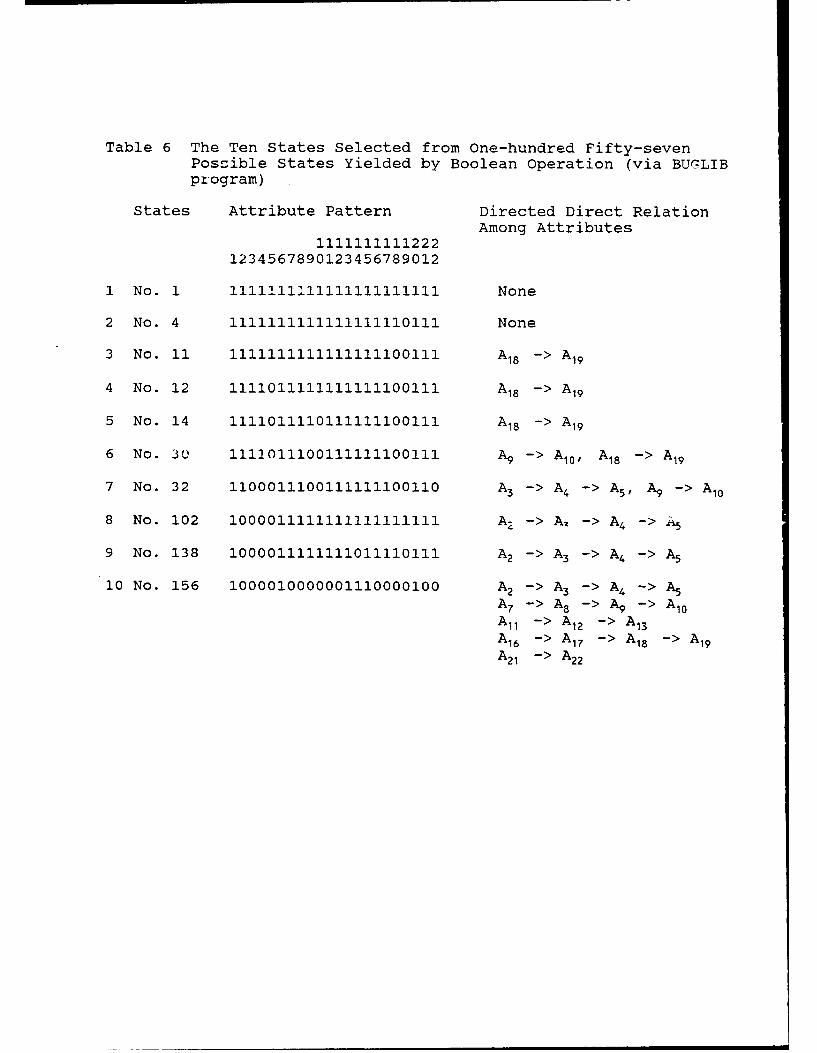
Table 6 The Ten States Selected from one-hundred Fifty-sevenPoscible States Yielded by Boolean Operation (via BUGLIBprogram)
States Attribute Pattern Directed Direct RelationAmong Attributes
11111111112221234567890123456789012
1 No. 1 ll1llllllllll11lll1 None
2 No. 4 1l1111111111011l None
3 No. 11 111111111111110011l A18 -> A19
4 No. 12 111011111111l0011 A18 -> A19
5 No. 14 1111011110l111111100111 A1 8 -> A19
6 No. 30 1111011100111111100111 A9 -> A1 0 , A18 -> A19
7 No. 32 11000110011111100110 A3 ->A 4 -> A 5 , A9 -> A10
8 No. 102 1000011111111111111111 A-z- A' - > A4 -> ;"5
9 No. 138 1000011111111011110111 A2 ->A 3 - > A4 - > A5
10 No. 156 1000010000001110000100 A2 - > A3 - > A4 ->A 5A7 -> A8 - > A9 - A10All -> A12 ->A 13A16 -> A 17 ->A 18 -> A19
A2 1 - > A2 2
A systematic analysis of task
skill I
I c o n t e n t
identifying prime components, abstracting attributesand naming them Al . .. . . .., Ak.
A2 A 2A 3
(A 1 A3
A1A2 AjA2 A3
Fu 1
Figure I Examples of Attributes
Al
A2
i A3 A4
Figure 2 An Example of Partially ordered Attributes
(f",
1 2
6
L2
16/
/ 23j~
Figure 3 The Rule Space Configuration.
The Numbers in Nine ellipses indicate error States (e.g., No. 5 State is"one cannot do the operation of borrowing in fraction subtraction problems.")and x marks represent students' points (0,0).
RT METHOD A
F OF NH R ESU TMO
C 1 OF HN E RELTN C
DIID FRACTIO FIODGT
[- -H-- '010 BORGOW FOM TTHETOCT£ N
MEHO TNP (0P ,)
Y" ,
Figure 4 Task Spec~~~~~IiainCatfrFrcinAdtoDnSub rac io ProbE m S EUTRC
Symbol P used THO Dnt h eea rcin r sdi
thi fgur i: ~b/) d~/f ;F i facton C iscomodenominator; CF is common facto~r;hN iswoenm rpat NU
is~~~ ~~ nuertrUDNOisdnoi AT; iseuvln frc o.
Diatribusico UKw
Dr. Terry Ackerman Dr. Gayneth Boodco, Dr. Hams F. CsombsigEduational Psycholopr Educational Testing Service Family of Law210 Education Bldg, Priniceto. NJ 041 Unsveraity of UmburgUniversity of 11linois P.O. Box 616Clsosiit IL 61801 Dr. Robert Bres Maastricht
Code 2S2 The NETHERLANDS Q0 MDDr. James Aina, Naval Trang Systms Center1403 Norman Hall Orlado. FL 32836-3224 Ma. Carolyn R.Ce
Unversity of Florida Johns Hopkis UGainesville. FL 32W0 Dr. Robert Brennan V-4attment of Pcoo
A -msia College Thung Charle &t 34th StreetDr. Nancy Allen Programs Baltimore MD 21218Educational Testng Service P. 0. Box 168Priinetn. NJ 06541 law City. IA 52243 Dr. Tio-by DaVeY
Az-rce College Te-g PlopDDr. Erdinl; B. Andersen Dr. DaM V. Budese, P.O. Box 168Department of Statsuit Department of Pcology Iciia City, 1A 5214Studiausade 6 University of Haifa1455 Copenhagen Mount Carmel. Haita 31999 Dr. C. M. DaytonDENMARK ISREAL Department of Measrmsen
Staisbtics & Evaluation
Dr. Ronald Armstrong Dr. Gregry Candel College of EducationRt=U yCI'BM.,Graw.il UniVerit of Maryland
raute Univr" fity inn 2500 Garden Road Callege Park. MD 217742
Newark. -, 70 Monterey, CA 93940 s~bJ D~a
Dr. F%-4 L B3c Dr. John B. Carroll Meesream. Statstcs
UCLA Cenier for the Study 4AIM Elliott Rd., North an ahiasstonof Evaluation Chapel Hill. NC 27514 Benjamin Bldg. Rm. 4112
145 Moore Haill University or Masyland
Univerity Or C36 0ifomi Dr. John M. Carroll College Parkt. MD, 20742Lee Angeles. CA 90024 IBM5 Watson Research Center
User Interface Institute, HI.BS2 Dr. Lou DiBello,
Dr. Laura, L Barnes P.O. Box 704 CERi.College or Edutration Yorktowni Heights. NY 10598 University of Illinois
Universirv, of Toldo 103 South Matbaas Avienue28011 W. .B3nceoft Stree Dr. Robert M. Carroll Urbana. IL 61801Toledo. OH 4-V,06 Chief of Na"a Operations
OP-.11B2 Dr. Dauprasad Divgi
Dr. William M. Bart Washington. DC 2035 Center for Naval AnalysisUniversity of Minneso43 4401 Ford Avenue
Dept. of Educ. Psvcholog Dr. W. Chsambers P.O. Bot 16268330 Burton Hall Technololy Manager. Code 2B -iora VA 212026
178 Pillburv Dr. .E. Naval Training Systetm CenterDr '
Minocapolik IVIN 554:15123-0 Research ParkwayDrNeloamMinnapoa. I~ 54 ~Orlandto. FL 32826-3224 Educational Teawig Service
I". ISaco Adissin Mr. Hua Huts Chang.a SivcholAduio University of Illinois Dr. Fritz Drasgous
P.O. BOX 40 epartnsent Or Satistics Universit of Illinois
Newtowns. PA 191W00 101 Ilin Hall Depar-n of Paycl-loV725 Soth Wright SL. 603 E. Daniel SL.
Dr. Arne Beland Chaimpaign, IL 61M2 Champlign IL 61820Educational Testing ServicePrinceton., NJ 0& t41 Dr. Ratymrond E. Christal Defense Technicl
UES LAMP Science Adysior Information Center
Dr. Ira Bernstein AFHRL/MOEL Camerort Station. Bldg SDepatrnent of ftyrtsology Brooks AFB, 17(78235 Aimnr.- VA 22314
University of Texas (2 ora Copies)P.O. Box 19528 D.Nra lfArlington. TX 76019.28 Department of Psychology Dr. Stephen Dunham
Univ. of So. California 224 Lndquist Cante
Dr. Menu.ctha Birenbur Los Angeles. CA 90089.1061 for MeasurementSchoolof EduationUniversity, of 3mw
STel of Euncation Director. Manpower Progra 3mw City, IA 52242Tel Aviv Uneeir Center for Naval Analse
ISAL4401 Ford Avenue Dr. James A. Eail.P.O. Box 1626 Asr Force Human Resource Lab
Dr. Bru~ce Btoxon Alexandria. VA 21302.0268 Broolks APE. T17W835Defese Manpower Chia Centerto Pacific St. Director, Dr. Susan Embretan
Suite 153A Manpower Support and University of YaasMnee.C 13wl"lReadiness Program Psydiol DeprtenMoteey C 944.331Center for Naval Ana"46sFase
Cd rodBhr4401 Ford Asenue Lawretnce. S M
Seetil Ps V"tol@~ch Onderroek Alexandria. VA 22302.08DrReknuteirings-En Selocmensn ums Dr. Stanrge Cotlyer J
KawiffKennge AsridDr.StaleyCalywDivismo of Educational Studes;Braprt O~nne srdCffit or Navl Tectsnololly Easoty Univiersity31Bmtrussels REGU"icd 222 210 Fisbbumne fldg,
1220 ELO 00 N. Ouincy Street Atlata GA 3032Arlington. VA =217.50=
ERIC Fadlity-Aequsitioos2440 Researcht BNAd Suitt 550Rockville. MD 2MO503238
Educational Testing SmwT*et suok3 ,29
Dr. Losrd Krmketr Dr. s&*iett Mayckinva Dr. )am B. OlseNay Personnel R&D Center The Nationsal Center fow University WICAT *"eam
code 62 Entrance Exminationa 1Ws South State SwretSmn Diego. CA 9211524800 2-19-23 KOMABLA. MEGURO-KU Ore. LIT 84058
To"y 153Dr. Julry Lchrnu JAPAN Wafit of Naval Research.Delimae Manper Data Center Code 1142MSuite 400 Dr. James IL McBride goo N. Quittey Scrodt14W Wilson Blvdi HurnRRO AftVingtlo VA 2127400Rowsy~t. VA 2209 643 ElmhIurst Drive (6 Copes)
San Diego. CA 9212DDr. Thomas Leonard Dr. Judith OrsawtUniversity or Wisconsin Dr. Clarence C. Mcormick Basic Reserch OffieDepartment of Statistics HO. USMEPCOM/MSEPCr Army Research Itiute
121 West Day-ton Street 2M0 Green Bay Road 5001 Eienhaw AvenueMdison W 53705 North Ccgoi IL 60064 Aleiodna, VA 1233
Dr. Richard Lwal Mr. Chritoipber Mc~wsker Dr. Jess Oelanaky
Educational Testing Service Unicveit or Ininco. bwute for Deee AmslysesPrinceton. NJ 0041i Deparmen of Psychology 101 NK Beauregard St.
601 E. Daniel Sc. Alexadria. VA 2211Dr. Michae Levine Charrpaip. IL 61820Educational Psychology Dr. Powe J. Piaibiey210 Education Bid&, Dr. Robert Mdl~nkey Educational Test Service
University of Ilinois Educacional Testing Service Rosedal RoadCapign. IL 61801 Princeton. K3 08541 Princeton. N3 08541
Dr. Charles LeiS Dr. Michsael McNeese Wayoe Y4 PatienceEducational Testing Scyrw-e DET-1. ALUMED American Council on EducationPrinceton. NJ W041-000 BLDG 246 GEl) Testing Service Suite 20
Wriolgtitaemon AMB OH 45432 One Dupont Circle. NW
Wa Hamn-hung U Washington. DC 20036Unuvrsurv of Illinois Mr. Alin MeadDepartment of Statittics c/o Dr. Michael Levine Dr. James Paulson
202 llii Hll Eucaionl Pscbolo*Department of Psychology
725 South Wright St. 220 Education Bldg.otad ut neevt
Cbaispoigni. IL 6110 Unnvemirv of Illinois P.O. Box 751Champaign, IL 61801 Portland. OR 9720
Mr. Rodnev LinUniversity of Illinois Dr. Timothy Miller Dept. of Adminleituative SciencesDepartment of Ptvrhcilogy ACT Code 5460 E. Darnicl St. P. 0. Box 16 Na"a Poutgraduate ShoChamnpoign., IL 6I1 km-a Cin-. IA 522413 Monterey. CA 93943-:5026
Dr. Robert L Unt, Dr. Robert Mislmy Dr. Mask D. ReckaaeCampus Box 249 Educational Testing Service ACTUniversity of Colorado Princeton, NJ 06541 P. 0. BOX 168Boulder. CO W*I0&0249 muav City. IA 52243
Dr. William MontagueDrMaclReDr. Robert Lockirrin NPRDC Code 13DrMaclRoCenter fmr Naval Analyisi San Diego. CA 9215S2-6800 AFHRUMOA4401 Ford Avenue Brooka AMB TX 79M3P.O. BOX 3166 Mi Kathileeni MorenoAleiria. VA 2-11
1)2-02AS Navv Personnel R&D Center Mr. Steve Retin
Code 62- N660 Elliott Hall
Dr. Frederic M. Lord San Diego. CA 9215260 University of MinnesotaEducational Teeiong Serc 75 E. River RoadPr inceton. NJ 0&541 Headquarters Marine Corps Minneapolis. MIN 55455034
Code MPI.21iDr. Richard Lueclrt Washington DC 203M Dr. W. A. Rizzo
ACT Head. Human Factors DivisonP.O0. BOa 16S Dr. Ratna Nandakturar Naval Training Systems CenterIW"- City., IA 522413 Educational Studies Code 26
Willard Hall. Rooms 213E W150 Research arkway
Dr. George B. Macread% Uniner of Delaware Orlando. FL 32826&31ADepartment or Measurement Newark. bE 1wi16
Stistics a Evaluation Dr. Carl RoesCollege of Education Library. NPRDC CI4ET-PDCDUnievit of Marvland Code P201L Building 90Coleg Park. MDj 2074- San Diego CA 92152480 Great Lakes NMTC IL G00M
Dr. Garm Marco Lirarsan Mr. Louis RoiosStop 31-E Naval Center for Applied Research Unvrior llinoisEducational Testing Servce in Artiiciall Intelligence Department of StatisticsPt-iam ont NJ 08451I Naval Research Laboratory 101 lahni Hall
codeS5l10 M South WrigbtSt.
Dr. Ckmen J. Martin Washington. DC 201373-SM0 Csampaigin. IL 618111Office of Chief or Naval
Operatioins (OP D~ F) Dr. Harold F. O74eit. Jr. Dr. J. RyanNavy Annex Retor 2932 Schiool of Eduration - WPH 801 Department of EducationWaultingon. DC 20350 Department or Educational University or South Carolina
Ptr-eholcr &i Technology Columbia. SC 2M20University or Southern CaliforniaLnit Angelles. CA 900896=01
Eicasimad Tesing Sen'ierTasuc'ka 829
Dr. Fuiko Sarnrjima Dr. Willim Stow Dr. Ming-Me WangDepartatent of I'ycolmg University of Illinois Edubcatona Teamin Ser viceUnaemay Of Tennessee Departmert of Sisst Mail Stop 03-T310 Atin Pety 354 101 Iflini Hall Prnceen NJ 085O41K~noxville, TN 37916-090 725 South Wrigha SL.
Claampaign. IL 65520 Dr. Thola A. WarmsMr. Drew Sands FAA Acadal AAC934DNPRDC Coda 62 Dr. Haribaran Smacommsaa PD. Box 2M05San Diego. CA 921324800 Laboratory of Psyciboaeii ad Okiaboms City, OK 7325
Evaluiation ResearchWe Kenneth Sarno Schsool of Education Dr. Brie Water
Educational payeolgi Unimsity of Masuachsetts HumRRO210 Education 984g Amfherst MA 01003 11005S WadngtnUniaarsiry of Illinois Ajessndria. VA 2214Cbmpin. IL 61801 Mr. Brad Sympace
Nasy Personne R&D Coxte Dr. David 3. WuimDr. Janice Scheunetnan Coe-2 660 Ebwn HaillEducational Testing Semorc San Diego, CA 92152480 Uiverity of MinnesotaPabinton, K3 08541 75 E P~r Road
Dr. John Tangney Minneapolis. MN 554554344Lowel Schorr AFOSRANL Bldg, 410Pqeoloica* &Quantitative Bolling, AFM DC =033.44W Dr. Ronald A. Weawanm
Foundations Box 146Coiqe of Educaion Dr IKiktUei TaSUo)ka Cirud, CA 9392Umcersmy of to"a Educational Testing Servielaws Cit. JA 52242 Mail StOP 03-T Major John welsh,
Princeton. N1 08541 AFHRLJMOANDr. Mary Schramz Brooks AMfi TX 78=134100 Parkside Dr. Maunice TatsuokaCarlsbad. CA 92tVW Educational Testing Senvir Dr. Douglas Wemze
Mail Stop 03-T Code 51Dr. Dan Segall Prnceton, NJ 08541 Navy Personnel R&D CenterNavy. Personnel R&D Center San Diego. CA 921524800Son Diego. CA 9ZI52 Dr. David Thmcert
Deatmn or Payebok0D- Dr. Rated R. %ilooMr. Robert Semnc University of Kanas University or SouthernN218 Elliott Hall Lwt-rence. KS (d"14 CalifoniaDepartmn of Psychsoop Department or Psycho~og,University of M~nnesna Mr. Thomas J. Thomas Los Angeles. CA 000891061Mitineapolit. M, 5.5455 Johns Hopkins Universiry
Depmemnt of Psychology Gaera Military RepresentativeDr. Robin Sely Charles & 34th St reet ATTN: Wolfgang WildgrubeIllin*i State Water Survy Baltimore. MD 21218 StrealraefteamnRoom 149 D-SJGJ Bonn 22204 Grith Dr. Mr. Gary Mtontasson 4W0 Brandysie Street. NWChampaigni IL 61S.!11 Univeenin. of Illinois Washingtont. DC 2016
Educational Ps~volo&t& Kathjeen Sheehan Champaign. IL 6120O Dr. David WileyEducational Testing Sermie School of EducationPr1ctn N) 08541 Mr. Shermaun Tsen Northwestern UniverSity
Educational Paychology Evanssoo IL a0wlDr. Kazuo Shigemsssu 210 Education Bld47.9-2A KugemurmaKatpn University of Illinois Dr. Charles WllkhnFujimawa Z51 CIhampaign, IL 61801 Navy Paerson!i R&D CenterJAPAN Code 13
Dr. Rotert Tauttakaw-A San Daeo CA 92152Dr. Randall Shumaker Unnvrsiy of MissouriNoel Research Lahontrr. Department of Statistics Dr. Bruce Williamscode 5510 22Math. Sciences 914g Department of Educastiomal4555 Overtook Aventue, S.W. Columbia. MO 65211 PwdaoouWashington, DC 2M375.541111 Unwveasity of Illinois
Dr. Ledrard Tucker Urbana IL 41801Dr. Richard E. Sow Uerait'. or IfllnoiSabnool of Education Department of Paycbolog. Dr. Mark WilsonSemford University 603 E Daniel Street Sdwol of EducationStanford, CA 94305 Chmaign. IL 61520 Univesity of California
Berkeley CA 947MDr. Richard C. Sorensen Dr. David Vale
"av Personnel R&D Center Asassment Sytems Cor;L Dr. Hilda WengSmn Diego. CA 921524lWO 233 Univerity Avenue Federal Aviation Aminstrton
Suite 440 S00 Independence Ame SWDr. Judy Spray StL P"ti MN 55114 Washinton DC 2%891ACrP.O. SOS 166 Dr. Fnk L Vieito Mr. John H. Walfelast City. IA 5224 Navy Peraonnel R&D Cenn Na" Personnel R&D Ceame
Smn Diego. CA 79213291K0 Son Diego, CA 921524800Dr. Martha StoctingEdational Trting Sernie Dr. Howard Waiter Dr. George Wongh amnon NJ O0541 Educational Testing Service Bioseaicm Laboratory
Princton, NJ 88541 menal son-KetsabDr. Peter Stolofr Cance CenterCenter for Naval Antapivs Dr. Michael T. Wailr 125York Avenue4401 Ford Avrnue Unitersen or Wisosin-Milaukee Now York. NY 10021P.O. BOX 1626w Educational Pv ehology DepartmentAlmndr.. VA 22102-n2a$ BOXs 413
mehwaukem WA 33201


