Embed Size (px)
Citation preview
Animal Feed Science and Technology131 (2006) 255–291
Effects of nutrition on the contents of fat, protein,somatic cells, aromatic compounds, and undesirable
substances in sheep milk
Giuseppe Pulina ∗, Anna Nudda, Gianni Battacone,Antonello Cannas
Dipartimento di Scienze Zootecniche, Facolta di Agraria, University of Sassari,Via E. De Nicola 9, 07100 Sassari, Italy
Accepted 15 May 2006
Abstract
This review discusses current knowledge of the main nutritional factors that influence compositionof sheep milk and, consequently, its processing into cheese, with special focus on milk fat and proteinconcentration and characteristics, content of bioactive compounds, somatic cell content, content ofaromatic compounds able to improve its organoleptic characteristics and content of toxic substances.Sheep milk composition is strongly influenced by ewe nutrition, especially in highly productiveanimals. Milk fat concentration is markedly affected by the ewe’s net energy (NE) balance, dietaryNDF content and dietary supplementation with ruminally protected/inert or unprotected marine andvegetable oils. Milk fat composition can be modified to contain higher levels of human healthyfatty acids (FA), such as conjugated linoleic acid and omega-3 FA. Milk protein content, and its
Abbreviations: AA, amino acid; AFB1, Aflatoxin B1; AFM1, Aflatoxin M1; BU, blood urea; BW, body weight;CLA, conjugated linoleic acid; CP, crude protein; CSFA, calcium soaps of fatty acids; CSPO, calcium soap of palmoil; DHA, docosahexaenoic acid; DM, dry matter; DMI, DM intake; EB, energy balance; EPA, eicosapentaenoicacid; FA, fatty acid; LCFA, long chain FA; Lys, lysine; Met, methionine; MFD, milk fat depression; MU, milkurea; NDF, neutral detergent fiber; NE, net energy; NEFA, non-esterified FA; NEL, net energy for lactation; NFC,non-fiber carbohydrate; NSC, non-structural carbohydrate; OTA, ochratoxin A; PCBs, polychlorinated biphenyls;PCDDs, polychlorinated dibenzo dioxins; PCDFs, polychlorinated dibenzo furans; RDOM, rumen degradable OM;RDP, rumen degradable CP; RUP, rumen undegraded CP; SCC, somatic cell content; TCDD, tetra-chlorinateddioxin
∗ Corresponding author. Tel.: +39 079 229307; fax: +39 079 229302.E-mail address: [email protected] (G. Pulina).
0377-8401/$ – see front matter © 2006 Elsevier B.V. All rights reserved.doi:10.1016/j.anifeedsci.2006.05.023
256 G. Pulina et al. / Animal Feed Science and Technology 131 (2006) 255–291
characteristics, are more difficult to change than milk fat, although dietary energy seems to have amajor role, while diet protein and amino acid supplementation only marginally affect milk protein leveland its characteristics. Nutritional stress, and some vitamins, affect the somatic cell content of milkand this impacts cheese yield and quality. Feeds in the diet can markedly influence milk aroma and,consequently, play a role in determining cheese flavor, especially when ewes are pastured. Possiblesources and causes of contamination of sheep milk by heavy metals or dioxins, and mycotoxins,through the diet are also addressed. Overall, quality and safety of sheep milk can be modified andimproved by the nutrition characteristics of the diet.© 2006 Elsevier B.V. All rights reserved.
Keywords: Nutrition; Milk quality; Sheep
1. Introduction
Most sheep milk produced in the world is processed into cheese, yogurt and other dairyproducts. For this reason, the relationship between ewe nutrition and milk quality is mainlyevaluated in terms of its technological and coagulation properties, which are markedlyaffected by milk fat and protein concentration and the somatic cell content (SCC). However,ewe nutrition also affects the presence, and concentration, of other important substances,such as those with nutraceutical action (e.g. conjugated linoleic acid (CLA) and other fattyacids (FA)), or those that affect milk flavor and its products. In addition, ewe nutrition alsoinfluences the presence of toxins, and other undesirable substances, in the milk and theirpresence in cheese and other dairy products. These substances are important because theymight affect food safety. For this reason, this review will discuss current knowledge of theeffects of ewe nutrition on milk content of fat, protein, somatic cells, aromatic compoundsand undesirable substances.
Reviews on effects of ewe nutrition on some specific aspects of milk quality have beenpublished by Bencini and Pulina (1997), Bocquier and Caja (2001), Schmidely and Sauvant(2001), Nudda et al. (2004a), and Mele et al. (2005a,b).
2. Milk fat and protein content
The yield of cheese mainly depends on milk fat and protein concentrations and SCCand varies depending on the type of cheese produced. However in all types of cheese, milkprotein contributes more than milk fat to total cheese yield (Table 1).
A major factor that impacts milk fat and protein concentration is milk yield. In sheep,as in other dairy ruminants, phenotypic and genetic correlations among fat and proteinconcentration and milk yield are negative (Emery, 1988). Pulina et al. (2005), using a totalof 6564 individual data from three main Italian dairy sheep breeds, reported phenotypiccorrelation coefficients between −0.33 and −0.42 for fat and −0.32 and −0.54 for protein(Table 2). Genetic correlations between milk yield and fat and protein concentrations arehigher than environmental factors (Table 3). The fat and protein content of milk from eweswith similar production levels can be improved, or worsened, by means other than genetics.
G. Pulina et al. / Animal Feed Science and Technology 131 (2006) 255–291 257
Table 1Equations estimating cheese yield (‘Y’, g of cheese/100 g of milk) as a function of fat and protein concentrationin ewe’s milk
Equation R2 Cheese Reference
Y = 1.747 protein (g/100 ml) + 1.272 fat (g/100 ml) 0.93 Pecorino Romano Pirisi et al. (1994)Y = 1.733 protein (g/100 ml) + 1.257 fat (g/100 ml) 0.95 Pecorino Sardo Pirisi et al. (1994)Y = 0.32 protein (g/l) + 0.06 fat (g/l) + 1.81 0.99 Roquefort Barillet et al. (1996)
Table 2Correlation coefficients between milk yield and fat (r1) and protein (r2) contents in three main Italian dairy sheepbreeds (Pulina et al., 2005)
Breed n Milk(g/day)
Fat(g/100 ml)
Protein(g/100 ml)
r1 r2
Sarda 1065 1006 6.70 6.09 −0.42 −0.39Comisana 441 658 7.31 6.14 −0.42 −0.32Valle del Belice 5058 1584 7.32 5.69 −0.33 −0.54
The reduction of fat and protein content of milk as milk yield increases is well-known(Emery, 1988). As milk yield, usually the amount of lactose synthesized and secreted,increases, fat and protein synthesis generally increases at a slower rate. This phenomenoncan be described by the allometric model:
Y = axb
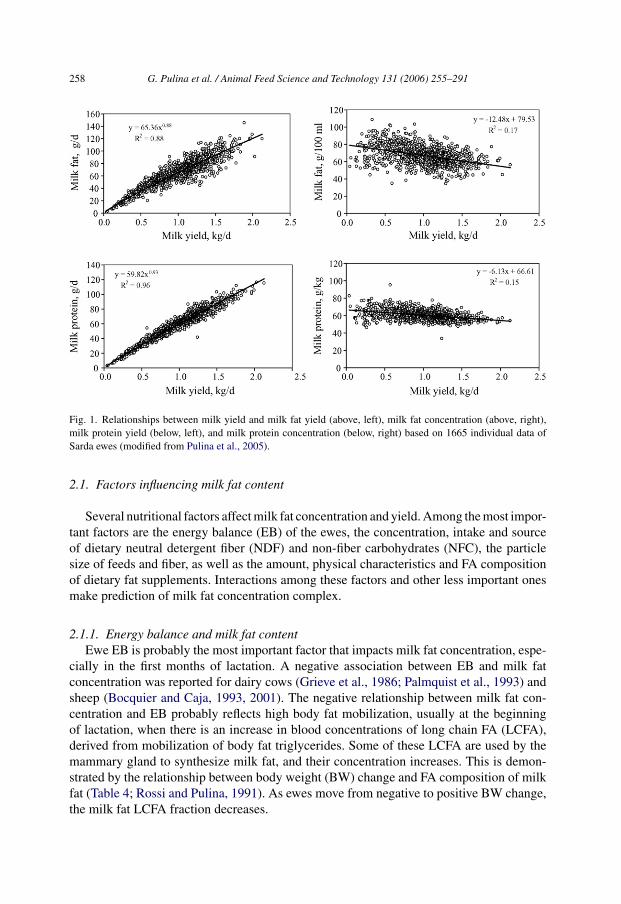
where ‘Y’ is fat or protein yield (g/day), ‘x’ the milk yield (kg/day), and ‘a’ and ‘b’ areequation coefficients. Application of this model to data of various dairy sheep breeds (Fig. 1for the Sarda breed, the main Italian dairy sheep breed) showed that fat and protein synthesisvaried proportional to output of milk (or synthesis of lactose) with an exponent that rangedbetween 0.82 and 0.88 for milk fat, and between 0.90 and 0.93 for milk protein, dependingon the breed (Pulina et al., 2005). Thus, the higher the milk yield, the more cheese producedper ewe, even though each additional unit of production results in a lower increase in cheeseyield per liter. The variability is higher for fat versus protein yield, with the total varianceaccounted for by the model being 82–92% for fat and 92–98% for protein (e.g. Fig. 1 for theSarda breed). Because the relationship between milk fat concentration and yield has a highervariability than that between milk protein concentration and yield (Fig. 1), modification ofmilk composition by nutritional means should be easier to achieve for fat than for protein.
Table 3Genetic and phenotypic correlation between milk yield and fat and protein concentration in milk
Breed Genetic fat Geneticprotein
Phenotypicfat
Phenotypicprotein
Reference
Sarda −0.42 −0.46 −0.19 −0.23 Sanna et al. (1997)French Lacaune −0.48 −0.53 −0.22 −0.37 Rupp et al. (2003)French Lacaune −0.52 −0.56 −0.14 −0.22 Barillet et al. (2001)Churra −0.63 −0.68 −0.43 −0.41 Othmane et al. (2002)
258 G. Pulina et al. / Animal Feed Science and Technology 131 (2006) 255–291
Fig. 1. Relationships between milk yield and milk fat yield (above, left), milk fat concentration (above, right),milk protein yield (below, left), and milk protein concentration (below, right) based on 1665 individual data ofSarda ewes (modified from Pulina et al., 2005).
2.1. Factors influencing milk fat content
Several nutritional factors affect milk fat concentration and yield. Among the most impor-tant factors are the energy balance (EB) of the ewes, the concentration, intake and sourceof dietary neutral detergent fiber (NDF) and non-fiber carbohydrates (NFC), the particlesize of feeds and fiber, as well as the amount, physical characteristics and FA compositionof dietary fat supplements. Interactions among these factors and other less important onesmake prediction of milk fat concentration complex.
2.1.1. Energy balance and milk fat contentEwe EB is probably the most important factor that impacts milk fat concentration, espe-
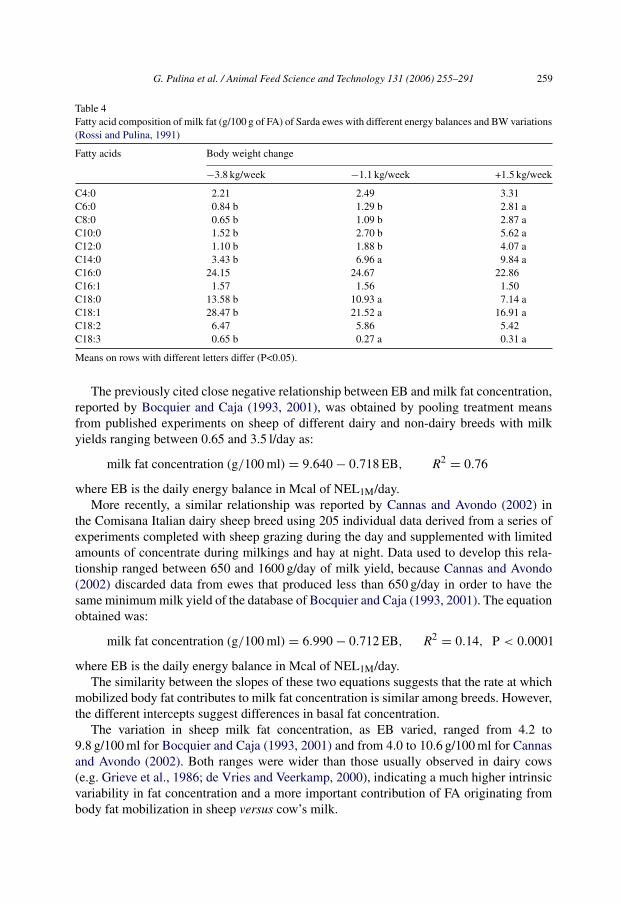
cially in the first months of lactation. A negative association between EB and milk fatconcentration was reported for dairy cows (Grieve et al., 1986; Palmquist et al., 1993) andsheep (Bocquier and Caja, 1993, 2001). The negative relationship between milk fat con-centration and EB probably reflects high body fat mobilization, usually at the beginningof lactation, when there is an increase in blood concentrations of long chain FA (LCFA),derived from mobilization of body fat triglycerides. Some of these LCFA are used by themammary gland to synthesize milk fat, and their concentration increases. This is demon-strated by the relationship between body weight (BW) change and FA composition of milkfat (Table 4; Rossi and Pulina, 1991). As ewes move from negative to positive BW change,the milk fat LCFA fraction decreases.
G. Pulina et al. / Animal Feed Science and Technology 131 (2006) 255–291 259
Table 4Fatty acid composition of milk fat (g/100 g of FA) of Sarda ewes with different energy balances and BW variations(Rossi and Pulina, 1991)
Fatty acids Body weight change
−3.8 kg/week −1.1 kg/week +1.5 kg/week
C4:0 2.21 2.49 3.31C6:0 0.84 b 1.29 b 2.81 aC8:0 0.65 b 1.09 b 2.87 aC10:0 1.52 b 2.70 b 5.62 aC12:0 1.10 b 1.88 b 4.07 aC14:0 3.43 b 6.96 a 9.84 aC16:0 24.15 24.67 22.86C16:1 1.57 1.56 1.50C18:0 13.58 b 10.93 a 7.14 aC18:1 28.47 b 21.52 a 16.91 aC18:2 6.47 5.86 5.42C18:3 0.65 b 0.27 a 0.31 a
Means on rows with different letters differ (P<0.05).
The previously cited close negative relationship between EB and milk fat concentration,reported by Bocquier and Caja (1993, 2001), was obtained by pooling treatment meansfrom published experiments on sheep of different dairy and non-dairy breeds with milkyields ranging between 0.65 and 3.5 l/day as:
milk fat concentration (g/100 ml) = 9.640 − 0.718 EB, R2 = 0.76
where EB is the daily energy balance in Mcal of NEL1M/day.More recently, a similar relationship was reported by Cannas and Avondo (2002) in
the Comisana Italian dairy sheep breed using 205 individual data derived from a series ofexperiments completed with sheep grazing during the day and supplemented with limitedamounts of concentrate during milkings and hay at night. Data used to develop this rela-tionship ranged between 650 and 1600 g/day of milk yield, because Cannas and Avondo(2002) discarded data from ewes that produced less than 650 g/day in order to have thesame minimum milk yield of the database of Bocquier and Caja (1993, 2001). The equationobtained was:
milk fat concentration (g/100 ml) = 6.990 − 0.712 EB, R2 = 0.14, P < 0.0001
where EB is the daily energy balance in Mcal of NEL1M/day.The similarity between the slopes of these two equations suggests that the rate at which
mobilized body fat contributes to milk fat concentration is similar among breeds. However,the different intercepts suggest differences in basal fat concentration.
The variation in sheep milk fat concentration, as EB varied, ranged from 4.2 to9.8 g/100 ml for Bocquier and Caja (1993, 2001) and from 4.0 to 10.6 g/100 ml for Cannasand Avondo (2002). Both ranges were wider than those usually observed in dairy cows(e.g. Grieve et al., 1986; de Vries and Veerkamp, 2000), indicating a much higher intrinsicvariability in fat concentration and a more important contribution of FA originating frombody fat mobilization in sheep versus cow’s milk.
260 G. Pulina et al. / Animal Feed Science and Technology 131 (2006) 255–291
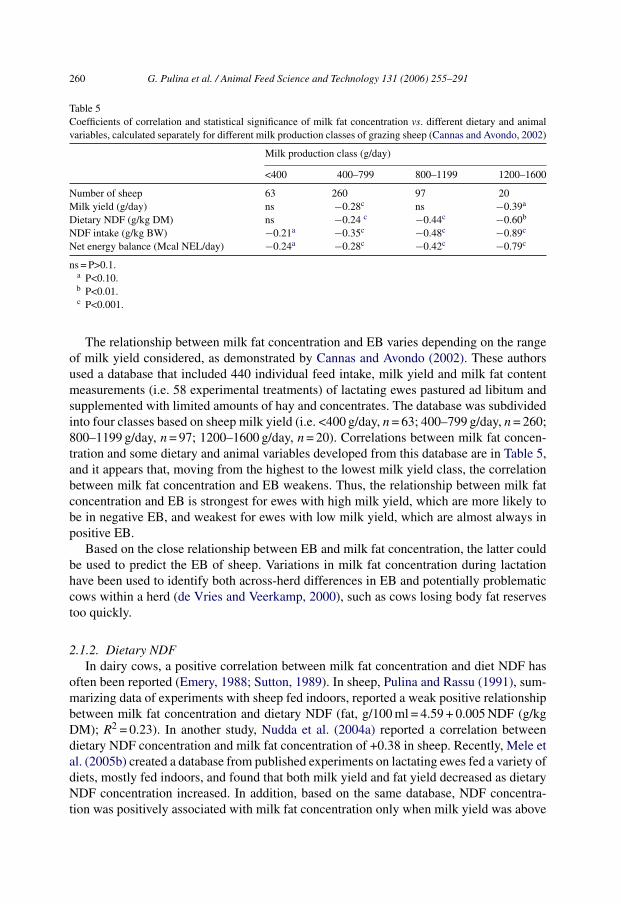
Table 5Coefficients of correlation and statistical significance of milk fat concentration vs. different dietary and animalvariables, calculated separately for different milk production classes of grazing sheep (Cannas and Avondo, 2002)
Milk production class (g/day)
<400 400–799 800–1199 1200–1600
Number of sheep 63 260 97 20Milk yield (g/day) ns −0.28c ns −0.39a
Dietary NDF (g/kg DM) ns −0.24 c −0.44c −0.60b
NDF intake (g/kg BW) −0.21a −0.35c −0.48c −0.89c
Net energy balance (Mcal NEL/day) −0.24a −0.28c −0.42c −0.79c
ns = P>0.1.a P<0.10.b P<0.01.c P<0.001.
The relationship between milk fat concentration and EB varies depending on the rangeof milk yield considered, as demonstrated by Cannas and Avondo (2002). These authorsused a database that included 440 individual feed intake, milk yield and milk fat contentmeasurements (i.e. 58 experimental treatments) of lactating ewes pastured ad libitum andsupplemented with limited amounts of hay and concentrates. The database was subdividedinto four classes based on sheep milk yield (i.e. <400 g/day, n = 63; 400–799 g/day, n = 260;800–1199 g/day, n = 97; 1200–1600 g/day, n = 20). Correlations between milk fat concen-tration and some dietary and animal variables developed from this database are in Table 5,and it appears that, moving from the highest to the lowest milk yield class, the correlationbetween milk fat concentration and EB weakens. Thus, the relationship between milk fatconcentration and EB is strongest for ewes with high milk yield, which are more likely tobe in negative EB, and weakest for ewes with low milk yield, which are almost always inpositive EB.
Based on the close relationship between EB and milk fat concentration, the latter couldbe used to predict the EB of sheep. Variations in milk fat concentration during lactationhave been used to identify both across-herd differences in EB and potentially problematiccows within a herd (de Vries and Veerkamp, 2000), such as cows losing body fat reservestoo quickly.
2.1.2. Dietary NDFIn dairy cows, a positive correlation between milk fat concentration and diet NDF has
often been reported (Emery, 1988; Sutton, 1989). In sheep, Pulina and Rassu (1991), sum-marizing data of experiments with sheep fed indoors, reported a weak positive relationshipbetween milk fat concentration and dietary NDF (fat, g/100 ml = 4.59 + 0.005 NDF (g/kgDM); R2 = 0.23). In another study, Nudda et al. (2004a) reported a correlation betweendietary NDF concentration and milk fat concentration of +0.38 in sheep. Recently, Mele etal. (2005b) created a database from published experiments on lactating ewes fed a variety ofdiets, mostly fed indoors, and found that both milk yield and fat yield decreased as dietaryNDF concentration increased. In addition, based on the same database, NDF concentra-tion was positively associated with milk fat concentration only when milk yield was above
G. Pulina et al. / Animal Feed Science and Technology 131 (2006) 255–291 261
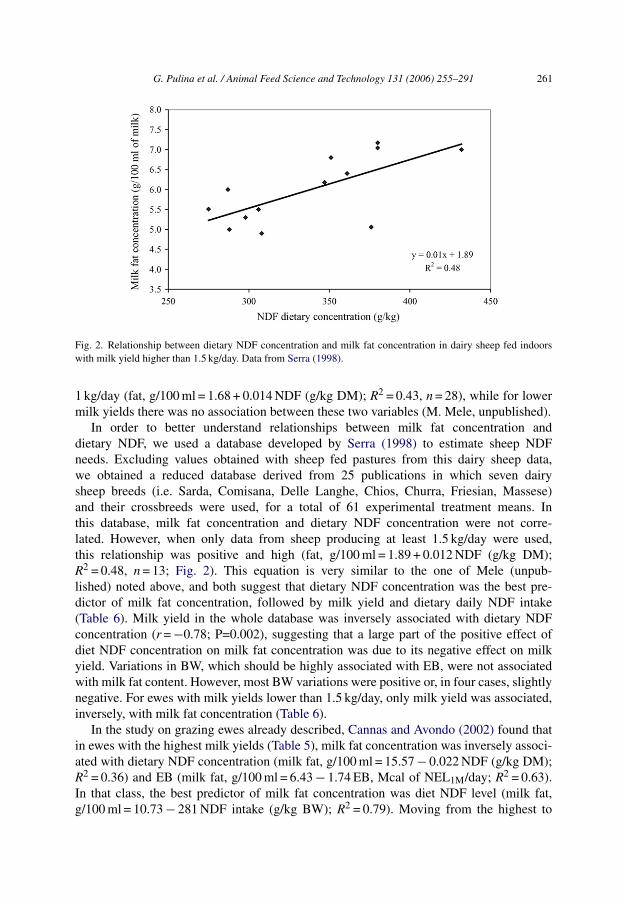
Fig. 2. Relationship between dietary NDF concentration and milk fat concentration in dairy sheep fed indoorswith milk yield higher than 1.5 kg/day. Data from Serra (1998).
1 kg/day (fat, g/100 ml = 1.68 + 0.014 NDF (g/kg DM); R2 = 0.43, n = 28), while for lowermilk yields there was no association between these two variables (M. Mele, unpublished).
In order to better understand relationships between milk fat concentration anddietary NDF, we used a database developed by Serra (1998) to estimate sheep NDFneeds. Excluding values obtained with sheep fed pastures from this dairy sheep data,we obtained a reduced database derived from 25 publications in which seven dairysheep breeds (i.e. Sarda, Comisana, Delle Langhe, Chios, Churra, Friesian, Massese)and their crossbreeds were used, for a total of 61 experimental treatment means. Inthis database, milk fat concentration and dietary NDF concentration were not corre-lated. However, when only data from sheep producing at least 1.5 kg/day were used,this relationship was positive and high (fat, g/100 ml = 1.89 + 0.012 NDF (g/kg DM);R2 = 0.48, n = 13; Fig. 2). This equation is very similar to the one of Mele (unpub-lished) noted above, and both suggest that dietary NDF concentration was the best pre-dictor of milk fat concentration, followed by milk yield and dietary daily NDF intake(Table 6). Milk yield in the whole database was inversely associated with dietary NDFconcentration (r = −0.78; P=0.002), suggesting that a large part of the positive effect ofdiet NDF concentration on milk fat concentration was due to its negative effect on milkyield. Variations in BW, which should be highly associated with EB, were not associatedwith milk fat content. However, most BW variations were positive or, in four cases, slightlynegative. For ewes with milk yields lower than 1.5 kg/day, only milk yield was associated,inversely, with milk fat concentration (Table 6).
In the study on grazing ewes already described, Cannas and Avondo (2002) found thatin ewes with the highest milk yields (Table 5), milk fat concentration was inversely associ-ated with dietary NDF concentration (milk fat, g/100 ml = 15.57 − 0.022 NDF (g/kg DM);R2 = 0.36) and EB (milk fat, g/100 ml = 6.43 − 1.74 EB, Mcal of NEL1M/day; R2 = 0.63).In that class, the best predictor of milk fat concentration was diet NDF level (milk fat,g/100 ml = 10.73 − 281 NDF intake (g/kg BW); R2 = 0.79). Moving from the highest to
262 G. Pulina et al. / Animal Feed Science and Technology 131 (2006) 255–291
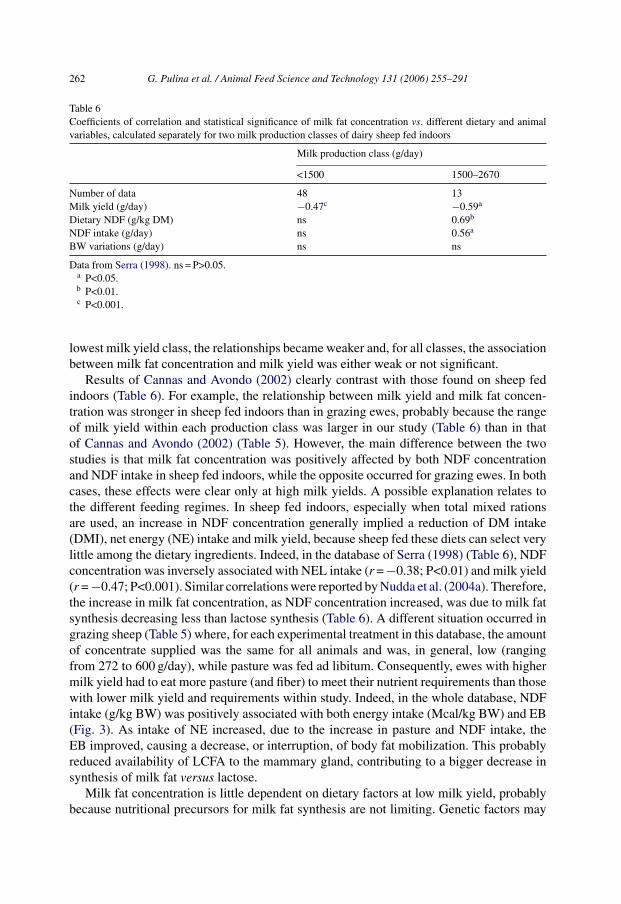
Table 6Coefficients of correlation and statistical significance of milk fat concentration vs. different dietary and animalvariables, calculated separately for two milk production classes of dairy sheep fed indoors
Milk production class (g/day)
<1500 1500–2670
Number of data 48 13Milk yield (g/day) −0.47c −0.59a
Dietary NDF (g/kg DM) ns 0.69b
NDF intake (g/day) ns 0.56a
BW variations (g/day) ns ns
Data from Serra (1998). ns = P>0.05.a P<0.05.b P<0.01.c P<0.001.
lowest milk yield class, the relationships became weaker and, for all classes, the associationbetween milk fat concentration and milk yield was either weak or not significant.
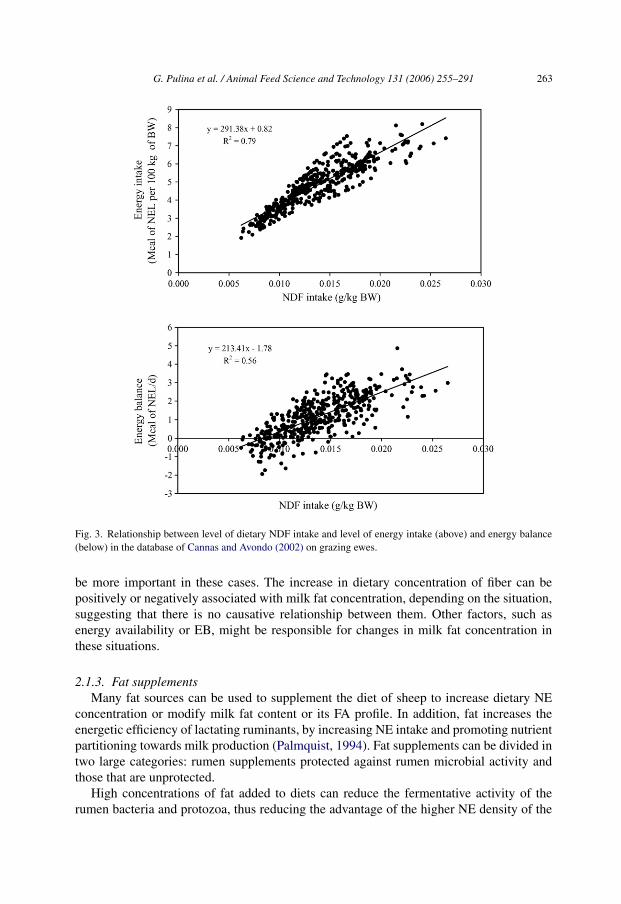
Results of Cannas and Avondo (2002) clearly contrast with those found on sheep fedindoors (Table 6). For example, the relationship between milk yield and milk fat concen-tration was stronger in sheep fed indoors than in grazing ewes, probably because the rangeof milk yield within each production class was larger in our study (Table 6) than in thatof Cannas and Avondo (2002) (Table 5). However, the main difference between the twostudies is that milk fat concentration was positively affected by both NDF concentrationand NDF intake in sheep fed indoors, while the opposite occurred for grazing ewes. In bothcases, these effects were clear only at high milk yields. A possible explanation relates tothe different feeding regimes. In sheep fed indoors, especially when total mixed rationsare used, an increase in NDF concentration generally implied a reduction of DM intake(DMI), net energy (NE) intake and milk yield, because sheep fed these diets can select verylittle among the dietary ingredients. Indeed, in the database of Serra (1998) (Table 6), NDFconcentration was inversely associated with NEL intake (r = −0.38; P<0.01) and milk yield(r = −0.47; P<0.001). Similar correlations were reported by Nudda et al. (2004a). Therefore,the increase in milk fat concentration, as NDF concentration increased, was due to milk fatsynthesis decreasing less than lactose synthesis (Table 6). A different situation occurred ingrazing sheep (Table 5) where, for each experimental treatment in this database, the amountof concentrate supplied was the same for all animals and was, in general, low (rangingfrom 272 to 600 g/day), while pasture was fed ad libitum. Consequently, ewes with highermilk yield had to eat more pasture (and fiber) to meet their nutrient requirements than thosewith lower milk yield and requirements within study. Indeed, in the whole database, NDFintake (g/kg BW) was positively associated with both energy intake (Mcal/kg BW) and EB(Fig. 3). As intake of NE increased, due to the increase in pasture and NDF intake, theEB improved, causing a decrease, or interruption, of body fat mobilization. This probablyreduced availability of LCFA to the mammary gland, contributing to a bigger decrease insynthesis of milk fat versus lactose.
Milk fat concentration is little dependent on dietary factors at low milk yield, probablybecause nutritional precursors for milk fat synthesis are not limiting. Genetic factors may
G. Pulina et al. / Animal Feed Science and Technology 131 (2006) 255–291 263
Fig. 3. Relationship between level of dietary NDF intake and level of energy intake (above) and energy balance(below) in the database of Cannas and Avondo (2002) on grazing ewes.
be more important in these cases. The increase in dietary concentration of fiber can bepositively or negatively associated with milk fat concentration, depending on the situation,suggesting that there is no causative relationship between them. Other factors, such asenergy availability or EB, might be responsible for changes in milk fat concentration inthese situations.
2.1.3. Fat supplementsMany fat sources can be used to supplement the diet of sheep to increase dietary NE
concentration or modify milk fat content or its FA profile. In addition, fat increases theenergetic efficiency of lactating ruminants, by increasing NE intake and promoting nutrientpartitioning towards milk production (Palmquist, 1994). Fat supplements can be divided intwo large categories: rumen supplements protected against rumen microbial activity andthose that are unprotected.
High concentrations of fat added to diets can reduce the fermentative activity of therumen bacteria and protozoa, thus reducing the advantage of the higher NE density of the
264 G. Pulina et al. / Animal Feed Science and Technology 131 (2006) 255–291
diet (Palmquist and Jenkins, 1980). Alteration of rumen microbial activity might also leadto depression in milk fat synthesis, reduction of short-chain FA synthesis in the udder anda decrease in the amount of metabolites (mainly FA from lipoproteins) that the mammarygland takes up from blood. However, use of rumen protected/inert fats often reduces thenegative ruminal effects associated with fat supplementation.
2.1.3.1. Rumen protected/inert fat supplements. The most commonly used rumen pro-tected/inert fats are calcium soaps of fatty acids (CSFA), and the most used CSFA is thecalcium soap of palm oil (CSPO).
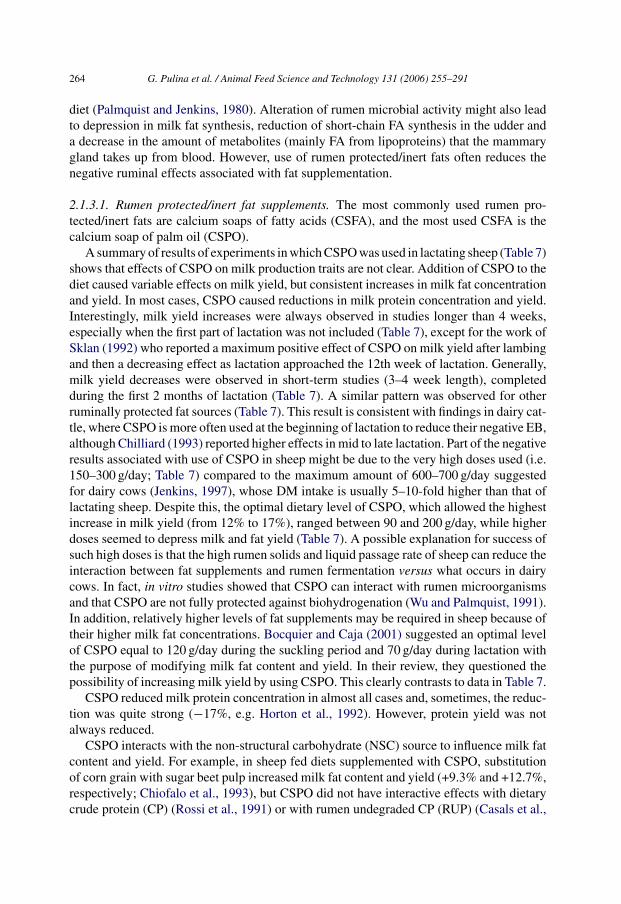
A summary of results of experiments in which CSPO was used in lactating sheep (Table 7)shows that effects of CSPO on milk production traits are not clear. Addition of CSPO to thediet caused variable effects on milk yield, but consistent increases in milk fat concentrationand yield. In most cases, CSPO caused reductions in milk protein concentration and yield.Interestingly, milk yield increases were always observed in studies longer than 4 weeks,especially when the first part of lactation was not included (Table 7), except for the work ofSklan (1992) who reported a maximum positive effect of CSPO on milk yield after lambingand then a decreasing effect as lactation approached the 12th week of lactation. Generally,milk yield decreases were observed in short-term studies (3–4 week length), completedduring the first 2 months of lactation (Table 7). A similar pattern was observed for otherruminally protected fat sources (Table 7). This result is consistent with findings in dairy cat-tle, where CSPO is more often used at the beginning of lactation to reduce their negative EB,although Chilliard (1993) reported higher effects in mid to late lactation. Part of the negativeresults associated with use of CSPO in sheep might be due to the very high doses used (i.e.150–300 g/day; Table 7) compared to the maximum amount of 600–700 g/day suggestedfor dairy cows (Jenkins, 1997), whose DM intake is usually 5–10-fold higher than that oflactating sheep. Despite this, the optimal dietary level of CSPO, which allowed the highestincrease in milk yield (from 12% to 17%), ranged between 90 and 200 g/day, while higherdoses seemed to depress milk and fat yield (Table 7). A possible explanation for success ofsuch high doses is that the high rumen solids and liquid passage rate of sheep can reduce theinteraction between fat supplements and rumen fermentation versus what occurs in dairycows. In fact, in vitro studies showed that CSPO can interact with rumen microorganismsand that CSPO are not fully protected against biohydrogenation (Wu and Palmquist, 1991).In addition, relatively higher levels of fat supplements may be required in sheep because oftheir higher milk fat concentrations. Bocquier and Caja (2001) suggested an optimal levelof CSPO equal to 120 g/day during the suckling period and 70 g/day during lactation withthe purpose of modifying milk fat content and yield. In their review, they questioned thepossibility of increasing milk yield by using CSPO. This clearly contrasts to data in Table 7.
CSPO reduced milk protein concentration in almost all cases and, sometimes, the reduc-tion was quite strong (−17%, e.g. Horton et al., 1992). However, protein yield was notalways reduced.
CSPO interacts with the non-structural carbohydrate (NSC) source to influence milk fatcontent and yield. For example, in sheep fed diets supplemented with CSPO, substitutionof corn grain with sugar beet pulp increased milk fat content and yield (+9.3% and +12.7%,respectively; Chiofalo et al., 1993), but CSPO did not have interactive effects with dietarycrude protein (CP) (Rossi et al., 1991) or with rumen undegraded CP (RUP) (Casals et al.,
G. Pulina et al. / Animal Feed Science and Technology 131 (2006) 255–291 265
Table 7Effects of calcium soaps of palm oil (CSPO) and other calcium soaps of fatty acids (CSFA) on sheep milkproduction and compositiona
Lipid source Dose(g/day)
Lactationstage(week)
Milkyield
Fatcontent
Fatyield
Proteincontent
Proteinyield
Reference
CSPOMegalac® 92 10–31 +12.0 +7.3 +20.0 −6.6 −7.1 Rossi et al. (1991)Megalac® 75 0–4 −1.3 – −6.4 −9.1 Horton et al.
(1992), Exp. 1150 0–4 −6.5 – −0.4 −9.0300 0–4 −7.0 – −17.3 −23.775 4–8 −2.2 +13.7 +14.6 −4.8 −7.2150 4–8 −7.7 +12.1 +6.8 −3.5 −11.1300 4–8 −27.2 +14.9 −13.6 −17.7 −39.7
CSPO Megalac® 150 0–3 −3.8 +39.3 +33.1 −6.1 −11.4 Horton et al.(1992), Exp. 2
150 3–6 −3.0 +40.1 +27.2 −4.0 −9.7CSPO 150 0–12 +16.9 +3.6 +21.1 −2.7 +13.8 Sklan (1992)CSPO 84 10–18 +1.0 0.0 +0.4 −8.9 Chiofalo et al.
(1993)CSPO 62 0–16 +6.4 +5.0 +12.3 −2.1 +6.3 Laudadio et al.
(1997)Megalac® 200 0–12 +16.8 +10.7 +29.4 −1.2 +15.4 Leto et al. (1997)CSPO-low RUPb 160 0–4 −3.7 +30.7 +26.0 −3.8 −8.4 Casals et al.
(1999)CSPO-high RUP 160 0–4 −15.5 +39.7 +18.5 −3.1 −18.3CSPO-low RUP 160 4–8 +4.0 +23.1 +26.7 −10.2 −8.2CSPO-high RUP 160 4–8 −8.2 +17.3 +8.5 −8.8 −15.9Megalac® 88 0–8 −3.6 +22.2 +18.4 −2.1 −3.5 Appeddu et al.
(2004)
Other CSFAOlive oil 144 2–4 −4.7 +11.0 +6.7 −0.9 −5.2 Alba et al. (1997)
195 5–10 +10.4 +4.7 +8.6 −5.1 +3.7Olive oil 45 6–15 +5.4 +7.7 +14.8 −3.5 +1.9 Garcıa et al.
(2005)Olive oil (Liposal)® 105 5–20 +23.0 +6.1 −9.7 Martini et al.
(2000)Olive oil (Liposal)® 50 4–8 0.0 +8.5 +8.8 −4.9 −4.7 Antongiovanni et
al. (2002)Liposal® + meth.c 50 4–8 −2.4 +12.9 +10.7 −4.6 −6.5CSFA 121 8–20 −1.0 +27.2 +28.7 −3.2 −1.4 Osuna et al.
(1998)PTOd 100 Last 4
weeks−0.8 +3.9 +3.1 +3.6 +2.8 Kitessa et al.
(2003)CP-PUFAe 230 0–3 −35.6 +41.0 −11.5 Palmquist et al.
(1977)a Differences between calcium soap supplemented diets are expressed as percentage relative to the control.b CSFA composed mainly by palm oil.c Methio-by®.d Protected tuna oil.e Commercial protected PUFA.
266 G. Pulina et al. / Animal Feed Science and Technology 131 (2006) 255–291
1999) on concentrations of milk fat and yield in sheep. In contrast, Palmquist et al. (1993)reported that a higher intake of RUP increased milk fat concentration in dairy cows fedsupplemental CSPO.
In addition to the stage of lactation and duration of the experiments, the variability inthe results summarized above may also be due to differences in feeding techniques (e.g.grazing versus indoor feeding), in the amount of pasture eaten in grazing studies, and in theway the supplement was fed (e.g. mixed in the concentrate supplied at milking or added toa total mixed ration).
Inclusion of another inert rumen fat source, such as the calcium soap of olive oil,induced effects on milk fat similar to those reported for calcium soap of palm oil (Table 7).The only study reporting effects of supplementation of inert polyunsaturated FA fromtuna oil did not effect milk yield, or its fat, protein and lactose composition over a 10day feeding period in different sheep breeds (Kitessa et al., 2003). In contrast, Columbiaewes fed a commercial protected polyunsaturated oil from 1 month pre-lambing to 1month post-lambing had a marked reduction in milk yield. In the same study, milk fatcontent increased by 41%, whereas milk protein content was slightly depressed (but notsignificantly; Palmquist et al., 1977). The discrepancy between the two studies may bedue to the different composition of the two unsaturated FA sources, by the different dosesused, by the different length of the experiments and by the different stage of lactation ofthe ewes to which the treatments were applied.
2.1.3.2. Rumen unprotected fat supplements. Effects of addition of ruminally unprotectedlipids to the diet of ewes on the content of their milk fat are not consistent. For example,Zervas et al. (1998) observed that addition of 50 g/kg soybean oil to the concentrate (30 g/kgof DM) for 5 weeks increased milk yield by 22.6% and decreased milk fat and proteinconcentrations versus the control diet in which wheat middlings substituted for the oil.Similarly, Sarda ewes in the third month of lactation fed diets supplemented with soybeanoil (38.5 g/kg of DM), at two forage to concentrate ratios (75:25 and 60:40), had a significantincrease of milk and fat yield, a similar fat concentration, and a lower protein concentrationcompared to the non-supplemented control ewes (Mele et al., 2002). In Merino and Awassiewes in mid-lactation, supplementation with complete pelleted diets containing 25 and50 g/kg of sunflower oil had no effects on milk yield, or milk fat and protein content, in15-day experimental periods (Bencini, unpublished) and, when the milk was processed intocheese, the consistency of curd did not differ at any level of sunflower oil. Addition ofensiled crude olive cake containing 106 g/kg oil to the diet at a dose of 150 g/kg of DM(for a mean addition of 12 g/kg of oil to the diet) in a 2 month experiment completed inmid lactation sheep did not influence milk yield, but increased milk fat content by 12%(Hadjipanayiotou, 1999). The source of fat supplemented, and its physical form, may bea reason for differences in responses among studies. For example, Zhang et al. (2006)found that flax and sunflower seeds used as fat supplements for 21 days, in amounts thatincreased total dietary fat by 22 and 25 g/kg respectively, had variable effects on milk yieldand composition. The sunflower seed supplement did not affect milk yield, but it reducedfat and protein yield, compared to the control. In contrast, flax seeds increased milk yieldabout 8%, and protein yield, but did not affect fat yield. These differences between the fatsources are likely to be related to their FA composition and/or their different seed size,
G. Pulina et al. / Animal Feed Science and Technology 131 (2006) 255–291 267
sunflower is much larger, which might have influenced rumination and rumen passage, thusaffecting rumen oil availability.
Supplementation of lactating ewes with animal fat (70 g/kg of the concentrate, 30 g/kgof the whole diet) decreased milk fat content by 14.4%, but did not change fat and proteinyield, in a 13 week study that started at lambing (Goulas et al., 2003). When the same fatsource was used with a source of rumen protected methionine (Met), there was a markedincrease of milk yield (+27%), milk fat (+27.8%) and milk protein yield (+22.2%) in earlylactation, but these effects were less pronounced in mid lactation (Goulas et al., 2003).Results suggest that addition of ruminally unprotected fat to the diet reduces amino acid(AA) availability to the mammary gland, probably due to reduced microbial activity in therumen, and passage from it. Addition of ruminally protected Met may have restored thesupply of the limiting AA and allowed the fat supplement to increase energy supply andmilk yield (Goulas et al., 2003).
It is possible that contrasting results obtained with unprotected fat among studies aredue to differences in doses, physical form and/or the FA composition of the fat sources,with different degrees of fat diffusion in rumen fluid and of its impact on rumen microbialgrowth and subsequent differences in the FA, as described later, and AA availability to themammary gland.
2.1.4. Milk fat depression syndrome and the role of trans-10, cis-12 CLA supplementsMilk fat depression (MFD) is a condition in which the diet markedly reduces milk fat
content and, above all, yield while altering milk FA composition. Bauman and Griinari(2000, 2003) stated that, in dairy cows, MFD occurs when dietary fiber is low and un-protected plant oils or fish oils are fed. They also found MFD was highly, and positively,associated with trans-10, cis-12 CLA concentration in milk fat.
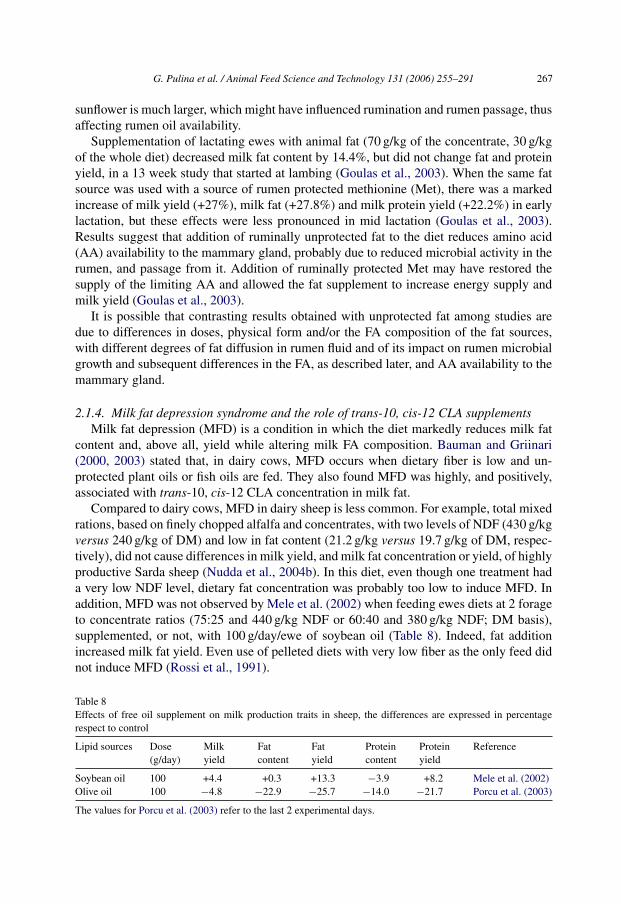
Compared to dairy cows, MFD in dairy sheep is less common. For example, total mixedrations, based on finely chopped alfalfa and concentrates, with two levels of NDF (430 g/kgversus 240 g/kg of DM) and low in fat content (21.2 g/kg versus 19.7 g/kg of DM, respec-tively), did not cause differences in milk yield, and milk fat concentration or yield, of highlyproductive Sarda sheep (Nudda et al., 2004b). In this diet, even though one treatment hada very low NDF level, dietary fat concentration was probably too low to induce MFD. Inaddition, MFD was not observed by Mele et al. (2002) when feeding ewes diets at 2 forageto concentrate ratios (75:25 and 440 g/kg NDF or 60:40 and 380 g/kg NDF; DM basis),supplemented, or not, with 100 g/day/ewe of soybean oil (Table 8). Indeed, fat additionincreased milk fat yield. Even use of pelleted diets with very low fiber as the only feed didnot induce MFD (Rossi et al., 1991).
Table 8Effects of free oil supplement on milk production traits in sheep, the differences are expressed in percentagerespect to control
Lipid sources Dose(g/day)
Milkyield
Fatcontent
Fatyield
Proteincontent
Proteinyield
Reference
Soybean oil 100 +4.4 +0.3 +13.3 −3.9 +8.2 Mele et al. (2002)Olive oil 100 −4.8 −22.9 −25.7 −14.0 −21.7 Porcu et al. (2003)
The values for Porcu et al. (2003) refer to the last 2 experimental days.
268 G. Pulina et al. / Animal Feed Science and Technology 131 (2006) 255–291
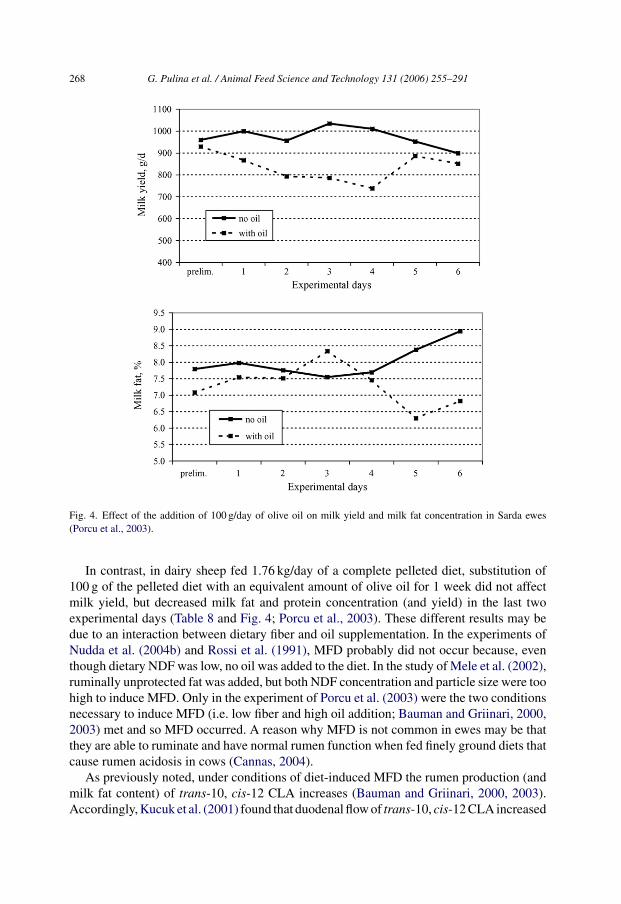
Fig. 4. Effect of the addition of 100 g/day of olive oil on milk yield and milk fat concentration in Sarda ewes(Porcu et al., 2003).
In contrast, in dairy sheep fed 1.76 kg/day of a complete pelleted diet, substitution of100 g of the pelleted diet with an equivalent amount of olive oil for 1 week did not affectmilk yield, but decreased milk fat and protein concentration (and yield) in the last twoexperimental days (Table 8 and Fig. 4; Porcu et al., 2003). These different results may bedue to an interaction between dietary fiber and oil supplementation. In the experiments ofNudda et al. (2004b) and Rossi et al. (1991), MFD probably did not occur because, eventhough dietary NDF was low, no oil was added to the diet. In the study of Mele et al. (2002),ruminally unprotected fat was added, but both NDF concentration and particle size were toohigh to induce MFD. Only in the experiment of Porcu et al. (2003) were the two conditionsnecessary to induce MFD (i.e. low fiber and high oil addition; Bauman and Griinari, 2000,2003) met and so MFD occurred. A reason why MFD is not common in ewes may be thatthey are able to ruminate and have normal rumen function when fed finely ground diets thatcause rumen acidosis in cows (Cannas, 2004).
As previously noted, under conditions of diet-induced MFD the rumen production (andmilk fat content) of trans-10, cis-12 CLA increases (Bauman and Griinari, 2000, 2003).Accordingly, Kucuk et al. (2001) found that duodenal flow of trans-10, cis-12 CLA increased
G. Pulina et al. / Animal Feed Science and Technology 131 (2006) 255–291 269
linearly as dietary concentrate intake increased in ewes. The higher rumen output of trans-10, cis-12 CLA from ewes fed diets with low forage to concentrate ratios might explain thehigher content of this FA in ewes milk (Antongiovanni et al., 2004).
In lactating sheep, supply in the diet of trans-10, cis-12 CLA reduced milk fat synthe-sis similar to that observed in lactating dairy cows (Baumgard et al., 2000; Giesy et al.,2002; Perfield et al., 2002). Multiparous ewes in early lactation supplemented with lipid-encapsulated trans-10, cis-12 CLA to provide 2.4 g/day of trans-10, cis-12 CLA, had areduction in milk fat content from 6.4 to 4.9 g/100 ml and fat yield from 95 to 80 g/day, buthad an increase in milk yield from 1471 to 1611 g/day and protein yield from 68 to 73 g/day,compared to the control group (Lock et al., 2006).
The mechanism of MFD in sheep seems to be similar to that of cows. However, sheepare probably less prone to MFD because of their ability to ruminate and to have normalrumen function, even when fed finely ground diets.
2.2. Factors influencing milk protein content
Milk protein concentration is influenced by many nutritional factors but, as previouslynoted, the range of milk protein concentration is much narrower than that of milk fat, sharplyreducing the possibilities to modify its concentration by nutritional means.
As in dairy cows (Sutton, 1989), sheep milk protein concentration (r = 0.64) is positivelyassociated with the energy concentration of the diet (Bocquier and Caja, 2001). Indeed,early lactation ewes with high milk yield fed high grain and NE diets had both higher milkyield and milk protein concentration (and yield) versus those fed low grain and energy diets(Susin et al., 1995). In contrast, no effects of pelleted diets, at two NE concentrations, onmilk protein concentration in ewes in mid-lactation occurred (Cannas et al., 1998). The dietwith the lowest NE concentration (i.e. 1.55 Mcal of NEL/kg DM) caused higher milk yieldand milk protein yield versus the diet with the higher NE concentration (i.e. 1.65 Mcal ofNEL/kg DM) diet, while milk protein concentration did not differ. In this case, the lowest NEdiet probably had sufficient fermentable carbohydrate to maximize milk protein synthesis,so that the higher concentration of fermentable carbohydrate in the higher NE diet did nothave an additional effect.
In an early lactation study, Susin et al. (1995) fed large amounts of grain (and thus ofNFC and energy), which probably helped the ewes with negative EB to reduce their energydeficit, and increased rumen propionate production, which spared AA from gluconeogenesisallowing their use for milk protein synthesis. In the mid lactation experiment of Cannas etal. (1998), due to the positive EB and lower milk yield, the high NE diets did not improveAA status through reduction of gluconeogenesis and actually stimulated NE partitioningtowards fattening (Cannas et al., 1998).
Attempts to increase milk protein content through dietary CP supplementation haveoften resulted in no effects, or in small changes (Bocquier and Caja, 2001). For example,use of diets with an increasing dietary CP concentration (140, 160, 190 and 210 g/kg, DMbasis) at two NE levels (1.65 and 1.55 Mcal of NEL/kg of DM) did not change milk proteinconcentration, but did increase milk protein yield (Cannas et al., 1998). However, in somestudies in which the dietary CP concentration was initially very low (i.e. 100–110 g/kgDM), its increase up to 140 g/kg DM increased daily milk protein concentration and yield

270 G. Pulina et al. / Animal Feed Science and Technology 131 (2006) 255–291
in early lactation ewes (Cortes et al., 1977; Cowan et al., 1981). However, this was not truefor ewes in the first month of lactation fed diets with 113 or 149 g/kg DM of CP, whichdid not show differences in milk production or composition (Hatfield et al., 1995). Thesecontrasting results with diets having low CP levels might be due to the milk productionlevel achieved, and thus on the AA requirement of the ewes as well as the optimal balanceamong essential amino acids.
Dietary protein sources can influence milk protein content and yield. For example, ewesfed fish meal had higher milk, and milk protein, yield versus those fed protein sources suchas soybean meal (Purroy and Jaime, 1995) or linseed or peanut proteins (Gonzalez et al.,1982). These results might be due to the combined effect of high RUP of fish meal and ofits close to optimal AA composition relative to milk protein synthesis.
Use of alternative protein sources in dairy sheep diets have been recently investi-gated. For example, partial and total replacement of soybean meal with Cicer arietinumL. (Christodoulou et al., 2005) or Lupinus albus L. (Masucci et al., in press) seeds did notchange milk yield, or milk protein yield and concentration in dairy sheep.
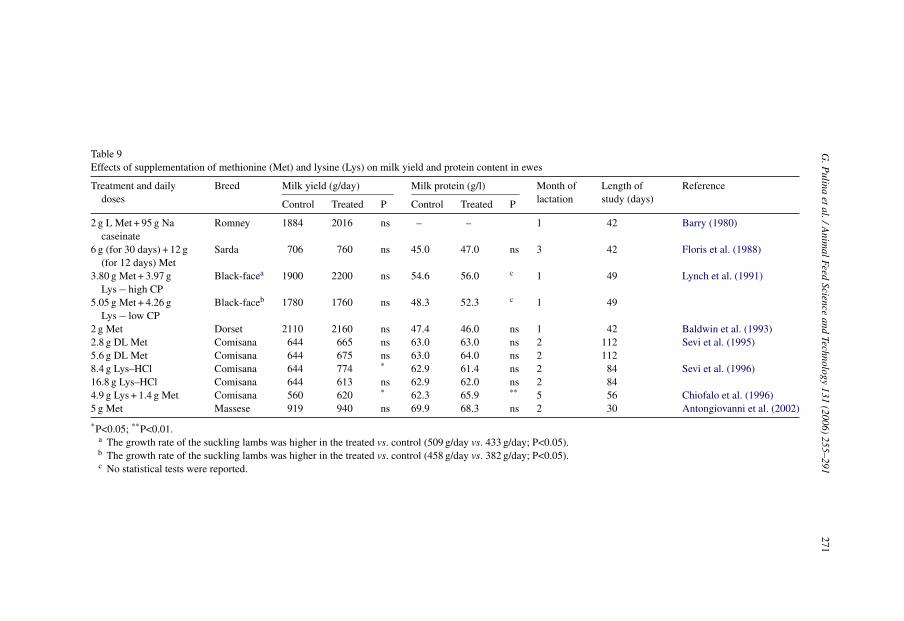
Despite the high requirement of Met for wool production of sheep, use of ruminallyprotected AA (i.e. Met or lysine (Lys)) to increase the amount of AA reaching the smallintestine in sheep has not shown consistent effects on milk yield and milk protein content(Table 9). Even though a general trend to higher milk yield and, less consistently, pro-tein concentration, when AA were supplied occurred, only in few cases were the effectssignificant (Table 9).
Use of CSFA in the diet is always accompanied by a reduction in milk protein concen-tration (Table 7). The reduction of milk protein synthesis may be due to an impairment ofFA transport into the mammary gland and by an induction of insulin resistance (Palmquistand Moser, 1981). Only in few cases was the reduction in milk protein concentration asso-ciated with positive effects of CSFA on milk protein yield, such as when ewes that ingested150 g/day of calcium soaps from lambing until 90 days post-partum in a diet composed byhay and commercial concentrate (Sklan, 1992). Similar results occurred under field condi-tions on Valle del Belice ewes supplemented with 200 g/day of calcium soaps (Leto et al.,1997).
3. Milk fat and protein composition
3.1. Factors influencing fat composition
Milk FA composition can be modified by feeding strategies that influence the patternof fat precursors that the mammary gland removes from blood for fat synthesis. The roleof some nutritional factors on milk FA composition was reviewed for sheep (Bocquier andCaja, 2001), cows (Chilliard and Ferlay, 2004) and goats (Chilliard et al., 2003). This reviewdeals with effects of diet energy concentration, dose and quality of fat supplements, foragetype and forage:concentrate ratio on sheep milk fat.
It is known that sheep fed low energy diets (Purroy and Jaime, 1995), or that are innegative EB (Cannas and Avondo, 2002), mobilize body fat by releasing non-esterified FA(NEFA) into the blood that are used as precursors of milk fat synthesis. As a consequence,
G.P
ulinaetal./A
nimalFeed
Scienceand
Technology131
(2006)255–291
271
Table 9Effects of supplementation of methionine (Met) and lysine (Lys) on milk yield and protein content in ewes
Treatment and dailydoses
Breed Milk yield (g/day) Milk protein (g/l) Month oflactation
Length ofstudy (days)
Reference
Control Treated P Control Treated P
2 g L Met + 95 g Nacaseinate
Romney 1884 2016 ns – – 1 42 Barry (1980)
6 g (for 30 days) + 12 g(for 12 days) Met
Sarda 706 760 ns 45.0 47.0 ns 3 42 Floris et al. (1988)
3.80 g Met + 3.97 gLys − high CP
Black-facea 1900 2200 ns 54.6 56.0 c 1 49 Lynch et al. (1991)
5.05 g Met + 4.26 gLys − low CP
Black-faceb 1780 1760 ns 48.3 52.3 c 1 49
2 g Met Dorset 2110 2160 ns 47.4 46.0 ns 1 42 Baldwin et al. (1993)2.8 g DL Met Comisana 644 665 ns 63.0 63.0 ns 2 112 Sevi et al. (1995)5.6 g DL Met Comisana 644 675 ns 63.0 64.0 ns 2 1128.4 g Lys–HCl Comisana 644 774 * 62.9 61.4 ns 2 84 Sevi et al. (1996)16.8 g Lys–HCl Comisana 644 613 ns 62.9 62.0 ns 2 844.9 g Lys + 1.4 g Met Comisana 560 620 * 62.3 65.9 ** 5 56 Chiofalo et al. (1996)5 g Met Massese 919 940 ns 69.9 68.3 ns 2 30 Antongiovanni et al. (2002)
*P<0.05; **P<0.01.a The growth rate of the suckling lambs was higher in the treated vs. control (509 g/day vs. 433 g/day; P<0.05).b The growth rate of the suckling lambs was higher in the treated vs. control (458 g/day vs. 382 g/day; P<0.05).c No statistical tests were reported.
272 G. Pulina et al. / Animal Feed Science and Technology 131 (2006) 255–291
the LCFA, particularly stearic, oleic and linoleic acids, increase in milk fat, while short-medium chain FA decrease (Nudda et al., 2004a).
3.1.1. Effects of lipid supplementation on milk fatty acid compositionDiet fat supplements can have a major effect on the milk FA profile. In fact, the FA
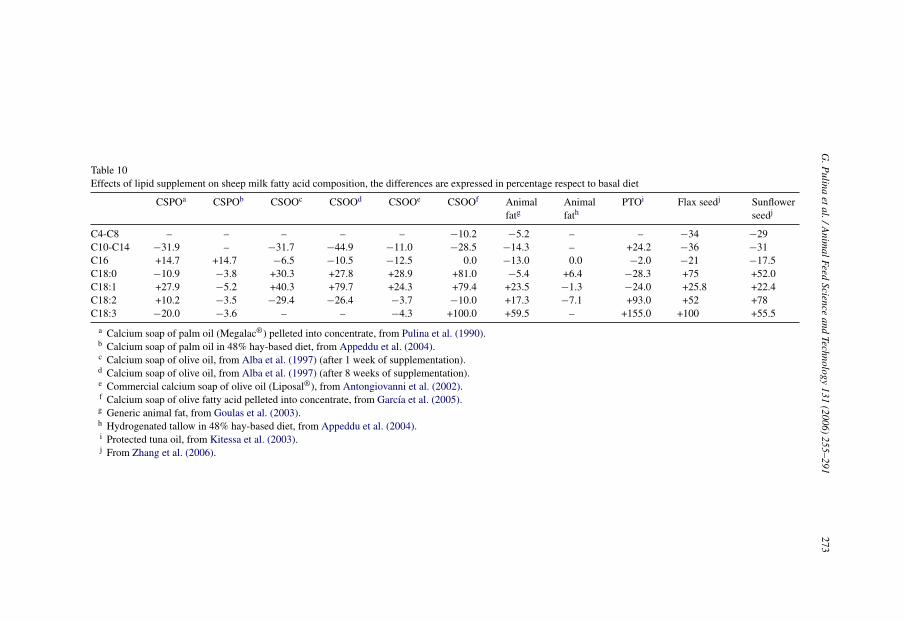
profile of milk produced by sheep fed ruminally protected/inert fat tends to reflect the FAcomposition of the supplement (summarized in Table 10). For example, calcium soaps ofpalm oil increased proportions of palmitic acid (Pulina et al., 1990; Sklan, 1992; Appedduet al., 2004), whereas calcium soaps of olive oil increased proportions of oleic and stearicacids (Alba et al., 1997; Antongiovanni et al., 2002; Martini et al., 2004; Garcıa et al., 2005)in sheep milk. A similar pattern was observed in goats (Chilliard et al., 2003).
Animal fats in the diet cause a reduction in short- and medium-chain FA and an increaseof unsaturated LCFA in sheep milk (Goulas et al., 2003; see Table 10), as observed in cows(Palmquist et al., 1993). This is probably due to an increase in uptake of preformed andLCFA by the mammary gland, with a consequent depression of de novo FA synthesis. Alack of effect of dietary hydrogenated tallow on the milk FA profile was attributed to a lowfat intake that did not supply enough FA to the mammary gland to alter markedly milk fatcomposition (Appeddu et al., 2004).
Recently, an increasing attention to the human healthfulness of dairy products (Lockand Bauman, 2004) has stimulated research on use of vegetable and marine oils to increaseproportions of unsaturated FA and LCFA in milk. Different vegetable oils and oilseeds havebeen examined in goats (Chilliard et al., 2003) and cows (Zheng et al., 2005), with the aimof increasing concentration of human health promoting FA, such as CLA and omega 3 FA.However, few experiments in this area have been conducted on dairy ewes. For example,ewes fed whole sunflower seed (rich in C18:2) and flax seed (rich in C18:3) produced milkwith markedly higher proportions of C18:1, C18:2 and C18:3, and a lower proportion ofC16:0 (Zhang et al., 2006; see Table 10).
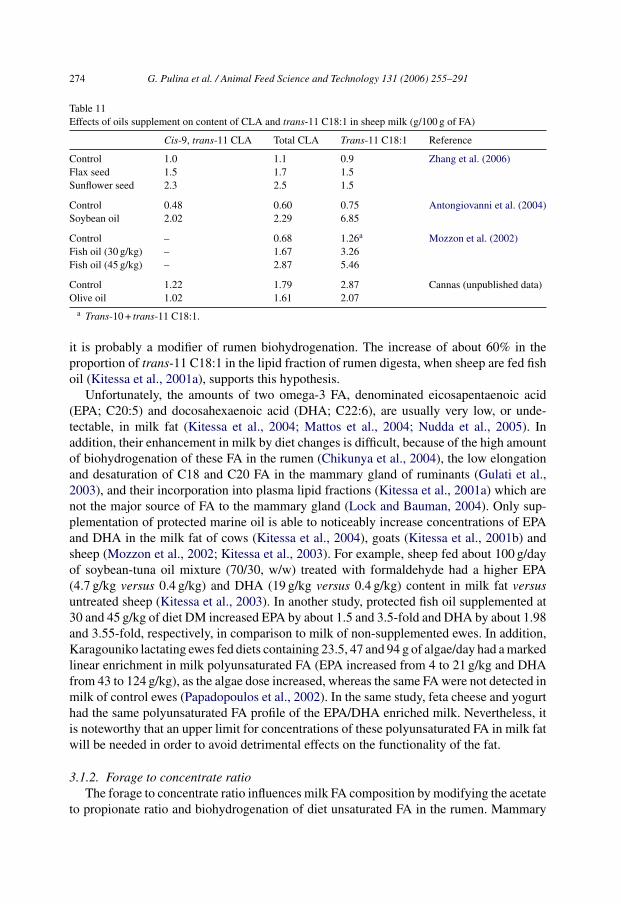
Studies on LCFA have focused mainly on CLA and, in sheep milk, almost 15 isomers ofCLA have been identified although the predominant is cis-9, trans-11 CLA (Antongiovanniet al., 2004; Luna et al., 2005). Effects of oil supplements on milk CLA content are summa-rized in Table 11. When dairy ewes were fed a soybean oil supplement, cis-9, trans-11 CLAin milk was enhanced about 3.2-fold, trans-10, cis-12 CLA increased about 1.3-fold, andtrans-11 C18:1 was increased more than eight-fold in milk (Antongiovanni et al., 2004).The latter is the precursor of cis-9, trans-11 CLA in bovine mammary gland (Mosley etal., 2006). Even though no direct measurements have been completed in sheep mammarygland, the strong relationship between cis-9, trans-11 and trans-11 C18:1 in ewes milk(Nudda et al., 2005) suggests that sheep do not differ from cows in this regard. Sheep fedflax seed and sunflower seed supplements showed a marked increase in total CLA, cis-9,trans-11 isomer and trans-11 C18:1 in milk (Zhang et al., 2006). In contrast, a free oliveoil supplement caused no change in cis-9, trans-11 CLA and trans-11 C18:1 in the milk ofewes fed a high concentrate diet (Cannas et al., unpublished).
The milk total CLA concentration was increased about 1.7 and 2.9-fold in sheep fedfish oil at 30 and 45 g/kg of diet DM, respectively (Mozzon et al., 2002). This is consistentwith findings in dairy cows (Donovan et al., 2000; AbuGhazaleh et al., 2002). Becausefish oil is characterized by a very low concentration of oleic, linoleic and linolenic acids,
G.P
ulinaetal./A
nimalFeed
Scienceand
Technology131
(2006)255–291
273
Table 10Effects of lipid supplement on sheep milk fatty acid composition, the differences are expressed in percentage respect to basal diet
CSPOa CSPOb CSOOc CSOOd CSOOe CSOOf Animalfatg
Animalfath
PTOi Flax seedj Sunflowerseedj
C4-C8 – – – – – −10.2 −5.2 – – −34 −29C10-C14 −31.9 – −31.7 −44.9 −11.0 −28.5 −14.3 – +24.2 −36 −31C16 +14.7 +14.7 −6.5 −10.5 −12.5 0.0 −13.0 0.0 −2.0 −21 −17.5C18:0 −10.9 −3.8 +30.3 +27.8 +28.9 +81.0 −5.4 +6.4 −28.3 +75 +52.0C18:1 +27.9 −5.2 +40.3 +79.7 +24.3 +79.4 +23.5 −1.3 −24.0 +25.8 +22.4C18:2 +10.2 −3.5 −29.4 −26.4 −3.7 −10.0 +17.3 −7.1 +93.0 +52 +78C18:3 −20.0 −3.6 – – −4.3 +100.0 +59.5 – +155.0 +100 +55.5
a Calcium soap of palm oil (Megalac®) pelleted into concentrate, from Pulina et al. (1990).b Calcium soap of palm oil in 48% hay-based diet, from Appeddu et al. (2004).c Calcium soap of olive oil, from Alba et al. (1997) (after 1 week of supplementation).d Calcium soap of olive oil, from Alba et al. (1997) (after 8 weeks of supplementation).e Commercial calcium soap of olive oil (Liposal®), from Antongiovanni et al. (2002).f Calcium soap of olive fatty acid pelleted into concentrate, from Garcıa et al. (2005).g Generic animal fat, from Goulas et al. (2003).h Hydrogenated tallow in 48% hay-based diet, from Appeddu et al. (2004).i Protected tuna oil, from Kitessa et al. (2003).j From Zhang et al. (2006).
274 G. Pulina et al. / Animal Feed Science and Technology 131 (2006) 255–291
Table 11Effects of oils supplement on content of CLA and trans-11 C18:1 in sheep milk (g/100 g of FA)
Cis-9, trans-11 CLA Total CLA Trans-11 C18:1 Reference
Control 1.0 1.1 0.9 Zhang et al. (2006)Flax seed 1.5 1.7 1.5Sunflower seed 2.3 2.5 1.5
Control 0.48 0.60 0.75 Antongiovanni et al. (2004)Soybean oil 2.02 2.29 6.85
Control – 0.68 1.26a Mozzon et al. (2002)Fish oil (30 g/kg) – 1.67 3.26Fish oil (45 g/kg) – 2.87 5.46
Control 1.22 1.79 2.87 Cannas (unpublished data)Olive oil 1.02 1.61 2.07
a Trans-10 + trans-11 C18:1.
it is probably a modifier of rumen biohydrogenation. The increase of about 60% in theproportion of trans-11 C18:1 in the lipid fraction of rumen digesta, when sheep are fed fishoil (Kitessa et al., 2001a), supports this hypothesis.
Unfortunately, the amounts of two omega-3 FA, denominated eicosapentaenoic acid(EPA; C20:5) and docosahexaenoic acid (DHA; C22:6), are usually very low, or unde-tectable, in milk fat (Kitessa et al., 2004; Mattos et al., 2004; Nudda et al., 2005). Inaddition, their enhancement in milk by diet changes is difficult, because of the high amountof biohydrogenation of these FA in the rumen (Chikunya et al., 2004), the low elongationand desaturation of C18 and C20 FA in the mammary gland of ruminants (Gulati et al.,2003), and their incorporation into plasma lipid fractions (Kitessa et al., 2001a) which arenot the major source of FA to the mammary gland (Lock and Bauman, 2004). Only sup-plementation of protected marine oil is able to noticeably increase concentrations of EPAand DHA in the milk fat of cows (Kitessa et al., 2004), goats (Kitessa et al., 2001b) andsheep (Mozzon et al., 2002; Kitessa et al., 2003). For example, sheep fed about 100 g/dayof soybean-tuna oil mixture (70/30, w/w) treated with formaldehyde had a higher EPA(4.7 g/kg versus 0.4 g/kg) and DHA (19 g/kg versus 0.4 g/kg) content in milk fat versusuntreated sheep (Kitessa et al., 2003). In another study, protected fish oil supplemented at30 and 45 g/kg of diet DM increased EPA by about 1.5 and 3.5-fold and DHA by about 1.98and 3.55-fold, respectively, in comparison to milk of non-supplemented ewes. In addition,Karagouniko lactating ewes fed diets containing 23.5, 47 and 94 g of algae/day had a markedlinear enrichment in milk polyunsaturated FA (EPA increased from 4 to 21 g/kg and DHAfrom 43 to 124 g/kg), as the algae dose increased, whereas the same FA were not detected inmilk of control ewes (Papadopoulos et al., 2002). In the same study, feta cheese and yogurthad the same polyunsaturated FA profile of the EPA/DHA enriched milk. Nevertheless, itis noteworthy that an upper limit for concentrations of these polyunsaturated FA in milk fatwill be needed in order to avoid detrimental effects on the functionality of the fat.
3.1.2. Forage to concentrate ratioThe forage to concentrate ratio influences milk FA composition by modifying the acetate
to propionate ratio and biohydrogenation of diet unsaturated FA in the rumen. Mammary
G. Pulina et al. / Animal Feed Science and Technology 131 (2006) 255–291 275
Table 12Fatty acids composition of milk fat in Sarda ewes grazing spring pasture (Nudda et al., 2003)
FAME (g/100 g of fat) Month P
April May
C6-C14 24.92 17.77 nsC16:0 17.16 18.91 nsC18:0 6.18 8.32 **
C18:1 t11 3.74 1.32 **
C18:1 total 20.96 20.22 *
C18:2 3.22 2.31 **
C18:3 0.88 0.62 **
CLA cis-9, trans-11 2.15 0.84 **
*P<0.10; **P<0.01.
synthesis of short and medium chain FA is favoured by a high rumen acetate to propionateratio. This ratio increases as fiber concentration, and its digestibility in the diet, increasesand decreases as fiber particle size decreases.
Alteration of rumen biohydrogenation of unsaturated FA leads to changes in the com-position of FA entering the duodenum and, subsequently, in milk FA composition. Forexample, a reduction in the forage:concentrate ratio in the diet from 73:17 to 18:82 (DMbasis) increased rumen escape of dietary unsaturated FA to the duodenum, especially trans-11 C18:1 (Kucuk et al., 2001). Dairy ewes fed diets containing 75:25 and 60:40 forageto concentrate ratios had small changes in milk trans-11 C18:1 (7.3 g/kg versus 7.7 g/kgrespectively) and CLA (5.0 g/kg versus 7.1 g/kg respectively). However, when both dietswere supplemented with soybean oil, the concentration of cis-9, trans-11 CLA in sheepmilk (25 and 21 g/kg respectively, for the 75:25 and 60:40 ratios) was higher than that ofsheep receiving no supplement (3.7 and 5.8 g/kg respectively; Antongiovanni et al., 2004).When dairy ewes were fed diets with high (430 g/kg of DM) and low (280 g/kg of DM)NFC, milk of sheep fed the high NFC had a higher content of all trans C18:1 positionalisomers and cis-9, trans-11 CLA, probably because of a slower rumen biohydrogenation ofunsaturated FA and higher rumen escape of unsaturated FA (Nudda et al., 2004b).
3.1.3. Fresh forage based dietsFeeding fresh forages can influence the polyunsaturated FA content in milk fat. This is
particularly important in farming systems of dairy sheep in Mediterranean countries, wherethe diet is based mainly on pasture, and quantitative and qualitative availability is heavilyinfluenced by environmental factors (Molle et al., 2004).
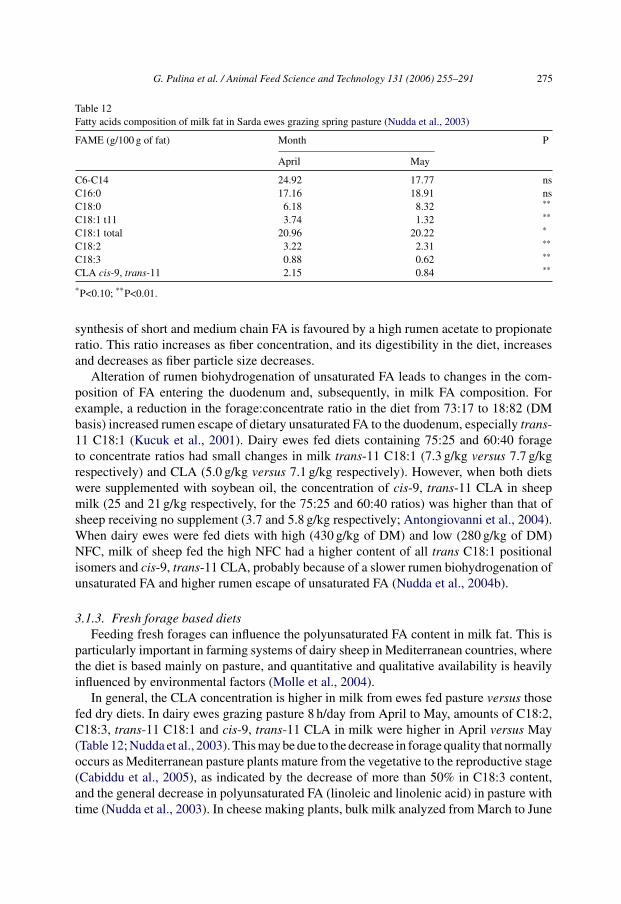
In general, the CLA concentration is higher in milk from ewes fed pasture versus thosefed dry diets. In dairy ewes grazing pasture 8 h/day from April to May, amounts of C18:2,C18:3, trans-11 C18:1 and cis-9, trans-11 CLA in milk were higher in April versus May(Table 12; Nudda et al., 2003). This may be due to the decrease in forage quality that normallyoccurs as Mediterranean pasture plants mature from the vegetative to the reproductive stage(Cabiddu et al., 2005), as indicated by the decrease of more than 50% in C18:3 content,and the general decrease in polyunsaturated FA (linoleic and linolenic acid) in pasture withtime (Nudda et al., 2003). In cheese making plants, bulk milk analyzed from March to June
276 G. Pulina et al. / Animal Feed Science and Technology 131 (2006) 255–291
also showed a decrease from 22.0 to 11.4 g/kg in cis-9, trans-11 CLA and from 45.2 to17.6 g/kg in trans-11 C18:1 content with season (Nudda et al., 2005).
Levels of polyunsaturated FA and CLA in milk are also markedly affected by botan-ical composition of the diet in ewes fed different pasture mixtures. High levels of milkC18:3, trans-11 C18:1 and CLA were obtained when diets were based on pure legumes orgrass–legume mixtures versus pure grass pastures (Cabiddu et al., 2005). In a study com-paring four forage species, the content of cis-9, trans-11 CLA in milk of ewes consumingdaisy forb (Chrysanthemum coronarium L., 23.5 g/kg) and burr medic (Medicago polymor-pha L., 23.0 g/kg) was higher than in milk from sheep fed annual ryegrass (Lolium rigidumGaudin, 12.0 g/kg) and sulla (Hedysarum coronarium L., 12.5 g/kg; Addis et al., 2005).These findings of high contents of CLA and trans-11 C18:1 in milk and dairy productsfrom ewes grazing fresh pastures are consistent with previous reports in dairy cattle (Kellyet al., 1998; Dhiman et al., 1999; Ward et al., 2003; Schroeder et al., 2003; Kay et al., 2004).
3.2. Factors influencing milk urea and other N compounds
In milk produced by healthy ewes, casein represents about 750 g/kg of CP (Bianchi etal., 2004; Albenzio et al., 2004; Leitner et al., 2004) and about 820 g/kg of protein (Jaeggiet al., 2005). Many genetic (Barillet et al., 2005) and environmental (Bianchi et al., 2004;Albenzio et al., 2004) factors affect the distribution of N fractions in ewes milk.
Few studies have dealt specifically with effects of nutrition of the ewe on milk proteinprofile. In general, an increase of dietary CP did not affect milk CP content, but influencedthe milk N fraction. In sheep fed diets with 4 levels of dietary CP (i.e. 140, 160 190and 210 g/kg DM), a close positive relationship between milk urea (MU) and dietary CPconcentration (R2 = 0.99) occurred, probably because efficiency of utilization of dietary Nfor milk protein synthesis decreased, and N losses increased, as CP content in the dietsincreased (Cannas et al., 1998). When dietary CP content increased from 130 to 160 g/kgDM in mid-lactation ewes, the consequent increase of MU was associated with a decreasein casein content (Albenzio et al., 2005). An increase of MU is particularly evident insheep grazing pasture fertilized with N (Borowiec et al., 1984) or immature pastures, inwhich the CP concentration is often higher than 250–300 g/kg DM (Cannas et al., 2002).A general positive relationship between MU and dietary CP concentration was also foundin experiments comparing corn gluten meal with soybean meal (Cannas et al., 1997) andtoasted soybean meal with normal soybean meal (Ubertalle et al., 1998), suggesting thatthe different supplemental protein sources had similar effects on MU.
Despite the importance of MU as a nutritional indicator in dairy cows, systematic studieson its use in dairy sheep are recent. Cannas et al. (1998), working with dairy ewes from thethird to the fifth month of lactation fed diets at two NE levels, developed relationships torelate MU with dietary CP concentration and intake as:
MU (mg/dl) = 0.41 CP concentration (g/kg DM) − 30.30 (R2 = 0.98) (1)
MU (mg/dl) = 0.14 CP intake (g/day) − 15.23 (R2 = 0.94) (2)
By pooling data of 66 different diets, and many different sources of protein in differentexperiments, the regressions between the dietary CP concentration or daily CP intake and
G. Pulina et al. / Animal Feed Science and Technology 131 (2006) 255–291 277
MU or blood urea (BU) confirmed that these two variables were closely linearly correlated,regardless the source of the protein or the feed intake level:
MU or BU (mg/dl) = 0.45 CP concentration (g/kg DM) − 38.9 (R2 = 0.82)
(3)
MU or BU (mg/dl) = 0.13 CP intake (g/day) − 17.9 (R2 = 0.56) (4)
Regression equations (3) and (4) are similar to Eqs. (1) and (2), but the association betweenMU or BU and daily CP intake was much lower in Eq. (4) versus Eq. (2). This suggeststhat the ratios among CP and other nutrients in the diet are more important than the totaldaily CP intake in control of the level of BU. This is probably because rumen microbialammonia utilization is markedly affected by the other nutrients in the diet (Cannas et al.,1998), with carbohydrates being probably the most important nutrient since, when theyare fermented in the rumen, bacteria grow faster and use rumen ammonia more efficiently,thereby causing a reduction in MU. In addition, high energy diets reduce the necessity ofewes to use AA as a energy source, so that less ammonia is produced from AA catabolism.Degradability of the dietary CP seems to be less important in sheep versus dairy cattle,probably because the higher rumen passage rate of sheep reduces the proportion of CPdegraded in the rumen compared to cattle (Cannas, 2004). Effects of dietary rumendegradable organic matter (RDOM) and rumen degradable CP (RDP) on milk urea wasexamined by Landau et al. (2005), who found differences of about 5–6 mg/dl of MU,depending on RDP to RDOM ratios, for similar dietary CP concentrations.
When comparing fish meal with soybean and linseed meal as dietary CP sources, the firsthad a positive effect on milk protein concentration (Gonzalez et al., 1982), perhaps relatedto its high (∼0.90) intestinal digestibility (Allison and Garnsworthy, 2002), which increasesAA supply for milk protein synthesis. Most experiments on use of ruminally protected AA toincrease the amount of AA reaching the small intestine in sheep did not report informationon milk protein composition. In dairy cows, addition of ruminally protected Met to thediet caused changes in the casein fraction of milk (Armentano et al., 1993). In sheep,supplementation of ruminally protected Met and Lys was used to increase the efficiency ofN utilization for milk protein synthesis (Lynch et al., 1991), and supplementation causeda slight increase of the Met and Lys content in milk, which was associated with a highergrowth of lambs suckling this milk.
Even if dietary fat induces less milk protein synthesis (Table 7), very little information isavailable on its effects on milk protein composition in sheep (Goulas et al., 2003; Zhang etal., 2006). For example, animal fat supplementation to lactating ewes did not influence themilk protein or casein contents (Campus et al., 1990; Goulas et al., 2003), and replacementof corn with sunflower seeds caused a decrease in CP, casein and MU in sheep milk (Zhanget al., 2006).
4. Somatic cell content
Increased SCC in sheep milk markedly reduces cheese yield by increasing the moisturein curd and cheese, and by reducing the quantity of casein trapped in it. As SCC increases,
278 G. Pulina et al. / Animal Feed Science and Technology 131 (2006) 255–291
proteolysis also increases more quickly as cheese ages, increasing the free FA concentration(Pirisi et al., 2000; Jaeggi et al., 2003; Albenzio et al., 2004).
The SCC in milk is indirectly affected by nutrition of the ewe. For example, poor nutritionmay predispose ewes to metabolic and infectious health disorders, which increase suscep-tibility of the mammary gland to inflammation. Correct integration of vitamin A, or betacarotene, and vitamin E and Se in the ration maintains immune responses of mammarygland cells, thereby reducing the incidence of infections that can lead to increases in milkSCC (Morgante et al., 1995, 1999). Such integration is particularly useful when ewes are fedmainly conserved fodders (i.e. hay or silage) that may have undergone considerable lossesin beta carotene and vitamin E during storage. Indeed, Pauselli et al. (2001) observed thatComisana dairy ewes fed diets supplemented with both vitamin E and Se (400 IU/head/dayand 0.3 mg/head/day, respectively) from 2 weeks before lambing to 60 days of lactationproduced milk with lower SCC, expressed as a linear score, than those receiving supple-mentation with vitamin E (400 IU/head/day) only. This is consistent with previous resultsobtained by administration of vitamin E (5 mg/kg BW) and Se (0.1 mg/kg BW) by subcu-taneous injection every 2 weeks to dairy ewes (Pauselli et al., 1997). In contrast, Chiofaloet al. (1998) noted a decrease of SCC in milk of ewes fed concentrates supplemented withvitamin E (200 IU/head/day) only.
5. Aromatic compounds
The components of the volatile fraction of sheep milk are strongly influenced by thediet of the ewe (Coulon et al., 2005). Cheese flavor is determined by a number of volatileand non-volatile compounds occurring in milk and/or produced during cheese manufac-ture or cheese ripening (Carbonell et al., 2002). In dairy sheep milk production, pasturequality is of importance to cheese bouquet. Odorous substances may be transferred to themilk directly through inhaled air, by lung-blood transfer, or indirectly from the diet, byabsorption from the digestive tract, or via rumen gases, to blood (Moio et al., 1996). Ewesfed pasture produced milk containing neutral volatile compounds (i.e. esters, aldehydes,alcohols, ketones), N compounds, S compounds, aromatic hydrocarbons (e.g. sesquiter-penes) and lactones. However all these compounds, except for two sesquiterpenes, werealso detected in milk of sheep fed a mixed grain diet in the same study (Moio et al., 1996).The botanical composition of pastures strongly influences the proportions and quantities ofmonoterpenes and sesquiterpenes in milk fat (Viallon et al., 2000) and, consequently, playsa role in determining milk and cheese flavor. Indeed Carpino et al. (2004) detected the samevolatile compounds in pasture plants and in the cheese made from milk of the grazing cows.The volatile fraction of forages are also important for their use as markers of dairy sheepproduction systems.
Mariaca et al. (1997) reported that flavor differences in cheeses made from the milk ofewes grazing different areas and seasons were related to botanical species, phenologicalstages and seasonal variation in the plant terpenoids. Among these sources of variability,botanical composition and seasonal evolution of pasture can affect the volatile compoundspresent in ewe raw milk. For example, Addis et al. (2006) observed that inclusion of C.coronarium in a grass-legume based pasture markedly influenced the occurrence of terpenic
G. Pulina et al. / Animal Feed Science and Technology 131 (2006) 255–291 279
hydrocarbons in the volatile fraction of sheep milk and cheese. Carbonell et al. (2002) foundthe highest concentrations and diversity of terpenes, and other aromatic compounds (e.g.toluene, naphthalene and phenol) and free FA in cheese from ewes milk produced duringthe spring versus that from other seasons.
6. Undesirable substances
In dairy livestock, intake of undesirable substances can occur throughout the animal feedchain. These compounds represent a danger to animal health, adversely affect livestockproduction and are a potential source of risk to human health. Contaminants are undesirablesubstances that have not been intentionally added to feed or diets at any stage of production.There is a wide range of toxic compounds, originating from anthropogenic and naturalsources. The most relevant contaminants in feedstuffs, which are a source of risk to publichealth, are heavy metals, dioxins and mycotoxins.
Contamination of agricultural products by heavy metals is mostly due to industrial pol-lutants and to sewage sludges used in agricultural practices. Heavy metals, such as Zn, Cu,Cr, Ar, Pb and Cd, are potential bio-accumulative toxins in the dairy production system.Several authors have shown the presence of heavy metals in feeds, milk and sheep dairyproducts (Coni et al., 1999; Caggiano et al., 2005). Passage of many heavy metals throughthe dairy food chain is limited by factors such as the absorption capacity of the soil, soilpH and salinity, and metal phytotoxicity, but Cd is an exception to this rule (Li et al., 2005)as it has the highest transmission potential throughout the food chain, reaching levels thatmay be dangerous to the health of dairy consumers. Transfer of Cd from feed to the milk,and the kinetics of Cd in lactating ewes, has been studied after a single oral or intravenousadministration (Houpert et al., 1997). The Cd concentration in milk increased rapidly, wasdetected at the first milking after administration (i.e. 6 h) and reached a maximum value on24–48 h after administration. Clearance of Cd in milk was not linear, reaching a maximumfrom 7 to 14 days after administration, decreasing thereafter. Mehennaoui et al. (1999) foundthat in ewes fed 2 mg/kg/day of CdCl by granulated feed supplementation for 70 days, theblood concentrations of Cd increased quickly and reached a stable value (2.7–3.8 �g/l) in28 days. Concentrations of Cd in milk (1.9–6.5 �g/l) were slightly higher than those foundin blood, but both parameters had a similar pattern over time.
Transfer of trace heavy metals into milk is a result of complex bio-mechanisms thatrequire activity of carrier proteins. Hallen et al. (1996) observed in cows that Pb was boundto casein and excreted by alveolar cells in the lumen of the alveolus suggesting that excretionof heavy metals via milk casein secretion is responsible for transfer of contaminants to cheeseand other dairy products. Concentrations of Cd in rennet curd of sheep milk was about fiveto six-fold higher than that of whole milk, while the Cd concentration in lactic curd wasabout three-fold higher than that of milk (Mehennaoui et al., 1999).
In recent years, several incidents of elevated dioxin levels in human foods have occurred.The term dioxin is commonly used to refer to a family of toxic chemicals that share a sim-ilar chemical structure and a common mechanism of toxic action. This family includespolychlorinated dibenzo dioxins (PCDDs), polychlorinated dibenzo furans (PCDFs) andpolychlorinated biphenyls (PCBs). Effects of dioxin exposure on animal cells have been the
280 G. Pulina et al. / Animal Feed Science and Technology 131 (2006) 255–291
subject of intensive investigations in laboratory animals over the last 30 years. Dioxins arepersistent and bio-accumulative and have a common spectrum of biologic responses medi-ated via binding to specific high-affinity cellular proteins. Tetra-chlorinated dioxin (TCDD),the most toxic of PCDDs, induces a broad spectrum of biological responses, including dis-ruption of normal hormone signaling pathways, as well as reproductive and developmentaldefects, immunotoxicity, liver damage, wasting and cancer. It may also cause changes inthe sex ratio and promote tumor development in animals (Mandal, 2005). TCDD classifica-tion was upgraded from “possible human carcinogen” (group 2B) to “human carcinogen”(group 1) by the International Agency for Research on Cancer (IARC, 1997). Recently,accumulating evidence shows that PCBs express neurotoxicity through alteration of geneexpression and signal transduction (Boersma and Lanting, 2000; Miyazaki et al., 2004).
All dioxins enter the food chain through animals that are exposed to contaminated sur-roundings and feed, and tend to concentrate mainly in body and milk fat. Dioxin levelsin dairy milk are related to emission from the nearby industries (Schmid et al., 2003) orto polluting manufacturing processes. Among foods of animal origin, dairy products havethe highest level of contamination (Bocio et al., 2003; Schecter et al., 2004). In a study ontransfer of PCBs from blood into sheep milk or faeces, Vrecl et al. (2005) observed that thepattern of excreted PCB differed between the two pathways. An enrichment of lipophilicprecursors was observed in milk, because of its higher lipid content, versus faeces. Thedistribution and clearance of many halogenated hydrocarbons have been studied in rumi-nants by administrating known quantities of these compounds (Willett et al., 1993). Manyof these hydrocarbons, including the precursors of PCB, have similar kinetic behavior inlactating dairy cows and sheep (Willett et al., 1993; Busbee and Ziprin, 1994; Vrecl et al.,2005). These studies suggest that in lactating sheep the higher chlorinated, coplanar andmetabolically stable PCB precursors, are preferentially excreted in milk and, due to the theirhigh toxicity, represent a potential risk to dairy consumers. In bulk milk of two flocks ofdairy sheep fed only pasture, Iannuzzi et al. (2004) reported a contamination of 5.27 pg ofdioxins/g of fat (as human WHO-TCDD equivalent). According to the authors, high con-centration of dioxins in milk was a consequence of the presence of dioxin contamination ingrass and water (1.22 and 0.07 pg/g, respectively). Since significant quantities of soil canbe ingested by sheep during grazing (Abrahams and Steigmajer, 2003), the presence of thedioxins in the upper layer of soil must be known in order to prevent milk contamination.
Mycotoxins are secondary metabolites produced by some species of moulds and areundesirable substances in foods and animal feeds. Mould growth and mycotoxin contam-ination of feedstuffs occur normally at all stages of their productive cycle (i.e. cropping,harvest, transport, storage). Although some mycotoxins seem not to be toxic to sheep, atleast at levels normally found in feeds, it is possible that some of their metabolites aretransferred to milk, creating a potential risk to dairy consumers.
Exposure of dairy consumers to mycotoxins and their metabolites in sheep milk products(i.e. secondary exposure) is mainly related to the presence of ochratoxins and aflatoxins.Ochratoxins are secondary metabolites of some species of Aspergillus and Penicillium andare constituted predominantly by ochratoxin A (OTA). The natural occurrence of OTA infeedstuffs is widespread, especially in temperate areas. The OTA has been described asnephrotoxic, carcinogenic, teratogenic, immunotoxic, and hepatotoxic in several animalspecies (O’Brien and Dietrich, 2005).
G. Pulina et al. / Animal Feed Science and Technology 131 (2006) 255–291 281
Several studies using rumen fluid reported that OTA is hydrolyzed by rumen microor-ganisms, yielding ochratoxin-�, which is non-toxic, or far less toxic, than OTA, andL-phenylalanine (Kiessling et al., 1984). However, conversion of OTA to ochratoxin-�is incomplete in sheep and leads to appearance of intact OTA in blood and urine (Blank etal., 2003). Disappearance of OTA from the rumen is faster for hay-fed, versus grain-fed,sheep (Xiao et al., 1991). However, since this toxin is not completely degraded by rumi-nal microflora, it appears in systemic circulation causing signs of ochratoxicosis, includingreduced feed intake and altered hemato-metabolic variables, in animals fed 0.225 mg/day/kgof BW of OTA (Hohler et al., 1999). To our knowledge, the only available data of milk con-tamination by OTA were reported by Skaug (1999), who surveyed Norwegian dairies andfound an incidence of 15% and 11% of contaminated milk on conventional and organicfarms, respectively, and by Breitholtz-Emanuelsson et al. (1993), who reported a similarcontamination incidence in Sweden.
Aflatoxins form a group of fungal toxins, produced mainly by Aspergillus flavus and A.parasiticus, which occur naturally in several important feedstuffs. Peanuts, maize grain andcottonseed are the major crops in which aflatoxins are produced. Aflatoxin B1 (AFB1) is themost toxic compound produced by these moulds. Aflatoxin M1 (AFM1) is the hydroxylatedmetabolite of AFB1 and may be in milk and milk products of animals that have ingestedfeeds contaminated by AFB1. The International Agency for Research on Cancer of WHO(IARC, 2002) includes aflatoxins among the substances which are carcinogenic to humans(Group 1). Several countries have regulated the maximum permissible levels of AFB1 infood and AFM1 in milk and dairy products. The European Union established 50 ng/kgas the maximum allowed concentration of AFM1 in liquid milk (European Commission,2001). In contrast, the USA-FDA as well as the FAO/WHO Joint Expert Committee on FoodAdditives established a maximum AFM1 concentration level of 500 ng/kg in milk (Berg,2003). One of the principal ways in which Aflatoxins are introduced into human diets isthrough consumption of milk and milk products (Galvano et al., 1998). Several authorsreported AFM1 contamination in samples of raw sheep milk, even though at levels below50 ng/kg (Roussi et al., 2002; Kaniou-Grigoriadou et al., 2005).
In vitro studies of ovine rumen fluid did not clarify the actual detoxification process ofrumen microbes (Kiessling et al., 1984; Westlake et al., 1989), but suggested that ruminantscould detoxify only part of the aflatoxins ingested in their digestive tract, mainly by actionof ruminal protozoa. Absorption of aflatoxins occurs in the rumen and the small intestine.The AFB1 is readily transported, probably by plasma lipoproteins, in the blood vascularsystem (Wilson et al., 1985). When sheep were fed AFB1, the AFM1 appeared in milkwithin 6 h (Battacone et al., 2003).
Concentration of AFM1 in milk was dose dependent, and approached steady-state 2 days(Fig. 5) after the start of administration in one study (Battacone et al., 2005a), and after9 days in another (Battacone et al., 2003). The difference in the observed kinetics couldbe due to the higher fiber content of the diet used in the first study. In fact, digesta with ahigher fiber content, thereby slowing rumen transit, allows more decontamination by rumenmicroorganisms (Westlake et al., 1989). Consequently, ewes fed diets with less fiber secretemilk containing three to six times more AFM1 than those fed diets with more fiber.
Transfer of AFB1 from feed into milk for sheep (2.6–3.3 g/kg), which is similar to thatreported for goats (4.0 g/kg; Rao and Chopra, 2001), can be calculated for dairy ewes using
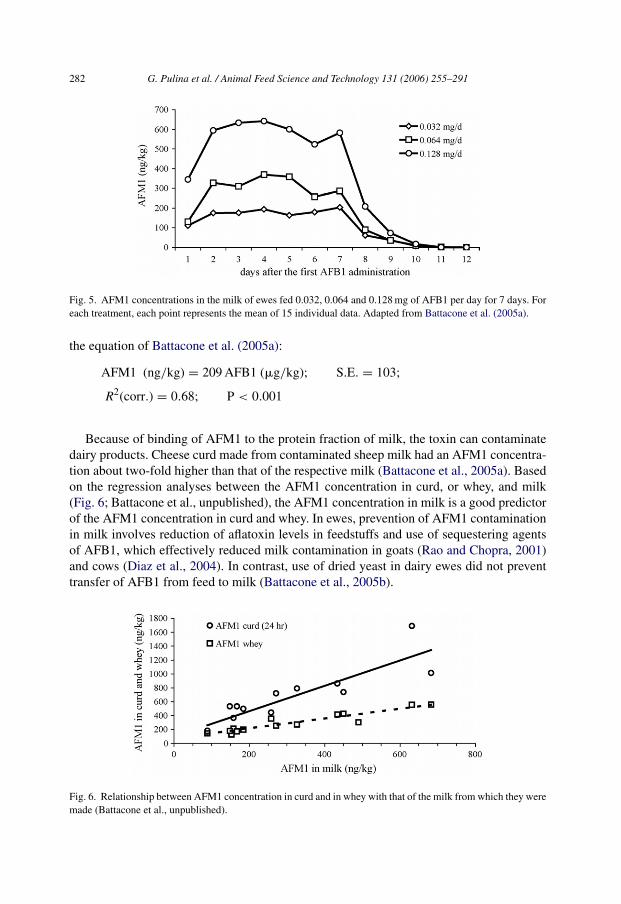
282 G. Pulina et al. / Animal Feed Science and Technology 131 (2006) 255–291
Fig. 5. AFM1 concentrations in the milk of ewes fed 0.032, 0.064 and 0.128 mg of AFB1 per day for 7 days. Foreach treatment, each point represents the mean of 15 individual data. Adapted from Battacone et al. (2005a).
the equation of Battacone et al. (2005a):
AFM1 (ng/kg) = 209 AFB1 (�g/kg); S.E. = 103;
R2(corr.) = 0.68; P < 0.001
Because of binding of AFM1 to the protein fraction of milk, the toxin can contaminatedairy products. Cheese curd made from contaminated sheep milk had an AFM1 concentra-tion about two-fold higher than that of the respective milk (Battacone et al., 2005a). Basedon the regression analyses between the AFM1 concentration in curd, or whey, and milk(Fig. 6; Battacone et al., unpublished), the AFM1 concentration in milk is a good predictorof the AFM1 concentration in curd and whey. In ewes, prevention of AFM1 contaminationin milk involves reduction of aflatoxin levels in feedstuffs and use of sequestering agentsof AFB1, which effectively reduced milk contamination in goats (Rao and Chopra, 2001)and cows (Diaz et al., 2004). In contrast, use of dried yeast in dairy ewes did not preventtransfer of AFB1 from feed to milk (Battacone et al., 2005b).
Fig. 6. Relationship between AFM1 concentration in curd and in whey with that of the milk from which they weremade (Battacone et al., unpublished).
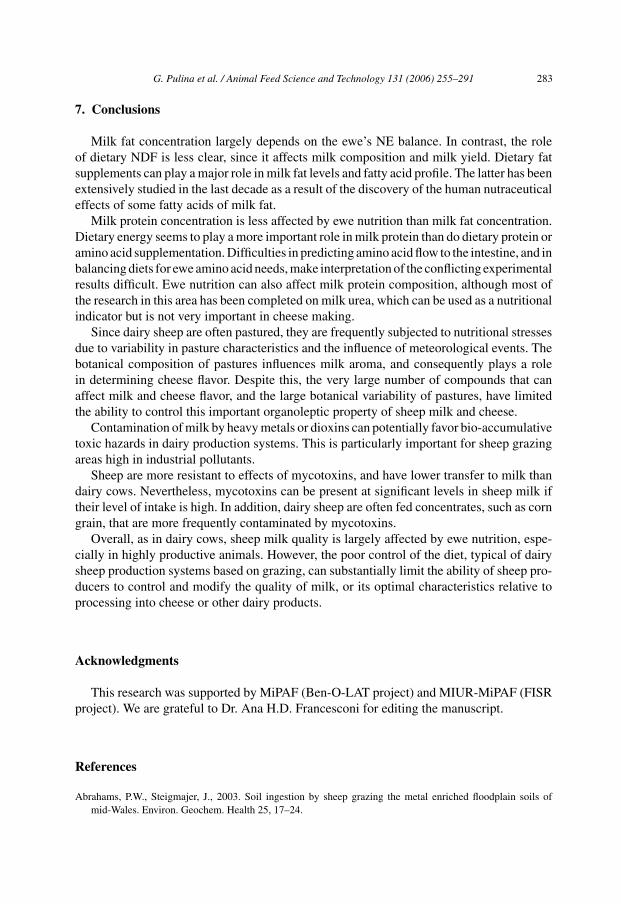
G. Pulina et al. / Animal Feed Science and Technology 131 (2006) 255–291 283
7. Conclusions
Milk fat concentration largely depends on the ewe’s NE balance. In contrast, the roleof dietary NDF is less clear, since it affects milk composition and milk yield. Dietary fatsupplements can play a major role in milk fat levels and fatty acid profile. The latter has beenextensively studied in the last decade as a result of the discovery of the human nutraceuticaleffects of some fatty acids of milk fat.
Milk protein concentration is less affected by ewe nutrition than milk fat concentration.Dietary energy seems to play a more important role in milk protein than do dietary protein oramino acid supplementation. Difficulties in predicting amino acid flow to the intestine, and inbalancing diets for ewe amino acid needs, make interpretation of the conflicting experimentalresults difficult. Ewe nutrition can also affect milk protein composition, although most ofthe research in this area has been completed on milk urea, which can be used as a nutritionalindicator but is not very important in cheese making.
Since dairy sheep are often pastured, they are frequently subjected to nutritional stressesdue to variability in pasture characteristics and the influence of meteorological events. Thebotanical composition of pastures influences milk aroma, and consequently plays a rolein determining cheese flavor. Despite this, the very large number of compounds that canaffect milk and cheese flavor, and the large botanical variability of pastures, have limitedthe ability to control this important organoleptic property of sheep milk and cheese.
Contamination of milk by heavy metals or dioxins can potentially favor bio-accumulativetoxic hazards in dairy production systems. This is particularly important for sheep grazingareas high in industrial pollutants.
Sheep are more resistant to effects of mycotoxins, and have lower transfer to milk thandairy cows. Nevertheless, mycotoxins can be present at significant levels in sheep milk iftheir level of intake is high. In addition, dairy sheep are often fed concentrates, such as corngrain, that are more frequently contaminated by mycotoxins.
Overall, as in dairy cows, sheep milk quality is largely affected by ewe nutrition, espe-cially in highly productive animals. However, the poor control of the diet, typical of dairysheep production systems based on grazing, can substantially limit the ability of sheep pro-ducers to control and modify the quality of milk, or its optimal characteristics relative toprocessing into cheese or other dairy products.
Acknowledgments
This research was supported by MiPAF (Ben-O-LAT project) and MIUR-MiPAF (FISRproject). We are grateful to Dr. Ana H.D. Francesconi for editing the manuscript.
References
Abrahams, P.W., Steigmajer, J., 2003. Soil ingestion by sheep grazing the metal enriched floodplain soils ofmid-Wales. Environ. Geochem. Health 25, 17–24.
284 G. Pulina et al. / Animal Feed Science and Technology 131 (2006) 255–291
AbuGhazaleh, A.A., Schingoethe, D.J., Hippen, A.R., Whitlock, L.A., 2002. Feeding fish meal and extrudedsoybeans enhances the conjugated linoleic acid (CLA) content of milk. J. Dairy Sci. 85, 624–631.
Addis, M., Cabiddu, A., Pinna, G., Decandia, M., Piredda, G., Pirisi, A., Molle, G., 2005. Milk and cheese fattyacid composition in sheep fed Mediterranean forages with reference to conjugated linoleic acid cis-9, trans-11.J. Dairy Sci. 88, 3443–3454.
Addis, M., Pinna, G., Molle, G., Fiori, M., Spada, S., Decandia, M., Scintu, M.F., Piredda, G., Pirisi, A., 2006.The inclusion of a daisy plant (Chrysanthemum coronarium) in dairy sheep diet. Part 2: effect on the volatilefraction of milk and cheese. Livest. Sci. 101, 68–80.
Alba, L.M.P., De Souza Cavalcanti, S., Hernandez, M.P., Marin, A.M., Marin, G.F., 1997. Calcium soap of olivefatty acid in the diets of Manchega dairy ewes: effects on digestibility and production. J. Dairy Sci. 80,3316–3324.
Albenzio, M., Annicchiarico, G., Santillo, A., Muscio, A., Sevi, A., 2005. Effect of dietary protein level on ewemilk yield and on air quality under different ventilation rates. Ital. J. Anim. Sci. 4 (Suppl. 2), 339–341.
Albenzio, M., Caroprese, M., Santillo, A., Marino, R., Taibi, L., Sevi, A., 2004. Effects of somatic cell count andstage of lactation on the plasmin activity and cheese-making properties of ewe milk. J. Dairy Sci. 87, 533–542.
Allison, R.D., Garnsworthy, P.C., 2002. Increasing the digestible undegraded protein intake of lactating dairy cowsby feeding fish meal or a rumen protected vegetable protein blend. Anim. Feed Sci. Technol. 96, 69–81.
Antongiovanni, M., Mele, M., Boccioni, A., Petacchi, F., Serra, A., Melis, M.P., Cordeddu, L., Banni, S., Secchiari,P., 2004. Effect of forage/concentrate ratio and oil supplementation on C18:1 and CLA isomers in milk fatfrom Sarda ewes. J. Anim. Feed Sci. 13 (Suppl. 1), 669–672.
Antongiovanni, M., Secchiari, P., Mele, M., Boccioni, A., Serra, A., Ferruzzi, G., Rapaccini, S., Pistoia, A., 2002.Olive oil calcium soaps and rumen protected methionine in the diet of lactating ewes: effect on milk quality.Ital. J. Anim. Sci. 1, 55–63.
Appeddu, L.A., Ely, D.G., Aaron, D.K., Deweese, W.P., Fink, E., 2004. Effects of supplementing with calciumsalts of palm oil fatty acids or hydrogenated tallow on ewe milk production and twin lamb growth. J. Anim.Sci. 82, 2780–2789.
Armentano, L.E., Swain, S.M., Ducharme, G.A., 1993. Lactation response to ruminally protected methionine andlysine at two amounts of ruminally available nitrogen. J. Dairy Sci. 76, 2963–2969.
Baldwin, J.A., Horton, G.M.J., Wohlt, J.E., Palatini, D.D., Emanuele, S.M., 1993. Rumen-protected methioninefor lactation, wool and growth in sheep. Small Rumin. Res. 12, 125–132.
Barillet, F., Arranz, J.J., Carta, A., 2005. Mapping quantitative trait loci for milk production and genetic polymor-phisms of milk proteins in dairy sheep. Genet. Sel. Evol. 37 (Suppl. 1), 109–123.
Barillet, F., Astruc, J.M., Bocquier, F., Jacquin, M., Fraysse, G., Lagriffoul, G., Marie, C., Pellegrini, O., Remeuf,F., 1996. Influence of production factors on milk composition for cheese production: the case of sheep milk.In: Flamant, J.C., Gabina, D., Espejo Diaz, M. (Eds.), Proceedings of the International Symposium of EAAP-CIHEAM-FAO on Basis of the quality of typical Mediterranean animal products, vol. 90. Badajoz, Spain, 29September–2 October, pp. 128–144.
Barillet, F., Rupp, R., Mignon-Grasteau, S., Astruc, J.M., Jacquin, M., 2001. Genetic analysis for mastitis resistanceand milk somatic cell score in French Lacaune dairy sheep. Genet. Sel. Evol. 33, 397–415.
Barry, T.N., 1980. Responses to abomasal infusions of casein plus methionine in lactating ewes fed fresh pasture.New Zeal. J. Agric. Res. 23, 427–431.
Battacone, G., Nudda, A., Cannas, A., Borlino, A.C., Bomboi, G., Pulina, G., 2003. Excretion of aflatoxin M1 inmilk of dairy ewes treated with different doses of aflatoxin B1. J. Dairy Sci. 86, 2667–2675.
Battacone, G., Nudda, A., Palomba, M., Pascale, M., Mazzette, A., Nicolussi, P., Pulina, G., 2005b. The effect ofdried yeast culture on the carry over of aflatoxin in sheep milk. J. Dairy Sci. 88 (Suppl. 1), 237.
Battacone, G., Nudda, A., Palomba, M., Pascale, M., Nicolussi, P., Pulina, G., 2005a. Transfer of aflatoxin B1from feed to milk and from milk to curd and whey in dairy sheep fed artificially contaminated concentrates.J. Dairy Sci. 88, 3063–3069.
Bauman, D.E., Griinari, J.M., 2000. Regulation and nutritional manipulation of milk fat: low-fat milk syndrome.Livest. Prod. Sci. 70, 15–29.
Bauman, D.E., Griinari, J.M., 2003. Nutritional regulation of milk fat synthesis. Annu. Rev. Nutr. 23, 203–227.Baumgard, L.H., Corl, B.A., Dwyer, D.A., Saebo, A., Bauman, D.E., 2000. Identification of the conjugated linoleic
acid isomer that inhibits milk fat synthesis. Am. J. Physiol. Regul. Integr. Comp. Physiol. 278, 179–184.
G. Pulina et al. / Animal Feed Science and Technology 131 (2006) 255–291 285
Bencini, R., Pulina, G., 1997. The quality of sheep milk: a review. Aust. J. Exp. Agric. 37, 485–504.Berg, T., 2003. How to establish international limits for mycotoxins in food and feed? Food Control 14, 219–224.Bianchi, L., Bolla, A., Budelli, E., Caroli, A., Casoli, C., Pauselli, M., Duranti, E., 2004. Effect of udder health
status and lactation phase on the characteristics of Sardinian ewe milk. J. Dairy Sci. 87, 2401–2418.Blank, R., Rolfs, J.P., Sudekum, K.H., Frohlich, A.A., Marquardt, R.R., Wolffram, S., 2003. Effects of chronic
ingestion of ochratoxin A on blood levels and excretion of the mycotoxin in sheep. J. Agric. Food Chem. 51,6899–6905.
Bocio, A., Llobet, J.M., Domingo, J.L., Corbella, J., Teixido, A., Casas, C., 2003. Polybrominated diphenyl ethers(PBDEs) in foodstuffs: human exposure through the diet. J. Agric. Food Chem. 51, 3191–3195.
Bocquier, F., Caja, G., 1993. Recent advances on nutrition and feeding of dairy sheep. In: Proceedings of the FifthInternational Symposium on Machine Milking of Small Ruminants. Hung. J. Anim. Prod. (Suppl. 1), 580–607.
Bocquier, F., Caja, G., 2001. Production et composition du lait de brebis: effets de l’alimentation. INRA Prod.Anim. 14, 129–140.
Boersma, E.R., Lanting, C.I., 2000. Environmental exposure to polychlorinated biphenyls (PCBs) and dioxins.Consequences for long-term neurological and cognitive development of the child lactation. Adv. Exp. Med.Biol. 478, 271–287.
Borowiec, F., Furgal, K., Siuta, A., Pys, J., Mraz, B., 1984. Effect of feeding ewes on mountain pastures intensivelyfertilized with nitrogen on yield and chemical composition of milk. Dairy Sci. 46, 906 (Abstract).
Breitholtz-Emanuelsson, A., Olsen, M., Oskarsson, A., Palminger, I., Hult, K., 1993. Ochratoxin A in cow’s milkand in human milk with corresponding human blood samples. J. AOAC Int. 76, 842–846.
Busbee, D.L., Ziprin, R.L., 1994. Gastrointestinal uptake and vascular transport of 2.4′-dichlorobiphenyl. Arch.Toxicol. 68, 96–102.
Cabiddu, A., Decandia, M., Addis, M., Piredda, G., Pirisi, A., Molle, G., 2005. Managing Mediterranean pasturesin order to enhance the level of beneficial fatty acids in sheep milk. Small Rumin. Res. 59, 169–180.
Caggiano, R., Sabia, S., D’Emilio, M., Macchiato, M., Anastasio, A., Ragosta, M., Paino, S., 2005. Metal levelsin fodder, milk, dairy products, and tissues sampled in ovine farms of Southern Italy. Environ. Res. 99, 48–57.
Cortes, J.F.C., Robinson, J.J., McHattie, I., Fraser, C., 1977. The sensitivity of ewe milk yield to changes in dietarycrude protein concentration. Anim. Prod. 24, 135 (Abstract).
Campus, R.L., Papoff, C.M., Cannas, A., Serra, A., 1990. Effetto della grassatura e della concentrazione proteicadella razione sulla composizione azotata e sulla attitudine alla coagulazione del latte di pecore di razza Sarda.In: Proceedings of the Ninth National Congress of SIPAOC, vol. 3.2, Grado, Italy (in Italian).
Cannas, A., 2004. Feeding of lactating ewes. In: Pulina, G. (Ed.), Dairy Sheep Nutrition. CABI Publishing,Wallingford, Oxfordshire, UK, pp. 79–108.
Cannas, A., Avondo, M., 2002. Relationships among milk fat content, energy balance and NDF intake in lactatingewes fed at pasture. In: Proceedings of the 53rd Annual Meeting of EAAP (European Association of AnimalProduction), Cairo, Egypt, p. 55 (Abstract).
Cannas, A., Nudda, A., Pulina, G., 2002. Nutritional strategies to improve lactation persistency in dairy ewes. In:Proceedings of the Eighth Great Lakes Dairy Sheep Symposium, Ithaca, NY, USA, pp. 17–59.
Cannas, A., Pes, A., Fresi, S., Serra, F., Pulina, G., 1997. Effects of feeling level and type of dietary proteinsupplement on milk urea content in ewes. In: Proceedings of the 48th Annual Meeting of the EAAP (EuropeanAssociation of Animal Production), p. 304 (Abstract).
Cannas, A., Pes, A., Mancuso, R., Vodret, B., Nudda, A., 1998. Effect of dietary energy and protein concentrationon the concentration of milk urea nitrogen in dairy ewes. J. Dairy Sci. 81, 499–508.
Carbonell, M., Nunez, M., Fernandez-Garcıa, E., 2002. Seasonal variation of volatile compounds in ewe raw milkLa Serena cheese. Lait 82, 699–711.
Carpino, S., Mallia, S., La Terra, S., Melilli, C., Licitra, G., Acree, T.E., Barbano, D.M., Van Soest, P.J., 2004.Composition and aroma compounds of Ragusano cheese: Native pasture and total mixed rations. J. Dairy Sci.87, 816–830.
Casals, R., Caja, G., Such, X., Torre, C., Calsamiglia, S., 1999. Effects of calcium soaps and rumen undegradableprotein on the milk production and composition of dairy ewes. J. Dairy Res. 66, 177–191.
Chikunya, S., Demirel, G., Enser, M., Wood, J.D., Wilkinson, R.G., Sinclair, L.A., 2004. Biohydrogenation ofdietary n − 3 PUFA and stability of ingested vitamin E in the rumen, and their effects on microbial activity insheep. Brit. J. Nutr. 91, 539–550.
286 G. Pulina et al. / Animal Feed Science and Technology 131 (2006) 255–291
Chilliard, Y., 1993. Dietary fat and adipose tissue metabolism in ruminants, pigs, and rodents: a review. J. DairySci. 76, 3897–3931.
Chilliard, Y., Ferlay, A., 2004. Dietary lipids and forages interactions on cow and goat milk fatty acid compositionand sensory properties. Reprod. Nutr. Dev. 44, 467–492.
Chilliard, Y., Ferlay, A., Rouel, J., Lamberet, G., 2003. A review of nutritional and physiological factors affectinggoat milk synthesis and lipolysis. J. Dairy Sci. 86, 1751–1770.
Chiofalo, V., Maldonato, R., Latona, F., Savoini, G., Capogreco, B., 1998. Effetto dell’integrazione nella dietacon vitamina E sulle caratteristiche quanti-qualitative e sul contenuto in cellule somatiche del latte ovino. In:Proceedings of the 13th National Congress of SIPAOC, Palermo, Italy, pp. 35–38 (in Italian).
Chiofalo, V., Savoini, G., Chiofalo, L., 1996. Variations of milk yield and quality in lactating ewes by usingrumen-protected amino acids. In: Proceedings of the 31st International Symposium of SIPZOO, Milano, Italy,pp. 83–85.
Chiofalo, V., Savoini, G., Micari, P., Zumbo, A., Contempo, V., Ziino, M., 1993. Impiego di differenti fonti ener-getiche per l’alimentazione della pecora: effetti sulle caratteristiche quanti-qualitative del latte. In: Proceedingsof the 10th National Congress of ASPA, Bologna, Italy, pp. 339–344 (in Italian).
Christodoulou, V., Bampidis, V.A., Hucko, B., Ploumi, K., Iliadis, C., Robinson, P.H., Mudrik, Z., 2005. Nutritionalvalue of chickpeas in rations of lactating ewes and growing lambs. Anim. Feed Sci. Technol. 118, 229–241.
Coni, E., Bocca, B., Caroli, S., 1999. Minor and trace element content of two typical Italian sheep dairy products.J. Dairy Res. 66, 589–598.
Coulon, J.B., Delacroix-Buchet, A., Martin, B., Pirisi, A., 2005. Facteurs de production et qualite sensorielle desfromages. Prod. Anim. 18, 49–62.
Cowan, R.T., Robinson, J.J., McHattie, I., Pennie, K., 1981. Effects of protein concentration in the diet on milkyield, change in body composition and the efficiency of utilization of body tissue for milk production in ewes.Anim. Prod. 33, 111–120.
de Vries, M.J., Veerkamp, R.F., 2000. Energy balance of dairy cattle in relation to milk production variables andfertility. J. Dairy Sci. 83, 62–69.
Dhiman, T.R., Anand, G.R., Satter, L.D., Pariza, M.W., 1999. Conjugated linoleic acid content of milk from cowsfed different diets. J. Dairy Sci. 82, 2146–2156.
Diaz, D.E., Hagler, W.M., Blackwelder, J.T., Eve, J.A., Hopkins, B.A., Anderson, K.L., Jones, F.T., Whitlow,L.W., 2004. Aflatoxin binders II: reduction of aflatoxin M1 in milk by sequestering agents of cows consumingaflatoxin in feed. Mycopathologia 157, 233–241.
Donovan, C.D., Schingoethe, D.J., Baer, R.J., Ryali, J., Hippen, A.R., Franklin, S.T., 2000. Influence of dietaryfish oil on conjugated linoleic acid and other fatty acids in milk fat from lactating dairy cows. J. Dairy Sci. 83,2620–2628.
Emery, R.S., 1988. Milk fat depression and the influence of diet on milk composition. Veterinary Clinics of NorthAmerica. Food Anim. Pract. 4, 289–305.
European Commission, 2001. Commission Regulation 2001/466/EC of 8 March 2001 setting maximum levels forcertain contaminants in foodstuffs (text with EEA relevance). Off. J. Eur. Commun. L 77, 1–13.
Floris, B., Bomboi, G., Sau, F., 1988. La metionina protetta nella pecora sarda: effetti sullalattazione e sulla crescitadella lana. Boll. Soc. Ital. Biol. Sper. 12, 1143–1149 (in Italian).
Galvano, F., Galofaro, V., De Angelis, A., Galvano, M., Bognanno, M., Galvano, G., 1998. Survey of the occurrenceof aflatoxin M1 in dairy products marketed in Italy. J. Food Prot. 61, 738–741.
Garcıa, C.G., Hernandez, M.G.P., Cantalapiedra, J., Salas, M., Merino, J.A., 2005. Bypassing the rumen in dairyewes: the reticular groove reflex vs. calcium soap of olive fatty acids. J. Dairy Sci. 88, 741–747.
Giesy, J.G., McGuire, M.A., Shafii, B., Hanson, T.W., 2002. Effect of dose of calcium salts of conjugated linoleicacid (CLA) on percentage and fatty acid content of milk fat in midlactation holstein cows. J. Dairy Sci. 85,2023–2029.
Gonzalez, J.S., Robinson, J.J., McHattie, I., Fraser, C., 1982. The effect in ewes of source and level of dietaryprotein on milk yield, and the relationship between the intestinal supply of non-ammonia nitrogen and theproduction of milk protein. Anim. Prod. 34, 31–40.
Goulas, C., Zervas, G., Papadopoulos, G., 2003. Effect of dietary animal fat and methionine on dairy ewes milkyield and milk composition. Anim. Feed Sci. Technol. 105, 43–54.
G. Pulina et al. / Animal Feed Science and Technology 131 (2006) 255–291 287
Grieve, D.G., Korver, S., Rijpkema, Y.S., Hof, G., 1986. Relationship between milk composition and some nutri-tional parameters in early lactation. Livest. Prod. Sci. 14, 239–254.
Gulati, S.K., McGrath, S., Wynn, P.C., Scott, T.W., 2003. Preliminary results on the relative incorporation ofdocosahexaenoic and eicosapentaenoic acids into cows milk from two types of rumen protected fish oil. Int.Dairy J. 13, 339–343.
Hadjipanayiotou, M., 1999. Feeding ensiled crude olive cake to lactating Chios ewes, Damascus goats and Friesiancows. Livest. Prod. Sci. 59, 61–66.
Hallen, I.P., Norrgren, L., Oskarsson, A., 1996. Distribution of lead in lactating mice and suckling offspring withspecial emphasis on the mammary gland. Arch. Toxicol. 70, 237–243.
Hatfield, P.G., Snowder, G.D., Head Jr., W.A., Glimp, H.A., Stobart, R.H., Besser, T., 1995. Production by ewesrearing single or twin lambs: effects of dietary crude protein percentage and supplemental zinc methionine. J.Anim. Sci. 73, 1227–1238.
Hohler, D., Sudekum, K.H., Wolffram, S., Frohlich, A.A., Marquardt, R.R., 1999. Metabolism and excretion ofochratoxin A fed to sheep. J. Anim. Sci. 77, 1217–1223.
Horton, G.M.J., Wohlt, J.E., Palatini, D.D., Baldwin, J.A., 1992. Rumen-protected lipid for lactating ewes andtheir nursing lambs. Small Rumin. Res. 9, 27–36.
Houpert, P., Federspiel, B., Milhaud, G., 1997. Toxicokinetics of cadmium in lactating and non-lactating ewesafter oral and intravenous administration. Environ. Res. 72, 140–150.
Iannuzzi, L., Perucatti, A., Di Meo, G.P., Polimeno, F., Ciotola, F., Incarnato, D., Peretti, V., Caputi-Jambrenghi,A., Pecoraro, A., Manniti, F., D’Alessandro, A., Vonghia, G., 2004. Chromosome fragility in two sheep flocksexposed to dioxins during pasturage. Mutagenesis 19, 355–359.
International Agency for Research on Cancer (IARC), 1997. Polychlorinated Dibenzo-para-Dioxins and Poly-chlorinated Dibenzofurans. Summary of Data Reported and Evaluation. IARC Monographs on the Evaluationof Carcinogenic Risks to Humans, vol. 69. International Agency for Research on Cancer, Lyon, France.
International Agency for Research on Cancer (IARC), 2002. Some Traditional Herbal Medicines, Some Myco-toxins, Naphthalene and Styrene. Summary of Data Reported and Evaluation. IARC Monographs on theEvaluation of the Carcinogenic Risk to Humans, vol. 82. International Agency for Research on Cancer, Lyon,France.
Jaeggi, J.J., Govindasamy-Lucey, S., Berger, Y.M., Johnson, M.E., McKusick, B.C., Thomas, D.L., Wendorff,W.L., 2003. Hard ewe’s milk cheese manufactured from milk of three different groups of somatic cell counts.J. Dairy Sci. 86, 3082–3089.
Jaeggi, J.J., Wendorff, W.L., Romero, J., Berger, Y.M., Johnson, M.E., 2005. Impact of seasonal changes in ovinemilk on composition and yield of a hard-pressed cheese. J. Dairy Sci. 88, 1358–1363.
Jenkins, T.C., 1997. Success of fat in dairy rations depends on the amount. Feedstuffs 69, 11–12.Kaniou-Grigoriadou, I., Eleftheriadou, A., Mouratidou, T., Katikou, P., 2005. Determination of aflatoxin M1 in
ewe’s milk samples and the produced curd and feta cheese. Food Control 16, 257–261.Kay, J.K., Mackle, T.R., Auldist, M.J., Thomson, N.A., Bauman, D.E., 2004. Endogenous synthesis of cis-9,
trans-11 conjugated linoleic acid in dairy cows fed fresh pasture. J. Dairy Sci. 87, 369–378.Kelly, M.L., Berry, J.R., Dwyer, D.A., Griinari, J.M., Chouinard, P.Y., Van Amburgh, M.E., Bauman, D.E., 1998.
Dietary fatty acid sources affect conjugated linoleic acid concentrations in milk from lactating dairy cows. J.Nutr. 128, 881–885.
Kiessling, K.H., Pettersson, H., Sandholm, K., Olsen, M., 1984. Metabolism of aflatoxin, ochratoxin, zearalenone,and three trichothecenes by intact rumen fluid, rumen protozoa, and rumen bacteria. Appl. Environ. Microbiol.47, 1070–1073.
Kitessa, S.M., Gulati, S.K., Ashes, J.R., 2001b. Utilization of fish oil in ruminants: II. Transfer of fish oil fattyacids into goat’s milk. Anim. Feed Sci. Technol. 89, 201–208.
Kitessa, S.M., Gulati, S.K., Ashes, J.R., Fleck, E., Scott, T.W., Nichols, P.D., 2001a. Utilization of fish oil inruminants: I. Fish oil metabolism in sheep. Anim. Feed Sci. Technol. 89, 189–199.
Kitessa, S.M., Gulati, S.K., Simos, G.C., Ashes, J.R., Scott, T.W., Fleck, E., Wynn, P.C., 2004. Supplementationof grazing dairy cows with rumen-protected tuna oil enriches milk fat with n − 3 fatty acids without affectingmilk production or sensory characteristics. Br. J. Nutr. 91, 271–278.
Kitessa, S.M., Peake, D., Bencini, R., Williams, A.J., 2003. Fish oil metabolism in ruminants: III. Transfer of n − 3polyunsaturated fatty acids (PUFA) from tuna oil into sheep’s milk. Anim. Feed Sci. Technol. 108, 1–14.
288 G. Pulina et al. / Animal Feed Science and Technology 131 (2006) 255–291
Kucuk, O., Hess, B.W., Ludden, P.A., Rule, D.C., 2001. Effect of forage:concentrate ratio on ruminal digestionand duodenal flow of fatty acids in ewes. J. Anim. Sci. 79, 2233–2240.
Landau, S., Kababya, D., Silanikove, N., Nitsan, R., Lifshitz, L., Baram, H., Bruckental, I., Mabjeesh, S.J., 2005.The ratio between dietary rumen degradable organic matter and crude protein may affect milk yield andcomposition in dairy sheep. Small Rumin. Res. 58, 115–122.
Laudadio, V., Centoducati, P., Ciruzzi, B., Zezza, L., 1997. Lutilizzazione di mangimi completi grassati nellapecora da latte. In: Proceedings of the 12th National Congress of ASPA, Pisa, Italy, pp. 259–260 (in Italian).
Leitner, G., Chaffer, M., Shamay, A., Shapiro, F., Merin, U., Ezra, E., Saran, A., Silanikove, N., 2004. Changes inmilk composition as affected by subclinical mastitis in sheep. J. Dairy Sci. 87, 46–52.
Leto, G., Todaro, M., Portolano, B., Giaccone, P., Di Marco, V., 1997. Mangime ruminoprotetto per ovini da latte.Inform. Zootecn. 44, 81–82 (in Italian).
Li, Y., McCrory, D.F., Powell, J.M., Saam, H., Jackson-Smith, D., 2005. A survey of selected heavy metal con-centrations in Wisconsin dairy feeds. J. Dairy Sci. 88, 2911–2922.
Lock, A.L., Bauman, D.E., 2004. Modifying milk fat composition of dairy cows to enhance fatty acids beneficialto human health. Lipids 39, 1197–1206.
Lock, A.L., Teles, B.M., Perfield II., J.W., Bauman, D.E., Sinclair, L.A., 2006. A conjugated linoleic acid sup-plement containing trans-10, cis-12 reduces milk fat synthesis in lactating sheep. J. Dairy Sci. 89, 1525–1532.
Luna, P., Fontecha, J., Juarez, M., de la Fuente, M.A., 2005. Conjugated linoleic acid in ewe milk fat. J. DairyRes. 72, 415–424.
Lynch, G.P., Elsasserj, T.H., Jackson, C., Rumsey, T.S., Camp, M.J., 1991. Nitrogen metabolism of lactating ewesfed rumen-protected methionine and lysine. J. Dairy Sci. 74, 2268–2276.
Mandal, P.K., 2005. Dioxin: a review of its environmental effects and its aryl hydrocarbon receptor biology. J.Comp. Physiol. B 175, 221–230.
Mariaca, R.G., Berger, T.F.H., Gauch, R., Imhof, M.I., Jeangros, B., Bosset, J.O., 1997. Occurrence of volatilemono- and sesquiterpenoids in highland and lowland plant species as possible precursors for flavor compoundsin milk and dairy products. J. Agric. Food Chem. 45, 4423–4434.
Martini, M., Rapaccini, S., Scolozzi, C., Taccini, F., Verita, P., 2000. Effetto dei saponi di calcio dell’olio d’olivasulle caratteristiche chimiche e reologiche del latte di pecora. In: Proceedings of the 35th International Sym-posium of SIPZOO, Ragusa, Italy, pp. 237–244 (in Italian).
Martini, M., Scolozzi, C., Gatta, D., Taccini, F., Verita, P., 2004. Effects of olive oil calcium soap and phase oflactation on the fatty acid composition in the milk of Massese ewes. Ital. J. Anim. Sci. 4, 353–362.
Masucci, F., Di Francia, A., Romano, R., di Serracapriola, M.T.M., Lambiase, G., Varricchio, M.L., Proto, V., inpress. Effect of Lupinus albus as protein supplement on yield, constituents, clotting properties and fatty acidcomposition in ewes’ milk. Small Rumin. Res.
Mattos, R., Staples, C.R., Arteche, A., Wiltbank, M.C., Diaz, F.J., Jenkins, T.C., Thatcher, W.W., 2004. The effectsof feeding fish oil on uterine secretion of PGF2, milk composition and metabolic status of periparturient holsteincows. J. Dairy Sci. 87, 921–932.
Mehennaoui, S., Delacroix-Buchet, A., Duche, A., Enriquez, B., Kolf-Clauw, M., Milhaud, G., 1999. Comparativestudy of cadmium transfer in ewe and cow milks during rennet and lactic curds preparation. Arch. Environ.Contam. Toxicol. 37, 389–395.
Mele, M., Buccioni, A., Serra, A., 2005a. Lipid requirements in the nutrition of dairy ewes. Ital. J. Anim. Sci. 4(Suppl. 1), 45–52.
Mele, M., Buccioni, A., Serra, A., 2005b. Neutral detergent fiber (NDF) and non-structural carbohydrate (NSC)requirements in the nutrition of dairy ewes. Ital. J. Anim. Sci. 4 (Suppl. 1), 53–62.
Mele, M., Petacchi, F., Boccioni, A., Serra, A., Ferruzzi, G., Antongiovanni, M., Secchiari, P., 2002. Qualita dellatte di pecore Sarde in relazione al contenuto di grasso e di foraggio della dieta. In: Proceedings of the 15thNational Congress of SIPAOC, Chia Laguna-Cagliari, Italy, p. 239.
Miyazaki, W., Iwasaki, T., Takeshita, A., Kuroda, Y., Koibuchi, N., 2004. Polychlorinated biphenyls suppressthyroid hormone receptor-mediated transcription through a novel mechanism. J. Biol. Chem. 279, 18195–18202.
Moio, L., Rillo, L., Ledda, A., Addeo, F., 1996. Odorous constituents of ovine milk in relationship to diet. J. DairySci. 79, 1322–1331.
G. Pulina et al. / Animal Feed Science and Technology 131 (2006) 255–291 289
Molle, G., Decandia, M., Ligios, S., Fois, N., Treacher, T.T., Sitzia, M., 2004. Grazing management and stockingrate with particular reference to the Mediterranean environment. In: Pulina, G. (Ed.), Dairy Sheep Nutrition.CABI Publishing, Wallingford, Oxfordshire, UK, pp. 191–211.
Morgante, M., Beghelli, D., Pauselli, M., Dall’Ara, P., Capuccella, M., Ranucci, S., 1999. Effect of administrationof vitamin E and selenium during the dry period on mammary health and milk cell counts in dairy ewes. J.Dairy Sci. 82, 623–631.
Morgante, M., Beghelli, D., Ranucci, S., Pauselli, M., Casoli, C., Duranti, E., 1995. Effects of selenium andvitamin E administration on ewe mammary health: preliminary results. In: Proceedings of the 30th InternationalSymposium of SIPZOO, Milano, Italy, pp. 419–420.
Mosley, E.E., Shafii, B., Moate, P.J., McGuire, M.A., 2006. Cis-9, trans-11 conjugated linoleic acid is synthesizeddirectly from vaccenic acid in lactating dairy cattle. J. Nutr. 136, 570–575.
Mozzon, M., Frega, N.G., Fronte, B., Tocchini, M., 2002. Effect of dietary fish oil supplements on levels of n − 3polyunsaturated fatty acids, trans acids and conjugated linoleic acid in ewe milk. Food Technol. Biotechnol.40, 213–219.
Nudda, A., Battacone, G., Bencini, R., Pulina, G., 2004a. Nutrition and milk quality. In: Pulina, G. (Ed.), DairySheep Nutrition. CABI Publishing, Wallingford, Oxfordshire, UK, pp. 129–149.
Nudda, A., Fancellu, S., Porcu, F., Boe, F., Cannas, A., 2004b. Responses of milk fat composition to dietarynon-fiber carbohydrates in Sarda dairy sheep. J. Dairy Sci. 87 (Suppl. 1), 310 (Abstract).
Nudda, A., McGuire, M.A., Battacone, G., Pulina, G., 2005. Seasonal variation in conjugated linoleic acidand vaccenic acid in milk fat of sheep and its transfer to cheese and ricotta. J. Dairy Sci. 88, 1311–1319.
Nudda, A., Mele, M., Battacone, G., Usai, M.G., Macciotta, N.P.P., 2003. Comparison of conjugated linoleic acid(CLA) content in milk of ewes and goats with the same dietary regimen. Ital. J. Anim. Sci. 2 (Suppl. 1),515–517.
O’Brien, E., Dietrich, D.R., 2005. Ochratoxin A: the continuing enigma. Crit. Rev. Toxicol. 35, 33–60.Osuna, D.R., Casals, R., Caja, G., Peris, S., 1998. Effects of feeding whole oilseeds to partially replace calcium
soaps of fatty acids on dairy ewes’ intake and milk production and composition. J. Dairy Sci. 81 (Suppl. 1),302.
Othmane, M.H., Carriedo, J.A., San Primitivo, F., de la Fuente, L.F., 2002. Genetic parameters for lactation traitsof milking ewes: protein content and composition, fat, somatic cells and individual laboratory cheese yield.Genet. Sel. Evol. 34, 581–596.
Palmquist, D.L., 1994. The role of dietary fats in efficiency of ruminants. J. Nutr. 124 (Suppl. 8), 1377S–1382S.Palmquist, D.L., Jenkins, T.C., 1980. Fat in lactation rations: review. J. Dairy Sci. 63, 1–14.Palmquist, D.L., Moser, E.A., 1981. Dietary fat effects on blood insulin, glucose utilization, and milk protein
content of lactating cows. J. Dairy Sci. 64, 1664–1670.Palmquist, D.L., Beaulieu, A.D., Barbano, D.M., 1993. Feed and animal factors influencing milk fat composition.
J. Dairy Sci. 76, 1753–1771.Palmquist, D.L., McClure, K.E., Parker, C.F., 1977. Effect of protected saturated or polyunsaturated fat fed to
pregnant and lactating ewes on milk composition, lamb plasma fatty acid and growth. J. Anim. Sci. 45,1152–1159.
Papadopoulos, G., Goulas, C., Apostolaki, E., Abril, R., 2002. Effects of dietary supplements of algae, containingpolyunsaturated fatty acids, on milk yield and the composition of milk products in dairy ewes. J. Dairy Res.69, 357–365.
Pauselli, M., Bolla, A., Casoli, C., Duranti, E., 2001. Effect of vitamin E and selenium administration on sheepmilk quality. In: Proceedings of the 14th National Congress of ASPA, Firenze, Italy, pp. 505–507.
Pauselli, M., Duranti, E., Casoli, C., Buttazzo, C., 1997. Effetto della somministrazione di Se e vit. E sullecaratteristiche qualitative del latte di pecora. In: Proceedings of the 14th National Congress of ASPA, Pisa,Italy, pp. 261–262.
Perfield II, J.W., Bernal-Santos, G., Overton, T.R., Bauman, D.E., 2002. Effects of dietary supplementationof rumen-protected conjugated linoleic acid in dairy cows during established lactation. J. Dairy Sci. 85,2609–2617.
Pirisi, A., Murgia, A., Scintu, M.F., 1994. Estimate of Pecorino Romano and Pecorino Sardo cheese yield fromthe protein and fat contents in sheep milk. Sci. Tecn. Latt. Cas. 48, 229–240.
290 G. Pulina et al. / Animal Feed Science and Technology 131 (2006) 255–291
Pirisi, A., Piredda, G., Corona, M., Pes, M., Pintus, S., Ledda, A., 2000. Influence of somatic cell count on ewe’smilk composition, cheese yield and cheese quality. In: Proceedings of the Sixth Great Lakes Dairy SheepSymposium, Guelph, Ontario, Canada, pp. 47–59.
Porcu, F., Cannas, A., Rubattu, R., 2003. Urinary and milk excretion of purine derivatives in lactating Sarda ewes.In: Proceedings of the 38th International Symposium of SIPZOO, Lodi, Italy, pp. 259–269.
Pulina, G., Rassu, S.P.G., 1991. Qualita del latte, occhio all’alimentazione. Inform. Zootec. 38, 28–34 (in Italian).Pulina, G., Macciotta, N., Nudda, A., 2005. Milk composition and feeding in the Italian dairy sheep. Ital. J. Anim.
Sci. 4 (Suppl. 1), 5–14.Pulina, G., Serra, A., Campus, R.L., Papoff, C.M., 1990. Effetto della grassatura e della concentrazione proteica
della razione sulla composizione acidica del grasso del latte di pecore di razza Sarda. In: Proceedings of theNinth National Congress of SIPAOC, vol. 3.3, Grado, Italy (in Italian).
Purroy, A., Jaime, C., 1995. The response of lactating and dry ewes to energy intake and protein source in the diet.Small Rumin. Res. 17, 17–24.
Rao, S.B.N., Chopra, R.C., 2001. Influence of sodium bentonite and activated charcoal on aflatoxin M1 excretionin milk of goats. Small Rumin. Res. 41, 203–213.
Rossi, G., Pulina, G., 1991. Il ruolo dell’alimentazione nella composizione lipidica del latte ovino. Inform. Agr.47, 1–5 (in Italian).
Rossi, G., Serra, A., Pulina, G., Cannas, A., Brandano, P., 1991. L’impiego di un alimento unico pellettato (Unipel-let) nell’alimentazione della pecora da latte: 1 Influenza della grassatura e del livello proteico sulla produzionequanti-qualitativa di latte in pecore di razza Sarda. Zoot. Nutr. Anim. 17, 23–34 (in Italian).
Roussi, V., Govaris, A., Varagouli, A., Botsoglou, N.A., 2002. Occurrence of aflatoxin M1 in raw and market milkcommercialized in Greece. Food Addit. Contam. 19, 863–868.
Rupp, R., Lagriffoul, G., Astruc, J.M., Barillet, F., 2003. Genetic parameters for milk somatic cell scores andrelationships with production traits in French Lacaune dairy sheep. J. Dairy Sci. 86, 1476–1481.
Sanna, S.R., Carta, A., Casu, S., 1997. (Co)variance component estimates for milk composition traits in Sardadairy sheep using a bivariate animal model. Small Rumin. Res. 25, 77–82.
Schecter, A., Papke, O., Tung, K.C., Staskal, D., Birnbaum, L., 2004. Polybrominated diphenyl ethers contami-nation of United States. Food Environ. Sci. Technol. 38, 5306–5311.
Schmid, P., Gujer, E., Zennegg, M., Studer, C., 2003. Temporal and local trends of PCDD/F levels in cow’s milkin Switzerland. Chemosphere 53, 129–136.
Schmidely, P., Sauvant, D., 2001. Taux butyreux et composition de la matiere grasse du lait chez les petitsruminants: effets de l’apport de matieres grasses ou d’aliment concentre. INRA Prod. Anim. 14, 337–354.
Schroeder, G.F., Delahoy, J.E., Vidaurreta, I., Bargo, F., Gagliostro, G.A., Muller, L.D., 2003. Milk fatty acidcomposition of cows fed a total mixed ration or pasture plus concentrates replacing corn with fat. J. Dairy Sci.86, 3237–3248.
Serra, F.A., 1998. La valutazione degli alimenti ed il razionamento negli ovini da latte. PhD Thesis, Perugia, Italy.(in Italian).
Sevi, A., Muscio, A., Dell’Aquila, S., Taibi, L., 1995. L’impiego della metionina protetta nell’alimentazione dellapecora: effetti sulla produzione quanti-qualitativa di latte. In: Proceedings of the National Congress. “Parliamodi produzione e trasformazione del latte, Fossano (Cuneo), pp. 195–202 (in Italian).
Sevi, A., Taibi, L., Muscio, A., Dell’Aquila, S., 1996. Effetto della somministrazione di livelli crescenti di lisinarumino-protetta sulla produzione quanti-qualitativa di latte in pecore di razza Comisana. Sci. Tecn. Latt. Cas.47, 182–192 (in Italian).
Skaug, M.A., 1999. Analysis of Norwegian milk and infant formulas for ochratoxin A. Food Addit. Contam. 26,75–78.
Sklan, D., 1992. A note on production responses of lactating ewes to calcium soaps of fatty acids. Anim. Prod.55, 288–291.
Susin, I., Loerch, S.C., McClure, K.E., 1995. Effects of feeding a high-grain diet at a restricted intake on lactationperformance and rebreeding of ewes. J. Anim. Sci. 73, 3199–3205.
Sutton, J.D., 1989. Altering milk composition by feeding. J. Dairy Sci. 72, 2801–2814.Ubertalle, A., Fortina, R., Battaglini, L.M., Mimosi, A., Profitti, M., 1998. Effect of protein degradability on urea
nitrogen in sheep milk. Sci. Tec. Latt. Cas. 49, 67–81.
G. Pulina et al. / Animal Feed Science and Technology 131 (2006) 255–291 291
Viallon, C., Martin, B., Verdier-Metz, I., Pradel, P., Garel, J.P., Coulon, J.B., Berdague, J.L., 2000. Transfer ofmonoterpenes and sesquiterpenes from forages into milk fat. Lait 80, 635–641.
Vrecl, M., Ursic, M., Pogacnik, A., Zupancic-Kralj, L., Jan, J., 2005. Excretion pattern of co-planar and non-planartetra- and hexa-chlorobiphenyls in ovine milk and faeces. Toxicol. Appl. Pharmacol. 204, 70–174.
Ward, A.T., Wittenberg, K.M., Froebe, H.M., Przybylski, R., Malcolmson, L., 2003. Fresh forage and solinsupplementation on conjugated linoleic acid level in plasma and milk. J. Dairy Sci. 86, 1742–1750.
Westlake, K., Mackie, R.I., Dutton, M.F., 1989. In vitro metabolism of mycotoxins by bacterial, protozoal andovine ruminal fluid preparations. Anim. Feed Sci. Technol. 25, 169–178.
Willett, L.B., O’Donnell, A.F., Durst, H.I., Kurz, M.M., 1993. Mechanisms of movement of organochlorinepesticides from soils to cows via forages. J. Dairy Sci. 76, 1635–1644.
Wilson, R., Ziprin, R., Ragsdale, S., Busbee, D., 1985. Uptake and vascular transport of ingested aflatoxin. Toxicol.Lett. 29, 169–176.
Wu, Z., Palmquist, D.L., 1991. Synthesis and biohydrogenation of fatty acids by ruminal microorganisms in vitro.J. Dairy Sci. 74, 3035–3046.
Xiao, H., Marquardt, R.R., Frohlich, A.A., Phillips, G.D., Vitti, T.G., 1991. Effect of a hay and a grain diet on thebioavailability of ochratoxin A in the rumen of sheep. J. Anim. Sci. 69, 3715–3723.
Zervas, G., Fegeros, K., Koytsotolis, K., Goulas, C., Mantzios, A., 1998. Soy hulls as a replacement for maize inlactating dairy ewe diets with or without dietary fat supplements. Anim. Feed Sci. Technol. 76, 65–75.
Zhang, R.H., Mustafa, A.F., Zhao, X., 2006. Effects of feeding oilseeds rich in linoleic and linolenic fatty acidsto lactating ewes on cheese yield and on fatty acid composition of milk and cheese. Anim. Feed Sci. Technol.127, 220–233.
Zheng, H.C., Liu, J.X., Yao, J.H., Yuan, Q., Ye, H.W., Ye, J.A., Wu, Y.M., 2005. Effects of dietary sources ofvegetable oils on performance of high-yielding lactating cows and conjugated linoleic acids in milk. J. DairySci. 88, 2037–2042.