Embed Size (px)
Citation preview
Effect of Thermal Cycling on Creep Behaviorof Powder-Metallurgy-Processed and Hot-RolledAl and Al-SiC Particulate Composites
SHARMILEE PAL, V.V. BHANUPRASAD, R. MITRA, and K.K. RAY
The tensile creep behavior of powder metallurgy (P/M)–processed and hot-rolled commerciallypure Al and Al-5 or Al-10 vol pct SiC particulate composites has been evaluated after subjectingto 0, 2, and 8 thermal cycles between 500 �C and 0 �C with rapid quenching. The images ofmicrostructures obtained using scanning and transmission electron microscopy as well aschanges in the electrical resistivity, Young’s modulus, and microhardness have been examined inthe samples subjected to thermal cycling, in order to compare the effects of structural damageand strengthening by dislocation generation. The damage is caused by voids formed by vacancycoalescence, and is more severe in pure Al than in Al-SiCp composites, because the particle-matrix interfaces in the composites act as effective sinks for vacancies. Creep tests have shownthat the application of 2 thermal cycles lowers the creep strain rates in both pure Al and Al-SiCp
composites. However, the creep resistance of pure Al gets significantly deteriorated, unlike themild deterioration in the Al-5 SiCp composite, while the time to rupture for the Al-10 SiCp
composite is increased. The dislocation structure and subgrain sizes in the Al and in the matricesof the Al-SiCp composites in the as-rolled condition, after thermal cycling, and after creep tests,have been compared and related to the creep behavior. The dimple sizes of the crept fracturesurfaces appear to be dependent on the void density, tertiary component of strain, and time torupture.
DOI: 10.1007/s11661-009-9982-2� The Minerals, Metals & Materials Society and ASM International 2009
I. INTRODUCTION
METAL matrix composites have earned significantinterest worldwide, for their potential to combine thestrength and high modulus of the ceramic reinforcementwith the ductility and toughness of the metals. Thediscontinuously reinforced aluminum (DRA) compos-ites possess a high strength-to-weight ratio and a highspecific stiffness; and as a result, they are of interest foruse in various automotive and aerospace components,particularly for weight reduction. Many of the automo-tive components are subjected to thermal cycles duringuse. The DRA composites are sensitive to thermalcycles, primarily because of the differences in thecoefficients of thermal expansion (CTEs) of the Almatrix and the ceramic reinforcement phases. Signifi-cant residual stress is also generated through thermalcycling and this has been measured by diffractiontechniques.[1,2] Relaxation of the thermal residualstresses during exposure to an elevated temperature inthe course of a given thermal cycle leads to dimensionalchanges.[3] Dimensional changes and hysteresis loops
have been observed both in the case of pure Al and inthe Al-based particulate composites. Furthermore,quench hardening has been observed in pure metals,such as in Al, due to the formation of vacancy loops andjogged dislocations.[4,5]
The Young’s modulus (E), CTE, and yield strength(YS) of Al (E = 70 GPa, CTE = 4 9 10�6 K�1, andYS = 35 MPa) and SiC (E = 450 GPa, CTE = 24 910�6 K�1, and YS = 600 MPa) are significantly differ-ent. The strain due to mismatch in the CTEs of Al andSiC leads to the generation of considerable internalstress at the particle-matrix interfaces on cooling fromthe temperature of fabrication to the ambient temper-atures.[6–8] Simple calculations have shown that theinternal stress due to the CTE mismatch exceeds theyield stress of the matrix.[9] The plastic deformationinside the matrix near the interface has been confirmedby observations of dislocation generation throughin-situ dynamic studies in the transmission electronmicroscope (TEM) and by correlating the dependence ofthe composite YS with the conditions of quenching fromhigher temperatures.[10–12] A recent study[13] has shownthat the matrix close to the particle-matrix interfaces ofthe Al-TiC and Al-SiC composites shows an increase inmicrohardness with an increasing number of thermalcycles, indicating that strain hardening is caused bydislocation generation and movement.Aided by increased internal interfacial strains, thermal
cycling of the Al alloys and composites during uniaxialtension tests is known to lead to a more significant
SHARMILEE PAL, Research Scholar, and R. MITRA andK.K. RAY, Professors, are with the Department of Metallurgicaland Materials Engineering, Indian Institute of Technology,Kharagpur–721 302, India. Contact e-mail: [email protected] V.V. BHANUPRASAD, Scientist ‘‘F,’’ is with the Ceramicsand Composites Group, Defence Metallurgical Research Laboratory,Hyderabad–500 058, India.
Manuscript submitted January 31, 2009.Article published online September 23, 2009
METALLURGICAL AND MATERIALS TRANSACTIONS A VOLUME 40A, DECEMBER 2009—3171

increase in elongation than is the case under isothermalconditions.[14] Furthermore, accelerated creep deforma-tion has been observed in tests carried out simulta-neously with thermal cycling.[14] However, prestressingof the DRA composites has led to significant enhance-ment in resistance to creep,[15] when it is dislocationsubstructure controlled. In addition, a study by Shin andNan[16] has shown that the quenching of pure Al samplesfrom high temperatures leads to a significant rise in thecreep strength at ambient temperature (30 �C), and suchcreep strengthening has been attributed to the formationof dislocation jogs in quenched Al. The vacancy loopsand dislocation jogs formed in the Al matrix byquenching may not be stable at elevated temperatures,but are expected to affect the dislocation substructureand mechanical properties. Prior thermal cycling of thecomposite before carrying out the creep experiment isexpected to show a result different from simultaneousthermal cycling during the test, because the former isequivalent to the prestraining of the particle-matrixinterfacial locations. Hence, the effect of prior thermalcycling on the creep of pure Al and DRA composites ismore complicated and needs to be understood.
In the present study, the effects of thermal cycling onthe microstructure and creep behavior of powder metal-lurgy (P/M)–processed and hot-rolled DRA compositeswith 0, 5, and 10 vol pct SiC reinforcements have beencompared. The structural damage caused by thermalcycling has been quantified in terms of the changesobserved in the electrical resistivity, Young’s modulus,and microhardness of the pure Al and DRA composites.
II. EXPERIMENTAL PROCEDURE
A. Materials and Processing
The materials used in the present investigation arecommercially pure Al and DRA composites with either5 or 10 vol pct SiC particulate reinforcements, obtainedfrom the Ceramics and Composites Group, DefenceMetallurgical Research Laboratory (Hyderabad, India).The samples of pure Al and both of the Al-SiCp
composites were prepared by P/M processing, the detailsof which have been published elsewhere.[17] The Alpowder with an average particle size of 40 lm was ofcommercial purity (99.5 pct), having 0.25 wt pct Fe and0.04 wt pct Si as the major impurities. The SiC particlesused in processing were nearly equiaxed, with averagesizes of 7 and 14.5 lm for the Al-5 and Al-10 SiCp
composites, respectively. The pure Al as well as the Al-5or Al-10 SiCp composite powder mixtures were vacuumhot pressed using a ram pressure of 100 MPa at 500 �Cfor 1 hour, to obtain plates 125 mm in diameter and23 mm in thickness. These plates were soaked at 500 �Cfor 0.5 hour and subsequently hot rolled with a reduc-tion per pass of approximately 4 to 8 pct. Hot rollingwas continued until sheets with a thickness in the rangeof 4 to 5 mm were obtained. The hot-rolled Al andAl-SiC composite samples, prior to any other kind oftreatment or testing, will henceforth be referred to as‘‘as-rolled.’’
B. Microstructural Characterization
The as-rolled samples were sectioned and their flatsurfaces along the longitudinal and transverse directionswere metallographically polished for characterization ofthe microstructure. The phases present in these sampleswere identified using X-ray diffraction (XRD). Themicrostructures of these samples were further examinedusing the optical microscope, as well as secondaryelectron (SE) and backscattered electron imaging modeson a scanning electron microscope (SEM), model JSM-5800 (JEOL*), or the Zeiss Supra 40 field-emission gun
scanning electron microscope (Carl Zeiss NTS GmbH,Oberkochen, Germany). The chemical composition ofthe individual phases was examined using the energy-dispersive X-ray (EDX) detector (Oxford Instruments,Ltd., High Wycombe, Bucks, UK) attached to the SEM.The average sizes of the SiC particles in the DRAcomposites were estimated through observations on anoptical microscope and from the SEM micrographs,using image analysis software along both the longitudi-nal and transverse directions, following the ASTME112-96 standard procedure.[18] The interface area wasmeasured from the sum of the perimeters of the SiCparticles using the intercept method proposed byUnderwood[19] and, following this procedure, the totalinterface length per unit area was determined.Electron-transparent specimens were prepared for
observation on the TEM, by mechanical thinningfollowed by jet polishing using an electrolyte comprisingnitric acid and methanol in a volumetric ratio of 1:3between �20 �C and �30 �C. Subsequently, the TEMobservations in bright- and dark-field imaging modesaccompanied by EDX analyses were carried out on aJEM 2100 high-resolution TEM (JEOL), operated at anacceleration voltage of 200 kV. The TEM micrographswere examined using BIOVIS software (MedimageTechnologies Pvt. Ltd., Hyderabad, India) for imageanalysis to assess the subgrain size in a two-dimensionalplane. The mean subgrain size was calculated bymeasuring the area of the subgrains and determiningthe diameter of a circle with the same area.
C. Thermal Cycling and Nondestructive DamageAssessment
Thermal cycling experiments were conducted onas-rolled samples of pure Al and Al-SiCp composites.For thermal cycling experiments, the samples wereinserted in the furnace chamber at 500 �C (±2 �C),soaked for 30 minutes, and then quenched in ice-coldwater (at approximately 0 �C), ensuring a cooling rate of475 �C to 480 �C per minute. The thermal cycles wererepeated for 2 and 8 times. For convenience, the samplessubjected to 2 and 8 thermal cycles are referred to as2-TC and 8-TC, respectively. The microstructures ofboth the 2-TC and 8-TC samples were studied using aSEM and a TEM to examine volume defects and the
*JEOL is a trademark of Japan Electron Optics Ltd., Tokyo.
3172—VOLUME 40A, DECEMBER 2009 METALLURGICAL AND MATERIALS TRANSACTIONS A
dislocation substructure, respectively. Furthermore, thedynamic Young’s moduli of the composites were deter-mined using a dynamic elastic properties analyzerDEPA Light System (Jagdish Electronics, Bangalore,India), which uses an impulse excitation technique.[20]
The specimens were subjected to vibration mechanicallywith the help of a tapping device, and the signalrepresenting the natural frequency of vibration wasanalyzed using the Fourier transform for determinationof the Young’s modulus. Electrical resistivity wasmeasured by a four-probe method with alternatingcurrent. The voltage drop in the different sections of thespecimen and the current were measured with anelectronic voltmeter and a milliammeter, respectively.The electrical resistivity was then calculated from thevalues of current and voltage.
D. Creep Tests
Flat tensile specimens with a square cross section werecut from the as-rolled sheets of Al as well as the Al-5 andAl-10 SiCp composites, so that their loading axescoincided with the direction of rolling. The specimensfor creep tests had a 20-mm gage length, a crosssection 4 9 4 mm, and collar dimensions as suggestedfor tensile specimens in the ASTM-8M standard.[21]
Tensile creep tests were carried out in air on theas-rolled, 2-TC, and 8-TC samples at 350 �C (T =423 K) under an applied stress (r) of 21 MPa on anATS 2320 creep testing machine. The experimentalconditions used for this study are similar to what hasbeen reported in the literature[22–24] for creep studies onDRA composites. The homologous temperature(T/TM) � 0.67 and the applied stress normalized bythe shear modulus (r/G) � 8 9 10�4 were chosen in thisstudy in order to have dislocation creep as the dominantmechanism, as predicted by the Weertman–Ashby creepdeformation mechanism maps.[25,26] The creep testingmachine was equipped with a three-zone clamshellfurnace, in which the specimen temperature was mon-itored to an accuracy of ±2 �C using three separatethermocouples, with the tip of one at the central part ofthe specimen and the other two tips in contact with thegrips. All the specimens were soaked at the testtemperature for 1 hour prior to the application of loadfor the purpose of stabilization. The load was appliedduring the creep test by employing a lever arm ratio of20:1, and the strain was monitored using an extensom-eter connected to a linear variable displacement trans-ducer. The crept samples were subsequently sectionedbelow the fracture surfaces and the electron-transparentspecimens prepared from such locations were examinedusing a TEM, to study the dislocation substructure.
III. RESULTS AND DISCUSSION
A. Microstructure of As-Rolled Al and Al-SiCp
Composites
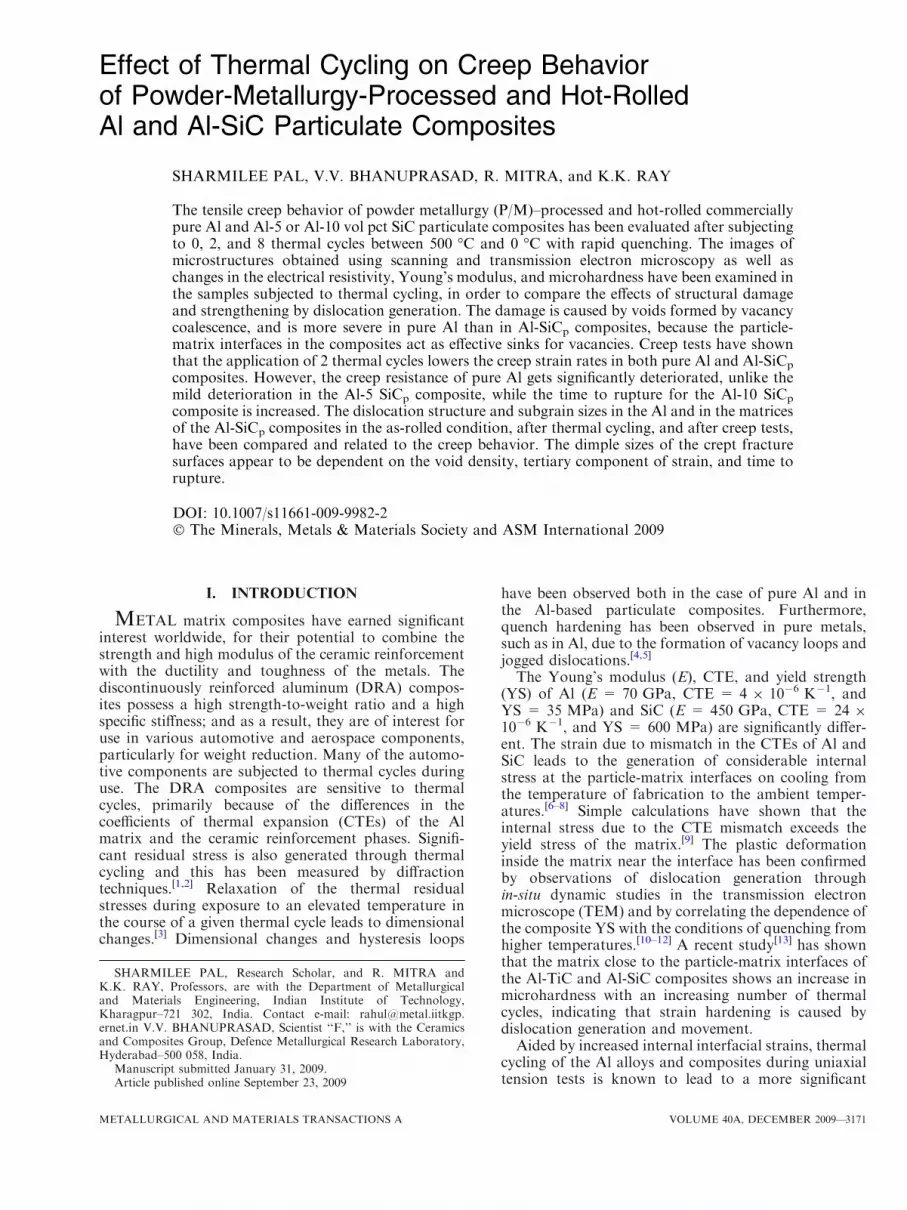
Typical SEM (SE) images depicting representativemicrostructures on the rolling plane of the as-rolled pureAl and the Al-5 and Al-10 SiCp composites are shown in
Figures 1(a) through (c), respectively. The averagespacing between the dispersed SiC particles and theirnet interfacial areas are primarily a function of thevolume fraction and particle size, as is obvious uponanalysis of the experimental data shown in Table I. It isshown (Table I) that the interparticle (SiC) spacing inthe Al-5 SiCp composite is less than half of that in theAl-10 SiCp composite, in spite of similar particle-matrix
Fig. 1—SEM SE images showing the microstructure on the rollingplane of the as-rolled (a) pure Al, (b) Al-5 SiCp composite, and(c) 10 SiCp composites.
METALLURGICAL AND MATERIALS TRANSACTIONS A VOLUME 40A, DECEMBER 2009—3173

interface areas in both composites. The smaller inter-particle spacing in the composite with a lower volumefraction of reinforcement is attributed to the SiC particlesize being half of that in the Al-10 SiCp composite. Onthe basis of the SEM and TEM studies accompanied byEDS analysis, it could be further inferred that the Aland both types of Al-SiCp composites have a distribu-tion of approximately 7 vol pct fine particles of Al2O3
and Fe-rich intermetallic phases dispersed in the Almatrix (Figure 2). The average size of the Al2O3
particles has been found to be 0.15 and 0.25 lm in thepure Al and Al-SiCp composites, respectively. Calcula-tions show that the average interparticle spacingbetween the Al2O3 particles in Al and in the matricesof both types of Al-SiCp composites is 0.4 and 0.7 lm,respectively. Comparison of the interparticle spacingsbetween Al2O3 particles with those between SiC parti-cles shows that the latter is two orders of magnitudehigher. Furthermore, examination of the TEM images(Figures 2(a) and (b)) reveals the interaction of disloca-tions with Al2O3 particles, which has been proposed[27]
as one of the mechanisms of creep strengthening in thesematerials. On the basis of the TEM studies, the averagegrain sizes in pure Al and the matrices of the Al-5 andAl-10 SiCp composites have been found to be 1.1, 1.2,and 1.6 lm, respectively. The grain aspect ratios havebeen found to be between 1.3 and 1.7.
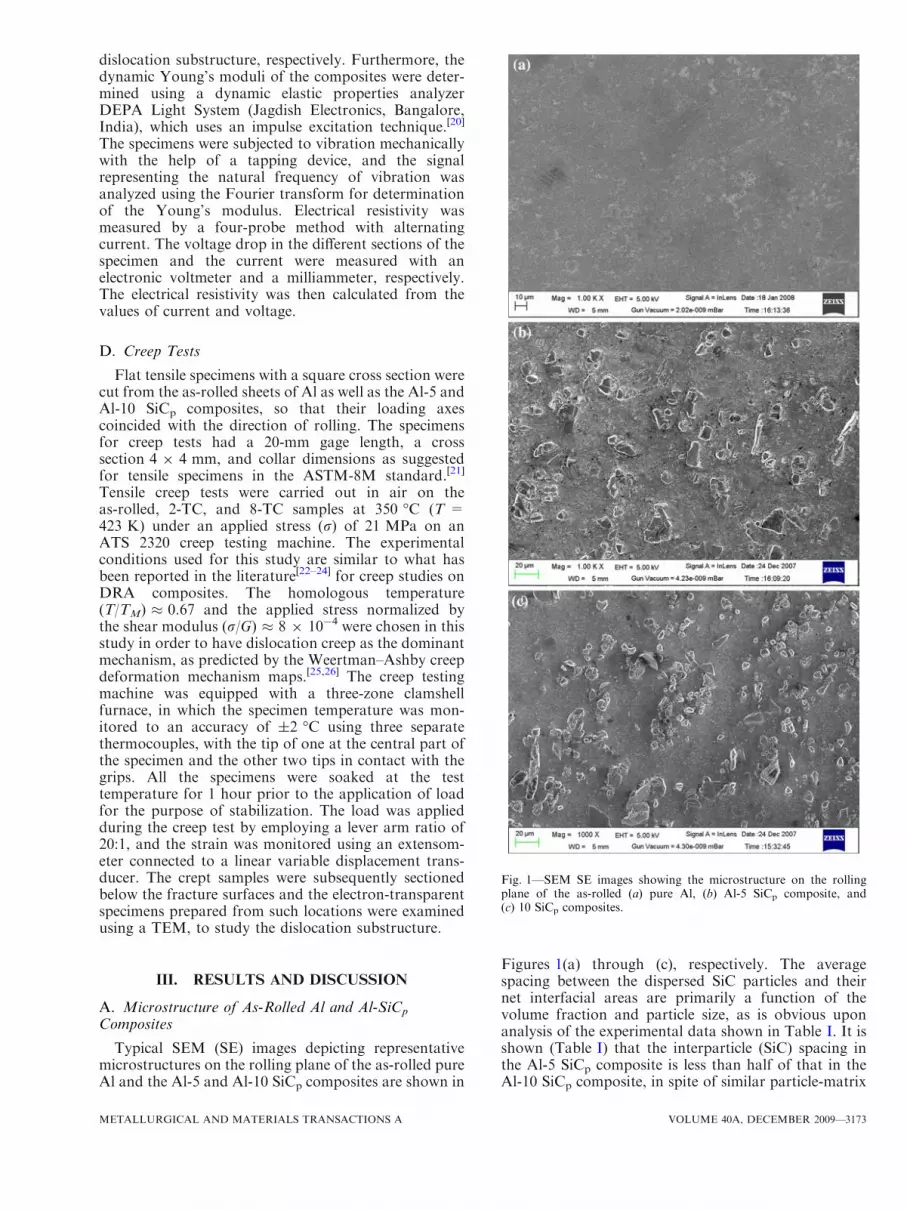
A typical XRD pattern from the as-rolled Al-10 SiCp
composite is shown in Figure 3, and contains only thepeaks of Al and SiC phases, with none of the usuallyexpected interfacial reaction product, Al4C3. Studiesusing the TEM have not shown any evidence of thepresence of Al4C3 in the microstructure. The peaks ofAl2O3 and Fe-rich intermetallic phases are also absentbecause of their low volume fraction.
B. Effect of Thermal Cycling
1. MicrostructureThe SEM (SE) images depicting the microstructures
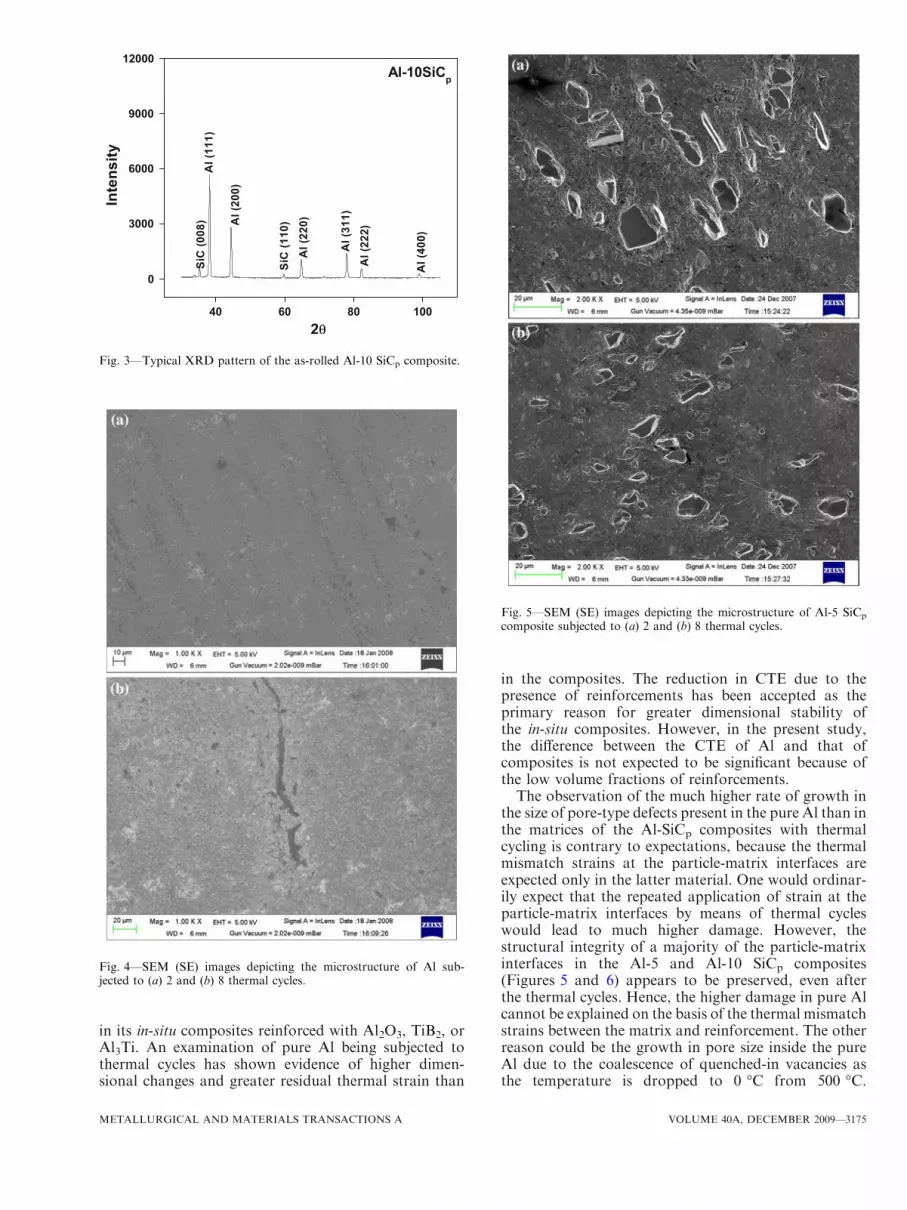
of pure Al, Al-5 and 10 SiCp composite samplessubjected to thermal cycles are shown in Figures 4, 5,and 6, respectively. On comparison of the microstruc-tures of pure Al samples, it is obvious that the averagesize of the cracks in the sample increases as the numberof thermal cycles is increased from 2 (Figure 4(a)) to 8(Figure 4(b)), while such flaws could not be observed inthe as-rolled samples (Figure 1(a)). However, a com-parison of the microstructures of the 2-TC and 8-TCAl-5 SiCp composites, as shown in Figures 5(a) and (b),respectively, with that in the as-rolled condition(Figure 1(b)) leads to the inference that the damage
caused in thematrix and at the particle-matrix interfaces isvery limited. In a similar way,microstructures of the 2-TCand8-TCAl-10SiCp composites, as shown inFigures 6(a)and (b), respectively, also confirms the occurrence oflimited damage inside the matrix and at the particle-matrix interfaces. Hence, on the basis of a comparison ofthe microstructures of the samples (Figures 4 through 6),it is possible to infer that the average size of the defectsformed in theAl-5 andAl-10 SiCp composites ismuch lessthan that observed in the case of pure Al on exposure tothe same number of thermal cycles.A previous study by Tjong and co-workers[3] on
thermal cycling between 50 �C and 300 �C has alsoshown evidence of much greater damage in pure Al than
Table I. Experimentally Determined Values of Interparticle
Spacings and Interface Areas in Al-5 and Al-10 SiCp
Composites
CompositeInterparticle
Spacing, k (lm)Particle-Matrix
Interface Area (m2/m3)
Al-5 SiCp 15.1 ± 5.4 8.3 9 104 ± 7.8Al-10 SiCp 33.3 ± 10.7 7 9 104 ± 12.8
Fig. 2—Bright-field TEM images of the microstructure of as-rolled(a) pure Al and (b) Al-10 SiCp composite showing Al2O3 particles(arrowed) in the Al matrix.
3174—VOLUME 40A, DECEMBER 2009 METALLURGICAL AND MATERIALS TRANSACTIONS A
in its in-situ composites reinforced with Al2O3, TiB2, orAl3Ti. An examination of pure Al being subjected tothermal cycles has shown evidence of higher dimen-sional changes and greater residual thermal strain than
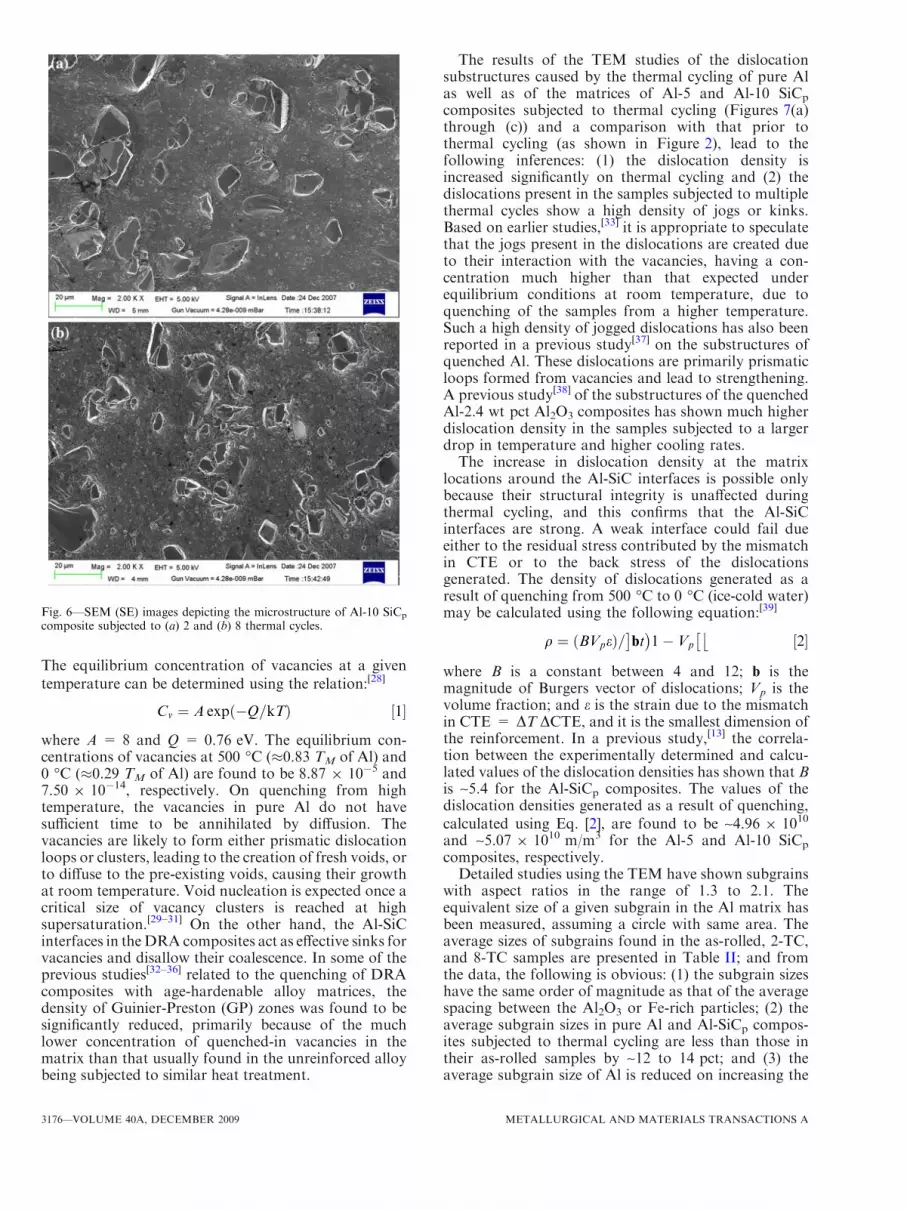
in the composites. The reduction in CTE due to thepresence of reinforcements has been accepted as theprimary reason for greater dimensional stability ofthe in-situ composites. However, in the present study,the difference between the CTE of Al and that ofcomposites is not expected to be significant because ofthe low volume fractions of reinforcements.The observation of the much higher rate of growth in
the size of pore-type defects present in the pure Al than inthe matrices of the Al-SiCp composites with thermalcycling is contrary to expectations, because the thermalmismatch strains at the particle-matrix interfaces areexpected only in the latter material. One would ordinar-ily expect that the repeated application of strain at theparticle-matrix interfaces by means of thermal cycleswould lead to much higher damage. However, thestructural integrity of a majority of the particle-matrixinterfaces in the Al-5 and Al-10 SiCp composites(Figures 5 and 6) appears to be preserved, even afterthe thermal cycles. Hence, the higher damage in pure Alcannot be explained on the basis of the thermal mismatchstrains between the matrix and reinforcement. The otherreason could be the growth in pore size inside the pureAl due to the coalescence of quenched-in vacancies asthe temperature is dropped to 0 �C from 500 �C.
Fig. 3—Typical XRD pattern of the as-rolled Al-10 SiCp composite.
Fig. 4—SEM (SE) images depicting the microstructure of Al sub-jected to (a) 2 and (b) 8 thermal cycles.
Fig. 5—SEM (SE) images depicting the microstructure of Al-5 SiCp
composite subjected to (a) 2 and (b) 8 thermal cycles.
METALLURGICAL AND MATERIALS TRANSACTIONS A VOLUME 40A, DECEMBER 2009—3175
The equilibrium concentration of vacancies at a giventemperature can be determined using the relation:[28]
Cv ¼ A exp �Q=kTð Þ ½1�
where A = 8 and Q = 0.76 eV. The equilibrium con-centrations of vacancies at 500 �C (�0.83 TM of Al) and0 �C (�0.29 TM of Al) are found to be 8.87 9 10�5 and7.50 9 10�14, respectively. On quenching from hightemperature, the vacancies in pure Al do not havesufficient time to be annihilated by diffusion. Thevacancies are likely to form either prismatic dislocationloops or clusters, leading to the creation of fresh voids, orto diffuse to the pre-existing voids, causing their growthat room temperature. Void nucleation is expected once acritical size of vacancy clusters is reached at highsupersaturation.[29–31] On the other hand, the Al-SiCinterfaces in theDRA composites act as effective sinks forvacancies and disallow their coalescence. In some of theprevious studies[32–36] related to the quenching of DRAcomposites with age-hardenable alloy matrices, thedensity of Guinier-Preston (GP) zones was found to besignificantly reduced, primarily because of the muchlower concentration of quenched-in vacancies in thematrix than that usually found in the unreinforced alloybeing subjected to similar heat treatment.
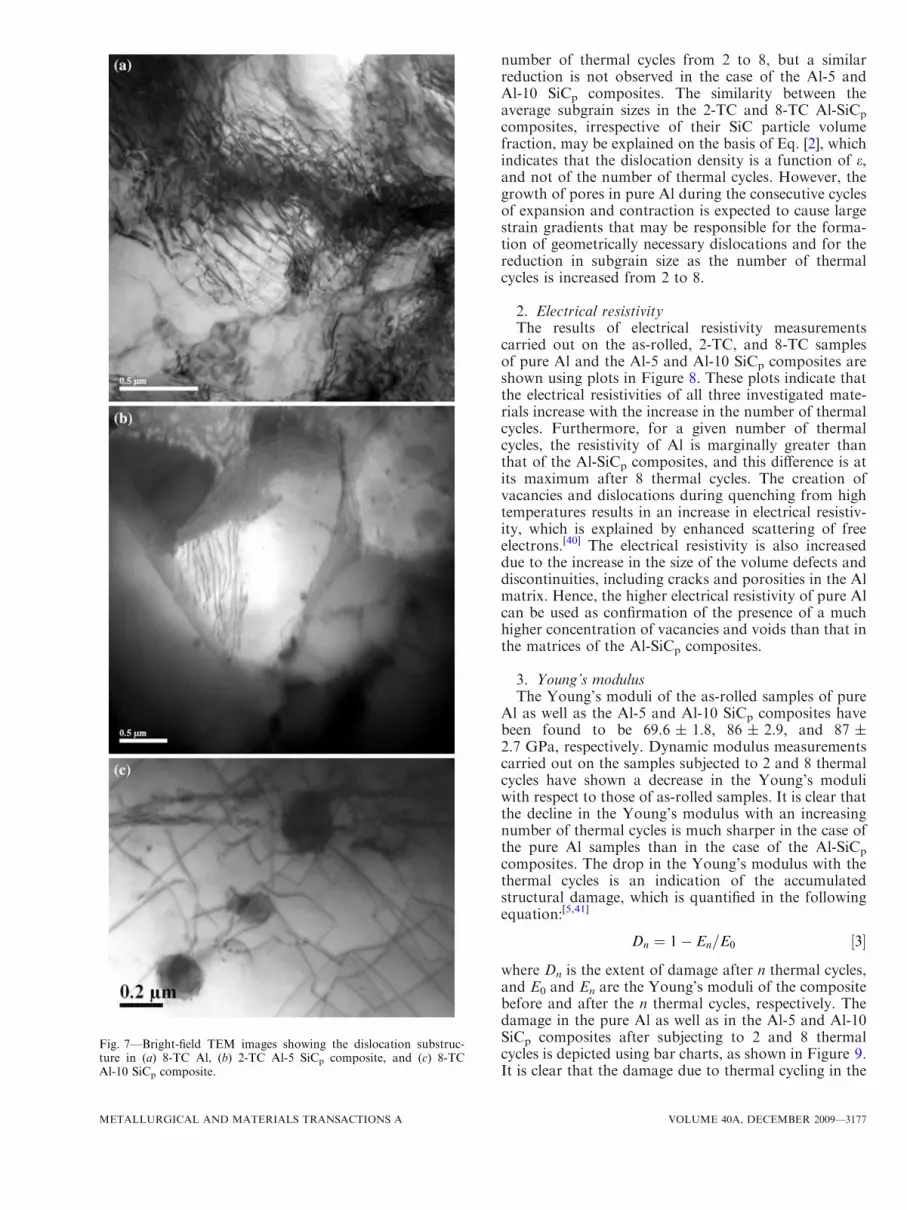
The results of the TEM studies of the dislocationsubstructures caused by the thermal cycling of pure Alas well as of the matrices of Al-5 and Al-10 SiCp
composites subjected to thermal cycling (Figures 7(a)through (c)) and a comparison with that prior tothermal cycling (as shown in Figure 2), lead to thefollowing inferences: (1) the dislocation density isincreased significantly on thermal cycling and (2) thedislocations present in the samples subjected to multiplethermal cycles show a high density of jogs or kinks.Based on earlier studies,[33] it is appropriate to speculatethat the jogs present in the dislocations are created dueto their interaction with the vacancies, having a con-centration much higher than that expected underequilibrium conditions at room temperature, due toquenching of the samples from a higher temperature.Such a high density of jogged dislocations has also beenreported in a previous study[37] on the substructures ofquenched Al. These dislocations are primarily prismaticloops formed from vacancies and lead to strengthening.A previous study[38] of the substructures of the quenchedAl-2.4 wt pct Al2O3 composites has shown much higherdislocation density in the samples subjected to a largerdrop in temperature and higher cooling rates.The increase in dislocation density at the matrix
locations around the Al-SiC interfaces is possible onlybecause their structural integrity is unaffected duringthermal cycling, and this confirms that the Al-SiCinterfaces are strong. A weak interface could fail dueeither to the residual stress contributed by the mismatchin CTE or to the back stress of the dislocationsgenerated. The density of dislocations generated as aresult of quenching from 500 �C to 0 �C (ice-cold water)may be calculated using the following equation:[39]
q ¼ ðBVpeÞ= bt 1� Vp
� �� �½2�
where B is a constant between 4 and 12; b is themagnitude of Burgers vector of dislocations; Vp is thevolume fraction; and e is the strain due to the mismatchin CTE = DTÆDCTE, and it is the smallest dimension ofthe reinforcement. In a previous study,[13] the correla-tion between the experimentally determined and calcu-lated values of the dislocation densities has shown that Bis ~5.4 for the Al-SiCp composites. The values of thedislocation densities generated as a result of quenching,calculated using Eq. [2], are found to be ~4.96 9 1010
and ~5.07 9 1010 m/m3 for the Al-5 and Al-10 SiCp
composites, respectively.Detailed studies using the TEM have shown subgrains
with aspect ratios in the range of 1.3 to 2.1. Theequivalent size of a given subgrain in the Al matrix hasbeen measured, assuming a circle with same area. Theaverage sizes of subgrains found in the as-rolled, 2-TC,and 8-TC samples are presented in Table II; and fromthe data, the following is obvious: (1) the subgrain sizeshave the same order of magnitude as that of the averagespacing between the Al2O3 or Fe-rich particles; (2) theaverage subgrain sizes in pure Al and Al-SiCp compos-ites subjected to thermal cycling are less than those intheir as-rolled samples by ~12 to 14 pct; and (3) theaverage subgrain size of Al is reduced on increasing the
Fig. 6—SEM (SE) images depicting the microstructure of Al-10 SiCp
composite subjected to (a) 2 and (b) 8 thermal cycles.
3176—VOLUME 40A, DECEMBER 2009 METALLURGICAL AND MATERIALS TRANSACTIONS A
number of thermal cycles from 2 to 8, but a similarreduction is not observed in the case of the Al-5 andAl-10 SiCp composites. The similarity between theaverage subgrain sizes in the 2-TC and 8-TC Al-SiCp
composites, irrespective of their SiC particle volumefraction, may be explained on the basis of Eq. [2], whichindicates that the dislocation density is a function of e,and not of the number of thermal cycles. However, thegrowth of pores in pure Al during the consecutive cyclesof expansion and contraction is expected to cause largestrain gradients that may be responsible for the forma-tion of geometrically necessary dislocations and for thereduction in subgrain size as the number of thermalcycles is increased from 2 to 8.
2. Electrical resistivityThe results of electrical resistivity measurements
carried out on the as-rolled, 2-TC, and 8-TC samplesof pure Al and the Al-5 and Al-10 SiCp composites areshown using plots in Figure 8. These plots indicate thatthe electrical resistivities of all three investigated mate-rials increase with the increase in the number of thermalcycles. Furthermore, for a given number of thermalcycles, the resistivity of Al is marginally greater thanthat of the Al-SiCp composites, and this difference is atits maximum after 8 thermal cycles. The creation ofvacancies and dislocations during quenching from hightemperatures results in an increase in electrical resistiv-ity, which is explained by enhanced scattering of freeelectrons.[40] The electrical resistivity is also increaseddue to the increase in the size of the volume defects anddiscontinuities, including cracks and porosities in the Almatrix. Hence, the higher electrical resistivity of pure Alcan be used as confirmation of the presence of a muchhigher concentration of vacancies and voids than that inthe matrices of the Al-SiCp composites.
3. Young’s modulusThe Young’s moduli of the as-rolled samples of pure
Al as well as the Al-5 and Al-10 SiCp composites havebeen found to be 69.6 ± 1.8, 86 ± 2.9, and 87 ±2.7 GPa, respectively. Dynamic modulus measurementscarried out on the samples subjected to 2 and 8 thermalcycles have shown a decrease in the Young’s moduliwith respect to those of as-rolled samples. It is clear thatthe decline in the Young’s modulus with an increasingnumber of thermal cycles is much sharper in the case ofthe pure Al samples than in the case of the Al-SiCp
composites. The drop in the Young’s modulus with thethermal cycles is an indication of the accumulatedstructural damage, which is quantified in the followingequation:[5,41]
Dn ¼ 1� En=E0 ½3�
where Dn is the extent of damage after n thermal cycles,and E0 and En are the Young’s moduli of the compositebefore and after the n thermal cycles, respectively. Thedamage in the pure Al as well as in the Al-5 and Al-10SiCp composites after subjecting to 2 and 8 thermalcycles is depicted using bar charts, as shown in Figure 9.It is clear that the damage due to thermal cycling in the
Fig. 7—Bright-field TEM images showing the dislocation substruc-ture in (a) 8-TC Al, (b) 2-TC Al-5 SiCp composite, and (c) 8-TCAl-10 SiCp composite.
METALLURGICAL AND MATERIALS TRANSACTIONS A VOLUME 40A, DECEMBER 2009—3177

pure Al is more extensive than that in the Al-SiCp
composites. The results of the Young’s modulus mea-surements, indicating much higher damage in the pureAl than in the Al-SiCp composites, are consistent with
the nature of the structural damage in their microstruc-tures, as shown in Figures 4 through 6 and with theresults of electrical resistivity measurements (Figure 8).An earlier study[42] has also shown that the Young’smodulus of Al decreases on quenching, and this hasbeen attributed to a weakening of the interatomic bondsdue to the presence of a higher concentration ofvacancies in the lattice.
4. MicrohardnessThe microhardness values of the as-rolled pure Al and
the matrices of the Al-5 and Al-10 SiCp composites havebeen found to be more or less similar, as shown inFigure 10. However, the microhardness of the matricesin the composites is expected to be higher than in pureAl because of the dislocations generated due to the CTEmismatch between the matrix and reinforcements.[39,43]
The mean-free path for dislocation motion is a functionof the interparticle spacing. It may be noted that thespacing between the Al2O3 particles is similar in pure Aland in the Al-SiCp composites. The submicrometer-sizeAl2O3 particles interact with dislocations more effec-tively (Figure 2) than the coarser SiC particles, whichare also farther apart from one another. Hence, it isintuitive that the microhardness values of the Al and theAl-SiCp composites are close to one another.
Table II. Average Sizes of Subgrains Measured Using Image Analysis of Micrographs Recorded on TEM Examination of Al
and Al-5 and Al-10 SiCp Composites; Values of Subgrain Sizes Calculated Using Eq. [4] Are Shown in Parentheses for Comparison
Material
Subgrain Size (lm) in Subgrain Size (lm) in Subgrain Size (lm) in
As-RolledSamples
As-Rolled andCrept Samples
2-TCSamples
2-TC andCrept Samples
8-TCSamples
8-TC andCrept Samples
Pure Al 0.95 ± 0.2 0.69 ± 0.2 (0.71) 0.87 ± 0.2 0.85 ± 0.2 (0.48) 0.58 ± 0.1 0.5 ± 0.2 (0.34)Al-5 SiCp composite 0. 9 ± 0.1 0.87 ± 0.1 (0.88) 0.7 ± 0.2 0.66 ± 0.3 (0.85) 0.74 ± 0.2 0.7 ± 0.1 (0.82)Al-10 SiCp composite 0.93 ± 0.2 0.72 ± 0.1 (0.90) 0.82 ± 0.1 0.76 ± 0.2 (0.86) 0.81 ± 0.1 0.73 ± 0.2 (0.83)
Fig. 8—Plots showing the variation in electrical resistivity with thenumber of thermal cycles for pure Al as well as Al-5 and 10 SiCp
composites.
Fig. 9—Bar charts depicting the extent of damage caused in the Aland in the Al-5 and Al-10 SiCp composites on subjecting to thermalcycling.
Fig. 10—Plots showing variation in the microhardness of matrices inthe Al and in the Al-5 and Al-10 SiCp composites with number ofthermal cycles.
3178—VOLUME 40A, DECEMBER 2009 METALLURGICAL AND MATERIALS TRANSACTIONS A
The plots in Figure 10 also indicate that the micro-hardness of pure Al drops monotonically as the numberof thermal cycles is increased, while that of the Al-5 andAl-10 SiCp composites decreases marginally after 2thermal cycles and increases after 8 thermal cycles. Someexplanations suggested for the drop in microhardness inthe Al and in the matrices of the Al-SiCp compositesafter the first 2 thermal cycles are the following: (1) graingrowth and (2) damage in the matrix due to cyclicthermal strains. Because the Young’s modulus of thecomposites is not affected much after the first 2 thermalcycles, the damage in their matrices is expected to beinsignificant. Limited grain growth is expected more inthe pure Al than in the Al-SiCp composites. Graingrowth in pure Al with an increase in the temperature ofannealing is well documented in the literature.[44,45] Theincrease in the microhardness of the composites after 8thermal cycles is attributed to the increase in thedislocation density (Figures 7(b) and (c)) at the parti-cle-matrix interfaces in order to relieve the thermalmismatch strains. Hence, in the composites, the initialreduction in the matrix microhardness due to the graingrowth is offset by the effect of the increase in thedislocation density after 8 thermal cycles.
5. Creep behaviorThe results of creep experiments carried out on the
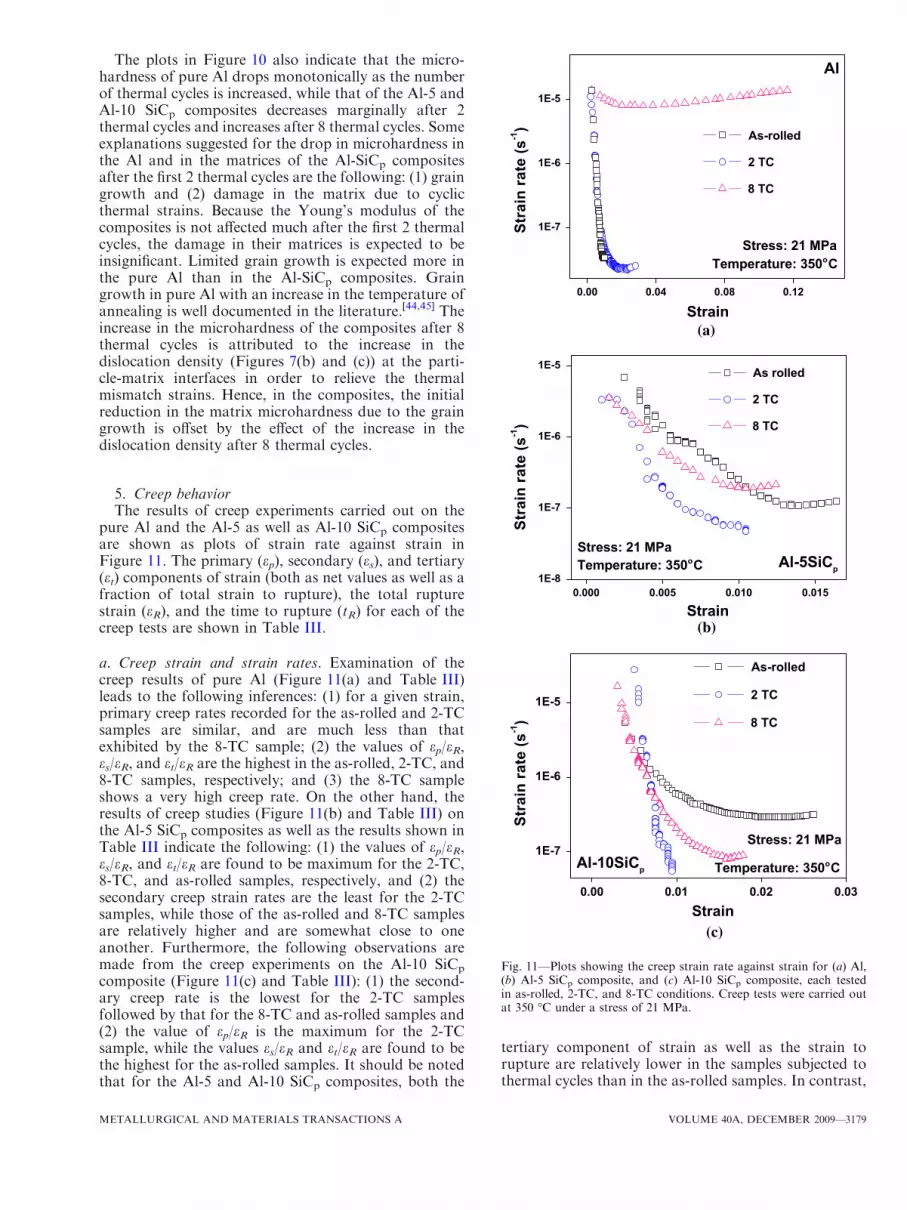
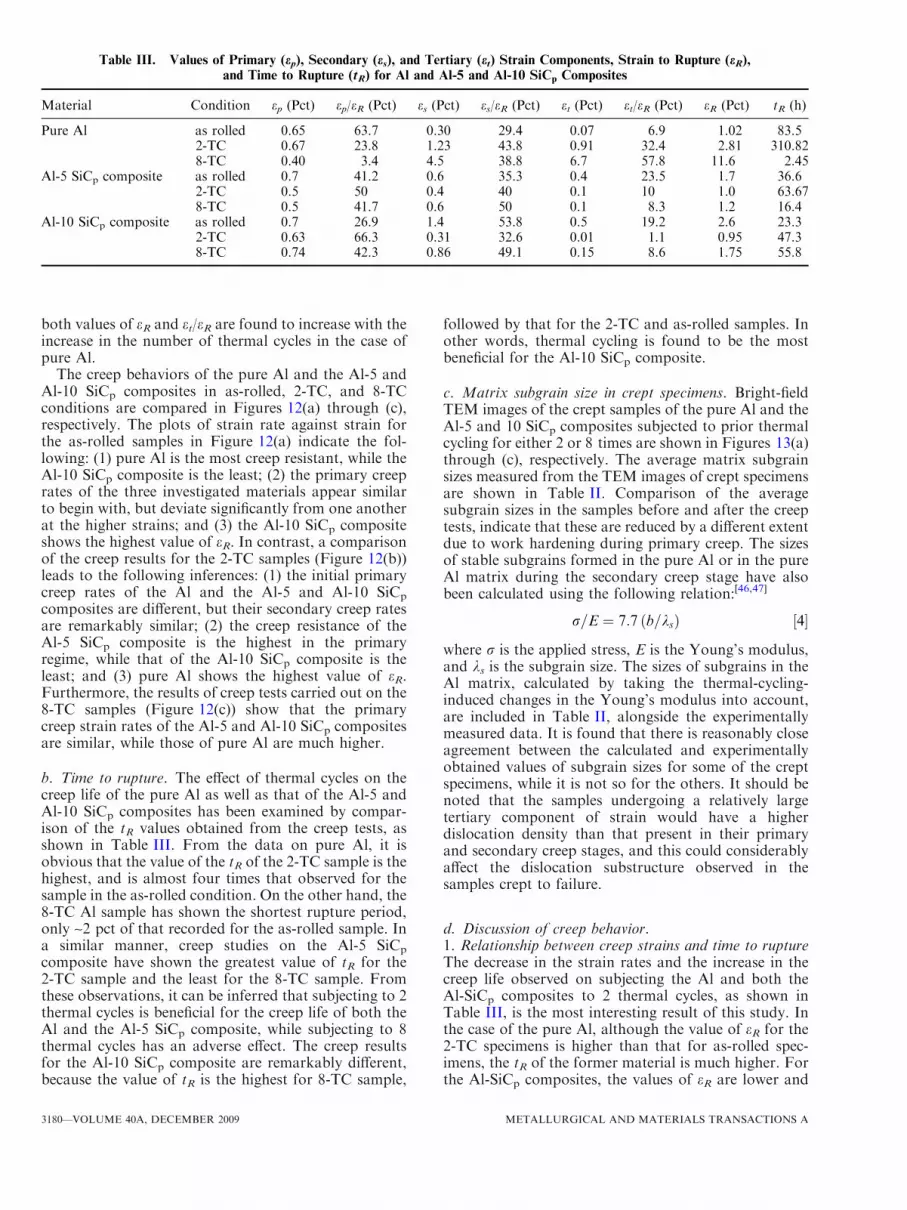
pure Al and the Al-5 as well as Al-10 SiCp compositesare shown as plots of strain rate against strain inFigure 11. The primary (ep), secondary (es), and tertiary(et) components of strain (both as net values as well as afraction of total strain to rupture), the total rupturestrain (eR), and the time to rupture (tR) for each of thecreep tests are shown in Table III.
a. Creep strain and strain rates. Examination of thecreep results of pure Al (Figure 11(a) and Table III)leads to the following inferences: (1) for a given strain,primary creep rates recorded for the as-rolled and 2-TCsamples are similar, and are much less than thatexhibited by the 8-TC sample; (2) the values of ep/eR,es/eR, and et/eR are the highest in the as-rolled, 2-TC, and8-TC samples, respectively; and (3) the 8-TC sampleshows a very high creep rate. On the other hand, theresults of creep studies (Figure 11(b) and Table III) onthe Al-5 SiCp composites as well as the results shown inTable III indicate the following: (1) the values of ep/eR,es/eR, and et/eR are found to be maximum for the 2-TC,8-TC, and as-rolled samples, respectively, and (2) thesecondary creep strain rates are the least for the 2-TCsamples, while those of the as-rolled and 8-TC samplesare relatively higher and are somewhat close to oneanother. Furthermore, the following observations aremade from the creep experiments on the Al-10 SiCp
composite (Figure 11(c) and Table III): (1) the second-ary creep rate is the lowest for the 2-TC samplesfollowed by that for the 8-TC and as-rolled samples and(2) the value of ep/eR is the maximum for the 2-TCsample, while the values es/eR and et/eR are found to bethe highest for the as-rolled samples. It should be notedthat for the Al-5 and Al-10 SiCp composites, both the
tertiary component of strain as well as the strain torupture are relatively lower in the samples subjected tothermal cycles than in the as-rolled samples. In contrast,
(a)
(b)
(c)
Fig. 11—Plots showing the creep strain rate against strain for (a) Al,(b) Al-5 SiCp composite, and (c) Al-10 SiCp composite, each testedin as-rolled, 2-TC, and 8-TC conditions. Creep tests were carried outat 350 �C under a stress of 21 MPa.
METALLURGICAL AND MATERIALS TRANSACTIONS A VOLUME 40A, DECEMBER 2009—3179
both values of eR and et/eR are found to increase with theincrease in the number of thermal cycles in the case ofpure Al.
The creep behaviors of the pure Al and the Al-5 andAl-10 SiCp composites in as-rolled, 2-TC, and 8-TCconditions are compared in Figures 12(a) through (c),respectively. The plots of strain rate against strain forthe as-rolled samples in Figure 12(a) indicate the fol-lowing: (1) pure Al is the most creep resistant, while theAl-10 SiCp composite is the least; (2) the primary creeprates of the three investigated materials appear similarto begin with, but deviate significantly from one anotherat the higher strains; and (3) the Al-10 SiCp compositeshows the highest value of eR. In contrast, a comparisonof the creep results for the 2-TC samples (Figure 12(b))leads to the following inferences: (1) the initial primarycreep rates of the Al and the Al-5 and Al-10 SiCp
composites are different, but their secondary creep ratesare remarkably similar; (2) the creep resistance of theAl-5 SiCp composite is the highest in the primaryregime, while that of the Al-10 SiCp composite is theleast; and (3) pure Al shows the highest value of eR.Furthermore, the results of creep tests carried out on the8-TC samples (Figure 12(c)) show that the primarycreep strain rates of the Al-5 and Al-10 SiCp compositesare similar, while those of pure Al are much higher.
b. Time to rupture. The effect of thermal cycles on thecreep life of the pure Al as well as that of the Al-5 andAl-10 SiCp composites has been examined by compar-ison of the tR values obtained from the creep tests, asshown in Table III. From the data on pure Al, it isobvious that the value of the tR of the 2-TC sample is thehighest, and is almost four times that observed for thesample in the as-rolled condition. On the other hand, the8-TC Al sample has shown the shortest rupture period,only ~2 pct of that recorded for the as-rolled sample. Ina similar manner, creep studies on the Al-5 SiCp
composite have shown the greatest value of tR for the2-TC sample and the least for the 8-TC sample. Fromthese observations, it can be inferred that subjecting to 2thermal cycles is beneficial for the creep life of both theAl and the Al-5 SiCp composite, while subjecting to 8thermal cycles has an adverse effect. The creep resultsfor the Al-10 SiCp composite are remarkably different,because the value of tR is the highest for 8-TC sample,
followed by that for the 2-TC and as-rolled samples. Inother words, thermal cycling is found to be the mostbeneficial for the Al-10 SiCp composite.
c. Matrix subgrain size in crept specimens. Bright-fieldTEM images of the crept samples of the pure Al and theAl-5 and 10 SiCp composites subjected to prior thermalcycling for either 2 or 8 times are shown in Figures 13(a)through (c), respectively. The average matrix subgrainsizes measured from the TEM images of crept specimensare shown in Table II. Comparison of the averagesubgrain sizes in the samples before and after the creeptests, indicate that these are reduced by a different extentdue to work hardening during primary creep. The sizesof stable subgrains formed in the pure Al or in the pureAl matrix during the secondary creep stage have alsobeen calculated using the following relation:[46,47]
r=E ¼ 7:7 ðb=ksÞ ½4�
where r is the applied stress, E is the Young’s modulus,and ks is the subgrain size. The sizes of subgrains in theAl matrix, calculated by taking the thermal-cycling-induced changes in the Young’s modulus into account,are included in Table II, alongside the experimentallymeasured data. It is found that there is reasonably closeagreement between the calculated and experimentallyobtained values of subgrain sizes for some of the creptspecimens, while it is not so for the others. It should benoted that the samples undergoing a relatively largetertiary component of strain would have a higherdislocation density than that present in their primaryand secondary creep stages, and this could considerablyaffect the dislocation substructure observed in thesamples crept to failure.
d. Discussion of creep behavior.1. Relationship between creep strains and time to ruptureThe decrease in the strain rates and the increase in thecreep life observed on subjecting the Al and both theAl-SiCp composites to 2 thermal cycles, as shown inTable III, is the most interesting result of this study. Inthe case of the pure Al, although the value of eR for the2-TC specimens is higher than that for as-rolled spec-imens, the tR of the former material is much higher. Forthe Al-SiCp composites, the values of eR are lower and
Table III. Values of Primary (ep), Secondary (es), and Tertiary (et) Strain Components, Strain to Rupture (eR),and Time to Rupture (tR) for Al and Al-5 and Al-10 SiCp Composites
Material Condition ep (Pct) ep/eR (Pct) es (Pct) es/eR (Pct) et (Pct) et/eR (Pct) eR (Pct) tR (h)
Pure Al as rolled 0.65 63.7 0.30 29.4 0.07 6.9 1.02 83.52-TC 0.67 23.8 1.23 43.8 0.91 32.4 2.81 310.828-TC 0.40 3.4 4.5 38.8 6.7 57.8 11.6 2.45
Al-5 SiCp composite as rolled 0.7 41.2 0.6 35.3 0.4 23.5 1.7 36.62-TC 0.5 50 0.4 40 0.1 10 1.0 63.678-TC 0.5 41.7 0.6 50 0.1 8.3 1.2 16.4
Al-10 SiCp composite as rolled 0.7 26.9 1.4 53.8 0.5 19.2 2.6 23.32-TC 0.63 66.3 0.31 32.6 0.01 1.1 0.95 47.38-TC 0.74 42.3 0.86 49.1 0.15 8.6 1.75 55.8
3180—VOLUME 40A, DECEMBER 2009 METALLURGICAL AND MATERIALS TRANSACTIONS A

(a)
(b)
(c)
Fig. 12—Plots showing the creep strain rate against strain for the Aland the Al-5 and Al-10 SiCp composites in: (a) as-rolled, (b) 2-TC,and (c) 8-TC conditions. Creep tests were carried out at 350 �Cunder a stress of 21 MPa.
Fig. 13—Typical bright-field TEM images showing dislocationsubstructure developed in the samples of (a) 8-TC and crept pure Al,(b) 2-TC and crept Al-5 SiCp composite, and (c) 2-TC and creptAl-10 SiCp composite. Subgrain boundaries are arrowed.
METALLURGICAL AND MATERIALS TRANSACTIONS A VOLUME 40A, DECEMBER 2009—3181

the values of tR are higher for the 2-TC or 8-TCspecimens than for the as-rolled specimens. Furtherexamination of the data in Table III indicates thatamong the three investigated materials, the highestvalues of ep/eR are found for creep tests on the 2-TCspecimens. The longer fraction of the primary creepperiod, when the work-hardening rate is higher thanthat of recovery, is expected to contribute to enhance-ment of the creep resistance. The extent of the workhardening is related to the dislocation substructureformed during the primary creep stage, and this will bediscussed in Section II.
2. Effect of dislocation substructure A high density ofdislocations formed through thermal cycling is expectedto give rise to a high back stress, opposing furtherdislocation motion. Previous studies by Mishra et al.[15]
on the Al alloy-SiC composites have shown that theprestressing of samples leads to enhancement in thecreep strength, because the boundaries of smallersubgrains formed during exposure to higher stress resistdislocation motion. A smaller size of subgrain wouldmean a reduced mean free path for dislocation move-ment, and this would enhance the resistance to disloca-tion creep. Considering that the SiC particles are coarse(ignoring the effect of Al2O3 or Fe-rich finer particles)and their average interparticle spacing (Table I) is muchlarger than the experimentally determined subgrain sizes(Table II), it is expected that the substructure is stressdependent.[24,46] In an earlier study, Pandey et al.[24]
have shown that the creep behavior of the Al-10 SiCp
composite with particle sizes of 14.5 and 45.9 lmfollows the stress-controlled substructure model. Theaverage SiC particle sizes in the Al-5 and Al-10 SiCp
composites in the present study (as discussed in SectionIII–B–5–d–2) are of a similar order.
The lower minimum creep rate of the as-rolled Althan of either of the as-rolled composites (Figure 12(a))appears contradictory to the trend observed in themajority of earlier studies on pure Al and Al alloys andcomposites.[48] The higher creep resistance of pure Alobserved in the present study is attributed to the smallersubgrain size compared to that found in the Al-SiCcomposites (Table II), which is consistent with thelowest primary creep strain rate observed in the caseof the former material (Figure 12(a)). Furthermore, acomparison of the data in Table III indicates that thevalue of ep/eR for the as-rolled pure Al is higherthan that of both the as-rolled Al-SiCp composites(Table III). The higher value of ep/eR is responsible forthe greater work-hardening rate, which ensures that thesubgrain size is smaller and the time to rupture is greaterin the pure Al than in the Al-SiCp composites. Thesmaller subgrain size in pure Al could be due to thesmaller average spacing between the Al2O3 and Fe-richparticles in it than in the Al-SiCp composites (as men-tioned in Section III–B–1), and also because of theeffects of the crystallographic texture developed duringhot rolling. Of course, the effects of the crystallographictexture, if any, needs further research, and study in thisdirection is in progress. It has been shown[24,49] that thecreep strengthening due to presence of particulatereinforcements can be negligible, if the interparticle
spacing is much larger than the subgrain size. Undersuch conditions, the stress-dependent substructure con-trols the creep process.3. Effect of structural damage The greater tR observed
for the as-rolled and 2-TC Al than for the Al-5 andAl-10 SiCp composites subjected to similar mechanicaland thermal treatments (Table III) can be explained onthe basis of the density of the available sites for strainlocalization and crack initiation. The particle-matrixinterfaces are the sites for high strain localization,[50] andcavity formation is usually initiated at metal-ceramicparticle interfaces under elevated temperature creepconditions.[51] The composites contain both Al-SiC andAl-Al2O3 interfaces, while the pure Al contains only thelatter type of interface. It is intuitive that the strainlocalization at the Al-SiC interfaces is much greater thanthat at the Al-Al2O3 interfaces, because of the muchfiner size and spheroidal shape of the Al2O3 particles.Hence, the tertiary component of strain, which involvesthe formation and growth of voids, is much moreextended in the Al-SiCp composites than in the pure Al.However, the damage in the pure Al sample after 8thermal cycles far exceeds the strength contributed bythe decrease in the subgrain size and, as a result, thecreep strain rates increase.The observation of high strain rates at all three creep
regimes in the 8-TC Al samples (Figure 11(a)), the largeet, and the small eR (Table III) can be explained on thebasis of the significantly larger structural damage takingplace. The argument on structural damage in pure Al isstrongly supported by evidence from the direct exami-nation of the microstructure (Figure 4) as well as theelectrical resistivity, Young’s modulus, and micro-hardness measurements (Figures 8 through 10). Thebeneficial effect of thermal cycling on the creep resis-tance of the Al-5 or Al-10 SiCp composite samples isattributed to the much smaller structural damage(Figures 5, 6, and 9) and the strengthening of the matrixby the increase in dislocation density due to 2 and 8thermal cycles (Figure 10).
6. Creep fracture mechanismsTypical SEM (SE) images depicting the creep frac-
ture surfaces of the pure Al as well as the Al-5 andAl-10 SiCp composites are presented in Figures 14, 15,and 16, respectively. While Figures 14(a), 15(a), and16(a) show the creep fracture surfaces of as-rolled pureAl and the Al-5 and Al-10 SiCp composites, respec-tively, Figures 14(b), 15(b), and 16(b) represent sam-ples crept to failure after 2 or 8 thermal cycles, in thesame order as Figures 14(a), 15(a), and 16(a). TheSEM images of the fracture surfaces exhibit dimpleswith various sizes, which is suggestive of ductilerupture through the nucleation, growth, and coales-cence of microvoids. A careful examination of thefracture surfaces of the composites indicates that themajority of the dimples are associated with SiCparticles, indicating that the particle-matrix interfacesare the preferred sites for cavity nucleation. Further-more, it is intuitive that creep damage is also initiatedfrom the flaws in the Al matrix, particularly in thesamples subjected to thermal cycling.
3182—VOLUME 40A, DECEMBER 2009 METALLURGICAL AND MATERIALS TRANSACTIONS A

The average sizes of dimples present in the creepfracture surfaces have been measured by the imageanalysis of a large number of SEM micrographs, and areshown in Table IV. From this data (Table IV), it is clearthat the average dimple size changes significantly withthe number of thermal cycles in the pure Al and theAl-10 SiCp composite, but not as much in the case of theAl-5 SiCp composite. For both the as-rolled samples andthose subjected to 2 thermal cycles, there appears to be astrong correlation between the dimple size (Table IV)and the corresponding value of et/eR (Table III). Forexample, among the as-rolled materials subjected tocreep tests, both the largest average dimple size as wellas the highest value of et/eR are observed for the Al-10SiCp composite. Similarly, among the 2-TC and creptsamples, the pure Al has shown the highest values ofboth the average dimple size (Table IV) and et/eR(Table III). Furthermore, among the as-rolled samples,both the smallest average dimple size and the lowestet/eR have been observed in the case of pure Al. Inaddition, both the dimple sizes and rupture strains of the8-TC Al-5 and Al-10 SiCp composites are very similar.The correlation between the dimple size and et/eR isunderstandable, considering the contribution of thegrowth of voids to the total rupture strain, particularly
during tertiary creep. However, some exceptions that donot follow the relationship between the dimple size andet/eR are also obvious. First, the average dimple sizes ofthe 2-TC Al-5 and Al-10 SiCp composites are close toone another, in spite of the dissimilarity in their valuesof et/eR. In fact, the value of et/eR for the 2-TC Al-10SiCp composite is almost negligible, which implies thatcavity formation and growth might have occurredduring the secondary stage of creep as well. Second,among the 8-TC samples, the smallest average dimplesize has been observed in the fracture surfaces of thepure Al, in spite of the highest tertiary creep rate and eRrecorded in the creep tests. The second exception can beexplained on the basis of the role of tR in void growth orcoalescence. The short tR observed for the 8-TC pure Aldoes not allow sufficient time for the growth orcoalescence of cavities. It is apparent that the mostprobable failure mechanism is the linkage of themicrocavities. These observations suggest that finerdimples are formed from the nucleation of a largernumber of microcavities, while larger dimples come intoexistence due to the growth or coalescence of therelatively smaller cavities. Hence, it is inferred that thedimple size is a combined function of the density of
Fig. 14—SEM (SE) images depicting creep fracture surfaces of Al in(a) as-rolled condition and (b) after 2 thermal cycles.
Fig. 15—SEM (SE) images depicting creep fracture surfaces of Al-5SiCp composite in (a) as-rolled condition and (b) after 2 thermalcycles.
METALLURGICAL AND MATERIALS TRANSACTIONS A VOLUME 40A, DECEMBER 2009—3183

the void nucleation sites, et/eR, and tR. While the densityof the void nucleation sites is a function of the damagecaused by thermal cycling, the values of et/eR and tR arerelated to the creep performance of the composite.
C. Impact of This Study
The results of the present study have shown thatsubjecting pure Al and Al-SiCp composites to a limitednumber of thermal cycles between 500 �C and 0 �C withrapid quenching leads to improvements in strength and
an increase in rupture life for creep tests carried out at350 �C. The improvement is more significant in the caseof the composite than in the pure Al. The results of thepresent study contradict the proposition in an earlierreport[17] that the positive effect of quench hardening onthe creep characteristics of Al is not expected whencarrying out tests above 260 �C. The creep strain ratesand fracture behavior are controlled both by the extentof strengthening due to dislocation generation and bythe damage due to void formation by vacancy conden-sation on thermal cycling. Thus, thermal cycling param-eters and particulate reinforcement characteristics canbe optimized to achieve high creep resistance in the hot-worked DRA composites.
IV. CONCLUSIONS
The effect of thermal cycles between 500 �C and 0 �Con the microstructure, electrical resistivity, Young’smodulus, microhardness, and creep behavior of the pureAl and the Al-5 and Al-10 SiCp composites has beenevaluated. The conclusions drawn from the presentstudy are described as follows.The results of the microstructural study, the increase
in electrical resistivity, as well as the decrease in theYoung’s modulus and microhardness of the investigatedmaterials provide a relative estimate of the structuraldamage caused by thermal cycling. Pure Al is moreprone to damage by thermal cycling than Al-5 and Al-10SiCp composites, because the particle-matrix interfacesand dislocations formed to relax the CTE mismatchstrains act as sinks for vacancies in the composites.Subjecting to thermal cycles leads to a decrease in themicrohardness of Al, as a result of the damage caused byvoid generation. In contrast, the Al-SiCp compositesshow a reduction in microhardness on subjecting to 2thermal cycles and an increase after 8 thermal cycles,because the effect of strain hardening by dislocationgeneration exceeds that of structural damage for thelatter thermal treatment.A study of the creep behavior indicates that it is
controlled by the dislocation substructure in as-rolledcondition and after 2 thermal cycles. On the other hand,structural damage has a stronger effect on the creep rateof the samples subjected to 8 thermal cycles. The creepstrain rate decreases and the time to rupture increasesfor the Al and both the Al-SiCp composites after 2thermal cycles, probably because of the strengtheningeffects of the increased dislocation density and subgrainsize reduction. On subjecting samples to 8 thermalcycles, the creep resistance is most severely deterioratedin pure Al, but not as much in the composites. For theAl-10 SiCp composite, the highest time to rupture isachieved in the 8-TC sample, indicating that thermalcycling is beneficial for this material. Failure in creepoccurs both from pre-existing flaws in the matrix and bycavity formation at particle-matrix interfaces. Thedimple sizes of the fracture surfaces of the creptspecimens appear to be dependent primarily on the voiddensity, the tertiary creep component expressed as afraction of strain to rupture, and the time to rupture.
Fig. 16—SEM (SE) images depicting creep fracture surfaces of Al-10SiCp composite in (a) as-rolled condition and (b) after 8 thermalcycles.
Table IV. Average Sizes of Dimples in Fracture Surfaces
of Al and Al-5 and Al-10 SiCp Composite Samples Crept
to Rupture in As-Rolled Condition and after Thermal
Cycling for 2 and 8 Hours
Material
Dimple Size (lm) in Samples
As-Rolledand Crept
2-TCand Crept
8-TCand Crept
Pure Al 9.5 ± 2.3 23.2 ± 2.6 8.4 ± 2.1Al-5 SiCp composite 12.3 ± 1.7 12.8 ± 1.9 16.2 ± 1.9Al-10 SiCp composite 25 ± 1.8 13.6 ± 1.1 17.6 ± 1.6
3184—VOLUME 40A, DECEMBER 2009 METALLURGICAL AND MATERIALS TRANSACTIONS A
ACKNOWLEDGMENTS
The technical assistance rendered by Messrs. B.P.Mirdya and Bijon Das for XRD, Mr. R. Maiti for theSEM studies, Mr. Ranadhir Bose for the TEM studies,Messrs. B.C. Jena and B. Deb for the metallographicstudies, and Mr. S. Bhattacharya for creep testing isgratefully acknowledged.
REFERENCES1. A. Yehia, E. Bahei, G.J. Dvorak, and J.F. Wu: Compos. Sci.
Technol., 1992, vol. 43, pp. 207–19.2. M. Taya, W.D. Armstrong, and M. Dunn: Mater. Sci. Eng., A.,
1991, vol. 143, pp. 143–54.3. S.C. Tjong, K.F. Tam, and S.Q. Wu: Compos. Sci. Technol., 2003,
vol. 63, pp. 89–97.4. P.B. Hirsch, J. Silcox, R.K. Smallman, and K.H. Westmacott:
Philos. Mag., 1958, vol. 3, pp. 897–908.5. N. Shiotani, H. Kimura, R.R. Hasiguti, and R. Maddin: Acta
Metall., 1967, vol. 15, pp. 287–96.6. M. Hu, W.D. Fei, and C.K. Yao: Mater. Lett., 2002, vol. 56 (5),
pp. 637–41.7. T. Christman, A. Needleman, and S. Suresh: Acta Metall., 1989,
vol. 37, pp. 3029–50.8. K.K. Chawla: Metall. Mater. Trans. A, 2004, vol. 35A, pp. 37–43.9. Z. Trojanova, P. Luka, W. Riehemann, and B.L. Mordike: Mater.
Sci. Eng., 2002, vol. 324, pp. 122–26.10. W.D. Fei, M. Hu, and C.K. Yao: Mater. Sci. Eng., A., 2003,
vol. 356, pp. 17–22.11. J. Deng and T. Lee: Int. J. Mach. Tools Manuf., 2002, vol. 42,
pp. 245–50.12. F. Zhang, P. Sun, X. Li, and G. Zhang:Mater. Lett., 2001, vol. 49,
pp. 69–74.13. S. Pal, V.V. Bhanuprasad, and R. Mitra: Mater. Sci. Eng., A.,
2008, vol. A489, pp. 11–20.14. M.Y. Wu and O.D. Sherby: Scripta Metall., 1984, vol. 18, pp. 773–
76.15. R.S. Mishra, R.H. Lu, R.B. Grishaber, and A.K. Mukherjee:
Scripta Mater., 1998, vol. 38 (12), pp. 1819–24.16. D.H. Shin and S.W. Nan: Scripta Metall., 1982, vol. 16, pp. 313–
15.17. M.K. Jain, V.V. Bhanuprasad, S.V. Kamat, A.B. Pandey,
V.K. Varma, B.V.R. Bhat, and Y.R. Mahajan: Int. J. PowderMetall., 1993, vol. 29 (3), pp. 267–75.
18. ‘‘ASTM E 112–96e2 Standard Test Methods for DeterminingAverage Grain Size,’’ Annual Book of ASTM Standards, ASTM,Philadelphia, PA, 2003, pp. 1–26.
19. E.E. Underwood: in Quantitative Microscopy, R.T. DeHoff andF.H. Rhines, eds., McGraw-Hill Book Company, New York, NY,1968, pp. 78–124.
20. ‘‘ASTMC 1259-08e1 Standard Test Method for Dynamic Young’sModulus, Shear Modulus, and Poisson’s Ratio for AdvancedCeramics by Impulse Excitation of Vibration,’’ Annual Book ofASTM Standards, ASTM, Philadelphia, PA, 2001, section 15,pp. 1–18.
21. ‘‘ASTM E-8M-00 Standard Test Methods for Tension Testing ofMetallic Materials,’’ Annual Book of ASTM Standards, ASTM,Philadelphia, PA, 2000, pp. 1–22.
22. A.B. Pandey, R.S. Mishra, and Y.R. Mahajan: Scripta Metall.Mater., 1990, vol. 24, pp. 1565–70.
23. A.B. Pandey, R.S. Mishra, A.G. Paradkar, and Y.R. Mahajan:Acta Mater., 1997, vol. 45 (3), pp. 1297–1306.
24. A.B. Pandey, R.S. Mishra, and Y.R. Mahajan: Acta Metall.Mater., 1992, vol. 40 (8), pp. 2045–52.
25. J. Weertman: Trans. ASM, 1968, vol. 61, pp. 681–94.26. M.F. Ashby: Acta Metall., 1972, vol. 20, pp. 887–97.27. K.-T. Park, E.J. Lavernia, and F.A. Mohamed: Acta Metall.
Mater., 1990, vol. 38 (11), pp. 2149–59.28. G.ThomasandR.H.Willens:ActaMetall., 1964, vol. 12, pp. 191–96.29. F. Seitz: Acta Metall., 1953, vol. 1, pp. 355–69.30. L. Siegel and R. Resnick: Acta Metall., 1955, vol. 3, pp. 605–06.31. J.B. Adams and W.G. Wolfer: Acta Metall. Mater., 1993, vol. 41
(9), pp. 2625–32.32. S. Pal, R. Mitra, and V.V. Bhanuprasad: Mater. Sci. Eng., A,
2008, vol. 480, pp. 496–505.33. J.M. Papazian: Metall. Mater. Trans. A, 1998, vol. 19A, pp. 2945–
53.34. M.P. Thomas and J.E. King: J. Mater. Sci., 1994, vol. 29,
pp. 5272–78.35. G.M. Janowski and B.J. Pletka: Metall. Mater. Trans. A, 1995,
vol. 26A, pp. 3027–35.36. K.-C. Cen and C.-G. Chao: Metall. Mater. Trans. A, 1995,
vol. 26A, pp. 1035–43.37. N. Shiotani, H. Kimura, R.R. Hasiguti, and R. Maddin: Acta
Metall., 1967, vol. 15, pp. 287–96.38. E. Ruedl and E. Staroate: Mater. Res. Bull., 1966, vol. 1, pp. 215–
21.39. R.J. Arsenault and N. Shi: Mater. Sci. Eng., A, 1986, vol. 81,
pp. 175–87.40. M. Ashby, H. Shercliff, and D. Cebon: Materials Engineering,
Science, Processing and Design, Butterworth-Heinemann, Oxford,United Kingdom, 2007, pp. 311–43.
41. J. Lemaitre: A Course on Damage Mechanics, Springer-Verlag,Berlin, 1992.
42. R.C. Fowlweiler and F.R. Brotzen: Acta Metall., 1959, vol. 7,pp. 716–21.
43. K.K. Chawla and M. Metzer: J. Mater. Sci., 1972, vol. 7, pp. 34–39.
44. C.J. Tweed, N. Hansen, and B. Ralph: Metall. Trans. A, 1983,vol. 14A, pp. 2235–43.
45. S.S. Iyer and C.Y. Young: J. Appl. Phys., 1985, vol. 57 (10),pp. 4594–98.
46. R.S. Mishra: Scripta Metall. Mater., 1992, vol. 26, pp. 309–13.47. S.V. Raj and G.M. Pharr:Mater. Sci. Eng., 1986, vol. 81, pp. 217–
37.48. Y. Huang and T.G. Langdon: JOM, 2003, vol. 55 (1), pp. 15–20.49. R.S. Mishra, A.B. Pandey, K.S. Prasad, and A.K. Mukherjee:
Scripta Metall. Mater., 1995, vol. 33 (3), pp. 479–84.50. S.R. Nutt: in Interfaces in Metal Matrix Composites, A.K.
Dhingra and S.G. Fishman, eds., TMS, Warrendale, PA, 1986,pp. 157–67.
51. R. Raj: Proc. Int. Cong. Intergranular and Interphase Boundariesin Materials, Marc Aucouturier, ed., Coll. De Physique, Paris,1990, vol. 51, pp. C1-393–C1-401.
METALLURGICAL AND MATERIALS TRANSACTIONS A VOLUME 40A, DECEMBER 2009—3185


