Embed Size (px)
Citation preview
INTRODUCTION TO PHYSICAL METALLURGY
Second Edition
SIDNEY H. AVNER Professor New York City Community College City University of New York
McGRAW-HILL BOOK COMPANY
Auckland Bogots Guatemala Hamburg Lisbon London Madrid Mexico New Delhi Panama Paris San Juan SHo Paulo Singapore Sydney Tokyo

INTRODUCTION TO PHYSICAL METALLURGY INTERNATIONAL EDITION
Copyright @ 1974 Exclusive rights by McGraw-Hill Book Co - Singapore for manufacture and export. This book cannot be re-exported from the country to which it is consigned by McGraw-Hill.
Copyright @ 1974, 1964 by McGraw-Hill, Inc. All rights reserved. No part of this publication may be reproduced or distributed in any form or by any means, or stored in a data base or retrieval system, without the prior written permission of the publisher.
Library of Congress Cataloging in Publication Data
Avner, Sidney H Introduction to physical metallurgy.
Includes bibliographies. 1. Physical metallurgy. I. Title.
&A86 1974 669'.9 74-807 1 0-07-002499-5
ten ordering this title use ISBN 0-07-Y85018-6
CONTENTS
Preface Introduction
1. Tools of the Metallurgist 2. Metal Structure and Crystallization 3. Plastic Deformation 4. Annealing and Hot Working 5. Constitution of Alloys 6. Phase Diagrams 7. The Iron-Iron Carbide Equilibrium Diagram 8. The Heat Treatment of Steel 9. Alloy Steels
10. Tool Steels 11. Cast Iron 12. Nonferrous Metals and Alloys 13. Metals at High and Low Temperatures 14. Wear of Metals 15. Corrosion of Metals 16. Powder Metallurgy 17. Failure Analysis
Appendix: Temperature-conversion Table Glossary Index
v vii 1
65 107 129 147 155 225, 249 349 387 423 461 547 567 583 605 633
inted in Singapore
PREFACE
Kenny, and Jeffrey, in whose hands the future lies
The emphasis of the second edition of this text remains on the basic con- cepts and applications of physical metallurgy.
The level of this edition is also essentially unchanged. The text is still considered appropriate for the teaching of physical metallurgy to students who are not majors in metallurgy as well as to engineering students as an introductory course. It has also proved useful for technician training pro- grams in industry. The fundamental concepts are still presented in a sim- plified form yet as accurately as possible. The only background required is an elementary course in physics.
During the past decade, the first edition of this text was found to be quite effective, and many favorable comments were received from both students and faculty members. However, advances in certain areas and suggestions from users have necessitated a revision of the first edition.
The following is a summary of the most notable improvements in the second edition:
In Chapter 1 , which covers some of the important tools and tests in the field of metallurgy, the section on nondestructive testing has been ex- panded to include eddy current testing and holography. The latest ASTM code has been used in the section on hardness testing.
Some changes have been made in Chapter 2 in order to make the simpli- fied explanation of atomic and metal structure more understandable. A brief explanation of x-ray diffraction and grain size measurement was added.
Chapters 3 and 4 which cover the fundamentals of plastic deformation and the effect of heat on cold-worked materials remain essentially the same except for an expanded discussion of dislocations and fracture.
Chapter 6, on binary phase diagrams, now includes diffusion, a more detailed explanation of the theory of age hardening, and more actual phase diagrams as illustrations.
Chapter 7 which considers the iron-iron carbide equilibrium diagram in some detail now also discusses wrought iron and the effect of small quantities of other elements on the properties of steel.
The section on case hardening of steel in Chapter 8 has been expanded to include a more detailed explanation of nitriding, flame hardening and induction hardening. A section on hardenable carbon steels has also been added.
In Chapter 9, the portion on stainless steels now encompasses new sections on precipitation-hardening stainless steels, maraging steels, and ausforming.
In Chapter 10 the section on cemented carbide tools has been expanded and a new section on ceramic tools has been added.
Chapter 11 now covers only cast iron and has been enhanced by addi- tional diagrams.
The numerous additional photomicrographs added to Chapter 72 il- lustrate various nonferrous microstructures. An entire section on titanium and titanium alloys has been included because of their increased com- mercial importance.
The chapter on wear of metals has been moved next to the one on cor- rosion of metals to improve the continuity of subject matter.
Chapter 15 now discusses the corrosion of metals in greater detail. A brief discussion of the powder metallurgy processing techniques has
been added to Chapter 16. There are two major changes in this edition as compared to the first
edition.
1. The replacement of Chapter 17 on extractive metallurgy by an entirely new chap- ter on failure analysis. It was felt that extractive metallurgy was not really part of physical metallurgy and that a chapter on failure analysis would be of greater in- terest and value t o technicians and engineers. 2. The addition of a glossary of terms related to physical metallurgy.
There IS very little on the details of operation of heat-treating and testing equipment since they are covered in the laboratory course which is taken in conjunction with the theory course.
Numerous photomicrographs have been used to illustrate typical struc- tures. Many tables have been included to present representative data on commercial alloys.
The aid received from the following people in reading portions of the manuscript or in preparations of photomicrographs for the first edition is gratefully acknowledged: J.E. Krauss, G. Cavaliere, A. Dimond, A. Smith, A. Cendrowski, J. Sadofsky, C. Pospisil, T. Ingraham. J. Kelch, and 0. Kammerer. Many companies have contributed generously from their pub- lications and credit is given where possible.
I make no particular claim for originality of material. The information of other al~thors and industrial companies has been drawn upon. The only justification for this book, then, lies in the particular topics covered, their sequence, and the way in which they are presented.
I would like to express my appreciation to Miss Barbara Worth for typing most of the first edition manuscript, to Mrs. Helen Braff and Mrs. Lillian Schwartz for typing the second edition material, and finally to my wife, without whose patience and understanding this book could never have been written.
Sidney H. Avner
Metallurgy is the science and technology of metals. It is beyond the scope of this text to cover the development of metallurgy as a science. Only certain highlights will be mentioned here for the purpose of orientation.
The worker of metals is mentioned in the Bible and in Greek and Norse mythology. Metallurgy as an art has been practiced since ancient times. Ancient man knew and used many native metals. Gold was used for orna- ments, plates, and utensils as early as 3500 B.C. The art of smelting, refin- ing, and shaping metals was highly developed by both the Egyptians and the Chinese. The ancient Egyptians knew how to separate iron from its ore and that steel had the ability to harden. but iron was not used widely before 1000 B.C. Iron was not popular with ancient people because of its tendency to rust, and they preferred working with gold, silver, copper, brass, and bronze.
Knowledge of dealing with metals was generally passed directly from master to apprentice in the Middle Ages, leading to an aura of super- stition surrounding many of the processes. Very little was written on metal- lurgical processes until Biringuccio published his "Pirotechnia" in 1540, followed by Agricola's "De Re Metallurgica" in 1556. In succeeding years, much knowledge was added to the field by people trying to duplicate the composition and etched structure of Damascus steel.
Until the beginning of the last quarter of the nineteenth century, most investigations of metal structure had been macroscopic (by eye) and super- ficial. The science of the structure of metals was almost nonexistent. The situation was ripe for the detailed attention of individuals whose back- ground was more scientific than practical. The individual most responsible for the period of rapid development that followed was Henry Clifton Sorby.
Sorby was an amateur English scientist who started with a study of meteorites and then went on to study metals.
In September 1864, Sorby presented a paper to the British Association for the Advancement of Science iil which he exhibited and described a number of microscopical photographs of various kinds of iron and steel. This paper marks the beginning of metallography, the field concerned with the use of the microscope to study the structure of metals. It seems that while many people appreciated the value of Sorby's studies at the time they were done, none of them had sufficient interest to develop the technique independently, and metallography lay dormant for almost twenty years.
Additional work by Martens in Germany (1878) revived Sorby's interest in metallurgical problems, and in 1887 he presented a paper to the tron and Steel Institute which summarized all his work in the field. Considerable attention was now generated by both scientists and industrial metal- lurgists in other countries. In the early part of the twentieth century, Albert Sauveur convinced American steel companies that the microscope was a practical tool to aid in the manufacture and heat treatment of steel.
About 1922, more knowledge of the structure and properties of metals was added by the application of x-ray diffraction and wave mechanics.
Metallurgy is really not an independent science since many of its funda- mental concepts are derived from physics, chemistry, and crystallography.
The metallurgist has become increasingly important in modern tech- nology. Years ago, the great majority of steel parts were made of cheap low- carbon steel that would machine and fabricate easily. Heat treatment was reserved largely for tools. Designers were unable to account fcr structural inhomogeneity, surface defects. etc., and it was considered good practice to use large factors of safety. Consequently, machines were much heavier than they should have been, and the weight was considered a mark of quality. This attitude has persisted, to some extent, to the present time but has been discouraged under the leadership of the aircraft and automotive industries. They have emphasized the importance of the strength-weight ratio in good design, and this has led to the development of new high- strength, lightweight alloys.
New technical applications and operating requirements pushed to higher levels have created a continued need for the development of new alloys. For example, an exciting development has been the Wankel rotary engine- an internal combustion engine of unusual design that is more compact, lighter, and mechanically far simpler than the ordinary reciprocating piston motor of equivalent horsepower. A particularly bothersome problem has been the seals between the rotor and the metal wall. Originally, the seals were made of carbon and seldom lasted more than 20,000 miles. Research developed a new sintered titanium-carbide alloy seal which has given life- times of up to 100,000 miles.
The metallurgical field may be divided into two large groups:
1. Process or extractive metallurgy-the science of obta~ning metals from the~r ores, includtng mining, concentration, extraction. and refining metals and alloys. 2. Physical metallurgy-the science concerned with the physical and mechanical characteristics of metals and alloys. This field studies the properties of metals and alloys as affected by three variables:
a. Chemical composition-the chemical constituents of the alloy b. Mechanical treatment-any operation that causes a change in shape such as rolling, draw~ng, stamping, forming, or machining c. Thermal or heat treatment-the effect of temperature and rate of heating and cool~ng
REFERENCES
Hoover and Hoover: "Georgius Agricola's De Re Metailurgica." Dover Publications, New York, 1912. b
Howe, H. M.: The Metallurgy of Steel, The Engineering and Mining Journal, 1st ed., New York, 1890.
Rickard, Thomas': "Man and Metals," McGraw-Hill Book Company, New York, 1932. Sauveur, Albert: "The Metallography and Heat Treatment of Iron and Steel," 4th ed.,
McGraw-Hill Book Company, New York, 1935. Smith and Gnudi: "Pirotechnia of Vannoccia Biringuccio," American Institute of
Mining and Metallurgical Engineers, New York, 1943. Smith, Cyril Stanley: "A History of Metallography," University of Chicago Press,
1960. Sullivan, F.: "The Story of Metals," American Society for Metals, Metals Park. Ohio,
viii 1951.
TOOLS OF THE I METALLURGIST
The purpose of this chapter is to glve the student an understanding of some of the common tools and tests that are used in the metallurgical field.
1.1 Temperature Scales In scientific research and in most foreign countries, the standard temperature-measuring scale is the centigrade scale. How- ever. in American industrial plants, the Fahrenheit scale is used almost exclusively. Therefore, all references to temperature in this book will be in terms of the Fahrenheit scale since this is the one most likely to be en- countered by the industrial technician. Conversion from one scale to the other may be made by the following equations:
'C = 5:9 - 32 (1.1)
"F = 9:5 'C + 32 (1.2)
The accuracy with which temperatures are measured and controlled will determine the successful operation of some metallurgical processes such as casting, smelting, refining, and heat treatment. It will also have
a profound effect on the strength properties of many metals and alloys.
TEMPERATURE MEASUREMENT
In order to understand the effect of thermal treatment on the properties, it is necessary to have some knowledge of how temperature is measured.
Pyrometry deals with the measurement of elevated temperatures, gen- erally above 950"F, 5nd instruments used for this purpose are known as pyrometers. 155 2. -
Thermometry deals with the measurement of temperatures below 950°F, and instruments for this purpose are known as thermometers.
1.2 Temperature Measurement by Color One of the simplest methods of esti; mating the temperature of a metal is by noting the color of the hot body. There is an apparent correlation between the temperature of a metal and
2 INTRODUCTION TO PHYSICAL METALLURGY
TABLE 1 .1 Variation of Color with Temperature
COLOR TEMP.. "F
TOOLS OF THE METALLURGIST 3
Farnt red Dark red Dark cherry Cherry red Bright cherry Dark orange Orange Yellow
its color, as shown by Table 1.1. Except when applied by an experienced observer, this method will give only rough temperature estimates. The principal difficulty is that judgment of color varies with the individual. Other sources of error are that the color may not be uniform and may vary somewhat with different materials.
If a continuous indication or recording of temperature is required, then the instruments in use may be divided into two general classifications: (1) mechanical systems that deal essentially with the expansion of a metal, a liquid, a gas or vapor; and (2) electrical systems which deal with resis- tance, thermocouple, radiation, and optical pyrometers.
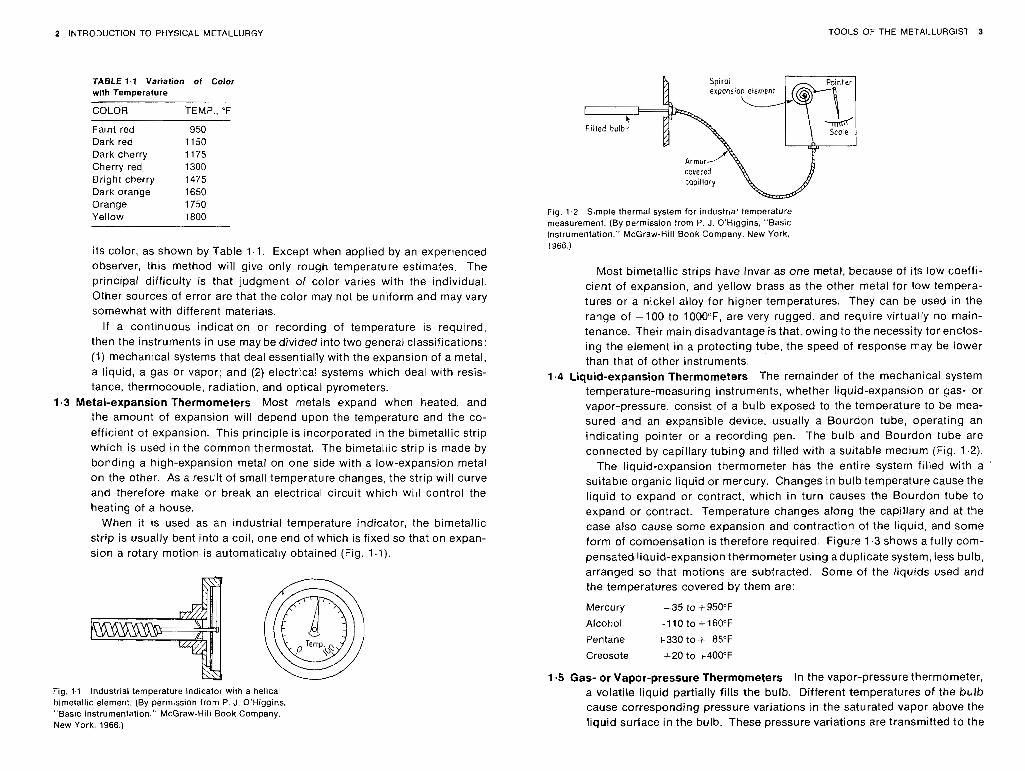
1.3 Metal-expansion Thermometers Most metals expand when heated, and the amount of expansion will depend upon the temperature and the co- efficient of expansion. This principle is incorporated in the bimetallic strip which is used in the common thermostat. The bimetallic strip is made by bonding a high-expansion metal on one side with a low-expansion metal on the other. As a result of small temperature changes, the strip will curve and therefore make or break an electrical circuit which will control the heating of a house.
When it is used as an industrial temperature indicator, the bimetallic strip is usually bent into a coil, one end of which is fixed so that on expan- sion a rotary motion is automatically obtained (Fig. 1.1).
Fig. 1.1 Industrial temperature indicator with a h e l m bimetallic element. (By permission from P. J. O'Higgins. "Basic Instrumentation," McGraw-Hill Book Company. New York, 1966.)
covered c~~i i lory \
Fig. 1.2 S~mple thermal system for industrial temperature measurement. (By permission from P. J. O'Higgins, "Basic Instrumentation." McGraw-Hill Book Company. New York. I966.)
Most bimetallic strips have lnvar as one metal, because of its low coeffi- cient of expansion, and yellow brass as the other metal for low tempera- tures or a nickel alloy for higher temperatures. They can be used in the range of -100 to 1000"F, are very rugged, and require virtually no main- tenance, Their main disadvantage is that. owing to the necessity for enclos- ing the element in a protecting tube, the speed of response may be lower than that of other instruments.
1.4 Liquid-expansion Thermometers The remainder of the mechanical system temperature-measuring instruments, whether liquid-expansion or gas- or vapor-pressure, consist of a bulb exposed to the temperature to be mea- sured and an expansible device, usually a Bourdon tube, operating an indicating pointer or a recording pen. The bulb and Bourdon tube are connected by capillary tubing and filled with a suitable medium (Fig. 1.2).
The liquid-expansion thermometer has the entire system filled with a suitable organic liquid or mercury. Changes in bulb temperature cause the liquid to expand or contract, which in turn causes the Bourdon tube to expand or contract. Temperature changes along the capillary and at the case also cause some expansion and contraction of the liquid, and some form of compensation is therefore required. Figure 1.3 shows a fully com- pensated.liquid-expansion thermometer using a duplicate system, less bulb, arranged so that motions are subtracted. Some of the liquids used and the temperatures covered by them are:
Mercury -35 to +950°F Alcohol -110 to -160°F Pentane +330 to + 85°F Creosote +20 to +400°F
1-5 Gas- or Vapor-pressure Thermometers In the vapor-pressure thermometer, a volatile liquid partially fills the bulb. Different temperatures of the bulb cause corresponding pressure variations in the saturated vapor above the tiquid surface in the bulb. These pressure variations are transmitted to the
4 INTRODUCTION TO PHYSICAL METALLURGY TOOLS OF THE METALLURGIST 5
Auxiliary
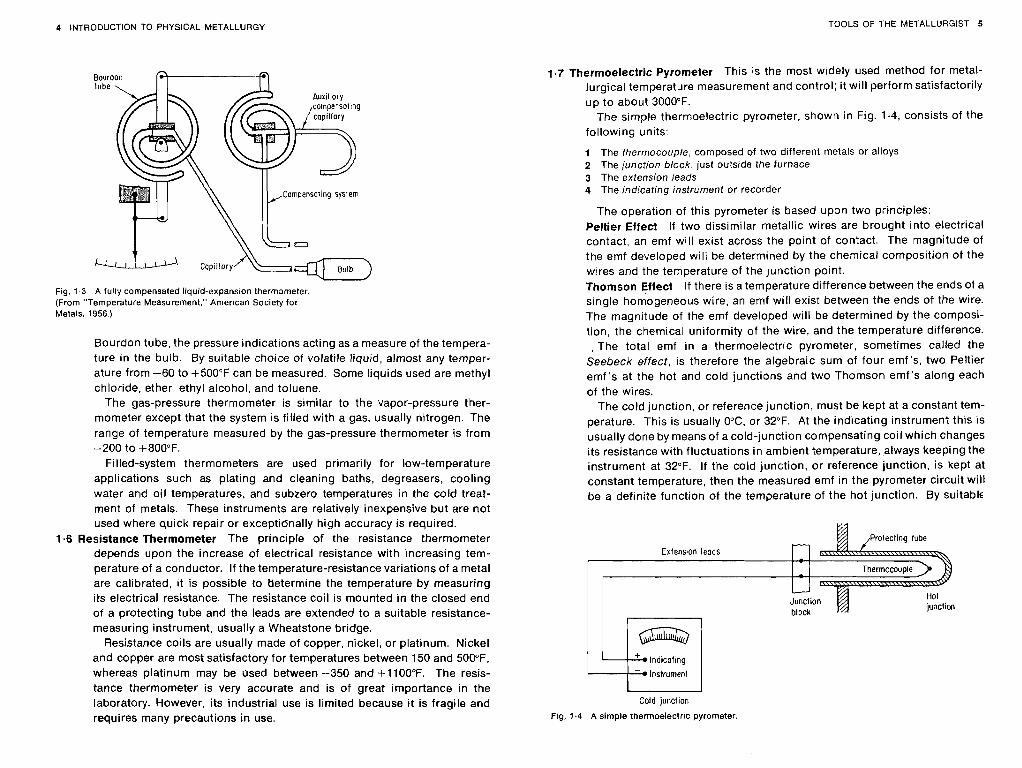
Fig. 1.3 A fully compensated liquid-expansion thermometer (From "Temperature Measurement," American Society for Metals, 1956.)
Bourdon tube, the pressure indications acting as a measure of the tempera- ture in the bulb. By suitable choice of volatile liquid, almost any temper- ature from -60 to +500°F can be measured. Some liquids used are methyl chloride, ether, ethyl alcohol, and toluene.
The gas-pressure thermometer is similar to the vapor-pressure ther- mometer except that the system is filled with a gas, usually nitrogen. The range of temperature measured by the gas-pressure thermometer is from -200 to +800°F.
Filled-system thermometers are used primarily for low-temperature applications such as plating and cleaning baths, degreasers, cooling water and oil temperatures, and subzero temperatures in the cold treat- ment of metals. These instruments are relatively inexpensive but are not used where quick repair or exceptionally high accuracy is required.
1.6 Resistance Thermometer The principle of the resistance thermometer depends upon the increase of electrical resistance with increasing tem- perature of a conductor. If the temperature-resistance variations of a metal are calibrated, it is possible to tfetermine the temperature by measuring its electrical resistance. The resistance coil is mounted in the closed end of a protecting tube and the leads are extended to a suitable resistance- measuring instrument, usually a Wheatstone bridge.
Resistance coils are usually made of copper, nickel, or platinum. Nickel and copper are most satisfactory for temperatures between 150 and 50(Y"F, whereas platinum may be used between -350 and +110O0F. The resis- tance thermometer is very accurate and is of great importance in the laboratory. However, its industrial use is limited because it is fragile and requires many precautions in use.
1.7 Thermoelectric Pyrometer This is the most widely used method for metal- lurgical temperature measurement and control; it will perform satisfactorily up to about 3000°F.
The simple thermoelectric pyrometer, shown in Fig. 1.4, consists of the following units:
1 The thermocouple, composed of two different metals or alloys 2 The junction block, just outside the furnace 3 The extension leads 4 The indicatrng instrument or recorder
The operation of this pyrometer is based upon two principles: Peltier Effect If two dissimilar metallic wires are brought into electrical contact, an emf will exist across the point of contact. The magnitude of the emf developed will be determined by the chemical composition of the wires and the temperature of the junction point. Thomson Effect If there is a temperature difference between the ends of a single homogeneous wire, an emf will exist between the ends of the wire. The magnitude of the emf developed will be determined by the composi- tion, the chemical uniformity of the wire, and the temperature difference. , The total emf in a thermoelectric pyrometer, sometimes called the
Seebeck effect, is therefore the algebraic sum of four emf's, two Pettier emf's at the hot and cold junctions and two Thomson emf's along each of the wires.
The cold junction, or reference junction, must be kept at a constant tem- perature. This is usually 0%. or 32°F. At the indicating instrument this is usually done by means of a cold-junction compensating coil which changes its resistance with fluctuations in ambient temperature, always keeping the instrument at 32°F. It the cold junction, or reference junction, is kept at constant temperature, then the measured emf in the pyrometer circuit will be a definite function of the temperature of the hot junction. By suitable
,Proieclinq lube
Cold junciion
Fig. 1.4 A simple thermoelectric pyrometer.
6 JNTRODUCTION TO PHYSICAL METALLURGY TOOLS OF THE METALLURGIST 7
- - -- - - - - -
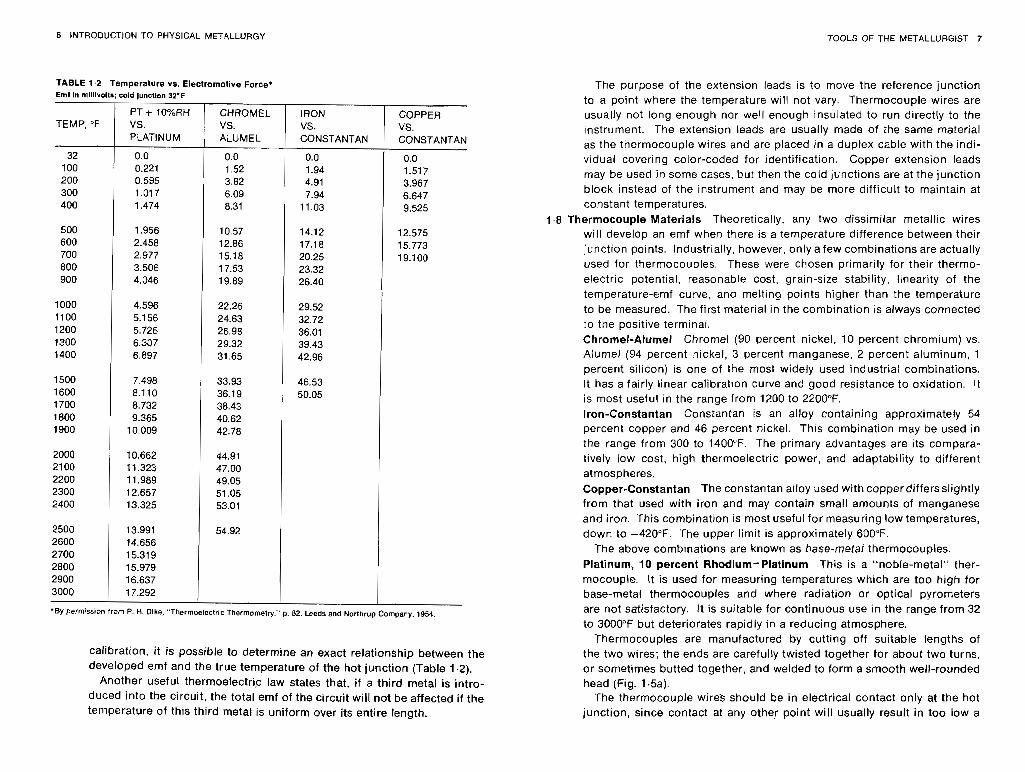
*By perm5sslon from P H Dike, Thermoelectr~c Thermomelry, ' p 82, Leeds and Northrup Company, 1954
TABLE 1.2 Temperature vs. Electromotive Force* Eml in millivolts; cold junction 32.F
calibration, i t is possible to determine an exact relationship between the developed emf and the true temperature of the hot junction (Table 1.2).
Another usefut thermoelectric law states that, if a third metal is intro- duced into the circuit, the total emf of the circuit will not be affected if the temperature of this third metal is uniform over its entire length.
TEMP, "F
The purpose of the extension leads is to move the reference junction to a point where the temperature will not vary. Thermocouple wires are usually not long enough nor well enough insulated to run directly to the ~nstrument. The extension leads are usually made of the same material as the thermocouple wires and are placed in a duplex cable with the indi- vidual covering color-coded for identification. Copper extension leads may be used in some cases, but then the cold junctions are at the junction block instead of the instrument and may be more difficult to maintain at constant temperatures.
1.8 Thermocouple Materials Theoretically, any two dissimilar metallic wires will develop an emf when there is a temperature difference between their junction points. Industrially, however, only afew combinations are actually used for thermocouples. These were chosen primarily for their thermo- electric potential, reasonable cost, grain-size stability, linearity of the temperature-emf curve, and melting points higher than the temperature to be measured. The first material in the combination is always connected to the positive terminal. Chromel-Alumel Chromel (90 percent nickel, 10 percent chromium) vs. Alumel (94 percent nickel, 3 percent manganese, 2 percent aluminum, 1 percent silicon) is one of the most widely used industrial combinations. It has a fairly linear calibration curve and good resistance to oxidation. It is most useful in the range from 1200 to 2200°F. Iron-Constantan Constantan is an alloy containing approximately 54 percent copper and 46 percent nickel. This combination may be used in the range from 300 to 1400°F. The primary advantages are its compara- tively low cost, high thermoelectric power, and adaptability to different atmospheres. Copper-Constantan The constantan alloy used with copperdiffersslightly from that used with iron and may contain small amounts of manganese and iron. This combination is most useful for measuring low temperatures, down to -420°F. The upper limit is approximately 600°F.
The above combinations are known as base-metal thermocouples. Platinum, 10 percent Rhodium-Platinum This is a "noble-metal" ther- mocouple. It is used for measuring temperatures which are too high for base-metal thermocouples and where radiation or optical pyrometers are not satisfactory. It is suitable for continuous use in the range from 32 to 3000°F but deteriorates rapidly in a reducing atmosphere.
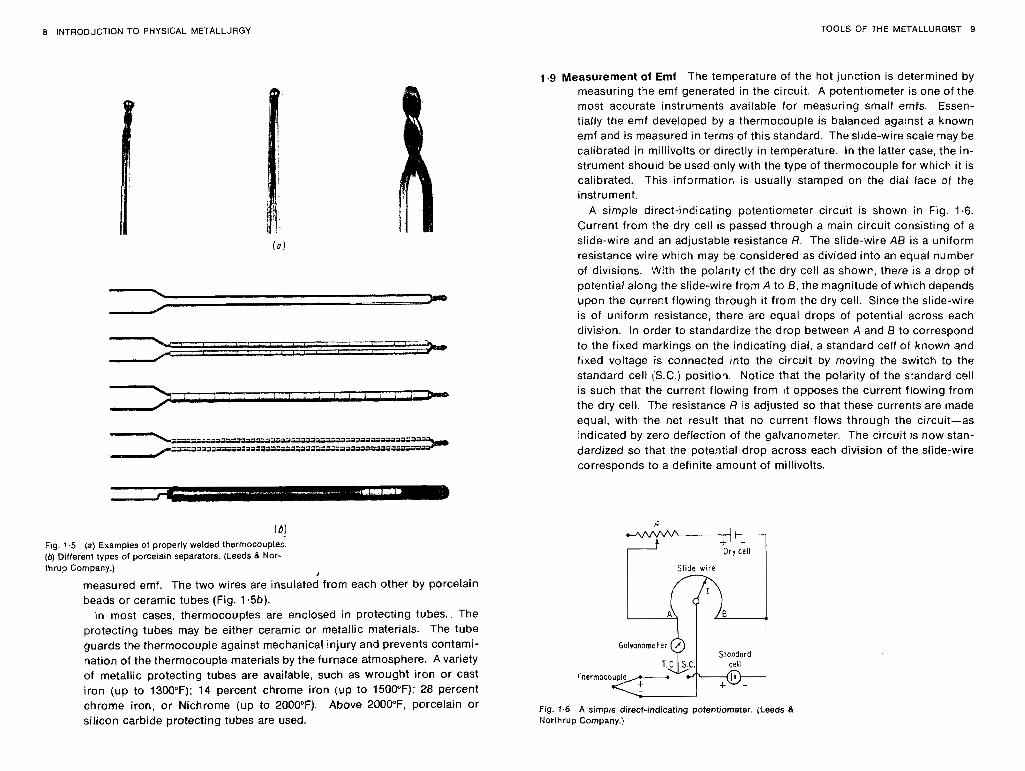
Thermocouples are manufactured by cutting off suitable lengths of the two wires; the ends are carefully twisted together for about two turns. or sometimes butted together, and welded to form a smooth well-rounded head (Fig. 1.5a).
The thermocouple wires should be in electrical contact only at the hot junction, since contact at any other point will usually result in too low a
PT + 10%RH CHROMEL VS. VS. PLATINUM 1 ALUMEL
IRON COPPER VS. CONSTANTAN
VS. CONSTANTAN
8 INTRODUCTION TO PHYSICAL METALLURGY TOOLS OF THE METALLURGIST 9
(bj Fig. 1.5 (a) Examples of properly welded thermocouples. (b) Different types of porcelain separators. (Leeds & Nor- thrup Company.)
I
measured emf. The two wires are insulated from each other by porcelain beads or ceramic tubes (Fig. 1 6 b ) .
In most cases, thermocouples are enclosed in protecting tubes.. The protecting tubes may be either ceramic or metallic materials. The tube guards the thermocouple against mechanical injury and prevents contami- nation of the thermocouple materials by the furnace atmosphere. Avariety of metallic protecting tubes are available, such as wrought iron or cast iron (up to 1300°F); 14 percent chrome iron (up to 1500°F); 28 percent chrome iron, or Nichrome (up to 2000°F). Above 2000"F, porcelain or silicon carbide protecting tubes are used.
1.9 Measurement of Emf The temperature of the hot junction is determined by measuring the emf generated in the circuit. A potentiometer is one of the most accurate instruments available for measuring small emfs. Essen- tially the emf developed by a thermocouple is balanced against a known emf and is measured in terms of this standard. The slide-wire scale may be calibrated in millivolts or directly in temperature. In the latter case, the in- strument should be used only with the type of thermocouple for which it is calibrated. This information is usually stamped on the dial face of the instrument.
A simple direct-indicating potentiometer circuit is shown in Fig. 1.6. Current from the dry cell is passed through a main circuit consisting of a slide-wire and an adjustable resistance R. The slide-wire AB is a uniform resistance wire which may be considered as divided into an equal number of divisions. With the potarity of the dry cell as shown, there is a drop of potential along the slide-wire from A to B, the magnitude of which depends upon the current flowing through it from the dry cell. Since the slide-wire is of uniform resistance, there are equal drops of potential across each division. In order to standardize the drop between A and 8 to correspond to the fixed markings on the indicating dial, a standard cell of known and fixed voltage is connected into the circuit by moving the switch to the standard cell (S.C.) position. Notice that the polarity of the standard cell is such that the current flowing from it opposes the current flowing from the dry cell. The resistance R is adjusted so that these currents are made equal, with the net result that no current flows through the circuit-as indicated by zero deflection of the galvanometer. The circuit is now stan- dardized so that the potential drop across each division of the slide-wire corresponds to a definite amount of millivolts.
Dry cell
Fig. 1.6 A simple direct-indicating potentcometer. (Leeds 8 Norihrup Company.)
10 INTRODUCTION TO PHYSICAL METALLURGY TOOLS OF THE METALLURGIST 11
When the emf of the thermocouple is to be measured, it replaces the standard cell in the circuit by moving the switch to the thermocouple (T.C.) position. The thermocouple must be properly connected so that the current flowing from it opposes the flow of current from the dry cell. The circuit is balanced, not by adjusting the resistance R, but by adjusting the resistance of that portion of the slide-wire which is contained in the ther- mocouple circuit. This adjustment is made by turning the indicator dial until the galvanometer reads zero. At this point, the drop of potential through the slide-wire up to the point of contact is equal to the emf of the thermocouple, and the millivolts may be read directly on the slide-wire scale. Reference to a suitable calibration table, such as Table 1.2, for the particular thermocouple being used will allow the conversion of millivolts to temperature, or the temperature may be read directly if the dial is so calibrated.
Since the cold ji.rnction at the instrument is usually higher than the stan- dard cold junction (32"F), it is necessary to compensate for this variation. The compensation may be made manually, or automatically by a tem- perature-sensitive resistor called a cold-junction compensator. In contrast to most materials, the cold-junction compensator has a negative tempera- ture resistance coefficient. This means that its resistance decreases with increasing temperature. It will, therefore, maintain the cold junction at a constant temperature by balancing any change in resistance as the instru- ment temperature varies.
1 . I0 Recording and Controlling Pyrorneter In most industrial installations, the instrument is required to do more than simply indicate temperature. The pointer of the potentiometer may be replaced by a pen that moves over a traveling chart to obtain a complete record of the temperature. This is called a recording pyrometer. The instrument, through the use of electric circuits, may also be used to control the flow of gas to the burners or electricity to the heating elements, and thereby maintain a constant pre- determined furnace temperature. Th-is is called a controlling pyrometer. It is possible to design the instrument to record and control the temperature from one or more thermocouples.
1 ,I1 Radiation Pyrometer The basic principles of the operation of the radiation pyrometer involve a standard radiating source known as a blackbody. A blackbody is a hypothetical body that absoibs all the radiation that falls upon it. Such a body radiates energy at a higher rate than any other body at the same temperature. Radiation pyrometers are generally calibrated to indicate blackbody or true temperatures. The Stefan-Boltzmann law, which is the basis for the temperature scale of radiation pyrometers, shows that the rate of radiant energy from a blackbody is proportional to the.fourth power of its absolute temperature.
where W = rate at which energy is emitted by a blackbody K = proportionality constant T = absolute temperature of blackbody
The apparent temperature measured from non-blackbody materials will always be lower than the true temperature. This is due to the emissivity of the material, which is defined as the ratio of the rate at which radiant energy is emitted from the non-blackbody material to the rate of that emitted from a blackbody at the same temperature. Hence
W = Ke,T4 - KT,' (1.4)
where T, = apparent absolute temperature of non-blackbody measured by pyrometer
e, = total emissivity of non-blackbody Therefore, knowing the total emissivity of the material, the indicated pyrom- eter temperature may be easily corrected to the true absolute temperature that would be read by the pyrometer under blackbody conditions.
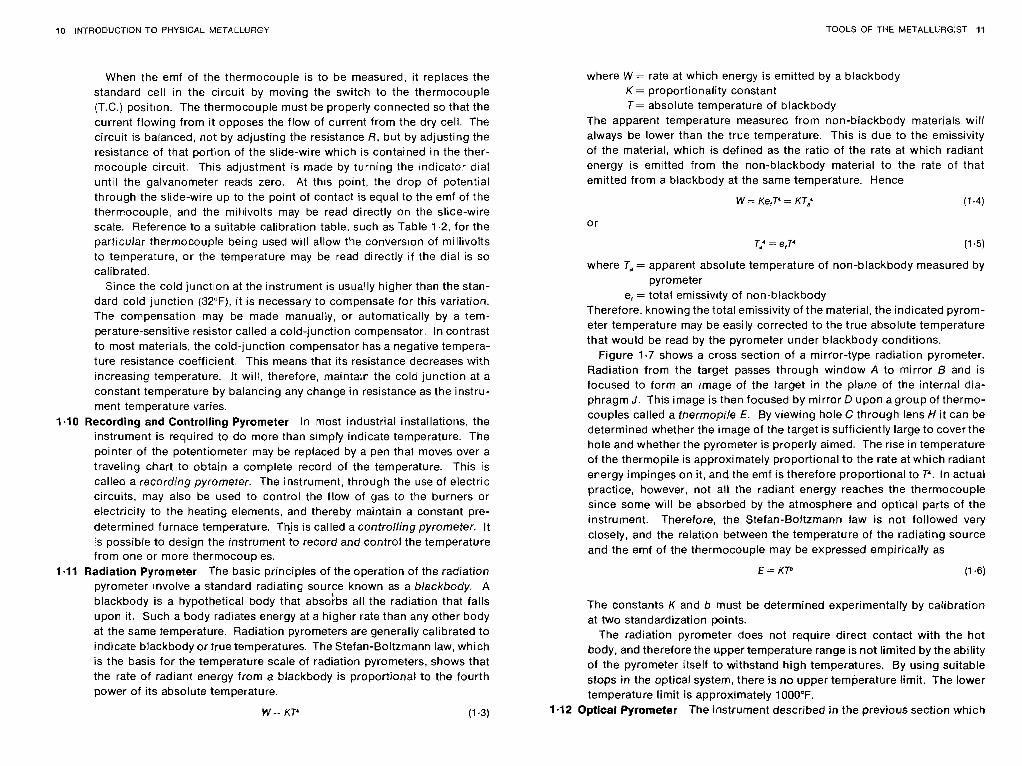
Figure 1.7 shows a cross section of a mirror-type radiation pyrometer. Radiation from the target passes through window A to mirror B and is focused to form an image of the target in the plane of the internal dia- phragm J. This image is then focused by mirror D upon a group of thermo- couples called a thermopile E. By viewing hole C through lens H i t can be determined whether the image of the target is sufficiently large to cover the hole and whether the pyrometer is properly aimed. The rise in temperature of the thermopile is approximately proportional to the rate at which radiant energy impinges on it, and the emf is therefore proportional to T4. In actual practice, however, not all the radiant energy reaches the thermocouple since some will be absorbed by the atmosphere and optical parts of the instrument. Therefore, the Stefan-Boltzrnann law is not followed very closely, and the relation between the temperature of the radiating source and the emf of the thermocouple may be expressed empirically as
The constants K and b must be determined experimentally by calibration at two standardization points.
The radiation pyrometer does not require direct contact with the hot body, and therefore the upper temperature range is not limited by the ability of the pyrometer itself to withstand high temperatures. By using suitable stops in the optical system, there is no upper temperature limit. The lower temperature limit is approximately 1000°F.
1.12 Optical Pyrometer The instrument described in the previous section which
12 INTRODUCTION TO PHYSICAL METALLURGY TOOLS OF THE METALLURGIST 13
Fig. 1.7 A mirror-type radiation pyrometer. (Leeds S Nor- thrup Company.)
responded to all wavelengths of radiation is known as a total-radiation pyrometer. While the general principles on which the optical pyrometer is based are the same as for the radiation pyrometer, they differ in that the optical pyrometer makes use of a single wavelength or a narrow band of wavelengths in the visible part of the spectrum. The optical pyrometer measures temperature by comparing the brightness of light emitted by the source with that of a standard source. To make the color comparison easier, a red filter is used which restricts the visible radiation to only the wavelength of red radiation.
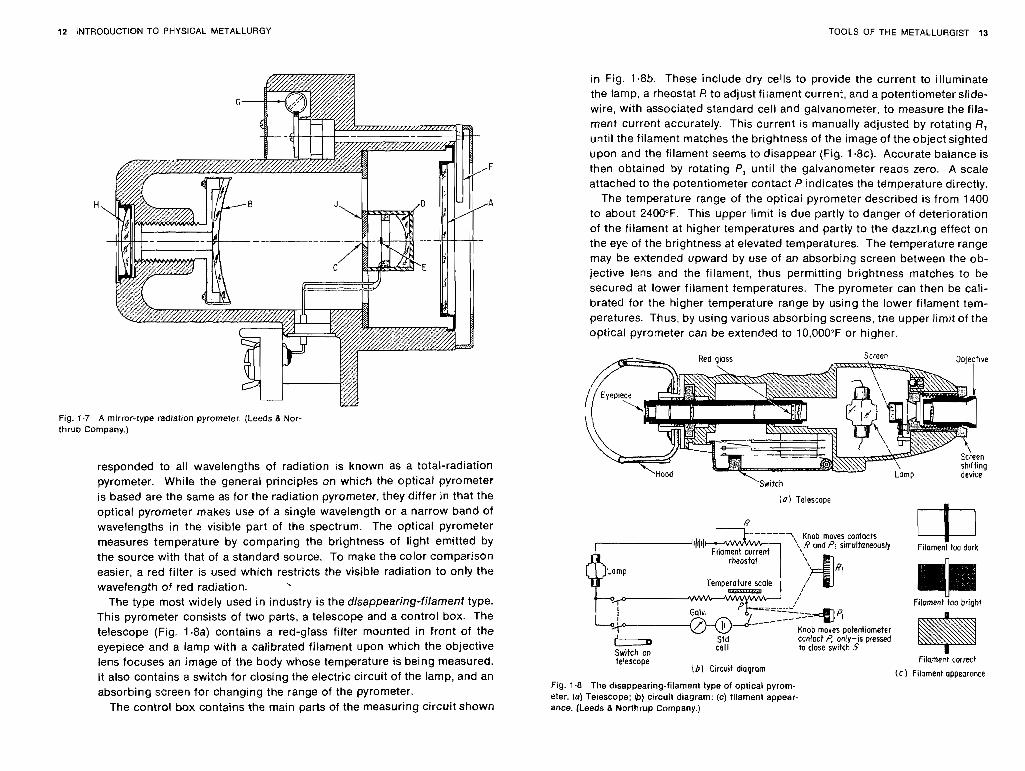
The type most widely used in industry is the disappearing-filament type. This pyrometer consists of two parts, a telescope and a control box. The telescope (Fig. 1.8a) contains a red-glass filter mounted in front of the eyepiece and a lamp with a calibrated filament upon which the objective lens focuses an image of the body whose temperature is being measured. It also contains a switch for closing the electric circuit of the lamp, and an absorbing screen for changing the range of the pyrometer.
The control box contains the main parts of the measuring circuit shown
in Fig. 1.8b. These include dry cells to provide the current to illuminate the lamp, a rheostat A to adjust filament current, and a potentiometer slide- wire, with associated standard cell and galvanometer, to measure the fila- ment current accurately. This current is manually adjusted by rotating R, until the filament matches the brightness of the image of the object sighted upon and the filament seems to disappear (Fig. 1 . 8~ ) . Accurate balance is then obtained by rotating P, until the galvanometer reads zero. A scale attached to the potentiometer contact P indicates the temperature directly.
The temperature range of the optical pyrometer described is from 1400 to about 240OCF. This upper limit is due partly to danger of deterioration of the filament at higher temperatures and partly to the dazzling effect on the eye of the brightness at elevated temperatures. The temperature range may be extended upward by use of an absorbing screen between the ob- jecttve lens and the filament, thus permitting brightness matches to be secured at lower filament temperatures. The pyrometer can then be cali- brated for the higher temperature range by using the lower filament tem- peratures. Thus, by using various absorbing screens, the upper limit of the optical pyrometer can be extended to 10,000"F or higher.
'Switch
io) Telescope
k: 2-7,
;;wi contacts \ ./? and ?I simultaneously
Filament current \
,' Temperature scale , a5naan I
;
b Std Switrh nn
" I...I-.,," ..., cell to close switch S" r' - - . . -. . - . .
telescope { b ) Circuit diagram
Fig. 1.8 The disappearing-filament type of optical pyrom- eter. (a) Telescope; 8) circuit diagram; (c) filament appear- ance. (Leeds & Northrup Company.)
L__C_J Filament toa dark
U Filament foo btlght
~ilameni correct
( C ) Filament appearance
14 INTRODUCTION TO PHYSICAL METALLURGY TOOLS OF THE METALLURGIST 15
Some advantages of the optical and radiation pyrometers are:
1 Measurement of high temperature. 2 Measurement of inaccessible bodies. 3 Measurement of moving or small bodies. 4 No part of the instrument is exposed to the destructive effects of heating
The principal disadvantages are:
1 Errors introduced because the photometric match is a matter ot ind~vidual judgment. 2 Errors introduced by smoke or gases between the observer and the source 3 Uncertainty as to the amount of departure from blackbody condit~ons.
METALLOGRAPHY
1.13 Introduction Metallography or microscopy consists of the microscopic study of the structural characteristics of a metal or an alloy. The micro- scope is by far the most important tool of the metallurgist from both the scientific and technical standpoints. It is possible to determine grain size and the size, shape, and distribution of various phases and inclusions which have a great effect on the mechanical properties of the metal. The microstructure will reveal the mechanical and thermal treatment of the metal, and i t may be possible to predict its expected behavior under a given set of conditions.
Experience has indicated that success in microscopic study depends largely upon the care taken in the preparation of the specimen. The most expensive microscope will not reveal the structure of a specimen that has been poorly prepared. The procedure to be followed in the preparation of
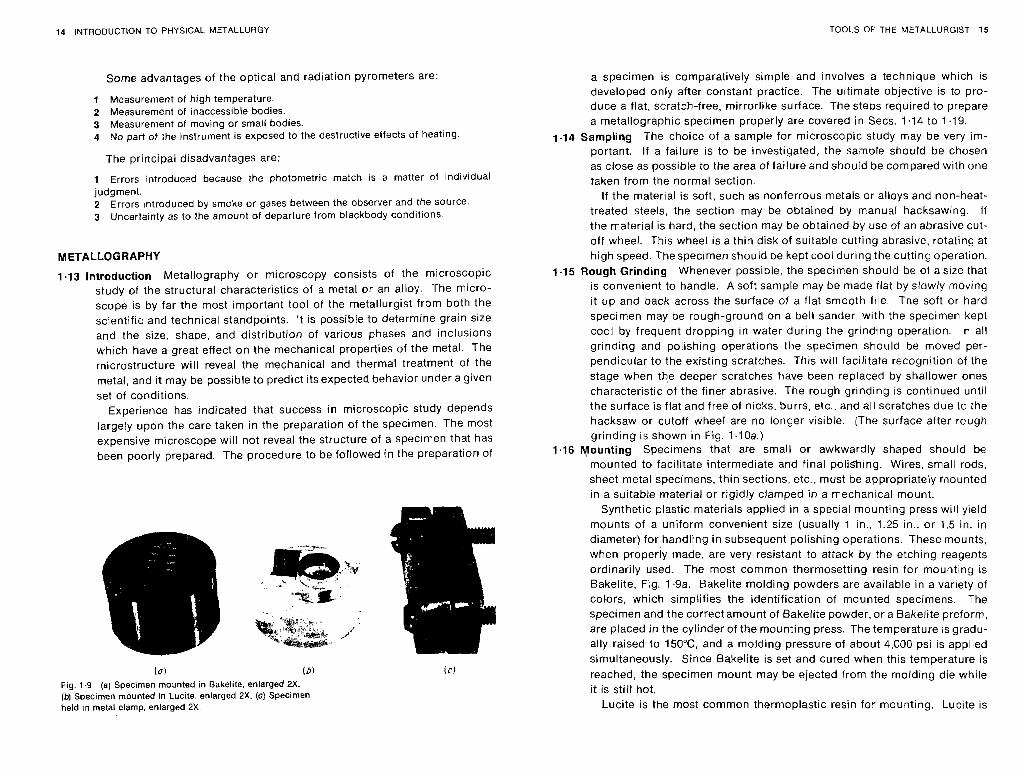
la) lb) Fig. 1.9 (a) Specimen mounted in Bakelite, enlarged 2X. (b) Spec~men mounted in Lucite, enlarged 2X. (c) Specimen held in metal clamp, enlarged 2X.
a specimen is comparatively simple and involves a technique which is developed only after constant practice. The ultimate objective is to pro- duce a flat, scratch-free, mirrorlike surface. The steps required to prepare a metallographic specimen properly are covered in Secs. 1 .I4 to 1.19.
1.14 Sampling The choice of a sample for microscopic study may be very im- portant. If a failure is to be investigated, the sample should be chosen as close as possible to the area of failure and should be compared with one taken from the normal section.
If the material is soft, such as nonferrous metals or alloys and non-heat- treated steels, the section may be obtained by manual hacksawing. If the material is hard, the section may be obtained by use of an abrasive cut- off wheel. This wheel is a thin disk of suitable cutting abrasive, rotating at high speed. Thespecimen should be kept cool during the cutting operation.
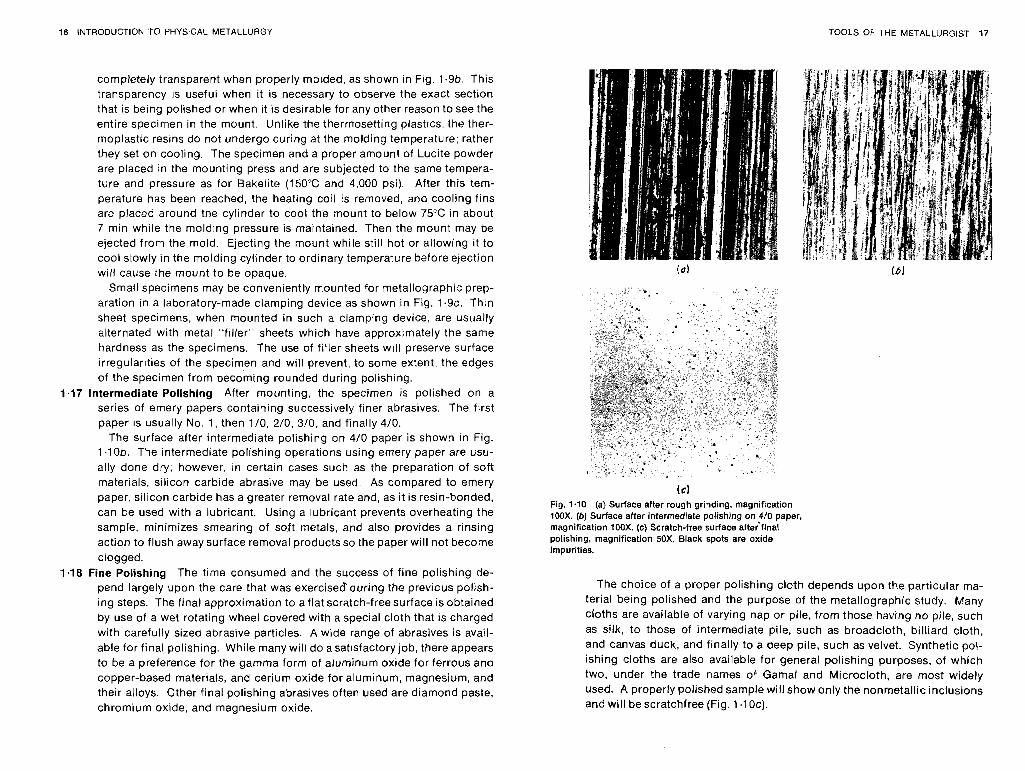
1.15 Rough Grinding Whenever possible, the specimen should be ot a size that is convenient to handle. A soft sample may be made flat by slowly moving i t up and back across the surface of a flat smooth flle. The soft or hard specimen may be rough-ground on a bell sander, with the specimen kept cool by frequent dropping in water during the grinding operation. In all grinding and polishing operations the specimen should be moved per- pendicular to the existing scratches. This will facilitate recognition of the stage when the deeper scratches have been replaced by shallower ones characteristic of the finer abrasive. The rough grinding is continued until the surface is flat and free of nicks, burrs, etc.. and all scratches due to the hacksaw or cutoff wheel are no longer visible. (The surface after rough grinding is shown in Fig. 1.IOa.)
1.16 Mounting Specimens that are small or awkwardly shaped should be mounted to facilitate intermediate and final polishing. Wires, small rods, sheet metal specimens, thin sections, etc.. must be appropriately rnounted in a suitable material or rigidly clamped in a mechanical mount.
Synthetic plastic materials applied in a special mounting press will yield mounts of a uniform convenient size (usually 1 in., 1.25 in., or 1.5 in. in diameter) for handling in subsequent polishing operations. These mounts, when properiy made, are very resistant to attack by the etching reagents ordinarily used. The most common thermosetting resin for mounting is Bakelite, Fig. 1.9a. Bakelite molding powders are available in a variety of colors, which simplifies the identification of mounted specimens. The specimen and the correct amount of Bakelite powder, o r a Bakelite preform, are placed in the cylinder of the mounting press. The temperature is gradu- ally raised to 150"C, and a molding pressure of about 4,000 psi is applied simultaneously. Since Bakelite is set and cured when this temperature is reached, the specimen mount may be ejected from the molding die while it is still hot.
Lucite is the most common thermoplastic resin for mounting. Lucite is
16 INTRODUCTION TO PHYSICAL METALLURGY TOOLS OF THE METALLURGIST 17
completely transparent when properly molded, as shown in Fig. 1.9b. This transparency IS useful when it is necessary to observe the exact section that is being polished or when it is desirable for any other reason to see the entire specimen in the mount. Unlike the thermosetting plastics, the ther- moplastic resins do not undergo curing at the molding temperature; rather they set on cooling. The specimen and a proper amount of Lucite powder are placed in the mounting press and are subjected to the same tempera- ture and pressure as for Bakelite (150°C and 4.000 psi). After this tem- perature has been reached, the heating coil is removed, and cooling fins are placed around the cylinder to cool the mount to below 75°C in about 7 min while the molding pressure is maintained. Then the mount may be ejected from the mold. Ejecting the mount while still hot or allowing it to cool slowly in the molding cylinder to ordinary temperature before ejection will cause the mount to be opaque.
Small specimens may be conveniently mounted for metallographic prep- aration in a laboratory-made clamping device as shown in Fig. 1 . 9 ~ . Thin sheet specimens, when mounted in such a clamping device, are usually alternated with metal "filler" sheets which have approximately the same hardness as the specimens. The use of filler sheets will preserve surface irregular~ties of the specimen and will prevent, to some extent, the edges of the specimen from becoming rounded during polishing.
1.17 Intermediate Polishing After mounting, the specimen is polished on a series of emery papers containing successively finer abrasives. The first paper is usually No. 1, then 110, 210, 310. and finally 410.
The surface after intermediate polishing on 410 paper is shown in Fig. 1 . lob. The intermediate polishing operations using emery paper are usu- ally done dry; however, in certain cases such as the preparation of soft materials, silicon carbide abrasive may be used. As compared to emery paper, silicon carbide has a greater removal rate and, as it is resin-bonded. can be used with a lubricant. Using a lubricant prevents overheating the sample, minimizes smearing of soft metals, and also provides a rinsing action to flush away surface removal products so the paper will not become clogged.
1.18 Fine Polishing The time consumed and the success of fine polishing de- pend largely upon the care that was exercisesduring the previous polish- ing steps. The final approximation to a flat scratch-free surface is obtained by use of a wet rotating wheel covered with a special cloth that is charged with carefully sized abrasive particles. A wide range of abrasives is avail- able for final polishing. While many will do a satisfactory job, there appears to be a preference for the gamma form of aluminum oxide for ferrous and copper-based materials, and cerium oxide for aluminum, magnesium, and their alloys. Other final polishing abrasives often used are diamond paste, chromium oxide, and magnesium oxide.
Fig. 1.10 (a) Surface after rough grinding, magnification 1OOX. (b) Surface after intermediate polishing on 4/0 paper, magnification 100X. (c) Scratch-free surface aftetfinal polishing, magnification 50X. Black spots are oxide impurities.
The choice of a proper polishing cloth depends upon the particular ma- terial being polished and the purpose of the metallographic study. Many cloths are available of varying nap or pile, from those having no pile, such as silk, to those of intermediate pile, such as broadcloth, billiard cloth, and canvas duck, and finally to a deep pile, such as velvet. Synthetic pol- ishing cloths are also available for general polishing purposes, of which two. under the trade names of Gamal and Microcloth, are most widely used. A properly polished sample will show only the nonmetallic inclusions and will be scratchfree (Fig. 1.10~).
18 INTRODUCTION TO PHYSICAL METALLURGY TOOLS OF THE METALLURGIST 19
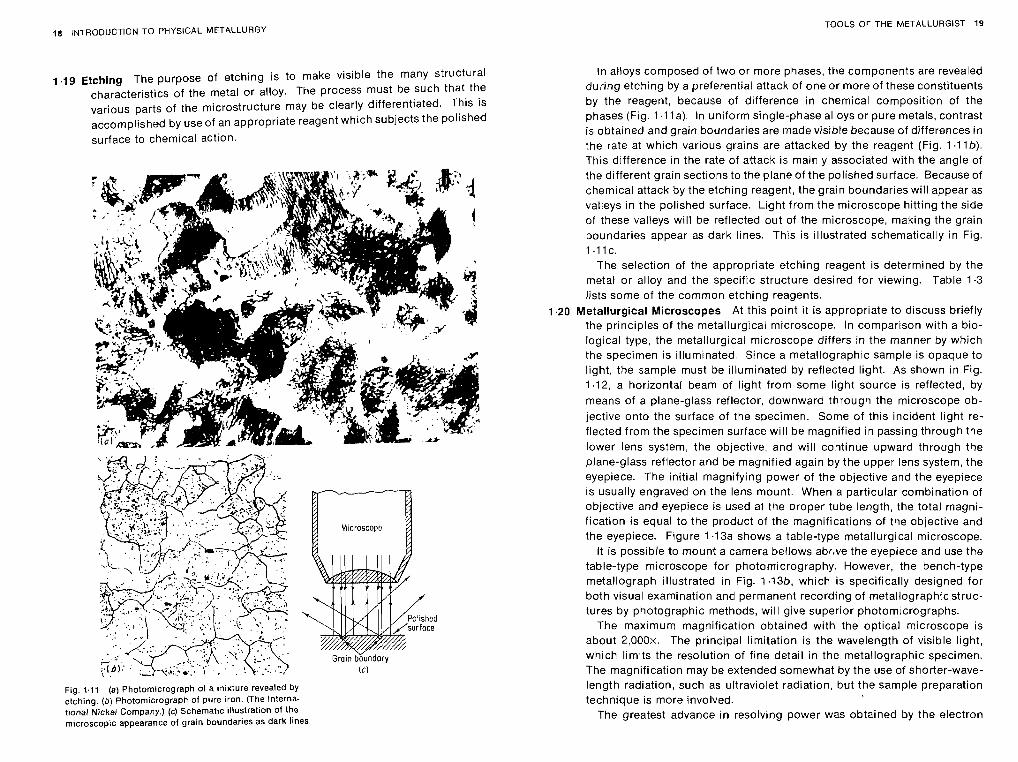
1.19 Etching The purpose of etching is to make visible the many structural characteristics of the metal or alloy. The process must be such that the various parts of the microstructure may be clearly differentiated. This is accomplished by use of an appropriate reagent which subjects the polished surface to chemical action.
Fig. 1.11 (a) Photomicrograph of a mcnture revealed by etching. (b) Photomicrograph of pure iron. (The Interna- tional Nickel Company.) (c) Schematcc ~llustration of the microscopic appearance of grain boundaries as dark lines
In alloys composed of two or more phases, the components are revealed during etching by a preferential attack of one or more of these constituents by the reagent, because of difference in chemical composition of the phases (Fig. 1 .l la) . In uniform single-phase alloys or pure metals, contrast is obtained and grain boundaries are made visible because of differences in the rate at which various grains are attacked by the reagent (Fig. 1.17b). This difference in the rate of attack is mainly associated with the angle of :he different grain sections to the plane of the polished surface. Because of chemical attack by the etching reagent, the grain boundaries will appear as valleys in the polished surface. Light from the microscope hitting the side of these valleys will be reflected out of the microscope, making the grain boundaries appear as dark lines. This is illustrated schematically in Fig. 1.11~.
The selection of the appropriate etching reagent is determined by the metal or alloy and the specific structure desired for viewing. Table 1.3 lists some of the common etching reagents.
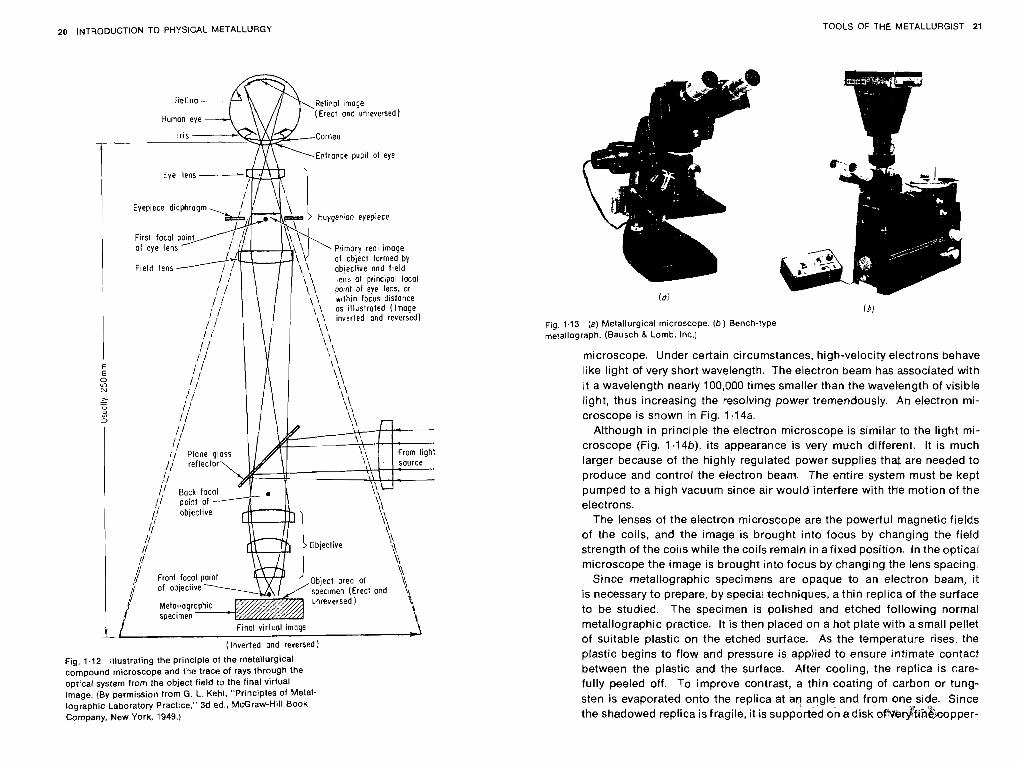
1.20 Metallurgical Microscopes At this point it is appropriate to discuss briefly the principles of the metallurgical microscope. In comparison with a bio- logical type, the metallurgical microscope differs in the manner by which the specimen is illuminated. Since a metallographic sample is opaque to light, the sample must be illuminated by reflected light. As shown in Fig. 1.12, a horizontal beam of light from some light source is reflected, by means of a plane-glass reflector, downward through the microscope ob- jective onto the surface of the specimen. Some of this incident light re- flected from the specimen surface will be magnified in passing through the lower lens system, the objective, and will continue upward through the plane-glass reflector and be magnified again by the upper lens system, the eyepiece. The initial magnifying power of the objective and the eyepiece is usually engraved on the lens mount. When a particular combination of objective and eyepiece is used at the proper tube length, the total magni- fication is equal to the product of the magnifications of the objective and the eyepiece. Figure 1.13a shows a table-type metallurgical microscope.
It is possible to mount a camera bellows abf,ve the eyepiece and use the table-type microscope for photomicrography. However, the bench-type metallograph illustrated in Fig. 1.13b, which is specifically designed for both visual examination and permanent recording of metallographic struc- tures by photographic methods, will give superior photomicrographs.
The maximum magnification obtained with the optical microscope is about 2.000~. The principal limitation is the wavelength of visible light, which limits the resolution of fine detail in the metallographic specimen. The magnification may be extended somewhat by the use of shorter-wave- length radiation, such as ultraviolet radiation, but the sample preparation technique is more involved.
The greatest advance in resolving power was obtained by the electron
20 INTRODUCTION TO PHYSICAL METALLURGY TOOLS OF THE METALLURGIST 21
(Inverted ond reversed!
Fig. 1.12 Illustrating the principle of the metallurgical compound microscope and the trace of rays through the optical system from the object field to the final virtual image. (By permission from G. L. Kehl. "Principles of Metal- lographic Laboratory Practice," 3d ed., McGraw-Hill Book Company, New York, 1949.)
Fig. 1.13 (a) Metallurgical microscope. ( b ) Bench-type metallograph. (Bausch & Lomb, Inc.)
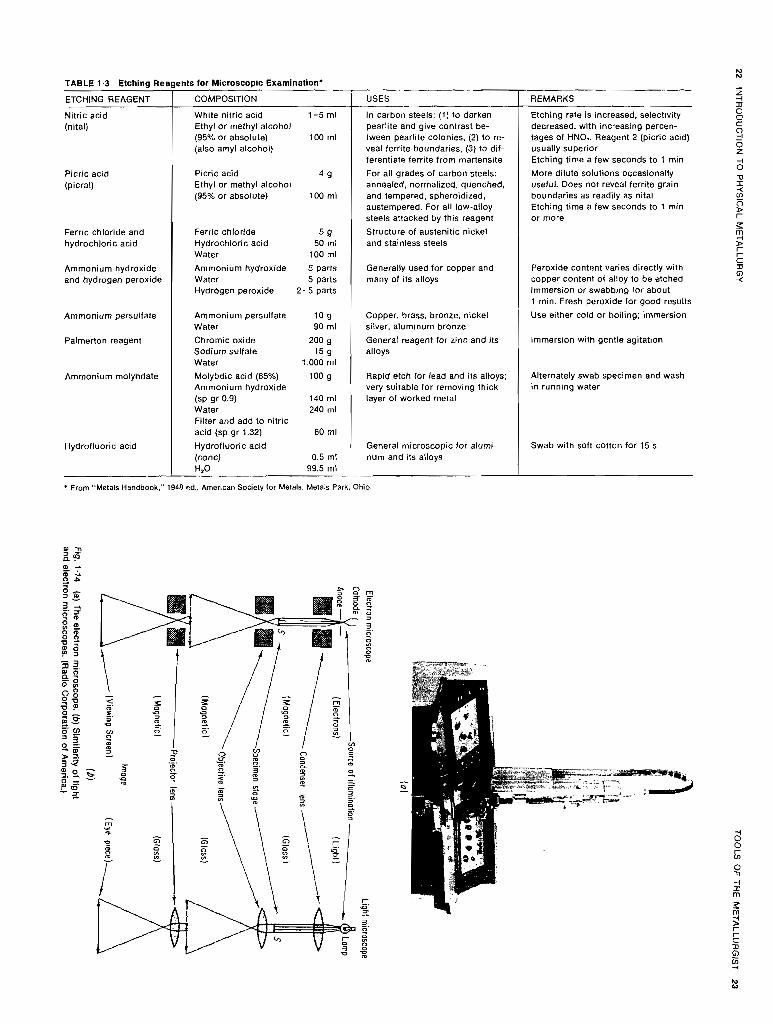
microscope. Under certain circumstances, high-velocity electrons behave like light of very short wavelength. The electron beam has associated with it a wavelength nearly 100,000 times smaller than the wavelength of visible light, thus increasing the resolving power tremendously. An electron mi- croscope is shown in Fig. 1.14a.
Although in principle the electron microscope is similar to the light mi- croscope (Fig. 1.14b), its appearance is very much different. It is much larger because of the highly regulated power supplies that are needed to produce and control the electron beam. The entire system must be kept pumped to a high vacuum since air would interfere with the motion of the electrons.
The lenses of the electron microscope are the powerful magnetic fields of the coils, and the image is brought into focus by changing the field strength of the coils while the coils remain in afixed position. In the optical microscope the image is brought into focus by changing the lens spacing.
Since metallographic specimens are opaque to an electron beam, it is necessary to prepare, by special techniques, a thin replica of the surface to be studied. The specimen is polished and etched following normal metallographic practice. It is then placed on a hot plate with a small pellet of suitable plastic on the etched surface. As the temperature rises, the plastic begins to flow and pressure is applied to ensure intimate contact between the plastic and the surface. After cooling, the replica is care- fully peeled off. To improve contrast, a thin coating of carbon or tung- sten is evaporated onto the replica at aq angle and from onelside. Since the shadowed replica is fragile, it is supported on a disk of"sier$.tih8~opper-
Picric acid (picral)
TABLE 1.3 Etching Reagents tor Microscopic Examination'
Ferric chloride and hydrochloric a c ~ d
ETCHING REAGENT
Nitric acid (nital)
Ammonium hydroxide and hydrogen peroxide
COMPOSITION
White nitric acid 1-5 ml Ethyl or methyl alcohol (95% or absolute) 100 ml (also amyl alcohol)
P~cric acid 4 9 Ethyl or methyl alcohol (95% or absolute) 100 ml
Ferric chloride 5 9 Hydrochloric acid 50 ml Water 100 ml
Ammonium hydroxide 5 parts Water 5 parts Hydrogen peroxide 2- 5 parts
USES
In carbon steels: (1) to darken pearlite and give contrast be- (ween pearlite colonies. (2) to re- veal ferrite boundaries. (3) to dif- ferentiate ferrite from martensite
For all grades of carbon steels: annealed, normalized, quenched, and tempered, spheroidized, austempered. For all low-alloy steels attacked by this reagent
Structure of austenitic nickei and stainless steels
Generally used for copper and many of its alloys
Ammonium persulfate Ammonium persulfate 10 g 1 Copper, brass, bronze, nickel
Water 90 ml silver, aluminum bronze
Palmerton reagent Chromic oxide 200 g General reagent for zinr: and its Sodium sulfate alloys Water 1,000 mi
REMARKS
Etching rate is increased, selectivity decreased, with increasing percen- tages of HNO,. Reagent 2 (picric acid) usually superior Etching time a few seconds to 1 min
More dilute solutions occasionally useful. Does not reveal ferrite grain boundaries as readily as nital Etching time a few seconds to 1 rnin or more
Ammonium molybdate
Hydrofluoric acid
Peroxide content varies directly with copper content of alloy to be etched lmmersion or swabbing for about 1 min. Fresh peroxide lor good results
Use either cold or boiling: immersion
Immersion with gentle agitation
From "Metals Handbook," 1948 ed.. American Sociely tor Metals. Metals Park. Ohio.
Molybdic acid (85%) 100 g Ammonium hydroxide (SP gr 0.9) 140 ml Water 240 ml Filter and add to nitric acid (sp gr 1.32) 60 ml
Hydrofluoric acid (conc) 0.5 ml Hz0 99.5 rnl
Alternately swab specimen and wash in running water
Rapid etch for lead and its alloys: very suitable for removing thick layer of worked metal
General microscopic for alumi- num and its alloys
Swab with soft cotton for 15 s
24 INTRODUCTtON TO PHYSICAL METALLURGY TOOLS OF THE METALLURGIST 25
wire mesh. The disk is then placed over the opening in the specimen holder, which is inserted in the column of the instrument.
The electrons emitted by a hot tungsten-filament cathode are accel- erated, to form a high-velocity beam, by the anode. This beam is con- centrated on the replica by the condensing lens. Depending upon the den- sity and thickness of the replica at each point, some of the electrons are absorbed or scattered while the remainder pass through. The magnetic field of the objective lens focuses and enlarges the electron beam that has passed through the replica. Some of the electrons in this image are brought into a second focus on a fluorescent screen by the projector lens. The electron microscope shown in Fig. 1.14a has a basic magnification range of 1,400 to 32,00Ox, which may be extended to 200,000~ with acces- sory lenses.
TESTS FOR MECHANICAL PROPERTIES
1.21 Hardness The property of "hardness" is difficult to define except in rela- tion to the particular test used to determine its value. It should be observed that a hardness number or value gannot be utilized directly in design, as can a tensile strength value, since hardness numbers have no intrinsic significance.
Hardness is not a fundamental property of a material but is related to the elastic and plastic properties. The hardness value obtained in a particular test serves only as a comparison between materials or treatments. The test procedure and sample preparation are usually simple, and the results may be used in estimating other mechanical properties. Hardness testing is widely used for inspection and control. Heat treatment or working usually results in a change in hardness. When the hardness resulting from treat- ing a given material by a given process is established, it affords a rapid and simple means of inspection and control for the particular material and process.
The various hardness tests may be divided into three categories:
Elastic hardness Resistance to cutting or abrasion Resistance to indentation
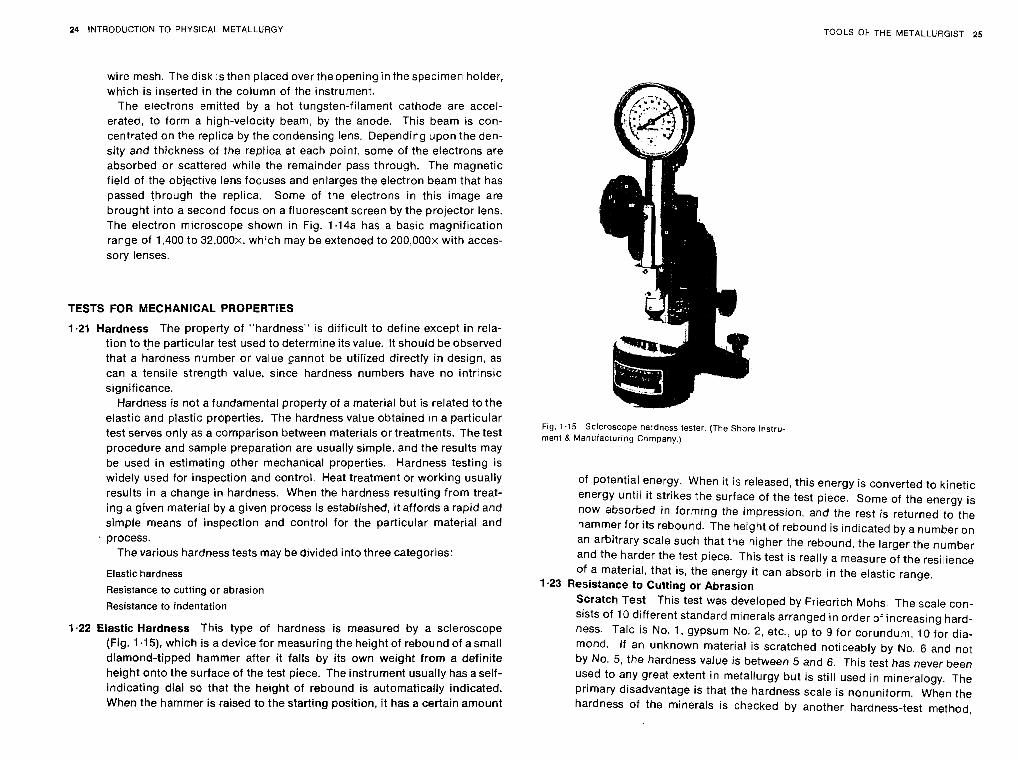
1.22 Elastic Hardness This type of hardness is measured by a scleroscope (Fig. 1 -15), which is a device for measuring the height of rebound of a small diamond-tipped hammer after i t falls by its own weight from a definite height onto the surface of the test piece. The instrument usually has aself- indicating dial so that the height of rebound is automatically indicated. When the hammer is raised to the starting position, i t has a certain amount
Fig. 1 . I5 Scleroscope nardness tester. (The Shore Instru- ment (1 Manufacruring Company.)
of potential energy. When it is released, this energy is converted to kinetic energy until it strikes the surface of the test piece. Some of the energy is now absorbed in forming the impression, and the rest is returned to the hammer for its rebound. The height of rebound is indicated by a number on an arbitrary scale such that the higher the rebound, the larger the number and the harder the test piece. This test is really a measure of the resilience of a material, that is, the energy it can absorb in the elastic range.
1.23 Resistance to Cutting or Abrasion Scratch Test This test was developed by Friedrich Mohs. The scale con- sists of 10 different standard minerals arranged in order of increasing hard- ness. Talc is No. 1, gypsum No. 2, etc., up to 9 for corundum, 10 for dia- mond. If an unknown material is scratched noticeably by No. 6 and not by No. 5, the hardness value is between 5 and 6. This test has never been used to any great extent in metallurgy but is still used in mineralogy. The primary disadvantage is that the hardness scale is nonuniform. When the hardness of the minerals is checked by another hardness-test method,
26 INTRODUCTION TO PHYSICAL METALLURGY TOOLS OF THE METALLURGIST 27
it is found that the values are compressed between 1 and 9, and there is a large gap in hardness between 9 and 10. File Test The test piece is subjected to the cutting action of a file of known hardness to determine whether a visible cut is produced. Compara- tive tests with a file depend upon the size, shape, and hardness of the file; the speed, pressure, and angle of filing during the test; and the composition and heat treatment of the material under test. The test is generally used industrially as one of acceptance or rejection.
In many cases, particularly with tool steels, when the steel is properly heat-treated it will be hard enough so that if a file is run across the surface it will not cut the surface. It is not unusual to find heat-treating specifica- tions which simply say "heat-treat until the material is file-hard." By run- ning a file across the surface an inspector may rapidly check a large num- ber of heat-treated parts to determine whether the treatment has been successful.
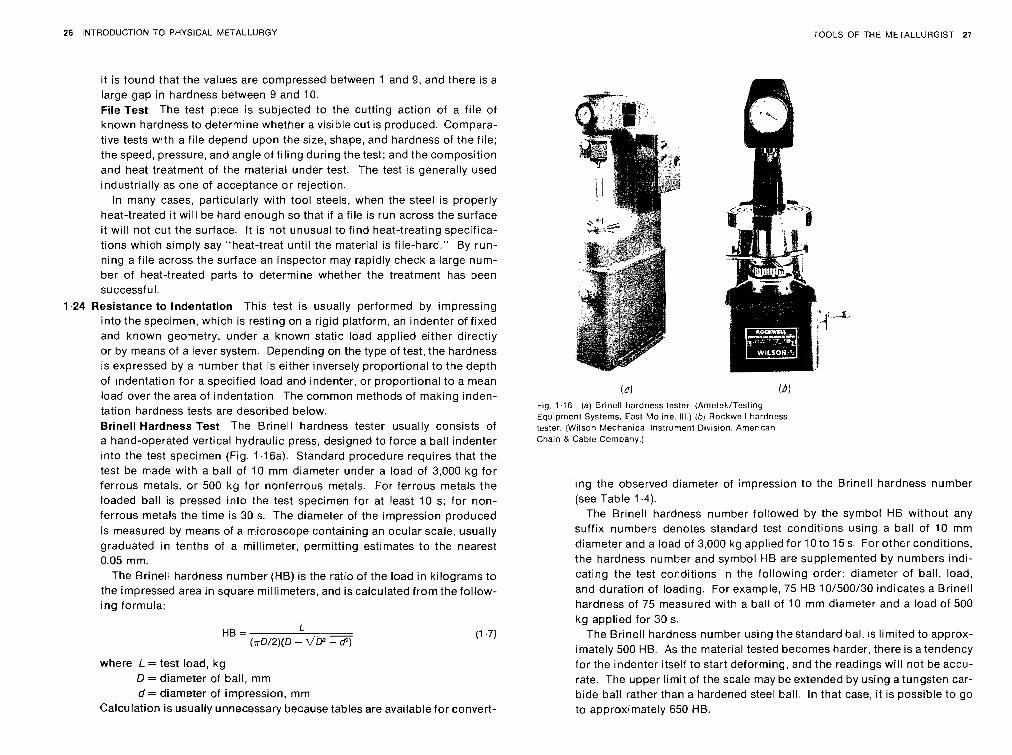
1.24 Resistance to Indentation This test is usually performed by impressing into the specimen, which is resting on a rigid platform, an indenter of fixed and known geometry, under a known static load applied either directly or by means of a lever system. Depending on the type of test, the hardness is expressed by a number that is either inversely proportional to the depth of indentation for a specified load and indenter, or proportional to a mean load over the area of indentation. The common methods of making inden- tation hardness tests are described below. Brinell Hardness Test The Brinell hardness tester usually consists of a hand-operated vertical hydraulic press, designed to force a ball indenter into the test specimen (Fig. 1.16a). Standard procedure requires that the test be made with a ball of 10 mm diameter under a load of 3,000 kg for ferrous metals, or 500 kg for nonferrous metals. For ferrous metals the loaded ball is pressed into the test specimen for at least 10 s; for non- ferrous metals the time is 30 s. The diameter of the impression produced is measured by means of a microscope containing an ocular scale, usually graduated in tenths of a millimeter, permitting estimates to the nearest 0.05 mm.
The Brinell hardness number (HB) is the ratio of the load in kilograms to the impressed area in square millimeters, and is calculated from thefollow- ing formula:
where L = test load, kg D = diameter of ball, mm d = diameter of impression, mm
Calculation is usually unnecessary because tables are available for convert-
(0) ( 6 ) Fig. 1.16 (a) Brinell hardness tester. IAmetek/Testing Equipment Systems. East Moline, Ill.) ~ b ) Rockwell hardness tester. (Wilson Mechanical Insrrurnent Div~sion. American Chain 8 Cable Company.)
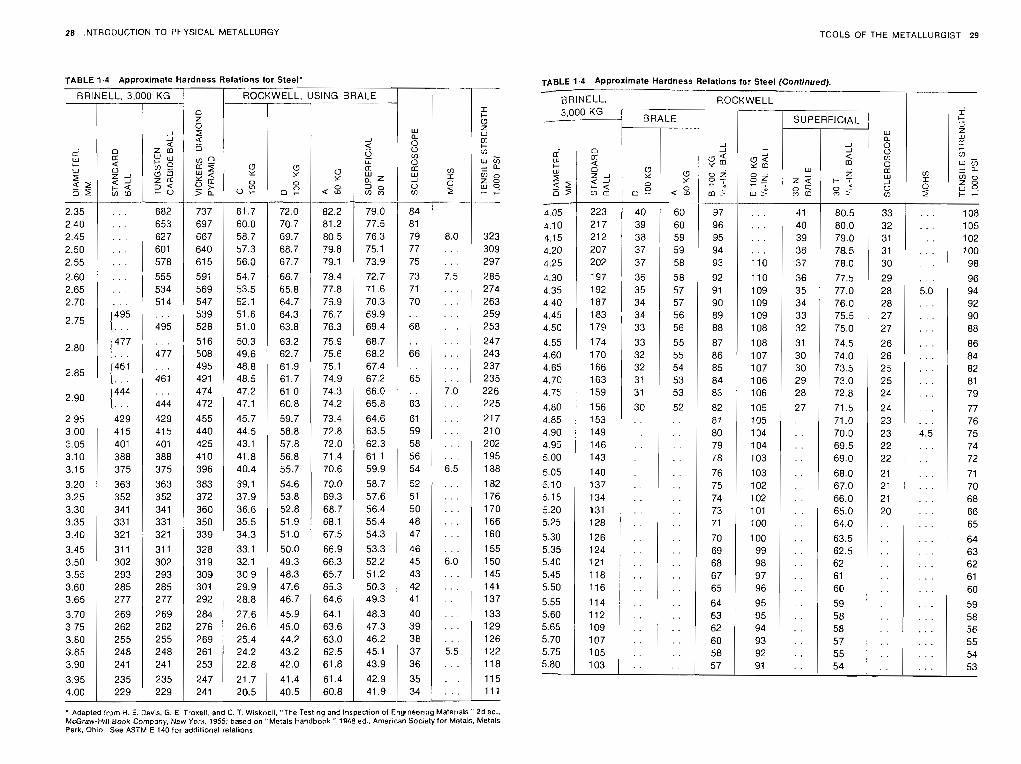
ing the observed diameter of impression to the Brinell hardness number (see Table 1.4).
The Brinell hardness number followed by the symbol HB without any suffix numbers denotes standard test conditions using a ball of 10 mm diameter and a load of 3,000 kg applied for 10 to 15 s. For other conditions, the hardness number and symbol HB are supplemented by numbers indi- cating the test conditions in the following order: diameter of ball, load, and duration of loading. For example, 75 HB 10/500/30 indicates a Brinell hardness of 75 measured with a ball of 10 mm diameter and a load of 500 kg applied for 30 s.
The Brinell hardness number using the standard ball is limited to approx- imately 500 HB. As the material tested becomes harder, there is a tendency for the indenter itself to start deforming, and the readings will not be accu- rate. The upper limit of the scale may be extended by using a tungsten car- bide ball rather than a hardened steel ball. In that case, it is possible to go to approximately 650 HB.
28 INTRODUCTION TO PHYSICAL METALLURGY TOOLS OF THE METALLURGIST 29
TABLE 1.4 Approximate Hardness Relations for Steel'
BRINELL, 3,000 KG 1 ROCKWELL, USING BRALE - I I -
TABLE 1.4 Approximate Hardness Relations for Steel (Continued).
I
2.35 2.40 2.45 2.50 2.55
2.60 2.65 2.70
2'75
682 653 627 601 578
555 534 514 . . . 495
. . .
. .
. . .
. . .
. . .
. . .
. . .
. . .
\491
- BRINELL. 1 ROCKWELL
2'90
2.95 3.00 3.05 3.10 3.15
3.20 3.25 3.30 3.35 3.40
3.45 3.50 3.55 3.60 3.65
3.70 3.75 3.80 3.85 3.90
3.95 4.00
' Adapted
W a 0
:: J W
2 33 32 31 31 30
29
3.000 KG .A---------
a
737 697 667 640 615
591 569 547 539 528
McGraw-Hill Book Company, New York. 1955: based on "Metals Handbook " 1943 ed.. American Society for Metals, Metals Park. Ohio. See ASTM E 140 for add~tional relallons.
144L . . . 429 415 401 388 375
363 352 341 331 321
311 302 293 285 277
269 262 255 248 241
235 229
from H. E.
0 -r
BRALE
J
61.7 60.0 58.7 57.3 56.3
54.7 53.5 52.1 51.6 51.0
r t- C Z w ,- - 21 W L 7 Yj 2. ( 00
5 s I- - 108
4.35 4.40 4.45 4.50
4.55 4.60
5.0 . . . . . . . . . . . . . . . . . . . . . .
. . . . . 4.5 . . . . . . . . . . .
. . . 444
429 415 A01 388 375
363 352 341 331 321
311 302 293 285 277
269 262 255 248 241
235 229
Davis. G. E.
105 1 0 2
. . . 100
. . . 98
. . . 96
A
72.0 70.7 69.7 68.7 67.7
66.7 65.8 64.7 64.3 63.8
109 109 109 108
108 107
94 92 90 88
86 84 82 81 79
77 76 75 74 72
71 70
SUPERFICIAL
J J
$5 0
$ 2 W K 4
91 90 89 88
87 86
192 187 183 179
174 170
82.2 81.2 80.5 79.8 79.1
78.4 77.8 76.9 76.7 76.3
. .
. .
. .
. .
. .
. . , . . . . . . .
35 34 33 32
31 30
474 472
455 440 425 410 396
383 372 360 350 339
328 319 309 301 292
284 2 7 6 . 269 261 253
247 241
Troxeli, and
515 5.20 5.25
5.30 5.35 5.40 5.45 5.50
5.55 5.60
U1 I--
2 5 2 0 2
4.05 4.10 4.15 4.20 4.25
4.30
61.0 60.8
59.7 58.8 57.8 56.8 55.7
54.6 53.8 52.8 51.9
50.0 49.3 48.3 47.6 46.7
45.9 45.0 44.2 43.2 42.0
41.4 40.5
"The
47.2 47.1
45.7 44.5 43.1 41.8 40.4
39.1 37.9 36.6 35.5 34.3
33.1 32.1 30.9 29.9 28.8
27.6 26.6
; 25.4 24.2 22.8
21.7 20.5
C. 1'. Wiskocil,
74 73 71
70 69 68 67 65
64 63 62 60 58 57
4.65 166 4.70 163 4.75 159 4.80 j 156 4.85 153
< m i
:$ ; z ? C W ' xf f i
. . . 41 79.0 77.5 76.3 75.1 73.9
72.7 71.6 70.3 69.9 69.4
32 31 31
30 . . . . . .
35 34 34 33
33 32
77.0 28 76.0 28
102 101 100
100 99 98 97 96
95 95 94 93 92 91
85 107 84 106
4.90 4.95
5.65 5.70 5.75 5.80
134 . . 131 . . 128 1 , .
126 1 . . 124 . . 121 1 . 118 ! . . 116 I
I ' ' 114 . .
b - 7
x ; 80.5
54 53 53
52 . .
57 57 56 56
55 55
68 , 66
30 29 28
27 . . . . . . . . . . . . . . .
75.5 75.0
74.5 74.0
83
82 81 80 79 78
76 75
, 149 146
112
g m
97 96 95 94 93
92
c S
84 81 79 77 75
73 71 70 . . 68
. .
. .
. .
27 27
26 26
74.3 74.2
73.4 72.8 72.0 71.4 70.6
70.0 69.3 68.7
, 68.1 5 1 . 0 ' 6 7 . 5
66.9 66.3 65.7 65.3 64.6
64.1 63.6 63.0 62.5 61.8
61.4 60.8
106
105 105 104 104 103
103 102
5.00
5.05 5.10
. . 109 107 105 103
Z J
2 2 c o r n
223 217 212 207 202
197
. . .
. . .
. . . 110
110
. .
. .
. .
. .
. .
. .
. .
. .
. .
. .
. .
. .
73.5 73.0 72.8
71.5 71.0 70.0 69.5 69.0
68.0 67.0 66.0 65.0
Testing and Inspection of Eng~neerlng Materials " 2d ed..
7.0 . . . . . . . . . . . . . . 6.5
. . .
. . .
. . .
. . .
. . .
. . . 6.0 . . . . . . . . . . . . . . . . . . 5.5 . . . . . . . . .
143 . .
140 . . 137 . .
8.0 . . . . .
7.5 . . . . . . . . . . . . . .
40 80.0 39 7 9 . 0 38 78.5 37 78.0
36 77.5
25 25 2L
2A 23 23 22 22
21 21 : 21 i . . . 20 . . .
226 225
217 210 202 195 188
182 176 170 166 160
155 150 145 141 137
133 129 126 122 118
115 111
66.0 65.8
64.6 63.5 62.3 61.1 59.9
58.7 57.6 56.4 55.4 54.3
53.3 52.2 51.2 50.3 49.3 1
48.3 47.3 46.2 45.1 43.9
42.9 41.9
.
323 309 297
285 274 263 259 253
247
0
0 : 4
64.0
63.5 62.5 62 61 60
59 '
. . 63
61 59 58 56 54
52 51 50 48 47
46 45 43 42 41
40 39 38 37 36
35 3 4
. .
. .
. .
40 39 38 37 37
36
. .
. .
. .
60 60 59 59 58
58
. .
. .
. .
. .
. .
. 58 . . 58 . . 57 . . 55 , . . 54 ' . .
. . . 65
. . .
. . .
. . .
. . .
. . .
. . .
. . .
. . .
. . .
. . .
. . .
64 63 62 61 60
59 58 56 55 54 53
30 INTRODUCTION TO PHYSICAL METALLURGY TOOLS OF THE METALLURGIST 31
Rockwell Hardness Test This hardness test uses a direct-reading in- strument based on the principle of differential depth measurement (Fig. 1.16b). The test is carried out by slowly raising the specimen against the indenter until a fixed minor load has been applied. This is indicated on the dial gauge. Then the major load is applied through a loaded lever system. After the dial pointer comes to rest, the major load is removed and, with the minor load still acting, the Rockwell hardness number is read on the dial gauge. Since the order of the numbers is reversed on the dial gauge, a shallow impression on a hard material will result in a high number while a deep impression on a soft material will result in a low number.
There are two Rockwell machines, the normal tester for relatively thick sections. and the superficial tester for thin sections. The minor load is 10 kg on the normal tester and 3 kg on the superficial tester.
A variety of indenters and loads may be used, and each combination de- termines a particular Rockwell scale. Indenters include hard steel balls '/la, '/8. )Id, and 1i2 in. in diameter and a 120" conical diamond (brale) point.
TABLE 1.5 The Rockwell Hardness Scales'
MAJOR LOAD. TYPE OF SCALE KG INDENTER
TYPICAL IJATERIALS TESTED
A 60 Diamond cone Extremely hard materials, tungsten carbides, etc.
B 100 lilb'' ball Medium hard materials, low- and medium-carbon steels, brass. bronze, etc.
Diamond cone Hardened steels, hardened and tempered alloys
D 100 Diamond cone Case-hardened steel E 100 ' /8" ball Cast iron, aluminum and magnesium
alloys F 60 1llb1' ball Annealed brass and copper
," bal i Beryllium copper, phosphor bronze, etc.
H 60 '/sf' ball Aluminum sheet K 150 'in" ball Cast iron, aluminum alloys L 60 lid'' ball Plastics and soft metals such as lead M 100 lid'' ball Same as L scale P 150 V4" ball Same as L scale
R 60 'I2" ball Same as L scale S 100 Ill" ball Same as L scale V 150 %" ball Same as L scale
Anierek Testing Equ~pnient Systems. East Mollne. Ill.
Major loads are usually 60, 100, and 150 kg on the normal tester and 15, 30, and 45 kg on the superficial tester.
The most commonly used Rockwell scales are the B (5'16-in. ball indenter and 100-kg load) and the C (diamond indenter and 150-kg load), both ob- tained with the normal tester. Because of the many Rockwell scales, the hardness number must be specified by uslng the symbol HR followed by the letter designating the scale and preceded by the hardness numbers. For example, 82 HRB means a Rockwell hardness of 82 measured on the B scale (l/l&-in ball and 100-kg load). The Rockwell hardness scales and some typical applications are given in Table 1.5.
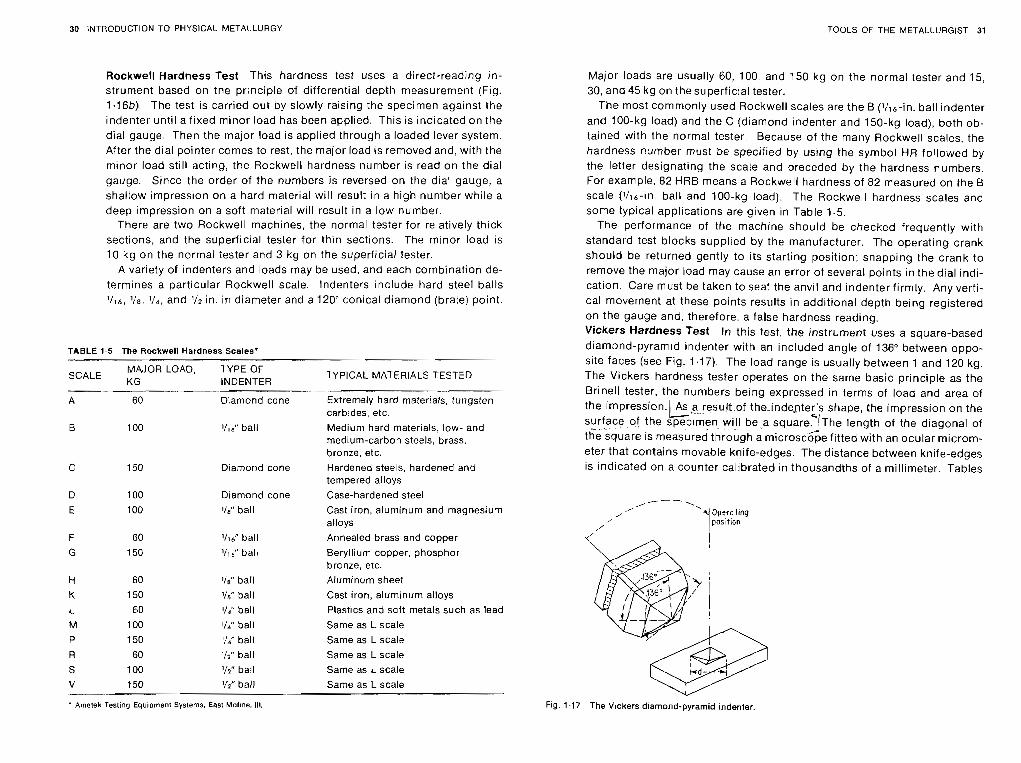
The performance of the machine should be checked frequently with standard test blocks supplied by the manufacturer. The operating crank should be returned gently to its starting position; snapping the crank to remove the major load may cause an error of several points in the dial indi- cation. Care must be taken to seat the anvil and indenter firmly. Any verti- cal movement at these points results in additional depth being registered on the gauge and, therefore. a false hardness reading. Vickers Hardness Test In this test, the instrument uses a square-based diamond-pyramid indenter with an included angle of 136" between oppo- site faces (see Fig. 1.17). The load range is usually between 1 and 120 kg. The Vickers hardness tester operates on the same basic principle as the Brinell tester, the numbers being expressed in terms of load and area of the impression.~~a~~resuIt , .of . the-indegter's shape, the impression on the surfaceof the speclmen wlll be a square?/~he length of the diagonal of ., ... . the square is measured th;oigh a microsc6~ef i t ted with an ocular microm- eter that contains movable knife-edges. The distance between knife-edges is indicated on a counter calibrated in thousandths of a millimeter. Tables
Fig. 1 . I7 The Vickers d~amond-pyramid indenter.
32 lN7RODUCTION TO PHYSICAL METALLURGY TOOLS OF THE METALLURGIST 33
Fig. 1.18 The Knoop diamond-pyramid indenter.
are usually available to convert the measured diagonal to Vickers pyramid hardness number (HV), or the following formula may be used:
where L - applied load, kg d = diagonal length of square impression, mm
As a result of the latitude in applied loads, the Vickers tester is applicable to measuring the hardness of very thin sheets as well as heavy sections. Microhardness Test This term, unfortunately, is misleading, as it could refer to the testing of small hardness values when it actually means the use of small indentations. Test loads are between 1 and 1,000 grn. Two types of indenters are used for microhardness testing: the 136" square-base Vickers diamond pyramid described previously, and the elongated Knoop diamond indenter.
The Knoop indenter (Fig. 1.18) IS ground to pyramidal form that produces a diamond-shaped indentation having long and short diagonals of approxi- mate ratio of 7:l. The pyramid shape employed has included longitudinal angles of 172'30' and transverse angles of 130". The depth of indentation is about l!30 of its length. As in the Vickers test, the long diagonal of the impression is measured optically with a filar micrometer eyepiece. The Knoop hardness number is the load divided by the area of the impression. Tables are usually available to convert the measured diagonal to Knoop hardness number (HK), or the following formula may be used:
where L == applied load, kg d 2- length of long diagonal, mm
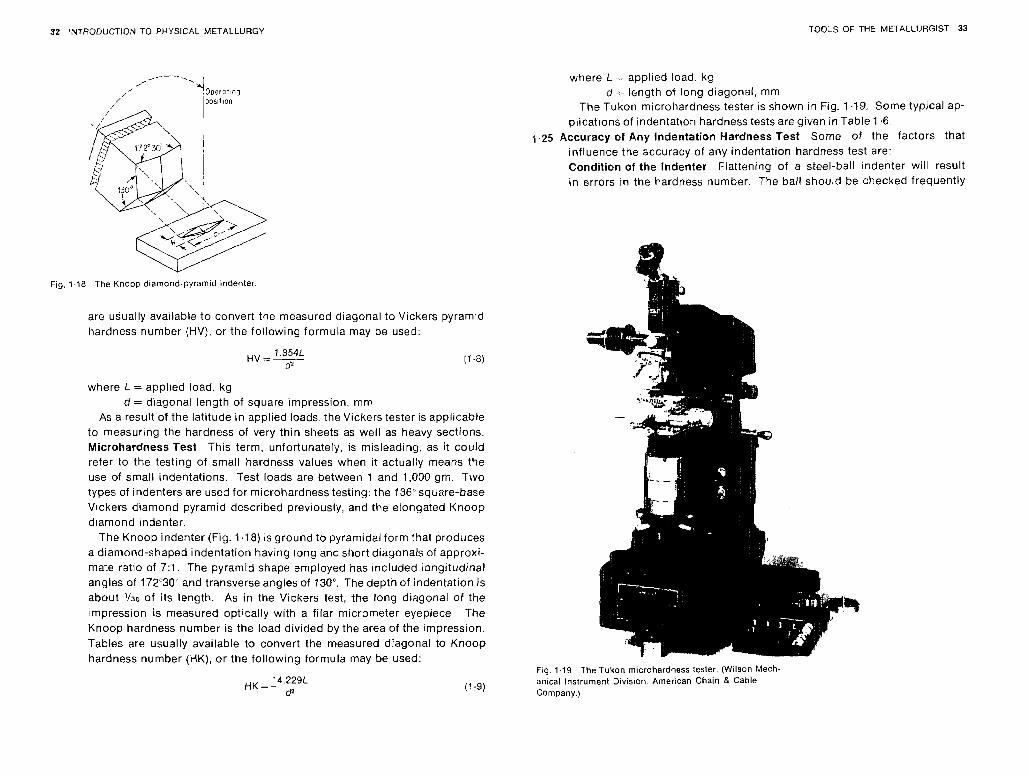
The Tukon microhardness tester is shown in Fig. 7.19. Some typical ap- plications of indentation hardness tests are given in Table 1.6.
1.25 Accuracy of Any Indentation Hardness Test Some of the factors that influence the accuracy of any indentation hardness test are: Condition of the indenter Flattening of a steel-ball indenter will result in errors in the hardness number. The ball should be checked frequently
Fig. 1.19 The Tukon microhardness tester. (Wilson Mech- anlcal Instrument Divis~on. American Chain & Gable Company.)
34 INTRODUCTION TO PHYSICAL METALLURGY TOOLS OF THE METALLURGIST 35
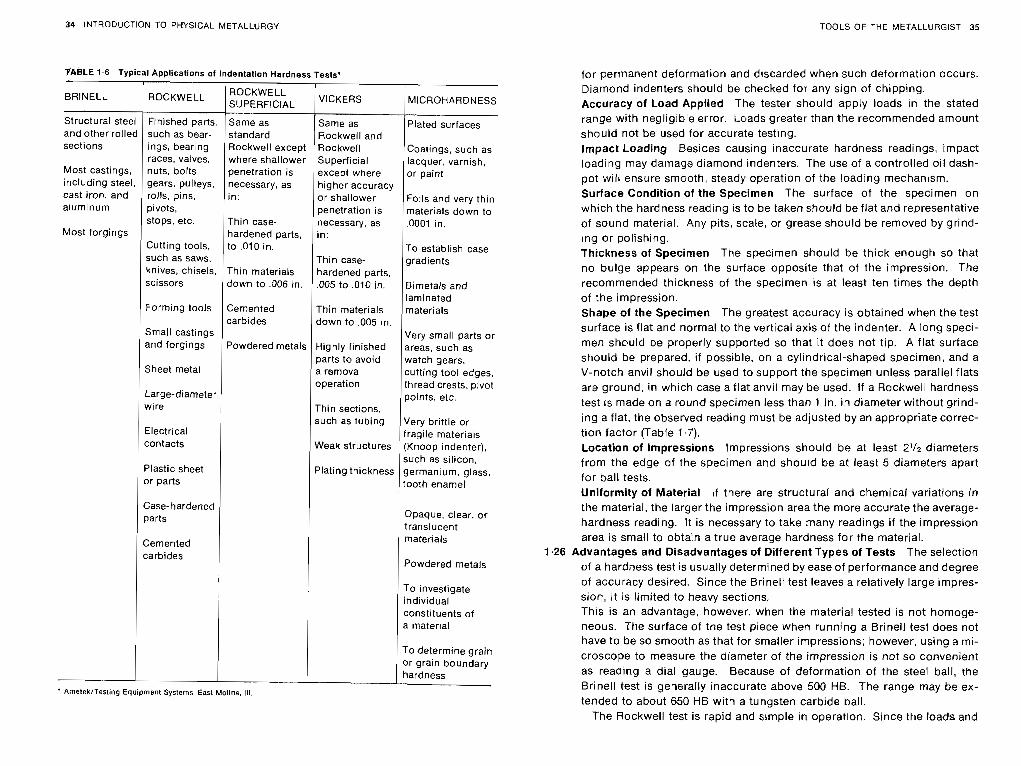
'P 'A~LE 1.6 Tvoical Ao~lications of Indentation Hardness Tests*
BRINELL ROCKWELL
Structural steel and other rollea sections
Most castings. including steel. cast iron, and aluminum
Most forgings
Finished parts. such as bear- ings, bearing races, valves, nuts, bolts, gears. pulleys. rolls, pins, pivots, stops, etc.
Cutting tools, such as saws. knives, chisels, scissors
/ Forming tools
Small castings and forgings
Large-diameter wire
Electrical contacts
Plastic sheet or parts
Cemented carbides
ROCKWELL I VICKERS SUPERFICIAL
Opaque, clear. or
i translucent materials
Same as standard Rockwell except where shallower penetration is necessary, as in:
Thin case- hardened parts, to ,010 in.
Thin materials down to ,006 in.
Cemented carbides
Powdered metals
/ Powdered metals
To investigate individual constituents of a material
Same as Rockwell and Rockwell Superficial except where higher accuracy or shallower penetration is necessary, as in:
Thin case- hardened parts. ,005 to ,010 in.
Thin materials down to .005 in.
Highly f~nished parts to avoid a removal operation
Thin sections, such as tubing
Weak structures
Plating thickness
To determine grain or grain boundary hardness
' Arn~leklTesllng Equ~prnent Systems East hloline. 111.
Plated surfaces
Coatings, such as lacquer, varnish, or paint
Foils and very thin materials down to .OD01 in.
To establish case gradients
Bimetals and laminated materials
Very small parts or areas, such as watch gears. cutting tool edges. thread crests, pivot points, etc.
Very brittle or fragile materials (Knoop indenter), such as silicon, germanium. glass, toorh enamel
for permanent deformation and discarded when such detormation occurs. Diamond indenters should be checked for any sign of chipping. Accuracy of Load Applied The tester should apply loads in the stated range with negligible error. Loads greater than the recommended amount should not be used for accurate testing. Impact Loading Besides causing inaccurate hardness readings, impact loading may damage diamond indenters. The use of a controlled oil dash- pot will ensure smooth, steady operation of the loading mechanism. Surface Condition of the Specimen The surface of the specimen on which the hardness reading is to be taken should be flat and representative of sound material. Any pits, scale, or grease should be removed by grind- ing or polishing. Thickness of Specimen The specimen should be thick enough so that no bulge appears on the surface opposite that of the impression. The recommended thickness of the specimen is at least ten times the depth of the impression. Shape of the Specimen The greatest accuracy is obtained when the test surface is flat and normal to the vertical axis of the indenter. A long speci- men should be properly supported so that it does not tip. A flat surface should be prepared, if possible, on a cylindrical-shaped specimen, and a V-notch anvil should be used to support the specimen unless parallel flats are ground, in which case a flat anvil may be used. If a Rockwell hardness test is made on a round specimen less than 1 in. in diameter without grind- ing a flat, the observed reading must be adjusted by an appropriate correc- tion factor (Table 1.7). Location of lmpressions lmpressions should be at least 2'12 diameters from the edge of the specimen and should be at least 5 diameters apart for ball tests. Uniformity of Material If there are structural and chemical variations in the material, the larger the impression area the more accurate the average- hardness reading. It is necessary to take many readings if the impression area is small to obtain a true average hardness for the material.
1.26 Advantages and Disadvantages of Different Types of Tests The selection of a hardness test is usually determined by ease of performance and degree of accuracy desired. Since the Brinell test leaves a relatively large impres- sion, it is limited to heavy sections. This is an advantage, however, when the material tested is not homoge- neous. The surface of the test piece when running a Brinell test does not have to be so smooth as that for smaller impressions; however, using a mi- croscope to measure the diameter of the impression is not so convenient as reading a dial gauge. Because of deformation of the steel ball, the Brinell test is generally inaccurate above 500 HB. The range may be ex- tended to about 650 HE3 with a tungsten carbide ball.
The Rockwell test is rapid and simple in operation. Since the loads and
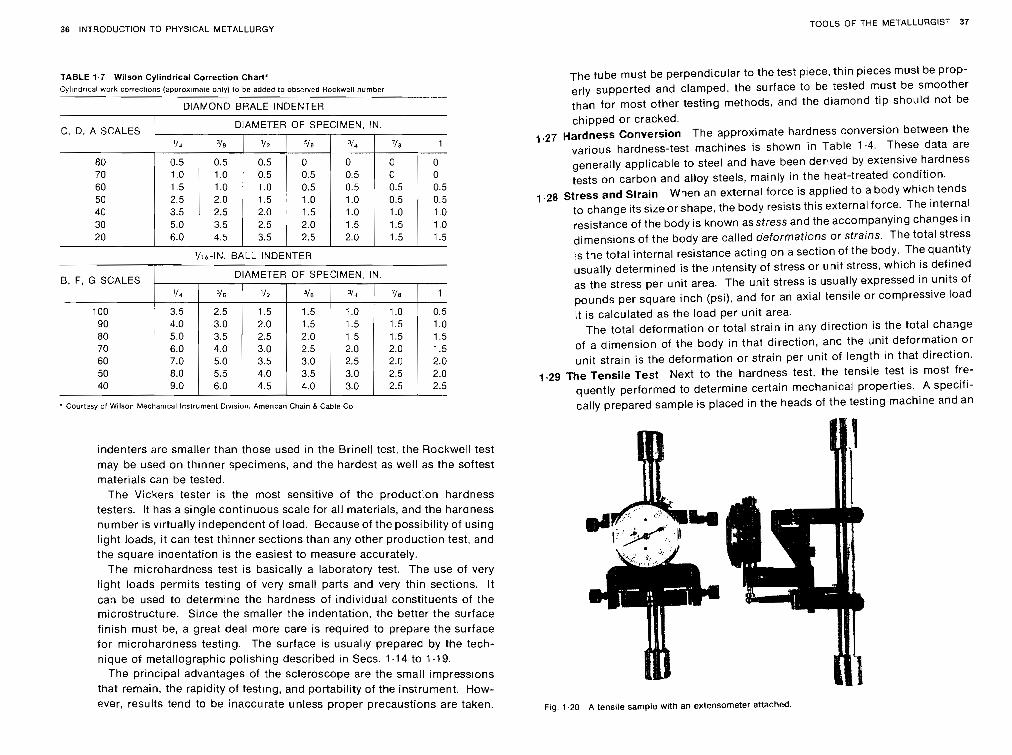
36 INTRODUCTION TO PHYSICAL METALLURGY TOOLS OF THE METALLURGIST 37
TABLE 1.7 Wilson Cylindrical Correction Chart* Cyllndrlcai work corrections (approximate only) to be added to observed Rockwell number
DIAMOND BRALE INDENTER
B. F, G SCALES DIAMETER OF SPECIMEN, IN
C. D, A SCALES
' Courtesy of Wilson Mechanical lnstrurnenl D~v~sion. Amer~can Cham 8 Cable Co
DIAMETER OF SPECIMEN. IN.
' I d I 31s 1 l/2 1 5l ' 8 I 3 id I I 1
indenters are smaller than those used in the Brinell test. the Rockwell test may be used on thinner specimens, and the hardest as well as the softest materials can be tested.
The Vickers tester is the most sensitive of the production hardness testers. It has a single continuous scale for all materials, and the hardness number is virtually independent of load. Because of the possibility of using light loads, it can test thinner sections than any other production test, and the square indentation is the easiest to measure accurately.
The microhardness test is basically a laboratory test. The use of very light loads permits testing of very small parts and very thin sections. It can be used to determine the hardness of individual constituents of the microstructure. Since the smaller the indentation, the better the surface finish must be, a great deal more care is required to prepare the surface for microhardness testing. The surface is usually prepared by the tech- nique of metallographic polishing described in Secs. 1 .I4 to 1.19.
The principal advantages of the scleroscope are the small impressions that remain, the rapidity of testing, and portability of the instrument. How- ever, results tend to be inaccurate unless proper precaustions are taken.
The tube must be perpendicular to the test piece, thin pieces must be prop- erly supported and clamped, the surface to be tested must be smoother than for most other testing methods, and the diamond tip should not be chipped or cracked.
1.27 Hardness Conversion The approximate hardness conversion between the various hardness-test machines is shown in Table 1.4. These data are
generally applicable to steel and have been derived by extensive hardness tests on carbon and alloy steels, mainly in the heat-treated condition.
1.28 Stress and Strain When an external force is applied to a body which tends to change its size or shape, the body resists this external force. The internal resistance of the body is known asstress and the accompanying changes in dimensions of the body are called deformations or strains. The total stress is the total internal resistance acting on a section of the body. The quantity usually determined is the intensity of stress or unit stress, which is defined as the stress per unit area. The unit stress is usually expressed in units of pounds per square inch (psi), and for an axial tensile or compressive load it is calculated as the load per unit area.
The total deformation or total strain in any direction is the total change of a dimension of the body in that direction, and the unit deformation or unit strain is the deformation or strair, per unit of length in that direction.
1.29 The Tensile Test Next to the hardness test, the tensile test is most fre- quently performed to determine certain mechanical properties. A specifi- cally prepared sample is placed in the heads of the testing machine and an
Fig. 1.20 A tensile sample with an extensometer attached.
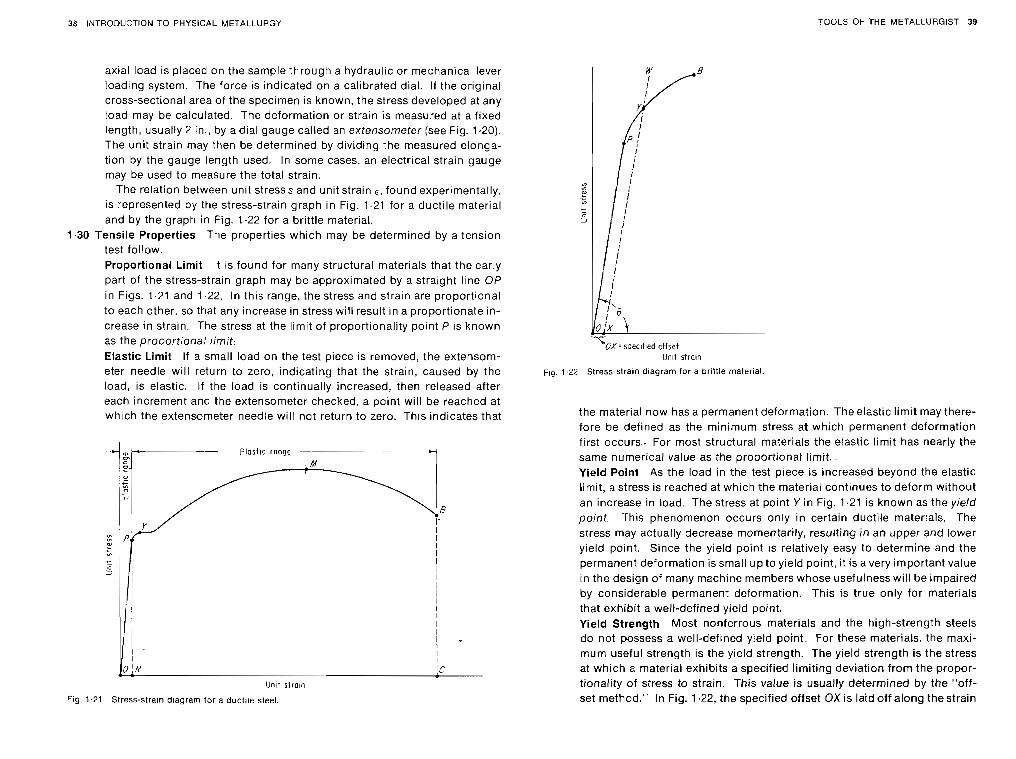
38 INTRODUCTION TO PHYSICAL METALLURGY TOOLS OF THE METALLURGIST 39
axial load is placed on the sample through a hydraulic or mechanical lever loading system. The force IS indicated on a calibrated dial. If the original cross-sectional area of the specimen is known, the stress developed at any load may be calculated. The deformation or strain is measured at a fixed length, usually 2 in., by a dial gauge called an extensometer (see Fig. 1.20). The unit strain may then be determ~ned by dividing the measured elonga- tion by the gauge length used. In some cases. an electrical strain gauge may be used to measure the total strain.
The relation between unit stresss and unit strain 6 , found experimentally. is represented by the stress-strain graph in Fig. 1.21 for a ductile material and by the graph in Fig. 1.22 for a brittle material.
1.30 Tensile Properties The properties which may be determined by a tension test follow. Proportional Limit It is found for many structural materials that the early part of the stress-strain graph may be approximated by a straight line OP in Figs. 1.21 and 1.22. In this range, the stress and strain are proportional to each other, so that any increase in stress will result in a proportionate in- crease in strain. The stress at the limit of proportionality point P is known as the proportional limit: Elastic Limit If a small load on the test piece is removed, the extensom- eter needle will return to zero, indicating that the strain, caused by the load, is elastic. If the load is continually increased, then released after each increment and the extensometer checked, a point will be reached at which the extensometer needle wilt not return to zero. This indicates that
Unir s t ro~n
Fig. 1.21 Stress-strain diagram for a duct~le steel.
Unlt strain
F1g. 1 22 Stress-strain d~agram for a brittle maler~al.
the material now has a permanent deformation. The elastic limit may there- fore be defined as the minimum stress at which permanent deformation first occurs.. For most structural materials the elastic limit has nearly the same numerical value as the proportional limit.. Yield Point As the load in the test piece is increased beyond the elastic limit, a stress is reached at which the material continues to deform without an increase in load. The stress at point Y in Fig. 1.21 is known as the yield point. This phenomenon occurs only in certain ductile materials. The stress may actually decrease momentarily, resulting i n an upper and lower yield point. Since the yield point is relatively easy to determine and the permanent deformation is small up to yield point, it is a very important value in the design of many machine members whose usefulness will be impaired by considerable permanent deformation. This is true only for materials that exhibit a well-defined yield point. Yield Strength Most nonferrous materials and the high-strength steels do not possess a well-defined yield point. For these materials, the maxi- mum useful strength is the yield strength. The yield strength is the stress at which a material exhibits a specified limiting deviation from the propor- tionality of stress to strain. This value is usually determined by the "off- set method." In Fig. I .22, the specified offset OX is laid off along the strain
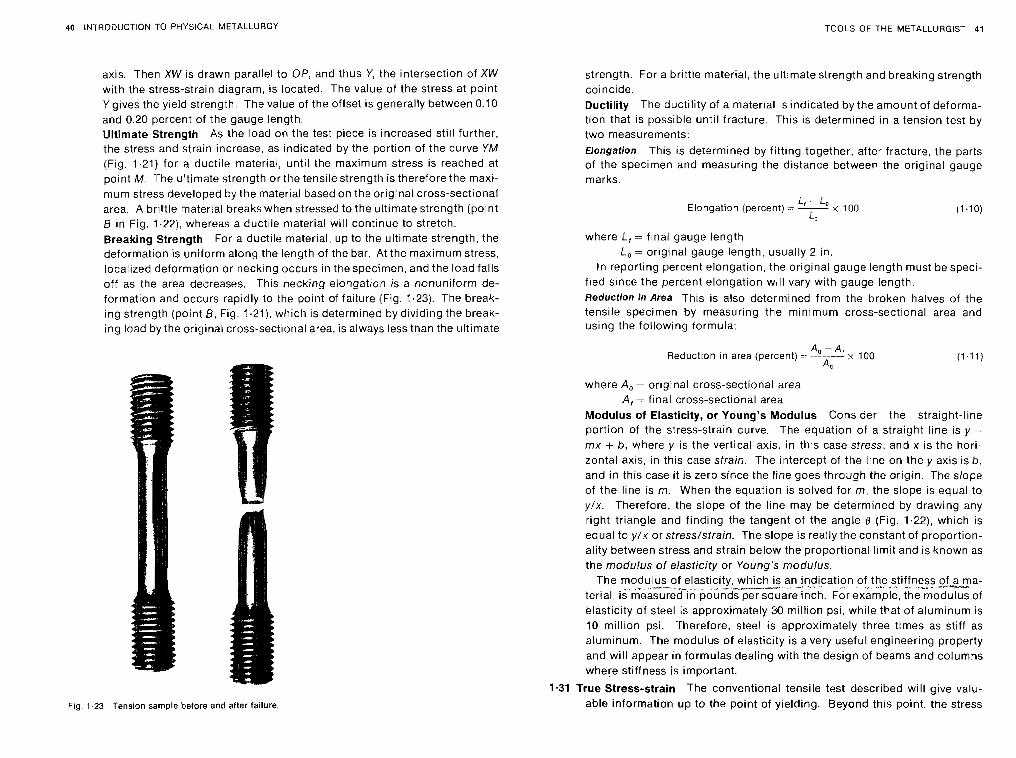
40 INTRODUCTION TO PHYSICAL METALLURGY TOOLS OF THE METALLURGIST 41
axis. Then XW is drawn parallel to Of, and thus Y, the intersection of XW with the stress-strain diagram, is located. The value of the stress at point Y gives the yield strength. The value of the offset is generally between 0.10 and 0.20 percent of the gauge length. Ultimate Strength As the load on the test piece is increased still further, the stress and strain increase, as Indicated by the portion of the curve YM (Fig. 1.21) for a ductile material, until the maximum stress is reached at point M. The ultimate strength or the tensile strength is therefore the maxi- mum stress developed by the material based on the original cross-sectional area. A brittle material breaks when stressed to the ultimate strength (point 8 in Fig. 1.22), whereas a ductile material will continue to stretch. Breaking Strength For a ductile material, up to the ultimate strength, the deformation is uniform along the length of the bar, At the maximum stress, localized deformation or necking occurs in the specimen, and the load falls off as the area decreases. This necking elongation is a nonuniform de- formation and occurs rapidly to the point of failure (Fig. 1.23). The break- ing strength (point B, Fig. 1.21), which is determined by dividing the break- ing load by the original cross-sectional area, is always less than the ultimate
Fig. 1.23 Tension sample before and after failure.
strength. For a brittle material, the ultimate strength and breaking strength coincide. Ductility The ductility of a material is indicated by the amount of deforma- tion that is possible until fracture. This is determined in a tension test by two measurements: Elongation This is determined by fitting together, after fracture, the parts of the specimen and measuring the distance between the original gauge marks.
L, -- Lo Elongation (percent) :- --- x 100
L9
where L, = final gauge length L, = original gauge length, usually 2 in.
In reporting percent elongation, the original gauge length must be speci- fied since the percent elongation will vary with gauge length. Reduction in Area This is also determined from the broken halves of the tensile specimen by measuring the minimum cross-sectional area and using the following formula:
A - A Reduction In area (percent) =: -?--.L :< 100 ( 1 , l l )
A0
where A, = original cross-sectional area A, - final cross-sectional area
Modulus of Elasticity, or Young's Modulus Consider the straight-line portion of the stress-strain curve. The equation of a straight line is y - mx + b, where y is the vertical axis, in this case stress, and x is the hori- zontal axis, in this case strain. The intercept of the line on they axis is b , and in this case it is zero since the line goes through the origin. The slope of the line is m. When the equation is solved for m, the slope is equal to y/x . Therefore, the slope of the line may be determined by drawing any right triangle and finding the tangent of the angle O (Fig. 1.22), which is equal to y / x or stresslstrain. The slope is really the constant of proportion- ality between stress and strain below the proportional limit and is known as the modulus of elasticity or Young's modulus.
The modulus of elasticity, whlch IS an~ndlcatlon of the str[fn%s ,off?-ma- --- *--- * ---",-- terlal, is measured in pounds per square Inch. For example, the modulus of Blasticity of steel is approximately 30 million psi, while that of aluminum is 10 million psi. Therefore. steel is approximately three times as stiff as aluminum. The modulus of elasticity is a very useful engineering property and will appear in formulas dealing with the design of beams and columns where stiffness is important.
1.31 True Stress-strain The conventional tensile test described will give valu- able information up to the point of yielding. Beyond this point, the stress
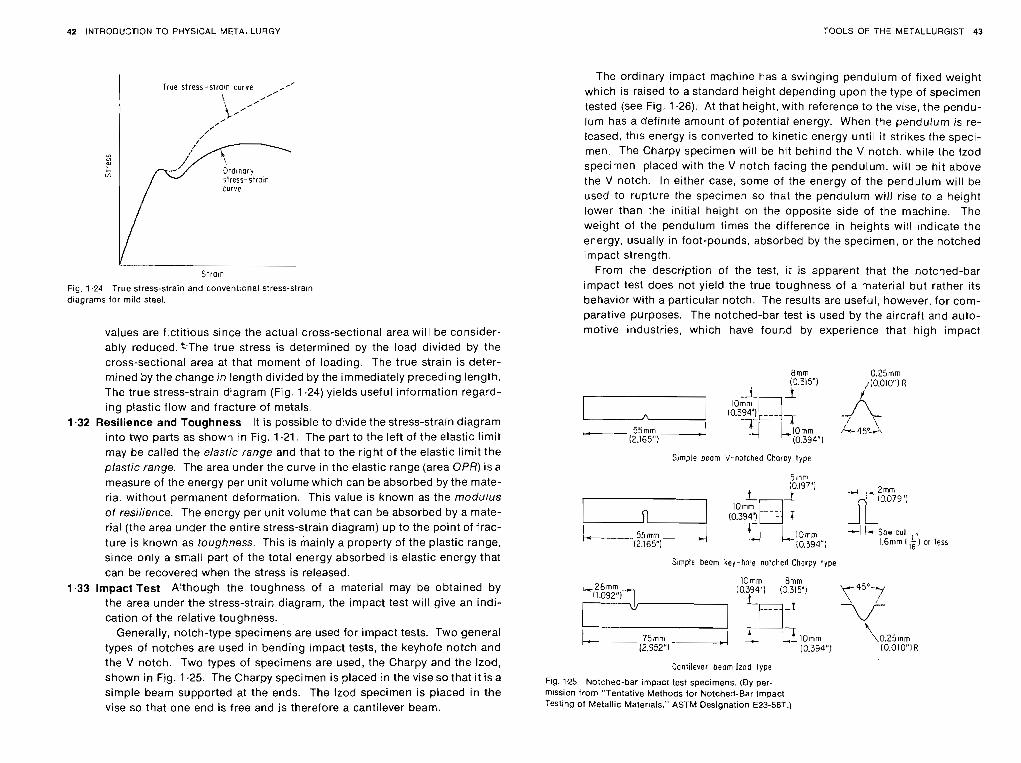
42 INTRODUCTION TO PHYSICAL METALLURGY TOOLS OF THE METALLURGIST 43
S t r a ~ n
Fig. 1.24 True stress-strain and conventional stress-strarn diagrams for mild steel.
values are fictitious since the actual cross-sectional area will be consider- ably reduced. eThe true stress is determined by the load divided by the cross-sectional area at that moment of loading. The true strain is deter- mined by the change in length divided by the immediately preceding length. The true stress-strain diagram (Fig. 1.24) yields useful information regard- ing plastic flow and fracture of metals.
1.32 Resilience and Toughness It is possible to divide the stress-strain diagram into two parts as shown in Fig. 1.21. The part to the left of the elastic limit may be called the elastic range and that to the right of the elastic limit the plastic range. The area under the curve in the elastic range (area OPR) is a measure of the energy per unit volume which can be absorbed by the mate- rial without permanent deformation. This value is known as the modulus of resilience. The energy per unit volume that can be absorbed by a mate- rial (the area under the entire stress-strain diagram) up to the point of frac- ture is known as toughness. This is mainly a property of the plastic range, since only a smalt part of the total energy absorbed is elastic energy that can be recovered when the stress is released.
1.33 Impact Test Although the toughness of a material may be obtained by the area under the stress-strain diagram, the impact test will give an indi- cation of the relative toughness.
Generally, notch-type specimens are used for impact tests. Two general types of notches are used in bending impact tests, the keyhole notch and the V notch. Two types of specimens are used, the Charpy and the Izod, shown in Fig. 1.25. The Charpy specimen is placed in the vise so that i t is a simple beam supported at the ends. The lzod specimen is placed in the vise so that one end is free and i s therefore a cantilever beam.
The ordinary impact machine has a swinging pendulum of fixed weight which is raised to a standard height depending upon the type of specimen tested (see Fig. 1.26). At that height, with reference to the vise, the pendu- lum has a definite amount of potential energy. When the pendulum is re- leased, this energy is converted to kinetic energy until it strikes the speci- men. The Charpy specimen will be hit behind the V notch. while the lzod specimen placed with the V notch facing the pendulum, will be hit above the V notch. In either case, some of the energy of the pendulum will be used to rupture the specimen so that the pendulum will rise to a height lower than the initial height on the opposite side of the machine. The weight of the pendulum times the difference in heights will indicate the energy, usually in foot-pounds, absorbed by the specimen, or the notched impact strength.
From the description of the test, i t is apparent that the notched-bar impact test does not yield the true toughness of a material but rather its behavior with a particular notch. The results are useful, however, for com- parative purposes. The notched-bar test is used by the aircraft and auto- motive industries, which have found by experience that high impact
Simple beom V-notched Ctocpy type
S~rnple beam key -hose notched Chorpy type
Cantilever beom lzod lype
Fig. 1.25 Notched-bar Impact test specimens. (By per- mission from "Tentative Methods for hiotched-Bar Impact test in^ of Metallic Mater~als," ASTM Designation E23-56T.)
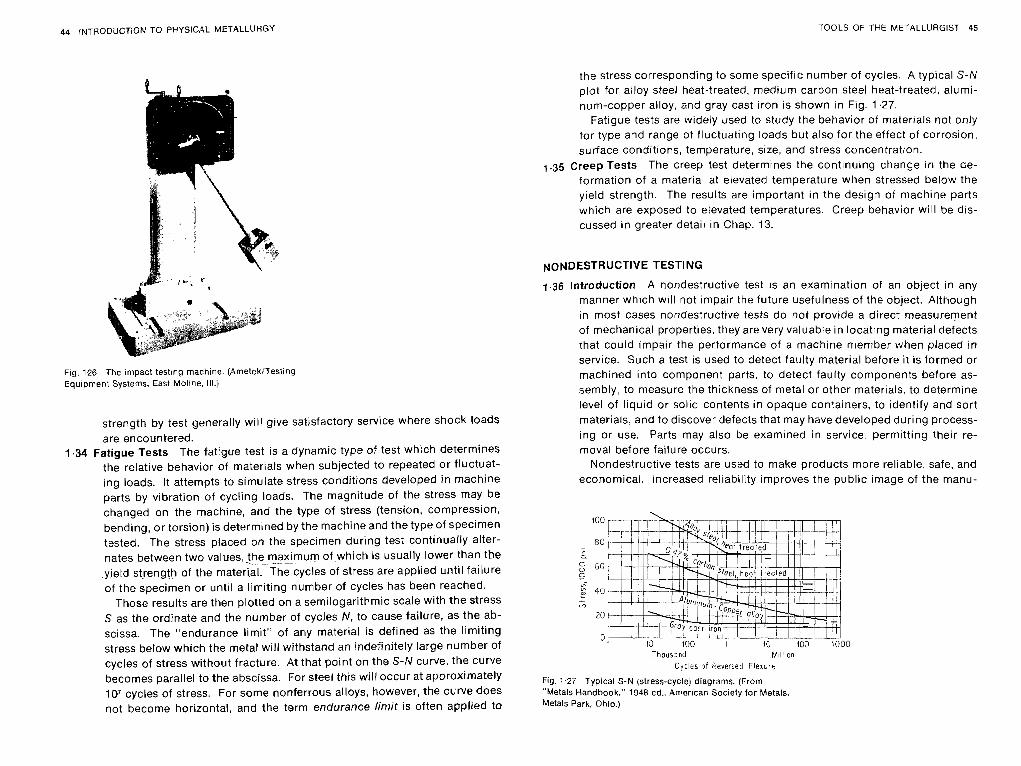
44 INTRODUCTION TO PHYSICAL METALLURGY TOOLS OF THE METALLURGIST 45
Fig. 126 The impact test~ng machine. (AmetekiTesting Equipmen; Systems. East Moltne. ill.:^
strength by test generally will give satisfactory service where shock loads are encountered.
1.34 Fatigue Tests The fatigue test is a dynamic type of test which determines the relative behavior of materials when subjected to repeated or fluctuat- ing loads. It attempts to simulate stress conditions developed in machine parts by vibration of cycling loads. The magnitude of the stress may be changed on the machine, and the type of stress (tension, compression, bending, or torsion) is determined by the machine and the type of specimen tested. The stress placed on the specimen during test continually alter- nates between two values,the . . . maximum - - - - . of which is usually lower than the ,yield strength of the material. The cycles of stress are applied until failure of the specimen or until a limiting number of cycles has been reached.
Those results are then plotted on a semilogarithmic scale with the stress S as the ordinate and the number of cycles N, to cause failure, as the ab- scissa. The "endurance limit" of any material is defined as the limiting stress below which the metal will withstand an indefinitely large number of cycles of stress without fracture. At that point on the S-N curve, the curve becomes parallel to the abscissa. For steel this will occur at approximately lo7 cycles of stress. For some nonferrous alloys, however, the curve does not become horizontal, and the term endurance limit is often applied to
the stress corresponding to some specif~c number of cycles. A typical S-N plot for alloy steel heat-treated, medium carbon steel heat-treated, alumi- num-copper alloy, znd gray cast iron is shown in Fig. 1.27.
Fatigue tests are widely used to study the behavior of materials not only for type and range of fluctuating loads but also for the effect of corrosion. surface conditions, temperature, size, and stress concentration.
1.35 Creep Tests The creep test determines the continuing change in the de- formation of a material at elevated temperature when stressed below the yield strength. The results are important in the design of machine parts which are exposed to elevated temperatures. Creep behavior will be dis- cussed in greater detail in Chap. 13.
NONDESTRUCTIVE TESTING
1.36 Introduction A nondestructive test IS an examination of an object in any manner which will not impair the future usefulness of the object. Although in most cases nondestructive tests do not provrde a direct measurement of mechanical properties. they are very valuable in locating material defects that could impair the performance of a machine nrember when placed in service. Such a test is used to detect faulty material before it is formed or machined into component parts, to detect faulty components before as- sembly, to measure the thickness of metal or other materials, to determine level of liquid or solid contents in opaque containers, to identify and sort materials, and to discover defects that may have developed during process- ing or use. Parts may also be examined in service, permitting their re- moval before failure occurs.
Nondestructive tests are used to make products more reliable, safe, and economical. Increased reliability improves the public image of the manu-
7hoos3nd t /~ l l ion
Cy - l es of 4eversed F l e x ~ r e
Fig. : .27 Typical S-N (stress-cycle) diagrams. (From "Metals Handbook." 1948 ed.. Amertcan Society for Metals, Metals Park. Ohio.)
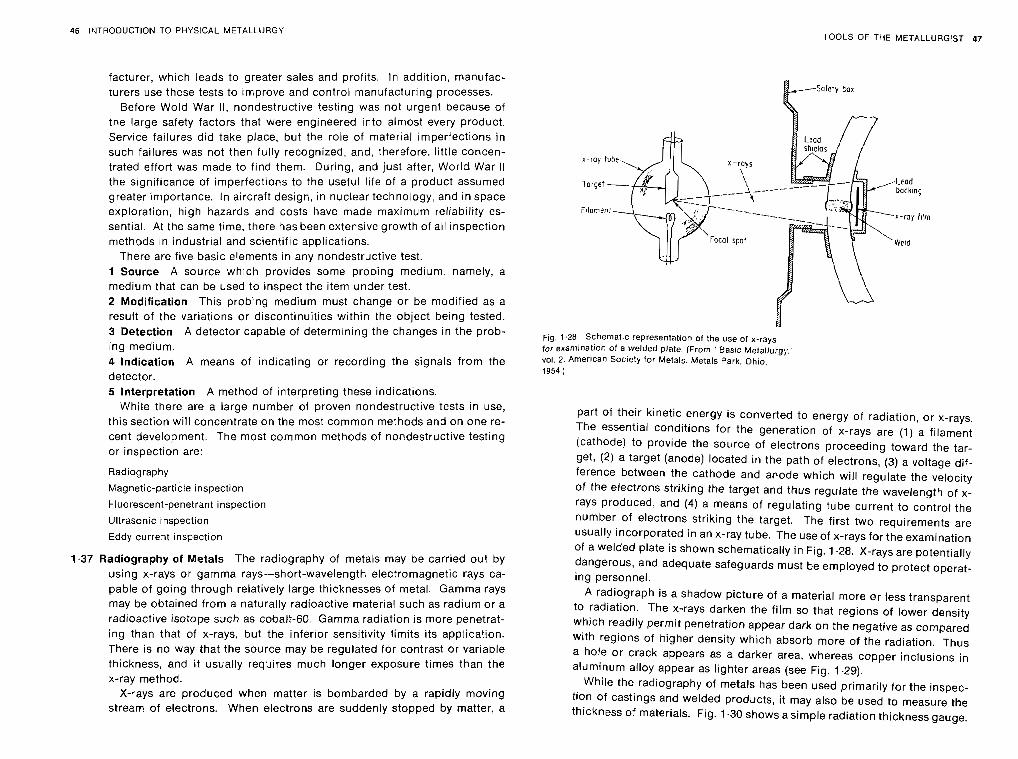
46 INTRODUCTION TO PHYSICAL METALLURGY TOOLS OF THE METALLURGIST 47
facturer, which leads to greater sales and profits. In addition, manufac-
turers use these tests to improve and control manufacturing processes. Before Wold War II, nondestructive testing was not urgent because of
the large safety factors that were engineered into almost every product. Service failures did take place, but the role of material imperfections in such failures was not then fully recognized, and, therefore, little concen- trated effort was made to find them. During, and just after, World War II the significance of imperfections to the useful life of a product assumed greater importance. In aircraft design, in nuclear technology, and in space exploration, high hazards and costs have made maximum reliability es- sentiar. At the same time, there has been extensive growth of all inspection methods in industrial and scientif~c applications.
There are five basic elements in any nondestructive test. 1 Source A source wh~ch provides some probing medium, namely, a medium that can be used to inspect the item under test. 2 Modification This probing medium must change or be modified as a result of the variations or discontinuities within the object being tested. 3 Detection A detector capable of determining the changes in the prob- Ing medium. 4 Indication A means of indicating or recording the signals from the detector. 5 Interpretation A method of interpreting these indications.
While there are a large number of proven nondestructive tests in use, this section will concentrate on the most common methods and on one re- cent development. The most common methods of nondestructive testing or inspection are:
Radiography ~agnetic-particle inspection
Fluorescent-penetrant inspection Ultrasonic inspection Eddy current inspection
1.37 Radiography of Metals The radiography of metals may be carried out by using x-rays or gamma rays-short-wavelength electromagnetic rays ca- pable of going through relatively large thicknesses of metal. Gamma rays may be obtained from a naturally radioactive material such as radium or a radioactive isotope such as cobalt-60. Gamma radiation is more penetrat- ing than that of x-rays, but the inferior sensitivity limits its application. There is no way that the source may be regulated for contrast or variable thickness, and it usually requires much longer exposure times than the x-ray method.
X-rays are produced when matter is bombarded by a rapidly moving stream of electrons. When electrons are suddenly stopped by matter, a
,I$------- Focal spot
Fig. 1.28 Schematic representation of the use of x-rays for examination of a welded plate. (From "Bas~c Metallurgy "01. 2. American Society for Metals. Metals Park. Ohio, 1954.)
part of their kinetic energy is converted to energy of radiation, or x-rays. The essential conditions for the generation of x-rays are (1) a filament (cathode) to provide the source of electrons proceeding toward the tar- get, (2) a target (anode) located in the path of electrons, (3) a voltage dif- ference between the cathode and anode which will regulate the velocity of the electrons striking the target and thus regulate the wavelength of x- rays produced, and (4) a means of regulating tube current to control the
number of electrons striking the target. The first two requirements are usually incorporated in an x-ray tube. The use of x-rays for the examination of a welded plate is shown schematically in Fig. 1.28. X-rays are potentially dangerous, and adequate safeguards must be employed to protect operat- ing personnel.
A radiograph is a shadow picture of a material more or less transparent to radiation. The x-rays darken the film so that regions of lower density which readily permit penetration appear dark on the negative as compared with regions of higher density which absorb more of the radiation. Thus a hole or crack appears as a darker area, whereas copper inclusions in aluminum alloy appear as lighter areas (see Fig. 1.29).
While the radiography of metals has been used primarily for the inspec- tion of castings and welded products, it may also be used to measure the thickness of materials. Fig. 1.30 shows a simple radiation thickness gauge.
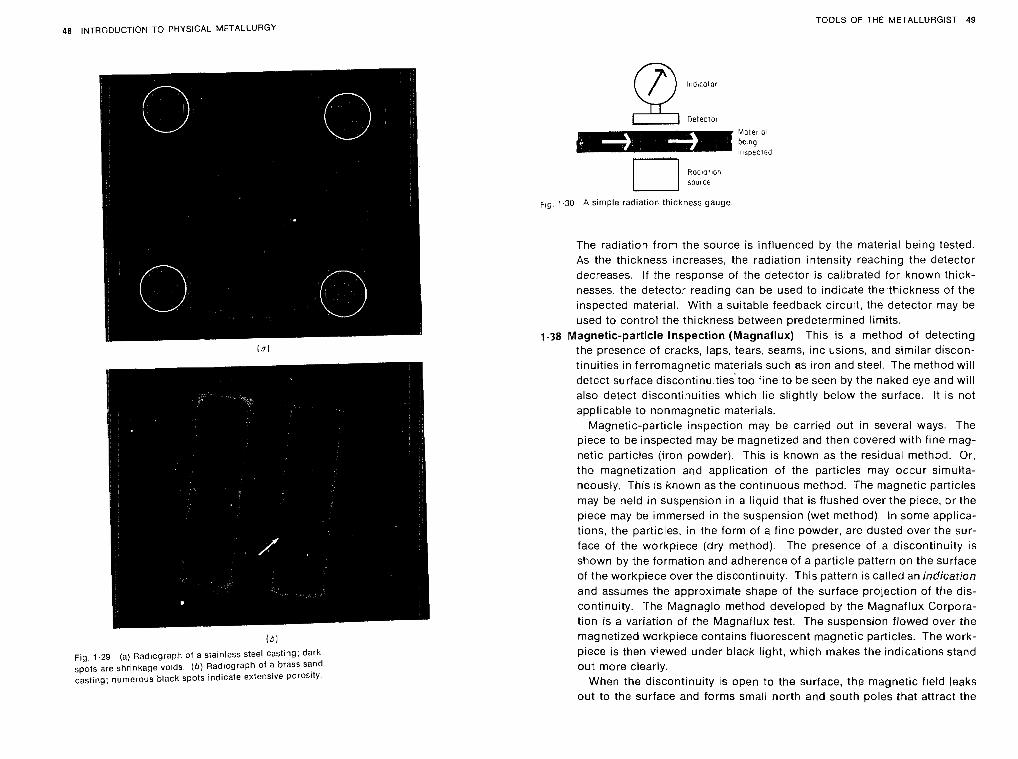
48 INTRODUCTION TO PHYSICAL METALLURGY TOOLS OF THE METALLURGIST 49
('5)
Fig. 1.29 (a) Rad~ograph of a stainless steel casting; dark
spots are shrinkage voids. ( b ) Radiograph of a brass sand casting; numerous black spots indicate extensive porosity.
1-30 k simple radiation thickness gauge
The radiation from the source is influenced by the material being tested. As the thickness increases, the radiation intensity reaching the detector decreases. If the response of the detector is calibrated for known thick- nesses, the detector reading can be used to indicate the,thickness of the inspected material. With a suitable feedback circuit, the detector may be used to control the thickness between predetermined limits.
1.38 Magnetic-particle Inspection (Magnaflux) This is a method of detecting the presence of cracks, laps, tears, seams, inclusions, and similar discon- tinuities in ferromagnetic materials such as iron and steel. The method will detect surface discontinuities'too fine to be seen by the naked eye and will also detect discontinuities which lie slightly below the surface. It is not applicable to nonmagnetic materials.
Magnetic-particle inspection may be carried out in several ways. The piece to be inspected may be magnetized and then covered with fine mag- netic particles (iron powder). This is known as the residual method. Or, the magnetization and application of the particles may occur simulta- neously. This is known as the continuous method. The magnetic particles may be held in suspension in a liquid that is flushed over the piece, or the piece may be immersed in the suspension (wet method). In some applica- tions, the particles. in the form of a fine powder, are dusted over the sur- face of the workpiece (dry method). The presence of a discontinuity is shown by the formation and adherence of a particle pattern on the surface of the workpiece over the discontinuity. This pattern is called an indication and assumes the approximate shape of the surface projection of the dis- continuity. The Magnaglo method developed by the Magnaflux Corpora- tion is a variation of the Magnaflux test. The suspension flowed over the magnetized workpiece contains fluorescent magnetic particles. The work- piece is then viewed under black light, which makes the indications stand out more clearly.
When the discontinuity is open to the surface, the magnetic field leaks out to the surface and forms small north and south poles that attract the
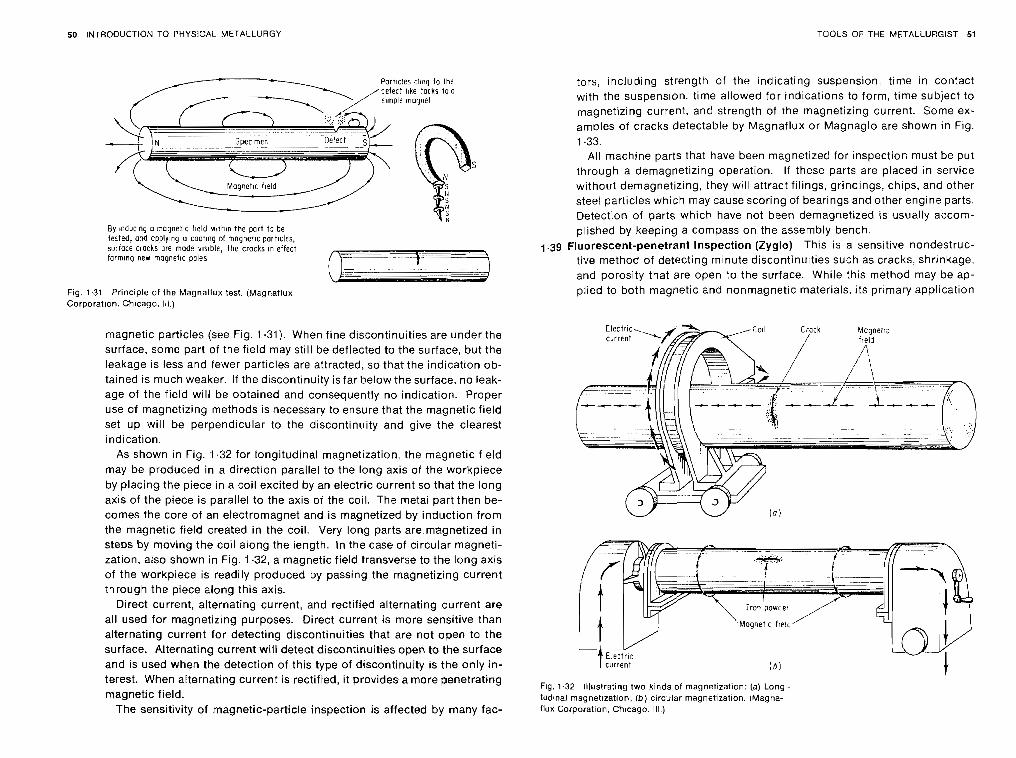
50 INTRODUCTION TO PHYSICAL METALLURGY TOOLS OF THE METALLURGIST 51
Par~icles il~nq to the efect ltke tocks la a
By bnd,~Unt) o magnerlc tteld witntn the part t> be tested, aid opply~ng o cooring of mogneilc part~cles, surioce cracks ore mode .risible, the cracks In effect
. forming new magnetic p31es
Fig. 1.31 Principle of the Magnatlux test. (Magnaflux Corporation. Ch~cago, lil.)
magnetic particles (see Fig. 1.31). When fine discontinuities are under the surface, some part of the field may still be deflected to the surface, but the leakage is less and fewer particles are attracted, so that the indication ob- tained is much weaker. If the discontinuity is far below the surface. no leak- age of the field will be obtained and consequently no indication. Proper use of magnetizing methods is necessary to ensure that the magnetic field set up will be perpendicular to the discontinuity and give the clearest indication.
As shown in Fig. 1.32 for longitudinal magnetization, the magnetic field may be produced in a direction parallel to the long axis of the workpiece by placing the piece in a coil excited by an electric current so that the long axis of the piece is parallel to the axis of the coil. The metal part then be- comes the core of an electromagnet and is magnetized by induction from the magnetic field created in the coil. Very long parts are-magnetized in steps by moving the coil along the length. In the case of circular magneti- zation, also shown in Fig. 1.32, a magnetic field transverse to the long axis of the workpiece is readily produced by passing the magnetizing current through the piece along this axis.
Direct current, alternating current, and rectified alternating current are all used for magnetizing purposes. Direct current is more sensitive than alternating current for detecting discontinuities that are not open to the surface. Alternating current will detect discontinuities open to the surface and is used when the detection of this type of discontinuity is the only in- terest. When alternating current is rectified, it provides a more penetrating magnetic field.
The sensitivity of magnetic-particle inspection is affected by many fac-
tors, including strength of the indicating suspension, time in contact with the suspension, time allowed for indications to form, time subject to magnetizing current, and strength of the magnetizing current. Some ex- amples of cracks detectable by Magnaflux or Magnaglo are shown in Fig. 1.33.
All machine parts that have been magnetized for inspectior; must be put through a demagnetizing operation. If these parts are placed in service without demagnetizing, they will attract filings, grindings, chips, and other steel particles which may cause scoring of bearings and other engine parts. Detection of parts which have not been demagnetized is usually accom- plished by keeping a compass on the assembly bench.
1.39 Fluorescent-penetrant Inspection (Zyglo) This is a sensitive nondestruc- tive method of detecting minute discontinuities such as cracks, shrinkage, and porosity that are open to the surface. While this method may be ap- plied to both magnetic and nonmagnetic materials, its primary application
I current
Fig. 1.32 Illustrating two kinds ot magnetlzation: (a) Longi- tudmal magnetlzation; (bj circular magnetization. (Magna- flux Corporation. Chlcago. Ill.)
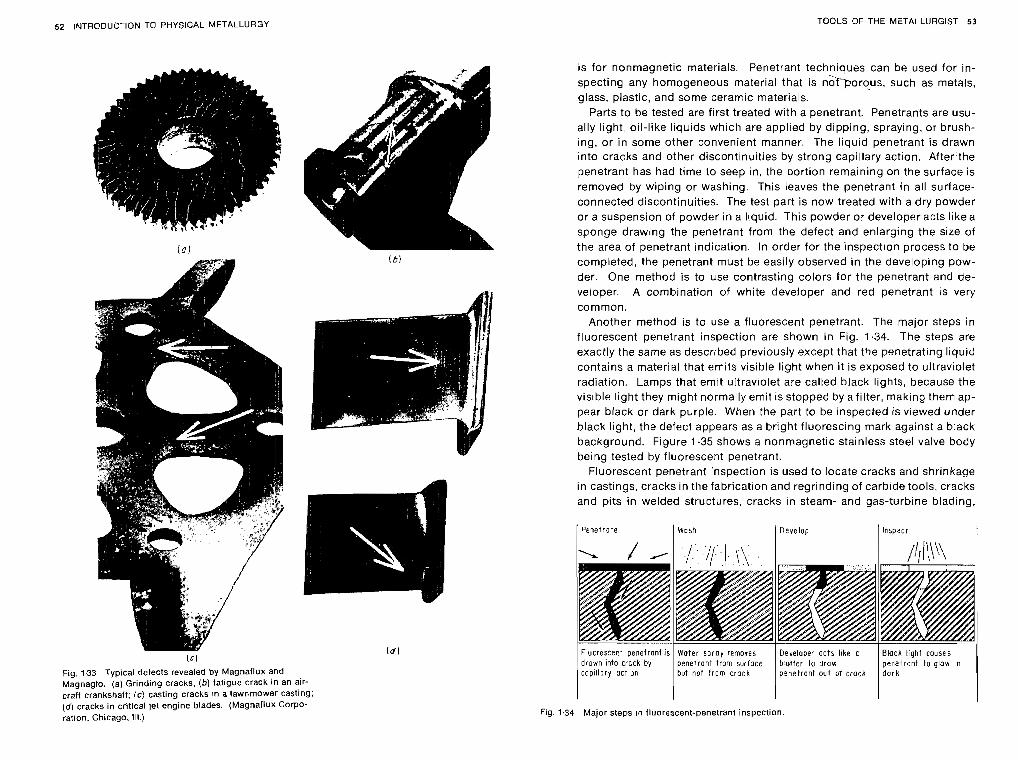
52 INTRODUCTION TO PHYSICAL METALLURGY TOOLS OF THE METALLURGIST 53
(dl (CI
Fig. 1.33 Typical defects revealed by Magnaflux and Magnaglo. (a) Grinding cracks; (b ) fatigue crack in an air- craft crankshaft: (c) casting cracks in a lawnmower casting; ( d ) cracks in critical jet engine blades. (Magnaflux Corpo- ration. Chicago. Ill.)
is for nonmagnetic materials. Penetrant techniques can be used for in- specting any homogeneous material that is n&-porous, such as metals, glass, plastic, and some ceramic materials.
Parts to be tested are first treated with a penetrant. Penetrants are usu- ally light, oil-like liquids which are applied by dipping, spraying, or brush- ing, or in some other convenient manner. The liquid penetrant is drawn into cracks and other discontinuities by strong capillary action. Afterithe penetrant has had time to seep in, the portion remaining on the surface is removed by wiping or washing. This leaves the penetrant in all surface- connected discontinuities. The test part is now treated with a dry powder or a suspension of powder in a liquid. This powder or developer acts like a sponge drawing the penetrant from the defect and enlarging the size of the area of penetrant indication. In order for the inspection process to be completed, the penetrant must be easily observed in the developing pow- der. One method is to use contrasting colors for the penetrant and de- veloper. A combination of white developer and red penetrant is very common.
Another method is to use a fluorescent penetrant. The major steps in fluorescent penetrant inspection are shown in Fig. 1.34. The steps are exactly the same as described previously except that the penetrating liquid contains a material that emits visible light when it is exposed to ultraviolet radiation. Lamps that emit ultraviolet are called black lights, because the visible light they might normally emit is stopped by afilter, making them ap- pear black or dark purple. When the part to be inspected is viewed under black light, the defect appears as a bright fluorescing mark against a black background. Figure 1.35 shows a nonmagnetic stainless steel valve body being tested by fluorescent penetrant.
Fluorescent penetrant inspection is used to locate cracks and shrinkage in castings, cracks in the fabrication and regrinding of carbide tools, cracks and pits in welded structures, cracks in steam- and gas-turbine blading.
( Penetrore ( Wash ( Develop 1 lnspect t
Fig. 1.34 Major steps lo fluorescent-penetrant inspection.
Flucrescerr penetrant i s drawn into croci! by copillory uction
Woter soray removes penetrant from surface but not frcm crock
Developer ac ts like c b'otler to j r a w penetrant out o i crock
Block light causes penetrant to glow n dark
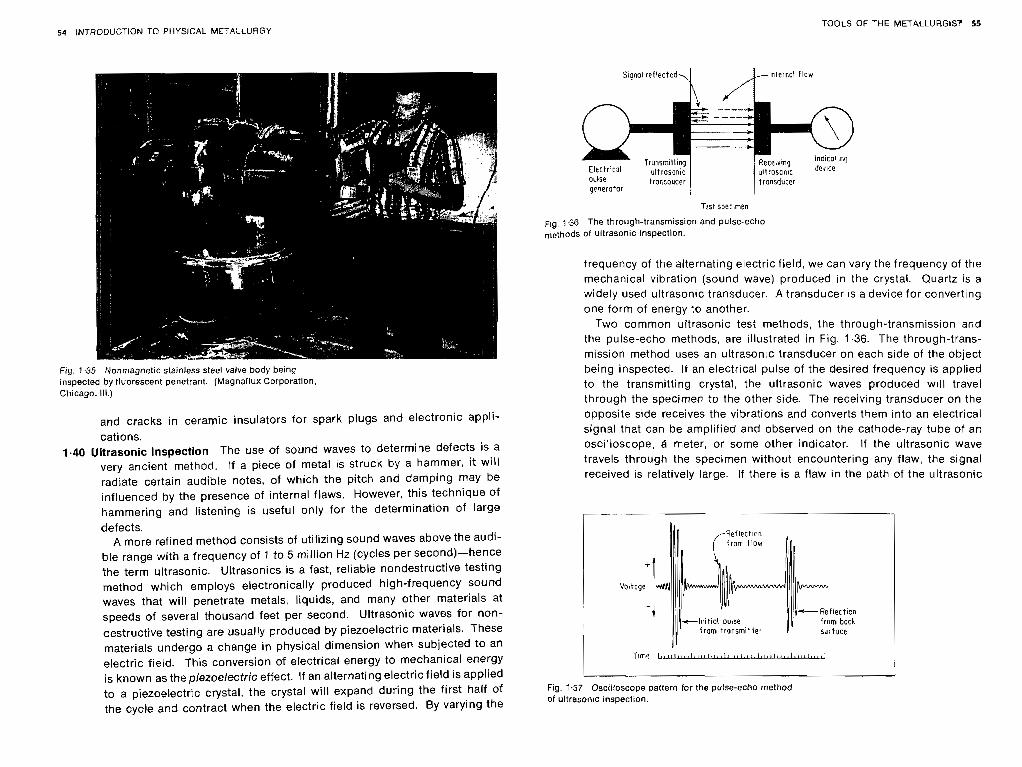
54 INTRODUCTION TO PHYSICAL METP.LLURGY
S~gnol reflected
TOOLS OF THE METALLURGIST 55
Fig. 1.35 Nonmagnetic stainless steel valve body being inspected by fluorescent penetrant. (Magnaflux Corporation, Chicago. Ill.)
and cracks in ceramic insulators for spark plugs and electronic appli- cations.
1-40 Ultrasonic Inspection The use of sound waves to determine defects is a very ancient method. If a piece of metal is struck by a hammer, i t will radiate certain audible notes, of which the pitch and damping may be influenced by the presence of internal flaws. However, this technique of hammering and listening is useful only for the determination of large defects.
A more refined method consists of utilizing sound waves above the audi- ble range with a frequency of 7 to 5 million Hz (cycles per second)-hence the term ultrasonic. Ultrasonics is a fast, reliable nondestructive testing method which employs electronically produced high-frequency sound waves that will penetrate metals, liquids, and many other materials at speeds of several thousand feet per second. Ultrasonic waves for non- destructive testing are usually produced by piezoelectric materials. These materials undergo a change in physical dimension when subjected to an electric field. This conversion of electrical energy to mechanical energy is known as the piezoelectric effect. If an alternating electric field is applied to a piezoelectric crystal, the crystal will expand during the first half of the cycle and contract when the electric field is reversed. By varying the
Test speomen
Fig. 7.36 The through-transmission and pulse-echo methods o l ultrasonic inspection.
frequency of the alternating electric field, we can vary the frequency of the mechanical vibration (sound wave) produced in the crystal. Quartz is a widely used ultrasonic transducer. A transducer is a device for converting one form of energy to another.
Two common ultrasonic test methods, the through-transmission and the pulse-echo methods, are illustrated in Fig. 1.36. The through-trans- mission method uses an ultrasonic transducer on each side of the object being inspected. If an electrical pulse of the desired frequency is applied to the transmitting crystal, the ultrasonic waves produced will travel through the specimen to the other side. The receiving transducer on the opposite side receives the vibrations and converts them into an electrical signal that can be amplified and observed on the cathode-ray tube of an oscilloscope, B meter, or some other indicator. If the ultrasonic wave travels through the specimen without encountering any flaw, the signal received is relatively large. If there is a flaw in the path of the ultrasonic
+ I Voltoge W
-1 c l n l t l a l pulse
irom fronsmif te-
I
Fig. 1.37 Oscilloscope pattern for the pulse-echo method of ultrason~c inspection.
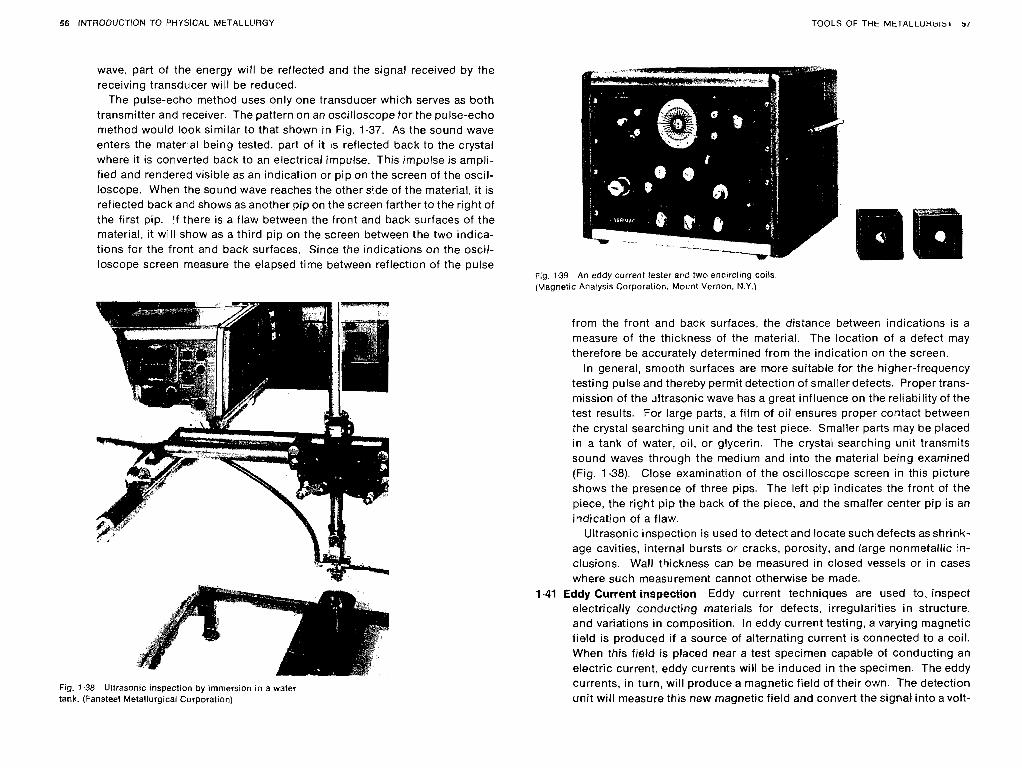
56 INTRODUCTION TO PHYSICAL METALLURGY TOOLS OF THE MEIALLUKblbl s f
wave, part of the energy will be reflected and the signal received by the receiving transducer will be reduced.
The pulse-echo method uses only one transducer which serves as both transmitter and receiver. The pattern on an oscilloscope for the pulse-echo method would look similar to that shown in Fig. 1.37. As the sound wave enters the material being tested. part of it is reflected back to the crystal where it is converted back to an electrical impulse. This impulse is ampli- fied and rendered visible as an indication or pip on the screen of the oscil- loscope. When the sound wave reaches the other side of the material, it is reflected back and shows as another pip on the screen farther to the right of the first pip. I f there is a flaw between the front and back surfaces of the material, it will show as a third pip on the screen between the two indica- tions for the front and back surfaces. Since the indications on the oscil- loscope screen measure the elapsed time between reflection of the pulse
Fig. 1.39 An eddy current tester and two encircling coils (Magnetic Analysis Corporation, Mount Vernon, N.Y.)
Fig. tank
1.38 Ultrasonic inspection by immersion in a water . (Fansteel Metallurgical Corporation)
from the front and back surfaces, the distance between indications is a measure of the thickness of the material. The location of a defect may therefore be accurately determined from the indication on the screen.
In general, smooth surfaces are more suitable for the higher-frequency testing pulse and thereby permit detection of smaller defects. Proper trans- mission of the ultrasonic wave has a great influence on the reliability of the test results. For large parts, a film of oil ensures proper contact between the crystal searching unit and the test piece. Smaller parts may be placed in a tank of water, oil, or glycerin. The crystal searching unit transmits sound waves through the medium and into the material being examined (Fig. I .38). Close examination of the oscilloscope screen in this picture shows the presence of three pips. The left pip indicates the front of the piece. the right pip the back of the piece, and the smaller center pip is an indication of a flaw.
Ultrasonic inspection is used to detect and locate such defects as shrink- age cavities, internal bursts or cracks, porosity, and large nonmetallic in- clusions. Wall thickness can be measured in closed vessels or in cases where such measurement cannot otherwise be made.
1.41 Eddy Current inspection Eddy current techniques are used to, inspect electrically conducting materials for defects, irregularities in structure, and variations in composition. In eddy current testing, a varying magnetic field is produced if a source of alternating current is connected to a coil. When this field is placed near a test specimen capable of conducting an electric current, eddy currents will be induced in the specimen. The eddy currents, in turn, will produce a magnetic field of their own. The detection unit will measure this new magnetic field and convert the signal into a volt-
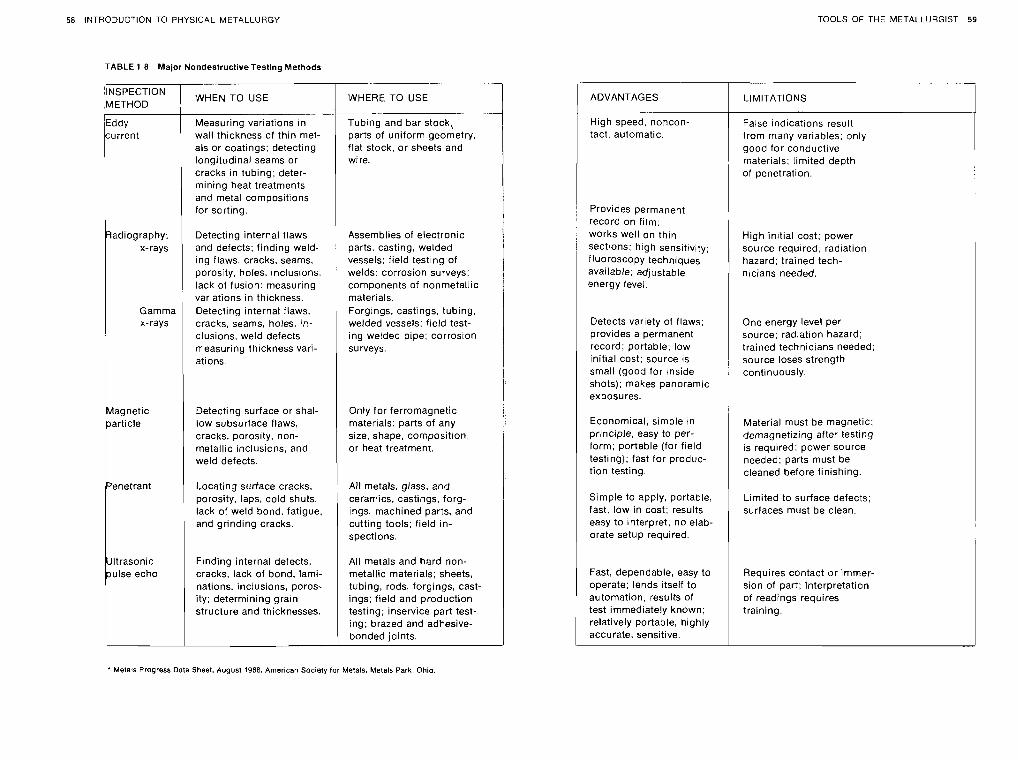
58 INTRODUCTION TO PHYSICAL METALLURGY TOOLS OF THE METALLURGIST 59
TABLE 1-8 Major Nondestructive Testing Methods
INSPECTION I WHEN TO USE METHOD
Eddy Measuring variations In current 1 wall thickness of thin met-
als or coatings; detecting longitudinal seams or cracks in tubing; deter- mining heat treatments and metal compositions for sorting.
ations
" adiography: x-rays
Gamma x-rays
agnetic Detecting surface or shal- low subsurface flaws, cracks, porosity, non- metallic inclusions, and weld defects.
Detecting internal flaws and defects; finding weld- ing flaws. cracks, seams, porosity, holes, inclusions, lack of fusion: measuring variations in thickness. Detecting internal flaws. cracks, seams, holes, in- clusions, weld defects: measuring thickness vari-
Locating surface cracks, porosity, laps, cold shuts, lack of weld bond, fatigue, and grinding cracks.
ltrasonic Finding internal defects, ulse echo cracks, lack of bond, lami-
nations. inclusions, poros- ity; determining grain structure and thicknesses.
1 WHERE 10 USE I Tubing and bar stock,. parts of uniform geometry, flat stock, or sheets and I- wire.
I Assemblies of electronic parts, casting, welded vessels; field testing of welds: corrosion surveys; components of nonmetallic materials. Forgings, castings, tubing. welded vessels; field test- ing welded pipe: corrosion surveys.
Only for ferromagnetic materials, parts of any sue, shape, composit~on. or heat treatment.
I All metals. glass. and ceramics, castings, forg- Ings, machlned parts, and cuttlng tools, fleld In- spect~ons
All metals and hard non- metall~c materials; sheets, tubing, rods, forgings, cast- Ings; fleld and production testlng; Inservice part test- ing, brazed and adhesive- bonded joints
I ADVANTAGES LIMITATIONS 1 High speed, noncon- tact, automatic.
Provides permanent record on film: works well on thin sections; high sensitivity; fluoroscopy techniques available; adjustable energy level.
Detects varlety of flaws; provides a permanent record; portable; low initial cost; source is small (good for knside shots); makes panoramic exposures.
Economical, simple In principle, easy to per- form; portable (for field test~ng); fast for produc- tion testing.
Simple to apply, portable, fast, low in cost; results easy to interpret: no elab- orate setup required.
Fast, dependable, easy to operate; lends itself to automation, results of test immediately known; relatively portable, highly accurate, sensitive.
False indications result from many variables; only good for conductive materials: limited depth of penetration.
High initial cost; power source requrred; radiation hazard; trained tech- nccians needed.
One energy level per source; radiation hazard; trained technicians needed; source loses strength continuously.
Material must be magnetic; demagnetizing after testing is required; power source needed; parts must be cleaned before finishing.
Limited to surface defects; surfaces must be clean.
Requires contact or immer- sion of part; Interpretation of readings requires training.
Meta!s Progress Data Sheet. August 1968. Amerlcan Society for Metals, Metals Park. Ohio.
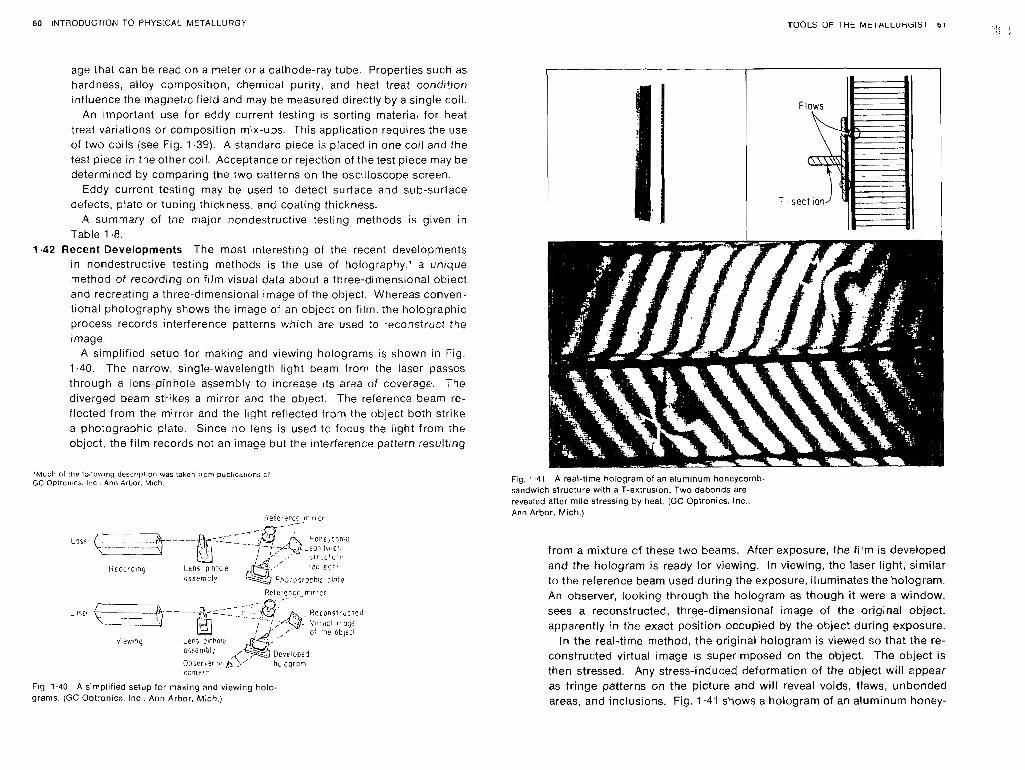
60 1NTRODUCTiOt.I TO PHYSICAL METALLURGt TOOLS OF 1 H t Mt IALLU~UIS I b l
age that can be read on a meter or a cathode-ray tube. Properties such as hardness, alloy composition, chemical purity. and heat treat condition influence the magnetic field and may be measured directly by a single coil.
An important use for eddy current testing is sorting material for heat treat variations or composition mix-ups. This appl~cation requires the use of two coils (see Fig. 1.39). A standard piece is placed in one coil and the test piece in the other coil. Acceptance or rejection of the test piece may be determined by comparing the two patterns on the oscilloscope screen
Eddy current testing may be used to detect surface and sub-surface defects, plate or tubing thickness, and coating thickness.
A summary of the major nondestructive testing methods is given in Table 1.8.
1.42 Recent Developments The most interesting of the recent developments in nondestructive testing methods is the use of holography,' a un iq~ ie method of recording on film visual data about a three-dimensional object and recreating a three-dimensional image of the object. Whereas conven- tional photography shows the Image of an object on filin, the holographic process records interference patterns which are used to reconstruct the image
A simplified setup for making and viewing holograms is shown in Fig. 1.40. The narrow, single-wavelength light beam from the laser passes through a lens-pinhole assembly to increase its area of coverage. The diverged beam strikes a mirror and the object. The reference beam re- flected from the mirror and the light reflected from the object both strike a photographic plate. Since no lens is used to focus the light from the object, the film records not an image but the interference pattern resulting
'Much c l i tlle toilowlng descripl~ori was taken irorzi p~bllchtlons 01 GC Oplrcn~rs. Inc . Ann Arbor. Mtch
F I ~ . 1.40 A sirnpllfied setup for making and viewing holo- grams, (GC Optronics. Inc.. Anti Arbor. Mich.)
Fig. 1.41 A real-time hologram of an aluminum honeycomb. sandwich structure with a T-extrusion. Two debonds are revealed after mild stressing by heat. (GC Optronics, I~c . , Ann Arbor. Mich.)
trom a mixture of these two beams. After exposure, the film is developed and the hologram is ready for viewing. In viewing, the laser light, similar to the reference beam used during the exposure, illuminates the hologram. An observer, looking through the hologram as though it were a window, sees a reconstructed, three-dimensional image of the original object, apparently i n the exact position occupied by the object during exposure.
In the real-time method, the original hologram is viewed so that the re- constructed virtual image is superimposed on the object. The object is then stressed. Any stress-induced deformation of the object will appear as fringe patterns on the picture and will reveal voids, flaws, unbonded areas, and inclusions. Fig. 1.41 shows a hologram of an aluminum honey-
62 INTRODUCTION TO PHYSICAL METALLURGY TOOLS OF THE METALLURGIST 63
comb-sandwich s t ruc ture w i t h a T-extrusion b o n d e d to the surface. T h e
structure was mi ld ly stressed by heat. a n d the real- t ime ho log ram reveals
t w o debonds under t h e T-section.
QUESTIONS
1.1 How are thermocouples calibrated? 1-2 What factors may lead to errors in a thermoelectric circuit? 1.3 Aside from being able to measure high temperatures, what is another advan- tage of the optical pyrometer? 1.4 Assuming that bare, not fused wlres 01 copper and constantan are put into a liquid metal below the melting point of copper, will the thermocouple measure the temperature of the liquid metal? 1.5 Assume that the thermocouple wires are reversed when connected to the poten- tiometer: how may this be detected? 1.6 How is "true stress" calculated? 1.7 Differentiate between resilience and toughness. 1.8 Which property in a tension 'est is an indication of the stiffness of a material? 1.9 Which properties in a tension test indicate the ductility of a material? 1.10 How will the speed of testing affect the yield strength and ultimate strength? 1.11 On a stress-strain graph. for a load beybnd the yield strength that is suddenly removed, show the elastic strain and the plast~c strain. 1.12 Why is the yield strength usually determined rather than the elastic limit? 1.13 What is the difference between the proportional limit and the elastic limit? 1.14 Why are impact specimens notched? 1.15 Discuss the effect of the type of notch and velocity of the hammer on the results of the impact test. 1.16 What limits the range of hardness in the Brinell machine? 1.17 What are the units for the Brinell hardness number? 1.18 Why is it possible to obtain the approximate tensile strength of steel by 500 times the Brinell hardness number? 1.19 Is there a unit associated with the Rockwell hardness number? Explain. 1.20 Why is a correction factor necessary for Rockwell readings on a specimen less than 1 in. in diameter? 1.21 Is the correction factor ~n Question 1.20 to be added or suotracted from the observed readings? Explain. 1.22 What is the minimum thickness of the specimen if a reading is to be taken in the range of Rockwell C 60? (Refer to "Metals Handbook," 1948 edition.) 1.23 If the specimen in Question 1.22 is to be checked with the Brinell test, what should its minimum thickness be" 1.24 If the specimen in Question 1.22 is to be checked on the Rockwell 15 N scale. what should its minimum thickness be? 1.25 How may one determine whether the specimen was too thin to be checked with a particular Hockwell scale? 1.26 List three factors that contribute to the inaccuracy of a scleroscope reading. 1.27 What factors may be varied in taking a radiograph with x-rays? 1.28 In a radiograph, what will be the difference in appearance of gas cavities. cracks, and impurities? 1.29 What are the limitations of magnetic-particle inspection? 1.30 What are the limitations of fluorescent-penetrant inspection?
1.31 What are the limitations of ultrasonic inspection? 1.32 Explain the difference between through-transmission and pulse-echo methods of ultrasonic inspection 1.33 What is a transducer? 1.34 Name and explain three transducers. 1.35 Which nondestructive testing methoo is best suited to determine the wall
thickness at the bottom of a steel tank? 1.36 Which nondestructtve testing method should be usea to sort out bars of mixed steel?
REFERENCES American Society for Metals: "Metals Handbook," 1948 ed.. Metals Park. Ohio. -: "Nondestructive Testing for Management," Metals Par!<, Ohio, 1963. -: "Temperature Measurement." Metals Park, Ohio. 1956. American Society for Testing and Materials: "Annual Book of Standards." Part 31.
Philadelphia, Pa.. 1971. Betz, C. E.: "Principles of Penetrants," Magnaflux Corporation. Chicago, 111. . 1963. Carlin, B.: "Ultrasonics," McGraw-Hill Book Company. New York, 1960. Coxon, W. F.: "Temperature Measurement and Control." The Macmillan Company,
New York, 1960. Davis, H. E., G. E. Troxell, and C. T. Wiskocil: "The Testing and Inspection of Engi-
neering Materials," 2d ed., McGraw-Hill Book Company, New York, 1955. Dike, P. H.: "Thermoelectric Thermometry." Leeds & Northrup Company, Philadel-
phia, Pa.. 1954. Doane. F. 0.: "Principles of Magnaflux Inspection," Magnaflux Corporation, Chicago,
Ill., 1940. Eastman Kodak Company: "Radiography in Modern Industry." Rochester, N.Y.,
1957. Kehl, G. L.: "Principles of Metallographic Laboratory Practice," 3d ed., McGraw-Hill
Book Company, New York, 1949. Lysaght, V. E.: "Indentation Hardness Testing. ' Van Nostrand Reinhold Company.
New York, 1949. McMaster, R. C.: "Nondestructive Testing Handbook," The Ronald Press Company.
New York, 1959. Williams, S. R.: "Hardness and Hardness Measurement," American Society for
Metals, Metals Park, Ohio, 1942.
METAL STRUCTURE AND CRYSTALLIZAT
2.1 Introduction All matter is considered to be composed of unit substances known as chemical elements. These are the smallest units that are distin- guishable on the basis of their chemical activity and physical properties. The elements are composed of atoms which have a distinct structure char- acteristic of each element.
2.2 Atomic Structure While each chemical element is composed of atoms, it is the difference in atomic structure that gives the element its characteristic properties. It is usefut to think of the free atom as being composed of three elementary particles: (1) electrons, tiny particles of negative electricity, (2) protons, particles of positive electricity, and (3) electrically neutral particles, called neutrons. Almost the entire mass of the atom is concen- trated in the nucleus, which contains the protons and neutrons. The mass of the proton is approximately 1.673 x g, and the neutron is just slightly heavier, approximately 1.675 x g, while the mass of the elec- tron is much lighter, approximately 9.11 x g. Therefore, the electron is approximately l/t 800 the mass of a proton. The diameter of the nucleus is of the order of 10-l2 cm and isvery small compared with the atomic diam- eter, which is approximately 1 0-8 cm. The atom consists of a minute posi- tively charged nucleus made up of protons and neutrons surrounded by a sufficient number of electrons to keep the atom as a whole electrically neutral. Since the electron and proton have equal but opposite electrical charge, the neutral atom must contain an equal number of electrons and protons.
The discovery of the atomic particles started in $874, when William Crooks, an Englishman, while experimenting with electrical discharges inside a partially evacuated tube, discovered that the so-called cathode rays could turn a small paddle wheel placed in the tube and would cast a shadow of any solid object placed in their path. This convinced him that the rays were material in nature. From the direction that they were de-
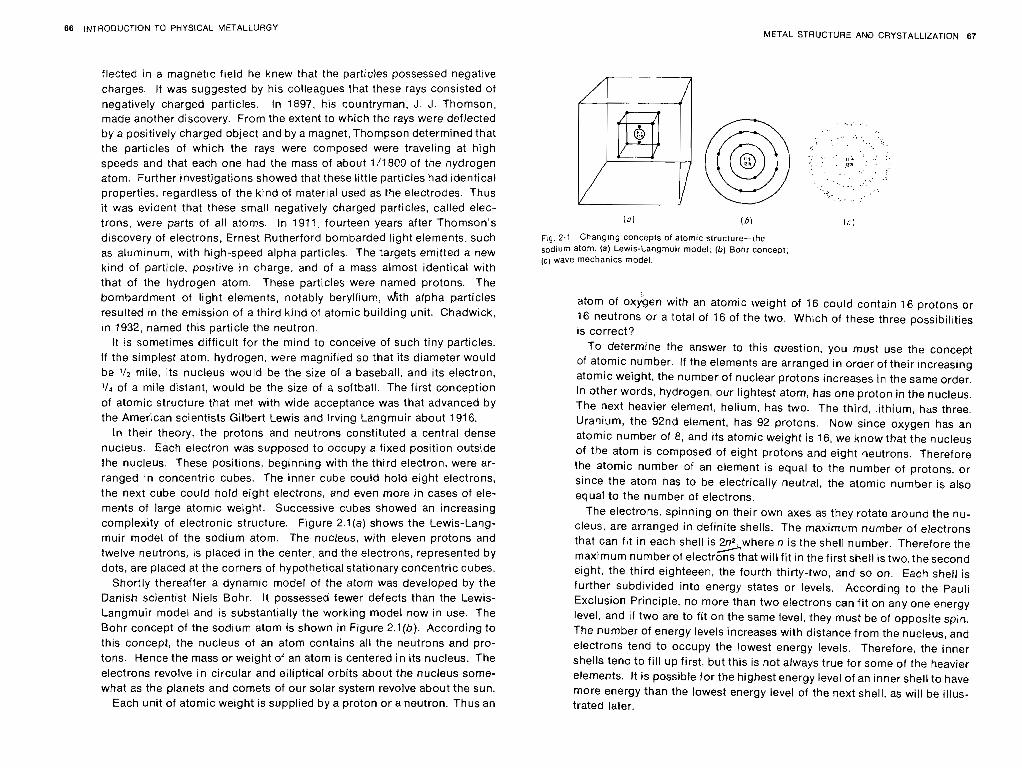
66 INTRODUCTION TO PHYSICAL METALLURGY METAL STRUCTURE AND CRYSTALLIZATION 67
flected in a magnetic field he knew that the particles possessed negative charges. It was suggested by his colleagues that these rays consisted of negatively charged particles. In 1897, his countryman, J. J. Thomson, made another discovery. From the extent to which the rays were deflected by a positively charged object and by a magnet, Thompson determined that the particles of which the rays were composed were traveling at high speeds and that each one had the mass of about ?/I800 of the hydrogen atom. Further investigations showed that these little particles had identical properties, regardless of the kind of mater~al used as the electrodes. Thus it was evident that these small negatively charged particles, called elec- trons, were parts of all atoms. In 191 1, fourteen years after Thomson's discovery of electrons, Ernest Rutherford bombarded light elements, such as aluminum, with high-speed alpha particles. The targets emitted a new kind of particle, positive in charge. and of a mass almost identical with that of the hydrogen atom. These particles were named protons. The
bombardment of light elements, notably beryllium, dith alpha particles resulted in the emission of a third kind of atomic building unit. Chadwick, in 1932, named this particle the neutron.
It is sometimes difficult for the mind to conceive of such tiny particles. i f the simplest atom. hydrogen, were magnified so that its diameter would be '12 mile, its nucleus would be the size of a baseball, and its electron, ' I4 of a mile distant, would be the size of a softball. The first conception of atomic structure that met with wide acceptance was that advanced by the American scientists Gilbert Lewis and Irving Langmuir about 1916.
In their theory, the protons and neutrons constituted a central dense nucleus. Each electron was supposed to occupy a fixed position outside the nucleus. These positions, beginning with the third electron, were ar- ranged in concentric cubes. The inner cube could hold eight electrons, the next cube could hold eight electrons, and even more in cases of ele- ments of large atomic weight. Successive cubes showed an increasing complexity of electronic structure. Figure 2.1 (a) shows the Lewis-Lang- muir model of the sodium atom. The nucleus, with eleven protons and twelve neutrons, is placed in the center, and the electrons, represented by dots, are placed at the corners of hypothetical stationary concentric cubes.
Shortly thereafter a dynamic model of the atom was developed by the Danish scientist Niels Bohr. It possessed fewer defects than the Lewis- Langmuir model and is substantially the working model now in use. The Bohr concept of the sodium atom is shown in Figure 2.1(6). According to this concept, the nucleus of an atom contains all the neutrons and pro- tons. Hence the mass or weight of an atom is centered in its nucleus. The electrons revolve in circular and elliptical orbits about the nucleus some- what as the planets and comets of our solar system revolve about the sun.
Each unit of atomic weight is supplied by a proton or a neutron. Thus an
(01 (31 (c)
~ t g . 2.1 Chang~ng concepts of atomlc structure-the sodium atom. (a) Lewis-Langmuir model; (b ) Bohr concept; (c) wave mechanics model.
atom of oxygen with an atomic weight d 16 could contain 16 protons or 16 neutrons or a total of 16 of the two. Which of these three possibilities is correct?
To determine the answer to this question, you must use the concept of atomic number. If the elements are arranged in order of their increasing atomic weight, the number of nuclear protons increases in the same order. In other words, hydrogen, our lightest atom, has one proton in the nucleus. The next heavier element, helium, has two. The third, lithium, has three. Uranium, the 92nd element, has 92 protons. Now since oxygen has an atomic number of 8, and its atomic weight is 16, we know that the nucleus of the atom is composed of eight protons and eight neutrons. Therefore the atomic number of an element is equal to the number of protons, or since the atom has to be electrically neutral, the atomic number is also equal to the number of electrons.
The electrons, spinning on their own axes as they rotate around the nu- cleus, are arranged in definite shells. The maximum number of electrons that can fit in each shell is 2n2: where n is the shell number. Therefore the
/ maximum number of electrons that wit1 fit in the first shell is two, the second eight, the third eighteeen, the fourth thirty-two, and so on. Each shell is further subdivided into energy states or levels. According to the Pauli Exclusion Principle, no more than two electrons can fit on any one energy level, and i f two are to fit on the same level, they must be of opposite spin. The number of energy levels increases with distance from the nucleus, and electrons tend to occupy the lowest energy levels. Therefore, the inner shells tend to fill up first, but this is not always true for some of the heavier elements. It is possible for the highest energy level of an inner shell to have more energy than the lowest energy level of the next shell, as will be illus- trated later.
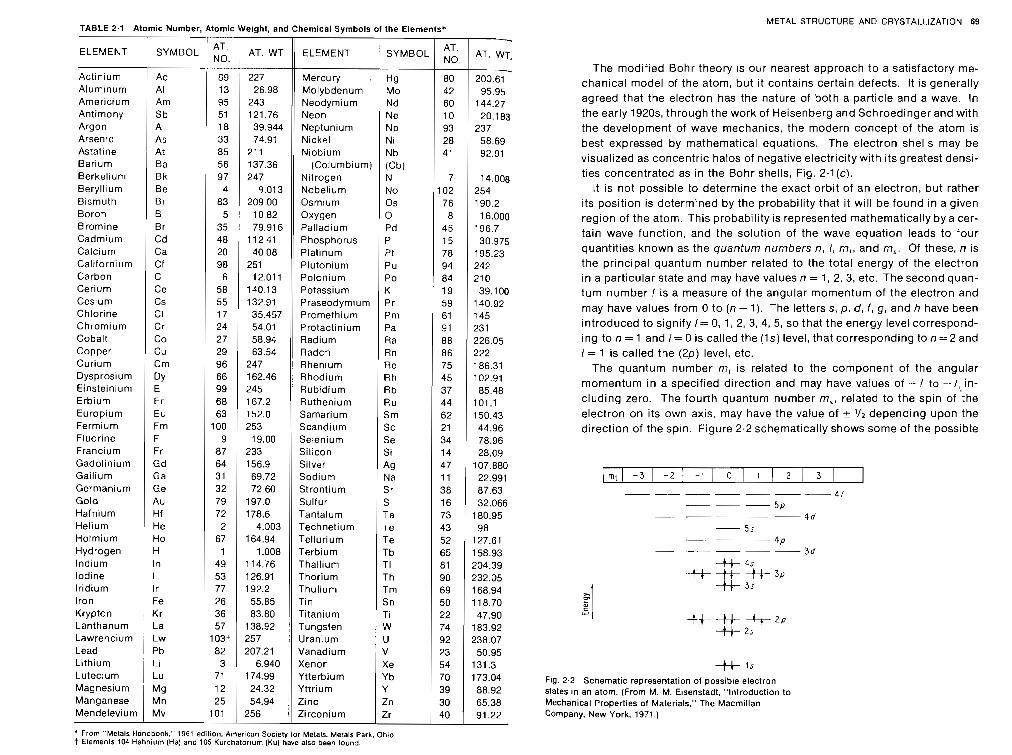
METAL STRUCTURE AND CRYSTALLIZATION 69 TABLE 2.1 Atomic Number, Atomic Weight, and Chemical Symbols of the Elementsv
The modified Bohr theory is our nearest approach to a satisfactory me- chanical model of the atom, but it contains certain defects. It is generally agreed that the electron has the nature of both a particle and a wave. In the early 1920s through the work of Heisenberg and Schroedinger and with the development of wave mechanics, the modern concept of the atom is best expressed by mathematical equations. The electron shells may be visualized as concentric halos of negative electricity with its greatest densi- ties concentrated as in the Bohr shells, Fig. 2.1 (c) .
It is not possible to determine the exact orbit of an electron, but rather
ELEMENT
Actinium Aluminum Americium Antimony Argon Arsenic Astatine Barium Berkelium Beryllium Bismuth Boron Bromine Cadmium Calcium Californiiim Carbon Cerium Cesium Chlorine Chromium Cobalt Copper Curium Dysprosium Einsteinium Erbium Europium Fermium Fluorine Francium Gadolinium Gallium Germanium Gold Hafnium Helium Holmium Hydrogen Indium
its position is determined by the probability that it will be found in a given region of the atom. This probability is represented mathematically by a cer- tain wave function, and the solution of the wave equation leads to four quantities known as the quantum numbers n, I , m,, and m,. Of these, n is the principal quantum number related to the total energy of the electron in a particular state and may have values n = 1 , 2, 3, etc. The second quan- tum number I is a measure of the angular momentum of the electron and may have values from 0 to (n - 1). The letters s , p , d , f , g, and h have been introduced to signify I= 0, 1. 2 , 3, 4, 5, so that the energy level correspond- ing to n = 1 and 1 = 0 is called the (1s) level, that corresponding t o n = 2 and I = 1 is called the (2p) level, etc.
The quantum number m, is related to the component of. the angular momentum in a specified direction and may have values of - I to - - - I , , in- cluding zero. The fourth quantum number m,, related to the spin of the electron on its own axis, may have the value of t 112 depending upon the direction of the spin. Figure 2.2 schematically shows some of the possible
Ac Al Am Sb
Fig. 2.2 Schematic representation of possible electron states in an atom. (From M. M. Eisenstadt, "lntroduction to Mechanical Properties of Materials." The Macmillan Company. New York. 1971.)
' From "Metals Hendbook." 1961 edition, Amerlcan Society for Metals. Metals Park, Ohlo t Elements 104 Hahnium (Ha) and 105 Kurchatorlum (Ku) have also been ioun3
1 In Iodine Iridium I l r Iron 1 Fe Krypton , Kr Lanthanum La Lawrencium Lw
A T A T WT. NO. i
204.39 232.05 168.94 118.70 47.90
183.92 238.07
Thallium Thorium Thulium Tin Titanium Tungsten Uranium
89 13 95 51
49 53 77 26 36 57
103+
I
A T < 200.61 95.95
144.27 20.183
50.95 131.3 173.04 88.92 65.38 91.22
227 26.98
243 121.76
114.76 126.91 192.2 55.85 83.80
138.92 j 257 i
237 58.69 92.91
14.008 254 190.2 16.000
196.7 30.975
195.23 242 210 39.100
140.92 145 231 226.05 222 186.31
$, 80 42 60 10
ELEMENT
Mercury . Molybdenum Neodymium Neon
39.944 74.91
211 137.36 247
9.013 209.00
A 18
TI Th Tm Sn Ti W
' U Lead i Pb Lithium Li Lutecium 1 Lu
93 28 41
7 102 76
8 46 15 78 94 84 19
SYMBOL
Hg Mo Nd Ne
Neptunium Nickel Niobium
(Columbium) Nitrogen Nobelium Osmium Oxygen Palladium Phosphorus Platinum Plutonium Polonium Potassium
As At Ba Bk Be B i
Dy E E r Eu Fm F F r Gd Ga Ge Au Hf He Ho H
82 3
71 12 25
101
81 90 69 50 22 74 92
Magnesium Manganese Mendelevium
NP Ni Nb (Cb) N No 0 s 0 Pd P Pt P u Po K
33 85 56 97
4
83 B B r Cd Ca Cf C Ce Cs C I Cr Co Cu Cm
Mg Mn Mv
102.91 85.48
101.1 150.43 44.96 78.96 28.09
107.880 22.991 87.63 32.066
180.95 98
127.61 158.93
. Rhodium Rubidium Ruthenium Samarium Scandium Selenium Silicon Silver Sodium Strontium Sulfur Tantalum Technetium Tellurium Terbium
Praseodymium Promethium Protactinium Radium Radon Rhenium
66 99 68 63
100 9
87 64 31 32 79 72 2
67 1
762.46 245 167.2 152.0 253
19.00 233 156.9 69.72 72.60
197.0 178.6
4.003 164.94
1.008
5 ! 10.82
23 54 70 39 30 40
207.21 6.940 /
174.99 24.32 54.94
256 i
35 48 20 98
6 58 55 17 24 27 29 96
R h Rb Ru S m Sc Se Si Ag Na Sr S Ta i e Te Tb
Pr Pm Pa R a R n Re
! 79.916 112.41 40.08
251 12.011
140 13 132.91 35.457 54.01 58.94 63.54
247 45 37 44 62 21 34 14 47 11 38 16 73 43 52 65
59 61 91 88 86 75
Vanadium v Xenon Ytterbium Yttrium Zinc Zirconium
Xe Yb Y Zn Zr
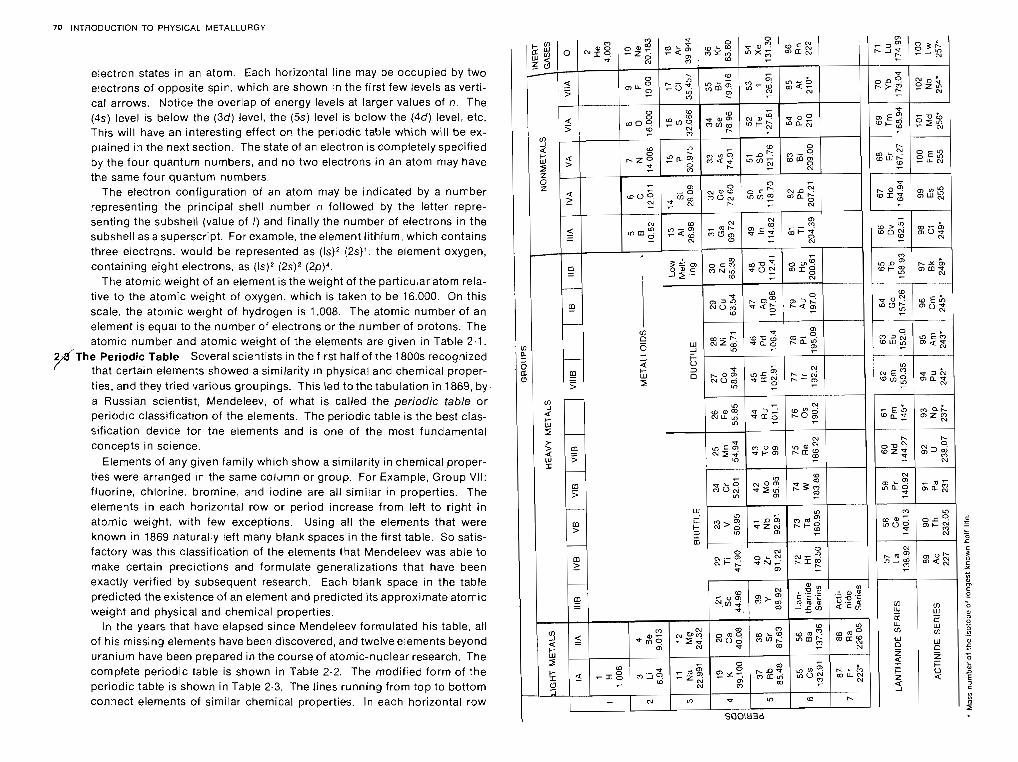
70 INTROOUCTION TO PHYSICAL METALLURGY
electron states in an atom. Each horizontal line may be occupied by two electrons of opposite spin, which are shown in the first few levels as verti- cal arrows. Notice the overlap of energy levels at larger values of n. The (4s) level is below the ( 3 d ) level, the (5s) level is below the (4d ) level, etc. This will have an interesting effect on the periodic table which will be ex- plained in the next section. The state of an electron is completely specified by the four quantum numbers, and no two electrons in an atom may have the same four quantum numbers.
The electron configuration of an atom may be indicated by a number representing the principal shell number n followed by the letter repre- senting the subshell (value of I) and finally the number of electrons in the subshell as a superscript. For example, the element lithium, which contains three electrons, would be represented as (2s) ' ; the element oxygen, containing eight electrons, as (Is)2 (2s)* ( 2 ~ ) ~ .
The atomic weight of an element is the weight of the particular atom rela- tive to the atomic weight of oxygen, which is taken to be 16.000. On this scale, the atomic weight of hydrogen is 1.008. The atomic number of an element is equal to the number of electrons or the number of protons. The atomic number and atomic weight of the elements are given in Table 2.1. he Periodic Table Several scientists in the first half of the 1800s recognized that certain elernunts showed a similarity In physical and chemical proper- ties, and they tried various groupings. This led to the tabulation in 1869, by a Russian scientist, Mendeleev, of what is called the periodic table or periodic classification of the elements. The periodic table is the best clas- sification device for the elements and is one of the most fundamental concepts in science.
Elements of any given family which show a similarity in chemical proper- ties were arranged in the same column or group. For Example, Group VII: fluorine, chlorine. bromine, and iodine are all similar in properties. The elements in each horizontal row or period increase from left to right in atomic weight, with few exceptions. Using all the elements that were known in 1869 naturally left many blank spaces in the first table. So satis- factory was this classification of the elements that Mendeleev was able to make certain predictions and formulate generalizations that have been exactly verified by subsequent research. Each blank space in the table predicted the existence of an element and predicted its approximate atomic weight and physical and chemical properties.
In the years that have elapsed since Mendeleev formulated his table, all of his missing elements have been discovered, and twelve elements beyond uranium have been prepared in the course of atomic-nuclear research. The complete periodic table is shown in Table 2.2. The modified form of the periodic table is shown in Table 2.3. The lines running from top to bottom connect elements of similar chemical properties. In each horizontal row
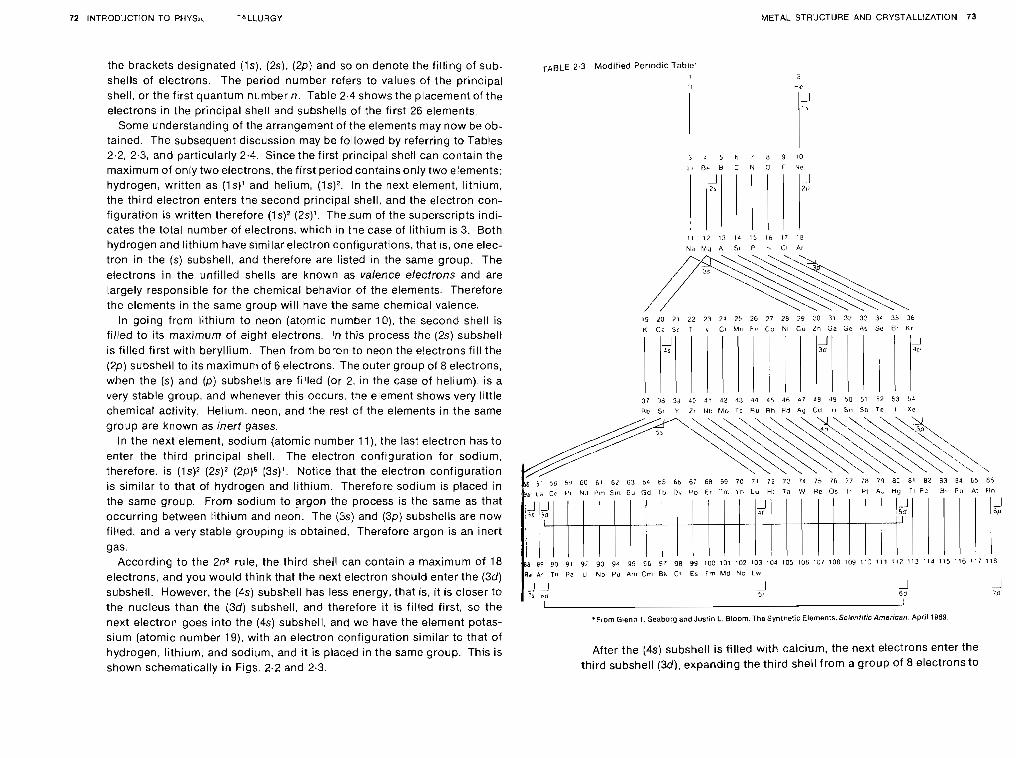
72 INTRODUCTION TO PHYSIC -&LLURGY METAL STRUCTURE .4ND CRYSTALLIZATION 73
the brackets designated (Is), (2s), (2p) and so on denote the filling of sub- shells of electrons. The period number refers to values of the principal shell, or the first quantum number n. Table 2.4 shows the placement of the electrons in the principal shell and subshells of the first 26 elements.
Some understanding of the arrangemont of the elements may now be ob- tained. The subsequent discussion may be followed by referring to Tables 2.2, 2.3, and particularly 2.4. Since the first principal shell can contain the maximum of only two electrons, the first period contains only two elements: hydrogen, written as (1s)' and helium, ( 1 ~ ) ~ . In the next element, lithium, the third electron enters the second principal shell, and the electron con- figuration is written therefore ( 1 ~ ) ~ (2s)'. Thesum of the superscripts indi- cates the total number of electrons, which in the case of lithium is 3. Both hydrogen and lithium have similar electron configurations, that IS, one elec- tron in the (s) subshell, and therefore are listed in the same group. The electrons in the unfilled shells are known as valence electrons and are largely responsible for the chemical behavior of the elements. Therefore the elements in the same group will have the same chemical valence.
In going from lithium to neon (atomic number lo), the second shell is filled to its maximum of eight electrons. In this process the (2s) subshell is filled first with beryllium. Then from boron to neon the electrons fill the (2p) subshell to its maximum of 6 electrons. The outer group of 8 electrons, when the (s) and (p) subshells are filled (or 2, in the case of helium), is a very stable group, and whenever this occurs, the element shows very tittle chemical activity. Hetium. neon, and the rest of the elements in the same group are known as inert gases.
In the next element, sodium (atomic number l l ) , the last electron has to enter the third principal shell. The electron configuration for sodium, therefore. is ( ls)* (2sj2 (2p)6 (3s)'. Notice that the electron configuration is similar to that of hydrogen and lithium. Therefore sodium is placed in the same group. From sodium to argon the process is the same as that occurring between lithium and neon. The (3s) and (3p) subshells are now filled, and a very stable grouping is obtained. Therefore argon is an inert gas.
According to the 2n2 rule, the third shell can contain a maximum of 18 electrons, and you would think that the next electron should enter the ( 3 4 subshell. However, the (4s) subshell has less energy, that is, it is closer to the nucleus than the (3d) subshell, and therefore it is filled first, so the next electron goes into the (4s) subshell, and we have the element potas- sium (atomic number 19), with an electron configuration similar to that of hydrogen, lithium, and sodium, and i t is placed in the same group. This is shown schematically in Figs. 2.2 and 2.3.
TABLE 2.3 Modified Periodic Table' 1
I I
K Ca Sc 1 1 v Cr Mn kc Co Ell Cu Zn Ga Ge Aa Se Bi Kr
J 48
J
I
hd i n CP P1 NO Pm S f n Eu GO Tb Pv Po E l T r i \ b Lu HI Ta 'I$ He 0 s It Pt Ad ti<, T I Pb 88 Po At Fln
L I
'From Gtenn T. Seaborg and Justin L. Bloom. The Syntnetic Elements. Scientilic American. April 1969.
After the (4s) subshell is filled with calcium, the next electrons enter the third subshell (3d), expanding the third shell from a group of 8 electrons to
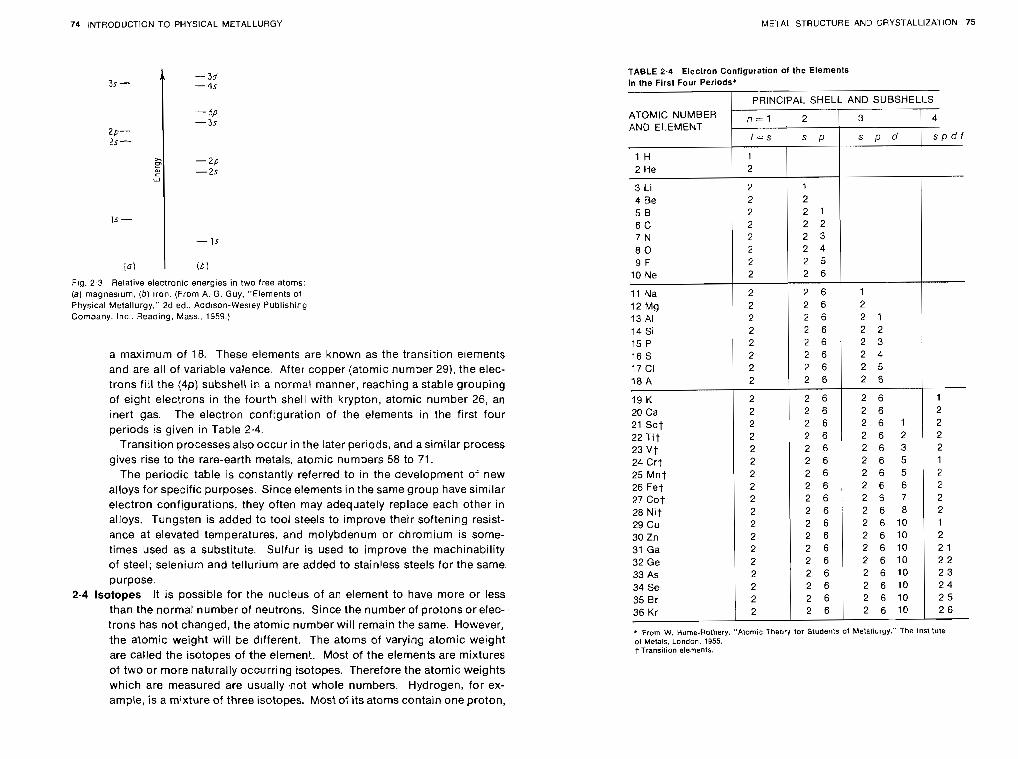
74 INTRODUCTION TO PHYSICAL METALLURGY METAL STRUCTURE AND CRYSTALLIZATION 75
Fig. 2.3 Relative electronic energies in two free atoms: (a) magnesium, (5) iron. (From A. G. Guy, "Elements of Physical Metallurgy," 2d ed., Addtson-Wesley Publishing Company. Inc.. Reading, Mass. 1959.)
a maximum of 18. These elements are known as the transition elements and are ail of variable valence. After copper (atomic number 291, the elec- trons fill the (4p) subshell in a normal manner, reaching a stable grouping of eight electrons in the fourth shell with krypton, atomic number 26, an inert gas. The electron configuration of the elements in the first four periods is given in Table 2.4.
Transition processes also occur in the later periods, and a similar process gives rise to the rare-earth metals, atomic numbers 58 to 71.
The periodic table is constantly referred to in the development of new alloys for specific purposes. Since elements in the same group have similar electron configurations, they often may adequately replace each other in alloys. Tungsten is added to tool steels to improve their softening resist- ance at elevated temperatures, and molybdenum or chromium is some- times used as a substitute. Sulfur is used to improve the machinability of steel; selenium and tellurium are added to stainless steels for the same purpose.
2.4 Isotopes It is possible for the nucleus of an element to have more or less than the normal number of neutrons. Since the number of protons or elec- trons has not changed, the atomic number will remain the same. However, the atomic weight will be different. The atoms of varying atomic weight are called the isotopes of the element. Most of the elements are mixtures of two or more naturally occurring isotopes. Therefore the atomic weights which are measured are usually .not whole numbers. Hydrogen, for ex- ample, is a mixture of three isotopes. Most of its atoms contain one proton,
TABLE 2.4 Electron Configuration of the Elements i n the First Four Periods*
PRINCIPAL SHELL AND SUBSHELLS
ATOMIC NUMBER _ AND ELEMENT
19 K 20 Ca 21 Sc t 22 T i t 23 V t 24 C r t 25 Mnt 26 Fet 27 C o t 28 N i t 29 Cu 30 Zn 31 Ga 32 Ge 33 As 34 Se 35 Br 36 Kr
From W. Hume-Rolhery. "Atom):: Theory tor Students at Metallurgy.' The Lnstitute of Metals, London, 1955 t Trans~l~on elenents
2 2 2 2 2 2 2 2 2 2 2 2 2 2 2 2 2 2
2 6 2 6 2 6 2 6
2 6 2 6 2 6 1 2 6 2
1 2 2 2 2 1 2 2 2 2 1 2 2 1 2 2 2 3 2 4 2 5 2 6
2 6 2 6 3 2 6 2 6 5 2 6 2 6 5 2 6 , 2 6 6 2 6 2 6 7 2 6 2 6 8 2 6 2 6 2 6 2 6 2 6 2 6 2 6 2 6
2 6 1 0 2 6 1 0 2 6 1 0 2 6 1 0 2 6 1 0 2 6 1 0 2 6 1 0 2 6 1 0
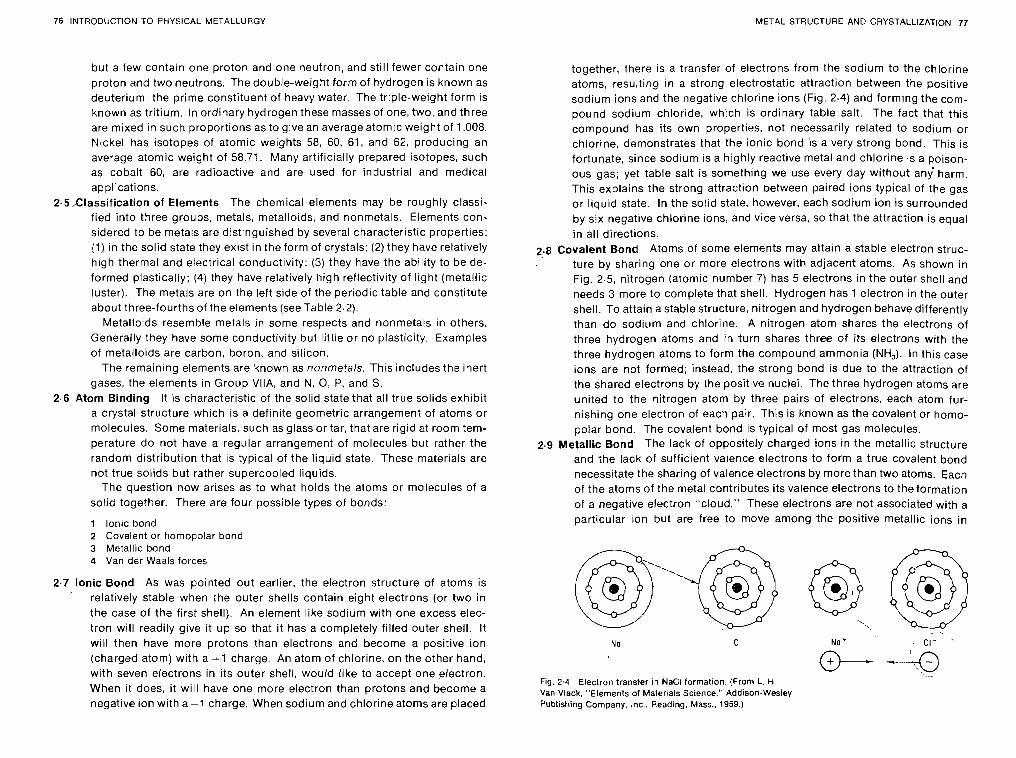
76 INTRODUCTION TO PHYSICAL METALLURGY METAL STRUCTURE AND CRYSTALLIZATION 77
but a few contain one proton and one neutron, and still fewer contain one proton and two neutrons. The double-weight form of hydrogen is known as deuterium, the prime constituent of heavy water. The triple-weight form is known as tritium. In ordinary hydrogen these masses of one, two, and three are mixed in such proportions as to give an average atomic weight of 1.008. Nickel has isotopes of atomic weights 58, 60, 61, and 62, producing an average atomic weight of 58.77. Many artificially prepared isotopes, such as cobalt 60, are radioactive and are used for industrial and medical applications.
2.5,Classification of Elements The chemical elements may be roughly classi- fied into three groups, metals, metalloids, and nonmetals. Elements con- sidered to be metals are distinguished by several characteristic properties: (1) in the solid state they exrst in the form of crystals; (2) they have relatively high thermal and electrical conductivity; (3) they have the ability to be de- formed plastically; (4) they have relatively high reflectivity of light (metallic luster). The metals are on the l e f side of the periodic table and constitute about three-fourths of the elements (see Table 2.2).
Metalloids resemble metals in some respects and nonmetals in others. Generally they have some conductivity but little or no plasticity. Examples of metalloids are carbon, boron, and silicon.
The remaining elements are known as nonmetals. This includes the inert gases, the elements in Group VIIA, and N, 0, P, and S.
2.6 Atom Binding It is characteristic of the solid state that all true solids exhibit a crystal structure which is a definite geometric arrangement of atoms or molecules. Some materials, such as glass or tar, that are rigid at room tem- perature do not have a regular arrangement of molecules but rather the random distribution that IS typical of the liquid state. These materials are not true solids but rather supercooled liquids.
The question now arises as to what holds the atoms or molecules of a solid together. There are four possible types of bonds:
1 lonic bond 2 Covalent or homopolar bond 3 Metallic bond 4 Van der Waals forces
2.7 lonic Bond As was pointed out earlier, the electron structure of atoms is relatively stable when the outer shells contain eight electrons (or two in the case of the first shell). An element like sodium with one excess elec- tron will readily give it up so that it has a completely filled outer shell. It will then have more protons than electrons and become a positive ion (charged atom) with a +I charge. An atom of chlorine, on the other hand, with seven electrons in its outer shell, would like to accept one .electron. When it does, it will have one more electron than protons and become a negative ion with a-1 charge. When sodium and chlorine atoms are placed
together, there is a transfer of electrons from the sodium to the chlorine atoms, resulting in a strong electrostatic attraction between the positive sodium ions and the negative chlorine ions (Fig. 2.4) and forming the com- pound sodium chloride, which is ordinary table salt. The fact that this compound has its own properties, not necessarily related to sodium or chlorine, demonstrates that the ionic bond is a very strong bond. This is fortunate, since sodium is a highly reactive metal and chlorine is a poison- ous gas; yet table salt is something we use every day without any'harm. This explains the strong attraction between paired ions typical of the gas or liquid state. In the solid state, however, each sodium ion is surrounded by six negative chlorine ions, and vice versa, so that the attraction is equal in all directions.
2:$ Covalent Bond Atoms of some elements may attain a stable electron struc- ture by sharing one or more electrons with adjacent atoms. As shown in Fig. 2.5, nitrogen (atomic number 7) has 5 electrons in the outer shell and needs 3 more to complete that shell. Hydrogen has 1 electron in the outer shell. To attain a stable structure, nitrogen and hydrogen behave differently than do sodium and chlorine. A nitrogen atom shares the electrons of three hydrogen atoms and in turn shares three of its electrons with the three hydrogen atoms to form the compound ammonia (NH,). In this case ions are not formed; instead, the strong bond is due to the attraction of the shared electrons by the positive nuclei. The three hydrogen atoms are united to the nitrogen atom by three pairs of electrons, each atom fur- nishing one electron of each pair. This is known as the covalent or homo- polar bond. The covalent bond is typical of most gas molecules.
2.9 Metallic Bond The lack of oppositely charged ions in the metallic structure and the lack of sufficient valence electrons to form a true covalent bond necessitate the sharing of valence electrons by more than two atoms. Each of the atoms of the metal contributes its valence electrons to the formation of a negative electron "cloud." These electrons are not associated with a particular ion but are free to move among the positive metallic ions in
No C I
-- Fig. 2.4 Electron transfer in NaCl formation. (From L. H. Van Vlack. "Elements of Materials Science," Addison-Wesley Publishing Company, Inc.. Reading. Mass.. 1959.)
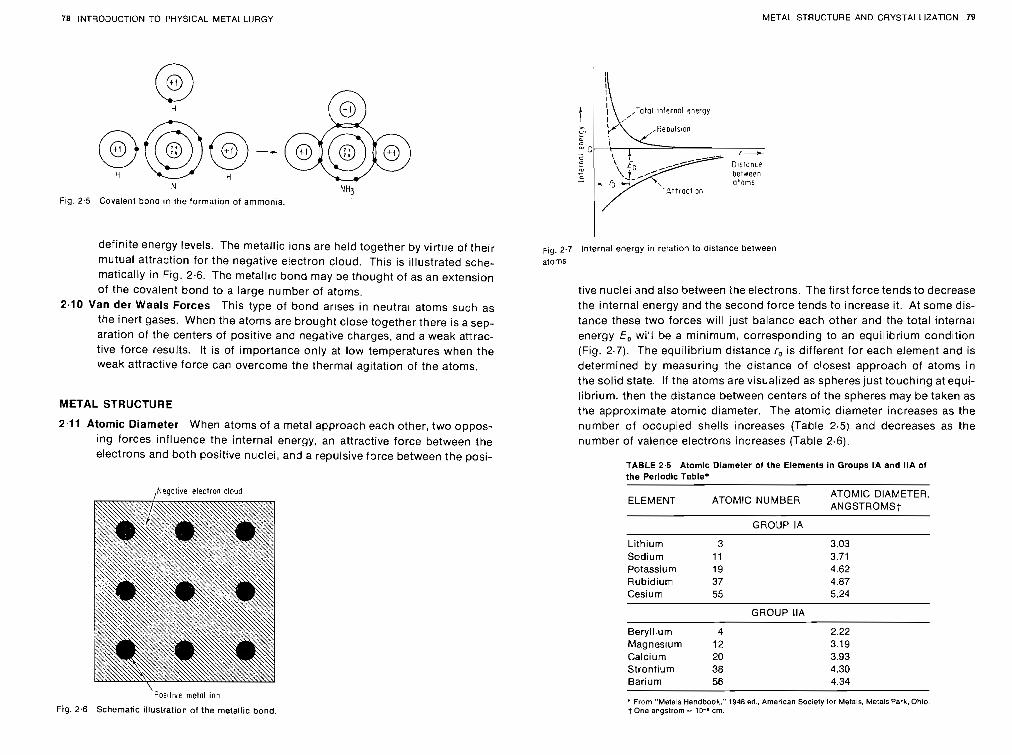
78 INTR03UCTION TO PHYSICAL METALLURGY METAL STRUCTURE AND CRYSTALLIZATION 79
U NH3 Fig. 2.5 Covalent bond in the forrnat~on of ammonla.
definite energy levels. The metallic ions are held together by virtue of their mutual attraction for the negative electron cloud. This is illustrated sche- matically in Fig. 2.6. The metallic bond may be thought of as an extension of the covalent bond to a large number of atoms.
2.10 Van der Waals Forces This type of bond arlses in neutral atoms such as the inert gases. When the atoms are brought close together there is a sep- aration of the centers of positive and negative charges, and a weak attrac- tive force results. It is of rmportance only at low temperatures when the weak attractwe force can overcome the thermal agitation of the atoms.
METAL STRUCTURE
2.11 Atomic Diameter When atoms of a metal approach each other, two oppos- ing forces influence the internal energy, an attractive force between the electrons and both positive nuclei, and a repulsive force between the posi-
,Regofive electron cloud
F o s ~ l i v e melal ion
Fig. 2.6 Schematic illustration of the metallic bond
I ----t
D~stclnce belween atoms
fig. 2.7 Internal energy in relation to distance between
atom5
tive nuclei and also between the electrons. The first force tends to decrease the internal energy and the second force tends to increase it. At some dis- tance these two forces will just balance each other and the total internal energy E, will be a minimum, corresponding to an equilibrium condition (Fig. 2.7). The equilibrium distance ro is different for each element and is determined by measuring the distance of closest approach of atoms in the solid state. If the atoms are visualized as spheres just touching at equi- li brium, then the distance between centers of the spheres may be taken as the approximate atomic diameter. The atomic diameter increases as the number of occupied shells increases (Table 2.5) and decreases as the number of valence electrons increases (Table 2.6).
TABLE 2.5 Atomic Diameter of the Elements in Groups IA and I IA of the Periodic Table*
ELEMENT ATOMIC DIAMETER,
ATOMIC NUMBER ANGSTROMS+
GROUP IA
Lithium 3 Sodium 11 Potassitim 19 Rubidium 37 Cesium 55
GROUP IIA
Beryllium 4 2.22 Magnesium 12 3.19 Calcium 20 3.93 Strontium 38 4.30 Barium 56 4.34
' From "Metals Handbook." 1948 ed.. American Society for Metals. Metals Park, Ohio. t One angstrom -- 1 0 ' cm.
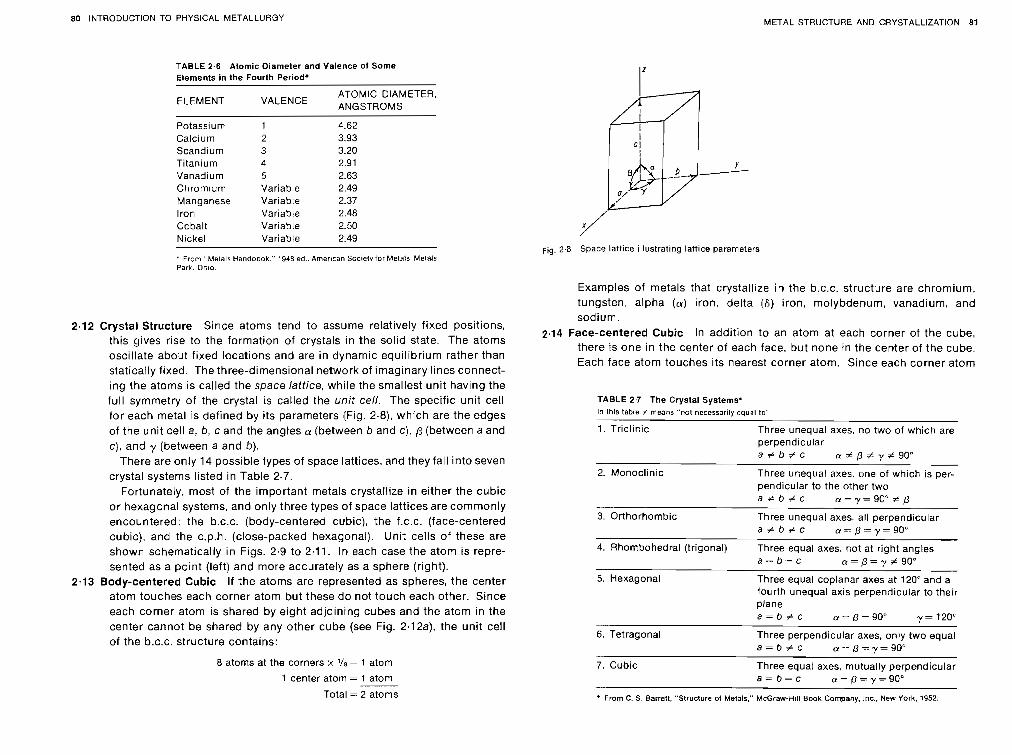
80 INTRODUCTION TO PHYSICAL METALLURGY METAL STRUCTURE AND CRYSTALLIZATION 81
TABLE 2.6 Atomic Diameter and Valence of Some Elements in the Fourth Period*
ELEMENT ATOMIC DIAMETER,
VALENCE ANGSTROMS
Potassium Calcium Scandium Titanium Vanadium Chromium Manganese Iron Cobalt Nickel
1 2 3 4 5 Variable Variable Variable Variable Variable
From ' Metals Handoook " 1948 ed.. Amerlcan Soclety for Melals Melals Park. 0r.10.
2.12 Crystal Structure Since atoms tend to assume relatively fixed positions, this gives rise to the formation of crystals in the solid state. The atoms oscillate about fixed locations and are in dynamic equilibrium rather than statically fixed. The three-dimensional network of imaginary lines connect- ing the atoms is called the space lattice, while the smallest unit having the full symmetry of the crystal is called the unit cell. The specific unit cell for each metal is defined by its parameters (Fig. 2.8), which are the edges of the unit cell a, b, c and the angles CY (between b and c), p (between a and c), and y (between a and b).
There are only 14 possible types of space lattices, and they fall into seven crystal systems listed in Table 2.7.
Fortunately, most of the important metals crystallize in either the cubic or hexagonal systems, and only three types of space lattices are commonly encountered: the b.c.c. (body-centered cubic), the f.c.c. (face-centered cubic), and the c.p.h. (close-packed hexagonal). Unit cells of these are shown schematically in Figs. 2.9 to 2.11. In each case the atom is repre- sented as a point (left) and more accurately as a sphere (right).
2.13 Body-centered Cubic If the atoms are represented as spheres, the center atom touches each corner atom but these do not touch each other. Since each corner atom is shared by eight adjoining cubes and the atom in the center cannot be shared by any other cube (see Fig. 2.12a), the unit cell of the b.c.c. structure contains:
8 atoms at the corners x 118 = 1 atom
1 center atom = 1 atom
Total = 2 atoms
Fig. 2.0 Space lattice illustrating lattice parameters
Examples of metals that crystall~ze in the b.c.c. structure are chromium, tungsten, alpha (a) iron, delta (6) iron, molybdenum, vanadbum, and sodium.
2.14 Face-centered Cubic In addition to an atom at each corner of the cube, there is one in the center of each face, but none in the center of the cube. Each face atom touches its nearest corner atom. Since each corner atom
TABLE 2.7 The Crystal Systems* I? this table #- means "not necessarily equal to"
1. Triclinic Three unequal axes, no two of which are perpendicular a f b f c n * p ; f - y # 9 0 n
2. Monoclinic Three unequal axes, one of which is per- pendicular to the other two a # b # c @ = y = 9 0 ° # p
3. Orthorhombic Three unequal axes. all perpendicular a # b # c n = p = y = 9 W
4. Rhombohedra1 (trigonal) Three equal axes, not at right angles a - b . = c n = n = *, # 90.
5. Hexagonal Three equal coplanar axes at 120" and a fourth unequal axis perpendicular to their plane a = b # C a=p=9CP y=12V
6. Tetragonal Three perpendicular axes, only two equal a = b # c I ~ = = ~ = Y = 9 0 0
7. Cubic Three equal axes, mutually perpendicular a = b = c a=p=r=gOo
* From C. S. Barrett, "Structure of Metals." McGraw-Hill Book Company, Jnc.. New York, 1952
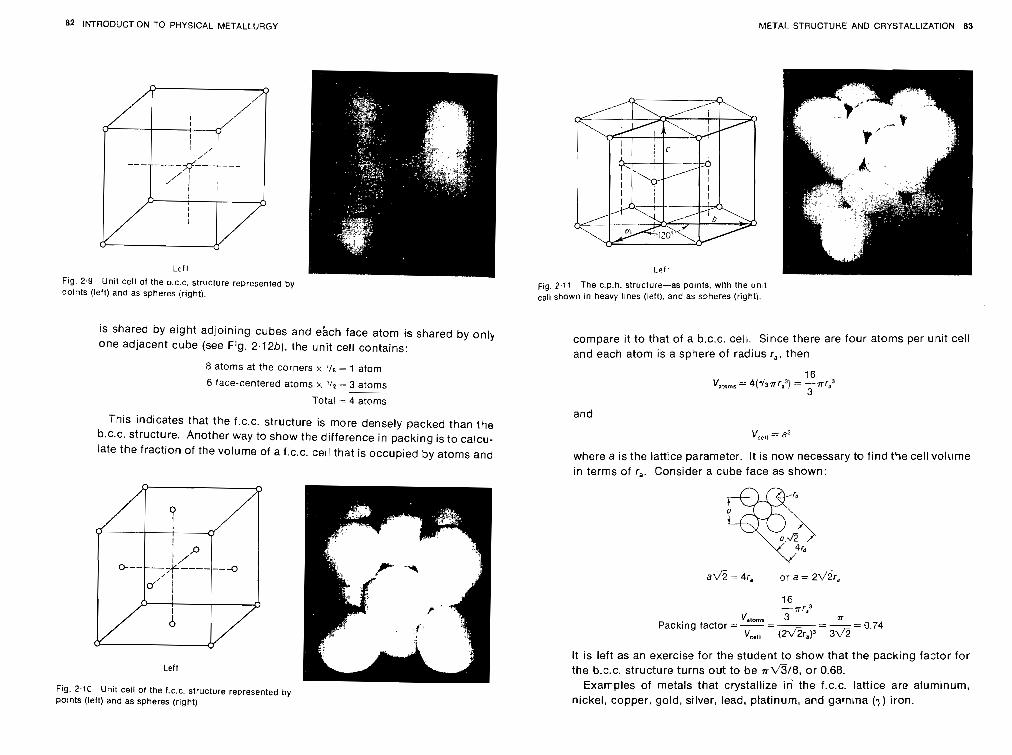
82 INTRODUCTION TO PHYSICAL METALLURGY METAL STRUCTURE AND CRYSTALLIZATION 83
Left
Fig. 2.9 Unit cell of the b.c.c. structure reDresented by ooints (left) and as spheres (right).
is shared by eight adjoining cubes and ebch face atom is shared by only one adjacent cube (see Fig. 2.12b), the unit cell contains:
8 a t o m s a t t h e corners x '1s = 1 a t o m
6 face-centered a t o m s x '12 -- 3 a toms
To ta l - 4 a toms
This indicates that the f.c.c. structure is more densely packed than the b.c.c. structure. Another way to show the difference in packing is to calcu- late the fraction of the volume of a f.c.c. cell that is occupied by atoms and
Left
Fig. 2.10 Unit celi of the f.c.c. structure represented by points (left) and as spheres (right).
Fig. 2.11 The c.p.h. structure-as points, with the unit shown i n heavy l ~nes (left), and as spheres (right).
compare it to that of a b.c.c. cell. Since there are four atoms per unit cell and each atom is a sphere of radius r,, then
and
V ce l l - a3
where a is the lattice parameter. It is now necessary to find the cell volume in terms of r,. Consider a cube face as shown:
. . -7ra3
vat,, 3 77 Pack ing f ac to r - ---- = - = - = 0.74
v,,,, (2<2r,)3 3 ~ 3
It is left as an exercise for the student to show that the packing factor for the b.c.c. structure turns out to be r t 3 1 8 , Or 0.68.
Examples of metals that crystallize in the f.c.c. lattice are aluminum, nickel, copper, gold. silver, lead, platinum, and gamma ( 7 ) iron.
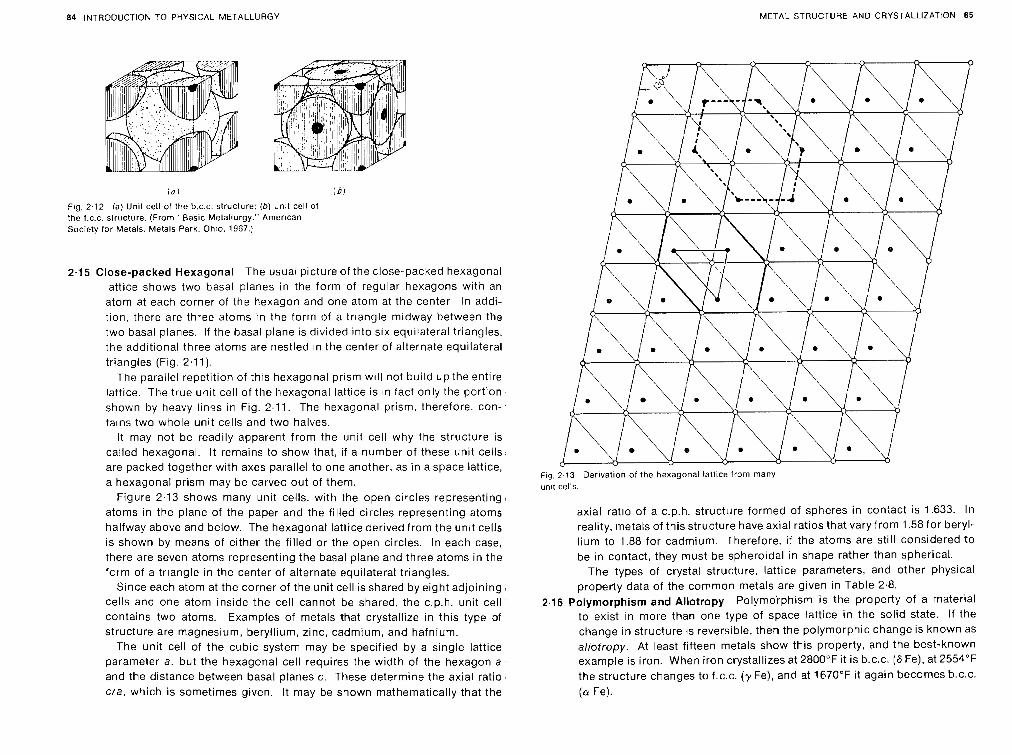
84 INTRODUCTlOlv TO PHYSlCAL METALLURGY METAL STRUCTURE AND CRYSTALLIZATION 85
in1 I b ,
Fig. 2.12 (a) U n ~ t cell of the b.c.c. structure: ( b ) dnlt cell of the f.c.c. structure. (From "Basic Metallurgy." Amerbcan Society for Metals. Metals Park. Ohro. 1967.:
2.15 Close-packed Hexagonal The usual picture of the close-pacited hexagonal lattice shows two basal planes in the form of regular hexagons with an atom at each corner of the hexagon and one atom at the center. In addi- tion, there are three atoms in the form Of a triangle midway between the two basal planes. If the basal plane is divided into six equilateral triangles, the additional three atoms are nestled In the center of alternate equilateral triangles (Fig. 2.11).
The parallel repetition of this hexagonal prism w ~ l l not build up the entire lattice. The true uoit cell of the hexagonal lattice is in fact only the portion* shown by heavy l~nos in Fig. 2.11. The hexagonal prism, therefore. con- tatns two whole untt cells and two halves.
It may not be readily apparent from the unit cell why the structure is called hexagonal. It remains to show that, if a number of these unit cells are packed together with axes parallel to one another, as in a space lattice, a hexagonal prism may be carved out of them.
Figure 2.13 shows many unit cells, with the open circles representing atoms in the plane of the paper and the filled circles representing atoms halfway above and below. The hexagonal lattice derived from the unit cells is shown by means of either the filled or the open circles. In each case, there are seven atoms representing the basal plane and three atoms in the form of a triangle in the center of alternate equilateral triangles.
Since each atom at the corner of the unit cell is shared by eight adjoining cells and one atom inside the cell cannot be shared, the c.p.h. unit cell contains two atoms. Examples of metals that crystallize in this type of structure are magnesium, beryllium, zinc, cadmium, and hafnium.
The unit cell of the cubic system may be specified by a single lattice parameter a. but the hexagonal cell requires the width of the hexagon a and the distance between basal planes c. These determine the axial ratio c/a, which is sometimes given. It may be shown mathematically that the
F I ~ . 2.13 ,Derivation of the hexagonal lattice f-om many un~ t cells.
axial ratlo of a c.p.h. structure formed of spheres in contact is 1.633. In reality, metals of this structure have axial ratios that vary from 1.58 for beryl- lium to 1.88 for cadmium. Therefore, if the atoms are still considered to be in contact, they must be spheroidal in shape rather than spherical.
The types of crystal structure, lattice parameters, and other physical property data of the common metals are given in Table 2.8.
2.16 Polymorphism and Allotropy Polymorphism is the property of a material to exist in more than one type of space lattice in the solid state. If the
change in structure is reversible, then the polymorphic change is known as allotropy. At least fifteen metals show this property, and the best-known example is iron. When iron crystallizes at 2800°F it is b.c.c. (S Fe), at 2554°F the structure changes to f,c.c. ( y Fe), and at 1670°F it again becomes b.c.c. (U Fe).
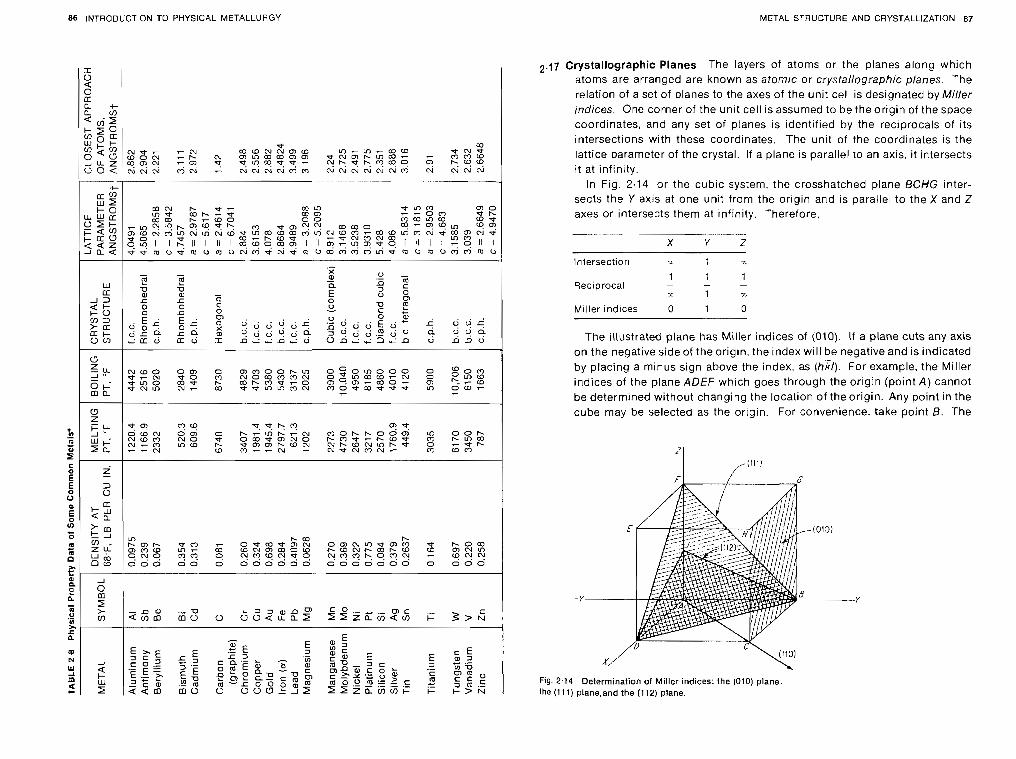
86 INTRODUCTION TO PHYSICAL METALLURGY METAL STRUCTURE AND CRYSTALLIZATION 87
P CO w w x c u m w L O . - o - m ( o 9 N b :SKi Z E N m m m m m z * m m t . m m - 7 m m w
N Y * Y P ? ~ O :?: 2: 2 Z X Z Z Z , N N N N N @ 1 0 ; Z ? ? Z
X - - (U - v - .- F 2
D 7J a - 5 z 8 L 0 c
O 0 n - " ? cn . U 6 5 . ":= := " " " " " = z + * + E * + 6 q $ s
q ~ a s a ? O V C ! ~ o * v . m ~ ~ ' 3 0 4 , r r d ( r d I n - - o - ? 0 o ; ~ o ~ o 4 o o o
N W O o m c m m o o r . m O o m o o o 3 8 0 0 e - c v - to o N O W O O N Z X g m w - ~ e m 0 . -a07 m F Y Z e w m % 2 2 % % $ S G % r n ~ b 3 0 P P - t m o w - 7
2,j7 Crystallographic Planes The layers of atoms or the planes along which atoms are arranged are known as atomlc or crystallographic planes. The relation of a set of planes to the axes of the unit cell is designated by Miller indices. One corner of the unit cell is assumed to be the origin of the space coordinates, and any set of planes is identified by the reciprocals of its intersections with these coordinates. The unit of the coordinates is the lattice parameter of the crystal. If a plane is parallel to an axis. it intersects it at infinity.
In Fig. 2.14. or the cubic system, the crosshatched plane BCHG inter- sects the Y axis at one unit from the origin and is parallel to the X and Z axes or intersects them at infinity. Therefore.
Intersection x 1 7.
1 -
1 - 1
Reciprocal - 2 1 7.
M~ller indices 0 1 0
The illustrated plane has Miller indices of (010). If a plane cuts any axis on the negative side of the origin, the index will be negative and is indicated by placing a minus sign above the index, as (hkl). For example. the Miller indices of the plane ADEF which goes through the origin (point A ) cannot be determined without changing the location of the origin. Any point in the cube may be selected as the origin. For convenience, take point 6. The
Fig. 2.14 Determination of Miller indices: the (010) plane. the (1 11) plane-and the (112) plane.
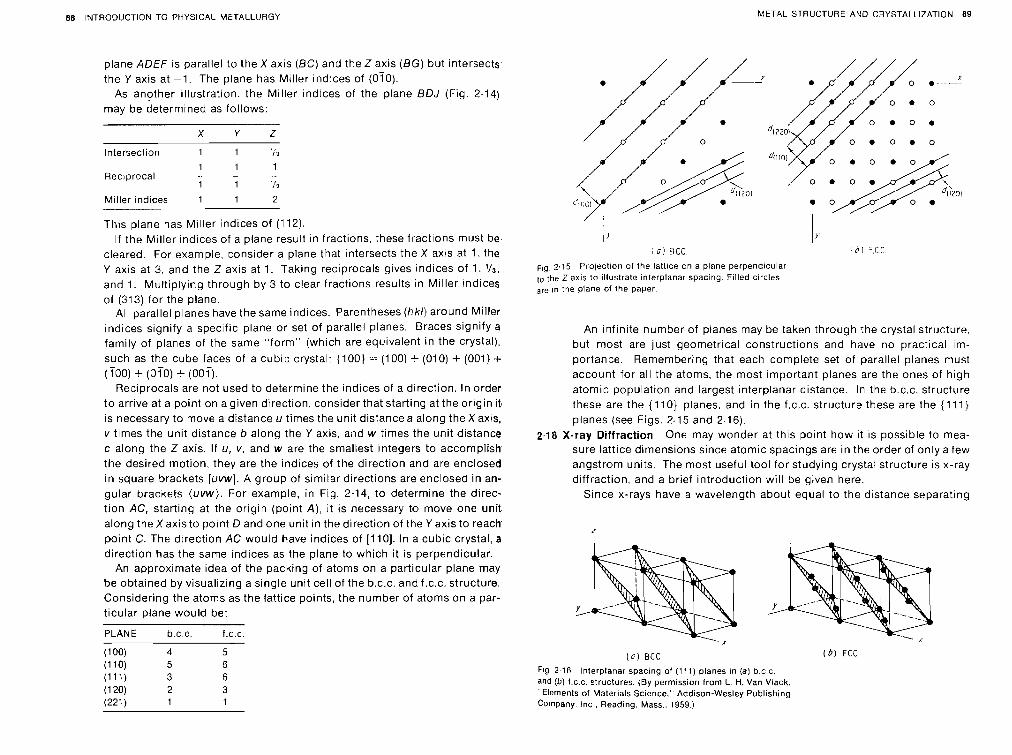
88 INTRODUCTION TO PHYSICAL METALLURGY METAL STRUCTURE AVO CRYSTALLIZATION 89
plane ADEF IS parallel to the X axis (BC) and the Z axis (BG) but intersects the Y axis at -1. The plane has Miller indlces of (070).
As another illustration the Miller indlces of the plane BDJ (Fig. 2.14) may be determined as follows:
X Y Z
Intersection I 1 I 7
I 1 1 Reciprocal - -
1 1 I 7
Miller indices 1 1 2
T h ~ s plane has Miller Indices of (1 121. If the Miller Indices of a plane result In fractions, these fractions must be
cleared. For example, cons~der a plane that Intersects the X axis at 1 the Y axis at 3, and the Z axis at 1. Taking reciprocals gives indices of 1. ' 1 3 ,
and 1. Multiplying through by 3 to clear fractions results in Miller indices of (313) for the plane.
All parallel planes have the same indlces. Parentheses (hk l ) around Miller Indices signify a spec~fic plane or set of parallel planes. Braces signify a family of planes of the same "form" (which are equivalent in the crystal), such as the cube faces of a cubic crystal: { I 00) - (1 00) + (010) + (001 1 + (Too) + (070) + (007).
Reciprocals are not used to determine the indices of a dlrection. In order to arrive at a point on a given drrection, cons~der that starting at the orlgin it IS necessary to move a drstance u times the unit distance a along the Xax~s, v tlmes the unit distance b along the Y axis, and w times the unit distance c along the Z axis. If u, v, and w are the smallest Integers to accomplish the desired motion. they are the indices of the direction and are enclosed in square brackets [uvw]. A group of similar directions are enclosed in an- gular brac~ets (uvw). For example, in Fig. 2.14, to determine the direc- tion AC, starting at the origin (point A ) , it is necessary to move one unit along the X axis to point D and one unit in the dlrection of the Y axis to reach point C. The dlrection AC would have indices of [110]. In a cublc crystal, a direction has the same indlces as the plane to which it is perpendicular.
An approximate idea of the packing of atoms on a particular plane may be obtained by visualizing a single unit cell of the b.c.c. and f.c.c. structure. Considering the atoms as the lattice points, the number of atoms on a par- ticular plane would be:
PLANE b.c.c. f.c.c.
(100) 4 5 (110) 5 6 (111) 3 6 (120) 2 3 (221) 1 1
I I Y i c ) 3CC
~ , g 2.15 Projection of the lattice on a plane perpendicular lo the Z axis to illustrate interplanar spacing. Filled clrcles are In rne plane of the paper.
An infinite number of planes may be taken through the crystal structure, but most are just geometrical constructions and have no practical im- portance. Remembering that each complete set of parallel planes must account for all the atoms, the most important planes are the ones of high atomic population and largest interplanar distance. In the b.c.c. structure these are the { I 10) planes, and in the f.c.c. structure these are the { I 11 1 planes (see Figs. 2.15 and 2.16).
2.18 X-ray Diffraction One may wonder at this point how it is possible to mea- sure lattice dimensions since atomic spacings are in the order of only a few angstrom units. The most useful tool for stodying crystal structure is x-ray diffraction, and a brief introduction will be given here.
Since x-rays have a wavelength about equal to the distance separating
(0) BCC ( b ) FCC
Fig 2 16 lnterplanar spacing of (111) planes in (a ) b.c.c. and (b) f.c.c. structures. (By permission from L. H. Van Viack. ' Elements of Materials Science.' Addison-Wesley Publishing Company. Inc.. Reading. Mass.. 1959.)
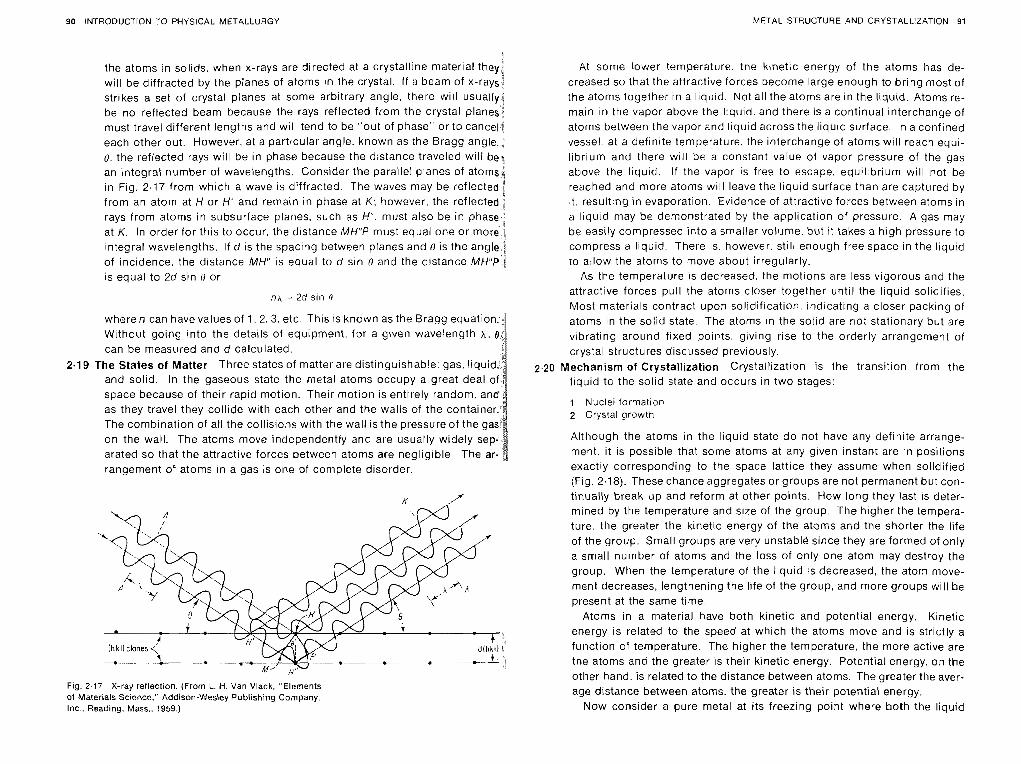
90 INTROOUCTiON TO PHYSICAL METALLURGY METAL STRUCTURE .4ND CRYSTALLIZATION 91
1
the atoms In solids, when x-rays are dlrected at a crystalline materlal they! '4 will be dlffracted by the planes of atoms In the crystal If a beam of x-raysd strikes a set of crystal planes at some arbitrary angle, there wlil usitally4 be no reflected beam because the rays reflected from the crystal planesd must travel different lengths and will tend to be ' out of phase or to cancel? each other out However, at a particular angle known as the Bragg angle : 0 the reflected rays will be In phase because the dlstance traveled will be1 an integral number of wavelengths Consider the parallel planes of atoms" "i In Flg 2 17 from whlch a wave IS dlffracted The waves may be reflected 1 from an atom at H or H and rematn In phase at K , however the reflected rays from atoms In subsurface planes such as H' must also be In phase at K In order for thts to occur, the dlstance MH"P must equal one or more 1 integral wavelengths If d IS the spac~ng between planes and 0 is the angle
1 of Incidence the drstance M H IS equal to d sin 0 and the distance MHP [ is equal to 2d sin 0 or
n;\ - 2d sin 0
where n can have values of 1 . 2 . 3 etc Thls +s known as the Bragg equation. - Without gotng into the details of equipment for a given wavelength A . @
can be measured ana d calculated 2.19 The States of Matter Three states of matter are dlsttngulshable gas. Iiquld,
and solld In the gaseous state the rfletal atoms occupy a great deal of space because of thelr rapld motlon Thelr motlon IS entirely random and as they travel they colllde wlth each other and the walls of the contarner The combination of all the coll~slons wlth the wall IS the pressure of the gas on the wall The atoms move independently and are usually w~dely sep- arated so that the attractive forces between atoms are negligible The ar- rangement of atoms rn a gas ts one of complete disorder
Fig. 2.17 X-ray reflection. (From L. ti. Van Vlack, "Elements of Materials Science." Addison-Wesley Publishing Company, Inc., Read~ng, Mass., 1959.)
At some lower temperature. the krnetic energy of the atoms has de- creased so that the attractive forces Decome large enough to bring most of the atoms together in a liquid. Not all the atoms are in the liquid. Atoms re- main in the vapor above the liquicl. and there is a continual interchange of atoms between the vapor end liquid across the liquid surface. In a confined vessel. at a definite temperature, the interchange of atoms will reach equi- librium and there will be a constant value of vapor pressure of the gas above the liquio. If the vapor is free to escape, equilibrium will not be reached and more atoms will leave the liquid surface than are captured by ~ t . result,ng in evaporation. Evidence of attractive forces between atoms in a liquid may be demonstrated by the application of pressure. A gas may be easily compressed into a smaller volume. but it takes a high pressure to compress a liquid. There is. however, still enough free space in the liquid to allow the atoms to move about irregularly.
As the temperature is decreased, the motions are less vigorous and the attractive forces pull ?he atoms closer together until the liquid solioifies. Most materials contract upon solidification. i .~dicating a closer packing of atoms in the soiid state. The atoms in the solid are no: stationary but are vibrating around fixed p o i ~ t s , giving rise to the orderly arrangement of crystal structures discussed previously.
2.20 Mechanism of Crystallization Crystatlization is the transition from the llqilid to the solid state and occurs in two stages:
1 Nuclei for-nation 2 Crystal growth
Although the atoms in the liquid state do not have any definite arrange- ment. it is possible that some atoms at any given instanr are in positions exactly corresponding to the space lattice they assume when solidified 11Fig. 2.18;). These chance aggregates or groups are not permanent but con- tinually break up and reform at other points. How long they last is deter- mined by the temperature and size of the group. The higher the tempera- ture. the greater the kinetic energy of the atoms and the shorter the life of the group. Small groups are very unstable since they are formed of only a small number of atoms and the loss of only one atom may destroy the group. When the temperature of the liquid is decreased, the atom move- ment decreases, lengthening the life of the group, and more groups will be present at the same time.
Atoms in a material have both kinetic and potential energy. Kinetic energy is related to the speed at which the atoms move and is strictly a function of temperature. The higher the temperature, the more active are the atoms and the greater is their kinetic energy. Potential energy, on the other hand, is related to the distance between atoms. The greater the aver- age distance between atoms. the greater is their potential energy.
Now consider a pure metal at its freezing point where both the liquid
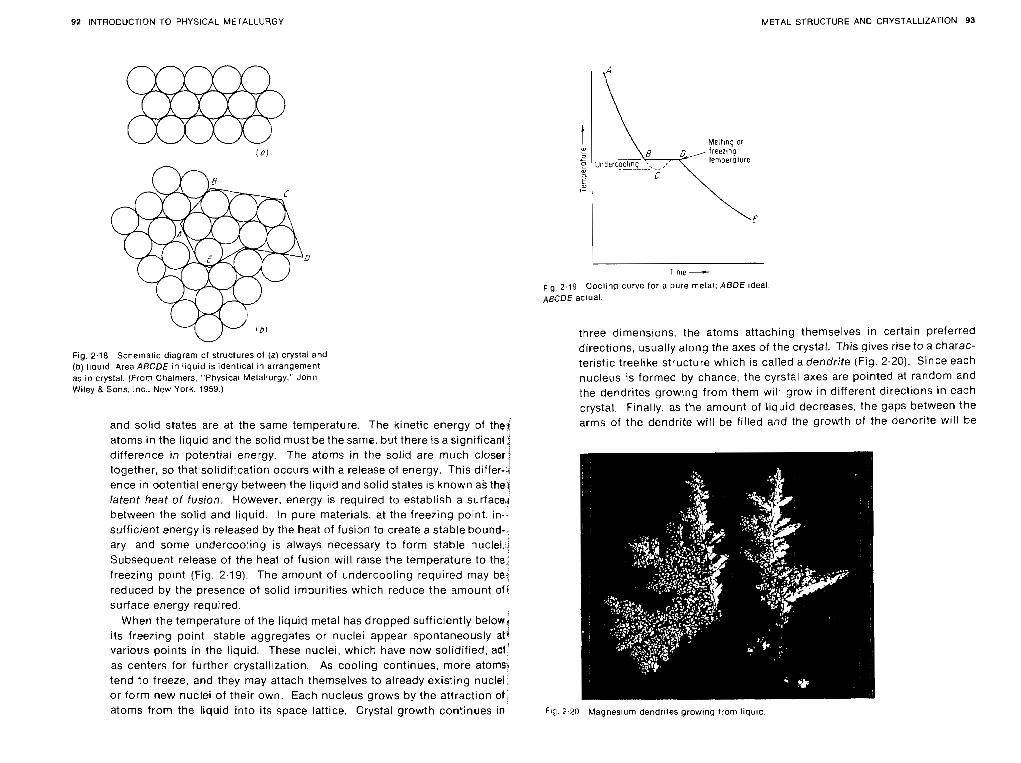
92 INTRODUCTION TO PHYSICAL METALLURGY METAL STRUCTURE AND CRYSTALLIZATION 93
Fig. 2.18 Schematic diagram of structures of (a) crystal and (b) liou~d. Area ABCDE in liquid is identical in arrangement as in crystal. (From Chalrners. "Physicai Metallurgy," John Wiley & Sons. Inc.. New York. 1959.)
and solid states are at the same temperature. The kinetic energy of the,i atoms in the liquid and the solid must be the same, but there is a significant{ difference in potential energy. The atoms in the solid are much closeri together, so that solidification occurs with a release of energy. This differ-] ence in potential energy between the liquid and solid states is known as thel/ latent heat of fusion. However, energy is required to establish a surface,i between the solid and liquid. In pure materials, at the freezing point, in-4 sufficient energy is released by the heat of fusion to create a stable bound-, ary, and some undercooling is always necessary to form stable nuclei. i Subsequent release of the heat of fusion will raise the temperature to the, freezing point (Fig. 2.19). The amount of undercooling required may baj reduced by the presence of solid impurities which reduce the amount of1 surface energy required.
I When the temperature of the liquid metal has dropped sufficiently below!
its freezing point, stable aggregates or nuclei appear spontaneously at1 various points in the liquid. These nuclei, which have now solidified, act; as centers for further crystallization. As cooling continues, more atoms9 tend to freeze, and they may attach themselves to already existing nuclei: or form new nuclei of their own. Each nucleus grows by the attraction of, atoms from the liquid into its space lattice. Crystal growth continues in'
~ t g . 2.19 Cooling curve for a pure metal; ABDE ideal. ABCDE acruai.
+ 2
2 I- !
three dimensions, the atoms attaching themselves in certain preferred directions, usually along the axes of the crystal. This gives rise to a charac- teristic treelike structure which is called a dendrite (Fig. 2.20). Since each nucleus is formed by chance, the cyrstal axes are pointed at random and the dendrites growing from them will grow in different directions in each crystal. Finally, as the amount of liquid decreases, the gaps between the arms of the dendrite will be filled and the growth of the dendrite will be
Melt~nq or D.,-.- f reez~nq
undercF=-,--,, lemperolure
'>\ E
Ftg 2.20 Magnesturn dendrites growing from liqu~c.
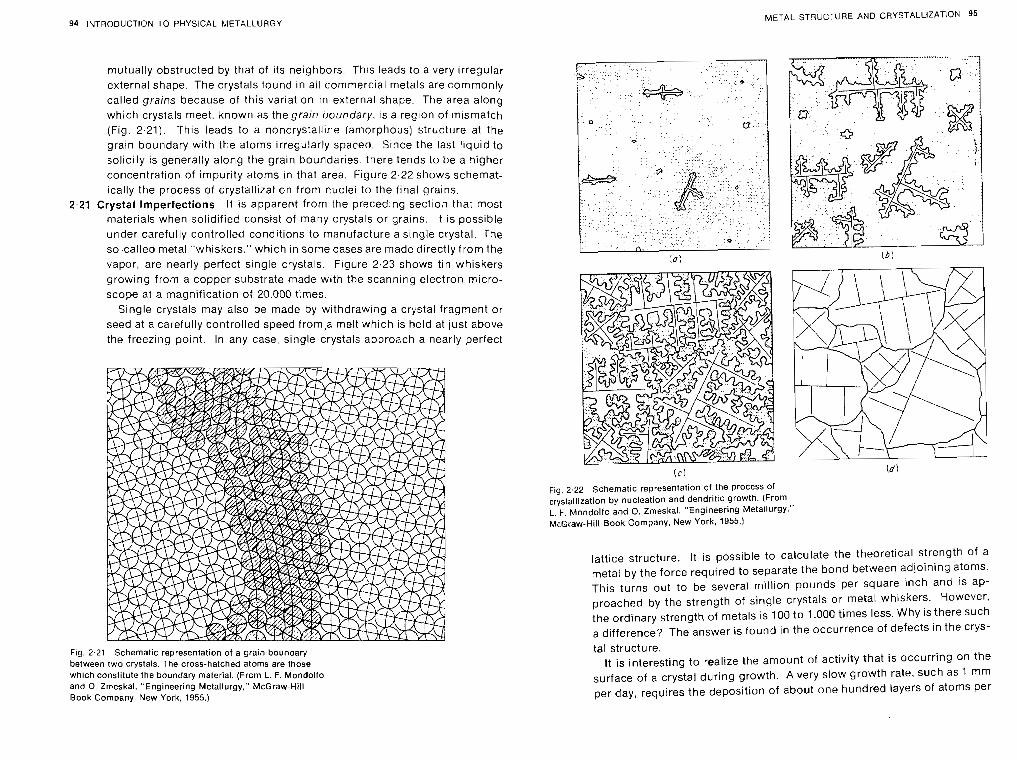
94 INTRODUCTION TO PHYSICAL METALLURGY METAL STSL'CTURE AND CRYSTALLIZATION 95
mutually obstructed by that of its neighbors. This leads to a very irregular external shape. The crystals found in all commercial metals are commonly called grains because of this variat~on in external shape. The area along which crystals meet. known as the grain ooundary, is a region of rnismatch (Fig. 2.21). This leads to a noncrystalline (amorphous) strticture at the grain boundary with the atoms irregularly spaced. Srnce the last liquid to solidify is generally along the grain boundaries, there tends to be a Oigher concentration of impurity atoms in that area. Figure 2.22 shows schemat- ically the process of crystallization from nuclei to the final grains.
2.21 Crystal Imperfections It is apparent from the preceding section thar most materials when solidified consist of maqy crystals or grains. It is possible under carefully controlled conditions to man~~facture a single crystal. The so-called metal "whiskers." which in some cases are made directly from the vapor, are nearly perfect single crystals. Figure 2.23 shows tin whiskers growing from a copper substrate made with the scanning electron micro- scope at a magnification of 20.000 times.
Single crystals may also be made by withdrawing a crystal fragment or seed at a carefully controlled speed from,a melt which is held at just above the freezing point. In any case. single crystals approach a nearly perfect
Fig. 2.21 Schematic representation of a grain bounoary between two crystals. The cross-hatched atoms are those which constitute the boundary material. (From L. F. Mondolfo and 0. Zmeskal, "Engineering Metallurgy." McGraw-Hill Book Com~any. New York. 1955.)
Fig. 2.22 Schematic representation of the process of crystallization by nucleation and dendrit~c growth. (From L. F. Mondolfo and 0. Zmeskal, "Engineering Metallurgy," McGraw-Hill Book Company. New York. 1955.)
lattice structure. It is possible to calculate the theoretical strength of a
metal by the force required to separate the bond between adjoining atoms. T h ~ s turns out to be several million pounds per square inch and Is ap- proached by the strength of single crystals or metal whiskers. However. the ordinary strength of metals is 100 to 1.000 times less. Why is there such a difference? The answer is found in the occurrence of defects in the crys- tal structure.
It is interesting to realize the amount of activity that is occurring on the surface of a crystal during growth. A very slow growth rate, such as 1 mm per day, requires the deposition of about one hundred layers of atoms per
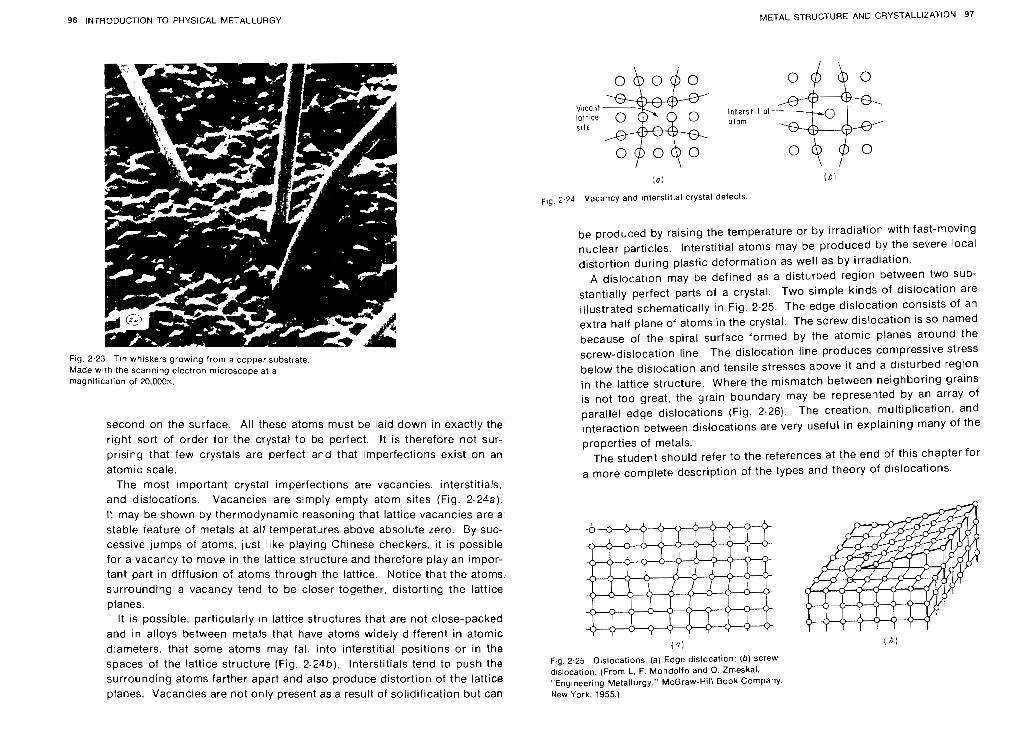
96 INTRODUCTION TO PHYSICAL METALLURGY METAL STRUCTURE AND CRYSTALLIZATION 97
Fig. 2.23 Tin whiskers growing from a copper substrate. Made wcrh the scanning electron microscope at a magnification of 20,000~.
second on the surface. All these atoms must be laid down in exactly the right sort of order for the crystal to be perfect. It is therefore not sur- prising that few crystals are perfect and that imperfections exist on an atomic scale.
The most important crystal imperfections are vacancies, interstitials, and dislocations. Vacancies are simply empty atom sites (Fig. 2.24a). It may be shown by thermodynamic reasoning that lattice vacancies are a stable feature of nietals at all temperatures above absolute zero. By suc- cessive j~ imps of atoms, just like playing Chinese checkers. it is possible for a vacancy to move in the lattice structure and therefore play an impor- tant part in diffusion of atoms through the lattice. Notice that the atoms: surrounding a vacancy tend to be closer together, distorting the lattice, planes.
It is possible. particularly in lattice structures that are not close-packed and in alloys between metals that have atoms widely different in atomic diameters, that some atoms may fall into interstitial positions or in the spaces of the lattice structure (Fig. 2.24b). lnterstitials tend to push the surrounding atoms farther apart and also produce distortion of the lattice planes. Vacancies are not only present as a result of solidification but can
Vacont I a t ~ i c e o tJm
lnterst tiol--- 5 l I E
Ig. 2.24 Vacancy and ~nterstittal crystal defects
be produced by raising the temperature or by irradiation with fast-moving nuclear particles. Interstitial atoms may be produced by the severe local distortion during plastic deformation as well as by irradiation.
A dislocation may be defined as a disturbed region between two sub- stantially perfect parts of a crystal. Two simple kinds of dislocation are
illustrated schematically in Fig. 2.25. The edge dislocation consists of an extra half plane of atoms in the crystal. The screw dislocation is so named because of the spiral surface formed by the atomic planes around the screw-dislocation line. The dislocation line produces compressive stress below the dislocation and tensile stresses above it and a disturbed region in the lattice structure. Where the mismatch between neighboring grains is not too great, the grain boundary may be represented by an array of parallel edge dislocations (Fig. 2.26). The creation. multiplication, and
interaction between dislocations are very useful in explaining many of the properties of metals.
The student should refer to the references at the end of this chapter for a more complete description of the types and theory of dislocations.
( 2 )
Fig. 2.25 Oislocations. (a) Eoge dislocation: (b) screw d~slocation. (From L. F. Mondolfo and 0. Zmeskal, ' Engineering Metallurgy." McGraw-Hill Book Company. New York. 1955.)
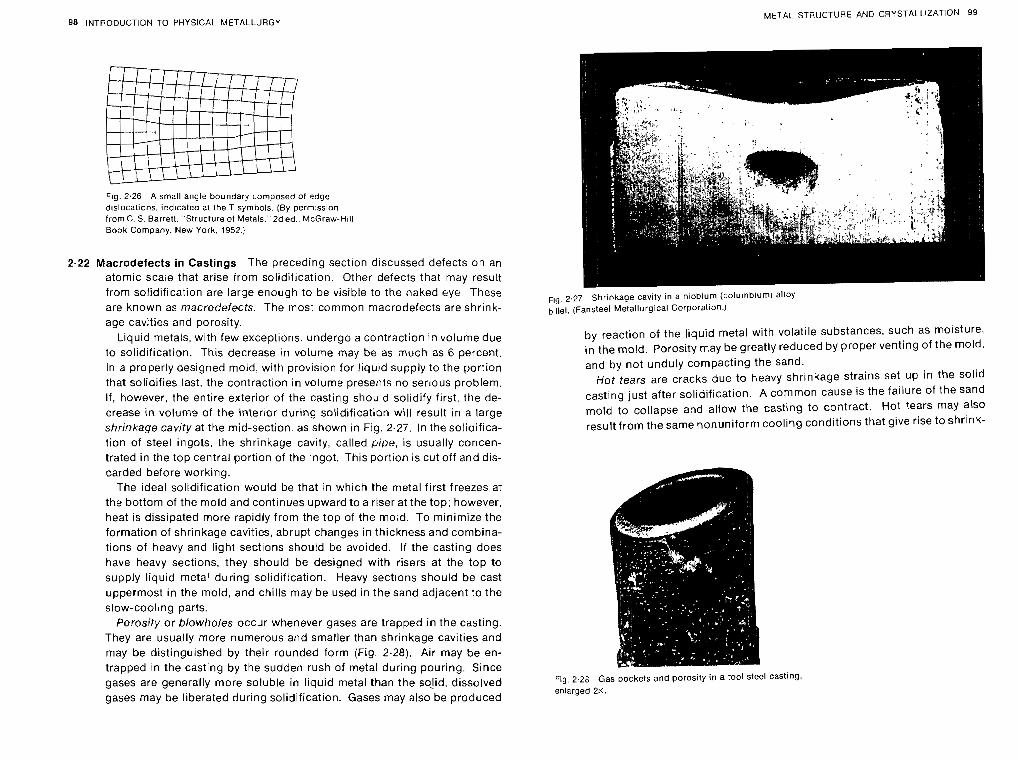
98 INTRODUCTION TO PHYSICAL METALLURGY METAL STRUCTURE AND CRYSTALLIZATION 99
Fig. 2.26 A small angle boundary composed of edge dislocations, indrcatea 21 the T symbols (By perrnissron from C. S. Barretl. "Structure of Metals," 2d ed., McGraw-Hill Book Company. New York. 1952.:
2.22 Macrodefects in Castings The preceding section discussed defects on an atomic scale that arise from solidification. Other defects that may result from solidification are large enough to be visible to the naked eye. These are known as macrodefects. The most common macrodefects are shrink- age cavities and porosity.
Liquid metals, with few exceptions. undergo a contraction in volume due to solidification. This decrease in volume may be as much as 6 percent. In a properly designed mold, with provision for liquid supply to the portion that solidifies last, the contraction in volume presents no serious problem. If, however, the entire exterior of the casting should solidify first, the de- crease i n volume of the interlor during solidification will result in a large shrinkage cavity at the mid-section. as shown in Fig. 2.27. In the solidifica- tion of steel ingots, the shrinkage cavity, called pipe, is usually concen- trated in the top central portion of the ingot. This portion is cut off and dis- carded before working.
The ideal solidification would be that in which the metal first freezes at the bottom of the mold and continues upward to a riser at the top; however, heat is dissipated more rapidly from the top of the mold. To minimize the formation of shrinkage cavities, abrupt changes in thickness and combina- tions of heavy and light sections should be avoided. If the casting does have heavy sections, they should be designed with risers at the top to supply liquid metal during solidification. Heavy sections should be cast uppermost in the mold, and chills may be used in the sand adjacent to the slow-cooling parts.
Porosity or blowholes occur whenever gases are trapped in the casting. They are usually more numerous and smaller than shrinkage cavities and may be distinguished by their rounded form (Fig. 2.28). Air may be en- trapped in the casting by the sudden rush of metal during pouring. Since
Fig. 2.27 Shrinkage cavity in a niobium (columbium) alloy billet. (Fansteel Metallurgical Corporation.!
by reaction of the liquid metal with volatile substances, such as moisture, i n the mold. Porosity may be greatly reduced by proper venting of the mold. and by not unduly compacting the sand.
Hot tears are cracks due to heavy shrinkage strains set up in the solid casting just after solidification. A common cause is the failure of the sand mold to collapse and allow the casting to contract. Hot tears may also
result from the same nonuniform cooling conditions that give rise to shrink-
- . - gases are generally more soluble in liquid metal than the so!id, dissolved Fig, 2.28 Gas oockets and porosity i n a tool steel casting,
gases may be liberated during solidification. Gases may also be produced enlarged 2x.
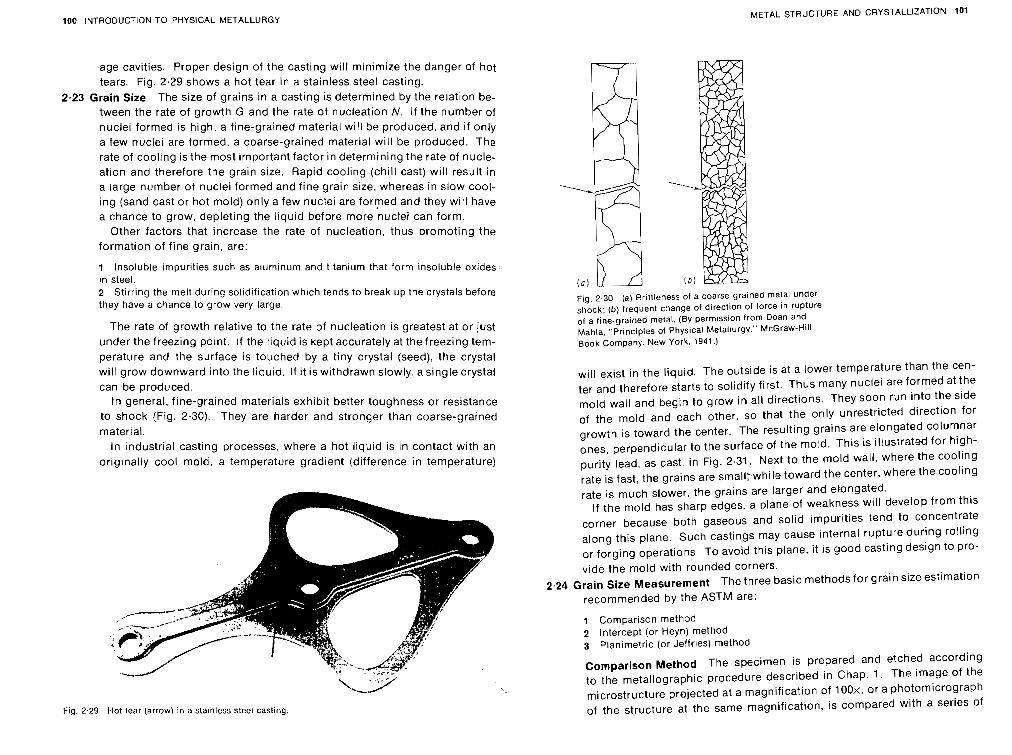
100 INTRODUCTION TO PHYSICAL METALLURGY METAL STRUCTURE AND CRYSTALLIZATION 101
age cavities. Proper design of the casting will minimize the danger of hot tears. Fig. 2.29 shows a hot tear in a stainless steel casting.
2.23 Grain Size The size of grains in a casting is determined by the relation be- tween the rate of growth G and the rate of nucleation N. If the number of nuclei formed is high, a fine-grained material will be produced, and if only a few nuclei are formed, a coarse-grained material will be produced. The rate of cooling is the most important factor in determining the rate of nucle- ation and therefore the grain size. Rapid cooling (chill cast) will result in a large number of nuclei formed and fine grain size, whereas in slow cool- ing (sand cast or hot mold) only a few nuclei are formed and they wi tl have a chance to grow, depleting the liquid before more nuclei can form.
Other factors that increase the rate of nucleation, thus promoting the formation of fine grain, are:
1 Insoluble impurities such as aluminum and titanium that form insoluble oxides in steel. 2 Stirring the melt during solidification which tends to break up the crystals before they have a chance to grow very large.
The rate of growth relative to the rate of nucleation is greatest at or just under the freezing point. If the liquid is kept accurately at the freezing tern- perature and the surface is touched by a tiny crystal (seed), the crystal will grow downward into the liquid. If it is withdrawn slowly, a single crystal can be produced.
In general, fine-grained materials exhibit better toughness or resistance
to shock (Fig. 2.30). They are harder and stronger than coarse-grained material.
In industrial casting processes, where a hot iiquid is in contact with an originally cool mola, a temperature gradient (difference in temperature)
Fig. 2.29 blot tear (arrow) in a slainless steel casting
Fig. 2.30 (a) Brittleness of a coarse-grained metal under shock; ( b ) frequent change of direction of force in rupture of a fine-grained metal. (By permission from Doan and Mahla, "Principles of Physical Metallurgy." McGraw-Hill Book Company. New Yor'n. 1941.)
will exist in the liquid. The outside is at a lower temperature than the cen- ter and therefore starts to solidify first. Thus many nuclei are formed at the mold wall and begin to grow in all directions. They soon run into the side of the mold and each other, so that the only unrestricted direction for growth is toward the center. The resulting grains are elongated columnar ones, perpendicular to the surface of the mold. This is illustrated for high- purity lead, as cast, in Fig. 2.31. Next to the mold wall, where the cooling rate is fast, the grains are smali;while toward the center, where the cooling rate is much slower, the grains are larger and elongated.
If the mold has sharp edges, a plane of weakness w ~ l l develop from this corner because both gaseous and solid impurities tend to concentrate along this plane. Such castings may cause internal rupture during rolling or forging operations. To avoid this plane, it is good casting design to pro- vide the mold with rounded corners.
2.24 Grain Size Measurement The three basic methods for grain size estimation recommended by the ASTM are:
1 Comparison method 2 Intercept (or Heyn) method 3 Planirnetric (or Jeffr~es) method
Comparison Method The specimen is prepared and etched according to the metallographic procedure described in Chap. 1. The image of the microstructure projected at a magnification of 100x, or a photomicrograph of the structure at the same magnification, is compared with a series of
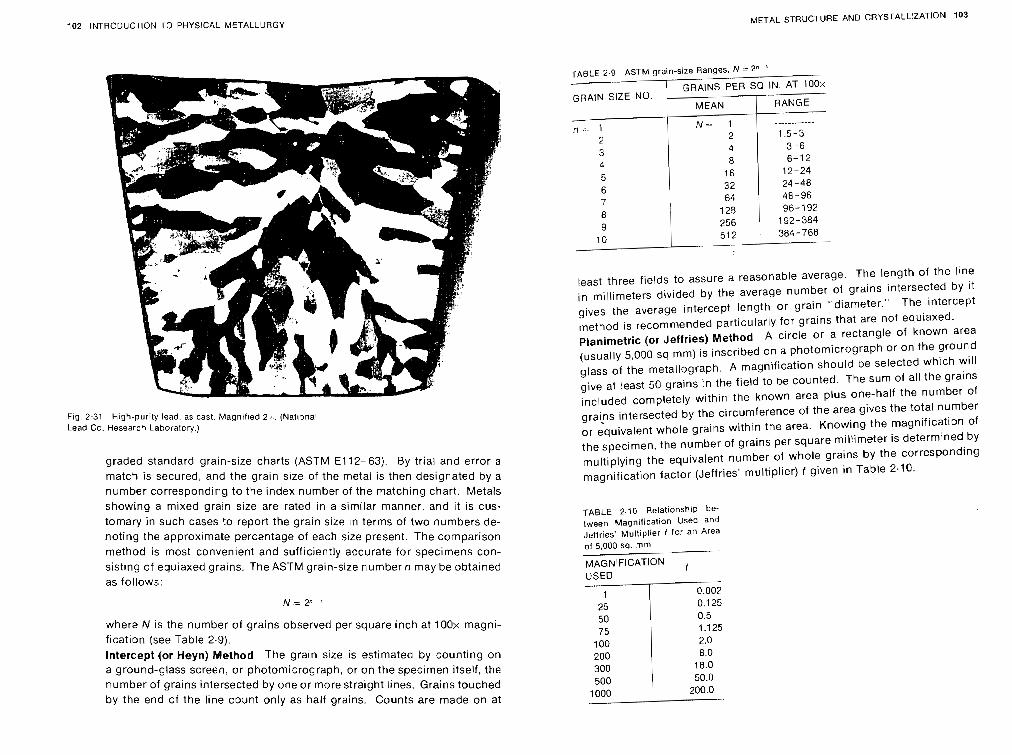
102 INTRODUCTION TO PHYSICAL METALLURGY METAL STRUCTURE AND CRYSTALLIZATION 103
Trial F 7.4 ASTM nrain-size Ranaes. N = 2" - '
Fig. 2.31 Hlgh-purity lead, as cast. lvlagnif~ed 2,. (National Lead Co. Research Laboratory.)
graded standard grain-size charts (ASTM E112-63). By trial and error a match is secured, and the grain size of the metal is then designated by a number corresponding to the index number of the matching chart. Metals showing a mixed grain size are rated in a similar manner, and it is cus- tomary in such cases to report the grain size in terms of two numbers de- noting the approxrmate percentage of each size present. The comparison method is most convenient and sufficiently accurate for specimens con- sisting of equiaxed grains. The ASTM grain-size numbern may be obtained as follows:
where N is the number of grains observed per square inch at 1OOx magni- fication (see Table 2.9).
Intercept (or Heyn) Method The grain size is estimated by counting on a ground-glass screen, or photomicrograph, or on the specimen itself, the number of grains intersected by one or more straight lines. Grains touched by the end of the line count only as half grains. Counts are made on at
, -"&- - - , ,- . ... =. - . --
GRAIN SIZE NO. GRAINS PER sa IN. AT IOOY - , . . . . . -
/ MEAN I RANGE
least three fields to assure a reasonable average. The length of the line in millimeters divided by the average number of grains intersected by it gives the average intercept length or grain "diameter." The intercept
method is recommended particularly for grains that are not equiaxed. Planimetric (or Jeffries) Method A circle or a rectangle of known area
(usually 5.000 sq mm) is inscribed on a photomicrograph or on the ground glass of the metallograph. A magnification should be selected which will give at least 50 grains in the field to be counted. The sum of all the grains included completely within the known area plus one-half the number of grai?s intersected by the circumference of the area gives the total number or equivalent whole grains within the area. Knowing the magnification of the specimen, the number of grains per square miltimeter is determined by multiplying the equivalent number of whole grains by the corresponding magnification factor (Jeffries' multiplier) f given in Table 2.10.
TABLE 2.16 Relationship be- tween Magn~fication Used and Jeffrles' Multiplier f for an Area of 5,000 sq. rnm
MAGNIFICATION , 0.125
18.0 50.0 200.0
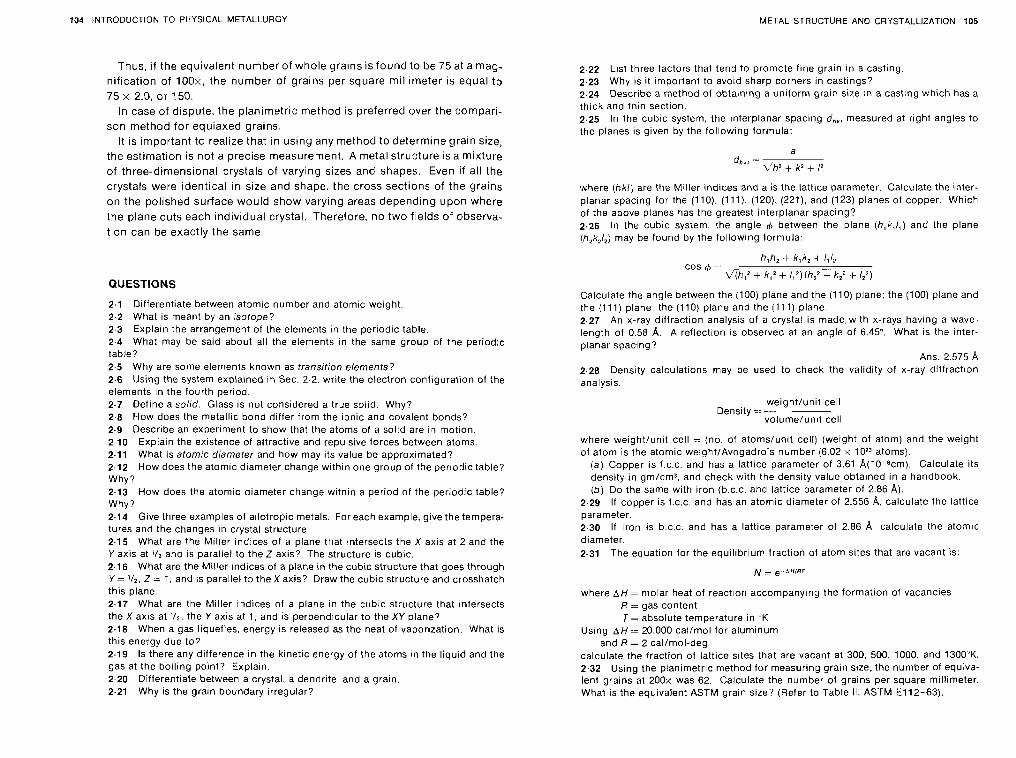
104 INTRODUCTION TO PHYSICAL METALLURGY METAL STRUCTURE AND CRYSTAI-LIZATION 105
Thus, if t h e equ~va len t number o f who le grains IS f o u n d t o b e 75 at a mag-
n ~ f ~ c a t ~ o n o f IOOx, t h e number of gralns per square m i l l ~ m e t e r IS equa l t o
75 x 20, o r 150 In case o f dispute. t he planlmetr lc me thod IS preferred over t h e compar i -
s o n me thod f o r e q u ~ a x e d gralns
It is impor tant t o r e a l ~ z e that I n us ing any me thod t o d e t e r m ~ n e gra in size,
t he es t rma t~on IS not a preclse measurement A meta l s t ruc ture IS a mlx ture
o f t h r e e - d ~ m e n s ~ o n a l crystals o f varying slzes a n d shapes Even i f a l l t he
crystals were r d e n t ~ c a l In size a n d shape, the c ross sect lons o f t h e grarns
on the po l lshed surface wou ld show varylng areas depend ing u p o n where
the p lane cu ts each ~ n d ~ v ~ d u a l crystal Therefore, n o t w o f ~ e l d s o f observa-
t l on can b e exact ly t h e same
QUESTIONS
2.1 Differentiate between atomic number and atomic weight. 2.2 What is meant by an isotope? 2.3 Explain the arrangement of the elements in the periodic table. 2.4 What may be said about all the elements in the same group of the period~c table'? 2.5 Why are some elements known as transition elements? 2.6 Using the system explained In Sec. 2.2. 'write the electron configuration of the elements in the fourth period. 2.7 Define a solid. Glass is not considered a true solid. Why? 2.8 How does the metallic bond differ from the ionic and covalent bonds? 2.9 Describe an experiment to show that the atoms of a solid are in motion. 2.10 Expla~n the existence of attractive and repulsive forces between atoms. 2.11 What is atomic diameter and how may its value be approximated? 2.12 How does the atomic diameter change within one group of the periodic table? Why? 2.13 How does the atomic diameter change witnin a period of the per iod~c table? Why? 2.14 Give three examples of allotropic metals. For each example, give the tempera- tures and the changes in crystal structure. 2.15 What are the Miller indlces of a plane that ~ntersects the X axis at 2 and the Y axis at ' 1 2 ana is parallel to the Z axis? The structure is cubic. 2.16 VJhat are the Miller indices of a plane in the cubic structure that goes through Y = I / ? , Z - 1, and is parallel to the X axis? Draw the cubic structure and crosshatch this plane. 2.17 What are the Miller indices of a plane in the cubic structure that intersects the X axis at ' 1 2 , the Y axis at 1 , and is perpendicular to the XY plane? 2.18 When a gas liquefies, energy is released as the neat of vaporization. What is this energy due to? 2.19 Is there any difference in the kinetic energy of the atoms in the liquid and the gas at the boiling point? Explain. 2.20 Differentiate between a crystal, a dendrite and a grain. 2.21 Why is the grain boundary irregular?
2.22 List three factors that tend to promote fine grain tn a casting. 2,23 Why is it important to avoid sharp corners in castings? 2.24 Describe a method of obtain~ng a uniform grain size i n a casting which has a thick and tnin section. 2,25 In the cubic system, the interplanar spacing a',,, measured at right angles to the planes is given by the following formula:
d,,, - b'h2 + k2 +Ti
where (hkl ) are the Miller indices and a is the lattice parameter. Calculate the inter- planar spacing for the (1 l o ) , (1 1 I ) , (120j, (221), and (123) planes of copper. Which of the above planes has the greatest interplanar spacing? 2,26 In the cubic sysrem. :he angle d, between the plane (h,k,l ,) and the plane (hzk,12j may be found by the following lormula:
h,h7 .t k,k2 -I I,i2 COS (b - --
\/(h,? + k,, + I ,2)(h22 kz2 .t I,?)
Calculate the angle between the (100) plane and the (110) plane: the (100) plane and the (1 11) plane: the (1 10) plane and the (1 11) plane. 2.27 An x-ray diffraction analysis of a crystal is made. w ~ t h x-rays having a wave- length of 0.58 A. A reflection is observed at an angle of 6.45". What is the inter- planar spacing?
Ans. 2.575 A 2.28 Density calculations may be used to check the validity of x-ray diffract~on analysis.
weightlunit cell Density == -
volurnelun~t cell
where weightlunit cell = (no. of atomstunit cell) (weight of atom) and the weight of atom is the atomic weight/Avogadro's number (6.02 x l oz3 atoms).
(a) Copper is f.c.c. and has a lattice parameter of 3.61 A(10 8cm). Calculate its density in gm/cm3, and check with the density value obtained in a handbook. ( b j Do the same with iron (b.c.c. ana lattice parameter of 2.86 Aj.
2.29 If copper is f.c.c. and has an atomic diameter of 2.556 A, calculate the lattice parameter. 2.30 If iron is b.c.c. and has a lattice parameter of 2.86 A, calculate the atomic diameter. 2.31 The equation for the equilibrium fraction of atom sites that are vacant is:
where AH = molar heat of reaction accompanying the formation of vacancies R = gas content T = absolute temperature in 'K
Using A H - 20.000 cal/mol for aluminum and R = 2 cal/moi-deg
calculate the fraction of lattice sites that are vacant at 300. 500, 1000, and 1300°K. 2.32 Using the planimetric method for measuring grain size. the number of equiva- lent grains at 200x was 62. Calculate the number of grains per square millimeter. What is the equivalent ASTM grain size? (Refer to Table II. ASTM E112-63).
106 INTROEUCTION TO PHYSICAL METALLURGY
REFERENCES
American Society for Metals: "Atom Movements." Metals Park. Ohio. 1951 Barrett. C. S.: "Structures of FAetals." 2d ed., McGraw-Htll Book Company. New Y
1952. Cottrell. A. H : "Dislocations and Plastic Flow io Crystals," Oxford University Pr
Fair Lawn t.1.J.. 1956. Culiity. €3. D.: "Elements of X-ray Diiiraction." Addison-Wesley Publishing Cowpan
Inc.. Reading Mass.. 1956. Eisenstadt. M. M.: "Introduction to Mechanical Properties of Materials." The Ma
millan Company, New York. 1971. Guy. A. G.: "Elements of Physical Metallurgy." 2d ed.. Add~son-Wesley Publishi
Company, Inc. Reading. Mass.. 1959. Hume-Rothery. W.: "Atomic Theory for Students of Metallurgy." The Institute
Metals. London 1955. -and G. V. Raynor: "The Structureof Metals and Alloys,' The Institute of Metal
London, 1969. Mason. C. W.' "Introductory Physical Metallurgy. ' American Society for Metal
Metals Park. Ohio. 1947. Mondolfo. L. F. and 0. Zmeskal. "Engineering Metallurgy." McGraw-Hill Book Co
pany, New York. 1955. Rogers. €3. A,: "The Nature of Metals." American Society for Metals. Metals Par
Ohio. 1951. Van Vlack. L. H.: "Elements of Materials Science." Addison-Wesley Publishing Co
pany. Inc.. Reading, Mass.. 1958. .- : "Materials Science for Engneers," Addison-Wesley Publishing Compan
Reading, Mass.. 1970. Weertman. J. and J. R. Weertman: "Elementary Dislocation Theory." The M
millan Company, New Yoric. 1964.
PLASTIC DEFORMATION
3.1 introduction When a material is stressed below its elastic l imit , tne resulting deformatiorl or strain is temporary. Removal of the stress results I n a grad- ual return of the object ot its original dimensions. When a material is stressed bi?yond its elastic limit. plastic o r permanent deformation takes place. and it wil l not return to its original shape by the application of force alcne. The ability of a metal to undergo plastic deformation is probably its rnost outstandins characteristic in comparison ,with other materials. All shap~ng operations such as stamping. pressing. spinning, roll ing, forging. drawing. and extruding involve plastic deformation of metals. Various machi r ing operations such as mill ing, turning. sawing, and punching also involve plastic detormation. The behavior of a metal under plastic deforma- tion and the mechanism by which it occurs are of essential interest i n per- fecting the w o r k ~ n g operation.
Much information regarding :he mechanism of plastic deformation may be obtained by studying the behavior of a single crystal under stress and later applying this knowledge t o a polycrystalline material.
Plastic deformation may taKe place by slip, twinning. o r a combinat ion of both methods.
3.2 Deformation by Slip If a single crystal of a metal is stressed in tension be- yond its elastic limit it elongates slightly. a step appears o n the surface indicating relative displacement of one part of the crystal with respect to the rest, and the elongation stops. Increasing the load will cause move- ment on another parallel plane, resulting in another step. It is as if neigh- boring th in sections of the crystal had slipped past one another l ike sliding cards on a deck. Each successive elongation requires a higher stress and results i n the appearance of another step, which is actually the intersec- tion of a slip plane with the surface of the crystal. Progressive increase of the load eventually causes the material to fracture.
Investigations showed that s l i d ~ n g occurred i n ce r ta~n planes of atoms
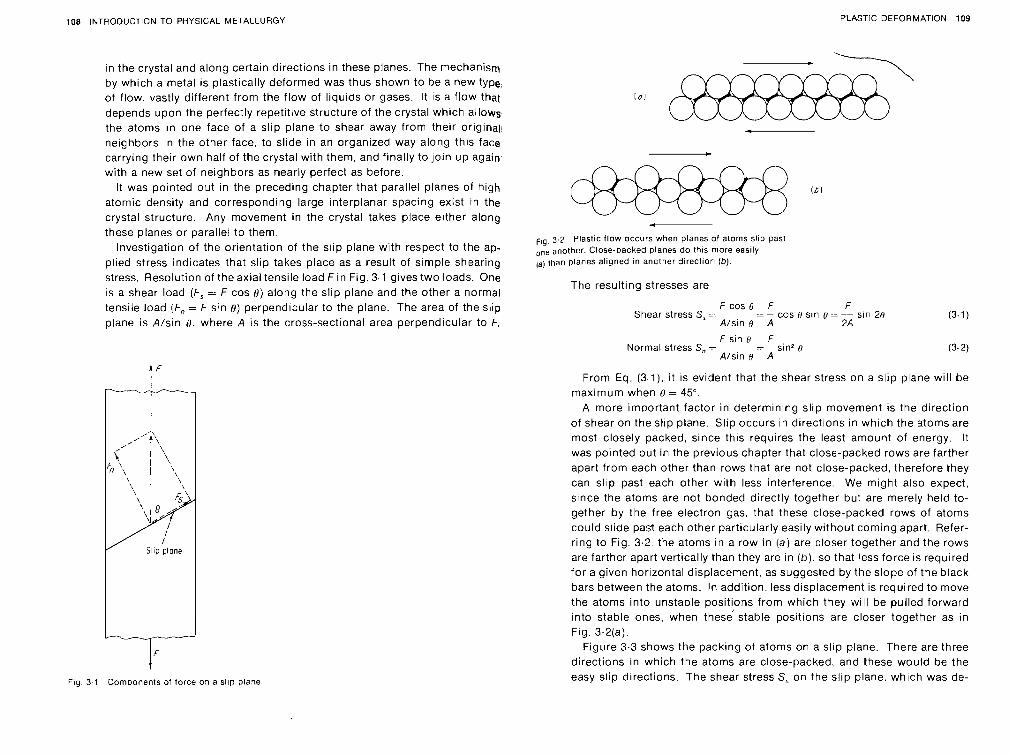
108 INTRODUCTION TO PHYSICAL METALLURGY PLASTIC DEFORMATION 109
in the crystal and a!ong certain directions ~n these planes The mechanism by w h ~ c h a metal IS plast~cally deformed was thus shown to be a new type of flow vastly different from the flow of liquids or gases It is a flow that depends upon the perfectly repetltlve structure of the crystal which allows the atoms in one face of a slip plane to shear away from their orlglnal neighbors In the other face, to sllde In an organized way along this face carrying thelr own half of the crystal wlth them, and flnally to joln up again with a new set of ne~ghbors as nearly perfect as before
It was po~nted out In the preced~ng chapter that parallel planes of high atomic density and correspond~ng large ~nterplanar spacing exkst In the crystal structure Any movement in the crystal takes place elther along these planes or parallel to them
lnvestigatlon of the orlentation of the s l ~ p plane wlth respect to the ap- plied stress indicates that slip takes place as a result of slmple shearlng stress Resolution of the axlal tens~le load F In Fig 3 1 glves two loads One is a shear ioad (F, - F cos 8) along the slrp plane and the other a normal tenslie ioad (F, = F stn 8) perpendl~ular to the plane The area of the slip plane is A / s ~ n 8 , where A IS the cross-sect~onal area perpendicular to F,
I F Fig. 3-1 Components of force on a sl~p plane
F~~ 3 2 Plastic flow occurs when planes of atoms slip past one another Close-packed planes do thls more easlly
than planes allgned in another direction (6)
The resulting stresses are
F cos 0 F F Shear stress S, -: ---- = - cos t, sin t, = -- sin 28
A/sin 0 A 2k
F s i n v F Normal stress S, 7 ---- - - .- sin2 ( I
A/sin tr A
From Eq. (3.1), it is evident that the shear stress on a slip plane will be maximum when 0 = 4Sc.
A more important factor in determining slip movement is the direction of shear on the slip plane. Slip occurs in directions in which the atoms are most closely packed, since this requires the least amount of energy. It was pointed out in the previous chapter that close-packed rows are farther apart from each other than rows that are not close-packed, therefore they can slip past each other with less interference. We might also expect. since the atoms are not bonded directly together but are merely held to- gether by the free electron gas, that these close-packed rows of atoms could slide past each other particularly easily without coming apart. Refer- ring to Fig. 3.2. tne atoms in a row In (a j are closer together and the rows are farther apart vertically than they are in ( b ) , so that less force is required for a given horizontal displacement, as suggested by the slope of the black bars between the atoms. In addition. less displacement is required to move the atoms into unstable positions from which they will be pulled forward into stable ones, when these stable positions are closer together as in Fig. 3.2(a).
Figure 3.3 shows the packing of atoms on a slip plane. There are three directions in which the atoms are close-packed, and these would be the easy slip directions. The shear stress S, on the slip plane, which was de-
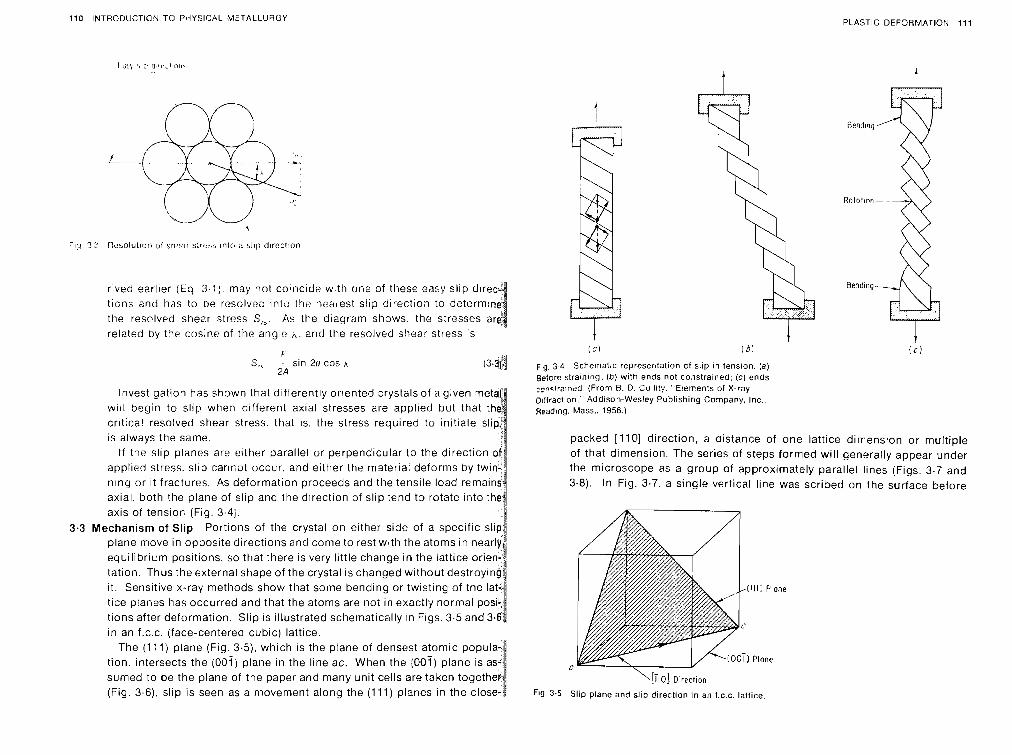
110 INTRODUCTION TO PtiYSICAL VIETALLURGY PLASTIC DEFORFhATlON 111
rived earlier (Eq 3.1 j may not coiricide vd th one of these easy slip dire t i ~ n s and has to be resolvec inlo the nr:-alest slip direction to determtn the resolved shear stress S,,. As the diagram shows. the s:resses ar related by tqe cosine of the anylc A , and the resolved shear stress IS
F S,, - sin 20 cos A
2A
Investigation has shown that differently oriented crystals of a given ,net will begin to slip when different axial stresses are applied but that t critical resolved shear stress. that is. the stress req~~ i red to initiate sli is always the same.
If the slip planes are either parallel or perpencficcilar to the direction applied stress. slip cannot occur, and either the materiar deforms by twi nlng or ~t fractures. P.s deformation proceeds and the tensile load remai axial, both the plane of slip and the d~rection of slip tend to rotate into t axis of tensior, (Fig. 3.4).
3.3 Mechanism of Slip Portions of the crystal on either side of a specific slip plane move in opposite directions and come to rest w ~ t h the atoms in nearly equilibrium positions, so that there is very little change in the lattice orien- tation. Thus the external shape of the crystal is changed without destroyin it. Sensitive x-ray methods show that some bending or twisting of the tice plarles has occurred and that the atoms are not in exactly normal p tions after deformation. Slip is illustrated schematically In Figs. 3.5 an in an f.c.c. (face-centereo cubic) lattice.
The (1 11) plane (Fig. 3.5), which is the plane o i densest atomrc popula- tion, intersects the (001) plane in the line ac. When the (00i) plane is as sumed to be the plane of the paper and many unit cells are taken togethe (Fig. 3.6), slip is seen as a movement along the (111) planes in the close
t I L'j ( b )
F I ~ . 3.4 Schematic representation of slip in tension. (a) Before stralnlng. (D! with ends not constrai~ed; (c) ends crnstra;ned (Fron B. D. Cullity. '.Elements of X-ray Diffraction, Addison-Wesley Publishing Company. Inc.. Reading. Mass.. 1956.)
packed [110] direction, a distance of one lattice dimension or multiple of that dimension. The series of steps formed will generally appear under the microscope as a group of approximately parallel lines (Figs. 3.7 and 3.8). In Fig. 3.7. a single vertical line was scribed on the surface before
\[TIO] Direction Fig. 3.5 Slip plane and slip direction in an f.c.c. lattice
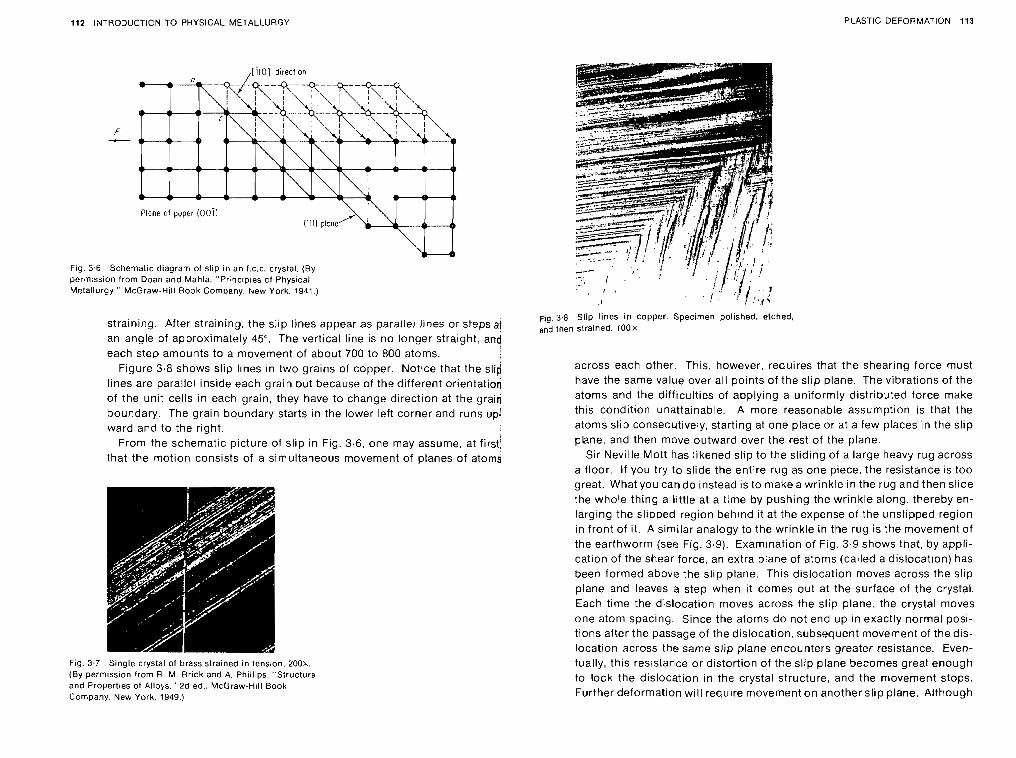
112 INTRODUCTION TO PHYSICAL METALLURGY
,[ilO] direction
PLASTIC DEFORMATION 113
Fig. 3.6 Schematic diagram of slip in an f.c.c. crystal. (By permkssion from Doan and Mahla. "Pr'nciples of Physical Metallurgy," McGraw-Hill Book Company. New York, 1941 :I
straining. After straining, the slip lines appear as parallel lines or stsps aj an angle of approximately 45". The vertical line is no longer straight, and each step amounts to a movement of about 700 to 800 atoms.
Figure 3.8 shows slip lines in two grains of copper. Notice that the slip lines are parallel inside each grain but because of the different orientatioi of the unit cells in each grain, they have to change direction at the grain boundary. The grain boundary starts in the lower left corner and runs u d ward and to the right.
From the schematic picture of slip in Fig. 3.6, one may assume, at first, that the motion consists of a simultaneous movement of planes of atoms
Fig. 3.7 Single crystal of brass strained In tension. 2 0 0 ~ . (By perm~ssion from R. M. Brick and A. Phillips. "Structure and Properties of Alloys." 26 ed., McGraw-HIII Book Company. New York. 1949.)
Fig. 3.8 Slip lines in copper Specimen polished, etched, and then strained. 100X.
across each other. This, however, requires that the shear~ng force must have the same value over all points of the slip plane. The vibrations of the atoms and the difficulties of applying a uniformly distributed force make this condition unattainable. A more reasonable assumption is that the atoms slip consecutively, starting at one place or at a few places in the slip plane, and then move outward over the rest of the plane.
Sir Neville Mott has likened slip to the sliding of a large heavy rug across a floor. If you try to slide the entire rug as one piece, the resistance is too great. What you can do instead is to make a wrinkle in the rug and then slide the whole thing a little at a time by pushing the wrinkle along, thereby en- larging the slipped region behrnd it at the expense of the unslipped region in front of it. A similar analogy to the wrinkle in the rug is the movement of the earthworm (see Fig. 3.9). Examination of Fig. 3.9 shows that, by appli- cation of the shear force, an extra plane of atoms (called a dislocation) has been formed above the slip plane. This dislocation moves across the slip plane and leaves a step when it comes out at the surface of the crystal. Each time the dislocation moves across the slip plane. the crystal moves one atom spacing. Since the atoms do not end up in exactly normal posi- tions after the passage of the dislocation, subsequent movement of the dis- location across the same slip plane encounters greater resistance. Even- tually, this resistance or distortion of the slip plane becomes great enough to lock the dislocation in the crystal structure, and the movement stops. Further deformation will require movement on another slip plane. Although
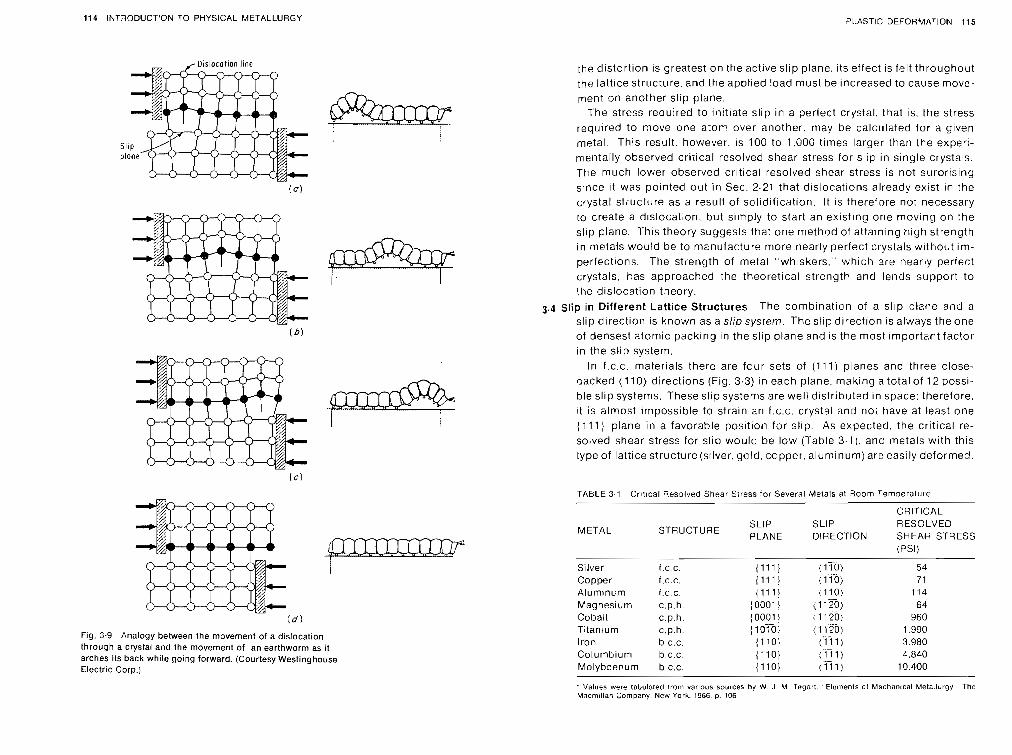
114 INTRODUCTION TO PHYSICAL EJETALLURGY Pi-ASTIC DEFORMATION 115
Fig. 3.9 Analogy between the movement of a dislocation through a crystal and the movement of an earthworm as it arches its back while going forward. (Courtesy Westinghouse Electric Corp.)
the distcrtion is greatest on the active slip plane, its effect is felt throctahout the lattlce structure. and the applied load must be increased to cause move- ment on another slip plane.
The stress required to initiate slip in a perfect crystal, that is, the stress required to move one atom over another. may be calculated for a given metal. This restllt. however. is 100 to 1.000 times larger than the experi- mentally observed criiical resolved shear stress for slip in single crystals. The much lower observed cr~tical resolved shear stress is not surpris~ng since it was pointed out in Sec. 2-21 that dislocations already exist in the crystal stiucture as a result of solidification. It is therefore not necessary to create a dislocatton, but simply to start an existing one rnoving on the slip plane. This theory suggests that one method of attaining high strength in metals would be to manufacture more nearly perfect crystals without im- perfections. The strength of metal "whiskers." which are nearly perfect crystals, has approached the theoretical strength ancl lends support to the dislocation t3eory.
3.4 Slip in Different Lattice Structures The combination of a slip olane and a slip direction is known as a s:ip system. The slip direction is always the one of densest atomic packing in the slip plane and is the most ~mportant factor in the slip system.
In f.c.c. materials there are four sets of (111) planes and three close- oacked (,I 10) directions (Fig. 3.3) in each plane. making a total of 12 possi- ble slip systems. These slip systems are well distributed in space: therefore. it is almost impossible to strain an f.c.c. crystal and not have at least one I111 1 plane in a favorable position for slip. As expected, the critical re- solved shear stress for slip would be low (Table 3.1). and metals with this type of lattice structure (srlver, gold, copper. aluminum) are easily deformed.
TABLE 3-1 Crrt~cal Resolved Shear Srress !or Several Metals at 3oom Ternoerature
CRITICAL SLIP SLIP RESOLVED
METAL STRUCTURE PLANE DIRECTION SHEAR STRESS
Silver Copper Aluminum Magnesium Cobalt Tjtan~urn Irofi Columbium Molvbdenurn
' Values were tabulaled from various sources hy 'N J M Tegart, ' Elements of Mechanical Metallurgy The Macmlllan Company. New York. 1'366. p 106
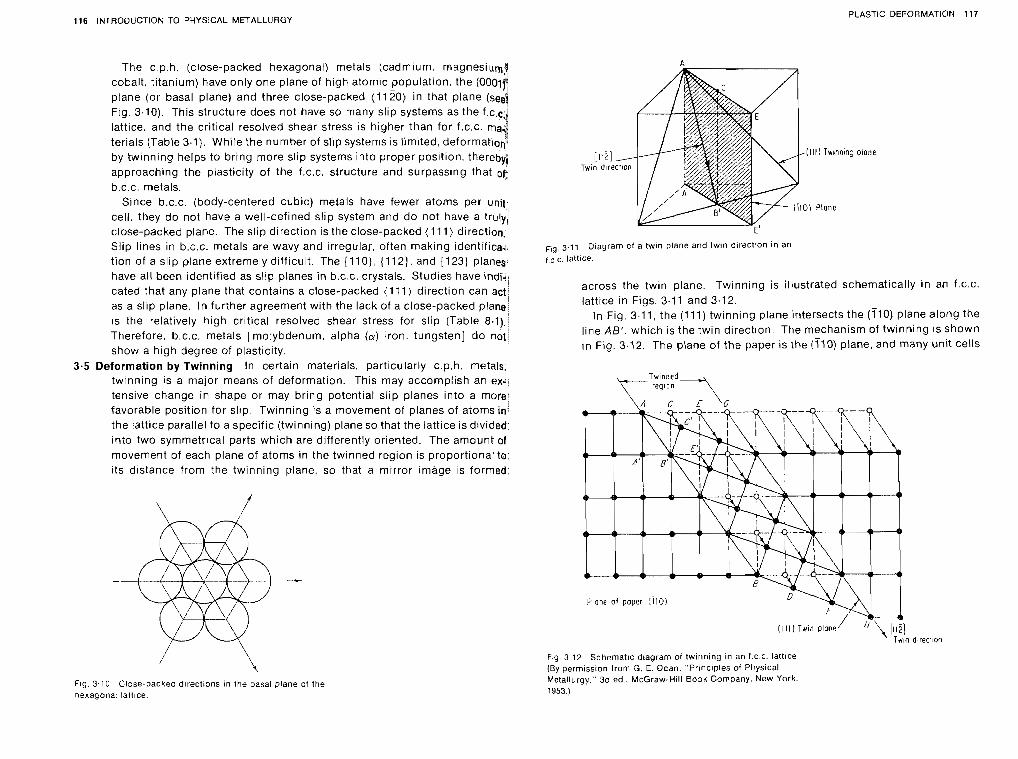
116 INTRODUCTION TO PHYSICAL METALLURGY PLASTIC DEFORMATION 117
The c p h (close-packed hexagonal) metals (cadrnlum magnesium
cobalt, t~tanium) have only one plane of hlgh atornlc population the (0001 plane (or basal plane) and three close-packed (1 120) In that plane (see Flg 3 10) Thls structure does not have so many s l ~ p systems as the f c. lattlce and the crltlcal resolved shear stress IS higher than for f c c terlals (Table 3.1) W h ~ l e the number of sllp systems IS Ilmited, deforma by twlnnlng helps to brlng more s l ~ p systems into proper posltlon, thereb$ approach~ng the plast~crty of the f c c structure and surpassing that on b c c metals
Slnce b c c (body-centered cubic) metals have fewer atoms per unit cell, they do not have a well-def~ned s l ~ p system and do not have a truly, close-packed plane The slip direct~on IS the close-packed (1 11) dlrectlon.1 Sllp llnes In b c c metals are wavy and ~rregular, often making identifrca,, t ~ o n of a slip plane extremely d~ff lcult The (1 101, 1112) and {123) planes! have all been identtf~zd as slip planes In b c c crystals Stud~es have rndi.+ cated that any plane that contains a close-packed (111) direct~on can act as a sllp plane. In further agreement wlth the lack of a close-packed plane' IS the relatively high crrtrcal resolved shear stress for sllp (Table 8.1). Therefore, b c c metals [molybdenum, alpha (a) cron, tungsten] do not show a high degree of piasticlty
3.5 Deformation by Twinning In certaln materials, part~cularly c p h metals, twinn~ng IS a major means of deformat~on Thls may accompl~sh an ex. tenslve change in shape or may bring potential sllp planes Into a more favorable p o s ~ t ~ o n for slip T w ~ n n ~ n g is a movement of planes of atoms in the lattice parallel to a spec~flc (twinning) plane so that the latt~ce IS drv~ded Into two symmetrical parts w h ~ c h are differently or~ented The amount of movement of each plane of atoms In the twlnned region IS proportional to ~ t s dlstance from the twlnn~ng plane, so that a rnlrror Image IS formed
Ftg. 3.10 Close-packeo dtrections in the basal plane cf the nexagonat latt~ce.
[II'] -- Twtn d~reciton
~ i g . 3.11 Diagram of a twln plane and twin direction in an c. ialtlce.
across the twin plane. Twinning is illustrated schematically In an f.c.c. lattice in Figs. 3.11 and 3.12.
In Fig. 3.11, the (711) twinning plane intersects the (710) plane along the line AB'. which is the twin direct~on. The mechanism of twinning is shown in Fig. 3.12. The plane of the paper is the (710) plane, and many unit cells
Twinned - reglan
Plone of paper I110) - v
( I ii ) Tutn pione' li '1 lii~l Tuin direcl~on
Fig. 3 12 Schematic diagram of twirining In an f.c.2. IaItlCe
(By permisston from G. E. Doan. "Principles of Physical Metallurgy." 36 ed . McGraw-Hill Book Company. New York. 1953.)
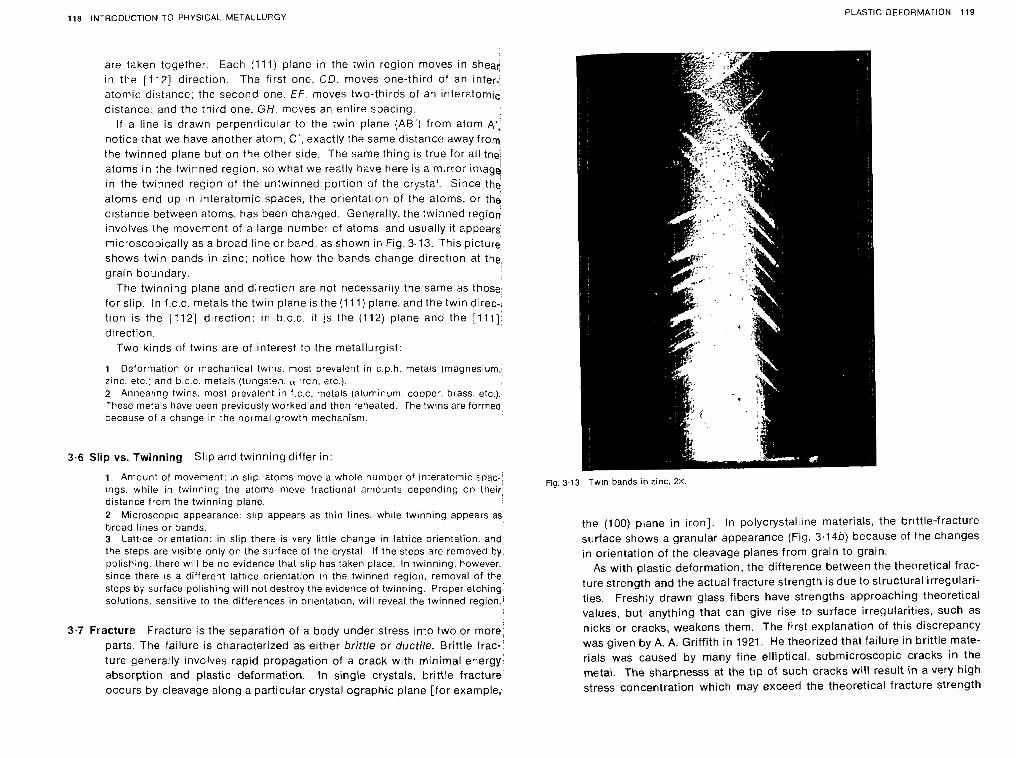
118 INTRODUCTION TO PI-IYSICAL METALLUPGY PLASTIC DEFORMATION 119
are taken together Each [ I l l ) plane In the twrn reglon moves In shear: In the [112] dlrectlon The flrst one. CD moves one-third of an Inter- atorrlc dlstance, the secord one EF moves two-thrrds of an lnteratornlc dlstance, and the thlrd one. GH moves an entrre spaclng
If a lrne IS drawn perpendicular to the twin plane (AB') from atom A', not~ce that we have another atom, C', exactly the same dlstance away from the twlnned plane but on the other slde The same thlng IS true for all the, atoms rn the tw~nned reglon, so what we really have here IS a mlrror Image In the twlnned reglon of the untwlnned portlon of the crystal Slnce the atoms end LIP In lnteratomlc spaces, the orlentatlon of the atoms, or the drstance between atoms, has been changed Generally the twlnned regton ~nvolves the movement of a large number c f atoms and usually ~t appears mrcroscop~cally as a broad llne or band as shown In Frg 3.13 Thls plcture shcws twln bands rn zfnc, notlce how the bands change direction at the graln boundary
The twlnnlng plane and dlrectlon are not necessarily the same as those for sllp In f c c metals the twln plane IS the (1 11) plane, and the twrn drrec- tlon IS the 1112) drrectron In b c c ~t !s the (1 12) plane and the ' 111) drrection
Two klnds of twlns are of Interest to the metallurgist
1 Deformat~on or inechanical t w ~ i s most prevalent In c p h metals (magnesium zinc etc ) and b c c metals (tungsten ( Y i rcn c?rc ) 2 Annealing twins most prevalent II f c c metals (alum~num coopee brass etc) These metals have been p r e v ~ o ~ ~ s l y worked and then releated The twlns are formed because of a change In the normal qrov~t? mechan~sm
Slip vs. Twinning Slip and twinning differ in:
1 Amount of movement In slip atoms move a whole number a' rnteratcm~c sDac- lngs wh~ le In twlnnlng tne atoms move fract~onal amounts depend~nq on thelr d~stance frcm the twlnnbng plane 2 Mlcroscop~c appearance slrp appears as thin I~nes, wh~ le tw~nnrng appears as brcad lrnes or oands 3 ia t t fce o~ ienta t~on In s l ~ p there IS very l~t t le change In latrice orientat~on and the steps are vlslble only on the surface of the crystal If the steps are removed by polishing there w ~ l l be no evtdence that s l ~ p has 'akert place In rwlnnlng however, since there IS a d~fferent lattice orientation In the twinned region, removal of the steps by surface polishing wtll not destroy the evidence of twlnning Proper etching soiut~ons sensitive to the differences In or ientat~on wrll reveal the tw~nned reglon
Fracture Fracture IS the separatron of a body under stress lnto two or more- parts The fallure IS charactenzed as elther brittle or ducble. Brlttle frac- ture generally lnvolves rapld propagatlon of a crack w ~ t h mrn~rnal energy absorpt~on and plastlc deformat~on. In s~ngle crystals, brlttle fractured occurs by cleavage along a part~cuiar crystallographic plane [for example,
Fig. 3 .13 Twin bands in zinc. 2X
the (100) plane in iron]. In polycrystalline materials, the brittle-fracture surface shows a granular appearance (Fig. 3.146) because of the changes in orientation of the cleavage planes from grain to grain.
As with plastic deformation, the difference between the theoretical frac- ture strength and the actual fracture strength is due to structural irregulari- ties. Freshly drawn glass fibers have strengths approaching theoretical values, but anything that can give rise to surface irregularities, such as nicks or cracks, weakens them. The first explanation of this discrepancy was given by A. A. Griffith in 1921. He theorized that failure in brittle mate- rials was caused by many fine elliptical, submicroscopic cracks in the metal. The sharpnesss at the tip of such cracks will result i n a very high stress concentration which may exceed the theoretical fracture strength
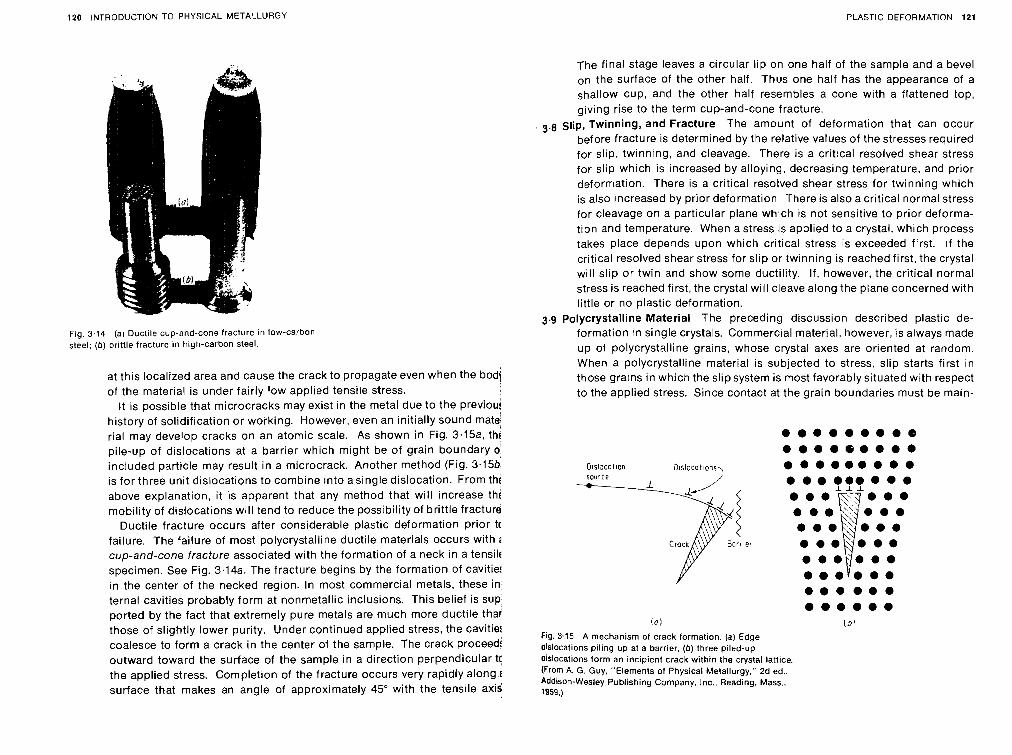
120 INTRODUCTION TO PHYSICAL METACLURGY PLASTIC DEFORMATION 121
Fig. 3.14 (a ) Ductile cup-and-cone fracture in low-carbon steel; ( b ) orittle fracture in high-carbon steel.
at this localized area and cause the crack to propagate even when the bodj of the material is under fairly low applied tensile stress.
It is possible that microcracks may exist in the metal due to the previous history of solidification or working. However, even an initially sound mate! rial may develop cracks on an atomic scale. As shown in Fig. 3.15% tht pile-up of dislocations at a barrier which might be of grain boundary o! included particle may result in a microcrack. Another method (Fig. 3.15b: is for three unit dislocations to combine into a single dislocation. From thi above explanation, it is apparent that any method that will increase thc mobility of dislocations will tend to reduce the possibility of brittle fracture
Ductile fracture occurs after considerable plastic deformation prior tc failure. The failure of most polycrystalline ductile materials occurs with I cup-and-cone fracture associated with the formation of a neck in a tensilc specimen. See Fig. 3.14a. The fracture begins by the formation of cavitie! in the center of the necked region. In most commercial metals, these in, ternal cavities probably form at nonmetallic inclusions. This belief is sup ported by the fact that extremely pure metals are much more ductile thar those of slightly lower purity. Under continued applied stress, the cavitie! coalesce to form a crack i n the center of the sample. The crack proceed: outward toward the surface of the sample in a direction perpendicular tc the applied stress. Completion of the fracture occurs very rapidly along i surface that makes an angle of approximately 45" with the tensile axis
The final stage leaves a circular lip on one half of the sample and a bevel on the surface of the other half. Thus one half has the appearance of a shallow cup, and the other half resembles a cone with a flattened top, giving rise to the term cup-and-cone fracture.
3.8 Slip, Twinning, and Fracture The amount of deformation that can occur before fracture is determined by the relative values of the stresses required for slip, twinning, and cleavage. There is a critical resolved shear stress for slip which is increased by alloying, decreasing temperature, and prior deformation. There is a critical resolved shear stress for twinning which is also increased by prior deformation. There is also a critical normal stress for cleavage on a particular plane which is not sensitive to prior deforma- tion and temperature. When a stress is applied to a crystal, which process takes place depends upon which critical stress is exceeded first. If the critical resolved shear stress for slip or twinning is reached first, the crystal will slip or twin and show some ductility. If, however, the critical normal stress is reached first, the crystal will cleave along the plane concerned with little or no plastic deformation.
3.9 polycrystalline Material The preceding discussion described plastic de- formation in single crystals. Commercial material, however, is always made up of polycrystalline grains, whose crystal axes are oriented at random. When a polycrystalline material is subjected to stress, slip starts first in those grains in which the slipsystem is most favorably situated with respect to the applied stress. Since contact at the grain boundaries must be main- . ....... 8
..me 0 . .a . D1sl3cof1on D slocot~ons, . e e......
...?B?... . e . . e .
...... e.....
!o) 13'
Fig 3 15 A mechanism of crack formation (a) Edge dislocations piling up at a barrier. (b ) three piled-up dlslocations form an incipient crack within the crystal lattice (From A G Guy. "Elements of Physical hlelailurgy.' 2d ed , Addison-Wesley Publishing Company Inc Reading. Mass . 1959 )
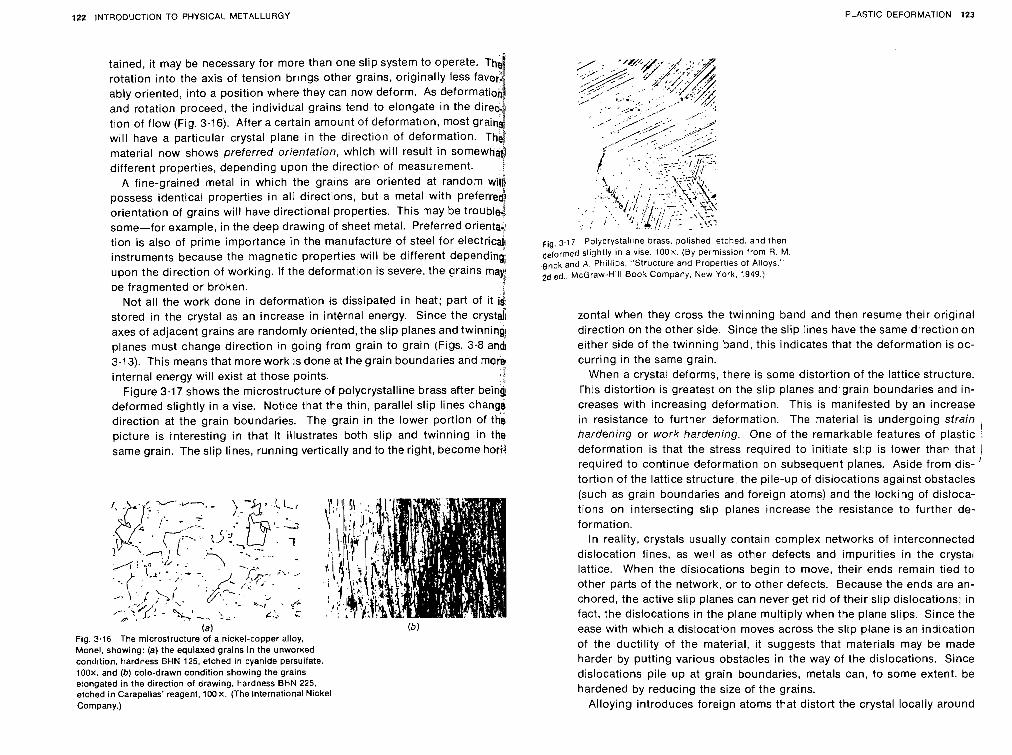
122 INTRODUCTION TO PHYSICAL METALLURGY PLASTIC DEFORMATION 123
tained, it may be necessary for more than one slip system to operate. T rotation into the axis of tension brings other grains, originally less favo ably oriented, into a position where they can now deform. As deformat' and rotation proceed, the individual grains tend to elongate in the dir tion of flow (Fig. 3.16). After a certain amount of deformation, most grat will have a particular crystal plane in the direction of deformation. Th material now shows preferred orientation, which will result in somewhd different properties, depending upon the direction of measurement. . f
A fine-grained metal in which the grains are oriented at random wi/A possess identical properties in all directions, but a metal with preferred orientation of grains will have directional properties. This may be troublej some-for example, in the deep drawing of sheet metal. Preferred orient& tion is also of prime importance in the manufacture of steel for electric4 instruments because the magnetic properties will be different depending upon the direction of working. If the deformation is severe, the grains may be fragmented or broken. I
Not all the work done in deformation is dissipated in heat; part of it ii stored in the crystal as an increase in internal energy. Since the crystaii axes of adjacent grains are randomly oriented, the slip planes and twinning planes must change direction in going from grain to grain (Figs. 3.8 and 3.13). This means that more work is done at the grain boundaries and more internal energy will exist at those points. ,! b
Figure 3.17 shows the microstructure of polycrystalline brass after being deformed slightly in a vise. Notice that the thin, parallel slip lines change direction at the grain boundaries. The grain in the lower portion of th i picture is interesting in that i t illustrates both slip and twinning in the same grain. The slip lines, running vertically and to the right, become hori4
(a) Fig. 3.16 The microstructure of a nickel-copper alloy, Monel, showing: (a) the equiaxed grains in the unworked condition, hardness BUN 125. etched in cyanide persulfate, 1 0 0 ~ . and (b) cold-drawn condition showing the grains elongated in the direction of drawing, hardness BHN 225, etched in Carapellas' reagent, 100 x. (The International Nickel Company.)
F , ~ 3 1 7 Polycrystalttne brass, pollshed, etched and then defortned s113htly In a vlse 1OOx (By permtsslon from R M srlck arid A Phlltlps. "Strucrure and Properties of Alloys "
2d cd McGraw-HIII Book Company. New York. $949 )
zontai when they cross the twinning band and then resume their original direction on the other side. Since the slip [ines have the same direction on either side of the twinning band, this indicates that the deformation is oc- curring in the same grain.
When a crystal deforms, there is some distortion of the lattice structure. This distortion is greatest on the slip planes and'grain boundaries and in- creases with increasing deformation. This is manifested by an increase in resistance to further deformation. The material is undergoing strain
I hardening or work hardening. One of the remarkable features of plastic ! deformation is that the stress required to initiate slip is lower than that required to continue deformation on subsequent planes. Aside from dis- ' tortion of the lattice structure, the pile-up of dislocations against obstacles (such as grain boundaries and foreign atoms) and the locking of disloca- tions on intersecting slip planes increase the resistance to further de- formation.
In reality, crystals usually contain complex networks of interconnected dislocation lines, as well as other defects and impurities in the crystal lattice. When the dislocations begin to move, their ends remain tied to other parts of the network, or to other defects. Because the ends are an- chored, the active slip planes can never get rid of their slip dislocations; in fact, the dislocations in the plane multiply when the plane slips. Since the ease with which a dislocation moves across the slip plane is an indication of the ductility of the material, it suggests that materials may be made harder by putting various obstacles in the way of the dislocations. Since dislocations pile up at grain boundaries, metals can, to some extent, be hardened by reducing the size of the grains.
Alloying introduces foreign atoms that distort the crystal locally around
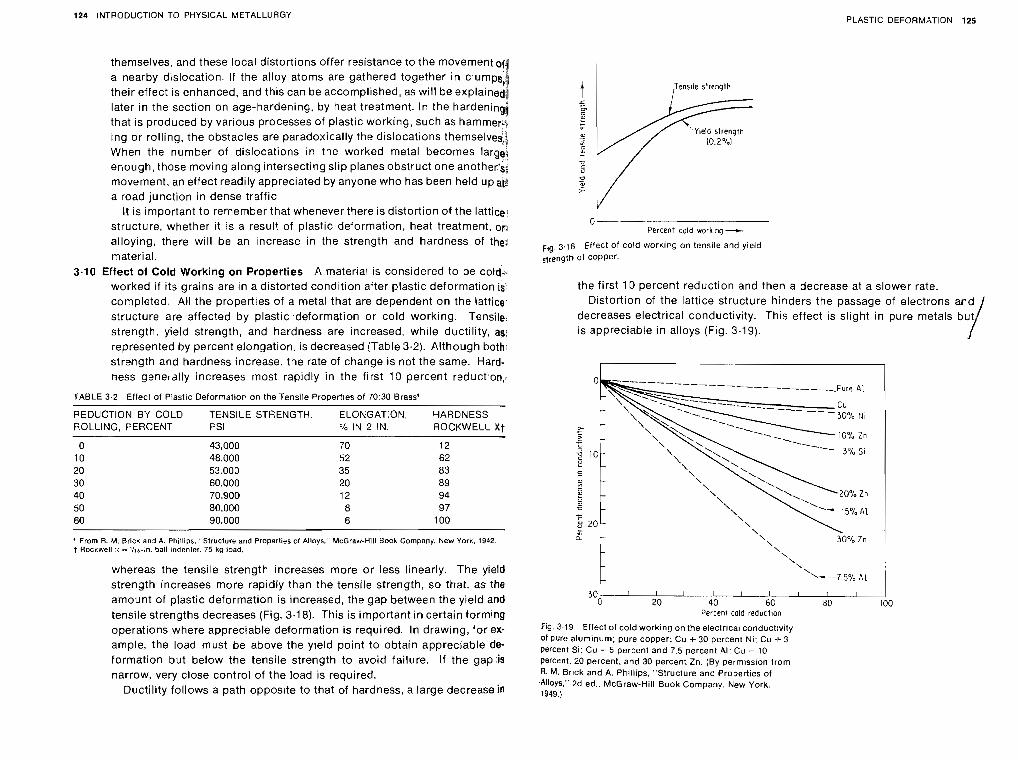
124 INTRODUCTION TO PHYSICAL METALLURGY PLASTIC DEFORMATION 125
themselves, and these local distortions offer resistance to the movement 0
a nearby dislocation. If the alloy atoms are gathered together i n clumps, their effect is enhanced, and this can be accomplished, as will be explained later in the section on age-hardening, by heat treatment. In the hardenin4 that is produced by various processes of plastic working, such as hammer+t ing or rolling, the obstacles are paradoxically the dislocations themselves,' 4 When the number of dislocations in the worked metal becomes large1 enough, those moving along intersecting slip planes obstruct one anothervse movement. an effect readily appreciated by anyone who has been held u p a ~ a road junction in dense traffic.
It is important to remember that wheneverthere is distortion of the lattice: structure, whether it is a result of plastic deformation, heat treatment, of3 alloying, there will be an increase in the strength and hardness of the; material.
3.10 Effect ot Cold Working on Properties A material is considered to be cold.. worked if its grains are in a distorted condition after plastic deformation is, completed. All the properties of a metal that are dependent on the lattice, structure are affected by plastic .deformation or cold working. Tensile, strength, yield strength, and hardness are increased, while ductility, represented by percent elongation, is decreased (Table 3.2). Although both; strength and hardness increase. the rate of change is not the same. Hard- ness genelally increases most rapidly in the first 10 percent reduction,^
TABLE 3.2 Effect of Plastic Deformation on the Tensile Properties of 70:30 Brass*
REDUCTION BY COLD TENSILE STRENGTH ELONGATION, HARDNESS ROLLING, PERCENT PSI ?/a IN 2 IN. ROCKWELL Xt
0 43,000 70 12 10 48,000 52 62 20 53.000 35 83 30 60,000 20 89 40 70.900 12 94 50 80.000 8 97 60 90,000 6 100 - -
' From R M Bricx and A Ph~ll~ps. Structure and Properties of Alloys. McGravf-HIII Book Company New York 1942 j Rockwell < - 'Ilr-in ball Indenter ' 5 kg lsad
whereas the tensile strength increases more or less linearly. The yield strength increases more rapidly than the tensile strength, so that, as the amount of plastic deformation is increased, the gap between the yield and tensile strengths decreases (Fig. 3.18). This is important i n certain forming operations where appreciable deformation is required. In drawing, for ex. ample, the load must be above the yield point to obtain appreciable d e formation but below the tensile strength to avoid failure. If the gap is narrow, very close control of the load is required.
Ductility follows a path opposite to that of hardness, a large decrease in
,Tensile strength
Yleld strength 113.2 %)
Percent cold work~ng --+
F ~ ~ , 3.18 Ef'ect of cold ~ 4 0 r k i ~ ~ on tensile and yield of Copper.
the first 10 percent reduction and then a decrease at a slower rate. Distortion of the lattice structure hinders the passage of electrons and
decreases electrical conductivity. This effect is slight in pure metals but is appreciable in alloys (Fig. 3.19).
-------- ----------, Fure A l
30 1 I I I I I I I I I I 0 20 40 60 $0 100
Percent cold reduction
Fig. 3.19 Effect of cold working on the electrical conductivity of Pure aluminum; pure copper; Cu + 30 percent Ni: Cu -t 3 Percent Si: Cu - 5 percent and 7.5 percent Al; Cu + 10 Percent, 20 percent, and 30 percent Zn. (By permission from R. M. Brick and A. Phillips. "Structure and Prooerties of Alloys.'' 2d ed.. ~ c ~ r a w - H i l l Book Company. New York. 1949.1
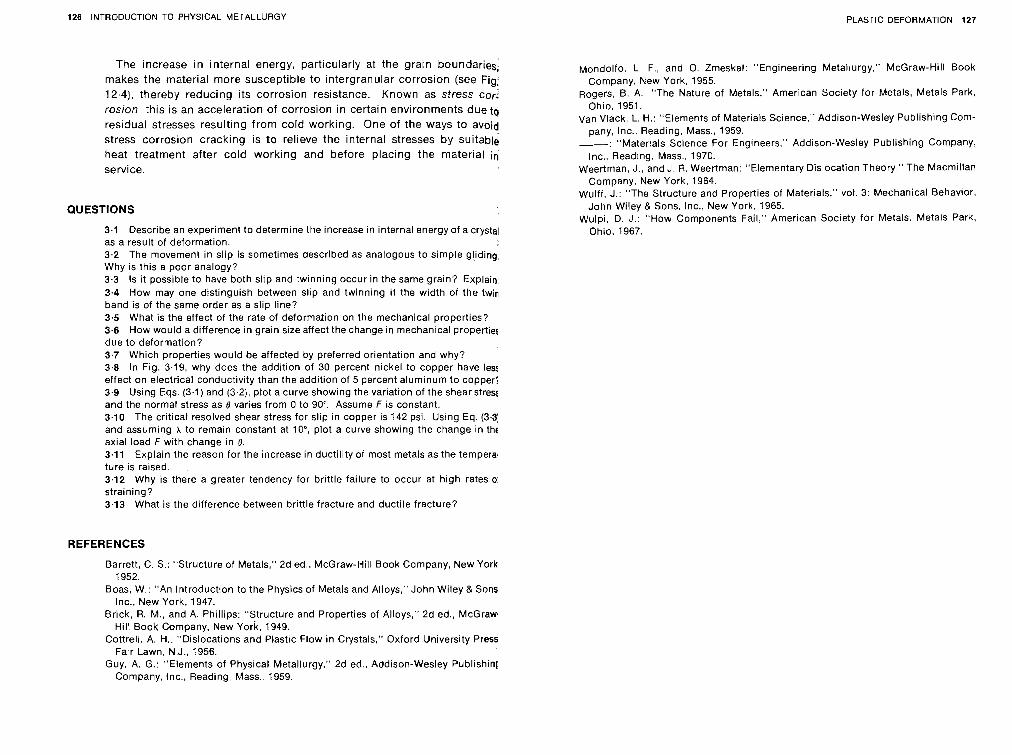
126 INTRODUCTION TO PHYSICAL METALLURGY PLASTIC DEFORMATION 127
The increase in internal energy, particularly at the gra[n boundar~e~, makes the material more susceptible to Intergranular corrosion (see Fig, 12.41, thereby reducing ~ t s corrosion resistance. Known as Stress car. rosron, thls is an acceleration of corrosion in certain environments dueto resldual stresses resulting from cold working. One of the ways to avoid stress corrosion cracking is to rel~eve the internal stresses by suitable heat treatment after cold working and before placlng the material in service.
QUESTIONS
3.1 Descr~be an experiment to determine the increase in internal energy of a crystal as a result of deformation. 3.2 The movement in slip is sometimes aescribed as analogous to simple gliding. Why is this a poor analogy? 3.3 Is it possible to have both slip and twinning occur in the same grain? Explain. 3.4 How may one distinguish between slip and twinning if the width of the twin band is of the same order as a slip line? 3.5 What is the effect of the rate of deformation on the mechanical properties? 3.6 How would a difference in grain size affect the change in mechanical properties due to deformation? 3.7 Which properties would be affected by preferred orientation and why? 3.8 In Fig. 3.19, why does the addition of 30 percent nickel to copper have les effect on electrical conductivity than the addition of 5 percent aluminum to copper? 3.9 Using Eqs. (3.1) and (3.2), plot a curve showing the variation of the shear s t r e ~ and the normal stress as 0 varies from 0 to 90. Assume F is constant. 3.10 The critical resolved shear stress for slip in copper is 142 psi. Using Eq. (3.33 and assuming h to remain constant at 10, plot a curve showing the change in the axial load F with change in 8 3.11 Explain the reason for the increase in ductility of most metals as the tempera. ture is raised. 3.12 Why is there a greater tendency for brittle failure to occur at high rates o4 straining? 3.13 What is the difference between brittle fracture and ductile fracture?
REFERENCES
Barrett, C. S.: "Structure of Metals," 2d ed., McGraw-Hill Book Company, New York 1952.
Boas. W.: "An Introduction to the Physics of Metals and Alloys," John Wiley & Sons Inc.. New York. 1947.
Brick, R. M., and A. Phillips: "Structure and Properties of Alloys," 2d ed., McGraw Hill Book Company, New York. 1949.
Cottrell, A. H.: "Dislocations and Plastrc Flow in Crystals," Oxford University Press Fair Lawn, N.J., 1956.
Guy, A. G.: "Elements of Physical Metallurgy," 2d ed., Addison-Wesley Publishin( Company, Inc., Reading, Mass.. 1959.
Mondolfo, L. F., and 0. Zmeskal: "Engineering Metallurgy." McGraw-Hill Book Company, New York, 1955.
Rogers, 5. A,: "The Nature of Metals," American Society for Metals. Metals Park. Ohio, 1951.
Van Vlack, L. H.: "Elements of Materials Science," Addison-Wesley Publish~ng Com- pany, Inc., Reading, Mass., 1959.
: "Materials Science For Engineers," Addison-Wesley Publishing Company, Inc., Reading, Mass., 1970.
Weertman, J., and J. R. Weertman: "Elementary Dislocation Theory," The Macmillan Company, New York, 1964.
Wulff, J.: "The Structure and Properties of Materials," vol. 3: Mechanical Behavior, John Wiley & Sons. Inc., New York, 1965.
Wulpi, D. J.: "How Components Fail," American Society for Metals. Metals Park. Ohio. 1967.

ANNEALING AND HOT WORKING
FULL ANNEALING
4.1 introduction in the previous chapter, the mechanism of plastic deformation by slip and twinnlng and the effect of cold working on the properties of the metal were studled. As a result of cold working, the hardness, tensile strength, and electrical resistance increased, while the ductility decreased. There was also a large Increase in the number of dislocations, and certain qlanes in the crystal structure were severely distorted. It was emphasized that while most of the energy used to cold-work the metal was dissipated in heat, a finite amount was stored in the crystal structure as internal energy associated with the lattice defects created by the deformat~on. The stored energy of cold work is that fraction, usually from 1 to approxi- mately 10 percent of the energy put into a material while producing a cold-worked state, which is retained in the material. Figure 4-1 shows the relationship between stored energy and the amount of deformation in high- purity copper.
Full annealing is the process by which the distorted cold-worked lattice structure is changed back to one which is strain-free through the appli- cation of heat. This process is carried out entirely in the solid state and is usually fdlowed by slow cooling in the furnace from the desired tempera- ture. The annealing process may be divided into three stages: recovery, recrystallization, and grain growth.
4.2 Recovery This is primarily a low-temperature process, and the properly changes produced do not cause appreciable change in the microstructure. The principal effect of recovery seems to be the relief of internal stresses due to cold working. This is shown in Fig. 4.2. At a given temperature, the rate of decrease in residual strain hardening is fastest at the beginning and drops off at longer times. Also, the amount of reduction in residual stress that occurs in a practical time increases with increasing temperature.
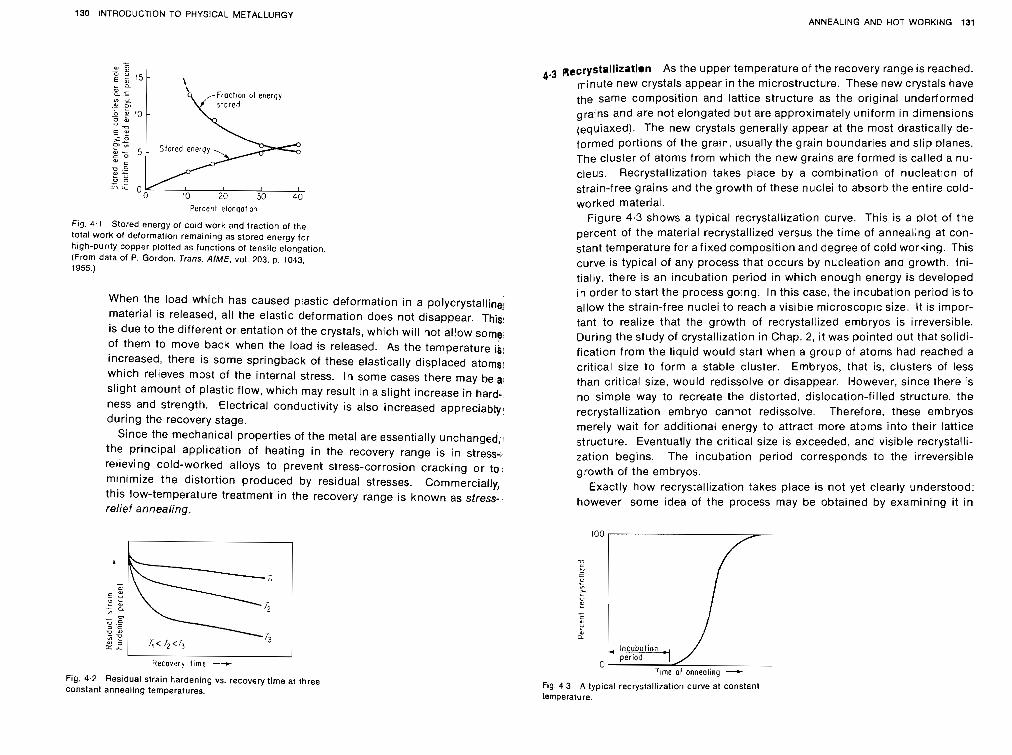
130 INTRODUCTION TO PHYSiCAL METALLURGY ANNEALING AND HOT WORKiNG 131
,-Fiact~on of energy stored
10 2.3 30 40 Percent elongotioi
Fig. 4.1 Stored energy of cold work and fraction of the total work of deformation remaining as stored energy for h~gh-purity copper plotted as functions of tensile elongation. (From data of P. Gordon. Trans. AIME, vol. 203, p. 1043, 1955.)
When the load which has caused plastic deformation in a polycrystallin~ material IS released, all the elastic deformation does not disappear. This1 is due to the different orientation of the crystals, whlch will not allow some of them to move back when the load IS released. As the temperature is! increased, there IS some sprlngback of these elastically displaced atoms whlch relleves most of the internal stress. In some cases there may be a slight amount of plastic flow, which may result In a slight increase in hard- ness and strength. Electrical conductivrty is also increased appreciably, during the recovery stage.
Since the mechanical properties of the metal are essentially unchanged, the pr~nclpal application of heating in the recovery range is In stress.. relieving cold-worked alloys to prevent stress-corrosion cracklng or to4 mlnlmlze the distortion produced by residual stresses. Commercially, this low-temperature treatment in the recovery range is known as stress- relief annealfng.
Recove ry t ~ m e -- Fig. 4-2 Residual strain hardening vs. recovery time at three constant annealing temperatures.
Recrystallizatien As the upper temperature of the recovery range is reached, minute new crystals appear in the microstructure. These new crystals have the same composition and lattice structure as the original underformed grains and are not elongated but are approximately uniform in dimensions (equiaxed). The new crystals generally appear at the most drastically de- formed portions of the grain, usually the grain boundaries and slip planes. The cluster of atoms from which the new grains are formed is called a nu- cleus. Recrystallization takes place by a combination of nucleation of strain-free grains and the growth of these nuclei to absorb the entire cold- worked material.
Figure 4.3 shows a typical recrystallization curve. This is a plot of the percent of the material recrystallized versus the time of annealing at con- stant temperature for afixed composition and degree of cold working. This curve is typical of any process that occurs by nucleation and growth. Ini- tially, there is an incubation period in which enough energy is developed in order to start the process going. In this case, the incubation period is to allow the strain-free nuclei to reach a visible microscop~c size. It is impor- tant to realize that the growth of recrystallized embryos is irreversible. During the study of crystallization in Chap. 2, i t was pointed out that solidi- fication from the liquid would start when a group of atoms had reached a critical size to form a stable cluster. Embryos, that is, clusters of less than critical size, would redissolve or disappear. However, since there is no simple way to recreate the distorted, dislocation-filled structure, the recrystallization embryo cannot redissolve. Therefore, these embryos merely wait for additional energy to attract more atoms into their lattice structure. Eventually the critical size is exceeded, and visible recrystalli- zation begins. The incubation period corresponds to the irreversible growth of the embryos.
Exactly how recrystallization takes place is not yet clearly understood: however, some idea of the process may be obtained by examining it in
Fig 4 .3 A typical recrystallization curve at constant temperature.
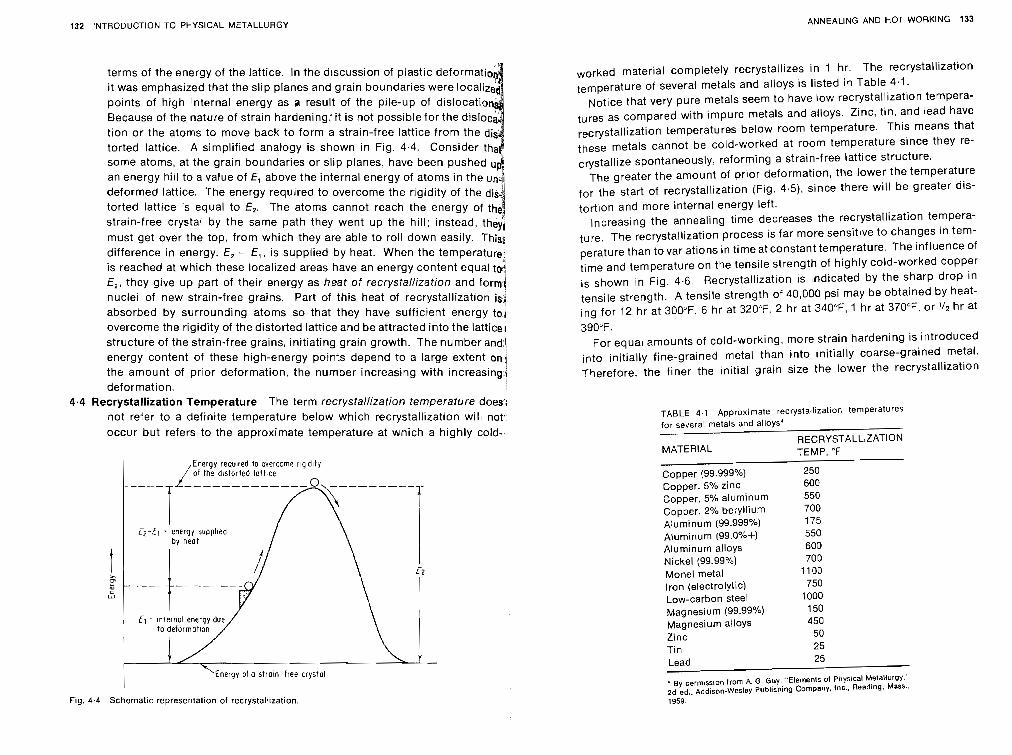
132 INTRODUCTION TO PHYSICAL METALLURGY ANNEALING AN0 HOT WORKING 133
terms of the energy of the lattice. In the discussion of plastic deformat it was emphasized that the slip planes and grain boundaries were locali points of high internal energy as p result of the pile-up of dislocation Because of the nature of strain hardening: it is not possiblefor the disloc tion or the atoms to move back to form a strain-free lattice from the di torted lattice. A simplified analogy is shown in Fig. 4.4. Consider th some atoms, at the grain boundaries or slip planes, have been pushed an energy hill to a value of E, above the internal energy of atoms in the u deformed lattice. The energy required to overcome the rigidity of the d
torted lattice is equal to E,. The atoms cannot reach the energy of t strain-free crystal by the same path they went up the hill; instead, they
i must get over the top, from which they are able to roll down easily. This& difference in energy, E, - E,, is supplied by heat. When the temperature 1 is reached at which these localized areas have an energy content equal ta? E,, they give up part of their energy as heat of recrystallization and formi nuclei of new strain-free grains. Part of this heat of recrystallization is; absorbed by surrounding atoms so that they have sufficient energy t0.j overcome the rigidity of the distorted lattice and be attracted into the lattice! structure of the strain-free grains, initiating grain growth. The number and.\ energy content of these high-energy points depend to a large extent on: the amount of prior deformation, the number increasing with increasing:^ deformation.
4.4 Recrystallization Temperature The term recrystallization temperature does'; not refer to a definite temperature below which recrystallization will not: occur but refers to the approximate temperature at which a highly cold-
I ,Energy requ~red to overccme rlg~dlty / of the d~storled lutt ce -
/ €1 : snrernal energy due to deformofion /
I / Y
\ \€nergy of a stro~n-free crystal
Fig. 4.4 Schematic representation of recrystallization
vIorked material completely recrystallizes in 1 hr. The recrystallization
temperature of several metals and alloys is listed in Table 4.1. Notice that very pure metals seem to have low recrystallization tempera-
tures as compared with impure metals and alloys. Zinc, tin, and lead have recrystallization temperatures below room temperature. This means that these metals cannot be cold-worked at room temperature since they re- crystallize spontaneously, reforming a strain-free lattice structure.
The greater the amount of prior deformation, the lower the temperature for the start of recrystallization (Fig. 4.5j, since there will be greater dis- tortion and more internal energy left.
Increasing the annealing time decreases the recrystallization tempera- ture. The recrystallization process is far more sensitive to changes in tem- perature than tovariations in time at constant temperature. The influence of time and temperature on the tensile strength of highly cold-worked copper is shown in Fig. 4.6. Recrystallization is indicated by the sharp drop in tensile strength. A tensile strength of 40,000 psi may be obtained by heat- ing for 12 hr at 300'F, 6 hr at 32OF, 2 hr at 34OCF, 1 hr at 370°F. or hr at
390°F. For equal amounts of cold-working, more strain hardening is introduced
into initially fine-grained metal than into initially coarse-grained metal. Therefore, the finer the initial grain size the lower the recrystallization
TABLE 4.1 Approximate recrystallization temperatures for several metals and alloys*
MATERIAL RECRYSTALLIZATION TEMP, "F
Copper (99.999%) 250 Copper, 5% zinc 600 Copper, 5% aluminum 550 Copper, 2% beryllium 700 Aluminum (99.999%) 175 Aluminum (99.0%+) 550 Aluminum alloys 600 Nickel (99.99%) 700 Monel metal 1100 Iron (electrolytic) 750 Low-carbon steel 1000 Magnesium (99.9936) 1 50 Magnesium alloys 450 Zinc 50 Tin 25 Lead 25
* By permbsston lrom A. G. Guy. "Elements of Physical Metallurgy,' 2d ed.. Addison-Wesley Publishing Company, Inc.. Reading. Mass.. 1959.
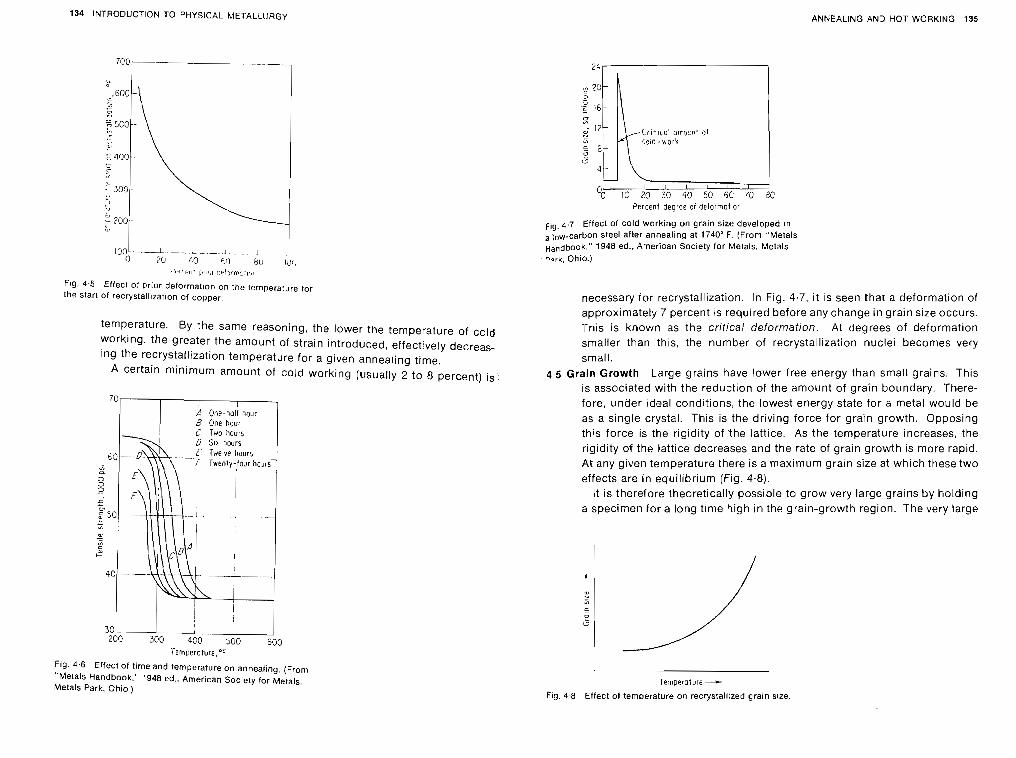
134 INTRODUCTION TO PHYSICAL METALLURGY ANNEALING AND HOT WORKING 135
0 70 3 0 80 i ~ i c i
, ' # . z # I W ~ ' j t ~ , ~ , , UVI~~IT%!,I$(JI
Fig. 4.5 Effect of prior deformation on the temperature fot the start of recrystall~zation of copper
temperature. By the same reasoning, the lower the temperature of cold working the greater the amount of strain introduced, effectively decreas- Ing the recrystaliization temperature for a given annealrng time.
A certain minimum amount of cold working (usually 2 to 8 percent) is
70 I I 1 One-half hour B One hou.
Temperature, O F
Fig. 4.6 Effect of time and temperature on annealing. (From "Metals Handbook." 1948 ed.. American Society for Metals, Metals Park. Ohio.)
Percent dearee or deformation
F , ~ 4.7 Effect of cold wcrklng on grain size developed in a low-carbon steel after annealing at 1740" F (From "Metals ~ ~ ~ d b o o k . " 1948 ed., American Society for Metals. Metals *wk. Ohlo.)
necessary for recrystallization. In Fig. 4.7, it IS seen that a deformation of approximately 7 percent IS required before any change in grain size occurs. This is known as the critical deformation. At degrees of deformation smaller than this, the number of recrystallization nuclei becomes very small.
4.5 Grain Growth Large grains have lower free energy than small grains. This is associated with the reduction of the amount of grain boundary. There- fore, under ideal conditions, the lowest energy state for a metal would be as a single crystal. This is the driving force for grain growth. Opposing this force is the rigidity of .the lattice. As the temperature increases, the rigidity of the lattice decreases and the rate of grain growth is more rapid. At any given temperature there is a maximum grain size at which thesetwo effects are in equilibrium (Fig. 4.8).
It is therefore theoretically possible to grow very large grains by holding a specimen for a long time high in the grain-growth region. The very large
Temperature--+
Fig. 4.8 Effect of temDerature on recrystallrzed grain size
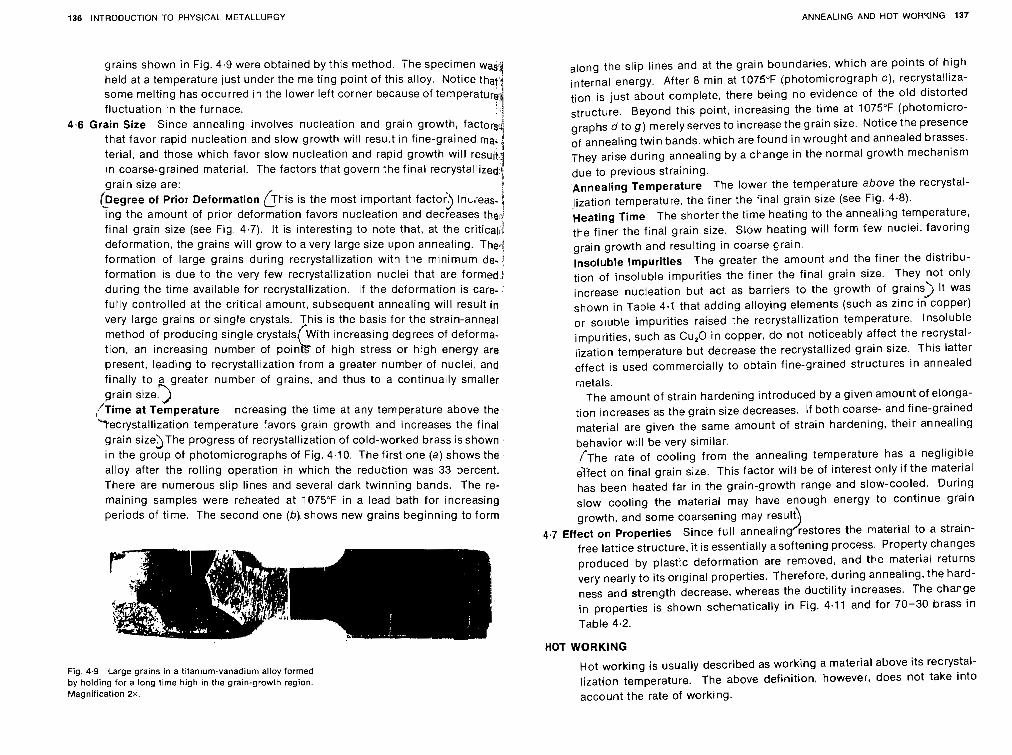
136 INTRODUCTION TO PHYSICAL METALLURGY ANNEALING AND HOT WORKING 137
grains shown in Fig. 4.9 were obtained by this method. The specimen wasZaf held at a temperature just under the melting point of this alloy. Notice th '
some melting has occurred in the lower left corner because of temperatu fluctuation in the furnace.
4.6 Grain Size Since annealing involves nucleation and grain growth, factorg.? that favor rapid nucleation and slow growth will result in fine-grained ma., teriai, and those which favor slow nucleation and rapid growth will result in coarse-grained material. The factors that govern the final recrystallized grain size are: i
@egree of Prior Deformation G h i s is the most important factor In~;eas- " J ing the amount of prior deformation favors nucleation and decreases the,,
final grain size (see Fig. 4.7). It is interesting to note that, at the criticalii deformation, the grains will grow to a very large size upon annealing. T h q formation of large grains during recrystallization with the minimum de. / formation is due to the very few recrystallization nuclei that are formed;; during the time available for recrystallization. I f the deformation is care- "
fully controlled at the critical amount, subsequent annealing will result in very large grains or single crystals. This is the basis for the strain-anneat method of producing single crystals With increasing degrees of deforma- tion, an increasing number of poin L of high stress or high energy are present, leading to recrystallization from a greater number of nuclei, and finally to a greater number of grains, and thus to a continually smaller grain size.>
( ~ i m e at Temperature Increasing the time at any temperature above the 'Tecrystallization temperature favors grain growth and increases the final
grain size>The progress of recrystallization of cold-worked brass is shown in the group of photomicrographs of Fig. 4.10. The first one (a) shows the alloy after the rolling operation in which the reduction was 33 percent. There are numerous slip lines and several dark twinning bands. The re- maining samples were reheated at 1075°F in a lead bath for increasing periods of time. The second one (b). shows new grains beginning to form
Fig. 4.9 Large grains in a titanium-vanadium alloy formed by holding for a long time high in the grain-growth region. Magnification 2x.
along the slip lines and at the grain boundaries, which are points of high internal energy. After 8 min at 1075°F (photomicrograph c), recrystalliza- tion is just about complete, there being no evidence of the old distorted structure. Beyond this point, increasing the time at 1075°F (photomicro- graphs d to g) merely serves to increase the grain size. Notice the presence of annealing twin bands, which are found in wrought and annealed brasses. They arise during annealing by a change in the normal growth mechanism due to previous straining. Annealing Temperature The lower the temperature above the recrystal- jization temperature, the finer the final grain size (see Fig. 4.8). Heating Time The shorter the time heating to the annealing temperature, the finer the final grain size. Slow heating will form few nuclei, favoring grain growth and resutting in coarse grain. insoluble Impurities The greater the amount and the finer the distribu- tion of insoluble impurities the finer the final grain size. They not only increase nucleation but act as barriers to the growth of grains) It was shown in Table 4.1 that adding alloying elements (such as zinc in copper) or soluble impurities raised the recrystallization temperature. Insoluble impurities, such as Cu,O in copper, do not noticeably affect the recrystal- lization temperature but decrease the recrystallized grain size. This latter effect is used commercially to obtain fine-grained structures in annealed metals.
The amount of strain hardening introduced by a given amount of etonga- tion increases'as the grain size decreases. If both coarse- and fine-grained material are given the same amount of strain hardening, their annealing behavior will be very similar. f ~ h e rate of cooling from the annealing temperature has a negligible elfect on final grain size. This factor will be of interest only if the material has been heated far in the grain-growth range and slow-cooled. During
slow cooling the material may have enough energy to continue grain growth, and some coarsening may result.
4.7 Effect on Properties Since full annealin restores the material to a strain- 2 free lattice structure, i t is essentially a softening process. Property changes produced by plastic deformation are removed, and the material returns very nearly to its original properties. Therefore, during annealing, the hard- ness and strength decrease, whereas the ductility increases. The change in properties is shown schematically in Fig. 4.11 and for 70-30 brass in Table 4.2.
HOT WORKING
Hot working is usually described as working a material above its recrystal- lization temperature. The above definition, however, does not take into account the rate of working.
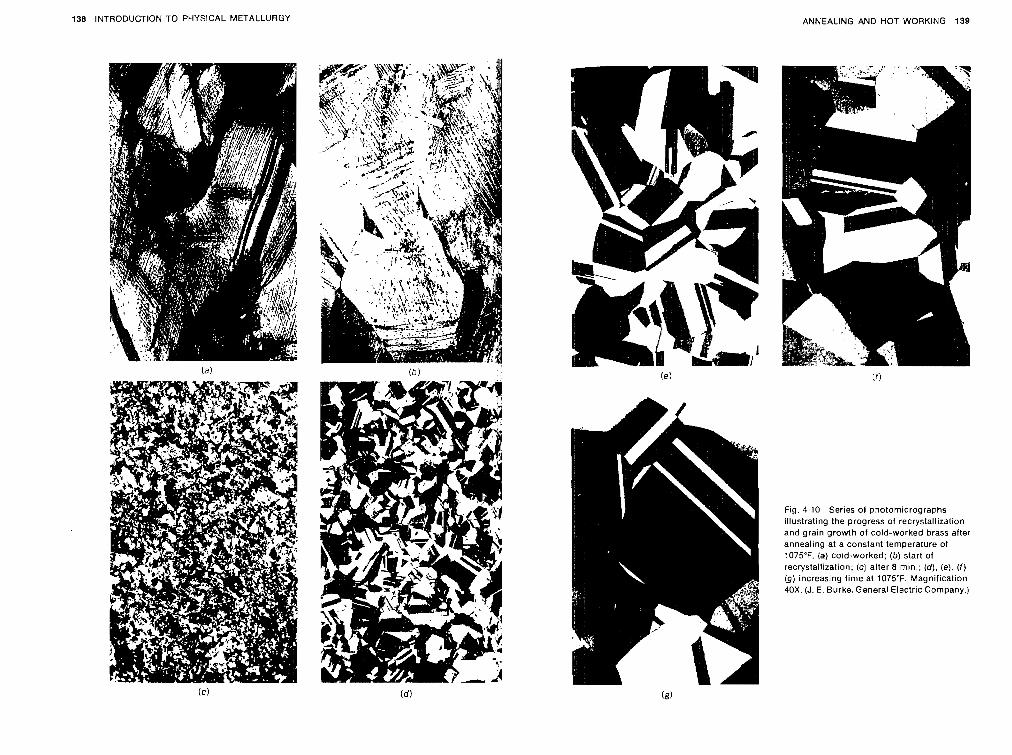
138 INTRODUCTION TO PHYSICAL METALLURGY ANNEALING AND HOT WORKING 139
Fig. 4, lO Series of pnotomicrographs illustrating the progress of recrystallization and grain growth of cold-worked brass after annealing at a constant temperature of 1075°F. (a) cold-worked; (b) start of recrystallization: (c) after 8 m u . ; ( d ) . !e). ( f ) (g) increasing time at 1075'F. Magnification 40X. (J. E. Burke. General Electric Company.)
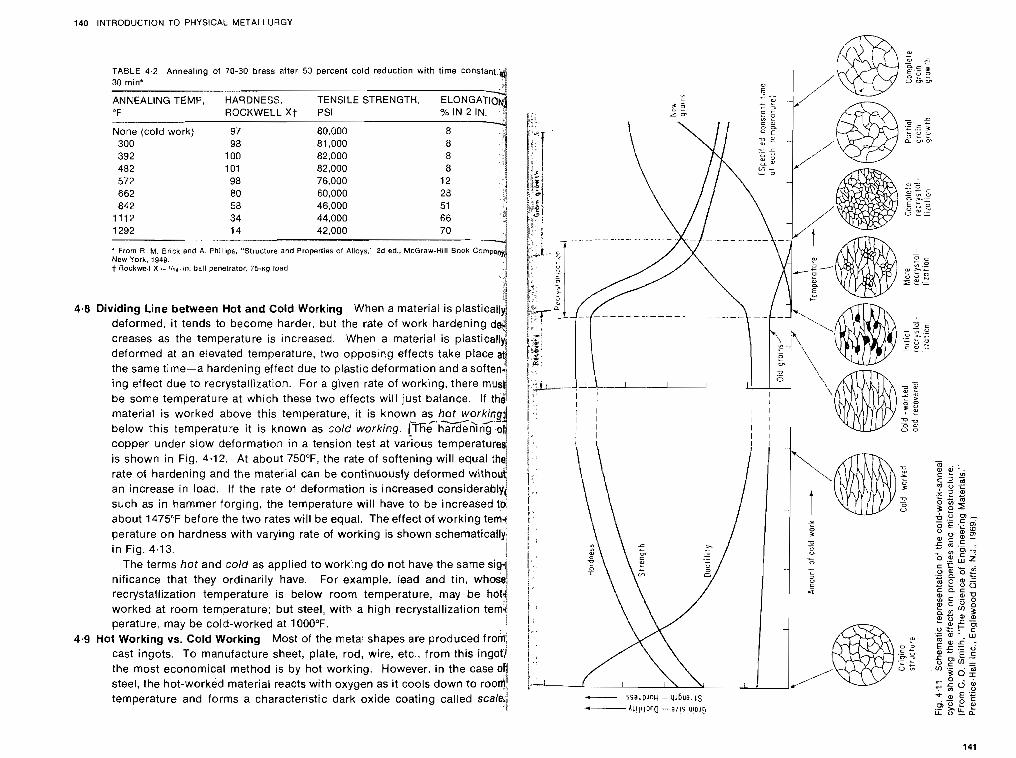
140 INTRODUCTION TO PHYSICAL METALLURGY
572 662 80 60.000 842 58 46.000
1112 34 44,000
deformed, i t tends to become harder, but the rate of work hardening d creases as the temperature is increased. When a material is plastica deformed at an elevated temperature, two opposing effects take place the same time-a hardening effect due to plastic deformation and a softe
be some temperature at which these two effects will just baiance. material is worked above this temperature, it is known as hot wo
is shown in Fig. 4.12. At about 750°F, the rate of softening will equal rate of hardening and the material can be continuously deformed with
such as in hammer forging, the temperature will have to be increased about 1475°F before the two rates will be equal. The effect of working temq perature on hardness with varying rate of working is shown schernatica in Fig. 4.13.
The terms hot and cold as applied to working do not have the same si nificance that they ordinarily have. For example, lead and tin, who recrystallization temperature is below room temperature, may be hot4 worked at room temperature; but steel, with a high recrystallization temd perature, may be cold-worked at 1000°F. !
4.9 Hot Working vs. Cold Working Most of the metal shapes are produced f r o 4 cast ingots. To manufacture sheet, plate, rod, wire, etc., from this ingot! the most economical method is by hot working. However, in the case 0 J steel, the hot-worked material reacts with oxygen as i t cools down to roo temperature and forms a characteristic dark oxide coating called scale? I
1
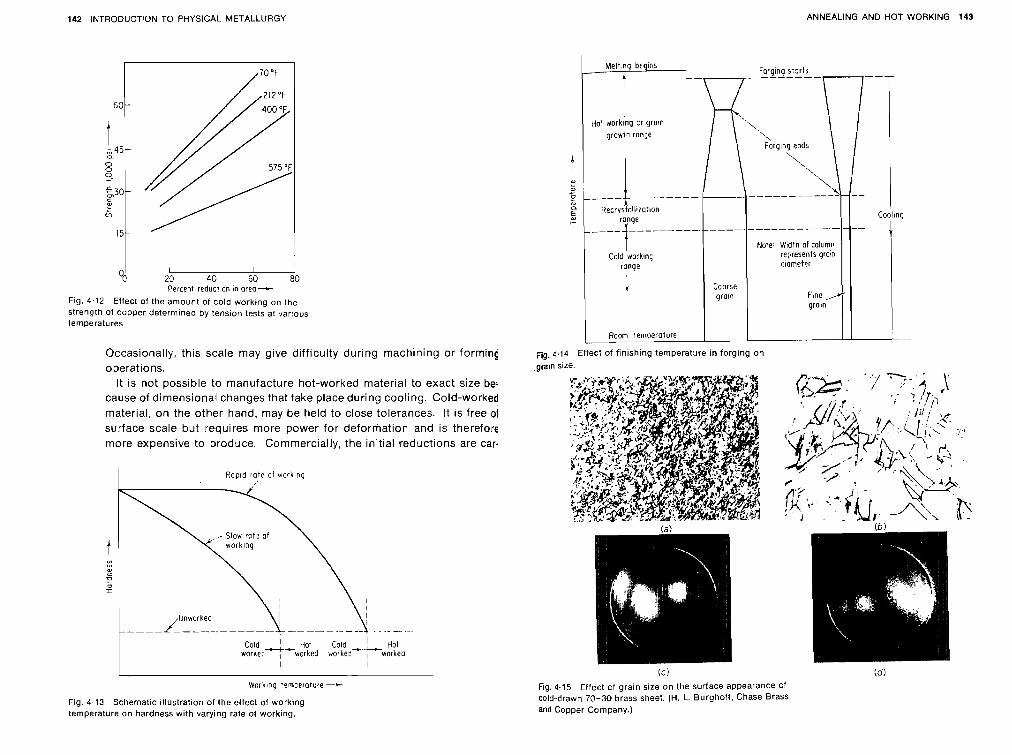
142 INTRODUCTION TO PHYSICAL METALLURGY ANNEALING AND HOT WORKING 143
I I I 23 4G 50 80 Percent reducr on in area -+
Fig. 4.12 Eftecr of the amount of cold working on the strength of copper determined by tension tests at varlous temperatures
O c c a s i o n a l l y , this scale may give d i f f i c u l t y during machining or f o r m i n g
operations. It 1s not possible to m a n u f a c t u r e h o t - w o r k e d material to exact size be.
cause o f dimensional changes that take place during cooling. C o l d - w o r k e d
m a t e r i a l , on the other hand, m a y be held to close tolerances. It is f r e e 01 s u r f a c e scale but r e q u i r e s more power f o r d e f o r m a t i o n and is therefore more expensive to produce. C o m m e r c ~ a l l y , the i n ~ t i a l reductions are car-
I Rapid rate of work,nq
Cold ' Ho- Cold ' Hot worae5~-worked workedf -$-+worked
I I
Fig. 4.13 Schematic illustration of the effect of working temperature on hardness with varying rate of working.
tiot working cr qralr
Forqlng ends
,rig. 4.14 Effect cf finishing temperature in forging on araln size.
Fig. 4.15 Effect of grain size on the surface appearance of Cold-drawn 70-30 brass sheet. (H. L. Burghoff, Chase Brass and Copper Company.)
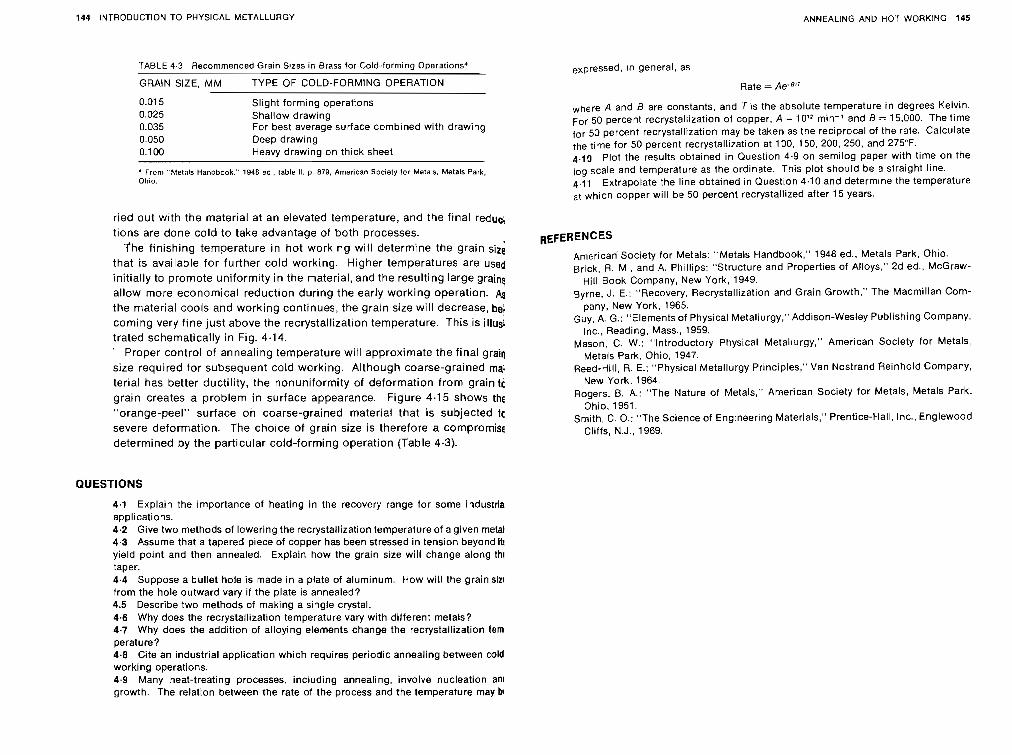
144 INTRODUCTION TO PHYSICAL METALLURGY ANNEALING AND HOT WORKING 145
TABLE 4.3 Recommended Grain Sizes in Brass for Cold-forming Operations*
GRAIN SIZE, MM TYPE OF COLD-FORMING OPERATION
Slight forming operations Shallow drawing For best average surface comblned with drawing Deep drawing Heavy drawing on thick sheet
' Froni "Metals tianabook." 1948 ed . table 11, p. 879. American Society ior Metals. Metals Park. Ohio.
r ied out with the material at an elevated temperature, and the final reduo,
tions are done cold to take advantage of both processes.
?'he finishing temperature i n hot working wi l l determine the grain sizi
that is available for further cold working. Higher temperatures are used initially to promote uniformity i n the material, and the resulting large grain8
allow more economical reduction during the early working operation. & the material cools and working continues, the grain size wi l l decrease, b& coming very f ine just above the recrystallization temperature. This is i l lug
trated schematically i n Fig. 4.14. '
Proper control of annealing temperature will approximate the final g r a i ~
size required for subsequent co ld working. Although coarse-grained ma: terial has better ductility, the nonuniformity of deformation f rom grain tc grain creates a problem in surface appearance. Figure 4.15 shows thc "orange-peel" surface o n coarse-grained material that is subjected tc severe deformation. The choice of grain size is therefore a cornpromis
determined by the particular cold-forming operation (Table 4.3).
QUESTIONS
4.1 Explain the importance of heating in the recovery range for some industria applications. 4.2 Give two methods of lowering the recrystallization temperature of agiven metal 4.3 Assume that a tapered piece of copper has been stressed in tension beyond il! yield point and then annealed. Explain how the grain size will change along t h ~ taper. 4.4 Suppose a bullet hole is made in a plate of aluminum. How will the grain sizl from the hole outward vary if the plate is annealed? 4.5 Describe two methods of making a single crystal. 4.6 Why does the recrystallization temperature vary with different metals? 4.7 Why does the addition of alloying elements change the recrystallization fern perature? 4.8 Cite an industrial application which requires periodic annealing between cold working operations. 4.9 Many heat-treating processes. including annealing, involve nucleation an1 growth. The relation between the rate of the process and the temperature may b
,xpressed, in general, as
Rate = Ae-B'T
where A and B are constants, and T is the absolute temperature in degrees Kelvin. For 50 percent recrystallization of copper, A = 10"min-I and B - 15,000. The time for 50 percent recrystallization may be taken as the reciprocal of the rate. Calculate the time for 50 percent recrystallizat~on at 100, 150, 200, 250, and 275°F. 4.10 Plot the results obtained in Question 4.9 on semilog paper with time on the log scale and temperature as the ordinate. This plot should be a straight line. 4.11 Extrapolate the line obtained in Question 4.10 and determine the temperature at whicn copper will be 50 percent recrystallized after 15 years.
American. Society for Metals: "Metals Handbook," 1948 ed., Metals Park, Ohio. Brick, R. M., and A. Phillips: "Structure and Properties of Alloys," 2d ed., McGraw-
Hill Book Company, New York, 1949. 9yrne, J. E.: "Recovery, Recrystallization and Grain Growth," The Macmillan Com-
pany, New York, 1965. Guy, A. G.: "Elements of Physical Metallurgy." Addison-Wesley Publishing Company,
Inc., Reading, Mass., 1959. Mason, C. W.: "Introductory Physical Metallurgy," American Society for Metals,
Metals Park, Ohio, 1947. Reed-Hill, R. E.: "Physical Metallurgy Principles," Van Nostrand Reinhold Company,
New York, 1964. Rogers, B. A,: "The Nature of Metals," American Society for Metals, Metals Park,
Ohio. 1951. Smith, C. 0.: "The Science of Engineering Materials," Prentice-Hall. Inc., Englewood
Cliffs, N.J., 1969.

CONSTITUTIOIV OF ALLOYS
5.1 Introduction An alloy is a substance that has metallic properties and is composed of two or more chemical elements, of which at least one is a metal.
An alloy system contains all the alloys that can be formed by several elements combined in all possible proportions. If the system is made up of two elements, i t is called a binary alloy system; three elements, a ternary alloy system; etc. Taking only 45 of the most common metals, any com- bination of two gives 990 binary systems. Combinations of three give over 14,000 ternary systems. However, in each system, a large number of dif- ferent alloys are possible. If the composition is varied by 1 percent, each binary system will yield 100 different alloys. Since commercial alloys often contain many elements, it is apparent that the number of possible alloys is almost infinite.
Alloys may be classified according to their structure, and complete alloy systems may be classified according to the type of their equilibrium or phase diagram. The basic types of phasediagramswill bestudied in Chap. 6.
5.2 Classification of Alloys Alloys may be homogeneous (uniform) or mixtures. If the alloy is homogeneous it will consist of a single phase. and i f it is a mixture it will be a combination of several phases. A phase is anything which is homogeneous and physically distinct. The uniformity of an alloy phase is not determined on an atomic scale, such as the coqposition of each unit lattice cell, but rather on a much larger scale. Any structure which is visible as physically distinct microscopically may be considered a phase. For most pure elements the term phase is synonymous with state. There is, therefore, for pure elements, a gaseous, liquid, and solid phase. Some metals are allotropic in the solid state and will have different solid phases. When the metal undergoes a change in crystal structure, it under- goes a phase change since each type of crystal structure is physically distinct.
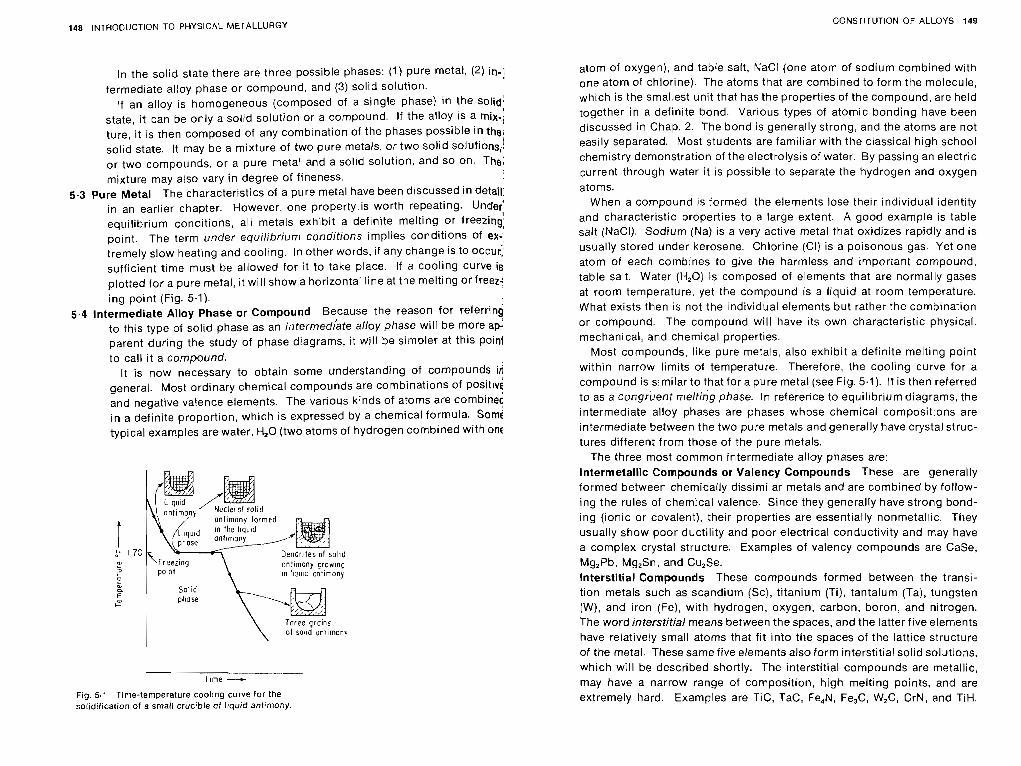
148 INTRODUCTION TO PHYSICAL METALLURGY CONSTITUTION OF ALLOYS 149
In the solid state there are three possible phases: (1) pure metal, (2) in-j termediate alloy phase or compound, and (3) solid solution.
If an alloy is homogeneous (composed of a single phase) in the solid! state, it can be only a solid solution or a compound. If the alloy is a mix-! ture, it is then composed of any combination of the phases possible in the; solid state. It may be a mixture of two pure metals, or two solid solutions,! or two compounds, or a pure metal and a solid solution, and so on. The: mixture may also vary in degree of fineness.
i
5.3 Pure Metal The characteristics of a pure metal have been discussed in detail: in an earlier chapter. However, one pr0perty.i~ worth repeating. Under: equilibrium conditions, all metals exhibit a definite melting or freezing; point. The term under equilibrium conditions implies conditions of ex? tremely slow heat~ng and cooling. In other words, if any change is to occu( sufficient time must be allowed for it to take place. If a cooling curve is plotted for a pure metal, it will show a horizontal line at the melting or freezj ing point (Fig. 5.1).
5.4 Intermediate Alloy Phase or Compound Because the reason for referring to this type of solid phase as an intermediate alloy phase will be more ap: parent during the study of phase diagrams, it will be simpler at this poinl to call it a compound.
It is now necessary to obtain some understanding of compounds iri general. Most ordinary chemical compounds are combinations of positiv€ and negative valence elements. The various kinds of atoms are combinec in a definite proportion, which is expressed by a chemical formula. Somi typical examples are water. H20 (two atoms of hydrogen combined with onf
ptiase
\ Three grcins 01 son~d anrimorv
Time ---+
Fig. 5.1 Time-temperature cooling curve for the solidification of a small crucible of l~quid antimony.
atom of oxygen), and table salt, NaCl (one atom of sodium combined with one atom of chlorine). The atoms that are combined to form the molecule, which is the smallest unit that has the properties of the compound, are held together in a definite bond. Various types of atomic bonding have been discussed in Chap. 2. The bond is generally strong, and the atoms are not easily separated. Most students are familiar with the classical high school chemistry demonstration of the electrolysis of water. By passing an electric current through water it is possible to separate the hydrogen and oxygen atoms.
When a compound is formed. the elements lose their individual identity and characteristic properties to a large extent. A good example is table salt (NaCI). Sodium (Na) is a very active metal that oxidizes rapidly and is usually stored under kerosene. Chlorine (CI) is a poisonous gas. Yet one atom of each combjnes to give the harmless and important compound, table salt. Water (H,O) is composed of elements that are normally gases at room temperature, yet the compound is a liquid at room temperature. What exists then is not the individual elements but rather the combination or compound. The compound will have its own characteristic physical. mechanical, and chemical properties.
Most compounds, like pure metals, also exhibit a definite melting point within narrow limits of temperature. Therefore, the cooling curve for a compound is similar to that for a pure metal (see Fig. 5.1). It is then referred to as a cong~uent melting phase. In reference to equilibrium diagrams. the intermediate alloy phases are phases whose chemical compositions are intermediate between the two pure metals and generally have crystal struc- tures different from those of the pure metals.
The three most common intermediate alloy phases are: Intermetallic Compounds or Valency Compounds These are generally formed between chemically dissimilar metals and are combined by follow- ing the rules of chemical valence. Since they generally have strong bond- ing (ionic or covalent), their properties are essentially nonmetallic. They usually show poor ductility and poor electrical conductivity and may have a complex crystal structure. Examples of valency compounds are Case, Mg,Pb, Mg2Sn, and Cu2Se. Interstitial Compounds These compounds formed between the transi- tion metals such as scandium (Sc), titanium (Ti), tantalum (Ta), tungsten (W), and iron (Fe), with hydrogen, oxygen, carbon, boron, and nitrogen. The word interstitial means between the spaces, and the latter five elements have relatively small atoms that fit into the spaces of the lattice structure of the metal. These same five elements also form interstitial solid solutions. which will be described shortly. The interstitial compounds are metallic, may have a narrow range of composition, high melting points, and are extremely hard. Examples are Tic, TaC, Fe,N, Fe,C, W,C, CrN, and TiH.
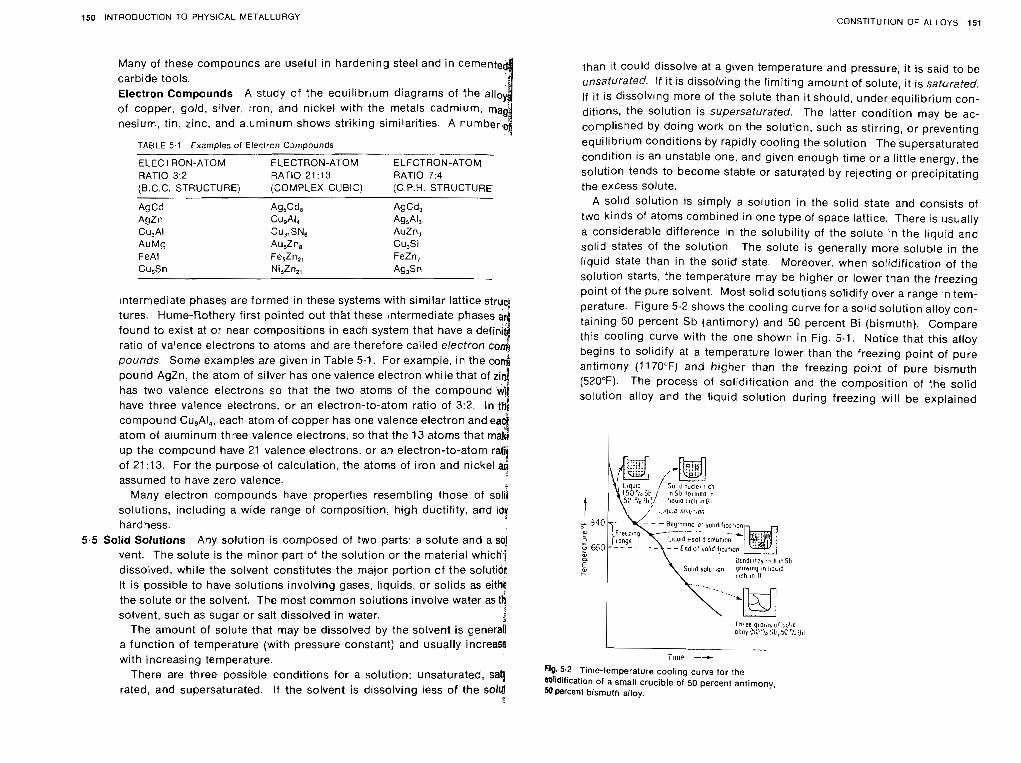
150 INTRODUCTION TO PHYSICAL METALLURGY CONSTITUTION OF ALLOYS 151
Many of these compounds are useful in hardening steel and in cemente carbide tools. Electron Compounds A study of the equilibrium diagrams of the alto of copper, gold, silver, iron, and nickel with the metals cadmium, ma nesium, tin, zinc, and aluminum shows striking similarities. A number
TABLE 5.1 Examples of Electron C~mpounds
ELECTRON-ATOM ELECTRON-ATOM ELECTRON-ATOM RATIO 3:2 RATIO 21:13 RATIO 7:4 {B.C.C. STRUCTURE) (COMPLEX CUBIC) (C.P.H. STRUCTURE'
AgCd A ~ 5 C d 8 A ~ C d 3
AgZn Cu,AI, AQ5AI3 Cu,AI CU,,SN, AuZn, AuMg Au,Zn, Cu,Si FeAl Fe5Zn2, FeZn, Cu,Sn Ni5Zn2, Ag3Sn
~ntermediate phases are formed in these systems with sim~lar lattice strug tures. Hume-Rothery frrst pointed out th'at these Intermediate phases found to exist at or near compositions in each system that have a defi ratlo of valence electrons to atoms and are therefore called electron co pounds. Some examples are given In Table 5.1. For example, In the co pound AgZn, the atom of s~lver has one valence electron while that of has two valence electrons so that the two atoms of the compound have three valence electrons, or an electron-to-atom ratio of 3 2 . In compound Cu,AI,, each atom of copper has one valence electron and e atom of alumrnum three valence electrons, so that the 13 atoms that m up the compound have 21 valence electrons. or an electron-to-atom ratji of 21:13. For the purpose of calculation, the atoms of iron and nickel a$
t assumed to have zero valence.
t
Many electron compounds have properties resembling those of solii solutions, including a wide range of composition, high ductility, and lo! hardness.
5.5 Solid Soiutlons Any solution is composed of two parts: a solute and a so! vent. The solute is the minor part of the solution or the material which! dissolved, while the solvent constitutes the major portion of the solutio~ It is possible to have solutions involving gases, liquids, or solids as eithf the solute or the solvent. The most common solutions involve water as th solvent, such as sugar or salt dissolved in water. i
The amount of solute that may be dissolved by the solvent is general1 a function of temperature (with pressure constant) and usually increase with increasing temperature.
There are three possible cond~tions for a solution: unsaturated, s q rated, and supersaturated. If the solvent is dissolving less of the sola
I
than it could dissolve at a given temperature and pressure, i t is said to be unsaturated. I f i t is dissolving the limiting amount of solute, i t is saturated. ~f it is dissolving more of the solute than it should, under equilibrium con- ditions, the solution is supersaturated. The latter condition may be ac- complished by doing work on the solution, such as stirring, or preventing equilibrium conditions by rapidly cooling the solution. The supersaturated condition is an unstable one, and given enough time or a little energy, the solution tends to become stable or saturated by rejecting or precipitating the excess solute.
A sol~d solution is simply a solution in the solid state and consists of two kinds of atoms combined in one type of space lattice. There is usually a considerable difference in the solubility of the solute in the liquid and solid states of the solution. The solute is generally more soluble in the liquid state than in the solid state. Moreover, when solidification of the solution starts, the temperature may be higher or lower than the freezing point of the Pure solvent. Most solid solutions solidify over a range in tem- perature. Figure 5.2 shows the cooling curve for a solid solution alloy con-
taining 50 percent Sb (antimony) and 50 percent Bi (bismuth). Compare this cooling curve with the one shown in Fig. 5.1. Notice that this alloy begins to solidify at a temperature lower than the freezing point of pure antimony (1170°F) and higher than the freezing point of pure bismuth (520°F). The process of solidification and the composition of the solid solution alloy and the liquid solution during freezing will be explained
L iqu~d I Sol40 nuclcs r c h (50%SC / , n S b iolmeo n
4 50 4: 8, 11 ~quba I I C ~ .n HI
- - f n d of s o l ~ d ~ l ~ c ~ ~ ~ ~ o n
I b e e grains o l :,olia alsoy i S O 1 :ib,bC%311
Fig. 5.2 Ttme-temperature coollng curve for the @d~ficatton of a small cructble of 50 percent antlrnony, %Percent bismuth alloy
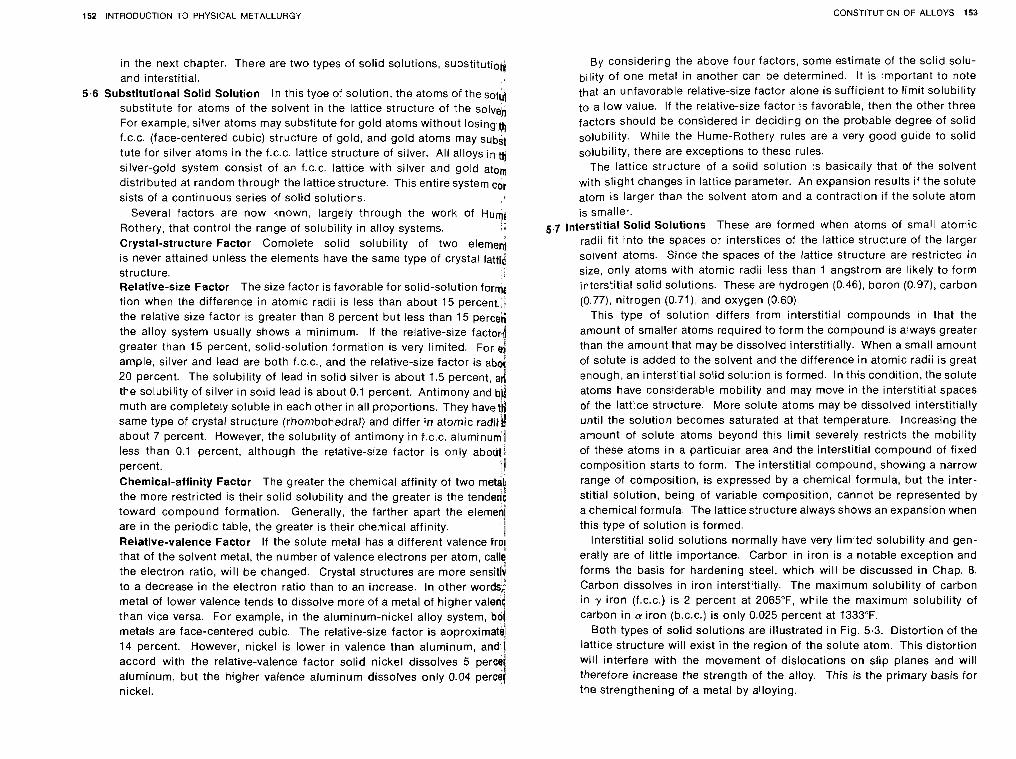
152 INTRODUCTION TO PHYSICAL METALLURGY CONSTITUTION OF ALLOYS 153
in the next chapter. There are two types of solid solutions, substitutiod and interstitial.
5.6 Substitutional Solid Solution In this type of solution, the atoms of thesol&! substitute for atoms of the solvent in the lattice structure of the solvelj For example, silver atoms may substitute for gold atoms without losing th f.c.c. (face-centered cubic) structure of gold, and gold atoms may subst tute for silver atoms in the f.c.c. lattice structure of silver. All alloys inth silver-gold system consist of an f.c.c. lattice with silver and gold atoa distributed at random through the lattice structure. This entire system cot sists of a continuous series of solid solutions.
Several factors are now known, largely through the work of Hum[ Rothery, that control the range of solubility in alloy systems. Crystal-structure Factor Complete solid solubility of two elerne4 is never attained unless the elements have the same type of crystal iattgd structure. Relative-size Factor The size factor is favorable for solid-solution formc tion when the difference in atomic radii is less than about 15 percent,; the relative size factor is greater than 8 percent but less than 15 perce; the alloy system usually shows a minimum. If the relative-size fact04 greater than 15 percent, solid-solution formation is very timited. For ample, silver and lead are both f.c.c., and the relative-size factor is abdI 20 percent. The solubility of lead in solid silver is about 1.5 percent, ad the solubility of silver in solid lead is about 0.1 percent. Antimony and bd muth are completely soluble in each other in all proportions. They have$ same type of crystal structure (rhombohedral) and differ in atomic radiid about 7 percent. However, the solubility of antimony in f.c.c. aluminum~ less than 0.1 percent, although the relative-size factor is only about! percent. :I Chemical-affinity Factor The greater the chemical affinity of two met&
:I the more restricted is their solid solubility and the greater is the tendenc toward compound formation. Generally, the farther apart the elemen are in the periodic table, the greater is their chemical affinity. Relative-valence Factor If the solute metal has a different valence fro, that of the solvent metal. the number of valence electrons per atom, call! the electron ratio, will be changed. Crystal structures are more sensitlq to a decrease in the electron ratio than to an increase. In other words;
1 metal of lower valence tends to dissolve more of a metal of higher valenc than vice versa. For example, in the aluminum-nickel alloy system, bdl metals are face-centered cubic. The relative-size factor is approximat 14 percent. However, nickel is lower in valence than aluminum, an accord with the relative-valence factor solid nickel dissolves 5 perc aluminum, but the higher valence aluminum dissolves only 0.04 perc nickel.
By considering the above four factors, some estimate of the solid solu- bility of one metal in another can be determined. It is important to note that an unfavorable relative-size factor alone is sufficient to limit solubility to a low value. If the relative-size factor is favorable, then the other three factors should be considered in deciding on the probable degree of solid solubility. While the Hume-Rothery rules are a very good guide to solid solubility, there are exceptions to these rules.
The lattice structure of a solid solution is basically that of the solvent with slight changes in lattice parameter. An expansion results if the solute atom is larger than the solvent atom and a contraction if the solute atom is smaller.
6.7 Interstitial Solid Solutions These are formed when atoms of small atomic radii fit into the spaces or interstices of the lattice structure of the larger solvent atoms. Since the spaces of the lattice structure are restricted in size, only atoms with atomic radii less than 1 angstrom are likely to form interstitial solid solutions. These are hydrogen (0.46), boron (0.97). carbon (0.77), nitrogen (0.71), and oxygen (0.60).
This type of solution differs from interstitial compounds in that the amount of smaller atoms required to form the compound is always greater than the amount that may be dissolved interstitially. When a small amount of solute is added to the solvent and the difference in atomic radii is great enough, an interstitial solid solution is formed. In this condition, the solute atoms have considerable mobility and may move in the interstitial spaces of the lattice structure. More solute atoms may be dissolved interstitially until the solution becomes saturated at that temperature. Increasing the amount of solute atoms beyond this limit severely restricts the mobility of these atoms in a particular area and the interstitial compound of fixed composition starts to form. The interstitial compound, showing a narrow range of composition, is expressed by a chemical formula, but the inter- stitial solution, being of variable composition, cannot be represented by a chemical formula. The lattice structure always shows an expansion when this type of solution is formed.
Interstitial solid solutions normally have very limited solubility and gen- erally are of little importance. Carbon in iron is a notable exception and forms the basis for hardening steel, which will be discussed in Chap. 8. Carbon dissolves in iron interstitially. The maximum solubility of carbon in y iron (f.c.c.) is 2 percent at 2065"F, while the maximum so[ubility of carbon in a iron (b.c.c.) is only 0.025 percent at 1333°F.
Both types of solid solutions are illustrated in Fig. 5.3. Distortion of the lattice structure will exist in the region of the solute atom. This distortion will interfere with the movement of dislocations on slip planes and will therefore increase the strength of the alloy. This is the primary basis for the strengthening of a metal by alloying.
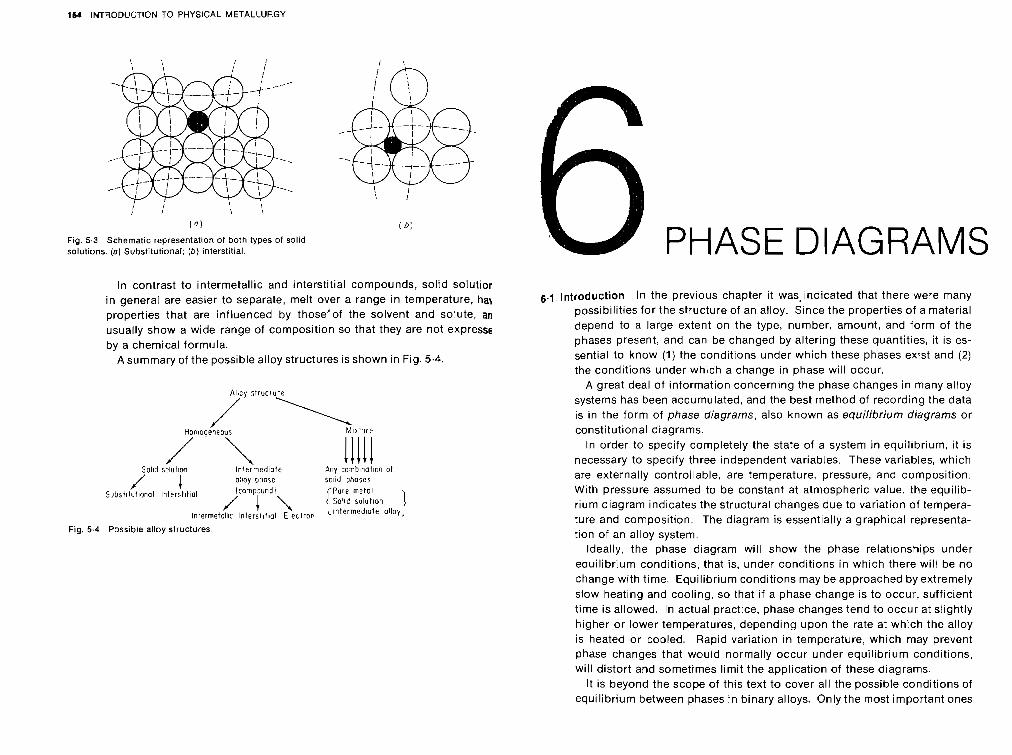
154 INTRODUCTION TO PHYSICAL METALLURGY
Fig. 5.3 Schematic representation of both types of solid solutions. (a ) Substitutional; ( b ) interstitial.
In contrast to intermetallic and interstitial compounds, solid solut~or i n general are easier to separate, melt over a range in temperature, ha$ properties that are influenced by those'of the solvent and soiute, an usually show a wide range of composition so that they are not expresse by a chemical formula.
Asummary of the possible alloy structures is shown in Fig. 5.4.
Al lcv s l rucrure
/ . -', Homogeneous iiiii / \
So113 sclulion Intermediate bnq eonhinat~on uf olioy piose sotid ?haws
Substilut~onal lnferst~t ial /coanp/md, { Pure S o l ~ d rnetol :.oliition
Inlermetoil~c I n t e r s i ~ t i a l E l e c t r o ~ 'ntermedlate
Fig. 5.4 Possible alloy structures
PHASE DIAGRAMS 6.1 introduction In the previous chapter it was, indicated that there were many
possibilities for the structure of an alloy. Since the properties of a material depend to a large extent on the type, number, amount, and form of the phases present, and can be changed by altering these quantities, it is es- sential to know (1) the conditions under which these phases exist and (2) the conditions under which a change in phase will occur.
A great deal of information concerning the phase changes in many alloy systems has been accumulated, and the best method of recording the data is in the form of phase diagrams, also known as equilibrium diagrams or constitutional diagrams.
In order to specify completely the state of a system in equilibrium, it is necessary to specify three independent variables. These variables, which are externally controllable, are temperature, pressure, and composition. With pressure assumed to be constant at atmospheric value. the equilib- rium diagram indicates the structural changes due to variation of tempera- ture and composition. The diagram is essentially a graphical representa- tion of an alloy system.
Ideally, the phase diagram will show the phase relationships under equilibrium conditions, that is, under conditions in which there will be no change with time. Equilibrium conditions may be approached by extremely slow heating and cooling. so that if a phase change is to occur, sufficient time is allowed. In actual practice, phase changes tend to occur at slightly higher or lower temperatures, depending upon the rate at which the alloy is heated or cooled. Rapid variation in temperature, which may prevent phase changes that would normally occur under equilibrium conditions, will distort and sometimes limit the application of these diagrams.
It is beyond the scope of this text to cover all the possible conditions of equilibrium between phases in binary alloys. Only the most important ones
156 INTRODUCTION TO PHYSICAL METALLURGY PHASE DIAGRAMS 157
will be considered, and they may be classified as follows:
1 Components completely soluble in the liquid state a Completely soluble in rhe solid state (Type I) b Insoluble in the solid state: the eutectic reaction (Type II) c Partly soluble in the solid state: the eutectic reaction (Type Ill) d Formation of a congruent-melting intermediate phase (Type IV) e The peritectic reaction (Type V)
2 Components partly soluble in the liquid state: the rnonotectic reaction (Type 3 Components insoluble in the liquid state and insoluble in the solid state (TypeR 4 Transformations in the solid state
a Allotropic change
1 b Order-disorder c The eutectoid reaction d The peritectoid reaction
A study of these diagrams will illustrate basic principles which maj be applied to understand and interpret more complex alloy systems.
6.2 Coordinates of Phase Diagrams Phase diagrams are usually plotted wit temperature, in degrees centigrade or Fahrenheit, as the ordinate and th alloy composition in weight percentage'as the abscissa. It is sometim more convenient for certain types of scientific work to express the all composition in atomic percent. The conversion from weight percentag$ to atomic percentage may be made by the following formulas:
Atomic percent of A = 1 OOX
X + Y(I"d/N)
Atomic percent of B - 100Y(M/N) X + Y(r"d/N)
where M = atomic weight of metal A N = atomic weight of metal B X = weight percentage of metal A Y = weight percentage of metal B
Regardless of the scale chosen for temperature or composition, therd will be no difference in the form of the resulting phase diagram.
6.3 Experimental Methods The data for the construction of equilibrium diaj grams are determined experimentally by a variety of methods, the mos! common being: Thermal Analysis This is by far the most widely used experimental method. As was shown in Chap. 5, when a plot is made of temperaturd vs. time, at constant composition, the resulting cooling curve will sh0w.d a change in slope when a phase change occurs because of the evotution 0
heat by the phase change. This method seems to be best for determinin the initial and final temperature of solidification. Phase changes occurrin
methods give more accurate results.
I solely in the solid state generally involve only small heat changes. and othel
f
Metallographic Methods This method consists in heating samples of an alloyto different temperatures, waiting for equilibrium to be established, and then quickly cooling to retain their high-temperature structure. The samples are then examined microscopically.
This method is difficult to apply to metals at high temperatures because the rapidly cooled samples do not always retain their high-temperature structure, and considerable skill is then required to interpret the observed microstructure correctly. This method is best suited for verification of a diagram. X-ray diffraction Since this method measures lattice dimensions, i t will indicate the appearance of a new phase either by the change in lattice di- mension or by the appearance of a new crystal structure. This method is simple, precise, and very useful in determining the changes in solid solu- bility with temperature.
6.4 Type I-Two Metals Completely Soluble i n the Liquid and Solid States Since the two metals are completely soluble in the solid state, the only type of solid phase formed will be a substitutional solid solution. The two metals will generally have the same type of crystal structure and differ in . atomic radii by less than 8 percent.
The result of running a series of cooling curves for various combinations or alloys between metals A and 5, varying in composition from 100 percent A 0 percent B to 0 percent A 100 percent 8, is shown in Fig. 6.1. In order to see the relationship between the cooling curves, they have been plotted on a single set of axes. However, the student should realize that each cool- ing curve has its own coordinates. In other words, each cooling curve is a separate experiment starting from zero time. The cooling curves for the pure metals A and B show only a horizontal line because the beginning and end of solidification take place at a constant temperature. However, since intermediate compositions form a solid solution, these cooling curves show two breaks or changes in slope. For an alloy containing 80A and 208, the first break is at temperature T,, which indicates the beginning of solidifi- cation, and the lower break at T, indicates the end of solidification. All intermediate alloy compositions will show a similar type of cooling curve. The sense of the phase diagram, or some idea of its form, may be obtained by drawing a line connecting all the points that show the beginning of solidification, the upper dotted line in Fig. 6.1, and another line connecting all the points that show the end of solidification, which is the lower dotted line in Fig. 6.1.
It is now possible to determine the actual phase diagram by plotting tem- perature vs. composition. The appropriate points are taken from the series of cooling curves and plotted on the new diagram. For example, in Fig. 6.2, since the left axis represents the pure metal A, T, is plotted along this line. Similarly, T, is plotted. Since all intermediate compositions are percent-
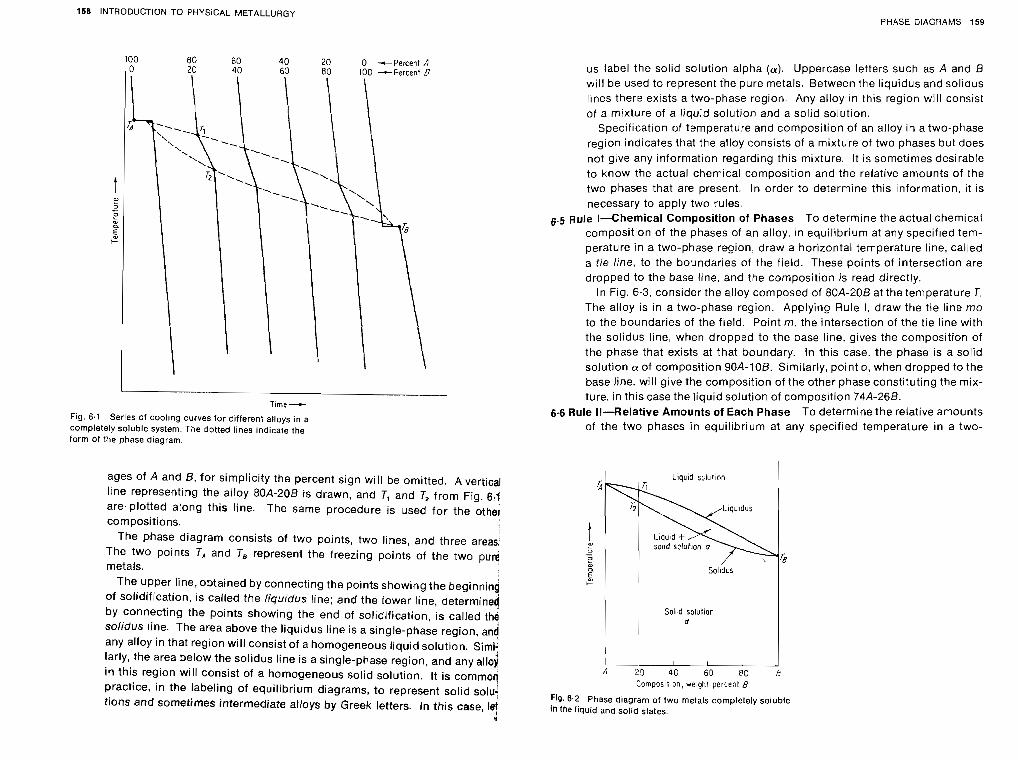
158 INTRODUCTION TO PHYSICAL METALLURGY PHASE C3IAGRAhlS 159
I
Time --t
Fig. 6.1 Series of cool~ng curves for different alloys in a completely soluble system. The dotted lines indicate the form of the phase diagram.
ages of A and 6 , for simplicity the percent sign will be omitted. A vertical lrne representing the alloy 80A-206 is drawn, and 1, and 7, from Fig. 6.1 are plotted along this line. The same procedure is used for the other composit~ons.
The phase diagram consists of two points, two lines, and three areas, The two points TA and TB represent the freezing points of the two purq metals.
The upper line, obtained by connecting the polnts showing the beginning of solidification, IS called the liqurdus line; and the lower tine, determine! by connecting the polnts showing the end of solldrfication, IS called the solidus line. The area above the liqurdus line IS a single-phase region, and any alloy in that region will consist of a homogeneous liquid solut~on. Simi: larly, the area below the solidus line is a single-phase region, and any all03 in this region will consist of a homogeneous solid solution. It is commoq practice, in the labeling of equilibrium diagrams, to represent solid solu! tlons and sometimes intermediate alloys by Greek letters. In thls case, let
1
us label the solid solution alpha (a) . Uppercase letters such as A and B will be used to represent ihe pure metals. Between the liquidus and solidus lines there exists a two-phase region. Any alloy in this region will consist of a mixture of a liquid solution and a solid solution.
Specification of temperature and composition of an alloy in a two-phase region indicates that the alloy consists of a mixture of two phases but does not give any information regarding this mixture. It is sometimes desirable to know the actual chemical composition and the relative amounts of the two phases that are present. In order to determine this ~nformation, it is necessary to apply two rules.
6.5 Rule I--Chemical Composition of Phases To determine the actual chemical composition of the phases of an alloy, in equilibrium at any specified tem- perature in a two-phase region, draw a horizontal temperature line, called a tie line, to the boundaries of the field. These points of intersection are dropped to the base line, and the composition is read directly.
In Fig. 6.3, consider the alloy composed of 80A-20B at the temperature T. The alloy is in a two-phase region. Applying Rule I, draw the tie line mo to the boundaries of the field. Point m, the intersection of the tie line with the solidus line, when dropped to the base line, gives the composition of the phase that exists at that boundary. In this case. the phase is a solid solution a of composition 90A-10B. Similarly, point o , when dropped to the base line, will give the composition of the other phase constituting the mix- ture, in this case the liquid solution of composition 74A-268.
6.6 Rule Il--Relative Amounts of Each Phase To determine the relative amounts of the two phases in equilibrium at any specified temperature in a two-
Sol d solutior
~ ' ; , 1 A 20 40 60 RC b
Compos~t.on, we,ght percenl 8
Fig. 6.2 Phase diagram of two metals completely soluble in the liquid and solid states.
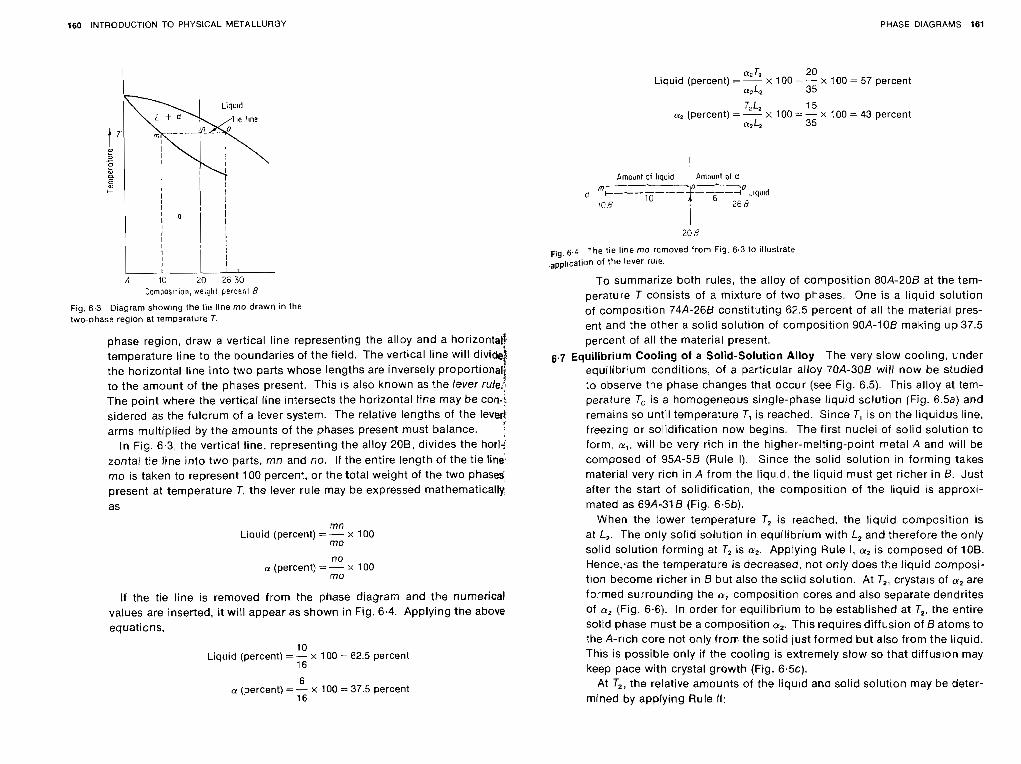
160 INTRODUCTION TO PHYSICAL METALLURGY PHASE DIAGRAMS 161
a 2 T2 20 Liquid (percent) = - x 100 = -- x 100 = 57 percent
L Y ~ L 2 35
C O ~ ~ O S I ~ ~ Q ~ , weioht percent 8
Fig. 6.3 Diagram show~ng the tie line mo drawn i n the two-phase region at temperature T.
phase region, draw a vertical line representing the alloy and a horizontal temperature line to the boundaries of the field. The vertical line will divide the horizontal line into two parts whose lengths are inversely proportional to the amount of the phases present. This is also known as the lever rule.! The point where the vertical line intersects the horizontal line may be con-! sidered as the fulcrum of a lever system. The relative lengths of the levee
arms multiplied by the amounts of the phases present must balance. I In Fig. 6.3, the vertical line, representing the alloy 208, divides the horii
zontat tie line into two parts, mn and no. If the entire length of the tie line. mo is taken to represent 100 percent, or the total weight of the two phase* present at temperature T, the lever rule may be expressed mathematically as
mn Liquid (percent) = - x 100
mo
no a (percent) - -- x 100
mo
If the tie line is removed from the phase diagram and the numerical values are inserted, it will appear as shown in Fig. 6.4. Applying the above equations,
10 Liquid (percent) = - x 100 = 62.5 percent
16
6 a (percent) = - x I00 = 37.5 percent
16
15 x 100 - - x 100 - 43 percent
35
Amount of liqcid Pmount of a
IC 4
i 6.6 t ie llne mo removed from Fig. 6.3 to illustrate
application of the lever rule.
To summarize both rules, the alloy of composition 80A-206 at the tem- perature T consists of a mixture of two phases. One is a liquid solution of composition 74A-268 constituting 62.5 percent of all the material pres- ent and the other a solid solution of composition 90A-108 making up 37.5 percent of all the material present.
6.7 Equilibrium Cooling of a Solid-Solution Alloy The very slow cooling, under equilibrium conditions, of a particular alloy 70A-308 will now be studied :o observe the phase changes that occur (see Fig. 6.5). This alloy at tem- perature To is a homogeneous single-phase liquid solution (Fig. 6.5a) and remains so until temperature T, is reached. Since T, is on the liquidus line, freezing or solidification now begins. The first nuclei of solid solution to form, a,, will be very rich in the higher-melting-point metal A and will be composed of 95A-5B (Rule I). Since the solid solution in forming takes material very rich in A from the liquid, the liquid must get richer in 6. Just after the start of solidification, the composition of the liquid is approxi- mated as 69A-31 B (Fig. 6.54).
When the lower temperature T, is reached, the liquid composition is at L,. The only solid solution in equilibrium with L, and therefore the only solid solution forming at T, is n2. Applying Rule I, a, is composed of 108. Hence.as the temperature is decreased, not only does the liquid composi- tion become richer in B but also the solid solution. At T,, crystals of a, are formed surrounding the a, composition cores and also separate dendrites of a, (Fig. 6.6). In order for equilibrium to be established at T,, the entire solid phase must be a composition a,. This requires diffusion of B atoms to the A-rich core not only from the solid just formed but also from the liquid. This is possible only if the cooling is extremely slow so that diffusion may keep pace with crystal growth (Fig. 6 . 5 ~ ) .
At T2, the relative amounts of the liquid and solid solution may be deter- mined by applying Rule II:
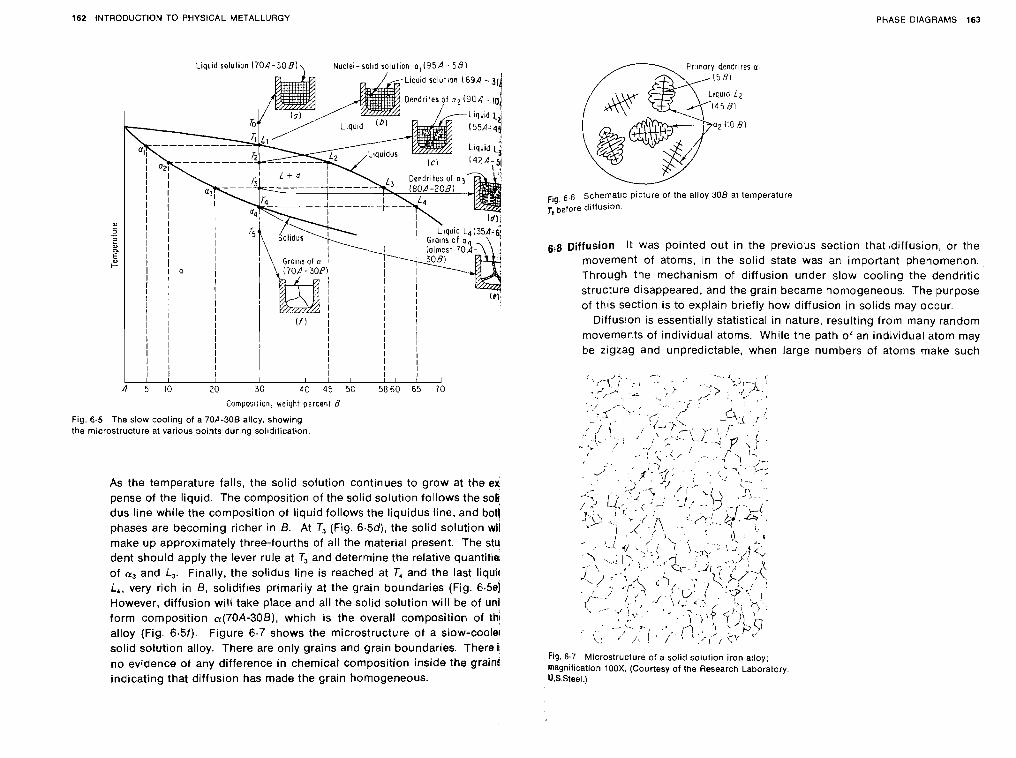
162 INTRODUCTION TO PHYSICAL METALLURGY PHASE DIAGRAMS 163
I-iqiid solution (70A-303) \ Nuclei- scl~d solution a, ( 9 5 A - . 58)
I I I I I I I l l I I
a 10 20 30 4c8 45 5c 5860 65 70
Cornpos~iion, weigbt percent 8
Fig. 6.5 The slow cooling of a 70A-305 alloy, showing the microstructure at various points during sol~dificatton.
As the temperature falls, the solid solution continues to grow at the ex. pense of the liquid. The composition of the solid solution follows the solt dus line while the composition of liquid follows the liquidus line. and bot! phases are becoming richer in 8 . At T3 (Fig. 6.5d), the solid solution wll make up approximately three-fourths of all the material present. The stu dent should apply the lever rule at T3 and determine the relative quantitier of a, and L,. Finally, the solidus line is reached at T, and the last liquic L,, very rich in B, solidifies primarily at the grain boundaries (Fig. 6.5e) However, diffusion will take place and all the solid solution will be of unl form composition a(70A-3081, which is the overall composition of th! alloy (Fig. 6.5f). Figure 6.7 shows the microstructure of a slow-coolet solid solution alloy. There are only grains and grain boundaries. There i; no evidence of any difference in chemical composition inside the grains indicating that diffusion has made the grain homogeneous.
F , ~ 6 6 Schematlc picture of the alloy 308 at temperature 7; before dlffuslon
6.8 Diffusion It was pointed out in the previous section that ,diffusion, or the movement of atoms, in the solid state was an important phenomenon. Through the mechanism of diffusion under slow cooling the dendritic structure disappeared, and the grain became homogeneous. The purpose of this section is to explain briefly how diffusion in solids may occur,
Diffusion is essentially statistical in nature, resulting from many random movements of individual atoms. While the path of an individual atom may be zigzag and unpredictable, when large numbers of atoms make such
Fig. 6.7 Microslructure of a solid solution iron alloy; magniftcation 100X. (Courtesy of the Research Laboratory U.S.Steel.)
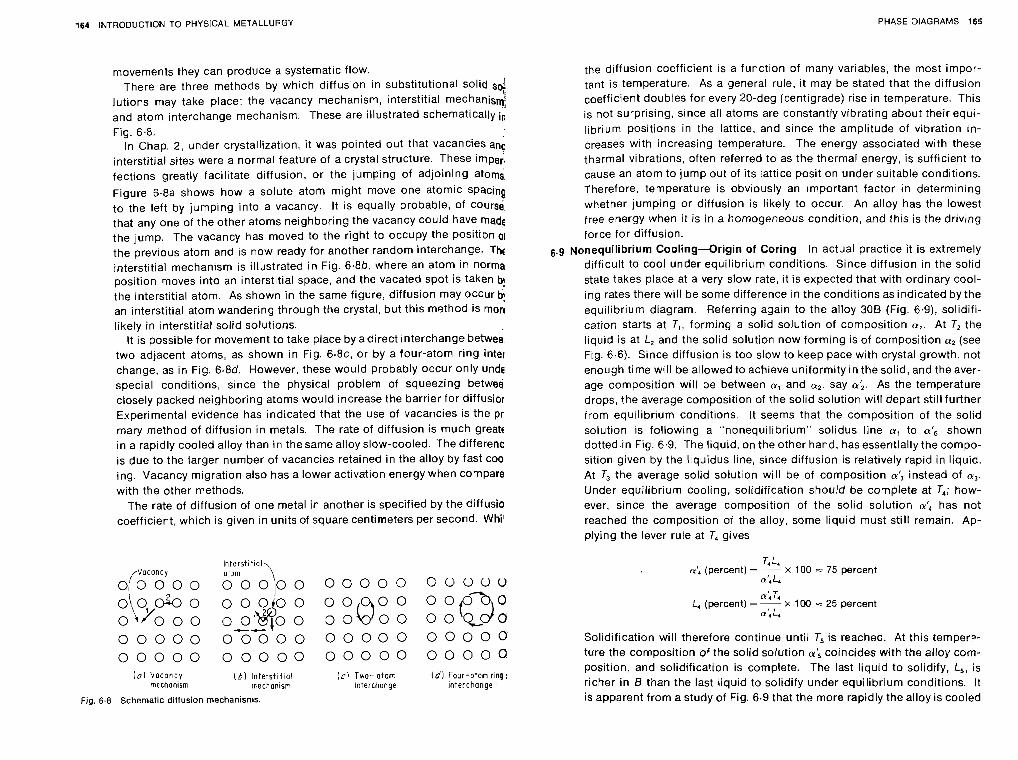
164 INTRODUCTION TO PHYSICAL METALLURGY PHASE DIAGRAMS 165
movements they can produce a systematic flow. There are three methods by which diffusion in substitutional solid Sd
lutions may take place: the vacancy mechanism, interstitial mechanisd and atom interchange mechanism. These are illustrated schematicallyi"
Fig. 6.8. In Chap. 2, under crystallization, it was pointed out that vacancies and
interstitial sites were a normal feature of a crystal structure. These imp&. fections greatly facilitate diffusion, or the jumping of adjoining atoms,
Figure 6.8a shows how a solute atom might move one atomic Spacing to the left by jumping into a vacancy. It is equally probable, of course, that any one of the other atoms neighboring the vacancy could have mad6 the jump. The vacancy has moved to the right to occupy the position 01
the previous atom and is now ready for another random interchange. Thc interstitial mechanism is illustrated in Fig. 6.8b, where an atom in norma position moves into an interstitial space, and the vacated spot is taken b! the interstitial atom. As shown in the same figure, diffusion may occur tj! an interstitial atom wandering through the crystal, but this method is morr likely in interstitial solid solutions.
It is possible for movement to take place by adirect interchange betwee, two adjacent atoms, as shown in Fig. 6.8c, or by a four-atom ring inter change, as in Fig. 6.8d. However, these would probably occur only unde special conditions, since the physical problem of squeezing betweij closely packed neighboring atoms would increase the barrier for diffusior Experimental evidence has indicated that the use of vacancies is the pr mary method of diffusion in metals. The rate of diffusion is much great6 in a rapidly cooled alloy than in the same alloy slow-cooled. The differenc is due to the larger number of vacancies retained in the alloy by fast coo ing. Vacancy migration also has a lower activation energy when compare with the other methods.
The rate of diffusion of one metal in another is specified by the diffusia coefficient, which is given in units of square centimeters per second. Whil
Intersti*iol-., /Vuconcy atom
o i o o o o o o o ; o o 0 0 0 0 0
CC-
0 0 0 0 0 0 0 0 0 0 0 0 0 0 0
0 0 0 0 0 0 0 0 0 0 0 0 0 0 0 iol 'JIlCon~y ( 6 ) lnterstitol ( c ) Two-oton;
mechanism rrechonisrn ~nterchonge
Fig. 6.8 Schematic diffusion mechanisms.
( a ) Fo~r-orom ring, ~nterchange
the diffusion coefficient is a function of many variables, the most impor- tant is temperature. As a general rule, it may be stated that the diffusion coefficient doubles for every 20-deg (centigrade) rise in temperature. This is not surprising, since all atoms are constantly vibrating about their equi- librium positions in the lattice, and since the amplitude of vibration in- creases with increasing temperature. The energy associated with these thermal vibrations, often referred to as the thermal energy, is sufficient to cause an atom to jump out of its lattice position under suitable conditions. Therefore, temperature is obviously an important factor in determining whether jumping or diffusion is likely to occur. An alloy has the lowest free energy when it is in a homogeneous condition, and this is the driving force for diffusion.
6.9 on equilibrium Cooling--Origin of Coring In actual practice it is extremely difficult to cool under equilibrium conditions. Since diffusion in the solid state takes place at a very slow rate, it is expected that with ordinary cool- ing rates there will be some difference in the conditions as indicated by the equilibrium diagram. Referring again to the alloy 308 (Fig. 6.9), solidifi- cation starts at T,, forming a solid solution of composition a,. At T, the liquid is at L, and the solid solution now forming is of composition a2 (see Fig. 6.6). Since diffusion is too slow to keep pace with crystal growth, not enough time will be allowed to achieve uniformity in the solid, and the aver- age composition will be between a, and t+, say cr;. As the temperature drops, the average composition of the solid solution will depart still further from equilibrium conditions. It seems that the composition of the solid solution is following a "nonequilibrium" solidus line a, to a',, shown dotted.in Fig. 6.9. The liquid, on the other hand, hasessentially the compo- sition given by the liquidus line, since diffusion is relatively rapid in liquid. At T, the average solid solution will be of composition a', instead of a,. Under equilibrium cooling, solidification should be complete at T,; how- ever, since the average composition of the solid solution has not
reached the composition of the alloy, some liquid must still remain. Ap- plying the lever rule at T, gives
T, L4 cr; (percent) = - x 100 ;- 75 percent
a ; L 4
a; 7, L, (percent) = - x 100 5 25 percent
a'J,
Solidification will therefore continue until T, is reached. At this temperr- ture the composition of the solid solution a; coincides with the alloy com- position, and solidification is complete. The last liquid to solidify, L,, is richer in 13 than the last liquid to solidify under equilibrium conditions. It is apparent from a study of Fig. 6.9 that the more rapidly the alloy is cooled
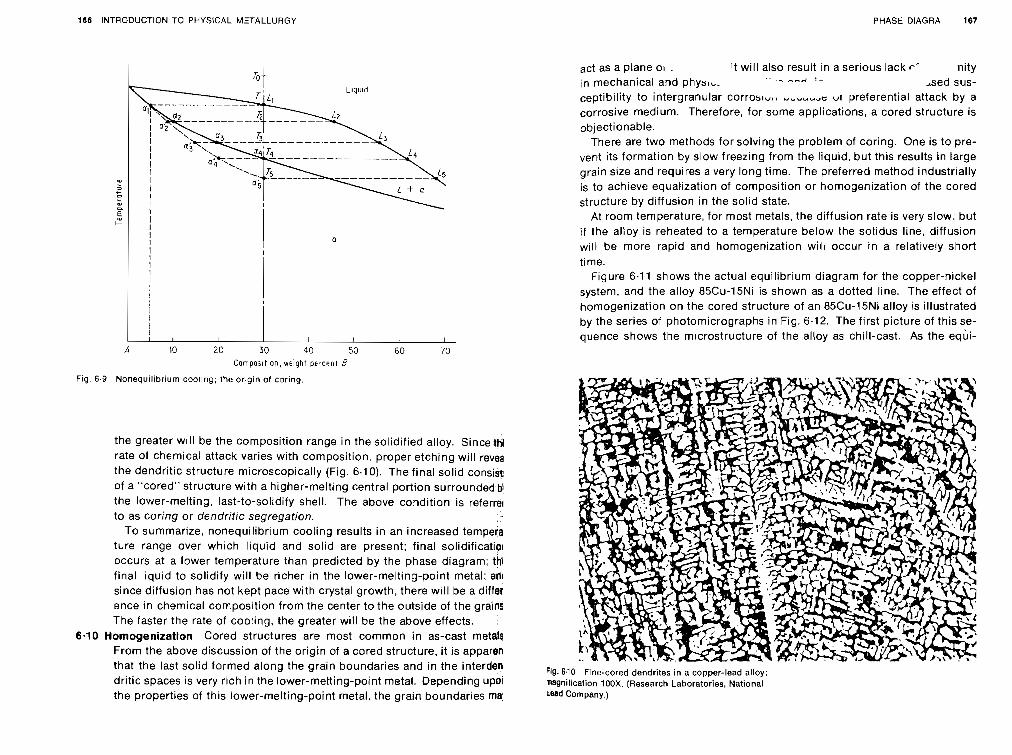
166 INTRODUCTION TO PHYSICAL METALLURGY PHASE DIAGRA 167
Fig. 6.9 Nonequilibrium cooling; the origin of coring
I I I I I I I I I
the greater will be the composition range in the solidified alloy. Sincettj rate of chemical attack varies with composition. proper etching will revea the dendritic structure microscopically (Fig. 6.10). The final solid consitit! of a "cored" structure with a higher-melting central portion surrounded& the lower-melting, last-to-solidify shell. The above condition is referrel to as coring or dendritic segregation.
To summarize, nonequilibrium cooling results in an increased tempera ture range over which liquid and solid are present; final solidificatiol occurs at a lower temperature than predicted by the phase diagram; tM final liquid to solidify will be richer in the lower-melting-point metal: an1 since diffusion has not kept pace with crystal growth, there will be a diffet ence in chemical composition from the center to the outside of the grains The faster the rate of cooling, the greater will be the above effects.
6.10 Homogenizatlon Cored structures are most common in as-cast metals From the above discussion of the origin of a cored structure, i t is apparen that the last solid formed along the grain boundaries and in the interden dritic spaces is very rich in the lower-melting-point metal. Depending up01 the properties of this lower-melting-point metal, the grain boundaries ma'
I I I
act as a plane 01 . It will also result in a serious lack r' nity
in mechanical and p h y s ~ .' ... - - A ! - ,sed sus- ceptibility to intergranular co r ros~~ , , ,,,,u,c: "I preferential attack by a corrosive medium. Therefore, for some applications, a cored structure is objectionable.
There are two methods for solving the problem of coring. One is to pre- vent its formation by slow freezing from the liquid, but this results in large grain size and requires a very long time. The preferred method industrially is to achieve equalization of composition or homogenization of the cored structure by diffusion in the solid state.
At room temperature, for most metals, the diffusion rate is very slow; but if the alloy is reheated to a temperature below the solidus line, diffusion will be more rapid and homogenization will occur in a relatively short time.
Figure 6.11 shows the actual equilibrium diagram for the copper-nickel system, and the alloy 85Cu-15Ni is shown as a dotted line. The effect of homogenization on the cored structure of an 85Cu-15Ni alloy is illustrated by the series of photomicrographs in Fig. 6.12. The first picture of this se- quence shows the microstructure of the alloy as chill-cast. As the equi-
B 10 2C SO 40 50 60 70 Cornpo;~t on, we~ght percent 8
' l g . 610 Ftne-cored dendrites in a copper-lead alloy, nagn~f~catton IOOX (Research Laboratories, National Lead Company )
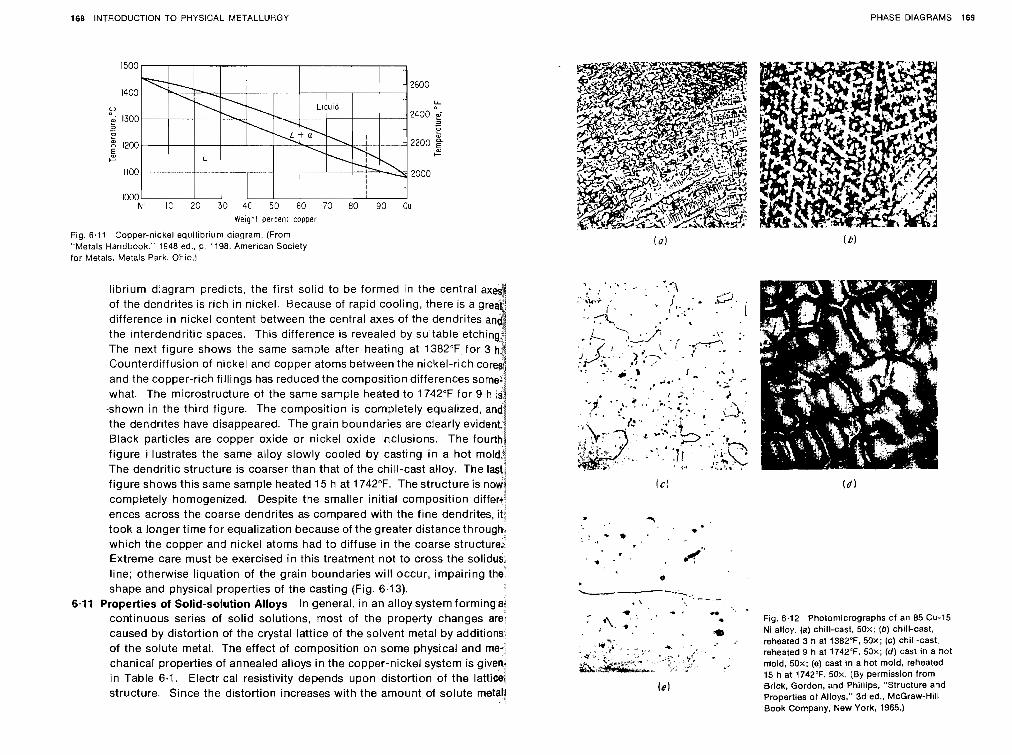
168 INTRODUCTION TO PHYSICAL METALLURGY PHASE DIAGRAMS 169
Weigh1 percent copper
Fig. 6 , l l Copper-nickel equilibrium diagram. (From "Metals Handbook. 1948 ed., p. 1198. American Society for Metals. Metals Park. Ohio.)
librium diagram predicts, the first solid to be formed in the central of the dendrites is rich in nickel. Because of rapid cooling, there is a g difference in nickel content between the central axes of the dendrites the interdendritic spaces. This difference is revealed by suitable etchrn The next figure shows the same sample after heating at 1382"F.for 3 Counterdiffusion of nickel and copper atoms between the nickel-rich and the copper-rich fillings has reduced the composition differences what. The microstructure of the same sample heated to 1742°F for 9 h is -shown in the third figure. The composition is completely equalized, an the dendrites have disappeared. The grain boundaries are clearly eviden Black particles are copper oxide or nickel oxide inclusions. The fourt figure illustrates the same alloy slowly cooled by casting in a hot mold The dendritic structure is coarser than that of the chill-cast alloy. The figure shows this same sample heated 15 h at 1742°F. The structure is now] completely homogenized. Despite the smaller initial composition differ-! ences across the coarse dendrites as compared with the fine dendrites, it; took a longer time for equalization because of the greater distance through,! which the copper and nickel atoms had to diffuse in the coarse structure-i Extreme care must be exercised in this treatment not to cross the solidus; line; otherwise liquation of the grain boundaries will occur, impairing the' shape and physical properties of the casting (Fig. 6.13).
6.11 Properties of Solid-solution Alloys In general, in an alloy system forming? continuous series of solid solutions, most of the property changes are: caused by distortion of the crystal lattice of the solvent metal by additions of the solute metal. The effect of composition on some physical and me! chanical properties of annealed alloys in the copper-nickel system is given! in Table 6.1. Electrical resistivity depends upon distortion of the lattiwi structure. Since the distortion increases with the amount of solute metail
Fig. 6.12 Photomicrographs of an 85 Cu-15 Ni alloy. (a) chill-cast. 50x: (b) chill-cast. reheated 3 h at 1382'F. 50x; (c) chill-cast. reheated 9 h at 1742°F. 50x; (d ) cast in a hot mold, 50x; (e) cast in a hot mold, reheated 15 h at 1742°F. 50x. (By permission from Brick. Gordon, and Phillips, "Structure and Properties of Alloys." 3d ed., McGraw-Hill Book Company, New York, 1965.)
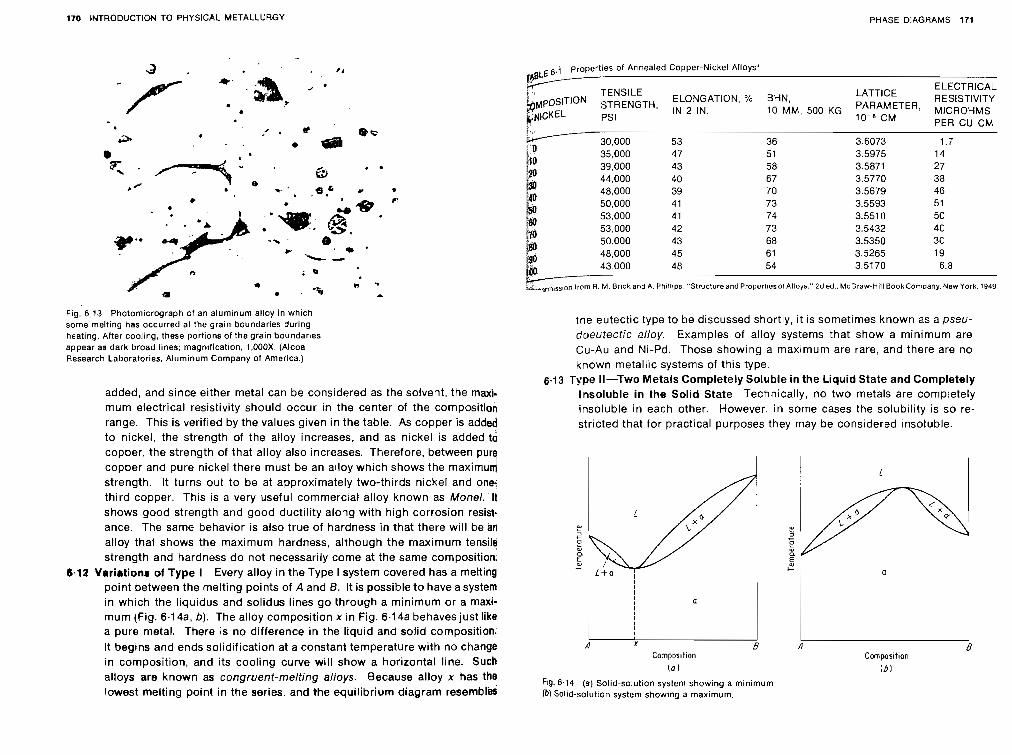
170 LNTRODUCTION TO PHYSICAL METALLURGY PHASE DIAGRAMS 171
Fig. 6.13 Photom~crograph of an aluminum alloy in which some melting has occurred at the grain boundaries during heating. After cooling, these portions of the grain boundaries appear as dark broad lines; magnlficatlon, 1,000X. (Alcoa Research Laboratories. Aluminum Company of America.)
added, and since e~ther metal can be considered as the solvent, the maxi- mum electrical res~stivity should occur In the center of the composition range. This is verifred by the values given in the table. As copper is added to n~ckel, the strength of the alloy Increases, and as nickel is added to copper, the strength of that alloy also increases. Therefore, between pure copper and pure nickel there must be an alloy which shows the maximum strength It turns out to be at approximately two-thirds nickel and one- third copper. This is a very useful commercial alloy known as Monel. It shows good strength and good ductility along w ~ t h high corrosion resist- ance. The same behavior is also true of hardness in that there will be an alloy that shows the maximum hardness, although the maxlmum tensile strength and hardness do not necessarily come at the same composition.
6.12 Variations of Type I Every alloy In the Type I system covered has a melting point between the melting points of A and 6 . It is possible to have asystem In which the liquidus and sol~dus lines go through a minlmum or a maxi- mum (Fig. 6.14a, b) The alloy composition x in Fig 6.14a behaves just like a pure metal. There is no d~fference In the liquid and solid composition. It begtns and ends sol~dification at a constant temperature with no change tn composit~on, and its cooling curve wrll show a horizontal line. Such alloys are known as congruent-melting alloys. Because alloy x has the lowest melttng point in the series. and the equil~brium diagram resembles
rrSLE 6,i properties of Annealed Copper-Nickel Alloys'
LATT l C E ELECTRICAL
ELONGATION. % BHN, RESISTIVITY PARAMETER, MlCROHMS
PSI 10 MM. 500 KG CM PER CU CM
the eutectic type to be discussed shortly, it is sometimes known as apseu- doeutectic alloy. Examples of alloy systems that show a minimum are Cu-Au and Ni-Pd. Those showing a maximum are rare, and there are no known metallic systems of this type.
6.13 Type 11-Two Metals Completely Soluble in the Liquid State and Completely Insoluble in the Solid State Technically, no two metals are completely insoluble in each other. However, in some cases the solubility is so re- stricted that for practical purposes they may be considered insoluble.
( a )
Fig. 6.14 (a) Solid-solution system showing a minlmum (bl Solid-solution system showing a maximum.
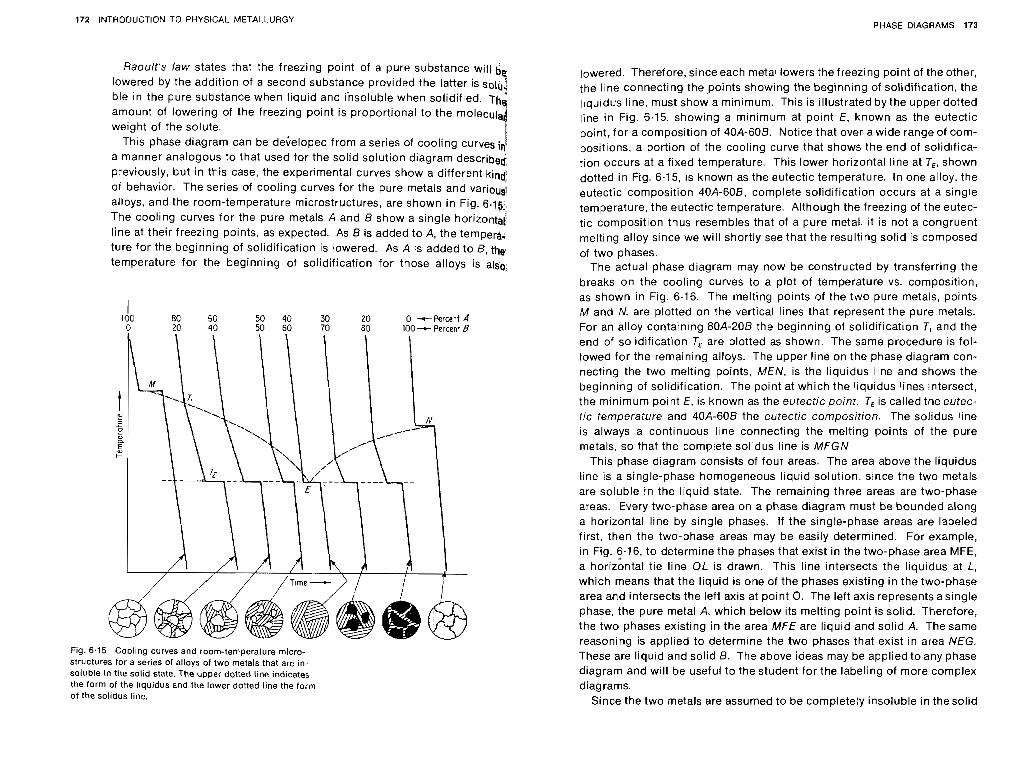
172 INTRODUCTION TO PHYSICAL METALLURGY PHASE DIAGRAMS 173
Raoult's law states that the freezing point of a pure substance will b ei lowered by the addition of a second substance provided the latter is solu4
ble in the pure substance when liquid and insoluble when solidified. hi amount of lowering of the freezing point is proportional to the molecula weight of the solute.
This phase diagram can be developed from a series of cooling curves in a manner analogous to that used for the solid solution diagram described; previously, but in this case, the experimental curves show a different kind of behavior. The series of cooling curves for the pure metals and various! alloys, and the room-temperature microstructures, are shown in Fig. 6.15.. The cooling curves for the pure metals A and 8 show a single horizontad line at their freezing points, as expected. As B is added to A, the tempera:' ture for the beginning of solidification is lowered. As A is added to B, the temperature for the beginning of solidification for those alloys is also:
I 100 8C 50 50 40 30 20 0 -c Percent A 0 20 40 50 60 70 80 loo--.- Percen: 8
Fig. 6.15 Cooling curves and room-temperature micro- structures for a series of alloys of two metals that are in- soluble in the solid state. The upper dotted line indicates the form of the l~quidus and the lower dotted line the form of the solidus line.
lowered. Therefore, since each metal lowers the freezing point of the other, the line connecting the ,points showing the beginning of solidification, the liquidus line, must show a minimum. This is illustrated by the upper dotted line in Fig. 6.15, showing a minimum at point E, known as the eutectic point, for a composition of 40A-608. Notice that over a wide range of com- positions, a portion of the cooling curve that shows the end of solidifica- tion occurs at a fixed temperature. This lower horizontal line at T,, shown dotted in Fig. 6.15, is known as the eutectic temperature. In one alloy, the eutectic composition 40A-608, complete solidification occurs at a single temperature, the eutectic temperature. Although the freezing of the eutec- tic composition thus resembles that of a pure metal, it is not a congruent melting alloy since we will shortly see that the resulting solid is composed of two phases.
The actual phase diagram may now be constructed by transferring the breaks on the cooling curves to a plot of temperature vs. composition, as shown in Fig. 6.16. The melting points of the two pure metals, points M and N, are plotted on the vertical lines that represent the pure metals. For an alloy containing 80A-206 the beginning of solidification T, and the end of solidification T, are plotted as shown. The same procedure is fol- lowed for the remaining alloys. The upper line on the phase diagram con- necting the two melting points, MEN, is the liquidus line and shows the beginning of solidification. The point at which the liquidus lines intersect, the minimum point E, is known as the eutectic point. TE is called the eutec- tic temperature and 40A-606 the eutectic composition. The solidus line is always a continuous line connecting the melting points of the pure metals, so that the complete solidus line is MFGN.
This phase diagram consists of four areas. The area above the liquidus line is a single-phase homogeneous liquid solution, since the two metals are soluble in the liquid state. The remaining three areas are two-phase areas. Every two-phase area on a phase diagram must be bounded along a horizontal line by single phases. If the single-phase areas are labeled first, then the two-phase areas may be easily determined. For example, in Fig. 6.16, to determine the phases that exist in the two-phase area MFE, a horizontal tie line OL is drawn. This line intersects the liquidus at L, which means that the liquid is one of the phases existing in the two-phase area and intersects the left axis at point 0. The left axis represents asingle phase, the pure metal A, which below its melting point is solid. Therefore, the two phases existing in the area MFE are liquid and solid A. The same reasoning is applied to determine the two phases that exist in area NEG. These are liquid and solid B. The above ideas may be applied to any phase diagram and will be useful to the student for the labeling of more complex diagrams.
Since the two metals are assumed to be completety insoluble in the solid
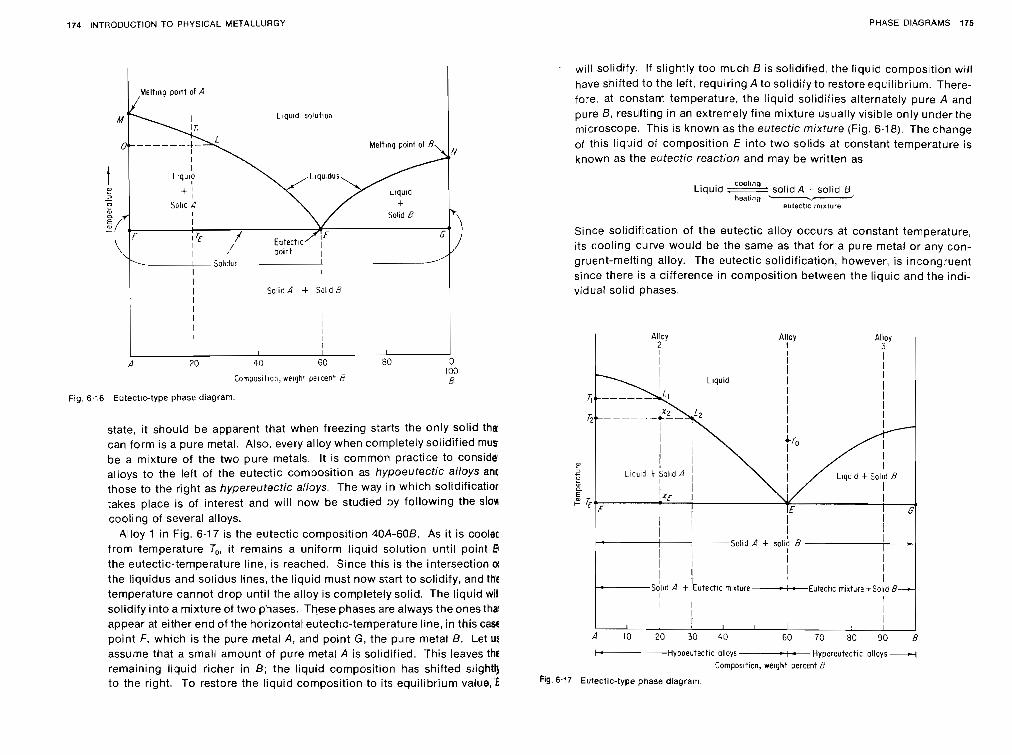
174 INTRODUCTION TO PHYSICAL METALLURGY PHASE DIAGRAMS 175
Solid d + Solid Y
I I I I I I
I I I
I I I
d 20 40 EC 80 3
Cornposit~on, we~qht percent 6 100 9
Fig. 6.'6 Eutectic-type phase diagram
state, it should be apparent that when freezing starts the only solid th3 can form is a pure metal. Also, every alloy when completely solidified mus be a mixture of the two pure metals. It is common practice to considel alloys to the left of the eutectic composition as hypoeutectic alloys anc those to the right as hypereutectic alloys. The way in which solidificatior takes place is of interest and will now be studied by following the s l o ~ cooling of several alloys.
Alloy 1 in Fig. 6.17 is the eutectic composition 40A-605. As it is coolec from temperature To, it remains a uniform liquid solution until point 6 the eutectic-temperature tine, is reached. Since this is the intersection a the liquidus and solidus lines, the liquid must now start to solidify, and tht temperature cannot drop until the alloy is completely solid. The liquid wil solidify into a mixture of two phases. These phases are always the ones tha: appear at either end of the horizontal eutectic-temperature line, in this casr point F, which is the pure metal A, and point G , the pure metal 5. Let ur assume that a small amount of pure metal A is solidified. This leaves th'c remaining liquid richer in 6; the liquid composition has shifted stightl) to the right. To restore the liquid composition to its equilibrium value, &
will solidify. If slightly too much B is solidified. the liquid composition will have shifted to the left, requiring A to solidify to restore equilibrium. There- fore, at constant temperature, the liquid solidifies alternately pure A and pure B, resulting in an extremely fine mixture usually visible only under the microscope. This is known as the eutectic mixture (Fig. 6.18). The change of this liquid of composition E into two solids at constant temperature is known as the eutectic reaction and may be written as
cooling Liquid - solid A -4- solid 8
heating eutectlc mlxture
Since solidification of the eutectic alloy occurs at constant temperature, its cooling curve would be the same as that for a pure metal or any con- gruent-melting alloy. The eutectic solidification, however, is incongruent since there is a difference in composition between the liquid and the indi- vidual solid phases.
Al lcy Alloy Alloy
T I 3 I
H y p o e u t e c t i c alloys-w Hypereutectic alloys 4
Composition, welght percent B
Fig. 6.17 Eutectic-type phase diagram.
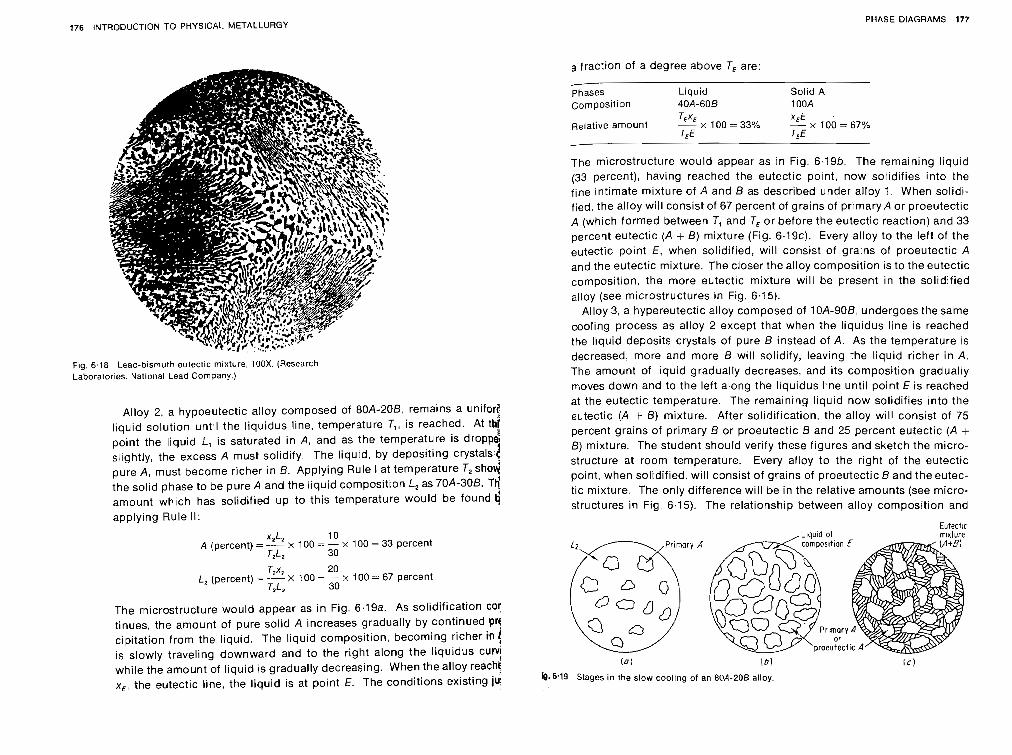
176 INTRODUCTION TO PHYSICAL METALLURGY
a fraction of a degree above T, are:
PHASE DIAGRAMS 177
Fig. 6.18 Leac-bismuth eutectic mixture, 100X. (Research Laboratories. National Lead Company.)
Alloy 2, a hypoeutectic alloy composed of 80A-208, remains a unifor? liquid solution until the liquidus line, temperature T,, is reached. At thj point the liquid L, is saturated in A, and as the temperature is dropp slightly, the excess A must solidify. The liquid, by depositing crystals t pure A, must become richer in 6'. Applying Rule I at temperature T, shovi the solid phase to be pure A and the liquid composition L, as 70A-308. TIS amount which has solidified up to this temperature would be found $ applying Rule II:
x,L, 10 A (percent) = -- x 100 = - x 100 = 33 percent
J J , 30
T2x, 20 L, (percent) = -- x 100 = -- x 100 - 67 percent
T2L2 30
The microstructure would appear as in Fig. 6.19a. As solidification cor
tinues, the amount of pure solid A increases gradually by continued pn cipitation from the liquid. The liquid composition, becomfng richer in 4 is slowly traveling downward and to the right along the l iqu~dus cuff! while the amount of liquid IS gradually decreasing. When the alloy reachf x, , the eutectic line, the liquid is at pornt E. The conditions existing ju:
phases Liquid Solid A composition 40A-60B 1 OOk
TEXE x,E . Relative amount - x 100-33% - x 100-6746
TEE TEE
The microstructure would appear as in Fig. 6.19b. The remaining liquid (33 percent), having reached the eutectic point, now solidifies into the fine intimate mixture of A and 8 as described under alloy 1. When solidi- fied, the alloy will consist of 67 percent of grains of primary A or proeutectic A (which formed between 1, and T, or before the eutectic reaction) and 33 percent eutectic (A + 8) mixture (Fig. 6.19~). Every alloy to the left of the eu tec t i~ point E, when solidified, will consist of grains of proeutectic A and the eutectic mixture. The closer the alloy composition is to the eutectic composition, the more eutectic mixture will be present in the solidified alloy (see microstructures in Fig. 6.15).
Alloy 3, a hypereutectic alloy composed of 1 OA-908, undergoes the same cooling process as alloy 2 except that when the liquidus line is reached the liquid deposits crystals of pure 8 instead of A. As the temperature is decreased, more and more B will solidify, leaving the liquid richer in A. The amount of liquid gradually decreases, and its composition gradually moves down and to the left along the liquidus line until point E is reached at the eutectic temperature. The remaining liquid now solidifies into the eutectic (A + 8) mixture. After solidification, the alloy will consist of 75 percent grains of primary B or proeutectic B and 25 percent eutectic (A + 8 ) mixture. The student should verify these figures and sketch the micro- structure at room temperature. Every alloy to the right of the eutectic point, when solidified. will consist of grains of proeutectic B and the eutec- tic mixture. The only difference will be in the relative amounts (see micro- structures in Fig. 6.15). The relationship between alloy composition and
Eutectic mixture
( a ) !61
b.8.19 Stages in the slow coollng of an 80A-206 alloy.
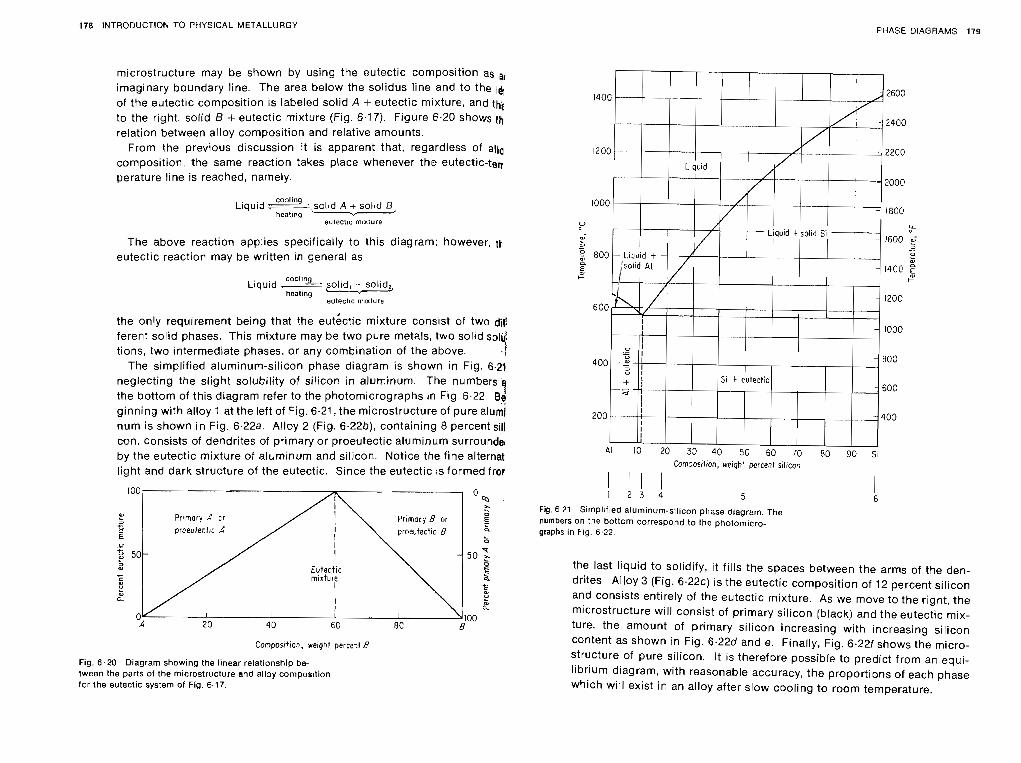
178 INTRODUCTION TO PHYSICAL METALLURGY PHASE DIAGRAMS 179
microstructure may be shown by using the eutectic composition as imaginary boundary line. The area below the solidus line and to the 16 of the eutectic composition is labeled solid A -t eutectic mixture, and t k to the right, solid B + eutectic mixture (Fig. 6.17). Figure 6.20 shows th relation between alloy composition and relative amounts.
From the previous discussion it is apparent that. regardless of all0 composition, the same reaction takes place whenever the eutectic-ten perature line is reached, namely.
cooling Liquid 7 solid A + sol~d B
heatlnp -- eutect~c rnlxture
The above reaction applies specifically to this diagram; however, ti. eutectic reaction may be written in general as
coollnp Liquid + >olid, . I solid4 healing
eutectlc rnlxture
the only requirement being that the eut6ctic mixture conslst of two di& ferent solid phases. This mixture may be two pure metals, two solid solu! tions, two intermediate phases, or any combination of the above. . /
The simplified aluminum-silicon phase diagram is shown in Fig. 6.21 neglecting the slight solubility of silicon in aluminum. The numbers
the bottom of this diagram refer to the photomicrographs in Fig. 6.22. B,< ginning with alloy 1 at the left of Fig. 6.21, the microstructure of pure alum/ num is shown i n Fig. 6.22a. Alloy 2 (Fig. 6.22b), containing 8 percent sill con, consists of dendrites of primary or proeutectic aluminum surroundel by the eutectic mixture of aluminum and silicon. Notice the fine alternat light and dark structure of the eutectic. Since the eutectic is formed fror
Conposrf ion, weight percel l 8
Fig. 6.20 Diagram showing the linear relationship be- tween the parts of the microstructure and alloy composition lor the eutectic system of Fig. 6.17.
Com~osition, weigh' percent sillcon
Fig 6 21 Simpltfbed aluminum-stlicon phase d~agram The numbers on The bottom correspond to the photom~cro- graphs In Flg 6 22
the last liquid to solidify, i t fills the spaces between the arms of the den- drites. Alloy 3 (Fig. 6.22~) is the eutectic composition of 12 percent silicon and consists entirely of the eutectic mixture. As we move to the right, the microstructure will consist of primary silicon (black) and the eutectic mix- ture, the amount of primary silicon increasing with increasing silicon content as shown in Fig. 6.220' and e. Finally, Fig. 6.221 shows the micro- structure of pure silicon. It is therefore possible to predict from an equi- librium diagram, with reasonable accuracy, the proportions of each phase which will exist in an alloy after slow cooling to room temperature.
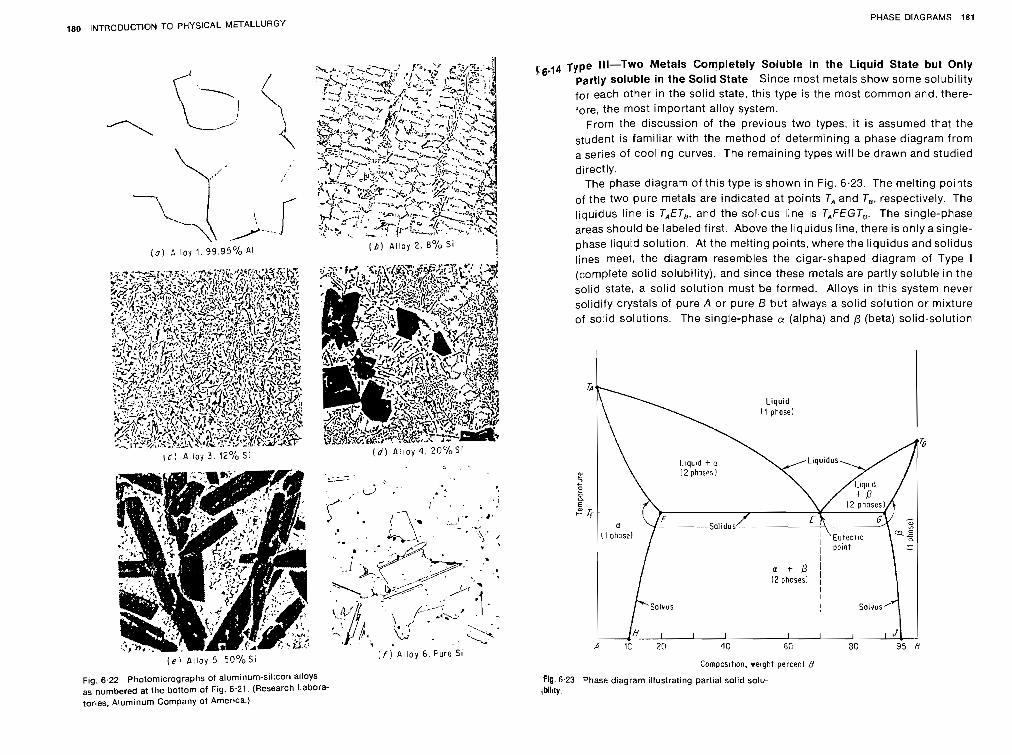
180 INTRODUCTION TO PHYSICAL METALLURGY PHASE DIAGRAMS 181
56-,4 Type Ill-Two Metals Completely Soluble in the Liquid State but Only partly soluble in the Solid State Since most metals show some solubility for each other in the solid state, this type is the most common and, there- fore, the most important alloy system. -'-. From the discussion of the previous two types, it is assumed that the student is familiar with the method of determining a phase diagram from a series of cooling curves. The remaining types will be drawn and studied directly.
The phase diagram of this type is shown in Fig. 6.23. The melting points
7 of the two pure metals are indicated at points T, and T,, respectively. The
liquidus line is TAETe7 and the solidus line is TAFEGTe. The single-phase areas should be labeled first. Above the liquidus line, there is only asingle-
1 0 ) L I I O V 1. 99.95% A1 ( d ) A I I O Y 2 . EO/O s i 1 phase liquid solution. At the melting points, where the liquidus and solidus lines meet, the diagram resembles the cigar-shaped diagram of Type I (complete solid solubility), and since these metals are partly soluble in the
solid state, a solid solution must be formed. Alloys in this system never solidify crystals of pure A or pure 5 but always a solid solution or mixture of solid solutions. The single-phase a (alpha) and p (beta) solid-solution
{c i Alloy 3 . 12°io S i ( d ) A : I O ~ 4. 20%Si
: f ) Alloy 6. Pure S i
Fig. 6.22 Photomicrographs of aluminum-silicon alloys as numbered at the bottom of Fig. 6.21. (Research Lab01 tortes. Aluminum Company of America.)
ra-
Composltlon, welyht percent R
fig. 6.23 Phase d~agram tllustrat~ng part~al solid solu- .bility.
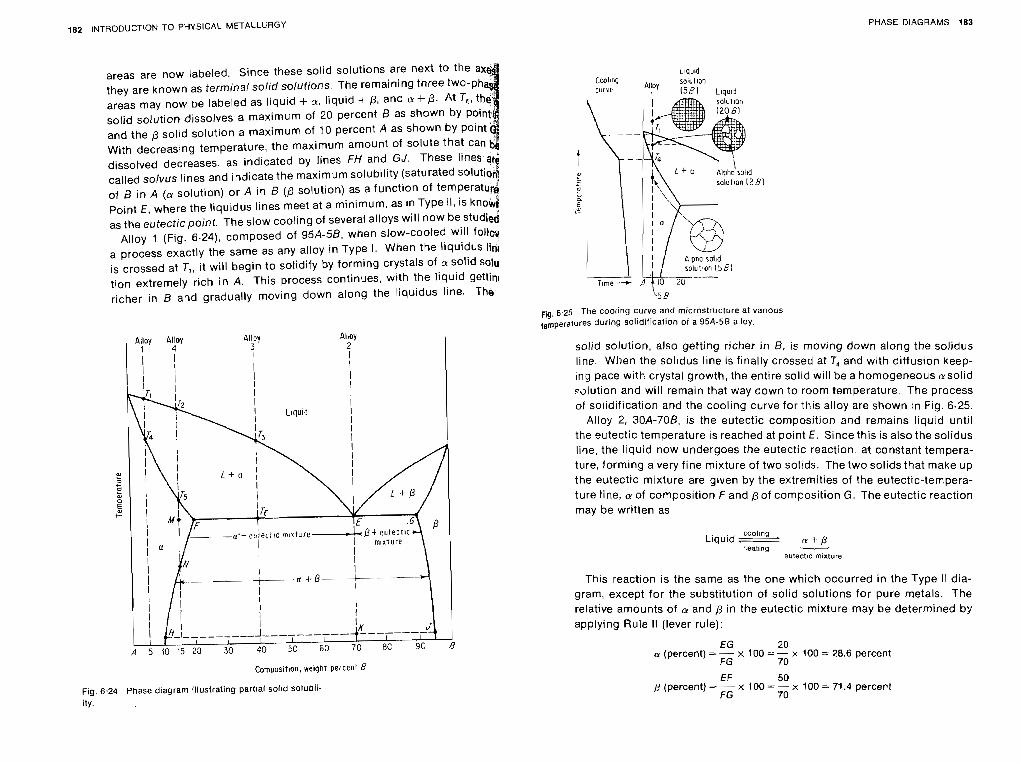
182 INTRODUCTlON TO PHYSICAL METALLURGY PHASE DIAGRAMS 183
areas are now labeled. Since these solid solutions are next to the a they are known as terminal solid solutions. The remaining three two- areas may now be labeled as liquid + a, liquid + p, and a + P . At TE, solid solution dissolves a maximum of 20 percent B as shown by point
and the p solid solution a maximum of 10 percent A as shown by point With decreasing temperature, the maximum amount of solute that dissolved decreases, as indicated by lines FH and GJ. These li
called solvus lines and indicate the maximum solubility (saturated so of B in A (a solution) or A in B (p solution) as a function of tempera Point E, where the liquidus lines meet at a minimum, as in Type 11, is kn as the eutecticpoint. The slow cooling of several alloys will now be studied
Alloy 1 (Fig. 6.24), composed of 95A-58, when slow-cooled will follod a process exactly the same as any alloy in Type I. When the liquidus lia is crossed at T,, it will begin to solidify by forming crystals of a solid solu tion extremely rich in A. This process continues, with the liquid gettin, richer in B and gradually moving down along the liquidus line. The,
Comoosition, we~qht percent 8
Fig. 6.24 Phase dlagram illustrating partial solid solubil- ity.
~ l g . 6 25 The ~00 l lng curve and microstructure at varrous %mperatures durlng sol~dtf~cat~on of a 95A-58 alloy
solid solution, also getting richer in B, is moving down along the solidus line. When the sol~dus line is finally crossed at T, and with diffusion keep- ing pace with crystal growth, the entire solid will be a homogeneous asolid ~olut ion and will remain that way down to room temperature. The process of solidification and the cooling curve for this alloy are shown in Fig. 6.25.
Alloy 2, 30A-70B, is the eutectic composition and remains liquid until the eutectic temperature is reached at point E. Since this is also the solidus line, the liquid now undergoes the eutectic reaction, at constant tempera- ture, formlng a very fine mixture of two solids. The two solids that make up the eutectic mixture are given by the extremities of the eutectic-tempera- ture line, a of composition F and p of composition G. The eutectic reaction may be written as
coollng Liquid , t. P
Peatlng - BUteCtlC rnlxture
This reaction is the same as the one which occurred in the Type I1 dia-
gram, except for the substitution of solid solutions for pure metals. The relative amounts of LY and p in the eutectic mixture may be determined by applying Rule II (lever rule):
EG 20 a (percent) = - x 100 - - x 100 = 28.6 percent
FG 70 EF 50
,8 (percent) = - x 100 - - x 100 -; 71.4 percent FG 70
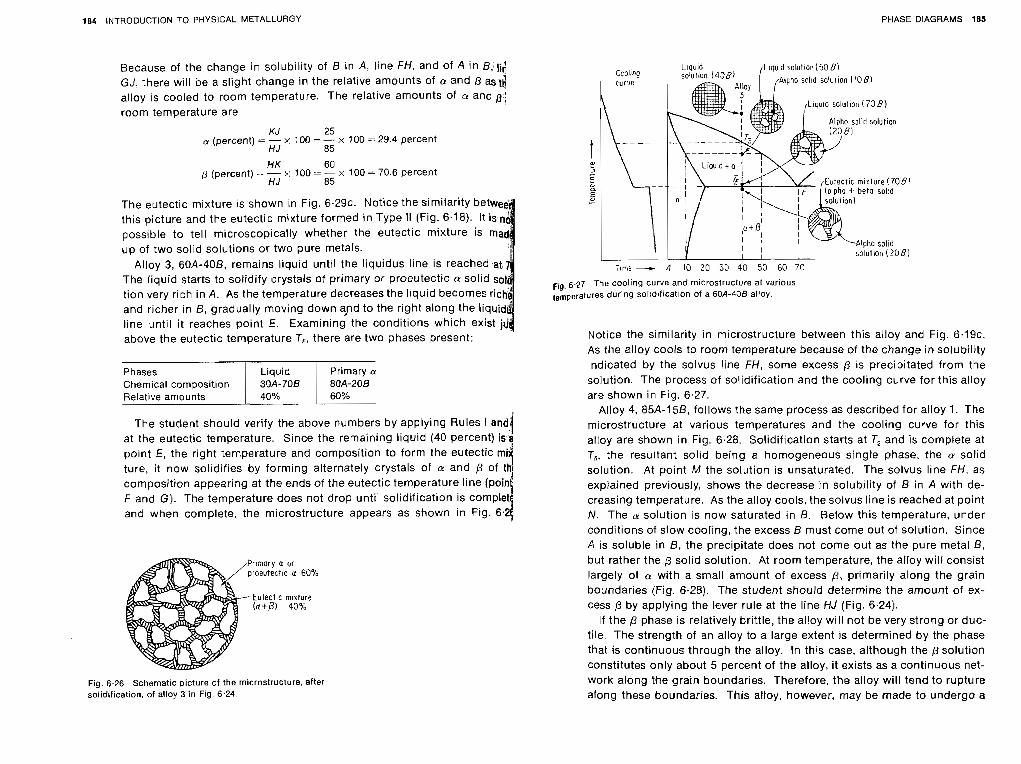
184 INTRODUCTION TO PHYSICAL METALLURGY PHASE DIAGRAMS 185
Because of the change in solubility of B in A, line FH, and of A in B, lii; GJ, there will oe a slight change in the relat~ve amounts of a: and p astd alloy is cooled to roorn temperature. The relative amounts of a and bj room temperature are
KJ 25 (percent) = - x 100 = -- x I 00 - 29.4 percent
HJ 85
HK 60 p (percent) - -- 2: I00 - -- x 100 = 70.6 percent
HJ 85
The eutectic mixture is shown in Fig. 6 . 2 9 ~ . Notics the similarity betw this picture and the eutectic mixture formed in Type II (Fig. 6.18). It is possible to tell microscopically whether the eutectic mixture is ma up of two solid solutions or two pure metals.
Alloy 3, 60A-408, remains liquid until the liquidus line is reached at The liquid starts to solidify crystals of primary or proeutectic cr solid so tion very rich in A. As the temperature decreases the liquid becomes ri and richer in B, gradually moving down a,nd to the right along the liqu line until it reaches point E. Examining the conditions which exist i above the eutectic temperature TE, there are two phases present:
The student should verify the above numbers by applying Rules I and at the eutectic temperature. Since the remaining liquid (40 percent) isa point E, the right temperature and composition to form the eutectic m ture, it now solidifies by forming alternately crystals of n and p of th composition appearing at the ends of the eutectic temperature line (poin F and G). The temperature does not drop until solidification is complet and when complete, the microstructure appears as shown in Fig. 6. 1
Fig. 6.26 Schematic ~icture of the microstructure, after solidification, of alloy 3 in Fig. 6.24.
Primary a
80A-208 60%
Phases Chemical composition Relative amounts
AIpho sol~d solur~on ! \OD)
I ~ U I G solution ( 7 3 8 )
Liquid 30A-706 40%
~ g . 6.27 The cooltng curve and mtcrostructure at vartous (emperattires during soltd~flcat~on of a 60A-435 alloy.
Notice the similarity in microstructure between this alloy and Fig. 6 .19~. As the alloy cools to roorn temperature because of the change in solubility indicated by the solvus line FH, some excess @ is precipitated from the solution. The process of solidification and the cooling curve for this altoy are shown in Fig. 6.27.
Alloy 4, 85A-158, follows the same process as described for alloy 1. The microstructure at various temperatures and the cooling cuwe for this alloy are shown in Fig. 6.28. Solidification starts at T, and is complete at Ts, the resultant solid being a homogeneous single phase, the n solid solution. At point M the solution is unsaturated. The solvus line FH, as explained previously, shows the decrease in solubility of B in A with de- creasing temperature. As the alloy cools, the solvus line is reached at point N. The u solution is now saturated in 6. Below this temperature, under conditions of slow cooling, the excess B must come out of solution. Since A is soluble in B, the precipitate does not come out as the pure metal 6. but rather the p solid solution. At room temperature, the alloy will consist largely of a with a small amount of excess @, primarily along the grain boundaries (Fig. 6.28). The student should determine the amount of ex- cess p by applying the lever rule at the line HJ (Fig. 6.24).
If the p phase is relatively brittle, the al!oy will not be very strong or duc- tile. The strength of an alloy to a large extent is determined by the phase that is continuous through the alloy. In this case, although the p solution constitutes only about 5 percent of the alloy, it exists as a continuous net- work along the grain boundaries. Therefore, the alloy will tend to rupture along these boundaries. This alloy, however, may be made to undergo a
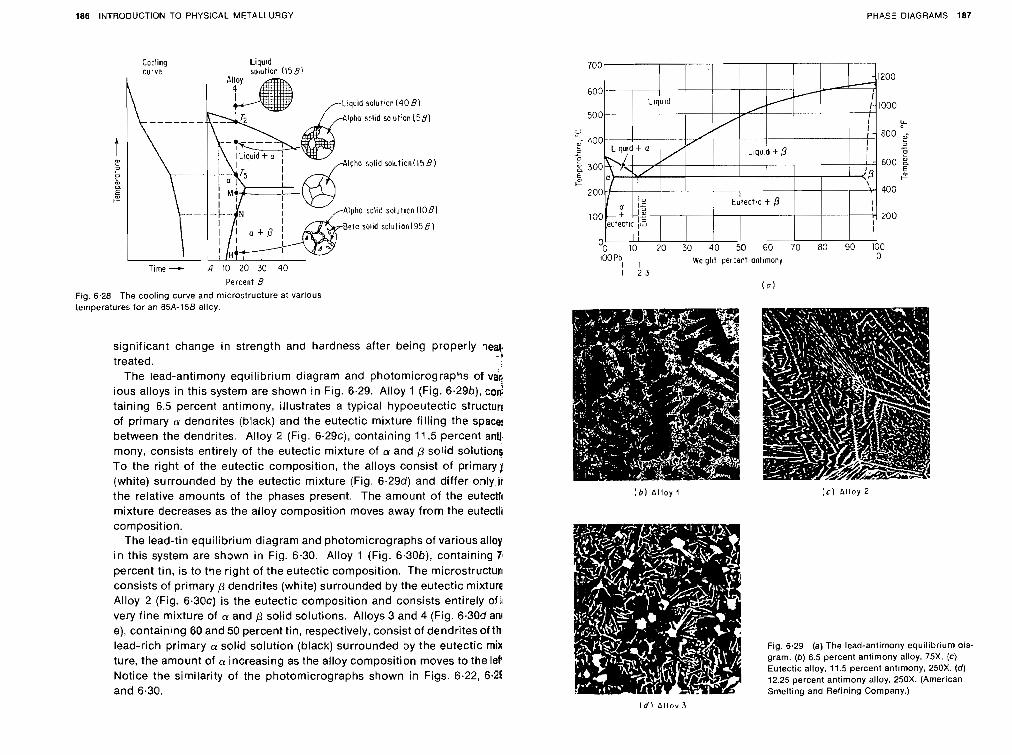
186 INTRODUCTION TO PHYSICAL METALLURGY PHASE DIAGRAMS 187
I - Alpho solid s o l i t i c n ( l 5 9 i ! ,f
' 1-- - - , i-;"pho >e+o solid solid s o l u t i o r i 9 5 b ) solur icn ( N I B )
d - ' H
Time -+ A 10 20 30 40 Percent 8
Fig. 6.28 The cooling curve and rn~crostructure at various temperatures for an 85A-156 alloy.
significant change in strength and hardness after being properly heat r )
treated. The lead-antimony equilibrium diagram and photomicrographs of vag
ious alloys in this system are shown in Fig. 6.29. Alloy 1 (Fig. 6.29b), COG taining 6.5 percent antimony, illustrates a typical hypoeutectic structorc of primary w dendrites (black) and the eutectic mixture filling the space! between the dendrites. Alloy 2 (Fig. 6.29~). containing 11.5 percent an8 mony, consists entirely of the eutectic mixture of a and p solid solutions To the right of the eutectic composition, the alloys consist of primary] (white) surrounded by the eutectic mixture (Fig. 6,294) and differ only ii the relative amounts of the phases present. The amount of the eutectic mixture decreases as the alloy composition moves away from the eutectfi composition.
The lead-tin equilibrium diagram and photomicrographs of various alloy in this system are shown in Fig. 6.30. Alloy 1 (Fig. 6.304), containing P percent tin, is to the right of the eutectic composition. The rnicrostructur~ consists of primary p dendrites (white) surrounded by the eutectic mixture Alloy 2 (Fig. 6.30~) is the eutectic composition and consists entirely o f i very fine mixture of CY and p solid solutions. Alloys 3 and 4 (Fig. 6.30d an! e), containing 60 and 50 percent tin, respectively, consist of dendrites of thl lead-rich primary CY solid solution (black) surrounded by the eutectic mix ture, the amount of a increasing as the alloy composition moves to the lefl Notice the similarity of the photomicrographs shown in Figs. 6.22, 6.2: and 6.30.
(6) A l l o y I ( c ) ! ~ l l o y 2
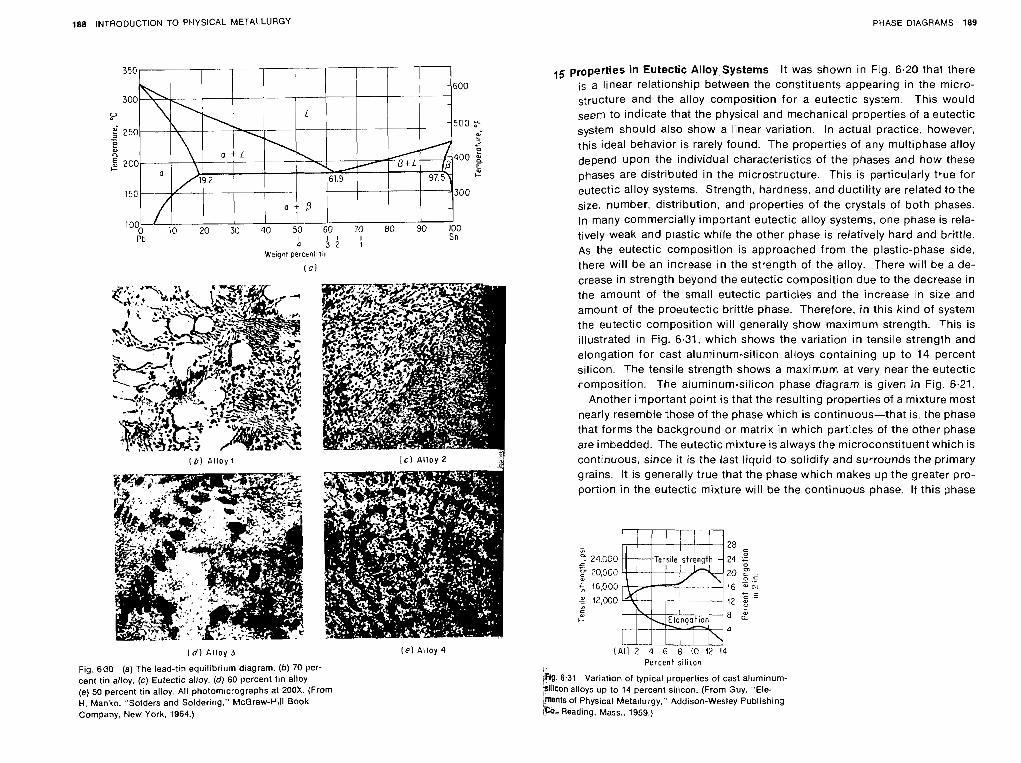
188 INTRODUCTION TO PHYSICAL METALLURGY PHASE DIAGRAMS 189
- - Weignt percent tin
(0)
Fig. 6.30 (a) The lead-tin equilibrium diagram. (b) 70 per- cent tin alloy. (c) Eutectic alloy. ( d ) 60 percent tin alloy. (e) 50 percent tin alloy. All photomicrographs at 200X. (From H. Manko. ,'Solders and Soldering." hlcGraw-Hill Book Company, New York, 1964.)
,5 properties in Eutectic Alloy,Systems It was shown in Fig. 6.20 that there is a linear relationship between the constituents appearing in the micro- structure and the alloy composition for a eutectic system. This would seem to indicate that the physical and mechanical properties of a eutectic system should also show a linear variation. In actual practice, however, this ideal behavior is rarely found. The properties of any multiphase alloy depend upon the individual characteristics of the phases and how these phases are distributed in the microstructure. This is particularly true for eutectic alloy systems. Strength, hardness, and ductility are related to the size, number, distribution, and properties of the crystals of both phases. In many commercially important eutectic alloy systems, one phase is rela- tively weak and plastic while the other phase is relatively hard and brittle. As the eutectic composition is approached from the plastic-phase side, there will be an increase in the strength of the alloy. There will be a de- crease in strength beyond the eutectic composition due to the decrease in the amount of the small eutectic particles and the increase in size and amount of the proeutectic brittle phase. Therefore, in this kind of system the eutectic composition will generally show maximum strength. This is illustrated in Fig. 6.31, which shows the variation in tensile strength and elongation for cast aluminum-silicon alloys containing up to 14 percent silicon. The tensile strength shows a maximum at very near the eutectic romposition. The aluminum-silicon phase diagram is given in Fig. 6.21.
Another important point is that the resulting properties of a mixture most nearly resemble those of the phase which is continuous-that is, the phase that forms the background or matrix in which particles of the other phase are imbedded. The eutectic mixture is always the microconstituent which is continuous, since it is the last liquid to solidify and surrounds the primary grains. It is generally true that the phase which makes up the greater pro- portion in the eutectic mixture will be the continuous phase. If this phase
28
4 24.CCO 24 r F 2opoo Y 20 - :.+ % 16,003 ' 6 * N
," r2,ooo 2 5
m 2
m 1-- 8 a"
4
( A l ) 2 4 6 8 !O 12 i 4 Percent silicon
Fkj. 6.31 Variation of typical properties of cast aluminum- PHcon alloys up to 14 percent silicon. (From Guy, "Ele-
of Phys~cal Metallurgy," Addison-Wesley Publishing ..Reading. Mass., 1959.)
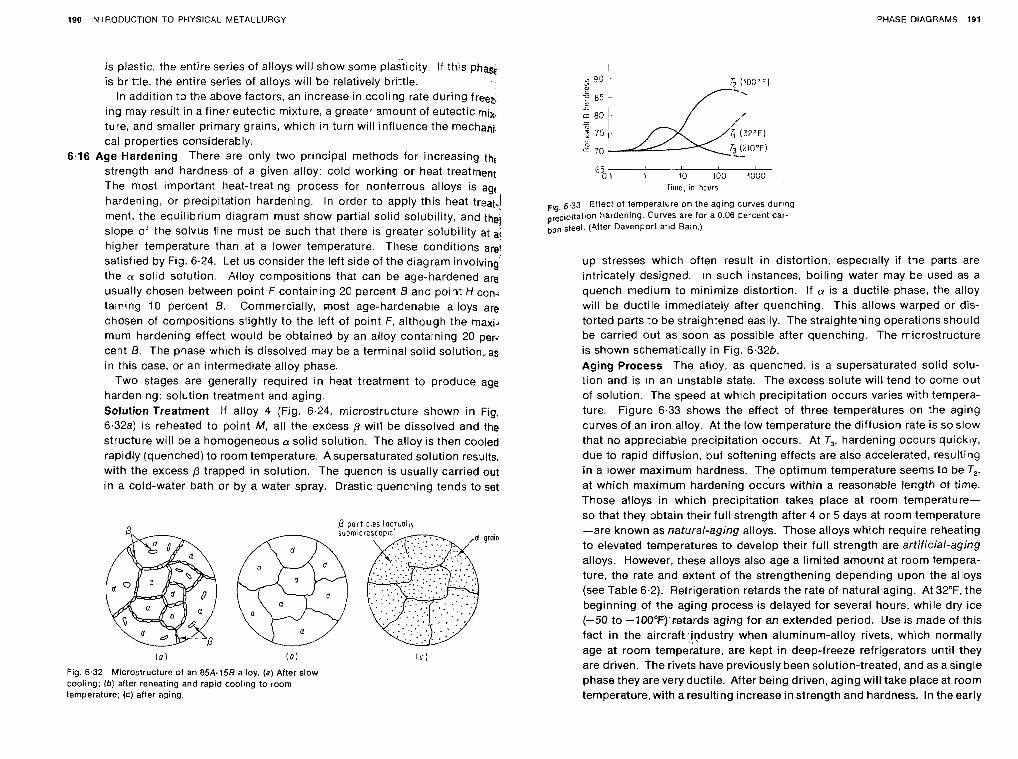
190 INTROOUCTION TO PHYSICAL METALLURGY PHASE DIAGRAMS 191
is plastic, the entire series of alloys will show some plasticity. If this ph* is brittle. the entire series of alloys will be relatively brittle.
In addition to the above factors, an increase in cooling rate during freez. ing may result in a finer eutectic mixture, a greater amount of eutectic mix. ture, and smaller primary grains, which in turn will influence the mechanj. cal properties considerably.
6.16 Age Hardening There are only two principal methods for increasing thf strength and hardness of a given alloy: cold working or heat treatment The most important heat-treating process for nonferrous alloys is agf hardening, or precipitation hardening. In order to apply this heat treat.! ment, the equilibrium diagram must show partial solid solubility, and thel slope of the solvus line must be such that there is greater solubility at ai higher temperature than at a lower temperature. These conditions are! satisfied by Fig. 6.24. Let us consider the left side of the diagram involving the solid solution. Alloy compositions that can be age-hardened are' usually chosen between point F containing 20 percent B and point H con: taining 10 percent B. Commercially, most age-hardenable alloys are chosen of compositions slightly to the left of point F, atthough the maxi. mum hardening effect would be obtained by an alloy containing 20 per. cent 8. The phase which is dissolved may be a terminal solid solution, as in this case, or an intermediate alloy phase.
Two stages are generally required in heat treatment to produce age hardening: solution treatment and aging. Solution Treatment If alloy 4 (Fig. 6.24, microstructure shown in Fig. 6.32a) is reheated to point M, all the excess 3 will be dissolved and the structure will be a homogeneous a solid solution. The alloy is then Cooled rapidly (quenched) to room temperature. A supersaturated solution results. with the excess p trapped in solution. The quench is usually carried out in a cold-water bath or by a water spray. Drastic quenching tends to set
4 o o i t cles ( o c r u a l l ~
Fig. 6.32 Microstructure of an 85A-158 alloy. (a) After slow cooling; Ib) after reheating and rapid cooling to room temperature; (c) after aging.
F , ~ 6.33 Effect of temperature on the aging curves during prec~pitation hardening. Curves are for a 0.06 percent car- bon steel. (After Davenport and B a n )
up stresses which often result in distortion, especially if the parts are intricately designed. In such instances, boiling water may be used as a quench medium to minimize distortion. If is a ductile phase, the alloy will be ductile immediately after quenching. This allows warped or dis- torted parts to be straightened easily. The straightening operations should be carried out as soon as possible after quenching. The microstructure is shown schematically in Fig. 6.32b. Aging Process The alloy, as quenched, is a supersaturated solid solu- lion and is in an unstable state. The excess solute will tend to come out of solution. The speed at which precipitation occurs varies with tempera- ture. Figure 6.33 shows the effect of three temperatures on the aging curves of an iron alloy. At the low temperature the diffusion rate is so slow that no appreciable precipitation occurs. At T,, hardening occurs quickly, due to rapid diffusion, but softening effects are also accelerated, resulting in a lower maximum hardness. The optimum temperature seems to be T,, at which maximum hardening occurs within a reasonable length of time. Those alloys in which precipitation takes place at room temperature- so that they obtain their full strength after 4 or 5 days at room temperature -are known as natural-aging alloys. Those alloys which require reheating to elevated temperatures to develop their full strength are artificial-aging alloys. However, these alloys also age a limited amount at room tempera- ture, the rate and extent of the strengthening depending upon the alloys (see Table 6-2). Refrigeration retards the rate of natural aging. At 32"F, the beginning of the aging process is delayed for several hours, while dry ice (-50 to -100?~'.retards aging for an extended period. Use is made of this fact in the aircraft.-industry when aluminum-alloy rivets, which normally age at room temperature, are kept in deep-freeze refrigerators until they are driven. t h e rivets have previously been solution-treated, and as a single phase they are very ductile. After being driven, aging will take place at room temperature, with a resulting increase in strength and hardness. In the early
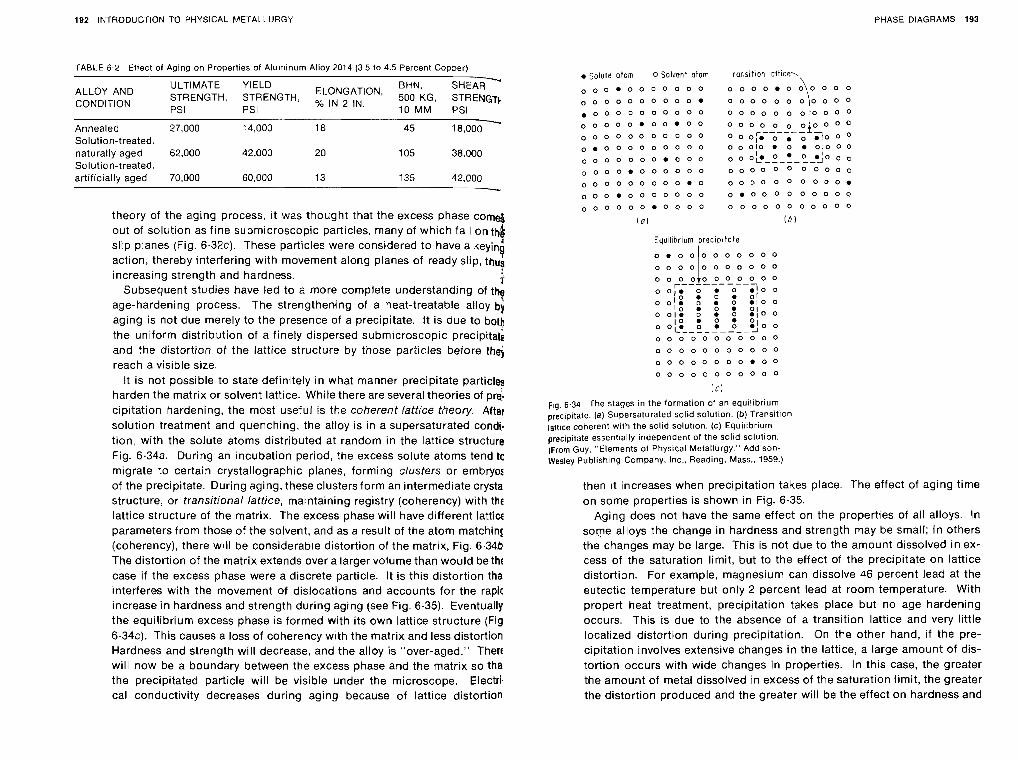
192 INTRODUCTION TO PHYSICAL METALLURGY PHASE DIAGRAMS 193
TABLE 6.2 Effect of Aqinq on Properties of Aluminum Alloy 2014 (3.5 to 4.5 Percent C o ~ ~ e r l
ULTIMATE YIELD SHEAR - ELONGATION. F::iONKG, STRENGTI AND STRENGTH, STRENGTH, %
CONDITION PSI PSI 10 MM PSI
Annealed 27.000 14,000 18 45 18.000 -
Solution-treated. naturally aged 62,000 42,000 20 105 38,000 Solution-treated, artificially aged 70,000 60,000 13 135 42,000
theory of the aging process, it was thought that the excess phase com out of solution as fine submicroscopic particles, many of which fall ontb 1 slip planes (Fig. 6.32~). These particles were considered to have a keyini 'B action, thereby interfering with movement along planes of ready slip, thus increasing strength and hardness. 3'
Subsequent studies have led to a more complete understanding of the age-hardening process. The strengthening of a heat-treatable alloy by aging is not due merely to the presence of a precipitate. It is due to both the uniform distribution of a finely dispersed submicroscopic precipitat;! and the distortion of the lattice structure by those particles before thej reach a visible size.
It is not possible to state definitely in what manner precipitate particleg harden the matrix or solvent lattice. While there are several theories of prej.
cipitation hardening, the most useful is the coherent lattice theory. Alter solution treatment and quenching, the alloy is in a supersaturated condi! tion, with the solute atoms distributed at random in the lattice structure Fig. 6.34a. During an incubation period, the excess solute atoms tend tc migrate to certain crystallographic planes, forming clusters or embrya of the precipitate. During aging, these clusters form an intermediate crysta structure, or transitional lattice, maintaining registry (coherency) with thb lattice structure of the matrix. The excess phase will have different lattia parameters from those of the solvent, and as a result of the atom matchin( (coherency), there will be considerable distortion of the matrix, Fig. 6.34b The distortion of the matrix extends over a larger volume than would be tht case if the excess phase were a discrete particle. It is this distortion tha interferes with the movement of dislocations and accounts for the rapic increase in hardness and strength during aging (see Fig. 6.35). Eventually the equilibrium excess phase is formed with its own lattice structure (Fig 6.34~). This causes a loss of coherency with the matrix and less distortion Hardness and strength will decrease, and the alloy is "over-aged." Thert will now be a boundary between the excess phase and the matrix so tha the precipitated particle will be visible under the microscope. Electrl. cal conductivity decreases during aging because of lattice distortion
Solute ofom 0 Solvent atom -ror,sition Icttice-. \
O O O O O O ~ O O O . O O O O O O O \ O O O O
. 0 0 0 0 0 0 0 0 0 0 0 0 0 0 0 0 0 ' 0 0 0 0 0 O O O O . O O . O O O O O O O ,------I 0 O ~ o O O O
0 0 0 0 0 0 0 0 0 0 0 0 O O 1 . J O O O
0 . 0 0 0 0 0 0 0 0 0 0 0 0 1 0 . 0 . 0 . 0 0 0 I. 0 0 0 0 ' 0 0 * 0 O O O O O O . O O O O O O L J
O 0 0 0 . 0 0 0 0 0 0 O O O O O 0 o o o o o O O O O O O O O 0 . O 0 0 0 0 0 0 0 0 0 0 . O 0 0 . 0 0 0 0 0 0 0 0 . 0 0 0 0 0 0 0 0 0 0 0 0 0 0 O . 0 0 0 0 0 0 0 0 0 0 0 0 0 0 0
(0) ( 3 )
Equilibrium precipi tote I
fig. 6.34 The stages in the formation of an equilibrium precipitate. (a) Supersaturated solid solution. (b ) Transition lettlce coherent with the solid solution. (c) Equilibrium preciphtate essentially independent of the solid solution. (From Guy. "Elements of Physical Metallurgy." Addison- Wesley P~~blishing Company. Inc.. Reading, Mass.. 1959.)
then it increases when precipitation takes place. The effect of aging time on some properties is shown in Fig. 6.35.
Aging does not have the same effect on the properties of all alloys. In some alloys the change in hardness and strength may be small; in others the changes may be large. This is not due to the amount dissolved in ex- cess of the saturation limit, but to the effect of the precipitate on lattice distortion. For example, magnesium can dissolve 46 percent lead at the eutectic temperature but only 2 percent lead at room temperature. With propert heat treatment, precipitation takes place but no age hardening occurs. This is due to the absence of a transition lattice and very little localized distortion during precipitation. On the other hand, if the pre- cipitation involves extensive changes in the lattice, a large amount of dis- tortion occurs with wide changes in properties. In this case, the greater the amount of metal dissolved in excess of the saturation limit, the greater the distortion produced and the greater will be the effect on hardness and
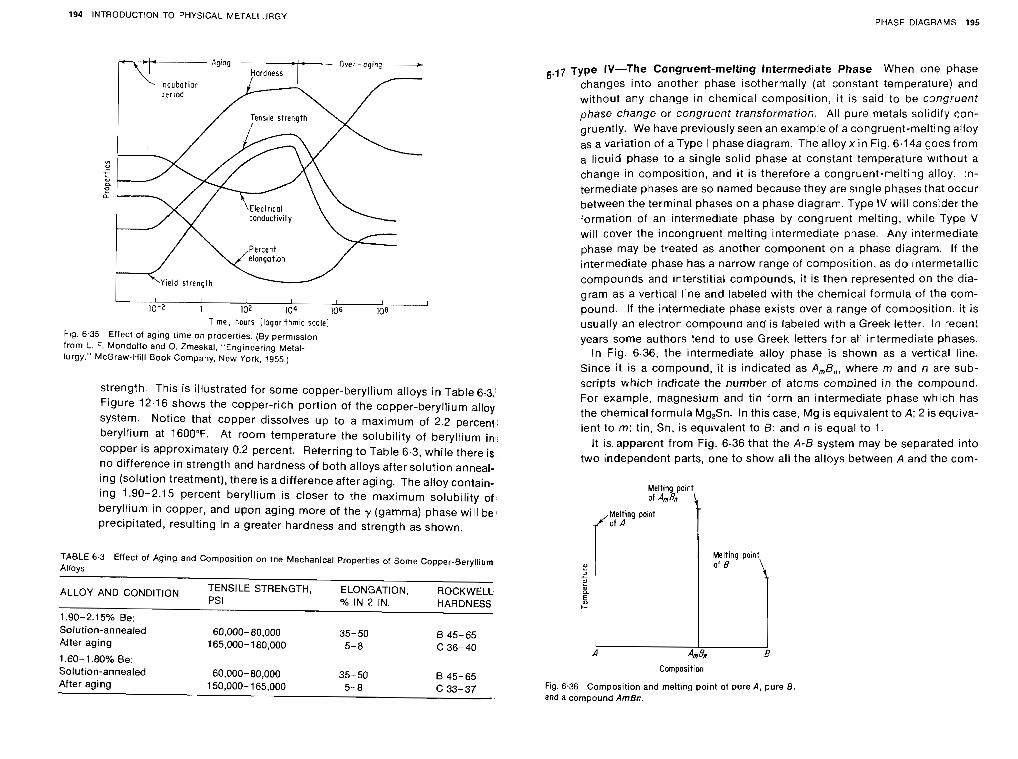
194 INTRODUCTtON TO PHYSICAL METALLURGY PHASE DIAGRAMS 195
I I I I t I I
10-2 I
I 132 104 106 108 T~me, Pours (logarithmic scale)
Fig. 6.35 Effect of aging rime on prooerties. (By perm~ssion from L. F. Mondolfo ancl 0. Zmeskal, "Engineering Metal- lurgy." McGraw-Hill Book Company. New York. 1955.)
strength. This is illustrated for some copper-beryllium alloys in Table 6.3. Figure 12.16 shows the copper-rich portion of the copper-beryllium alloy system. Not~ce that copper dissolves up to a maxlrnum of 2.2 percent beryllium at 1600°F. At room temperature the solub~lity of beryllium in copper is approximately 0.2 percent. Referring to Table 6.3, while there is no difference in strength and hardness of both alloys after solution anneal- ing (solution treatment), there is a d~fference after aging. The alloy contain- ing 1.90-2.15 percent beryll~um is closer to the maximum solubility of beryllium in copper, and upon aging more of the y (gamma) phase will be prec~pitated, resulting I n a greater hardness and strength as shown.
TABLE 6.3 Effect of Aging and Composition on the Mechanical Properties of Some Copper-Beryllium Alloys
ALLOY AND CONDITION Tp'YSILE STRENGTH. ELONGATION. ROCKWELL
'10 IN 2 IN. HARDNESS
1.90-2.1 5% Be:
Solution-annealed 60.000-80.000 35-50 B 45-65 After aging 165.000- 180,000 5-8 C 36-40 1.60- 1.80% Be: Solution-annealed 60,000- 80,000 35-50 6 45-65 After aging 150,000-1 65,000 5-8 C 33-37
6.f7 Type IV-The Congruent-melting Intermediate Phase When one phase changes into another phase isothermally (at constant temperature) and without any change in chemical composition, it is said to be congruent phase change or congruent transformation. All pure metals solidify con- gruently. We have previously seen an example of a congruent-melting alloy as a variation of a Type I phase diagram. The alloy x in Fig. 6.14a goes from a liquid phase to a single solid phase at constant temperature without a change in composition, and it is therefore a congruent-melting alloy. tn- termediate phases are so named because they are single phases that occur between the terminal phases on a phase diagram. Type 1V will consider the formation of an intermediate phase by congruent melting, while Type V will cover the incongruent melting intermediate phase. Any intermediate phase may be treated as another component on a phase diagram. If the intermediate phase has a narrow range of composition. as do intermetallic compounds and interstitial compounds, it is then represented on the dia- gram as a vertical line and labeled with the chemical formula of the com- pound. If the intermediate phase exists over a range of composition. it is usually an electron compound and is labeled with a Greek letter. In recent years some authors tend to use Greek letters for all intermediate phases.
In Fig. 6.36, the intermediate alloy phase is shown as a vertical line. Since it is a compound, i t is indicated as A,B,, where m and n are sub- scripts which indicate the number of atoms combined in the compound. For example, magnesium and tin form an intermediate phase which has the chemical formula Mg,Sn. In this case, Mg is equivalent to A; 2 is equiva- lent to m: tin, Sn, is equivalent to 6: and n is equal to 1.
It is apparent from Fig. 6.36 that the A-B system may be separated into two independent parts, one to show all the alloys between A and the com-
Melting point 0fA"B" J
Composition
Fig. 6.36 Composition and melting point of pure A. pure 6. and a compound AmBn.
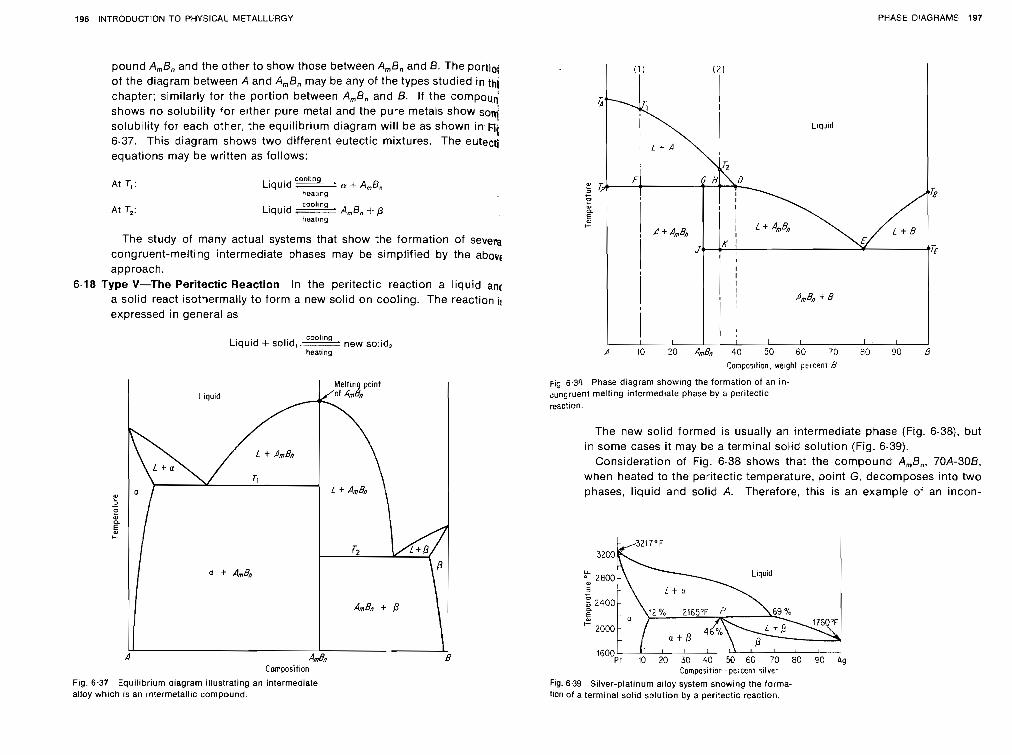
196 INTRODUCTION TO PHYSICAL METALLURGY PHASE DIAGRAMS 197
pound AmB, and the other to show those between AmB, and 8 . The portiq of the diagram between A and A,B, may be any of the types studied in th' 3 chapter; similarly for the portion between AmB, and B. If the compouq shows no solubility for elther pure metal and the pure metals show sod solubility for each other, the equilibrium diagram will be as shown in M; 6.37. This diagram shows two different eutectic mixtures. The eutecti equations may be written as follows:
At T, :
At T,:
Liquid coolw u + A,B,
pealing
cooling Liquid A,B, t- /3
heallng
The study of many actual systems that show the formation of sever3 congruent-melting intermediate phases may be simplified by the above approach.
6.18 Type V-The Peritectic Reaction In the peritectic reaction a liquid ant a solid react isothermally to form a new solid on cooling. The reaction if expressed in general as
coollng Liquid + solid, = new solid,
healing
Fig. 6.37 Equilibrium diagram illustrating an intermediate alloy whtch is an intermetallic compound.
Conpostt~on, weight percent B
Fig, 6.3Gf'hase diagram showing the formation of an in- congruent melting intermediate phase by a peritectic
The new solid formed is usually an intermediate phase (Fig. 6.381, but in some cases it may be a terminal solid solution (Fig. 6.39).
Consideration of Fig. 6.38 shows that the compound A,B,, 70A-30B, when heated to the peritectic temperature, point G, decomposes into two phases, liquid and solid A. Therefore, this is an example of an incon-
Liquid I
Cornpositior -percent silver
Fig. 6.39 Silver-platinum ailoy system showing the forma- tion of a terminal solid solution by a peritectic reaction.
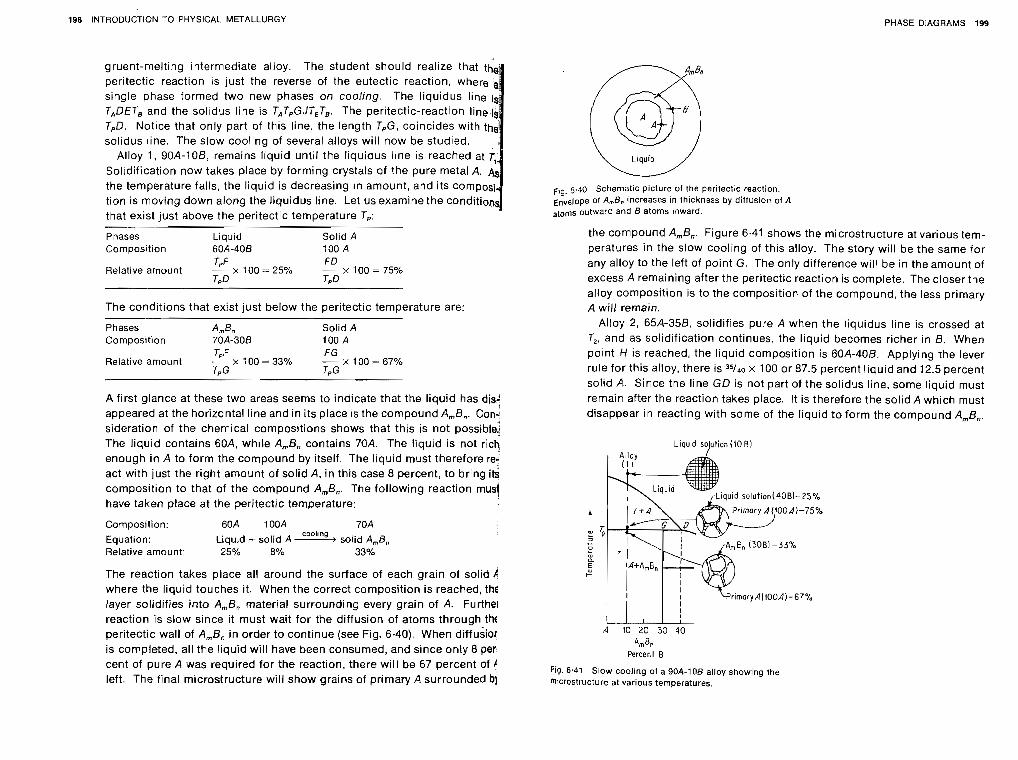
198 INTRODUCTION TO PHYSICAL METALLURGY PHASE DIAGRAMS 199
gruent-melting intermediate alloy. The student should realize that t i peritectic reaction is just the reverse of the eutectic reaction, where single phase formed two new phases on cooling. The liquidus line / TADET, and the solidus line is TATpGJTET,. The peritectic-reaction line 1 TpD. Notice that only part of this line, the length TpG, coincides with the solidus line. The slow cooling of several alloys will now be studied.
Alloy 1, 90A-106, remains liquid until the liquidus line is reached at Solidification now takes place by forming crystals of the pure metal A. the temperature falls, the liquid is decreasing in amount, and its compo tion is moving down along the liquidus line. Let us examine the conditio that exist just above the peritectic temperature Tp:
Phases Liquid Solid A Composition 60k-40B 100 A
TPF FD Relative amount -. x 100 = 25% - X 100 = 75%
To D TPD
The conditions that exist just below the peritectic temperature are:
Phases A,$" Solid A Composition 70A-30B 100 A
TPF FG Relative amount -- x 100 = 33% - x 100 = 67Y0
TPG TPG
A first glance at these two areas seems to indicate that the liquid has dis: appeared at the horizontal line and in its place IS the compound A$,. Con: sideration of the chem~cal compos~tions shows that this IS not possible, The liquid contains 60A, wh~le A,B, contains 70A. The liqurd is not rich enough in A to form the compound by itself. The liquid must therefore re: act with just the right amount of solid A, in this case 8 percent, to bring its composition to that of the compound A,B,. The following reaction must have taken ptace at the peritectic temperature:
Composition: 60A 'I OOA 70A cooling
Equation: Liquid + solid A + solid A,B, Relative amount: 25% 8% 33%
The reaction takes place all around the surface of each grain of solid A where the liqurd touches it. When the correct composition is reached, thE layer solidifies into Am6, material surrounding every grain of A. Further reaction is slow since it must wait for the diffusion of atoms through th6 peritectic wall of A,B, in order to continue (see Fig. 6.40). When diffusior is completed, all the liquid will have been consumed, and since onty 8 per. cent of pure A was required for the reaction, there will be 67 percent of 1 left. The final m~crostructure will show grains of primary A surrounded b]
F,~. 6.40 Schematic picture of the peritectic reaction. Envelope of AmB. increases in thickness by diffusion of A
outwar0 and B atoms inward.
the compound A,Bn. Figure 6.41 shows the microstructure at various tem- peratures in the slow cooling of this alloy. The story will be the same for any alloy to the left of point G. The only difference will be in the amount of excess A remaining after the peritectic reaction is complete. The closer the alloy composition is to the composition of the compound, the less primary A will remain.
Alloy 2 , 65A-356, solidifies pure A when the liquidus line is crossed at T,, and as solidification continues, the liquid becomes richer in 6 . When point H is reached, the liquid composition is 60A-406. Applying the lever rule for this alloy, there is 35/40 s 100 or 87.5 percent liquid and 12.5 percent solid A. Since the line G D is not part of the solidus line, some liquid must remain after the reaction takes place. It is therefore the solid A which must disappear in reacting with some of the liquid to form the compound Am&.
Liqu d so!ution (10 B)
solution(4OB)- 25%
rimory A(fOO4)-75%
4 I@ 2G 30 40
A,,, B, Percer,t 8
Fig. 6.41 Slow cooling of a 90A-10B alloy showing the microstt'ucture at various temperatures.
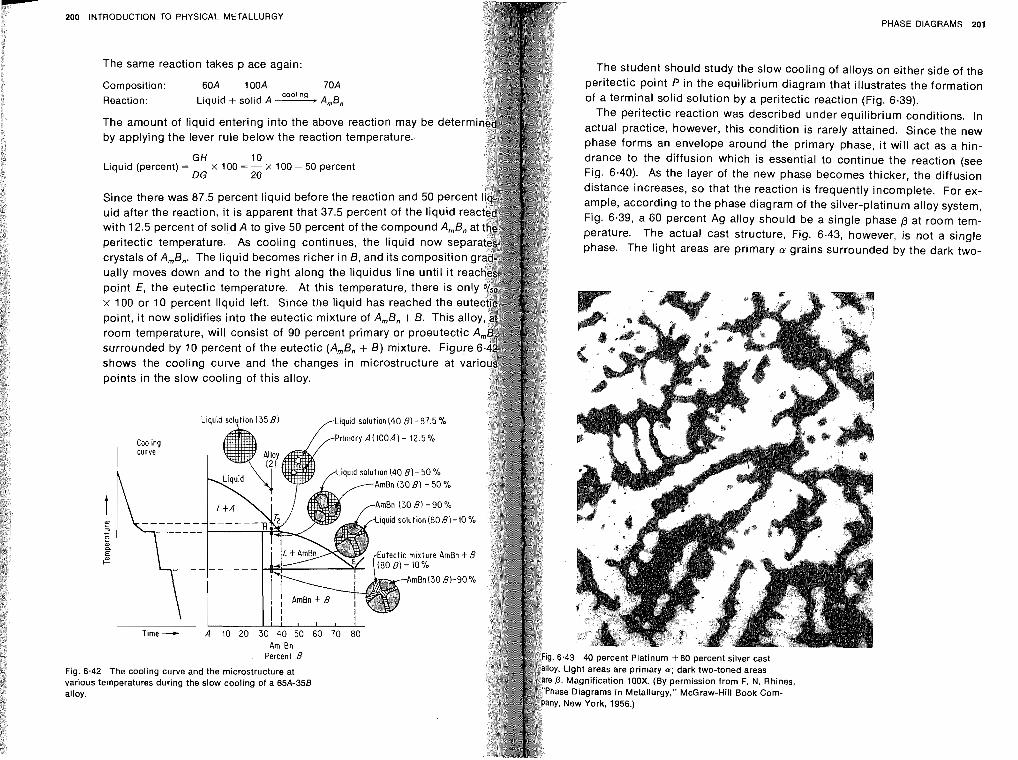
200 INTRODUCTION TO PHYSICAL METALLURGY PHASE DIAGRAMS 201
The same reaction takes place again: The student should study the slow cooling of alloys on either side of the
Composition: 60A 100A 70A peritectic point P in the equilibrium diagram that illustrates the formation Reaction: Liquid + solid A ) AmBn of a terminal solid solution by a peritectic reaction (Fig. 6.39).
The peritectic reaction was described under equilibrium conditions. In The amount of liquid entering into the above reaction may be deter actual practice, however, this condition is rarely attained. Since the new by applying the lever rule below the reaction temperature.. phase forms an envelope around the primary phase, it will act as a hin-
GH 10 drance to the diffusion which is essential to continue the reaction (see Liquid (percent) = - x I00 = - X I 00 = 50 percent
DG 20 Fig. 6.40). As the layer of the new phase becomes thicker, the diffusion distance increases, so that the reaction is frequently incomplete. For ex-
Since there was 87.5 percent liquid before the reaction and 50 per ample, according to the phase diagram of the silver-platinum alloy system, uid after the reaction, it is apparent that 37.5 percent of the liquid Fig. 6.39, a 60 percent Ag alloy should be a single phase p at room tem- with 12.5 percent of solid A to give 50 percent of the compound Am perature. The actual cast structure, Fig. 6.43, however, is not a single peritectic temperature. As cooling continues, the liquid now s phase. The light areas are primary a grains surrounded by the dark two- crystals of AmB,. The liquid becomes richer in B, and its composition ually moves down and to the right along the liquidus line until i t re point E, the eutectic temperature. At this temperature, there is x 100 or 10 percent liquid left. Since the liquid has reached the eu point, i t now solidifies into the eutectic mixture of AmBn + B. This all room temperature, will consist of 90 percent primary or proeutectic surrounded by 10 percent of the eutectic (A,Bn + B) mixture. Figure shows the cooling curve and the changes in microstructure at vari points in the slow cooling of this alloy.
Liquid solution I 4 0 B ) - 87.5 %
Primary A I IOOA) - 12.5%
mBn I30 B ) - 9 0 '10
iquid solution I80 8 ) - 10 %
mBnI30 8 ) -90%
Time -+ A 10 20 30 40 50 60 70 8 0 Am Bn
Percent 8
Fig. 6.42 The cooling curve and the microstructure at various temperatures during the slow cooling of a 65A-358 alloy.
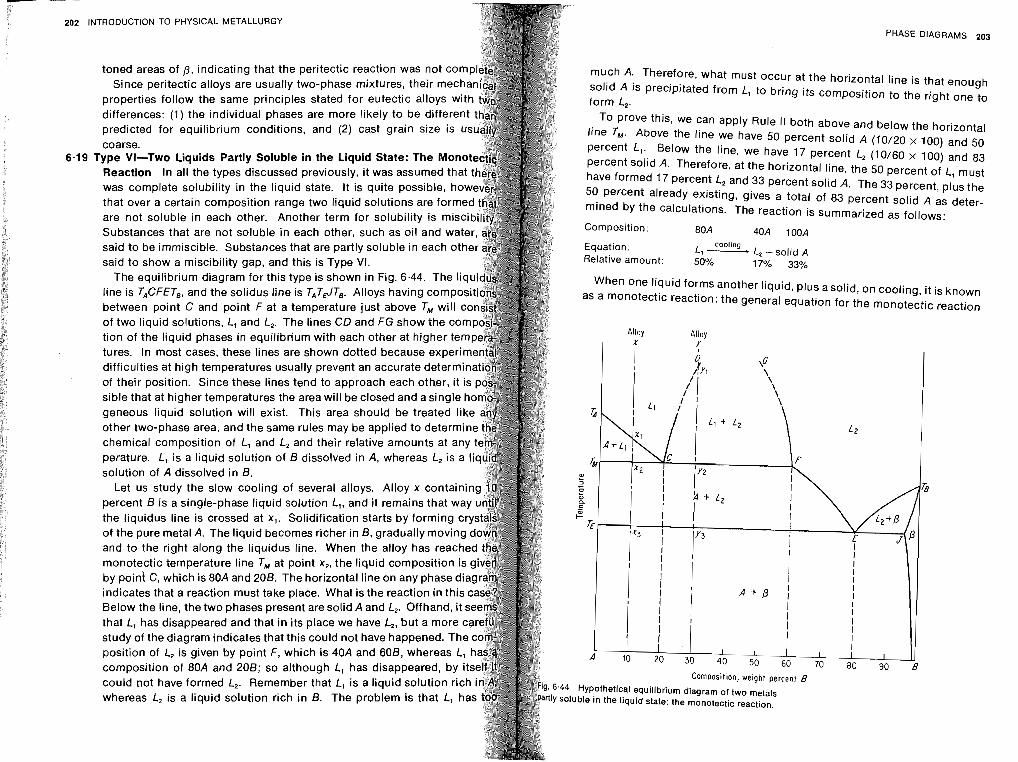
202 INTRODUCTION TO PHYSICAL METALLURGY PHASE DIAGRAMS
toned areas of p , indicating that the peritectic reaction was not complet Since peritectic alloys are usually two-phase mixtures, their mechanic
predicted for equilibrium conditions, and (2) cast grain size is usual%
was complete solubility in the liquid state. It is quite possible, howeve@ that over a certain composition range two liquid solutions are formed th
A
are not soluble in each other. Another term for solubility is miscibility: Substances that are not soluble in each other, such as oil and water, ar$ said to be immiscible. Substances that are partly soluble in each ot said to show a miscibility gap, and this is Type VI.
The equilibrium diagram for this type is shown in Fig. 6.44. The li line is T,CFET,, and the solidus line is T,TJT,. Alloys having comp between point C and point F at a temperature just above TM will of two liquid solutions, L, and L,. The lines CD and FG show the corn tion of the liquid phases in equilibrium with each other at higher tem tures. In most cases, these lines are shown dotted because exper' difficulties at high temperatures usually prevent an accurate determin of their position. Since these lines tend to approach each other, i t is sible that at higher temperatures the area will be closed and asingle geneous liquid solution will exist. This area should be treated li other two-phase area, and the same rules may be applied to determ~ chemical composition of L, and L, and their relative amounts at an perature. L, is a liquid solution of B dissolved in A, whereas L2 is a solution of A dissolved in B.
Let us study the slow cooling of several alloys. Alloy x contai percent B is a single-phase liquid solution L,, and it remains that way untij the liquidus line is crossed at x,. Solidification starts by forming crystal2 of the pure metal A. The liquid becomes richer in B, gradually moving dow and to the right along the liquidus line. When the alloy has reach monotectic temperature line T, at point x,, the liquid composition i by point C , which is 80A and 208. The horizontal line on any phased indicates that a reaction must take place. What is the re: Below the line, the two phases present are solid A and L,. Offhand, it that L, has disappeared and that in its place we have L, but a more study of the diagram indicates that this could not have happened. Th position of L, is given by point F, which is 40A and 60B, whereas L, composition of 80A and 208; so although L, has disappeared, by i could not have formed L,. Remember that L, is a liquid solution ric whereas L, is a liquid solution rich in B. The problem
much A. Therefore, what must occur at the horizontal line is that enough solid A is precipitated from L, to bring its composition to the right one to form L,.
Equation: cooling L, - L, +solid A
Relative amount: 50% 17% 33%
When one liquid forms another liquid, plus asolid, on cooling, it is known as a monotectic reaction; the general equation for the monotectic reaction
follow the same principles stated for eutectic alloys wit differences: (1) the individual phases are mc3re likely to be different To prove this, we can apply Rule 11 both above and below the horizontal
line TM. Above the line we have 50 percent solid A (10/20 x 100) and 50 coarse. Percent L1. Below the line, we have 17 percent L, (10/60 x 100) and 83
.ype v1--rwo Liquids partly Soluble in the Liquid State: The wonot Percent solid A. Therefore, at the horizontal line, the 50 percent of L, must Reaction In all the types discussed previously, i t was assumed that have famed 17 Percent L2 and 33 percent solid A. The 33 percent, pius the
50 Percent already existing, gives a total of 83 percent solid A as deter- mined by the calculations. The reaction is summarized as follows:
Composition: 80A 40A 100A
iction in thls c
Compos~t~on, we~ght percent B Hypothetical equilibrium diagram of two metals
luble in the liquid state: the monotectic reaction.
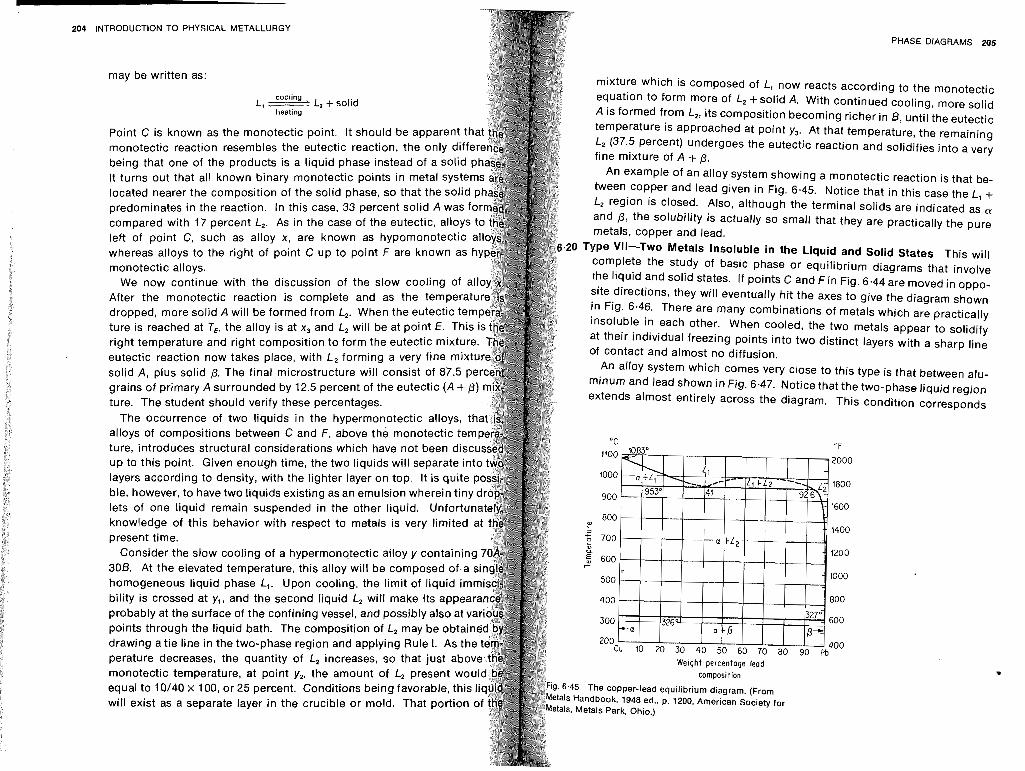
204 INTRODUCTION TO PHYSICAL METALLURGY
may be written as:
PHASE OtAGRAMS 205
mixture which is composed Of L, now reacts according to the monotectic
cooling equation to form more of L, +solid A. With continued cooling, more solid L, ' L, + solid
heating A is formed from L2, its Composition becoming richer in B, until the eutectic temperature is approached at point y,. At that temperature, the remaining
Point C is known as the monotectic point. It should be apparent th L2 (37.5 Percent) undergoes the eutectic reaction and solidifies into a very
monotectic reaction resembles the eutectic reaction, the on1 fine mixture of A + p . being that one of the products is a liquid phase instead of a solid
An example of an alloy System showing a monotectic reaction is that be- it turns out that all known binary monotectic points in ineta1 syste
tween copper and lead given in Fig. 6.45. Notice that in this case the L, + located nearer the composition of the solid phase, SO that the solid L2 region is closed. Also, although the terminal solids are indicated as a predominates in the reaction. In this case, 33 percent solid A was f and p, the solubility is actually SO small that they are practically the pure compared with 17 percent L,. As in the case of the eutectic, alloys metals, copper and lead. left of point C, such as alloy x, are known as hypomonotectic 0 Type Vli-Two Metals Insoluble in the Liquid and Solid States This will whereas alloys to the right of point C up to point F are known as complete the study of basic phase or equilibrium diagrams that involve monotectic alloys. (he liquid and solid states. If points C and F i n Fig. 6.44 are moved in oppo-
We now continue with the discussion of the slow coo site directions, they will eventually hit the axes to give the diagram shown
After the monotectic reaction is complete and as the te in Fig. 6.46. There are many combinations of metals which are practically
dropped, more solid A will be formed from L,. When the eutectic te insoluble in each other. When cooled, the two metals appear to solidify
ture is reached at T,, the alloy is at x, and L, will be at point E. Thi at their individual freezing points into two distinct layers with a sharp line
right temperature and right composition to form the eutectic mixtur of Contact and almost no diffusion. eutectic reaction now takes place, with L, forming a very fine mix
An alloy system which comes Very close to this type is that between alu- solid A, plus solid 0. The final microstructure will consist of 87.5 pe
minum and lead shown in Fig. 6.47. Notice that the two-phase liquid region grains of primary A surrounded by 12.5 percent of the eutectic ( A + P )
extends aIfllost entirely across the diagram. This condition corresponds ture. The student should verify these percentages.
The occurrence of two liquids in the hypermonotectic alloys, t alloys of compositions between C and F, above the monote " F ture, introduces structural considerations which have not been di 2000 up to this point. Given enough time, the two liquids will separate layers according to density, with the lighter layer on top. It is qu 1800
ble, however, to have two liquids existing as an emulsion wherein 1600
lets of one liquid remain suspended in the other liquid. Unf0 knowledge of this behavior with respect to metals is very limi (400
present time. 1200
Consider the slow cooling of a hypermonotectic alloy y containin 308. At the elevated temperature, this alloy will be composed of a 1000
homogeneous liquid phase L,. Upon cooling, the limit of liquid im
bility is crossed at y,, and the second liquid L, will make its a 800
probably at the surface of the confining vessel, and possibly 600
points through the liquid bath. The composition of L, may drawing a tie line in the two-phase region and applying Rule I. 400
perature decreases, the quantity of L, increases, SO that jus Weight percentage lead
monotectic temperature, at point y,, the amount of Lz pr composition
equal to 10140 x 100, or 25 percent. Conditions being favorabl . 6'45 The copper-lead equilibrium diagram. (From tals Handbook, 1948 ed., p. 1200, American Society for
will exist as a separate layer in the crucible or mold. That p Metals Park, Ohio.)
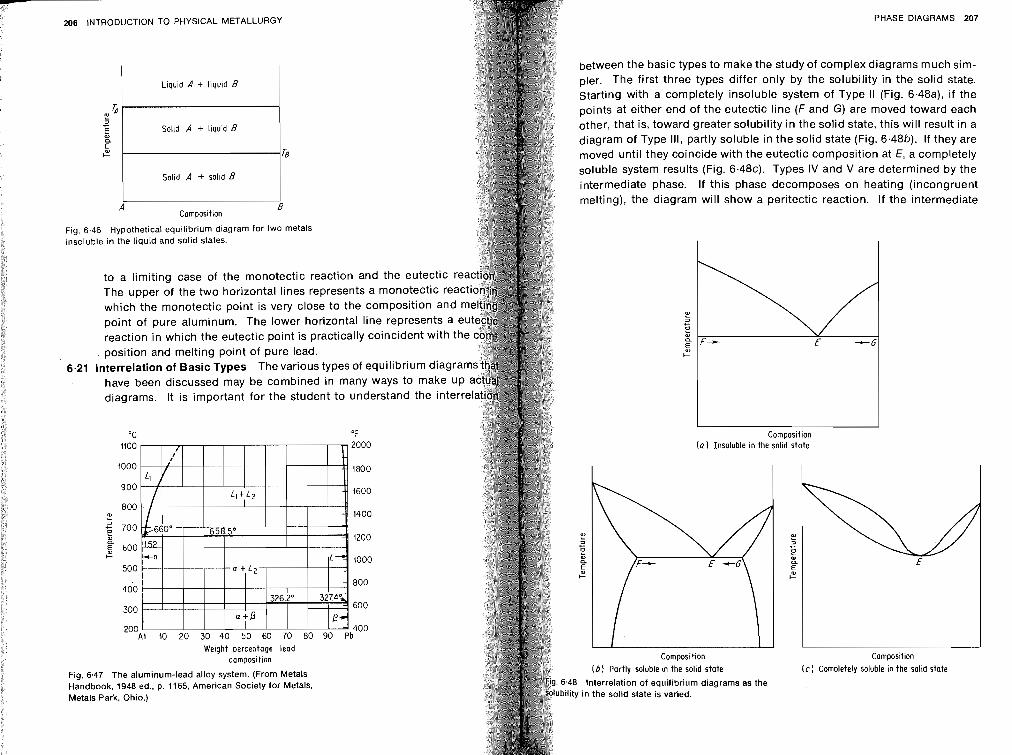
PHASE DIAGRAMS 207 206 INTRODUCTION TO PHYSICAL METALLURGY
between the basic types to make the study of complex diagrams much sim- pler. The first three types differ only by the solubility in the solid state. Starting with a completely insoluble system of Type II (Fig. 6,48a), if the points at either end of the eutectic line (F and G) are moved toward each other, that is, toward greater solubility in the solid state, this will result in a diagram of Type Ill, partly soluble in the solid state (Fig. 6.48b). If they are moved until they coincide with the eutectic composition at E, a completely soluble system results (Fig. 6.48~). Types IV and V are determined by the intermediate phase. If this phase decomposes on heating (incongruent melting), the diagram will show a peritectic reaction. If the intermediate
Composition ( a ) Insoluble in the solid state
.J8
e r, ... E
2 z .
Composition Composition (61 Partly SOluble in the solid state (c) Completely soluble in the solid state
Interrelation of equilibrium diagrams as the in the solid state is varied.
A Composition
8
Fig. 6.46 Hypothetical equilibrium diagram for two metals insoluble in the liquid and solid states.
to a limiting case of the monotectic reaction and the eutectic re The upper of the two horizontal lines represents a monotectic reacti which the monotectic point is very close to the composition and point of pure aluminum. The lower horizontal line represents a reaction in which the eutectic point is practically coincident with th position and melting point of pure lead.
6-21 Interrelation of Basic Types The various types of equilibrium diagra have been discussed may be combined in many ways to make up diagrams. It is important for the student to understand the interrel
"C "F 1100 2000
1000 1800
900 1600
800 a 1400 .. 5 700 ..
1200 g 600 C 1000
500
400 800
300 600
200 409 b
Weight percentoge lead composition
Fig. 6.47 The aluminum-lead alloy system. (From Metals Handbook, 1948 ed., p. 1165, American Society for Metals, Metals Park. Ohio.)
Liquld A + l~quld B
Solid A + liqu~d B
Sol~d A + solid B
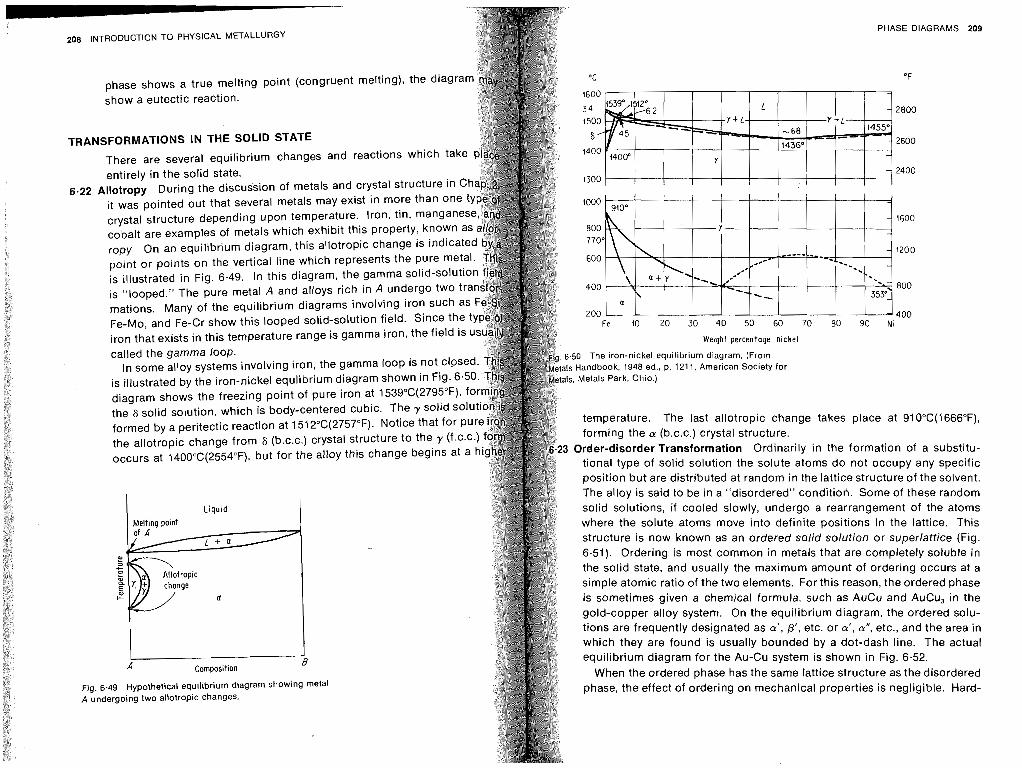
PHASE OIAC
. -
C Werqht percentage n ~ c k e l
208 INTRODUCTION TO PHYSICAL METALLURGY
phase shows a true melting point (congruent melting), the diagra "F
show a eutectic reaction. 1600 I I I
TRANSFORMATIONS IN THE SOLID STATE
There are several equilibrium changes and reactions which take entirely in the solid state.
6.22 Allotropy During the discussion of metals and crystal structure in C it was pointed out that several metals may exist in more than crystal structure depending upon temperature. Iron, tin, man cobalt are examples of metals which exhibit this property, kn ropy. On an equilibrium diagram, this allotropic change is indicate point or points on the vertical line which represents the pure met is illustrated in Fig. 6.49. In this diagram, the gamma solid-solut is "looped." The pure metal A and alloys rich in A undergo two tr mations. Many of the equilibrium diagrams involving iron such as Fe-Mo, and Fe-Cr show this looped solid-solution field. Since the iron that exists in this temperature range is gamma iron, the field is called the gamma loop.
In some alloy systems involving iron, the gamma loop is not close is illustrated by the iron-nickel equlibrium diagram shown in Fig. 6.5 diagram shows the freezing point of pure iron at 1539"C(2795"F), f the 6 solid solution, which is body-centered cubic. The y solid solu formed by a peritectic reaction at 1512"C(2757"F). Notice that for pur the allotropic change from 6 (b.c.c.) crystal structure to the y (f.c.c occurs at 1400°C(2554"F), but for the alloy this change begins at a
Liquid
Melting point
A Composition 8
Fig. 6.49 Hypothetical equilibrium diagram showing metal A undergoing two allotropic changes.
j0 The iron-nickel equilibrium diagram. (From Handbook, 1948 ed., p. 1211. American Society for Metals Park, Ohio.)
temperature. The last allotropic change takes place at 910°C(1666"F), forming the a (b.c.c.) crystal structure.
3 Order-disorder Transformation Ordinarily in the formation of a substitu- tional type of solid solution the solute atoms do not occupy any specific position but are distributed at random in the lattice structure of the solvent. The alloy is said to be in a "disordered" conditiorl. Some of these random solid solutions, if cooled slowly, undergo a rearrangement of the atoms
where the solute atoms move into definite positions in the lattice. This structure is now known as an ordered solid solution or superlattice (Fig. 6.51). Ordering is most common in metals that are completely soluble in the solid state, and usually the maximum amount of ordering occurs at a simple atomic ratio of the two elements. Forthis reason, the ordered phase is sometimes given a chemical formula, such as AuCu and AuCu, in the gold-copper alloy system. On the equilibrium diagram, the ordered solu- tions are frequently designated as a', /3', etc. or a' , a", etc., and the area in
which they are found is usually bounded by a dot-dash line. The actual equilibrium diagram for the Au-Cu system is shown in Fig. 6.52.
When the ordered phase has the same lattice structure as the disordered phase, the effect of ordering on mechanical properties is negligible. Hard-
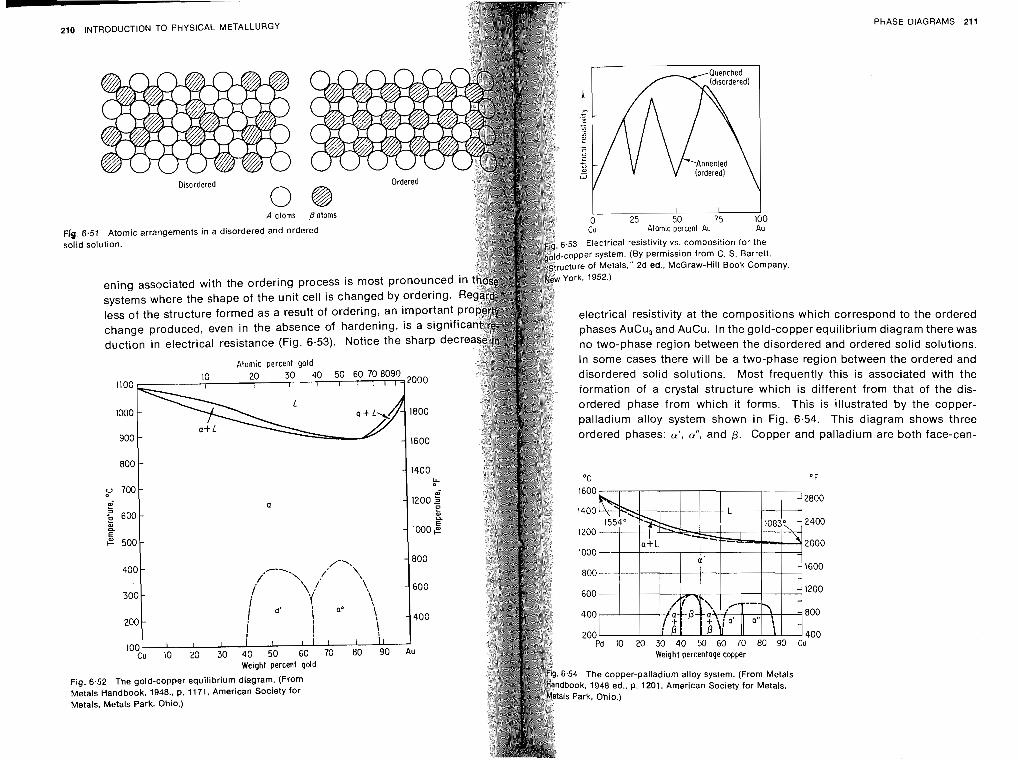
PHASE DIAGRAMS 211
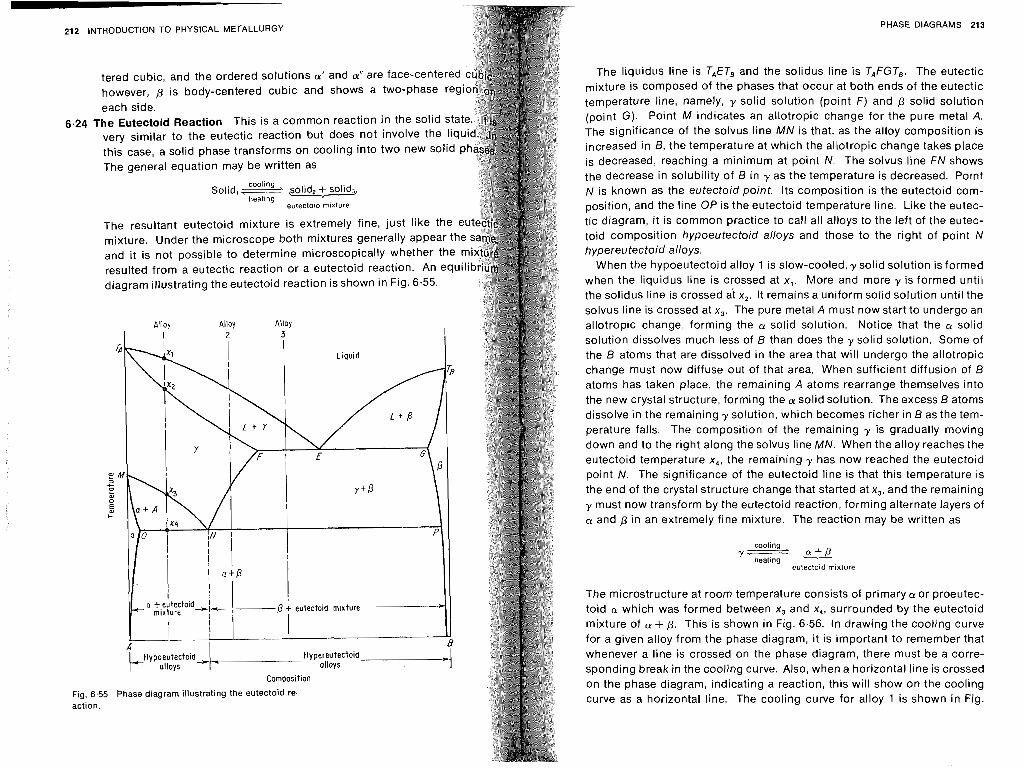
212 INTRODUCTION TO PHYSICAL METALLURGY
tered cubic, and the ordered solutions a' and a" are face-centere however, p is body-centered cubic and shows a two-phase re each side.
6.24 The Eutectoid Reaction This is a common reaction in the solid sta very similar to the eutectic reaction but does not involve the liq this case, a solid phase transforms on cooling into two new solid The general equation may be written as
cooling Solid, .- solid, + solid,
heating L---C-J eutectold rnlxture
The resultant eutectoid mixture is extremely fine, just like the eu mixture. Under the microscope both mixtures generally appear the
diagram illustrating the eutectoid reaction is shown in Fig. 6.55.
Fig. 6.55 Phase diagram illustrating the eutectoid re- action.
PHASE DIAGRAMS 213
The liquidus line is TAETB and the solidus line is TAFGTB. The eutectic mixture is composed of the phases that occur at both ends of the eutectic temperature line, namely, y solid solution (point F) and p solid solution (point G ) . Point M indicates an allotropic change for the pure metal A. The significance of the solvus line M N is that, as the alloy composition is increased in B, the temperature at which the allotropic change takes place is decreased, reaching a minimum at point N. The solvus line FN shows the decrease in solubility of B in .L. as the temperature is decreased. Point N is known as the eutectoid point. Its composition is the eutectoid com- position, and the line OP is the eutectoid temperature line. Like the eutec- tic diagram, it is common practice to call all alloys to the left of the eutec- toid composition hypoeutectoid alloys and those to the right of point N hypereutectoid alloys.
When the hypoeutectoid alloy 1 is slow-cooled, y solid solution is formed when the liquidus line is crossed at x,. More and more y is formed until the solidus line is crossed at x,. It remains a uniform solid solution until the solvus line is crossed at x,. The pure metal A must now start to undergo an allotropic change, forming the a solid solution. Notice that the a solid solution dissolves much less of B than does the y solid solution. Some of the B atoms that are dissolved in the area that will undergo the allotropic change must now diffuse out of that area. When sufficient diffusion of B atoms has taken place, the remaining A atoms rearrange themselves into the new crystal structure, forming the a solid solution. The excess B atoms dissolve in the remaining y solution, which becomes richer in B as the tem- perature falls. The composition of the remaining y is gradually moving down and to the right along the solvus line MN. When the alloy reaches the eutectoid temperature x,, the remaining y has now reached the eutectoid point N. The significance of the eutectoid line is that this temperature is the end of the crystal structure change that started at x,, and the remaining y must now transform by the eutectoid reaction, forming alternate layers of CY and p in an extremely fine mixture. The reaction may be written as
cooling Y. ."+P
heating eutectoid rntxture
The microstructure at room temperature consists of primary a or proeutec- toid a which was formed between x, and x,, surrounded by the eutectoid mixture of a + p. This is shown in Fig. 6.56. In drawing the cooling curve for a given alloy from the phase diagram, it is important to remember that whenever a line is crossed on the phase diagram, there must be a corre- sponding break in the cooling curve. Also, when a horizontal line is crossed on the phase diagram, indicating a reaction, this will show on the cooling curve as a horizontal line. The cooling curve for alloy 1 is shown in Fig.
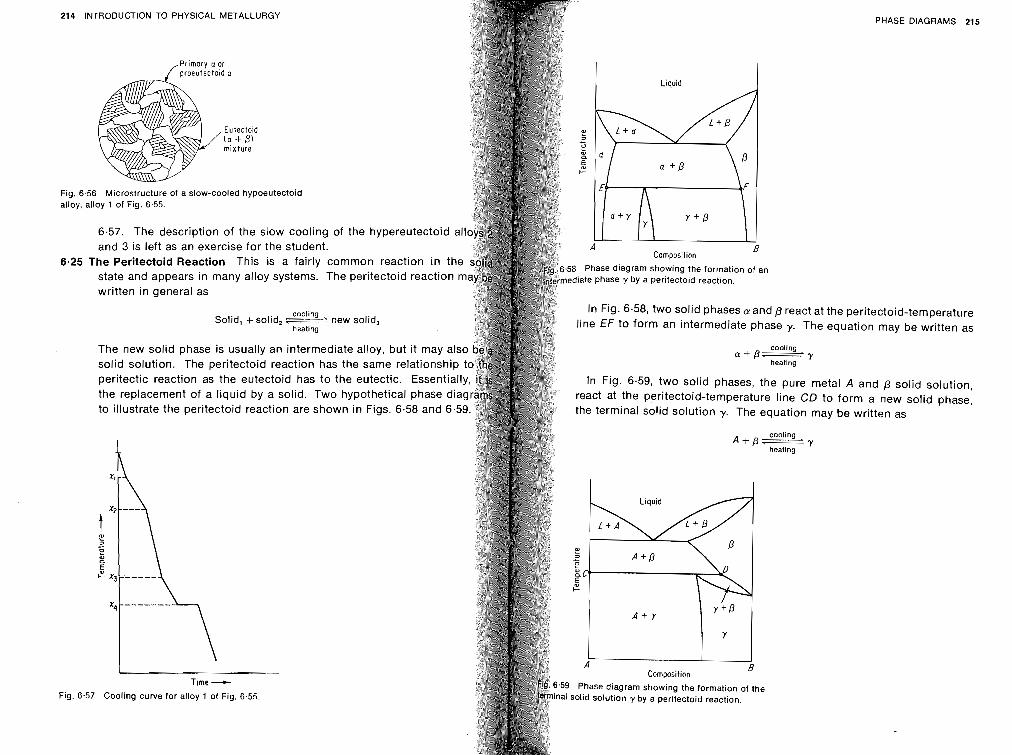
- 214 INTRODUCTION TO PHYSICAL METALLURGY
Fig. 6 alloy.
Fig.
PHASE DIAGRAMS 215
Liquid
.56 Microstructure of a slow-cooled hypoeutectoid alloy 1 of Fig. 6.55.
6.57. The description of the slow cooling of the hypereutectoid a and 3 is left as an exercise for the student. A B
Cornpos~tion
The peritectoid Reaction This is a fairly common reaction in th .58 Phase diagram showing the formation of an state and appears in many alloy systems. The peritectoid reaction m ediate phase y by a peritectoid reaction.
written in general as
cooling In Fig. 6.58, two solid phases a and P react at the peritectoid-temperature
Solid, + solid* new solid, heating
line Ef to form an intermediate phase y. The equation may be written as
cooling The new solid phase is usually an intermediate alloy, but it may a ~ + P - Y heatlng
solid solution. The peritectoid reaction has the same relationshi peritectic reaction as the eutectoid has to the eutectic. Essentia In Fig. 6.59, two solid phases, the pure metal A and P solid solution, the replacement of a liquid by a solid. Two hypothetical phase di react at the peritectoid-temperature line CD to form a new solid phase, to illustrate the peritectoid reaction are shown in Figs. 6.58 and 6. the terminal solid solution y. The equation may be written as
cooling A + P - ~ heating
E' +.. I? % 0' z
A + Y
Y
A Composition
e
T ~ m e - 59 Phase diagram showing the formation of the
6.57 Cooling curve for alloy 1 of Fig. 6.55. a1 solid solution y by a peritectoid reaction.
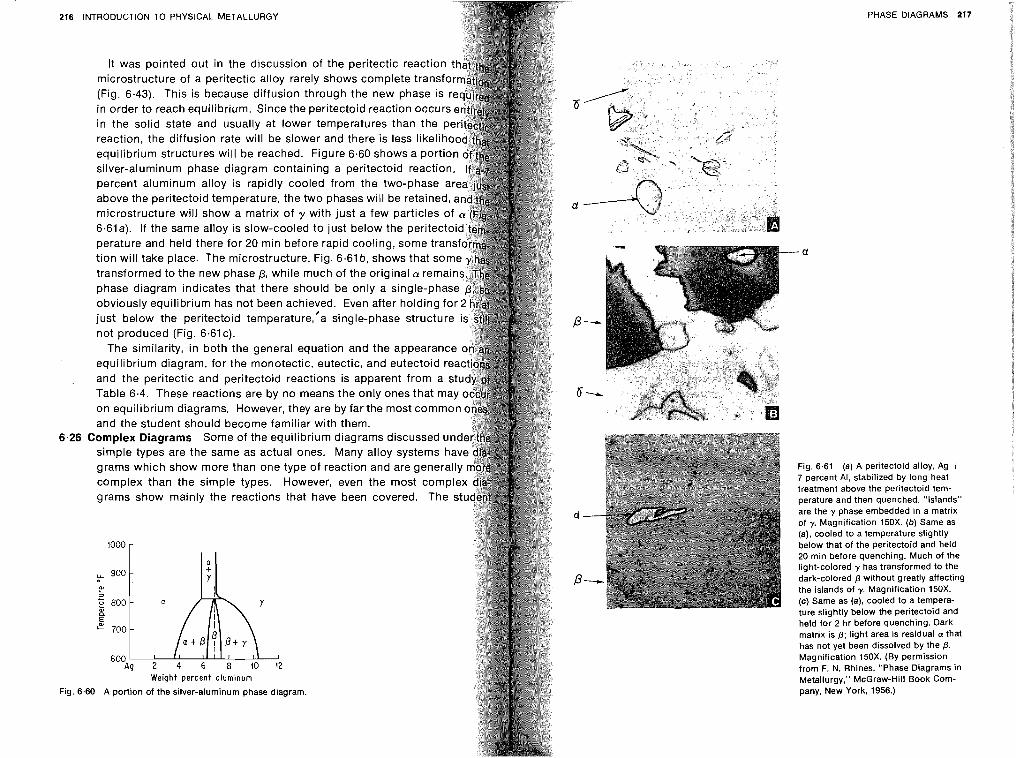
Fig. 6
INTRODUCTION TO PHYSICAL METALLURGY
It was pointed out in the discussion of the peritectic reaction microstructure of a peritectic alloy rarely shows complete transf (Fig. 6.43). This is because diffusion through the new phase is in order to reach equilibrium. Since the peritectoid reaction occur in the solid state and usually at lower temperatures than the reaction, the diffusion rate will be slower and there is less likeli equilibrium structures will be reached. Figure 6.60 shows a port silver-aluminum phase diagram containing a peritectoid reaction. percent aluminum alloy is rapidly cooled from the two-phase a above the peritectoid temperature, the two phases will be retained, microstructure will show a matrix of y with just a few particles of 6.61 a). If the same alloy is slow-cooled to just below the peritect perature and held there for 20 min before rapid cooling, some tra tion will take place. The microstructure, Fig. 6.61b, shows that som transformed to the new phase p, while much of the original a remai phase diagram indicates that there should be only a single-phas obviously equilibrium has not been achieved. Even after holding for just below the peritectoid temperature,'a single-phase structure not produced (Fig. 6.61~).
The similarity, in both the general equation and the appearance equilibrium diagram, for the monotectic, eutectic, and eutectoid re and the peritectic and peritectoid reactions is apparent from a s Table 6.4. These reactions are by no means the only ones that may on equilibrium diagrams. However, they are by far the most common and the student should become familiar with them.
Complex Diagrams Some of the equilibrium diagrams discussed und simple types are the same as actual ones. Many alloy systems ha grams which show more than one type of reaction and are general1 complex than the simple types. However, even the most comp grams show mainly the reactions that have been covered. The
tlIIl 2 2 800 ,oh a
700
a t 0 P + y
600 Ag 2 4 6 8 10 12
Weight percent aluminum
6 0 A portion of the silver-aluminum phase diagram.
PHASE DIAGRAMS 217
, . . -. . - : . .. . . . _ . . . . :@. z . .. . . ( I . .- .I " . .. . .
: - . . . . . .. . , , ., 4 . . ., ' 2 . : b "i, *:-s+,& - . . , -* , . . "." '
. .
Fig. 6.61 (a) A peritectoid alloy. Ag + 7 percent Al, stabilized by long heat treatment above the peritectoid tem- perature and then quenched. "Islands" are the y phase embedded in a matrix of y. Magnification 150X. (b) Same as (a), cooled to a temperature slightly below that of the peritectoid and held 20 min before quenching. Much of the light-colored y has transformed to the dark-colored p without greatly affecting the islands of y. Magnification 150X. (c) Same as (a), cooled to a tempera- ture slightly below the peritectoid and held for 2 hr before quenching. Dark matrix is p; light area is residual a that has not yet been dissolved by the p. Magnification 150X. (By permission from F. N. Rhines. "Phase Diagrams in Metallurgy," McGraw-Hill Book Corn- pany, New York. 1956.)
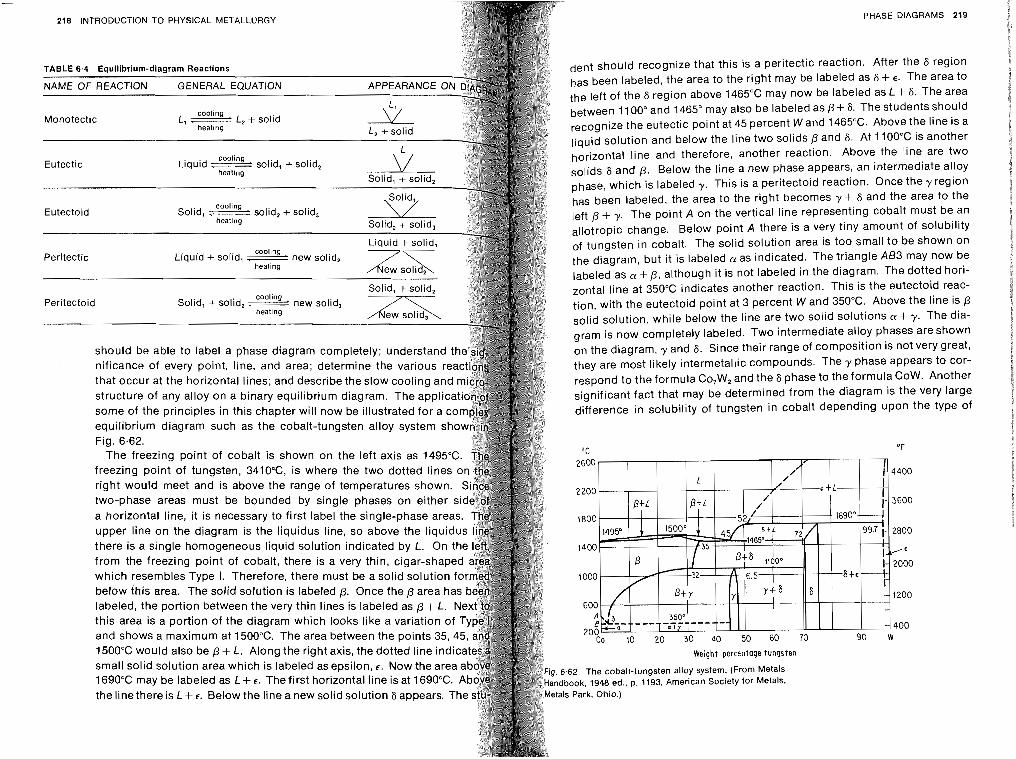
- 218 INTRODUCTION TO PHYSICAL METALLURGY PHASE DIAGRAMS 219
dent should recognize that this is a peritectic reaction. After the 6 region has been labeled, the area to the right may be labeled as 6 + E. The area to the left of the 6 region above 1465°C may now be labeled as L + 6. The area
Monotectic between 1100" and 1465" may also be labeled as p+ 6. The students should the eutectic point at 45 percent Wand 1465°C. Above the line is a
liquid solution and below the line two solids P and 6. At 1100°C is another
Eutectic horizontal line and therefore, another reaction. Above the line are two
6 and P. Below the line a new phase appears, an intermediate alloy phase, which is labeled y. This is a peritectoid reaction. Once they region
cooling has been labeled, the area to the right becomes y + 6 and the area to the Eutectoid Solid, .------ solid, + solid,
heating left p + Y. The point A on the vertical line representing cobalt must be an change. Below point A there is a very tiny amount of solubility
of tungsten in cobalt. The solid solution area is too small to be shown on the diagram, but it is labeled a as indicated. The triangle A63 may now be labeled as a + p, although it is not labeled in the diagram. The dotted hori-
cooling zontal line at 350°C indicates another reaction. This is the eutectoid reac- Peritectoid Solid, + solid, new solid,
heating tion, with the eutectoid point at 3 percent Wand 350°C. Above the line is p solid solution, while below the line are two solid solutions a + y. The dia- gram is now completely labeled. Two intermediate alloy phases are shown
should be able to label a phase diagram completely; understand on the diagram, y and 6. Since their range of composition is not very great, nificance of every point, line, and area; determine the various r they are most likely intermetallic compounds. The y phase appears to cor- that occur at the horizontal lines; and describe the slow cooling an respond to the formula Co,W, and the 6 phase to the formula COW. Another structure of any alloy on a binary equilibrium diagram. The applic significant fact that may be determined from the diagram is the very large some of the principles in this chapter will now be illustrated for a co difference in solubility of tungsten in cobalt depending upon the type of equilibrium diagram such as the cobalt-tungsten alloy system sho Fig. 6.62.
The freezing point of cobalt is shown on the left axis as 1495°C OF
freezing point of tungsten, 3410°C, is where the two dotted lines right would meet and is above the range of temperatures shown.
two-phase areas must be bounded by single phases on either s a horizontal line, i t is necessary to first label the single-phase area upper line on the diagram is the liquidus line, so above the liquid there is a single homogeneous liquid solution indicated by L. On t
which resembles Type I. Therefore, there must be a solid solution below ihis area. The solid solution is labeled p. Once the p area h
and shows a maximum at 1500°C. The area between the points 35,
Weight percentage tungsten
6.62 The cobalt-tungsten alloy system. (From Metals 1690°C may be labeled as L+ E. The first horizontal line is at 1690°C. dbook, 1948 ed.. p. 1193, American Society for Metals. the line there is L+ 6. Below the line a new solid solution 6 appears. The
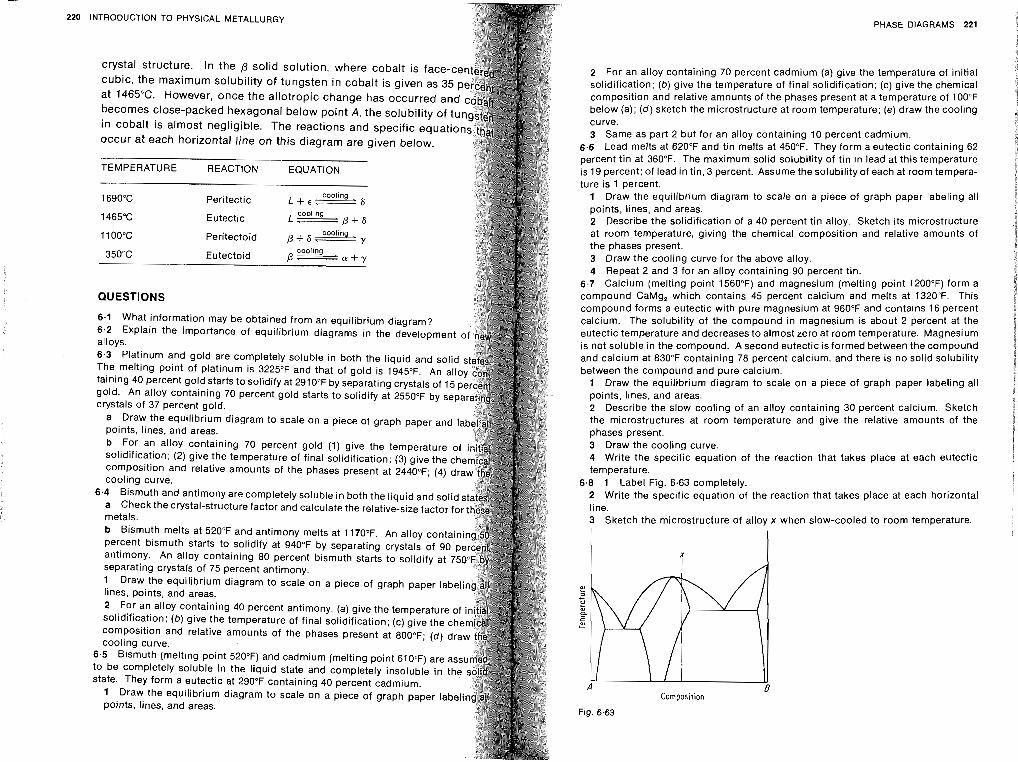
220 INTRODUCTION TO PHYSICAL METALLURGY
crystal structure. In the p solid solution, where cobalt is face-ce cubic, the maximum solubility of tungsten in cobalt is given as 35 p at 1465°C. However, once the allotropic change has occurred and becomes close-packed hexagonal below point A, the solubility of t in cobalt is almost negligible. The reactions and specific equa occur at each horizontal line on this diagram are given below.
TEMPERATURE REACTION EQUATION
1690°C cooling
Peritectic L + E - % ~
1465°C cooling
Eutectic L-p+S
1 100°C coolin Peritectoid p + S 2 y
350°C cooling
Eutectoid P --------' + Y
QUESTIONS
6.1 What information may be obtained from an equilibrium diagram? 6.2 Explain the importance of equilibrium diagrams in the development alloys. 6.3 Platinum and gold are completely soluble in both the liquid and solid The melting point of platinum is 3225°F and that of gold is 1945°F. An allo taining 40 percent gold starts to solidify at 2910°F by separating crystals of 15 p gold. An alloy containing 70 percent gold starts to solidify at 2550°F by sepa crystals of 37 percent gold.
a Draw the equilibrium diagram to scale on a piece of graph paper and I points, lines, and areas. b For an alloy containing 70 percent gold (1) give the temperature solidification; (2) give the temperature of final solidification; (3) give the composition and relative amounts of the phases present at 2440°F; (4) cooling curve.
6.4 Bismuth and antimony are completely soluble in both the liquid and solid a Check the crystal-structure factor and calculate the relative-size factor f metals. b Bismuth melts at 520°F and antimony melts at 1170°F. An alloy cont percent bismuth starts to solidify at 940°F by separating crystals of 90 antimony. An alloy containing 80 percent bismuth starts to solidify at 7 separating crystals of 75 percent antimony. 1 Draw the equilibrium diagram to scale on a piece of graph paper lab lines, points, and areas. 2 For an alloy containing 40 percent antimony, (a) give the temperature o solidification; (b) give the temperature of final solidification; (c) give the c composition and relative amounts of the phases present at 800°F; (d) d cooling curve.
6.5 Bismuth (melt~ng point 520°F) and cadmium (melting point 610°F) are to be completely soluble in the liquid state and completely insoluble in state. They form a eutectic at 290°F containing 40 percent cadmium.
1 Draw the equilibrium diagram to scale on a piece of graph paper labe points, lines, and areas.
PHASE DIAGRAMS 221
2 For an alloy containing 70 percent cadmium (a) give the temperature of initial solidification; (b) give the temperature of final solidification; (c) give the chemical composition and relative amounts of the phases present at a temperature of 100°F below (a); (d) sketch the microstructure at room temperature; (e ) draw the cooling curve. 3 Same as part 2 but for an alloy containing 10 percent cadmium.
6.6 Lead melts at 620°F and tin melts at 450°F. They form a eutectic containing 62 percent tin at 360°F. The maximum solid solubility of tin in lead at this temperature is 19 percent; of lead in tin, 3 percent. Assume the solubility of each at room tempera- ture is 1 percent. 1 Draw the equilibrium diagram to scale on a piece of graph paper labeling all points, lines, and areas. 2 Describe the solidification of a 40 percent tin alloy. Sketch its microstructure at room temperature, giving the chemical composition and relative amounts of the phases present. 3 Draw the cooling curve for the above alloy. 4 Repeat 2 and 3 for an alloy containing 90 percent tin.
6.7 Calcium (melting point 1560°F) and magnesium (melting point 1200°F) form a compound CaMg, which contains 45 percent calcium and melts at 1320°F. This compound forms a eutectic with pure magnesium at 960°F and contains 16 percent calcium. The solubility of the compound in magnesium is about 2 percent at the eutectic temperature and decreases to almost zero at room temperature. Magnesium is not soluble in the compound. A second eutectic is formed between the compound and calcium at 830°F containing 78 percent calcium, and there is no solid solubility between the compound and pure calcium.
1 Draw the equilibrium diagram to scale on a piece of graph paper labeling all points, lines, and areas. 2 Describe the slow cooling of an alloy containing 30 percent calcium. Sketch the microstructures at room temperature and give the relative amounts of the phases present. 3 Draw the cooling curve. 4 Write the specific equation of the reaction that takes place at each eutectic temperature.
6.8 1 Label Fig. 6.63 completely. 2 Write the specific equation of the reaction that takes place at each horizontal line. 3 Sketch the microstructure of alloy x when slow-cooled to room temperature.
Composition
Fig. 6.63
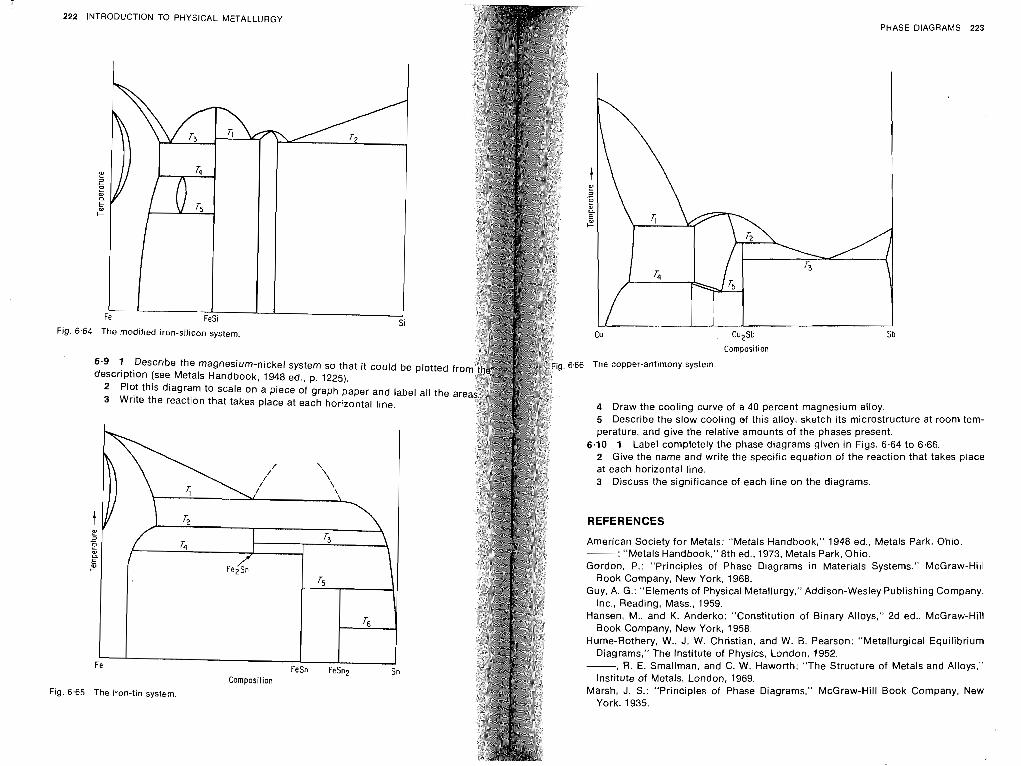
IC-
222 INTRODUCTION TO PHYSICAL METALLURGY
Fig. 6.64 The modified iron-silicon system.
6.9 1 Describe the magnesium-nickel system so that it could be plotted description (see Metals Handbook, 1948 ed., p. 1225).
2 Plot this diagram to scale on a piece of graph paper and label all the 3 Write the reaction that takes place at each horizo~ital line.
Composition
Fig. 6.65 The iron-tin system.
PHASE DIAGRAMS 223
CU Cu2Sb
Composition
.66 The copper-antimony system.
4 Draw the cooling curve of a 40 percent magnesium alloy. 5 Describe the slow cooling of this alloy, sketch its microstructure at room tem- perature, and give the relative amounts of the phases present.
6.10 1 Label completely the phase diagrams given in Figs. 6.64 to 6.66. 2 Give the name and write the specific equation of the reaction that takes place at each horizontal line. 3 Discuss the significance of each line on the diagrams.
REFERENCES
American Society for Metals: "Metals Handbook," 1948 ed., Metals Park. Ohio. -: "Metals Handbook," 8th ed.. 1973. Metals Park, Ohio. Gordon, P.: "Principles of Phase Diagrams in Materials Systems," McGraw-Hill
Book Company, New York, 1968. Guy, A. G.: "Elements of Physical Metallurgy," Addison-Wesley Publishing Company,
Inc., Reading, Mass.. 1959. Hansen, M., and K. Anderko: "Constitution of Binary Alloys," 2d ed., McGraw-Hill
Book Company. New York, 1958. Hume-Rothery, W., J. W. Christian, and W. B. Pearson: "Metallurgical Equilibrium
Diagrams," The lnstitute of Physics, London, 1952. - R. E. Smallman, and C. W. Haworth: "The Structure of Metals and Alloys,"
Institute of Metals, London. 1969. Marsh, J. S.: "Principles of Phase Diagrams," McGraw-Hill Book Company. New
York, 1935.
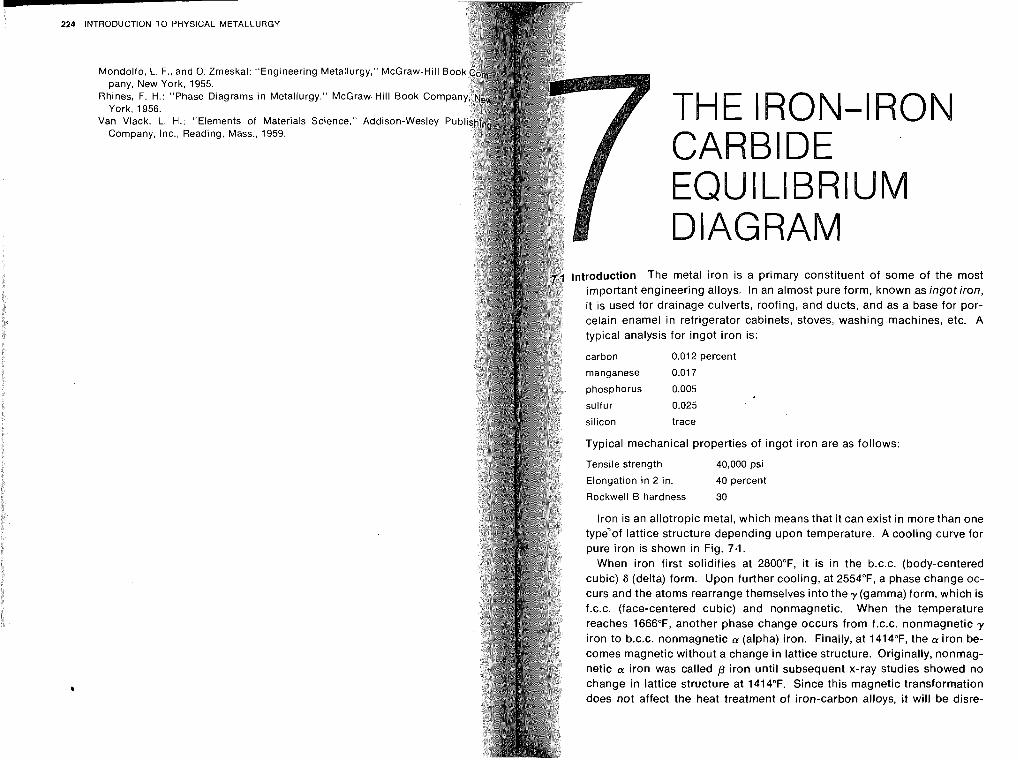
224 INTRODUCTION TO PHYSICAL METALLURGY
Mondolfo, L. F., and 0. Zmeskal: "Engineeri pany, New York, 1955.
Rhines, F. H.: "Phase Diagrams in Metallu~ York, 1956.
Van Vlack, L. H.: "Elements of Materials Company, Inc., Reading, Mass., 1959.
ng Metallurgy," McGraw
-gy." McGraw-Hill Book
Science." Addison-WE
!-Hill
Cor
isley THE CAR EQU
IRON-IR( BIDE ILIBRIUM ;RAM
introduction The metal iron is a primary constituent of some of the most important engineering alloys. In an almost pure form, known as ingot iron, it is used for drainage culverts, roofing, and ducts, and as a base for por- celain enamel in refrigerator cabinets, stoves, washing machines, etc. A typical analysis for ingot iron is:
carbon 0.01 2 percent
manganese 0.01 7
phosphorus 0.005
sulfur 0.025
silicon trace
Typical mechanical properties of ingot iron are as follows:
Tensile strength 40,000 psi
Elongation in 2 in. 40 percent
Rockwell B hardness 30
Iron is an allotropic metal, which means that it can exist in more than one type'of lattice structure depending upon temperature. A cooling curve for pure iron is shown in Fig. 7.1.
When iron first solidifies at 280OoF, it is in the b.c.c. (body-centered cubic) 8 (delta) form. Upon further cooling, at 2554"F, a phase change oc- curs and the atoms rearrange themselves into the gamma) form, which is f.c.c. (face-centered cubic) and nonmagnetic. When the temperature reaches 1666"F, another phase change occurs from f.c.c. nonmagnetic y iron to b.c.c. nonmagnetic cx (alpha) iron. Finally, at 1414"F, the CY iron be- comes magnetic without a change in lattice structure. Originally, nonmag- netic cx iron was called P iron until subsequent x-ray studies showed no change in lattice structure at 1414°F. Since this magnetic transformation does not affect the heat treatment of iron-carbon alloys, i t will be disre-
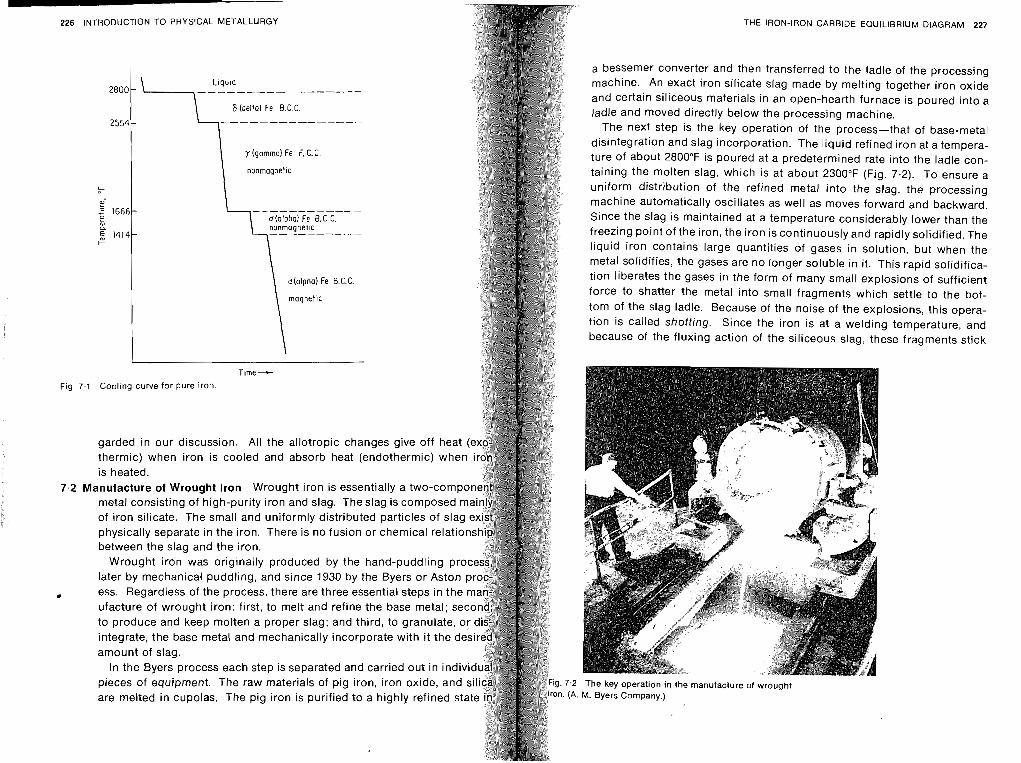
THE IRON-IRON CARBIDE EQUILIBRIUM DIAGRAM 227 226 INTRODUCTION TO PHYSICAL METALLURGY
2 8 0 0
2 5 5 4
E Y 2 1666-
a E_ 1 4 1 4 - t-
a bessemer converter and then transferred to the ladle of the processing L I ~ U I ~ machine. An exact iron silicate slag made by melting together iron oxide - ----------- ------
and certain siliceous materials in an open-hearth furnace is poured into a 6 (delta) Fe B.C.C. ladle and moved directly below the processing machine.
- --------------- The next step is the key operation of the process-that of base-metal disintegration and slag incorporation. The liquid refined iron at a tempera-
y (gamma1 Fe F. C.C. ture of about 2800°F is poured at a predetermined rate into the ladle con- taining the molten slag, which is at about 2300°F (Fig. 7.2). To ensure a uniform distribution of the refined metal into the slag, the processing machine automatically oscillates as well as moves forward and backward.
-------- ---- a(olpha1 Fe 8.C.C. Since the slag is maintained at a temperature considerably lower than the
freezing point of the iron, the iron is continuously and rapidly solidified. The liquid iron contains large quantities of gases in solution, but when the metal solidifies, the gases are no longer soluble in it. This rapid solidifica-
@(alpha) Fe 8.C.C. tion liberates the gases in the form of many small explosions of sufficient force to shatter the metal into small fragments which settle to the bot- tom of the slag ladle. Because of the noise of the explosions, this opera- tion is called shotting. Since the iron is at a welding temperature, and because of the fluxing action of the siliceous slag, these fragments stick
Time-+
Fig. 7.1 Cooling curve for pure iron.
garded in our discussion. All the allotropic changes give off heat ( thermic) when iron is cooled and absorb heat (endothermic) when is heated.
7.2 Manufacture of Wrought Iron Wrought iron is essentially a two-compo metal consisting of high-purity iron and slag. The slag is composed m of iron silicate. The small and uniformly distributed particles of slag physically separate in the iron. There is no fusion or chemical relatio between the slag and the iron.
Wrought iron was originally produced by the hand-puddling pro later by mechanical puddling, and since 1930 by the Byers or Aston ess. Regardless of the process, there are three essential steps in the * ufacture of wrought iron: first, to melt and refine the base metal; sec to produce and keep molten a proper slag; and third, to granulate, integrate, the base metal and mechanically incorporate with it the d amount of slag.
In the Byers process each step is separated and carried out in individ pieces of equipment. The raw materials of pig iron, iron oxide, and si anufacture of
are melted in cupolas. The pig iron is purified to a highly refined stat
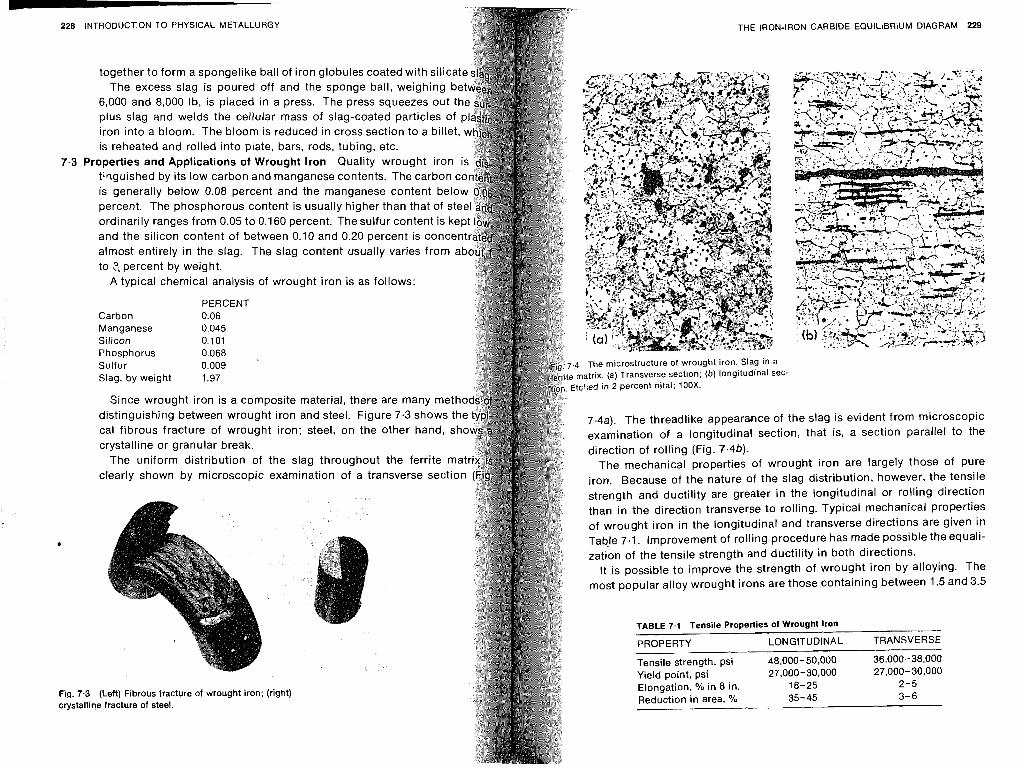
228 INTRODUCTION TO PHYSICAL METALLURGY
together to form a spongelike ball of iron globules coated with silicat The excess slag is poured off and the sponge ball, weighing b
6,000 and 8,000 Ib, is placed in a press. The press squeezes out t plus slag and welds the cellular mass of slag-coated particles of iron into a bloom. The bloom is reduced in cross section to a billet, is reheated and rolled into plate, bars, rods, tubing, etc.
7.3 Properties and Applications of Wrought lron Quality wrought iron tirlguished by its low carbon and manganese contents. The carbon is generally below 0.08 percent and the manganese content be1 percent. The phosphorous content is usually higher than that of st ordinarily ranges from 0.05 to 0.760 percent. The sulfur content is and the silicon content of between 0.10 and 0.20 percent is con almost entirely in the slag. The slag content usually varies from a to 2, percent by weight.
A typical chemical analysis of wrought iron is as follows:
PERCENT Carbon 0.06 Manganese 0.045 Silicon 0.101 Phosphorus 0.068 . Sulfur 0.009 Slag, by weight 1.97
Since wrought iron is a composite material, there are many metho distinguishing between wrought iron and steel. Figure 7.3 shows the cal fibrous fracture of wrought iron; steel, on the other hand, sh crystalline or granular break.
The uniform distribution of the slag throughout the ferrite mat clearly shown by microscopic examination of a transverse section
Fig. 7.3 (Left) Fibrous fracture of wrought iron; (right) 4 crystalline fracture of steel.
THE IRON-IRON CARBIDE EQUILIBRIUM DIAGRAM 229
4 The microstructure of wrought iron. Slag in a matrix. (a) Transverse section; (b) longitudinal sec- Itched in 2 percent nital; 100X.
7.4a). The threadlike appearance of the slag is evident from microscopic examination of a longitudinal section, that is, a section parallel to the direction of rolling (Fig. 7.4b).
The mechanical properties of wrought iron are largely those of pure iron. Because of the nature of the slag distribution, however, the tensile strength and ductility are greater in the longitudinal or rolling direction than in the direction transverse to rolling. Typical mechanical properties of wrought iron in the longitudinal and transverse directions are given in TaQle 7.1. Improvement of rolling procedure has made possible the equali- zation of the tensile strength and ductility in both directions.
It is possible to improve the strength of wrought iron by alloying. The most popular alloy wrought irons are those containing between 1.5 and 3.5
TABLE 7.1 Tensile Properties of Wrought lron
PROPERTY LONGITUDINAL TRANSVERSE
Tensile strength, psi 48,000- 50,000 36,000-38,000 Yield point, psi 27,000-30,000 27,000-30,000
Elongation, O/O in 8 in. 18- 25 2-5 Reduction in area, % 35-45 3-6
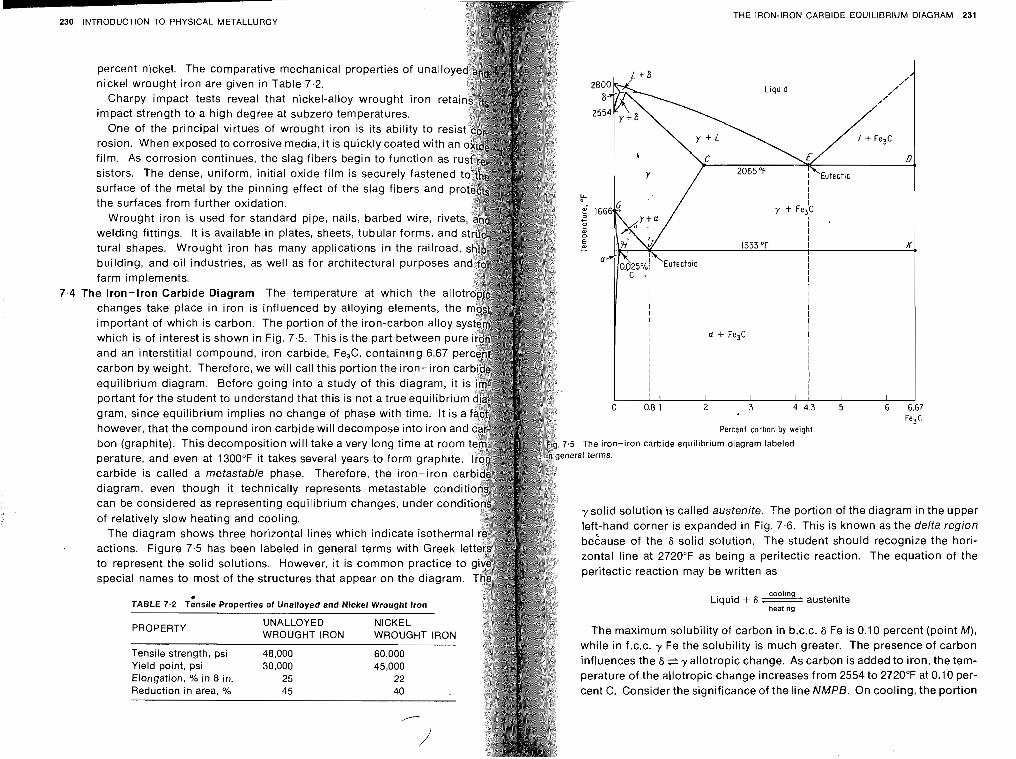
230 INTRODUCTION TO PHYSICAL METALLURGY
percent nickel. The comparative mechanical properties of unalloy nickel wrought iron are given in Table 7.2.
Charpy impact tests reveal that nickel-alloy wrought iron ret impact strength to a high degree at subzero temperatures.
One of the principal virtues of wrought iron is its ability to resi rosion. When exposed to corrosive media, it is quickly coated with an film. As corrosion continues, the slag fibers begin to function as r sistors. The dense, uniform, initial oxide film is securely fastened surface of the metal by the pinning effect of the slag fibers and pr the surfaces from further oxidation.
Wrought iron is used for standard pipe, nails, barbed wire, rivet welding fittings. It is available in plates, sheets, tubular forms, and tural shapes. Wrought iron has many applications in the railroad, building, and oil industries, as well as for architectural purposes a farm implements.
'he Iron-Iron Carbide Diagram The temperature at which the allot changes take place in iron is influenced by alloying elements, the important of which is carbon. The portion of the iron-carbon alloy which is of interest is shown in Fig. 7.5. This is the part between pu and an interstitial compound, iron carbide, Fe,C, containing 6.67 p carbon by weight. Therefore, we will call this portion the iron-iron ca equilibrium diagram. Before going into a study of this diagram, it portant for the student to understand that this is not a true equilibrium gram, since equilibrium implies no change of phase with time. It is a however, that the compound iron carbide will decompose into iron an bon (graphite). This decomposition will take a very long time at room perature, and even at 1300°F it takes several years to form graphite. carbide is called a metastable phase. Therefore, the iron-iron diagram, even though it technically represents metastable co can be considered as representing equilibrium changes, under c of relatively slow heating and cooling.
The diagram shows three horizontal lines which indicate isotherma actions. Figure 7.5 has been labeled in general terms with Greek let to represent the solid solutions. However, it is common practice to special names to most of the structures that appear on the diagram.
* TABLE 7.2 Tensile Properties of Unalloyed and Nickel Wrought iron
PROPERTY UNALLOYED NICKEL WROUGHT IRON WROUGHT IRON
Tensile strength, psi 48,000 60,000 Yield point, psi 30,000 45,000 Elongation, % in 8 in. 25 22 Reduction in area, % 45 40
,--- /'
- THE IRON-IRON CARBIDE EQUILIBRIUM DIAGRAM 231
Percent carbon by weight
.5 The iron-iron carbide equilibrium diagram labeled ieral terms.
y solid solution is called austenite. The portion of the diagram in the upper left-hand corner is expanded in Fig. 7.6. This is known as the delta region be6ause of the 6 solid solution. The student should recognize the hori- zontal line at 2720°F as being a peritectic reaction. The equation of the peritectic reaction may be written as
cooling Liquid + 6 austenite
heating
The maximum solubility of carbon in b.c.c. 6 Fe is 0.10 percent (point M), while in f.c.c. Fe the solubility is much greater. The presence of carbon influences the 6 e y allotropic change. As carbon is added to iron, the tem- perature of the allotropic change increases from 2554 to 2720°F at 0.10 per- cent C. Consider the significance of the line NMPB. On cooling, the portion
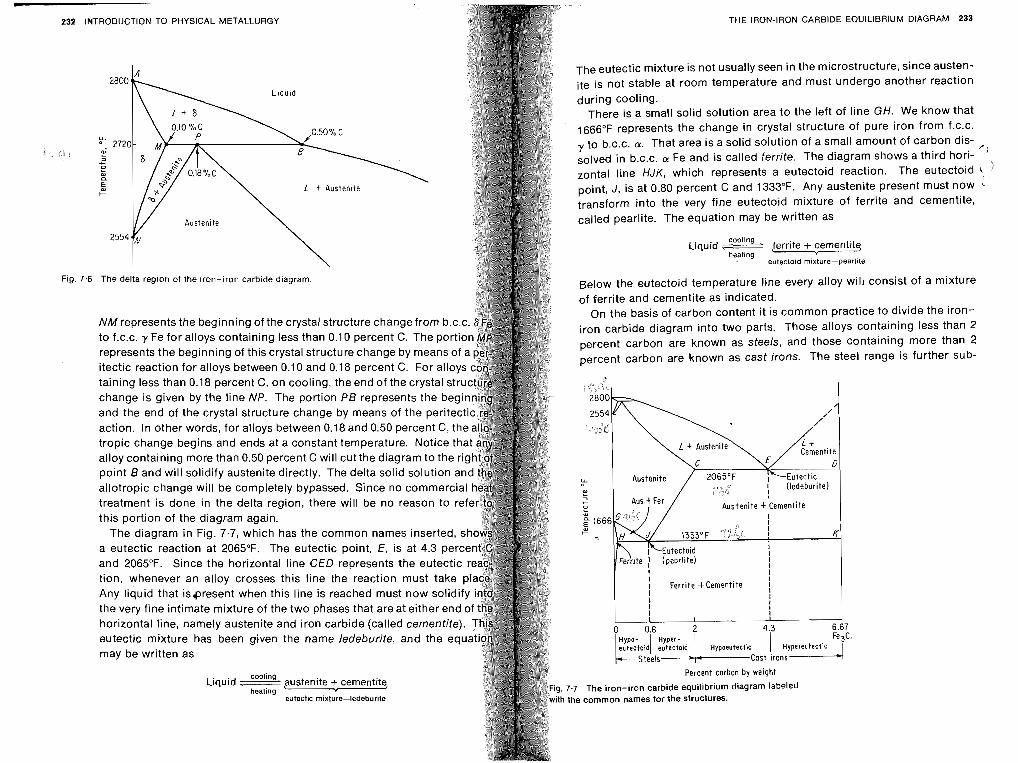
232 INTRODUCTION TO PHYSICAL METALLURGY
Fig. The delta region of the won-iron carb~de d~agram 4
NM represents the beginning of the crystal structure change from b. to f.c.c. y Fe for alloys containing less than 0.10 percent C. The po represents the beginning of this crystal structure change by means of a itectic reaction for alloys between 0.10 and 0.18 percent C. For alloys taining less than 0.18 percent C, on cooling, the end of the crystal stru change is given by the line NP. The portion PB represents the be and the end of the crystal structure change by means of the perit action. In other words, for alloys between 0.18 and 0.50 percent C, tropic change begins and ends at a constant temperature. Notice t alloy containing more than 0.50 percent C will cut the diagram to the point 6 and will solidify austenite directly. The delta solid solution a allotropic change will be completely bypassed. Since no commercia treatment is done in the delta region, there will be no reason to ref this portion of the diagram again.
The diagram in Fig. 7.7, which has the common names inserted, a eutectic reaction at 2065°F. The eutectic point, E, is at 4.3 perc and 2065°F. Since the horizontal line CEO represents the eutectic r tion, whenever an alloy crosses this line the reaction must take p Any liquid that isgresent when this line is reached must now solidify the very fine intimate mixture of the two phases that are at either end of horizontal line, namely austenite and iron carbide (called cementite). eutectic mixture has been given the name ledeburite, and the equ may be written as
cooling Liquid . austenite -I- cementite heating
eutectic mixture-ledeburite
THE IRON-IRON CARBIDE EQUILIBRIUM DIAGRAM 233
The eutectic mixture is not usually seen in the microstructure, since austen- ite is not stable at room temperature and must undergo another reaction during cooling.
There is a small solid solution area to the left of line GH. We know that 1666°F represents the change in crystal structure of pure iron from f.c.c.
to b.c.c. a. That area is a solid solution of a small amount of carbon dis- solved in b.c.c. a Fe and is called ferrite. The diagram shows a third hori- zontal line HJK, which represents a eutectoid reaction. The eutectoid
~ o i n t , J , is at 0.80 percent C and 1333°F. Any austenite present must now transform into the very fine eutectoid mixture of ferrite and cementite, called pearlite. The equation may be written as
CooIlng Liquid ======= ferrite + cementite
heat~ng eutectold rn~xture-pearlite
Below the eutectoid temperature line every alloy will consist of a mixture of ferrite and cementite as indicated.
On the basis of carbon content it is common practice to divide the iron- iron carbide diagram into two parts. Those alloys containing less than 2 percent carbon are known as steels, and those containing more than 2 percent carbon are known as cast irons. The steel range is further sub-
I Austenite / 2065'F
HU>. T 1 5 1 .
A ) / Austenite + Cementite I
I Ferrite +Cementite I / I I I I I
I I 0 6.67
Steels Cost irons Percent carbon by weight
7.7 The iron-iron carbide equilibrium diagram labeled the common names for the structures.
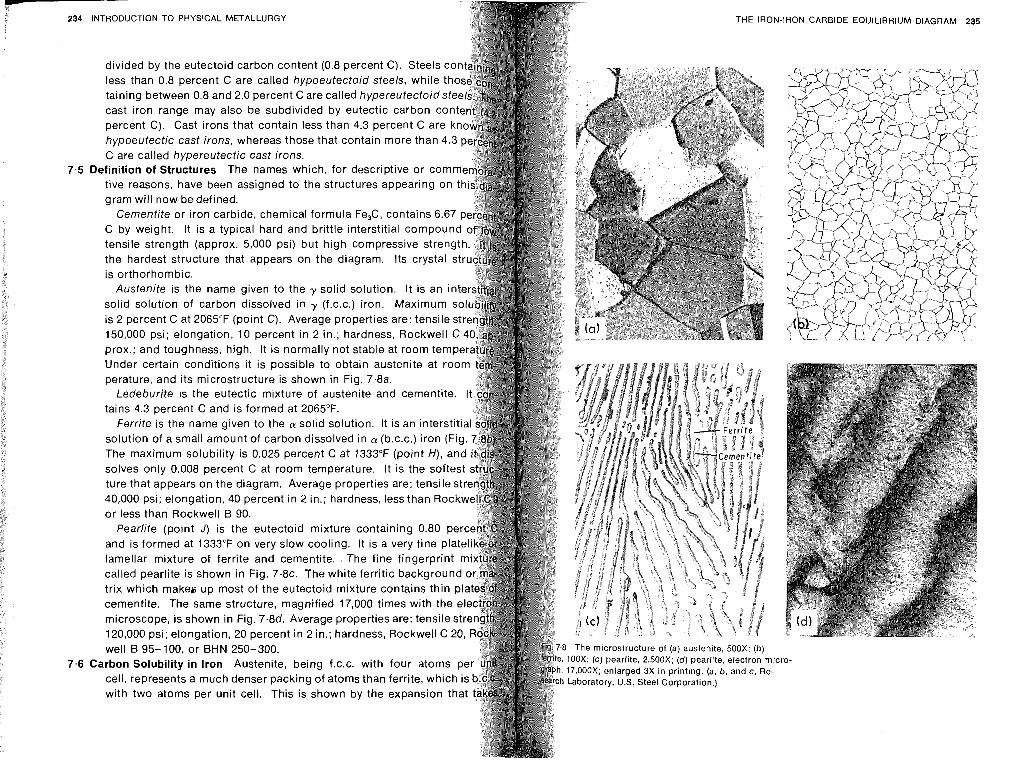
INTRODUCTION TO PHYSICAL METALLURGY THE IRON
less than 0.8 percent C are called hypoeutectoid steels, while th
percent C). Cast irons that contain less than 4.3 percent C ar hypoeutectic cast irons, whereas those that contain more than C are called hypereutectic cast irons.
Definition of Structures The names which, for descriptive or com
gram will now be defined. Cementite or iron carbide, chemical formula Fe,C, contains 6.67
C by weight. It is a typical hard and brittle interstitial compoun tensile strength (approx. 5,000 psi) but high compressive streng the hardest structure that appears on the diagram. Its crystal s is orthorhombic.
Austenite is the name given to the solid solution. It is an int
is 2 percent C at 2065°F (point C). Average properties are: tensile str
prox.; and toughness, high. i t is normally not stable at room te Under certain conditions it is possible to obtain austenite at perature, and its microstructure is shown in Fig. 7.8a.
tains 4.3 percent C and is formed at 2065°F.
solves only 0.008 percent C at room temperature. It is the so ture that appears on the diagram. Average properties are: tensi
or less than Rockwell B 90. Pearlite (point J) is the eutectoid mixture containing 0.80
called pearlite is shown in Fig. 7 . 8 ~ . The white ferritic backgroun trix which makes up most of the eutectoid mixture contains thin cementite. The same structure, magnified 17,000 times with the
well B 95-100, or BHN 250-300. microstructure of (a) austenite, 500X: (b)
Carbon Solubility in Iron Austenite, being f.c.c. with four atoms OX; enlarged 3X i n printing. (a, b, and c, Re-
cell, represents a much denser packing of atoms than ferrite, which ratory. U.S. Steel Corporation.) with two atoms per unit cell. This is shown by the expansion th
-IRON CARBIDE EQUILIBRIUM DIAGRAM 235
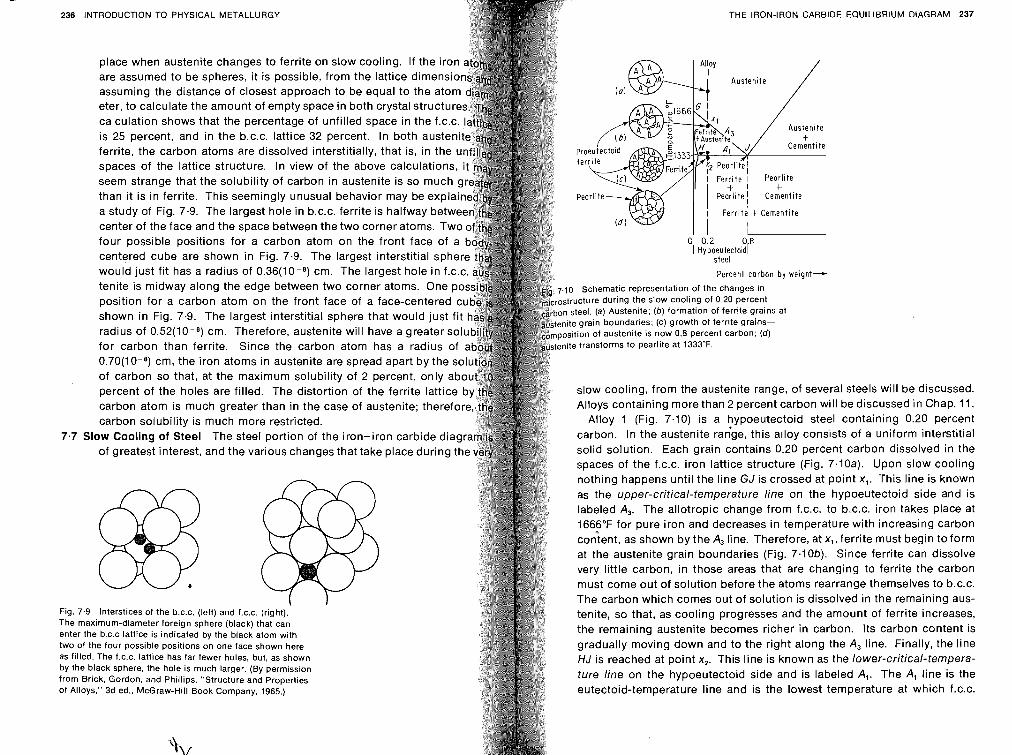
236 INTRODUCTION TO PHYSICAL METALLURGY THE IRON-IRON CARBIDE EQUILIBRIUM DIAGRAM 237
place when austenite changes to ferrite on slow cooling. If the iron are assumed to be spheres, it is possible, from the lattice dimensio assuming the distance of closest approach to be equal to the eter, to calculate the amount of empty space in both crystal stru calculation shows that the percentage of unfilled space in the is 25 percent, and in the b.c.c. lattice 32 percent. In both auste ferrite, the carbon atoms are dissolved interstitially, that is, in the u spaces of the lattice structure. In view of the above calculations, seem strange that the solubility of carbon in austenite is so much than it is in ferrite. This seemingly unusual behavior may be expla a study of Fig. 7.9. The largest hole in b.c.c. ferrite is halfway betw center of the face and the space between the two corner atoms. Two four possible positions for a carbon atom on the front face of a 0 0.2 0 8
I ~~poeutectoidl centered cube are shown in Fig. 7.9. The largest interstitial sphe steel would just fit has a radius of 0.36(10-8) cm. The largest hole in f.c. Percent carbon by weight+
tenite is midway along the edge between two corner atoms. One p 0 Schematic representation of the changes in position for a carbon atom on the front face of a face-centered c structure during the slow cooling of 0.20 percent
shown in Fig. 7.9. The largest interstitial sphere that would just fit n steel. (a) Austenite; (b) formation of ferrite grains at enite grain boundaries; (c) growth of ferrite grains-
radius of 0.52(10-8) cm. Therefore, austenite will have a greater sol position of austenite is now 0.8 percent carbon; (d)
for carbon than ferrite. Since the carbon atom has a radius of enite transforms to pearlite at 1333°F.
0.70(1 0-8) cm, the iron atoms in austenite are spread apart by the s of carbon so that, at the maximum solubility of 2 percent, only ab percent of the holes are filled. The distortion of the ferrite lattice slow cooling, from the austenite range, of several steels will be discussed.
carbon atom is much greater than in the case of austenite; therefor Alloys containing more than 2 percent carbon will be discussed in Chap. 11.
carbon solubility is much more restricted. Alloy 1 (Fig. 7.10) is a hypoeutectoid steel containing 0.20 percent
7.7 Slow Cooling of Steel The steel portion of the iron-iron carbide di carbon. In the austenite raGge, this alloy consists of a uniform interstitial
of greatest interest, and the various changes that take place during solid solution. Each grain contains 0.20 percent carbon dissolved in the spaces of the f.c.c. iron lattice structure (Fig. 7.10a). Upon slow cooling nothing happens until the line GJ is crossed at point x,. This line is known
@ @ as the upper-critical-temperature line on the hypoeutectoid side and is labeled A,. The allotropic change from f.c.c. to b.c.c. iron takes place at 16696°F for pure iron and decreases in temperature with increasing carbon content, as shown by the A, line. Therefore, at x,, ferrite must begin to form at the austenite grain boundaries (Fig. 7.10b). Since ferrite can dissolve very little carbon, in those areas that are changing to ferrite the carbon must come out of solution before the atoms rearrange themselves to b.c.c. The carbon which comes out of solution is dissolved in the remaining aus-
Fig. 7.9 Interstices of the b.c.c. (left) and f.c.c. (right). tenite, so that, as cooling progresses and the amount of ferrite increases, The maximum-diameter foreign sphere (black) that can enter the b.c.c lattice is indicated by the black atom with the remaining austenite becomes richer in carbon. Its carbon content is
two of the four possible positions on one face shown here gradually moving down and to the right along the A, line. Finally, the line as filled. The f.c.c. lattice has far fewer holes, but, as shown HJ is reached at point x,. This line is known as the lower-critical-tempera- by the black sphere, the hole is much larger. (By permission from Brick, Gordon, and Phillips, "Structure and Properties ture line on the hypoeutectoid side and is labeled A,. The A, line is the
of Alloys," 3d ed., McGraw-Hill Book Company, 1965.) eutectoid-temperature line and is the lowest temperature at which f.c.c.
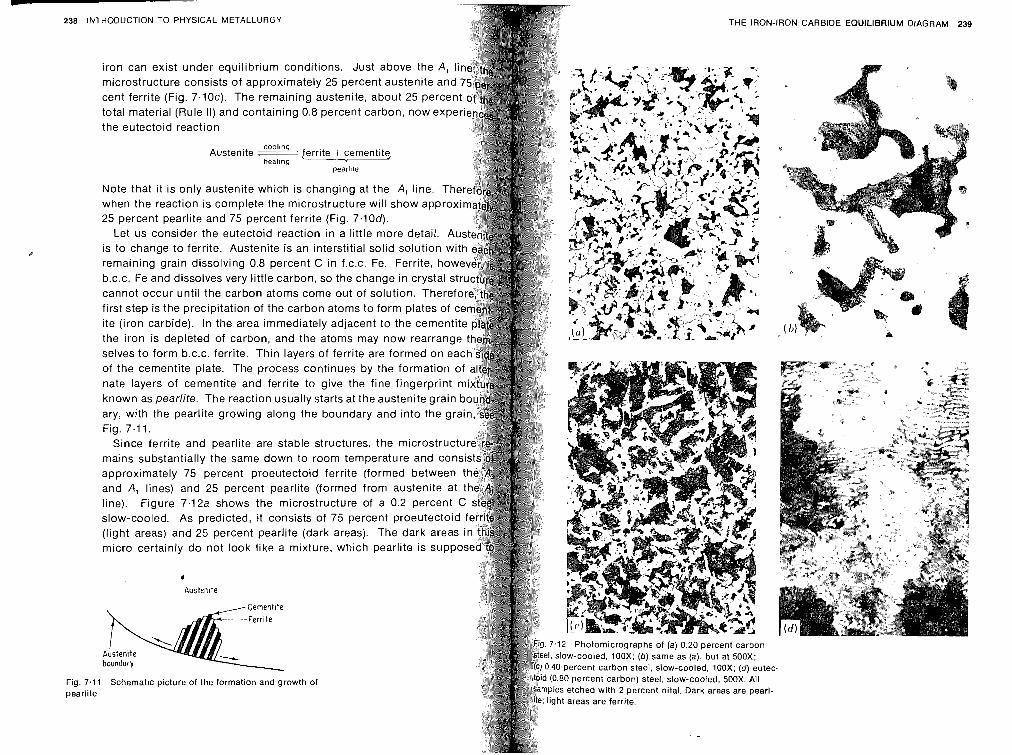
238 INTRODUCTION TO PHYSICAL METALLURGY
iron can exist under equilibrium conditions. Just above the A, microstructure consists of approximately 25 percent austenite and cent ferrite (Fig. 7.10~). The remaining austenite, about 25 percen total material (Rule II) and containing 0.8 percent carbon, now expe the eutectoid reaction
cooling Austenite ------' ferrite + cementltq
heatlng pearllte
Note that it is only austenite which is changing at the A, line. when the reaction is complete the microstructure will show app 25 percent pearlite and 75 percent ferrite (Fig. 7.10d).
Let us consider the eutectoid reaction in a little more detail. Aus is to change to ferrite. Austenite is an interstitial solid solution remaining grain dissolving 0.8 percent C in f.c.c. Fe. Ferrite, h b.c.c. Fe and dissolves very little carbon, so the change in crysta cannot occur until the carbon atoms come out of solution. There first step is the precipitation of the carbon atoms to form plates of ite (iron carbide). In the area immediately adjacent to the cement the iron is depleted of carbon, and the atoms may now rearrange selves to form b.c.c. ferrite. Thin layers of ferrite are formed on eac of the cementite plate. The process continues by the formation of nate layers of cementite and ferrite to give the fine fingerprint known as pearlite. The reaction usually starts at the austenite grain b ary, with the pearlite growing along the boundary and into the grai Fig. 7.11.
Since ferrite and pearlite are stable structures, the microstruc mains substantially the same down to room temperature and con approximately 75 percent proeutectoid ferrite (formed between and A, lines) and 25 percent pearlite (formed from austenite at line). Figure 7.12a shows the microstructure of a 0.2 percent slow-cooled. As predicted, it consists of 75 percent proeutectoid (light areas) and 25 percent pearlite (dark areas). The dark areas micro certainly do not look like a mixture, which pearlite is suppo
4
Austenite
-IRON CARBIDE EQUILIBRIUM DIAGRAM 239
tec-
rl- Fig. 7 pearli
11 Schernattc picture of the formation and growth of 4
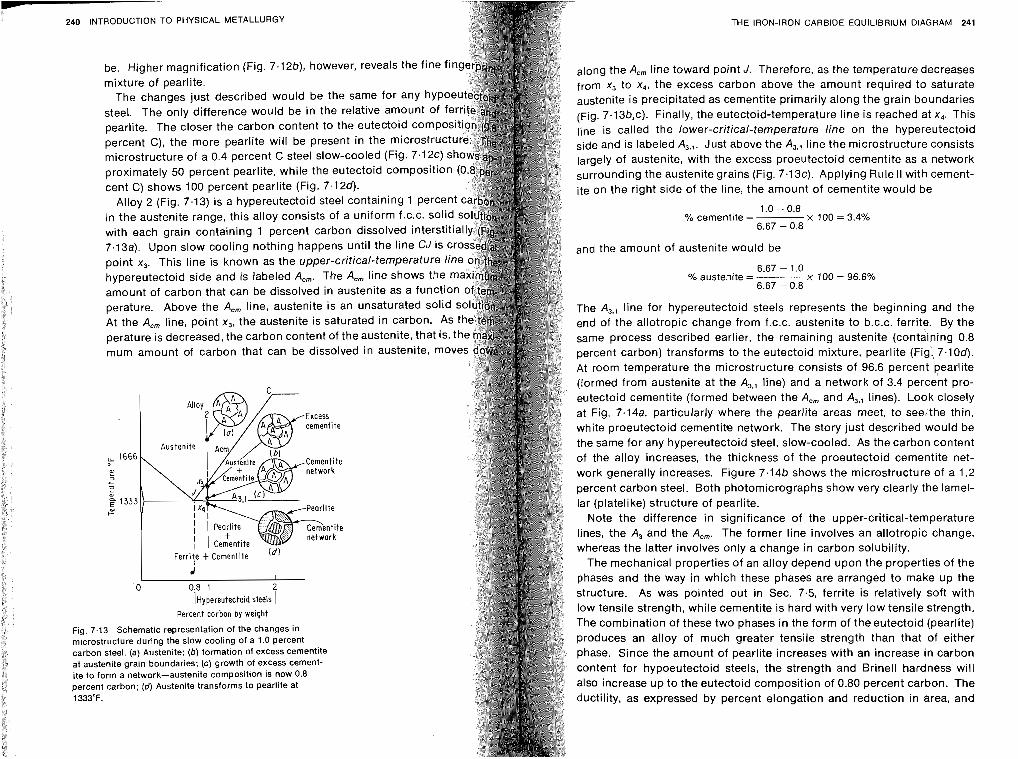
w 240 INTRODUCTION TO PHYSICAL METALLURGY
be. Higher magnification (Fig. 7.12b), however, reveals the fine fin mixture of pearlite.
The changes just described would be the same for any hypo steel. The only difference would be in the relative amount of fe pearlite. The closer the carbon content to the eutectoid co percent C), the more peariite wilt be present in the micros microstructure of a 0.4 percent C steel slow-cooled (Fig. 7.1 proximately 50 percent pearlite, while the eutectoid compositio cent C) shows 100 percent pearlite (Fig. 7.12d).
Alloy 2 (Fig. 7.13) is a hypereutectoid steel containing 1 perc In the austenite range, this alloy consists of a uniform f.c.c. so with each grain containing 1 percent carbon dissolved inters 7.13a). Upon slow cooling nothing happens until the line CJ is cr point x,. This line is known as the upper-critical-temperature lin hypereutectoid side and is labeled A,,. The A,, line shows the m amount of carbon that can be dissolved in austenite as a functio perature. Above the A,, line, austenite is an unsaturated solid At the A,, line, point x,, the austenite is saturated in carbon. As perature is decreased, the carbon content of the austenite, that is, t mum amount of carbon that can be dissolved in austenite, mo
l~~pereutectoid steels I Percent carbon by weight
Fig. 7.13 Schematic representation of the changes in microstructure during the slow cooling of a 1.0 percent carbon steel. (a) Austenite; (b) formation of excess cementite at austenite grain boundaries; (c) growth of excess cement- ite to form a network-austenite composition is now 0.8 percent carbon; (d) Austenite transforms to pearlite at 1333°F.
THE IRON-IRON CARBIDE EQUILIBRIUM DIAGRAM 241
along the A,, line toward point J. Therefore, as the temperature decreases from x, to x,, the excess carbon above the amount required to saturate austenite is precipitated as cementite primarily along the grain boundaries (Fig. 7.13b,c). Finally, the eutectoid-temperature line is reached at x,. This line is called the lower-critical-temperature line on the hypereutectoid side and is labeled A,.,. Just above the A , , line the microstructure consists largely of austenite, with the excess proeutectoid cementite as a network surrounding the austenite grains (Fig. 7.13~). Applying Rule II with cement- ite on the right side of the line, the amount of cementite would be
1 .O - 0.8 % cementite = - x 100=3.4%
6.67 - 0.8
and the amount of austenite would be
6.67 - 1 .O % austenite = - x 100 = 96.6%
6.67 - 0.8
The A,,, line for hypereutectoid steels represents the beginning and the end of the allotropic change from f.c.c. austenite to b.c.c. ferrite. By the same process described earlier, the remaining austenite (containing 0.8 percent carbon) transforms to the eutectoid mixture, pearlite (Fig. 7.10d). At room temperature the microstructure consists of 96.6 percent pearlite (formed from austenite at the A , , line) and a network of 3.4 percent pro- eutectoid cementite (formed between the A,, and A,,, lines). Look closely at Fig. 7.14a, particularly where the pearlite areas meet, to see.the thin, white proeutectoid cementite network. The story just described would be the same for any hypereutectoid steel, slow-cooled. As the carbon content of the alloy increases, the thickness of the proeutectoid cementite net- work generally increases. Figure 7.14b shows the microstructure of a 1.2 percent carbon steel. Both photomicrographs show very clearly the lamel- lar (platelike) structure of pearlite.
Note the difference in significance of the upper-critical-temperature lines, the A, and the A,,. The former line involves an allotropic change, whereas the latter involves only a change in carbon solubility.
The mechanical properties of an alloy depend upon the properties of the phases and the way in which these phases are arranged to make up the structure. As was pointed out in Sec. 7.5, ferrite is relatively soft with low tensile strength, while cementite is hard with very low tensile strength. The combination of these two phases in the form of the eutectoid (pearlite) produces an alloy of much greater tensile strength than that of either phase. Since the amount of pearlite increases with an increase in carbon content for hypoeutectoid steels, the strength and Brinell hardness will also increase up to the eutectoid composition of 0.80 percent carbon. The ductility, as expressed by percent elongation and reduction in area, and
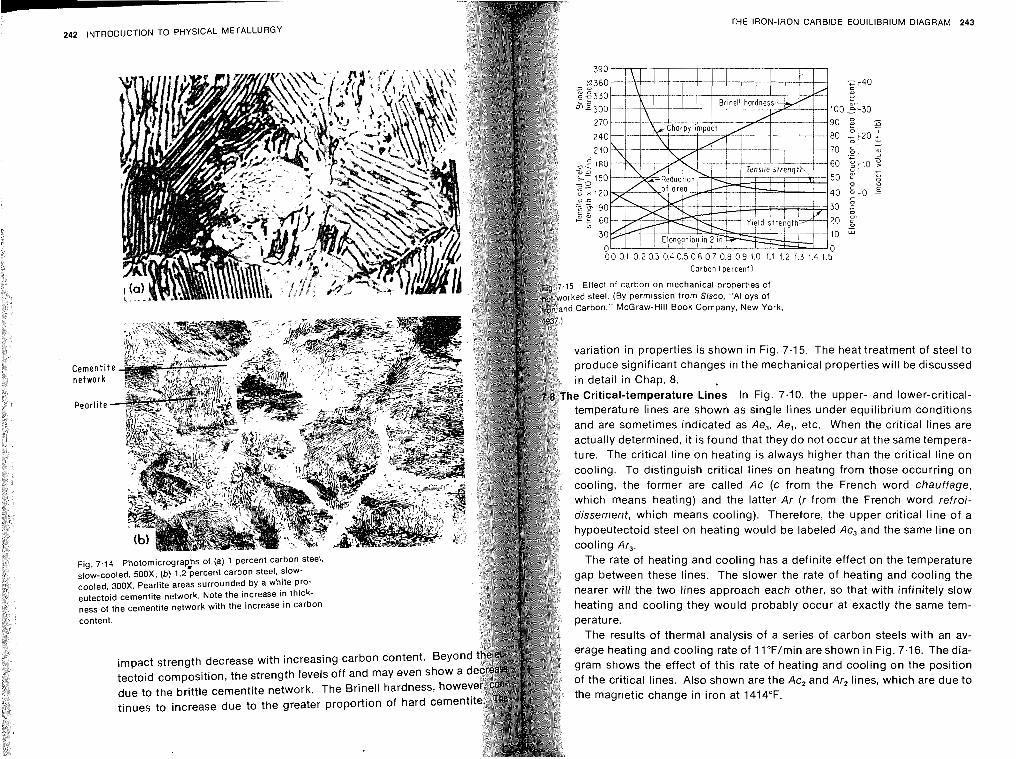
THE IRON-IRON CARBIDE EQUILIBRIUM DIAGRAM 243
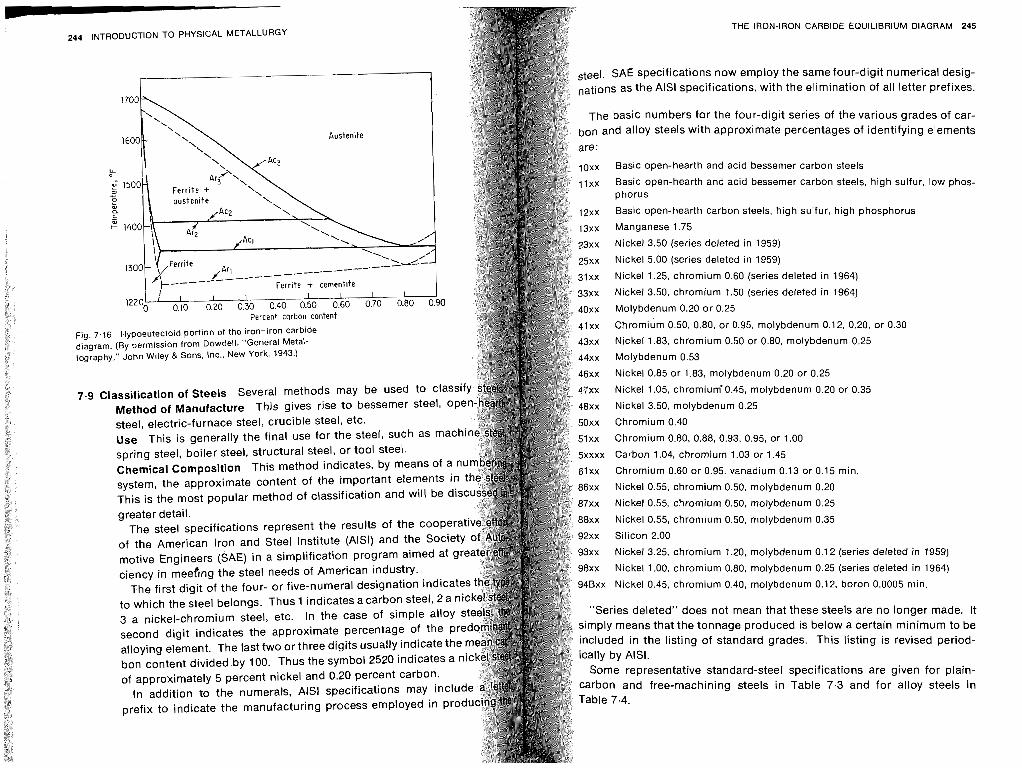
V A A INTRnnllCTlON TO PHYSICAL METALLURGY THE RON CP rRBlDE EQUILIBRIUM t
Austenite
Percent carbon content
Fig. 7.16 Hypoeutectoid portion of the iron-iron carbide diagram. (By permission from Dowdell, "General Metal- lography," John Wiley & Sons, Inc., New York, 1943.)
7.9 Classification of Steels Several methods may be used to class Method of Manufacture This gives rise to bessemer steel, op steel, electric-furnace steel, crucible steel, etc. Use This is generally the final use for the steel, such as m spring steel, boiler steel, structural steel, or tool steel. Chemical Composition This method indicates, by means of system, the approximate content of the important elements In t This is the most popular method of classification and will be disc greater detail.
The steel specifications represent the results of the cooperat of the American Iron and Steel Institute (AISI) and the Society motive Engineers (SAE) in a simplification program aimed at gre ciency in meefing the steel needs of American industry.
The first digit of the four- or five-numeral designation indicates to which the steel belongs. Thus 1 indicates a carbon steel, 2 a nic 3 a nickel-chromium steel, etc. In the case of simple alloy s second digit indicates the approximate percentage of the pre alloying element. The last two or three digits usually indicate the m bon content divided by 100. Thus the symbol 2520 indicates a of approximately 5 percent nickel and 0.20 percent carbon.
In addition to the numerals, AlSI specifications may inclu prefix to indicate the manufacturing process employed in produ
steel. SAE specifications now employ the same four-digit numerical desig- nations as the AlSl specifications, with the elimination of all letter prefixes.
The basic numbers for the four-digit series of the various grades of car- bon and alloy steels with approximate percentages of identifying elements
are:
~ O X X Basic open-hearth and acid bessemer carbon steels
I ~ X X Basic open-hearth and acid bessemer carbon steels, high sulfur, low phos- phorus
Basic open-hearth carbon steels, high sulfur, high phosphorus
Manganese 1.75
Nickel 3.50 (series deleted in 7959)
Nickel 5.00 (series deleted in 1959)
Nickel 1.25, chromium 0.60 (series deleted in 1964)
Nickel 3.50, chromium 1.50 (series deleted in 1964)
Molybdenum 0.20 or 0.25
Chromium 0.50, 0.80, or 0.95, molybdenum 0.12, 0.20, or 0.30
Nickel 1.83, chromium 0.50 or 0.80, molybdenum 0.25
Molybdenum 0.53
Nickel 0.85 or 1.83, molybdenum 0.20 or 0.25
Nickel 1.05, chromium'0.45, molybdenum 0.20 or 0.35
Nickel 3.50, molybdenum 0.25
Chromium 0.40
Chromium 0.80, 0.88, 0.93, 0.95, or 1.00
Carbon 1.04. chromium 1.03 or 1.45
Chromium 0.60 or 0.95, vanadium 0.13 or 0.15 min.
Nickel 0.55, chromium 0.50, molybdenum 0.20
Nickel 0.55, chromium 0.50, molybdenum 0.25
Nickel 0.55, chromium 0.50, molybdenum 0.35
Silicon 2.00
Nickel 3.25, chromium 1.20, molybdenum 0.12 (series deleted in 1959)
Nickel 1.00, chromium 0.80. molybdenum 0.25 (series deleted in 1964)
Nickel 0.45, chromium 0.40, molybdenum 0.12, boron 0.0005 min.
"Series deleted" does not mean that these steels are no longer made. It mply means that the tonnage produced is below a certain minimum to be cluded in the listing of standard grades. This listing is revised period- ally by AISI. Some representative standard-steel soecifications are aivan fnr nlnin-
free- Table - - . - - . - 3. - -. -
7.3 and for alloy .-. r.-.
steels
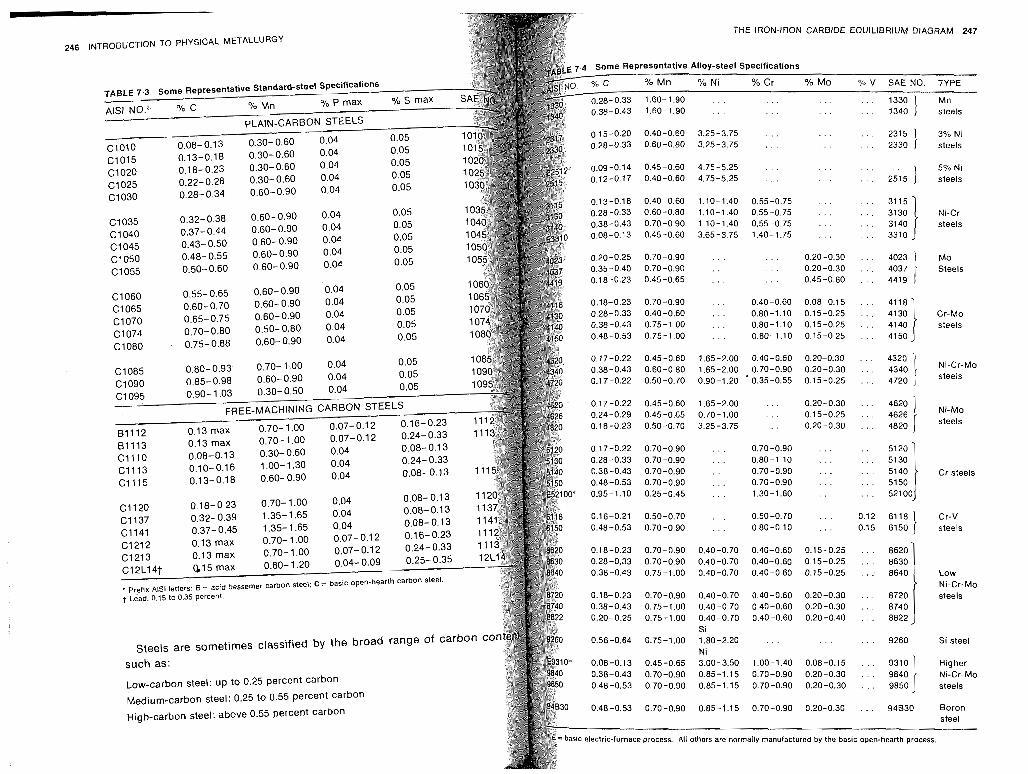
246 l ~ ~ ~ ~ ~ ~ C T I O N TO PHYSICAL METALLURGY THE IRON-IRON CARBIDE EQUILIBRIUM DIAGRAM 247
0.15-0.20 0.40-0.60 3.25-3.75 . . . 0.28-0.33 0.60-0.80 3.25-3.75 , . .
0.09-0.14 0.45-0.60 4.75-5.25 . , , . . . 0.22- 0.28 0.30- 0.60 o.04 0.12-0.17 0.40-0.60 4.75-5.25 . . . . . . . . . 5% Ni . . . - . . 2515 } steels 0.28- 0.34 0.60- 0.90 0.04
0.13-0.18 0.40-0.60 1.10-1.40 0.55-0.75 . . .
C1035 0.32- 0.38 0.60- 0.90 0.04 0.28-0.33 0.60-0.80 1.10-1.40 0.55-0.75 , . .
C1040 0.37-0.44 0.60-0.90 0.04 0.38-0.43 0.70-0.90 1.10-1.40 0.55-0.75 . . .
C1045 0.43- 0.50 0.60- 0.90 0.04 0.08-0.13 0.45-0.60 3.65-3.75 1.40-1.75 . . . (21050 0.48-0.55 0.60-0.90 0.04
0.50- 0.60 0.60- 0.90 OD4 0.20-0.25 0.70-0.90 , . . C1055 . . . 0.20-0.30 . . . 4023 Mo
0.35-0.40 0.70-0.90 . . . . . . 0.20-0.30 . . . 4037 Steels 0.18-0.23 0.45-0.65 . , , . . . 0.45-0.60 . . . 4419
C1060 0.55- 0.65 0.60- 0.90 o.04
GI065 0.60- 0.70 0.60-0.90 0.04 C1070 0.65- 0.75 0.60- 0.90 0.04 C1074 0.70- 0.80 0.50- 0.80 0.04 ~ 1 0 8 0 . 0.75-0.88 0.60-0.90 o.04
0.17-0.22 0.45-0.60 1.65-2.00 0.40-0.60 0.20-0.30 . 4320 0.38-0.43 0.60-0.80 1.65-2.00 0.70-0.90 0.20-0.30 . . . 4340 } Ni-Cr-MO
0.17-0.22 0.50-0.70 0.90-1.20 ' 0.35-0.55 0.15-0.25 . . . 4720
0.17-0.22 0.45-0.60 1.65-2.00 . . . 0.20-0.30 . 4620
.12 0.16-0.23 0.24-0.29 0.45-0.65 0.70-1.00 . . . 0.15-0.2 . . . 4.26 } Ni-MO 0.18-0.23 0.50-0.70 3.25-3.75 . . . 0.20-0.30 . . . 4820 Steels
0.70- 1 .oo 0.07-0.1 2 0.24-0.33
0.30- 0.60 0.04 0.17-0.22 0.70-0.90 . 0.70-0.90 . . . 1 .OO- 1.30 0.04 0.28-0.33 0.70-0.90 . 0.80-1.10 . . . 0.60- 0.90 0.04 0.08-0.13 11 0.38-0.43 0.70-0.90 . 0.70-0.90 . . .
0.48-0.53 0.70-0.90 . 0.70-0.90 . . . * 0.95-1.10 0.25-0.45 . 1.30-1.60 . . .
0.18-0.23 0.70-0.90 0.40-0.70 0.40-0.60 0.15-0.25 . 8620
steels are sometimes classified by the broad range 0.56-0.64 0.75-1.00 1.80-2.20 . . . . . . . . . 9260 Si steel
such as: Ni
Low-carbon steel: up to 0.25 percent carbon Medium-carbon steel: 0.25 to 0.55 percent carbon
~igh-carbon steel: above 0.55 percent carbon
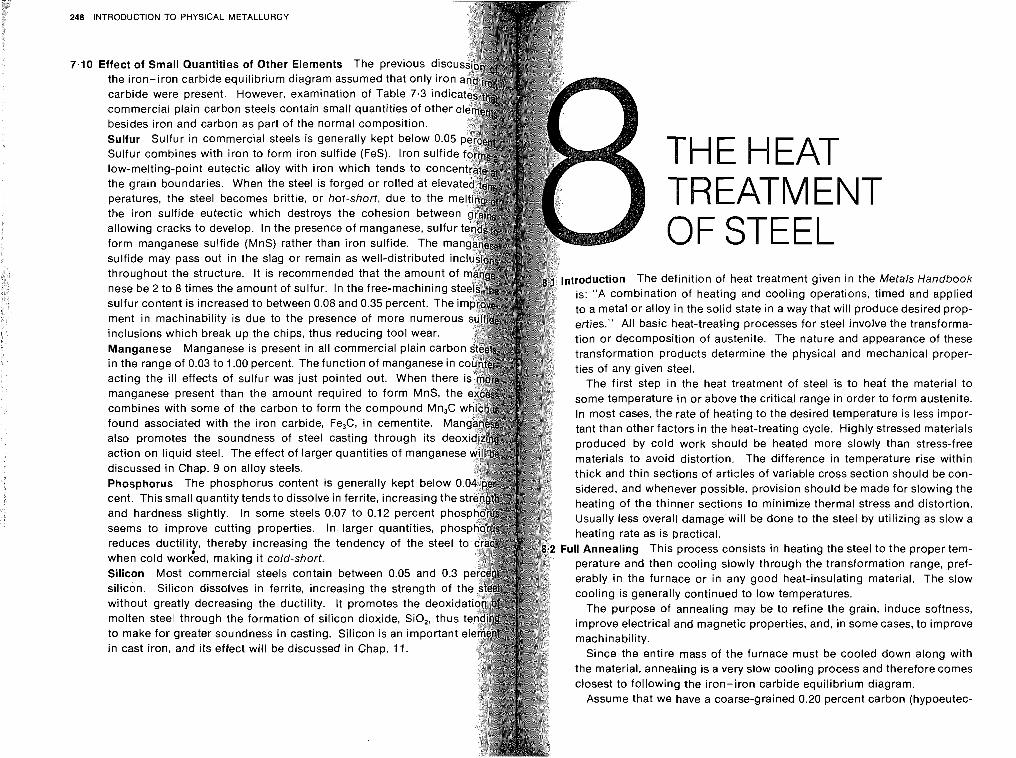
248 INTRODUCTION TO PHYSICAL METALLURGY
7.10 Effect of Small Quantities of Other Elements The previous disc the iron-iron carbide equilibrium diagram assumed that only carbide were present. However, examination of Table 7.3 '
commercial plain carbon steels contain small quantities of besides iron and carbon as part of the normal composition. Sulfur Sulfur in commercial steels is generally kept below 0. Sulfur combines with iron to form iron sulfide (FeS). Iron sulf low-melting-point eutectic alloy with iron which tends to conce the grain boundaries. When the steel is forged or rolled at elevat
THE HEAT peratures, the steel becomes brittle, or hot-short, due to the the iron sulfide eutectic which destroys the cohesion betwe
TREATMENT allowing cracks to develop. In the presence of manganese, sulfur form manganese sulfide (MnS) rather than iron sulfide. The ma sulfide may pass out in the slag or remain as well-distributed in
OF STEEL throughout the structure. It is recommended that the amount of ntrodu~tion The definition of heat treatment given in the Metals Handbook nese be 2 to 8 times the amount of sulfur. In the free-machining s is: "A combination of heating and cooling operations, timed and applied sulfur content is increased to between 0.08 and 0.35 percent. The to a metal or alloy in the solid state in a way that will produce desired prop- ment in machinability is due to the presence of more numerou erties." All basic heat-treating processes for steel involve the transforma- inclusions which break up the chips, thus reducing tool wear. tion or decomposition of austenite. The nature and appearance of these Manganese Manganese is present in all commercial plain carbo transformation products determine the physical and mechanical proper- in the range of 0.03 to 1 .OO percent. The function of manganese in ties of any given steel. acting the ill effects of sulfur was just pointed out. When there The first step in the heat treatment of steel is to heat the material to manganese present than the amount required to form MnS, th some temperature in or above the critical range in order to form austenite. combines with some of the carbon to form the compound In most cases, the rate of heating to the desired temperature is less impor- found associated with the iron carbide, Fe,C, in cementite. tant than other factors in the heat-treating cycle. Highly stressed materials also promotes the soundness of steel casting through its produced by cold work should be heated more slowly than stress-free action on liquid steel. The effect of larger quantities of manganes materials to avoid distortion. The difference in temperature rise within discussed in Chap. 9 on alloy steels. thick and thin sections of articles of variable cross section should be con- Phosphorus The phosphorus content is generally kept below sidered, and whenever possible, provision should be made for slowing the cent. This small quantity tends to dissolve in ferrite, increasing the heating of the thinner sections to minimize thermal stress and distortion. and hardness slightly. In some steels 0.07 to 0.12 percent pho Usually less overall damage will be done to the steel by utilizing as slow a seems to improve cutting properties. In larger quantities, ph heating rate as is practical. reduces ductility, thereby increasing €he tendency of the steel Full Annealing This process consists in heating the steel to the proper tem- when cold worced, making it cold-short. perature and then cooling slowly through the transformation range, pref- Silicon Most commercial steels contain between 0.05 and 0.3 erably in the furnace or in any good heat-insulating material. The slow silicon. Silicon dissolves in ferrite, increasing the strength of t cooling is generally continued to low temperatures. without greatly decreasing the ductility. It promotes the deoxid The purpose of annealing may be to refine the grain, induce softness, molten steel through the formation of silicon dioxide, SiO,, thus improve electrical and magnetic properties, and, in some cases, to improve to make for greater soundness in casting. Silicon is an important in cast iron, and its effect will be discussed in Chap. 1 1 . Since the entire mass of the furnace must be cooled down along with
the material, annealing is a very slow cooling process and therefore comes closest to following the iron-iron carbide equilibrium diagram.
Assume that we have a coarse-grained 0.20 percent carbon (hypoeutec-
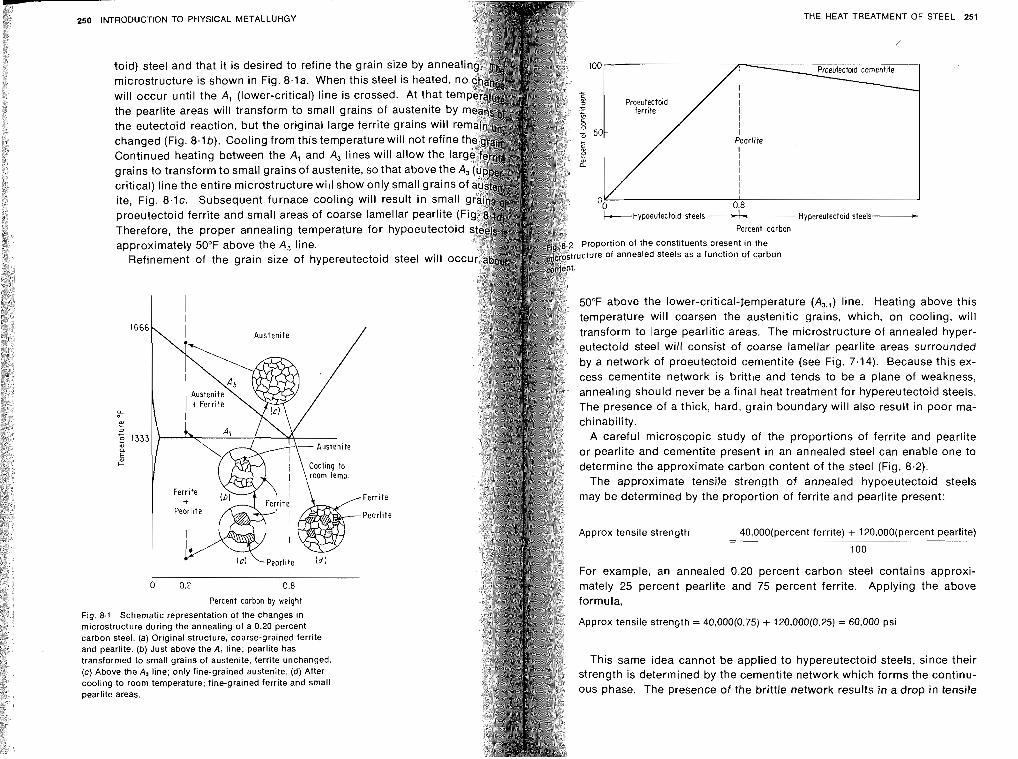
-
250 INTRODUCTION TO PHYSICAL METALLURGY
toid) steel and that it is desired to refine the grain size by anne microstructure is shown in Fig. 8.1~1. When this steel is heated will occur until the A, (lower-critical) line is crossed. At that t the pearlite areas will transform to small grains of austenite by the eutectoid reaction, but the original large ferrite grains will r changed (Fig. 8.16). Cooling from this temperature will not refine Continued heating between the A, and A, lines will allow the la grains to transform to small grains of austenite, so that above the critical) line the entire microstructure will show only small grains ite, Fig. 8 .1~ . Subsequent furnace cooling will result in small proeutectoid ferrite and small areas of coarse lamellar pearlite ( Therefore, the proper annealing temperature for hypoeutectoid approximately 50°F above the A, line.
Refinement of the grain size of hypereutectoid steel will occ
THE HEAT TREATMENT OF STEEL 251
I
I Ferrite t
Pearlite
I I I',
\ Cooling to room temp.
I 1 e r e ( d )
Percent corbon by weight
Fig. 8.1 Schematic representation of the changes in microstructure during the annealing of a 0.20 percent carbon steel. (a) Original structure, coarse-grained ferrite and pearlite. (b ) Just above the A, line; pearlite has transformed to small grains of austenite, ferrite unchanged. (c) Above the A, line; only fine-grained austenite. (d) After cooling to room temperature; fine-grained ferrite and small
arc
-Ferrite
- Pearlite
k--~~poeutectoid steels Hypereutectoid steels-
Percent carbon
proportion of the constituents present in the ucture of annealed steels as a function of carbon
50°F above the lower-critical-Iemperature (A,,,) line. Heating above this temperature will coarsen the austenitic grains, which, on cooling, will transform to large pearlitic areas. The microstructure of annealed hyper- eutectoid steel will consist of coarse lamellar pearlite areas surrounded by a network of proeutectoid cementite (see Fig. 7.14). Because this ex- cess cementite network is brittle and tends to be a plane of weakness, annealing should never be a final heat treatment for hypereutectoid steels. The presence of a thick, hard, grain boundary will also result in poor ma- chinability.
A careful microscopic study of the proportions of ferrite and pearlite or pearlite and cementite present in an annealed steel can enable one to determine the approximate carbon content of the steel (Fig. 8.2).
The approximate tensile strength of annealed hypoeutectoid steels may be determined by the proportion of ferrite and pearlite present:
Approx tensile strength -
40,00O(percent ferrite) + l20,000(percent pearlite) -
100
For example, an annealed 0.20 percent carbon steel contains approxi- mately 25 percent pearlite and 75 percent ferrite. Applying the above formula,
Approx tensile strength = 40,000(0.75) + 120,000(0.25) = 60,000 psi
This same idea cannot be applied to hypereutectoid steels, since their strength is determined by the cementite network which forms the continu- ous phase. The presence of the brittle network results in a drop in tensile
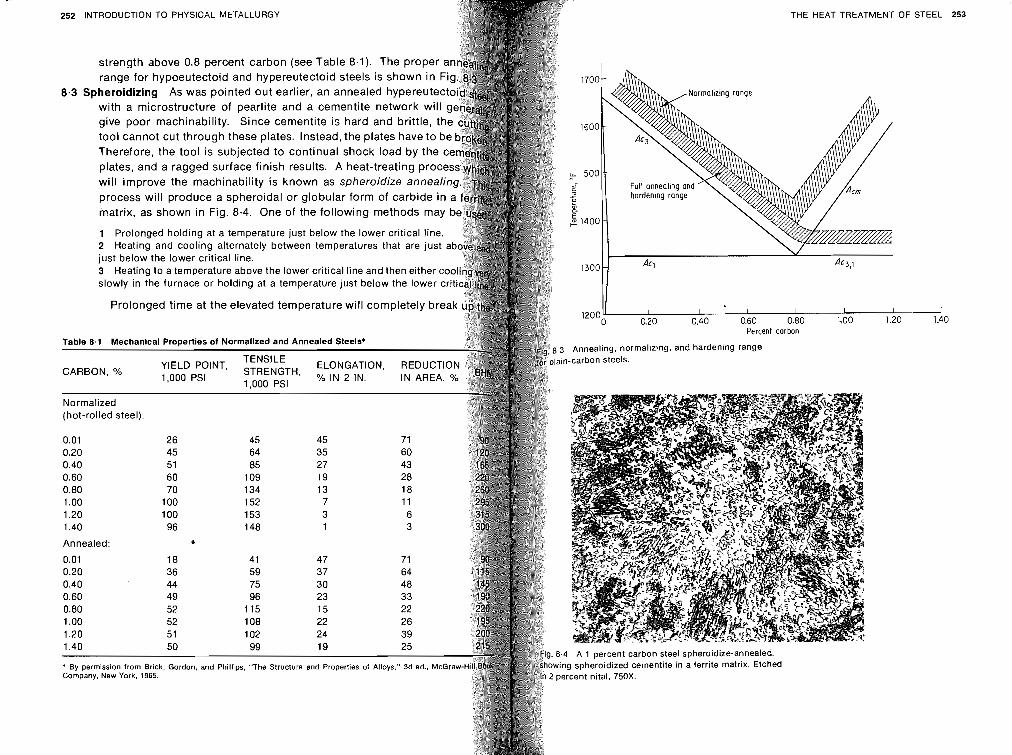
THE HEAT TREATMENT OF STEEL 253
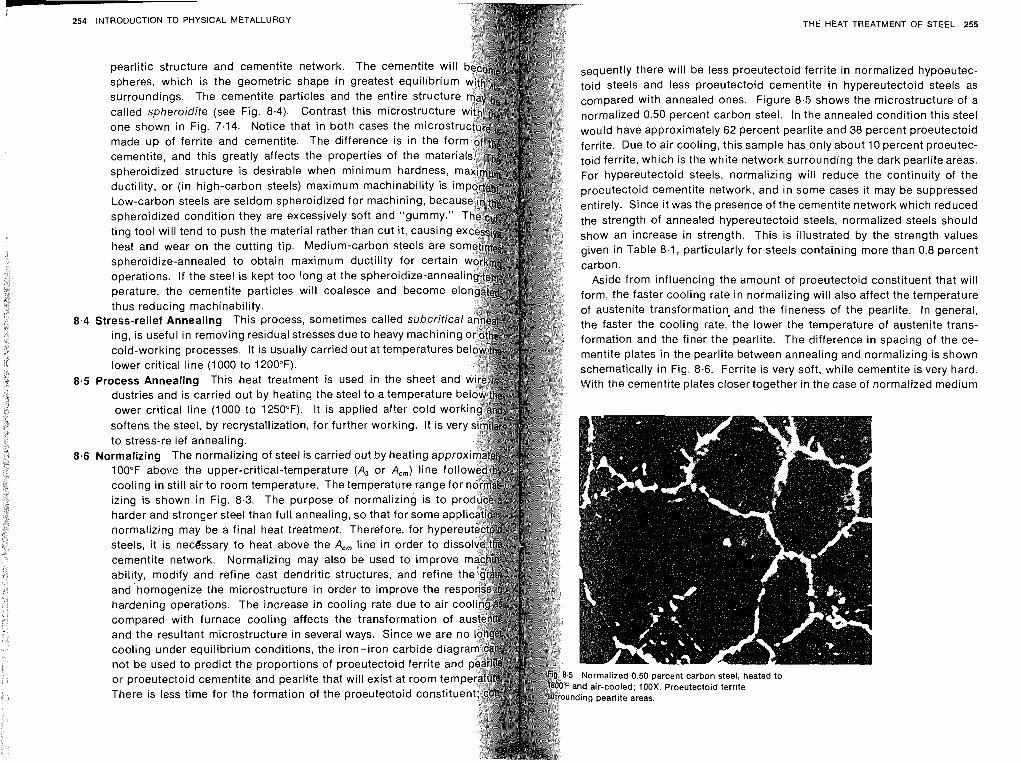
- 254 INTRODUCTION TO PHYSICAL METALLURGY THE HEAT TREATMENT OF STEEL 255
pearlitic structure and cementite network. The cementite will sequently there will be less proeutectoid ferrite in normalized hypoeutec- spheres, which is the geometric shape in greatest equilibriu toid steels and less proeutectoid cementite in hypereutectoid steels as surroundings. The cementite particles and the entire structu with annealed ones. Figure 8.5 shows the microstructure of a called spheroidite (see Fig. 8.4). Contrast this microstructure normalized 0.50 percent carbon steel. In the annealed condition this steel one shown in Fig. 7.14. Notice that in both cases the microst would have approximately 62 percent pearlite and 38 percent proeutectoid made up of ferrite and cementite. The difference is in the fo ferrite. Due to air cooling, this sample has only about 10 percent proeutec- cementite, and this greatly affects the properties of the mater toid ferrite, which is the white network surrounding the dark pearlite areas. spheroidized structure is desirable when minimum hardness, For hypereutectoid steels, normalizing will reduce the continuity of the ductility, or (in high-carbon steels) maximum machinability is i proeutectoid cementite network, and in some cases it may be suppressed Low-carbon steels are seldom spheroidized for machining, beca entirely. Since it was the presence of the cementite network which reduced spheroidized condition they are excessively soft and "gummy." the strength of annealed hypereutectoid steels, normalized steels should ting tool will tend to push the material rather than cut it, causin show an increase in strength. This is illustrated by the strength values heat and wear on the cutting tip. Medium-carbon steels are given in Table 8.1, particularly for steels containing more than 0.8 percent spheroidize-annealed to obtain maximum ductility for certai operations. If the steel is kept too long at the spheroidize-annea Aside from influencing the amount of proeutectoid constituent that will perature, the cementite particles will coalesce and become el form, the faster cooling rate in normalizing will also affect the temperature thus reducing machinability. of austenite transformation and the fineness of the pearlite. In general,
8.4 Stress-relief Annealing This process, sometimes called subcritica the faster the cooling rate, the lower the temperature of austenite trans- ing, is useful in removing residual stresses due to heavy machinin formation and the finer the pearlite. The difference in spacing of the ce- cold-working processes. It is usually carried out at temperatures mentite plates in the pearlite between annealing and normalizing is shown lower critical line (1000 to 1200°F). schematically in Fig. 8.6. Ferrite is very soft, while cementite is very hard.
8.5 Process Annealing This heat treatment is used in the sheet and ith the cementite plates closer together in the case of normalized medium dustries and is carried out by heating the steel to a temperature b lower critical line (1000 to 1250°F). It is applied after cold wor softens the steel, by recrystallization, for further working. It is ver to stress-relief annealing.
8.6 Normalizing The normalizing of steel is carried out by heating appr 100°F above the upper-critical-temperature (A, or A,,) line foll cooling in still air to room temperature. The temperature rangefo izing is shown in Fig. 8.3. The purpose of normalizing is to p harder and stronger steel than full annealing, so that for some normalizing may be a final heat treatment. Therefore, for hy steels, it is nec6sary to heat above the A,, line in order to cementite network. Normalizing may also be used to improve ability, modify and refine cast dendritic structures, and refine t and.homogenize the microstructure in order to improve the re hardening operations. The increase in cooling rate due to air c compared with furnace cooling affects the transformation of and the resultant microstructure in several ways. Since we are cooling under equilibrium conditions, the iron-iron carbide dia not be used to predict the proportions of proeutectoid ferrite an or proeutectoid cementite and pearlite that will exist at room tern There is less time for the formation of the proeutectoid constitu
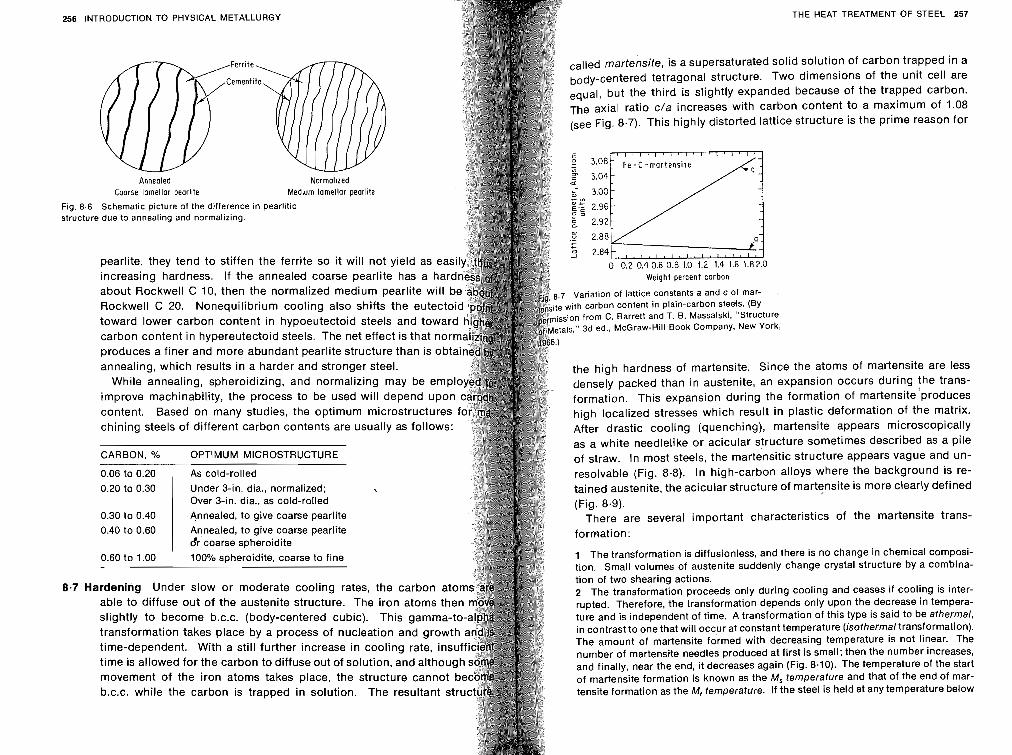
Fig. stru
INTRODUCTION TO PHYSICAL METALLURGY THE HEAT TREATMENT OF STEEL 257
called martensite, is a supersaturated solid solution of carbon trapped in a body-centered tetragonal structure. Two dimensions of the unit cell are equal, but the third is slightly expanded because of the trapped carbon. The axial ratio c/a increases with carbon content to a maximum of 1.08 (see Fig. 8.7). This highly distorted lattice structure is the prime reason for
Annealed Normallzed Coarse lamellar peorl~le Med~um lamellar pearlite
8.6 Schematic picture of the difference in pearlitic cture due to annealing and normalizing.
increasing hardness. If the annealed coarse pearlite has a ha Weight percent carbon about Rockwell C 10, then the normalized medium pearlite will Variation of lattice constants a and c of mar- . Rockwell C 20. Nonequilibrium cooling also shifts the eutect
n from C. Barrett and T. 6. Massalski, "Structure
carbon content in hypereutectoid steels. The net effect is that nor produces a finer and more abundant pearlite structure than is obtai
annealing, which results in a harder and stronger steel. the high hardness of martensite. Since the atoms of martensite are less While annealing, spheroidizing, and normalizing may be empl densely packed than in austenite, an expansion occurs during the trans-
improve machinability, the process to be used will depend upon formation. This expansion during the formation of martensiteiproduces content. Based on many studies, the optimum microstructures f high localized stresses which result in plastic deformation of the matrix. chining steels of different carbon contents are usually as follows: After drastic cooling (quenching), martensite appears microscopically
as a white needlelike or acicular structure sometimes described as a pile CARBON, % OPTIMUM MICROSTRUCTURE of straw. In most steels, the martensitic structure appears vague and un- 0.06 to 0.20 As cold-rolled resolvable (Fig. 8.8). In high-carbon alloys where the background is re- 0.20 to 0.30 Under 3-in. dia., normalized; tained austenite, the acicular structure of martensite is more clearly defined
Over 3-in. dia., as cold-rolled 0.30 to 0.40 .Annealed, to give coarse pearlite There are several important characteristics of the martensite trans- 0.40 to 0.60 Annealed, to give coarse pearlite
dr coarse spheroidite 0.60 to 1 .OO 100% spheroidite, coarse to fine 1 The transformation is diffusionless, and there is no change in chemical composi-
tion. Small volumes of austenite suddenly change crystal structure by a combina- tion of two shearing actions. 2 The transformation proceeds only during cooling and ceases if cooling is inter- rupted. Therefore, the transformation depends only upon the decrease in tempera-
slightly to become b.c.c. (body-centered cubic). This gamma-t ture and is independent of time. A transformation of this type is said to be athermal, in contrast to one that will occur at constant temperature (isothermal transformation). The amount of martensite formed with decreasing temperature is not linear. The number of martensite needles produced at first is small; then the number increases, time is allowed for the carbon to diffuse out of solution, and althoug and finally, near the end, it decreases again (Fig. 8.10). The temperature of the start
movement of the iron atoms takes place, the structure cannot of martensite formation is known as the M, temperature and that of the end of mar- b.c.c. while the carbon is trapped in solution. The resultant stru tensite formation as the M, temperature. If the steel is held at any temperature below
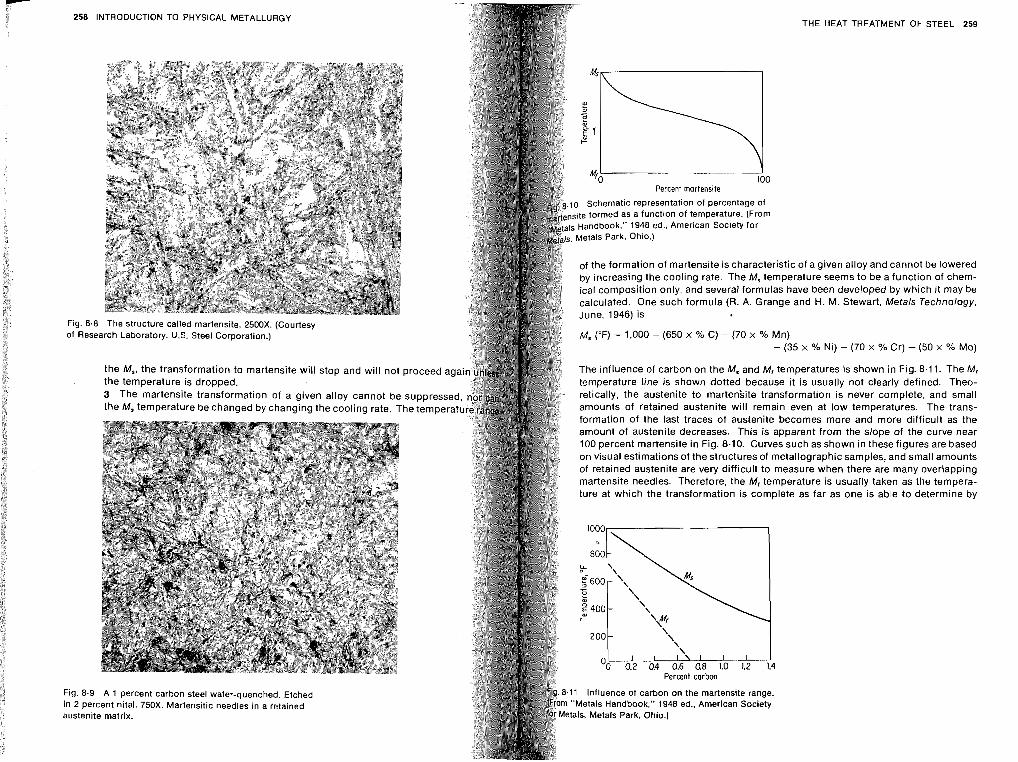
258 INTRODUCTION TO PHYSICAL METALLURGY
Fig. 8.8 The structure called martensite, 2500X. (Courtesy of Research Laboratory, U.S. Steel Corporation.)
the M,, the transformation to martensite will stop and will not prl the temperature is dropped. 3 The martensite transformation of a given alloy cannot be SL
the M, temperature be changed by changing the cooling rate. The
Fig. 8.9 A 1 percent carbon steel water-quenched. Etched in 2 percent nital. 750X. Martensitic needles in a retained austenite matrix.
THE HEAT TREATMENT OF STEEL 259
Percent martensite
of the formation of martensite is characteristic of a given alloy and cannot be lowered
Ms ("F) = 1,000 - (650 x % C) - (70 x % Mn) -(35 x % Ni) -(70 x % Cr) -(50 x % Mo)
amounts of retained austenite will remain even at low temperatures. The trans- formation of the last traces of austenite becomes more and more difficult as the amount of austenite decreases. This is apparent from the slope of the curve near I00 percent martensite in Fig. 8.10. Curves such as shown in these figures are based on visual estimations of the structures of metallographic samples, and small amounts of retained austenite are very difficult to measure when there are many overlapping martensite needles. Therefore, the M, temperature is usually taken as the tempera- ture at which the transformation is complete as far as one is able to determine by
Percent carbon
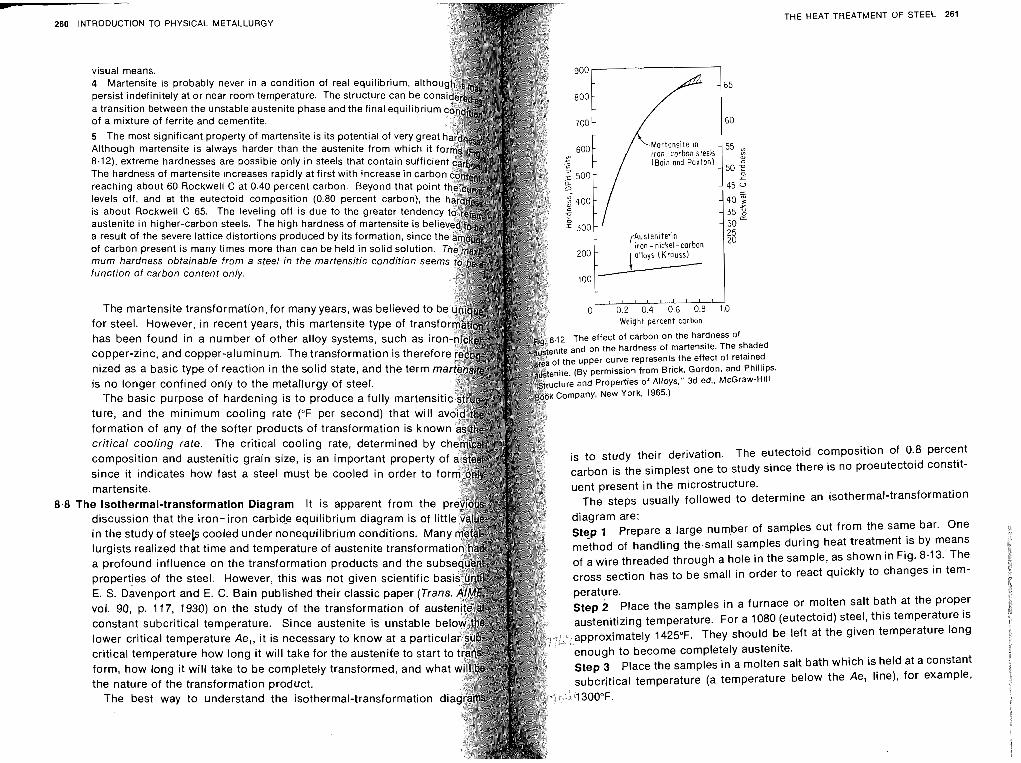
260 INTRODUCTION TO PHYSICAL METALLURGY THE HEAT TREATMENT OF STEEL 261
visual means.
of a mixture of ferrite and cementite.
is about Rockwell C 65. The leveling off is due to the austenite in higher-carbon steels. The high hardness of a result of the severe lattice distortions produced by its f of carbon present is many times more than can be held mum hardness obtainable frgm a steel in the martensitr function of carbon content only.
The martensite transformation, for many years, was believed to for steel. However, in recent years, this martensit Weight percent carbon has been found in a number of other alloy s The effect of carbon on the hardness of
and on the hardness of martensite. The shaded
nized as a basic type of reaction in the solid state, and the term is no longer confined only to the metallurgy of steel.
The basic purpose of hardening is to produce a fully marten mpany, New York, 1965.)
ture, and the minimum cooling rate ( O F per second) that will formation of any of the softer products of transformation is know critical cooling rate. The critical cooling rate, composition and austenitic grain size, is an important property is to study their derivation. The eutectoid composition of 0.8 Percent since it indicates how fast a steel must be cooled in order to carbon is the simplest one to study since there is no proeutectoid constit- martensite. uent present in the microstructure.
The steps usually followed to determine an isothermal-transformation discussion that the iron-iron carbide equilibriu
in the study of steels cooled under nonequilibrium conditions. Man stgp 1 Prepare a large number of samples cut from the Sane bar. One method of handling the-small samples during heat treatment is by m~eans of a wire threaded through a hole in the sample, as shown in Fig. 8.l3. The cross section has to be small in order to react quickly to changes in tern-
E. S. Davenport and E. C . Bain published their classic paper (Tra
vol. 90, p. 117, 1930) on the study of the transformation of au ce or molten salt bath at the Proper constant subcritical temperature. Since austenite is unstable be1 (eutectoid) steel, this temperature is
e left at the given temperature long
form, how long it will take to be completely transformed, and wha It bath which is held at a constant the nature of the transformation product.
The best way to understand the isothermal-transformation di
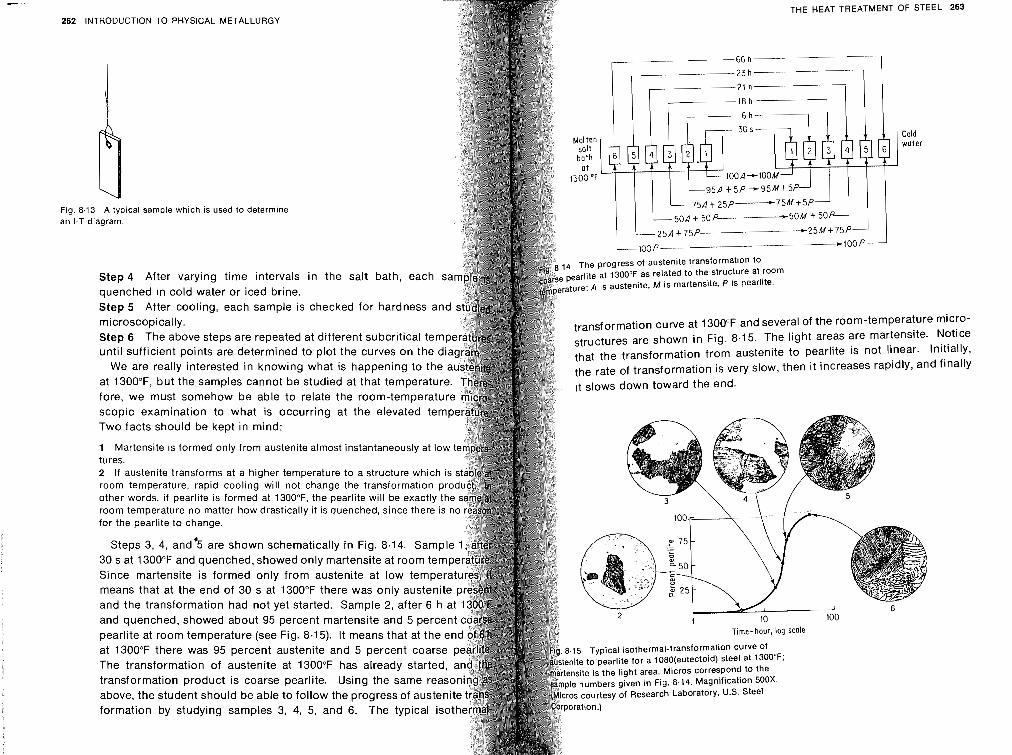
7-
262 INTRODUCTION TO PHYSICAL METALLURGY
Fig. an I.
13 A typlcal sample wh~ch IS used to determ~ne # diagram
Step 4 After varying time intervals in the salt bath, each sa quenched in cold water or iced brine. Step 5 After cooling, each sample is checked for hardness an microscopically. Step 6 The above steps are repeated at different subcritical tem until sufficient points are determined to plot the curves on the d
We are really interested in knowing what is happening to the at 1300"F, but the samples cannot be studied at that temperatur fore, we must somehow be able to relate the room-temperatu scopic examination to what is occurring at the elevated tem Two facts should be kept in mind:
Steps 3, 4, and.5 are shown schematically in Fig. 8.14. Sampl 30 s at 1300°F and quenched, showed only martensite at room tem Since martensite is formed only from austenite at low tempe means that at the end of 30 s at 1300°F there was only austeni and the transformation had not yet started. Sample 2, after 6 h and quenched, showed about 95 percent martensite and 5 perce pearlite at room temperature (see Fig. 8.15). It means that at 1300°F there was 95 percent austenite and 5 percent The transformation of austenite at 1300°F has already transformation product is coarse pearlite. Using the same reas above, the student should be able to follow the progress of aust formation by studying samples 3, 4, 5, and 6. The typical
THE HEAT TREATMENT OF STEEL 263
t 25P--------t75M t 5P
-1OOP
transformation curve at 1300°F and several of the room-temperature micro- structures are shown in Fig. 8.15. The light areas are martensite. Notice that the transformation from austenite to pearlite is not linear. Initially,
the rate of transformation is very slow, then i t increases rapidly, and finally it slows down toward the end.
1 Martensite is formed only from austenite almost instantaneously at low tures. 2 If austenite transforms at a higher temperature to a structure which room temperature, rapid cooling will not change the transformation other words, if Pearlite is formed at 130OoF, the pearkite will be exactly room temperature no matter how drastically it is quenched, since there for the pearlite to change.
Time- hour, log scale
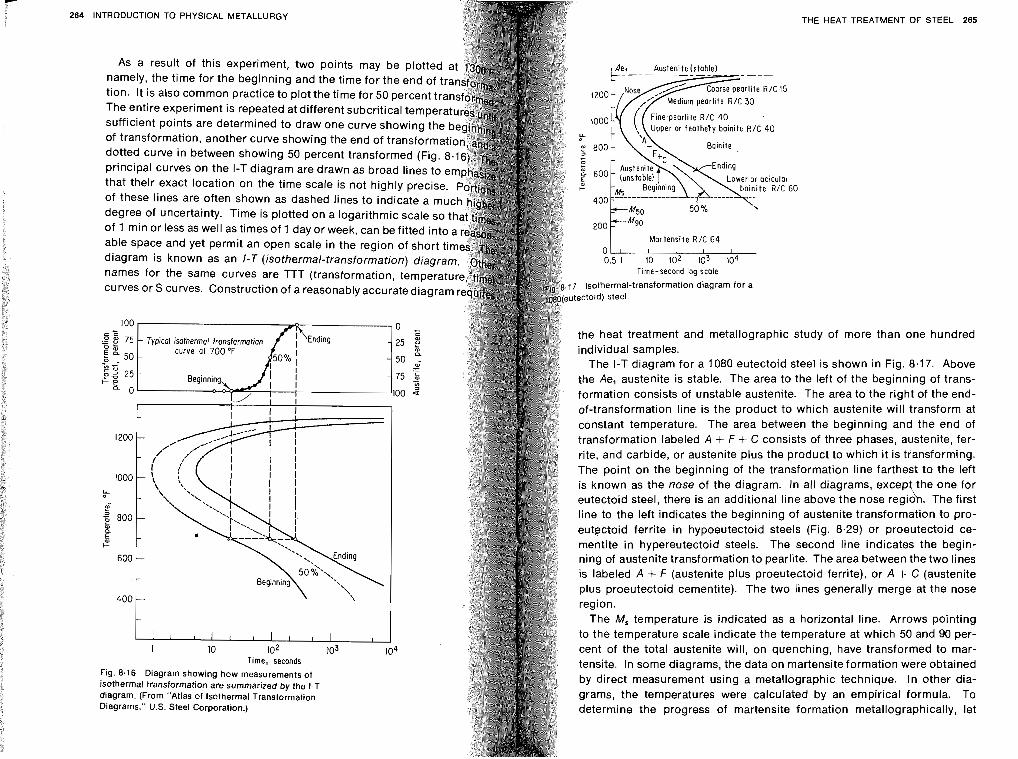
INTRODUCTION TO PHYSICAL METALLURGY
As a result of this experiment, two points may be plotted a namely, the time for the beginning and the time for the end of tra tion. It is also common practice to plot the time for 50 percent tran The entire experiment is repeated at different subcritical tempera sufficient points are determined to draw one curve showing the of transformation, another curve showing the end of transformat dotted curve in between showing 50 percent transformed (Fig. 8 principal curves on the I-T diagram are drawn as broad lines to e that their exact location on the time scale is not highly precise. of these lines are often shown as dashed lines to indicate a muc degree of uncertainty. Time is plotted on a logarithmic scale so of 1 min or less as well as times of 1 day or week, can be fitted into able space and yet permit an open scale in the region of short ti diagram is known as an I -T (isothermal-transformation) diagra names for the same curves are TTT (transformation, temperat curves or S curves. Construction of a reasonably accuratediagram r
Beginning
I
I 1 1
600 -
-
400 -
- I I , I I $ 1 , , I , , I 10 102 103 104
Time, seconds Fig. 8.16 Diagram showing how measurements of isothermal transformation are summarized by the I-T diagram. (From "Atlas of isothermal Transformation Diagrams." U.S. Steel Corporation.)
THE HEAT TREATMENT OF STEEL 265
Ael Austenite (stable)
I000 Upper or feathefy boinite R / C 40
LL
"00 - Bainite ,
200 -"30 Martensite R I C 64
0 I I I , I
0.5 1 10 i02 103 lo4 Time-second log scale
r Isothermal-transformation diagram for a tectoid) steel.
the heat treatment and metallographic study of more than one hundred individual samples.
The I-T diagram for a 1080 eutectoid steel is shown in Fig. 8.17. Above the Ae, austenite is stable. The area to the left of the beginning of trans- formation consists of unstable austenite. The area to the right of the end- of-transformation line is the product to which austenite will transform at constant temperature. The area between the beginning and the end of transformation labeled A + F + C consists of three phases, austenite, fer- rite, and carbide, or austenite plus the product to which it is transforming. The point on the beginning of the transformation line farthest to the left is known as the nose of the diagram. In all diagrams, excep the one for l eutectoid steel, there is an additional line above the nose regio . The first line to the left indicates the beginning of austenite transformation to pro- eutgctoid ferrite in hypoeutectoid steels (Fig. 8.29) or proeutectoid ce- mentite in hypereutectoid steels. The second line indicates the begin- ning of austenite transformation to pearlite. The area between the two lines is labeled A + F (austenite plus proeutectoid ferrite), or A + C (austenite plus proeutectoid cementite). The two lines generally merge at the nose region.
The M, temperature is indicated as a horizontal line. Arrows pointing to the temperature scale indicate the temperature at which 50 and 90 per- cent of the total austenite will, on quenching, have transformed to mar- tensite. In some diagrams, the data on martensite formation were obtained by direct measurement using a metallographic technique. In other dia- grams, the temperatures were calculated by an empirical formula. To determine the progress of martensite formation metallographically, let
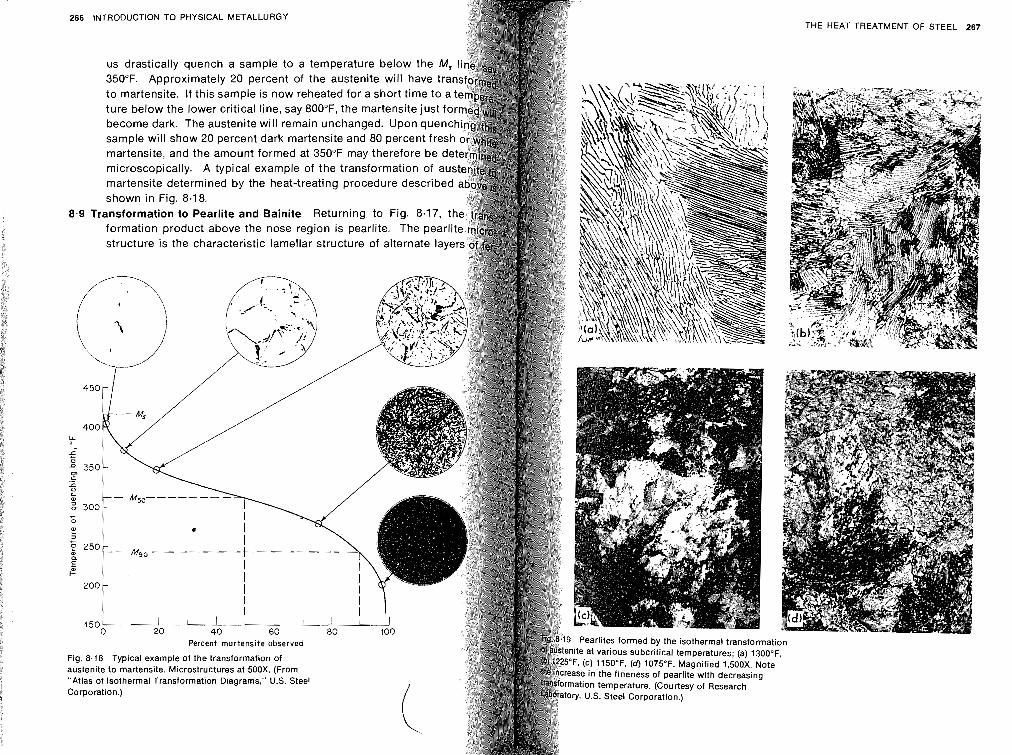
THE HEAT TREATMENT OF STEEL 267
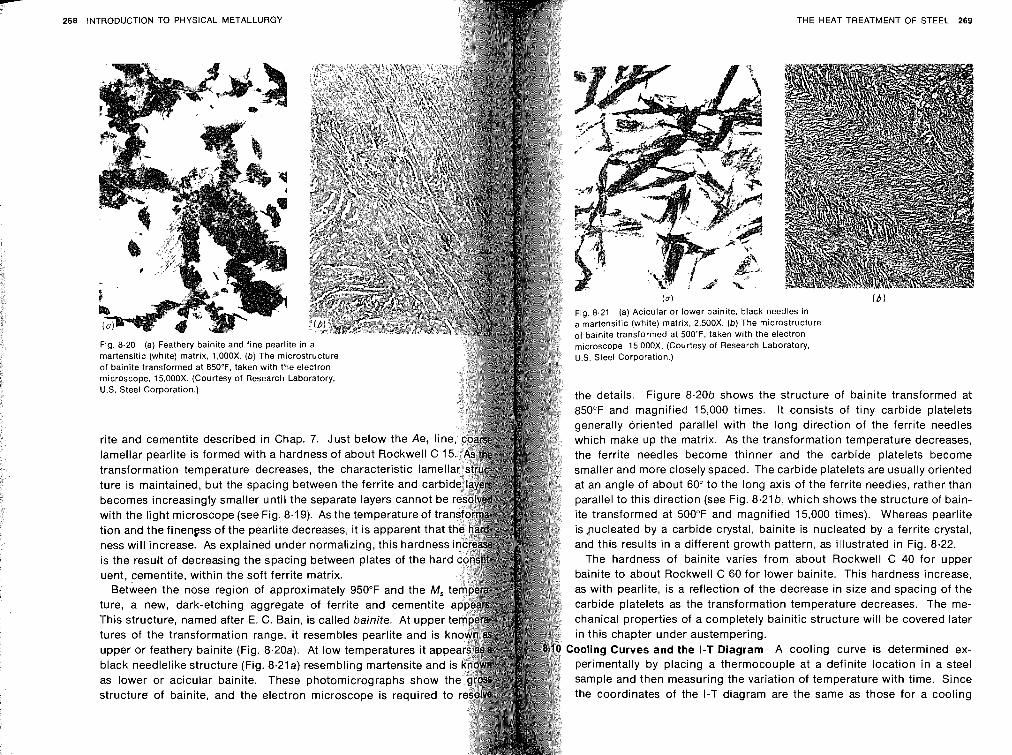
- 268 INTRODUCTION TO PHYSICAL METALLURGY THE HEAT TREATMENT OF STEEL 269
Fig. 8.21 (a) Acicular or lower bainite, black needles in a martensitic (white) matrix. 2,500X. (b ) The microstructure of bainite transformed at 500"F, taken with the electron microscope. 15,000X. (Courtesy of Research Laboratory,
martensitic (white) matrix. 1.000X. (b ) The microstructure U.S. Steel Corporation.) of bainite transformed at 850°F, taken with the electron microscope, 15,000X. (Courtesy of Research Laboratory. U.S. Steel Corporation.) the details. Figure 8.20b shows the structure of bainite transformed at
850°F and magnified 15,000 times. It consists of tiny carbide platelets generally oriented parallel with the long direction of the ferrite needles which make up the matrix. As the transformation temperature decreases, the ferrite needles become thinner and the carbide platelets become smaller and more closely spaced. The carbide platelets are usually oriented at an angle of about 60" to the long axis of the ferrite needles, rather than parallel to this direction (see Fig. 8.21 b, which shows the structure of bain- ite transformed at 500°F and magnified 15,000 times). Whereas pearlite is *nucleated by a carbide crystal, bainite is nucleated by a ferrite crystal,
ness will increase. As explained under normalizing, this hard and this results in a different growth pattern, as illustrated in Fig. 8.22. The hardness of bainite varies from about Rockwell C 40 for upper
uent, cementite, within the soft ferrite matrix. bainite to about Rockwell C 60 for lower bainite. This hardness increase, Between the nose region of approximately 950°F and the M, as with pearlite, is a reflection of the decrease in size and spacing of the
ture, a new, dark-etching aggregate of ferrite and cementite carbide platelets as the transformation temperature decreases. The me- This structure, named after E. C. Bain, is called bainite. At upper chanical properties of a completely bainitic structure will be covered later tures of the transformation range, it resembles pearlite and is in this chapter under austempering. upper or feathery bainite (Fig. 8.20a). At low temperatures it ap Cooling Curves and the I-T Diagram A cooling curve is determined ex-
perimentally by placing a thermocouple at a definite location in a steel as lower or acicular bainite. These photomicrographs show t sample and then measuring the variation of temperature with time. Since
structure of bainite, and the electron microscope is required to the coordinates of the I-T diagram are the same as those for a cooling
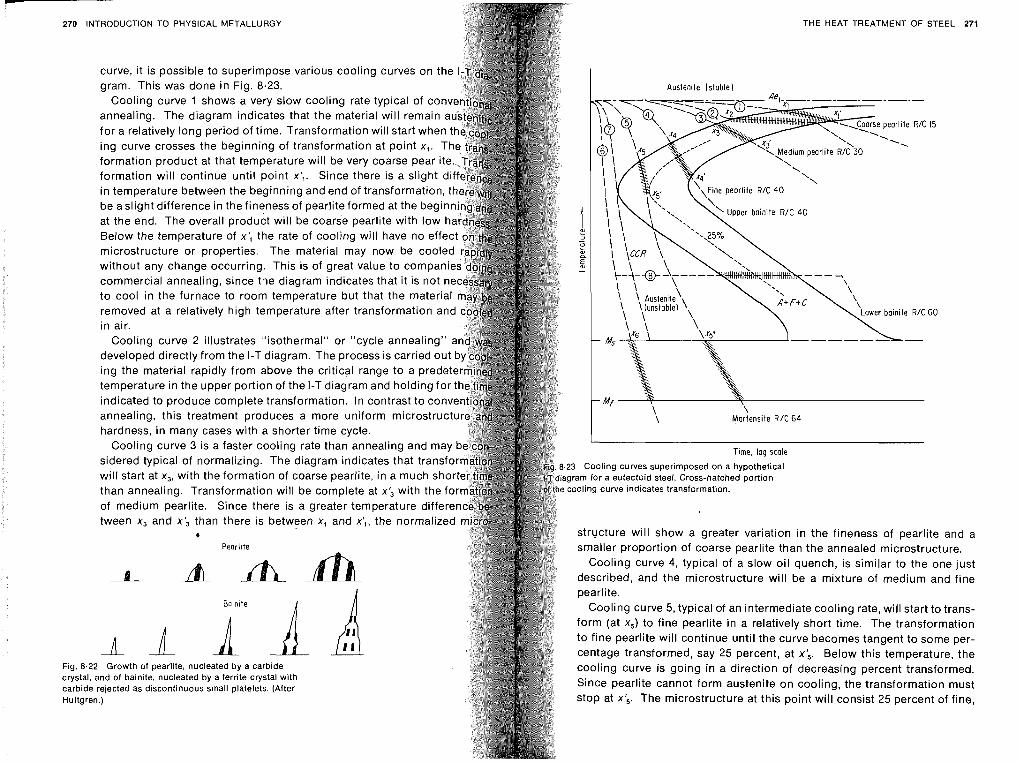
L
270 INTRODUCTION TO PHYSICAL METALLURGY
curve, it is possible to superimpose various cooling curves on th gram. This was done in Fig. 8.23.
Cooling curve 1 shows a very slow cooling rate typical of co annealing. The diagram indicates that the material will remain for a relatively long period of time. Transformation will start whe ing curve crosses the beginning of transformation at point x,. Th formation product at that temperature will be very coarse pearli formation will continue until point x ; . Since there is a slight in temperature between the beginning and end of transformation, be aslight difference in the fineness of pearlite formed at the begin at the end. The overall product will be coarse pearlite with low Below the temperature of x ; the rate of cooling will have no eff microstructure or properties. The material may now be cool without any change occurring. This is of great value to compa commercial annealing, since the diagram indicates that it is not to cool in the furnace to room temperature but that the materi removed at a relatively high temperature after transformation an in air.
Cooling curve 2 illustrates "isothermal" or "cycle annealing" developed directly from the I-T diagram. The process is carried ou ing the material rapidly from above the critical range to a prede temperature in the upper portion of the I-T diagram and holding fo indicated to produce complete transformation. In contrast to con annealing, this treatment produces a more uniform microstru hardness, in many cases with a shorter time cycle.
Cooling curve 3 is a faster cooling rate than annealing and sidered typical of normalizing. The diagram indicates that tra will start at x3, with the formation of coarse pearlite, in a much s than annealing. Transformation will be complete at x ; with the f of medium pearlite. Since there is a greater temperature differe tween x, and x j than there is between x, and x',, the normalize
* Pearl~te
Fig. 8.22 Growth of pearlite, nucleated by a carbide crystal, and of bainite, nucleated by a ferrite crystal with carbide rejected as discontinuous small platelets. (After Hultgren.)
THE HEAT TREATMENT OF STEEL 271
I Auslenite (stable)
\ \ '~ower boinile R/C 60
\ \ \ Martensile R / C 64
I
T~rne, log scale sg. 8.23 Cooling Curves superimposed on a hypothetical g~d iag ram for a eutecto~d steel. Cross-hatched portron
cooling curve indicates transformation
strycture will show a greater variation in the fineness of pearlite and a smaller proportion of coarse pearlite than the annealed microstructure.
Cooling curve 4, typical of a slow oil quench, is similar to the one just described, and the microstructure will be a mixture of medium and fine pearlite.
Cooling curve 5, typical of an intermediate cooling rate, will start to trans- form (at x 5 ) to fine pearlite in a relatively short time. The transformation to fine pearlite will continue until the curve becomes tangent to some per- centage transformed, say 25 percent, at x ; . Below this temperature, the cooling curve is going in a direction of decreasing percent transformed. Since pearlite cannot form austenite on cooling, the transformation must stop at x ; . The microstructure at this point will consist 25 percent of fine,
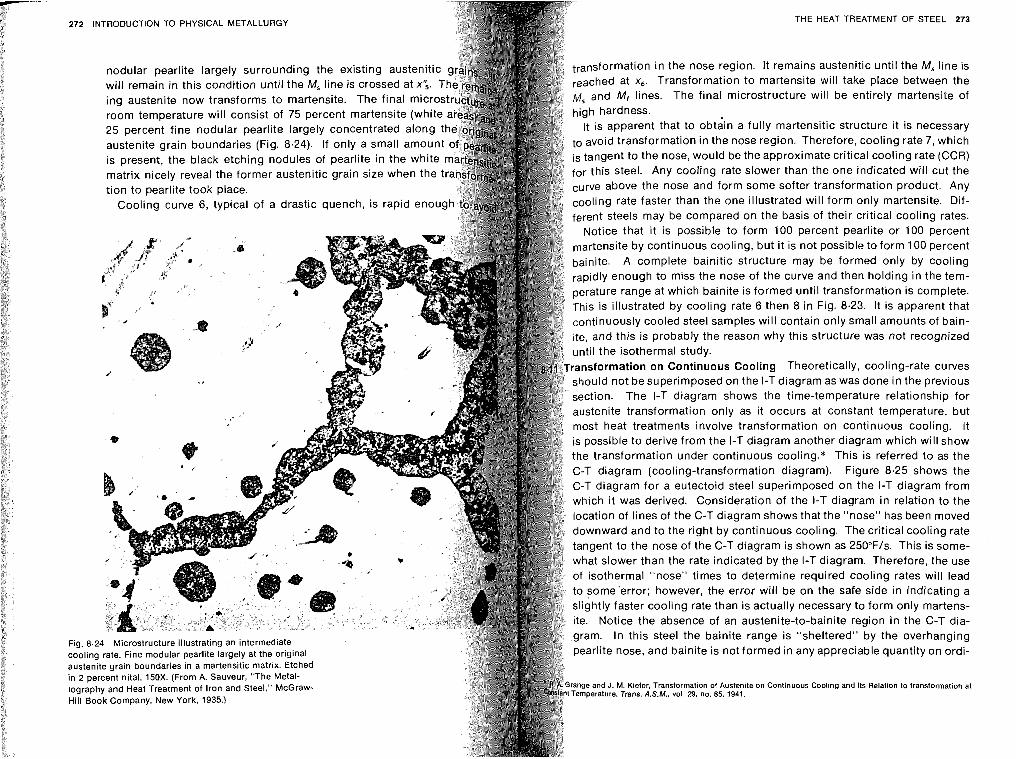
272 INTRODUCTION TO PHYSICAL METALLURGY
nodular pearlite largely surrounding the existing austenitic will remain in this condition until the M, line is crossed at x';. T ing austenite now transforms to martensite. The final micros room temperature will consist of 75 percent martensite (white 25 percent fine nodular pearlite largely concentrated along t austenite grain boundaries (Fig. 8.24). If only a small amount is present, the black etching nodules of pearlite in the white matrix nicely reveal the former austenitic grain size when the t tion to pearlite took place.
Cooling curve 6, typical of a drastic quench, is rapid enoug
THE HEAT TREATMENT OF STEEL 273
transformation in the nose region. It remains austenitic until the M, line is reached at x,. Transformation to martensite will take place between the M, and M, lines. The final microstructure will be entirely martensite of high hardness.
it is apparent that to obtain a fully martensitic structure it is necessary to avoid transformation in the nose region. Therefore, cooling rate 7 , which is tangent to the nose, would be the approximate critical cooling rate (CCR) for this steel. Any cooling rate slower than the one indicated will cut the
curve above the nose and form some softer transformation product. Any cooling rate faster than the one illustrated will form only martensite. Dif- ferent steels may be compared on the basis of their critical cooling rates.
Notice that it is possible to form 100 percent pearlite or 100 percent martensite by continuous cooling, but it is not possible to form 100 percent bainite. A complete bainitic structure may be formed only by cooling
pldly enough to mlss the nose of the curve and then holding In the tem- p { / a erature range at which balnlte IS formed untll transformat~on is complete
I f , h ~ s is ~llustrated by coollng rate 6 then 8 In Fig 8.23 It IS apparent that
Ir ont~nuously cooled steel samples will contaln only small amounts of ba~n- , and thls is probably the reason why this structure was not recogn~zed
nital, 150X. (From A. Sauveur, "The Metal- a ~ h ~ and Heat Treatment of iron and Steel," McGraw-
Fig. 8.24 Microstructure illustrating an intermediate cooling rate. Fine modular pearlite largely at the original austenite wain boundaries in a martensitic matrix. Etched
~ i i 6o;k Company, New York, 1935.)
ntil the isothermal study. nsformation on Continuous Cooling Theoretically, cooling-rate curves
uld not be superimposed on the I-T diagram as was done in the previous tion. The I-T diagram shows the time-temperature relationship for
ustenite transformation only as it occurs at constant temperature, but ost heat treatments involve transformation on continuous cooling. It possible to derive from the I-T diagram another diagram which will show
the transformation under continuous cooling.* This is referred to as the C-T diagram (cooling-transformation diagram). Figure 8.25 shows the C-T diagram for a eutectoid steel superimposed on the I-T diagram from
hich it was derived. Consideration of the I-T diagram in relation to the tion of lines of the C-T diagram shows that the "nose" has been moved nward and to the right by continuous cooling. The critical cooling rate
ngent to the nose of the C-T diagram is shown as 250"F/s. This is some- what slower than the rate indicated by the I-T diagram. Therefore, the use of isothermal "nose" times to determine required cooling rates will lead to some'error; however, the error will be on the safe side in indicatina a slightly faster cooling rate than is actually necessary to form only ite. Notice the absence of an austenite-to-bainite region in the
" martens-
! C-T dia- ram. In this steel the bainite range is "sheltered" by the overhanging earlite nose, and bainite is not formed in any appreciable quantity on ordi-
range and J. M. Kiefer, Transformation of Austenite on Continuous Cooling and Its Relation to Ira Temperature. Trans. A.S.M.. vol. 29, no. 85. 1941.
nsformation at
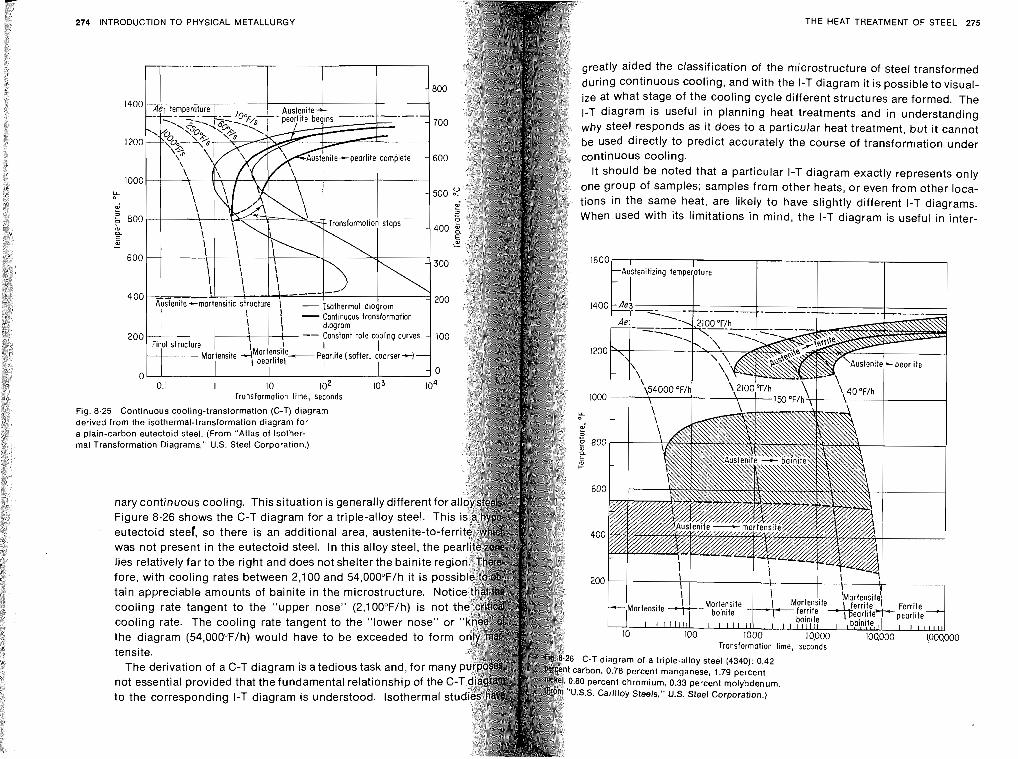
274 INTRODUCTION PHYSICAL METALLURGY
\ I I ', -_--I--'. \ 400 khite-mortensitic dructure i - I
Isofhermol diagram - 20
I - Conf~nuous tronsformoiion diagram --
1 1 FinLol structure 1 - ~o!tensite 4'"'~~!!~!!~- ~earlite ( sdler, c o o r s e r ~
0.1 I 10 102 103 lo4 Tronsformotion lime, seconds
Fig. 8.25 Continuous cooling-transformation (C-T) diagram derived from the isothermal-transformation diagram for a plain-carbon eutectoid steel. (From "Atlas of Isother- mal Transformation Diagrams." U.S. Steel Corporation.)
nary continuous cooling. This situation is generally different for Figure 8.26 shows the C-T diagram for a triple-alloy steel. Th eutectoid steel, so there is an additional area, austenite-to-f was not present in the eutectoid steel. In this alloy steel, the lies relatively far to the right and does not shelter the bainite re fore, with cooling rates between 2,100 and 54,00O0F/h it is po tain appreciable amounts of bainite in the microstructure. N cooling rate tangent to the "upper nose" (2,10O0F/h) is not t cooling rate. The cooling rate tangent to the "lower nose" or the diagram (54,000"Flh) would have to be exceeded to form tensite.
The derivation of a C-T diagram is a tedious task and, for man not essential provided that the fundamental relationship of the to the corresponding I-T diagram is understood. Isothermal
THE HEAT TREATMENT OF STEEL 275
aided the classification of the microstructure of steef transformed during continuous cooling, and with the I-T diagram it is possible to visual- ize at what stage of the cooling cycle different structures are formed. The 1-T diagram is useful in planning heat treatments and in understanding why steel responds as it does to a particular heat treatment, but i t cannot be used directly to predict accurately the course of transformation under continuous cooling.
It should be noted that a particular I-T diagram exactly represents only one group of samples; samples from other heats, or even from other loca- tions in the same heat, are likely to have slightly different I-T diagrams. When used with its limitations in mind, the I-T diagram is useful in inter-
Austenitizing tempe;oture
I I I
I I \ I I 'Martensitei -- Martensite
t--Mg;;;te ::"- Mb:"+rriie I eorllfe)tc-pear~ite- 1 Ferrite I I I I I I I I I I I I I I I I Ic I 1 1 boinite 1 1 1 1 1 1 I I boinite I 1 I 1 I,,uL
10 too 1000 IO,OOO ~oaooo ~,ooo,ooo Transformalion time, seconds
C-T diagram of a triple-alloy steel (4340): 0.42 carbon. 0.78 percent manganese, 1.79 percent .80 percent chromium. 0.33 percent molybdenum. J.S.S. Carilloy Steels," U.S. Steel Corporation.)
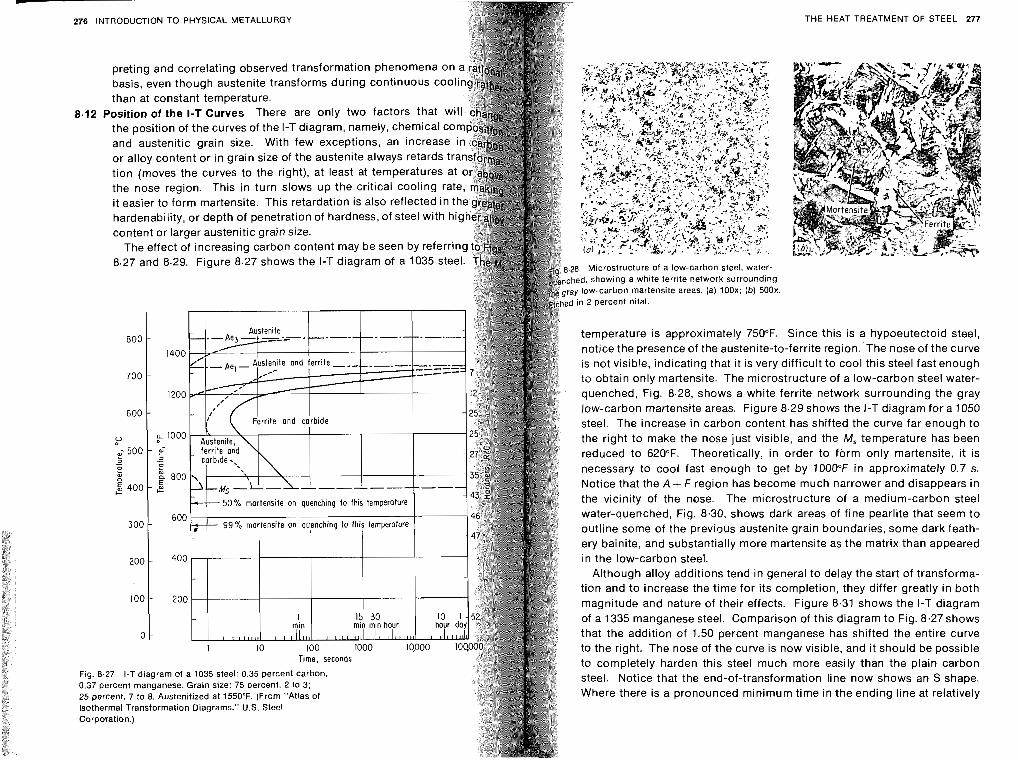
276 INTRODUCTION TO PHYSICAL METALLURGY
preting and correlating observed transformation phenomena on basis, even though austenite transforms during continuous cool than at constant temperature.
8.12 Position of the I-T Curves There are only two factors that wi the position of the curves of the I-T diagram, namely, chemical co and austenitic grain size. With few exceptions, an increase or alloy content or in grain size of the austenite always retards tra
it easier to form martensite. This retardation is also reflected in t hardenability, or depth of penetration of hardness, of steel with hi content or larger austenitic grain size.
Isothermal Transformation Diagrams." U.S. Steel Corporation.)
THE HEAT TREATMENT OF STEEL 277
, Microstructure of a low-carbon steel, water- :d, showing a white ferrite network surrounding low-carbon martensite areas. (a) 100x; (b) 500x
n 2 Dercent nital.
temperature is approximately 750°F. Since this is a hypoeutectoid steel, notice the presence of the austenite-to-ferrite region. The nose of the curve is not visible, indicating that it is very difficult to cool this steel fast enough to obtain only martensite. The microstructure of a low-carbon steel water- quenched, Fig. 8.28, shows a white ferrite network surrounding the gray low-carbon martensite areas. Figure 8.29 shows the I-T diagram for a 1050 steel. The increase in carbon content has shifted the curve far enough to the right to make the nose just visible, and the M, temperature has been reduced to 620°F. Theoretically, in order to form only martensite, it is necessary to cool fast enough to get by 1000°F in approximately 0.7 s. Notice that the A + F region has become much narrower and disappears in the vicinity of the nose. The microstructure of a medium-carbon steel water-quenched, Fig. 8.30, shows dark areas of fine pearlite that seem to outline some of the previous austenite grain boundaries, some dark feath- ery bainite, and substantially more martensite as the matrix than appeared in the low-carbon steel.
Although alloy additions tend in general to delay the start of transforma- tion and to increase the time for its completion, they differ greatly in both magnitude and nature of their effects. Figure 8.31 shows the I-T diagram of a 1335 manganese steel. Comparison of this diagram to Fig. 8.27 shows that the addition of 1.50 percent manganese has shifted the entire curve to the right. The nose of the curve is now visible, and it should be possible to completely harden this steel much more easily than the plain carbon steel. Notice that the end-of-transformation line now shows an S shape. Where there is a pronounced minimum time in the ending line at relatively
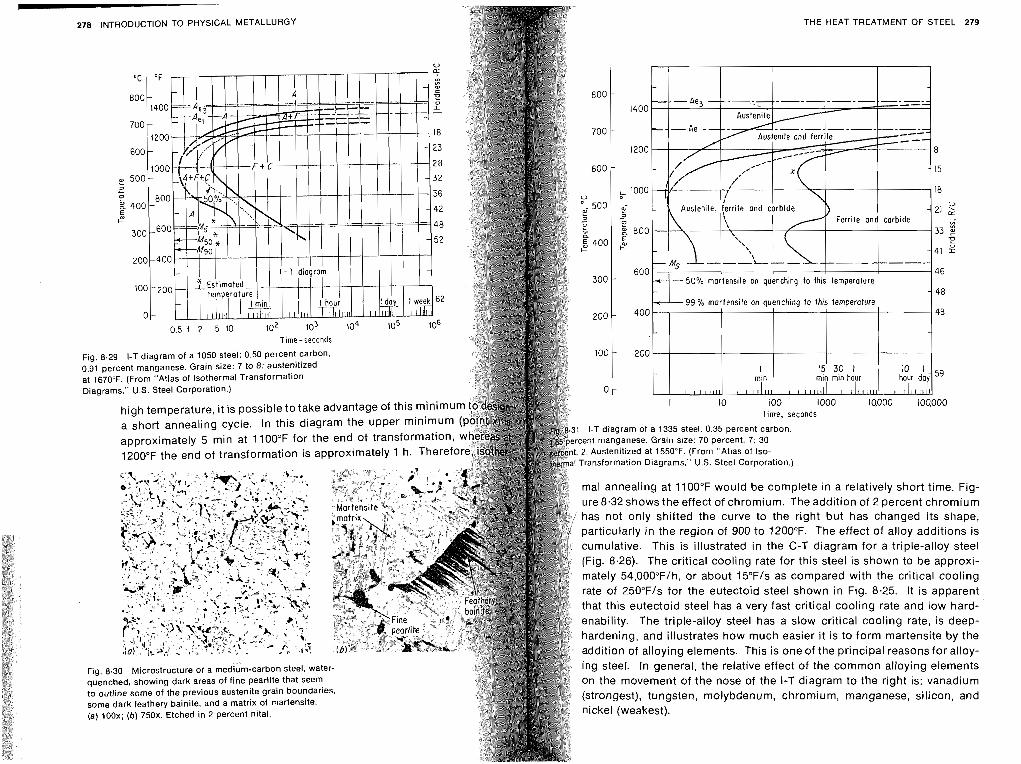
METALLURGY THE HEAT TREATMENT OF STEEL 279
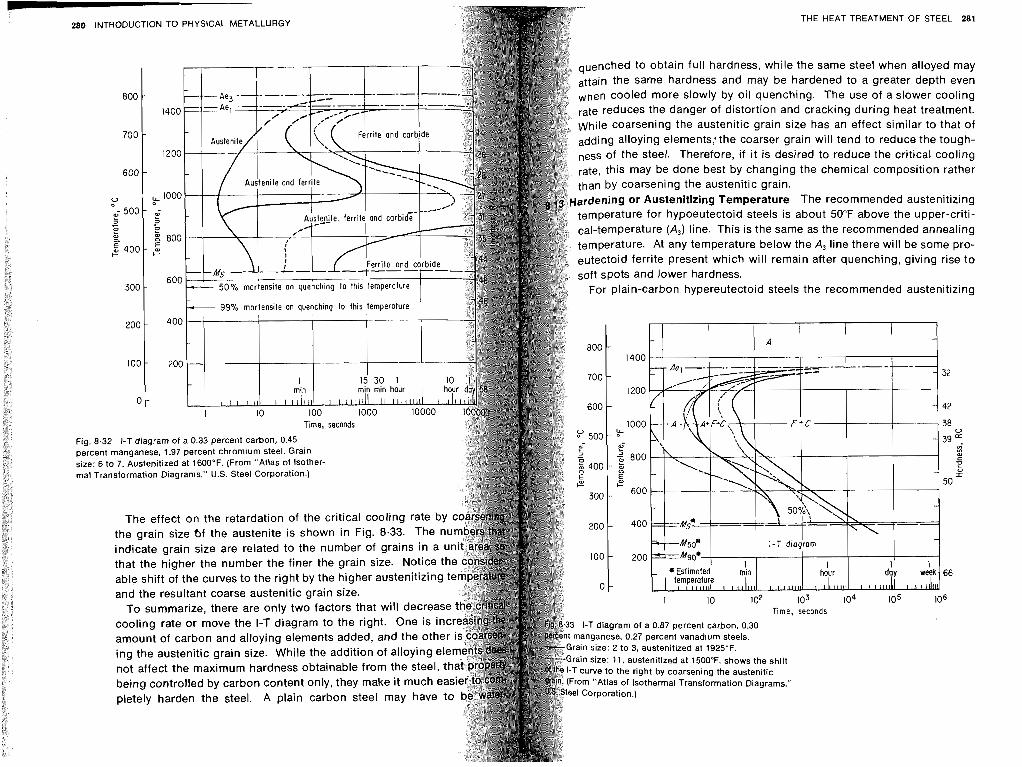
280 INTRODUCTION TO PHYSICAL METALLURGY THE HEAT TREATMENT OF STEEL 281
quenched to obtain full hardness, while the same steel when alloyed may attain the same hardness and may be hardened to a greater depth even when cooled more slowly by oil quenching. The use of a slower cooling rate reduces the danger of distortion and cracking during heat treatment. While coarsening the austenitic grain size has an effect similar to that of adding alloying elements: the coarser grain will tend to reduce the tough- ness of the steel. Therefore, if it is desired to reduce the critical cooling rate, this may be done best by changing the chemical composition rather than by coarsening the austenitic grain. ardening or Austenitizing Temperature The recommended austenitizing temperature for hypoeutectoid steels is about 50°F above the upper-criti- cabtemperature (A,) line. This is the same as the recommended annealing temperature. At any temperature below the A, line there will be some pro- eutectoid ferrite present which will remain after quenching, giving rise to soft spots and lower hardness.
For plain-carbon hypereutectoid steels the recommended austenitizing
Fig. 8.32 I-T diagram of a 0.33 percent carbon. 0.45 percent manganese. 1.97 percent chromium steel. Grain size: 6 to 7. Austenitized at 1600°F. (From "Atlas of Isother- mal Transformation Diagrams." U.S. Steel Corporation.)
indicate grain size are related to the number of grains in a that the higher the number the finer the grain size. Notice t able shift of the curves to the right by the higher austenitizing
diagram of a 0.87 percent carbon, 0.30 amount of carbon and alloying elements added, and the othe anese, 0.27 percent vanadium steels.
ing the austenitic grain size. While the addition of alloying el ize: 2 to 3, austenitized at 1925"~.
e to the right by coarsening the austenitic being controlled by carbon content only, they make it much e Atlas of lsothermal Transformation Diagrams,"
pletely harden the steel. A plain carbon steel may have
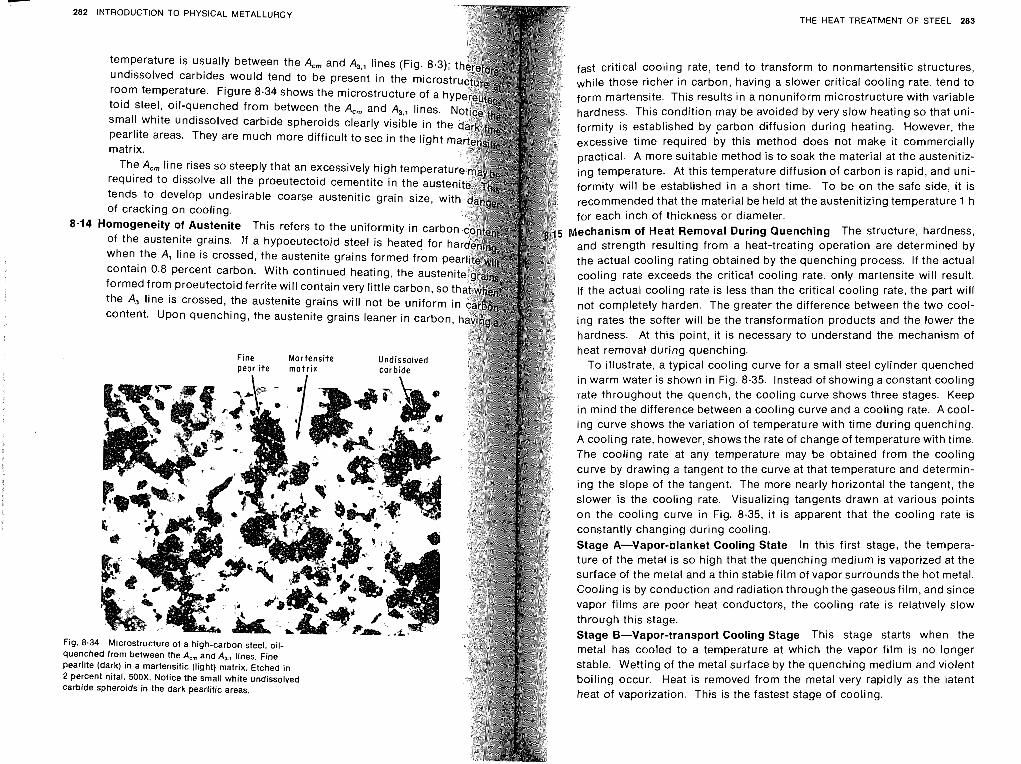
282 INTRODUCTION TO PHYSICAL METALLURGY
temperature is usually between the A,, and A,,, lines (Fig. 8.3); undissolved carbides would tend to be present in the micros room temperature. Figure 8.34 shows the microstructure of a h toid steel, oil-quenched from between the A,, and A,,, lines. small white undissolved carbide spheroids clearly visible in th pearlite areas. They are much more difficult to see in the light matrix.
The A,, line rises so steeply that an excessively high temperat required to dissolve all the proeutectoid cementite in the auste
when the A, line is crossed, the austenite grains formed from pe contain 0.8 percent carbon. With continued heating, the austen
the A, line is crossed, the austenite grains will not be uniform i content. Upon quenching, the austenite grains leaner in carbon,
Fig. 8.34 Microstructure of a high-carbon steel, oil- quenched from between the A,, and A,., lines. Fine pearlite (dark) in a martensitic (light) matrix. Etched in 2 percent nital, 500X. Notice the small white undissolved carbide spheroids in the dark pearlitic areas.
- THE HEAT TREATMENT OF STEEL 283
fast critical cooling rate, tend to transform to nonmartensitic structures, while those richer in carbon, having a slower critical cooling rate, tend to form martensite. This results in a nonuniform microstructure with variable hardness. This condition may be avoided by very slow heating so that uni- formity is established by carbon diffusion during heating. However, the excessive time required by this method does not make it commercially practical. A more suitable method is to soak the material at the austenitiz- ing temperature. At this temperature diffusion of carbon is rapid, and uni- formity will be established in a short time. To be on the safe side, it is recommended that the material be held at the austenitizing temperature 1 h for each inch of thickness or diameter.
Mechanism of Heat Removal During Quenching The structure, hardness, and strength resulting from a heat-treating operation are determined by the actual cooling rating obtained by the quenching process. If the actual cooling rate exceeds the critical cooling rate, only martensite will result. If the actual cooling rate is less than the critical cooling rate, the part will not completely harden. The greater the difference between the two cool- ing rates the softer will be the transformation products and the lower the hardness. At this point, it is necessary to understand the mechanism of heat removal during quenching.
To illustrate, a typical cooling curve for a small steel cylinder quenched in warm water is shown in Fig. 8.35. Instead of showing a constant cooling late throughout the quench, the cooling curve shows three stages. Keep in mind the difference between a cooling curve and a cooling rate. A cool- ing curve shows the variation of temperature with time during quenching. A cooling rate, however, shows the rate of change of temperature with time. The cooling rate at any temperature may be obtained from the cooling curve by drawing a tangent to the curve at that temperature and determin- ing the slope of the tangent. The more nearly horizontal the tangent, the slower is the cooling rate. Visualizing tangents drawn at various points on the cooling curve in Fig. 8.35, it is apparent that the cooling rate is constantly changing during cooling. Stage A-Vapor-lolanket Cooling State In this first stage, the tempera- ture of the metal is so high that the quenching medium is vaporized at the surface of the metal and a thin stable film of vapor surrounds the hot metal. Cooling is by conduction and radiation through the gaseousfilm, and since vapor films are poor heat conductors, the cooling rate is relatively slow through this stage. Stage B-Vapor-transport Cooling Stage This stage starts when the metal has cooled to a temperature at which the vapor film is no longer stable. Wetting of the metal surface by the quenching medium and violent boiling occur. Heat is removed from the metal very rapidly as the latent heat of vaporization. This is the fastest stage of cooling.
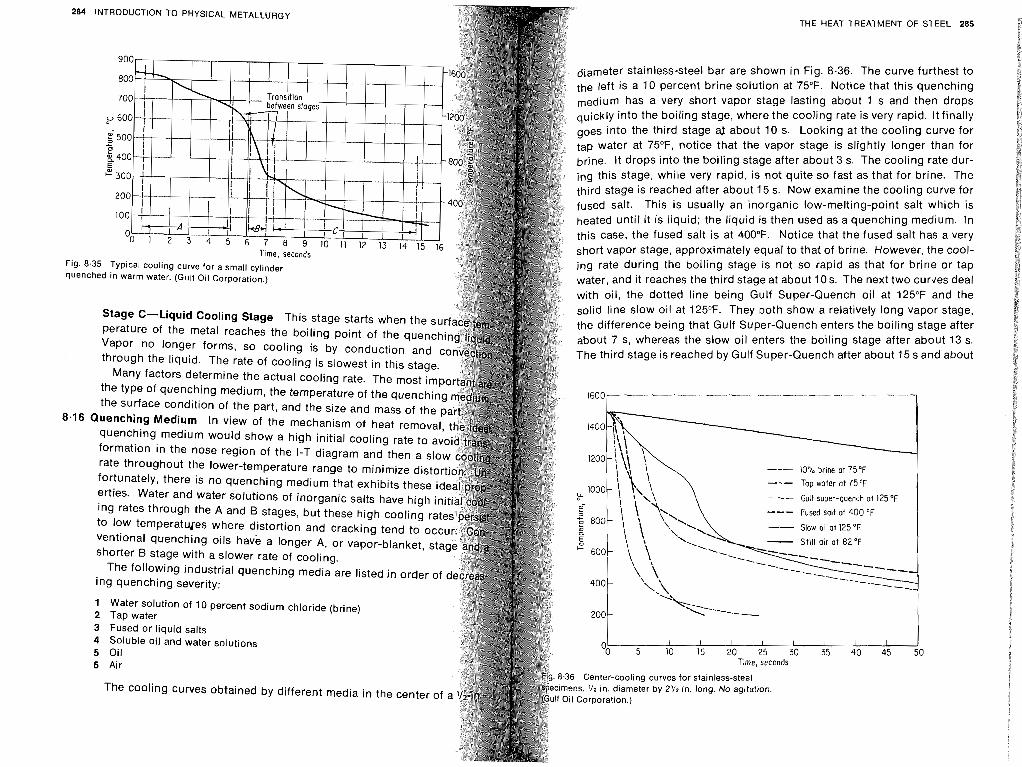
THE HEAT TREATMENT OF STEEL 285
Fig. 8 quenl
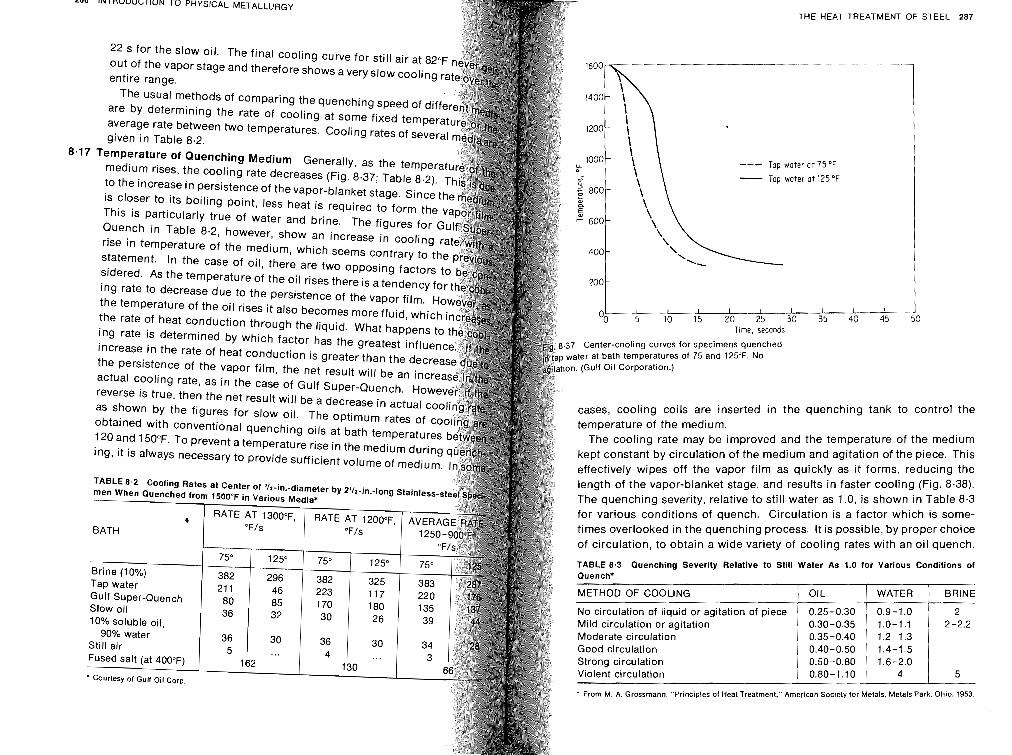
--- Top water at 75°F
- Top water at 125°F
INTRODUCTION TO PHYSICAL METALLURGY THE HEAT TREATMENT OF STEEL 2B7
22 s for the slow oil. The final cooling curve for still air at 82"
entire range.
The usual methods of comparing the quenching speed of diff
given in Table 8.2.
statement. In the case of oil, there are two opposing factors to sidered. As the temperature of the oil rises there is a tendency for 200 -
I I I I
the temperature of the oil rises it also becomes more fluid, which o0 ,b ;o ;5 30 35 40 45 50 Time, seconds
the rate of heat conduction through the liquid. What happens to .37 center-cooling curves for specimens quenched water at bath temperatures of 75 and 125°F.
ion. (GUI~ Oil Corporation.)
cases, cooling coils are inserted in the quenching tank the
as shown by the figures for slow oil. The optimum rates of co temperature of the medium. obtaii~ed with conventional quenching oils at bath temperatures The cooling rate may be improved and the temperature the medium
120and 150°F. To Prevent a temperature rise in the medium during kept by circulation of the medium and agitation of the piece. This
ing, it is always necessary to provide sufficient volume of medium, effectively wipes off the vapor film as quickly as it reducing the
length of the vspor-blanket stage, and results in faster cooling iFig 8.38)'
The relative to still water as 1.0. is shown in Table 8.3
for various conditions of quench. circulation is a factor which is some- times overlooked in the quenching process. It is possible, by proper
BATH of circulation, to obtain a wide variety of cooling rates with an oil quench.
TABLE 8,3 Quenching Severity Relative to Still Water AS 1.0 for Various Conditions Of
Quench* BRINE
2 2-2.2
5
* From M, A, Grossmann, ..Principles of Heat Treatment." American Society for ~ e t a l s , Metals park. Ohio.
WATER
0.9-I.o 1.0-1.1 1.2-1.3 1.4-1.5 1.6-2.0
4
METHOD OF COOLlNG
No circulation of liquid or agitation of piece slow oil Mild circulation or agitation 10% soluble oil, Moderate circulation 90% water Good circulation
Still air Strong circulation Violent circulation
01 L
0.25-0.30 0.30-0.35 0.35-0.40 0.40-0.50 0.50-0.80 0.80-1.10
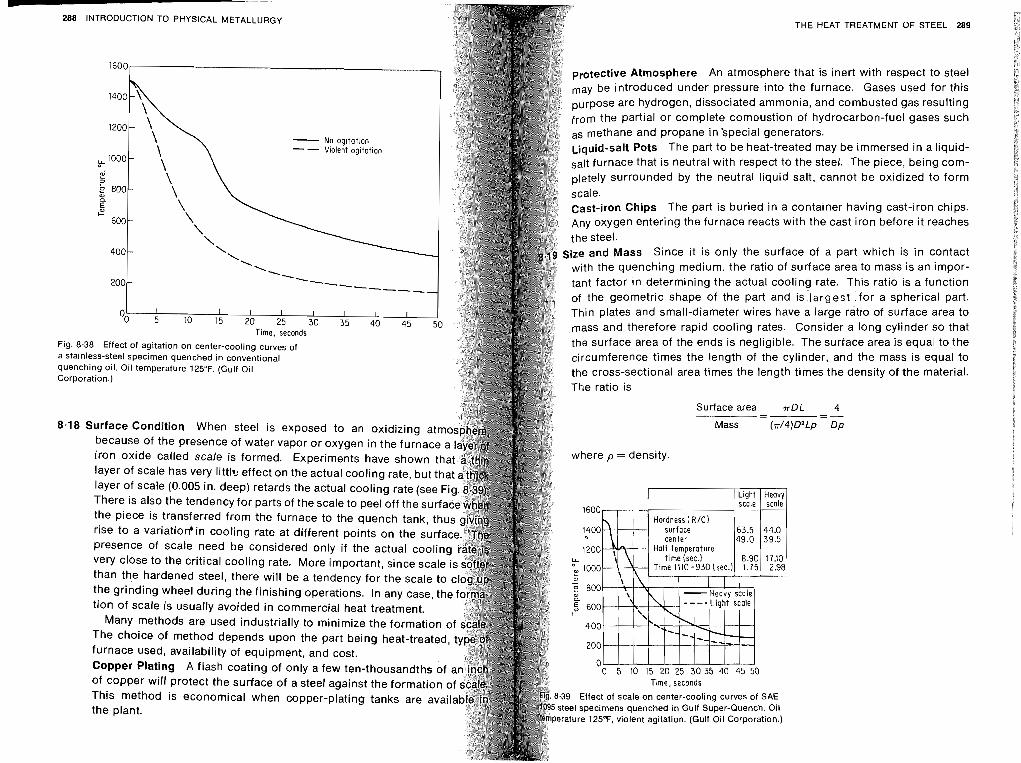
L 288 INTRODUCTION TO PHYSICAL METALLURGY THE HEAT TREATMENT OF STEEL 289
- No og~tation -- V~olent agitation
protective Atmosphere An atmosphere that is inert with respect to steel may be introduced under pressure into the furnace. Gases used for this purpose are hydrogen, dissociated ammonia, and combusted gas resulting from the partial or complete combustion of hydrocarbon-fuel gases such as methane and propane in Special generators. Liquid-~alt Pots The part to be heat-treated may be immersed in a liquid- salt furnace that is neutral with respect to the steel. The piece, being com-
ounded by the neutral liquid salt, cannot be oxidized to form
cast-iron Chips The part is buried in a container having cast-iron chips. Any oxygen entering the furnace reacts with the cast iron before it reaches
Size and Mass Since it is only the surface of a part which is in contact
with the quenching medium, the ratio of surface area to mass is an impor- tant factor in determining the actual cooling rate. This ratio is a function of the geometric shape of the part and is:largest .for a spherical part. Thin plates and small-diameter wires have a large ratio of surface area to mass and therefore rapid cooling rates. Consider a long cylinder so that
the surface area of the ends is negligible. The surface area is equal to the Fig. 8.38 Effect of agitation on center-cooling curves of a stainless-steel specimen quenched in conventional circumference times the length of the cylinder, and the mass is equal to quenching oil. Oil temperature 125°F. (GUI~ Oil the cross-sectional area times the length times the density of the material. Corporation.)
Surface area T D L 4 - --=-
8.18 Surface Condition When steel is exposed to an oxidizing atm Mass (d4)D2Lp Dp
where p = density.
presence of scale need be considered only if the actual coolin very close to the critical cooling rate. More important, since scale than the hardened steel, there will be a tendency for the scale to the grinding wheel during the finishing operations. In any case, the tion of scale is usually avoided in commercial heat treatment.
Many methods are used industrially to minimize the formation o The choice of method depends upon the part being heat-treated, furnace used, availability of equipment, and cost.
Time, seconds
Effect of scale on center-cooling curves of SAE
the plant. specimens quenched in Gulf Super-Quench. Oil re 125"F, violent agitation. (Gulf Oil Corporation.)
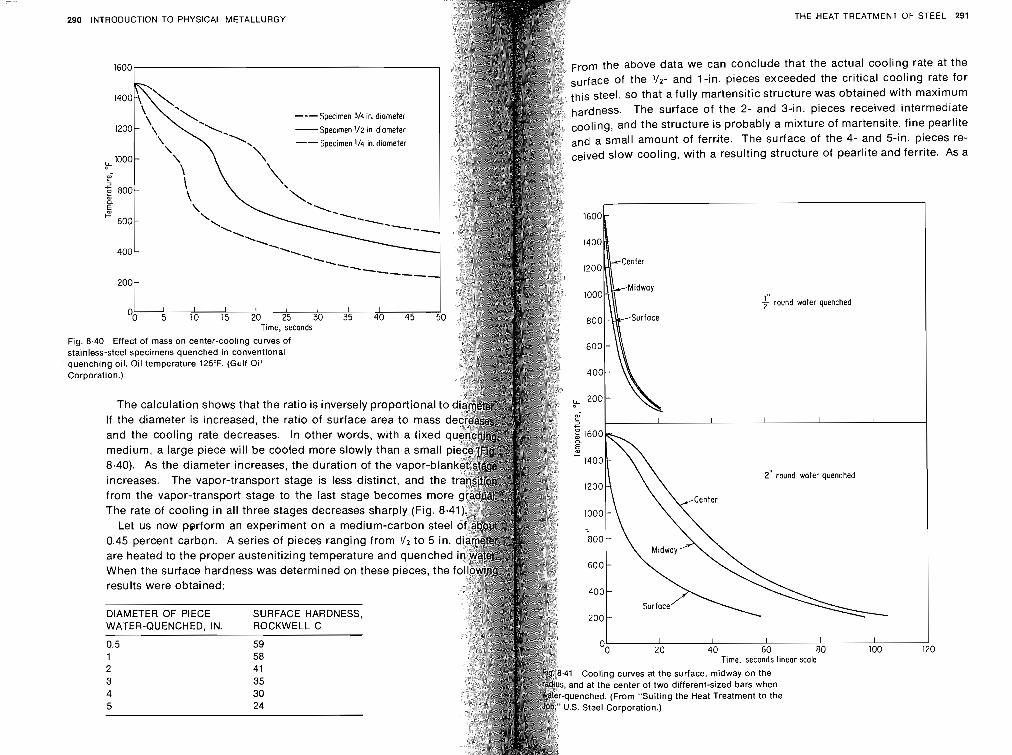
290 INTRODUCTION TO PHYSICAL METALLURGY
round water quenched
2" round water quenched
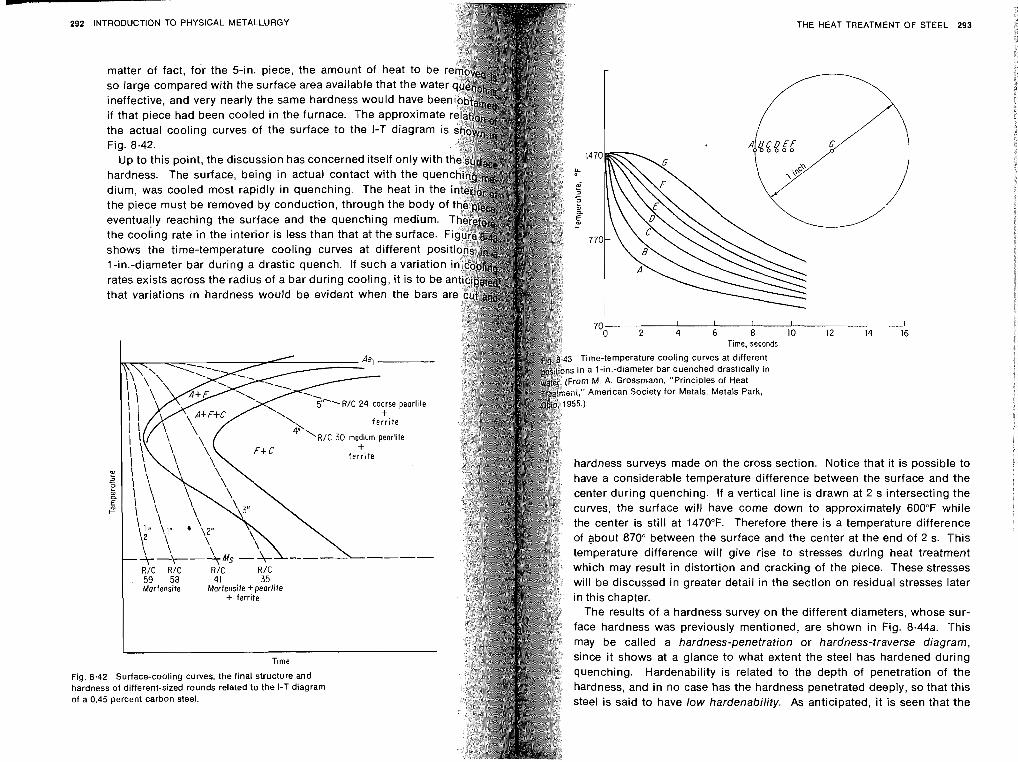
292 INTRODUCTION TO PHYSICAL METALLURGY THE HEAT TREATMENT OF STEEL 293
if that piece had been cooled in the furnace. The approxima the actual cooling curves of the surface to the I-T diagram Fig. 8.42.
eventually reaching the surface and the quenching medium.
that variations in hardness would be evident when the ba
Time, seconds
hardness surveys made on the cross section. Notice that it is possible to have a considerable temperature difference between the surface and the center during quenching. If a vertical line is drawn at 2 s intersecting the curves, the surface will have come down to approximately 600°F while the center is still at 1470°F. Therefore there is a temperature difference of gibout 870" between the surface and the center at the end of 2 s. This temperature difference will give rise to stresses during heat treatment which may result in distortion and cracking of the piece. These stresses will be discussed in greater detail in the section on residual stresses later
face hardness was previously mentioned, are shown in Fig. 8.44a. This may be called a hardness-penetration or hardness-traverse diagram,
Time since it shows at a glance to what extent the steel has hardened during
Fig. 8.12 surface-cooling curves, the final structure and quenching. Hardenability is related to the depth of penetration of the hardness of different-sized rounds related to the I-T diagram hardness, and in no case has the hardness penetrated deeply, SO that this of a 0.45 percent carbon steel. steel is said to have low hardenability. As anticipated, it is seen that the
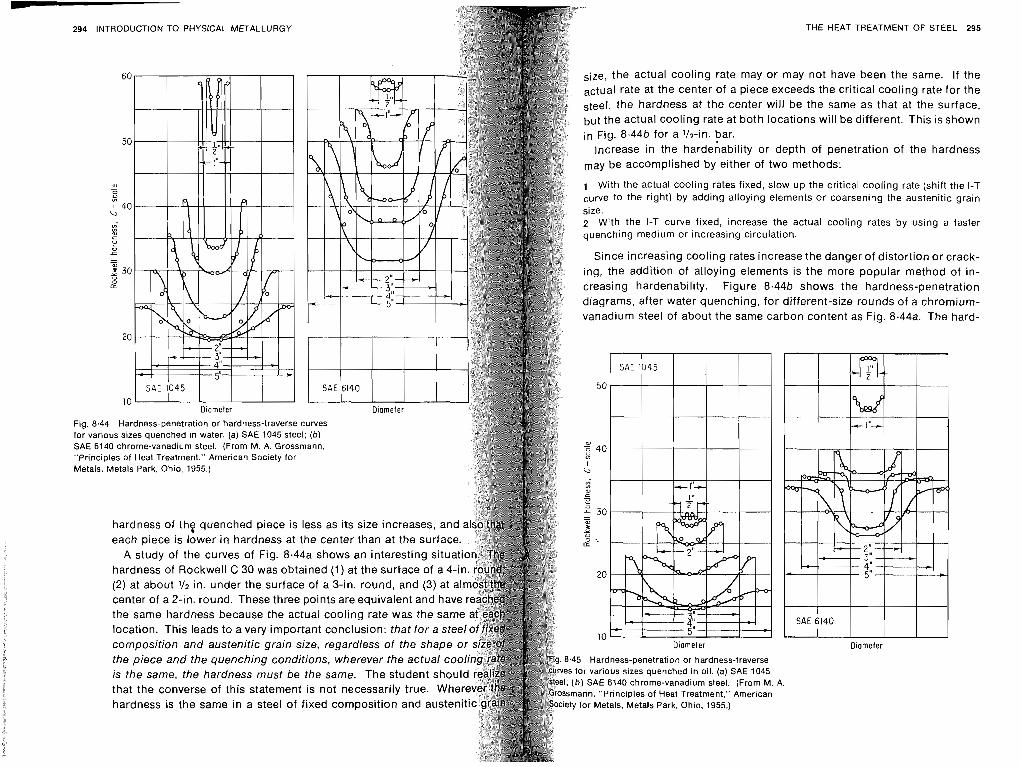
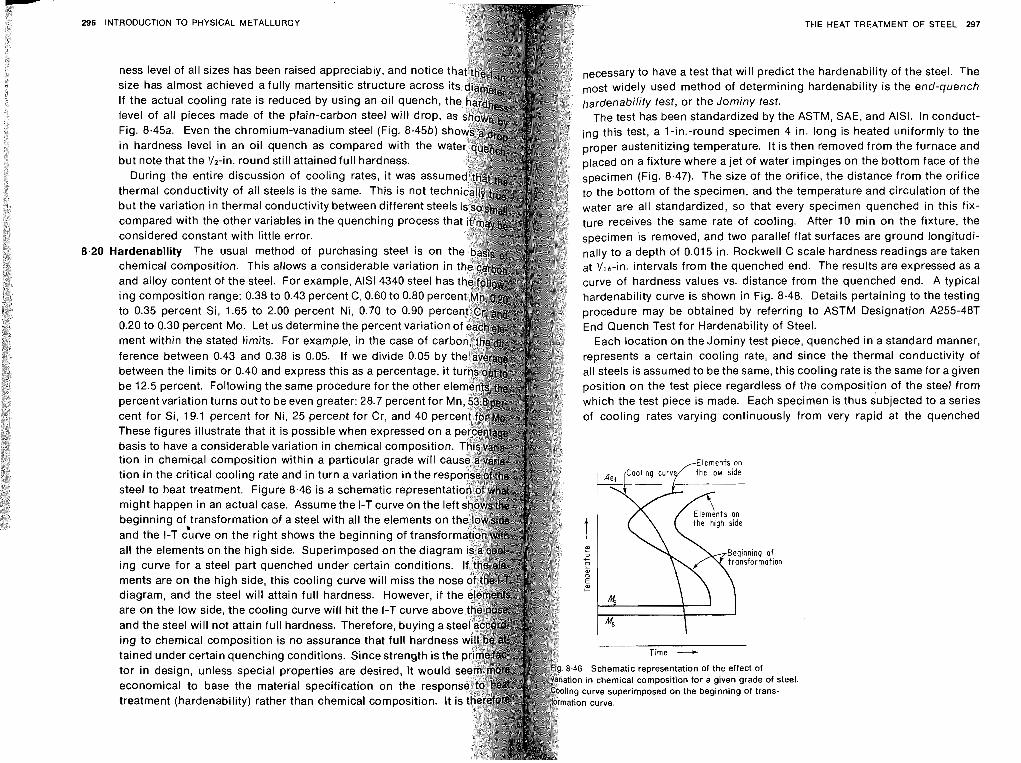
- 296 INTRODUCTION TO PHYSICAL METALLURGY THE HEAT TREATMENT OF STEEL 297
ness level of all sizes has been raised appreciably, and notice necessary to have a test that will predict the hardenability of the steel. The size has almost achieved a fully martensitic structure across most widely used method of determining hardenability is the end-quench If the actual cooling rate is reduced by using an oil quench, hardenability test, or the Jominy test. level of all pieces made of the plain-carbon steel will drop, The test has been standardized by the ASTM, SAE, and AISI. In conduct- Fig. 8.45a. Even the chromium-vanadium steel (Fig. 8.45b) ing this test, a 1-in.-round specimen 4 in. long is heated uniformly to the
proper austenitizing temperature. It is then removed from the furnace and but note that the '12-in. round still attained full hardness. on a fixture where a jet of water impinges on the bottom face of the
During the entire discussion of cooling rates, i t was a specimen (Fig. 8.47). The size of the orifice, the distance from the orifice thermal conductivity of all steels is the same. This is not to the bottom of the specimen, and the temperature and circulation of the but the variation in thermal conductivity between different steel water are all standardized, so that every specimen quenched in this fix- compared with the other variables in the quenching process th ture receives the same rate of cooling. After 10 min on the fixture, the considered constant with little error. is removed, and two parallel fiat surfaces are ground longitudi- ardenability The usual method of purchasing steel is on t naily to a depth of 0.015 in. Rockwell C scale hardness readings are taken chemical composition. This allows a considerable variation in at VT6-in. intervals from the quenched end. The results are expressed as a
curve of hardness values vs. distance from the quenched end. A typical hardenability curve is shown in Fig. 8.48. Details pertaining to the testing procedure may be obtained by referring to ASTM Designation A255-48T End Quench Test for Hardenability of Steel.
ment within the stated limits. For example, in the case of car Each location on the Jominy test piece, quenched in a standard manner, represents a certain cooling rate, and since the thermal conductivity of all steels is assumed to be the same, this cooling rate is the same for a given
be 12.5 percent. Following the same procedure for the other position on the test piece regardless of the composition of the steel from percent variation turns out to be even greater: 28.7 percent for which the test piece is made. Each specimen is thus subjected to a series cent for Si, 19.1 percent for Ni, 25 percent for Cr, and 40 perc of cooling rates varying continuously from very rapid at the quenched These figures illustrate that it is possible when expressed on a basis to have a considerable variation in chemical composition.
all the elements on the high side. Superimposed on the diagra ing curve for a steel part quenched under certain conditions.
are on the low side, the cooling curve will hit the I-T curve abo and the steel will not attain full hardness. Therefore, buying as ing to chemical composition is no assurance that full hardness
Time ----t
tor in design, unless special properties are desired, it would economical to base the material specification on the respo
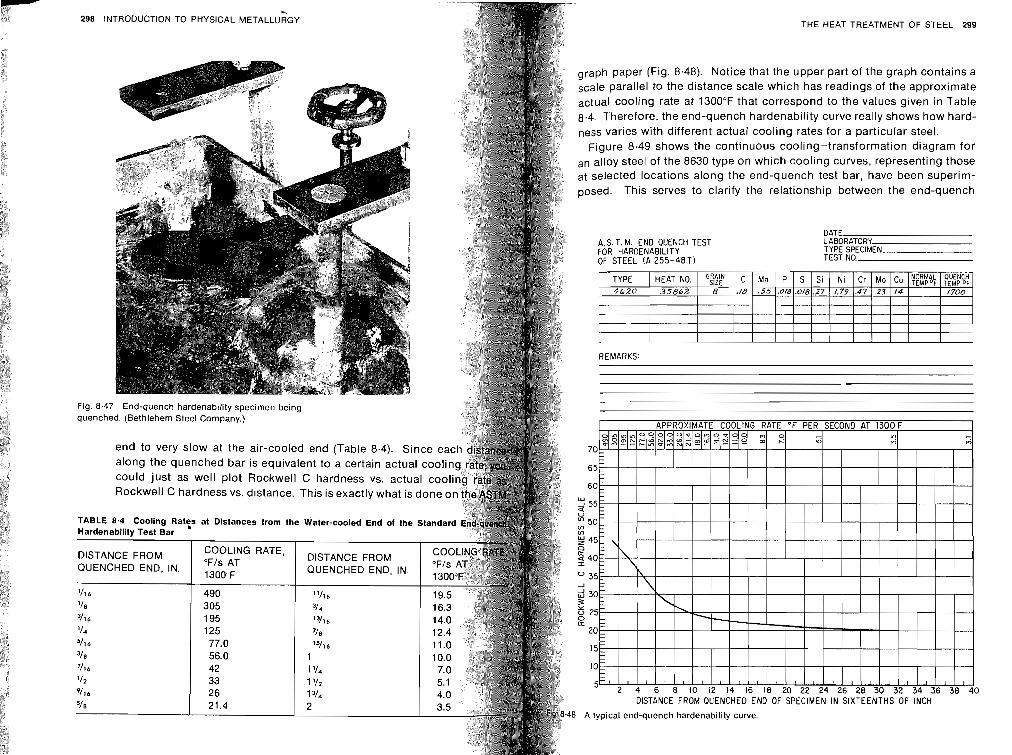
T H E H E A T TREATMENT OF S T E E L 299
graph paper (Fig. 8.48). Notice that the upper part of the graph contains a scale parallel to the distance scale which has readings of the approximate actual cooling rate at 1300°F that correspond to the values given in Table 8.4. Therefore, the end-quench hardenability curve really shows how hard- ness varies with different actual cooling rates for a particular steel.
Figure 8.49 shows the continuous cooling-transformation diagram for an alloy steel of the 8630 type on which cooling curves, representing those at selected locations along the end-quench test bar, have been superim- posed This serves to clarify the relationship between the end-quench
A.S. T, M. END QUENCH TEST FOR HARDENABILITY OF STEEL (A 2 5 5 - 4 8 T )
DATE LABORATORY
TYPE SPECIMEN TEST NO.
TYPE I H E A T N O . I ~ F $ ~ [ C I M ~ ) P I S I S ~ ( N ~ I C ~ I M O I C ~ ~ ~ ~ ~ ~ $ ~ ) ~ ~ $ ~ % ~ 4620 1 35862 1 8 1.18 1 .55 1.0181.018(.27 1 1.79 1.47 1.23 1.14 1 1 1700
I f I I I I I I I I I
REMARKS:
DISTANCE FROM QUENCHED END OF SPECIMEN IN SIXTEENTHS OF INCH
.48 A t yp i ca l end -quench hardenabi l i ty CuNe.
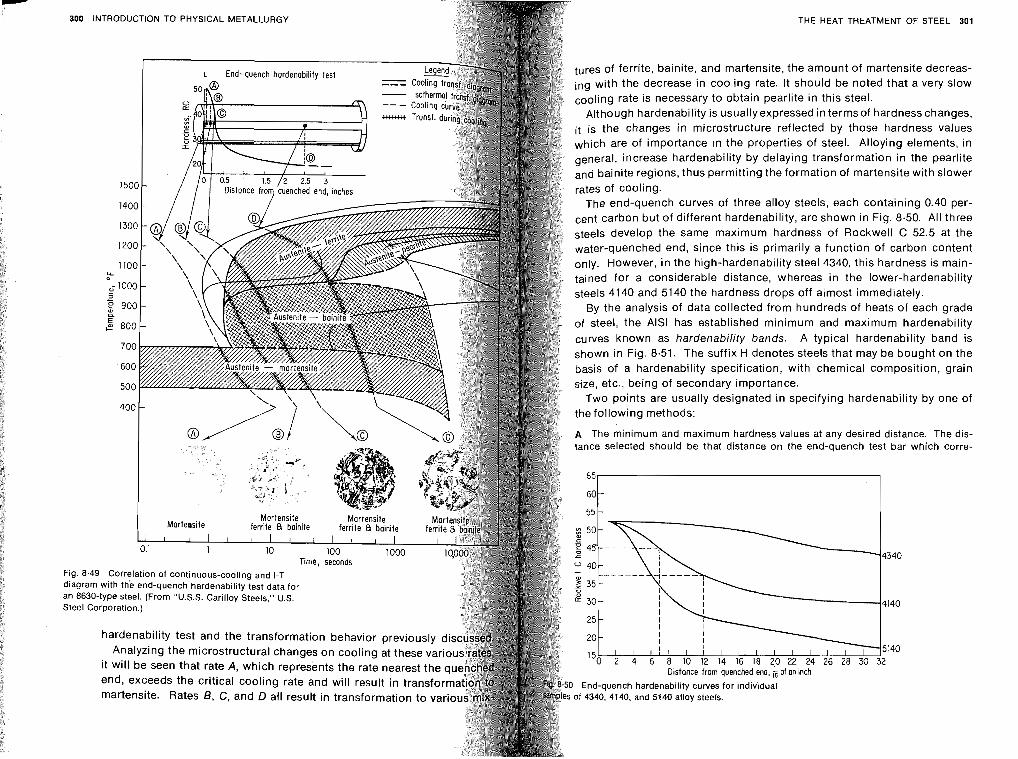
- 300 INTRODUCTION TO PHYSICAL METALLURGY THE HEAT TREATMENT OF STEEL 301
Fig. 8.49 diagram an 8630- Steel Co
tures of ferrite, bainite, and martensite, the amount of martensite decreas- ing with the decrease in cooling rate. It should be noted that a very slow cooling rate is necessary to obtain pearlite in this steel.
~ l t h o u g h hardenability is usually expressed in termsof hardnesschanges, it is the changes in microstructure reflected by those hardness values which are of importance in the properties of steel. Alloying elements, in general, increase hardenability by delaying transformation in the pearlite and bainite regions, thus permitting the formation of martensite with slower rates of cooling.
The end-quench curves of three alloy steels, each containing 0.40 per- cent carbon but of different hardenability, are shown in Fig. 8.50. All three steels develop the same maximum hardness of Rockwell C 52.5 at the water-quenched end, since this is primarily a function of carbon content only. However, in the high-hardenability steel 4340, this hardness is main- tained for a considerable distance, whereas in the lower-hardenability steels 4140 and 5140 the hardness drops off almost immediately.
By the analysis of data collected from hundreds of heats of each grade of steel, the AlSl has established minimum and maximum hardenability curves known as hardenability bands. A typical hardenability band is shown in Fig. 8.51. The suffix H denotes steels that may be bought on the basis of a hardenability specification, with chemical composition, grain size, etc., being of secondary importance.
Two points are usually designated in specifying hardenability by one of the following methods:
A The minimum and maximum hardness values at any desired distance. The dis- tance selected should be that distance on the end-quench test bar which corre-
I I I I I
h k k ' i Ib 1; Id Ik- Distance from quenched end, of on inch
I End-quench hardenability curves for individual of 4340, 4140, and 5140 alloy steels.
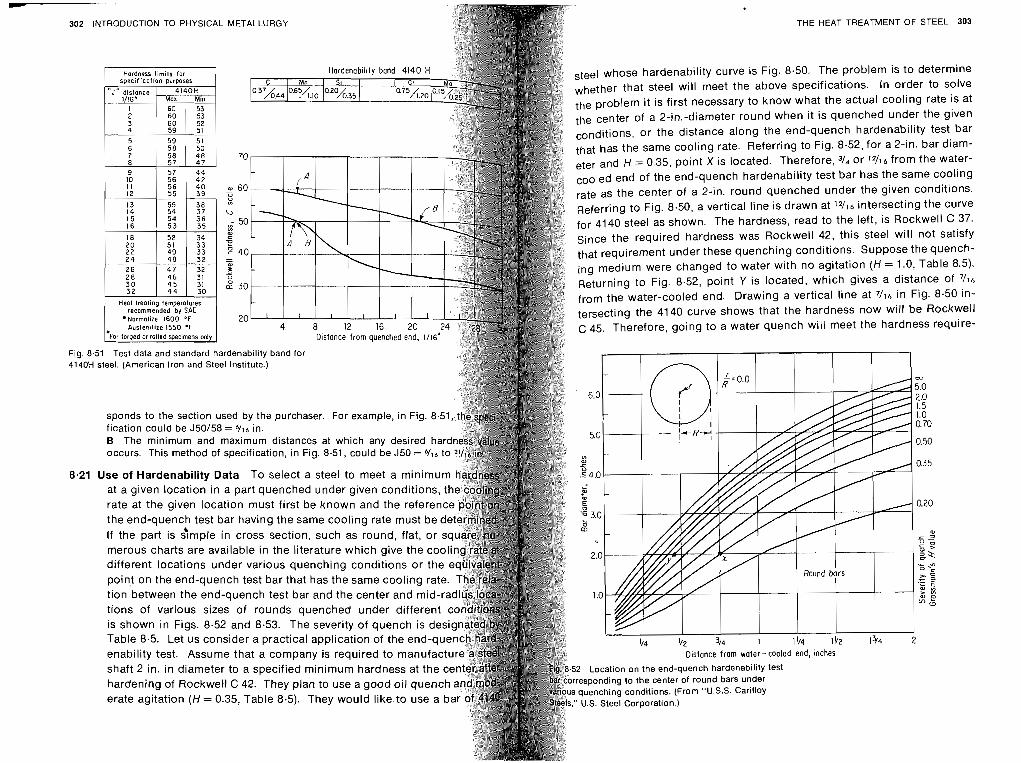
- 302 INTRODUCTION TO PHYSICAL METALLURGY THE HEAT TREATMENT OF STEEL 303
For forged ar rolled specimens only
Fig. 8 4140H
,tee1 whose hardenability curve is Fig. 8.50. The problem is to determine whether that steel will meet the above specifications. In order to solve the problem it is first necessary to know what the actual cooling rate is at the center of a 2-in.-diameter round when it is quenched under the given conditions, or the distance along the end-quench hardenability test bar
70 that has the same cooling rate. Referring to Fig. 8.52, for a 2-in. bar diam- eter and H = 0.35, point X is located. Therefore, 3/4 or 12/16 from the water-
end of the end-quench hardenability test bar has the same cooling a, 60 - o u ,-ate as the center of a 2-in. round quenched under the given conditions. "7
C, Referring to Fig. 8.50, a vertical line is drawn at 12/16 intersecting the curve , 50 for 4140 steel as shown. The hardness, read to the left, is Rockwell C 37. '" a,
'? Since the required hardness was Rockwell 42, this steel will not satisfy 2 40 - - that requirement under these quenching conditions. Suppose the quench- a, 3 A! " ing medium were changed to water with no agitation (H = 1 .O, Table 8.5).
I? 30 Returning to Fig. 8.52, point Y is located, which gives a distance of 7/16
from the water-cooled end. Drawing a vertical line at 7/16 in Fig. 8.50 in-
20 tersecting the 4140 curve shows that the hardness now will be Rockwell C 45. Therefore, going to a water quench will meet the hardness require-
Distonce from quenched end, 1/16"
,51 Test data and standard hardenability band for steel. (American Iron and Steel Institute.)
m
5.0 2.0 1.5 sponds to the section used by the purchaser. For example, in Fig. 8.5 1.0
fication could be J50158 = 6/16 in. 0.70 B The minimum and maximum distances at which any desired hard
0.50 occurs. This method of specification, in Fig. 8.51, could be J50 = 6Il6 to
0.35 Use of Hardenability Data To select a steel to meet a minimu at a given location in a part quenched under given conditions, t
rate at the given location must first be known and the referen 0.20 the end-quench test bar having the same cooling rate must bed
If the part is dmple in cross section, such as round, flat, or s a, .G 2
merous charts are available in the literature which give the coo 2 different locations under various quenching conditions or the .- point on the end-quench test bar that has the same cooling rate 2 :
';I E tion between the end-quench test bar and the center and mid-ra m Y) > ", ? tions of various sizes of rounds quenched under different w
is shown in Figs. 8.52 and 8.53. The severity of quench is Table 8.5. Let us consider a practical application of the end- enability test. Assume that a company is required to manufac Distonce from water-cooled end, inches shaft 2 in. in diameter to a specified minimum hardness at the c 2 Location on the end-quench hardenability test hardening of Rockwell C 42. They plan to use a good oil quenc responding to the center of round bars under
erate agitation (H = 0.35, Table 8.5). They would l iketo use a s quenching conditions. (From "U.S.S. Carilloy U.S. Steel Corporation.)
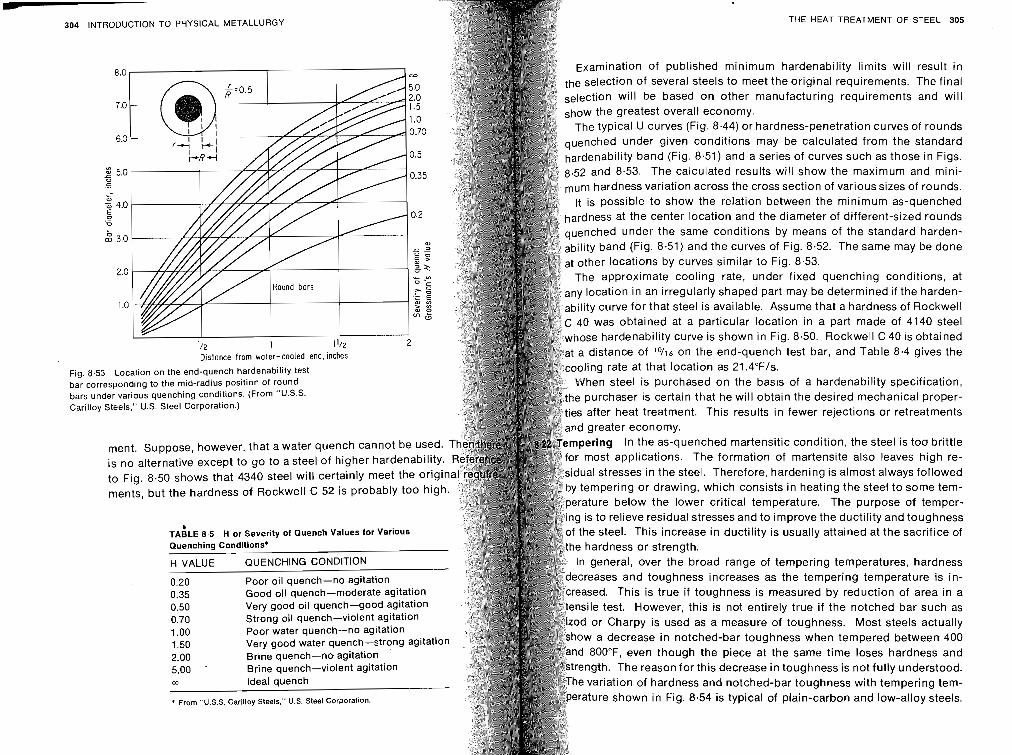
304 INTRODUCTION TO PHYSICAL METALLURGY
Fig bar bar Car
Distance from water-cooled end, inches
3 Location on the end-quench hardenability test responding to the mid-radius position of round der various quenching conditions. (From "U.S.S. Steels," U.S. Steel Corporation.)
ment. Suppose, however, that a water quench cannot be
b TABLE 8.5 H or Severity of Quench Values for Various Quenching Conditions*
H VALUE QUENCHING CONDITION
Poor oil quench-no agitation 0.35 Good oil quench-moderate agitation 0.50 Very good oil quench-good agitation 0.70 Strong oil quench-violent agitation 1 .OO Poor water quench-no agitation 1.50 Very good water quench-strong agitation 2.00 Brine quench-no agitation 5.00 ' Brine quench-violent agitation a Ideal quench
* From "U.S.S. Carilloy Steels." U.S. Steel Corporation.
THE HEAT TREATMENT OF STEEL 305
~xaminat ion of published minimum hardenability limits will result in the selection of several steels to meet the original requirements. The final
will be based on other manufacturing requirements and will show the greatest overall economy.
The typical U curves (Fig. 8.44) or hardness-penetration curves of rounds auenched under given conditions may be calculated from the standard
ard .52
enab and
(Fig. 8.51) e calculate
,cries
:s will of cur shon
ves suc r the m
I Figs. mini-
m hardness variation across the cross section of various sizes of rounds. is possible to show the relation between the minimum as-quenched
rdness at the center location and the diameter of different-sized rounds enched under the same conditions by means of the standard harden- ility band (Fig. 8.51) and the curves of Fig. 8.52. The same may be done
t other locations by curves similar to Fig. 8.53. The approximate cooling rate, under fixed quenching conditions, at
ocati :y cut
in for
rregularly s it steel is ab
aPl ilat
)art m Ass u
determ at a hat
rden- :kwell
40 was obtained at a particular location in a part made of 4140 steel hose hardenability curve is shown in Fig. 8.50. Rockwell C 40 is obtained a distance of 1°/16 on the end-quench test bar, and Table 8.4 gives the oling rate at that location as 21.4"F/s.
hen steel is purchased on the basis of a hardenability specification, purchaser is certain that he will obtain the desired mechanical proper- after heat treatment. This results in fewer rejections or retreatments greater economy.
pering In the as-quenched martensitic condition, the steel is too brittle most applications. The formation of martensite also leaves high re-
ual stresses in the steel. Therefore, hardening is almost always followed tempering or drawing, which consists in heating the steel to some tem- rature below the lower critical temperature. The purpose of temper- is to relieve residual stresses and to improve the ductility and toughness he steel. This increase in ductility is usually attained at the sacrifice of hardness or strength.
n general, over the broad range of tempering temperatures, hardness reases and toughness increases as the tempering temperature is in- ased. This is true if toughness is measured by reduction of area in a sile test. However, this is not entirely true if the notched bar such as
or Charpy is used as a measure of toughness. Most steels actually a decrease in notched-bar toughness when tempered between 400 OO°F, even though the piece at the same time loses hardness and
ngth. The reason for this decrease in toughness is not fully understood. e variation of hardness and notched-bar toughness with tempering tem- rature shown in Fig. 8.54 is typical of plain-carbon and low-alloy steels.
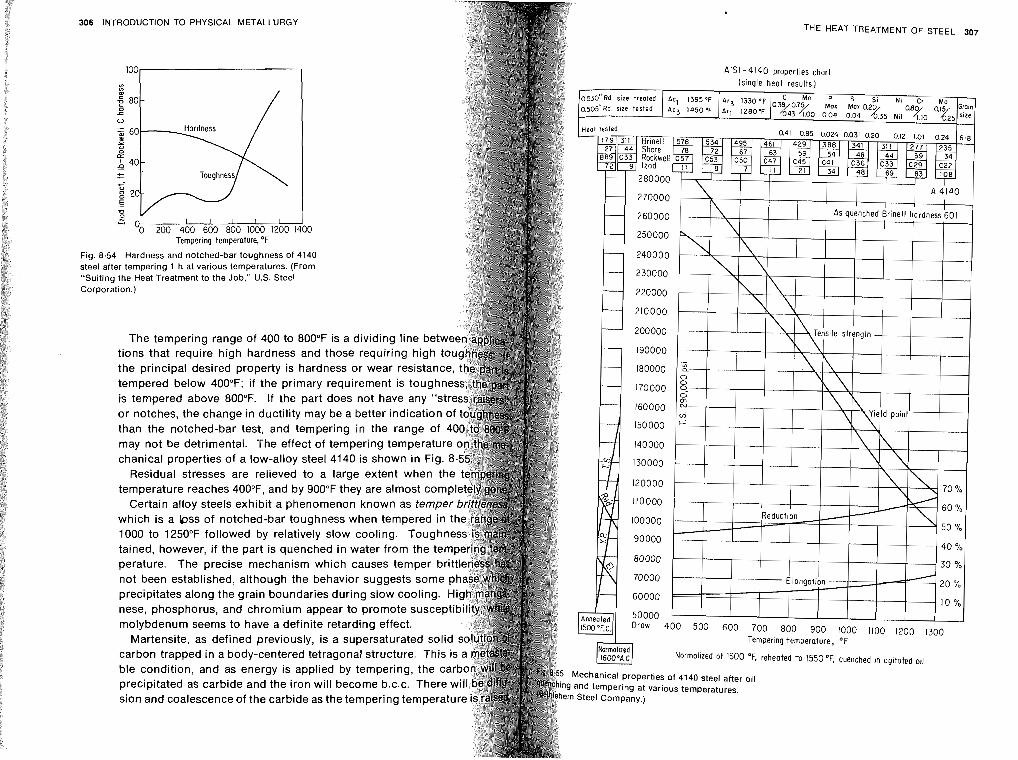
306 INTRODUCTION TO PHYSICAL METALLURGY
m 0)
c
.- Oo 260 4b0 660 sbo 10m 1200 1400
Tempering temperoture, O F
Fig. 8.54 Hardness and notched-bar toughness of 4140 steel after tempering 1 h at various temperatures. (From "Suiting the Heat Treatment to the Job." U.S. Steel Corporation.)
THE HEAT TREATMENT OF STEEL 307
The tempering range of 400 to 800°F is a dividing line bet tions that require high hardness and those requiring high the principal desired property is hardness or wear resistance tempered below 400°F; if the primary requirement is toug is tempered above 800°F. If the part does not have any "s or notches, the change in ductility may be a better indication
may not be detrimental. The effect of temper chanical properties of a low-alloy steel 4140 is shown in Fig.
which is a bss of notched-bar toughness when tempered 1000 to 1250°F followed by relatively slow cooling. To tained, however, if the part is quenched in water from the te
precipitates along the grain boundaries during slow cooling. nese, phosphorus, and chromium appear to promote suscepti molybdenum seems to have a definite retarding effect.
Martensite, as defined previously, is a supersaturated solid carbon trapped in a body-centered tetragonal structure. ble condition, and as energy is applied by tempering, the precipitated as carbide and the iron will become b.c.c. The
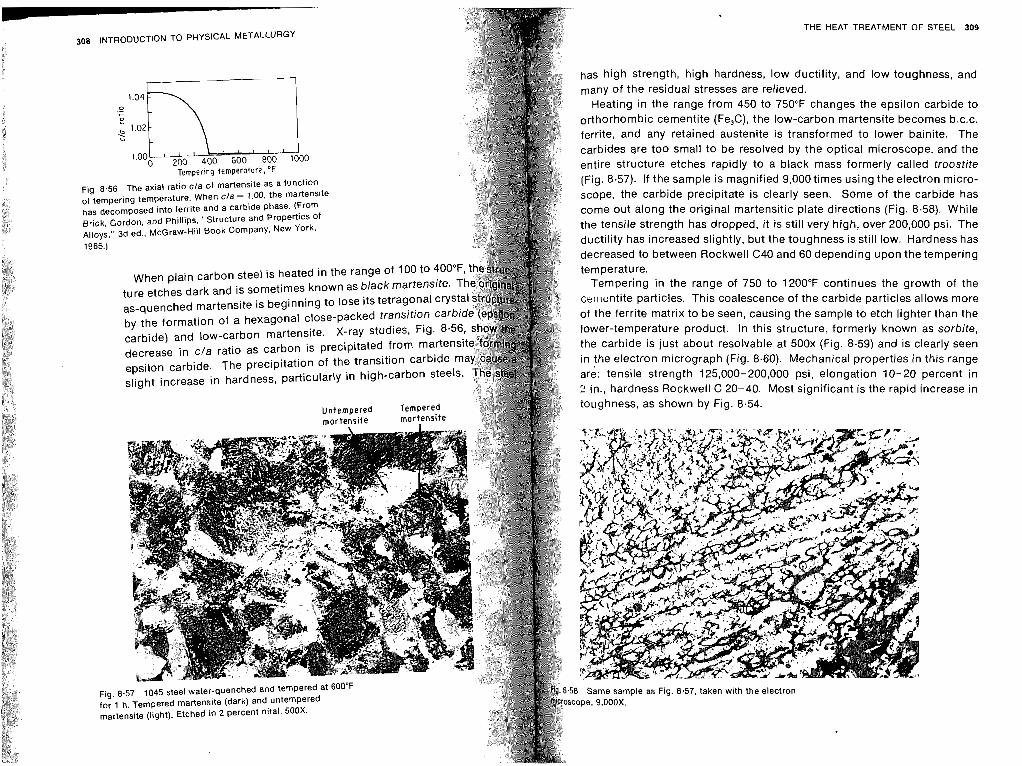
THE HEAT TREATMENT OF STEEL 309
has high strength, high hardness, low ductility, and low toughness, and many of the residual stresses are relieved.
Heating in the range from 450 to 750°F changes the epsilon carbide to orthorhombic cementite (Fe,C), the low-carbon martensite becomes b.c.c. ferrite, and any retained austenite is transformed to lower bainite. The carbides are too small to be resolved by the optical microscope, and the entire structure etches rapidly to a black mass formerly called troostite (Fig. 8.57). If the sample is magnified 9,000 times using the electron micro- scope, the carbide precipitate is clearly seen. Some of the carbide has come out along the original martensitic plate directions (Fig. 8.58). While the tensile strength has dropped, it is still very high, over 200,000 psi. The ductility has increased slightly, but the toughness is still low. Hardness has decreased to between Rockwell C40 and 60 depending upon the tempering temperature.
Tempering in the range of 750 to 1200°F continues the growth of the ce~~~ent i te particles. This coalescence of the carbide particles allows more of the ferrite matrix to be seen, causing the sample to etch lighter than the lower-temperature product. In this structure, formerly known as sorbite, the carbide is just about resolvable at 500x (Fig. 8.59) and is clearly seen in the electron micrograph (Fig. 8.60). Mechanical properties in this range are: tensile strength 125,000-200,000 psi, elongation 10-20 percent in 2 in., hardness Rockwell C 20-40. Most significant is the rapid increase in toughness, as shown by Fig. 8.54.
3 Same sample as Fig. 8.57. taken with the electron ope, 9.000X.
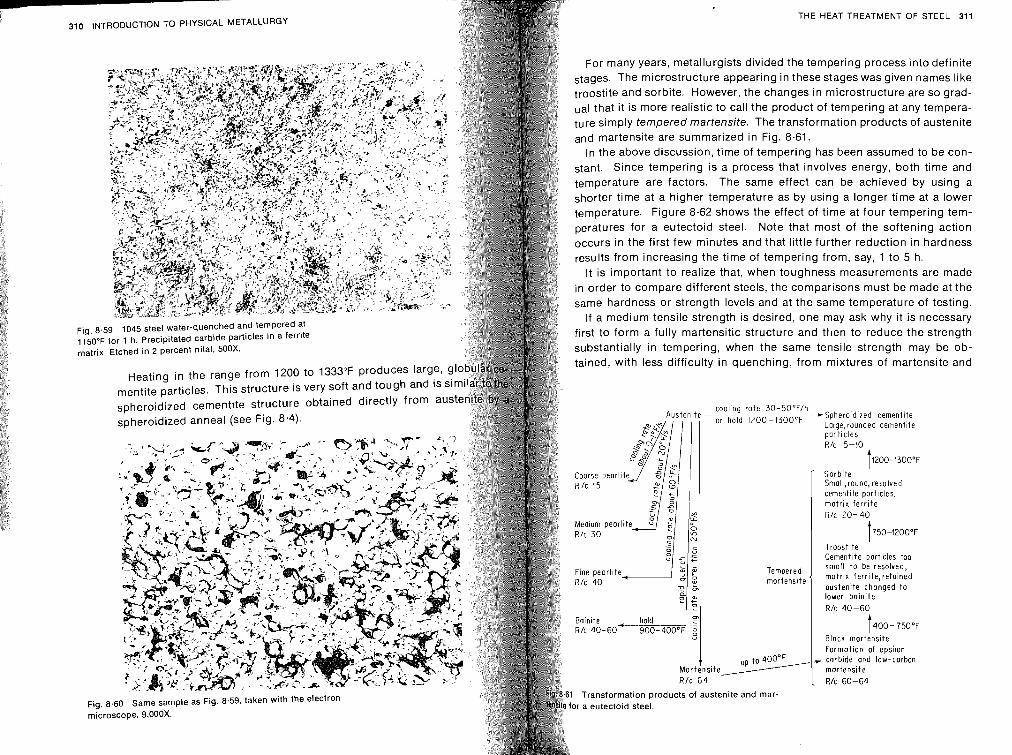
THE HEAT TREATMENT OF STEEL 311
For many years, metallurgists divided the tempering process into definite stages. The microstructure appearing in these stages was given names like troostite and sorbite. However, the changes in microstructure are so grad- ual that it is more realistic to call the product of tempering at any tempera- ture simply tempered martensite. The transformation products of austenite and martensite are summarized in Fig. 8.61.
In the above discussion, time of tempering has been assumed to be con- stant. Since tempering is a process that involves energy, both time and temperature are factors. The same effect can be achieved by using a shorter time at a higher temperature as by using a longer time at a lower temperature. Figure 8.62 shows the effect of time at four tempering tem- peratures for a eutectoid steel. Note that most of the softening action occurs in the first few minutes and that little further reduction in hardness results from increasing the time of tempering from, say, 1 to 5 h.
It is important to realize that, when toughness measurements are made in order to compare different steels, the comparisons must be made at the same hardness or strength levels and at the same temperature of testing.
If a medium tensile strength is desired, one may ask why it is necessary first to form a fully martensitic structure and then to reduce the strength substantially in tempering, when the same tensile strength may be ob- tained, with less difficulty in quenching, from mixtures of martensite and
Austenite
R/c 15
Fine pearl i te R/c 40
a : 2
e Boinite Rlc 40-60 900-400°F 2 "
cooling rote 30-5O0F/h o r h o i d p h e r o i d ~ z e d cementite
Lorae.rounded cementite
f 1200-1300~~
Sorbite Small,round, resolved cementlte part~cles, mat r ix fer r i te R/c 20- 40
I E E E e ;articles too
I lower boinite R/c 40-60
400-750°F Block mortensite
I Formation of epsilon 1 , up t o 4OO0F - carbide and low-carbon Mar tens i te / mortensite R/c 64 R/c 60-64
Transformation products of austenite and mar- or a eutectoid steel.
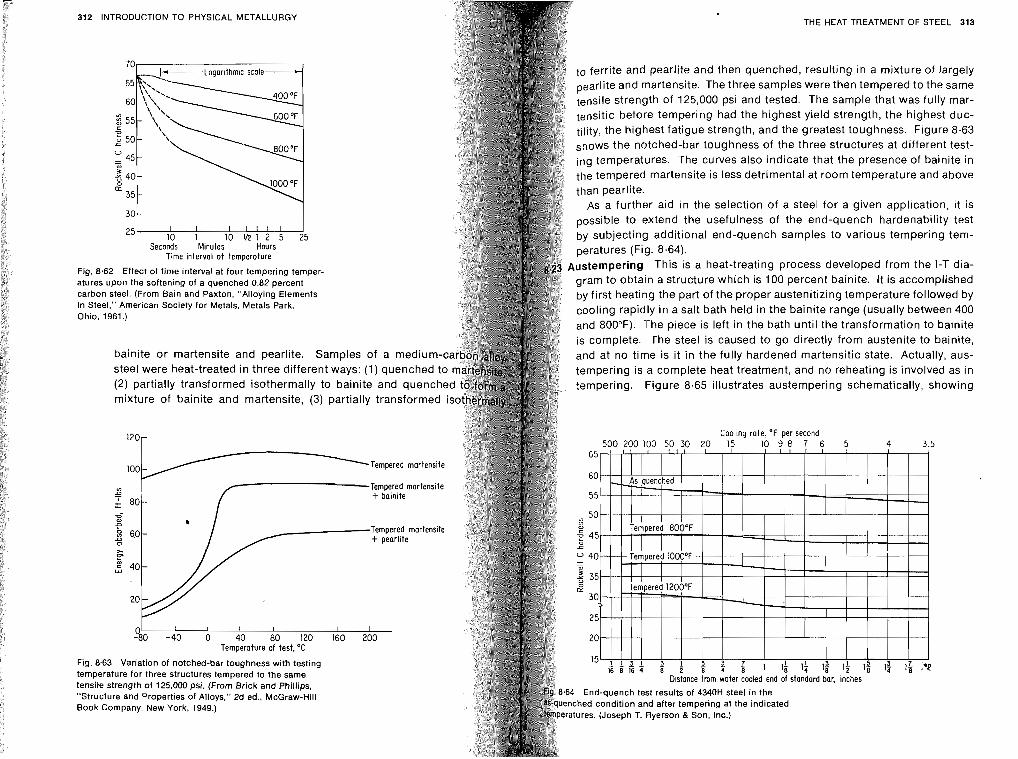
312 INTRODUCTION TO PHYSICAL METALLURGY THE HEAT TREATMENT OF STEEL 313
70, to ferrite and pearlite and then quenched, resulting in a mixture of largely pearlite and martensite. The three samples were then tempered to the same tensile strength of 125,000 psi and tested. The sample that was fully mar- tensitic before tempering had the highest yield strength, the highest duc- tility, the highest fatigue strength, and the greatest toughness. Figure 8.63 shows the notched-bar toughness of the three structures at different test- ing temperatures. The curves also indicate that the presence of bainite in the tempered martensite is less detrimental at room temperature and above
0 n 35 -
AS a further aid in the selection of a steel for a given application, it is 30 - possible to extend the usefulness of the end-quench hardenability test
by subjecting additional end-quench samples to various tempering tem- Seconds Minutes Hours peratures (Fig. 8.64).
Time interval ot temperature ~"stempering This is a heat-treating process developed from the I-T dia- Fig. 8.62 Effect of time interval at four tempering temper-
atures upon the softening of a quenched 0.82 percent gram to obtain a structure which is 100 percent bainite. It is accomplished carbon steel. (From Bain and Paxton, "Alloying Elements by first heating the part of the proper austenitizing temperature followed by in Steel," American Society for Metals, Metals Park. Ohio, 1961.) cooling rapidly in a salt bath held in the bainite range (usually between 400
and 800°F). The piece is left in the bath until the transformation to bainite is complete. The steel is caused to go directly from austenite to bainite,
bainite or martensite and pearlite. Samples of a medium-c and at no time is it in the fully hardened martensitic state. Actually, aus- steel were heat-treated in three different ways: (1) quenched to tempering is a complete heat treatment, and no reheating is involved as in (2) partially transformed isothermally to bainite and quenched tempering. Figure 8.65 illustrates austempering schematically, showing mixture of bainite and martensite, (3) partially transformed is
Cooling rate, O F per second
Tempered rnartensite
Tempered mortensite + bainite L 80- -
Tempered martensite + pearlite
30 -40 b 40 E;o I;O 1io 2h0 Temperature of test, OC
Fig. 8.63 Variation of notched-bar toughness with testing temperature for three structures tempered to the same tensile strength of 125,000 psi. (From Brick and Phillips. "Structure and Properties of Alloys," 2d ed., McGraw-Hill End-quench test results of 43401-1 steel in the
Book Company. New York. 1949.) hed condition and after tempering at the indicated eratures. (Joseph T. Ryerson B Son. Inc.)
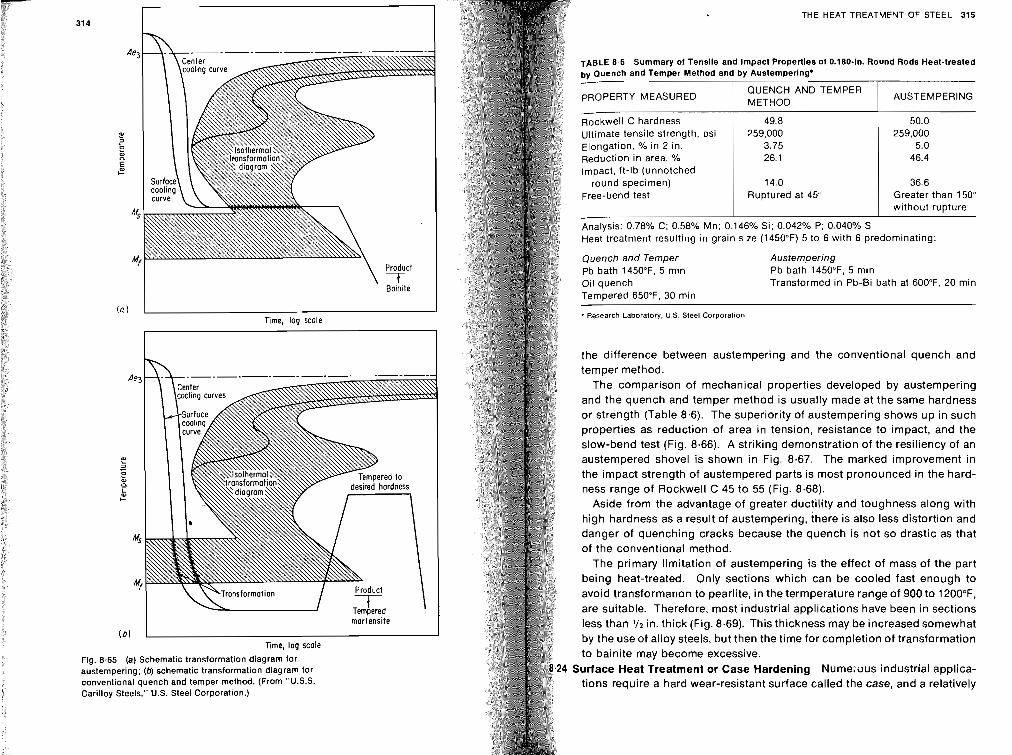
THE HEAT TREATMFYT OF STEEL 315
Boinite 'y I ( a ) I I
Time, log scole
t Tempered ' t martensite
( 6 ) I Time, log scole
Fig. 8.65 (a) Schematic transformation diagram for austempering; (b) schematic transformation diagram for conventional quench and temper method. (From "U.S.S Carilloy Steels," U.S. Steel Corporation.)
TABLE 8.6 Summary of Tensile and Impact Properties of 0.180-in. Round Rods Heat-treated by Quench and Temper Method and by Austempering*
Quench and Temper Austempering Pb bath 1450°F. 5 min Pb bath 1450"F, 5 min Oil quench Transformed in Pb-Bi bath at 600"F, 20 min Tempered 650°F. 30 min
PROPERTY MEASURED
~ o c k w e l l C hardness Ultimate tensile strength, psi Elongation, % in 2 in. Reduction in area, % Impact, ft-lb (unnotched
round specimen) Free-bend test
* Research Laboratory. U.S. Steel Corporation.
the difference between austempering and the conventional quench and temper method.
The comparison of mechanical properties developed by austempering and the quench and temper method is usually made at the same hardness or strength (Table 8.6). The superiority of austempering shows up in such properties as reduction of area in tension, resistance to impact, and the slow-bend test (Fig. 8.66). A striking demonstration of the resiliency of an austempered shovel is shown in Fig. 8.67. The marked improvement in the impact strength of austempered parts is most pronounced in the hard- ness range of Rockwell C 45 to 55 (Fig. 8.68).
Aside from the advantage of greater ductility and toughness along with high hardness as a result of austempering, there is also less distortion and danger of quenching cracks because the quench is not so drastic as that of the conventional method.
The primary limitation of austempering is the effect of mass of the part being heat-treated. Only sections which can be cooled fast enough to avoid transformarlon to pearlite, in the termperature range of 900 to 1200"F, are suitable. Therefore, most industrial applications have been in sections less than l/2 in. thick (Fig. 8.69). This thickness may be increased somewhat by the use of alloy steels, but then the time for completion of transformation to bainite may become excessive. urface Heat Treatment or Case Hardening Nume;.uus industrial applica- tions require a hard wear-resistant surface called the case, and a relatively
QUENCH AND TEMPER METHOD
Analysis: 0.78% C; 0.58% Mn; 0.146% Si; 0.042% P; 0.040% S Heat treatment resulting in grain size (1450°F) 5 to 6 with 6 predominating:
49.8 259.000
3.75 26.1
14.0 Ruptured at 45"
AUSTEMPERING
50.0 259,000
5.0 46.4
36.6 Greater than 150" without rupture
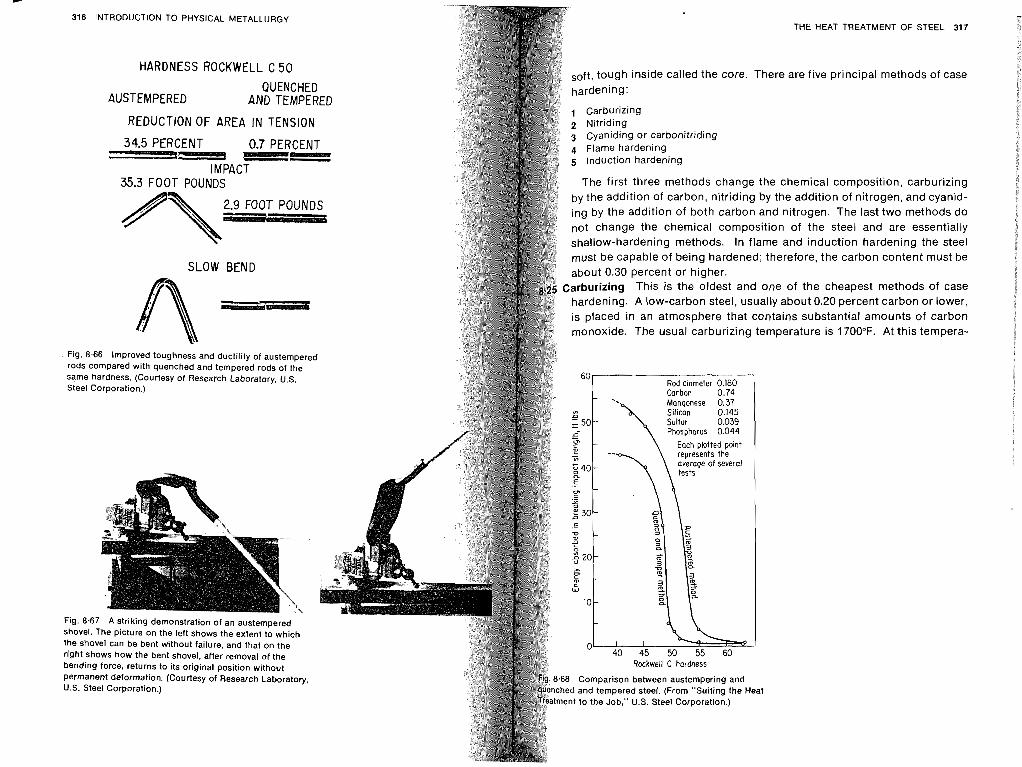
IL
316 INTRODUCTION TO PHYSICAL METALLURGY
HARDNESS ROCKWELL C 5 0
AUSTEMPERED QUENCHED
AND TEMPERED
REDUCTION OF AREA IN TENSION
34.5 PERCENT 0.7 PERCENT
IMPACT 35.3 FOOT POUNDS
SLOW BEND
Fig. 8.66 Improved toughness and ductility of austempered rods compared with quenched and tempered rods of the same hardness. (Courtesy of Research Laboratory, U.S. Steel Corporation.)
Fig. 8.67 A striking demonstration of an austempered shovel. The picture on the left shows the extent to which the shovel can be bent without failure, and that on the right shows how the bent shovel, after removal of the bending force, returns to its original position without permanent deformation. (Courtesy of Research Laboratory, U.S. Steel Corporation.)
THE HEAT TREATMENT OF STEEL 317
soft, tough inside called the core. There are five principal methods of case " - hardening:
1 carburizing o Nitr idina & . ..- ~ *
3 Cyaniding o r carbonitr iding 4 Flame hardening 5 Induction hardening
The first three methods change the chemical composition, carburizing by the addition of carbon, nitriding by the addition of nitrogen, and cyanid- ing by the addition of both carbon and nitrogen. The last two methods do not change the chemical composition of the steel and are essentially shallow-hardening methods. In flame and induction hardening the steel must be capable of being hardened; therefore, the carbon content must be about 0.30 percent or higher.
Carburiring This is the oldest and one of the cheapest methods of case hardening. A low-carbon steel, usually about 0.20 percent carbon or lower, is placed in an atmosphere that contains substantial amounts of carbon monoxide. The usual carburizing temperature is 1700°F. At this tempera-
Rod d~arneter 0.180 Carbon 0.74 1 Manganese 0.37 Sillcon 0.145 Sulfur 0.039 Phosphorus 0.044
Each plotted polnt
O 40 45 50 55 60 Rockwell C hardness
8 Comparison between austempering and ed and tempered steel. (From "Suiting the Heat ent to the Job." U.S. Steel Corporation.)
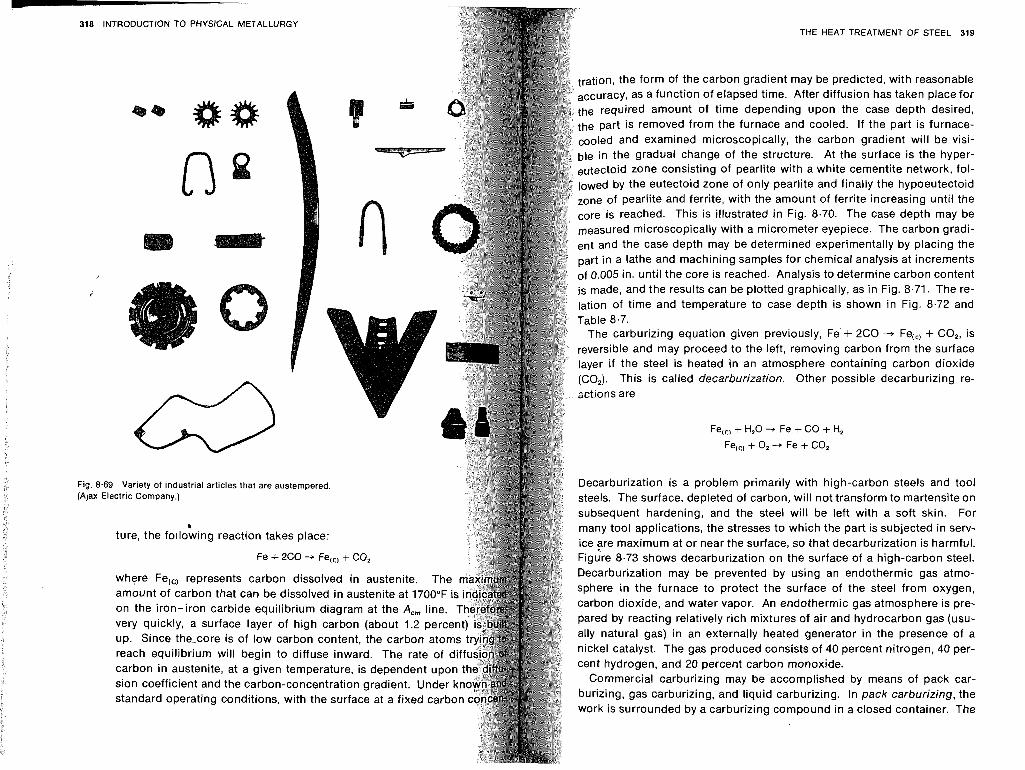
318 INTRODUCTION TO PHYSICAL METALLURGY
Fig. 8.69 (Ajax Ela
he required amount of time depending upon the case depth desired, he part is removed from the furnace and cooled. If the part is furnace-
The carburizing equation given previously, Fe + 2C0 -+ Fe,,, + CO,, is reversible and may proceed to the left, removing carbon from the surface
1 Variety of industrial articles that are austempered tctric Company.)
ture, the following reaction takes place:
Fe + 2C0 --, Fe,,, + CO,
where Fe,,, represents carbon dissolved in austenite. Th amount of carbon that can be dissolved in austenite at 1700°F on the iron-iron carbide equilibrium diagram at the A,, line. very quickly, a surface layer of high carbon (about 1.2 perce up. Since the-core is of low carbon content, the carbon atom reach equilibrium will begin to diffuse inward. The rate of dif carbon in austenite, at a given temperature, is dependent upo sion coefficient and the carbon-concentration gradient. Under standard operating conditions, with the surface at a fixed carbon
THE HEAT TREATMENT OF STEEL 319
ration, the form of the carbon gradient may be predicted, with reasonable .~curacv, as a function of elapsed time. After diffusion has taken place for
oled and examined microscopically, the carbon gradient will be visi- in the gradual change of the structure. At the surface is the hyper-
ectoid zone consisting of pearlite with a white cementite network, fol- ed by the eutectoid zone of only pearlite and finally the hypoeutectoid e of pearlite and ferrite, with the amount of ferrite increasing until the
core is reached. This is illustrated in Fig. 8.70. The case depth may be measured microscopically with a micrometer eyepiece. The carbon gradi- ent and the case depth may be determined experimentally by placing the part in a lathe and machining samples for chemical analysis at increments of 0.005 in. until the core is reached. Analysis to determine carbon content is made, and the results can be plotted graphically, as in Fig. 8.71. The re- lation of time and temperature to case depth is shown in Fig. 8.72 and
ayer if the steel is heated in an atmosphere containing carbon dioxide CO,). This is called decarburization. Other possible decarburizing re- ctions are
Fe,,, + H,O -+ Fe + CO + H, Fe,,, + 0, + Fe + CO,
Decarburization is a problem primarily with high-carbon steels and tool steels. The surface, depleted of carbon, will not transform to martensite on subsequent hardening, and the steel will be left with a soft skin. For many tool applications, the stresses to which the part is subjected in serv- ice $re maximum at or near the surface, so that decarburization is harmful. Figure 8.73 shows decarburization on the surface of a high-carbon steel.
f# Decarburization may be prevented by using an endothermic gas atmo- sphere in the furnace to protect the surface of the steel from oxygen, carbon dioxide, and water vapor. An endothermic gas atmosphere is pre- pared by reacting relatively rich mixtures of air and hydrocarbon gas (usu- ally natural gas) in an externally heated generator in the presence of a nickel catalyst. The gas produced consists of 40 percent nitrogen, 40 per- cent hydrogen, and 20 percent carbon monoxide.
Commercial carburizing may be accomplished by means of pack car- burizing, gas carburizing, and liquid carburizing. In pack carburizing, the work is surrounded by a carburizing compound in a closed container. The
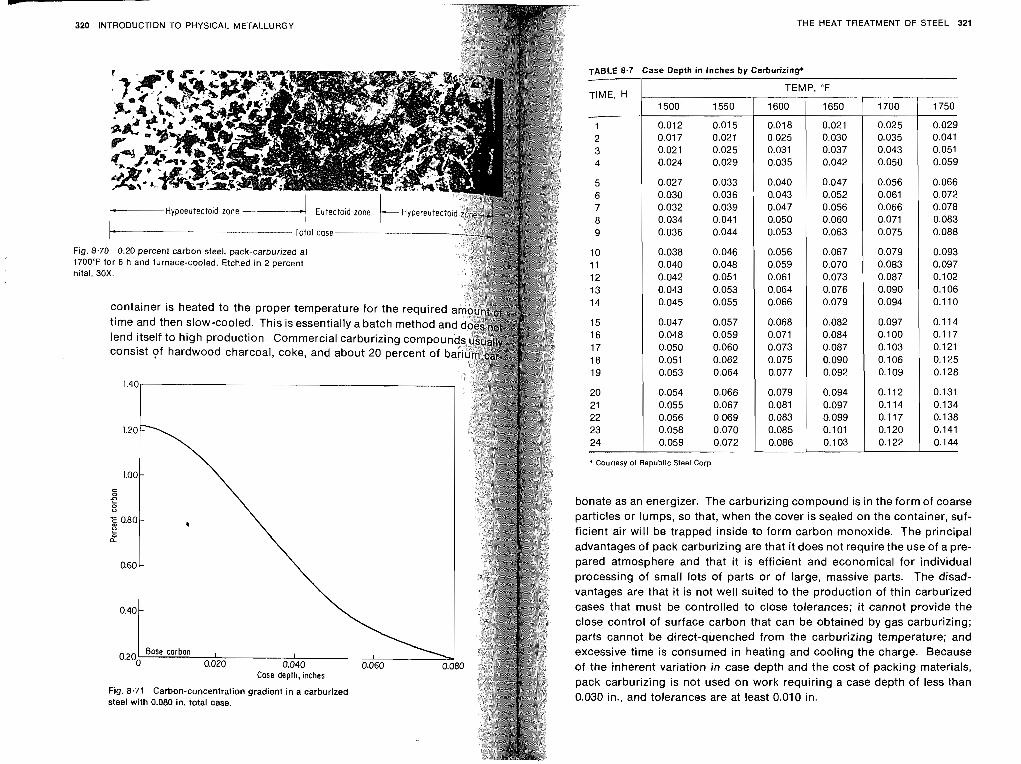
320
Fig. , 1700 nital,
INTRODUCTION TO PHYSICAL METALLURGY
"F for 6 h and furnace-cooled. Etched i n 2 percent 30X.
container is heated to the proper temperature for the required time and then slow-cooled. This is essentially a batch method lend itself to high production. Commercial carburizing compo consist of hardwood charcoal, coke, and about 20 percent of
Case depth, inches
Fig. 8.71 Carbon-concentration gradient in a carburized steel with 0.080 in. total case.
THE HEAT TREATMENT OF STEEL 321
TABLE 8.7 Case D e ~ t h in inches bv Carburizing* - TEMP. "F
TIME, H
0.054 0.066 0.055 0.067 0.056 0.069 0.058 0.070
24 0.059 0.072
* Courtesy of Republic Steel Corp.
bonate as an energizer. The carburizing compound is in the form of coarse particles or lumps, so that, when the cover is sealed on the container, suf- ficient air will be trapped inside to form carbon monoxide. The principal advantages of pack carburizing are that it does not require the use of a pre- pared atmosphere and that it is efficient and economical for individual processing of small lots of parts or of large, massive parts. The disad- vantages are that it is not well suited to the production of thin carburized cases that must be controlled to close tolerances; it cannot provide the close control of surface carbon that can be obtained by gas carburizing; parts cannot be direct-quenched from the carburizing temperature; and excessive time is consumed in heating and cooling the charge. Because of the inherent variation in case depth and the cost of packing materials, pack carburizing is not used on work requiring a case depth of less than 0.030 in., and tolerances are at least 0.010 in.
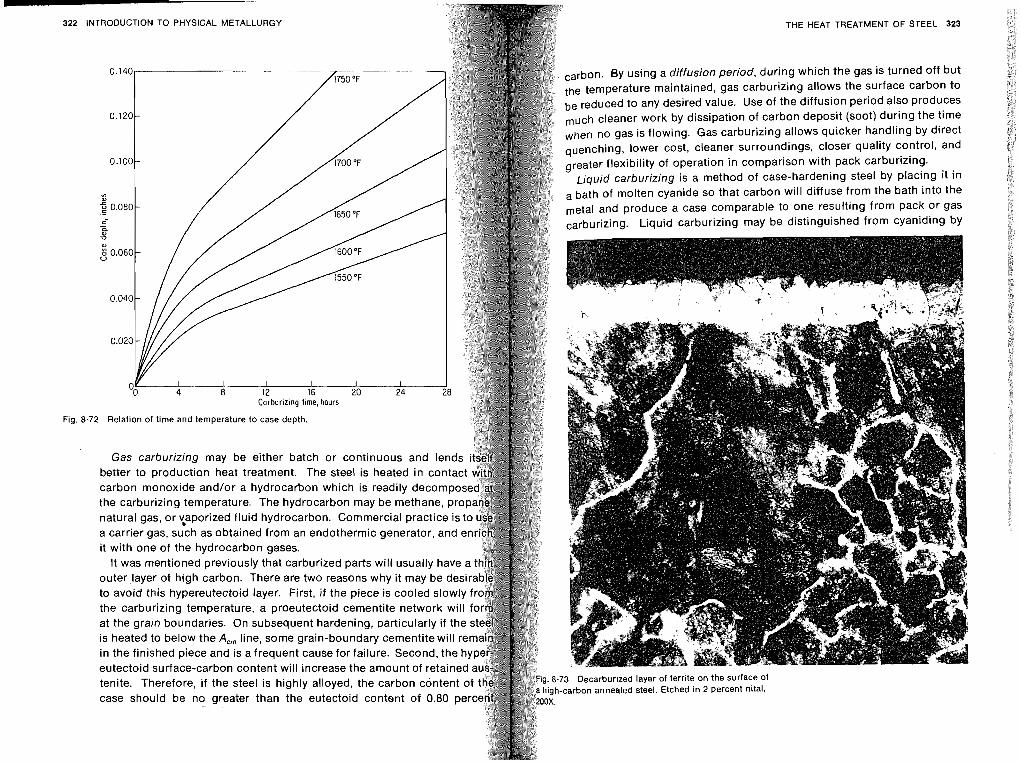
322 INTRODUCTION TO PHYSICAL METALLURGY THE HEAT TREATMENT OF STEEL 323
carbon. By using a diffusion period, during which the gas is turned off but the temperature maintained, gas carburizing allows the surface carbon to be reduced to any desired value. Use of the diffusion period also produces much cleaner work by dissipation of carbon deposit (soot) during the time
no gas is flowing. Gas carburizing allows quicker handling by direct quenching, lower cost, cleaner surroundings, closer quality control, and
Fig. 8.72 Relation of time and temperature to case depth.
natural gas, or {aporized fluid hydrocarbon. Commercial practice is t a carrier gas, such as obtained from an endothermic generator, and e it with one of the hydrocarbon gases.
the carburizing temperature, a proeutectoid cementite network will at the grain boundaries. On subsequent hardening, particularly if the
tenite. Therefore, if the steel is highly alloyed, the carbon content h-carbon annealed steel. Etched in 2 percent nital,
case should be no greater than the eutectoid content of 0.80 p
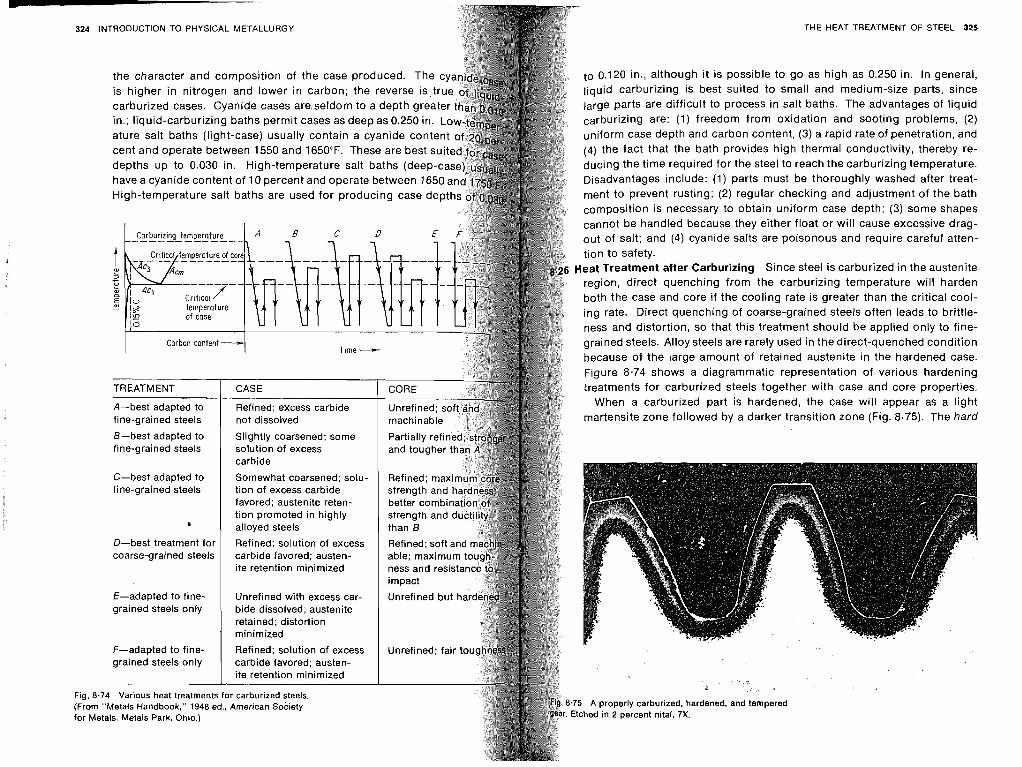
324 INTRODUCTION TO PHYSICAL METALLURGY
the character and composition of the case produced. The is higher in nitrogen and lower in carbon; the reverse is,t carburized cases. Cyanide cases aresseldom to a depth grea in.; liquid-carburizing baths permit cases as deep as 0.250 in. ature salt baths (light-case) usually contain a cyanide cont cent and operate between 1550 and 1650°F. These are best s depths up to 0.030 in. High-temperature salt baths (deep- have a cyanide content of 10 percent and operate between 1650 High-temperature salt baths are used for producing case dep
----7 temperature of case
'0
I Carbon content 4 I I Time -
not dissolved 6-best adapted to fine-grained steels
Slightly coarsened; solution of excess
Partially and tout
carbide C-best adapted to Somewhat coarsened; solu- Refined; m fine-grained steels tion of excess carbide
favored; austenite reten- tion promoted in highly * alloyed steels
D-best treatment for Refined; solution of excess Refined; s coarse-grained steels carbide favored; austen-
ite retention minimized
E-adapted to fine- Unrefined with excess car- Unrefined grained steels only bide dissolved; austenite
retained; distortion minimized
F-adapted to fine- Refined; solution of excess Unrefined; fai grained steels only carbide favored; austen-
ite retention minimized
Fig. 8.74 Various heat treatments for carburized steels. (From "Metals Handbook," 1948 ed.. American Society
s, Metals Park. Ohio.) Metal: for
THE HEAT TREATMENT OF STEEL 325
to 0.120 in., although it is possible to go as high as 0.250 in. In general, liquid carburizing is best suited to small and medium-size parts, since large parts are difficult to process in salt baths. The advantages of liquid carburizing are: (1) freedom from oxidation and sooting problems, (2) uniform case depth and carbon content, (3) a rapid rate of penetration, and (4) the fact that the bath provides high thermal conductivity, thereby re- ducing the time required for the steel to reach the carburizing temperature. Disadvantages include: (1) parts must be thoroughly washed after treat- ment to prevent rusting; (2) regular checking and adjustment of the bath composition is necessary to obtain uniform case depth; (3) some shapes cannot be handled because they either float or will cause excessive drag- out of salt; and (4) cyanide salts are poisonous and require careful atten- tion to safety.
Heat Treatment after Carburizing Since steel is carburized in the austenite region, direct quenching from the carburizing temperature will harden both the case and core if the cooling rate is greater than the critical cool- ing rate. Direct quenching of coarse-grained steels often leads to brittle- ness and distortion, so that this treatment should be applied only to fine- grained steels. Alloy steels are rarely used in the direct-quenched condition because of the large amount of retained austenite in the hardened case. Figure 8.74 shows a diagrammatic representation of various hardening treatments for carburized steels together with case and core properties.
When a carburized part is hardened, the case will appear as a light martensite zone followed by a darker transition zone (Fig. 8.75). The hard
75 A properly carburized, hardened. and tempered Etched in 2 percent nital, 7X.
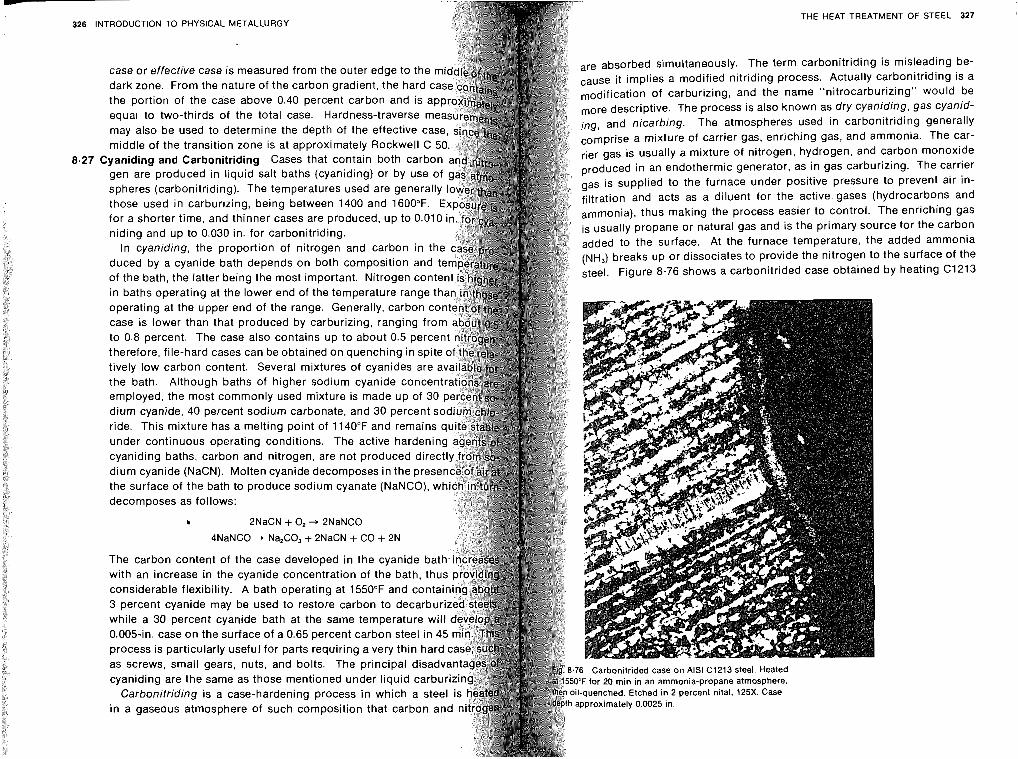
326 INTRODUCTION TO PHYSICAL METALLURGY THE HEAT TREATMENT OF STEEL 327
case or effective case is measured from the outer edge to the are absorbed simultaneously. The term carbonitriding is misleading be-
dark zone. From the nature of the carbon gradient, the hard cas cause it implies a modified nitriding process. Actually carbonitriding is a of carburizing, and the name "nitrocarburizing" would be the portion of the case above 0.40 percent carbon and is a
equal to two-thirds of the total case. Hardness-traverse m more descriptive. The process is also known as dry cyaniding, gas cyanid- ing, and nicarbing. The atmospheres used in carbonitriding generally
may also be used to determine the depth of the effective ca middle of the transition zone is at approximately Rockwell C comprise a mixture of carrier gas, enriching gas, and ammonia. The car-
:yaniding and Carbonitriding Cases that contain both carbo rier gas is usually a mixture of nitrogen, hydrogen, and carbon monoxide
gen are produced in liquid salt baths (cyaniding) or by use produced in an endothermic generator, as in gas carburizing. The carrier
spheres (carbonitriding). The temperatures used are general gas is supplied to the furnace under positive pressure to prevent air in-
those used in carburizing, being between 1400 and 1600°F. filtration and acts as a diluent for the active gases (hydrocarbons and
for a shorter time, and thinner cases are produced, up to 0.010 i ammonia), thus making the process easier to control. The enriching gas
niding and up to 0.030 in. for carbonitriding. is usually propane or natural gas and is the primary source for the carbon
In cyaniding, the proportion of nitrogen and carbon in th added to the surface. At the furnace temperature, the added ammonia
duced by a cyanide bath depends on both composition and t (NH,) breaks up or dissociates to provide the nitrogen to the surface of the
of the bath, the latter being the most important. Nitrogen conten steel. Figure 8.76 shows a carbonitrided case obtained by heating C1213
in baths operating at the lower end of the temperature rang operating at the upper end of the range. Generally, carbon case is lower than that produced by carburizing, ranging fro to 0.8 percent. The case also contains up to about 0.5 perc therefore, file-hard cases can be obtained on quenching in spit tively low carbon content. Several mixtures of cyanides are the bath. Although baths of higher sodium cyanide concent employed, the most commonly used mixture is made up of 30 dium cyanide, 40 percent sodium carbonate, and 30 percents ride. This mixture has a melting point of 1140°F and remains under continuous operating conditions. The active hardeni cyaniding baths, carbon and nitrogen, are not produced dium cyanide (NaCN). Molten cyanide decomposes in the the surface of the bath to produce sodium cyanate (NaN decomposes as follows:
b 2NaCN + 0, -, 2NaNCO
4NaNCO + Na,CO, + 2NaCN + CO + 2N
The carbon content of the case developed in the cyanide bat with an increase in the cyanide concentration of the bath, thu considerable flexibility. A bath operating at 1550°F and conta 3 percent cyanide may be used to restore carbon to decarbur while a 30 percent cyanide bath at the same temperature will 0.005-in. case on the surface of a 0.65 percent carbon steel in process is particularly useful for parts requiring a very thin ha as screws, small gears, nuts, and bolts. The principal
6 Carbonitrided case on AlSl C1213 steel. Heated cyaniding are the same as those mentioned under liquid carburiz "F for 20 min in an ammonia-propane atmosphere,
Carbonitriding is a case-hardening process in which a steel i -quenched. Etched in 2 percent nital, 125X. Case
in a gaseous atmosphere of such composition that carbon and pproximately 0.0025 in.
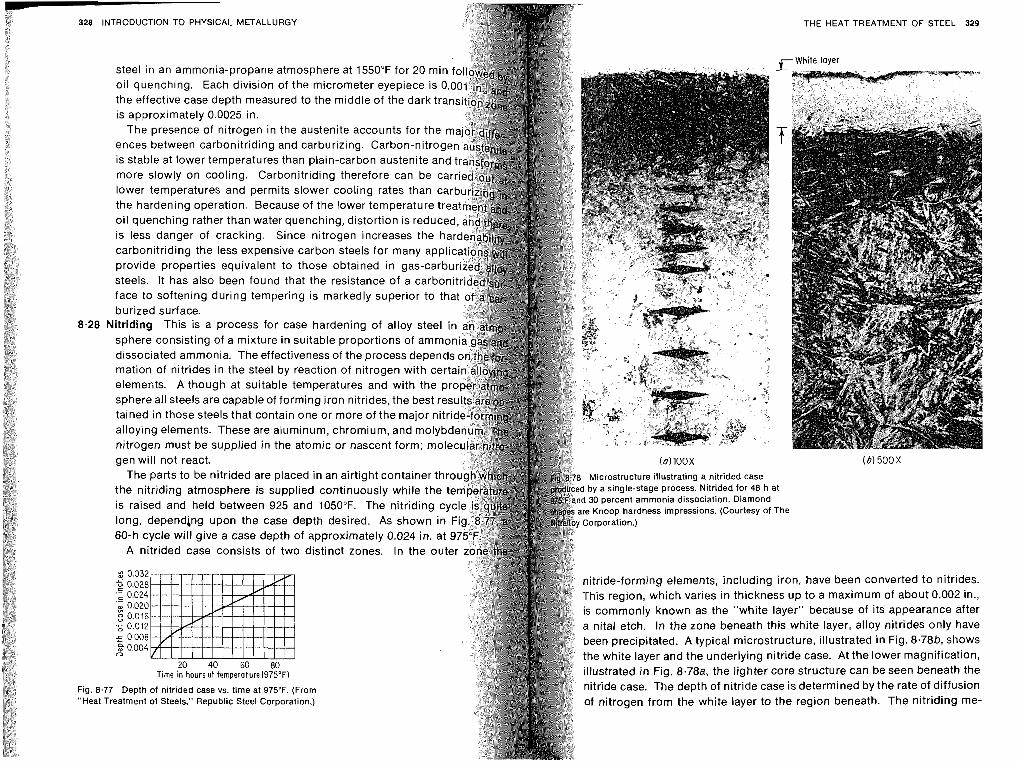
328 INTRODUCTION TO PHYSICAL METALLURGY
Fig. 8 "Heat
THE HEAT TREATMENT OF STEEL 329
steel in an ammonia-propane atmosphere at 1550°F for 20 mi oil quenching. Each division of the micrometer eyepiece is the effective case depth measured to the middle of the dark t is approximately 0.0025 in.
The presence of nitrogen in the austenite accounts for the ences between carbonitriding and carburizing. Carbon-nitro is stable at lower temperatures than plain-carbon austenite an more slowly on cooling. Carbonitriding therefore can be ca lower temperatures and permits slower cooling rates than ca the hardening operation. Because of the lower temperature tr oil quenching rather than water quenching, distortion is reduc is less danger of cracking. Since nitrogen increases the carbonitriding the less expensive carbon steels for many ap provide properties equivalent to those obtained in gas-carb steels. It has also been found that the resistance of a carb face to softening during tempering is markedly superior to burized surface.
Nitriding This is a process for case hardening of alloy steel i sphere consisting of a mixture in suitable proportions of am dissociated ammonia. The effectiveness of the process depe mation of nitrides in the steel by reaction of nitrogen with cer elements. Although at suitable temperatures and with the sphere all steels are capable of forming iron nitrides, the bes tained in those steels that contain one or more of the major alloying elements. These are aluminum, chromium, and mol nitrogen must be supplied in the atomic or nascent form; m gen will not react.
The parts to be nitrided are placed in an airtight container thr Microstructure illustrating a nitrided case
the nitriding atmosphere is supplied continuously while the t d by a single-stage process. Nitrided for 48 h at
is raised and held between 925 and 1050°F. The nitriding c 0 percent ammonia dissociation. Diamond Knoop hardness impressions. (Courtesy of The
long, depending upon the case depth desired. As shown in 60-h cycle will give a case depth of approximately 0.024 in. at
A nitrided case consists of two distinct zones. In the out
2 0.032 2 0.028 'tride-forming elements, including iron, have been converted to nitrides. '; 0.024 .- is region, which varies in thickness up to a maximum of about 0.002 in., '" 0.020 % 0.016 commonly known as the "white layer" because of its appearance after --, 0.012 nital etch. In the zone beneath this white layer, alloy nitrides only have 5 0 008
0.004 en precipitated. A typical microstructure, illustrated in Fig. 8.78b, shows
o e white layer and the underlying nitride case. At the lower magnification,
Time in hoursat temperature(975"F) ted in Fig. 8.78a, the lighter core structure can be seen beneath the
.77 Depth of nitrided case vs. time at 975°F. (From case. The depth of nitride case is determined by the rate of diffusion Treatment of Steels." Republic Steel Corporation.) of nitrogen from the white layer to the region beneath. The nitriding me-
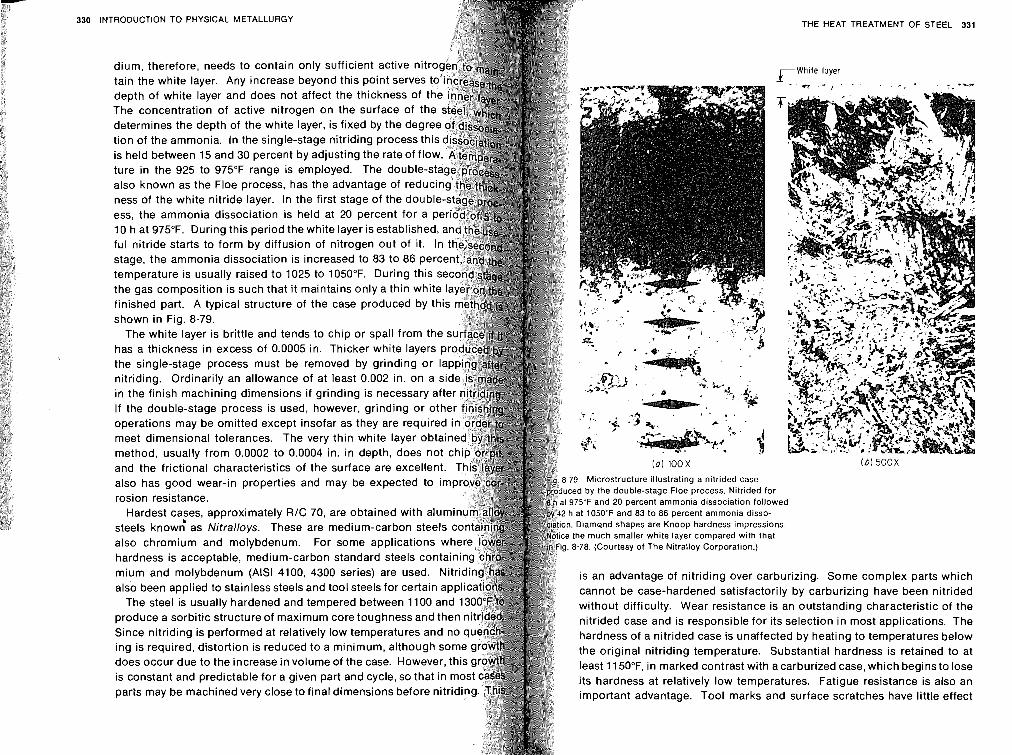
330 INTRODUCTION PHYSICAL METALLURGY THE HEAT TREATMENT OF STEEL 331
The concentration of active nitrogen on the surface of t determines the depth of the white layer, is fixed by the deg tion of the ammonia. In the single-stage nitriding process t is held between 15 and 30 percent by adjusting the rate of f l ture in the 925 to 975°F range is employed. The double-s also known as the Floe process, has the advantage of reduc ness of the white nitride layer. In the first stage of the double ess, the ammonia dissociation is held at 20 percent for a p 10 h at 975°F. During this period the white layer is established, ful nitride starts to form by diffusion of nitrogen out of it. In
finished part. A typical structure of the case produced by thi shown in Fig. 8.79.
The white layer is brittle and tends to chip or spall from the has a thickness in excess of 0.0005 in. Thicker white layers p the single-stage process must be removed by grinding or la nitriding. Ordinarily an allowance of at least 0.002 in. on a si in the finish machining dimensions if grinding is necessary aft If the double-stage process is used, however, grinding or 0th operations may be omitted except insofar as they are required meet dimensional tolerances. The very thin white layer obtai
also has good wear-in properties and may be expected to im rosion resistance.
Hardest cases, approximately R/C 70, are obtained with alu steels know; as Nitra
78. (Courtesy of The Nitralloy Corporation.)
is an advantage of nitriding over carburizing. Some complex parts which cannot be case-hardened satisfactorily by carburizing have been nitrided without difficulty. Wear resistance is an outstanding characteristic of the nitrided case and is responsible for its selection in most applications. The hardness of a nitrided case is unaffected by heating to temperatures below the original nitriding temperature. Substantial hardness is retained to at least 11 5O0F, in marked contrast with a carburized case, which begins to lose its hardness at relatively low temperatures. Fatigue resistance is also an important advantage. Tool marks and surface scratches have little effect
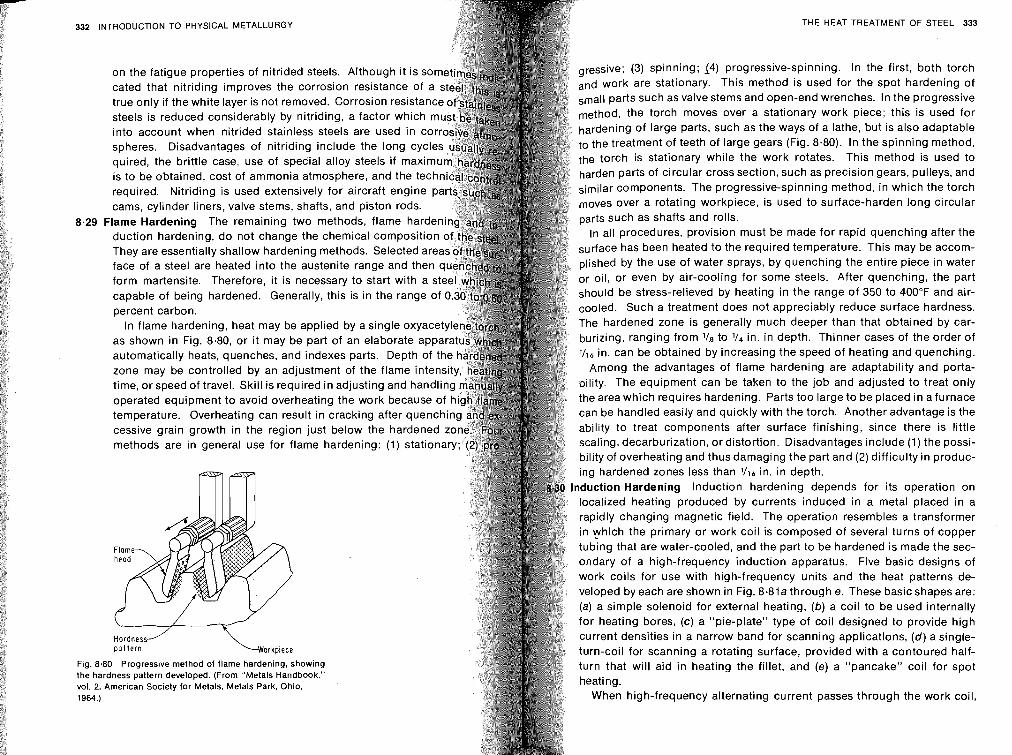
332 INTRODUCTION TO PHYSICAL METALLURGY THE HEAT TREATMENT OF STEEL 333
Fig. 8 the ha vol. 2, 1964.)
on the fatigue properties of nitrided steels. Although it is so gressive; (3) spinning; 14) progressive-spinning. In the first, both torch
cated that nitriding improves the corrosion resistance of a and work are stationary. This method is used for the spot hardening of
true only if the white layer is not removed. Corrosion resistan parts such as valve stems and open-end wrenches. In the progressive
steels is reduced considerably by nitriding, a factor which method, the torch moves over a stationary work piece; this is used for
into account when nitrided stainless steels are used in c hardening of large parts, such as the ways of a lathe, but is also adaptable
spheres. Disadvantages of nitriding include the long cyc to the treatment of teeth of large gears (Fig. 8.80). In the spinning method,
quired, the brittle case, use of special alloy steels if maxim the torch is stationary while the work rotates. This method is used to
is to be obtained, cost of ammonia atmosphere, and the tec harden parts of circular cross section, such as precision gears, pulleys, and
required. Nitriding is used extensively for aircraft engine p similar components. The progressive-spinning method, in which the torch
cams, cylinder liners, valve stems, shafts, and piston rods. moves over a rotating workpiece, is used to surface-harden long circular
Flame Hardening The remaining two methods, flame ha parts such as shafts and rolls.
duction hardening, do not change the chemical composi In all procedures, provision must be made for rapid quenching after the
They are essentially shallow hardening methods. Selected area surface has been heated to the required temperature. This may be accom-
face of a steel are heated into the austenite range and then plished by the use of water sprays, by quenching the entire piece in water
form martensite. Therefore, it is necessary to start with a s or oil, or even by air-cooling for some steels. After quenching, the part
capable of being hardened. Generally, this is in the range o should be stress-relieved by heating in the range of 350 to 400°F and air-
percent carbon. cooled. Such a treatment does not appreciably reduce surface hardness.
In flame hardening, heat may be applied by a single ox The hardened zone is generally much deeper than that obtained by car-
as shown in Fig. 8.80, or it may be part of an elaborate ranging from '/a to V.4 in. in depth. Thinner cases of the order of
automatically heats, quenches, and indexes parts. Depth n be obtained by increasing the speed of heating and quenching.
zone may be controlled by an adjustment of the flame inten mong the advantages of flame hardening are adaptability and porta-
time, or speed of travel. Skill is required in adjusting and handlin ty. The equipment can be taken to the job and adjusted to treat only operated equipment to avoid overheating the work because of the area which requires hardening. Parts too large to be placed in afurnace
temperature. Overheating can result in cracking after quenchi can be handled easily and quickly with the torch. Another advantage is the
cessive grain growth in the region just below the hardened ability to treat components after surface finishing, since there is little
methods are in general use for flame hardening: (1) stationa scaling, decarburization, or distortion. Disadvantages include (1) the possi- bility of overheating and thus damaging the part and (2) difficulty in produc- ing hardened zones less than '/16 in. in depth.
Induction Hardening lnduction hardening depends for its operation on localized heating produced by currents induced in a metal placed in a rapidly changing magnetic field. The operation resembles a transformer in yhich the primary or work coil is composed of several turns of copper tubing that are water-cooled, and the part to be hardened is made the sec- ondary of a high-frequency induction apparatus. Five basic designs of work coils for use with high-frequency units and the heat patterns de- veloped by each are shown in Fig. 8.81a through e. These basic shapes are: (a) a simple solenoid for external heating, (b) a coil to be used internally for heating bores, (c) a "pie-plate" type of coil designed to provide high current densities in a narrow band for scanning applications, ( d ) a single- turn-coil for scanning a rotating surface, provided with a contoured half- turn that will aid in heating the fillet, and (e) a "pancake" coil for spot
irdness pattern developed. (From "Metals Handbook." American Society for Metals, Metals Park, Ohio.
When high-frequency alternating current passes through the work coil,
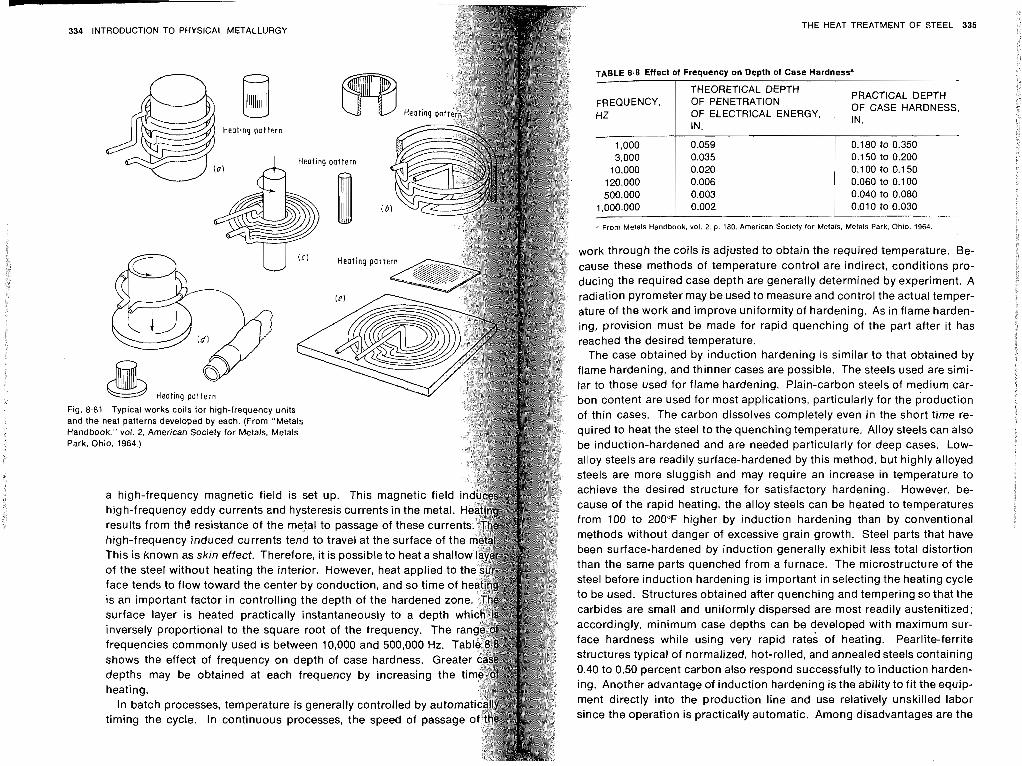
334 INTRODUCTION TO PHYSICAL METALLURGY
u w w nearing pattern a Heat!nq pattern
/------
i d )
Fig. 8.81 Typical works coils for high-frequency units and the heat patterns developed by each. (From "Metals Handbook," vol. 2, American Society for Metals. Metals Park. Ohio, 1964.)
a high-frequency magnetic field is set up. This magnetic field high-frequency eddy currents and hysteresis currents in the metal. results from the resistance of the metal to passage of these currents. T high-frequency induced currents tend to travel at the surface o f t This is known as skin effect. Therefore, it is possible to heat a shal of the steel without heating the interior. However, heat applied to face tends to flow toward the center by conduction, and so time of is an important factor in controlling the depth of the hardened zone. T surface layer is heated practically instantaneously to a depth which inversely proportional to the square root of the frequency. The frequencies commonly used is between 10,000 and 500,000 Hz. T shows the effect of frequency on depth of case hardness. Grea depths may be obtained at each frequency by increasing the heating.
In batch processes, temperature is generally controlled by automa timing the cycle. In continuous processes, the speed of passage of t
THE HEAT TREATMENT OF STEEL 335
TABLE 8.8 Effect of Frequency on Depth of Case Hardness*
3,000 0.035 0.150 to 0.200 10,000 0.020 0.100 to 0.150
120,000 0.006 0.060 to 0.100 500,000 0.003 0.040 to 0.080
1,000,O~~ 0.002 0.010 to 0.030
From Metals Handbook, vol. 2, p 180. Amerlcan Society lor Metals. Metals Park. Ohio. 1964.
. . .- . -
work through the coils is adjusted to obtain the required temperature. Be- cause these methods of temperature control are indirect, conditions pro- ducing the required case depth are generally determined by experiment. A radiation pyrometer may be used to measure and control the actual temper- ature of the work and improve uniformity of hardening. As in flame harden- ing, provision must be made for rapid quenching of the part after it has reached the desired temperature.
The case obtained by induction hardening is similar to that obtained by flame hardening, and thinner cases are possible. The steels used are simi- lar to those used for flame hardening. Plain-carbon steels of medium car- bon content are used for most applications, particularly for the production of thin cases. The carbon dissolves completely even in the short time re- quired to heat the steel to the quenching temperature. Alloy steels can also be induction-hardened and are needed particularly for deep cases. Low- alloy steels are readily surface-hardened by this method, but highly alloyed steels are more sluggish and may require an increase in temperature to achieve the desired structure for satisfactory hardening. However, be- cause of the rapid heating, the alloy steels can be heated to temperatures from 100 to 200°F higher by induction hardening than by conventional methods without danger of excessive grain growth. Steel parts that have been surface-hardened by induction generally exhibit less total distortion than the same parts quenched from a furnace. The microstructure of the steel before induction hardening is important in selecting the heating cycle to be used. Structures obtained after quenching and tempering so that the carbides are small and uniformly dispersed are most readily austenitized; accordingly, minimum case depths can be developed with maximum sur- face hardness while using very rapid rates of heating. Pearlite-ferrite structures typical of normalized, hot-rolled, and annealed steels containing 0.40 to 0.50 percent carbon also respond successfully to induction harden- ing. Another advantage of induction hardening is the ability to fit the equip- ment directly into the production line and use relatively unskilled labor since the operation is practically automatic. Among disadvantages are the
PRACTICAL DEPTH OF CASE HARDNESS, FREQUENCY,
HZ
THEORETICAL DEPTH OF PENETRATION OF ELECTRICAL ENERGY, IN.
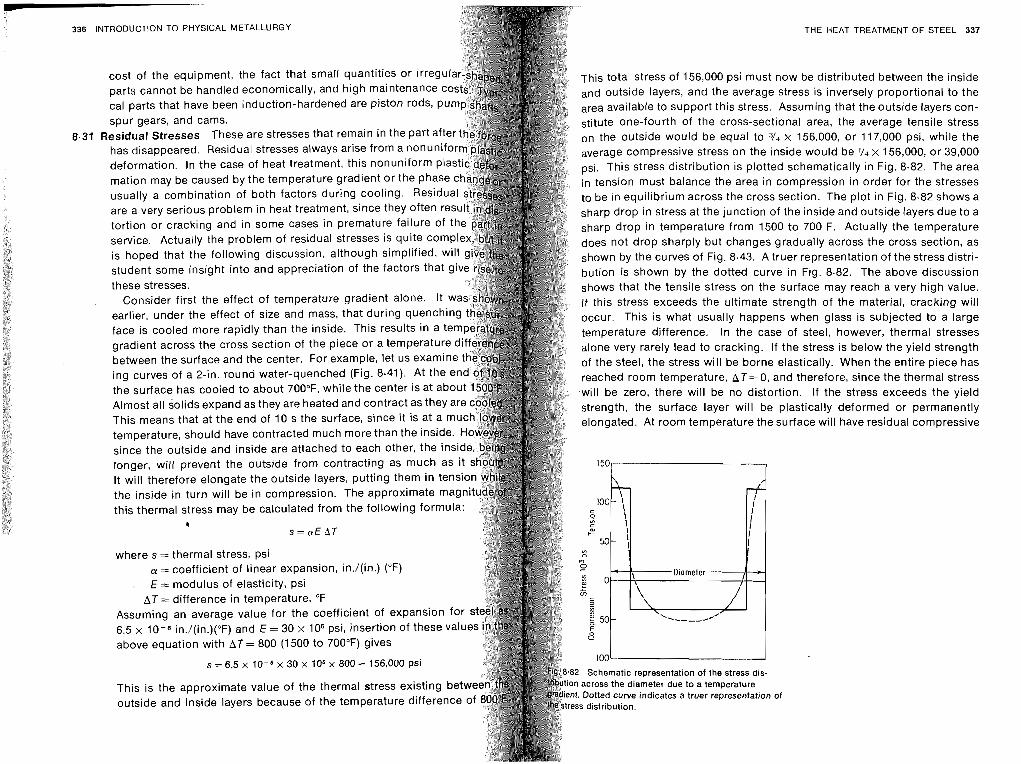
D
336 INTRODUCTION TO PHYSICAL METALLURGY
cost of the equipment, the fact that small quantities or irreg parts cannot be handled economically, and high maintenance cal parts that have been induction-hardened are piston rods, spur gears, and cams.
qesidual Stresses These are stresses that remain in the part a has disappear deformation.
Residual 7e case o
stresses always arise lf heat treatment, this
from a nonu nonuniform
mation may be caused by the temperature gradient or the phas usually a combination of both factors during cooling. Resid are a very serious problem in heat treatment, since they often r tortion or cracking and in some cases in premature failure of service. Actually the problem of residual stresses is quite com is hoped that the following discussion, although simplified, wi student some insight into and appreciation of the factors that these stresses.
Consider first the effect of temperature gradient alone. It earlier, under the effect of size and mass, that during quenchin face is cooled more rapidly than the inside. This results in a te gradient across the cross section of the piece or a temperatur between the surface and the center. For example, let us exami ing curves of a 2-in. round water-quenched (Fig. 8.41). At the the surface has cooled to about 700°F, while the center is at abo Almost all solids expand as they are heated and contract as they a This means that at the end of 10 s the surface, since it is at a m temperature, should have contracted much more than the inside. since the outside and inside are attached to each other, the longer, will prevent the outside from contracting as much It will therefore elongate the outside layers, putting them in ten the inside in turn will be in compression. The approximate ma this thermal stress may be calculated from the following formul
where s = thermal stress, psi LY = coefficient of linear expansion, in./(in.) ("F) E = modulus of elasticity, psi
A T = difference in temperature, "F Assuming an average value for the coefficient of expansion for s 6.5 x 10⁻⁶ in./(in.)("F) and E = 30 x 106 psi, insertion of these val above equation with A T - 800 (1500 to 700°F) gives
s = 6.5 x 10-6 x 30 x lo6 x 800 = 156,000 psi
This is the approximate value of the thermal stress existing bet outside and inside layers because of the temperature difference
THE HEAT TREATMENT OF STEEL 337
This total Stress of 156,000 psi must now be distributed between the inside and outs~de layers, and the average stress is inversely proportional to the area available to support this stress. Assuming that the outside layers con- stitute one-fourth of the cross-sectional area, the average tensile stress on the outside would be equal to 3/4 x 156,000, or 117,000 psi, while the average compressive stress on the inside would be 'I4 x 156,000, or 39,000 PSI. This stress distribution is plotted schematically in Fig. 8.82. The area in tension must balance the area in compression in order for the stresses to be In equilibrium across the cross section. The plot in Fig. 8.82 shows a sharp drop in stress at the junction of the inside and outside layers due to a sharp drop in temperature from 1500 to 700 F. Actually the temperature does not drop sharply but changes gradually across the cross section, as shown by the curves of Fig. 8.43. A truer representation of the stress distri- bution is shown by the dotted curve in Fig. 8.82. The above discussion shows that the tensile stress on the surface may reach a very high value. If this stress exceeds the ultimate strength of the material, cracking will occur. This is what usually happens when glass is subjected to a large temperature difference. In the case of steel, however, thermal stresses alone very rarely lead to cracking. If the stress is below the yield strength of the steel, the stress will be borne elastically. When the entire piece has reached room temperature, A T = 0, and therefore, since the thermal stress will be zero, there will be no distortion. If the stress exceeds the yield strength, the surface layer will be plastically deformed or permanently elonaated. At room temDerature the surface will have residual comoressive
@client. Dotted curve lnd~cates a truer representation of
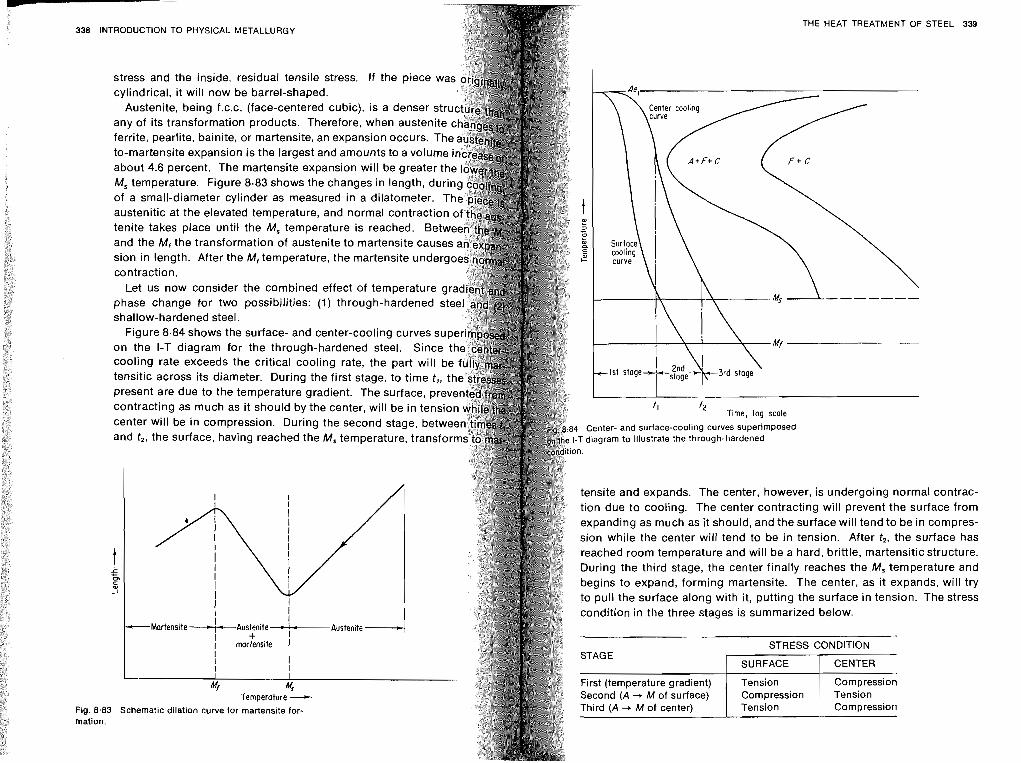
THE HEAT TREATMENT OF STEEL 339 338 INTRODUCTION TO PHYSICAL METALLURGY
stress and the inside, residual tensile stress. If the piece cylindrical, it will now be barrel-shaped.
Austenite, being f.c.c. (face-centered cubic), is a denser st
M, temperature. Figure 8.83 shows the changes in length, du of a small-diameter cylinder as measured in a dilatometer. T
sion in length. After the M'temperature, the martensite underg contraction.
Let us now consider the combined effect of temperature g phase change for two possibilities: (I) through-hardened st shallow-hardened steel.
Figure 8.84 shows the surface- and center-cooling curves sup on the I-T diagram for the through-hardened steel. Since cooling rate exceeds the critical cooling rate, the part will b tensitic across its diameter. During the first stage, to time t,,
center will be in compression. During the second stage, bet 84 Center- and surface-cooling curves superimposed and t,, the surface, having reached the M, temperature, trans T diagram to illustrate the through-hardened
tensite and expands. The center, however, is undergoing normal contrac- tion due to cooling. The center contracting will prevent the surface from expanding as much as it should, and the surface will tend to be in compres- sion while the center will tend to be in tension. After t,, the surface has reached room temperature and will be a hard, brittle, martensitic structure. During the third stage, the center finally reaches the M, temperature and begins to expand, forming martensite. The center, as it expands, will try to pull the surface along with it, putting the surface in tension. The stress condition in the three stages is summarized below.
Temperature - Fig. 8.83 Schematic dilation curve for rnartensite for- mation.
STRESS CONDITION STAGE
SURFACE CENTER
First (temperature gradient) Tension Compression Second (A -+ M of surface) Compression Tension Third (A -+ M of center) Tension Compression
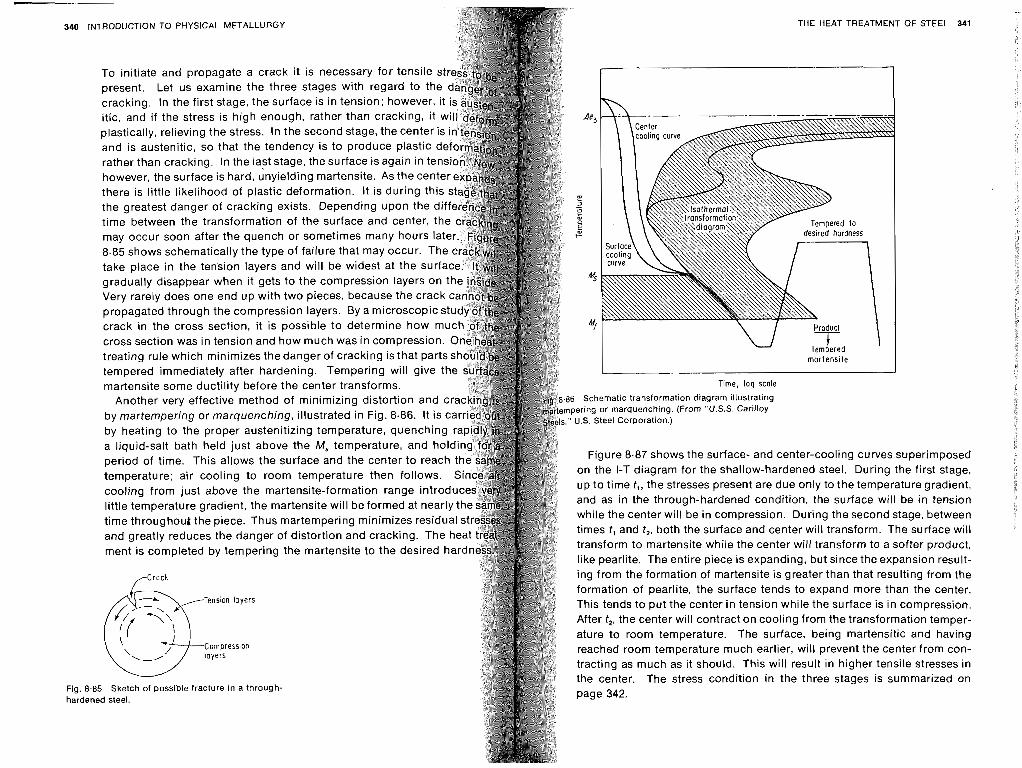
C
340 INTRODUCTION TO PHYSICAL METALLURGY THE HEAT TREATMENT OF STEEL 341
Fig ha1
To initiate and propagate a crack it is necessary for tensile present. Let us examine the three stages with regard to th cracking. In the first stage, the surface is in tension; however, itic, and if the stress is high enough, rather than cracking, '
plastically, relieving the stress. In the second stage, the cente and is austenitic, so that the tendency is to produce plastic rather than cracking. In the last stage, the surface is again in te however, the surface is hard, unyielding martcnsite. As the cen there is little likelihood of plastic deformation. It is during th the greatest danger of cracking exists. Depending upon the - 5 time between the transformation of the surface and center, !2 z may occur soon after the quench or sometimes many hours lat I-"
8.85 shows schematically the type of failure that may occur. The take place in the tension layers and will be widest at the surfa gradually disappear when it gets to the compression layers on Very rarely does one end up with two pieces, because the crack propagated through the compression layers. By a microscopic s crack in the cross section, it is possible to determine how muc cross section was in tension and how much was in compression. treating rule which minimizes the danger of cracking is that parts tempered immediately after hardening. Tempering will give th martensite some ductility before the center transforms. Time, log scole
Another very effective method of minimizing distortion and c 6 Schematic transformation diagram illustrating
by martempering or marquenching, illustrated in Fig. 8.86. It is c pering or marquenching. (From "U.S.S. Carilloy ' U.S. Steel Corporation.)
by heating to the proper austenitizing temperature, quenching r a liquid-salt bath held just above the M, temperature, and holdi period of time. This allows the surface and the center to reach Figure 8.87 shows the surface- and center-cooling curves superimposed
temperature; air cooling to room temperature then follows. on the I-T diagram for the shallow-hardened steel. During the first stage,
cooling from just above the martensite-formation range introduc up to time t,, the stresses present are due only to the temperature gradient,
little temperature gradient, the martensite will be formed at nearly t and as in the through-hardened condition, the surface will be in tension
time throughout the piece. Thus martempering minimizes residual while the center will be in compression. During the second stage, between
and greatly reduces the danger of distortion and cracking. The hea times t , and t,, both the surface and center will transform. The surface will
ment is completed by tempering the martensite to the desired hard transform to martensite while the center will transform to a softer product, like pearlite. The entire piece is expanding, but since the expansion result- ing from the formation of martensite is greater than that resulting from the formation of pearlite, the surface tends to expand more than the center.
Tension layers This tends to put the center in tension while the surface is in compression.
q( %\, After t,, the center will contract on cooling from the transformation temper- ature to room temperature. The surface, being martensitic and having
Compression layers reached room temperature much earlier, will prevent the center from con- '.--' 0 the tracting center. as much The as stress it should. condition This in will the result three in stages higher is tensile summarized stresses on in
,85 Sketch of possible fracture in a through- ned steel. page 342.
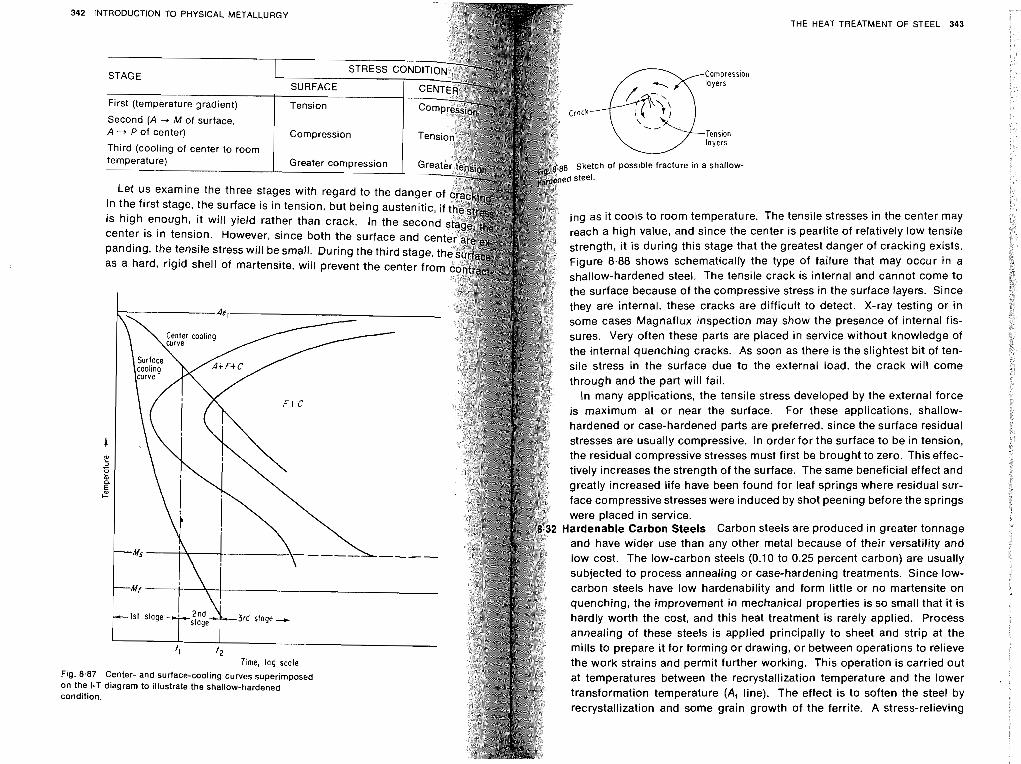
-
Crock
layers
Tension layers
THE HEAT TREATMENT STEEL
a p8.88 Sketch of poss~ble fracture in a Shallow-
d steel.
342 lNTRODUCTlON TO PHYSICAL METALLURGY
g of center to room
In the first Stage, the surface is in tension, but being aus is high enough, it will yield rather than crack. In the ing as it cools to room temperature. The tensile stresses in the center may
reach a high value, and since the center is pearlite of relatively low tensile strength, it is during this stage that the greatest danger of cracking exists. Figure 8.88 shows schematically the type of failure that may occur in a shallow-hardened steel. The tensile crack is internal and cannot come to the surface because of the compressive stress in the surface layers. Since they are internal, these cracks are difficult to detect. X-ray testing or in some cases Magnaflux inspection may show the presence of internal fis- sures. Very often these parts are placed in service without knowledge of the internal quenching cracks. As soon as there is the slightest bit of ten- sile stress in the surface due to the external load, the crack will come through and the part will fail.
In many applications, the tensile stress developed by the external force is maximum at or near the surface. For these applications, shallow- hardened or case-hardened parts are preferred, since the surface residual stresses are usually compressive. In order for the surface to be in tension, the residual compressive stresses must first be brought to zero. This effec- tively increases the strength of the surface. The same beneficial effect and greatly increased life have been found for leaf springs where residual sur- face compressive stresses were induced by shot peening before the springs were placed in service.
Hardenable Carbon Steels Carbon steels are produced in greater tonnage and have wider use than any other metal because of their versatility and low cost. The low-carbon steels (0.10 to 0.25 percent carbon) are usually subjected to process annealing or case-hardening treatments. Since low- carbon steels have low hardenability and form little or no martensite on quenching, the improvement in mechanical properties is so small that i t is hardly worth the cost, and this heat treatment is rarely applied. Process annealing of these steels is applied principally to sheet and strip at the mills to prepare it for forming or drawing, or between operations to relieve the work strains and permit further working. This operation is carried out
Fig. 8.87 Center- and surface-cooling CUNeS superimposed at temperatures between the recrystallization temperature and the lower On the 1-T diagram to illustrate the shallow-hardened condition.
transformation temperature (A, line). The effect is to soften the steel by recrystallization and some grain growth of the ferrite. A stress-relieving
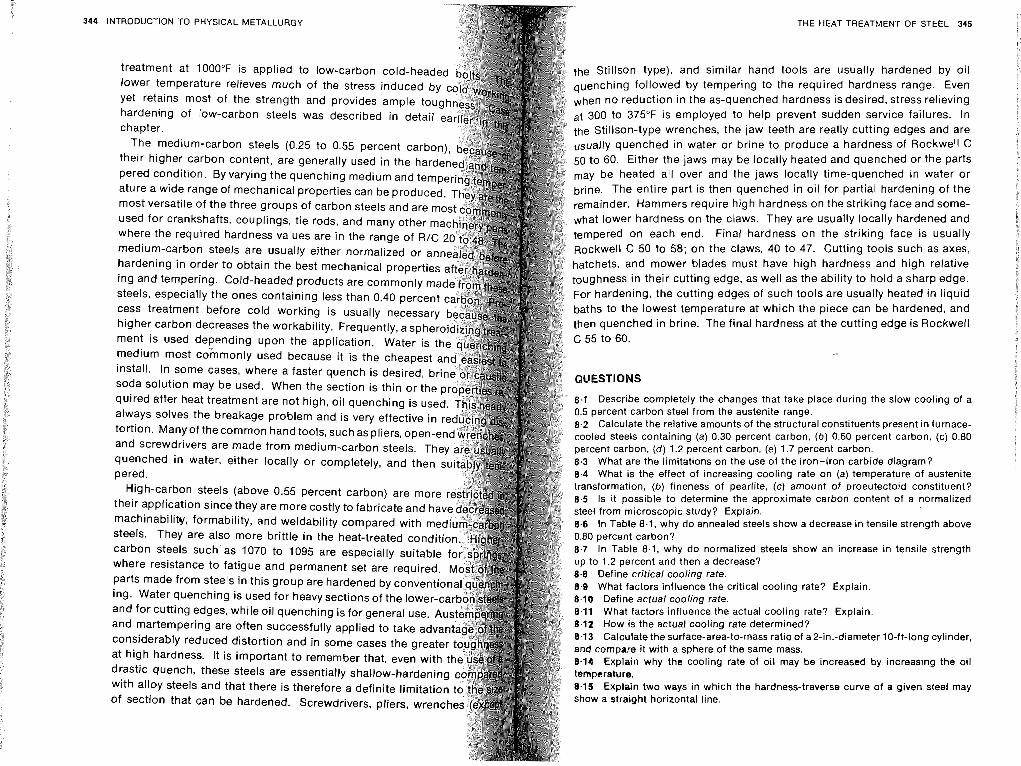
344 INTRODUCTION TO PHYSICAL METALLURGY
treatment at 1000°F is applied to low-carbon cold-head lower temperature relieves much of the stress induced by yet retains most of the strength and provides ample tou hardening of low-carbon steels was described in detail chapter.
The medium-carbon steels (0.25 to 0.55 percent carbo their higher carbon content, are generally used in the ha pered condition. By varying the quenching medium and te ature a wide range of mechanical properties can be produce most versatile of the three groups of carbon steels and are used for crankshafts, couplings, tie rods, and many other where the required hardness values are in the range of R medium-carbon steels are usually either normalized or a hardening in order to obtain the best mechanical propert ing and tempering. Cold-headed products are commonly steels, especially the ones containing less than 0.40 percen cess treatment before cold working is usually necessa higher carbon decreases the workability. Frequently, a sph ment is used depending upon the application. Water is medium most commonly used because it is the cheapest install. In some cases, where a faster quench is desired, soda solution may be used. When the section is thin or t quired after heat treatment are not high, oil quenching is always solves the breakage problem and is very effective in tortion. Many of the common hand tools, such as pliers, open-
and screwdrivers are made from medium-carbon steels. T quenched in water, either locally or completely, and then pered.
High-carbon steels (above 0.55 percent carbon) are more their application since they are more costly to fabricate and ha machinability, formability, and weldability compared with me steels. They are also more brittle in the heat-treated condit carbon steels such as 1070 to 1095 are especially suitable where resistance to fatigue and permanent set are required. parts made from steels in this group are hardened by conventio ing. Water quenching is used for heavy sections of the lower and for cutting edges, while oil quenching is for general use. and martempering are often successfully applied to take adva considerably reduced distortion and in some cases the greate at high hardness. It is important to remember that, even with drastic quench, these steels are essentially shallow-hardenin with alloy steels and that there is therefore a definite limitation of section that can be hardened. Screwdrivers, pliers, wrench
THE HEAT TREATMENT OF STEEL 345
the Stillson type), and similar hand tools are usually hardened by oil quenching followed by tempering to the required hardness range. Even when no reduction in the as-quenched hardness is desired, stress relieving .t 300 to 375°F is employed to help prevent sudden service failures. In - the Stillson-type wrenches, the jaw teeth are really cutting edges and are usually quenched in water or brine to produce a hardness of Rockwell C 50 to 60. Either the jaws may be locally heated and quenched or the parts may be heated all over and the jaws locally time-quenched in water or brine. The entire part is then quenched in oil for partial hardening of the remainder. Hammers require high hardness on the striking face and some- what lower hardness on the claws. They are usually locally hardened and tempered on each end. Final hardness on the striking face is usually Rockwell C 50 to 58; on the claws, 40 to 47. Cutting tools such as axes,
hatchets, and mower blades must have high hardness and high relative toughness in their cutting edge, as well as the ability to hold a sharp edge. For hardening, the cutting edges of such tools are usually heated in liquid baths to the lowest temperature at which the piece can be hardened, and then quenched in brine. The final hardness at the cutting edge is Rockwell
QUESTIONS
8.1 Describe completely the changes that take place during the slow cooling of a 0.5 percent carbon steel from the austenite range. 8.2 Calculate the relative amounts of the structural constituents present in furnace- cooled steels containing (a) 0.30 percent carbon, (b) 0.60 percent carbon, (c) 0.80 percent carbon, ( d ) 1.2 percent carbon, (e) 1.7 percent carbon. 8.3 What are the limitations on the use of the iron-iron carbide diagram? 8.4 What is the effect of increasing cooling rate on (a) temperature of austenite transformation, (b) fineness of pearlite. (c) amount of proeutectoid constituent? 8.5 Is it possible to determine the approximate carbon content of a normalized steel from microscopic study? Explain. 8.6 In Table 8.1, why do annealed steels show a decrease in tensile strength above 0.80 percent carbon? 8.7 In Table 8.1, why do normalized steels show an increase in tensile strength up to 1.2 percent and then a decrease? 8.8 Define critical cooling rate. 8.9 What factors influence the critical cooling rate? Explain. 8.10 Define actual cooling rate. 8.11 What factors influence the actual cooling rate? Explain. 8.12 How is the actual cooling rate determined? 8.13 Calculate the surface-area-to-mass ratio of a2-in.-diameter 10-ft-long cylinder, and compare it with a sphere of the same mass. 8.14 Explain why the cooling rate of oil may be increased by increasing the oil temperature. 8.15 Explain two ways in which the hardness-traverse curve of a given steel may show a straight horizontal line.
b
346 INTRODUCTION TO PHYSICAL METALLURGY THE HEAT TREATMENT OF STEEL 347
8.16 Explain why the surface hardness of quenched high-carbon than the hardness under the surface.
American lron and Steel Institute: "Steel Products Manual, Alloy Steel-Semifinished; ~ o t Rolled and Cold Finished Bars," New York, 1970.
after the following heat treatments? (a) Heated to 1700°F and f ~ m ~ r i c a n Society for Metals: "Metals Handbook," 1948 ed., Metals Park, Ohio. -: "Metals Handbook," vol. 2, 1964, and vol. 7, 1972, Metals Park, Ohio.
I Corporation: "Modern Steels and Their Properties," Bethlehem,
tructure and Properties of Alloys,"
8.20 If the samples in Question 8.19 are 2 in. in diameter, sketch t 01s. 1 to 3, John Wiley & Sons, Inc., hardness-traverse curves after the given heat treatments. New York, 1948-1949.
Clark, D. S., and W. R. Varney: "Physical Metallurgy for Engineers," Van Nostrand Reinhold Company, New York, 1962.
Crafts, W.. and J. L. Lamont: "Hardenability and Steel Selection," Pitman Publish- show a cooling curve that will result in a uniform pearlitic structure ing Corporation, New York, 1949. 8.23 A steel showed a hardness of Rockwell C 40 at the quenched DuMond, T. C.: "Quenching of Steels," American Society for Metals, Metals Park, ability test. What was the approximate carbon content? 8.24 What will be the approximate hardness at the quenched end Felbeck, D. K.: "Introduction to Strengthening Mechanisms," Prentice-Hall, Inc., hardenability test specimen; (b) a 6150 hardenability test specime Englewood Cliffs, N.J., 1968. hardenability test specimen? Grossmann, M. A,: "Elements of Hardenability," American Society for Metals, Metals 8.25 Describe how an I-T diagram is determined experimentally. Park, Ohio, 1952. 8.26 What are the limitations on the use of the I-T diagram? - and E. C. Bain: "Principles of Heat Treatment," American Society for Metals, 8.27 What will be the hardness at the center and mid-radius positi Metals Park, Ohio, 1964.
Guy, A. G.: "Elements of Physical Metallurgy," 2d ed., Addison-Wesley Publishing Company, Inc., Reading, Mass., 1959.
----: "Physical Metallurgy for Engineers," Addison-Wesley Publishing Company, Inc., Reading, Mass., 1962.
ing from the data in Fig. 8.55. Hultgren, R.: "Fundamentals of Physical Metallurgy," Prentice-Hall, Inc., Engle- 8.29 What are the principal advantages of austempering compared wood Cliffs, N.J., 1952. ventional quench and temper method? Hume-Rothery, W.: "Structure of Alloys and Iron," Pergamon Press Inc., New York, 8.30 What are the limitations of austempering? 8.31 From the data in Table 8.7, plot case depth vs. time at 1500, 1600 Peckner, D.: "The Strengthening of Metals," Van Nostrand Reinhold Company, What conclusions may be drawn from the shape of these curves? New York, 1964. 8.32 From the data in Table 8.7, plot case depth vs. temperature at 4, Reed-Hill. R. E.: "Physical Metallurgy Principles," Van Nostrand Reinhold Company, What conclusions may be drawn from these curves? New York, 1964. 8.33 What are Qe limitations on the use of high carburizing temperat Republic Steel Corporation: "Heat Treatment of Steels," Cleveland, Ohio. 1900 and 2000°F? 'The Nature of Metals," American Society for Metals, Metals Park, 8.34 What are the advantages of gas carburizing compared with pack 8.35 Define hard case or effective case. aterials," Prentice-Hall, Inc., Engle-
Smith, M. C.: "Alloy Series in Physical Metallurgy," Harper & Row, Publishers, Incor- porated, New York, 1956.
8.38 What are the limitations of martempering? U.S. Steel Corporation: "Atlas of Isothermal Transformation Diagrams," Pittsburgh, 8.39 You have been given a gear with a broken tooth that has failed in service. The normal heat treatment is carburize, harden, and temp -: "Suiting the Heat Treatment to the Job," Pittsburgh, Pa., 1967. completely how this gear would be studied to determine possible metall Williams, R. S., and V. 0. Homerberg: "Principles of Metallurgy," 5th ed., McGraw- for failure. Hill Book Company, New York, 1948. 8.40 Assume that a cold chisel is to be made of plain-carbon steel. application for properties required, select the hardness range desire carbon content, and specify the heat treatment.
ALLOY STEELS roducti~n Plain-carbon steels are very satisfactory where strength and other requirements are not too severe. They are also used successfully at ordinary temperatures and in atmospheres that are not highly corrosive, but their relatively low hardenability limits the strength that can be ob- tained except in fairly thin sections. Almost all hardened steels are tem- pered to reduce internal stresses. It was pointed out in the previous chapter that plain-carbon steels show a marked softening with increasing tem-
ing temperature. This behavior will lessen their applicability for parts t require hardness above room temperature. Most of the limitations of
plain-carbon steels may be overcome by the use of alloying elements. An alloy steel may be defined as one whose characteristic properties are
due to some element other than carbon. Although all plain-carbon steels contain moderate amounts of manganese (up to about 0.90 percent) and silicon (up to about 0.30 percent), they are not considered alloy steels because the principal function of the manganese and silicon is to act as deoxidizers. They combine with oxygen and sulfur to reduce the harmful effect of those elements. rpose of Alloying Alloying elements are added to steels for many pur- poses. Some of the most important are:
1 lncrease hardenability 2 lmprove strength at ordinary temperatures 3 lmprove mechanical properties at either high or low temperatures 4 lmprove toughness at any minimum hardness or strength 5 lncrease wear resistance 6 lncrease corrosion resistance 7 lmprove magnetic properties
Alloying elements may be classified according to the way they may be distributed in the two main constituents of annealed steel.
Group 1 Elements which dissolve in ferrite Group 2 Elements which combine with carbon to form simple or complex carbides
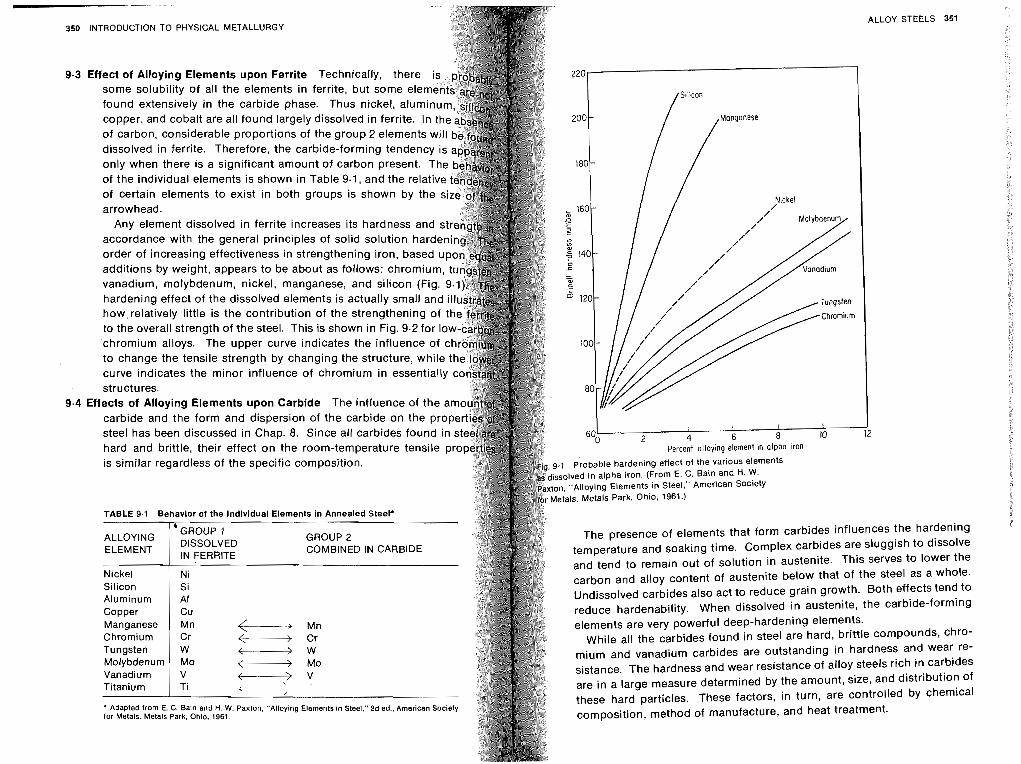
L
350 INTRODUCTION TO PHYSICAL METALLURGY ALLOY STEELS 351
dissolved in ferrite. Therefore, the carbide-forming tendenc
arrowhead. Any element dissolved in ferrite increases its hardness and
how.relatively little is the contribution of the strengthening of t to the overall strength of the steel. This is shown in Fig. 9.2 for I
chromium alloys. The upper curve indicates the influence of to change the tensile strength by changing the structure, while curve indicates the minor influence of chromium in essentially structures.
Effects of Alloying Elements upon Carbide The influence of the a carbide and the form and dispersion of the carbide on the prop
steel has been discussed in Chap. 8. Since all carbides found in hard and brittle, their effect on the room-temperature tensile p percent alloying element in alpha Iron is similar regardless of the specific composition.
The presence of elements that form carbides inf l~ences the hardening temperature and soaking time. Complex carbides are sluggish to dissolve and tend to remain out of solution in austenite. This serves to lower the carbon and alloy content of austenite below that of the steel as a whole. Undissolved carbides also act to reduce grain growth. Both effectstend reduce hardenability. When dissolved in austenite, the carbide-forming elements are very powerful deep-hardening fAements.
While all the carbides found in steel are hard, brittle com~ounds~ chrO- U W mium and vanadium carbides are outstanding in hardness and wear re- '+----+ Mo
sistance, The hardness and wear resistance of alloy steels rich in carbides are in a large measure determined by the amount, size, and distribution of these hard particles. These factors, in turn, are controlled by chemical composition, method of manufacture, and heat treatment.
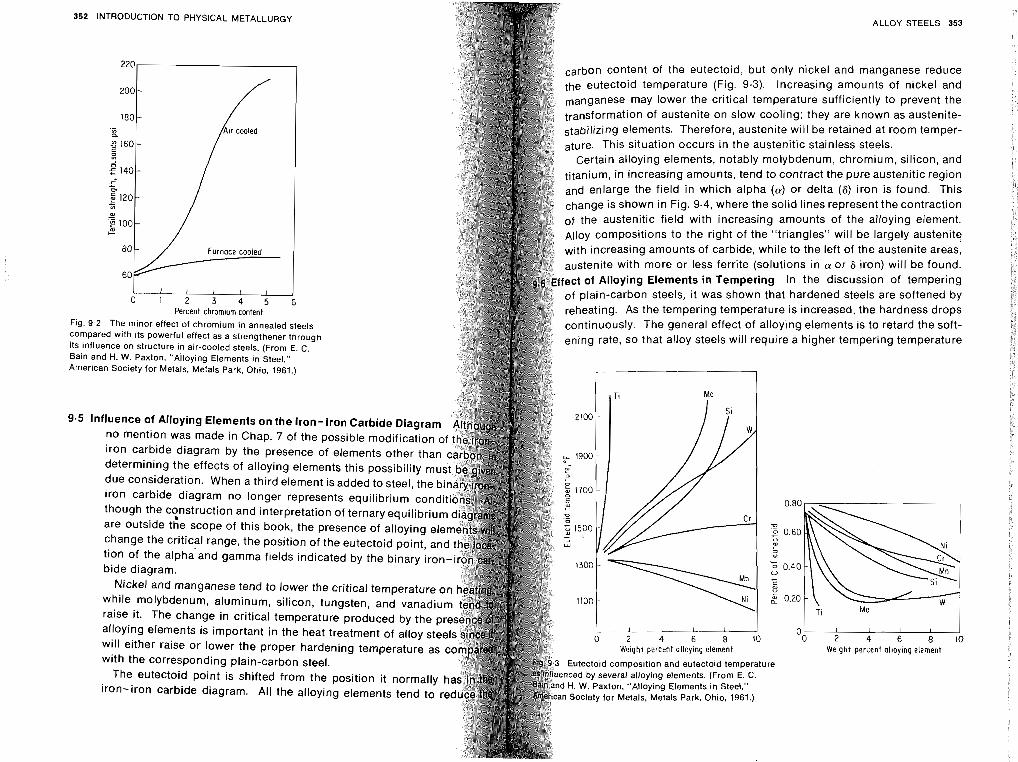
L-
352 INTRODUCTION TO PHYSICAL METALLURGY ALLOY STEELS 353
220- orbon content of the eutectoid, but only nickel and manganese reduce the eutectoid temperature (Fig. 9.3). Increasing amounts of nickel and
200 - manganese may lower the critical temperature sufficiently to prevent the of austenite on slow cooling; they are known as austenite-
180 - .- '" elements. Therefore, austenite will be retained at room temper- a ature. This situation occurs in the austenitic stainless steels.
Certain alloying elements, notably molybdenum, chromium, silicon, and titanium, in increasing amounts, tend to contract the pure austenitic region and enlarge the field in which alpha (a) or delta ( 6 ) iron is found. This
change is shown in Fig. 9.4, where the solid lines represent the contraction of the austenitic field with increasing amounts of the alloying element. ~ l l o y compositions to the right of the "triangles" will be largely austenite
Furnace cooled with increasing amounts of carbide, while to the left of the austenite areas, austenite with more or less ferrite (solutions in (Y or 6 iron) will be found.
ffect of Alloying Elements in Tempering In the discussion of tempering 1 I I t I of plain-carbon steels, it was shown that hardened steels are softened by
0 1 2 3 4 5 6 Percent chrom~um content reheating. As the tempering temperature is increased, the hardness drops
Fig. 9.2 The minor effect of chromium in annealed steels The general effect of alloying elements is to retard the soft- compared with its powerful effect as a strengthener through ening rate, so that alloy steels will require a higher tempering temperature its influence on structure in air-cooled steels. (From E. C. Bain and H. W. Paxton, "~ i loy ing Elements in Steel," American Society for Metals. Metals Park. Ohio. 1961.)
9.5 influence of Alloying Elements on the Iron-iron Carbide no mention was made in Chap. 7 of the possible modi iron carbide diagram by the presence of elements other than determining the effects of alloying elements this possibility mu due consideration. When a third element is added to steel, the b iron carbide diagram no longer represents equilibriu though the c:nstruction and interpretation of ternary eq are outside the scope of this book, the presence of alloyi change the critical range, the position of the eutectoid point, tion of the alphiand gamma fields indicated by the binary ir bide diagram.
Nickel and manganese tend to lower the critical temperature while molybdenum, aluminum, silicon, tungsten, and vanadiu
raise it. The change in critical temperature produced by alloying elements is important in the heat treatment of alloy ste will either raise or lower the proper hardening temperature as Weight percent alloying element Weight percent alloying element
with the corresponding plain-carbon steel. Eutectoid composition and eutectoid temperature
The eutectoid point is shifted from the position it normally ced by several alloying elements. (From E. C. H. W. Paxton. "Alloying Elements in Steel."
iron-iron carbide diagram. All the alloying elements tend to r Society for Metals, Metals Park. Ohio. 1961.)
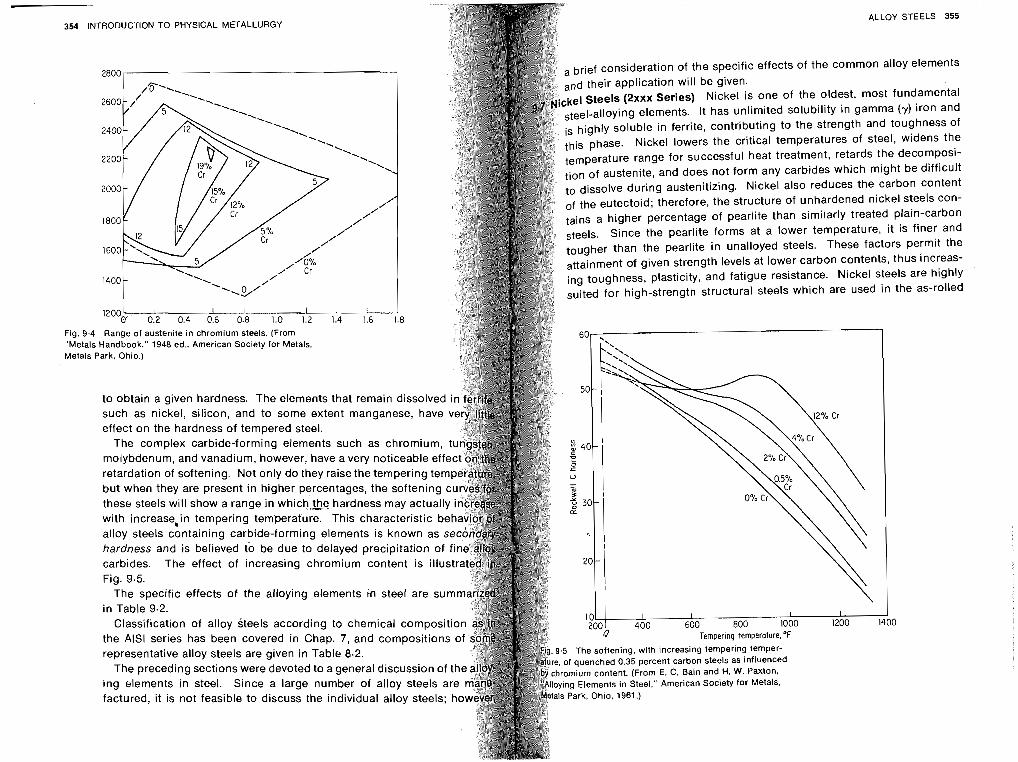
354 INTRODUCTION TO PHYSICAL METALLURGY ALLOY STEELS 355
Fig. 9.4 "Metals Metals F
2800
2600 - /' -1.
" .'. -1 '. ' .
'1 2200 - 'l '.. 2000 -
/ /,
1800 Cr
/// /'
/ /'
1
1400 - '\ '. // ',$A
I20O0 I I I I I I I I 0.2 0.4 0.6 0.8 1.0 1.2 1.4 1.6
a brief consideration of the specific effects of the common alloy elements and their application will be given.
el Steels (2xxx Series) Nickel is one of the oldest, most fundamental eel-all~ying elements. It has unlimited solubility in gamma (Y) iron and highly soluble in ferrite, contributing to the strength and toughness of
se. Nickel lowers the critical temperatures of steel, widens the perature range for successful heat treatment, retards the decomposi- of austenite, and does not form any carbides which might be difficult issolve during austenitizing. Nickel also reduces the carbon content
of the eutectoid; therefore, the structure of unhardened nickel steels con- tains a higher percentage of pearlite than similarly treated plain-carbon steels. Since the pearlite forms at a lower temperature, it is finer and tougher than the pearlite in unalloyed steels. These factors permit the attainment of given strength levels at lower carbon contents, thus increas- ing toughness, plasticity, and fatigue resistance. Nickel steels are highly suited for high-strength structural steels which are used in the as-rolled
1.8 Range of austenite in chromium steels. (From
Handbook." 1948 ed., American Society for Metals, 'ark. Ohio.)
to obtain a given hardness. The elements that remain dissolved such as nickel, silicon, and to some extent manganese, have effect on the hardness of tempered steel.
The complex carbide-forming elements such as chromium, molybdenum, and vanadium, however, have a very noticeable retardation of softening. Not only do they raise the tempering but when they are present in higher percentages, the softe these steels will show a range in which,$e hardness may act
with increase*in tempering temperature. This characteris alloy steels containing carbide-forming elements is known as hardness and is believed tb be due to delayed precipitatio carbides. The effect of increasing chromium content is illust Fig. 9.5.
The specific effects of the alloying elements h steel are sum in Table 9.2.
Classification of alloy steels according to chemical compositi 1200 1400
the AlSl series has been covered in Chap. 7, and compositions Tempering temperof~re,~F representative alloy steels are given in Table 8.2.
The preceding sections were devoted to a general discussion o f t
ing elements in steel. Since a large number of alloy steels a factured, it is not feasible to discuss the individual alloy steels;
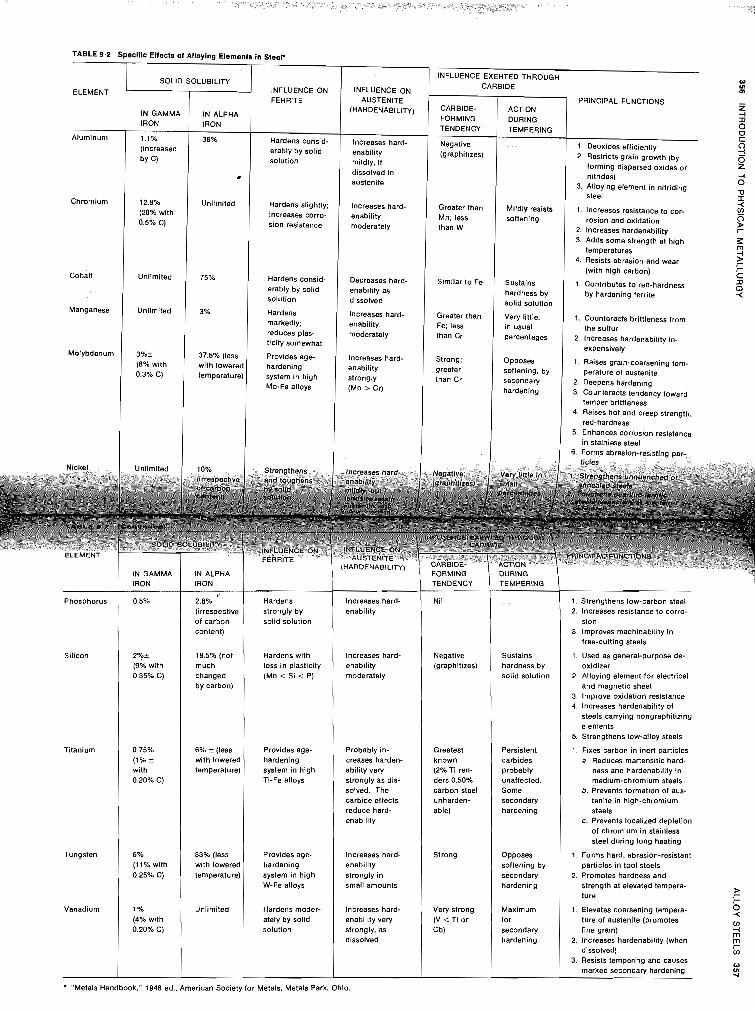
TABLE 9.2 Specific Effects of Alloylng Elements In Steer
6 Forms abrns~on-res~stdng par-
PRINCIPAL FUNCTIONS
ELEMENT
Aluminum
Chromium
Cobalt
Manganese
Molybdenum
Silicon
Titanium
Phosphorus
Tungsten
SOLID '
IN GAMMA IRON
1.1% (increased
by C)
12.8% (20% with 0.5% C)
Unlimited
Unlimited
3%2 (8% with 0.3% C)
1 solid iolution 1
INFLUENCE ON FERRITE
Hardens consid- erably by solid solution
Hardens slightly; increases corro- sion resistance
Hardens consid- erably by solid solution
Hardens markedly; reduces plas- ticity somewhat
Provides age- hardening system in high Mo-Fe alloys
SOLUBILITY
IN ALPHA IRON
36%
. Unlimited
75%
3%
37.5% (less with lowered temperature)
, , . - . . . . . . . . . . IRON
0.5%
2962 (9% with 0.35% C)
0.75% (1% 2
with 0.20% C)
6% (11% with 0.25% C)
INFLUENCE ON AUSTENITE
(HARDENABILITY)
Increases hard- enability mildly, i f dissolved in austenite
Increases hard- enability moderately
Decreases hard- enability as dissolved
Increases hard- enability moderately
Increases hard- enability strongly (Mo > Cr)
IRON
2.8% iirres~ective
18.5% (not much changed by carbon)
6% 2 (less with lowered temperature)
Hardens with loss in plasticity (Mn < Si < P)
Hardens strongly by
Provides age- hardening system in high Ti-Fe alloys
w UI Cn
PRINCIPAL FUNCTIONS E -4 n 0 0 C
1 Deoxides efficiently 2 Restricts grain growth (by
2 forming dispersed oxides or e nitrides) -4
3. Alloying element in nitriding 0
steel D I <
1. lncreases resistance to cor- rosion and oxidation :
2. Increases hardenability ? 3. Adds some strength at high
temperatures 5 4. Resists abrasion and wear 1 r
(with high carbon) r C 1. Contributes to red-hardness n
by hardening ferrite 2 1. Counteracts brittleness from
the sulfur 2. Increases hardenability in-
expensively
1. Raises grain-coarsening tam- perature of austenite
2. Deepens hardening 3. Counteracts tendency toward
temper brittleness 4. Raises hot and creep strength.
red-hardness 5. Enhances corrosion resistance
in stainless steel
INFLUENCE EXERTED THROUGH
FORMING TENDENCY
Negative (graphitizes)
Greater than Mn; less than W
Similar to Fe
Greater than Fe: less than Cr
Strong; greater than Cr
Increases hard- enability
lncreases hard- enability moderately
CARBIDE
ACTION DURING TEMPERING
...
Mildly resists softening
Sustains hardness by solid solution
Very little. in usual percentages
Opposes softening, by secondary hardening
33% (less with lowered temperature)
Probably in- creases harden. ability very strongly as dis- solved. The carbide effects reduce hard- enability
TENDENCY
Nil
Provides age- hardening system in high W-Fe alloys
lncreases hard- enability strongly in small amounts
Vanadium Unlimited (4% with ately by solid enability very
0.20% C) solution strongly, as dissolved
* "Metals Handbook." 1948 ed., American Society for Metals, Metals Park, Ohio.
TEMPERING
. . .
Negative (graphitizes)
Greatest known (2% Ti ren- ders 0.50% carbon steel unharden- able)
Strong
Very strong (V < Ti or Cb)
1. Strengthens low-carbon steel 2. lncreases resistance to corro-
Sustains hardness by solid solution
Persistent carbides probably unaffected Some secondary hardening
Opposes softening by secondary hardening
Maxlmum for secondary hardening
sion 3. Improves machinability in
free-cutting steels
1. Used as general-purpose de- oxidizer
2. Alloying element for electrical and magnetic sheet
3. Improve oxidation resistance 4, lncreases hardenability of
steels carrying nongraphitizing elements
5. Strengthens low-alloy steels
1. Fixes carbon in inert particles a. Reduces martensitic hard-
ness and hardenability in medium-chromium steels
b Prevents formation of aus- tenite in high-chromium steels
c. Prevents localized depletion of chromium in stainless steel during long heating
1. Forms hard, abrasion-resistant particles in tool steels
2. Promotes hardness and strength at elevated tempera- ture
1. Elevates coarsening tempera- ture of austenite (promotes fine grain)
2. lncreases hardenability (when dissolved)
3. Resists tempering and causes marked secondary hardening
INTRODUCTION TO PHYSICAL METALLURGY
condition or for large forgings which are not adapted to quen 3.5 percent nickel steels (23xx series) with low carbon are us for carburizing of drive gears, connecting-rod bolts, studs, The 5 percent nickel steels (25xx series) provide increased tou are used for heavy-duty applications such as bus and truck and crankshafts. Nickel has only a mild effect on hardenabili standing in its ability to improve toughness, particularly peratures.
While nickel steels of the 2xxx series have been deleted fro SAE classification of standard alloy steels, it does not mean not manufactured. Removal from the classification simply m tonnage produced is below a certain minimum. The steels have been largely replaced in many applications by the lower alloy steels of the 86xx series.
Chromium Steels (5xxx Series) Chromium is a less expensive a ment than nickel and forms simple carbides (Cr,C,, Cr,C) or co bides [(FeCr),C]. These carbides have high hardness and resistance. Chromium is soluble up to about 13 percent in y ir unlimited solubility in CY ferrite. In low-carbon steels, chromium into solution, thus increasing the strength and toughness of When chromium is present in amounts in excess of 5 percen temperature properties and corrosion resistance of the steel improved.
The plain-chromium steels of the 51xx series contain betwe 0.64 percent carbon and between 0.70 and 1.15 percent ch low-carbon alloy steels in this series are usually carburized. of chromium increases the wear resistance of the case, but in the core is not so high as the nickel steels. With medium car steels are oil-hardening and are used for springs, engine b axles, etc. A high-carbon (1 percent) high-chromium (1.5 pe steel (52100).is characterized by high hardness and wear resista steel is used extensively for ball and roller bearings and for cru chinery. A special type of chromium steel containing 1 percent c 2 to 4 percent chromium has excellent magnetic properties and i permanent magnets.
The high-chromium steels containing over 10 percent chro noted for their high resistance to corrosion and will be dis Sec. 9.15.
Nickel-chromium Steels (3xxx Series) In these steels the ratio to chromium is approximately 2'12 parts nickel to 1 part chrom bination of alloying elements usually imparts some of the c properties of each one. The effect of nickel in increasing toug ductility is combined with the effect of chromium in improving
ALLOY STEELS 359
ability and wear resistance. It is important to remember that the combined effect of two or more alloying elements on hardenability is usually greater than the sum of the effects of the same alloying elements used separately.
The low-carbon nickel-chromium alloy steels are carburized. The chro- mium supplies the wear resistance to the case, while both alloying elements improve the toughness of the core. With 1.5 percent nickel and 0.60 per- cent chromium (31xx series) they are used for worm gears, piston pins, etc. For heavy-duty applications, such as aircraft gears, shafts, and cams, the nickel content is increased to 3.5 percent and the chromium content to 1.5 percent (33xx series). The medium-carbon nickel-chromium steels are used in the manufacture of automotive connecting rods and drive shafts.
As in the case of the nickel steels, the steels in this series have also been deleted from the classification. In many cases, these steels have been re- placed by the triple-alloy steels of the 87xx and 88xx series because of lower cost.
The very high nickel-chromium alloy steels will be discussed in Sec. 9.15. wanganese Steels (31xx Series) Manganese is one of the least expensive
alloying elements and is present in all steels as a deoxidizer. Manganese also reduces the tendency toward hot-shortness (red-shortness) resulting from the presence of sulfur, thereby enabling the metal to be hot-worked. When manganese is absent or very low, the predominant sulfide is FeS, which forms a eutectic with iron and has a tendency to form thin contin- uous films around the primary crystals during solidification of the steel. These films are liquid at the rolling temperature of steel and produce a condition of hot-shortness which is a tendency to crack through the grain boundaries during working. Manganese is outstanding in its power to combine with sulfur, and manganese sulfide has a much higher melting point than the iron sulfide eutectic. The manganese sulfide remains solid at the rolling temperature and has a less adverse effect on the hot-working properties of steel.
It is only when the manganese content exceeds about 0.80 percent that thcsteel may be classed as an alloy steel. Manganese contributes markedly to strength and hardness, but to a lesser degree than carbon, and is most effective in the higher-carbon steels. This element is a weak carbide former and has a moderate effect on hardenability. Like nickel, manganese lowers the critical range and decreases the carbon content of the eutectoid.
Fine-grained manganese steels attain unusual toughness and strength. These steels are often used for gears, spline shafts, axles, and rifle barrels. With a moderate amount of vanadium added, manganese steels are used for large forgings that must be air-cooled. After normalizing, this steel will yield properties equivalent to those obtained in a plain-carbon steel after a full hardening and tempering operation.
When the manganese content exceeds about 10 percent, the steel will
- 360 INTRODUCTION TO PHYSICAL METALLURGY
be austenitic after slow cooling. A special steel, known as Hadfi nese steel, usually contains 12 percent manganese. After a pr trolled heat treatment, this steel is characterized by high stre ductility, and excellent resistance to wear. It is an outstandi for resisting severe service that combines abrasion and wear power-shovel buckets and teeth, grinding and crushing mac railway-track work. If this alloy is slow-cooled from 175OoF, the will consist of large brittle carbides surrounding austenite g structure has low strength and ductility. In this condition strength is about 70,000 psi, with elongation values down to 1 the same alloy, after allowing the carbides to dissolve, is quen 185O0F, the structure will be fully austenitic with a tensile strengt 120,000 psi, elongation of 45 percent, and a BHN of 180. The allo much greater strength and ductility as compared with the anne dition. The steel is usually reheated below 500°F to reduce stresses. In the austenitic condition following rapid cooling, t not very hard; however, when it is placed in service and subject peated impact, the hardness increases to about 500 BHN. This i hardness is due to the ability of manganese steels to work-hard and to the conversion of some austenite to martensite.
Molybdenum Steels (4xxx Series) Molybdenum is a relatively alloying element, has a limited solubility in y and cx iron, and carbide former. Molybdenum has a strong effect on hardenabil chromium, increases the high-temperature hardness and streng Steels containing molybdenum are less susceptible to temper br than other alloy steels. This element is most often used in corn with nickel or chromium or both nickel and chromium. For car applications i t improves the wear resistance of the case and the t of the core.
The plain-molybdenum steels (40xx and 44xx series) with I content are generally carburized and are used for spline sh mission gears, and similar applications where service conditio too severe. With higher carbon they have been used for aut and leaf springs. The chromium-molybdenum steels (41xx ser tively cheap and possess good deep-hardening characteristics, and weldability. They have been used extensively for pressure aircraft structural parts, automobile axles, and similar app nickel-molybdenum steels (46xx and 48xx series) have the ad high strength and ductility from nickel, combined with d
and improved machinability imparted by molybden;m. They hav toughness combined with high fatigue strength and wear resista are used for transmission gears, chain pins, shafts, and beari
ALLOY STEELS 361
triple-alloy nickel-chromium-molybdenum steels (43xx and 47xx series) have the advantages of the nickel-chromium steels along with the high hardenability imparted by molybdenum. They are used extensively in the
aircraft industry for the structural parts of the wing assembly, fuselage, and landing gear.
Tungsten Steel Tungsten has a marked effect on hardenability, is a strong carbide former, and retards the softening of martensite on tempering. In general, the effect of tungsten in steel is similar to that of molybdenum, al- though larger quantities are required. Approximately 2 to 3 percent tung- sten is equivalent to 1 percent molybdenum. Since tungsten is relatively expensive and large quantities are necessary to obtain an appreciable ef- fect, it is not used in general engineering steels. Tungsten is used pri- marily in tool steels.
Vanadium Steels Vanadium is the most expensive of the common alloying elements. It is a powerful deoxidizer and a strong carbide former which inhibits grain growth. Vanadium additions of about 0.05 percent produce a sound, uniform, fine-grain casting. When dissolved, vanadium has a marked effect on hardenability, yielding high mechanical properties on air cooling. Therefore, carbon-vanadium steels are used for heavy locomotive and machinery forgings that are normalized.
The low-carbon chromium-vanadium steels (61xx series) are used in the case-hardened condition in the manufacture of pins and crank- shafts. The medium-carbon chromium-vanadium steels have high tough- ness and strength and are used for axles and springs. The high-carbon
grade with high hardness and wear resistance is used for bearings and tools.
Silicon Steels (92xx Series) Silicon, like manganese, is present in all steels as a cheap deoxidizer. When a steel contains more than 0.60 percent silicon, it is classed as a silicon steel. Like nickel, silicon is not a carbide former but rather dissolves in ferrite, increasing strength and toughness. A steel containing 1 to 2 percent silicon known as navy steel is used for st[uctural applications requiring a high yield point. Hadfield silicon steel with less than 0.01 percent carbon and about 3 percent silicon has ex- cellent magnetic properties for use in the cores and poles of electrical machinery.
A properly balanced combination of manganese and silicon produces a steel with unusually high strength and with good ductility and toughness. This silicon-manganese steel (9260) is widely used for coil and leaf springs and also for chisels and punches.
Stlinless Steels Stainless steels are used for both corrosion- and heat- resisting applications. A three-numeral numbering system is used to iden- tify stainless steels. The last two numerals have no particular significance,
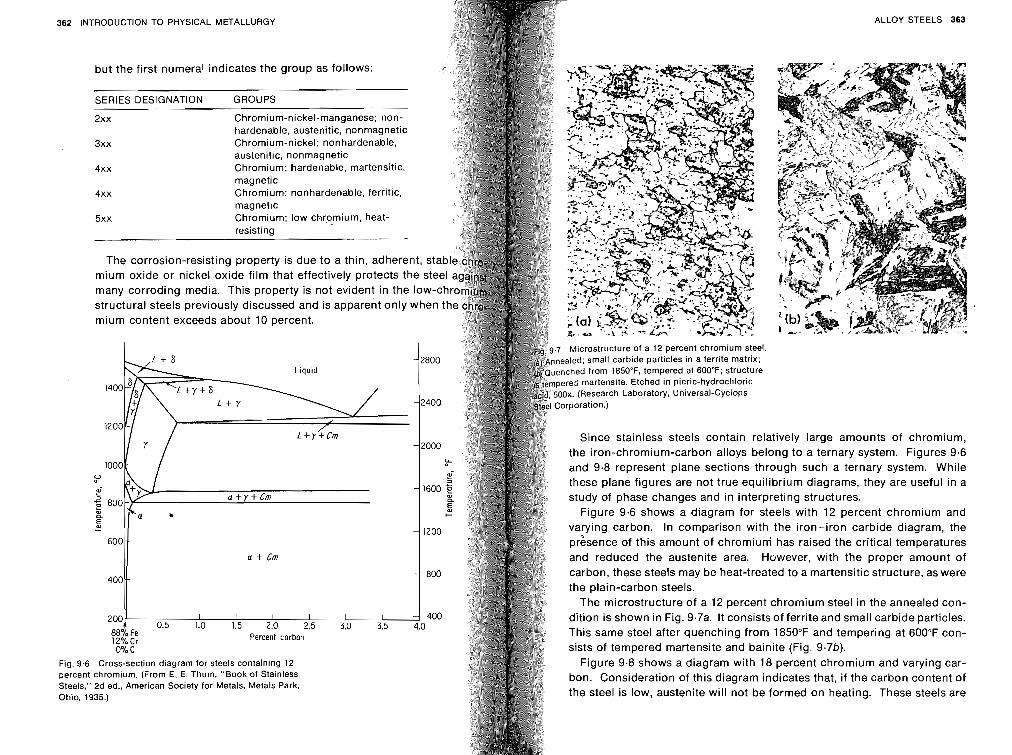
- 362 INTRODUCTION TO PHYSICAL METALLURGY ALLOY STEELS 363
but the first numeral indicates the group as follows:
SERIES DESIGNATION GROUPS
2xx Chromium-nickel-manganese; non- hardenable, austenitic, nonmagnetic Chromium-nickel; nonhardenable, 3xx austenitic, nonmagnetic
4xx Chromium; hardenable, martensitic, magnetic Chromium; nonhardenable, ferritic, 4xx magnetic Chromium; low chromium, heat- 5xx resisting
many corroding media. This property is n structural steels previously discussed and is apparent only when t mium content exceeds about 10 percent.
Since stainless steels contain relatively large amounts of chromium, the iron-chromium-carbon alloys belong to a ternary system. Figures 9.6 and 9.8 represent plane sections through such a ternary system. While these plane figures are not true equilibrium diagrams, they are useful in a study of phase changes and in interpreting structures.
Figure 9.6 shows a diagram for steels with 12 percent chromium and varying carbon. In comparison with the iron-iron carbide diagram, the
600 - presence of this amount of chromiuni has raised the critical temperatures and reduced the austenite area. However, with the proper amount of carbon, these steels may be heat-treated to a martensitic structure, as were
400 - the plain-carbon steels.
The microstructure of a 12 percent chromium steel in the annealed con- dition is shown in Fig. 9.7a. It consists of ferrite and small carbide particles. Zoo+ 0:s 1.'0 1:s 210
88% Fe Percent carbon This same steel after quenching from 1850°F and tempering at 600°F con- 12%Cr 0% C sists of tempered martensite and bainite (Fig. 9.7b).
Fig. 9.6 Cross-section diagram for steels containing 12 Figure 9.8 shows a diagram with 18 percent chromium and varying car- percent chromium. (From E. E. Thum. " ~ o o k of Stainless bon. Consideration of this diagram indicates that, if the carbon content of Steels." 2d ed.. American Society for Metals, Metals Park, Ohio, 193s.) the steel is low, austenite will not be formed on heating. These steels are
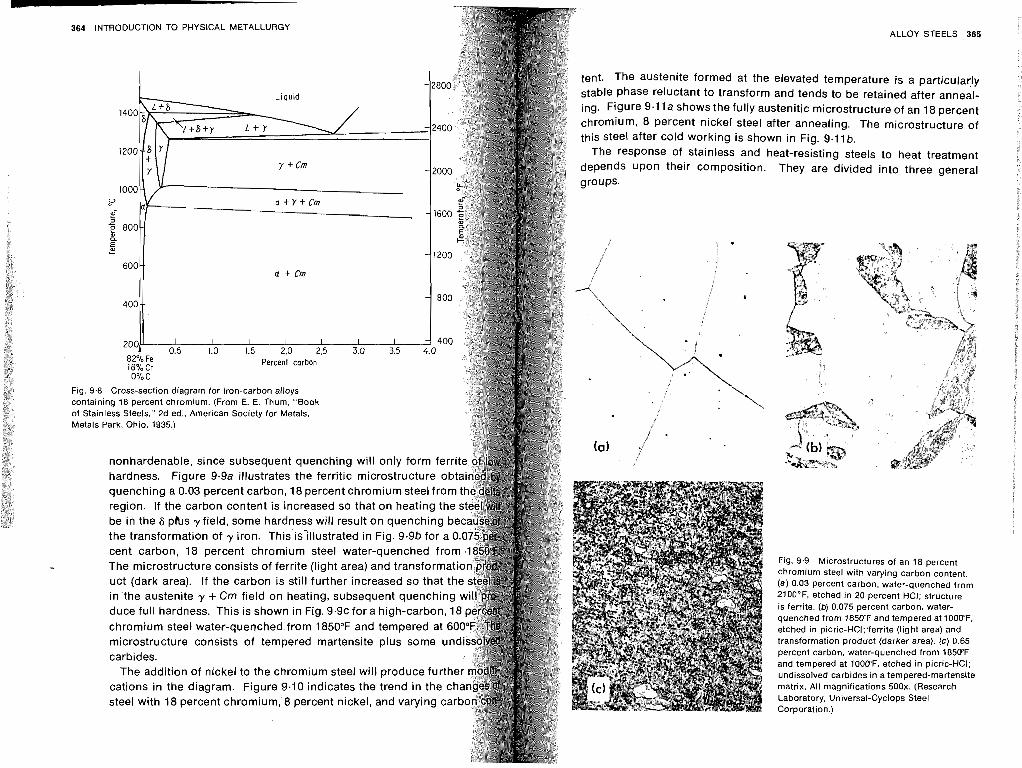
364 INTRODUCTION TO PHYSICAL METALLURGY
a + Cm
0% C Fig. 9.8 Cross-section diagram for iron-carbon alloys containing 18 percent chromium. (From E. E. Thum, "Book of Stainless Steels," 2d ed.. American Society for Metals, Metals Park. Ohio, 1935.)
nonhardenable, since subsequent quenching will only form fe
region. If the carbon content is increased so that on heating
cent carbon, 18 percent chromium steel water-quenched fro The microstructure consists of ferrite (light area) and transforma uct (dark area). If the carbon is still further increased so that t
chromium steel water-quenched.from 1850°F and tempered at microstructure consists of tempered martensite plus some un carbides.
The addition of nickel to the chromium steel will produce furth cations in the diagram. Figure 9.10 indicates the trend in the c
ALLOY STEELS 365
tent. The austenite formed at the elevated temperature is a particularly stable phase reluctant to transform and tends to be retained after anneal- ing. Figure 9.1 l a shows the fully austenitic microstructure of an 18 percent chromium, 8 percent nickel steel after annealing. The microstructure of this steel after cold working is shown in Fig. 9.1 1b.
The response of stainless and heat-resisting steels to heat treatment depends upon their composition. They are divided into three general groups.
Fig. 9.9 Microstructures of an 18 percent chromium steel with varying carbon content. (a) 0.03 percent carbon, water-quenched from 2100°F, is ferrite. etched (b) 0.075 in 20 percent percent carbon, HCI; structure water-
quenched from 1850°F and tempered at 1000"F, etched in picric-HCl;ierrite (light area) and transformation product (darker area). (c) 0.65 percent carbon, water-quenched from 185O'F and tempered at 1000"F, etched in picric-HCI; undissolved carbides in a tempered-martensite matrix. All magnifications 500x. (Research Laboratory, Universal-Cyclops Steel Corporation.)
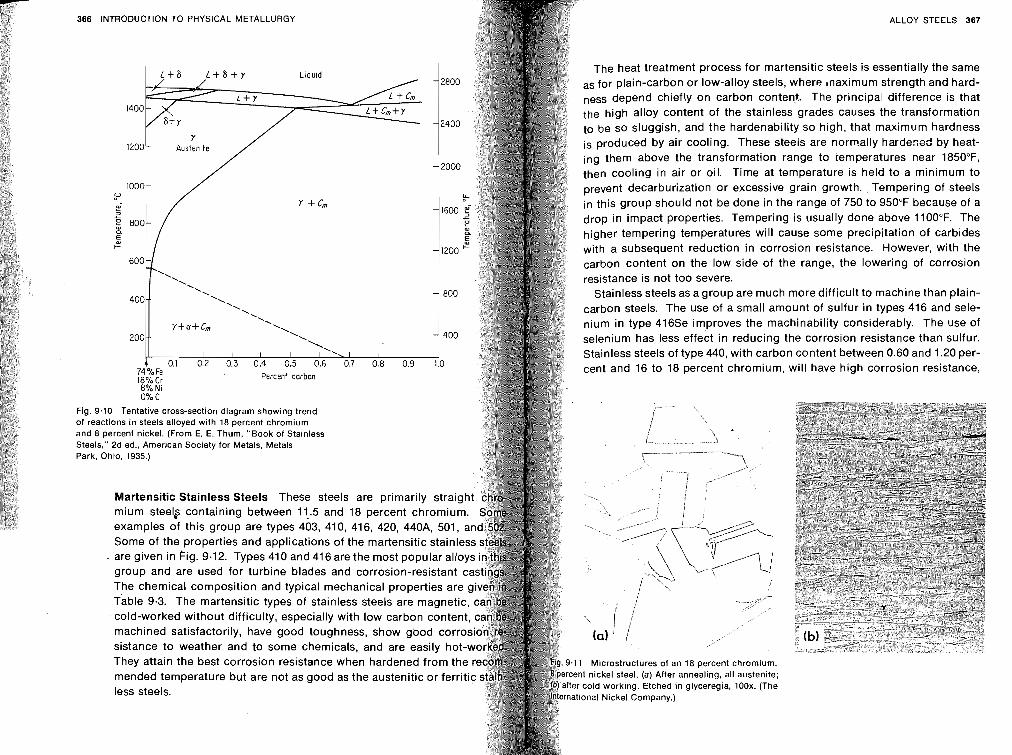
366 INTRODUCTION TO PHYSICAL METALLURGY ALLOY STEELS 367
The heat treatment process for martensitic steels is essentially the same as for plain-carbon or low-alloy steels, where tnaximum strength and hard-
e so sluggish, and the hardenability so high, that maximum hardness
them above the transformation range to remperatures near 1850"F,
drop in impact properties. Tempering is usually done above 1100°F. The higher tempering temperatures will cause some precipitation of carbides with a subsequent reduction in corrosion resistance. However, with the carbon content on the low side of the range, the lowering of corrosion resistance is not too severe.
400- ' . Stainless steels as a group are much more difficult to machine than plain- '. \ ' . carbon steels. The use of a small amount of sulfur in types 416 and sele-
nium in type 416Se improves the machinability considerably. The use of 200 -- selenium has less effect in reducing the corrosion resistance than sulfur.
Stainless steels of type 440, with carbon content between 0.60 and 1.20 per- cent and 16 to 18 percent chromium, will have high corrosion resistance,
Percent carbon 8% Ni 0% C
Fig. 9.10 Tentative cross-section diagram showing trend of reactions in steels alloyed with 18 percent chromium and 8 percent nickel. (From E. E. Thum, "Book of Stainless Steels," 2d ed.. American Society for Metals, Metals Park. Ohio. 1935.)
Martensitic Stainless Steels These steels are primarily str
examples of this group are types 403, 410, 416, 420, 440A, 501 Some of the properties and applications of the martensitic stain1
. are given in pig. 9-12. Types 410 and 416 are the most popular all group and are used for turbine blades and corrosion-resistant The chemical composition and typical mechanical properties ar Table 9.3. The martensitic types of stainless steels are magnet cold-worked without difficulty, especially with low carbon conte machined satisfactorily, have good toughness, show gbod corr sistance to weather and to some chemicals, and are easily h They attain the best corrosion resistance when hardened from 1 Microstructures of an 18 percent chromium.
nt nickel steel. (a) After annealing, all austenite; cold working. Etched in glyceregia, 100x. (The
less steels. tional Nickel Company.)
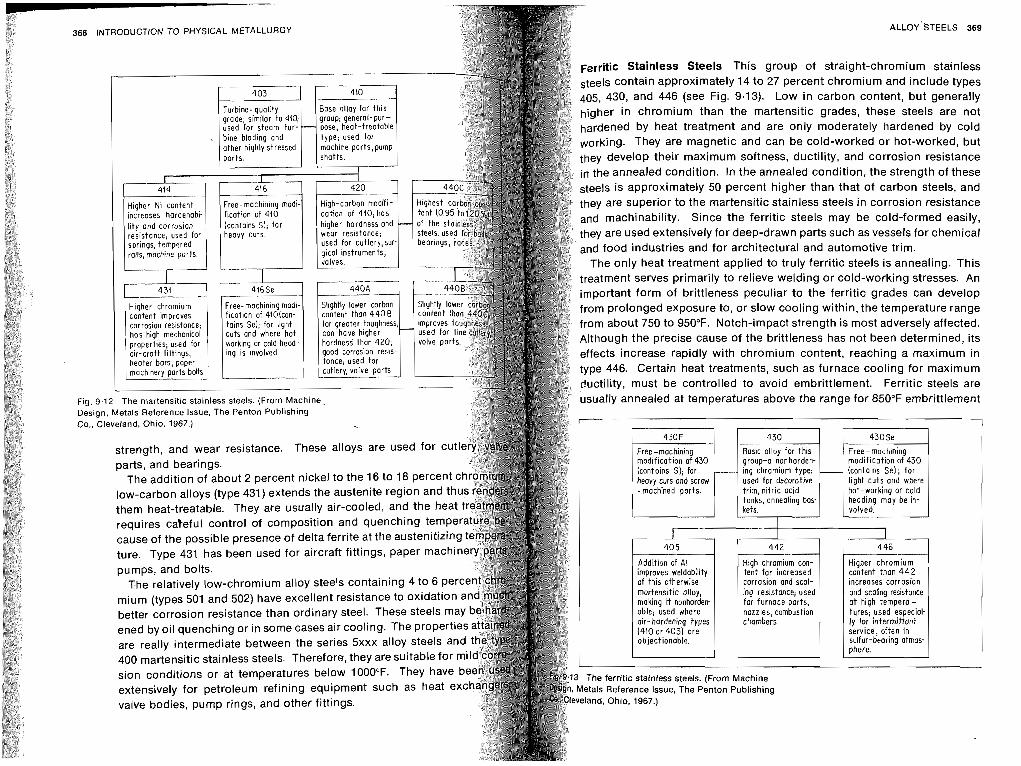
368 INTRODUCTION TO PHYSICAL METALLURGY ALLOY'STEELS 369
~erritic Stainless Steels This group of straight-chromium stainless
the annealed condition. In the annealed condition, the strength of these eels is approximately 50 percent higher than that of carbon steels, and ey are superior to the martensitic stainless steels in corrosion resistance
food industries and for architectural and automotive trim.
Although the precise cause of the brittleness has not been determined, its effects increase rapidly with chromium content, reaching a maximum in type 446. Certain heat treatments, such as furnace cooling for maximum
sually annealed at temperatures above the range for 850°F embrittlement
pumps, and bolts.
better corrosion resistance than ordinary steel. These steels m ened by oil quenching or in some cases air cooling. The propert are really intermediate between the series 5xxx alloy steels a 400 martensitic stainless steels. Therefore, they are suitable for sion conditions or at temperatures below 1000°F. They have extensively for petroleum refining equipment such as heat e valve bodies, pump rings, and other fittings.
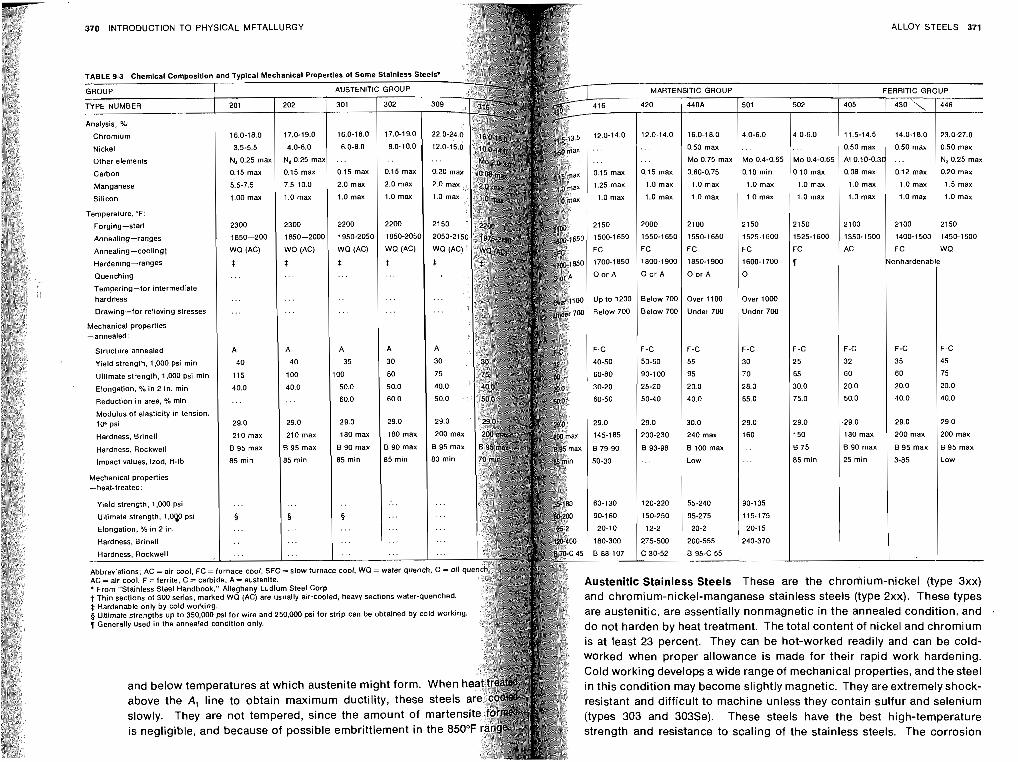
ALLOY STEELS 371 370 INTRODUCTION TO PHYSICAL METALLURGY
Nickel
Other elements
Carbon
Manganese
Silicon
Temperature. "F:
Forging-start
Annealing-ranges
Annealing-coolingt
Hardening-ranges
Quenching
Tempering-for intermediate hardness
Mechanical properties -annealed:
Structure annealed
Yield strength, 1.000 psi rnin
Elongation, % i n 2 in. min
Reduction in area. S min
Modulus of elasticity in tension, l(r psi
Hardness, Brine11
Hardness. Rockwell
Impact values, Izod, ft-lb
Mechanical properties -heat-treated:
Yield strength, 1.300 psi
Ultimate strength, 1,000 psi
Elongation, X in 2 in.
Austenitic Stainless Steels These are the chromium-nickel (type 3xx t Thin sections of 300 series, marked wo (AC) are usually air-cooled, heavy sections water-quenched. and chromium-nickel-manganese stainless steels (type 2xx). These types $ Hardenable only by cold working. g Ultimate strengths up to 3 5 0 , ~ psi for wire and 250.000 psi for strip can be obtained by cold workin are austenitic, are essentially nonmagnetic in the annealed condition, and .
Generally used in the annealed condition only. do not harden by heat treatment. The total content of nickel and chromium is at least 23 percent. They can be hot-worked readily and can be cold- worked when proper allowance is made for their rapid work hardening. Cold working develops a wide range of mechanical properties, and the steel
and below temperatures at which austenite might form. When in this condition may become slightly magnetic. They are extremely shock- above the A, line to obtain maximum ductility, these steels resistant and difficult to machine unless they contain sulfur and selenium
(types 303 and 303Se). These steels have the best high-temperature is negligible, and because of possible embrittlement in the 850" strength and resistance to scaling of the stainless steels. The corrosion
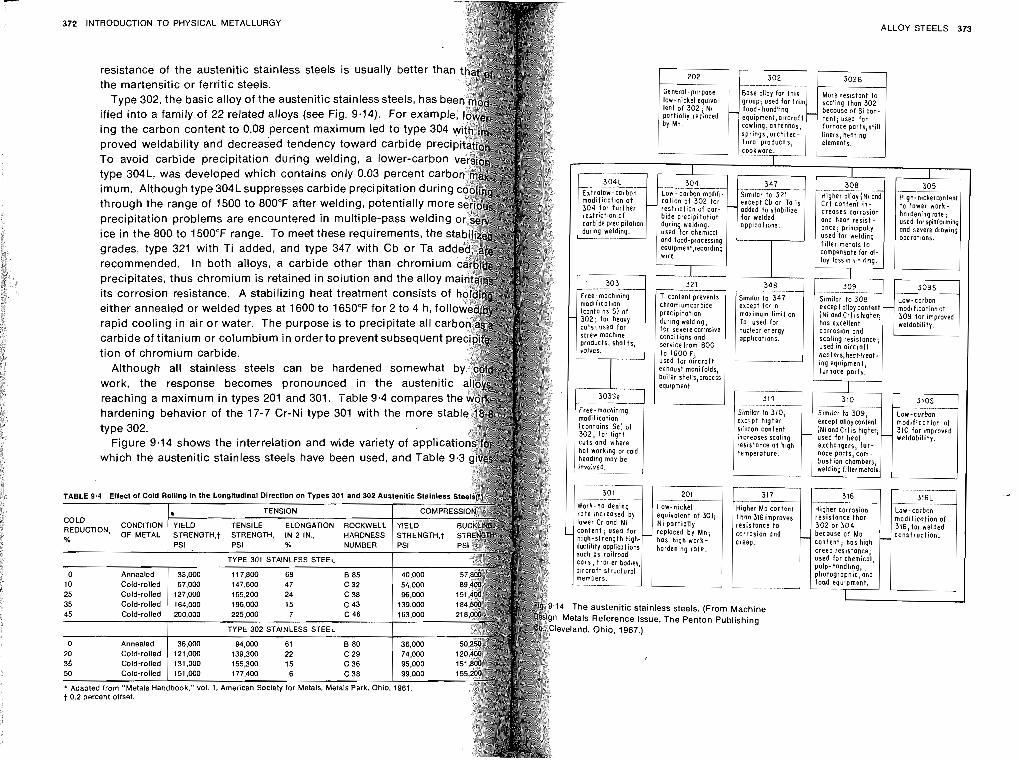
372 INTRODUCTION TO PHYSICAL METALLURGY ALLOY STEELS 373
resistance of the austenitic stainless steels is usually better th the martensitic or ferritic steels.
Type 302, the basic alloy of the austenitic stainless steels, has b ified into a family of 22 related alloys (see Fig. 9.14). For exa ing the carbon content to 0.08 percent maximum led to type proved weldability and decreased tendency toward carbide pre To avoid carbide precipitation during welding, a lower-carbon type 304L, was developed which contains only 0.03 perc imum. Although type 304Lsuppresses carbide precipitation durin through the range of 1500 to 800°F after welding, potentially mo precipitation problems are encountered in multiple-pass weldin ice in the 800 to 1500°F range. To meet these requirements, the grades, type 321 with Ti added, and type 347 with Cb or Ta a recommended. In both alloys, a carbide other than chromiu precipitates, thus chromium is retained in solution and the alloy its corrosion resistance. A stabilizing heat treatment consists either annealed or welded types at 1600 to 1650°F for 2 to 4 h, fo rapid cooling in air or water. The purpose is to precipitate all ca carbide of titanium or columbium in orderto prevent subsequent p tion of chromium carbide.
Although all stainless steels can be hardened somewhat work, the response becomes pronounced in the austenitic reaching a maximum in types 201 and 301. Table 9.4 c hardening behavior of the 17-7 Cr-Ni type 301 with the more stabl type 302.
Figure 9.14 shows the interrelation and wide variety of applic which the austenitic stainless steels have been used, and Table 9
Generol-purpose low-nickel equiva- lent of 302 ; Ni part~ol ly replaced
- - . - -- --
group; used tor t r im food- hondllng equipment,oircraft cowling, antennas, springs ,architec- tural products, cookware.
More reststant to scoltng than 302 becouse of SI con- tent . used for furnkce parts,stil l liners, heatmg
1 I 1 I
3 0 4 L -. - - - - - - - 3 0 4 - - - - - -- -- 347 3 0 8 - - -- 3 0 5 Extralow-Corbon Low - carbon modifl. S ~ m ~ l a r to 321 Higher olloy ( N I and Hlgh- n!ckelcontent modtf icot~on of co t~on of 302 for except Cb or To is C r i content tn- to lower work- 304 for fur ther - r e s t r ~ c t ~ o n of cor- - odded to s tob~ l~ze creases corrosion hardening rote; re j t r i c t~on of bide preclpi tot~on for welded carb~deprec~p~tal~on dur~ng weld~ng app~cat~ons.
and heat resist- used forspinformmq
durlng weldlng. used for chem:cal once; PrlnClpolly ond severe draw~ng
ond food-process~ng used for welding operations.
equlpment,record~ng f i l ler metals to
used for akcrof t exhaust manifolds, bo~ler shells,process
exchangers, f u r - nace parts com- bust ion chambers welding filler meia/s.
Similar to 310, exc,pt hlgher silicon content increases scaling resistance a t h ~ g h temperature.
iconto~ns Sel of 302 , for l ight cuts and where / hot workng or cold / heod~ng moy be tnvolved.
rate ~ncreosed by lower Cr and Ni content, used for h~gh-strength high- ductlllty opplicotions such as roilroad cars, t ro l ler bodies, a ~ r c r o f t structural members.
modif icat ion of 316, for welded construction.
equivalent of 301; Ni partially replaced by Mn, has hzgh work- harden~ng rote.
t2-l Hiqher Mo content
resistance than 3 0 2 or 3 0 4 becouse o t Ma content, has high creep resistance; used for chemical, pulp-handling photographic 'and foad equipmint.
TENSION
VELL HARDNESS NUMBER
t h i n 316improves resistance to corrosion and
GULU --,,,,,,,., CONDITION [ YIELD TENSILE ELONGATION ROCKV ntuub~ IUN,
% O F METAL STRENGTH,t
PSI STRENGTH. I N 2 IN PSI %
0 Annealed 1 0 Cold-rol led
4 The austenitic stainless steels. (From Machine Metals Reference Issue, The Penton Publishing
?vetand. Ohio. 1967.)
225.000 7
TYPE 302 STAINLESS - STE - - LEL -
0 Annealed
- jbook." vol. 1, P i rner ican Society t o r M e
- tals. - M e t als Park. O h i Adapted f r o m "Melals Ha!
t 0.2 percen t offset.
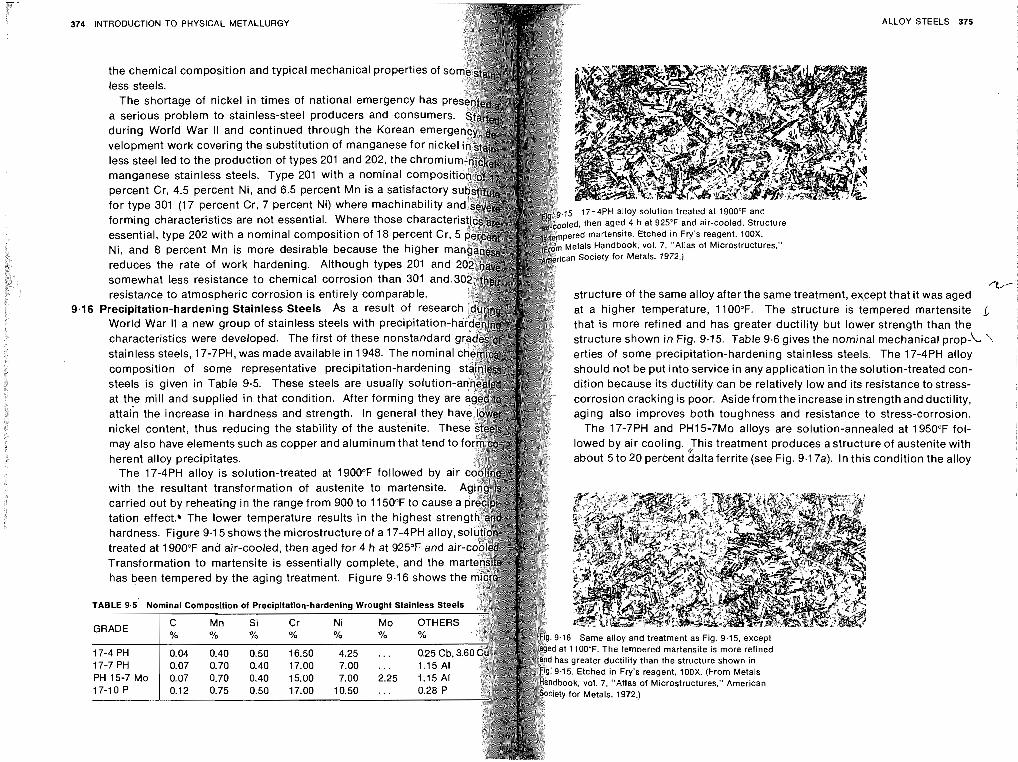
374 INTRODUCTION TO PHYSICAL METALLURGY ALLOY STEELS 375
the chemical composition and typical mechanical properties of s less steels.
a serious problem to stainless-steel producers and consume during World War II and continued through the Korean eme
manganese stainless steels. Type 201 with a nominal compo percent Cr, 4.5 percent Ni, and 6.5 percent Mn is a satisfactor for type 301 (17 percent Cr, 7 percent Ni) where machinability a forming characteristics are not essential. Where those characte 4 h at 925°F and air-cooled. Structure essential, type 202 with a nominal composition of 18 percent Cr, e. Etched in Fry's reagent. 100X.
Ni, and 8 percent Mn is more desirable because the higher m ok, vol. 7, "Atlas of Microstructures."
reduces the rate of work hardening. Although types 201 and
resistance to atmospheric corrosion is entirely comparable. structure of the same alloy after the same treatment, except that it was aged 6 Precipitation-hardening Stainless Steels As a result of resea at a higher temperature, 1100°F. The structure is tempered martensite
World War II a new group of stainless steels with precipitation that is more refined and has greater ductility but lower strength than the characteristics were developed. The first of these nonstandard structure shown in Fig. 9.15. Table 9.6 gives the nominal mechanical p rop - l stainless steels, 17-7PH, was made available in 1948. The nominal erties of some precipitation-hardening stainless steels. The 17-4PH alloy
should not be put into service in any application in the solution-treated con- dition because its ductility can be relatively low and its resistance to stress-
at the mill and supplied in that condition. After forming they ar corrosion cracking is poor. Asidefromtheincrease instrength and ductility, aging also improves both toughness and resistance to stress-corrosion.
The 17-7PH and PH15-7Mo alloys are solution-annealed at 1950°F fol- lowed by air cooling. :his treatment produces a structure of austenite with about 5 to 20 percent dsltaferrite (see Fig. 9.17a). In this condition the alloy
The 17-4PH alloy is solution-treated at 1900°F followed by air with the resultant transformation of austenite to martensite.
tation effect: The lower temperature results in the highest stre hardness. Figure 9.15 shows the microstructure of a 17-4PH alloy,
Transformation to martensite is essentially complete, and the m
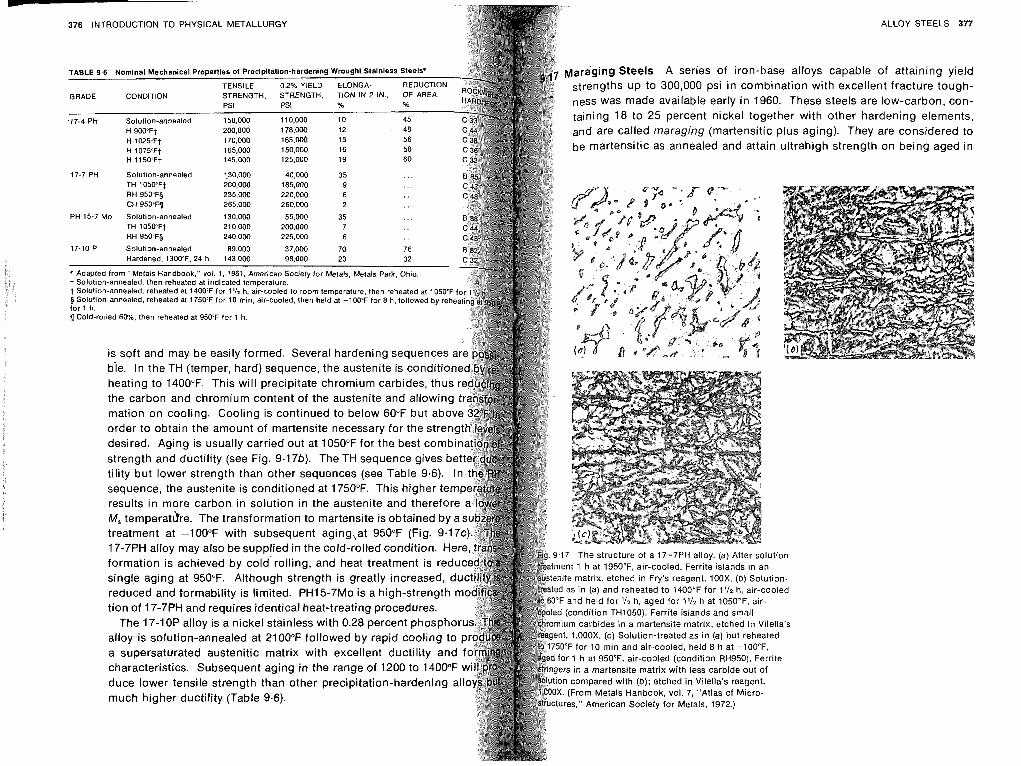
C
376 INTRODUCTION TO PHYSICAL METALLURGY ALLOY STEELS 377
Maraging Steels A serles of ~ron-base alloys capable of attarnrng y~eld up to 300,000 psi In comb~nat~on w ~ t h excellent fracture tough-
ness was made ava~lable early In 1960 These steels are low-carbon, con- talnlng 18 to 25 percent nlckel together with other harden~ng elements,
H 90O'Ft and are called maraglng (martensltlc plus agtng) They are cons~dered to H 10259t H 1075"Ft
be martensltlc as annealed and attaln ultrah~gh strength on be~ng aged in H 1150 Ft
17-7 PH Solut~on-annealed 130,000 40,000 35 TH 1050 F+ 200,000 185,000 9 RH 95O'FS 235,000 220.000 6 CH 950 Fn 265 000 260 000 2
IS soft and may be eastly formed. Several harden~ng sequences
the carbon and chromlum content of the austenrte and allow
strength and duct~ l~ty (see Fig. 9.17b). The TH sequence glves b t~lity but lower strength than other sequences (see Table 9.6).
M, temperathe. The transformation to martenstte is obtained by treatment at -100°F with subsequent aging,at 950°F (Fig. 9.1 17-7PH alloy may also be supplied in the cold-rolled condition. H
tlon of 17-7PH and requires identtcal heat-treating procedures. The 17-10P alloy is a nickel stainless with 0.28 percent phospho
alloy is solutron-annealed at 2100°F followed by rapid cooling to a supersaturated austenitlc matrix with excellent ductility and characteristics. Subsequent aging in the range of 1200 to 1400°F duce lower tensile strength than other precipitation-hardening al much higher ductility (Table 9.6).
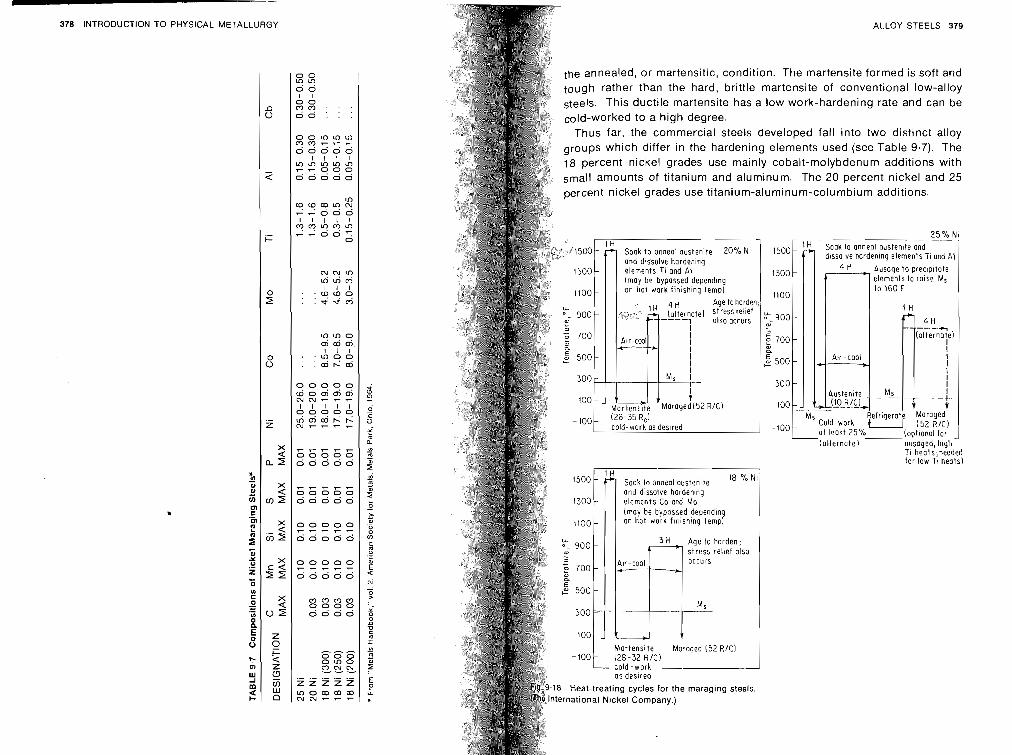
- 378 INTRODUCTION TO PHYSICAL METALLURGY
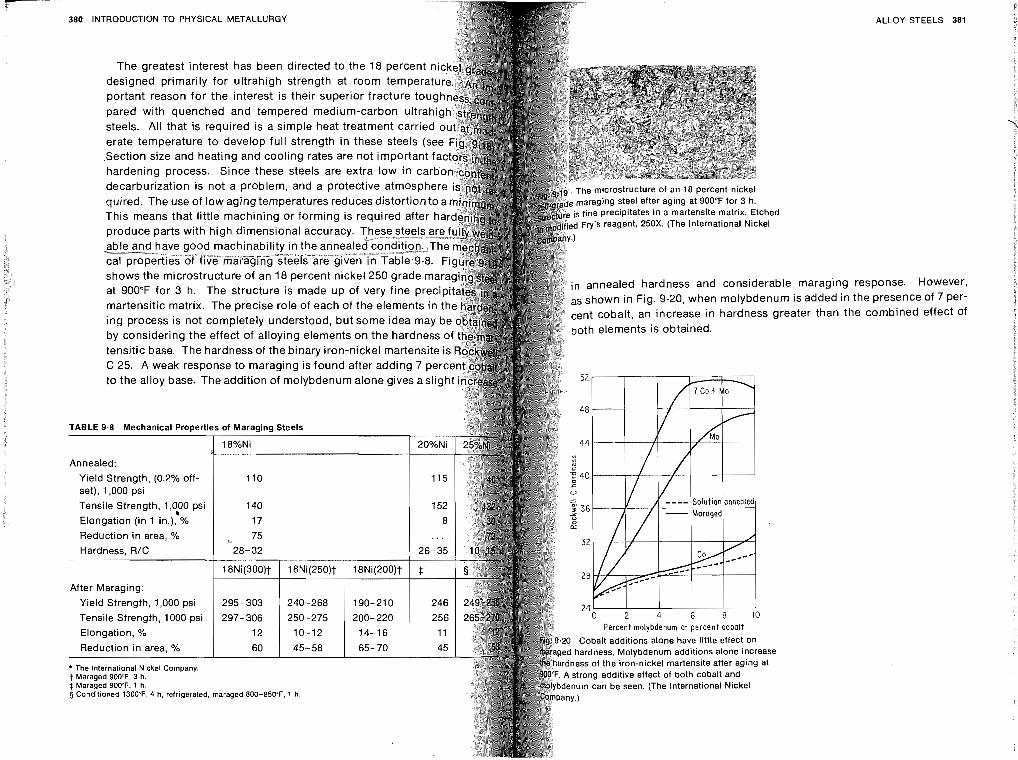
380 INTRODUCTION TO PHYSICAL METALLURGY
The greatest interest has been directed to the 18 percent designed primarily for ultrahigh strength at room tempera
steels. All that is required is a simple heat treatment carri erate temperature to develop full strength in these steels
decarburization is not a problem, and a protective atmo
able and have goo --------.----- cal properties of f
in annealed hardness and considerable
martensitic matrix. The precise role of each of the elements in as shown in Fig. 9.20, when molybdenum
ing process is not completely understood, but some idea may cent cobalt, an increase in hardness gre
by considering the effect of alloying elements on the hardness both elements is obtained.
tensitic base. The hardness of the binary iron-nickel martensite C 25. A weak response to maraging is found after adding 7 per to the alloy base. The addition of molybdenum alone gives aslig
Annealed:
Yield Strength, (0.2% off- set), 1,000 psi
Elongation (in 1 in.), %
After Maraging:
.20 Cobalt additions alone have little effect on hardness. Molybdenum additions alone increase
strong additive effect of both cobalt and $ Maraged 900°F. 1 h. g Conditioned 1300'F. 4 h. refrigerated, rnaraged 800-850°F. 1 h.
ALLOY STEELS 381
maraging response. t is added in the presence ater than the combined
iowever, of 7 per- effect of
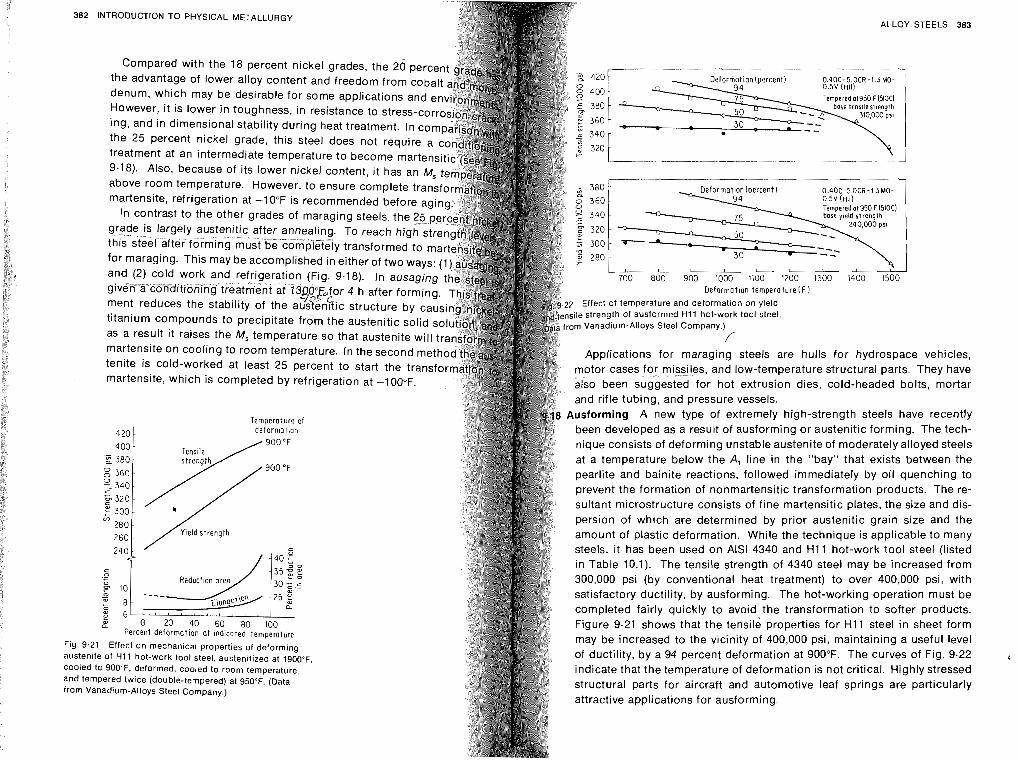
382 INTRODUCTION TO PHYSICAL METALLURGY
Fig. aus COO
and fron
Compared with the 18 percent nickel grades, the 20 pe the advantage of lower alloy content and freedom from co denum, which may be desirable for some applications and However, it is lower in toughness, in resistance to stress-co ing, and in dimensional stability during heat treatment. In co the 25 percent nickel grade, this steel does not require treatment at an intermediate temperature to become marte 9.18). Also, because of its lower nickel content, i t has an above room temperature. However, to ensure complete tr martensite, refrigeration at -10°F is recommended before a
In contrast to the other grades of maraging steels, the 2 grade - is largely austenitic after annealing. To reach high
- - this steel after forming must be completely transformed to for maraging. This may be accomplished in either of two ways: and (2) cold work and refrigeration (Fig. 9.18). In ausaging given"ac8nditioi~ing treatment at 4 h after forming ment reduces the stability of the titanium compounds to precipitate from the austenitic solid s as a result it raises the M, temperature so that austenite will martensite on cooling to room temperature. In the second met tenite is cold-worked at least 25 percent to start the transf martensite, which is completed by refrigeration at -100°F.
Temperature of
420 - deformatbon 900 O F
.- Tensile g 380 8 360 340
IT
300 Ln 280 - 260 -
a" 6 ' " 4 " " L
g 0 20 40 60 80 100 Percent deformation at indicated temperature
9.21 Effect on mechanical properties of deforming tenite of HI1 hot-work tool steel, austenitized at 1900CF. led to 900°F. deformed, cooled to room temperature. tempered twice (double-tempered) at 950'F. (Data
n Vanadium-Alloys Steel Company.)
ALLOY STEELS 383
Deformation (percent) 0.40C-5 OCR-1.3MO- n 1 94 0.5V (HII)
red a1950 F(YOC1 e tens~lestrength
310,000 PSI
I I
700 800 900 1000 !I00 1200 1300 Deformation temperoture(F)
Effect of temperature and deformation on yield strength of ausformed H11 hot-work tool Steel. Vanadium-Alloys Steel Company.)
f
HI11 red a t 950 F (510CI ~eld strength
240,000 PSI
Applications for maraging steels are hulls for hydrospace vehicles, motor case s, and low-temperature structural parts. They have
aiso been or hot extrusion dies, cold-headed bolts, mortar
and rifle tubing, and pressure vessels. Ausforming A new type of extremely high-strength steels have recently
been developed as a result of ausforming or austenitic forming. The tech- nique consists of deforming unstable austenite of moderately alloyed steels at a temperature below the A, line in the "bay" that exists between the pearlite and bainite reactions, followed immediately by oil quenching to prevent the formation of nonmartensitic transformation products. The re- sultant microstructure consists of fine martensitic plates, the size and dis- persion of which are determined by prior austenitic grain size and the amount of plastic deformation. While the technique is applicable to many steels, it has been used on AlSl 4340 and HI1 hot-work tool steel (listed in Table 10.1). The tensile strength of 4340 steel may be increased from 300,000 psi (by conventional heat treatment) to over 400,000 psi, with satisfactory ductility, by ausforming. The hot-working operation must be completed fairly quickly to avoid the transformation to softer products. Figure 9.21 shows that the tensile properties for HI1 steel in sheet form may be increased to the vicinity of 400,000 psi, maintaining a useful level of ductility, by a 94 percent deformation at 900°F. The curves of Fig. 9.22 indicate that the temperature of deformation is not critical. Highly stressed structural parts for aircraft and automotive leaf springs are particularly Ittractive applications for ausforming.
384 INTRODUCTION TO PHYSICAL METALLURGY
TlONS
9.1 Explain how alloying elements that dissolve in ferrite increase it 9.2 What effect would the addition of 1 percent chromium have on of a low-carbon steel? A high-carbon steel? 9.3 What factors determine the wear-resisting properties of a steel 9.4 Devise and explain a practical test to compare the wear resista steels. 9.5 If the primary consideration is hardenability, which alloy steel s lected? 9.6 Look up the chemical composition of 4340 steel (Table 7.2). This used as a structural member in an aircraft landing-gear assembly. Wha properties would be desirable for this application? Describe a heat tr would be applied to obtain these properties. 9.7 Same as Question 9.6 for 6150 steel to be used as a front coil sprin mobile. 9.8 Look up the chemical composition of 4620 steel. On the basis o composition, what mechanical properties would you expect this stee Specify a heat treatment for this steel and give some possible applicatio 9.9 Why was manganese chosen as asubstitutefor nickel in the develop 2xx series of stainless steels? 9.10 Which stainless steel is best suited for surgical instruments? Expl 9.11 Why do some pots and pans have a copper bottom and stainless st What type of stainless steel is best for this application? Why? 9.12 What is the difference in chemical composition between the stan less steels and the precipitati n hardenable stainless steels? '3: 9.13 Describe three ways in which precipitation-hardenable stainless ste hardened. 9.14 Why does aging 17-4PH at 1150°F give lower mechanical propertie at 1050"F? 9.15 What effect does reduction of the carbon and chromium content o tenite have on the M, temperature? 9.16 Why is refrigeration or subzero treatment sometimes used for pr hardening stainless steels? 9.17 Explain the term maraging. 9.18 What is the difference in heat treatment between the 18 percent 25 percent Nimaraging steels? 9.19 Give at least four advantages of maraging steels as compared t stainless steels.
ZEMGES
Allegheny Ludlum Steel Corp.: "Stainless Steel Handbook," Pittsburgh, 19 American lron and Steel Institute: "Stainless and Heat-Resisting Steels," St
ucts Manual, New York, 1963. American Society for Metals: "Metals Handbook," 7th ed., 1948; 1954 Su
8th ed., vol. 1, 1961, vol. 2, 1964 and vol. 7, 1972, Metals Park, Ohio. Archer, R. S., J. F. Briggs, and C. M. Loeb: "Molybdenum; Steels, lron
Climax Molybdenum Co., New York. 1948. Bain, E. C., and H. W. Paxton: "Alloying Elements in Steel," 2d ed., Americ
for Metals, Metals Park, Ohio, 1961.
ALLOY STEELS 385
Bilby, Glover, and Wakeman: "Modern Theory in the Design of Alloys," The Institute of Metallurgists, London, 1967.
Burnham, T. H.: "Special Steels," 2d ed., Sir Isaac Pitman & Sons, Ltd., London, 1933.
Hall, A. M., and C. J. Slunder: "The Metallurgy. Behavior and Application of the 18 Per Cent Nickel Maraging Steels," NASA SP-5051, National Aeronautics and Space Administration, Washington, D.C., 1968.
~ u l l , A. M.: "Nickel in lron and Steel," John Wiley & Sons, Inc., New York. 1954. international Nickel CO.: "Nickel Alloy Steels," 2d ed., New York, 1949. Monypenny. J. H. G.: "Stainless lron and Steel.'' 2 vols., 3d ed., Chapman and Hall,
London, 1951 - 1954. parr, J. G.. and A. Hanson: "An Introduction to Stainless Steel," American Society
for Metals, Metals Park, Ohio, 1965. Thum. E. E.: "Book of Stainless Steels," 2d ed., American Society for Metals, Metals
Park, Ohio, 1935. U.S. Steel Corp.: "The Making, Shaping and Treating of Steel," 7th ed., Pittsburgh,
1957. Zapffe, C. A.: "Stainless Steels," American Society for Metals, Metals Park. Ohio,
1949.
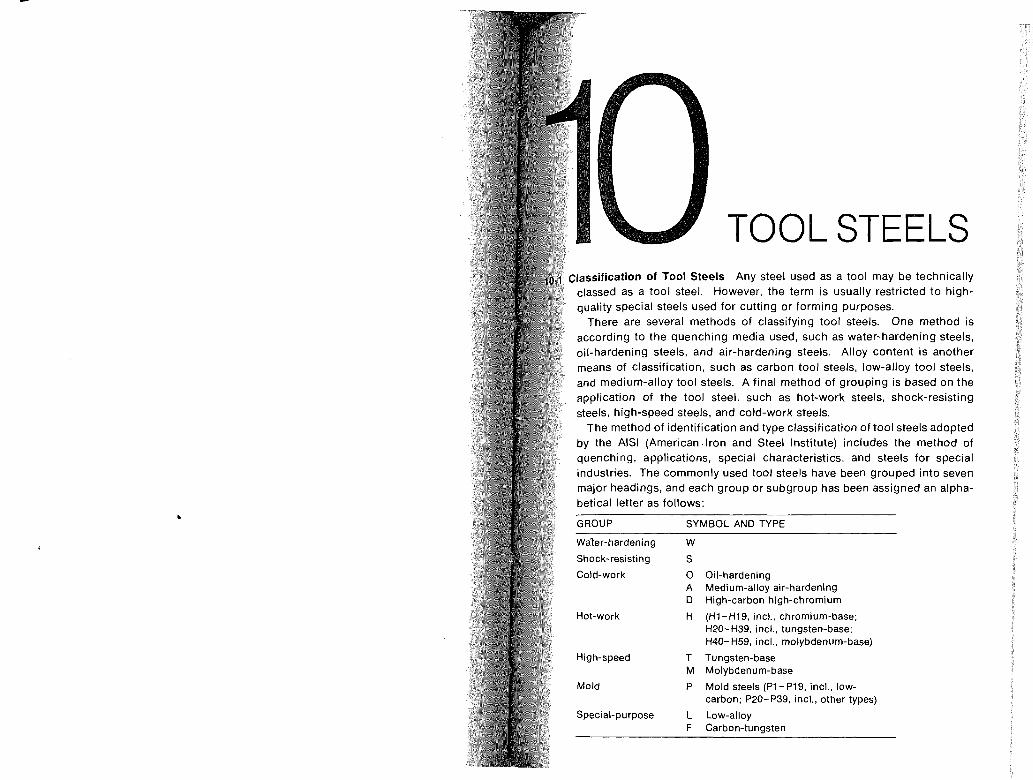
lassification of Tool Steels Any steel used as a tool may be technically classed as a tool steel. However, the term is usually restricted to high- quality special steels used for cutting or forming purposes.
There are several methods of classifying tool steels. One method is according to the quenching media used, such as water-hardening steels, oil-hardening steels, and air-hardening steels. Alloy content is another means of classification, such as carbon tool steels, low-alloy tool steels, and medium-alloy tool steels. A final method of grouping is based on the pplication of the tool steel, such as hot-work steels, shock-resisting
steels, high-speed steels, and cold-work steels. The method of identification and type classification of tool steels adopted
by the AlSl (American.lron and Steel Institute) includes the method of quenching, applications, special characteristics, and steels for special industries. The commonly used tool steels have been grouped into seven major headings, and each group or subgroup has been assigned an alpha- betical letter as follows:
GROUP SYMBOL AND TYPE
Water-hardening W
Shock-resisting S
Cold-work 0 Oil-hardening A Medium-alloy air-hardening D High-carbon high-chromium
Hot-work H (HI -H19, incl., chromium-base; H20-H39, incl., tungsten-base; H40-H59, incl., molybdenum-base)
High-speed T Tungsten-base M Molybdenum-base
Mold P Mold steels (PI-P19, incl.. low- carbon; P20-P39, incl., other types)
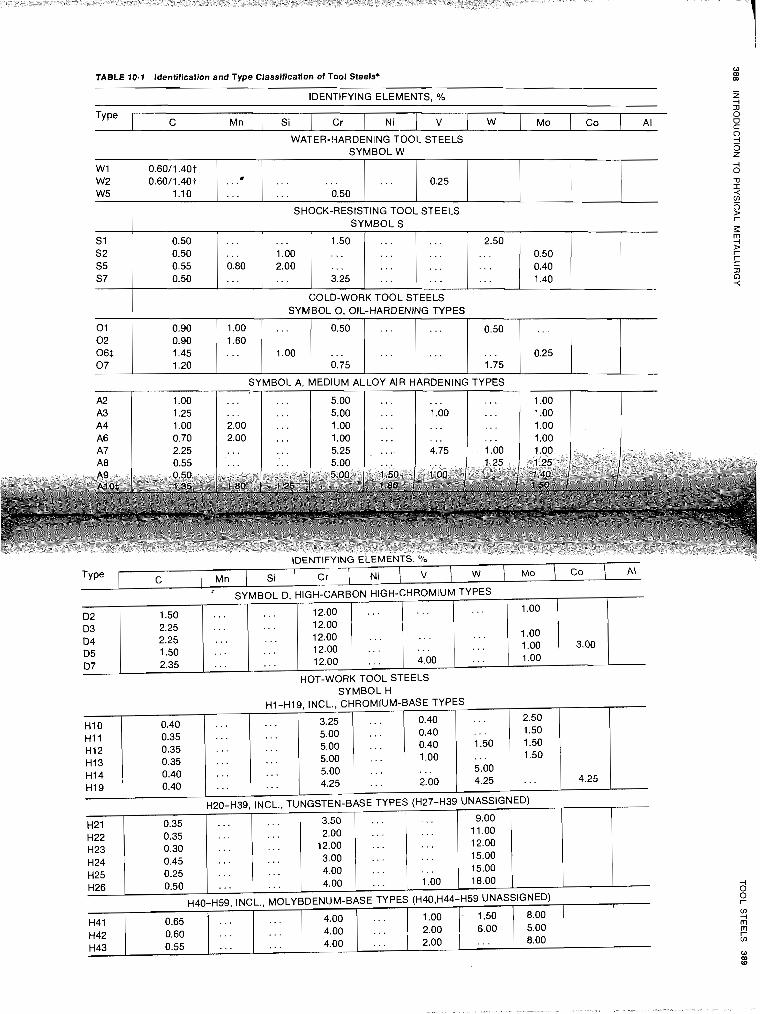
SYMBOL H
TABLE 10.1 Identification and Type Classification of Tool Steels* W m w
IDENTIFYING ELEMENTS, % - z -4
Type I n C Mn
C
WATER-HARDENING TOOL STEELS 3 SYMBOL W P
Si
W 1 W2 W5
S 1 S2 55 S7
0 1 0 2 06$ 0 7
0.60/1.40t 0.60/1.40t
1.10
Cr
SYMBOL A, MEDIUM ALLOY AIR HARDENING TYPES
" SYMBOL D, HIGH-CARBON HIGH-CHROMIUM T
Ni V
. . .'
. . . v,
SHOCK-RESISTING TOOL STEELS 0
SYMBOL S $ K
3.00
0 W
. . .
. . . . . .
0.50
0.50 0.50 0.55 0.50
HOT-WORK TOOL STEELS
1 .oo
1 .oo 1 .OO 1 .OO
. . .
. . . . . . . . .
Mo
. . .
. . .
. . . . . . 4.00
. . .
. . . 0.80 . . .
COLD-WORK TOOL STEELS SYMBOL 0 , OIL-HARDENING TYPES
. . .
. . . . . . . . .
Co
0.25
. . . 1 .OO 2.00 . . .
0.90 0.90 1.45 1.20
12.00 12.00 12.00 12.00 12.00
Al o
-4 0 'D I <
1.50 . , . . . . 3.25
. . .
. . . . . . . . . . . .
. . .
. . .
. . .
. . .
. . .
. . .
. . .
. . .
1.00 1.60 . . .
. . .
. . . . . . . . . . . .
D2 03 04 D5 07
1.50 2.25 2.25 1.50 2.35
2.50 . . . . . . . . .
...
1 .OO
0.50 0.40 1.40
0.50
. . . 0.75
1 > r r c 3) o <
. . .
. . .
. . .
. . .
0.50
. . . 1.75
. . .
0.25
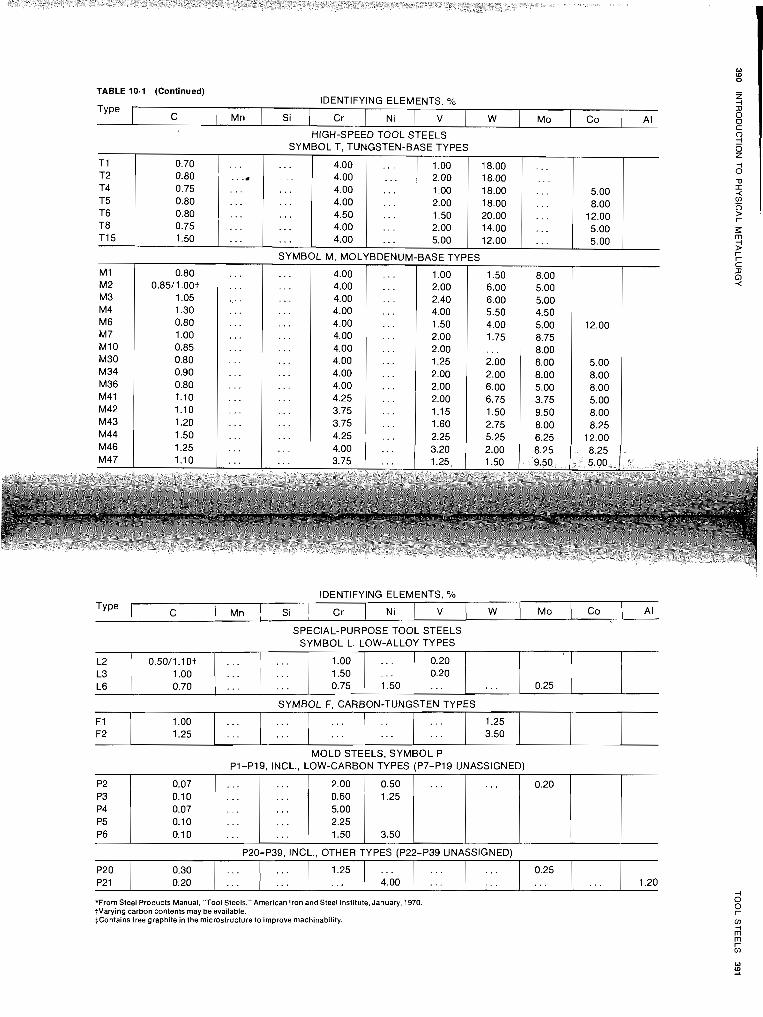
TABLE 10.1 (Continued) IDENTIFYING ELEMENTS. %
C Mn Si Cr Ni V W Mo Co A1 o C
HIGH-SPEED TOOL STEELS 9
IDENTIFYING ELEMENTS, '10 Type I r 1 LA- 1 4i I Cr I Ni I V 1 W \ M o \ C o \ A l
SYMBOL T, TUNGSTEN-BASE TYPES
T I 0.70 . . . . . . 4.00 . . . 1.00 18.00 . . . T2 0.80 .... . . . 4.00 . . . 2.00 . . . 18.00 T4 0.75 . . . . . . 4.00 . . . 1.00 18.00 . . . 5.00 T5 0.80 . . . . . . 4.00 . . . 2.00 18.00 . . . 8.00 T6 0.80 . . . . . . 4.50 . . . 1.50 20.00 . . . 12.00 T8 0.75 . . . . . . 4.00 . . . 2.00 14.00 . . . 5.00 T15 1.50 . . . ... 4.00 . . . 5.00 12.00 . . . 5.00
SYMBOL M, MOLYBDENUM-BASE TYPES
M1 0.80 . . . . . . 4.00 . . . 1 .OO 1.50 8.00
... I V L",, 8 "a I I -.
SPECIAL-PURPOSE TOOL STEELS
M2 M3 M4 M6 M7 M I 0 M30 M34 M36 M41 M42 M43 M44
*From Steel Products Manual. "Tool Steels," American Iron and Steel Institute. January. 1970 tVarying carbon contents may be available. $Contains free graphite in the microstructure to improve machinability.
0.85/1.00t 1.05 1.30 0.80 1 .OO 0.85 0.80 0.90 0.80 1.10 1.10 1.20 1.50
SYMBOL L. LOW-ALLOY TYPES
. . .
. . .
. . .
. . .
. . .
. . .
. . .
. . .
. . .
. . .
. . .
. . .
. . .
0.25 . . .
. . .
. . .
. . .
. . .
. . .
. . .
. . .
. . .
. . .
. . .
. . .
. . .
. . .
0.20 0.20 . . .
SYMBOL F, CARBON-TUNGSTEN TYPES
. . .
. . . 1.50
4.00 4.00 4.00 4.00 4.00 4.00 4.00 4.00 4.00 4.25 3.75 3.75 4.25
1.00 1.50 0.75
1.25 3.50
. . .
...
. . .
. . .
. . .
. . .
. . .
. . .
. . .
. . .
. . .
. . . 1
. . .
. . .
. . .
. . .
. . .
. . .
. . .
L2 L3 L6
. . .
. . . F1 F2
MOLD STEELS, SYMBOL P PI-P19, INCL.. LOW-CARBON TYPES (P7-PI9 UNASSIGNED)
0.50/1.101 1 .OO 0.70
. . .
. . . . . . . . .
2.00 2.40 4.00 1.50 2.00 2.00 1.25 2.00 2.00 2.00 1.15 1.60 2.25
. . .
. . . 1 .OO 1.25
. . .
...
. . .
6.00 6.00 5.50 4.00 1.75 . . . 2.00 2.00 6.00 6.75 1.50 2.75 5.25
0.20 0.50 1.25
3.50
P20-P39, INCL., OTHER TYPES (P22-P39 UNASSIGNED)
. . . . . . . . . . . . . . . ...
. . .
. . .
. . .
. . .
. . .
P2 P3 P4 P5 P6
5.00 5.00 4.50 5.00 8.75 8.00 8.00 8.00 5.00 3.75 9.50 8.00 6.25
2.00 0.60 5.00 2.25 1.50
0.07 0.10 0.07 0.10 0.10
12.00
5.00 8.00 8.00 5.00 8.00 8.25
12.00
. . . 0.25 . . . 1.20
. . .
. . . ... . . .
P20 P21
. . .
. . . 0.30 0.20
1.25 . . .
. . .
... . . . 4.00
-
INTRODUCTION TO PHYSICAL METALLURGY TOOL STEELS 393
The AlSl identification and type classification of tool steels i From the above discussion, it is apparent that, for most applications, Table 10.1. hardness, toughness, wear resistance, and red-hardness are the most
Selection of Tool Steels The selection of a proper tool steel f important selection factors in choosing tool steels. In individual appli- application is a difficult task. The best approach is to correlate t Cations, many other factors must be seriously considered. They include lurgical characteristics of tool steels with the requirements of t the amount of distortion which is permissible in the shape under consid- operation. eration; the amount of surface decarburization which can be tolerated;
In most cases, the choice of a tool steel is not limited to a sing hardenability or depth of hardness which can be obtained; resistance to even to a particular family for a working solution to an individua heat checking; heat-treating requirements, including temperatures, at- problem. Although many tool steels will perform on any given job, rnospheres, and equipment; and finally, the machinability. have to be judged on the basis of expected productivity, ease of fab omparative Properties The comparative properties of the most common and cost. In the final analysis, it is the cost per unit part made b tool steels are given in Table 10.2. Toughness, red-hardness, wear resist- that determines the proper selection.
ante, nondeforming properties, machinability, safety in hardening, and Most tool-steel applications, with the exception of those to resistance to decarburization have been qualitatively rated good, fair, or
into machine parts, may be divided into types of operations: poor. Depth of hardening is rated shallow, medium, or deep. The steels shearing, forming, drawing, extrusion, rolling, and battering. have been rated relative to each other rather than within any one particular tool may have a single cutting edge which is in continuous conta class. The hot-work steels have been rated good or very good in red-hard- work, such as a lathe or planer tool; or it may have two or mo ness, but significant differences exist in "hot strength" of these steels, edges which do continuous cutting, such as a drill or a tap; or it and a steel to be selected for hot die work requires careful study. Although a number of cutting edges, with each edge taking short cuts and the high speed steels are rated poor in toughness, there are differences in ing only part of the time, such as a milling cutter or hob. When this property between the different high-speed steels which should be the chief function of the tool steel, it should have high hardness taken into account for a particular application. good heat and wear resistance. Nsndeforming Properties The tool steels in Table 10.2 have been rated on
Shearing tools for use in shears, punches, and blanking di the basis of distortion obtained in hardening from the recommended hard- high wear resistance and fair toughness. These characteris ening temperatures. Since steels expand and contract during heating be properly balanced, depending on the tool design, thickness of th and quenching, the extent to which dimensions change is most important being sheared, and temperature of the shearing operation. for complex shapes. Intricately designed tools and dies must maintain
Forming tools are characterized by imparting their form to the pa their shape after hardening. Those steels rated good or best in nondeform- made. This may be done by forcing the solid metal into the tool im ing properties can be machined very close to size before heat treatment, either hot or cold by using a hot-forging or cold-heading die. Th so that little grinding will be required after hardening. Parts that involve also includes qies for die casting where the molten or semimolten rather drastic section changes should not be made of steels which are sub- forced under pressure into the form of the die. Forming tools mu ject to excessive warpage in heating or quenching, as this will generally high toughness and high strength, and many require high red-h lead to cracking during hardening. In general, air-hardening steels exhibit (resistance to heat softening). the least distortion; those quenched in oil show moderate distortion; and
Drawing and extrusion dies are characterized by substantial s water-hardening steels show the greatest distortion. The distortion is between the metal being formed and the tool itself. Deep-drawi associated with the temperature gradient and the resulting dimensional such as those used for the forming of cartridge cases general1 changes during heating and cooling, which were discussed in detail under high strength and high wear resistance. Toughness to withstand residual stresses in Chap. 8. pressures and wear resistance is most important for cold-extrusi Depth of Hardening This is related to the hardenability of the individual whereas dies for hot extrusion require, in addition, high red-hardn tool steels. The hardenability ratings in Table 10.2 are based on the use of
Thread-rolling dies must be hard enough to withstand the forces i the recommended quenching medium. The shallow-hardening steels such ing the thread and must have sufficient wear resistance and tough as the carbon tool steels (group W), the tungsten finishing steels (group F), adjust to the stresses developed. Battering tools include chisels and several of the carburizing grades in group P are generally quenched in forms of tools involving heavy shock loads. The most important char water. The hardenability increases with increasing alloy content. The only istic for these tools is high toughness. alloyiilg element which decreases hardenability is cobalt. To develop high
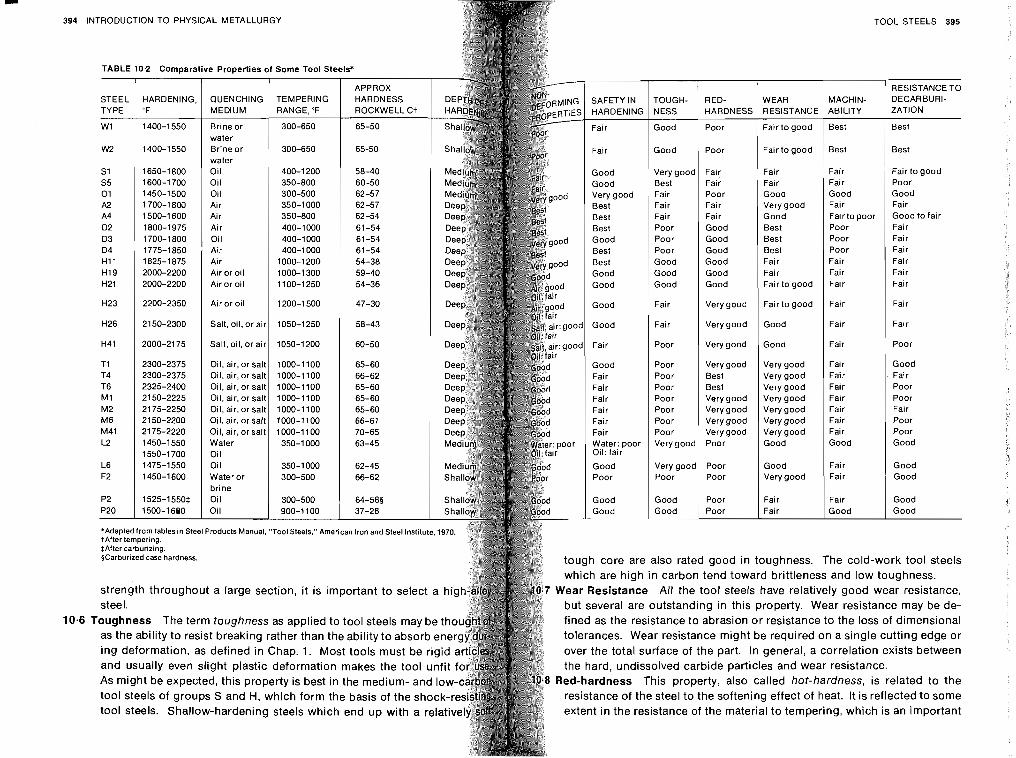
_I
394 INTRODUCTION TO PHYSICAL METALLURGY TOOL STEELS 395
tough core are also rated good in toughness. The cold-work tool steels which are high in carbon tend toward brittleness and low toughness.
Wear Resistance All the tool steels have relatively good wear resistance, but several are outstanding in this property. Wear resistance may be de-
'oughness The term toughness as applied to tool steels may be fined as the resistance to abrasion or resistance to the loss of dimensional tolerances. Wear resistance might be required on a single cutting edge or over the total surface of the part. In general, a correlation exists between the hard, undissolved carbide particles and wear resistance.
Red-hardness This property, also called hot-hardness, is related to the
tool steels of groups S and H, which form the basis of the shock-r resistance of the steel to the softening effect of heat. It is reflected to some extent in the resistance of the material to tempering, which is an important
396 INTRODUCTION TO PHYSICAL METALLURGY
selective factor for high-speed and hot-work tools. A tool steel red-hardness is essential when temperatures at which the tool erate exceed 900°F. Alloying elements which form hard, sta generally improve the resistance to softening at elevated temp standing in this property are the tool steels that contain re1 amounts of tungsten, chromium, and molybdenum.
chin
goo
ability ~d fink
This is the ability of the material to be cut freely ;h after being machined. The machinability rati
Table 10.2 merely show the relative difficulty which might be en in machining the steels in question during manufacture of tool The factors that affect machinability of tool steels are the hard annealed condition, the microstructure of the steel, and the quan excess carbides.
When compared with the conventional alloy steels, tool st siderably more difficult to machine. The best machinable tool has a machinability rating of about 30 percent that of B1112 sc is therefore usual to compare the machinability of tool steels w arbitrary rating of 100. On this basis, the machinability for each
!rent The
types mach
of tool steel is rated in Table 10.3. inability and general workability of tool steels dec~
creasing carbon and alloy content. Low annealed hardnesses a more difficult to attain as the carbon and alloy content increases. ence of carbon in combination with strong carbide-forming elem as vanadium, chromium, and molybdenum reduces machina formation of a large number of hard carbide particles which solution after annealing.
TABLE 10.3 Machinability Ratings of Tool Steels Water-hardening grades rated at 100
TQOL-STEEL GROUP MACHINABILITY RATING
W 100
0 90 - A 85 D 40-50 H (Cr) 75 H (W or Mo) 50- 60 T 40-55 M 45
From "Metals Handbook," 8th ed.. Amerlcan Society for Metals. Metals Park. Ohio. 1961.
TOOL STEELS 397
Resistance to Decarburization This is an important factor in the selection of tool steels since it influences the type of heat-treating equipment se- lected and the amount of material to be removed from the surface after hardening. Decarburization usually occurs when steels are heated above 1300°F, and unless some method is used to protect them (such as heating in a protective atmosphere), they are likely to lose some of their surface carbon. Decarburization will result in a soft rather than a hard surface after hardening. Tools that are intricately designed and cannot be ground after hardening must not show any decarburization.
The straight-carbon tool steels are least subject to decarburization. The shock-resisting tool steels are poor in this property; the hot-work tool steels are considered fair; and the majority of the other tool steels have good re- sistance to decarburization. Brand Names For many years, a manufacturer requiring a tool steel for a particular application would indicate the nature of this application to a tool- steel producer and would receive a recommended tool steel. This practice has led to the use of brand names which the tool-steel producer gave to each of his different types of steel. Tool-steel producers made every effort to maintain the quality and thus the reputation of their brand names.
With the rapid growth of industry, many tool-steel consumers had more than one source of supply and had to issue specifications covering chemi- cal composition and some physical properties of the steel. At the same time, many tool-steel manufacturers published information regarding the chemical composition and physical properties of their various brands of tool steel. Although the AiSl has standardized the chemical composition of tool steels (Table 10.1), the use of trade names has persisted to the present day. Table 10.4 lists approximate comparable tool-steel brand names of various manufacturers. Water-hardening Tool Steels (Group W) These are essentially plain- carbon tool steels, although some of the higher-carbon-content steels have small amounts of chromium and vanadium added to improve hardenability and wear resistance. The carbon content varies between 0.60 and 1.40 per- cent, and the steels may be roughly placed into three subdivisions accord- ing to carbon content.
0.60 to 0.75 percent carbon-for applications where toughness is the primary consid- eration, such as hammers, concrete breakers, rivet sets, and heading dies for short runs.
0.75 to 0.95 percent carbon-for applications where toughness and hardness are equally important, such as punches, chisels, dies, and shear blades.
0.95 to 1.40 percent carbon-for applications where increased wear resistance and retention of cutting edge are important. They are used for woodworking tools, drills, taps, reamers, and turning tools.
In general, the straight-carbon tool steels are less expensive than the
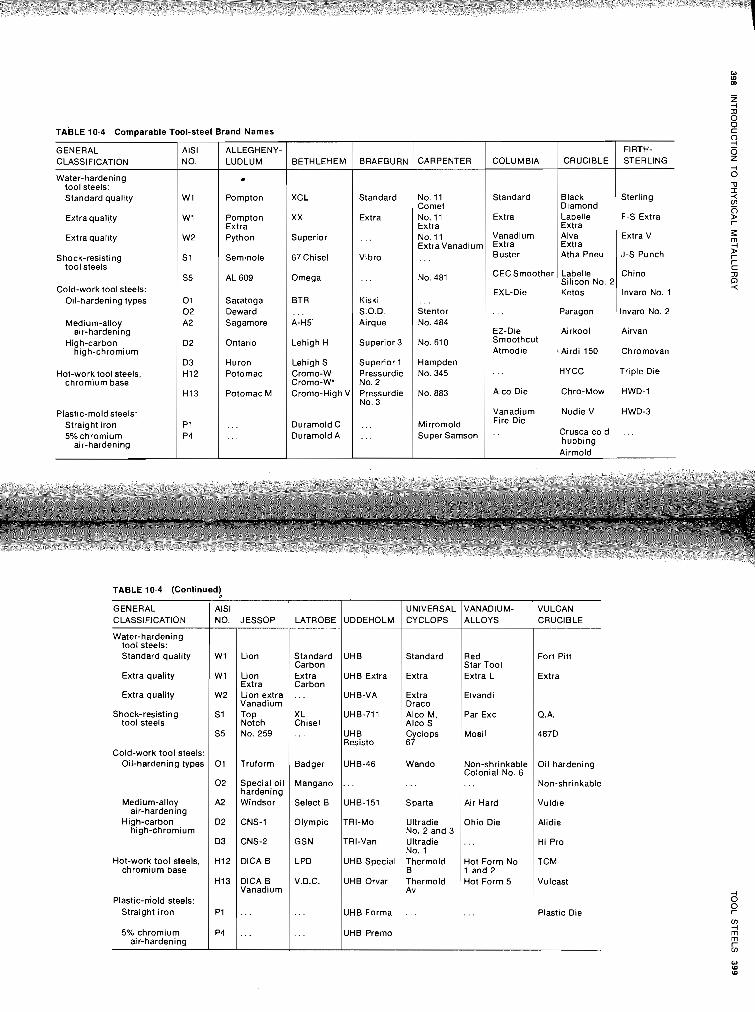
TABLE 10.4 Comparable Tool-steel Brand Names
GENERAL CLASSIFICATION
AISI NO.
W1
W1
W2
S1
S5
0 1 02 A2
D2
D3 HI2
H13
PI P4
ALLEGHENY- LUDLUM
Water-hardening tool steels: Standard quality
BETHLEHEM
.I
Pompton XCL
XX
Superior
67 Chisel
Omega
BRAEBURN
Standard
Extra
No. 11 Comet No. 11 Extra No. 11 Extra Vanadium
No. 481
CARPENTER
Standard Black Sterling Dtamond
Extra 1 %Ie 1 F-S Extra Extra quality
COLUMBIA
Pompton Extra Python Vanadium 1 Iya 1 Extra V
Extra Buster Atha Pneu J-S Punch
CRUCIBLE
Extra quality
FIRTH- STERLING
Shock-resisting t o ~ l steels
I Seminole Vibro
CEC Smoother Labelle Chino Silicon No. 2
EXL-Die 1 Ketos 1 nvaro No. 1 Cold-work tool steels: Oil-hardening types Saratoga
Deward Sagamore
BTR Kiski S.O.D. Airque
. . . Stentor No. 484 Medium-alloy
air-hardening High-carbon
high-chromium
€1-Die ~ i r k o o l 1 Airvan Smoothcut Atmodie Airdi 150 Chromovan
1 Ontario Lehigh H Superior 3 No. 610 I Huron Potomac
Lehigh S Cromo-W Cromo-Wv Cromo-High
Superior 1 Pressurdie No. 2
Hampden No. 345 I /HYCC / ~ r i ~ l e Die Hot-work tool steels,
chromium base Alco Die 1 Chro-MOW 1 HWD-1 Potomac M Pressurdie
NO. 3 No. 883 I Vanad~um Nud~e V HWD-3
F~re Dte Crusca cold hubbing A~rmold 1 Plastic-mold steels:
Straight iron 5% chromium
air-hardening
Mirromold Super Samson
Duramold C Duramold A
Standard quality
Extra quality
Extra quality
Shock-resisting tool steels
TABLE 10.4 (Continued!
Lion
Lion Extra Lion extra Vanadium TOP Notch
GENERAL CLASSIFICATION
Water-hardening tool steels:
Standard
Extra
Extra Draco Alco M, Alco S
VANADIUM- ALLOYS
Standard Carbon Extra Carbon . . .
X L Chisel
Red Star Tool Extra L
Elvandi
Par Exc
VULCAN CRUCIBLE
AlSI NO.
UHB
UHB Extra
UHB-VA
UHB-711
Fort Pitt
Extra
Q.A.
No. 259
Truform
Special oil hardening Windsor
JESSOP
Cyclops 67
Wando
. . .
Sparta
LATROBE
. . .
Badger
Mangano
Select B
Mosil UHB Resisto
UHB-46
. . .
UHB-151
Cold-work tool steels: Oil-hardening types
UDDEHOLM
Oil hardening
Non-shrinkable
Vuldie
UNIVERSAL CYCLOPS
Non-shrinkable Colonial No. 6 . . .
Air Hard Medium-alloy air-hardenina
High-carbon high-chromium
CNS-1
CNS-2
DlCA B
DlCA B Vanadium
. . .
Olympic
GSN
LPD
V.D.C.
TRI-MO
TRI-Van
UHB Special
UHB Orvar
UHB Forma
Ultradie No. 2 and 3 Ultradie No. 1 Thermold B Thermold Av
. . .
Ohio Die Alidie
Hi Pro
TCM
Vulcast
Plastic Die
Hot-work tool steels, chromium base
Hot Form No. 1 and 2 Hot Form 5
Plastic-dold steels: Straight iron
5% chromium air-hardening
P4 . . . . . . UHB Premo
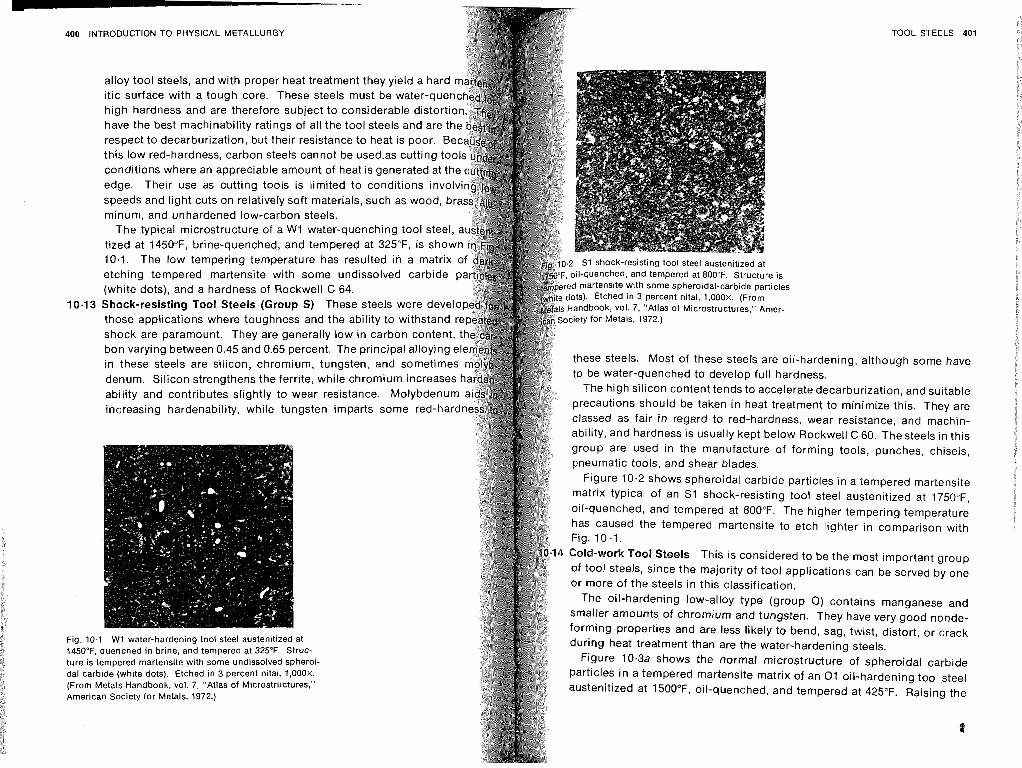
TOOL STEELS 401 400 INTRODUCTION TO PHYSICAL METALLURGY
alloy tool steels, and with proper heat treatment they yield a hard itic surface with a tough core. These steels must be water-que high hardness and are therefore subject to considerable dist have the best machinability ratings of all the tool steels and a respect to decarburization, but their resistance to heat is poor. this low red-hardness, carbon steels cannot be used.as cutting conditions where an appreciable amount of heat is generated edge. Their use as cutting tools is limited to conditions inv speeds and light cuts on relatively soft materials, such as wood, minum, and unhardened low-carbon steels.
The typical microstructure of a W1 water-quenching tool steel, tized at 1450°F. brine-quenched, and tempered at 325"F, is shown 10.1. The low tempering temperature has resulted i r i a matrix o etching tempered martensite with some undissolved carbide (white dots), and a hardness of Rockwell C 64.
10.13 Shock-resisting Tool Steels (Group S) These steels were devel those applications where toughness and the ability to withstand shock are paramount. They are generally low in carbon con bon varying between 0.45 and 0.65 percent. The principal alloying e
these steels. Most of these steels are oil-hardening, although some have in these steels are silicon, chromium, tungsten, and sometimes
to be water-quenched to develop full hardness. denum. Silicon strengthens the ferrite, while chromium increases ability and contributes slightly to wear resistance. Molybdenum
The high silicon content tends to accelerate decarburization, and suitable precautions should be taken in heat treatment to minimize this. They are
increasing-hardenability, while tungsten imparts some red-hard classed as fair in regard to red-hardness, wear resistance, and machin- ability, and hardness is usually kept below Rockwell C 60. The steels in this group are used in the manufacture of forming tools, punches, chisels, pneumatic tools, and shear blades.
Figure 10-2 shows spheroidal carbide particles in a tempered martensite matrix typical of an S1 shock-resisting tool steel austenitized at 1750°F, oil-quenched, and tempered at 800°F. The higher tempering temperature has caused the tempered martensile to etch lighter in comparison with
4 Cold-work Tool Steels This is considered to be the most important group of tool steels, since the majority of tool applications can be served by one or more of the steels in this classification.
The oil-hardening low-alloy type (group 0) contains manganese and smaller amounts of chromium and tungsten. They have very good nonde- forming properties and are less likely to bend, sag, twist, distort, or crack during heat treatment than are the water-hardening steels.
1450°F, quenched in brine, and tempered at 325°F. Struc- ture is tempered martensite with some undissolved spheroi- Figure 10.3a shows the normal microstructure of spheroidal carbide dal carbide (white dots). Etched in 3 percent nitai. 1,000~. particles in a tempered martensite matrix of an 01 oil-hardening tool steel (From Metals Handbook, vol. 7, "Atlas of Microstructures." austenitized at 1500°F. oil-quenched, and tempered at 425°F. Raising the American Society for Metals, 1972.)
t
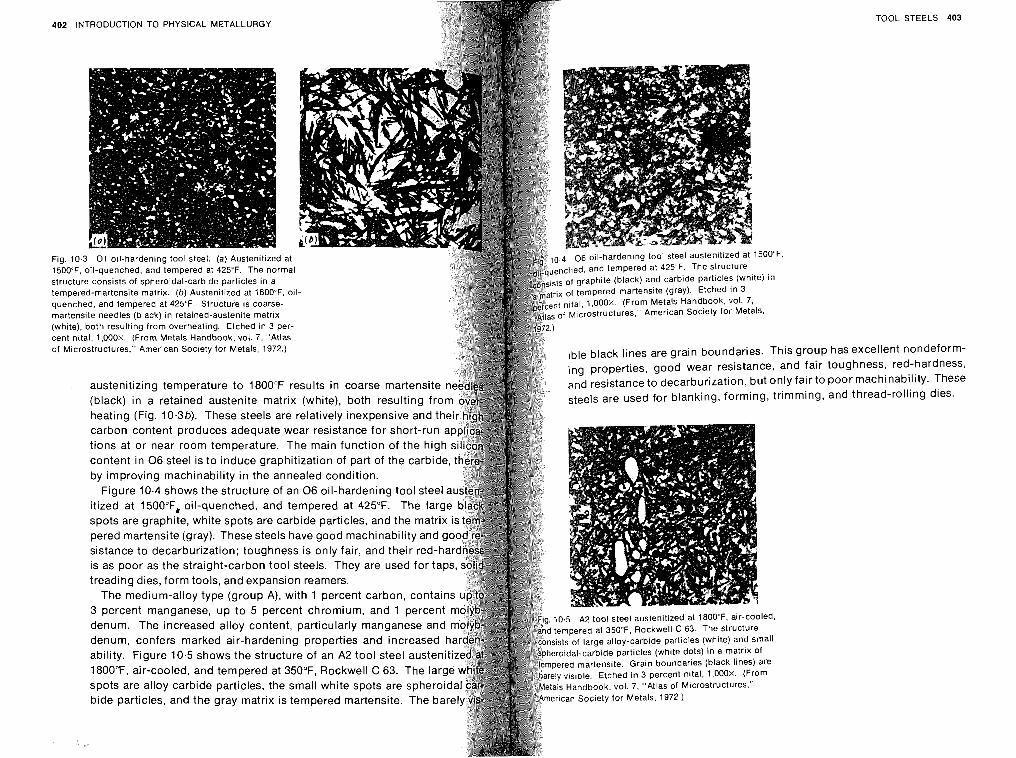
-
402 INTRODUCTION TO PHYSICAL METALLURGY TOOL STEELS 403
150OF. oil-quenched, and tempered at 425°F. The normal enc.,ed. and tempered at 425'F. The structure structure consists of spheroidal-carbide particles in a ts of graphite (black) and carbide particles (white) in tempered-martensite matrix. (b) Austenitized at 1800°F. oil- , of tempered martensite (gray). Etched in 3 quenched, and tempered at 425F. Structure is coarse- n,tal, I ,000~ . (From Metals Handbook, vol. 7, martensite needles (black) in retained-austenite matrix of ~ i~rost ructures." American Society for Metals. (white), both resulting from overheating. Etched in 3 per- cent nital. 1,000x. (From Metals Handbook, vol. 7, "Atlas of Microstructures." American Society for Metals, 1972.)
ible black lines are grain boundaries. TI ing properties, good wear ~esistance,
austenitizing temperature to 180OCF results in coarse martens arid resistance to decarburization, but 01 (black) in a retained austenite matrix (white), both resulting steels are used for blanking, forming, t l heating (Fig. 10.3b). These steels are relatively inexpensive an carbon content produces adequate wear resistance for short-
tions at or near room temperature. The main function of the content in 0 6 steel is to induce graphitization of part of the car by improving machinability in the annealed condition.
Figure 10.4 shows the structure of an 0 6 oil-hardening tool steel
itized at 1500"F, oil-quenched, and tempered at 425°F. The la spots are graphite, white spots are carbide particles, and the mat pered martensite (gray). These steels have good machinability and sistance to decarburization; toughness is only fair, and their red is as poor as the straight-carbon tool steels. They are used f o r t treading dies, form tools, and expansion reamers.
The medium-alloy type (group A), with 1 percent carbon, contai 3 percent manganese, up to 5 percent chromium, and 1 percent denum. The increased alloy content, particularly manganese and 10.5 ~2 tool steel austenitized at 1800'F, air-cooled,
tempered at 350°F. Rockwell C 63. The Structure denum, confers marked air-hardening properties and increased ts of large alloy-carbide particles (white) and small ability. Figure 10.5 shows the Structure of an A2 tool steel auste eroidal-carbide particles (white dots) in a matrix of
1800°F, air-cooled, and tempered at 350°F, Rockwell C 63. The I mpered martensite. Grain boundaries (black lines) are rely visible. Etched in 3 percent nital. 1.000x. (From
spots are alloy carbide particles, the small white spots are sphe etals Handbook, VOI. 7, "Atlas of Microstructures," bide particles, and the gray matrix is tempered martensite. The bar erican Society for Metals, 1972.)
his an
I~Y 'i rr
b grour ~d fair fair to
~ming,
has excellc toughness, poor machi and thread
?nt nond red-ha1
nability. -rolling
eform- ,dness, These
dies.
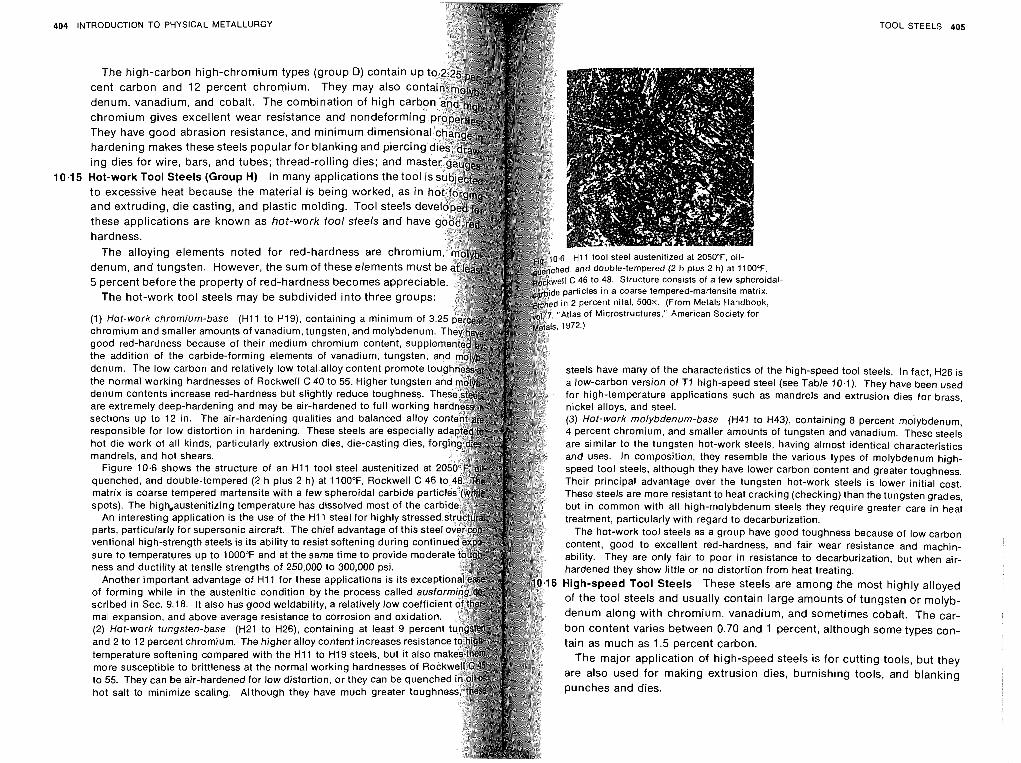
-.
TRODUCTION TO PHYSICAL METALLURGY TOOL STEELS 405
The high-carbon high-chromium types (group D) contain
denum, vanadium, and cobalt. The combination of high
ing dies for wire, bars, and tubes; thread-rolling dies; and
and extruding, die casting, and plastic molding. Tool steels these applications are known as hot-work tool steels and h hardness.
5 percent before the property of red-hardness becomes appreci
(1) Hot-work chromium-base (HI1 to H19), containing a minimum of 3. chromium and smaller amounts of vanadium, tungsten, and molybdenum.
high-speed tool steels. In fact, H26 is the normal working hardnesses of Rockwell C 40 to 55. Higher tungsten low-carbon version of T i high-speed steel (see Table 10.1). They have been used denum contents increase red-hardness but slightly reduce toughness. T r high-temperature applications such as mandrels and extrusion dies for brass, are extremely deep-hardening and may be air-hardened to full working nickel alloys, and steel.
(3) Hot-work molybdenum-base (H41 to H43), containing 8 percent mojybdenum, 4 percent chromium, and smaller amounts of tungsten and vanadium. These steels are similar to the tungsten hot-work steels, having almost identical characteristics and uses. In composition, they resemble the various types of molybdenum high- speed tool steels, although they have lower carbon content and greater toughness. Their principal advantage over the tungsten hot-work steels is lower initial cost. These steels are more resistant to heat cracking (checking) than the tungsten grades, but in common with all high-molybdenum steels they require greater care in heat treatment, particularly with regard to decarburization.
The hot-work tool steels as a group have good toughness because of low carbon content, good to excellent red-hardness, and fair wear resistance and machin- ability. They are only fair to poor in resistance to decarburization, but when air- hardened they show little or no distortion from heat treating.
6 High-speed Tool Steels These steels are among the most highly alloyed of the tool steels and usually contain large amounts of tungsten or molyb- denum along with chromium, vanadium, and sometimes cobalt. The car-
(2) Hot-work tungsten-base (H21 to H26), containing at least 9 percen bon content varies between 0.70 and 1 percent, although some types con- tain as much as 1.5 percent carbon.
The major application of high-speed steels is for cutting tools, but they are also used for making extrusion dies, burnishing tools, and blanking punches and dies.
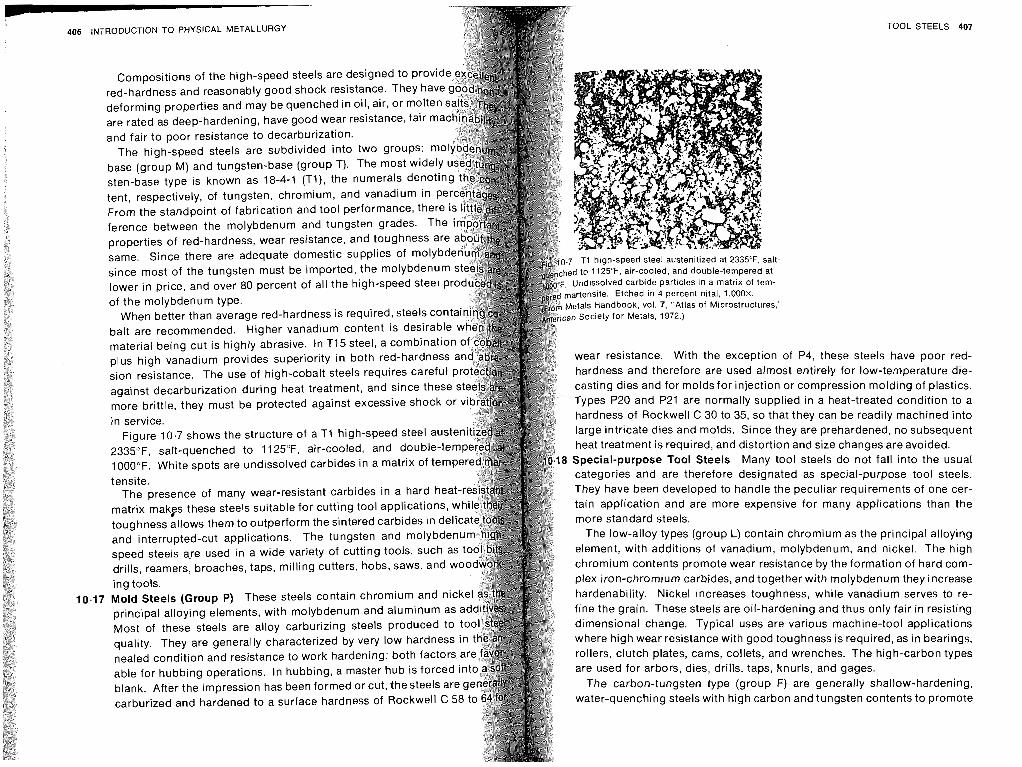
406 INTRODUCTION TO PHYSICAL METALLURGY TOOL STEELS 407
tent, respectively, of tungsten, chr From the standpoint of fabrication ference between the molybdenum and tungsten grades. properties of red-hardness, wear resistance, and toughnes same. Since there are adequate domestic supplies of m since most of the tungsten must be imported, the molybdenum lower in price, and over 80 percent of all the high-speed steel p of the molybdenum type.
When better than average red-ha balt are recommended. Higher vanadium content is desirab material being cut is highly abrasive. In T i 5 steel, a combinati plus high vanadium provides superiority in both red-hardnes sion resistance. The use of high-cobalt steels requires careful against decarburization during heat treatment, and since these more brittle, they must be protected against excessive shock or in service.
Figure 10.7 shows the structure of a T I high-speed steel aus 2335"F, salt-quenched to 1125"F, air-cooled, and double- 1000°F. White spots are undissolved carbides in a matrix of te tensite.
The presence of many wear-resistant carbides in a hard heat-
-
Compositions of the high-speed steels are designed to ~ r o v i d red-hardness and reasonably good shock resistance. They hav deforming properties and may be q are rated as deep-hardening, have good Wear resistance, fair and fair to poor resistance to decarburization.
The high-speed steels are subd base (group M) and tungsten-base (group TI. The most wi sten-base type is known as 18-4-1 (Tl), the numerals de
.omium, and vanadium In and tool performance, ther
rdness is required, steels cont
wear resistance. With the exception of P4, these steels have poor red- hardness and therefore are used almost entirely for low-temperature die- casting dies and for molds for injection or compression molding of plastics. Types P20 and P21 are normally supplied in a heat-treated condition to a hardness of Rockwell C 30 to 35, so that they can be readily machined into large intricate dies and molds. Since they are prehardened, no subsequent heat treatment is required, and distortion and size changes are avoided.
8 Special-purpose Tool Steels Many tool steels do not fall into the usual categories and are therefore designated as special-purpose tool steels. They have been developed to handle the peculiar requirements of one cer-
for cutting tool applications, tain application and are more expensive for many applications than the rm the sintered carbides in de more standard steels.
The low-alloy types (group L) contain chromium as the principal alloying wiety of cutting tools, such as t element, with additions of vanadium, molybdenum, and nickel. The high
chromium contents promote wear resistance by the formation of hard com- plex iron-chromium carbides, and together with molybdenum they increase
hardenability. Nickel increases toughness, while vanadium serves to re- fine the grain. These steels are oil-hardening and thus only fair in resisting dimensional change. Typical uses are various machine-tool applications where high wear resistance with good toughness is required, as in bearings, rollers, clutch plates, cams, collets, and wrenches. The high-carbon types are used for arbors, dies, drills, taps, knurls, and gages.
The carbon-tungsten type (group F) are generally shallow-hardening, water-quenching steels with high carbon and tungsten contents to promote
matrix makes these steels suitable toughness allows them to outperfo and interrupted-cut applications. speed steels are used in a wide vi drills, reamers, broaches, taps, milling cutters, hobs, saws, and w ing tools.
10.17 Mold Steels (Group P) These steels contain chromium and nic principal alloying elements, with molybdenum and aluminum as Most of these steels are alloy carburizing steels produced to quality. They are generally characterized by very low hardness nealed condition and resistance to work hardening; both factors able for hubbing operations. In hubbing, a master hub is forced i blank. After the impression has been formed or cut, thesteels a carburized and hardened to a surface hardness of Rockwell C
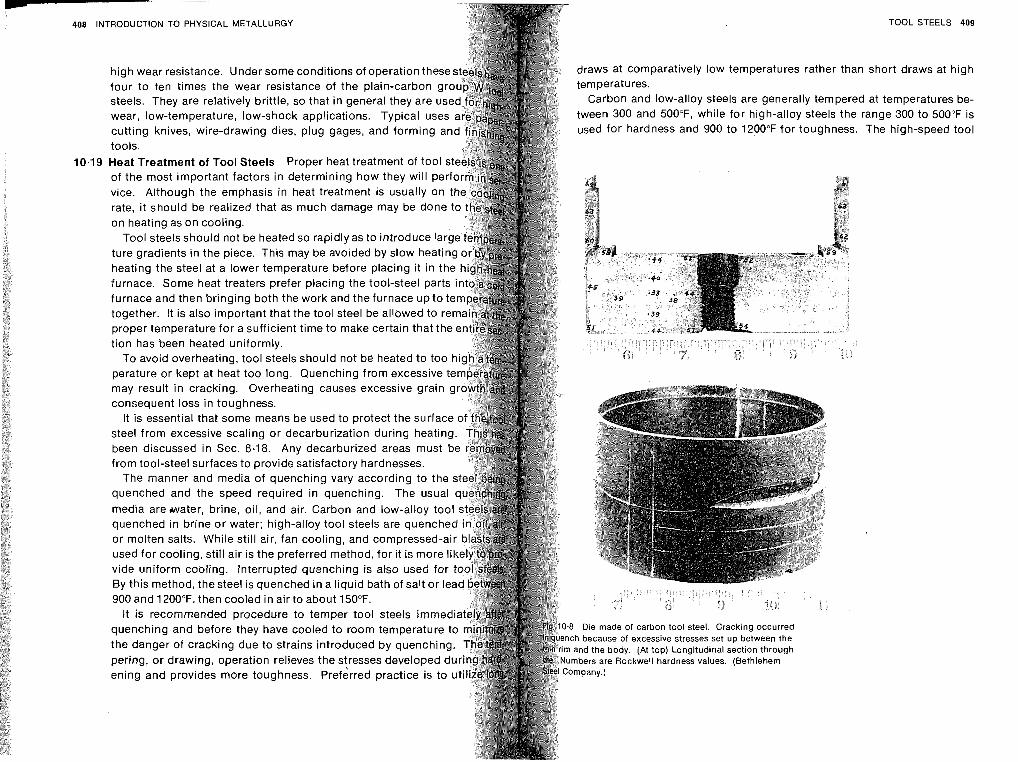
408 INTRODUCTION TO PHYSICAL METALLURGY
draws at comparatively low temperatures rather than
four to ten times the wear resistance of the plain-carbon steels. They are relatively brittle, so that in general they are Carbon and low-alloy steels are generally tempered
wear, low-temperature, low-shock applications. Typical us tween 300 and 500°F, while for high-alloy steels the r
cutting knives, wire-drawing dies, plug gages, and forming used for hardness and 900 to 1200°F for toughness.
tools. Heat Treatment of Tool Steels Proper heat treatment of tool
rate, it should be realized that as much damage may be do on heating as on cooling.
Tool steels should not be heated so rapidly as to introduce I
furnace. Some heat treaters prefer placing the tool-steel part furnace and then bringing both the work and the furnace up to together. It is also important that the tool steel be allowed to r
tion has been heated uniformly. To avoid overheating, tool steels should not be heated to too
perature or kept at heat too long. Quenching from excessive t may result in cracking. Overheating causes excessive grain consequent loss in toughness.
It is essential that some means be used to protect the surface steel from excessive scaling or decarburization during healing been discussed in Sec. 8.18. Any decarburized areas must b from tool-steel surfaces to provide satisfactory hardnesses.
The manner and media of quenching vary according to the quenched and the speed required in quenching. The usual media are water, brine, oil, and air. Carbon and low-alloy too
used for cooling, still air is the preferred method, for it is more vide uniform cobling. Interrupted quenching is also used fo By this method, thesteel is quenched in a liquid bath of salt or I 900 and 1 200°F, then cooled in air to about 150°F.
It is recommended procedure to temper tool steels imme quenching and before they have cooled to room temperature the danger of cracking due to strains introduced by quench pering, or drawing, operation relieves the sfresses develope ening and provides more toughness. Preferred practice is
TOOL STEELS 409
short draws at t
I at temperatures .ange 300 to 500' The high-speed
i igh
be- 'F is tool
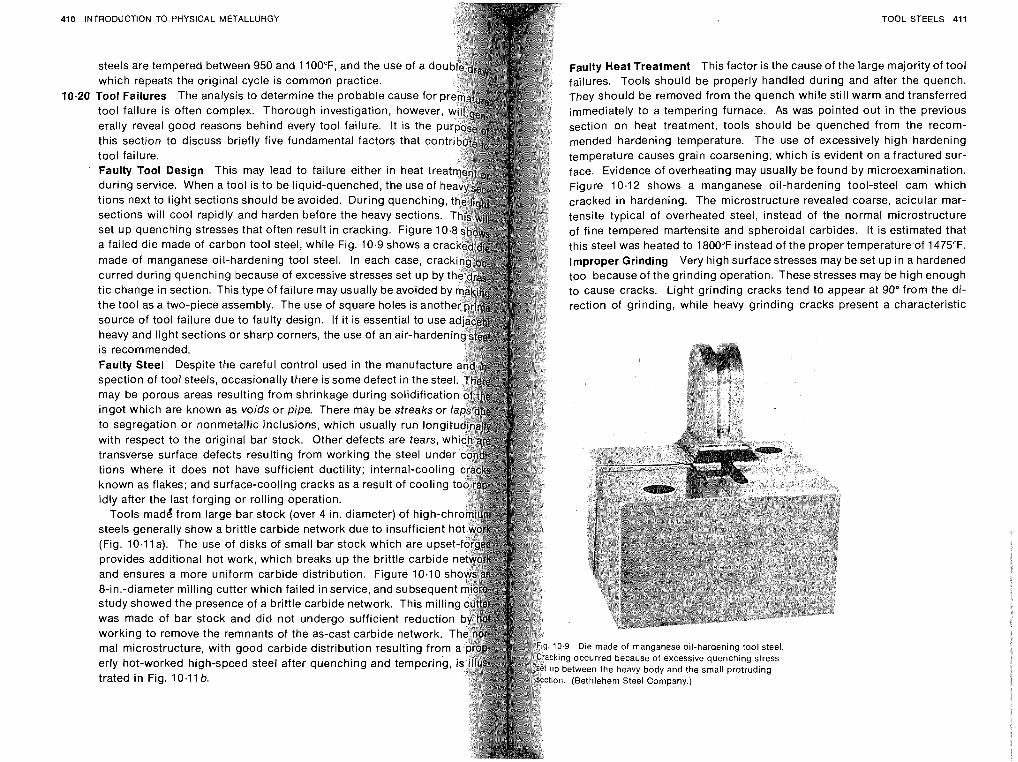
7-
410 INTRODUCTION TO PHYSICAL METALLURGY TOOL STEELS 411
Faulty Heat Treatment This factor is the cause of the large majority of tool which repeats the original cycle is common practice. failures. Tools should be properly handled during and after the quench. Tool Failures The analysis to determine the probable cause fo They should be removed from the quench while still warm and transferred tool failure is often complex. Thorough investigation, howeve immediately to a tempering furnace. As was pointed out in the previous erally reveal good reasons behind every tool failure. It is the section on heat treatment, tools should be quenched from the recom- this section to discuss briefly five fundamental factors that c mended hardening temperature. The use of excessively high hardening tool failure. temperature causes grain coarsening, which is evident on a fractured sur- Faulty Tool Design This may lead to failure either in heat tr face Evidence of overheating may usually be found by microexamination. during service. When a tool is to be liquid-quenched, the use of Figure 10.12 shows a manganese oil-hardening tool-steel cam which tions next to light sections should be avoided. During quenchin cracked in hardening. The microstructure revealed coarse, acicular mar- sections will cool rapidly and harden before the heavy section tensite typical of overheated steel, instead of the normal microstructure set up quenching stresses that often result in cracking. Figure of fine tempered martensite and spheroidal carbides. It is estimated that a failed die made of carbon tool steel, while Fig. 10.9 shows a this steel was heated to 1800°F instead of the proper temperature.of 1475°F.
improper Grinding Very high surface stresses may be set up in a hardened tool because of the grinding operation. These stresses may be high enough to cause cracks. Light grinding cracks tend to appear at 90" from the di-
the tool as a two-piece assembly. The use of square holes is an rection of grinding, while heavy grinding cracks present a characteristic
is recommended. Faulty Steel Despite the careful control used in the manufact spection of tool steels, occasionally there is some defect in the s may be porous areas resulting from shrinkage during solidific ingot which are known as voids or pipe. There may be streaks or to segregation or nonmetallic inclusions, which usually run longi with respect to the original bar stock. Other defects are tears,
tions where it does not have sufficient ductility; internal-coolin known as flakes; and surface-cooling cracks as a result of cooling idly after the last forging or rolling operation.
Tools mad6 from large bar stock (over 4 in. diameter) of high-c
and ensures a more uniform carbide distribution. Figure 10.10 8-in.-diameter milling cutter which failed in service, and subseque
working to remove the remnants of the as-cast carbide network. ma1 microstructure, with good carbide distribution resulting fro
trated in Fig. 10.11 b.
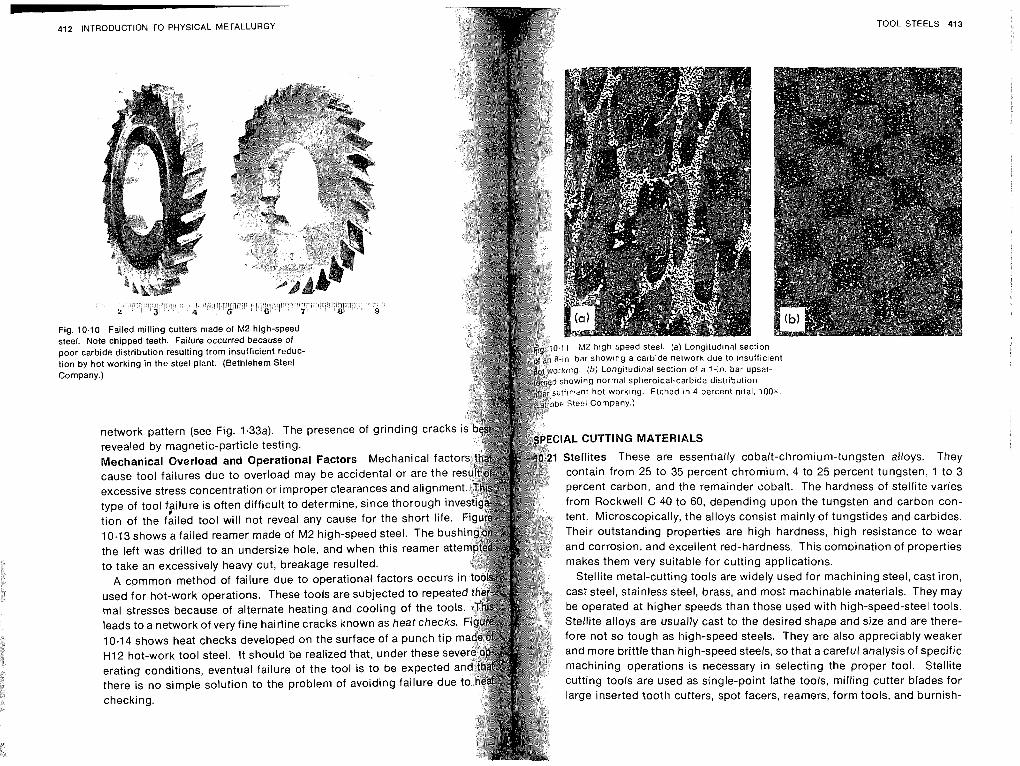
TOOL STEELS 413 412 INTRODUCTION TO PHYSICAL METALLURGY
Fig. 10.1 steel. Note chipped teeth. Failure occurred because of poor carbide distribution resulting from insufficient reduc-
1 M2 high-speed steel. (a) Longitudinal section
tion by hot working in the steel plant. (Bethlehem Steel n bar showing a carbide network due to insuffic~ent
Company.) rng (b) Longitudinal section of a 7-in. bar upset- howing normal spheroidal-carbide distribution ficw-it hot working Etched in 4 percent n~tal, 100x. Steel Company.)
network pattern (see Fig. 1.33a). The presence of grinding cracks revealed by magnetic-particle testing.
AL CUTTING MATERIALS
Mechanical Overload and Operational Factors Mechanical fac Stellites These are essentially cobalt-chromium-tungsten alloys. They cause tool failures due to overload may be accidental or are the contain from 25 to 35 percent chromium, 4 to 25 percent tungsten, 1 to 3
excessive stress concentration or improper clearances and alignme percent carbon, and the remainder cobalt. The hardness of stellite varies
type of tool f?ilure is often difficult to determine, since thorough inv from Rockwell C 40 to 60, depending upon the tungsten and carbon con-
tion of the failed tool will not reveal any cause for the short life. tent. Microscopically, the alloys consist mainly of tungstides and carbides.
10.13 shows a failed reamer made of M2 high-speed steel. The bus Their outstanding properties are high hardness, high resistance to wear
the left was drilled to an undersize hole, and when this reamer att and corrosion, and excellent red-hardness. This combination of properties
to take an excessively heavy cut, breakage resulted. makes them very suitable for cutting applications.
A common method of failure due to operational factors occurs i Stellite metal-cutting tools are widely used for machining steel, cast iron,
used for hot-work operations. These tools are subjected to repeat cast steel, stainless steel, brass, and most machinable materials. They may
ma1 stresses because of alternate heating and cooling of the tool be operated at higher speeds than those used with high-speed-steel tools.
leads to a network of very fine hairline cracks known as heat checks Stellite alloys are usually cast to the desired shape and size and are there-
10.14 shows heat checks developed on the surface of a punch tip fore not so tough as high-speed steels. They are also appreciably weaker
HI2 hot-work tool steel. It should be realized that, under these se and more brittle than high-speed steels, so that a careful analysis of specific
erating conditions, eventual failure of the tool is to be expected a machining operations is necessary in selecting the proper tool. Stellite
there is no simple solution to the problem of avoiding failure due cutting tools are used as single-point lathe tools, milling cutter blades for
checking. large inserted tooth cutters, spot facers, reamers, form tools, and burnish-
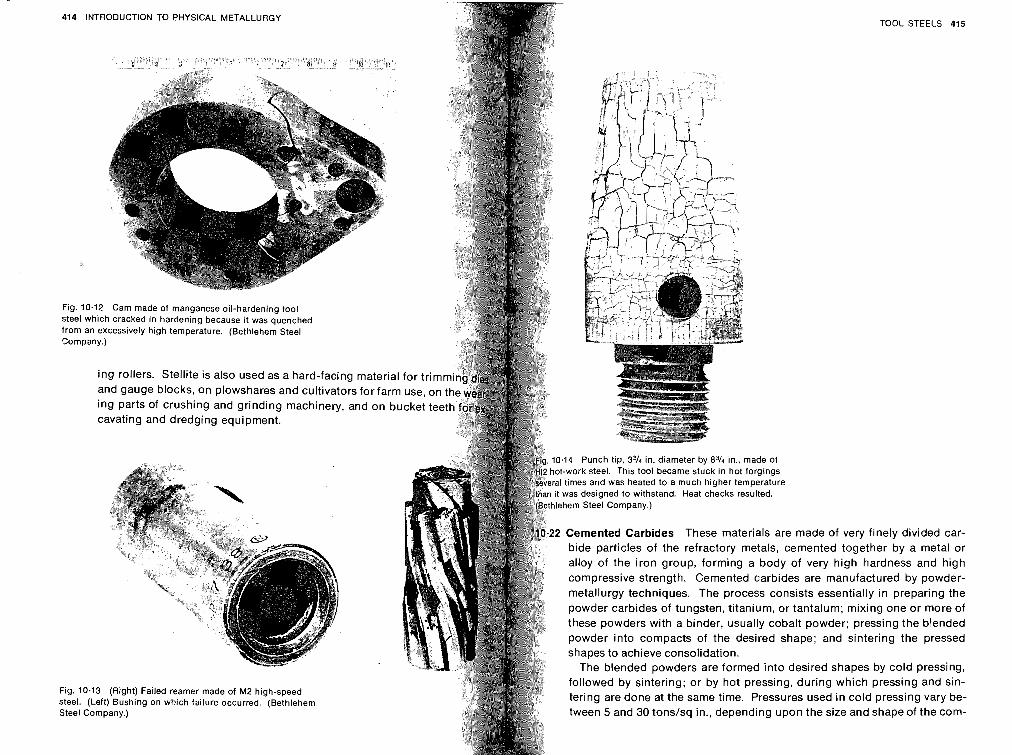
414 INTRODUCTION TO PHYSICAL METALLURGY
Fig. 10.12 Cam made of manganese oil-hardening tool steel which cracked in hardening because i t was quenched from an excessively high temperature. (Bethlehem Steel Company.)
ing rollers. Stellite is also used as a hard-facing material and gauge blocks, on plowshares and cultivators for farm ing parts of crushing and grinding machinery, and on b~ cavating and dredging equipment.
Fig. 10.13 (Right) Failed reamer made of M2 high-speed steel. (Left) Bushing on which failure occurred. (Bethlehem Steel Company.)
TOOL STEELS 415
10.14 Punch tip. 33/4 in. diameter by 8314 in.. made of hot-work steel. This tool became stuck in hot forgings
I times and was heated to a much higher temperature was designed to withstand. Heat checks resulted.
thlehem Steel Company.)
2 Cemented Carbides These materials are made of very finely divided car- bide particles of the refractory metals, cemented together by a metal or alloy of the iron group, forming a body of very high hardness and high compressive strength. Cemented carbides are manufactured by powder- metallurgy techniques. The process consists essentially in preparing the powder carbides of tungsten, titanium, or tantalum; mixing one or more of these powders with a binder, usually cobalt powder; pressing the blended powder into compacts of the desired shape; and sintering the pressed shapes to achieve consolidation.
The blended powders are formed into desired shapes by cold pressing, followed by sintering; or by hot pressing, during which pressing and sin- tering are done at the same time. Pressures used in cold pressing vary be- tween 5 and 30 tonslsq in., depending upon the size and sh of the com-
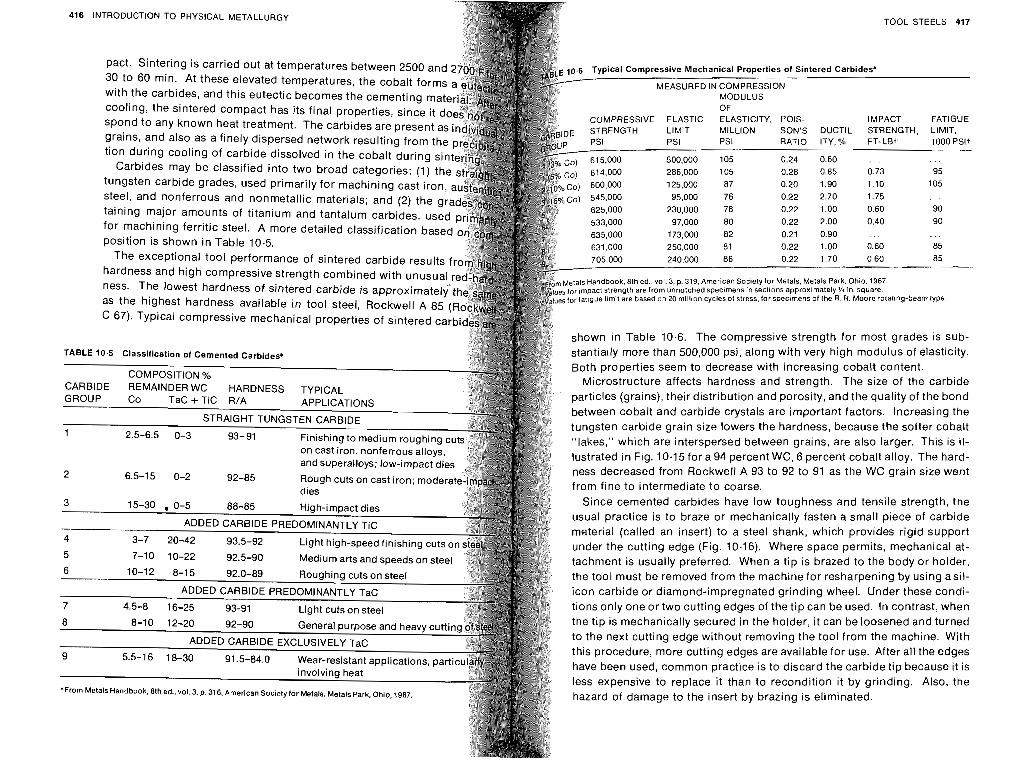
416 INTRODUCTION TO PHYSICAL METALLURGY TOOL STEELS 417
pact. Sintering is carried out at temperatures between 2500 and 30 to 60 min. At these elevated temperatures, the cobalt forms
cooling, the sintered compact has its final properties, since it spend to any known heat treatment. The carbides are present grains, and also as afinely dispersed network resulting from t tion during Cooling of carbide dissolved in the cobalt during
Carbides may be classified into two broad categories: (I) th 286,000 105 0.28 0.85
tungsten carbide grades, used primarily for machining cast iron, 125,000 87 0.20 1.90 1.10 105
95,000 76 0.22 2.70 1.75 . . . steel, and nonferrous and nonmetallic materials; and (2) the gr 0.22 1.00 0.60 90 taining major amounts of titanium and tantalum carbides, used 0.22 2.00 0.40 90
for machining ferritic Steel. A more detailed classification based position is shown in Table 10.5.
The exceptional tool performance of sintered carbide results f
shown in Table 10.6. The compressive strength for most grades is sub-
TABLE 10.5 classification of Cemented Carbides* stantially more than 500,000 psi, along with very high modulus of elasticity. Both properties seem to decrease with increasing cobalt content.
Microstructure affects hardness and strength. The size of the carbide
particles (grains), their distribution and porosity, and the quality of the bond between cobalt and carbide crystals are important factors. Increasing the
tungsten carbide grain size lowers the hardness, because the softer cobalt "lakes," which are interspersed between grains, are also larger. This is ii- iustrated in Fig. 10.15 for a 94 percent WC, 6 percent cobalt alloy. The hard-
2 ness decreased from Rockwell A 93 to 92 to 91 as the WC grain size went
6.5-15 0-2 from fine to intermediate to coarse. Since cemented carbides have low toughness and tensile strength, the
usual practice is to braze or mechanically fasten a small piece of carbide material (called an insert) to a steel shank, which provides rigid support under the cutting edge (Fig. 10.16). Where space permits, mechanical at- tachment is usually preferred. When a tip is brazed to the body or holder, the tool must be removed from the machine for resharpening by using asii- icon carbide or diamond-impregnated grinding wheel. Under these condi- tions only one or two cutting edges of the tip can be used. In contrast, when the tip is mechanically secured in the holder, it can be loosened and turned to the next cutting edge without removing the tool from the machine. With this procedure, more cutting edges are available for use. After all the edges have been used, common practice is to discard the carbide tip because it is less expensive to replace it than to recondition it by grinding. Also, the
hazard of damage to the insert by brazing is eliminated.
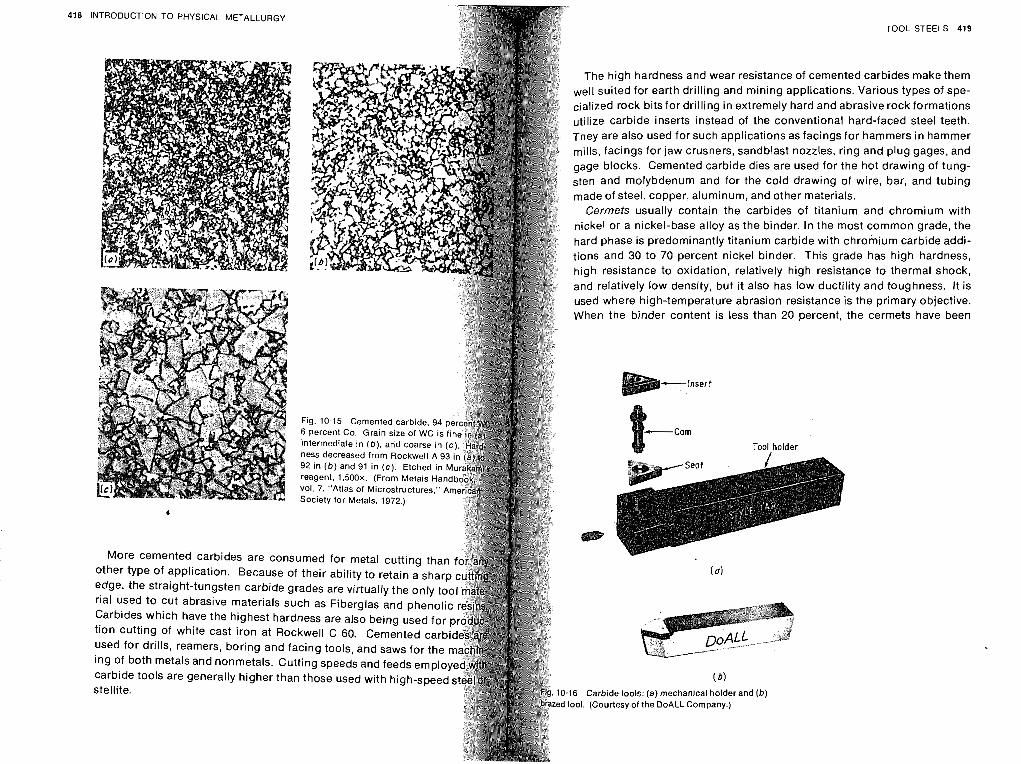
TOOL STEELS 419
The high hardness and wear resistance of cemented carbides make them well suited for earth drilling and mining applications. Various types of spe- cialized rock bits for drilling in extremely hard and abrasive rock formations utilize carbide inserts instead of the conventional hard-faced steel teeth. They are also used for such applications as facings for hammers in hammer mills, facings for jaw crushers, sandblast nozzles, ring and plug gages, and gage blocks. Cemented carbide dies are used for the hot drawing of tung- sten and molybdenum and for the cold drawing of wire, bar, and tubing made of steel, copper, aluminum, and other materials.
Cermets usually contain the carbides of titanium and chromium with nickel or a nickel-base alloy as the binder. In the most common grade, the hard phase is predominantly titanium carbide with chromium carbide addi- tions and 30 to 70 percent nickel binder. This grade has high hardness, high resistance to oxidation, relatively high resistance to thermal shock, and relatively low density, but it also has low ductility and toughness. It is used where high-temperature abrasion resistance is the primary objective. When the binder content is less than 20 percent, the cermets have been
Cam Tool,holder
[ b ) .I6 Carbide tools: (a) mechanical holder and ( b ) tool. (Courtesy of the DoALL Company.)
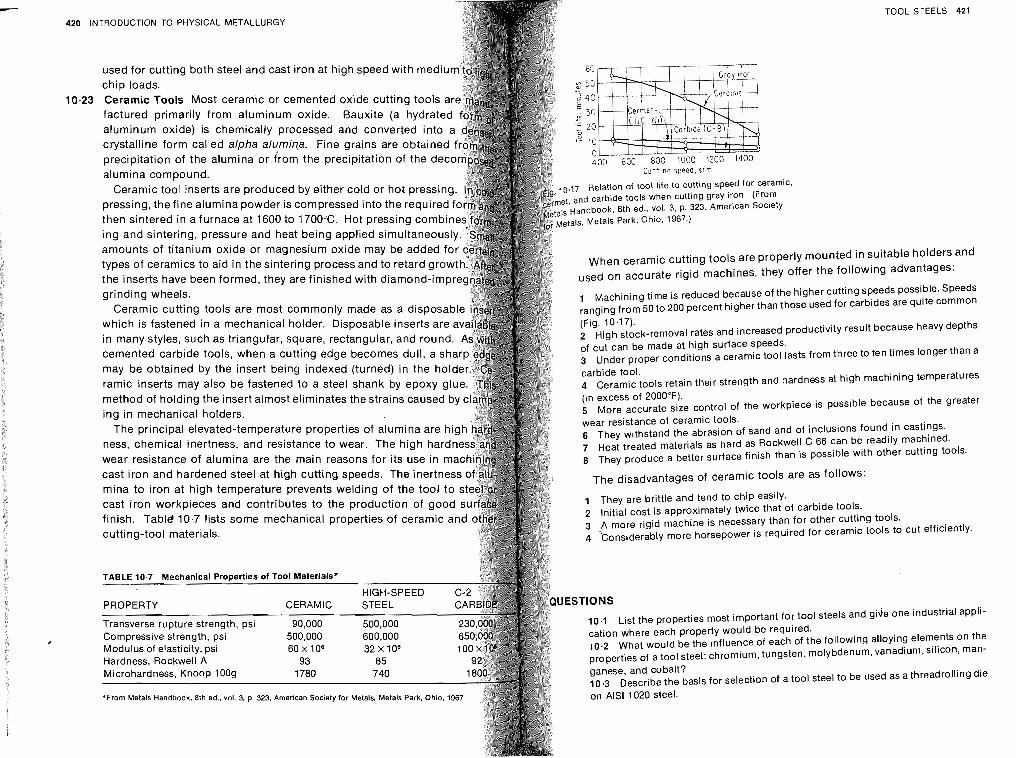
420 INTRODUCTION TO PHYSICAL METALLURGY TOOL STEELS 421
used for cutting both steel and cast iron at high speed with medi chip loads. Ceramic Tools Most ceramic or cemented oxide cutting tools
aluminum oxide) is chemically processed and converted into crystalline form called alpha alurniqa. Fine grains are obtaine Precipitation of the alumina or from the precipitation of the dec alumina compound.
0,.,7 Relation of tool life to cutting speed for ceramic. et, and carbide tools when cutting gray iron. (From
a,s 8th ed., VOI. 3, p. 323, American Society then sintered in a furnace at 1600 to 1700°C. ~ o t pressing comb ~ ~ t ~ l s , Metals Park, Ohio, 1967.) ing and sintering, pressure and heat being applied simultaneou
When ceramic cutting tools are properly mounted in suitable holdersand used on accurate rigid machines, they offer the following advantages:
grinding wheels. 1 Machining time is reduced because of the higher cutting speeds possible. Speeds
Ceramic cutting tools are most commonly made as a disposabl 50 to 200 percent higher than those used for carbides are quite COmnon which is fastened in a mechanical holder. Disposable inserts are a in many styles, such as triangular, square, rectangular, and round. cemented carbide tools, when a cutting edge becomes dull, a sha of cut can be made at high surface speeds.
3 Under proper conditions a ceramic tool lasts from three to ten times iongerthan a may be obtained by the insert being indexed (turned) in the hold
carbide tool. ramie inserts may atso be fastened to a steel shank by epoxy glu 4 ceramic tools retain their strength and hardness at high machining temperatures method of holding the insert almost eliminates the strains caused by (in excess of 2000°F). ing in mechanical holders. 5 M~~~ accurate size control of the workpiece is possible because of the greater
wear resistance of ceramic tools. 6 ~h~~ withstand the abrasion of sand and of inclusions found in castings.
7 Heat treated materials as hard as Rockwell C 66 Can be readily machined. wear resistance of alumina are the main reasons for its use in 8 ~h~~ produce a better surface finish than is possible with other cutting tools. cast iron and hardened steel at high cutting speeds. The inertn
The disadvantages of ceramic tools are as follows:
1 They are brittle and tend to chip easily.
finish. Table 10.7 lists some mechanical properties of ceramic an 2 initial cost is approximately twice that of carbide tools.
cutting-tool materials. 3 p more rigid machine is necessary than for other cutting tools.
4 Considerably more horsepower is required for ceramic tools to cut efficiently.
10.1 ~ i ~ t the properties most important for tool steels and gide one industrialappli- cation where each property would be required. 10.2 What would be the influence of each of the following alloying elements On the properties of at001 steel: chromium, tungsten, molybdenum, vanadium, silicon, n~an-
ganese, and cobalt? 10.3 Describe the basis for selection of a tool steel to be used as athreadrolling die on AlSl 1020 steel.
L 422 INTRODUCTION TO PHYSICAL METALLURGY
10.4 Describe the heat treatment you would apply to the tool steel selecte tion 10.3 and the reasons for this heat treatment. 10.5 Same as Questions 10.3 and 10.4, for a die to be used to cold-head bearing rollers. 10.6 Using the equation given below, plot a graph showing the dimensional inches per inches, when spheroidite changes to austenite as the carbo varies from 0 to 1.40 percent.
Dimensional change, in./in. = 0.1555 + 0.0075 (percent'c)
10.7 Same as Question 10.6 for the change from austenite to martensite ing carbon, using the following formula:
Dimensional change, in./in. = 0.0155 - 0.0018 (percent C)
10.8 Plot the net dimensional change for the reaction spheroidite -+ au martensite as the carbon content varies from 0 to 1.40 percent. (Hint: Use introduction Cast irons, like steels, are basically alloys of iron and carbon. tions given in Questions 10.6 and 10.7 to determine an equation for the n sional change.) In relation to the iron-iron carbide diagram, cast irons contain a greater
amount of carbon than that necessary to saturate austenite at the eutectic
REFERENCES temperature. Therefore, cast irons contain between 2 and 6.67 percent carbon. Since high carbon content tends to make the cast iron very brittle,
Allegheny Ludlum Steel Corporation: "Tool Steel Handbook," Pittsburgh, most commercially manufactured types are in the range of 2.5 to 4 percent American lron and Steel Institute: Steel Products Manual, "Tool Steels,"
1970. American Society for Metals: "Metals Handbook," 7th ed., 1948; 8th ed., 19 The ductility of cast iron is very low, and it cannot be rolled, drawn, or
and vol 7, 1972, Metals Park, Ohio. worked at room temperature. Most of the cast irons are not malleable at American Society of Tool and Manufacturing Engineers: "Tool Engineer any temperature. However, they melt readily and can be cast into compli-
book," 2d ed., McGraw-Hill Book Company, New York, 1959. cated shapes which are usually machined to final dimensions. Since cast- Bethlehem Steel Company: "The Tool Steel Trouble Shooter Handbo
Bethlehem, Pa., 1952. ing is the only suitable process applied to these alloys, they are known as
Palmer, F. R., and G. V. Luerssen: "Tool Steel Simplified," 2d ed., Carpen Co., Reading, Pa., 1948. Although the common cast irons are brittle and have lower strength
Roberts, G. A,, J. C. Hamaker, and A. R. Johnson: "Tool Steels," American properties than most steels, they are cheap, can be cast more readily than for Metals, Metals Park, Ohio, 1962. steel, and have other useful properties. In addition, by proper alloying,
Seabright, L. 4.: "The Selection and Hardening of Tool Steels," McGraw-Hi Company, New York, 1950. good foundry control, and appropriate heat treatment, the properties of any
type of cast iron may be varied over a wide range. Significant developments in fo;ndry control have led to the production of large tonnages of cast irons whose properties are generally consistent.
Types of Cast lron The best method of classifying cast iron is according to metallographic structure. There are four variables to be considered which lead to the different types of cast iron, namely the carbon content, the alloy and impurity content, the cooling rate during and after freezing, and the heat treatment after casting. These variables control the condition of the carbon and also its physical form. The carbon may be combined as iron carbide in cementite, or it may exist as free carbon in graphite. The shape and distribution of the free carbon particles will greatly influence the
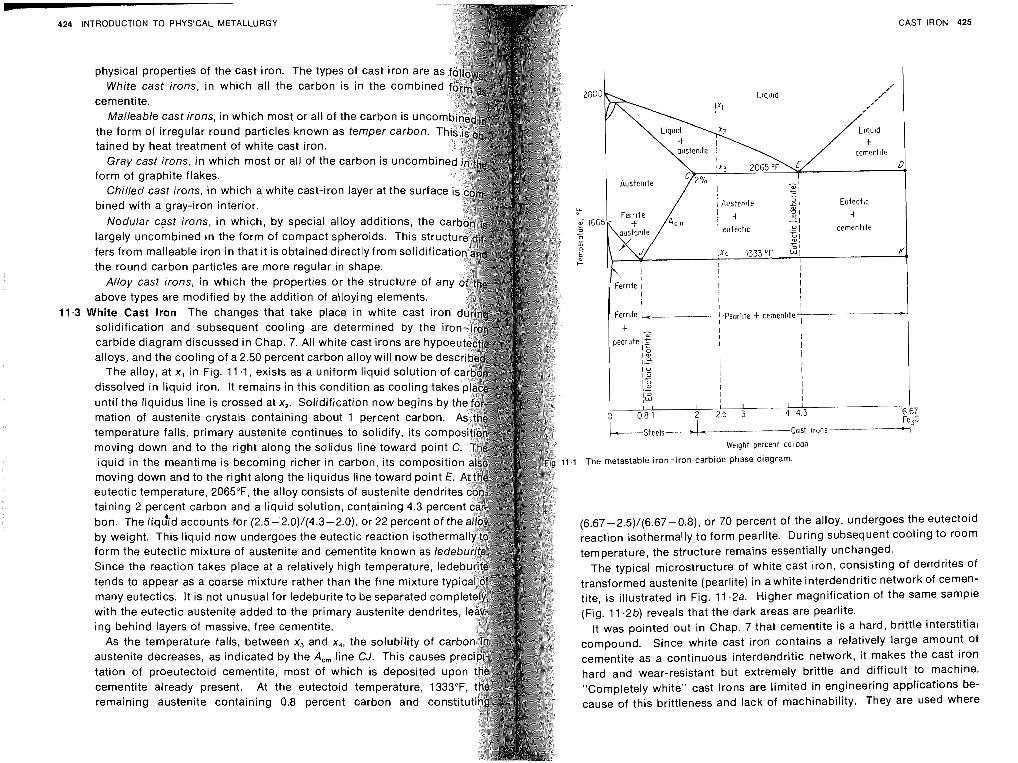
C
424 INTRODUCTION TO PHYSICAL METALLURGY
physical properties of the cast iron. The types of cast iron are White cast irons, in which all the carbon is in the combin
cementite. Malleable cast irons, in which most or all of the carbon is unc
the form of irregular round particles known as temper carbon. tained by heat treatment of white cast iron.
Gray cast irons, in which most or all of the carbon is uncomb form of graphite flakes.
Chilled cast irons, in which a white cast-iron layer at the surfa bined with a gray-iron interior.
Nodular cast irons, in which, by special alloy additions, the largely uncombined in the form of compact spheroids. This str fers from malleable iron in that it is obtained directly from solidifica the round carbon particles are more regular in shape.
Alloy cast irons, in which the properties or the structure of an above types are modified by the addition of alloying elements.
White Cast Iron The changes that take place in white cast iron solidification and subsequent cooling are determined by the ir carbide diagram discussed in Chap. 7. All white cast irons are hypo alloys, and the cooling of a 2.50 percent carbon alloy will now be des
The alloy, at x, in Fig. 11 . I , exists as a uniform liquid solution of dissolved in liquid iron. It remains in this condition as cooling ta until the liquidus line is crossed at x,. Solidification now begins mation of austenite crystals containing about 1 percent carbon. temperature falls, primary austenite continues to solidify, its moving down and to the right along the solidus line toward poin liquid in the meantime is becoming richer in carbon, its com moving down and to the right along the liquidus line toward point eutectic temperature, 2065"F, the alloy consists of austenite dendrites taining 2 percent carbon and a liquid solution, containing 4.3 perce bon. The liqGd accounts for (2.5-2.0)/(4.3-2.0). or 22 percent of th by weight. This liquid now undergoes the eutectic reaction isotherm form the eutectic mixture of austenite and cementite known as lede Since the reaction takes place at a relatively high temperature, led tends to appear as a coarse mixture rather than the fine mixture ty many eutectics. It is not unusual for ledeburite to be separated compl with the eutectic austenite added to the primary austenite dendrites, ing behind layers of massive, free cementite.
As the temperature falls, between x, and x,, the solubility of car austenite decreases, as indicated by the A,, line CJ. This causes tation of proeutectoid cementite, most of which is deposited u cementite already present. At the eutectoid temperature, 133 remaining austenite containing 0.8 percent carbon and constitu
CAST IRON 425
V4e1ght percent carbon
.I The metastable iron-iron carbide phase diagram.
(6.67-2.5)/(6.67-0.8), or 70 percent of the alloy, undergoes the eutectoid reaction isothermally to form pearlite. During subsequent cooling to room temperature, the structure remains essentially unchanged.
The typical microstructure of white cast iron, consisting of dendrites of transformed austenite (pearlite) in a white interdendritic network of cemen- tite, is illustrated in Fig. 11.2a. Higher magnification of the same sample (Fig. 11.2b) reveals that the dark areas are pearlite.
It was pointed out in Chap. 7 that cementite is a hard, brittle interstitial compound. Since white cast iron contains a relatively large amount of cementite as a continuous interdendritic network, i t makes the cast iron hard and wear-resistant but extremely brittle and difficult to machine. "Completely white" cast irons are limited in engineering applications be- cause of this brittleness and lack of machinability. They are used where
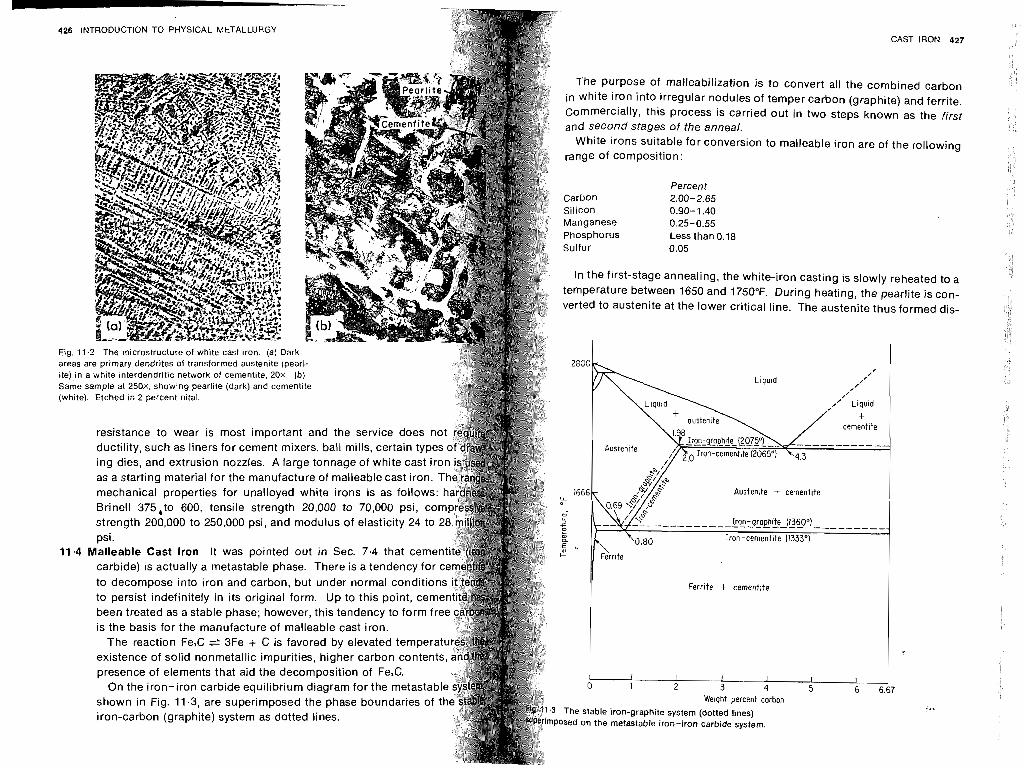
1 426 INTRODUCTION TO PHYSICAL METALLURGY
Fig. 11.2 The microstructure of white cast iron. (a) Dark areas are primary dendrites of transformed austenite (pearl- ite) in a white interdendritic network of cementite, 20X. (b) Same sample at 250x, showing pearlite (dark) and cementite (white). Etched in 2 percent nital.
resistance to wear is most important and the service does no ductility, such as liners for cement mixers, ball mills, certain typ ing dies, and extrusion nozzles. A large tonnage of white cast i as a starting material for the manufacture of malleable cast iron. mechanical properties for unalloyed white irons is as follows: Brinell 375,to 600, tensile strength 20,000 to 70,000 psi, co strength 200,000 to 250,000 psi, and modulus of elasticity 24 to psi.
11.4 Malleable Cast Iron It was pointed out in Sec. 7.4 that ceme carbide) is actually a metastable phase. There is a tendency for to decompose into iron and carbon, but under normal condition to persist indefinitely in its original form. Up to this point, cem been treated as a stable phase; however, this tendency to form fr is the basis for the manufacture of malleable cast iron.
The reaction Fe,C 3Fe + C is favored by elevated tempera existence of solid nonmetallic impurities, higher carbon content presence of elements that aid the decomposition of Fe,C.
On the iron-iron carbide equilibrium diagram for the metastab shown in Fig. 11.3, are superimposed the phase boundaries of iron-carbon (graphite) system as dotted lines.
CAST IRON 427
The purpose of malleabilization is to convert all the combined carbon in white iron into irregular nodules of temper carbon (graphite) and ferrite. commercially, this process is carried out in two steps known as the first and second stages of the anneal.
White irons suitable for conversion to malleable iron are of the rollowing range of composition:
Percent Carbon 2.00-2.65 Silicon 0.90- 1.40 Manganese 0.25-0.55 phosphorus Less than 0.18 sulfur 0.05
In the first-stage annealing, the white-iron casting is slowly reheated to a temperature between 1650 and 1750°F. During heating, the pearlite is con- verted to austenite at the lower critical line. The austenite thus formed dis-
Ferrtte f cementite
I I 1 I I I
0 1 2 3 4 5 6 6.6 We~ght percent corbon
The stable iron-graphite system (dotted lines) ~osed on the metastable iron-iron carbide system
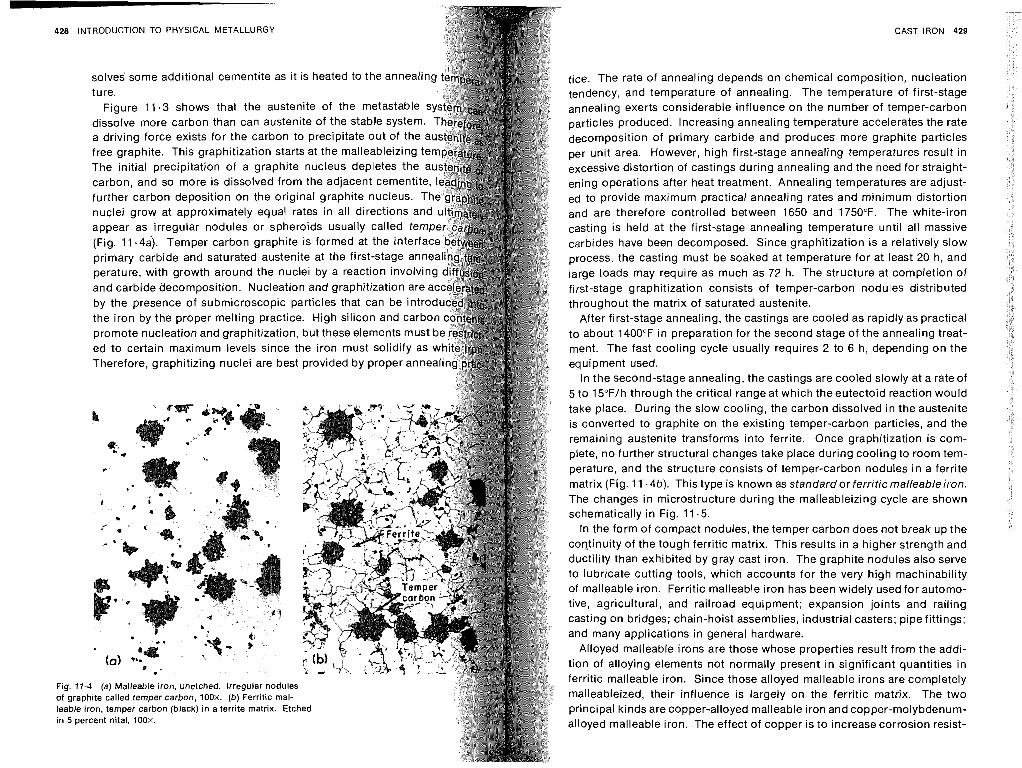
428 INTRODUCTION TO PHYSICAL METALLURGY
ture. Figure 11.3 shows that the austenite of the metastable
dissolve more carbon than can austenite of the stable system a driving force exists for the carbon to precipitate out of the free graphite. This graphitization starts at the malleableizing t
further carbon deposition on the original graphite nucleus.
(Fig. 11.4a). Temper carbon graphit primary carbide and saturated austenite at the first-stage an perature, with growth around the nuclei by a reaction involv
the iron by the proper melting practice. High silicon and carbo promote nucleation and graphitization, but these elements must ed to certain maximum levels since the iron must solidify as Therefore, graphitizing nuclei are best provided by proper annea
leable iron, temper carbon (black) in a ferrite matrix. Etched in 5 percent nital, 100X.
CAST IRON 429
tice. The rate of annealing depends on chemical composition, nucleation tendency, and temperature of annealing. The temperature of first-stage annealing exerts considerable influence on the number of temper-carbon particles produced. Increasing annealing temperature accelerates the rate decomposition of primary carbide and produces more graphite particles per unit area. However, high first-stage annealing temperatures result in excessive distortion of castings during annealing and the need for straight- ening operations after heat treatment. Annealing temperatures are adjust- ed to provide maximum practical annealing rates and minimum distortion and are therefore controlled between 1650 and 1750°F. The white-iron casting is held at the first-stage annealing temperature until all massive carbides have been decomposed. Since graphitization is a relatively slow process, the casting must be soaked at temperature for at least 20 h, and large loads may require as much as 72 h. The structure at completion of first-stage graphitization consists of temper-carbon nodules distributed throughout the matrix of saturated austenite.
After first-stage annealing, the castings are cooled as rapidly as practical to about 1400°F in preparation for the second stage of the annealing treat- ment. The fast cooling cycle usually requires 2 to 6 h, depending on the equipment used.
In the second-stage annealing, the castings are cooled slowly at a rate of 5 to 15"FIh through the critical range at which the eutectoid reaction would take place. During the slow cooling, the carbon dissolved in the austenite is converted to graphite on the existing temper-carbon particles, and the remaining austenite transforms into ferrite. Once graphitization is com- plete, no further structural changes take place during cooling to room tem- perature, and the structure consists of temper-carbon nodules in a ferrite matrix (Fig. 11.4b). This type is known as standard or ferritic malleable iron. The changes in microstructure during the malleableizing cycle are shown schematically in Fig. 11.5.
In the form of compact nodules, the temper carbon does not break up the coqtinuity of the tough ferritic matrix. This results in a higher strength and ductility than exhibited by gray cast iron. The graphite nodules also serve to lubricate cutting tools, which accounts for the very high machinability of malleable iron. Ferritic malleable iron has been widely used for automo- tive, agricultural, and railroad equipment; expansion joints and railing casting on bridges; chain-hoist assemblies, industrial casters; pipe fittings; and many applications in general hardware.
Alloyed malleable irons are those whose properties result from the addi- tion of alloying elements not normally present in significant quantities in ferritic malleable iron. Since those alloyed malleable irons are completely malleableized, their influence is largely on the ferritic matrix. The two principal kinds are copper-alloyed malleable iron and copper-molybdenum- alloyed malleable iron. The effect of copper is to increase corrosion resist-
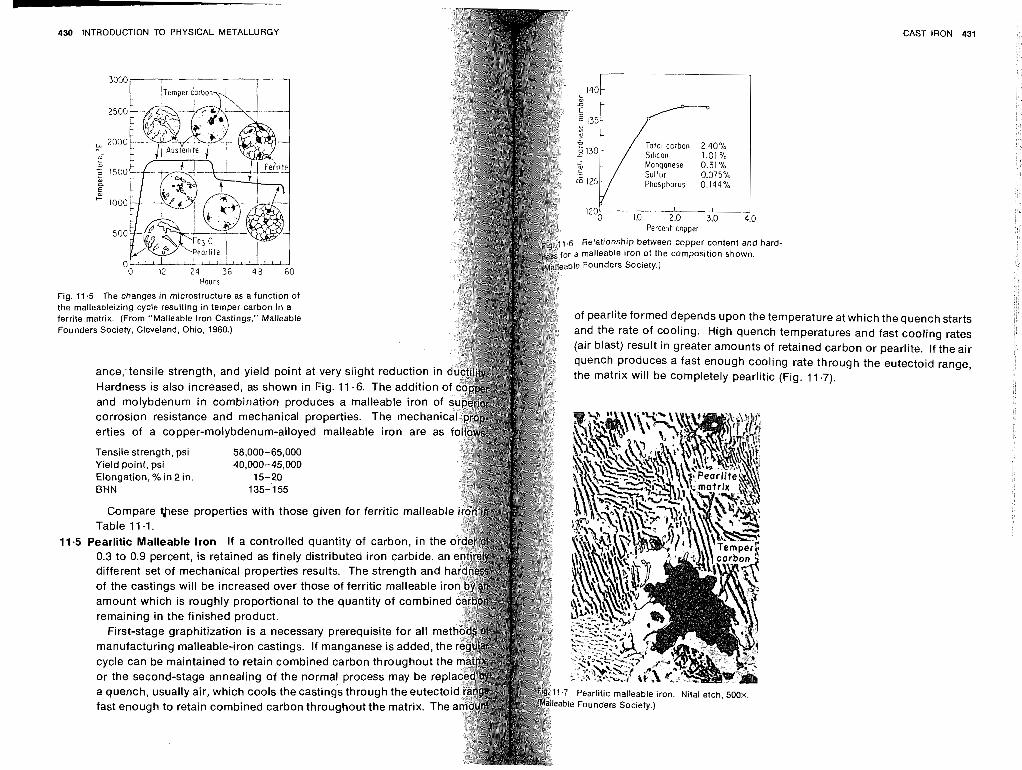
CAST IRON 431
L
430 INTRODUCTION TO PHYSICAL METALLURGY
3060
2500
, 2000
m >
1500 a
2 + 1000
500
r a malleable iron of the composition shown.
C ble Founders Society.) 0 12 24 36 4 8 60
Hour s
Fig. 11.5 The changes in microstructure as a function of the malleableizing cycle resulting in temper carbon in a ferrite matrix. (From "Malleable Iron Castings," Malleable of pearlite formed depends Upon the temperature at which the quench starts Founders Society, Cleveland, Ohio, 1960.) and the rate of cooling. High quench temperatures and fast cooling rates
(air blast) result in greater amounts of retained carbon or pearlite. If the air quench produces a fast enough cooling rate through the eutectoid range,
ance,tensile strength, and yield point at very slight reducti the matrix will be completely pearlitic (Fig. 11.7). Hardness is also increased, as shown in Fig. 11.6. The add and molybdenum in combination produces a malleable iron corrosion resistance and mechanical properties. The mecha erties of a copper-molybdenum-alloyed malleable iron are as
Tensile strength, psi 58,000-65,000 Yield point, psi 40,000-45,000
15-20 Elongation, O/O in 2 in. BHN 135-155
Compare qese properties with those given for ferritic malleabl Table 11 . I .
11.5 Pearlitic Malleable lron If a controlled quantity of carbon, in t 0.3 to 0.9 percent, is retained as finely distributed iron carbide, different set of mechanical properties results. The strength an of the castings will be increased over those of ferritic malleable i amount which is roughly proportional to the quantity of combine remaining in the finished product.
First-stage graphitization is a necessary prerequisite for all m manufacturing malleable-iron castings. If manganese is added, th cycle can be maintained to retain combined carbon throughout or the second-stage annealing of the normal process may be r a quench, usually air, which cools the castings through thee fast enough to retain combined carbon throughout the matrix. The
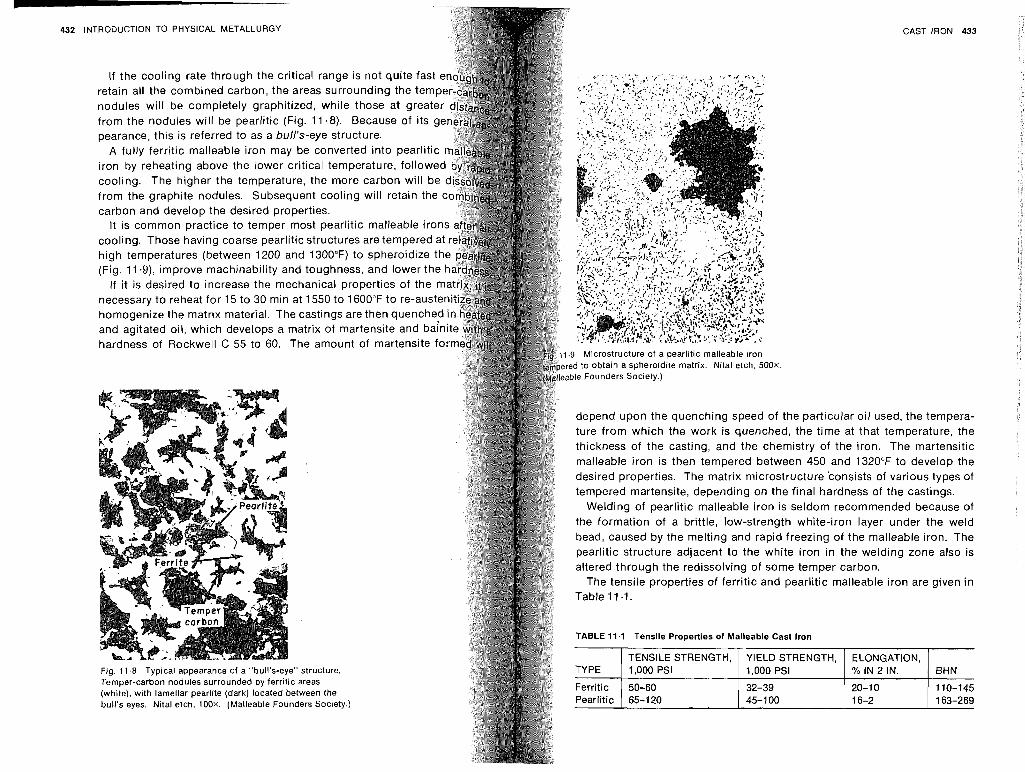
CAST IRON 433 432 INTRODUCTION TO PHYSICAL METALLURGY
pearance, this is referred to as a bull's-eye structure. A fully ferritic malleable iron may be converted into pearlitic
iron by reheating above the lower critical temperature, followe cooling. The higher the temperature, the more carbon will be from the graphite nodules. Subsequent cooling will retain the c carbon and develop the desired properties.
It is common practice to temper most pearlitic malleable irons
(Fig. 11.9), improve machinability and toughness, and lower the
necessary to reheat for 15 to 30 min at 1550 to 1600°F to re-auste homogenize the matrix material. The castings are then quenched i and agitated oil, which develops a matrix of martensite and ba/ni
to obtain a spheroidite matrix. Nital etch. 500x. Founders Society.)
depend upon the quenching speed of the particular oil used, the tempera- ture from which the work is quenched, the time at that temperature, the thickness of the casting, and the chemistry of the iron. The martensitic malleable iron is then tempered between 450 and 1320°F to develop the desired properties. The matrix microstructure consists of various types of tempered martensite, depending on the final hardness of the castings.
Welding of pearlitic malleable iron is seldom recommended because of the formation of a brittle, low-strength white-iron layer under the weld bead, caused by the melting and rapid freezing of the malleable iron. The pearlitic structure adjacent to the white iron in the welding zone also is altered through the redissolving of some temper carbon.
The tensile properties of ferritic and pearlitic malleable iron are given in
TABLE 11.1 Tensile Properties of Malleable Cast Iron
Fig. 11 43 Typical appearance of a "bull's-eye" structure. Temper-carbon nodules surrounded by ferritic areas (white), with lamellar pearlite (dark) located between the bull's eyes. Nital etch, 100X. (Malleable Founders Society.)
TENSILE STRENGTH, YIELD STRENGTH, TYPE 1,000 PSI 1,000 PSI
Ferritic 50-60 32-39 Pearlitic 65-120 45-1 00
ELONGATION, % IN 2 IN.
20-1 0 16-2
- -
BHN
110-145 163-269
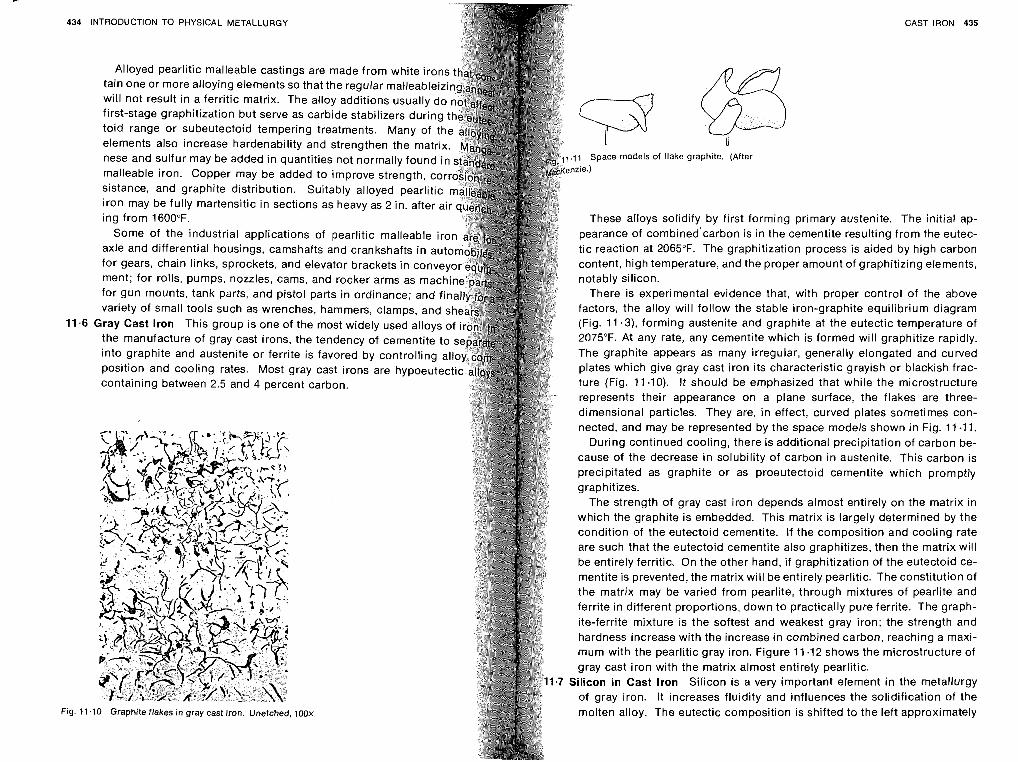
- 434 INTRODUCTION TO PHYSICAL METALLURGY
11.6
Fig. 11
Alloyed pearlltlc malleable castings are made from white iro tain one or more alloying elements so that the regular malleable will not result in a ferritic matrix. The alloy additlons usually do flrst-stage graphitization but serve as carbide stablllzers during toid range or subeutectold tempering treatments. Many of th elements also Increase hardenability and strengthen the matri nese and sulfur may be added in quantities not normally found i malleable iron. Copper may be added to improve strength, c slstance, and graphlte distribution. Suitably alloyed pearlitic lron may be fully martensitlc in sections as heavy as 2 in. after ai Ing from 1600°F.
Some of the Industrial appllcatlons of pearlltic malleable iro axle and differential housrngs, camshafts and crankshafts in aut for gears, chain links, sprockets, and elevator brackets in conve ment, for rolls, pumps, nozzles, cams, and rocker arms as mac for gun mounts, tank parts, and pistol parts in ordinance; and f variety of small tools such as wrenches, hammers, clamps, and
Gray Cast lron This group IS one of the most wldely used alloys of i the manufacture of gray cast irons, the tendency of cementite to s Into graphlte and austenlte or ferrite IS favored by controlling all positlon and cooling rates. Most gray cast irons are hypoeutecti containing between 2.5 and 4 percent carbon.
10 Graph~te flakes In gray cast Iron Unetched, lOOx
CAST IRON 435
.I 1 Space models of flake graphite. (After nzie.)
These alloys solidify by first forming primary austenite. The initial ap- pearance of combined'carbon is in the cementite resulting from the eutec- tic reaction at 2065°F. The graphitization process is aided by high carbon content, high temperature, and the proper amount of graphitizing elements, notably silicon.
There is experimental evidence that, with proper control of the above factors, the alloy will follow the stable iron-graphite equilibrium diagram (Fig. 11.3), forming austenite and graphite at the eutectic temperature of 2075°F. At any rate, any cementite which is formed will graphitize rapidly. The graphite appears as many irregular, generally elongated and curved plates which give gray cast iron its characteristic grayish or blackish frac- ture (Fig. 1 1 .lo). It should be emphasized that while the microstructure represents their appearance on a plane surface, the flakes are three- dimensional particles. They are, in effect, curved plates sometimes con- nected, and may be represented by the space models shown in Fig. 11 -1 1.
During continued cooling, there is additional precipitation of carbon be- cause of the decrease in solubility of carbon in austenite. This carbon is precipitated as graphite or as proeutectoid cementite which promptly graphitizes.
The strength of gray cast iron depends almost entirely on the matrix in which the graphite is embedded. This matrix is largely determined by the condition of the eutectoid cementite. If the composition and cooling rate are such that the eutectoid cementite also graphitizes, then the matrix will be entirely ferritic. On the other hand, if graphitization of the eutectoid ce- mentite is prevented, the matrix will be entirely pearlitic. The constitution Of
the matrix may be varied from pearlite, through mixtures of pearlite and ferrite in different proportions, down to practically pure ferrite. The graph- ite-ferrite mixture is the softest and weakest gray iron; the strength and hardness increase with the increase in combined carbon, reaching a maxi- mum with the pearlitic gray iron. Figure 11 .I2 shows the microstructure of gray cast iron with the matrix almost entirely pearlitic.
Silicon in Cast lron Silicon is a very important element in the metallurgy of gray iron. It increases fluidity and influences the solidification of the molten alloy. The eutectic composition is shifted to the left approximately
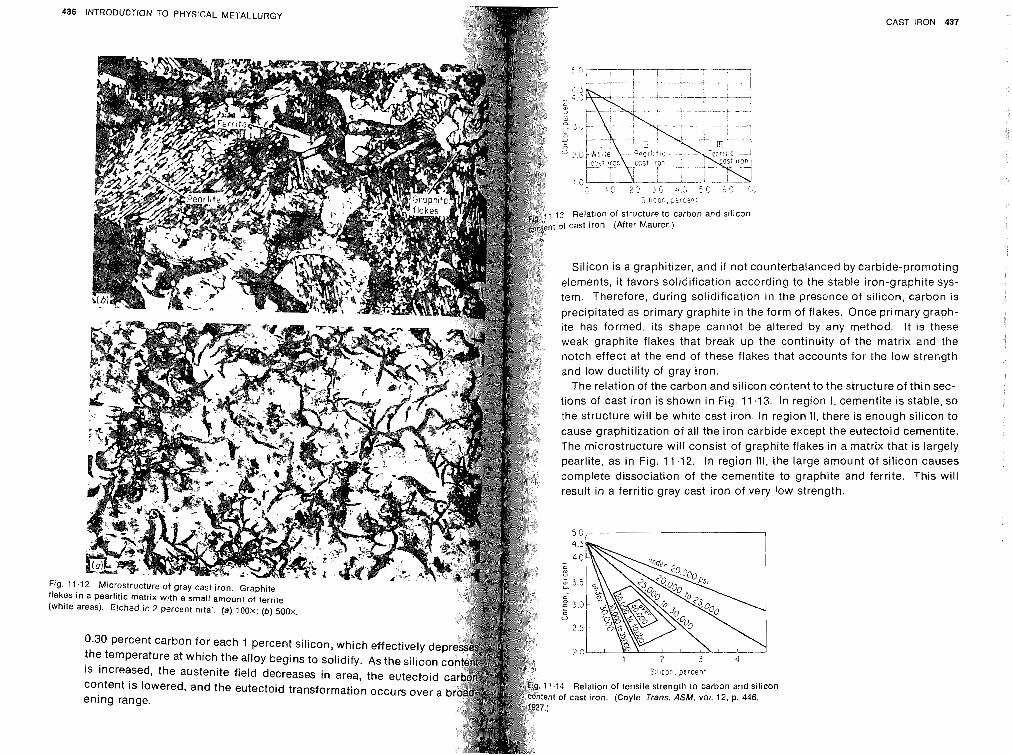
436
Fig. 1 flakes (white
CAST IRON 437
S i l i ~ o r , pc-rcer:
3 Relation of structure to carbon and silicon of cast Iron. (After Maurer.)
Silicon is a graphitizer, and if not counterbalanced by carbide-promoting elements, it favors solidification according to the stable iron-graphite sys- tem. Therefore, during solidification in the presence of silicon, carbon is precipitated as primary graphite in the form of flakes. Once primary graph- ite has formed, its shape cannot be altered by any method. It is these weak graphite flakes that break up the continuity of the matrix and the notch effect at the end of these flakes that accounts for the low strength and low ductility of gray iron.
The relation of the carbon and silicon content to the structure of thin sec- tions of cast iron is shown in Fig. 11.13. In region I, cementite is stable, so the structure will be white cast iron. In region 11, there is enough silicon to cause graphitization of all the iron carbide except the eutectoid cementite. The microstructure will consist of graphite flakes in a matrix that is largely pearlite, as in Fig. 11.12. In region Ill, the large amount of silicon causes complete dissociation of the cementite to graphite and ferrite. This will result in a ferritic gray cast iron of very low strength.
Silicon, percen t
1.14 Relation of tensile strength to carbon and silicon i t of cast iron. (Coyle, Trans. ASM, vol. 12, p. 446,
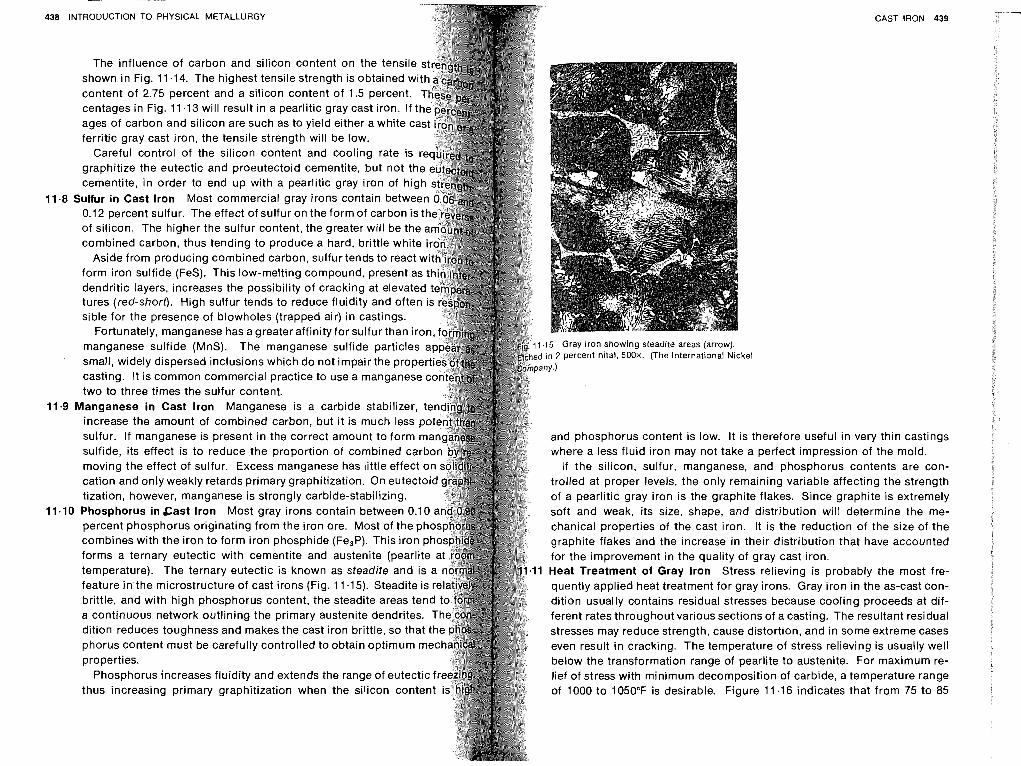
--
INTRODUCTION TO PHYSICAL METALLURGY
The influence of carbon and silicon content on the tensile shown in Fig. 11.14. The highest tensile strength is obtained w content of 2.75 percent and a silicon content of 1.5 percent. centages in Fig. 11.13 will result in a pearlitic gray cast iron. If ages of carbon and silicon are such as to yield either a white c ferritic gray cast iron, the tensile strength will be low.
Careful control of the silicon content and cooling rate is graphitize the eutectic and proeutectoid cementite, but not th cementite, in order to end up with a pearlitic gray iron of hi
.8 Sulfur in Cast lron Most commercial gray irons contain betw 0.1 2 percent sulfur. The effect of sulfur on the form of carbon of silicon. The higher the sulfur content, the greater will be the combined carbon, thus tending to produce a hard, brittle white
Aside from producing combined carbon, sulfur tends to react form iron sulfide (FeS). This low-melting compound, present as dendritic layers, increases the possibility of cracking at elevated tures (red-short). High sulfur tends to reduce fluidity and often sible for the presence of blowholes (trapped air) in castings.
Fortunately, manganese has a greater affinity for sulfur than iro manganese sulfide (MnS). The manganese sulfide particles small, widely dispersed inclusions which do not impair the prope casting. It is common commercial practice to use a manganese two to three times the sulfur content.
.9 Manganese in Cast lron Manganese is a carbide stabilizer, te increase the amount of combined carbon, but it is much less sulfur. If manganese is present in the correct amount to form sulfide, its effect is to reduce .the proportion of combine moving the effect of sulfur. Excess manganese has little effect on cation and only weakly retards primary graphitization. On eutectoi tization, however, manganese is strongly carbide-stabilizing.
. I 0 Phosphorus in gast lron Most gray irons contain between 0.10 percent phosphorus originating from the iron ore. Most of the pho combines with the iron to form iron phosphide (Fe,P). This iron ph forms a ternary eutectic with cementite and austenite (pearlite temperature). The ternary eutectic is known as steadite and is feature in the microstructure of cast irons (Fig. 11.15). Steadite is re brittle, and with high phosphorus content, the steadite areas tend a continuous network outlining the primary austenite dendrites. T dition reduces toughness and makes the cast iron brittle, so that th phorus content must be carefully controlled to obtain optimum mec properties.
Phosphorus increases fluidity and extends the range of eutectic fr thus increasing primary graphitization when the silicon content
CAST IRON 439
15 Gray iron showing steadite areas (arrow). in 2 percent nital, 500x. (The International Nickel
ny.)
and phosphorus content is low. It is therefore useful in very thin castings where a less fluid iron may not take a perfect impression of the mold.
If the silicon, sulfur, manganese, and phosphorus contents are con- trolled at proper levels, the only remaining variable affecting the strength of a pearlitic gray iron is the graphite flakes. Since graphite is extremely soft and weak, its size, shape, and distribution will determine the me- chanical properties of the cast iron. It is the reduction of the size of the graphite flakes and the increase in their distribution that have accounted for the improvement in the quality of gray cast iron. Heat Treatment of Gray lron Stress relieving is probably the most fre- quently applied heat treatment for gray irons. Gray iron in the as-cast con- dition usually contains residual stresses because cooling proceeds at dif- ferent rates throughout various sections of a casting. The resultant residual stresses may reduce strength, cause distortion, and in some extreme cases even result in cracking. The temperature of stress relieving is usually well below the transformation range of pearlite to austenite. For maximum re- lief of stress with minimum decomposition of carbide, a temperature range of 1000 to 1050°F is desirable. Figure 11.16 indicates that from 75 to 85
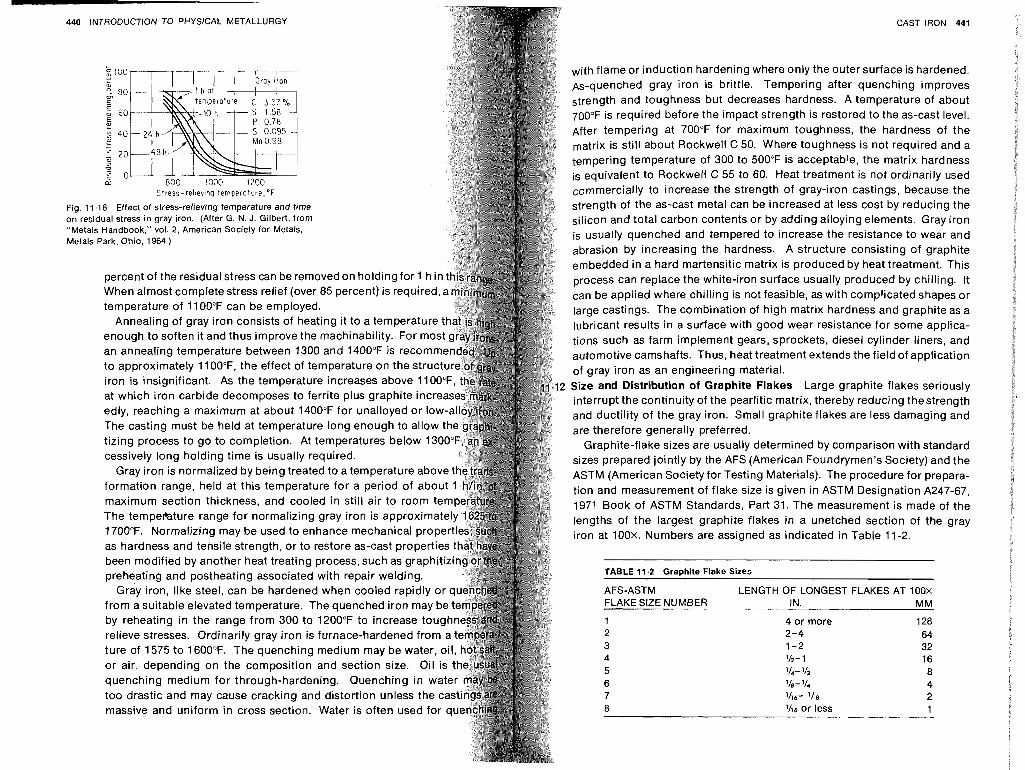
440 lNTROOUCTlON TO PHYSICAL METALLURGY
Fig. 11 on resi "Metal Metals
Stress-rel~evinq temperoture,'F
.16 Effect of stress-relieving temperature and time dual stress in gray iron. (After G. N. J. Gilbert, from s Handbook," vol. 2, American Society for Metals. Park, Ohio, 1964.)
percent of the residual stress can be removed on holding for 1 h i When almost complete stress relief (over 85 percent) is required, temperature of 11 00°F can be employed.
Annealing of gray iron consists of heating it to a temperature enough to soften it and thus improve the machinability. For most an annealing temperature between 1300 and 1400°F is recomm to approximately 1 10O0F, the effect of temperature on the struct iron is insignificant. As the temperature increases above 1100 at which iron carbide decomposes to ferrite plus graphite increa edly, reaching a maximum at about 1400°F for unalloyed or low- The casting must be held at temperature long enough to allow t tizing process to go to completion. At temperatures below 130 cessively long holding time is usually required.
Gray iron is normalized by being treated to a temperature abov formation range, held at this temperature for a period of abou maximum section thickness, and cooled in still air to room te The tempeFature range for normalizing gray iron is approxim 1700°F. Normalizing may be used to enhance mechanical pro as hardness and tensile strength, or to restore as-cast propertle been modified by another heat treating process, such as graphiti preheating and postheating associated with repair welding.
Gray iron, like steel, can be hardened when cooled rapidly or from a suitable elevated temperature. The quenched iron may be by reheating in the range from 300 to 1200°F to increase tou relieve stresses. Ordinarily gray iron is furnace-hardened ture of 1575 to 1600°F. The quenching medium may be w or air, depending on the composition and section size. Oil is quenching medium for through-hardening. Quenching in wat too drastic and may cause cracking and distortion unless the casti massive and uniform in cross section. Water is often used for qu
CAST IRON 441
with flame or induction hardening where only the outer surface is hardened. A~-quenched gray iron is brittle. Tempering after quenching improves strength and toughness but decreases hardness. A temperature of about 700°F is required before the impact strength is restored to the as-cast level. After tempering at 700°F for maximum toughness, the hardness of the matrix is still about Rockwell C 50. Where toughness is not required and a tempering temperature of 300 to 500°F is acceptable, the matrix hardness is equivalent to Rockwell C 55 to 60. Heat treatment is not ordinarily used commercially to increase the strength of gray-iron castings, because the strength of the as-cast metal can be increased at less cost by reducing the silicon and total carbon contents or by adding alloying elements. Gray iron is usually quenched and tempered to increase the resistance to wear and abrasion by increasing the hardness. A structure consisting of graphite embedded in a hard martensitic matrix is produced by heat treatment. This process can replace the white-iron surface usually produced by chilling. It can be applied where chilling is not feasible, as with complicated shapes or large castings. The combination of high matrix hardness and graphite as a lubricant results in a surface with good wear resistance for some applica- tions such as farm implement gears, sprockets, diesel cylinder liners, and automotive camshafts. Thus, heat treatment extends the field of application of gray iron as an engineering material. Size and Distribution of Graphite Flakes Large graphite flakes seriously interrupt the continuity of the pearlitic matrix, thereby reducing thestrength and ductility of the gray iron. Small graphite flakes are less damaging and are therefore generally preferred.
Graphite-flake sizes are usually determined by comparison with standard sizes prepared jointly by the AFS (American Foundrymen's Society) and the ASTM (American Society for Testing Materials). The procedure for prepara- tion and measurement of flake size is given in ASTM Designation A247-67, 1971 Book of ASTM Standards, Part 31. The measurement is made of the lengths of the largest graphite flakes in a unetched section of the gray iron at 100X. Numbers are assigned as indicated in Table 11 -2.
TABLE 11.2 Graphite Flake Sizes
AFS-ASTM LENGTH OF LONGEST FLAKES AT 100X FLAKE SIZE NUMBER IN. MM
1 4 or more 128 2 2-4 64 3 1-2 32 4 l l z - 1 16 5 l1.r '12 8 6 '/e- % 4 7 '116- '18 2 8 'A6 or less 1
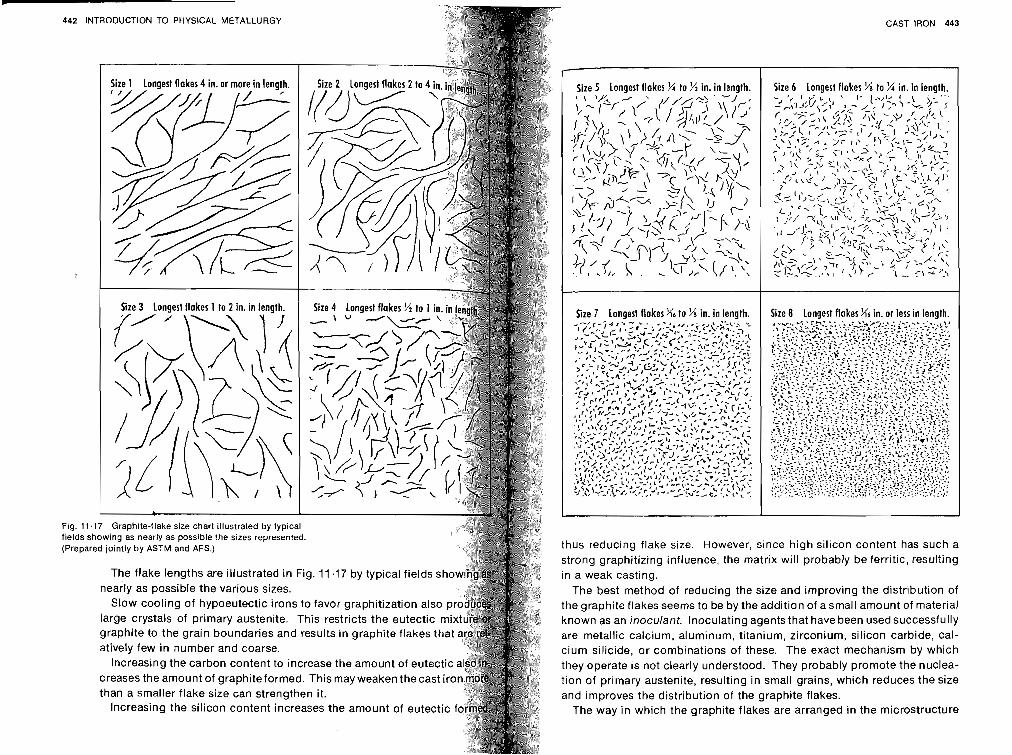
CAST IRON 443
thus reducing flake size. However, since high silicon content has such a strong graphitizing influence, the matrix will probably be ferritic, resulting in a weak casting.
The best method of reducing the size and improving the distribution of the graphite flakes seems to be by the addition of a small amount of material known as an inoculant. Inoculating agents that have been used successfully are metallic calcium, aluminum, titanium, zirconium, silicon carbide, cal- cium silicide, or combinations of these. The exact mechanism by which they operate is not clearly understood. They probably promote the nuclea- tion of primary austenite, resulting in small grains, which reduces the size and improves the distribution of the graphite flakes.
The way in which the graphite flakes are arranged in the microstructure
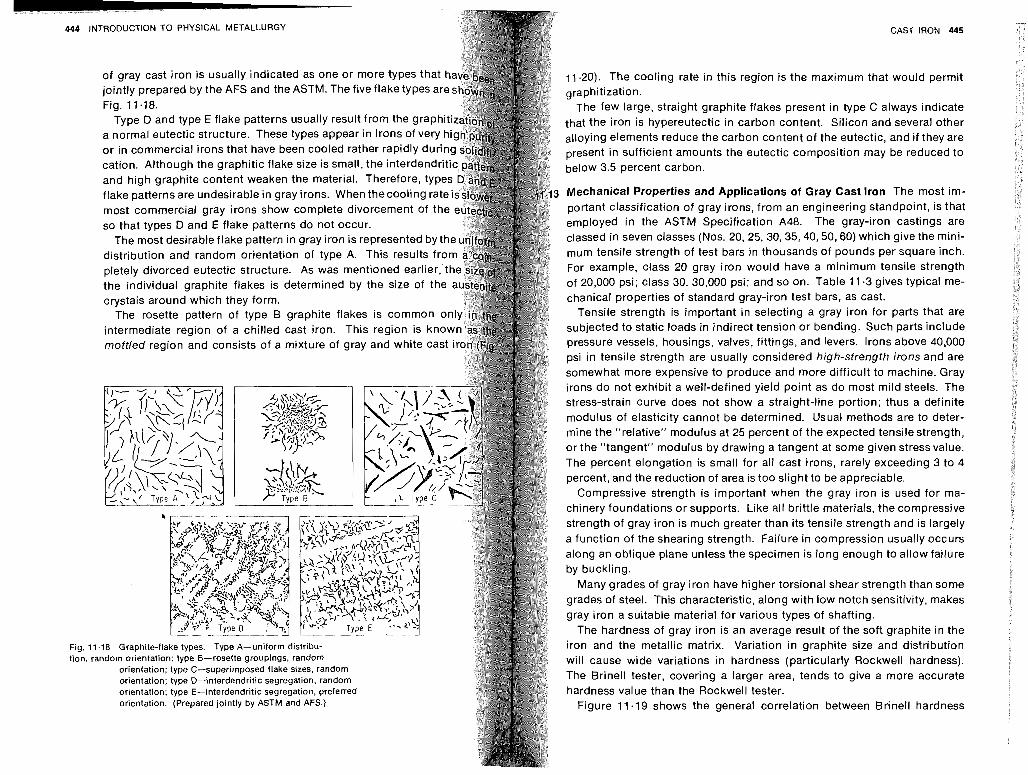
444 INTRODUCTION TO PHYSICAL METALLURGY
of gray cast iron is usually indicated as one or more types that jointly prepared by the AFS and the ASTM. The five flake types ar Fig. 11.18.
Type D and type E flake patterns usually result from the grap a normal eutectic structure. These types appear in irons of very or in commercial irons that have been cooled rather rapidly du cation. Although the graphitic flake size is small, the interde and high graphite content weaken the material. Therefore, flake patterns are undesirable in gray irons. When thecooling rat most commercial gray irons show complete divorcement of th so that types D and E flake patterns do not occur.
The most desirable flake pattern in gray iron is represented by t distribution and random orientation of type A. This results fr pletely divorced eutectic structure. As was mentioned earlier, the individual graphite flakes is determined by the size of th crystals around which they form.
The rosette pattern of type B graphite flakes is common o intermediate region of a chilled cast iron. This region is kn moffled region and consists of a mixture of gray and white ca
Fig. 11.18 Graphite-flake types. Type A-uniform distribu- tion, random orientation; type 6-rosette groupings, random
orientation; type C-superimposed flake sizes, random orientation; type D-interdendritic segregation, random orientation; type E-interdendritic segregation, preferred orientation. (Prepared jointly by ASTM and AFS.)
CAST IRON 445
11.20). The cooling rate in this region is the maximum that would permit graphitization.
The few large, straight graphite flakes present in type C always indicate that the iron is hypereutectic in carbon content. Silicon and several other alloying elements reduce the carbon content of the eutectic, and if they are present in sufficient amounts the eutectic composition may be reduced to below 3.5 percent carbon.
Mechanical Properties and Applications of Gray Cast Iron The most im- portant classification of gray irons, from an engineering standpoint, is that employed in the ASTM Specification A48. The gray-iron castings are classed in seven classes (Nos. 20, 25, 30,35,40,50,60) which give the mini- mum tensile strength of test bars in thousands of pounds per square inch. For example, class 20 gray iron would have a minimum tensile strength of 20,000 psi; class 30, 30,000 psi; and so on. Table 11.3 gives typical me- chanical properties of standard gray-iron test bars, as cast.
Tensile strength is important in selecting a gray iron for parts that are subjected to static loads in indirect tension or bending. Such parts include pressure vessels, housings, valves, fittings, and levers. Irons above 40,000 psi in tensile strength are usually considered high-strength irons and are somewhat more expensive to produce and more difficult to machine. Gray irons do not exhibit a well-defined yield point as do most mild steels. The stress-strain curve does not show a straight-line portion; thus a definite modulus of elasticity cannot be determined. Usual methods are to deter- mine the "relative" modulus at 25 percent of the expected tensile strength, or the "tangent" modulus by drawing a tangent at some given stressvalue. The percent elongation is small for all cast irons, rarely exceeding 3 to 4 percent, and the reduction of area is too slight to be appreciable.
Compressive strength is important when the gray iron is used for ma- chinery foundations or supports. Like all brittle materials, the compressive strength of gray iron is much greater than its tensile strength and is largely a function of the shearing strength. Failure in compression usually occurs along an oblique plane unless the specimen is long enough to allow failure by buckling.
Many grades of gray iron have higher torsional shear strength than some grades of steel. This characteristic, along with low notch sensitivity, makes gray iron a suitable material for various types of shafting.
The hardness of gray iron is an average result of the soft graphite in the iron and the metallic matrix. Variation in graphite size and distribution will cause wide variations in hardness (particularly Rockwell hardness). The Brinell tester, covering a larger area, tends to give a more accurate hardness value than the Rockwell tester.
Figure 11.19 shows the general correlation between Brinell hardness

L 446 INTRODUCTION TO PHYSICAL METALLURGY
m a w
m
Hardness, br~nel l number
$9 General correlation between Brinell hardness mpressive strength. (After Donoho.)
CAST IRON 447
and compressive strength. This correlation is much better than that be- tween tensile strength and hardness, because the compressive strength steadily increases with increasing hardness and is not greatly influenced by microstructural variations as is the tensile strength.
The microstructure is the primary factor in determining the hardness of gray iron. Table 11.4 indicates the wide range of Brinell hardness num- bers obtainable with various iron structures. The composition also exerts
considerable effect on the hardness. Increasing carbon and silicon con- nts will result in decreasing hardness, although the effect is not as
marked on hardness as it is on tensile strength. Because gray iron is the least expensive type of casting, i t should always
be considered first when a cast metal is being selected. Another metal should be chosen only when the mechanical and physical properties of gray iron are inadequate. Examples of applications requiring a bare mini-
TABLE 11.4 The Brinell Hardness of Iron Castings Classed by General Microstructure
TYPE BHN
Ferritic (annealed) gray iron 110-140 Austenitic irons 140- 160 Soft gray iron 140-180 Pearlitic irons 160-220 Pearlitic alloy iron of low alloy content 200-250 Tempered martensitic irons 260-350 Martensitic irons 350-450 White iron, unalloyed (according to
carbon content) 280-500 Alloy white iron 450- 550 Martensitic white iron 550- 700 Nitrided iron (surface only) 900- 1,000
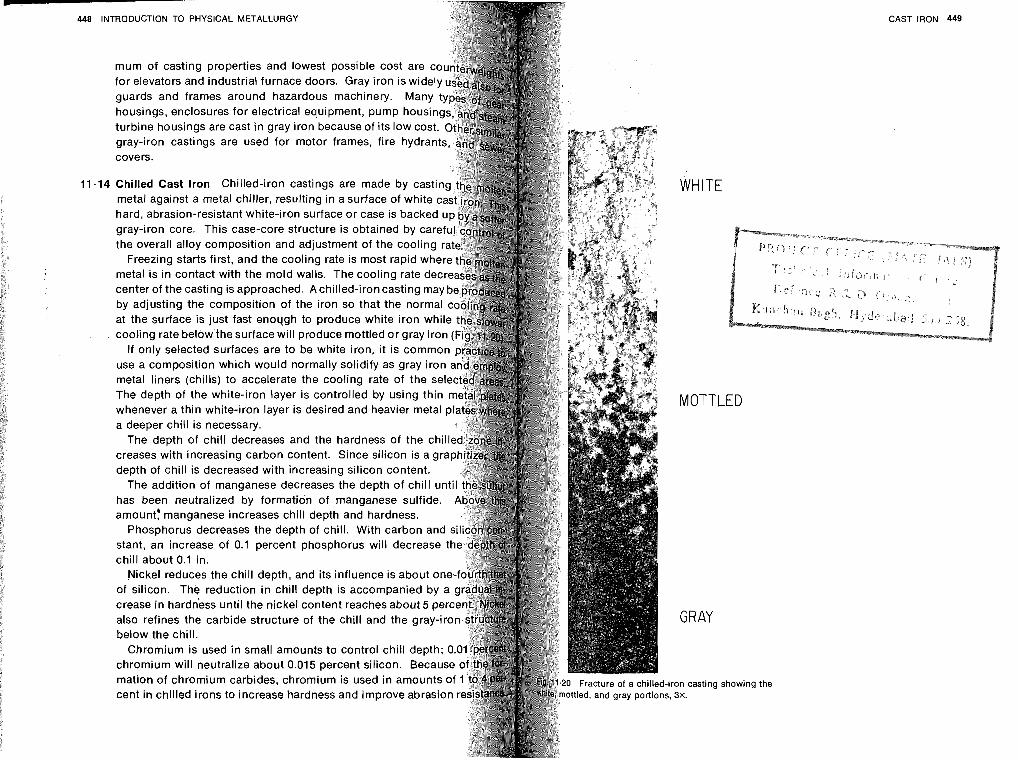
INTRODUCTION TO PHYSICAL METALLURGY
mum of casting properties and lowest possible cost are for elevators and industrial furnace doors. Gray iron is wid guards and frames around hazardous machinery. Many housings, enclosures for electrical equipment, pump housin turbine housings are cast in gray iron because of its low cos gray-iron castings are used for motor frames, fire hydran covers.
,I4 Chilled Cast Iron Chilled-iron castings are made by cast metal against a metal chiller, resulting in a surface of whit hard, abrasion-resistant white-iron surface or case is backe gray-iron core. This case-core structure is obtained by car the overall alloy composition and adjustment of the cooling
Freezing starts first, and the cooling rate is most rapid whe metal is in contact with the mold walls. The cooling rate dec center of the casting is approached. Achilled-iron casting ma by adjusting the composition of the iron so that the norm at the surface is just fast enoqgh to produce white iron w cooling rate below the surface will produce mottled or gray i
If only selected surfaces are to be white iron, i t is corn use a composition which would normally solidify as gray i metal liners (chills) to accelerate the cooling rate of the se The depth of the white-iron layer is controlled by using th whenever a thin white-iron layer is desired and heavier met a deeper chill is necessary.
The depth of chill decreases and the hardness of the chill creases with increasing carbon content. Since silicon is a gra depth of chill is decreased with increasing silicon content.
The addition of manganese decreases the depth of chill un has been neutralized by formation of manganese sulfide. amount! manganese increases chill depth and hardness.
Phosphorus decreases the depth of chill. With carbon and stant, an increase of 0.1 percent phosphorus will decrease t chill about 0.1 in.
Nickel reduces the chill depth, and its influence is about o of.silicon. The reduction in chill depth is accompanied by crease in hardn'ess until the nickel content reaches about 5 p also refines the carbide structure of the chill and the gray-i below the chill.
Chromium is used in small amounts to control chill depth; chromium will neutralize about 0.015 percent silicon. Becau mation of chromium carbides, chromium is used in amount cent in chilled irons to increase hardness and improve abras
d-ii ns.
CAST IRON 449
WHITE
MOT TI
GRAY
ion casting 3x.
showing the
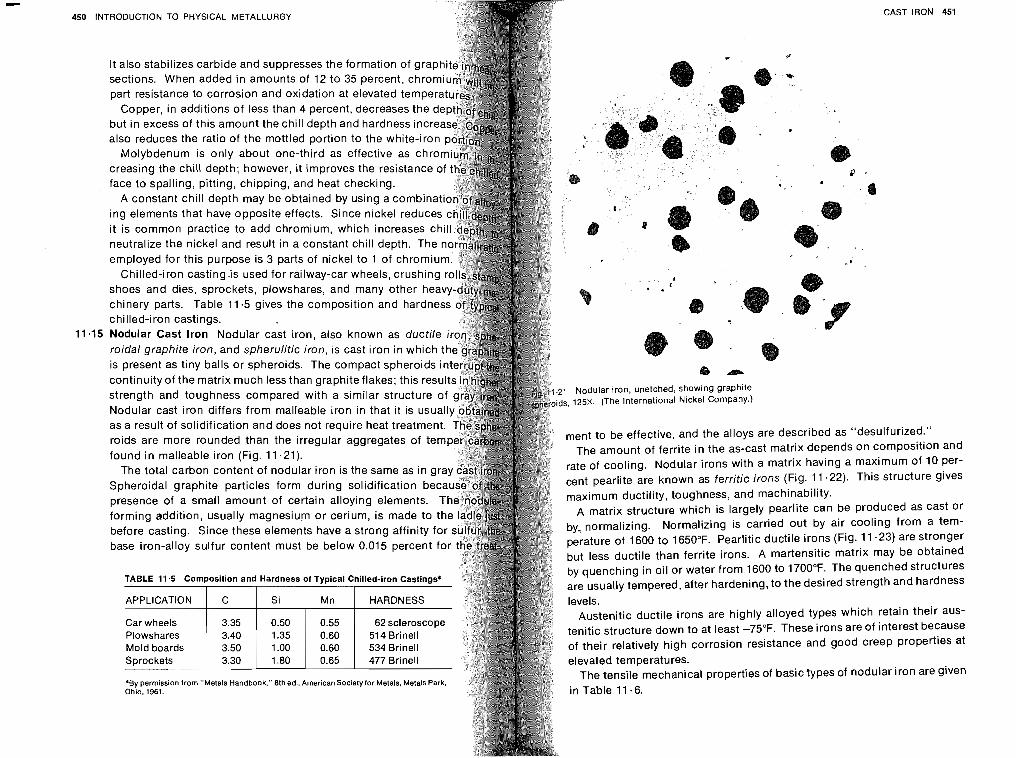
CAST IRON 451 rROOUCTlON TO PHYSICAL METALLURGY
It also stabilizes carbide and suppresses the formation of gra sections. When added in amounts of 12 to 35 percent, chro part resistance to corrosion and oxidation at elevated tempe
Copper, in additions of less than 4 percent, decreases the but in excess of this amount the chill depth and hardness incr also reduces the ratio of the mottled portion to the white-iro
Molybdenum is only about one-third as effective as chr creasing the chill depth; however, i t improves the resistance
neutralize the nickel and result in a constant chill depth. The employed for this purpose is 3 parts of nickel to 1 of chromiu
Chilled-iron casting is used for railway-car wheels, crushing shoes and dies, sprockets, plowshares, and many other hea chinery parts. Table 11.5 gives the composition and hardnes chilled-iron castings. Nodular Cast Iron Nodular cast iron, also known as ductile roidal graphite iron, and spherulitic iron, is cast iron in which
is present as tiny balls or spheroids. The compact spheroids i D 1L continuity of the matrix much less than graphite flakes; this resu
strength and toughness compared with a similar structure o 1 Nodular iron, unetched, showing graphite s, 125%. (The International Nickel Company.)
as a result of solidification and does not require heat treatment. merit to be effective, and the alloys are described as "desulfurized."
found in malleable iron (Fig. 11.21). The amount of ferrite in the as-cast matrix depends on composition and
The total carbon content of nodular iron is the same as in rate of cooling. Nodular irons with a matrix having a maximum of 10 per-
Spheroidal graphite particles form during solidification b cent pearlite are known as ferritic irons (Fig. 11.22). This structure gives
presence of a small amount of certain alloying elements. maximum ductility, toughness, and machinability.
forming addition, usually magnesium or cerium, is made to A matrix structure which is largely pearlite can be produced as cast or
before casting. Since these elements have a strong affinity f by, normalizing. Normalizing is carried out by air cooling from a tem-
base iron-alloy sulfur content must be below 0.015 percent perature of 1600 to 1650°F. Pearlitic ductile irons (Fig. 11.23) are stronger but less ductile than ferrite irons. A martensitic matrix may be obtained by quenching in oil or water from 1600 to 1700°F. The quenched structures are usually tempered, after hardening, to the desired strength and hardness
Austenitic ductile irons are highly alloyed types which retain their aus- tenitic structure down to at least -75°F. These irons are of interest because
of their relatively high corrosion resistance and good creep properties at elevated temperatures.
*By permission from "Metals Handbook." 8th ed., American Society for Metals. Metals Park, The tensile mechanical properties of basic types of nodular iron are given Ohio. 1961. in Table 11 +6.
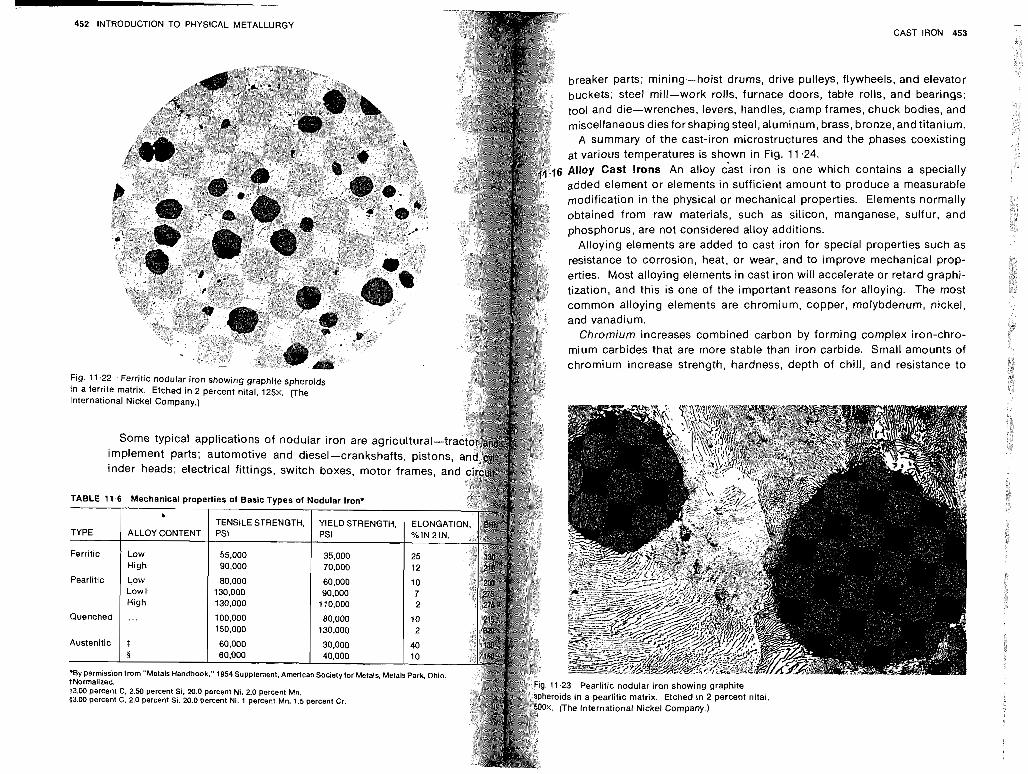
-
452 INTRODUCTION TO PHYSICAL METALLURGY CAST IRON 453
breaker parts; mining-hoist drums, drive pulleys, flywheels, and elevator buckets; steel mill-work rolls, furnace doors, table rolls, and bearings; tool and die-wrenches, levers, handles, clamp frames, chuck bodies, and ~iscellaneous dies for shaping steel, aluminum, brass, bronze, and titanium.
A summary of the cast-iron microstructures and the phases coexisting at various temperatures is shown in Fig. 11.24. Alloy Cast irons An alloy <ast iron is one which contains a specially added element or elements in sufficient amount to produce a measurable modification in the physical or mechanical properties. Elements normally obtained from raw materials, such as silicon, manganese, sulfur, and phosphorus, are not considered alloy additions.
Alloying elements are added to cast iron for special properties such as resistance to corrosion, heat, or wear, and to improve mechanical prop- erties. Most alloying elements in cast iron will accelerate or retard graphi- tization, and this is one of the important reasons for alloying. The most common alloying elements are chromium, copper, molybdenum, nickel, and vanadium.
Chromium increases combined carbon by forming complex iron-chro- mium carbides that are more stable than iron carbide. Small amounts of chromium increase strength, hardness, depth of chill, and resistance to
.23 Pearlitic nodular iron showing graphite ds in a pearlitic matrix. Etched in 2 percent nital, The International Nickel Company.)
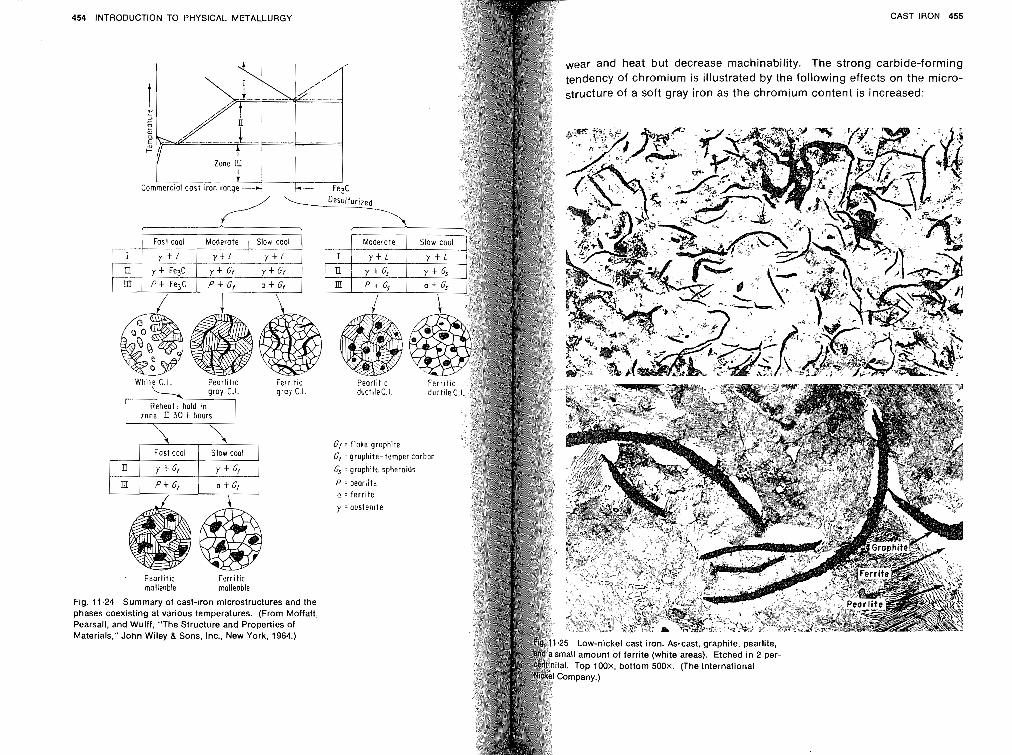
454 INTRODUCTION TO PHYSICAL METALLURGY
Fig. 1 phasc Pears Mate1
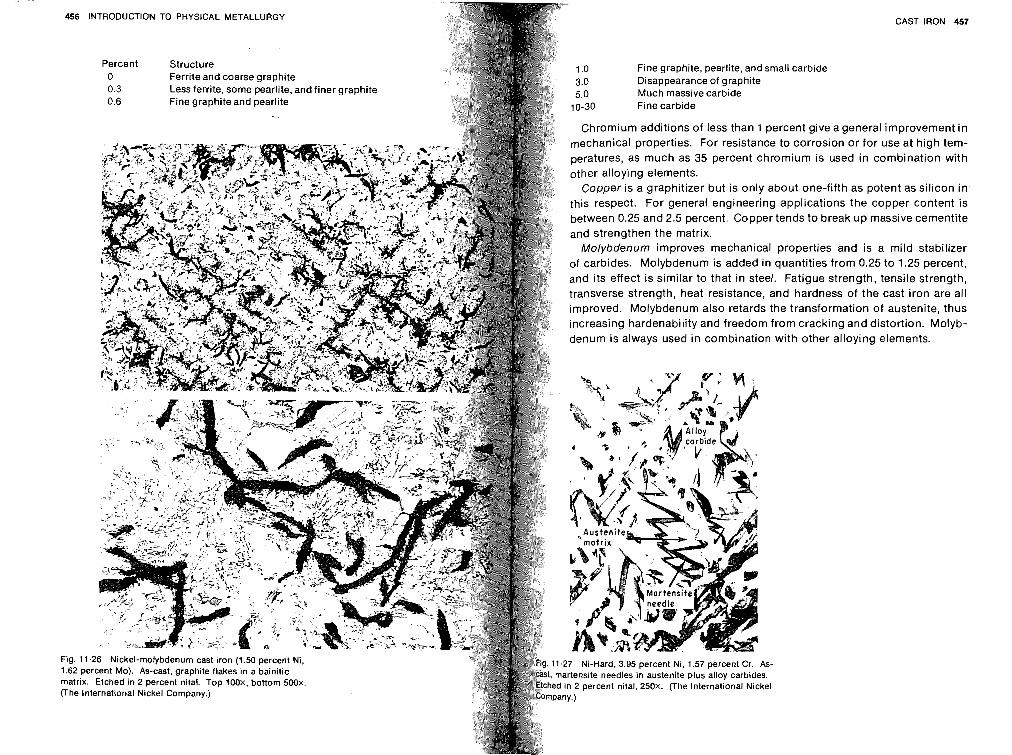
456 INTRODUCTION TO PHYSICAL METALLURGY
Fig. 11 1.62 pc matrix. (The In
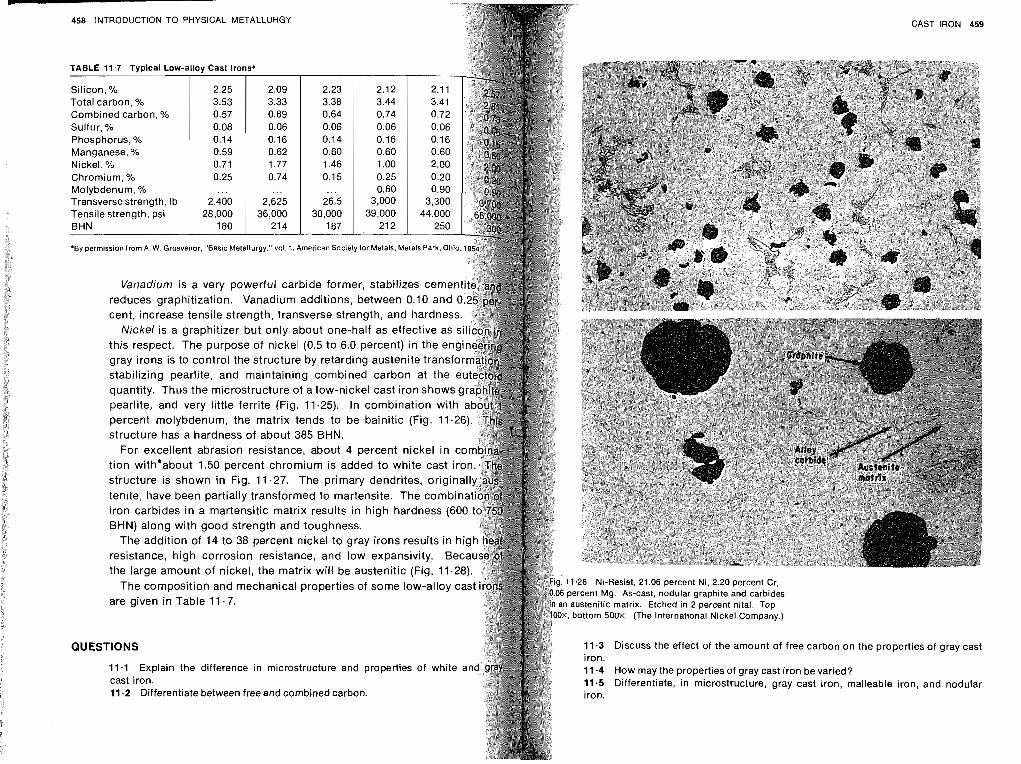
b -
458 INTRODUCTION TO PHYSICAL METALLURGY
Silicon, Total carbon, % Combined carbon, % Sulfur, % Phosphorus, % Manganese, % Nickel, O h
Chromium, %
Vanadium is a very powerful carbide former, stabilizes cemen
cent, increase tensile strength, transverse strength, and hardnes Nickel is a graphitizer but only about one-half as effective as
this respect. The purpose of nickel (0.5 to 6.0 percent) in the en
stabilizing pearlite, and maintaining combined carbon at the quantity. Thus the microstructure of a low-nickel cast iron shows pearlite, and very little ferrite (Fig. 11.25). In combination with
structure has a hardness of about 385 BHN.
structure is shown in Fig. 11.27. The primary dendrites, tenite, have been partially transformed to martensite. The
BHN) along with good strength and toughness. The addition of 14 to 38 percent nickel to gray irons results in hi
resistance, high corrosion resistance, and low expansivity. Bec
The composition and mechanical properties of some low-alloy c are given in Table 11 .7.
QUESTIONS
11 .1 Explain the difference in microstructure and properties of white a cast iron. 11.2 Differentiate between free and combined carbon.
CAST IRON 459
1.28 Ni-Resist. 21.06 percent Ni, 2.20 percent Cr, Iercent Mg. As-cast, nodular graphite and carbides austenitic matrix. Etched in 2 percent nital. Top bottom 500x. (The International Nickel Company.)
11.3 Discuss the effect of the amount of free carbon on the properties of gray cast iron. 11.4 How may the properties of gray cast iron be varied? 11.5 Differentiate, in microstructure, gray cast iron, malleable iron, and nodular iron.

460 INTRODUCTION TO PHYSICAL METALLURGY
11 43 Why are graphite flakes in gray iron very often surrounded by fe. 11.7 Why should the iron-iron carbide diagram not be used to deter tures in gray 11.8 Whvis
iron? malleable iron made onlv from hvooeutectic white iron? . .
11.9 Is it possible to make nodular iron by heat treatment? Explain. 10.10 Why should the sulfur content be low in the manufacture of nodu 11.1 1 In the manufacture of nodular iron, why are inoculants added on casting? 11 .I2 Why is welding of chilled cast irons not recommended? 11.13 Why is welding of pearlitic malleable iron not recommended? 11.14 What is the disadvantage of too high a first-stage annealing tem malleable cast iron? Too low a temperature? Explain. 11.15 Assume that a C clamp is to made of cast iron. Select a suitable t iron and explain the reasons for the selection.
lENCES
American Foundrymen's Association: "Cast Metals Handbook," Chicago, American Society for Metals: "Metals Handbook," 7th ed., 1948; 8th ed., v
vol. 2, 1964, "dl. 7, 1972, Metals Park, Ohio. American Society for Testing Materials: "Gray, Ductile and Malleable lron
Special Technical Publication no. 455, Philadelphia, 1969. Boyles, A.: "The Structure of Cast Iron," American Society for Metals, M
Ohio, 1947. Climax Molybdenum Company: "The Uses of Molybdenum in Nodular Ir
York, 1964. Gray lron Founders' Society: "Gray lron Castings Handbook," Cleveland, 1 Malleable Founders Societv: "Malleable lron Castinas." Cleveland. 1960. Merchapt, H.
Publishers,
- . D. (ed.): "Recent Research on Cast Iron," Gordon and BI
, New York, 1968. Walton C. F. (ed.): "Gray and Ductile lron Castings Handbook," Gray an
lron Founders' Society, Cleveland, 1971.
NONFERROU METALS AND ALLOYS
1 Introduction Metallic materials, when considered in a broad sense, may be divided into two large groups, ferrous and nonferrous. The ferrous materials are iron-based, and the nonferrous materials have some element other than iron as the principal constituent. The bulk of the nonferrous materials is made up of the alloys of copper, aluminum, magnesium, nickel, tin, lead, and zinc. Other nonferrous metals and alloys that are used to a lesser extent include cadmium, molybdenum, cobalt, zirconium, beryllium, titanium, tantalum, and the precious metals gold, silver, and the platinum group.
This chapter will be concerned with the more important nonferrous metals and alloys.
PPER AND COPPER ALLOYS
.2 Copper The properties of copper that are most important are high elec- trical and thermal conductivity, good corrosion resistance, machinability, strength, and ease of fabrication. In addition, copper is nonmagnetic, has a pleasing color, can be welded, brazed, and soldered, and is easily finished by plating or lacquering. Certain of these basic properties may be improved by suitable alloying. Most of the copper that is used for electrical conduc- tors contains over 99.9 percent copper and is identified as electrolytic tough-pitch copper (ETP) or oxygen-free high-conductivity copper (OFHC). Electrolytic tough-pitch copper is also used for roofing, gutters, down- spouts, automobile radiators and gaskets, kettles, vats, pressure vessels, and distillery and other process equipment. Electrolytic tough-pitch cop- per contains from 0.02 to 0.05 percent oxygen, which is combined with copper as the compound cuprous oxide (Cu,O). As cast, copper oxide and copper form an interdendritic eutectic mixture (Fig. 12-1). After working
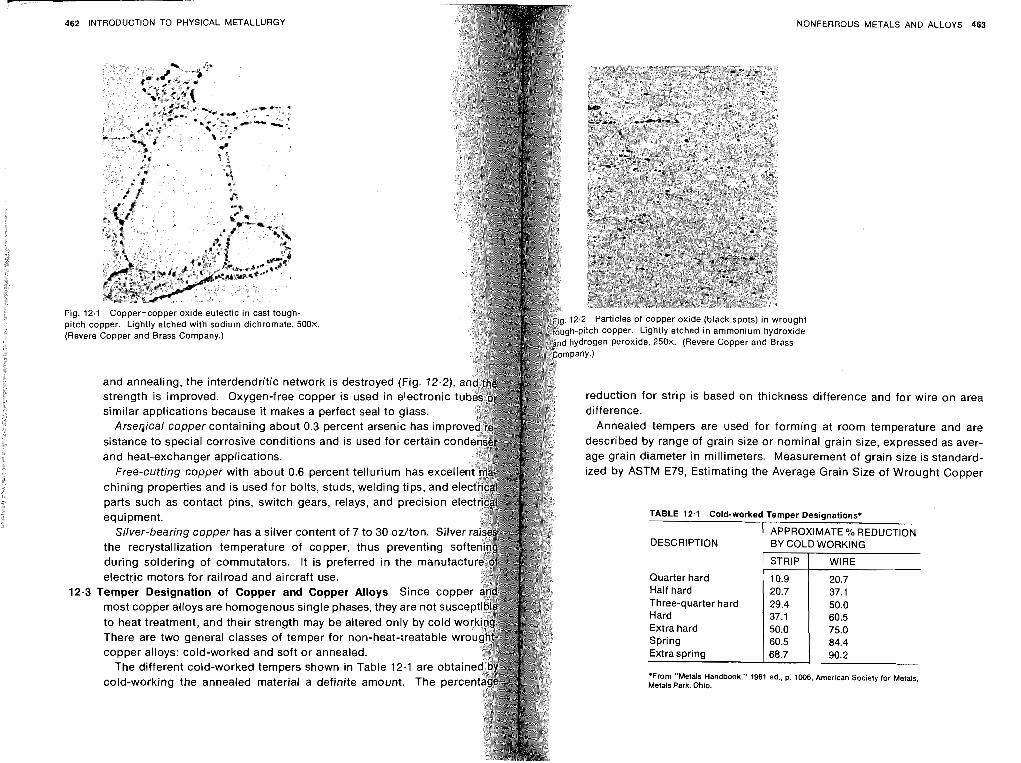
462 INTRODUCTION TO PHYSICAL METALLURGY NONFERROUS METALS AN0 ALLOYS 463
(Revere Copper and Brass Company.)
and annealing, the interdendritic network is destroyed (Fig. 12.2) strength is improved. Oxygen-free copper is used in electronic t reduction for strip is based on thickness difference and for wire on area
similar applications because it makes a perfect seal to glass. Arsegical copper containing about 0.3 percent arsenic has impr Annealed tempers are used for forming at room temperature and are
sistance to special corrosive conditions and is used for certain co described by range of grain size or nominal grain size, expressed as aver-
and heat-exchanger applications. age grain diameter in millimeters. Measurement of grain size is standard-
Free-cutting copper with about 0.6 percent tellurium has exce ized by ASTM E79, Estimating the Average Grain Size of Wrought Copper
chining properties and is used for bolts, studs, welding tips parts such as contact pins, switch gears, relays, and precision ele equipment. TABLE 12.1 Cold-worked Temper Designations*
Silver-bearing copper has a silver content of 7 to 30 oz/ton. Silver APPROXIMATE % REDUCTION
the recrystallization temperature of copper, thus preventing s0f DESCRIPTION BY COLD WORKING
during soldering of commutators. It is preferred in the manufactu STRIP
electric motors for railroad and aircraft use. Quarter hard 10.9 12.3 Temper Designation of Copper and Copper Alloys Since coppe Half hard 20.7
most copper alloys are homogenous single phases, they are not susce Three-quarter hard 29.4 Hard 37.1
to heat treatment, and their strength may be altered only by cold WO Extra hard 50.0 There are two general classes of temper for non-heat-treatable wro copper alloys: cold-worked and soft or annealed. Extra spring 68.7
WIRE
20.7 37.1 50.0 60.5 75.0 84.4 90.2
The different cold-worked tempers shown in Table 12.1 are obtain 'From "Metals Handbook." 1961 ed.. p. 1006. American Society for Metals,
cold-working the annealed material a definite amount. The perCe Metals Park. Ohio.
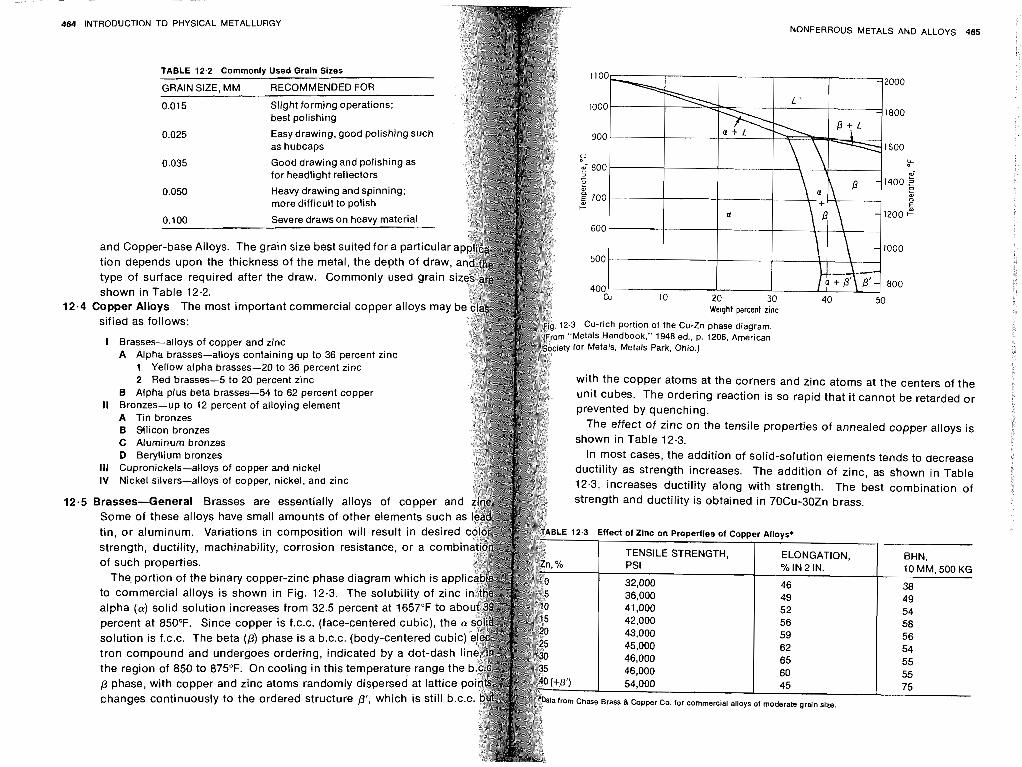
464 INTRODUCTION TO PHYSICAL METALLURGY
TABLE
GRAIN I SIZE
Used Grain Sizes
RECOMMENDED FOR
0.015 Slight forming operations; best polishing
0.025 Easy drawing, good polishing such as hubcaps
0.035 Good drawing and polishing as for headlight reflectors
Heavy drawing and spin1 more difficult to polish
ning ;
0.100 Severe draws on heavy material
and Copper-base Alloys. The grain size best suited for a particular appli tion depends upon the thickness of the metal, the depth of draw type of surface required after the draw. Commonly used grain shown in Table 12.2.
Copper Alloys The most important commercial copper alloys may sified as follows:
I Brasses-alloys of copper and zinc A Alpha brasses-alloys containing up to 36 percent zinc
1 Yellow alpha brasses-20 to 36 percent zinc 2 Red brasses-5 to 20 percent zinc
B Alpha plus beta brasses-54 to 62 percent copper II Bronzes-up to 12 percent of alloying element
A Tin bronzes B Sllicon bronzes C Aluminum bronzes D Beryllium bronzes
I l l Cupronickels-alloys of copper and nickel IV Nickel silvers-alloys of copper, nickel, and zinc
Brasses--General Brasses are essentially alloys of copper an Some of these alloys have small amounts of other elements such tin, or aluminum. Variations in composition will result in desire strength, ductility, machinability, corrosion resistance, or a com of such properties.
The. portion of the binary copper-zinc phase diagram which is app to commercial alloys is shown in Fig. 12.3. The solubility of zinc alpha (a) solid solution increases from 32.5 percent at 1657°F to a percent at 850°F. Since copper is f.c.c. (face-centered cubic), the solution is f.c.c. The beta (p) phase is a b.c.c. (body-centered cubic) el0 tron compound and undergoes ordering, indicated by a dot-dash line, the region of 850 to 875°F. On cooling in this temperature range the b.c p phase, with copper and zinc atoms randomly dispersed at lattice poin* changes continuously to the ordered structure P ' , which is still b.c.e. bl
NONFERROUS METALS AND ALLOYS 465
Cu 10 20 30 40 50 Weight percent z~nc
.3 Cu-rich portion of the Cu-Zn phase diagram. "Metals Handbook," 1948 ed., p. 1206. American I for Metals, Metals Park. Ohio.)
with the copper atoms at the corners and zinc atoms at the centers of the unit cubes. The ordering reaction is so rapid that it cannot be retarded or prevented by quenching.
The effect of zinc on the tensile properties of annealed copper alloys is shown in Table 12.3.
In most cases, the addition of solid-solution elements tends to decrease ductility as strength increases. The addition of zinc, as shown in Table 12.3, increases ductility along with strength. The best combination of strength and ductility is obtained in 70Cu-30Zn brass.
12.3 Effect of Zinc on Properties of Copper Alloys*
TENSILE STRENGTH, PSI
32,000 36,000 41,000 42,000 43.000 45,000 46,000 46,000 54.000
--
ELONGATION, %IN 2 IN.
BHN, 10 MM, 500 KG
38 49 54 58 56 54 55 55 75
Im Chase Brass 8 Copper Co. for commercial alloys of moderate grain size.
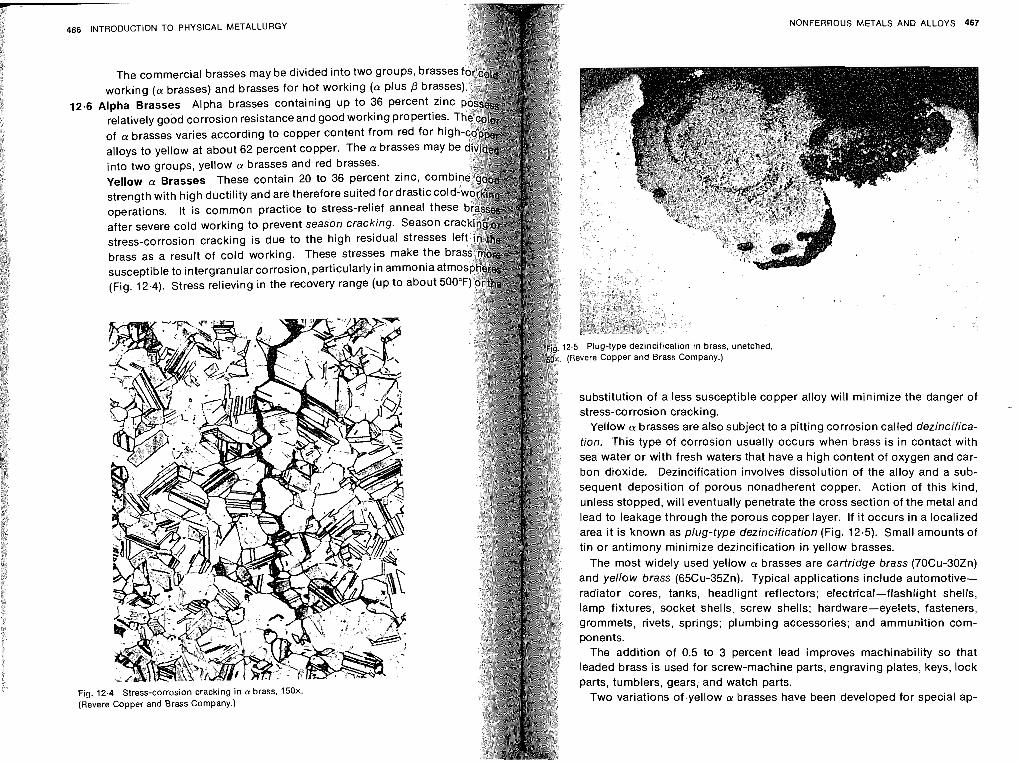
12.6
Fig. (Re\
466 INTRODUCTION TO PHYSICAL METALLURGY NONFERROUS METALS AND ALLOYS 467
.5 Plug-type dezincification in brass, unetched, Revere Copper and Brass Company.)
substitution of a less susceptible copper alloy will minimize the danger of stress-corrosion cracking.
Yellow CY brasses are also subject to a pitting corrosion called dezincifica- tion. This type of corrosion usually occurs when brass is in contact with sea water or with fresh waters that have a high content of oxygen and car- bon dioxide. Dezincification involves dissolution of the alloy and a sub- sequent deposition of porous nonadherent copper. Action of this kind, unless stopped, will eventually penetrate the cross section of the metal and lead to leakage through the porous copper layer. If it occurs in a localized area it is known as plug-type dezincification (Fig. 12.5). Small amounts of tin or antimony minimize dezincification in yellow brasses.
The most widely used yellow CY brasses are cartridge brass (70Cu-30Zn) and yellow brass (65Cu-35Zn). Typical applications include automotive- radiator cores, tanlts, headlignt reflectors; electrical-flashlight shells, lamp fixtures, socket shells, screw shells; hardware-eyelets, fasteners, grommets, rivets, springs; plumbing accessories; and ammunition com- ponents.
The addition of 0.5 to 3 percent lead improves machinability so that leaded brass is used for screw-machine parts, engraving plates, keys, lock parts, tumblers, gears, and watch parts.
Two variations of yellow CY brasses have been developed for special ap-
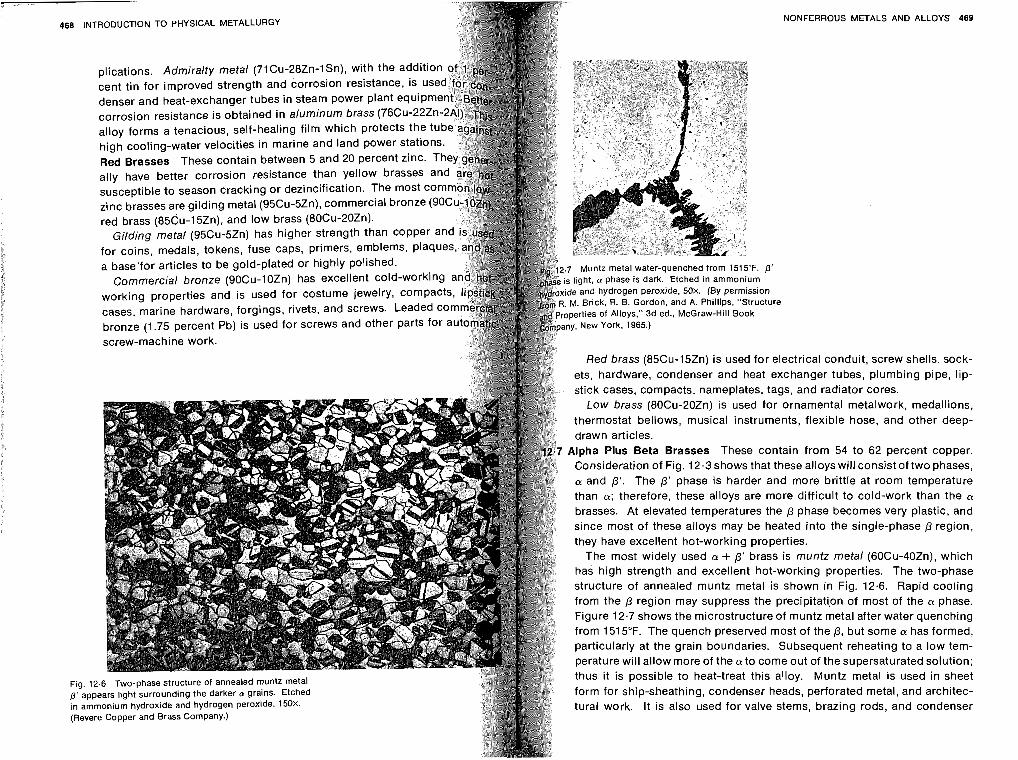
- - -
468 INTRODUCTION TO PHYSICAL METALLURGY NONFERROUS METALS AN0 ALLOYS 469
plications. Admiralty metal (71Cu-28Zn-ISn), with the additi cent tin for improved strength and corrosion resistance, is u denser and heat-exchanger tubes in steam power plant equip corrosion resistance is obtained in aluminum brass (76Cu-22Z alloy forms a tenacious, self-healing film which protects the high cooling-water velocities in marine and land power statio Red Brasses These contain between 5 and 20 percent zinc. Th ally have better corrosion resistance than yellow brasses an susceptible to season cracking or dezincification. The zinc brasses are gilding metal (95Cu-5Zn), commercial br red brass (856~-15~n) , and low brass (80Cu-20Zn).
Gilding metal (95Cu-5Zn) has higher strength than copper an for coins, medals, tokens, fuse caps, primers, emblems, plaque a base'for articles to be gold-plated or highly polished. eta1 water-quenched
Commercial bronze (9OCu-1OZn) has excellent cold-working P'
ase is dark. Etched i working properties and is used for costume jewelry, COmpaC ogen peroxide, 50x. n
cases, marine hardware, forgings, rivets, and screws. Leaded c . B. Gordon, and A. ture
bronze (1.75 percent Pb) is used for screws and other parts for New York. 1965.)
screw-machine work.
Red brass (85Cu-15Zn) is used for electrical conduit, screw shells, sock- hardware, condenser and heat exchanger tubes, plumbing pipe, lip-
k cases, compacts, nameplates, tags, and radiator cores. Low brass (80Cu-20Zn) is used for ornamental metalwork, medallions,
thermostat bellows, musical instruments, flexible hose, and other deep- drawn articles.
Alpha Plus Beta Brasses These contain from 54 to 62 percent copper. Consideration of Fig. 12.3 shows that these alloys will consist of two phases, a and p'. The p' phase is harder and more brittle at room temperature than a; therefore, these alloys are more difficult to cold-work than the a brasses. At elevated temperatures the p phase becomes very plastic, and since most of these alloys may be heated into the single-phase p region, they have excellent hot-working properties.
The most widely used a + p' brass is muntz metal (60Cu-40Zn), which
has high strength and excellent hot-working properties. The two-phase structure of annealed muntz metal is shown in Fig. 12.6. Rapid cooling from the p region may suppress the precipitatipn of most of the a phase. Figure 12.7 shows the microstructure of muntz metal after water quenching from 1515°F. The quench preserved most of the p, but some a has formed,
particularly at the grain boundaries. Subsequent reheating to a low tem- perature will allow more of the a to come out of the supersaturated solution;
thus it is possible to heat-treat this alloy. Muntz metal is used in sheet g the darker a grains. Etched form for ship-sheathing, condenser heads, perforated metal, and architec-
tural work. It is also used for valve stems, brazing rods, and condenser (Revere Copper and Brass Company.)
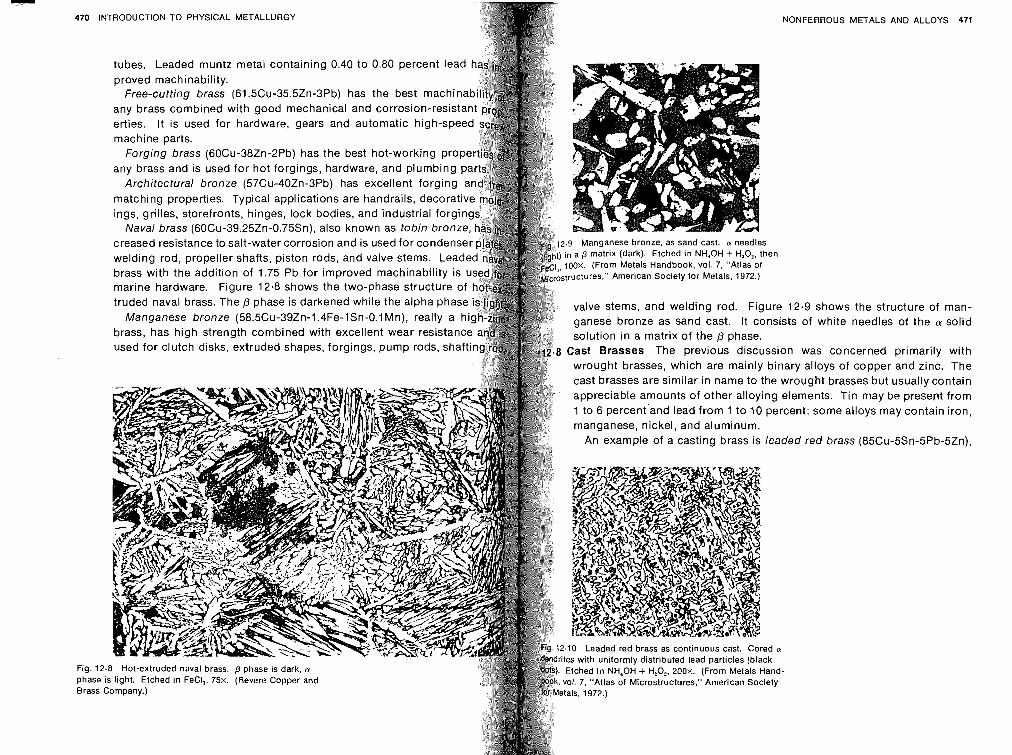
Fig phz Bra
NONFERROUS METALS AND ALLOYS 471 INTRODUCTION TO PHYSICAL METALLURGY
tubes. Leaded muntz metal containing 0.40 to 0.80 percent lead proved machinability.
machine parts. Forging brass (60Cu-38Zn-2Pb) has the best hot-working pro
ings, grilles, storefronts, hinges, lock bodies, and industrial forgin Naval brass (60Cu-39.25Zn-0.75Sn), also known as tobin bronze
brass with the addition of 1.75 Pb for improved machinability i marine hardware. Figure 12.8 shows the two-phase structure truded naval brass. The p phase is darkened while the alpha pha valve stems, and welding rod. Figure 12.9 shows the structure of man-
ganese bronze as sand cast. It consists of white needles of the solid solution in a matrix of the p phase.
8 Cast Brasses The previous discussion was concerned primarily with wrought brasses, which are mainly binary alloys of copper and zinc. The cast brasses are similar in name to the wrought brasses but usually contain appreciable amounts of other alloying elements. Tin may be present from 1 to 6 percent and lead from 1 to 10 percent; some alloys may contain iron, manganese, nickel, and aluminum.
An example of a casting brass is leaded red brass (85Cu-5Sn-5Pb-5Zn),
0 Leaded red brass as continuous cast. Cored a
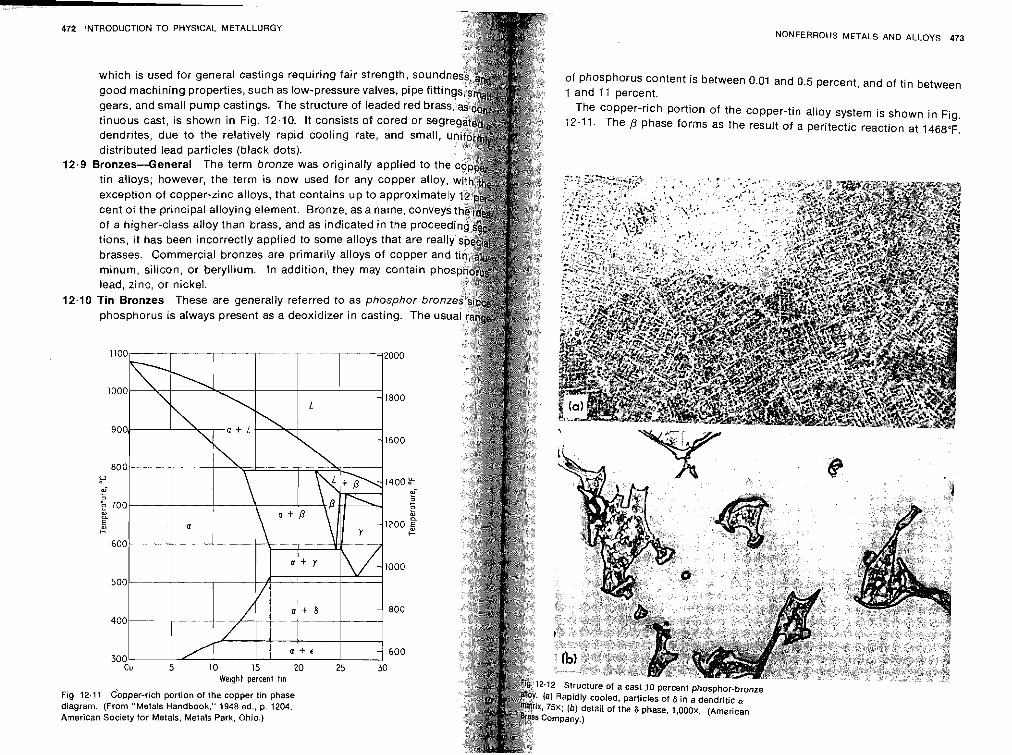
472 INTRODUCTION TO PHYSICAL METALLURGY
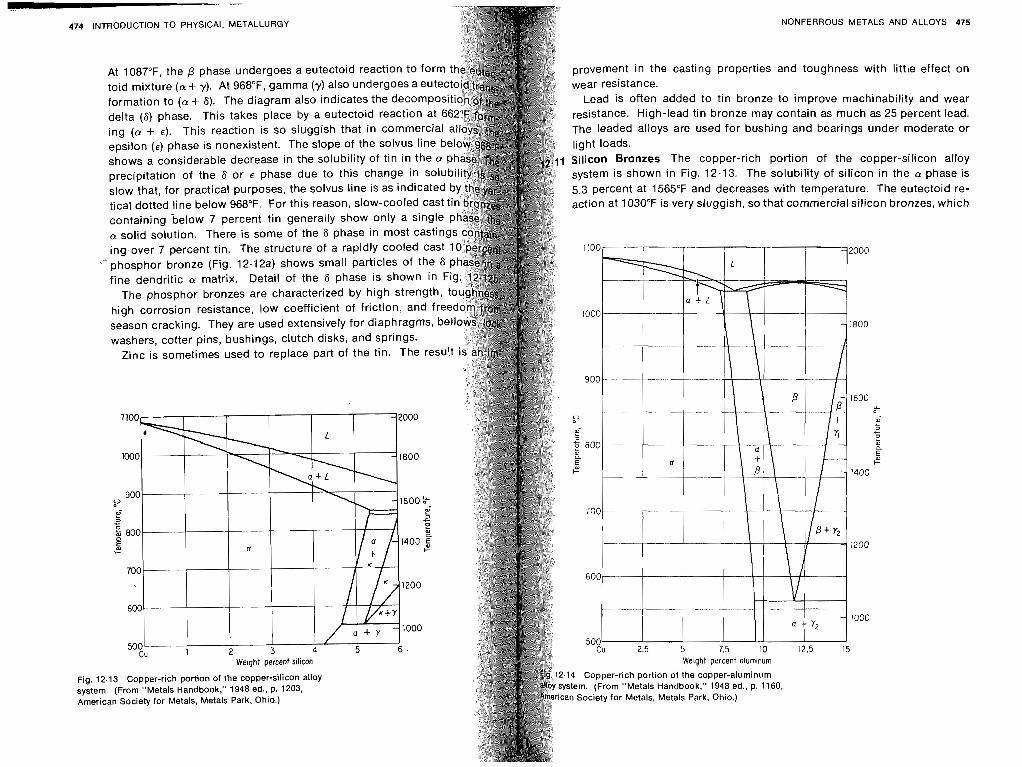
474 INTRODUCTION TO PHYSICAL METALLURGY NONFERROUS METALS AND ALLOYS 475
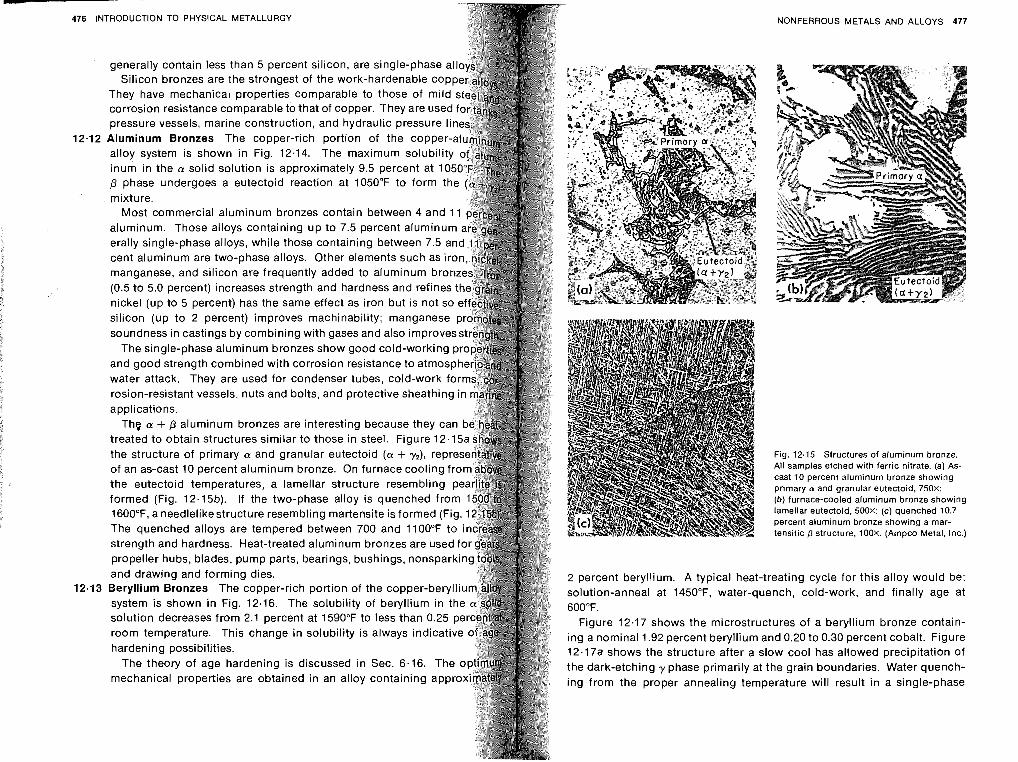
476 INTRODUCTION TO PHYSICAL METALLURGY
generally contain less than 5 percent silicon, are single-phase all Silicon bronzes are the strongest of the work-hardenable c
They have mechanical properties comparable to those of m corrosion resistance comparable to that of copper. They are us pressure vessels, marine construction, and hydraulic pressure I Aluminum Bronzes The copper-rich portion of the coppe alloy system is shown in Fig. 12.14. The maximum solubili inum in the a solid solution is approximately 9.5 percent at I p phase undergoes a eutectoid reaction at 1050°F to form t mixture.
Most commercial aluminum bronzes contain between 4 and aluminum. Those alloys containing up to 7.5 percent aluminu erally single-phase alloys, while those containing between 7.5 an cent aluminum are two-phase alloys. Other elements such as ' manganese, and silicon are frequently added to aluminum br (0.5 to 5.0 percent) increases strength and hardness and refines nickel (up to 5 percent) has the same effect as iron but is not so silicon (up to 2 percent) improves machinabiliiy; manganese soundness in castings by combining with gases and also improves
The single-phase aluminum bronzes show good cold-working and good strength combined with corrosion resistance to atmos water attack. They are used for condenser tubes, cold-work f rosion-resistant vessels, nuts and bolts, and protective sheathin applications.
The a + p aluminum bronzes are interesting because they can treated to obtain structures similar to those in steel. Figure 12.1 the structure of primary a and granular eutectoid (a + y2), repr of an as-cast 10 percent aluminum bronze. On furnace cooling f the eutectoid temperatures, a lamellar structure resembling formed (Fig. 12.15b). If the two-phase alloy is quenched from 1600°F. a needlelike structure resembling martensite is formed (Fi The quenched alloys are tempered between 700 and 1100°F strength and hardness. Heat-treated aluminum bronzes are us propeller hubs, blades, pump parts, bearings, bushings, nons and drawing and forming dies. Beryllium Bronzes The copper-rich portion of the copper-bery system is shown in Fig. 12-16. The solubility of beryllium in t solution decreases from 2.1 percent at 1590°F to less than 0.25 room temperature. This change in solubility is always indicati hardening possibilities.
The theory of age hardening is discussed in Sec. 6.16. The mechanical properties are obtained in an alloy containing appro
NONFERROUS METALS AND ALLOYS 477
Fig. 12.15 Structures of aluminum bronze. Ail samples etched with ferric nitrate. (a) As- cast 10 percent aluminum bronze showing primary ol and granular eutectoid, 750X; (b) furnace-cooled aluminum bronze showing lamellar eutectoid. 500x: (c) quenched 10.7 percent aluminum bronze showing a mar- tensitic p structure, loox. (Ampco Metal, lnc.)
2 percent beryllium. A typical heat-treating cycle for this alloy would be: solution-anneal at 1450°F, water-quench, cold-work, and finally age at 600°F.
Figure 12.17 shows the microstructures of a beryllium bronze contain- ing a nominal 1.92 percent beryllium and 0.20 to 0.30 percent cobalt. Figure 12.17a shows the structure after a slow cool has allowed precipitation of the dark-etching y phase primarily at the grain boundaries. Water quench- ing from the proper annealing temperature will result in a single-phase
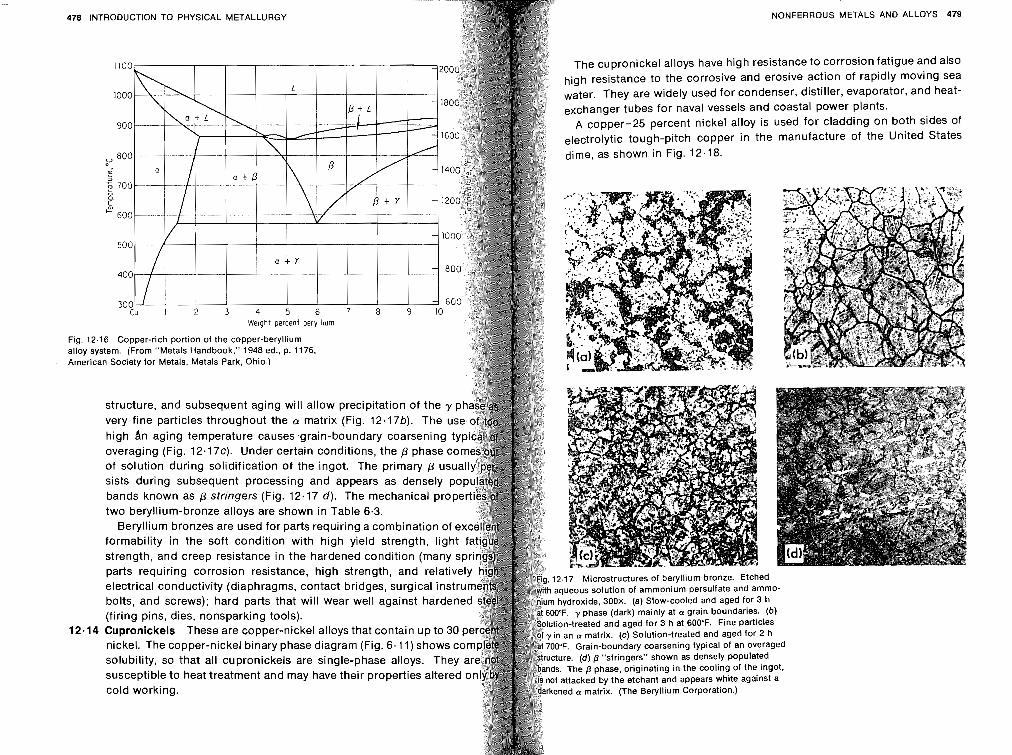
478 INTRODUCTION TO PHYSICAL METAL I llRGY 4
Fig. 12. alloy sy
Weight percent ber
16 ster
Copper-rich portion of the copper-beryllium n. (From "Metals Handbook." 1948 ed.. D. 1176
American Society for Metals. Metals Park. Ohio.)
structure, and subsequent aging will allow precipitation of the very fine particles throughout the CY matrix (Fig. 12.176). The high An aging temperature causes .grain-boundary coarsening overaging (Fig. 12.17~). Under certain conditions, the p phase of solution during solidification of the ingot. The primary p u sists during subsequent processing and appears as densely bands known as p stringers (Fig. 12.17 d). The mechanical pr two beryllium-bronze alloys are shown in Table 6.3.
Beryllium bronzes are used for parts requiring a combination of e formability in the soft condition with high yield strength, ligh strength, and creep resistance in the hardened condition (many parts requiring corrosion resistance, high strength, and relativ electrical conductivity (diaphragms, contact bridges, surgical inst bolts, and screws): hard arts that will wear well anainst hardon
. . . - -r -- - - r - - -
nickel. The copper-nickel binary phase diagram (Fig. 6.1 1) shows co solubility, so that all cupronickels are single-phase alloys. They susceptible to heat treatment and may have their properties altered cold working.
-
NONFERROUS METALS AN0 ALLOYS 479
The cupronickel alloys have high resistance to corrosion fatigue and also high resistance to the corrosive and erosive action of rapidly moving sea water. They are widely used for condenser, distiller, evaporator, and heat- exchanger tubes for naval vessels and coastal power plants.
A copper-25 percent nickel alloy is used for cladding on both sides of electrolytic tough-pitch copper in the manufacture of the United States dime, as shown in Fig. 12.18.
, . , - - . - . . . .. . . . . .
ring pins, dies, nonsparking tools). pron nickels These are cooper-nickel
. . . - - . . . - . .
allovs that
. .-. . .-. . contain uo to
Microstructures of beryllium bronze. Etched ous solution of ammonium persulfate and ammo- oxide, 300x. (a) Slow-cooled and aged for 3 h y phase (dark) mainly at a grain boundaries. (b)
-treated and aged for 3 h at 600°F. Fine particles n a matrix. (c) Solution-treated and aged for 2 h
Grain-boundary coarsening typical of an overaged (d) p "stringers" shown as densely populated
he p phase, originating in the cooling of the ingot, t attacked by the etchant and appears white against a
rkened a matrix. (The Beryllium Corporation.)
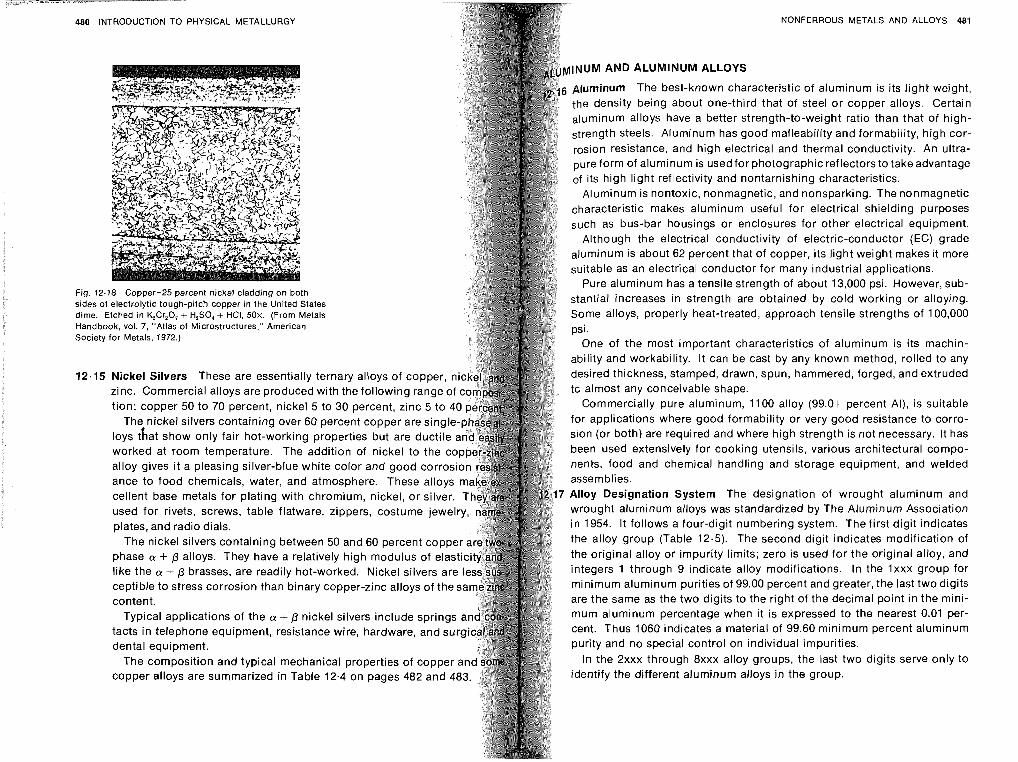
"--,--
480 INTRODUCTION TO PHYSICAL METALLURGY NONFERROUS METALS AND ALLOYS 481
lNUM AND ALUMINUM ALLOYS
Aluminum The best-known characteristic of aluminum is its light weight, the density being about one-third that of steel or copper alloys. Certain aluminum alloys have a better strength-to-weight ratio than that of high- strength steels. Aluminum has good malleability and formability, high cor- rosion resistance, and high electrical and thermal conductivity. An ultra- pure form of aluminum is used for photographic reflectors to take advantage of its high light reflectivity and nontarnishing characteristics.
Aluminum is nontoxic, nonmagnetic, and nonsparking. The nonmagnetic characteristic makes aluminum useful for electrical shielding purposes such as bus-bar housings or enclosures for other electrical equipment.
Although the electrical conductivity of electric-conductor (EC) grade aluminum is about 62 percent that of copper, its light weight makes it more suitable as an electrical conductor for many industrial applications.
Pure aluminum has a tensile strength of about 13,000 psi. However, sub- Fig. 12,18 Copper-25 percent nickel cladding on both sides of electrolytic tough-pitch copper in the United States stantial increases in strength are obtained by cold working or alloying. dime. Etched in K,Cr,O, + H,SO, + HCI. 50x. (From Metals Some alloys, properly heat-treated, approach tensile strengths of 100,000 Handbook, vol. 7, "Atlas of Microstructures." American Society for Metals, 1972.) One of the most important characteristics of aluminum is its machin-
ability and workability. It can be cast by any known method, rolled to any
12.15 Nickel Silvers These are essentially ternary alloys of copper, n sired thickness, stamped, drawn, spun, hammered, forged, and extruded
zinc. Commercial alloys are produced with the following range of almost any conceivable shape.
tion: copper 50 to 70 percent, nickel 5 to 30 percent, zinc 5 to 40 Commercially pure aluminum, 1100 alloy (99.0+ percent Al), is suitable
The nickel silvers containing over 60 percent copper ares for applications where good formability or very good resistance to corro-
loys that show only fair hot-working properties but are du sion (or both) are required and where high strength is not necessary. It has
worked at room temperature. The addition of nickel to the co been used extensively for cooking utensils, various architectural compo-
alloy gives it a pleasing silver-blue white color and good corrosi nents, food and chemical handling and storage equipment, and welded
ance to food chemicals, water, and atmosphere. These alloys cellent base metals for plating with chromium, nickel, or silver. 7 Alloy Designation System The designation of wrought aluminum and
used for rivets, screws, table flatware, zippers, costume jewel wrought aluminum alloys was standardized by The Aluminum Association
plates, and radio dials. in 1954. It follows a four-digit numbering system. The first digit indicates
The nickel silvers containing between 50 and 60 percent copp the alloy group (Table 12.5). The second digit indicates modification of
phase a + p alloys. They have a relatively high modulus of elas the original alloy or impurity limits; zero is used for the original alloy, and
like the + p brasses, are readily hot-worked. Nickel silvers are integers 1 through 9 indicate alloy modifications. In the lxxx group for
ceptible to stress corrosion than binary copper-zinc alloys of the s minimum aluminum purities of 99.00 percent and greater, the last two digits
content. are the same as the two digits to the right of the decimal point in the mini-
Typical applications of the a + p nickel silvers include springs mum aluminum percentage when it is expressed to the nearest 0.01 per-
taCtS in telephone equipment, resistance wire, hardware, and sur cent. Thus 1060 indicates a materia! of 99.60 minimum percent aluminum
dental equipment. purity and no special control on individual impurities.
The composition and typical mechanical properties of copper In the 2xxx through 8xxx alloy groups, the last two digits serve only to
copper alloys are summarized in Table 12.4 on pages 482 and 4 identify the different aluminum alloys in the group.
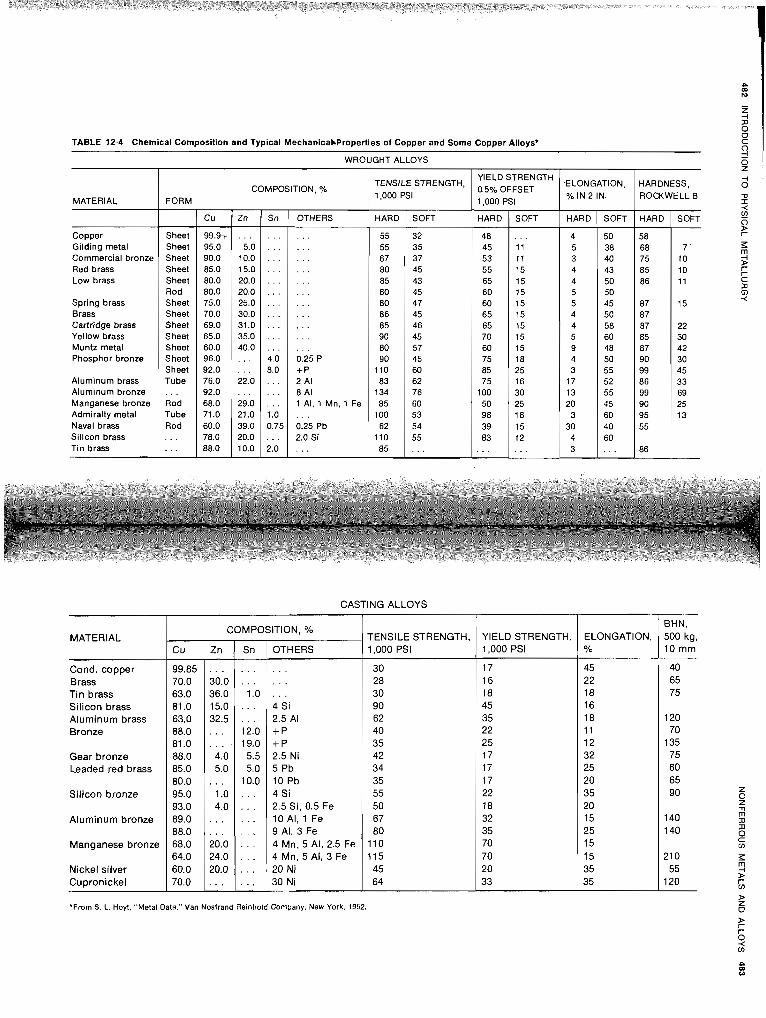
TABLE 12.4 Chemical Composition and Typical Mechanicabproperties of Copper and Some Copper Alloys'
WROUGHT ALLOYS 0 Z
CASTING ALLOYS
YIELD STRENGTH ELONGATION,
COMPOSITION. % TENSILE STRENGTH,
0,5% OFFSET HARDNESS,
MATERIAL FORM 1,000 PSI
1,000 PSI % I N 2 IN. ROWWELL B
Cu Zn Sn OTHERS HARD SOFT HARD SOFT HARD SOFT HARD SOFT
Copper Sheet 99.9+ . . . . . . . . . 55 32 48 . . . 4 50 58 Gilding metal Sheet 95.0 5.0 . . . . . . 55 35 45 11 5 38 68 7 Commercial bronze Sheet 90.0 10.0 . . . . . . 67 37 53 11 3 40 75 10 Red brass Sheet 85.0 15.0 . . . . . . 80 45 55 15 4 43 85 10 Low brass Sheet 80.0 20.0 . . . . . . 85 43 65 15 4 50 86 11
Rod 80.0 20.0 . . . . . . 80 45 60 15 5 50 Spring brass Brass Cartridge brass Yellow brass Muntz metal Phosphor bronze
Aluminum brass Aluminum bronze Manganese bronze Admiralty metal Naval brass Silicon brass Tin brass
*From S. L. Hoyt. "Metal Data," Van Nostrand Reinhotd Company. New York. 1952
Sheet Sheet Sheet Sheet Sheet Sheet Sheet Tube . . . Rod Tube Rod . . . . . .
BHN, 500 kg, 10 mm
40 65 75
120 70
135 75 60 65 90
140 140
21 0 55
120
ELONGATION, YO
45 22 18 16 18 11 12 32 25 20 35 20 15 25 15 15 35 35
75.0 70.0 69.0 65.0 60.0 96.0 92.0 76.0 92.0 68.0 71.0 60.0 78.0 88.0
YIELD STRENGTH, 1,000 PSI
17 16 18 45 35 22 25 17 17 17 22 18 32 35 70 70 20 33
TENSILE STRENGTH. 1,000 PSI
30 28 30 90 62 40 35 42 34 35 55 50 67 80
110 115 45 64
MATERIAL
Cond. copper Brass Tin brass Silicon brass Aluminum brass Bronze
Gear bronze Leaded red brass
Silicon bronze
Aluminum bronze
Manganese bronze
Nickel silver Cupronickel
25.0 30.0 31.0 35.0 40.0 . . . . . . 22.0 . . . . . . 29.0 21.0 39.0 20.0 10.0
COMPOSITION, %
4.0 8.0 . . .
. . . 1.0 0.75 . . . 2.0
Cu
99.85 70.0 63.0 81.0 63.0 88.0 81.0 88.0 85.0 80.0 95.0 93.0 89.0 88.0 68.0 64.0 60.0 70.0
. . . . . .
. . . . . .
. . . . . .
. . . . . .
. . . . . . 0.25 P +P 2 Al 8 Al 1 Al. 1 Mn, 1 Fe . . . 0.25 Pb 2.0 Si . . .
Sn
. . . . . . . . . . . . . . . 1.0
. . .
. . . 12.0 19.0 5.5 5.0
10.0 . . . . . .
. . .
. . .
. . .
Zn
30.0 36.0 15.0 32.5 . . . . . . 4.0 5.0
. . . 1.0 4.0
. . . . . .
. . . . . . 20.0 24.0 20.0 . . . . . .
OTHERS
. . . 4 Si 2.5 Al +P +P 2.5 Ni 5 Pb 10 Pb 4Si 2.5 Si, 0.5 Fe 10 Al, 1 Fe 9A l ,3Fe 4 Mn, 5 Al, 2.5 Fe 4Mn,5A l ,3Fe 20 Ni 30Ni
80 86 85 90 80 90
110 83
134 85
100 62
110 85
47 45 46 45 57 45 60 62 76 60 53 54 55 . . .
60 65 65 70 60 75 85 75
100 50 98 39 83
. . .
15 15 15 15 15 18 25 16 30 25 18 15 12 . . .
5 4 4 5 9 4 3
17 13 20 3
30 4 3
45 50 58 60 48 50 55 52 55 45 60 40 60 . . .
87 87 87 85 87 90 99 86 99 90 95 55
86
15
22 30 42 30 45 33 69 25 13
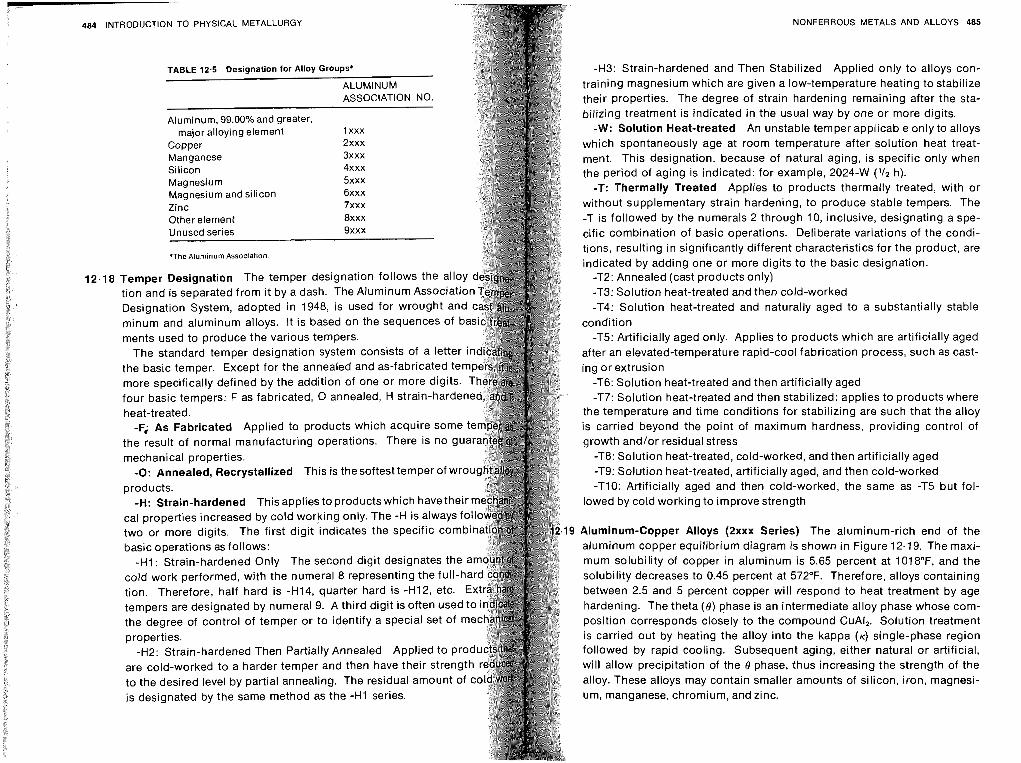
L -
484 INTRODUCTION TO PHYSICAL METALLURGY
TABLE 12.5 Designation for Alloy Groups*
Alumi num, 99.00% and greater, major alloying element
Copper Manganese Silicon Magnesium Magnesium and silicon Zinc Other element Unused series
*The Aluminum Association
ALUMINUM ASSOCIATION
1 xxx 2xxx 3xxx 4xxx 5xxx 6xxx
- NO. 7
Temper Designation The temper designation follows the allo tion and is separated from it by a dash. The Aluminum Associati Designation System, adopted in 1948, is used for wrought a minum and aluminum alloys. It is based on the sequences of ments used to produce the various tempers.
The standard temper designation system consists of a letter the basic temper. Except for the annealed and as-fabricated te more specifically defined by the addition of one or more digits. four basic tempers: F as fabricated, 0 annealed, H strain-harde heat-treated.
-F; As Fabricated Applied to products which acquire some the result of normal manufacturing operations. There is no g mechanical properties.
-0: Annealed, Recrystallized This is the softest temper of wro products.
-H: Strain-hardened This applies to products which have their cal properties increased by cold working only. The -H is always fol two or more digits. The first digit indicates the specific combi basic operations as follows:
-HI : Strain-hardened Only The second digit designates the a cold work performed, with the numeral 8 representing the full-ha tion. Therefore, half hard is -H14, quarter hard is -H12, etc. tempers are designated by numeral 9. A third digit is often used the degree of control of temper or to identify a special set of m properties.
-H2: Strain-hardened Then Partially Annealed Applied to prod are cold-worked to a harder temper and then have their strength to the desired level by partial annealing. The residual amount of is designated by the same method as the -H1 series.
NONFERROUS METALS AND ALLOYS 485
-H3: Strain-hardened and Then Stabilized Applied only to alloys con- training magnesium which are given a low-temperature heating to stabilize their properties. The degree of strain hardening remaining after the sta- bilizing treatment is indicated in the usual way by one or more digits.
-W: Solution Heat-treated An unstable temper applicable only to alloys which spontaneously age at room temperature after solution heat treat- ment. This designation, because of natural aging, is specific only when the period of aging is indicated: for example, 2024-W ('/z h).
-T: Thermally Treated Applies to products thermally treated, with or without supplementary strain hardening, to produce stable tempers. The -5 is followed by the numerals 2 through 10, inclusive, designating a spe- cific combination of basic operations. Deliberate variations of the condi- tions, resulting in significantly different characteristics for the product, are indicated by adding one or more digits to the basic designation.
-T2: Annealed (cast products only) -T3: Solution heat-treated and then cold-worked -14: Solution heat-treated and naturally aged to a substantially stable
condition -T5: Artificially aged only. Applies to products which are artificially aged
after an elevated-temperature rapid-cool fabrication process, such as cast- ing or extrusion
-T6: Solution heat-treated and then artificially aged -T7: Solution heat-treated and then stabilized: applies to products where
the temperature and time conditions for stabilizing are such that the alloy is carried beyond the point of maximum hardness, providing control of growth and/or residual stress
-T8: Solution heat-treated, cold-worked, and then artificially aged -T9: Solution heat-treated, artificially aged, and then cold-worked -T10: Artificially aged and then cold-worked, the same as -T5 but fol-
lowed by cold working to improve strength
Aluminum-Copper Alloys (2xxx Series) The aluminum-rich end of the aluminum copper equilibrium diagram is shown in Figure 12-19. The maxi- mum solubility of copper in aluminum is 5.65 percent at 1018"F, and the solubility decreases to 0.45 percent at 572°F. Therefore, alloys containing between 2.5 and 5 percent copper will respond to heat treatment by age hardening. The theta (8) phase is an intermediate alloy phase whose com- position corresponds closely to the compound CuAI,. Solution treatment is carried out by heating the alloy into the kappa ( K ) single-phase region followed by rapid cooling. Subsequent aging, either natural or artificial, will allow precipitation of the 8 phase, thus increasing the strength of the alloy. These alloys may contain smaller amounts of silicon, iron, magnesi- um, manganese, chromium, and zinc.
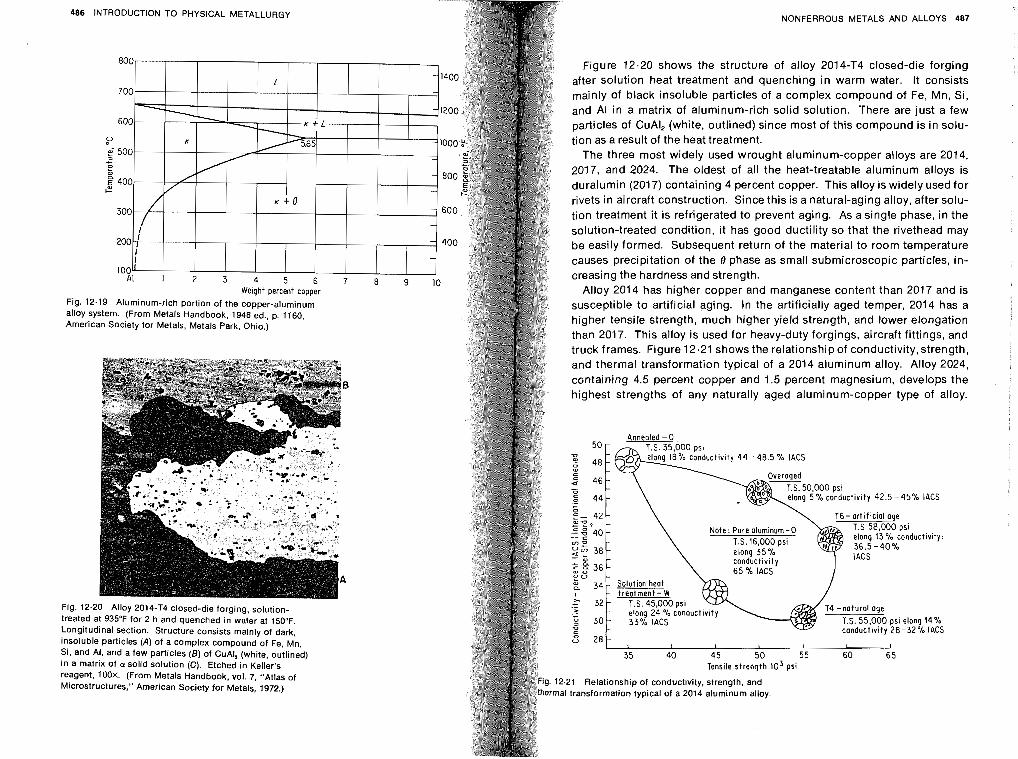
486 INTRODUCTION TO PHYSICAL METALLURGY
-
NONFERROUS METALS AND ALLOYS 487
Figure 12.20 shows the structure of alloy 2014-T4 closed-die forging after solution heat treatment and quenching in warm water. It consists mainly of black insoluble particles of a complex compound of Fe, Mn, Si, and Al in a matrix of aluminum-rich solid solution. There are just a few particles of CuAI, (white, outlined) since most of this compound is in solu- tion as a result of the heat treatment.
The three most widely used wrought aluminum-copper alloys are 2014, 2017, and 2024. The oldest of all the heat-treatable aluminum alloys is duralumin (201 7) containing 4 percent copper. This alloy is widely used for rivets in aircraft construction. Since this is a natural-aging alloy, after solu- tion treatment it is refrigerated to prevent aging. As a single phase, in the solution-treated condition, it has good ductility so that the rivethead may be easily formed. Subsequent return of the material to room temperature causes precipitation of the 8 phase as small submicroscopic particles, in- creasing the hardness and strength.
Alloy 2014 has higher copper and manganese content than 2017 and is susceptible to artificial aging. In the artificially aged temper, 2014 has a higher tensile strength, much higher yield strength, and lower elongation than 2017. This alloy is used for heavy-duty forgings, aircraft fittings, and truck frames. Figure 12.21 shows the relationship of conductivity, strength, and thermal transformation typical of a 2014 aluminum alloy. Alloy 2024, containing 4.5 percent copper and 1.5 percent magnesium, develops the .
highest strengths of any naturally aged aluminum-copper type of alloy.
Annealed - 0
48
5 44 ng 5% conductivity 42.5-45% \ACS
T6- artificial age
Note: Pure aluminum -0 T.S 58,000 psi
conductiv~ty IACS c a
36 65 % IACS 0 U g 34 Solution heat
321 treatment- W
.- T.S. 45,000 psi
.- - elong 24 % conducti : 30 33% IACS T.S. 55,000 psi elong 14% P conductivity 28-3270 IACS .. S 28
I I t 1
35 40 45 50 55 60 65 Tensile strength lo3 psi
12.21 Relationship of conductivity, strength, and ma1 transformation typical of a 2014 aluminum alloy.
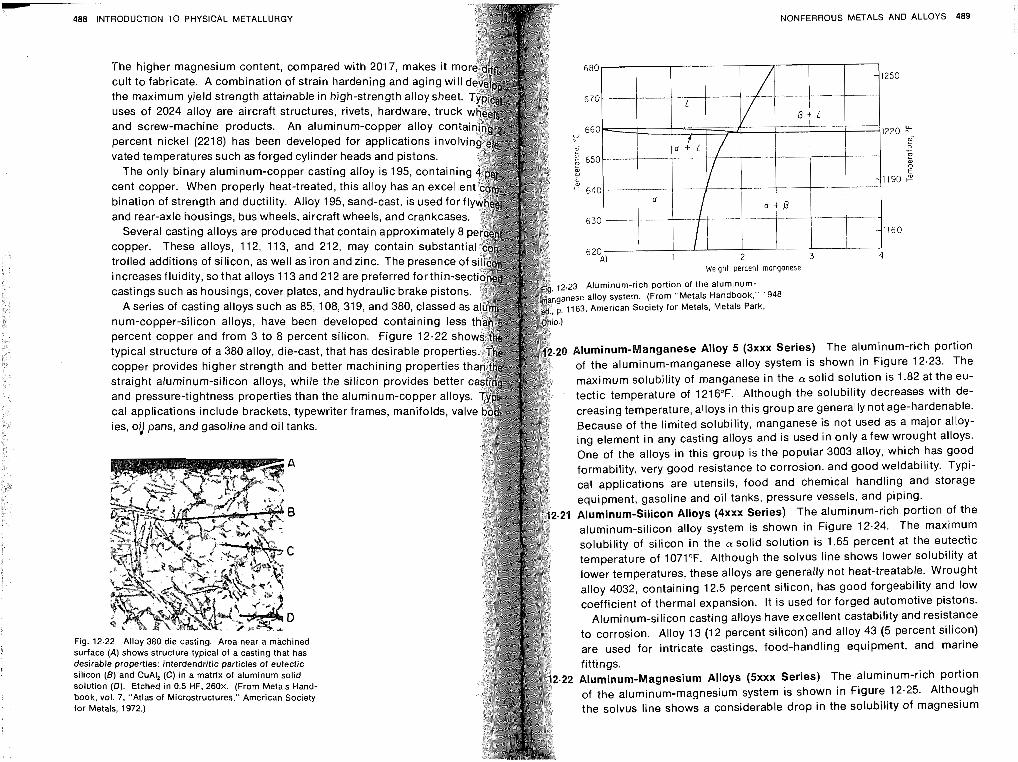
488 INTRODUCTION TO PHYSICAL METALLURGY
The only binary aluminum-copper casting alloy is 195, cc cent copper. When properly heat-treated, this alloy has an bination of strength and ductility. Alloy 195, sand-cast, is used forf l and rear-axle housings, bus wheels, aircraft wheels, and crankcases.
Several casting alloys are produced that contain approximately 8 copper. These alloys, 112, 113, and 212, may contain substant trolled additions of silicon, as well as iron and zinc. The presence o increases fluidity, so that alloys 113 and 21 2 are preferred forthin-se castings such as housings, cover plates, and hydraulic brake pisto
A series of casting alloys such as 85, 108,319, and 380, classed num-copper-silicon alloys, have been developed containing I percent copper and from 3 to 8 percent silicon. Figure 12.22 s typical structure of a 380 alloy, die-cast, that has desirable prope copper provides higher strength and better machining propertie straight aluminum-silicon alloys, while the silicon provides bette and pressure-tightness properties than the aluminum-copper allo cal applications include brackets, typewriter frames, manifolds, v ies, oil Dans, and gasoline and oil tanks.
The higher magnesium content, compared with 2017, makes it cult to fabricate. A combination of strain hardening and aging wi the maximum yield strength attainable in high-strength alloy shee uses of 2024 alloy are aircraft structures, rivets, hardware, truc
and screw-machine products. An aluminum-copper alloy con Percent nickel (2218) has been developed for applications invo vated temperatures such as forged cylinder heads and pistons.
We~ght percent mongonese
12.23 Aluminum-rich portion of the aluminum- nese alloy system. (From "Metals Handbook," 1948
163, American Society for Metals, Metals Park,
0 Aluminum-Manganese Alloy 5 (3xxx Series) The aluminum-rich portion of the aluminum-manganese alloy system is shown in Figure 12.23. The
maximum solubility of manganese in the CY solid solution is 1.82 at the eu- tectic temperature of 1216°F. Although the solubility decreases with de- creasing temperature, alloys in this group are generally not age-hardenable. Because of the limited solubility, manganese is not used as a major alloy- ing element in any casting alloys and is used in only a few wrought alloys. One of the alloys in this group is the popular 3003 alloy, which has good formability, very good resistance to corrosion, and good weldability. Typi- cal applications are utensils, food and chemical handling and storage equipment, gasoline and oil tanks, pressure vessels, and piping.
2.21 Aluminum-Silicon Alloys (4xxx Series) The aluminum-rich portion of the aluminum-silicon alloy system is shown in Figure 12.24. The maximum
solubility of silicon in the CY solid solution is 1.65 percent at the eutectic temperature of 1071°F. Although the solvus line shows lower solubility at lower temperatures, these alloys are generally not heat-treatable. Wrought alloy 4032, containing 12.5 percent silicon, has good forgeability and low coefficient of thermal expansion. It is used for forged automotive pistons.
Aluminum-silicon casting alloys have excellent castability and resistance to corrosion. Alloy 13 (12 percent silicon) and alloy 43 (5 percent silicon) are used for intricate castings, food-handling equipment, and marine fittings.
.22 Aluminum-Magnesium Alloys (5xxx Series) The aluminum-rich portion of the aluminum-magnesium system is shown in Figure 12.25. Although
the solvus line shows a considerable drop in the solubility of magnesium
Fig. 12.22 Alloy 380 die casting. Area near a machined surface (A) shows structure typical of a casting that has desirable properties: interdendritic particles of eutectic silicon (6) and CuAI, (C) in a matrix of aluminum solid solution (0). Etched in 0.5 HF, 260x. (From Metals Hand- book, vol. 7. "Atlas of Microstructures," American Society z-. . . ~. -. . --- < ror Merais, IYIC.)
NONFERROUS METALS AND ALLOYS 489
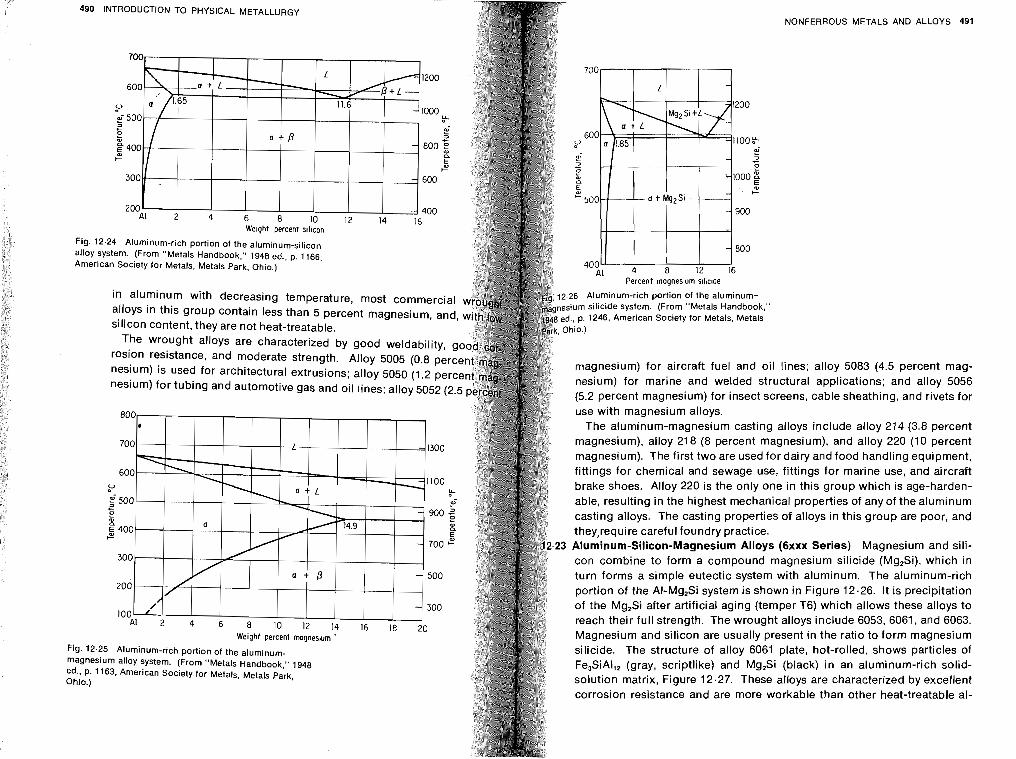
NONFERROUS METALS AND ALLOYS 491 490 ~NTRODUCTlON TO PHYSICAL METALLURGY
Fig. 12.24 Aluminum-rich portion of the aluminum-silicon alloy system. (From "Metals Handbook," 1948 ed., p. 1166, American Society for Metals. Metals Park, Ohio.)
Percent magnesium s ~ l ~ o d e
in aluminum with decreasing temperature, most commercial 6 Aluminum-rich portion of the aluminum-
alloys in this group Contain less than 5 percent magnesium, and, silicon Content, they are not heat-treatable.
magnesium) for aircraft fuel and oil lines; alloy 5083 (4.5 percent mag- nesium) i~ used for architectural extrusions; alloy 5050 (1.2 pe nesium) for marine and welded structural applications; and alloy 5056 nesium) for tubing and automotive gas and oil lines; alloy 5052 ( (5.2 percent magnesium) for insect screens, cable sheathing, and rivets for
use with magnesium alloys. The aluminum-magnesium casting alloys include alloy 214 (3.8 percent
magnesium), alloy 218 (8 percent magnesium), and alloy 220 (10 percent magnesium). The first two are used for dairy and food handling equipment, fittings for chemical and sewage use, fittings for marine use, and aircraft brake shoes. Alloy 220 is the only one in this group which is age-harden- able, resulting in the highest mechanical properties of any of the aluminum casting alloys. The casting properties of alloys in this group are poor, and theyorequire careful foundry practice.
23 Aluminum-Silicon-Magnesium Alloys (6xxx Series) Magnesium and sili-
con combine to form a compound magnesium silicide (Mg,Si), which in turn forms a simple eutectic system with aluminum. The aluminum-rich portion of the AI-Mg,Si system is shown in Figure 12.26. It is precipitation of the Mg,Si after artificial aging (temper T6) which allows these alloys to reach their full strength. The wrought alloys include 6053, 6061, and 6063. Magnesium and silicon are usually present in the ratio to form magnesium
Fig. 12.25 Aluminum-rich portion of the aluminum- silicide. The structure of alloy 6061 plate, hot-rolled, shows particles of
magnesium alloy system. (From "Metals Handbook," 1948 Fe,SiAl,, (gray, scriptlike) and Mg,Si (black) in an aluminum-rich solid- ed., P. 1163. American Society for Metals, Metals Park, solution matrix, Figure 12.27. These alloys are characterized by excellent Ohio.)
corrosion resistance and are more workable than other heat-treatable al-
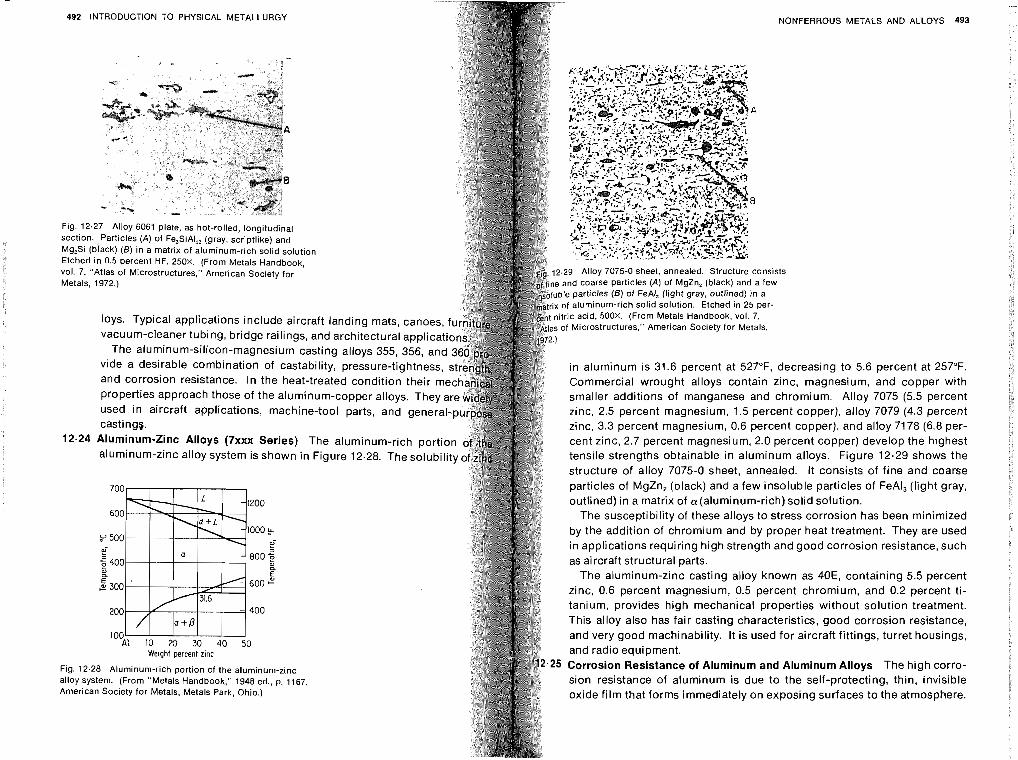
492 INTRODUCTION TO PHYSICAL METALLURGY
Mg,Si (black) (B) in a matrix of aluminum-rich solid solution Etched in 0.5 percent HF, 250x. (From Metals Handbook, vol. 7, "Atlas of Microstructures." American Society for Metals. 1972.)
loys. Typical applications include aircraft landing mats, canoes, f vacuum-cleaner tubing, bridge railings, and architectural applicati
The aluminum-silicon-magnesium casting alloys 355, 356, and vide a desirable combination of castability, pressure-tightness, and corrosion resistance. In the heat-treated condition their m properties approach those of the aluminum-copper alloys. They a used in aircraft applications, machine-tool parts, and general castings.
12.24 Aluminum-Zinc Alloys (7xxx Series) The aluminum-rich portion aluminum-zinc alloy system is shown in Figure 12.28. The solubility
1200
Ioooy ?!
800 5 01
8. 600 2
400
0 Weight percent zinc
Fig. 12.28 Aluminum-rich portion of the aluminum-zinc alloy system. (From "Metals Handbook," 1948 ed.. p. 1167, American Society for Metals. Metals Park, Ohio.)
g. 12 29 Alloy 7075-0 sheet, annealed Structure consists f flne and coarse particles (A) of MgZn, (black) and a few soluble part~cles (8) of FeAI, (Itght gray, outlined) rn a
gi,t,atri~ of aluminum-rich solid solut~on Etched In 25 per- b n t nitrlc ac~d. 500X (From Metals Handbook, vol 7, fi*j$tlas of M~crostructures," American Soc~ety for Metals,
in aluminum is 31.6 percent at 527OF, decreasing to 5.6 percent at 257°F. Commercial wrought alloys contain zinc, magnesium, and copper with smaller additions of manganese and chromium. Alloy 7075 (5.5 percent zinc, 2.5 percent magnesium, 7.5 percent copper), alloy 7079 (4.3 percent zinc, 3.3 percent magnesium, 0.6 percent copper), and alloy 7178 (6.8 per- cent zinc, 2.7 percent magnesium, 2.0 percent copper) develop the highest tensile strengths obtainable in aluminum alloys. Figure 12.29 shows the
& structure of alloy 7075-0 sheet, annealed. It consists of fine and coarse particles of MgZn, (black) and a few insoluble particles of FeAI, (light gray,
g g outlined) in a matrix of ~~(aluminum-rich) solid solution.
The susceptibility of these alloys to stress corrosion has been minimized by the addition of chromium and by proper heat treatment. They are used in applications requiring high strength and good corrosion resistance, such as aircraft structural parts.
The aluminum-zinc casting alloy known as 40E, containing 5.5 percent $ zinc, 0.6 percent magnesium, 0.5 percent chromium, and 0.2 percent ti-
5 e tanium, provides high mechanical properties without solution treatment. This alloy also has fair casting characteristics, good corrosion resistance, and very good machinability. It is used for aircraft fittings, turret housings, and radio equipment.
.25 Corrosion Resistance of Aluminum and Aluminum Alloys The high corro- sion resistance of aluminum is due to the self-protecting, thin, invisible oxide film that forms immediately on exposing surfaces to the atmosphere.
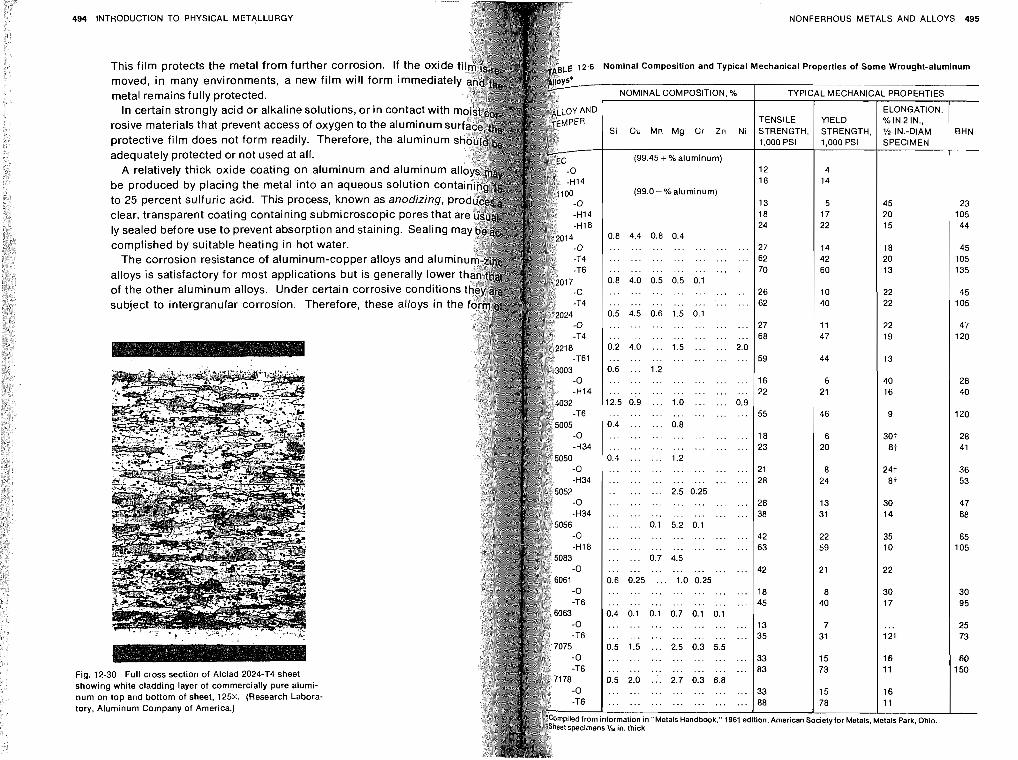
- 494 INTRODUCTION TO PHYSICAL METALLURGY NONFERROUS METALS AND ALLOYS 495
Fig. shov nurn tory.
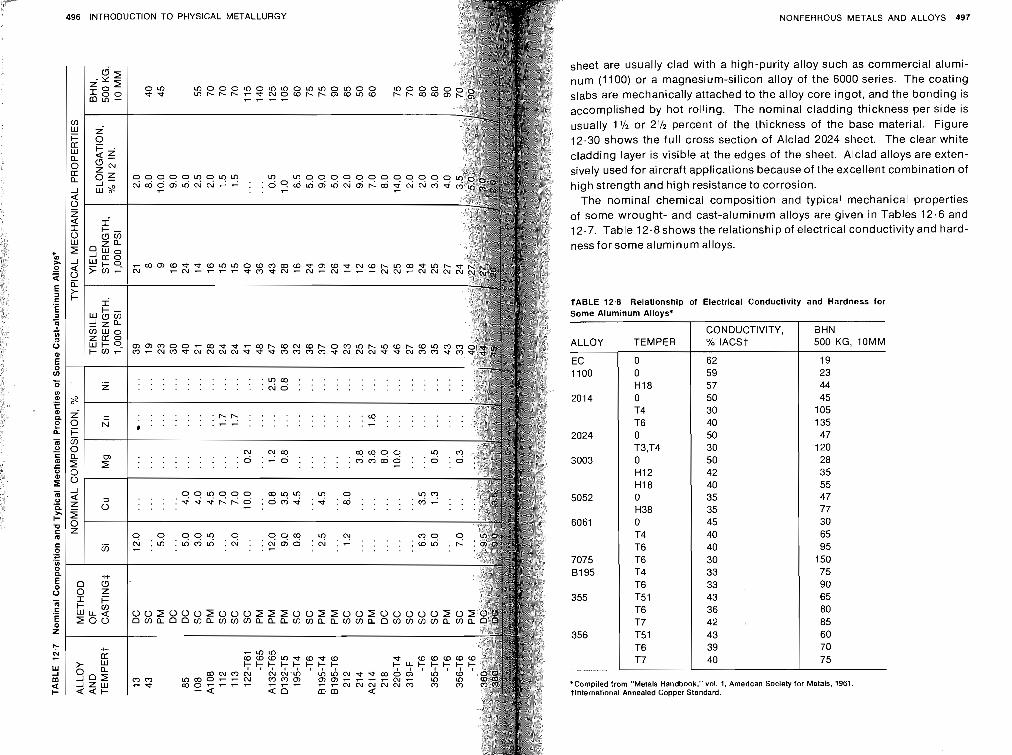
NONFERROUS METALS AND ALLOYS 497
sheet are usually clad with a high-purity alloy such as commercial alumi- num (1100) or a magnesium-silicon alloy of the 6000 series. The coating slabs are mechanically attached to the alloy core ingot, and the bonding is accomplished by hot rolling. The nominal cladding thickness per side is usually 1'12 or 2'12 percent of the thickness of the base material. Figure 12.30 shows the full cross section of Alclad 2024 sheet. The clear white cladding layer is visible at the edges of the sheet. Alclad alloys are exten- sively used for aircraft applications because of the excellent combination of high strength and high resistance to corrosion.
The nominal chemical composition and typical mechanical properties of some wrought- and cast-aluminum alloys are given in Tables 12.6 and 12.7. Table 12.8shows the relationship of electrical conductivity and hard- ness for some aluminum alloys.
TABLE 12.8 Relationship of Electrical Conductivity and Hardness for Some Aluminum Allovs*
BHN 500 KG, 10MM
EC 1100
201 4
2024
3003
5052
6061
7075 8195
355
356
CONDUCTIVITY, % l A C S i ALLOY TEMPER
*Compiled from "Metals Handbook." vol. 1. American Society for Metals, 1961. ?International Annealed Copper Standard.
0 0 HI8 0 T4 T6 0 T3,T4 0 H I2 HI8 0 H38 0 T4 T6 T6 T4 T6 T5 1 T6 T7 T5 1 T6 T7
I
62 59 57 50 30 40 50 30 50 42 40 35 35 45 40 40 30 33 33 43 36 42 8
43 39 40
19 23 44 45
105 135 47
120 28 35 55 47 77 30 65 95
150 75 90 65 80 85 60 70 75
PHYSICAL METALLURGY
IESIUM AND MAGNESIUM ALLOYS
Magnesium The chief advantages of magnesium are its light of machinability, and the high strength-to-weight ratio obtain alloys.
On the basis of equal volumes, aluminum weighs 1% times m steel weigh 4 times more, and copper and nickel alloys weigh than magnesium.
Magnesium has a c.p.h. (close-packed hexagonal) crystal str plastic deformation takes place at room temperature by slip alon planes. The ductility of magnesium is lower than that of f. since there are fewer slip systems available for plastic deformat 400°F, however, additional planes become active, and the magnesium and many of its alloys is improved.
Commercially pure magnesium or primary magnesium has a purity of 99.8 percent and usually contains small amounts of a iron, manganese, silicon, and copper.
Approximately half the magnesium produced is used in alloy structural purposes, primarily in the aircraft and missile industries. sium is used as an alloying element in aluminum, zinc, lead, and ot ferrous alloys. It has found increasing use in photo-engraving be its light weight and rapid but controlled etching characteristics.
Magnesium has a great affinity for oxygen and other chemical agents. It is used as a deoxidizer and desulfurizer in the manu nickel and copper alloys, also as a "getter" in the manufacture of tubes.' Because of its high chemical activity, it finds use in the pr of uranium and zirconium by thermal reduction with magnesium.
Magnesium anodes provide effective corrosion protection for w ers, underground pipelines, ship hulls, and ballast tanks. Alloy Designation and Temper The American Society for Tes terials (ASTM) has published a system of alloy nomenclature (Spe 8275-61) and temper designation (Specification B296-61) for lig and alloys. This system has been officially adopted by The Magne sociation for all magnesium alloys. The temper designation is the that adopted by The Aluminum Association for aluminum alloys covered in Sec. 12.18. The designation for alloys and unalloyed m based on their chemical-composition limits as follows (from AS nation 8275-61 by permission of the American Society for Testing
ALLOYS
a Designations for alloys consist of not more than two letters representin loying elements (Note 1) specified in the greatest amount, arranged in ord creasing percentages, or in alphabetical order if of equal percentages, foil the respective percentages rounded off to whole numbers and a serial letter
NONFERROUS METALS AND ALLOYS 499
and 3). The full name of the base metal precedes the designation, but it is omitted for brevity when the base metal being referred to is obvious. b The letters used to represent alloying elements should be those listed in Table 12.9. c In rounding-off percentages, the nearest whole number shall be used. If the deci- mal is followed by a 5, the nearest even whole number shall be used. d When a range is specified for the alloying element, the rounded-off mean should be used in the designation. e When only a minimum percentage is specified for the alloying element, the rounded-off minimum percentage should be used in the designation. NOTE 1 For codification, an alloying element is defined as an element (other than the base metal) having a minimum content greater than zero either directly specified or computed in accordance with the percentages specified for other elements. The amount present is the mean of the range (or the minimum percentage if only that is specified) before rounding off. NOTE 2 The serial letter is arbitrarily assigned in alphabetical sequence starting with A (omitting I and 0 ) and serves to differentiate otherwise identical designations. A serial letter is necessary to complete each designation. NOTE 3 The designation of a casting alloy in ingot form is derived from the com- position specified for the corresponding alloy in the form of castings. Thus, a casting ingot designation may consist of an alloy designation having one or more serial letters, one for each product composition, or it may consist of one or more alloy designations.
UNALLOYED METALS
Designations for unalloyed metals consist of the specified minimum purity, all digits retained but dropping the decimal point, followed by a serial number (Note 2). The full name of the base metal precedes the designation, but it is omitted for brevity when the base metal being referred to is obvious.
As an example, for magnesium alloy AZ92A, " A represents aluminum, the alloying element specified in the greatest amount; "Z" represents zinc, the alloying element specified in the second greatest amount; "9" indicates that the rounded-off mean aluminum percentage lies between 8.6 and 9.4; "2" signifies that the rounded-off mean zinc percentage lies between 1.5 and 2.5; and "A" as the final letter indicates that this is the first alloy whose composition qualified assignment of the designa- tion AZ92.
TABLE 12.9 Letters Representing Alloy Elements
Aluminum Bismuth Copper Cadmium Rare earths Iron Magnesium Thorium Zirconium Beryllium
Manganese Nickel Lead Silver Chromium Silicon Tin Antimony Zinc
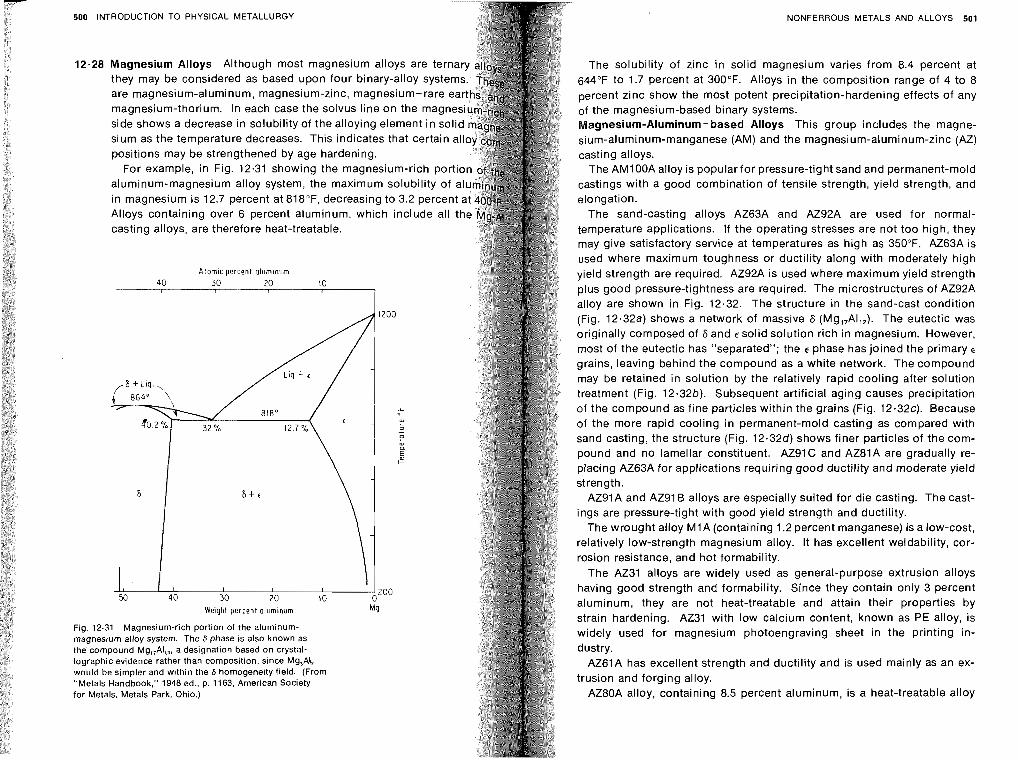
500 INTRODUCTION TO PHYSICAL METALLURGY
12.28 Magnesium Alloys Although most magnesium alloys are terna they may be considered as based upon four binary-alloy syst are magnesium-aluminum, magnesium-zinc, magnesium-rare magnesium-thorium. In each case the solvus line on the mag side shows a decrease in solubility of the alloying element in so sium as the temperature decreases. This indicates that certain positions may be strengthened by age hardening.
For example, in Fig. 12.31 showing the magnesium-rich port aluminum-magnesium alloy system, the maximum solubility of in magnesium is 12.7 percent at 818OF, decreasing to 3.2 percent Alloys containing over 6 percent aluminum, which include all t casting alloys, are therefore heat-treatable.
Atomic percent aluminum
Weight percent alum~num Mg
Fig. 12.31 Magnesium-rich portion of the alurninurn- rnaanesiurn allov svstern. The 6 phase is also known as . . the compound Mg,,AI,,, a designation based on crystal- loqraphic evidence rather than composition, since Mg,AI, would be stm~ler and w~thin the 6 hornoaeneitv f~eld (From +
ad - . "Metals Handbook." 1948 ed., p. 1163, American Society for Metals, Metals Park, Ohio.)
NONFERROUS METALS AND ALLOYS 501
The solubility of zinc in solid magnesium varies from 8.4 percent at 644°F to 1.7 percent at 300°F. Alloys in the composition range of 4 to 8 percent zinc show the most potent precipitation-hardening effects of any of the magnesium-based binary systems. Magnesium-Aluminum-based Alloys This group includes the magne- sium-aluminum-manganese (AM) and the magnesium-aluminum-zinc (AZ) casting alloys.
The AM100A alloy is popular for pressure-tight sand and permanent-mold castings with a good combination of tensile strength, yield strength, and elongation.
The sand-casting alloys AZ63A and AZ92A are used for normal- temperature applications. If the operating stresses are not too high, they may give satisfactory service at temperatures as high as 350°F. AZ63A is used where maximum toughness or ductility along with moderately high yield strength are required. AZ92A is used where maximum yield strength plus good pressure-tightness are required. The microstructures of AZ92A alloy are shown in Fig. 12.32. The structure in the sand-cast condition (Fig. 12.32a) shows a network of massive 8 (Mg,,AI,,). The eutectic was originally composed of F and €solid solution rich in magnesium. However, most of the eutectic has "separated"; the E phase has joined the primary E
grains, leaving behind the compound as a white network. The compound may be retained in solution by the relatively rapid cooling after solution treatment (Fig. 12.32b). Subsequent artificial aging causes precipitation of the compound as fine particles within the grains (Fig. 12.32~). Because of the more rapid cooling in permanent-mold casting as compared with sand casting, the structure (Fig. 12.32d) shows finer particles of the com- pounci and no lamellar constituent. AZ91C and AZ81A are gradually re- placing AZ63A for applications requiring good ductility and moderate yield strength.
AZ9IA and AZ9IB alloys are especially suited for die casting. The cast- ings are pressure-tight with good yield strength and ductility.
The wrought alloy MIA (containing I .2 percent manganese) is a low-cost, relatively low-strength magnesium alloy. It has excellent weldability, cor- rosion resistance, and hot formability.
The AZ31 alloys are widely used as general-purpose extrusion alloys having good strength and formability. Since they contain only 3 percent aluminum, they are not heat-treatable and attain their properties by strain hardening. AZ31 with low calcium content, known as PE alloy, is widely used for magnesium photoengraving sheet in the printing in- dustry.
AZ6IA has excellent strength and ductility and is used mainly as an ex- trusion and forging alloy.
AZ80A alloy, containing 8.5 percent aluminum, is a heat-treatable alloy
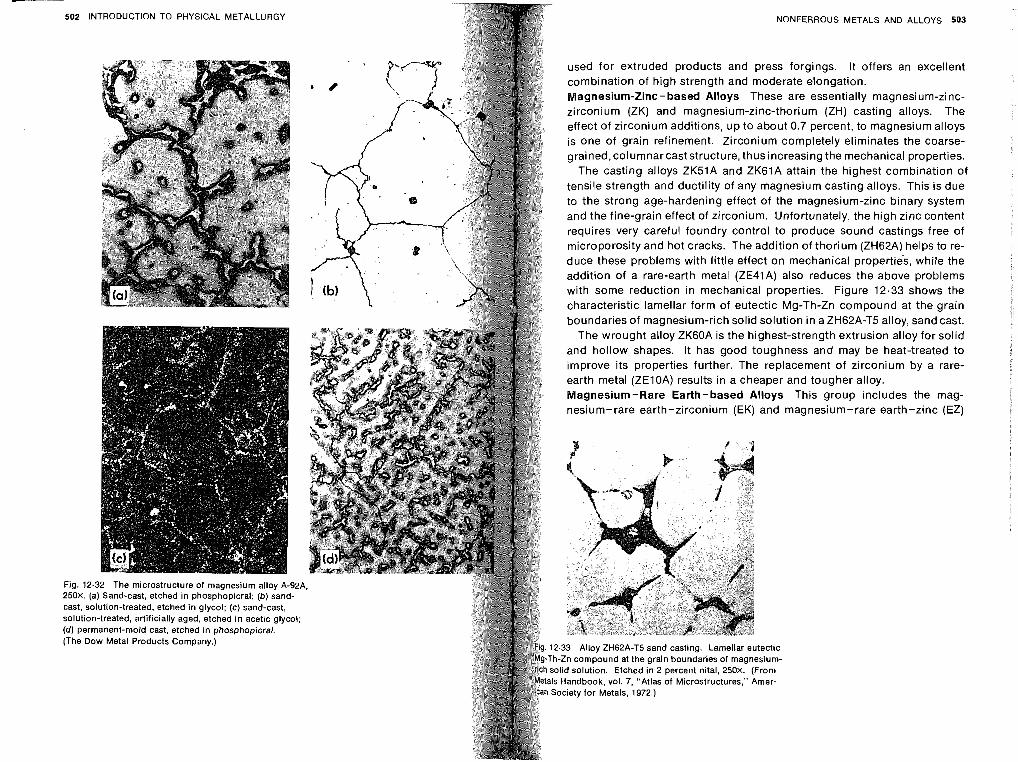
- 502 INTRODUCTION TO PHYSICAL METALLURGY
Fig. 12.32 The microstructure of magnesium alloy A-92A 250x. (a) Sand-cast, etched in phosphopicral; (b) sand- cast, solution-treated, etched in glycol; (c) sand-cast, solution-treated, artificially aged, etched in acetic glycol; (d) permanent-mold cast, etched in phosphopicral. (The Dow Metal Products Company.)
NONFERROUS METALS AND ALLOYS 503
used for extruded products and press forgings. It offers an excellent combination of high strength and moderate elongation. Magnesium-Zinc-based Alloys These are essentially magnesium-zinc- zirconium (ZK) and magnesium-zinc-thorium (ZH) casting alloys. The effect of zirconium additions, up to about 0.7 percent, to magnesium alloys is one of grain refinement. Zirconium completely eliminates the coarse- grained,columnar cast structure, thus increasing the mechanical properties.
The casting alloys ZK51A and ZK61A attain the highest combination of tensile strength and ductility of any magnesium casting alloys. This is due to the strong age-hardening effect of the magnesium-zinc binary system and the fine-grain effect of zirconium. Unfortunately, the high zinc content requires very careful foundry control to produce sound castings free of microporosity and hot cracks. The addition of thorium (ZH62A) helps to re- duce these problems with little effect on mechanical properties, while the addition of a rare-earth metal (ZE41A) also reduces the above problems with some reduction in mechanical properties. Figure 12.33 shows the characteristic lamellar form of eutectic Mg-Th-Zn compound at the grain boundaries of magnesium-rich solid solution in a ZH62A-T5 alloy, sand cast.
The wrought alloy ZKGOA is the highest-strength extrusion alloy for solid and hollow shapes. It has good toughness and may be heat-treated to improve its properties further. The replacement of zirconium by a rare- earth metal (ZEIOA) results in a cheaper and tougher alloy. Magnesium-Rare Earth-based Alloys This group includes the mag- nesium-rare earth-zirconium (EK) and magnesium-rare earth-zinc (EZ)
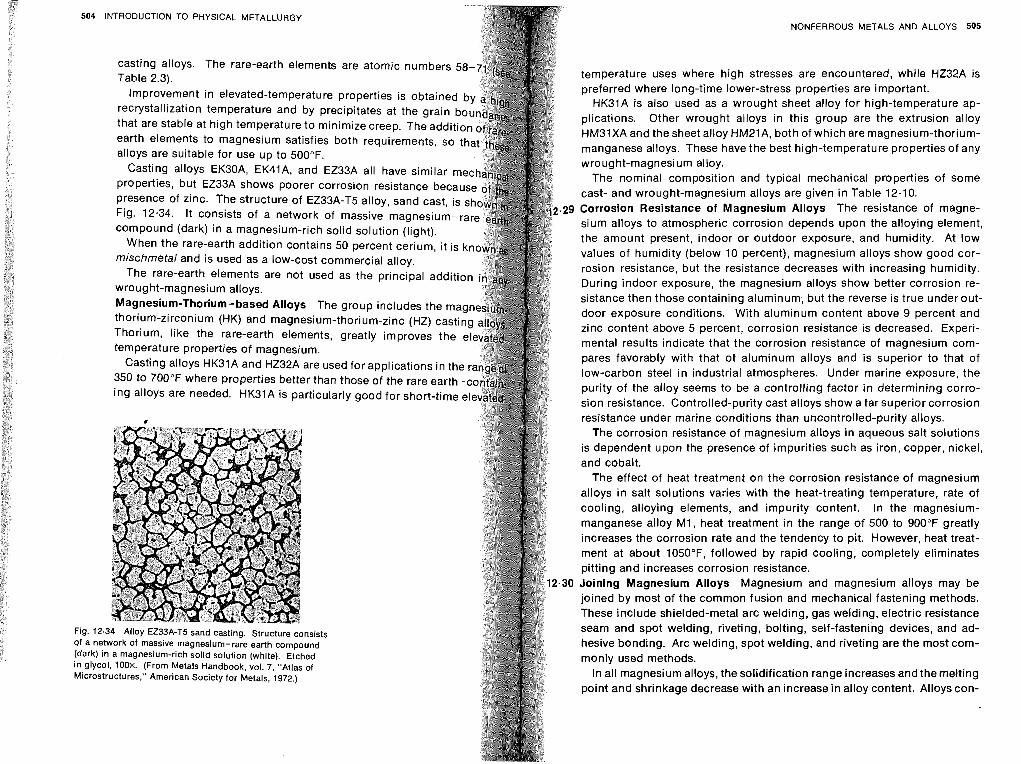
NONFERROUS METALS AND ALLOYS 505 504 INTRODUCTION TO PHYSICAL METALLURGY
casting alloys. The rare-earth elements are atomic numbers 5 temperature uses where high stresses are encountered, while HZ32A is Table 2.3). preferred where long-time lower-stress properties are important.
Improvement in elevated-temperature properties is obtained HK31A is also used as a wrought sheet alloy for high-temperature ap- recrystallization temperature and by precipitates at the grain b
plications. Other wrought alloys in this group are the extrusion alloy that are stable at high temperature to minimize creep. The ad
HM3lXA and the sheet alloy HM21A, both of which are magnesium-thorium- earth elements to magnesium satisfies both requirements,
manganese alloys. These have the best high-temperature properties of any alloys are suitable for use up to 500°F.
wrought-magnesium alloy. Casting alloys EKBOA, EK41A, and EZ33A all have similar The nominal composition and typical mechanical properties of some
properties, but EZ33A shows poorer corrosion resistance bec cast- and wrought-magnesium alloys are given in Table 12.10. presence of zinc. The structure of EZ33A-T5 alloy, sand cast, .29 Corrosion Resistance of Magnesium Alloys The resistance of magne- Fig. 12.34. It consists of a network of massive magnesium-
sium alloys to atmospheric corrosion depends upon the alloying element, compound (dark) in a magnesium-rich solid solution (light).
the amount present, indoor or outdoor exposure, and humidity. At low When the rare-earth addition contains 50 percent cerium, it is
values of humidity (below 10 percent), magnesium alloys show good cor- rnischrnetal and is used as a low-cost commercial alloy. rosion resistance, but the resistance decreases with increasing humidity. The rare-earth elements are not used as the principal additi During indoor exposure, the magnesium alloys show better corrosion re- wrought-magnesium alloys. sistance then those containing aluminum; but the reverse is true underout-
Magnesium-Thorium-based Alloys The group includes the door exposure conditions. With aluminum content above 9 percent and thorium-zirconium (HK) and magnesium-thorium-zinc (HZ) c
zinc content above 5 percent, corrosion resistance is decreased. Experi- Thorium, like the rare-earth elements, greatly improves the
mental results indicate that the corrosion resistance of magnesium com- temperature properties of magnesium. pares favorably with that of aluminum alloys and is superior to that of
Casting alloys HK31A and HZ32A are used for applications in the low-carbon steel in industrial atmospheres. Under marine exposure, the 350 to 700°F where properties better than those of the rare earth purity of the alloy seems to be a controlling factor in determining corro-
ing alloys are needed. HK31A is particularly good for short-time sion resistance. Controlled-purity cast alloys show a far superior corrosion resistance under marine conditions than uncontrolled-purity alloys.
The corrosion resistance of magnesium alloys in aqueous salt solutions is dependent upon the presence of impurities such as iron, copper, nickel, and cobalt.
The effect of heat treatment on the corrosion resistance of magnesium alloys in salt solutions varies with the heat-treating temperature, rate of cooling, alloying elements, and impurity content. In the magnesium- manganese alloy M1, heat treatment in the range of 500 to 900°F greatly increases the corrosion rate and the tendency to pit. However, heat treat- ment at about 1050°F, followed by rapid cooling, completely eliminates pitting and increases corrosion resistance.
2.30 Joining Magnesium Alloys Magnesium and magnesium alloys may be joined by most of the common fusion and mechanical fastening methods. These include shielded-metal arc welding, gas welding, electric resistance
Fig. 12.34 Alloy EZ33A-T5 sa seam and spot welding, riveting, bolting, self-fastening devices, and ad- hesive bonding. Arc welding, spot welding, and riveting are the most com-
(dark) in a magnesium-rich solid solution (white). Etched moniy used methods. in glycol, IOOx. (From Metals Handbook, vol. 7, "Atlas of Microstructures," American Society for Metals, 1972.) In all magnesium alloys, the solidification range increases and the melting
point and shrinkage decrease with an increase in alloy content. Alloys con-
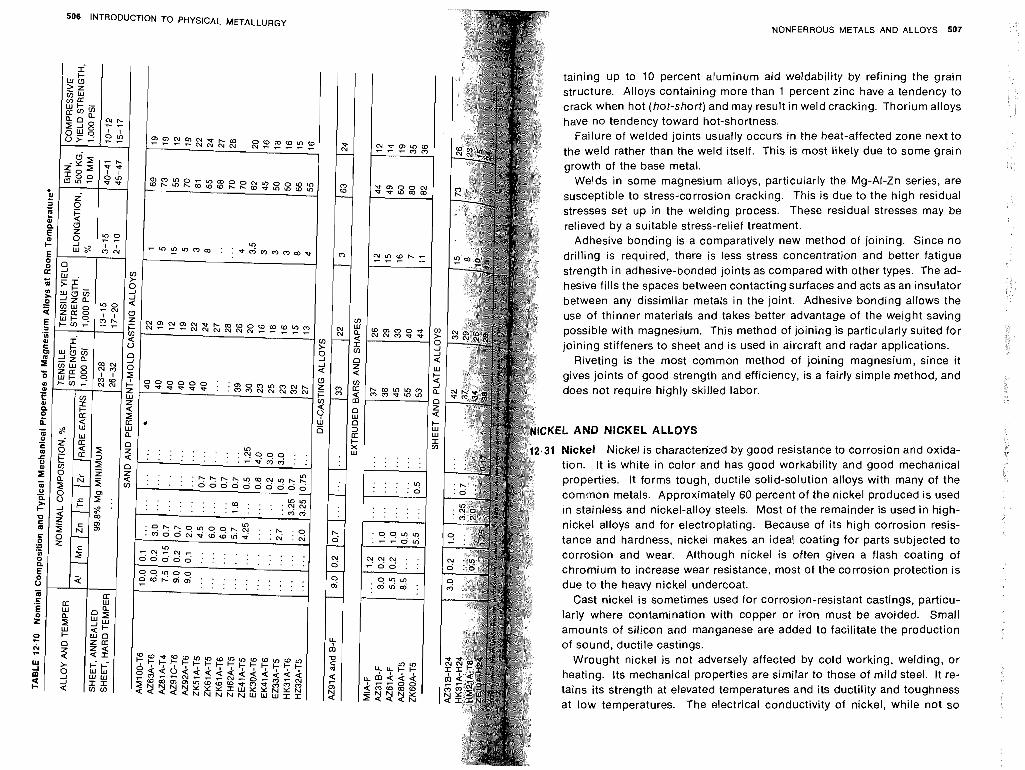
506 INTRODUCTION TO PHYSICAL METALLURGY NONFERROUS METALS AND ALLOYS 507
taining up to 10 percent aluminum aid weldability by refining the grain structure. Alloys containing more than 1 percent zinc have a tendency to crack when hot (hot-short) and may result in weld cracking. Thorium alloys have no tendency toward hot-shortness.
Failure of welded joints usually occurs in the heat-affected zone next to the weld rather than the weld itself. This is most likely due to some grain growth of the base metal.
Welds in some magnesium alloys, particularly the Mg-AI-Zn series, are susceptible to stress-corrosion cracking. This is due to the high residual stresses set up in the welding process. These residual stresses may be relieved by a suitable stress-relief treatment.
Adhesive bonding is a comparatively new method of joining. Since no drilling is required, there is less stress concentration and better fatigue strength in adhesive-bonded joints as compared with other types. The ad- hesive fills the spaces between contacting surfaces and acts as an insulator between any dissimilar metals in the joint. Adhesive bonding allows the use of thinner materials and takes better advantage of the weight saving possible with magnesium. This method of joining is particularly suited for joining stiffeners to sheet and is used in aircraft and radar applications.
Riveting is the most common method of joining magnesium, since it gives joints of good strength and efficiency, is a fairly simple method, and does not require highly skilled labor.
:EL AND NICKEL ALLOYS
I Nickel Nickel is characterized by good resistance to corrosion and oxida- tion. It is white in color and has good workability and good mechanical properties. It forms tough, ductile solid-solution alloys with many of the common metals. Approximately 60 percent of the nickel produced is used in stainless and nickel-alloy steels. Most of the remainder is used in high- nickel alloys and for electroplating. Because of its high corrosion resis- tance and hardness, nickel makes an ideal coating for parts subjected to corrosion and wear. Although nickel is often given a flash coating of chromium to increase wear resistance, most of the corrosion protection is due to the heavy nickel undercoat.
Cast nickel is sometimes used for corrosion-resistant castings, particu- larly where contamination with copper or iron must be avoided. Small amounts of silicon and manganese are added to facilitate the production of sound, ductile castings.
Wrought nickel is not adversely affected by cold working, welding, or heating. Its mechanical properties are similar to those of mild steel. It re- tains its strength at elevated temperatures and its ductility and toughness at low temperatures. The electrical conductivity of nickel, while not so
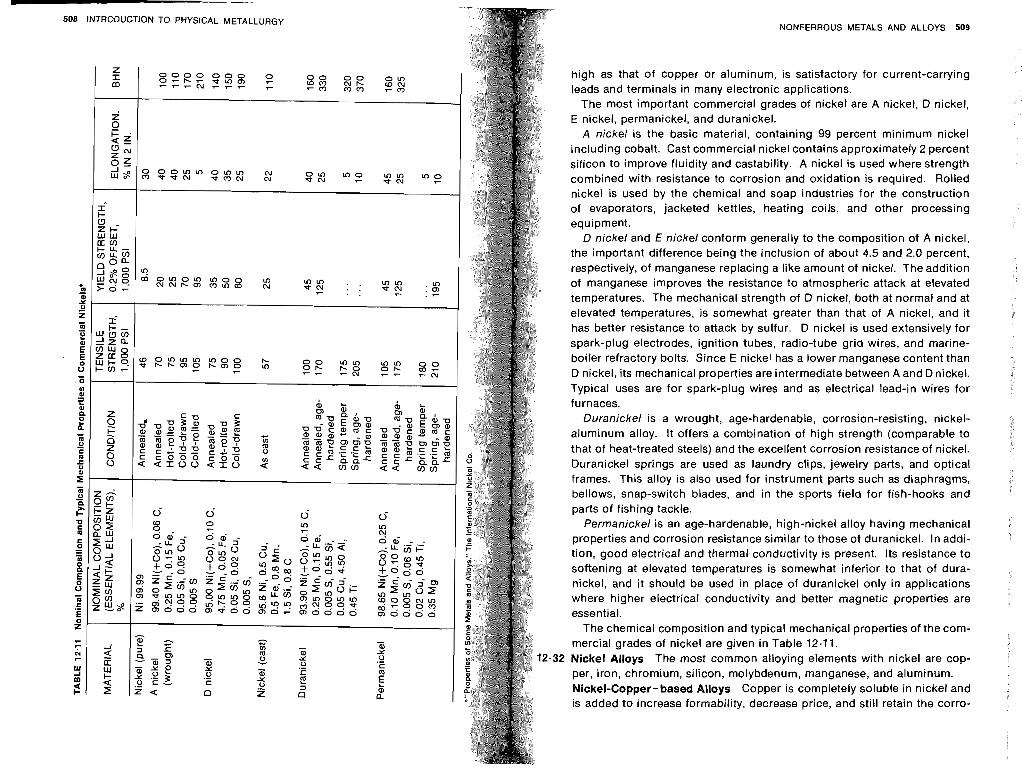
NONFERROUS METALS AND ALLOYS 509
high as that of copper or aluminum, is satisfactory for current-carrying leads and terminals in many electronic applications.
The most important commercial grades of nickel are A nickel, D nickel, E nickel, permanickel, and duranickel.
A nickel is the basic material, containing 99 percent minimum nickel including cobalt. Cast commercial nickel contains approximately 2 percent silicon to improve fluidity and castability. A nickel is used where strength combined with resistance to corrosion and oxidation is required. Rolled nickel is used by the chemical and soap industries for the construction of evaporators, jacketed kettles, heating coils, and other processing equipment.
D nickel and E nickel conform generally to the composition of A nickel, the important difference being the inclusion of about 4.5 and 2.0 percent, respectively, of manganese replacing a like amount of nickel. The addition of manganese improves the resistance to atmospheric attack at elevated temperatures. The mechanical strength of D nickel, both at normal and at elevated temperatures, is somewhat greater than that of A nickel, and it has better resistance to attack by sulfur. D nickel is used extensively for spark-plug electrodes, ignition tubes, radio-tube grid wires, and marine- boiler refractory bolts. Since E nickel has a lower manganese content than D nickel, its mechanical properties are intermediate between A and D nickel. Typical uses are for spark-plug wires and as electrical lead-in wires for furnaces.
Duranickel is a wrought, age-hardenable, corrosion-resisting, nickel- aluminum alloy. It offers a combination of high strength (comparable to that of heat-treated steels) and the excellent corrosion resistance of nickel. Duranickel springs are used as laundry clips, jewelry parts, and optical frames. This alloy is also used for instrument parts such as diaphragms, bellows, snap-switch blades, and in the sports field for fish-hooks and parts of fishing tackle.
Permanickel is an age-hardenable, high-nickel alloy having mechanical properties and corrosion resistance similar to those of duranickel. In addi- tion, good electrical and thermal conductivity is present. Its resistance to softening at elevated temperatures is somewhat inferior to that of dura- nickel, and it should be used in place of duranickel only in applications where higher electrical conductivity and better magnetic properties are essential.
The chemical composition and typical mechanical properties of the com- mercial grades of nickel are given in Table 12.11. Nickel Alloys The most common alloying elements with nickel are cop- per, iron, chromium, silicon, molybdenum, manganese, and aluminum. Nickel-Copper-based Alloys Copper is completely soluble in nickel and is added to increase formability, decrease price, and still retain the corro-
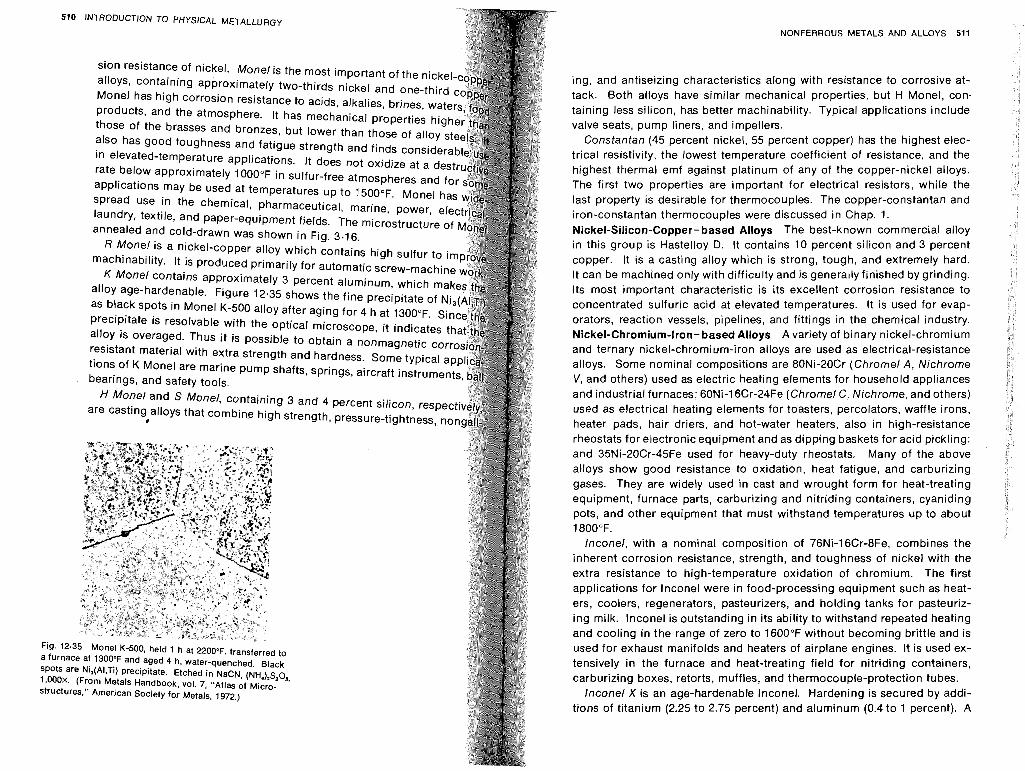
510 INTRODUCTION TO PHYSICAL METALLURGY
sion resistance of nickel. Monel is the most important of the nickel alloys, containing approximately two-thirds nickel and one-third Monel has high corrosion resistance to acids, alkalies, brines, wat products, and the atmosphere. It has mechanical properties hig those of the brasses and bronzes, but lower than those of alloys also has good toughness and fatigue strength and finds consid in elevated-temperature applications. It does not oxidize at a rate below approximately 1000°F in sulfur-free atmospheres an applications may be used at temperatures up to 1500°F. Monel h spread use in the chemical, pharmaceutical, marine, power, laundry, textile, and paper-equipment fields. The microstructur annealed and cold-drawn was shown in Fig. 3.16.
R Monel is a nickel-copper alloy which contains high sulfur to im machinability. It is produced primarily for automatic screw-machine
K Monel contains approximately 3 percent aluminum, which mak alloy age-hardenable. Figure 12.35 shows the fine precipitate of Ni, as black spots in Monel K-500 alloy after aging for 4 h at 1300°F. Sin precipitate is resolvable with the optical microscope, it indicates t alloy is overaged. Thus i t is possible to obtain a nonmagnetic cor resistant material with extra strength and hardness. Some typical a tions of K Monel are marine pump shafts, springs, aircraft instruments bearings, and safety tools.
ti Monel and S Monel, containing 3 and 4 percent silicon, respec are casting alloys that combine high strength, pressure-tightness, non
#
a furnace at 1300°F and aged 4 h, water-quenched. Black spots are Ni,(AI,Ti) precipitate. Etched in NaCN, (NH,),S,O, 1,000~. (From Metals Handbook, voi. 7, "Atlas of Micro- structures," American Society for Metals, 1972.)
NONFERROUS METALS AND ALLOYS 511
ing, and antiseizing characteristics along with resistance to corrosive at- tack. Both alloys have similar mechanical properties, but H Monel, con- taining less silicon, has better machinability. Typical applications include valve seats, pump liners, and impellers.
Constantan (45 percent nickel, 55 percent copper) has the highest elec- trical resistivity, the lowest temperature coefficient of resistance, and the highest thermal emf against platinum of any of the copper-nickel alloys. The first two properties are important for electrical resistors, while the last property is desirable for thermocouples. The copper-constantan and iron-constantan thermocouples were discussed in Chap. 1. Nickel-Silicon-Copper-based Alloys The best-known commercial alloy in this group is Hastelloy D. It contains 10 percent silicon and 3 percent copper. It is a casting alloy which is strong, tough, and extremely hard. It can be machined only with difficulty and is generally finished by grinding. Its most important characteristic is its excellent corrosioti resistance to concentrated sulfuric acid at elevated temperatures. It is used for evap-
orators, reaction vessels, pipelines, and fittings in the chemical industry. Nickel-Chromium-Iron- based Alloys A variety of binary nickel-chromium and ternary nickel-chromium-iron alloys are used as electrical-resistance alloys. Some nominal compositions are 80Ni-20Cr (Chromel A, Nichrome V, and others) used as electric heating elements for household appliances and industrial furnaces; 60Ni-16Cr-24Fe (Chromel C, Nichrome, and others) used as electrical heating elements for toasters, percolators, waffle irons, heater pads, hair driers, and hot-water heaters, also in high-resistance rheostats for electronic equipment and as dipping baskets for acid pickling; and 35Ni-20Cr-45Fe used for heavy-duty rheostats. Many of the above
alloys show good resistance to oxidation, heat fatigue, and carburizing gases. They are widely used in cast and wrought form for heat-treating equipment, furnace parts, carburizing and nitriding containers, cyaniding pots, and other equipment that must withstand temperatures up to about 1800°F.
Inconel, with a nominal composition of 76Ni-16Cr-8Fe, combines the inherent corrosion resistance, strength, and toughness of nickel with the extra resistance to high-temperature oxidation of chromium. The first
applications for lnconel were in food-processing equipment such as heat- ers, coolers, regenerators, pasteurizers, and holding tanks for pasteuriz- ing milk. lnconel is outstanding in its ability to withstand repeated heating and cooling in the range of zero to 1600°F without becoming brittle and is used for exhaust manifolds and heaters of airplane engines. It is used ex- tensively in the furnace and heat-treating field for nitriding containers, carburizing boxes, retorts, muffles, and thermocouple-protection tubes.
lnconel X is an age-hardenable Inconel. Hardening is secured by addi- tions of titanium (2.25 to 2.75 percent) and aluminum (0.4 to 1 percent). A
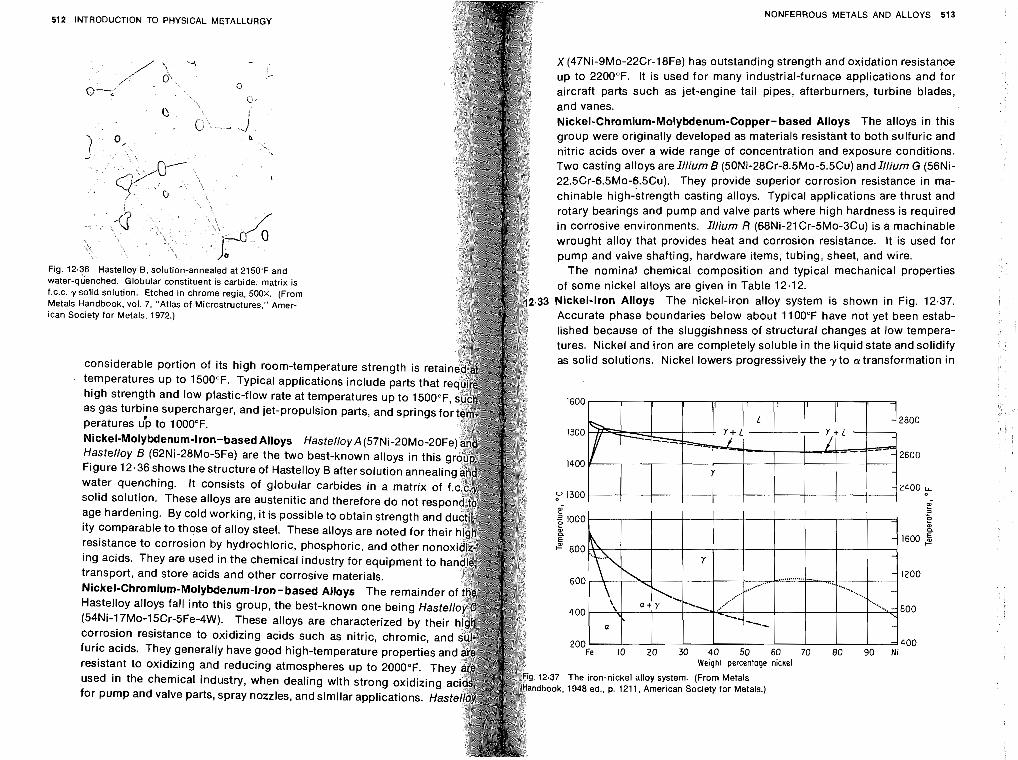
512 INTRODUCTION TO PHYSICAL METALLURGY
Fig. watc
2.36 Hastelloy B, solution-annealed at 2150°F and '-auenched. Globular constituent is carbide: matrix
f.c.c. y solid solution. Etched in chrome regia. 500x. (From Metals Handbook, vol. 7, "Atlas of Microstructures," Amer- ican Society for Metals. 1972.)
considerable portion of its high room-temperature strength is ret temperatures up to 1500°F. Typical applications include parts that high strength and low plastic-flow rate at temperatures up to 1500" as gas turbine supercharger, and jet-propulsion parts, and springs f peratures <p to 1000°F. Nickel-Molybdenum-Iron-based Alloys Hastelloy A (57Ni-20Mo-20F Hastelloy 6 (62Ni-28Mo-5Fe) are the two best-known alloys in this Figure 12.36 shows the structure of Hastelloy B after solution anneali water quenching. It consists of globular carbides in a matrix of solid solution. These alloys are austenitic and therefore do not resp age hardening. By cold working, it is possible to obtain strength and ity comparable to those of alloy steel. These alloys are noted for the1 resistance to corrosion by hydrochloric, phosphoric, and other non ing acids. They are used in the chemical industry for equipment to h transport, and store acids and other corrosive materials. Nickel-Chromium-Molybdenum-Iron-based Alloys The remainder Hastelloy alloys fall into this group, the best-known one being Hast (54Ni-17Mo-15Cr-5Fe-4W). These alloys are characterized by t corrosion resistance to oxidizing acids such as nitric, chromic, furic acids. They generally have good high-temperature properties a resistant to oxidizing and reducing atmospheres up to 2000°F. Th used in the chemical industry, when dealing with strong oxidizing for pump and valve parts, spray nozzles, and similar applications. Has
NONFERROUS METALS AND ALLOYS 513
X (47Ni-9Mo-22Cr-18Fe) has outstanding strength and oxidation resistance up to 2200°F. It is used for many industrial-furnace applications and for aircraft parts such as jet-engine tail pipes, afterburners, turbine blades, and vanes. Nickel-Chromium-Molybdenum-Copper-based Alloys The alloys in this group were originally developed as materials resistant to both sulfuric and nitric acids over a wide range of concentration and exposure conditions. Two casting alloys are Illium B (50Ni-28Cr-8.5Mo-5.5Cu) and Illium G (56Ni- 22.5Cr-6.5Mo-6.5Cu). They provide superior corrosion resistance in ma- chinable high-strength casting alloys. Typical applications are thrust and rotary bearings and pump and valve parts where high hardness is required in corrosive environments. Illium R (68Ni-21Cr-5Mo-3Cu) is a machinable wrought alloy that provides heat and corrosion resistance. It is used for pump and valve shafting, hardware items, tubing, sheet, and wire.
The nominal chemical composition and typical mechanical properties of some nickel alloys are given in Table 12.12. Nickel-Iron Alloys The nickel-iron alloy system is shown in Fig. 12.37. Accurate phase boundaries below about 1100°F have not yet been estab- lished because of the sluggishness of structural changes at low tempera- tures. Nickel and iron are completely soluble in the liquid state and solidify as solid solutions. Nickel lowers progressively the y to transformation in
Weight percentage nickel
.37 The iron-nickel alloy system. (From Metals ook, 1948 ed., p. 1211, American Society for Metals.)
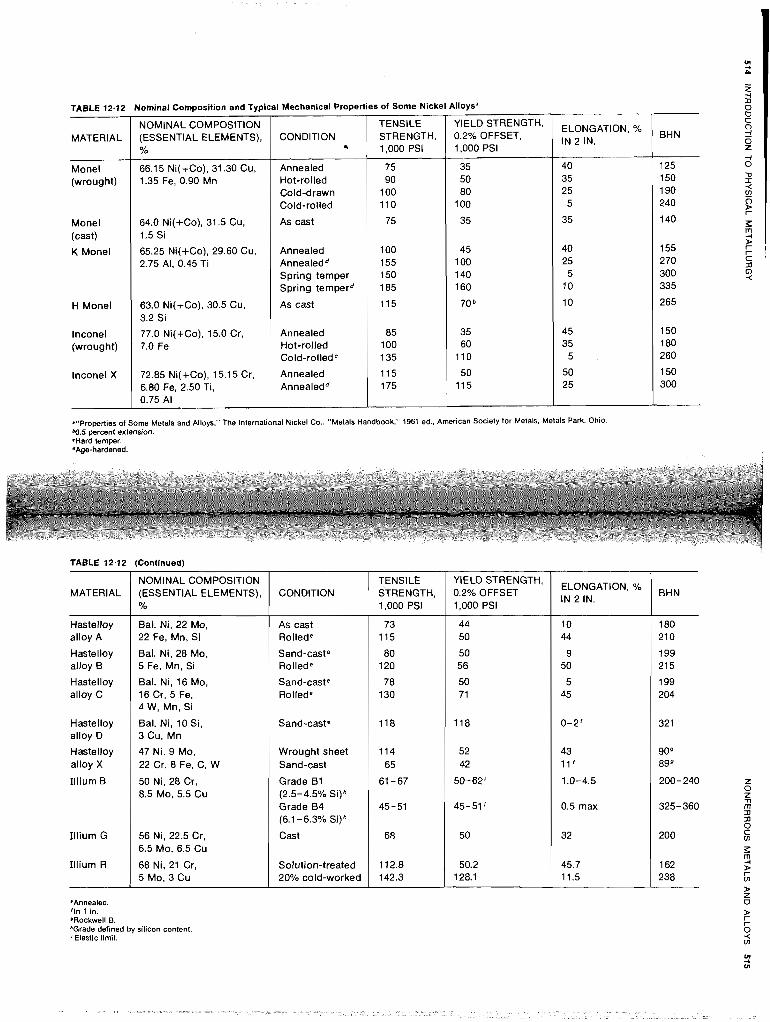
TABLE 12.12 (Continued)
9 e
I -4
TABLE 12.12 Nominal Composition and Typical Mechanical Properties of Some Nickel
'Annealed. 'In 1 in. 'Rockwell 8. Grade defined by silicon content. 'Elastic limit.
Alloys"
MATERIAL
Hastelloy alloy A
Hastelloy alloy B
Hastelloy alloy C
Hastelloy alloy D
Hastelloy alloy X
Illium B
Illium G
Illium R
3
NOMINAL COMPOSITION (ESSENTIAL ELEMENTS), %
Bal. Ni, 22 Mo, 22 Fe, Mn, Si
Bal. Ni, 28 Mo, 5 Fe, Mn, Si
Bal, Ni, 16 Mo, 16 Cr, 5 Fe, 4 W, Mn, Si
Bal. Ni, 10 Si, 3 Cu, Mn
47 Ni, 9 Mo, 22 Cr, 8 Fe, C, W
50 Ni, 28 Cr, 8.5 Mo, 5.5 Cu
56 Ni, 22.5 Cr, 6.5 Mo, 6.5 Cu
68 Ni, 21 Cr, 5 Mo, 3 Cu
8 BHN
C
3 P 4
125 0
150 I 0
190 < 2 240 o
140 $ 5 -4
155 F" r
270 C n
300 0 < 335
265
150 1 80 260
150 300
'"Properties of Some Metals and Alloys." The International Nickel Co.; "Metals Handbook." 1961 ed.. American Society for Metals. Metals Park, Ohio. b0.5 percent extension. Ward temper. 4Age-hardened.
ELONGATION, Yo IN 2 IN.
40 35 25 5
35
40 25 5
10
10
45 35
5
50 25
CONDITION
As cast Rollede
Sand-caste Rollede
Sand-caste Rollede
Sand-caste
Wrought sheet Sand-cast
Grade 01 (2.5-4.5% Si)h Grade 8 4 (6.1 - 6.3% Si)
Cast
Solution-treated 20% cold-worked
'IELD STRENGTH' 0.2% OFFSET, 1,000 PSI
35 50 80
100
35
45 100 140 160
70
35 60
110
50 11 5
'IELD STRENGTH' 0.2% OFFSET 1,000 PSI
44 50
50 56
50 71
11 8
52 42
50-62'
45-51 I
50
50.2 1 28.1
TENSILE STRENGTH, 1,000 PSI
73 11 5
80 120
78 130
118
11 4 65
61-67
45-51
6'3
112.8 142.3
MATERIAL
Monel (wrought)
Monel (cast)
K Monel
H Monel
lnconel (wrought)
lnconel X
CONDITION *
Annealed Hot-rolled Cold-drawn Cold-rolled
As cast
Annealed Annealedd Spring temper Spring temperd
As cast
Annealed Hot-rolled Cold-rolledc
Annealed Annealedd
NOMINAL COMPOSITION (ESSENTIAL ELEMENTS), Yo
66.15 Ni(+Co), 31.30 Cu, 1.35 Fe, 0.90 Mn
64.0 Ni(+Co). 31.5 Cu, 1.5 Si
65.25 Ni(+Co), 29.60 Cu. 2.75 Al, 0.45 Ti
63.0 Ni(i-Co), 30.5 Cu, 3.2 Si
77.0 Ni(+Co), 15.0 Cr, 7.0 Fe
72.85 Ni(+Co), 15.15 Cr. 6.80 Fe, 2.50 Ti, 0.75 Al
ELONGATION. % IN 2 IN.
10 44
9 50
5 45
0-2'
43 11'
1.0-4.5
0.5 max
32
45.7 11.5
TENSILE STRENGTH. 1,000 PSI
75 90
100 110
75
100 155 150 185
115
85 100 135
115 175
BHN
180 21 0
199 21 5
199 204
321
9O9 89@
200-240
325-360
200
162 238
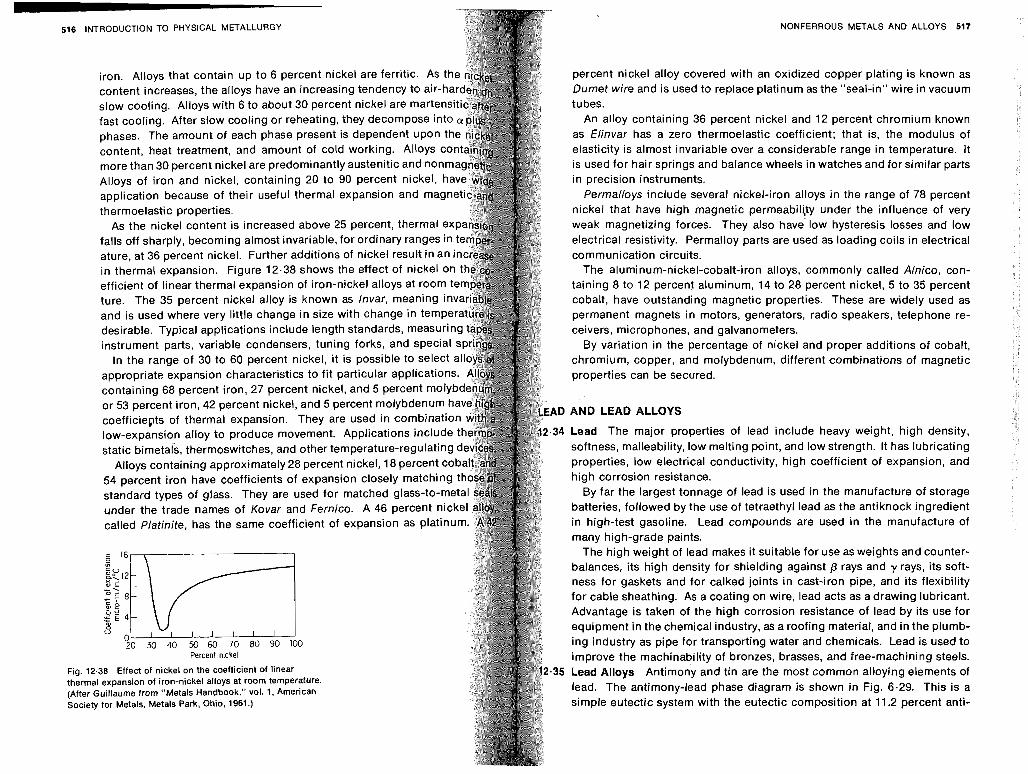
516 INTRODUCTION TO PHYSICAL METALLURGY NONFERROUS METALS AND ALLOYS 517
iron. Alloys that contain up to 6 percent nickel are ferritic. As t content increases, the alloys have an increasing tendency to air-h slow cooling. Alloys with 6 to about 30 percent nickel are mart fast cooling. After slow cooling or reheating, they decompose phases. The amount of each phase present is dependent upon content, heat treatment, and amount of cold working. Alloys c more than 30 percent nickel are predominantly austenitic and no Alloys of iron and nickel, containing 20 to 90 percent nickel, application because of their useful thermal expansion and mag thermoelastic properties.
As the nickel content is increased above 25 percent, thermal falls off sharply, becoming almost invariable, for ordinary ranges I ature, at 36 percent nickel. Further additions of nickel result in a in thermal expansion. Figure 12.38 shows the effect of nickel o efficient of linear thermal expansion of iron-nickel alloys at room ture. The 35 percent nickel alloy is known as Invar, meaning inv and is used where very little change in size with change in temp desirable. Typical applications include length standards, measuri instrument parts, variable condensers, tuning forks, and specia
In the range of 30 to 60 percent nickel, it is possible to select appropriate expansion characteristics to fit particular applicatio containing 68 percent iron, 27 percent nickel, and 5 percent mol or 53 percent iron, 42 percent nickel, and 5 percent molybdenum coefficiepts of thermal expansion. They are used in combinatio low-expansion alloy to produce movement. Applications include t static bimetals, thermoswitches, and other temperature-regulating
Alloys containing approximately 28 percent nickel, 18 percent co 54 percent iron have coefficients of expansion closely matching t standard types of glass. They are used for matched glass-to-m under the trade names of Kovar and Fernico. A 46 percent n called Platinite, has the same coefficient of expansion as pl
Percent n~ckel
Fig. 12.38 Effect of nickel on the coefficient of linear thermal exoansion of iron-nickel alloys at room temperature. (After G Society
iuiliaume from "Metals and book," for Metals, Metals Park, Ohio, 1961
vol. .)
1. American
percent nickel alloy covered with an oxidized copper plating is known as Dumet wire and is used to replace platinum as the "seal-in" wire in vacuum tubes.
An alloy containing 36 percent nickel and 12 percent chromium known as Elinvar has a zero thermoelastic coefficient; that is, the modulus of elasticity is almost invariable over a considerable range in temperature. It is used for hair springs and balance wheels in watches and for similar parts in precision instruments.
Permalloys include several nickel-iron alloys in the range of 78 percent nickel that have high magnetic permeability under the influence of very weak magnetizing forces. They also have' low hysteresis losses and low electrical resistivity. Permalloy parts are used as loading coils in electrical communication circuits.
The aluminum-nickel-cobalt-iron alloys, commonly called Alnico, con- taining 8 to 12 percent aluminum, 14 to 28 percent nickel, 5 to 35 percent cobalt, have outstanding magnetic properties. These are widely used as permanent magnets in motors, generators, radio speakers, telephone re- ceivers, microphones, and galvanometers.
By variation in the percentage of nickel and proper additions of cobalt, chromium, copper, and molybdenum, different combinations of magnetic properties can be secured.
AND LEAD ALLOYS
Lead The major properties of lead include heavy weight, high density, softness, malleability, low melting point, and low strength. It has lubricating properties, low electrical conductivity, high coefficient of expansion, and high corrosion resistance.
By far the largest tonnage of lead is used in the manufacture of storage batteries, followed by the use of tetraethyl lead as the antiknock ingredient in high-test gasoline. Lead compounds are used in the manufacture of many high-griide paints.
The high weight of lead makes it suitable for use as weights and counter- balances, its high density for shielding against /3 rays and y rays, its soft- ness for gaskets and for calked joints in cast-iron pipe, and its flexibility for cable sheathing. As a coating on wire, lead acts as adrawing lubricant. Advantage is taken of the high corrosion resistance of lead by its use for equipment in the chemical industry, as a roofing material, and in the plumb- ing industry as pipe for transporting water and chemicals. Lead is used to improve the machinability of bronzes, brasses, and free-machining steels. Lead Alloys Antimony and tin are the most common alloying elements of lead. The antimony-lead phase diagram is shown in Fig. 6.29. This is a simple eutectic system with the eutectic composition at 11.2 percent anti-
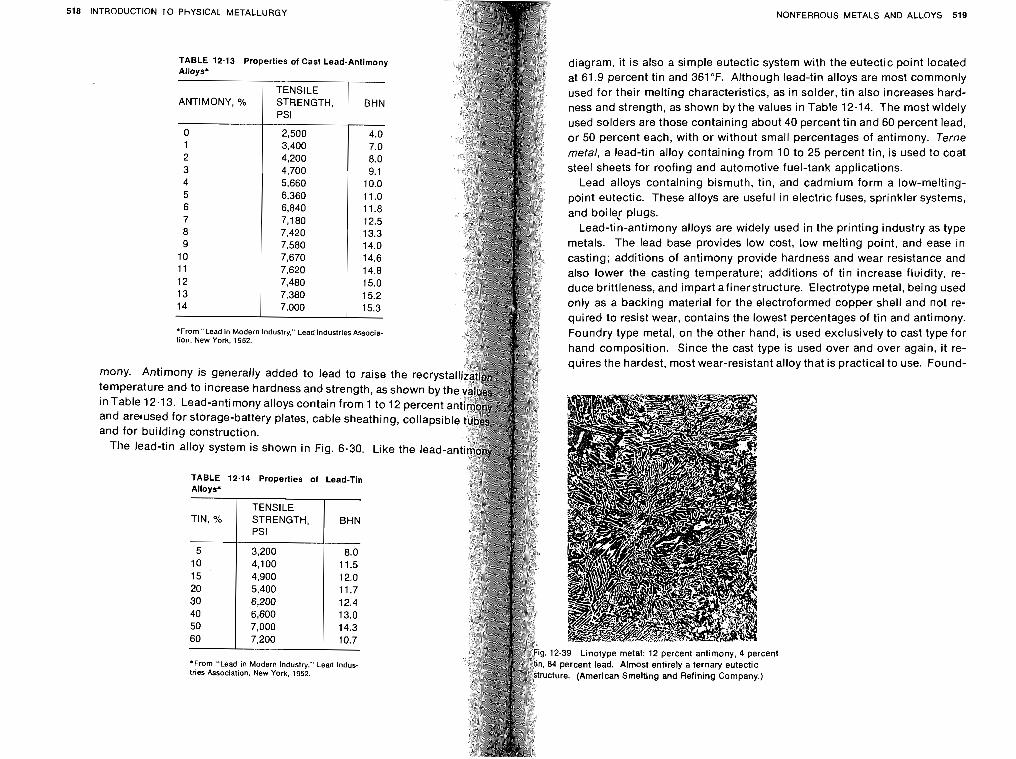
INTRODUCTION TO PHYSICAL METALLURGY
TABLE 12.13 Properties of Cast Lead-Antimony Alloys*
NONFERROUS METALS AN0 ALLOYS 519
ANTIMONY, %
0 1 2 3 4 5 6 7 8 9
10 11 12 13 14
diagram, it is also a simple eutectic system with the eutectic point located at 61.9 percent tin and 361°F. Although lead-tin alloys are most commonly used for their melting characteristics, as in solder, tin also increases hard- ness and strength, as shown by the values in Table 12.14. The most widely used solders are those containing about 40 percent tin and 60 percent lead, or 50 percent each, with or without small percentages of antimony. Terne metal, a lead-tin alloy containing from 10 to 25 percent tin, is used to coat steel sheets for roofing and automotive fuel-tank applications.
Lead alloys containing bismuth, tin, and cadmium form a low-melting- point eutectic. These alloys are useful in electric fuses, sprinkler systems, and boile,r plugs.
Lead-tin-antimony alloys are widely used in the printing industry as type metals. The lead base provides low cost, low melting point, and ease in casting; additions of antimony provide hardness and wear resistance and also lower the casting temperature; additions of tin increase fluidity, re- duce brittleness, and impart afinerstructure. Electrotype metal, being used only as a backing material for the electroformed copper shell and not re- quired to resist wear, contains the lowest percentages of tin and antimony. Foundry type metal, on the other hand, is used exclusively to cast type for hand composition. Since the cast type is used over and over again, i t re- quires the hardest, most wear-resistant alloy that is practical to use. Found-
BHN
8.0 11.5 12.0 11.7 12.4 13.0 14.3 10.7
TIN, %
5 10 15 20 30 40 50 60
12.39 Linotype metal: 12 percent antimony, 4 percent 84 percent lead. Almost entirely a ternary eutectic Icture. (American Smelting and Refining Company.)
*From "Lead in Modern Industry." Lead Industries Associa- tion. New York. 1952.
mony. Antimony is generally added to lead to raise the recry temperature and to increase hardness and strength, as shown by in Table 12.13. Lead-antimony alloys contain from 1 to 12 percent a and armused for storage-battery plates, cable sheathing, collapsibl and for building construction.
The lead-tin alloy system is shown in Fig. 6.30. Like the lead-an
TABLE 12.14 Properties of Lead-Tin Alloys*
'From "Lead in Modern Industry," Lead Indus- tries Association, New York, 1952.
TENS1 LE STRENGTH, PSI
2,500 3,400 4,200 4,700 5,660 6,360 6,840 7,180 7,420 7.580 7,670 7,620 7,480 7,380 7,000
TENSILE STRENGTH, PSI
3,200 4,100 4.900 5,400 6,200 6,600 7.000 7,200
BHN
4.0 7.0 8.0 9.1
10.0 11 .O 11.8 12.5 13.3 14.0 14.6 14.8 15.0 15.2 15.3
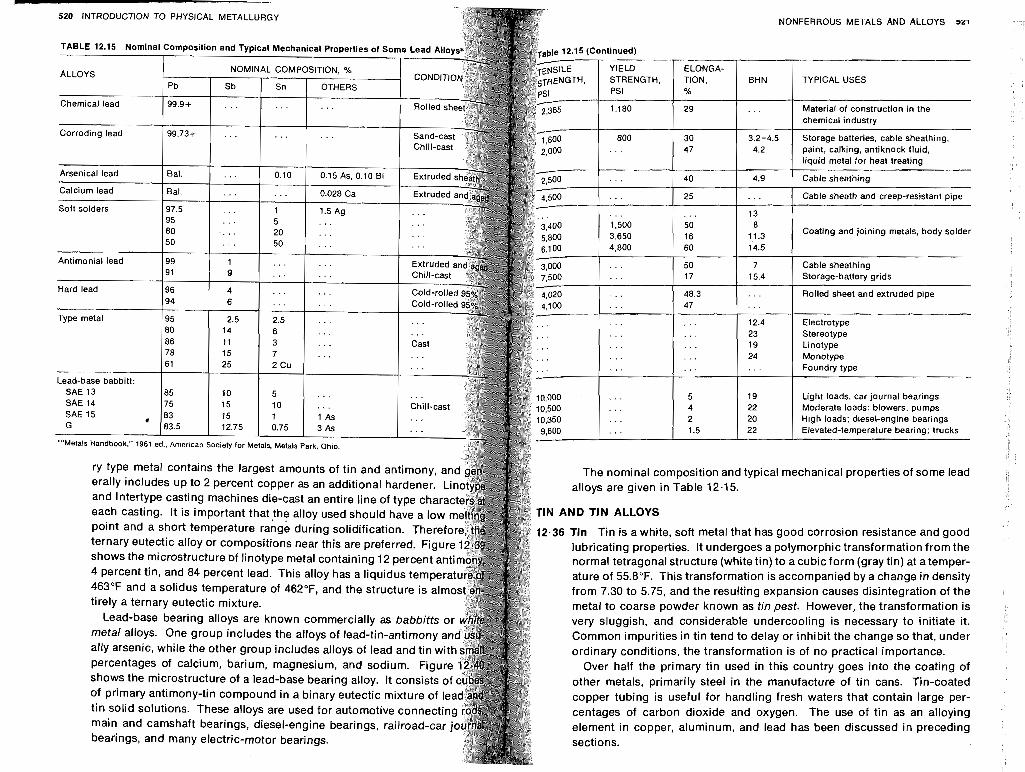
520 INTRODUCTION TO PHYSICAL METALLURGY NONFERROUS METALS AND ALLOYS sL1
Coating and joining metals, body solder
SAE 13 SAE 14 SAE 15
ry type metal contains the largest amounts of tin and antimony, The nominal composition and typical mechanical properties of some lead erally includes up to 2 percent copper as an additional hardener. alloys are given in Table 12,15.
TIN AND TIN ALLOYS
12.36 Tin Tin is a white, soft metal that has good corrosion resistance and good lubricating properties. It undergoes a polymorphic transformation from the normal tetragonal structure (white tin) to a cubic form (gray tin) at a temper-
4 percent tin, and 84 percent lead. This alloy has a liquidus tem ature of 55.8OF. This transformation is accompanied by a change in density 463°F and a solidus temperature of 462"F, and the structure is from 7.30 to 5.75, and the resulting expansion causes disintegration of the tirely a ternary eutectic mixture. metal to coarse powder known as tin pest. However, the transformation is
very sluggish, and considerable undercooling is necessary to initiate it. Common impurities in tin tend to delay or inhibit the change so that, under
ally arsenic, while the other group includes alloys of lead and tin ordinary conditions, the transformation is of no practical importance. Over half the primary tin used in this country goes into the coating of
other metals, primarily steel in the manufacture of tin cans. Tin-coated
of primary antimony-tin compound in a binary eutectic mixture of copper tubing is useful for handling fresh waters that contain large per- centages of carbon dioxide and oxygen. The use of tin as an alloying element in copper, aluminum, and lead has been discussed in preceding
bearings, and many electric-motor bearings.
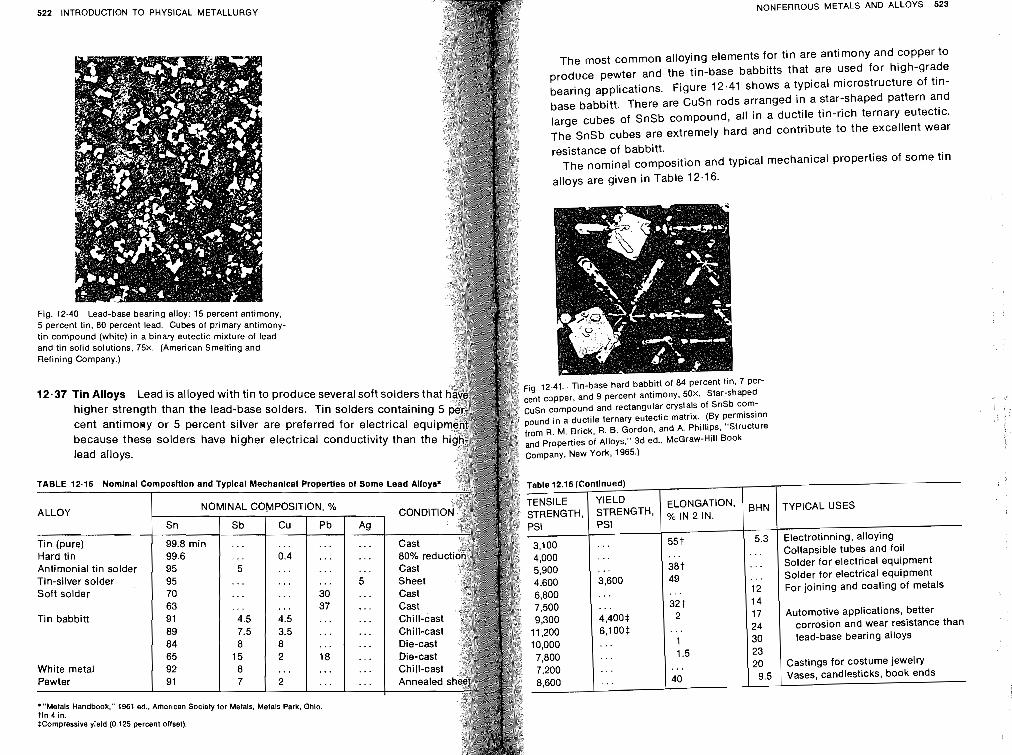
522 lNTRODUCTlON TO PHYSICAL METALLURGY NONFERROUS METALS AND ALLOYS 523
The most common alloying elements for tin are antimony and copper to produce pewter and the tin-base babbitts that are used for high-grade bearing applications. Figure 12.41 shows a typical microstructure of tin- base babbitt. There are CuSn rods arranged in a star-shaped pattern and large cubes of SnSb compound, all in a ductile tin-rich ternary eutectic.
The SnSb cubes are extremely hard and contribute to the excellent wear resistance of babbitt.
The nominal composition and typical mechanical properties of some t in alloys are given in Table 12.1 6.
. 75x. (American Smelting and
12'37 Tin Alloys Lead is alloyed with tin to produce several soft solders th ~ i ~ . 12.41 in-base hard babbitt of 84 percent tin. 7 per- cent copper, and 9 percent antimony. 50X. Star-shaped
higher strength than the lead-base solders. Tin solders containing CuSn compound and rectangular crystals of SnSb com- cent a n t i m o ~ ~ or 5 percent silver are preferred for electrical equi pound in a ductile ternary eutectic matrix. (BY permission
because these solders have higher electrical conductivity than the from R. M. Brick, R. B. Gordon, and A. Phillips, "Structure
lead alloys. and properties of Alloys," 3d ed., McGraw-Hill Book Company. New York. 1965.)
TYPICAL USES
Electrotinning, alloying Collapsible tubes and foil Solder for electrical equipment Solder for electrical equipment For joining and coating of metals
Automotive applications, better corrosion and wear resistance than lead-base bearing alloys
Castings for costume jewelry Vases, candlesticks, book ends
Table 12.16 (Continued)
Hard tin
Tin-silver solder Soft solder
Tin babbitt
BHN
5.3 . . . . . . . . . 12 14 17 24 30 23 20
9.5
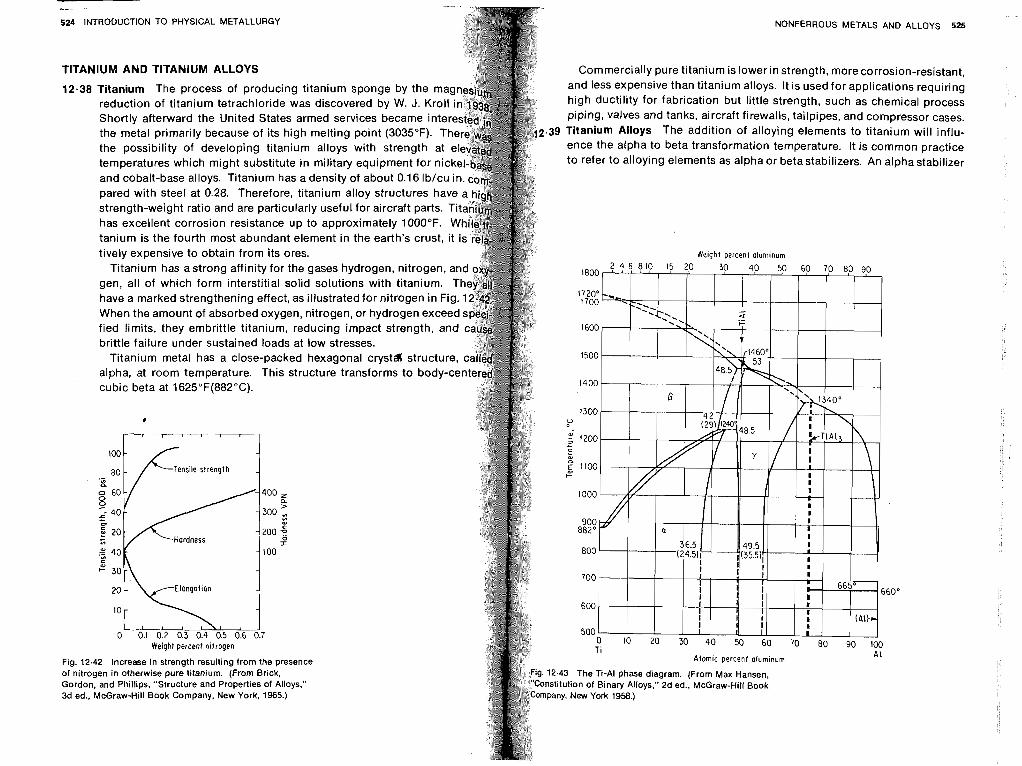
L --- -
524 INTRODUCTION TO PHYSICAL METALLURGY
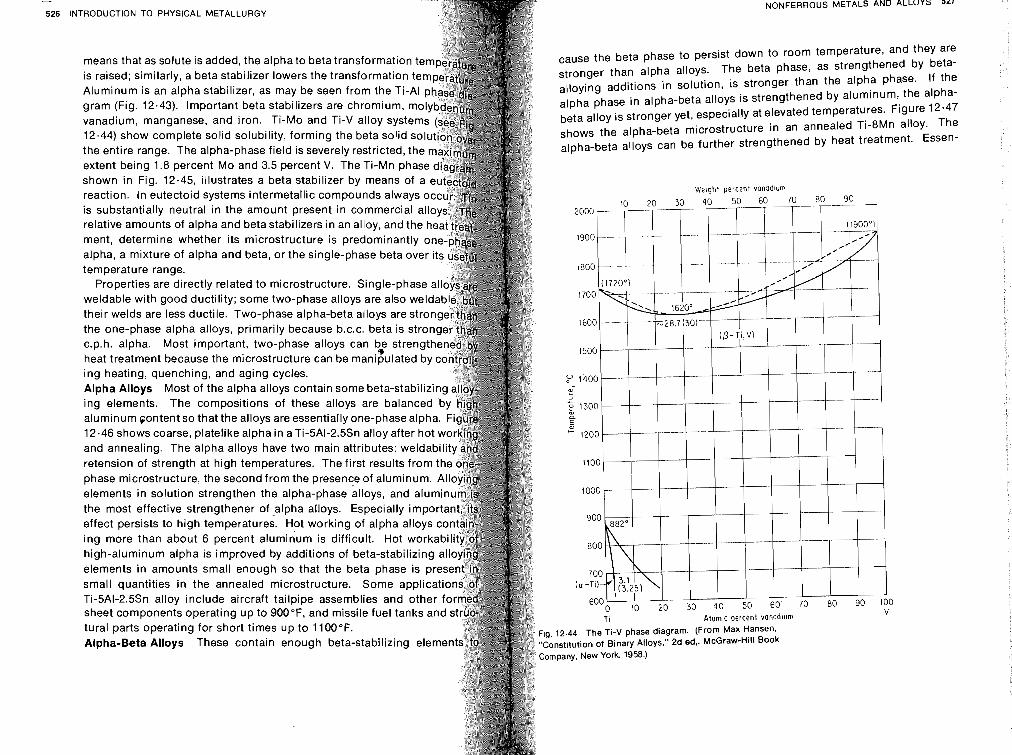
ITRODUCTION TO PHYSICAL METALLURGY NONFERROUS METALS AND ALLOYS 527
means that as solute is added, the alpha to beta transformation cause the beta phase to persist down to room temperaturel and they are
is raised; similarly, a beta stabilizer lowers the transformation t than alpha alloys. The beta phase, as strengthened by beta- Aluminum is an alpha stabilizer, as may be seen from the Ti-A additions in solution, is stronger than the alpha Phase If the
gram (Fig. 12.43). Important beta stabilizers are chromium, m alpha phase in alpha-befa alloys is strengthened by aluminum$ the alpha-
vanadium, manganese, and iron. Ti-Mo and Ti-V alloy system beta alloy is stronger yet, especially at elevated temperatures- Figure 12'47
12.44) show complete solid solubility, forming the beta solid so shows the alpha-beta microstructure in an annealed Ti-8Mn alloy. The
the entire range. The alpha-phase field is severely restricted, th aipha-beta alloys can be further strengthened by heat treatment. Essen- extent being 1.8 percent Mo and 3.5 percent V. The Ti-Mn pha shown in Fig. 12.45, illustrates a beta stabilizer by means of a reaction. In eutectoid systems intermetallic compounds always o Weight percent vonadlum
is substantially neutral in the amount present in commercial al 10 20 30 40 50 60 70 80 90
Properties are directly related to microstructure. Single-phase all weldable with good ductility; some two-phase alloys are also weld their welds are less ductile. Two-phase alpha-beta alloys are stro the one-phase alpha alloys, primarily because b.c.c. beta is stro c.p.h. alpha. Most important, two-phase alloys can be strengt
P I500 heat treatment because the microstructure can be manipulated by ing heating, quenching, and aging cycles.
2 1400 Alpha Alloys Most of the alpha alloys contain some beta-stabilizing o,
ing elements. The compositions of these alloys are balanced b 3
aluminum content so that the alloys are essentially one-phase alpha. 12.46 shows coarse, platelike alpha in aTi-5AI-2.5Sn alloy after h and annealing. The alpha alloys have two main attributes: weld retension of strength at high temperatures. The first results from phase microstructure, the second from the presence of aluminum. Al elements in solution strengthen the alpha-phase alloys, and alumi
the most effective strengthener of -alpha alloys. Especially import effect persists to high temperatures. Hot working df alpha alloys c ing more than about 6 percent aluminum is difficult. Hot worka high-aluminum alpha is improved by additions of beta-stabilizing all elements in amounts small enough so that the beta phase is pres
small quantities in the annealed microstructure. Some applicatio Ti-5AI-2.5Sn alloy include aircraft tailpipe assemblies and other f
0 sheet components operating up to 900°F, and missile fuel tanks and Ti Atorn~c percent vanodlum tural parts operating for short times up to 1100°F.
ig. 12.44 The TI-v phase diagram. (From Max Hansen, Alpha-Beta Alloys These contain enough beta-stabilizing elemen constitution of Binary AIIOYS," 2d ed,. McGraw-Hill Book
ompany. New York 1958.)
0°
( 1900~)
v O ~ O _ --
,-
- _ -
- -
2000 relative amounts of alpha and beta stabilizers in an alloy, and the ment, determine whether its microstructure is predominantly o 1900
alpha, a mixture of alpha and beta, or the single-phase beta over it temperature range. 1800
--
-- -- -
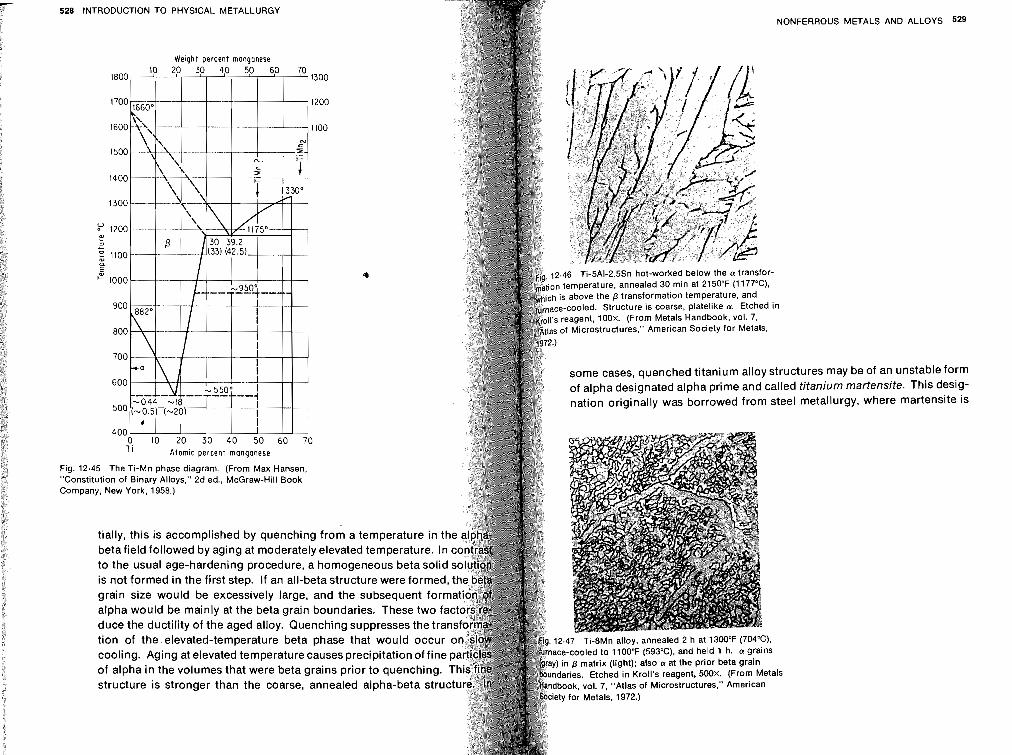
Fig. "Co Con
NONFERROUS METALS AND ALLOYS 529
tures may be of an unstable form titanium martensite. This desig- metallurgy, where martensite is
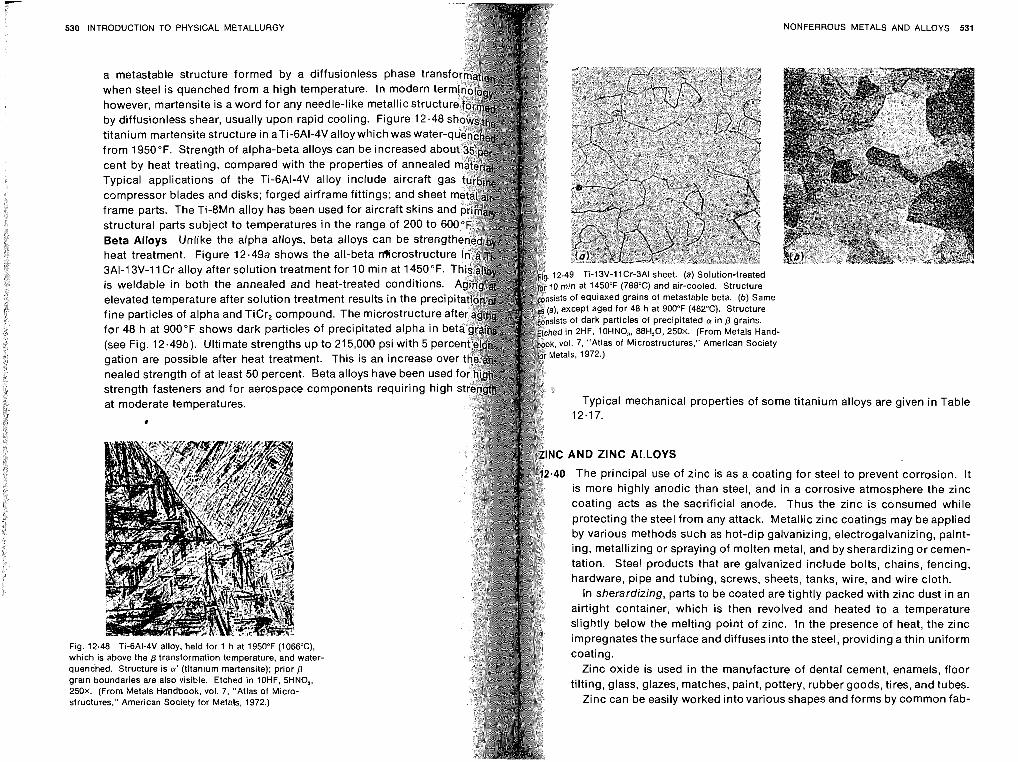
530 INTRODUCTION TO PHYSICAL METALLURGY
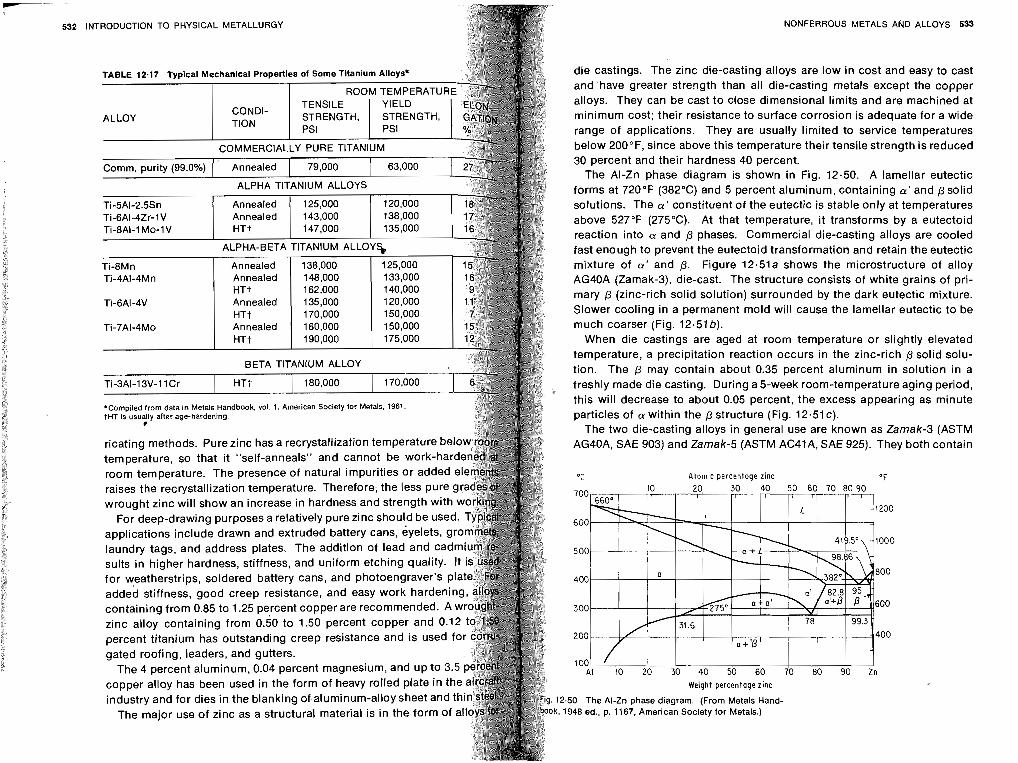
TlODUCTION TO PHYSICAL METALLURGY
TENSILE ALLOY I :;;rtuuln, UAI I 0,
3OOM TEMPERATI I YIELD 'U c.TrJTkIPTU
rill
COMMERCIALLY PURE TITANIUM
Annealed 1 125,000 1 120.000 Ti-6Al-4Zr-1 V Annealed 143,000 138,000 Ti-8AI-1 Mo-1 V I HTt 1 ~47.000 1 135.000
I I
ALPHA-BETA TITANIUM ALLOYS
BETA TlTANtUM ALLOY
'Compiled from data in Metals Handbook, vol. 1, American Society for Metals, 1961. tHT is usually after age-hardening.
ricating methods. Pure zinc has a recrystallization temperature be temperature, so that it "self-anneals" and cannot be work-har room temperature. The presence of natural impurities or added raises the recrystallization temperature. Therefore, the less pure wrought zinc will show an increase in hardness and strength with
For deep-drawing purposes a relatively pure zinc should be us applications include drawn and extruded battery cans, eyelets, laundry tags, and address plates. The addition of lead and ca sults in higher hardness, stiffness, and uniform etching quality. I for weatherstrips, soldered battery cans, and photoengraver's pl added stiffness, good creep resistance, and easy work hardenin containing from 0.85 to 1.25 percent copper are recommended. A w zinc alloy containing from 0.50 to 1.50 percent copper and 0.1 percent titanium has outstanding creep resistance and is used f gated roofing, leaders, and gutters.
The 4 percent aluminum, 0.04 percent magnesium, and up to 3.5 copper alloy has been used in the form of heavy rollod plate in t industry and for dies in the blanking of.aluminum-alloy sheet and
The major use of zinc as a structural material is in the form of a
NONFERROUS METALS AND ALLOYS 533
die castings. The zinc die-casting alloys are low in cost and easy to cast and have greater strength than all die-casting metals except the copper alloys. They can be cast to close dimensional limits and are machined at minimum cost; their resistance to surface corrosion is adequate for a wide range of applications. They are usually limited to service temperatures below 200°F, since above this temperature their tensile strength is reduced 30 percent and their hardness 40 percent.
The Al-Zn phase diagram is shown in Fig. 12.50. A lamellar eutectic forms at 720°F (382°C) and 5 percent aluminum, containing a!' and p solid solutions. The a!' constituent of the eutectic is stable only at temperatures above 527°F (275°C). At that temperature, it transforms by a eutectoid reaction into CY and p phases. Commercial die-casting alloys are cooled fast enough to prevent the eutectoid transformation and retain the eutectic mixture of a' and p. Figure 12.51a shows the microstructure of alloy AG40A (ZamakB), die-cast. The structure consists of white grains of pri- mary p (zinc-rich solid solution) surrounded by the dark eutectic mixture. Slower cooling in a permanent mold will cause the lamellar eutectic to be much coarser (Fig. 12.51 b).
When die castings are aged at room temperature or slightly elevated temperature, a precipitation reaction occurs in the zinc-rich p solid solu- tion. The p may contain about 0.35 percent aluminum in solution in a freshly made die casting. During a 5-week room-temperature aging period, this will decrease to about 0.05 percent, the excess appearing as minute particles of a! within the p structure (Fig. 12.51~).
The two die-casting alloys in general use are known as Zamak-3 (ASTM AG4OA, SAE 903) and Zamak-5 (ASTM AC47 A, SAE 925). They both contain
"C Atomic percentaqe zinc
Weight percentage zinc
.50 The Al-Zn phase diagram. (From Metals Hand. 1948 ed., p. 1167, American Society for Metals.)
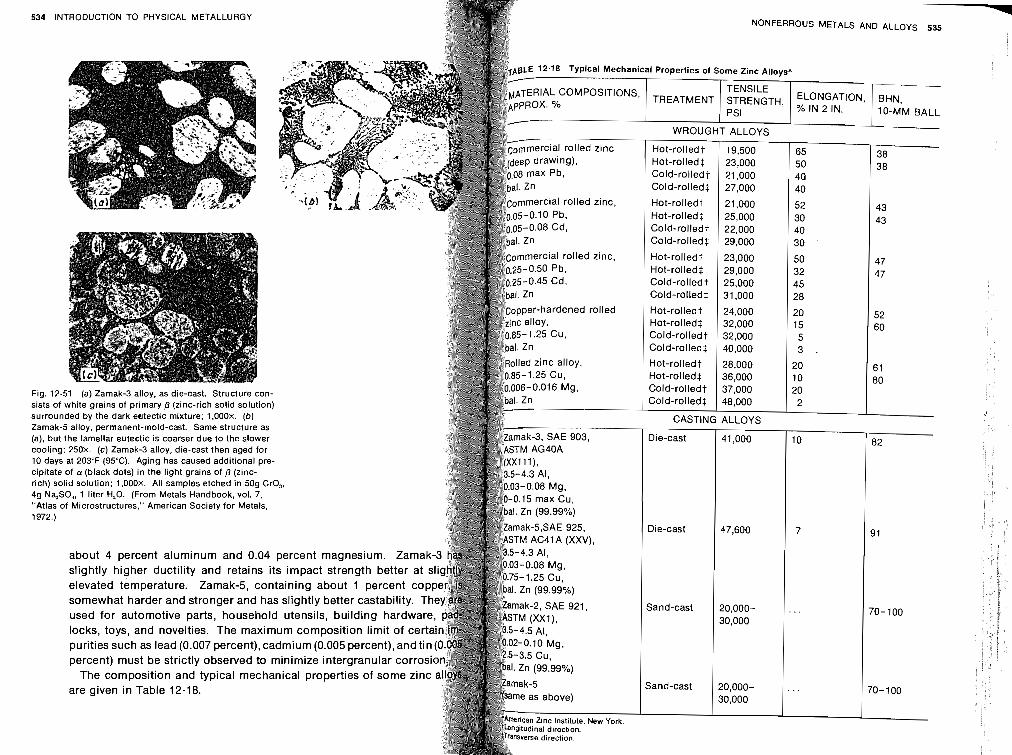
-
534 INTRODUCTION TO PHYSICAL METALLURGY NONFERROUS METALS AND ALLOYS 535
ELONGATION, BHN, 10-MM BALL
WROUGHT ALLOYS
Hot-rolled t 19,500 65 38 Hot-rolled$. 23,000 50 38 Cold-rolled? 21,000 40 Cold-rolled? 27,000 40
Hot-rolled? 21,000 52 43 Hot-rolled* 25,000 30 43 Cold-rol ledt 22,000 40 Cold-rolled$. 29,000 30
Hot-rolled? 23,000 50 47 Hot-rolled* 29,000 32 47 Cold-rolled? 25,000 45 Cold-rolled!: 31,000 28
Hot-rolled: 24,000 20 52 Hot-rolled? 32,000 15 60 Cold-rol led? 32,000 5 Cold-rolled!: 40,000 3 .
Hot-rolled t 28,000 20 61 Hot-rolled$. 36,000 10 80 Cold-rolled? 37,000
Fig. 12.51 (a) Zamak-3 alloy, as die-cast. Structure con- 20
sists of white grains of primary p (zinc-rich solid solution) Cold-rolled!: 48,000 2
surrounded by the dark eutectic mixture; 1.000~. (b) CASTING ALLOYS Zamak-5 alloy, permanent-mold-cast. Same structure as (a), but the lamellar eutectic is coarser due to the slower cooling; 250x. (c) Zamak-3 alloy, die-cast then aged for 10 days at 203°F (95°C). Aging has caused additional pre- cipitate of a (black dots) in the light grains of p (zinc- rich) solid solution; 1,000~. All samples etched in 509 CrO,, 49 NqSO,. I liter H,O. (From Metals Handbook. vol. 7. "Atlas of Microstructures," American Society for Metals. 1972.)
STM AC41 A (XXV),
about 4 percent aluminum and 0.04 slightly higher ductility and retains its impact strength better at elevated temperature. Zamak-5, con somewhat harder and stronger and has slightly better castability. used for automotive parts, househol locks, toys, and novelties. The maxi purities such as lead (0.007 percent), cadmium (0.005 percent), and tin percent) must be strictly observed to minimize intergranular corrosi
The composition and typical mechanical properties of some zinc are given in Table 12.18.
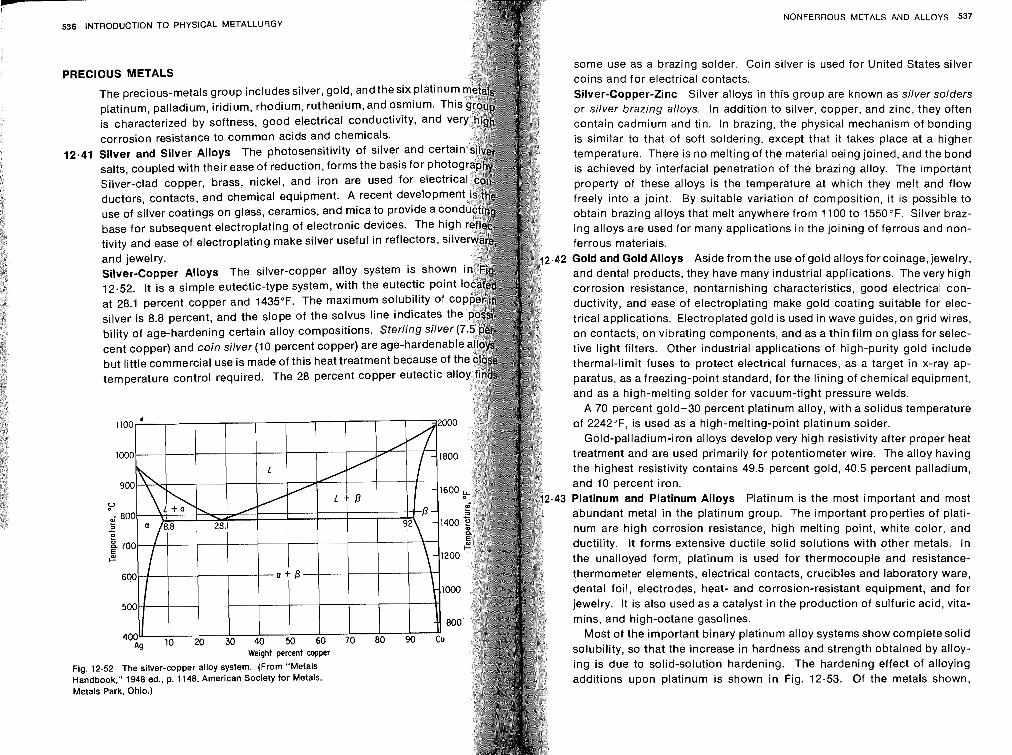
538 INTRODUCTION TO PHYSICAL METALLURGY
PRECIOUS METALS
The precious-metals group includes silver, gold, andthesix platin platinum, palladium, iridium, rhodium, ruthenium, and osmium. T is characterized by softness, good electrical conductivity, and corrosion resistance to common acids and chemicals.
12.41 Silver and Silver Alloys The photosensitivity of silver and cer salts, coupled with their ease of reduction, forms the basis for pho
use of silver coatings on glass, ceramics, and mica to provide a c base for subsequent electroplating of electronic devices. The h
temperature control required. The 28 percent copper eutectic a
NONFERROUS METALS AND ALLOYS 537
some use as a brazing solder. Coin silver is used for United States silver coins and for electrical contacts. Silver-Copper-Zinc Silver alloys in this group are known as silver solders or silver brazing alloys. In addition to silver, copper, and zinc, they often contain cadmium and tin. In brazing, the physical mechanism of bonding is similar to that of soft soldering, except that it takes place at a higher temperature. There is no melting of the material being joined, and the bond is achieved by interfacial penetration of the brazing alloy. The important property of these alloys is the temperature at which they melt and flow freely into a joint. By suitable variation of composition, it is possible to obtain brazing alloys that melt anywhere from 1100 to 1550°F. Silver braz- ing alloys are used for many applications in the joining of ferrous and non- ferrous materials. Gold and Gold Alloys Aside from the use of gold alloysfor coinage, jewelry, and dental products, they have many industrial applications. The very high corrosion resistance, nontarnishing characteristics, good electrical con- ductivity, and ease of electroplating make gold coating suitable for elec- trical applications. Electroplated gold is used in wave guides, on grid wires, on contacts, on vibrating components, and as a thin film on glass for selec- tive light filters. Other industrial applications of high-purity gold include thermal-limit fuses to protect electrical furnaces, as a target in x-ray ap- paratus, as a freezing-point standard, for the lining of chemical equipment, and as a high-melting solder for vacuum-tight pressure welds.
A 70 percent gold-30 percent platinum alloy, with a solidus temperature of 2242"F, is used as a high-melting-point platinum solder.
Gold-palladium-iron alloys develop very high resistivity after proper heat treatment and are used primarily for potentiometer wire. The alloy having the highest resistivity contains 49.5 percent gold, 40.5 percent palladium, and 10 percent iron. Platinum and Platinum Alloys Platinum is the most important and most abundant metal in the platinum group. The important properties of plati- num are high corrosion resistance, high melting point, white color, and ductility. It forms extensive ductile solid solutions with other metals. In the unalloyed form, platinum is used for thermocouple and resistance- thermometer elements, electrical contacts, crucibles and laboratory ware, dental foil, electrodes, heat- and corrosion-resistant equipment, and for jewelry. It is also used as a catalyst in the production of sulfuric acid, vita- mins, and high-octane gasolines.
Most of the important binary platinum alloy systems show complete solid solubility, so that the increase in hardness and strength obtained by alloy- ing is due to solid-solution hardening. The hardening effect of alloying additions upon platinum is shown in Fig. 12.53. Of the metals shown,
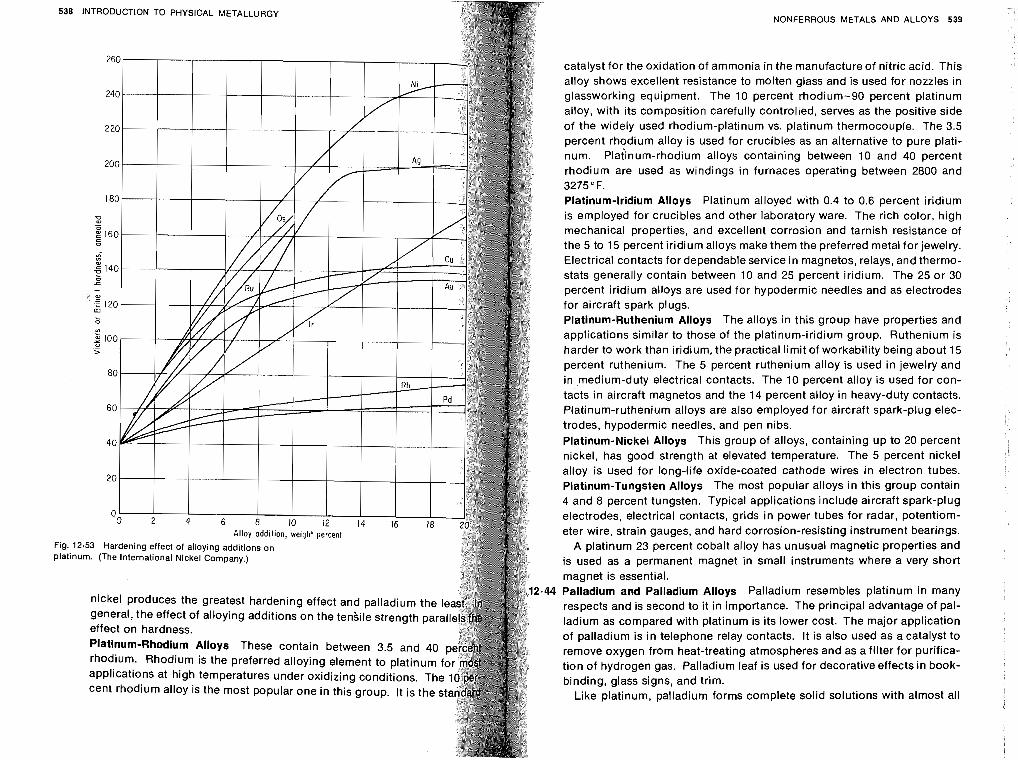
Fig. ~ i a t
NONFERROUS METALS AND ALLOYS 539
catalyst for the oxidation of ammonia in the manufacture of nitric acid. This alloy shows excellent resistance to molten glass and is used for nozzles in glassworking equipment. The 10 percent rhodium-90 percent platinum alloy, with its composition carefully controlled, serves as the positive side of the widely used rhodium-platinum vs. platinum thermocouple. The 3.5 percent rhodium alloy is used for crucibles as an alternative to pure plati- num. ~la6num-rhodium alloys containing between 10 and 40 percent rhodium are used as windings in furnaces operating between 2800 and 3275" F. Platinum-Iridium Alloys Platinum alloyed with 0.4 to 0.6 percent iridium is employed for crucibles and other laboratory ware. The rich color, high mechanical properties, and excellent corrosion and tarnish resistance of the 5 to 15 percent iridium alloys make them the preferred metal for jewelry. Electrical contacts for dependable service in magnetos, relays, and thermo- stats generally contain between 10 and 25 percent iridium. The 25 or 30 percent iridium alloys are used for hypodermic needles and as electrodes for aircraft spark plugs. Platinum-Ruthenium Alloys The alloys in this group have properties and applications similar to those of the platinum-iridium group. Ruthenium is harder to work than iridium, the practical limit of workability being about 15 percent ruthenium. The 5 percent ruthenium alloy is used in jewelry and in medium-duty electrical contacts. The 10 percent alloy is used for con- tacts in aircraft magnetos and the 14 percent alloy in heavy-duty contacts. Platinum-ruthenium alloys are also employed for aircraft spark-plug elec- trodes, hypodermic needles, and pen nibs. Platinum-Nickel Alloys This group of alloys, containing up to 20 percent nickel, has good strength at elevated temperature. The 5 percent nickel alloy is used for long-life oxide-coated cathode wires in electron tubes. Platinum-Tungsten Alloys The most popular alloys in this group contain 4 and 8 percent tungsten. Typical applications include aircraft spark-plug electrodes, electrical contacts, grids in power tubes for radar, potentiom- eter wire, strain gauges, and hard corrosion-resisting instrument bearings.
A platinum 23 percent cobalt alloy has unusual magnetic properties and is used as a permanent magnet in small instruments where a very short magnet is essential. Palladium and Palladium Alloys Palladium resembles platinum in many respects and is second to it in importance. The principal advantage of pal- ladium as compared with platinum is its lower cost. The major application of palladium is in telephone relay contacts. It is also used as a catalyst to remove oxygen from heat-treating atmospheres and as a filter for purifica- tion of hydrogen gas. Palladium leaf is used for decorative effects in book- binding, glass signs, and trim.
Like platinum, palladium forms complete solid solutions with almost all
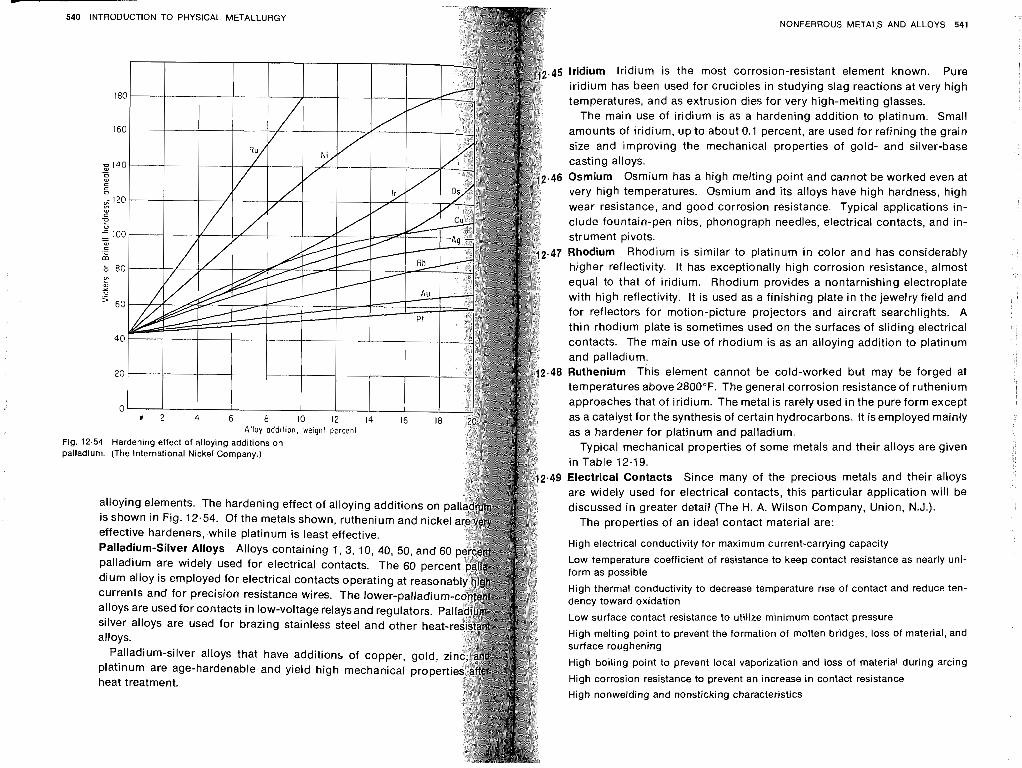
- - 540 INTRODUCTION TO PHYSICAL METALLURGY
0 2 4 6 8 10 12 14 16 18 Alloy odd~tion, weight percent
Fig. 11 palladi
alloying elements. The hardening effect of alloying additions on p is shown in Fig. 12.54. Of the metals shown, ruthenium and nicke effective hardeners, while platinum is least effective. Palladium-Silver Alloys Alloys containing 1, 3, 10, 40, 50, and 60 palladium are widely used for electrical contacts. The 60 perc dium alloy is employed for electrical contacts operating at reason currents and for precision resistance wires. The lower-palladiu alloys are used for contacts in low-voltage relaysand regulators. P silver alloys are used for brazing stainless steel and other heat alloys.
Palladium-silver alloys that have additions of copper, gold, platinum are age-hardenable and yield high mechanical prope
NONFERROUS METALfj AND ALLOYS 541
Iridium lridium is the most corrosion-resistant element known. Pure iridium has been used for crucibles in studying slag reactions at very high temperatures, and as extrusion dies for very high-melting glasses.
The main use of iridium is as a hardening addition to platinum. Small amounts of iridium, up to about 0.1 percent, are used for refining the grain size and improving the mechanical properties of gold- and silver-base casting alloys. Osmium Osmium has a high melting point and cannot be worked even at very high temperatures. Osmium and its alloys have high hardness, high wear resistance, and good corrosion resistance. Typical applications in- clude fountain-pen nibs, phonograph needles, electrical contacts, and in- strument pivots. Rhodium Rhodium is similar to platinum in color and has considerably higher reflectivity. It has exceptionally high corrosion resistance, almost equal to that of iridium. Rhodium provides a nontarnishing electroplate with high reflectivity. It is used as a finishing plate in the jewelry field and for reflectors for motion-picture projectors and aircraft searchlights. A thin rhodium plate is sometimes used on the surfaces of sliding electrical contacts. The main use of rhodium is as an alloying addition to platinum and palladium. Ruthenium This element cannot be cold-worked but may be forged at temperatures above 2800°F. The general corrosion resistance of ruthenium approaches that of iridium. The metal is rarely used in the pure form except as a catalyst for the synthesis of certain hydrocarbons. It isemployed mainly as a hardener for platinum and palladium.
Typical mechanical properties of some metals and their alloys are given in Table 12.19. Electrical Contacts Since many of the precious metals and their alloys are widely used for electrical contacts, this particular application will be discussed in greater detail (The H. A. Wilson Company, Union, N.J.).
The properties of an ideal contact material are:
High electrical conductivity for maximum current-carrying capacity
Low temperature coefficient of resistance to keep contact resistance as nearly uni- form as possible
High thermal conductivity to decrease temperature rise of contact and reduce ten- dency toward oxidation
Low surface contact resistance to utilize minimum contact pressure
High melting point to prevent the formation of molten bridges, loss of material, and surface roughening
High boiling point to prevent local vaporization and loss of material during arcing
High corrosion resistance to prevent an increase in contact resistance
High nonwelding and nonsticking characteristics
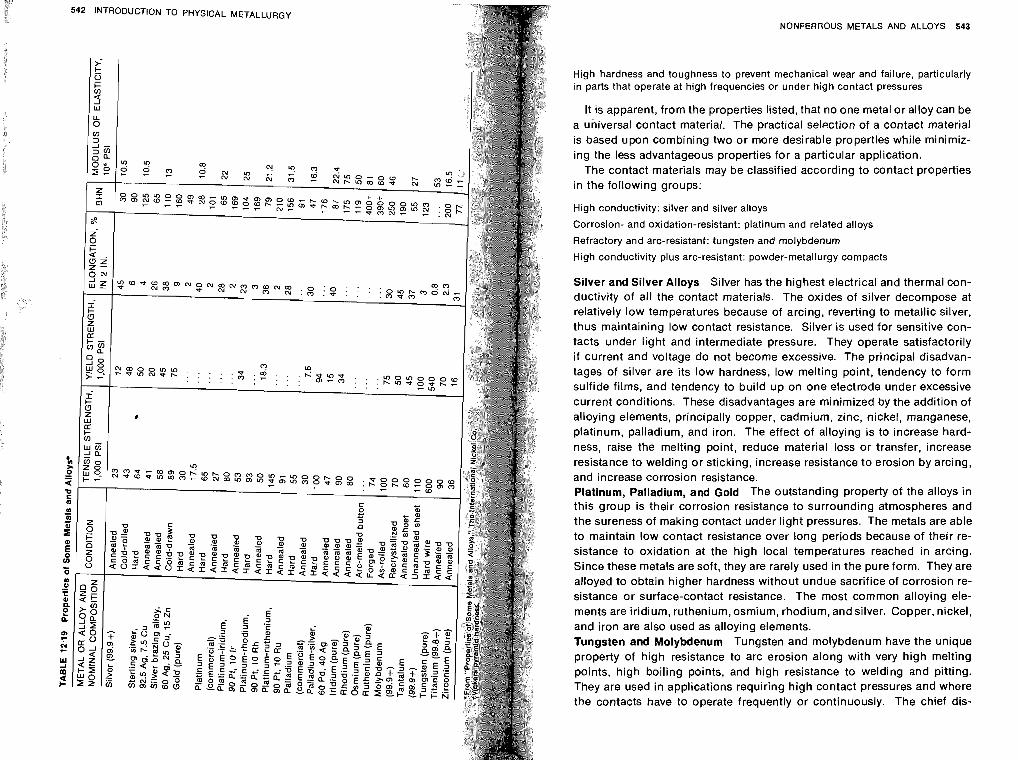
NONFERROUS METALS AND ALLOYS 543
High hardness and toughness to prevent mechanical wear and failure, particularly in parts that operate at high frequencies or under high contact pressures
It is apparent, from the properties listed, that no one metal or alloy can be a universal contact material. The practical selection of a contact material is based upon combining two or more desirable properties while minimiz- ing the less advantageous properties for a particular application.
The contact materials may be classified according to contact properties in the following groups:
High conductivity: silver and silver alloys
Corrosion- and oxidation-resistant: platinum and related alloys
Refractory and arc-resistant: tungsten and molybdenum
High conductivity plus arc-resistant: powder-metallurgy compacts
Silver and Silver Alloys Silver has the highest electrical and thermal con- ductivity of all the contact materials. The oxides of silver decompose at relatively low temperatures because of arcing, reverting to metallic silver, thus maintaining low contact resistance. Silver is used for sensitive con- tacts under light and intermediate pressure. They operate satisfactorily if current and voltage do not become excessive. The principal disadvan- tages of silver are its low hardness, low melting point, tendency to form sulfide films, and tendency to build up on one electrode under excessive current conditions. These disadvantages are minimized by the addition of alloying elements, principally copper, cadmium, zinc, nickel, manganese, platinum, palladium, and iron. The effect of alloying is to increase hard- ness, raise the melting point, reduce material loss or transfer, increase resistance to welding or sticking, increase resistance to erosion by arcing, and increase corrosion resistance. Platinum, Palladium, and Gold The outstanding property of the alloys in this group is their corrosion resistance to surrounding atmospheres and the sureness of making contact under light pressures. The metals are able to maintain low contact resistance over long periods because of their re- sistance to oxidation at the high local temperatures reached in arcing. Since these metals are soft, they are rarely used in the pure form. They are alloyed to obtain higher hardness without undue sacrifice of corrosion re- sistance or surface-contact resistance. The most common alloying eie- ments are iridium, ruthenium, osmium, rhodium, and silver. Copper, nickel, and iron are also used as alloying elements. Tungsten and Molybdenum Tungsten and molybdenum have the unique property of high resistance to arc erosion along with very high melting points, high boiling points, and high resistance to welding and pitting. They are used in applications requiring high contact pressures and where the contacts have to operate frequently or continuously. The chief dis-
544
OUE
INTRODUCTION TO PHYSICAL METALLURGY
advantage of tungsten and molybdenum is their tendency to for particularly where severe arcing takes place. In some applicatio disadvantages may be overcome by using very h igh contact press incorporating a wiping action in the contacts, o r by use of protec cuits t o suppress excessive arcing. Powder-metallurgy Compacts Silver and tungsten do not alloy other by the ordinary process of melting and casting. These me ever, may b e combined by using the techniques of powder metallur cussed i n Chap. 16) t o produce alloys which are homogeneous h igh physical properties. It is thus possible t o take advantage of electrical conductivity of silver o r copper and the h igh arc resis tungsten o r molybdenum. These materials are designed to operat conditions of heavy current and voltage and are also often used current high-frequency applications.
Typical combinations i n this group are silver-tungsten, silver denum, silver-tungsten carbide, silver-molybdenum carbide, t u n g s t e n carb ide, a n d copper - tungs ten . Other c o m p o s i t i manufactured by powder metallurgy to take advantage of the h igh e conductivity o f silver and copper and the semirefractory properties mium oxide, iron, graphite, and nickel.
Many of these compositions can be produced in str ip and wire f may be drilled, rolled, swaged, drawn, formed, bent, and extruded difficulty. They may be used as replacements for f ine silver o r silver in some applications, since they give greater resistance t o s t i c k i w e ~ d i n ( ~ , have improved mechanical properties, and possess gre sistance t o electrical erosion.
STIONS
12.1 What is the most important property of copper? 12.2 Explain why copper is a suitable material for automobile radiators. 12.3 Explain the reasons for the difference in microstructure of Figs. 12.1 12.4 What would be the temper of 0.25-in.-diameter copper wire cold-dr 0.50-in.-diameter soft wire? 12.5 What is season cracking? How may it be minimized? 12.6 What is dezincification? How may it be minimized? 12.7 How does the addition of lead to brass improve its machinability? 12.8 Which copper alloy would be best for the tubes in a marine heat exc Why? 12.9 Why are most copper-zinc alloys not age-hardenable? 12.10 Discuss the effect on corrosion resistance of copper by increasing a of (a) zinc, (b) tin, (c) nickel. 12-11 Why is muntz metal heat-treatable? Describe a typical heat treatmen resulting microstructure. 12.12 What properties would be important in the choice of a copper-alloy 12.13 Why is "manganese bronze" a misnomer?
NONFERROUS METALS AND ALLOYS 545
12.14 Differentiate between the terms brass and bronze. 12.15 Why are tin bronzes suitable for use as bearings? 12.16 Why is beryllium suitable for tools in the petroleum industry? 12.17 What are the outstanding properties of cupronickel alloys? 12.18 What are the outstanding properties of aluminum? 12.19 Why do long-range electrical transmission lines use a steel core and an aluminum shell? 12.20 Explain the meaning of the digits in the following aluminum specifications: 21 07-T4, 5056-HI 6, 7075-T6, 6061 -0. 12.21 Why do many aluminum alloys respond to age hardening? Give some ex- amples. 12.22 Why do aluminum alloy 2017 rivets have to be refrigerated until used? 12.23 What outstanding properties are generally given an alloy by the addition of nickel? 12.24 What outstanding properties do aluminum-silicon alloys have? Give some typical applications. 12.25 Which aluminum casting alloy develops the highest mechanical properties? Why? 12.26 What is meant by anodizing aluminum? 12.27 What are the outstanding properties of magnesium? Of nickel? 12.28 What is the effect of zirconium additions to magnesium alloys? 12.29 What is the effect of a rare-earth metal addition to magnesium? Of thorium addition? 12.30 Compare aluminum and magnesium with regard to corrosion resistance. 12.31 Discuss the methods used to join magnesium alloys. 12.32 Give one application and the reasons for selection of the following nickel alloys: duranickel, permanickel. Monel, K Monel, constantan, Inconel, lnconel X, Hastelloy C, and lllium G. 12.33 G~ve the composition, special properties, and one application of the following iron-nickel alloys: Invar, Kovar, Platinite, and Elinvar. 12.34 What are the outstanding properties of lead? Give one application for each property. 12.35 What property is important for fusible plugs? Give the composition of a . . . suitable alloy for this application. 12.36 What properties are important in alloys for type metals? 12.37 Why is "white metal" suitable for bearing applications? 12.38 Which type of soft solder is preferred for electrical equipment and why? 12.39 Compare the lead-base and tin-base babbitts with regard to properties and applications. 12.40 Why is it difficult to work-harden lead, tin, or zinc at room temperature? 12.41 Why is tin-coated steel used for tin cans to hold food and not zinc-coated steel? 12.42 What are the outstanding properties of (a) silver, (b) gold, and (c) platinum? 12.43 Which of the platinum metals has the highest corrosion resistance? Which has the highest modulus of elasticity? 12.44 Name two important properties of titanium. 12.45 What is one disadvantage of titanium? 12.46 What are the two crystal structures of titanium, and what is the transforma- tion temperature? 12.47 Explain what is meant by an alpha or beta stabilizer. 12.48 Name one alpha stabilizer and three beta stabilizers.
546 lNTRODUCTlON TO PHYSICAL METALLURGY
12.49 Explain why the two-phase titanium alloys are strongerthan the sing alpha alloys. 12.50 What are the two main attributes of alpha alloys? 12.51 How may alpha-beta alloys be strengthened? 12.52 How may beta alloys be strengthened? 12.53 Give at least two applications for alpha alloys, alpha-beta alloys, alloys.
REFERENCES METALS AT
Alice, J.: "Introduction to Magnesium and Its Alloys," ziff-Davis publishing, 1945.
Aluminum of America: "Casting Alcoa Alloys," Pittsburgh, Pa,, 19
HIGH AND LOW American Society for Metals: "Magnesium," Metals Park, Ohio, 1946, -: "Metals Handbook," Metals Park, Ohio, 1948, 1961, 1972, -: "Physical Metallurgy of Aluminum Alloys," Metals Park, ohio, 194
TEMPERATURES Bunn, E.S., and R. A. Wilkins: "Copper and Copper-base ~ l loys," M ~ G ~ ~ ~ -
Company, New York, 1943. introduction The terms high and /ow temperature are entirely relative to our Dew Chemical Company: "Magnesium AIIOYS and products," Midland, ~i~ own natural environment. What is considered a high temperature for low- Ellis, O. W.: "Copper and Copper Alloys," American Society for Metals, Met
Ohio, 1948. melting metals such as tin and lead may be considered a low temperature
Gibbs, L. E.: "Cold Working of Brass," American Society for Metals, M~ for a high-melting metal such as tungsten. Therefore, lower-melting metals Ohio, 1946. will exhibit characteristics at low temperatures that will require relatively
higher temperatures for other metals. For example, atemperature "Age-hardening lnco Nickel Alloys," "Engineering Properties of D~~ 1 0 0 0 0 ~ may be necessary to recrystallize iron after cold working, but tin gineering Properties Of Inconel," "Engineering Properties of Properties of Nickel," New York. and lead will recrystallize at or near room temperature. The properties of
Lead Industries Association: "Lead in Modern Industry," pjew york, 1952. metals are usually determined at room temperature, and our thinking about idd dell,'^. M.: "Handbook of Nonferrous Metallurgy," McGraw-Hill ~~~k metals is based on their behavior at normal temperatures. When the
New York, 1945. perature is changed, becoming either higher Or lower,Fhanges in the be- Mathewson, C. H. (ed.): "Modern Uses of Nonferrous Metals," 2d ed., A havior of metals often occur which may seriously affect their usefulness in
stitUte of Mining and Metallurgical Engineers, New York, 1958. Mondolfo, L. F.: "Metallography of Aluminum alloy^,^ John Wiley &sons, ln a particular application.
York, 1943.
National E3ureau of Standards (U.S.): Zinc and Its Alloys, Natl. Bur. std. (u, ,- .. 395, 1931. ALS AT HIGH TEMPERATURES
Raudebaugh, R. J.: "Nonferrous Physical Metallurgy;" Pitman publishing c tion, New York, 1952. 2 Elevated-temperature Tests The behavior of metals observed by stressing
Raynor, G. V.: "Physical Metallurgy of Mg and Its Alloys," Pergamon press, N~ at elevated temperatures depends upon the length of the test period. Since 1959. life expectancy of machine parts is usually high, it is not possible to run a
Reynolds Metals Company: "Heat Treating Aluminum ~ l f o ~ ~ , - 1948; test for many years to determine what to use in current construction. It is Forming." 1952; "Finishes for Aluminum," 1951, ~ ~ ~ i ~ ~ i l l ~ , K ~ , necessary to extrapolate from shorter-time tests. This extrapolation, how-
Roberts, C. S.: "Magnesium and Its Alloys." John Wiley & Sons, Inc. Samans, C. H.: "Engineering Metals and TheirAlloys," The ill ill^ ever, must be done with great care from tests that wi 11 provide useful data.
York, 1964. This is especially difficult for high-temperature applications, since changes Van Kent R.: "Aluminum," 3 vols., American Society for Metals, Metal in behavior will occur with time at temperature.
Ohio, 1967. In high-temperature tests it is necessary to determine the dependence of Vines, R. F.: "The Platinum Metals and Their Alloys," The International ~i~
New York, 1941. ultimate strength (rupture strength) and yield strength (creep strength) on the time application of the stress. In investigating the plastic behavior of metals at elevated temperatures, i t is convenient to apply a tensile load on the test specimen. While this procedure, in many Cases, does not duplicate
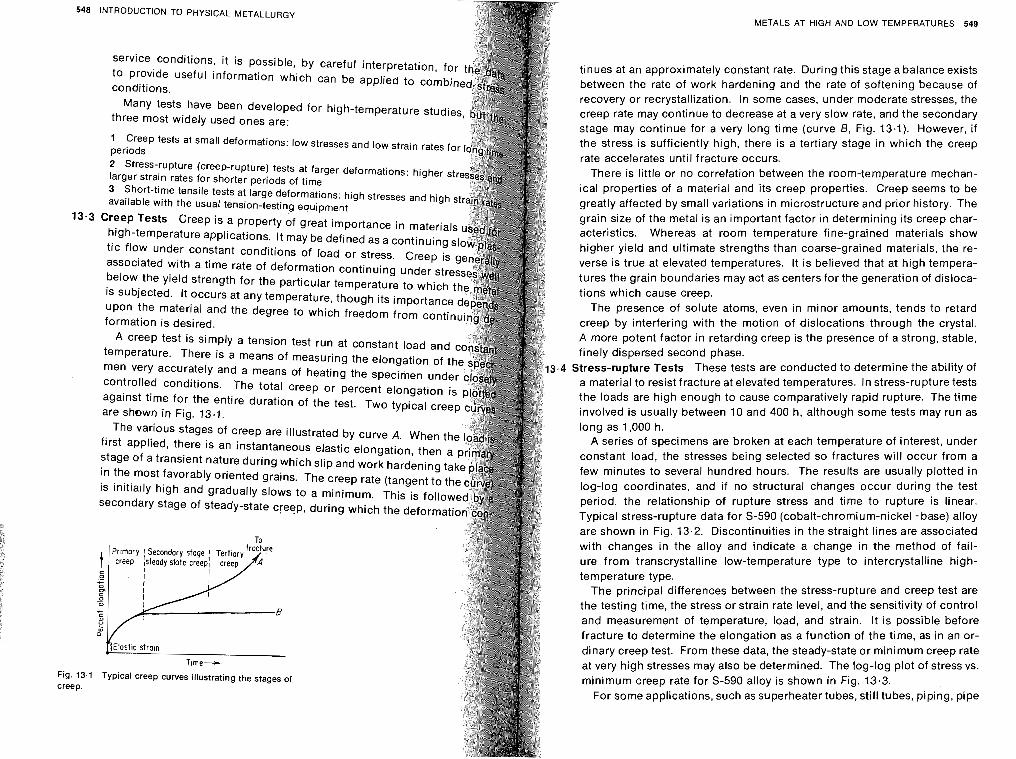
Fig. 13.1 creep.
INTRODUCTION TO PHYSICAL METALLURGY
service conditions, i t is possible, by careful interpretation, for to provide useful information which can be applied to combin conditions.
Many tests have been developed for high-temperature stu three most widely used ones are:
1 Creep tests at small deformations: low stresses and low strain rates for periods 2 Stress-rupture (creep-rupture) tests at larger deformations: higher str larger strain rates for shorter periods of time 3 Short-time tensile tests at large deformations: high stresses and high available with the usual tension-testing equipment
Creep Tests Creep is a property of great importance in materials high-temperature applications. It may be defined as a continuing
tic flow under constant conditions of load or stress. Creep is associated with a time rate of deformation continuing under stre below the yield strength for the particular temperature to which t is subjected. It occurs at any temperature, though its importance upon the material and the degree to which freedom from contin formation is desired.
A creep test is simply a tension test run at constant load and temperature. There is a means of measuring the elongation men very accurately and a means of heating the specimen
controlled conditions. The total creep or percent elongation I against time for the entire duration of the test. Two typical Cree are shown in Fig. 13.1.
The various stages of creep are illustrated by curve A. When th first applied, there is an instantaneous elastic elongation, then a stage of a transient nature during which slip and work hardening tak in the most favorably oriented grains. The creep rate (tangent to th is initially high and gradually slows to a minimum. This is follo secondary stage of steady-state creep, during which the deform
To
B
Tme+ Typical creep curves illustrating the stages of
METALS AT HIGH AND LOW TEMPERATURES 549
tinues at an approximately constant rate. During this stage a balance exists between the rate of work hardening and the rate of softening because of recovery or recrystallization. In some cases, under moderate stresses, the creep rate may continue to decrease at a very slow rate, and the secondary stage may continue for a very long time (curve 6, Fig. 13.1). However, if the stress is sufficiently high, there is a tertiary stage in which the creep rate accelerates until fracture occurs.
There is little or no correlation between the room-temperature mechan- ical properties of a material and its creep properties. Creep seems to be greatly affected by small variations in microstructure and prior history. The grain size of the metal is an important factor in determining its creep char- acteristics. Whereas at room temperature fine-grained materials show higher yield and ultimate strengths than coarse-grained materials, the re- verse is true at elevated temperatures. It is believed that at high tempera- tures the grain boundaries may act as centersforthe generation of disloca- tions which cause creep.
The presence of solute atoms, even in minor amounts, tends to retard creep by interfering with the motion of dislocations through the crystal. A more potent factor in retarding creep is the presence of a strong, stable, finely dispersed second phase.
Stress-rupture Tests These tests are conducted to determine the ability of a material to resist fracture at elevated temperatures. In stress-rupture tests the loads are high enough to cause comparatively rapid rupture. The time involved is usually between 10 and 400 h, although some tests may run as long as 1,000 h.
A series of s~ecimens are broken at each temperature of interest, under constant load, the stresses being selected so fractures will occur from a few minutes to several hundred hours. The results are usually plotted in log-log coordinates, and if no structural changes occur during the test period, the relationship of rupture stress and time to rupture is linear. Typical stress-rupture data for S-590 (cobalt-chromium-nickel-base) alloy are shown in Fig. 13.2. Discontinuities in the straight lines are associated with changes in the alloy and indicate a change in the method of fail- ure from transcrystalline low-temperature type to intercrystalline high- temperature type.
The principal differences between the stress-rupture and creep test are the testing time, the stress or strain rate level, and the sensitivity of control and measurement of temperature, load, and strain. It is possible before
fracture to determine the elongation as a function of the time, as in an or- dinary creep test. From these data, the steady-state or minimum creep rate at very high stresses may also be determined. The log-log plot of stress vs. minimum creep rate for S-590 alloy is shown in Fig. 13.3.
For some applications, such as superheater tubes, still tubes, piping, pipe
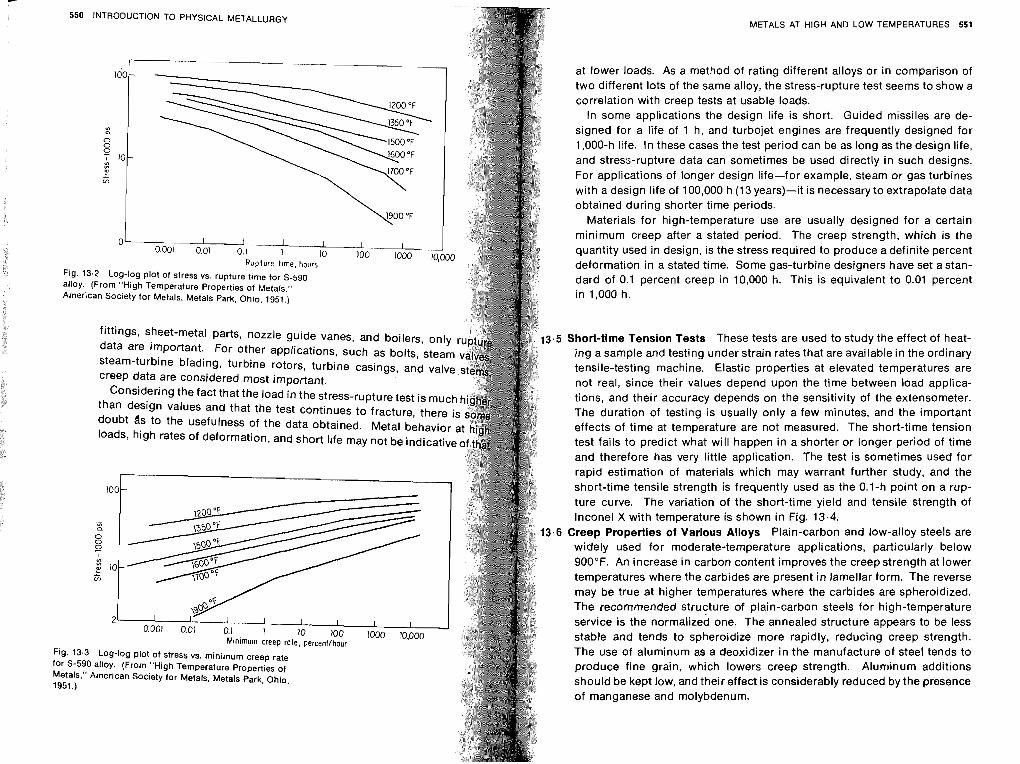
METALS AT HIGH AND LOW TEMPERATURES 551
at lower loads. As a method of rating different alloys or in comparison of two different lots of the same alloy, the stress-rupture test seems to show a correlation with creep tests at usable loads.
In some applications the design life is short. Guided missiles are de- signed for a life of 1 h, and turbojet engines are frequently designed for 1,000-h life. In these cases the test period can be as long as the design life, and stress-rupture data can sometimes be used directly in such designs. For applications of longer design life-for example, steam or gas turbines with a design life of 100,000 h (13 years)-it is necessary to extrapolate data obtained during shorter time periods.
Materials for high-temperature use are usually designed for a certain minimum creep after a stated period. The creep strength, which is the quantity used in design, is the stress required to produce a definite percent deformation in a stated time. Some gas-turbine designers have set a stan- dard of 0.1 percent creep in 10,000 ti. This is equivalent to 0.01 percent in 1,000 h.
Short-time Tension Tests These tests are used to study the effect of heat- ing a sample and testing under strain rates that are available in the ordinary tensile-testing machine. Elastic properties at elevated temperatures are not real, since their values depend upon the time between load applica- tions, and their accuracy depends on the sensitivity of the extensometer. The duration of testing is usually only a few minutes, and the important effects of time at temperature are not measured. The short-time tension test fails to predict what will happen in a shorter or longer period of time and therefore has very little application. The test is sometimes used for rapid estimation of materials which may warrant further study, and the short-time tensile strength is frequently used as the 0.1-h point on a rup- ture curve. The variation of the short-time yield and tensile strength of lnconel X with temperature is shown in Fig. 13.4.
Creep Properties of Various Alloys Plain-carbon and low-alloy steels are widely used for moderate-temperature applications, particularly below 900°F. An increase in carbon content improves the creepstrength at lower temperatures where the carbides are present in lamellar form. The reverse may be true at higher temperatures where the carbides are spheroidized. The recommended structure of plain-carbon steels for high-temperature service is the normalized one. The annealed structure appears to be less stable and tends to spheroidize more rapidly, reducing creep strength. The use of aluminum as a deoxidizer in the manufacture of steel tends to produce fine grain, which lowers creep strength. Aluminum additions should be kept low, and their effect is considerably reduced by the presence of manganese and molybdenum.
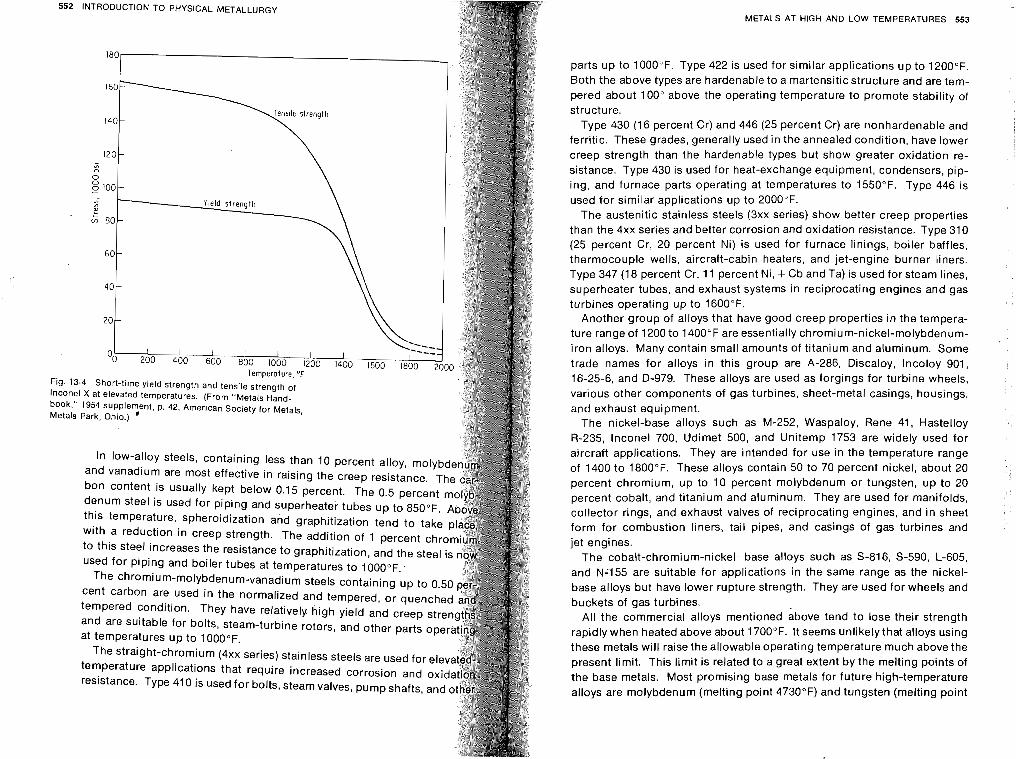
552 INTRODUCTION TO PHYSICAL METALLURGY
In low-alloy steels, containing less than 10 percent alloy, molyb and vanadium are most effective in raising the creep resistance. T bon content is usually kept below 0.15 percent. The 0.5 percent denum steel is used for piping and superheater tubes up to 850°F. this temperature, spheroidization and graphitization tend to take with a reduction in creep strength. The addition of 1 percent chr to this steel increases the resistance to graphitization, and the steel used for piping and boiler tubes at temperatures to 1000°F.
and are suitable for bolts, steam-turbine rotors, and other parts ope at temperatures up to 1000°F.
METALS AT HIGH AND LOW TEMPERATURES 553
parts up to 1000°F. Type 422 is used for similar applications up to 120OoF. Both the above types are hardenable to a martensitic structure and are tem- pered about 100" above the operating temperature to promote stability of structure.
Type 430 (16 percent Cr) and 446 (25 percent Cr) are nonhardenable and ferritic. These grades, generally used in the annealed condition, have lower creep strength than the hardenable types but show greater oxidation re- sistance. Type 430 is used for heat-exchange equipment, condensers, pip- ing, and furnace parts operating at temperatures to 1550°F. Type 446 is used for similar applications up to 2000°F.
The austenitic stainless steels (3xx series) show better creep properties than the 4xx series and better corrosion and oxidation resistance. Type 310 (25 percent Cr, 20 percent Ni) is used for furnace linings, boiler baffles, thermocouple wells, aircraft-cabin heaters, and jet-engine burner liners. Type 347 (1 8 percent Cr, 1 1 percent Ni, + Cb and Ta) is used for steam lines, superheater tubes, and exhaust systems in reciprocating engines and gas turbines operating up to 1600°F.
Another group of alloys that have good creep properties in the tempera- ture range of 1200 to 1400°F are essentially chromium-nickel-molybdenum- iron alloys. Many contain small amounts of titanium and aluminum. Some trade names for alloys in this group are A-286, Discaloy, lncoloy 901, 16-25-6, and 0-979. These alloys are used as forgings for turbine wheels, various other components of gas turbines, sheet-metal casings, housings, and exhaust equipment.
The nickel-base alloys such as M-252, Waspaloy, Rene 41, Hastelloy R-235, lnconel 700, Udimet 500, and Unitemp 1753 are widely used for aircraft applications. They are intended for use in the temperature range of 1400 to 1800°F. These alloys contain 50 to 70 percent nickel, about 20 percent chromium, up to 10 percent molybdenum or tungsten, up to 20 percent cobalt, and titanium and aluminum. They are used for manifolds, collector rings, and exhaust valves of reciprocating engines, and in sheet form for combustion liners, tail pipes, and casings of gas turbines and jet engines.
The cobalt-chromium-nickel-base alloys such as S-816, S-590, L-605, and N-155 are suitable for applications in the same range as the nickel- base alloys but have lower rupture strength. They are used for wheels and buckets of gas turbines.
All the commercial alloys mentioned above tend to lose their strength rapidly when heated above about 1700°F. It seems unlikely that alloys using these metals will raise the allowable operating temperature much above the present limit. This limit is related to a great extent by the melting points of the base metals. Most promising base metals for future high-temperature alloys are molybdenum (melting point 4730°F) and tungsten (melting point
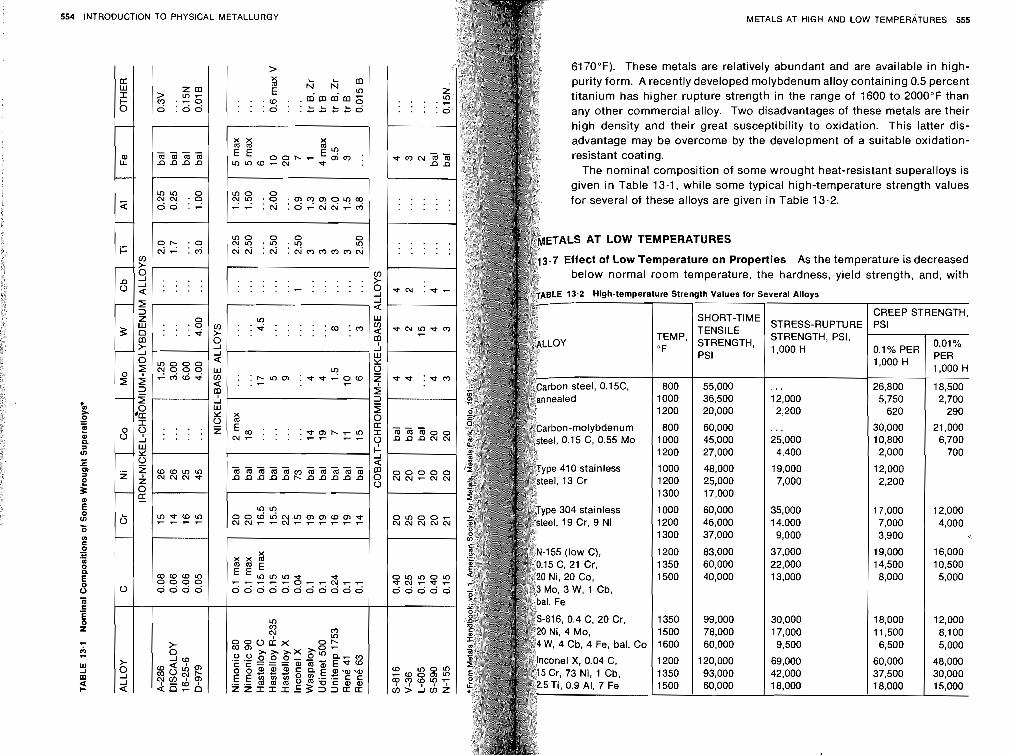
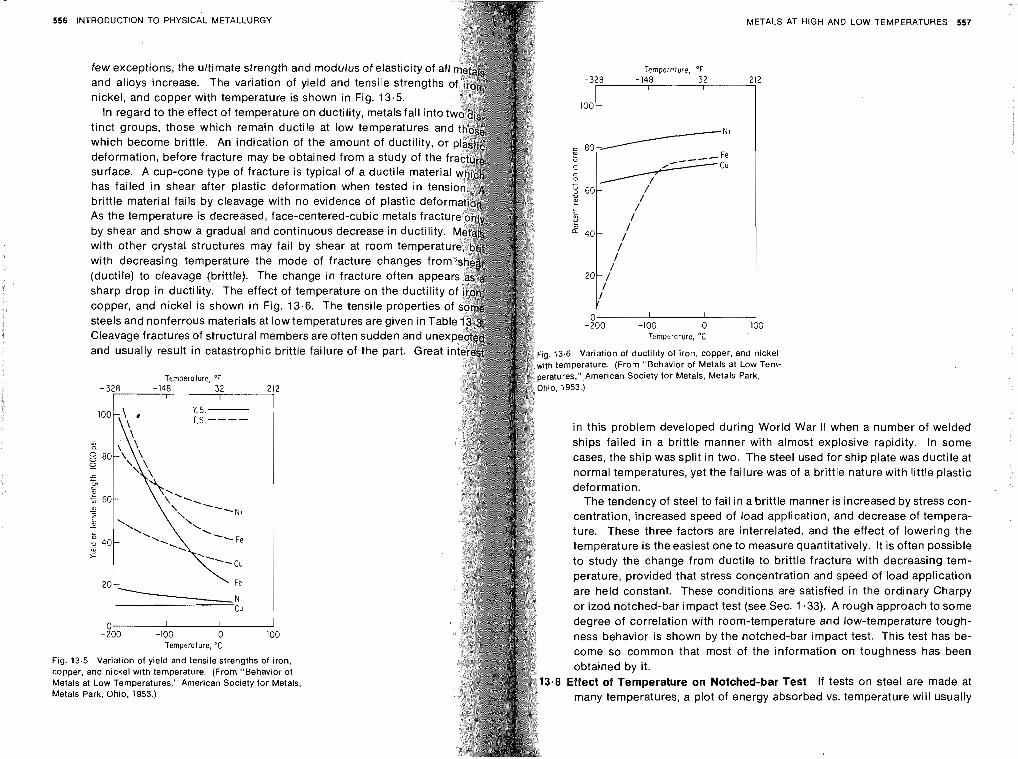
- -
556 INTRODUCTION TO PHYSICAL METALLURGY METALS AT HIGH AND LOW TEMPERATURES 557
few exceptions, the ultimate strength and modulus of elasticity of Tempeioiure, OF
and alloys increase. The variation of yield and tensile strength -328
nickel, and copper with temperature is shown in Fig. 13.5. I00
In regard to the effect of temperature on ductility, metals fall int tinct groups, those which remain ductile at low temperatures which become brittle. An indication of the amount of ductility,
o 80- deformation, before fracture may be obtained from a study of th %
C
surface. A cup-cone type of fracture is typical of a ductile mat c 0
has failed in shear after plastic deformation when tested in - + Y 60- D
brittle material fails by cleavage with no evidence of plastic d z - As the temperature is decreased, face-centered-cubic metals fract ar
by shear and show a gradual and continuous decrease in ductility. " 40- with other crystal structures may fail by shear at room temperat with decreasing temperature the mode of fracture changes fro (ductile) to cleavage (brittle). The change in fracture often appe sharp drop in ductility. The effect of temperature on the ducti copper, and nickel is shown in Fig. 13.6. The tensile properti steels and nonferrous materials at low temperatures are given in 0.
-200
-148 32 212 I I
-
YN' _..-----Fe
4 Cu
/ <
/ / /
I 1 /
20-/ I /
I I
-100 0 100 Cleavage fractures of structural members are often sudden and une Temperature. "C
and usually result in catastrophic brittle failure of the part. Great i g. 13.6 Variation of ductility of iron, copper, and nickel h temperature. (From "Behavior of Metals at Low Tem-
Temperature, OF atures." American Society for Metals, Metals Park,
- 328 - I48 32 212 io. 1953.) I I
Y.S.- T.S.----
cu
0 I I
in this problem developed during World War II when a number of welded ships failed in a brittle manner with almost explosive rapidity. In some cases, the ship was split in two. The steel used for ship late was ductile at normal temperatures, yet the failure was of a brittle nature with little plastic deformation.
The tendency of steel to fail in a brittle manner is increased by stress con- centration, increased speed of load application, and decrease of tempera- ture. These three factors are interrelated, and the effect of lowering the temperature is the easiest one to measure quantitatively. It is often possible to study the change from ductile to brittle fracture with decreasing tem- perature, provided that stress concentration and speed of load application are held constant. These conditions are satisfied in the ordinary Charpy or lzod notched-bar impact test (see Sec. 1.33). A rough approach to some degree of correlation with room-temperature and low-temperature tough-
-200 -100 o 100 ness behavior is shown by the notched-bar impact test. This test has be- Temperature, "C come so common that most of the information on toughness has been
Fig. 13.5 Variation of yield and tensile strengths of iron, copper, and nickel with temperature. (From "Behavior of obtained by it. Metals at Low Temperatures," American Society for Metals. 3.8 Effect of Temperature on Notched-bar Test If tests on steel are made at Metals Park, Ohio, 1953.) many temperatures, a plot of energy absorbed vs. temperature will usually
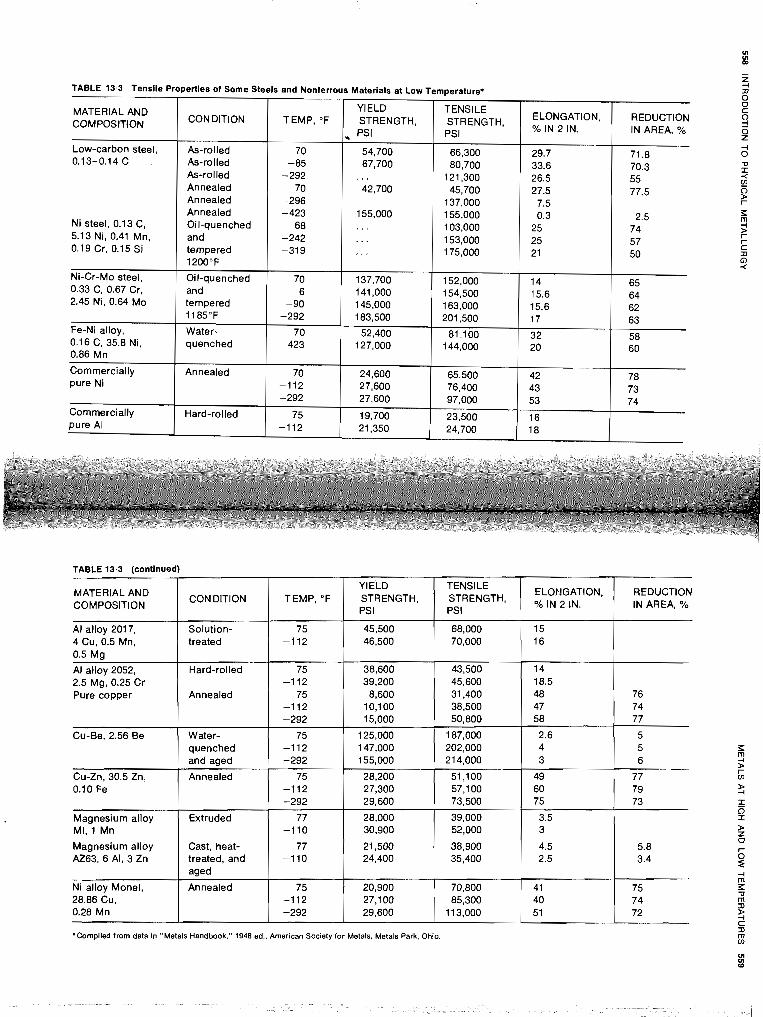
TABLE 13.3 Tensile Properties of Some Steels and Nonferrous Materials at Low Temperature*
MATERIAL AND COMPOSITION
Low-carbon steel, 0.13-0.14 C
Ni steel, 0.13 C, 5.13 Ni, 0.41 Mn, 0.19 Cr, 0.15 Si
Ni-Cr-Mo steel, 0.33 C, 0.67 Cr, 2.45 Ni. 0.64 Mo
Fe-Ni alloy, 0.16 C, 35.8 Ni, 0.86 Mn
Commercially Dure Ni
Commercially pure A1
YIELD CON DlTlON 1 TEMP, OF 1 STRENGTH, _ PSI
As-rolled As-rolled As-rolled Annealed Annealed Annealed Oil-quenched and tempered 1200°F
OiI-quenched and tempered 1185°F
Water- quenched
Annealed 24,600 27,600
TENSILE STRENGTH, PSI
ELONGATION, % IN 2 IN.
REDUCTION IN AREA, %
71.8 70.3 55 77.5
2.5 74 57 50
REDUCTION IN AREA, %
76 74 77
5 5 6
77 79 73
5.8 3.4
75 74 72
'Corn~lled from data in "Metals Handbook." 1948 ed , American Soclety for Metals. Metals Park. Ohto
ELOEJGATION, % IN IN,
15 16
14 18.5 48 47 58
2.6 4 3
49 60 75
3.5 3
4.5 2.5
41 40 51
TENSILE STRENGTH, PSI
68,000 70,000
43.500 45,600 31,400 38,500 50,800
187,000 202,000 214,000
51 ,I 00 57,100 73,500
39,000 52,000
38,900 35,400
70,800 85,300
1 1 3,000
YIELD STRENGTH, PSI
45,500 46,500
38,600 39,200 8,600 10,100 15,000
125,000 147,000 155,000
28,200 27,300 29,600
28,000 30,900
21,500 24,400
20,900 27,100 29,600
TEMP, "F
75 -112
75 -112
75 -112 -292
75 -112 -292
75 -112 -292
77 -110
77 -110
75 -112 -292
TABLE 13.3 (continued)
MATERIAL AND COMPOSITION
Al alloy 201 7, 4 Cu, 0.5 Mn, 0.5 Mg
Al alloy 2052, 2.5 Mg, 0.25 Cr Pure copper
Cu-Be, 2.56 Be
Cu-Zn, 30.5 Zn, 0.10 Fe
Magnesium alloy MI, 1 Mn
Magnesium alloy AZ63, 6 Al, 3 Zn
Ni alloy Monel, 28.86 CU, 0.28 Mn
CON DlTlON
Solution- treated
Hard-rolled
Annealed
Water- quenched and aged
Annealed
Extruded
Cast, heat- treated, and aged
Annealed
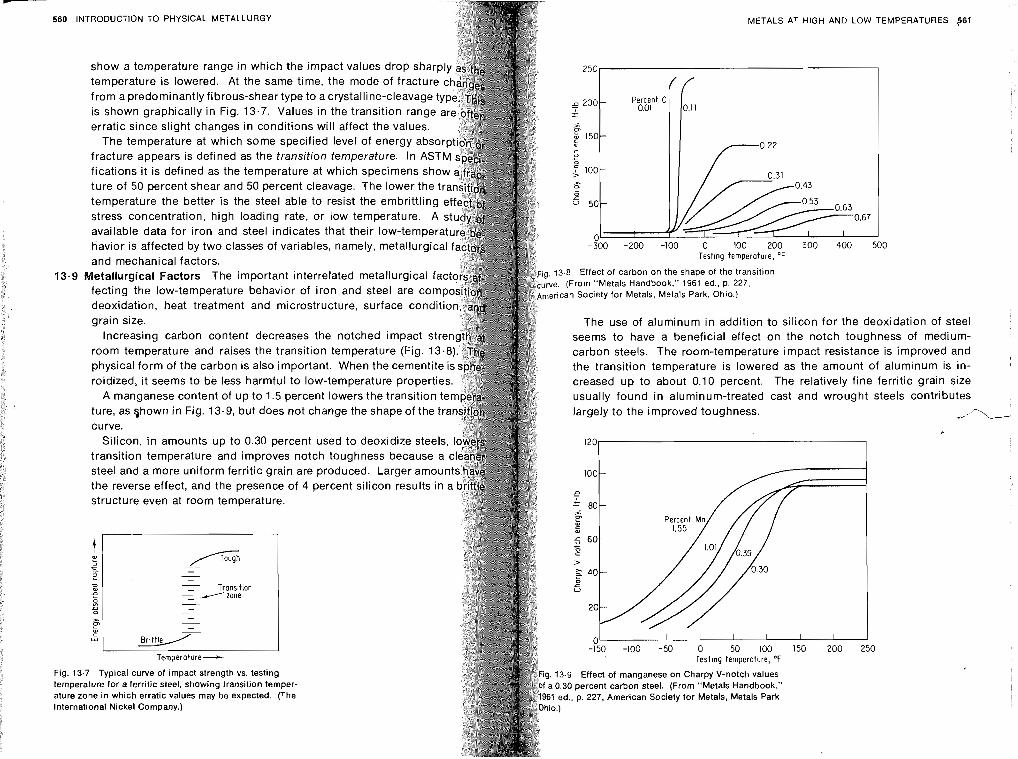
- 560 INTRODUCTION TO PHYSICAL METALLURGY
show a temperature range in which the impact values drop s temperature is lowered. At the same time, the mode of frac
stress concentration, high loading rate, or low temperature. A study< available data for iron and steel indicates that their low-temper havior is affected by two classes of variables, namely, metallurgic and mechanical factors.
13.9 Metallurgical Factors The important interrelated metallurgical f fecting the low-temperature behavior of iron and steel are deoxidation, heat treatment and microstructure, surface c grain size.
Increasing carbon content decreases the notched impact s room temperature and raises the transition temperature (Fig. 13.8 physical form of the carbon is also important. When the cementit roidized, it seems to be less harmful to low-temperature properti
A manganese content of up to 1.5 percent lowers the transition ture, as shown in Fig. 13-9, but does not change the shape of the tra curve.
Silicon, in amounts up to 0.30 percent used to deoxidize steels, transition temperature and improves notch toughness because a clean steel and a more uniform ferritic grain are produced. Larger amounts hay the reverse effect, and the presence of 4 percent silicon results in a britf structure even at room temperature.
1 I
METALS AT HIGH AND LOW TEMPERATURES 561
Temperature-
250
from a predominantly fibrous-shear type to a crystalline-cleavage 5 200
is shown graphically in Fig. 13.7. Values in the transition r - - erratic since slight changes in conditions will affect the va i
The temperature at which some specified level of energ 150- m c
fracture appears is defined as the transition temperature. + Y
fications it is defined as the temperature at which specimens sho 5 l oo - ture of 50 percent shear and 50 percent cleavage. The lower t Z
Et
temperature the better is the steel able to resist the embrittll r 50-
0
Fig. 13.7 Typical curve of impact strength vs. testing temperature for a ferritic steel, showing transition temper- ature zone in which erratic values may be expected. (The International Nickel Company.)
-300 -200 -100 0 100 200 300 400 500 Test~ng temperature, O F
13.8 Effect of carbon on the shape of the transition ve. (From "Metals Handbook," 1961 ed., p. 227, erican Society for Metals. Metals Park, Ohio.)
The use of aluminum in addition to silicon for the deoxidation of steel seems to have a beneficial effect on the notch toughness of medium- carbon steels. The room-temperature impact resistance is improved and the transition temperature is lowered as the amount of aluminum is in- creased up to about 0.10 percent. The relatively fine ferritic grain size usually found in aluminum-treated cast and wrought steels contributes largely to the improved toughness. --'-
C
120
100 -
r, 60-
0 I I I I I I I
-150 -100 -50 0 50 100 150 200 250 Testing temperature, "F
3.9 Effect of manganese on Charpy V-notch values .30 percent carbon steel. (From "Metals Handbook," ed., p. 227, American Society for Metals, Metals Park,
f f - Percent C
0.01 0.11
0.67 1
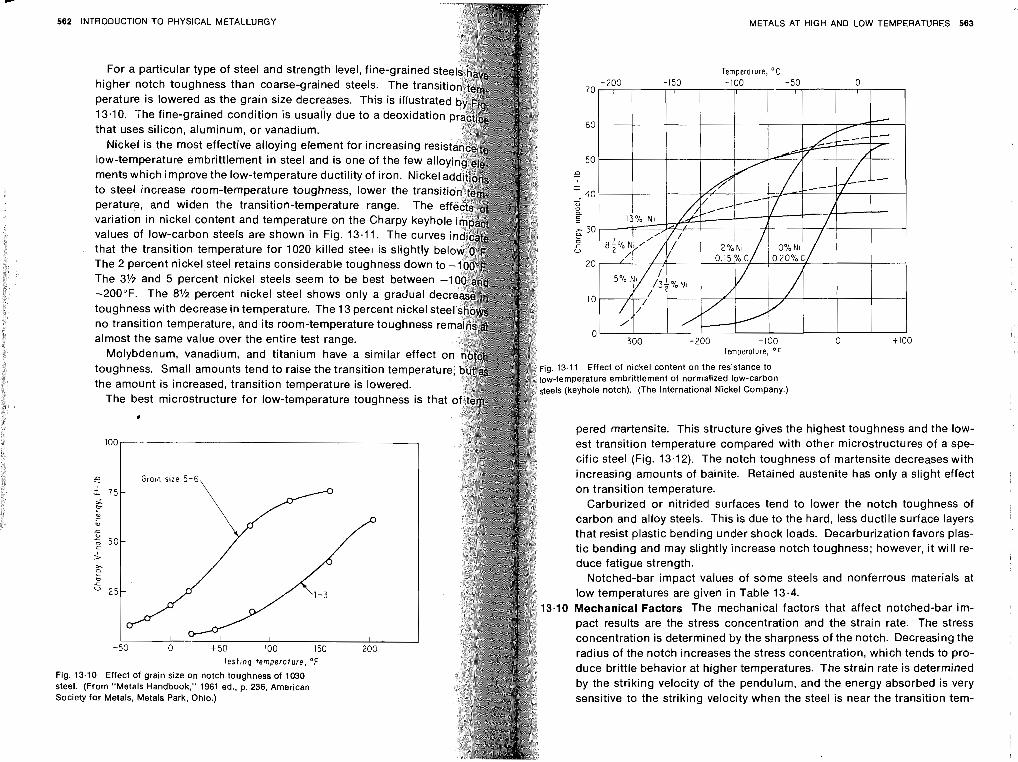
METALS AT HIGH AN0 LOW TEMPERATURES 563
Temperature, "F
13.11 Effect of nickel content on the resistance to -temperature ernbrittlernent of normalized low-carbon !Is (keyhole notch). (The International Nickel Company.)
pered martensite. This structure gives the highest toughness and the low- est transition temperature compared with other microstructures of a spe- cific steel (Fig. 13.12). The notch toughness of martensite decreases with increasing amounts of bainite. Retained austenite has only a slight effect on transition temperature.
Carburized or nitrided surfaces tend to lower the notch toughness of carbon and alloy steels. This is due to the hard, less ductile surface layers that resist plastic bending under shock loads. Decarburization favors plas- tic bending and may slightly increase notch toughness; however, i t will re- duce fatigue strength.
Notched-bar impact values of some steels and nonferrous materials at low temperatures are given in Table 13.4.
. I0 Mechanical Factors The mechanical factors that affect notched-bar im- pact results are the stress concentration and the strain rate. The stress concentration is determined by the sharpness of the notch. Decreasing the radius of the notch increases the stress concentration, which tends to pro- duce brittle behavior at higher temperatures. The strain rate is determined by the striking velocity of the pendulum, and the energy absorbed is very sensitive to the striking velocity when the steel is near the transition tem-
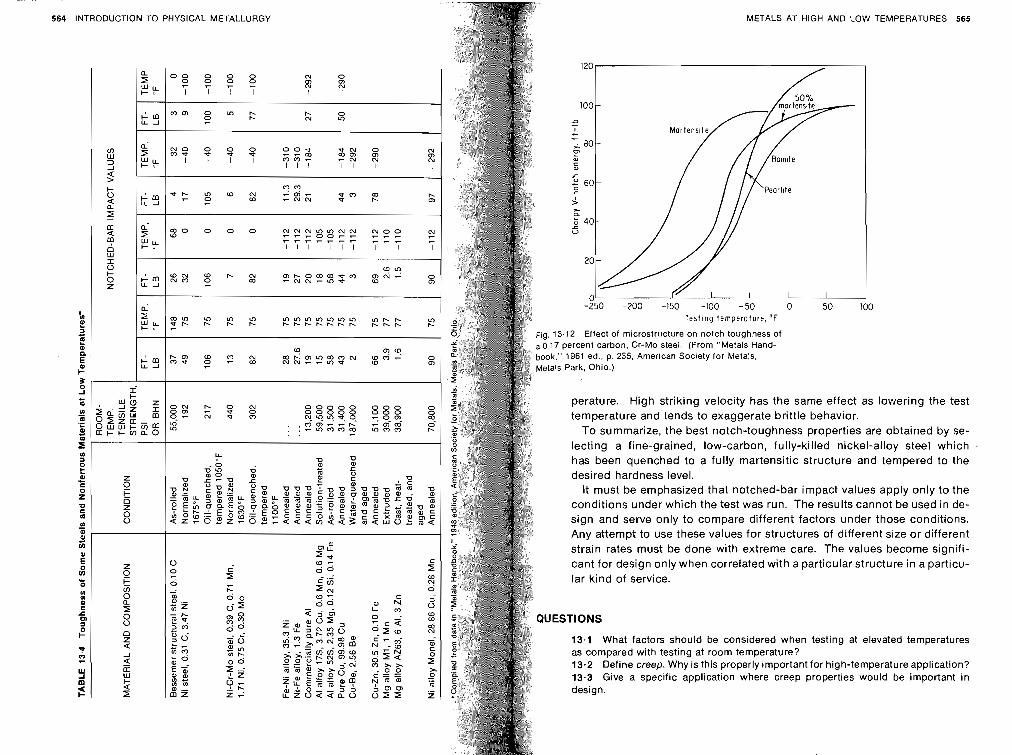
7
564 INTRODUCTION TO PHYSICAL METALLURGY
INTRODUCTION TO PHYSICAL METALLURGY
REFE
13.4 Draw a typical creep curve and explain the stages of creep. $3.5 What metallurgical factors affect the creep characteristics of meta 13.6 What are the limitations on the use of stress-rupture data? 13.7 Which alloying elements are most effective in raising the creep steels? 13.8 What is the effect of low temperatureson the mechanical properties 13.9 What is meant by transition temperature? How is it measured? 13.10 What factors influence brittle failure? 13.11 What are the limitations on the use of notched-bar data for the p of actual parts? 13.12 Differentiate between a shear fracture and a cleavage fracture. 13.13 What alloying element is most effective in improving the low-te toughness of steel? WEAR OF
RENCES
American Society for Metals: "Behavior of Metals at Low Temperatures,'
METALS Park, Ohio, 1953.
-: "Creep and Recovery," Metals Park, Ohio, 1957. 4.1 Introduction The quality of most metal products depends on the condition -: "High Temperature Properties of Metals," Metals Park, Ohio, 1961. -: "Metals Handbook," 1948 and 1961 editions, Metals Park, Ohio. of their surfaces and on surface deterioration due to use. Surface deteri-
American Society for Testing Materials: "Evaluation of Metallic Material oration is also important in engineering practice; i t is often the major factor for Low-temperature Service," Special Technical Publication no. 302, P limiting the life and the performance of machine components. Wear may 1962. be defined as unintentional deterioration resulting from use or environ-
Clark, F. H.: "Metals at High Temperatures," Van Nostrand Reinhold Com ment. It may be considered essentially a surface phenomenon. Wear is York, 1950.
Clauss, F. J.: "Engineer's Guide to High-temperature Materials," Addiso one of the most destructive influences to which metals are exposed, and
Publighing Company, Inc., Reading, Mass., 1969. the importance of wear resistance needs no amplification. Conway, S. 0.: "Numerical Methods for Creep and Rupture," Gordon & Bre (\The displacement and detachment of metallic particles from a metallic
ence Publishers, New York, 1967. surface may be caused by contact with (1) another metal (adhesive or Dorn, J. E. (ed.): "Mechanical Behavior of Materials at Elevated Temp metallic wear), (2) a metallic or a nonmetallic abrasive (abrasion), or (3)
McGraw-Hill Book Company, New York, 1961. Heheman and Ault (eds.): "High Temperature Materials," John Wiley & S
moving liquids or gases (erosion). Erosion is usually accompanied by some
New York, 1959. form of corrosion. The above three types of wear may be subdivided into International Nickel Company: "Nickel Alloy Steels," 2d ed., New York, 194 wear under rolling friction or sliding friction and, further, according to Parker, E. R.: "Brittle Behavior of Engineering Structures," John Wiley & S whether lubrication can 0r cannot be used. t \
New York, 1957. e type is rare, and in most cases both abrasive Savitsky, E. M.: "The Influence of Temperature on the Mechanical Propertie
als and Alloys," Stanford University Press, Stanford, Calif., 1961. r. Each form of wear is affected by a vaFX~-of-
Seigle, L., and R. M. Brick: "Mechanical Properties of Metals at Low Temper vironment, type of loading, relative speeds of A Survey, Trans. ASM., vol. 40, p. 813, 1948. mating parts, lubricant, temperature, hardness, surface finish, presence
Sully, A. H.: "Metallic Creep," lnterscience Publishers, Inc., New York, 1949 of foreign particles, and composition and compatibility of the mating Wigley, D. A.: "Mechanical Properties of Materials at Low Temperatures," parts involved. Since in most machinery applications wear can rarely be
Press, New York, 1971. avoided completely even with the best lubrication, i t is common practice o use a hard metal and a relatively soft one togethe s used o-,,--________-- (as in a beadng)Lofih.epehich is most-e
-1'. echanism of Wear In adhesive wear, also called scoring, galling, seizing and scuffing, tiny projections produce friction by mechanical interference, with the relative motion of contacting surfaces increasing resistance to further movement. If the driving force is sufficient to maintain movement, the interlocked particles are deformed. If they are of a brittle material, they
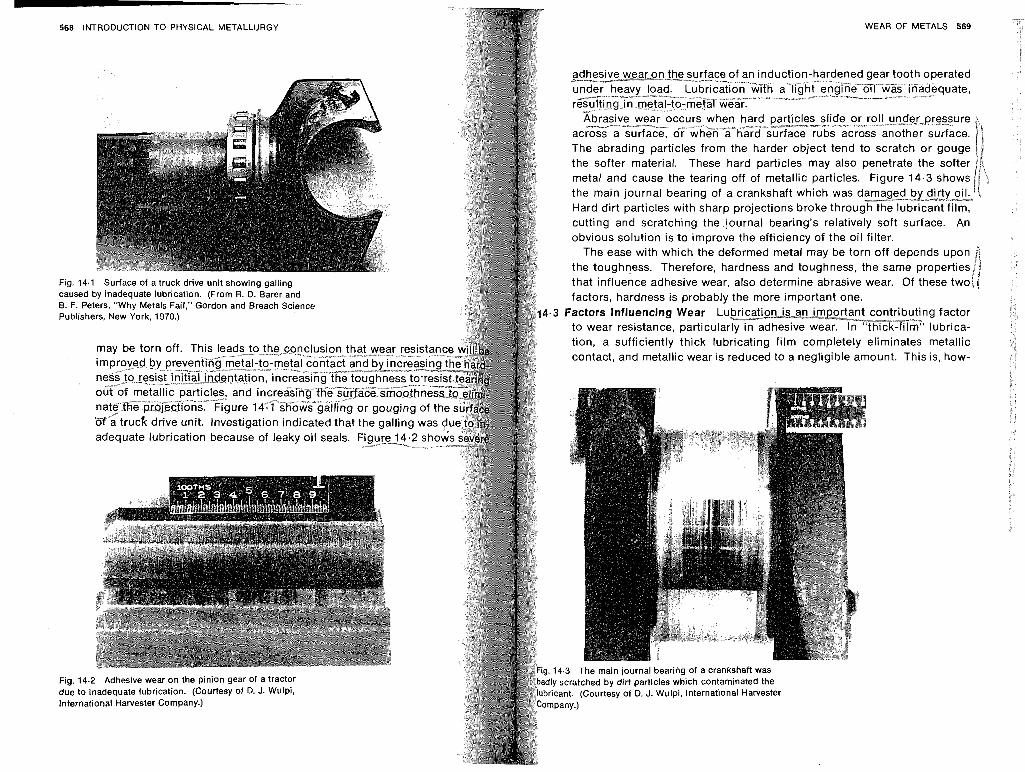
WEAR OF METALS 569
ever, the ideal condition, and more frequently "boundary I occurs. This is the condition of intermittent metallic contact when the oil film cannot be continuously maintained. Und conditions, the amount of wear depends upon speed, pressu the mating surfaces, and efficiency of the residual oil film. however, lubrication is impractical or is not wanted, as in b
Although actual melting of the metal occurs only in rare In effect of heat produced by dry wear can reduce wear resistanc ways. It may temper hardened structures, cause phase chan crease hardness and brittleness, and decrease mechanical pro it accelerates corrosion reactions.
The dominant frictional factor for metallic materials is beli welding. Atoms of the same or crystallographically similar very strong forces of cohesion. When two clean surfaces of th actually touch each other, they will weld together because o traction. If, by friction, sufficient pressure is applied to brea any residual separating material such as oil, dirt, or adsorbe and the surfaces are in sufficient contact to have elastic or pl mation occur, then seizing or welding takes place. The softening by high temperatures increases the ease of plastic deformation tates welding. Seizing may cause complete stoppage, or if rela is not prevented, pieces of the opposite face may be pulled out. ant projection then may cause scoring, galling, and excessive I
[Many methods may be used to minimize the danger of seizing use thin*layers of hard surfacing materiarj The use of at least that forms some sort of lubricating film or thin, tightly adhe sulfide, or phosphide coating is frequently helpful. fAluminu very effective in preventing welding17 For parts that operate u high pressures that elastic deformation permits intimate contac preventive method is a lubricant that combines with the metal form a "corrosion" product of sufficient strength to'keep th separated. t h e use of materials of high elastic limit will minimi due to intimate contact produced by plastic deformatiog
Impact is a factor in wear, since the suddenly applied load m plastic flow and a change in shape. Proper design should provide compressive yield strength above the compressive stress pr impact and sufficient support so that subsurface flow does not
_/Fatigue failure is included in a discussion of wear since it is a deterioration due to use. Proper design to eliminate stress conce at notches and sharp angles will increase fatigue strength. Sinc failures are always due to tensile stress, residual compressive the surface will provide additional protection. This may be acco by case hardening, such as carburiiing, and by shot peening.
t
570 INTRODUCrlON TO PHYSICAL METALLURGY
Electroplating L--
Anodizing G- Diffusion Metal spraying- Hard facing -- Selective heat treatment w
WEAR OF METALS 571
K t h o d s of Testing for Wear Resistance Since wear is not a simple phe- nomenon, wear resistance is represented by fewer standardized tests than other engineering properties. It is generall-t a "univer~al" wear tsst is not feasible. ~here fo reTe~u i~ment for wear testing must be de'Ggned to simulate actual service conditions. These tests should have proved reproducibility, should be able to rank various materials under con- sideration, and most important, should be validated by correlation with
/service data. Protection against Wear Many materials and methods are available for
protection against wear. The selection of a particular material and process requires a thorough analysis of the actual service conditions, a knowl- edge of applicability and limitations of the particular material and process, and data concerning the cost involved. The lack of engineering data avail- able for comparisons imposes a need for good judgment on the engineer or technician who selects materials to withstand wear.
Various techniques for providing surface protection to wear are as follows:
Electroplating b e wear resistance of a metal part can be improved by electroplating a harder metal on its surface. The metals most often plated on base materials are chromium, nickel, and rhodium. Indium plating has been used to reduce the wear of lead bearings3 1_7wo types of chromium plating used industrially are known as h s chromium and porous chromium. The hard-chromium plate is the same as that used for decorative purposes but much thicker, usually from 0.0001 to 0.010 in2 Porous chromium plate has on its surface carefully controlled pits or channels to hold lubricants. The term is misleading, since below the specially prepared surface, it is no more porous than ordinary hard- chromium plate. r h e hardness of chromium plate is equivalent to 950 to 1050 V i c k e 5 knother factor contributing to thereduction of wear is the low - coefficient of f r W n of chromium p l a a bhromium plating is used in the cylinders and piston rings of internal-combustion engines. Non- galling is another useful property of chromium plate. Force-fitted chro- mium-plated steel parts may be assembled and disassembled many times without seizing or galling. K h e high corrosion resist nce of chromium is helpful in reducing wear under corrosive conditions. 4
L
572 INTRODUCTION TO PHYSICAL METALLURGY WEAR OF METALS 573
@he hardness of hickel plate is from 140 to 425 ~ickers' depend The first four of these processes were discussed in detail in Chap. 8, and the nickel-plating solution u s e 9 Nickel plate is a good deal s only the last two will be discussed here. chromium plate, but in many cases it is hard enough for the pu Chromizing consists of the introduction of chromium into the surface - _..- --- more economical. A nickel plate may be finished by machinin layers of the base metal. The process is not restricted to ferrous materials chromium plate must be ground. The better throwing power a d may be applied to nickel, ;obalt, molybdenum, and tungsten to improve plating solutions as compared with chromium-plating solutio corrosion resistance and heat resistancg ...--- advantage in plating parts that have recesses. When it is applied to iron or steel, i t converts the surface layer into a C ~ h e hardness of rhodium plate is from 540 to 640 Vickers, stainless-steel case> If the steel contains appreciable amounts of carbon
resistance is between those of nickel plate and chromium pla (above 0.60 percent), chromium carbides will precipitate, increasing wear plate has high reflectivity, high heat resistance, and nontarnis resistance. The chromizing process most widely used employs the prin- erties along with good hardness and wear resistance, The use of ciple of transfer of chromium through the gas phase at elevated tempera- plate for reflectors of high-intensity light sources, for electrical tures. The temperatures used range from 1650 to 2000'F. These high tem- and for slip rings and commutators has been mentioned in Cha peratures may produce some distortion and grain growth during treatment.
4 4 . 7 Anodizing b e formation of an oxide coating by anodizing may Chromized high-carbon steels have a hardness of 800 to 1000 Vickers and improve the Wear resistance of certain metals. The anodizing 43 a low coefficient of friction. Chromizing is used on drop-forging dies, u ually applied to aluminum, magnesium, zinc, and their alloys. tools, hydraulic rams, pistons, and pump shafts. - izing, the work is t 6 anodeznd oxide l a y G a r c built up on Siliconizing, or Ihrigizing, consists of impregnation of an iron-base ma- metal. Since the newest oxide layer always forms next to the terial with silicon. The process is carried out in the temperature range of in order for the process to continue, the previously formed 1700 to 1850°F. The work is heated in contact with a silicon-bearing ma- must be porous enough t~ allow the oxygen ions to pass thro terial such as silicon carbide, and chlorine gas is used as a catalyst. The
Anodizing aluminum is simply a method of building up a muc case depth ranges from 0.005 to 0.1 in., depending mainly on the carbon oxide coating than may be obtained by exposure to air. The Alu content of the base material. The case produced contains approximately C ~ S S developed by the Aluminum Company of America uses su 14 percent silicon and is essentially an iron-silicon solid solution. Sili- as an el@ctrolyte for anodizing. The films produced are transparen conized cases are difficult to machine, although the hardness is only and more porous than those produced by other electrolytes. c Rockwell B 80 to 85. The increase in wear resistance by siliconizing is development resulted in Alumilite hard coatings, which are thi due to a low coefficient of friction and nongalling properties. Siliconized harder than ordinary anodic coatings.\alrcraft parts such as cases have been used on pump shafts, conveyor chain links, cylinder liners, pistons, guide tracks, gears, cams, screws, swivel joints, and fricti valve guides, veves, and fittings for the chemical and oil industries. are made of hard-coated aluminum alloys.
_JJ Lds Metal spraying@etal spraying or flame spraying has been used for many The production of a hard wear-resistant surface by anodizing h years in production salvage to build up dimensions that are undersize and
extended the uses of magnesium and its alloys. Flash anodic co to repair worn surfaces. It has found increased use for wear-resistant often used as a base for paint adherence. applications.
Anodizing zinc produces a coating which has greater resist 7 Lsrayed cbatings can be applied by several methods: metallizing; flame-
than chromate films. Anodic zinc coatings are used for car plating, which is used to deposit tungsten carbide and aluminum oxide; airplane propeller blades, wire-screen cloth, and refrigerator s plasma arc spraying, which can deposit almost all inorganic materials. d iffu us ion Several processes improve wear resistance by diffusi 3
peta l l i z ing is usually done by automatically feeding a metal wire at a element into the surface layers. These are: controlled rate of speed through the metallizing tool or "gun" (Fig. 1 4 . 4 a CarburizingY Air, oxygen, and a combustible gas are supplied to the gun by means of
hoses and form a high-temperature high-velocity flame around the wire Cyaniding, tip. The wire tip is continuously melted off, and the liquid-metal particles Carbonitriding are directed at the work by the high-velocity flame. When they strike the
Nitriding / surface, these particles flatten out to form irregularly shaped disks. At the
Chromizing/ same time they are forced into surface pores and irregularities to provide Siiiconizing / some mechanical interlock with previously deposited material. cooling is
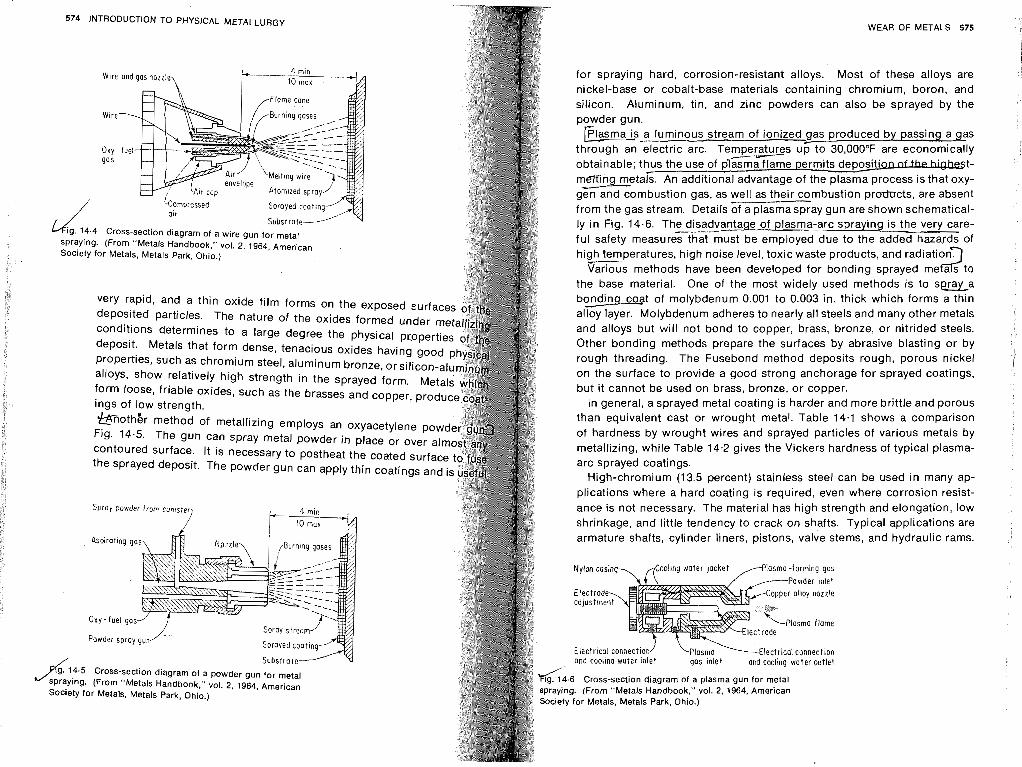
L
574 INTRODUCTION TO PHYSICAL METALLURGY
W~re
o x y - gas
Compressed atr
wig. 14.4 Cross-section diagram of a wire gun for met>&
spraying. (From "Metals Handbook," vol. 2, 1964, American . Society for Metals, Metals Park, Ohio.)
very rapid, and a thin oxide film forms on the exposed e u r f ~ deposited particles. The nature of the oxides formed under conditions determines to a large degree the physical pcopei deposit. Metals that form dense, tenacious oxides having go( properties, such as chromium steel, aluminum bronze, or silicon alloys, show relatively high strength in the sprayed form. Met, form loose, friable oxides, such as the brasses and copper, produ ings of low strength. &riothkr method of metallizing employs an oxyacetylene pow Fig. 14.5. The gun can spray metal powder in place or over al contoured surface. It is necessary to postheat the coated surfa the sprayed deposit. The powder gun can apply thin coatings an
Sproy powder from conrster
#' ,'
Aspirating gas\ fl N,o:lle\ / [Burning gases
-. =.... ,-' "'".", 1964. American
WEAR OF METALS 575
for spraying hard, corrosion-resistant alloys. Most of these alloys are
nickel-base or cobalt-base materials containing chromium, boron, and silicon. Aluminum, tin, and zinc powders can also be sprayed by the powder gun.
plasma is a luminous stream of ionized gas produced by passing a gas through an electric arc. T e ~ e z t u r e s u p to 30,000°F are economically obtainable; thus the use of plasma flame ~ermi ts depositi-t- m z i n g metals. An additional advantage of the plasma process is that oxy-
- gen and combustion gas, as well as their combustion prodncts, are absent from the gas stream. Details of a plasmaspray gun are shown schematical- ly in Fig. 14.6. The disadvantage of plasma-arc spraying is the very care- ful safety measurezhat must be employed due to the added hazards of high ---7- temperatures, high noise level, toxic waste products, and radiation. 2 Varlous methods have been developed for bonding sprayed me a s to the base material. One of the most widely used methods is to spray_a bond in^ coat of molybdenum 0.001 to 0.003 in. thick which forms a thin alloy layer. Molybdenum adheres to nearly all steels and many other metals and alloys but will not bond to copper, brass, bronze, or nitrided steels. Other bonding methods prepare the surfaces by abrasive blasting or by rough threading. The Fusebond method deposits rough, porous nickel on the surface to provide a good strong anchorage for sprayed coatings, but it cannot be used on brass, bronze, or copper.
In general, a sprayed metal coating is harder and more brittle and porous than equivalent cast or wrought metal. Table 14.1 shows a comparison of hardness by wrought wires and sprayed particles of various metals by metallizing, while Table 14.2 gives the Vickers hardness of typ~cal plasma- arc sprayed coatings.
High-chromium (13.5 percent) stainless steel can be used in many ap- plications where a hard coating is required, even where corrosion resist- ance is not necessary. The material has high strength and elongation, low shrinkage, and little tendency to crack on shafts. Typical applications are armature shafts, cylinder liners, pistons, valve stems, and hydraulic rams.
Nylon casinq, ,.$ooling woter jacket , - - P l a s m a -forming gas
Electr adjust
t * m h i
Electrical connection 1 ~plasm%Electrical connection and cool~na water inlet gas inlet and cooling water outlet
, . d 1 4 . 6 Cross-section diagram of a plasma gun tor metal spraying. (From "Metals Handbook." vol. 2, 1964, American Society for Metals. Metals Park, Ohio.)
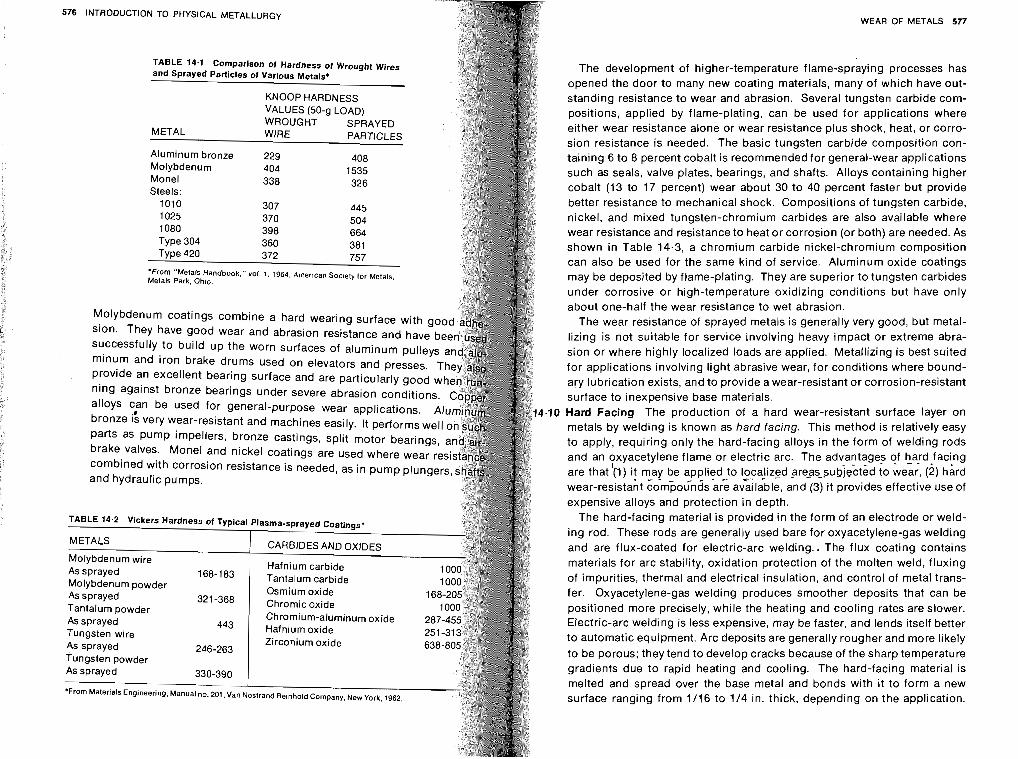
576 INTRODUCTION TO PHYSICAL METALLURGY WEAR OF METALS 577
TABLE 14.1 Comparison of Hardness of Wrouoht Wiraa =..- ....- " and Sprayed ~articles of Various Metals*
KNOOP HARDNESS VALUES (50-CJ LOAD) WROUGHT SPRAYED
METAL WIRE PARTICLES
Aluminum bronze 229 408 Molybdenum 404 1535 Monel 338 326 Steels:
1010 307 445 1025 370 504 1080 398 664 Type 304 360 381 Type 420 372 757
'From "Metals Handbook." vol 1. 1964. Amerlcan Soc~ety for Metals. Metals Park. Ohio.
Molybdenum coatings combine a hard wearing surface with g sion. They have good wear and abrasion resistance and have b successfully to build up the worn surfaces of aluminum pulleys rninum and iron brake drums used on elevators and presses. T provide an excellent bearing surface and are particularly good w ning against bronze bearings under severe abrasion conditions. alloys can be used for general-purpose wear applications. bronze & very wear-resistant and machines easily. It performs we parts as pump impellers, bronze castings, split motor bearing brake valves. Monel and nickel coatings are used where wear combined with corrosion resistance is needed, as in pump plung and hydraulic pumps.
METALS CARBiDFS AND nx ln~s
Molybdenum wire Hafnium carbide
As sprayed 168-183 Tantalum carbide
Molybdenum powder Osmium oxide As sprayed
Tantalum powder 321-368 Chromic oxide
Chromium-aluminum oxide 287 As sprayed 443 Hafnium oxide Tungsten wire Zirconium oxide As sprayed 246-263
Tungsten powder AS sprayed 330-390
*From Materials Engineering. Manual no. 201. Van Nostrand Reinhold Company. New York. 1962.
The development of higher-temperature flame-spraying processes has opened the door to many new coating materials, many of which have out- standing resistance to wear and abrasion. Several tungsten carbide com- positions, applied by flame-plating, can be used for applications where either wear resistance alone or wear resistance plus shock, heat, or corro- sion resistance is needed. The basic tungsten carbide composition con- taining 6 to 8 percent cobalt is recommended for general-wear applications such as seals, valve plates, bearings, and shafts. Alloys containing higher cobalt (13 to 17 percent) wear about 30 to 40 percent faster but provide better resistance to mechanical shock. Compositions of tungsten carbide, nickel, and mixed tungsten-chromium carbides are also available where wear resistance and resistance to heat or corrosion (or both) are needed. As shown in Table 14.3, a chromium carbide nickel-chromium composition can also be used for the same kind of service. Aluminum oxide coatings may be deposited by flame-plating. They are superior to tungsten carbides under corrosive or high-temperature oxidizing conditions but have only about one-half the wear resistance to wet abrasion.
The wear resistance of sprayed metals is generally very good, but metal- lizing is not suitable for service involving heavy impact or extreme abra- sion or where highly localized loads are applied. Metallizing is best suited for applications involving light abrasive wear, for conditions where bound- ary lubrication exists, and to provide a wear-resistant or corrosion-resistant surface to inexpensive base materials. Hard Facing The production of a hard wear-resistant surface layer on metals by welding is known as hard facing. This method is relatively easy to apply, requiring only the hard-facing alloys in the form of welding rods and an oxyacetylene flame or electric arc. The advantages - - - qf WdJacing are that h ) i! may be applied to loca!izgd ?re-as-subj,lected to wear. (2) hsrd
* c - -
wear-resistant cornbounds are available, and (3) it provides effective use of expensive alloys and protection in depth.
The hard-facing material is provided in the form of an electrode or weld- ing rod. These rods are generally used bare for oxyacetylene-gas welding and are flux-coated for electric-arc welding.. The flux coating contains materials for arc stability, oxidation protection of the molten weld, fluxing of impurities, thermal and electrical insulation, and control of metal trans- fer. Oxyacetylene-gas welding produces smoother deposits that can be positioned more precisely, while the heating and cooling rates are slower. Electric-arc welding is less expensive, may be faster, and lends itself better to automatic equipment. Arc deposits are generally rougher and more likely to be porous; they tend to develop cracks because of the sharp temperature gradients due to rapid heating and cooling. The hard-facing material is melted and spread over the base metal and bonds with it to form a new surface ranging from 1/16 to 114 in. thick, depending on the application.
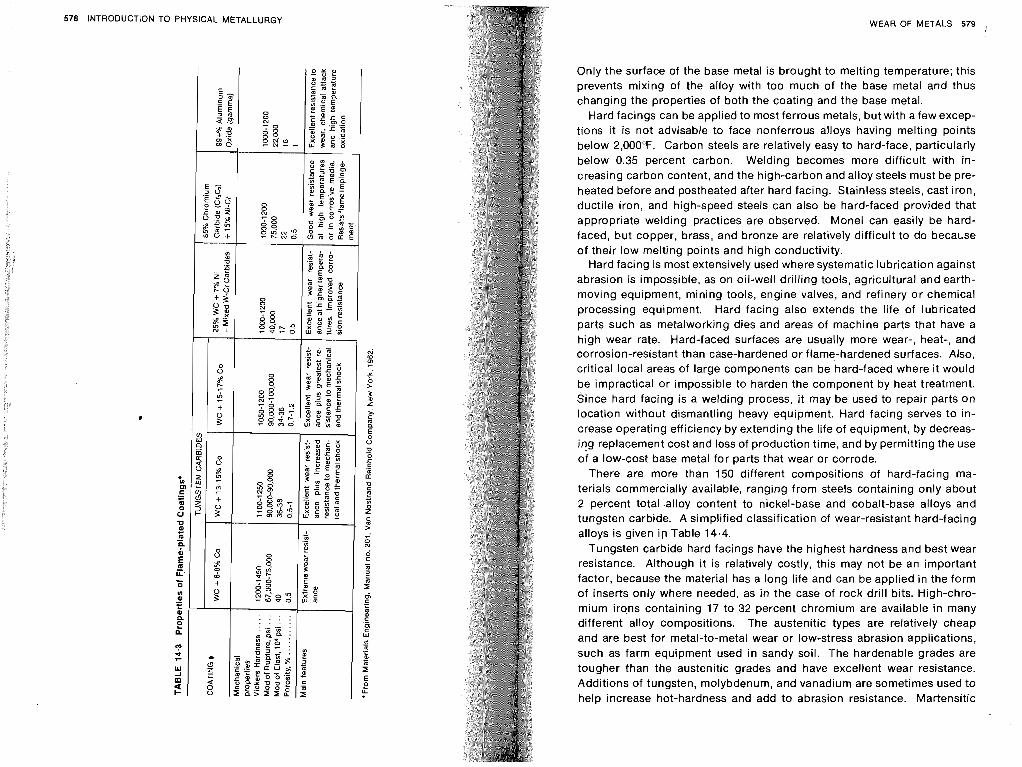
578 INTRODUCTION TO PHYSICAL METALLURGY WEAR OF METALS 579
Only the surface of the base metal is brought to melting temperature; this prevents mixing of the alloy with too much of the base metal and thus changing the properties of both the coating and the base metal.
Hard facings can be applied to most ferrous metals, but with a few excep- tions it is not advisable to face nonferrous alloys having melting points below 2,000°F. Carbon steels are relatively easy to hard-face, particularly below 0.35 percent carbon. Welding becomes more difficult with in- creasing carbon content, and the high-carbon and alloy steels must be pre- heated before and postheated after hard facing. Stainless steels, cast iron, ductile iron, and high-speed steels can also be hard-faced provided that appropriate welding practices are observed. Monel can easily be hard- faced, but copper, brass, and bronze are relatively difficult to do beca~se of their low melting points and high conductivity.
Hard facing is most extensively used where systematic lubrication against abrasion is impossible, as on oil-well drilling tools, agricultural and earth- moving equipment, mining tools, engine valves, and refinery or chemical processing equipment. Hard facing also extends the life of lubricated parts such as metalworking dies and areas of machine parts that have a high wear rate. Hard-faced surfaces are usually more wear-, heat-, and corrosion-resistant than case-hardened or flame-hardened surfaces. Also, critical local areas of large components can be hard-faced where it would be impractical or impossible to harden the component by heat treatment. Since hard facing is a welding process, it may be used to repair parts on location without dismantling heavy equipment. Hard facing serves to in- crease operating efficiency by extending the life of equipment, by decreas- ing replacement cost and loss of production time, and by permitting the use of a low-cost base metal for parts that wear or corrode.
There are more than 150 different compositions of hard-facing ma- terials commercially available, ranging from steels containing only about 2 percent total alloy content to nickel-base and cobalt-base alloys and tungsten carbide. A simplified classification of wear-resistant hard-f acing alloys is given ip Table 14.4.
Tungsten carbide hard facings have the highest hardness and best wear resistance. Although it is relatively costly, this may not be an important factor, because the material has a long life and can be applied in the form of inserts only where needed, as in the case of rock drill bits. High-chro- mium irons containing 17 to 32 percent chromium are available in many different alloy compositions. The austenitic types are relatively cheap and are best for metal-to-metal wear or low-stress abrasion applications, such as farm equipment used in sandy soil. The hardenable grades are tougher than the austenitic grades and have excellent wear resistance. Additions of tungsten, molybdenum, and vanadium are sometimes used to help increase hot-hardness and add to abrasion resistance. Martensitic
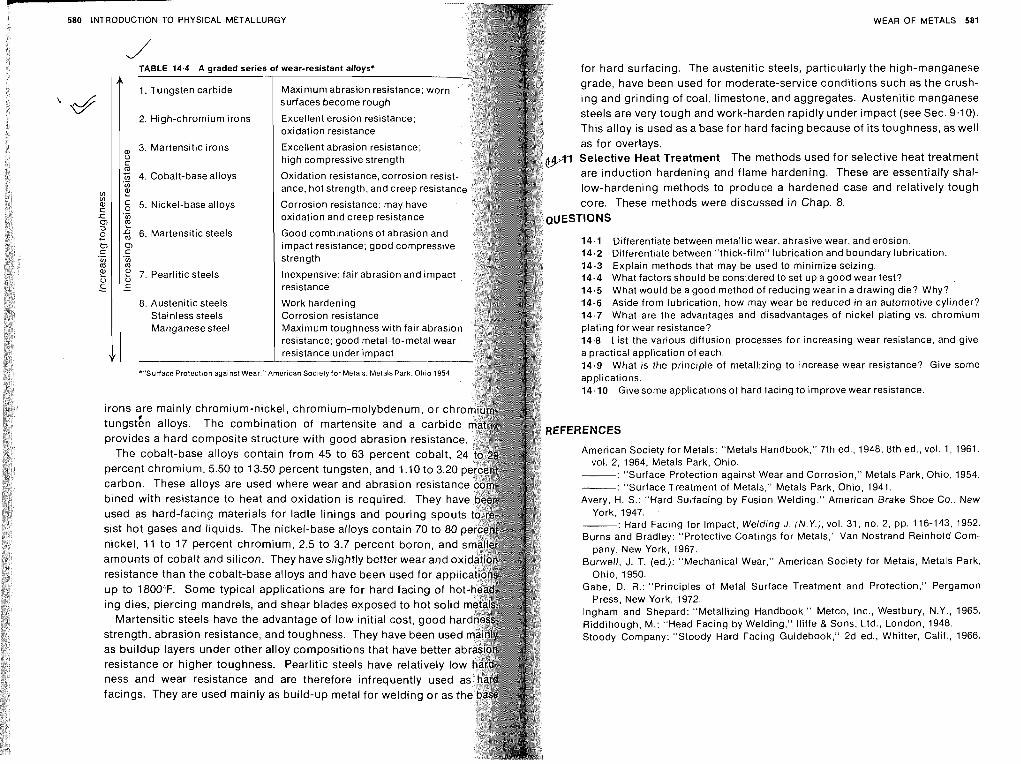
WEAR OF METALS 581 580 INTRODUCTION TO PHYSICAL METALLURGY
v, v,
c c 9 o +- t)) (r .- 0) m
C -
14.9 What is the principle of metallizing to increase wear resistance? Give some *"Surface Protection agalnst Wear." Arner~can Society for Metals. Metals Park. Ohio 195 applications.
14.10 Give some applications of hard facing to improve wear resistance.
irons are mainly chromium-nickel, chromium-molybdenum, or c tungst6n alloys. The combination of martensite and a carbi REFERENCES provides a hard composite structure with good abrasion resistanc
The cobalt-base alloys contain from 45 to 63 percent cobalt, American Society for Metals: "Metals Handbook," 7th ed., 1948: 8th ed., vol. 1, 1961, vol. 2, 1964, Metals Park, Ohio.
percent chromium, 5.50 to 13.50 percent tungsten, and 1.10 to 3.20 : "Surface Protection against Wear and Corrosion," Metals Park. Ohio, 1954. carbon. These alloys are used where wear and abrasion resistan : "Surface Treatment of Metals," Metals Park, Ohio. 1941. bined with resistance to heat and oxidation is required. They ha Avery. H. S.: "Hard Su~.facing by Fusion Welding," American Brake Shoe Co.. New
used as hard-facing materials for ladle linings and pouring spout York. 1947.
sist hot gases and liquids. The nickel-base alloys contain 70 to 80 -: Hard Facing for Impact, Welding J. (N.Y.), vol. 31, no. 2, pp. 116-143. 1952. Burns and Bradley: "Protective Coat~ngs for Metals," Van Nostrand Re~nhold Com-
nickel, 11 to 17 percent chromium, 2.5 to 3.7 percent boron, and pany, New York, 1967. amounts of cobalt and silicon. They have slightly better wear and o Burwell, J. T. (ed.): "Mechanical Wear," American Society for Metals, Metals Park, resistance than the cobalt-base alloys and have been used for ap Ohio, 1950.
up to 1800°F. Some typical applications are for hard facing of Gabe, D. R.: "Principles of Metal Surface Treatment and Protection," Pergamon
ing dies, piercing mandrels, and shear blades exposed to hot soli Press, New York, 1972. lngham and Shepard: "Metallizing Handbook," Metco. Inc., Westbury, N.Y., 1965.
Martensitic steels have the advantage of low initial cost, good h Riddihough, M.: "Head Facing by Welding," lliffe & Sons, Ltd., London, 1948. strength, abrasion resistance, and toughness. They have been Stoody Company: "Stoody Hard Facing Guidebook." 2d ed.. Whitter, Calif., 1966. as buildup layers under other alloy compositions that have bet resistance or higher toughness. Pearlitic steels have relatively lo ness and wear resistance and are therefore infrequently used facings. They are used mainly as build-up metal for welding or as t
for hard surfacing. The austenitic steels, particularly the high-manganese A
Y
grade, have been used for moderate-service conditions such as the crush-
surfaces become rough ing and grinding of coal, limestone, and aggregates. Austenitic manganese steels are very tough and work-harden rapidly under impact (see Sec. 9.10).
oxidation resistance This alloy is used as a base for hard facing because of its toughness, as well
3. Martensitic irons Excellent abrasion resistance; as for overlays. 0 c high compressive strength Selective Heat Treatment The methods used for selective heat treatment
'G 4. Cobalt-base alloys .- Oxidation resistance, corrosion r are induction hardening and flame hardening. These are essentially shal- V)
2! ance, hot strength, and creep res low-hardening methods to produce a hardened case and relatively tough
5 5. Nickel-base alloys Corrosion resistance; may have core. These methods were discussed in Chap. 8. .- V) oxidation and creep resistance E -0, 6. Martensitic steels Good combinations of abrasion an o, impact resistance; good compress 14.1 Differentiate between metallic wear, abrasive wear, and erosion. c .- 14.2 Differentiate between "thick-film" lubrication and boundary lubrication. V) m 14.3 Explain methods that may be used to minimize seizing.
7. Pearlitic steels Inexpensive: fair abrasion and impa 14.4 What factors should be constdered to set up a good wear test? c - 14.5 What would be a good method of reducing wear in a drawing die? Why?
8. Austenitic steels 14.6 Aside from lubrication, how may wear be reduced in an automotive cylinder? Stainless steels 14.7 What are the advantages and disadvantages of nickel plating vs. chromium Manganese steel plating for wear resistance?
14.8 List the various diffusion processes for increasing wear resistance, and give a practical application of each.
CORROSION OF METALS
5.1 introduction b t h e broad sense, corrosion may be defined as "the destruc- tion of a material by chemical, electrochemical, or metallurgical interaction between the environment and the material2Gene.rally it is slow but per- sistent in character. In some instances the corrosion products exist as a thin adherent film which merely stains or tarnishes the metal and may act as a retardant to further corrosive action. In other cases, the products of corrosion are bulky and porous in character, offering no protection.
One of the most sericus problems of industry, corrosion causes damage in the billions of dollars each year. It is a complex problem about which a great deal is known; yet despite extensive research and experimentation, there is still a lot to learn. In some cases, such as direct chemical attack, corrosion is highly obvious, but in other cases, such as intergranular cor- rosion, it is less obvious but just as damaging.
d-The basic cause of corrosion is the instability of metals in their refined forms. The metals tend to revert to their natural states through the proc-
les korrosion is essentially an electrochemical process resulting in part or all of the metal being transformed from the metallic to the ionic s t a t 4 Corrosion requires a flow of electricity between certain areas of a metal surface through an electrolyte. An electrolyte is any solution that contains ions. Ions are electrically charged atoms or groups of atoms. Pure water, for example, contains positively charged hydrogen ions (H+) and negatively charged hydroxyl ions (OH-) in equal amounts. ~k~e lec t r o l y t e , therefore, may be plain water, salt water, or acid or alkaline solutions of any concentration. To complete the electric cir- cuit, there must be two electrodes, an anode and a cathode, and they must be connected.' The electrodes may be two different kinds of metals, or they may be different areas on the same piece of metal. The connection be- tween the anode and the cathode may be by a metallic bridge, but in cor-
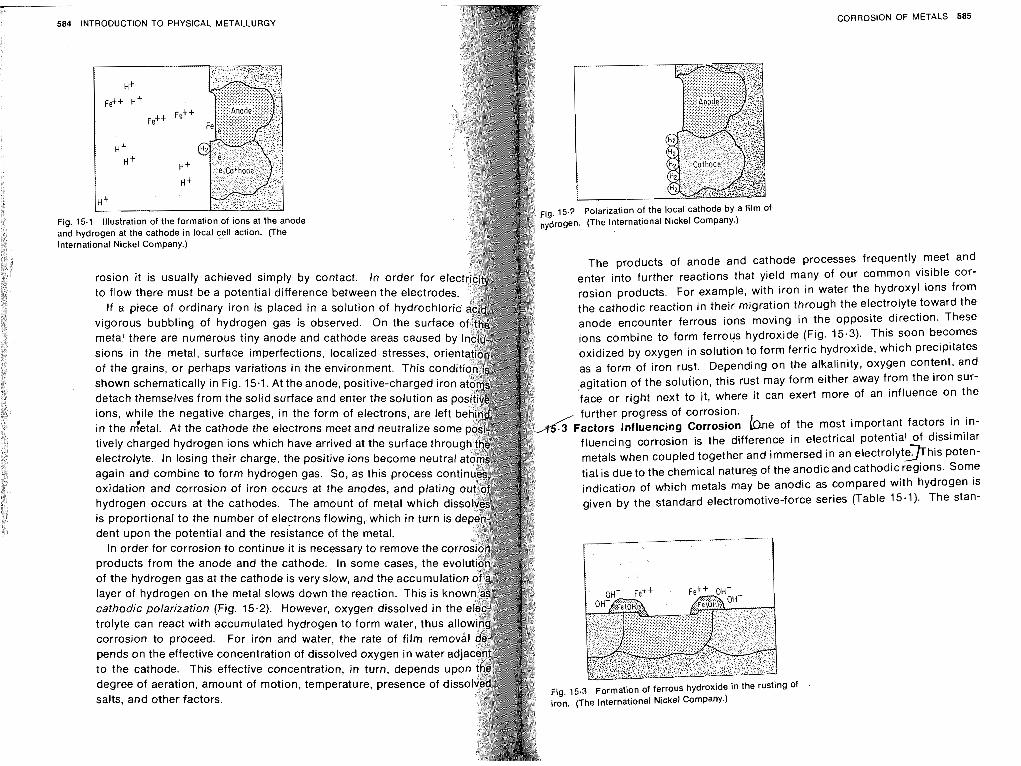
584
Fig. and Intel
INTRODUCTION TO PHYSICAL METALLlJRGY
15.1 Illustration of the formation of ions at the anode hydrogen at the cathode in local cell action. (The 'national Nickel Company.)
rosion it is usually achieved simply by contact. In order for to flow there must be a potential difference between the electro
If a piece of ordinary iron is placed in a solution of hydroch vigorous bubbling of hydrogen gas is observed. On the surfa metal there are numerous tiny anode and cathode areas caused sions in the metal, surface imperfections, localized stresses, or
of the grains, or perhaps variations in the environment. This con shown schematically in Fig. 15.1. At the anode, positive-charged iron detach themselves from the solid surface and enter the solution as ions, while the negative charges, in the form of electrons, are left in the detal. At the cathode the electrons meet and neutralize som tively charged hydrogen ions which have arrived at the surface throu electrolyte. In losing their charge, the positive ions become neutral again and combine to form hydrogen gas. So, as this process con oxidation and corrosion of iron occurs at the anodes, and plating hydrogen occurs at the cathodes. The amount of metal which dis is proportional to the number of electrons flowing, which in turn is d dent upon the potential and the resistance of the metal.
In order for corrosion to continue it is necessary to remove the cor products from the anode and the cathode. In some cases, the evo of the hydrogen gas at the cathode is very slow, and the accumulatio layer of hydrogen on the metal slows down the reaction. This is kno cathodic polarization (Fig. 15.2). However, oxygen dissolved in th trolyte can react with accumulated hydrogen to form water, thus corrosion to proceed. For iron and water, the rate of film rem pends on the effective concentration of dissolved oxygen in water a to the cathode. This effective concentration, in turn, depends upo degree of aeration, amount of motion, temperature, presence of diss salts, and other factors.
rogen. (The lnternatlonal Nlckel Company.)
CORROSION OF METALS 585
.2 Polarization of the local cathode by a film of
The products of anode and cathode processes frequently meet and enter ~ n t o further reactions that yleld many of our common visible cor- rosion products. For example, with iron in water the hydroxyl ions from the cathodic reaction in their migration through the electrolyte toward the anode encounter ferrous ions moving in the opposite direction. These ions combine to form ferrous hydroxide (Fig. 15.3). This soon becomes
oxidized by oxygen in solution to form ferric hydroxide, which precipitates as a form of iron rust. Depend~ng on the alkalinity, oxygen content, and agitation of the solution, this rust may form either away from the iron sur- face or right next to it, where it can exert more of an influence on the further progress of corrosion.
A F a d o r s Influencing Corrosion b e of the most important factors in in- fluencing corrosion is the difference in electrical potential of dissimilar metals when coupled together and immersed in an electrolyt$his poten- tial is due to the chemical natures of the anodic and cathodic regions. Some indication of which metals may be anodic as compared with hydrogen is given by the standard electromotive-force series (Table 15.1). The stan-
Ftg 15.3 Formation of ferrous hydroxtde In the rustlng of iron. (The International Nickel Company.)
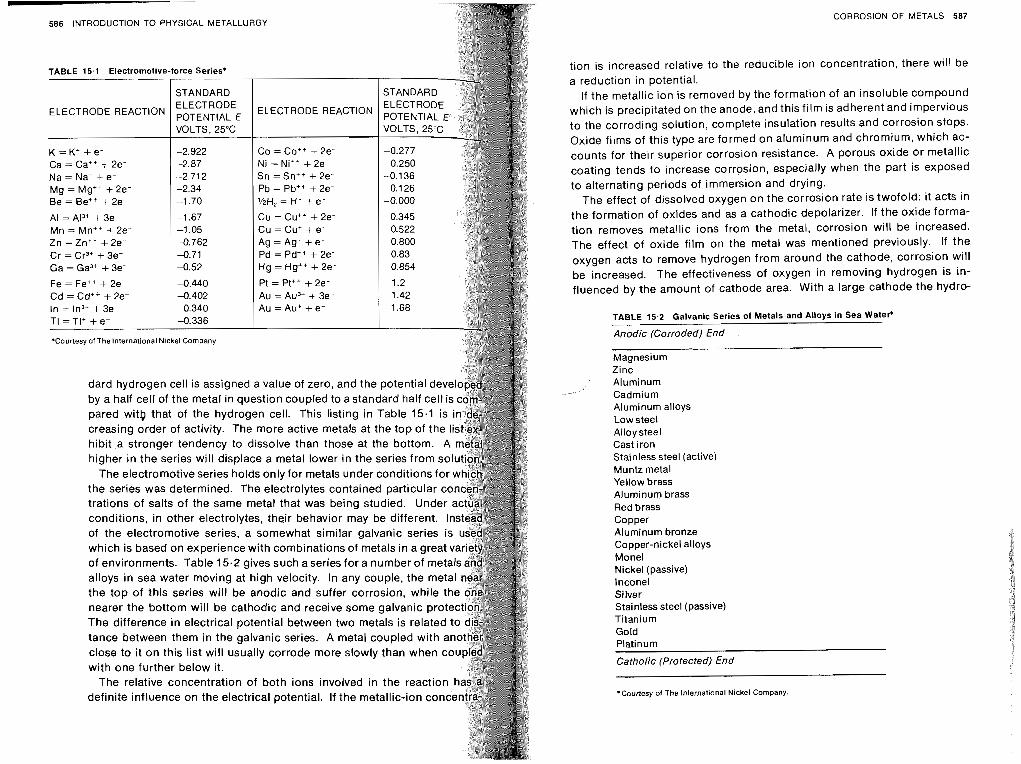
586 INTRODUCTION TO PHYSICAL METALLURGY
ELECTRODE REACTION ELECTRODE REACTION
A1 = A13+ + 3e- Mn = Mni+ + 2e- Zn = Zn++ + 2e-
by a half cell of the metal in question coupled to a standard half cell pared witb that of the hydrogen cell. This listing in Table 15.1 i creasing order of activity. The more active metals at the top of the I hibit a stronger tendency to dissolve than those at the bottom. A higher in the series will displace a metal lower in the series from sol
The electromotive series holds only for metals under conditions for the series was determined. The electrolytes contained particular c trations of salts of the same metal that was being studied. Under conditions, in other electrolytes, their behavior may be different. I of the electromotive series, a somewhat similar galvanic series i which is based on experience with combinations of metals in a great of environments. Table 15.2 gives such aseries for a number of met alloys in sea water moving at high velocity. In any couple, the met the top of this series will be anodic and suffer corrosion, while t
The difference in electrical potential between two metals is related tance between them in the galvanic series. A metal coupled with a
with one further below it. The relative concentration of both ions involved in the reaction
definite influence on the electrical potential. If the metallic-ion conc
CORROSION OF METALS 587
tion is increased relative to the reducible ion concentration, there will be a reduction in potential.
If the metallic ion is removed by the formation of an insoluble compound which is precipitated on the anode, and this film is adherent and imperv~ous to the corroding solution, complete insulation results and corrosion stops. Oxide films of this type are formed on aluminum and chromium, which ac- counts for their superior corrosion resistance. A porous oxide or metallic coating tends to increase corrosion, especially when the part is exposed to alternating periods of immersion and drying.
The effect of dissolved oxygen on the corrosion rate is twofold: it acts in the formation of oxldes and as a cathodic depolarizer. If the oxide forma- tion removes metallic ions from the metal, corrosion will be increased. The effect of oxide film on the metal was mentioned previously. If the
oxygen acts to remove hydrogen from around the cathode, corrosion will be increased. The effectiveness of oxygen in removing hydrogen is in- fluenced by the amount of cathode area. With a large cathode the hydro-
TABLE 15.2 Galvanic Series of Metals and Alloys in Sea WateP
Anodic (Corroded) End
Magnesium Zinc Aluminum Cadmium Aluminum alloys Low steel Alloy steel Cast Iron Stainless steel (active) Muntz metal Yellow brass Aluminum brass Red brass Copper Aluminum bronze Copper-nickel alloys Monel Nickel (passive) lnconel Silver Stainless steel (passive) Titanium Gold Platinum -
Catholic (Protected) End
*Courtesy of The International Nlckel Company.
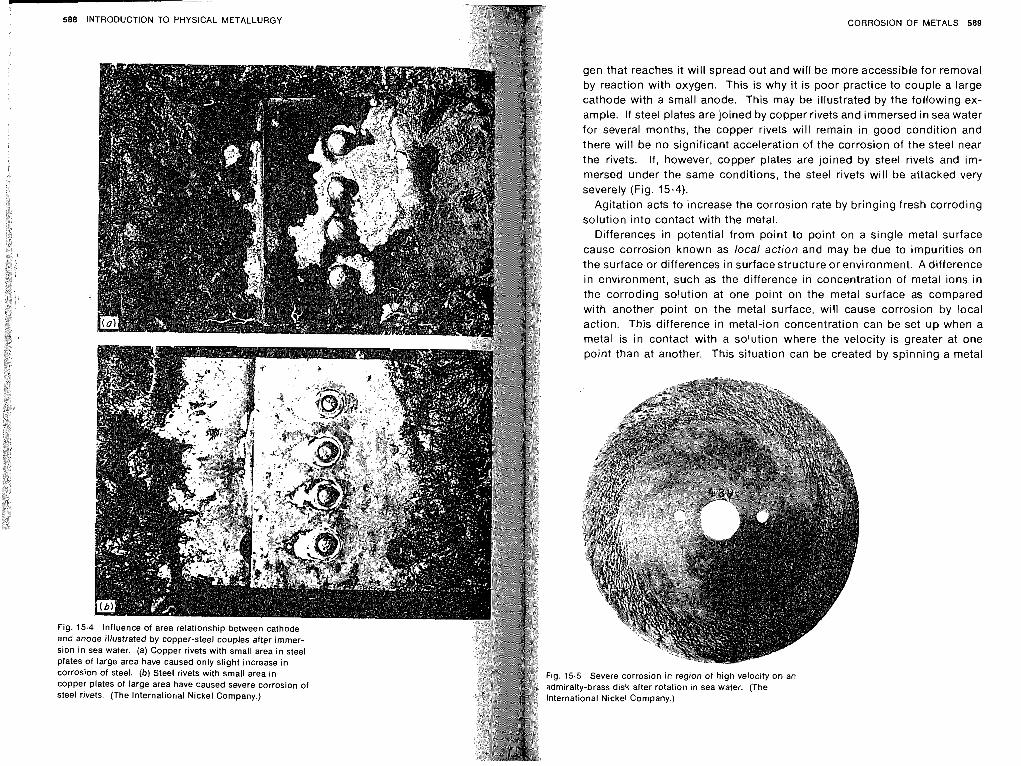
588 INTRODUCTION TO PHYSICAL METALLURGY
Fig. 15.4 Influence of area relationship between cathode and anode illustrated by copper-steel couples after immer- sion in sea water. (a) Copper rivets with small area in steel plates of large area have caused only slight increase in corrosion of steel. ( b ) Steel rivets with small area in copper plates of large area have caused severe corrosion of steel rivets. (The International Nickel Company.)
CORROSION OF METALS 589
gen that reaches it will spread out and will be more accessible for removal by reaction with oxygen. This is why it is poor practice to couple a large cathode with a small anode. This may be illustrated by the following ex- ample. If steel plates are joined by copper rivets and immersed in sea water for several months, the copper rivets will remain in good condition and there will be no significant acceleration of the corrosion of the steel near the rivets. If, however, copper plates are joined by steel rivets and im- mersed under the same conditions, the steel rivets will be attacked very severely (Fig. 15.4).
Agitation acts to increase the corrosion rate by bringing fresh corroding solution into contact with the metal.
Differences in potential from point to point on a single metal surface cause corrosion known as local action and may be due to impurities on the surface or differences in surface structure or environment. A difference in environment, such as the difference in concentration of metal ions in the corroding solution at one point on the metal surface as compared with another point on the metal surface, will cause corrosion by local action. This difference in metal-ion concentration can be set up when a metal is in contact with a solution where the velocity is greater at one point than at another. This situation can be created by spinning a metal
Fig. adn lnte
15.5 Severe corrosion in region of high velocity on an ,iralty-brass disk after rotation in sea water. (The rnational Nickel Company.)
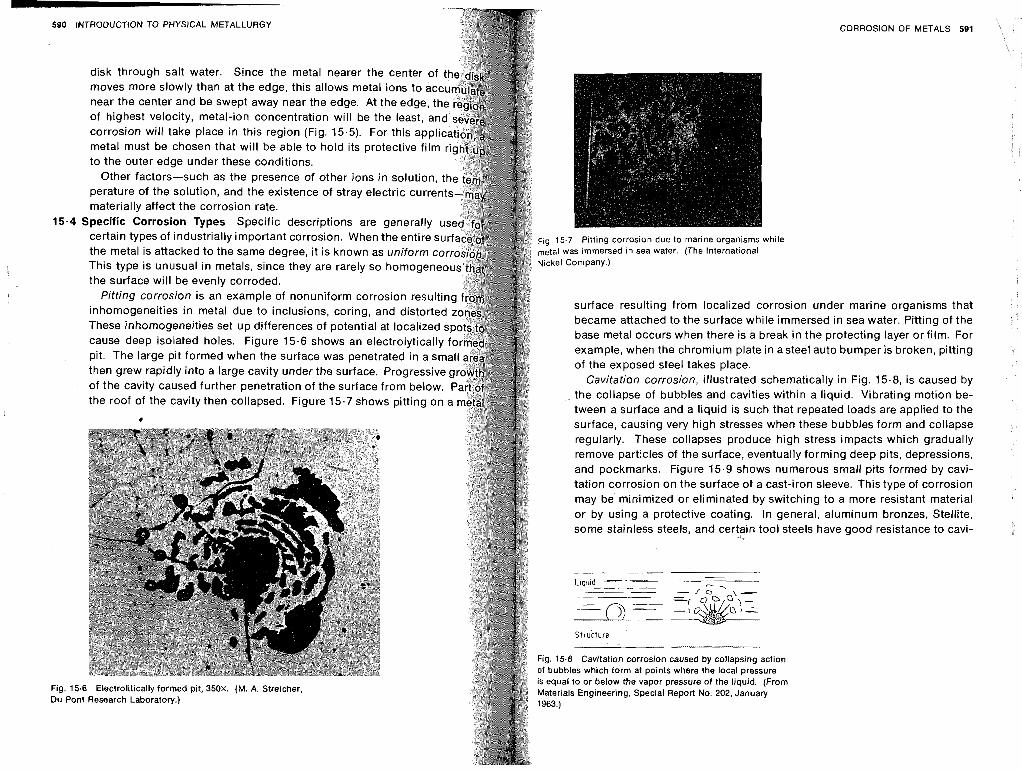
590 INTRODUCTION TO PHYSICAL METALLURGY
disk through salt water. Since the metal nearer the center o moves more slowly than at the edge, this allows metal ions to ac near the center and be swept away near the edge. At the edge of highest velocity, metal-ion concentration will be the least, corrosion will take place in this region (Fig. 15.5). For this ap metal must be chosen that will be able to hold its protective film to the outer edge under these conditions.
Other factors-such as the presence of other ions in solution perature of the solution, and the existence of stray electric curre materially affect the corrosion rate.
ipecific Corrosion Types Specific descriptions are generally u certain types of industrially important corrosion. When the entire su the metal is attacked to the same degree, it is known as uniform co This type is unusual in metals, since they are rarely so homogeneo the surface will be evenly corroded.
Pitting corrosion is an example of nonuniform corrosion result inhomogeneities in metal due to inclusions, coring, and distorte These inhomogeneities set up differences of potential at localized cause deep isolated holes. Figure 15.6 shows an electrolytically pit. The large pit formed when the surface was penetrated in a sm then grew rapidly into a large cavity under the surface. Progressive of the cavity caused further penetration of the surface from below. the roof of the cavity then collapsed. Figure 15.7 shows pitting on
#
Fig Du
i Electrolitically formed pit, 350x. (M. A. Streicher, Research ~aboiatory.)
CORROSION OF METALS 591
Fig. 15.7 Pitting corrosion due to marine organisms while metal was immersed in sea water. (The International Nickel Company.)
surface resulting from localized corrosion under marine organisms that became attached to the surface while immersed in sea water. Pitting of the base metal occurs when there is a break in the protecting layer or film. For example, when the chromium plate in asteel auto bumper is broken, pitting of the exposed steel takes place.
Cavitation corrosion, illustrated schematically in Fig. 15.8, is caused by the collapse of bubbles and cavities within a liquid. Vibrating motion be- tween a surface and a liquid is such that repeated loads are applied to the surface, causing very high stresses when these bubbles form and collapse regularly. These collapses produce high stress impacts which gradually remove particles of the surface, eventually forming deep pits, depressions, and pockmarks. Figure 15.9 shows numerous small pits formed by cavi- tation corrosion on the surface of a cast-iron sleeve. This type of corrosion may be minimized or eliminated by switching to a more resistant material or by using a protective coating. In general, aluminum bronzes, Stellite, some stainless steels, and certain tool steels have good resistance to cavi-
Struc ture -
Fig. 15.8 Cavitation corrosion caused by collapsing action of bubbles which form at points where the local pressure is equal to or below the vapor pressure of the liquid. (From Materials Engineering, Special Report No. 202, January 1963.)
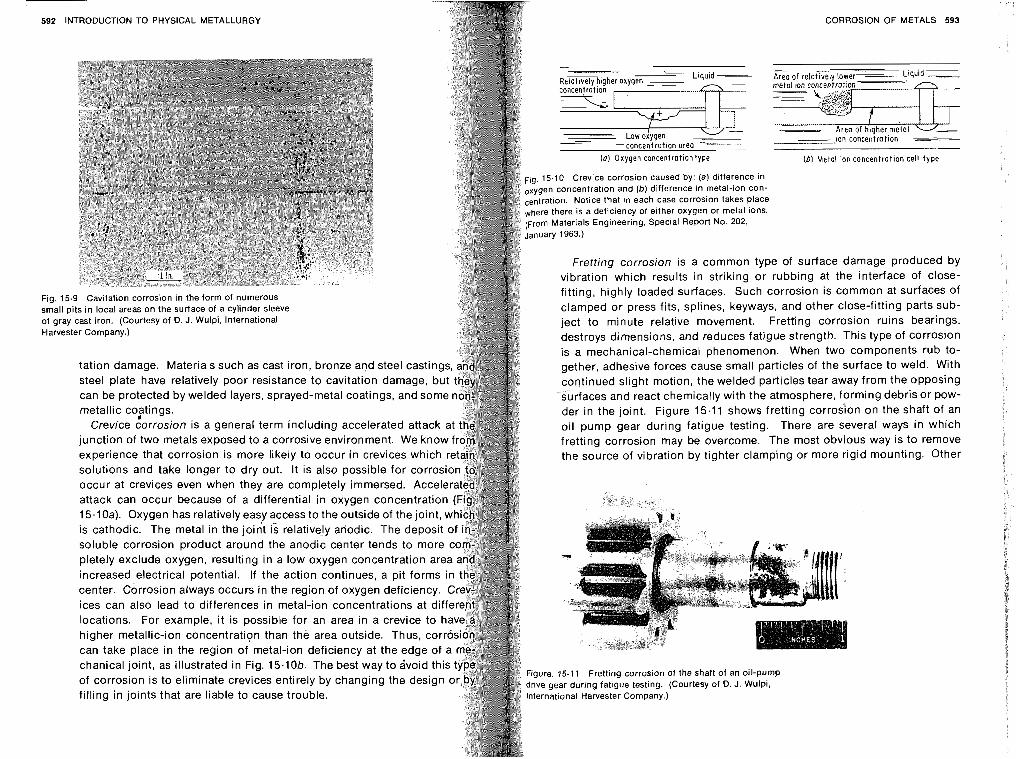
592 INTRODUCTION TO PHYSICAL METALLURGY CORROSION OF METALS 593
- Ion concentration --- (6) Metal ion concentration cell type
ion. Notice that in each case corrosion takes place here is a deficiency of either oxygen or metal ions.
Materials Engineering, Special Report No. 202,
Fretting corrosion is a common type of surface damage produced by vibration which results in striking or rubbing at the interface of close- fitting, highly loaded surfaces. Such corrosion is common at surfaces of clamped or press fits, splines, keyways, and other close-fitting parts sub-
of gray cast iron. (Courtesy of D. J. Wulpi, International ject to minute relative movement. Fretting corrosion ruins bearings, Ha~es te r Company.) destroys dimensions, and reduces fatigue strength. This type of corrosion
is a mechanical-chemical phenomenon. When two components rub to- tation damage. Materials such as cast iron, bronze and steel castin gether, adhesive forces cause small particles of the surface to weld. With steel plate have relatively poor resistance to cavitation damage, b continued slight motion, the welded particles tear away from the opposing
surfaces and react chemically with the atmosphere, forming debris or pow- der in the joint. Figure 15.11 shows fretting corroson on the shaft of an oil pump gear during fatigue testing. There are several ways in which fretting corrosion may be overcome. The most obvious way is to remove the source of vibration by tighter clamping or more rigid mounting. Other
is cathodic. The metal in the j soluble corrosion product around the anodic center tends to more
ices can also lead to differences in metal-ion concentrations at dif
1 1 Fretting corrosion of the shaft of an oil-pump of corrosion is to eliminate crevices entirely by changing the desig during fatigue testing. (Courtesy of D. J. Wulpi, filling in joints that are liable to cause trouble. al Hamester Company.)
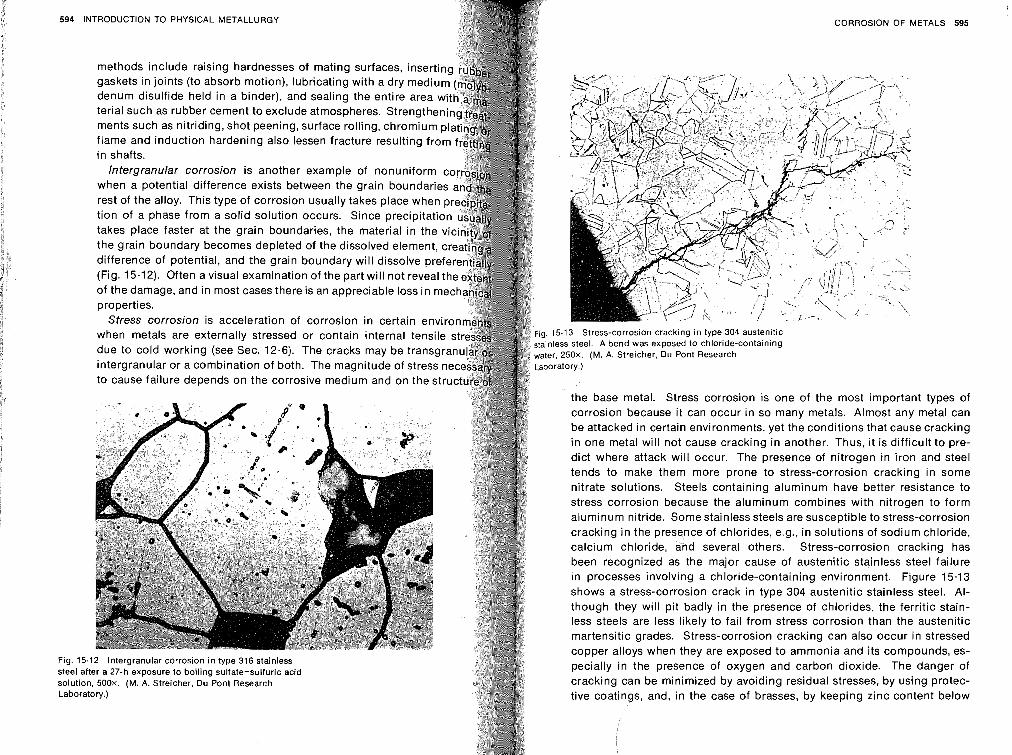
CORROSION OF METALS 595
methods include raising hardnesses of mating surfaces, in gaskets in joints (to absorb motion), lubricating with a dry m
ments such as nitriding, shot peening, surface rolling, chro flame and induction hardening also lessen fracture resulti in shafts.
when a potential difference exists between the grain bou rest of the alloy. This type of corrosion usually takes place tion of a phase from a solid solution occurs. Since precip~t takes place faster at the grain boundaries, the material in t
difference of potential, and the grain boundary will dissolve pref
of the damage, and in most cases there is an appreciable loss in properties.
Stress corrosion is acceleration of corrosion in certain env
due to cold working (see Sec. 12.6). The cracks may be transg intergranular or a combination of both. The magnitude of stress to cause failure depends on the corrosive medium and on the str
the base metal. Stress corrosion is one of the most important types of corrosion because it can occur in so many metals. Almost any metal can be attacked in certain environments, yet the conditions that cause cracking in one metal will not cause cracking in another. Thus, it is difficult to pre- dict where attack will occur. The presence of nitrogen in iron and steel tends to make them more prone to stress-corrosion cracking in some nitrate solutions. Steels containing aluminum have better resistance to stress corrosion because the aluminum combines with nitrogen to form aluminum nitride. Some stainless steels are susceptible tb stress-corrosion cracking in the presence of chlorides, e.g., in solutions of sodium chloride, calcium chloride, and several others. Stress-corrosion cracking has been recognized as the major cause of austenitic stainless steel failure in processes involving a chloride-containing environment. Figure 15.13 shows a stress-corrosion crack in type 304 austenitic stainless steel. Al- though they will pit badly in the presence of chlorides, the ferritic stain- less steels are less likely to fail from stress corrosion than the austenitic martensitic grades. Stress-corrosion cracking can also occur in stressed copper alloys when they are exposed to ammonia and its compounds, es- pecially in the presence of oxygen and carbon dioxide. The danger of
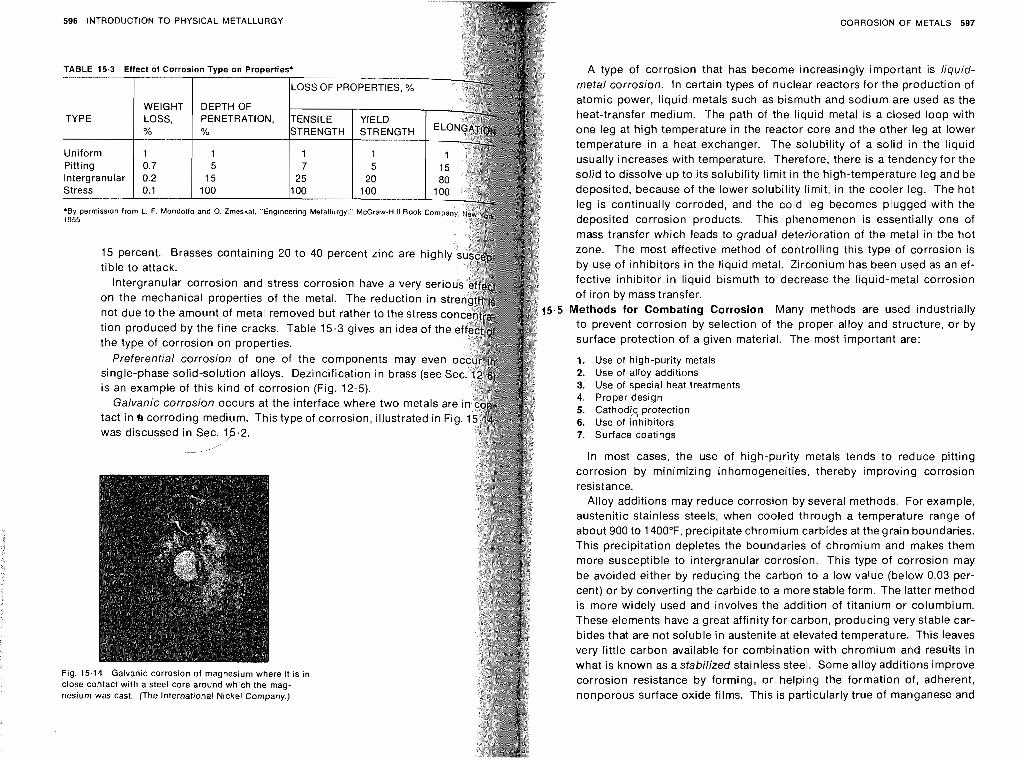
596 INTRODUCTION TO PHYSICAL METALLURGY CORROSION OF METALS 597
Fig. 15.14 Galvanic corrosion of magnesium where it is in close contact with a steel core around which the mag- nesium was cast. (The International Nickel Company.)
A type of corrosion that has become increasingly important is liquid- metal corrosion. In certain types of nuclear reactors for the production of atomic power, liquid metals such as bismuth and sodium are used as the heat-transfer medium. The path of the liquid metal is a closed loop with one leg at high temperature in the reactor core and the other leg at lower temperature in a heat exchanger. The solubility of a solid in the liquid usually increases with temperature. Therefore, there is a tendency for the solid to dissolve up to its solubility limit in the high-temperature leg and be deposited, because of the lower solubility limit, in the cooler leg. The hot leg is continually corroded, and the cold leg becomes plugged with the deposited corrosion products. This phenomenon is essentially one of mass transfer which leads to gradual deterioration of the metal in the hot zone. The most effective method of controlling this type of corrosion is by use of inhibitors in the liquid metal. Zirconium has been used as an ef- fective inhibitor in liquid bismuth to decrease the liquid-metal corrosion of iron by mass transfer.
Methods for Combating Corrosion Many methods are used industrially to prevent corrosion by selection of the proper alloy and structure, or by surface protection of a given material. The most important are:
1. Use of high-pur~ty metals 2. Use of alloy additions 3. Use of special heat treatments 4 Proper design 5. Cathod15 protection 6. Use of inhibitors 7. Surface coat~ngs
In most cases, the use of high-purity metals tends to reduce pitting corrosion by minimizing inhomogeneities, thereby improving corrosion resistance.
Alloy additions may reduce corrosion by several methods. For example, austenitic stainless steels, when cooled through a temperature range of about 900 to l40O0F, precipitate chromium carbides at the grain boundaries. This precipitation depletes the boundaries of chromium and makes them more susceptible to intergranular corrosion. This type of corrosion may be avoided either by reducing the carbon to a low value (below 0.03 per- cent) or by converting the carbide to a more stable form. The latter method is more widely used and involves the addition of titanium or columbium. These elements have a great affinity for carbon, producing very stable car- bides that are not soluble in austenite at elevated temperature. This leaves very little carbon available for combination with chromium and results in what is known as a stabilized stainless steel. Some alloy additions improve corrosion resistance by forming, or helping the formation of, adherent, nonporous surface oxide films. This is particularly true of manganese and
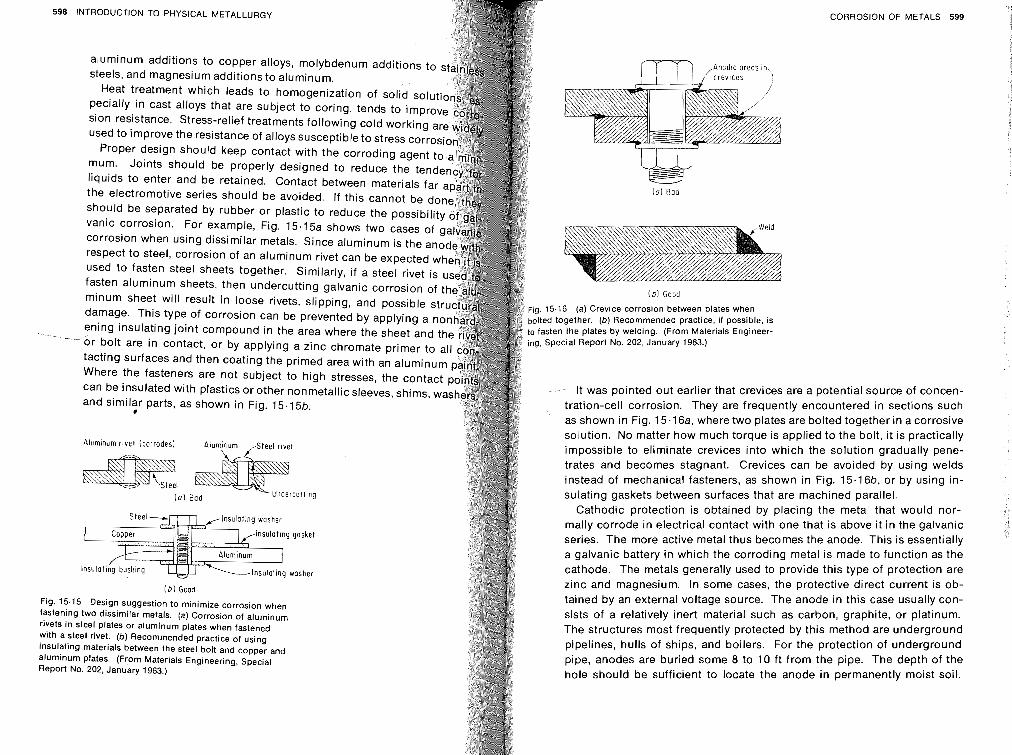
598 INTRODUCTION TO PHYSICAL METALLURGY
aluminum additions to copper alloys, molybdenum additions t steels, and magnesium additions to aluminum.
Heat treatment which leads to homogenization of solid solu pecially in cast alloys that are subject to coring, tends to impr sion resistance. Stress-relief treatments following cold working used to improve the resistance of alloys susceptible to stress corr
Proper design should keep contact with the corroding agent mum. Joints should be properly designed to reduce the ten liquids to enter and be retained. Contact between materials far the electromotive series should be avoided. If this cannot be do should be separated by rubber or plastic to reduce the possibili vanic corrosion. For example, Fig. 15.15a shows two cases of corrosion when using dissimilar metals. Since aluminum is the a respect to steel, corrosion of an aluminum rivet can be expected used to fasten steel sheets together. Similarly, if a steel rivet i fasten aluminum sheets, then undercutting galvanic corrosion o minum sheet will result in loose rivets, slipping, and possible damage. This type of corrosion can be ~revented bv aoolvina , . . , " ening insulating joint compound in the area where the sheet and or bolt are in contact, or by applying a zinc chromate primer to
. .
tacting surfaces and then coating the primed area with an aluminu Where the fasteners are not subject to high stresses, the contac can be insulated with plastics or other nonmetallic sleeves, shims, w and similar parts, as shown in Fig. 15.15b.
L
Alumlnum rivet (corrodes) Alurn~norn ,S~PPI ~ I Y P I
I (01 Bod
S t e e l - - - c ~ N l n s u l o t i n q wosher
ket
wosher
( b l Good
Fig. 15.15 Design suggestion to minimize corrosion when fastening two dissimilar metals. (a) Corrosion of aluminum rivets in steel plates or aluminum plates when fastened with a steel rivet. (b) Recommended practice of using insulating materials between the steel bolt and copper and aluminum plates. (From Materials Engineering, Special Report No. 202, January 1963.)
CORROSION OF METALS 599
E (ol Bod
( b ) Good
g. 15.16 (a) Crevice corrosion between plates when lted together. (b) Recommended practice, if possible, is fasten the plates by welding. (From Materials Engineer-
g, Special Report No. 202, January 1963.)
was pointed out earlier that crevices are a potential source of concen- on-cell corrosion. They are frequently encountered in sections such
as shown in Fig. 15.16a, where two plates are bolted together in a corrosive solution. No matter how much torque is applied to the bolt, it is practically impossible to eliminate crevices into which the solution gradually pene- trates and becomes stagnant. Crevices can be avoided by using welds instead of mechanical fasteners, as shown in Fig. 15.16b, or by using in- sulating gaskets between surfaces that are machined parallel.
Cathodic protection is obtained by placing the metal that would nor- mally corrode in electrical contact with one that is above it in the galvanic series. The more active metal thus becomes the anode. This is essentially a galvanic battery in which the corroding metal is made to function as the cathode. The metals generally used to provide this type of protection are zinc and magnesium. In some cases, the protective direct current is ob- tained by an external voltage source. The anode in this case usually con- sists of a relatively inert material such as carbon, graphite, or platinum. The structures most frequently protected by this method are underground pipelines, hulls of ships, and boilers. For the protection of underground pipe, anodes are buried some 8 to 10 ft from the pipe. The depth of the hole should be sufficient to locate the anode in permanently moist soil.
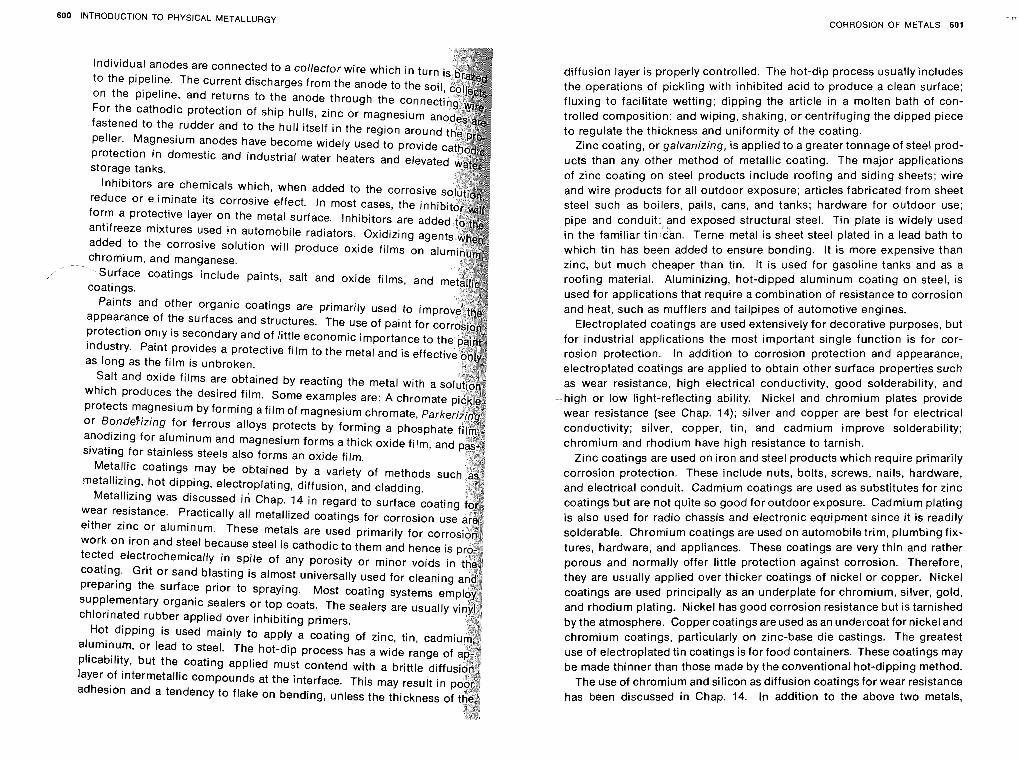
600 INTRODUCTION TO PHYSICAL METALLURGY CORROSION OF METALS 601
Individual anodes are connected to a collector wire which in t to the pipeline. The current discharges from the anode to the on the pipeline, and returns to the anode through the conne For the cathodic protection of ship hulls, zinc or magnesium fastened to the rudder and to the hull itself in the region aro peller. Magnesium anodes have become widely used to prov protection in domestic and industrial water heaters and elevate storage tanks.
Inhibitors are chemicals which, when added to the corrosiv reduce or eliminate its corrosive effect. In most cases, the in form a protective layer on the metal surface. Inhibitors are add antifreeze mixtures used in automobile radiators. Oxidizing age added to the corrosive solution will produce oxide films on
omium, and manganese. urface coatings include paints, salt and oxide films, and
coatings. Paints and other organic coatings are primarily used to imp
appearance of the surfaces and structures. The use of paint for co protection only is secondary and of little economic importance to industry. Paint provides a protective film to the metal and is effe as long as the film is unbroken.
Salt and oxide films are obtained by reacting the metal with a which produces the desired film. Some examples are: A chroma protects magnesium by forming afilm of magnesium chr or ~ondefizing for ferrous alloys protects by forming anodizing for aluminum and magnesium forms a thick sivating for stainless steels also forms an oxide film.
Metallic coatings may be obtained by a variety of methods suc metallizing, hot dipping, electroplating, diffusion, and cladding.
Metallizing was discussed iri Chap. 14 in regard to surface coati wear resistance. Practically all metallized coatings for corrosion u either zinc or aluminum. These metals are used primarily for cor work on iron and steel because steel is cathodic to them and hence tected electrochemically in spite of any porosity or minor voids coating. Grit or sand blasting is almost universally used for cleani
preparing the surface prior to spraying. Most coating systems e supplementary organic sealers or top coats. The sealers are usual1 chlorinated rubber applied over inhibiting primers.
Hot dipping is used mainly to apply a coating of zinc, tin, cad aluminum, or lead to steel. The hot-dip process has a wide range plicability, but the coating applied must contend with a brittle dif layer of intermetallic compounds at the interface. This may result i adhesion and a tendency to flake on bending, unless the thickness
diffusion layer is properly controlled. The hot-dip process usually includes the operations of pickling with inhibited acid to produce a clean surface; fluxing to facilitate wetting; dipping the article in a molten bath of con- trolled composition; and wiping, shaking, or centrifuging the dipped piece to regulate the thickness and uniformity of the coating.
Zinc coating, or galvanrzing, is applied to a greater tonnage of steel prod- ucts than any other method of metallic coating. The major applications of zinc coating on steel products include roofing and siding sheets; wire and wire products for all outdoor exposure; articles fabricated from sheet steel such as boilers, pails, cans, and tanks; hardware for outdoor use; pipe and conduit; and exposed structural steel. Tin plate is widely used in the familiar tin can. Terne metal is sheet steel plated in a lead bath to which tin has been added to ensure bonding. It is more expensive than zinc, but much cheaper than tin. It is used for gasoline tanks and as a roofing material. Aluminizing, hot-dipped aluminum coating on steel, is used for applications that require a combination of resistance to corrosion and heat, such as mufflers and tailpipes of automotive engines.
Electroplated coatings are used extensively for decorative purposes, but for industrial applications the most important single function is for cor- rosion protection. In addition to corrosion protection and appearance, electroplated coatings are applied to obtain other surface properties such as wear resistance, high electrical conductivity, good solderability, and high or low light-reflecting ability. Nickel and chromium plates provide wear resistance (see Chap. 14); silver and copper are best for electrical conductivity; silver, copper, tin, and cadmium improve solderability; chromium and rhodium have high resistance to tarnish.
Zinc coatings are used on iron and steel products which require primarily corrosion protection. These include nuts, bolts, screws, nails, hardware, and electrical conduit. Cadmium coatings are used as substitutes for zinc coatings but are not quite so good for outdoor exposure. Cadmium plating is also used for radio chassis and electronic equipment since it is readily solderable. Chromium coatings are used on automobile trim, plumbing fix- tures, hardware, and appliances. These coatings are very thin and rather porous and normally offer little protection against corrosion. Therefore, they are us!~ally applied over thicker coatings of nickel or copper. Nickel coatings are used principally as an underplate for chromium, silver, gold, and rhodium plating. Nickel has good corrosion resistance but is tarnished by the atmosphere. Copper coatings are used as an undercoat for nickel and chromium coatings, particularly on zinc-base die castings. The greatest use of electroplated tin coatings is for food containers. These coatings may be made thinner than those made by the conventional hot-dipping method.
The use of chromium and silicon as diffusion coatings for wear resistance has been discussed in Chap. 14. In addition to the above two metals,
QUE
4TROOUCTION TO PHYSICAL METALLURGY
aluminum and zinc diffusion coatings are also used to provide
protection. All diffusion-coating processes follow essentially procedure and are based on the same principles. The part to is placed in contact with a powder containing the metal to p
coating. At elevated temperature there is a transfer of the metal t
material, through the vapor phase, usually by means of a suitabl
Holding at temperature or reheating without the powder after
penetration will allow further diffusion to the desired depth. Th of alloying steel with aluminum by diffusion is called calorizing.
steel is highly resistant to oxidation and corrosion by hot gase
larly sulfurous gases. Calorized parts are used in furnaces th fuels high in sulfur; bolts for use up to 1400°F; salt, cyanide, and
and oi l refineries. Zinc impregnation is obtained by a process sherardizing. The principal application of sherardizing is for s parts, such as bolts, nuts, and washers, or for castings exposed
atmosphere.
Cladding is a method by which the coating becomes an integra the material. This may be accomplished by casting or hot working.
is best suited when there is a considerable difference in the melti
of the cladding material and the base material. Hot rolling is widely used method for cladding. Slabs or sheets of the cladding
are strapped to an ingot of the base material. After heating to th temperature, the straps are removed and the entire assembly is rol
heat and pressure during rolling weld the two materials together.
cladding may be of the same base material as the core. Alclad is the applied to aluminum alloys which are clad with pure aluminum to im
corrosion resistance (see Fig. 12.30). Steel may be clad with nickel, n chromium, or nickel-copper alloys. Aside from corrosion resistance,
ding is sometimes done to obtain a combination of properties that a
available by any other method. Copper-clad steel wire is a good The copper exterior provides high electrical conductivity and g
rosion resistance, while the steel core provides high tensile strengt wire is produced by pouring molten copper into a mold containing a r
heated steel billet. A weld that is able to withstand cold working is
duced between the two metals. After solidification, the composite is hot-rolled to a rod and then drawn to the desired size.
'IONS
15.1 Define corrosion. 15.2 How does corrosion differ from erosion? 15.3 Explain the mechanism of electrochemical corrosion. 15.4 Why does corrosion generally occur at the anode?
CORROSION OF METALS 603
15.5 What determines whether a given area is anodic or cathodic? 15.6 What is the limitation on the use of the electromotive series (Table 15.1) in the corrosion of metals? 15.7 How does the distance between metals in the galvanic series (Table 15.2) affect corrosion rate? 15.8 Why do aluminum and chromium show superior corrosion resistance? 15.9 What is meant bv anodizing? How does it affect corrosion resistance? .- - 15.10 What three factors are necessary to form a galvanic cell? .- . -
15.1 1 Explain and describe the mechanism of dezincification. 15.12 Discuss the differences and similarities between intergranular corrosion and stress corrosion. 15.13 Describe each of the following: pitting corrosion, crevice corrosion, cavita- tion corrosion, fretting corrosion. 15.14 Explain cathodic protection. 15.15 List seven methods of corrosion protection and explain why each method is effective.
iRENCES
Ailor, William H. (ed): "Handbook on Corrosion Testing and Evaluation," John Wiley & Sons, Inc., New York, 1971.
American Society for Metals: "Corrosion of Metals," Metals Park, Ohio, 1946. -: "Metals Handbook," 1948, 1961, and 1964 ed., Metals Park, Ohio. -: "Surface Protection against Wear and Corrosion." Metals Park, Ohio, 1954. Bosich. Jose~h F.: "Corrosion Prevention for Practicing Engineers," Barnes and
Noble, New York, 1970 Burns, R M , and W W Bradley "Protective Coatlngs for Metals," Amerlcan Chem-
lcal Soclety Monograph 129, Van Nostrand Relnhold Company, New York, 1955 Evans, U R "An lntroduct~on to Metalllc Corrosion," 2d ed , St Martln's Press,
New York, 1963. -: "Metallic Corrosion Passivity and Protection," Edward Arnold (Publishers)
Ltd., London, 1946. Fontana and Greene: "Corrosion Engineering," McGraw-Hill Book Company, New
York, 1967. International Nickel Company: "Corrosion in Action," New York, 1955. LaQue, F. L., and H. R. Copson: "Corrosion Resistance of Metals and Alloys," 2d
ed., Van Nostrand Reinhold Company, New York, 1963. Scully, J. C.: "Fundamentals of Corrosion," Pergamon Press, New York, 1966. Speller, F. N.: "Corrosion," 3d ed., McGraw-Hill Book Company, New York, 1951. Uhlig, H. H.: "Corrosion and Corrosion Control," 2d ed., John Wiley & Sons, Inc.,
N ~ W York, 1971. -: "The Corrosion Handbook," John Wiley &Sons, Inc., New York, 1948.
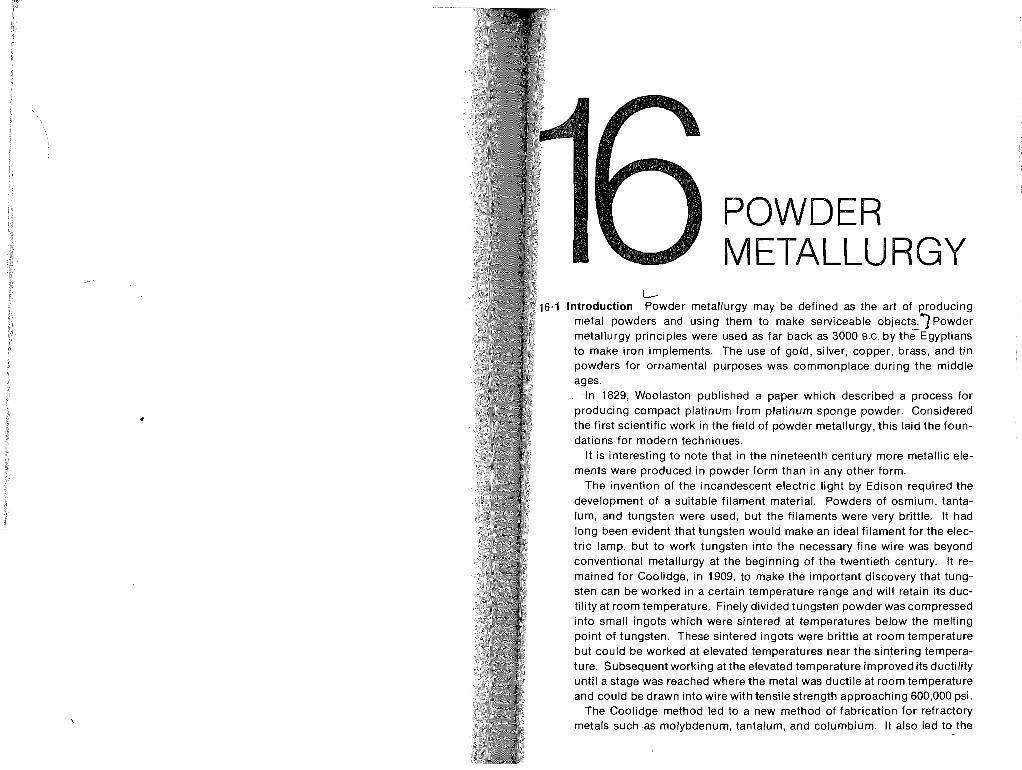
I 1 1
~
POWDER I METALLURGY
V
6.1 Introduction Powder metallurgy may be defined as the art of producing metal powders and using them to make serviceable objects.?~owder metallurgy principles were used as far back as 3000 B.C. by the~gypt ians to make iron implements. The use of gold, silver, copper, brass, and tin powders for ornamental purposes was commonplace during the middle ages.
In 1829, Woolaston published a paper which described a process for producing compact platinum from platinum sponge powder. Considered the first scientific work in the field of powder metallurgy, this laid the foun- dations for modern techniques.
It is interesting to note that in the nineteenth century more metallic ele- ments were produced in powder form than in any other form.
The invention of the incandescent electric light by Edison required the development of a suitable filament material. Powders of osmium, tanta- lum, and tungsten were used, but the filaments were very brittle. It had long been evident that tungsten would make an ideal filament for the elec- tric lamp, but to work tungsten into the necessary fine wire was beyond conventional metallurgy at the beginning of the twentieth century. It re- mained for Coolidge, in 1909, to make the important discovery that tung- sten can be worked in a certain temperature range and will retain its duc- tility at room temperature. Finely divided tungsten powder was compressed into small ingots which were sintered at temperatures below the melting point of tungsten. These sintered ingots were brittle at room temperature but could be worked at elevated temperatures near the sintering tempera- ture. Subsequent working at the elevated temperature improved its ductility until a stage was reached where the metal was ductile at room temperature and could be drawn into wire with tensile strength approaching 600,000 psi.
The Coolidge method led to a new method of fabrication for refractory metals such as molybdenum, tantalum, and columbium. It also led to the
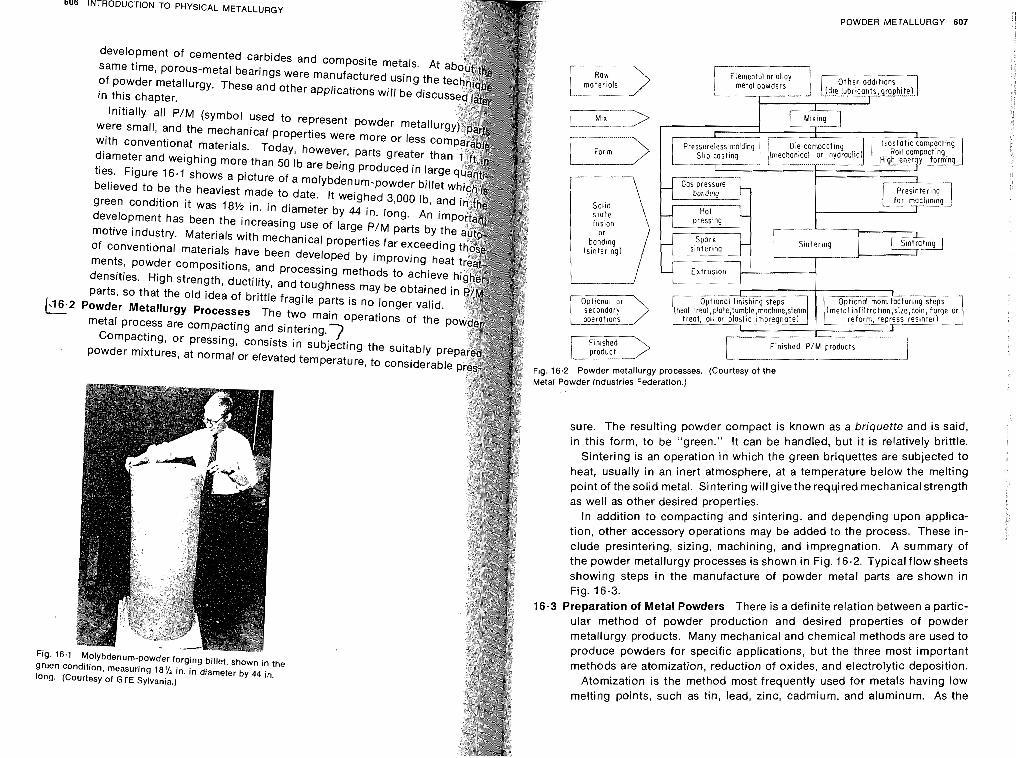
Fig. 16.1 green cc long. (C
INTRODUC'TION TO PHYSICAL METALLURGY
development of cemented carbides and composite metals. At same time, porous-metal bearings were manufactured using the of powder metallurgy. These and other applications will be disc in this chapter.
Initially all P/M (symbol used to represent powder metal were small, and the mechanical properties were more or less with conventional materials. Today, however, parts greater t diameter and weighing more than 50 Ib are being produced in la ties. Figure 16.1 shows a picture of a molybdenum-powder bill believed to be the heaviest made to date. It weighed 3,000 Ib, green condition it was 18% in. in diameter by 44 in. long. An imp development has been the increasing use of large P/M parts by the motive industry. Materials with mechanical properties far exceeding of conventional materials have been developed by improving heat ments, powder compositions, and processing methods to achieve densities. High strength, ductility, and toughness may be obtained parts, so that the old idea of brittle fragile parts is no longer valid.
Powder Metallurgy Processes The two main operations of the p metal process are compacting and sintering.3
Compacting, or pressing, consists in subjecting the suitably pre powder mixtures, at normal or elevated temperature, to considerable
Molybdenum-powder forging billet, shown in the mdition, measuring lE1/2 in. in diameter by 44 in. :ourtesy of GTE Sylvania.)
'ig. 16 detal f
POWDER METALLURGY 607
Elemental or alloy Other additions moter 101s metal powders ( d ~ e l~b~iconts .graphi te)
I J
state fusion
bonding Spark L Sinterinq L I ( ~ tn t ro t i ng ]
(sinter~ng) s~nter ing I
Extrusion .
I Finished \
I I Opt~onal finishing steps Optional manufacturing steps
(heat treot,plote,tumble,mochine,steam (metal infiltrot~on,size,cojn,torge or treat, oil or plastic impregnate) reform, repress reslnter)
I I I
product L_- _- .2 Powder metallurgy processes (Courtesy of the Jowder Industries Federat~on )
sure. The resulting powder compact is known as a briquette and is said, in this form, to be "green." It can be handled, but it is relatively brittle.
Sintering is an operation in which the green briquettes are subjected to heat, usually in an inert atmosphere, at a temperature below the melting point of the solid metal. Sintering will give the required mechanical strength as well as other desired properties.
In addition to compacting and sintering, and depending upon applica- tion, other accessory operations may be added to the process. These in- clude presintering, sizing, machining, and impregnation. A summary of the powder metallurgy processes is shown in Fig. 16.2. Typical flow sheets showing steps in the manufacture of powder metal parts are shown in Fig. 16.3.
Preparation of Metal Powders There is a definite relation between a partic- ular method of powder production and desired properties of powder metallurgy products. Many mechanical and chemical methods are used to produce powders for specific applications, but the three most important methods are atomization, reduction of oxides, and electrolytic deposition.
Atomization is the method most frequently used for metals having low melting points, such as tin, lead, zinc, cadmium, and aluminum. As the
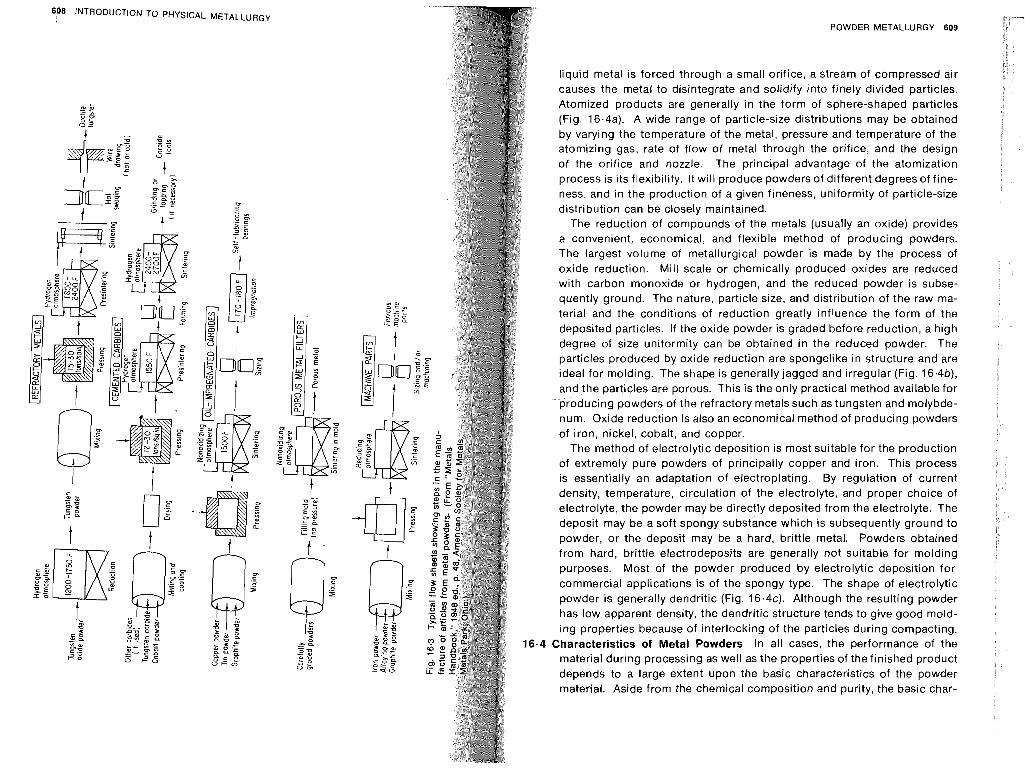
608 INTRODUCTION TO PHYSICAL METALLURGY
POWDER METALLURGY 609
liquid metal is forced through a small orifice, a stream of compressed air causes the metal to disintegrate and solidify into finely divided particles.
c - 0 1 - - .- Atomized products are generally in the form of sphere-shaped particles - ", r p
a - (Fig. 16.4a). A wide range of particle-size distributions may be obtained by varying the temperature of the metal, pressure and temperature of the atomizing gas, rate of flow of metal through the orifice, and the design of the orifice and nozzle. The principal advantage of the atomization process is its flexibility. It will produce powders of different degrees of fine- ness, and in the production of a given fineness, uniformity of particle-size distribution can be closely maintained.
The reduction of compounds of the metals (usually an oxide) provides a convenient, economical, and flexible method of producing powders. The largest volume of metallurgical powder is made by the process of oxide reduction. Mill scale or chemically produced oxides are reduced with carbon monoxide or hydrogen, and the reduced powder is subse- quently ground. The nature, particle size, and distribution of the raw ma- terial and the conditions of reduction greatly influence the form of the deposited particles. If the oxide powder is graded before reduction, a high degree of size uniformity can be obtained in the reduced powder. The particles produced by oxide reduction are spongelike in structure and are ideal for molding. The shape is generally jagged and irregular (Fig. 16.4b), and the particles are porous. This is the only practical method available for producing powders of the refractory metals such as tungsten and molybde- num. Oxide reduction is also an economical method of producing powders of iron, nickel, cobalt, and copper.
The method of electrolytic deposition is most suitable for the production of extremely pure powders of principally copper and iron. This process is essentially an adaptation of electroplating. By regulation of current density, temperature, circulation of the electrolyte, and proper choice of electrolyte, the powder may be directly deposited from the electrolyte. The deposit may be a soft spongy substance which is subsequently ground to powder, or the deposit may be a hard, brittle metal. Powders obtained from hard, brittle electrodeposits are generally not suitable for molding purposes. Most of the powder produced by electrolytic deposition for commercial applications is of the spongy type. The shape of electrolytic powder is generally dendritic (Fig. 16.4~) . Although the resulting powder has low apparent density, the dendritic structure tends to give good mold- ing properties because of interlocking of the particles during compacting.
16.4 Characteristics of Metal Powders In all cases, the performance of the material during processing as well as the properties of the finished product depends to a large extent upon the basic characteristics of the powder material. Aside from the chemical composition and purity, the basic char-
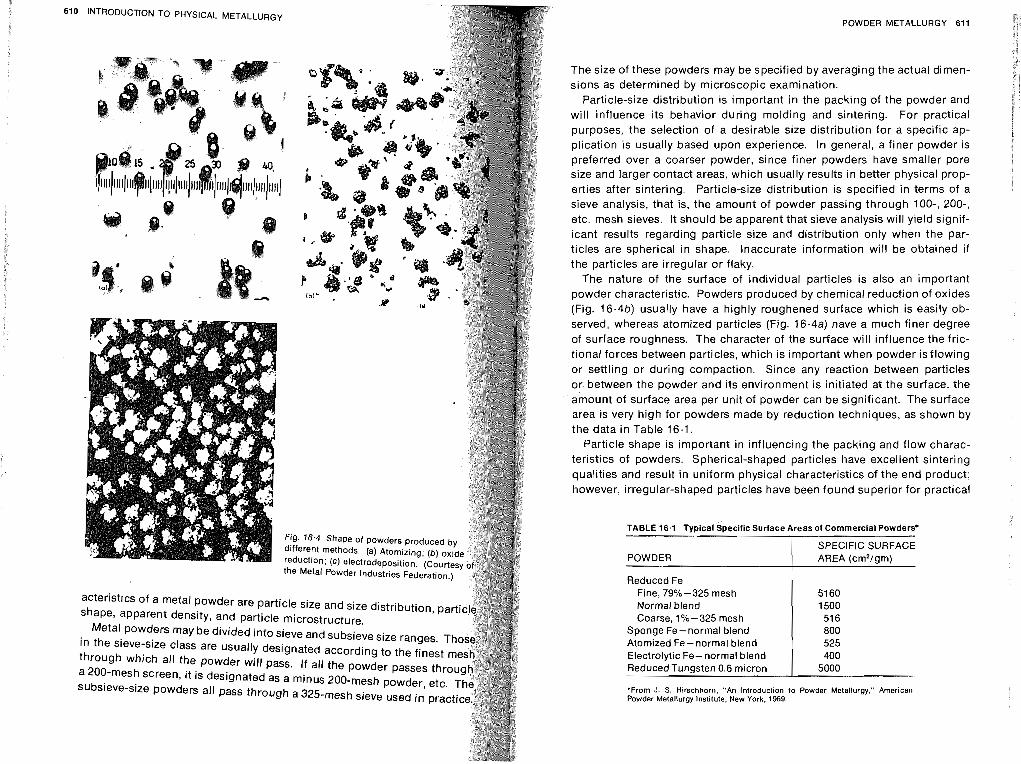
INTRODUCTION TO PHYSICAL METALLURGY
acterist~cs of a metal powder are particle size and size distribution, pa shape, apparent density, and particle microstructure.
Metal powders may be divided into sieve and subsieve size ranges. Th in the sieve-size class are usually designated according to the finest m through which all the powder will pass. If all the powder passes thro a 200-mesh screen, it is designated as a minus 200-mesh powder, etc. subsieve-size powders all pass through a 325-mesh sieve used in prac
POWDER METALLURGY 611
The size of these powders may be specified by averaging the actual dimen- sions as determined by microscopic examination.
Particle-size distribution is important in the packing of the powder and will influence its behavior during molding and sintering. For practical purposes, the selection of a desirable size distribution for a specific ap- plication is usually based upon experience. In general, a finer powder is preferred over a coarser powder, since finer powders have smaller pore size and larger contact areas, which usually results in better physical prop- erties after sintering. Particle-size distribution is specified in terms of a sieve analysis, that is, the amount of powder passing through loo-, ZOO-, etc, mesh sieves. It should be apparent that sieve analysis will yield signif- icant results regarding particle size and distribution only when the par- ticles are spherical in shape. Inaccurate information will be obtained if the particles are irregular or flaky.
The nature of the surface of individual particles is also an important powder characteristic. Powders produced by chemical reduction of oxides (Fig. 16.4b) usually have a highly roughened surface which is easily ob- served, whereas atomized particles (Fig. 16.4a) have a much finer degree of surface roughness. The character of the surface will influence the fric- tional forces between particles, which is important when powder is flowing or settling or during compaction. Since any reaction between particles or between the powder and its environment is initiated at the surface, the amount of surface area per unit of powder can be significant. The surface area is very high for powders made by reduction techniques, as shown by the data in Table 16.1.
Particle shape is important in influencing the packing and flow charac- teristics of powders. Spherical-shaped particles have excellent sintering qualities and result in uniform physical characteristics of the end product; however, irregular-shaped particles have been found superior for practical
'From J. S. Hirschhorn, "An Introduction to Powder Metallurgy," American Powder Metallurgy Institute. New York. 1969.
TABLE 16.1 Typicalspecific Surface Areas of Commercial Powders"
POWDER
Reduced Fe Fine, 79%-325 mesh Normal blend Coarse, 1%-325 mesh
Sponge Fe- normal blend Atomized Fe- normal blend Electrolytic Fe-normal blend Reduced Tungsten 0.6 micron
SPECIFIC SURFACE AREA (cm2/gm)
51 60 1500 51 6 800 525 400
5000
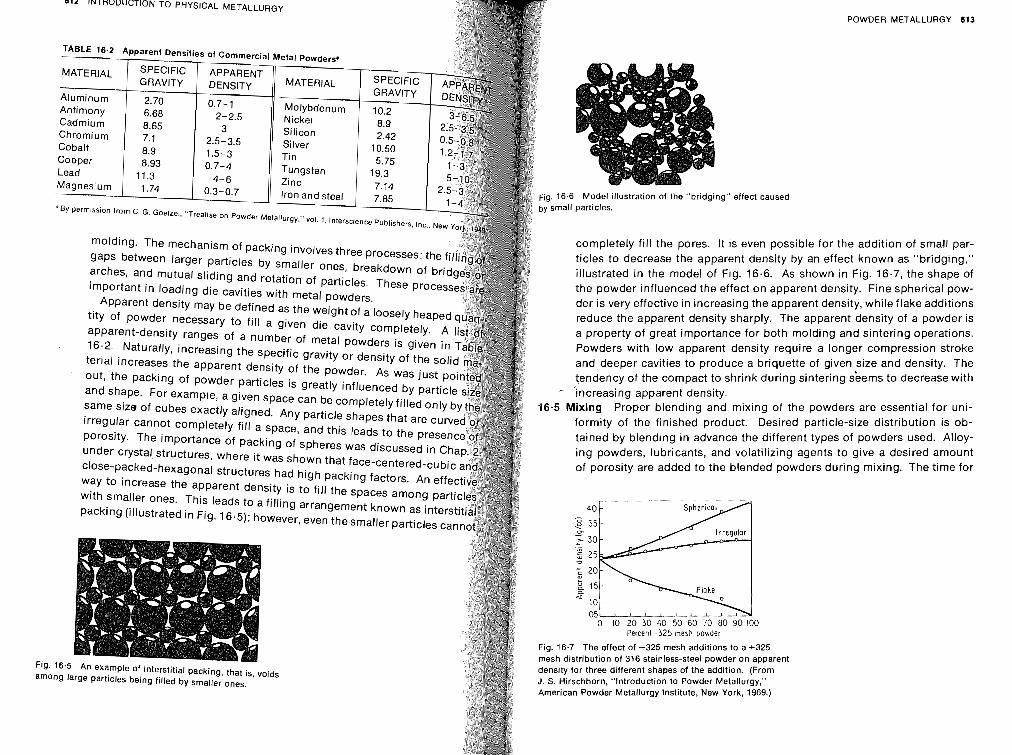
612 INTRODUCTION TO PHYSICAL METALLURGY POWDER METALLURGY 613
16.6 Model illustration of the "bridging" effect caused mall particles.
completely fill the pores. is even possible for the addition of small par-
titles to decrease the apparent density by an effect kIWwn as "bridging1" illustrated in the model of Fig. 16.6. As shown in Fig. 16.7, the shape Of
the powder influenced the effect on apparent density. Fine pow-
der is very effective in increasing the apparent density, while flake additions reduce the apparent density sharply. The apparent density Of a powder is a property of great importance for both molding and sintering operations. Powders with low apparent density require a longer com~ression stroke and deeper cavities to produce a briquette Of given size and density. The tendency of the compact to shrink during sintering Gems to decrease with
Out* the packing of Powder particles is greatly influenced by parti increasing apparent density. and shape. For example, a given Space can be completely filled only 16.5 wixing proper blending and mixing of the powders are essential for
formity of the finished product, Desired particle-size distribution is ob- tained by blending in advance the different types of powders used Alloy- ing powders, lubricants, and volatilizing agents to give a desired amount
under structures, where it was shown that face-centered-cu of porosity are added to the blended powders during mixing The time
~ i ~ . 16.7 The effect of -325 mesh additions to a +325 mesh distribution of 316 stainless-steel powder on apparent density for three different shapes of the addition. J, S, Hirschhorn, "Introduction to Powder MetaliurgY." American Powder Metallurgy Institute. New York 1969.)
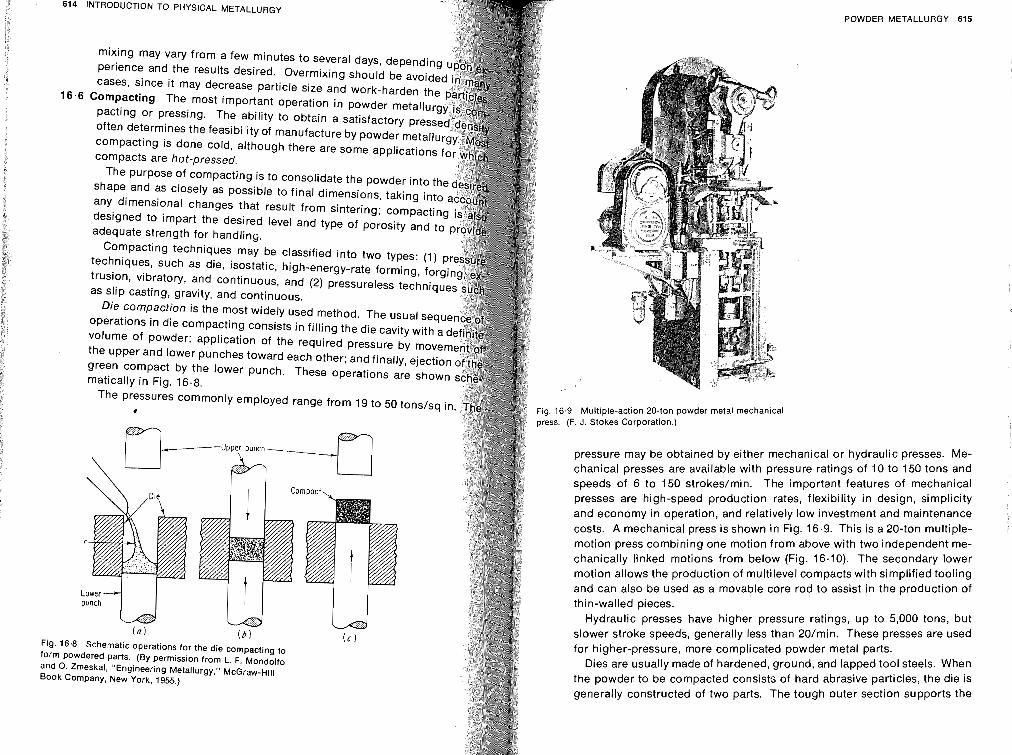
614 INTRODUCTION TO PHYSICAL METALLURGY
mixing may vary from a few minutes to several days, dependi- perience and the results desired. Overmixing should be avoicr cases, since it may decrease particle size and we-'- "--'-- .'
16.6 Compacting The most important operation in pohur;l Illatall pacting or pressing. The ability to obtein a satisfactorv nra often determines the feasibility of manufacture by powde~ Illr;tallu compacting is done cold, although there are some applications compacts are hot-pressed.
The purpose of compacting is to consolidate the ' ' ' '
shape and as closely as possible to final dimensiul~s, t a K l r l g lnro any dimensional changes that result from sintering; compact'- designed to impart the desired level and type of porosity ano ro adequate strength for handlin~.
Compacting techniques may be classified into two types: (" - techniques, such as die, isostatic, high-energy-rate forming, luly trusion, vibratory, and continuous, and (2) pressureless techniqu as slip casting, gravity, and continuous.
Die compaction is the most widely used method. The usual seq operations in die compacting consists in filling the die cavity wit' -
volume of powder; application of the required pressure by m~ the upper and lower punches toward each other; and finally, e j e ~ t 1 ~ 1 1
green compact by the lower punch. These operations are shown matically in Fig. 16.8.
-Upper punch ---+
pvwaer In1 1-1 . : - _
E y r s#vmll I J LU uu lull
punch
( a ) . - . Fig. 16.8 Schematic operations for the die compacting to form powdered Darts. IBv ~errnission frnm I F Mnnrlnlfm
and Boc
~ , . - - - Zrneskal, "Engineering Metall :ornpany, New York, 1955.)
POWDER METALLURGY 615
16.9 Multiple-action 20-ton powder metal mechanical is. (F. J. Stokes Corporation.)
pressure may be obtained by either mechanical or hydraulic presses. Me- chanical presses are available with pressure ratings of 10 to 150 tons and speeds of 6 to 150 strokeslmin. The important features of mechanical presses are high-speed production rates, flexibility in design, simplicity and economy in operation, and relatively low investment and maintenance costs. A mechanical press is shown in Fig. 16.9. This is a 20-ton multiple- motion press combining one motion from above with two independent me- chanically linked motions from below (Fig. 16.10). The secondary lower motion allows the production of multilevel compacts with simplified tooling and can also be used as a movable core rod to assist in the production of thin-walled pieces.
Hydraulic presses have higher pressure ratings, up to 5,000 tons, but slower stroke speeds, generally less than 201min. These presses are used for higher-pressure, more complicated powder metal parts.
Dies are usually made of hardened, ground, and lapped tool steels. When the powder to be compacted consists of hard abrasive particles, the die is generally constructed of two parts. The tough outer section supports the
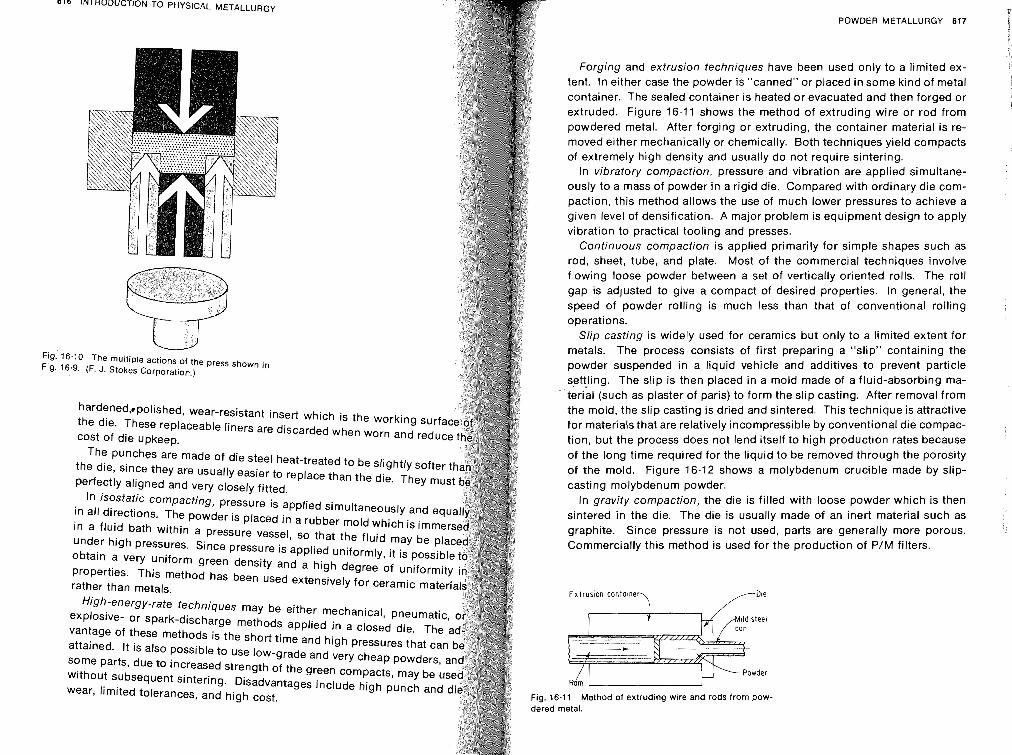
616 INTRODUCTION TO PHYSICAL METALLURGY
Fig. 16.10 The multiple actions of the press shown in Fig. 16.9. (F. J. Stokes Corporation.)
hardened,rpolished, wear-resistant insert which IS the %=,--I-.-- - - . -
the die. These replaceable liners are discarded when u-,,,, ailu I ~ U U G ~
cost of die upkeep. The punches are made of die steel heat-treated to be slightly sof+-- a
the die, since they are usually easier to replace than the die. They I , , ,
perfectly aligned and very closely fitted. In isostatic compacting, pressure is applied simultar--,,-I.. - - A
in all directions. The powder is placed in a rubber molc in a fluid bath within a pressure vessel, so that the f,,,u t t tay U,
under high pressures. Since pressure is applied uniformly, it is pos obtain a very uniform green density and a high degree of unifor properties. This method has been used extensively for ceramic m rather than metals.
High-energy-rate techniques may be either mechani--I ---..---.I-
explosive- or spark-discharge methods applied in a CI,,,~ I 11, vantage of these methods is the short time and high pressures that ---
attained. It is also possible to use low-grade and very cheap powde some parts, due to increased strength of the green compacts, may b without subsequent sintering. Disadvantages include high punch 2
wear, limited tolerances, and high cost.
lavusty a
f which is 1 , , ; , 4 --.,
POWDER METALLURGY 617
C n r n i n n snd putr,rsinn fnchnjoues have been used only to a limited ex- , v r y r r r y u,,- " ,..,--.-.. .-- tent. In either case the powder is "canned" or placed in some kind of metal rnntsinnr The q ~ a I ~ d container is heated or evacuated and then forged or & U", ,.UI, ,", . . . .- --.-.-- - -
* O V ~ ~ I I ~ P ~ Fin~lre 16.11 shows the method of extruding wire or rod from ,,Arm "-"-. . .=-. - . - -
powdered metal. After forging or extruding, the container material is re- moved either mechanically or chemically. Both techniques yield compacts of extremely high density and usually do not require sintering.
In ~,ihrsr+nrt/ r n m n ~ c t i ~ n DreSSUre and vibration are applied simultane- ,,, ",",c.,",, -" ...r--..-.., ,. - ~
ously to a mass of powder in a rigid die. Compared with ordinary die com- paction, this method allows the use of much lower pressures to achieve a given level of densification. A major problem is equipment design to apply vibration to practical tooling and presses.
Continuous compaction is applied primarily for simple shapes such as v n r l chant +llhp and nlnte. Most Of the commercial techniques involve lVU, * , I , , . , \ , ' "Y ' , .... .- - ~
flowing loose powder between a set of vertically oriented rolls. The roll nsn ic adillqtpd to ~ i v e a com~act of desired properties. In general, the yuy ," ... -,--.-- -- a . speed of powder rolling is much less than that of conventional rolling operations.
Slip casting is widely used for ceramics but only to a limited extent for metals. The process consists of first preparing a "slip" containing the powder suspended in a liquid vehicle and additives to prevent particle setting. The slip is then placed in a mold made of a fluid-absorbing ma- terial (such as plaster of paris) to form the slip casting. After removal from the mold, the slip casting is dried and sintered. This technique is attractive for materials that are relatively incompressible by conventional die compac- tion, but the process does not lend itself to high production rates because of the long time required for the liquid to be removed through the porosity of the mold. Figure 16.12 shows a molybdenum crucible made by slip- casting molybdenum powder.
In nral/itv pnmnnctjon the die is filled with loose powder which is then " 9 Y'""', --... r - - . - ,
sintered in the die. The die is usually made of an inert material such as graphite. Since pressure is not used, parts are generally more porous. Commercially this method is used for the production of P/M filters.
E x t r u s ~ o n container
I t ,Mild steel JDLe I I Y l / can
Fin 16.11 Method of extrud~ng wire and rods from pow- . .-- -
dered metal.
618 INTRODUCTION TO PHYSICAL METALLURGY POWDER METALLURGY 619
7 - H 90-
i v a - > 80 - ", c a , *
D
c w w .. W
70
1 -
*
-
L I , 20 30 40
Apparent density (percent theoret ical i
~ i ~ . 16.13 Dependence of green density (at 30 tonslsq in.) on apparent density for different iron powders. (From 3. S. Hirschhorn, "Introduction to Powder Metallurgy," American powder Metallurgy Institute. New York 1969.)
b7 Sinteling &sintering process is usually carried out at a temperature bigow the highest melting constituent. In some cases the temperature is
Fig. 16.12 Molybdenum crucible made by slip-casting high enough to form a liquid constituent, such as in the manufacture of molybdenum powder of I to 3 f i particle size, followed by air drying and sintering 73 h at 3270°F in hydrogen: unetched, cemented carbides, where sintering is done above the melting point of 3x. (Courtesy of T. I. Jones, Los Alamos Scientific the binder metal. In other cases, no melting of any constituent takes place.> Laboratory.)
Continuous pressureless compaction is used to produce porous s for electrodes in nickel-cadmium rechargeable batteries. The powder
10,000 - be applied in the form of a slurry (similar to the slip in slip cast be coated on a metal screen or solid metal sheet to produce u - .-
8,003 - composites. -
The green compact density is a most useful property, since it is an ... dication of the effectiveness of compaction and also determines the havior of the material during subsequent sintering. Green density seem increase with increasing compaction pressure, increasing particle siz
apparent density, decreasing hardness and strength of particles, and creasing compaction speed. The dependence of green density at 30 t sq in. on apparent density is shown in Fig. 16.13. The strength of g o 40 80 120 160
compacts results chiefly from mechanical interlocking of the.irregulari Compaction pressure ( t s i )
on the particle surfaces. Increasing compaction pressure (Fig. 16. Fig. 16.14 Dependence of green strength on compaction pressure for electrolytic iron powder. (From H. H. Hausner, green density, increases green strength because more particle mov "Powder Metallurgy," Chemical Publishing Co.. New York.
and deformation will promote greater interlocking.
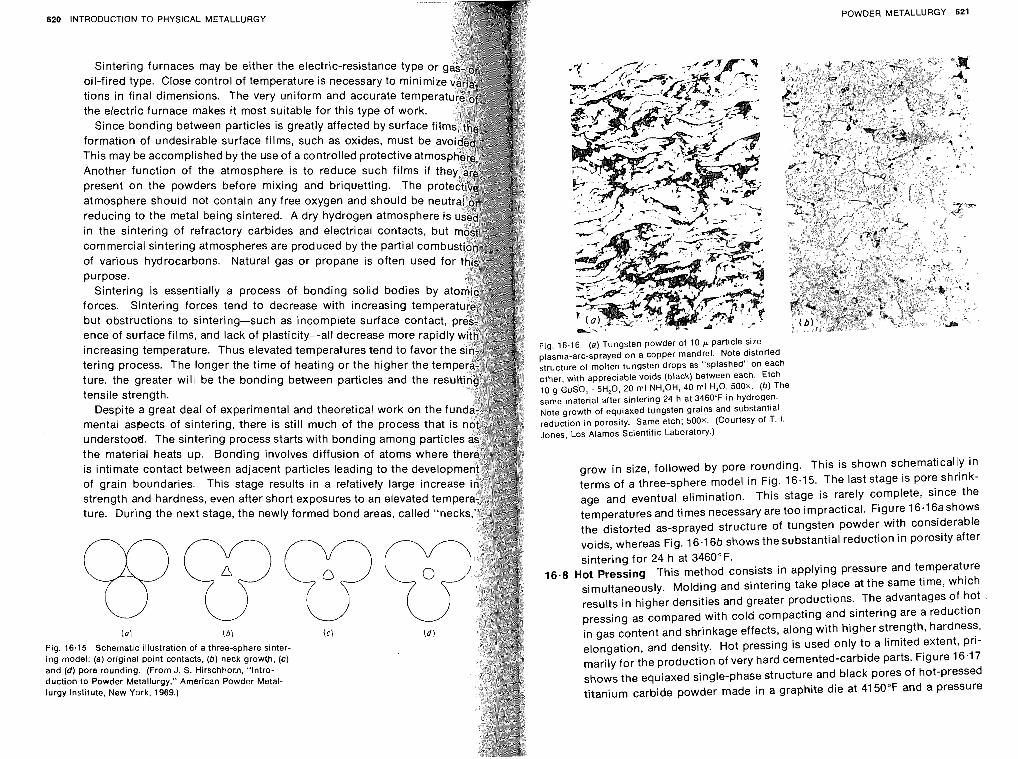
620 INTRODUCTION TO PHYSICAL METALLURGY
Sintering furnaces may be either the electric-resistance type o oil-fired type. Close control of temperature is necessary to minim
the electric furnace makes it most suitable for this type of work.
formation of undesirable surface films, such as oxides, must be
present on the powders before mixing and briquetting. The p atmosphere should not contain any free oxygen and should be n reducing to the metal being sintered. A dry hydrogen atmosphere i
in the sintering of refractory carbides and electrical contacts, bu commercial sintering atmospheres are produced by the partial comb
purpose. Sintering is essentially a process of bonding solid bodies by
forces. Sintering forces tend to decrease with increasing tempe but obstructions to sintering-such as incomplete surface contact,
increasing temperature. Thus elevated temperatures tend to favo tering process. The longer the time of heating or the higher the
tensile strength. Despite a great deal of experimental and theoretical work on the f
mental aspects of sintering, there is still much of the process that
ture. During the next stage, the newly formed bond areas, called "nec
Fig. 16.15 Schematic illustration of a three-sphere sinter- ing model: (a) original point contacts, (b) neck growth, (c) and (d) pore rounding. (From J. S. Hirschhorn. "lntro- duction to Powder Metallurgy," American Powder Metal- lurgy Institute, New York, 1969.)
POWDER METALLURGY 621
Fig. 16.16 (a) Tungsten powder of 10 p particle size plasma-arc-sprayed on a copper mandrel. Note distorted structure of molten tungsten drops as "splashed" on each other, with appreciable voids (black) between each. Etch 10 g CuSO, . 5H,O. 20 ml NH,OH, 40 ml H,O, 500x. ( b ) The same material after sintering 24 h at 3460°F in hydrogen. Note growth of equiaxed tungsten grains and substantial reduction in porosity. Same etch; 500X. (Courtesy of T. I. Jones, Los Alamos Scientific Laboratory.)
grow in size, followed by pore rounding. This is shown schematically in terms of a three-sphere model in Fig. 16.15. The last stage is pore shrink- age and eventual elimination. This stage is rarely complete, since the temperatures and times necessary are too impractical. Figure 16.1 6ashows the distorted as-sprayed structure of tungsten powder with considerable voids, whereas Fig. 16.16b shows the substantial reduction in porosity after sintering for 24 h at 3460°F.
16.8 Hot Pressing This method consists in applying pressure and temperature simultaneously. Molding and sintering take place at the same time, which results in higher densities and greater productions. The advantages of hot pressing as compared with cola compacting and sintering are a reduction in gas content and shrinkage effects, along with higher strength, hardness, elongation, and density. Hot pressing is used only to a limited extent, pri- marily for the production of very hard cemented-carbide parts. Figure 16.17 shows the equiaxed single-phase structure and black pores of hot-pressed titanium carbide powder made in a graphite die at 4150°F and a pressure
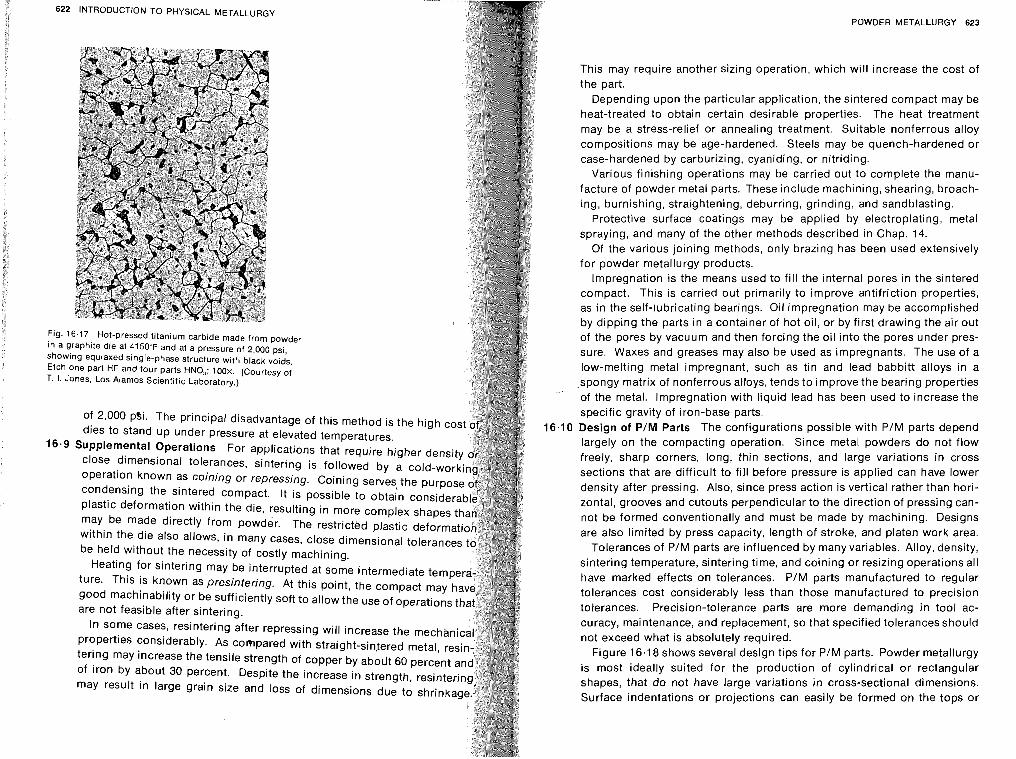
622 INTRODUCTION TO PHYSICAL METALLURGY
Fig. 16.17 Hot-pressed titanium carbide made from powder in a graphite die at 4150°F and at a pressure of 2.000 psi, showing equiaxed single-phase structure with black voids. Etch one part HF and four parts HNO,; 100x. (Courtesy of T. I. Jones, Los Alamos Scientific Laboratory.)
of 2,000 psi. The principal disadvantage of this method is the high cos dies to stand up under pressure at elevated temperatures.
16.9 Supplemental Operations For applications that require higher den close dimensional tolerances, sintering is followed by a cold- operation known as coining or repressing. Coining serves, the pu
condensing the sintered compact. It is possible to obtain c plastic deformation within the die, resulting in more complex shapes
may be made directly from powder. The restricted plastic deform within the die also allows, in many cases, close dimensional toleranc be held without the necessity of costly machining.
Heating for sintering may be interrupted at some intermediate temp ture. This is known as presintering. At this point, the compact may h good machinability or be sufficiently soft to allow the use of operations t are not feasible after sintering.
In some cases, resintering after repressing will increase the mech properties considerably. As compared with straight-sinfered metal, tering may increase the tensile strength of copper by abollt 60 percen of iron by about 30 percent. Despite the increase in strength, resinter may result in large grain size and loss of dimensions due to shrinka
POWDER METALLURGY 623
This may require another sizing operation, which will increase the cost of the part.
Depending upon the particular application, the sintered compact may be heat-treated to obtain certain desirable properties. The heat treatment
may be a stress-relief or annealing treatment. Suitable nonferrous alloy
compositions may be age-hardened. Steels may be quench-hardened or case-hardened by carburizing, cyaniding, or nitriding.
Various finishing operations may be carried out to complete the manu- facture of powder metal parts. These include machining, shearing, broach- ing, burnishing, straightening, deburring, grinding, and sandblasting.
Protective surface coatings may be applied by electroplating, metal spraying, and many of the other methods described in Chap. 14.
Of the various joining methods, only brazing has been used extensively for powder metallurgy products.
lmpregnation is the means used to fill the internal pores in the sintered compact. This is carried out primarily to improve antifriction properties, as in the self-lubricating bearings. Oil impregnation may be accomplished by dipping the parts in a container of hot oil, or by first drawing the air out of the pores by vacuum and then forcing the oil into the pores under pres- sure. Waxes and greases may also be used as impregnants. The use of a low-melting metal impregnant, such as tin and lead babbitt alloys in a spongy matrix of nonferrous alloys, tends to improve the bearing properties of the metal. lmpregnation with liquid lead has been used to increase the specific gravity of iron-base parts. Design of PIM Parts The configurations possible with PIM parts depend largely on the compacting operation. Since metal powders do not flow freely, sharp corners, long, thin sections, and large variations in cross sections that are difficult to fill before pressure is applied can have lower density after pressing. Also, since press action is vertical rather than hori- zontal, grooves and cutouts perpendicular to the direction of pressing can- not be formed conventionally and must be made by machining. Designs
are also limited by press capacity, length of stroke, and platen work area. Tolerances of PIM parts are influenced by many variables. Alloy, density,
sintering temperature, sintering time, and coining or resizing operations all have marked effects on tolerances. PIM parts manufactured to regular tolerances cost considerably less than those manufactured to precision tolerances. Precision-tolerance parts are more demanding in tool ac- curacy, maintenance, and replacement, so that specified tolerances should not exceed what is absolutely required.
Figure 16.18 shows several design tips for PIM parts. Powder metallurgy is most ideally suited for the production of cylindrical or rectangular shapes, that do not have large variations in cross-sectional dimensions. Surface indentations or projections can easily be formed on the tops or
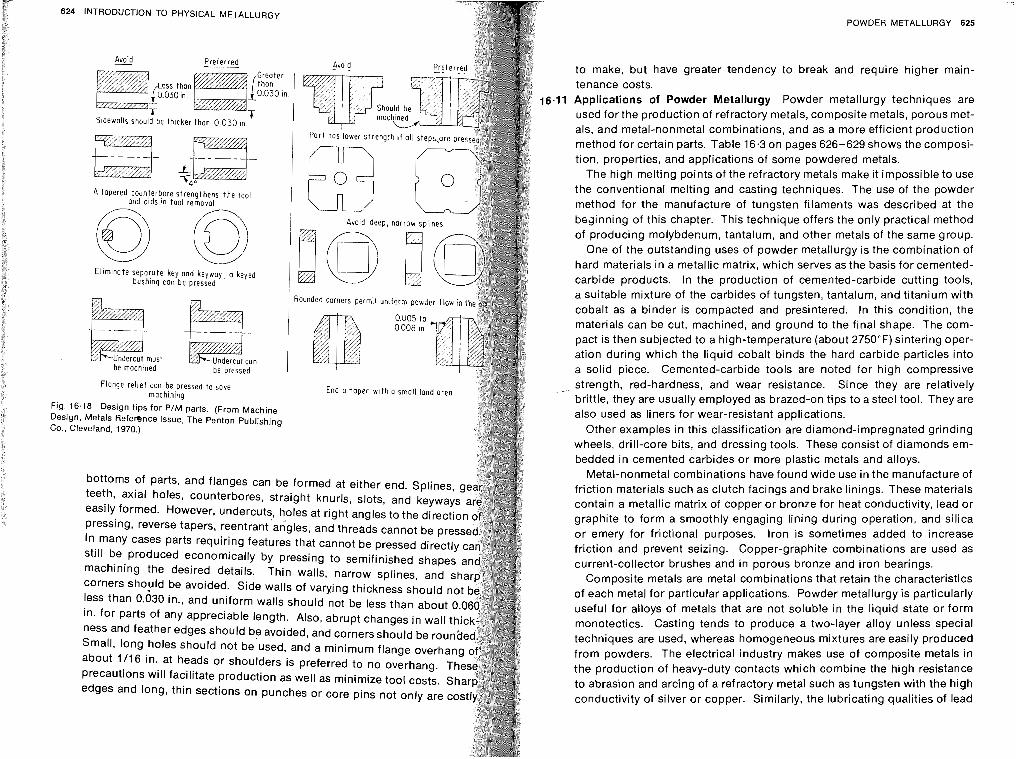
624 INTRODUCTION TO PHYSICAL METALLURGY POWDER METALLURGY 625
Avoid Preferred to make, but have greater tendency to break and require higher main- tenance costs. Applications of Powder Metallurgy Powder metallurgy techniques are used for the production of refractory metals, composite metals, porous met- als, and metal-nonmetal combinations, and as a more efficient production method for certain parts. Table 16.3 on pages 626-629 shows the composi- tion, properties, and applications of some powdered metals.
The high melting points of the refractory metals make it impossible to use the conventional melting and casting techniques. The use of the powder method for the manufacture of tungsten filaments was described at the bsginning of this chapter. This technique offers the only practical method of producing molybdenum, tantalum, and other metals of the same group.
One of the outstanding uses of powder metallurgy is the combination of hard materials in a metallic matrix, which serves as the basis for cemented- carbide products. In the production of cemented-carbide cutting tools, a suitable mixture of the carbides of tungsten, tantalum, and titanium with cobalt as a binder is compacted and presintered. In this condition, the materials can be cut, machined, and ground to the final shape. The com- pact is then subjected to a high-temperature (about 2750°F) sintering oper- ation during which the liquid cobalt binds the hard carbide particles into a solid piece. Cemented-carbide tools are noted for high compressive strength, red-hardness, and wear resistance. Since they are relatively brittle, they are usually employed as brazed-on tips to a steel tool. They are also used as liners for wear-resistant applications.
Other examples in this classification are diamond-impregnated grinding wheels, drill-core bits, and dressing tools. These consist of diamonds em- bedded in cemented carbides or more plastic metals and alloys.
Metal-nonmetal combinations have found wide use in the manufacture of friction materials such as clutch facings and brake linings. These materials contain a metallic matrix of copper or bronze for heat conductivity, lead or graphite to form a smoothly engaging lining during operation, and silica or emery for frictional purposes. Iron is sometimes added to increase friction and prevent seizing. Copper-graphite combinations are used as current-collector brushes and in porous bronze and iron bearings.
Composite metals are metal combinations that retain the characteristics of each metal for particular applications. Powder metallurgy is particularly useful for alloys of metals that are not soluble in the liquid state or form monotectics. Casting tends to produce a two-layer alloy unless special techniques are used, whereas homogeneous mixtures are easily produced from powders. The electrical industry makes use of composite metals in the production of heavy-duty contacts which combine the high resistance to abrasion and arcing of a refractory metal such as tungsten with the high conductivity of silver or copper. Similarly, the lubricating qualities of lead
Greater
0.030 11
r S~dewa l l s should be thlcker than 0 030 ln
T
ower s t reng t
A tapered counterbore strengthens t he tool and alds in too l removal
/ Part has'l
A v o ~ d deep, narrow sp l~ne 0 ir;\ I m - m
Eliminate separate key and keyway, o keyed bushing can be pressed
jed corners perm.1 unifoim powder f low i n t h e dl&(#
must can be mach~ned be pressed 1 I
Flange relief con be pressed to save End a toper w l t h a small land area machinlnq Fig. 16.18 Design tips for P/M parts. (From Machine Design, Metals Reference Issue, The Penton Publishing Co.. Cleveland. 1970.)
bottoms of parts, and flanges can be formed at either end. Splines, g teeth, axial holes, counterbores, straight knurls, slots, and keyways easily formed. However, undercuts, holes at right angles to the directi pressing, reverse tapers, reentrant'angles, and threads cannot be pre In many cases parts requiring features that cannot be pressed dirmrfl\i still be produced economically by pressing to semifinished shapes a
machining the desired details. Thin walls, narrow splines, and sl, corners should be avoided. Side walls of varying thickness should not less than 0.030 in., and uniform walls should not be less than about 0. in. for parts of any appreciable length. Also, abrupt changes in wall th ness and feather edges should be avoided, and corners should be rou Small, long holes should not be used, and a minimum flange overhang about 1/16 in. at heads or shoulders is preferred to no overhang. Th precautions will facilitate production as well as minimize tool costs. Sh edges and long, thin sections on punches or core pins not only are co
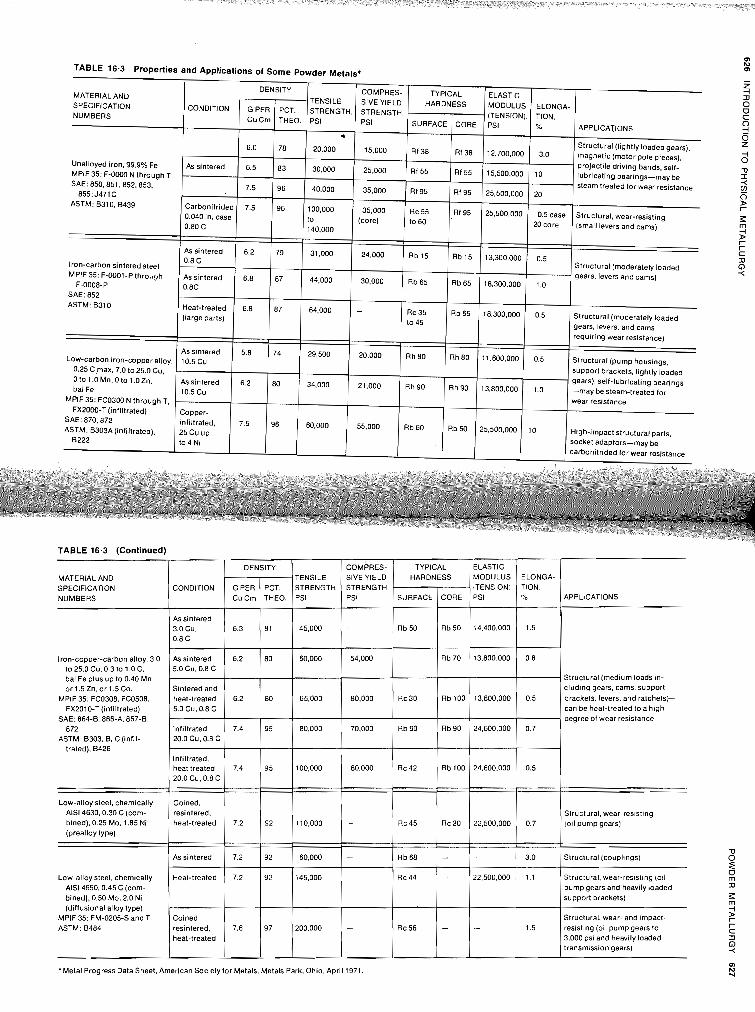
m N 0)
TABLE 16.3 Properties and Applications of Some Powder Metals* -
MATERIAL AND SPECIFICATION NUMBERS
Unalloyed iron. 99.946 Fe MPlF 35: F-0000 N through T SAE: 850,851,852,853,
855; J471 C ASTM: 6310,6439
APPLICATIONS
Structural (medlum loads In- clud~ng gears, cams, support
brackets, levers. and ratchets)- can be heat-treated to a high degree of wear resistance
Structural, wear-reslstlng (011 pump gears)
D Structural (couplings) 0
Structural. wear-resisting (011 5 rn
pump gears and heavily loaded a
support brackets) 5 -4
Structural, wear- and impact- g reslstlng (oil pump gears to
r
3,000 psi and heavily loaded 3 C
transmission gears) 0 < 0)
Structural (moderately loaded 6) Iron-carbon sinteredsteel gears, levers and cams) < MPlF35: F-0001-P throl'gh
F-0008-P SAE: 852 ASTM: 6310
Low-carbon iron-copper alloy. 0.25 C.max, 7.0 to 25.0 Cu. Oto 1.0Mn.Oto 1.0Zn. bal Fe
MPIF35: FC0300 N through T. FX20W-T (infiltrated)
SAE: 870,872 ASTM: 6303A(infiltrated),
6222
CONDITION
As sintered
Carbonitride6 0.040 in. case 0.80 C
'Metal Progress Data Sheet. American Society for Metals. Metals Park. Ohio. April 1971. N -J
ELONGA- TION, O/ ,
1.5
0.8
0.5
0.7
0.5
0.7
3.0
1.1
1.5
ELASTIC MODULUS (TENSION1 PSI
14.400.000
13.800.000
13.800.000
29,600,000
24.600.000
22,500.000
-
22.500.000
.-
DENSITY
COMPRES- SlVEYlELD STRENGTH PSI
-
54.000
80.000
70.000
80.000
-
-
-
-
TYPICAL
a
TENSILE STRENGTH, PSI . 20,000
30.000
40,000
100.000 to 140.000
G PER CuCm
6.0
6.5
7.5
7.5
TENSILE STRENGTH PSI
45.000
p-
60,000
65,000
80,000
100,000
tlO.OOO
60,000
145.000
200,000
HARDNESS
SURFACE
Rb50
-
Rc 30
Rb90
Rc42
Rc 45
Rb68
Rc 44
Rc56
PCT. THEO.
78
83
96
96
TABLE 16.3 (Continued)
MATERIAL AND SPECIFICATION NUMBERS
Iron-copper-carbon alloy. 3.0 to25.0Cu.0.3to1.0C. bal Fe plus up to 0.40 Mn or 1.5 Zn. or 1.5 Co.
MPlF 35: FC0308. FC0508. FX2010-T (infiltrated)
SAE: 864-6.866-A. 867-8. 872
ASTM. 8303. 8. C (infil- trated). 6426
Low-alloy steel, chemically AlSl4630,0.30 C (com- bined). 0.25 Mo. 1.85 Ni (prealloy type)
Low-alloy steel. chemically AISI 4650.0.45 C (com- bined). 0.50 Mo. 2.0 Ni (diffusional alloy type)
MPlF 35: FM-02054 and T ASTM: B484
CORE
Rb 50
Rb 70
Rb 100
Rb90
Rb 100
Rc 20
-
-
-
COMPRES- SlVEYlELD STRENGTH. PSI
15.000
25.000
35.000
35.000 (core)
CONDITION
As sintered 3.0 CU. 0.8 C
As sintered 5.0Cu.0.8C
S~ntered and heat-treated 5.0 Cu. 0.8 C
Infiltrated 20.0 CU. 0.8 C P
Infiltrated. heat treated 20.0 Cu. 0.8 C
Coined. resintered. heat-treated
As sintered
Heat-treated
Coined resintered, heat-treated
DENSITY
G PER CuCrn
6.3
--- 6.2
6.2
7.4
7.4
7.2
7.2
7.2
7.6
PCT. THEO.
81
80
80
95
95
92
92
92
97
TYPICAL HARDNESS
ELASTIC MODULUS (TENSION). PSI
12.700,000
15.500.000
25,500,000
25.500.000
SURFACE
Rf 38
Rf 55
Rf 95
Rc 55 to 60
CORE
Rf 38
Rf 55
Rf 95
Rf 95
Z
ELONGA- TION, O/o
3.0
10
20
0.5 case 20 core
-I a 0 0 C
APPLICATIONS a 0
Structural (lightly loaded gears). Z magnetic (motor pole pieces), -4 0 projectile driving bands, self- D lubricating bearings-may be I steam treated for wear resistance < v,
0 > r-
Structural, wear-resisting h (small levers and cams) rn
2 r- C
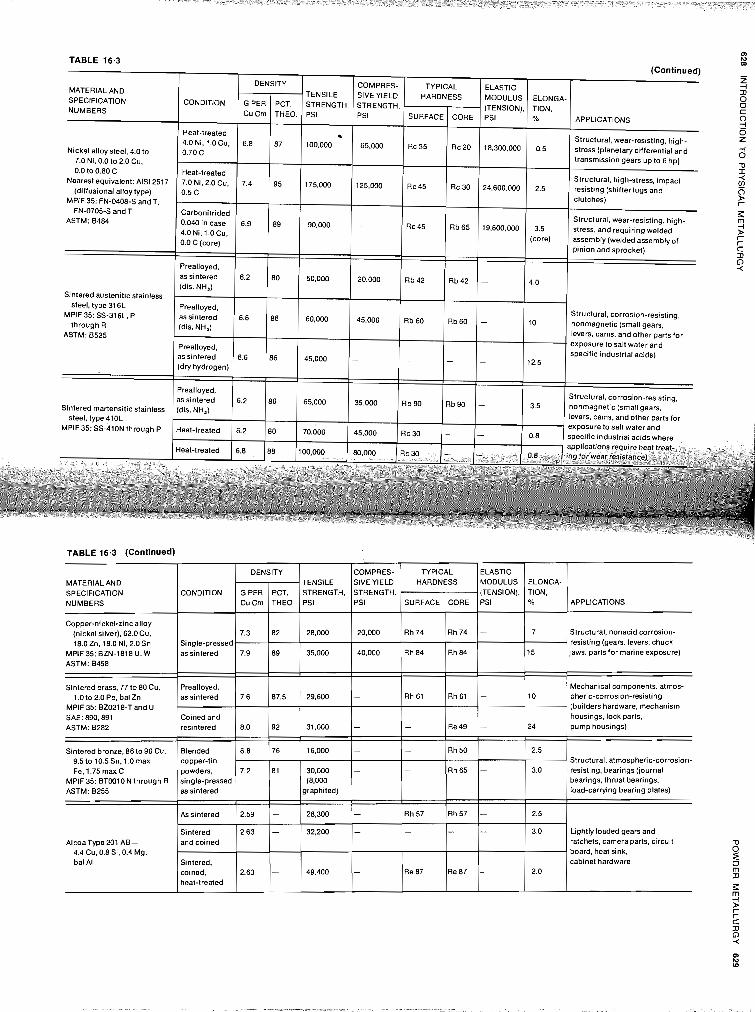
a3 N
TABLE 16.3 (Continued) m
MATERIAL AND SPECIFICATION NUMBERS
Nickel alloy steel. 4.0 to 7.0 Ni, 0.0 to 2.0 Cu, 0.0 to 0.80 C
Nearest equivalent: AIS12517 (diffusional alloy type)
MPlF 35: FN-0408-S and T. FN-07054 and T
ASTM: 8484
Sintered austenitic stainless steel, type316L
Structural, corrosion-resisting. MPIF 35: SS-316L. P
through R nonmagnetic (small gears. levers, cams, and other parts for
ASTM: 8525 exposure to salt water and specific industrial acids)
Sintered martensitic stainless steel, type410L
MPlF35: SS-410N through P
CONDITION
Heat-treated 4.0Ni3 1.OCu. 0.70 C
Heat-treated 7.0 Ni. 2.0 Cu, 0.5 C
Carbonitrided 0.040 in case 4.0Ni, I.OCu, 0.0 C (core)
ELONGA- TION. -10
7
15
10
24
2.5
3.0
2.5
3.0
2.0
ELASTIC MODULUS (TENSION). PSI
-
-
-
-
-
-
-
-
-
APPLICATIONS
Structural, nonacid corrosion- resisting (gears, levers, chuck jaws, partsfor marine exposure)
Mechanical components, atmos- pheric-corrosion-resisting (builders hardware, mechanism housings, lock parts, pump housings)
Structural, atmospheric-corrosion- resisting, bearings (journal bearings, thrust bearings. load-carrying bearing plates)
Lightly loaded gears and ratchets, camera parts, circuit board, heat sink, cabinet hardware
COMPRES- SlVEYlELD STRENGTH. PSI
20,000
40,000
-
-
-
-
-
-
-
TYPICAL
DENSITY
TENSILE STRENGTH. PSI
28.000
35,000
29,600
31,000
16,WO
30,000 (8.000
graphited)
28,300
32.200
49,400
HARDNESS
SURFACE
Rh 74
Rh 84
Rh61
-
-
-
Rh57
-
Re87
G PER CuCm
6.8
7.4
6.9
- z
COMPRES- TYPICAL ELASTIC -4 TENSILE SIVEYIELD a HARDNESS MODULUS ELONGA- 0 STRENGTH, STRENGTH, (TENSION). TION. 0 C PSI PSI SURFACE CORE PSI % APPLICATIONS 0
. 3 Z 100.000 65.000 Rc35 Rc20 18.300.000 -4
transmission gears up to 6 hp) 0 D
TABLE 16.3 (Continued)
MATERIAL AND SPECIFICATION NUMBERS
Copper-nickel-zinc alloy (nickel silver). 62.0Cu. 18.0Zn. 18.0 Ni. 2.0 Sn
MPIF 35: BZN-1818 U. W ASTM: 8458
Sintered brass, 77 to 80 Cu, 1.0 to 2.0 Pb. bal Zn
MPlF 35: 820218-T and U SAE: 890.891 ASTM: 6282
Sintered bronze. 86 to 90 Cu. 9.5 to 10.5 Sn. 1.0 max Fe. 1.75 max C
MPIF35: BTWIO N through R ASTM: 8255
AlcoaType 201 AB- 4.4 Cu. 0.8 Si. 0.4 Mg, bal Al
CORE
Rh 74
Rh 64
Rh61
Re49
Rh50
Rh65
Rh57
-
Re87
PCT. THEO.
87
95
89
175,000
90.000
CONDITION
Single-pressed as sintered
Prealloyed, assintered
Coined and resintered
Blended copper-tin powders. single-pressed as sintered
Assintered
Sintered and coined
Sintered. coined. heat-treated
DENSITY
G PER CuCm
7.3
7.9
7.6
8.0
6.8
7.2
2.59
2.63
2.63
PCT. THE0
82
89
87.5
92
76
81
-
-
-
125,000
-
Rc 45
Rc45
Rc 30
Rb 65
24,600,000
19,600.000
2.5
3.5 (core)
Structural, high-stress, impact < I
resisting (shifter lugs and L? 0 clutches) g Structural, wear-resisting, high- stress. and requiring welded -4
5 assembly (welded assembly of ? r pinion and sprocket) C a
0 <
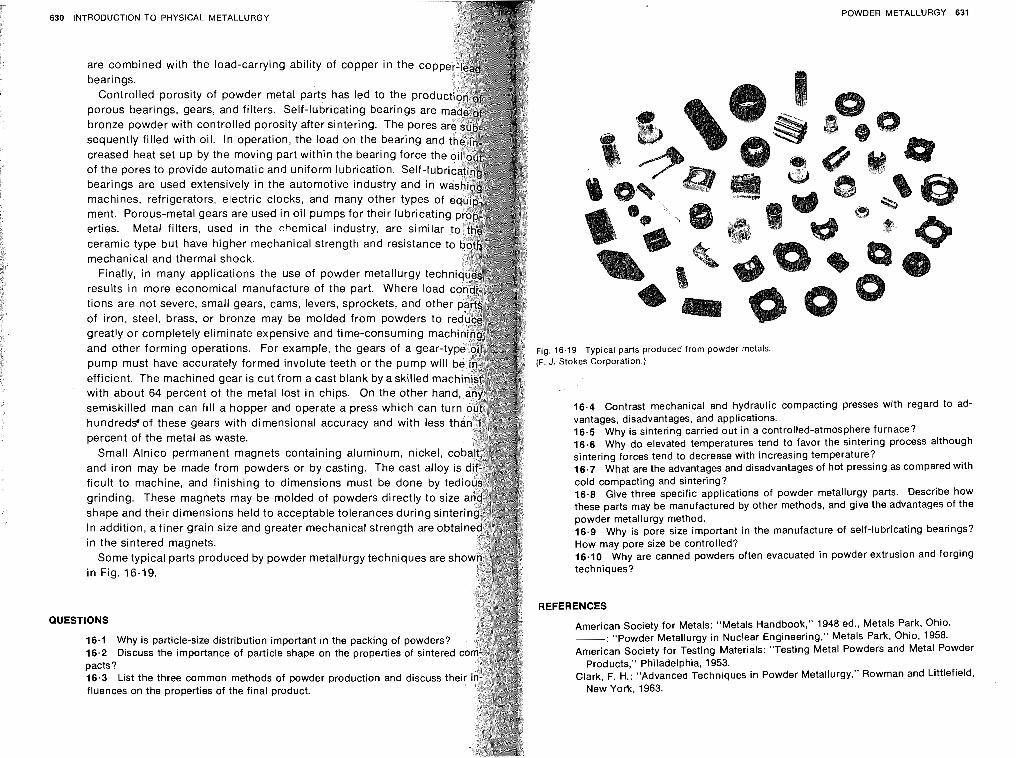
QUE
POWDER METALLURGY 631 INTRODUCTION TO PHYSICAL METALLURGY
are comblned wrth the load-carry~ng ablllty of copper in the co bearlngs
Controlled poroslty of powder metal parts has led to the pro porous bearlngs, gears, and fliters Self-lubricating bearlngs ar bronze powder wlth controlled poroslty after slnterlng The pore sequently fllled wlth 011 In operation, the load on the bearlng creased heat set up by the moving part wlthln the bearlng forc of the pores to provlde automatrc and untform lubrlcatlon Self-lu bearlngs are used extensively In the automotrve Industry and In w machines, refrrgerators, electrlc clocks, and many other types of ment Porous-metal gears are used In 011 pumps for thelr lubrlcatln ertles Metal fllters, used In the chemical Industry, are slmllar ceramic type but have hlgher mechanlcal strength and resistance mechanlcal and thermal shock
Flnally, In many appllcatrons the use of powder metallurgy tech results In more economlcal manufacture of the part Where load tlons are not severe, small gears, cams, levers, sprockets, and 0th of Iron, steel, brass, or bronze may be molded from powders to greatly or completely eliminate expenslve and time-consuming ma and other formlng Operattons For example, the gears of a gear-t Fig 16 19 Typ~cal parts produced from powder metals pump must have accurately formed lnvolute teeth or the pump will (F J Stokes Corporat~on )
efflctent The machlned gear IS cut from a cast blank by a skilled ma with about 64 percent of the metal lost In chlps On the other han semlsk~lled man can fil l a hopper and operate a press whlch can tu 16.4 Contrast mechanlcal and hydraulic compactlng presses wtth regard to ad- hundred9 of these gears wlth dlmenslonal accuracy and wlth less th vantages, disadvantages, and appllcatlons
percent of the metal as waste. 16 5 Why IS slntering carrled out In a controlled-atmosphere furnace? 16 6 Why do elevated temperatures tend to favor the sinterrng process although
Small Aln~co permanent magnets contalnlng aluminum, n~ckel, slnterlng forces tend to decrease wtth lncreaslng temperature? and Iron may be made from powders or by castlng The cast allo 16 7 What are the advantages and disadvantages of hot presstng as compared with flcult to machlne, and ftnlshlng to d~menslons must be done by cold compactlng and slnterlng? grlndlng. These magnets may be molded of powders dlrectly to slze 16 8 Glve three specific appllcatlons of powder metallurgy parts Descrlbe how
shape and thelr dlmenstons held to acceptable tolerances durlng s~n te these parts may be manufactured by other methods, and give the advantages of the powder metallurgy method
In addltlon, a flner graln slze and greater mechanical strength are obta 16.9 Why IS pore size Important in the manufacture of self-lubrtcatlng beartngs? In the slntered magnets How may pore slze be controlled?
Some typlcal parts produced by powder metallurgy techniques are sh 16.10 Why are canned powders often evacuated In powder extrusion and forgtng in Flg. 76.19 techntques?
REFERENCES STIONS
Amertcan Society for Metals "Metals Handbook," 1948 ed., Metals Park, Oh10 16.1 Why IS particle-slze distrlbutlon Important in the packlng of powders - "Powder Metallurgy in Nuclear Englneerlng," Metals Park, Ohio, 1958 16 2 Discuss the importance of partlcle shape on the propertles of slntere American Soctety for Testing Matertals "Testtng Metal Powders and Metal Powder pacts? Products," Philadelphia, 1953 16.3 Llst the three common methods of powder production and discuss t Clark, F H. "Advanced Techniques in Powder Metallurgy," Rowman and Littlefleld, fluences on the propert~es of the flnal product New York, 1963

ANALYSIS
INTRODUCTION TO PHYSICAL METALLURGY
Goetzel, C. G.: "Treatise on Powder Metallurgy," ~ 0 1 s . 1 to 3, interscience inc., New York, 1949-1952.
Hausner, H. H.: "Powder Metallurgy," Chemical Publishing Company, lnc., 1947.
- (ed.): "Modern Developments in Powder Metallurgy," Plenum York. 1966. - K. H. Roll, and P. K. Johnson (eds.): "Iron Powder Metallurgy, Press, New York, 1968.
Hirschhorn, J. S.: "Introduction to Powder Metallurgy," American powd lurgy Institute, New York, 1969.
The Iron and Steel Institute: "Symposium on Powder Metallurgy," Special R~ London, 1947.
Jones, W. D.: "Fundamental Principles of Powder Metallurgy," ~ d ~ ~ ~ d lishers Ltd., London, 1960.
Lesz~nski, W. J. (ed.): "Powder Metallurgy,', Interscience Publishers, Inc,, N~ 1961.
Metal Powder Industries Federation: "Powder Metallurgy Equipment ~~~~~l York, 1968.
Poster, A. R. (ed.): "Handbook of Metal Powders," Van Nostrand Reinhold 17.1 Introduction When one considers the many millions of metallic parts that pany, New York, 1966. are fabricated and placed in service, i t is not unusual that some will fail
prematurely. Simply from a statistical viewpoint it is not reasonable, with present engineering practice, to expect no failures. However, even though the number of failures of a particular component may be small, they are important because they may affect the manufacturer's reputation for re- liability. In some cases, particularly when the failure results in personal injury or death, i t will lead to expensive lawsuits. It is not unusual for auto- motive manufacturers under prodding and publicity from consumer watch- dogs to recall millions of cars to correct a design or heat-treating defect even though the actual number of failures was very small.
The purpose of this chapter is to briefly explain the basic causesfor metal failure and to illustrate some of the failures by case histories. Most of the
illustrations in this chapter were taken from two excellent books on metal failure-"How Components Fail" by Donald J. Wulpi (American Society for Metals, 1966) and "Why Metals Fail" by R. D. Barer and B. F. Peters (Gordon and Breach Science Publishers, 1970).
17.2 Procedure In any failure analysis it is important to get as much information as possible from the failed part itself along with an investigation of the con- ditions at the time of failure. Some of the questions to be asked are:
1. How long was the part in service? 2. What was the nature of the stresses at the time of failure? 3. Was the part subjected to an overload? 4. Was the part properly installed? 5. Was it subjected to service abuse? 6. Were there any changes in the environment? 7. Was the part properly maintained?
A study of the fractured surface should answer the following questions:
1. Was the fracture ductile, brittle, or a combination of the two? 2. Did failure start at or below the surface?
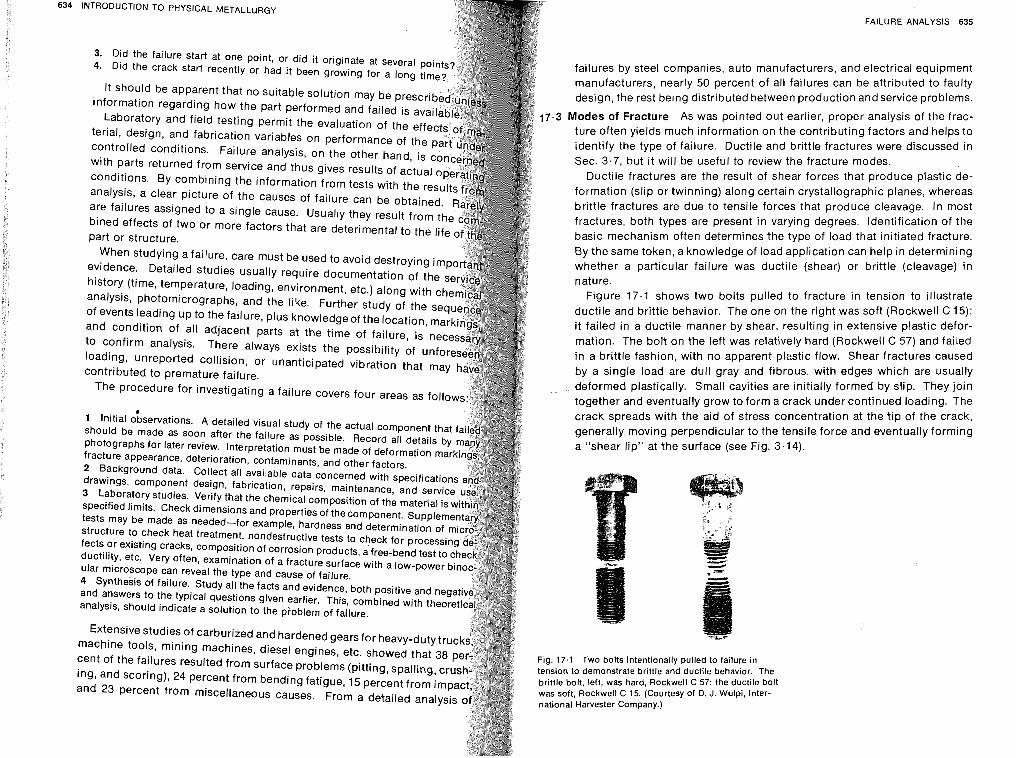
INTRODUCTION TO PHYSICAL METALLURGY
3. Did the failure start at one point, or did it originate at se 4. Did the crack start recently or had it been growing for a
It should be apparent that no suitable solution may be information regarding how the part performed and failed is
Laboratory and field testing permit the evaluation of the terial, design, and fabrication variables on performance controlled conditions. Failure analysis, on the other hand, is with parts returned from service and thus gives results of actual conditions. By combining the information from tests with the re analysis, a clear picture of the causes of failure can be obtaine are failures assigned to a single cause. Usually they result from bined effects of two or more factors that are deterimental to the part or structure.
When studying a failure, care must be used to avoid de evidence. Detailed studies usually require documenta history (time, temperature, loading, environment, etc
analysis, photomicrographs, and the like. Further stu of events leading up to the failure, plus knowledgeof th and condition of all adjacent parts at the time of to confirm analysis. There always exists the pos loading, unreported collision, or unanticipated vibr contributed to premature failure.
The procedure for investigating a failure covers four areas as follo
# 1 Initial observations. A detailed visual study of the actual component that f should be made as soon after the failure as possible. Record all detail photographs for later review. Interpretation must be made of deformation fracture appearance, d 2 Background data. drawings, component 3 Laboratory studies. specified limits. Check dimensions and properties of the tests may be made as structure to check heat treatment, nondestructive tests to check fects or existing cracks, composition of corrosion products, ductility, etc. Very often, examination of a fracture surface with ular microscope can reveal the type and cause of failure. 4 Synthesis of failure. Study all the facts and evidence, both positive and neg and answers to the typical questions given earlier. This, combined with theor analysis, should indicate a solution to the pioblem of failure.
Extensive studies of carburized and hardened gears for heavy-duty tru machine tools, mining machines, diesel engines, etc. showed that 38 cent of the failures resulted from surface problems (pitting, spalling, cr ing, and scoring), 24 percent from bending fatigue, 15 percent from imp
and 23 percent from miscellaneous causes. From a detailed analysi
FAILURE ANALYSIS 635
failures by steel companies, auto manufacturers, and electrical equipment manufacturers, nearly 50 percent of all failures can be attributed to faulty design, the rest being distributed between production and service problems.
7.3 Modes of Fracture As was pointed out earlier, proper analysis of the frac- ture often yields much information on the contributing factors and helps to identify the type of failure. Ductile and brittle fractures were discussed in Sec. 3.7, but i t will be useful to review the fracture modes.
Ductile fractures are the result of shear forces that produce plastic de- formation (slip or twinning) along certain crystallographic planes, whereas brittle fractures are due to tensile forces that produce cleavage. In most fractures, both types are present in varying degrees. Identification of the basic mechanism often determines the type of load that initiated fracture. By the same token, a knowledge of load application can help in determining whether a particular failure was ductile (shear) or brittle (cleavage) in nature.
Figure 17.1 shows two bolts pulled to fracture in tension to illustrate ductile and brittle behavior. The one on the right was soft (Rockwell C 15); it failed in a ductile manner by shear, resulting in extensive plastic defor- mation. The bolt on the left was relatively hard (Rockwell C 57) and failed in a brittle fashion, with no apparent plostic flow. Shear fractures caused by a single load are dull gray and fibrous, with edges which are usually deformed plastically. Small cavities are initially formed by slip. They join together and eventually grow to form a crack under continued loading. The crack spreads with the aid of stress concentration at the t ip of the crack, generally moving perpendicular to the tensile force and eventually forming a "shear lip" at the surface (see Fig. 3.14).
Fig. 17.1 Two bolts intentionally pulled to failure in tension to demonstrate brittle and ductile behavior. The brittle bolt, left, was hard, Rockwell C 57; the ductile bolt was soft, Rockwell C 15. (Courtesy of D. J. Wulpi, Inter- national Harvester Company.)
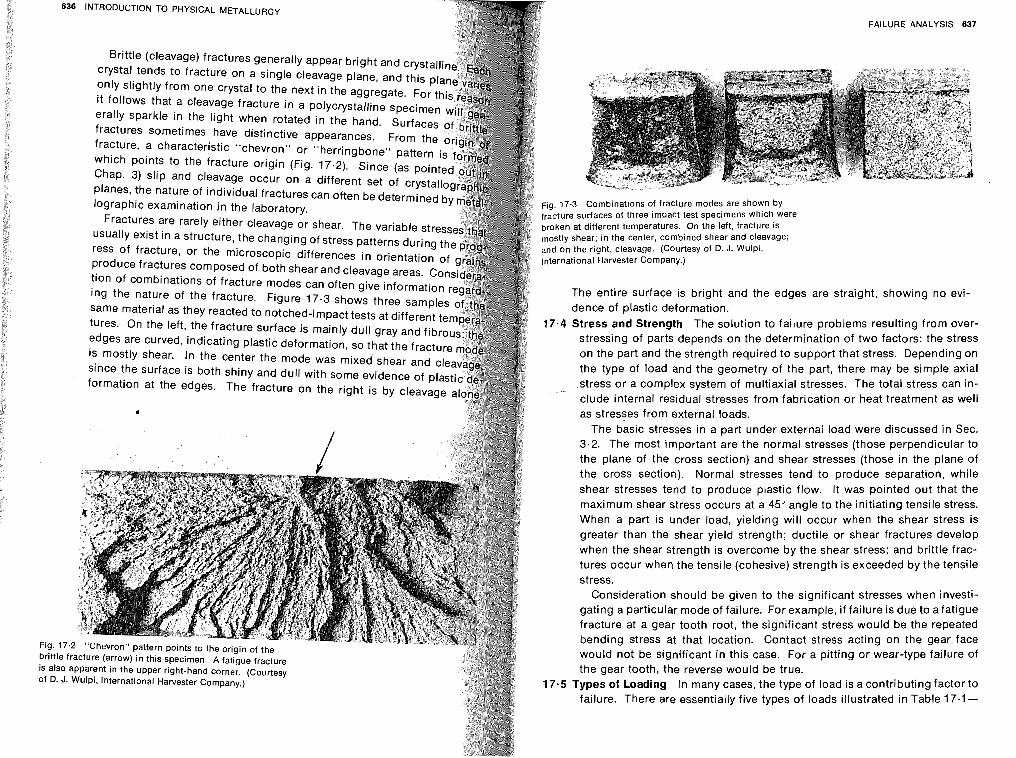
Fig. 17 brittle 1 is also of D. J.
INTRODUCTION TO PHYSICAL METALLURGY
Brittle (cleavage) fractures generally appear bright and cryst crystal tends to fracture on a single cleavage plane, and this only slightly from one crystal to the next in the aggregate. Fo it follows that a cleavage fracture in a polycrystalline specim
erally sparkle in the light when rotated in the hand. Surfac fractures sometimes have distinctive appearances. From fracture, a characteristic "chevron" or "herringbone" patt which points to the fracture origin (Fig. 17.2). Since (as po Chap. 3) slip and cleavage occur on a different set of crystal planes, the nature of individual fractures can often be determined lographic examination in the laboratory.
Fractures are rarely either cleavage or shear. The variable stre usually exist in a structure, the changing of stress patterns during th ress of fracture, or the microscopic differences in orientation of produce fractures composed of both shear and cleavage areas. Con tion of combinations of fracture modes can often give information ing the nature of the fracture. Figure 17.3 shows three sampl same material as they reacted to notched-impact tests at different tures. On the left, the fracture surface is mainly dull gray and fibr edges are curved, indicating plastic deformation, so that the fractur is mostly shear. In the center the mode was mixed shear and cl since the surface is both shiny and dull with some evidence of pla formation at the edges. The fracture on the right is by cleavag
.2 "Chevron" pattern points to the origin of the fracture (arrow) in this specimen. A fatigue fracture apparent in the upper right-hand corner. (Courtesy Wulpi, international Harvester Company.)
- FAILURE ANALYSIS 637
Fig. 17.3 Combinations of fracture modes are shown by fracture surfaces of three impact test specimens which were broken at different temperatures. On the left, fracture is mostly shear; in the center, combined shear and cleavage; and on the right, cleavage. (Courtesy of D. J. Wulpi. International Harvester Company.)
The entire surface is bright and the edges are straight, showing no evi- dence of plastic deformation.
17.4 Stress and Strength The solution to failure problems resulting from over- stressing of parts depends on the determination of two factors: the stress on the part and the strength required to support that stress. Depending on the type of load and the geometry of the part, there may be simple axial stress or a complex system of multiaxial stresses. The total stress can in- clude internal residual stresses from fabrication or heat treatment as well as stresses from external loads.
The basic stresses in a part under externai load were discussed in Sec. 3.2. The most important are the normal stresses (those perpendicular to the plane of the cross section) and shear stresses (those in the plane of the cross section). Normal stresses tend to produce separation, while shear stresses tend to produce plastic flow. It was pointed out that the
maximum shear stress occurs at a 45" angle to the initiating tensile stress. When a part is under load, yielding will occur when the shear stress is greater than the shear yield strength; ductile or shear fractures develop when the shear strength is overcome by the shear stress; and brittle frac- tures occur when the tensile (cohesive) strength is exceeded by the tensile stress.
Consideration should be given to the significant stresses when investi- gating a particular mode of failure. For example, if failure is due to afatigue fracture at a gear tooth root, the significant stress would be the repeated bending stress at that location. Contact stress acting on the gear face would not be significant in this case. For a pitting or wear-type failure of the gear tooth, the reverse would be true.
17.5 Types of Loading In many cases, the type of load is a contributing factor to failure. There are essentially five types of loads illustrated in Table 17.1 -
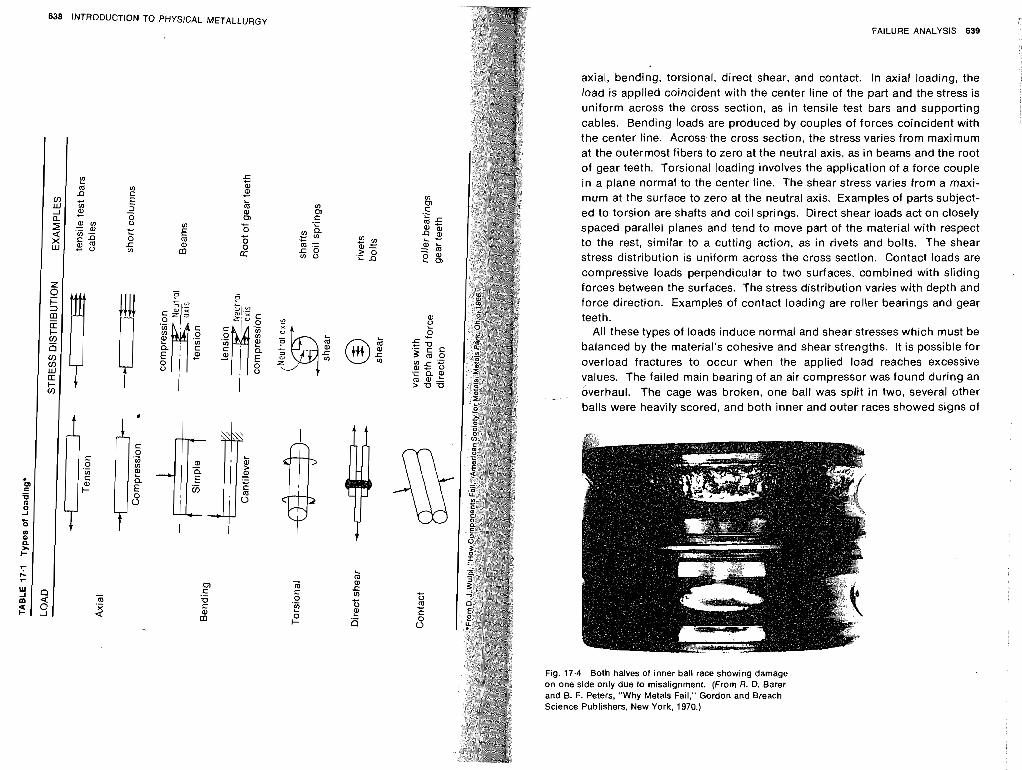
638 INTRODUCTION TO PHYSICAL METALLURGY FAILURE ANALYSIS 639
axial, bending, torsional, direct shear, and contact. In axial loading, the load is applied coincident with the center line of the part and the stress is uniform across the cross section, as in tensile test bars and supporting cables. Bending loads are produced by couples of forces coincident with the center line. Across the cross section, the stress varies from maximum at the outermost fibers to zero at the neutral axis, as in beams and the root of gear teeth. Torsional loading involves the application of a force couple in a plane normal to the center line. The shear stress varies from a maxi- mum at the surface to zero at the neutral axis. Examples of parts subject- ed to torsion are shafts and coil springs. Direct shear loads act on closely spaced parallel planes and tend to move part of the material with respect to the rest, similar to a cutting action, as in rivets and bolts. The shear stress distribution is uniform across the cross section. Contact loads are compressive loads perpendicular to two surfaces, combined with sliding forces between the surfaces. The stress distribution varies with depth and force direction. Examples of contact loading are roller bearings and gear teeth.
All these types of loads induce normal and shear stresses which must be balanced by the material's cohesive and shear strengths. It is possible for overload fractures to occur when the applied load reaches excessive values. The failed main bearing of an air compressor was found during an overhaul. The cage was broken, one ball was split in two, several other balls were heavily scored, and both inner and outer races showed signs of
Fig. 17.4 Both halves of inner ball race showing damage on one side only due to misalignment. (From R. D. Barer and 6. F. Peters, "Why Metals Fail," Gordon and Breach Science Publishers, New York, 1970.)
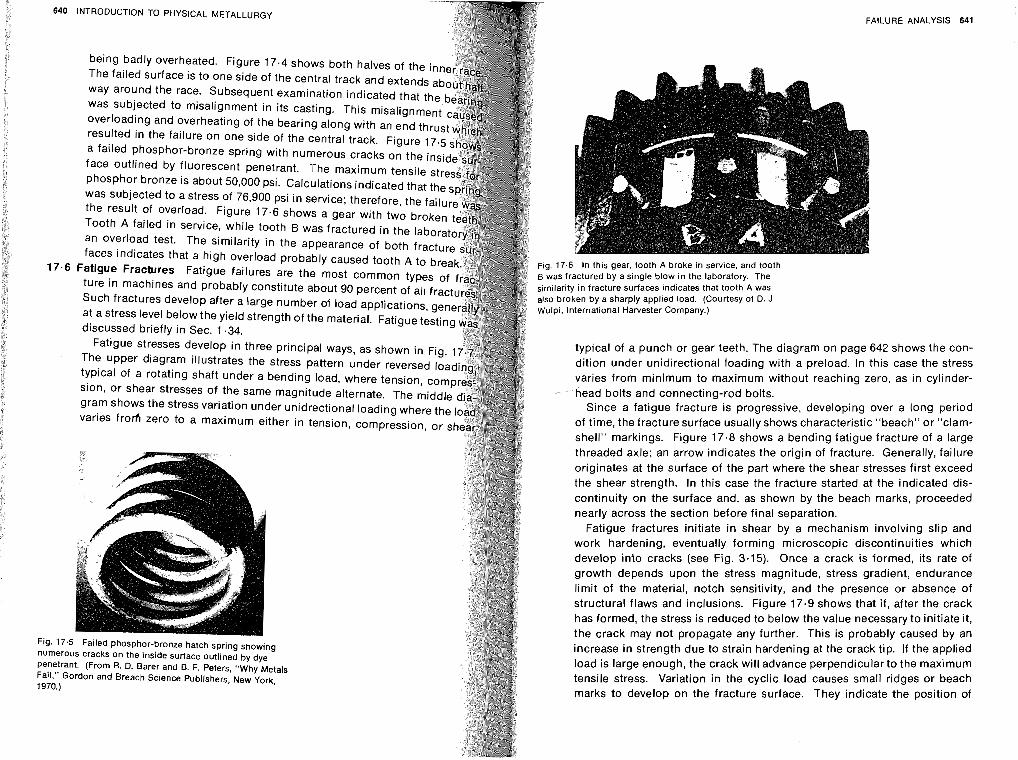
INTRODUCTION TO PHYSICAL METALLURGY
being badly overheated. Figure 17.4 shows both halves of the The failed surface is to one side of the central track and extend way around the race. Subsequent examination indicated that t was subjected to misalignment in its casting. This misalign overloading and overheating of the bearing along with an end resulted in the failure on one side of the central track. Figure a failed phosphor-bronze spring with numerous cracks on the i
face outlined by fluorescent penetrant. The maximum tensile phosphor bronze is about 50,000 psi. Calculations indicated that was subjected to a stress of 76,900 psi in service; therefore, the f the result of overload. Figure 17.6 shows a gear with two broke Tooth A failed in service, while tooth B was fractured in the labora an overload test. The similarity in the appearance of both fract faces indicates that a high overload probably caused tooth A to br
1 Fatigue Fractures Fatigue failures are the most common types ture in machines and probably constitute about 90 percent of all fr Such fractures develop after a large number of load applications, ge at a stress level below the yield strength of the material. Fatigue testin discussed briefly in Sec. 1.34.
Fatigue stresses develop in three principal ways, as shown in F The upper diagram illustrates the stress pattern under reversed typical of a rotating shaft under a bending load, where tension, c sion, or shear stresses of the same magnitude alternate. The middl gram shows the stress variation under unidrectional loading where th varies frorfi zero to a maximum either in tension, compression, or
Fig. 17.5 Failed phosphor-bronze hatch spring showing numerous cracks on the inside surface outlined by dye penetrant. (From R. 0. Barer and B. F. Peters. "Why Metals Fail," Gordon and Breach Science Publishers, New York, 1970.)
FAILURE ANALYSIS 641
Fig. 17.6 In this gear, tooth A broke in service, and tooth B was fractured by a single blow in the laboratory. The similarity in fracture surfaces indicates that tooth A was also broken by a sharply applied load. (Courtesy of 0. J. Wulpi, International Harvester Company.)
typical of a punch or gear teeth. The diagram on page 642 shows the con- dition under unidirectional loading with a preload. In this case the stress varies from minimum to maximum without reaching zero, as in cylinder- head bolts and connecting-rod bolts.
Since a fatigue fracture is progressive, developing over a long period of time, the fracture surface usually shows characteristic "beach" or "clam- shell" markings. Figure 17.8 shows a bending fatigue fracture of a large threaded axle; an arrow indicates the origin of fracture. Generally, failure originates at the surface of the part where the shear stresses first exceed the shear strength. In this case the fracture started at the indicated dis- continuity on the surface and, as shown by the beach marks, proceeded nearly across the section before final separation.
Fatigue fractures initiate in shear by a mechanism involving slip and work hardening, eventually forming microscopic discontinuities which develop into cracks (see Fig. 3.15). Once a crack is formed, its rate of growth depends upon the stress magnitude, stress gradient, endurance limit of the material, notch sensitivity, and the presence or absence of structural flaws and inclusions. Figure 17.9 shows that if, after the crack has formed, the stress is reduced to below the value necessary to initiate it, the crack may not propagate any further. This is probably caused by an increase in strength due to strain hardening at the crack tip. If the applied load is large enough, the crack will advance perpendicularto the maximum tensile stress. Variation in the cyclic load causes small ridges or beach marks to develop on the fracture surface. They indicate the position of
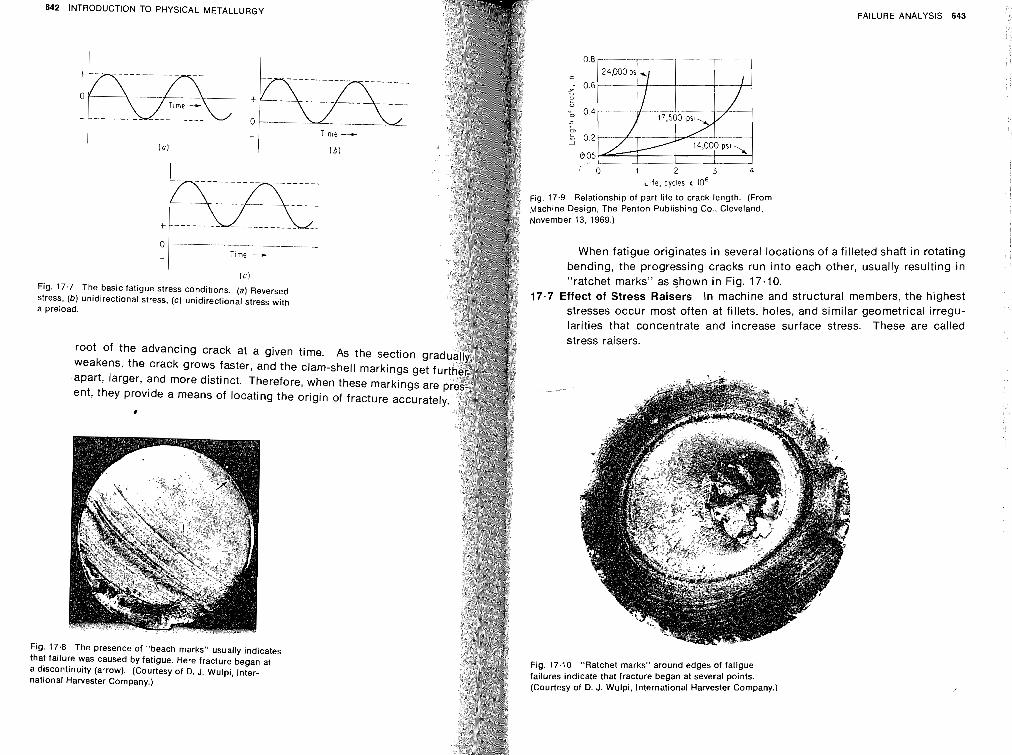
642 INTRODUCTION TO PHYSICAL METALLURGY
0 T ~ m e -+
I l l Fig. 17.7 The basic fatigue stress conditions. (a) Reversed stress, (b) unidirectional stress. (c) unidirectional stress with a preload.
root of the advancing crack at weakens, the crack grows faster, apart, larger, and more distinct. Therefore, when these markings are ent, they provide a means of locating the origin of fracture accurate!
0
Fig. 17.8 The presence of "beach marks" usually indicates that failure was caused by fatigue. Here fracture began at a discontinuity (arrow). (Courtesy of D. J. Wulpi, Inter- national Harvester Company.)
FAILURE ANALYSIS 643
'3 1 2 3 4 i l f e , cycles x lo6
Fig 17.9 Relat~onsh~p of part l ~ f e to crack length (From Machine Des~gn, The Penton Publlshtng Co , Cleveland, November 13.1969 )
When fatigue originates in several locations of a filleted shaft in rotating bending, the progressing cracks run into each other, usually resulting in "ratchet marks" as shown in Fig. 17.10.
17.7 Effect of Stress Raisers In machine and structural members, the highest stresses occur most often at fillets, holes, and similar geometrical irregu- larities that concentrate and increase surface stress. These are called
stress raisers.
Fig. 17.10 "Ratchet marks" around edges of fatigue failures indicate that fracture began at several points. (Courtesy of D. J. Wulpi, International Harvester Company.) /
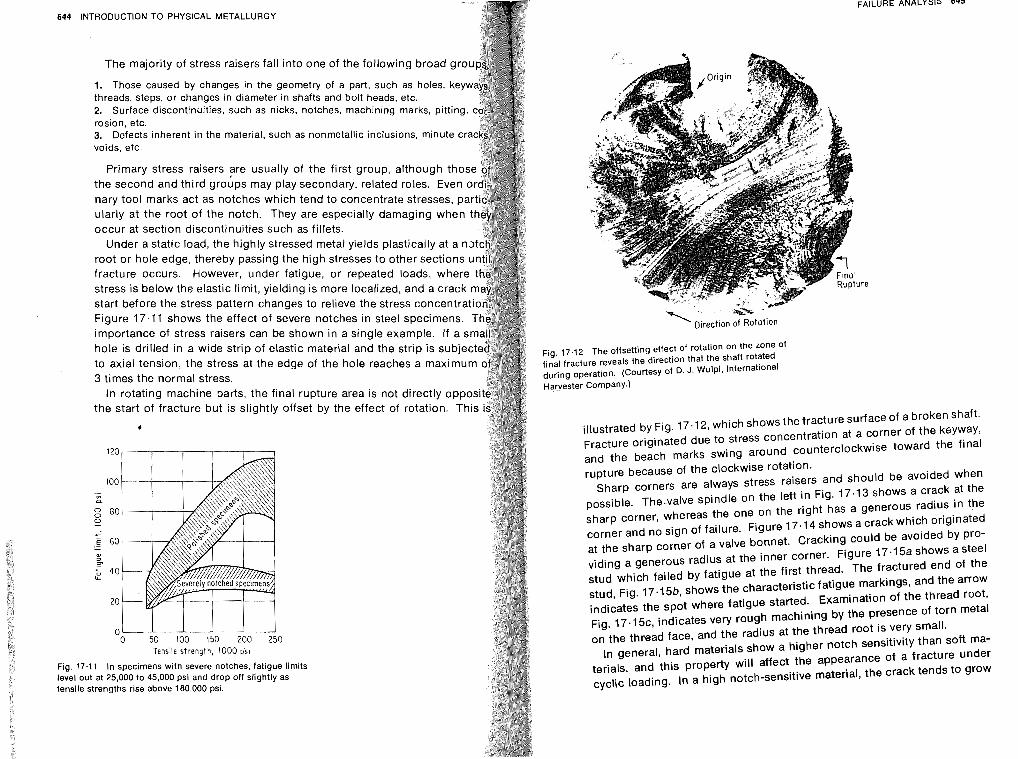
644
Fig. 17 level 01
tensile
INTRODUCTION TO PHYSICAL METALLURGY
Primary stress raisers are usually of the first group, -lth--.-h *L---
the second and third groups may play secondary, relate0 roles. tvc nary tool marks act as notches which tend to concentreto c~.-----
ularly at the root of the notch. They are especially da,,,,,,,,, ..,,,,, , occur at section discontinuities such as fillets.
Under a static load, the highly stressed metal yields PI--*:--".. -' - - -. root or hole edge, thereby passing the hinh stre*-- +- - fracture occurs. However, under fati,-,, or stress is below the elastic limit, yielding is more I U ~
start before the stress pattern changes to relieve t Figure 17.11 shows the effect of severe notches i.. ,.,,. ,,,, importance of stress raisers can be shown in a single eramnl hole is drilled in a wide strip of elastic material and the atilp to axial tension, the stress at the edge of the hole reaches a III~AIIIIU
3 times the normal stress. In rotating machine parts, the final rupture area is not directly oppo
the start of fracture but is slightly offset by the effect of rotation. This
0- 0 5 0 100 150 2 0 0 2 5 0
Tensile strength, 1 0 0 0 psi
The majority of stress raisers fall into one of the following broad gr
1. Those caused by changes in the geometry of a part, such as holes, key threads, steps, or changes in diameter in shafts and bolt heads, etc. 2. Surface discontinuities, such as nicks, notches, machining marks, pitting rosion, etc. 3. Defects inherent in the material, such as nonmetallic inclusions, minute cr voids, etc.
aorliuuyll lllu - 8 8 -
L I T 3 L I G33G.3, p maninn t r r h - -
aaiicalcy at a nJ .uirGa ru dther sections u repeated loads, where ' '--ahzed, and a crack
n s t e ~ l cnnsimens.
.11 In specimens with severe notches, fatigue limitr
ut at 25,000 to 45,000 psi and drop off slightly strengths rise above 180.000 psi.
FAILURE ANALYSIS 645
--2 ' ,irec+,on of Rotot ion
Fig 17 12 The offsetttng effect of rotat~on on the zone of f~nal fracture reveals the d~rect~on that the shaft rotated dur~ng operatton (Courtesy of D J Wulpt, internat~onal Harvester Company )
illustrated by Fig. 17.1 2, which shows the fracture surface of a broken shaft. Fracture originated due to stress concentration at a corner of the keyway, and the beach marks swing around counterclockwise toward the final rupture because of the clockwise rotation.
Sharp corners are always stress raisers and should be avoided when possible. The-valve spindle on the left in Fig. 17.13 shows a crack at the sharp corner, whereas the one on the right has a generous radius in the corner and no sign of failure. Figure 17-14 shows a crack which originated at the sharp corner of a valve bonnet. Cracking could be avoided by pro- viding a generous radius at the inner corner. Figure 17.15a shows a steel stud which failed by fatigue at the first thread. The fractured end of the stud, Fig. 17.15b, shows the characteristic fatigue markings, and the arrow indicates the spot where fatigue started. Examination of the thread root, Fig. 17.15c, indicates very rough machining by the presence of torn metal on the thread face, and the radius at the thread root is very small.
In general, hard materials show a higher notch sensitivity than soft ma- terials, and this property will affect the appearance of a fracture under cyclic loading. In a high notch-sensitive material, the crack tends to grow
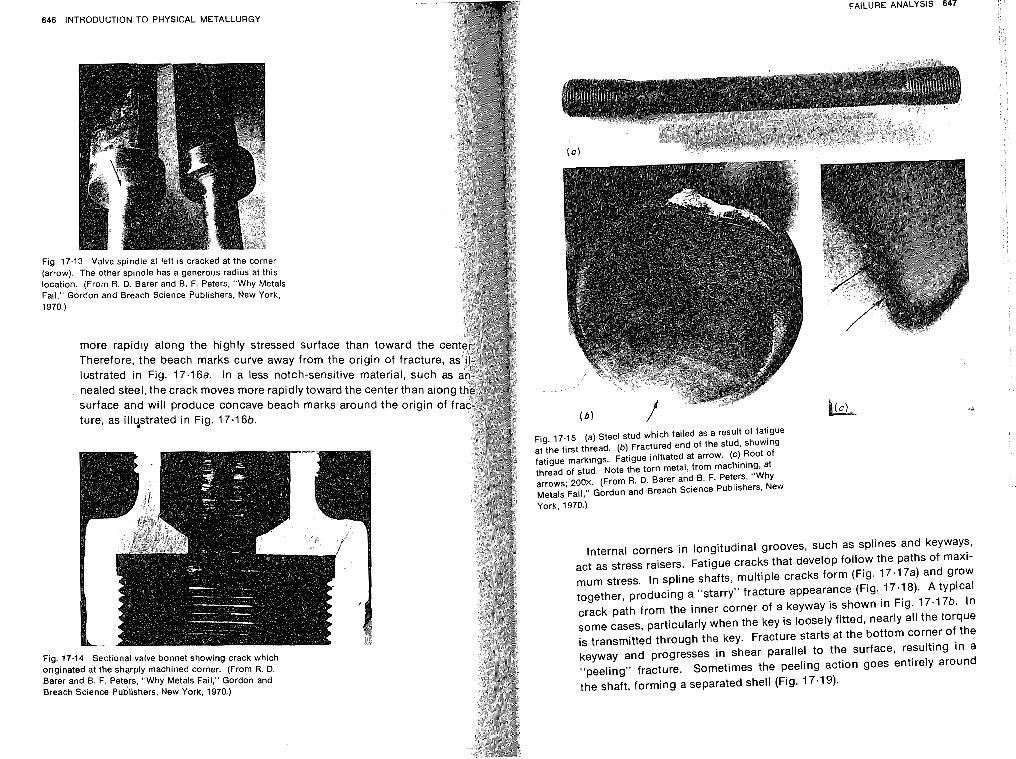
646 INTRODUCTION TO PHYSICAL METALLURGY
Fig. 17.13 Valve spindle at left is cracked at the corner (arrow). The other spindle has a generous radius at this location. (From R. D. Barer and B. F. Peters, "Why Metals Fail," Gordon and Breach Science Publishers. New York, 1970.)
more rapidly along the highly stressed surface than toward the ce Therefore, the beach marks curve away from the origin of fracture, lustrated in Fig. 17.16a. In a less notch-sensitive material, such nealed steel, the crack moves more rapidly toward the center than a10 surface and will produce concave beach marks around the origin o ture, as illystrated in Fig. 17.16b.
Fig. 17.14 Sectional valve bonnet showing crack which originated at the sharply machined corner. (From R. D. Barer and B. F. Peters, "Why Metals Fail," Gordon and Breach Science ~ublishers. New York, 1970.)
FAILURE ANALYSIS 647
Fig. 17.15 (a) Steel stud which failed as a result of fatigue at the first thread. (b) Fractured end of the stud, showing fatigue markings. Fatigue initiated at arrow. (c) Root of thread of stud. Note the torn metal, from machining, at arrows; 200x. (From R. D. Barer and B. F. Peters, "Why Metals Fail," Gordon and Breach Science Publishers, New York. 19703
Internal corners in longitudinal grooves, such as splines and keyways, act as stress raisers. Fatigue cracks that develop follow the paths of maxi- mum stress. In spline shafts, multiple cracks form (Fig. 17.17a) and grow together, producing a "starry" fracture appearance (Fig. 17.18). A typical crack path from the inner corner of a keyway is shown in Fig. 17.17b. In some cases, particularly when the key is loosely fitted, nearly all the torque is transmitted through the key. Fracture starts at the bottom corner of the keyway and progresses in shear parallel to the surface, resulting in a "peeling" fracture. Sometimes the peeling action goes entirely around the shaft, forming a separated shell (Fig. 17.19).
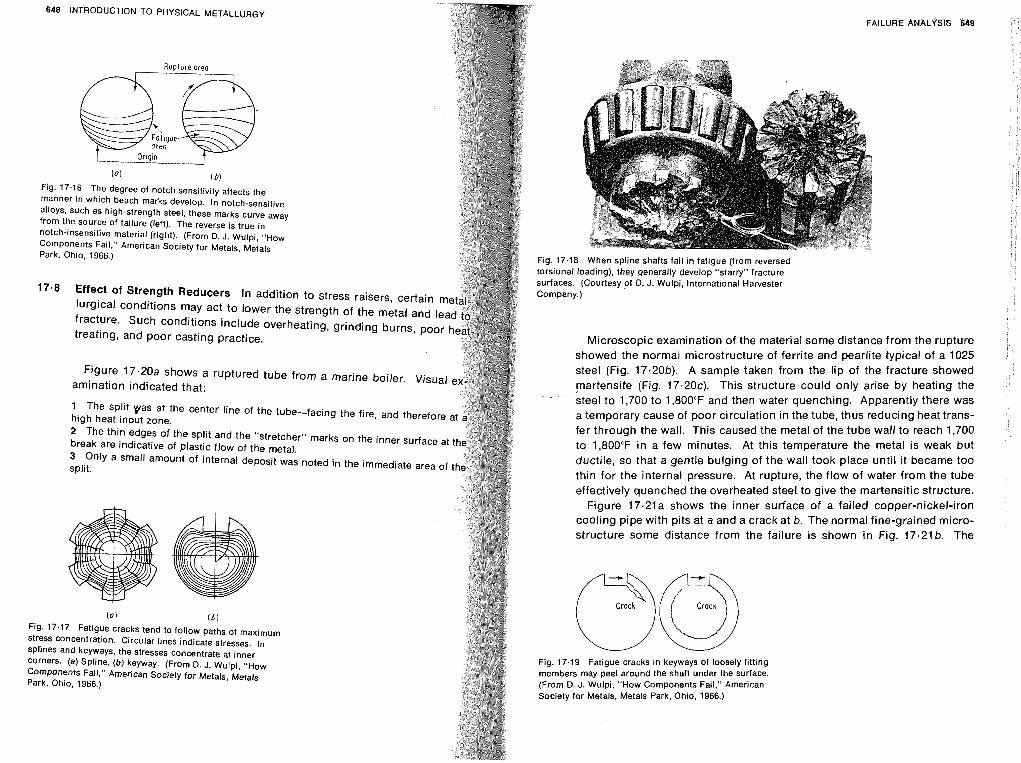
648 INTRODUCTION TO PHYSICAL METALLURGY
a 16)
Fig. 17.16 The degree of notch sensitivity affects the manner in which beach marks develop. In notch-sensitive alloys, such as high-strength steel, these marks curve away from the source of failure (left). The reverse is true in notch-insensitive material (right). (From D. J. Wulpi, "How Components Fail," American Society for Metals, Metals Park, Ohio, 1966.)
17.8 Effect of Strength Reducers In addition to stress raisers, certain m lurgical conditions may act to lower the strength of the metal and I fracture. Such conditions include overheating, grinding burns, po treating, and poor casting practice.
Figure 17.20a shows a ruptured tube from a marine boiler. Visua amination indicated that:
1 The split was at the center line of the tube-facing the fire, and therefore high heat input zone. 2 The thin edges of the split and the "stretcher" marks on the inner surface at break are indicative of plastic flow of the metal. 3 Only a small amount of internal deposit was noted in the immediate area o split.
( 0 1 (bl Fig. 17.17 Fatigue cracks tend to follow paths of maximum stress concentration. Circular lines indicate stresses. In splines and keyways, the stresses concentrate at inner corners. (a) Spline, (b) keyway. (From D. J. Wulpi, "How Components Fail," American Society for Metals, Metals Park. Ohio, 1966.)
FAILURE ANALYSIE; 649
Fig. 17.18 When spline shafts fail in fatigue (from reversed torsional loading), they generally develop "starry" fracture surfaces. (Courtesy of D. J. Wulpi, International Harvester Company.)
Microscopic examination of the material some distance from the rupture showed the normal microstructure of ferrite and pearlite typical of a 1025 steel (Fig. 17.20b). A sample taken from the lip of the fracture showed martensite (Fig. 17 .20~) . This structure could only arise by heating the steel to 1,700 to 1 ,800°F and then water quenching. Apparently there was a temporary cause of poor circulation in the tube, thus reducing heat trans- fer through the wall. This caused the metal of the tube wall to reach 1,700 to 1,80O0F in a few minutes. At this temperature the metal is weak but ductile, so that a gentle bulging of the wall took place until i t became too thin for the internal pressure. At rupture, the flow of water from the tube effectively quenched the overheated steel to give the martensitic structure.
Figure 17.21a shows the inner surface of a failed copper-nickel-iron cooling pipe with pits at a and a crack at b. The normal fine-grained micro- structure some distance from the failure is shown in Fig. 17.21b. The
Fig. 17.19 Fatigue cracks in keyways of loosely fitting members may peel around the shaft under the surface. (From D. J. Wulpi, "How Components Fail," American Society for Metals, Metals Park, Ohio, 1966.)
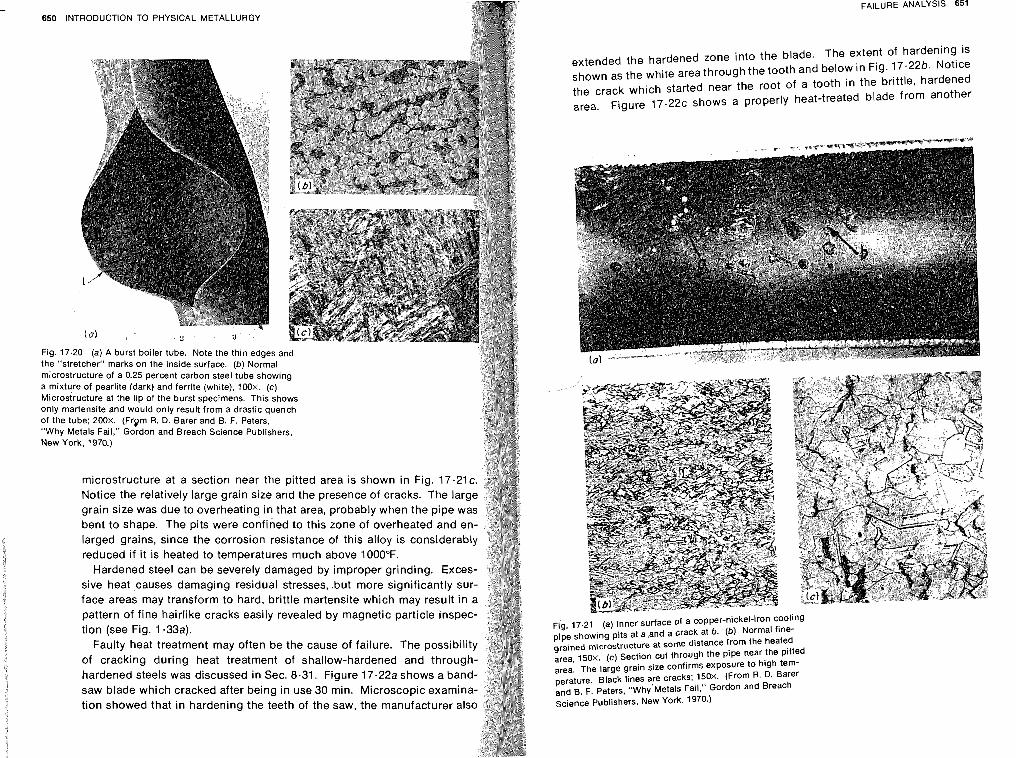
650 INTRODUCTION TO PHYSICAL METALLURGY FAILURE ANALYSIS 651
Fig. 17.20 (a) A burst boiler tube. Note the thin edges and the "stretcher" marks on the inside surface. (b) Normal microstructure of a 0.25 percent carbon steel tube showino
- . . . . . . a mixture of pearlite (dark) and ferrite (white), 100x. (c) Microstructure at the lip of the burst specimens. This shows only martensite and would only result from a drastic quench of the tube; 200X. (Frpm R. D. Barer and B. F. Peters, "Why Metals Fail," Gordon and Breach Science Publishers, New York. 1970.)
microstructure at a section near the pitted area is shown in Fig. 17- Notice the relatively large grain size and the presence of cracks. The I grain size was due to overheating in that area, probably when the pipe bent to shape. The pits were confined to this zone of overheated and e larged grains, since the corrosion resistance of this alloy is considerabl reduced if it is heated to temperatures much above 1000°F.
Hardened steel can be severely damaged by improper grinding. Exces sive heat causes damaging residual stresses, .but more significantly su face areas may transform to hard, brittle martensite which may result in pattern of fine hairlike cracks easily revealed by magnetic particle inspe tion (see Fig. 1.33a).
Faulty heat treatment may often be the cause of failure. The poss of cracking during heat treatment of shallow-hardened and throug hardened steels was discussed in Sec. 8.31. Figure 17.22a shows a ban saw blade which cracked after being in use 30 min. Microscopic examin tion showed that in hardening the teeth of the saw, the manufacturer al
extended the hardened zone into the blade. The extent of hardening is shown as the while area through the tooth and below in Fig. 17.22b. Notice the crack which started near the root of a tooth in the brittle, hardened area. Figure 17 .22~ shows a properly heat-treated blade from another
~ i ' ~ . 17.21 (a) Inner surface of a copper-nickel-iron cooling
pipe showing pits at a .and a crack at b. .(bf Normal fine- grained microstructure at some distance from the heated area, 150x. (c) Section cut through the pipe near the pitted area. The large grain size confirms exposure to high tem- perature. Black lines are cracks; 150x. (From R. D. Barer and B. F. Peters, "Why'Metals Fail." Gordon and Breach Science Publishers, New York, 1970.)
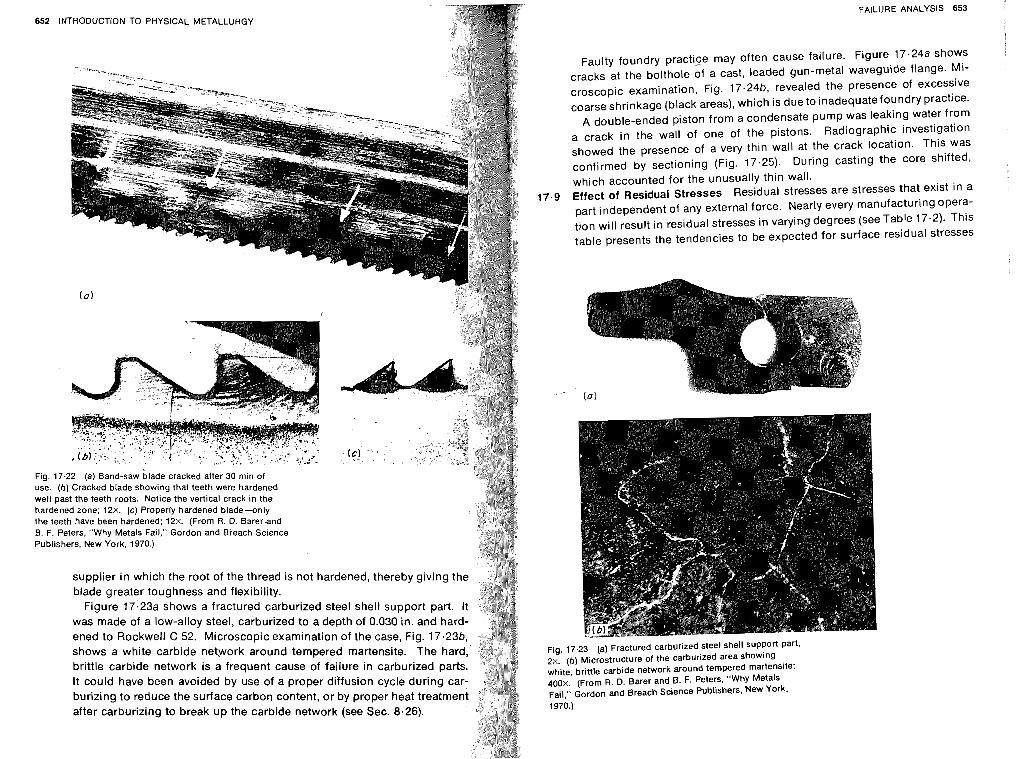
Fig. 17.22 (a) Band-saw blade cracked after 30 min of use. (b) Cracked blade showing that teeth were hardened well past the teeth roots. Notice the vertical crack in the hardened zone; 12X. (c) Properly hardened blade-only the teeth have been hardened; 12X. (From R. D. Barerand 8. F. Peters. "Why Metals Fail," Gordon and Bieach Science Publishers, New York. 1970.)
supplier in which the root of the thread is not hardened, thereby giving t blade greater toughness and flexibility.
Figure 17:23a shows a fractured carburized steel shell support part. I was made of a low-alloy steel, carburized to a depth of 0.030 in. and hard ened to Rockwell C 52. Microscopic examination of the case, Fig. 17
shows a white carbide network around tempered martensite. The brittle carbide network is a frequent cause of failure in carburized p It could have been avoided by use of a proper diffusion cycle durin burizing to reduce the surface carbon content, or by proper heat tre after carburizing to break up the carbide network (see Sec. 8.26).
FAILURE ANALYSIS 653
Faulty foundry practice may often cause failure. Figure 17.24a shows cracks at the bolthole of a cast, leaded gun-metal waveguide flange. Mi- croscopic examination, Fig. 17.24b, revealed the presence of excessive coarse shrinkage (black areas), which is dueto inadequate foundry practice.
A double-ended piston from a condensate pump was leaking water from a crack in the wall of one of the pistons. Radiographic investigation showed the presence of a very thin wall at the crack location. This was confirmed by sectioning (Fig. 17.25). During casting the core shifted,
which accounted for the unusually thin wall. 17.9 Effect of Residual Stresses Residual stresses are stresses that exist in a
part independent of any external force. Nearly every manufacturing opera- tion will result in residual stresses in varying degrees (seeTable 17.2). This table presents the tendencies to be expected for surface residual stresses
Fig. 17.23 (a) Fractured carburized steel shell support part, 2x. (b) Microstructure of the carburized area showing white, brittle carbide network around tempered martensite; 400x. (From R. D. Barer and B. F. Petem, "Why Metals Fail," Gordon and Breach Science Publishers, New York, 1970.)
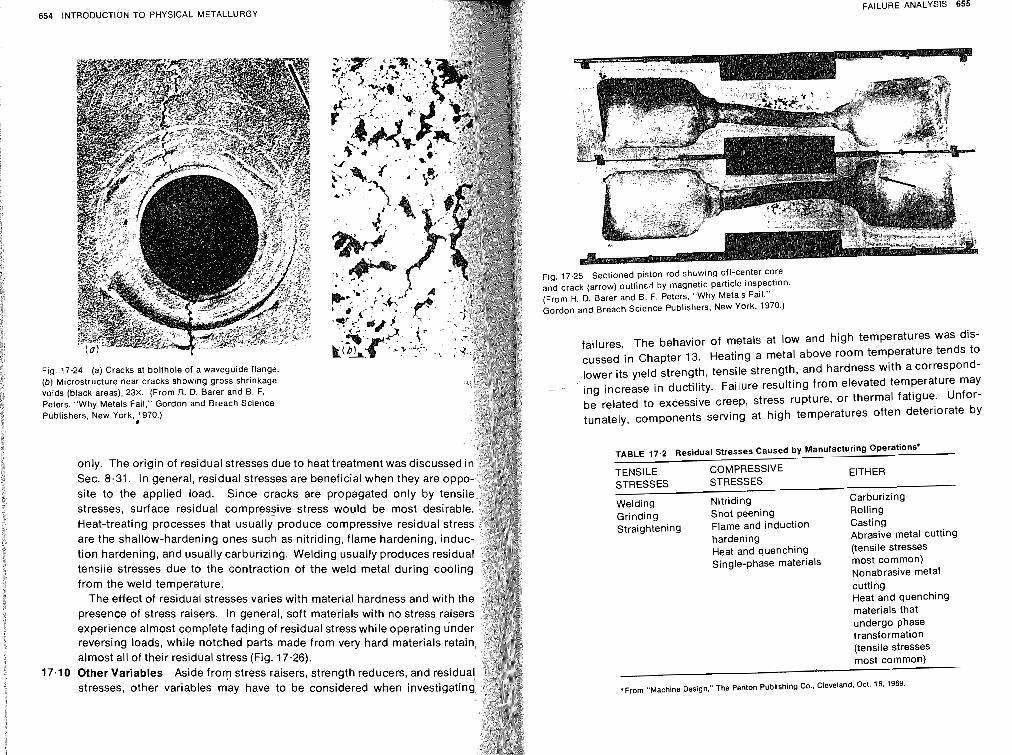
654 INTRODUCTION TO PHYSICAL METALLURGY
Fig. 17.24 (a) Cracks at bolthole of a waveguide flange. (b) Microstructure near cracks showing gross shrinkage voids (black areas), 23x. (From R. D. Barer and B. F. Peters, "Why Metals Fail," Gordon and Breach Science Publishers, New York. 1970.)
only. The origin of residual stresses due to heat treatment was discusse Sec. 8.31. In general, residual stresses are beneficial when they are op site to the applied load. Since cracks are propagated only by ten stresses, surface residual compressive stress would be most desira Heat-treating processes that usually produce compressive residual str are the shallow-hardening ones such as nitriding, flame hardening, indu tion hardening, and usually carburizing. Welding usually produces resid tensile stresses due to the contraction of the weld metal during cooli from the weld temperature.
The effect of residual stresses varies with material hardness and with t presence of stress raisers. In general, soft materials with no stress raise experience almost complete facjing of residual stress while operating und reversing loads, while notched parts made from very hard materials r almost all of their residual stress (Fig. 17.26).
17.10 Other Variables Aside from stress raisers, strength reducers, and resi stresses, other variables may have to be considered when investig
FAILURE ANALYSIS 655
Fig. 17.25 Sectioned piston rod shbwing off-center core and crack (arrow) outlined by magnetic particle inspection (From R. D. Barer and 0. F. Peters, "Why Metals Fail," Gordon and Breach Science Publishers. New York, 1970.)
failures. The behavior of metals at low and high temperatures was dis- cussed in Chapter 13. Heating a metal above room temperature tends to lower its yield strength, tensile strength, and hardness with a correspond- ing increase in ductility. Failure resulting from elevated temperature may be related to excessive creep, stress rupture, or thermal fatigue. Unfor-
tunately, components serving at high temperatures often deteriorate by
TABLE 17.2 Residual Stresses Caused by Manufacturing Operations*
TENSILE COMPRESSIVE STRESSES
EITHER STRESSES
Welding Grinding Straightening
Nitriding Carburizing Shot peening Rolling Flame and induction Casting hardening Abrasive metal cutting Heat and quenching (tensile stresses Single-phase materials most common)
Nonabrasive metal cutting Heat and quenching materials that undergo phase transformation (tensile stresses most common)
'From "Machine Design," The Penton Publishing Co., Cleveland, Oct. 16, 1969
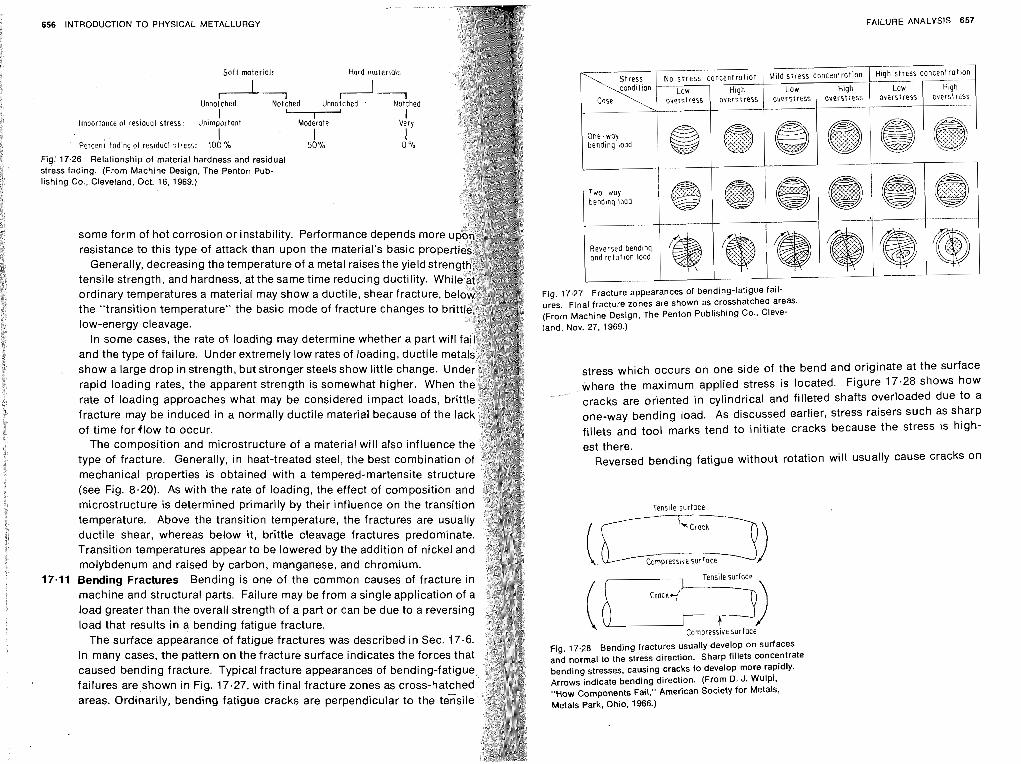
FAILURE ANALYSIS 657 656 INTRODUCTION TO PHYSICAL METALLURGY
ordinary temperatures a material may show a ductile, shear fracture, ~ i ~ . 17.27 Fracture appearances of bending-fatigue fail-
the "transition temperature" the basic mode of fracture changes to ures. Final fracture zones are shown as crosshatched areas. (From Machine Design, The Penton Publishing C0.. Cleve-
low-energy cleavage. land. NOV. 27. 1969.)
In some cases, the rate of loading may determine whether a part w and the type of failure. Under extremely low rates of loading, ductile m
show a large drop in strength, but stronger steels show little change. U stress which occurs on one side of the bend and originate at the surface rapid loading rates, the apparent strength is somewhat higher. When where the maximum applied stress is located. Figure 17.28 shows how rate of loading approaches what may be considered impact loads, br cracks are oriented in cylindrical and filleted shafts overloaded due to a fracture may be induced in a normally ductile material because of the I one-way bending load. As discussed earlier, Stress raisers such as sharp of time for (low to occur. fillets and tool marks tend to initiate cracks because the stress is high-
The composition and microstructure of a material will also influence t est there. type of fracture. Generally, in heat-treated steel, the best combinatio Reversed bending fatigue without rotation will usually cause cracks on mechanical p,roperties is obtained with a tempered-martensite struc (see Fig. 8.20). As with the rate of loading, the effect of composition a
microstructure is determined primarily by their influence on the transitio Tensile surface
temperature. Above the transition temperature, the fractures are usu ductile shear, whereas below it, brittle cleavage fractures predomin Transition temperatures appear to be lowered by the addition of nickel an
molybdenum and raised by carbon, manganese, and chromium. I ~ ) Compresave surface
17.11 Bending Fractures Bending is one of the common causes of fracture . Tensile surface
machine and structural parts. Failure may be from a single application of (6 Crack?' load greater than the overall strength of a part or can be due to a reversin
load that results in a bending fatigue fracture. t The surface appearance of fatigue fractures was described in Sec. 1
9 Compressive surface
In many cases, the pattern on the fracture surface indicates the forces t Fig. 17.28 Bending fractures usually develop on surfaces and normal to the stress direction. Sharp fillets ~0i7centrate
caused bending fracture. Typical fracture appearances of bending-fati bending stresses, causing cracks to develop more rapidly. failures are shown in Fig. 17.27, with final fracture zones as cross-hatc Arrows indicate bending direction. (From D. J. WulPi,
Components Fail," American Society for Metals, areas. Ordinarily, bending fatigue cracks are perpendicular to the ten Metals Park, Ohio, 1966.)
High stress concentrot ion Soft materials Hard mater~als
I Unnolched Nolched Unnotched . Notched
I Importance of residual stress. Unimportant
r Maderare
I ~ e r c e n i fading of resfduol stress: 100 %
I 50 %
Fig: 17.26 Relationship of material hardness and residual stress fading. (From Machine Design, The Penton Pub- lishing Co., Cleveland, Oct. 16, 1969.)
some form of hot corrosion or instability. Performance depends mo
resistance to this type of attack than upon the material's basic pro Generally, decreasing the temperature of a metal raises the yieldstr
tensile strength, and hardness, at the same time reducing ductility. W
LO w overstre5s
/@
E4ild stress concentrofion s t r ess condl t ion
Case
One -way bending load
Two-way bendlnq loo5
Reversed bendlng and rota t ion load
High overstress
~1
/@
Low overstress
@
concentration
High averstress
@a@@@@) ---
@@@@@a @&
Low overstress
---
@ " \
High overstress
@
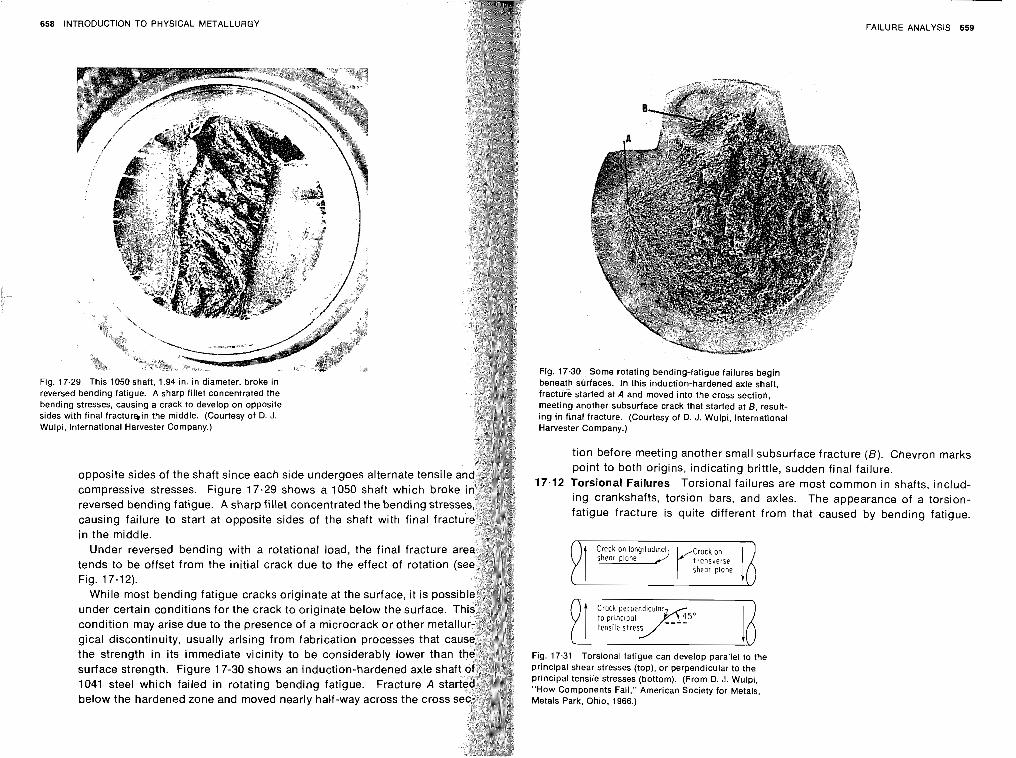
658 INTRODUCTION TO PHYSICAL METALLURGY FAILURE ANALYSIS 659
Fig. 17.29 This 1050 shaft, 1.94 in. in diameter. broke in reversed bending fatigue. A sharp fillet concentrated the bending stresses, causing a crack to develop on opposite sides with final fracturgin the middle. (Courtesy of D. J. Wulpi, International Harvester Company.)
opposite sides of the shaft since each side undergoes alternate tensil compressive stresses. Figure 17.29 shows a 1050 shaft which bro reversed bending fatigue. A sharp fillet concentrated the bending st causing failure to start at opposite sides of the shaft with final f in the middle.
Under reversed bending with a rotational load, the final fracture a tends to be offset from the initial crack due to the effect of rotation (s Fig. 17.12).
While most bending fatigue cracks originate at the surface, it is possi under certain conditions for the crack to originate below the surface. condition may arise due to the presence of a microcrack or other met gical discontinuity, usually arising from fabrication processes that the strength in its immediate vicinity to be considerably lower tha surface strength. Figure 17-30 shows an induction-hardened axle 1041 steel which failed in rotating bending fatigue. Fracture A below the hardened zone and moved nearly half-way across the cross
Fig. 17.30 Some rotating bending-fatigue failures begin beneath surfaces. In this induction-hardened axle shaft, fracture started at A and moved into the cross section, meeting another subsurface crack that started at 6, result- ing in final fracture. (Courtesy of D. J. Wulpi. International Harvester Company.)
tion before meeting another small subsurface fracture (B). Chevron marks point to both origins, indicating brittle, sudden final failure.
17.12 Torsional Failures Torsional failures are most common in shafts, includ- ing crankshafts, torsion bars, and axles. The appearance of a torsion- fatigue fracture is quite different from that caused by bending fatigue.
yI ti::: ;/::g1tud2 r':":"e 1:; shear plane
Yl "$";:F-50 tensile stress
Fig. 17.31 Torsional fatigue can develop parallel to the principal shear stresses (top), or perpendicular to the principal tensile stresses (bottom). (From D. J. Wulpi. "How Components Fail," American Society for Metals, Metals Park. Ohio. 1966.)
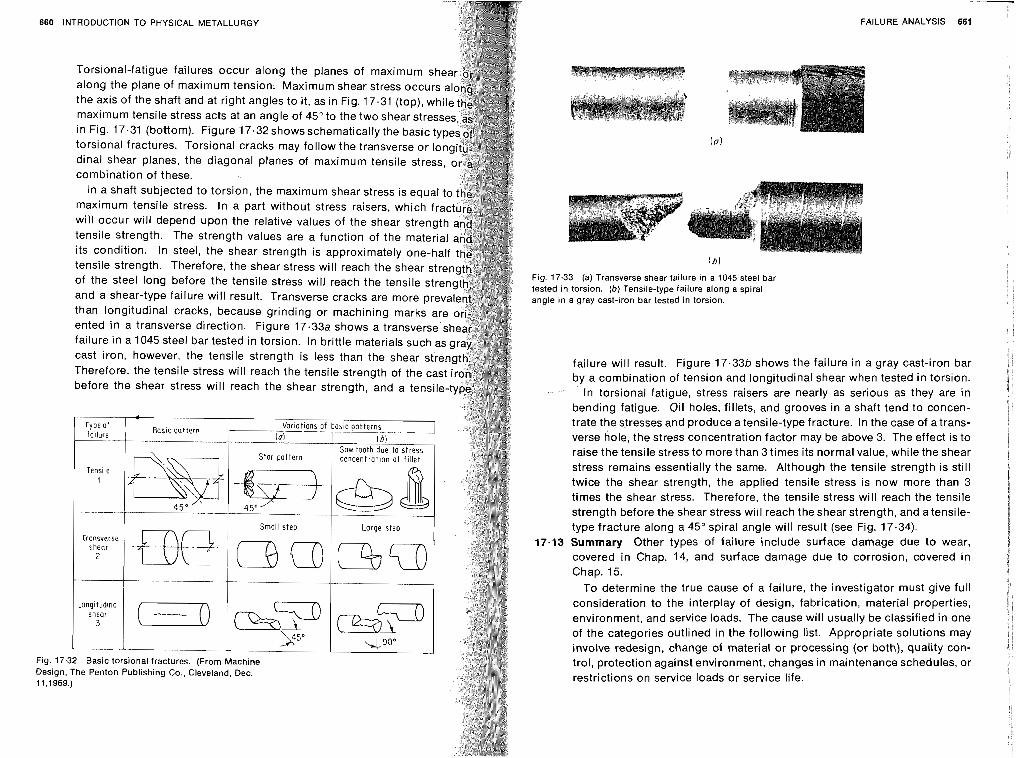
660 INTRODUCTION TO PHYSICAL METALLURGY
dinal shear planes, the diagonal planes of maximum tensile stress, combination of these.
maximum tensile stress. In a part without stress raisers, which f will occur will depend upon the relative values of the shear stren
tensile strength. Therefore, the shear stress will reach the shear st of the steel long before the tensile stress will reach the tensile str
than longitudinal cracks, because grinding or machining marks are ented in a transverse direction. Figure 17.33a shows a transverse s failure in a 1045 steel bar tested in torsion. In brittle materials such as
Therefore, the tensile stress will reach the tensile strength of the ca before the shear stress will reach the shear strength, and a tensil
FAILURE ANALYSIS 661
Fig. 17.33 (a) Transverse shear failure in a 1045 steel bar tested in torsion. (b) Tensile-type failure along a spiral angle in a gray cast-iron bar tested in torsion.
failure will result. Figure 17.336 shows the failure in a gray cast-iron bar by a combination of tension and longitudinal shear when tested in torsion.
In torsional fatigue, stress raisers are nearly as serious as they are in bending fatigue. Oil holes, fillets, and grooves in a shaft tend to concen- trate the stresses and produce a tensile-type fracture. In the case of a trans- verse hole, the stress concentration factor may be above 3. The effect is to raise the tensile stress to more than 3 times its normal value, while the shear stress remains essentially the same. Although the tensile strength is still twice the shear strength, the applied tensile stress is now more than 3 times the shear stress. Therefore, the tensile stress will reach the tensile strength before the shear stress will reach the shear strength, and a tensile- type fracture along a 45" spiral angle will result (see Fig. 17.34).
17.13 Summary Other types of failure include surface damage due to wear, covered in Chap. 14, and surface damage due to corrosion, covered in Chap. 15.
To determine the true cause of a failure, the investigator must give full consideration to the interplay of design, fabrication, material properties, environment, and service loads. The cause will usually be classified in one of the categories outlined in the following list. Appropriate solutions may involve redesign, change of material or processing (or both), quality con- trol, protection against environment, changes in maintenance schedules, or restrictions on service loads or service life.
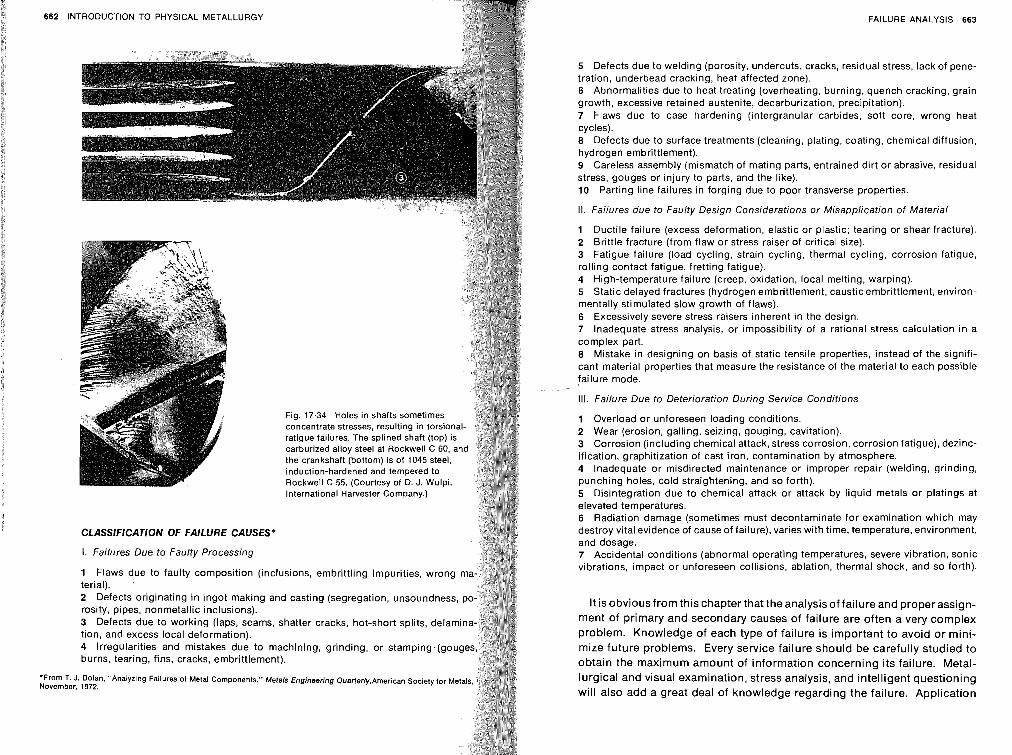
662 INTRODUCTION TO PHYSICAL METALLURGY FAILURE ANALYSIS 663
Fig. 17.34 Holes in shafts sometimes concentrate stresses, resulting in torsi0 fatigue failures. The splined shaft (top) carburized alloy steel at Rockwell C 60, the crankshaft (bottom) is of 1045 steel, induction-hardened and tempered to Rockwell C 55. (Courtesy of 0. J. Wulpi, International Harvester Company.)
CLASSIFICATION OF FAILURE CAUSES*
I. Failures Due to Faulty Processing
1 Flaws due to faulty composition (inclusions, embrittling impurities, wrong terial). 2 Defects originating in ingot making and casting (segregation, unsoundness, rosity, pipes, nonmetallic inclusions). 3 Defects due to working (laps, seams, shatter cracks, hot-short splits, delami tion, and excess local deformation). 4 Irregularities and mistakes due to machining, grinding, or stamping.(go burns, tearing, fins, cracks, embrittlement).
*From T. J. Dolan. "Analyzing Failures of Metal Components." Metals Engineering Quarterly,American Society for M November, 1972.
5 Defects due to welding (porosity, undercuts, cracks, residual stress, lack of pene- tration, underbead cracking, heat affected zone). 6 Abnormalities due to heat treating (overheating, burning, quench cracking, grain growth, excessive retained austenite, decarburization, precipitation). 7 Flaws due to case hardening (intergranular carbides, soft core, wrong heat cycles). 8 Defects due to surface treatments (cleaning, plating, coating, chemical diffusion, hydrogen embrittlement). 9 Careless assembly (mismatch of mating parts, entrained dirt or abrasive, residual stress, gouges or injury to parts, and the like). 10 Parting line failures in forging due to poor transverse properties.
II. Failures due to Faulty Design Considerations or Misapplication of Material
1 Ductile failure (excess deformation, elastic or plastic; tearing or shear fracture). 2 Brittle fracture (from flaw or stress raiser of critical size). 3 Fatigue failure (load cycling, strain cycling, thermal cycling, corrosion fatigue, rolling contact fatigue, fretting fatigue). 4 High-temperature failure (creep, oxidation, local melting, warping). 5 Static delayed fractures (hydrogen embrittlement, causticembrittlement, environ- mentally stimulated slow growth of flaws). 6 Excessively severe stress raisers inherent in the design. 7 lnadequate stress analysis, or impossibility of a rational stress calculation in a complex part. 8 Mistake in designing on basis of static tensile properties, instead of the signifi- cant material properties that measure the resistance of the material to each possible failure mode.
Ill. Failure Due to Deterioration During Service Conditions
1 Overload or unforeseen loading conditions. 2 Wear (erosion, galling, seizing, gouging, cavitation). 3 Corrosion (including chemical attack, stress corrosion, corrosion fatigue), dezinc- ification, graphitization of cast iron, contamination by atmosphere. 4 Inadequate or misdirected maintenance or improper repair (welding, grinding, punching holes, cold straightening, and so forth). 5 Disintegration due to chemical attack or attack by liquid metals or platings at elevated temperatures. 6 Radiation damage (sometimes must decontaminate for examination which may destroy vital evidence of cause of failure), varies with time, temperature, environment, and dosage. 7 Accidental conditions (abnormal operating temperatures, severe vibration, sonic vibrations, impact or unforeseen collisions, ablation, thermal shock, and so forth).
It is obvious from this chapter that the analysisof failure and properassign- ment of primary and secondary causes of failure are often a very complex problem. Knowledge of each type of failure is important to avoid or mini- mize future problems. Every service failure should be carefully studied to obtain the maximum amount of information concerning its failure. Metal- lurgical and visual examination, stress analysis, and intelligent questioning will also add a great deal of knowledge regarding the failure. Application
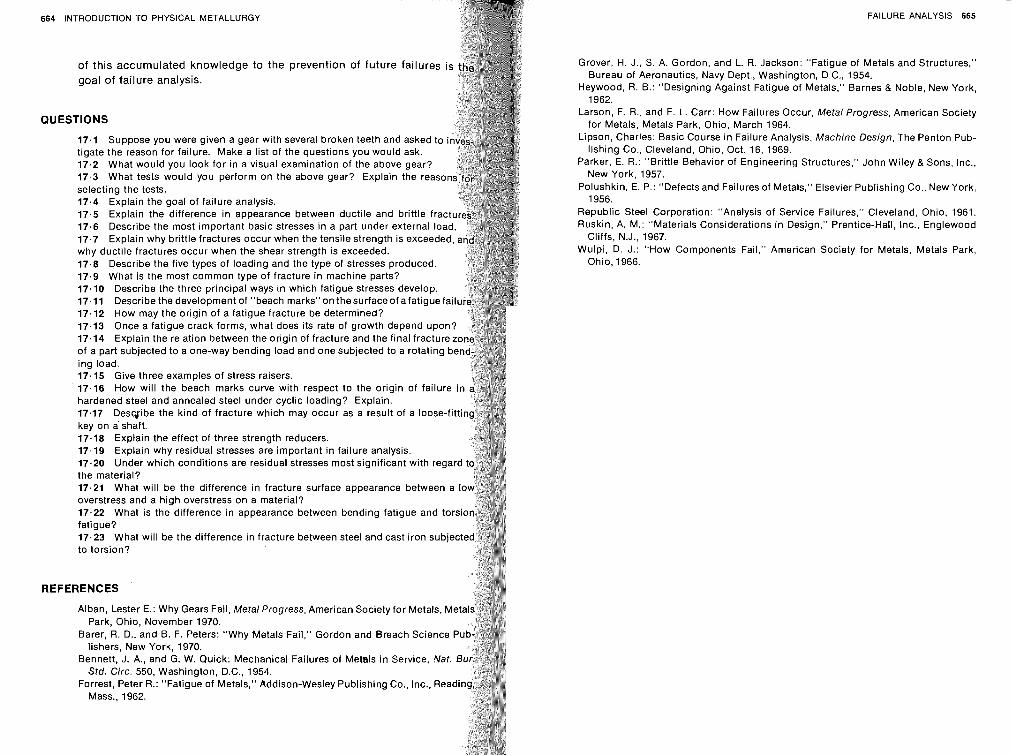
INTRODUCTION TO PHYSICAL METALLURGY
of this accumulated knowledge to the prevention of future failure goal of failure analysis.
ESTIONS
17.1 Suppose you were given a gear with several broken teeth and asked tigate the reason for failure. Make a list of the questions you would ask. 17.2 What would you look for in a visual examination of the above gear? 17.3 What tests would you perform on the above gear? Explain the reaso selecting the tests. 17.4 Explain the goal of failure analysis. 17.5 Explain the difference in appearance between ductile and brittle frac 17.6 Describe the most important basic stresses in a part under external lo 17.7 Explain why brittle fractures occur when the tensile strength is exceede why ductile fractures occur when the shear strength is exceeded. 17.8 Describe the five types of loading and the type of stresses produced. 17.9 What is the most common type of fracture in machine parts? 17.10 Describe the three principal ways in which fatigue stresses develop. 17.11 Describe the development of "beach marks"onthesurfaceof afatiguef 17.12 How may the origin of a fatigue fracture be determined? 17.13 Once a fatigue crack forms, what does its rate of growth depend upo 17.14 Explain the relation between the origin of fracture and the final fractur of a part subjected to a one-way bending load and one subjected to a rotating ing load. 17.15 Give three examples of stress raisers 17.16 How will the beach marks curve with respect to the origin of failure hardened steel and annealed steel under cyclic loading? Explain. 17.17 Desqibe the kind of fracture which may occur as a result of a loose-fit key on a shaft. 17.18 Explain the effect of three strength reducers. 17.19 Explain why residual stresses are important in failure analysis. 17.20 Under which conditions are residual stresses most significant with regar the material? 17.21 What will be the difference in fracture surface appearance between a I overstress and a high overstress on a material? 17.22 What is the difference in appearance between bending fatigue and tor fatigue? 17.23 What will be the difference in fracture between steel and cast iron subie to torsion?
REFERENCES
Alban, Lester E.: Why Gears Fail, Metal Progress, American Society for Metals, M Park, Ohio, November 1970.
Barer, I?. D., and B. F. Peters: "Why Metals Fail," Gordon and Breach Science lishers, New York, 1970.
Bennett, J. A., and G. W. Quick: Mechanical Failures of Metals in Service. Nat. Std. Circ. 550, Washington, D.C., 1954.
Forrest, Peter R.: "Fatigue of Metals," Addison-Wesley Publishing Co., Inc., Rea Mass., 1962.
FAILURE ANALYSIS 665
Grover, H. J., S. A. Gordon, and L. R. Jackson: "Fatigue of Metals and Structures," Bureau of Aeronautics, Navy Dept., Washington, D.C., 1954.
Heywood, R. 6.: "Designing Against Fatigue of Metals," Barnes & Noble, New York, 1962.
Larson, F. R., and F. L. Carr: How Failures Occur, Metal Progress, American Society for Metals, Metals Park, Ohio, March 1964.
Lipson, Charles: Basic Course in Failure Analysis, Machine Design, The Penton Pub- lishing Co., Cleveland, Ohio, Oct. 16, 1969.
Parker, E. R.: "Brittle Behavior of Engineering Structures," John Wiley & Sons, Inc., New York, 1957.
Polushkin, E. P.: "Defects and Failures of Metals," Elsevier Publishing Co., New York, 1956.
Republic Steel Corporation: "Analysis of Service Failures," Cleveland, Ohio, 1961. Ruskin, A. M.: "Materials Considerations in Design," Prentice-Hall, Inc., Englewood
Cliffs, N.J., 1967. Wulpi, D. J.: "How Components Fail," American Society for Metals, Metals Park,
Ohio, 1966.
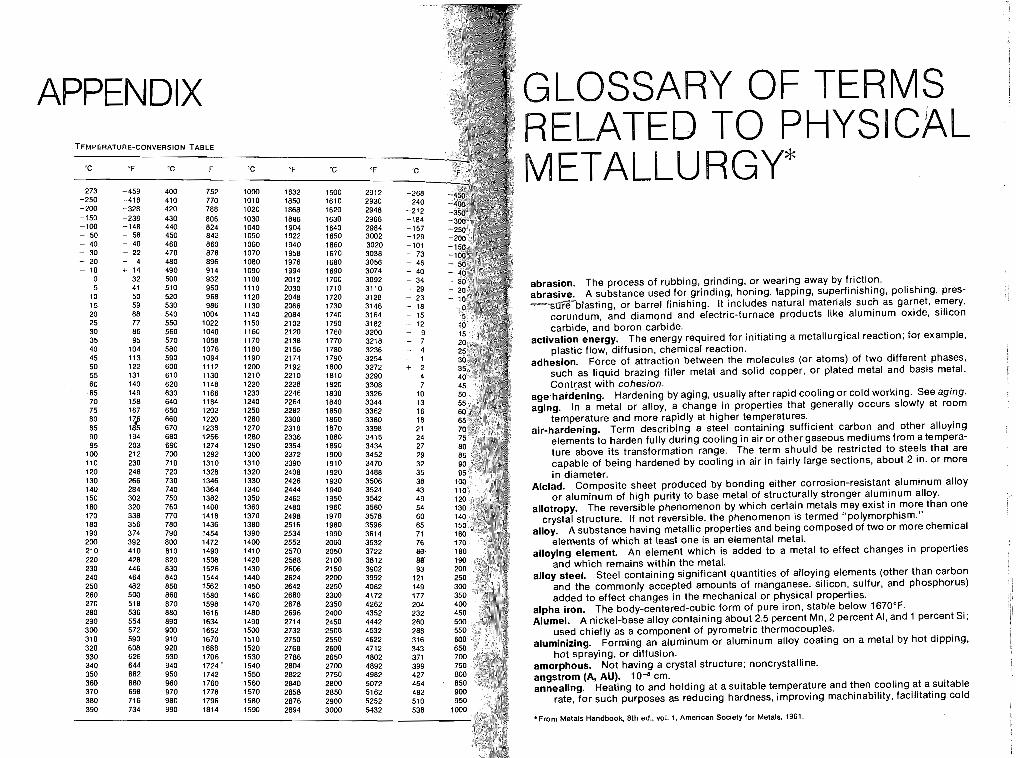
APPENDIX TEMPERATURE-CONVERSION TABLE
"C "F -C 'F
-273 -459 400 752 -250 -418 410 770 -200 -328 420 788 -150 -238 430 806 -100 -148 440 824 - 50 - 58 450 842 - 40 - 40 460 860 - 30 - 22 470 878 - 20 - 4 480 896 - 10 + 14 490 914
0 32 500 932 5 41 510 950
10 50 520 968 15 59 530 986 20 68 540 1004 25 77 550 1022 30 88 560 1040 35 95 570 1058 40 104 580 1076 45 113 590 1094 50 122 600 1112 55 131 610 1130 60 140 820 1148 65 149 630 1166 70 158 840 1184 75 167 650 1202 80 660 1220 85 670 1238 90 194 680 1256 95 203 690 1274
100 212 700 1292 110 230 710 1310 120 248 720 1328 130 266 730 1346 140 284 740 1364 150 302 750 1382 160 320 780 1400 170 338 770 1418 180 356 780 1436 190 374 790 1454 200 392 800 1472 210 410 810 1490 220 428 820 1506 230 446 830 1526 240 464 840 1544 250 482 850 1562 260 500 860 1580 270 518 870 1598 280 536 880 1616 290 554 890 1634 300 572 900 1652 310 590 910 1670 320 608 920 1688 330 626 930 1706 340 644 940 1724 ' 350 662 950 1742 360 680 960 1760 370 698 970 1778 380 716 980 1796 390 734 990 1814
GLOSSARY OF TERMS RELATED TO PHYS METALLURGY*
abrasion. The process of rubbing, grinding, or wearing away by friction. abrasive. A substance used for grinding, honing, lapping, superfinishing, polishing, pres-
lasting, or barrel finishing. It includes natural materials such as garnet, emery, corundum, and diamond and electric-furnace products like aluminum oxide, silicon carbide, and boron carbide.
activation energy. The energy required for initiating a metallurgical reaction; for example, plastic flow, diffusion, chemical reaction.
adhesion. Force of attraction between the molecules (or atoms) of two different phases, such as liquid brazing filler metal and solid copper, or plated metal and basis metal. Contrast with cohesion.
age hardening. Hardening by aging, usually after rapid cooling or cold working. See aging. aging. In a metal or alloy, a change in properties that generally occurs slowly at room
temperature and more rapidly at higher temperatures. air-hardening. Term describing a steel containing sufficient carbon and other alloying
elements to harden fully during cooling in air or other gaseous mediums from atempera- ture above its transformation range. The term should be restricted to steels that are capable of being hardened by cooling in air in fairly large sections, about 2 in. or more in diameter.
Alclad. Composite sheet produced by bonding either corrosion-resistant aluminum alloy or aluminum of high purity to base metal of structurally stronger aluminum alloy.
allotropy. The reversible phenomenon by which certain metals may exist in more than one crystal structure. If not reversible, the phenomenon is termed "polymorphism."
alloy. A substance having metallic properties and being composed of two or more chemical elements of which at least one is an elemental metal.
alloying element. An element which is added to a metal to effect changes in properties and which remains within the metal.
alloy steel. Steel containing significant quantities of alloying elements (other than carbon and the commonly accepted amounts of manganese, silicon, sulfur, and phosphorus) added to effect changes in the mechanical or physical properties.
alpha iron. The body-centered-cubic form of pure iron, stable below 1670°F. Alumel. A nickel-base alloy containing about 2.5 percent Mn, 2 percent Al, and 1 percent Si;
used chiefly as a component of pyrometric thermocouples. aluminizing. Forming an aluminum or aluminum alloy coating on a metal by hot dipping,
hot spraying, or diffusion. amorphous. Not having a crystal structure; noncrystalline. angstrom (A, AU). cm. annealing. Heating to and holding at a suitable temperature and then cooling at a suitable
rate, for such purposes as reducing hardness, improving machinability, facilitating cold
'From Metals Handbook. 8th ed., vol. 1. American Society for Metals, 1961
668 INTRODUCTION TO PHYSICAL METALLURGY
working, producing a desired microstructure, or obtaining desired mechanical, or other properties.
When applied to ferrous alloys, the term annealing, without qualification, i annealing.
When applied to nonferrous alloys, the term annealing imp signed to soften a cold-worked structure by recrystallization or or to soften an age-hardened alloy by causing a nearly corn second phase in relatively coarse form.
Any process of annealing will usually reduce stresses, but if the treatment is for the sole purpose of such relief, it should be designated stress relieving.
anode. The electrode where electrons leave (current enters) an operating system a battery, an electrolytic cell, an x-ray tube, or a vacuum tube.
anode corrosion. The dissolution of a metal acting as an anode. anodizing. Forming a conversion coating on a metal surface by anodic oxidatio
frequently applied to aluminum. apparent density. (Powd. met.) The weight of a unit volume of powder, determin
specified method of loading and usually expressed in grams per cubic centime artificial aging. Aging above room temperature. See aging and precipitation heat tr athermal transformation. A reaction that proceeds without benefit of thermal fluct
that is, thermal activation is not required. Such reactions are diffusionless and place with great speed when the driving force is sufficiently high. For exampl martensitic transformations occur athermally on cooling, even at relatively low t tures, because of the progressively increasing driving force. In contrast, a react occurs at constant temperature is an isothermal transformation; thermal acti necessary in this case, and the reaction proceeds as a function of time.
atomic percent. The number of atoms of an element in a total of 100 representative of a substance; often written a/o.
atomization. (Powd. met.) The dispersion of a molten metal into particles by a rapi ing stream of gas or liauid.
austekpering. ~Genching a ferrous alloy from a temperature above the tran range, in a medium having a rate of heat abstraction high enough to prevent tion of high-temperature transformation products, and then holding the transformation iQ complete, at a temperature below that of pearlite formation that of martensite formation.
austenite. A solid solution of one or more elements in face-centered-cubic iron. The is generally assumed to be carbon.
austenitic steel. An alloy steel whose structure is normally austenitic at room temperatu austenitizing. Forming austenite by heating a ferrous alloy above the transformation r
bainite. A decomposition product of austenite consisting of an aggregate of fer carbide. In general, it forms at temperatures lower than those where very fine forms and higher than those where martensite begins to form on cooling. Its app is feathery if formed in the upper part of the temperature range and acicular, res tempered martensite, if formed in the lower part.
banded structure. A segregated structure of nearly parallel bands aligned in the dire of working.
basal plane. A plane perpendicular to the c, or principal, axis in a tetragonal or hexa structure.
base metal. (1) The metal present in the largest proportion in an alloy; brass, fore is a copper-base alloy. (2) The metal to be brazed, cut, or welded. (3) Afterweld part of the metal which was not melted.
bend test. A test for determining relative ductility of metal that is to be formed, sheet, strip, plate, or wire, and for determining soundness and toughness of metal. specimen is usually bent over a specified diameter through a specified angle for a s fied number of cycles.
GLOSSARY 669
binary alloy. An alloy containing two component elements. binder. (1) In founding, a material, other than water, added to foundry sand to bind the
particles together, sometimes with the use of heat. (2) (Powd. met.) A cementing me- dium: either a material added to the powder to increase the green strength of the com- pact that is expelled during sintering, or a material (usually of relatively low melting point) added to a powder mixture for the specific purpose of cementing together powder particles which alone would not sinter into a strong body.
black light. Electromagnetic radiation not visible to the human eye. The portion of the spectrum generally used in fluorescent inspection falls in the ultraviolet region between 3300 and 4000 A, with the peak at 3650 A.
blowhole. A hole in a casting or a weld caused by gas entrapped during solidification. blue brittleness. Brittleness exhibited by some steels after being heated to some tempera-
ture within the range of 300 to 650°F, and more especially if the steel is worked at the elevated temperature.
brale. A diamond penetrator of specified sphero-conical shape used with a Rockwell hard- ness tester for hard metals. This penetrator is used for the A, C, D, and N scales.
brass. An alloy consisting mainly of copper (over 50 percent) and zinc, to which smaller amounts of other elements may be added.
brazing. Joining metals by flowing a thin layer, capillary thickness, of nonferrous filler metal into the space between them. Bonding results from the intimate contact produced by the dissolution of a small amount of base metal in the molten filler metal, without fusion of the base metal. Sometimes the filler metal is put in place as a thin solid sheet or as a clad layer, and the composite is heated, as in furnace brazing. The term brazing is used where the temoerature exceeds some arbitrary value, such as 800°F; the term soldering is used for temberatures lower than the arbitrary value.
Brinell hardness test. A test for determining the hardness of a material by forcing a hard steel or carbide ball of specified diameter into it under a specified load. The result is expressed as the Brinell hardness number, which is the value obtained by dividing the applied load in kilograms by the surface area of the resulting impression in square
- millimeters. brittle crack propagation. A very sudden propagation of a crack with the absorption of no
energy except that stored elastically in the body. Microscopic examination may reveal some deformation even though it is not noticeable to the unaided eye.
brittle fracture. Fracture with little or no plastic deformation. brittleness. The quality of a material that leads to crack propagation without appreciable
plastic deformation. bronze. A copper-rich copper-tin alloy with or without small proportions of other elements
such as zinc and phosphorus. Also, certain other essentially binary copper-base alloys containing no tin, such as aluminum bronze (copper-aluminum), silicon bronze (copper- silicon), &d beryllium bronze (copper-beryllium).
burning. (1) Permanently damaging a metal or alloy by heating to cause either incipient melting or intergranular oxidation. (2) In grinding, getting the work hot enough to cause discoloration or to change the microstructure by tempering or hardening.
carbide. A compound of carbon with one or more metallic elements. carbide tools. Cutting tools, made of tungsten carbide, titanium carbide, tantalum carbide,
or combinations of them, in a matrix of cobalt or nickel, having sufficient wear resistance and heat resistance to permit high machining speeds.
carbonitriding. Introducing carbon and nitrogen into a solid ferrous alloy by holding above Ac, in an atmosphere that contains suitable gases such as hydrocarbons, carbon mon- oxide, and ammonia. The carbonitrided alloy is usually quench-hardened.
carbon steel. Steel containing carbon up to about 2 percent and only residual q other elements, except those added for deoxidation, with silicon usually percent and manganese to about 1.65 percent. Also termed plain-carbon steel, ordinary steel, and straight-carbon steel.
. .
670 INTRODUCTION TO PHYSICAL METALLURGY
carburizing. Introducing carbon into a solid ferrous alloy by holding above Ac, with a suitable carbonaceous material, which may be a solid, liquid, or gas. burized alloy is usually quench-hardened.
case. In a ferrous alloy, the outer portion that has been made harder than the inn or core, by case hardening.
case hardening. Hardening a ferrous alloy so that the outer portion, or case, is m stantially harder than the inner portion, or core. Typical processes used for case ing are carburizing, cyaniding, carbonitriding, nitriding, induction hardening, hardening.
casting. (1) An object at or near finished shape obtained by solid a mold. (2) Pouring molten metal into a mold to produce an obj
cast iron. An iron containing carbon in excess of the solubility in the alloy at the eutectic temperature. For the various forms iron, malleable cast iron, and nodular cast iron, the word "cast' in "gray iron," "white iron," "malleable iron," and "nodular iron,"
cast structure. The internal physical structure of a casting evidenced tation of crystals and segregation of impurities.
cathode. The electrode where electrons enter (current leaves) an operating syste a battery, an electrolytic cell, an x-ray tube, or a vacuum tube.
cathodic protection. Partial or complete protection of a metal from corrosion by a cathode, using either a galvanic or impressed current.
cavitation. The formation and instantaneous collapse of innumerable tiny voids or within a liquid subjected to rapid and intense pressure changes.
cavitation damage. Wearing away of metal through the formation and collapse of in a liquid.
cemented carbide. A solid and coherent mass made by pressing and sintering a mix powders of one or more metallic carbides and a much smaller amount of a metal, su cobalt, to serve as a binder.
cementite. A compound of iron and carbon, known chemically as iron carbide, an the approximate chemical formula Fe,C. It is characterized by an orthorhombic structure.
ceramic tools. Cutting tools made from fused, sintered, or cemented metallic oxide cermet. A body consisting of ceramic particles bonded with a metal. Charpy test. A pendulum-type single-bow impact test in which the specim
notched, is supported at both ends as a simple beam and broken by a falling The energy absorbed, as determined by the subsequent rise of the pend measure of impact strength or notch toughness.
Chromel. (1) A 9ONi-1OCr alloy used in thermocouples. (2) A series of nickel-ch alloys, some with iron, used for heat-resistant applications.
chromizing. A surface treatment at elevated temperature, generally carried out i vapor, or salt bath, in which an alloy is formed by the inward diffusion of chromi the base metal.
clad metal. A composite metal containing two or three layers that have been bond gether. The bonding may have been accomplished by co-rolling, welding, casting, h chemical deposition, or heavy electroplating.
cleavage. The splitting (fracture) of a crystal on a crystallographic plane of low ind cleavage fracture. A fracture, usually of a polycrystalline metal, in which most of the
have failed by cleavage, resulting in bright reflecting facets. cleavage plane. A characteristic crystallographic plane or set of planes on which cl
fracture easily occurs. coherency. The continuity of lattice of precipitate and parent phase (solvent) mai
by mutual strain and not separated by a phase boundary. coherent precipitate. A precipitate in a stage intermediate between a solute and
phase, formed from a supersaturated solid solution but still retaining the latt' solvent even though the lattice may be distorted. Such a precipitate has boundary.
cohesion. Force of attraction between the molecules (or atoms) within a single ph Contrast with adhesion.
GLOSSARY 671
cohesive strength. (7) The hypothetical stress in an unnotched bar causing tensile frac- ture without plastic deformation. (2) The stress corresponding to the forces between atoms.
cold-short. A condition of brittleness existing in some metals at temperatures below the recrystallization temperature.
cold treatment. Cooling to a low temperature, often near -10O0F, for the purpose of ob- taining desired conditions or properties, such as dimensional or structural stability.
cold working. Deforming metal plastically at a temperature lower than the recrystallization temperature.
columnar structure. A coarse structure of parallel columns of grains, having the long axis perpendicular to the casting surface.
combined carbon. The part of the total carbon in steel or cast iron that is present as other than free carbon.
congruent melting. An isothermal melting in which both the solid and liquid phases have the same composition throughout the transformation.
constantan. A group of copper-nickel alloys containing 45 to 60 percent Cu with minor amounts of iron and manganese, and characterized by relatively constant electrical resistivity irrespective of temperature; used in resistors and thermocouples.
constitution diagram. A graphical representation of the temperature and composition limits of phase fields in an alloy system as they actually exist under the specific condi- tions of heating or cooling (synonymous with phase diagram).
continuous phase. In an alloy or portion of an alloy containing more than one phase, the phase that forms the background or matrix in which the other phase or phases are present as isolated units.
cooling stresses. Residual stresses resulting from nonuniform distribution of temperature during cooling.
coring. A variable composition between the center and surface of a unit of structure (such as a dendrite. arain, carbide particle) resulting from nonequilibrium growth which occurs . - over a range of temperature:
corrosion. The deterioration of a metal by chemical or electrochemical reaction with its environment.
corrosion embrittlement. The severe loss of ductility of a metal resulting from corrosive attack, usually intergranular and often not visually apparent.
corrosion fatigue. Effect of the application of repeated or fluctuating stresses in a cor- rosive environment characterized by shorter life than would be encountered as a result of either the repeated or fluctuating stresses alone or the corrosive environment alone.
covalent bond. A bond between two or more atoms resulting from the completion of shells by the sharing of electrons.
creep. Time-dependent strain occurring under stress. The creep strain occurring at a diminishing rate is called primary creep; that occurring at a minimum and almost con- stant rate, secondary creep; that occurring at an accelerating rate, tertiary creep.
creep strength. (1) The constant nominal stress that will cause a specified quantity of creep in a given time at constant temperature. (2)The constant nominal stress that will cause a specified creep rate at constant temperature.
crevice corrosion. A type of concentration-cell corrosion; corrosion of a metal that is caused by the concentration of dissolved salts, metal ions, oxygen or other gases, and such, in crevices or pockets remote from the principal fluid stream, with a resultant building up of differential cells that ultimately cause deep pitting.
critical cooling rate. The minimum rate of continuous cooling just sufficient to prevent undesired transformations. For steel, the slowest rate at which it can be cooled from above the upper critical temperature to prevent the decomposition of austenite at any temperature above the Ms.
critical point. (1) The temperature or pressure at which a change in crystal structure, phase, or ohvsical orooerties occurs. Same as transformation temperature. (2) In an equilibri- - r , - - - , , um diagram, that specific value of composition, temperature and pressure, or combina- tions thereof, at which the phases of a heterogeneous system are in equilibrium.
critical strain. The strain just sufficient to cause the growth of very large grains during heat- ing where no phase transformations take place.
672 INTRODUCTION TO PHYSICAL METALLURGY GLOSSARY 673 I I jl
crystal. A solid composed of a t~ms, ions, Or molecules arranged in a pattern which i petitive in three dimensions.
crystalline fracture. A fracture of a Polycrystalline metal characterized by a grainy ap ance.
crystallization. The separation, usually from a liquid phase on cooling, of a solid crystal phase.
cubic plane. A plane perpendicular to any one of three crystallographic axes of the cu (isometric) system; the Miller indices are {loo).
cup fracture (cup-and-cone fracture). Fracture, frequently seen in tensile test pieces ductile material, in which the surface of failure on one portion shows a central flat of failure in tension, with an exterior extended rim of failure in shear.
cyaniding. introducing carbon and nitrogen into a solid ferrous alloy by holding abo Ac,, in contact with molten cyanide of suitable composition. The cyanided alloy usually quench-hardened.
decalescence. A P h ~ ~ ~ m e n o n , associated with the transformation of alpha iron to ga iron on the heating (superheating) of iron or steel, revealed by the darkening of the m surface owing to the sudden decrease in temperature caused by the fast absorptio that latent heat of transformation.
decarburization. The loss of carbon from the surface of a ferrous alloy as a result of heat ing in a medium that reacts with the carbon at the surface.
deep etching. Severe etching of a metallic surface for examination at a magnification of diameters or less to reveal gross features Such as segregation, cracks, porosity, or gr flow.
defect. A condition that impairs the usefulness of an object or of a part. deformation bands. Parts of a crystal which have rotated differently during deformatio
to produce bands of varied orientation within individual grains. dendrite. A crystal that has a tree-like branching pattern, being most evident in cast metal
slowly cooled through the solidification range. deoxidizer. A substance that can be added to molten metal to remove either free or com-
bined oxygen. dezincification. Corrosion of copper-zinc alloys involving loss of zinc and the for
mation of a spongy Porous copper. diamond-pyramid hardness test. An indentation hardness test employing a diamo
pyramid indenter and variable loads enabling the use of one hardness scale for all ran of~hardness from very soft lead to tungsten carbide. See Knoop hardness and Vic hardness.
dichromate treatment. A chromate conversion coating produced on magnesium alloys in a boilina solution of sddium dichromate. -
die casting. (1) A casting made in a die. (2) A casting process where molten metal is forced under high pressure into the cavity of a metal mold.
diffusion. (1) spreading of a constituent in a gas, liquid, or solid, tending to make the com- position of all parts uniform. (2) The spontaneous movement of atoms or molecules to new sites within a material.
diffusion coating. (1) An alloy coating Produced at high temperatures by the inward diffu- sion of the coating material into the base metal. (2) Composite electrodeposited coatings which are subsequently interdiffused by thermal treatment.
diffusion coefficient. A factor of Proportionality representing the amount of substance in grams diffusing across an area of 1 sq cm through a unit concentration gradient in 1 s of time.
dilatometer. An instrument for measuring the expansion or contraction in a metal resulting from changes in such factors as temperature or allotropy.
dip brazing. Brazing by immersion in a molten salt or metal bath. Wher: a metal bath is employed, it may provide the filler metal.
direct quenching. Quenching carburized parts directly from the carburizing operation. discontinuous precipitation. Precipitation, mainly at the grain boundaries of a super-
saturated solid solution, accompanied by the appearance of two lattice parameters: one, of the solute atoms still in solution, the other, of the precipitate.
dislocation. A linear defect in the structure of a crystal. Two basic types are recognized, but combinations and partial dislocations are most prevalent. An "edge dislocation" corresponds to the row of mismatched atoms along a straight edge formed by an extra, partial plane of atoms within the body of the crystal, that is, by a plane of smaller area than any other parallel section through the crystal. A "screw dislocation" corresponds to the highly distorted lattice adjacent to the axis of a spiral structure in a crystal, the spiral structure being characterized by a distortion that has joined normally parallel nianes tooether to form a continuous helical ramp winding about the dislocation as an ~-., axis with a pitch of one interplanar distance.
distortion. Any deviation from the desired shape or contour. drawability. A measure of the workability of a metal subject to a drawing
usually expressed to indicate a metal's ability to be deep-drawn. drawing. (1) Forming recessed parts by forcing the plastic flow of metal
ducing the cross section of wire or tubing by pulling it through a die.
process. A term
in dies. (2) Re- (3) A misnomer
for tempering. ductile crack propagation. Slow crack propagation that is accompanied by noticeable
plastic deformation and requires energy to be supplied from outside the body. ductility. The ability of a material to deform plastically without fracturing, being measured
by elongation or reduction of area in a tensile test. duralumin. (obsolete) A term formerly applied to the class of age-hardenable aluminum-
copper alloys containing manganese, magnesium, or silicon. dve venetrant. Penetrant with dye added to make it more readily visible under normal - lighting conditions.
eddy-current testing. Nondestructive testing method in which eddy-current flow IS induced in the test object Changes in the flow caused by variations in the object are reflected ~ n t o a nearby coil or coils for subsequent analysis by sultable instrumentation and techniques.
elastic deformation. Change of dimensions accompanying stress in the elastic range, ori- ginal dimensions being restored upon release of stress.
elasticity. That property of a material by virtue of which it tends to recover its original size-and shape after deformation.
elastic limit. The maximum stress to which a material may be subjected without any per- manent strain remaining upon complete release of stress.
electrochemical corrosion. Corrosion which occurs when current flows between cathodic - . - - . . - . and anodic areas on metallic surfaces.
electrogalvanizing. The electroplating of zinc upon iron or steel. electrolyte. (1) An ionic conductor. (2) A liquid, most often a solution, that will conduct an
electric current. electromotive series. A list of elements arranged according to their standardelectrodepo-
tentials. In corrosion studies, the analogous but more practical galvanic series of metals is generally used. The relative position of a given metal is not necessarily the same in the two series.
electron compound. A term used to describe intermediate phases of metal systems that have both a common crystal structure and a common ratio of valence electrons to atoms. Thus, CuZn, Cu,AI, Cu,Sn, and FeAl all have the body-centered-cubic structure and an electron-to-atom ratio of 3 to 2.
electroplating. Electrodepositing metal (may be an alloy) in an adherent form upon an ob- ject serving as a cathode.
elongation. In tensile testing, the increase in the gage length, measured after fracture of the specimen within the gage length, usually expressed as a percentage of the original gage-length.
emulsifier. (1) Same as emulsifying agent. (2) In penetrant inspection, a material that is
JTRODUCTION TO PHYSICAL METALLURGY GLOSSARY 675
Ided to some penetrants, after the penetrant is applied, to make a water-wa re. file hardness. Hardness as determined by the use of a file of standardized hardness on the
ion. A suspension of one liquid phase in another. assumption that a material which cannot be cut with the file is as hard as, or harder than,
3rium. A dynamic condition of balance between atomic movements wher the file. Files covering a range of hardnesses may be employed. flame hardening. Quench hardening in which the heat is applied directly by aflame. nt is zero and the condition appears to be one of rest rather than change. fluidity. The ability of liquid metal to run into and fill a mold cavity.
wium diagram. A graphipal representation of the temperature, pressure, fluorescent magnetic-particle inspection. Inspection with either dry magnetic particles or
:ion limits of phase fields ip an alloy system as they exist under condtions those in a liquid suspension, the particles being coated with a fluorescent substance to luilibrium. In metal systems, pressure is usually considered constant ( t h phase diagram). increase the visibility of the indications.
fluoroscopy. An inspection procedure in which the radiographic image of the subject is n. Destruction of metals or other materials by the abrasive action of mov
viewed on a fluorescent screen, normally limited to low-density materials or thin sections ,ually accelerated by the presence of solid particles or matter in suspensio rrrosion occurs simultaneously, the term erosion-corrosion is often used. of metals because of the low light output of the fluorescent screen at safe levels of
g. Subjecting the surface of a metal to preferential chemical or electrolytic radiation. der to reveal structural details. focal spot. The area on the anode of an x-ray tube where the electron beam impinges, thus
ic. (1) An isothermal reversible reaction in which a liquid solution is conve producing x-rays. o or more intimately mixed solids on cooling, the number of solids formed b forging. Plastically deforming metal, usually hot, into desired shapes with compressive
me as the number of components in the system. (2) An alloy having the corn .force, with or.without dies. jicated by the eutectic point on an equilibrium diagram. (3) An alloy structure formability. The relativeease with which a metal can beshaped through plastic deformation.
xed solid constituents formed by a eutectic reaction. fractogrsphy. Descriptive treatment of fracture, especially in metals, with specific reference
oid. (1) An isothermal reversible reaction in which a solid phase (usually to photographs of the fracture surface. Macrofractography involves photographs at low
n ) is converted into two or more intimately mixed solids on cooling, the nu magnification; microfractography, at high magnification. ; formed being the same as the number of components in the system. fracture stress. (1) The maximum principal true stress at fracture. Usually refers to un-
ving the composition indicated by the eutectoid point on an equilibrium d notched tensile specimens. (2) The (hypothetical) true stress which will cause fracture
I alloy structure Of intermixed solid constituents formed by a eutectoid rea without further deformation at any given strain.
'ometer. An instrument for measuring changes caused by stress in a linear fracture test. Breaking a specimen and examining the fractured surface with the unaided
a body. eye or with a low-power microscope to determine such things as composition, grain size, case depth, soundness, or presence of defects.
. The phenomenon leading to fracture under repeated or fluctuating stresses fragmentation. The subdivision of a grain into small discrete crystallites outlined by a
naximum value less than the tensile strength of the material. Fatigue fractu heavily deformed network of intersecting slip as a result of cold working. These small
>gressive, beginning as minute cracks that grow under the action of the flue crystals or fragments differ from one another in orientation and tend to rotate to astable
ess. orientation determined by the slip, systems.
! life. The number of cyclesof stress that can be sustained prior to failure for free carbon. The part of the total carbon in steel or cast iron that is present in the elemental
it condition. form as graphite or temper carbon.
! limit. The maximum stress below which a material can presumably endure free ferrite. Ferrite that is structurally separate and distinct, as may be formed without the
e number of stress cycles. If the stress is not completely reversed, the valu simultaneous formation of carbide when cooling hypoeutectoid austenite into the ?an stress, the minimum stress, or the stress ratio should be stated. critical temperature range. Also proeutectoid ferrite.
1 strength. The maximum stress that can be sustained for a specified numbe fretting (fretting corrosion). Action that results in surface damage, especially in a corrosive !s without failure', the stress being completely reversed within each cycle unless o environment, when there is relative motion between solid surfaces in contact under je stated. pressure.
(1) A solid solution of one or more full annealing. Annealing a ferrous alloy by austenitizing and then cooling slowly through lerwise designated, the solute is generally assumed to be carbon. On the transformation range. The austenitizing temperature for hypoeutectoid steel is
I diagrams there are two ferrite regions Sekarated by an austenite area. usually above Ac,; and for hypereutectoid steel, usually between Ac,,, and Ac,,. tlpha ferrite; the upper, delta ferrite. If there is no designation, alpha ferr banding. Parallel bands of free ferri les referred to as ferrite streaks. gage length. The original length of that portion of the specimen over which strain, change
ibre). (1) The characteristic of wrought metal that indicates direc of length, and other characteristics are measured. j is revealed by the etching of a longitudinal section or is manifested galling. Developing a condition on the rubbing surface of one or both mating parts where ody appearance of a fracture. It is caused chiefly by the extension of excessive friction between high spots results in localized welding with subsequent the metal, both metallic and nonmeta spalling and afurther roughening of the surface. xeferred orientation of metal crystals galvanic corrosion. Corrosion associated with the current of a galvanic cell consisting of wing. two dissimilar conductors in an electrolyte or two similar conductors in dissimilar elec- fracture. A fracture where the surface is characterized by adull gray or silky ap trolytes. Where the two dissimilar metals are in contact, the resulting reaction is referred
:e. Contrast with crystalline fracture. to as couple action. structure. (1) In forgings, a structure revealed as laminations, not necessarily galvanic series. A series of metals and alloys arranged according to their relative elec- ntal, on an etched section or as a ropy appearance on a fracture. It is not to be trode potentials in a specified environment.
ed with the "silky" or "ductile" fracture of a clean metal. (2) In wrought ir gamma iron. The face-centered-cubic form of pure iron, stable from 1670 to 2550°F. ~cture consisting of slag fibers embedded in ferrite. grain. An individual crystal in a polycrystalline metal or alloy.
grain growth (coarsening). An increase in the size of grains in polycrystalline metal, usually effected during heating at elevated temperatures. The increase may be gradual or
- 676 INTRODUCTION TO PHYSICAL METALLURGY
abrupt, resulting in either uniform or nonuniform grains after growth has ce ture of nonuniform grains is sometimes termed duplexed. Abnormal grain g gerated grain growth) implies the formation of excessively large grains, uni uniform.
grain refiner. A material added to a molten metal to attain finer grains in the final grain size. For metals, a measure of the areas or volumes of grains in a poIycrystal
terial, usually expressed as an average when the individual sizes are fairly Grain sizes are reported in terms of number of grains per unit area or volume, in t average diameter, or as a grain-size number derived from area measurements.
granular fracture. A type of irregular surface produced when metal is broken; &ara by a rough, grain-like appearance as differentiated from a smooth and silky or a f type. It can be subclassified into transgranular and intergranular forms. This t fracture is frequently called crystalline fracture, but the inference that the metal h tallized is not justified.
graphitic carbon. Free carbon in steel or cast iron. graphite steel. Alloy steel made so that part of the carbon is present as graphite. graphitization. Formation of graphite in iron or steel. Where graphite is formed
solidification, the phenomenon is called primary graphitization; where formed I heat treatment, secondary graphitization.
graphitizing. Annealing a ferrous alloy in Such a way that some or all of the carbon . cipitated as graphite.
grey cast iron. A cast iron that gives a gray fracture due to the presence of flake gr Often called gray iron.
grinding cracks. Shallow cracks formed in the surface of relatively hard materials bec of excessive grinding heat or the high sensitivity of the material.
hard chromium. Chromium deposited for engineering purposes, such as increasing wear resistance of sliding metal surfaces, rather than as a decorative coating. It is us ly applied directly to basis metal and is customarily thicker than a decorative dep
hard-drawn. Temper of copper Or copper-alloy tubing drawn in excess of 25 percen duction in area.
hardenability. In a ferrous alloy, the Property that determines the depth and distributio hardness induced by quenching.
hardening. Increasing the hardness by suitable treatment, usually involving hea cooling. When applicable, the following more specific terms should be used: a ening, case hardening, flame hardening, induction hardening, precipitation ha and quench hardening.
hard facing. Depositing filler metal On a surface by welding, spraying, or braze welding fo the purpose of resisting abrasion, erosion, wear, galling, and impact.
hardness. Resistance of metal to Plastic deformation usually by identation. However, th term may also refer to stiffness or temper, Or to resistance to scratching, abrasion, o cutting. Indentation hardness may be measured by various hardness tests, such a Brinell, Rockwell, and microhardness.
heat check. A pattern of parallel surface cracks that are formed by alternate rapid heating and cooling of the extreme surface metal, sometimes found on forging dies and piercin ~unches. There may be two sets of parallel cracks, one set perpendicular to the other.
heat treatment. Heating and cooling asolid metal or alloy in such a way as to obtain desi conditions or properties. Heating for the sole purpose of hot working is excluded fr the meaning of this definition.
homogenizing. Holding at high temperature to eliminate or decrease chemical segregatio by diffusion.
homogenizing treatment. A heat treatment of an alloy intended to make it uniform in com- position by eliminating coring and concentration gradients.
homopolar crystal. A crystal characterized by covalent bonding, the type of atomic bonding resulting from the sharing of electrons by neighboring atoms.
hot forming. Working operations such as bending, drawing, forging, piercing, pressing, and heading performed above the recrystallization temperature of the metal.
GLOSSARY 677
hot-shortness. Brittleness in metal in the hot-forming range. hot tear. Afracture formed in a metal during solidification because of hindered contraction. hot working. Deforming metal plastically at such a temperature and rate that strain harden-
ing does not occur. The low limit of temperature is the recrystallization temperature. hypereutectic alloy. Any binary alloy whose composition lies to the right of the eutectic on
an equilibrium diagram and which contains some eutectic structure. hypereutectoid. Analogous to hypereutectic. hypoeutectic alloy. Any binary alloy whose composition lies to the left of the eutectic on
an equilibrium diagram and which contains some eutectic structure. hypoeutectoid. Analogous to hypoeutectic.
immersion plating (dip plating). Depositing a metallic coating on a metal immersed in a liquid solution, without the aid of an external electric current.
impact energy (impact value). The amount of energy required to fracture a material, usu- ally measured by means of an lzodor Charpy test. The type of specimen and testing con- ditions affect the values and therefore should be specified.
impact test. A test to determine the behavior of materials when subjected to high rates of loading, usually in bending, tension, or torsion. The quantity measured is the energy absorbed in breaking the specimen by a single blow, as in the Charpy or lzod tests.
inclusions. Nonmetallic materials in a solid metallic matrix. indentation hardness. The resistance of a material to indentation. This is the usual type of
hardness test, in which a pointed or rounded indenter is pressed into a surface under a substantially static load.
indication. In nondestructive inspection, a response, or evidence of a response, that requires interpretation to determine its significance.
induction furnace. An a-c electric furnace in which the primary conductor is coiled and generates, by electromagnetic induction, a secondary current which develops heat
- within the metal charge. induction hardening. Quench hardening in which the heat is generated by electrical
induction. inoculation. The addition of a material to molten metal to form nuclei for crystallization. - intercept method. A method of determining grain size by counting the number of grains per
unit lenath intersected bv straight lines. intercrysta~$ne. Between the crystals, or grains, of a metal. interdendritic corrosion. Corrosive attack which progresses preferentially along interden-
dritic oaths. This t v ~ e of attack results from local differences in composition, such as coring' commonly encountered in alloy castings. -
intergranular corrosion. Corrosion occuring preferentially at grain boundaries. intermediate annealing. Annealing wrought metals at one or more stages during manufac-
ture and before final treatment. intermediate phase. In an alloy or a chemical system, a distinguishable homogeneous
phase whose composition range does not extend to any of the pure components of the system.
intermetallic compound. An intermediate phase in an alloy system, having a narrow range of homogeneity and relatively simple stoichiometric proportions, in which the nature of the atomic binding can vary from metallic to ionic.
interruoted aaina. Aging at two or more temperatures, by steps, and cooling to room tem- .....
pe;ature i f t& each step. interrupted quenching. Quenching in which the metal object being quenched is removed
frnm the auenchina medium while the object is at a temperature substantially higher . . - . . . . . . 7 - - ~
than that of the quekhing medium. See also time quenching. interstitial solid solution. Asolid solution in which the solute atoms occupy positions within
the lattice of the solvent. See also substitutional solid solution. intracrystalline. Within or across the crystals or grains of a metal; same as transcrystalline
and transgranular. ion. An atom, or group of atoms, that has gained or lost one or more outer electrons and
678 INTRODUCTION TO PHYSICAL METALLURGY
thus carries an electric charge. Positive ions, or cations, are deficient in outer Negative ions, or anions, have an excess of outer electrons.
ionic crystal. A crystal in which atomic bonding results from the elect forces between positively and negatively charged ions; for example, This type of atomic linkage, also known as polar bonding, is chara compounds.
isothermal annealing. Austenitizing a ferrous alloy and then cooling to and h temperature at which austenite transforms to a relatively soft ferrite carbide ag
isothermal transformation. A change in phase at any constant temperature. isotropy. Quality of having identical properties in all directions. lzod test. A pendulum type of single-blow impact test in which the speci
notched, is fixed at one end and broken by a falling pendulum. The energy measured by the subsequent rise of the pendulum, is a measure of impact notch toughness.
Knoop hardness. Microhardness determined from the resistance of metal to indentati a pyramidal diamond indenter, having edge angles of 172" 30' and 130°, making a r bohedral impression with one long and one short diagonal. The long diagonal is sured microscopically to determine the KHN.
lea@2~fp*n. In radiography, a screen used (1) to filter out soft-wave or scattered radia ' ' to increase the intensity of the remaining radiation so that the exposure time :*. ' W b & ased.
ledeburiti. '-he eutectic of the iron-carbon system, the constituents being austenite a cement -he austenite decomposes into ferrite and cementite on cooling below t Ar,.
liquidus. In a constitution or equilibrium diagram, the locus of points representing th temperatures at which the various compositions in the system begin to freeze on coo ing or to finish meking on heating.
Luder bandf Surface markings or depressions resulting from localized plastic deformatio in metals which show discontinuous yielding. See stretcher strains.
macro-etch. Etching Df a metal surface for accentuation of gross structural details and defects for observation by the unaided eye or at magnifications not exceeding ten di- ameters.
macrograph. A graphic reproduction of the surface of a prepared specimen at a magnifi- cation not exceeding ten diameters. When photographed, the reproduction is known as a photomacrograph.
macroscopic. Visible at magnifications from one to ten diameters. macroshrinkage. A casting defect, detectable at magnifications not exceeding ten diame-
ters, consisting of voids in the form of stringers shorter than shrinkage cracks. This defect results from contraction during solidification where there is not an adequate opportunity to supply filler material to compensate for the shrinkage. It is usually associated with abrupt changes in section size.
macrostructure. The structure of metals as revealed by examination of the etched surface of polished specimen at a magnification not exceeding ten diameters.
magnetic-particle inspection. A nondestructive method of inspection for determining the existence and extent of possible defects in ferromagnetic materials. Finely divided mag- netic particles, applied to the magnetized part, are attracted to and outline the pattern of any magnetic-leakage fields created by discontinuities.
malleability. The characteristic of metals which permits plastic deformation in compres- sion without rupture.
malleable cast iron. A cast iron made by a prolonged anneal of white cast iron in which decarburization or graphitization, or both, take place to eliminate some or all of the
I GLOSSARY 679 i
cementite. The graphite is in the form of temper carbon. If decarburization is the pre- dominant reaction, the product will have a light fracture, hence, "white-heart malleable"; otherwrse, the fracture will be dark, hence, "black-heart malleable." "Pearl~trc mal- leable" is a black-heart variety having a pearlitic matrix alont with perhaps some free ferrite.
malleableizing. Annealing white cast iron in such a way that some or all of the combined car- bon is transformed to graphite, or, in some instances, part of the carbon is removed completely.
martempering. Quenching an austenitized ferrous alloy in a medium at a temperature in the upper part of the martensite range, or slightly above that range, and holding it in the medium until the temperature throughout the alloy is substantially uniform. The alloy is then allowed to cool in air through the martensite range.
martensite. (1) In an alloy, a metastable transitional structure intermediate between two allotropic modifications whose abilities to dissolve a given solute differ considerably, the high-temperature phase having the greater solubility. The amount of the high- temperature phase transformed to martensite depends to a large extent upon the temper- ature attained in cooling, there being a rather distinct beginning temperature. (2) A me- tastable phase of steel, formed by a transformation of austenite below the M, (or Ar") temperature. It is an interstitial supersaturated solid solution of carbon in iron having a body-centered-tetragonal lattice. Its microstructure is characterized by an acicular, or needlelike, pattern.
martensitic transformation. A reaction which takes place in some metals on cooling, with the formation of an acicular structure called martensite.
matrix. The principal phase or aggregate in which another constituent is embedded. mechanical metallurgy. The technology dealing with the manner in which metals react to
their mechanical environment. mechanical properties. The properties of a material that reveal
behavior where force is applied, thereby indicating its suitabil cations: for exam~le. modulus of elasticity, tensile strength, el fatigue Itmit. I
mechanical twin. A twin formed in a metal during plastic deformation by a simple shear of the lattice.
melting point. The temperature at which a pure metal, compound, or eutwtic changes from solid to liquid; the temperature at which the liquid and the solid are in equilibrium.
metal. (1) An opaque lustrous elemental chemical substance that is a good conductor of heat and electricity and, when polished, a good reflector of light. Most elemental metals are malleable and ductileand are, in general, heavierthan theothe: elemental substances. (2) As to structure, metals may be distinguished from nonmetals by their atomic binding and electron availability. Metallic atoms tend to lose electrons from the outer shells, the positive ions thus formed being held together by the electron gas produced by the sep- aration. The ability of these free electrons to carry an electric current, and the fact that the conducting power decreases as temperature increases, establish one of the prime distinctions of a metallic solid.
metallizing (spray metallizing). Forming a metallic coating by atomized spraying with molten metal or by vacuum deposition.
metallograph. An optical instrument designed for both visual observation and photomi- crogrdphy of prepared surfaces of opaque materials at magnifications ranging from about 25 to about 1,500 diameters. The instrument consists of a high-intensity illuminat- ing source, a microscope, and a camera bellows. On some instruments provisions are made for examination of specimen surfaces with polarized light, phase contrast, oblique illumination, dark-field illumination, and customary bright-field illumination.
rnetallography. The science dealing with the constitution and structure of metals and alloys as revealed by the unaided eye or by such tools as low-powered magnification, optical microscope, electron microscope, and diffraction or x-ray techniques.
metallurgy. The science and technology of metals. Process (chemical) metallurgy is con- cerned with the extraction of metals from their ores and with the refining of metals; phys- ical metallurgy deals with the physical and mechanical properties of metals as affected by composition, mechanical working, and heat treatment.
680 1NTRODUCTlON TO PHYSICAL METALLURGY GLOSSARY 681
metal Coating metal objects by spraying molten metal upon the surface normalizing, Heating a ferrous alloy to a suitable temperature above the transformation pressure. range and then cooling in air to a temperature substantially below the transformation
metastable. In a state Of pseudoequilibrium which has a higher free energy than range. true equilibrium state yet does not change spontaneously. nucleation. -rhe initiation of a phase transformation at discrete sites, the new phase grow-
micrograph. A graphic reproduction of the surface of a prepared specimen, ing on nuclei. at a magnification greater than ten diamaters. ~f produced by photographic mea nucleus. (1) The first structurally stable particle capable of initiating recrystallization of a 1 called a photomicrograph (not a microphotograph). phase or the growth of a new phase, and possessing an interface with the parent matrix.
microhardness. Hardness determined by using a microscope to measure the diagon ~h~ term is also applied to a foreign particle which initiates such action. (2) The heavy the impression left by a Knoop or Vickers indenter. The hardness is the load divide central core of an atom, in which most of the mass and the total positive electric charge the area of the impression. are concentrated.
microsegregation. Segregation within a grain, crystal, or small particle, see microshrinkage. A casting defect, not detectable at magnifications lower than ten
eters, consisting of interdendritic voids. This defect results from contraction octahedral plane. In cubic crystals, a plane with equal intercepts on all three axes. solidification where there is not an adequate opportunity to supply filler material offset, ~h~ distance along the strain coordinate between the initial portion of a stress- Pensate for shrinkage. Alloys with a wide range in solidification temperature a strain curve and a parallel line that intersects the stress-strain curve at a value Of stress titularly susceptible. is used as a measure of the yield strength. It is used for materials that have no
microstructure. The Structure of polished and etched metals as revealed by a microsc obvious yield point. A value of 0.2 percent is commonly used. at a magnification greater than ten diameters. optical pyrometer. An instrument for measuring the temperature of heated material by
FAiller indices, Plane. Indices which identify a family of planes in crystal structure, the intensity of light emitted with a known intensity of an incandescent lamp m, n, and P for any Plane within a crystal give the reciprocals I / ~ , I,/", and filament.
which may be changed to a Common denominator, resulting in the numerators h, k, orange A pebble-grained surface which develops in forming of n ~ t a l s having respectively. These I-tUrTIeratOrS when written as (hkl) identify the family of plane grains.
which the specific plane belongs. ordering. Forming a superlattice. of elasticity. A measure of the stiffness of metal. Ratio of stress, prop averaging. Aging under conditions of time and temperature greater than those required
ti0nal limit, to corresponding strain. to obtain maximum change in a certain property, SO that the property is altered in the monotectic. An isothermal reversible reaction in a binary system, in which a liquid on co direction of the initial value. See aging.
ing decom~oses into a second liquid of a different composition and a ~t diff overheating. eating a metal or alloy to such a high temperature that its properties are im- a eutectic in that only one Of the two products of the reaction is below its freezi paired. When the original properties cannot be restored by further heat treating, by
range. mechanical working, or a combination of working and heat treating, the overheating Is Ms temperature. The temperature at which martensite begins to form in an alloy system known as burning.
Specifically for Steel, it is the temperature at which austenite begins to than oxidation. A reaction in which there is an increase in valence resulting from a loss of elec- into martensite on ~ool ing. trons.
parameter (lattice). In a crystal, the length. usually in angstrom units, of the unit cell alon'g one of its axes or edges; also called lattice constant.
natural aging. S~ontaneous aging of a Supersaturated solid solution at room temperatu particle size. (powd. met,) The controlling lineal dimension of an individual particle, as See aging, and Compare with artificial aging. determined by analysis with screens or other suitable instruments.
necking. (1) Reducing the cross-sectional area of metal in a localized area by stretching, patenting. in wire making, a heat treatment applied to medium-carbon or high-carbonsteei PI Reducing the diameter of a portion of the length of a cylindrical shell or tube. before the drawing of wire or between drafts. This process consists in heating a 1
network structure. A structure in which one constituent occurs primarily at the grain dound- perature above the transformation range and then cooling to a temperature Ae% 1 aries, thus Partially or completely enveloping the grains of the other constituents, in air or in a bath of molten lead or salt.
neutron. nuclear Particle with a mass approximately the same as that of a hydro- pearlite. A lamellar aggregate of ferrite and cementite, often occurring in steel and cast gen atom and electrically neutral. iron.
nitriding. Introducing nitrogen into a solid ferrous alloy by holding at a suitable temperature penetrant. A liquid with low surface tension used in penetrant inspection to flow into sur- (below Ac, for ferritic steels) in contact with a nitrogenous material, usually ammonia or face openings of parts being inspected.
of appropriate Composition. Quenching is not required to produce a penetrant inspection. A method of nondestructive testing for determining the existence 1 hard case. extent of discontinuities that are open to the surface in the Pad being
' noble Ineta!. (1) A metal whose potential is highly positive relative to the hydrogen elec- l-he indicationr are made visible through the use of a dye or fkI0rescent chemical in the
trade. (2) A metal with marked resistance to chemical reaction, particularly to oxidation liquid employed as the inspection medium. and solution by inorganic acids. The term as often used is synonymous with precious peritec.ic. An isothermal reversible reaction in which a liquid phase reacts with a "lid metal. phase to produce another solid phase On cooling.
nodular cast iron- A cast iron that has been treated while molten with a master alloy con- peritectoid. An isothermal reversible reaction in which a solid phase reacts with a taining an element such as magnesium or cerium to give primary graphite in the spheru- solid phase to produce yet a third solid phase on cooling. litic form. permanent mold. A metal mold (other than an ingot mold) of two or more parts that is used
nondestructive inspection. Inspection by methods that do not destroy the pad to determine repeatedly for the production of many castings of the same form. Liquid metal is poured its suitability for use. in by gravity.
682 INTRODUCTION TO PHYSICAL METALLURGY
permanent set. Plastic deformation that remains upon releasing the stress that p the deformation.
phase. A physically homogeneous and distinct portion of a material system. phase diagram. Same as constitution diagram or equilibrium diagram. phosphatizing. Forming an adherent phosphate coating on a metal immersed in a
aqueous phosphate solution. pitting. Forming small sharp cdvities in a metal surface by nonuniform electrodepo
by corrosion. plastic deformation. Deformation that does or will remain permanent after removal 0
load which caused it. plasticity. The ability of a metal to deform nonelastically without rupture. polycrystalline. Pertaining to asolid composed of many crystals. polymorphism. See allotropy. porosity. Fine holes or pores within a metal. powder metallurgy. (Powd.met.) The art of producing metal powders and of utilizing m
powders for the production of massive materials and shaped objects. precipitation hardening. Hardening caused by the precipitation of a constituent
supersaturated solid solution. See also age hardening and aging. precipitation heat treatment. Artificial aging in which a constituent precipitates
supersaturated solid solution. precision casting. A metal casting of reproducible accurate dimensions, regardless of
it is made. preferred orientation. A condition of a polycrystalline aggregate in which the crystal
entations are not random. preheating. Heating before some further thermal or mechanical treatment. For tool s
heating to an intermediate temperature immediately before final austenitizing. For s nonferrous alloys, heating to a high temperature for a long time, in order to homoge the structure before working.
process annealing. In the sheet and wire industries, heating a ferrous alloy to a temperat close to, but below, the lower limit of the transformation range and then cooling, in ord to soften the alloy for further cold working.
progressive aging. Aging by increasing the temperature in steps or continuously du the aging cycle. Sedaging and compare with interruptedaging.
proportional limit. The maximum stress at which strain remains directly proportional to stress.
pyrometer. A devlce for measuring temperatures above the range of l lqu~d thermometer
quench hardening. Hardening a ferrous alloy by austenitizing and then cooling rapidly enough so that some or all of the austenite transforms to martensite. The austenitizing temperature for hypoeutectoid steels is usually above Ac, and for hypereutectoid.steels usually between Ac, . and Ac,,.
quenching. Rapid cooljng. When applicable, the following more specific terms should be used: direct quenching, interrupted quenching, selective quenching, spray quenching, and time quenching.
radiograph. A photographic shadow image resulting from uneven absorption of radiation in the object being subjected to penetrating radiation.
radiography. A nondestructive method of internal examination in which metal or other objects are exposed to a beam of x-ray or gamma radiation. Differences in thickness, density, or absorption caused by internal discontinuities are apparent in the shadow image e~ther on a fluorescent screen or on photographic film placed behind the object.
recalescence. A phenomenon associated with the transformation of gamma iron to alpha iron on the cooling (supercooling) of iron or steel; it is revealed by the brightening (re- glowing) of the metal surface owing to the sudden increase in temperature caused by the fast liberation of the latent heat of transformation.
GLOSSARY 683
recarburize. (1) To increase the carbon content of molten cast iron or steel by adding car- I bonaceous material, high-carbon pig iron or a high-carbon alloy. (2) To carburize a I
metal part to retc~rn surface carbon lost in processin . 1 recovery. Reduction or removal of work-hardening effects, w~thout motlon of large-angle 1
grain boundaries. I
recrystallization. (1) The change from one crystal structure to another, as occurs on heating or cooling through a cr':':al temperature. (2) The formation of a new, strain-free grain 1 structure from that exi,tinq in cold-worked metal, usually accomplished by heating.
i recrystallization annealing. Annealing cold-worked metal to produce a new grain structure I
without phase change. recrystallization temperature. The approximate minimum temperature at which complete
recrystallization of a highly cold-worked metal occurs within aspecified time, usually 1 h. reduction of area. (1) Commonly, the difference, expressed as a percentage of original
area, between the original cross-sectional area of a tensile test specimen and the mini- mum cross-sectional area measured after complete separation. (2) The difference, ex- pressed as a percentage of original area, between original cross-sectional area and that after straining the specimen.
refractory metal. A metal having an extremely high melting point. In the broad sense, it refers to metals having melting points above the range of iron, cobalt, and nickel.
residual method. Method of magnetic-particle inspection in which the particles are applied after the magnetizing force has been removed.
residual stress. Stress present in a body that is free of external forces or thermal gradients. resilience. (1) The amount of energy per unit volume released upon unloading. (2) The
capacity of a metal, by virtue of high yield strength and low elastic modulus, to exhibit considerable elastic recovery upon release of load.
Rockwell hardness test. A test for determining the hardness of a material based upon the depth of penetration of a specified penetrator into the specimen under certain arbitrarily fixed conditions of test.
rolling: Reducing the cross-sectional area of metal stock, or otherwise shaping metal prod- ucts, through the use of rotating rolls.
rubber forming. Forming where rubber is used as a funct~onal dle part. Processes In whlch rubber is employed only to contain the hydraulic fluid should not be classified as rubber form~ng.
rust. A corrosion product consisting of hydrated oxides of iron. Applied only to ferrous alloys.
-_ scale. Formation of a layer of iron oxide on the surface of steel when heated at high tem-
perature in a furnace. scleroscope test. A hardness test where the loss in kinetic energy of a falling diamond-
tipped metal "tup," absorbed by indentation upon impact of the tup on the metal being tested, is indicated by the height of rebound.
scoring. Marring or scratching of any formed part by metal pickup oh the punch or die. scratch hardness. The hardness of a metal determined by the width of a scratch made by
a cutting point drawn across the surface under a given pressure. seam. On the surface of metal, an unwelded fold or lap which appears as a crack, usually
resulting from a defect obtained in casting or in working. season cracking. Cracking resulting from the combined effects of corrosion and internal
stress. A term usually applied to stress-corrosion cracking of brass. secondary hardening. Tempering certain alloy steels at certain temperatures so that the
resulting hardness is greater than that obtained by tempering the same steel at some lower temperature for the same time.
seizing. Stopping of a moving part by a matifig surface as a result of excessive friction caused by galling.
selective heatino. Heating only certain portions of an object so that they have the desired properties acer cooling
selective quenching. Quenching only certain portions of an object.
684 INTRODUCTION TO PHYSICAL METALLURGY
self-diffusion. The spontaneous movement of an atom to a new site in a crystal of species, as, for example, a copper atom within a crystal of copper.
shear. (1) That type of force which causes or tends to cause two contiguous part same body to slide relative to each other in a direction parallel to their plane of (2) A type of cutting tool with which a material in the form of wire, sheet, plate, or cut between two opposing blades.
shear angle. The angle that the shearplane, in metal cutting, makes with the work su shear fracture. A fracture in which a crystal (or a polycrystalline mass) has separat
sliding or tearing under the action of shear stresses. shear strength. The stress required to produce fracture in the plane of cross sectio
conditions of loading being such that the directions of force and of resistance are allel and opposite, although their paths are offset aspecified minimum amount.
shortness. A form of brittleness in metal. It is designated as "cold," "hot," and "re indicate the temperature range in which the brittleness occurs.
shot peening. cold working the-surface of a metal by metal-shot impingement. shrinkage cavity. Avoid left in cast metals as a result of solidification shrinkage. shrinkage cracks. Hot tears associated with shrinkage cavities. sieve analysis. (Powd. met.) Particle-size distribution; usually expressed as the w
percentage retained upon each of a series of standard sieves of decreasing size an percentage passed by the sieve of finest size.
siliconizing. Diffusing silicon into solid metal, usually steel, at an elevated temperature. silky fracture. A metal fracture in which the broken metal surface has a fine texture us
dull in appearance. Characteristic of tough and strong metals. sinter. To heat a mass of fine particles for a prolonged time below the melting point, us
to cause agglomeration. sintering. (Powd. met.) (1) The bonding of adjacent surfaces of particles in a mass of m
powders or a compact, by heating. (2) A shaped body composed of metal powders produced by sintering with or without prior compacting.
skin. A thin outside metal layer, not formed by bonding (as in cladding or electroplatin that differs in composition, structure, or other characteristic from the main mass of me
slack quenching. The process of hardening steel by quenching from the austenitizing perature at a rateslower than the critical cooling rate for the particular steel, resu in incomplete hardening and the formation of one or more transformation produ addition to or instead of martensite.
slag. A nonmetallic product resulting from the mbtual dissolution of flux and nonmeta impurities in smelting and refining operations.
slip. Plastic deformation by the irreversible shear displacement (translation) of one p a crystal relative to another in a definite crystallographic direction and usually specific crystallographic plane.
slip band. A group of parallel slip lines so closely spaced as to appear as asingleline wh observed under an optical microscope. See sjip line.
slip direction. The crystallographic direction in which the translation of slip takes place. slip line. The trace of the slip plane on the viewing surface; the trace is (usually) observable
only if the surface has been polished before deformation. The usual observations on metal crystals (under the light microscope) are of a cluster of slip lines.
slip plane. The crystallographic plane in which slip occurs in a crystal. S-N diagram. A plot showing the relationship of stress S and the number of cycles N before
failure in fatigue testing. soldering. Similar to brazing, with the filler metal having a melting temperature range below
an arbitrary value, generally 800°F. Soft solders are usually lead-tin alloys. solidification shrinkage. The decrease in volume of a metal during solidification. solid solution. A single solid homogeneous crystalline phase containing two or mor
chemical species. solidus. In a constitution or equilibrium diagram, the locus of points representing the
temperatures at which various compositions finish freezing on cooling or begin to melt on heating.
solute. The component of either a liquid or solid solution that is present to a lesser or minor extent; the component that is dissolved in the solvent.
GLOSSARY 685
solution heat treatment. Heating an alloy to a suitable temperature, holding at that tem- perature long enough to allow one or more constituents to enter into solid solution, and then cooling rapidly enough to hold the constituents in solution. The alloy is left in a supersaturated, unstable state.
solvent. The component of either a liquid or solid solution that is present to a greater or major extent; the component that dissolves the solute.
solvus. In a phase or equilibrium diagram, the locus of points representing the tempera- tures at which the various compositions of the solid phases coexist with other solid phases, that is, the limits of solid solubility.
sorbite. (obsolete) A fine mixture of ferrite and cementite produced either by regulating the rate of cooling of steel or tempering steel after hardening. The first type is very fine pearlite difficult to resolve under the microscope; the second type is tempered martensite.
spheroidal-graphite cast iron. Same as nodular cast iron. cpheroidite. An aggregate of iron or alloy carbides of essentially spherical shape dispersed
throughout a matrix of ferrite. spheroidizing. Heating and cooling to produce a spheroidal or globular form of carbide in
steel. Spheroidizing methods frequently used are: 1 Prolonged holding at a temperature just below Ae,. 2 Heating and cooling alternately between temperatures that are just above and just
below Ae,. 3 Heating to a temperature above Ae, or Ae, and then cooling very slowly in the furnace
or holding at a temperature just below Ae,. 4 Cooling at a suitable rate from the minimum temperature at which all carbide is dis-
solved, to prevent the reformation of a carbide network, and then reheating in ac- cordance with methods 1 or 2 above. (Applicable to hypereutectoid steel containing a carbide network.)
spray quenching. Quenching in a spray of liquid. stabilizing treatment. Any treatment intended to stabilize the structure of an alloy or the
dimensions of a part. (1) Heating austenitic stainless steels that contain titanium, columbium, or tantalum to a suitable temperature below that of a full anneal in order to inactivate the maximum amount of carbon by precipitation as a carbide of titanium, co- lumbium, or tantalum. (2) Transforming retained austenite in parts made from tool steel. (3) Precipitating a constituent from a nonferrous solid solution in order to improve the workability, to decrease the tendency of certain alloys to age harden at room tempera- ture, or to obtain dimensional stability.
steadite. A hard structural constituent of cast iron that consists of a binary eutectic of ferrite (containing some phosphorous in solution) and iron phosphide (Fe,P). The com- position of the eutectic is 10.2 percent P and 89.8 percent Fe, and the melting tempera- ture is 1920°F.
steel. An iron-base alloy, malleable in some temperature range as initially cast, contain- ing manganese, usually carbon, and often other alloying elements. In carbon steel and low-alloy steel, the maximum carbon is about 2.0 percent; in high-alloy steel, about 2.5 percent. The dividing line between low-alloy and high-alloy steels is generally regarded as being at about 5 percent metallic alloying elements.
Steel is to be differentiated from two general classes of "irons"; the cast irons, on the high-carbon side, and the relatively pure irons such as ingot iron, carbonyl iron, and electrolytic iron, on the low-carbon side. In some steels containing extremely low car- bon, the manganese content is the principal differentiating factor, steel usually con- taining at least 0.25 percent; ingot iron contains considerably less.
-@"ess. The ability of a metal or shape to resist elastic deflection. For identical shapes. the stiffness is proportional to the modulus of elasticity.
strain. A measure of the change in the size or shape of a body, referred to its original size or shape. Linear strain is the change per unit length of a linear dimension. Conventional strain is the linear strain referred to the original gage length. When the term strain is used alone, it usually refers to the linear strain in the direction of the applied stress.
strain hardening. An increase in hardness and strength caused by plastic deformation at temperatures lower than the recrystallization range.
stress. Force per unit area, often thought of as force acting through a small area within a
686 INTRODUCTION TO PHYSICAL METALLURGY
plane. It can be divided into components, normal and parallel to the plane normal stress and shear stress, respectively.
stress-corrosion cracking. Failure by cracking under combined action of corro stress, either external (applied) or internal (residual). Cracking may be eit granular or transgranular, depending on metal and corrosive medium.
stress raisers. Changes in contour or discontinuities in structure that cause local in in stress.
stress relieving. Heating to a suitable temperature, holding long enough to reduce stresses, and then cooling slowly enough to minimize the development of new res stresses.
stress-rupture test. A tension test performed at constant load and constant tem the load being held at such a level as to cause rupture. Also known as creep-rup
stretcher strains. Elongated markings that appear on the surface of some materi deformed just past the yield point. These markings lie approximately parallel t direction of maximum shear stress and are the result of localized yielding. Sa Liiders lines.
stringer. In wrought materials, an elongated configuration of microconstituents or f material aligned in the direction of working. Commonly, the term is associate elonqated oxide or sulfide inclusions in steel.
substitutional solid solution. A solid alloy in which the solute atoms are located at the lattice points of thesolvent, the distribution being random.
substrate. Layer of metal underlying a coating, regardless of whether the layer metal.
subsurface corrosion. Formation of isolated particles of corrosion products beneath metal surface. This results from the preferential reaction of certain alloy constitu by inward diffusion of oxygen, nitrogen, and sulfur.
superalloy. An alloy developed for very high-temperature service where relative1 stresses (tensile, thermal, vibratory, and shock) are encountered and where oxi resistance is frequently required.
supercooling. Cooling below the temperature at which an equilibrium-phase transf tion can take place without actually obtaining the transformation.
superficial Rockwell hardness test. Form of Rockwell hardness test using relatively loads which produce minimum penetration. Used for determining surface hardnes hardness of thin sections or small parts, or where a large hardness impression mig be harmful.
superlattice. An ordered arrangement of atoms in a solid solution to form a lattice sup imposed on the normal solid-solution lattice.
temper. (1) In heat treatment, to reheat hardened steel or hardened cast iron to temperature below the eutectoid temperature for the purpose of decreasing the har and increasing the toughness. The process is also sometimes applied to norm steel. (2) In nonferrous alloys and in some ferrous alloys (steels that cannot be ened by heat treatment), the hardness and strength produced by mechanical or th treatment, or both, and characterized by a certain structure, mechanical properties reduction in area during cold working.
temper brittleness. Brittleness that results when certain steels are held within, or a cooled slowly through, a certain range of temperature below the transformation rang The brittleness is revealed by notched-bar impact tests at or below room temperatur
tempering. Reheating a quench-hardened or normalized ferrous alloy to a temperatu below the transformation range and then cooling at any rate desired.
tensile strength. In tensile testing, the ratio of maximum load to original cross-sectional area. Also called ultimate strength.
terminal phase. A solid solution, represented by an area, at either extreme side of a bin diagram.
thermal analysis. A method for determining transformations in a metal by noting the te
GLOSSARY 687
peratures at which thermal arrests occur. These arrests are manifested by changes in slope of the plotted or mechanically traced heating and cooling curves. When such data are secured under nearly equilibrium conditions of heating and cooling, the method is commonly used for determining certain critical temperatures required for the con- struction of equilibrium diagrams.
thermal fatigue. Fracture resulting from the presence of temperature gradients which vary with time in such a manner as to produce cyclic stresses in a structure.
thermocouple. A device for measuring temperatures consisting of two dissimilar metals which produce an electromotive force roughly proportional to the temperature differ- ence between their hot and cold junction ends.
time quenching. Interrupted quenching in which the time in the quenching medium is controlled.
tinning. Coating metal with a very thin layer of molten filler metal. torsion. A twisting action resulting in shear stresses and strains. total carbon. The sum of the free and combined carbon (including carbon in solution) in a
ferrous alloy. toughness. Ability of a metal to absorb energy and deform plastically before fracturing. It
is usually measured by the energy absorbed in a notch-impact test, but the area under the stress-strain curve in tensile testing is also a measure of toughness.
transformation temperature. The temperature at which a change in phase occurs. The term is sometimes used to denote the limiting temperature of a transformation range. The following symbols are used for iron and steels: Ac,,. In hypereutectoid steel, the temperature at which the solution of cementite in
austenite is completed during heating. Ac,. The temperature at which austenite begins to form during heating. Ac,. The temperature at which transformation of ferrite to austenite is completed
during heatrng. Ac,. The temperature at whrch austenite transforms to delta ferrite during heating. Ae,,, Ae,, Ae,, Ae, The temperatures of phase changes at equilibrium. A . In hy~ereutectoid steel, the temperature at which precipitation of cementite starts -...
duringcooling. Ar,. The temperature at which transformation of austenite to ferrite or to ferrite plus
cementite is completed during cooling. Ar,. The temperature at which austenite begins to transform to ferrite during cooling. Ar,. The temperature at which delta ferrite transforms to austenite during cooling. M, (or Ar"). The temperature at which transformation of austenite to martensite starts
during cooling. M,. The temperature at which martensite formation finishes during cooling.
Note: All these changes, except the formation of martensite, occur at lower tempera- tures during cooling than during heating, and depend on the rate of change of tempera- ture.
transition lattice. An intermediate unstable crystallographic configuration that formsduring solid-state reactions such as precipitation from solid solution and eutectoid decompo- sition.
transition temperature. (1) An arbitrarily defined temperature within the temperature range in which metal-fracture characteristics, determined usually by notched tests, are chang- ing rapidly, for example from primarily fibrous (shear) to primarily crystalline (cleavage) fracture. Commonly used definitions are transition temperature for 50 percent cleavage fracture, 10-ft-lb transition temperature, and transition temperature for half maximum energy. (2) Sometimes also used to denote the arbitrarily defined temperature in a range in which the ductility changes rapidly with temperature.
troostite. (obsolete) A previously unresolvable, rapidly etching fine aggregate of carbide and ferrite produced either by tempering martensite at low temperature or by quenching a steel at a rate slower than the critical cooling rate. Preferred terminology for the first product is tempered martensite; for the latter, fine pearlite.
twin. Two portions of a crystal having a definite crystallographic relationship; one may be regarded as the parent, the other as the twin. The orientation of the twin is either a mir-

688 INTRODUCTION TO PHYSICAL METALLURGY
ror image of the orientation of the parent about a "twinning plane" or an orient can be derived by rotating the twin portion about a "twinning axis."
twin band. On a polished and etched surface, the section through a twin and th crystal.
ultimate strength. The maximum conventional stress-tensile, compressive, o r sh a material can withstand.
upsetting. Working metal so that the cross-sectional area of a portion or all of the increased.
vacancy. A type of lattice imperfection i n which an individual atom site is tempor occupied. Diffusion (of other than interstitial solutes) is generally visualized as t ing of vacancies.
Vickers hardness. Microhardness determined from the resistance of a metal to ind by a 136" diamond-pyramid indenter making a square impression.
white cast iron. Cast i ron that gives a white fracture because the carbon is in com form.
white metal. A general term covering a groupof white-colored metals of relatively low ing points (lead, antimony, bismuth, tin, cadmium, and zinc) and of the alloys bas these metals.
Widmanstatten structure. A structure characterized by a geometrical pattern resulting the formation of a new phase along certain crystallographic planes of the parent solution. The orientation of the lattice in the new phase is related crystallographical the orientation of the lattice in the parent phase. The structure was originally obse in meteorites but is readily produced in many other allovs with certain heat treatment
~ - . .. - . . - . . . . wire drawing. Reducing the cross section of wire by it through a die. wrought iron. A commercial iron consisting of slag (iron silicate) fibers entrained in a fer
matrix. e
x-ray. Electromagnetic radiation, of wavelength less than about 500 angstrom units, emi as the result of deceleration of fast-moving electrons or decay of atomic electrons f excited orbital states; specifically, the radiation produced when an electron beam of ficient energy impinges upon a target of suitable material.
yield point. The first stress in a material, usually less than the maximum attainable stre at which an increase in strain occurs without an increase in stress. Only certain met exhibit a yield point. If there is a decrease in stress after yielding, a distinction may made between upper and lower yield points.
yield strength. The stress at which a material exhibits a specified deviation from propor tionality of stress and strain. An offset of 0.2 percent is used for many metals.
Young's modulus. See modulus of elasticity.
zone melting. Highly localized melting, usually by induction heating, of a small volume of an otherwise solid piece. By moving the induction coil along the rod, the melted zone can be transferred from one end to the other. In a binary mixture where there is a larg difference i n composition on the liquidus and solidus lines, high purity can be attained by concentrating one of the constituents in the liquid as it moves along the rod.
NDEX Abrasion of metals, 567 Actual cooling rate, 283-287
determination of. 283 effect on microstructure, 290-292 effect of size and mass of piece, 289-296 quenching medium, 284-287 surface area to mass ratio, 289-290 surface condit~on of piece, 288-289
Admiralty metal, 468 Age hardening, 190-194
aging process, 191-194 property changes due to, 193-194 solution treatment, 190-191
AiSl (American Iron and Steel Institute) c1ass:fication system for steels, 244-245
Alclad, 497. 602 Allotropy, 85, 208-209 Alloy cast iron, 454-458
chromium, 457 copper, 457 molybdenum, 457 nickel, 458 vanadium, 458
Alloy steels, 349-383 chromium, 358 definition of, 349 manganese, 359-360 molybdenum, 360-361 nickel, 355-358 nickel-chromium, 358-359 silicon, 361 stainless, 361476 tungsten, 361 vanadium, 361
Alloy systems: . aluminum-copper, 485-486 aluminum-lead, 206 aluminum-magnesium, 490 aluminum-magnesium-silicide, 491 aluminum-manganese, 489
cobalt-tungsten, 219 copper-antimony, 222 copper-beryllium, 478 copper-lead, 205 copper-nickel. 168 copper-palladium, 211 copper-silicon, 474 copper-tin, 472 copper-zinc, 465 gold-copper, 210 iron-chromium-carbon, 362-364 iron-nickel, 209 iron-nickel-chromium-carbon, 366 iron-silicon. 222 iron-tin, 222 lead-antimony, 187 lead-tin, 188 magnesium-aluminum, 500 nickel-iron, 513 silver-copper, 536 silver-platinum, 197 titanium-aluminum, 526
Alloy systems: titanium-manganese, 528 titanium-vanadium, 527
Alnico, 517, 630 Aluminizing, 601 Aluminum, 481-485
anodizing, 494 corrosion resistance, 493-497
Aluminum alloys, 485-497 aluminum-copper. 485-488 aluminum-magnesium, 489-491 aluminum-manganese. 489 aluminum-silicon, 489 aluminum-silicon-magnesium, 491-492 aluminum-zinc, 492-493 composition and properties of, table, 496 corrosion resistance, 493-497 designation system, 481. 484 temper designation, 484-485
Aluminum Association: alloy designation, 481, 484 temper designation, 484-485
Aluminum brass, 468 Aluminum bronze, 476 Annealing, 129-144
effect on properties, 137 grain growth, 135-136 grain size, 136-137 recovery, 129-1 30 recrystallization, 131-135
temperature, 132-135 of steel: full, 249-252
process, 254 properties, table, 252 spheroidizing, 252-254 stress-relief, 254
Annealing twins. 118 Anodizing, 572 Apparent density of metai powders,
table, 612 Architectural bronze, 470 Arsenical copper, 462 Atom covalent, binding. 77 76-78
ionic, 76-77 metallic, 77-78 van der Waals, 78
Atomic diameter, 78-79 table, 79
Atomic numbers and weights, table, 68 Atomic structure, 65-70
electrons, 65 neutrons, 65 protons, 65 quantum numbers, 69
Atomization, 607-609 Ausforming. 383 Austempering, 313-315 Austenite:
definition of, 234 homogeneity, effect of, 282-283 microstructure of, 235
Austenite transformation: on continuous cooling, 273-276
690 INDEX INDEX 691
Austenite transformation: isothermal, 261-273 slow cooling, 237-241
Austenitic stainless steels, 371-374 Austenitizing temperature, 281-282 Axial ratio, 84
Babbitt:
Bainite: austempering, 313-315 microstructure, 268-269
Bakelite, 15 Bending fractures, 656-659 Beryllium bronze, 476-479
age hardening, effect of, 478479 microstructure, 479 phase diagram, 478
Bonderizing, 600 Bragg equation, 90
yellow, 466-468 alpha plus beta, 469-471 cast, 471472
Breaking strength, 4 0 4 1 Brinell hardness test, 26-27 Briquette. 607 Bronzes, 472-478
aluminum, 476 beryllium, 47-78 silicon, 475-476 tin, 472-473
Bulls-eye structure, 432
Calorizing, 602 Carbon-concentration gradient, 318-319 Carbon solubility in iron, 234-236 Carbonitriding, 326-328 Carburizing, 317-326
case depth by, table, 321 equation, 319 gas, 322-323 heat treatment after, 32-26 liquid, 323-325 pack, 319-321
Cartridge brass, 467 Case hardening, 315-336
carbonitriding. 326-328 carburizing, 31 6-326 cyaniding, 326-328 flame hardening, 332333 gas cyaniding, 327 induction hardening, 333-336 nitriding, 328-332
Cast iron, 423-459 alloy, 453-458 chilled, 448-450 gray, 434-448
graphite flake, 441-445 size chart, 442 types of, 444
,nalleable, 426-434
Cast iron, malleable: ferritic. 429-430 manufacture of, 426-429 pearlitic. 430-434
nodular, 450-453 microstructure, 450-454 propert~es of, 452
types of, 423-424 white, 424-426
Castings, defects in, 98-100 hot tears, 99-100 pipe, 98 porosity, 98-99 shrinkage, 98
Cathodic polarization, 584 Cavitation corrosion, 591-592 Cemented carbide tools, 415-419, 625 Cementite, definition of, 234 Ceramic tools, 420-421 Cermets, 419-420 Charpy impact specimen, 43 . Chemical elements:
atomic number, atomic weight, and symbols, table, 68
definition of, 65 periodic table, 71
Chilled cast iron. 448-450 Chromel A, 511 Chromel-alumel, 7 Chromel C. 511 Chromium in cast iron, 453-457 Chromium steels, 358 Chromizing, 573 Classification of failure causes, 662-663 Coherent lattice theory, 192 Coin silver, 536 Coining, 622 Commercial bronze, 468 Comparison method to measure
grain size, 101-102 Composite metals, 625 Congruent-melting alloy, 170, 195 Constantan, 51 1 Cooling rate:
actual (see Actual cooling .rate) critical, 260
Copper, 461-464 arsenical. 462 in cast iron, 457 electrolytic tough-pitch, 461 free-cutting, 462 mechanical properties of, table, 482 oxygen-free high-conductivity, 461 silver-bearing, 462 temper designation, 462-463
Copper alloys, 464-480 brasses, 464-472
alpha, 466-469 alpha plus beta, 469-471 effect of zinc on, table, 465
bronzes, 472-480 aluminum, 476 beryllium, 476-479 silicon, 475-476 tin, 472-475
copper-aluminum, 476
Copper alloys: copper-beryllium, 478 copper-nickel. 478-479 copper-silicon, 474 copper-tin, 472 mechanical properties of, table, 482483 nickel silvers, 480 temper designation, 463
Copper-constantan, 7 Copper oxide in copper, 461-462 Coring, 165-166 Corrosion of metals, 583-602
definition of, 583 dezincification, 467 effect on properties, table, 596 electrochemical principles, 583-585 electromotive-force series, 586 factors in, 585-590 galvanic serles, 587 inhibitors, 600 methods of combating, 597-602 season cracking, 466 specific types, 590-597
Creep, properties of, table, 555 Creep tests, 45, 548-549 Crevice corrosion, 592 Critical cooling rate, definition of, 260 Critical resolved shear stress, table, 115 Crystal imperfections, 94-98
dislocations, 97-98 interstitials, 96-97 vacancies, 96
Crystal structure, 80-85 body-centered cubic, 80-81 close-packed hexagonal, 84-85 face-centered cubic, 81-83 space lattice, 80 unit cell, 80
Crystal systems, table, 81 Crystallization, 91-94 Crystallographic planes, 87-89 Cupronickels, 478-479 Cyaniding, 326-328
Davenport, E. S., 260 Decarburization, 319
in tool steels, 397 Dendrite, 93 Dendritic segregation, 166 Dezincification, 467 Die compaction of powders, 614-616 Diffusion, 163-165 Dislocation, 97-98
in slip, 113-115 Ductile iron (see Nodular cast iron) Ductility elongation, 41
reduction in area, 41 Dumet wire, 517
Eddy current inspection, 57-60 Elastic hardness, 24-25 Elastic limit, 38-39 Electrolytic deposition of powders, 609 Electrolytic tough-pitch copper, 461 Electron configuration, table, 75 Electroplating, 571-572
Electrotype metal, 519 Elinvar, 517 End-quench hardenability test, 297402
correlation with C-T diagram. 300 Endurance limit, 44 Equilibrium diagrams (see Phase diagrams) Erosion of metals, 567 Etching, 18-19
reagents, table, 22 Eutectic reaction. 175
equation, 178, 183, 218 Eutectic systems, 171-179
microstructures: AI-Si, 180 Pb-Sb, 187 Pb-Sn, 188
properties, 189-190 Eutectoid reaction, 212-214
equation, 212 Extractive metallurgy, viii
Failure analysis, 633-664 bending fractures, 656-659 classification of causes, 662-663 effect of residual stresses, 653-654 effect of strength reducers, 648 effect of stress raisers, 643-647 fatigue fractures, 640-643 loading, types of, 637-640 modes of fracture, 635-636 torsional fractures, 659-661
Fatigue fractures. 640-643 Fatigue Fernico, tests, 576 44-45
Ferrite: definition of, 234 microstructure of, 235
Ferritic irons, 451 Ferritic stainless steels, 369-370 Flame hardening, 332-333 Flame-plated table, 578 coatings, properties of,
Floe process, 330 Fluorescent-penetrant inspection, 51-54 Forging brass, 470 Foundry type metal, 519 Fracture, 118-121 Fracture modes, 635-636 Free-cutting brass, 470 Free-cutting copper, 462 Fretting corrosion, 593-594 Fusebond method of spraying, 575
Galvanic corrosion, 596 Galvanizing, 601 Gas carburizing, 322-323 Gilding metal, 468 Gold, 543
properties of, 537 Gold alloys, 537 Grain size i n castings, 100-101 Grain size measurement, 101-104 Gravity compaction of powders, 617 Gray cast iron, 434-448
graphite flake, 441-445 size chart, 442 types of, 444
692 INDEX
Gray cast iron: heat treatment, 439441 manganese in, 438 microstructure, 436 phosphorus in, 438-439 Properties of, 446 silicon in, 435-438 sulfur in, 438
H Monel, 510 Hadfield manganese steel, 360 Hadfield silicon steel, 361 Hard facing, 577-581 Hardenability, 296-302
definition of, 293 specification for, 301-302 test for, 297-299
Hardenability bands, 301 Hardenable carbon steels, 343-345 Hardness, 24-37
conversion, table, 26-29 cylindrical correction chart, 36 definition of, 24 tests for: applications, table, 34
Brinell, 26-27 file, 26 microhardness, 32-33
Knoop, 32-33 Vickers, 32
Rockwell: scales, table, 30 superficial tester, 30-31
scleroscope, 24-25 scratch, 25-26 Vickers, 31-32
Hardness-penetration diagram, 293 Hastelloy A, 512 Hastelloy B, 512 Hastelloy C, 512 Hastelloy D, 511 Hastelloy X, 512-513 Heat of fusion, 92 Heyn method to measure grain size, 1 Holography, 60-62 Homogenization, 166-168 Hot hardness, 395 Hot pressing of powders, 621-622 Hot working, 137-140 Hume-Rothery, William, 150, 152 Hypereutectic alloys, 174 Hypereutectic cast irons, 234 Hypereutectoid alloys, 213 Hypereutectoid steels, 234 Hypoeutectic alloys, 174 Hypoeutectic cast irons, 234 Hypoeutectoid alloys, 213 Hypoeutectoid steels, 234
Ihrigizing, 573 lllium B, 513 lllium G, 513 lllium R, 513 Impact test, 42-44
specimen: Charpy, 42-43 Izod, 43-44
Impregnation, 623 Inconel, 511
lnconei X. 511-512 Induction .hardening, 333-336 Ingot iron, 225 Intergranular corrosion, 594 Intermediate alloy phases, 146-150, 19s-196
electron Compound, 150 intermetallic compound, 149 interstitial compound, 149-150
Intermetallic compound, 149 Interstitial compound, 149-150 Interstitial solid solution, 153-154 Interstitials, 96-97 Invar, 516 Iridium, 541 Iron:
alpha, 225 beta, 225 cooling curve, 226 delta, 225 gamma. 225
Iron-constantan, 7 Iron-iron carbide phase diagram, 230-234
delta region, 231-232 effect of alloying elements on, 352-353 eutectic reaction, 232 eutectoid reaction, 233 peritectic reaction, 231 structures: austenite, 234
cementite, 234 ferrite, 234 ledeburite, 234 pearlite, 234
Isostatic compaction of powders, 616 Isothermal annealing, 270 Isothermal-transformation diagram, 260-266
alloy element, effect of, 277-279 austenitic grain size, effect of, 280-281 determination, 260-265
isotopes, 74-76 lzod impact specimen, 43
Jeffries method to measure grain size, 103-1 04
Jominy hardenability test, 297-302
K Monel. 510 Knoop hardness test, 32-33 Kovar, 516
Lead, 517 Lead alloys, 517-521
composition and properties of, table, 520-521
lead-antimony, 517-518 lead-tin, 516-520 terne metal, 519
Ledeburite, definition of, 234 Linotype metal, 520 Liquid carburizing, 323-325 Liquid-metal corrosion, 597 Liquidus line, 158 Low brass, 469 Lucite, 15-16
Mt temperature, 257 effect of carbon, 259
M, temperature, 257-259 effect of carbon, 259 formula for calculation, 259
Magnaflus test, 49-51 Magnaglo test, 49-51 Magnesium, 498-499 Magnesium alloys, 500-507
composition and properties of, table, 506 corrosion rcrsistance, 505 designation and temper, 498-499 joining. 505, 507 magnesium-aluminum-based, 501-503 magnesium-rare earth-based, 503-504 magnesium-thorium-based, 504-505 magnesium-zinc-based, 503
Magnetic-particle inspection. 49-51 Malleable cast iron, 426-434
copper-alloyed, 434 ferritic, 429-430 manufacture of, 426-429 pearlitic, 430-434
Manganese bronze, 470 Manganese steel, 359-360 Maraging steels, 377-383
composition of, table, 378 properties of, table, 360
Martens, A., vii Martensite:
definition of, 257 microstructure of, 258-260
Martensite transformation, 257-260 Martensitic stainless steels, 366-368 Metal spraying, 573-577 Metal "whiskers," 95 Metallizing, 600
(See also Metal spraying) Metallograph, 19 Metallographic sample preparation, 15-19
etching, 18-13 reagents, table, 22
fine polishing, 16-17 intermediate polishing, 16 mounting, 15-16
in Bakelite, 15 in Lucite, 15-16
rough grinding, 15 sampling, 15
Metallography, definition of, 14 Metalloids, 76 Metallurgical microscopes, 19-24
electron, 19-24 optical, 19-20
Metals: characteristics of, 76 at high temperatures, 547-555
elevated-temperature test, 547-548 properties of, table, 555
at low temperatures, 555-565 properties of, table, 556-559
Metastable phase, 230 Miller indices, 87-89 Modules of elasticity, 41 Molybdenum:
in cast iron, 457 electrical contacts, 543-544 properties of, 542
INDEX 693
Molybdenum steel, 360-361 Monel, 170, 510 Monotectic reaction, equation, 204 Muntz metal, 469
Naval brass, 470 Navy steel, 361 Nichrome, 511 Nichrome V, 511 Nickel, 507-509
A nickel, 509 in cast iron, 458 composition and properties, table, 508 D nickel, 509 duranickel, 509 E nickel, 509 effect of low temperature, 562 effect on transition temperature, 562 permanickel, 509
Nickel alloys, 509-517 composition and properties, table,
514-515 nickel-chromium-iron-based, 511-512 nickel-chromium-molybdenum- copper-based. 513
nickel-chromium-molybdenum- iron-based, 51 2-513
nickel-copper-based, 509-511 nickel-iron, 513, 516-517 nickel-molybdenum-iron-based, 512 nickel-silicon-copper-based, 511
Nickel-chromium steels, 358-359 Nickel silvers, 480 Nickel steels, 355458 Nitriding, 328-332
case depth by, 328 Floe process, 330
Nodular cast iron, 450-453 microstructure, 450-452 properties of, 452
Nondestructive testing, 45-62 eddy current, 57-60 elements of, 46 fluorescent penetrant, 51-54 holography, 60-62 magnetic particle, 49-50 radiography, 46-49 summary, table, 58-59 ultrasonic, 54-57
Normalizing, steel, 254-256
Optical pyrometer, 11-14 Order-disorder transformation, 209-212 Osmium, 541 Oxygen-free high-conductivity copper, 461
Pack carburizing, 319-321 Palladium, 543
properties of, 539 Palladium alloys, 539-540
properties of, table, 542 Parkerizing, 600 Pauli excluston principle, 67 Pearlite:
definition of, 234 microstructure, 235
-*w
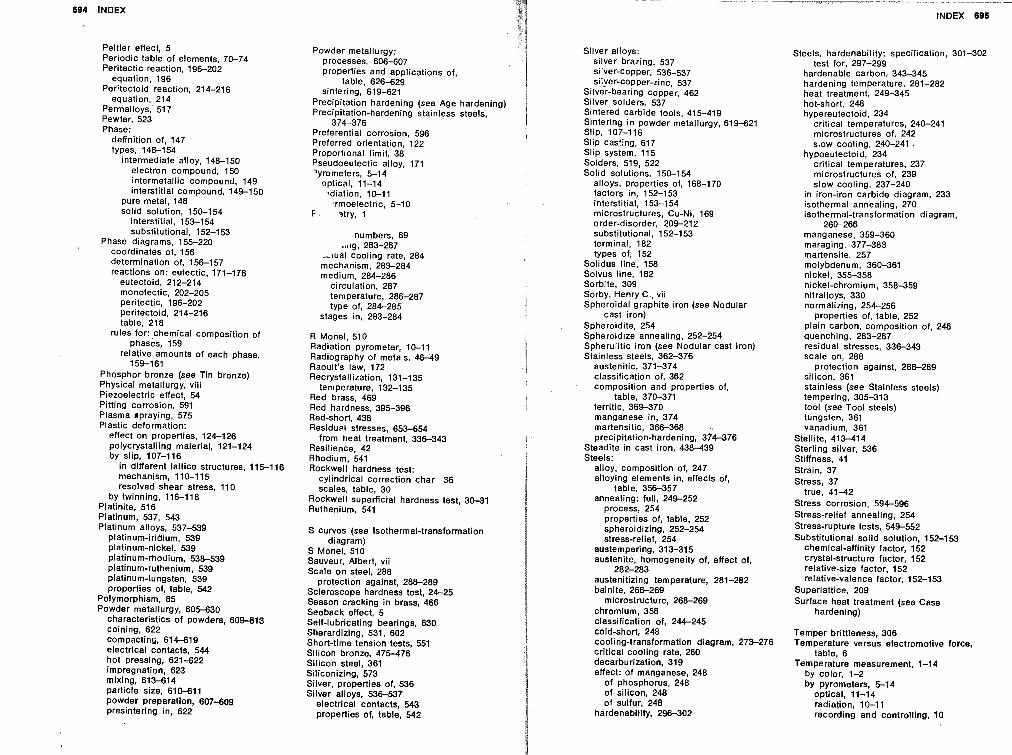
694 INDEX INDEX 895
Peltier effect, 5 Periodic table of elements, 70-74 Peritectic reaction, 196-202
equation, 196 Peritectoid reaction, 214-216
equation, 214 Permalloys. 517 Pewter, 523 Phase:
definition of, 147 types, 148-154
intermediate alloy, 148-150 electron compound, 150 intermetallic compound, 149 interstitial compound, 149-150
pure metal, 148 solid solution, 150-154
interstitial, 153-154 substitutional, 152-153
Phase diagrams, 155-220 coordinates of, 156 determination of, 156-157 reactions on: eutectic, 171-178
eutectoid, 212-214 monotectic, 202-205 peritectic, 196-202 peritectoid, 214-216 table, 218
rules for: ,chemical composition of phases, 159
relative amounts of each phase, 159-1 61
Phosphor bronze (see Tin bronze) Physical metallurgy, viii Piezoelectric effect, 54 Pitting corrosion, 591 Plasma Spraying, 575 Plastic deformation:
effect on properties, 124-126 polycrystalling material, 121-124 by slip, 107-116
in different lattice structures, 115-116 mechanism, 110-115 resolved shear stress, 110
by twinning, 116-118 Platinite, 516 Platinum, 537, 543 Platinum alloys, 537-539
platinum-iridium, 539 platinum-nickel, 539 platinum-rhodium, 538-539 platinum-ruthenium, 539 platinum-tungsten, 539 properties of, table, 542
Polymorphism, 85 Powder metallurgy, 605-630
characteristics of powders, 604613 coining, 622 compacting, 614-619 electrical contacts, 544 hot pressing, 621-622 impregnation, 623 mixing, 613-614 particle size, 610-611 powder preparation, 607-609 presintering in, 622
Powder metallurgy: processes, 606-607 properties and appllcatlons of,
table, 626-629 stntertng, 619-621
Prectpltatton hardening (see Age hardening) Prec~pttat~on-harden~ng stainless steels,
374-376 Preferential corroston, 596
i I
Preferred ortentatton, 122 Proportional Ilmlt, 38 Pseudoeutect~c alloy, 171 7yrometers, 5-14
9ptlcal. 11-14 Idtatlon, 10-11
rmoelectrlc, 5-10 F. ?try, 1
numbers, 69 tg, 283-287
-,tual cooling rate. 284 mechanism, 283-284 medium, 284-286
circulation, 287 temperature, 286-287 type of, 284-285
stages in. 283-284
R Monel, 510 Radiation pyrometer, 10-11 Radiography of metals, 4 6 4 9 Raoult's law, 172 Recrystallization, 131-135
temperature, 132-135 Red brass, 469 Red hardness, 395-396 Red-short, 438 Residue1 stresses, 653-654
from heat treatment, 336-343 Resilience, 42 Rhodium, 541 Rockwell hardness test:
cylindrical correction char S6 scales, table, 30
Rockwell superficial hardness test, 30-31 Ruthenium, 541
S curves (see Isothermal-transformation diagram)
S Monel. 510 Sauveur, Albert, vii Scale on steel, 288
protection against, 288-289 Scleroscope hardness test, 24-25 Season cracking in brass, 466 Seeback effect, 5 Self-lubricating bearings, 630 Sherardizing, 531, 602 Short-time tension tests, 551 Silicon bronze, 475-476 Silicon steel, 361 Siliconizing, 573 Silver, properties of, 536 Silver alloys, 536-537
electrical contacts, 543 properties of, table, 542
Silver alloys: silver brazing, 537 silver-copper, 536-537 silyer-copper-zinc, 537
Silver-bearing copper, 462 Silver solders, 537 Sintered carbide tools, 41 5-419 Sintering in powder metallurgy, 619-621 Slip, 107-116 Slip casting, 617 Slip system, 115 Solders, 519, 522 Solid solutions, 150-154
alloys, properties of. 168-170 factors in, 152-153 interstitial, 153-154 microstructures, Cu-Ni. 169 order-disorder, 209-212 substitutional, 152-153 terminal, 182 types of, 152
Solidus line, 158 Solvus line, 182 Sorbite, 309 Sorby, Henry C., vii Spheroidal graphite iron (see Nodular
cast iron) Spheroidite, 254 Spheroidize annealing, 252-254 Spherulitic iron (see Nodular cast iron) Stainless steels, 362-376
austenitic, 371474 classification of, 362 composition and properties of,
table, 370-371 ferritic, 369-370 manganese in, 374 martensitic, 366-368 - precipitation-hardening, 374-376
Steadite in cast iron, 438-439 Steels:
alloy, composition of, 247 alloying elements in, effects of,
table, 356-357 annealing: full, 249-252
process, 254 properties of, table, 252 spheroidizing, 252-254 stress-relief, 254
austempering, 313-315 austenite, homogeneity of, effect of,
282-283 austenitizing temperature, 281-282 bainite, 268-269
microstructure, 268-269 chromium, 358 classification of, 244-245 cold-short, 248 cooling-transformation diagram, 273-276 critical cooling rate, 260 decarburization, 319 effect: of manganese, 248
of phosphorus, 248 of silicon, 248 of sulfur, 248
hardenability. 296-302
Steels, hardenability: specification, 301-302 test for, 297-299
hardenable carbon, 343-345 hardening temperature, 281-282 heat treatment, 249-345 hot-short, 248 hypereutectoid, 234
critical temperatures, 240-241 microstructures of, 242 slow cooling, 240-241 .
hypoeutectoid, 234 critical temperatures, 237 microstructures of, 239 slow cooling, 237-240
in iron-iron carbide diagram, 233 isothermal annealing, 270 isothermal-transformation diagram,
260-266 manganese, 359460 maraging, 377-383 martensite, 257 molybdenum, 360-361 nickel, 355-358 nickel-chromium, 358-359 nitralloys, 330 normalizing, 254-256
properties of, table, 252 plain carbon, composition of, 246 quenching, 283-287 residual stresses, 336-343 scale on, 288
protection against, 288-289 silicon, 361 stainless (see Stainless steels) tempering, 305-313 tool (see Tool steels) tungsten, 361 vanadium, 361
Stellite, 413414 Sterling silver, 536 Stiffness, 41 Strain, 37 Stress, 37
true, 4 1 4 2 Stress corrosion, 594-596 Stress-relief annealing, 254 Stress-rupture tests, 549-552 Substitutional solid solution, 152-153
chemical-affinity factor, 152 crystal-structure factor, 152 relative-size factor, 152 relative-valence factor, 152-153
Superlattice, 209 Surface heat treatment (see Case
hardening)
Temper brittleness, 306 Temperature versus electromotive force,
table, 6 Temperature measurement, 1-14
by color, 1-2 by pyrometers, 5-14
optical. 11-14 radiation, 10-11 recording and controlling, 10
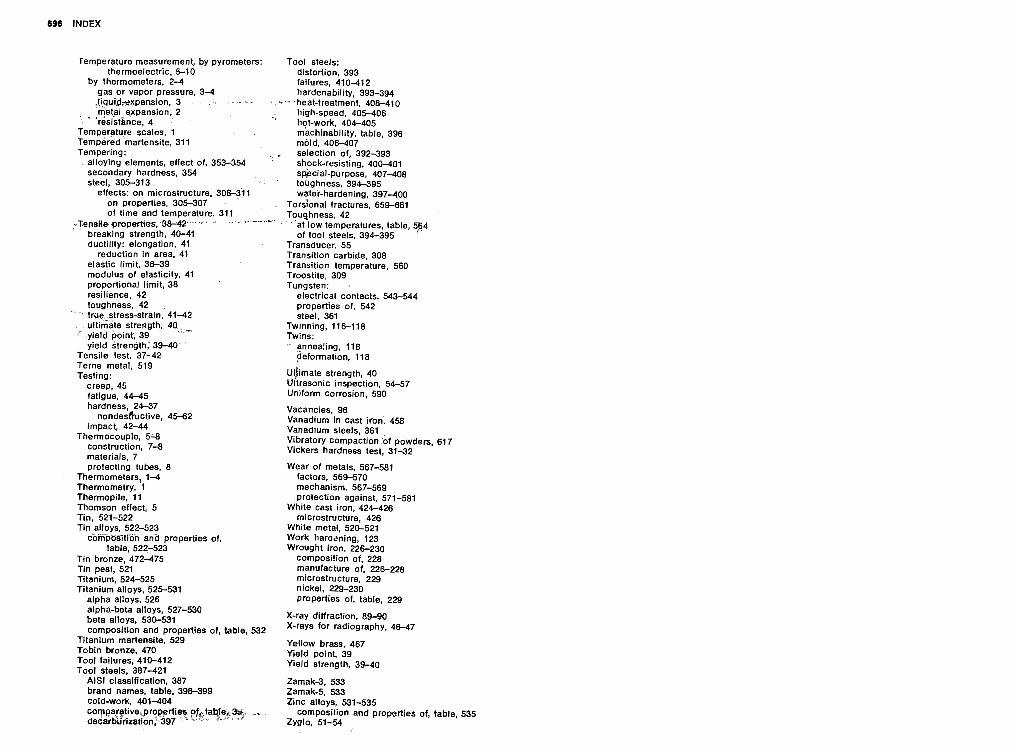
remperature measurement, by pyrometers: thermoelectric, 5-10
by thermometers, 2-4 gas or vapor pressure, 3-4 .!iqui~-qxpansion, 3 - . . - metal expansion, 2
' ' 'rQsLtlnce, 4 Temperature Scales, 1 Tempered martensite, 311 Tempering:
alloying elements, effect of, 353-354 secondary hardness, 354 steel, 305-313
effects: on microstructure, 308-31 on properties, 305307 of time and temperature, 311
-TmsHe.ptopf&~, 38-42 breaking strength, 40-41 ductility: elongation, 41
reduction in area, 41 elastic limit, 38-39 modulus of elasticity, 41 proportional limit, 38 resilience, 42 toughness, 42 true stress-strain, 41-42 ultimate strength. 40. , ' yield point, 39
yield strength,' 39-40 Tensile test. 37-42 Terne metal. 519 Testing:
creep, 45 fatigue, 44-45 hardness, 24-37
nondesfiuctive, 45-62 impact, 42-44
Thermocouple, 5;8 construction, 7-8 materials, 7 protecting tubes, 8
Thermometers, 1-4 Thermometry, 1 Thermopile. 11 Thomson effect, 5
~in'alloys, 522-523 c7jfiffo~lfion'and properties of,
table, 522-523 Tin bronze, 472-475 Tin pest, 521 Titanium, 524-525 Titanium alloys, 525-531
alpha alloys, 526 alpha-beta alloys. 527-530 beta alloys, 530-531 composition and properties of, table,
Titanium martensite, 529 Tobin bronze, 470 Tool failures, 410-412 Tool steels, 387-421
IS! classification, 387 rand name% table, 398-399 old-work, 401-404 ompa~~tiveh,pr?pprti@ $ctab!ec%
ded&L%frisation, 397 "'" ""* '
Tool steels: distortion, 393 failures, 410-412 hardenability, 393-394
-.. heat-treatment, 408-410 high-speed, 405-406
' hot-work, 404-405 machinability, table, 396 mold, 406-407
, selection of, 392-393 ' shock-resisting, 400-401
syjecial-purpose, 407-408 toughness, 394-395 water-hardening, 397-400
~orsional fractures, 659-661 Toughness, 42
at low temperatures, table, 594 of tool steels, 394-395
Transducer, 55 Transition carbide, 308 Transition temperature, 560 Troostite, 309 Tungsten:
electrical contacts, 543-544 oroperties of, 542 steel, 361
Twinning, 116-118 Twins:
annealing, 118 deformation, 118
~4imate strength, 40 Ultrasonic inspection, 54-57 Uniform corrosion, 590
Vacancies, 96 Vanadium in cast iron, 458 Vanadium steels, 361 Vibratory compaction of powders, 617 Vickers hardness test, 31-32
Wear of metals, 567-581 factors, 569-570 mechanism, 567-569 protection against, 571-581
White cast iron, 424-426 microstructure, 426
White metal, 520-521 Work haraening, 123 Wrought iron, 226-230
composition of, 228 manufacture of, 226-228 microstructure, 229 nickel, 229-230 properties of, table, 229
X-ray diffraction. 89-90
532 X-rays for radiography, 46-47
Yellow brass, 467 Yield point, 39 Yield strength, 39-40
Zamak-3, 533 Zamak-5, 533 Zinc alloys, 531-535 -. composition and properties of, table, 535 Zyglo, 51-54