Embed Size (px)
Citation preview

M A T E R I A L S C H A R A C T E R I Z A T I O N 6 9 ( 2 0 1 2 ) 1 6 – 3 0
Ava i l ab l e on l i ne a t www.sc i enced i r ec t . com
www.e l sev i e r . com/ loca te /matcha r
Electrochemical study of Aluminum-Fly Ash compositesobtained by powder metallurgy
E. Marina, M. Lekkaa,⁎, F. Andreattaa, L. Fedrizzia, G. Itskosb, c, A. Moutsatsoub,N. Koukouzasc, N. Kouloumbib
aDepartment of Chemistry, Physics and Environment, University of Udine, Via Cotonificio 108, 33100, Udine, ItalybSchool of Chemical Engineering, National Technical University of Athens, Iroon Polytechneiou 9, Zografou 15780, Athens, GreececCentre for Research and Technology Hellas/Institute for Solid Fuels Technology and Applications, Mesogeion Avenue 357-359, Halandri 15231,Athens, Greece
A R T I C L E D A T A
⁎ Corresponding author. Tel.: +39 0432558831;E-mail address: [email protected] (M.
1044-5803/$ – see front matter © 2012 Elseviedoi:10.1016/j.matchar.2012.04.004
A B S T R A C T
Article history:Received 2 February 2012Received in revised form26 March 2012Accepted 3 April 2012
In this paper, two different ASTM C 618 Class C fly ashes (FA) were used for the productionof aluminum metal matrix composites (MMCs) using powder metallurgy (PM) technology.Calcareous FAs were sampled from the electrostatic precipitators of two different lignite-fired power stations: from Megalopolis, Southern Greece (MFA) and from Kardia, NorthenGreece (KFA), under maximum electricity load. FAs were milled in order to reduce the meanparticle diameter and Aluminum-FA composites containing 10% and 20% of FA were thenprepared and compacted. The green products were sintered for 2 h at 600 °C. Sintered Al-FAMMCs showed increased hardness and wear resistance suggesting their possible use inindustrial applications for example in covers, casings, brake rotors or engine blocks. Asmost possible industrial applications of MMCs not only require wear resistance, but alsocorrosion resistance in different mild aggressive medias, this paper aims to study theelectrochemical behavior of FA MMCs in order to evaluate their corrosion resistance.The morphology and chemical composition of the phases in the Aluminum-FA compositesamples were investigated using Scanning Electron Microscopy (SEM) and EnergyDispersive X-ray Spectroscopy (EDXS). Moreover, topographic and Volta potential mapswere acquired by Scanning Kelvin Probe Force Microscopy (SKP-FM). Volta potential mapsprovide information about the electrochemical behavior of the different phases in absenceof electrolyte. The electrochemical behavior was investigated by Open Circuit Potentialmeasurements and potentiodynamic polarization, while the corrosion mechanisms werestudied by SEM observations after different times of immersion in amild corrosive medium.In all cases it could be stated that the addition of the FA particles into the Al matrix mightcause an increase of the hardness and mechanical properties of the pure aluminum butdeteriorates the corrosion resistance.The degradation phenomena occurring on the FA containing samples might be related tothe following mechanisms: 1) Partial detachment or dissolution of the FA soluble phases, inparticular based on Si, Fe and Ca; 2) dissolution of the Al matrix surrounding the FAparticles due to crevice corrosion; 3) Al localized dissolution due to galvanic couplingbetween the Fe-rich intermetallics and the matrix.
© 2012 Elsevier Inc. All rights reserved.
Keywords:AlFly ashCompositesCorrosion mechanisms
fax: +39 0432558803.Lekka).
r Inc. All rights reserved.
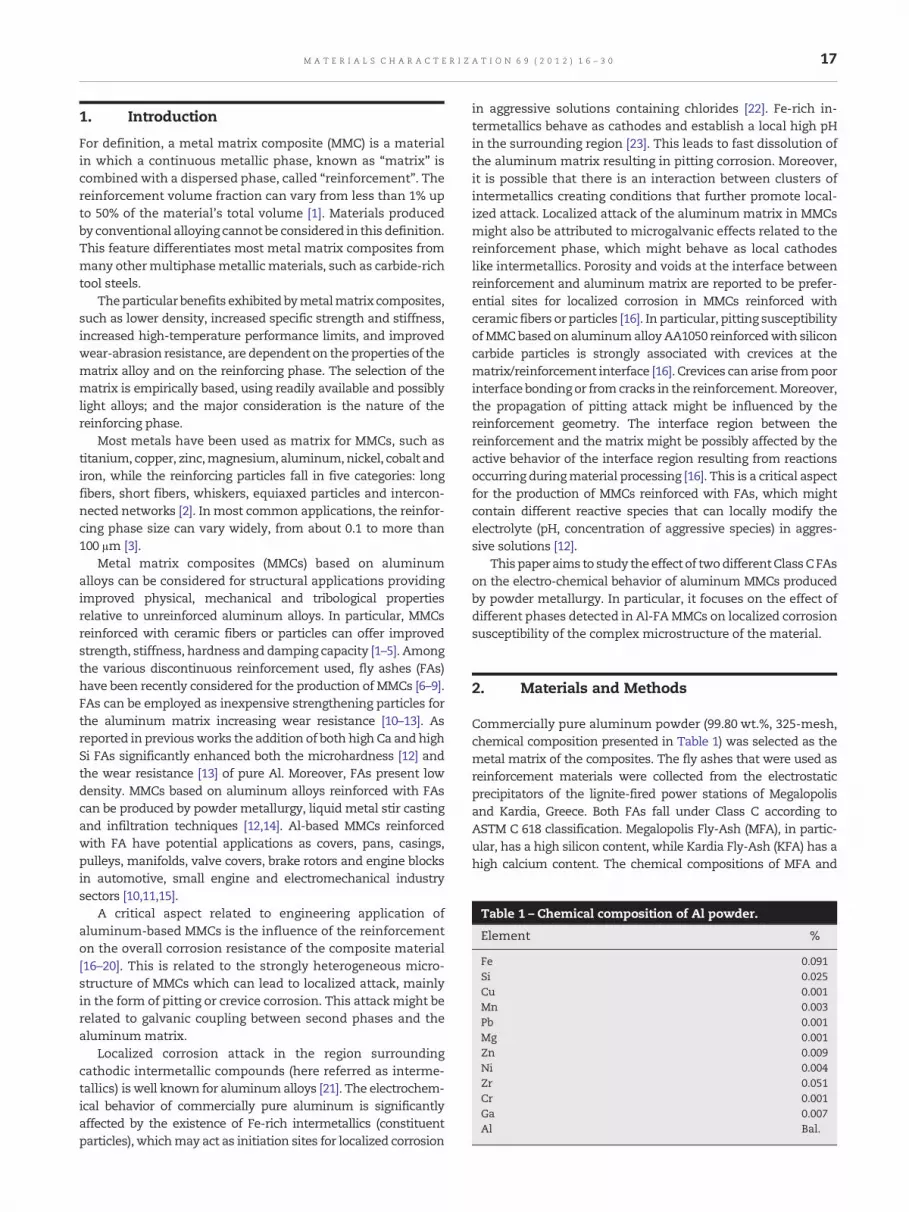
Table 1 – Chemical composition of Al powder.
Element %
Fe 0.091Si 0.025Cu 0.001Mn 0.003Pb 0.001Mg 0.001Zn 0.009Ni 0.004Zr 0.051Cr 0.001Ga 0.007Al Bal.
17M A T E R I A L S C H A R A C T E R I Z A T I O N 6 9 ( 2 0 1 2 ) 1 6 – 3 0
1. Introduction
For definition, a metal matrix composite (MMC) is a materialin which a continuous metallic phase, known as “matrix” iscombined with a dispersed phase, called “reinforcement”. Thereinforcement volume fraction can vary from less than 1% upto 50% of the material's total volume [1]. Materials producedby conventional alloying cannot be considered in this definition.This feature differentiates most metal matrix composites frommany othermultiphasemetallicmaterials, such as carbide-richtool steels.
Theparticular benefits exhibited bymetalmatrix composites,such as lower density, increased specific strength and stiffness,increased high-temperature performance limits, and improvedwear-abrasion resistance, are dependent on the properties of thematrix alloy and on the reinforcing phase. The selection of thematrix is empirically based, using readily available and possiblylight alloys; and the major consideration is the nature of thereinforcing phase.
Most metals have been used as matrix for MMCs, such astitanium, copper, zinc,magnesium, aluminum,nickel, cobalt andiron, while the reinforcing particles fall in five categories: longfibers, short fibers, whiskers, equiaxed particles and intercon-nected networks [2]. Inmost common applications, the reinfor-cing phase size can vary widely, from about 0.1 to more than100 μm [3].
Metal matrix composites (MMCs) based on aluminumalloys can be considered for structural applications providingimproved physical, mechanical and tribological propertiesrelative to unreinforced aluminum alloys. In particular, MMCsreinforced with ceramic fibers or particles can offer improvedstrength, stiffness, hardness and damping capacity [1–5]. Amongthe various discontinuous reinforcement used, fly ashes (FAs)have been recently considered for the production of MMCs [6–9].FAs can be employed as inexpensive strengthening particles forthe aluminum matrix increasing wear resistance [10–13]. Asreported in previousworks the addition of both high Ca andhighSi FAs significantly enhanced both the microhardness [12] andthe wear resistance [13] of pure Al. Moreover, FAs present lowdensity. MMCs based on aluminum alloys reinforced with FAscan be produced by powder metallurgy, liquid metal stir castingand infiltration techniques [12,14]. Al-based MMCs reinforcedwith FA have potential applications as covers, pans, casings,pulleys, manifolds, valve covers, brake rotors and engine blocksin automotive, small engine and electromechanical industrysectors [10,11,15].
A critical aspect related to engineering application ofaluminum-based MMCs is the influence of the reinforcementon the overall corrosion resistance of the composite material[16–20]. This is related to the strongly heterogeneous micro-structure of MMCs which can lead to localized attack, mainlyin the form of pitting or crevice corrosion. This attack might berelated to galvanic coupling between second phases and thealuminum matrix.
Localized corrosion attack in the region surroundingcathodic intermetallic compounds (here referred as interme-tallics) is well known for aluminumalloys [21]. The electrochem-ical behavior of commercially pure aluminum is significantlyaffected by the existence of Fe-rich intermetallics (constituentparticles), whichmay act as initiation sites for localized corrosion
in aggressive solutions containing chlorides [22]. Fe-rich in-termetallics behave as cathodes and establish a local high pHin the surrounding region [23]. This leads to fast dissolution ofthe aluminum matrix resulting in pitting corrosion. Moreover,it is possible that there is an interaction between clusters ofintermetallics creating conditions that further promote local-ized attack. Localized attack of the aluminum matrix in MMCsmight also be attributed to microgalvanic effects related to thereinforcement phase, which might behave as local cathodeslike intermetallics. Porosity and voids at the interface betweenreinforcement and aluminum matrix are reported to be prefer-ential sites for localized corrosion in MMCs reinforced withceramic fibers or particles [16]. In particular, pitting susceptibilityofMMCbased on aluminumalloyAA1050 reinforcedwith siliconcarbide particles is strongly associated with crevices at thematrix/reinforcement interface [16]. Crevices canarise frompoorinterface bonding or fromcracks in the reinforcement.Moreover,the propagation of pitting attack might be influenced by thereinforcement geometry. The interface region between thereinforcement and the matrix might be possibly affected by theactive behavior of the interface region resulting from reactionsoccurring duringmaterial processing [16]. This is a critical aspectfor the production of MMCs reinforced with FAs, which mightcontain different reactive species that can locally modify theelectrolyte (pH, concentration of aggressive species) in aggres-sive solutions [12].
This paper aims to study theeffect of twodifferentClassCFAson the electro-chemical behavior of aluminum MMCs producedby powder metallurgy. In particular, it focuses on the effect ofdifferent phases detected in Al-FAMMCs on localized corrosionsusceptibility of the complex microstructure of the material.
2. Materials and Methods
Commercially pure aluminum powder (99.80 wt.%, 325-mesh,chemical composition presented in Table 1) was selected as themetal matrix of the composites. The fly ashes that were used asreinforcement materials were collected from the electrostaticprecipitators of the lignite-fired power stations of Megalopolisand Kardia, Greece. Both FAs fall under Class C according toASTM C 618 classification. Megalopolis Fly-Ash (MFA), in partic-ular, has a high silicon content, while Kardia Fly-Ash (KFA) has ahigh calcium content. The chemical compositions of MFA and

Table 2 – Chemical composition of FAs.
Compound KFA%
MFA%
SiO2 30.16 49.54Al2O3 14.93 19.25Fe2O3 5.10 8.44CaO 34.49 11.82Na2O 1.01 0.53K2O 0.40 1.81MgO 2.69 2.27P2O5 0.34 0.37TiO2 0.60 1.35SO3 6.28 2.91MnO 0.07 0.14LOI 3.95 1.67
18 M A T E R I A L S C H A R A C T E R I Z A T I O N 6 9 ( 2 0 1 2 ) 1 6 – 3 0
KFA are presented in Table 2. Moreover, the KFA has a freecalcium oxide (CaOf) between 15% and 18%, while theMFA below1%. As-collected FAs were then mechanically grinded until adiameter of less than 56 μm was obtained. The ganulometricdistribution of the two types of fly ashes as determined bymeansof a MalVern MasterSizer-S instrument, using the wet dispersionmethod in water is reported in Fig. 1. Al-FA mixtures, containing10 and 20 wt.% ground MFA or KFA particles were compactedusing cold axial pressing (applied pressure: 600 MPa). Thepreparation stage included ultrasonic vibration and mechanicalblending in order to achieve a high homogeneity level. Thecomposites were then sintered at 600 °C for 2 h in an inertatmosphere under constant flow of nitrogen. The sinteringprocess parameters have been chosen based on previouslyreported results [12]. For comparison, 100% Al samples wereprepared following the same procedure. The obtained speci-mens have a cylindrical form with a diameter of 13 mm and aheight of 3.5 mm.
For the characterization, sintered samples were grindedusing abrasive SiC paper under a constant liquid ethanol jet inorder to prevent a possible dissolution of the fly ash phases orcorrosion phenomena caused by the contact with water.Polishing was then performed using water-free diamond sus-pensions in order to obtain a final surface roughness of about20 nm Ra. After polishing, the samples were cleaned in anethanol ultrasonic bath for about 15 min and then heat-dried
Fig. 1 – Granulometric distribution of (
in a heat sterilizer at constant temperature of 50 °C. Samples'surfaces were then marked in order to perform, on the sameareas, analyses using different techniques.
AVeecoMultimodeNanoscope IIIaAtomic ForceMicroscope(AFM) was used to map the samples surface. Topographic andSurface Volta Potential maps were simultaneously obtainedusing tapping and Scanning Kelvin Probe Force Microscopy(SKPFM)-interleavemode configuration onmarked 100×100 μmareas. SKPFM gives information about the anodic and/orcathodic behavior of the different particles and phases presenton the sample surface. On the same areas, observations werethen performed using a Karl Zeiss EVO-40 Scanning ElectronMicroscope (SEM) in backscattered electrons configuration(BSE), which provides a clear overview of the particle dimen-sions and distribution inside the metal matrix. Energy Disper-sive X-Ray Spectroscopy (EDXS) was used in order to obtain asemi-quantitative compositional analysis of the differentphases present on the sample surface.
The corrosion resistance of the different samples wasfirstly evaluated by potentiodynamic polarization curves in a0.05 M NaCl solution. Measurements were performed under athree electrode configuration, with Ag/AgCl as Reference Elec-trode (RE) and a platinum wire as a Counter Electrode (CE). Theanalyzed surface was 0.785 cm2 (O-ring with a diameter of 1 cmwas used). The equipment used was an Autolab PGSTAT-20potentiostat. Open Circuit Potential (OCP) was measured for15min before starting the test and then the potential has beenscanned starting from−0.2 Vvs.OCP. The scan ratewas 0.2 mV/s.The measurement was stopped when a corrosion currentdensity of about 0.01 A/cm2 was reached, considered indicativefor a fast corrosion degradation of the sample surface. Threepotentiodynamic polarization curves were recorded for eachsample.
Immersion tests were carried out in a 0.05 M NaCl solutionfor 300 h using a vertical configuration electrochemical celland a 10 mm diameter O-ring to prevent solution leakage.Vertical sample positioning was considered fundamental inorder to avoid re-deposition of corrosion products on thesurface, which may act as an insulator for the underneathmetallic surface. Open Circuit Potential (OCP) has been moni-tored for the whole immersion time. Samples were extractedfrom the electrolyte every 50 h in order to be analyzed by SEM-
a) MFA and (b) KFA after grinding.

Fig. 2 – (a) AFM topographic map, (b) SKPFM Volta potential map and (c) SEM-BSE micrograph of the sintered Al sample.
19M A T E R I A L S C H A R A C T E R I Z A T I O N 6 9 ( 2 0 1 2 ) 1 6 – 3 0
EDXS. The morphological and compositional modificationsinduced by the prolonged contact with the sodium chloridecontaining solution were monitored to discriminate thedifferent corrosion phenomena.
3. Results and Discussion
Fig. 2 shows an AFM topographic map, a SKPFM Voltapotential map and SEM-BSE micrograph for the same repre-sentative area of the sintered Al sample. The topographic map(Fig. 2a) of the sintered Al sample evidences the typicalmorphology for a polished sample, with a surface roughnessof about 35 nm Ra. Some small features higher than the
Fig. 3 – Linear Volta potential scans
matrix (bright spots) as well as lower than the matrix (darkspots) could be recognized. Bright spots can be associatedwith the presence of particles on the sample surface, whiledark spots can be associated with the residual porosities leftby the sintering process. The Volta potential map (Fig. 2b)reveals the grain structure of the material. Fig. 3 shows someVolta potential line scans corresponding to the marks ofFig. 1b. Regions with different Volta potential could be clearlyidentified, most likely corresponding to grains with differentoxidation level (Fig. 3a and b). Small bright spots can beassociated with the presence of intermetallics, which exhibita Volta Potential of about 250 mV relative to the Al matrix(Fig. 3c). Moreover, the grain boundaries exhibit slightly higherpotential (about 20 mV, Fig. 3d) than the interior of the grain.
corresponding to Fig. 1b marks.
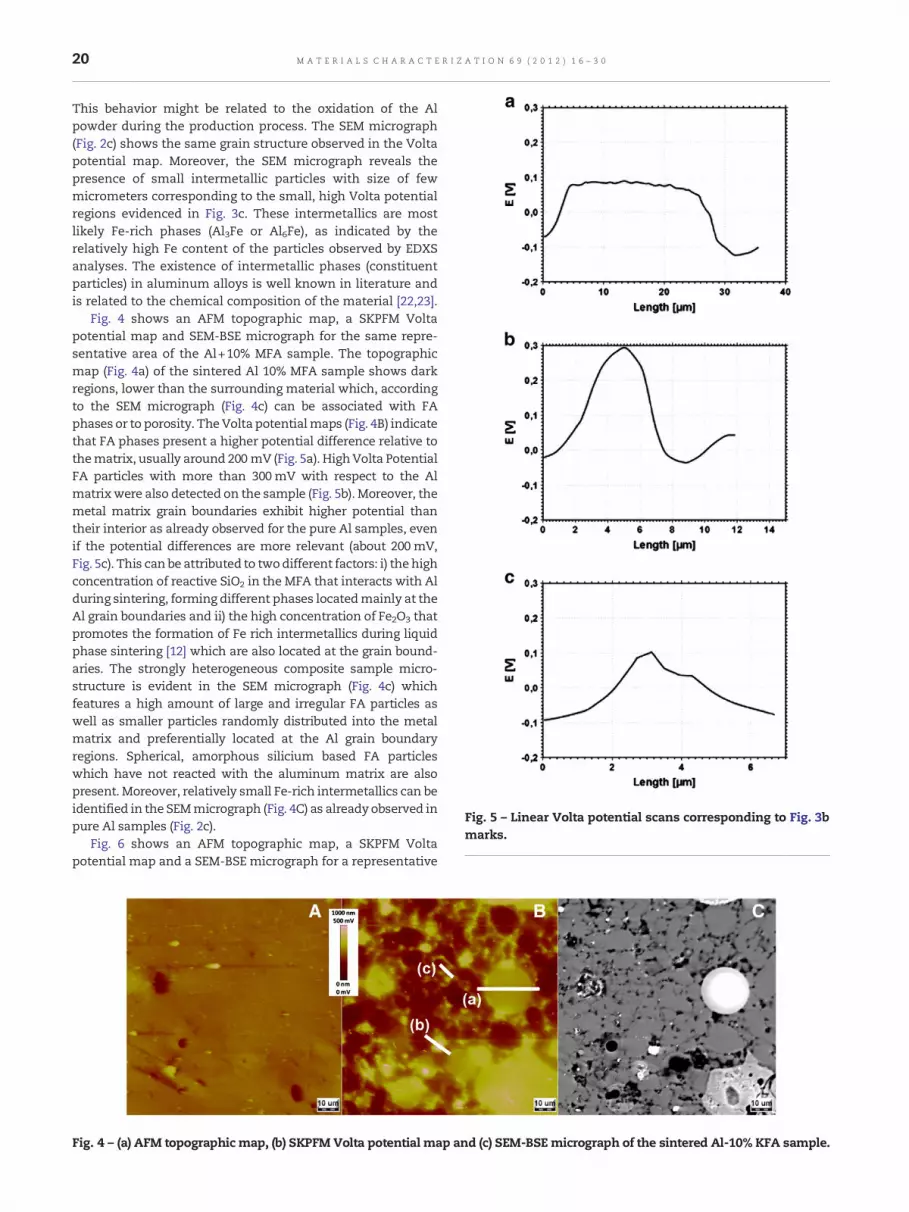
Fig. 5 – Linear Volta potential scans corresponding to Fig. 3bmarks.
20 M A T E R I A L S C H A R A C T E R I Z A T I O N 6 9 ( 2 0 1 2 ) 1 6 – 3 0
This behavior might be related to the oxidation of the Alpowder during the production process. The SEM micrograph(Fig. 2c) shows the same grain structure observed in the Voltapotential map. Moreover, the SEM micrograph reveals thepresence of small intermetallic particles with size of fewmicrometers corresponding to the small, high Volta potentialregions evidenced in Fig. 3c. These intermetallics are mostlikely Fe-rich phases (Al3Fe or Al6Fe), as indicated by therelatively high Fe content of the particles observed by EDXSanalyses. The existence of intermetallic phases (constituentparticles) in aluminum alloys is well known in literature andis related to the chemical composition of the material [22,23].
Fig. 4 shows an AFM topographic map, a SKPFM Voltapotential map and SEM-BSE micrograph for the same repre-sentative area of the Al+10% MFA sample. The topographicmap (Fig. 4a) of the sintered Al 10% MFA sample shows darkregions, lower than the surrounding material which, accordingto the SEM micrograph (Fig. 4c) can be associated with FAphases or to porosity. TheVolta potentialmaps (Fig. 4B) indicatethat FA phases present a higher potential difference relative tothematrix, usually around 200 mV (Fig. 5a). HighVolta PotentialFA particles with more than 300mV with respect to the Almatrixwere also detected on the sample (Fig. 5b). Moreover, themetal matrix grain boundaries exhibit higher potential thantheir interior as already observed for the pure Al samples, evenif the potential differences are more relevant (about 200 mV,Fig. 5c). This can be attributed to twodifferent factors: i) thehighconcentration of reactive SiO2 in the MFA that interacts with Alduring sintering, forming different phases locatedmainly at theAl grain boundaries and ii) the high concentration of Fe2O3 thatpromotes the formation of Fe rich intermetallics during liquidphase sintering [12] which are also located at the grain bound-aries. The strongly heterogeneous composite sample micro-structure is evident in the SEM micrograph (Fig. 4c) whichfeatures a high amount of large and irregular FA particles aswell as smaller particles randomly distributed into the metalmatrix and preferentially located at the Al grain boundaryregions. Spherical, amorphous silicium based FA particleswhich have not reacted with the aluminum matrix are alsopresent. Moreover, relatively small Fe-rich intermetallics can beidentified in the SEMmicrograph (Fig. 4C) as already observed inpure Al samples (Fig. 2c).
Fig. 6 shows an AFM topographic map, a SKPFM Voltapotential map and a SEM-BSE micrograph for a representative
Fig. 4 – (a) AFM topographic map, (b) SKPFM Volta potential map and (c) SEM-BSE micrograph of the sintered Al-10% KFA sample.

Fig. 6 – (a) AFM topographic map, (b) SKPFM Volta potential map and (c) SEM-BSE micrograph of the sintered Al-20% KFA sample.
Fig. 7 – Linear Volta potential scans corresponding to Fig. 5bmarks.
21M A T E R I A L S C H A R A C T E R I Z A T I O N 6 9 ( 2 0 1 2 ) 1 6 – 3 0
area of the Al+20% MFA sample. The topographic map (Fig. 6a)of the sintered Al 20% MFA sample shows a dispersion of darkspots that can be associated with the presence of large FAparticles and related porosities. Observing the Volta potentialmap of Fig. 6b, the big FA particles which appear lower than themetal matrix on the topographic map exhibit higher potentialwith respect to the surrounding aluminum matrix, about250 mV (Fig. 7a). A number of relatively high potential (about300 mV on Fig. 7b) Fe-rich intermetallics, showing an elongatedshape, can be easily observed on the SEM micrograph (Fig. 6c).They were not observed on pure-Al and Al-10% MFA sample,and were supposed to be formed by the reactions between thehigh fraction of FA and the Almatrix during sintering. The grainboundaries also display higher potential than the grain interiorin line with the results obtained for the Al+10% MFA sample(Fig. 7c). Comparing the Volta potential map with the SEMmicrograph it could be noticed the presence of large FA particleswith high Volta potential which are not easily observable in theSEMmicrograph.
Fig. 8 shows an AFM topographic map, a SKPFM Voltapotential map and SEM-BSE micrograph for the same repre-sentative area of the Al+10% KFA sample. The topographicmap (Fig. 8a) of the sintered Al 10% KFA sample shows darkregions, lower than the surrounding material which, accord-ing to the SEM micrograph (Fig. 8c) can be associated with FAphases. The Volta potential maps (Fig. 8b) indicate that theseFA phases present a higher potential than thematrix (Fig. 9a, b)in the range of 200mV. The composite samplemicrostructure ismore evident in the SEM micrograph (Fig. 8c). The surfacemicrostructure appears to be more uniform when compared tothe samples containing MFAs. The grain boundaries are wellevidenced, probably due to the presence of second phases thatprecipitated during the sintering process. In addition to somelarge FA particles, smaller ones are also present randomlydistributed into the metal matrix and preferentially located atthe Al grain boundary regions. Moreover, relatively small Fe-rich intermetallics can be identified in the SEM micrograph(Fig. 8c) as already observed in pure Al samples (Fig. 2c).
Fig. 10 shows an AFM topographic map, a SKPFM Voltapotential map and SEM-BSE micrograph for the same repre-sentative area of the Al+20% KFA sample. The topographicmap (Fig. 10a) of the sintered Al 20% KFA sample shows darkspots that can be associatedwith large FA particles. The few big

Fig. 8 – (a) AFM topographic map, (b) SKPFM Volta potential map and (c) SEM-BSE micrograph of the sintered Al-10% MFAsample.
22 M A T E R I A L S C H A R A C T E R I Z A T I O N 6 9 ( 2 0 1 2 ) 1 6 – 3 0
FA particles exhibit higher potential relatively to the surround-ing aluminum matrix (Fig. 11b). The grain boundaries also dis-play higher potential than the grain interior in line with theresults obtained for the pure Al sample (Fig. 10a). However thepotential difference between the grain boundaries and theinterior appears higher for this sample compared to the 10%KFA sample. This behavior might be related to segregation orprecipitation at the grain boundaries of second phases due tothe high fraction of FA. In fact the higher concentration of CaOf
andMgO, present in the KFA, leads to the formation of differentphases due to the reduction of themelting point of thematerialas it was verified in previous paper [12]. The sample displays
Fig. 9 – Linear Volta potential scans corresponding to Fig. 7bmarks.
randomly distributed large FA particles, smaller FA particlespreferentially located at themetal matrix grain boundaries andsmall Fe-rich intermetallics.
Potentiodynamic polarization curves obtained in a 0.05 Msolution of NaCl were well reproducible for all samples.Representative potentiodynamic polarization curves for pureAl, 10% MFA, 20% MFA, 10% KFA and 20% KFA samples arereported in Fig. 12.
The potentiodynamic polarization curve for the pure Alsample exhibits a corrosion potential of about −0.860 V vs Ag/AgCl. The corrosion current density is about 10−6 A/cm2. Thecurve exhibits a relatively low current density before thebreakdown at −0.650 V vs. Ag/AgCl. All curves related to Al-FAmetal matrix composites clearly show a corrosion currentdensity of about 3×10⁻⁵ A/cm2 and relatively high currentdensity in the anodic branch. The corrosion current densityand the anodic current density are higher than those detectedfor the pure Al samples.
The potentiodynamic polarization curves relative to thealuminum matrix composites show a marked decrease of thecorrosion potential with respect to the pure Al sample, and inparticular:
- −1.05±0.11 V for Al 10% MFA;- −1.17±0.08 V for Al 20% MFA;- −1.30±0.12 V for Al 10% KFA;- −1.39±0.15 V for Al 20% KFA.
Moreover, samples containing higher fractions of FAclearly show a lower corrosion potential when compared tosamples with lower fractions of FA. All samples containingKFA show lower corrosion potentials when compared tosamples containing MFA.
The different electrochemical behavior between pure Aland the Al/FA MMC can be explained by taking into accountdifferent phenomena:
a) other parallel oxidation reactions which occur due to thepresence of the FA, such as the oxidation of Mg;
b) local dissolution of the Al matrix due to galvanic couplingwith both FA particles and intermetallics which are formedduring sintering;

Fig. 10 – (a) AFM topographic map, (b) SKPFM Volta potential map and (c) SEM-BSE micrograph of the sintered Al-20% MFAsample.
23M A T E R I A L S C H A R A C T E R I Z A T I O N 6 9 ( 2 0 1 2 ) 1 6 – 3 0
c) activation phenomena due to a localized pH variation atthe FA/metal interface. It is in fact known that the FAshave a pH between 11.2 and 11.7 (measured according tothe ASTM D4972 standard), interval in which the Al doesnot exhibit passive behavior. For this reason, local pHvariations might impair the passivity of the Al metalmatrix leading to severe Al dissolution.
Differences in the corrosion potential between KFA andMFA MMC can be explained by taking into account thedifferent chemical and mineralogical composition of the twoFAs: a) the higher fraction of reactive silicon dioxide (amorphousphase of SiO2) in the MFA and b) the higher concentration of
Fig. 11 – Linear Volta potential scans corresponding to Fig. 9bmarks.
Fe2O3 in the MFA which might be responsible for its highercorrosion potential.
The sharp increase of the current density which is noticedat a potential of about −0.6 V vs. Ag/AgCl for all four MMCsamples is in agreement with the behavior of the pure Alsample andmight be also attributed to the oxidation of Fe richphases, which are also present in the FA.
It is indeed known that Fe is present in the FA as Fe2O3, butduring sintering it may react with aluminum according to [12]:
2Alþ Fe2O3 sð Þ→2Fe sð Þ þ Al2O3 sð Þ:
The Fe present in the specimen can be oxidized not onlyduring the exposure to the environment but also during thepolarization curve from Fe2+ to Fe3+.
The Open Circuit Potential values as a function of theimmersion time in the electrolyte for all types of specimensare presented in Fig. 13. As can be observed, all samples showa clear decrease of the OCP (about 200 mV for all the differentsamples, more intense for the KFA containing samples) duringimmersion time and in particular during the first 20–50 h ofimmersion. All the composite specimens show lower potentialvalues as compared to the pure Al, in line with the behaviorobserved in the potentiodynamic polarization curves. Samplescontaining MFAs, show higher OCP values at all immersiontimes, among the composite specimens,with a sharper decrease
Fig. 12 – Representative potentiodynamic polarization curvesof the five different specimens.

Fig. 13 – Open Cirquit Potential measurements of the fivedifferent specimens.
24 M A T E R I A L S C H A R A C T E R I Z A T I O N 6 9 ( 2 0 1 2 ) 1 6 – 3 0
of the values in the first 20 h of immersion. For all samples,the OCP decrease over time slows down after about 50 h ofimmersion and becomes almost stationary after about 200 h ofimmersion.
SEM micrographs of a pure Al sample representative areaare reported in Fig. 13 before and after different immersiontimes in the corrosive media.
The SEM micrographs acquired before the immersion(Fig. 14a) and after 50 h of immersion (Fig. 14b) show a very
Fig. 14 – SEM micrographs of a pure Al sample representative sur(b) 50 h, (c) 100 h and (d) 300 h of immersion.
similar morphology. In particular no evident signs of corro-sion can be observed in Fig. 14b. After longer immersion times(Fig. 14c, d) localized corrosion attacks become visible atlocations near the second phase particles. EDXS spectra havebeen acquired on these particles showing that these are mostlikely Fe-rich intermetallics. Representative analyses acquiredon the marked area of Fig. 14 are reported in Table 3.
As can be observed from the SEM micrographs and therelative EDXS analyses, localized corrosion mainly occurs atthe location of cathodic intermetallics due to the galvaniccoupling with the aluminum matrix. This causes localizeddissolution of the Al matrix in the region surrounding theintermetallic particles. After longer immersion times, thelocalized corrosion at the intermetallic sites might cause thedetachment of the particles thus leading to the formation ofpits on the sample surface. Indeed the pit formation is evidentin Fig. 14c and d and the relative EDXS analyses revealed thedecrease and final disappearance of the Fe signal confirmingthe detachment of the Fe-rich intermetallic particle.
SEMmicrographsof a10%MFAcontaining specimenobtainedbefore and after different immersion times in the corrosivemedia are reported in Fig. 15.
From the SEM micrographs it is clear that the immersion inthe NaCl electrolyte induces localized corrosion mainly inter-esting the areas surrounding the FA phases. The attack is more
face area (a) before the immersion in the electrolyte and after

Table 3 – EDXS localized analyses results (wt.%) on themarked area of Fig. 13.
Immersiontime (h)
O Al Cl Ni Fe
0 4.39 88.74 – 0.32 5.0450 4.90 87.37 – 0.26 4.68100 18.27 80.21 0.44 – 0.26300 17.73 79.70 0.20 – –
Table 4 – EDXS localized analyses results (wt.%) on themarked areas of Fig. 14.
Immersiontime (h)
O Mg Al Si S Ca Fe
Area 10 46.53 1.69 8.54 15.97 17.67 9.5950 43.83 0.73 20.92 6.10 0.95 13.76 13.70100 46.68 0.67 20.18 6.13 1.93 13.34 11.02200 49.51 0.72 20.46 7.75 2.12 11.75 7.62300 52.31 0.41 18.52 4.94 2.08 11.25 10.43
Area 20 35.72 1.00 3.13 3.07 2.62 54.4650 38.09 0.75 7.35 3.75 2.71 47.35100 38.73 0.93 11.92 5.85 3.36 39.21200 34.95 0.00 4.92 2.74 2.56 54.83300 34.87 0.80 3.57 3.78 2.86 54.13
25M A T E R I A L S C H A R A C T E R I Z A T I O N 6 9 ( 2 0 1 2 ) 1 6 – 3 0
intense with respect to the one observed on pure aluminumsample and occurs at a shorter immersion time. A numberof dark spots appear onto the surface, mainly near partiallyexposed FA particles. Most of the Fe-rich intermetallics are stillpresent in the metal matrix (small white spots), but a smallpercentage of them has been removed after only 50 h ofimmersion, leaving open pores. In addition some of the largeFA particles are most likely undergoing partial dissolution. Inorder to better understand the degradation mechanisms, EDXSanalyses have been performed on different zones of the samplearea. The results acquired on themarked areas 1 and 2 of Fig. 15for different immersion times are reported in Table 4. The EDXSanalysis performed on area 1 before immersion in the electro-lyte reveals the presenceof a highamountofO, togetherwith Si,Ca, Al and Fe. Si is present in the FA composition as SiO2. Fe can
Fig. 15 – SEM micrographs of a Al-10% KFA sample representativafter (b) 50 h, (c) 100 h and (d) 300 h of immersion.
be present either as small FeO2 FA particles or as FeO partiallyoxidized phases or even as metallic Fe because of chemicalreaction occurring between Fe-rich particles and the Al matrix[12]. Ca can be present either as CaSiO3 or as CaO [12]. After 50 hof immersion there is a strong decrease of the Si signal, togetherwith an evident increase in the Al content. This might beattributed to the detachment of Si rich FA phases due to the
e surface area (a) before the immersion in the electrolyte and

Table 5 – EDXS localized analyses results (wt.%) on themarked areas of Fig. 15.
Area 1
Immersion time (h) O Mg Al Si K Ca Fe
0 40.49 – 30.89 14.82 2.35 5.72 4.5350 39.18 1.29 27.70 17.49 2.78 5.63 5.94100 38.60 1.13 31.61 14.81 2.42 5.04 4.40200 41.77 0.96 29.61 15.85 2.31 4.65 3.34300 39.46 1.04 34.28 14.65 2.15 4.03 3.79
Area 2
Immersion time (h) O Al Cl Fe
0 6.95 81.46 – 11.5950 39.91 51.98 1.49 6.58100 44.28 43.24 1.84 10.41200 48.78 31.15 2.57 17.01300 44.95 33.38 3.62 18.31
26 M A T E R I A L S C H A R A C T E R I Z A T I O N 6 9 ( 2 0 1 2 ) 1 6 – 3 0
local dissolution of the surrounding Almatrix whichmight alsobe enhanced by a local increase of the solution pH.
EDXS data acquired on the marked area 2 of Fig. 15 showthat the composition of the white iron-rich FA particle ismaintained almost constant during the immersion time, evenif it appears partially surrounded by a dark region after 50 h ofimmersion. In agreement with observations on pure Al sam-ples, the dark region surrounding the Fe rich particle is a voidgenerated by the galvanic corrosion of the Al matrix, whichseems to be the main corrosion mechanism for this type ofparticle.
The EDXS analyses performed on the two big FA particlesmarked as 3 and 4 mainly revealed the presence of O, Ca, Si,and Al. These big particles do not undergo any chemicalmodification during immersion (300 h) and their compositionremains almost constant. No interstitial or galvanic corrosionseems to be triggered by their presence and thus these par-ticles can be considered inert in the chosen media.
SEM micrographs of a specimen containing 20% MFAobtained before and after different immersion times in thecorrosive media are reported in Fig. 16.
The SEM micrograph of Fig. 16b shows that already afteronly 50 h of immersion the composite specimen exhibitsstrong localized attack. It is evident that the higher amount ofFA particles in the metal matrix causes a more intense andfaster degradation than for the 10% MFA containing samples.
Fig. 16 – SEM micrographs of a Al-20% KFA sample representativafter (b) 50 h, (c) 100 h and (d) 300 h of immersion.
EDXS analyses have been performed on different zones of thesample surface. The results of these analyses acquired arereported in Table 5.
From the analysis before immersion on the marked area 1revealed that the particle is composed mainly of O, Al, Si, Caand Fe. During immersion, the content of Ca was slowlyreduced due to dissolution of Ca-rich phases, such as CaSiO3
e surface area (a) before the immersion in the electrolyte and

Table 6 – EDXS localized analyses results (wt.%) on themarked areas of Fig. 16.
Immersiontime (h)
O Mg Al Si S K Ca Ti Fe
Area 10 52.24 0.35 3.66 0.53 1.77 0.25 40.86 0.3350 29.26 1.32 43.90 5.75 0.27 13.48 0.34 4.42100 31.36 1.57 36.32 7.67 0.29 16.12 0.26 5.55200 37.74 1.22 34.24 9.41 0.34 12.26 0.32 3.95300 41.09 35.11 8.78 0.31 11.11 0.33 4.05
Area 20 19.41 62.22 0.87 1.79 0.21 13.15 1.4650 37.11 1.05 37.14 9.35 0.24 11.94 2.26100 36.35 0.70 45.64 6.80 0.26 7.75 1.80200 35.65 59.47 0.50 0.29 0.21 0.97300 40.02 58.11 0.56 0.24 0.17 0.90 40.02
27M A T E R I A L S C H A R A C T E R I Z A T I O N 6 9 ( 2 0 1 2 ) 1 6 – 3 0
[12]. Similar behavior is shown by the Fe signal. As a result, thecontent of Al shows an increase, due to the removal of solublephases and the exposure of Al matrix.
The results of the analyses acquired in the marked area 2of Fig. 16, before the immersion, revealed a high amount of Ferelated to the presence of a Fe rich intermetallics probablyformed during sintering. The high fraction of FA phases leadsto the formation of a high amount of relatively big, elongatedFe-rich intermetallics in the composite material. As observedalso for the 10% MFA specimen, Fe-rich intermetallics causesevere localized corrosion and are eventually detached forlonger immersion times.
SEM micrographs of 10% of KFA containing specimen arereported in Fig. 17 before and after different immersion timesin the corrosive media. It is evident that the immersion in theNaCl electrolyte causes a localized corrosion mainly interest-ing the FA surrounding areas which is more intense and fastwith respect to the pure aluminum sample. A number of darkspots appears onto the surface, mainly near partially exposedFA particles. The Fe-rich intermetallics are most likely stillpresent in themetal matrix (small white spots) and a localizedcorrosion attack at these interfaces is still evident althoughless severe than that occurring near the FA particles. Inaddition the large FA particles have most likely undergonepartial dissolution which becomes more evident after longer
Fig. 17 – SEM micrographs of a Al-10% MFA sample representativafter (b) 50 h, (c) 100 h and (d) 300 h of immersion.
immersion times (Fig. 17c, d). The results of the EDXS analysesacquired on the marked areas 1 and 2 of Fig. 17 for differentimmersion times are reported in Table 6.
The EDXS analysis performed before the immersion in theelectrolyte on themarked area 1 reveals the presence of a highamount of Ca, much higher in comparison to the Al-MFAsamples, which might be present either as CaSiO3 or as CaO
e surface area (a) before the immersion in the electrolyte and

28 M A T E R I A L S C H A R A C T E R I Z A T I O N 6 9 ( 2 0 1 2 ) 1 6 – 3 0
[12]. However, low amounts of S, Si, Fe andMg can be detectedin this area as well. This corresponds to the typical compo-sition of MFA. After 50 h of immersion there is a completedissolution or detachment of S containing phases and anoticeable decrease of the Ca signal. This might be attributedto the dissolution of the CaSiO3 phase, which is soluble inNaCl solutions. As a consequence there is an increase of theAl, Si and Fe signals. The SEM micrographs (Fig. 17b–d) showalso an intense dissolution of the aluminum matrix aroundthe analyzed area, which might be related to a local increaseof the pH.
On the marked area 2, before the immersion in theelectrolyte, Al grains are observed.(Fig. 17a). The EDXS analysisacquired on these grains shows a high amount of Al togetherwith a relevant amount of Ca aswell as low amounts of Si, S andFe. It is possible that a FA particle is located immediately belowthe visible Al grains thus affecting the chemical microanalysis.After the first 50 h of immersion, these particles became visibledue to the dissolution of the Al matrix (Fig. 17b). Indeed theEDXS analyses reveal an increase of all elements present in theFAexcept fromSandCa. TheS containingphases are completelydissolved after 50 h of immersion, while the slight decrease ofthe Ca signal might be attributed to a partial dissolution of theCaSiO3 phase. After longer times of immersion the Al matrix is
Fig. 18 – SEM micrographs of a Al-20% MFA sample representativafter (b) 50 h, (c) 100 h and (d) 300 h of immersion.
subjected to dissolution due to crevice corrosion leading to thedetachment of the FA particles.
SEM micrographs of 20% of KFA containing specimen arereported in Fig. 18 before and after different immersion timesin the corrosive media.
The SEM micrograph of Fig. 18b shows that the higheramount of FA particles in the metal matrix might cause amore intense degradation after the immersion in the electro-lyte in comparison to the Al/10% KFA samples.
There is, also in this case, a partial dissolution of the largeFA particles and a Al matrix dissolution at the areassurrounding the FA particles. The EDXS analysis, performedbefore the immersion, on themarked area 1 of Fig. 18 reveals ahigh amount of Al and Ca related to a Ca rich FA particleembedded in the Al matrix. After only 50 h of immersion themorphological observation (Fig. 17b) reveals the formation ofwell defined crystals on this site, which disappear after 100 hof immersion (Fig. 18c). SEM micrographs of the same area athigher magnification are reported in Fig. 19 and the EDXSanalyses results on the marked area in Table 7.
From the EDXS analyses is evident that the formed crystalsare composed by a Ca rich phase, probably CaCl2 due to thedissolution of the CaSiO3 phase. After 100 h of exposure the Caamount is really low. It is likely that the crystals have been
e surface area (a) before the immersion in the electrolyte and

Fig. 19 – SEM micrographs of Fig. 17 marked area 1 after (a) 50 h and (b) 100 h of immersion in the electrolyte.
29M A T E R I A L S C H A R A C T E R I Z A T I O N 6 9 ( 2 0 1 2 ) 1 6 – 3 0
detached and the hole has been filled in by Al and Sihydroxides formed due to the dissolution of both CaSiO3 andsurrounding metal.
The marked area 2 of Fig. 18 contains a spherical particlewhich is firmly embedded into the metal matrix before theimmersion. Indeed the EDXS analysis before the immersionreveals a high amount of Al and small amounts of Si, Ca, Tiand Fe suggesting the existence of a FA particle. After 50 h ofimmersion (Fig. 18b) dissolution of the aluminum surround-ing the particle is noticed. The Al matrix dissolution becomesmore evident after longer times of immersion while the FAparticle remains unaffected as demonstrated by the EDXSanalyses. Based on the morphology and the chemical compo-sition of the FA particle, it might be deduced that it is a Si richstable FA particle that has not reacted with the metal matrixduring sintering as it is covered by an amorphous glass layerof SiO2[24]. This could lead to a preferential dissolution of theAl matrix at the interface due to crevice corrosion.
The degradation morphologies observed by SEM and therelative EDXS analyses after different immersion timessuggest the following degradation mechanisms:
1) FA particles undergo a partial dissolution of the phasessoluble in the NaCl electrolyte. This phenomenon is moreintense for the KFA containing specimens. The highcontent of CaOf leads to the dissolution of the Ca richphases such as CaSiO3 and CaO and the formation of CaCl2;
2) the aluminum matrix surrounding the FA particles issubjected to localized corrosion; This behavior is observedfor both MFA and KFA containing specimens. The potentialdifference between the FA particles and the aluminummatrix is the driving force for the Al dissolution.
Table 7 – EDXS localized analyses results (wt.%) on themarked area of Fig. 18.
Immersiontime (h)
O Mg Al Si K Cl Ca Fe
50 65.99 2.40 0.34 0.68 30.59100 51.86 1.12 36.02 6.66 0.44 0.13 2.13 1.64
3) galvanic coupling between Fe-rich intermetallics and thematrix leads to localized Al dissolution. In pure Al samplesand samples containing KFA the Fe-rich intermetallics arerelatively small and located in the Al matrix. In the MFAcontaining specimens, and in particular in those with thehigher fraction of fly ash, there is also the formation ofrelatively big, elongated intermetallics during sintering.The high concentration of FeO in the MFA and the lowconcentration of CaOf, which could bind the FeO, lead tothe formation of a high amount of intermetallics whichpromote the localized dissolution of the Al matrix. As aconsequence this is the main degradation mechanism ofthe Al-20% MFA samples.
4. Conclusions
In this work the electrochemical behavior of Al matrix com-posites containing different amounts of High Siliceous andHighCalcareous ASTM Class C 618 FA has been studied andcompared to sintered pure Al.
Pure Al sintered specimens display the existence ofheterogeneously distributedmicrometric Fe-rich intermetallics.These particles present cathodic behavior with respect to theAl matrix and act as preferential sites for localized corrosionfavored by galvanic coupling thus leading to the breakdown ofthe Al passive layer.
The incorporation of the FA particles leads to the forma-tion of a strongly heterogeneous microstructure. FA particleswith different sizes are randomly distributed into the Almatrix leading to the formation of surface areas with differentVolta potential. Potentiodynamic polarization curves show amarked activation of the corrosion for the composite speci-mens with respect to the pure Al specimens. This behaviorcould be related to the effect of the FA particles, which impairthe passive behavior of the Al matrix.
The degradation phenomena occurring on the FA contain-ing samples might be related to the following mechanisms:
1) partial detachment or dissolution of the FA soluble phases,in particular those based on Si, Fe and Ca;

30 M A T E R I A L S C H A R A C T E R I Z A T I O N 6 9 ( 2 0 1 2 ) 1 6 – 3 0
2) dissolution of the Al matrix surrounding the FA particlesdue to crevice corrosion;
3) Al localized dissolution due to galvanic coupling betweenthe Fe-rich intermetallics and the matrix.
Al dissolution due to galvanic coupling resulted to becaused by the presence of small intermetallics also present inthe pure Al sintered sample, but mainly by the presence ofelongated intermetallics formed at the grain boundaries of theAl matrix as a consequence of the reaction with the MFAduring sintering when added to a high quantity (20%). Basedon the degradation morphology it might be stated that thedissolution of the soluble FA phases and the crevice corrosionare themain degradationmechanisms in the 10%MFA, 10%KFAand 20% KFA samples, while galvanic coupling and partialdissolution of the soluble FA phases, due to the formation ofrelatively big Fe-rich intermetallic phases are themain degrada-tionmechanisms in the 20%MFAsample. Finally itwas observedthat localized attack was more intense for the 20% MFA samplecompared to all other samples.
In all the considered cases it can be stated that althoughFAs addition into the Al matrix determines a remarkableincrease of mechanical properties and hardness with respectto pure sintered aluminum, it also negatively affects thecorrosion behavior of the composite samples with respect tothe pure aluminum ones.
R E F E R E N C E S
[1] Rohatgi PK. Low-cost, fly-ash-containing aluminum-matrixcomposites. JOM 1994;46:55–9.
[2] Daoud A. Effect of strain rate on compressive properties ofnovel Zn12Al based composite foams containing hybridpores. Mater Sci Eng A 2009;525:7–17.
[3] Karayiannis VG, Moutsatsou A. Fabrication of MMCs frommetal and alloy powders produced from scrap. J MaterProcess Technol 2006;171:295–300.
[4] Hassan SF, Gupta M. Effect of length scale of Al2O3 particulateson microstructural and tensile properties of elemental Mg.Mater Sci Eng A 2006;425:22–7.
[5] Hajjari E, Divandari M. An investigation on the microstructureand tensile properties of direct squeeze cast and gravity die cast2024 wrought Al alloy. Mater Des 2008;29:1685–9.
[6] Rajan TPD, Pillai RM, Pai BC, Satyanarayana KG, Rohatgi PK.Fabrication and characterisation of Al–7Si–0.35Mg/fly ashmetal matrix composites processed by different stir castingroutes. Compos Sci Technol 2007;67:3369–77.
[7] Daoud A, Abou El-Khair MT, Shenouda AY, Mohammed E,Rohatgi PK. Microstructure, tensile properties and
electrochemical behavior of Pb alloy-45 vol.% fly ashmicroballoon composites. Mater Sci Eng A 2009;526:225–34.
[8] Gupta N, Gupta K, Mueller BJ. Analysis of a functionallygraded particulate composite under flexural loading conditions.Mater Sci Eng A 2008;485:439–47.
[9] Karayiannis VG, Moutsatsou A. The contribution of waste inthe construction of composite materials. J Eur Ceram Soc2007;27:843–9.
[10] Mondal DP, Das S, Ramakrishnan N, Uday Bhasker K.Cenosphere filled aluminum syntactic foammade throughstir-casting technique. ComposAAppl SciManuf 2009;40:279–88.
[11] Rohatgi PK, Kim JK, Guo RK, Robertson DP,Gajdardziska-Josifovska M. Age-hardening characteristics ofaluminum alloy-hollow fly ash composites. Metall MaterTrans A 2002;33:1541–7.
[12] Moutsatsou A, Itskos G, Vounatsos P, Koukouzas N, VasilatosC. Microstructural characterization of PM-Al and PM-Al/Sicomposites reinforced with lignite fly ash. Mater Sci Eng A2010;527:4788–95.
[13] Itskos G, Moutsatsou A, Rohatgi PK, Koukouzas N, Vasilatos C,Katsika E. Compaction of high-Ca fly ash-Al andAl-alloy-composites: evaluation of their microstructure andtribological performance. Coal Combust Gasif Prod 2011;3:75–82.
[14] Sudarshan SurappaMK. Synthesis of fly ash particle reinforcedA356 Al composites and their characterization. Mater Sci Eng A2008;480:117–24.
[15] Rohatgi PK, Daoud A, Schultz BF, Puri T. Microstructure andmechanical behavior of die casting AZ91D-fly ash cenospherecomposites. Compos A Appl Sci Manuf 2009;40:883–96.
[16] Trowsdale AJ, Noble B, Harris SJ, Gibbins ISR, Thompson GE,WoodGC. The influence of silicon carbide reinforcement on thepitting behaviour of aluminium. Corros Sci 1996;38:177–91.
[17] Coleman SL, Scott VD, McEnaney B. Corrosion behaviour ofaluminium-based metal matrix composites. J Mater Sci1994;29:2826–34.
[18] Pardo A,MerinoMC,Merino S, Viejo F, CarbonerasM, Arrabal R.Influence of reinforcement proportion andmatrix compositionon pitting corrosion behaviour of cast aluminium matrixcomposites (A3xx.x/SiCp). Corros Sci 2005;47:1750–64.
[19] Ahmad Z, Paulette PT, Aleem BJA. Mechanism of localizedcorrosion of aluminum-silicon carbide composites in achloride containing environment. J Mater Sci 2000;35:2573–9.
[20] Roper GW, Attwood PA. Corrosion behaviour of aluminiummatrix composites. J Mater Sci 1995;30:898–903.
[21] Birbilis N, Buchheit RG. Electrochemical characteristics ofintermetallic phases in aluminum alloys. J Electrochem Soc2005;152:140–51.
[22] Nisancioglu K, Davanger KY, Strandmyr O. Cathodic behaviourof impure aluminum in aqueous media. J Electrochem Soc1981;128:1523–6.
[23] Park JO, Paik CH, Huang YH, Alkire RC. Influence of Fe-richintermetallic inclusions on pit initiation on aluminum alloysin aerated NaCl. J Electrochem Soc 1999;146:517–23.
[24] Vom Berg W, Lutze D. Handbook on fly ash in concrete. VerlaElsen 2010.