Embed Size (px)
Citation preview

* Corresponding author. E-mail address: [email protected] (M. Simanjuntak) © 2020 by the authors; licensee Growing Science, Canada doi: 10.5267/j.msl.2019.10.017
Management Science Letters 10 (2020) 801–814
Contents lists available at GrowingScience
Management Science Letters
homepage: www.GrowingScience.com/msl
A general structural equation model of the emotions and repurchase intention in modern retail
Megawati Simanjuntaka*, Hanum Rachmawati Nurb, Bagus Sartonoa and Mohamad Fazli Sabric aDepartment of Family and Consumer Sciences, Faculty of Human Ecology, IPB University, Bogor, Indonesia bSchool of Business, IPB University, Bogor, Indonesia cDepartment of Resource Management & Consumer Studies, Faculty of Human Ecology, Universiti Putra Malaysia, 43400 UPM Serdang, Selan-gor, Malaysia C H R O N I C L E A B S T R A C T
Article history: Received: September 5 2019 Received in revised format: Sep-tember 5 2019 Accepted: October 15, 2019 Available online: October 16, 2019
The major objective of this study is to analyze the effect of the shopping environment and situation as perceived by modern retail shoppers into perceived crowding, store image, and shopping motives toward emotions and repurchase intention in the context of a grocery modern retail. The cross-sectional design method was used in this study, and the data were collected from a customer survey with randomly selected 244 respondents using an online questionnaire. According to the findings the perceived crowding, store image, and shopping motives affected positively on the customer emotions. The perceived crowding was revealed as the most influential variable on the emotions. We also found a direct effect of perceived crowding and store image on repurchase intention. Furthermore, the high-density retail condition shoppers tend to feel pleased with the shopping envi-ronment and give a positive appraisal to the store image. But unfortunately, a high-density retail condition could discourage the shoppers to have repurchase intention. Interestingly, when the emotions were used as a mediating variable of perceived crowding and repurchase intention, those independent variables affected on repurchase intention, positively. Therefore, the shoppers' emotions were the most important factor affected on repurchase intention in modern retail. The more they enjoy the shopping environment and situations, the more they are interested in making future purchases.
© 2020 by the authors; licensee Growing Science, Canada
Keywords: Emotions Perceived crowding Repurchase intention Shopping motives Store image
1. Introduction Retail is a business of selling products and services which aim to fulfill the daily needs of the end customers. Here, the selling products include mainly household products, such as basic needs. Retail as the last chain distribution is an encounter media between household product and end customers. Customer as a household actor and also a family is able to make a purchase of product in accordance to demand and needs. Therefore, retail is an important aspect in the product distribution chain (Soliha, 2008). Retail still has a growing opportunity in Indonesia. Its development is supported by Indonesian population growth that would be estimated to reach 271.1 million by 2020, with age group ranging from 5 to 34 years as one of the groups of the society that will prioritize daily necessities (BPS or Indonesia Statistic Centre, 2013). The demographic bonus will certainly impact on the demand for basic and household needs. According to this statement, national retail business has an exceptional opportunity to be developed. Despite increasing retail development opportunity due to forecasted demographic bonus which will most likely be occurred in Indonesia, modern retail business opportunity is decreasing. Based on the data released by the United States of Agriculture (USDA), the growth percentage in sales value and number of outlets were declined from 2013 to 2016. The growth percentage in sales value for convenience store category reached 36.9 percent in 2013, and it continued to decline to 17.7 percent in 2016. In addition, the growth percentage in sales value for hypermarket and supermarket catego-ries was reached only 6 percent in 2016. The decline in growth of sales value was in accordance with the decrease in the number of modern outlets in Indonesia. The tendency of decline was caused by the competition of similar business due to the technological developments. The technological developments are the driven factor of online marketplace development as an alternative of shopping in fulfilling customer needs and demands. According to the online and offline transaction growth data, an increment was observed in online shopping transactions in 2016, which was in contrary to the offline shopping transactions

802
(IDPRO, 2016). It shows that customer’s interest is shifting from offline to online shopping which stimulates online market growth which could be one of the major shopping alternatives. The growth of online marketplace generates a shift of lifestyle as well as customer purchasing behavior (Farki et al., 2016). The higher the number of shopping options, the more critical and stricter the customer purchasing behavior as they become more selective in choosing shopping media to suit their demands (Fikriati, 2015). Due to the higher business competition, modern retail should maintain their businesses by having exceptional advantages. One of the alternatives is to influence repurchase intention of customers. “Repurchase” is a probability of one customer to make similar purchase to the product or seller for more than once (Ibzan et al., 2016). However, it is still a subjectivity that one customer will continuously purchase a product from one vendor or store in the future (Chiu et al., 2009). According to Schiffman and Kanuk (2007), emotion is classified as one of the key aspects of purchasing process. Emotion is a multi-dimensional feeling, reflecting an information of customer relationship with his/her social life and surrounding envi-ronments, including their interpretations of these relationships (Achar et al., 2016). Emotion, which is a multi-dimensional aspect that is closely correlated to repurchase, as the customer emotion during the usage of product or service will build their memory and stimulus to repurchase and has effects on overall financial well-being of the customer (Prastyaningsih et al., 2014; Falahati & Sabri, 2015; Wijaya, 2016). Some factors that may affect emotion and repurchase intention are perceived crowding, store image, and shopping motives. Customer perceived crowding is needed to understand the pressure perceived by customer due to social and spatial densities (Machleit et al., 1994). According to Yuksel (2009), the factor of perceived crowding is known to have a negative effect on emotions as it may affect the customer's space. Store image is needed to understand the customer impression toward important attributes of the store (Waja, 2013). According to Park and Lennon (2009), it is known to influence the purchase intention. Shopping motives are needed to determine the customer's response to their emotional benefits generated during the shopping process (Babin et al., 1994). According to Peng and Kim (2014), shopping motives are known to influence repurchase interest with emotional response perceived by the customer. Lifestyle changes which trigger a shift in shopping preferences resulting a behavior of customer for not only valuing ones that satisfy their household needs, but also valuing luxury and various essential things that will significantly affect their emotions and overall financial well-being (Sabri & Zakaria, 2015). Certain valuation standards set by customer should be a guide for businessmen to maintain their stability amidst of the high competition of modern retail businesses. Therefore, emotion be-comes crucial aspect to discuss due to the interest of customer purchase in the selection of modern retail, thus businessmen are able to develop the right marketing strategy to survive in the business competition.
2. Literature Review
2.1. Modern Retail Modern retail or modern store is defined by Presidential Regulation No. 112 of 2007 as an independent service system shop which sells various types of goods in retail, such as minimarket or convenience store, supermarket, department stores, hyper-market, wholesaler or grocery. Shopping Center and Modern Store establishment must refer to the Regency or City Spatial Plan, and Regency or City Spatial Detail Plan, including their Zoning Regulation. Its establishment should be initiated by forecasting the socio-economic conditions as well as existence of local traditional market, providing parking lot in accordance with store total area, managing distance of each store and providing clean, healthy, safe as well as comfortable public facilities. Each type of modern retail is distinguished by total area limit and sales system that have been regulated in the Presidential Regulation. Generally, various types of modern retailer use particular retail system which is selling the household products as their key products with different total area limit. Total area limit affects the size parking lot as one unit for four-wheeled vehicle requires 60 m2 of store total area. Table 1 shows the details of modern retail types in Indonesia in accordance with Presidential Regulation (PP) No. 112 of 2007. Table 1 Criteria of Indonesia Modern Retail
Criteria Modern Retail Type
Minimarket Supermarket Hypermarket Department Store Wholesale Total area (m2) 400 400 – 5000 >5000 >400 >5000 Selling system Retail Retail Retail Retail Wholesaler
Product type Food and per-sonal hygiene.
Food and household products.
Food, household products and textile.
Household products and textile.
General consuma-bles.
Source: PP No. 112 of 2007 2.2. Perceived Crowding Perceived crowding is an unpleasant feeling felt by customer if only the density is too high and it exceeds the limit of control (Mowen & Minor, 1997). Crowding as the impact of physical, social, and personal factors caused by limited space, such as number of people, objects, or both, which interferes individual activities in achieving goals, thus they feel that the environment is too crowded. Perceived crowding tends to be personal or individual. Different buyers in the same shopping center are able to feel the pressure due to different density depending on individual characteristics and situation constraints (Machleit et al.,

M. Simanjuntak et al. / Management Science Letters 10 (2020) 803
2000). Retail perceived crowding consists of two dimensions; spatial and social. Social or human density dimensions are related to the number of individual and social interaction level in a particular environment. High social density may cause undesirable impacts such as lack of privacy or private area, resulting a higher feeling of pressure (Machleit et al., 1994). Spatial density is a visitor's perception of limiting physical body movements in a certain space, especially at the moment of shopping in the store. The number of non-human elements in the environment and its correlation can determine spatial density level perceived by an individual. In the retail context, number of products, equipment and elements sold in the store may affect the stress as well as physical stimulus (Machleit et al., 1994). The feeling arises due to restrictions on physical movement caused by high spatial density. The physical environment drives a higher crowding and packed feelings (Eroglu & Harrell, 1986). The physical environment at the retail refers to store layout, products sold, and display products layout (Berman et al., 2011). According to Machleit et al. (2000), human and spatial density level perceived by customer costs a deduction in positive feelings and will impact on the increase of negative feelings, especially for those who have low crowding tolerance. This feeling arises due to the number of people or objects which is limiting customer activities, driving environmental stimulus to exceed the capacity of an individual (Machleit et al., 1994). Similar to Baker and Wakefield's (2012), perceived of crowding will increase stress and reduce feelings of joy. In contrast to the research of Wu and Luan (2008), in collectivistic cultures of the density perceived is known to influence emotions and positive purchase interests. The higher the density of human and space, the greater positive emotions could be occurred. This is supported by the statement that was given by Babin and Harris (2017) that customer do not feel attraction to make any purchase at the low-density store, because the absence of customer is a sign of low quality and inconvenience of the store. H1: Perceived crowding significantly influences on emotion of modern retail customer. Kim and In (2015) stated that human density provides a significant positive impact on repurchase intention. While according to Pramatatya (2015), it provides a positive impact on the intention to repurchase which involving customer’s emotion. Thus, the perceived of crowding has both direct and indirect relationships with the intention to repurchase. H2: Perceived crowding significantly influences on repurchase intention of modern retail customer. According to Machleit et al. (1994), human and spatial density may provide a different effect on store image. Customer concludes promotional activities, value of products sold and service quality in accordance with the density conditions in the store, thus store image plays a huge part in influencing store density perceived. According to Harrel et al. (1980), it happens because customer evaluates shopping experience in a crowded environment. When customer experiences a crowded place, it gives such an impression that interesting thing is happening in the store. Thus, customer can consider density as a sign that products sold has a good value. Similar to the study of Tse et al. (2002), the perceived crowding is believed to be able to improve the store image. Meanwhile, according to Mowen and Minor (1997), crowding can make a store's image negative for the customer. H3: Perceived crowding significantly influences on the store images of modern retail customer. 2.3. Store image Store image is the key basis for retail businessmen as it determines customer’s choice toward store and products quality as well as the store satisfaction and loyalty. Store image is defined as the way a store can be perceived and be defined by the buyer (Cornelius et al., 2010). According to Schiffman and Kanuk (2007) store image is the way customer sees store, including his/her impressions or perceptions. Store image depends on perceptions that vary based on retailer, product, and target market. Therefore, store image is influenced by customer perceptions to the series of dimensions of store image, sub dimension of store attributes and manipulation of a retailer to the store attributes (Waja, 2013). Store image is considered as a multi-dimen-sional concept, involving various aspects of retail stores. According to Diallo (2012), the structure of store image dimension includes products sold, service, customer, physical facilities, convenience, promotion, store atmosphere, institutional and post-transaction satisfaction factors. Ghosh (1990) stated that the dimension which plays a part in forming store image includes location, products sold, product quality, store atmosphere, price, employee quality, visibility, promotion and services. While Waja (2013) stated that atmosphere, convenience, facilities, institutions, products sold, promotions, salespeople, and services are factors to form store image dimension. Baker et al. (1994) stated, store image is represented by three elements of the store environment; social factors related to the salespeople appearance, design factors related to the visual interior design of the store, and environmental factors related to non-visual elements. While, Hosseini et al. (2014) stated, store image dimensions include atmosphere, music, quality of goods, price, service, and convenience. Similar with Chowdhury et al. (1998), major influential dimensions are service, product quality, store atmosphere, convenience, and price. Supported by the statement of Kim (2004), the dimensions of store image are service, product quality, product choice, atmosphere, convenience, and price. The customer's image also plays an important role in the concept of store image. The store image needs to bring a sense of ownership to customers because they tend to choose a store that suits their self-image or image that the customer wants. Store selection in customer’s mind is formed based on connections among key elements of their self-concept and their value of store image (Newman & Cullen, 2002). The factor of store image is also examined by Yusof and Arifin (2016), who stated that the

804
store image is functionally in accordance with the customer's self-concept, which has a significant positive relationship with the customer's emotions in shopping. H4: Store image significantly influences on the emotions of modern retail customer. In the study of Varga et al. (2014), it is known that store image is able to influence repurchase intention based on atmosphere dimension. A pleasant atmosphere is able to encourage for more purchases and drives customer interest in exploring products in the store. According to Kim and Na (2015), store image attributes for satisfaction and repurchase intention and increases sales. Smith and Sherman (1993) found that store image is able to influence the emotional state of customer and increase purchases. It can be occurred if the store environment and the customer's self-image is match to one another, making an emotional bond is formed. H5: Store image significantly influences on the intention to repurchase modern retail customer. 2.4. Shopping Motives Shopping experience encourages the occurrence of shopping motives, such as hedonic and utilitarian shopping motives. The hedonic reflects the potential of entertainment, emotion, and can also be indicated by an increase in experience and freedom in shopping. While, the utilitarian occurs if only shopping becomes an activity to fulfill certain consumption needs, which reflects the achievement of goals, cognitive, and non-emotion. Thus, shopping motive can be both intrinsic or extrinsic for a customer. Hedonic shopping motive tends to be intrinsic, which indicates joyful, pleasure, and leisure. Meanwhile, utilitarian shopping motive tends to be extrinsic, which relates to functional attributes of shopping (Babin et al., 1994). Hirschman (1984) confirms that the shopping experience involves stimulation of thought and senses, that can be seen as a process that provides benefits in cognitive (utilitarian) and affective (hedonic). In utilitarian motive, both product and services attributes are actually affecting on cognitive processes, thus, customer said to have a utilitarian motive when they successfully obtain products needed and this value will increase along with the convenience of customer in obtaining products (Babin et al., 1994). On contrary to utilitarian motive, hedonic motive is more subjective and individualistic as it is not for achieving goals (Hirschman & Holbrook, 1982). It reflects pleasure and emotionality instead (Bellenger et al., 1976). Therefore, it refers to the level of perception when shopping is considered emotionally beneficial through a variety of positive feelings. According to Babin et al. (1994), it considers as entertainment and emotional perceived through shopping activities. As stated by Bloch and Bruce (1984), customer gets hedonic value and related basic needs during the shopping experience. The shopping motives of utilitarian and hedonic have different emotional effects, depending on the tendency of the customer's consumption motives. In a study conducted by Anderson et al. (2014), utilitarian shopping motive will have a positive emo-tional impact if there is time saving and convenience of access to information, since it tends to be more efficient and rational (Babin et al. 1994). While, the hedonic shopping motive will have a positive emotional impact if there is an ease in bargaining and a pleasant shopping experience (Childers et al., 2001; To et al., 2007). This is also supported by Hirschman and Holbrook (1982) who state that positive emotion of hedonic value perceived by customer based on the experience of feeling consump-tion, fantasies, pleasures, and senses, which affect someone’s emotional experience. Customers who have a high score on hedonic motive is more interested in the act of shopping itself or the point of view of self-expression and personal satisfaction related to the shopping (Babin & Attaway, 2000). Hedonic type customer will shop only to find something entertaining, varying, and challenging (Kasnaeny et al., 2013). H6: Shopping motive has a significant effect on the emotion of modern retail customer. 2.5. Emotion Emotion is highly correlated to the affective psychology of a human being. This feeling is defined as a mental classification which is subjective, consciously experienced, and usually in parallel with emotion and mood. Different with the mood, emo-tion has a greater intensity and psychological impact. Positive emotion will be perceived when an object is satisfied toward his achievement, otherwise negative emotion will be perceived when a goal cannot be accomplished (Mowen & Minor, 1977). Emotion is oriented towards a particular action (Robbins et al., 2010). According to Holbrook and Hirschman (1982), emo-tions can be distinguished into two dimensions which are either positive or negative. Positive emotional states are including excitement, acceptance, and interest, while negative emotional states are including anger, dissatisfaction, irritation, worry, sadness, disgust, and humiliation (Babin & Attaway, 2000). Mowen and Minor (1997) stated that emotion derived from two opposite dimensions of affective response, such as excitement - unpleasant and passionate - passive. These two-dimensional combinations divide emotions into four categories including joy, anger, contentment and sadness. According to Palacios et al. (2016), the affective dimensions of customer occurs from environmental stimulation such as positive and negative affective responses. Emotions on the positive affective response are calm - excitement, while the negative affective response are frus-trating - stressful. Mehrabian and Russell (1974) stated that human response to the physical arrangement is distinguished into

M. Simanjuntak et al. / Management Science Letters 10 (2020) 805
three dimensions; pleasure, arousal, and dominance. The following are explanations of the emotional dimension caused by the situation experienced by customer according to Mehrabian and Russell (1974): 1. Pleasure: A level of emotion occurs when an individual feel good, full of excitement, and happy. 2. Passion (Arousal): A level of emotion occurs when an individual feel excited, passionate and active. 3. Domination (Dominance): A level of emotion occurs when an individual feel restricted, controlled, and freed in doing
activities. Emotion is defined as a gaining benefits which is derived from feelings or affective states (ex: pleasure or joy) resulted by the product (Sweeney & Soutar, 2001). According to Liang (2012), the side of positive emotions perceived by customer is im-pacting on the increase of purchase intention. Customer perception of various brands are also based on affective components (Kumar et al., 2009). It is perceived by customer as a form of pleasant emotional experiences. According to Bagozzi et al. (1998) emotion can be associated to repurchase intention formed in response to customer consideration in purchasing product. H7: Emotions have significant effects on the repurchase intention of modern retail customer. 2.6. Repurchase Intention Repurchase intention is a consideration of making decisions for repeatedly purchasing products from prior or same seller by estimating situation and current circumstances (Hellier et al., 2003). While according to Varga et al. (2014), it is the intention to often buy or utilize the product or service of a company in the future. Pramatatya (2015), also stated that it is a consideration to purchase more than once. 2.7. Conceptual Framework
Perceived perceptions, shopping motives, and store image can influence the affective aspects perceived by customers. A feeling and emotion when doing shopping, can influence customer repurchase intentions in modern retail. Based on this, the conceptual framework that can be built as shown in Fig. 1.
Fig. 1. Conceptual Framework
3. Research Methodology
This study used a cross sectional design method, which is conducting momentarily trace. While the descriptive, quantitative was used in this study to analyze perceived crowding, store image, and shopping motives as well as their effects on emotions and repurchase intention. The quantitative approach performed by doing online survey to the respondents. The sample popu-lation in this study was the customers of hypermarkets and supermarkets. The respondents were determined by sampling technique. Purposive sampling method was used to obtain samples required. The selected respondents were aged 18 years old and above customers who visited modern retailers at least three times in the past one month. According to Hair et al. (2006), the number of samples needed for each exogenous and endogenous variable parameter were five to ten observations. The number of indicator variables required for the model in this study were 44 indicator variables or attributes, when each variable needs five to ten observations, thus the limit of sample is between 44 × 5 = 220 up to 44 × 10 = 440 people with unit analysis
Perceived Crowding
Store
Image
Shopping Mo-tives
Emotions
Repurchase Inten-tion
H3 H2
H1
H4
H7
H7 H6

806
used was individual. The instrument used in this study was online questionnaire supported by Google Docs. The questionnaire was divided into three parts, such as screening, profiling, and main questions related to study variables. The number of re-spondents who filled out the online questionnaire were 501, but representative respondents who are considered to be in ac-cordance with the criteria were only 244 respondents. Based on these circumstances, the number of respondents selected for the processing data were 244 individuals. Endogenous variables (Y) in this study are emotions and repurchase intention. While, exogenous variables (X) are perceived crowding, store image, and shopping motives. The scale used was the Likert scale with five levels, (1) strongly disagree, (2) disagree, (3) quite agree, (4) agree, (5) strongly agree. The research variables are shown in the Table 2. Table 2 The research variables
Latent variable Operational definition Indicator variable 1. Perceived crowding (Bakker, 2010)
Social Perceived crowding due to human density in store SOS1 - SOS3
Spatial Perceived crowding due to spatial/products density in store SPA1 - SPA3
2. Store image (Chowdury et al., 1998) Employee services Customer evaluation to the employee attitudes while serving in store. EMS1 - EMS4 Products quality Customer evaluation to the quality and availability of products sold in general. KUP1 - KUP6 Atmosphere Customer evaluation to the atmosphere and appearance of the store in general. ATO1 - ATO4 Convenience Customer evaluation to the convenience of shopping and affordability of the store in general KNY1 - KNY 4
Price Customer evaluation to the level of prices of products in store. HRG1 - HRG3
3. Shopping motive (Rintamaki et al., 2006) Hedonic Customer’s pleasure or preferences to the store environment and condition. HED1 - HED6
Utilitarian Customer’s rationality to the store environment and condition UTI1 - UTI6
4. Emotion (Pramatatya, 2015)
Customer evaluation to the overall environment and condition of modern retail. EM1 - EM3
5. Repurchase intention (Pebriani, 2017)
Consideration of customer who have made a purchase at least once, to repurchase in the store. PU1 - PU3
Analysis of the causal relationship was used Structured Equation Model (SEM) method by LISREL 8.70 software. The level of conformity of the results of the test were examined by Goodness of Fit criteria so that the model is further reflected the actual conditions. If the model meets the criteria, then the testing on model can be continued with compatibility test of the measurement model and conformity test of the structural model. 4. Findings 4.1. Respondents Characteristics and Behaviors Majority of modern retail customers were dominated by female respondents by 62.8 percent for supermarkets and 57.3 percent for hypermarket, and the highest range of respondents was 25-34 years old. The dominance of respondents found in hyper-market were Jakarta residents by 41.7 percent, while dominance of respondents found in supermarket were Bogor residents by 26.4 percent. Shopping in modern retailers were mostly carried out by undergraduate students, which was 61.5 percent of total hypermarket respondents and 75.7 percent of total supermarket respondents. Majority of the participants preferred su-permarket as the place for shopping. In modern retail hypermarkets and supermarkets, the frequency of shopping was domi-nated by the results of 3-5 times of shopping in the last 1 month. The majority of respondents who were dominated this shopping frequency were usually aged 25-34 years for hypermarkets and 18-24 years for supermarkets. Both women and men in both types of modern retailers had similar behavior, but in modern retail hypermarkets, respondents tend to prioritize con-venience in the store as a reason to shop, while in modern retail supermarkets, respondents tend to prioritize affordable product price. The average expenses per shopping was dominated by Rp. 100,000 - Rp. 500,000. The average time per shopping at a hypermarket was 1-3 hours, while the supermarket was less than 1 hour. Women preferred shopping on weekdays, while men preferred shopping on weekends or national holidays. All respondents preferred shopping late in the evening at 15.00 - 22.00 hrs. Women hypermarket and all supermarket customer preferred to make a payment by using debit card, while male super-market customer preferred make a payment by using cash. In general, modern retail hypermarkets which became the cus-tomer’s first choice was Hypermart, while in modern supermarket retailers was Super Indo. The top three products purchased by hypermarket customers were personal-care, food and beverages, as well as home care products, while in supermarket customers, the top three were food and beverages, personal-care, and home care products.
4.2. Analysis of Structured Equation Model (SEM) 4.1.1. Overall Model Compatibility Test Results The overall compatibility test of the model was reviewed based on several Goodness-of-Fit indicators. Overall, the model has met the Goodness-of-Fit criteria. It indicates that the design of the model is compatible with the sample data. Thus, the design

M. Simanjuntak et al. / Management Science Letters 10 (2020) 807
of the model is able to be used in evaluating perceived crowding, store image, emotion and repurchase intention, which indicated that the testing of theoretical hypothesis could be performed. Table 3 shows the Goodness-of-Fit test results. Table 3 Goodness-of-Fit Test Results
Goodness-of-Fit Size Cut-off Value Results Description Root Mean Square Residual (RMR) ≤ 0.1 0.065 Good fit
Root Mean Square Error of Approximation (RMSEA) ≤ 0.08 0.03 Good fit Goodness of Fit (GFI) ≥ 0.9 0.97 Good fit
Adjusted Goodness of Fit Index (AGFI) ≥ 0.9 0.96 Good fit Normed Fit Index (NFI) ≥ 0.9 0.96 Good fit
Comparative Fit Index (CFI) ≥ 0.9 0.99 Good fit Relative Fit Index (RFI) ≥ 0.9 0.96 Good fit
4.1.2. Measurement Model Compatibility Test Results The compatibility of the measurement model was reviewed based on several measurement criteria, such as validity and con-struct reliability. Validity test is related to the accuracy of a measurement which aims to assess a set of measurement indicators on a model that truly reflects its latent construct. The construct validity is valid if the standardized value of loading factor ≥ 0.5 (Hair et al., 2014). In addition, an indicator variable is valid if the t-estimate is 1.96, referring to the confidence level of 95 percent with an error of 0.05. The standardized value of loading factor of each indicator is known to exceed 0.5 with a t-estimate value above 1.96, which means that all measurement indicators have reflected latent constructs on the model, so that indicators for each latent construct are considered valid for measurement of latent constructs (Table 4). Table 4 Latent construct reliability test results
Latent Construct Indicator Variables VE CR 1. Perceived crowding/Density SOS and SPA 0.61 0.74 Social (SOS) SOS1 - SOS3 0.59 0.81 Spatial (SPA) SPA1 - SPA3 0.73 0.89
2. Store image EMS - HRG 0.72 0.93 Employee service (EMS) EMS1 - EMS4 0.74 0.92 Products quality (KUP) KUP1 - KUP6 0.58 0.89 Atmosphere (ATO) ATO1 - ATO3 0.74 0.89 Convenience (KNY) KNY1 - KNY4 0.59 0.85 Price (HRG) HRG1 - HRG3 0.49 0.74
3. Shopping Motive HED and UTI 0.64 0.78 Hedonic (HED) HED1 - HED6 0.73 0.94
Utilitarian (UTI) UTI1 - UTI6 0.54 0.87 4. Emotion EM1 - EM3 0.78 0.88 5. Repurchase Intention PU1 - PU3 0.63 0.77
On the contrary with construct validity test, the construct reliability test aims to measure the reliability and internal consistency of the measured variables which is representing latent constructs. Reliability assessment is divided into two main measure-ments, such as Variance Extracted (VE) and Construct Reliability (CR). According to Hair et al. (2014), latent constructs is reliable if the minimum value of VE is 0.5 and the minimum value of CR is 0.7. The results of the test showed that the latent variables of perceived crowding, store image, shopping motives, emotions and repurchase intentions had VE values ≥ 0.5 and CR values 0.7. Similar to the main latent variable, the indicator variable used had a value of VE ≥ 0.5 and CR value ≥ 0.7. It shows that all variables and indicators are reliable to be used as measurement tools of the latent construct. 4.1.3. Structural Model Compatibility Test Results The standardized value of loading factors of each indicator is known to have exceeded 0.5 with a t-estimate value above 1.96, indicating that all measurement indicators have reflected latent constructs on the model, so that all indicators were considered to be valid for latent constructs measurement. The t-estimate value among latent variables were above 1.96. The t-estimate for each line of H1 to H7 were 9.49, 4.52, 11.33, 3.52, 8.62, 21.53, and 9.54, respectively. It indicated that the relationship among latent variables which was in accordance with each line had a significant relationship. The path coefficient assessment showed a number above 0.05. The coefficient values for each H1 to H7 lines were 0.53, -0.34, 0.55, 0.14, 0.27, 0.41, and 0.79, respectively. Based on this data, the perceived crowding had a greatest significant effect on customer emotions compared with store images and shopping motives which was equal to 0.53, indicating that the higher perceived crowding, the higher the emotions of customer related to the condition and environment of modern retail shopping. The variable that provided the greatest contribution was spatial density which was equal to 1.00 (Fig. 2).

808
Persepsi kepadatan
(PEK)
Citra toko(CIT)
Motif belanja(MBE)
Emosi(EM)
Niat pembelian ulang (PU)
SOS1
SOS2
SOS3
PU1
PU2
PU3
SOS
SPA1
SPA2
SPA3SPA
EMS1
EMS2
EMS3EMS
EMS4
KUP1
KUP2
KUP3KUP
KUP4
KUP5
KNY1
KNY2
KNY3
ATO
KNY4
ATO1
ATO2
ATO3
KNY
HRG1
HRG2
HRG3HRG
HED1
HED2
HED3HED
HED4
HED5
UTI1
UTI2
UTI3UTI
UTI4
UTI5
0.55*
HED6
KUP6
EM1
EM2
EM3
UTI6
0.90*
0.72*
0.82*
0.87*
0.73*
0.86*
0.95*
0.95*
0.88*
0.79*
0.89*
Note : * significant to t-estimate ≥ 1.96
Fig. 2. Standardized loading factor of SEM model
4.1.4. Factors Affecting Emotions and Repurchase Intention The hypothesis testing of this study was executed by analyzing the value of the coefficient of each line and the value of t-estimate of the structural model. The effect of variable will be considered as significant if only the value of the coefficient line ≥ 0.05 with the value of t estimate> 1.96. The diversity of factors was also reviewed through the R-square value model (Table 5). Based on the results of hypothesis testing, it is known that all related variables have a significant effect. The greatest influence to the emotional variable was contributed by the perceived crowding with path coefficient value of 0.53 and t-estimate value of 9.49, indicates that the perceived crowding had a significant positive effect on emotions by 0.53. Perceived crowding was also influenced store image with path coefficient value of 0.55 and t-estimate of 11.33, indicating that the better the perceived crowding, the better the store image. Furthermore, the variable which had the greatest influence on repurchase intention was the perceived crowding. Perceived crowding was known to have a significant negative effect on repurchase intention by 0.34, indicating that the higher the perception of density, the lower the repurchase intention of the customer.
Perceived crowding
(PEK)
Emotion (EM)
Store Image (CIT)
Repurchase in-tention
Shopping mo-tive

M. Simanjuntak et al. / Management Science Letters 10 (2020) 809
Table 5 Hypothesis testing results
Inter Variable Effects Coefficient
LIne │t-test│>1.96 Description
Perceived crowding (PEK) → Emotion (EM) 0.53 9.49* Accept H1 Perceived crowding (PEK) → Repurchase Intention (PU) -0.34 4.52* Accept H2 Perceived crowding (PEK) → Store Image (CIT) 0.55 11.33* Accept H3
Store Image (CIT) → Emotion (EM) 0.14 3.52* Accept H4 Store Image (CIT) → Repurchase Intention (PU) 0.27 8.62* Accept H5
Shopping Motive (MBE) → Emotion (EM) 0.41 21.53* Accept H6 Emotion (EM) → Repurchase Intention (PU) 0.79 9.14* Accept H7
Note: * significant at t-estimate ≥ 1.96 The R-square value of the store image latent variable was 0.3, indicating that the diversity of store images that can be explained by the latent variable of perceived crowding was 30 percent while the remaining 70 percent was explained by other factors outside the model. The value of the R-square model on the emotional latent variable was 0.65, indicating that the diversity of customer emotions that can be explained by store image, perceived crowding, and shopping motives was 65 percent while the remaining 35 percent explained by other factors outside the model. The R-square value of the repurchase intention model was 0.55 which means that 55 percent of the diversity of repurchase intentions can be explained by store image and emotions, while the remaining 45 percent was explained by other factors outside the model. The first hypothesis test was related to the effect of perceived crowding to the emotions. The results of the testing showed that the variable of perceived crowding had a significant positive effect to the emotions with a coefficient line value of 0.53 and t-estimate of 9.49. The higher the perceived crowding felt by customer, the more the emotions felt by customer. The analysis of effect was supported by the study conducted by Li et al. (2009) about the effect of perceived crowding to the customer emotions. Based on the results of his study, customer perception to the social density was not only about negative emotions, but also pleasure feelings in the hypermarket environment. According to Ferreira et al. (2017) and Machleit et al. (2000), it was occurred due to customer’s high tolerance to the density, thus it reduced the negative effects of density occurred in the shopping environment and condition. The second hypothesis testing was related to the effect of perceived crowding to the repurchase intention. The results of the testing showed that variable of perceived crowding has a significant negative effect to the repurchase intention with a loading factor value of -0.34 and t-estimate of 4.52. It showed that the higher customer’s perceived crowding, the lower repurchase intention was occurred. According to Aylott and Mitchell (1998), crowding is one of the factors that plays a role in stress driven in shopping. If crowding occurs in a retail, then it will disturb customers who have rational goals in shopping as the shopping efficiency will be decreased and they will pay no more visit to the store for shopping. As a result, customers will look for a new shopping place, interest in modern retail shopping will be decreasing. In addition to spatial and social density, queuing also become as a stress factor in shopping. The third hypothesis testing was related to the effect of perceptions to the image of the store. The results showed that the variable of perception had a significant positive effect on the store image with a loading factor value of 0.55 and t-estimate of 11.33. It showed that if the perceived crowding is higher, we expect higher image of store. These results are similar to the results of a study conducted by Lee et al. (2011) and Gogoi (2017) about the effect of perceived crowding that had a positive effect on store image. In this study, a positive relationship between perceived crowding and store image showed that the value and service provided by store were in accordance with customer expectations. The crowding occurred may indicate a good quality of products so that customer would be interested in making a store-purchase. The fourth hypothesis testing was related to the effect of store image to the emotions. The results of testing showed that the variable of store image had a significant positive effect on the emotions with a loading factor value of 0.14 and t-estimate of 3.52. It showed that the higher the store image, the more customer’s emotion. Similar to the study of Smith and Sherman (1993), store image had a significant positive effect on emotions. Thus, it can affect customer shopping behavior. Other studies supporting these analyses are from Cho and Lee (2016) and Yoo et al. (1998), which stated that characteristics shown by the store will positively influence on the emotions of customer at the moment of visitation. A great employee in service and convenient shopping facilities will make customers feel happier toward modern retail environment and condition. The fifth hypothesis testing was related to the effect of variable of store image to the repurchase intention. The results of testing showed that the variable of store image provided a significant positive effect on the repurchase intention with a loading factor value of 0.27 and t-estimate of 8.62, indicating that the higher the store image, the more repurchase intention. These results are similar to the study conducted by Azhari et al. (2014) which stated that store image had a positive effect on repur-chase intention. The main reasons of revisit are well-arranged products as well as friendly and agile employees. These results are also supported by a comfortable store atmosphere that stimulates customer to make more purchases next time. Another supporting study obtained from Park and Lennon (2009) which stated that store image had a significant positive effect on repurchase intention.
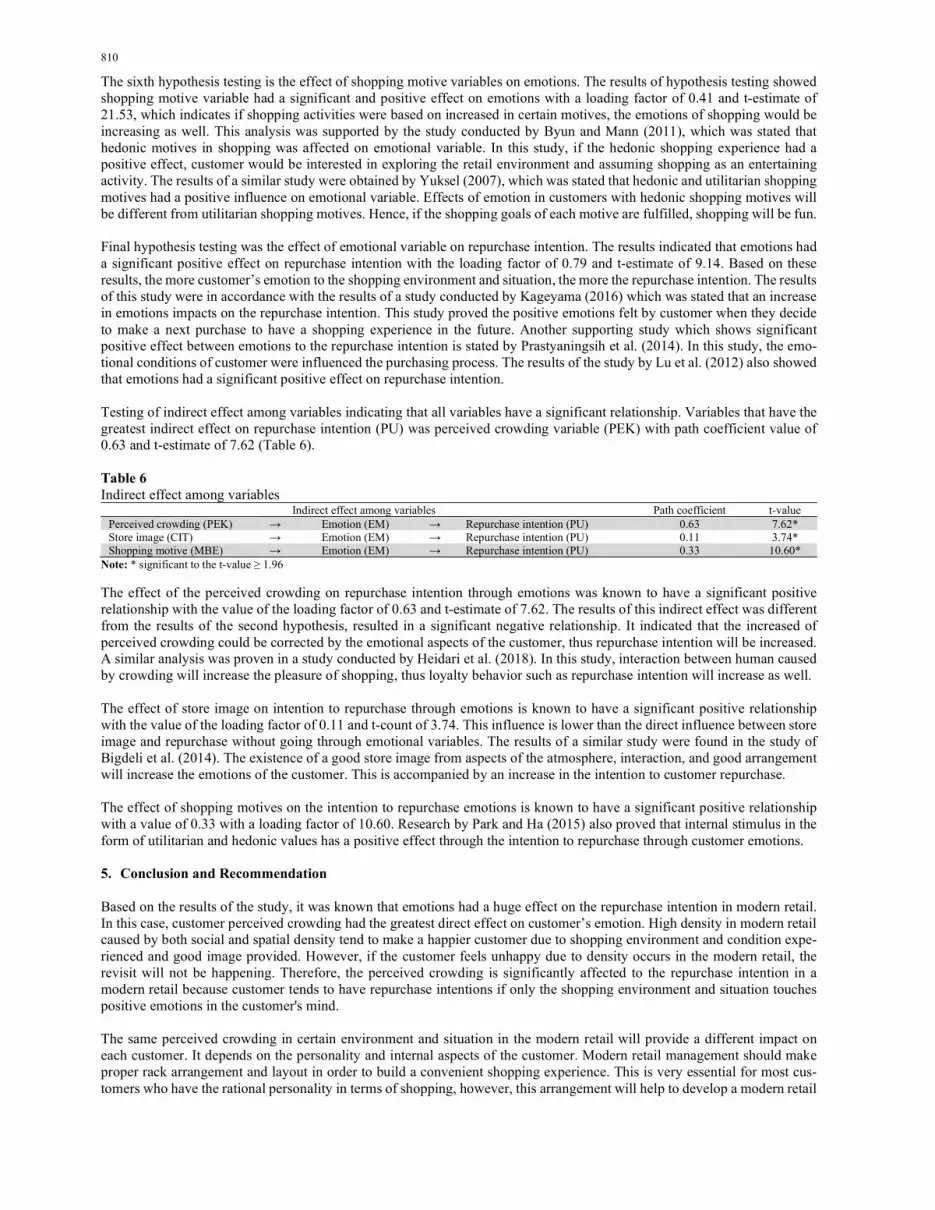
810
The sixth hypothesis testing is the effect of shopping motive variables on emotions. The results of hypothesis testing showed shopping motive variable had a significant and positive effect on emotions with a loading factor of 0.41 and t-estimate of 21.53, which indicates if shopping activities were based on increased in certain motives, the emotions of shopping would be increasing as well. This analysis was supported by the study conducted by Byun and Mann (2011), which was stated that hedonic motives in shopping was affected on emotional variable. In this study, if the hedonic shopping experience had a positive effect, customer would be interested in exploring the retail environment and assuming shopping as an entertaining activity. The results of a similar study were obtained by Yuksel (2007), which was stated that hedonic and utilitarian shopping motives had a positive influence on emotional variable. Effects of emotion in customers with hedonic shopping motives will be different from utilitarian shopping motives. Hence, if the shopping goals of each motive are fulfilled, shopping will be fun. Final hypothesis testing was the effect of emotional variable on repurchase intention. The results indicated that emotions had a significant positive effect on repurchase intention with the loading factor of 0.79 and t-estimate of 9.14. Based on these results, the more customer’s emotion to the shopping environment and situation, the more the repurchase intention. The results of this study were in accordance with the results of a study conducted by Kageyama (2016) which was stated that an increase in emotions impacts on the repurchase intention. This study proved the positive emotions felt by customer when they decide to make a next purchase to have a shopping experience in the future. Another supporting study which shows significant positive effect between emotions to the repurchase intention is stated by Prastyaningsih et al. (2014). In this study, the emo-tional conditions of customer were influenced the purchasing process. The results of the study by Lu et al. (2012) also showed that emotions had a significant positive effect on repurchase intention. Testing of indirect effect among variables indicating that all variables have a significant relationship. Variables that have the greatest indirect effect on repurchase intention (PU) was perceived crowding variable (PEK) with path coefficient value of 0.63 and t-estimate of 7.62 (Table 6). Table 6 Indirect effect among variables
Indirect effect among variables Path coefficient t-value Perceived crowding (PEK) → Emotion (EM) → Repurchase intention (PU) 0.63 7.62* Store image (CIT) → Emotion (EM) → Repurchase intention (PU) 0.11 3.74* Shopping motive (MBE) → Emotion (EM) → Repurchase intention (PU) 0.33 10.60*
Note: * significant to the t-value ≥ 1.96 The effect of the perceived crowding on repurchase intention through emotions was known to have a significant positive relationship with the value of the loading factor of 0.63 and t-estimate of 7.62. The results of this indirect effect was different from the results of the second hypothesis, resulted in a significant negative relationship. It indicated that the increased of perceived crowding could be corrected by the emotional aspects of the customer, thus repurchase intention will be increased. A similar analysis was proven in a study conducted by Heidari et al. (2018). In this study, interaction between human caused by crowding will increase the pleasure of shopping, thus loyalty behavior such as repurchase intention will increase as well. The effect of store image on intention to repurchase through emotions is known to have a significant positive relationship with the value of the loading factor of 0.11 and t-count of 3.74. This influence is lower than the direct influence between store image and repurchase without going through emotional variables. The results of a similar study were found in the study of Bigdeli et al. (2014). The existence of a good store image from aspects of the atmosphere, interaction, and good arrangement will increase the emotions of the customer. This is accompanied by an increase in the intention to customer repurchase. The effect of shopping motives on the intention to repurchase emotions is known to have a significant positive relationship with a value of 0.33 with a loading factor of 10.60. Research by Park and Ha (2015) also proved that internal stimulus in the form of utilitarian and hedonic values has a positive effect through the intention to repurchase through customer emotions. 5. Conclusion and Recommendation Based on the results of the study, it was known that emotions had a huge effect on the repurchase intention in modern retail. In this case, customer perceived crowding had the greatest direct effect on customer’s emotion. High density in modern retail caused by both social and spatial density tend to make a happier customer due to shopping environment and condition expe-rienced and good image provided. However, if the customer feels unhappy due to density occurs in the modern retail, the revisit will not be happening. Therefore, the perceived crowding is significantly affected to the repurchase intention in a modern retail because customer tends to have repurchase intentions if only the shopping environment and situation touches positive emotions in the customer's mind. The same perceived crowding in certain environment and situation in the modern retail will provide a different impact on each customer. It depends on the personality and internal aspects of the customer. Modern retail management should make proper rack arrangement and layout in order to build a convenient shopping experience. This is very essential for most cus-tomers who have the rational personality in terms of shopping, however, this arrangement will help to develop a modern retail

M. Simanjuntak et al. / Management Science Letters 10 (2020) 811
image, especially in creating a good image for customer and business competitor. In addition, routine evaluation of density in modern retail needs to be done by management for the improvement of facilities in order to create convenient shopping conditions. A review of store image is a basis that can be done to build great perceptions of store attributes for customers and business competitors. Modern retail has an important aspect on its attributes, such as quality of services, products, environment, and facilities. Establishment of standard operating procedure (SOP) of manners is the first step to minimize the risk of employee negligence, thus services provided will match the criteria of customer and modern retail management. Besides manner, neatly-arranged products should be one of management’s attention as it will simplify and improve customer’s efficiency in shopping. The establishment of SOPs will facilitate audit and evaluation by management regarding service conditions and product qual-ity on site. In addition, modern retail operation could be initialed by employee training, thus they would be able to memorize the SOP, which will be performed. Another aspect that needs to be considered is the shopping environment, which is the atmosphere of modern retail. Cleanliness and neatness are aspects that can build perceptions of modern retail. In addition, cleanliness and neatness are able to raise the convenience in shopping. Damaged parts of modern retail should be immediately repaired as well. These activities will lead to positive emotions for customer and directly attract customer to pay a visit in the future. The building can also be an attractive point for young customers to shop at modern retail. Shopping motives are internal aspects of the customer as they are related to the customer's personality. If the customer with a hedonic shopping motive feels happy, then he will explore further to find an interesting product for himself. Therefore, to attract customer who has hedonic shopping motive, the product display should be more attractive. Its attractiveness will make hedonic shopping motive customer feels happy and plans to revisit based on curiosity of the-always-updating product display. In contrary with utilitarian shopping motive customer, as for them, the shopping efficiency is a priority. A complete and varied product can be the main aspects for this type of customer because variation of products will facilitate them to stay at one place, without moving to other places, to complete their shopping goals. The appropriate product grouping also becomes a strong point that can be done by management; thus, the shopping efficiency of utilitarian shopping motive customer could be improved. This study only reviews environmental aspects and shopping conditions; thus, the number of respondents were limited to assess the repurchase intention based on store physical attributes. Another limitation is, the study was based only on modern retail of wholesalers, so the results cannot represent other types of modern retails such as shopping malls. In addition, the store image examined is only based on the customer’s physical and psychological dimensions, for example, perceived crowd-ing, store image based on store attributes, and shopping motives. The image of the retailer itself was also not included in this study. The use of purposive sampling method of data collection is only limited to describe the characteristics of modern retail populations for both hypermarket and supermarket, so that they cannot be used to describe overall modern retail population.
References Achar, C., So, J., Agrawal, & Duchachek, A. (2016). What we feel and why we buy: The influence of emotions on consumer
decision-making. Journal of Psychology, 10, 166 – 170. Anderson, K., Knight, D., Pookulangara, S., & Josiam, B. (2014). Influence of hedonik and utilitarian motivations on retailer
loyalty and purchase intention: a Facebook perspective. Journal of Retailing and Consumer Service, 21(5), 773-779. Azhari, M., Farida, N., & Saryadi. (2014). Effect of store image, store atmosphere, brand association, and brand awareness
on repurchase decisions: a study of consumers of Body Shop at Java Mall Semarang. Jurnal Ilmu Administrasi Bisnis, 3(2), 1-10.
Aylott, R., & Mitchell, V.W. (1998). An exploratory study of grocery shopping stressors. International Journal of Retail and Distribution Management, 26(9), 362-373.
Babin, B., & Attaway, J. (2000). Atmospheric affect as a tool creating value and gaining share of customer. Journal of Busi-ness Research, 49(2), 91-99.
Babin, B., Darden, R., & Griffin, M. (1994). Work and or fun: Measuring hedonik and utilitarian shopping value. Journal of Consumer Research, 20(4), 644-656.
Babin, B., & Harris, E. (2017). Consumer Behavior: 8th Edition. Boston: Cengage Learning. Bagozzi, R., Gopinath, M., & Nyer, P. (1998). The role of emotions in marketing. Journal of The Academy of Marketing
Science, 27(2), 184-206. Baker, J., Levy, M., & Grewal, D. (1994). An experimental approach to marketing retail store environment. Journal of Acad-
emy Marketing Science, 22(4), 328-339. Baker, J., & Wakefield, K. (2012). How consumer shopping orientation influences perceived crowding, excitement and stress
at the mall. Journal of the Academy of Marketing Science, 40(6), 791-806. Bakker, S. (2010). Exploring The Consequences and Antecedents of Perceived Crowing in The Retail Environment (Un-
published master’s thesis). Erasmus University Rotterdam, NL.

812
Berman, B., Evans J., & Mathur, M. (2011). Retail Management: A Strategic Approach 11th Edition. New Jersey: Pearson Prentice Hall.
Bellenger, D., Steinberg, E., & Stanton, W. (1976). The congruence of store image and self image. Journal of Retailing, 52(1), 17-32.
Bigdeli, F., Bigdeli, A., Bigdeli, F. (2014). The influence of atmospheric elements on emotions, perceived value, and behav-ioral intention. Management Science Letters, 4(5), 859-870.
Bloch, P., & Bruce, G. (1984). Product investment as leisure behavior. Journal of Advances in Consumer Research, 11, 197-202.
BPS (Statistics Indonesia). (2013). Projection of Indonesian Population (2010 -2035). Jakarta: Badan Pusat Statistik. Byun, S., & Mann, M. (2011). The influence of others: The impact of perceived human crowding on perceived competition,
emotions, and hedonik shopping value. Clothing and Textiles Research Journal, 29(4), 284-297. Chiu, C., Chang C., Cheng H., & Fang, Y. (2009). Determinants of customer repurchase intention in online shopping. Online
Information Review, 33(4), 761-764. Childers, T., Carr, C., Peck, J., & Carson, S. (2001). Hedonik and utilitarian motivations for online retail shopping behavior.
Journal of Retailing and Consumer Service, 77, 511–535. Cho, Y., & Lee, E. (2016). Impact of interior colors in retail atmosphere on consumers perceived store, luxury, emotions, and
preference. Journal of Clothing and Textiles, 35(1), 33-34. Chowdury, J., Reardon J., & Srivastava. (1998). Alternative modes of measuring store image: An empirical assessment of
structured versus unstructured message. Journal of Marketing Theory and Practices, 6(2), 72-86. Cornelius, B., Natter, M., & Faure, C. (2010). How store front displays influence retail store image. Journal of Retailing and
Consumer Services, 17(2), 143-151. Diallo, M. (2012). Effects of store image and store brand price image on store brand purchase intention: An application to an
emerging market. Journal of Retailing and Consumer Services, 19(3), 360-367. Eroglu, S., & Harrell, G. (1986). Retail crowding: Theoretical and strategic implications. Journal of Retailing, 6(2), 346-363. Falahati, L., & Sabri, M.F. (2015). An exploratory study of personal financial well-being determinants: Examining the mod-
erating effect of gender. Asian Social Science, 11(4), 33-42. Farki, A., Baihaqi I., & Wibawa, B. (2016). Pengaruh online customer review dan rating terhadap kepercayaan dan minat
pembelian pada online marketplace di Indonesia. Jurnal Teknik ITS, 5(2), 614-619. Fikriati, M. (2015). Analysis of Consumer Perceptions, Attitudes, and Behavior Towards Private Products (Unpublished mas-
ter’s thesis). IPB University, ID. Ferreira, M., Brandao M., & Bizzarias, F. (2017). Understanding consumer’s response to negative emotions related to crowd-
ing on satisfaction and impulse purchase in retail: the mediating role of coping. Journal of Marketing, 52(4), 431-442. Ghosh, A. 1990. Retail Management. Chicago: Drydden press. Gogoi, B.J. (2017). Effect of store design on perceived crowding and impulse buying behavior. International Review of Man-
agement and Marketing, 7(2), 180-186. Hair, R., Black, W., Babin, B., Anderson, R., & Tarham, R. (2006). Multivariate Data Analysis Ed 6th. New Jersey: Pearson
Prentice Hall. Harrell, G., Hutt, M., & Anderson, J. (1980). Path analysis of buyer behaviour under conditions of crowding. Journal of
Marketing Research, 17(1), 45-51. Hellier, P., Geursen, G., Carr, R., & Rickard, J. (2003). Customer repurchase intention: A general structural equation model.
European Journal of Marketing, 35(11/12), 1762-1800. Heidari, M., Alibeigi, H., & Aghaeifar, A. (2018). An analytical study on consumer perception of store environment
and its effect on brand loyalty through joy of shopping (a case study: LG home appliance store). Journal of Problems and Perspectives in Management, 14(3), 380-387.
Hirschman, E. (1984). Experience seeking: a Subjectivist perspective of consumption. Journal of Business Research, 12(1), 115-136.
Hirscman, E., & Holbrook, M. (1982). The experiential aspects of consumption: Consumer fantasies, feelings, and fun. Jour-nal of Consumer Research, 9(2), 132-140.
Hosseini, Z., Jayashree, S., & Malarvizhi, C. (2014). Store image and its effect on customer perception of retail stores. Journal of Asian Social Science, 10(21), 223-235.
Ibzan, E., Balarabe, F., & Jakada, B. (2016). Consumer satisfaction and repurchase intention. Journal of International Institute for Science Technology and Education, 6(2), 96-100.
IDPRO. (2016). Data Center Business In Indonesia: Switching From Online to Offline. Retrieved March 12, 2018 from https://apjii.or.id/gudang/down/Topik-1-:-Industri-Data-Center.pdf Indonesia Data Center Provider Association (2018). Retrieved from www.apjii.or.id.
Kageyama, Y. (2016). The Effect of Employee Behaviors on Consumers Emotions and Behavioral Intentions in Positive Sevice Enccounters (Unpublished doctoral dissertation). Univeristy of Central Florida, USA.
Kasnaeny, K., Sudiro, A., Hadiwidjodjo, D., & Rochman, F. (2013). Hedonik and utilitarian motives of coffee shop customer in Makassar Indonesia. European Journal of Business and Management, 5(25), 75-81.
Kim, M. (2004). Consumer Response to Stockouts in Online Apparel Shopping (Unpublished doctoral dissertation). The Ohio State University, USA.

M. Simanjuntak et al. / Management Science Letters 10 (2020) 813
Kim, S., & In, O. (2015). A study on the impact of perceived crowding on emotional response and revisit intention. Journal of The Korea Society of Computer and Information, 20(5), 141-150.
Kim, H., & Na, K. (2015). Understanding repurchase intention in online fashion shopping mall. Indian Journal of Science and Technology, 8(57), 554-562
Kumar, A., Lee, H., & Kim, Y. (2009). Indian consumers purchase intention toward a United States versus local brand. Journal of Business Research, 62(5), 521- 527.
Lee, S.Y., Kim, J., & Li, J. (2011). Impacts of store crowding on shopping behavior and store image. Journal of Asian Archi-tecture and Building Engineering, 10(1), 133-140.
Li, J.G.T., Kim, J.O., & Lee, S. (2009). An empirical examination of perceived retail crowding, emotion, and retail outcomes. The Service Industries Journal, 29(5), 635-652.
Liang, Y. (2012). Effects of Personality on Satisfaction and Repurchase Intention of Online Games: IEEE International Con-ference on Management of Innovation and Technology (ICMIT) (pp. 349-352). Bali: IEEE.
Lu, Y., Lu, Y., & Wang, B. (2012). Effects of dissatisfaction on consumer repurchase decisions in e-commerce-an emotion-based perspective. Journal of Electronic Commerce Research, 13(3), 224-237.
Machleit, A., Kellaris, J., & Eroglu, A. (1994). Human vs. spatial dimensions of crowding perceptions in retail environments: A note on their measurement and effect on shopper satisfaction. Marketing Letters, 5, 183-194.
Machleit, A., Eroglu, A., & Davis, M. (2000). Atmospheric qualities of online retailing: A conceptual model and implications. Journal of Business Research, 54, 177-184.
Machleit, A., & Eroglu, A. (2000). Describing and measuring emotional response to shopping experience. Journal of Business Research, 49(2), 101-111.
Mehrabian, A., & Russell, J.A. (1974). The basic emotional impact of environments. Perceptual and Motor Skills, 38(1), 283-301.
Mowen, J., & Minor, M. (1997). Consumer Behavior 5th Edition. New Jersey: Prentice Hall. Newman, A., & Cullen, P. (2002). Retailing: Environment and Operations. London: Thomson Learning. Palacios, L., Lopez, R., & Redondo, Y. (2016). Cognitive, affective, and behavioral responses in mall experience. Interna-
tional Journal of Retail and Distribution Management, 44(1), 4-21. Park, J., & Ha, S. (2015). Co-creation of service recovery: Utilitarian and hedonik value and post-recovery responses. Journal
of Retailing and Consumer Services, 28(C), 310-316. Park, M., & Lennon, S. (2009). Brand name and promotion in online shopping contexts. Journal of Fashion Marketing and
Management, 13(2), 149-160. Pebriani, W. (2017). The Influence of Lifestyle, Perception, and Satisfaction on the Intention to Purchase Online Shopping
(Unpublished master’s thesis). IPb University, ID. Peng, C., & Kim, Y. (2014). Application of the stimuli-organism-response (SOR) framework to online shopping behavior.
Journal of Internet Commerce, 13(3-4), 159-176. Prastyaningsih, A., Suyadi, I., & Yulianto, E. (2014). The influence of customer experience on repurchase intention (Survey
on KFC Consumers in RW 3 Citizens' Neighborhood in Kandangrejo Village, Kedungpring, Lamongan). Jurnal Admin-istrasi Bisnis, 16(1), 1-8.
Rintamaki, T., Kanto, A., Kuusela, H., & Spence, M. (2006). Decomposing the value of department store shopping into utilitarian, hedonik and social dimensions. International Journal of Retail Distribution and Management, 34(1), 6-24.
Robbins, S., Judge,T., & Campbell, T. (2010). Organizational Behavior. New Jersey: Pearson Prentice Hall. Schiffman, L., & Kanuk, L. (2007). Consumer Behavior 9th Edition. New Jersey: Pearson Prentice Hall. Sabri, M. F., & Zakaria, N. F. (2015). Financial well-being among young employees in Malaysia. In Z. Copur (Ed.), Handbook
of research on behavioral finance and investment strategies: Decision making in the financial industry (pp. 221-235). Hershey,USA: IGI Global.
Smith, R., & Sherman, E. (1993). Effects of store image and mood on consumer behavior: a Theoretical and empirical analysis. Advances in Consumer Research, 20(1), 631-638.
Soliha, E. (2008). Analysis of the retail industry in Indonesia. Jurnal Bisnis dan Ekonomi, 15(2), 128-142. Sweeney, J., & Soutar, G. (2001). Consumer perceived value: The development of a multiple item scale. Journal of Retailing,
77(2), 203-220. USDA. 2013. Global Agricultural Information Network: Retail Foods Update. Jakarta: United States Department of Agricul-
ture. USDA. 2014. Global Agricultural Information Network: Retail Foods Update. Jakarta: United States Department of Agricul-
ture. USDA. 2015. Global Agricultural Information Network: Retail Foods Update. Jakarta: United States Department of Agricul-
ture. USDA. 2016. Global Agricultural Information Network: Retail Foods Update. Jakarta: United States Department of Agricul-
ture. To, P., Liao, C., & Lin, T. (2007). Shopping motivations on Internet: A study based on utilitarian and hedonik value. Journal
of Technovation, 27(12), 774–787. Tse, A., Sin, L., & Yim, F. (2002). How a crowded restaurant affects consumers’ attribution behavior. Journal of Hospitality
Management, 21(4), 449-454.

814
Varga, A., Dlacic, J., & Vujicic, M. (2014). Repurchase intentions in a retail store – exploring the impact of colours. Journal of Econviews, 27(2), 229-224.
Waja, N. (2013). Impact of Store Image on Customer Perception (Unpublished master’s thesis). University of The Western Cape, ZA.
Wijaya, A. (2016). The influence store atmosphere to repurchase intention towards consumer emotion and purchase decision. Retrieved 11 April, 2018 from https://www.researchgate.net/publication/319771678_THE_ INFLUENCE_STORE_AT-MOSPHERE_TO_REPURCHASE_INTENTION_TOWARDS_CONSUMER_EMOTION_AND_PURCHASE_DECI-SION (2016). Retrieved from www.researchgate.net.
Wu, Y., & Luan, C. (2008). Relationships among experiential marketing, experiential value, and customer satisfaction. Jour-nal of Hospitality and Tourism, 32(3), 397-410.
Yoo, C., Park, J., & MacInnis, D. (1998). Effect of store characteristics and in-store emotional experiences on store attitude. Journal of Business Research, 42(3), 253-263.
Yuksel, A. (2009). Exterior color and perceived retail crowding: effects on tourists' shopping quality inferences and approach behaviors. Journal of Quality Assurance in Hospitality and Tourism, 10(4), 233-254.
Yusof, J., & Ariffin, S. (2016). The influence of self-congruity, functional image, and emotional attachment on loyalty. Pro-cedia Economics and Finance, 37, 350-357.
© 2020 by the authors; licensee Growing Science, Canada. This is an open access article distrib-uted under the terms and conditions of the Creative Commons Attribution (CC-BY) license (http://creativecommons.org/licenses/by/4.0/).