Embed Size (px)
Citation preview
[Siraj, 4(1): February, 2017] ISSN 2349-6193
Impact Factor: 2.805
IJESMR International Journal OF Engineering Sciences & Management Research
© International Journal of Engineering Sciences & Management Research
[7]
FLEXURAL TOUGHNESS AND IMPACT RESISTANCE OF PYROLISED
RECYCLED STEEL FIBER REINFORCED CONCRETE Nasir B. Siraj *1, Prof. Abebe Dinku2, Nebiyu S. Kedir3 *1 Department of Civil and Environmental Engineering, University of Alberta, Edmonton, Canada. 2,3 School of Civil and Environmental Engineering, Addis Ababa University, Addis Ababa, Ethiopia.
Keywords: recycled steel fiber, steel fiber reinforced concrete, flexural toughness, impact resistance,
energy absorption
ABSTRACT Concrete’s role as a building material still continues, unparalleled in this modern era. Current population explosion
and the demand for increased standard of living has fueled mankind’s ever-growing commitment in building
structures. In this regard, the prospect of utilizing environmentally friendly ingredients should always be
prioritized, especially if such option has proved to be economically feasible. In this research, the fiber-reinforcing
material obtained from recycled tyres is adopted to further analyze its role in improving the mechanical properties
such as flexural toughness, energy absorption and impact resistance. In such pursuit; 39 concrete mixes with 0.5%,
1.0% and 1.5% volume of fibers; and a fiber length of 20mm, 40mm and 60mm were produced to determine the
effect of recycled steel fiber on concrete. The main contributions of this paper are: a) characterization of the
mechanical properties of recycled steel fiber reinforced concrete in the hardened state b) Measurement of flexural
toughness, energy absorption and impact resistance, as the indicators of performance variation between plain and
recycled fiber reinforced concrete.
INTRODUCTION
Steel fibers can be used in place of stirrups to increase shear strength and ensure ductile failure, in addition to
reducing crack sizes and spacing [1]. Depending on the distribution and orientations of fibers in cement matrix,
the addition of fibers makes the cementitious material more isotropic and transforms it from a brittle to a quasi-
ductile material. In fact, the real benefits of adding fibers to concrete become evident in the stage of post-cracking
[2], [3].
In structural members where flexural tensile or axial tensile stresses will occur such as beams, columns and
suspended slabs; the reinforcing steel must be capable of resisting the tensile stresses [4]. However, in applications
where the presence of continuous tensile reinforcement is not essential to the safety and integrity of the structure,
e.g. floors on grade, pavements, overlays, ground support and shotcrete linings, the improvements in flexural
strength, impact resistance, toughness, and fatigue performance can be utilized to reduce section thickness,
improve performance, or both [5], [6].
Several types of steel fibers are being used in different forms as Steel Fiber Reinforced Concrete (SFRC) globally.
Reinforcement of concrete with fibers, however, still remains a science in its infancy, and ideas are still evolving
towards assessing the characteristics of an optimal fiber system [7]. The increased application of steel fiber
reinforced concrete as an engineering material demands an additional knowledge of its behavior under several
types of loading to which it is subjected [8]. These behaviors are influenced by the type of fiber, length-to-diameter
ratio (which is also called ‘aspect ratio’, and typically ranges from 30-150 [9]); the amount of fiber, the strength
of the matrix; the size, shape and method of preparation of the specimen; and the size of the aggregate [5].
Steel fiber reinforced concrete is usually specified by strength and fiber content [4]. A flexural strength of 700 to
1000 psi (4.8 to 6.9 MPa) at 28 days and a compressive strength of 5000 to 7000 psi (34.5 to 48.3MPa) are typical
values [4]. Furthermore, SFRC mixtures that can be mixed and placed with conventional equipment and
procedures use from 0.5 to 1.5 volume percent (percent by volume of the total concrete mixture) of fibers and an
aspect ratio of less than 100 [5].
In general, the most significant properties of SFRC are the improved flexural toughness (the ability to absorb
energy after cracking), impact resistance, strain capacity [5]; and flexural fatigue endurance [10]. The volume
percent mentioned previously in [5] can extend further to 2% when an effective way to improve the toughness of
concrete is sought [11].
[Siraj, 4(1): February, 2017] ISSN 2349-6193
Impact Factor: 2.805
IJESMR International Journal OF Engineering Sciences & Management Research
© International Journal of Engineering Sciences & Management Research
[8]
Toughness is a measure of the energy absorption capacity of a material and is used to characterize the material’s
ability to resist fracture when subjected to static strains or to dynamic or impact loads [3]. Toughness of a fiber-
reinforced concrete can also be characterized as its ability to transfer stress across a cracked section [2]. The
principal role of the fibers is to bridge across the cracks that develop in concrete as it is loaded (or as it dries). If
the fiber has sufficient strength and stiffness, and if they can achieve sufficient bond with the matrix, they will
tend to keep the crack widths small and will permit the fiber reinforced concrete (FRC) to withstand significant
stresses over a relatively large strain capacity in the post-cracking (or strain softening) stage. Thus, the fibers can
provide a considerable amount of post-cracking “ductility.” In other words, they increase the toughness of the
FRC [12].
The flexural fatigue strength of plain concrete (out to 2 million cycles of loading) is about 55% of the static
strength, for all types of loading [12]. A properly designed FRC, however, will display fatigue strengths of from
65% to 90% of the static load. This improvement is due largely to the effectiveness of the fibers in “tying” the
cracks together, and thus inhibiting crack extension during the loading cycles [12].
The energy consumed to fracture a notched beam specimen, the number of blows in a “repeated impact” test to
achieve a prescribed level of distress and the size of the damage (cater/perforation/scab); are conventionally used
to characterize the impact resistance [3]. Results usually depend on testing procedures used. The impact resistance
of plain concrete, which is quite low, can be increased dramatically (by more than an order of magnitude) by the
addition of fibers. Steel and carbon fibers are more effective in this regard than synthetic fibers, but all types of
fibers increase both the fracture energy and generally the peak loads under impact [12].
In their pursuit to quantify the mechanical properties in concrete, which are improved with the addition of fibers;
several researchers have studied the effects of one or many parameters. These include, but are not limited to
permeability and porosity characteristics [13]; ductility under cyclic loading [14]; flexural fatigue strength [8],
[15], [16] and flexural toughness [17]. Similar studies also extend to the use of recycled steel fibers in enhancing
mechanical properties in concrete, such as shrinkage and shrinkage cracking [11]; splitting tensile strength [18];
energy-absorption [19].
EXPERIMENTAL PROGRAM
Materials
A. Cement Matrix
Locally manufactured Portland Pozzolana Cement (PPC) which was produced in accordance with EN 196 and BS 1370 was used. Natural sand meeting the gradation requirements of the Ethiopian Standard [20] was used. The coarse aggregate used for the preparation of the specimens was a crushed basaltic stone with maximum size of 19mm. Potable (tap) water supplied by the municipality was used for all concrete mixes. A commercial sulphonated naphthalene type superplasticizer in compliance with BSEN 934-2, BS 5075 Part 3, and with ASTM C494 as Type A and Type F (depending on dosage) was used to produce a workable mix. The dosage of the superplasticizer in mass basis was 1% of the cement content, with a specific gravity of 1.18.
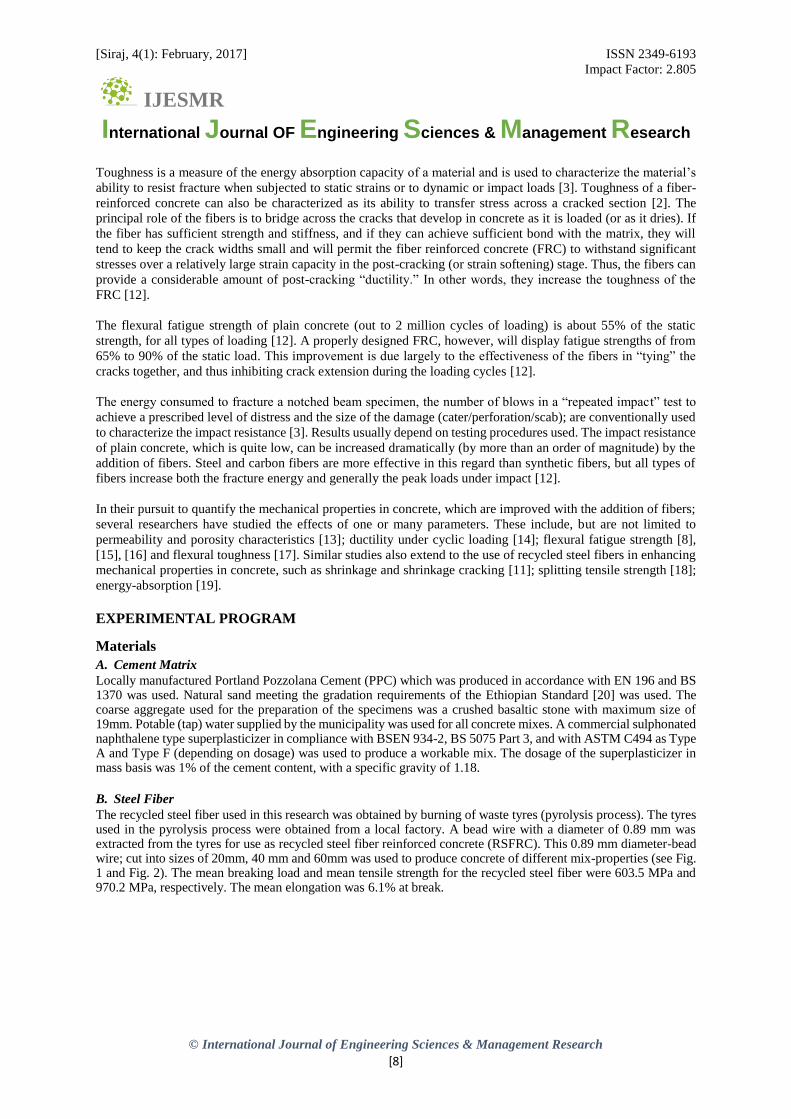
B. Steel Fiber
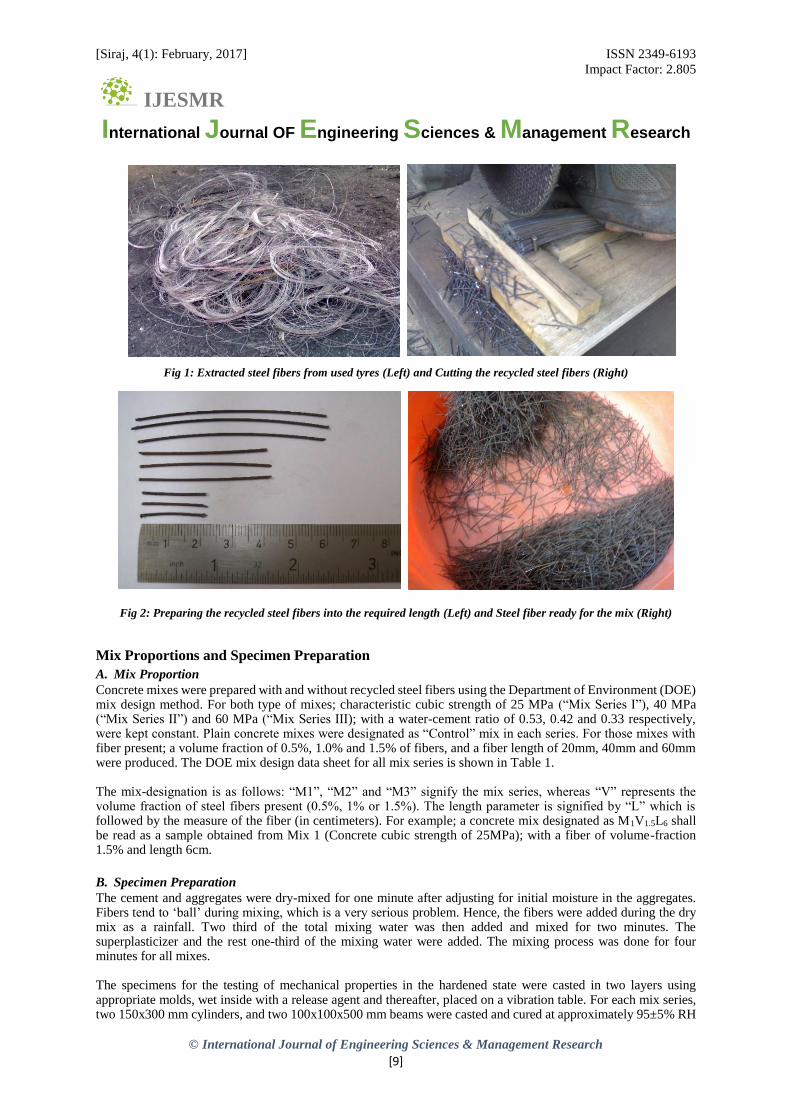
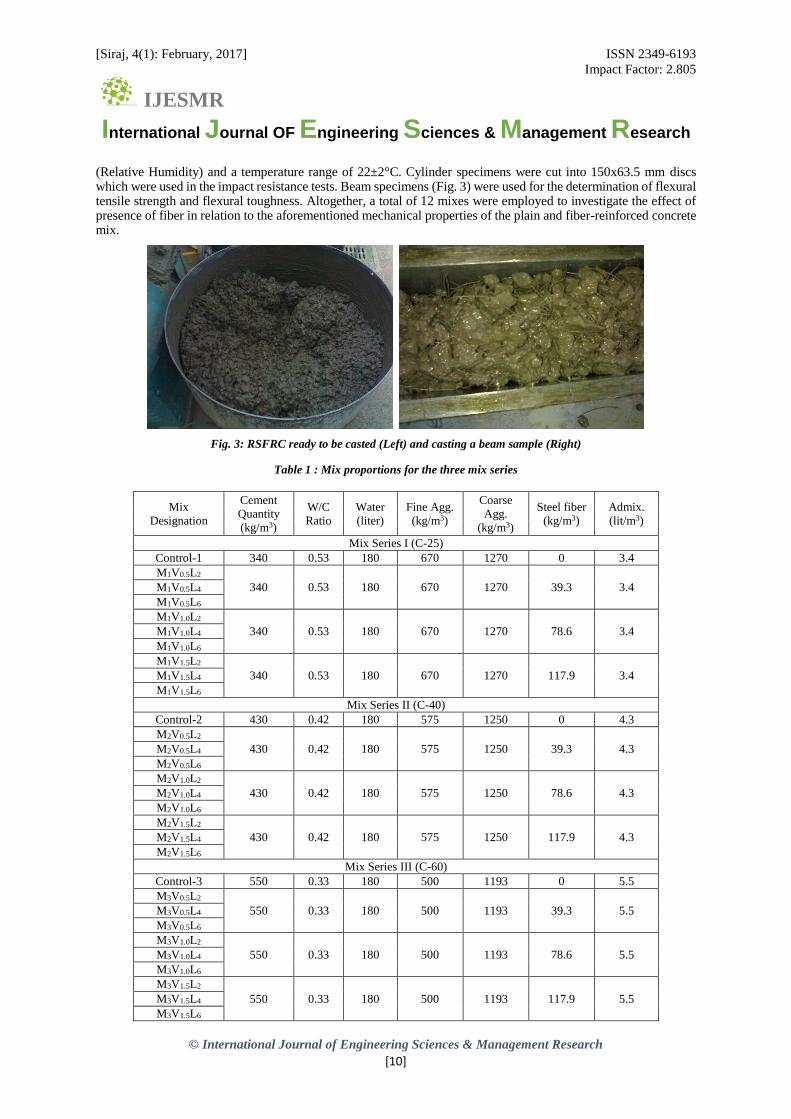
The recycled steel fiber used in this research was obtained by burning of waste tyres (pyrolysis process). The tyres used in the pyrolysis process were obtained from a local factory. A bead wire with a diameter of 0.89 mm was extracted from the tyres for use as recycled steel fiber reinforced concrete (RSFRC). This 0.89 mm diameter-bead wire; cut into sizes of 20mm, 40 mm and 60mm was used to produce concrete of different mix-properties (see Fig. 1 and Fig. 2). The mean breaking load and mean tensile strength for the recycled steel fiber were 603.5 MPa and 970.2 MPa, respectively. The mean elongation was 6.1% at break.
[Siraj, 4(1): February, 2017] ISSN 2349-6193
Impact Factor: 2.805
IJESMR International Journal OF Engineering Sciences & Management Research
© International Journal of Engineering Sciences & Management Research
[9]
Fig 1: Extracted steel fibers from used tyres (Left) and Cutting the recycled steel fibers (Right)
Fig 2: Preparing the recycled steel fibers into the required length (Left) and Steel fiber ready for the mix (Right)
Mix Proportions and Specimen Preparation
A. Mix Proportion
Concrete mixes were prepared with and without recycled steel fibers using the Department of Environment (DOE) mix design method. For both type of mixes; characteristic cubic strength of 25 MPa (“Mix Series I”), 40 MPa (“Mix Series II”) and 60 MPa (“Mix Series III); with a water-cement ratio of 0.53, 0.42 and 0.33 respectively, were kept constant. Plain concrete mixes were designated as “Control” mix in each series. For those mixes with fiber present; a volume fraction of 0.5%, 1.0% and 1.5% of fibers, and a fiber length of 20mm, 40mm and 60mm were produced. The DOE mix design data sheet for all mix series is shown in Table 1. The mix-designation is as follows: “M1”, “M2” and “M3” signify the mix series, whereas “V” represents the volume fraction of steel fibers present (0.5%, 1% or 1.5%). The length parameter is signified by “L” which is followed by the measure of the fiber (in centimeters). For example; a concrete mix designated as M1V1.5L6 shall be read as a sample obtained from Mix 1 (Concrete cubic strength of 25MPa); with a fiber of volume-fraction 1.5% and length 6cm.
B. Specimen Preparation
The cement and aggregates were dry-mixed for one minute after adjusting for initial moisture in the aggregates. Fibers tend to ‘ball’ during mixing, which is a very serious problem. Hence, the fibers were added during the dry mix as a rainfall. Two third of the total mixing water was then added and mixed for two minutes. The superplasticizer and the rest one-third of the mixing water were added. The mixing process was done for four minutes for all mixes. The specimens for the testing of mechanical properties in the hardened state were casted in two layers using appropriate molds, wet inside with a release agent and thereafter, placed on a vibration table. For each mix series, two 150x300 mm cylinders, and two 100x100x500 mm beams were casted and cured at approximately 95±5% RH
[Siraj, 4(1): February, 2017] ISSN 2349-6193
Impact Factor: 2.805
IJESMR International Journal OF Engineering Sciences & Management Research
© International Journal of Engineering Sciences & Management Research
[10]
(Relative Humidity) and a temperature range of 22±2°C. Cylinder specimens were cut into 150x63.5 mm discs which were used in the impact resistance tests. Beam specimens (Fig. 3) were used for the determination of flexural tensile strength and flexural toughness. Altogether, a total of 12 mixes were employed to investigate the effect of presence of fiber in relation to the aforementioned mechanical properties of the plain and fiber-reinforced concrete mix.
Fig. 3: RSFRC ready to be casted (Left) and casting a beam sample (Right)
Table 1 : Mix proportions for the three mix series
Mix
Designation
Cement
Quantity
(kg/m3)
W/C
Ratio
Water
(liter)
Fine Agg.
(kg/m3)
Coarse
Agg.
(kg/m3)
Steel fiber
(kg/m3)
Admix.
(lit/m3)
Mix Series I (C-25)
Control-1 340 0.53 180 670 1270 0 3.4
M1V0.5L2
340 0.53 180 670 1270 39.3 3.4 M1V0.5L4
M1V0.5L6
M1V1.0L2
340 0.53 180 670 1270 78.6 3.4 M1V1.0L4
M1V1.0L6
M1V1.5L2
340 0.53 180 670 1270 117.9 3.4 M1V1.5L4
M1V1.5L6
Mix Series II (C-40)
Control-2 430 0.42 180 575 1250 0 4.3
M2V0.5L2
430 0.42 180 575 1250 39.3 4.3 M2V0.5L4
M2V0.5L6
M2V1.0L2
430 0.42 180 575 1250 78.6 4.3 M2V1.0L4
M2V1.0L6
M2V1.5L2
430 0.42 180 575 1250 117.9 4.3 M2V1.5L4
M2V1.5L6
Mix Series III (C-60)
Control-3 550 0.33 180 500 1193 0 5.5
M3V0.5L2
550 0.33 180 500 1193 39.3 5.5 M3V0.5L4
M3V0.5L6
M3V1.0L2
550 0.33 180 500 1193 78.6 5.5 M3V1.0L4
M3V1.0L6
M3V1.5L2
550 0.33 180 500 1193 117.9 5.5 M3V1.5L4
M3V1.5L6
[Siraj, 4(1): February, 2017] ISSN 2349-6193
Impact Factor: 2.805
IJESMR International Journal OF Engineering Sciences & Management Research
© International Journal of Engineering Sciences & Management Research
[11]
Testing Procedure of Hardened Concrete
A. Flexural Toughness
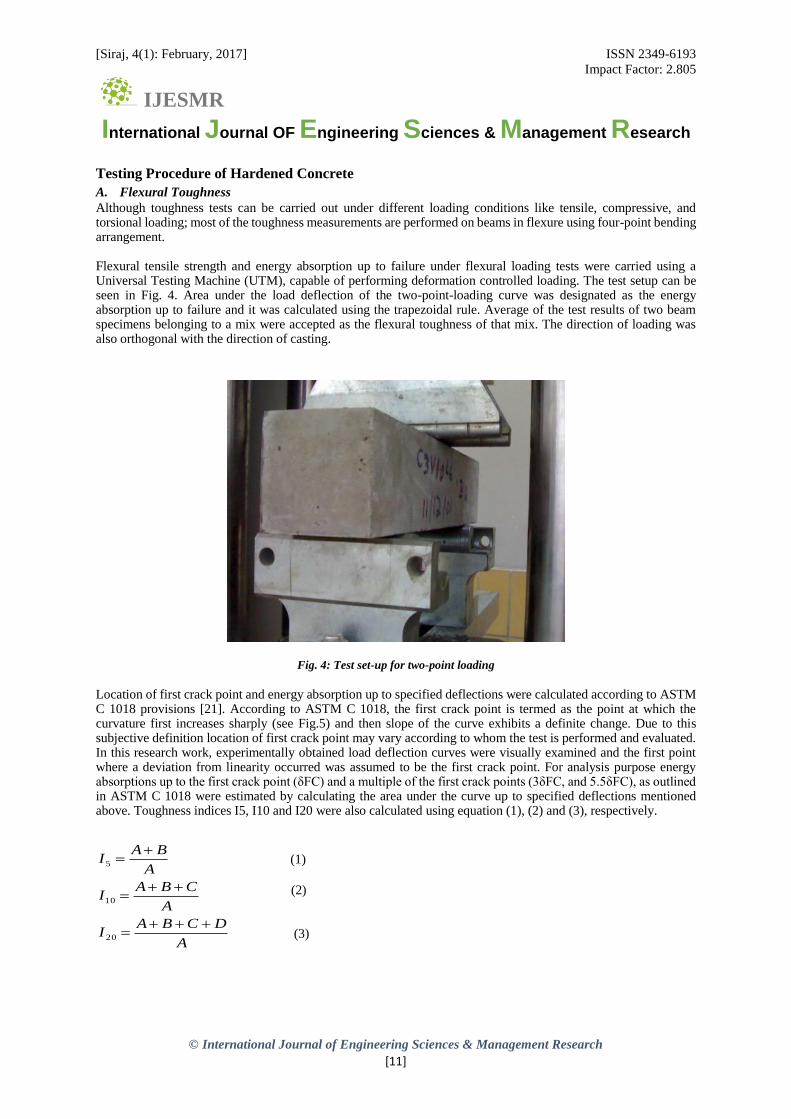
Although toughness tests can be carried out under different loading conditions like tensile, compressive, and torsional loading; most of the toughness measurements are performed on beams in flexure using four-point bending arrangement. Flexural tensile strength and energy absorption up to failure under flexural loading tests were carried using a Universal Testing Machine (UTM), capable of performing deformation controlled loading. The test setup can be seen in Fig. 4. Area under the load deflection of the two-point-loading curve was designated as the energy absorption up to failure and it was calculated using the trapezoidal rule. Average of the test results of two beam specimens belonging to a mix were accepted as the flexural toughness of that mix. The direction of loading was also orthogonal with the direction of casting.
Fig. 4: Test set-up for two-point loading
Location of first crack point and energy absorption up to specified deflections were calculated according to ASTM C 1018 provisions [21]. According to ASTM C 1018, the first crack point is termed as the point at which the curvature first increases sharply (see Fig.5) and then slope of the curve exhibits a definite change. Due to this subjective definition location of first crack point may vary according to whom the test is performed and evaluated. In this research work, experimentally obtained load deflection curves were visually examined and the first point where a deviation from linearity occurred was assumed to be the first crack point. For analysis purpose energy absorptions up to the first crack point (δFC) and a multiple of the first crack points (3δFC, and 5.5δFC), as outlined in ASTM C 1018 were estimated by calculating the area under the curve up to specified deflections mentioned above. Toughness indices I5, I10 and I20 were also calculated using equation (1), (2) and (3), respectively.
(1)
(2) (3)
A
DCBAI
A
CBAI
A
BAI
20
10
5
[Siraj, 4(1): February, 2017] ISSN 2349-6193
Impact Factor: 2.805
IJESMR International Journal OF Engineering Sciences & Management Research
© International Journal of Engineering Sciences & Management Research
[12]
Fig. 5: Flexural toughness indices [21]
B. Impact Resistance
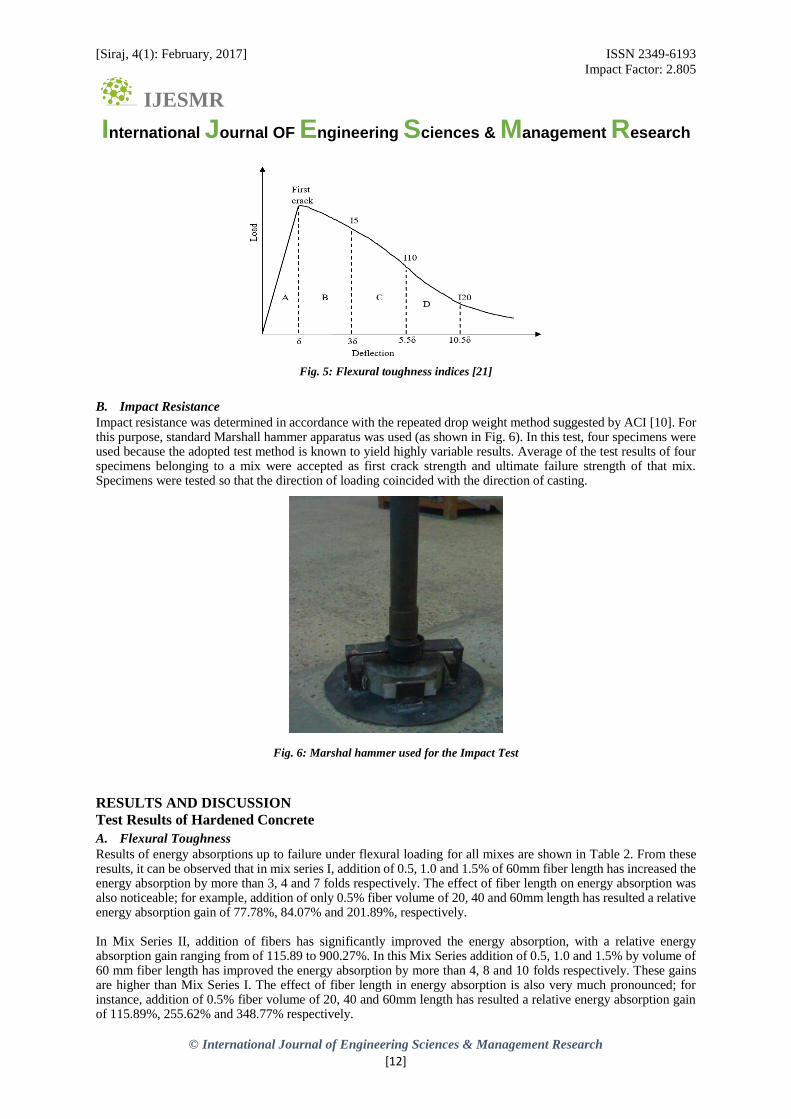
Impact resistance was determined in accordance with the repeated drop weight method suggested by ACI [10]. For this purpose, standard Marshall hammer apparatus was used (as shown in Fig. 6). In this test, four specimens were used because the adopted test method is known to yield highly variable results. Average of the test results of four specimens belonging to a mix were accepted as first crack strength and ultimate failure strength of that mix. Specimens were tested so that the direction of loading coincided with the direction of casting.
Fig. 6: Marshal hammer used for the Impact Test
RESULTS AND DISCUSSION
Test Results of Hardened Concrete
A. Flexural Toughness
Results of energy absorptions up to failure under flexural loading for all mixes are shown in Table 2. From these results, it can be observed that in mix series I, addition of 0.5, 1.0 and 1.5% of 60mm fiber length has increased the energy absorption by more than 3, 4 and 7 folds respectively. The effect of fiber length on energy absorption was also noticeable; for example, addition of only 0.5% fiber volume of 20, 40 and 60mm length has resulted a relative energy absorption gain of 77.78%, 84.07% and 201.89%, respectively. In Mix Series II, addition of fibers has significantly improved the energy absorption, with a relative energy absorption gain ranging from of 115.89 to 900.27%. In this Mix Series addition of 0.5, 1.0 and 1.5% by volume of 60 mm fiber length has improved the energy absorption by more than 4, 8 and 10 folds respectively. These gains are higher than Mix Series I. The effect of fiber length in energy absorption is also very much pronounced; for instance, addition of 0.5% fiber volume of 20, 40 and 60mm length has resulted a relative energy absorption gain of 115.89%, 255.62% and 348.77% respectively.

[Siraj, 4(1): February, 2017] ISSN 2349-6193
Impact Factor: 2.805
IJESMR International Journal OF Engineering Sciences & Management Research
© International Journal of Engineering Sciences & Management Research
[13]
The relative energy absorption gains in Mix Series III are lower than the other two mix series. This can be a good evidence that in SFRC, higher concrete grades do not necessarily secure higher energy absorption even if the higher peak flexural strength can be achieved. Similar to the other mix series, an increase in fiber length and volume has increased the energy absorption of the concrete. In general, it can be noted that higher energy absorption was exhibited in those beams reinforced with larger aspect ratio and volume of fibers. Highest energy absorption was acquired in Mix M1V1.5L6, M2V1.5L6 and M3V1.5L6 with a relative energy absorption gain of 625.37, 900.27 and 263.15% respectively. From this, it can be inferred that utilization of 1.5% fiber volume and 60mm fiber length is more efficient on flexural toughness. Addition of steel fibers extracted from used tyres has significantly improved the flexural toughness of concrete. The experiment bolsters the underlying fact that the main use of the steel fibers is to prevent and control the crack propagation. As a consequence, the flexural behavior is characterized by a residual strength in the post cracking stage with a significant improvement of the material toughness. The flexural failure for all RSFRC specimens was due to fiber pull-out. Such typical failure is shown in Fig. 7. However, all control plain beams broke suddenly in two halves, which is evidenced from the load versus deflection curves of each mix-series. The control mixes at each series made a closed loop instantly after the first crack was observed. A sample load-deflection curve is shown from mix-series I in Fig. 8. This clearly shows the typical brittleness of plain concrete, which makes this material unsuitable for a reliable structural use without tensile reinforcement. Apparently steel fiber inclusion prevented sudden and brittle failure. Despite variabilities, this phenomenon was observed in all the other mix-series as well. Fiber inclusion of all length and volume of fraction greatly enhanced the flexural toughness up to failure compared with the plain control mixes.
Table 2: Calculated Mean Energy Gain and Absorption
Mix Series I Mix Series II Mix Series III
Mix
Designation
Energy
Absorption
(Joule)
Relative
Energy
Gain
(%)
Mix
Designation
Energy
Absorption
(Joule)
Relative
Energy
Gain
(%)
Mix
Designation
Energy
Absorption
(Joule)
Relative
Energy
Gain
(%)
Control-1 4.77 Control-2 3.65 Control-3 9.77
M1V0.5L2 8.48 77.78 C2V0.5L2 7.88 115.89 C3V0.5L2 11.44 17.09
M1V0.5L4 8.78 84.07 C2V0.5L4 12.98 255.62 C3V0.5L4 12.12 24.05
M1V0.5L6 14.4 201.89 C2V0.5L6 16.38 348.77 C3V0.5L6 16.17 65.51
M1V1.0L2 9.26 94.13 C2V1.0L2 11.52 215.62 C3V1.0L2 16.91 73.08
M1V1.0L4 16.34 242.56 C2V1.0L4 21.89 499.73 C3V1.0L4 26.68 173.08
M1V1.0L6 20.85 337.11 C2V1.0L6 29.41 705.75 C3V1.0L6 29.71 204.09
M1V1.5L2 13.84 190.15 C2V1.5L2 15.74 331.23 C3V1.5L2 18.39 88.23
M1V1.5L4 19.6 310.90 C2V1.5L4 21.51 489.32 C3V1.5L4 28.8 194.78
M1V1.5L6 34.6 625.37 C2V1.5L6 36.51 900.27 C3V1.5L6 35.48 263.15
Fig. 7: A beam sample failing in flexure by fiber pull-out

[Siraj, 4(1): February, 2017] ISSN 2349-6193
Impact Factor: 2.805
IJESMR International Journal OF Engineering Sciences & Management Research
© International Journal of Engineering Sciences & Management Research
[14]
Fig. 8: Sample load-deflection curve from Mix-series I
The effect of fiber length, volume of fiber, and concrete strength on the load versus deflection curves from which the flexural toughness of SFRC determined is further discussed as follows:
(i) Effects of Fiber Length
As the diameter of the recycled steel fiber is kept at 0.89mm, the aspect ratio is directly affected by any length
change. An overall comparison between the examined fiber lengths, as shown in Fig. 9 reveals that an increase in
fiber length for each fiber volume results a considerable increase in the peak flexural load. Among the examined
specimens, those with 60mm fiber length exhibit were presented here as they showed the most stable post peak
load-deflection response in all mix series.
Fig. 9: Effect of fiber length on the ductility of RSFRC (Mix-series III)
(ii) Effects of Fiber Volume
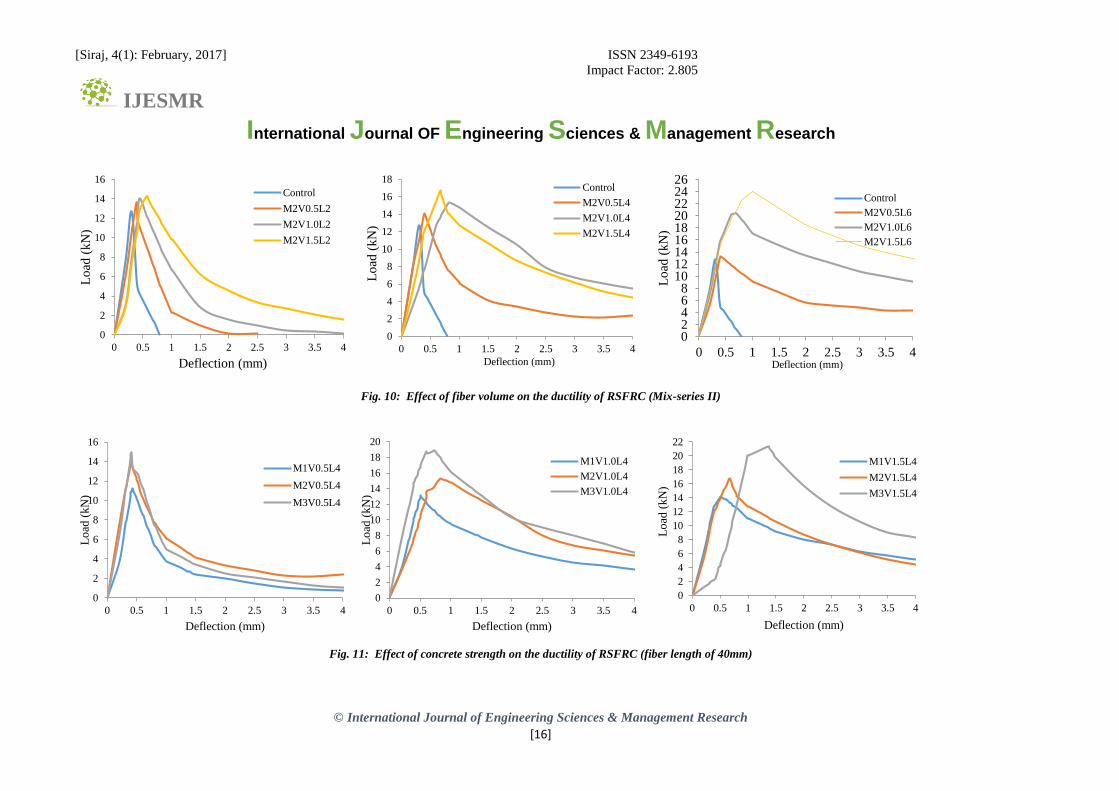
The flexural strength of RSFRC largely depends on the quantity of fibers used. Fig 10 shows the effect of fiber
volume on the flexural toughness of the concrete mix (Mix-series II). There is no specific reason for choosing this
mix-series. However, it can be seen that the increase in the fiber volume (keeping the aspect ratio constant) will
lead to an increase in the peak load and the residual strength. after cracking. This increase is true for all the mix-
series; but it is more pronounced for those recycled steel fibers with higher aspect ratio.
(iii) Effects of Concrete Strength The average length of RSF samples from the three mix series (i.e. 40mm) was taken in order to show the effects of concrete strength on flexural toughness. Keeping this aspect ratio and the volume of RSF present constant, the load versus deflection curve for different concrete grades is shown in Fig. 11. From this figure it can be noted that high
0
2
4
6
8
10
12
14
0 0.5 1 1.5 2 2.5 3 3.5 4
Lo
ad (
kN
)
Deflection (mm)
Control
M1V0.5L2
M1V0.5L4
M1V0.5L6
0
2
4
6
8
10
12
14
16
0 0.5 1 1.5 2 2.5 3 3.5 4
Lo
ad (
kN
)
Deflection (mm)
Control
M3V0.5L2
M3V0.5L4
M3V0.5L6
02468
101214161820222426
0 0.5 1 1.5 2 2.5 3 3.5 4
Lo
ad (
kN
)
Deflection (mm)
Control
M3V1.5L2
M3V1.5L4
M3V1.5L6
[Siraj, 4(1): February, 2017] ISSN 2349-6193
Impact Factor: 2.805
IJESMR International Journal OF Engineering Sciences & Management Research
© International Journal of Engineering Sciences & Management Research
[15]
strength concrete results in a much higher peak load for all fiber volume percentages, but not necessarily ductility. This statement also holds true for the other fiber lengths.
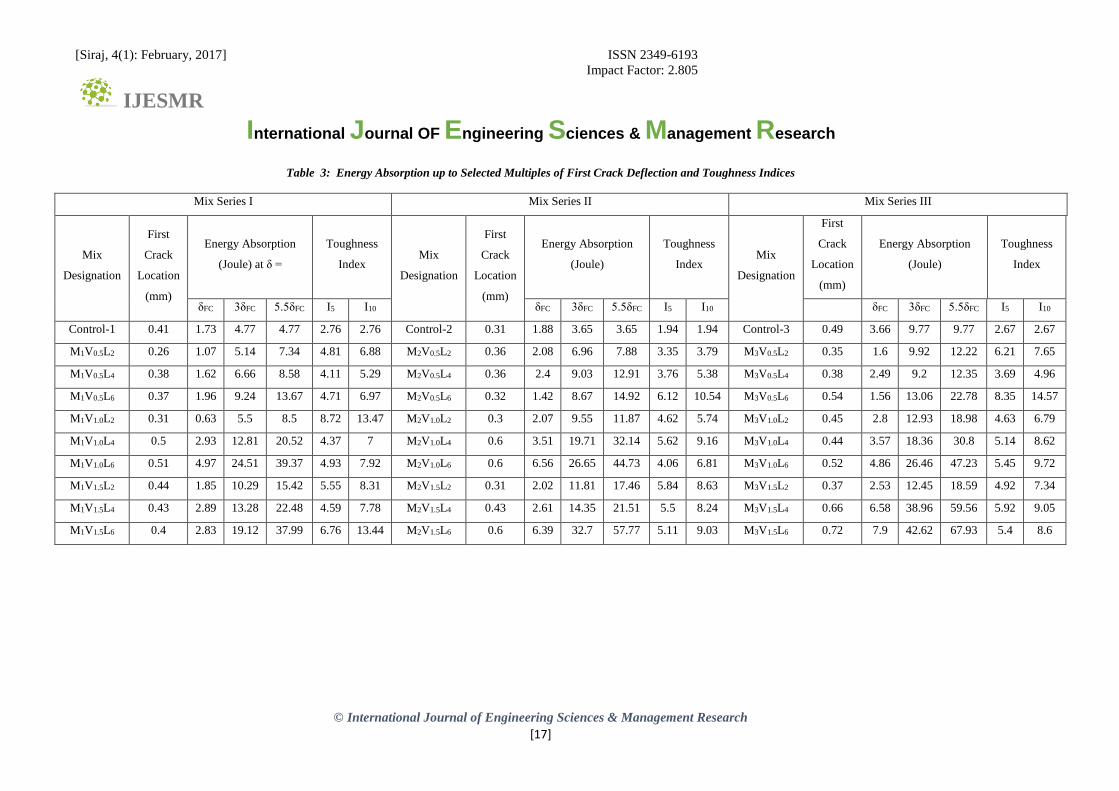
B. Location of First Crack Point and Energy Absorption up to Specified Deflections
Table 3 shows the values of energy absorptions for selected multiples of first crack deflection and toughness indices. In mix Series I, the maximum I5 and I10 values were observed in mix M1V1.0L2 with I5 and I10 values of 8.72 and 13.47; which had relative gains of 215.9% and 388%, respectively. It was possible to observe an increase in energy absorption up to specified points of deflection when both the fiber length and volume increase. An increase in energy absorption up to specified points of deflection was witnessed when both the fiber length and volume increased in mix series II and III, similar to the previous mix series. However, such a direct relationship was not observed regarding the toughness indices as these values greatly depend on the first crack point. These toughness index values were also found to be the highest in the normal strength concrete mix. For an ideally elastic-plastic material, toughness index value would be equal to the index itself. The toughness indices obtained in this research work for RSFRC were by far better than the toughness indices for the control mixes. However, depending on amount, type and orientation of fibers, calculated toughness indices of some mix were either higher or lower than the index values and very much variable due to the subjective definition of the first crack point. Furthermore, micro-cracks which lead to subsequent cracking prior to the attainment of the peak load often obscure the load-deflection curves. The lower toughness indices observed in the control mix were the brittle nature of failures that plain concrete beams show immediately after first crack.
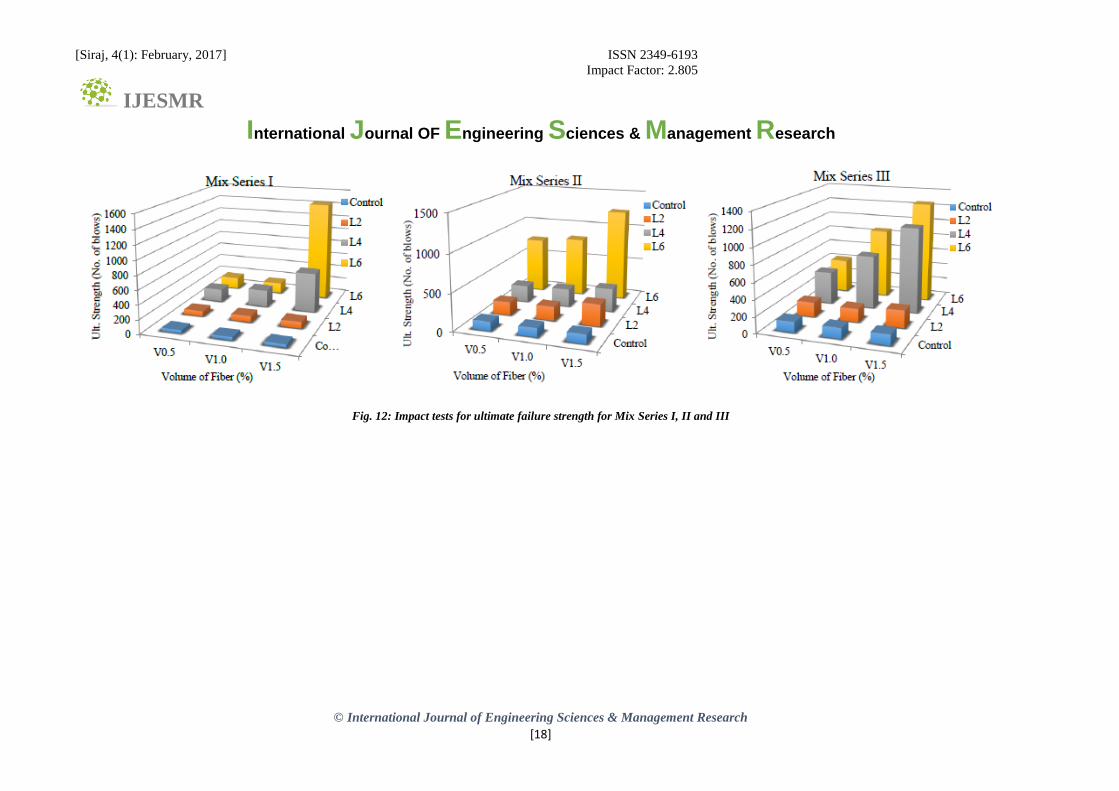
C. Impact Resistance
The results of the impact resistance tests are summarized in Table 4 and further depicted in Fig. 12. In mix series I, only 3 numbers of blows were enough to bring the control mix to the ultimate failure. In this mix the minimum and maximum numbers of blows were observed in mix M1V0.5L2 and M1V1.5L6, respectively. The addition of fibers of different length and volume brought drastic improvements in this mix, both in the first crack (47.5%-2930%) and ultimate strength (67.4%-3230%). Fig. 13 shows the improvement in the first crack strength and the ultimate failure strength due to increase in aspect ratio, as well as fiber volume for Mix Series 1. For 0.5% and 1% fiber volumes, fiber length of 40mm was optimum for improved impact resistance. However, the mix with fiber volume of 1.5% and 60mm length showed the highest impact resistance.
[Siraj, 4(1): February, 2017] ISSN 2349-6193
Impact Factor: 2.805
IJESMR International Journal OF Engineering Sciences & Management Research
© International Journal of Engineering Sciences & Management Research
[16]
Fig. 10: Effect of fiber volume on the ductility of RSFRC (Mix-series II)
Fig. 11: Effect of concrete strength on the ductility of RSFRC (fiber length of 40mm)
0
2
4
6
8
10
12
14
16
0 0.5 1 1.5 2 2.5 3 3.5 4
Lo
ad (
kN
)
Deflection (mm)
Control
M2V0.5L2
M2V1.0L2
M2V1.5L2
0
2
4
6
8
10
12
14
16
18
0 0.5 1 1.5 2 2.5 3 3.5 4
Lo
ad (
kN
)Deflection (mm)
Control
M2V0.5L4
M2V1.0L4
M2V1.5L4
02468
101214161820222426
0 0.5 1 1.5 2 2.5 3 3.5 4
Lo
ad (
kN
)
Deflection (mm)
Control
M2V0.5L6
M2V1.0L6
M2V1.5L6
0
2
4
6
8
10
12
14
16
0 0.5 1 1.5 2 2.5 3 3.5 4
Lo
ad (
kN
)
Deflection (mm)
M1V0.5L4
M2V0.5L4
M3V0.5L4
0
2
4
6
8
10
12
14
16
18
20
0 0.5 1 1.5 2 2.5 3 3.5 4
Lo
ad (
kN
)
Deflection (mm)
M1V1.0L4
M2V1.0L4
M3V1.0L4
0
2
4
6
8
10
12
14
16
18
20
22
0 0.5 1 1.5 2 2.5 3 3.5 4
Lo
ad (
kN
)
Deflection (mm)
M1V1.5L4
M2V1.5L4
M3V1.5L4
[Siraj, 4(1): February, 2017] ISSN 2349-6193
Impact Factor: 2.805
IJESMR International Journal OF Engineering Sciences & Management Research
© International Journal of Engineering Sciences & Management Research
[17]
Table 3: Energy Absorption up to Selected Multiples of First Crack Deflection and Toughness Indices
Mix Series I Mix Series II Mix Series III
Mix
Designation
First
Crack
Location
(mm)
Energy Absorption
(Joule) at δ =
Toughness
Index Mix
Designation
First
Crack
Location
(mm)
Energy Absorption
(Joule)
Toughness
Index Mix
Designation
First
Crack
Location
(mm)
Energy Absorption
(Joule)
Toughness
Index
δFC 3δFC 5.5δFC I5 I10 δFC 3δFC 5.5δFC I5 I10 δFC 3δFC 5.5δFC I5 I10
Control-1 0.41 1.73 4.77 4.77 2.76 2.76 Control-2 0.31 1.88 3.65 3.65 1.94 1.94 Control-3 0.49 3.66 9.77 9.77 2.67 2.67
M1V0.5L2 0.26 1.07 5.14 7.34 4.81 6.88 M2V0.5L2 0.36 2.08 6.96 7.88 3.35 3.79 M3V0.5L2 0.35 1.6 9.92 12.22 6.21 7.65
M1V0.5L4 0.38 1.62 6.66 8.58 4.11 5.29 M2V0.5L4 0.36 2.4 9.03 12.91 3.76 5.38 M3V0.5L4 0.38 2.49 9.2 12.35 3.69 4.96
M1V0.5L6 0.37 1.96 9.24 13.67 4.71 6.97 M2V0.5L6 0.32 1.42 8.67 14.92 6.12 10.54 M3V0.5L6 0.54 1.56 13.06 22.78 8.35 14.57
M1V1.0L2 0.31 0.63 5.5 8.5 8.72 13.47 M2V1.0L2 0.3 2.07 9.55 11.87 4.62 5.74 M3V1.0L2 0.45 2.8 12.93 18.98 4.63 6.79
M1V1.0L4 0.5 2.93 12.81 20.52 4.37 7 M2V1.0L4 0.6 3.51 19.71 32.14 5.62 9.16 M3V1.0L4 0.44 3.57 18.36 30.8 5.14 8.62
M1V1.0L6 0.51 4.97 24.51 39.37 4.93 7.92 M2V1.0L6 0.6 6.56 26.65 44.73 4.06 6.81 M3V1.0L6 0.52 4.86 26.46 47.23 5.45 9.72
M1V1.5L2 0.44 1.85 10.29 15.42 5.55 8.31 M2V1.5L2 0.31 2.02 11.81 17.46 5.84 8.63 M3V1.5L2 0.37 2.53 12.45 18.59 4.92 7.34
M1V1.5L4 0.43 2.89 13.28 22.48 4.59 7.78 M2V1.5L4 0.43 2.61 14.35 21.51 5.5 8.24 M3V1.5L4 0.66 6.58 38.96 59.56 5.92 9.05
M1V1.5L6 0.4 2.83 19.12 37.99 6.76 13.44 M2V1.5L6 0.6 6.39 32.7 57.77 5.11 9.03 M3V1.5L6 0.72 7.9 42.62 67.93 5.4 8.6
[Siraj, 4(1): February, 2017] ISSN 2349-6193
Impact Factor: 2.805
IJESMR International Journal OF Engineering Sciences & Management Research
© International Journal of Engineering Sciences & Management Research
[18]
Fig. 12: Impact tests for ultimate failure strength for Mix Series I, II and III
[Siraj, 4(1): February, 2017] ISSN 2349-6193
Impact Factor: 2.805
IJESMR International Journal OF Engineering Sciences & Management Research
© International Journal of Engineering Sciences & Management Research
[19]
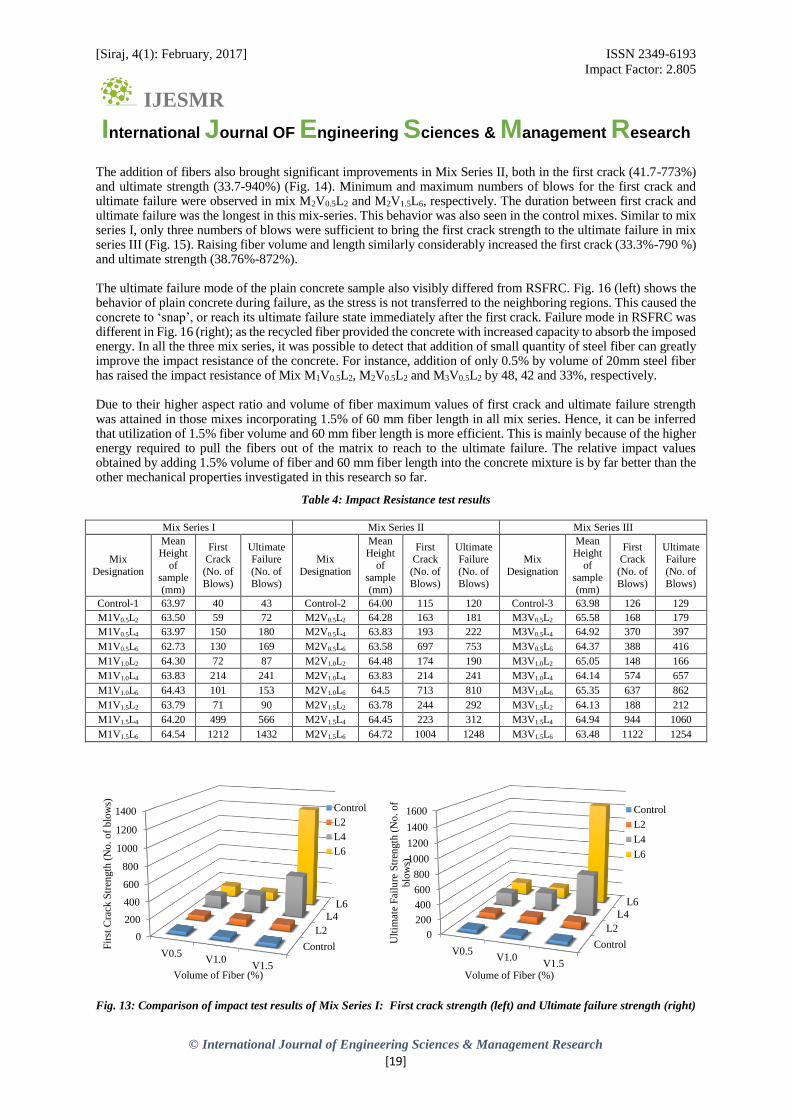
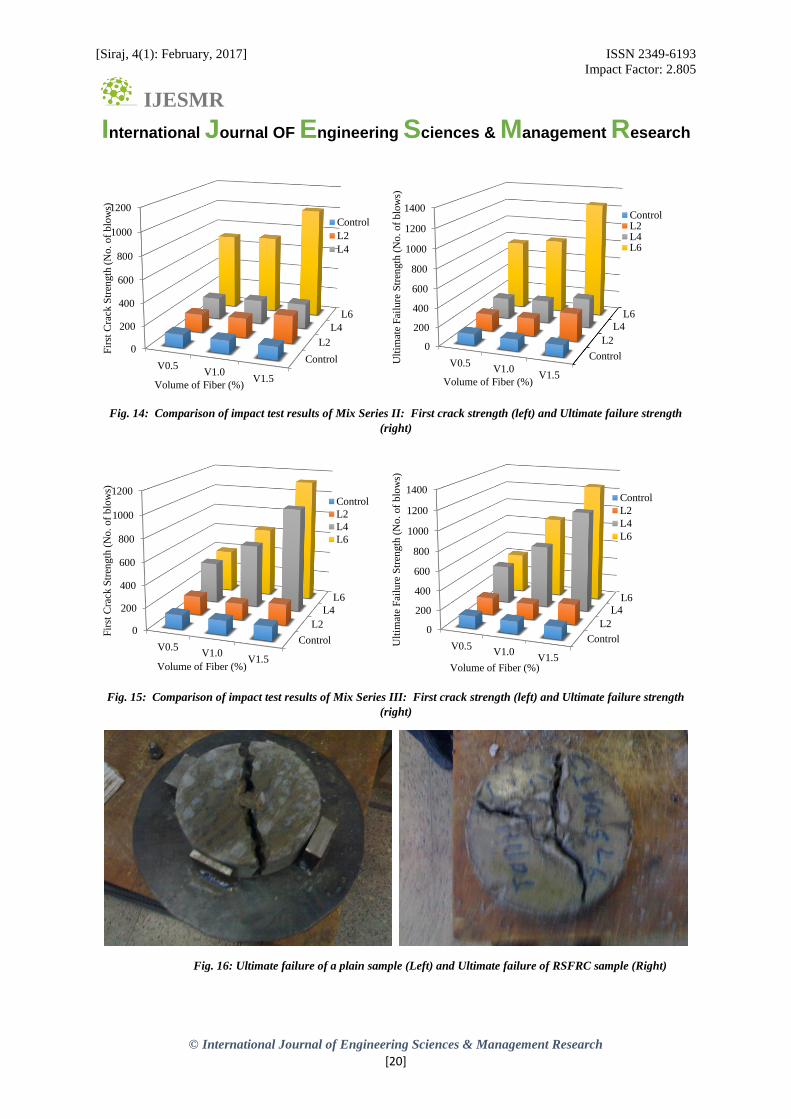
The addition of fibers also brought significant improvements in Mix Series II, both in the first crack (41.7-773%) and ultimate strength (33.7-940%) (Fig. 14). Minimum and maximum numbers of blows for the first crack and ultimate failure were observed in mix M2V0.5L2 and M2V1.5L6, respectively. The duration between first crack and ultimate failure was the longest in this mix-series. This behavior was also seen in the control mixes. Similar to mix series I, only three numbers of blows were sufficient to bring the first crack strength to the ultimate failure in mix series III (Fig. 15). Raising fiber volume and length similarly considerably increased the first crack (33.3%-790 %) and ultimate strength (38.76%-872%). The ultimate failure mode of the plain concrete sample also visibly differed from RSFRC. Fig. 16 (left) shows the behavior of plain concrete during failure, as the stress is not transferred to the neighboring regions. This caused the concrete to ‘snap’, or reach its ultimate failure state immediately after the first crack. Failure mode in RSFRC was different in Fig. 16 (right); as the recycled fiber provided the concrete with increased capacity to absorb the imposed energy. In all the three mix series, it was possible to detect that addition of small quantity of steel fiber can greatly improve the impact resistance of the concrete. For instance, addition of only 0.5% by volume of 20mm steel fiber has raised the impact resistance of Mix M1V0.5L2, M2V0.5L2 and M3V0.5L2 by 48, 42 and 33%, respectively. Due to their higher aspect ratio and volume of fiber maximum values of first crack and ultimate failure strength was attained in those mixes incorporating 1.5% of 60 mm fiber length in all mix series. Hence, it can be inferred that utilization of 1.5% fiber volume and 60 mm fiber length is more efficient. This is mainly because of the higher energy required to pull the fibers out of the matrix to reach to the ultimate failure. The relative impact values obtained by adding 1.5% volume of fiber and 60 mm fiber length into the concrete mixture is by far better than the other mechanical properties investigated in this research so far.
Table 4: Impact Resistance test results
Mix Series I Mix Series II Mix Series III
Mix
Designation
Mean Height
of sample
(mm)
First Crack
(No. of
Blows)
Ultimate Failure
(No. of
Blows)
Mix
Designation
Mean Height
of sample
(mm)
First Crack
(No. of
Blows)
Ultimate Failure
(No. of
Blows)
Mix
Designation
Mean Height
of sample
(mm)
First Crack
(No. of
Blows)
Ultimate Failure
(No. of
Blows)
Control-1 63.97 40 43 Control-2 64.00 115 120 Control-3 63.98 126 129
M1V0.5L2 63.50 59 72 M2V0.5L2 64.28 163 181 M3V0.5L2 65.58 168 179
M1V0.5L4 63.97 150 180 M2V0.5L4 63.83 193 222 M3V0.5L4 64.92 370 397
M1V0.5L6 62.73 130 169 M2V0.5L6 63.58 697 753 M3V0.5L6 64.37 388 416
M1V1.0L2 64.30 72 87 M2V1.0L2 64.48 174 190 M3V1.0L2 65.05 148 166
M1V1.0L4 63.83 214 241 M2V1.0L4 63.83 214 241 M3V1.0L4 64.14 574 657
M1V1.0L6 64.43 101 153 M2V1.0L6 64.5 713 810 M3V1.0L6 65.35 637 862
M1V1.5L2 63.79 71 90 M2V1.5L2 63.78 244 292 M3V1.5L2 64.13 188 212
M1V1.5L4 64.20 499 566 M2V1.5L4 64.45 223 312 M3V1.5L4 64.94 944 1060
M1V1.5L6 64.54 1212 1432 M2V1.5L6 64.72 1004 1248 M3V1.5L6 63.48 1122 1254
Fig. 13: Comparison of impact test results of Mix Series I: First crack strength (left) and Ultimate failure strength (right)
Control
L2
L4
L6
0
200
400
600
800
1000
1200
1400
V0.5V1.0
V1.5
Fir
st C
rack
Str
ength
(N
o.
of
blo
ws)
Volume of Fiber (%)
Control
L2
L4
L6
Control
L2
L4
L6
0
200
400
600
800
1000
1200
1400
1600
V0.5V1.0
V1.5
Ult
imat
e F
ailu
re S
tren
gth
(N
o.
of
blo
ws)
Volume of Fiber (%)
Control
L2
L4
L6
[Siraj, 4(1): February, 2017] ISSN 2349-6193
Impact Factor: 2.805
IJESMR International Journal OF Engineering Sciences & Management Research
© International Journal of Engineering Sciences & Management Research
[20]
Fig. 14: Comparison of impact test results of Mix Series II: First crack strength (left) and Ultimate failure strength
(right)
Fig. 15: Comparison of impact test results of Mix Series III: First crack strength (left) and Ultimate failure strength
(right)
Fig. 16: Ultimate failure of a plain sample (Left) and Ultimate failure of RSFRC sample (Right)
Control
L2
L4
L6
0
200
400
600
800
1000
1200
V0.5V1.0
V1.5
Fir
st C
rack
Str
ength
(N
o.
of
blo
ws)
Volume of Fiber (%)
Control
L2
L4
Control
L2
L4
L6
0
200
400
600
800
1000
1200
1400
V0.5V1.0
V1.5
Ult
imat
e F
ailu
re S
tren
gth
(N
o.
of
blo
ws)
Volume of Fiber (%)
ControlL2L4L6
Control
L2
L4
L6
0
200
400
600
800
1000
1200
V0.5V1.0
V1.5
Fir
st C
rack
Str
ength
(N
o.
of
blo
ws)
Volume of Fiber (%)
Control
L2
L4
L6
Control
L2
L4
L6
0
200
400
600
800
1000
1200
1400
V0.5V1.0
V1.5
Ult
imat
e F
ailu
re S
tren
gth
(N
o.
of
blo
ws)
Volume of Fiber (%)
Control
L2
L4
L6
[Siraj, 4(1): February, 2017] ISSN 2349-6193
Impact Factor: 2.805
IJESMR International Journal OF Engineering Sciences & Management Research
© International Journal of Engineering Sciences & Management Research
[21]
CONCLUSIONS AND FUTURE WORK In an effort to study the effect of recycled steel fibers on the mechanical properties of recycled steel fiber reinforced concrete; mainly the flexural toughness, energy absorption and impact resistance, are investigated. Energy absorption under flexural loading was greatly enhanced with recycled steel fiber reinforcement. The optimum volume of fibers as well as the fibers’ optimum aspect ratio will depend on the fiber type. But an increase in fiber aspect ratio results in a considerable increase of the peak flexural load and ductility. Among the examined specimens, it was found that fibers with 60mm length had a stable post-peak load-deflection response. An increase in the volume of fibers increases the peak load and residual strength after cracking. These effects are also very much pronounced for fibers with a higher aspect ratio. High strength concrete also results in a much higher peak load irrespective of the volume of fiber used. However, this does not necessarily hold true for the concrete’s ductility. Furthermore, an increase in energy absorption up to specified points of deflections can be attained when both the fiber length and volume increase. Such a direct relationship, however, cannot be inferred regarding the toughness indices, as these values greatly depend on the first crack point; which is highly subjective. Despite such inconsistency, the RSF reinforced concrete have shown an improved toughness indices compared to the control specimens. Steel fiber inclusion has enormously increased both the first crack and ultimate failure strength. Addition of small quantity of steel fiber can greatly improve the impact resistance of the concrete. Higher volume percentages (1.5%) decreased the ductility of concrete mixes with a higher compressive strength. This signifies the need to striking the balance between improving mechanical properties and amount of fiber reinforcement to be used, especially for concrete mixes with higher concrete grades. With regards to the testing procedures; since material properties of steel fiber reinforced concrete depend, to a relevant extent, on the bond between the fibers and the matrix, direct or indirect fiber pull out test should be carried out in order to attain a comprehensible view on the behavior of pulling out of a fiber from a matrix already reinforced with steel fiber. Results from flexural tests on concrete beams are prone to significant experimental errors due to spurious support displacements, machine stiffness, load rate and rocking of specimen on its support. Hence, it is recommended to use a yoke along with resistive clip gauge. The interesting results confirm the promising application of concrete reinforced with steel fibers extracted from used tyres. However, further, research work is still necessary in order to have a more in-depth understanding of the material properties and to evaluate possible practical applications. And also economic evaluation of the adoption of currently available steel fibers extraction technology should be investigated. Further research is proposed in (i) use of SFRC to replace the minimum reinforcement recommended on ground slab for shrinkage and temperature and (ii) development of rational design procedures to incorporate the properties of RSFRC to replace stirrups provided for shear in load carrying beams.
REFERENCES
1. Y. Kwak, M. O. Eberhard, W. Kim and J. Kim, "Shear Strength of Steel Fiber-Reinforced Concrete
Beams without Stirrups," ACI Structural Journal, vol. 99, no. 4, pp. 530-538, 2002.
2. M. S. Meddah and M. Bencheikh, "Properties of Concrete Reinforced with Different Kinds of Industrial
Waste," Construction and Building Materials, vol. 23, pp. 3196-3205, 2009.
3. ACI Committee 544, "Measurement of Properties of Fiber Reinforced Concrete," ACI 544.2R-89, 1999.
4. ACI Committee 544, "Guide for Specifying, Proportioning, Mixing, Placing, and Finishing Steel Fiber
Reinforced Concrete," ACI 544.3R-93, 1998.
5. A. C. 544, "Design Considerations for Steel Fiber Reinforced Concrete," American Concrete Institute,
1999.
6. P. C. Tantall and L. Kuitenbrouwer, "Steel fiber reinforced concrete in industrial floors”, Concrete
International, pp. 43-47, 1992.
7. N. Banthia and N. Nandakumar, "Crack Growth Resistance of Hybrid Fiber Reinforced Cement
Composites," Cement & Concrete Composites, no. 25, pp. 3-9, 2003.
8. S. P. Singh, B. R. Ambedkar, Y. Mohammadi and S. K. Kaushik, "Flexural Fatigue Strength Prediction
of Steel Fibre Reinforced Concrete," Electronic Journal of Structural Engineering, 2008.
9. M. S. Shetty, Concrete Technology Theory and Practice, Revised Edition, New Delhi: S. Chand and
Company LTD, 2005.
10. ACI Committee 544, "Measurement of Properties of Fiber Reinforced Concrete," ACI 544.2R-89, 1999.
[Siraj, 4(1): February, 2017] ISSN 2349-6193
Impact Factor: 2.805
IJESMR International Journal OF Engineering Sciences & Management Research
© International Journal of Engineering Sciences & Management Research
[22]
11. Y. Wang, H. Wu and L. Victor, "Concrete Reinforcement with Recycled Fibers," Journal of Materials in
Civil Engineering, vol. 12, no. 4, pp. 314-319, 2000.
12. S. Mindess, F. Young and D. Darwin, Concrete, 2nd Edition, New Jersey: Prentice Hall, Pearson
Education, Inc., 2003.
13. B. Miloud, "Permeability and Porosity Characteristics of Steel Fiber Reinforced Concrete," Asian Journal
of Civil Engineering (Building and Housing), vol. 6, no. 4, pp. 317-330, 2005.
14. N. Ghosni, B. Samali and H. Valipour, "Evaluation of the Mechanical Properties of Steel and
Polypropylene Fibre-Reinforced Concrete Used in Beam Column Joints," Composite Construction in
Steel and Concrete VII, pp. 401-407, 2013.
15. T. Mailhot, B. Bissonnette, F. Saucie and M. Pigeon, "Flexural Fatigue Behavior of Steel Fibre
Reinforced Concrete Before and After Cracking," Materials and Structures, vol. 34, pp. 351-359, 2001.
16. P. S. Singh, Y. Mohammadi and K. S. Madan, "Flexural Fatigue Strength of Steel Fibrous Concrete
Containing Mixed Steel Fibres," Journal of Zhejiang University SCIENCE A, vol. 7, no. 8, pp. 1329-
1335, 2006.
17. V. S. Gopalaratnam and R. Gettu, "On the Characterization of Flexural Toughness in Fiber Reinforced
Concretes," Cement & Concrete Composites, vol. 17, pp. 239-254, 1995.
18. C. G. Papakonstantinou and M. J. Tobolski, "Use of Waste Tire Steel Beads in Portland Cement
Concrete," Cement and Concrete Research, vol. 36, pp. 1686-1691, 2006.
19. K. Pilakoutas, K. Neocleous and H. Tlemat, "Reuse of Tyre Steel Fibers as Concrete Reinforcement,"
Proceedings of the ICE: Engineering Sustainability, pp. 131-138, 2004.
20. Ethiopian Standard, "Aggregates: Normal Concrete Aggregates," ESC. D3. 201, Addis Ababa, 1990.
21. ASTM C1018, "Standard Test Method for Flexural Toughness and First-crack Strength of Fiber-
Reinforced Concrete," ASTM International, Philadelphia, 1997.