Embed Size (px)
Citation preview
* Corresponding author. E-mail address: [email protected] (D. R. Lim) © 2022 Growing Science Ltd. All rights reserved. doi: 10.5267/j.ac.2021.7.009
Accounting 8 (2022) 123–138
Contents lists available at GrowingScience
Accounting
homepage: www.GrowingScience.com/ac/ac.html
Causative dynamics of overconfidence, optimism, framing effects and demographic attributes as capital structure determinants for publicly listed firms in Indonesia
David Rimbo Lima*, Hendrawan Supratiknoa, Gracia Shinta S. Uguta and Edison Hulua aUniversitas Pelita Harapan, Indonesia C H R O N I C L E A B S T R A C T
Article history: Received June 10, 2021 Received in revised format June 29 2021 Accepted July 29 2021 Available online July 29 2021
This study examines whether capital structure determinations by Indonesian publicly listed firms (Tbks) are influenced by the behavioural biases of overconfidence and optimism, with the underlying rationality frameworks being framed by relevant financial information and impacted by decision-makers’ demographic attributes. Data were obtained from survey respondents and statistically analysed using partial least squares structural equation modelling to identify the indicators of causative dynamics within the hypothesised relationships. Sampled Tbks’ management (CEOs/CFOs) displayed the inherent behavioural traits of overconfidence and optimism in their capital structure determinations. However, such behavioural variables were not statistically proven to significantly influence capital structure decision-making and, hence, were not validated as capital structure determinants. The pecking order framework was revealed to have a significant framing effect on capital structure decision-making by sampled managers. Sampled managers’ demographic attributes and backgrounds were found to be capital structure determinants but did not have a mediating or moderating influence on the modelled relationship between behavioural variables and capital structure.
Growing Science Ltd. All rights reserved. 22© 20
Keywords: Overconfidence Optimism Pecking order theory Demographic attributes Framing effects Capital structure determinants
1. Introduction
The progressive development of modern corporate finance theory has seen the incorporation of behavioural variables into the theoretical frameworks of financial economics, particularly as a complementing discourse to mitigate the challenges to the foundational concept of rationality in decision-making. A growing body of knowledge on behavioural finance has emerged through application of a dynamic modelling construct onto the ‘traditionally’ static modelling framework of neoclassical capital and market economy grand theorems on financing structure. Studies on the grand frameworks of modern financial economics have identified capital structure decisions as the most extensively researched area in corporate finance (Harris & Raviv, 1991). Various frameworks have been adopted to examine the underlying rationales, objectives, processes and mechanics behind capital structure determinations, yet there is limited consensus on how firms choose their capital structure (Lemmon, et al., 2014). This has induced postulations as to the relevance of behavioural variables in explaining the widely applied theoretical frameworks, such as capital structure irrelevance, pecking order, trade-off, agency cost, signalling mechanisms and asymmetric information (Myers & Majluf, 1984; Ross, 1977; Desai, et al., 2005). Studies on capital structure determinants have introduced specific theoretical conceptualisations and research frameworks (Titman & Wessels, 1988; Rajan & Zingales, 1995; Fama & French, 2002; Frank & Goyal, 2004), and it is agreed that capital structure decisions and strategic choices deviate from the traditional neoclassical paradigms (Bilgehan, 2014). This has provided greater impetus for the study of how behavioural characteristics affect financing decision-making.
124
Recent studies have shown how biases such as overconfidence and optimism can affect corporate decisions (Azouzi & Jarboui, 2012) and that managers’ overconfidence is positively and significantly related to leverage ratio when used as a proxy for capital structure (Malmendier et al., 2011; Cronqvist et al., 2012). Nevertheless, most studies on the relationships between managers’ individual characteristics and firms’ capital structure have focused on developed economies and more established capital markets, with limited research on wider capital markets. The present study examines behavioural variables as capital structure determinants for publicly listed firms (a wide capital market) in Indonesia (a developing/emerging economy). 2. Literature review 2.1 Rationality versus Irrationality in Corporate Decision-making Rationality is the foundational and fundamental theoretical conceptualisation of decision-making (Vasiliou & Nikolaos, 2009) and is adopted in modelling assumptions such as efficient markets, symmetrical information, and tax neutrality. Studies on the grand frameworks of capital structure determinants have yielded significant derivative theories, which are typically adopted in testing capital structure efficiency and rationality considerations in financing and capital decisions. Trade-off theory (Kraus & Litzenberger, 1973) postulated the determination of an optimal capital structure, while ‘pecking order’ theory (Myers, 1984; Myers & Majluf, 1984) contradicted such a notion. The implicit assumption that investors and company managers will always act rationally is key for the operational functioning of the grand theorems of corporate finance and capital structure. This assumption does not consistently hold true, as evidenced by market anomalies, capital market imperfection, labour market imperfection and information asymmetry (Sanvicente, 2011). Extensive empirical research has been undertaken to explain the observed irrationality in financial and capital decisions. Initial conceptualisations of how psychological and behavioural variables might impact rational decision-making date back to Mackay’s (1841) Extraordinary popular delusions and the madness of crowds. However, only much later did scholars expound more applicable frameworks for finance and economics (see Simon, 1955; Pratt, 1964; Raiffa, 1968; Kahneman & Tversky, 1979), such as behavioural finance, which assumed that investors are ‘normal’ rather than rational and that the market is inefficient. Accordingly, investors might not consistently adopt a mean–variance approach in constructing their portfolios and expected returns are a function of more than just risk–reward trade-offs (Stratman, 2008). Behavioural finance has its roots in earlier branches of social psychology. Initial significant works include The theory of moral sentiments (1759) and The wealth of nations (1776) by Adam Smith, who argued that there is an ‘invisible hand’ (moral compass) guiding individuals in decision-making, and Jeremy Bentham’s (1789) framework on the psychological aspects of utility functions. These scholars laid the foundational theme of the role of human psychology in influencing economic behaviour, but this aspect of their works was not revisited until the early 20th century. 2.2 Capital Structure Irrelevance Theory Modigliani and Miller’s (1958) capital structure irrelevance theory (the Modigliani–Miller Proposition-I or MM-I) is the basis for modern capital structure theories. MM-I is generally perceived as theoretically sound but based on unrealistic assumptions (e.g., a world without tax; see Abeywardhana, 2017). Following important refinements by Hirshleifer (1966) and Stiglitz (1969), Modigliani and Miller (1963) incorporated tax effects on the cost of capital and firm value assumptions in their model (MM-II). In the face of corporate taxes, the value of a firm increases with leverage due to tax shielding, indicating an optimum level where such shielding benefits would be maximised. 2.3 Pecking Order Theory Pecking order theory postulates that there is a latent preference for companies to prioritise internal financing rather than utilising debt capital, while equity raising/issuance is least preferred (Abeywardhana, 2017). This is supported by Al-Tally (2014). Firms borrow more when internally generated funds are insufficient to meet investment needs (Shyam-Sunder & Myers, 1999). Firms with higher profits and growth opportunities will use less debt capital, with the company’s debt ratio representing the accumulation of external financing as the company reaches an optimal debt ratio (Myers, 2001). Under this framework, Harris and Raviv (1991) suggested that capital structure decisions are intended to eliminate inefficiencies caused by information asymmetry. Firms avoid capital market issuance due to information asymmetry and separation of ownership (Myers, 2001). Corporate debt issues signal to the market that a company is remarkable and its management is not afraid of debt financing (Frydenberg, 2004). Studies have offered inconsistent conclusions on significance of the pecking order framework for companies’ capital structure. Fama and French (2002) argued that optimal capital structure can be identified through the benefits of debt interest reduction, bankruptcy costs and agency costs. 2.4 Trade-off Theory Arnold (2008) demonstrated how an increase in capital debt affects the value of a firm; as the weighted average cost of capital of a company’s leverage structure decreases until the company reaches its optimal gearing level, the cost of financial pressure increases along with the level of debt. This is consistent with Miller’s (1988) findings that the optimal debt-to-
D. R. Lim et al. / Accounting 8 (2022) 125
equity ratio reflects the highest possible tax shield that can be enjoyed by the company; this then increases shareholder wealth. Under trade-off theory, the cost of debt is associated with the direct and indirect costs of bankruptcy (see Bradley et al., 1984). 2.5 Market Timing Firms decide on the ‘timing’ of the issuance of new equities and debts based on the perceived mispricing of their shares (Baker & Wurgler, 2002). Firms are expected to favour issuance of new equities when their stock prices are high, and vice versa. Accordingly, stock price fluctuations affect firms’ financing decisions and, ultimately, influence capital structure (Baker & Wurgler, 2002). This implies that change in capital structure is sustained by durable market timing (Bessler et al., 2008) and that, conceptually, capital structure can be seen as the direct consequence of the cumulative outcome of prior periods’ attempts at timing the equity market, with the gearing ratio is negatively related to past stock returns (Bessler & David, 2004). However, Hovakimian (2006) revealed that market timing does not significantly affect companies’ long-term capital structure, and Alti (2006) indicated that the impact of market-timing efforts will completely fade within two years. Kisgen (2006) posited that capital structure decisions will change based on the costs and benefits of different rating levels of financing. 2.6 Behavioural Finance Tversky and Kahneman (1979) introduced prospect theory to explain how behavioural variables relate to financial and economic considerations, laying the foundation for behavioural finance theory. Pompian (2011) categorised behavioural biases into cognitive and emotional biases. Cognitive biases include overconfidence, representativeness, anchoring and adjustment, framing, cognitive dissonance, availability, and mental accounting. Emotional biases include endowment bias, loss aversion, optimism and status quo. Optimistic managers prefer to use the pecking order approach in capital structure decisions, while overconfident managers exhibit debt-funding bias in such decisions. It has been empirically demonstrated that CEOs’ characteristics and risk preference influence corporate leverage policy (Malmendier et al., 2011; Chen, et al., 2014) and managers’ characteristics influence capital structure decisions (Armstrong et al., 2010; Huang & Kisgen, 2013; Serfling, 2014; Faccio et al., 2016; Li et al., 2017). Overconfidence Odean (1998) defined overconfidence as the tendency of investors to overestimate the precision and relevance of their knowledge about the value of a security. Overconfidence is among the most researched biases and there is a wealth of empirical findings. Overconfidence is empirically proven to be widespread in the corporate world (De Bondt & Thaler, 1995; Malmendier & Tate, 2005). CEOs’ and management’s overconfidence has been shown to have negative (Heaton, 2002; Malmendier & Tate, 2005; Benson & Ziedonis, 2010; Ben-David et al., 2013; Shu et al., 2013; Aghazadeh et al., 2018) and positive (Hirshleifer et al., 2012) effects on firms’ capital structure and value. Optimism Heifetzy and Spiegel (2001), Germain et al. (2005) and Barone-Adesi et al. (2012) undertook substantial research on optimism as a heuristic bias within the context of financial economics. Optimism (pessimism) is among the greatest influencing biases—being principally driven and guided by past returns, it has direct impacts on investors’ return expectations, return tolerance and risk perceptions (Hoffmann & Post, 2012) and significantly influences capital structure decisions (Abdeldayem & Sedeek, 2018). 2.7 Demographic Characteristics and Attributes Top management teams (TMTs) are considered a visible representation of an organisation’s workforce and the structural proxy for otherwise unobservable characteristics of human resources and culture (Sørensen, 2000). Both Pfeffer (1983) and Hambrick and Mason (1984) argued that TMTs’ background characteristics could be used to predict behaviours and firm outcomes. A resulting large body of empirical research has substantively linked aggregate measures of team composition (e.g., functional heterogeneity, age diversity and tenure diversity) to firm-level outcomes. Upper echelons perspective has increasingly moved towards examining social psychological processes, individual perceptions and beliefs, contextually linked demographic variables and team-level variables (Jackson et al., 2003; Finkelstein et al., 2009; Nielsen, 2009). Contrasting schools of thoughts have emerged, with some questioning the empirical basis for focusing on ‘simplistic’ demographic variables and stating, ‘we do not need “yet another study that examines the main effect of top management team’s demographic effects on another organisational outcome” ’ (Carpenter et al., 2004: 770). However, important empirical and theoretical insights have been provided by studies of demographic effects on corporate results. Having explored the limitations of past empirical findings on TMTs and organisational performance, the present study aims to better model the relationships between top managements’ attributes, their impacts on strategic decision-making and the eventual impacts on capital structure determinations.
126
3. Research hypotheses As previously discussed, prior empirical evidence suggests that managerial overconfidence and optimism can be important determinants of firms’ capital structure (Barros & Da Silveira, 2007). Accordingly, the following hypotheses are introduced:
Hypothesis 1: Capital structure is positively influenced by overconfidence, as a behavioural bias that impacts on the capital structure decisions.
Hypothesis 2: Capital structure is positively influenced by optimism, as a behavioural bias that impacts on capital structure decisions.
The choice of information used in making decisions results in an information frame that affects decision-making (Kahneman & Tversky, 1979; Shefrin, 2000; Pompian, 2011). Based on this, the following hypothesis is introduced:
Hypothesis 3: Capital structure preference is framed by relevant information.
As previously discussed, prior studies have empirically proved that: 1) managerial traits explain the remaining variations of the traditional capital structure model, 2) personal portfolio choices are directly influenced by CEOs’ and/or CFOs’ behavioural biases and 3) formative experiences have a significant impact on decision-making. Based on this, the following hypothesis is introduced:
Hypothesis 4: Management’s (CEOs/CFOs)’ demographic attributes as moderating variables modify the relationship between overconfidence and optimism to capital structure decisions.
4. Research method 4.1 Collected Data This study collected data from survey responses from CEOs and CFOs of public corporations (Tbks) listed on the Indonesian Stock Exchange (IDX; Bursa Efek Indonesia, BEI). The IDX provided the contact details of over 500 Tbks. Survey questionnaires were distributed to Tbks using Google Forms. This study excluded responses from banking and insurance and public utility firms, whose capital structures and equity formations are specifically regulated and mandated to comply with certain prescribed corporate entity and governance structures that practically and directly restrict their options of accessing financial and equity markets. Fifty fully completed surveys were considered suitable for the intended statistical analysis and measurement. Respondents represented the following industry sectors: agribusiness and forestry = 12%; real estate = 12%; basic industry and chemicals = 14%; consumer goods = 12%; transportation and infrastructure = 12%; mining = 14%; miscellaneous industry = 8%; and trade service and investment = 16%. 4.2 Research model Model I, to test and validate Hypotheses 1, 2 and 3: D = ß
O CONF
1 + ß
1 CONF2
+ ß
2 CONF
3 + ß
3 OPT + ß
4 FE
1 + ß
5 FE
2 + ß
6 FE
3 + ß
7 FE
4 + ß
8 FE
5,
where: D = Capital Structure (Leverage Ratio as the proxy) CONF1 = Overconfidence 1; Delusion of being in control CONF2 = Overconfidence 2; An extensive level of commitment to a positive outcome CONF3 = Overconfidence 3; Vague parameters for comparison of performance OPT = Optimism FE1 = Framing Effect 1; Information: trade-off theory; industrial capital structure; credit rating; takeover risk FE2 = Framing Effect 2; Information: signalling theory; lower cost of debt; market timing theory; close banking relationships FE3 = Framing Effect 3; Information: average past P/E ratio FE4 = Framing Effect 4; Information: past credit rating FE5 = Framing Effect 5; Information: past market timing
Model II, to test and validate Hypothesis 4, with demographic attributes construct (constrained form): D = β19CONF1 + β20CONF2 + β21CONF3 + β22FE1 + β23FE2 + β24FE3 + β25FE4 + β26FE5 + β27OPT + β28DM + β29DM*CONF1+ β30DM*CONF2 + β31DM*CONF3 + β32DM*OPT.

D. R. Lim et al. / Accounting 8 (2022) 127
where: D = Capital Structure (Leverage Ratio as the proxy) CONF1 = Overconfidence 1; Delusion of being in control CONF2 = Overconfidence 2; An extensive level of commitment to a positive outcome CONF3 = Overconfidence 3; Vague parameters for comparison of performance FE1 = Framing Effect 1; Information: trade-off theory; industrial capital structure; credit rating; takeover risk FE2 = Framing Effect 2; Information: signalling theory; lower cost of debt; market timing theory; close banking relationships FE3 = Framing Effect 3; Information: average past P/E ratio FE4 = Framing Effect 4; Information: past credit rating FE5 = Framing Effect 5; Information: past market timing OPT = Optimism DM = Demography Attributes DM*CONF1 = Demographic Attributes interacted CONF1 DM*CONF2 = Demographic Attributes interacted CONF2 DM*CONF3 = Demographic Attributes interacted CONF3 DM*OPT =Demographic Attributes interacted OPT
Model II, with demographic attributes construct (unconstrained form): D = β9CONF1 + β10CONF2 + β11CONF3 + β12FE1 + β13FE2 + β14FE3 + β15FE4 + β16FE5 + β17OPT + β18DM where: D = Capital structure (leverage ratio as the proxy) CONF1 = Overconfidence 1; Delusion of being in control CONF2 = Overconfidence 2; An extensive level of commitment to a positive outcome CONF3 = Overconfidence 3; Vague parameters for comparison of performance FE1 = Framing Effect 1; Information: trade-off theory; industrial capital structure; credit rating; takeover risk FE2 = Framing Effect 2; Information: signalling theory; lower cost of debt; market timing theory; close banking relationships FE3 = Framing Effect 3; Information: average past P/E ratio FE4 = Framing Effect 4; Information: past credit rating FE5 = Framing Effect 5; information: past market timing OPT = Optimism DM = Demography attributes
Measurement variables. Independent variable: Capital structure The value of the leveraged firm is equal to the company’s unobserved value. Managers’ choose the composition of debt to equity (Modigliani & Miller, 1958).
Dependent variables: Overconfidence variable (Malmendier & Tate, 2005) CONF1 = delusion of being in control CONF2 = an extensive level of commitment to a positive outcome CONF3 = vague parameters for comparison of performance Optimism variable (Hoffmann & Post, 2012). OPT = Return expectations, variance tolerance, risks perceptions
Framing effect variables: FE1 = Information: trade-off theory; industrial capital structure; credit rating; takeover risk FE2 = Information: signalling theory; lower cost of debt; market timing theory; close relationships to bank FE3 = Information: average past P/E ratio FE4 = Information: past credit rating FE5 = Information: past market timing
Moderating variables:
Demographic characteristic indicators (demographic attributes) (Sørensen, 2000) Age Gender Education Professional experience
128
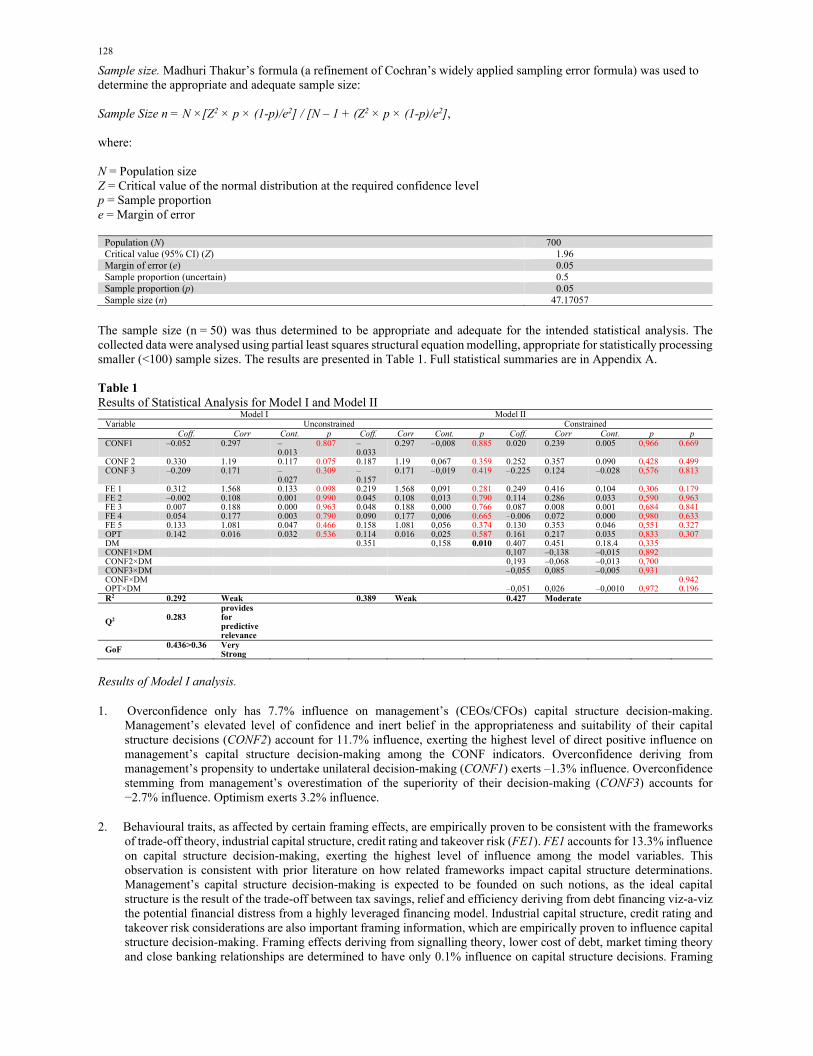
Sample size. Madhuri Thakur’s formula (a refinement of Cochran’s widely applied sampling error formula) was used to determine the appropriate and adequate sample size: Sample Size n = N ×[Z2 × p × (1-p)/e2] / [N – 1 + (Z2 × p × (1-p)/e2], where: N = Population size Z = Critical value of the normal distribution at the required confidence level p = Sample proportion e = Margin of error
Population (N) 700 Critical value (95% CI) (Z) 1.96 Margin of error (e) 0.05 Sample proportion (uncertain) 0.5 Sample proportion (p) 0.05 Sample size (n) 47.17057
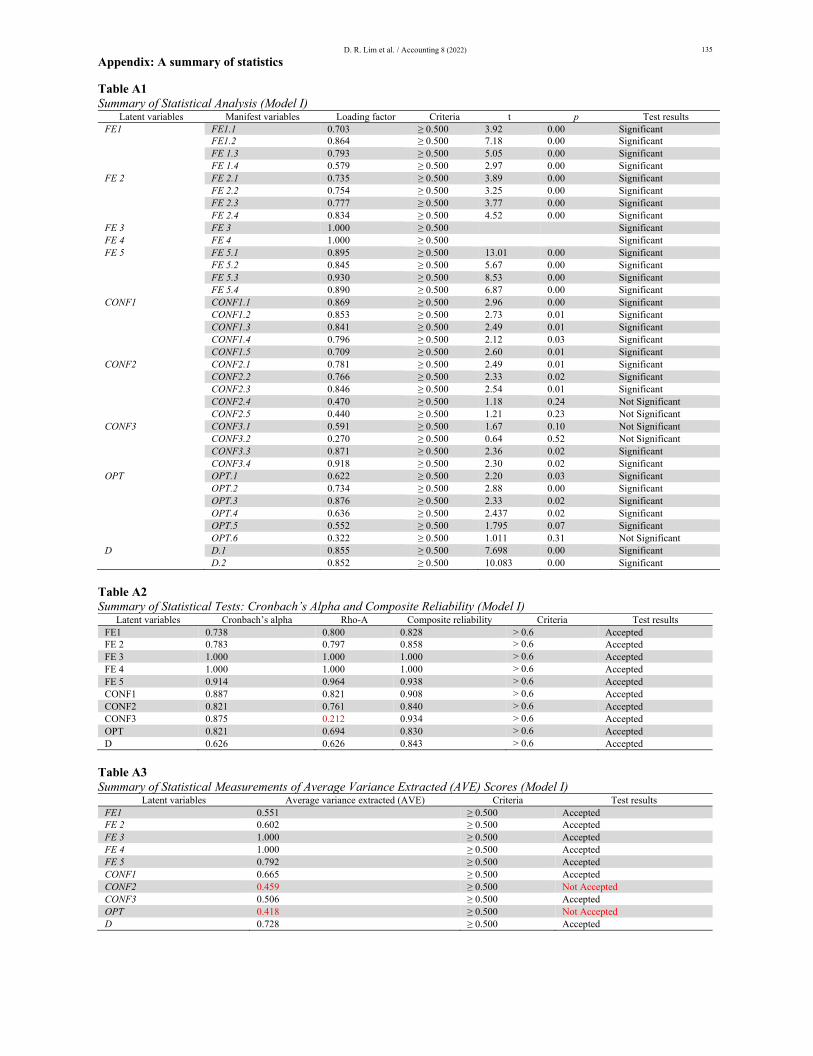
The sample size (n = 50) was thus determined to be appropriate and adequate for the intended statistical analysis. The collected data were analysed using partial least squares structural equation modelling, appropriate for statistically processing smaller (<100) sample sizes. The results are presented in Table 1. Full statistical summaries are in Appendix A. Table 1 Results of Statistical Analysis for Model I and Model II
Model I Model II Variable Unconstrained Constrained Coff. Corr Cont. p Coff. Corr Cont. p Coff. Corr Cont. p p CONF1 –0.052 0.297 –
0.013 0.807 –
0.033 0.297 –0,008 0.885 0.020 0.239 0.005 0,966 0.669
CONF 2 0.330 1.19 0.117 0.075 0.187 1.19 0,067 0.359 0.252 0.357 0.090 0,428 0.499 CONF 3 –0.209 0.171 –
0.027 0.309 –
0.157 0.171 –0,019 0.419 –0.225 0.124 –0.028 0,576 0.813
FE 1 0.312 1.568 0.133 0.098 0.219 1.568 0,091 0.281 0.249 0.416 0.104 0,306 0.179 FE 2 –0.002 0.108 0.001 0.990 0.045 0.108 0,013 0.790 0.114 0.286 0.033 0,590 0.963 FE 3 0.007 0.188 0.000 0.963 0.048 0.188 0,000 0.766 0.087 0.008 0.001 0,684 0.841 FE 4 0.054 0.177 0.003 0.790 0.090 0.177 0,006 0.665 –0.006 0.072 0.000 0,980 0.633 FE 5 0.133 1.081 0.047 0.466 0.158 1.081 0,056 0.374 0.130 0.353 0.046 0,551 0.327 OPT 0.142 0.016 0.032 0.536 0.114 0.016 0,025 0.587 0.161 0.217 0.035 0,833 0.307 DM 0.351 0,158 0.010 0.407 0.451 0.18.4 0,335 CONF1×DM 0,107 –0,138 –0,015 0,892 CONF2×DM 0,193 –0,068 –0,013 0,700 CONF3×DM –0,055 0,085 –0,005 0,931 CONF×DM 0.942 OPT×DM –0,051 0,026 –0,0010 0,972 0.196 R2 0.292 Weak 0.389 Weak 0.427 Moderate
Q2 0.283
provides for predictive relevance
GoF 0.436>0.36 Very Strong
Results of Model I analysis.
1. Overconfidence only has 7.7% influence on management’s (CEOs/CFOs) capital structure decision-making. Management’s elevated level of confidence and inert belief in the appropriateness and suitability of their capital structure decisions (CONF2) account for 11.7% influence, exerting the highest level of direct positive influence on management’s capital structure decision-making among the CONF indicators. Overconfidence deriving from management’s propensity to undertake unilateral decision-making (CONF1) exerts –1.3% influence. Overconfidence stemming from management’s overestimation of the superiority of their decision-making (CONF3) accounts for −2.7% influence. Optimism exerts 3.2% influence.
2. Behavioural traits, as affected by certain framing effects, are empirically proven to be consistent with the frameworks of trade-off theory, industrial capital structure, credit rating and takeover risk (FE1). FE1 accounts for 13.3% influence on capital structure decision-making, exerting the highest level of influence among the model variables. This observation is consistent with prior literature on how related frameworks impact capital structure determinations. Management’s capital structure decision-making is expected to be founded on such notions, as the ideal capital structure is the result of the trade-off between tax savings, relief and efficiency deriving from debt financing viz-a-viz the potential financial distress from a highly leveraged financing model. Industrial capital structure, credit rating and takeover risk considerations are also important framing information, which are empirically proven to influence capital structure decision-making. Framing effects deriving from signalling theory, lower cost of debt, market timing theory and close banking relationships are determined to have only 0.1% influence on capital structure decisions. Framing

D. R. Lim et al. / Accounting 8 (2022) 129
effects arising from heightened referencing against comparative financial performance metrics, such as the P/E ratio (as linked to agency theory, hence reflective of expectations on opportunity growth), account for 0.0% influence. Framing effects stemming from due consideration of creditworthiness position account for 0.3% influence.
3. Sampled management’s (CEOs/CFOs) capital structure decision-making appears to not be significantly influenced by credit rating status and information on corporate creditworthiness. This is further confirmed by survey responses clearly indicating preference for bank loans rather than issuance of corporate bonds, despite the publicly listed firm status of their companies, which would be advantageous for the credit rating process. This indicates that the framing effect from credit rating (FE4) does not significantly influence capital structure determinations by Indonesian Tbks. Only ~10% of the sampled Tbks have issued corporate bonds, and this, on average, accounts for a small percentage (10–30%) of their long-term debt. Of the 727 companies publicly listed on the IDX as at the end of 2020, only 49 (6.7%; primarily the larger-capped and blue-chip firms) have issued corporate bonds.
4. Framing effects from market timing information have 3.2% influence on capital structure decision-making.
5. Framing effects deriving from various relevant financial and share performance information, available market comparable data, and sector and peer group benchmarks collectively exert 18.3% influence on capital structure decision-making.
Conclusions from statistical testing on Model I. Behavioural traits as modelled in this research are statistically validated to exert 29.2% influence on the capital structure
decision-making by the sampled management (CEOs/CFOs). Accordingly, it can be concluded that behavioural traits and attributes do not significantly influence and are not determinants of capital structure decision-making for Indonesian Tbks.
Hypotheses testing results: Hypotheses 1, 2 and 3 are disproved (null hypothesis is rejected).
Results of Model II analysis: Demographic attributes (unconstrained form). 1. Model II (unconstrained form), with the inclusion of variables for demographic attributes, was statistically validated
for representing the influence of overconfidence, optimism, framing effect and demographic attributes on capital structure decision-making.
2. Under unmoderated equation modelling, the DM (demographic attributes) variables (age, gender, professional experience and education) are statistically determined to significantly (15.8%) influence the sampled management’s (CEOs/CFOs) capital structure decision-making.
3. While statistical testing confirmed the demographic attributes are determinants of capital structure, the variables (overconfidence, optimism, framing effect and demographic attributes) were found to collectively only exert 38.9% influence on management’s capital structure decision-making. This indicates that other variables yet to be incorporated into Model II have the power to explain the remaining 61.1% influence on management’s capital structure decisions.
Results of Model II analysis: Demographic attributes (constrained form) as moderators of the influence of overconfidence and optimism on capital structure.
Statistical measurement shows that DM does not significantly moderate CONF and OPT in regard to capital structure decision-making (p > 0.05). Demographic attributes were not statistically determined to mediate overconfidence and optimism in influencing capital structure determinations.
Conclusions from statistical testing on Model II. Statistical analysis confirmed that demographic attributes (DM) are determinants of capital structure, significantly
influencing (15.82%) management’s (CEOs and CFOs) capital structure decisions. However, DM was statistically determined to exert insignificant moderating power on the behavioural traits of overconfidence and optimism in their respective and combined influence on capital structure (D) decisions. Despite exerting 14% influence on the endogenous capital structure (D) variable, statistical measures do not suggest that the DM moderator will always and significantly influence management’s capital structure decision-making.
Hypothesis testing result: Hypothesis 4 is disproved (null hypothesis is rejected).
5. Discussion 5.1 Overconfidence and Optimism The general premise that management’s decision-making, including decisions on capital structure, is influenced by the behavioural traits of overconfidence and optimism was statistically determined and validated (in Model I and Model II). This appears to support the notion that management’s latent tendency to overestimate their competency and the superiority of their decisions is prevalent among the upper echelon of management in general.
130
The sampled management (CEOs/CFOs) was statistically determined to not be consistently and substantially influenced by the behavioural traits of overconfidence and optimism in their capital structure decisions. This observation was validated despite a portion (14.5%) of the sampled Tbks being public corporations founded, operated and controlled by successful entrepreneurs and their associated business groups. Several prior studies have concluded that entrepreneurs, founders and business owners possess higher overconfidence levels compared to managers and that this behavioural trait directly influences decision-making (see, e.g., Busenitz & Barney. 1997). In the present study, the sampled management (CEOs/CFOs) was found to possess these behavioural inclinations at a comparatively lower level. Nevertheless, the behavioural traits of overconfidence and optimism were not consistent and significant determinants of capital structure. In a corporate setting, it is suggested that the degree of ignorance/incomplete understanding/overconfidence should be diminished by the general and wide availability of data and information pertaining to a specific company, investment or project. Management (CEOs/CFOs) is expected to rely on such data, as opposed to ‘gut feel’ and confidence, in decision-making. The present study’s results suggest that comprehensive and relevant information and data are considered by the sampled Tbks’ management (CEOs/CFOs) in capital structure decisions and are validated determinants of capital structure. However, the proposed models suggest that other factors and determinants have more influence on capital structure than overconfidence, optimism and framing effects from information. Survey responses suggested that, in any capital structure decisions, the sampled management considered relevant information and data (including project- or investment-specific data), broader datasets concerning sectoral and competitive benchmarks, and pertinent macro indicators. The implications of pecking order theory appear to be validated, as the results indicate a consistent lower level of preference for debt issuance among the sampled Tbks. Prior experience of financial and operational difficulties resulting from market shocks and macroeconomic malaise appear to shape the conservative mindset of Tbks’ management (CEOs/CFOs) in prioritising internal sources of financing and equity capital, despite any influence of overconfidence. The typical determinants of capital structure (as modelled in this study) are not consistently significant in influencing management’s capital structure decision-making. It can be inferred that the sampled management is likely to opt for delaying investments and projects if internal sources of capital are insufficient, rather than aggressively raising debt. The behavioural trait of optimism is statistically determined to have a moderate influence on the sampled management’s capital structure decision-making and empirically proven to influence their utilisation of equity funding sources (preferring obtainment of loans and straight debts, rather than issuance of corporate bonds, when debt funding is required). The construct of market timing influence is statistically validated to have a moderate influence on capital structure decision-making, pointing to the preference for equity in the capital structure. The above observations suggest that existing banking relationships may significantly influence the sampled management’s (CEOs/CFOs) capital structure decisions, beyond the influence of the capital structure determinants modelled and tested in this study. The prevalence of business group or conglomeration structures among the IDX-listed Tbks may help explain this. A business group structure might provide a greater level of comfort to bankers in extending various debt accommodations, and, if controlled by a successful and creditworthy founder or entrepreneur, would provide a higher level of comfort to creditors (given the perception that such figurehead businesspeople would not risk their reputation). Entrepreneurs and founders might also value enduring banking relationships, expecting that this would shield the business from aggressive loan enforcements during times of financial distress and increase the likelihood of negotiating workable loan restructuring. For Indonesian public limited companies, such a perception of mutual benefits was likely solidified through experiences such as the 1997/1998 Asian Financial Crisis, 2008/2009 Global Financial Crisis and EM Currency Shocks of 2013/2014. The behavioural traits of overconfidence and optimism did not positively signal management’s confidence and expectations of their firm’s prospective net operating income and future financial performance. Despite tax expensing and deductibility benefits, any debt load-up was not statistically determined to positively influence share prices. The above discussions provide ample impetus for broadening the classical theoretical frameworks typically applied for studying management decision-making in general and capital structure determinations, which are primarily and traditionally framed within the spectrum of rational or irrational decision-making. This study’s results have indicated the influence of the behavioural traits of overconfidence and optimism in capital structure determinations, albeit at a lower level of significance for the CEOs/CFOs of sampled Tbks. Further studies are warranted to explore consistent modelling of the influence dynamics among the key variables and determinants, to determine the efficacy of capital structure decisions more precisely. From the capital market perspective, share prices are correlated with a firm’s capital structure strategies; certain capital structure determinations—those perceived to contribute to improving a firm’s operational and financial performance—are expected to positively influence share price. Overconfident and overly optimistic management (CEOs/CFOs) is generally perceived to have the propensity to embark on investments and/or projects aggressively funded by debt, while moderately confident and temperately optimistic management is expected to rely more on internal sources of funding. However, this study’s results show that such behavioural inclinations are not the sole determinants of capital structure decisions that positively impact share prices. Prospects for increased share prices can be presumed to increase when confidently and optimistically driven capital structure decisions are coupled with management’s competencies in 1) achieving a desired capital costs structure, 2) sustaining and improving revenue growth trends, 3) stable management of cashflows and 4) implementing effective monitoring and mitigation of operational and financial risks.
D. R. Lim et al. / Accounting 8 (2022) 131
5.2 Demographic Attributes Statistical testing results confirm the direct influence of certain demographic attributes—gender, age, education and professional experience—on capital structure determinations. Gender Prior studies have consistently articulated that 1) female executives rely more on information, data and relevant analysis in their decision-making process; 2) female executives’ less optimistic management style entails them being more cautious, risk-averse and conservative in their decision-making; 3) ceteris paribus, female executives prefer to rely on established banking relationships and secure loans to fund projects and for investments thoroughly evaluated to contribute net-positive returns and improve their firm’s growth trends; and 4) female executives appear to favour lower leveraged capital structures and are not fixated on achieving optimal capital structure (see Bellucci et al., 2010; Maurice et al., 2013; Mara et al., 2016; Adusei & Obeng, 2019; Đang et al., 2020; Schopohl et al., 2020; Benkraiem et al., 2021; Sudip et al., 2021). The present study found that gender (as a component of demographic attributes) is a key determinant of capital structure. Female executives display lower levels of overconfidence and are more cautious, less optimistic, more risk-averse and more focused on managing and avoiding financial risks, instead of purely endeavouring to achieve optimal capital structure. Female managers (CEOs/CFOs) who have held these roles/positions for long periods appear to be more risk-tolerant and aggressive in their capital structure determinations. Age The influence of age (as a demographic attribute) on capital structure determinations has been widely researched. Older managers/executives are typically found to prefer more moderate, conservative and cautious capital structure strategies, compared to younger executives who prefer aggressive leveraged models and are more tolerant of project and portfolio risks (Tibor et al., 2012; McGuinness, 2020). The present study’s findings agree with this. As previously discussed, past experiences with challenging externalities (market and financial shocks and crises) and lengthy and costly adjustments had affected older sampled managers (CEOs/CFOs), leading them to adopt more cautious approaches in determining capital structure compositions. Education and professional experience The present study notes a positive correlation between education (as a component of demographic attributes) and leverage ratio. Nevertheless, it is also noted that highly educated managers (CEOs/CFOs) who possess significantly high levels of overconfidence have the propensity to favour a lower leveraged capital structure composition. Sampled managers (CEOs/CFOs) possessing both education and previous career experience in fields related to corporate finance (finance, accounting, economics, mathematics, statistics and data analytics) appear to be more aggressive with debt loading, maintain a lower balance of cash-at-hand and are more prone to engage in debt repurchase strategies. This is consistent with Custódio and Metzger’s (2014) finding that managers (CEOs/CFOs) with relevant experience and training tend to opt for more aggressive capital structure strategies. Survey responses indicate that sampled managers (CEOs/CFOs) with higher education levels tend to adopt a more active financial management strategy, paying greater attention to project- and investment-level funding costs while ensuring their selected capital structure is less exposed to potential volatility in cash flows. They also showed comparatively higher confidence in being able to secure external funding, even during periods of tight liquidity. Financially trained executives (CEOs/CFOs) appeared to be more closely involved in the setting of dividend policy and focused on the impacts of relevant fiscal and taxation regulations. More experienced and technically trained executives (CEOs/CFOs) were predominantly employed by larger Tbks. It is reasonable to suggest that managers (CEOs/CFOs) with greater technical competency and experience in corporate financial and financial management would adopt more rigorous evaluation and assessment in decision-making, and rely less on behavioural and heuristic tendencies and guesswork or ‘feel’. Potential Confounders: ‘Anomalies’ and ‘Disturbances’ The proposed model adopted to test the underlying relationships between selected capital structure determinants and the dependent variable (D) did not statistically validate the relevant classical frameworks’ discourses on optimal capital structure. Where direct influences were found between the determinant variables and dependent capital structure variables, their significance was inconsistent. A possible explanation for this is the existence of ‘anomalies’ and ‘disturbances’ that might have impacted the relationships more significantly than the selected determinants. External occurrences and events beyond the control of and unanticipated by capital structure decision-makers (e.g., external economic shocks, financial crises, market turmoil and sharp currency depreciations) would act as anomalies and disturbances that might upend the stability, consistency and direction of the influence dynamics within the modelled relationship. In practical terms, such anomalies and disturbances would prevent management from achieving optimal capital structure decisions. Management, in turn, is required to adopt rectifying adjustments. The ‘speed of adjustment’ and ‘adjustment costs’ would differ depending
132
on the characteristics of the affected variables, underlying type and dynamics of the relationship, and significance of the ‘disturbance’ by the anomalies. References
Abdeldayem, M. M. & Sedeek, D. S. (2018). Managerial behavior and capital structure decisions; do overconfidence, optimism and risk aversion matter? Asian Economic and Financial Review, Asian Economic and Social Society, 8(7), 925–945.
Abeywardhana, D. K. Y. (2017). Capital structure theory: An overview. Accounting and Finance Research, 6(1), 131–138. Adusei, M. & Obeng, E. Y. T. (2018). Board gender diversity and the capital structure of microfinance institutions: A global
analysis. The Quarterly Review of Economics and Finance, 71, 258–269. Al-Tally, H. A. (2014). An investigation of the effect of financial leverage on firm financial performance in Saudi Arabia’s
public listed companies. Unpublished doctoral dissertation, Victoria University, Victoria, Australia. Alti, A. (2006). How persistent is the impact of market timing on capital structure? The Journal of Finance, 61(4), 1681–
1710. Armstrong, M., Brown, D. & Reilly, P. (2010). Evidence-base reward management. London Kogan Page. Aghazadeh, S., Sun, L., Wang, Q. & Yang, R. (2018). Investors’ perception of CEO overconfidence: Evidence from the
cost of equity capital. Review of Quantitative Finance and Accounting, 51(4). Arnold, G. (2008). Corporate financial management (4th ed.). Prentice-Hall. Azouzi, M. A. & Jarboui, A. (2012). CEO emotional bias and capital structure choice, Bayesian Network Method. Journal
of Business Excellence and Management, 2(2), 47–70. Baker, M. & Wurgler, J. (2002. Market timing and capital structure. Journal of Finance, 57. Barone-Adesi, G., Mancini, L. & Shefrin, H. (2012). A tale of two investors: Estimating risk aversion, optimism and
overconfidence. Working paper. Barros, L. A. & Da Silveira, D. M. (2007). Overconfidence, managerial optimism and the determinants of capital structure.
Brazilian Review of Finance, 6(3). Bellucci, A., Borisov, A. & Zazzaro, A. (2010). Does gender matter in bank–firm relationships? Evidence from small
business lending. Journal of Banking & Finance, 34(12), 2968–2984. Benson, D. & Ziedonis, R. H. (2010). Corporate venture capital and the returns to acquiring portfolio companies. Journal
of Financial Economics, 98(3), 478–499. Ben-David, I., Graham, J. R. & Harvey, C. R. (2013). Managerial miscalibration. Quarterly Journal of Economics, 128(4),
1547–1584. Benkraiem, R., Boubaker, S., Brinette, S. & Khemiri, S. (2021). Board feminization and innovation through corporate
venture capital investments: the moderating effects of independence and management skills. Technological Forecasting and Social Change, 163.
Bentham, J. (1789). An introduction to the principles of morals and legislation. The first edition of this work was printed in the year 1780 and first published in 1789. The present edition is a careful reprint of ‘A New Edition, corrected by the Author’, published in 1823.
Bessler, D. A. & David, E. E. (2004). Price discovery in the Texas cash cattle market. Applied Stochastic Models in Business and Industry, 20(4).
Bessler, W. D., Drobetz, W. & Holler, J. (2008). Capital markets and corporate control: Empirical evidence from hedge fund activism in Germany. Working paper, Justus-Liebig-University Giessen, Germany.
Bilgehan, T. (2014). Psychological biases and the capital structure decisions; a literature review. Theoretical Ans Applied Economics, 21(12), 123–142.
Bradley, M., Jarrell, G. A. & Kim, E. H. (1984). On the existence of an optimal capital structure: Theory and evidence. Journal of Finance, 39, 857–878.
Busenitz, L. & Barney, J. (1997). Differences between entrepreneurs and managers in large organizations: Biases and heuristics in strategic decision making. Journal of Business Venturing, 12, 9–30.
Carpenter, M. A., Geletkanycz, M. A. & Sanders, W. G. (2004). Upper echelons research revisited: Antecedents, elements, and consequences of top management team composition. Journal of Management, 30, 747–778.
Chen, H., De, P., Hu, J. & Hwang, B.-H. (2014). Wisdom of crowds: The value of stock opinions transmitted through social media. Review of Financial Studies, 27(5), 1367–1403.
Custódio, C. & Metzger, D. (2014). Financial expert CEOs: CEO’s work experience and firm’s financial policies. Journal of Financial Economics, 114(1), 125–154.
Cronqvist, H. & Makhija, A. K. & Yonker, S. E. (2012). Behavioral consistency in corporate finance: CEO personal and corporate leverage. Journal of Financial Economics, 103(1), (20–40.
Đang, R., Houanti, L. Reddy, K. & Simioni, M. (2020). Does board gender diversity influence firm profitability? A control function approach. Economic Modelling, 90, 168–181.
De Bondt, W. F. M. & Thaler, R. M. (1995). Financial decision-making in markets and firms: A behavioral perspective. In R. Jarrow, V. Maksimovic & W. T. Ziemba (Eds.), Finance (Handbooks in Operations Research and Management Science, vol. 9, 385–410. North Holland: Elsevier B.V.
D. R. Lim et al. / Accounting 8 (2022) 133
Desai, M. A. & Fritz Foley, C. (2005). A multinational perspective on capital structure choice and internal capital markets. The Journal of Finance, 59(6), 2451–2487.
Faccio, M., Marchica, M.-T. & Murac, R. (2016). CEO gender, corporate risk-taking, and the efficiency of capital allocation. Journal of Corporate Finance, 39, 193–(209.
Fama, E. F. & French, K. R. (1998). Value versus growth: The international evidence. Journal of Finance, 53(6), 1975–1999.
Fama, E. F. & French, K. R. (2002). Testing trade-off and pecking order predictions about dividends and debt. The Review of Financial Studies, 15(1), 1–33.
Finkelstein, S., Hambrick, D. C. & Cannella, A. A. (2009. Strategic leadership: Theory and research on executives, top management teams, and boards. Oxford University Press.
Frank, M. Z. & Goyal, V. K. (2004). The effect of market conditions on capital structure adjustment. Finance Research Letters, 1(1), 47–55.
Frydenberg, S. (2004). Determinants of corporate capital structure of Norwegian manufacturing firms. Working Paper No. 1999:6, Trondheim Business School. https://doi.org/10).2139/ssrn.556634
Germain, L., Rosseau, F. & Vanhems, A. (2005). Optimistic and pessimistic trading in financial markets. Working paper. Hambrick, D. C. & Mason, P. (1984). Upper echelons: The organization as a reflection of its top managers. Academy of
Management Review, 9, 193–206. Harris, M. & Raviv, A. (1991). The theory of capital structure. Journal of Finance, 46(1), 297–355. Heaton, J. B. (2002). Managerial optimism and corporate finance. Financial Management, 31(2), 33–45. Heifetzy, A. & Spiegel, Y. (2001). The evolution of biased perceptions. Paper presented at The (2001 Summer Meetings of
the Econometric Society in University of Maryland. Hribar, P. & Yang, H. (2010). Does CEO overconfidence affect management forecasting and subsequent earnings
management? Working paper. Hirshleifer, J. (1966). Investment decisions under uncertainty: Applications of the state-preference approach. Quarterly
Journal of Economics, 80(2), 237–277. https://doi.org/10).2307/1880692 Hirshleifer, D., Low, A. & Teoh, S. H. (2012). Are overconfident CEOs better innovators? Journal of Finance, 67(4), 1457–
1498. Hoffmann, A. & Post, T. (2012). What makes investors optimistic? What makes them afraid? Netspar Working Paper Series
No. 44. Hovakimian, A. (2006). Are observed capital structures determined by equity market timing? The Journal of Financial and
Quantitative Analysis, 41(1), 221–243. Huang, J. & Kisgen, D. J. (2013). Gender and corporate finance: Are male executives overconfident relative to female
executives? Journal of Financial Economics, 108(3), 822–839. Jackson, S. E., Joshi, A. & Erhardt, N. L. (2003). Recent research on team and organizational diversity: SWOT analysis
and implications. Journal of Management, 29, 801–830. Kahneman, D. & Tversky, A. (1979). Prospect theory: An analysis of decision under risk. Econometrica, 42(2), 263–292. Kisgen, D. J. (2006). Credit ratings and capital structure. Journal of Finance, 61(3), 1035–1072. Kraus, A. & Litzenberger, R. H. (1973). A state-preference model of optimal financial leverage. Journal of Finance, 28(4),
911–933. Lemmon, M., Liu, L. X., Mao, M. Q. & Nini, G. (2014). Securitization and capital structure in nonfinancial firms: An
empirical investigation. The Journal of Finance, 69(4), 1787–1825. Li, J., Zhao, F., Chen, S., Jiang, W., Liu, T. & Shi, S. (2017). Gender diversity on boards and firms/environmental policy.
Business Strategy and Environment, 26(3), 306–315. Mackay, C. (1841). Extraordinary popular delusions and the madness of crowds. Richard Bentley. Malmendier, U. & Tate, G. (2005). CEO overconfidence and corporate investment. Journal of Finance, 60(6), 2661–2700. Malmendier, U., Tate, G. & Yan, J. (2011). Overconfidence and early-life experiences: The effect of managerial traits on
corporate financial policies. The Journal of Finance, 66(5), 1687–1733. Maurice, D. L., Li, K. & Zhang, F. (2013). Director gender and mergers and acquisitions. Journal of Corporate Finance,
28, 185–200. McGuinness, P. B. (2020). Board member age, stock seasoning and the evolution of capital structure in Chinese firms.
International Business Review, 30(3). Miller, M. H. (1977). Debt and taxes. The Journal of Finance, 32(2), 261–275. Miller, M. H. (1988). The Modigliani–Miller propositions after thirty years. Journal of Economic Perspectives, 2(4), 99–
120. Modigliani, F. & Miller, M. H. (1958). The cost of capital, corporation finance, and the theory of investment. American
Economic Review, 48(3), 261–297. Modigliani, F. & Miller, M. H. (1963). Corporate income taxes and cost of capital: A correction. American Economic
Review, 53, 443–453. Myers, S. C. (1984). The capital structure puzzle. The Journal of Finance, 39(3), 575–592. Myers, S. C. & Majluf, N. (1984). Corporate financing and investment decisions when firms have information that investors
do not have. Journal of Financial Economics, 13, 187–221. Myers, S. C. (2001). Capital structure. The Journal of Economic Perspectives, 15(2), 81–102.
134
Nielsen, S. (2009). Why do top management teams look the way they do? A multilevel exploration of the antecedents of TMT heterogeneity. Strategic Organization, 7(3), 277–305.
Odean, T. (1998). Volume, volatility, price, and profit when all traders are above average. Journal of Finance, 53(6), 1887–1934.
Pfeffer, J. (1983). Organizational demography. In L. L. Cummings & B. M. Staw (Eds.), Research in organizational behavior (vol. 5), 299–357. JAI Press.
Pompian, M. M. (2011). Behavioral finance and investor types: Managing behavior to make better investment decisions. John Wiley & Sons.
Pratt, J. W. (1964). Risk aversion in the small and in the large. Econometrica, 32(1/2), 122–136. Raiffa, H. (1968). Decision analysis: Introductory lectures on choices under uncertainty reading. Addison Wesley. Rajan, R. G. & Zingales, L. (1995). What do we know about capital structure? Some evidence from international data. The
Journal of Finance, 50, 1421–1460. Ross, S. A. (1977). The determination of financial structure: The incentive-signaling approach. Bell Journal of Economics,
8, 23–40. Sanvicente, A. Z. (2011). Capital structure decisions and the interaction with payout and ownership decisions: Evidence
from Brazil. Insper Working Paper WPE: 264/(2011. Schopohl, L., Urquhart, A. & Zhang, H.-X. (2020). Female CFOs, leverage and the moderating role of board diversity and
CEO power. Journal of Corporate Finance. https://doi.org/10).1016/j.jcorpfin.(20(20.101858 Serfling, M. A. (2014). CEO age and the riskiness of corporate policies. Journal of Corporate Finance, 25, 251–273. Shefrin, H. (2000). Beyond greed and Fear: Understanding behavioral finance and the psychology of investing. Harvard
Business School Press. Shyam-Sunder, L. & Myers, S. (1999). Testing static trade-off against pecking order models of capital structure. Journal of
Financial Economics, 51(2), 219–244. Simon, H. A. (1955). A behavioural model of rational choice. The Quarterly Journal of Economics, 69(1), 99–118.
DOI: 10).2307/1884852. Smith, A. (1759). The theory of moral sentiments. Edinburgh: A. Millar, A. Kincaid & J. Bell. Smith, A. (1776). The wealth of nations. London: W. Strahan and T. Cadell. Stiglitz, J. E. (1969). A re-examination of the Modigliani–Miller theorem. The American Economic Review, 59, 784–793. Sudip, D., Doan, T. & Toscano, F. (2021). Top executive gender, board gender diversity, and financing decisions: Evidence
from debt structure choice. Journal of Banking & Finance, 125. https://doi.org/10.1016/j.jbankfin.2021.106070 Tibor, B., Deck, C. & Sarang, S. (2012). Age effects and heuristics in decision making. Review of Economics and Statistics,
94(2), 580–595. https://doi.org/10).1162/rest_a_00174 Titman, S. & Wessels, R. (1988). The determinants of capital structure choice. Journal of Finance, 43, 1–18. Vasiliou, D. & Nikolaos, D. (2009). Behavioral capital structure: Is the neoclassical paradigm threatened? Evidence from
the field. Journal of Behavioral Finance, 10. DOI: 10.1080/15427560902719802.
D. R. Lim et al. / Accounting 8 (2022) 135
Appendix: A summary of statistics
Table A1 Summary of Statistical Analysis (Model I)
Latent variables Manifest variables Loading factor Criteria t p Test results FE1 FE1.1 0.703 ≥ 0.500 3.92 0.00 Significant
FE1.2 0.864 ≥ 0.500 7.18 0.00 Significant FE 1.3 0.793 ≥ 0.500 5.05 0.00 Significant FE 1.4 0.579 ≥ 0.500 2.97 0.00 Significant
FE 2 FE 2.1 0.735 ≥ 0.500 3.89 0.00 Significant FE 2.2 0.754 ≥ 0.500 3.25 0.00 Significant FE 2.3 0.777 ≥ 0.500 3.77 0.00 Significant FE 2.4 0.834 ≥ 0.500 4.52 0.00 Significant
FE 3 FE 3 1.000 ≥ 0.500
Significant FE 4 FE 4 1.000 ≥ 0.500
Significant
FE 5 FE 5.1 0.895 ≥ 0.500 13.01 0.00 Significant FE 5.2 0.845 ≥ 0.500 5.67 0.00 Significant FE 5.3 0.930 ≥ 0.500 8.53 0.00 Significant FE 5.4 0.890 ≥ 0.500 6.87 0.00 Significant
CONF1 CONF1.1 0.869 ≥ 0.500 2.96 0.00 Significant CONF1.2 0.853 ≥ 0.500 2.73 0.01 Significant CONF1.3 0.841 ≥ 0.500 2.49 0.01 Significant CONF1.4 0.796 ≥ 0.500 2.12 0.03 Significant CONF1.5 0.709 ≥ 0.500 2.60 0.01 Significant
CONF2 CONF2.1 0.781 ≥ 0.500 2.49 0.01 Significant CONF2.2 0.766 ≥ 0.500 2.33 0.02 Significant CONF2.3 0.846 ≥ 0.500 2.54 0.01 Significant CONF2.4 0.470 ≥ 0.500 1.18 0.24 Not Significant CONF2.5 0.440 ≥ 0.500 1.21 0.23 Not Significant
CONF3 CONF3.1 0.591 ≥ 0.500 1.67 0.10 Not Significant CONF3.2 0.270 ≥ 0.500 0.64 0.52 Not Significant CONF3.3 0.871 ≥ 0.500 2.36 0.02 Significant CONF3.4 0.918 ≥ 0.500 2.30 0.02 Significant
OPT OPT.1 0.622 ≥ 0.500 2.20 0.03 Significant OPT.2 0.734 ≥ 0.500 2.88 0.00 Significant OPT.3 0.876 ≥ 0.500 2.33 0.02 Significant OPT.4 0.636 ≥ 0.500 2.437 0.02 Significant OPT.5 0.552 ≥ 0.500 1.795 0.07 Significant OPT.6 0.322 ≥ 0.500 1.011 0.31 Not Significant
D D.1 0.855 ≥ 0.500 7.698 0.00 Significant D.2 0.852 ≥ 0.500 10.083 0.00 Significant
Table A2 Summary of Statistical Tests: Cronbach’s Alpha and Composite Reliability (Model I)
Latent variables Cronbach’s alpha Rho-A Composite reliability Criteria Test results FE1 0.738 0.800 0.828 > 0.6 Accepted FE 2 0.783 0.797 0.858 > 0.6 Accepted FE 3 1.000 1.000 1.000 > 0.6 Accepted FE 4 1.000 1.000 1.000 > 0.6 Accepted FE 5 0.914 0.964 0.938 > 0.6 Accepted CONF1 0.887 0.821 0.908 > 0.6 Accepted CONF2 0.821 0.761 0.840 > 0.6 Accepted CONF3 0.875 0.212 0.934 > 0.6 Accepted OPT 0.821 0.694 0.830 > 0.6 Accepted D 0.626 0.626 0.843 > 0.6 Accepted
Table A3 Summary of Statistical Measurements of Average Variance Extracted (AVE) Scores (Model I)
Latent variables Average variance extracted (AVE) Criteria Test results FE1 0.551 ≥ 0.500 Accepted FE 2 0.602 ≥ 0.500 Accepted FE 3 1.000 ≥ 0.500 Accepted FE 4 1.000 ≥ 0.500 Accepted FE 5 0.792 ≥ 0.500 Accepted CONF1 0.665 ≥ 0.500 Accepted CONF2 0.459 ≥ 0.500 Not Accepted CONF3 0.506 ≥ 0.500 Accepted OPT 0.418 ≥ 0.500 Not Accepted D 0.728 ≥ 0.500 Accepted
136
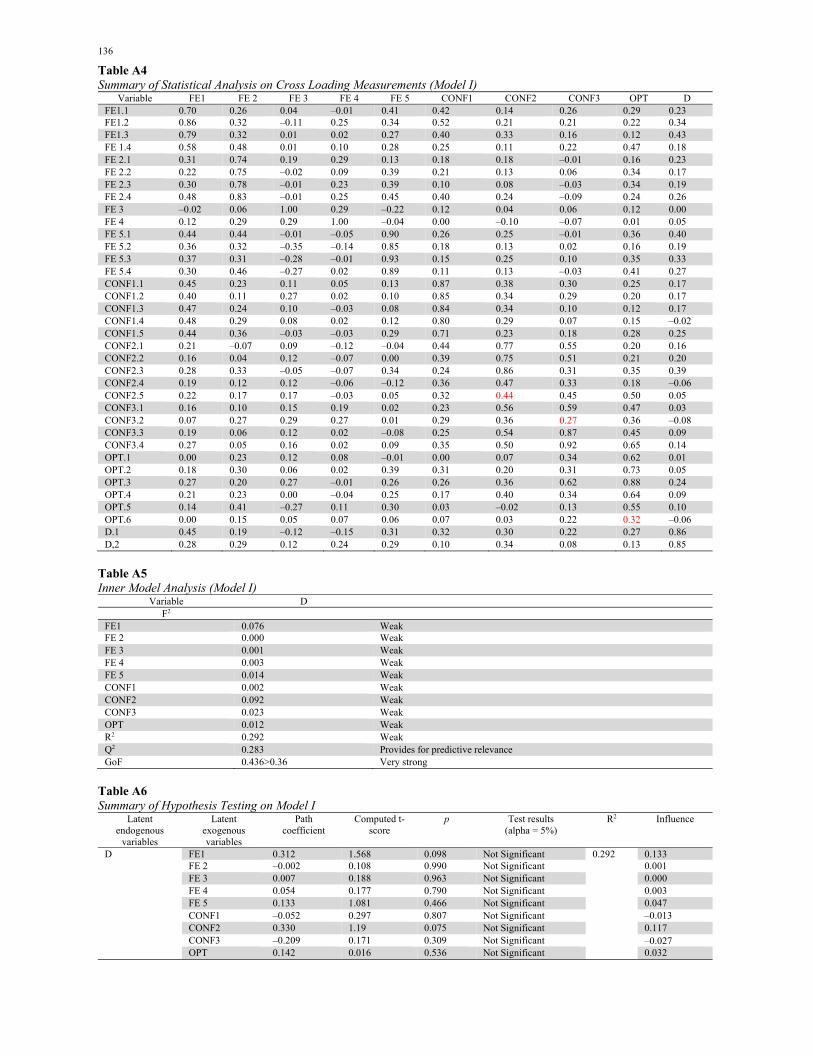
Table A4 Summary of Statistical Analysis on Cross Loading Measurements (Model I)
Variable FE1 FE 2 FE 3 FE 4 FE 5 CONF1 CONF2 CONF3 OPT D FE1.1 0.70 0.26 0.04 –0.01 0.41 0.42 0.14 0.26 0.29 0.23 FE1.2 0.86 0.32 –0.11 0.25 0.34 0.52 0.21 0.21 0.22 0.34 FE1.3 0.79 0.32 0.01 0.02 0.27 0.40 0.33 0.16 0.12 0.43 FE 1.4 0.58 0.48 0.01 0.10 0.28 0.25 0.11 0.22 0.47 0.18 FE 2.1 0.31 0.74 0.19 0.29 0.13 0.18 0.18 –0.01 0.16 0.23 FE 2.2 0.22 0.75 –0.02 0.09 0.39 0.21 0.13 0.06 0.34 0.17 FE 2.3 0.30 0.78 –0.01 0.23 0.39 0.10 0.08 –0.03 0.34 0.19 FE 2.4 0.48 0.83 –0.01 0.25 0.45 0.40 0.24 –0.09 0.24 0.26 FE 3 –0.02 0.06 1.00 0.29 –0.22 0.12 0.04 0.06 0.12 0.00 FE 4 0.12 0.29 0.29 1.00 –0.04 0.00 –0.10 –0.07 0.01 0.05 FE 5.1 0.44 0.44 –0.01 –0.05 0.90 0.26 0.25 –0.01 0.36 0.40 FE 5.2 0.36 0.32 –0.35 –0.14 0.85 0.18 0.13 0.02 0.16 0.19 FE 5.3 0.37 0.31 –0.28 –0.01 0.93 0.15 0.25 0.10 0.35 0.33 FE 5.4 0.30 0.46 –0.27 0.02 0.89 0.11 0.13 –0.03 0.41 0.27 CONF1.1 0.45 0.23 0.11 0.05 0.13 0.87 0.38 0.30 0.25 0.17 CONF1.2 0.40 0.11 0.27 0.02 0.10 0.85 0.34 0.29 0.20 0.17 CONF1.3 0.47 0.24 0.10 –0.03 0.08 0.84 0.34 0.10 0.12 0.17 CONF1.4 0.48 0.29 0.08 0.02 0.12 0.80 0.29 0.07 0.15 –0.02 CONF1.5 0.44 0.36 –0.03 –0.03 0.29 0.71 0.23 0.18 0.28 0.25 CONF2.1 0.21 –0.07 0.09 –0.12 –0.04 0.44 0.77 0.55 0.20 0.16 CONF2.2 0.16 0.04 0.12 –0.07 0.00 0.39 0.75 0.51 0.21 0.20 CONF2.3 0.28 0.33 –0.05 –0.07 0.34 0.24 0.86 0.31 0.35 0.39 CONF2.4 0.19 0.12 0.12 –0.06 –0.12 0.36 0.47 0.33 0.18 –0.06 CONF2.5 0.22 0.17 0.17 –0.03 0.05 0.32 0.44 0.45 0.50 0.05 CONF3.1 0.16 0.10 0.15 0.19 0.02 0.23 0.56 0.59 0.47 0.03 CONF3.2 0.07 0.27 0.29 0.27 0.01 0.29 0.36 0.27 0.36 –0.08 CONF3.3 0.19 0.06 0.12 0.02 –0.08 0.25 0.54 0.87 0.45 0.09 CONF3.4 0.27 0.05 0.16 0.02 0.09 0.35 0.50 0.92 0.65 0.14 OPT.1 0.00 0.23 0.12 0.08 –0.01 0.00 0.07 0.34 0.62 0.01 OPT.2 0.18 0.30 0.06 0.02 0.39 0.31 0.20 0.31 0.73 0.05 OPT.3 0.27 0.20 0.27 –0.01 0.26 0.26 0.36 0.62 0.88 0.24 OPT.4 0.21 0.23 0.00 –0.04 0.25 0.17 0.40 0.34 0.64 0.09 OPT.5 0.14 0.41 –0.27 0.11 0.30 0.03 –0.02 0.13 0.55 0.10 OPT.6 0.00 0.15 0.05 0.07 0.06 0.07 0.03 0.22 0.32 –0.06 D.1 0.45 0.19 –0.12 –0.15 0.31 0.32 0.30 0.22 0.27 0.86 D,2 0.28 0.29 0.12 0.24 0.29 0.10 0.34 0.08 0.13 0.85
Table A5 Inner Model Analysis (Model I)
Variable D F2
FE1 0.076 Weak FE 2 0.000 Weak FE 3 0.001 Weak FE 4 0.003 Weak FE 5 0.014 Weak CONF1 0.002 Weak CONF2 0.092 Weak CONF3 0.023 Weak OPT 0.012 Weak R2 0.292 Weak Q2 0.283 Provides for predictive relevance GoF 0.436>0.36 Very strong
Table A6 Summary of Hypothesis Testing on Model I
Latent endogenous
variables
Latent exogenous variables
Path coefficient
Computed t-score
p Test results (alpha = 5%)
R2 Influence
D FE1 0.312 1.568 0.098 Not Significant 0.292 0.133 FE 2 –0.002 0.108 0.990 Not Significant 0.001 FE 3 0.007 0.188 0.963 Not Significant 0.000 FE 4 0.054 0.177 0.790 Not Significant 0.003 FE 5 0.133 1.081 0.466 Not Significant 0.047 CONF1 –0.052 0.297 0.807 Not Significant –0.013 CONF2 0.330 1.19 0.075 Not Significant 0.117 CONF3 –0.209 0.171 0.309 Not Significant –0.027 OPT 0.142 0.016 0.536 Not Significant 0.032
D. R. Lim et al. / Accounting 8 (2022) 137
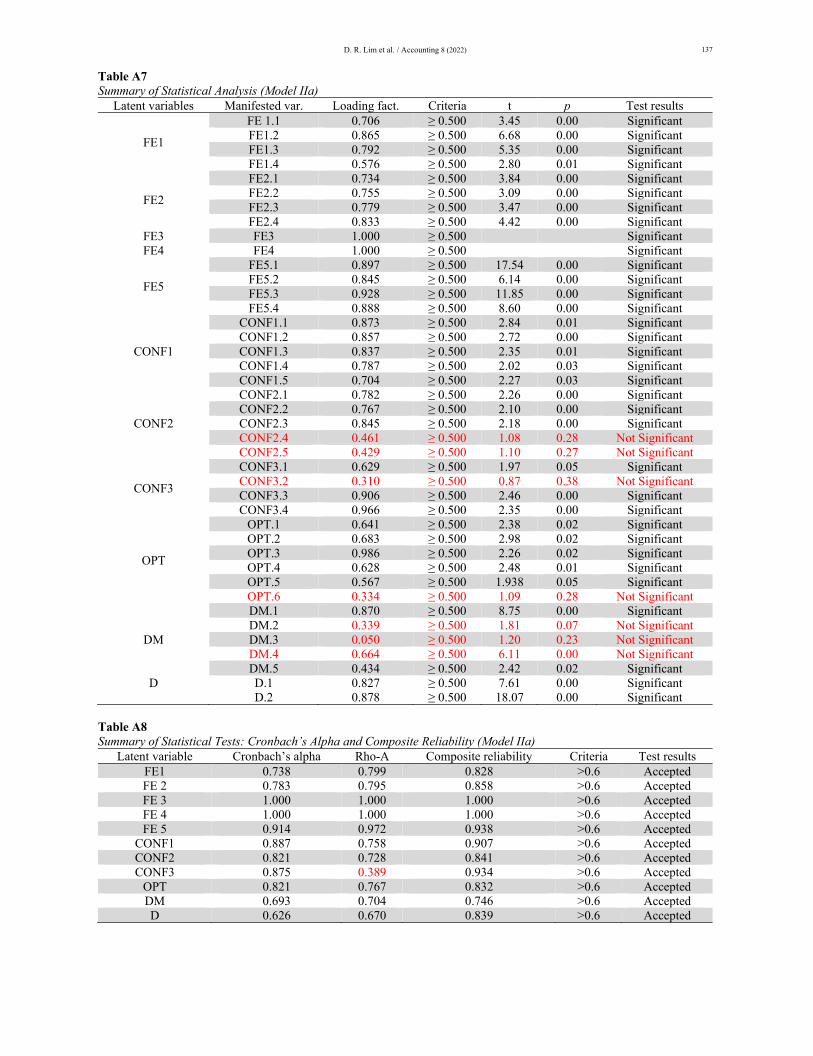
Table A7 Summary of Statistical Analysis (Model IIa)
Latent variables Manifested var. Loading fact. Criteria t p Test results
FE1
FE 1.1 0.706 ≥ 0.500 3.45 0.00 Significant FE1.2 0.865 ≥ 0.500 6.68 0.00 Significant FE1.3 0.792 ≥ 0.500 5.35 0.00 Significant FE1.4 0.576 ≥ 0.500 2.80 0.01 Significant
FE2
FE2.1 0.734 ≥ 0.500 3.84 0.00 Significant FE2.2 0.755 ≥ 0.500 3.09 0.00 Significant FE2.3 0.779 ≥ 0.500 3.47 0.00 Significant FE2.4 0.833 ≥ 0.500 4.42 0.00 Significant
FE3 FE3 1.000 ≥ 0.500 Significant FE4 FE4 1.000 ≥ 0.500 Significant
FE5
FE5.1 0.897 ≥ 0.500 17.54 0.00 Significant FE5.2 0.845 ≥ 0.500 6.14 0.00 Significant FE5.3 0.928 ≥ 0.500 11.85 0.00 Significant FE5.4 0.888 ≥ 0.500 8.60 0.00 Significant
CONF1
CONF1.1 0.873 ≥ 0.500 2.84 0.01 Significant CONF1.2 0.857 ≥ 0.500 2.72 0.00 Significant CONF1.3 0.837 ≥ 0.500 2.35 0.01 Significant CONF1.4 0.787 ≥ 0.500 2.02 0.03 Significant CONF1.5 0.704 ≥ 0.500 2.27 0.03 Significant
CONF2
CONF2.1 0.782 ≥ 0.500 2.26 0.00 Significant CONF2.2 0.767 ≥ 0.500 2.10 0.00 Significant CONF2.3 0.845 ≥ 0.500 2.18 0.00 Significant CONF2.4 0.461 ≥ 0.500 1.08 0.28 Not Significant CONF2.5 0.429 ≥ 0.500 1.10 0.27 Not Significant
CONF3
CONF3.1 0.629 ≥ 0.500 1.97 0.05 Significant CONF3.2 0.310 ≥ 0.500 0.87 0.38 Not Significant CONF3.3 0.906 ≥ 0.500 2.46 0.00 Significant CONF3.4 0.966 ≥ 0.500 2.35 0.00 Significant
OPT
OPT.1 0.641 ≥ 0.500 2.38 0.02 Significant OPT.2 0.683 ≥ 0.500 2.98 0.02 Significant OPT.3 0.986 ≥ 0.500 2.26 0.02 Significant OPT.4 0.628 ≥ 0.500 2.48 0.01 Significant OPT.5 0.567 ≥ 0.500 1.938 0.05 Significant OPT.6 0.334 ≥ 0.500 1.09 0.28 Not Significant
DM
DM.1 0.870 ≥ 0.500 8.75 0.00 Significant DM.2 0.339 ≥ 0.500 1.81 0.07 Not Significant DM.3 0.050 ≥ 0.500 1.20 0.23 Not Significant DM.4 0.664 ≥ 0.500 6.11 0.00 Not Significant DM.5 0.434 ≥ 0.500 2.42 0.02 Significant
D D.1 0.827 ≥ 0.500 7.61 0.00 Significant D.2 0.878 ≥ 0.500 18.07 0.00 Significant
Table A8 Summary of Statistical Tests: Cronbach’s Alpha and Composite Reliability (Model IIa)
Latent variable Cronbach’s alpha Rho-A Composite reliability Criteria Test results FE1 0.738 0.799 0.828 >0.6 Accepted FE 2 0.783 0.795 0.858 >0.6 Accepted FE 3 1.000 1.000 1.000 >0.6 Accepted FE 4 1.000 1.000 1.000 >0.6 Accepted FE 5 0.914 0.972 0.938 >0.6 Accepted
CONF1 0.887 0.758 0.907 >0.6 Accepted CONF2 0.821 0.728 0.841 >0.6 Accepted CONF3 0.875 0.389 0.934 >0.6 Accepted
OPT 0.821 0.767 0.832 >0.6 Accepted DM 0.693 0.704 0.746 >0.6 Accepted D 0.626 0.670 0.839 >0.6 Accepted
138
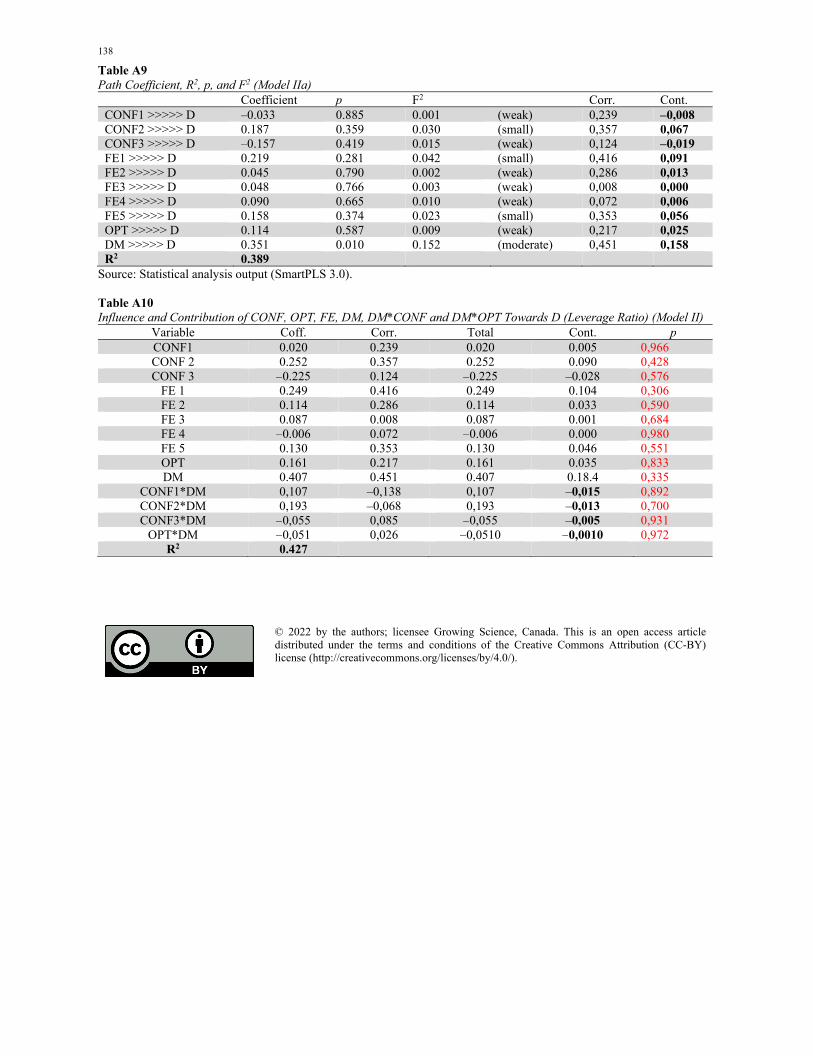
Table A9 Path Coefficient, R2, p, and F2 (Model IIa)
Coefficient p F2 Corr. Cont. CONF1 >>>>> D –0.033 0.885 0.001 (weak) 0,239 –0,008 CONF2 >>>>> D 0.187 0.359 0.030 (small) 0,357 0,067 CONF3 >>>>> D –0.157 0.419 0.015 (weak) 0,124 –0,019 FE1 >>>>> D 0.219 0.281 0.042 (small) 0,416 0,091 FE2 >>>>> D 0.045 0.790 0.002 (weak) 0,286 0,013 FE3 >>>>> D 0.048 0.766 0.003 (weak) 0,008 0,000 FE4 >>>>> D 0.090 0.665 0.010 (weak) 0,072 0,006 FE5 >>>>> D 0.158 0.374 0.023 (small) 0,353 0,056 OPT >>>>> D 0.114 0.587 0.009 (weak) 0,217 0,025 DM >>>>> D 0.351 0.010 0.152 (moderate) 0,451 0,158 R2 0.389
Source: Statistical analysis output (SmartPLS 3.0). Table A10 Influence and Contribution of CONF, OPT, FE, DM, DM*CONF and DM*OPT Towards D (Leverage Ratio) (Model II)
Variable Coff. Corr. Total Cont. p CONF1 0.020 0.239 0.020 0.005 0,966 CONF 2 0.252 0.357 0.252 0.090 0,428 CONF 3 –0.225 0.124 –0.225 –0.028 0,576
FE 1 0.249 0.416 0.249 0.104 0,306 FE 2 0.114 0.286 0.114 0.033 0,590 FE 3 0.087 0.008 0.087 0.001 0,684 FE 4 –0.006 0.072 –0.006 0.000 0,980 FE 5 0.130 0.353 0.130 0.046 0,551 OPT 0.161 0.217 0.161 0.035 0,833 DM 0.407 0.451 0.407 0.18.4 0,335
CONF1*DM 0,107 –0,138 0,107 –0,015 0,892 CONF2*DM 0,193 –0,068 0,193 –0,013 0,700 CONF3*DM –0,055 0,085 –0,055 –0,005 0,931
OPT*DM –0,051 0,026 –0,0510 –0,0010 0,972 R2 0.427
© 2022 by the authors; licensee Growing Science, Canada. This is an open access article distributed under the terms and conditions of the Creative Commons Attribution (CC-BY) license (http://creativecommons.org/licenses/by/4.0/).


