Embed Size (px)
Citation preview

Data Analysis and Interpretation
Presented by Martin Otundo Richard-PhD JKUAT-
Mombasa CBD. +254721246744
Data analysis involves three Data analysis involves three major stepsmajor steps, , Cleaning and organizing the data for
analysis (Data Preparation)Describing the data (Descriptive
Statistics)Testing Hypotheses and Models
(Inferential Statistics)

Statistics...Statistics...
A set of mathematical procedures for describing, synthesizing, analyzing, and interpreting quantitative data…the selection of an appropriate
statistical technique is determined by the research design, hypothesis, and the data collected

Preparing data for analysis...Preparing data for analysis...
Data must be accurately scored and systematically organized to facilitate data analysis:
tabulatingtabulating: organizing the data in a systematic manner
codingcoding: assigning numerals (e.g., ID) to data
scoringscoring: assigning a total to each participant’s instrument

Data AnalysisData Analysis
Data analysis is the process of finding the right data to answer your question, understanding the processes underlying the data, discovering the important patterns in the data, and then communicating your results to have the biggest possible impact

descriptive statistics...descriptive statistics...…permit the researcher to describe
many pieces of data with a few indices

statistics...statistics...…indices calculated by the researcher
for a sample drawn from a population

parameters...parameters...…indices calculated by the researcher
for an entire population
Types of descriptive statistics…Types of descriptive statistics…
1. graphs2. measures of central tendency3. measures of variability

graphs...graphs...…representations of data enabling the
researcher to see what the distribution of scores look like

1. Graphs…1. Graphs…
frequency polygon pie chart boxplot stem-and-leaf chart

measures of central tendency...measures of central tendency...…indices enabling the researcher to
determine the typical or average score of a group of scores

2. Measures of central tendency…2. Measures of central tendency…
mode median mean
mode...mode...…the score attained by more
participants than any other score
median median …the point in a distribution above and below which are 50% of the scores
mean…mean…the arithmetic average of the scores

measures of variability...measures of variability...…indices enabling the researcher to
indicate how spread out a group of scores are

3. Measures of variability…3. Measures of variability…
range quartile deviation variance standard deviation

range...range...…the difference between the highest
and lowest score in a distribution

quartile deviation...quartile deviation...…one half of the difference between
the upper quartile (the 75%’ile) and the lower quartile (the 25%’ile) in a distribution

variance...variance...…a summary statistic indicating the
degree of variability among participants for a given variable
standard deviation...standard deviation...…the square root of variance providing
an index of variability in the distribution of scores

Normal distributions of dataNormal distributions of data(the normal curve)...(the normal curve)...
A bell-shaped distribution of scores having four identifiable properties……50% of the scores fall above the
mean and 50% of the scores fall below the mean
…the mean, median, and mode are the same value

…most scores are near the mean and, the farther from the mean a score is, the fewer the number of participants who attained that score
…the same number, or percentage, of scores is between the mean and plus one standard deviation as is between the mean and minus one standard deviation

Non-normal distributions of data Non-normal distributions of data (skewed distributions)...(skewed distributions)...
A non-bell-shaped distribution of scores where……mean < median < mode (a “negatively skewed distributionnegatively skewed distribution”)…mean > median > mode (a “positively skewed distributionpositively skewed distribution”)

measures of relative position...measures of relative position...…indices enabling the researcher to
describe a participant’s performance compared to the performance of all other participants

4. Measures of relative position…4. Measures of relative position…
percentile ranks standard scores

percentile rank...percentile rank...…indicates the percentage of scores
that fall at or below a given score

standard score...standard score...…a measure of relative position

Types of standard scores...Types of standard scores...…z score…T score…stanines

z score...z score...…a statistic expressing how far a score
is from the mean in terms of standard deviation units

T score...T score...…a transformed z score that voids
negative numbers and decimals by multiplying the z score by 10 and adding 50

stanines...stanines...…a standard score that divides a
distribution into nine parts

measures of relationship...measures of relationship...…indices enabling the researcher to
indicate the degree to which two sets of scores are related

5. Measures of relationship…5. Measures of relationship…
Spearman Rho Pearson r

correlationscorrelations…determines whether and to what
degree a relationship exists between two or more quantifiable variablesvariables
…the degree of the relationship is expressed as a coefficient of correlation

…the presence of a correlation does not indicate a cause-effect relationship primarily because of the possibility of multiple confounding confounding factorsfactors
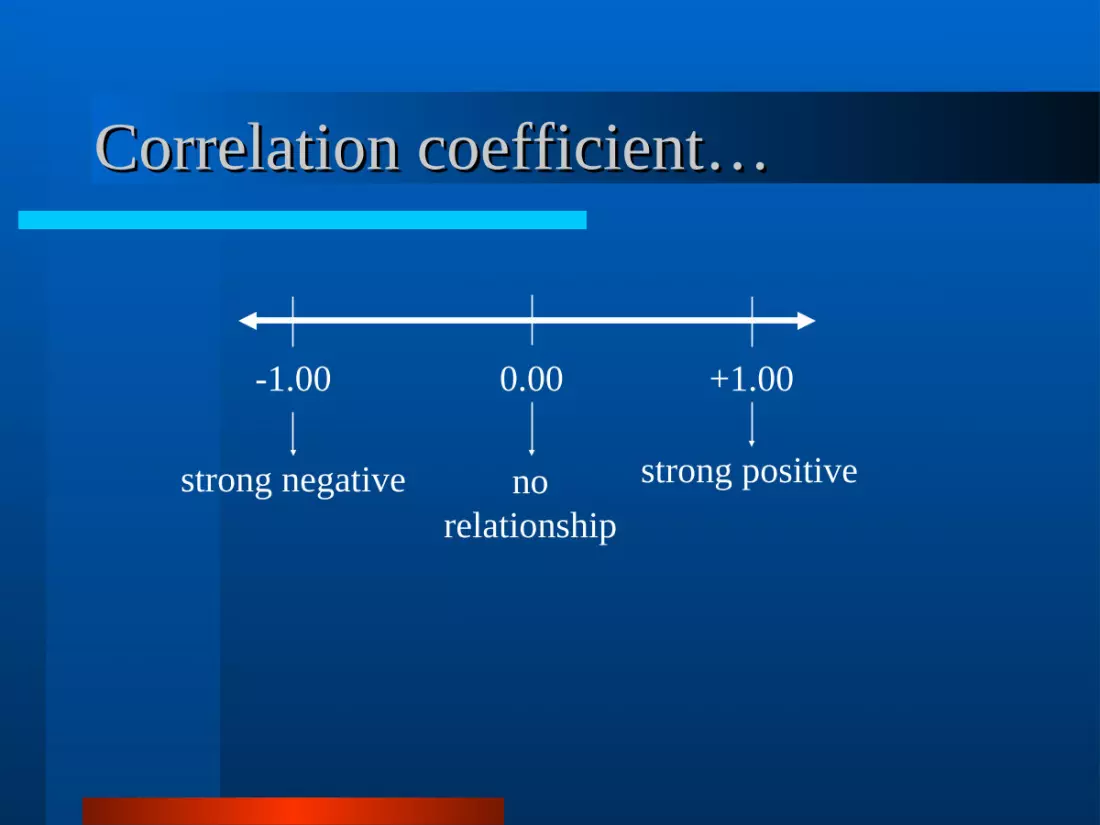
Correlation coefficient…Correlation coefficient…
-1.00 +1.00
strong negative strong positive
0.00
no relationship

Spearman Spearman RhoRho......…a measure of correlation used for
rank and ordinal data

Pearson Pearson rr......…a measure of correlation used for
data of interval or ratio scales…assumes that the relationship
between the variables being correlated is linear

Data Analysis ProcedureData Analysis Procedure

1. Coding Coding – process of translating information
gathered from questionnaires or other sources into something that can be analyzed
Involves assigning a value to the information given—often value is given a label
Coding can make data more consistent: Example: Question = Sex Answers = Male, Female, M, or F Coding will avoid such inconsistencies

Coding Systems Common coding systems (code and label) for
dichotomous variables: 0=No 1=Yes
(1 = value assigned, Yes= label of value) OR: 1=No 2=Yes
When you assign a value you must also make it clear what that value means
In first example above, 1=Yes but in second example 1=No
As long as it is clear how the data are coded, either is fine You can make it clear by creating a data dictionary
to accompany the dataset

Coding: Dummy Variables A “dummy” variable is any variable that is
coded to have 2 levels (yes/no, male/female, etc.)
Dummy variables may be used to represent more complicated variables
Example: # of cigarettes smoked per week--answers total 75 different responses ranging from 0 cigarettes to 3 packs per week
Can be recoded as a dummy variable:1=smokes (at all) 0=non-smoker
This type of coding is useful in later stages of analysis

Coding:Attaching Labels to Values Many analysis software packages allow you to
attach a label to the variable valuesExample: Label 0’s as male and 1’s as female
Makes reading data output easier:Without label: Variable SEX Frequency Percent
0 21 60%1 14 40%
With label: Variable SEX Frequency PercentMale 21 60%Female 14 40%

Coding- Ordinal Variables Coding process is similar with other categorical
variables Example: variable EDUCATION, possible coding:
0 = Did not graduate from high school1 = High school graduate2 = Some college or post-high school education3 = College graduate
Could be coded in reverse order (0=college graduate, 3=did not graduate high school)
For this ordinal categorical variable we want to be consistent with numbering because the value of the code assigned has significance

Coding – Ordinal Variables (cont Example of bad coding:
0 = Some college or post-high school education1 = High school graduate2 = College graduate3 = Did not graduate from high school
Data has an inherent order but coding does not follow that order—NOT appropriate coding for an ordinal categorical variable

Coding: Nominal Variables For coding nominal variables, order
makes no difference Example: variable RESIDE
1 = Northeast 2 = South 3 = Northwest 4 = Midwest 5 = Southwest
Order does not matter, no ordered value associated with each response

Coding: Continuous Variables Creating categories from a continuous variable
(ex. age) is common May break down a continuous variable into
chosen categories by creating an ordinal categorical variable
Example: variable = AGECAT1 = 0–9 years old2 = 10–19 years old3 = 20–39 years old4 = 40–59 years old5 = 60 years or older

Coding:Continuous Variables (cont.) May need to code responses from fill-in-the-
blank and open-ended questions Example: “Why did you choose not to see a doctor
about this illness?” One approach is to group together responses
with similar themes Example: “didn’t feel sick enough to see a doctor”,
“symptoms stopped,” and “illness didn’t last very long” Could all be grouped together as “illness was not
severe” Also need to code for “don’t know” responses”
Typically, “don’t know” is coded as 9
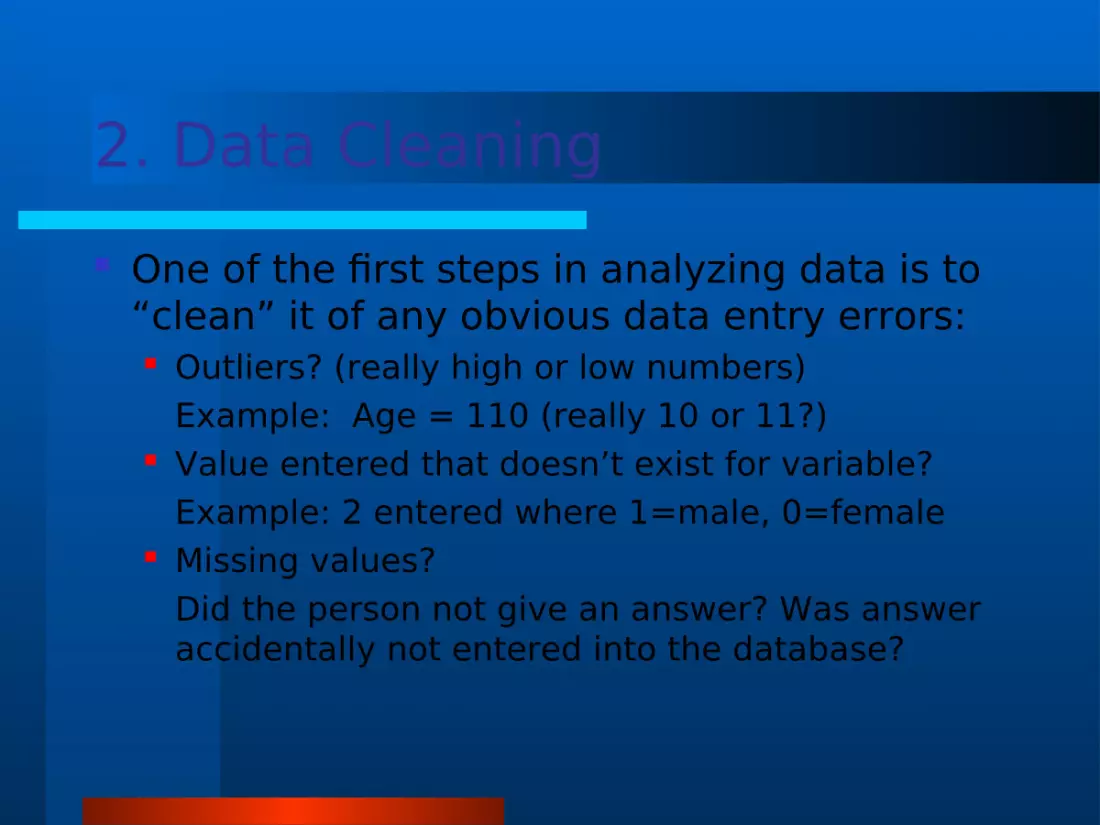
2. Data Cleaning One of the first steps in analyzing data is to
“clean” it of any obvious data entry errors: Outliers? (really high or low numbers)
Example: Age = 110 (really 10 or 11?) Value entered that doesn’t exist for variable?
Example: 2 entered where 1=male, 0=female Missing values?
Did the person not give an answer? Was answer accidentally not entered into the database?

Data Cleaning (cont.) May be able to set defined limits when entering
data Prevents entering a 2 when only 1, 0, or missing are
acceptable values Limits can be set for continuous and nominal
variables Examples: Only allowing 3 digits for age, limiting words
that can be entered, assigning field types (e.g. formatting dates as mm/dd/yyyy or specifying numeric values or text)
Many data entry systems allow “double-entry” – ie., entering the data twice and then comparing both entries for discrepancies
Univariate data analysis is a useful way to check the quality of the data

Univariate Data Analysis Univariate data analysis-explores each
variable in a data set separately Serves as a good method to check the
quality of the data Inconsistencies or unexpected results
should be investigated using the original data as the reference point
Frequencies can tell you if many study participants share a characteristic of interest (age, gender, etc.) Graphs and tables can be helpful

Univariate Data Analysis (cont.) Examining continuous variables can give
you important information: Do all subjects have data, or are values
missing? Are most values clumped together, or is
there a lot of variation? Are there outliers? Do the minimum and maximum values make
sense, or could there be mistakes in the coding

Univariate Data Analysis (cont.) Commonly used statistics with univariate
analysis of continuous variables: Mean – average of all values of this variable in
the dataset Median – the middle of the distribution, the
number where half of the values are above and half are below
Mode – the value that occurs the most times Range of values – from minimum value to
maximum value

Conclusion Defining variables and basic coding
are basic steps in data analysis Simple univariate analysis may be
used with continuous and categorical variables
Further analysis may require statistical tests such as chi-squares and other more extensive data analysis
REFERENCE Mugenda, O.M & Mugenda, A. G (2003)
Research Methods: Qualitative and Quantitative Approaches. Nairobi: Acts Press
SCEA (2012), East Africa Logistics Performance Survey; Nairobi, Kenya
Hek G, Judd M, Moule P (2002) Making Sense of Research. An introduction for health and social care practitioners. 2nd Edition. London : Continuum

THANK YOU/
SHUKRAN


