Embed Size (px)
Citation preview
minerals
Article
Seismic Data Interpretation and Identification ofHydrocarbon-Bearing Zones of Rajian Area, Pakistan
Naveed Ahmad 1 , Sikandar Khan 2,* , Eisha Fatima Noor 3, Zhihui Zou 4 and Abdullatif Al-Shuhail 5
�����������������
Citation: Ahmad, N.; Khan, S.; Noor,
E.F.; Zou, Z.; Al-Shuhail, A. Seismic
Data Interpretation and Identification
of Hydrocarbon-Bearing Zones of
Rajian Area, Pakistan. Minerals 2021,
11, 891. https://doi.org/10.3390/
min11080891
Academic Editors: Monika Ivandic
and Fengjiao Zhang
Received: 8 June 2021
Accepted: 16 August 2021
Published: 18 August 2021
Publisher’s Note: MDPI stays neutral
with regard to jurisdictional claims in
published maps and institutional affil-
iations.
Copyright: © 2021 by the authors.
Licensee MDPI, Basel, Switzerland.
This article is an open access article
distributed under the terms and
conditions of the Creative Commons
Attribution (CC BY) license (https://
creativecommons.org/licenses/by/
4.0/).
1 Department of Marine Geophysics, Ocean University of China, Qingdao 266100, China;[email protected]
2 Department of Mechanical Engineering, King Fahd University of Petroleum and Minerals,Dhahran 31261, Saudi Arabia
3 Department of Earth and Environmental Sciences, Bahria University Islamabad, Islamabad 44000, Pakistan;[email protected]
4 Department of Geodetection and Information Technology, College of Marine Geosciences, Ocean Universityof China, Qingdao 266100, China; [email protected]
5 Department of Geosciences, King Fahd University of Petroleum and Minerals, Dhahran 31261, Saudi Arabia;[email protected]
* Correspondence: [email protected]
Abstract: The present study interprets the subsurface structure of the Rajian area using seismicsections and the identification of hydrocarbon-bearing zones using petrophysical analysis. The Rajianarea lies within the Upper Indus Basin in the southeast (SE) of the Salt Range Potwar ForelandBasin. The marked horizons are identified using formation tops from two vertical wells. Seismicinterpretation of the given 2D seismic data reveals that the study area has undergone severe distor-tion illustrated by thrusts and back thrusts, forming a triangular zone within the subsurface. Thefinal trend of those structures is northwest–southeast (NW–SE), indicating that the area is part ofthe compressional regime. The zones interpreted by the study of hydrocarbon potential includeSakessar limestone and Khewra sandstone. Due to the unavailability of a petrophysics log withinthe desired investigation depths, lithology cross-plots were used for the identification of two po-tential hydrocarbon-bearing zones in one well at depths of 3740–3835 m (zone 1) and 4015–4100 m(zone 2). The results show that zone 2 is almost devoid of hydrocarbons, while zone 1 has an averagehydrocarbon saturation of about 11%.
Keywords: subsurface structural interpretation; contour mapping; hydrocarbon-bearing zones;petrophysical analysis
1. Introduction
The main task of seismic interpretation is to characterize underground geologicalstructures and lithology with high precision. Seismic data analysis can distinguish betweenrocks that contain hydrocarbons and rocks that do not contain hydrocarbons. In contrast, itis difficult to distinguish between payable oil and gas intervals and non-payable oil andgas intervals just by interpreting seismic data [1–3]. Several strategies have been widelyused in seismic description, notably, seismic attributes, petrophysical models, and fluidsaturation. Increased water saturation is the main reason for the development of wellfailure. The water saturation information obtained from seismic data is somewhat complexif petrophysical modeling methods are not used. Fluid substitution in well data providestools for the identification and quantification of fluids in reservoirs [4,5].
Seismic structural interpretation involves highlighting and extracting faults and hori-zons that are apparent as geometric features in a seismic image. Seismic image processingmethods have been proposed to automate fault and horizon interpretation, each of whichtoday still requires significant human effort. Velocity modeling is highly dependent uponinput from geological and petrophysical data and interpretations. Faults and horizons are
Minerals 2021, 11, 891. https://doi.org/10.3390/min11080891 https://www.mdpi.com/journal/minerals
Minerals 2021, 11, 891 2 of 18
the most important structural mappings that can be extracted from a 3D seismic image. Ina seismic image, interpreters laterally track geologically consistent reflections to extracthorizons while identifying reflection discontinuities to pick faults. Measuring reflectiondiscontinuity alone is insufficient to distinguish faults from other discontinuous featuressuch as noise and stratigraphic features [6].
The expedition to survey hydrocarbons in Pakistan began in 1868, when the firstdrilling operation was performed at Kundal near Mianwali. The first oil discovery wasmade in 1915, with the drill of Khaur-01. The majority of the rocks in Pakistan are sedi-mentary and are rich in petroliferous content. The main goal of petroleum companies is toidentify structural and stratigraphic traps where the potential of hydrocarbon accumulationis high. In Pakistan, these structures are present in areas of strong folding and faulting, i.e.,the Potwar area [7].
The analysis and interpretation of geophysical data provide an understanding of thestructural geology of the Gorgan plain, which is crucial for the investigation of structuraltraps. Seismic interpretation indicates structural features, such as deep reverse listric faults(inverted normal faults) for older formations; strike-slip and normal faults in youngersequences; and dome and basin interference patterns of folding for all of the above forma-tions [8].
Geophysicists have conducted petroleum exploration for a considerable amount oftime, and they have developed many methods for hydrocarbon exploration. The seismicreflection technique is used for deep hydrocarbon exploration. Petroleum geologists haveintroduced major useful techniques for hydrocarbon exploration. Geophysical methodsare used to study the earth’s interior. These methods are used to take measurements at ornear the earth’s surface for investigation that can disclose both lateral and vertical changesin physical properties of the earth’s subsurface. Logs such as electrical, nuclear, andacoustic have been used to study these subsurface changes. The carbon dioxide geologicalsequestration and utilization requires that the reservoir properties should be known beforeperforming the actual injection process. The reservoir properties evaluated from thegeophysical methods can be used as inputs when performing reservoir geomechanicalmodeling before the actual carbon dioxide injection process [9–15].
The integrated strategy optimizes well performance in an iterative manner. Theintegrated solution is introduced by integrating various well types of geometry and finezonation of the target formation. The combination of each zone and each well type is basedon potential oil-bearing zones predefined by well log data analysis [16].
Introducing and applying an appropriate strategy for reservoir modeling in stronglyheterogeneous and fractured reservoirs is a controversial issue in reservoir engineering.Various integration approaches have been introduced to combine different sources of infor-mation and model building techniques to handle heterogeneity in geologically complexreservoirs. However, most of these integration approaches in several studies fail in termsof modeling strongly fractured limestone reservoir rocks [17].
The current study is a first attempt to perform a subsurface structural interpretation ofthe Rajian area using seismic sections. The identification of the hydrocarbon-bearing zonesis also performed for the first time in the current study using a petrophysical analysis. Themarked horizons are identified using formation tops from two vertical wells. The Rajianarea is under the compressional stress regime. The lithology cross-plots are used for theidentification of the potential hydrocarbon-bearing zones. Based on the current study, thezones with hydrocarbon potential include Sakessar limestone and Khewra sandstone.
2. Location and Tectonics of the Study Area
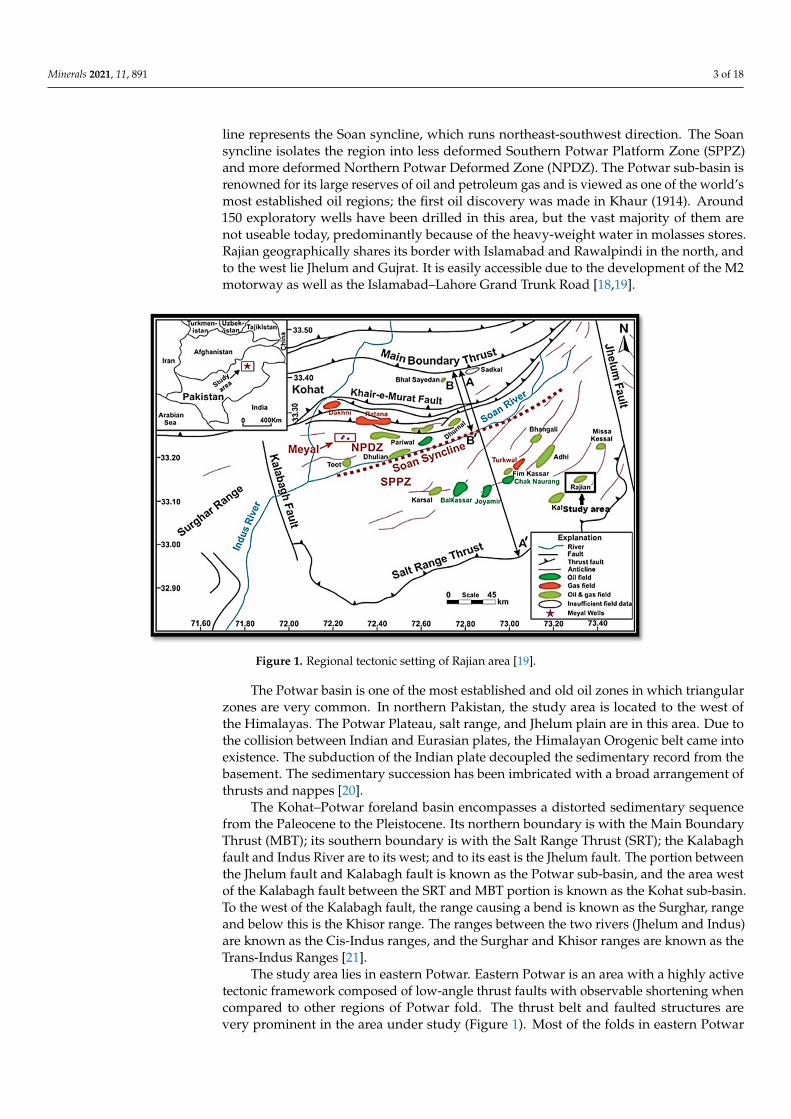
The area under study is the Rajian field, Gujar Khan, as shown in Figure 1. It islocated about 60 KM SE of Islamabad. The Gujar Khan is located in the western lowerregion of the Himalayas in north Pakistan. The terms NPDZ and SPPZ represent NorthernPotwar Deformed Zone and Southern Potwar Platform Zone, respectively. A-A′ and B-B′
depict cross-sections locations for the Potwar Basin in Northern Pakistan. The dotted
Minerals 2021, 11, 891 3 of 18
line represents the Soan syncline, which runs northeast-southwest direction. The Soansyncline isolates the region into less deformed Southern Potwar Platform Zone (SPPZ)and more deformed Northern Potwar Deformed Zone (NPDZ). The Potwar sub-basin isrenowned for its large reserves of oil and petroleum gas and is viewed as one of the world’smost established oil regions; the first oil discovery was made in Khaur (1914). Around150 exploratory wells have been drilled in this area, but the vast majority of them arenot useable today, predominantly because of the heavy-weight water in molasses stores.Rajian geographically shares its border with Islamabad and Rawalpindi in the north, andto the west lie Jhelum and Gujrat. It is easily accessible due to the development of the M2motorway as well as the Islamabad–Lahore Grand Trunk Road [18,19].
Figure 1. Regional tectonic setting of Rajian area [19].
The Potwar basin is one of the most established and old oil zones in which triangularzones are very common. In northern Pakistan, the study area is located to the west ofthe Himalayas. The Potwar Plateau, salt range, and Jhelum plain are in this area. Due tothe collision between Indian and Eurasian plates, the Himalayan Orogenic belt came intoexistence. The subduction of the Indian plate decoupled the sedimentary record from thebasement. The sedimentary succession has been imbricated with a broad arrangement ofthrusts and nappes [20].
The Kohat–Potwar foreland basin encompasses a distorted sedimentary sequencefrom the Paleocene to the Pleistocene. Its northern boundary is with the Main BoundaryThrust (MBT); its southern boundary is with the Salt Range Thrust (SRT); the Kalabaghfault and Indus River are to its west; and to its east is the Jhelum fault. The portion betweenthe Jhelum fault and Kalabagh fault is known as the Potwar sub-basin, and the area westof the Kalabagh fault between the SRT and MBT portion is known as the Kohat sub-basin.To the west of the Kalabagh fault, the range causing a bend is known as the Surghar, rangeand below this is the Khisor range. The ranges between the two rivers (Jhelum and Indus)are known as the Cis-Indus ranges, and the Surghar and Khisor ranges are known as theTrans-Indus Ranges [21].
The study area lies in eastern Potwar. Eastern Potwar is an area with a highly activetectonic framework composed of low-angle thrust faults with observable shortening whencompared to other regions of Potwar fold. The thrust belt and faulted structures arevery prominent in the area under study (Figure 1). Most of the folds in eastern Potwar
Minerals 2021, 11, 891 4 of 18
have a direction of NE–SW, and there are very few east–west (E–W) trending folds inthe focal district. Imbricate thrusts, popup structures, and triangular zones are foundhere. Over-thrusting in the area resulted in the formation of fault-limited hydrocarbon(HC) traps. Potwar is bounded by a salt range thrust in the south. The second importantthrust is the Domeli thrust fault in eastern Potwar. This Domeli thrust is predicted to bea foreland-verging thrust that demonstrates a great deal of shortening. Potwar is limitedby the Domeli thrust in the east [22]. In eastern Potwar, the Domeli back thrust can beobserved. No other obstructed back thrust in any sub-district of Potwar is greater in sizethan the Domeli back thrust. The structure present in the Rajian area is a fault-limitedanticline. Other fundamental structural faults compensate their separation level that occursin Precambrian salt. The Potwar Plateau involves disturbed landscapes. The sub-basin ofPotwar is structurally arranged to the south of the western lower regions of the Himalayasand falls in the Potwar Plateau. The Main Boundary Thrust (MBT) limits the basin in thenorth and toward the east it is limited by the Jhelum left lateral strike slip fault, by the saltrange thrust toward the south, and by the Kalabagh right lateral strike slip fault towardthe west. Fundamentally, the Potwar sub-basin is unpredictable, and surface structures donot truly mirror the subsurface structures [19].
3. Stratigraphy of the Study Area
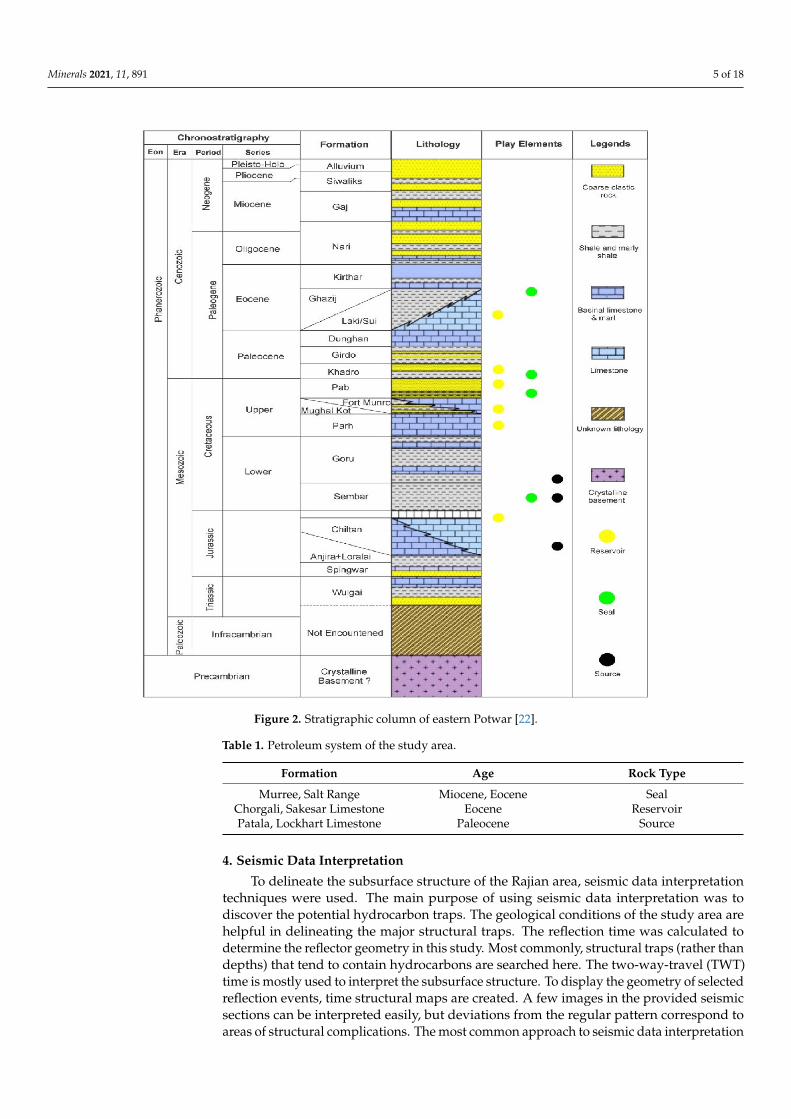
The Potwar basin is composed of thick Precambrian evaporate deposits, above whichmedium to thin Cambrian to Eocene deposits are present, which are further overlain bythick Miocene–Pliocene molasses deposits (Figure 2). The salt lies over the SRT basement,and the thick sand sequence is preserved. The Kussak, Jutana, and Baghanwala Formationsare composed of sandstone, siltstone, shales, and dolomites. The whole stratigraphicsequence was interrupted by a few unconformities, and the sequence was highly deformedduring Himalayan collision in the Pliocene to Pleistocene period [23].
Three major unconformities reported in the study area are Carboniferous to Ordovi-cian, Mesozoic to Paleocene, and the Oligocene age. During the period of Ordovicianto Carboniferous, the Potwar basin uplift began, which is why the sedimentation ceasedduring this time period. The salt range formation of the Pre-Cambrian age is the oldestformation present here, composed mostly of halite with subordinate marl, dolomite, andshale. This salt range formation lies unconformably over the basement. The overlyingsedimentary column includes Eocene to Cambrian shallow marine facies with major un-conformities found in the age of Permian and Paleocene. The second major unconformitypresent in the region, among which no sediment deposition is observed, is the Mesozoicage. In the Mesozoic age, the epicenter area was the central Potwar basin, where thicksedimentary succession of Mesozoic age is preserved. The third major unconformity foundis Oligocene age unconformity, where no sedimentary record can be found [19].
The Rajian area is composed of large petroleum deposits, and the petroleum systemis well established here. In a subduction association complex, the fore arc area/basinshave the best probability of discovering hydrocarbons in huge amount for commercial use.A precise foreland basin (Kohat–Potwar) in a significant part of the Himalayan chain inPakistan has proved to be the foremost productive region for the discovery of hydrocarbons.The Paleocene Patala shales are considered the most productive wellspring of hydrocarbonin the Potwar basin. Fractured limestone of the Sakesar Formation (Eocene age) andLockhart Formation (Paleocene age), arenaceous rock of the Tobra Formation (Permianage), and Khewra sandstone (early Cambrian age) are the conceivable reservoir rocks inthe Potwar basin. Within the investigation region, the reservoir zone is Chorgali. To sealthe leakage of hydrocarbons, drainage, further hydrocarbon migration, and the presenceof an impermeable rock layer are fundamental. Fine-grained rocks, for example, shales,evaporate and claystone acts as a compelling top cap rock. In the study region, the MurreeFormation of Miocene age provides the hydrocarbons with a seal. Meanwhile, the Dandotand Kussak Formations are also conceivable seal rocks. The petroleum system of the studyarea is shown in Table 1 [24–26].
Minerals 2021, 11, 891 5 of 18
Figure 2. Stratigraphic column of eastern Potwar [22].
Table 1. Petroleum system of the study area.
Formation Age Rock Type
Murree, Salt Range Miocene, Eocene SealChorgali, Sakesar Limestone Eocene ReservoirPatala, Lockhart Limestone Paleocene Source
4. Seismic Data Interpretation
To delineate the subsurface structure of the Rajian area, seismic data interpretationtechniques were used. The main purpose of using seismic data interpretation was todiscover the potential hydrocarbon traps. The geological conditions of the study area arehelpful in delineating the major structural traps. The reflection time was calculated todetermine the reflector geometry in this study. Most commonly, structural traps (rather thandepths) that tend to contain hydrocarbons are searched here. The two-way-travel (TWT)time is mostly used to interpret the subsurface structure. To display the geometry of selectedreflection events, time structural maps are created. A few images in the provided seismicsections can be interpreted easily, but deviations from the regular pattern correspond toareas of structural complications. The most common approach to seismic data interpretation
Minerals 2021, 11, 891 6 of 18
reveals discontinuous reflections as faults and undulating reflections as folds. This methodwas selected to identify different seismic facies and their characteristics; to facilitate thedissemination of information regarding the environment of deposition and characteristicsof reflection variations; and to identify the stratigraphy and HC potential. Changes in thevalues of amplitude, frequency, and phase within the waveform are indications of organiccompound accretions. Amplitude variation with offset additionally indicates the presenceof hydrocarbons. The amendment in the drainage area marking unconformities is useful inthe development of depositional surroundings.
4.1. Structural Interpretation
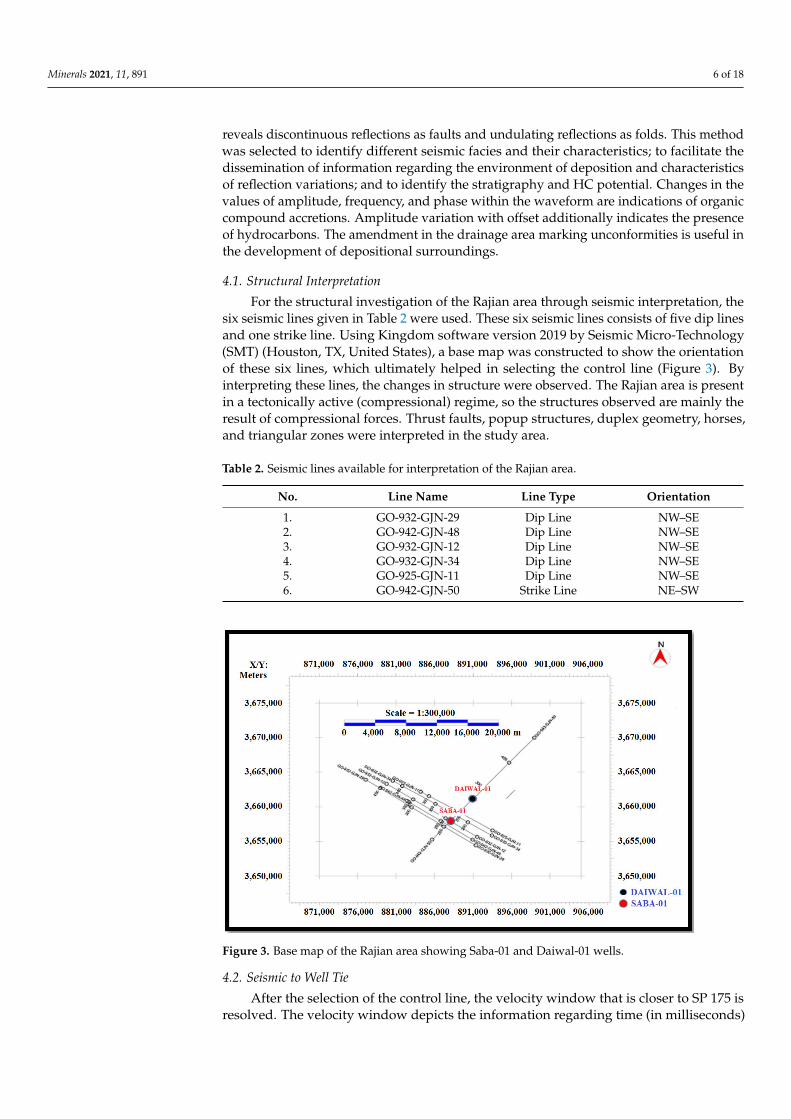
For the structural investigation of the Rajian area through seismic interpretation, thesix seismic lines given in Table 2 were used. These six seismic lines consists of five dip linesand one strike line. Using Kingdom software version 2019 by Seismic Micro-Technology(SMT) (Houston, TX, United States), a base map was constructed to show the orientationof these six lines, which ultimately helped in selecting the control line (Figure 3). Byinterpreting these lines, the changes in structure were observed. The Rajian area is presentin a tectonically active (compressional) regime, so the structures observed are mainly theresult of compressional forces. Thrust faults, popup structures, duplex geometry, horses,and triangular zones were interpreted in the study area.
Table 2. Seismic lines available for interpretation of the Rajian area.
No. Line Name Line Type Orientation
1. GO-932-GJN-29 Dip Line NW–SE2. GO-942-GJN-48 Dip Line NW–SE3. GO-932-GJN-12 Dip Line NW–SE4. GO-932-GJN-34 Dip Line NW–SE5. GO-925-GJN-11 Dip Line NW–SE6. GO-942-GJN-50 Strike Line NE–SW
Figure 3. Base map of the Rajian area showing Saba-01 and Daiwal-01 wells.
4.2. Seismic to Well Tie
After the selection of the control line, the velocity window that is closer to SP 175 isresolved. The velocity window depicts the information regarding time (in milliseconds)
Minerals 2021, 11, 891 7 of 18
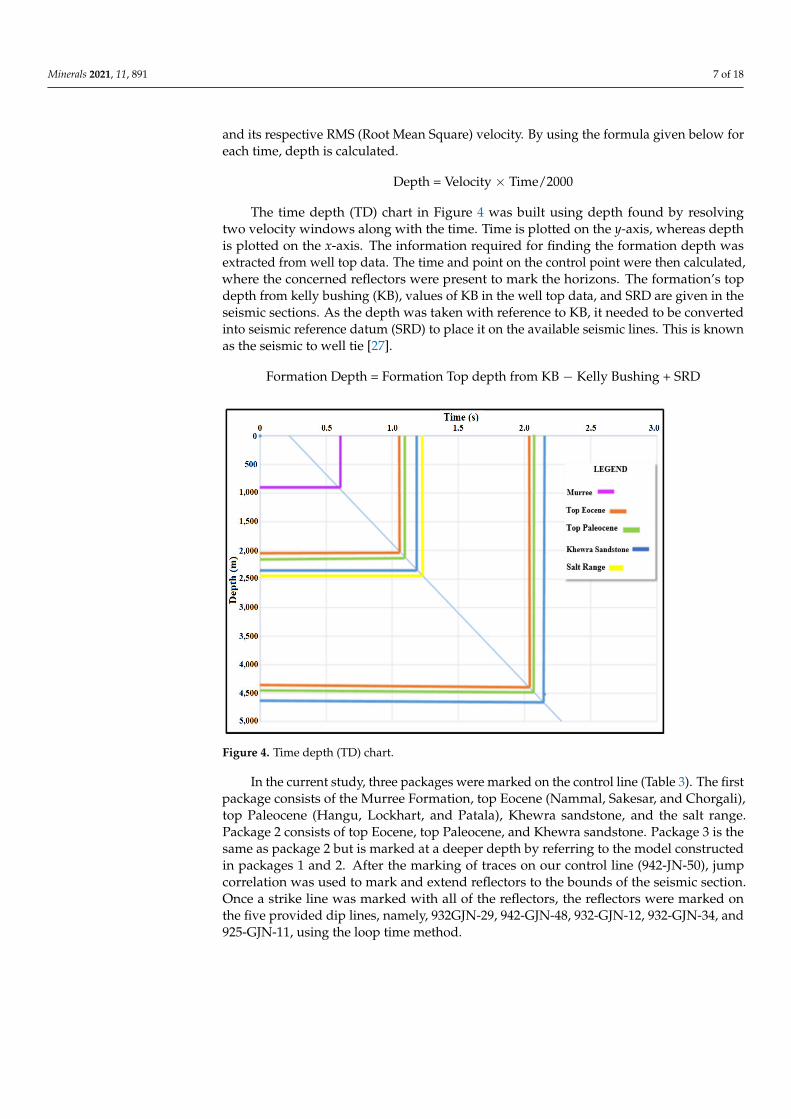
and its respective RMS (Root Mean Square) velocity. By using the formula given below foreach time, depth is calculated.
Depth = Velocity × Time/2000
The time depth (TD) chart in Figure 4 was built using depth found by resolvingtwo velocity windows along with the time. Time is plotted on the y-axis, whereas depthis plotted on the x-axis. The information required for finding the formation depth wasextracted from well top data. The time and point on the control point were then calculated,where the concerned reflectors were present to mark the horizons. The formation’s topdepth from kelly bushing (KB), values of KB in the well top data, and SRD are given in theseismic sections. As the depth was taken with reference to KB, it needed to be convertedinto seismic reference datum (SRD) to place it on the available seismic lines. This is knownas the seismic to well tie [27].
Formation Depth = Formation Top depth from KB − Kelly Bushing + SRD
Figure 4. Time depth (TD) chart.
In the current study, three packages were marked on the control line (Table 3). The firstpackage consists of the Murree Formation, top Eocene (Nammal, Sakesar, and Chorgali),top Paleocene (Hangu, Lockhart, and Patala), Khewra sandstone, and the salt range.Package 2 consists of top Eocene, top Paleocene, and Khewra sandstone. Package 3 is thesame as package 2 but is marked at a deeper depth by referring to the model constructedin packages 1 and 2. After the marking of traces on our control line (942-JN-50), jumpcorrelation was used to mark and extend reflectors to the bounds of the seismic section.Once a strike line was marked with all of the reflectors, the reflectors were marked onthe five provided dip lines, namely, 932GJN-29, 942-GJN-48, 932-GJN-12, 932-GJN-34, and925-GJN-11, using the loop time method.
Minerals 2021, 11, 891 8 of 18
Table 3. Marking of horizons on control line through well to seismic tie.
Formation Name Formation Depth = Formation Top −Kelly bushing + SRD
FormationDepth (m)
Two Way Time(seconds) Well Name
Murree 1 Formation FD = 1079 − 513 + 350 916 0.55 Saba-01Top Eocene 1 FD = 2215 − 513 + 350 2052 1.17 Saba-01
Top Paleocene 1 FD = 2337 − 513 + 350 2174 1.24 Saba-01Khewra Sandstone 1 FD = 2526 − 513 + 350 2363 1.32 Saba-01
Salt Range FD = 2654 − 513 + 350 2491 1.39 Saba-01Top Eocene 2 FD = 4587 − 577 + 350 4360 2.07 Daiwal-01
Top Paleocene 2 FD = 4700 − 577 + 350 4473 2.12 Daiwal-01Khewra Sandstone 2 FD = 4890 − 577 + 350 4663 2.18 Daiwal-01
4.3. Fault Marking and Interpretation
Based on the break in continuity, faults were marked on all dip lines. The currentstudy area lies in the eastern part of the Potwar Plateau, with northward dipping strataand local open folds of low structural relief and axes. In addition to these clearly plottedmajor and minor faults, there are a number of minor faults present in the area whosestructural importance was somewhat ambiguous (Table 4). Rajian is a structure formed bythe grouping of thrusts (SRT and Dil jabba) and a back thrust (Domeli), forming a triangularzone in the subsurface. Saba-01 is drilled on the strike line at shot point 175. However,for better understanding of the structural complexities of the subsurface, the well tops ofDaiwal-01 well drilled at shot point 260 on the same strike line were used.
Table 4. Major and minor faults marked on seismic sections.
Fault Name Fault Nature Tectonic Transport Direction
Major Fault (F1) Basement Thrust SEMajor Fault (F2) Major Thrust SEMajor Fault (F3) Roof Thrust SEMajor Fault (F4) Back Thrust NWMinor Fault (f1) Thrust SEMinor Fault (f2) Thrust SEMinor Fault (f3) Thrust SEMinor Fault (f4) Thrust SEMinor Fault (f5) Thrust SE
4.4. Horizon Marking and Interpretation
The target horizons were picked up across seismic lines after the identification ofthe horizons when the reflectors changed their character from high to low amplitude.Interpretation was performed on the basis of the difference in the acoustic impedance orthickening or thinning of the different formations. The horizons were selected along allof the seismic girds by correlating the seismic events. In Figure 5a, the line 942-GJN-50 isoriented in the NE–SW direction, perpendicular to the dip of the major faults, and parallelto the axis of the structure present in the area. Two packages were encountered on thestrike line. Package 1 is composed of the Murree Formation, top Eocene, top Paleocene,Khewra sandstone, and the salt range formation. Package 2 is composed of top Eocene,top Paleocene, and Khewra sandstone. Saba-01 is drilled at SP 175 on the SW flank, andDaiwal-01 is drilled at SP 230 on the SE flank.
Minerals 2021, 11, 891 9 of 18
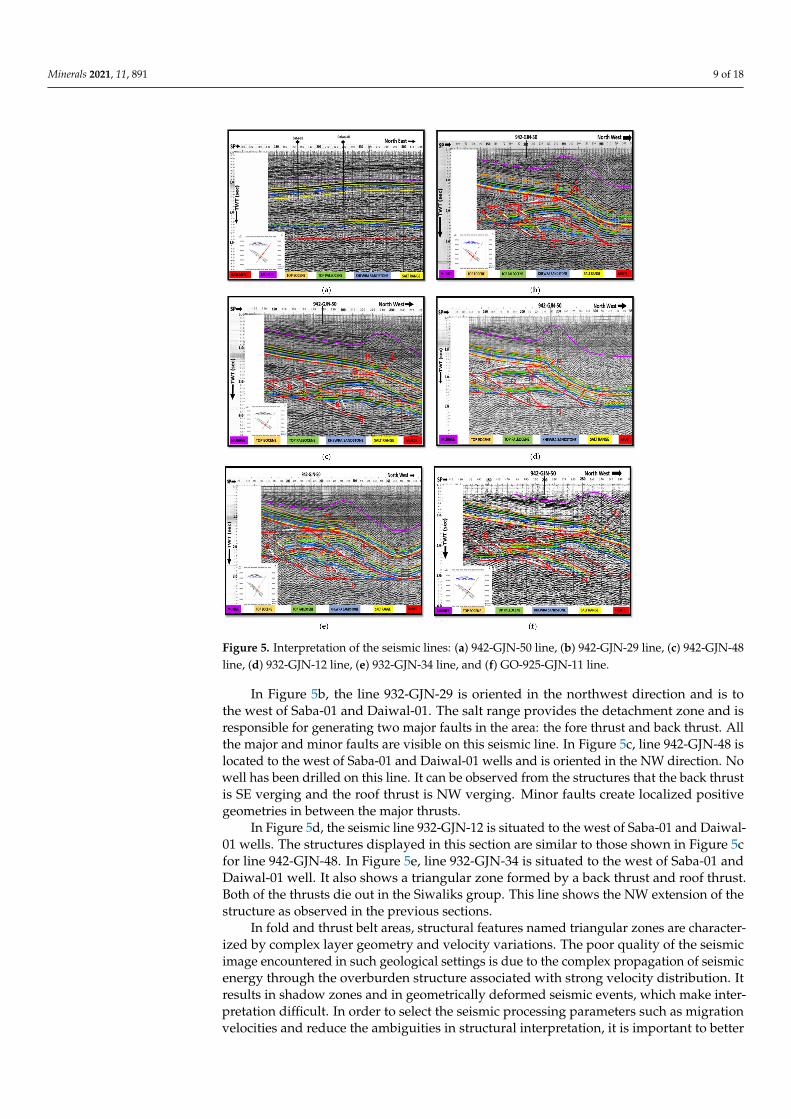
Figure 5. Interpretation of the seismic lines: (a) 942-GJN-50 line, (b) 942-GJN-29 line, (c) 942-GJN-48line, (d) 932-GJN-12 line, (e) 932-GJN-34 line, and (f) GO-925-GJN-11 line.
In Figure 5b, the line 932-GJN-29 is oriented in the northwest direction and is tothe west of Saba-01 and Daiwal-01. The salt range provides the detachment zone and isresponsible for generating two major faults in the area: the fore thrust and back thrust. Allthe major and minor faults are visible on this seismic line. In Figure 5c, line 942-GJN-48 islocated to the west of Saba-01 and Daiwal-01 wells and is oriented in the NW direction. Nowell has been drilled on this line. It can be observed from the structures that the back thrustis SE verging and the roof thrust is NW verging. Minor faults create localized positivegeometries in between the major thrusts.
In Figure 5d, the seismic line 932-GJN-12 is situated to the west of Saba-01 and Daiwal-01 wells. The structures displayed in this section are similar to those shown in Figure 5cfor line 942-GJN-48. In Figure 5e, line 932-GJN-34 is situated to the west of Saba-01 andDaiwal-01 well. It also shows a triangular zone formed by a back thrust and roof thrust.Both of the thrusts die out in the Siwaliks group. This line shows the NW extension of thestructure as observed in the previous sections.
In fold and thrust belt areas, structural features named triangular zones are character-ized by complex layer geometry and velocity variations. The poor quality of the seismicimage encountered in such geological settings is due to the complex propagation of seismicenergy through the overburden structure associated with strong velocity distribution. Itresults in shadow zones and in geometrically deformed seismic events, which make inter-pretation difficult. In order to select the seismic processing parameters such as migrationvelocities and reduce the ambiguities in structural interpretation, it is important to better
Minerals 2021, 11, 891 10 of 18
understand the real seismic wave propagation for these specific seismic events that we canclearly see in the seismic section (Figure 5f). Velocity models were built and introducedinto the Kingdom software version 2019 by Seismic Micro-Technology (SMT) (Houston, TX,United States). Using non-zero and zero-offset ray tracing modelling, seismic interpretationwas carried out to analyze specific seismic travel paths encountered in these areas. Wedemonstrated that these events could be generated by complex seismic wave propagation,which leads to ambiguities in time seismic sections (Figure 5f). As specific artefacts such aspull-up and shadow zone effects are present in Figure 5f, the line 925-GJN-11 is presentto the west of Saba-01 and Daiwal-01 wells. The major structural framework in all thedip lines is the same, consisting of four major thrust faults; in between these, there are anumber of minor faults. The Rajian area is in the region of the Potwar basin where thepresence of a triangular zone has been confirmed, and the direction of thrust sheets in ourarea of interest also suggested its presence. The minor faults cut into the rock packagesand give them localized positive geometries. A large number of clear and ambiguous splayfaults are also present here.
The interpretation of various dip lines shows that the strata continuation has beendisturbed by faulting. Four major faults in addition to minor faults were observed. F3is the roof thrust dipping in the NW direction. F4 is the back thrust dipping in the SEdirection. The hanging wall has moved upward relative to the foot wall, and, therefore,higher values of time are noted for the foot wall. F3 shows greater throw when comparedto that of F4. The combination of a back thrust and salt range thrust, also called roof thrust(bounding the strata from below), results in the formation of a structure known as thetriangular zone. The other two major faults (F1 and F2) are present in the lower packageand regard the strata uplift in the same manner as that of F3 and F4. F1 acts as a majorthrust dipping in the NW direction and bounding the second package in the subsurface.Fault F1 is essentially the basement or floor thrust, below which the zone of interest isabsent.
5. Contour Maps
The structural and stratigraphic configuration of the subsurface was performed usingTWT and depth contour maps. The results of seismic interpretation are represented incontours maps; that is, the three-dimensional earth surface is represented in dimensionsusing contouring. Kingdom software version 2019 by Seismic Micro-Technology (SMT)(Houston, TX, United States) was used for the construction of contour maps.
Time and Depth Contour Maps
The time contour maps show the contour lines with the same values of time. Theyrepresent the two-way travel time. The values are plotted on the base where the informationof latitude and longitude is already present. For the interpretation of an area, more thanone section of seismic data is required for the same area. The contour interval for topEocene 1, top Paleocene 1, Khewra sandstone, and the salt range is 0.05 s. Similarly, thetime contour interval for top Eocene 2 and Paleocene 2 is also 0.05 s. The darker the color,the greater the values of time and the deeper it is, whereas the lighter the color, the lowerthe time values and the shallower it is. The time values are low in the anticlines along thecore, while they are high along the flanks. In the synclines, the time values are high alongthe core but low along the flanks. All of this information was interpreted using contourmaps.
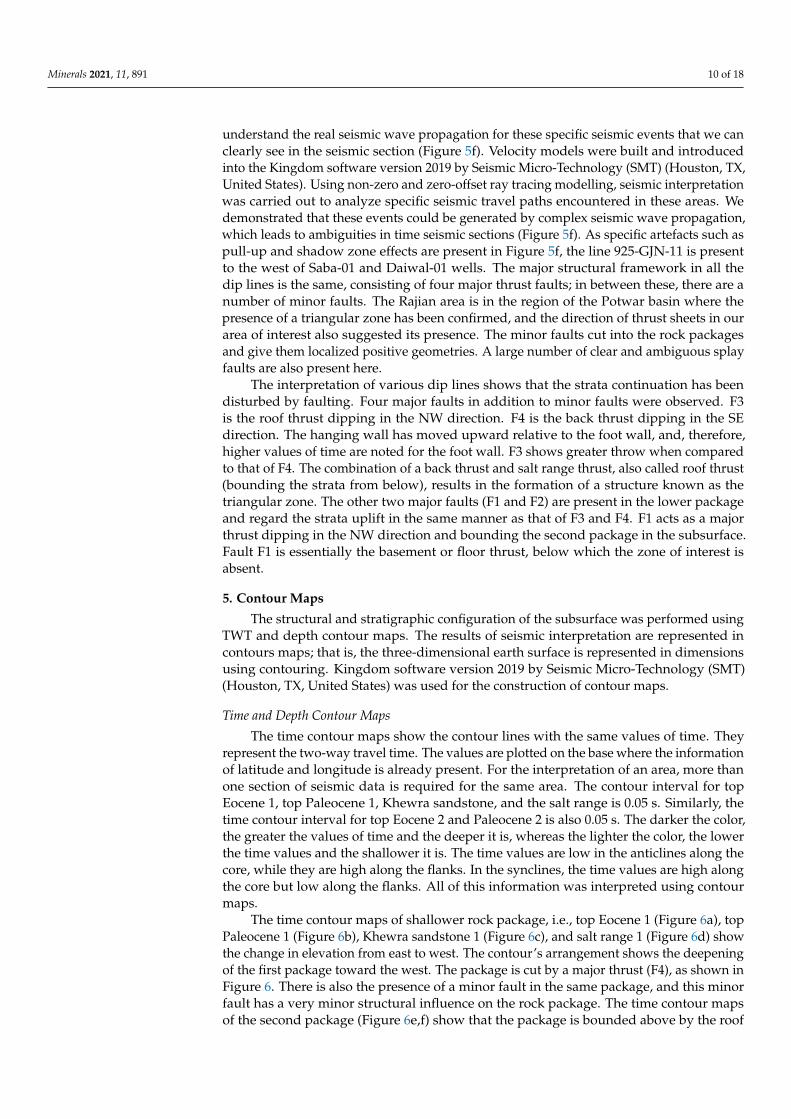
The time contour maps of shallower rock package, i.e., top Eocene 1 (Figure 6a), topPaleocene 1 (Figure 6b), Khewra sandstone 1 (Figure 6c), and salt range 1 (Figure 6d) showthe change in elevation from east to west. The contour’s arrangement shows the deepeningof the first package toward the west. The package is cut by a major thrust (F4), as shown inFigure 6. There is also the presence of a minor fault in the same package, and this minorfault has a very minor structural influence on the rock package. The time contour mapsof the second package (Figure 6e,f) show that the package is bounded above by the roof
Minerals 2021, 11, 891 11 of 18
thrust (F3) and below by a major thrust (F2). These two thrusts bind the anticlinal packageand provide it with the sealing effect. Three minor faults cut the package and change itssmooth dipping from east to west.
Figure 6. Time contour maps for Contour Interval (C.I) of 0.05 sec, for (a) top Eocene 1, (b) top Paleocene 1, (c) Khewrasandstone 1, (d) walt range 1, (e) top Eocene 2, and (f) top Paleocene 2.
Minerals 2021, 11, 891 12 of 18
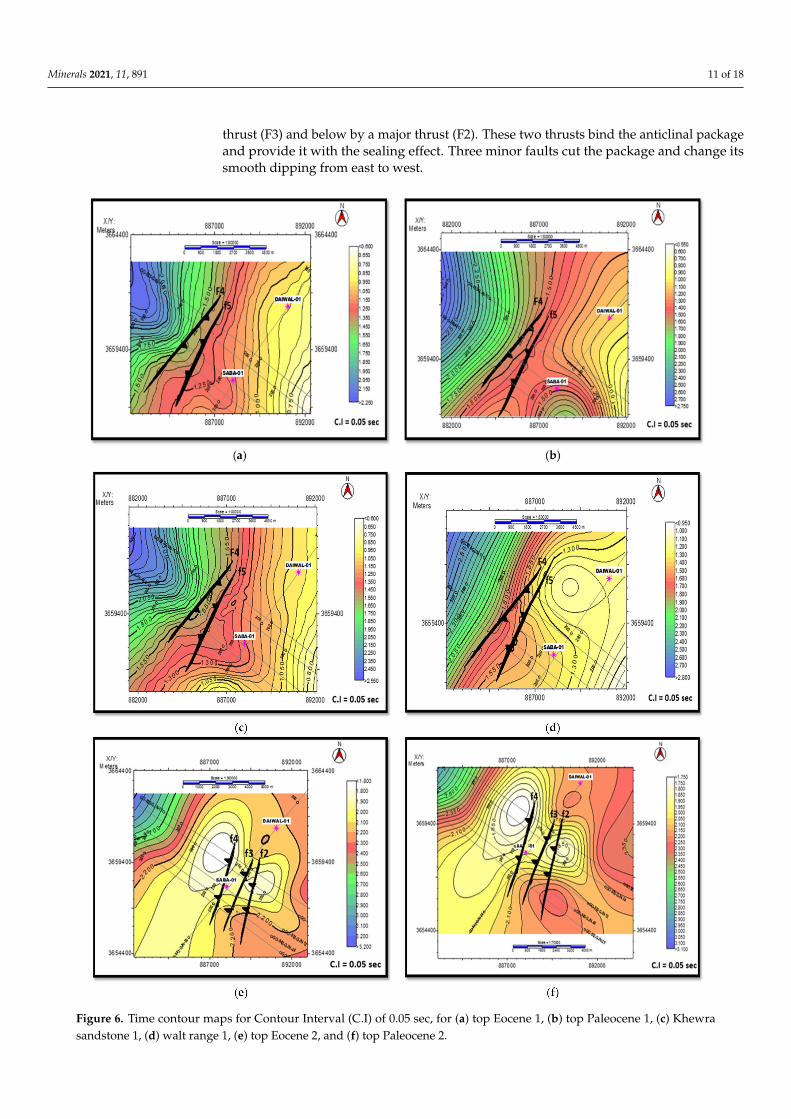
Depth contour maps mainly show the depth of underlying strata and the structures.Faults, anticlines, and folds are usually portrayed by depth contour maps. Their inter-pretation is similar to that for contour maps of time. This allows for correct informationregarding the structure style in the subsurface to be obtained. With the help of these depthand TWT contour maps, it can be concluded that Eocene age formations and Khewrasandstone are the reservoir rocks of the Rajian area. The depth contour maps of the shallowrock package are top Eocene 1 (Figure 7a), top Paleocene 1 (Figure 7b), Khewra sand-stone 1 (Figure 7c), and salt range 1 (Figure 7d). The depth contour maps of top Eocene 2(Figure 7e) and top Paleocene 2 (Figure 7f) were constructed with a contour break of 250 m.These maps for top Paleocene, top Eocene, and Khewra sandstone show that the KhewraFormation is deeper than the other two marked formations. While moving from blue towhite color, the structure becomes shallower, indicating that the structure is changing fromsyncline to anticline.
Figure 7. Depth contour maps for Contour Interval (C.I) of 250 m, for (a) top Eocene 1, (b) top Paleocene 1, (c) Khewrasandstone 1, (d) salt range 1, (e) top Eocene 2, and (f) top Paleocene 2.
Both types of contour maps (time and depth) represent the subsurface structuralarrangement. Only those faults that are cutting the formations and producing localized
Minerals 2021, 11, 891 13 of 18
structural changes in the whole package are displayed in the contour maps. However,the two packages are bounded by major thrust faults as discussed thoroughly in seismicinterpretation of the given lines.
6. Petrophysical Analysis
Petrophysics is a method that is used to describe the reservoir, and it helps in theidentification and quantification of a fluid in a reservoir. By using wireline logs (density,neutron, self-potential, and resistivity), petrophysical analysis was performed for one zonein Saba-01. The analyses were performed to calculate porosity, water resistivity, watersaturation, and oil saturation, which are used to identify the hydrocarbon potential of thereservoir. Three types of wireline logs were used (Table 5) to carry out reservoir analysis.Due to the unavailability of the well tops of the lower sheet of Saba-01 well, a gamma raylog was used to identify a clean zone (Table 6).
Table 5. Logs available for petrophysical interpretation of reservoir zones.
Lithological Logs Porosity Logs Fluid Dynamic Logs
Gamma Ray Log (GR) Sonic Log (DT) Resistivity Logs (LLD and LLS)Self-Potential Log (SP) Density Log (RHOB) -
- Neutron Log (NPHi) -
Table 6. Potential zones for hydrocarbon accumulation.
ZONE 1
Initial Depth (m) 3740End Depth (m) 3835Thickness (m) 95
ZONE 2
Initial Depth (m) 4015End Depth (m) 4100Thickness (m) 85
6.1. Interpreting the Hydrocarbon-Bearing Zone
For the interpretation of the hydrocarbon-bearing zone (thought to be potential), thefollowing methodology was adopted:
1. Calculation of the volume of shale (Vsh);2. Calculation of the volume of clean (Vclean);3. Calculation of density porosity (DPHI);4. Calculation of neutron porosity (NPHI);5. Calculation of average porosity (APHI);6. Calculation of effective porosity (EPHI) and sonic porosity (SPHI);7. Calculation of the resistivity of water (Rw);8. Calculation of water saturation (Sw);9. Calculation of hydrocarbon saturation (Sh).
6.1.1. Petrophysical Interpretation of Reservoir Zone 1
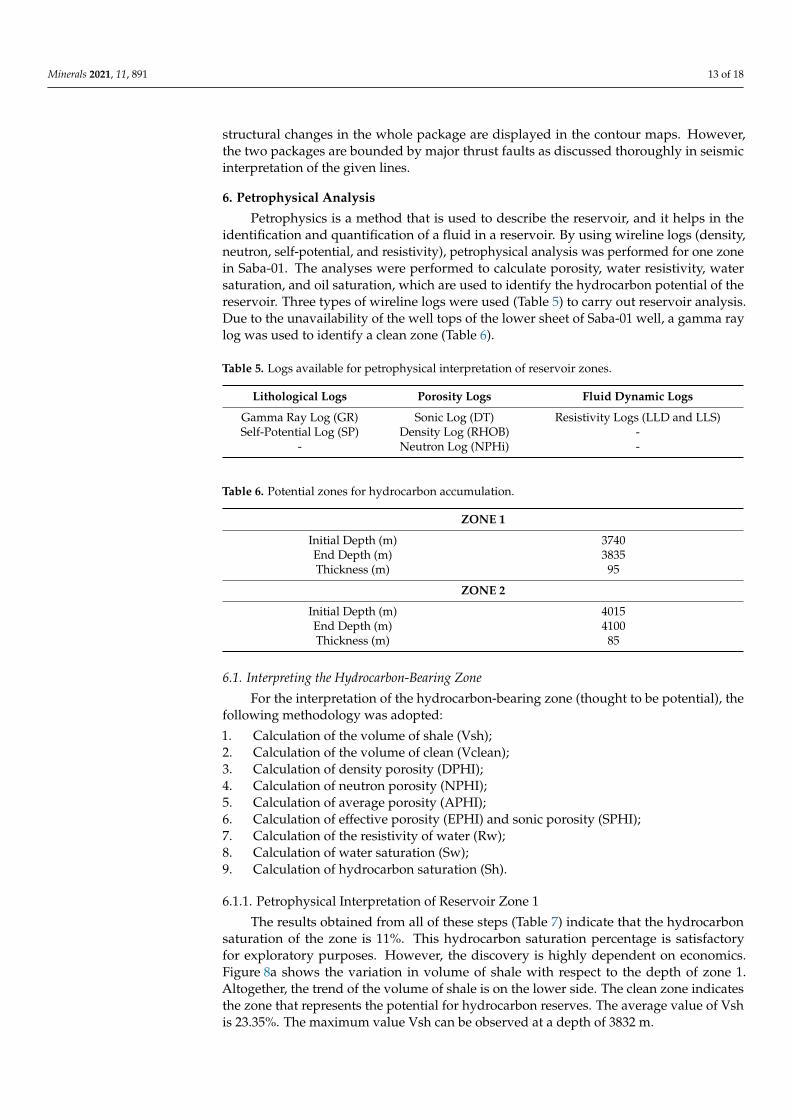
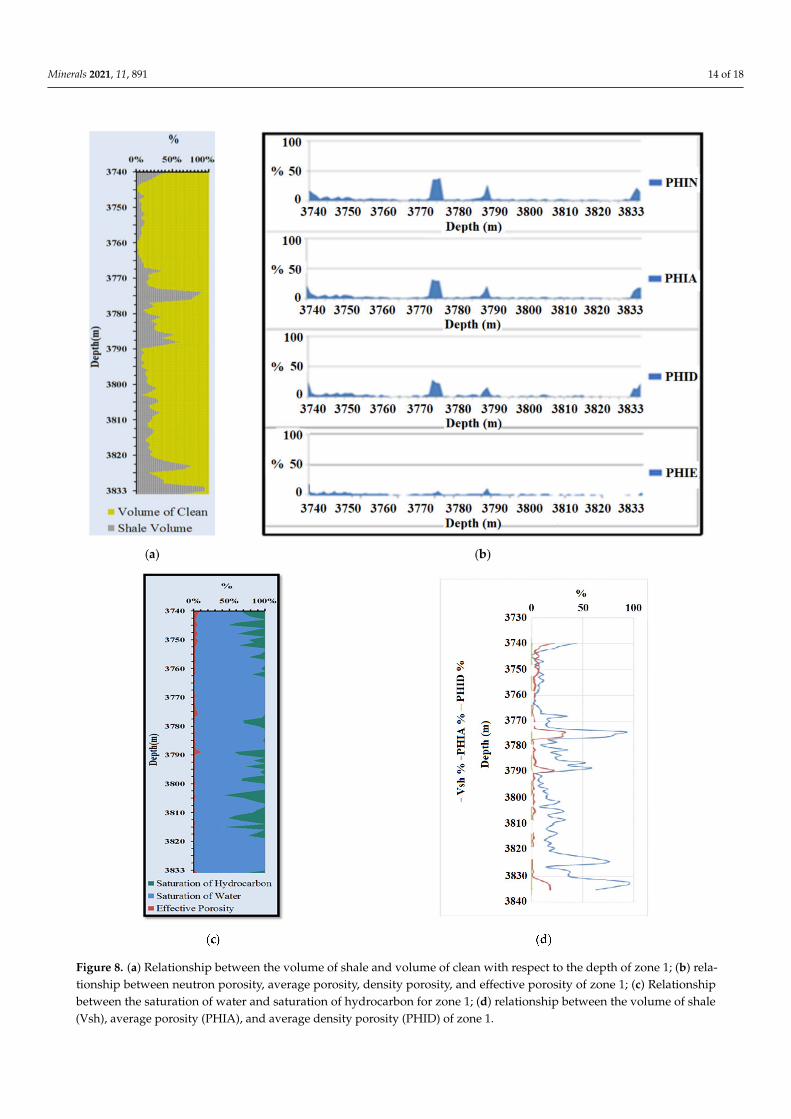
The results obtained from all of these steps (Table 7) indicate that the hydrocarbonsaturation of the zone is 11%. This hydrocarbon saturation percentage is satisfactoryfor exploratory purposes. However, the discovery is highly dependent on economics.Figure 8a shows the variation in volume of shale with respect to the depth of zone 1.Altogether, the trend of the volume of shale is on the lower side. The clean zone indicatesthe zone that represents the potential for hydrocarbon reserves. The average value of Vshis 23.35%. The maximum value Vsh can be observed at a depth of 3832 m.
Minerals 2021, 11, 891 14 of 18
Figure 8. (a) Relationship between the volume of shale and volume of clean with respect to the depth of zone 1; (b) rela-tionship between neutron porosity, average porosity, density porosity, and effective porosity of zone 1; (c) Relationshipbetween the saturation of water and saturation of hydrocarbon for zone 1; (d) relationship between the volume of shale(Vsh), average porosity (PHIA), and average density porosity (PHID) of zone 1.
Minerals 2021, 11, 891 15 of 18
Table 7. Petrophysical analysis results obtained for zone 1.
Zone 1
Depth (m) 3740 to 3835Thickness (m) 95
Average Vsh (%) 23.35Average Vclean (%) 76.64
Average Density Porosity (PHID) (%) 3.92Average Neutron Porosity (PHIN) (%) 4.69
Average Porosity (PHIA) (%) 4.30Average Effective Porosity (PHIE) (%) 2.42
Average Water Saturation (Sw) (%) 88.09Average Hydrocarbon Saturation (Sh) (%) 11.9
Figure 8b shows the variation in neutron porosity, average porosity, density porosity,and effective porosity with respect to depth. The average value of neutron porosity is 4.69%;the average porosity is 4.30%; the density porosity is 3.92%; and the effective porosity is2.42%. In Figure 8c, the variation in water saturation and hydrocarbon saturation accordingto depth is presented. Average hydrocarbon saturation is about 11.09% and average watersaturation is about 88.09%. In Figure 8d, the variation in average porosity and effectiveporosity can be seen with respect to depth. The effective porosity average value is 2.3%;the volume of the shale average value is 23.35%; and average value of average porosity is4.1%. The effective porosity indicates the amount of connected pore spaces.
6.1.2. Petrophysical Interpretation of Reservoir Zone 2
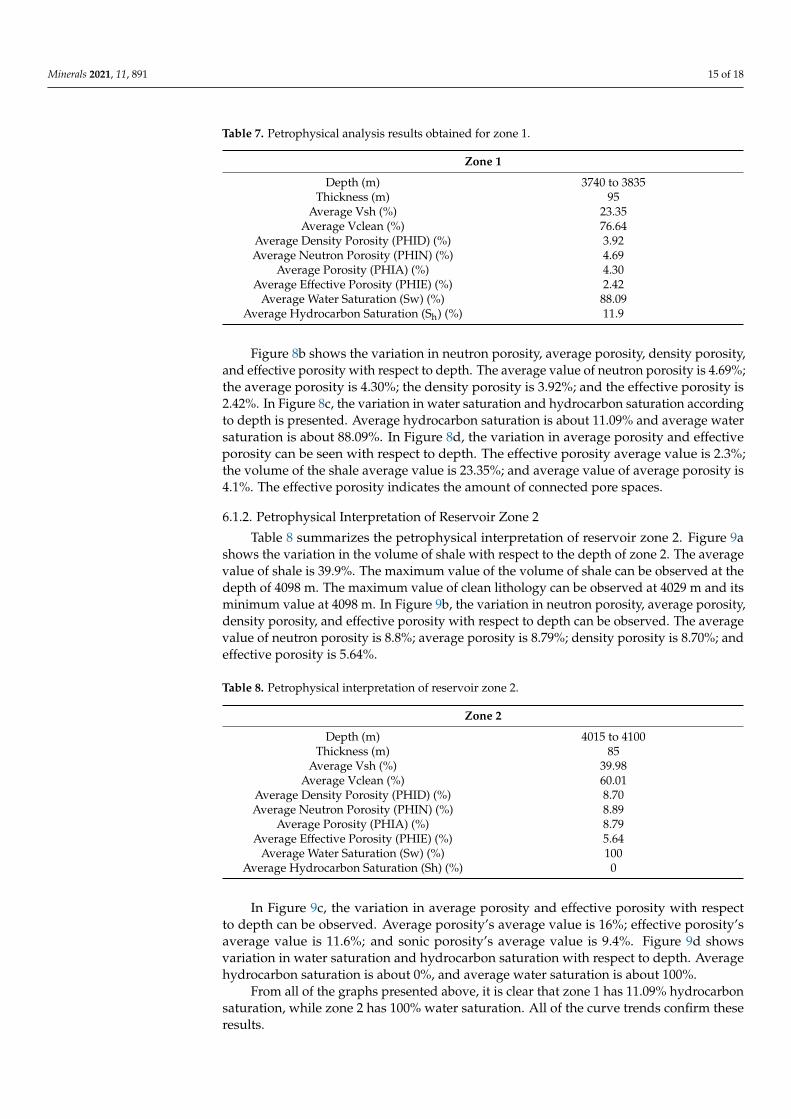
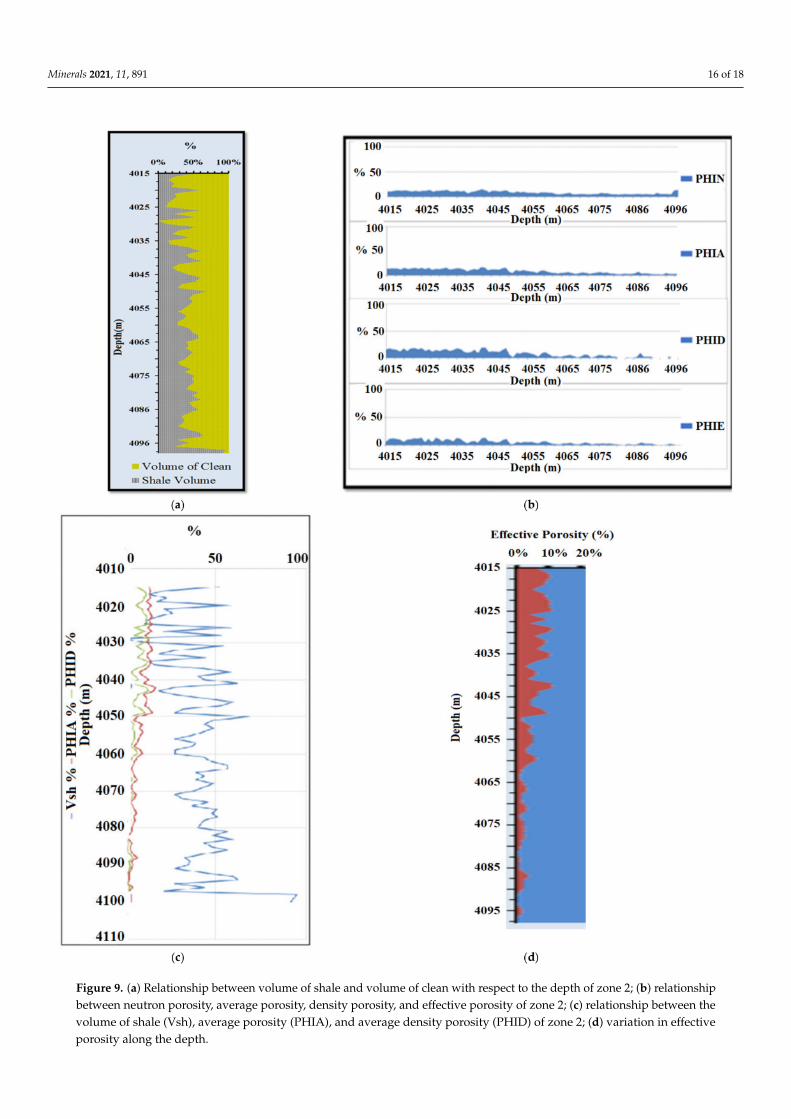
Table 8 summarizes the petrophysical interpretation of reservoir zone 2. Figure 9ashows the variation in the volume of shale with respect to the depth of zone 2. The averagevalue of shale is 39.9%. The maximum value of the volume of shale can be observed at thedepth of 4098 m. The maximum value of clean lithology can be observed at 4029 m and itsminimum value at 4098 m. In Figure 9b, the variation in neutron porosity, average porosity,density porosity, and effective porosity with respect to depth can be observed. The averagevalue of neutron porosity is 8.8%; average porosity is 8.79%; density porosity is 8.70%; andeffective porosity is 5.64%.
Table 8. Petrophysical interpretation of reservoir zone 2.
Zone 2
Depth (m) 4015 to 4100Thickness (m) 85
Average Vsh (%) 39.98Average Vclean (%) 60.01
Average Density Porosity (PHID) (%) 8.70Average Neutron Porosity (PHIN) (%) 8.89
Average Porosity (PHIA) (%) 8.79Average Effective Porosity (PHIE) (%) 5.64
Average Water Saturation (Sw) (%) 100Average Hydrocarbon Saturation (Sh) (%) 0
In Figure 9c, the variation in average porosity and effective porosity with respectto depth can be observed. Average porosity’s average value is 16%; effective porosity’saverage value is 11.6%; and sonic porosity’s average value is 9.4%. Figure 9d showsvariation in water saturation and hydrocarbon saturation with respect to depth. Averagehydrocarbon saturation is about 0%, and average water saturation is about 100%.
From all of the graphs presented above, it is clear that zone 1 has 11.09% hydrocarbonsaturation, while zone 2 has 100% water saturation. All of the curve trends confirm theseresults.
Minerals 2021, 11, 891 16 of 18
Figure 9. (a) Relationship between volume of shale and volume of clean with respect to the depth of zone 2; (b) relationshipbetween neutron porosity, average porosity, density porosity, and effective porosity of zone 2; (c) relationship between thevolume of shale (Vsh), average porosity (PHIA), and average density porosity (PHID) of zone 2; (d) variation in effectiveporosity along the depth.
Minerals 2021, 11, 891 17 of 18
7. Conclusions
The objective of the current research was to interpret the subsurface structural featuresof the Rajian area, Upper Indus Basin, Pakistan, using 2D seismic sections and identificationof hydrocarbon-bearing zones using petrophysical analysis. The main outcomes of thestudy are summarized as follows:
• The presence of reverse (thrust) faults indicates that the Rajian area lies in a compres-sional regime.
• Seismic data interpretation shows that the Rajian oil field has a triangular zone struc-ture formed by a major thrust that dips in the NW direction, while the back thrustdips in the SE direction.
• The overall structure presented in the study area supports a duplex geometry, wherethe salt range thrust acts as a floor thrust and the roof thrust is a back thrust markinga passive roof duplex.
• The package bounded by roof and floor thrusts is bisected by several low angle thrustfaults (imbrications) presenting the phenomenon of horizontal stacking, which, inturn, shows intense shortening in the area.
• Time and depth contour maps of top Eocene and top Paleocene formations helpedus to confirm the presence of positive structures in the area. The time contour mapsfor the first package show the change in elevation from east to west. The contour’sarrangement shows the deepening of the first package toward the west. The packageis cut by a major thrust (F4). There is also the presence of a minor fault in the samepackage, but this minor fault has a very minor structural influence on the rock package.Time contour maps of the second package show that the package is bounded aboveby the roof thrust (F3) and below by a major thrust (F2). These two thrusts bind theanticlinal package and provide it with a sealing effect. Three minor faults cut thepackage and change its smooth dipping from east to west.
• Petrophysical analysis performed on one zone of saba-01 suggests that hydrocarbonsaturation in zone 1 is about 11.09%. The hydrocarbon saturation percentage in zone1 is sufficient to be considered for future oil and gas production. The petrophysicalanalysis of zone 2 suggests negligible traces of the hydrocarbon, and, as such, zone 2should not be considered for future oil and gas production. Based on the petrophysicalanalysis performed in this study, the water saturation is 100% in zone 2; thus, it can beused as a potential CO2 sequestration site.
Author Contributions: Conceptualization, N.A., S.K., E.F.N., Z.Z. and A.A.-S.; methodology, N.A.,S.K., E.F.N., Z.Z. and A.A.-S.; software, N.A., S.K. and E.F.N.; validation, N.A., S.K., E.F.N., Z.Z.and A.A.-S.; formal analysis, N.A., S.K., E.F.N. and A.A.-S.; investigation, N.A., S.K. and A.A.-S.;resources, N.A., S.K. and A.A.-S.; data curation, N.A., S.K. and A.A.-S.; writing—original draftpreparation, N.A., S.K., E.F.N., Z.Z. and A.A.-S.; writing—review and editing, N.A., S.K. and A.A.-S.;visualization, N.A., S.K., E.F.N., Z.Z. and A.A.-S. All authors have read and agreed to the publishedversion of the manuscript.
Funding: This research received funding from the College of Petroleum Engineering and Geosciencesof KFUPM through Startup Fund grant number SF 18060.
Data Availability Statement: The data presented in this study are available upon request from thecorresponding author.
Acknowledgments: The authors appreciate and acknowledge the support provided by King FahdUniversity of Petroleum and Minerals (KFUPM) for providing all the essential resources for conduct-ing this study.
Conflicts of Interest: The authors declare no conflict of interest.
References1. Ahmad, N.; Khan, S.; Al-Shuhail, A. Seismic Data Interpretation and Petrophysical Analysis of Kabirwala Area Tola (01) Well,
Central Indus Basin, Pakistan. Appl. Sci. 2021, 11, 2911. [CrossRef]
Minerals 2021, 11, 891 18 of 18
2. Khan, A.M.; Al-Juhani, S.G.; Abdul, S. Digital Viscoelastic Seismic Models and Data Sets Of Central Saudi Arabia in the Presenceof Near-Surface Karst Features. J. Seism. Explor. 2020, 29, 15–28.
3. Chan, S.A.; Edigbue, P.; Khan, S.; Ashadi, A.L.; Al-Shuhail, A.A. Viscoelastic Model and Synthetic Seismic Data of EasternRub’Al-Khali. Appl. Sci. 2021, 11, 1401. [CrossRef]
4. A Study on Multiple Time-Lapse Seismic AVO Inversion—LI—2005—Chinese Journal of Geophysics Wiley Online Library.Available online: https://agupubs.onlinelibrary.wiley.com/doi/abs/10.1002/cjg2.738 (accessed on 5 November 2020).
5. Ou, C.; Li, C.; Rui, Z.; Ma, Q. Lithofacies distribution and gas-controlling characteristics of the Wufeng–Longmaxi black shales inthe southeastern region of the Sichuan Basin, China. J. Pet. Sci. Eng. 2018, 165, 269–283. [CrossRef]
6. Soleimani, M. Seismic imaging by 3D partial CDS method in complex media. J. Pet. Sci. Eng. 2016, 143, 54–64. [CrossRef]7. Parvez, M.K. Petroleum Geology of Kohat-Bannu Plateau, Northwest Frontier Province, Pakistan. Ph.D. Thesis, University of
South Carolina, Columbia, SC, USA, 1992.8. Soleimani, M. Well performance optimization for gas lift operation in a heterogeneous reservoir by fine zonation and different
well type integration. J. Nat. Gas Sci. Eng. 2017, 40, 277–287. [CrossRef]9. Al-Shuhail, A.A.; Alshuhail, A.A.; Khulief, Y.A.; Salam, S.A.; Chan, S.A.; Ashadi, A.L.; Al-Lehyani, A.F.; Almubarak, A.M.; Khan,
M.Z.U.; Abdulrahman, K.A.; et al. KFUPM Ghawar digital viscoelastic seismic model. Arab. J. Geosci. 2019, 12, 245. [CrossRef]10. Khan, S.; Al-Shuhail, A.A.; Khulief, Y.A. Numerical modeling of the geomechanical behavior of Ghawar Arab-D carbonate
petroleum reservoir undergoing CO2 injection. Environ. Earth Sci. 2016, 75, 1499. [CrossRef]11. Khan, S.; Khulief, Y.A.; Al-Shuhail, A.A. The effect of injection well arrangement on CO2 injection into carbonate petroleum
reservoir. Int. J. Glob. Warm. 2018, 14, 462–487. [CrossRef]12. Khan, S.; Khulief, Y.A.; Al-Shuhail, A.A. Numerical modeling of the geomechanical behavior of Biyadh reservoir undergoing
CO2 injection. Int. J. Geomech. 2017, 17, 04017039. [CrossRef]13. Khan, S.; Khulief, Y.A.; Al-Shuhail, A.A. Reservoir Geomechanical Modeling during CO2 Injection into Deep Qasim Reservoir:
A Study Focused on Mitigating Climate Change. In World Environmental and Water Resources Congress 2020: Groundwater,Sustainability, Hydro Climate/Climate Change, and Environmental Engineering; American Society of Civil Engineers: Reston, VA, USA,2020; pp. 29–40.
14. Garba, M.D.; Muhammad, U.; Khan, S.; Farrukh, K.; Ahmad, S.; Muhamad, G.; Akram, F.E.; Muhammad, H. CO2 towards fuels:A review of catalytic conversion of carbon dioxide to hydrocarbons. J. Environ. Chem. Eng. 2021, 9, 104756. [CrossRef]
15. Israf, U.D.; Usman, M.; Khan, S.; Aasif, H.; Alotaibi, M.A.; Alharthi, A.I.; Centi, G. Prospects for a green methanol thermo-catalyticprocess from CO2 by using MOFs based materials: A mini-review. J. CO2 Util. 2021, 43, 101361. [CrossRef]
16. Soleimani, M.; Shokri, B.J.; Rafiei, M. Integrated petrophysical modeling for a strongly heterogeneous and fractured reservoir,Sarvak Formation, SW Iran. Nat. Resour. Res. 2017, 26, 75–88. [CrossRef]
17. Radfar, A.; Chakdel, A.R.; Nejati, A.; Soleimani, M. New insights into the structure of the South Caspian Basin from seismicreflection data, Gorgan Plain, Iran. Int. J. Earth Sci. 2019, 108, 379–402. [CrossRef]
18. Khan, M.A.; Ahmed, R.; Raza, H.A.; Kemal, A. Geology of petroleum in Kohat-Potwar depression, Pakistan. AAPG Bull. 1986, 70,396–414.
19. Riaz, M.; Nuno, P.; Zafar, T.; Ghazi, S. 2D Seismic Interpretation of the Meyal Area, Northern Potwar Deform Zone, Potwar Basin,Pakistan. Open Geosci. 2019, 11, 1–16. [CrossRef]
20. Jaumé, S.C.; Lillie, R.J. Mechanics of the Salt Range-Potwar Plateau, Pakistan: A fold-and-thrust belt underlain by evaporites.Tectonics 1988, 7, 57–71. [CrossRef]
21. Hussain, W.; Abbas, S.Q.; Hussain, S. Structure Investigation, Economics and Stratigraphy of the Paleozoic, Mesozoic andCenozoic Sequence in the Vicinity Eastern and Western side of the Salt Range, Punjab Pakistan. J. Inf. Commun. Technol. Robot.Appl. 2018, 6, 95–116.
22. Qureshi, M.A.; Ghazi, S.; Riaz, M.; Ahmad, S. Geo-seismic model for petroleum plays an assessment of the Zamzama area,Southern Indus Basin, Pakistan. J. Pet. Explor. Prod. Technol. 2021, 11, 33–44.
23. Khel, B.; Hills, T.; Nilawan, K.R. Surghar Range Soan River 20 40 60 33 N km BANNU Potwar Plateau. In Earth’s Pre-PleistoceneGlacial Record; University of Rochester: Rochester, NY, USA, 2011; p. 278.
24. Gee, E.R.; Gee, D.G. Overview of the geology and structure of the Salt Range, with observations on related areas of northernPakistan. Geol. Soc. Am. Spec. Pap. 1989, 232, 95–112.
25. Ghazi, S.; Ali, A.; Hanif, T.; Sharif, S.; Arif, .J. Larger benthic foraminiferal assemblage from the Early Eocene Chor Gali Formation,Salt Range, Pakistan. Geol. Bull. Punjab Univ. 2010, 45, 8391.
26. Sameeni, S.J.; Nazir, N.; Abdul-Karim, A.; Naz, H. Foraminiferal biostratigraphy and reconnaissance microfacies of PaleoceneLockhart Limestone of Jabri area, Hazara, northern Pakistan. Geol. Bull. Punjab Univ. 2009, 44, 85–96.
27. Margrave, G.F. Why Seismic-to-Well Ties Are Difficult. 25th Annual Report of the CREWES Project 2013. Available online:https://www.crewes.org/Documents/ResearchReports/2013/CRR201359.pdf (accessed on 10 August 2021).


