Embed Size (px)
Citation preview
European Journal of Scientific Research ISSN 1450-216X Vol.43 No.3 (2010), pp.316-330 © EuroJournals Publishing, Inc. 2010 http://www.eurojournals.com/ejsr.htm
Interpretation of the Gravity and Magnetic Anomalies of the
Ajdabiya Trough in the Sirt Basin, Libya
Ahmed Salem Saheel Libyan Petroleum Institute-Tripoli-Libya
E-mail: [email protected] Tel: +60-172-322706
Abdul Rahim Bin Samsudin
School of Environment and Natural Resource Sciences, Faculty of Science and Technology Universiti Kebangsaan Malaysia, 43600 Bangi, Selangor
E-mail: [email protected] Tel: +60-1333-31441
Umar Bin Hamzah
School of Environment and Natural Resource Sciences, Faculty of Science and Technology Universiti Kebangsaan Malaysia, 43600 Bangi, Selangor
E-mail: [email protected] Tel: +60-1330-53275
Abstract
The area involved in this study is north part of Libya, which is located in the northeast part of Sirt basin within the bounds 29oN-31oN and 19oE-21oE. The study involves analysis of gravity and magnetic data to delineate structures and faults and to locate any major structures in the Ajdabiya trough and surrounding area. The produced Bouguer gravity map shows prominent NW-SE and NE-SW trends. Isostatic residual map for gravity data is characterized by a dominant NW-SE trend in the study area. This is clearly evident in the Isostatic residual map. The main trending anomalies are in the northern and southeastern parts of the study area with NW-SE orientation. A strong NW-SE trend is truncated by E-W trending in the southeastern and southwestern parts of the area. This is consistent with the change of tectonic zones. The magnetic expression in the northern part of Ajdabiya trough is characterized by NW-SE trending structures which coincide with late Cretaceous structures of the Sirt basin, while the southern part is characterized by NE-SW trending features which coincide with a late Paleozoic trend. The northern part of the Ajdabiya trough is separated from the southern part by a prominent NE-SW lineament that is expressed in both the gravity and magnetic data. It is interpreted as a basement fault, which separates a thicker southern crust from a thinner northern crust. The high gravity anomaly within the northern part of the Ajdabiya trough is interpreted as a result of mantle upwelling which caused thinning of the continental crust beneath the northern part of the Ajdabiya trough. Total horizontal derivative of the gravity and magnetic RTP anomalies generally reflect faults or compositional changes which can be seen to describe structural trends. High gradient values delineate NNE-SSW and NW-SE trends which mark the faulted southwestern and northeastern boundaries of the basin,
Interpretation of the Gravity and Magnetic Anomalies of the Ajdabiya Trough in the Sirt Basin, Libya 317
respectively. Strong N-S lineaments occur over the Central part of study area and are well indicated by the horizontal derivative. From this study, the horizontal derivative provides very useful information of the rift structures. Keywords: Sirt basin; Ajdabiya trough; gravity data; magnetic data; Total horizontal
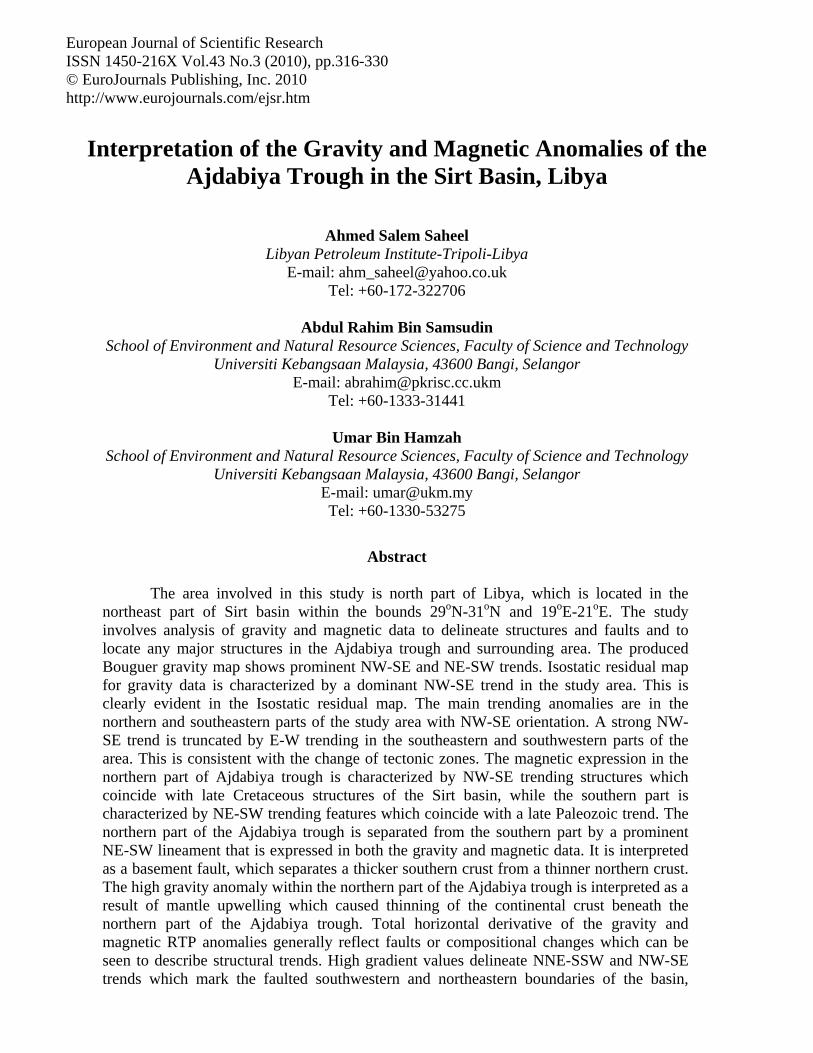
derivative. 1. Introduction The Sirt basin is one of the youngest sedimentary basins in Libya and covers an area of approximately 500.000 Km2 in north central Libya (Fig.1). The study area is called Ajdabiya trough area, it is located on the northern margin of the Sirt basin, with approximate coordinates (29o- 31oN) and (19o- 21oE).The study area margin of the Sirt basin was affected by a series of tectonic activities due to interaction of the African and Eurasian plates that formed the structural features of the Sirt basin. The formation of the Sirt basin was associated with series of subsidence events which caused number of troughs along E-W trending basement faults during the Early Cretaceous and NW-SE trending basement faults during the late Cretaceous. The troughs are separated by a series of platforms. These structures are obscured by a thick sedimentary cover.
Even though petroleum exploration activity in Libya started more than 55 years ago, little is known about the structure of this basin. The present study employed the gravity and magnetic data provided by the Libyan Petroleum Institute (LPI), Shell Oil Company license (NC213) and Geodetic Survey Department of Libya (SDL).
A total of 85,692 gravity points and 2000 magnetic lines were used in the current study. The main purpose of this study was to compile the available geology, gravity and magnetic data in the Ajdabiya trough in order to gain better understanding of the structural framework, basement configuration, sediment thickness and eventually, construct a tectonic map of the study area.
Figure 1: Location Map of the Basins in Libya (after Shah et al., 1993).
318 Ahmed Salem Saheel, Abdul Rahim Bin Samsudin and Umar Bin Hamzah
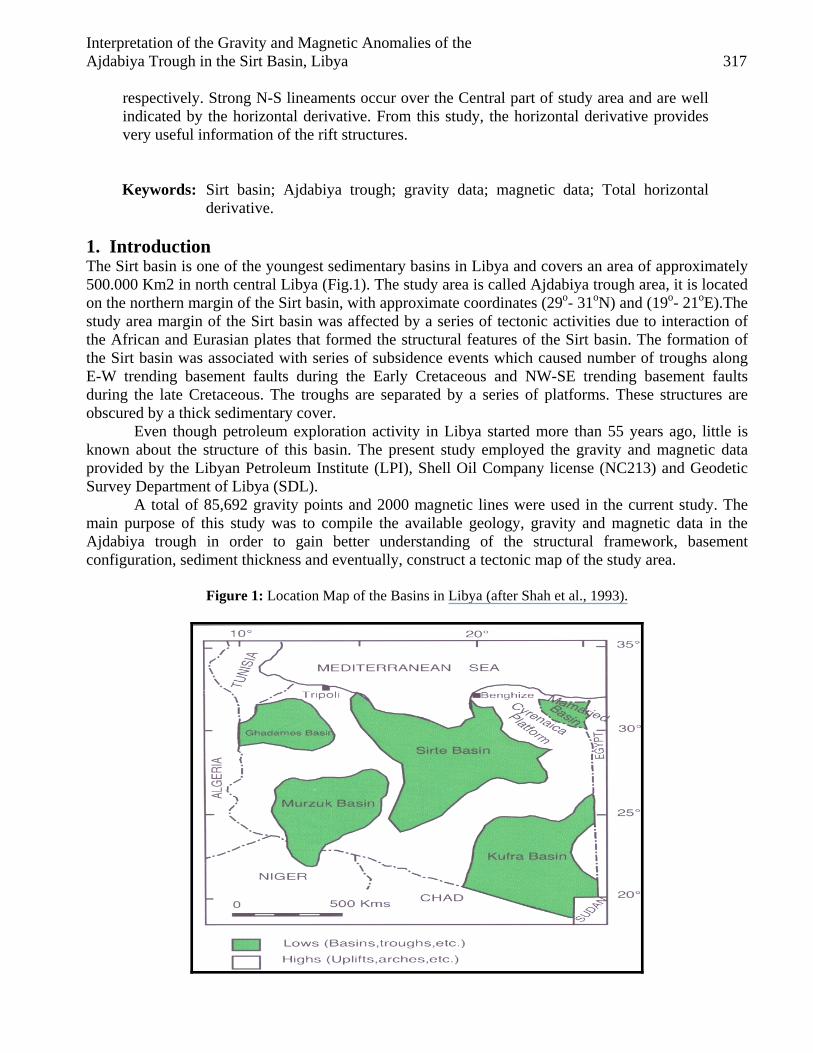
2. Geological Setting and Tectonic Setting of Sirt Basin During the Early Cretaceous (Aptian), organic movement affected most of North Africa. Africa was separated from Asia along the red sea graben (Extension). This movement produced the rifting of Sirt basin (Anketell, 1996 and Hallett, 2002). The post Cretaceous faulting system was generated by sinistral and dextral strike slip movement of Sahara platform west ward along the Mediterranean Sea (Tethys). The formation of NWSE faulting system of horst and graben patterns started in Early Cretaceous and culminated during the Tertiary (Fig.2). In the beginning of the Late Cretaceous (Cenomanian) the sea entered the basin and only the major horsts in Sirt basin were emergent. Throughout the Late Cretaceous, the sea continued to advance south wards and by the end of Maastrichtian age only a few scattered crests remained above the sea level as isolated island (Duronio and Colombi, 1983). The period from Maastrichtian to Upper Eocene was characterized by macro basin subsidence and continued transgression with minor regression. Source rocks, reservoirs and seals were formed during this period (Hallett and El Ghoul, 1996).
The final structure stage developed the traps and migration of hydrocarbon from source rocks and accumulated in the different reservoirs during Early Oligocene and Pleistocene Epoch (Baird, Aburawi and Bailey, 1996).
Figure 2: Major structural elements of the Study area in the Sirt basin, (Modified after, Roohi. M., 1996).
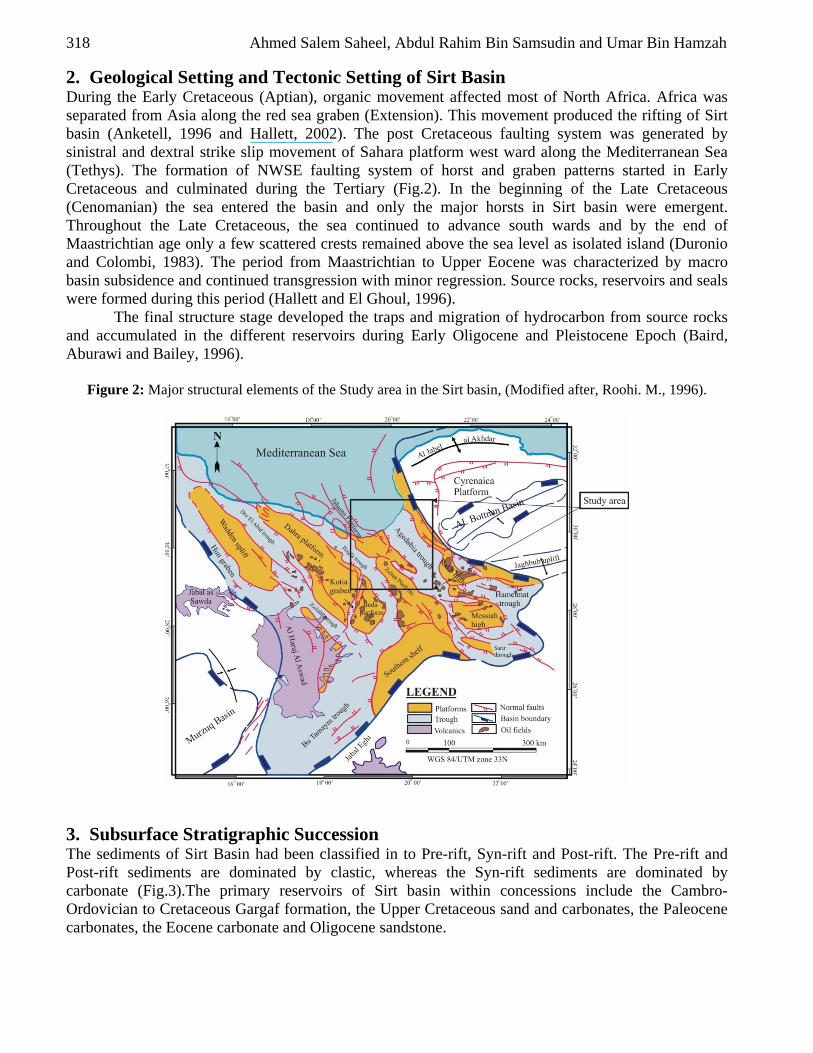
3. Subsurface Stratigraphic Succession The sediments of Sirt Basin had been classified in to Pre-rift, Syn-rift and Post-rift. The Pre-rift and Post-rift sediments are dominated by clastic, whereas the Syn-rift sediments are dominated by carbonate (Fig.3).The primary reservoirs of Sirt basin within concessions include the Cambro- Ordovician to Cretaceous Gargaf formation, the Upper Cretaceous sand and carbonates, the Paleocene carbonates, the Eocene carbonate and Oligocene sandstone.
Interpretation of the Gravity and Magnetic Anomalies of the Ajdabiya Trough in the Sirt Basin, Libya 319
Figure 3: Stratigraphic section in central Sirt Basin (modified after Barr and Weegar, 1972; Montgomery, 1994).
3.1. The Pre Rifting Sediments (Cambro – Ordovician)
The Cambro - Ordovician sediments were represented by Gargaf Formation which consisted of continental sandstone, conglomerate and shale beds (Goudarzi, 1970, 1980). The Gargaf Formation bounded by unconformable boundaries and overlain by Bahi Formation and underlain by Basement igneous rocks. 3.2. The Syn Rifting Sediments (Late Cretaceous–Late Eocene)
This stage represents the Late Cretaceous–Late Eocene sediments (basin fill stage). These sediments were mainly marine of different depositional environments as result of fluctuation in sea level either raising (Transgression) or lowering (Regression), controlled by NW – SE oriented horst and graben structures. The Cretaceous sediments unconformable over lay the Gargaf quartzite Formation. These sediments represented Bahi sandstone, Waha, Sirt Shale and Kalash Formations. The Bahi, Waha and Arshad are the principal reservoirs while the Sirt Shale Formation is the source rock (Parsons and others, 1980; Gumati and Schamel, 1988; Montgomery, 1994; El Alami, 1996; Ghori and Mohammed, 1996; Mansour and Magairhy, 1996; Macgregor and Moody, 1998; Ambrose, 2000). The Kalash Formation was widespread in concessions and acted as a cap rock in some places of central Sirt basin. The Tertiary sediments represent Hagfa Shale Formation which acts as source rock for Tertiary
320 Ahmed Salem Saheel, Abdul Rahim Bin Samsudin and Umar Bin Hamzah
reservoirs in the Sirt Basin (Thomas, 1995).The Hagfa Formation overlain by succession of carbonate, shale, dolomite and evaporate. 3.3. The Post Rifting Sediments
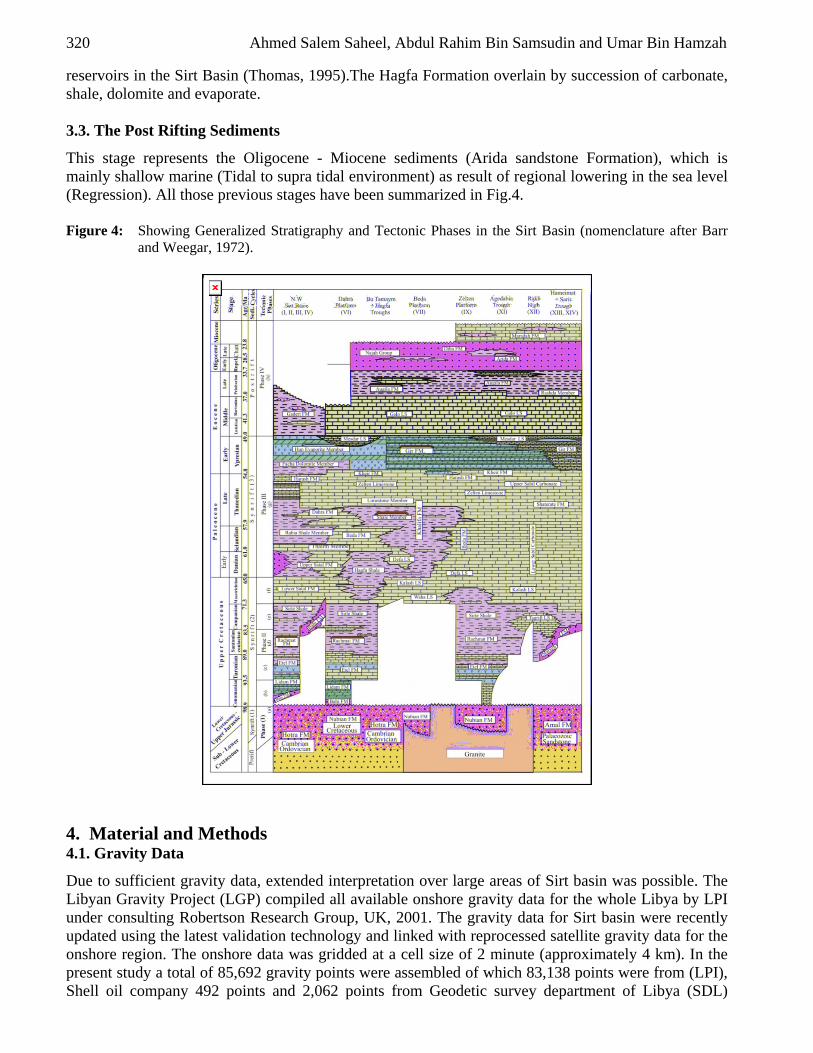
This stage represents the Oligocene - Miocene sediments (Arida sandstone Formation), which is mainly shallow marine (Tidal to supra tidal environment) as result of regional lowering in the sea level (Regression). All those previous stages have been summarized in Fig.4. Figure 4: Showing Generalized Stratigraphy and Tectonic Phases in the Sirt Basin (nomenclature after Barr
and Weegar, 1972).
4. Material and Methods 4.1. Gravity Data
Due to sufficient gravity data, extended interpretation over large areas of Sirt basin was possible. The Libyan Gravity Project (LGP) compiled all available onshore gravity data for the whole Libya by LPI under consulting Robertson Research Group, UK, 2001. The gravity data for Sirt basin were recently updated using the latest validation technology and linked with reprocessed satellite gravity data for the onshore region. The onshore data was gridded at a cell size of 2 minute (approximately 4 km). In the present study a total of 85,692 gravity points were assembled of which 83,138 points were from (LPI), Shell oil company 492 points and 2,062 points from Geodetic survey department of Libya (SDL)
Interpretation of the Gravity and Magnetic Anomalies of the Ajdabiya Trough in the Sirt Basin, Libya 321
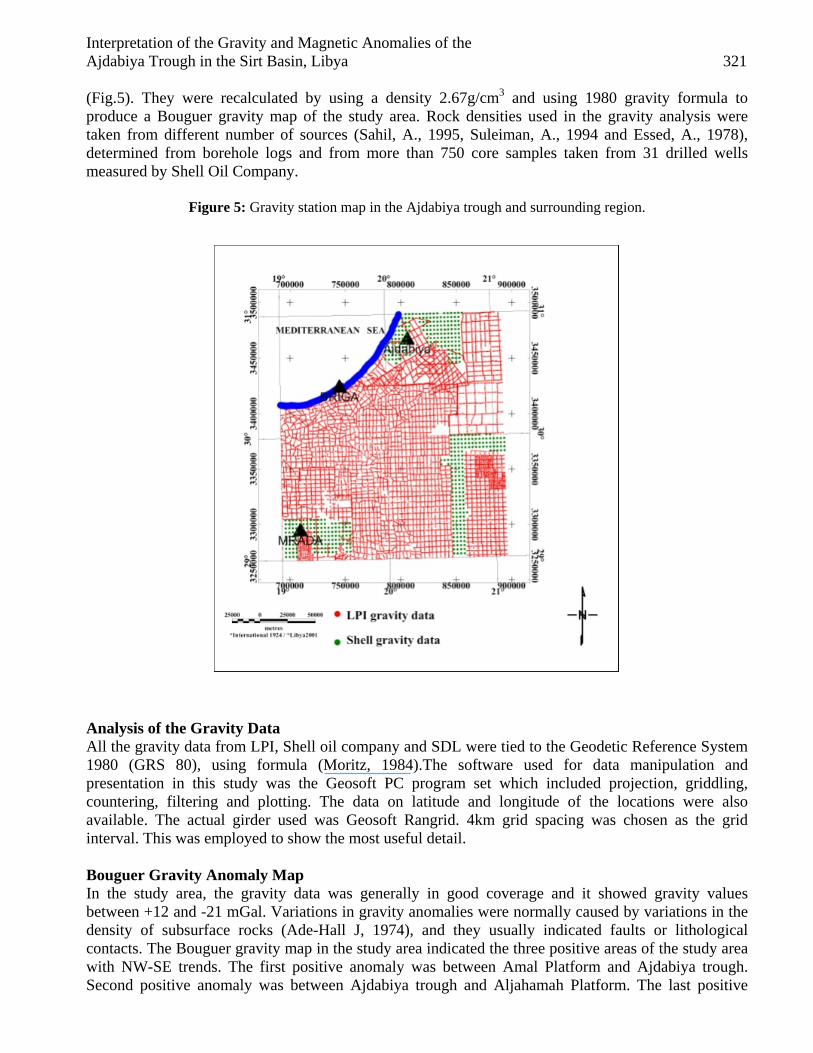
(Fig.5). They were recalculated by using a density 2.67g/cm3 and using 1980 gravity formula to produce a Bouguer gravity map of the study area. Rock densities used in the gravity analysis were taken from different number of sources (Sahil, A., 1995, Suleiman, A., 1994 and Essed, A., 1978), determined from borehole logs and from more than 750 core samples taken from 31 drilled wells measured by Shell Oil Company.
Figure 5: Gravity station map in the Ajdabiya trough and surrounding region.
Analysis of the Gravity Data All the gravity data from LPI, Shell oil company and SDL were tied to the Geodetic Reference System 1980 (GRS 80), using formula (Moritz, 1984).The software used for data manipulation and presentation in this study was the Geosoft PC program set which included projection, griddling, countering, filtering and plotting. The data on latitude and longitude of the locations were also available. The actual girder used was Geosoft Rangrid. 4km grid spacing was chosen as the grid interval. This was employed to show the most useful detail. Bouguer Gravity Anomaly Map In the study area, the gravity data was generally in good coverage and it showed gravity values between +12 and -21 mGal. Variations in gravity anomalies were normally caused by variations in the density of subsurface rocks (Ade-Hall J, 1974), and they usually indicated faults or lithological contacts. The Bouguer gravity map in the study area indicated the three positive areas of the study area with NW-SE trends. The first positive anomaly was between Amal Platform and Ajdabiya trough. Second positive anomaly was between Ajdabiya trough and Aljahamah Platform. The last positive
322 Ahmed Salem Saheel, Abdul Rahim Bin Samsudin and Umar Bin Hamzah
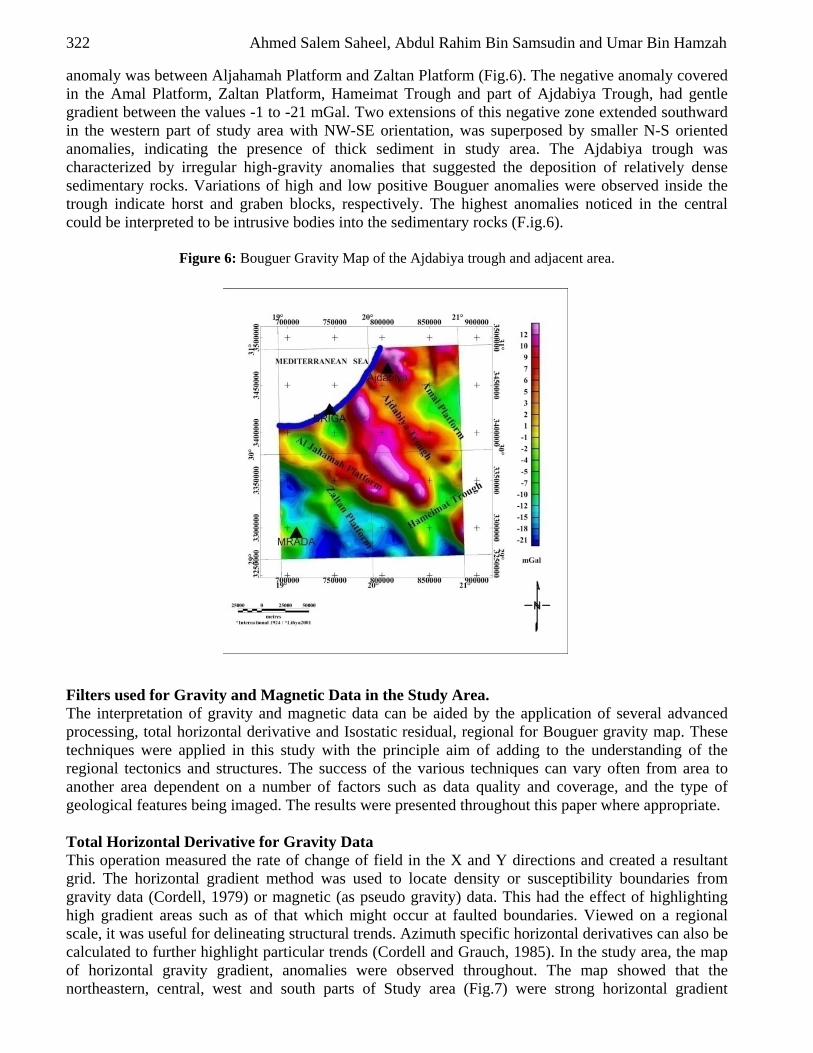
anomaly was between Aljahamah Platform and Zaltan Platform (Fig.6). The negative anomaly covered in the Amal Platform, Zaltan Platform, Hameimat Trough and part of Ajdabiya Trough, had gentle gradient between the values -1 to -21 mGal. Two extensions of this negative zone extended southward in the western part of study area with NW-SE orientation, was superposed by smaller N-S oriented anomalies, indicating the presence of thick sediment in study area. The Ajdabiya trough was characterized by irregular high-gravity anomalies that suggested the deposition of relatively dense sedimentary rocks. Variations of high and low positive Bouguer anomalies were observed inside the trough indicate horst and graben blocks, respectively. The highest anomalies noticed in the central could be interpreted to be intrusive bodies into the sedimentary rocks (F.ig.6).
Figure 6: Bouguer Gravity Map of the Ajdabiya trough and adjacent area.
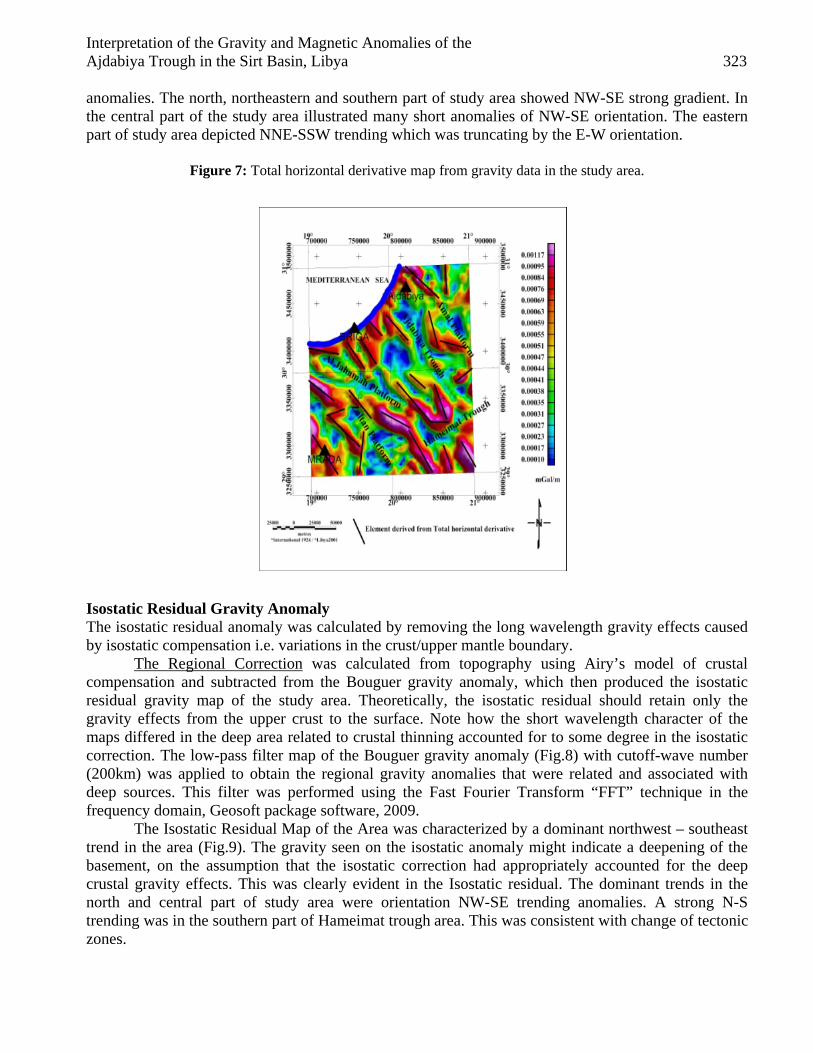
Filters used for Gravity and Magnetic Data in the Study Area. The interpretation of gravity and magnetic data can be aided by the application of several advanced processing, total horizontal derivative and Isostatic residual, regional for Bouguer gravity map. These techniques were applied in this study with the principle aim of adding to the understanding of the regional tectonics and structures. The success of the various techniques can vary often from area to another area dependent on a number of factors such as data quality and coverage, and the type of geological features being imaged. The results were presented throughout this paper where appropriate. Total Horizontal Derivative for Gravity Data This operation measured the rate of change of field in the X and Y directions and created a resultant grid. The horizontal gradient method was used to locate density or susceptibility boundaries from gravity data (Cordell, 1979) or magnetic (as pseudo gravity) data. This had the effect of highlighting high gradient areas such as of that which might occur at faulted boundaries. Viewed on a regional scale, it was useful for delineating structural trends. Azimuth specific horizontal derivatives can also be calculated to further highlight particular trends (Cordell and Grauch, 1985). In the study area, the map of horizontal gravity gradient, anomalies were observed throughout. The map showed that the northeastern, central, west and south parts of Study area (Fig.7) were strong horizontal gradient
Interpretation of the Gravity and Magnetic Anomalies of the Ajdabiya Trough in the Sirt Basin, Libya 323
anomalies. The north, northeastern and southern part of study area showed NW-SE strong gradient. In the central part of the study area illustrated many short anomalies of NW-SE orientation. The eastern part of study area depicted NNE-SSW trending which was truncating by the E-W orientation.
Figure 7: Total horizontal derivative map from gravity data in the study area.
Isostatic Residual Gravity Anomaly The isostatic residual anomaly was calculated by removing the long wavelength gravity effects caused by isostatic compensation i.e. variations in the crust/upper mantle boundary.
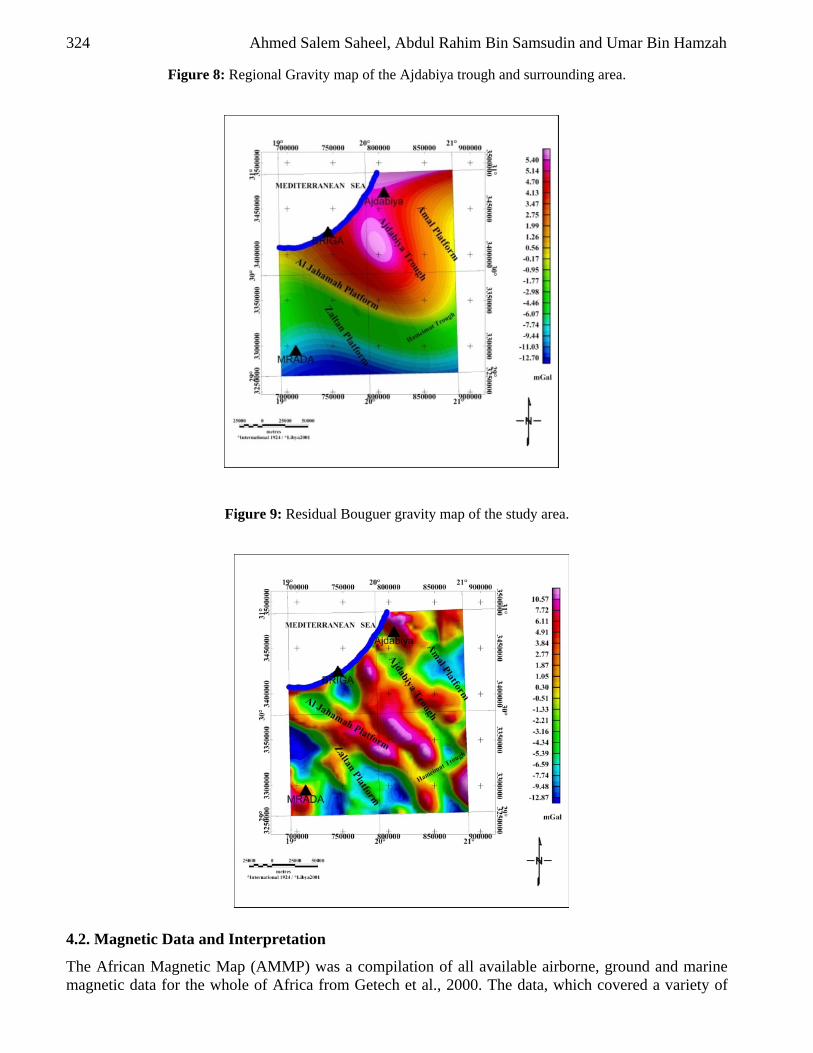
The Regional Correction was calculated from topography using Airy’s model of crustal compensation and subtracted from the Bouguer gravity anomaly, which then produced the isostatic residual gravity map of the study area. Theoretically, the isostatic residual should retain only the gravity effects from the upper crust to the surface. Note how the short wavelength character of the maps differed in the deep area related to crustal thinning accounted for to some degree in the isostatic correction. The low-pass filter map of the Bouguer gravity anomaly (Fig.8) with cutoff-wave number (200km) was applied to obtain the regional gravity anomalies that were related and associated with deep sources. This filter was performed using the Fast Fourier Transform “FFT” technique in the frequency domain, Geosoft package software, 2009.
The Isostatic Residual Map of the Area was characterized by a dominant northwest – southeast trend in the area (Fig.9). The gravity seen on the isostatic anomaly might indicate a deepening of the basement, on the assumption that the isostatic correction had appropriately accounted for the deep crustal gravity effects. This was clearly evident in the Isostatic residual. The dominant trends in the north and central part of study area were orientation NW-SE trending anomalies. A strong N-S trending was in the southern part of Hameimat trough area. This was consistent with change of tectonic zones.
324 Ahmed Salem Saheel, Abdul Rahim Bin Samsudin and Umar Bin Hamzah
Figure 8: Regional Gravity map of the Ajdabiya trough and surrounding area.
Figure 9: Residual Bouguer gravity map of the study area.
4.2. Magnetic Data and Interpretation
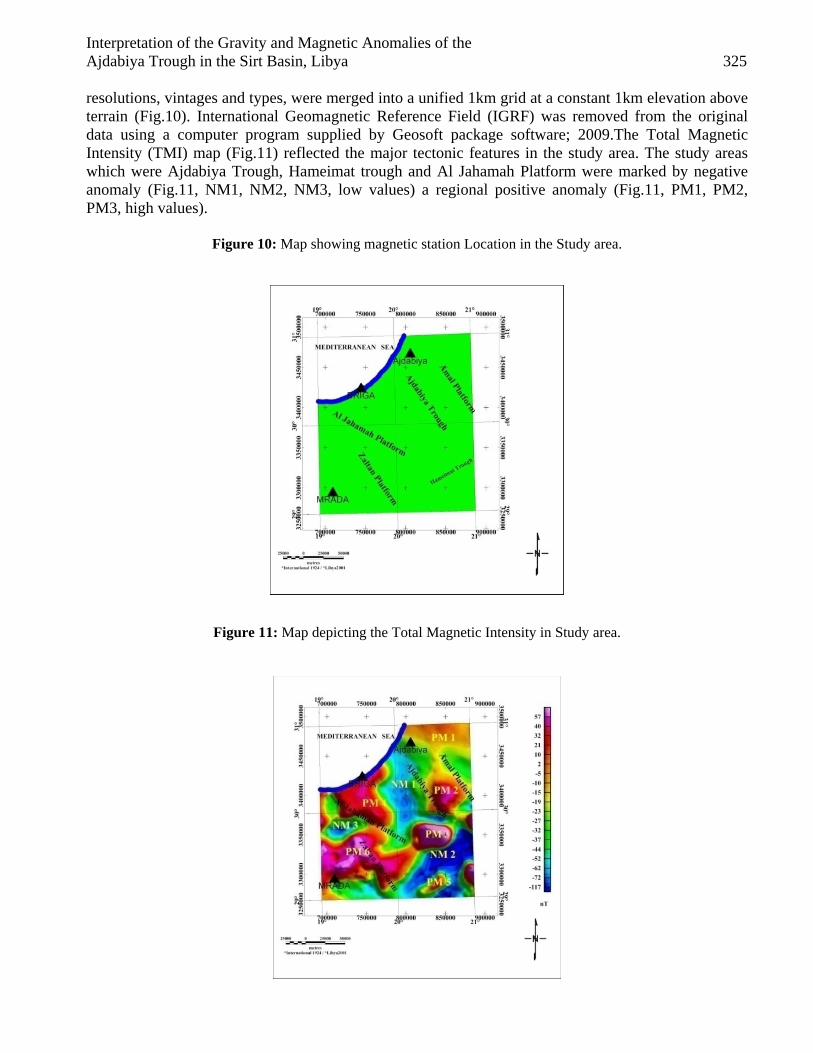
The African Magnetic Map (AMMP) was a compilation of all available airborne, ground and marine magnetic data for the whole of Africa from Getech et al., 2000. The data, which covered a variety of
Interpretation of the Gravity and Magnetic Anomalies of the Ajdabiya Trough in the Sirt Basin, Libya 325
resolutions, vintages and types, were merged into a unified 1km grid at a constant 1km elevation above terrain (Fig.10). International Geomagnetic Reference Field (IGRF) was removed from the original data using a computer program supplied by Geosoft package software; 2009.The Total Magnetic Intensity (TMI) map (Fig.11) reflected the major tectonic features in the study area. The study areas which were Ajdabiya Trough, Hameimat trough and Al Jahamah Platform were marked by negative anomaly (Fig.11, NM1, NM2, NM3, low values) a regional positive anomaly (Fig.11, PM1, PM2, PM3, high values).
Figure 10: Map showing magnetic station Location in the Study area.
Figure 11: Map depicting the Total Magnetic Intensity in Study area.
326 Ahmed Salem Saheel, Abdul Rahim Bin Samsudin and Umar Bin Hamzah
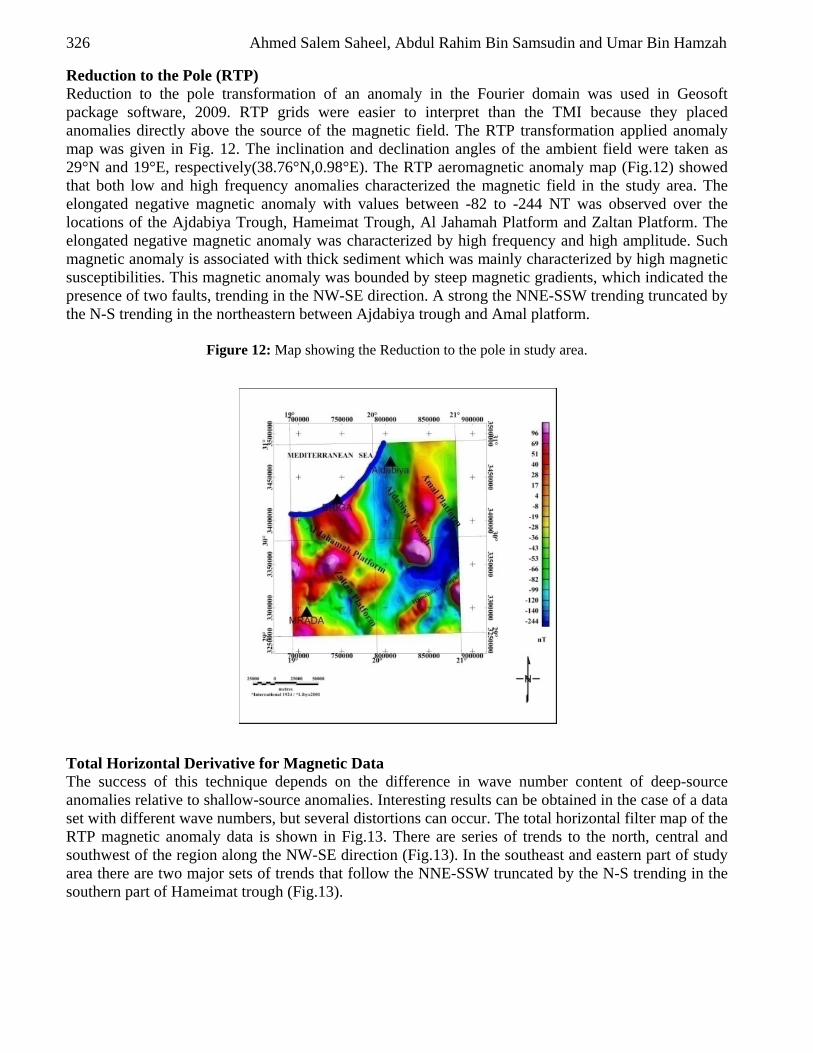
Reduction to the Pole (RTP) Reduction to the pole transformation of an anomaly in the Fourier domain was used in Geosoft package software, 2009. RTP grids were easier to interpret than the TMI because they placed anomalies directly above the source of the magnetic field. The RTP transformation applied anomaly map was given in Fig. 12. The inclination and declination angles of the ambient field were taken as 29°N and 19°E, respectively(38.76°N,0.98°E). The RTP aeromagnetic anomaly map (Fig.12) showed that both low and high frequency anomalies characterized the magnetic field in the study area. The elongated negative magnetic anomaly with values between -82 to -244 NT was observed over the locations of the Ajdabiya Trough, Hameimat Trough, Al Jahamah Platform and Zaltan Platform. The elongated negative magnetic anomaly was characterized by high frequency and high amplitude. Such magnetic anomaly is associated with thick sediment which was mainly characterized by high magnetic susceptibilities. This magnetic anomaly was bounded by steep magnetic gradients, which indicated the presence of two faults, trending in the NW-SE direction. A strong the NNE-SSW trending truncated by the N-S trending in the northeastern between Ajdabiya trough and Amal platform.
Figure 12: Map showing the Reduction to the pole in study area.
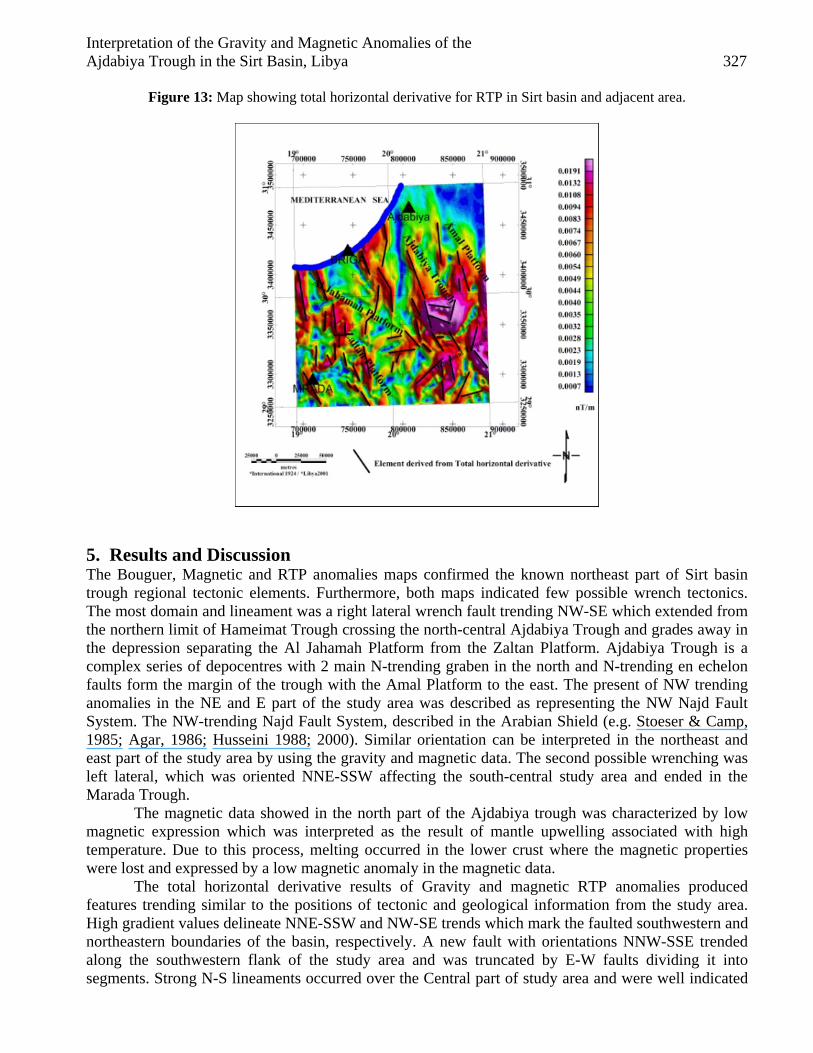
Total Horizontal Derivative for Magnetic Data The success of this technique depends on the difference in wave number content of deep-source anomalies relative to shallow-source anomalies. Interesting results can be obtained in the case of a data set with different wave numbers, but several distortions can occur. The total horizontal filter map of the RTP magnetic anomaly data is shown in Fig.13. There are series of trends to the north, central and southwest of the region along the NW-SE direction (Fig.13). In the southeast and eastern part of study area there are two major sets of trends that follow the NNE-SSW truncated by the N-S trending in the southern part of Hameimat trough (Fig.13).
Interpretation of the Gravity and Magnetic Anomalies of the Ajdabiya Trough in the Sirt Basin, Libya 327
Figure 13: Map showing total horizontal derivative for RTP in Sirt basin and adjacent area.
5. Results and Discussion The Bouguer, Magnetic and RTP anomalies maps confirmed the known northeast part of Sirt basin trough regional tectonic elements. Furthermore, both maps indicated few possible wrench tectonics. The most domain and lineament was a right lateral wrench fault trending NW-SE which extended from the northern limit of Hameimat Trough crossing the north-central Ajdabiya Trough and grades away in the depression separating the Al Jahamah Platform from the Zaltan Platform. Ajdabiya Trough is a complex series of depocentres with 2 main N-trending graben in the north and N-trending en echelon faults form the margin of the trough with the Amal Platform to the east. The present of NW trending anomalies in the NE and E part of the study area was described as representing the NW Najd Fault System. The NW-trending Najd Fault System, described in the Arabian Shield (e.g. Stoeser & Camp, 1985; Agar, 1986; Husseini 1988; 2000). Similar orientation can be interpreted in the northeast and east part of the study area by using the gravity and magnetic data. The second possible wrenching was left lateral, which was oriented NNE-SSW affecting the south-central study area and ended in the Marada Trough.
The magnetic data showed in the north part of the Ajdabiya trough was characterized by low magnetic expression which was interpreted as the result of mantle upwelling associated with high temperature. Due to this process, melting occurred in the lower crust where the magnetic properties were lost and expressed by a low magnetic anomaly in the magnetic data.
The total horizontal derivative results of Gravity and magnetic RTP anomalies produced features trending similar to the positions of tectonic and geological information from the study area. High gradient values delineate NNE-SSW and NW-SE trends which mark the faulted southwestern and northeastern boundaries of the basin, respectively. A new fault with orientations NNW-SSE trended along the southwestern flank of the study area and was truncated by E-W faults dividing it into segments. Strong N-S lineaments occurred over the Central part of study area and were well indicated
328 Ahmed Salem Saheel, Abdul Rahim Bin Samsudin and Umar Bin Hamzah
by the horizontal derivative. From this study the horizontal derivative provided very useful information of the rift structures. 6. Conclusion Generally, the low gravity anomaly expressions are normally associated with low trends features (troughs), while the high gravity anomaly expressions are associated with high features (platforms). However, some of the geological features within the study area are characterized by reverse gravity expressions. The platforms are having low gravity expressions and the troughs are having high gravity expressions. For example, the Ajdabiya trough is characterized by high gravity expression. On the other hand, the Zaltan platform is characterized by low gravity expressions.
Ajdabiya trough is characterized by two gravity anomaly indication high gravity anomaly expressions in the north part, which is characterized by long wavelength and low anomaly expressions on the southern part of trough. The northern part is showed by NW trend on both gravity and magnetic data. These two areas are separated by a pronounced ENE trending lineament, which is recognized on both gravity and magnetic data, and is interpreted as basement fault. The final conclusion is that both sides of the Ajdabiya trough represent different basement structure. 7. Acknowledgments The authors express their gratitude to the National Oil Corporation in Libya (NOC), the Libyan Petroleum Institute (LPI), the Shell Exploration teams in Tripoli and Rijswijk for providing gravity, magnetic data and the information needed for this Paper. We would like to thank the School of Environment and Natural Resource Sciences, Faculty of Science and Technology, Universiti Kebangsaan Malaysia for giving us the opportunity to use the facilities.
Interpretation of the Gravity and Magnetic Anomalies of the Ajdabiya Trough in the Sirt Basin, Libya 329
References [1] Ade-Hall J, Reynolds P, Dagley P, Mussett A, Hubbard T and Klitzsch E, 1974. Geophysical
studies of North African Cenozoic volcanic areas. 1: Haruj Assuad, Libya. Canadian Journal of Earth Sciences, 11. P 998-1006.
[2] Agar, R.A., 1986. The Bani Ghayy Group; sedimentation and volcanism in pull- apart grabens of the Najd strike-slip orogen, Saudi Arabian Shield. Precambrian Research,31:3. pp 259-274.
[3] Anketell, J. M., 1996. Structural history of the Sirt Basin and its relationships to the Sabratah Basin and Cyrenaica Platform, Northern Libya, The Geology of Sirt Basin, Volume III, pp 57-87.
[4] Ambrose, 2000. The geology and hydrocarbon habitat of the Sarir Sandstone, SE Sirt Basin, Libya: Journal of Petroleum Geology, v. 23, pp 165–192.
[5] Baird, D.W., Aburawi, R.M., and Bailey, N.J.L., 1996. Geohistory and petroleum in the Central Sirt Basin. In: Salem MJ, El-Hawat AS, and Sbeta AM (editors), The geology of the Sirt Basin. Elsevier, Amsterdam: pp.3-56.
[6] Barr, F.T. and Weegar, A.A., 1972. Stratigraphic nomenclature of the Sirte basin, Libya. Petrol. Explor. Soc. Libya, p179.
[7] Cordell, L.,1979, Gravimetric expression on graben faulting in santa Fe country and the Espanola basin, New Mexico: Guidebo., 30th Filed conf., Santa Fe country, N.Mex. Geol. Soc., pp 59-64.
[8] Cordell, L., and Grauch, V.J.S., 1985. Mapping basement magnetization zones from aeromagnetic data in the San Juan basin, New Mexico. The utility of regional gravity and magnetic anomaly rnaps, society of exploration geophysicists.
[9] Duronio, P., and Colombi, L., 1983. Mesozoic rocks of Libya, Spec. Pap, Petroleum Exploration Society Libya, pp 1-12.
[10] El Alami, M., 1996. Petrography and reservoir quality of the Lower Cretaceous Sandstone in the deep Mar Trough, Sirt Basin, in Salem, M.J., El-Hawat, A.S., and Sbeta, A.M., eds., The geology of Sirt Basin: Amsterdam, Elsevier, v. II, p. 309–322.
[11] Essed, A. S., 1978. A reconnaissance Bouguer gravity map of Libya, M.Sc. thesis, Purdue University.
[12] Geosoft, reference manual, 2009, software for Earth Sciences Geosoft INC.,Toronto, Canada. [13] Getech and Dr Saad Z Jassim, 2000. Libya A Tectonic and Depth – to-Basement study using
well, gravity and magnetic data, unpublished report, No G0030. [14] Ghori, K.A.R., and Mohammed, R.A., 1996. The application of petroleum generation modeling
to the eastern Sirt Basin, Libya, in Salem, M.J., El-Hawat, A.S., and Sbeta, A.M., eds., The geology of Sirt Basin: Amsterdam, Elsevier, v. II,pp 529–540.
[15] Goudarzi G. H., 1970. Geology and mineral resources of Libya: a reconnaissance. U.S.Geol. Surv. Prof. Paper no. 660, Washington, p104.
[16] Goudarzi, G.H., 1980, Structure—Libya, in Salem, M.S., and Busrewil, M.T., eds., The Geology of Libya: London, Academic Press, v. 3, pp 879–892.
[17] Gumati, Y.D., and Schamel, S., 1988. Thermal maturation history of the Sirte basin, Libya: Journal of Petroleum Geology, v. 11, pp 205–218.
[18] Hallett, D., 2002. Petroleum geology of Libya. Elsevier, Amsterdam, Netherlands. [19] Hallett, D., and El Ghoul, A., 1996. Oil and gas potential of the Deep Trough Areas in the Sirt
Basin, Libya. In: Salem MJ, El-Hawat AS, and Sbeta AM (editors), The geology of the Sirt Basin. Elsevier, Amsterdam: pp 455-484.
[20] Husseini MI, 1988. The Arabian Infracambrian extensional system. Tectonophysics 148(1-2): p.93-103.
[21] Husseini MI, 2000. Origin of the Arabian Plate structures; Amar collision and Najd Rift. GeoArabia (Manama) 5(4): p.527-542.
330 Ahmed Salem Saheel, Abdul Rahim Bin Samsudin and Umar Bin Hamzah
[22] MacGregor, D.S., and Moody, R.T.J., 1998. Mesozoic and Cenozoic petroleum systems of North Africa, in MacGregor, D.S., Moody, R.T.J., and Clark-Lowes,D.D., eds., Petroleum geology of North Africa: Geological Society, Special Publication 132, pp 201–216.
[23] Mansour, A.T., and Magairhy, I.A., 1996. Petroleum geology and stratigraphy of the southeastern part of the Sirt Basin, Libya. In: Salem MJ, El-Hawat AS, and Sbeta AM (editors), The geology of the Sirt Basin. Elsevier, Amsterdam: pp 485- 428.
[24] Montgomery, S., 1994. Sirte Basin, North-Central Libya, prospects for the future: Petroleum Frontiers, Petroleum Information Corporation, v. 11, no. 1, 94 p.
[25] Moritz, H., 1984.Geodetic reference system 1980,Bul. Geode’sique,v.58,pp 388-393. [26] Parsons, M.B., Azgaar, A.M., and Curry, J.J., 1980. Hydrocarbon occurrences in the Sirte
Basin, Libya, in Miall, A.D., ed.: Canadian Society Petroleum Geologists Memoir 6, pp 723– 732.
[27] Roohi. M, 1996. First symposium of the sedimentary Basins of Libya:Geology of Sirt Basin, vol.II, pp 323-336.
[28] Sahil, A. S., 1995. An Integrated geophysical study in Murzuq Basin (Southwest Libya). M Phil Thesis, University of Leeds.
[29] Shah,S.H.A., Mansouri,A., El Ghoul, M., 1993, Paleozoic sandstone reservoirs of the Hammada (Ghadames) Basin,NW Libya: Effects of synsedimentry processes on porosity. Journal of Petroleum Geology,v.16(3),pp.345-352.
[30] Stoeser, D.B., and Camp, V.E., 1985. Pan-African microplate accretion of the Arabian Shield. Geological Society of America Bulletin, 96:7. pp 817-826.
[31] Suleiman, A. S., 1994. Geophysics of the rifts associated with the Sirt Basin (North Africa) and the Anadarco Basin (North America), Doctoral Dissertation, University of Texas at El Paso, pp 150.
[32] Thomas, D., 1995. Exploration limited since 70s in Libya’s Sirte basin. Oil and gas journal. Vol. 93, no. 11, pp 99-104


