Embed Size (px)
Citation preview
Mikrochimica Acta [Wien] 1983 III, 399414
O by Springer-Verlag 1983
Metallwerk Plansee GmbH, A-6600 Reutte, Austria, and Institute for Physical Chemistry, University of Vienna, Austria
Analytical Data in Technology, Their Analysis, Structure and Interpretation*
By
Erich Kny and Gerhard Nauer
With 11 Figures
(Received October 10, I983)
Most of the many data that are collected during production of industrial goods, for quality control of raw materials and pro- ducts, and for R & D purposes are related to a specific object, sample, batch of raw material, or product. To generalize, such samples, batches, products or, whatsoever may be called objects. The properties of those objects are measured; this can be the trace element content, the chemical composition, the physical character- istics, the color, size, or any other attribute which is used to char- acterize the objects in question. To generalize, attributes, prop- erties, dimensions, etc. may called characters. In the case that M objects are characterized in L characters, the data collection can be arranged into a data matrix of size M • L. Each row of this matrix describes one single object characterized by L characters.
It is almost obvious to mention that large multivariate data matrices are very difficult to overlook, and that the inherent infor- mation is hard to extract. In common technological practice, some of the most significant property values are checked to fall within the limits of a predetermined interval. Additional to that, some simple statistical evaluations are carried out with the data. Any other valuable informatoin will in effect be lost if the data are just
* Paper presented at the 19th International Symposium on Micro- chemical Techniques, Amsterdam, August 1983.
26 Mikrochim. Acta 1983 11[/5-6
400 E. Kny and G. Nauer:
filed after such a simple procedure. Chemometrics offers powerful tools to deal with multivariate data. Clustering technique is among these tools. The two main techniques used in clustering are the hierarchical and the non-hierarchical clustering technique. While hierarchical techniques find widespread use in the life sciences, non- hierarchical techniques are more appropriate for technological and analytical chemical data. A non-hierarchical clustering algorithm 1 has been adopted for this purpose and has been described elsewhere. To this an effective iterative, selfstarting strategy has been developed to enhance the basic algorithm 2.
This paper deals with additional developments to measure the clustering significance of the results of the clustering procedure.
Definition of Terms Used
Basic terms which are used throughout are summarized here:
Data Matrix
Any set of numerical data which can be arranged in such a way that each row represents an object which is characterized by a number of mea- sured characters. The characters make up the columns of the data matrix. The term object is synonymous with the term OTU which is used in Numerical Taxonomy a.
Partition
The arrangement of the objects of the data matrix into groups (Clusters) according to the similarity of their characters.
Target Function
A function used in the clustering procedure that can be calculated from any particular partition. The partition with the highest or lowest possible value of the target function is defined to be the optimum partition for a fixed number of clusters.
Clustering Significance Parameter
A parameter derived from the optimum partition for the purpose of comparing optimum partitions of different cluster numbers with each other.
Experimental
All computations have been carried out with the aid of a table desk calculator HP 9825. With a RAM of 23 kbytes the calculator can handle up to 2000 matrix elements. One floppy disk drive was
Analytical Data in Technology 401
used for permanent data storage and for storage of intermediate results. A 80 column printer was used for output. Prior to the calcu- lations, the data matrix was standardized 3 to give each column equal weight. The Euclidean distance was used as a measure of similarity. The algorithm uses the non-hierarchical clustering technique KMEANS 1 modified in its search strategy to arrive at the absolute minimum of the target function in a reasonable time 2. The sum of the squared distance from each cluster member to its cluster center (center of gravity) is taken as target function. This target function is minimized as much as possible by exchanging the cluster mem- bers between different clusters. The programmes are written in HPL, a programming language similar to BASIC. The computation speed of the rather slow HP 9825 table desk calculator permits to finish a complete structural analysis of a 2000 element matrix in about 12 hours. The same task has been performed on a somewhat faster ECLIPSE S 104 minicomputer in about 1.5 hours. The full programme listing with detailed documentation is published sep- arately 4.
Measures for Clustering, Significance
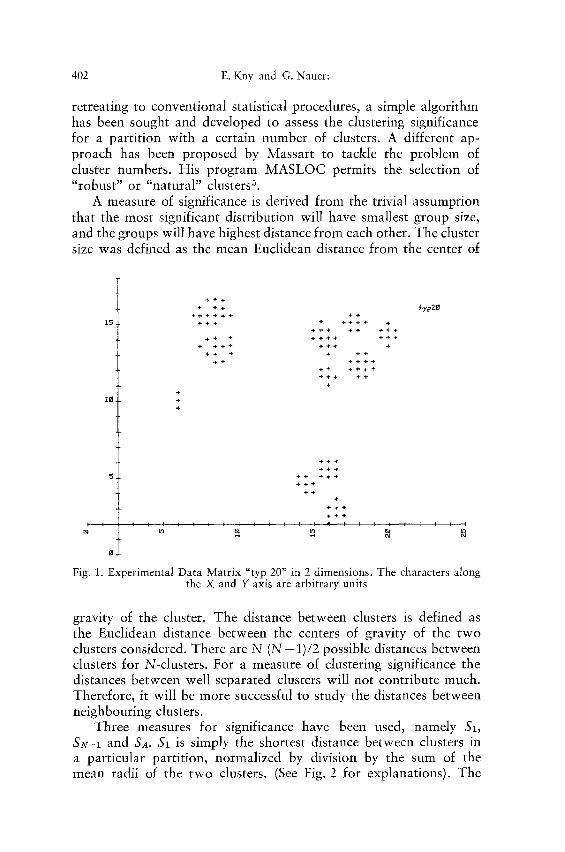
The data matrix represents the distribution of M elements, the rows of the matrix, in L-dimensional space (L = number of char- acters). Each character defines one of the L axes in L-dimensional space. For L = 2 or L = 3 this is easily visualized in a graph or in a 3-D model. The objects in Fig. 1 represent a well developed struc- ture when plotted as a graph according to their two dimensions. One can argue about the number of groups contributing to the overall structure, but most observes will either find 3, 4, or 11 groups to represent the data matrix best. The partition of the data matrix into for example 2, 5, or 9 groups will bear less significance in repre- senting "true" structure, although such a partition is possible and can be calculated by hierarchical and non-hierarchical clustering techniques. A conventional procedure of clustering technique will be of no help in finding the most likely number of groups which represent the "true" structure. Conventional techniques rather re- quire from the operator to define the cluster number in advance.
The results of the clustering procedure have to be evaluated afterwards according to their significance, and partitions with dif- ferent number of clusters have to be compared with each other. This can be a very tedious and time consuming procedure. The significance of a partition into groups can be calculated by tech- niques of statistical multivariate analysis, but certain assumption have to be made about the distribution of the data points. Instead of
26*
402 E. Kny and G. Nauer:
retreating to conventional statistical procedures, a simple algorithm has been sought and developed to assess the clustering significance for a partition with a certain number of clusters. A different ap- proach has been proposed by Massart to tackle the problem of cluster numbers. His program MASLOC permits the selection of "robust" or "natural" clusters 5.
A measure of significance is derived from the trivial assumption that the most significant distribution will have smallest group size, and the groups will have highest distance from each other. The cluster size was defined as the mean Euclidean distance from the center of
1 5
5 .
I I ISl
+ + +
+ ++
+ + + + + § ++
§ 2 4 7 § + § 2 4 7 2 4 7 + §247 §247 +++
§ § § 2 4 7 +§247
+ +§ +++
++ + + +§
++ + + + §
++ + §
+++ §247
+
~+yp2g
§ 2 4 7
+ §
§ 2 4 7 § 2 4 7 2 4 7
§ 2 4 7 2 4 7
§ 2 4 7 §
§
+ + +
I I I I I I I I I I I I I W I I I I I I I I I
Fig. 1. Experimental Data Matrix "typ 20" in 2 dimensions. The characters along the X and Y axis are arbitrary units
gravity of the cluster. The distance between clusters is defined as the Euclidean distance between the centers of gravity of the two clusters considered. There are N ( N - 1)/2 possible distances between clusters for N-clusters. For a measure of clustering significance the distances between well separated clusters will not contribute much. Therefore, it will be more successful to study the distances between neighbouring clusters.
Three measures for significance have been used, namely $1, S~v-z and SA. $1 is simply the shortest distance between clusters in a particular partition, normalized by division by the sum of the mean radii of the two clusters. (See Fig. 2 for explanations). The
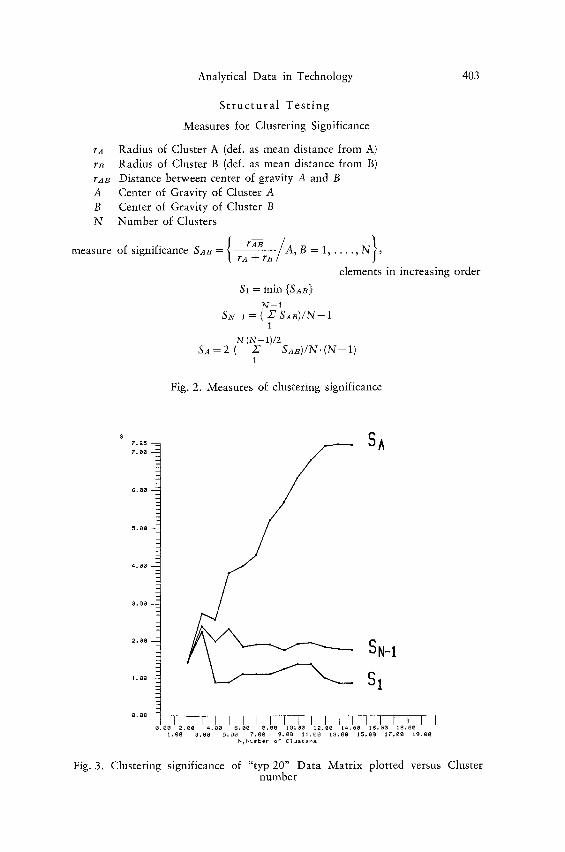
Analytical Data in Technology 403
S t r u c t u r a l T e s t i n g
Measures for Clustering Significance
rA Radius of Cluster A (def. as mean distance from A) rB Radius of Cluster B (def. as mean distance from B) rAT Distance between center of gravity A and B A Center of Gravity of Cluster A B Center of Gravity of Cluster B N Number of Clusters
/a } measure of significance SAB = | ~ / , B = 1, . . . . , N ,
elements in increasing order
$1 = min {SAB} N--1
SN-1 = ( X S A B ) / N - - 1 1
N (N--1)/2 SA = 2 ( X SAB)/N" ( N - - 1)
1
Fig. 2. Measures of clustering significance
7.25
?.O8
4.20
3 . 2 2
S
SN-I
$I
I I I L I I I i I I I b I I I I I I e.80 2.20 4.0o 6.22 8.22 12;20 12.80 t4 .00 12 .00 18.02
1,28 3,80 5.80 7,08 9.28 11.22 13.22 15.82 17,28 19.00 HjHumber of" C1u~ter~
Fig. 3. Clustering significance of "typ 20" Data Matrix plotted versus Cluster number
404 E. Kny and G. Nauer:
two clusters will be separated the better the more $1 is above 1. For values of S < 1 the two clusters are not separated completely. Not only the shortest distance between two clusters ought to be considered. The distance of the nearest cluster to each ought cluster contributes to the overall clustering significances mot. As an ap- proximation the term SN-1 is computed by adding together the N - 1 shortest normalized distances. After dividing this term by N - 1 the resulting term SN-1 represents the mean value of the N - 1 shortest normalized distances between clusters in a particular parti- tion. SA is simply the mean normalized distance between clusters computed for all possible distances.
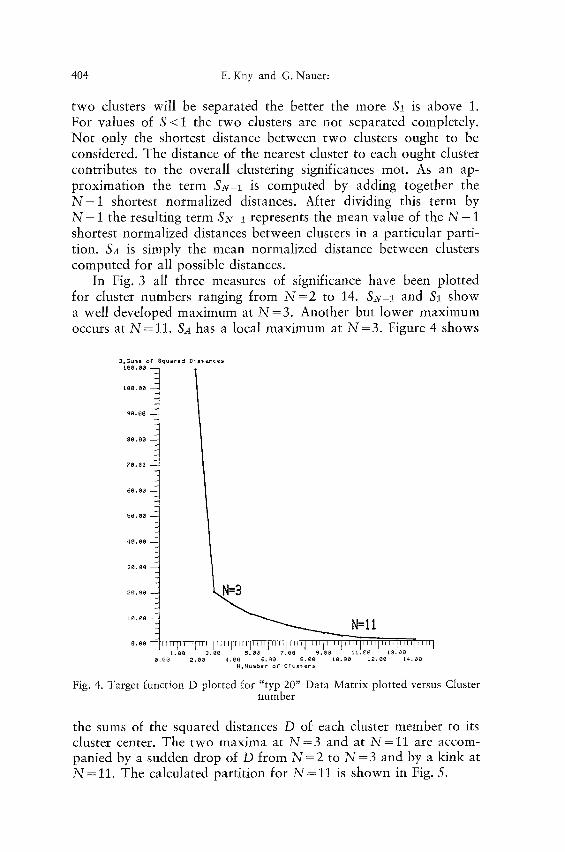
In Fig. 3 all three measures of significance have been plotted for cluster numbers ranging from N = 2 to 14. &v-1 and $1 show a well developed maximum at N =3. Another but lower maximum occurs at N=11. SA has a local maximum at N=3 . Figure 4 shows
#,Sums of Squared Distances 108 .00 - -
1oo.oo
90 .00
00 .00
70 .00
6 0 . 0 0
50 .ae
48 .00 -
30 .88 -
20 ,0o - q
10 .00 -
N,--3
N=II 0.00- , , , [ , , , q , , , , i , , , , i , , , , i , , , , I . . . . i ~ , , , i , , , , i , , , q , , , , i , , , ~ [ , , ~ , i , , , ~ , , , , i
1.00 3.00 5.00 7.00 9.00 II,00 t3.00 0.00 2,00 4.00 ~,00 0,00 10,00 12.00 14.00
NsNumber o~ CTusters
Fig. 4. Target function D plotted for "typ 20" Data Matrix plotted versus Cluster number
the sums of the squared distances D of each cluster member to its cluster center. The two maxima at N = 3 and at N = 11 are accom- panied by a sudden drop of D from N = 2 to N = 3 and by a kink at N=11. The calculated partition for N = 11 is shown in Fig. 5.
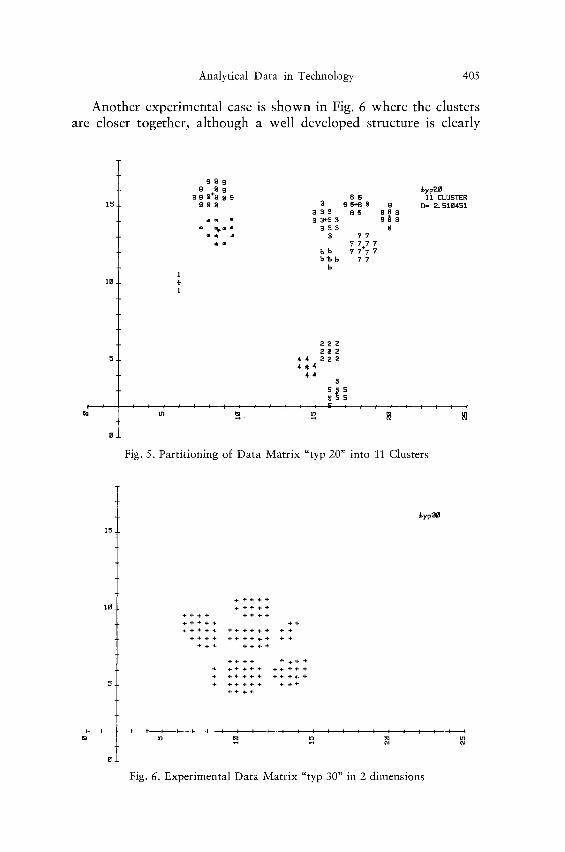
Analytical Data in Technology 40S
Another experimental case is shown in Fig. 6 where the clusters are closer together, although a well developed structure is clearly
15
10
5 .
]3.
9 9 9 9 9 9 s
9 9 S+S S 9 6 S 11 CLUSTER 9 9 S ~1 6 6 + 6 S 8 D= 2, $ 2 0 4 5 2
3 3 3 6 6 8 8 8 = , ~ = 3 3 + 3 3 8 w
= % = = 3 3 3 8 e e = 3 7 7
~ =
'/+7 b ' ~ b 7 7
b
2 2 2 2 2 2
44 2 2 2 4 ~ 4
4 4 5
S s~s S
! l i ! I i 1 l i l i : l 5 l ? i J J J i i ?
Fig. 5. Partitioning of Data Matrix "typ 20" into 11 Clusters
I
byp3~
§ 2 4 7 2 4 7 2 4 7 § 2 4 7
§ 2 4 7 2 4 7 + § 2 4 7 2 4 7 + § 2 4 7 + § + + + + ~ + + § 2 4 7 §
+ § 2 4 7 § 2 4 7 2 4 7 2 4 7 § 2 4 7 + + ~ § 2 4 7 2 4 7 2 4 7
§ 2 4 7 2 4 7 2 4 7 § 2 4 7 2 4 7 § 2 4 7 2 4 7 2 4 7 + § 2 4 7
§ § 2 4 7 2 4 7 2 4 7 § 2 4 7 + § 2 4 7 2 4 7 2 4 7 § 2 4 7 + + * +
I l l n l l l l t l l l l l l l l l l l I I
Fig. 6. Experimental Data Matrix "typ 30" in 2 dimensions
406 E. Kny and G. Nauer:
2.G5 - - 2.6@ - -
2.5@ - -
2.463 i
2 . 3 0 - -
2 . 2 0 - -
2 , 1 0 - -
2,•0 - -
1.9@ - -
1 .80 - -
1 , 7 o - -
1 . ~ a - -
1,~@ - -
1 , 4 @ - -
1 , 3 0 - -
1 .20 --
1 . 1 o - -
1 ,e@ - -
0 . 9 0 - -
0 . @ @ - -
0.?@ - -
0.6@ --
0.50 --
@ , 4 0 - -
0 . 3 @ - -
@,2@ - -
@. 1 o --
0.00
STRUCTURAL TESTING j*
f /
/
/
/'J S / ^
/ /
1
l /
/
~.J \ ,." \ i / ~ ....
@.@@ 10,o@
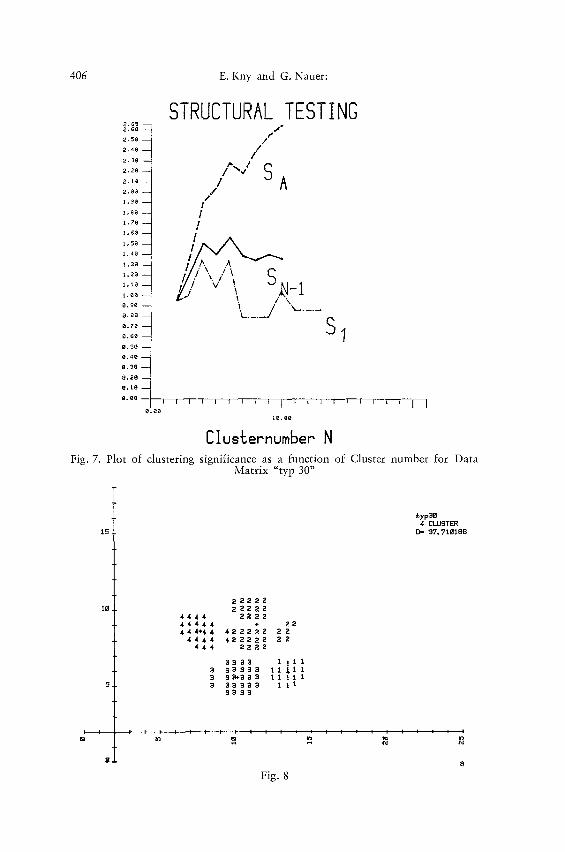
Cluslernumber N Fig. 7. Plot of clustering significance as a function of Cluster number for Data
Matrix "typ 30"
15
10
I
0 ,
~ y p 3 B 4 CLUSTER
D= 3 7 . 7 1 0 1 8 6
2 2 2 2 2 2 2 2 2 2
. 4 4 4 4 2 ' = ' 2 2 4 4 4 4 4 + 2 2 4 4 4 + 4 4 4 2 2 2 2 2 3
4 4 4 4 4 2 2 2 3 2 2 2 4 4 4 2 2 2 2
3 3 3 3 1 1 1 1 3 3 3 3 3 3 1 1 ~.1 ! 3 3 ~ - 3 3 3 1 1 1 1 1 3 3 3 3 1 3 3 1 1 1
3 3 3 3
. . . . . . . . . . . . . . . . . o . . . o ~ . . . .
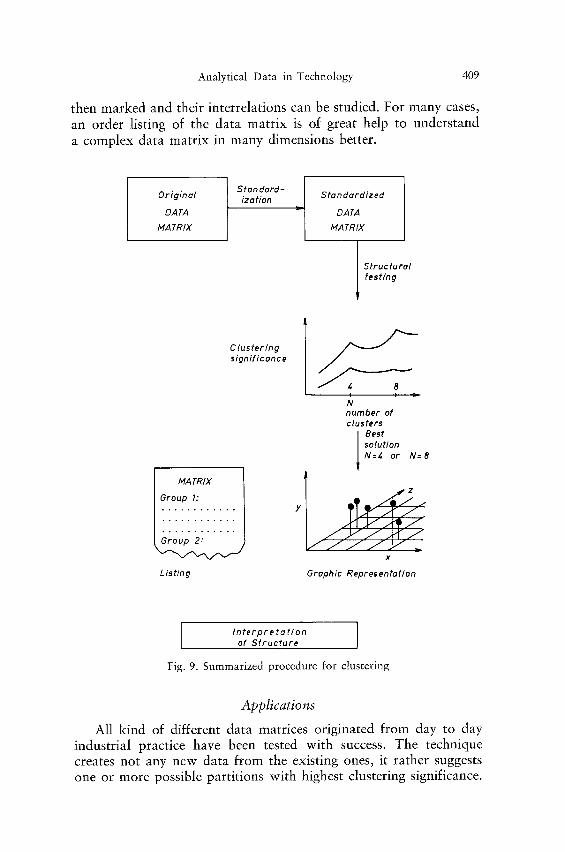
Fig. 8
Analytical Data in Technology 407
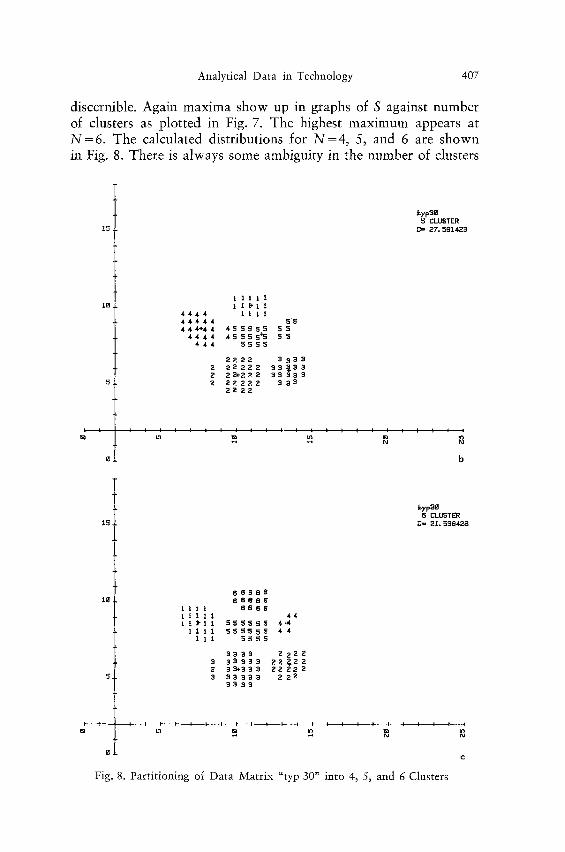
discernible. Again maxima show up in graphs of S against number of clusters as plotted in Fig. 7. The highest maximum appears at N= 6. The calculated distributions for N=4 , 5, and 6 are shown in Fig. 8. There is always some ambiguity in the number of clusters
15
~yp30 5 CLUSTER
D= 27.5g1423
1 1 1 1 1 111< '11
4 4 4 4 1 1 1 1 4 4 4 4 4 $5 4 4 4 + 4 4 4 5 5 5 5 5 5 5
4 4 4 4 4 5 5 5 5 + ' 3 5 5 4 4 4 5 5 5 5
2 2 2 2 3 3 3 3 2 2 2 2 2 E 3 5 - ~ 3 3 2 2 Z ~ 2 2 2 3 5 3 3 5 2 2 2 2 2 2 3 3 3
22 2 2
H H N N
s 8 CLUSTER
D= 21.538428
BSSS6 Ssees
1111 SSss 11111 44 1111"11 S ~ S S S 5 4~ 1111 S S ~ 3 S S 44
111 ~ S S
33S~ 2222 9 3 3 9 3 3 2 2 ~ 2 2
3 3 * 3 3 3 2 2 2 2 2 3 3 3 3 3 3 2 2 2
3 3 3 3
l l l l l l l l l l l l l l l l l l l l l l
Fig. 8. Partitioning of Data Matrix "typ 30" into 4, 5, and 6 Clusters
408 E. Kny and G. Nauer:
representing the "true" structure, but the measures of clustering significance are appearently a good guide to evaluate partitions with different cluster numbers.
The definition of the cluster size as the mean circular radius gives preference to circular or, for higher dimensions, hypercircular cluster shapes. However, by the particular measure for cluster size taken, this preference could be changed to give preference to other cluster shapes.
The prerequisite of such a clustering significance test will be a powerful algorithm which arrives at the absolute minimum of the chosen target function in a reasonable time. For this purpose, the algorithm APART with its iterative, selfstarting capabilities to over- come local minima of the target function has proven valuable 2. A local minimum of the target function represents an alternate partition of the data matrix with smaller clustering significance parameters. Such a local minimum of the target function can simu- late a local maximum in the plot of the significance parameters versus the cluster numbers. It is therefore advisable to check a local maximum for stability by increasing the number of iterative steps in the cluster procedure APART 2.
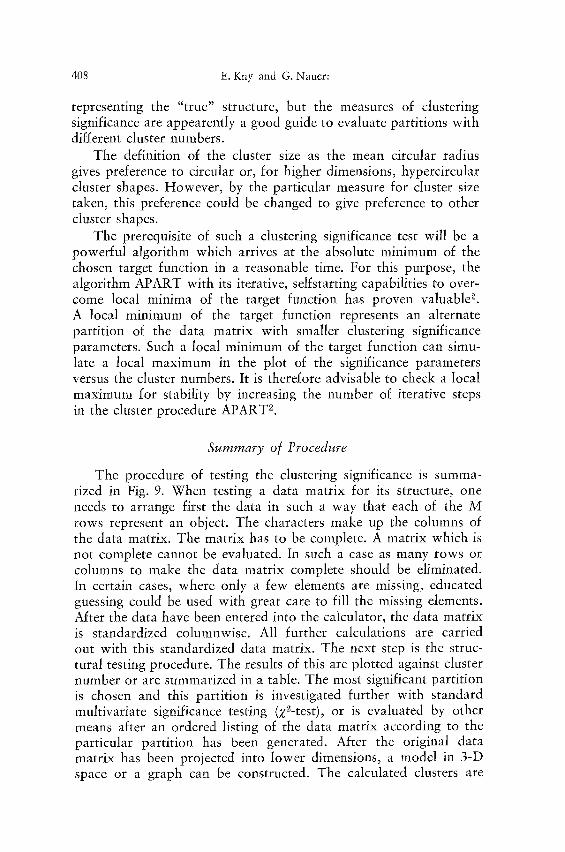
Summary o[ Procedure
The procedure of testing the clustering significance is summa- rized in Fig. 9. When testing a data matrix for its structure, one needs to arrange first the data in such a way that each of the M rows represent an object. The characters make up the columns of the data matrix. The matrix has to be complete. A matrix which is not complete cannot be evaluated. In such a case as many rows or columns to make the data matrix complete should be eliminated. In certain cases, where only a few elements are missing, educated guessing could be used with great care to fill the missing elements. After the data have been entered into the calculator, the data matrix is standardized columnwise. All further calculations are carried out with this standardized data matrix. The next step is the struc- tural testing procedure. The results of this are plotted against cluster number or are summarized in a table. The most significant partition is chosen and this partition is investigated further with standard multivariate significance testing (Z~-test), or is evaluated by other means after an ordered listing of the data matrix according to the particular partition has been generated. After the original data matrix has been projected into lower dimensions, a model in 3-D space or a graph can be constructed. The calculated clusters are
Analytical Data in Technology 409
then marked and their interrelations can be studied. For many cases, an order listing of the data matrix is of great help to understand a complex data matrix in many dimensions better.
Original DATA
MA TRIX
Standard- ] ization Start dardized
~= DATA MA TRIX
Strut rural testing
Clustering significance
~via TRIX I
I
Listing
N number of clusters
I Best solution N=4 or N= 8
x
Graphic Representation
I Interpre to tion ] of Structure I
Fig. 9. Summarized procedure for clustering
Applications All kind of different data matrices originated from day to day
industrial practice have been tested with success. The technique creates not any new data from the existing ones, it rather suggests one or more possible partitions with highest clustering significance.
410 E. Kny and G. Nauer:
After the data have been structured according to this partition, it is the task of the observer to evaluate the statistical significance of this particular partition by a, for example, standard Z2-test. (Such a test is provided with the programming package.) If this particular partition is shown to be significant for a chosen confi- dence level, the partition can then be used to check hypotheses, etc. A structured data matrix is in most cases of great help to com- prehend the interrelations of data elements. Two examples are presented to clarify the procedure further.
Trace Element Content o[ Co-Powders
42 cobalt powder batches which were used for cemented carbide production have been analysed for 16 trace elements (N, H, C, S, Mn, Fe, Ni, Cu, Zr, Na, K, Mg, Ca, Si, Cr). Together with the average Fisher grain size this makes up a 42 x 17 data matrix. Some of the cobalt powders received from 5 different suppliers form "flakes" during milling. These "flakes" give problems in the subsequent processing of hardmetals and their formation is highly undesirable. The plot of the clustering significance for this data matrix shows partitions with N = 5 , 9, or 21 the ones with highest clustering significance. A close examination shows the parti- tion with 9 clusters only weakly separated. The partition with 21 clusters has a well separated structure, and the clusters obtained reflect the origin and the manufacturers of the powders very closely. This is not surprising, since trace elements are a function of raw materials and the process of manufacture. In this particular partition, as in any other of the distinguished partitions including the one with 2 clusters, the cobalt powders which are prone to form "flakes" are not united in a single cluster, but are rather scattered among many clusters.
Therefore, it was concluded that the trace elements investigated have no relation to the "flake" forming behaviour. The powders which are prone to form "flakes" during milling have nothing in common concerning their trace element content. It is therefore unlikely that impurities in the cobalt powders contribute to the "flake" forming behaviour. The cause of this undesired behaviour has to be sought in other properties of the cobalt powders. This has indeed been found in the ratio of hexagonal to cubic cobalt modification and in the width of the grain size distribution. The cubic, high temperature, cobalt modification which is more ductile than the hexagonal one makes the powders more susceptible to form "flakes". The ratio of hexagonal to cubic depends on the manufacturing procedure and the temperatures used. Another ira-
Analytical Data in Technology 411
portant influence is exerted by the grain size distribution which is again influenced by the manufacturing procedure. The details of this investigation have been published elsewhere 6.
Cemented Carbide Alloys
The large number of different cemented carbide alloys is diffi- cult to overlook. The main properties which distinguish the dif- ferent alloys and make up their different technological behaviour
3 . 2 3 - - = STRUCTURAL TESTING d'
I I
I
l 'v' ! /
S ! ! /\ /
p.... ./-.j ~J
@.e@
e.o@ [email protected]
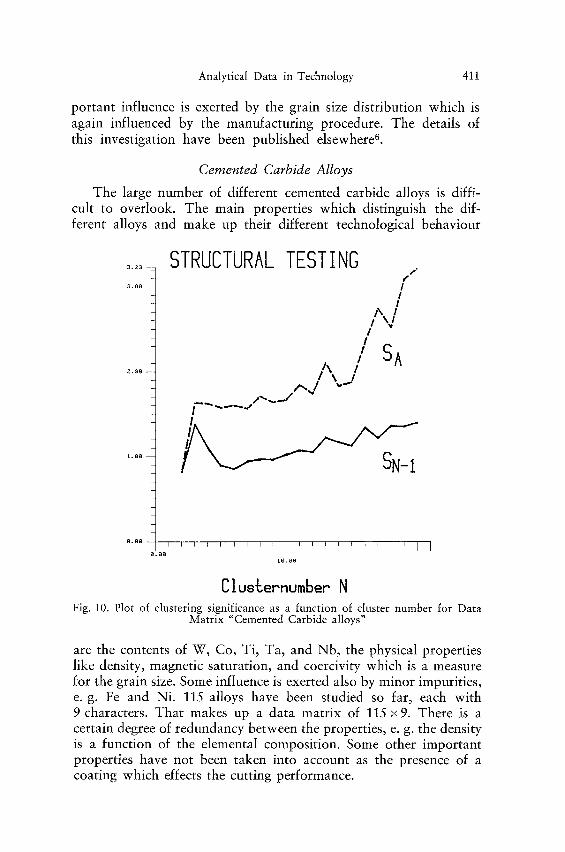
Clus~ernumber N Fig. 10. Plot of clustering significance as a function of cluster number for Data
Matrix "Cemented Carbide alloys"
are the contents of W, Co, Ti, Ta, and Nb, the physical properties like density, magnetic saturation, and coercivity which is a measure for the grain size. Some influence is exerted also by minor impurities, e.g. Fe and Ni. 115 alloys have been studied so far, each with 9 characters. That makes up a data matrix of 115 x9. There is a certain degree of redundancy between the properties, e. g. the density is a function of the elemental composition. Some other important properties have not been taken into account as the presence of a coating which effects the cutting performance.
412 E. Kny and G. Nauer:
Nevertheless, it was the aim of this study of reveal the structure of this data matrix and to study its structure and its relations to the overall cutting performance of the alloys. A well developed maximum at a cluster number of 3 represents the broad classifi- cations of the alloys in three categories: One category consists of the straight WC-Co-alloys used for cutting cast iron, the other of the alloys containing mixed carbides used for steel cutting, and the third or exotic compositions. This partition, although well ac- cepted in technology, contributes not any new information. By
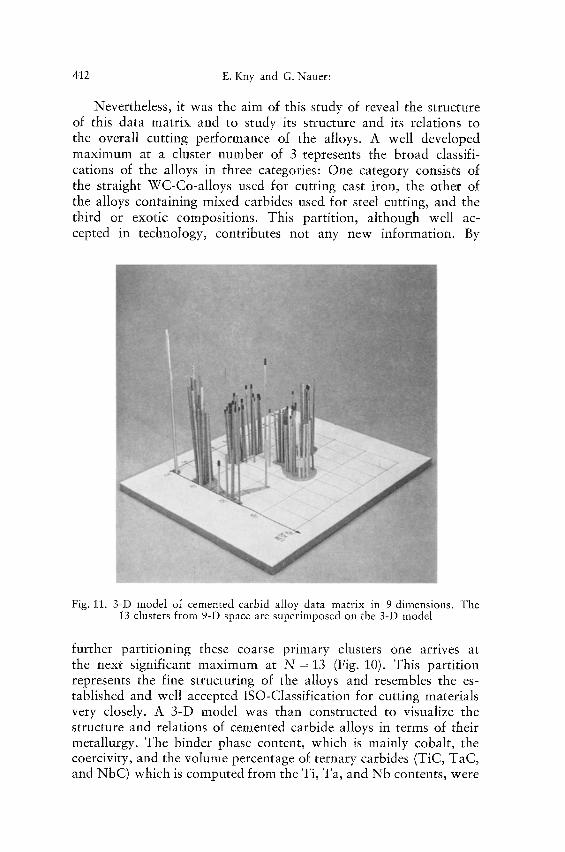
Fig. 11. 3-D model of cemented carbid alloy data matrix in 9 dimensions. The 13 clusters from 9-D space are superimposed on the 3-D model
further partitioning these coarse primary clusters one arrives at the next significant maximum at N = 13 (Fig. 10). This partition represents the fine structuring of the alloys and resembles the es- tablished and well accepted ISO-Classification for cutting materials very closely. A 3-D model was than constructed to visualize the structure and relations of cemented carbide alloys in terms of their metallurgy. The binder phase content, which is mainly cobalt, the coercivity, and the volume percentage of ternary carbides (TIC, TaC, and NbC) which is computed from the Ti, Ta, and Nb contents, were
Analytical Data in Technology 413
chosen as the three axes. This reduction in dimensionality can, in general, be done by principal component analysis, although this ac- cepted, and are important parameters for hardmetal manufacturing and alloy development. The model is depicted in Fig. 11. By such modelling in 3 dimensions some of the information available in 9 dimensions gets inevitably lost. This is demonstrated by superim- posing the 13 clusters, as revealed by structural analysis, onto the 3-D model. Although some of the structure in 3-D space coincides with the clusters of 9-D character space, there is a lot of over- lapping of clusters, when the data structure from 9-D space is projected onto 3-D space. The distinguished partition with 13 clus- ters has an overall statistical significance, evaluated in a standard X2-test, well above the 95% confidence level.
This model and the associated clusters from the complete char- acter space are of great help in studying the relations between metallurgy and cutting performance. The established clusters coin- cide in most cases with ISO-Classification for cutting materials al- though there are some interesting deviations from this which can now be studied in detail with the help of this particular clustering technique. In another case, the cemented carbide alloys used for cutting of superalloys have been structured by such a technique. The results of this are published elsewhereL
Summary
Analytical Data in Technology, Their Analysis, Structure and Interpretation
For analysis and understanding of complex analytical data the search for internal structure, if there is any, will be the most pro- mising strategy. A non-hierarchical clustering technique has been employed for this purpose. The important question of how many clusters will represent the structure of the data matrix can be deter- mined by an algorithm which gives a measure for the clustering significance of the distribution into a number of clusters. The dis- tribution with a high clustering significance will then be taken as the distribution which resembles the internal data structure best. The algorithm and its performance is demonstrated. Two examples of industrial practice are shown. The technique proves useful for the control of raw materials quality by their trace elements and for the evaluation of a number of cemented carbide compositions by their physical and chemical properties. The obtained distribution into groups reflects the technological properties of the alloys very
414 E. Kny and G. Nauer: Analytical Data in Technology
closely. An easy understanding of data structure and interrelations of elements can be obtained by this approach.
Zusammenfassung
Analytische Datensammlungen, deren Analyse, Struktur und Interpretation
Die Suche nach einer inneren Struktur in komplexen analytischen Daten- sammlungen ist eine zielfiihrende Strategie, um ein besseres Verst~indnis der Daten und ihre Analyse zu gew~ihrleisten. Fiir diesen Zweck wurde eine nichthierarchische Cluster-Technik verwendet. Zur Beantwortung der wichtigen Frage, durch wie vide Gruppen die jeweilige Datensammlung am besten repr~isentiert wird, wurde ein Algorithmus entwickelt, der die Ermittlung der Gruppensignifikanz gestattet. Die Gruppeneinteilung mit einer hohen Gruppensignifikanz wird dann als jene aufgefaf~t, die die innere Struktur der Datensammlung am besten repr~isentiert. Der Algorithmus und seine Leistungsf/ihigkeit werden demonstriert. Zwei Beispiele aus der industriellen Praxis werden angefiihrt. Einmal wurde diese Cluster-Technik verwendet, um Rohstoffe nach Spurenelementgehalten zu klassifizieren, und ein anderes Mal zur Darstellung einer Reihe von Hartmetallegierungen entsprechend ihren physikalischen Eigenschaften sowie ihrer chemischen Zusammensetzung. Die erhaltene Einteilung in Gruppen reflektiert die tecb- nologischen Eigenschaften dieser Legierungen. Durch diese Cluster-Technik ist es mSglich, die Struktur yon Datensammlungen zu untersuchen und die Beziehungen zwischen den Gruppen zu studieren.
References
1 j. McQueen in: L. M. Le Cam and J. Neymen (eds.), Proc. 5th Ber- keley Syrup. on Math. Statistics and Probability, Vol. 1, Berkeley, Calif., University of California Press. 1967. pp. 281--297.
2 E. Kny and G. Nauer, Mikrochim. Acta [Wien] 1982 I, 285. a p. H. A. Sheath and R. R. Sokal, "Numerical Taxonomy. The Prin-
ciple and Practice of Numerical Classification". San Francisco: Freeman. 1973.
4 E. Kny, "A Software Package for Data Structuring", MP report No. E 258.0185/1, Sept. 1983, Metallwerk Plansee, A-6600 Reutte.
5 D. L. Massart, K. H. Esbensen, and L. Kaufman, Analyt. Chemistry 54, 911 (1982).
6 E. Kny, "The Milling Behaviour of Cobalt-Powders", MP report No. E 258.7056/1, Sept. 1983, Metallwerk Plansee, A-6600 Reutte.
7 A. Bartenstein, "Zerspanung von Superlegierungen", Diplomarbeit TU Miinchen, Dezember 1982.
Correspondence and reprints: E. Kny, Metallwerk Plansee GmbH, A-6600 Reutte, Austria.