Embed Size (px)
Citation preview
Principles of Image Interpretation (Ref. http://seros.us/moodle/) Danny M. Vaughn, Ph.D., CMS
Forward
At this stage of the Introduction to Spectral (Light) Interactions with Earth
Features students have learned to display single band black and white and color-
composite images along with other types of display procedures using MultiSpec
image processing software. Computer-assisted processing of digital image products
also requires skills in visual interpretation which provide a foundation to
understand important basic elements of remote sensing analysis. These basic
interpretation skills complement knowledge about how light energy from the sun
interacts directly or indirectly (reflected and emitted energy) with Earth features,
and how these interactions can be analyzed and interpreted to provide information
valuable to aid in resolving environmental issues affecting human settlements. This
last Unit (3) in the introductory spectral short course, Introduction to Image
Interpretation, builds upon the information provided in Unit 1 and Unit 2, and adds
new material that will require hands-on student experiences that focus on detailed
visual interpretation of images acquired from airborne and satellite sensor data. A
number of common image interpretation elements including tone/color, contrast,
size, shape, texture, pattern, shadow, site location, feature class association, and
spectral signatures are examined. Examples of visual interpretation techniques are
explored using a variety of images that provide necessary skills employed when
processing digital images in MultiSpec.
Students will gain a good measure of experience in image interpretation techniques
which will form the basic foundation to be applied in extracting information from
photos/images that can be used in experiential learning projects and advanced level
research. This Unit also uses a computer and monitor to display images to use for
visual interpretation (see the link Image Interpretation: A Digital Application, page
frame 3, Unit III, Introduction to Image Interpretation). The five Units that
follow in the course, Advanced-Introduction to Spectral (Light) Interactions with
Earth Features provide a more in depth treatment focusing on basic computer-
aided classification systems and advanced topics to be used in higher-level
experiential learning activities.
2
Introduction
Images are captured by a variety of sensing systems. Biological life forms possess
an ability to visually sense reflected light measured in wavelengths of the
electromagnetic spectrum (EMS). Other more permanent forms of capturing
images have been developed including traditional cameras which sense visible and
near (short) wavelength infrared reflected light on to a light sensitive film. The
more universal use of multispectral scanning instruments can capture light at
wavelengths much longer than what the human eyes are capable of sensing. This
provides a significant advantage over the more limited spectral range of traditional
photographic film since more spectral detail can be captured with a larger number
of spectral bands and coverage over a wider range of the EMS.
An image representing a small area of the Earth’s surface can be captured as a
scene and represented as a contact print. Multispectral scanning systems collect
and store spectral data in a digital file which can be displayed as an image on a
computer monitor through digital image processing procedures. Whether images
are captured by the unaided eye, through the lens of a camera, or with an electro-
mechanical multispectral scanning system, they are each said to be sensing
electromagnetic energy from a remote device. The practice of processing and
analyzing the spectral measurements of electromagnetic energy reflected and
emitted from Earth surface features from a distant sensing platform is termed
Remote Sensing.
The thesis of the course, Exploring Spectral (Light) Interactions with Earth
Features, is an introduction to digital image processing of remotely sensed,
multispectral imagery. Images are derived from digital data files processed with
computer-driven software algorithms and typically displayed on a computer
monitor. Various software algorithms are designed to separate reflected and
emitted light energy into discrete spectral classes that can be ultimately associated
with Earth surface features. The linkage between digitally enhanced spectral
classes and what they actually represent as identifiable Earth surface feature
classes ultimately require an understanding and ability to make visual associations.
This essay provides a brief introduction to visual image interpretation by
illuminating skills that enable an investigator to identify, interpret, analyze and
3
derive meaningful spatial relationships from a number of elements that form the
content of images.
The creation of the Landsat (land satellites) program initiated by NASA in 1972
propelled the United States on a mission to capture multi-temporal (time intervals),
multi-spectral, small scale digital imagery covering large regions of the Earth’s
surface for the purpose of land and water resources studies. In keeping with this
mission, computer-driven image processing software began to appear throughout
the scientific community as the need to enhance the digital satellite data clearly
became the next step in gathering critical information for Earth system studies.
Computer-enhanced digital image processing technology is among the most
important investigative tools in Earth and environmental sciences. While the
practice of contemporary remote sensing involves a variety of classification and
image enhancement algorithms, the results of these highly technical applications
ultimately require an investigator to possess the ability to identify and interpret the
relationships between the computer generated data and what the data actually
represents as actual Earth surface features. Skills in visual image interpretation are
therefore required to complete the process of understanding the utility and value of
the digitally enhanced imagery and traditional photographic imagery produced by
remotely sensed systems.
The fundamental principles of visual image interpretation are based upon a number
of elements that can form any digital image or photograph. Before these elements
can be used to identify and interpret surface features and their associations with
physical and human-derived processes, several questions should be addressed.
Among the most fundamental questions include:
1. Where is the geographic location of the area represented by the image?
2. What direction is the image oriented (top north, etc.)?
3. What is the scale of the image?
4. During what season was the image captured?
5. When (what year) was the imagery collected?
A failure to answer these questions would be like teaching a student to use a
calculator to input equations, yet omitting the lessons that explain what the
formulas mean and how they were derived.
4
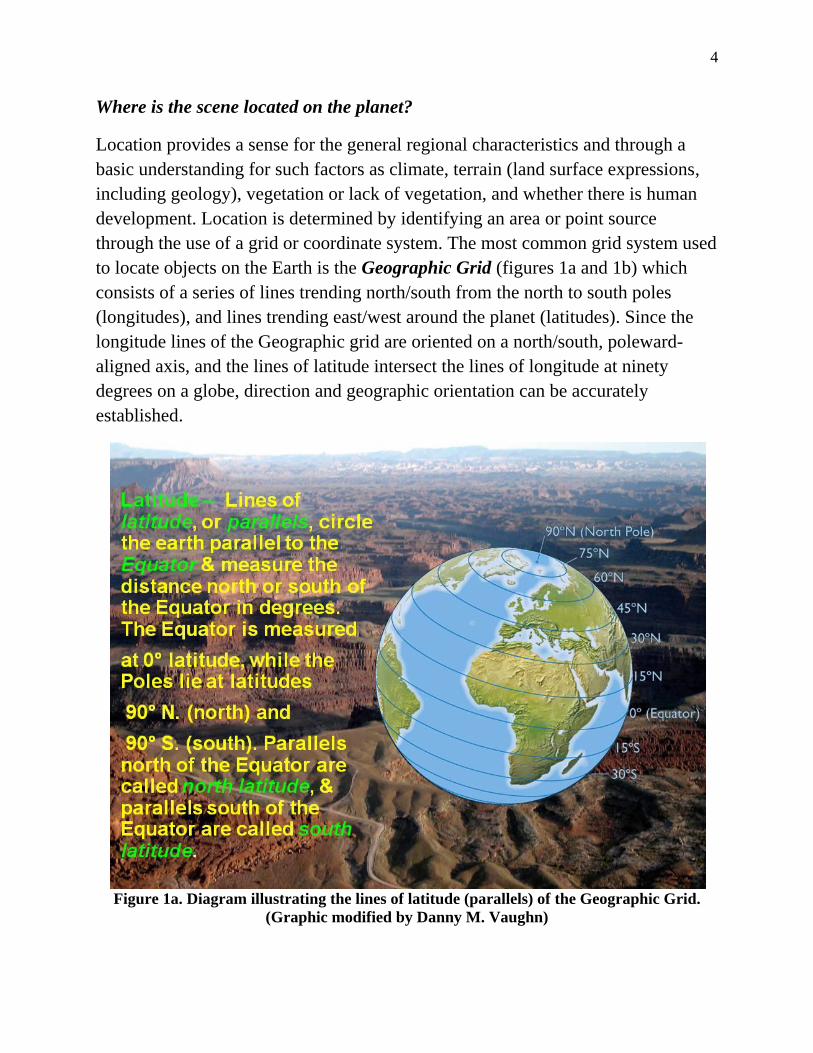
Where is the scene located on the planet?
Location provides a sense for the general regional characteristics and through a
basic understanding for such factors as climate, terrain (land surface expressions,
including geology), vegetation or lack of vegetation, and whether there is human
development. Location is determined by identifying an area or point source
through the use of a grid or coordinate system. The most common grid system used
to locate objects on the Earth is the Geographic Grid (figures 1a and 1b) which
consists of a series of lines trending north/south from the north to south poles
(longitudes), and lines trending east/west around the planet (latitudes). Since the
longitude lines of the Geographic grid are oriented on a north/south, poleward-
aligned axis, and the lines of latitude intersect the lines of longitude at ninety
degrees on a globe, direction and geographic orientation can be accurately
established.
Figure 1a. Diagram illustrating the lines of latitude (parallels) of the Geographic Grid.
(Graphic modified by Danny M. Vaughn)
5
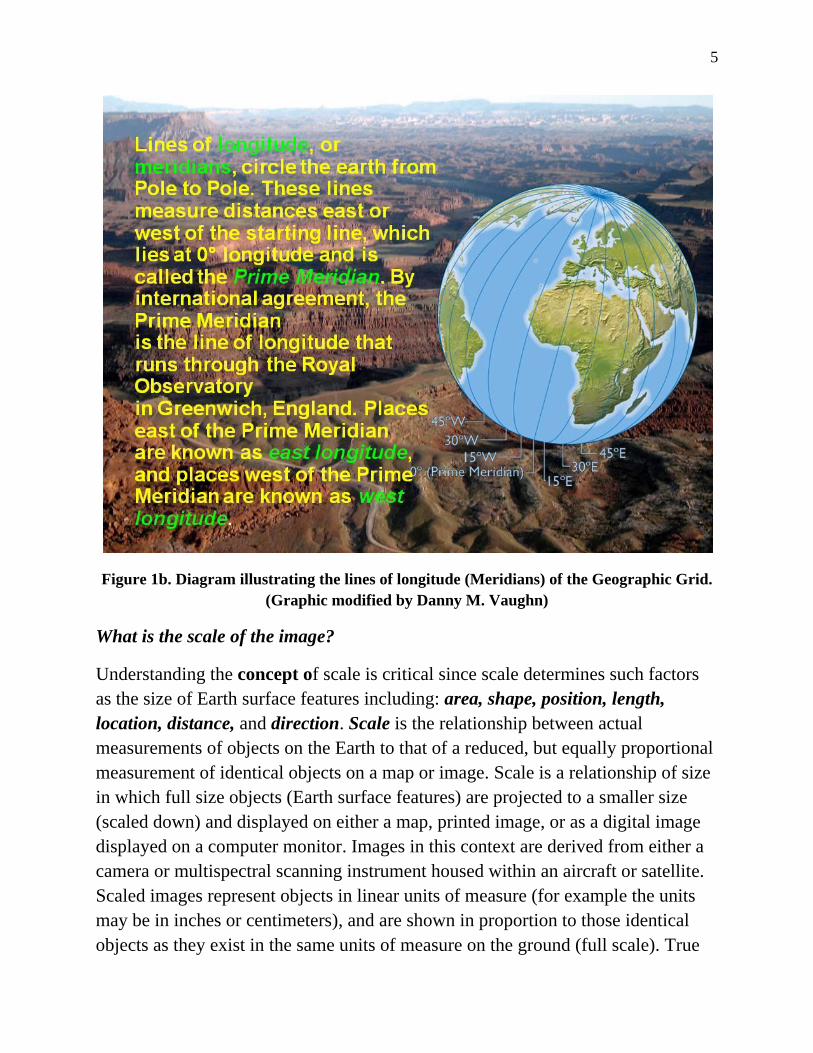
Figure 1b. Diagram illustrating the lines of longitude (Meridians) of the Geographic Grid.
(Graphic modified by Danny M. Vaughn)
What is the scale of the image?
Understanding the concept of scale is critical since scale determines such factors
as the size of Earth surface features including: area, shape, position, length,
location, distance, and direction. Scale is the relationship between actual
measurements of objects on the Earth to that of a reduced, but equally proportional
measurement of identical objects on a map or image. Scale is a relationship of size
in which full size objects (Earth surface features) are projected to a smaller size
(scaled down) and displayed on either a map, printed image, or as a digital image
displayed on a computer monitor. Images in this context are derived from either a
camera or multispectral scanning instrument housed within an aircraft or satellite.
Scaled images represent objects in linear units of measure (for example the units
may be in inches or centimeters), and are shown in proportion to those identical
objects as they exist in the same units of measure on the ground (full scale). True
6
proportion and uniform scale is maintained when there is symmetry or balance
between the size, shape, and magnitude of objects at full scale compared to a
reduced (scaled down) model. When the scale of an image is uniform, the position
of surface features, linear distances, and directions are accurate, and the image is
ortho-corrected. When an ortho-photograph has a grid or coordinate system
overlaid on top, it can serves as a photographic (ortho-photographic) map.
Scale can be represented as a descriptor such as one inch equals one mile; as a
graphical representation such as a bar scale; or as a representative fraction
(1:63,360). The representative fraction is the most common expression of scale in
imagery. A 1/63,360 representative fraction is generally expressed as a proportion
(1:63,360), and implies one unit of measurement on an image or map is equal to
63,360 units of actual ground measurement. If the unit of measurement is the inch,
then one inch on the image would represent 63,360 inches or one mile on the
ground (there are 63,360 inches in one mile). It does not matter whether the units
of measurement are in inches or centimeters. The proportionality between map
units and Earth measurements is always maintained as long as the values in the
representative fraction are constant. Mapped features at a scale of 1:63,360 in
inches will be precisely proportional to those at a scale of 1:63,360 in centimeters.
The length and area measurements on maps created from different units of
measurement will differ, but proportionality between the objects will be preserved.
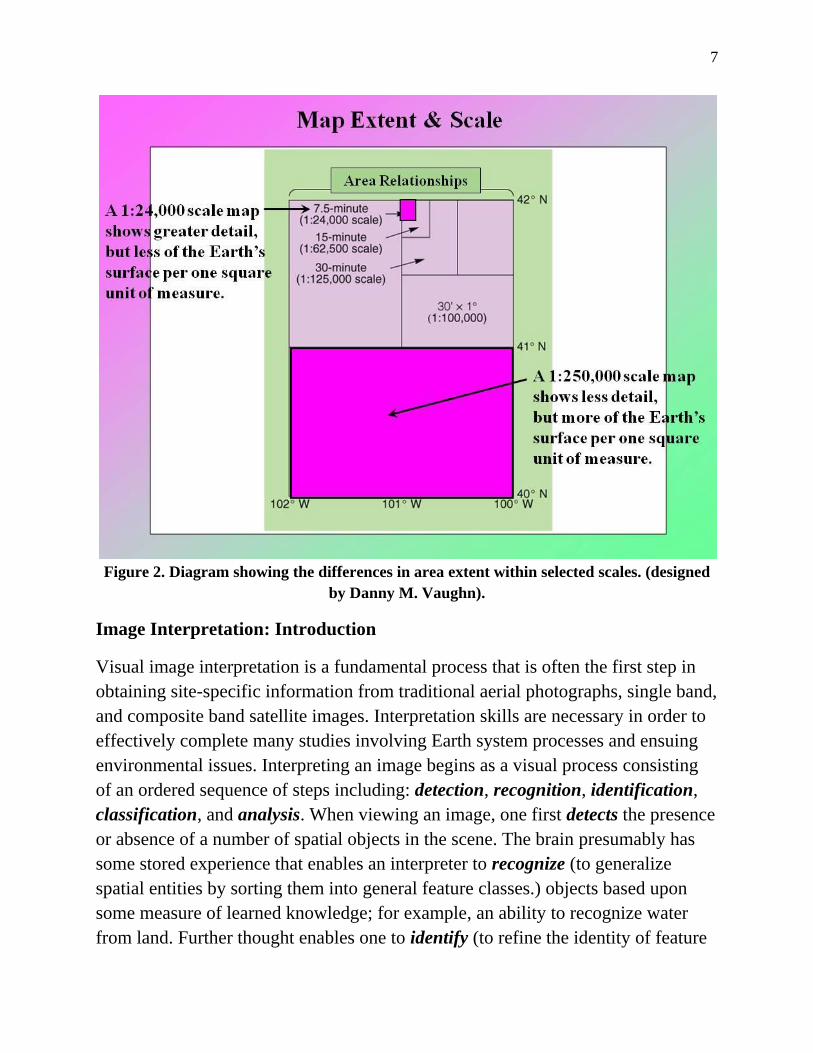
As scale changes, so also does the ability to accurately map the location and shape
of Earth features (figure 2). A point representing a town at a small scale
(1:500,000), could be a well-developed polygon with streets, parks, buildings, etc.
at a larger scale (1:1,000).
The following common scales (representative fractions) are used for maps and
imagery.
• 1:24,000 1 inch = 0.38 mile (2,000 ft.)
• 1:62,500 1 inch = 0.99 mile (5,208 ft.)
• 1:63,360 1 inch = 1 mile (5,280 ft.)
• 1:100,000 1 inch = 1.58 miles (8,333 ft.)
• 1:250,000 1 inch = 3.95 miles (20,833 ft.)
• 1:500,000 1 inch = 7.89 miles (41,667 ft.)
7
Figure 2. Diagram showing the differences in area extent within selected scales. (designed
by Danny M. Vaughn).
Image Interpretation: Introduction
Visual image interpretation is a fundamental process that is often the first step in
obtaining site-specific information from traditional aerial photographs, single band,
and composite band satellite images. Interpretation skills are necessary in order to
effectively complete many studies involving Earth system processes and ensuing
environmental issues. Interpreting an image begins as a visual process consisting
of an ordered sequence of steps including: detection, recognition, identification,
classification, and analysis. When viewing an image, one first detects the presence
or absence of a number of spatial objects in the scene. The brain presumably has
some stored experience that enables an interpreter to recognize (to generalize
spatial entities by sorting them into general feature classes.) objects based upon
some measure of learned knowledge; for example, an ability to recognize water
from land. Further thought enables one to identify (to refine the identity of feature
8
classes) water as having different physical properties such as variances in color,
tone (lightness/darkness), and perhaps patterns such as flow lines indicating
movement and direction. The variations in these properties are next classified
(categorizing objects or areas by specific criteria through a more formal process of
discrimination.) either by manually drawing boundaries between these visual
properties, or by running computer driven classifiers (software algorithms). Once
the image has been classified, an analysis may seek to answer such questions as:
1. What do these water classes represent – sediment, fish, pollutants, sun glint,
etc?
2. What processes of energy exchange are directing their development and
change?
3. Why are they in this image?
4. What significance do they have towards an understanding for the nature of
their existence in the water body as a whole?
5. Can reasonable conclusions be made?
6. What additional questions require field reconnaissance or further data
collection?
Although some conclusions may be stated from visual interpretations of remotely
sensed imagery, the final word of any study involving Earth systems science must
be supported by field evidence through a combination of on-site confirmation and
evaluations based on measured data.
Most interpretation processes are based upon an interpreter’s ability to recognize a
number of physical properties that form the objects/surface features in all images.
Digital images are composed of a number of pixels (picture elements) stored in a
digital file with each pixel registering light intensity captured from a multispectral
sensor. Traditional photographs are formed when light sensitive bits mounted on
traditional photographic film are exposed by a measure of light and chemically
developed in a laboratory to form a contact print. In figure 3a, a small one block
area of the town square in Mitchell, Indiana is outlined in red. This is a fairly large
scale digital aerial photograph (~1:2,000) in which each pixel represents a spatial
resolution of approximately one square meter of ground sampled distance. The
higher spatial resolution (small pixel size) image/photograph enables more detail to
be captured in a scene which is advantageous when attempting to gather
9
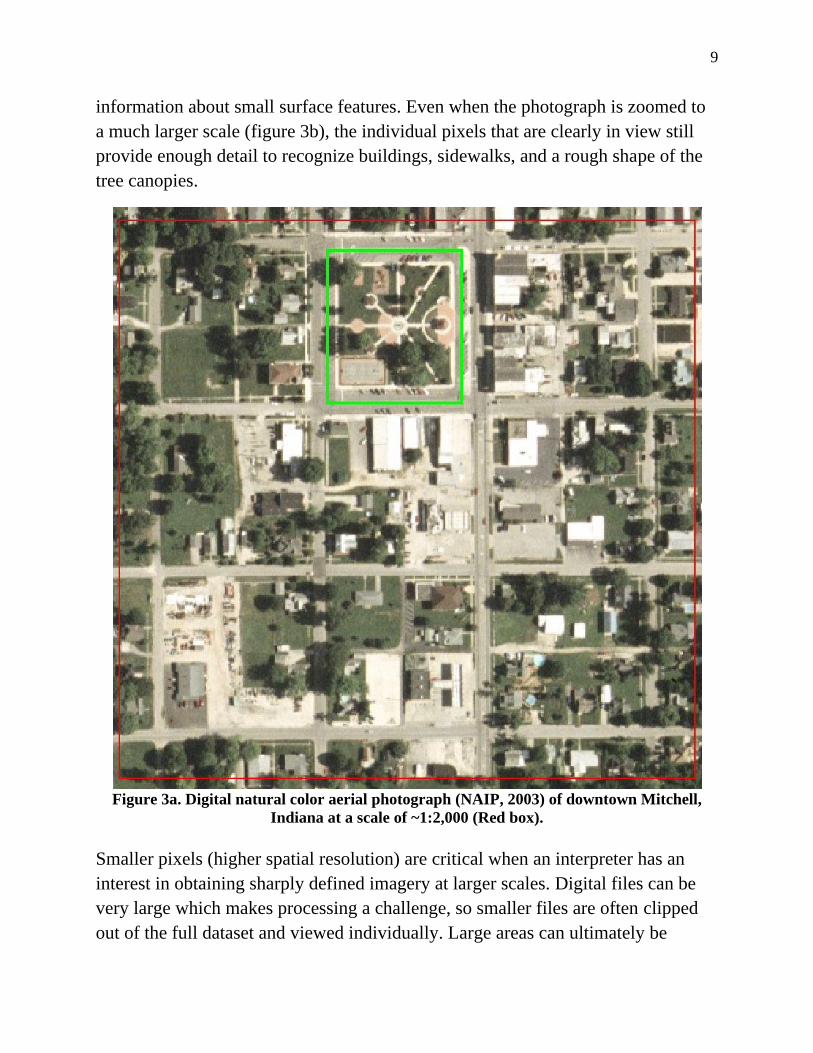
information about small surface features. Even when the photograph is zoomed to
a much larger scale (figure 3b), the individual pixels that are clearly in view still
provide enough detail to recognize buildings, sidewalks, and a rough shape of the
tree canopies.
Figure 3a. Digital natural color aerial photograph (NAIP, 2003) of downtown Mitchell,
Indiana at a scale of ~1:2,000 (Red box).
Smaller pixels (higher spatial resolution) are critical when an interpreter has an
interest in obtaining sharply defined imagery at larger scales. Digital files can be
very large which makes processing a challenge, so smaller files are often clipped
out of the full dataset and viewed individually. Large areas can ultimately be
10
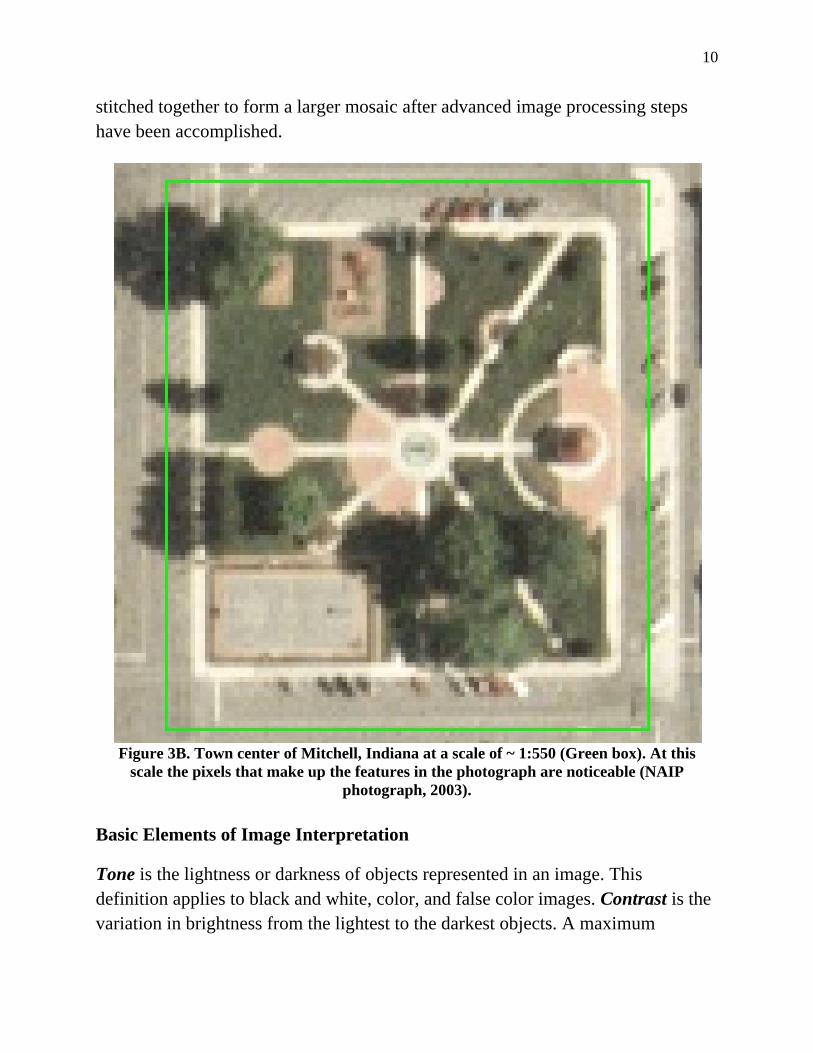
stitched together to form a larger mosaic after advanced image processing steps
have been accomplished.
Figure 3B. Town center of Mitchell, Indiana at a scale of ~ 1:550 (Green box). At this
scale the pixels that make up the features in the photograph are noticeable (NAIP
photograph, 2003).
Basic Elements of Image Interpretation
Tone is the lightness or darkness of objects represented in an image. This
definition applies to black and white, color, and false color images. Contrast is the
variation in brightness from the lightest to the darkest objects. A maximum
11
contrast occurs between two objects when one is expressed as white while the
other is black, or in the case of color images, when there is maximum variance in
brightness between hues (colors). Texture is the apparent smoothness or roughness
which is exhibited in an image by a contrast in the distribution of brightness
values. Smooth objects have many brightness values that are similar or the same
value whether dark or light; while coarse textured objects have more variable
(contrast) brightness values. Spatial objects that are expressed with similar or like
brightness values are generally of a homogeneous feature class. Large variations in
brightness values can denote different feature classes; or display a pattern within a
course textured field of brightness values which may be of a similar class such as
row crops, an orchard, or other objects created within a human settlement. Tone
and texture are closely associated and based upon the distribution of brightness
values (figure 4).
Shape defines the geometry of objects, while size represents length, area, or
volume. Shadow reveals the position of the sun, and can be useful in determining
symmetry or asymmetry, size, and shape. This can be particularly effective in
identifying buildings and other structures that only show a top view of the
structure. Shadows also illuminate smaller surface features casting a linear or area
dimension that may not be noticeable when viewed from an airborne or space
borne platform. Pattern suggests something is influencing the spatial distribution
of surface features, although a lack of pattern can also be significant in that it may
suggest an anomaly that is not a function of a normal condition or process. Trees
aligned in a linear pattern may suggest the underlying geology has some control or
influence on the distribution of surface features. On the other hand, specific
vegetation species that are not indigenous to an area may suggest something more
interesting is a contributing factor. Density refers to the number of objects taking
up an area or region which may be an indication of vegetation health or vigor.
Clustering of objects can generally indicate something is controlling the manner in
which they have assembled (figure 5). Multispectral color composites create an
entirely different set of properties to be used in image interpretation than the black
and white (gray tone) images, and are explored further in the Spectral course.
12
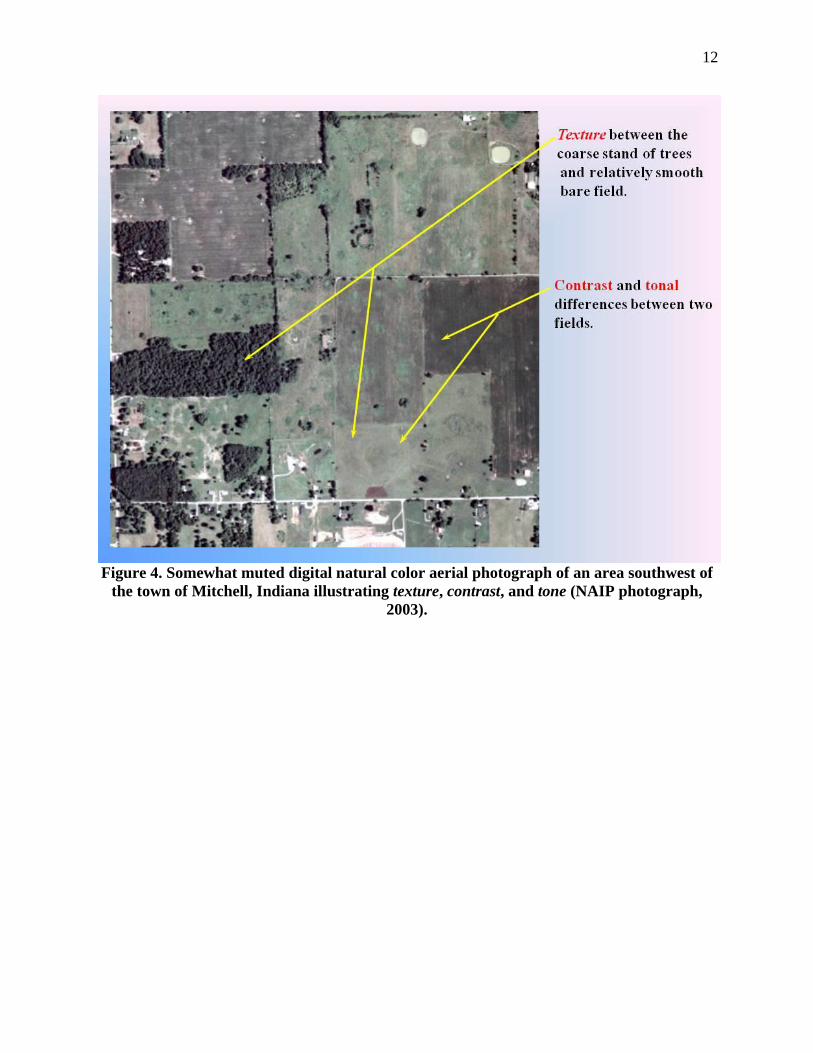
Figure 4. Somewhat muted digital natural color aerial photograph of an area southwest of
the town of Mitchell, Indiana illustrating texture, contrast, and tone (NAIP photograph,
2003).
13
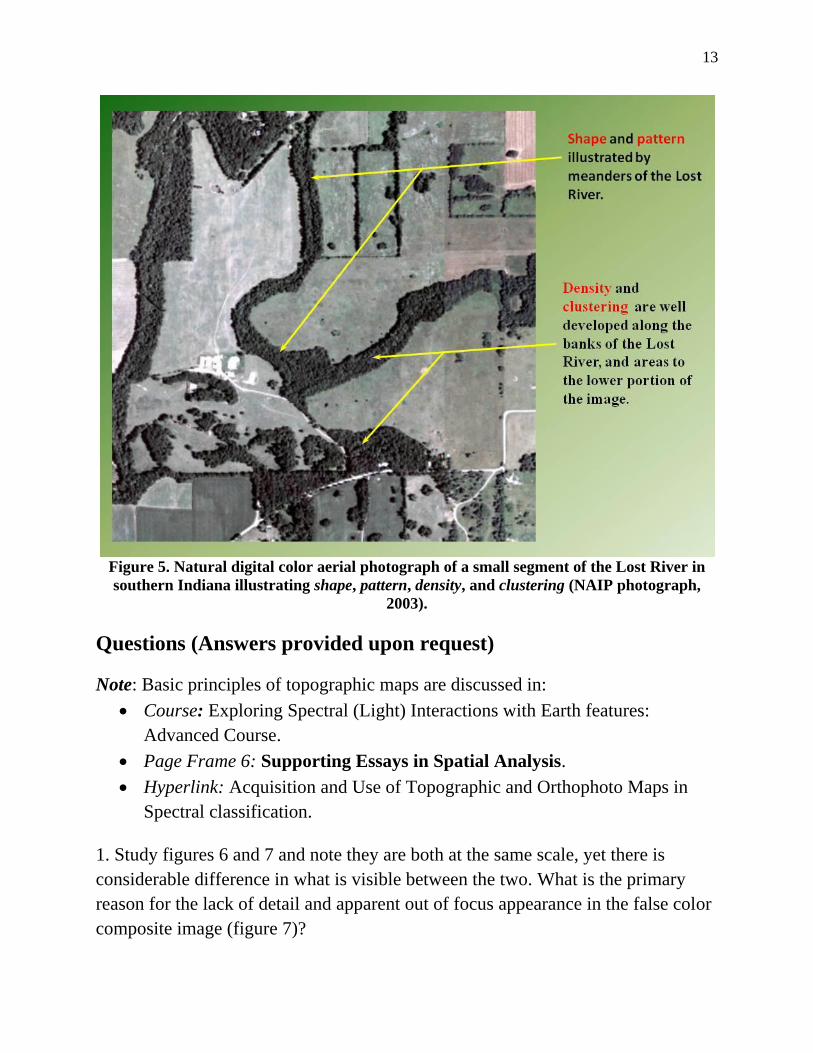
Figure 5. Natural digital color aerial photograph of a small segment of the Lost River in
southern Indiana illustrating shape, pattern, density, and clustering (NAIP photograph,
2003).
Questions (Answers provided upon request)
Note: Basic principles of topographic maps are discussed in:
Course: Exploring Spectral (Light) Interactions with Earth features:
Advanced Course.
Page Frame 6: Supporting Essays in Spatial Analysis.
Hyperlink: Acquisition and Use of Topographic and Orthophoto Maps in
Spectral classification.
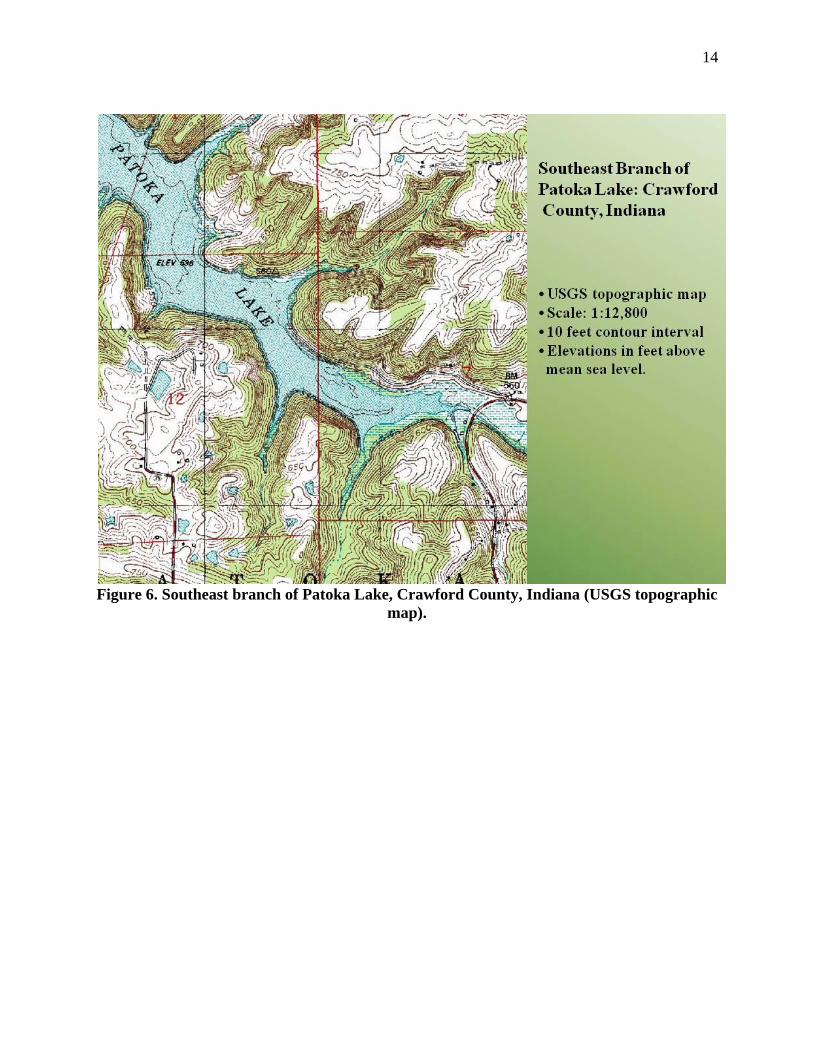
1. Study figures 6 and 7 and note they are both at the same scale, yet there is
considerable difference in what is visible between the two. What is the primary
reason for the lack of detail and apparent out of focus appearance in the false color
composite image (figure 7)?
14
Figure 6. Southeast branch of Patoka Lake, Crawford County, Indiana (USGS topographic
map).
15
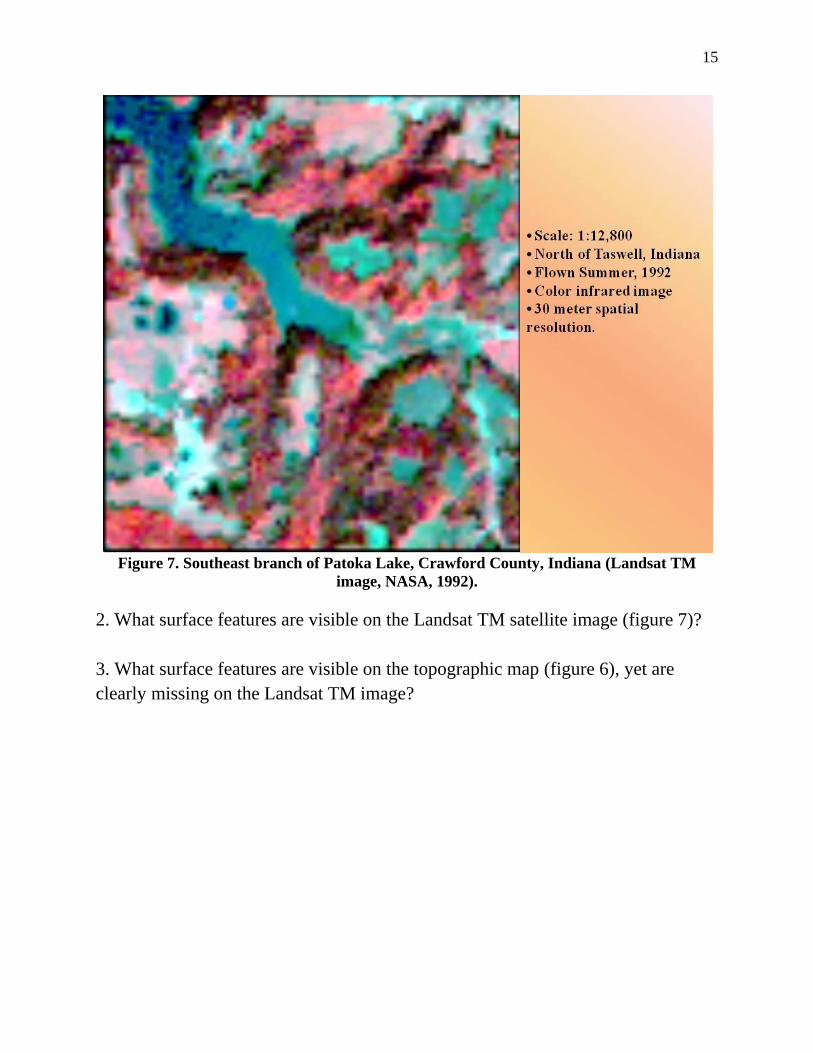
Figure 7. Southeast branch of Patoka Lake, Crawford County, Indiana (Landsat TM
image, NASA, 1992).
2. What surface features are visible on the Landsat TM satellite image (figure 7)?
3. What surface features are visible on the topographic map (figure 6), yet are
clearly missing on the Landsat TM image?
16
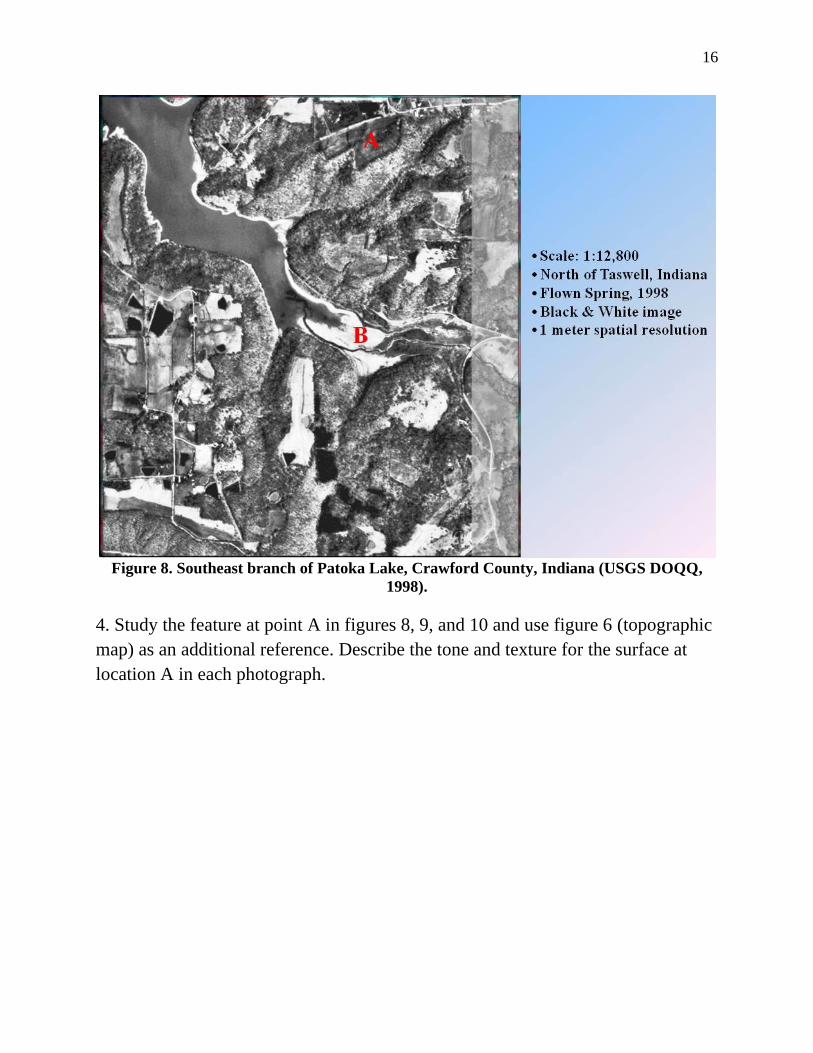
Figure 8. Southeast branch of Patoka Lake, Crawford County, Indiana (USGS DOQQ,
1998).
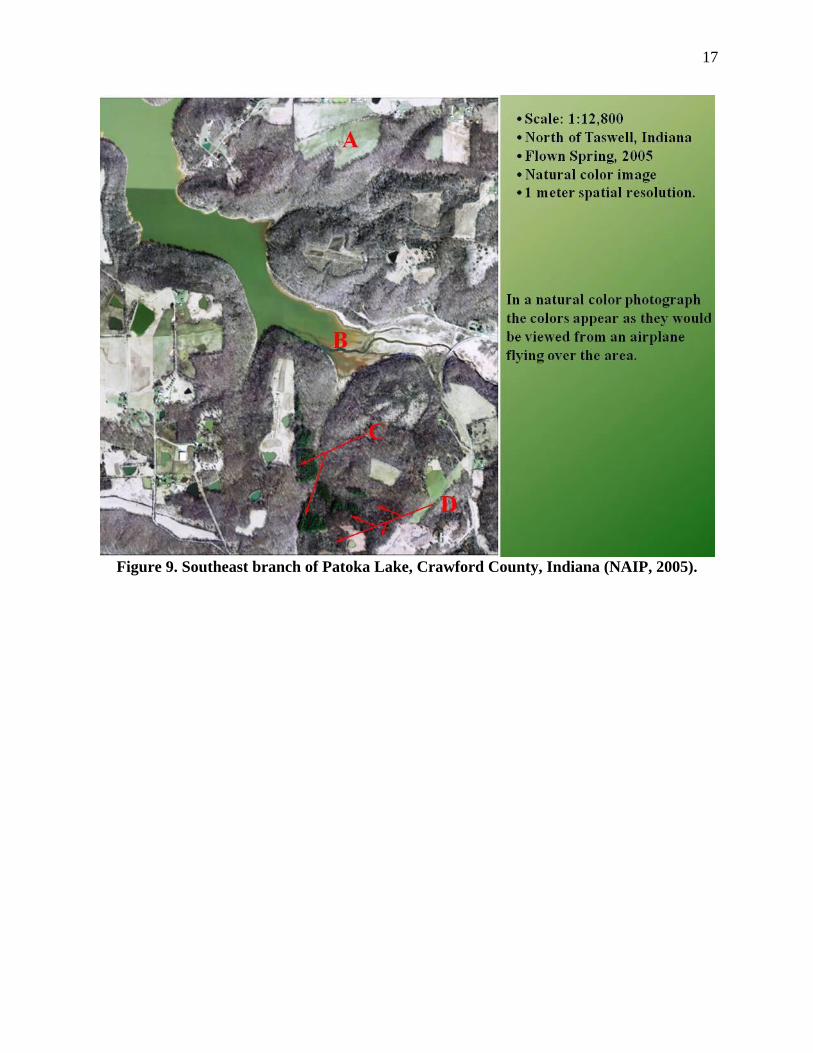
4. Study the feature at point A in figures 8, 9, and 10 and use figure 6 (topographic
map) as an additional reference. Describe the tone and texture for the surface at
location A in each photograph.
17
Figure 9. Southeast branch of Patoka Lake, Crawford County, Indiana (NAIP, 2005).
18
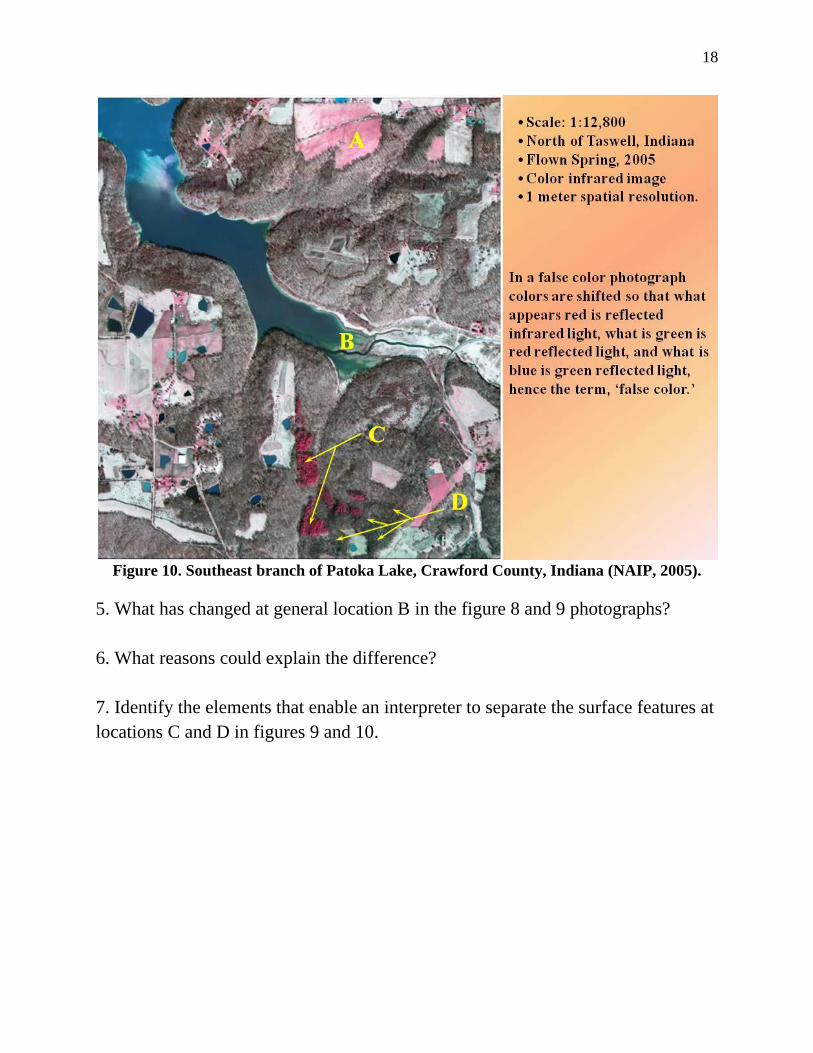
Figure 10. Southeast branch of Patoka Lake, Crawford County, Indiana (NAIP, 2005).
5. What has changed at general location B in the figure 8 and 9 photographs?
6. What reasons could explain the difference?
7. Identify the elements that enable an interpreter to separate the surface features at
locations C and D in figures 9 and 10.


![[IMAGE][IMAGE]-Macroglobulin Bait Region Variants](https://img.dokumen.tips/doc/110x75/635d8d00fd007d475b0336aa/imageimage-macroglobulin-bait-region-variants.jpg)