Embed Size (px)
Citation preview
Towards an Interpretation of Intestinal MotilityUsing Capsule Endoscopy Image Sequences
Hai Vu1, Tomio Echigo2, Ryusuke Sagawa1, Keiko Yagi3, Masatsugu Shiba4,Kazuhide Higuchi4, Tetsuo Arakawa4, and Yasushi Yagi1
1 The Institute of Scientific and Industrial Research, Osaka University{vhai,sagawa,yagi}@am.sanken.osaka-u.ac.jp
2 Osaka Electro-Communication [email protected]
3 Kobe Pharmaceutical [email protected]
4 Graduate School of Medicine, Osaka City University{shiba,khiguchi,arakawat}@med.osaka-cu.ac.jp
Abstract. Human intestinal motility is presented by the propagationof peristaltic waves with their frequencies gradually decreasing along thelength of the small bowel. This paper describes a heuristic method, whichcan be used towards interpreting intestinal motility through recognizingtheir frequency characteristics from capsule endoscopy image sequences.First, image features that reflect peristaltic activities are extracted tobuild a functional signal. Then, a Multi-Resolution Analysis techniquein the wavelet domain is used to decompose the functional signal takinginto account the non-stationary nature of intestinal motility. For peri-staltic waveform recognition, the method relies on the principle of peakdetections from the decomposed signals. Each waveform is detected whenit exceeds a baseline level. The frequency characteristics are interpretedthrough analysis of the waveform appearance and their velocity propaga-tion. Three healthy sequences were tested in experiments. The estimatedtrends of the peristaltic wave propagation from the experimental resultsshow a frequency gradient, which follows the well-recognized character-istics of intestinal motility propagation. Therefore, this study is the firstdemonstration of a detailed interpretation of intestinal motility, and wesuggest that further research focuses on intestinal motility dysfunctions.
1 Introduction
Interpretation of human intestinal motility has been the subject of exhaustiveresearch over many decades by physiologists. The intestinal motility consistsof peristaltic waves (slow waves) [1,2], in which the propagation of waveformsalong the length of the small bowel has also been well recognized and confirmedin the literature, e.g. [1,2,3]. There is a gradient in the propagation velocity ofthe peristaltic waves, where the frequency of appearance of waveforms is highestin the proximal regions and lowest in the distal regions; for example, in manthe maximal frequency is 12 cycles/min in the duodenum and 3-5 cycles/min in
T. Wada, F. Huang, and S. Lin (Eds.): PSIVT 2009, LNCS 5414, pp. 839–850, 2009.c© Springer-Verlag Berlin Heidelberg 2009
840 H. Vu et al.
the terminal ileum [1,2,3]. Although the intestinal motility characteristics canbe affected by disorders such as bacterial overgrowth, intestine obstruction orparalysis [1,2], the clinical applications of these findings are still limited becauseit is necessary to take many recordings along the entire length of the small bowel.The recent recording technique [4] is still an invasive measurement because ofthe long distance and loop configuration of the small bowel.
Capsule Endoscopy (CE) [5] was recently introduced as a non-invasive andeffective means of inspecting bleeding regions, Crohn’s disease and suspectedtumors in the small bowel [6,7]. The CE utilizes a swallowable endoscopic devicethat is ingested and propelled by peristaltic waves through the GastroIntestinal(GI) tract. Although this technique was not originally designed for assessmentof intestinal motility, CE image sequences present a useful source of informationfor investigating intestinal motility (e.g. works in [8,9,10,11]). Thus the aim ofthis study was to use a functional signal extracted from the CE image sequencesto interpret intestinal motility. This is a promising method for overcoming thelimitations of the current techniques because of its non-invasive nature and min-imal demands on physicians’ time. To investigate intestinal motility using CEimage sequences, works in [9,10,11] proposed methods to detect intestinal con-tractions. They used the same approaches that utilized the learning schemesto recognize the contractions. The contractile patterns can be represented bystar-wise patterns [9], linear radial patterns [10] or as a directional histogram ofedge intestinal folds [11]. Although the results of these studies show successfulrecognition rates, it is still unclear what information can be derived from re-sults of the detected contractions to understand intestinal motility. On the otherhand, from the viewpoint of GI physiology [1,2], locating only the positions ofthe contractions does not seem to provide enough information to interpret in-testinal motility. Thus, in contrast with the earlier approaches, we attempted touse a heuristic method, which measured the propagation of the peristaltic wavesinstead of identifying the contractile patterns.
We first considered the disparity of consecutive frames in a CE image se-quence such as color dissimilarity, motion displacement, and changes in edges ofthe intestinal folds. This step can be considered a series of intestinal motility ob-servations. Based on the high correlation of these features, a functional signal isbuilt by averaging multiple observations to reduce artifacts or other influencingfactors. Then, the signal is decomposed into its components at different scalesby wavelet transformation taking into account the non-stationary characteristicsof intestinal motility. The attractive properties of decomposition signals are thatthey reflect the noise level and baseline level, which form the waveforms of theperistaltic waves. For waveform recognition, the method relies on the principle ofpeak detection of the decomposed signal where each waveform exceeds a baselinelevel. The propagation of slow waves are influenced by the frequency appearanceof the peaks and their velocity. The method was tested on sequences obtainedfrom three healthy volunteers. Estimated trends of slow wave propagation alongthe CE and transit time determined from the experimental results matched thewell-known frequency gradient of intestinal motility. This study was the first to
Towards an Interpretation of Intestinal Motility 841
provide a detailed interpretation of intestinal motility and that the results canbe used to identify motility dysfunctions in patients.
2 Developing a Functional Signal of Intestinal Motilityfrom CE Image Features
2.1 Intestinal Motility and Its Characteristics
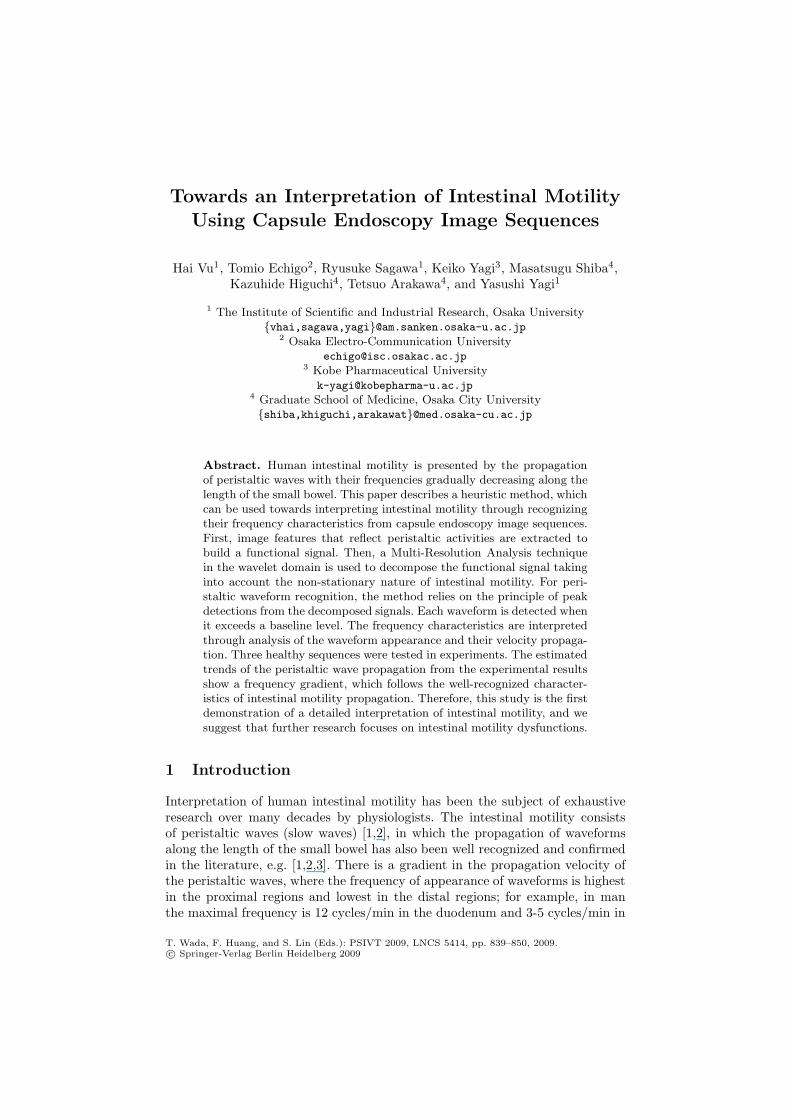
Intestinal motility is manifested by electrical activity, that constitutes electricaloscillations called slow waves [2]. Schematic views of the waveforms (convexand concave waveforms) are shown in Fig. 1a. With intermittent bursts of rapidelectrical oscillations, spike bursts occur and are superimposed on the slow wavessignal (Fig. 1b). The spike bursts are associated with muscular contractions thatproduce the segmentary contractions (Fig. 1c). The characteristics of slow wavesinclude the appearance or propagation velocity of these waveforms. As statedby [1,2], the propagation velocity decreases in a series of steps from proximal todistal regions of the small bowel, as shown in Fig. 1d. For further detail, pleaserefer to Chapter 7 in [1] or Chapter 6 in [2].
It can be noted that the concave and/or convex waveforms are always present,even in the absence of contractions. For recognition of the contractile patternsfrom the CE image sequences, the contractions in Fig. 1c are well described in
t1
t1 t2
t2
υ~
υ~
convex slow wave
concave slow wave
Positions around t2 with spike bursts
t1
t1 t2
t2
υ~
υ~
convex slow wave
concave slow wave
Positions around t2 with spike bursts
(a) Propagation of the slow wave
Spike bursts
Slow wave
Spike bursts
Slow wave
(b) Spike bursts superimposed on theslow wave signal
Segmenting contractionsconcurrently appear around
t2 positions
Segmenting contractionsconcurrently appear around
t2 positions
(c) Segmenting contractions
Duodenum Jejunum Ileum
Fre
quen
cy o
f sl
ow w
ave
as %
of
max
imum
see
n in
situ
[A]
[B]
12 cycle/min
3-5 cycles/min
Duodenum Jejunum Ileum
Fre
quen
cy o
f sl
ow w
ave
as %
of
max
imum
see
n in
situ
[A]
[B][B]
12 cycle/min
3-5 cycles/min
(d) A gradient frequency for slow wavepropagation
Fig. 1. Organization and frequency characteristics of intestinal motility
842 H. Vu et al.
the earlier studies [9,10,11], whereas the concave/convex patterns are ambigu-ously described. In fact, the propagation of slow waves propel the CE throughthe small bowel and, therefore, this represents the main factor responsible for thechanges between the acquired images. These changes can be measured by iden-tifying the disparity between consecutive frames. Although this measurementcan be affected by other factors such as human activities during examinationsor imminent movements (or non-rigidity) of the small intestine. From the viewof signal processing, an ensemble averaging technique has advances as it elimi-nates undesirable noise through multiple observations. To develop a functionalsignal of intestinal motility from CE image sequences, these observations can bederived from image features that are high correlated.
2.2 Developing the Functional Signal from Image Features
In a typical examination, CE takes approximately 7-8 hours to pass through theGI tract and captures images at a rate of 2 fps. Therefore, an image sequencehas around 57,000 frames, including 20,000 to 30,000 frames that belong tothe small bowel regions, which can be used to investigate intestinal motility.To measure the disparity between adjacent frames, we considered a series ofimage features that were successfully used in previous studies. These featuresinclude the edges of intestinal folds (in [8,9,10,11] for recognizing the segmentarycontractions), color dissimilarity and motion displacements (in [12] for evaluatingimage disparity).
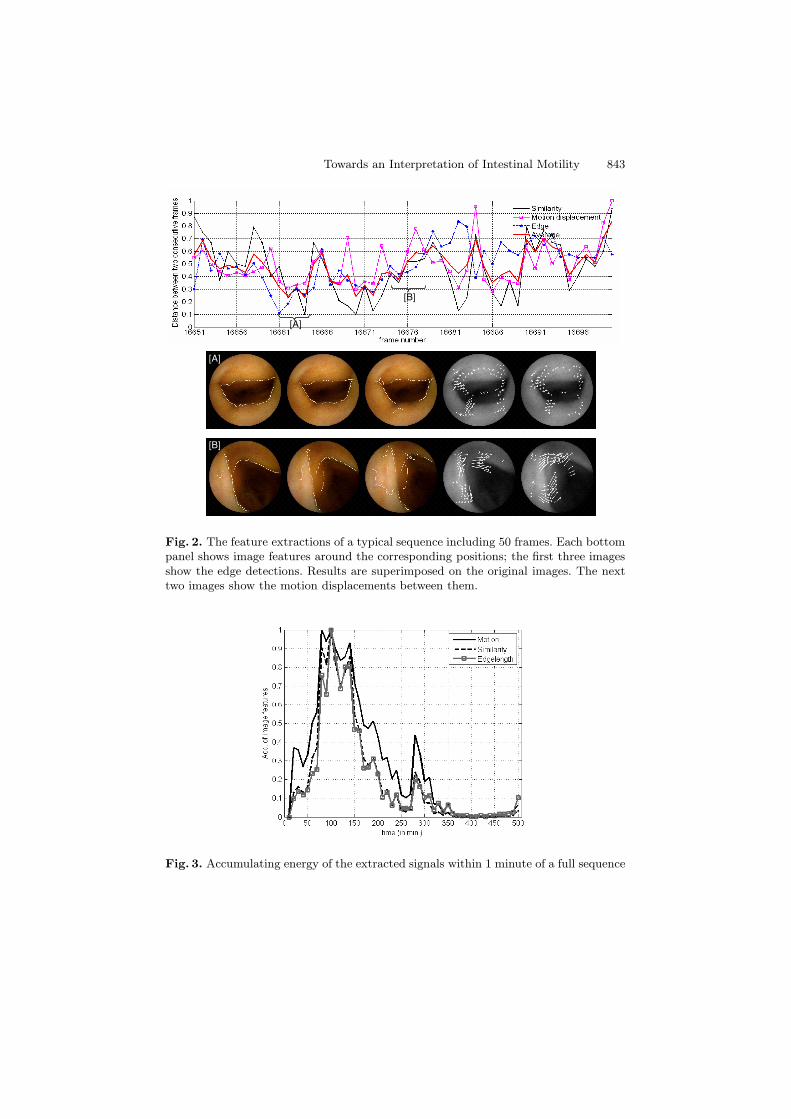
The CE image features include a standard size of 256x256 pixels, 8 bit perchannel in RGB color space [13]. To determine color dissimilarity between frames〈n, n + 1〉 (Dissim(n)), we used the color local histogram method in [14]. Theimage is divided into blocks, with the number of blocks Nblocks = 64. Thecolor histogram is applied to each block by dividing RGB components intoNbins = 16. The distance of local histograms is calculated by L1 distance.Dissim(n) is obtained by accumulating the different blocks. The motion dis-placement (Motion(n)) is evaluated as the length of the maximum motion vec-tor, in which the motion fields of frames 〈n, n + 1〉 are detected and trackedusing the Kanade-Lucas-Tomasi (KLT) algorithm [15,16,17]. The Canny opera-tor techniques [18] was used to identify the edges of intestinal folds. Edge pixelswere counted in a region where most of the edges appear. Edge(n) is calculatedby subtracting the edge pixels detected in frames 〈n, n + 1〉. Feature extractionsof a typical sequence including 50 frames are shown in Fig. 2.
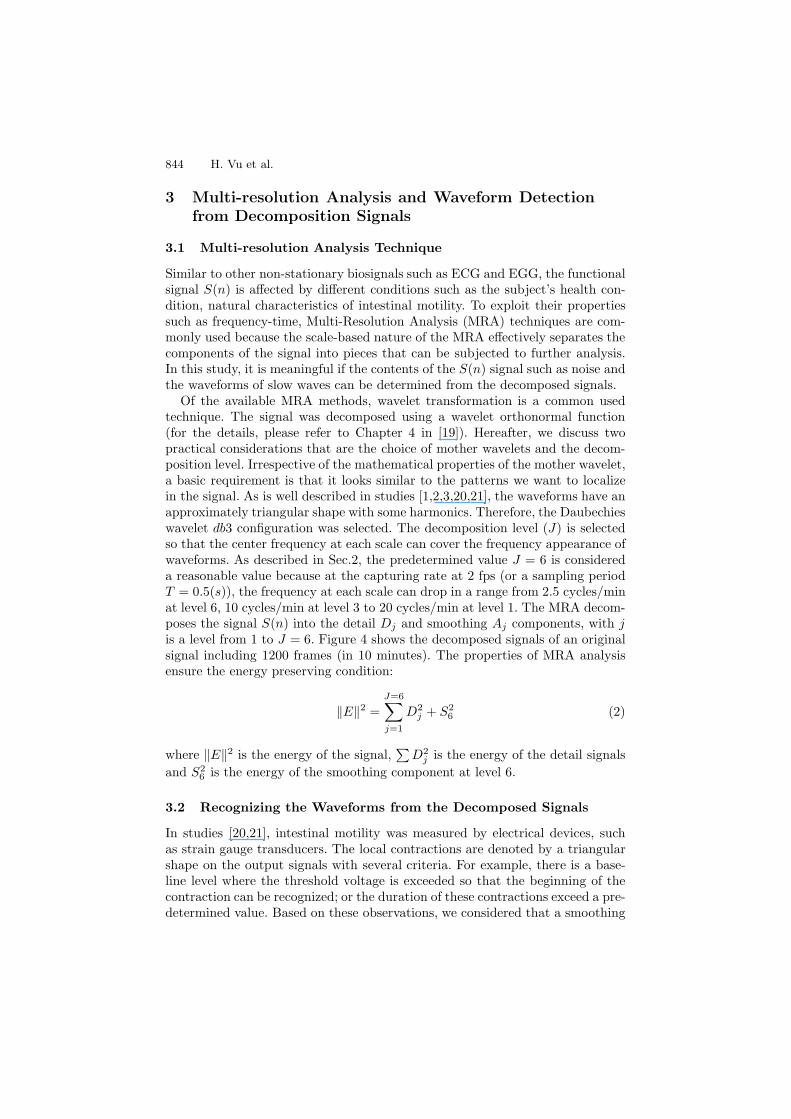
The extracted signals are normalized into [0,1], with the maximum value in-dicating the most different and the minimum value indicating the best match oftwo consecutive frames. To evaluate the correlation of these signals, we calcu-lated their energy in a duration ΔT . Figure 3 shows the energy of the extractedsignals with ΔT = 1 min. of a full sequence. This figure shows the high cor-relations of the selected features. Therefore, the functional signal of intestinalmotility was calculated by:
S(n) =Dissim(n) + Motion(n) + Edge(n)
3(1)
Towards an Interpretation of Intestinal Motility 843
[A]
[A]
[B]
[B]
[A]
[A]
[B]
[B]
Fig. 2. The feature extractions of a typical sequence including 50 frames. Each bottompanel shows image features around the corresponding positions; the first three imagesshow the edge detections. Results are superimposed on the original images. The nexttwo images show the motion displacements between them.
Fig. 3. Accumulating energy of the extracted signals within 1 minute of a full sequence
844 H. Vu et al.
3 Multi-resolution Analysis and Waveform Detectionfrom Decomposition Signals
3.1 Multi-resolution Analysis Technique
Similar to other non-stationary biosignals such as ECG and EGG, the functionalsignal S(n) is affected by different conditions such as the subject’s health con-dition, natural characteristics of intestinal motility. To exploit their propertiessuch as frequency-time, Multi-Resolution Analysis (MRA) techniques are com-monly used because the scale-based nature of the MRA effectively separates thecomponents of the signal into pieces that can be subjected to further analysis.In this study, it is meaningful if the contents of the S(n) signal such as noise andthe waveforms of slow waves can be determined from the decomposed signals.
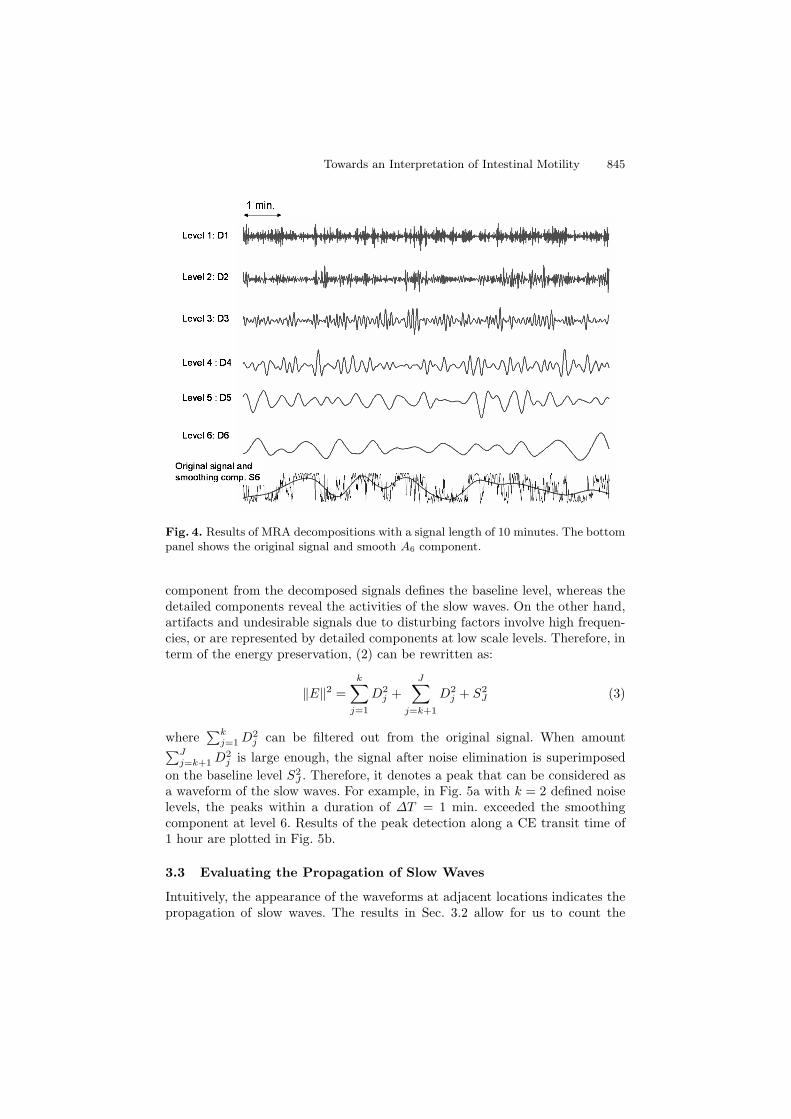
Of the available MRA methods, wavelet transformation is a common usedtechnique. The signal was decomposed using a wavelet orthonormal function(for the details, please refer to Chapter 4 in [19]). Hereafter, we discuss twopractical considerations that are the choice of mother wavelets and the decom-position level. Irrespective of the mathematical properties of the mother wavelet,a basic requirement is that it looks similar to the patterns we want to localizein the signal. As is well described in studies [1,2,3,20,21], the waveforms have anapproximately triangular shape with some harmonics. Therefore, the Daubechieswavelet db3 configuration was selected. The decomposition level (J) is selectedso that the center frequency at each scale can cover the frequency appearance ofwaveforms. As described in Sec.2, the predetermined value J = 6 is considereda reasonable value because at the capturing rate at 2 fps (or a sampling periodT = 0.5(s)), the frequency at each scale can drop in a range from 2.5 cycles/minat level 6, 10 cycles/min at level 3 to 20 cycles/min at level 1. The MRA decom-poses the signal S(n) into the detail Dj and smoothing Aj components, with jis a level from 1 to J = 6. Figure 4 shows the decomposed signals of an originalsignal including 1200 frames (in 10 minutes). The properties of MRA analysisensure the energy preserving condition:
‖E‖2 =J=6∑
j=1
D2j + S2
6 (2)
where ‖E‖2 is the energy of the signal,∑
D2j is the energy of the detail signals
and S26 is the energy of the smoothing component at level 6.
3.2 Recognizing the Waveforms from the Decomposed Signals
In studies [20,21], intestinal motility was measured by electrical devices, suchas strain gauge transducers. The local contractions are denoted by a triangularshape on the output signals with several criteria. For example, there is a base-line level where the threshold voltage is exceeded so that the beginning of thecontraction can be recognized; or the duration of these contractions exceed a pre-determined value. Based on these observations, we considered that a smoothing
Towards an Interpretation of Intestinal Motility 845
Fig. 4. Results of MRA decompositions with a signal length of 10 minutes. The bottompanel shows the original signal and smooth A6 component.
component from the decomposed signals defines the baseline level, whereas thedetailed components reveal the activities of the slow waves. On the other hand,artifacts and undesirable signals due to disturbing factors involve high frequen-cies, or are represented by detailed components at low scale levels. Therefore, interm of the energy preservation, (2) can be rewritten as:
‖E‖2 =k∑
j=1
D2j +
J∑
j=k+1
D2j + S2
J (3)
where∑k
j=1 D2j can be filtered out from the original signal. When amount
∑Jj=k+1 D2
j is large enough, the signal after noise elimination is superimposedon the baseline level S2
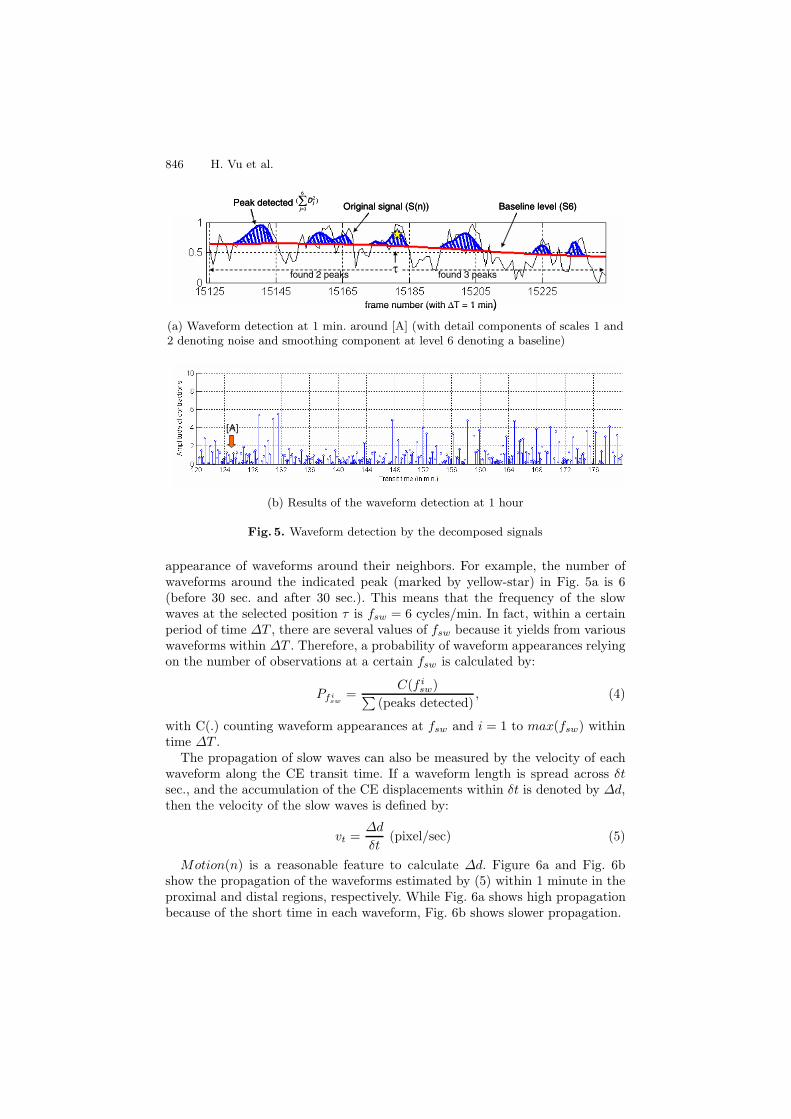
J . Therefore, it denotes a peak that can be considered asa waveform of the slow waves. For example, in Fig. 5a with k = 2 defined noiselevels, the peaks within a duration of ΔT = 1 min. exceeded the smoothingcomponent at level 6. Results of the peak detection along a CE transit time of1 hour are plotted in Fig. 5b.
3.3 Evaluating the Propagation of Slow Waves
Intuitively, the appearance of the waveforms at adjacent locations indicates thepropagation of slow waves. The results in Sec. 3.2 allow for us to count the
846 H. Vu et al.
frame number (with ΔT = 1 min)
Baseline level (S6)Original signal (S(n))Peak detected ∑=
6
3
2 )(j
jD
τfound 2 peaks found 3 peaks
frame number (with ΔT = 1 min)
Baseline level (S6)Original signal (S(n))Peak detected ∑=
6
3
2 )(j
jD
τfound 2 peaks found 3 peaks
(a) Waveform detection at 1 min. around [A] (with detail components of scales 1 and2 denoting noise and smoothing component at level 6 denoting a baseline)
[A][A]
(b) Results of the waveform detection at 1 hour
Fig. 5. Waveform detection by the decomposed signals
appearance of waveforms around their neighbors. For example, the number ofwaveforms around the indicated peak (marked by yellow-star) in Fig. 5a is 6(before 30 sec. and after 30 sec.). This means that the frequency of the slowwaves at the selected position τ is fsw = 6 cycles/min. In fact, within a certainperiod of time ΔT , there are several values of fsw because it yields from variouswaveforms within ΔT . Therefore, a probability of waveform appearances relyingon the number of observations at a certain fsw is calculated by:
Pfisw
=C(f i
sw)∑(peaks detected)
, (4)
with C(.) counting waveform appearances at fsw and i = 1 to max(fsw) withintime ΔT .
The propagation of slow waves can also be measured by the velocity of eachwaveform along the CE transit time. If a waveform length is spread across δtsec., and the accumulation of the CE displacements within δt is denoted by Δd,then the velocity of the slow waves is defined by:
vt =Δd
δt(pixel/sec) (5)
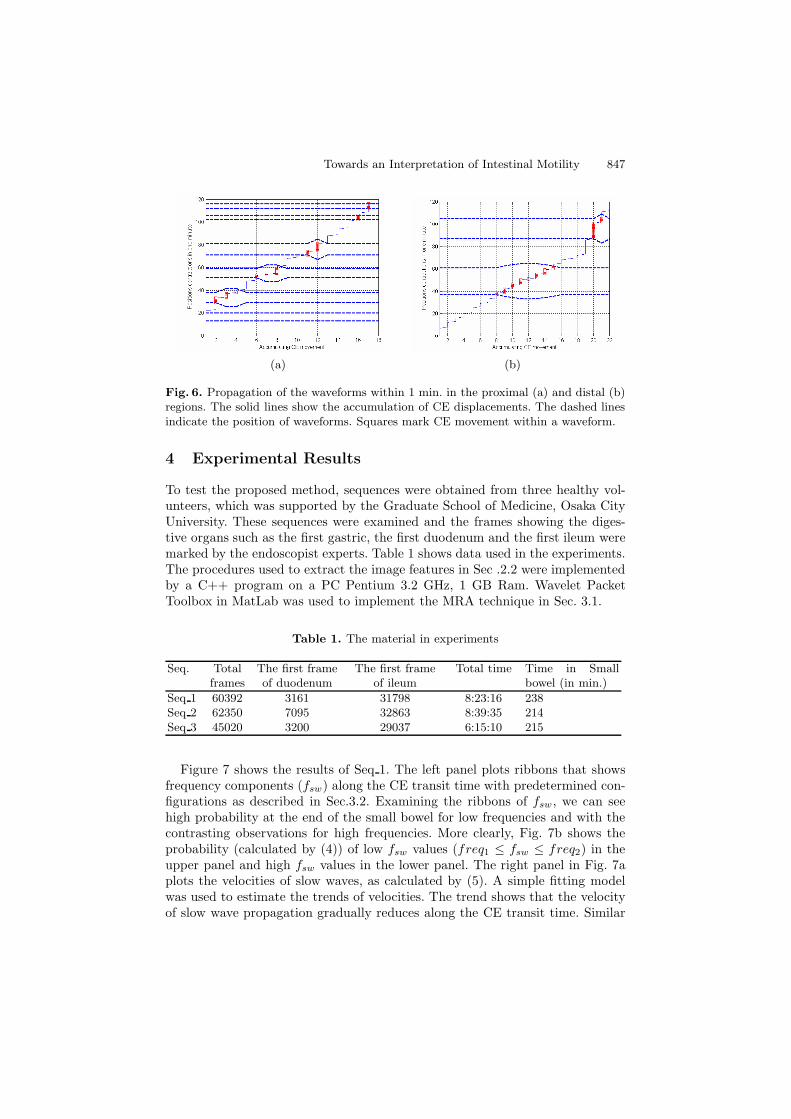
Motion(n) is a reasonable feature to calculate Δd. Figure 6a and Fig. 6bshow the propagation of the waveforms estimated by (5) within 1 minute in theproximal and distal regions, respectively. While Fig. 6a shows high propagationbecause of the short time in each waveform, Fig. 6b shows slower propagation.
Towards an Interpretation of Intestinal Motility 847
(a) (b)
Fig. 6. Propagation of the waveforms within 1 min. in the proximal (a) and distal (b)regions. The solid lines show the accumulation of CE displacements. The dashed linesindicate the position of waveforms. Squares mark CE movement within a waveform.
4 Experimental Results
To test the proposed method, sequences were obtained from three healthy vol-unteers, which was supported by the Graduate School of Medicine, Osaka CityUniversity. These sequences were examined and the frames showing the diges-tive organs such as the first gastric, the first duodenum and the first ileum weremarked by the endoscopist experts. Table 1 shows data used in the experiments.The procedures used to extract the image features in Sec .2.2 were implementedby a C++ program on a PC Pentium 3.2 GHz, 1 GB Ram. Wavelet PacketToolbox in MatLab was used to implement the MRA technique in Sec. 3.1.
Table 1. The material in experiments
Seq. Totalframes
The first frameof duodenum
The first frameof ileum
Total time Time in Smallbowel (in min.)
Seq 1 60392 3161 31798 8:23:16 238Seq 2 62350 7095 32863 8:39:35 214Seq 3 45020 3200 29037 6:15:10 215
Figure 7 shows the results of Seq 1. The left panel plots ribbons that showsfrequency components (fsw) along the CE transit time with predetermined con-figurations as described in Sec.3.2. Examining the ribbons of fsw, we can seehigh probability at the end of the small bowel for low frequencies and with thecontrasting observations for high frequencies. More clearly, Fig. 7b shows theprobability (calculated by (4)) of low fsw values (freq1 ≤ fsw ≤ freq2) in theupper panel and high fsw values in the lower panel. The right panel in Fig. 7aplots the velocities of slow waves, as calculated by (5). A simple fitting modelwas used to estimate the trends of velocities. The trend shows that the velocityof slow wave propagation gradually reduces along the CE transit time. Similar

848 H. Vu et al.
Estimated trendSmall bowel regions Estimated trendSmall bowel regions
(a) Left panel: Ribbons of fsw components along the CE transit time. Right panel: Thevelocities calculated by (5). The slant line represents an estimated trend of the velocityin the small bowel regions (marked by stems) using a least square fitting model.
(b) Upper panel with freq1 = 1 cycle/min ≤ fsw ≤ freq2 = 4 cycles/min . Lowerpanel with freq1 = 8 cycles/min ≤ fsw ≤ freq2 = 10 cycles/min
Fig. 7. Slow wave propagation of Seq 1
Seq_2Seq_2 Seq_3Seq_3
Fig. 8. Slow wave propagation of Seq 2 and Seq 3
Towards an Interpretation of Intestinal Motility 849
results are also shown in Fig. 8 for Seq 2 and Seq 3. By examining the threesequences, the propagation of slow waves interpreted by the proposed method isa good match with well-known characteristics of slow waves, as stated in [1,2,3].
5 Discussions and Conclusions
This study was to investigate of the small intestinal motility using CE imagesequences. In fact interest in small intestinal motility had also measured byother techniques such as in [4] or in [20,21]. The proposed method thus needsto be confirmed by these measurements using same healthy control data. Onthe other hand, the proposed method still lacks evidence and suffers ambiguousexplanations for noise and other factors for separation from the decomposedsignals. The relationship between the segmentary contractions and smoothingcomponents can support the definition of the baseline level as well as verifyingthe waveform detection results. In terms of experimental data, the frequencypatterns estimated from patient data, which represent dysfunctional motilitycan offer more valuable evaluation.
In summary, this paper proposed a heuristic method using functional signalsextracted from CE image sequences to study intestinal motility. The functionalsignal was averaged from multiple image features, by observing the high cor-relations between them. To exploit the information content of the functionalsignal, a MRA technique in wavelet domain was used. MRA results allowed usto separate the noise and the slow wave signal. The slow wave waveforms weredetected when their energy exceeded the baseline level. Some analyses relied onthe frequency appearance of the waveforms and their velocity along CE transittime were evaluated to estimate the propagation of slow wave. The experimentalresults shown provide the first results of a detailed interpretation of intestinalmotility from CE image sequences. Therefore, we believe that this provides apromising method with which to develop clinical applications.
References
1. Grundy, D.: GastroIntestinal Motility - The Integration of Physiological Mecha-nisms. MTP Press Limited, Lancaster (1985)
2. Bronzino, J.D.: The Biomedical Engineering Handbook, 3rd edn. CRC Press, BocaRaton (2006)
3. Dunn, R.B., Linkens, D.A.: A mathematical model of the slow-wave electrical ac-tivity of the human small intestine. Medical and Biological Engineering 12, 750–758(1974)
4. Hansen, M.B.: Small intestinal manometry. Physiological Research 51, 541–556(2002)
5. Iddan, G., Meron, G., Glukovsky, A., Swain, P.: Wireless capsule endoscope. Na-ture 405, 417 (2000)
6. Adler, D.G., Gostout, C.J.: Wireless capsule endoscopy - state of art. HospitalPhysician, 14–22 (2003)
850 H. Vu et al.
7. Swain, P., Fritscher-Ravens, A.: Role of video endoscopy in managing small boweldisease. GUT 53, 1866–1875 (2004)
8. Spyridonos, P., Vilarino, F., Vitria, J., Azpiroz, F., Radeva, P.: Identification ofintestinal motility events of capsule endoscopy video analysis. In: Blanc-Talon, J.,Philips, W., Popescu, D.C., Scheunders, P. (eds.) ACIVS 2005. LNCS, vol. 3708,pp. 531–537. Springer, Heidelberg (2005)
9. Spyridonos, P., Vilarino, F., Vitria, J., Azpiroz, F., Radeva, P.: Anisotropic featureextraction from endoluminal images for detection of intestinal contractions. In:Larsen, R., Nielsen, M., Sporring, J. (eds.) MICCAI 2006. LNCS, vol. 4191, pp.161–168. Springer, Heidelberg (2006)
10. Vilarino, F., Spyridonos, P., Vitria, J., Azpiroz, F., Radeva, P.: Linear radial pat-terns characterization for automatic detection of tonic intestinal contractions. In:Mart́ınez-Trinidad, J.F., Carrasco Ochoa, J.A., Kittler, J. (eds.) CIARP 2006.LNCS, vol. 4225, pp. 178–187. Springer, Heidelberg (2006)
11. Vu, H., Echigo, T., Sagawa, R., Yagi, K., Shiba, M., Higuchi, K., Arakawa, T.,Yagi, Y.: Contraction detection in small bowel from an image sequence of wirelesscapsule endoscopy. In: Ayache, N., Ourselin, S., Maeder, A. (eds.) MICCAI 2007,Part I. LNCS, vol. 4791, pp. 775–783. Springer, Heidelberg (2007)
12. Vu, H., Echigo, T., Sagawa, R., Yagi, K., Shiba, M., Higuchi, K., Arakawa, T.,Yagi, Y.: Adaptive control of video display for diagnostic assistance by analysis ofcapsule endoscopic images. In: Proc. of the 18th ICPR, pp. 980–983 (2006)
13. American Society for Gastrointestinal Endoscopy - ASGE: Technology status evalu-ation report wireless capsule endoscopy. Gastrointestinal Endoscopy 56, 1866–1875(2002)
14. Swain, M., Ballard, D.: Color indexing. International Journal of Computer Vision 7,11–32 (1991)
15. Lucas, B.D., Kanade, T.: An iterative image registration technique with an appli-cation to stereo vision. In: Proc. of the Intl. Joint Conf. on Artificial Intelligence,pp. 674–679 (1981)
16. Tomasi, C., Kanade, T.: Detection and tracking of point features. Technical report(1991)
17. Birchfield, S.: KLT: Kanade-Lucas-Tomasi Feature Tracker (2006),http://www.ces.clemson.edu/∼stb/klt/
18. Canny, J.: A computational approach to edge detection. IEEE T-PAMI 8, 679–698(1986)
19. Percival, B.D., Walden, T.A.: Wavelet Methods for Time Series Analysis. Cam-bridge University Press, Cambridge (2000)
20. Schemann, M., Ehrlein, H.-J.: Computerised method for pattern recognition ofintestinal motility: functional significance of the spread of contractions. Medicaland Biological Engineering 23, 143–149 (1985)
21. De Ridder, W.J.E., Voeten, J.J., Rombouts, J.A.C.A., Van Nueten, J.M., Schu-urkes, J.A.J.: Computer-assisted method for analysis of postprandial gastrointesti-nal motility in conscious dogs. Medical and Biological Engineering 27, 470–476(1989)


