Embed Size (px)
Citation preview

Automatic Region-of-Interest Segmentation andPathology Detection in Magnetically Guided
Capsule Endoscopy
Philip W. Mewes1,2, Dominik Neumann1, Oleg Licegevic1, Johannes Simon1,Aleksandar Lj. Juloski1, and Elli Angelopoulou2
1 Siemens AG, Healthcare Sector, Erlangen, Germany2 Pattern Recognition Lab, University of Erlangen-Nurnberg, Erlangen, Germany
Abstract. Magnetically-guided capsule endoscopy (MGCE) was intro-duced in 2010 as a procedure where a capsule in the stomach is navigatedvia an external magnetic field. The quality of the examination depends onthe operator’s ability to detect aspects of interest in real time. We presenta novel two step computer-assisted diagnostic-procedure (CADP) algo-rithm for indicating gastritis and gastrointestinal bleedings in the stom-ach during the examination. First, we identify and exclude subregions ofbubbles which can interfere with further processing. Then we address thechallenge of lesion localization in an environment with changing contrastand lighting conditions. After a contrast-normalized filtering, feature ex-traction is performed. The proposed algorithm was tested on 300 imagesof different patients with uniformly distributed occurrences of the targetpathologies. We correctly segmented 84.72% of bubble areas. A meandetection rate of 86% for the target pathologies was achieved during a5-fold leave-one-out cross-validation.
1 Introduction
Background and Purpose of This Work. Endoscopy of the upper gastrointestinal(GI) tract with flexible endoscopes is a standard clinical procedure. The maindisadvantages of this procedure are high invasiveness and patient discomfort.Wireless capsule endoscopy (WCE) was introduced in 2001 and is mainly usedin the duodenum. The stomach, in comparison, has large surface and volume andcan not be reliably examined with an uncontrolled capsule. Endoscopic capsulesthat can be steered from the outside by means of magnets have been reportedin [7,12,11]. In this paper we use human data from the clinical study of [11]that stems from 29 volunteers and 24 patients (Fig.1c and 1d). A single datasetfrom one patient contains on average 3600 images. For the MGCE procedure,the patient’s stomach is filled with water and the capsule is navigated from theoutside using an external magnetic field. During the examination the operatorcan control the motion of the capsule so as to obtain a sufficient number ofstomach-surface images with diagnostic value. The quality of the examination

depends on the skill of the operator and his ability to detect aspects of interest inreal time. We present a novel two-step computer-assisted diagnostic-procedure(CADP) algorithm for detecting, during the examination, two distinct stomachpathologies: gastritis and haematin. Gastritis is one of the main causes of stom-ach cancer. Chronic gastritis usually appears as a reddish and blotched turgor,while acute gastritis often appears as a small circle-shaped bleeding (Fig.2b).Haematin on the other hand, accrues from blood coming in contact with stom-ach acid. It is a sign of gastrointestinal bleeding and is an indicator of manysignificant diseases. It appears as a uniform brownish shape close to the stomachwall (Fig.2a). The proposed algorithm is divided into two steps: 1) a region-of-interest (ROI) segmentation to separate medically relevant sections of the imagefrom parts containing bubbles; 2) a contrast-normalized filtering to identify andlocalize possible lesions of pathologies. For this 2nd task we develop a featurevector, which is used for classifying pathologies in a machine learning approach.State of the Art. In a typical WCE examination a large number of frames ismedically irrelevant, as they either do not show pathologies or contain mainlyintestinal juices, bubbles or debris. To assist the physician in reviewing up toten hours of video material, software for computer-aided diagnosis (CAD) hasbeen developed. In [2,14,13] different descriptors for the task of blood and ulceradetection and topographic segmentation of the GI tract are investigated. Topo-graphic segmentation is addressed in [1] and [5] for the purpose of a more efficientand faster review. In [4] and [15] the issue of eliminating redundant frames, aswell as those with intestinal juices, is addressed. In [6] a set of color and texturebased features for the detection of intestinal bleedings is presented. These meth-ods are not directly applicable to MGCE. The duodenum, when compared to thestomach, exhibits different pathologies and imaging conditions, such as textureand distance to objects of interest. In [8] a method for the automatic detectionof gastritis aspects in MGCE was presented. In this paper we used the methodfrom [8] as a starting point and developed a ROI pre-segmentation for bubblesand an improved segmentation method for different pathologies (gastritis andhaematin). Compared to the aforementioned existing CAD algorithms which areonly used for review, our method indicates the pathologies during the examina-tion itself. The operator can, for instance, navigate to a suspicious region forfurther closer inspection. Even if 100% accuracy is not achieved, our algorithmmay still point out lesions which would otherwise be missed.
2 Automatic pathology detection in MGCE
2.1 Region of Interest Segmentation
Endoscopic images obtained via MGCEmay contain bubbles and mucus (Fig.1a).Such a region within an image usually contains no medically relevant informa-tion. One should, thus, segment such regions to exclude them from further pro-cessing. In [15] and [10] two methods for automatic detection of intestinal juicesare presented that exclude entire frames containing intestinal juices and bubblesfor the review process. The location of bubbles in the stomach is relatively stable

(a) (b) (c) (d)
Fig. 1: (a) sample image with bubbles. (b) segmented bubble area (c) lessercurvature and body (d)mucosa close-up B
and localized. Rejecting an entire frame with bubbles could therefore eliminateimages of whole stomach regions together with possible pathologies.The segmentation of bubble regions is not as straightforward as it may initiallyappear. The edges of most bubbles appear bright, but the translucent part isdominated by the color of the underlying tissue (Fig. 1a). Therefore, an inten-sity based approach is not effective. One has to combine geometry and colorcues in order to detect the entire bubbles region. To that end, we investigateda large variety of robust feature descriptors initialized with different key pointdetectors. We randomly chose as our training data 100 healthy and 100 diseasedimages from our dataset containing different amounts and spatial distributionsof bubbles. Regions with bubbles were hand-labeled. We denote one pixel withinan image as a tuple (x, y, v), where x and y are the pixel coordinates, and vis a pixel value. An image I (432×432 pixels) is defined as a set of pixels,I = {(x1, y1, v1), . . . , (xN , yN , vN )} where N is the total number of pixels in theimage. We define O1 ⊆ I as the set of all pixels in a bubble area and O2 ⊆ I asthe area without bubbles. In addition O1 ∩ O2 = ∅, and O1 ∪ O2 = I.We considered 5 descriptors (SIFT, steerable filters, GLOH, SPIN, Cross Corre-lation), each of which can be initialized with one of 5 different key point detectors(Hessian-Laplacian, Harris-Laplacian, Harris-Affine, Hessian-affine, Harris)1. Foreach combination of descriptor type and key point detector we obtained n de-scriptors (feature vectors) Dk, k = 1, ..., n, which were calculated on the corre-sponding image patches Pk ⊂ I, k = 1, ..., n around the detected key points. Weused the labeled data to train (using Adaboost) a 2-class classifier that coulddistinguish between descriptors corresponding to O1 and O2. We evaluated eachdescriptor / key-point-detector combination for bubble detection using a 5-foldleave-one-out cross-validation (LOO CV).Training phase: An image patch Pk is characterized by its center point c = (x, y)and an ellipse centered at c which is defined by one or two radii r1,2 respectively.For the supervised training input, a label
1 Affine covariant features [Online]. Available: http://www.robots.ox.ac.uk/~vgg/research/affine/
l(Pk) =
{0 if Pk ⊂ O1
1 if Pk ⊂ O2(1)
was assigned. The remaining Pks (i.e. image patches which do not completelybelong to either of the classes) were discarded from training. For training thefeature vector Dk was extended by 10 features based on HSV and RGB his-tograms. More specifically, the mean, variance, skew, kurtosis and entropy werecomputed for the S and R channel histograms for each patch Pk. These featuresenhance the classifier’s ability to distinguish structures with geometric similari-ties to bubbles (such as a round shape) which are, however, part of the stomachmucosa or a target pathology.Testing: After the training was completed, the new labels l(Pk) were computedbased on the obtained classifier. We define two measures for the quality of seg-mentation:
E(Oi) =
card
(( ∪{Pk|l(Pk)=1}
Pk
)∩Oi
)card(Oi)
(2)
with i = {1, 2 }.2 E(O1) measures the proportion of the ground-truth bubblearea covered by image patches classified as l = 1, while 1 − E(O2) measuresthe area without bubbles, that is wrongly covered by image patches classified asl = 1. We found that the combination of a Hessian-affine key point detector and asteerable filter descriptor yields the best results (see Table 1 (first row)). We referto the union {∪(Pk|l(Pk) = 0)} as the binary mask Ib and to bubble free areaas Ibn = I\Ib. Note that, the use of an elliptic shape for the image patches Pk
yields small areas between the image patches which are not classified as bubblesarea. To overcome this problem we introduced a circular morphologic dilationelement with a radius rs. The circle radius adapts to the size of the surroundingimage patches to ensure gap closing between large image patches and preventthe dilation of non-bubbles areas. A neighborhood around the dilation elementis defined as a window W of 30× 30 pixels around the center of the structuringelement. The radius rs at a position x, y within Ib is computed from the averageradii of all Pk|Pk ⊆ W.The improvement obtained with the dilation can be seen in Table 1. The quan-titative measurements were obtained by equation 2. After the segmentation wechecked if some pathologies were wrongly classified as bubbles and confirmedthat this was not the case (Visual results in Fig. 1b).
2.2 Contrast normalization and region localization
For the following steps only Ibn (i.e. areas without bubbles) are considered. Thepathological lesions exhibit low intensity while the surrounding tissue has high in-tensity values. In order to detect such lesions a LoG-edge detection, as proposedby [8], is performed. Thereby, Ibn is convolved with a Laplacian-of-Gaussian
2 card(·) denotes the cardinality, i.e. the number of pixels in the image subset

Table 1: Results of Bubble Segmentation
Method E(O1) 1− E(O2)
Direct use of descriptor 81.53% 4.24%With adaptive morphological operation 84.72% 5.74%
kernel K. The resulting image Ic is subsequently searched for prominent edgeswhose magnitude is above a certain threshold. Because images suffer from vary-ing contrast and lighting conditions, a contrast normalized variable threshold isintroduced. To that end, Ic is converted into a probability mass function f(bi)with Nbi intervals. The contrast normalized threshold tc is then computed asfollows. We first define the index tpos of an interval bi
tpos =
1∑i=Nbi
I
i∑j=Nbi
f(bj)
<
(∑f(bi)
4
) (3)
where I is an indicator function which is equal to 1 if its argument is true andzero otherwise. tc is then computed as tc = max(btpos).A binary edge image I(tc) is then computed using the variable threshold tc.I(tc) is 1 for Ic > tc and 0 otherwise. Given such a binary image our goal is tomerge connected pixels into areas representing possible locations of pathologies.A morphologic closing operator with a disc-shaped structuring element of aradius of 5 pixels is applied to I(tc). Subsequently, using 4-connectivity, pixelsare grouped into structures that we refer to as Sj with j = 1, ...,m where m isthe total number of structures per image. On average, images contain 45 Sj ’swith a mean size of 20×14 pixels. Ultimately, we want to classify each structureSj into one of the three classes: the gastritis class C1, the haematin class C2 andthe negative class C3 without any abnormalities. For training purposes, all Sj
are superimposed on to the original RGB-image. Visual inspection shows thatall possible lesions of C1 and C2 are detected by the above described regionlocalization method. All computed Sj are therefore directly hand-labeled by anexpert so that a label L is assigned to each structure Sj
L(Sj) =
0 if Sj ∈ C1 (gastritis class)1 if Sj ∈ C2 (haematin class)2 if Sj ∈ C3 (negative class)
(4)
2.3 Feature Extraction
The following sets of features are extracted for each structure Sj (Fig. 2c).Geometric features (GF). Geometric features describe the specific shape ofpathologies. We extract the maximal vertical and horizontal dimensions of Sj andof its minimal bounding box and their corresponding aspect ratio. Furthermorethe ratio between the area covered by Sj and the area of the minimal bounding
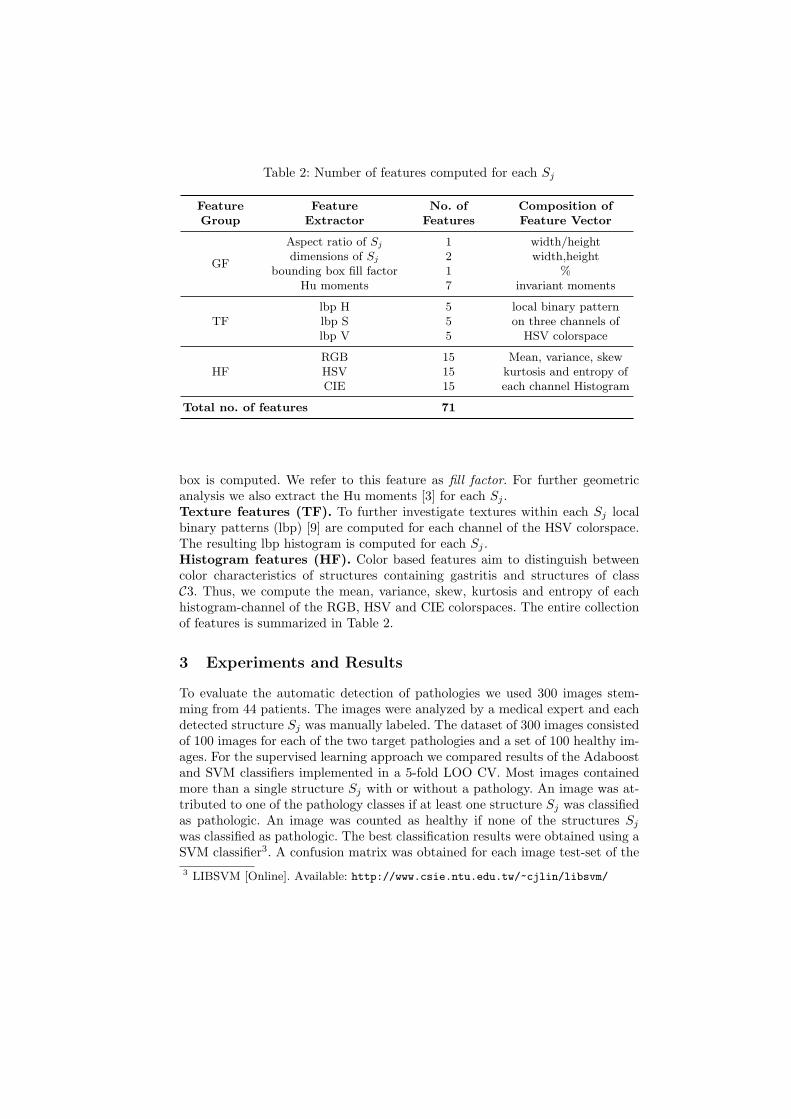
Table 2: Number of features computed for each Sj
FeatureGroup
FeatureExtractor
No. ofFeatures
Composition ofFeature Vector
GF
Aspect ratio of Sj 1 width/heightdimensions of Sj 2 width,height
bounding box fill factor 1 %Hu moments 7 invariant moments
TFlbp H 5 local binary pattern
on three channels ofHSV colorspace
lbp S 5lbp V 5
HFRGB 15 Mean, variance, skew
kurtosis and entropy ofeach channel Histogram
HSV 15CIE 15
Total no. of features 71
box is computed. We refer to this feature as fill factor. For further geometricanalysis we also extract the Hu moments [3] for each Sj .Texture features (TF). To further investigate textures within each Sj localbinary patterns (lbp) [9] are computed for each channel of the HSV colorspace.The resulting lbp histogram is computed for each Sj .Histogram features (HF). Color based features aim to distinguish betweencolor characteristics of structures containing gastritis and structures of classC3. Thus, we compute the mean, variance, skew, kurtosis and entropy of eachhistogram-channel of the RGB, HSV and CIE colorspaces. The entire collectionof features is summarized in Table 2.
3 Experiments and Results
To evaluate the automatic detection of pathologies we used 300 images stem-ming from 44 patients. The images were analyzed by a medical expert and eachdetected structure Sj was manually labeled. The dataset of 300 images consistedof 100 images for each of the two target pathologies and a set of 100 healthy im-ages. For the supervised learning approach we compared results of the Adaboostand SVM classifiers implemented in a 5-fold LOO CV. Most images containedmore than a single structure Sj with or without a pathology. An image was at-tributed to one of the pathology classes if at least one structure Sj was classifiedas pathologic. An image was counted as healthy if none of the structures Sj
was classified as pathologic. The best classification results were obtained using aSVM classifier3. A confusion matrix was obtained for each image test-set of the
3 LIBSVM [Online]. Available: http://www.csie.ntu.edu.tw/~cjlin/libsvm/
(a) (b) (c)
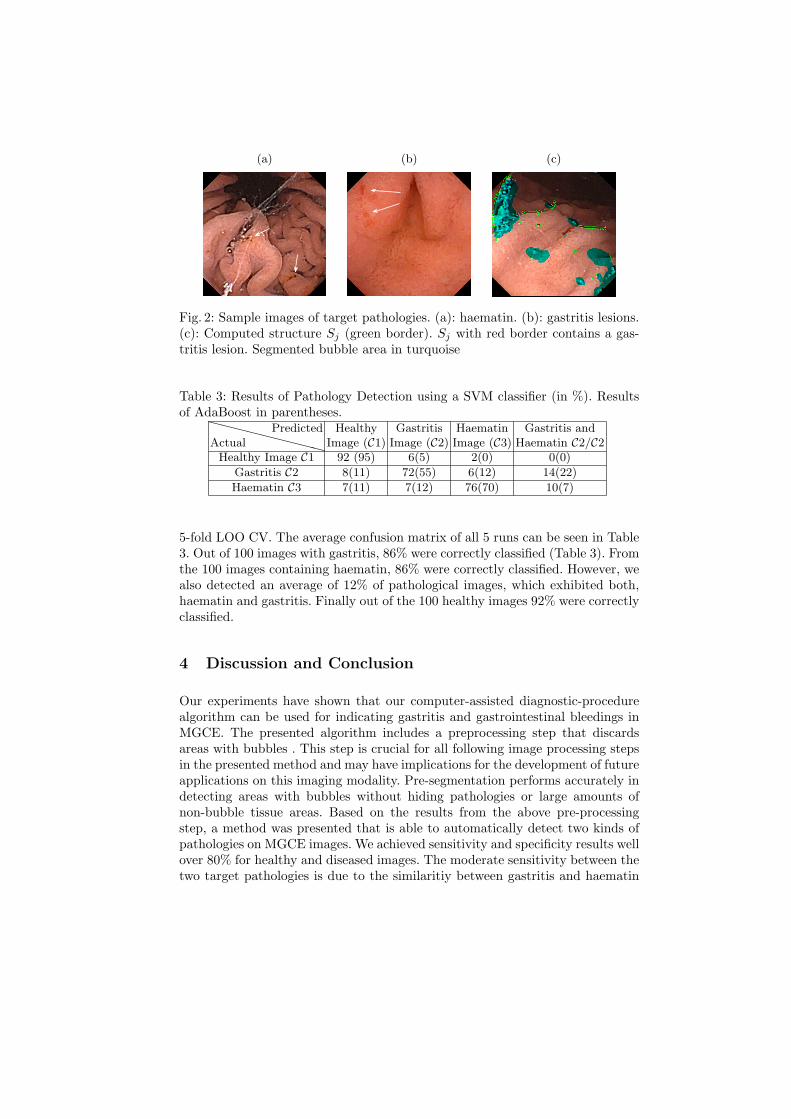
Fig. 2: Sample images of target pathologies. (a): haematin. (b): gastritis lesions.(c): Computed structure Sj (green border). Sj with red border contains a gas-tritis lesion. Segmented bubble area in turquoise
Table 3: Results of Pathology Detection using a SVM classifier (in %). Resultsof AdaBoost in parentheses.
XXXXXXXXXActualPredicted Healthy Gastritis Haematin Gastritis and
Image (C1) Image (C2) Image (C3) Haematin C2/C2Healthy Image C1 92 (95) 6(5) 2(0) 0(0)
Gastritis C2 8(11) 72(55) 6(12) 14(22)
Haematin C3 7(11) 7(12) 76(70) 10(7)
5-fold LOO CV. The average confusion matrix of all 5 runs can be seen in Table3. Out of 100 images with gastritis, 86% were correctly classified (Table 3). Fromthe 100 images containing haematin, 86% were correctly classified. However, wealso detected an average of 12% of pathological images, which exhibited both,haematin and gastritis. Finally out of the 100 healthy images 92% were correctlyclassified.
4 Discussion and Conclusion
Our experiments have shown that our computer-assisted diagnostic-procedurealgorithm can be used for indicating gastritis and gastrointestinal bleedings inMGCE. The presented algorithm includes a preprocessing step that discardsareas with bubbles . This step is crucial for all following image processing stepsin the presented method and may have implications for the development of futureapplications on this imaging modality. Pre-segmentation performs accurately indetecting areas with bubbles without hiding pathologies or large amounts ofnon-bubble tissue areas. Based on the results from the above pre-processingstep, a method was presented that is able to automatically detect two kinds ofpathologies on MGCE images. We achieved sensitivity and specificity results wellover 80% for healthy and diseased images. The moderate sensitivity between thetwo target pathologies is due to the similaritiy between gastritis and haematin
aspects in terms of color and texture. Still, the algorithm performs well, especiallywithin the context of real-time warnings for certain gastritis aspects.
References
1. Berens, J., Mackiewicz, M., Bell, D.: Stomach, intestine, and colon tissue discrim-inators for wireless capsule endoscopy images. In: Fitzpatrick, J., Reinhardt, J.(eds.) Proceedings of SPIE. vol. 5747, p. 283 (2005)
2. Cunha, J., Coimbra, M., Campos, P., Soares, J.: Automated topographic segmen-tation and transit time estimation in endoscopic capsule exams. IEEE T MedImaging 27(1), 19–27 (2007)
3. Hu, M.: Visual pattern recognition by moment invariants. IRE Trans. Info. Theory8, 179–187 (1962)
4. Karargyris, A., et al.: A video-frame based registration using segmentation andgraph connectivity for Wireless Capsule Endoscopy. In: Life Science Systems andApplications Workshop LiSSA 2009. IEEE/NIH. pp. 74–79. IEEE (2009)
5. Mackiewicz, M., Berens, J., Fisher, M.: Wireless capsule endoscopy color videosegmentation. IEEE T Med Imaging 27(12), 1769–1781 (2008)
6. Mackiewicz, M., Fisher, M., Jamieson, C.: Bleeding detection in wireless capsuleendoscopy using adaptive colour histogram model and support vector classification.In: Joseph, M., Josien, P. (eds.) Proceedings of SPIE. vol. 6914, p. 69140R (2008)
7. Menciassi, A., Valdastri, P., Quaglia, C., Buselli, E., Dario, P.: Wireless steeringmechanism with magnetic actuation for an endoscopic capsule. In: Engineering inMedicine and Biology Society, 2009. EMBC 2009. Annual International Conferenceof the IEEE. pp. 1204–1207. IEEE (2009)
8. Mewes, P., Neumann, D., Juloski, A., Angelopoulou, E., Hornegger, J.: On-the-fly detection of images with gastritis aspects in magnetically-guided capsule en-doscopy. In: Ronald, M., Bram van Ginneken (eds.) Medical Imaging - Computer-Aided Diagnosis. Proceedings of the SPIE. vol. 7963, p. 79631I3. SPIE (2011)
9. Ojala, T., Pietikainen, M., Harwood, D.: A comparative study of texture measureswith classification based on featured distributions. Pattern Recognition 29(1), 51–59 (1996)
10. Reingruber, H.: Intestinal content detection in capsule endoscopy using robustfeatures @ONLINE (2009), http://www.recercat.net/handle/2072/43221
11. Rey, J., Ogata, H., Hosoe, N., Ohtsuka, K., Ogata, N., Ikeda, K., Aihara, H.,Pangtay, I., Hibi, T., Kudo, S., Tajiri, H.: Feasibility of stomach exploration witha guided capsule endoscope. Endoscopy 42(7), 541–545 (2010)
12. Swain, P., Toor, A., Volke, F., Keller, J., Gerber, J., Rabinovitz, E., Rothstein, R.:Remote magnetic manipulation of a wireless capsule endoscope in the esophagusand stomach of humans. Gastrointest Endosc (2010)
13. Szczypinski, P., Klepaczko, A.: Selecting texture discriminative descriptors of cap-sule endpscopy images. In: Zinterhof, P. (ed.) Proceedings of ISPA 2009. pp. 701–706. IEEE (2009)
14. Szczypiski, P., Sriram, P., Sriram, R., Reddy, D.: Model of deformable rings foraiding the wireless capsule endoscopy video interpretation and reporting. CompImag Vis pp. 167–172 (2006)
15. Vilarino, F., Spyridonos, P., Pujol, O., Vitria, J., Radeva, P., De Iorio, F.: Auto-matic detection of intestinal juices in wireless capsule video endoscopy. In: Tang,Y., Wang, S., Lorette, G., Yeung, D., Yan, H. (eds.) ICPR 2006. vol. 4, pp. 719–722.IEEE (2006)


