Embed Size (px)
Citation preview
G
C
R
Da
b
c
a
ARRA
KNWVS
1
sebivbbisTwvreuab
r
T
(
0d
ARTICLE IN PRESSModel
MIG-983; No. of Pages 8
Computerized Medical Imaging and Graphics xxx (2009) xxx–xxx
Contents lists available at ScienceDirect
Computerized Medical Imaging and Graphics
journa l homepage: www.e lsev ier .com/ locate /compmedimag
eduction of capsule endoscopy reading times by unsupervised image mining
.K. Iakovidisa, S. Tsevasa,b,∗, A. Polydorouc
Department of Informatics and Computer Technology, Technological Educational Institute of Lamia, GreeceDepartment of Computer Science, University of Geneva, Geneva, SwitzerlandDepartment of Surgery, Aretaieion Hospital, V. Sofias 76 Avenue, 115 27 Athens, Greece
r t i c l e i n f o
rticle history:eceived 1 April 2009eceived in revised form 29 August 2009ccepted 8 November 2009
eywords:
a b s t r a c t
The screening of the small intestine has become painless and easy with wireless capsule endoscopy (WCE)that is a revolutionary, relatively non-invasive imaging technique performed by a wireless swallowableendoscopic capsule transmitting thousands of video frames per examination. The average time requiredfor the visual inspection of a full 8-h WCE video ranges from 45 to 120 min, depending on the experienceof the examiner. In this paper, we propose a novel approach to WCE reading time reduction by unsuper-
on-negative matrix factorizationireless capsule endoscopy
ideoummarization
vised mining of video frames. The proposed methodology is based on a data reduction algorithm which isapplied according to a novel scheme for the extraction of representative video frames from a full lengthWCE video. It can be used either as a video summarization or as a video bookmarking tool, providing thecomparative advantage of being general, unbounded by the finiteness of a training set. The number offrames extracted is controlled by a parameter that can be tuned automatically. Comprehensive experi-
s indihis re
ments on real WCE videoof the WCE videos used t
. Introduction
Wireless capsule endoscopy (WCE) has been established as atandard imaging technique for screening the gastrointestinal tract,specially the small intestine mucosa, which is not easily reachedy the usual upper endoscopy and colonoscopy [1] methods. It
s performed by a swallowable capsule with the size of a largeitamin that includes a miniature color video camera, a light, aattery and a video stream transmitter. The capsule is propelledy peristalsis through the gut and reaches the right colon typically
n 5–8 h. During its journey in the human body it captures thou-ands of video frames and transmits them wirelessly to a recorder.he average number of frames collected for an 8-h examinationith a contemporary capsule is of the order of 50,000 [2]. The
isual inspection of such a full-length video takes place offline, andequires 45–120 min of intense labour, depending on the experi-nce of the examiner [2,3]. Such a manual examination process isndoubtedly time-consuming and does not guarantee that some
Please cite this article in press as: Iakovidis DK, et al. Reduction of capsule eImaging Graph (2009), doi:10.1016/j.compmedimag.2009.11.005
bnormal regions are not missed, since abnormalities may be visi-le in only a few frames.
State of the art computational approaches developed to aideading and interpretation of WCE videos include methods for the
∗ Corresponding author at: Department of Informatics and Computer Technology,echnological Educational Institute of Lamia, Greece. Tel.: +30 6946430629.
E-mail addresses: [email protected] (D.K. Iakovidis), [email protected]. Tsevas).
895-6111/$ – see front matter © 2009 Elsevier Ltd. All rights reserved.oi:10.1016/j.compmedimag.2009.11.005
cate that a significant reduction in the reading times is feasible. In the caseduction reached 85% without any loss of abnormalities.
© 2009 Elsevier Ltd. All rights reserved.
detection of abnormalities, such as ulcer and polyps, and bloodfindings indicating the presence of abnormalities [4–11]; the iden-tification of the digestive different organs [12,13]; the detectionof intestinal contractions [14,15]; and the rejection of invalid partsfrom the WCE video by intestinal juice detection [16]. Most of thesemethods have been based on supervised classification of low-levelpatterns extracted from video frames, such as hidden markov mod-els and support vector machines [12] and classifier ensembles [14],sometimes supported by soft computing techniques [10,11]. Fewermethods have been based on unsupervised approaches such as selforganizing maps [15] and expectation maximization clustering [8].Feature extraction methods used include chromaticity moments[4], Gabor [16] and MPEG-7 visual descriptors [7], whereas thesynergy of image registration and local-global graphs has provedto be a valuable alternative [5,9]. Although these approaches aremainly oriented to automatic video content interpretation, theirapplication could relatively speed up the reading times, since theexaminers could be driven by auto-annotations, bookmarking theregions where visual inspection should be more thorough. How-ever, a major drawback is that they are not general, in the sensethat they are subject-dependent, often bounded by the finitenessof a training set.
Other, more general approaches to the reduction of the WCE
ndoscopy reading times by unsupervised image mining. Comput Med
reading times include adaptive control of video display [17], andfusion of redundant video frames [18]. According to the methodproposed in [17], the WCE video can be played back at high speed instable smooth frame sequences to save time and then be decreasedat frame sequences where there are sudden rough changes, in
ARTICLE IN PRESSG Model
CMIG-983; No. of Pages 8
2 D.K. Iakovidis et al. / Computerized Medical Imaging and Graphics xxx (2009) xxx–xxx
rvised
oist
tvaflebTfpitTamptm
pedt
2
oreforit
matnt
2
atos
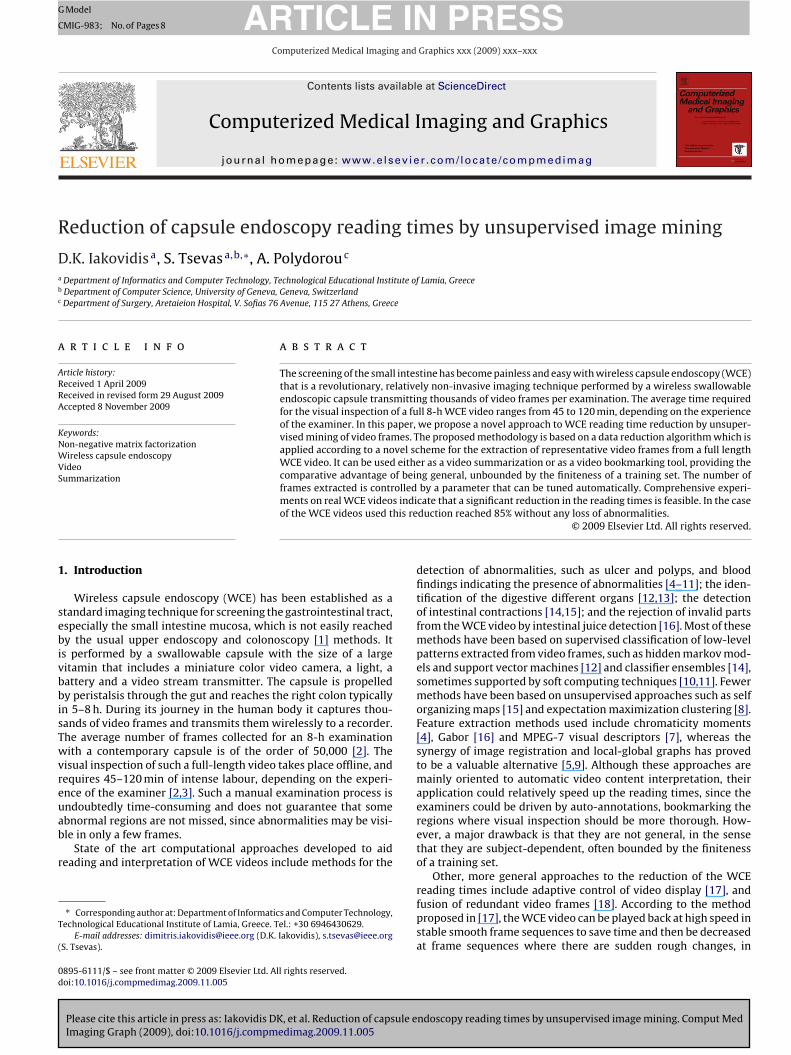
Fig. 1. Methodology for unsupe
rder to assess suspicious findings in detail. The fusion technique ismplemented by the Quickview option of the commercial imagingoftware Rapid 4 [18]; however, a recent study showed that withhis approach leads to an unacceptable diagnostic miss rate [19].
In this paper we propose a novel image mining approach tohe reduction of WCE reading times. It is based on an unsuper-ised data reduction algorithm [23] which is applied according tonovel scheme for the extraction of representative video frames
rom a WCE video, by imposing orthogonality constraints to theocal frame space of consecutively sampled video segments. Thextracted frames can be regarded as a summary or as set ofookmarks indicating the frames of interest of the original video.he proposed methodology provides generality and independencerom any training set, and it has two additional features over itsreliminary instances presented in [20–22]: (a) an automatic tun-
ng mechanism for the parameter controlling the number of frameso be extracted, and (b) applicability on full length WCE videos.his was still an open issue in [20–22], since a straightforwardpplication of that methodology would yield a very large dataatrix containing thousands of video frames, and its size would be
rohibiting for processing by conventional computer systems. Fur-hermore, this study presents an extended evaluation which spans
ultiple segments of real full length WCE videos.The rest of this paper consists of three sections. Section 2
resents the proposed methodology, which is comprehensivelyvaluated in Section 3. The last section summarises the conclusionserived from this study, and suggests future research perspec-ives.
. Methodology
The proposed methodology considers video frames as membersf a vector space and applies an unsupervised data reduction algo-ithm based on non-negative matrix factorization (NMF) [23] toxtract a set of orthogonal vectors. The whole WCE video is uni-ormly sampled and consecutive non-overlapping video segmentsf length N are extracted. The unsupervised data reduction algo-ithm is applied on each segment, and a subset of orthogonal framess extracted from the segment as the most representative ones forhat segment.
In the following subsections, we briefly refer to the necessaryathematical background on NMF, we provide the details on the
pplication of the methodology proposed in [23] for the reduc-ion of frames from a WCE video segment, and we present theovel approach to automatic tuning of the parameter controllinghe number of extracted frames.
.1. Non-negative matrix factorization
Please cite this article in press as: Iakovidis DK, et al. Reduction of capsule eImaging Graph (2009), doi:10.1016/j.compmedimag.2009.11.005
Non-negative Matrix Factorization was introduced by Paaterond Tapper [24] as a way to find a non-negative reduced representa-ion of non-negative data, but it has gained popularity by the worksf Lee and Seung [25,26]. In contrast to other factorization methodsuch as Principal Component Analysis (PCA), NMF allows only addi-
summarization of WCE video.
tive combinations of non-negative data, leading to a representationthat is more intuitive and closer to the human perception.
Given a non-negative m×n matrix V, and a reduced rankr(r < min(m,n)), the NMF algorithms seek to find non-negative fac-tors W and H of V such that:
V ≈ V =W ×H (1)
where W∈�m×r and H∈�r×n.Intuitively, we may think of W as the matrix containing the NMF
basis and H as the matrix containing the non-negative coefficients.Consequently, NMF solves the following optimization problem:
minW,H||V −WH||2F , W, H ≥ 0 (2)
where H is actually a reduced representation of V with lowerdimensionality and F stands for the Frobenius norm of a matrix.
This optimization problem is solved using the following multi-plicative update rules:
War ←War(V ×WT)ar
(W ×H ×HT)ar
(3)
Hrb ← Hrb(WT × V )rb
(WT ×W ×H)rb
(4)
where War and Hrb are the (a, r) and (b, j) entries of W and Haccordingly.
2.2. B. Unsupervised video frame reduction
The unsupervised data reduction algorithm proposed in [23] isapplied on each WCE video segment as illustrated in Fig. 1. Initiallythe video segment is pre-processed by dimensionality reductionalgorithm so that a symmetric data matrix V of smaller dimen-sionality is obtained. The use of such a matrix provides fasterconvergence for NMF and NLR, which are subsequently applied forclustering of the video frames. The frames are clustered so thatorthogonality constraints can be imposed for the extraction of mostrepresentative frames (MRFs) from the whole video, in the last stepof this algorithm.
Among other algorithms, fuzzy C-means (FCM) has been pro-posed as a soft clustering method to initialize NMF [27,23]. Morespecifically, for a given number of clusters, the NMF basis matrixW is initialized by the cluster centroids obtained after FCM con-vergence, whereas factor H is initialized by the fuzzy membershipvalues assigned to each data vector. Since, W and H correspond toa clustering result after their initialization, NMF can be regarded asthe method to improve this result, leading to a more visible clusterstructure. This process determines both the dimensionality and theinitial values of W and H (or just H in certain algorithms).
ndoscopy reading times by unsupervised image mining. Comput Med
The membership values obtained by FCM are stored in a n× kmatrix UFCM, and a n×n similarity matrix V is constructed accord-ing to the process described in [23]. The dimension k of themembership matrix UFCM of the converged FCM, is set equal tothe predefined number of clusters c and the values of its transpose
IN PRESSG
C
ical Imaging and Graphics xxx (2009) xxx–xxx 3
admtpatp
V
V
iltr
H
w0j∣∣woa
L
va
srbni
X
u
|wo
L
or
afctsInaSof
ARTICLEModel
MIG-983; No. of Pages 8
D.K. Iakovidis et al. / Computerized Med
re used to initialize H. The neighbouring frames in the original n-imensional vector space are determined by calculating the n×natrix DE of the Euclidean distances. Using DE, the calculation of
he geodesic distance matrix takes place by finding the shortestaths in a graph connecting neighbouring data points, resulting inmatrix DG that contains the geodesic distances between the vec-
orial representations of the frames. Next, DG is transformed into aairwise similarity matrix according to Eq. (5),
= e−DG/r (5)
The symmetric NMF (SymNMF) which for a square matrix is:
≈ H ×HT (6)
s applied on V in order to improve the result of the FCM clustering,eading to a more transparent cluster structure. According to [29]he calculation of H is iterative according to the following updateule:
j+1ik= Hj
ik
(1− ˇ + ˇ
(VH)jik
(HHTH)jik
)(7)
here j stands for the iteration index, Hik is the (i,k) entry of H and< ˇ≤1, with 0.5 advised as a good choice for beta value [30]. For
=0, H is set to UFCM. SymNMF iterates until
Lj+1 − Lj
∣∣< ε1 (8)
here ε1 is a small positive constant close to zero and Lj is thebjective function of the SymNMF at the jth iteration and is defineds:
j = ||V j −H jHTj ||2F (9)
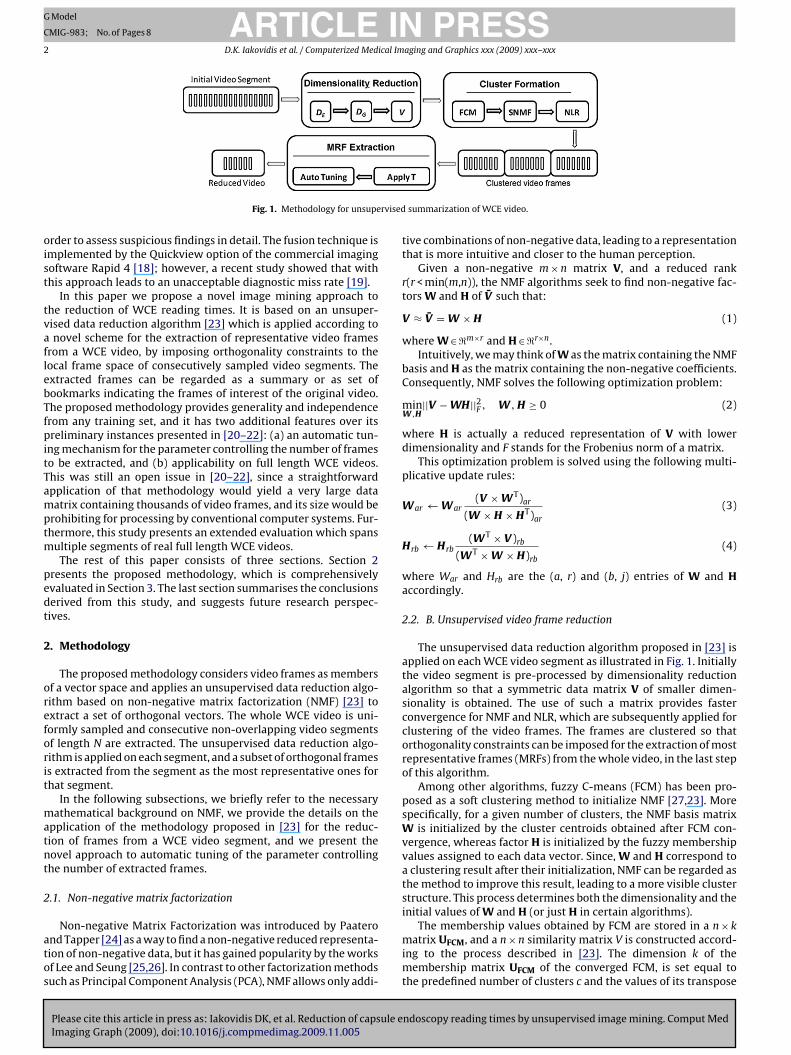
An example illustrating the way the membership values of eachectorized frame of a video segment are distributed to four clustersfter the application of SymNMF is provided in Fig. 2.
The final step of the methodology imposes orthogonality con-traints on the output of SymNMF so as to extract the mostepresentative members of a given cluster. It is implementedy means of an NMF multiplicative update algorithm known ason-negative lagrangian relaxation (NLR) [30,23]. This algorithm
terates according to the following update rule:
j+1ik= Xj
ik
√(VX)j
ik
(X˛)jik
, ˛ = XTVX (10)
ntil:
Lj+1 − Lj|< ε2 (11)
here ε2 is a very small positive constant close to zero and Lj is thebjective function of the NLR at the jth iteration and is defined as:
j = Tr(XTVX)− Tr(˛(XTX − I)) (12)
Tr(·) stands for the trace of the matrix (the summary of the diag-nal elements) and I is the identity matrix. For j = 0, X is set to theesult obtained by the SymNMF.
In NLR the entries of X are viewed as cluster indicators and, asresult, the interpretation of its output at convergence is straight-
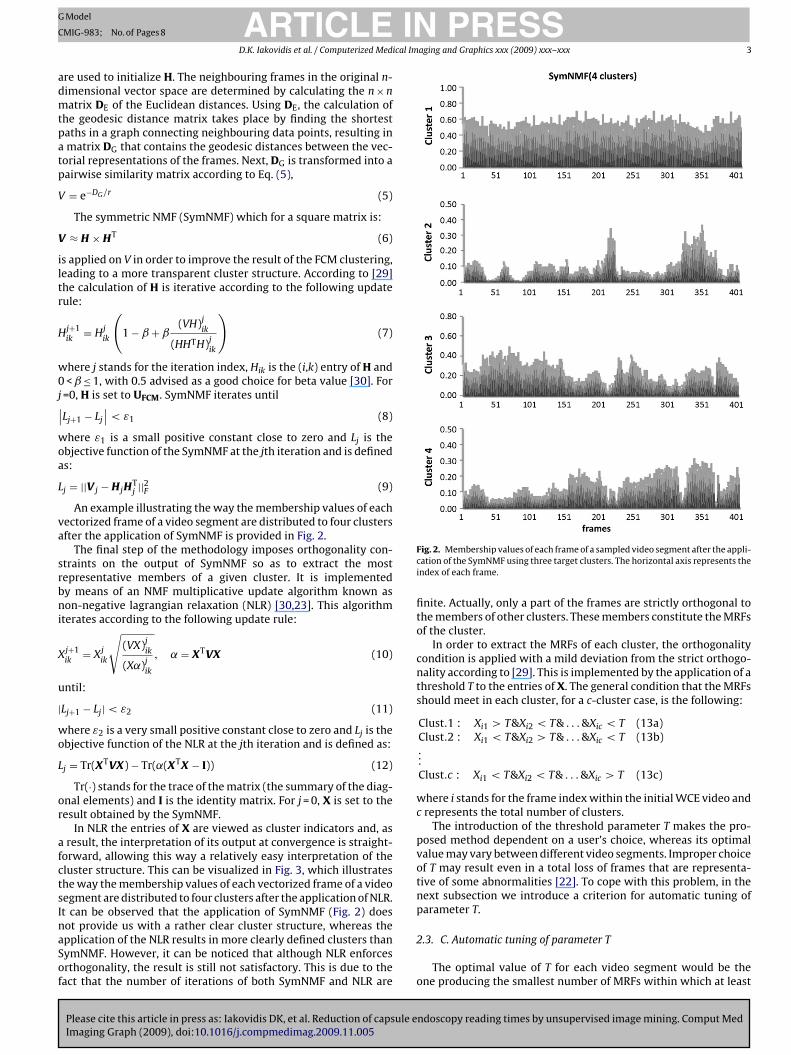
orward, allowing this way a relatively easy interpretation of theluster structure. This can be visualized in Fig. 3, which illustrateshe way the membership values of each vectorized frame of a videoegment are distributed to four clusters after the application of NLR.t can be observed that the application of SymNMF (Fig. 2) does
Please cite this article in press as: Iakovidis DK, et al. Reduction of capsule eImaging Graph (2009), doi:10.1016/j.compmedimag.2009.11.005
ot provide us with a rather clear cluster structure, whereas thepplication of the NLR results in more clearly defined clusters thanymNMF. However, it can be noticed that although NLR enforcesrthogonality, the result is still not satisfactory. This is due to theact that the number of iterations of both SymNMF and NLR are
Fig. 2. Membership values of each frame of a sampled video segment after the appli-cation of the SymNMF using three target clusters. The horizontal axis represents theindex of each frame.
finite. Actually, only a part of the frames are strictly orthogonal tothe members of other clusters. These members constitute the MRFsof the cluster.
In order to extract the MRFs of each cluster, the orthogonalitycondition is applied with a mild deviation from the strict orthogo-nality according to [29]. This is implemented by the application of athreshold T to the entries of X. The general condition that the MRFsshould meet in each cluster, for a c-cluster case, is the following:
Clust.1 : Xi1 > T&Xi2 < T& . . . &Xic < T (13a)Clust.2 : Xi1 < T&Xi2 > T& . . . &Xic < T (13b)...Clust.c : Xi1 < T&Xi2 < T& . . . &Xic > T (13c)
where i stands for the frame index within the initial WCE video andc represents the total number of clusters.
The introduction of the threshold parameter T makes the pro-posed method dependent on a user’s choice, whereas its optimalvalue may vary between different video segments. Improper choiceof T may result even in a total loss of frames that are representa-tive of some abnormalities [22]. To cope with this problem, in thenext subsection we introduce a criterion for automatic tuning ofparameter T.
ndoscopy reading times by unsupervised image mining. Comput Med
2.3. C. Automatic tuning of parameter T
The optimal value of T for each video segment would be theone producing the smallest number of MRFs within which at least
ARTICLE IN PRESSG Model
CMIG-983; No. of Pages 8
4 D.K. Iakovidis et al. / Computerized Medical Imaging and Graphics xxx (2009) xxx–xxx
Fco
oHimov
taTfpstoehih
nIlatibmb
A total of eight approximately 8-h WCE videos have been
ig. 3. Membership values of each frame of a sampled video segment after the appli-ation of the NLR using three target clusters. The horizontal axis represents the indexf each frame.
ne representative from all the existent abnormalities is present.owever, neither the number nor the extent of the abnormalities
s known a priori. Qualitatively, the probability of losing any abnor-alities is becoming lower as the number of MRFs increases, but
n the other hand, in order to obtain high frame reduction rates thealue of T should be kept low.
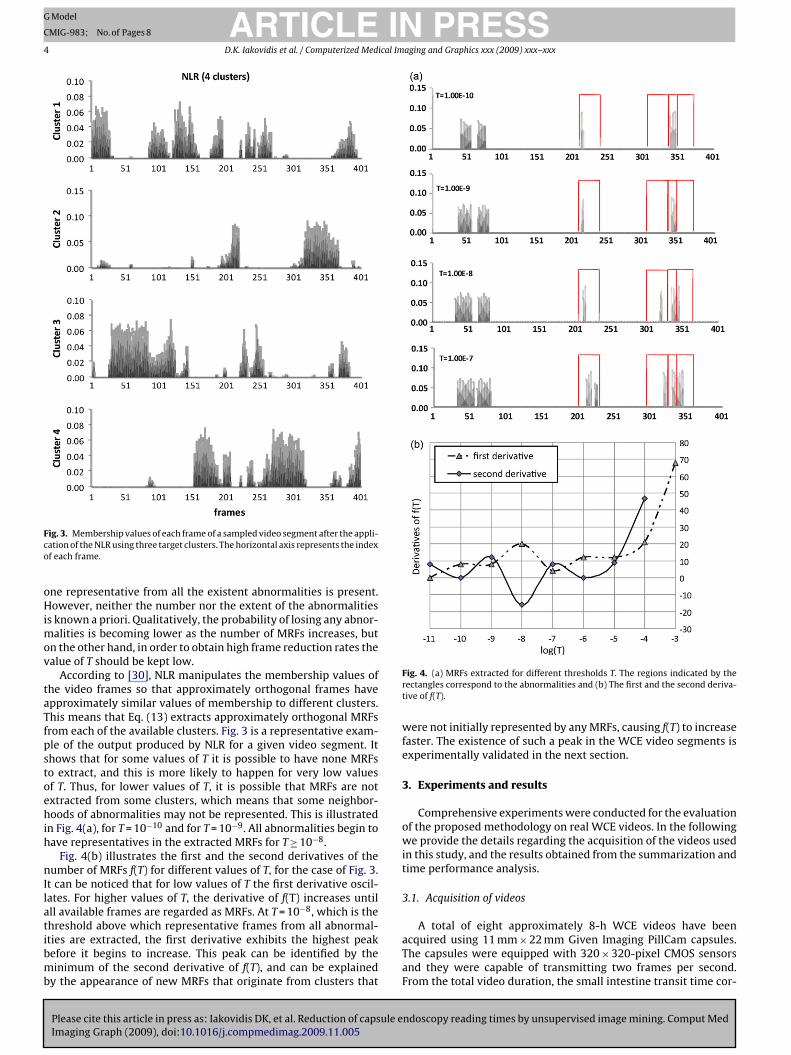
According to [30], NLR manipulates the membership values ofhe video frames so that approximately orthogonal frames havepproximately similar values of membership to different clusters.his means that Eq. (13) extracts approximately orthogonal MRFsrom each of the available clusters. Fig. 3 is a representative exam-le of the output produced by NLR for a given video segment. Ithows that for some values of T it is possible to have none MRFso extract, and this is more likely to happen for very low valuesf T. Thus, for lower values of T, it is possible that MRFs are notxtracted from some clusters, which means that some neighbor-oods of abnormalities may not be represented. This is illustrated
n Fig. 4(a), for T = 10−10 and for T = 10−9. All abnormalities begin toave representatives in the extracted MRFs for T≥10−8.
Fig. 4(b) illustrates the first and the second derivatives of theumber of MRFs f(T) for different values of T, for the case of Fig. 3.
t can be noticed that for low values of T the first derivative oscil-ates. For higher values of T, the derivative of f(T) increases untilll available frames are regarded as MRFs. At T = 10−8, which is thehreshold above which representative frames from all abnormal-
Please cite this article in press as: Iakovidis DK, et al. Reduction of capsule eImaging Graph (2009), doi:10.1016/j.compmedimag.2009.11.005
ties are extracted, the first derivative exhibits the highest peakefore it begins to increase. This peak can be identified by theinimum of the second derivative of f(T), and can be explained
y the appearance of new MRFs that originate from clusters that
Fig. 4. (a) MRFs extracted for different thresholds T. The regions indicated by therectangles correspond to the abnormalities and (b) The first and the second deriva-tive of f(T).
were not initially represented by any MRFs, causing f(T) to increasefaster. The existence of such a peak in the WCE video segments isexperimentally validated in the next section.
3. Experiments and results
Comprehensive experiments were conducted for the evaluationof the proposed methodology on real WCE videos. In the followingwe provide the details regarding the acquisition of the videos usedin this study, and the results obtained from the summarization andtime performance analysis.
3.1. Acquisition of videos
ndoscopy reading times by unsupervised image mining. Comput Med
acquired using 11 mm×22 mm Given Imaging PillCam capsules.The capsules were equipped with 320×320-pixel CMOS sensorsand they were capable of transmitting two frames per second.From the total video duration, the small intestine transit time cor-
ARTICLE IN PRESSG Model
CMIG-983; No. of Pages 8
D.K. Iakovidis et al. / Computerized Medical Imaging and Graphics xxx (2009) xxx–xxx 5
l muc
riswfswtdfiTtg
fegVdbwa
3
ok
ie
C
c
w
R
wvi
o
TD
we manage to obtain high ratios for both recall and coverage bykeeping at the same time only a small fraction of the total videoframes. As a result, a considerable reduction in the video readingtime can be achieved without loss of any abnormal finding.
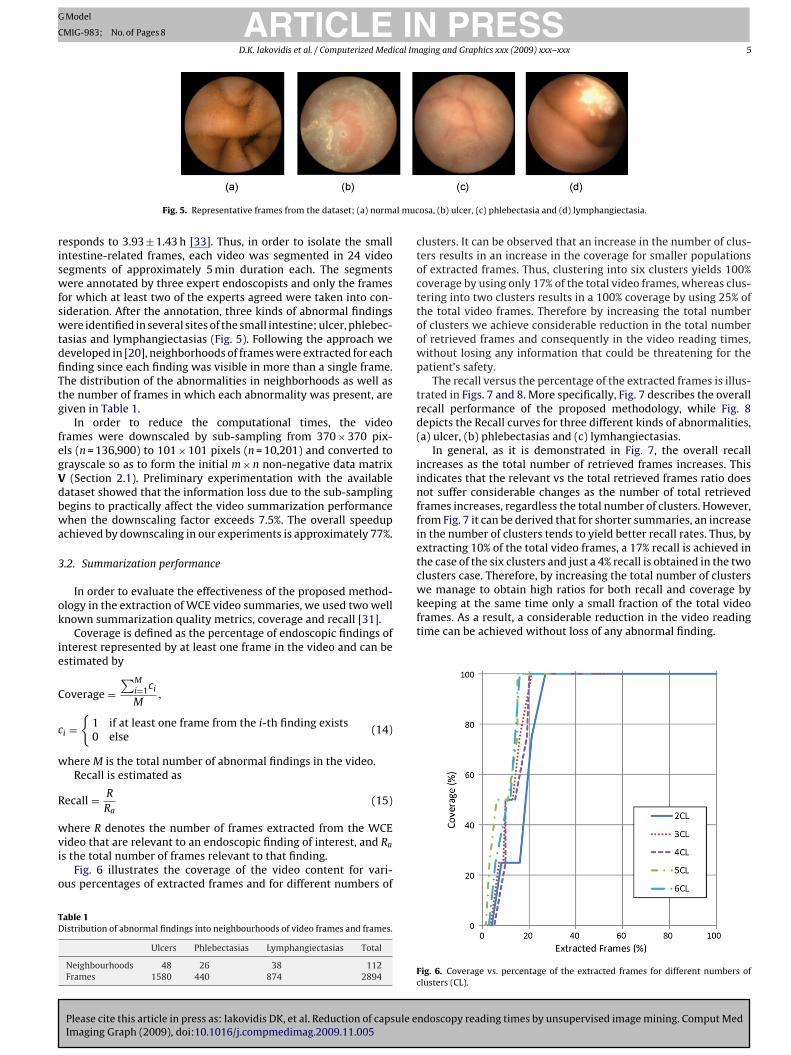
Fig. 5. Representative frames from the dataset; (a) norma
esponds to 3.93±1.43 h [33]. Thus, in order to isolate the smallntestine-related frames, each video was segmented in 24 videoegments of approximately 5 min duration each. The segmentsere annotated by three expert endoscopists and only the frames
or which at least two of the experts agreed were taken into con-ideration. After the annotation, three kinds of abnormal findingsere identified in several sites of the small intestine; ulcer, phlebec-
asias and lymphangiectasias (Fig. 5). Following the approach weeveloped in [20], neighborhoods of frames were extracted for eachnding since each finding was visible in more than a single frame.he distribution of the abnormalities in neighborhoods as well ashe number of frames in which each abnormality was present, areiven in Table 1.
In order to reduce the computational times, the videorames were downscaled by sub-sampling from 370×370 pix-ls (n = 136,900) to 101×101 pixels (n = 10,201) and converted torayscale so as to form the initial m×n non-negative data matrix
(Section 2.1). Preliminary experimentation with the availableataset showed that the information loss due to the sub-samplingegins to practically affect the video summarization performancehen the downscaling factor exceeds 7.5%. The overall speedup
chieved by downscaling in our experiments is approximately 77%.
.2. Summarization performance
In order to evaluate the effectiveness of the proposed method-logy in the extraction of WCE video summaries, we used two wellnown summarization quality metrics, coverage and recall [31].
Coverage is defined as the percentage of endoscopic findings ofnterest represented by at least one frame in the video and can bestimated by
overage =∑M
i=1ci
M,
i ={
1 if at least one frame from the i-th finding exists0 else
(14)
here M is the total number of abnormal findings in the video.Recall is estimated as
ecall = R
Ra(15)
Please cite this article in press as: Iakovidis DK, et al. Reduction of capsule eImaging Graph (2009), doi:10.1016/j.compmedimag.2009.11.005
here R denotes the number of frames extracted from the WCEideo that are relevant to an endoscopic finding of interest, and Ra
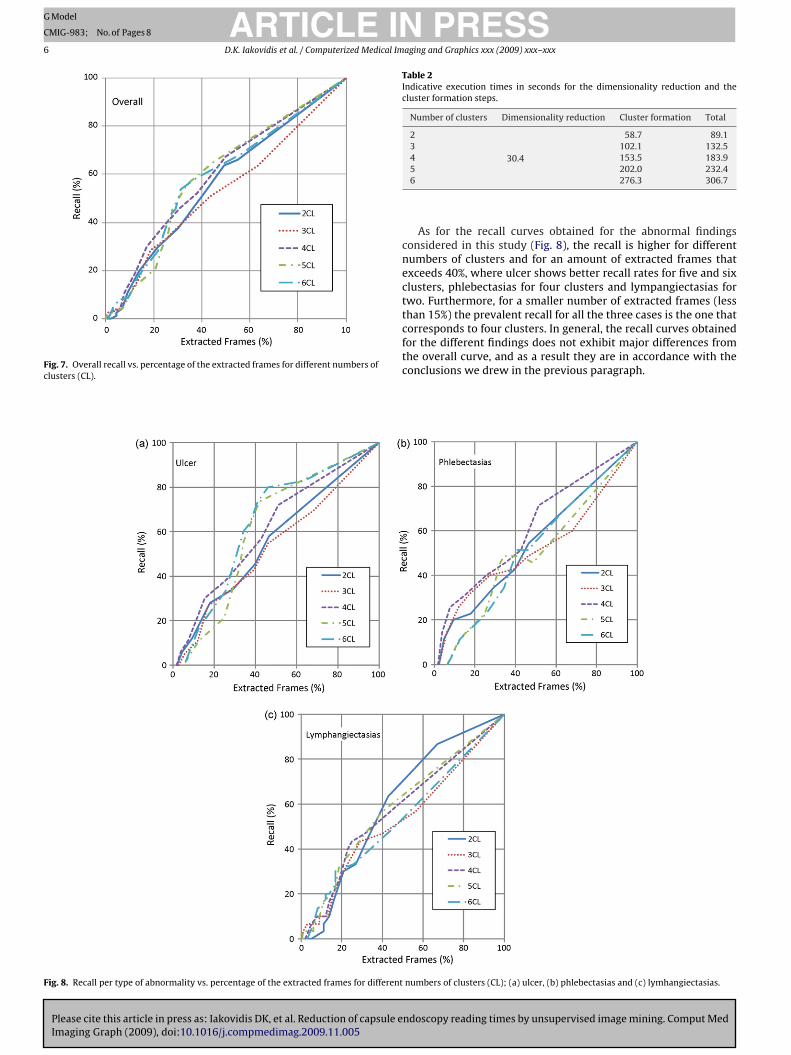
s the total number of frames relevant to that finding.Fig. 6 illustrates the coverage of the video content for vari-
us percentages of extracted frames and for different numbers of
able 1istribution of abnormal findings into neighbourhoods of video frames and frames.
Ulcers Phlebectasias Lymphangiectasias Total
Neighbourhoods 48 26 38 112Frames 1580 440 874 2894
osa, (b) ulcer, (c) phlebectasia and (d) lymphangiectasia.
clusters. It can be observed that an increase in the number of clus-ters results in an increase in the coverage for smaller populationsof extracted frames. Thus, clustering into six clusters yields 100%coverage by using only 17% of the total video frames, whereas clus-tering into two clusters results in a 100% coverage by using 25% ofthe total video frames. Therefore by increasing the total numberof clusters we achieve considerable reduction in the total numberof retrieved frames and consequently in the video reading times,without losing any information that could be threatening for thepatient’s safety.
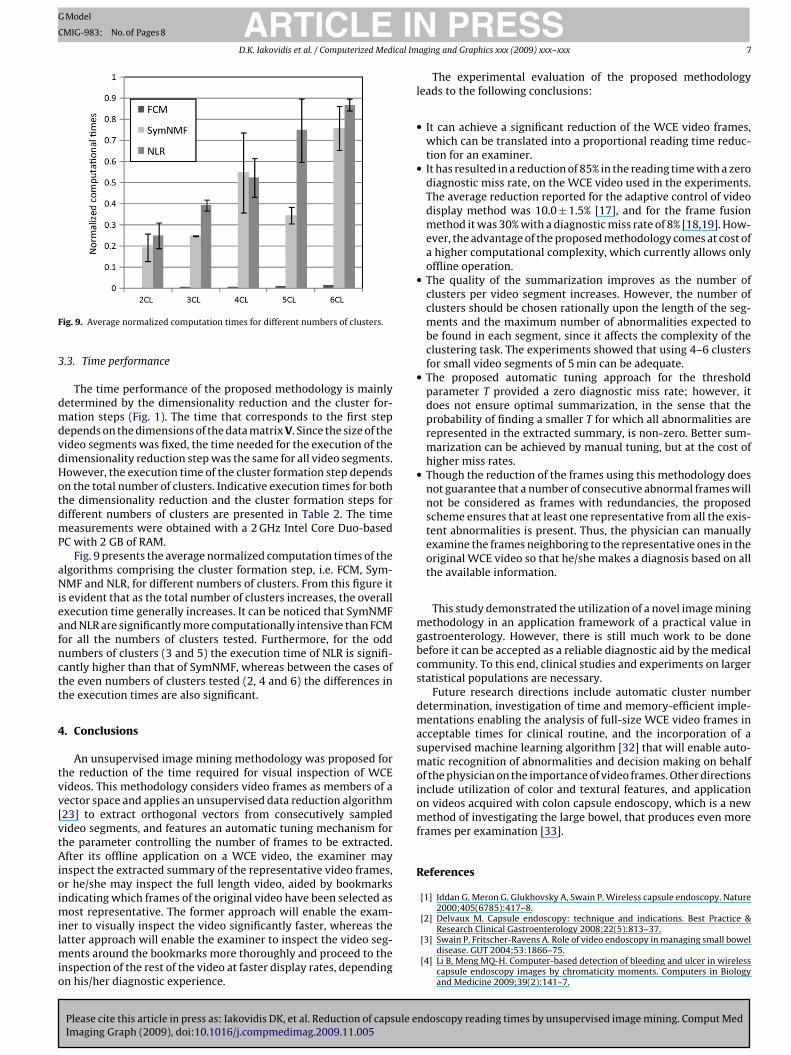
The recall versus the percentage of the extracted frames is illus-trated in Figs. 7 and 8. More specifically, Fig. 7 describes the overallrecall performance of the proposed methodology, while Fig. 8depicts the Recall curves for three different kinds of abnormalities,(a) ulcer, (b) phlebectasias and (c) lymhangiectasias.
In general, as it is demonstrated in Fig. 7, the overall recallincreases as the total number of retrieved frames increases. Thisindicates that the relevant vs the total retrieved frames ratio doesnot suffer considerable changes as the number of total retrievedframes increases, regardless the total number of clusters. However,from Fig. 7 it can be derived that for shorter summaries, an increasein the number of clusters tends to yield better recall rates. Thus, byextracting 10% of the total video frames, a 17% recall is achieved inthe case of the six clusters and just a 4% recall is obtained in the twoclusters case. Therefore, by increasing the total number of clusters
ndoscopy reading times by unsupervised image mining. Comput Med
Fig. 6. Coverage vs. percentage of the extracted frames for different numbers ofclusters (CL).
ARTICLE IN PRESSG Model
CMIG-983; No. of Pages 8
6 D.K. Iakovidis et al. / Computerized Medical Imaging and Graphics xxx (2009) xxx–xxx
Fc
Table 2Indicative execution times in seconds for the dimensionality reduction and thecluster formation steps.
Number of clusters Dimensionality reduction Cluster formation Total
2
30.4
58.7 89.13 102.1 132.54 153.5 183.9
than 15%) the prevalent recall for all the three cases is the one thatcorresponds to four clusters. In general, the recall curves obtainedfor the different findings does not exhibit major differences from
F
Please cite this article in press as: Iakovidis DK, et al. Reduction of capsule eImaging Graph (2009), doi:10.1016/j.compmedimag.2009.11.005
ig. 7. Overall recall vs. percentage of the extracted frames for different numbers oflusters (CL).
ig. 8. Recall per type of abnormality vs. percentage of the extracted frames for different
5 202.0 232.46 276.3 306.7
As for the recall curves obtained for the abnormal findingsconsidered in this study (Fig. 8), the recall is higher for differentnumbers of clusters and for an amount of extracted frames thatexceeds 40%, where ulcer shows better recall rates for five and sixclusters, phlebectasias for four clusters and lympangiectasias fortwo. Furthermore, for a smaller number of extracted frames (less
ndoscopy reading times by unsupervised image mining. Comput Med
the overall curve, and as a result they are in accordance with theconclusions we drew in the previous paragraph.
numbers of clusters (CL); (a) ulcer, (b) phlebectasias and (c) lymhangiectasias.
ARTICLE ING Model
CMIG-983; No. of Pages 8
D.K. Iakovidis et al. / Computerized Medical Im
F
3
dmdvdHotdmP
aNieafnctt
4
tvv[vtAioimilmio
[1] Iddan G, Meron G, Glukhovsky A, Swain P. Wireless capsule endoscopy. Nature2000;405(6785):417–8.
[2] Delvaux M. Capsule endoscopy: technique and indications. Best Practice &Research Clinical Gastroenterology 2008;22(5):813–37.
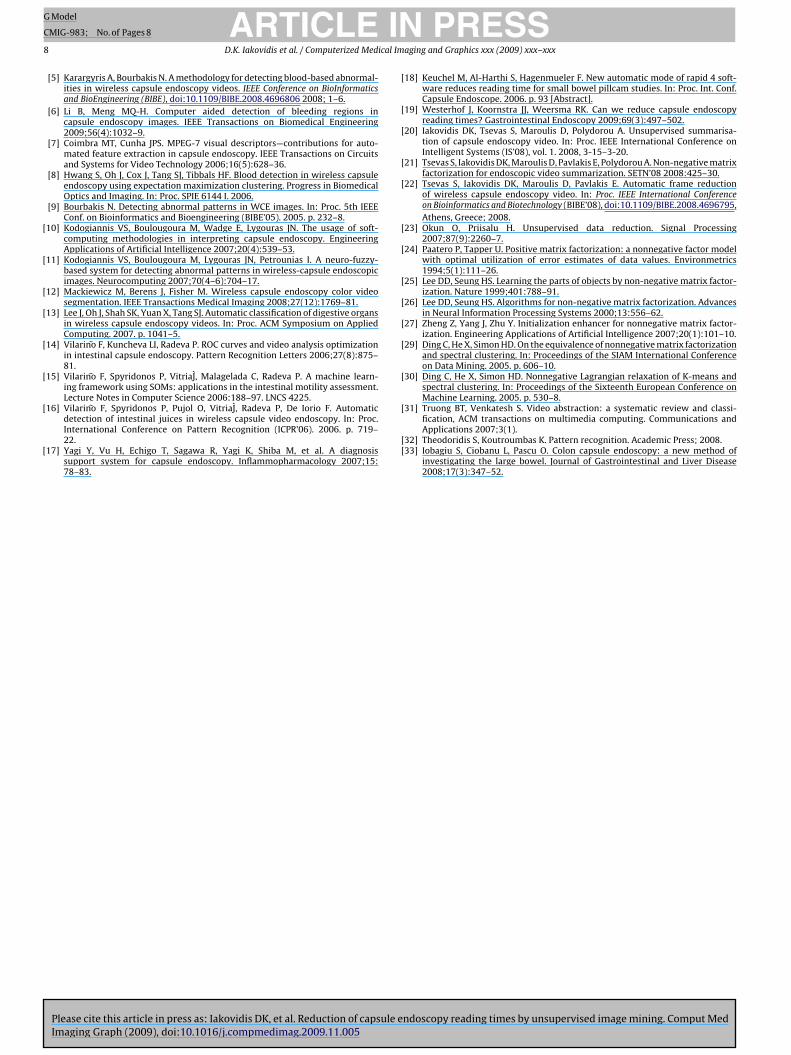
ig. 9. Average normalized computation times for different numbers of clusters.
.3. Time performance
The time performance of the proposed methodology is mainlyetermined by the dimensionality reduction and the cluster for-ation steps (Fig. 1). The time that corresponds to the first step
epends on the dimensions of the data matrix V. Since the size of theideo segments was fixed, the time needed for the execution of theimensionality reduction step was the same for all video segments.owever, the execution time of the cluster formation step dependsn the total number of clusters. Indicative execution times for bothhe dimensionality reduction and the cluster formation steps forifferent numbers of clusters are presented in Table 2. The timeeasurements were obtained with a 2 GHz Intel Core Duo-based
C with 2 GB of RAM.Fig. 9 presents the average normalized computation times of the
lgorithms comprising the cluster formation step, i.e. FCM, Sym-MF and NLR, for different numbers of clusters. From this figure it
s evident that as the total number of clusters increases, the overallxecution time generally increases. It can be noticed that SymNMFnd NLR are significantly more computationally intensive than FCMor all the numbers of clusters tested. Furthermore, for the oddumbers of clusters (3 and 5) the execution time of NLR is signifi-antly higher than that of SymNMF, whereas between the cases ofhe even numbers of clusters tested (2, 4 and 6) the differences inhe execution times are also significant.
. Conclusions
An unsupervised image mining methodology was proposed forhe reduction of the time required for visual inspection of WCEideos. This methodology considers video frames as members of aector space and applies an unsupervised data reduction algorithm23] to extract orthogonal vectors from consecutively sampledideo segments, and features an automatic tuning mechanism forhe parameter controlling the number of frames to be extracted.fter its offline application on a WCE video, the examiner may
nspect the extracted summary of the representative video frames,r he/she may inspect the full length video, aided by bookmarksndicating which frames of the original video have been selected as
ost representative. The former approach will enable the exam-ner to visually inspect the video significantly faster, whereas the
Please cite this article in press as: Iakovidis DK, et al. Reduction of capsule eImaging Graph (2009), doi:10.1016/j.compmedimag.2009.11.005
atter approach will enable the examiner to inspect the video seg-ents around the bookmarks more thoroughly and proceed to the
nspection of the rest of the video at faster display rates, dependingn his/her diagnostic experience.
PRESSaging and Graphics xxx (2009) xxx–xxx 7
The experimental evaluation of the proposed methodologyleads to the following conclusions:
• It can achieve a significant reduction of the WCE video frames,which can be translated into a proportional reading time reduc-tion for an examiner.• It has resulted in a reduction of 85% in the reading time with a zero
diagnostic miss rate, on the WCE video used in the experiments.The average reduction reported for the adaptive control of videodisplay method was 10.0±1.5% [17], and for the frame fusionmethod it was 30% with a diagnostic miss rate of 8% [18,19]. How-ever, the advantage of the proposed methodology comes at cost ofa higher computational complexity, which currently allows onlyoffline operation.• The quality of the summarization improves as the number of
clusters per video segment increases. However, the number ofclusters should be chosen rationally upon the length of the seg-ments and the maximum number of abnormalities expected tobe found in each segment, since it affects the complexity of theclustering task. The experiments showed that using 4–6 clustersfor small video segments of 5 min can be adequate.• The proposed automatic tuning approach for the threshold
parameter T provided a zero diagnostic miss rate; however, itdoes not ensure optimal summarization, in the sense that theprobability of finding a smaller T for which all abnormalities arerepresented in the extracted summary, is non-zero. Better sum-marization can be achieved by manual tuning, but at the cost ofhigher miss rates.• Though the reduction of the frames using this methodology does
not guarantee that a number of consecutive abnormal frames willnot be considered as frames with redundancies, the proposedscheme ensures that at least one representative from all the exis-tent abnormalities is present. Thus, the physician can manuallyexamine the frames neighboring to the representative ones in theoriginal WCE video so that he/she makes a diagnosis based on allthe available information.
This study demonstrated the utilization of a novel image miningmethodology in an application framework of a practical value ingastroenterology. However, there is still much work to be donebefore it can be accepted as a reliable diagnostic aid by the medicalcommunity. To this end, clinical studies and experiments on largerstatistical populations are necessary.
Future research directions include automatic cluster numberdetermination, investigation of time and memory-efficient imple-mentations enabling the analysis of full-size WCE video frames inacceptable times for clinical routine, and the incorporation of asupervised machine learning algorithm [32] that will enable auto-matic recognition of abnormalities and decision making on behalfof the physician on the importance of video frames. Other directionsinclude utilization of color and textural features, and applicationon videos acquired with colon capsule endoscopy, which is a newmethod of investigating the large bowel, that produces even moreframes per examination [33].
References
ndoscopy reading times by unsupervised image mining. Comput Med
[3] Swain P, Fritscher-Ravens A. Role of video endoscopy in managing small boweldisease. GUT 2004;53:1866–75.
[4] Li B, Meng MQ-H. Computer-based detection of bleeding and ulcer in wirelesscapsule endoscopy images by chromaticity moments. Computers in Biologyand Medicine 2009;39(2):141–7.
ING
C
8 ical Im
[
[
[
[
[
[
[
[
[
[
[
[
[
[
[
[
[
[
[
[
[
ARTICLEModel
MIG-983; No. of Pages 8
D.K. Iakovidis et al. / Computerized Med
[5] Karargyris A, Bourbakis N. A methodology for detecting blood-based abnormal-ities in wireless capsule endoscopy videos. IEEE Conference on BioInformaticsand BioEngineering (BIBE), doi:10.1109/BIBE.2008.4696806 2008; 1–6.
[6] Li B, Meng MQ-H. Computer aided detection of bleeding regions incapsule endoscopy images. IEEE Transactions on Biomedical Engineering2009;56(4):1032–9.
[7] Coimbra MT, Cunha JPS. MPEG-7 visual descriptors—contributions for auto-mated feature extraction in capsule endoscopy. IEEE Transactions on Circuitsand Systems for Video Technology 2006;16(5):628–36.
[8] Hwang S, Oh J, Cox J, Tang SJ, Tibbals HF. Blood detection in wireless capsuleendoscopy using expectation maximization clustering. Progress in BiomedicalOptics and Imaging. In: Proc. SPIE 6144 I. 2006.
[9] Bourbakis N. Detecting abnormal patterns in WCE images. In: Proc. 5th IEEEConf. on Bioinformatics and Bioengineering (BIBE’05). 2005. p. 232–8.
10] Kodogiannis VS, Boulougoura M, Wadge E, Lygouras JN. The usage of soft-computing methodologies in interpreting capsule endoscopy. EngineeringApplications of Artificial Intelligence 2007;20(4):539–53.
11] Kodogiannis VS, Boulougoura M, Lygouras JN, Petrounias I. A neuro-fuzzy-based system for detecting abnormal patterns in wireless-capsule endoscopicimages. Neurocomputing 2007;70(4–6):704–17.
12] Mackiewicz M, Berens J, Fisher M. Wireless capsule endoscopy color videosegmentation. IEEE Transactions Medical Imaging 2008;27(12):1769–81.
13] Lee J, Oh J, Shah SK, Yuan X, Tang SJ. Automatic classification of digestive organsin wireless capsule endoscopy videos. In: Proc. ACM Symposium on AppliedComputing. 2007. p. 1041–5.
14] Vilarino F, Kuncheva LI, Radeva P. ROC curves and video analysis optimizationin intestinal capsule endoscopy. Pattern Recognition Letters 2006;27(8):875–81.
15] Vilarino F, Spyridonos P, VitriaJ, Malagelada C, Radeva P. A machine learn-ing framework using SOMs: applications in the intestinal motility assessment.Lecture Notes in Computer Science 2006:188–97. LNCS 4225.
16] Vilarino F, Spyridonos P, Pujol O, VitriaJ, Radeva P, De Iorio F. Automatic
Please cite this article in press as: Iakovidis DK, et al. Reduction of capsule eImaging Graph (2009), doi:10.1016/j.compmedimag.2009.11.005
detection of intestinal juices in wireless capsule video endoscopy. In: Proc.International Conference on Pattern Recognition (ICPR’06). 2006. p. 719–22.
17] Yagi Y, Vu H, Echigo T, Sagawa R, Yagi K, Shiba M, et al. A diagnosissupport system for capsule endoscopy. Inflammopharmacology 2007;15:78–83.
[[
PRESSaging and Graphics xxx (2009) xxx–xxx
18] Keuchel M, Al-Harthi S, Hagenmueler F. New automatic mode of rapid 4 soft-ware reduces reading time for small bowel pillcam studies. In: Proc. Int. Conf.Capsule Endoscope. 2006. p. 93 [Abstract].
19] Westerhof J, Koornstra JJ, Weersma RK. Can we reduce capsule endoscopyreading times? Gastrointestinal Endoscopy 2009;69(3):497–502.
20] Iakovidis DK, Tsevas S, Maroulis D, Polydorou A. Unsupervised summarisa-tion of capsule endoscopy video. In: Proc. IEEE International Conference onIntelligent Systems (IS’08), vol. 1. 2008, 3-15–3-20.
21] Tsevas S, Iakovidis DK, Maroulis D, Pavlakis E, Polydorou A. Non-negative matrixfactorization for endoscopic video summarization. SETN’08 2008:425–30.
22] Tsevas S, Iakovidis DK, Maroulis D, Pavlakis E. Automatic frame reductionof wireless capsule endoscopy video. In: Proc. IEEE International Conferenceon Bioinformatics and Biotechnology (BIBE’08), doi:10.1109/BIBE.2008.4696795,Athens, Greece; 2008.
23] Okun O, Priisalu H. Unsupervised data reduction. Signal Processing2007;87(9):2260–7.
24] Paatero P, Tapper U. Positive matrix factorization: a nonnegative factor modelwith optimal utilization of error estimates of data values. Environmetrics1994;5(1):111–26.
25] Lee DD, Seung HS. Learning the parts of objects by non-negative matrix factor-ization. Nature 1999;401:788–91.
26] Lee DD, Seung HS. Algorithms for non-negative matrix factorization. Advancesin Neural Information Processing Systems 2000;13:556–62.
27] Zheng Z, Yang J, Zhu Y. Initialization enhancer for nonnegative matrix factor-ization. Engineering Applications of Artificial Intelligence 2007;20(1):101–10.
29] Ding C, He X, Simon HD. On the equivalence of nonnegative matrix factorizationand spectral clustering. In: Proceedings of the SIAM International Conferenceon Data Mining. 2005. p. 606–10.
30] Ding C, He X, Simon HD. Nonnegative Lagrangian relaxation of K-means andspectral clustering. In: Proceedings of the Sixteenth European Conference onMachine Learning. 2005. p. 530–8.
31] Truong BT, Venkatesh S. Video abstraction: a systematic review and classi-
ndoscopy reading times by unsupervised image mining. Comput Med
fication, ACM transactions on multimedia computing. Communications andApplications 2007;3(1).
32] Theodoridis S, Koutroumbas K. Pattern recognition. Academic Press; 2008.33] Iobagiu S, Ciobanu L, Pascu O. Colon capsule endoscopy: a new method of
investigating the large bowel. Journal of Gastrointestinal and Liver Disease2008;17(3):347–52.


