Embed Size (px)
Citation preview
Bond of GFRP Bars in Concrete: Experimental Studyand Analytical InterpretationS. P. Tastani1 and S. J. Pantazopoulou, M.ASCE2
Abstract: The local bond mechanics of glass-fiber reinforced polymer �GFRP� bars in normal strength concrete was investigated throughexperimental testing and analytical modeling. The experimental program was comprised of 30 direct tension pullout specimens with shortanchorages. A novel test setup, specially designed so as to minimize the spurious influence of testing conditions on measured bondproperties was adopted in the study. Parameters considered were the bar roughness and diameter, the size effect expressed by the constantcover to bar diameter ratio, and the external confining pressure exerted over the anchorage length by transverse externally bonded FRPsheets. Results of the study were summarized in the form of local bond-slip curves, whereby performance limit states were quantified bythe amount of loaded end slip and bond strength. An analytical model of the bond stress-slip response of a GFRP bar was derived fromfirst principles and calibrated against the test data of the present investigation. Using the calibrated model, design values for bond and slipwere estimated with reference to the code limit state model for bond.
DOI: 10.1061/�ASCE�1090-0268�2006�10:5�381�
CE Database subject headings: Fiber reinforced polymers; Bars; Roughness; Models; Concrete.
Introduction
The use of fiber-reinforced polymer �FRP� reinforcement in struc-tural construction was motivated by the poor corrosion resistanceof steel reinforcement and the need to extend the service life ofreinforced concrete structures. This is particularly relevant incases where design is controlled by durability requirements ofreinforced concrete �RC� members. As concrete reinforcement,FRP bars present some favorable characteristics such as high ten-sile strength, low weight, and durability against corrosive agents,as well as inertia to magnetic and electrical fields. But the rela-tively low elastic modulus of some FRPs and the absence of awell-defined yield plateau in their characteristic stress-straincurve render these materials incompatible with the establisheddesign framework which aims to control the hierarchy of failurein RC through rebar yielding. In this regard, composite action inFRP RC largely depends on the magnitude of bond that maydevelop at the contact interface between concrete and the barsurface.
Although widespread effort has been invested in studying thestructural behavior of concrete members with internal FRP rein-forcement, the great variety of products available �in terms of
1Civil Engineer, Ph.D. Candidate, Dept. of Civil Engineering.,Laboratory of Reinforced Concrete, Demokritus Univ. of Thrace �DUTh�,Xanthi 67100, Greece. E-mail: [email protected]
2Professor, Dept. of Civil Engineering, Laboratory of ReinforcedConcrete, Demokritus Univ. of Thrace, Xanthi 67100, Greece. E-mail:[email protected]
Note. Discussion open until March 1, 2007. Separate discussions mustbe submitted for individual papers. To extend the closing date by onemonth, a written request must be filed with the ASCE Managing Editor.The manuscript for this paper was submitted for review and possiblepublication on September 15, 2005; approved on December 16, 2005.This paper is part of the Journal of Composites for Construction, Vol.10, No. 5, October 1, 2006. ©ASCE, ISSN 1090-0268/2006/5-381–391/
$25.00.JOURNAL OF COMPOSITES F
reported material stiffness, surface characteristics and cross-sectional shapes� limit the scope of the available databank in anysingle category of bar type considered �FIB 2000�. Enrichment ofthe available database with additional bond tests is necessary inorder to establish generalized bond-slip relationships for practicaldesign. Currently, other issues affecting the structural perfor-mance of FRP products as reinforcement for concrete structures,such as resistance to sustained loads and alkaline environments,as well as susceptibility to elevated temperatures are dealt with bythe research community using the so-called environmental factorsfor reduction of the nominal material strength.
Another reason for the large range of reported bond strengthproperties of composite bars is sensitivity of bond to the test setupused in the background experimental studies. Malvar �1995� mea-sured bond strengths in the range of 5–14 MPa using a speciallydesigned direct pullout bond test where the higher the controllingactive confining pressure, the more notable the increase in bond.Using a modified beam-end test Cosenza et al. �1999� measuredbond strengths in the order of 14 MPa but the cover was unusu-ally high �5Db� thereby mobilizing a pullout failure and an almostductile response. Tepfers et al. �1998� conducted conventionalconcentric and eccentric pullout tests with study parameters suchas concrete strength, bar diameter, embedment length, and cover.Considerable scatter in bond resistance �in the range of5–22 MPa� and in the shape of the bond stress—slip relationswas reported: All curves were ductile but there was a notabledifference in the recorded slip magnitude; the difference wassmaller for eccentric as compared to the concentric pullout tests.More recently Achillides and Pilakoutas �2004� conducted con-ventional pullout tests with a resultant bond strength in the rangeof 2–14 MPa for low to moderate concrete strengths, respec-tively; smaller diameter bars developed higher bond strengthsthan larger diameter bars. Bond strength was controlled by theshear strength of the bar-cover interface when normal to highstrength concrete had been used, whereas for low strength con-
crete the bond strength was controlled by the shear strength ofOR CONSTRUCTION © ASCE / SEPTEMBER/OCTOBER 2006 / 381
concrete. This observation was also confirmed by Cosenza et al.�1999�.
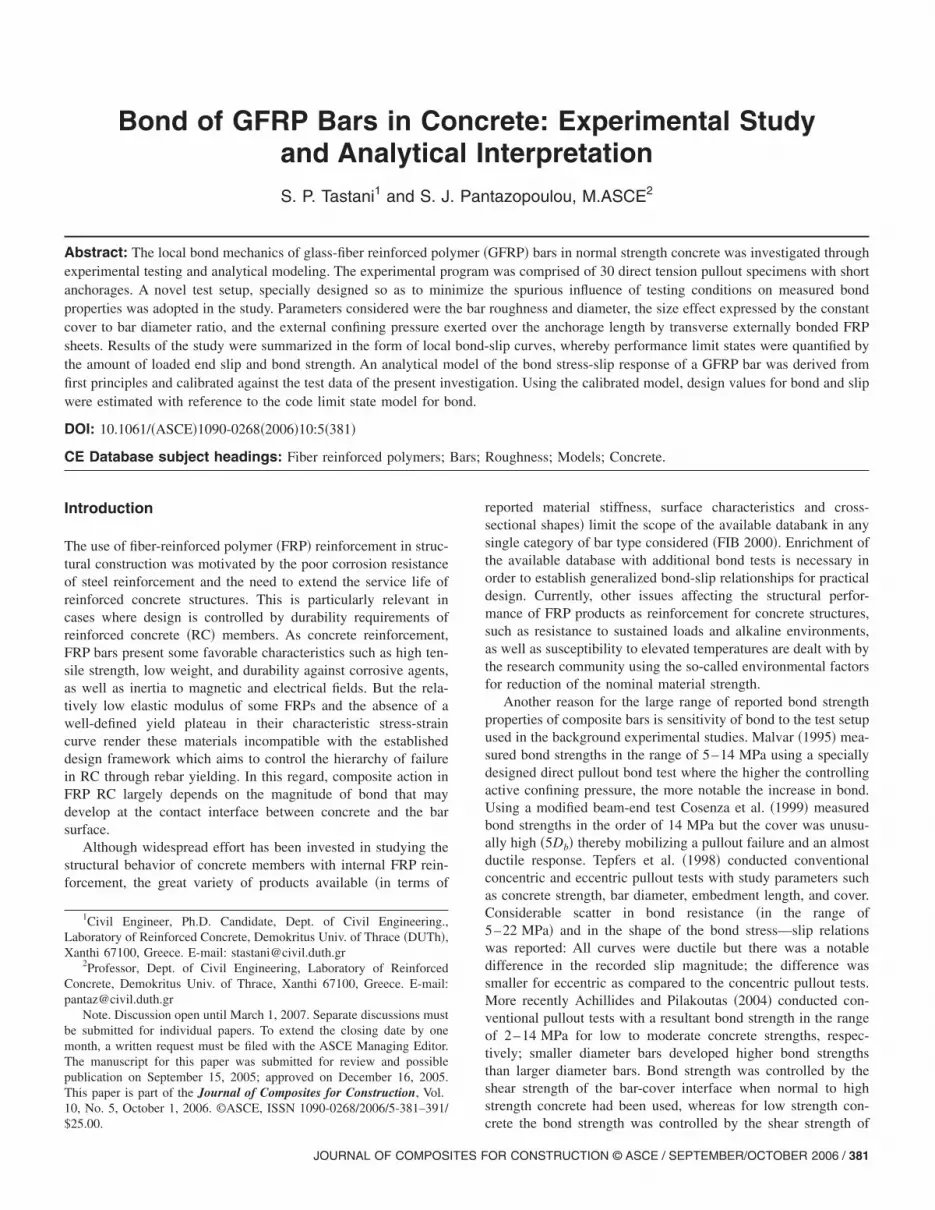
For the experimental bond values to be relevant, a criticalissue in experimental investigations of FRP bar anchorages is thatthe stress conditions in the cover concrete should resemble thoseoccurring in the tension zone of flexural members where bothmaterials are mobilized in tension �Figs. 1�a� and 2�a��. Thisstress state is very much unlike what occurs in conventional pull-out tests �Figs. 1�b� and 2�b�� where, apart from the normal con-fining pressure generated by the pullout specimen on the lateralsurface of the bar, the concrete surrounding the bar is placedunder longitudinal compression �Fig. 1�b��. The diagonal com-pression stress field from the support plate to the anchorage zoneproduces unaccountable favorable influence on the bond mecha-nism, leading to as high as a 100% increase in bond strength ascompared to beam-splice tests �Achillides and Pilakoutas 2004;Malvar 1995�. Note that the higher the normal pressure, thehigher the frictional force required for pullout and the higher thestrength reserves of the splitting failure mechanism �based on thefrictional concept for stress transfer between bar and concrete�.
The sensitivity of measured bond properties to the test setupmentioned previously emphasizes the need for the establishmentof a uniformly accepted test method whereby the tensioned bar isanchored in concrete that is also in a state of normal tension.Several test arrangements, partially or totally modified from theconventional direct pullout test have been proposed to date �Fig.2�b��, in response to this need. In general, the resulting bond-slipcurves differ depending on the global response of the specimentype and testing hardware, particularly with regards to the defor-mation capacity of the anchorage �Malvar 1995; Tepfers et al.
Fig. 1. Stress conditions of pullout tests: �a� eccentric and�b� concentric bar placement �shaded areas=longitudinalcompression and blank areas=in tension�
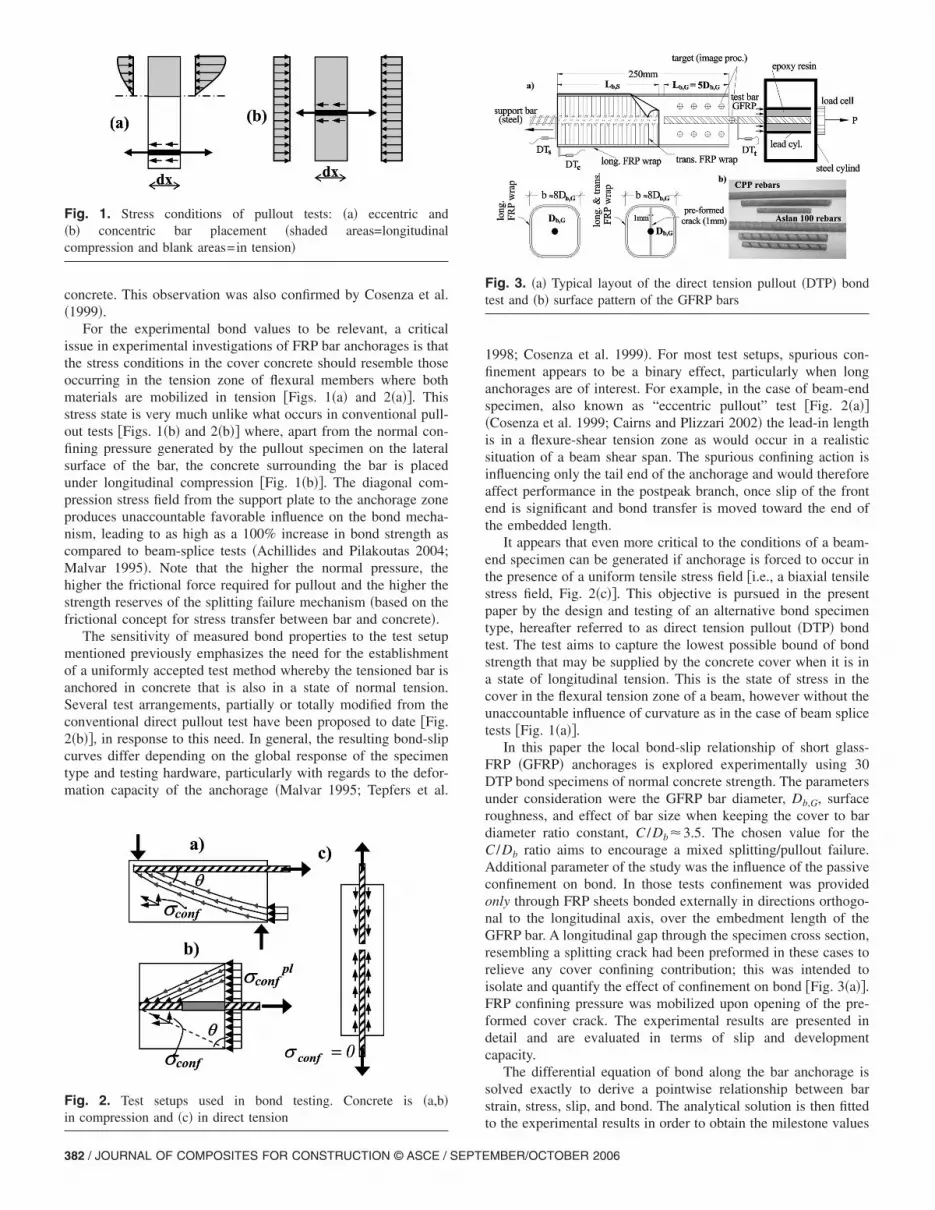
Fig. 2. Test setups used in bond testing. Concrete is �a,b�in compression and �c� in direct tension
382 / JOURNAL OF COMPOSITES FOR CONSTRUCTION © ASCE / SEPTE
1998; Cosenza et al. 1999�. For most test setups, spurious con-finement appears to be a binary effect, particularly when longanchorages are of interest. For example, in the case of beam-endspecimen, also known as “eccentric pullout” test �Fig. 2�a���Cosenza et al. 1999; Cairns and Plizzari 2002� the lead-in lengthis in a flexure-shear tension zone as would occur in a realisticsituation of a beam shear span. The spurious confining action isinfluencing only the tail end of the anchorage and would thereforeaffect performance in the postpeak branch, once slip of the frontend is significant and bond transfer is moved toward the end ofthe embedded length.
It appears that even more critical to the conditions of a beam-end specimen can be generated if anchorage is forced to occur inthe presence of a uniform tensile stress field �i.e., a biaxial tensilestress field, Fig. 2�c��. This objective is pursued in the presentpaper by the design and testing of an alternative bond specimentype, hereafter referred to as direct tension pullout �DTP� bondtest. The test aims to capture the lowest possible bound of bondstrength that may be supplied by the concrete cover when it is ina state of longitudinal tension. This is the state of stress in thecover in the flexural tension zone of a beam, however without theunaccountable influence of curvature as in the case of beam splicetests �Fig. 1�a��.
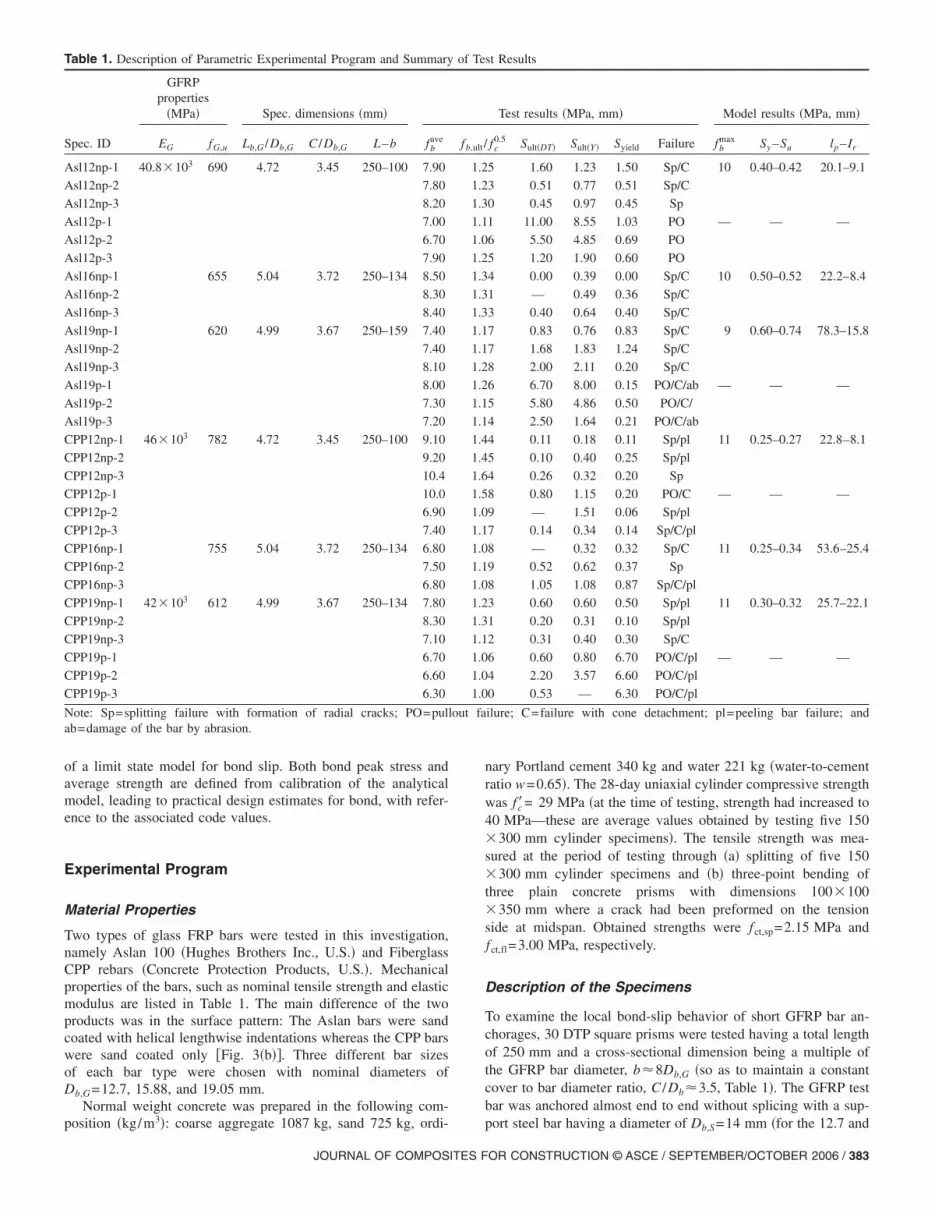
In this paper the local bond-slip relationship of short glass-FRP �GFRP� anchorages is explored experimentally using 30DTP bond specimens of normal concrete strength. The parametersunder consideration were the GFRP bar diameter, Db,G, surfaceroughness, and effect of bar size when keeping the cover to bardiameter ratio constant, C /Db�3.5. The chosen value for theC /Db ratio aims to encourage a mixed splitting/pullout failure.Additional parameter of the study was the influence of the passiveconfinement on bond. In those tests confinement was providedonly through FRP sheets bonded externally in directions orthogo-nal to the longitudinal axis, over the embedment length of theGFRP bar. A longitudinal gap through the specimen cross section,resembling a splitting crack had been preformed in these cases torelieve any cover confining contribution; this was intended toisolate and quantify the effect of confinement on bond �Fig. 3�a��.FRP confining pressure was mobilized upon opening of the pre-formed cover crack. The experimental results are presented indetail and are evaluated in terms of slip and developmentcapacity.
The differential equation of bond along the bar anchorage issolved exactly to derive a pointwise relationship between barstrain, stress, slip, and bond. The analytical solution is then fitted
Fig. 3. �a� Typical layout of the direct tension pullout �DTP� bondtest and �b� surface pattern of the GFRP bars
to the experimental results in order to obtain the milestone values
MBER/OCTOBER 2006
of a limit state model for bond slip. Both bond peak stress andaverage strength are defined from calibration of the analyticalmodel, leading to practical design estimates for bond, with refer-ence to the associated code values.
Experimental Program
Material Properties
Two types of glass FRP bars were tested in this investigation,namely Aslan 100 �Hughes Brothers Inc., U.S.� and FiberglassCPP rebars �Concrete Protection Products, U.S.�. Mechanicalproperties of the bars, such as nominal tensile strength and elasticmodulus are listed in Table 1. The main difference of the twoproducts was in the surface pattern: The Aslan bars were sandcoated with helical lengthwise indentations whereas the CPP barswere sand coated only �Fig. 3�b��. Three different bar sizesof each bar type were chosen with nominal diameters ofDb,G=12.7, 15.88, and 19.05 mm.
Normal weight concrete was prepared in the following com-3
Table 1. Description of Parametric Experimental Program and Summary
Spec. ID
GFRPproperties
�MPa� Spec. dimensions �mm�
EG fG,u Lb,G /Db,G C /Db,G L–b fbave
Asl12np-1 40.8�103 690 4.72 3.45 250–100 7.90
Asl12np-2 7.80
Asl12np-3 8.20
Asl12p-1 7.00
Asl12p-2 6.70
Asl12p-3 7.90
Asl16np-1 655 5.04 3.72 250–134 8.50
Asl16np-2 8.30
Asl16np-3 8.40
Asl19np-1 620 4.99 3.67 250–159 7.40
Asl19np-2 7.40
Asl19np-3 8.10
Asl19p-1 8.00
Asl19p-2 7.30
Asl19p-3 7.20
CPP12np-1 46�103 782 4.72 3.45 250–100 9.10
CPP12np-2 9.20
CPP12np-3 10.4
CPP12p-1 10.0
CPP12p-2 6.90
CPP12p-3 7.40
CPP16np-1 755 5.04 3.72 250–134 6.80
CPP16np-2 7.50
CPP16np-3 6.80
CPP19np-1 42�103 612 4.99 3.67 250–134 7.80
CPP19np-2 8.30
CPP19np-3 7.10
CPP19p-1 6.70
CPP19p-2 6.60
CPP19p-3 6.30
Note: Sp=splitting failure with formation of radial cracks; PO=pullab=damage of the bar by abrasion.
position �kg/m �: coarse aggregate 1087 kg, sand 725 kg, ordi-
JOURNAL OF COMPOSITES F
nary Portland cement 340 kg and water 221 kg �water-to-cementratio w=0.65�. The 28-day uniaxial cylinder compressive strengthwas fc�= 29 MPa �at the time of testing, strength had increased to40 MPa—these are average values obtained by testing five 150�300 mm cylinder specimens�. The tensile strength was mea-sured at the period of testing through �a� splitting of five 150�300 mm cylinder specimens and �b� three-point bending ofthree plain concrete prisms with dimensions 100�100�350 mm where a crack had been preformed on the tensionside at midspan. Obtained strengths were fct,sp=2.15 MPa andfct,fl=3.00 MPa, respectively.
Description of the Specimens
To examine the local bond-slip behavior of short GFRP bar an-chorages, 30 DTP square prisms were tested having a total lengthof 250 mm and a cross-sectional dimension being a multiple ofthe GFRP bar diameter, b�8Db,G �so as to maintain a constantcover to bar diameter ratio, C /Db�3.5, Table 1�. The GFRP testbar was anchored almost end to end without splicing with a sup-
st Results
Test results �MPa, mm� Model results �MPa, mm�
fc0.5 Sult�DT� Sult�Y� Syield Failure fb
max Sy –Su lp– Ir
5 1.60 1.23 1.50 Sp/C 10 0.40–0.42 20.1–9.1
3 0.51 0.77 0.51 Sp/C
0 0.45 0.97 0.45 Sp
1 11.00 8.55 1.03 PO — — —
6 5.50 4.85 0.69 PO
5 1.20 1.90 0.60 PO
4 0.00 0.39 0.00 Sp/C 10 0.50–0.52 22.2–8.4
1 — 0.49 0.36 Sp/C
3 0.40 0.64 0.40 Sp/C
7 0.83 0.76 0.83 Sp/C 9 0.60–0.74 78.3–15.8
7 1.68 1.83 1.24 Sp/C
8 2.00 2.11 0.20 Sp/C
6 6.70 8.00 0.15 PO/C/ab — — —
5 5.80 4.86 0.50 PO/C/
4 2.50 1.64 0.21 PO/C/ab
4 0.11 0.18 0.11 Sp/pl 11 0.25–0.27 22.8–8.1
5 0.10 0.40 0.25 Sp/pl
4 0.26 0.32 0.20 Sp
8 0.80 1.15 0.20 PO/C — — —
9 — 1.51 0.06 Sp/pl
7 0.14 0.34 0.14 Sp/C/pl
8 — 0.32 0.32 Sp/C 11 0.25–0.34 53.6–25.4
9 0.52 0.62 0.37 Sp
8 1.05 1.08 0.87 Sp/C/pl
3 0.60 0.60 0.50 Sp/pl 11 0.30–0.32 25.7–22.1
1 0.20 0.31 0.10 Sp/pl
2 0.31 0.40 0.30 Sp/C
6 0.60 0.80 6.70 PO/C/pl — — —
4 2.20 3.57 6.60 PO/C/pl
0 0.53 — 6.30 PO/C/pl
ilure; C=failure with cone detachment; pl=peeling bar failure; and
of Te
fb,ult /
1.2
1.2
1.3
1.1
1.0
1.2
1.3
1.3
1.3
1.1
1.1
1.2
1.2
1.1
1.1
1.4
1.4
1.6
1.5
1.0
1.1
1.0
1.1
1.0
1.2
1.3
1.1
1.0
1.0
1.0
out fa
port steel bar having a diameter of Db,S=14 mm �for the 12.7 and
OR CONSTRUCTION © ASCE / SEPTEMBER/OCTOBER 2006 / 383
15.88 mm GFRP bars� and Db,S=16 mm �for the 19.05 mmGFRP bar�. The embedment length of the GFRP bar wasLb,G�5Db,G, whereas for the steel bar Lb,S= �250−5�-Lb,G, i.e.,greater than Lb,G in order to secure bond failure along the test bar�Fig. 3�a��. To assess the influence of passive confinement on thebond mechanism, a single ply of carbon FRP �CFRP� jacket wasapplied on the lateral surface, orthogonal to the longitudinal axis,along the embedment length of the GFRP bar. The nominal valuesof the elastic modulus, tensile strength and thickness per ply ofthe fiber material �CFRP sheet� were: EC=230 GPa,fu,C=3,430 MPa, and tC=0.17 mm �commercially available prod-uct, known as MBrace Fiber, Degussa, Germany�. The corre-sponding properties of the resin were ER=3.8 GPa andfR=30 MPa shear strength �Sikadur 330, Sika, Switzerland�.Jackets were overlapped by one full side of the cross section forprotection against delamination. To avoid also premature failureof the CFRP jacket due to stress concentration at the specimen’scorners, common polyester tubes sliced lengthwise in four pieceswere placed at the corners of the molds before casting to achievea chamfering radius of approximately 15 mm �for uniformity thistechnique was applied to all specimens, even if transverse pres-sure was not a parameter of study�. In order to isolate and mea-sure the true contribution of confinement through the FRP jacketto bond, a diametric cover crack 1 mm wide was preformed alongthe embedment length of the test bar in all confined specimens�Fig. 3�a��.
In the specimen identification code �Table 1� the first threecharacters mark the bar type �either Asl or CPP�, followed by atwo digit number that refers to the bar size �12, 16, 19�. Charac-ters p and np refer to the presence or not of a simultaneous jacketconfining pressure. The last numeral refers to the specimen num-ber in the subgroup �three coupons were tested for each parametercombination�.
Preparation and Test Setup
The proposed pullout specimen comprises a concrete prism with aconcentric test bar anchored end to end with a support bar withoutsplicing �Fig. 3�a��. In conducting the DTP bond experiment, boththe test and the support bars were pulled in tension simulta-neously. Thus, force transfer was achieved from one anchorage tothe next by tension of the core concrete in the central unrein-forced portion of the specimen, but also through an external two-ply layer of CFRP sheet, bonded longitudinally over the totallength of the specimen. To prevent undesirable splitting failures inthe support region �anchorage zone of the support steel bar� anexternally bonded CFRP jacket was glued over that zone so thatthe primary fibers were oriented transversally to the longitudinalaxis of the chamfered prism. The transverse sheet was discontin-ued past the end point of the support bar anchorage, so the em-bedment length of the test bar was left entirely unconfined exceptfor specimens where confinement was a study variable. For ex-ample in the case of the Asl/CPP#p the transverse jacket com-prised two regions: Sheets were wrapped over the embedmentlength of both test and support bars in this group of specimenswith the central unreinforced region being uncovered. These pre-cautions were essential in order to discourage other undesirablefailure modes from occurring except bond failure along the testbar, which was the subject of investigation.
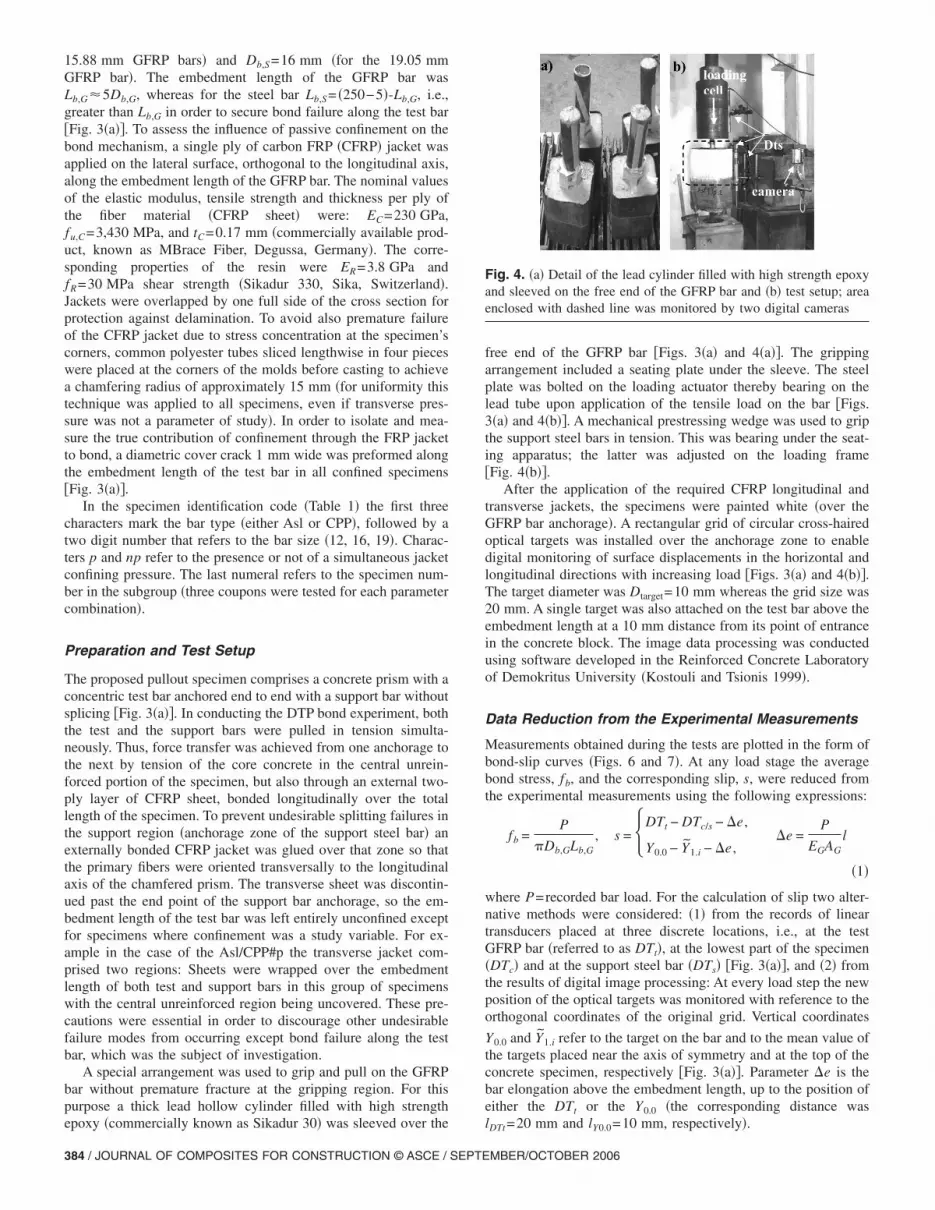
A special arrangement was used to grip and pull on the GFRPbar without premature fracture at the gripping region. For thispurpose a thick lead hollow cylinder filled with high strength
epoxy �commercially known as Sikadur 30� was sleeved over the384 / JOURNAL OF COMPOSITES FOR CONSTRUCTION © ASCE / SEPTE
free end of the GFRP bar �Figs. 3�a� and 4�a��. The grippingarrangement included a seating plate under the sleeve. The steelplate was bolted on the loading actuator thereby bearing on thelead tube upon application of the tensile load on the bar �Figs.3�a� and 4�b��. A mechanical prestressing wedge was used to gripthe support steel bars in tension. This was bearing under the seat-ing apparatus; the latter was adjusted on the loading frame�Fig. 4�b��.
After the application of the required CFRP longitudinal andtransverse jackets, the specimens were painted white �over theGFRP bar anchorage�. A rectangular grid of circular cross-hairedoptical targets was installed over the anchorage zone to enabledigital monitoring of surface displacements in the horizontal andlongitudinal directions with increasing load �Figs. 3�a� and 4�b��.The target diameter was Dtarget=10 mm whereas the grid size was20 mm. A single target was also attached on the test bar above theembedment length at a 10 mm distance from its point of entrancein the concrete block. The image data processing was conductedusing software developed in the Reinforced Concrete Laboratoryof Demokritus University �Kostouli and Tsionis 1999�.
Data Reduction from the Experimental Measurements
Measurements obtained during the tests are plotted in the form ofbond-slip curves �Figs. 6 and 7�. At any load stage the averagebond stress, fb, and the corresponding slip, s, were reduced fromthe experimental measurements using the following expressions:
fb =P
�Db,GLb,G, s = �DTt − DTc/s − �e ,
Y0.0 − Y1.i − �e ,� �e =
P
EGAGl
�1�
where P=recorded bar load. For the calculation of slip two alter-native methods were considered: �1� from the records of lineartransducers placed at three discrete locations, i.e., at the testGFRP bar �referred to as DTt�, at the lowest part of the specimen�DTc� and at the support steel bar �DTs� �Fig. 3�a��, and �2� fromthe results of digital image processing: At every load step the newposition of the optical targets was monitored with reference to theorthogonal coordinates of the original grid. Vertical coordinates
Y0.0 and Y1.i refer to the target on the bar and to the mean value ofthe targets placed near the axis of symmetry and at the top of theconcrete specimen, respectively �Fig. 3�a��. Parameter �e is thebar elongation above the embedment length, up to the position ofeither the DTt or the Y0.0 �the corresponding distance was
Fig. 4. �a� Detail of the lead cylinder filled with high strength epoxyand sleeved on the free end of the GFRP bar and �b� test setup; areaenclosed with dashed line was monitored by two digital cameras
lDTt=20 mm and lY0.0=10 mm, respectively�.
MBER/OCTOBER 2006
Experimental Results
In this section, results of the 30 DTP bond tests are used forevaluation of the bond mechanics of short GFRP bar anchorages.The primary response indices, including bond strength fb
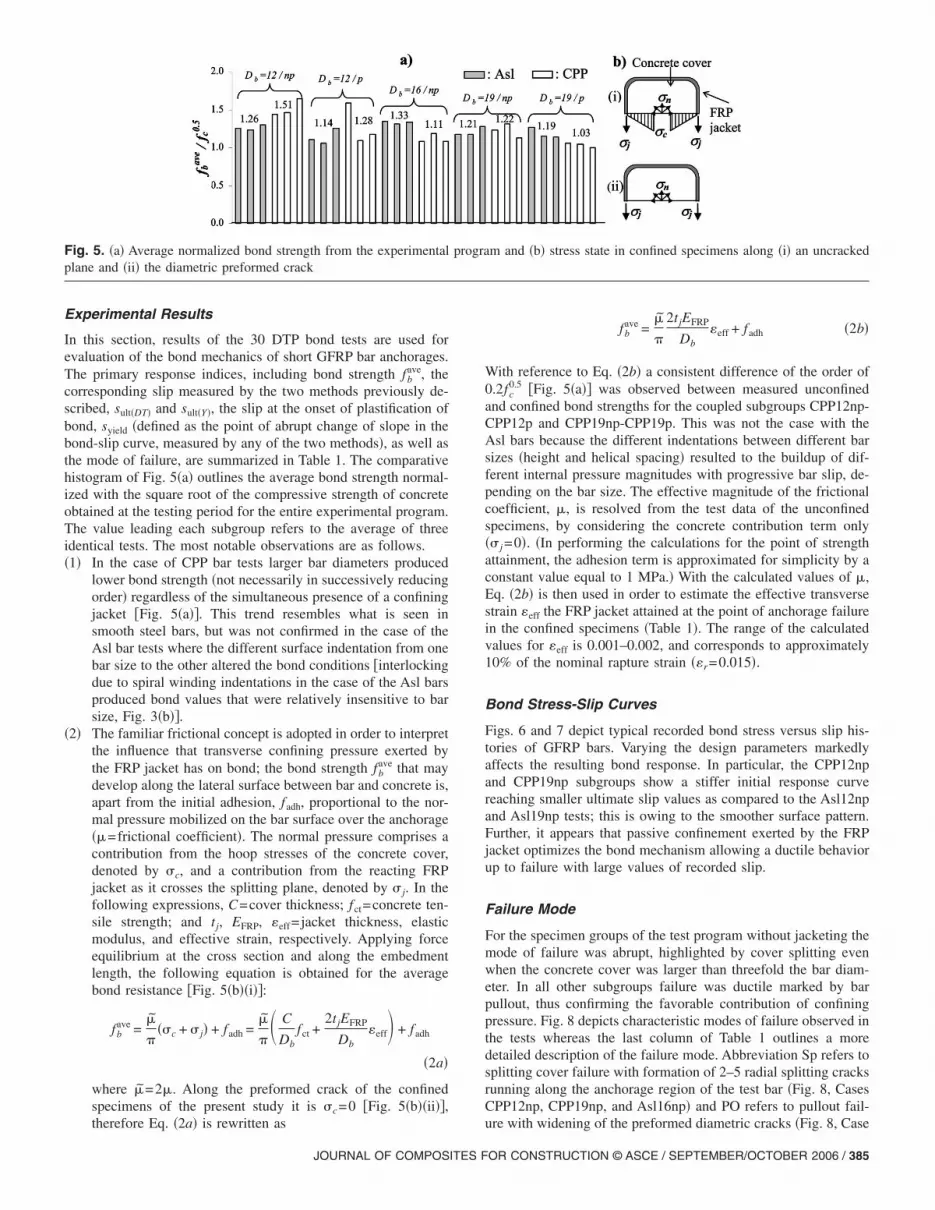
ave, thecorresponding slip measured by the two methods previously de-scribed, sult�DT� and sult�Y�, the slip at the onset of plastification ofbond, syield �defined as the point of abrupt change of slope in thebond-slip curve, measured by any of the two methods�, as well asthe mode of failure, are summarized in Table 1. The comparativehistogram of Fig. 5�a� outlines the average bond strength normal-ized with the square root of the compressive strength of concreteobtained at the testing period for the entire experimental program.The value leading each subgroup refers to the average of threeidentical tests. The most notable observations are as follows.�1� In the case of CPP bar tests larger bar diameters produced
lower bond strength �not necessarily in successively reducingorder� regardless of the simultaneous presence of a confiningjacket �Fig. 5�a��. This trend resembles what is seen insmooth steel bars, but was not confirmed in the case of theAsl bar tests where the different surface indentation from onebar size to the other altered the bond conditions �interlockingdue to spiral winding indentations in the case of the Asl barsproduced bond values that were relatively insensitive to barsize, Fig. 3�b��.
�2� The familiar frictional concept is adopted in order to interpretthe influence that transverse confining pressure exerted bythe FRP jacket has on bond; the bond strength fb
ave that maydevelop along the lateral surface between bar and concrete is,apart from the initial adhesion, fadh, proportional to the nor-mal pressure mobilized on the bar surface over the anchorage��=frictional coefficient�. The normal pressure comprises acontribution from the hoop stresses of the concrete cover,denoted by �c, and a contribution from the reacting FRPjacket as it crosses the splitting plane, denoted by � j. In thefollowing expressions, C=cover thickness; fct=concrete ten-sile strength; and tj, EFRP, �eff= jacket thickness, elasticmodulus, and effective strain, respectively. Applying forceequilibrium at the cross section and along the embedmentlength, the following equation is obtained for the averagebond resistance �Fig. 5�b��i��:
fbave =
�
���c + � j� + fadh =
�
�� C
Dbfct +
2tjEFRP
Db�eff� + fadh
�2a�
where �=2�. Along the preformed crack of the confinedspecimens of the present study it is �c=0 �Fig. 5�b��ii��,
Fig. 5. �a� Average normalized bond strength from the experimentalplane and �ii� the diametric preformed crack
therefore Eq. �2a� is rewritten as
JOURNAL OF COMPOSITES F
fbave =
�
�
2tjEFRP
Db�eff + fadh �2b�
With reference to Eq. �2b� a consistent difference of the order of0.2fc
0.5 �Fig. 5�a�� was observed between measured unconfinedand confined bond strengths for the coupled subgroups CPP12np-CPP12p and CPP19np-CPP19p. This was not the case with theAsl bars because the different indentations between different barsizes �height and helical spacing� resulted to the buildup of dif-ferent internal pressure magnitudes with progressive bar slip, de-pending on the bar size. The effective magnitude of the frictionalcoefficient, �, is resolved from the test data of the unconfinedspecimens, by considering the concrete contribution term only�� j =0�. �In performing the calculations for the point of strengthattainment, the adhesion term is approximated for simplicity by aconstant value equal to 1 MPa.� With the calculated values of �,Eq. �2b� is then used in order to estimate the effective transversestrain �eff the FRP jacket attained at the point of anchorage failurein the confined specimens �Table 1�. The range of the calculatedvalues for �eff is 0.001–0.002, and corresponds to approximately10% of the nominal rapture strain ��r=0.015�.
Bond Stress-Slip Curves
Figs. 6 and 7 depict typical recorded bond stress versus slip his-tories of GFRP bars. Varying the design parameters markedlyaffects the resulting bond response. In particular, the CPP12npand CPP19np subgroups show a stiffer initial response curvereaching smaller ultimate slip values as compared to the Asl12npand Asl19np tests; this is owing to the smoother surface pattern.Further, it appears that passive confinement exerted by the FRPjacket optimizes the bond mechanism allowing a ductile behaviorup to failure with large values of recorded slip.
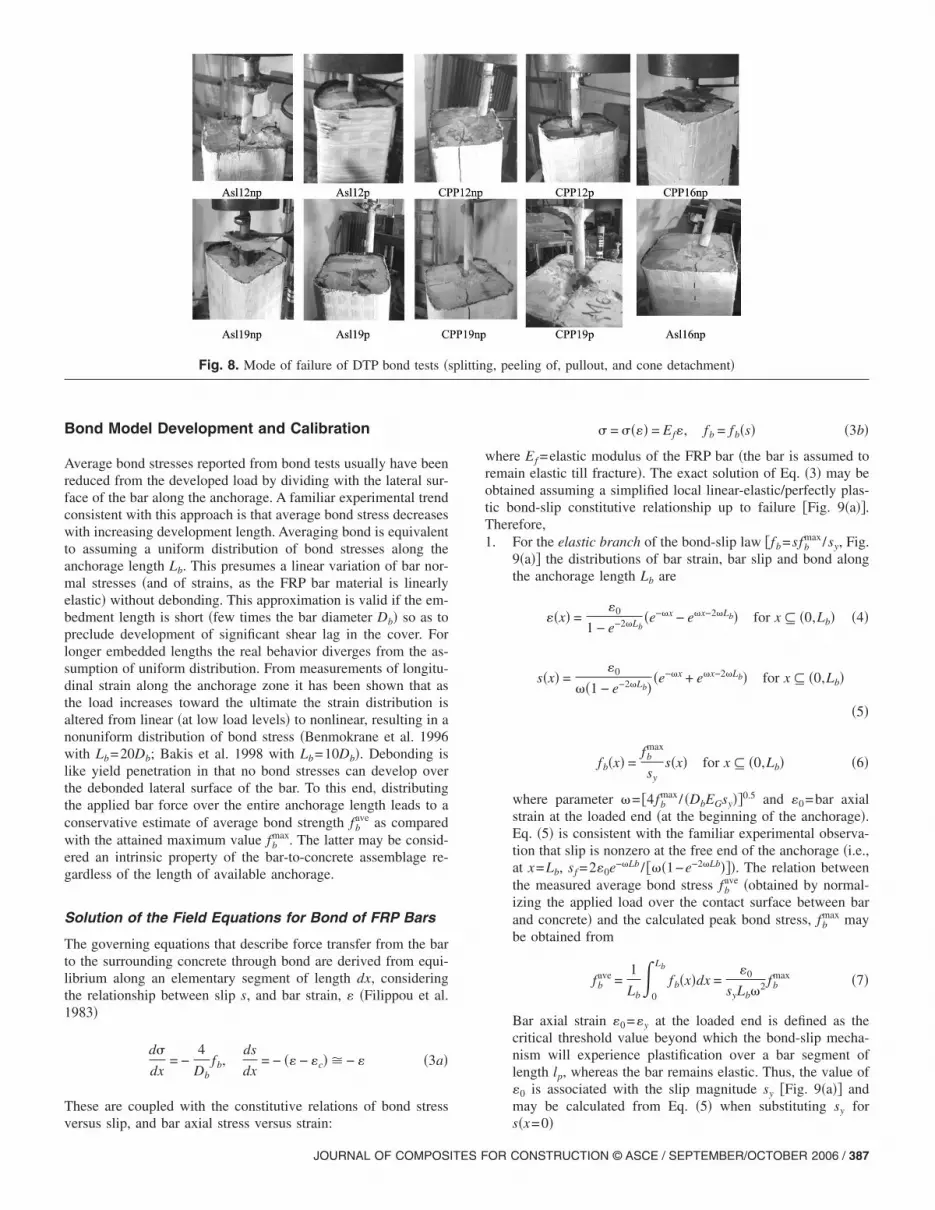
Failure Mode
For the specimen groups of the test program without jacketing themode of failure was abrupt, highlighted by cover splitting evenwhen the concrete cover was larger than threefold the bar diam-eter. In all other subgroups failure was ductile marked by barpullout, thus confirming the favorable contribution of confiningpressure. Fig. 8 depicts characteristic modes of failure observed inthe tests whereas the last column of Table 1 outlines a moredetailed description of the failure mode. Abbreviation Sp refers tosplitting cover failure with formation of 2–5 radial splitting cracksrunning along the anchorage region of the test bar �Fig. 8, CasesCPP12np, CPP19np, and Asl16np� and PO refers to pullout fail-
m and �b� stress state in confined specimens along �i� an uncracked
prograure with widening of the preformed diametric cracks �Fig. 8, Case
OR CONSTRUCTION © ASCE / SEPTEMBER/OCTOBER 2006 / 385

CPP19p�. In some cases an additional crack was also formedduring the tests, with spalling of the concrete cover or even fail-ure of the FRP confining jacket at the ultimate �Fig. 8, CasesAsl12p, CPP12p, and Asl19p�. Character C refers to failure ac-companied by cone detachment �Fig. 8, Cases Asl19np andCPP16np�. Cone failure was witnessed mostly in specimens withlarger bar diameters. When it occurred, this mode of failure wasobserved toward the end of the test without prior signs, in com-bination with either splitting or pullout of the bar.
After the end of each experiment the test bar was removedfrom the concrete block for visual assessment. Bar damage by
Fig. 6. Local bond-slip histories of Asl12np, Asl12
Fig. 7. Local bond-slip histories of CCP12np, CCP12p
386 / JOURNAL OF COMPOSITES FOR CONSTRUCTION © ASCE / SEPTE
peeling off of the sand-coated layer from the bar core is denotedby pl in Table 1 �this was the typical failure mode of the CPP barswhere peeling off was observed in the lower half of the embed-ment length�. As previously mentioned, concrete quality plays animportant role in the mode of bond failure: for moderate strengthconcrete �such as was used here, i.e., 40 MPa� usually the covershear resistance surpasses the shear strength of the interface be-tween the GFRP bar core and the exterior layer, resulting inpeeling-off failures within the bar. Finally ab in Table 1 refers tobar damage by abrasion of the exterior surface �observed in someof the Asl bars�.
6np, Asl19np, and Asl19p subgroups of specimens
16np, CPP19np, and CPP19p subgroups of specimens
p, Asl1
, CCP
MBER/OCTOBER 2006
Bond Model Development and Calibration
Average bond stresses reported from bond tests usually have beenreduced from the developed load by dividing with the lateral sur-face of the bar along the anchorage. A familiar experimental trendconsistent with this approach is that average bond stress decreaseswith increasing development length. Averaging bond is equivalentto assuming a uniform distribution of bond stresses along theanchorage length Lb. This presumes a linear variation of bar nor-mal stresses �and of strains, as the FRP bar material is linearlyelastic� without debonding. This approximation is valid if the em-bedment length is short �few times the bar diameter Db� so as topreclude development of significant shear lag in the cover. Forlonger embedded lengths the real behavior diverges from the as-sumption of uniform distribution. From measurements of longitu-dinal strain along the anchorage zone it has been shown that asthe load increases toward the ultimate the strain distribution isaltered from linear �at low load levels� to nonlinear, resulting in anonuniform distribution of bond stress �Benmokrane et al. 1996with Lb=20Db; Bakis et al. 1998 with Lb=10Db�. Debonding islike yield penetration in that no bond stresses can develop overthe debonded lateral surface of the bar. To this end, distributingthe applied bar force over the entire anchorage length leads to aconservative estimate of average bond strength fb
ave as comparedwith the attained maximum value fb
max. The latter may be consid-ered an intrinsic property of the bar-to-concrete assemblage re-gardless of the length of available anchorage.
Solution of the Field Equations for Bond of FRP Bars
The governing equations that describe force transfer from the barto the surrounding concrete through bond are derived from equi-librium along an elementary segment of length dx, consideringthe relationship between slip s, and bar strain, � �Filippou et al.1983�
d�
dx= −
4
Dbfb,
ds
dx= − �� − �c� � − � �3a�
These are coupled with the constitutive relations of bond stress
Fig. 8. Mode of failure of DTP bond tests �s
versus slip, and bar axial stress versus strain:
JOURNAL OF COMPOSITES F
� = ���� = Ef�, fb = fb�s� �3b�
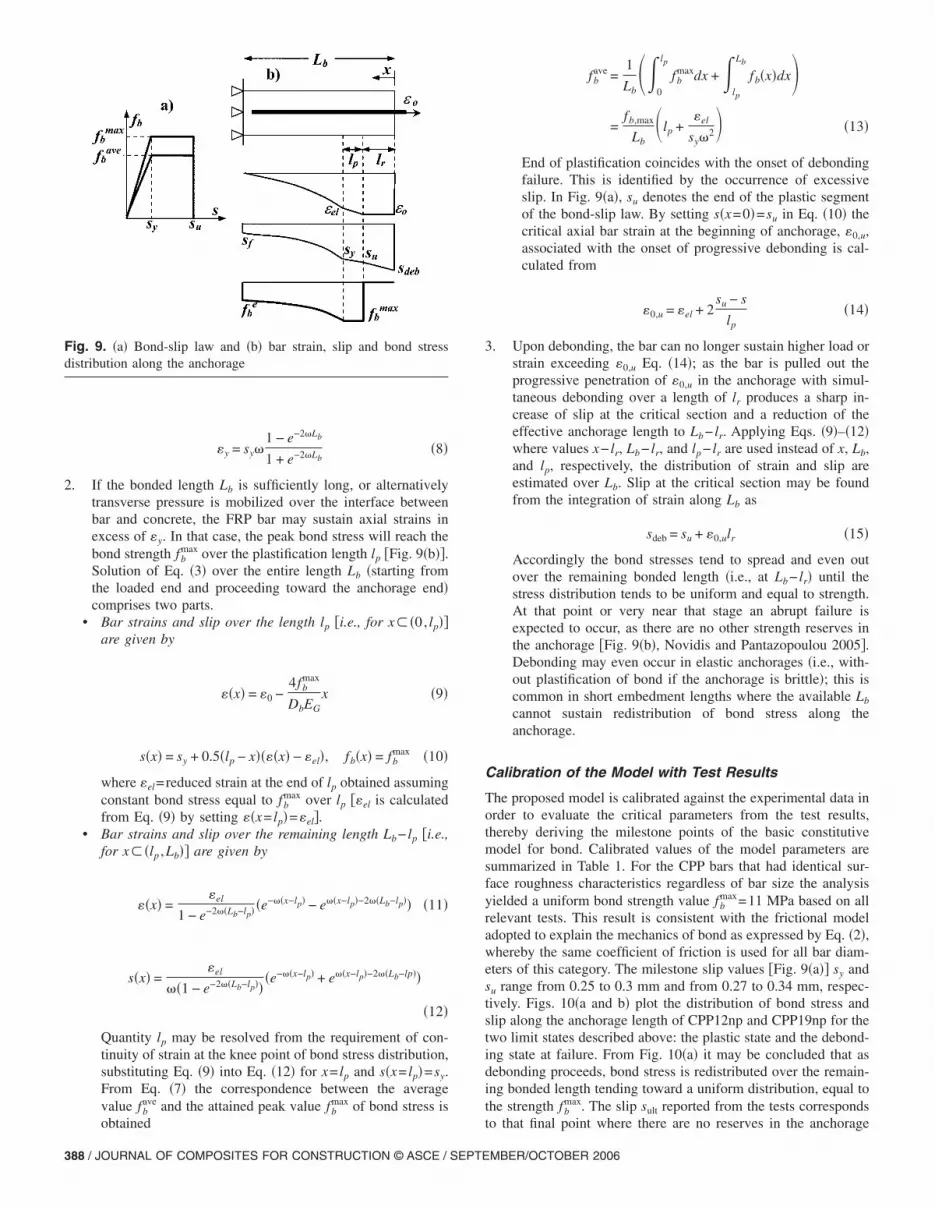
where Ef =elastic modulus of the FRP bar �the bar is assumed toremain elastic till fracture�. The exact solution of Eq. �3� may beobtained assuming a simplified local linear-elastic/perfectly plas-tic bond-slip constitutive relationship up to failure �Fig. 9�a��.Therefore,1. For the elastic branch of the bond-slip law �fb=sfb
max/sy, Fig.9�a�� the distributions of bar strain, bar slip and bond alongthe anchorage length Lb are
��x� =�0
1 − e−2�Lb�e−�x − e�x−2�Lb� for x � �0,Lb� �4�
s�x� =�0
��1 − e−2�Lb��e−�x + e�x−2�Lb� for x � �0,Lb�
�5�
fb�x� =fb
max
sys�x� for x � �0,Lb� �6�
where parameter �= 4fbmax/ �DbEGsy�0.5 and �0=bar axial
strain at the loaded end �at the beginning of the anchorage�.Eq. �5� is consistent with the familiar experimental observa-tion that slip is nonzero at the free end of the anchorage �i.e.,at x=Lb, sf =2�0e−�Lb / ��1−e−2�Lb��. The relation betweenthe measured average bond stress fb
ave �obtained by normal-izing the applied load over the contact surface between barand concrete� and the calculated peak bond stress, fb
max maybe obtained from
fbave =
1
Lb�
0
Lb
fb�x�dx =�0
syLb�2 fbmax �7�
Bar axial strain �0=�y at the loaded end is defined as thecritical threshold value beyond which the bond-slip mecha-nism will experience plastification over a bar segment oflength lp, whereas the bar remains elastic. Thus, the value of�0 is associated with the slip magnitude sy �Fig. 9�a�� andmay be calculated from Eq. �5� when substituting sy for
g, peeling of, pullout, and cone detachment�
plittins�x=0�
OR CONSTRUCTION © ASCE / SEPTEMBER/OCTOBER 2006 / 387
�y = sy�1 − e−2�Lb
1 + e−2�Lb�8�
2. If the bonded length Lb is sufficiently long, or alternativelytransverse pressure is mobilized over the interface betweenbar and concrete, the FRP bar may sustain axial strains inexcess of �y. In that case, the peak bond stress will reach thebond strength fb
max over the plastification length lp �Fig. 9�b��.Solution of Eq. �3� over the entire length Lb �starting fromthe loaded end and proceeding toward the anchorage end�comprises two parts.
• Bar strains and slip over the length lp �i.e., for x� �0, lp��are given by
��x� = �0 −4fb
max
DbEGx �9�
s�x� = sy + 0.5�lp − x����x� − �el�, fb�x� = fbmax �10�
where �el=reduced strain at the end of lp obtained assumingconstant bond stress equal to fb
max over lp ��el is calculatedfrom Eq. �9� by setting ��x= lp�=�el�.
• Bar strains and slip over the remaining length Lb− lp �i.e.,for x� �lp ,Lb�� are given by
��x� =�el
1 − e−2��Lb−lp� �e−��x−lp� − e��x−lp�−2��Lb−lp�� �11�
s�x� =�el
��1 − e−2��Lb−lp���e−��x−lp� + e��x−lp�−2��Lb−lp��
�12�
Quantity lp may be resolved from the requirement of con-tinuity of strain at the knee point of bond stress distribution,substituting Eq. �9� into Eq. �12� for x= lp and s�x= lp�=sy.From Eq. �7� the correspondence between the averagevalue fb
ave and the attained peak value fbmax of bond stress is
Fig. 9. �a� Bond-slip law and �b� bar strain, slip and bond stressdistribution along the anchorage
obtained
388 / JOURNAL OF COMPOSITES FOR CONSTRUCTION © ASCE / SEPTE
fbave =
1
Lb��
0
lp
fbmaxdx +�
lp
Lb
fb�x�dx�=
fb,max
Lb�lp +
�el
sy�2� �13�
End of plastification coincides with the onset of debondingfailure. This is identified by the occurrence of excessiveslip. In Fig. 9�a�, su denotes the end of the plastic segmentof the bond-slip law. By setting s�x=0�=su in Eq. �10� thecritical axial bar strain at the beginning of anchorage, �0,u,associated with the onset of progressive debonding is cal-culated from
�0,u = �el + 2su − s
lp�14�
3. Upon debonding, the bar can no longer sustain higher load orstrain exceeding �0,u Eq. �14�; as the bar is pulled out theprogressive penetration of �0,u in the anchorage with simul-taneous debonding over a length of lr produces a sharp in-crease of slip at the critical section and a reduction of theeffective anchorage length to Lb− lr. Applying Eqs. �9�–�12�where values x− lr, Lb− lr, and lp− lr are used instead of x, Lb,and lp, respectively, the distribution of strain and slip areestimated over Lb. Slip at the critical section may be foundfrom the integration of strain along Lb as
sdeb = su + �0,ulr �15�
Accordingly the bond stresses tend to spread and even outover the remaining bonded length �i.e., at Lb− lr� until thestress distribution tends to be uniform and equal to strength.At that point or very near that stage an abrupt failure isexpected to occur, as there are no other strength reserves inthe anchorage �Fig. 9�b�, Novidis and Pantazopoulou 2005�.Debonding may even occur in elastic anchorages �i.e., with-out plastification of bond if the anchorage is brittle�; this iscommon in short embedment lengths where the available Lb
cannot sustain redistribution of bond stress along theanchorage.
Calibration of the Model with Test Results
The proposed model is calibrated against the experimental data inorder to evaluate the critical parameters from the test results,thereby deriving the milestone points of the basic constitutivemodel for bond. Calibrated values of the model parameters aresummarized in Table 1. For the CPP bars that had identical sur-face roughness characteristics regardless of bar size the analysisyielded a uniform bond strength value fb
max=11 MPa based on allrelevant tests. This result is consistent with the frictional modeladopted to explain the mechanics of bond as expressed by Eq. �2�,whereby the same coefficient of friction is used for all bar diam-eters of this category. The milestone slip values �Fig. 9�a�� sy andsu range from 0.25 to 0.3 mm and from 0.27 to 0.34 mm, respec-tively. Figs. 10�a and b� plot the distribution of bond stress andslip along the anchorage length of CPP12np and CPP19np for thetwo limit states described above: the plastic state and the debond-ing state at failure. From Fig. 10�a� it may be concluded that asdebonding proceeds, bond stress is redistributed over the remain-ing bonded length tending toward a uniform distribution, equal tothe strength fb
max. The slip sult reported from the tests corresponds
to that final point where there are no reserves in the anchorageMBER/OCTOBER 2006
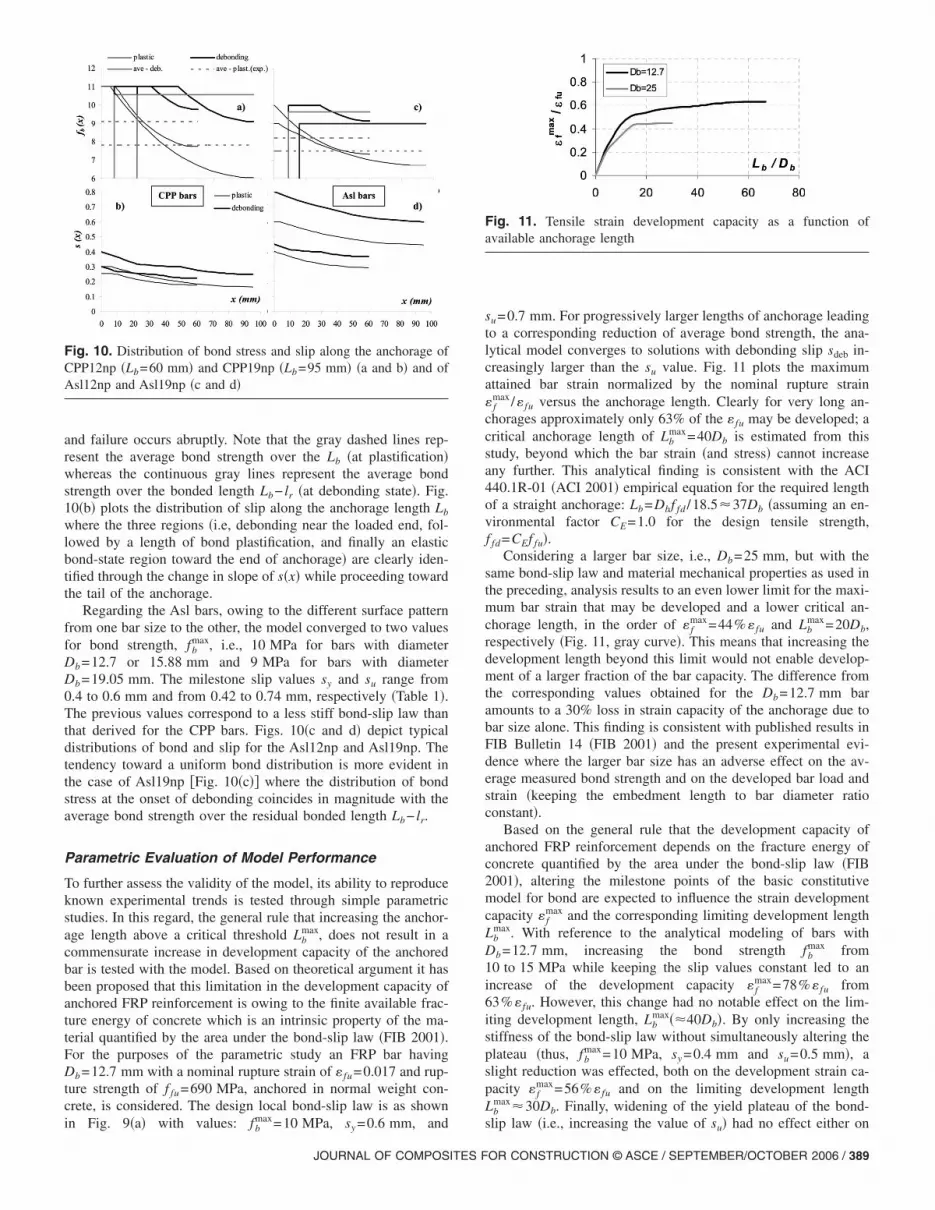
and failure occurs abruptly. Note that the gray dashed lines rep-resent the average bond strength over the Lb �at plastification�whereas the continuous gray lines represent the average bondstrength over the bonded length Lb− lr �at debonding state�. Fig.10�b� plots the distribution of slip along the anchorage length Lb
where the three regions �i.e, debonding near the loaded end, fol-lowed by a length of bond plastification, and finally an elasticbond-state region toward the end of anchorage� are clearly iden-tified through the change in slope of s�x� while proceeding towardthe tail of the anchorage.
Regarding the Asl bars, owing to the different surface patternfrom one bar size to the other, the model converged to two valuesfor bond strength, fb
max, i.e., 10 MPa for bars with diameterDb=12.7 or 15.88 mm and 9 MPa for bars with diameterDb=19.05 mm. The milestone slip values sy and su range from0.4 to 0.6 mm and from 0.42 to 0.74 mm, respectively �Table 1�.The previous values correspond to a less stiff bond-slip law thanthat derived for the CPP bars. Figs. 10�c and d� depict typicaldistributions of bond and slip for the Asl12np and Asl19np. Thetendency toward a uniform bond distribution is more evident inthe case of Asl19np �Fig. 10�c�� where the distribution of bondstress at the onset of debonding coincides in magnitude with theaverage bond strength over the residual bonded length Lb− lr.
Parametric Evaluation of Model Performance
To further assess the validity of the model, its ability to reproduceknown experimental trends is tested through simple parametricstudies. In this regard, the general rule that increasing the anchor-age length above a critical threshold Lb
max, does not result in acommensurate increase in development capacity of the anchoredbar is tested with the model. Based on theoretical argument it hasbeen proposed that this limitation in the development capacity ofanchored FRP reinforcement is owing to the finite available frac-ture energy of concrete which is an intrinsic property of the ma-terial quantified by the area under the bond-slip law �FIB 2001�.For the purposes of the parametric study an FRP bar havingDb=12.7 mm with a nominal rupture strain of � fu=0.017 and rup-ture strength of f fu=690 MPa, anchored in normal weight con-crete, is considered. The design local bond-slip law is as shown
max
Fig. 10. Distribution of bond stress and slip along the anchorage ofCPP12np �Lb=60 mm� and CPP19np �Lb=95 mm� �a and b� and ofAsl12np and Asl19np �c and d�
in Fig. 9�a� with values: fb =10 MPa, sy =0.6 mm, and
JOURNAL OF COMPOSITES F
su=0.7 mm. For progressively larger lengths of anchorage leadingto a corresponding reduction of average bond strength, the ana-lytical model converges to solutions with debonding slip sdeb in-creasingly larger than the su value. Fig. 11 plots the maximumattained bar strain normalized by the nominal rupture strain� f
max/� fu versus the anchorage length. Clearly for very long an-chorages approximately only 63% of the � fu may be developed; acritical anchorage length of Lb
max=40Db is estimated from thisstudy, beyond which the bar strain �and stress� cannot increaseany further. This analytical finding is consistent with the ACI440.1R-01 �ACI 2001� empirical equation for the required lengthof a straight anchorage: Lb=Dbf fd /18.5�37Db �assuming an en-vironmental factor CE=1.0 for the design tensile strength,f fd=CEf fu�.
Considering a larger bar size, i.e., Db=25 mm, but with thesame bond-slip law and material mechanical properties as used inthe preceding, analysis results to an even lower limit for the maxi-mum bar strain that may be developed and a lower critical an-chorage length, in the order of � f
max=44%� fu and Lbmax=20Db,
respectively �Fig. 11, gray curve�. This means that increasing thedevelopment length beyond this limit would not enable develop-ment of a larger fraction of the bar capacity. The difference fromthe corresponding values obtained for the Db=12.7 mm baramounts to a 30% loss in strain capacity of the anchorage due tobar size alone. This finding is consistent with published results inFIB Bulletin 14 �FIB 2001� and the present experimental evi-dence where the larger bar size has an adverse effect on the av-erage measured bond strength and on the developed bar load andstrain �keeping the embedment length to bar diameter ratioconstant�.
Based on the general rule that the development capacity ofanchored FRP reinforcement depends on the fracture energy ofconcrete quantified by the area under the bond-slip law �FIB2001�, altering the milestone points of the basic constitutivemodel for bond are expected to influence the strain developmentcapacity � f
max and the corresponding limiting development lengthLb
max. With reference to the analytical modeling of bars withDb=12.7 mm, increasing the bond strength fb
max from10 to 15 MPa while keeping the slip values constant led to anincrease of the development capacity � f
max=78%� fu from63%� fu. However, this change had no notable effect on the lim-iting development length, Lb
max��40Db�. By only increasing thestiffness of the bond-slip law without simultaneously altering theplateau �thus, fb
max=10 MPa, sy =0.4 mm and su=0.5 mm�, aslight reduction was effected, both on the development strain ca-pacity � f
max=56%� fu and on the limiting development lengthLb
max�30Db. Finally, widening of the yield plateau of the bond-
Fig. 11. Tensile strain development capacity as a function ofavailable anchorage length
slip law �i.e., increasing the value of su� had no effect either on
OR CONSTRUCTION © ASCE / SEPTEMBER/OCTOBER 2006 / 389
� fmax or Lb
max, although it resulted to higher values of sr �or sdeb�and an increase in the associated length of debonding, lr.
Conclusions
The local bond mechanics of glass FRP bars in normal strengthconcrete is investigated through experimental testing and analyti-cal modeling. The experimental program was conducted using anovel specimen form designed so as to measure bond when thesurrounding concrete is a state of uniform tension as occurs in thetension zone of usual flexural members. The experimental vari-ables studied included the bar size and roughness as well as thepresence of confining pressures. The formulated analytical modelwas based on the mathematical solution of the field differentialequations and was used to interpret the experimental findings andto derive the milestone points of a characteristic local bond-sliplaw for the bar types considered.
The primary conclusions from the experimental research wereas follows: �1� Local bond strength of GFRP bars anchored in atension stress field was in the order of fb
ave=6–10 MPa, i.e., lowerthan the values reported in international literature that are ob-tained from conventional pullout tests. �2� Unless confining pres-sure was provided through a transverse CFRP jacket, the mode offailure was marked by abrupt splitting of the concrete cover alongthe embedment length of the test bar, even though the cover usedwas thick enough to promote a mixed splitting/pullout failure.The effect of confining pressure over the anchorage on bondstrength was interpreted using the frictional concept for bond. Forcover thickness in the range of 3.5Db the composite material wasactivated up to only 10% of its nominal rupture strain as a resultof the limited radial displacement imposed to the surroundingconcrete by the indentations of the pulled bar as it slipped. �3�CPP bars were damaged by peeling off because the high shearstrength of the concrete cover exceeded the correspondingstrength at the interface between the sand covering layer and thebar core. Asl bars demonstrated only abrasion damage of the ex-ternal surface. �4� The generally reported trend �FIB 2000� thathigher bar diameter produce a lower bond strength was confirmedonly by the CPP tests. The Asl bars produced similar bond valuesregardless of the bar size owing to the different surface indenta-tion from one bar size to the other.
In general a range of values for the average bond strength fbave
was measured even in the same subgroup owing to the scatter inthe response of concrete under tension. The fb
ave calculated as theratio of the applied load over the lateral surface of the bar ignoresthat as debonding proceeds near instantaneous failure �while theload is sustained� the effective embedded length shortens result-ing in an increase of the actual average bond stress tending nearthe strength, fb
max. The latter is an intrinsic property of the bar-to-concrete interface as illustrated by the frictional concept for bond�2a� regardless of the available anchorage length.
A linear elastic-perfectly plastic model for the bond-slip rela-tionship of FRP bars in concrete was reduced from the test resultsthrough systematic calibration of the exact solution of the gov-erning differential equations for bond. For the CPP bars bondstrength as derived from model calibration was fb
max=11 MPa�surface pattern was identical for all bars of this type regardless ofbar size� whereas the measured average bond fb
ave ranged from6.8 to 10.4 MPa. The difference between actual bond strength andaverage bond strength is explained by the presence of progressive
390 / JOURNAL OF COMPOSITES FOR CONSTRUCTION © ASCE / SEPTE
debonding leading to terminal failure, as identified by the analyti-cal model. Overlooking this aspect of behavior in practical designleads to rather conservative magnitudes for fb
ave as compared topeak strengths. The critical slip values that define the milestoneevents of a limit state model for bond are, sy =0.25–0.3 mm andsu=0.27–0.34 mm. The relatively wide range of slip values isattributed to experimental factors affecting the measurements dueto the very small size of recorded displacements �e.g., number ofpixels required to define the optical targets in digital imaging ofdisplacements�. The corresponding magnitudes for the Asl barswere estimated as fb
max=10 MPa �for Db=12.7 and 15.88 mm�and 9 MPa �for Db=19.05 mm� due to the different surfaceroughness from one bar size to the other, and sy =0.4–0.6 mm andsu=0.42–0.74 mm. Average bond strengths were in the range offb
ave=7.4–8.5 MPa.The general rule that the increase of the anchorage length
above a critical threshold Lbmax does not result in an increase in
development capacity of the FRP bar owing to the limited fractureenergy of concrete �FIB 2001� was confirmed by the analyticalmodel.
Acknowledgments
Funding for this investigation was provided by the Hellenic Gen-eral Secretariat for Research and Technology, Greece. Tests wereconducted in the Laboratory of Reinforced Concrete, Departmentof Civil Engineering, Democritus University, Greece. The com-posite materials were generously donated by MAC BETONHELLAS S.A, SIKA Hellas and Concrete Protection ProductsInc. Asl bars were purchased from Hughes Brothers Inc.
References
Achillides, Z., and Pilakoutas, K. �2004�. “Bond behavior of fiber rein-forced polymer bars under direct pullout conditions.” J. Compos.Constr., 8�2�, 173–181.
American Concrete Institute �ACI�. �2001�. “Guide for the design andconstruction or concrete reinforced with FRP bars.” ACI 440.1R-01,ACI Committee 440, Farmington Hills, Mich.
Bakis, C., Uppuluri, V., Nanni, A., and Boothby, T. �1998�. “Analysis ofbonding mechanisms of smooth and lugged FRP rods embedded inconcrete.” Compos. Sci. Technol., 58�8�, 1307–1319.
Benmokrane, B., Tighiouart, B., and Chaallal, O. �1996�. “Bond strengthand load distribution of composite GFRP reinforcing bars in con-crete.” ACI Mater. J., 93�3�, 246–253.
Cairns, J., and Plizzari, G. A. �2002�. “Do we need a standard test forbond?” Proc., Bond in Concrete—From Research to Standards, L.Balazs, J. M. Bartos, J. Cairns, and A. Borosnyoi, eds., fib �federationinternationale du beton�, Budapest, 259–267.
Cosenza, E., Manfredi, G., Pecce, M., and Realfonzo, R. �1999� “Bondbetween glass fiber reinforced plastic reinforcing bars and concrete—Experimental analysis.” Proc., 4th Int. Symp. of FRP Reinforcementfor R.C. Structures (SP188), C. Dolan, S. Rizkalla, and A. Nanni, eds.,ACI, 347–358.
FIB Bulletin 10 �FIB�. �2000�. “Bond of reinforcement in concrete.” Rep.by former CEB Task Group 2.5, Ch.7/TG 4.2/WP 7, International Fed-eration for Concrete, Lausanne, Switzerland.
FIB Bulletin No. 14 �FIB�. �2001�. “Externally bonded FRP reinforce-ment for r. c. structures.” Rep. by Task Group 9.3/Ch.4, InternationalFederation for Structural Concrete, Lausanne, Switzerland.
Filippou, F., Popov, E., and Bertero, V. �1983�. “Modeling of r/c jointsunder cyclic excitations.” J. Struct. Eng., 109�11�, 2666–2684.
MBER/OCTOBER 2006
Kostouli, V., and Tsionis, I. �1999�. “SmartLab—Software of digitalimage processing for calculations of surface concrete strains.”Dipl. thesis, Dept. of Civil Engineering, Demokritus Univ., Xanthi,Greece.
Malvar, J. �1995�. “Tensile and bond properties of GFRP reinforcingbars” ACI Mater. J., 92�3�, 276–285.
Novidis, D., and Pantazopoulou, S. J. �2005�. “Experimental study of
JOURNAL OF COMPOSITES F
short NSM—FRP bar anchorages.” Proc., 7th Int. Symp. on FRP Re-
inforcement for R.C. Structures (FRPRCS-7), ACI, Kansas City, Kan.Tepfers, R., Hedlund, G., and Rosinski, B. �1998�. “Pull-out and tensile
reinforcement splice tests with GFRP bars.” Proc., 2nd Int. Conf. on
Composites in Infrastructure, H. Saadatmanesh and M. R. Ehsani,eds., Tucson, Ariz.
OR CONSTRUCTION © ASCE / SEPTEMBER/OCTOBER 2006 / 391


